UNITED STATES
SECURITIES AND EXCHANGE COMMISSION
Washington, D.C. 20549
FORM N-CSR
CERTIFIED SHAREHOLDER REPORT OF REGISTERED MANAGEMENT INVESTMENT COMPANIES
Investment Company Act file number 811-22245
First Trust Exchange-Traded Fund III
(Exact name of registrant as specified in charter)
120 East Liberty Drive, Suite 400
Wheaton, IL 60187
(Address of principal executive offices) (Zip code)
W. Scott Jardine, Esq.
First Trust Portfolios L.P.
120 East Liberty Drive, Suite 400
Wheaton, IL 60187
(Name and address of agent for service)
Registrant’s telephone number, including area code: (630) 765-8000
Date of fiscal year end: July 31
Date of reporting period: January 31, 2021
Form N-CSR is to be used by management investment companies to file reports with the Commission not later than 10 days after the transmission to stockholders of any report that is required to be transmitted to stockholders under Rule 30e-1 under the Investment Company Act of 1940 (17 CFR 270.30e-1). The Commission may use the information provided on Form N-CSR in its regulatory, disclosure review, inspection, and policymaking roles.
A registrant is required to disclose the information specified by Form N-CSR, and the Commission will make this information public. A registrant is not required to respond to the collection of information contained in Form N-CSR unless the Form displays a currently valid Office of Management and Budget (“OMB”) control number. Please direct comments concerning the accuracy of the information collection burden estimate and any suggestions for reducing the burden to Secretary, Securities and Exchange Commission, 100 F Street, NE, Washington, DC 20549. The OMB has reviewed this collection of information under the clearance requirements of 44 U.S.C. § 3507.
Item 1. Report to Stockholders.
(a) The Report to Shareholders is attached herewith.
First Trust Exchange-Traded Fund III
First Trust Horizon Managed Volatility Domestic ETF (HUSV)
First Trust Horizon Managed Volatility Developed International ETF (HDMV)
First Trust Horizon Managed Volatility Small/Mid ETF (HSMV)
Semi-Annual Report
For the Six Months Ended
January 31, 2021
First Trust Exchange-Traded Fund III
Semi-Annual Report
January 31, 2021
Caution Regarding Forward-Looking Statements
This report contains certain forward-looking statements within the meaning of the Securities Act of 1933, as amended, and the Securities Exchange Act of 1934, as amended. Forward-looking statements include statements regarding the goals, beliefs, plans or current expectations of First Trust Advisors L.P. (“First Trust” or the “Advisor”) and/or Horizon Investments, LLC (“Horizon” or the “Sub-Advisor”) and their respective representatives, taking into account the information currently available to them. Forward-looking statements include all statements that do not relate solely to current or historical fact. For example, forward-looking statements include the use of words such as “anticipate,” “estimate,” “intend,” “expect,” “believe,” “plan,” “may,” “should,” “would” or other words that convey uncertainty of future events or outcomes.
Forward-looking statements involve known and unknown risks, uncertainties and other factors that may cause the actual results, performance or achievements of any series of First Trust Exchange-Traded Fund III (the “Trust”) described in this report (each such series is referred to as a “Fund” and collectively, the “Funds”) to be materially different from any future results, performance or achievements expressed or implied by the forward-looking statements. When evaluating the information included in this report, you are cautioned not to place undue reliance on these forward-looking statements, which reflect the judgment of the Advisor and/or Sub-Advisor and their respective representatives only as of the date hereof. We undertake no obligation to publicly revise or update these forward-looking statements to reflect events and circumstances that arise after the date hereof.
Performance and Risk Disclosure
There is no assurance that any Fund described in this report will achieve its investment objective. Each Fund is subject to market risk, which is the possibility that the market values of securities owned by the Fund will decline and that the value of the Fund’s shares may therefore be less than what you paid for them. Accordingly, you can lose money by investing in a Fund. See “Risk Considerations” in the Additional Information section of this report for a discussion of certain other risks of investing in the Funds.
Performance data quoted represents past performance, which is no guarantee of future results, and current performance may be lower or higher than the figures shown. For the most recent month-end performance figures, please visit www.ftportfolios.com or speak with your financial advisor. Investment returns, net asset value and share price will fluctuate and Fund shares, when sold, may be worth more or less than their original cost.
The Advisor may also periodically provide additional information on Fund performance on each Fund’s web page at www.ftportfolios.com.
How to Read This Report
This report contains information that may help you evaluate your investment. It includes details about each Fund and presents data and analysis that provide insight into each Fund’s performance and investment approach.
The statistical information that follows may help you understand each Fund’s performance compared to that of a relevant market benchmark.
It is important to keep in mind that the opinions expressed by personnel of the Advisor and/or Sub-Advisor are just that: informed opinions. They should not be considered to be promises or advice. The opinions, like the statistics, cover the period through the date on the cover of this report. The material risks of investing in each Fund are spelled out in the prospectus, the statement of additional information, and other Fund regulatory filings.
First Trust Exchange-Traded Fund III
Semi-Annual Letter from the Chairman and CEO
January 31, 2021
Dear Shareholders,
First Trust is pleased to provide you with the semi-annual report for the Managed Volatility Funds of First Trust Exchange-Traded Fund III (the “Funds”), which contains detailed information about the Funds for the six months ended January 31, 2021.
There is so much to talk about, yet so little space. Rather than drill down on politics or belabor the coronavirus (“COVID-19”) pandemic, I would like to take this opportunity to convey a brief message on the current economic/business/investment climate in the U.S. The one thing I feel compelled to point out, however, is that unlike the Trump Administration’s approach of delegating the lion’s share of the responsibility of executing the medical ground assault against COVID-19 to the states, the Biden Administration has communicated its intention to play more of an integral role at the federal level. The distribution of the FDA-approved vaccines, of which there are currently three, and the push for a huge bump up in the next round of fiscal stimulus to help millions of Americans cope with the economic fallout stemming from the pandemic are just two examples. While he was hoping to make it a bipartisan effort, President Joe Biden was prepared to utilize a tactic in Congress, particularly in the Senate, known as reconciliation to pass his $1.9 trillion stimulus bill. Reconciliation would only require a simple majority of Senate votes to pass the bill. In the end, Congress did just that and the Senate passed the bill with a 50-49 count. President Biden signed the “American Rescue Plan Act” into law on March 11, 2021. Not one Republican in Congress voted for the bill.
The current climate strikes me as one where “Cash is King.” A recent survey by Money and Morning Consult found that 68% of adults said they need another stimulus check from the government to get by, and 39% of those polled claimed they need the additional financial support “a lot,” according to their own release. Overall, respondents said that the $600 checks sent out this past December were not enough. Seventy-seven percent of adults say they need the checks to exceed $1,000 and 36% say they need more than $2,000 to make ends meet. President Joe Biden’s American Rescue Plan will make payments of up to $1,400 to those who are eligible. Suffice it to say, cash tends to be an urgent priority for those who do not have it.
While most investors are likely hunting for opportunities to generate higher returns on their capital, many Americans are sitting on their cash. Brian Wesbury, Chief Economist at First Trust, recently noted that, as of the third quarter of 2020, the amount of capital held by Americans in checking accounts, savings accounts, time deposits and money market funds stood $2.8 trillion higher than their combined total in the third quarter of 2019. If you have listened to what Federal Reserve Chairman Jerome Powell has said about keeping short-term interest rates low for two or three more years if need be to significantly lower unemployment and generate inflationary pressure beyond the Federal Reserve’s 2.0% target, it makes the thought of harboring such an extraordinary volume of capital in these low-paying, interest-bearing accounts even harder to fathom, in my opinion.
The state of the U.S. economy is on the mend, but likely won’t make a full recovery for at least a couple more years, according to Wesbury. In our opinion, most of the weakness in the economy is stemming from some key service-oriented sectors, such as hotels and airlines, that remain sheltered or lightly used. Wesbury believes that a full recovery requires the reopening of the entire U.S. economy. The speed of the vaccine rollout in the weeks ahead could help determine when the economy is ready to fully reopen.
We believe investors should take solace in how upbeat our top executives are about the near future. The Conference Board’s Measure of CEO Confidence™ rose to a 17-year high in the first quarter of 2021, according to Fox Business. The measure currently stands at 73. A reading above 50 points reflects more positive than negative responses from CEOs. Its quarterly survey revealed that 82% of CEOs expect economic conditions to improve over the next six months, up from 63% in the prior survey. Forty-five percent of them expect to increase capital spending, up from 25% in the prior survey. The good news is that Corporate America’s largest companies have the cash to fund projects. In the third quarter of 2020 (most recent data), S&P 500® Industrials (Old) cash and equivalents, which excludes cash held by Financials, Utilities and Transportation companies, stood at a near-record high of $1.88 trillion, according to S&P Dow Jones Indices. The all-time high was $1.89 trillion, set in the second quarter of 2020.
It seems the economy is on the cusp of another major cash injection from the government. We encourage investors to stay the course.
Thank you for giving First Trust the opportunity to play a role in your financial future. We value our relationship with you and will report on the Funds again in six months.
Sincerely,
James A. Bowen
Chairman of the Board of Trustees
Chief Executive Officer of First Trust Advisors L.P.
Fund Performance Overview (Unaudited)
First Trust Horizon Managed Volatility Domestic ETF (HUSV)
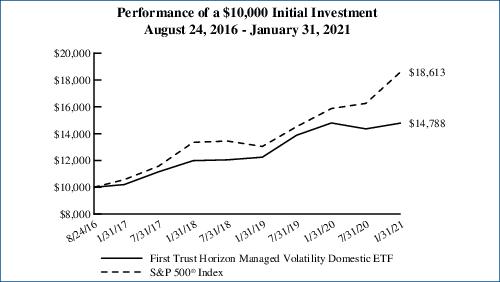
The investment objective of First Trust Horizon Managed Volatility Domestic ETF (the “Fund”) is to provide capital appreciation. Under normal market conditions, the Fund seeks to achieve its investment objective by investing at least 80% of its net assets (including investment borrowings) in common stocks of domestic companies listed and traded on U.S. national securities exchanges that Horizon Investments, LLC (“Horizon” or the “Sub-Advisor”) believes exhibit low future expected volatility. The goal of this strategy is to capture upside price movements in rising markets and reduce downside risk when markets decline. To implement this strategy, the Sub-Advisor employs volatility forecasting models to forecast future expected volatility. The strategy is largely quantitative and rules-based, but also includes multiple parameters over which the Sub-Advisor may exercise discretion (including, but not limited to, the number of holdings and the weightings of particular holdings) in connection with its active management of the Fund. Shares of the Fund are listed and trade on the NYSE Arca, Inc. under the ticker symbol “HUSV”. The first day of secondary market trading in shares of the Fund was August 25, 2016.
| Performance | | | | |
| | | | Average Annual
Total Returns | Cumulative
Total Returns |
| | 6 Months Ended
1/31/21 | 1 Year Ended
1/31/21 | Inception (8/24/16)
to 1/31/21 | Inception (8/24/16)
to 1/31/21 |
| Fund Performance | | | | |
| NAV | 3.00% | -0.07% | 9.22% | 47.88% |
| Market Price | 2.93% | -0.14% | 9.20% | 47.77% |
| Index Performance | | | | |
| S&P 500® Index | 14.47% | 17.25% | 15.03% | 86.13% |
(See Notes to Fund Performance Overview on page 9.)
Fund Performance Overview (Unaudited) (Continued)
First Trust Horizon Managed Volatility Domestic ETF (HUSV) (Continued)
| Sector Allocation | % of Total
Investments |
| Consumer Staples | 18.9% |
| Information Technology | 15.1 |
| Health Care | 13.5 |
| Industrials | 10.8 |
| Financials | 10.0 |
| Consumer Discretionary | 9.4 |
| Utilities | 8.9 |
| Communication Services | 5.7 |
| Real Estate | 4.9 |
| Materials | 2.8 |
| Total | 100.0% |
| Top Ten Holdings | % of Total
Investments |
| Oracle Corp. | 2.7% |
| Johnson & Johnson | 2.7 |
| Tyler Technologies, Inc. | 2.6 |
| Accenture PLC, Class A | 2.5 |
| Amphenol Corp., Class A | 2.5 |
| Broadridge Financial Solutions, Inc. | 2.5 |
| AT&T, Inc. | 2.4 |
| Hormel Foods Corp. | 2.4 |
| Visa, Inc., Class A | 2.3 |
| Verizon Communications, Inc. | 2.2 |
| Total | 24.8% |
Performance figures assume reinvestment of all distributions and do not reflect the deduction of taxes that a shareholder would pay on Fund distributions or the redemption or sale of Fund shares. An index is a statistical composite that tracks a specified financial market or sector. Unlike the Fund, the index does not actually hold a portfolio of securities and therefore does not incur the expenses incurred by the Fund. These expenses negatively impact the performance of the Fund. The Fund’s past performance does not predict future performance.
Frequency Distribution of Discounts and Premiums
Information showing the number of days the market price of the Fund’s shares was greater (at a premium) and less (at a discount) than the Fund’s net asset value for the most recently completed year, and the most recently completed calendar quarters since that year (or life of the Fund, if shorter), is available at https://www.ftportfolios.com/Retail/etf/home.aspx.
Fund Performance Overview (Unaudited) (Continued)
First Trust Horizon Managed Volatility Developed International ETF (HDMV)
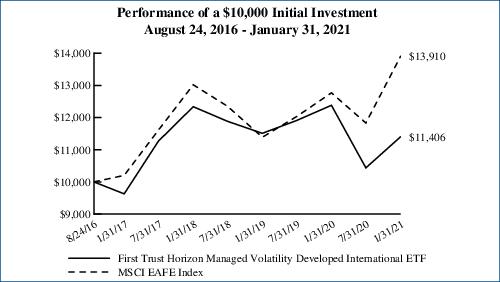
The investment objective of First Trust Horizon Managed Volatility Developed International ETF (the “Fund”) is to provide capital appreciation. Under normal market conditions, the Fund seeks to achieve its investment objective by investing at least 80% of its net assets (including investment borrowings) in common stocks and depositary receipts of developed market companies listed and traded on non-U.S. exchanges that Horizon Investments, LLC (“Horizon” or the “Sub-Advisor”) believes exhibit low future expected volatility. The term “developed market companies” means those companies (i) whose securities are traded principally on a stock exchange in a developed market country, (ii) with a primary business office in a developed market country, or (iii) that have at least 50% of their assets in, or derive at least 50% of their revenues or profits from, a developed market country. The Sub-Advisor considers Australia, Austria, Belgium, Canada, Denmark, Finland, France, Germany, Hong Kong, Ireland, Israel, Italy, Japan, Luxembourg, the Netherlands, New Zealand, Norway, Portugal, Singapore, Spain, Sweden, Switzerland, the United Kingdom and the United States to be developed market countries. However, this list may change in response to market and geopolitical events. Under normal market conditions, the Fund will invest in at least three countries and at least 40% of its net assets in countries other than the United States. Shares of the Fund are listed and trade on the NYSE Arca, Inc. under the ticker symbol “HDMV”. The first day of secondary market trading in shares of the Fund was August 25, 2016.
| Performance | | | | |
| | | | Average Annual
Total Returns | Cumulative
Total Returns |
| | 6 Months Ended
1/31/21 | 1 Year Ended
1/31/21 | Inception (8/24/16)
to 1/31/21 | Inception (8/24/16)
to 1/31/21 |
| Fund Performance | | | | |
| NAV | 9.28% | -7.88% | 3.01% | 14.06% |
| Market Price | 9.50% | -7.94% | 2.97% | 13.88% |
| Index Performance | | | | |
| MSCI EAFE Index | 17.58% | 8.94% | 7.72% | 39.10% |
(See Notes to Fund Performance Overview on page 9.)
Fund Performance Overview (Unaudited) (Continued)
First Trust Horizon Managed Volatility Developed International ETF (HDMV) (Continued)
| Sector Allocation | % of Total
Investments |
| Consumer Staples | 20.9% |
| Utilities | 14.5 |
| Industrials | 14.5 |
| Communication Services | 12.7 |
| Financials | 10.7 |
| Health Care | 7.8 |
| Consumer Discretionary | 5.3 |
| Real Estate | 5.2 |
| Information Technology | 3.2 |
| Energy | 3.1 |
| Materials | 2.1 |
| Total | 100.0% |
| Top Ten Holdings | % of Total
Investments |
| Novartis AG | 1.8% |
| Swisscom AG | 1.8 |
| Vivendi S.A. | 1.8 |
| Power Assets Holdings Ltd. | 1.7 |
| CLP Holdings, Ltd. | 1.7 |
| Nestle S.A. | 1.7 |
| McDonald’s Holdings Co., Japan Ltd. | 1.7 |
| Chugoku Electric Power (The) Co., Inc. | 1.6 |
| Japan Tobacco, Inc. | 1.6 |
| ITOCHU Corp. | 1.5 |
| Total | 16.9% |
Performance figures assume reinvestment of all distributions and do not reflect the deduction of taxes that a shareholder would pay on Fund distributions or the redemption or sale of Fund shares. An index is a statistical composite that tracks a specified financial market or sector. Unlike the Fund, the index does not actually hold a portfolio of securities and therefore does not incur the expenses incurred by the Fund. These expenses negatively impact the performance of the Fund. The Fund’s past performance does not predict future performance.
Frequency Distribution of Discounts and Premiums
Information showing the number of days the market price of the Fund’s shares was greater (at a premium) and less (at a discount) than the Fund’s net asset value for the most recently completed year, and the most recently completed calendar quarters since that year (or life of the Fund, if shorter), is available at https://www.ftportfolios.com/Retail/etf/home.aspx.
Fund Performance Overview (Unaudited) (Continued)
First Trust Horizon Managed Volatility Small/Mid ETF (HSMV)
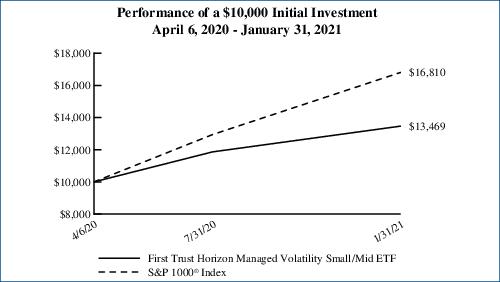
The investment objective of First Trust Horizon Managed Volatility Small/Mid ETF (the “Fund”) is to seek to provide investors with capital appreciation. Under normal market conditions, the Fund seeks to achieve its investment objective by investing at least 80% of its net assets (including investment borrowings) in small- and/or mid-capitalization common stocks listed and traded on U.S. national securities exchanges that Horizon Investments, LLC (“Horizon” or the “Sub-Advisor”) believes exhibit low future expected volatility. The goal of this strategy is to capture upside price movements in rising markets and reduce downside risk when markets decline. To implement this strategy, the Sub-Advisor employs volatility forecasting models to forecast future expected volatility. The strategy is largely quantitative and rules-based, but also includes multiple parameters over which the Sub-Advisor may exercise discretion (including, but not limited to, the number of holdings and the weightings of particular holdings) in connection with its active management of the Fund. Shares of the Fund are listed and trade on the NYSE Arca, Inc. under the ticker symbol “HSMV”. The first day of secondary market trading in shares of the Fund was April 7, 2020.
| Performance | | |
| | | Cumulative
Total Returns |
| | 6 Months Ended
1/31/21 | Inception (4/6/20)
to 1/31/21 |
| Fund Performance | | |
| NAV | 13.50% | 34.69% |
| Market Price | 13.69% | 34.64% |
| Index Performance | | |
| S&P 1000® Index | 29.86% | 68.10% |
(See Notes to Fund Performance Overview on page 9.)
Fund Performance Overview (Unaudited) (Continued)
First Trust Horizon Managed Volatility Small/Mid ETF (HSMV) (Continued)
| Sector Allocation | % of Total
Investments |
| Industrials | 18.4% |
| Information Technology | 14.4 |
| Financials | 12.4 |
| Real Estate | 11.5 |
| Consumer Staples | 11.5 |
| Utilities | 10.2 |
| Health Care | 7.3 |
| Materials | 7.1 |
| Communication Services | 3.8 |
| Consumer Discretionary | 3.4 |
| Total | 100.0% |
| Top Ten Holdings | % of Total
Investments |
| WD-40 Co. | 1.9% |
| Rayonier, Inc. | 1.9 |
| Valmont Industries, Inc. | 1.8 |
| Horace Mann Educators Corp. | 1.7 |
| Cogent Communications Holdings, Inc. | 1.7 |
| Park Aerospace Corp. | 1.6 |
| South Jersey Industries, Inc. | 1.6 |
| RLI Corp. | 1.6 |
| ALLETE, Inc. | 1.6 |
| Schweitzer-Mauduit International, Inc. | 1.6 |
| Total | 17.0% |
Performance figures assume reinvestment of all distributions and do not reflect the deduction of taxes that a shareholder would pay on Fund distributions or the redemption or sale of Fund shares. An index is a statistical composite that tracks a specified financial market or sector. Unlike the Fund, the index does not actually hold a portfolio of securities and therefore does not incur the expenses incurred by the Fund. These expenses negatively impact the performance of the Fund. The Fund’s past performance does not predict future performance.
Frequency Distribution of Discounts and Premiums
Information showing the number of days the market price of the Fund’s shares was greater (at a premium) and less (at a discount) than the Fund’s net asset value for the most recently completed year, and the most recently completed calendar quarters since that year (or life of the Fund, if shorter), is available at https://www.ftportfolios.com/Retail/etf/home.aspx.
Notes to Fund Performance Overview (Unaudited)
Total returns for the periods since inception are calculated from the inception date of each Fund. “Average Annual Total Returns” represent the average annual change in value of an investment over the periods indicated. “Cumulative Total Returns” represent the total change in value of an investment over the periods indicated.
Each Fund’s per share net asset value (“NAV”) is the value of one share of the Fund and is computed by dividing the value of all assets of the Fund (including accrued interest and dividends), less all liabilities (including accrued expenses and dividends declared but unpaid), by the total number of outstanding shares. The price used to calculate market return (“Market Price”) is determined by using the midpoint of the national best bid and offer price (“NBBO”) as of the time that the Fund’s NAV is calculated. Under SEC rules, the NBBO consists of the highest displayed buy and lowest sell prices among the various exchanges trading the Fund at the time the Fund’s NAV is calculated. Prior to January 1, 2019, the price used was the midpoint between the highest bid and the lowest offer on the stock exchange on which shares of the Fund were listed for trading as of the time that the Fund’s NAV was calculated. Since shares of each Fund did not trade in the secondary market until after the Fund’s inception, for the period from inception to the first day of secondary market trading in shares of the Fund, the NAV of each Fund is used as a proxy for the secondary market trading price to calculate market returns. NAV and market returns assume that all distributions have been reinvested in each Fund at NAV and Market Price, respectively.
An index is a statistical composite that tracks a specified financial market or sector. Unlike each Fund, the indices do not actually hold a portfolio of securities and therefore do not incur the expenses incurred by each Fund. These expenses negatively impact the performance of each Fund. Also, market returns do not include brokerage commissions that may be payable on secondary market transactions. If brokerage commissions were included, market returns would be lower. The total returns presented reflect the reinvestment of dividends on securities in the indices. The returns presented do not reflect the deduction of taxes that a shareholder would pay on Fund distributions or the redemption or sale of Fund shares. The investment return and principal value of shares of each Fund will vary with changes in market conditions. Shares of each Fund may be worth more or less than their original cost when they are redeemed or sold in the market. Each Fund’s past performance is no guarantee of future performance.
Portfolio Management
First Trust Exchange-Traded Fund III
First Trust Horizon Funds
January 31, 2021 (Unaudited)
Advisor
First Trust Advisors L.P. (“First Trust” or the “Advisor”) serves as the investment advisor to the First Trust Horizon Managed Volatility Domestic ETF (“HUSV”), the First Trust Horizon Managed Volatility Developed International ETF (“HDMV”), and the First Trust Horizon Managed Volatility Small/Mid ETF (“HSMV”) (each a “Fund” and collectively, the “Funds”). First Trust is responsible for the ongoing monitoring of each Fund’s investment portfolio, managing each Fund’s business affairs and providing certain administrative services necessary for the management of each Fund.
Sub-Advisor
Horizon Investments, LLC (“Horizon” or the “Sub-Advisor”) serves as the investment sub-advisor to the Funds.
Portfolio Management Team
The following persons serve as portfolio managers of the Funds:
Michael Dickson, PhD, Portfolio Manager of Horizon
Scott Ladner, Portfolio Manager of Horizon
Steven Clark, PhD, Portfolio Manager of Horizon
The portfolio managers are primarily and jointly responsible for the day-to-day management of the Funds. Each portfolio manager has served as part of the portfolio management team of the Funds since each Fund’s inception.
First Trust Exchange-Traded Fund III
Understanding Your Fund Expenses
January 31, 2021 (Unaudited)
As a shareholder of First Trust Horizon Managed Volatility Domestic ETF, First Trust Horizon Managed Volatility Developed International ETF or First Trust Horizon Managed Volatility Small/Mid ETF (each a “Fund” and collectively, the “Funds”), you incur two types of costs: (1) transaction costs; and (2) ongoing costs, including management fees, distribution and/or service (12b-1) fees, if any, and other Fund expenses. This Example is intended to help you understand your ongoing costs (in U.S. dollars) of investing in the Funds and to compare these costs with the ongoing costs of investing in other funds.
The Example is based on an investment of $1,000 invested at the beginning of the period and held through the six-month period ended January 31, 2021.
Actual Expenses
The first line in the following table provides information about actual account values and actual expenses. You may use the information in this line, together with the amount you invested, to estimate the expenses that you paid over the period. Simply divide your account value by $1,000 (for example, an $8,600 account value divided by $1,000 = 8.6), then multiply the result by the number in the first line under the heading entitled “Expenses Paid During the Six-Month Period” to estimate the expenses you paid on your account during this six-month period.
Hypothetical Example for Comparison Purposes
The second line in the following table provides information about hypothetical account values and hypothetical expenses based on each Fund’s actual expense ratio and an assumed rate of return of 5% per year before expenses, which is not each Fund’s actual return. The hypothetical account values and expenses may not be used to estimate the actual ending account balance or expenses you paid for the period. You may use this information to compare the ongoing costs of investing in the Funds and other funds. To do so, compare this 5% hypothetical example with the 5% hypothetical examples that appear in the shareholder reports of the other funds.
Please note that the expenses shown in the table are meant to highlight your ongoing costs only and do not reflect any transactional costs such as brokerage commissions. Therefore, the second line in the table is useful in comparing ongoing costs only, and will not help you determine the relative total costs of owning different funds. In addition, if these transactional costs were included, your costs would have been higher.
| | Beginning
Account Value
August 1, 2020 | Ending
Account Value
January 31, 2021 | Annualized
Expense Ratio
Based on the
Six-Month
Period | Expenses Paid
During the
Six-Month
Period (a) |
| First Trust Horizon Managed Volatility Domestic ETF (HUSV) |
| Actual | $1,000.00 | $1,030.00 | 0.70% | $3.58 |
| Hypothetical (5% return before expenses) | $1,000.00 | $1,021.68 | 0.70% | $3.57 |
| First Trust Horizon Managed Volatility Developed International ETF (HDMV) |
| Actual | $1,000.00 | $1,092.80 | 0.80% | $4.22 |
| Hypothetical (5% return before expenses) | $1,000.00 | $1,021.17 | 0.80% | $4.08 |
| First Trust Horizon Managed Volatility Small/Mid ETF (HSMV) |
| Actual | $1,000.00 | $1,135.00 | 0.80% | $4.31 |
| Hypothetical (5% return before expenses) | $1,000.00 | $1,021.17 | 0.80% | $4.08 |
| (a) | Expenses are equal to the annualized expense ratios as indicated in the table multiplied by the average account value over the period (August 1, 2020 through January 31, 2021), multiplied by 184/365 (to reflect the six-month period). |
First Trust Horizon Managed Volatility Domestic ETF (HUSV)
Portfolio of Investments
January 31, 2021 (Unaudited)
| Shares | | Description | | Value |
| COMMON STOCKS – 94.9% |
| | | Aerospace & Defense – 0.8% | | |
| 4,126 | | Lockheed Martin Corp. | | $1,327,829 |
| | | Air Freight & Logistics – 2.2% | | |
| 17,371 | | CH Robinson Worldwide, Inc. | | 1,486,263 |
| 23,956 | | Expeditors International of Washington, Inc. | | 2,144,541 |
| | | | | 3,630,804 |
| | | Beverages – 3.3% | | |
| 34,394 | | Coca-Cola (The) Co. | | 1,656,071 |
| 12,408 | | Monster Beverage Corp. (a) | | 1,077,386 |
| 19,417 | | PepsiCo, Inc. | | 2,651,780 |
| | | | | 5,385,237 |
| | | Capital Markets – 2.8% | | |
| 2,108 | | BlackRock, Inc. | | 1,478,256 |
| 12,149 | | Intercontinental Exchange, Inc. | | 1,340,642 |
| 12,615 | | Nasdaq, Inc. | | 1,706,431 |
| | | | | 4,525,329 |
| | | Chemicals – 2.7% | | |
| 11,284 | | International Flavors & Fragrances, Inc. | | 1,268,096 |
| 7,954 | | Linde PLC | | 1,951,911 |
| 1,867 | | Sherwin-Williams (The) Co. | | 1,291,591 |
| | | | | 4,511,598 |
| | | Commercial Services &
Supplies – 2.9% | | |
| 27,135 | | Republic Services, Inc. | | 2,456,260 |
| 20,426 | | Waste Management, Inc. | | 2,273,823 |
| | | | | 4,730,083 |
| | | Diversified Financial Services – 1.4% | | |
| 10,067 | | Berkshire Hathaway, Inc., Class B (a) | | 2,293,967 |
| | | Diversified Telecommunication
Services – 4.6% | | |
| 138,792 | | AT&T, Inc. | | 3,973,615 |
| 65,610 | | Verizon Communications, Inc. | | 3,592,148 |
| | | | | 7,565,763 |
| | | Electric Utilities – 5.4% | | |
| 58,297 | | Alliant Energy Corp. | | 2,836,149 |
| 42,660 | | American Electric Power Co., Inc. | | 3,451,621 |
| 39,280 | | Xcel Energy, Inc. | | 2,513,527 |
| | | | | 8,801,297 |
| | | Electronic Equipment,
Instruments & Components – 2.5% | | |
| 32,661 | | Amphenol Corp., Class A | | 4,078,706 |
| Shares | | Description | | Value |
|
| | | Food & Staples Retailing – 3.3% | | |
| 7,449 | | Costco Wholesale Corp. | | $2,625,251 |
| 22,274 | | Kroger (The) Co. | | 768,453 |
| 14,570 | | Walmart, Inc. | | 2,046,939 |
| | | | | 5,440,643 |
| | | Food Products – 6.2% | | |
| 21,141 | | Campbell Soup Co. | | 1,017,094 |
| 5,825 | | Hershey (The) Co. | | 847,188 |
| 84,175 | | Hormel Foods Corp. | | 3,944,440 |
| 6,433 | | JM Smucker (The) Co. | | 748,866 |
| 26,960 | | Kellogg Co. | | 1,589,022 |
| 36,312 | | Mondelez International, Inc., Class A | | 2,013,137 |
| | | | | 10,159,747 |
| | | Health Care Equipment &
Supplies – 4.9% | | |
| 28,837 | | Baxter International, Inc. | | 2,215,547 |
| 7,970 | | Becton Dickinson and Co. | | 2,086,466 |
| 8,361 | | Danaher Corp. | | 1,988,580 |
| 9,220 | | STERIS PLC | | 1,725,154 |
| | | | | 8,015,747 |
| | | Health Care Technology – 1.0% | | |
| 20,222 | | Cerner Corp. | | 1,619,984 |
| | | Hotels, Restaurants &
Leisure – 2.2% | | |
| 7,471 | | McDonald’s Corp. | | 1,552,773 |
| 20,197 | | Yum! Brands, Inc. | | 2,049,793 |
| | | | | 3,602,566 |
| | | Household Durables – 1.0% | | |
| 14,524 | | Garmin Ltd. | | 1,668,227 |
| | | Household Products – 6.0% | | |
| 23,369 | | Church & Dwight Co., Inc. | | 1,973,045 |
| 38,307 | | Colgate-Palmolive Co. | | 2,987,946 |
| 20,969 | | Kimberly-Clark Corp. | | 2,770,005 |
| 16,881 | | Procter & Gamble (The) Co. | | 2,164,313 |
| | | | | 9,895,309 |
| | | Insurance – 5.8% | | |
| 24,148 | | Allstate (The) Corp. | | 2,588,183 |
| 12,472 | | Aon PLC, Class A | | 2,533,063 |
| 15,437 | | Arthur J. Gallagher & Co. | | 1,781,584 |
| 11,834 | | Marsh & McLennan Cos., Inc. | | 1,300,675 |
| 14,893 | | Progressive (The) Corp. | | 1,298,521 |
| | | | | 9,502,026 |
| | | IT Services – 7.3% | | |
| 17,067 | | Accenture PLC, Class A | | 4,128,849 |
| 28,723 | | Broadridge Financial Solutions, Inc. | | 4,058,847 |
Page 12
See Notes to Financial Statements
First Trust Horizon Managed Volatility Domestic ETF (HUSV)
Portfolio of Investments (Continued)
January 31, 2021 (Unaudited)
| Shares | | Description | | Value |
| COMMON STOCKS (Continued) |
| | | IT Services (Continued) | | |
| 19,299 | | Visa, Inc., Class A | | $3,729,532 |
| | | | | 11,917,228 |
| | | Life Sciences Tools &
Services – 1.2% | | |
| 16,467 | | Agilent Technologies, Inc. | | 1,978,839 |
| | | Machinery – 1.3% | | |
| 23,035 | | PACCAR, Inc. | | 2,101,253 |
| | | Media – 1.1% | | |
| 2,990 | | Charter Communications, Inc., Class A (a) | | 1,816,604 |
| | | Multiline Retail – 1.1% | | |
| 9,040 | | Dollar General Corp. | | 1,759,274 |
| | | Multi-Utilities – 2.4% | | |
| 40,634 | | CMS Energy Corp. | | 2,311,262 |
| 18,057 | | WEC Energy Group, Inc. | | 1,605,267 |
| | | | | 3,916,529 |
| | | Pharmaceuticals – 6.4% | | |
| 38,938 | | Bristol-Myers Squibb Co. | | 2,391,961 |
| 27,084 | | Johnson & Johnson | | 4,418,213 |
| 24,021 | | Merck & Co., Inc. | | 1,851,299 |
| 11,977 | | Zoetis, Inc. | | 1,847,452 |
| | | | | 10,508,925 |
| | | Professional Services – 1.9% | | |
| 17,602 | | IHS Markit Ltd. | | 1,532,782 |
| 8,583 | | Verisk Analytics, Inc. | | 1,574,981 |
| | | | | 3,107,763 |
| | | Road & Rail – 0.8% | | |
| 7,119 | | Old Dominion Freight Line, Inc. | | 1,381,086 |
| | | Software – 5.3% | | |
| 74,416 | | Oracle Corp. | | 4,496,959 |
| 10,038 | | Tyler Technologies, Inc. (a) | | 4,243,966 |
| | | | | 8,740,925 |
| | | Specialty Retail – 4.3% | | |
| 8,840 | | Advance Auto Parts, Inc. | | 1,318,397 |
| 2,649 | | AutoZone, Inc. (a) | | 2,962,562 |
| 6,359 | | O’Reilly Automotive, Inc. (a) | | 2,705,564 |
| | | | | 6,986,523 |
| | | Textiles, Apparel & Luxury
Goods – 0.8% | | |
| 10,257 | | NIKE, Inc., Class B | | 1,370,233 |
| | | Trading Companies &
Distributors – 0.9% | | |
| 30,928 | | Fastenal Co. | | 1,410,008 |
| Shares | | Description | | Value |
|
| | | Water Utilities – 1.1% | | |
| 11,391 | | American Water Works Co., Inc. | | $1,811,397 |
| | | Total Common Stocks | | 155,561,449 |
| | | (Cost $148,500,703) | | |
| REAL ESTATE INVESTMENT TRUSTS – 4.9% |
| | | Equity Real Estate Investment
Trusts – 4.9% | | |
| 61,302 | | Duke Realty Corp. | | 2,425,107 |
| 17,348 | | Mid-America Apartment Communities, Inc. | | 2,302,947 |
| 16,711 | | Prologis, Inc. | | 1,724,575 |
| 7,174 | | Public Storage | | 1,632,946 |
| | | Total Real Estate Investment Trusts | | 8,085,575 |
| | | (Cost $7,247,326) | | |
| | | Total Investments – 99.8% | | 163,647,024 |
| | | (Cost $155,748,029) (b) | | |
| | | Net Other Assets and Liabilities – 0.2% | | 375,224 |
| | | Net Assets – 100.0% | | $164,022,248 |
|
| (a) | Non-income producing security. |
| (b) | Aggregate cost for financial reporting purposes approximates the aggregate cost for federal income tax purposes. As of January 31, 2021, the aggregate gross unrealized appreciation for all investments in which there was an excess of value over tax cost was $11,382,490 and the aggregate gross unrealized depreciation for all investments in which there was an excess of tax cost over value was $3,483,495. The net unrealized appreciation was $7,898,995. |
Valuation Inputs
A summary of the inputs used to value the Fund’s investments as of January 31, 2021 is as follows (see Note 2A - Portfolio Valuation in the Notes to Financial Statements):
| | Total
Value at
1/31/2021 | Level 1
Quoted
Prices | Level 2
Significant
Observable
Inputs | Level 3
Significant
Unobservable
Inputs |
| Common Stocks* | $ 155,561,449 | $ 155,561,449 | $ — | $ — |
| Real Estate Investment Trusts* | 8,085,575 | 8,085,575 | — | — |
| Total Investments | $ 163,647,024 | $ 163,647,024 | $— | $— |
| * | See Portfolio of Investments for industry breakout. |
See Notes to Financial Statements
Page 13
First Trust Horizon Managed Volatility Developed International ETF (HDMV)
Portfolio of Investments
January 31, 2021 (Unaudited)
| Shares | | Description | | Value |
| COMMON STOCKS (a) – 98.1% |
| | | Australia – 4.4% | | |
| 39,165 | | AGL Energy Ltd. (b) | | $342,363 |
| 12,388 | | ASX Ltd. (b) | | 676,906 |
| 495,151 | | AusNet Services (b) | | 651,813 |
| 50,551 | | Coles Group Ltd. (b) | | 699,791 |
| 211,826 | | Telstra Corp., Ltd. (b) | | 503,059 |
| 17,963 | | Wesfarmers Ltd. (b) | | 745,632 |
| 14,608 | | Woolworths Group Ltd. (b) | | 454,363 |
| | | | | 4,073,927 |
| | | Denmark – 2.4% | | |
| 4,803 | | Coloplast A.S., Class B (b) | | 716,934 |
| 11,136 | | Novo Nordisk A.S., Class B (b) | | 775,825 |
| 23,276 | | Tryg A.S. (b) | | 724,122 |
| | | | | 2,216,881 |
| | | France – 7.4% | | |
| 3,885 | | Air Liquide S.A. (b) | | 635,380 |
| 40,619 | | Carrefour S.A. (b) | | 688,795 |
| 10,344 | | Danone S.A. (b) | | 687,862 |
| 940 | | Hermes International (b) | | 959,117 |
| 1,591 | | L’Oreal S.A. (b) | | 559,714 |
| 3,216 | | Pernod Ricard S.A. (b) | | 606,094 |
| 8,415 | | Sanofi (b) | | 791,416 |
| 52,351 | | Vivendi S.A. (b) | | 1,608,668 |
| | | | | 6,537,046 |
| | | Germany – 6.7% | | |
| 7,540 | | Beiersdorf AG (b) | | 823,030 |
| 39,525 | | Deutsche Telekom AG (b) | | 702,856 |
| 98,656 | | E.ON SE (b) | | 1,043,637 |
| 7,885 | | Fresenius Medical Care AG & Co., KGaA (b) | | 637,888 |
| 4,945 | | Knorr-Bremse AG (b) | | 654,380 |
| 5,147 | | LEG Immobilien AG (b) | | 737,831 |
| 14,716 | | Siemens Healthineers AG (b) (c) (d) | | 825,295 |
| 260,490 | | Telefonica Deutschland Holding AG (b) | | 713,858 |
| | | | | 6,138,775 |
| | | Hong Kong – 8.8% | | |
| 270,394 | | BOC Hong Kong Holdings Ltd. (b) | | 806,316 |
| 167,001 | | CLP Holdings, Ltd. (b) | | 1,567,232 |
| 152,493 | | Henderson Land Development Co., Ltd. (b) | | 623,693 |
| 933,875 | | Hong Kong & China Gas Co., Ltd. (b) | | 1,341,264 |
| 145,283 | | MTR Corp., Ltd. (b) | | 843,120 |
| 2,091,924 | | PCCW Ltd. (b) | | 1,163,332 |
| 298,650 | | Power Assets Holdings Ltd. (b) | | 1,584,834 |
| | | | | 7,929,791 |
| | | Ireland – 0.8% | | |
| 5,519 | | Kerry Group PLC, Class A (b) | | 748,968 |
| Shares | | Description | | Value |
|
| | | Israel – 0.8% | | |
| 5,661 | | Check Point Software Technologies Ltd. (e) | | $723,136 |
| | | Italy – 0.6% | | |
| 78,138 | | Terna Rete Elettrica Nazionale S.p.A (b) | | 566,669 |
| | | Japan – 28.0% | | |
| 9,600 | | Calbee, Inc. (b) | | 283,904 |
| 36,400 | | Chubu Electric Power Co., Inc. (b) | | 445,818 |
| 117,400 | | Chugoku Electric Power (The) Co., Inc. (b) | | 1,447,645 |
| 1,500 | | Daikin Industries Ltd. (b) | | 316,699 |
| 142,200 | | ENEOS Holdings, Inc. (b) | | 576,301 |
| 1,900 | | Hirose Electric Co., Ltd. (b) | | 298,316 |
| 44,200 | | Idemitsu Kosan Co., Ltd. (b) | | 1,037,990 |
| 47,100 | | ITOCHU Corp. (b) | | 1,348,896 |
| 6,100 | | Itochu Techno-Solutions Corp. (b) | | 215,050 |
| 71,100 | | Japan Tobacco, Inc. (b) | | 1,412,351 |
| 9,000 | | JSR Corp. (b) | | 274,641 |
| 30,100 | | Kansai Electric Power (The) Co., Inc. (b) | | 295,112 |
| 12,600 | | Kansai Paint Co. Ltd. (b) | | 370,882 |
| 9,800 | | Kao Corp. (b) | | 711,057 |
| 12,700 | | KDDI Corp. (b) | | 373,288 |
| 6,500 | | Keihan Holdings Co., Ltd. (b) | | 296,327 |
| 1,200 | | Keyence Corp. (b) | | 644,258 |
| 3,500 | | Kobayashi Pharmaceutical Co., Ltd. (b) | | 394,132 |
| 9,000 | | Kyocera Corp. (b) | | 576,830 |
| 33,100 | | Kyushu Electric Power Co., Inc. (b) | | 307,073 |
| 6,300 | | Lawson, Inc. (b) | | 305,977 |
| 31,100 | | McDonald’s Holdings Co., Japan Ltd. (b) | | 1,516,584 |
| 15,100 | | MEIJI Holdings Co., Ltd. (b) | | 1,030,725 |
| 37,800 | | Mitsubishi Corp. (b) | | 957,554 |
| 31,300 | | Mitsubishi Electric Corp. (b) | | 477,475 |
| 17,000 | | Mitsui & Co., Ltd. (b) | | 315,428 |
| 23,700 | | MS&AD Insurance Group Holdings, Inc. (b) | | 681,881 |
| 5,000 | | Murata Manufacturing Co., Ltd. (b) | | 480,240 |
| 32,800 | | Nagoya Railroad Co., Ltd. (b) | | 835,407 |
| 500 | | Nintendo Co., Ltd. (b) | | 287,818 |
| 16,500 | | Nippon Telegraph & Telephone Corp. (b) | | 412,398 |
| 6,400 | | Nissin Foods Holdings Co., Ltd. (b) | | 553,178 |
| 3,000 | | Nitto Denko Corp. (b) | | 271,927 |
| 20,100 | | Osaka Gas Co., Ltd. (b) | | 371,703 |
| 3,100 | | Rinnai Corp. (b) | | 323,790 |
| 6,200 | | Secom Co., Ltd. (b) | | 561,776 |
| 19,800 | | Sega Sammy Holdings, Inc. (b) | | 315,354 |
Page 14
See Notes to Financial Statements
First Trust Horizon Managed Volatility Developed International ETF (HDMV)
Portfolio of Investments (Continued)
January 31, 2021 (Unaudited)
| Shares | | Description | | Value |
| COMMON STOCKS (a) (Continued) |
| | | Japan (Continued) | | |
| 148,700 | | Seven Bank Ltd. (b) | | $327,595 |
| 67,200 | | Shizuoka Bank (The), Ltd. (b) | | 488,507 |
| 93,000 | | Softbank Corp. (b) | | 1,221,691 |
| 4,900 | | Sohgo Security Services Co., Ltd. (b) | | 241,118 |
| 2,900 | | Sony Corp. (b) | | 277,567 |
| 5,100 | | Takeda Pharmaceutical Co., Ltd. (b) | | 179,365 |
| 18,300 | | Teijin Ltd. (b) | | 334,789 |
| 73,400 | | Tohoku Electric Power Co., Inc. (b) | | 629,955 |
| 7,300 | | Toyota Motor Corp. (b) | | 511,992 |
| 10,500 | | USS Co., Ltd. (b) | | 206,762 |
| | | | | 25,745,126 |
| | | Netherlands – 3.5% | | |
| 36,835 | | Koninklijke Ahold Delhaize N.V. (b) | | 1,057,332 |
| 24,509 | | Koninklijke Vopak N.V. (b) | | 1,240,467 |
| 9,828 | | Wolters Kluwer N.V. (b) | | 816,612 |
| | | | | 3,114,411 |
| | | New Zealand – 1.0% | | |
| 258,967 | | Spark New Zealand Ltd. (b) | | 889,125 |
| | | Norway – 0.8% | | |
| 76,092 | | Orkla ASA (b) | | 739,666 |
| | | Singapore – 6.0% | | |
| 299,500 | | CapitaLand Ltd. (b) | | 719,894 |
| 37,300 | | DBS Group Holdings Ltd. (b) | | 703,376 |
| 197,000 | | Keppel Corp., Ltd. (b) | | 740,452 |
| 164,100 | | Oversea-Chinese Banking Corp., Ltd. (b) | | 1,271,817 |
| 521,800 | | Singapore Telecommunications Ltd. (b) | | 924,393 |
| 64,500 | | United Overseas Bank Ltd. (b) | | 1,133,253 |
| | | | | 5,493,185 |
| | | Spain – 2.2% | | |
| 24,162 | | Endesa S.A. (b) | | 617,514 |
| 60,878 | | Iberdrola S.A. (b) | | 824,239 |
| 29,903 | | Red Electrica Corp. S.A. (b) | | 567,795 |
| | | | | 2,009,548 |
| | | Sweden – 3.0% | | |
| 16,641 | | Essity AB, Class B (b) | | 531,528 |
| 11,463 | | ICA Gruppen AB (b) | | 574,578 |
| 7,137 | | Investor AB, Class B (b) | | 523,494 |
| 30,971 | | Tele2 AB, Class B (b) | | 427,426 |
| 149,856 | | Telia Co., AB (b) | | 656,712 |
| | | | | 2,713,738 |
| | | Switzerland – 13.8% | | |
| 26,470 | | ABB Ltd. (b) | | 780,770 |
| 7,955 | | Banque Cantonale Vaudoise (b) | | 841,736 |
| Shares | | Description | | Value |
|
| | | Switzerland (Continued) | | |
| 1,920 | | Geberit AG (b) | | $1,175,168 |
| 3,425 | | Kuehne + Nagel International AG | | 779,379 |
| 13,654 | | Nestle S.A. (b) | | 1,530,567 |
| 18,252 | | Novartis AG (b) | | 1,652,631 |
| 700 | | Partners Group Holding AG (b) | | 826,554 |
| 2,613 | | Roche Holding AG (b) | | 901,778 |
| 5,007 | | Schindler Holding AG (b) | | 1,321,471 |
| 11,004 | | Swiss Prime Site AG (b) | | 1,069,499 |
| 3,016 | | Swisscom AG (b) | | 1,641,545 |
| | | | | 12,521,098 |
| | | United Kingdom – 7.9% | | |
| 18,307 | | Admiral Group PLC (b) | | 721,494 |
| 34,662 | | GlaxoSmithKline PLC (b) | | 643,719 |
| 227,019 | | J Sainsbury PLC (b) | | 758,177 |
| 54,835 | | National Grid PLC (b) | | 636,946 |
| 6,683 | | Reckitt Benckiser Group PLC (b) | | 566,574 |
| 4,598 | | Spirax-Sarco Engineering PLC (b) | | 695,173 |
| 341,826 | | Tesco PLC (b) | | 1,118,591 |
| 9,614 | | Unilever PLC (b) | | 560,065 |
| 15,951 | | Unilever PLC | | 927,217 |
| 270,668 | | Wm Morrison Supermarkets PLC (b) | | 663,786 |
| | | | | 7,291,742 |
| | | Total Common Stocks | | 89,452,832 |
| | | (Cost $84,119,663) | | |
| REAL ESTATE INVESTMENT TRUSTS (a) – 1.7% |
| | | Singapore – 1.7% | | |
| 359,500 | | Ascendas Real Estate Investment Trust (b) | | 829,486 |
| 486,800 | | Mapletree Commercial Trust (b) | | 753,141 |
| | | Total Real Estate Investment Trusts | | 1,582,627 |
| | | (Cost $1,655,095) | | |
| | | Total Investments – 99.8% | | 91,035,459 |
| | | (Cost $85,774,758) (f) | | |
| | | Net Other Assets and Liabilities – 0.2% | | 200,213 |
| | | Net Assets – 100.0% | | $91,235,672 |
|
| (a) | Portfolio securities are categorized based upon their country of incorporation. For a breakdown of the portfolio securities by sector, please see the Fund Performance Overview. |
See Notes to Financial Statements
Page 15
First Trust Horizon Managed Volatility Developed International ETF (HDMV)
Portfolio of Investments (Continued)
January 31, 2021 (Unaudited)
| (b) | This security is fair valued by the Advisor’s Pricing Committee in accordance with procedures adopted by the Trust’s Board of Trustees and in accordance with provisions of the Investment Company Act of 1940, as amended. At January 31, 2021, securities noted as such are valued at $89,385,106 or 98.0% of net assets. Certain of these securities are fair valued using a factor provided by a third-party pricing service due to the change in value between the foreign markets’ close and the New York Stock Exchange close exceeding a certain threshold. On days when this threshold is not exceeded, these securities are typically valued at the last sale price on the exchange on which they are principally traded. |
| (c) | This security may be resold to qualified foreign investors and foreign institutional buyers under Regulation S of the Securities Act of 1933, as amended (the “1933 Act”). |
| (d) | This security is exempt from registration upon resale under Rule 144A of the 1933 Act and may be resold in transactions exempt from registration, normally to qualified institutional buyers. This security is not restricted on the foreign exchange where it trades freely without any additional registration. As such, it does not require the additional disclosure required of restricted securities. |
| (e) | Non-income producing security. |
| (f) | Aggregate cost for financial reporting purposes approximates the aggregate cost for federal income tax purposes. As of January 31, 2021, the aggregate gross unrealized appreciation for all investments in which there was an excess of value over tax cost was $7,202,871 and the aggregate gross unrealized depreciation for all investments in which there was an excess of tax cost over value was $1,942,170. The net unrealized appreciation was $5,260,701. |
Valuation Inputs
A summary of the inputs used to value the Fund’s investments as of January 31, 2021 is as follows (see Note 2A - Portfolio Valuation in the Notes to Financial Statements):
| | Total
Value at
1/31/2021 | Level 1
Quoted
Prices | Level 2
Significant
Observable
Inputs | Level 3
Significant
Unobservable
Inputs |
| Common Stocks: | | | | |
| Israel | $ 723,136 | $ 723,136 | $ — | $ — |
| United Kingdom | 7,291,742 | 927,217 | 6,364,525 | — |
| Other Country Categories* | 81,437,954 | — | 81,437,954 | — |
| Real Estate Investment Trusts* | 1,582,627 | — | 1,582,627 | — |
| Total Investments | $ 91,035,459 | $ 1,650,353 | $ 89,385,106 | $— |
| * | See Portfolio of Investments for country breakout. |
Currency Exposure
Diversification | % of Total
Investments |
| Japanese Yen | 28.3% |
| Euro | 22.0 |
| Swiss Franc | 13.7 |
| Hong Kong Dollar | 8.7 |
| Singapore Dollar | 7.8 |
| British Pound Sterling | 7.0 |
| Australian Dollar | 4.5 |
| Swedish Krona | 3.0 |
| Danish Krone | 2.4 |
| New Zealand Dollar | 1.0 |
| Norwegian Krone | 0.8 |
| United States Dollar | 0.8 |
| Total | 100.0% |
Page 16
See Notes to Financial Statements
First Trust Horizon Managed Volatility Small/Mid ETF (HSMV)
Portfolio of Investments
January 31, 2021 (Unaudited)
| Shares | | Description | | Value |
| COMMON STOCKS – 86.9% |
| | | Aerospace & Defense – 1.6% | | |
| 17,352 | | Park Aerospace Corp. | | $230,435 |
| | | Air Freight & Logistics – 1.0% | | |
| 1,034 | | Forward Air Corp. | | 74,127 |
| 1,404 | | Hub Group, Inc., Class A (a) | | 73,893 |
| | | | | 148,020 |
| | | Auto Components – 1.1% | | |
| 2,357 | | Gentex Corp. | | 77,899 |
| 1,987 | | Standard Motor Products, Inc. | | 77,950 |
| | | | | 155,849 |
| | | Banks – 1.1% | | |
| 1,176 | | Commerce Bancshares, Inc. | | 78,615 |
| 1,390 | | Westamerica BanCorp | | 77,590 |
| | | | | 156,205 |
| | | Biotechnology – 0.6% | | |
| 496 | | United Therapeutics Corp. (a) | | 81,255 |
| | | Building Products – 0.6% | | |
| 285 | | Lennox International, Inc. | | 78,515 |
| | | Capital Markets – 1.1% | | |
| 714 | | Affiliated Managers Group, Inc. | | 78,675 |
| 264 | | FactSet Research Systems, Inc. | | 79,818 |
| | | | | 158,493 |
| | | Chemicals – 2.7% | | |
| 982 | | Ashland Global Holdings, Inc. | | 78,550 |
| 714 | | Balchem Corp. | | 76,420 |
| 943 | | RPM International, Inc. | | 77,769 |
| 1,072 | | Sensient Technologies Corp. | | 75,608 |
| 678 | | Stepan Co. | | 76,397 |
| | | | | 384,744 |
| | | Commercial Services &
Supplies – 1.7% | | |
| 515 | | MSA Safety, Inc. | | 80,402 |
| 1,232 | | Stericycle, Inc. (a) | | 80,671 |
| 614 | | Tetra Tech, Inc. | | 74,644 |
| | | | | 235,717 |
| | | Construction & Engineering – 1.8% | | |
| 1,332 | | Valmont Industries, Inc. | | 256,969 |
| | | Containers & Packaging – 1.7% | | |
| 592 | | AptarGroup, Inc. | | 78,718 |
| 2,256 | | Silgan Holdings, Inc. | | 82,186 |
| 1,371 | | Sonoco Products Co. | | 79,395 |
| | | | | 240,299 |
| Shares | | Description | | Value |
|
| | | Diversified Consumer
Services – 1.1% | | |
| 955 | | Grand Canyon Education, Inc. (a) | | $81,118 |
| 1,547 | | Service Corp. International | | 78,015 |
| | | | | 159,133 |
| | | Diversified Financial Services – 0.6% | | |
| 3,397 | | Jefferies Financial Group, Inc. | | 79,320 |
| | | Diversified Telecommunication
Services – 1.7% | | |
| 4,136 | | Cogent Communications Holdings, Inc. | | 235,545 |
| | | Electric Utilities – 3.3% | | |
| 3,607 | | ALLETE, Inc. | | 226,664 |
| 2,427 | | Hawaiian Electric Industries, Inc. | | 80,236 |
| 913 | | IDACORP, Inc. | | 80,618 |
| 2,607 | | OGE Energy Corp. | | 79,566 |
| | | | | 467,084 |
| | | Electrical Equipment – 1.1% | | |
| 1,405 | | Encore Wire Corp. | | 81,139 |
| 503 | | Hubbell, Inc. | | 78,267 |
| | | | | 159,406 |
| | | Electronic Equipment,
Instruments & Components – 3.8% | | |
| 796 | | Arrow Electronics, Inc. (a) | | 77,713 |
| 2,352 | | Badger Meter, Inc. | | 215,702 |
| 990 | | Fabrinet (a) | | 78,151 |
| 883 | | OSI Systems, Inc. (a) | | 79,488 |
| 5,864 | | TTM Technologies, Inc. (a) | | 78,636 |
| | | | | 529,690 |
| | | Food & Staples Retailing – 1.7% | | |
| 405 | | Casey’s General Stores, Inc. | | 75,930 |
| 848 | | PriceSmart, Inc. | | 79,610 |
| 3,519 | | Sprouts Farmers Market, Inc. (a) | | 79,705 |
| | | | | 235,245 |
| | | Food Products – 6.7% | | |
| 2,190 | | Cal-Maine Foods, Inc. (a) | | 83,965 |
| 3,611 | | Flowers Foods, Inc. | | 82,908 |
| 1,935 | | Hain Celestial Group (The), Inc. (a) | | 80,467 |
| 1,061 | | Ingredion, Inc. | | 80,074 |
| 1,016 | | John B. Sanfilippo & Son, Inc. | | 81,717 |
| 464 | | Lancaster Colony Corp. | | 81,005 |
| 10,969 | | Pilgrim’s Pride Corp. (a) | | 212,579 |
| 826 | | Post Holdings, Inc. (a) | | 78,346 |
| 2,214 | | Tootsie Roll Industries, Inc. | | 87,630 |
See Notes to Financial Statements
Page 17
First Trust Horizon Managed Volatility Small/Mid ETF (HSMV)
Portfolio of Investments (Continued)
January 31, 2021 (Unaudited)
| Shares | | Description | | Value |
| COMMON STOCKS (Continued) |
| | | Food Products (Continued) | | |
| 1,923 | | TreeHouse Foods, Inc. (a) | | $81,208 |
| | | | | 949,899 |
| | | Gas Utilities – 4.0% | | |
| 2,008 | | National Fuel Gas Co. | | 80,842 |
| 1,133 | | ONE Gas, Inc. | | 82,856 |
| 9,965 | | South Jersey Industries, Inc. | | 230,191 |
| 1,355 | | Southwest Gas Holdings, Inc. | | 81,246 |
| 1,361 | | Spire, Inc. | | 83,280 |
| | | | | 558,415 |
| | | Health Care Equipment &
Supplies – 2.8% | | |
| 1,292 | | Globus Medical, Inc., Class A (a) | | 79,703 |
| 807 | | Hill-Rom Holdings, Inc. | | 77,504 |
| 382 | | ICU Medical, Inc. (a) | | 78,111 |
| 330 | | Masimo Corp. (a) | | 84,454 |
| 950 | | Neogen Corp. (a) | | 76,827 |
| | | | | 396,599 |
| | | Health Care Providers &
Services – 1.1% | | |
| 149 | | Chemed Corp. | | 77,167 |
| 965 | | Encompass Health Corp. | | 77,586 |
| | | | | 154,753 |
| | | Health Care Technology – 0.5% | | |
| 3,271 | | HealthStream, Inc. (a) | | 76,149 |
| | | Household Durables – 0.5% | | |
| 1,902 | | La-Z-Boy, Inc. | | 73,645 |
| | | Household Products – 2.4% | | |
| 1,906 | | Central Garden & Pet Co. (a) | | 80,605 |
| 867 | | WD-40 Co. | | 263,923 |
| | | | | 344,528 |
| | | Industrial Conglomerates – 0.6% | | |
| 547 | | Carlisle Cos., Inc. | | 79,277 |
| | | Insurance – 8.4% | | |
| 1,446 | | AMERISAFE, Inc. | | 80,253 |
| 1,783 | | Brown & Brown, Inc. | | 76,829 |
| 2,542 | | Employers Holdings, Inc. | | 77,531 |
| 711 | | Hanover Insurance Group (The), Inc. | | 79,966 |
| 6,169 | | Horace Mann Educators Corp. | | 241,640 |
| 1,112 | | Kemper Corp. | | 78,229 |
| 1,560 | | Mercury General Corp. | | 82,696 |
| 4,444 | | Old Republic International Corp. | | 80,436 |
| 535 | | RenaissanceRe Holdings Ltd. | | 80,485 |
| 2,350 | | RLI Corp. | | 227,433 |
| 1,074 | | Safety Insurance Group, Inc. | | 78,875 |
| | | | | 1,184,373 |
| Shares | | Description | | Value |
|
| | | IT Services – 3.9% | | |
| 327 | | CACI International, Inc., Class A (a) | | $78,879 |
| 1,824 | | CSG Systems International, Inc. | | 78,596 |
| 978 | | ExlService Holdings, Inc. (a) | | 74,993 |
| 863 | | ManTech International Corp., Class A | | 77,403 |
| 1,056 | | MAXIMUS, Inc. | | 79,263 |
| 2,836 | | NIC, Inc. | | 76,345 |
| 816 | | Science Applications International Corp. | | 78,361 |
| | | | | 543,840 |
| | | Life Sciences Tools &
Services – 1.1% | | |
| 241 | | Bio-Techne Corp. | | 78,303 |
| 308 | | Charles River Laboratories International, Inc. (a) | | 79,788 |
| | | | | 158,091 |
| | | Machinery – 5.6% | | |
| 1,361 | | Donaldson Co., Inc. | | 80,898 |
| 799 | | ESCO Technologies, Inc. | | 75,969 |
| 2,386 | | Federal Signal Corp. | | 77,998 |
| 1,149 | | Graco, Inc. | | 79,212 |
| 1,045 | | ITT, Inc. | | 78,072 |
| 689 | | Lincoln Electric Holdings, Inc. | | 78,890 |
| 439 | | Nordson Corp. | | 78,577 |
| 1,138 | | Tennant Co. | | 77,100 |
| 836 | | Toro (The) Co. | | 78,793 |
| 649 | | Watts Water Technologies, Inc., Class A | | 77,925 |
| | | | | 783,434 |
| | | Media – 2.1% | | |
| 4,810 | | John Wiley & Sons, Inc., Class A | | 219,384 |
| 1,484 | | New York Times (The) Co., Class A | | 73,592 |
| | | | | 292,976 |
| | | Metals & Mining – 1.1% | | |
| 1,346 | | Compass Minerals International, Inc. | | 78,418 |
| 663 | | Reliance Steel & Aluminum Co. | | 76,961 |
| | | | | 155,379 |
| | | Multi-Utilities – 1.7% | | |
| 1,363 | | Black Hills Corp. | | 80,581 |
| 3,070 | | MDU Resources Group, Inc. | | 80,710 |
| 1,487 | | NorthWestern Corp. | | 80,997 |
| | | | | 242,288 |
| | | Paper & Forest Products – 1.6% | | |
| 5,979 | | Schweitzer-Mauduit International, Inc. | | 222,060 |
Page 18
See Notes to Financial Statements
First Trust Horizon Managed Volatility Small/Mid ETF (HSMV)
Portfolio of Investments (Continued)
January 31, 2021 (Unaudited)
| Shares | | Description | | Value |
| COMMON STOCKS (Continued) |
| | | Pharmaceuticals – 1.1% | | |
| 4,300 | | Amphastar Pharmaceuticals, Inc. (a) | | $78,174 |
| 1,931 | | Prestige Consumer Healthcare, Inc. (a) | | 77,240 |
| | | | | 155,414 |
| | | Professional Services – 1.1% | | |
| 917 | | Exponent, Inc. | | 75,726 |
| 691 | | FTI Consulting, Inc. (a) | | 75,989 |
| | | | | 151,715 |
| | | Road & Rail – 2.2% | | |
| 4,222 | | Heartland Express, Inc. | | 79,247 |
| 1,845 | | Knight-Swift Transportation Holdings, Inc. | | 73,800 |
| 549 | | Landstar System, Inc. | | 76,530 |
| 1,903 | | Werner Enterprises, Inc. | | 74,674 |
| | | | | 304,251 |
| | | Semiconductors &
Semiconductor Equipment – 0.6% | | |
| 4,934 | | DSP Group, Inc. (a) | | 79,585 |
| | | Software – 6.1% | | |
| 1,647 | | Bottomline Technologies DE, Inc. (a) | | 78,694 |
| 1,628 | | CDK Global, Inc. | | 81,237 |
| 1,366 | | CommVault Systems, Inc. (a) | | 85,758 |
| 1,227 | | InterDigital, Inc. | | 78,786 |
| 811 | | J2 Global, Inc. (a) | | 83,241 |
| 1,906 | | Progress Software Corp. | | 76,583 |
| 635 | | PTC, Inc. (a) | | 84,398 |
| 780 | | SPS Commerce, Inc. (a) | | 77,134 |
| 7,996 | | Teradata Corp. (a) | | 215,092 |
| | | | | 860,923 |
| | | Specialty Retail – 0.6% | | |
| 659 | | Murphy USA, Inc. | | 82,092 |
| | | Tobacco – 0.6% | | |
| 1,716 | | Universal Corp. | | 78,713 |
| | | Trading Companies &
Distributors – 1.1% | | |
| 1,025 | | MSC Industrial Direct Co., Inc., Class A | | 79,509 |
| 333 | | Watsco, Inc. | | 79,417 |
| | | | | 158,926 |
| | | Water Utilities – 1.1% | | |
| 1,027 | | American States Water Co. | | 79,346 |
| Shares | | Description | | Value |
|
| | | Water Utilities (Continued) | | |
| 1,792 | | Essential Utilities, Inc. | | $82,970 |
| | | | | 162,316 |
| | | Total Common Stocks | | 12,241,565 |
| | | (Cost $11,767,447) | | |
| REAL ESTATE INVESTMENT TRUSTS – 12.6% |
| | | Equity Real Estate Investment
Trusts – 11.5% | | |
| 1,272 | | Agree Realty Corp. | | 80,390 |
| 796 | | Camden Property Trust | | 81,311 |
| 1,141 | | Centerspace | | 79,802 |
| 607 | | CoreSite Realty Corp. | | 81,605 |
| 3,090 | | Corporate Office Properties Trust | | 81,174 |
| 3,505 | | Easterly Government Properties, Inc. | | 76,935 |
| 1,960 | | First Industrial Realty Trust, Inc. | | 79,654 |
| 2,968 | | Getty Realty Corp. | | 78,860 |
| 2,652 | | Healthcare Realty Trust, Inc. | | 79,587 |
| 6,049 | | Independence Realty Trust, Inc. | | 80,331 |
| 3,675 | | Industrial Logistics Properties Trust | | 77,947 |
| 7,761 | | Lexington Realty Trust | | 79,550 |
| 990 | | Life Storage, Inc. | | 80,764 |
| 2,044 | | LTC Properties, Inc. | | 78,980 |
| 2,209 | | National Storage Affiliates Trust | | 80,717 |
| 4,511 | | Physicians Realty Trust | | 79,529 |
| 1,621 | | PotlatchDeltic Corp. | | 77,419 |
| 8,519 | | Rayonier, Inc. | | 261,959 |
| | | | | 1,616,514 |
| | | Mortgage Real Estate
Investment Trusts – 1.1% | | |
| 7,125 | | ARMOUR Residential REIT, Inc. | | 79,587 |
| 4,667 | | KKR Real Estate Finance Trust, Inc. | | 79,899 |
| | | | | 159,486 |
| | | Total Real Estate Investment Trusts | | 1,776,000 |
| | | (Cost $1,771,419) | | |
| | | Total Investments – 99.5% | | 14,017,565 |
| | | (Cost $13,538,866) (b) | | |
| | | Net Other Assets and Liabilities – 0.5% | | 71,297 |
| | | Net Assets – 100.0% | | $14,088,862 |
|
| (a) | Non-income producing security. |
See Notes to Financial Statements
Page 19
First Trust Horizon Managed Volatility Small/Mid ETF (HSMV)
Portfolio of Investments (Continued)
January 31, 2021 (Unaudited)
| (b) | Aggregate cost for financial reporting purposes approximates the aggregate cost for federal income tax purposes. As of January 31, 2021, the aggregate gross unrealized appreciation for all investments in which there was an excess of value over tax cost was $741,717 and the aggregate gross unrealized depreciation for all investments in which there was an excess of tax cost over value was $263,018. The net unrealized appreciation was $478,699. |
Valuation Inputs
A summary of the inputs used to value the Fund’s investments as of January 31, 2021 is as follows (see Note 2A - Portfolio Valuation in the Notes to Financial Statements):
| | Total
Value at
1/31/2021 | Level 1
Quoted
Prices | Level 2
Significant
Observable
Inputs | Level 3
Significant
Unobservable
Inputs |
| Common Stocks* | $ 12,241,565 | $ 12,241,565 | $ — | $ — |
| Real Estate Investment Trusts* | 1,776,000 | 1,776,000 | — | — |
| Total Investments | $ 14,017,565 | $ 14,017,565 | $— | $— |
| * | See Portfolio of Investments for industry breakout. |
Page 20
See Notes to Financial Statements
This page intentionally left blank
First Trust Exchange-Traded Fund III
Statements of Assets and Liabilities
January 31, 2021 (Unaudited)
| | First Trust
Horizon
Managed
Volatility
Domestic
ETF
(HUSV) | | First Trust
Horizon
Managed
Volatility
Developed
International
ETF
(HDMV) | | First Trust
Horizon
Managed
Volatility
Small/Mid
ETF
(HSMV) |
| ASSETS: | | | | | |
Investments, at value
| $ 163,647,024 | | $ 91,035,459 | | $ 14,017,565 |
Cash
| 246,910 | | 65,320 | | 159,365 |
Foreign currency
| — | | 5,295 | | — |
| Receivables: | | | | | |
Investment securities sold
| 11,089,681 | | 4,496,921 | | — |
Dividends
| 261,259 | | 66,324 | | 4,547 |
Dividend reclaims
| 5,542 | | 194,663 | | — |
Total Assets
| 175,250,416 | | 95,863,982 | | 14,181,477 |
| LIABILITIES: | | | | | |
| Payables: | | | | | |
Fund shares redeemed
| 11,120,148 | | 4,561,777 | | — |
Investment advisory fees
| 108,020 | | 66,533 | | 9,927 |
Investment securities purchased
| — | | — | | 82,688 |
Total Liabilities
| 11,228,168 | | 4,628,310 | | 92,615 |
NET ASSETS
| $164,022,248 | | $91,235,672 | | $14,088,862 |
| NET ASSETS consist of: | | | | | |
Paid-in capital
| $ 195,396,328 | | $ 115,568,775 | | $ 11,297,460 |
Par value
| 59,000 | | 30,000 | | 5,000 |
Accumulated distributable earnings (loss)
| (31,433,080) | | (24,363,103) | | 2,786,402 |
NET ASSETS
| $164,022,248 | | $91,235,672 | | $14,088,862 |
NET ASSET VALUE, per share
| $27.80 | | $30.41 | | $28.18 |
Number of shares outstanding (unlimited number of shares authorized, par value $0.01 per share)
| 5,900,002 | | 3,000,002 | | 500,002 |
Investments, at cost
| $155,748,029 | | $85,774,758 | | $13,538,866 |
Foreign currency, at cost (proceeds)
| $— | | $5,291 | | $— |
Page 22
See Notes to Financial Statements
First Trust Exchange-Traded Fund III
Statements of Operations
For the Six Months Ended January 31, 2021 (Unaudited)
| | First Trust
Horizon
Managed
Volatility
Domestic
ETF
(HUSV) | | First Trust
Horizon
Managed
Volatility
Developed
International
ETF
(HDMV) | | First Trust
Horizon
Managed
Volatility
Small/Mid
ETF
(HSMV) |
| INVESTMENT INCOME: | | | | | |
Dividends
| $ 2,099,059 | | $ 1,397,148 | | $ 170,930 |
Interest
| 22 | | 7 | | — |
Foreign withholding tax
| — | | (89,643) | | — |
Other
| 13 | | — | | — |
Total investment income
| 2,099,094 | | 1,307,512 | | 170,930 |
| EXPENSES: | | | | | |
Investment advisory fees
| 678,216 | | 421,566 | | 63,210 |
Total expenses
| 678,216 | | 421,566 | | 63,210 |
NET INVESTMENT INCOME (LOSS)
| 1,420,878 | | 885,946 | | 107,720 |
| NET REALIZED AND UNREALIZED GAIN (LOSS): | | | | | |
| Net realized gain (loss) on: | | | | | |
Investments
| (2,849,773) | | 3,017,990 | | (265,443) |
In-kind redemptions
| 19,217,626 | | 2,599,586 | | 2,586,008 |
Foreign currency transactions
| — | | (15,210) | | — |
Net realized gain (loss)
| 16,367,853 | | 5,602,366 | | 2,320,565 |
Net increase from payment by the advisor
| — | | 6,254 | | — |
| Net change in unrealized appreciation (depreciation) on: | | | | | |
Investments
| (11,187,533) | | 3,168,459 | | (598,270) |
Foreign currency translation
| — | | 12,213 | | — |
Net change in unrealized appreciation (depreciation)
| (11,187,533) | | 3,180,672 | | (598,270) |
NET REALIZED AND UNREALIZED GAIN (LOSS)
| 5,180,320 | | 8,789,292 | | 1,722,295 |
NET INCREASE (DECREASE) IN NET ASSETS RESULTING FROM OPERATIONS
| $ 6,601,198 | | $ 9,675,238 | | $ 1,830,015 |
See Notes to Financial Statements
Page 23
First Trust Exchange-Traded Fund III
Statements of Changes in Net Assets
| | First Trust Horizon Managed
Volatility Domestic ETF
(HUSV) | | First Trust Horizon Managed
Volatility Developed International ETF
(HDMV) |
| | Six Months
Ended
1/31/2021
(Unaudited) | | Year
Ended
7/31/2020 | | Six Months
Ended
1/31/2021
(Unaudited) | | Year
Ended
7/31/2020 |
| OPERATIONS: | | | | | | | |
Net investment income (loss)
| $ 1,420,878 | | $ 3,252,411 | | $ 885,946 | | $ 2,996,449 |
Net realized gain (loss)
| 16,367,853 | | (4,596,249) | | 5,602,366 | | (24,727,414) |
Net increase from payment by the advisor
| — | | — | | 6,254 | | — |
Net change in unrealized appreciation (depreciation)
| (11,187,533) | | 1,915,698 | | 3,180,672 | | 956,053 |
Net increase (decrease) in net assets resulting from operations
| 6,601,198 | | 571,860 | | 9,675,238 | | (20,774,912) |
| DISTRIBUTIONS TO SHAREHOLDERS FROM: | | | | | | | |
Investment operations
| (1,398,160) | | (3,582,296) | | (1,069,875) | | (3,755,422) |
| SHAREHOLDER TRANSACTIONS: | | | | | | | |
Proceeds from shares sold
| 124,628,083 | | 355,667,495 | | — | | 87,535,588 |
Cost of shares redeemed
| (180,630,987) | | (362,223,485) | | (41,083,209) | | (67,686,203) |
Net increase (decrease) in net assets resulting from shareholder transactions
| (56,002,904) | | (6,555,990) | | (41,083,209) | | 19,849,385 |
Total increase (decrease) in net assets
| (50,799,866) | | (9,566,426) | | (32,477,846) | | (4,680,949) |
| NET ASSETS: | | | | | | | |
Beginning of period
| 214,822,114 | | 224,388,540 | | 123,713,518 | | 128,394,467 |
End of period
| $164,022,248 | | $214,822,114 | | $91,235,672 | | $123,713,518 |
| CHANGES IN SHARES OUTSTANDING: | | | | | | | |
Shares outstanding, beginning of period
| 7,900,002 | | 8,400,002 | | 4,400,002 | | 3,900,002 |
Shares sold
| 4,500,000 | | 13,500,000 | | — | | 2,750,000 |
Shares redeemed
| (6,500,000) | | (14,000,000) | | (1,400,000) | | (2,250,000) |
Shares outstanding, end of period
| 5,900,002 | | 7,900,002 | | 3,000,002 | | 4,400,002 |
| (a) | Inception date is April 6, 2020, which is consistent with the commencement of investment operations and is the date the initial creation units were established. |
Page 24
See Notes to Financial Statements
First Trust
Horizon Managed
Volatility
Small/Mid ETF
(HSMV) |
Six Months
Ended
1/31/2021
(Unaudited) | | Period
Ended
7/31/2020 (a) |
| | | |
| $ 107,720 | | $ 14,506 |
| 2,320,565 | | 213,038 |
| — | | — |
| (598,270) | | 1,076,969 |
| 1,830,015 | | 1,304,513 |
| | | |
| (120,206) | | (6,225) |
| | | |
| 12,292,789 | | 19,986,223 |
| (19,936,432) | | (1,261,815) |
| (7,643,643) | | 18,724,408 |
| (5,933,834) | | 20,022,696 |
| | | |
| 20,022,696 | | — |
| $14,088,862 | | $ 20,022,696 |
| | | |
| 800,002 | | — |
| 450,000 | | 850,002 |
| (750,000) | | (50,000) |
| 500,002 | | 800,002 |
See Notes to Financial Statements
Page 25
First Trust Exchange-Traded Fund III
Financial Highlights
For a share outstanding throughout each period
First Trust Horizon Managed Volatility Domestic ETF (HUSV)
| | Six Months
Ended
1/31/2021
(Unaudited) | | Year Ended July 31, | | Period
Ended
7/31/2017 (a) |
| 2020 | | 2019 | | 2018 |
Net asset value, beginning of period
| $ 27.19 | | $ 26.71 | | $ 23.49 | | $ 22.03 | | $ 19.96 |
| Income from investment operations: | | | | | | | | | |
Net investment income (loss)
| 0.22 | | 0.37 | | 0.37 | | 0.30 | | 0.24 |
Net realized and unrealized gain (loss)
| 0.60 | | 0.52 | | 3.17 | | 1.46 | | 2.05 |
Total from investment operations
| 0.82 | | 0.89 | | 3.54 | | 1.76 | | 2.29 |
| Distributions paid to shareholders from: | | | | | | | | | |
Net investment income
| (0.21) | | (0.41) | | (0.32) | | (0.30) | | (0.22) |
Net asset value, end of period
| $27.80 | | $27.19 | | $26.71 | | $23.49 | | $22.03 |
Total return (b)
| 3.00% | | 3.41% | | 15.24% | | 8.04% | | 11.51% |
| Ratios to average net assets/supplemental data: | | | | | | | | | |
Net assets, end of period (in 000’s)
| $ 164,022 | | $ 214,822 | | $ 224,389 | | $ 133,888 | | $ 62,799 |
Ratio of total expenses to average net assets
| 0.70% (c) | | 0.70% | | 0.70% | | 0.70% | | 0.70% (c) |
Ratio of net investment income (loss) to average net assets
| 1.47% (c) | | 1.39% | | 1.58% | | 1.37% | | 1.50% (c) |
Portfolio turnover rate (d)
| 77% | | 211% | | 147% | | 157% | | 149% |
| (a) | Inception date is August 24, 2016, which is consistent with the commencement of investment operations and is the date the initial creation units were established. |
| (b) | Total return is calculated assuming an initial investment made at the net asset value at the beginning of the period, reinvestment of all distributions at net asset value during the period, and redemption at net asset value on the last day of the period. The returns presented do not reflect the deduction of taxes that a shareholder would pay on Fund distributions or the redemption or sale of Fund shares. Total return is calculated for the time period presented and is not annualized for periods of less than a year. |
| (c) | Annualized. |
| (d) | Portfolio turnover is calculated for the time period presented and is not annualized for periods of less than a year and does not include securities received or delivered from processing creations or redemptions and in-kind transactions. |
Page 26
See Notes to Financial Statements
First Trust Exchange-Traded Fund III
Financial Highlights (Continued)
For a share outstanding throughout each period
First Trust Horizon Managed Volatility Developed International ETF (HDMV)
| | Six Months
Ended
1/31/2021
(Unaudited) | | Year Ended July 31, | | Period
Ended
7/31/2017 (a) |
| 2020 | | 2019 | | 2018 |
Net asset value, beginning of period
| $ 28.12 | | $ 32.92 | | $ 33.72 | | $ 33.05 | | $ 29.89 |
| Income from investment operations: | | | | | | | | | |
Net investment income (loss)
| 0.26 | | 0.65 | | 0.86 | | 0.91 | | 0.63 |
Net realized and unrealized gain (loss)
| 2.35 | | (4.61) | | (0.79) | | 0.87 | | 3.13 |
Total from investment operations
| 2.61 | | (3.96) | | 0.07 | | 1.78 | | 3.76 |
| Distributions paid to shareholders from: | | | | | | | | | |
Net investment income
| (0.32) | | (0.84) | | (0.87) | | (1.11) | | (0.60) |
Net asset value, end of period
| $30.41 | | $28.12 | | $32.92 | | $33.72 | | $33.05 |
Total return (b)
| 9.28% (c) | | (12.37)% | | 0.21% | | 5.48% | | 12.68% |
| Ratios to average net assets/supplemental data: | | | | | | | | | |
Net assets, end of period (in 000’s)
| $ 91,236 | | $ 123,714 | | $ 128,394 | | $ 59,010 | | $ 29,745 |
Ratio of total expenses to average net assets
| 0.80% (d) | | 0.80% | | 0.80% | | 0.80% | | 0.80% (d) |
Ratio of net investment income (loss) to average net assets
| 1.68% (d) | | 2.08% | | 2.74% | | 2.73% | | 2.74% (d) |
Portfolio turnover rate (e)
| 62% | | 196% | | 99% | | 133% | | 150% |
| (a) | Inception date is August 24, 2016, which is consistent with the commencement of investment operations and is the date the initial creation units were established. |
| (b) | Total return is calculated assuming an initial investment made at the net asset value at the beginning of the period, reinvestment of all distributions at net asset value during the period, and redemption at net asset value on the last day of the period. The returns presented do not reflect the deduction of taxes that a shareholder would pay on Fund distributions or the redemption or sale of Fund shares. Total return is calculated for the time period presented and is not annualized for periods of less than a year. |
| (c) | The Fund received a reimbursement from the advisor in the amount of $6,254, which represents less than $0.01 per share. Since the advisor reimbursed the Fund, there was no effect on the Fund’s total return. |
| (d) | Annualized. |
| (e) | Portfolio turnover is calculated for the time period presented and is not annualized for periods of less than a year and does not include securities received or delivered from processing creations or redemptions and in-kind transactions. |
See Notes to Financial Statements
Page 27
First Trust Exchange-Traded Fund III
Financial Highlights (Continued)
For a share outstanding throughout each period
First Trust Horizon Managed Volatility Small/Mid ETF (HSMV)
| | Six Months
Ended
1/31/2021
(Unaudited) | | Period
Ended
7/31/2020 (a) |
Net asset value, beginning of period
| $ 25.03 | | $ 21.10 |
| Income from investment operations: | | | |
Net investment income (loss)
| 0.20 | | 0.02 |
Net realized and unrealized gain (loss)
| 3.17 | | 3.92 |
Total from investment operations
| 3.37 | | 3.94 |
| Distributions paid to shareholders from: | | | |
Net investment income
| (0.22) | | (0.01) |
Net asset value, end of period
| $28.18 | | $25.03 |
Total return (b)
| 13.50% | | 18.67% |
| Ratios to average net assets/supplemental data: | | | |
Net assets, end of period (in 000’s)
| $ 14,089 | | $ 20,023 |
Ratio of total expenses to average net assets
| 0.80% (c) | | 0.80% (c) |
Ratio of net investment income (loss) to average net assets
| 1.36% (c) | | 0.60% (c) |
Portfolio turnover rate (d)
| 60% | | 5% |
| (a) | Inception date is April 6, 2020, which is consistent with the commencement of investment operations and is the date the initial creation units were established. |
| (b) | Total return is calculated assuming an initial investment made at the net asset value at the beginning of the period, reinvestment of all distributions at net asset value during the period, and redemption at net asset value on the last day of the period. The returns presented do not reflect the deduction of taxes that a shareholder would pay on Fund distributions or the redemption or sale of Fund shares. Total return is calculated for the time period presented and is not annualized for periods of less than a year. |
| (c) | Annualized. |
| (d) | Portfolio turnover is calculated for the time period presented and is not annualized for periods of less than a year and does not include securities received or delivered from processing creations or redemptions and in-kind transactions. |
Page 28
See Notes to Financial Statements
Notes to Financial Statements
First Trust Exchange-Traded Fund III
January 31, 2021 (Unaudited)
1. Organization
First Trust Exchange-Traded Fund III (the “Trust”) is an open-end management investment company organized as a Massachusetts business trust on January 9, 2008, and is registered with the Securities and Exchange Commission under the Investment Company Act of 1940, as amended (the “1940 Act”).
The Trust currently consists of seventeen funds that are offering shares. This report covers the following funds (each a “Fund” and collectively, the “Funds”):
First Trust Horizon Managed Volatility Domestic ETF – (NYSE Arca, Inc. (“NYSE Arca”) ticker “HUSV”)
First Trust Horizon Managed Volatility Developed International ETF – (NYSE Arca ticker “HDMV”)
First Trust Horizon Managed Volatility Small/Mid ETF – (NYSE Arca ticker “HSMV”)
HUSV and HDMV are a diversified series of the Trust. HSMV is a non-diversified series of the Trust.
Each Fund represents a separate series of shares of beneficial interest in the Trust. Unlike conventional mutual funds, each Fund issues and redeems shares on a continuous basis, at net asset value (“NAV”), only in large blocks of shares known as “Creation Units.”
Each Fund is an actively managed exchange-traded fund. The investment objective of each Fund is to provide capital appreciation.
Under normal market conditions, HUSV seeks to achieve its investment objective by investing at least 80% of its net assets (including investment borrowings) in common stocks of domestic companies listed and traded on U.S. national securities exchanges that Horizon Investments, LLC (“Horizon” or the “Sub-Advisor”) believes exhibit low future expected volatility.
Under normal market conditions, HDMV seeks to achieve its investment objective by investing at least 80% of its net assets (including investment borrowings) in common stocks and depositary receipts of developed market companies listed and traded on non-U.S. exchanges that Horizon believes exhibit low future expected volatility.
Under normal market conditions, HSMV seeks to achieve its investment objective by investing at least 80% of its net assets (including investment borrowings) in small- and/or mid-capitalization common stocks listed and traded on U.S. national securities exchanges that Horizon believes exhibit low future expected volatility.
There can be no assurance that a Fund will achieve its investment objective. The Funds may not be appropriate for all investors.
2. Significant Accounting Policies
The Funds are each considered an investment company and follow accounting and reporting guidance under Financial Accounting Standards Board Accounting Standards Codification Topic 946, “Financial Services-Investment Companies.” The following is a summary of significant accounting policies consistently followed by the Funds in the preparation of the financial statements. The preparation of the financial statements in accordance with accounting principles generally accepted in the United States of America (“U.S. GAAP”) requires management to make estimates and assumptions that affect the reported amounts and disclosures in the financial statements. Actual results could differ from those estimates.
A. Portfolio Valuation
Each Fund’s NAV is determined daily as of the close of regular trading on the New York Stock Exchange (“NYSE”), normally 4:00 p.m. Eastern time, on each day the NYSE is open for trading. If the NYSE closes early on a valuation day, the NAV is determined as of that time. Foreign securities are priced using data reflecting the earlier closing of the principal markets for those securities. Each Fund’s NAV is calculated by dividing the value of all assets of each Fund (including accrued interest and dividends), less all liabilities (including accrued expenses and dividends declared but unpaid), by the total number of shares outstanding.
Each Fund’s investments are valued daily at market value or, in the absence of market value with respect to any portfolio securities, at fair value. Market value prices represent last sale or official closing prices from a national or foreign exchange (i.e., a regulated market) and are primarily obtained from third-party pricing services. Fair value prices represent any prices not considered market value prices and are either obtained from a third-party pricing service or are determined by the Pricing Committee of the Funds’ investment advisor, First Trust Advisors L.P. (“First Trust” or the “Advisor”), in accordance with valuation procedures adopted by the Trust’s Board of Trustees, and in accordance with provisions of the 1940 Act. Investments valued by the Advisor’s Pricing Committee, if any, are footnoted as such in the footnotes to the Portfolio of Investments. Each Fund’s investments are valued as follows:
Common stocks, real estate investment trusts (“REITs”) and other equity securities listed on any national or foreign exchange (excluding The Nasdaq Stock Market LLC (“Nasdaq”) and the London Stock Exchange Alternative Investment Market (“AIM”)) are valued at the last sale price on the exchange on which they are principally traded or, for Nasdaq and AIM securities, the
Notes to Financial Statements (Continued)
First Trust Exchange-Traded Fund III
January 31, 2021 (Unaudited)
official closing price. Securities traded on more than one securities exchange are valued at the last sale price or official closing price, as applicable, at the close of the securities exchange representing the principal market for such securities.
Securities traded in an over-the-counter market are fair valued at the mean of their most recent bid and asked price, if available, and otherwise at their closing bid price.
Certain securities may not be able to be priced by pre-established pricing methods. Such securities may be valued by the Trust’s Board of Trustees or its delegate, the Advisor’s Pricing Committee, at fair value. These securities generally include, but are not limited to, restricted securities (securities which may not be publicly sold without registration under the Securities Act of 1933, as amended) for which a third-party pricing service is unable to provide a market price; securities whose trading has been formally suspended; a security whose market or fair value price is not available from a pre-established pricing source; a security with respect to which an event has occurred that is likely to materially affect the value of the security after the market has closed but before the calculation of a Fund’s NAV or make it difficult or impossible to obtain a reliable market quotation; and a security whose price, as provided by the third-party pricing service, does not reflect the security’s fair value. As a general principle, the current fair value of a security would appear to be the amount which the owner might reasonably expect to receive for the security upon its current sale. When fair value prices are used, generally they will differ from market quotations or official closing prices on the applicable exchanges. A variety of factors may be considered in determining the fair value of such securities, including, but not limited to, the following:
| 1) | the type of security; |
| 2) | the size of the holding; |
| 3) | the initial cost of the security; |
| 4) | transactions in comparable securities; |
| 5) | price quotes from dealers and/or third-party pricing services; |
| 6) | relationships among various securities; |
| 7) | information obtained by contacting the issuer, analysts, or the appropriate stock exchange; |
| 8) | an analysis of the issuer’s financial statements; and |
| 9) | the existence of merger proposals or tender offers that might affect the value of the security. |
If the securities in question are foreign securities, the following additional information may be considered:
| 1) | the value of similar foreign securities traded on other foreign markets; |
| 2) | ADR trading of similar securities; |
| 3) | closed-end fund or exchange-traded fund trading of similar securities; |
| 4) | foreign currency exchange activity; |
| 5) | the trading prices of financial products that are tied to baskets of foreign securities; |
| 6) | factors relating to the event that precipitated the pricing problem; |
| 7) | whether the event is likely to recur; and |
| 8) | whether the effects of the event are isolated or whether they affect entire markets, countries or regions. |
Because foreign markets may be open on different days than the days during which investors may transact in the shares of a Fund, the value of the Fund’s securities may change on the days when investors are not able to transact in the shares of the Fund. The value of securities denominated in foreign currencies is converted into U.S. dollars using exchange rates determined daily as of the close of regular trading on the NYSE.
The Funds are subject to fair value accounting standards that define fair value, establish the framework for measuring fair value and provide a three-level hierarchy for fair valuation based upon the inputs to the valuation as of the measurement date. The three levels of the fair value hierarchy are as follows:
| • | Level 1 – Level 1 inputs are quoted prices in active markets for identical investments. An active market is a market in which transactions for the investment occur with sufficient frequency and volume to provide pricing information on an ongoing basis. |
| • | Level 2 – Level 2 inputs are observable inputs, either directly or indirectly, and include the following: |
| o | Quoted prices for similar investments in active markets. |
| o | Quoted prices for identical or similar investments in markets that are non-active. A non-active market is a market where there are few transactions for the investment, the prices are not current, or price quotations vary substantially either over time or among market makers, or in which little information is released publicly. |
Notes to Financial Statements (Continued)
First Trust Exchange-Traded Fund III
January 31, 2021 (Unaudited)
| o | Inputs other than quoted prices that are observable for the investment (for example, interest rates and yield curves observable at commonly quoted intervals, volatilities, prepayment speeds, loss severities, credit risks, and default rates). |
| o | Inputs that are derived principally from or corroborated by observable market data by correlation or other means. |
| • | Level 3 – Level 3 inputs are unobservable inputs. Unobservable inputs may reflect the reporting entity’s own assumptions about the assumptions that market participants would use in pricing the investment. |
The inputs or methodologies used for valuing investments are not necessarily an indication of the risk associated with investing in those investments. A summary of the inputs used to value each Fund’s investments as of January 31, 2021, is included with each Fund’s Portfolio of Investments.
B. Securities Transactions and Investment Income
Securities transactions are recorded as of the trade date. Realized gains and losses from securities transactions are recorded on the identified cost basis. Dividend income is recorded on the ex-dividend date. Interest income is recorded daily on the accrual basis.
Withholding taxes and tax reclaims on foreign dividends have been provided for in accordance with each Fund’s understanding of the applicable country’s tax rules and rates.
Distributions received from a Fund’s investments in REITs may be comprised of return of capital, capital gains, and income. The actual character of the amounts received during the year are not known until after the REITs’ fiscal year end. A Fund records the character of distributions received from the REITs during the year based on estimates available. The characterization of distributions received by a Fund may be subsequently revised based on information received from the REITs after their tax reporting periods conclude.
C. Foreign Currency
The books and records of the Funds are maintained in U.S. dollars. Foreign currencies, investments and other assets and liabilities are translated into U.S. dollars at the exchange rates prevailing at the end of the period. Purchases and sales of investments and items of income and expense are translated on the respective dates of such transactions. Unrealized gains and losses on assets and liabilities, other than investments in securities, which result from changes in foreign currency exchange rates have been included in “Net change in unrealized appreciation (depreciation) on foreign currency translation” on the Statements of Operations. Unrealized gains and losses on investments in securities which result from changes in foreign exchange rates are included with fluctuations arising from changes in market price and are included in “Net change in unrealized appreciation (depreciation) on investments” on the Statements of Operations. Net realized foreign currency gains and losses include the effect of changes in exchange rates between trade date and settlement date on investment security transactions, foreign currency transactions and interest and dividends received and are included in “Net realized gain (loss) on foreign currency transactions” on the Statements of Operations. The portion of foreign currency gains and losses related to fluctuations in exchange rates between the initial purchase settlement date and subsequent sale trade date is included in “Net realized gain (loss) on investments” on the Statements of Operations.
D. Dividends and Distributions to Shareholders
Dividends from net investment income, if any, are declared and paid quarterly by each Fund, or as the Board of Trustees may determine from time to time. Distributions of net realized capital gains earned by each Fund, if any, are distributed at least annually.
Distributions from net investment income and realized capital gains are determined in accordance with federal income tax regulations, which may differ from U.S. GAAP. Certain capital accounts in the financial statements are periodically adjusted for permanent differences in order to reflect their tax character. These permanent differences are primarily due to the varying treatment of income and gain/loss on portfolio securities held by the Funds and have no impact on net assets or NAV per share. Temporary differences, which arise from recognizing certain items of income, expense and gain/loss in different periods for financial statement and tax purposes, will reverse at some time in the future.
The tax character of distributions paid by each Fund during the fiscal period ended July 31, 2020, was as follows:
Notes to Financial Statements (Continued)
First Trust Exchange-Traded Fund III
January 31, 2021 (Unaudited)
| | Distributions
paid from
Ordinary
Income | | Distributions
paid from
Capital
Gains | | Distributions
paid from
Return of
Capital |
First Trust Horizon Managed Volatility Domestic ETF
| $ 3,582,296 | | $ — | | $ — |
First Trust Horizon Managed Volatility Developed International ETF
| 3,755,422 | | — | | — |
First Trust Horizon Managed Volatility Small/Mid ETF
| 6,225 | | — | | — |
As of July 31, 2020, the components of distributable earnings on a tax basis for each Fund were as follows:
| | Undistributed
Ordinary
Income | | Accumulated
Capital and
Other
Gain (Loss) | | Net
Unrealized
Appreciation
(Depreciation) |
First Trust Horizon Managed Volatility Domestic ETF
| $ 180,784 | | $ (55,601,206) | | $ 18,784,304 |
First Trust Horizon Managed Volatility Developed International ETF
| 31,560 | | (34,892,318) | | 1,892,292 |
First Trust Horizon Managed Volatility Small/Mid ETF
| 8,281 | | (769) | | 1,069,081 |
E. Income Taxes
Each Fund intends to qualify or continue to qualify as a regulated investment company by complying with the requirements under Subchapter M of the Internal Revenue Code of 1986, as amended, which includes distributing substantially all of its net investment income and net realized gains to shareholders. Accordingly, no provision has been made for federal and state income taxes. However, due to the timing and amount of distributions, each Fund may be subject to an excise tax of 4% of the amount by which approximately 98% of each Fund’s taxable income exceeds the distributions from such taxable income for the calendar year.
The Funds are subject to accounting standards that establish a minimum threshold for recognizing, and a system for measuring, the benefits of a tax position taken or expected to be taken in a tax return. For HUSV and HDMV, taxable years ended 2017, 2018, 2019, and 2020 remain open to federal and state audit. For HSMV, the taxable year ended 2020 remains open to federal and state audit. As of January 31, 2021, management has evaluated the application of these standards to the Funds and has determined that no provision for income tax is required in the Funds’ financial statements for uncertain tax positions.
The Funds intend to utilize provisions of the federal income tax laws, which allow them to carry a realized capital loss forward indefinitely following the year of the loss and offset such loss against any future realized capital gains. The Funds are subject to certain limitations under U.S. tax rules on the use of capital loss carryforwards and net unrealized built-in losses. These limitations apply when there has been a 50% change in ownership. At July 31, 2020, for federal income tax purposes, each applicable Fund had a capital loss carryforward available that is shown in the table below, to the extent provided by regulations, to offset future capital gains.
| | Non-Expiring
Capital Loss
Carryforward |
First Trust Horizon Managed Volatility Domestic ETF
| $ 55,601,206 |
First Trust Horizon Managed Volatility Developed International ETF
| 34,892,318 |
First Trust Horizon Managed Volatility Small/Mid ETF
| 769 |
F. Expenses
Expenses, other than the investment advisory fee and other excluded expenses, are paid by the Advisor (See Note 3).
3. Investment Advisory Fee, Affiliated Transactions and Other Fee Arrangements
First Trust, the investment advisor to the Funds, is a limited partnership with one limited partner, Grace Partners of DuPage L.P., and one general partner, The Charger Corporation. The Charger Corporation is an Illinois corporation controlled by James A. Bowen, Chief Executive Officer of First Trust. First Trust is responsible for supervising the selection and ongoing monitoring of the securities in each Fund’s portfolio, managing the Funds’ business affairs and providing certain administrative services necessary for the management of the Funds.
Notes to Financial Statements (Continued)
First Trust Exchange-Traded Fund III
January 31, 2021 (Unaudited)
HUSV has agreed to pay First Trust an annual unitary management fee of 0.70% of its average daily net assets. HDMV and HSMV have agreed to pay First Trust an annual unitary management fee of 0.80% of their average daily net assets. Pursuant to the Investment Management Agreement between First Trust and the Trust, First Trust manages the investment of the Funds’ assets and is responsible for the expenses of each Fund, including the cost of transfer agency, sub-advisory, custody, fund administration, legal, audit and other services, but excluding fee payments under the Investment Management Agreement, interest, taxes, brokerage commissions and other expenses connected with the execution of portfolio transactions, distribution and service fees payable pursuant to a Rule 12b-1 plan, if any, and extraordinary expenses, which are paid by each respective Fund. First Trust also provides fund reporting services to each Fund for a flat annual fee in the amount of $9,250, which is covered under the annual unitary management fee.
During the six months ended January 31, 2021, HDMV received a payment from the Advisor of $6,254 in connection with a trade error.
Horizon serves as the Funds’ sub-advisor and manages each Fund’s portfolio subject to First Trust’s supervision. The Sub-Advisor receives a sub-advisory fee from First Trust equal to 50% of any remaining monthly unitary management fee paid to the Advisor after the average Fund’s expenses accrued during the most recent twelve months are subtracted from the unitary management fee for that month.
The Trust has multiple service agreements with Brown Brothers Harriman & Co. (“BBH”). Under the service agreements, BBH performs custodial, fund accounting, certain administrative services, and transfer agency services for the Funds. As custodian, BBH is responsible for custody of each Fund’s assets. As fund accountant and administrator, BBH is responsible for maintaining the books and records of each Fund’s securities and cash. As transfer agent, BBH is responsible for maintaining shareholder records for each Fund.
Each Trustee who is not an officer or employee of First Trust, any sub-advisor or any of their affiliates (“Independent Trustees”) is paid a fixed annual retainer that is allocated equally among each fund in the First Trust Fund Complex. Each Independent Trustee is also paid an annual per fund fee that varies based on whether the fund is a closed-end or other actively managed fund, a defined-outcome fund or an index fund.
Additionally, the Lead Independent Trustee and the Chairmen of the Audit Committee, Nominating and Governance Committee and Valuation Committee are paid annual fees to serve in such capacities, with such compensation allocated pro rata among each fund in the First Trust Fund Complex based on net assets. Independent Trustees are reimbursed for travel and out-of-pocket expenses in connection with all meetings. The Lead Independent Trustee and Committee Chairmen rotate every three years. The officers and “Interested” Trustee receive no compensation from the Trust for acting in such capacities.
4. Purchases and Sales of Securities
For the six months ended January 31, 2021, the cost of purchases and proceeds from sales of investment securities for each Fund, excluding short-term investments and in-kind transactions, were as follows:
| | Purchases | | Sales |
| First Trust Horizon Managed Volatility Domestic ETF | $ 145,278,836 | | $ 144,703,450 |
| First Trust Horizon Managed Volatility Developed International ETF | 63,480,719 | | 64,325,394 |
| First Trust Horizon Managed Volatility Small/Mid ETF | 9,445,212 | | 9,139,271 |
| | | | |
For the six months ended January 31, 2021, the cost of in-kind purchases and proceeds from in-kind sales for each Fund were as follows:
| | Purchases | | Sales |
| First Trust Horizon Managed Volatility Domestic ETF | $ 124,053,537 | | $ 180,540,375 |
| First Trust Horizon Managed Volatility Developed International ETF | — | | 40,310,800 |
| First Trust Horizon Managed Volatility Small/Mid ETF | 12,163,160 | | 19,798,359 |
Notes to Financial Statements (Continued)
First Trust Exchange-Traded Fund III
January 31, 2021 (Unaudited)
5. Creations, Redemptions and Transaction Fees
Each Fund generally issues and redeems its shares in primary market transactions through a creation and redemption mechanism and does not sell or redeem individual shares. Instead, financial entities known as “Authorized Participants” have contractual arrangements with a Fund or one of the Fund’s service providers to purchase and redeem Fund shares directly with the Fund in large blocks of shares known as “Creation Units.” Prior to the start of trading on every business day, a Fund publishes through the National Securities Clearing Corporation (“NSCC”) the “basket” of securities, cash or other assets that it will accept in exchange for a Creation Unit of the Fund’s shares. An Authorized Participant that wishes to effectuate a creation of a Fund’s shares deposits with the Fund the “basket” of securities, cash or other assets identified by the Fund that day, and then receives the Creation Unit of the Fund’s shares in return for those assets. After purchasing a Creation Unit, the Authorized Participant may continue to hold the Fund’s shares or sell them in the secondary market. The redemption process is the reverse of the purchase process: the authorized participant redeems a Creation Unit of a Fund’s shares for a basket of securities, cash or other assets. The combination of the creation and redemption process with secondary market trading in a Fund’s shares and underlying securities provides arbitrage opportunities that are designed to help keep the market price of a Fund’s shares at or close to the NAV per share of the Fund.
Each Fund imposes fees in connection with the purchase of Creation Units. These fees may vary based upon various fact-based circumstances, including, but not limited to, the composition of the securities included in the Creation Unit or the countries in which the transactions are settled. The price for each Creation Unit will equal the daily NAV per share of a Fund times the number of shares in a Creation Unit, plus the fees described above and, if applicable, any operational processing and brokerage costs, transfer fees, stamp taxes and part or all of the spread between the expected bid and offer side of the market related to the securities comprising the creation basket.
Each Fund also imposes fees in connection with the redemption of Creation Units. These fees may vary based upon various fact-based circumstances, including, but not limited to, the composition of the securities included in the Creation Unit or the countries in which the transactions are settled. The price received for each Creation Unit will equal the daily NAV per share of a Fund times the number of shares in a Creation Unit, minus the fees described above and, if applicable, any operational processing and brokerage costs, transfer fees, stamp taxes and part or all of the spread between the expected bid and offer side of the market related to the securities comprising the redemption basket. Investors who use the services of a broker or other such intermediary in addition to an Authorized Participant to effect a redemption of a Creation Unit may also be assessed an amount to cover the cost of such services. The redemption fee charged by a Fund will comply with Rule 22c-2 of the 1940 Act which limits redemption fees to no more than 2% of the value of the shares redeemed.
6. Distribution Plan
The Board of Trustees adopted a Distribution and Service Plan pursuant to Rule 12b-1 under the 1940 Act. In accordance with the Rule 12b-1 plan, each Fund is authorized to pay an amount up to 0.25% of its average daily net assets each year to reimburse First Trust Portfolios L.P. (“FTP”), the distributor of the Funds, for amounts expended to finance activities primarily intended to result in the sale of Creation Units or to provide investor services. FTP may also use this amount to compensate securities dealers or other persons that are Authorized Participants for providing distribution assistance, including broker-dealer and shareholder support and educational and promotional services.
No 12b-1 fees are currently paid by the Funds, and pursuant to a contractual arrangement, no 12b-1 fees will be paid any time before November 30, 2021 for HUSV and HDMV and March 14, 2022 for HSMV.
7. Indemnification
The Trust, on behalf of the Funds, has a variety of indemnification obligations under contracts with its service providers. The Trust’s maximum exposure under these arrangements is unknown. However, the Trust has not had prior claims or losses pursuant to these contracts and expects the risk of loss to be remote.
8. Other Matters
By operation of law, HUSV and HDMV now operate as diversified open-end management investment companies as defined in Section 5(b) of the 1940 Act.
9. Subsequent Events
Management has evaluated the impact of all subsequent events to the Funds through the date the financial statements were issued, and has determined that there were no subsequent events requiring recognition or disclosure in the financial statements that have not already been disclosed.
Additional Information
First Trust Exchange-Traded Fund III
January 31, 2021 (Unaudited)
Proxy Voting Policies and Procedures
A description of the policies and procedures that the Trust uses to determine how to vote proxies and information on how each Fund voted proxies relating to portfolio securities during the most recent 12-month period ended June 30 is available (1) without charge, upon request, by calling (800) 988-5891; (2) on each Fund’s website at www.ftportfolios.com; and (3) on the Securities and Exchange Commission’s (“SEC”) website at www.sec.gov.
Portfolio Holdings
Each Fund files portfolio holdings information for each month in a fiscal quarter within 60 days after the end of the relevant fiscal quarter on Form N-PORT. Portfolio holdings information for the third month of each fiscal quarter will be publicly available on the SEC’s website at www.sec.gov. Each Fund’s complete schedule of portfolio holdings for the second and fourth quarters of each fiscal year is included in the semi-annual and annual reports to shareholders, respectively, and is filed with the SEC on Form N-CSR. The semi-annual and annual report for each Fund is available to investors within 60 days after the period to which it relates. Each Fund’s Forms N-PORT and Forms N-CSR are available on the SEC’s website listed above.
Risk Considerations
Risks are inherent in all investing. Certain general risks that may be applicable to a Fund are identified below, but not all of the material risks relevant to each Fund are included in this report and not all of the risks below apply to each Fund. The material risks of investing in each Fund are spelled out in its prospectus, statement of additional information and other regulatory filings. Before investing, you should consider each Fund’s investment objective, risks, charges and expenses, and read each Fund’s prospectus and statement of additional information carefully. You can download each Fund’s prospectus at www.ftportfolios.com or contact First Trust Portfolios L.P. at (800) 621-1675 to request a prospectus, which contains this and other information about each Fund.
Concentration Risk. To the extent that a fund is able to invest a large percentage of its assets in a single asset class or the securities of issuers within the same country, state, region, industry or sector, an adverse economic, business or political development may affect the value of the fund’s investments more than if the fund were more broadly diversified. A fund that tracks an index will be concentrated to the extent the fund’s corresponding index is concentrated. A concentration makes a fund more susceptible to any single occurrence and may subject the fund to greater market risk than a fund that is not concentrated.
Credit Risk. Credit risk is the risk that an issuer of a security will be unable or unwilling to make dividend, interest and/or principal payments when due and the related risk that the value of a security may decline because of concerns about the issuer’s ability to make such payments.
Cyber Security Risk. The funds are susceptible to potential operational risks through breaches in cyber security. A breach in cyber security refers to both intentional and unintentional events that may cause a fund to lose proprietary information, suffer data corruption or lose operational capacity. Such events could cause a fund to incur regulatory penalties, reputational damage, additional compliance costs associated with corrective measures and/or financial loss. In addition, cyber security breaches of a fund’s third-party service providers, such as its administrator, transfer agent, custodian, or sub-advisor, as applicable, or issuers in which the fund invests, can also subject a fund to many of the same risks associated with direct cyber security breaches.
Derivatives Risk. To the extent a fund uses derivative instruments such as futures contracts, options contracts and swaps, the fund may experience losses because of adverse movements in the price or value of the underlying asset, index or rate, which may be magnified by certain features of the derivative. These risks are heightened when a fund’s portfolio managers use derivatives to enhance the fund’s return or as a substitute for a position or security, rather than solely to hedge (or offset) the risk of a position or security held by the fund.
Equity Securities Risk. To the extent a fund invests in equity securities, the value of the fund’s shares will fluctuate with changes in the value of the equity securities. Equity securities prices fluctuate for several reasons, including changes in investors’ perceptions of the financial condition of an issuer or the general condition of the relevant stock market, such as market volatility, or when political or economic events affecting the issuers occur. In addition, common stock prices may be particularly sensitive to rising interest rates, as the cost of capital rises and borrowing costs increase. Equity securities may decline significantly in price over short or extended periods of time, and such declines may occur in the equity market as a whole, or they may occur in only a particular country, company, industry or sector of the market.
ETF Risk. The shares of an ETF trade like common stock and represent an interest in a portfolio of securities. The risks of owning an ETF generally reflect the risks of owning the underlying securities, although lack of liquidity in an ETF could result in it being more volatile and ETFs have management fees that increase their costs. Shares of an ETF trade on an exchange at market prices rather than
Additional Information (Continued)
First Trust Exchange-Traded Fund III
January 31, 2021 (Unaudited)
net asset value, which may cause the shares to trade at a price greater than net asset value (premium) or less than net asset value (discount). In times of market stress, decisions by market makers to reduce or step away from their role of providing a market for an ETF’s shares, or decisions by an ETF’s authorized participants that they are unable or unwilling to proceed with creation and/or redemption orders of an ETF’s shares, could result in shares of the ETF trading at a discount to net asset value and in greater than normal intraday bid-ask spreads.
Fixed Income Securities Risk. To the extent a fund invests in fixed income securities, the fund will be subject to credit risk, income risk, interest rate risk, liquidity risk and prepayment risk. Income risk is the risk that income from a fund’s fixed income investments could decline during periods of falling interest rates. Interest rate risk is the risk that the value of a fund’s fixed income securities will decline because of rising interest rates. Liquidity risk is the risk that a security cannot be purchased or sold at the time desired, or cannot be purchased or sold without adversely affecting the price. Prepayment risk is the risk that the securities will be redeemed or prepaid by the issuer, resulting in lower interest payments received by the fund. In addition to these risks, high yield securities, or “junk” bonds, are subject to greater market fluctuations and risk of loss than securities with higher ratings, and the market for high yield securities is generally smaller and less liquid than that for investment grade securities.
Index Constituent Risk. Certain funds may be a constituent of one or more indices. As a result, such a fund may be included in one or more index-tracking exchange-traded funds or mutual funds. Being a component security of such a vehicle could greatly affect the trading activity involving a fund, the size of the fund and the market volatility of the fund. Inclusion in an index could significantly increase demand for the fund and removal from an index could result in outsized selling activity in a relatively short period of time. As a result, a fund’s net asset value could be negatively impacted and the fund’s market price may be significantly below its net asset value during certain periods.
Index Provider Risk. To the extent a fund seeks to track an index, it is subject to Index Provider Risk. There is no assurance that the Index Provider will compile the Index accurately, or that the Index will be determined, maintained, constructed, reconstituted, rebalanced, composed, calculated or disseminated accurately. To correct any such error, the Index Provider may carry out an unscheduled rebalance or other modification of the Index constituents or weightings, which may increase the fund’s costs. The Index Provider does not provide any representation or warranty in relation to the quality, accuracy or completeness of data in the Index, and it does not guarantee that the Index will be calculated in accordance with its stated methodology. Losses or costs associated with any Index Provider errors generally will be borne by the fund and its shareholders.
Investment Companies Risk. To the extent a fund invests in the securities of other investment vehicles, the fund will incur additional fees and expenses that would not be present in a direct investment in those investment vehicles. Furthermore, the fund’s investment performance and risks are directly related to the investment performance and risks of the investment vehicles in which the fund invests.
LIBOR Risk. To the extent a fund invests in floating or variable rate obligations that use the London Interbank Offered Rate (“LIBOR”) as a reference interest rate, it is subject to LIBOR Risk. The United Kingdom’s Financial Conduct Authority, which regulates LIBOR, will cease making LIBOR available as a reference rate over a phase-out period that will begin immediately after December 31, 2021. The unavailability or replacement of LIBOR may affect the value, liquidity or return on certain fund investments and may result in costs incurred in connection with closing out positions and entering into new trades. Any potential effects of the transition away from LIBOR on the fund or on certain instruments in which the fund invests can be difficult to ascertain, and they may vary depending on a variety of factors, and they could result in losses to the fund.
Management Risk. To the extent that a fund is actively managed, it is subject to management risk. In managing an actively-managed fund’s investment portfolio, the fund’s portfolio managers will apply investment techniques and risk analyses that may not have the desired result. There can be no guarantee that a fund will meet its investment objective.
Market Risk. Securities held by a fund, as well as shares of a fund itself, are subject to market fluctuations caused by factors such as general economic conditions, political events, regulatory or market developments, changes in interest rates and perceived trends in securities prices. Shares of a fund could decline in value or underperform other investments as a result of the risk of loss associated with these market fluctuations. In addition, local, regional or global events such as war, acts of terrorism, spread of infectious diseases or other public health issues, recessions, or other events could have a significant negative impact on a fund and its investments. Such events may affect certain geographic regions, countries, sectors and industries more significantly than others. The outbreak of the respiratory disease designated as COVID-19 in December 2019 has caused significant volatility and declines in global financial markets, which have caused losses for investors. The COVID-19 pandemic may last for an extended period of time and will continue to impact the economy for the foreseeable future.
Non-U.S. Securities Risk. To the extent a fund invests in non-U.S. securities, it is subject to additional risks not associated with securities of domestic issuers. Non-U.S. securities are subject to higher volatility than securities of domestic issuers due to: possible adverse political, social or economic developments; restrictions on foreign investment or exchange of securities; lack of liquidity;
Additional Information (Continued)
First Trust Exchange-Traded Fund III
January 31, 2021 (Unaudited)
currency exchange rates; excessive taxation; government seizure of assets; different legal or accounting standards; and less government supervision and regulation of exchanges in foreign countries. Investments in non-U.S. securities may involve higher costs than investments in U.S. securities, including higher transaction and custody costs, as well as additional taxes imposed by non-U.S. governments. These risks may be heightened for securities of companies located, or with significant operations, in emerging market countries.
Operational Risk. Each fund is subject to risks arising from various operational factors, including, but not limited to, human error, processing and communication errors, errors of a fund’s service providers, counterparties or other third-parties, failed or inadequate processes and technology or systems failures. Although the funds and the Advisor seek to reduce these operational risks through controls and procedures, there is no way to completely protect against such risks.
Passive Investment Risk. To the extent a fund seeks to track an index, the fund will invest in the securities included in, or representative of, the index regardless of their investment merit. A fund generally will not attempt to take defensive positions in declining markets.
| NOT FDIC INSURED | NOT BANK GUARANTEED | MAY LOSE VALUE |
This page intentionally left blank
This page intentionally left blank
This page intentionally left blank
First Trust Exchange-Traded Fund III
INVESTMENT ADVISOR
First Trust Advisors L.P.
120 East Liberty Drive, Suite 400
Wheaton, IL 60187
INVESTMENT SUB-ADVISOR
Horizon Investments, LLC
6210 Ardrey Kell Road, Suite 300
Charlotte, NC 28277
ADMINISTRATOR, CUSTODIAN,
FUND ACCOUNTANT &
TRANSFER AGENT
Brown Brothers Harriman & Co.
50 Post Office Square
Boston, MA 02110
INDEPENDENT REGISTERED
PUBLIC ACCOUNTING FIRM
Deloitte & Touche LLP
111 S. Wacker Drive
Chicago, IL 60606
LEGAL COUNSEL
Chapman and Cutler LLP
111 W. Monroe Street
Chicago, IL 60603
First Trust Exchange-Traded Fund III
First Trust California Municipal High Income ETF (FCAL)
Semi-Annual Report
For the Six Months Ended
January 31, 2021
First Trust California Municipal High Income ETF (FCAL)
Semi-Annual Report
January 31, 2021
Caution Regarding Forward-Looking Statements
This report contains certain forward-looking statements within the meaning of the Securities Act of 1933, as amended, and the Securities Exchange Act of 1934, as amended. Forward-looking statements include statements regarding the goals, beliefs, plans or current expectations of First Trust Advisors L.P. (“First Trust” or the “Advisor”) and its representatives, taking into account the information currently available to them. Forward-looking statements include all statements that do not relate solely to current or historical fact. For example, forward-looking statements include the use of words such as “anticipate,” “estimate,” “intend,” “expect,” “believe,” “plan,” “may,” “should,” “would” or other words that convey uncertainty of future events or outcomes.
Forward-looking statements involve known and unknown risks, uncertainties and other factors that may cause the actual results, performance or achievements of the series of First Trust Exchange-Traded Fund III (the “Trust”) described in this report (First Trust California Municipal High Income ETF; hereinafter referred to as the “Fund”) to be materially different from any future results, performance or achievements expressed or implied by the forward-looking statements. When evaluating the information included in this report, you are cautioned not to place undue reliance on these forward-looking statements, which reflect the judgment of the Advisor and its representatives only as of the date hereof. We undertake no obligation to publicly revise or update these forward-looking statements to reflect events and circumstances that arise after the date hereof.
Performance and Risk Disclosure
There is no assurance that the Fund will achieve its investment objectives. The Fund is subject to market risk, which is the possibility that the market values of securities owned by the Fund will decline and that the value of the Fund’s shares may therefore be less than what you paid for them. Accordingly, you can lose money by investing in the Fund. See “Risk Considerations” in the Additional Information section of this report for a discussion of certain other risks of investing in the Fund.
Performance data quoted represents past performance, which is no guarantee of future results, and current performance may be lower or higher than the figures shown. For the most recent month-end performance figures, please visit www.ftportfolios.com or speak with your financial advisor. Investment returns, net asset value and share price will fluctuate and Fund shares, when sold, may be worth more or less than their original cost.
The Advisor may also periodically provide additional information on Fund performance on the Fund’s web page at www.ftportfolios.com.
How to Read This Report
This report contains information that may help you evaluate your investment in the Fund. It includes details about the Fund and presents data and analysis that provide insight into the Fund’s performance and investment approach.
The statistical information that follows may help you understand the Fund’s performance compared to that of a relevant market benchmark.
It is important to keep in mind that the opinions expressed by personnel of the Advisor are just that: informed opinions. They should not be considered to be promises or advice. The opinions, like the statistics, cover the period through the date on the cover of this report. The material risks of investing in the Fund are spelled out in the prospectus, the statement of additional information, and other Fund regulatory filings.
First Trust California Municipal High Income ETF (FCAL)
Semi-Annual Letter from the Chairman and CEO
January 31, 2021
Dear Shareholders,
First Trust is pleased to provide you with the semi-annual report for the First Trust California Municipal High Income ETF (the “Fund”), which contains detailed information about the Fund for the six months ended January 31, 2021.
There is so much to talk about, yet so little space. Rather than drill down on politics or belabor the coronavirus (“COVID-19”) pandemic, I would like to take this opportunity to convey a brief message on the current economic/business/investment climate in the U.S. The one thing I feel compelled to point out, however, is that unlike the Trump Administration’s approach of delegating the lion’s share of the responsibility of executing the medical ground assault against COVID-19 to the states, the Biden Administration has communicated its intention to play more of an integral role at the federal level. The distribution of the FDA-approved vaccines, of which there are currently three, and the push for a huge bump up in the next round of fiscal stimulus to help millions of Americans cope with the economic fallout stemming from the pandemic are just two examples. While he was hoping to make it a bipartisan effort, President Joe Biden was prepared to utilize a tactic in Congress, particularly in the Senate, known as reconciliation to pass his $1.9 trillion stimulus bill. Reconciliation would only require a simple majority of Senate votes to pass the bill. In the end, Congress did just that and the Senate passed the bill with a 50-49 count. President Biden signed the “American Rescue Plan Act “ into law on March 11, 2021. Not one Republican in Congress voted for the bill.
The current climate strikes me as one where “Cash is King.” A recent survey by Money and Morning Consult found that 68% of adults said they need another stimulus check from the government to get by, and 39% of those polled claimed they need the additional financial support ”a lot,“ according to their own release. Overall, respondents said that the $600 checks sent out this past December were not enough. Seventy-seven percent of adults say they need the checks to exceed $1,000 and 36% say they need more than $2,000 to make ends meet. President Joe Biden’s American Rescue Plan will make payments of up to $1,400 to those who are eligible. Suffice it to say, cash tends to be an urgent priority for those who do not have it.
While most investors are likely hunting for opportunities to generate higher returns on their capital, many Americans are sitting on their cash. Brian Wesbury, Chief Economist at First Trust, recently noted that, as of the third quarter of 2020, the amount of capital held by Americans in checking accounts, savings accounts, time deposits and money market funds stood $2.8 trillion higher than their combined total in the third quarter of 2019. If you have listened to what Federal Reserve Chairman Jerome Powell has said about keeping short-term interest rates low for two or three more years if need be to significantly lower unemployment and generate inflationary pressure beyond the Federal Reserve’s 2.0% target, it makes the thought of harboring such an extraordinary volume of capital in these low-paying, interest-bearing accounts even harder to fathom, in my opinion.
The state of the U.S. economy is on the mend, but likely won’t make a full recovery for at least a couple more years, according to Wesbury. In our opinion, most of the weakness in the economy is stemming from some key service-oriented sectors, such as hotels and airlines, that remain sheltered or lightly used. Wesbury believes that a full recovery requires the reopening of the entire U.S. economy. The speed of the vaccine rollout in the weeks ahead could help determine when the economy is ready to fully reopen.
We believe investors should take solace in how upbeat our top executives are about the near future. The Conference Board’s Measure of CEO Confidence™ rose to a 17-year high in the first quarter of 2021, according to Fox Business. The measure currently stands at 73. A reading above 50 points reflects more positive than negative responses from CEOs. Its quarterly survey revealed that 82% of CEOs expect economic conditions to improve over the next six months, up from 63% in the prior survey. Forty-five percent of them expect to increase capital spending, up from 25% in the prior survey. The good news is that Corporate America’s largest companies have the cash to fund projects. In the third quarter of 2020 (most recent data), S&P 500 Industrials (Old) cash and equivalents, which excludes cash held by Financials, Utilities and Transportation companies, stood at a near-record high of $1.88 trillion, according to S&P Dow Jones Indices. The all-time high was $1.89 trillion, set in the second quarter of 2020.
It seems the economy is on the cusp of another major cash injection from the government. We encourage investors to stay the course.
Thank you for giving First Trust the opportunity to play a role in your financial future. We value our relationship with you and will report on the Fund again in six months.
Sincerely,
James A. Bowen
Chairman of the Board of Trustees
Chief Executive Officer of First Trust Advisors L.P.
Fund Performance Overview (Unaudited)
First Trust California Municipal High Income ETF (FCAL)
The primary investment objective of First Trust California Municipal High Income ETF (the “Fund”) is to seek to provide current income that is exempt from regular federal income taxes and California income taxes, and its secondary objective is long-term capital appreciation. Under normal market conditions, the Fund seeks to achieve its investment objectives by investing at least 80% of its net assets (including investment borrowings) in municipal debt securities that pay interest that is exempt from regular federal income taxes and California income taxes (“Municipal Securities”). Municipal Securities will be issued by or on behalf of the State of California or territories or possessions of the U.S. (including but not limited to Puerto Rico, the U.S. Virgin Islands and Guam) and/or the political subdivisions, agencies, authorities and other instrumentalities of such state, territories or possessions. The Fund lists and principally trades its shares on The Nasdaq Stock Market LLC under the ticker symbol “FCAL.”
| Performance | | | | |
| | | | Average Annual
Total Returns | Cumulative
Total Returns |
| | 6 Months Ended
1/31/21 | 1 Year Ended
1/31/21 | Inception (6/20/17)
to 1/31/21 | Inception (6/20/17)
to 1/31/21 |
| Fund Performance | | | | |
| NAV | 3.69% | 2.56% | 5.13% | 19.82% |
| Market Price | 3.60% | 2.30% | 5.09% | 19.68% |
| Index Performance | | | | |
| Bloomberg Barclays 10 Year California Exempt Index | 1.20% | 4.02% | 4.21% | 16.08% |
Total returns for the period since inception are calculated from the inception date of the Fund. “Average Annual Total Returns” represent the average annual change in value of an investment over the period indicated. “Cumulative Total Returns” represent the total change in value of an investment over the period indicated. The total returns would have been lower if certain fees had not been waived by the Advisor.
The Fund’s per share net asset value (“NAV”) is the value of one share of the Fund and is computed by dividing the value of all assets of the Fund (including accrued interest and dividends), less all liabilities (including accrued expenses and dividends declared but unpaid), by the total number of outstanding shares. The price used to calculate market return (“Market Price”) is determined by using the midpoint of the national best bid and offer price (“NBBO”) as of the time that the Fund’s NAV is calculated. Under SEC rules, the NBBO consists of the highest displayed buy and lowest sell prices among the various exchanges trading the Fund at the time the Fund’s NAV is calculated. Prior to January 1, 2019, the price used was the midpoint between the highest bid and the lowest offer on the stock exchange on which shares of the Fund were listed for trading as of the time that the Fund’s NAV was calculated. Since shares of the Fund did not trade in the secondary market until after its inception, for the period from inception to the first day of secondary market trading in shares of the Fund, the NAV of the Fund is used as a proxy for the secondary market trading price to calculate market returns. NAV and market returns assume that all distributions have been reinvested in the Fund at NAV and Market Price, respectively.
An index is a statistical composite that tracks a specified financial market or sector. Unlike the Fund, the index does not actually hold a portfolio of securities and therefore does not incur the expenses incurred by the Fund. These expenses negatively impact the performance of the Fund. Also, market returns do not include brokerage commissions that may be payable on secondary market transactions. If brokerage commissions were included, market returns would be lower. The total returns presented reflect the reinvestment of dividends on securities in the index. The returns presented do not reflect the deduction of taxes that a shareholder would pay on Fund distributions or the redemption or sale of Fund shares. The investment return and principal value of shares of the Fund will vary with changes in market conditions. Shares of the Fund may be worth more or less than their original cost when they are redeemed or sold in the market. The Fund’s past performance is no guarantee of future performance.
Fund Performance Overview (Unaudited) (Continued)
First Trust California Municipal High Income ETF (FCAL) (Continued)
| Sector Allocation | % of Total
Investments
(including cash) |
| Insured | 17.8% |
| Special Assessment | 13.9 |
| Education | 9.6 |
| Tobacco | 8.5 |
| Government Obligation Bond - Unlimited Tax | 6.4 |
| Dedicated Tax | 6.3 |
| Hospital | 6.0 |
| Industrial Development Bond | 5.6 |
| Continuing Care Retirement Communities | 4.2 |
| Student Housing | 3.7 |
| Certificates of Participation | 3.7 |
| Water & Sewer | 3.3 |
| Tax Increment | 3.0 |
| Higher Education | 2.5 |
| Airport | 2.0 |
| Local Housing | 0.7 |
| Other Health | 0.7 |
| Gas | 0.6 |
| Government Obligation Bond - Limited Tax | 0.6 |
| Housing | 0.5 |
| Toll Road | 0.2 |
| Cash | 0.2 |
| Total | 100.0% |
| Fund Allocation | % of Net Assets |
| Municipal Bonds | 95.5% |
| Net Other Assets and Liabilities(1) | 4.5 |
| Total | 100.0% |
| Credit Rating(2) | % of Total
Investments
(including cash) |
| AAA | 0.3% |
| AA | 32.1 |
| A | 19.9 |
| BBB | 15.8 |
| BB | 8.4 |
| B | 1.9 |
| Not Rated | 21.4 |
| Cash | 0.2 |
| Total | 100.0% |
| (1) | Includes variation margin on futures. |
| (2) | The credit quality and ratings information presented above reflect the ratings assigned by one or more nationally recognized statistical rating organizations (NRSROs), including Standard & Poor’s Ratings Group, a division of the McGraw Hill Companies, Inc., Moody’s Investors Service, Inc., Fitch Ratings or a comparably rated NRSRO. For situations in which a security is rated by more than one NRSRO and the ratings are not equivalent, the highest rating is used. Sub-investment grade ratings are those rated BB+/Ba1 or lower. Investment grade ratings are those rated BBB-/Baa3 or higher. The credit ratings shown relate to the creditworthiness of the issuers of the underlying securities in the Fund, and not to the Fund or its shares. Credit ratings are subject to change. |
Fund Performance Overview (Unaudited) (Continued)
First Trust California Municipal High Income ETF (FCAL) (Continued)
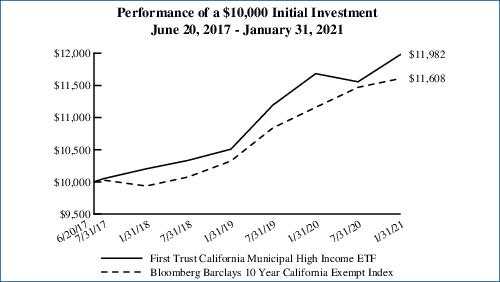
Performance figures assume reinvestment of all distributions and do not reflect the deduction of taxes that a shareholder would pay on Fund distributions or the redemption or sale of Fund shares. An index is a statistical composite that tracks a specified financial market or sector. Unlike the Fund, the index does not actually hold a portfolio of securities and therefore does not incur the expenses incurred by the Fund. These expenses negatively impact the performance of the Fund. The Fund’s past performance does not predict future performance.
Frequency Distribution of Discounts and Premiums
Information showing the number of days the market price of the Fund’s shares was greater (at a premium) and less (at a discount) than the Fund’s net asset value for the most recently completed year, and the most recently completed calendar quarters since that year (or life of the Fund, if shorter), is available at https://www.ftportfolios.com/Retail/etf/home.aspx.
Portfolio Management
First Trust California Municipal High Income ETF (FCAL)
Semi-Annual Report
January 31, 2021 (Unaudited)
Advisor
First Trust Advisors L.P. (“First Trust” or the “Advisor”) is the investment advisor to the First Trust California Municipal High Income ETF (the “Fund”). First Trust is responsible for the ongoing monitoring of the Fund’s investment portfolio, managing the Fund’s business affairs and providing certain administrative services necessary for the management of the Fund.
Portfolio Management Team
Tom Futrell, CFA, Senior Vice President, Senior Portfolio Manager
Johnathan N. Wilhelm, Senior Vice President, Senior Portfolio Manager
The First Trust Municipal Securities Team was formed in September of 2013 and is headed by Tom Futrell, CFA, and Johnathan Wilhelm who serve as senior portfolio managers of the Fund. Messrs. Futrell and Wilhelm have a combined 50+ years of investment experience and prior to joining First Trust, served as portfolio managers of municipal bonds at Nuveen Investments and Performance Trust Investment Advisors. In addition to the Fund, the Team manages/consults for a variety of First Trust investment portfolios and separately managed accounts.
First Trust California Municipal High Income ETF (FCAL)
Understanding Your Fund Expenses
January 31, 2021 (Unaudited)
As a shareholder of the First Trust California Municipal High Income ETF (the “Fund”), you incur two types of costs: (1) transaction costs; and (2) ongoing costs, including management fees, distribution and/or service (12b-1) fees, if any, and other Fund expenses. This Example is intended to help you understand your ongoing costs of investing in the Fund and to compare these costs with the ongoing costs of investing in other funds.
The Example is based on an investment of $1,000 invested at the beginning of the period and held through the six-month period ended January 31, 2021.
Actual Expenses
The first line in the following table provides information about actual account values and actual expenses. You may use the information in this line, together with the amount you invested, to estimate the expenses that you paid over the period. Simply divide your account value by $1,000 (for example, an $8,600 account value divided by $1,000 = 8.6), then multiply the result by the number in the first line under the heading entitled “Expenses Paid During the Six-Month Period” to estimate the expenses you paid on your account during this six-month period.
Hypothetical Example for Comparison Purposes
The second line in the following table provides information about hypothetical account values and hypothetical expenses based on the Fund’s actual expense ratio and an assumed rate of return of 5% per year before expenses, which is not the Fund’s actual return. The hypothetical account values and expenses may not be used to estimate the actual ending account balance or expenses you paid for the period. You may use this information to compare the ongoing costs of investing in the Fund and other funds. To do so, compare this 5% hypothetical example with the 5% hypothetical examples that appear in the shareholder reports of the other funds.
Please note that the expenses shown in the table are meant to highlight your ongoing costs only and do not reflect any transactional costs such as brokerage commissions. Therefore, the second line in the table is useful in comparing ongoing costs only, and will not help you determine the relative total costs of owning different funds. In addition, if these transactional costs were included, your costs would have been higher.
| | Beginning
Account Value
August 1, 2020 | Ending
Account Value
January 31, 2021 | Annualized
Expense Ratio
Based on the
Six-Month
Period (a) | Expenses Paid
During the
Six-Month
Period (b) |
| First Trust California Municipal High Income ETF (FCAL) |
| Actual | $1,000.00 | $1,036.90 | 0.50% | $2.57 |
| Hypothetical (5% return before expenses) | $1,000.00 | $1,022.68 | 0.50% | $2.55 |
| (a) | These expense ratios reflect expense waivers. See Note 3 in the Notes to Financial Statements. |
| (b) | Expenses are equal to the annualized expense ratios as indicated in the table multiplied by the average account value over the period (August 1, 2020 through January 31, 2021), multiplied by 184/365 (to reflect the six-month period). |
First Trust California Municipal High Income ETF (FCAL)
Portfolio of Investments
January 31, 2021 (Unaudited)
Principal
Value | | Description | | Stated
Coupon | | Stated
Maturity | | Value |
| MUNICIPAL BONDS – 95.5% |
| | | California – 86.3% | | | | | | |
| $350,000 | | Alameda CA Corridor Transprtn Auth Ref 2nd Sub Lien, Ser B, AGM
| | 4.00% | | 10/01/37 | | $389,620 |
| 150,000 | | Alameda CA Corridor Transprtn Auth Ref Subordinate Lien, Ser A
| | 5.00% | | 10/01/25 | | 180,815 |
| 500,000 | | Anaheim CA Pub Fin Auth Lease Rev Pub Imps Proj, Ser A
| | 5.00% | | 09/01/28 | | 622,435 |
| 215,000 | | Antelope Vly E Kern CA Wtr Agy Wtr Rev Ref
| | 5.00% | | 06/01/35 | | 260,976 |
| 525,000 | | Azusa CA Spl Tax Cmnty Facs Dist No 2005-1 Impt
| | 4.00% | | 09/01/34 | | 597,912 |
| 100,000 | | Beaumont CA Spl Tax Cmnty Facs Dist No 93-1 Impt Area 8F
| | 4.00% | | 09/01/33 | | 113,159 |
| 175,000 | | Beaumont CA Spl Tax Cmnty Facs Dist No 93-1 Impt Area 8F
| | 4.00% | | 09/01/34 | | 197,341 |
| 330,000 | | Beaumont CA Spl Tax Cmnty Facs Dist No 93-1 Impt Area 8F
| | 4.00% | | 09/01/36 | | 370,917 |
| 620,000 | | Beaumont CA Spl Tax Cmnty Facs Dist No 93-1 Impt Area 8F
| | 4.00% | | 09/01/40 | | 691,312 |
| 200,000 | | CA Cnty CA Tobacco Securitization Agy Tobacco Settlement Ref, Sonoma Cnty Securitization Corp, Ser A
| | 4.00% | | 06/01/35 | | 246,566 |
| 665,000 | | CA Cnty CA Tobacco Securitization Agy Tobacco Settlement Sr Ref, Ser A
| | 5.00% | | 06/01/32 | | 903,043 |
| 200,000 | | CA Cnty CA Tobacco Securitization Agy Tobacco Settlement Sr Ref, Ser A
| | 5.00% | | 06/01/33 | | 269,752 |
| 200,000 | | CA Cnty CA Tobacco Securitization Agy Tobacco Settlement Sr Ref, Ser A
| | 4.00% | | 06/01/35 | | 249,890 |
| 200,000 | | CA Cnty CA Tobacco Securitization Agy Tobacco Settlement Sr Ref, Ser A
| | 4.00% | | 06/01/39 | | 245,528 |
| 440,908 | | CA Hsg Fin Agy Muni Ctfs, Ser A
| | 4.25% | | 01/15/35 | | 517,234 |
| 200,000 | | CA Sch Fin Auth Sch Fac Rev Alliance Clg Ready Pub Schs Proj, Ser C
| | 4.50% | | 07/01/26 | | 230,326 |
| 255,000 | | CA Sch Fin Auth Sch Fac Rev Alliance Clg Ready Pub Schs Projs, Ser A (a)
| | 5.00% | | 07/01/30 | | 297,238 |
| 505,000 | | CA Sch Fin Auth Sch Fac Rev Granada Hills Chrt Oblig Grp (a)
| | 5.00% | | 07/01/34 | | 579,008 |
| 105,000 | | CA Sch Fin Auth Sch Fac Rev Kipp Socal Pub Schs, Ser A (a)
| | 5.00% | | 07/01/26 | | 129,486 |
| 105,000 | | CA Sch Fin Auth Sch Fac Rev Kipp Socal Pub Schs, Ser A (a)
| | 5.00% | | 07/01/27 | | 133,128 |
| 400,000 | | CA Sch Fin Auth Sch Fac Rev Kipp Socal Pub Schs, Ser A (a)
| | 5.00% | | 07/01/39 | | 512,012 |
| 200,000 | | CA Sch Fin Auth Sch Fac Rev Ref Hlth Learning Proj, Ser A (a)
| | 4.00% | | 07/01/25 | | 220,196 |
| 200,000 | | CA Sch Fin Auth Sch Fac Rev Ref Hlth Learning Proj, Ser A (a)
| | 5.00% | | 07/01/32 | | 231,252 |
| 650,000 | | CA Sch Fin Auth Sch Fac Rev, Ser A (a)
| | 5.00% | | 07/01/40 | | 733,902 |
| 1,000,000 | | CA St Ent Dev Auth Lease Rev Riverside Cnty Library Fac Proj
| | 4.00% | | 11/01/37 | | 1,144,900 |
| 100,000 | | CA St Ent Dev Auth Student Hsg Rev M@College Proj, Ser A
| | 5.00% | | 08/01/35 | | 125,635 |
| 100,000 | | CA St Ent Dev Auth Student Hsg Rev M@College Proj, Ser A
| | 5.00% | | 08/01/40 | | 123,880 |
| 30,000 | | CA St Hlth Facs Fing Auth Rev El Camino Hosp
| | 5.00% | | 02/01/33 | | 36,741 |
| 220,000 | | CA St Hlth Facs Fing Auth Rev Ref Sutter Hlth, Ser B
| | 5.00% | | 11/15/33 | | 272,886 |
| 1,000,000 | | CA St Hlth Facs Fing Auth Rev Ref, Commonspirit Hlth, Ser A
| | 4.00% | | 04/01/36 | | 1,199,040 |
| 250,000 | | CA St Hlth Facs Fing Auth Rev Sutter Hlth, Ser A
| | 5.00% | | 11/15/30 | | 320,665 |
| 500,000 | | CA St Infrastructure & Econ Dev Bank Natl Chartr Social Bond, Ser B
| | 4.00% | | 11/01/39 | | 605,345 |
| 250,000 | | CA St Muni Fin Auth Chrt Sch Lease Rev Sycamore Academy Proj (b)
| | 5.38% | | 07/01/34 | | 270,560 |
| 250,000 | | CA St Muni Fin Auth Chrt Sch Lease Rev Vista Chrt Middle Sch Proj (c)
| | 5.38% | | 07/01/34 | | 270,052 |
| 900,000 | | CA St Muni Fin Auth Chrt Sch Rev John Adams Academies Lincoln Proj, Ser A (a)
| | 5.00% | | 10/01/39 | | 971,253 |
| 200,000 | | CA St Muni Fin Auth Chrt Sch Rev Palmdale Aerospace Academy Proj (a)
| | 4.00% | | 07/01/26 | | 210,918 |
| 200,000 | | CA St Muni Fin Auth Chrt Sch Rev Palmdale Aerospace Academy Proj, Ser A (a)
| | 5.00% | | 07/01/38 | | 229,268 |
| 250,000 | | CA St Muni Fin Auth Chrt Sch Rev, Ser A (a)
| | 5.50% | | 06/01/38 | | 277,315 |
| 60,000 | | CA St Muni Fin Auth Eductnl Rev Ref American Heritage Edu, Ser A
| | 4.00% | | 06/01/26 | | 64,136 |
See Notes to Financial Statements
Page 7
First Trust California Municipal High Income ETF (FCAL)
Portfolio of Investments (Continued)
January 31, 2021 (Unaudited)
Principal
Value | | Description | | Stated
Coupon | | Stated
Maturity | | Value |
| MUNICIPAL BONDS (Continued) |
| | | California (Continued) | | | | | | |
| $605,000 | | CA St Muni Fin Auth Mobile Home Park Rev Sr Caritas Affordable Hsg Inc Projs, Ser A
| | 5.25% | | 08/15/49 | | $670,092 |
| 155,000 | | CA St Muni Fin Auth Rev Ref Biola Univ
| | 5.00% | | 10/01/37 | | 185,764 |
| 225,000 | | CA St Muni Fin Auth Rev Ref CA Lutheran Univ
| | 5.00% | | 10/01/30 | | 283,176 |
| 225,000 | | CA St Muni Fin Auth Rev Ref CA Lutheran Univ
| | 5.00% | | 10/01/32 | | 280,312 |
| 675,000 | | CA St Muni Fin Auth Rev Ref CA Lutheran Univ
| | 5.00% | | 10/01/33 | | 837,668 |
| 475,000 | | CA St Muni Fin Auth Rev Ref Cmnty Med Centers, Ser A
| | 5.00% | | 02/01/36 | | 561,854 |
| 200,000 | | CA St Muni Fin Auth Rev Ref Eisenhower Med Ctr, Ser A
| | 5.00% | | 07/01/32 | | 240,312 |
| 400,000 | | CA St Muni Fin Auth Rev Ref Eisenhower Med Ctr, Ser A
| | 5.00% | | 07/01/34 | | 477,736 |
| 250,000 | | CA St Muni Fin Auth Rev Ref Emerson Clg, Ser B
| | 5.00% | | 01/01/33 | | 301,607 |
| 700,000 | | CA St Muni Fin Auth Rev Ref HumanGood Oblig Grp, Ser A
| | 4.00% | | 10/01/34 | | 788,991 |
| 500,000 | | CA St Muni Fin Auth Rev Ref HumanGood Oblig Grp, Ser A
| | 4.00% | | 10/01/36 | | 560,400 |
| 110,000 | | CA St Muni Fin Auth Rev Ref Retmnt Hsg Fdtn Oblig Grp, Ser A
| | 5.00% | | 11/15/26 | | 127,826 |
| 435,000 | | CA St Muni Fin Auth Rev Ref Retmnt Hsg Fdtn Oblig Grp, Ser A
| | 5.00% | | 11/15/27 | | 514,379 |
| 700,000 | | CA St Muni Fin Auth Spl Fac Rev United Airls Inc Proj, AMT
| | 4.00% | | 07/15/29 | | 790,937 |
| 500,000 | | CA St Muni Fin Auth Sr Living Rev Ref Mt San Antonio Gardens Proj
| | 5.00% | | 11/15/49 | | 569,975 |
| 500,000 | | CA St Muni Fin Auth Student Hsg Rev Chf Davis I, LLC West Vlg Student Hsg Proj
| | 5.00% | | 05/15/27 | | 609,285 |
| 350,000 | | CA St Muni Fin Auth Student Hsg Rev Chf Davis I, LLC West Vlg Student Hsg Proj
| | 5.00% | | 05/15/40 | | 418,656 |
| 75,000 | | CA St Muni Fin Auth Student Hsg Rev Chf Davis I, LLC West Vlg Student Hsg Proj TCRS, BAM
| | 5.00% | | 05/15/29 | | 95,507 |
| 1,000,000 | | CA St Muni Fin Auth Student Hsg Rev Chf-Davis I, LLC West Vlg Student Hsg Proj
| | 5.00% | | 05/15/38 | | 1,202,500 |
| 600,000 | | CA St Poll Control Fin Auth Sol Wst Disp Rev Ref Wst Mgmt Inc, Ser A1, AMT
| | 3.38% | | 07/01/25 | | 678,300 |
| 250,000 | | CA St Poll Control Fin Auth Sol Wst Disp Rev Rialto Bioenergy Fac LLC Proj Green Bond, AMT (a)
| | 6.75% | | 12/01/28 | | 255,757 |
| 250,000 | | CA St Poll Control Fin Auth Sol Wst Disp Rev Rialto Bioenergy Fac LLC Proj Green Bond, AMT (a)
| | 7.50% | | 12/01/40 | | 257,100 |
| 150,000 | | CA St Poll Control Fin Auth Sol Wst Disp Rev Waste Mgmt Inc Proj, Ser C (Mandatory put 06/03/24)
| | 3.25% | | 12/01/27 | | 164,783 |
| 1,000,000 | | CA St Poll Control Fin Auth Wtr Furnishing Rev, AMT (a)
| | 5.00% | | 07/01/37 | | 1,069,950 |
| 15,000 | | CA St Pub Wks Brd Lease Rev Judicial Council CA, Ser B
| | 5.00% | | 06/01/34 | | 17,850 |
| 175,000 | | CA St Pub Wks Brd Lease Rev Ref, Ser B
| | 5.00% | | 10/01/26 | | 220,448 |
| 165,000 | | CA St Pub Wks Brd Lease Rev Ref, Ser B
| | 5.00% | | 05/01/29 | | 222,511 |
| 125,000 | | CA St Pub Wks Brd Lease Rev Ref, Ser F
| | 5.00% | | 05/01/24 | | 144,458 |
| 100,000 | | CA St Pub Wks Brd Lease Rev Various Corr Facs, Ser A
| | 5.00% | | 09/01/27 | | 116,763 |
| 75,000 | | CA St Ref
| | 4.00% | | 09/01/32 | | 88,725 |
| 75,000 | | CA St Ref
| | 4.00% | | 08/01/34 | | 88,091 |
| 155,000 | | CA St Ref
| | 4.00% | | 09/01/35 | | 182,074 |
| 75,000 | | CA St Ref Various Purpose
| | 4.00% | | 09/01/33 | | 88,449 |
| 275,000 | | CA St Ref Various Purpose
| | 4.00% | | 09/01/35 | | 323,034 |
| 565,000 | | CA St Sch Fin Auth Chrt Sch Rev Arts in Action Chrt Schs, Ser A (a)
| | 5.00% | | 06/01/30 | | 645,077 |
| 335,000 | | CA St Sch Fin Auth Chrt Sch Rev Arts in Action Chrt Schs, Ser A (a)
| | 5.00% | | 06/01/40 | | 371,522 |
| 600,000 | | CA St Sch Fin Auth Chrt Sch Rev Fenton Chrt Schs, Ser A (a)
| | 4.00% | | 07/01/30 | | 661,248 |
| 600,000 | | CA St Sch Fin Auth Chrt Sch Rev Fenton Chrt Schs, Ser A (a)
| | 5.00% | | 07/01/40 | | 675,864 |
| 300,000 | | CA St Sch Fin Auth Chrt Sch Rev Rocketship Pub Schs, Ser G (b)
| | 5.00% | | 06/01/37 | | 340,455 |
| 100,000 | | CA St Sch Fin Auth Chrt Sch Rev Summit Pub Schs (a)
| | 5.00% | | 06/01/25 | | 116,336 |
| 210,000 | | CA St Sch Fin Auth Chrt Sch Rev Summit Pub Schs (a)
| | 5.00% | | 06/01/31 | | 249,505 |
Page 8
See Notes to Financial Statements
First Trust California Municipal High Income ETF (FCAL)
Portfolio of Investments (Continued)
January 31, 2021 (Unaudited)
Principal
Value | | Description | | Stated
Coupon | | Stated
Maturity | | Value |
| MUNICIPAL BONDS (Continued) |
| | | California (Continued) | | | | | | |
| $400,000 | | CA St Stwd Cmntys Dev Auth Clg Hsg Rev NCCD Hooper Street LLC CA Clg of the Arts Projs (a)
| | 5.25% | | 07/01/39 | | $447,840 |
| 200,000 | | CA St Stwd Cmntys Dev Auth Student Hsg Rev Ref Chf Irvine LLC
| | 5.00% | | 05/15/30 | | 231,036 |
| 280,000 | | CA St Stwd Cmntys Dev Auth Student Hsg Rev Ref Chf Irvine LLC
| | 5.00% | | 05/15/35 | | 317,120 |
| 100,000 | | CA St Various Purpose
| | 5.00% | | 10/01/35 | | 122,200 |
| 600,000 | | CA Stwd Cmntys Dev Auth Rev Loma Linda Univ Med Ctr, Ser A (a)
| | 5.00% | | 12/01/30 | | 707,982 |
| 300,000 | | CA Stwd Cmntys Dev Auth Rev Loma Linda Univ Med Ctr, Ser A (a)
| | 5.00% | | 12/01/33 | | 363,372 |
| 150,000 | | CA Stwd Cmntys Dev Auth Rev Ref CA Baptist Univ, Ser A (a)
| | 3.00% | | 11/01/22 | | 152,448 |
| 250,000 | | CA Stwd Cmntys Dev Auth Rev Ref CA Baptist Univ, Ser A (a)
| | 5.00% | | 11/01/32 | | 293,147 |
| 190,000 | | CA Stwd Cmntys Dev Auth Rev Ref Front Porch Cmntys & Svcs, Ser A
| | 5.00% | | 04/01/27 | | 231,496 |
| 50,000 | | CA Stwd Cmntys Dev Auth Rev Ref Front Porch Cmntys & Svcs, Ser A
| | 5.00% | | 04/01/30 | | 59,758 |
| 175,000 | | CA Stwd Cmntys Dev Auth Rev Ref Front Porch Cmntys & Svcs, Ser A
| | 5.00% | | 04/01/31 | | 208,460 |
| 50,000 | | CA Stwd Cmntys Dev Auth Rev Ref Front Porch Cmntys & Svcs, Ser A
| | 4.00% | | 04/01/32 | | 56,006 |
| 50,000 | | CA Stwd Cmntys Dev Auth Rev Ref Insd Enloe Med Ctr
| | 5.00% | | 08/15/33 | | 59,788 |
| 125,000 | | Camarillo CA Cmnty Dev Commn Successor Agy Tax Allocation Ref Camarillo Corridor Proj, AGM
| | 5.00% | | 09/01/25 | | 145,266 |
| 240,000 | | Camarillo CA Cmnty Dev Commn Successor Agy Tax Allocation Ref Sub Lien, Ser B, BAM
| | 5.00% | | 09/01/28 | | 295,171 |
| 305,000 | | Camarillo CA Cmnty Dev Commn Successor Agy Tax Allocation Ref Sub Lien, Ser B, BAM
| | 5.00% | | 09/01/30 | | 371,588 |
| 400,000 | | Casitas Muni Wtr Dist CA Spl Tax Cmnty Facs Dist No 2013-1, BAM
| | 4.00% | | 09/01/34 | | 481,832 |
| 355,000 | | Centinela Vly CA Union High Sch Dist Ref, Ser C, AGM
| | 3.00% | | 08/01/36 | | 380,361 |
| 450,000 | | Chino CA Cmnty Facs Dist Spl Tax #2003-3 Impt Area #7
| | 5.00% | | 09/01/31 | | 554,679 |
| 425,000 | | Chino Vly CA Unif Sch Dist, Ser B
| | 5.00% | | 08/01/36 | | 575,186 |
| 250,000 | | Compton CA Unif Sch Dist Los Angeles Co Schs Fing Progr, Ser A, COPS, BAM
| | 5.00% | | 06/01/31 | | 308,632 |
| 250,000 | | Compton CA Unif Sch Dist Los Angeles Co Schs Fing Progr, Ser A, COPS, BAM
| | 4.00% | | 06/01/35 | | 288,542 |
| 200,000 | | Compton CA Unif Sch Dist Los Angeles Co Schs Fing Progr, Ser A, COPS, BAM
| | 4.00% | | 06/01/36 | | 229,980 |
| 210,000 | | Cotati-Rohnert Park CA Unif Sch Dist 2016 Election, Ser C, AGM
| | 5.00% | | 08/01/32 | | 257,676 |
| 170,000 | | Dana Point CA Cmnty Facs Distspl Tax Ref, Ser A, BAM
| | 4.00% | | 09/01/32 | | 211,480 |
| 175,000 | | Dana Point CA Cmnty Facs Distspl Tax Ref, Ser A, BAM
| | 4.00% | | 09/01/33 | | 216,435 |
| 180,000 | | Dana Point CA Cmnty Facs Distspl Tax Ref, Ser A, BAM
| | 4.00% | | 09/01/34 | | 221,729 |
| 200,000 | | Dana Point CA Cmnty Facs Distspl Tax Ref, Ser A, BAM
| | 4.00% | | 09/01/35 | | 245,584 |
| 200,000 | | Del Mar CA Union Sch Dist Spl Tax Ref
| | 4.00% | | 09/01/33 | | 233,174 |
| 300,000 | | Del Mar CA Union Sch Dist Spl Tax Ref
| | 4.00% | | 09/01/34 | | 347,982 |
| 270,000 | | Diablo CA Wtr Dist Wtr Rev Ref, COPS, BAM
| | 4.00% | | 01/01/32 | | 321,475 |
| 150,000 | | Dinuba CA Jt Unif Sch Dist, COPS, AGM
| | 4.00% | | 02/01/35 | | 171,731 |
| 755,000 | | El Dorado CA Irr Dist Rev Ref, Ser C
| | 4.00% | | 03/01/34 | | 860,881 |
| 300,000 | | Estrn CA Muni Wtr Dist Wtr & Wstwtr Rev Sub Ref, Ser A
| | 5.00% | | 07/01/31 | | 371,766 |
| 350,000 | | Folsom Ranch CA Fing Auth Spl Tax Rev Cmnty Facs Dist No. 19 Mangini
| | 5.00% | | 09/01/32 | | 420,532 |
| 155,000 | | Fontana CA Spl Tax Cmnty Facs Dist #80 Bella Strada
| | 5.00% | | 09/01/29 | | 190,077 |
| 240,000 | | Fontana CA Spl Tax Spl Tax, The Meadows
| | 4.00% | | 09/01/32 | | 274,886 |
See Notes to Financial Statements
Page 9
First Trust California Municipal High Income ETF (FCAL)
Portfolio of Investments (Continued)
January 31, 2021 (Unaudited)
Principal
Value | | Description | | Stated
Coupon | | Stated
Maturity | | Value |
| MUNICIPAL BONDS (Continued) |
| | | California (Continued) | | | | | | |
| $165,000 | | Fontana CA Unif Sch Dist Prerefunded, AGM
| | (d) | | 02/01/33 | | $135,381 |
| 310,000 | | Fountain Vly CA Pub Fing Auth Lease Rev Ref, Ser A
| | 4.00% | | 11/01/29 | | 361,252 |
| 140,000 | | Fresno CA Jt Pwrs Fing Auth Lease Rev Ref Master Lease Proj, Ser A, AGM
| | 5.00% | | 04/01/32 | | 170,365 |
| 200,000 | | Golden St Tobacco Securitization Corp CA Tobacco Settlement Asset Bkd, Ref, Ser A
| | 3.25% | | 06/01/32 | | 218,256 |
| 100,000 | | Golden St Tobacco Securitization Corp CA Tobacco Settlement Enhncd Asset Bkd, Ser A
| | 5.00% | | 06/01/29 | | 110,066 |
| 340,000 | | Golden St Tobacco Securitization Corp CA Tobacco Settlement Ref, Ser A-1
| | 5.00% | | 06/01/26 | | 419,169 |
| 750,000 | | Golden St Tobacco Securitization Corp CA Tobacco Settlement Ref, Ser A-1
| | 5.00% | | 06/01/34 | | 929,805 |
| 145,000 | | Golden West CA Schs Fing Auth Ref Beverly Hills Uni Sch Dist, NATL
| | 5.25% | | 08/01/23 | | 163,622 |
| 265,000 | | Imperial CA Pub Fing Authrev Ref, AGM
| | 4.00% | | 10/15/33 | | 320,960 |
| 360,000 | | Imperial CA Pub Fing Authrev Ref, AGM
| | 4.00% | | 10/15/35 | | 431,233 |
| 140,000 | | Inglewood CA Unif Sch Dist, Ser C, BAM
| | 4.00% | | 08/01/35 | | 162,624 |
| 860,000 | | Irvine CA Impt Bond Act 1915 Ref
| | 4.00% | | 09/02/35 | | 1,046,121 |
| 150,000 | | Irvine CA Unif Sch Dist Spl Tax Cmnty Facs Dist #09-1, Ser C
| | 5.00% | | 09/01/31 | | 186,237 |
| 890,000 | | Jurupa CA Public Fing Auth Spl Tax Rev Ref, Ser A, AGM
| | 4.00% | | 09/01/34 | | 1,058,637 |
| 290,000 | | Kaweah CA Delta Healthcare Dist Rev, Ser B
| | 5.00% | | 06/01/40 | | 328,495 |
| 100,000 | | Kern Cnty CA Wtr Agy Impt Dist #4 Wtr Rev Ref, Ser A, AGM
| | 5.00% | | 05/01/29 | | 123,778 |
| 485,000 | | King City CA Union Sch Dist Cap Apprec Election 1998-C, CABS, AMBAC
| | (d) | | 08/01/29 | | 429,691 |
| 250,000 | | La Verne CA Ref Brethren Hillcrest Homes, COPS
| | 5.00% | | 05/15/36 | | 268,000 |
| 25,000 | | Lammersville CA Jt Unif Sch Dist Spl Tax
| | 4.00% | | 09/01/33 | | 28,532 |
| 25,000 | | Lammersville CA Jt Unif Sch Dist Spl Tax
| | 4.00% | | 09/01/34 | | 28,450 |
| 200,000 | | Lammersville CA Jt Unif Sch Dist Spl Tax
| | 4.00% | | 09/01/40 | | 224,384 |
| 1,055,000 | | Lancaster CA Fing Auth Rev Measure M&R Street Impts Proj
| | 4.00% | | 06/01/35 | | 1,262,381 |
| 100,000 | | Long Beach CA Bond Fin Auth Nat Gas Purchase Rev, Ser A
| | 5.25% | | 11/15/23 | | 113,795 |
| 330,000 | | Long Beach CA Bond Fin Auth Nat Gas Purchase Rev, Ser A
| | 5.50% | | 11/15/30 | | 455,367 |
| 460,000 | | Los Angeles CA Dept of Arpts Arpt Rev Ref Sub Los Angeles Intl Arpt, Ser D, AMT
| | 5.00% | | 05/15/32 | | 595,245 |
| 700,000 | | Los Angeles CA Dept of Arpts Arpt Rev Sub Los Angeles Intl Arpt, Ser B, AMT
| | 5.00% | | 05/15/31 | | 848,414 |
| 250,000 | | Los Angeles CA Dept of Arpts Arpt Rev Sub Los Angeles Intl Arpt, Ser F, AMT
| | 5.00% | | 05/15/32 | | 323,502 |
| 10,000 | | Los Angeles CA Dept of Arpts, Ser E
| | 5.00% | | 05/15/28 | | 11,900 |
| 215,000 | | Los Angeles CA Muni Impt Corplease Rev Ref Real Property, Ser B
| | 4.00% | | 11/01/37 | | 251,247 |
| 500,000 | | Los Angeles CA Unif Sch Dist, Ser C
| | 4.00% | | 07/01/36 | | 618,650 |
| 410,000 | | Los Osos CA Cmnty Svcs Wstwtr Assmnt Dist #1 Ref Reassmnt
| | 3.13% | | 09/02/32 | | 455,567 |
| 100,000 | | Marina CA Redev Agy Successor Agy Tax Allocation Hsg, Ser B
| | 5.00% | | 09/01/27 | | 118,449 |
| 250,000 | | Marina CA Redev Agy Successor Agy Tax Allocation Hsg, Ser B
| | 5.00% | | 09/01/33 | | 289,080 |
| 250,000 | | Marina Coast CA Wtr Dist Enterprise Rev, COPS
| | 4.00% | | 06/01/35 | | 305,272 |
| 310,000 | | Marina Coast CA Wtr Dist Enterprise Rev, COPS
| | 4.00% | | 06/01/36 | | 375,655 |
| 245,000 | | Menifee CA Union Sch Dist Spl Tax Cmnty Facs Dist #2011-1
| | 5.00% | | 09/01/34 | | 287,412 |
| 500,000 | | Menifee CA Union Sch Dist Spl Tax Cmnty Facs Dist #2011-1
| | 5.00% | | 09/01/44 | | 573,390 |
| 100,000 | | Modesto CA Spl Tax Ref Cmnty Facs Dist # 2004-1 Vlg 1 #2
| | 5.00% | | 09/01/27 | | 115,112 |
| 200,000 | | Morongo Band of Mission Indians CA Rev Ref, Ser B (a)
| | 5.00% | | 10/01/42 | | 225,156 |
| 1,115,000 | | Natomas CA Unif Sch Dist, AGM
| | 3.00% | | 08/01/36 | | 1,199,528 |
| 250,000 | | Norco CA Spl Tax Ref Norco Ridge Ranch, BAM
| | 5.00% | | 09/01/32 | | 309,135 |
| 750,000 | | Oak Vly CA Hosp Dist Hlth Facs Rev Ref, Ser A
| | 4.00% | | 11/01/36 | | 812,865 |
Page 10
See Notes to Financial Statements
First Trust California Municipal High Income ETF (FCAL)
Portfolio of Investments (Continued)
January 31, 2021 (Unaudited)
Principal
Value | | Description | | Stated
Coupon | | Stated
Maturity | | Value |
| MUNICIPAL BONDS (Continued) |
| | | California (Continued) | | | | | | |
| $405,000 | | Oakland CA Unif Sch Dist Alameda Cnty Election of 2012, Ser A, AGM
| | 4.00% | | 08/01/36 | | $472,210 |
| 100,000 | | Ontario CA Cmnty Facs Dist 40 Spl Tax Emeral Park Facilites
| | 4.00% | | 09/01/34 | | 115,140 |
| 65,000 | | Ontario CA Cmnty Facs Dist 40 Spl Tax Emeral Park Facilites
| | 4.00% | | 09/01/35 | | 74,715 |
| 275,000 | | Ontario CA Cmnty Facs Dist 40 Spl Tax Emeral Park Facilites
| | 4.00% | | 09/01/39 | | 314,025 |
| 750,000 | | Oxnard CA Sch Dist Election of 2016, Ser C, AGM
| | 4.00% | | 08/01/49 | | 872,812 |
| 250,000 | | Palomar Hlth CA Rev Ref
| | 5.00% | | 11/01/31 | | 292,815 |
| 750,000 | | Pleasanton CA Unif Sch Dist
| | 3.00% | | 08/01/36 | | 796,530 |
| 210,000 | | Rancho Cordova CA Cmnty Facs Dist Spl Tax No 2018-1 Grantline 208
| | 5.00% | | 09/01/33 | | 245,488 |
| 220,000 | | Rancho Cordova CA Cmnty Facs Dist Spl Tax No 2018-1 Grantline 208
| | 5.00% | | 09/01/34 | | 256,430 |
| 340,000 | | Rancho Cordova CA Cmnty Facs Dist Spl Tax No 2018-1 Grantline 208
| | 5.00% | | 09/01/39 | | 391,993 |
| 200,000 | | Rancho Cordova CA Cmnty Facs Dist Spl Tax Ref #2004-1 Sunridge Park Area
| | 5.00% | | 09/01/25 | | 236,994 |
| 500,000 | | River Islands CA Pub Fing Auth Spl Tax Cmnty Facs Dist #2019-1 Phase 2 Pub Impts
| | 5.00% | | 09/01/40 | | 572,710 |
| 300,000 | | River Islands CA Pub Fing Auth Spl Tax Ref Cmnty Facs Dist #2003-1
| | 5.38% | | 09/01/31 | | 321,414 |
| 1,500,000 | | River Islands Pub Fin Auth CA Lathrop Irr Dt Elec Rev Bds, AGM
| | 4.00% | | 09/01/40 | | 1,796,670 |
| 575,000 | | Riverside CA Unif Sch Dist Election of 2016, Ser B
| | 3.00% | | 08/01/38 | | 622,518 |
| 185,000 | | Riverside CA Unif Sch Dist Fing Auth Spl Tax Ref, BAM
| | 5.00% | | 09/01/34 | | 212,952 |
| 1,495,000 | | Rocklin CA Unif Sch Dist Cmnty Facs Dist Subordinate, Ser 2019, BAM
| | 4.00% | | 09/15/37 | | 1,785,239 |
| 185,000 | | Roseville CA Spl Tax
| | 5.00% | | 09/01/32 | | 217,349 |
| 160,000 | | Roseville CA Spl Tax
| | 5.00% | | 09/01/33 | | 187,224 |
| 170,000 | | Roseville CA Spl Tax
| | 4.00% | | 09/01/34 | | 188,921 |
| 150,000 | | Roseville CA Spl Tax
| | 4.00% | | 09/01/35 | | 166,370 |
| 200,000 | | Sacramento CA Spl Tax Natomas Meadows Cmnty Facs Dist #2007-01 (a)
| | 5.00% | | 09/01/32 | | 227,684 |
| 500,000 | | Sacramento CA Transient Occupancy Tax Rev Sub Convention Ctr Complex, Ser C
| | 5.00% | | 06/01/32 | | 618,060 |
| 385,000 | | San Bruno CA Park Sch Dist, Ser B
| | 4.00% | | 08/01/34 | | 461,992 |
| 200,000 | | San Bruno CA Park Sch Dist, Ser B
| | 4.00% | | 08/01/37 | | 238,030 |
| 510,000 | | San Diego Cnty CA Limited Rev Obligs Ref Sanford Burnham Prebys Med Discovery Institute, Ser A
| | 5.00% | | 11/01/28 | | 618,151 |
| 125,000 | | San Diego Cnty CA Spl Tax Harmony Grove Vlg Impt Area No.2, Ser A
| | 4.00% | | 09/01/32 | | 142,246 |
| 85,000 | | San Diego Cnty CA Spl Tax Harmony Grove Vlg Impt Area No.2, Ser A
| | 4.00% | | 09/01/33 | | 96,429 |
| 100,000 | | San Diego Cnty CA Spl Tax Harmony Grove Vlg Impt Area No.2, Ser A
| | 4.00% | | 09/01/34 | | 113,222 |
| 500,000 | | San Francisco CA Bay Area Rapid Transit Dist Sales Tax Rev, Ser A
| | 4.00% | | 07/01/36 | | 596,320 |
| 140,000 | | San Francisco CA City & Cnty Arpts Commn Intl Arpt Rev Ref, Ser D, AMT
| | 5.00% | | 05/01/22 | | 148,221 |
| 100,000 | | San Francisco City & Cnty CA Redev Agy Successor Agy Tax Ref Mission Bay N Redev Proj, Ser A
| | 5.00% | | 08/01/35 | | 119,509 |
| 165,000 | | San Joaquin Hills CA Transprtn Corridor Agy Toll Road Rev Cap Apprec Ref, Ser A, NATL
| | (d) | | 01/15/29 | | 140,963 |
| 675,000 | | Santa Clarita CA Cmnty Facs Dist Vista Canyon #2016-1 (a)
| | 4.00% | | 09/01/35 | | 745,193 |
| 250,000 | | Santa Monica-Malibu CA Unif Sch Dist, COPS
| | 4.00% | | 05/01/34 | | 299,497 |
| 250,000 | | Santa Monica-Malibu CA Unif Sch Dist, COPS
| | 4.00% | | 05/01/35 | | 298,847 |
See Notes to Financial Statements
Page 11
First Trust California Municipal High Income ETF (FCAL)
Portfolio of Investments (Continued)
January 31, 2021 (Unaudited)
Principal
Value | | Description | | Stated
Coupon | | Stated
Maturity | | Value |
| MUNICIPAL BONDS (Continued) |
| | | California (Continued) | | | | | | |
| $175,000 | | Simi Vly CA Unif Sch Dist, Ser B
| | 4.00% | | 08/01/33 | | $208,896 |
| 370,000 | | Simi Vly CA Unif Sch Dist, Ser B
| | 4.00% | | 08/01/38 | | 432,974 |
| 500,000 | | Simi Vly CA Unif Sch Dist, Ser C
| | 4.00% | | 08/01/43 | | 586,970 |
| 150,000 | | Soledad CA Unif Sch Dist Premium Ref Bans, CABS
| | (d) | | 08/01/21 | | 149,681 |
| 305,000 | | Tahoe-Truckee CA Unif Sch Dist, COPS, BAM
| | 4.00% | | 06/01/37 | | 352,019 |
| 260,000 | | Tahoe-Truckee CA Unif Sch Dist, COPS, BAM
| | 4.00% | | 06/01/39 | | 299,075 |
| 150,000 | | Temecula Vly CA Unif Sch Dist Cmnty Facs Dist #2014-1
| | 5.00% | | 09/01/32 | | 175,340 |
| 400,000 | | Temecula Vly Unif Sch Dist Fing Auth CA Spl Tax Rev, BAM
| | 5.00% | | 09/01/34 | | 455,292 |
| 500,000 | | Temescal Vly CA Wtr Dist Spl Tax Terramor Cmnty Facs Dist #4 Impt Area #1
| | 5.00% | | 09/01/31 | | 583,995 |
| 500,000 | | Tobacco Securitization Auth Nthrn CA Tobacco Settlement Rev Asset Bkd Bds, Ser A-1
| | 5.38% | | 06/01/38 | | 501,885 |
| 500,000 | | Tobacco Securitization Auth Nthrn CA Tobacco Settlement Rev Asset Bkd Bds, Ser A-1
| | 5.50% | | 06/01/45 | | 502,620 |
| 1,000,000 | | Tobacco Securitization Auth Sthrn CA Tobacco Settlement Rev Ref San Diego Co Tobacco Securitization Corp Class 1, Ser A
| | 5.00% | | 06/01/37 | | 1,323,290 |
| 145,000 | | Tobacco Securitization Auth Sthrn CA Tobacco Settlement Rev Ref San Diego Co Tobacco Securitization Corp Class 2, Ser B-1
| | 2.25% | | 06/01/29 | | 146,291 |
| 1,000,000 | | Tobacco Securitization Auth Sthrn CA Tobacco Settlement Rev San Diego Co Asset Securitization Corp Class 1, Ser A
| | 5.00% | | 06/01/38 | | 1,317,470 |
| 250,000 | | Tracy CA Cmnty Facs Dist
| | 5.00% | | 09/01/33 | | 288,960 |
| 470,000 | | Transbay Jt Powers Auth CA Green Bnd Sr Tax Alloc Bnds, Ser A
| | 5.00% | | 10/01/33 | | 614,069 |
| 900,000 | | Transbay Jt Powers Auth CA Green Bnd Sr Tax Alloc Bnds, Ser A
| | 5.00% | | 10/01/39 | | 1,155,546 |
| 835,000 | | Tulare CA Loc Healthcare Dist Ref, BAM
| | 4.00% | | 08/01/39 | | 1,002,426 |
| 100,000 | | W Contra Costa CA Unif Sch Dist Ref, Ser A
| | 5.00% | | 08/01/31 | | 118,668 |
| | | | | 84,680,747 |
| | | Colorado – 0.5% | | | | | | |
| 500,000 | | Willow Bend Met Dist CO Sr, Ser A
| | 5.00% | | 12/01/39 | | 535,450 |
| | | Florida – 1.0% | | | | | | |
| 500,000 | | FL Dev Fin Corp Surface Tranprtn Fac Rev Green Bond-Brightline Passenger Rail Remk, Ser B, AMT (a)
| | 7.38% | | 01/01/49 | | 488,295 |
| 205,000 | | Parkland Preserve CDD FL Spl Assmnt Rev, Ser A
| | 4.50% | | 05/01/24 | | 211,205 |
| 250,000 | | Rhodine Road North CDD FL Spl Assmnt
| | 4.00% | | 05/01/30 | | 270,533 |
| | | | | 970,033 |
| | | Georgia – 0.5% | | | | | | |
| 500,000 | | Fulton Cnty GA Rsdl Care Facs Elderly Auth Retmnt Fac Rev Ref Lenbrook Sq Fdtn Inc
| | 5.00% | | 07/01/42 | | 537,555 |
| | | Guam – 1.4% | | | | | | |
| 100,000 | | Guam Govt Business Privilege Tax Rev Ref, Ser D
| | 5.00% | | 11/15/32 | | 113,769 |
| 355,000 | | Guam Govt Business Privilege Tax Rev, Ser B-1
| | 5.00% | | 01/01/37 | | 364,475 |
| 750,000 | | Guam Govt Wtrwks Auth Wtr & Wstwtr Sys Rev, Ser A
| | 5.00% | | 01/01/50 | | 931,620 |
| | | | | 1,409,864 |
| | | Illinois – 1.0% | | | | | | |
| 195,000 | | Chicago IL Brd of Edu Ref, Ser F
| | 5.00% | | 12/01/31 | | 195,573 |
| 35,000 | | Chicago IL Ref, Ser C, CABS
| | (d) | | 01/01/22 | | 34,444 |
| 135,000 | | Chicago IL Ref, Ser C, CABS
| | (d) | | 01/01/24 | | 127,398 |
| 120,000 | | IL St, Ser A
| | 4.00% | | 01/01/25 | | 123,177 |
| 500,000 | | Morton Grove IL Tax Incr Rev Sawmill Station Redev Proj
| | 4.25% | | 01/01/29 | | 506,180 |
| | | | | 986,772 |
Page 12
See Notes to Financial Statements
First Trust California Municipal High Income ETF (FCAL)
Portfolio of Investments (Continued)
January 31, 2021 (Unaudited)
Principal
Value | | Description | | Stated
Coupon | | Stated
Maturity | | Value |
| MUNICIPAL BONDS (Continued) |
| | | Kansas – 0.4% | | | | | | |
| $375,000 | | Goddard KS Sales Tax Spl Oblg Rev Ref Olympic Park Star Bond Proj
| | 3.60% | | 06/01/30 | | $378,566 |
| | | Louisiana – 1.0% | | | | | | |
| 750,000 | | Saint James Parish LA Rev Var Nustar Logistics LP Proj, Ser 2008 (Mandatory put 06/01/30) (a)
| | 6.10% | | 06/01/38 | | 952,665 |
| | | Ohio – 0.9% | | | | | | |
| 750,000 | | Buckeye OH Tobacco Settlement Fing Auth Ref Sr, Class 2, Ser B-2
| | 5.00% | | 06/01/55 | | 874,582 |
| | | Puerto Rico – 2.1% | | | | | | |
| 100,000 | | Puerto Rico Cmwlth Ref Pub Impt, Ser A, AGM
| | 5.00% | | 07/01/35 | | 105,354 |
| 1,295,000 | | Puerto Rico Sales Tax Fing Corp Sales Tax Rev Restructured, Ser A-1
| | 4.50% | | 07/01/34 | | 1,425,536 |
| 604,000 | | Puerto Rico Sales Tax Fing Corp Sales Tax Rev Restructured, Ser A-1, CABS
| | (d) | | 07/01/29 | | 515,919 |
| | | | | 2,046,809 |
| | | Texas – 0.4% | | | | | | |
| 370,000 | | Houston TX Arpt Sys Rev Ref United Airls Inc Terminal Improv Proj, Ser B-2, AMT
| | 5.00% | | 07/15/27 | | 428,378 |
| | Total Investments – 95.5%
| | 93,801,421 |
| | (Cost $88,373,987) (e) | | |
| | Net Other Assets and Liabilities – 4.5%
| | 4,373,471 |
| | Net Assets – 100.0%
| | $98,174,892 |
Futures Contracts (See Note 2D - Futures Contracts in the Notes to Financial Statements):
| Futures Contracts | | Position | | Number of
Contracts | | Expiration
Date | | Notional
Value | | Unrealized
Appreciation
(Depreciation)/
Value |
| U.S. Treasury Long Bonds | | Short | | 4 | | Mar 2021 | | $ (674,875) | | $(62) |
| U.S. Treasury Ultra 10-Year Notes | | Short | | 20 | | Mar 2021 | | (3,076,563) | | 19,078 |
| Total Futures Contracts | | | | | | | | $(3,751,438) | | $19,016 |
|
| (a) | This security, sold within the terms of a private placement memorandum, is exempt from registration upon resale under Rule 144A under the Securities Act of 1933, as amended (the “1933 Act”), and may be resold in transactions exempt from registration, normally to qualified institutional buyers. Pursuant to procedures adopted by the Trust’s Board of Trustees, this security has been determined to be liquid by First Trust Advisors L.P. (the “Advisor”). Although market instability can result in periods of increased overall market illiquidity, liquidity for each security is determined based on security specific factors and assumptions, which require subjective judgment. At January 31, 2021, securities noted as such amounted to $13,431,117 or 13.7% of net assets. |
| (b) | This security, sold within the terms of a private placement memorandum, is exempt from registration upon resale under Rule 144A under the 1933 Act, and may be resold in transactions exempt from registration, normally to qualified institutional buyers (see Note 2C - Restricted Securities in the Notes to Financial Statements). |
| (c) | Pursuant to procedures adopted by the Trust’s Board of Trustees, this security has been determined to be illiquid by the Advisor. |
| (d) | Zero coupon bond. |
See Notes to Financial Statements
Page 13
First Trust California Municipal High Income ETF (FCAL)
Portfolio of Investments (Continued)
January 31, 2021 (Unaudited)
| (e) | Aggregate cost for financial reporting purposes approximates the aggregate cost for federal income tax purposes. As of January 31, 2021, the aggregate gross unrealized appreciation for all investments in which there was an excess of value over tax cost was $5,471,473 and the aggregate gross unrealized depreciation for all investments in which there was an excess of tax cost over value was $25,023. The net unrealized appreciation was $5,446,450. The unrealized amounts presented are inclusive of derivative contracts. |
| AGM | Assured Guaranty Municipal Corp. |
| AMBAC | American Municipal Bond Assurance Corp. |
| AMT | Alternative Minimum Tax |
| BAM | Build America Mutual |
| CABS | Capital Appreciation Bonds |
| COPS | Certificates of Participation |
| NATL | National Public Finance Guarantee Corp. |
Valuation Inputs
A summary of the inputs used to value the Fund’s investments as of January 31, 2021 is as follows (see Note 2A - Portfolio Valuation in the Notes to Financial Statements):
| ASSETS TABLE |
| | Total
Value at
1/31/2021 | Level 1
Quoted
Prices | Level 2
Significant
Observable
Inputs | Level 3
Significant
Unobservable
Inputs |
Municipal Bonds*
| $ 93,801,421 | $ — | $ 93,801,421 | $ — |
Futures Contracts**
| 19,078 | 19,078 | — | — |
Total
| $ 93,820,499 | $ 19,078 | $ 93,801,421 | $— |
LIABILITIES TABLE |
| | Total
Value at
1/31/2021 | Level 1
Quoted
Prices | Level 2
Significant
Observable
Inputs | Level 3
Significant
Unobservable
Inputs |
Futures Contracts**
| $ (62) | $ (62) | $ — | $ — |
| * | See Portfolio of Investments for state and territory breakout. |
| ** | Includes cumulative appreciation/depreciation on futures contracts as reported in the Futures Contracts table. Only the current day’s variation margin is presented on the Statement of Assets and Labilities. |
Page 14
See Notes to Financial Statements
First Trust California Municipal High Income ETF (FCAL)
Statement of Assets and Liabilities
January 31, 2021 (Unaudited)
| ASSETS: | |
Investments, at value
(Cost $88,373,987)
| $ 93,801,421 |
Cash
| 177,016 |
Cash segregated as collateral for open futures contracts
| 49,145 |
| Receivables: | |
Investment securities sold
| 3,224,577 |
Interest
| 954,568 |
Variation margin
| 9,625 |
Total Assets
| 98,216,352 |
| LIABILITIES: | |
Investment advisory fees payable
| 41,460 |
Total Liabilities
| 41,460 |
NET ASSETS
| $98,174,892 |
| NET ASSETS consist of: | |
Paid-in capital
| $ 94,634,329 |
Par value
| 18,000 |
Accumulated distributable earnings (loss)
| 3,522,563 |
NET ASSETS
| $98,174,892 |
NET ASSET VALUE, per share
| $54.54 |
Number of shares outstanding (unlimited number of shares authorized, par value $0.01 per share)
| 1,800,002 |
See Notes to Financial Statements
Page 15
First Trust California Municipal High Income ETF (FCAL)
Statement of Operations
For the Six Months Ended January 31, 2021 (Unaudited)
| INVESTMENT INCOME: | |
Interest
| $ 1,260,519 |
Total investment income
| 1,260,519 |
| EXPENSES: | |
Investment advisory fees
| 300,383 |
Total expenses
| 300,383 |
Fees waived by the investment advisor
| (69,319) |
Net expenses
| 231,064 |
NET INVESTMENT INCOME (LOSS)
| 1,029,455 |
| NET REALIZED AND UNREALIZED GAIN (LOSS): | |
| Net realized gain (loss) on: | |
Investments
| (12,647) |
Futures contracts
| 73,599 |
Net realized gain (loss)
| 60,952 |
| Net change in unrealized appreciation (depreciation) on: | |
Investments
| 2,244,847 |
Futures contracts
| 114,954 |
Net change in unrealized appreciation (depreciation)
| 2,359,801 |
NET REALIZED AND UNREALIZED GAIN (LOSS)
| 2,420,753 |
NET INCREASE (DECREASE) IN NET ASSETS RESULTING FROM OPERATIONS
| $ 3,450,208 |
Page 16
See Notes to Financial Statements
First Trust California Municipal High Income ETF (FCAL)
Statements of Changes in Net Assets
| | Six Months
Ended
1/31/2021
(Unaudited) | | Year
Ended
7/31/2020 |
| OPERATIONS: | | | |
Net investment income (loss)
| $ 1,029,455 | | $ 1,594,302 |
Net realized gain (loss)
| 60,952 | | (1,928,615) |
Net change in unrealized appreciation (depreciation)
| 2,359,801 | | 1,613,667 |
Net increase (decrease) in net assets resulting from operations
| 3,450,208 | | 1,279,354 |
| DISTRIBUTIONS TO SHAREHOLDERS FROM: | | | |
Investment operations
| (988,001) | | (1,554,337) |
Return of capital
| — | | (72,665) |
Total distributions to shareholders
| (988,001) | | (1,627,002) |
| SHAREHOLDER TRANSACTIONS: | | | |
Proceeds from shares sold
| 8,006,298 | | 56,172,036 |
Cost of shares redeemed
| — | | (2,375,228) |
Net increase (decrease) in net assets resulting from shareholder transactions
| 8,006,298 | | 53,796,808 |
Total increase (decrease) in net assets
| 10,468,505 | | 53,449,160 |
| NET ASSETS: | | | |
Beginning of period
| 87,706,387 | | 34,257,227 |
End of period
| $ 98,174,892 | | $ 87,706,387 |
| CHANGES IN SHARES OUTSTANDING: | | | |
Shares outstanding, beginning of period
| 1,650,002 | | 650,002 |
Shares sold
| 150,000 | | 1,050,000 |
Shares redeemed
| — | | (50,000) |
Shares outstanding, end of period
| 1,800,002 | | 1,650,002 |
See Notes to Financial Statements
Page 17
First Trust California Municipal High Income ETF (FCAL)
Financial Highlights
For a Common Share outstanding throughout each period
| | Six Months
Ended
1/31/2021
(Unaudited) | | Year Ended | | Period
Ended
7/31/2017 (a) |
| 7/31/2020 | | 7/31/2019 | | 7/31/2018 |
Net asset value, beginning of period
| $ 53.16 | | $ 52.70 | | $ 50.11 | | $ 50.14 | | $ 50.00 |
| Income from investment operations: | | | | | | | | | |
Net investment income (loss)
| 0.59 | | 1.17 | | 1.49 | | 1.45 | | 0.10 |
Net realized and unrealized gain (loss)
| 1.36 | | 0.51 | | 2.60 | | (0.04) | | 0.14 |
Total from investment operations
| 1.95 | | 1.68 | | 4.09 | | 1.41 | | 0.24 |
| Distributions paid to shareholders from: | | | | | | | | | |
Net investment income
| (0.57) | | (1.17) | | (1.50) | | (1.40) | | (0.10) |
Net realized gain
| — | | — | | — | | (0.04) | | — |
Return of capital
| — | | (0.05) | | — | | — | | (0.00) (b) |
Total distributions
| (0.57) | | (1.22) | | (1.50) | | (1.44) | | (0.10) |
Net asset value, end of period
| $54.54 | | $53.16 | | $52.70 | | $50.11 | | $50.14 |
Total return (c)
| 3.69% | | 3.23% | | 8.32% | | 2.83% | | 0.50% |
| Ratios to average net assets/supplemental data: | | | | | | | | | |
Net assets, end of period (in 000’s)
| $ 98,175 | | $ 87,706 | | $ 34,257 | | $ 17,539 | | $ 10,029 |
Ratio of total expenses to average net assets
| 0.65% (d) | | 0.65% | | 0.65% | | 0.65% | | 0.65% (d) |
Ratio of net expenses to average net assets
| 0.50% (d) | | 0.50% | | 0.50% | | 0.50% | | 0.50% (d) |
Ratio of net investment income (loss) to average net assets
| 2.23% (d) | | 2.28% | | 3.01% | | 2.97% | | 1.74% (d) |
Portfolio turnover rate (e)
| 10% | | 81% | | 69% | | 91% | | 22% |
| (a) | Inception date is June 20, 2017, which is consistent with the commencement of investment operations and is the date the initial creation units were established. |
| (b) | Amount is less than $0.01. |
| (c) | Total return is calculated assuming an initial investment made at the net asset value at the beginning of the period, reinvestment of all distributions at net asset value during the period, and redemption at net asset value on the last day of the period. The returns presented do not reflect the deduction of taxes that a shareholder would pay on Fund distributions or the redemption or sale of Fund shares. Total return is calculated for the time period presented and is not annualized for periods of less than a year. The total return would have been lower if certain fees had not been waived by the investment advisor. |
| (d) | Annualized. |
| (e) | Portfolio turnover is calculated for the time period presented and is not annualized for periods of less than a year and does not include securities received or delivered from processing creations or redemptions and in-kind transactions. |
Page 18
See Notes to Financial Statements
Notes to Financial Statements
First Trust California Municipal High Income ETF (FCAL)
January 31, 2021 (Unaudited)
1. Organization
First Trust Exchange-Traded Fund III (the “Trust”) is an open-end management investment company organized as a Massachusetts business trust on January 9, 2008, and is registered with the Securities and Exchange Commission (the “SEC”) under the Investment Company Act of 1940, as amended (the “1940 Act”).
The Trust currently consists of seventeen funds that are offering shares. This report covers the First Trust California Municipal High Income ETF (the “Fund”), a diversified series of the Trust, which trades under the ticker “FCAL” on The Nasdaq Stock Market LLC (“Nasdaq”). The Fund represents a separate series of beneficial interest in the Trust. Unlike conventional mutual funds, the Fund issues and redeems shares on a continuous basis, at net asset value (“NAV”), only in large blocks of shares known as “Creation Units.”
The primary investment objective of the Fund is to seek to provide current income that is exempt from regular federal income taxes and California income taxes, and its secondary objective is long-term capital appreciation. Under normal market conditions, the Fund seeks to achieve its investment objectives by investing at least 80% of its net assets (including investment borrowings) in municipal debt securities that pay interest that is exempt from regular federal income taxes and California income taxes. There can be no assurance that the Fund will achieve its investment objectives. The Fund may not be appropriate for all investors.
2. Significant Accounting Policies
The Fund is considered an investment company and follows accounting and reporting guidance under Financial Accounting Standards Board (“FASB”) Accounting Standards Codification Topic 946, “Financial Services-Investment Companies.” The following is a summary of significant accounting policies consistently followed by the Fund in the preparation of the financial statements. The preparation of the financial statements in accordance with accounting principles generally accepted in the United States of America (“U.S. GAAP”) requires management to make estimates and assumptions that affect the reported amounts and disclosures in the financial statements. Actual results could differ from those estimates.
A. Portfolio Valuation
The Fund’s NAV is determined daily as of the close of regular trading on the New York Stock Exchange (“NYSE”), normally 4:00 p.m. Eastern time, on each day the NYSE is open for trading. If the NYSE closes early on a valuation day, the NAV is determined as of that time. Domestic debt securities are priced using data reflecting the earlier closing of the principal markets for those securities. The Fund’s NAV is calculated by dividing the value of all assets of the Fund (including accrued interest and dividends), less all liabilities (including accrued expenses and dividends declared but unpaid), by the total number of shares outstanding.
The Fund’s investments are valued daily at market value or, in the absence of market value with respect to any portfolio securities, at fair value. Market value prices represent last sale or official closing prices from a national or foreign exchange (i.e., a regulated market) and are primarily obtained from third-party pricing services. Fair value prices represent any prices not considered market value prices and are either obtained from a third-party pricing service or are determined by the Pricing Committee of the Fund’s investment advisor, First Trust Advisors L.P. (“First Trust” or the “Advisor”), in accordance with valuation procedures adopted by the Trust’s Board of Trustees, and in accordance with provisions of the 1940 Act. Investments valued by the Advisor’s Pricing Committee, if any, are footnoted as such in the footnotes to the Portfolio of Investments. The Fund’s investments are valued as follows:
Municipal securities and other debt securities are fair valued on the basis of fair valuations provided by dealers who make markets in such securities or by a third-party pricing service approved by the Trust’s Board of Trustees, which may use the following valuation inputs when available:
| 1) | benchmark yields; |
| 2) | reported trades; |
| 3) | broker/dealer quotes; |
| 4) | issuer spreads; |
| 5) | benchmark securities; |
| 6) | bids and offers; and |
| 7) | reference data including market research publications. |
Exchange-traded futures contracts are valued at the closing price in the market where such contracts are principally traded. If no closing price is available, exchange-traded futures contracts are fair valued at the mean of their most recent bid and asked price, if available, and otherwise at their closing bid price.
Fixed income and other debt securities having a remaining maturity of sixty days or less when purchased are fair valued at cost adjusted for amortization of premiums and accretion of discounts (amortized cost), provided the Advisor’s Pricing Committee has determined that the use of amortized cost is an appropriate reflection of fair value given market and issuer-specific
Notes to Financial Statements (Continued)
First Trust California Municipal High Income ETF (FCAL)
January 31, 2021 (Unaudited)
conditions existing at the time of the determination. Factors that may be considered in determining the appropriateness of the use of amortized cost include, but are not limited to, the following:
| 1) | the credit conditions in the relevant market and changes thereto; |
| 2) | the liquidity conditions in the relevant market and changes thereto; |
| 3) | the interest rate conditions in the relevant market and changes thereto (such as significant changes in interest rates); |
| 4) | issuer-specific conditions (such as significant credit deterioration); and |
| 5) | any other market-based data the Advisor’s Pricing Committee considers relevant. In this regard, the Advisor’s Pricing Committee may use last-obtained market-based data to assist it when valuing portfolio securities using amortized cost. |
Certain securities may not be able to be priced by pre-established pricing methods. Such securities may be valued by the Trust’s Board of Trustees or its delegate, the Advisor’s Pricing Committee, at fair value. These securities generally include, but are not limited to, restricted securities (securities which may not be publicly sold without registration under the Securities Act of 1933, as amended (the “1933 Act”)) for which a third-party pricing service is unable to provide a market price; securities whose trading has been formally suspended; a security whose market or fair value price is not available from a pre-established pricing source; a security with respect to which an event has occurred that is likely to materially affect the value of the security after the market has closed but before the calculation of the Fund’s NAV or make it difficult or impossible to obtain a reliable market quotation; and a security whose price, as provided by the third-party pricing service, does not reflect the security’s fair value. As a general principle, the current fair value of a security would appear to be the amount which the owner might reasonably expect to receive for the security upon its current sale. When fair value prices are used, generally they will differ from market quotations or official closing prices on the applicable exchanges. A variety of factors may be considered in determining the fair value of such securities, including, but not limited to, the following:
| 1) | the fundamental business data relating to the issuer; |
| 2) | an evaluation of the forces which influence the market in which these securities are purchased and sold; |
| 3) | the type, size and cost of the security; |
| 4) | the financial statements of the issuer; |
| 5) | the credit quality and cash flow of the issuer, based on the Advisor’s or external analysis; |
| 6) | the information as to any transactions in or offers for the security; |
| 7) | the price and extent of public trading in similar securities (or equity securities) of the issuer/borrower, or comparable companies; |
| 8) | the coupon payments; |
| 9) | the quality, value and salability of collateral, if any, securing the security; and |
| 10) | other relevant factors. |
The Fund is subject to fair value accounting standards that define fair value, establish the framework for measuring fair value and provide a three-level hierarchy for fair valuation based upon the inputs to the valuation as of the measurement date. The three levels of the fair value hierarchy are as follows:
| • | Level 1 – Level 1 inputs are quoted prices in active markets for identical investments. An active market is a market in which transactions for the investment occur with sufficient frequency and volume to provide pricing information on an ongoing basis. |
| • | Level 2 – Level 2 inputs are observable inputs, either directly or indirectly, and include the following: |
| o | Quoted prices for similar investments in active markets. |
| o | Quoted prices for identical or similar investments in markets that are non-active. A non-active market is a market where there are few transactions for the investment, the prices are not current, or price quotations vary substantially either over time or among market makers, or in which little information is released publicly. |
| o | Inputs other than quoted prices that are observable for the investment (for example, interest rates and yield curves observable at commonly quoted intervals, volatilities, prepayment speeds, loss severities, credit risks, and default rates). |
| o | Inputs that are derived principally from or corroborated by observable market data by correlation or other means. |
| • | Level 3 – Level 3 inputs are unobservable inputs. Unobservable inputs may reflect the reporting entity’s own assumptions about the assumptions that market participants would use in pricing the investment. |
Notes to Financial Statements (Continued)
First Trust California Municipal High Income ETF (FCAL)
January 31, 2021 (Unaudited)
The inputs or methodologies used for valuing investments are not necessarily an indication of the risk associated with investing in those investments. A summary of the inputs used to value the Fund’s investments as of January 31, 2021, is included with the Fund’s Portfolio of Investments.
B. Securities Transactions and Investment Income
Securities transactions are recorded as of the trade date. Realized gains and losses from securities transactions are recorded on the identified cost basis. Interest income is recorded daily on the accrual basis. Amortization of premiums and accretion of discounts are recorded using the effective interest method.
C. Restricted Securities
The Fund invests in restricted securities, which are securities that may not be offered for public sale without first being registered under the 1933 Act. Prior to registration, restricted securities may only be resold in transactions exempt from registration under Rule 144A under the 1933 Act, normally to qualified institutional buyers. As of January 31, 2021, the Fund held restricted securities as shown in the following table that the Advisor has deemed illiquid pursuant to procedures adopted by the Trust’s Board of Trustees. Although market instability can result in periods of increased overall market illiquidity, liquidity for each security is determined based on security-specific factors and assumptions, which require subjective judgment. The Fund does not have the right to demand that such securities be registered. These securities are valued according to the valuation procedures as stated in the Portfolio Valuation note (Note 2A) and are not expressed as a discount to the carrying value of a comparable unrestricted security. There are no unrestricted securities with the same maturity dates and yields for these issuers.
| Security | Acquisition
Date | Principal
Value | Current Price | Carrying
Cost | | Value | | % of
Net
Assets |
| CA St Muni Fin Auth Chrt Sch Lease Rev Sycamore Academy Proj, 5.38%, 07/01/34 | 06/14/18 | $250,000 | $108.22 | $252,663 | | $270,560 | | 0.28% |
| CA St Sch Fin Auth Chrt Sch Rev Rocketship Pub Schs, Ser G, 5.00%, 06/01/37 | 12/05/17 | $300,000 | 113.49 | 311,147 | | 340,455 | | 0.35 |
| | | | | $563,810 | | $611,015 | | 0.63% |
D. Futures Contracts
The Fund may purchase or sell (i.e., is long or short) exchange-listed futures contracts to hedge against changes in interest rates (interest rate risk). Futures contracts are agreements between the Fund and a counterparty to buy or sell a specific quantity of an underlying instrument at a specified price and at a specified date. Depending on the terms of the contract, futures contracts are settled either through physical delivery of the underlying instrument on the settlement date or by payment of a cash settlement amount on the settlement date. Open futures contracts can also be closed out prior to settlement by entering into an offsetting transaction in a matching futures contract. If the Fund is not able to enter into an offsetting transaction, the Fund will continue to be required to maintain margin deposits on the futures contract. When the contract is closed or expires, the Fund records a realized gain or loss equal to the difference between the value of the contract at the time it was opened and the value at the time it was closed or expired. This gain or loss is included in “Net realized gain (loss) on futures contracts” on the Statement of Operations.
Upon entering into a futures contract, the Fund must deposit funds, called margin, with its custodian in the name of the clearing broker equal to a specified percentage of the current value of the contract. Open futures contracts are marked to market daily with the change in value recognized as a component of “Net change in unrealized appreciation (depreciation) on futures contracts” on the Statement of Operations. This daily fluctuation in the value of the contracts is also known as variation margin and is included in “Variation margin” payable or receivable on the Statement of Assets and Liabilities.
If market conditions change unexpectedly, the Fund may not achieve the anticipated benefits of the futures contract and may realize a loss. The use of futures contracts involves the risk of imperfect correlation in movements in the price of the futures contracts, interest rates and the underlying instruments.
Restricted cash segregated as collateral for futures contracts in the amount of $49,145 is shown as “Cash segregated as collateral for open futures contracts” on the Statement of Assets and Liabilities.
E. Dividends and Distributions to Shareholders
Dividends from net investment income, if any, are declared and paid monthly by the Fund, or as the Board of Trustees may determine from time to time. Distributions of net realized capital gains earned by the Fund, if any, are distributed at least annually.
Notes to Financial Statements (Continued)
First Trust California Municipal High Income ETF (FCAL)
January 31, 2021 (Unaudited)
Distributions from net investment income and realized capital gains are determined in accordance with federal income tax regulations, which may differ from U.S. GAAP. Certain capital accounts in the financial statements are periodically adjusted for permanent differences in order to reflect their tax character. These permanent differences are primarily due to the varying treatment of income and gain/loss on portfolio securities held by the Fund and have no impact on net assets or NAV per share. Temporary differences, which arise from recognizing certain items of income, expense and gain/loss in different periods for financial statement and tax purposes, will reverse at some time in the future.
The tax character of distributions paid by the Fund during the fiscal year ended July 31, 2020, was as follows:
| Distributions paid from: | |
Ordinary income
| $— |
Long-term capital gains
| — |
Tax-exempt income
| 1,554,337 |
Return of capital
| 72,665 |
As of July 31, 2020, the components of distributable earnings on a tax basis were as follows:
Undistributed ordinary income
| $— |
Accumulated capital and other gain (loss)
| (2,182,633) |
Net unrealized appreciation (depreciation)
| 3,242,989 |
F. Income Taxes
The Fund intends to continue to qualify as a regulated investment company by complying with the requirements under Subchapter M of the Internal Revenue Code of 1986, as amended (the “Code”), which includes distributing substantially all of its net investment income and net realized gains to shareholders. Accordingly, no provision has been made for federal and state income taxes. However, due to the timing and amount of distributions, the Fund may be subject to an excise tax of 4% of the amount by which approximately 98% of the Fund’s taxable income exceeds the distributions from such taxable income for the calendar year.
In addition, the Fund intends to invest in municipal securities to allow it to pay shareholders “exempt dividends” as defined in the Code.
The Fund is subject to accounting standards that establish a minimum threshold for recognizing, and a system for measuring, the benefits of a tax position taken or expected to be taken in a tax return. Taxable years ended 2018, 2019 and 2020 remain open to federal and state audit. As of January 31, 2021, management has evaluated the application of these standards to the Fund and has determined that no provision for income tax is required in the Fund’s financial statements for uncertain tax positions.
The Fund intends to utilize provisions of the federal income tax laws, which allow it to carry a realized capital loss forward indefinitely following the year of the loss and offset such loss against any future realized capital gains. The Fund is subject to certain limitations under U.S. tax rules on the use of capital loss carryforwards and net unrealized built-in losses. These limitations apply when there has been a 50% change in ownership. At July 31, 2020, for federal income tax purposes, the Fund had $2,182,633 of non-expiring capital loss carryforwards available to the extent provided by regulations to offset future capital gains.
Certain losses realized during the current fiscal year may be deferred and treated as occurring on the first day of the following fiscal year for federal income tax purposes. For the fiscal year ended July 31, 2020, the Fund had no net ordinary losses.
G. Expenses
Expenses, other than the investment advisory fee and other excluded expenses, are paid by the Advisor (See Note 3).
3. Investment Advisory Fee, Affiliated Transactions and Other Fee Arrangements
First Trust, the investment advisor to the Fund, is a limited partnership with one limited partner, Grace Partners of DuPage L.P., and one general partner, The Charger Corporation. The Charger Corporation is an Illinois corporation controlled by James A. Bowen, Chief Executive Officer of First Trust. First Trust is responsible for the selection and ongoing monitoring of the securities in the Fund’s portfolio, managing the Fund’s business affairs and providing certain administrative services necessary for the management of the Fund.
Pursuant to the Investment Management Agreement between the Trust and the Advisor, First Trust manages the investment of the Fund’s assets and is responsible for the Fund’s expenses, including the cost of transfer agency, custody, fund administration, legal,
Notes to Financial Statements (Continued)
First Trust California Municipal High Income ETF (FCAL)
January 31, 2021 (Unaudited)
audit and other services, but excluding fee payments under the Investment Management Agreement, interest, taxes, acquired fund fees and expenses, if any, brokerage commissions and other expenses connected with the execution of portfolio transactions, distribution and service fees pursuant to a Rule 12b-1 plan, if any, and extraordinary expenses. The Fund has agreed to pay First Trust an annual unitary management fee equal to 0.65% of its average daily net assets. First Trust also provides fund reporting services to the Fund for a flat annual fee in the amount of $9,250, which is covered under the annual unitary management fee.
The Trust’s Board of Trustees and the Advisor have entered into a Fee Waiver Agreement for the Fund pursuant to which the Advisor contractually agreed to waive management fees of 0.15% of average daily net assets until November 30, 2021. The waiver agreement may be terminated by action of the Trust’s Board of Trustees at any time upon 60 days’ written notice by the Trust on behalf of the Fund or by the Advisor only after November 30, 2021. First Trust does not have the right to recover the fees waived. During the six months ended January 31, 2021, the Advisor waived fees of $69,319.
The Trust has multiple service agreements with Brown Brothers Harriman & Co. (“BBH”). Under the service agreements, BBH performs custodial, fund accounting, certain administrative services, and transfer agency services for the Fund. As custodian, BBH is responsible for custody of the Fund’s assets. As fund accountant and administrator, BBH is responsible for maintaining the books and records of the Fund’s securities and cash. As transfer agent, BBH is responsible for maintaining shareholder records for the Fund.
Each Trustee who is not an officer or employee of First Trust, any sub-advisor or any of their affiliates (“Independent Trustees”) is paid a fixed annual retainer that is allocated equally among each fund in the First Trust Fund Complex. Each Independent Trustee is also paid an annual per fund fee that varies based on whether the fund is a closed-end or other actively managed fund, a defined-outcome fund or an index fund.
Additionally, the Lead Independent Trustee and the Chairmen of the Audit Committee, Nominating and Governance Committee and Valuation Committee are paid annual fees to serve in such capacities, with such compensation allocated pro rata among each fund in the First Trust Fund Complex based on net assets. Independent Trustees are reimbursed for travel and out-of-pocket expenses in connection with all meetings. The Lead Independent Trustee and Committee Chairmen rotate every three years. The officers and “Interested” Trustee receive no compensation from the Trust for acting in such capacities.
4. Purchases and Sales of Securities
For the six months ended January 31, 2021, the cost of purchases and proceeds from sales of investments, excluding short term investments and in-kind transactions, were $15,209,387 and $8,559,007, respectively.
For the six months ended January 31, 2021, the Fund had no in-kind transactions.
5. Derivative Transactions
The following table presents the type of derivatives held by the Fund at January 31, 2021, the primary underlying risk exposure and the location of these instruments as presented on the Statement of Assets and Liabilities.
| | | | | Asset Derivatives | | Liability Derivatives |
Derivative
Instrument | | Risk
Exposure | | Statement of Assets and
Liabilities Location | | Value | | Statement of Assets and
Liabilities Location | | Value |
| Futures Contracts | | Interest Rate Risk | | Unrealized Appreciation
on Futures Contracts* | | $ 19,078 | | Unrealized Depreciation
on Futures Contracts* | | $ 62 |
* Includes cumulative appreciation/depreciation on futures contracts as reported in the Futures Contracts table. Only the current day’s variation margin is presented on the Statement of Assets and Liabilities.
The following table presents the amount of net realized gain (loss) and change in net unrealized appreciation (depreciation) recognized for the six months ended January 31, 2021, on derivative instruments, as well as the primary underlying risk exposure associated with each instrument.
| Statement of Operations Location | |
| Interest Rate Risk Exposure | |
| Net realized gain (loss) on futures contracts | $73,599 |
| Net change in unrealized appreciation (depreciation) on futures contracts | 114,954 |
Notes to Financial Statements (Continued)
First Trust California Municipal High Income ETF (FCAL)
January 31, 2021 (Unaudited)
During the six months ended January 31, 2021, the notional value of futures contracts opened and closed were $26,197,719 and $27,791,890, respectively.
The Fund does not have the right to offset financial assets and liabilities related to futures contracts on the Statement of Assets and Liabilities.
6. Creations, Redemptions and Transaction Fees
The Fund generally issues and redeems its shares in primary market transactions through a creation and redemption mechanism and does not sell or redeem individual shares. Instead, financial entities known as “Authorized Participants” have contractual arrangements with the Fund or one of the Fund’s service providers to purchase and redeem Fund shares directly with the Fund in large blocks of shares known as “Creation Units.” Prior to the start of trading on every business day, the Fund publishes through the National Securities Clearing Corporation (“NSCC”) the “basket” of securities, cash or other assets that it will accept in exchange for a Creation Unit of the Fund’s shares. An Authorized Participant that wishes to effectuate a creation of the Fund’s shares deposits with the Fund the “basket” of securities, cash or other assets identified by the Fund that day, and then receives the Creation Unit of the Fund’s shares in return for those assets. After purchasing a Creation Unit, the Authorized Participant may continue to hold the Fund’s shares or sell them in the secondary market. The redemption process is the reverse of the purchase process: the authorized participant redeems a Creation Unit of the Fund’s shares for a basket of securities, cash or other assets. The combination of the creation and redemption process with secondary market trading in the Fund’s shares and underlying securities provides arbitrage opportunities that are designed to help keep the market price of the Fund’s shares at or close to the NAV per share of the Fund.
The Fund imposes fees in connection with the purchase of Creation Units. These fees may vary based upon various fact-based circumstances, including, but not limited to, the composition of the securities included in the Creation Unit or the countries in which the transactions are settled. The price for each Creation Unit will equal the daily NAV per share of the Fund times the number of shares in a Creation Unit, plus the fees described above and, if applicable, any operational processing and brokerage costs, transfer fees, stamp taxes and part or all of the spread between the expected bid and offer side of the market related to the securities comprising the creation basket.
The Fund also imposes fees in connection with the redemption of Creation Units. These fees may vary based upon various fact-based circumstances, including, but not limited to, the composition of the securities included in the Creation Unit or the countries in which the transactions are settled. The price received for each Creation Unit will equal the daily NAV per share of the Fund times the number of shares in a Creation Unit, minus the fees described above and, if applicable, any operational processing and brokerage costs, transfer fees, stamp taxes and part or all of the spread between the expected bid and offer side of the market related to the securities comprising the redemption basket. Investors who use the services of a broker or other such intermediary in addition to an Authorized Participant to effect a redemption of a Creation Unit may also be assessed an amount to cover the cost of such services. The redemption fee charged by the Fund will comply with Rule 22c-2 of the 1940 Act which limits redemption fees to no more than 2% of the value of the shares redeemed.
7. Distribution Plan
The Board of Trustees adopted a Distribution and Service Plan pursuant to Rule 12b-1 under the 1940 Act. In accordance with the Rule 12b-1 plan, the Fund is authorized to pay an amount up to 0.25% of its average daily net assets each year to reimburse First Trust Portfolios L.P. (“FTP”), the distributor of the Fund, for amounts expended to finance activities primarily intended to result in the sale of Creation Units or to provide investor services. FTP may also use this amount to compensate securities dealers or other persons that are Authorized Participants for providing distribution assistance, including broker-dealer and shareholder support and educational and promotional services.
No 12b-1 fees are currently paid by the Fund, and pursuant to a contractual arrangement, no 12b-1 fees will be paid any time before November 30, 2021.
8. Borrowings
The Trust, on behalf of the Fund, along with First Trust Series Fund and First Trust Exchange-Traded Fund IV have a $410 million Credit Agreement with The Bank of Nova Scotia (“Scotia”) as administrative agent for a group of lenders. Scotia charges a commitment fee of 0.25% of the daily amount of the excess of the commitment amount over the outstanding principal balance of the loans and an agency fee. First Trust allocates the commitment fee and agency fee amongst the funds that have access to the credit line. To the extent that the Fund accesses the credit line, there would also be an interest fee charged. The Fund did not have any borrowings outstanding during the six months ended January 31, 2021.
Notes to Financial Statements (Continued)
First Trust California Municipal High Income ETF (FCAL)
January 31, 2021 (Unaudited)
9. Indemnification
The Trust, on behalf of the Fund, has a variety of indemnification obligations under contracts with its service providers. The Trust’s maximum exposure under these arrangements is unknown. However, the Trust has not had prior claims or losses pursuant to these contracts and expects the risk of loss to be remote.
10. Other Matters
By operation of law, the Fund now operates as a diversified open-end management investment company as defined in Section 5(b) of the 1940 Act.
11. Subsequent Events
Management has evaluated the impact of all subsequent events to the Fund through the date the financial statements were issued, and has determined that there was the following subsequent event:
Effective March 3, 2021, the credit agreement with Scotia was amended, and the maximum commitment amount changed from $410,000,000 to $330,000,000.
Additional Information
First Trust California Municipal High Income ETF (FCAL)
January 31, 2021 (Unaudited)
Proxy Voting Policies and Procedures
A description of the policies and procedures that the Trust uses to determine how to vote proxies and information on how the Fund voted proxies relating to portfolio securities during the most recent 12-month period ended June 30 is available (1) without charge, upon request, by calling (800) 988-5891; (2) on the Fund’s website at www.ftportfolios.com; and (3) on the Securities and Exchange Commission’s (“SEC”) website at www.sec.gov.
Portfolio Holdings
The Fund files portfolio holdings information for each month in a fiscal quarter within 60 days after the end of the relevant fiscal quarter on Form N-PORT. Portfolio holdings information for the third month of each fiscal quarter will be publicly available on the SEC’s website at www.sec.gov. The Fund’s complete schedule of portfolio holdings for the second and fourth quarters of each fiscal year is included in the semi-annual and annual reports to shareholders, respectively, and is filed with the SEC on Form N-CSR. The semi-annual and annual report for the Fund is available to investors within 60 days after the period to which it relates. The Fund’s Forms N-PORT and Forms N-CSR are available on the SEC’s website listed above.
Risk Considerations
Risks are inherent in all investing. Certain general risks that may be applicable to a Fund are identified below, but not all of the material risks relevant to each Fund are included in this report and not all of the risks below apply to each Fund. The material risks of investing in each Fund are spelled out in its prospectus, statement of additional information and other regulatory filings. Before investing, you should consider each Fund’s investment objective, risks, charges and expenses, and read each Fund’s prospectus and statement of additional information carefully. You can download each Fund’s prospectus at www.ftportfolios.com or contact First Trust Portfolios L.P. at (800) 621-1675 to request a prospectus, which contains this and other information about each Fund.
Concentration Risk. To the extent that a fund is able to invest a large percentage of its assets in a single asset class or the securities of issuers within the same country, state, region, industry or sector, an adverse economic, business or political development may affect the value of the fund’s investments more than if the fund were more broadly diversified. A fund that tracks an index will be concentrated to the extent the fund’s corresponding index is concentrated. A concentration makes a fund more susceptible to any single occurrence and may subject the fund to greater market risk than a fund that is not concentrated.
Credit Risk. Credit risk is the risk that an issuer of a security will be unable or unwilling to make dividend, interest and/or principal payments when due and the related risk that the value of a security may decline because of concerns about the issuer’s ability to make such payments.
Cyber Security Risk. The funds are susceptible to potential operational risks through breaches in cyber security. A breach in cyber security refers to both intentional and unintentional events that may cause a fund to lose proprietary information, suffer data corruption or lose operational capacity. Such events could cause a fund to incur regulatory penalties, reputational damage, additional compliance costs associated with corrective measures and/or financial loss. In addition, cyber security breaches of a fund’s third-party service providers, such as its administrator, transfer agent, custodian, or sub-advisor, as applicable, or issuers in which the fund invests, can also subject a fund to many of the same risks associated with direct cyber security breaches.
Derivatives Risk. To the extent a fund uses derivative instruments such as futures contracts, options contracts and swaps, the fund may experience losses because of adverse movements in the price or value of the underlying asset, index or rate, which may be magnified by certain features of the derivative. These risks are heightened when a fund’s portfolio managers use derivatives to enhance the fund’s return or as a substitute for a position or security, rather than solely to hedge (or offset) the risk of a position or security held by the fund.
Equity Securities Risk. To the extent a fund invests in equity securities, the value of the fund’s shares will fluctuate with changes in the value of the equity securities. Equity securities prices fluctuate for several reasons, including changes in investors’ perceptions of the financial condition of an issuer or the general condition of the relevant stock market, such as market volatility, or when political or economic events affecting the issuers occur. In addition, common stock prices may be particularly sensitive to rising interest rates, as the cost of capital rises and borrowing costs increase. Equity securities may decline significantly in price over short or extended periods of time, and such declines may occur in the equity market as a whole, or they may occur in only a particular country, company, industry or sector of the market.
ETF Risk. The shares of an ETF trade like common stock and represent an interest in a portfolio of securities. The risks of owning an ETF generally reflect the risks of owning the underlying securities, although lack of liquidity in an ETF could result in it being more volatile and ETFs have management fees that increase their costs. Shares of an ETF trade on an exchange at market prices rather than
Additional Information (Continued)
First Trust California Municipal High Income ETF (FCAL)
January 31, 2021 (Unaudited)
net asset value, which may cause the shares to trade at a price greater than net asset value (premium) or less than net asset value (discount). In times of market stress, decisions by market makers to reduce or step away from their role of providing a market for an ETF’s shares, or decisions by an ETF’s authorized participants that they are unable or unwilling to proceed with creation and/or redemption orders of an ETF’s shares, could result in shares of the ETF trading at a discount to net asset value and in greater than normal intraday bid-ask spreads.
Fixed Income Securities Risk. To the extent a fund invests in fixed income securities, the fund will be subject to credit risk, income risk, interest rate risk, liquidity risk and prepayment risk. Income risk is the risk that income from a fund’s fixed income investments could decline during periods of falling interest rates. Interest rate risk is the risk that the value of a fund’s fixed income securities will decline because of rising interest rates. Liquidity risk is the risk that a security cannot be purchased or sold at the time desired, or cannot be purchased or sold without adversely affecting the price. Prepayment risk is the risk that the securities will be redeemed or prepaid by the issuer, resulting in lower interest payments received by the fund. In addition to these risks, high yield securities, or “junk” bonds, are subject to greater market fluctuations and risk of loss than securities with higher ratings, and the market for high yield securities is generally smaller and less liquid than that for investment grade securities.
Index Constituent Risk. Certain funds may be a constituent of one or more indices. As a result, such a fund may be included in one or more index-tracking exchange-traded funds or mutual funds. Being a component security of such a vehicle could greatly affect the trading activity involving a fund, the size of the fund and the market volatility of the fund. Inclusion in an index could significantly increase demand for the fund and removal from an index could result in outsized selling activity in a relatively short period of time. As a result, a fund’s net asset value could be negatively impacted and the fund’s market price may be significantly below its net asset value during certain periods.
Index Provider Risk. To the extent a fund seeks to track an index, it is subject to Index Provider Risk. There is no assurance that the Index Provider will compile the Index accurately, or that the Index will be determined, maintained, constructed, reconstituted, rebalanced, composed, calculated or disseminated accurately. To correct any such error, the Index Provider may carry out an unscheduled rebalance or other modification of the Index constituents or weightings, which may increase the fund’s costs. The Index Provider does not provide any representation or warranty in relation to the quality, accuracy or completeness of data in the Index, and it does not guarantee that the Index will be calculated in accordance with its stated methodology. Losses or costs associated with any Index Provider errors generally will be borne by the fund and its shareholders.
Investment Companies Risk. To the extent a fund invests in the securities of other investment vehicles, the fund will incur additional fees and expenses that would not be present in a direct investment in those investment vehicles. Furthermore, the fund’s investment performance and risks are directly related to the investment performance and risks of the investment vehicles in which the fund invests.
LIBOR Risk. To the extent a fund invests in floating or variable rate obligations that use the London Interbank Offered Rate (“LIBOR”) as a reference interest rate, it is subject to LIBOR Risk. The United Kingdom’s Financial Conduct Authority, which regulates LIBOR, will cease making LIBOR available as a reference rate over a phase-out period that will begin immediately after December 31, 2021. The unavailability or replacement of LIBOR may affect the value, liquidity or return on certain fund investments and may result in costs incurred in connection with closing out positions and entering into new trades. Any potential effects of the transition away from LIBOR on the fund or on certain instruments in which the fund invests can be difficult to ascertain, and they may vary depending on a variety of factors, and they could result in losses to the fund.
Management Risk. To the extent that a fund is actively managed, it is subject to management risk. In managing an actively-managed fund’s investment portfolio, the fund’s portfolio managers will apply investment techniques and risk analyses that may not have the desired result. There can be no guarantee that a fund will meet its investment objective.
Market Risk. Securities held by a fund, as well as shares of a fund itself, are subject to market fluctuations caused by factors such as general economic conditions, political events, regulatory or market developments, changes in interest rates and perceived trends in securities prices. Shares of a fund could decline in value or underperform other investments as a result of the risk of loss associated with these market fluctuations. In addition, local, regional or global events such as war, acts of terrorism, spread of infectious diseases or other public health issues, recessions, or other events could have a significant negative impact on a fund and its investments. Such events may affect certain geographic regions, countries, sectors and industries more significantly than others. The outbreak of the respiratory disease designated as COVID-19 in December 2019 has caused significant volatility and declines in global financial markets, which have caused losses for investors. The COVID-19 pandemic may last for an extended period of time and will continue to impact the economy for the foreseeable future.
Non-U.S. Securities Risk. To the extent a fund invests in non-U.S. securities, it is subject to additional risks not associated with securities of domestic issuers. Non-U.S. securities are subject to higher volatility than securities of domestic issuers due to: possible adverse political, social or economic developments; restrictions on foreign investment or exchange of securities; lack of liquidity;
Additional Information (Continued)
First Trust California Municipal High Income ETF (FCAL)
January 31, 2021 (Unaudited)
currency exchange rates; excessive taxation; government seizure of assets; different legal or accounting standards; and less government supervision and regulation of exchanges in foreign countries. Investments in non-U.S. securities may involve higher costs than investments in U.S. securities, including higher transaction and custody costs, as well as additional taxes imposed by non-U.S. governments. These risks may be heightened for securities of companies located, or with significant operations, in emerging market countries.
Operational Risk. Each fund is subject to risks arising from various operational factors, including, but not limited to, human error, processing and communication errors, errors of a fund’s service providers, counterparties or other third-parties, failed or inadequate processes and technology or systems failures. Although the funds and the Advisor seek to reduce these operational risks through controls and procedures, there is no way to completely protect against such risks.
Passive Investment Risk. To the extent a fund seeks to track an index, the fund will invest in the securities included in, or representative of, the index regardless of their investment merit. A fund generally will not attempt to take defensive positions in declining markets.
| NOT FDIC INSURED | NOT BANK GUARANTEED | MAY LOSE VALUE |
First Trust Exchange-Traded Fund III
INVESTMENT ADVISOR
First Trust Advisors L.P.
120 East Liberty Drive, Suite 400
Wheaton, IL 60187
ADMINISTRATOR, CUSTODIAN,
FUND ACCOUNTANT &
TRANSFER AGENT
Brown Brothers Harriman & Co.
50 Post Office Square
Boston, MA 02110
INDEPENDENT REGISTERED
PUBLIC ACCOUNTING FIRM
Deloitte & Touche LLP
111 S. Wacker Drive
Chicago, IL 60606
LEGAL COUNSEL
Chapman and Cutler LLP
111 W. Monroe Street
Chicago, IL 60603
First Trust Exchange-Traded Fund III
First Trust Municipal High Income ETF (FMHI)
Semi-Annual Report
For the Six Months Ended
January 31, 2021
First Trust Municipal High Income ETF (FMHI)
Semi-Annual Report
January 31, 2021
Caution Regarding Forward-Looking Statements
This report contains certain forward-looking statements within the meaning of the Securities Act of 1933, as amended, and the Securities Exchange Act of 1934, as amended. Forward-looking statements include statements regarding the goals, beliefs, plans or current expectations of First Trust Advisors L.P. (“First Trust” or the “Advisor”) and its representatives, taking into account the information currently available to them. Forward-looking statements include all statements that do not relate solely to current or historical fact. For example, forward-looking statements include the use of words such as “anticipate,” “estimate,” “intend,” “expect,” “believe,” “plan,” “may,” “should,” “would” or other words that convey uncertainty of future events or outcomes.
Forward-looking statements involve known and unknown risks, uncertainties and other factors that may cause the actual results, performance or achievements of the series of First Trust Exchange-Traded Fund III (the “Trust”) described in this report (First Trust Municipal High Income ETF; hereinafter referred to as the “Fund”) to be materially different from any future results, performance or achievements expressed or implied by the forward-looking statements. When evaluating the information included in this report, you are cautioned not to place undue reliance on these forward-looking statements, which reflect the judgment of the Advisor and its representatives only as of the date hereof. We undertake no obligation to publicly revise or update these forward-looking statements to reflect events and circumstances that arise after the date hereof.
Performance and Risk Disclosure
There is no assurance that the Fund will achieve its investment objectives. The Fund is subject to market risk, which is the possibility that the market values of securities owned by the Fund will decline and that the value of the Fund’s shares may therefore be less than what you paid for them. Accordingly, you can lose money by investing in the Fund. See “Risk Considerations” in the Additional Information section of this report for a discussion of certain other risks of investing in the Fund.
Performance data quoted represents past performance, which is no guarantee of future results, and current performance may be lower or higher than the figures shown. For the most recent month-end performance figures, please visit www.ftportfolios.com or speak with your financial advisor. Investment returns, net asset value and share price will fluctuate and Fund shares, when sold, may be worth more or less than their original cost.
The Advisor may also periodically provide additional information on Fund performance on the Fund’s web page at www.ftportfolios.com.
How to Read This Report
This report contains information that may help you evaluate your investment in the Fund. It includes details about the Fund and presents data and analysis that provide insight into the Fund’s performance and investment approach.
The statistical information that follows may help you understand the Fund’s performance compared to that of relevant market benchmarks.
It is important to keep in mind that the opinions expressed by personnel of the Advisor are just that: informed opinions. They should not be considered to be promises or advice. The opinions, like the statistics, cover the period through the date on the cover of this report. The material risks of investing in the Fund are spelled out in the prospectus, the statement of additional information, and other Fund regulatory filings.
First Trust Municipal High Income ETF (FMHI)
Semi-Annual Letter from the Chairman and CEO
January 31, 2021
Dear Shareholders,
First Trust is pleased to provide you with the semi-annual report for the First Trust Municipal High Income ETF (the “Fund”), which contains detailed information about the Fund for the six months ended January 31, 2021.
There is so much to talk about, yet so little space. Rather than drill down on politics or belabor the coronavirus (“COVID-19”) pandemic, I would like to take this opportunity to convey a brief message on the current economic/business/investment climate in the U.S. The one thing I feel compelled to point out, however, is that unlike the Trump Administration’s approach of delegating the lion’s share of the responsibility of executing the medical ground assault against COVID-19 to the states, the Biden Administration has communicated its intention to play more of an integral role at the federal level. The distribution of the FDA-approved vaccines, of which there are currently three, and the push for a huge bump up in the next round of fiscal stimulus to help millions of Americans cope with the economic fallout stemming from the pandemic are just two examples. While he was hoping to make it a bipartisan effort, President Joe Biden was prepared to utilize a tactic in Congress, particularly in the Senate, known as reconciliation to pass his $1.9 trillion stimulus bill. Reconciliation would only require a simple majority of Senate votes to pass the bill. In the end, Congress did just that and the Senate passed the bill with a 50-49 count. President Biden signed the “American Rescue Plan Act” into law on March 11, 2021. Not one Republican in Congress voted for the bill.
The current climate strikes me as one where “Cash is King.” A recent survey by Money and Morning Consult found that 68% of adults said they need another stimulus check from the government to get by, and 39% of those polled claimed they need the additional financial support “a lot,” according to their own release. Overall, respondents said that the $600 checks sent out this past December were not enough. Seventy-seven percent of adults say they need the checks to exceed $1,000 and 36% say they need more than $2,000 to make ends meet. President Joe Biden’s American Rescue Plan will make payments of up to $1,400 to those who are eligible. Suffice it to say, cash tends to be an urgent priority for those who do not have it.
While most investors are likely hunting for opportunities to generate higher returns on their capital, many Americans are sitting on their cash. Brian Wesbury, Chief Economist at First Trust, recently noted that, as of the third quarter of 2020, the amount of capital held by Americans in checking accounts, savings accounts, time deposits and money market funds stood $2.8 trillion higher than their combined total in the third quarter of 2019. If you have listened to what Federal Reserve Chairman Jerome Powell has said about keeping short-term interest rates low for two or three more years if need be to significantly lower unemployment and generate inflationary pressure beyond the Federal Reserve’s 2.0% target, it makes the thought of harboring such an extraordinary volume of capital in these low-paying, interest-bearing accounts even harder to fathom, in my opinion.
The state of the U.S. economy is on the mend, but likely won’t make a full recovery for at least a couple more years, according to Wesbury. In our opinion, most of the weakness in the economy is stemming from some key service-oriented sectors, such as hotels and airlines, that remain sheltered or lightly used. Wesbury believes that a full recovery requires the reopening of the entire U.S. economy. The speed of the vaccine rollout in the weeks ahead could help determine when the economy is ready to fully reopen.
We believe investors should take solace in how upbeat our top executives are about the near future. The Conference Board’s Measure of CEO Confidence™ rose to a 17-year high in the first quarter of 2021, according to Fox Business. The measure currently stands at 73. A reading above 50 points reflects more positive than negative responses from CEOs. Its quarterly survey revealed that 82% of CEOs expect economic conditions to improve over the next six months, up from 63% in the prior survey. Forty-five percent of them expect to increase capital spending, up from 25% in the prior survey. The good news is that Corporate America’s largest companies have the cash to fund projects. In the third quarter of 2020 (most recent data), S&P 500 Industrials (Old) cash and equivalents, which excludes cash held by Financials, Utilities and Transportation companies, stood at a near-record high of $1.88 trillion, according to S&P Dow Jones Indices. The all-time high was $1.89 trillion, set in the second quarter of 2020.
It seems the economy is on the cusp of another major cash injection from the government. We encourage investors to stay the course.
Thank you for giving First Trust the opportunity to play a role in your financial future. We value our relationship with you and will report on the Fund again in six months.
Sincerely,
James A. Bowen
Chairman of the Board of Trustees
Chief Executive Officer of First Trust Advisors L.P.
Fund Performance Overview (Unaudited)
First Trust Municipal High Income ETF (FMHI)
The primary investment objective of the First Trust Municipal High Income ETF (the “Fund”) is to provide federally tax-exempt income, and its secondary objective is long-term capital appreciation. Under normal market conditions, the Fund seeks to achieve its investment objectives by investing at least 80% of its net assets (including investment borrowings) in municipal debt securities that pay interest that is exempt from regular federal income taxes (“Municipal Securities”). The Fund invests at least 50% of its net assets in Municipal Securities that are, at the time of investment, rated below investment grade by at least one nationally recognized statistical rating organization rating such securities (or Municipal Securities that are unrated and determined by the Fund’s advisor to be of comparable quality), commonly referred to as “high yield” or “junk” bonds. The Fund lists and principally trades its shares on The Nasdaq Stock Market LLC under the ticker symbol “FMHI.”
| Performance | | | | |
| | | | Average Annual
Total Returns | Cumulative
Total Returns |
| | 6 Months Ended
1/31/21 | 1 Year Ended
1/31/21 | Inception (11/1/17)
to 1/31/21 | Inception (11/1/17)
to 1/31/21 |
| Fund Performance | | | | |
| NAV | 6.71% | 4.20% | 6.14% | 21.35% |
| Market Price | 6.73% | 4.00% | 6.12% | 21.27% |
| Index Performance | | | | |
| Bloomberg Barclays Municipal Bond Index | 2.01% | 4.01% | 4.66% | 15.94% |
| Blended Benchmark(1) | 4.62% | 3.47% | 5.49% | 18.96% |
Total returns for the period since inception are calculated from the inception date of the Fund. “Average Annual Total Returns” represent the average annual change in value of an investment over the period indicated. “Cumulative Total Returns” represent the total change in value of an investment over the period indicated. The total returns would have been lower if certain fees had not been waived by the Advisor.
The Fund’s per share net asset value (“NAV”) is the value of one share of the Fund and is computed by dividing the value of all assets of the Fund (including accrued interest and dividends), less all liabilities (including accrued expenses and dividends declared but unpaid), by the total number of outstanding shares. The price used to calculate market return (“Market Price”) is determined by using the midpoint of the national best bid and offer price (“NBBO”) as of the time that the Fund’s NAV is calculated. Under SEC rules, the NBBO consists of the highest displayed buy and lowest sell prices among the various exchanges trading the Fund at the time the Fund’s NAV is calculated. Prior to January 1, 2019, the price used was the midpoint between the highest bid and the lowest offer on the stock exchange on which shares of the Fund were listed for trading as of the time that the Fund’s NAV was calculated. Since shares of the Fund did not trade in the secondary market until after its inception, for the period from inception to the first day of secondary market trading in shares of the Fund, the NAV of the Fund is used as a proxy for the secondary market trading price to calculate market returns. NAV and market returns assume that all distributions have been reinvested in the Fund at NAV and Market Price, respectively.
An index is a statistical composite that tracks a specified financial market or sector. Unlike the Fund, the indices that make up the Blended Benchmark do not actually hold a portfolio of securities and therefore do not incur the expenses incurred by the Fund. These expenses negatively impact the performance of the Fund. Also, market returns do not include brokerage commissions that may be payable on secondary market transactions. If brokerage commissions were included, market returns would be lower. The total returns presented reflect the reinvestment of dividends on securities in the indices. The returns presented do not reflect the deduction of taxes that a shareholder would pay on Fund distributions or the redemption or sale of Fund shares. The investment return and principal value of shares of the Fund will vary with changes in market conditions. Shares of the Fund may be worth more or less than their original cost when they are redeemed or sold in the market. The Fund’s past performance is no guarantee of future performance.
| (1) | The Blended Benchmark consists of the following two indexes: 50% of the Bloomberg Barclays High Yield 10-Year Municipal Index (8-12 years) which is comprised of bonds with a final maturity between 8 and 12 years that are part of the Bloomberg Barclays Municipal Bond High Yield Index; and 50% of the Bloomberg Barclays Revenue 10-Year Municipal Index (8-12 years), which is comprised of revenue bonds that have a final maturity between 8 and 12 years that are part of the Bloomberg Barclays Municipal Bond Index. Indexes do not charge management fees or brokerage expenses, and no such fees or expenses were deducted from the index performance shown. Indexes are unmanaged and an investor cannot invest directly in an index. The Blended Index returns are calculated by using the monthly return of the two indices during each period shown above. At the beginning of each month the two indices are rebalanced to a 50-50 ratio to account for divergence from that ratio that occurred during the course of each month. The monthly returns are then compounded for each period shown above, giving the performance for the Blended Index for each period shown above. |
Fund Performance Overview (Unaudited) (Continued)
First Trust Municipal High Income ETF (FMHI) (Continued)
| Sector Allocation | % of Total
Investments
(including cash) |
| Education | 12.3% |
| Industrial Development Bond | 10.3 |
| Government Obligation Bond - Limited Tax | 9.0 |
| Special Assessment | 8.4 |
| Continuing Care Retirement Communities | 6.8 |
| Higher Education | 6.5 |
| Tobacco | 6.2 |
| Dedicated Tax | 5.9 |
| Government Obligation Bond - Unlimited Tax | 5.2 |
| Hospital | 4.9 |
| Tax Increment | 4.6 |
| Airport | 3.0 |
| Student Housing | 2.9 |
| Local Housing | 2.8 |
| Gas | 1.9 |
| Insured | 1.8 |
| Certificates of Participation | 1.3 |
| Utility | 0.9 |
| Mass Transit | 0.9 |
| Toll Road | 0.5 |
| Water & Sewer | 0.4 |
| Other Health | 0.4 |
| Hotel | 0.3 |
| Port | 0.1 |
| Pre-refunded/Escrowed-to-maturity | 0.0* |
| Cash | 2.7 |
| Total | 100.0% |
| * | Amount is less than 0.1%. |
| Credit Rating(2) | % of Total
Investments
(including cash) |
| AAA | 0.8% |
| AA | 4.7 |
| A | 11.2 |
| BBB | 17.3 |
| BB | 18.6 |
| B | 2.2 |
| CCC | 1.5 |
| Not Rated | 40.1 |
| SP-2/MIG1 | 0.9 |
| Cash | 2.7 |
| Total | 100.0% |
| Fund Allocation | % of Net Assets |
| Municipal Bonds | 98.5% |
| Net Other Assets and Liabilities** | 1.5 |
| Total | 100.0% |
| ** | Includes variation margin on futures contracts. |
| (2) | The credit quality and ratings information presented above reflect the ratings assigned by one or more nationally recognized statistical rating organizations (NRSROs), including Standard & Poor’s Ratings Group, a division of the McGraw Hill Companies, Inc., Moody’s Investors Service, Inc., Fitch Ratings or a comparably rated NRSRO. For situations in which a security is rated by more than one NRSRO and the ratings are not equivalent, the highest rating is used. Sub-investment grade ratings are those rated BB+/Ba1 or lower. Investment grade ratings are those rated BBB-/Baa3 or higher. The credit ratings shown relate to the creditworthiness of the issuers of the underlying securities in the Fund, and not to the Fund or its shares. Credit ratings are subject to change. |
Fund Performance Overview (Unaudited) (Continued)
First Trust Municipal High Income ETF (FMHI) (Continued)
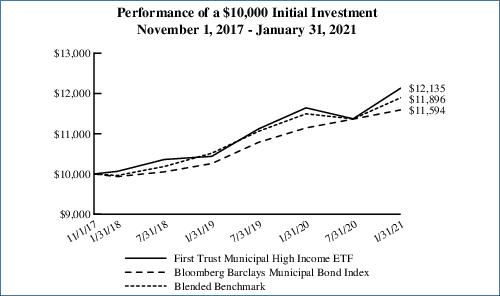
Performance figures assume reinvestment of all distributions and do not reflect the deduction of taxes that a shareholder would pay on Fund distributions or the redemption or sale of Fund shares. An index is a statistical composite that tracks a specified financial market or sector. Unlike the Fund, the index does not actually hold a portfolio of securities and therefore does not incur the expenses incurred by the Fund. These expenses negatively impact the performance of the Fund. The Fund’s past performance does not predict future performance.
Frequency Distribution of Discounts and Premiums
Information showing the number of days the market price of the Fund’s shares was greater (at a premium) and less (at a discount) than the Fund’s net asset value for the most recently completed year, and the most recently completed calendar quarters since that year (or life of the Fund, if shorter), is available at https://www.ftportfolios.com/Retail/etf/home.aspx.
Portfolio Management
First Trust Municipal High Income ETF (FMHI)
Semi-Annual Report
January 31, 2021 (Unaudited)
Advisor
First Trust Advisors L.P. (“First Trust” or the “Advisor”) is the investment advisor to the First Trust Municipal High Income ETF (the “Fund”). First Trust is responsible for the ongoing monitoring of the Fund’s investment portfolio, managing the Fund’s business affairs and providing certain administrative services necessary for the management of the Fund.
Portfolio Management Team
Tom Futrell, CFA, Senior Vice President, Senior Portfolio Manager
Johnathan N. Wilhelm, Senior Vice President, Senior Portfolio Manager
The First Trust Municipal Securities Team was formed in September of 2013 and is headed by Tom Futrell, CFA, and Johnathan Wilhelm who serve as senior portfolio managers of the Fund. Messrs. Futrell and Wilhelm have a combined 50+ years of investment experience and prior to joining First Trust, served as portfolio managers of municipal bonds at Nuveen Investments and Performance Trust Investment Advisors. In addition to the Fund, the Team manages/consults for a variety of First Trust investment portfolios and separately managed accounts.
First Trust Municipal High Income ETF (FMHI)
Understanding Your Fund Expenses
January 31, 2021 (Unaudited)
As a shareholder of the First Trust Municipal High Income ETF (the “Fund”), you incur two types of costs: (1) transaction costs; and (2) ongoing costs, including management fees, distribution and/or service (12b-1) fees, if any, and other Fund expenses. This Example is intended to help you understand your ongoing costs of investing in the Fund and to compare these costs with the ongoing costs of investing in other funds.
The Example is based on an investment of $1,000 invested at the beginning of the period and held through the six-month period ended January 31, 2021.
Actual Expenses
The first line in the following table provides information about actual account values and actual expenses. You may use the information in this line, together with the amount you invested, to estimate the expenses that you paid over the period. Simply divide your account value by $1,000 (for example, an $8,600 account value divided by $1,000 = 8.6), then multiply the result by the number in the first line under the heading entitled “Expenses Paid During the Six-Month Period” to estimate the expenses you paid on your account during this six-month period.
Hypothetical Example for Comparison Purposes
The second line in the following table provides information about hypothetical account values and hypothetical expenses based on the Fund’s actual expense ratio and an assumed rate of return of 5% per year before expenses, which is not the Fund’s actual return. The hypothetical account values and expenses may not be used to estimate the actual ending account balance or expenses you paid for the period. You may use this information to compare the ongoing costs of investing in the Fund and other funds. To do so, compare this 5% hypothetical example with the 5% hypothetical examples that appear in the shareholder reports of the other funds.
Please note that the expenses shown in the table are meant to highlight your ongoing costs only and do not reflect any transactional costs such as brokerage commissions. Therefore, the second line in the table is useful in comparing ongoing costs only, and will not help you determine the relative total costs of owning different funds. In addition, if these transactional costs were included, your costs would have been higher.
| | Beginning
Account Value
August 1, 2020 | Ending
Account Value
January 31, 2021 | Annualized
Expense Ratio
Based on the
Six-Month
Period (a) | Expenses Paid
During the
Six-Month
Period (b) |
| First Trust Municipal High Income ETF (FMHI) |
| Actual | $1,000.00 | $1,067.10 | 0.55% | $2.87 |
| Hypothetical (5% return before expenses) | $1,000.00 | $1,022.43 | 0.55% | $2.80 |
| (a) | These expense ratios reflect expense waivers. See Note 3 in the Notes to Financial Statements. |
| (b) | Expenses are equal to the annualized expense ratios as indicated in the table multiplied by the average account value over the period (August 1, 2020 through January 31, 2021), multiplied by 184/365 (to reflect the six-month period). |
First Trust Municipal High Income ETF (FMHI)
Portfolio of Investments
January 31, 2021 (Unaudited)
Principal
Value | | Description | | Stated
Coupon | | Stated
Maturity | | Value |
| MUNICIPAL BONDS – 98.5% |
| | | Arizona – 4.2% | | | | | | |
| $780,000 | | AZ St Indl Dev Auth Edu Rev Academics of Math & Science Proj (a)
| | 5.00% | | 07/01/39 | | $901,500 |
| 750,000 | | AZ St Indl Dev Auth Edu Rev Doral Academy NV Fire Mesa & Red Rock Campus Proj, Ser A (a)
| | 5.00% | | 07/15/39 | | 854,850 |
| 400,000 | | AZ St Indl Dev Auth Edu Rev Lone Mountain Campus Proj, Ser A (a)
| | 5.00% | | 12/15/39 | | 440,476 |
| 1,255,000 | | AZ St Indl Dev Auth Edu Rev Ref Basis Sch Projs, Ser D (a)
| | 4.00% | | 07/01/27 | | 1,371,602 |
| 500,000 | | AZ St Indl Dev Auth Edu Rev, Ser A (a)
| | 5.00% | | 07/15/40 | | 568,630 |
| 500,000 | | Glendale AZ Indl Dev Auth Sr Living Facs Rev Royal Oaks Inspirata Pointe Proj, Ser A
| | 5.00% | | 05/15/41 | | 570,400 |
| 1,000,000 | | Maricopa Cnty AZ Indl Dev Auth Edu Rev Ref Legacy Traditional Schs Proj Auth, Ser B (a)
| | 4.00% | | 07/01/29 | | 1,106,760 |
| 100,000 | | Phoenix AZ Indl Dev Auth Student Hsg Rev Ref Downtown Phoenix Student Hsg LLC AZ St Univ Proj, Ser A
| | 5.00% | | 07/01/27 | | 115,691 |
| 205,000 | | Pima Cnty AZ Indl Dev Auth Edu Rev Fac American Leadership Academy Proj (a)
| | 4.00% | | 06/15/22 | | 207,694 |
| | | | | 6,137,603 |
| | | California – 3.3% | | | | | | |
| 450,000 | | CA St Muni Fin Auth Chrt Sch Rev, Ser A (a)
| | 5.50% | | 06/01/38 | | 499,167 |
| 205,000 | | CA St Muni Fin Auth Rev Ref Eisenhower Med Ctr, Ser A
| | 5.00% | | 07/01/32 | | 246,320 |
| 250,000 | | CA St Poll Control Fin Auth Sol Wst Disp Rev Rialto Bioenergy Fac LLC Proj Green Bond, AMT (a)
| | 6.75% | | 12/01/28 | | 255,758 |
| 500,000 | | CA St Poll Control Fin Auth Sol Wst Disp Rev Rialto Bioenergy Fac LLC Proj Green Bond, AMT (a)
| | 7.50% | | 12/01/40 | | 514,200 |
| 750,000 | | CA St Poll Control Fin Auth Wtr Furnishing Rev, AMT (a)
| | 5.00% | | 07/01/37 | | 802,462 |
| 415,000 | | CA St Stwd Cmntys Dev Auth Clg Hsg Rev NCCD Hooper Street LLC CA Clg of the Arts Projs (a)
| | 5.25% | | 07/01/39 | | 464,634 |
| 550,000 | | CA Stwd Cmntys Dev Auth Rev Loma Linda Univ Med Ctr, Ser A (a)
| | 5.00% | | 12/01/33 | | 666,182 |
| 300,000 | | Morongo Band of Mission Indians CA Rev Ref, Ser B (a)
| | 5.00% | | 10/01/42 | | 337,734 |
| 1,000,000 | | Tobacco Securitization Auth Nthrn CA Tobacco Settlement Rev Asset Bkd Bds, Ser A-1
| | 5.38% | | 06/01/38 | | 1,003,770 |
| | | | | 4,790,227 |
| | | Colorado – 12.8% | | | | | | |
| 1,125,000 | | Allison Vly Met Dist #2 CO Ref
| | 4.70% | | 12/01/47 | | 1,150,830 |
| 1,000,000 | | Bennett Ranch Met Dist #1 CO, Ser A
| | 5.00% | | 12/01/51 | | 1,026,020 |
| 525,000 | | Brighton Crossing Met Dist #6 CO, Ser A
| | 5.00% | | 12/01/35 | | 565,425 |
| 515,000 | | Brighton Crossing Met Dist #6 CO, Ser A
| | 5.00% | | 12/01/40 | | 547,167 |
| 735,000 | | Broadway Station Met Dist No 2 CO, Ser A
| | 5.00% | | 12/01/35 | | 794,020 |
| 150,000 | | CO Eductnl & Cultural Auth Rev Ref West Ridge Academy Chrt Sch Proj, Ser A
| | 5.00% | | 06/01/27 | | 169,502 |
| 1,000,000 | | CO St Eductnl & Cultural Facs Auth Rev Ref & Impt Chrt Sch Univ Lab Bldg Corp
| | 5.00% | | 12/15/45 | | 1,101,220 |
| 850,000 | | CO St Hlth Facs Auth Hosp Rev Ref Commonspirit Hlth, Ser A-1
| | 4.00% | | 08/01/38 | | 989,221 |
| 625,000 | | CO St Hlth Facs Auth Hosp Rev Sr Living Ralston Creek Arvada Proj, Ser A
| | 5.25% | | 11/01/32 | | 550,644 |
| 500,000 | | Denver CO Intl Business Ctr CO Met Dist #1 Subordinate, Ser B
| | 6.00% | | 12/01/48 | | 541,360 |
| 900,000 | | Hunters Overlook Metro Dist #5 CO Sr Bonds, Ser A
| | 5.00% | | 12/01/39 | | 970,533 |
| 500,000 | | Independence Met Dist #3 CO, Ser A
| | 6.25% | | 12/01/49 | | 539,960 |
| 575,000 | | Jefferson Ctr CO Met Dist #1 Spl Rev, Ser A-2
| | 4.13% | | 12/01/40 | | 607,614 |
| 875,000 | | Lanterns Met Dist #1 CO, Ser A
| | 5.00% | | 12/01/39 | | 939,785 |
| 1,000,000 | | Painted Prairie Pub Impt Auth CO
| | 4.00% | | 12/01/29 | | 1,071,380 |
See Notes to Financial Statements
Page 7
First Trust Municipal High Income ETF (FMHI)
Portfolio of Investments (Continued)
January 31, 2021 (Unaudited)
Principal
Value | | Description | | Stated
Coupon | | Stated
Maturity | | Value |
| MUNICIPAL BONDS (Continued) |
| | | Colorado (Continued) | | | | | | |
| $500,000 | | Park Creek CO Met Dist Rev Ref Sr Ltd Property Tax Supported, Ser A
| | 5.00% | | 12/01/34 | | $583,800 |
| 900,000 | | Prairie Ctr Met Dist #7 CO
| | 4.13% | | 12/15/36 | | 955,872 |
| 500,000 | | Regl CO Transprtn Dist Priv Activity Rev Ref Denver Transit Partners Eagle P3 Proj, Ser A
| | 5.00% | | 07/15/27 | | 627,405 |
| 325,000 | | Regl CO Transprtn Dist Priv Activity Rev Ref Denver Transit Partners Eagle P3 Proj, Ser A
| | 5.00% | | 07/15/28 | | 416,010 |
| 300,000 | | Regl CO Transprtn Dist Priv Activity Rev Ref Denver Transit Partners Eagle P3 Proj, Ser A
| | 5.00% | | 07/15/29 | | 391,506 |
| 560,000 | | Stc Met Dist #2 CO Ref, Ser A
| | 3.00% | | 12/01/25 | | 566,821 |
| 1,000,000 | | Stc Met Dist #2 CO Ref, Ser A
| | 5.00% | | 12/01/38 | | 1,070,920 |
| 1,000,000 | | Sterling Ranch Met Dist #1 CO
| | 5.00% | | 12/01/40 | | 1,060,250 |
| 500,000 | | Trails at Crowfoot Met Dist #3 CO Sr Series, Ser A
| | 5.00% | | 12/01/39 | | 533,700 |
| 740,000 | | Willow Bend Met Dist CO Sr, Ser A
| | 5.00% | | 12/01/39 | | 792,466 |
| | | | | 18,563,431 |
| | | Connecticut – 3.1% | | | | | | |
| 250,000 | | Bridgeport CT, Ser A, BAM
| | 5.00% | | 02/01/31 | | 320,117 |
| 540,000 | | CT St Hlth & Eductnl Facs Auth Rev Mclean Issue, Ser A (a)
| | 5.00% | | 01/01/55 | | 583,292 |
| 250,000 | | CT St Hlth & Eductnl Facs Auth Rev Quinnipiac Univ Ref, Ser M
| | 5.00% | | 07/01/36 | | 297,455 |
| 250,000 | | CT St Hlth & Eductnl Facs Auth Rev Ref Quinnipiac Univ, Ser L
| | 5.00% | | 07/01/31 | | 292,205 |
| 1,500,000 | | Harbor Point CT Infrastructure Impt Dist Spl Oblig Rev Ref Harbor Point Proj Ltd (a)
| | 5.00% | | 04/01/39 | | 1,689,195 |
| 1,000,000 | | Univ Of CT CT, Ser A
| | 5.00% | | 11/01/35 | | 1,275,930 |
| | | | | 4,458,194 |
| | | Delaware – 0.4% | | | | | | |
| 562,000 | | Millsboro DE Spl Oblig Ref Plantation Lakes Spl Dev Dist (a)
| | 5.00% | | 07/01/28 | | 603,133 |
| | | District of Columbia – 1.2% | | | | | | |
| 1,500,000 | | DC Rev Rocketship DC Oblig Grp, Ser A (a)
| | 5.00% | | 06/01/51 | | 1,692,105 |
| | | Florida – 8.2% | | | | | | |
| 300,000 | | Capital Region FL Cdd Rev Ref Capital Impt, Ser A-1
| | 4.13% | | 05/01/23 | | 304,914 |
| 200,000 | | Capital Trust Agy FL Eductnl Facs Rev Liza Jackson Preparatory Sch Inc Proj, Ser A
| | 4.00% | | 08/01/30 | | 230,452 |
| 300,000 | | Capital Trust Agy FL Eductnl Facs Rev Liza Jackson Preparatory Sch Inc Proj, Ser A
| | 5.00% | | 08/01/40 | | 362,052 |
| 140,000 | | Capital Trust Agy FL Eductnl Facs Rev Viera Chrt Schs Inc Proj, Ser A (a)
| | 5.00% | | 10/15/37 | | 153,847 |
| 650,000 | | Coco Palms FL CDD Spl Assmnt
| | 4.50% | | 05/01/32 | | 717,385 |
| 580,000 | | Epperson Ranch Cdd FL Capital Impt Rev, Ser A-1
| | 5.00% | | 11/01/28 | | 624,614 |
| 1,500,000 | | FL Dev Fin Corp Surface Tranprtn Fac Rev Green Bond-Brightline Passenger Rail Remk, Ser B, AMT (a)
| | 7.38% | | 01/01/49 | | 1,464,885 |
| 1,000,000 | | Hills Minneola Cmnty Dev Dist FL Spl Assmnt Rev South Parcel Assmnt Area (a)
| | 4.00% | | 05/01/40 | | 1,065,980 |
| 85,000 | | Miami-Dade Cnty FL Eductnl Facs Auth Rev Ref Univ Miami, Ser A
| | 5.00% | | 04/01/31 | | 97,790 |
| 1,250,000 | | Mirada Ii Cmnty Dev Dist FL Cap Impt Rev
| | 4.00% | | 05/01/51 | | 1,280,600 |
| 200,000 | | North Park Isle Cmnty Dev Dist FL Spl Assmnt Rev Assmnt Area One
| | 4.50% | | 05/01/40 | | 215,348 |
| 210,000 | | Orange Cnty FL Hlth Facs Auth Rev Ref Orlando Hlth Inc, Ser A
| | 5.00% | | 10/01/36 | | 251,612 |
| 465,000 | | Parkland Preserve Cdd FL Spl Assmnt Rev, Ser A
| | 5.25% | | 05/01/39 | | 525,650 |
| 1,500,000 | | Polk Cnty FL Indl Dev Auth Mineral Dev LLC Secondary Phosphate Tailings Recovery Proj (a)
| | 5.88% | | 01/01/33 | | 1,608,135 |
Page 8
See Notes to Financial Statements
First Trust Municipal High Income ETF (FMHI)
Portfolio of Investments (Continued)
January 31, 2021 (Unaudited)
Principal
Value | | Description | | Stated
Coupon | | Stated
Maturity | | Value |
| MUNICIPAL BONDS (Continued) |
| | | Florida (Continued) | | | | | | |
| $250,000 | | SE Overtown Park W Cmnty Redev Agy FL Tax, Ser A-1 (a)
| | 5.00% | | 03/01/30 | | $278,075 |
| 1,000,000 | | Seminole Cnty FL Indl Dev Auth Ref Legacy Pointe at UCF Proj, Ser A
| | 5.00% | | 11/15/29 | | 1,023,490 |
| 500,000 | | Shell Point Cmnty Dev Dist FL Spl Assmnt (a)
| | 5.25% | | 11/01/39 | | 566,600 |
| 255,000 | | Trout Creek Cdd FL Capital Impt Rev (b)
| | 5.38% | | 05/01/38 | | 288,627 |
| 230,000 | | Villamar Cdd FL Spl Assmnt (b)
| | 4.00% | | 05/01/29 | | 245,541 |
| 440,000 | | W Vlgs FL Impt Dist Spl Assmt Unit Dev #7 Master Infrastructure
| | 4.25% | | 05/01/29 | | 481,320 |
| | | | | 11,786,917 |
| | | Georgia – 1.6% | | | | | | |
| 1,000,000 | | Atlanta GA Arpt Passenger Fac Charge Rev Arpt Rev Subordinate, Ser D, AMT
| | 4.00% | | 07/01/38 | | 1,170,180 |
| 55,000 | | Fulton Cnty GA Rsdl Care Facs Elderly Auth Retmnt Fac Rev Ref Lenbrook Sq Fdtn Inc
| | 5.00% | | 07/01/31 | | 59,850 |
| 500,000 | | Fulton Cnty GA Rsdl Care Facs Elderly Auth Retmnt Fac Rev Ref Lenbrook Sq Fdtn Inc
| | 5.00% | | 07/01/42 | | 537,555 |
| 400,000 | | Main Street Nat Gas Inc GA Gas Sply Rev, Ser A
| | 5.00% | | 05/15/30 | | 514,684 |
| | | | | 2,282,269 |
| | | Guam – 0.8% | | | | | | |
| 250,000 | | Guam Govt Business Privilege Tax Rev Ref, Ser-D
| | 5.00% | | 11/15/35 | | 282,800 |
| 235,000 | | Guam Govt Business Privilege Tax Rev, Ser B-1
| | 5.00% | | 01/01/37 | | 241,272 |
| 500,000 | | Guam Govt Wtrwks Auth Wtr & Wstwtr Sys Rev, Ser A
| | 5.00% | | 01/01/50 | | 621,080 |
| | | | | 1,145,152 |
| | | Idaho – 0.2% | | | | | | |
| 260,000 | | ID St Hlth Facs Auth Rev Ref Vly Vista Care Corp, Ser A
| | 4.00% | | 11/15/27 | | 256,503 |
| | | Illinois – 6.7% | | | | | | |
| 275,000 | | Chicago IL Brd of Edu Cap Apprec Sch Reform, Ser B-1, NATL-RE
| | (c) | | 12/01/22 | | 270,443 |
| 300,000 | | Chicago IL Brd of Edu Ref Dedicated, Ser C
| | 5.00% | | 12/01/30 | | 367,050 |
| 870,000 | | Chicago IL Brd of Edu Ref, Ser F
| | 5.00% | | 12/01/31 | | 872,558 |
| 100,000 | | Chicago IL Brd of Edu, Ser A
| | 5.50% | | 12/01/39 | | 103,147 |
| 400,000 | | Chicago IL O’Hare Intl Arpt Rev Ref Sr Lien, Ser A, AMT
| | 5.00% | | 01/01/37 | | 496,176 |
| 400,000 | | Chicago IL Ref 2003B
| | 5.25% | | 01/01/29 | | 455,336 |
| 20,000 | | Chicago IL Ref, Ser C
| | 5.00% | | 01/01/25 | | 20,728 |
| 515,000 | | Chicago IL Ref, Ser C, CABS
| | (c) | | 01/01/25 | | 473,991 |
| 360,000 | | Hillside IL Tax Incr Rev Ref
| | 5.00% | | 01/01/24 | | 373,414 |
| 100,000 | | IL St
| | 5.00% | | 04/01/24 | | 112,370 |
| 500,000 | | IL St
| | 5.50% | | 05/01/26 | | 603,890 |
| 200,000 | | IL St
| | 5.00% | | 06/01/27 | | 235,640 |
| 250,000 | | IL St Fin Auth Chrt Sch Rev Ref & Impt Chicago Intl Chrt Sch Proj
| | 5.00% | | 12/01/30 | | 295,267 |
| 250,000 | | IL St Fin Auth Chrt Sch Rev Ref & Impt Chicago Intl Chrt Sch Proj
| | 5.00% | | 12/01/31 | | 293,460 |
| 15,000 | | IL St Fin Auth Rev Ref Lifespace Cmntys, Ser A
| | 5.00% | | 05/15/24 | | 16,682 |
| 100,000 | | IL St Fin Auth Student Hsg & Academic Fac Rev Chf Chicago LLC Univ IL Chicago Proj, Ser A
| | 5.00% | | 02/15/26 | | 109,675 |
| 300,000 | | IL St Fin Auth Student Hsg & Academic Fac Rev Chf Chicago LLC Univ IL Chicago Proj, Ser A
| | 5.00% | | 02/15/27 | | 333,423 |
| 145,000 | | IL St Fin Auth Student Hsg & Academic Fac Rev Chf Chicago LLC Univ IL Chicago Proj, Ser A
| | 5.00% | | 02/15/28 | | 161,913 |
| 2,000,000 | | IL St, Ser C
| | 5.00% | | 11/01/29 | | 2,373,160 |
| 650,000 | | IL St, Ser D
| | 5.00% | | 11/01/24 | | 732,491 |
See Notes to Financial Statements
Page 9
First Trust Municipal High Income ETF (FMHI)
Portfolio of Investments (Continued)
January 31, 2021 (Unaudited)
Principal
Value | | Description | | Stated
Coupon | | Stated
Maturity | | Value |
| MUNICIPAL BONDS (Continued) |
| | | Illinois (Continued) | | | | | | |
| $500,000 | | Morton Grove IL Tax Incr Rev Sawmill Station Redev Proj
| | 4.25% | | 01/01/29 | | $506,180 |
| 500,000 | | Morton Grove IL Tax Incr Rev Sawmill Station Redev Proj
| | 5.00% | | 01/01/39 | | 507,590 |
| | | | | 9,714,584 |
| | | Indiana – 3.5% | | | | | | |
| 1,370,000 | | Anderson IN Mf Rev Sweet Galilee at the Wigwam Proj, Ser A
| | 5.38% | | 01/01/40 | | 1,429,554 |
| 1,000,000 | | Evansville IN Mf Hsg Rev Silver Birch Evansville Proj
| | 5.45% | | 01/01/38 | | 1,024,220 |
| 250,000 | | Fort Wayne IN Mf Hsg Rev Silver Birch at Cook Road (a)
| | 5.30% | | 01/01/32 | | 258,962 |
| 665,000 | | IN St Fin Auth Hosp Rev Goshen Hlth, Ser A
| | 4.00% | | 11/01/37 | | 767,490 |
| 200,000 | | IN St Fin Auth Rev Eductnl Facs Rock Creek Cmnty Academy Proj, Ser A (d)
| | 5.25% | | 07/01/28 | | 223,506 |
| 600,000 | | Plainfield IN Mf Hsg Rev Glasswater Creek Proj
| | 5.38% | | 09/01/38 | | 614,256 |
| 700,000 | | Terre Haute IN Mf Hsg Rev Silver Birch of Terre Haute Proj
| | 5.10% | | 01/01/32 | | 714,168 |
| | | | | 5,032,156 |
| | | Kansas – 0.8% | | | | | | |
| 1,175,000 | | Goddard KS Sales Tax Spl Oblg Rev Ref Olympic Park Star Bond Proj
| | 3.60% | | 06/01/30 | | 1,186,174 |
| | | Kentucky – 0.6% | | | | | | |
| 750,000 | | KY St Pub Energy Auth Gas Sply Rev Gas Sply, Ser B (Mandatory put 01/01/25)
| | 4.00% | | 01/01/49 | | 844,440 |
| | | Louisiana – 2.3% | | | | | | |
| 200,000 | | Monroe LA Wtr Rev, BAM
| | 5.00% | | 11/01/32 | | 254,916 |
| 900,000 | | New Orleans LA Aviation Brd Gen Arpt N Term, Ser B, AMT
| | 5.00% | | 01/01/30 | | 1,092,564 |
| 1,000,000 | | Saint James Parish LA Rev NuStar Logistics LP Proj Remk, Ser 2010 (a)
| | 6.35% | | 07/01/40 | | 1,290,630 |
| 500,000 | | Saint James Parish LA Rev Variable NuStar Logistics LP Proj Remk, Ser 2010B (Mandatory put 06/01/30) (a)
| | 6.10% | | 12/01/40 | | 635,110 |
| | | | | 3,273,220 |
| | | Maryland – 3.3% | | | | | | |
| 175,000 | | Baltimore MD Spl Oblig Ref Sr Lien Harbor Point Proj, Ser A (a)
| | 2.95% | | 06/01/27 | | 181,557 |
| 185,000 | | Baltimore MD Spl Oblig Ref Sr Lien Harbor Point Proj, Ser A (a)
| | 3.05% | | 06/01/28 | | 191,020 |
| 200,000 | | Baltimore MD Spl Oblig Ref Sr Lien Harbor Point Proj, Ser A (a)
| | 3.15% | | 06/01/29 | | 207,578 |
| 190,000 | | Baltimore MD Spl Oblig Ref Sr Lien Harbor Point Proj, Ser A (a)
| | 3.20% | | 06/01/30 | | 196,990 |
| 1,000,000 | | Frederick Cnty MD Tax Incr & Spl Tax Ref Jefferson Technology Park Proj, Ser B (a)
| | 4.63% | | 07/01/43 | | 1,152,860 |
| 1,000,000 | | MD St Econ Dev Corp Spl Oblig Port Covington Proj
| | 4.00% | | 09/01/50 | | 1,094,050 |
| 1,150,000 | | MD St Econ Dev Corp Student Hsg Rev Morgan St Univ Proj
| | 5.00% | | 07/01/50 | | 1,383,393 |
| 300,000 | | MD St Hlth & Hgr Eductnl Facs Auth Rev Ref Adventist Healthcare
| | 4.00% | | 01/01/38 | | 342,060 |
| | | | | 4,749,508 |
| | | Massachusetts – 2.0% | | | | | | |
| 1,000,000 | | MA St Bay Transprtn Auth Sales Tax Rev Ref Sr, Ser B
| | 5.25% | | 07/01/30 | | 1,344,180 |
| 500,000 | | MA St Dev Fin Agy Rev Linden Ponds Inc Fac (a)
| | 5.00% | | 11/15/28 | | 563,995 |
| 1,000,000 | | MA St Dev Fin Agy Rev Umass Dartmouth Student Hsg Proj
| | 5.00% | | 10/01/48 | | 1,048,560 |
| | | | | 2,956,735 |
| | | Michigan – 0.2% | | | | | | |
| 300,000 | | Detroit MI Downtown Dev Auth Tax Incr Rev Ref Catalyst Dev Proj, Ser A, AGM
| | 5.00% | | 07/01/31 | | 342,513 |
Page 10
See Notes to Financial Statements
First Trust Municipal High Income ETF (FMHI)
Portfolio of Investments (Continued)
January 31, 2021 (Unaudited)
Principal
Value | | Description | | Stated
Coupon | | Stated
Maturity | | Value |
| MUNICIPAL BONDS (Continued) |
| | | Minnesota – 0.5% | | | | | | |
| $350,000 | | Duluth MN Indep Sch Dist #709 Cops Ref, Ser B
| | 5.00% | | 02/01/28 | | $444,293 |
| 150,000 | | Minneapolis MN Student Hsg Rev Riverton Cmnty Hsg Proj (a)
| | 3.80% | | 08/01/27 | | 153,515 |
| 105,000 | | Saint Paul MN Hsg & Redev Auth Chrt Sch Lease Rev Ref, Ser A
| | 5.00% | | 12/01/30 | | 116,449 |
| | | | | 714,257 |
| | | Missouri – 0.1% | | | | | | |
| 80,000 | | MO St Hlth & Eductnl Facs Auth Lutheran Sr Svcs
| | 5.00% | | 02/01/35 | | 86,705 |
| 10,000 | | MO St Hlth & Eductnl Facs Auth Med Research Lutheran Svcs, Ser A
| | 5.00% | | 02/01/29 | | 11,574 |
| | | | | 98,279 |
| | | Nevada – 1.5% | | | | | | |
| 315,000 | | Carson City NV Hosp Rev Ref Carson Tahoe Regl Med Ctr, Ser A
| | 5.00% | | 09/01/25 | | 375,612 |
| 210,000 | | North Las Vegas NV Local Impt Valley Vista Spl Impt Dist #64
| | 4.00% | | 06/01/29 | | 225,311 |
| 500,000 | | NV Dept Of Business & Industry NV Doral Academy, Ser A (a)
| | 5.00% | | 07/15/37 | | 549,040 |
| 1,000,000 | | Sparks NV Tourism Impt Dist #1 Rev Ref Sales Tax Sr, Ser A (a)
| | 2.75% | | 06/15/28 | | 1,023,450 |
| | | | | 2,173,413 |
| | | New Hampshire – 1.1% | | | | | | |
| 1,000,000 | | National Fin Auth NH Rev Ref Green Bond, Ser B, AMT (Mandatory put 07/02/40) (a)
| | 3.75% | | 07/01/45 | | 1,042,970 |
| 500,000 | | NH St Hlth & Edu Facs Auth Rev Ref Sthrn NH Med Ctr
| | 5.00% | | 10/01/37 | | 582,465 |
| | | | | 1,625,435 |
| | | New Jersey – 3.6% | | | | | | |
| 1,000,000 | | NJ St Covid-19 Go Emergency Bonds, Ser A
| | 4.00% | | 06/01/30 | | 1,242,850 |
| 500,000 | | NJ St Econ Dev Auth Rev Self Designated Social Bonds, Ser Qqq
| | 4.00% | | 06/15/36 | | 591,400 |
| 100,000 | | NJ St Econ Dev Auth Spl Fac Rev Ref Port Newark Container Terminal LLC Proj, AMT
| | 5.00% | | 10/01/25 | | 116,295 |
| 850,000 | | NJ St Transprtn Trust Fund Auth Cap Apprec Transprtn Sys, Ser C, AMBAC
| | (c) | | 12/15/25 | | 807,721 |
| 500,000 | | NJ St Transprtn Trust Fund Auth Ref Transprtn Sys, Ser A
| | 5.00% | | 12/15/30 | | 630,715 |
| 500,000 | | Tobacco Settlement Fing Corp NJ Ref, Ser A
| | 5.00% | | 06/01/27 | | 638,585 |
| 1,000,000 | | Tobacco Settlement Fing Corp NJ Ref, Subser B
| | 5.00% | | 06/01/46 | | 1,192,310 |
| | | | | 5,219,876 |
| | | New York – 7.6% | | | | | | |
| 1,000,000 | | Dutchess Cnty NY Loc Dev Corp Rev Ref Bard Clg Proj, Ser A (a)
| | 5.00% | | 07/01/40 | | 1,202,020 |
| 1,250,000 | | Met Transprtn Auth NY Rev, Ser A-2S, BANS
| | 4.00% | | 02/01/22 | | 1,287,238 |
| 1,000,000 | | New York City NY Transitional Fin Auth Rev Subordinate-Future Tax Secured, Ser C-1
| | 4.00% | | 11/01/40 | | 1,175,030 |
| 1,000,000 | | NY St Transprtn Dev Corpspl Fac Rev Delta Air Lines Inc Laguardia Arpt Terminals C&D Redev, AMT
| | 5.00% | | 10/01/35 | | 1,256,440 |
| 1,000,000 | | NY St Transprtn Dev Corpspl Fac Rev Ref John F. Kennedy Intl Arpt Proj, AMT
| | 5.25% | | 08/01/31 | | 1,167,640 |
| 400,000 | | NY St Transprtn Dev Corpspl Fac Rev Ref Terminal 4 JFK Intl Arpt Proj, Ser A, AMT
| | 5.00% | | 12/01/31 | | 519,424 |
| 450,000 | | NY St Transprtn Dev Corpspl Fac Rev Ref Terminal 4 JFK Intl Arpt Proj, Ser A, AMT
| | 5.00% | | 12/01/32 | | 583,263 |
| 450,000 | | NY St Transprtn Dev Corpspl Fac Rev Ref Terminal 4 JFK Intl Arpt Proj, Ser A, AMT
| | 5.00% | | 12/01/33 | | 584,892 |
| 2,000,000 | | Tsasc Inc NY Tsasc Inc Rev Ref Turbo, Subser B
| | 5.00% | | 06/01/45 | | 2,184,740 |
| 100,000 | | Westchester Co NY Local Dev Corp Rev Ref Miriam Osborn Memorial Home Assn Proj
| | 5.00% | | 07/01/34 | | 113,587 |
See Notes to Financial Statements
Page 11
First Trust Municipal High Income ETF (FMHI)
Portfolio of Investments (Continued)
January 31, 2021 (Unaudited)
Principal
Value | | Description | | Stated
Coupon | | Stated
Maturity | | Value |
| MUNICIPAL BONDS (Continued) |
| | | New York (Continued) | | | | | | |
| $840,000 | | Yonkers NY Econ Dev Corp Eductnl Rev Chrt Sch Edu Excellence Proj, Ser A
| | 5.00% | | 10/15/39 | | $969,192 |
| | | | | 11,043,466 |
| | | North Carolina – 1.3% | | | | | | |
| 1,000,000 | | NC St Agric & Tech Univ Ref Gen, Ser A
| | 5.00% | | 10/01/40 | | 1,166,810 |
| 690,000 | | NC St Med Care Commn Retmnt Facs Rev Pennybyrn At Maryfield Proj, Ser A
| | 5.00% | | 10/01/45 | | 770,075 |
| | | | | 1,936,885 |
| | | Ohio – 7.8% | | | | | | |
| 750,000 | | Allen Cnty OH Hosp Facs Rev Ref Bon Secours Mercy Hlth Inc, Ser A
| | 5.00% | | 12/01/35 | | 990,360 |
| 3,500,000 | | Buckeye OH Tobacco Settlement Fing Auth Ref Sr, Class 2, Ser B-2
| | 5.00% | | 06/01/55 | | 4,081,385 |
| 415,000 | | Franklin Cnty OH Convention Facs Auth Hotel Proj Rev Grtr Columbus Convention Cntr Hotel Exp Proj
| | 5.00% | | 12/01/32 | | 441,353 |
| 750,000 | | OH St Air Quality Dev Auth Exempt Facs Rev AMG Vanadium Proj, AMT (a)
| | 5.00% | | 07/01/49 | | 841,230 |
| 1,200,000 | | OH St Air Quality Dev Auth Ref OH Vly Elec Corp Proj, Ser A
| | 3.25% | | 09/01/29 | | 1,318,776 |
| 1,000,000 | | OH St Hgr Eductnl Fac Commn Ref Rev Judson Oblig Grp 2020 Proj, Ser A
| | 5.00% | | 12/01/45 | | 1,133,450 |
| 750,000 | | OH St Hgr Eductnl Fac Commn Ref Univ Of Dayton 2020 Proj
| | 4.00% | | 02/01/36 | | 892,477 |
| 1,500,000 | | Sthrn OH Port Exempt Fac Rev Purecycle Proj, Ser A, AMT (a)
| | 7.00% | | 12/01/42 | | 1,629,735 |
| | | | | 11,328,766 |
| | | Oklahoma – 0.1% | | | | | | |
| 150,000 | | OK St Dev Fin Auth Hlthsys Rev Ou Medicine Proj, Ser B
| | 5.00% | | 08/15/26 | | 178,331 |
| | | Oregon – 1.6% | | | | | | |
| 290,000 | | Clackamas Cnty OR Hosp Fac Auth Rev Mary’s Woods at Marylhurst Inc Proj, Ser A
| | 5.00% | | 05/15/26 | | 316,811 |
| 500,000 | | Clackamas Cnty OR Hosp Fac Auth Rev Ref Rose Villa Proj, Ser A
| | 5.13% | | 11/15/40 | | 542,160 |
| 1,150,000 | | OR St Facs Auth Rev Ref Samaritan Hlth Svcs Proj, Ser A
| | 5.00% | | 10/01/40 | | 1,449,264 |
| | | | | 2,308,235 |
| | | Pennsylvania – 4.0% | | | | | | |
| 300,000 | | Allegheny Cnty PA Hosp Dev Auth Ref Allegheny Hlth Network Oblig Grp Issue, Ser A
| | 5.00% | | 04/01/32 | | 377,940 |
| 1,780,000 | | Berks Cnty PA Muni Auth Univ Rev Alvernia Univ Proj
| | 5.00% | | 10/01/39 | | 1,891,428 |
| 100,000 | | Chester Cnty PA Indl Dev Auth Renaissance Academy Chrt Sch
| | 5.00% | | 10/01/34 | | 109,293 |
| 250,000 | | Lancaster Cnty PA Hosp Auth Healthcare Facs Rev Moravian Manors Inc Proj, Ser A
| | 5.00% | | 06/15/28 | | 281,678 |
| 515,000 | | Lancaster Cnty PA Hosp Auth Healthcare Facs Rev Moravian Manors Inc Proj, Ser A
| | 5.00% | | 06/15/31 | | 571,238 |
| 665,000 | | Northampton Cnty PA Gen Purpose Auth Clg Rev Ref Moravian Clg
| | 5.00% | | 10/01/36 | | 738,529 |
| 350,000 | | PA St Turnpike Commn Oil Franchise Tax Rev Ref Sub, Ser B
| | 5.00% | | 12/01/30 | | 434,556 |
| 10,000 | | PA St Turnpike Commn Turnpike Rev Ref Sub, Ser B
| | 5.00% | | 06/01/39 | | 11,758 |
| 900,000 | | Philadelphia PA Auth for Indl Dev Chrt Sch Rev Ref String Theory Chrt Sch Proj (a)
| | 5.00% | | 06/15/40 | | 1,050,552 |
| 215,000 | | Philadelphia PA Auth for Indl Dev Revs Kipp Philadelphia Chrt Sch Proj, Ser A
| | 5.00% | | 04/01/36 | | 238,130 |
| | | | | 5,705,102 |
Page 12
See Notes to Financial Statements
First Trust Municipal High Income ETF (FMHI)
Portfolio of Investments (Continued)
January 31, 2021 (Unaudited)
Principal
Value | | Description | | Stated
Coupon | | Stated
Maturity | | Value |
| MUNICIPAL BONDS (Continued) |
| | | Puerto Rico – 1.5% | | | | | | |
| $250,000 | | Puerto Rico Cmwlth Ref Pub Impt, Ser A, AGM
| | 5.00% | | 07/01/35 | | $263,385 |
| 1,559,000 | | Puerto Rico Sales Tax Fing Corp Sales Tax Rev Restructured, Ser A-1
| | 4.50% | | 07/01/34 | | 1,716,147 |
| 177,000 | | Puerto Rico Sales Tax Fing Corp Sales Tax Rev Restructured, Ser A-1, CABS
| | (c) | | 07/01/29 | | 151,188 |
| | | | | 2,130,720 |
| | | South Carolina – 1.0% | | | | | | |
| 425,000 | | Berkeley Cnty SC Assmnt Rev Nexton Impt Dist
| | 4.00% | | 11/01/30 | | 476,927 |
| 230,000 | | Lancaster Cnty SC Assmnt Rev Ref Walnut Creek Impt Dist, Ser A-1
| | 5.00% | | 12/01/31 | | 241,985 |
| 580,000 | | SC St Jobs Econ Dev Auth Econ Dev Rev Woodlands at Furman Proj, Ser A
| | 5.00% | | 11/15/42 | | 622,178 |
| 135,000 | | SC St Jobs Econ Dev Auth Hlth Facs Rev Ref Lutheran Homes of SC Inc
| | 5.00% | | 05/01/42 | | 140,721 |
| | | | | 1,481,811 |
| | | Tennessee – 1.4% | | | | | | |
| 25,000 | | Chattanooga TN Hlth Eductnl & Hsg Fac Brd Rev Ref Student Hsg CDFI Phase I
| | 5.00% | | 10/01/23 | | 26,969 |
| 440,000 | | Met Govt Nashville & Davidson Cnty TN Hlth & Eductnl Fac Brd Ref Lipscomb Univ Proj, Ser A
| | 5.00% | | 10/01/36 | | 523,930 |
| 500,000 | | TN St Energy Acquisition Corp Gas Rev Proj, Ser A (Mandatory put 05/01/23)
| | 4.00% | | 05/01/48 | | 538,085 |
| 730,000 | | TN St Energy Acquisition Corp Gas Rev, Ser A
| | 5.25% | | 09/01/26 | | 902,295 |
| | | | | 1,991,279 |
| | | Texas – 4.5% | | | | | | |
| 50,000 | | Centrl TX Regl Mobility Auth Rev Ref Sub Lien
| | 5.00% | | 01/01/33 | | 54,623 |
| 420,000 | | Harris-Brazoria Cntys TX Muni Utility Dist #509, AGM
| | 3.00% | | 09/01/32 | | 436,582 |
| 1,250,000 | | Houston TX Arpt Sys Rev Ref United Airls Inc Terminal E Proj, Ser A, AMT
| | 5.00% | | 07/01/27 | | 1,446,487 |
| 125,000 | | Houston TX Arpt Sys Rev Ref United Airls Inc Terminal Improv Proj, Ser B-2, AMT
| | 5.00% | | 07/15/27 | | 144,723 |
| 250,000 | | Kyle TX Spl Assmnt Rev 6 Creeks Pid #1 (d)
| | 4.13% | | 09/01/29 | | 281,343 |
| 500,000 | | Kyle TX Spl Assmnt Rev 6 Creeks Pid #1 (a)
| | 4.63% | | 09/01/39 | | 570,760 |
| 375,000 | | La Vernia TX Hgr Edu Fin Corp Edu Rev Meridian World Sch (a)
| | 4.35% | | 08/15/25 | | 396,990 |
| 1,250,000 | | Lago Vista TX Spl Assmt Rev Ref Tessera On Lake Travis, Ser B (a)
| | 4.88% | | 09/01/50 | | 1,332,712 |
| 445,000 | | Leander TX Spl Assmnt Rev Crystal Springs Pub Impt Dist Proj Accd Inv (d)
| | 4.50% | | 09/01/28 | | 458,354 |
| 285,000 | | New Hope Cultural Edu Facs Fin Corp TX Retmnt Fac Rev Ref Longhorn Vlg Proj
| | 5.00% | | 01/01/32 | | 311,998 |
| 205,000 | | New Hope Cultural Edu Facs Fin Corp TX Retmnt Fac Rev Ref Wesleyan Homes Inc Proj Fin Corp
| | 5.00% | | 01/01/39 | | 216,503 |
| 500,000 | | New Hope Cultural Edu Facs Fin Corp TX Student Hsg Rev Chf TX A&M Univ Corpus Christi Island Campus Proj, Ser A (b)
| | 5.00% | | 04/01/25 | | 504,980 |
| 250,000 | | TX St Transprtn Commn Central TX Turnpike Sys Rev Ref, Ser B
| | 5.00% | | 08/15/37 | | 284,572 |
| | | | | 6,440,627 |
| | | Utah – 1.6% | | | | | | |
| 1,000,000 | | Med Sch Campus Pub Infrastructure Dist UT, Ser A (a)
| | 5.25% | | 02/01/40 | | 1,017,000 |
| 475,000 | | UT St Chrt Sch Fin Auth Chrt Sch Rev Mountain West Montessori Academy Proj, Ser A (a)
| | 5.00% | | 06/15/39 | | 522,818 |
See Notes to Financial Statements
Page 13
First Trust Municipal High Income ETF (FMHI)
Portfolio of Investments (Continued)
January 31, 2021 (Unaudited)
Principal
Value | | Description | | Stated
Coupon | | Stated
Maturity | | Value |
| MUNICIPAL BONDS (Continued) |
| | | Utah (Continued) | | | | | | |
| $675,000 | | UT St Chrt Sch Fin Auth Chrt Sch Rev Wallace Stegner Academy Proj, Ser A (a)
| | 5.00% | | 06/15/39 | | $728,332 |
| | | | | 2,268,150 |
| | | Virginia – 0.6% | | | | | | |
| 500,000 | | Norfolk VA Redev & Hsg Auth Rev Ft Norfolk Retmnt Cmnty Harbors Edge Proj, Ser A (b)
| | 5.00% | | 01/01/34 | | 537,645 |
| 300,000 | | Norfolk VA Redev & Hsg Auth Rev Ft Norfolk Retmnt Cmnty Harbors Edge Proj, Ser A (b)
| | 4.38% | | 01/01/39 | | 310,578 |
| | | | | 848,223 |
| | | Washington – 1.4% | | | | | | |
| 560,000 | | Kalispel Tribe of Indians Priority Dist WA Rev, Ser A (a)
| | 5.00% | | 01/01/32 | | 645,299 |
| 230,000 | | WA St Healthcare Facs Auth Ref Fred Hutchinson Cancer Research Ctr
| | 5.00% | | 01/01/26 | | 274,997 |
| 1,000,000 | | WA St Hgr Edu Facs Auth Seattle Univ Proj Rev
| | 4.00% | | 05/01/45 | | 1,153,620 |
| | | | | 2,073,916 |
| | | Wisconsin – 2.1% | | | | | | |
| 470,000 | | Pub Fin Auth WI Chrt Sch Rev Eno River Academy Proj, Ser A (a)
| | 4.00% | | 06/15/30 | | 514,156 |
| 810,000 | | Pub Fin Auth WI Chrt Sch Rev Eno River Academy Proj, Ser A (a)
| | 5.00% | | 06/15/40 | | 920,168 |
| 500,000 | | Pub Fin Auth WI Chrt Sch Rev Founders Of Academy Las Vegas Proj, Ser A (a)
| | 4.00% | | 07/01/30 | | 526,205 |
| 500,000 | | Pub Fin Auth WI Chrt Sch Rev Ltd American Prep Academy Las Vegas Proj, Ser A (a)
| | 4.20% | | 07/15/27 | | 530,835 |
| 250,000 | | Pub Fin Auth WI Chrt Sch Rev Ltd American Prep Academy Las Vegas Proj, Ser A (a)
| | 5.13% | | 07/15/37 | | 276,930 |
| 160,000 | | Pub Fin Auth WI Eductnl Rev Piedmont Cmnty Chrt Sch
| | 5.00% | | 06/15/27 | | 194,501 |
| | | | | 2,962,795 |
| | Total Investments – 98.5%
| | 142,344,430 |
| | (Cost $132,478,945) (e) | | |
| | Net Other Assets and Liabilities – 1.5%
| | 2,186,132 |
| | Net Assets – 100.0%
| | $144,530,562 |
Futures Contracts (See Note 2D - Futures Contracts in the Notes to Financial Statements):
| Futures Contracts | | Position | | Number of
Contracts | | Expiration
Date | | Notional
Value | | Unrealized
Appreciation
(Depreciation)/
Value |
| U.S. Treasury Long Bonds | | Short | | 4 | | Mar 2021 | | $ (674,875) | | $(31) |
| U.S. Treasury Ultra 10-Year Notes | | Short | | 32 | | Mar 2021 | | (4,922,500) | | 33,234 |
| Total Futures Contracts | | | | | | | | $(5,597,375) | | $33,203 |
Page 14
See Notes to Financial Statements
First Trust Municipal High Income ETF (FMHI)
Portfolio of Investments (Continued)
January 31, 2021 (Unaudited)
|
| (a) | This security, sold within the terms of a private placement memorandum, is exempt from registration upon resale under Rule 144A under the Securities Act of 1933, as amended (the “1933 Act”), and may be resold in transactions exempt from registration, normally to qualified institutional buyers. Pursuant to procedures adopted by the Trust’s Board of Trustees, this security has been determined to be liquid by First Trust Advisors L.P. (the “Advisor”). Although market instability can result in periods of increased overall market illiquidity, liquidity for each security is determined based on security specific factors and assumptions, which require subjective judgment. At January 31, 2021, securities noted as such amounted to $38,850,315 or 26.9% of net assets. |
| (b) | Pursuant to procedures adopted by the Trust’s Board of Trustees, this security has been determined to be illiquid by the Advisor. |
| (c) | Zero coupon bond. |
| (d) | This security, sold within the terms of a private placement memorandum, is exempt from registration upon resale under Rule 144A under the 1933 Act, and may be resold in transactions exempt from registration, normally to qualified institutional buyers (see Note 2C - Restricted Securities in the Notes to Financial Statements). |
| (e) | Aggregate cost for financial reporting purposes approximates the aggregate cost for federal income tax purposes. As of January 31, 2021, the aggregate gross unrealized appreciation for all investments in which there was an excess of value over tax cost was $10,180,539 and the aggregate gross unrealized depreciation for all investments in which there was an excess of tax cost over value was $281,851. The net unrealized appreciation was $9,898,688. The unrealized amounts presented are inclusive of derivative contracts. |
| AGM | Assured Guaranty Municipal Corp. |
| AMBAC | American Municipal Bond Assurance Corp. |
| AMT | Alternative Minimum Tax |
| BAM | Build America Mutual |
| BANS | Bond Anticipation Notes |
| CABS | Capital Appreciation Bonds |
| NATL-RE | National Public Finance Guarantee Corp. |
Valuation Inputs
A summary of the inputs used to value the Fund’s investments as of January 31, 2021 is as follows (see Note 2A - Portfolio Valuation in the Notes to Financial Statements):
| ASSETS TABLE |
| | Total
Value at
1/31/2021 | Level 1
Quoted
Prices | Level 2
Significant
Observable
Inputs | Level 3
Significant
Unobservable
Inputs |
Municipal Bonds*
| $ 142,344,430 | $ — | $ 142,344,430 | $ — |
Futures Contracts**
| 33,234 | 33,234 | — | — |
Total
| $ 142,377,664 | $ 33,234 | $ 142,344,430 | $— |
LIABILITIES TABLE |
| | Total
Value at
1/31/2021 | Level 1
Quoted
Prices | Level 2
Significant
Observable
Inputs | Level 3
Significant
Unobservable
Inputs |
Futures Contracts**
| $ (31) | $ (31) | $ — | $ — |
| * | See Portfolio of Investments for state breakout. |
| |
| ** | Includes cumulative appreciation/depreciation on futures contracts as reported in the Futures Contracts table. Only the current day’s variation margin is presented on the Statement of Assets and Liabilities. |
See Notes to Financial Statements
Page 15
First Trust Municipal High Income ETF (FMHI)
Statement of Assets and Liabilities
January 31, 2021 (Unaudited)
| ASSETS: | |
Investments, at value
(Cost $132,478,945)
| $ 142,344,430 |
Cash
| 3,888,594 |
Cash segregated as collateral for open futures contracts
| 84,302 |
| Receivables: | |
Investment securities sold
| 2,995,833 |
Interest
| 1,189,491 |
Total Assets
| 150,502,650 |
| LIABILITIES: | |
| Payables: | |
Investment securities purchased
| 5,905,105 |
Investment advisory fees
| 65,858 |
Variation margin
| 1,125 |
Total Liabilities
| 5,972,088 |
NET ASSETS
| $144,530,562 |
| NET ASSETS consist of: | |
Paid-in capital
| $ 137,683,630 |
Par value
| 26,500 |
Accumulated distributable earnings (loss)
| 6,820,432 |
NET ASSETS
| $144,530,562 |
NET ASSET VALUE, per share
| $54.54 |
Number of shares outstanding (unlimited number of shares authorized, par value $0.01 per share)
| 2,650,002 |
Page 16
See Notes to Financial Statements
First Trust Municipal High Income ETF (FMHI)
Statement of Operations
For the Six Months Ended January 31, 2021 (Unaudited)
| INVESTMENT INCOME: | |
Interest
| $ 2,392,556 |
Total investment income
| 2,392,556 |
| EXPENSES: | |
Investment advisory fees
| 438,508 |
Total expenses
| 438,508 |
Fees waived by the investment advisor
| (93,966) |
Net expenses
| 344,542 |
NET INVESTMENT INCOME (LOSS)
| 2,048,014 |
| NET REALIZED AND UNREALIZED GAIN (LOSS): | |
| Net realized gain (loss) on: | |
Investments
| 126,962 |
Futures contracts
| 96,919 |
Net realized gain (loss)
| 223,881 |
| Net change in unrealized appreciation (depreciation) on: | |
Investments
| 6,042,211 |
Futures contracts
| 148,500 |
Net change in unrealized appreciation (depreciation)
| 6,190,711 |
NET REALIZED AND UNREALIZED GAIN (LOSS)
| 6,414,592 |
NET INCREASE (DECREASE) IN NET ASSETS RESULTING FROM OPERATIONS
| $ 8,462,606 |
See Notes to Financial Statements
Page 17
First Trust Municipal High Income ETF (FMHI)
Statements of Changes in Net Assets
| | Six Months
Ended
1/31/2021
(Unaudited) | | Year
Ended
7/31/2020 |
| OPERATIONS: | | | |
Net investment income (loss)
| $ 2,048,014 | | $ 2,881,986 |
Net realized gain (loss)
| 223,881 | | (3,389,878) |
Net change in unrealized appreciation (depreciation)
| 6,190,711 | | 1,303,058 |
Net increase (decrease) in net assets resulting from operations
| 8,462,606 | | 795,166 |
| DISTRIBUTIONS TO SHAREHOLDERS FROM: | | | |
Investment operations
| (1,988,002) | | (2,807,500) |
Return of capital
| — | | (155,753) |
Total distributions to shareholders
| (1,988,002) | | (2,963,253) |
| SHAREHOLDER TRANSACTIONS: | | | |
Proceeds from shares sold
| 26,406,018 | | 60,684,489 |
Cost of shares redeemed
| — | | (9,845,363) |
Net increase (decrease) in net assets resulting from shareholder transactions
| 26,406,018 | | 50,839,126 |
Total increase (decrease) in net assets
| 32,880,622 | | 48,671,039 |
| NET ASSETS: | | | |
Beginning of period
| 111,649,940 | | 62,978,901 |
End of period
| $ 144,530,562 | | $ 111,649,940 |
| CHANGES IN SHARES OUTSTANDING: | | | |
Shares outstanding, beginning of period
| 2,150,002 | | 1,200,002 |
Shares sold
| 500,000 | | 1,150,000 |
Shares redeemed
| — | | (200,000) |
Shares outstanding, end of period
| 2,650,002 | | 2,150,002 |
Page 18
See Notes to Financial Statements
First Trust Municipal High Income ETF (FMHI)
Financial Highlights
For a share outstanding throughout each period
| | Six Months
Ended
1/31/2021
(Unaudited) | | Year Ended | | Period
Ended
7/31/2018 (a) |
| 7/31/2020 | | 7/31/2019 |
Net asset value, beginning of period
| $ 51.93 | | $ 52.48 | | $ 50.32 | | $ 50.00 |
| Income from investment operations: | | | | | | | |
Net investment income (loss)
| 0.85 | | 1.64 | | 1.69 | | 1.15 |
Net realized and unrealized gain (loss)
| 2.60 | | (0.48) | | 2.27 | | 0.30 |
Total from investment operations
| 3.45 | | 1.16 | | 3.96 | | 1.45 |
| Distributions paid to shareholders from: | | | | | | | |
Net investment income
| (0.84) | | (1.62) | | (1.67) | | (1.13) |
Return of capital
| — | | (0.09) | | (0.13) | | — |
Total distributions
| (0.84) | | (1.71) | | (1.80) | | (1.13) |
Net asset value, end of period
| $54.54 | | $51.93 | | $52.48 | | $50.32 |
Total return (b)
| 6.71% | | 2.25% | | 8.05% | | 2.93% |
| Ratios to average net assets/supplemental data: | | | | | | | |
Net assets, end of period (in 000’s)
| $ 144,531 | | $ 111,650 | | $ 62,979 | | $ 27,677 |
Ratio of total expenses to average net assets
| 0.70% (c) | | 0.70% | | 0.70% | | 0.70% (c) |
Ratio of net expenses to average net assets
| 0.55% (c) | | 0.55% | | 0.55% | | 0.55% (c) |
Ratio of net investment income (loss) to average net assets
| 3.27% (c) | | 3.22% | | 3.44% | | 3.13% (c) |
Portfolio turnover rate (d)
| 11% | | 89% | | 71% | | 74% |
| (a) | Inception date is November 1, 2017, which is consistent with the commencement of investment operations and is the date the initial creation units were established. |
| (b) | Total return is calculated assuming an initial investment made at the net asset value at the beginning of the period, reinvestment of all distributions at net asset value during the period, and redemption at net asset value on the last day of the period. The returns presented do not reflect the deduction of taxes that a shareholder would pay on Fund distributions or the redemption or sale of Fund shares. Total return is calculated for the time period presented and is not annualized for periods of less than a year. The total returns would have been lower if certain fees had not been waived by the investment advisor. |
| (c) | Annualized. |
| (d) | Portfolio turnover is calculated for the time period presented and is not annualized for periods of less than a year and does not include securities received or delivered from processing creations or redemptions and in-kind transactions. |
See Notes to Financial Statements
Page 19
Notes to Financial Statements
First Trust Municipal High Income ETF (FMHI)
January 31, 2021 (Unaudited)
1. Organization
First Trust Exchange-Traded Fund III (the “Trust”) is an open-end management investment company organized as a Massachusetts business trust on January 9, 2008, and is registered with the Securities and Exchange Commission (the “SEC”) under the Investment Company Act of 1940, as amended (the “1940 Act”).
The Trust currently consists of seventeen funds that are offering shares. This report covers the First Trust Municipal High Income ETF (the “Fund”), a diversified series of the Trust, which trades under the ticker “FMHI” on The Nasdaq Stock Market LLC (“Nasdaq”). The Fund represents a separate series of beneficial interest in the Trust. Unlike conventional mutual funds, the Fund issues and redeems shares on a continuous basis, at net asset value (“NAV”), only in large blocks of shares known as “Creation Units.”
The primary investment objective of the Fund is to provide federally tax-exempt income, and its secondary objective is long-term capital appreciation. Under normal market conditions, the Fund seeks to achieve its investment objectives by investing at least 80% of its net assets (including investment borrowings) in municipal debt securities that pay interest that is exempt from regular federal income taxes. There can be no assurance that the Fund will achieve its investment objectives. The Fund may not be appropriate for all investors.
2. Significant Accounting Policies
The Fund is considered an investment company and follows accounting and reporting guidance under Financial Accounting Standards Board (“FASB”) Accounting Standards Codification Topic 946, “Financial Services-Investment Companies.” The following is a summary of significant accounting policies consistently followed by the Fund in the preparation of the financial statements. The preparation of the financial statements in accordance with accounting principles generally accepted in the United States of America (“U.S. GAAP”) requires management to make estimates and assumptions that affect the reported amounts and disclosures in the financial statements. Actual results could differ from those estimates.
A. Portfolio Valuation
The Fund’s NAV is determined daily as of the close of regular trading on the New York Stock Exchange (“NYSE”), normally 4:00 p.m. Eastern time, on each day the NYSE is open for trading. If the NYSE closes early on a valuation day, the NAV is determined as of that time. Domestic debt securities are priced using data reflecting the earlier closing of the principal markets for those securities. The Fund’s NAV is calculated by dividing the value of all assets of the Fund (including accrued interest and dividends), less all liabilities (including accrued expenses and dividends declared but unpaid), by the total number of shares outstanding.
The Fund’s investments are valued daily at market value or, in the absence of market value with respect to any portfolio securities, at fair value. Market value prices represent last sale or official closing prices from a national or foreign exchange (i.e., a regulated market) and are primarily obtained from third-party pricing services. Fair value prices represent any prices not considered market value prices and are either obtained from a third-party pricing service or are determined by the Pricing Committee of the Fund’s investment advisor, First Trust Advisors L.P. (“First Trust” or the “Advisor”), in accordance with valuation procedures adopted by the Trust’s Board of Trustees, and in accordance with provisions of the 1940 Act. Investments valued by the Advisor’s Pricing Committee, if any, are footnoted as such in the footnotes to the Portfolio of Investments. The Fund’s investments are valued as follows:
Municipal securities and other debt securities are fair valued on the basis of fair valuations provided by dealers who make markets in such securities or by a third-party pricing service approved by the Trust’s Board of Trustees, which may use the following valuation inputs when available:
| 1) | benchmark yields; |
| 2) | reported trades; |
| 3) | broker/dealer quotes; |
| 4) | issuer spreads; |
| 5) | benchmark securities; |
| 6) | bids and offers; and |
| 7) | reference data including market research publications. |
Exchange-traded futures contracts are valued at the closing price in the market where such contracts are principally traded. If no closing price is available, exchange-traded futures contracts are fair valued at the mean of their most recent bid and asked price, if available, and otherwise at their closing bid price.
Fixed income and other debt securities having a remaining maturity of sixty days or less when purchased are fair valued at cost adjusted for amortization of premiums and accretion of discounts (amortized cost), provided the Advisor’s Pricing Committee has determined that the use of amortized cost is an appropriate reflection of fair value given market and issuer-specific
Notes to Financial Statements (Continued)
First Trust Municipal High Income ETF (FMHI)
January 31, 2021 (Unaudited)
conditions existing at the time of the determination. Factors that may be considered in determining the appropriateness of the use of amortized cost include, but are not limited to, the following:
| 1) | the credit conditions in the relevant market and changes thereto; |
| 2) | the liquidity conditions in the relevant market and changes thereto; |
| 3) | the interest rate conditions in the relevant market and changes thereto (such as significant changes in interest rates); |
| 4) | issuer-specific conditions (such as significant credit deterioration); and |
| 5) | any other market-based data the Advisor’s Pricing Committee considers relevant. In this regard, the Advisor’s Pricing Committee may use last-obtained market-based data to assist it when valuing portfolio securities using amortized cost. |
Certain securities may not be able to be priced by pre-established pricing methods. Such securities may be valued by the Trust’s Board of Trustees or its delegate, the Advisor’s Pricing Committee, at fair value. These securities generally include, but are not limited to, restricted securities (securities which may not be publicly sold without registration under the Securities Act of 1933, as amended (the “1933 Act”)) for which a third-party pricing service is unable to provide a market price; securities whose trading has been formally suspended; a security whose market or fair value price is not available from a pre-established pricing source; a security with respect to which an event has occurred that is likely to materially affect the value of the security after the market has closed but before the calculation of the Fund’s NAV or make it difficult or impossible to obtain a reliable market quotation; and a security whose price, as provided by the third-party pricing service, does not reflect the security’s fair value. As a general principle, the current fair value of a security would appear to be the amount which the owner might reasonably expect to receive for the security upon its current sale. When fair value prices are used, generally they will differ from market quotations or official closing prices on the applicable exchanges. A variety of factors may be considered in determining the fair value of such securities, including, but not limited to, the following:
| 1) | the fundamental business data relating to the issuer; |
| 2) | an evaluation of the forces which influence the market in which these securities are purchased and sold; |
| 3) | the type, size and cost of the security; |
| 4) | the financial statements of the issuer; |
| 5) | the credit quality and cash flow of the issuer, based on the Advisor’s or external analysis; |
| 6) | the information as to any transactions in or offers for the security; |
| 7) | the price and extent of public trading in similar securities (or equity securities) of the issuer/borrower, or comparable companies; |
| 8) | the coupon payments; |
| 9) | the quality, value and salability of collateral, if any, securing the security; and |
| 10) | other relevant factors. |
The Fund is subject to fair value accounting standards that define fair value, establish the framework for measuring fair value and provide a three-level hierarchy for fair valuation based upon the inputs to the valuation as of the measurement date. The three levels of the fair value hierarchy are as follows:
| • | Level 1 – Level 1 inputs are quoted prices in active markets for identical investments. An active market is a market in which transactions for the investment occur with sufficient frequency and volume to provide pricing information on an ongoing basis. |
| • | Level 2 – Level 2 inputs are observable inputs, either directly or indirectly, and include the following: |
| o | Quoted prices for similar investments in active markets. |
| o | Quoted prices for identical or similar investments in markets that are non-active. A non-active market is a market where there are few transactions for the investment, the prices are not current, or price quotations vary substantially either over time or among market makers, or in which little information is released publicly. |
| o | Inputs other than quoted prices that are observable for the investment (for example, interest rates and yield curves observable at commonly quoted intervals, volatilities, prepayment speeds, loss severities, credit risks, and default rates). |
| o | Inputs that are derived principally from or corroborated by observable market data by correlation or other means. |
| • | Level 3 – Level 3 inputs are unobservable inputs. Unobservable inputs may reflect the reporting entity’s own assumptions about the assumptions that market participants would use in pricing the investment. |
Notes to Financial Statements (Continued)
First Trust Municipal High Income ETF (FMHI)
January 31, 2021 (Unaudited)
The inputs or methodologies used for valuing investments are not necessarily an indication of the risk associated with investing in those investments. A summary of the inputs used to value the Fund’s investments as of January 31, 2021, is included with the Fund’s Portfolio of Investments.
B. Securities Transactions and Investment Income
Securities transactions are recorded as of the trade date. Realized gains and losses from securities transactions are recorded on the identified cost basis. Interest income is recorded daily on the accrual basis. Amortization of premiums and accretion of discounts are recorded using the effective interest method.
C. Restricted Securities
The Fund invests in restricted securities, which are securities that may not be offered for public sale without first being registered under the 1933 Act. Prior to registration, restricted securities may only be resold in transactions exempt from registration under Rule 144A under the 1933 Act, normally to qualified institutional buyers. As of January 31, 2021, the Fund held restricted securities as shown in the following table that the Advisor has deemed illiquid pursuant to procedures adopted by the Trust’s Board of Trustees. Although market instability can result in periods of increased overall market illiquidity, liquidity for each security is determined based on security-specific factors and assumptions, which require subjective judgment. The Fund does not have the right to demand that such securities be registered. These securities are valued according to the valuation procedures as stated in the Portfolio Valuation note (Note 2A) and are not expressed as a discount to the carrying value of a comparable unrestricted security. There are no unrestricted securities with the same maturity dates and yields for these issuers.
| Security | Acquisition
Date | Principal
Value | Current Price | Carrying
Cost | | Value | | % of
Net
Assets |
| IN St Fin Auth Rev Eductnl Facs Rock Creek Cmnty Academy Proj, Ser A, 5.25%, 07/01/28 | 08/31/18 | $200,000 | $111.75 | $201,822 | | $223,506 | | 0.15% |
| Kyle TX Spl Assmnt Rev 6 Creeks Pid #1, 4.13%, 09/01/29 | 05/08/19 | 250,000 | 112.54 | 250,000 | | 281,343 | | 0.19 |
| Leander TX Spl Assmnt Rev Crystal Springs Pub Impt Dist Proj Accd Inv, 4.50%, 09/01/28 | 05/04/18 | 445,000 | 103.00 | 441,439 | | 458,354 | | 0.32 |
| | | | | $893,261 | | $963,203 | | 0.66% |
D. Futures Contracts
The Fund may purchase or sell (i.e., is long or short) exchange-listed futures contracts to hedge against changes in interest rates (interest rate risk). Futures contracts are agreements between the Fund and a counterparty to buy or sell a specific quantity of an underlying instrument at a specified price and at a specified date. Depending on the terms of the contract, futures contracts are settled either through physical delivery of the underlying instrument on the settlement date or by payment of a cash settlement amount on the settlement date. Open futures contracts can also be closed out prior to settlement by entering into an offsetting transaction in a matching futures contract. If the Fund is not able to enter into an offsetting transaction, the Fund will continue to be required to maintain margin deposits on the futures contract. When the contract is closed or expires, the Fund records a realized gain or loss equal to the difference between the value of the contract at the time it was opened and the value at the time it was closed or expired. This gain or loss is included in “Net realized gain (loss) on futures contracts” on the Statement of Operations.
Upon entering into a futures contract, the Fund must deposit funds, called margin, with its custodian in the name of the clearing broker equal to a specified percentage of the current value of the contract. Open futures contracts are marked to market daily with the change in value recognized as a component of “Net change in unrealized appreciation (depreciation) on futures contracts” on the Statement of Operations. This daily fluctuation in the value of the contracts is also known as variation margin and is included in “Variation margin” payable or receivable on the Statement of Assets and Liabilities.
If market conditions change unexpectedly, the Fund may not achieve the anticipated benefits of the futures contract and may realize a loss. The use of futures contracts involves the risk of imperfect correlation in movements in the price of the futures contracts, interest rates and the underlying instruments.
Restricted cash segregated as collateral for futures contracts in the amount of $84,302 is shown as “Cash segregated as collateral for open futures contracts” on the Statement of Assets and Liabilities.
Notes to Financial Statements (Continued)
First Trust Municipal High Income ETF (FMHI)
January 31, 2021 (Unaudited)
E. Dividends and Distributions to Shareholders
Dividends from net investment income, if any, are declared and paid monthly by the Fund, or as the Board of Trustees may determine from time to time. Distributions of net realized capital gains earned by the Fund, if any, are distributed at least annually.
Distributions from net investment income and realized capital gains are determined in accordance with federal income tax regulations, which may differ from U.S. GAAP. Certain capital accounts in the financial statements are periodically adjusted for permanent differences in order to reflect their tax character. These permanent differences are primarily due to the varying treatment of income and gain/loss on portfolio securities held by the Fund and have no impact on net assets or NAV per share. Temporary differences, which arise from recognizing certain items of income, expense and gain/loss in different periods for financial statement and tax purposes, will reverse at some time in the future.
The tax character of distributions paid by the Fund during the fiscal year ended July 31, 2020, was as follows:
| Distributions paid from: | |
Ordinary income
| $13,767 |
Capital gains
| — |
Tax-exempt income
| 2,793,733 |
Return of capital
| 155,753 |
As of July 31, 2020, the components of distributable earnings on a tax basis were as follows:
Undistributed ordinary income
| $— |
Accumulated capital and other gain (loss)
| (3,356,320) |
Net unrealized appreciation (depreciation)
| 3,702,148 |
F. Income Taxes
The Fund intends to continue to qualify as a regulated investment company by complying with the requirements under Subchapter M of the Internal Revenue Code of 1986, as amended (the “Code”), which includes distributing substantially all of its net investment income and net realized gains to shareholders. Accordingly, no provision has been made for federal and state income taxes. However, due to the timing and amount of distributions, the Fund may be subject to an excise tax of 4% of the amount by which approximately 98% of the Fund’s taxable income exceeds the distributions from such taxable income for the calendar year.
In addition, the Fund intends to invest in such municipal securities to allow it to pay shareholders “exempt dividends” as defined in the Code.
The Fund is subject to accounting standards that establish a minimum threshold for recognizing, and a system for measuring, the benefits of a tax position taken or expected to be taken in a tax return. Taxable years ended 2018, 2019 and 2020 remain open to federal and state audit. As of January 31, 2021, management has evaluated the application of these standards to the Fund, and has determined that no provision for income tax is required in the Fund’s financial statements for uncertain tax positions.
The Fund intends to utilize provisions of the federal income tax laws, which allow it to carry a realized capital loss forward indefinitely following the year of the loss and offset such loss against any future realized capital gains. The Fund is subject to certain limitations under U.S. tax rules on the use of capital loss carryforwards and net unrealized built-in losses. These limitations apply when there has been a 50% change in ownership. At July 31, 2020, for federal income tax purposes, the Fund had $3,356,320 of non-expiring capital loss carryforwards available to the extent provided by regulations to offset future capital gains.
Certain losses realized during the current fiscal year may be deferred and treated as occurring on the first day of the following fiscal year for federal income tax purposes. For the fiscal year ended July 31, 2020, the Fund had no net ordinary losses.
G. Expenses
Expenses, other than the investment advisory fee and other excluded expenses, are paid by the Advisor (See Note 3).
Notes to Financial Statements (Continued)
First Trust Municipal High Income ETF (FMHI)
January 31, 2021 (Unaudited)
3. Investment Advisory Fee, Affiliated Transactions and Other Fee Arrangements
First Trust, the investment advisor to the Fund, is a limited partnership with one limited partner, Grace Partners of DuPage L.P., and one general partner, The Charger Corporation. The Charger Corporation is an Illinois corporation controlled by James A. Bowen, Chief Executive Officer of First Trust. First Trust is responsible for the selection and ongoing monitoring of the securities in the Fund’s portfolio, managing the Fund’s business affairs and providing certain administrative services necessary for the management of the Fund.
Pursuant to the Investment Management Agreement between the Trust and the Advisor, First Trust manages the investment of the Fund’s assets and is responsible for the Fund’s expenses, including the cost of transfer agency, custody, fund administration, legal, audit and other services, but excluding fee payments under the Investment Management Agreement, interest, taxes, acquired fund fees and expenses, if any, brokerage commissions and other expenses connected with the execution of portfolio transactions, distribution and service fees pursuant to a Rule 12b-1 plan, if any, and extraordinary expenses. The Fund has agreed to pay First Trust an annual unitary management fee equal to 0.70% of its average daily net assets. First Trust also provides fund reporting services to the Fund for a flat annual fee in the amount of $9,250, which is covered under the annual unitary management fee.
The Trust’s Board of Trustees and the Advisor have entered into a Fee Waiver Agreement for the Fund pursuant to which the Advisor contractually agreed to waive management fees of 0.15% of average daily net assets until November 30, 2021. The waiver agreement may be terminated by action of the Trust’s Board of Trustees at any time upon 60 days’ written notice by the Trust on behalf of the Fund or by the Advisor only after November 30, 2021. First Trust does not have the right to recover the fees waived. During the six months ended January 31, 2021, the Advisor waived fees of $93,966.
The Trust has multiple service agreements with Brown Brothers Harriman & Co. (“BBH”). Under the service agreements, BBH performs custodial, fund accounting, certain administrative services, and transfer agency services for the Fund. As custodian, BBH is responsible for custody of the Fund’s assets. As fund accountant and administrator, BBH is responsible for maintaining the books and records of the Fund’s securities and cash. As transfer agent, BBH is responsible for maintaining shareholder records for the Fund.
Each Trustee who is not an officer or employee of First Trust, any sub-advisor or any of their affiliates (“Independent Trustees”) is paid a fixed annual retainer that is allocated equally among each fund in the First Trust Fund Complex. Each Independent Trustee is also paid an annual per fund fee that varies based on whether the fund is a closed-end or other actively managed fund, a defined-outcome fund or an index fund.
Additionally, the Lead Independent Trustee and the Chairmen of the Audit Committee, Nominating and Governance Committee and Valuation Committee are paid annual fees to serve in such capacities, with such compensation allocated pro rata among each fund in the First Trust Fund Complex based on net assets. Independent Trustees are reimbursed for travel and out-of-pocket expenses in connection with all meetings. The Lead Independent Trustee and Committee Chairmen rotate every three years. The officers and “Interested” Trustee receive no compensation from the Trust for acting in such capacities.
4. Purchases and Sales of Securities
For the six months ended January 31, 2021, the cost of purchases and proceeds from sales of investments, excluding short term investments and in-kind transactions, were $41,711,817 and $13,600,113, respectively.
For the six months ended January 31, 2021, the Fund had no in-kind transactions.
5. Derivative Transactions
The following table presents the type of derivatives held by the Fund at January 31, 2021, the primary underlying risk exposure and the location of these instruments as presented on the Statement of Assets and Liabilities.
| | | | | Asset Derivatives | | Liability Derivatives |
Derivative
Instrument | | Risk
Exposure | | Statement of Assets and
Liabilities Location | | Value | | Statement of Assets and
Liabilities Location | | Value |
| Futures contracts | | Interest Rate Risk | | Unrealized appreciation
on futures contracts* | | $ 33,234 | | Unrealized depreciation
on futures contracts* | | $ 31 |
*Includes cumulative appreciation/depreciation on futures contracts as reported in the Portfolio of Investments. Only the current day’s variation margin is presented on the Statement of Assets and Liabilities.
Notes to Financial Statements (Continued)
First Trust Municipal High Income ETF (FMHI)
January 31, 2021 (Unaudited)
The following table presents the amount of net realized gain (loss) and change in net unrealized appreciation (depreciation) recognized for the six months ended January 31, 2021, on derivative instruments, as well as the primary underlying risk exposure associated with each instrument.
| Statement of Operations Location | |
| Interest Rate Risk Exposure | |
| Net realized gain (loss) on futures contracts | $96,919 |
| Net change in unrealized appreciation (depreciation) on futures contracts | 148,500 |
During the six months ended January 31, 2021, the notional value of futures contracts opened and closed were $34,463,055 and $35,657,055, respectively.
The Fund does not have the right to offset financial assets and liabilities related to futures contracts on the Statement of Assets and Liabilities.
6. Creations, Redemptions and Transaction Fees
The Fund generally issues and redeems its shares in primary market transactions through a creation and redemption mechanism and does not sell or redeem individual shares. Instead, financial entities known as “Authorized Participants” have contractual arrangements with the Fund or one of the Fund’s service providers to purchase and redeem Fund shares directly with the Fund in large blocks of shares known as “Creation Units.” Prior to the start of trading on every business day, the Fund publishes through the National Securities Clearing Corporation (“NSCC”) the “basket” of securities, cash or other assets that it will accept in exchange for a Creation Unit of the Fund’s shares. An Authorized Participant that wishes to effectuate a creation of the Fund’s shares deposits with the Fund the “basket” of securities, cash or other assets identified by the Fund that day, and then receives the Creation Unit of the Fund’s shares in return for those assets. After purchasing a Creation Unit, the Authorized Participant may continue to hold the Fund’s shares or sell them in the secondary market. The redemption process is the reverse of the purchase process: the authorized participant redeems a Creation Unit of the Fund’s shares for a basket of securities, cash or other assets. The combination of the creation and redemption process with secondary market trading in the Fund’s shares and underlying securities provides arbitrage opportunities that are designed to help keep the market price of the Fund’s shares at or close to the NAV per share of the Fund.
The Fund imposes fees in connection with the purchase of Creation Units. These fees may vary based upon various fact-based circumstances, including, but not limited to, the composition of the securities included in the Creation Unit or the countries in which the transactions are settled. The price for each Creation Unit will equal the daily NAV per share of the Fund times the number of shares in a Creation Unit, plus the fees described above and, if applicable, any operational processing and brokerage costs, transfer fees, stamp taxes and part or all of the spread between the expected bid and offer side of the market related to the securities comprising the creation basket.
The Fund also imposes fees in connection with the redemption of Creation Units. These fees may vary based upon various fact-based circumstances, including, but not limited to, the composition of the securities included in the Creation Unit or the countries in which the transactions are settled. The price received for each Creation Unit will equal the daily NAV per share of the Fund times the number of shares in a Creation Unit, minus the fees described above and, if applicable, any operational processing and brokerage costs, transfer fees, stamp taxes and part or all of the spread between the expected bid and offer side of the market related to the securities comprising the redemption basket. Investors who use the services of a broker or other such intermediary in addition to an Authorized Participant to effect a redemption of a Creation Unit may also be assessed an amount to cover the cost of such services. The redemption fee charged by the Fund will comply with Rule 22c-2 of the 1940 Act which limits redemption fees to no more than 2% of the value of the shares redeemed.
7. Distribution Plan
The Board of Trustees adopted a Distribution and Service Plan pursuant to Rule 12b-1 under the 1940 Act. In accordance with the Rule 12b-1 plan, the Fund is authorized to pay an amount up to 0.25% of its average daily net assets each year to reimburse First Trust Portfolios L.P. (“FTP”), the distributor of the Fund, for amounts expended to finance activities primarily intended to result in the sale of Creation Units or to provide investor services. FTP may also use this amount to compensate securities dealers or other persons that are Authorized Participants for providing distribution assistance, including broker-dealer and shareholder support and educational and promotional services.
No 12b-1 fees are currently paid by the Fund, and pursuant to a contractual arrangement, no 12b-1 fees will be paid any time before November 30, 2021.
Notes to Financial Statements (Continued)
First Trust Municipal High Income ETF (FMHI)
January 31, 2021 (Unaudited)
8. Borrowings
The Trust, on behalf of the Fund, along with First Trust Series Fund and First Trust Exchange-Traded Fund IV have a $410 million Credit Agreement with The Bank of Nova Scotia (“Scotia”) as administrative agent for a group of lenders. Scotia charges a commitment fee of 0.25% of the daily amount of the excess of the commitment amount over the outstanding principal balance of the loans and an agency fee. First Trust allocates the commitment fee and agency fee amongst the funds that have access to the credit line. To the extent that the Fund accesses the credit line, there would also be an interest fee charged. The Fund did not have any borrowings outstanding during the six months ended January 31, 2021.
9. Indemnification
The Trust, on behalf of the Fund, has a variety of indemnification obligations under contracts with its service providers. The Trust’s maximum exposure under these arrangements is unknown. However, the Trust has not had prior claims or losses pursuant to these contracts and expects the risk of loss to be remote.
10. Other Matters
By operation of law, the Fund now operates as a diversified open-end management investment company as defined in Section 5(b) of the 1940 Act.
11. Subsequent Events
Management has evaluated the impact of all subsequent events to the Fund through the date the financial statements were issued, and has determined that there was the following subsequent event:
Effective March 3, 2021, the credit agreement with Scotia was amended and the maximum commitment amount changed from $410,000,000 to $330,000,000.
Additional Information
First Trust Municipal High Income ETF (FMHI)
January 31, 2021 (Unaudited)
Proxy Voting Policies and Procedures
A description of the policies and procedures that the Trust uses to determine how to vote proxies and information on how the Fund voted proxies relating to portfolio securities during the most recent 12-month period ended June 30 is available (1) without charge, upon request, by calling (800) 988-5891; (2) on the Fund’s website at www.ftportfolios.com; and (3) on the Securities and Exchange Commission’s (“SEC”) website at www.sec.gov.
Portfolio Holdings
The Fund files portfolio holdings information for each month in a fiscal quarter within 60 days after the end of the relevant fiscal quarter on Form N-PORT. Portfolio holdings information for the third month of each fiscal quarter will be publicly available on the SEC’s website at www.sec.gov. The Fund’s complete schedule of portfolio holdings for the second and fourth quarters of each fiscal year is included in the semi-annual and annual reports to shareholders, respectively, and is filed with the SEC on Form N-CSR. The semi-annual and annual report for the Fund is available to investors within 60 days after the period to which it relates. The Fund’s Forms N-PORT and Forms N-CSR are available on the SEC’s website listed above.
Risk Considerations
Risks are inherent in all investing. Certain general risks that may be applicable to a Fund are identified below, but not all of the material risks relevant to each Fund are included in this report and not all of the risks below apply to each Fund. The material risks of investing in each Fund are spelled out in its prospectus, statement of additional information and other regulatory filings. Before investing, you should consider each Fund’s investment objective, risks, charges and expenses, and read each Fund’s prospectus and statement of additional information carefully. You can download each Fund’s prospectus at www.ftportfolios.com or contact First Trust Portfolios L.P. at (800) 621-1675 to request a prospectus, which contains this and other information about each Fund.
Concentration Risk. To the extent that a fund is able to invest a large percentage of its assets in a single asset class or the securities of issuers within the same country, state, region, industry or sector, an adverse economic, business or political development may affect the value of the fund’s investments more than if the fund were more broadly diversified. A fund that tracks an index will be concentrated to the extent the fund’s corresponding index is concentrated. A concentration makes a fund more susceptible to any single occurrence and may subject the fund to greater market risk than a fund that is not concentrated.
Credit Risk. Credit risk is the risk that an issuer of a security will be unable or unwilling to make dividend, interest and/or principal payments when due and the related risk that the value of a security may decline because of concerns about the issuer’s ability to make such payments.
Cyber Security Risk. The funds are susceptible to potential operational risks through breaches in cyber security. A breach in cyber security refers to both intentional and unintentional events that may cause a fund to lose proprietary information, suffer data corruption or lose operational capacity. Such events could cause a fund to incur regulatory penalties, reputational damage, additional compliance costs associated with corrective measures and/or financial loss. In addition, cyber security breaches of a fund’s third-party service providers, such as its administrator, transfer agent, custodian, or sub-advisor, as applicable, or issuers in which the fund invests, can also subject a fund to many of the same risks associated with direct cyber security breaches.
Derivatives Risk. To the extent a fund uses derivative instruments such as futures contracts, options contracts and swaps, the fund may experience losses because of adverse movements in the price or value of the underlying asset, index or rate, which may be magnified by certain features of the derivative. These risks are heightened when a fund’s portfolio managers use derivatives to enhance the fund’s return or as a substitute for a position or security, rather than solely to hedge (or offset) the risk of a position or security held by the fund.
Equity Securities Risk. To the extent a fund invests in equity securities, the value of the fund’s shares will fluctuate with changes in the value of the equity securities. Equity securities prices fluctuate for several reasons, including changes in investors’ perceptions of the financial condition of an issuer or the general condition of the relevant stock market, such as market volatility, or when political or economic events affecting the issuers occur. In addition, common stock prices may be particularly sensitive to rising interest rates, as the cost of capital rises and borrowing costs increase. Equity securities may decline significantly in price over short or extended periods of time, and such declines may occur in the equity market as a whole, or they may occur in only a particular country, company, industry or sector of the market.
ETF Risk. The shares of an ETF trade like common stock and represent an interest in a portfolio of securities. The risks of owning an ETF generally reflect the risks of owning the underlying securities, although lack of liquidity in an ETF could result in it being more volatile and ETFs have management fees that increase their costs. Shares of an ETF trade on an exchange at market prices rather than
Additional Information (Continued)
First Trust Municipal High Income ETF (FMHI)
January 31, 2021 (Unaudited)
net asset value, which may cause the shares to trade at a price greater than net asset value (premium) or less than net asset value (discount). In times of market stress, decisions by market makers to reduce or step away from their role of providing a market for an ETF’s shares, or decisions by an ETF’s authorized participants that they are unable or unwilling to proceed with creation and/or redemption orders of an ETF’s shares, could result in shares of the ETF trading at a discount to net asset value and in greater than normal intraday bid-ask spreads.
Fixed Income Securities Risk. To the extent a fund invests in fixed income securities, the fund will be subject to credit risk, income risk, interest rate risk, liquidity risk and prepayment risk. Income risk is the risk that income from a fund’s fixed income investments could decline during periods of falling interest rates. Interest rate risk is the risk that the value of a fund’s fixed income securities will decline because of rising interest rates. Liquidity risk is the risk that a security cannot be purchased or sold at the time desired, or cannot be purchased or sold without adversely affecting the price. Prepayment risk is the risk that the securities will be redeemed or prepaid by the issuer, resulting in lower interest payments received by the fund. In addition to these risks, high yield securities, or “junk” bonds, are subject to greater market fluctuations and risk of loss than securities with higher ratings, and the market for high yield securities is generally smaller and less liquid than that for investment grade securities.
Index Constituent Risk. Certain funds may be a constituent of one or more indices. As a result, such a fund may be included in one or more index-tracking exchange-traded funds or mutual funds. Being a component security of such a vehicle could greatly affect the trading activity involving a fund, the size of the fund and the market volatility of the fund. Inclusion in an index could significantly increase demand for the fund and removal from an index could result in outsized selling activity in a relatively short period of time. As a result, a fund’s net asset value could be negatively impacted and the fund’s market price may be significantly below its net asset value during certain periods.
Index Provider Risk. To the extent a fund seeks to track an index, it is subject to Index Provider Risk. There is no assurance that the Index Provider will compile the Index accurately, or that the Index will be determined, maintained, constructed, reconstituted, rebalanced, composed, calculated or disseminated accurately. To correct any such error, the Index Provider may carry out an unscheduled rebalance or other modification of the Index constituents or weightings, which may increase the fund’s costs. The Index Provider does not provide any representation or warranty in relation to the quality, accuracy or completeness of data in the Index, and it does not guarantee that the Index will be calculated in accordance with its stated methodology. Losses or costs associated with any Index Provider errors generally will be borne by the fund and its shareholders.
Investment Companies Risk. To the extent a fund invests in the securities of other investment vehicles, the fund will incur additional fees and expenses that would not be present in a direct investment in those investment vehicles. Furthermore, the fund’s investment performance and risks are directly related to the investment performance and risks of the investment vehicles in which the fund invests.
LIBOR Risk. To the extent a fund invests in floating or variable rate obligations that use the London Interbank Offered Rate (“LIBOR”) as a reference interest rate, it is subject to LIBOR Risk. The United Kingdom’s Financial Conduct Authority, which regulates LIBOR, will cease making LIBOR available as a reference rate over a phase-out period that will begin immediately after December 31, 2021. The unavailability or replacement of LIBOR may affect the value, liquidity or return on certain fund investments and may result in costs incurred in connection with closing out positions and entering into new trades. Any potential effects of the transition away from LIBOR on the fund or on certain instruments in which the fund invests can be difficult to ascertain, and they may vary depending on a variety of factors, and they could result in losses to the fund.
Management Risk. To the extent that a fund is actively managed, it is subject to management risk. In managing an actively-managed fund’s investment portfolio, the fund’s portfolio managers will apply investment techniques and risk analyses that may not have the desired result. There can be no guarantee that a fund will meet its investment objective.
Market Risk. Securities held by a fund, as well as shares of a fund itself, are subject to market fluctuations caused by factors such as general economic conditions, political events, regulatory or market developments, changes in interest rates and perceived trends in securities prices. Shares of a fund could decline in value or underperform other investments as a result of the risk of loss associated with these market fluctuations. In addition, local, regional or global events such as war, acts of terrorism, spread of infectious diseases or other public health issues, recessions, or other events could have a significant negative impact on a fund and its investments. Such events may affect certain geographic regions, countries, sectors and industries more significantly than others. The outbreak of the respiratory disease designated as COVID-19 in December 2019 has caused significant volatility and declines in global financial markets, which have caused losses for investors. The COVID-19 pandemic may last for an extended period of time and will continue to impact the economy for the foreseeable future.
Non-U.S. Securities Risk. To the extent a fund invests in non-U.S. securities, it is subject to additional risks not associated with securities of domestic issuers. Non-U.S. securities are subject to higher volatility than securities of domestic issuers due to: possible adverse political, social or economic developments; restrictions on foreign investment or exchange of securities; lack of liquidity;
Additional Information (Continued)
First Trust Municipal High Income ETF (FMHI)
January 31, 2021 (Unaudited)
currency exchange rates; excessive taxation; government seizure of assets; different legal or accounting standards; and less government supervision and regulation of exchanges in foreign countries. Investments in non-U.S. securities may involve higher costs than investments in U.S. securities, including higher transaction and custody costs, as well as additional taxes imposed by non-U.S. governments. These risks may be heightened for securities of companies located, or with significant operations, in emerging market countries.
Operational Risk. Each fund is subject to risks arising from various operational factors, including, but not limited to, human error, processing and communication errors, errors of a fund’s service providers, counterparties or other third-parties, failed or inadequate processes and technology or systems failures. Although the funds and the Advisor seek to reduce these operational risks through controls and procedures, there is no way to completely protect against such risks.
Passive Investment Risk. To the extent a fund seeks to track an index, the fund will invest in the securities included in, or representative of, the index regardless of their investment merit. A fund generally will not attempt to take defensive positions in declining markets.
| NOT FDIC INSURED | NOT BANK GUARANTEED | MAY LOSE VALUE |
This page intentionally left blank
This page intentionally left blank
This page intentionally left blank
First Trust Exchange-Traded Fund III
INVESTMENT ADVISOR
First Trust Advisors L.P.
120 East Liberty Drive, Suite 400
Wheaton, IL 60187
ADMINISTRATOR, CUSTODIAN,
FUND ACCOUNTANT &
TRANSFER AGENT
Brown Brothers Harriman & Co.
50 Post Office Square
Boston, MA 02110
INDEPENDENT REGISTERED
PUBLIC ACCOUNTING FIRM
Deloitte & Touche LLP
111 S. Wacker Drive
Chicago, IL 60606
LEGAL COUNSEL
Chapman and Cutler LLP
111 W. Monroe Street
Chicago, IL 60603
First Trust Exchange-Traded Fund III
First Trust Short Duration Managed Municipal ETF (FSMB)
First Trust Ultra Short Duration Municipal ETF (FUMB)
Semi-Annual Report
For the Six Months Ended
January 31, 2021
First Trust Exchange-Traded Fund III
Semi-Annual Report
January 31, 2021
Caution Regarding Forward-Looking Statements
This report contains certain forward-looking statements within the meaning of the Securities Act of 1933, as amended, and the Securities Exchange Act of 1934, as amended. Forward-looking statements include statements regarding the goals, beliefs, plans or current expectations of First Trust Advisors L.P. (“First Trust” or the “Advisor”) and its representatives, taking into account the information currently available to them. Forward-looking statements include all statements that do not relate solely to current or historical fact. For example, forward-looking statements include the use of words such as “anticipate,” “estimate,” “intend,” “expect,” “believe,” “plan,” “may,” “should,” “would” or other words that convey uncertainty of future events or outcomes.
Forward-looking statements involve known and unknown risks, uncertainties and other factors that may cause the actual results, performance or achievements of any series of First Trust Exchange-Traded Fund III (the “Trust”) described in this report (each such series is referred to as a “Fund” and collectively, the “Funds”) to be materially different from any future results, performance or achievements expressed or implied by the forward-looking statements. When evaluating the information included in this report, you are cautioned not to place undue reliance on these forward-looking statements, which reflect the judgment of the Advisor and its representatives only as of the date hereof. We undertake no obligation to publicly revise or update these forward-looking statements to reflect events and circumstances that arise after the date hereof.
Performance and Risk Disclosure
There is no assurance that any Fund described in this report will achieve its investment objective. Each Fund is subject to market risk, which is the possibility that the market values of securities owned by the Fund will decline and that the value of the Fund’s shares may therefore be less than what you paid for them. Accordingly, you can lose money by investing in a Fund. See “Risk Considerations” in the Additional Information section of this report for a discussion of certain other risks of investing in the Funds.
Performance data quoted represents past performance, which is no guarantee of future results, and current performance may be lower or higher than the figures shown. For the most recent month-end performance figures, please visit www.ftportfolios.com or speak with your financial advisor. Investment returns, net asset value and share price will fluctuate and Fund shares, when sold, may be worth more or less than their original cost.
The Advisor may also periodically provide additional information on Fund performance on each Fund’s web page at www.ftportfolios.com.
How to Read This Report
This report contains information that may help you evaluate your investment. It includes details about each Fund and presents data and analysis that provide insight into each Fund’s performance and investment approach.
The statistical information that follows may help you understand each Fund’s performance compared to that of a relevant market benchmark.
It is important to keep in mind that the opinions expressed by personnel of the Advisor are just that: informed opinions. They should not be considered to be promises or advice. The opinions, like the statistics, cover the period through the date on the cover of this report. The material risks of investing in each Fund are spelled out in the prospectus, the statement of additional information, and other Fund regulatory filings.
First Trust Exchange-Traded Fund III
Semi-Annual Letter from the Chairman and CEO
January 31, 2021
Dear Shareholders,
First Trust is pleased to provide you with the semi-annual report for certain series of the First Trust Exchange-Traded Fund III (the “Funds”), which contains detailed information about the Funds for the six months ended January 31, 2021.
There is so much to talk about, yet so little space. Rather than drill down on politics or belabor the coronavirus (“COVID-19”) pandemic, I would like to take this opportunity to convey a brief message on the current economic/business/investment climate in the U.S. The one thing I feel compelled to point out, however, is that unlike the Trump Administration’s approach of delegating the lion’s share of the responsibility of executing the medical ground assault against COVID-19 to the states, the Biden Administration has communicated its intention to play more of an integral role at the federal level. The distribution of the FDA-approved vaccines, of which there are currently three, and the push for a huge bump up in the next round of fiscal stimulus to help millions of Americans cope with the economic fallout stemming from the pandemic are just two examples. While he was hoping to make it a bipartisan effort, President Joe Biden was prepared to utilize a tactic in Congress, particularly in the Senate, known as reconciliation to pass his $1.9 trillion stimulus bill. Reconciliation would only require a simple majority of Senate votes to pass the bill. In the end, Congress did just that and the Senate passed the bill with a 50-49 count. President Biden signed the “American Rescue Plan Act” into law on March 11, 2021. Not one Republican in Congress voted for the bill.
The current climate strikes me as one where “Cash is King.” A recent survey by Money and Morning Consult found that 68% of adults said they need another stimulus check from the government to get by, and 39% of those polled claimed they need the additional financial support “a lot,” according to their own release. Overall, respondents said that the $600 checks sent out this past December were not enough. Seventy-seven percent of adults say they need the checks to exceed $1,000 and 36% say they need more than $2,000 to make ends meet. President Joe Biden’s American Rescue Plan will make payments of up to $1,400 to those who are eligible. Suffice it to say, cash tends to be an urgent priority for those who do not have it.
While most investors are likely hunting for opportunities to generate higher returns on their capital, many Americans are sitting on their cash. Brian Wesbury, Chief Economist at First Trust, recently noted that, as of the third quarter of 2020, the amount of capital held by Americans in checking accounts, savings accounts, time deposits and money market funds stood $2.8 trillion higher than their combined total in the third quarter of 2019. If you have listened to what Federal Reserve Chairman Jerome Powell has said about keeping short-term interest rates low for two or three more years if need be to significantly lower unemployment and generate inflationary pressure beyond the Federal Reserve’s 2.0% target, it makes the thought of harboring such an extraordinary volume of capital in these low-paying, interest-bearing accounts even harder to fathom, in my opinion.
The state of the U.S. economy is on the mend, but likely won’t make a full recovery for at least a couple more years, according to Wesbury. In our opinion, most of the weakness in the economy is stemming from some key service-oriented sectors, such as hotels and airlines, that remain sheltered or lightly used. Wesbury believes that a full recovery requires the reopening of the entire U.S. economy. The speed of the vaccine rollout in the weeks ahead could help determine when the economy is ready to fully reopen.
We believe investors should take solace in how upbeat our top executives are about the near future. The Conference Board’s Measure of CEO Confidence™ rose to a 17-year high in the first quarter of 2021, according to Fox Business. The measure currently stands at 73. A reading above 50 points reflects more positive than negative responses from CEOs. Its quarterly survey revealed that 82% of CEOs expect economic conditions to improve over the next six months, up from 63% in the prior survey. Forty-five percent of them expect to increase capital spending, up from 25% in the prior survey. The good news is that Corporate America’s largest companies have the cash to fund projects. In the third quarter of 2020 (most recent data), S&P 500 Industrials (Old) cash and equivalents, which excludes cash held by Financials, Utilities and Transportation companies, stood at a near-record high of $1.88 trillion, according to S&P Dow Jones Indices. The all-time high was $1.89 trillion, set in the second quarter of 2020.
It seems the economy is on the cusp of another major cash injection from the government. We encourage investors to stay the course.
Thank you for giving First Trust the opportunity to play a role in your financial future. We value our relationship with you and will report on the Funds again in six months.
Sincerely,
James A. Bowen
Chairman of the Board of Trustees
Chief Executive Officer of First Trust Advisors L.P.
Fund Performance Overview (Unaudited)
First Trust Short Duration Managed Municipal ETF (FSMB)
The investment objective of First Trust Short Duration Managed Municipal ETF (the “Fund”) seeks to provide federally tax-exempt income consistent with capital preservation. Under normal market conditions, the Fund seeks to achieve its investment objective by investing at least 80% of its net assets (including investment borrowings) in municipal debt securities that pay interest that is exempt from regular federal income taxes. The Fund’s investment advisor seeks to construct a portfolio that has a weighted average duration of 1-3 years. The Fund lists and principally trades its shares on NYSE Arca, Inc. under the ticker symbol “FSMB.”
| Performance | | | | |
| | | | Average Annual
Total Returns | Cumulative
Total Returns |
| | 6 Months Ended
1/31/21 | 1 Year Ended
1/31/21 | Inception (11/1/18)
to 1/31/21 | Inception (11/1/18)
to 1/31/21 |
| Fund Performance | | | | |
| NAV | 1.84% | 3.11% | 3.93% | 9.05% |
| Market Price | 1.84% | 3.11% | 3.95% | 9.10% |
| Index Performance | | | | |
| Bloomberg Barclays Municipal Short (1-5) Year Index | 0.67% | 2.38% | 3.52% | 8.10% |
(See Notes to Fund Performance Overview on page 6.)
| Sector Allocation | % of Total
Investments
(including cash) |
| Government Obligation Bond - Unlimited Tax | 11.1% |
| Insured | 9.5 |
| Gas | 8.4 |
| Hospital | 6.9 |
| Certificates of Participation | 6.8 |
| Special Assessment | 6.7 |
| Education | 6.3 |
| Utility | 5.8 |
| Continuing Care Retirement Communities | 4.8 |
| Dedicated Tax | 4.8 |
| Higher Education | 3.9 |
| Industrial Development Bond | 3.7 |
| Water & Sewer | 3.7 |
| Mass Transit | 3.4 |
| Government Obligation Bond - Limited Tax | 2.2 |
| Airport | 2.0 |
| Student Loan | 2.0 |
| Tax Increment | 1.5 |
| Housing | 0.6 |
| Tobacco | 0.6 |
| Student Housing | 0.3 |
| Pre-refunded/Escrowed-to-maturity | 0.2 |
| Toll Road | 0.1 |
| Cash | 4.7 |
| Total | 100.0% |
| Credit Quality(1) | % of Total
Investments
(including cash) |
| AAA | 2.5% |
| AA | 26.4 |
| A | 29.3 |
| BBB | 17.0 |
| BB | 6.4 |
| B | 0.6 |
| Not Rated | 8.5 |
| SP-1+ (short-term) | 0.6 |
| SP-1/MIG1 (short-term) | 0.6 |
| SP-2/MIG2 (short-term) | 3.4 |
| Cash | 4.7 |
| Total | 100.0% |
| Fund Allocation | % of Net Assets |
| Municipal Bonds | 99.0% |
| Net Other Assets and Liabilities(2) | 1.0 |
| Total | 100.0% |
| (1) | The credit quality and ratings information presented above reflect the ratings assigned by one or more nationally recognized statistical rating organizations (NRSROs), including Standard & Poor’s Ratings Group, a division of the McGraw Hill Companies, Inc., Moody’s Investors Service, Inc., Fitch Ratings or a comparably rated NRSRO. For situations in which a security is rated by more than one NRSRO and the ratings are not equivalent, the highest rating is used. Sub-investment grade ratings are those rated BB+/Ba1 or lower. Investment grade ratings are those rated BBB-/Baa3 or higher. The credit ratings shown relate to the creditworthiness of the issuers of the underlying securities in the Fund, and not to the Fund or its shares. Credit ratings are subject to change. |
| (2) | Includes variation margin on futures. |
Fund Performance Overview (Unaudited) (Continued)
First Trust Short Duration Managed Municipal ETF (FSMB) (Continued)
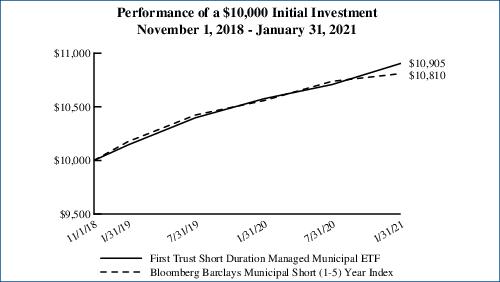
Performance figures assume reinvestment of all distributions and do not reflect the deduction of taxes that a shareholder would pay on Fund distributions or the redemption or sale of Fund shares. An index is a statistical composite that tracks a specified financial market or sector. Unlike the Fund, the index does not actually hold a portfolio of securities and therefore does not incur the expenses incurred by the Fund. These expenses negatively impact the performance of the Fund. The Fund’s past performance does not predict future performance.
Frequency Distribution of Discounts and Premiums
Information showing the number of days the market price of the Fund’s shares was greater (at a premium) and less (at a discount) than the Fund’s net asset value for the most recently completed year, and the most recently completed calendar quarters since that year (or life of the Fund, if shorter), is available at https://www.ftportfolios.com/Retail/etf/home.aspx.
Fund Performance Overview (Unaudited) (Continued)
First Trust Ultra Short Duration Municipal ETF (FUMB)
The investment objective of First Trust Ultra Short Duration Municipal ETF (the “Fund”) seeks to provide federally tax-exempt income consistent with capital preservation. Under normal market conditions, the Fund seeks to achieve its investment objective by investing at least 80% of its net assets (including investment borrowings) in municipal debt securities that pay interest that is exempt from regular federal income taxes. Under normal market conditions, the weighted average duration of the Fund’s portfolio is expected to be less than one year. The Fund lists and principally trades its shares on NYSE Arca, Inc. under the ticker symbol “FUMB.”
| Performance | | | | |
| | | | Average Annual
Total Returns | Cumulative
Total Returns |
| | 6 Months Ended
1/31/21 | 1 Year Ended
1/31/21 | Inception (11/1/18)
to 1/31/21 | Inception (11/1/18)
to 1/31/21 |
| Fund Performance | | | | |
| NAV | 0.47% | 1.35% | 1.70% | 3.86% |
| Market Price | 0.42% | 1.45% | 1.70% | 3.86% |
| Index Performance | | | | |
| Bloomberg Barclays Municipal Short-Term Index | 0.27% | 0.92% | 1.45% | 3.28% |
(See Notes to Fund Performance Overview on page 6.)
| Sector Allocation | % of Total
Investments
(including cash) |
| Government Obligation Bond - Unlimited Tax | 16.0% |
| Certificates of Participation | 10.7 |
| Industrial Development Bond | 9.9 |
| Government Obligation Bond - Limited Tax | 8.6 |
| Gas | 8.5 |
| Insured | 7.0 |
| Hospital | 6.4 |
| Water & Sewer | 5.5 |
| Education | 4.6 |
| Pre-refunded/Escrowed-to-maturity | 4.1 |
| Dedicated Tax | 3.9 |
| Housing | 3.7 |
| Higher Education | 2.5 |
| Utility | 1.4 |
| Mass Transit | 1.0 |
| Tax Increment | 0.9 |
| Tobacco | 0.7 |
| Special Assessment | 0.7 |
| Student Loan | 0.6 |
| Continuing Care Retirement Communities | 0.5 |
| Airport | 0.4 |
| Toll Road | 0.2 |
| Cash | 2.2 |
| Total | 100.0% |
| Credit Quality(1) | % of Total
Investments
(including cash) |
| AAA | 3.0% |
| AA | 27.3 |
| A | 34.3 |
| BBB | 9.2 |
| BB | 1.0 |
| Not Rated | 11.4 |
| SP-1+ (short-term) | 4.5 |
| SP-1/MIG1 (short-term) | 3.0 |
| SP-2/MIG2 (short-term) | 4.1 |
| Cash | 2.2 |
| Total | 100.0% |
| (1) | The credit quality and ratings information presented above reflect the ratings assigned by one or more nationally recognized statistical rating organizations (NRSROs), including Standard & Poor’s Ratings Group, a division of the McGraw Hill Companies, Inc., Moody’s Investors Service, Inc., Fitch Ratings or a comparably rated NRSRO. For situations in which a security is rated by more than one NRSRO and the ratings are not equivalent, the highest rating is used. Sub-investment grade ratings are those rated BB+/Ba1 or lower. Investment grade ratings are those rated BBB-/Baa3 or higher. The credit ratings shown relate to the creditworthiness of the issuers of the underlying securities in the Fund, and not to the Fund or its shares. Credit ratings are subject to change. |
Fund Performance Overview (Unaudited) (Continued)
First Trust Ultra Short Duration Municipal ETF (FUMB) (Continued)
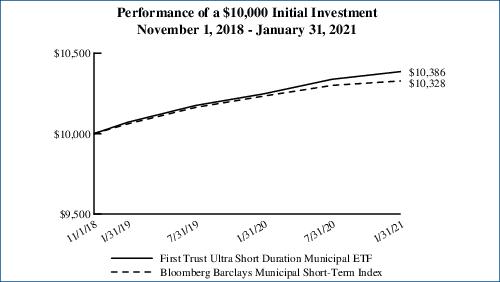
Performance figures assume reinvestment of all distributions and do not reflect the deduction of taxes that a shareholder would pay on Fund distributions or the redemption or sale of Fund shares. An index is a statistical composite that tracks a specified financial market or sector. Unlike the Fund, the index does not actually hold a portfolio of securities and therefore does not incur the expenses incurred by the Fund. These expenses negatively impact the performance of the Fund. The Fund’s past performance does not predict future performance.
Frequency Distribution of Discounts and Premiums
Information showing the number of days the market price of the Fund’s shares was greater (at a premium) and less (at a discount) than the Fund’s net asset value for the most recently completed year, and the most recently completed calendar quarters since that year (or life of the Fund, if shorter), is available at https://www.ftportfolios.com/Retail/etf/home.aspx.
Notes to Fund Performance Overview (Unaudited)
Total returns for the period since inception are calculated from the inception date of each Fund. “Average Annual Total Returns” represent the average annual change in value of an investment over the periods indicated. “Cumulative Total Returns” represent the total change in value of an investment over the periods indicated. The total returns would have been lower if certain fees had not been waived by the Advisor.
Each Fund’s per share net asset value (“NAV”) is the value of one share of the Fund and is computed by dividing the value of all assets of the Fund (including accrued interest and dividends), less all liabilities (including accrued expenses and dividends declared but unpaid), by the total number of outstanding shares. The price used to calculate market return (“Market Price”) is determined by using the midpoint of the national best bid and offer price (“NBBO”) as of the time that the Fund’s NAV is calculated. Under SEC rules, the NBBO consists of the highest displayed buy and lowest sell prices among the various exchanges trading the Fund at the time the Fund’s NAV is calculated. Prior to January 1, 2019, the price used was the midpoint between the highest bid and the lowest offer on the stock exchange on which shares of the Fund were listed for trading as of the time that the Fund’s NAV was calculated. Since shares of each Fund did not trade in the secondary market until after the Fund’s inception, for the period from inception to the first day of secondary market trading in shares of the Fund, the NAV of each Fund is used as a proxy for the secondary market trading price to calculate market returns. NAV and market returns assume that all distributions have been reinvested in each Fund at NAV and Market Price, respectively.
An index is a statistical composite that tracks a specified financial market or sector. Unlike each Fund, the indices do not actually hold a portfolio of securities and therefore do not incur the expenses incurred by each Fund. These expenses negatively impact the performance of each Fund. Also, market returns do not include brokerage commissions that may be payable on secondary market transactions. If brokerage commissions were included, market returns would be lower. The total returns presented reflect the reinvestment of dividends on securities in the indices. The returns presented do not reflect the deduction of taxes that a shareholder would pay on Fund distributions or the redemption or sale of Fund shares. The investment return and principal value of shares of each Fund will vary with changes in market conditions. Shares of each Fund may be worth more or less than their original cost when they are redeemed or sold in the market. Each Fund’s past performance is no guarantee of future performance.
Portfolio Management
First Trust Exchange-Traded Fund III
Semi-Annual Report
January 31, 2021 (Unaudited)
Advisor
First Trust Advisors L.P. (“First Trust”) serves as the investment advisor to the First Trust Short Duration Managed Municipal ETF (“FSMB”) and the First Trust Ultra Short Duration Municipal ETF (“FUMB”) (each a “Fund” and collectively, the “Funds”). First Trust is responsible for the ongoing monitoring of each Fund’s investment portfolio, managing each Fund’s business affairs and providing certain administrative services necessary for the management of each Fund.
Portfolio Management Team
Tom Futrell, CFA, Senior Vice President, Senior Portfolio Manager
Johnathan N. Wilhelm, Senior Vice President, Senior Portfolio Manager
The First Trust Municipal Securities Team was formed in September of 2013 and is headed by Tom Futrell, CFA, and Johnathan Wilhelm who serve as senior portfolio managers of the Funds. Messrs. Futrell and Wilhelm have a combined 50+ years of investment experience and prior to joining First Trust, served as portfolio managers of municipal bonds at Nuveen Investments and Performance Trust Investment Advisors. In addition to the Funds, the team manages/consults for a variety of First Trust investment portfolios and separately managed accounts.
First Trust Exchange-Traded Fund III
Understanding Your Fund Expenses
January 31, 2021 (Unaudited)
As a shareholder of First Trust Short Duration Managed Municipal ETF or First Trust Ultra Short Duration Municipal ETF (each a “Fund” and collectively, the “Funds”), you incur two types of costs: (1) transaction costs; and (2) ongoing costs, including management fees, distribution and/or service (12b-1) fees, if any, and other Fund expenses. This Example is intended to help you understand your ongoing costs of investing in the Funds and to compare these costs with the ongoing costs of investing in other funds.
The Example is based on an investment of $1,000 invested at the beginning of the period and held through the six-month period ended January 31, 2021.
Actual Expenses
The first line in the following table provides information about actual account values and actual expenses. You may use the information in this line, together with the amount you invested, to estimate the expenses that you paid over the period. Simply divide your account value by $1,000 (for example, an $8,600 account value divided by $1,000 = 8.6), then multiply the result by the number in the first line under the heading entitled “Expenses Paid During the Six-Month Period” to estimate the expenses you paid on your account during this six-month period.
Hypothetical Example for Comparison Purposes
The second line in the following table provides information about hypothetical account values and hypothetical expenses based on each Fund’s actual expense ratio and an assumed rate of return of 5% per year before expenses, which is not each Fund’s actual return. The hypothetical account values and expenses may not be used to estimate the actual ending account balance or expenses you paid for the period. You may use this information to compare the ongoing costs of investing in the Funds and other funds. To do so, compare this 5% hypothetical example with the 5% hypothetical examples that appear in the shareholder reports of the other funds.
Please note that the expenses shown in the table are meant to highlight your ongoing costs only and do not reflect any transactional costs such as brokerage commissions. Therefore, the second line in the table is useful in comparing ongoing costs only, and will not help you determine the relative total costs of owning different funds. In addition, if these transactional costs were included, your costs would have been higher.
| | Beginning
Account Value
August 1, 2020 | Ending
Account Value
January 31, 2021 | Annualized
Expense Ratio
Based on the
Six-Month
Period (a) | Expenses Paid
During the
Six-Month
Period (b) |
| First Trust Short Duration Managed Municipal ETF (FSMB) |
| Actual | $1,000.00 | $1,018.40 | 0.45% | $2.29 |
| Hypothetical (5% return before expenses) | $1,000.00 | $1,022.94 | 0.45% | $2.29 |
| First Trust Ultra Short Duration Municipal ETF (FUMB) |
| Actual | $1,000.00 | $1,004.70 | 0.27% | $1.36 |
| Hypothetical (5% return before expenses) | $1,000.00 | $1,023.84 | 0.27% | $1.38 |
| (a) | These expense ratios reflect expense waivers. See Note 3 in the Notes to Financial Statements. |
| (b) | Expenses are equal to the annualized expense ratios as indicated in the table multiplied by the average account value over the period (August 1, 2020 through January 31, 2021), multiplied by 184/365 (to reflect the six-month period). |
First Trust Short Duration Managed Municipal ETF (FSMB)
Portfolio of Investments
January 31, 2021 (Unaudited)
Principal
Value | | Description | | Stated
Coupon | | Stated
Maturity | | Value |
| MUNICIPAL BONDS – 99.0% |
| | | Alabama – 3.7% | | | | | | |
| $1,000,000 | | AL Federal Aid Highway Fin Auth Spl Oblig Rev, GARVEE
| | 5.00% | | 09/01/30 | | $1,149,080 |
| 210,000 | | Black Belt Energy Gas Dist AL Gas Prepay Rev Proj #5, Ser A-1 (Mandatory put 10/01/26)
| | 4.00% | | 10/01/49 | | 248,678 |
| 275,000 | | Black Belt Energy Gas Dist AL Gas Sply Rev, Ser A (Mandatory put 07/01/22)
| | 4.00% | | 08/01/47 | | 288,668 |
| 100,000 | | Greenville AL Pub Impt Cooperative Pub Impt Rev Greenville Funding, BAM
| | 5.00% | | 03/01/25 | | 118,301 |
| 95,000 | | Infirmary Hlth Sys AL Spl Care Facs Fing Auth Rev Infirmary Hlth Sys Inc, Ser A
| | 5.00% | | 02/01/25 | | 110,363 |
| 500,000 | | Mizuho Floater Residual Trust Various States Floaters Miz 9024, Ser 2020 (a) (b)
| | 0.44% | | 12/01/48 | | 500,000 |
| 430,000 | | Prichard AL Wtrwks & Swr Brd Wtr & Swr Rev Ref
| | 5.00% | | 11/01/25 | | 505,026 |
| 150,000 | | SE AL St Gas Sply Dist Gas Sply Rev Proj #2, Ser A (Mandatory put 06/01/24)
| | 4.00% | | 06/01/49 | | 166,770 |
| | | | | 3,086,886 |
| | | Arizona – 4.3% | | | | | | |
| 1,000,000 | | AZ St Indl Dev Auth Rev Lincoln South Beltway Proj
| | 5.00% | | 05/01/27 | | 1,266,780 |
| 1,000,000 | | Coconino Cnty AZ Poll Controlcorp Ref NV Pwr Company, Ser A, AMT (Mandatory put 03/31/23)
| | 1.88% | | 09/01/32 | | 1,030,180 |
| 615,000 | | Maricopa Cnty AZ Indl Dev Auth Edu Rev Legacy Traditional Sch Proj
| | 5.00% | | 07/01/24 | | 699,692 |
| 500,000 | | Phoenix AZ Indl Dev Auth Edu Rev Ref Basis Sch (a)
| | 5.00% | | 07/01/35 | | 552,360 |
| | | | | 3,549,012 |
| | | California – 3.8% | | | | | | |
| 175,000 | | CA Cnty CA Tobacco Securitization Agy Tobacco Settle Ref Sonoma Cnty Securitization Corp, Ser A
| | 3.00% | | 06/01/21 | | 176,629 |
| 25,000 | | CA St Enterprise Dev Auth Student Hsg Rev M@College Proj, Ser A
| | 5.00% | | 08/01/23 | | 27,578 |
| 50,000 | | CA St Enterprise Dev Auth Student Hsg Rev M@College Proj, Ser A
| | 5.00% | | 08/01/24 | | 56,968 |
| 205,000 | | CA St Hlth Facs Fing Auth Rev Adventist Hlth Sys West, Ser A
| | 5.00% | | 03/01/23 | | 225,104 |
| 295,000 | | CA St Hlth Facs Fing Auth Rev Adventist Hlth Sys West, Ser A
| | 4.00% | | 03/01/33 | | 312,986 |
| 385,000 | | CA St Hlth Facs Fing Auth Rev El Camino Hosp
| | 5.00% | | 02/01/33 | | 471,513 |
| 215,000 | | Cathedral City CA Redev Agy Successor Agy Tax Allocation Rev Ref Sub Hsg Merged Redev Proj Area, Ser C
| | 4.00% | | 08/01/23 | | 231,759 |
| 160,000 | | Golden St Tobacco Securitization Corp CA Tobacco Settlement Enhanced Asset Bkd, Ser A
| | 5.00% | | 06/01/30 | | 175,735 |
| 400,000 | | Long Beach CA Bond Fin Auth Nat Gas Purchase Rev, Ser A
| | 5.25% | | 11/15/22 | | 435,816 |
| 105,000 | | Rancho Cordova CA Cmnty Facs Dist Spl Tax Rev Grantline 208 Cmnty Fac Dt #2018-1
| | 3.00% | | 09/01/21 | | 106,268 |
| 85,000 | | Rancho Cordova CA Cmnty Facs Dist Spl Tax Rev Grantline 208 Cmnty Fac Dt #2018-1
| | 3.00% | | 09/01/23 | | 89,104 |
| 90,000 | | Rancho Cordova CA Cmnty Facs Dist Spl Tax Rev Grantline 208 Cmnty Fac Dt #2018-1
| | 3.00% | | 09/01/24 | | 95,457 |
| 240,000 | | Roseville CA Fin Auth Spl Tax Rev Ref, Ser A
| | 5.00% | | 09/01/25 | | 292,726 |
| 100,000 | | San Diego Cnty CA Regl Arpt Auth Subordinate Ref, Ser A
| | 5.00% | | 07/01/24 | | 116,044 |
| 140,000 | | San Francisco CA City & Cnty Arpts Commn Intl Arpt Rev Ref 2nd Ser, Ser A
| | 4.00% | | 05/01/26 | | 167,075 |
| 125,000 | | Tobacco Securitization Auth Sthrn CA Tobacco Settlement Rev Ref San Diego Co Asset Securitization Corp Class 1, Ser A
| | 5.00% | | 06/01/25 | | 151,236 |
| | | | | 3,131,998 |
See Notes to Financial Statements
Page 9
First Trust Short Duration Managed Municipal ETF (FSMB)
Portfolio of Investments (Continued)
January 31, 2021 (Unaudited)
Principal
Value | | Description | | Stated
Coupon | | Stated
Maturity | | Value |
| MUNICIPAL BONDS (Continued) |
| | | Colorado – 1.8% | | | | | | |
| $500,000 | | CO St Eductnl & Cultural Facs Auth Rev Ref & Impt Chrt Sch Univ Lab Bldg Corp
| | 5.00% | | 12/15/28 | | $569,225 |
| 110,000 | | CO St Eductnl & Cultural Facs Auth Rev Ref Chrt Sch Stargate Chrt Sch Proj, Ser A
| | 5.00% | | 12/01/25 | | 131,621 |
| 100,000 | | CO St Eductnl & Cultural Facs Auth Rev Ref N Star Academy Chrt Sch Proj
| | 4.00% | | 11/01/23 | | 109,177 |
| 130,000 | | CO St Hlth Facs Auth Hosp Rev Ref Commonspirit Hlth, Ser B-1 (Mandatory put 08/01/25)
| | 5.00% | | 08/01/49 | | 152,123 |
| 80,000 | | CO St Hlth Facs Auth Rev Ref Parkview Med Cntr, Ser A
| | 3.25% | | 09/01/25 | | 88,259 |
| 190,000 | | CO St Hlth Facs Auth Rev Ref Parkview Med Cntr, Ser B
| | 5.00% | | 09/01/28 | | 222,157 |
| 100,000 | | Colorado Springs CO Pikes Peak Americas Mountain Enterprise Pikes Peak
| | 5.00% | | 12/01/21 | | 103,938 |
| 125,000 | | Crystal Vly CO Met Dist #2 Ref, Ser A, AGM
| | 5.00% | | 12/01/23 | | 141,444 |
| | | | | 1,517,944 |
| | | Connecticut – 4.1% | | | | | | |
| 100,000 | | CT St
| | 5.00% | | 08/01/31 | | 119,303 |
| 50,000 | | CT St Hlth & Eductnl Facs Auth Rev Hartford Healthcare, Ser E
| | 5.00% | | 07/01/25 | | 57,908 |
| 170,000 | | CT St Hlth & Eductnl Facs Auth Rev Ref
| | 5.00% | | 07/01/29 | | 200,362 |
| 650,000 | | CT St Hlth & Eductnl Facs Auth Rev Temps 50 Mclean Issue, Ser B-2 (a)
| | 2.75% | | 01/01/26 | | 657,845 |
| 50,000 | | CT St Spl Tax Oblig Rev Ref Transprtn Infrastructure, Ser B
| | 5.00% | | 08/01/27 | | 59,946 |
| 165,000 | | CT St Spl Tax Oblig Rev Transptrn Infrastructure, Ser A
| | 5.00% | | 09/01/33 | | 189,283 |
| 100,000 | | CT St, Ser F
| | 2.00% | | 11/15/21 | | 101,477 |
| 315,000 | | Hamden CT Ref, Ser A, BAM
| | 5.00% | | 08/01/23 | | 349,143 |
| 145,000 | | Hamden CT Ref, Ser A, BAM
| | 5.00% | | 08/01/24 | | 166,788 |
| 200,000 | | Hamden CT Ref, Ser A, BAM
| | 5.00% | | 08/01/25 | | 238,212 |
| 970,000 | | Univ Of CT CT, Ser A
| | 5.00% | | 11/01/26 | | 1,213,664 |
| 25,000 | | Univ Of CT CT, Ser A
| | 5.00% | | 11/01/35 | | 31,898 |
| | | | | 3,385,829 |
| | | Florida – 7.3% | | | | | | |
| 250,000 | | Berry Bay Cdd FL Spl Assmt Rev Assmt Area 1
| | 2.63% | | 05/01/26 | | 250,702 |
| 250,000 | | Citizens Property Insurance Corp FL, Ser A1
| | 5.00% | | 06/01/22 | | 260,017 |
| 110,000 | | FL St Dev Fin Corp Eductnl Facs Rev River City Science Academy Projs, Ser A
| | 4.00% | | 07/01/24 | | 120,429 |
| 130,000 | | FL St Dev Fin Corp Eductnl Facs Rev River City Science Academy Projs, Ser A
| | 4.00% | | 07/01/25 | | 145,483 |
| 155,000 | | FL St Dev Fin Corp Eductnl Facs Rev River City Science Academy Projs, Ser A
| | 4.00% | | 07/01/26 | | 176,754 |
| 150,000 | | FL St Dev Fin Corp Eductnl Facs Rev River City Science Academy Projs, Ser A
| | 4.00% | | 07/01/28 | | 175,565 |
| 245,000 | | Gulfstream Polo Cmnty Dev Dist FL Spl Assmnt Phase 2 Proj
| | 3.00% | | 11/01/24 | | 249,991 |
| 500,000 | | Hills Minneola Cmnty Dev Dist FL Spl Assmnt Rev South Parcel Assmnt Area (a)
| | 3.00% | | 05/01/25 | | 509,410 |
| 450,000 | | Hollywood Beach FL Cmnty Dev Dist Rev Cdd Ref Pub Pkg Fac Proj, Ser I
| | 5.00% | | 10/01/23 | | 503,604 |
| 475,000 | | Hollywood Beach FL Cmnty Dev Dist Rev Cdd Ref Pub Pkg Fac Proj, Ser I
| | 5.00% | | 10/01/24 | | 551,879 |
| 210,000 | | Jea FL Elec Sys Rev Sub, Ser B
| | 5.00% | | 10/01/22 | | 226,002 |
| 100,000 | | Lakeland FL Hosp Sys Rev Lakeland Regl Hlth
| | 5.00% | | 11/15/33 | | 114,434 |
| 170,000 | | Lakewood Ranch FL Stewardship Dist Spl Assmnt Rev Ref Country Club East Proj, AGM
| | 5.00% | | 05/01/25 | | 199,898 |
| 500,000 | | Mirada Ii Cmnty Dev Dist FL Cap Impt Rev
| | 2.50% | | 05/01/26 | | 500,620 |
| 220,000 | | Parkway Ctr FL Cdd Spl Assmnt Rev Ref Assmt Area, Ser 1
| | 3.50% | | 05/01/21 | | 221,258 |
Page 10
See Notes to Financial Statements
First Trust Short Duration Managed Municipal ETF (FSMB)
Portfolio of Investments (Continued)
January 31, 2021 (Unaudited)
Principal
Value | | Description | | Stated
Coupon | | Stated
Maturity | | Value |
| MUNICIPAL BONDS (Continued) |
| | | Florida (Continued) | | | | | | |
| $230,000 | | Parkway Ctr FL Cdd Spl Assmnt Rev Ref Assmt Area, Ser 1
| | 3.50% | | 05/01/22 | | $235,141 |
| 160,000 | | Rhodine Road North CDD FL Spl Assmnt
| | 3.50% | | 05/01/24 | | 163,936 |
| 385,000 | | Sarasota National FL Cdd Spl Assmnt Ref
| | 3.00% | | 05/01/23 | | 397,971 |
| 375,000 | | Sarasota National FL Cdd Spl Assmnt Ref
| | 3.00% | | 05/01/24 | | 390,090 |
| 240,000 | | Sarasota National FL Cdd Spl Assmnt Ref
| | 3.00% | | 05/01/25 | | 250,020 |
| 50,000 | | Vlg FL CDD #6 Spl Assmnt Rev Ref
| | 4.00% | | 05/01/25 | | 55,974 |
| 310,000 | | W Vlgs FL Impt Dist Spl Assmt Unit Dev #7 Master Infrastructure
| | 4.00% | | 05/01/24 | | 319,266 |
| | | | | 6,018,444 |
| | | Georgia – 3.8% | | | | | | |
| 100,000 | | Burke Cnty GA Dev Auth Poll Control Rev Var GA Pwr Co Plant Vogtle Proj (Mandatory put 06/13/24)
| | 2.15% | | 10/01/32 | | 105,177 |
| 600,000 | | GA St Muni Gas Auth Ref Gas Portfolio III, Ser S
| | 5.00% | | 10/01/23 | | 647,046 |
| 175,000 | | Gainesville & Hall Cnty GA Hosp Auth Ref Northeast GA Hlth System Inc Proj, Ser A
| | 5.00% | | 02/15/24 | | 198,800 |
| 175,000 | | Glynn Brunswick GA Memorial Hosp Auth Ref Antic Ctfs Southeast GA Hlth
| | 5.00% | | 08/01/23 | | 193,461 |
| 715,000 | | Madison Cnty GA Sch Dist Ref, COPS
| | 4.00% | | 05/01/25 | | 812,862 |
| 45,000 | | Main Street Nat Gas Inc GA Gas Rev, Ser A
| | 5.50% | | 09/15/23 | | 51,009 |
| 830,000 | | Main Street Nat Gas Inc GA Gas Rev, Ser B
| | 5.00% | | 03/15/22 | | 873,343 |
| 240,000 | | Main Street Nat Gas Inc GA Gas Sply Rev, Ser A
| | 5.00% | | 05/15/25 | | 284,246 |
| | | | | 3,165,944 |
| | | Hawaii – 0.2% | | | | | | |
| 25,000 | | HI St, Ser Fb
| | 5.00% | | 04/01/21 | | 25,203 |
| 100,000 | | Honolulu City & Cnty HI Wstwtr Sys Rev Ref Sr First Bd Resolution, Ser B
| | 4.00% | | 07/01/32 | | 113,420 |
| | | | | 138,623 |
| | | Illinois – 6.4% | | | | | | |
| 400,000 | | Chicago IL Brd of Edu Ref, Ser C
| | 5.00% | | 12/01/22 | | 431,212 |
| 50,000 | | Chicago IL Brd of Edu Ref, Ser F
| | 5.00% | | 12/01/21 | | 50,179 |
| 50,000 | | Chicago IL Ref Proj, Ser A
| | 5.00% | | 01/01/27 | | 55,212 |
| 100,000 | | Chicago IL Ref, 2003B
| | 5.13% | | 01/01/27 | | 114,425 |
| 25,000 | | Chicago IL Ref, Ser C
| | 5.00% | | 01/01/26 | | 29,402 |
| 65,000 | | Chicago IL Ref, Ser C, CABS
| | (c) | | 01/01/25 | | 59,824 |
| 160,000 | | Hillside IL Tax Incr Rev Ref
| | 5.00% | | 01/01/24 | | 165,962 |
| 250,000 | | IL St
| | 5.00% | | 03/01/22 | | 261,572 |
| 395,000 | | IL St
| | 5.00% | | 05/01/23 | | 431,170 |
| 105,000 | | IL St
| | 5.00% | | 05/01/24 | | 118,243 |
| 85,000 | | IL St
| | 4.00% | | 01/01/31 | | 92,911 |
| 195,000 | | IL St Fin Auth Hlth Svcs Facs Lease Rev Univ Of IL Hlth Svcs Facility Proj
| | 5.00% | | 10/01/24 | | 223,573 |
| 50,000 | | IL St Ref
| | 5.00% | | 08/01/21 | | 51,093 |
| 70,000 | | IL St, Ser A
| | 5.25% | | 05/01/22 | | 73,914 |
| 100,000 | | IL St, Ser A
| | 4.00% | | 01/01/24 | | 102,797 |
| 15,000 | | IL St, Ser A
| | 4.00% | | 01/01/25 | | 15,397 |
| 700,000 | | IL St, Ser C
| | 5.00% | | 11/01/29 | | 830,606 |
| 210,000 | | IL St, Ser D
| | 5.00% | | 11/01/23 | | 230,168 |
| 60,000 | | IL St, Ser D
| | 5.00% | | 11/01/24 | | 67,615 |
| 700,000 | | Macon Cnty IL Sch Dist #61, AGM
| | 4.00% | | 12/01/25 | | 804,643 |
| 75,000 | | Railsplitter IL Tobacco Settlement Auth
| | 5.25% | | 06/01/21 | | 76,218 |
| 540,000 | | Springfield IL Elec Rev Ref Sr Lien
| | 5.00% | | 03/01/31 | | 629,764 |
See Notes to Financial Statements
Page 11
First Trust Short Duration Managed Municipal ETF (FSMB)
Portfolio of Investments (Continued)
January 31, 2021 (Unaudited)
Principal
Value | | Description | | Stated
Coupon | | Stated
Maturity | | Value |
| MUNICIPAL BONDS (Continued) |
| | | Illinois (Continued) | | | | | | |
| $365,000 | | Univ Of IL IL Ref Auxiliary Facs Sys, Ser A
| | 5.00% | | 04/01/22 | | $383,203 |
| | | | | 5,299,103 |
| | | Indiana – 1.4% | | | | | | |
| 125,000 | | IN Bond Bank Rev Hamilton Co Projs, CABS
| | (c) | | 01/15/26 | | 120,908 |
| 215,000 | | IN St Bond Bank Spl Program Gas Rev, Ser A
| | 5.25% | | 10/15/21 | | 221,736 |
| 100,000 | | La Porte IN Wtrwks Rev, AGM
| | 4.00% | | 01/01/24 | | 109,262 |
| 105,000 | | La Porte IN Wtrwks Rev, AGM
| | 4.00% | | 07/01/24 | | 116,312 |
| 545,000 | | Merrillville IN Conservancy Dist
| | 3.00% | | 01/15/23 | | 571,552 |
| | | | | 1,139,770 |
| | | Kentucky – 2.2% | | | | | | |
| 240,000 | | KY St Econ Dev Fin Auth Hlth Sys Rev Norton Healthcare Inc, Ser B, NATL-RE
| | (c) | | 10/01/25 | | 226,090 |
| 250,000 | | KY St Econ Dev Fin Auth Ref Hosp Rev Owensboro Hlth Inc Oblig Grp, Ser B
| | 5.00% | | 06/01/21 | | 252,465 |
| 20,000 | | KY St Econ Dev Fin Auth Ref Owensboro Hlth, Ser A
| | 5.00% | | 06/01/25 | | 22,491 |
| 355,000 | | KY St Hgr Edu Student Loan Corp Sr, Ser A, AMT
| | 5.00% | | 06/01/26 | | 423,760 |
| 255,000 | | KY St Pub Energy Auth Gas Sply Rev Gas Sply, Ser B (Mandatory put 01/01/25)
| | 4.00% | | 01/01/49 | | 287,109 |
| 350,000 | | KY St Pub Energy Auth Gas Sply Rev Gas Sply, Ser C-1
| | 4.00% | | 12/01/21 | | 360,615 |
| 75,000 | | KY St Pub Energy Auth Gas Sply Rev, Ser A (Mandatory put 06/01/26)
| | 4.00% | | 12/01/50 | | 87,699 |
| 105,000 | | KY St Pub Energy Auth Gas Sply Rev, Ser A-1 (Mandatory put 06/01/25)
| | 4.00% | | 12/01/49 | | 120,056 |
| | | | | 1,780,285 |
| | | Louisiana – 2.0% | | | | | | |
| 455,000 | | New Orleans LA Aviation Brd, Ser B, AMT
| | 5.00% | | 01/01/31 | | 520,693 |
| 150,000 | | New Orleans LA Wtr Rev Wtr Rev
| | 5.00% | | 12/01/26 | | 179,769 |
| 350,000 | | New Orleans LA Wtr Rev Wtr Rev
| | 5.00% | | 12/01/28 | | 416,454 |
| 500,000 | | Saint John the Baptist Parish LA Rev Var Ref Marathon Oil Corp Proj, Subser 2017B-1 (Mandatory put 07/01/24)
| | 2.13% | | 06/01/37 | | 515,255 |
| | | | | 1,632,171 |
| | | Maryland – 0.7% | | | | | | |
| 115,000 | | Harford Cnty MD Spl Oblg Ref Beechtree Estates Proj
| | 4.00% | | 07/01/23 | | 124,161 |
| 300,000 | | Harford Cnty MD Spl Oblg Ref Beechtree Estates Proj
| | 4.00% | | 07/01/24 | | 332,748 |
| 100,000 | | Maryland St Hlth & Hgr Eductnl Facs Auth Rev Ref Stevenson Univ Proj, Ser A
| | 5.00% | | 06/01/28 | | 125,179 |
| | | | | 582,088 |
| | | Massachusetts – 2.4% | | | | | | |
| 350,000 | | MA St Clg Bldg Auth, Ser A
| | 5.00% | | 05/01/28 | | 388,234 |
| 100,000 | | MA St Dev Fin Agy Rev Ref Milford Regl Med Ctr, Ser G (a)
| | 5.00% | | 07/15/21 | | 101,595 |
| 200,000 | | MA St Dev Fin Agy Rev Umass Darthmouth Student Hsg Proj
| | 5.00% | | 10/01/21 | | 201,838 |
| 575,000 | | MA St Eductnl Fing Auth, Ser B, AMT
| | 5.00% | | 07/01/24 | | 661,106 |
| 500,000 | | MA St Eductnl Fing Auth, Ser B, AMT
| | 5.00% | | 07/01/25 | | 594,080 |
| | | | | 1,946,853 |
| | | Michigan – 3.5% | | | | | | |
| 70,000 | | Detroit MI Downtown Dev Auth Tax Incr Rev Ref Catalyst Dev Proj, Ser A, AGM
| | 5.00% | | 07/01/30 | | 79,945 |
| 100,000 | | Great Lakes MI Wtr Auth Wtr Sply Sys Rev Sr Lien Bond, Ser A
| | 5.00% | | 07/01/25 | | 119,684 |
Page 12
See Notes to Financial Statements
First Trust Short Duration Managed Municipal ETF (FSMB)
Portfolio of Investments (Continued)
January 31, 2021 (Unaudited)
Principal
Value | | Description | | Stated
Coupon | | Stated
Maturity | | Value |
| MUNICIPAL BONDS (Continued) |
| | | Michigan (Continued) | | | | | | |
| $575,000 | | Kalamazoo MI Econ Dev Corp Heritage Cmnty of Kalamazoo Revel Creek Proj Temps 60, Ser B2
| | 2.63% | | 05/15/25 | | $577,421 |
| 300,000 | | MI St Fin Auth Rev Ref Beaumont Hlth Credit Grp
| | 5.00% | | 08/01/28 | | 345,798 |
| 100,000 | | MI St Fin Auth Rev Ref Hosp Beaumont Hlth Credit Grp
| | 5.00% | | 11/01/21 | | 103,367 |
| 150,000 | | MI St Fin Auth Rev Ref Loc Govt Loan Program Great Lakes Wtr Auth, Ser D-1, AGM
| | 5.00% | | 07/01/28 | | 178,224 |
| 935,000 | | MI St Fin Auth Rev Ref Loc Govt Loan Program Great Lakes Wtr Auth, Ser D2, AGM
| | 5.00% | | 07/01/28 | | 1,072,613 |
| 250,000 | | MI St Fin Auth Rev Sr Lien Great Lakes Wtr Auth, Ser C-3, AGM
| | 5.00% | | 07/01/27 | | 287,070 |
| 90,000 | | MI St Hosp Fin Auth Ref Mclaren Healthcare, Ser A
| | 5.00% | | 06/01/24 | | 95,610 |
| | | | | 2,859,732 |
| | | Missouri – 1.1% | | | | | | |
| 350,000 | | MO St Hlth & Eductnl Facs Auth Hlth Facs Rev Ref Saint Lukes Hlth Sys Inc
| | 4.00% | | 11/15/33 | | 396,645 |
| 500,000 | | Saint Louis MO Gen Fnd Rev Trans
| | 2.00% | | 06/01/21 | | 503,030 |
| | | | | 899,675 |
| | | Montana – 0.4% | | | | | | |
| 150,000 | | MT St Fac Fin Auth Hlth Care Facs Rev MT Children’s Home and Hosp Proj, Ser A
| | 4.00% | | 07/01/24 | | 162,825 |
| 155,000 | | MT St Fac Fin Auth Hlth Care Facs Rev MT Children’s Home and Hosp Proj, Ser A
| | 4.00% | | 07/01/25 | | 171,371 |
| | | | | 334,196 |
| | | Nebraska – 1.6% | | | | | | |
| 420,000 | | Centrl Plains Energy Proj NE Gas Proj Rev Proj #3
| | 5.00% | | 09/01/22 | | 450,475 |
| 150,000 | | Centrl Plains Energy Proj NE Gas Proj Rev Proj #3
| | 5.25% | | 09/01/37 | | 160,808 |
| 70,000 | | Centrl Plains Energy Proj NE Gas Proj Rev Proj No. 4
| | 5.00% | | 01/01/24 | | 79,321 |
| 175,000 | | Centrl Plains Energy Proj NE Gas Proj Rev Proj No. 4 (Mandatory put 01/01/24)
| | 5.00% | | 03/01/50 | | 196,866 |
| 330,000 | | Centrl Plains Energy Proj NE Gas Proj Rev Ref Proj #3, Ser A
| | 5.00% | | 09/01/26 | | 404,616 |
| | | | | 1,292,086 |
| | | Nevada – 2.5% | | | | | | |
| 500,000 | | Clark Cnty NV Sch Dist Ref Bldg, Ser A, BAM
| | 5.00% | | 06/15/30 | | 621,070 |
| 410,000 | | Las Vegas NV Redev Agy Tax Incr Rev Ref
| | 4.00% | | 06/15/21 | | 415,010 |
| 330,000 | | Las Vegas NV Spl Impt Dist #808 & #810 Ref
| | 5.00% | | 06/01/28 | | 361,020 |
| 125,000 | | Reno NV Capital Impt Rev Ref, Ser A-1, AGM
| | 5.00% | | 06/01/25 | | 147,452 |
| 500,000 | | Yerington NV USDA Interim Debs
| | 1.63% | | 11/01/23 | | 506,835 |
| | | | | 2,051,387 |
| | | New Hampshire – 0.3% | | | | | | |
| 220,000 | | National Fin Auth NH Sr Living Rev Ref Springpoint Sr Living
| | 4.00% | | 01/01/24 | | 240,616 |
| | | New Jersey – 6.7% | | | | | | |
| 1,100,000 | | Middlesex Cnty NJ Ref Civic Square IV Redev, COPS
| | 5.00% | | 10/15/31 | | 1,298,792 |
| 1,500,000 | | Newark NJ Prom Nts
| | 3.50% | | 07/27/21 | | 1,521,645 |
| 1,000,000 | | NJ St Covid-19 Go Emergency Bonds, Ser A
| | 5.00% | | 06/01/25 | | 1,193,280 |
| 110,000 | | NJ St Econ Dev Auth Rev Ref Sch Facs Constr, Ser PP
| | 3.50% | | 06/15/27 | | 118,280 |
| 275,000 | | NJ St Econ Dev Auth Rev Ref Sch Facs Construction, Ser NN
| | 5.00% | | 03/01/29 | | 299,148 |
| 50,000 | | NJ St Transprtn Trust Fund Auth Cap Apprec Transprtn Sys, Ser C, AMBAC
| | (c) | | 12/15/25 | | 47,513 |
| 45,000 | | NJ St Transprtn Trust Fund Auth Fed Hwy Reimbursement Nts, Ser A-1, GARVEE
| | 5.00% | | 06/15/27 | | 54,402 |
See Notes to Financial Statements
Page 13
First Trust Short Duration Managed Municipal ETF (FSMB)
Portfolio of Investments (Continued)
January 31, 2021 (Unaudited)
Principal
Value | | Description | | Stated
Coupon | | Stated
Maturity | | Value |
| MUNICIPAL BONDS (Continued) |
| | | New Jersey (Continued) | | | | | | |
| $45,000 | | NJ St Transprtn Trust Fund Auth Ref Fed Highway Reimbursement Nts, Ser A, GARVEE
| | 5.00% | | 06/15/21 | | $45,802 |
| 275,000 | | NJ St Transprtn Trust Fund Auth Sys, Ser C
| | 5.25% | | 06/15/32 | | 317,141 |
| 260,000 | | NJ St Transprtn Trust Fund Auth Transprtn Program, Ser AA
| | 5.00% | | 06/15/22 | | 276,315 |
| 160,000 | | NJ St Transprtn Trust Fund Auth Transprtn Program, Ser AA
| | 5.00% | | 06/15/25 | | 183,459 |
| 150,000 | | NJ St Transprtn Trust Fund Auth Transprtn Sys, Ser A
| | 5.00% | | 06/15/22 | | 152,681 |
| | | | | 5,508,458 |
| | | New York – 7.9% | | | | | | |
| 785,000 | | Met Transprtn Auth NY Rev Transprtn, Subser C-2, BANS
| | 5.00% | | 09/01/21 | | 803,447 |
| 750,000 | | Met Transprtn Auth NY Rev, Ser A-2S, BANS
| | 4.00% | | 02/01/22 | | 772,343 |
| 305,000 | | Met Transprtn Auth NY Rev, Ser D-1, BANS
| | 5.00% | | 09/01/22 | | 324,297 |
| 1,000,000 | | NY NY Adj Fiscal 2020, Subser B-3 (b)
| | 0.30% | | 10/01/46 | | 1,000,000 |
| 125,000 | | NY NY, Ser G
| | 4.00% | | 08/01/29 | | 137,645 |
| 460,000 | | NY NY, Ser J
| | 5.00% | | 08/01/21 | | 471,247 |
| 250,000 | | NY NY, Subser F-1
| | 5.00% | | 03/01/27 | | 274,408 |
| 255,000 | | NY St Dorm Auth St Personal Income Tax Rev, Ser B
| | 5.00% | | 03/15/30 | | 268,168 |
| 200,000 | | NY St Transprtn Dev Corpspl Fac Rev Rev Ref Terminal 4 JFK Intl Arpt Proj, Ser C
| | 5.00% | | 12/01/24 | | 233,366 |
| 125,000 | | NY St Transprtn Dev Corpspl Fac Rev Rev Ref Terminal 4 JFK Intl Arpt Proj, Ser C
| | 5.00% | | 12/01/25 | | 150,490 |
| 15,000 | | Port Auth of New York & New Jersey NY Consol One Hundred Eighty Fifth Ref, AMT
| | 5.00% | | 09/01/23 | | 16,810 |
| 855,000 | | Port Auth of NY & NJ NY Ref, Ser 223, AMT
| | 5.00% | | 07/15/25 | | 1,025,658 |
| 1,000,000 | | Suffolk Cnty NY, Ser I, TANS
| | 2.00% | | 07/22/21 | | 1,008,020 |
| | | | | 6,485,899 |
| | | North Dakota – 1.2% | | | | | | |
| 500,000 | | Horace ND Ref & Impt, Ser A
| | 1.90% | | 08/01/22 | | 500,470 |
| 460,000 | | Williston ND Cnty Wide Pub Safety Sales Tax Rev Ref, Ser A
| | 5.00% | | 07/15/22 | | 486,675 |
| | | | | 987,145 |
| | | Ohio – 0.6% | | | | | | |
| 500,000 | | OH St Air Quality Dev Auth Ref American Elec Pwr Company Proj, Ser B, AMT (Mandatory put 10/01/24)
| | 2.10% | | 07/01/28 | | 526,295 |
| | | Oklahoma – 1.5% | | | | | | |
| 700,000 | | OK St Dev Fin Auth Gilcrease Expressway West Proj P3 Proj, AMT
| | 1.63% | | 07/06/23 | | 701,820 |
| 495,000 | | Oklahoma City OK Arpt Trust Junior Lien, AMT
| | 5.00% | | 07/01/22 | | 524,457 |
| | | | | 1,226,277 |
| | | Oregon – 0.6% | | | | | | |
| 500,000 | | Clackamas Cnty OR Hosp Fac Auth Rev Ref Temps 50 Rose Villa Proj, Ser B2
| | 2.75% | | 11/15/25 | | 505,135 |
| | | Pennsylvania – 7.1% | | | | | | |
| 280,000 | | Cumberland Cnty PA Muni Auth Ref Messiah Vlg Proj
| | 4.00% | | 07/01/22 | | 288,677 |
| 295,000 | | Cumberland Cnty PA Muni Auth Ref Messiah Vlg Proj
| | 5.00% | | 07/01/23 | | 316,907 |
| 90,000 | | E Hempfield Twp PA Indl Dev Auth Ref Willow Vly Cmntys Proj
| | 5.00% | | 12/01/24 | | 103,244 |
| 90,000 | | E Hempfield Twp PA Indl Dev Auth Ref Willow Vly Cmntys Proj
| | 5.00% | | 12/01/28 | | 104,910 |
| 500,000 | | Lancaster PA Ref, BAM
| | 5.00% | | 05/01/25 | | 595,555 |
| 255,000 | | Lehigh Cnty PA Gen Purpose Auth Revs Ref Lehigh Carbon Cmnty Clg, Ser 2016, BAM
| | 5.00% | | 11/01/26 | | 314,022 |
| 245,000 | | Monroeville PA Fin Auth Upmc Rev
| | 5.00% | | 02/15/30 | | 262,601 |
| 100,000 | | Montgomery Cnty PA Indl Dev Auth Acts Retmnt Life Cmntys Ref
| | 5.00% | | 11/15/23 | | 106,296 |
Page 14
See Notes to Financial Statements
First Trust Short Duration Managed Municipal ETF (FSMB)
Portfolio of Investments (Continued)
January 31, 2021 (Unaudited)
Principal
Value | | Description | | Stated
Coupon | | Stated
Maturity | | Value |
| MUNICIPAL BONDS (Continued) |
| | | Pennsylvania (Continued) | | | | | | |
| $200,000 | | Montgomery Cnty PA Indl Dev Auth Ref Meadowood Sr Living Proj, Ser A
| | 3.00% | | 12/01/21 | | $202,580 |
| 345,000 | | Montgomery Cnty PA Indl Dev Auth Ref Meadowood Sr Living Proj, Ser A
| | 4.00% | | 12/01/22 | | 360,639 |
| 400,000 | | Northampton Cnty PA Gen Purpose Auth Clg Rev Ref Moravian Clg
| | 5.00% | | 10/01/25 | | 452,408 |
| 210,000 | | Northampton Cnty PA Gen Purpose Auth Clg Rev Ref Moravian Clg
| | 5.00% | | 10/01/27 | | 240,904 |
| 495,000 | | PA St Hsg Fin Agy SF Mtge Rev Non Ace, Ser 123B
| | 3.45% | | 10/01/32 | | 541,268 |
| 100,000 | | PA St Turnpike Commn Turnpike Rev Sub, Ser A
| | 5.00% | | 12/01/21 | | 103,784 |
| 570,000 | | Philadelphia PA Auth for Indl Dev Chrt Sch Rev Ref String Theory Chrt Sch Proj (a)
| | 5.00% | | 06/15/24 | | 638,098 |
| 300,000 | | Philadelphia PA Auth for Indl Dev Chrt Sch Rev Ref String Theory Chrt Sch Proj (a)
| | 5.00% | | 06/15/25 | | 344,790 |
| 35,000 | | Philadelphia PA Ref, Ser A
| | 5.00% | | 08/01/27 | | 44,370 |
| 475,000 | | Scranton PA Sch Dist Ref, Ser D
| | 5.00% | | 06/01/27 | | 562,096 |
| 250,000 | | Westmoreland Cnty PA Indl Dev Auth Hlth Sys Rev Ref Excela Hlth Proj, Ser A
| | 4.00% | | 07/01/21 | | 253,077 |
| | | | | 5,836,226 |
| | | Puerto Rico – 1.0% | | | | | | |
| 433,000 | | Puerto Rico Sales Tax Fing Corp Sales Tax Rev Restructured, Ser A-1, CABS
| | (c) | | 07/01/24 | | 412,506 |
| 328,000 | | Puerto Rico Sales Tax Fing Corp Sales Tax Rev Restructured, Ser A-1, CABS
| | (c) | | 07/01/27 | | 295,597 |
| 168,000 | | Puerto Rico Sales Tax Fing Corp Sales Tax Rev Restructured, Ser A-1, CABS
| | (c) | | 07/01/29 | | 143,501 |
| | | | | 851,604 |
| | | Rhode Island – 0.5% | | | | | | |
| 370,000 | | RI St Hlth & Eductnl Bldg Corp Pub Schs Rev Ref Providence Pub Bldg Auth, AGM
| | 5.00% | | 05/15/28 | | 435,464 |
| | | Tennessee – 1.6% | | | | | | |
| 920,000 | | TN St Energy Acquisition Corp Gas Rev Proj, Ser A (Mandatory put 05/01/23)
| | 4.00% | | 05/01/48 | | 990,077 |
| 215,000 | | TN St Energy Acquisition Corp Gas Rev, Ser A
| | 5.25% | | 09/01/26 | | 265,744 |
| 50,000 | | TN St Energy Acquisition Corp Gas Rev, Ser C
| | 5.00% | | 02/01/21 | | 50,000 |
| | | | | 1,305,821 |
| | | Texas – 9.0% | | | | | | |
| 175,000 | | Bexar Cnty TX Hlth Facs Dev Corp Ref Army Retmnt Residence Fndtn Proj
| | 5.00% | | 07/15/21 | | 177,320 |
| 125,000 | | Bexar Cnty TX Hlth Facs Dev Corp Ref Army Retmnt Residence Fndtn Proj
| | 5.00% | | 07/15/23 | | 133,404 |
| 240,000 | | Brazoria Cnty TX Ref
| | 5.00% | | 03/01/27 | | 295,270 |
| 295,000 | | Celina TX Spl Assmt Rev Ref The Lakes at Mustang Ranch Pub Impt Dt Phase #1 Proj, BAM
| | 4.00% | | 09/01/24 | | 325,167 |
| 35,000 | | Clifton TX Hgr Edu Fin Corp Edu Rev Idea Pub Sch, Ser B
| | 5.00% | | 08/15/24 | | 39,958 |
| 150,000 | | Dallas TX Ref
| | 5.00% | | 02/15/27 | | 170,643 |
| 485,000 | | Garland TX Elec Utility Sys Rev Ref, Ser A
| | 5.00% | | 03/01/21 | | 486,882 |
| 380,000 | | Harris Cnty TX Cultural Edu Facs Fin Corp Med Facs Rev Ref Baylor Clg of Med
| | 5.00% | | 11/15/23 | | 423,594 |
| 250,000 | | Harris Cnty TX Muni Utility Dist #105, BAM
| | 2.00% | | 03/01/21 | | 250,325 |
See Notes to Financial Statements
Page 15
First Trust Short Duration Managed Municipal ETF (FSMB)
Portfolio of Investments (Continued)
January 31, 2021 (Unaudited)
Principal
Value | | Description | | Stated
Coupon | | Stated
Maturity | | Value |
| MUNICIPAL BONDS (Continued) |
| | | Texas (Continued) | | | | | | |
| $1,275,000 | | Houston TX Arpt Sys Rev Ref United Airls Inc Terminal Improv Proj, Ser B-2, AMT
| | 5.00% | | 07/15/27 | | $1,476,169 |
| 200,000 | | Houston TX Hgr Edu Fin Corp Edu Rev Ref Harmony Pub Schs, Ser A
| | 5.00% | | 02/15/22 | | 209,674 |
| 435,000 | | Lower Colorado River TX Auth Transmission Contract Rev Ref
| | 5.00% | | 05/15/23 | | 482,128 |
| 500,000 | | Matagorda Cnty TX Nav Dist #1 Var Rev Cent Pwr & Lt Ref, AMT (Mandatory put 09/01/23)
| | 0.90% | | 05/01/30 | | 504,595 |
| 275,000 | | Mclendon Chisholm TX Spl Assmnt Rev Ref Sonoma Pub Impt Dt Phase 1 Proj, BAM
| | 4.00% | | 09/15/24 | | 303,303 |
| 200,000 | | Mesquite TX Indep Sch Dist Ref, Ser A
| | 5.00% | | 08/15/27 | | 250,218 |
| 450,000 | | N TX St Muni Wtr Dist Upper Efork Wstwtr Intercpt Ref & Impt
| | 6.25% | | 06/01/23 | | 513,886 |
| 120,000 | | New Hope Cultural Ed Facs Fin Corp TX Retmnt Fac Rev Ref Wesleyan Homes Inc Proj Fin Corp
| | 3.00% | | 01/01/24 | | 119,666 |
| 160,000 | | Oak Point TX Spl Assmnt Rev Wildridge Pub Impt Dist #1 Impt Area #2 Proj Accd Inv (a)
| | 3.50% | | 09/01/23 | | 165,658 |
| 85,000 | | Sa Energy Acquisition Pub Fac Corp TX Gas Sply Rev Gas Sply Rev
| | 5.50% | | 08/01/25 | | 103,035 |
| 85,000 | | SA Energy Acquisition Pub Fac Corp TX Gas Sply Rev Gas Sply Rev
| | 5.50% | | 08/01/21 | | 87,212 |
| 50,000 | | San Antonio TX Tax Nts
| | 5.00% | | 08/01/21 | | 51,233 |
| 300,000 | | TX St Muni Gas Acquisition & Sply Corp III Gas Sply Rev Ref
| | 5.00% | | 12/15/24 | | 350,451 |
| 500,000 | | TX St Pub Fin Auth Ref Sthrn Univ Fing Sys, BAM
| | 5.00% | | 11/01/21 | | 514,540 |
| | | | | 7,434,331 |
| | | Utah – 0.3% | | | | | | |
| 100,000 | | UT Cnty UT Hosp Rev Ihc Hlth Svcs Inc
| | 5.00% | | 05/15/23 | | 101,401 |
| 135,000 | | UT St Chrt Sch Fin Auth Chrt Sch Rev Ref Spectrum Academy Proj
| | 4.00% | | 04/15/24 | | 148,913 |
| | | | | 250,314 |
| | | Vermont – 0.5% | | | | | | |
| 140,000 | | Burlington VT, Ser B
| | 5.00% | | 11/01/21 | | 145,036 |
| 250,000 | | VT St Econ Dev Auth Mtge Rev Wake Robin Corp Proj
| | 5.00% | | 05/01/21 | | 251,397 |
| | | | | 396,433 |
| | | Washington – 2.3% | | | | | | |
| 1,000,000 | | Energy NW WA Elec Rev Ref Columbia Generating, Ser A
| | 5.00% | | 07/01/21 | | 1,020,140 |
| 600,000 | | King Cnty WA Swr Rev Sub (Mandatory put 12/01/21)
| | 2.60% | | 01/01/43 | | 601,218 |
| 150,000 | | Seattle WA Wtr Sys Rev Ref & Impt
| | 5.00% | | 05/01/28 | | 178,597 |
| 105,000 | | Tobacco Settlement Auth WA Tobacco Settlement Rev Ref
| | 5.00% | | 06/01/23 | | 116,922 |
| | | | | 1,916,877 |
| | | West Virginia – 0.6% | | | | | | |
| 500,000 | | WV St Econ Dev Auth Sol Wst Disp Facs Var Sr Arch Resources Proj, AMT (Mandatory put 07/01/25)
| | 5.00% | | 07/01/45 | | 521,800 |
| | | Wisconsin – 3.8% | | | | | | |
| 185,000 | | Pub Fin Auth WI Eductnl Rev Piedmont Cmnty Chrt Sch
| | 5.00% | | 06/15/25 | | 214,532 |
| 425,000 | | Pub Fin Auth WI Rev Roseman Univ Of Hlth Sciences Proj (a)
| | 3.00% | | 04/01/25 | | 436,449 |
| 1,435,000 | | Tender Option Bond Trust Receipts / Ctfs Various States Floaters, Ser 2020-XF2887 (a) (b)
| | 0.29% | | 06/15/38 | | 1,435,000 |
| 395,000 | | WI St Hlth & Eductnl Facs Auth Rev Ref Ascension Hlth Credit Grp, Ser A
| | 5.00% | | 11/15/36 | | 477,978 |
Page 16
See Notes to Financial Statements
First Trust Short Duration Managed Municipal ETF (FSMB)
Portfolio of Investments (Continued)
January 31, 2021 (Unaudited)
Principal
Value | | Description | | Stated
Coupon | | Stated
Maturity | | Value |
| MUNICIPAL BONDS (Continued) |
| | | Wisconsin (Continued) | | | | | | |
| $500,000 | | WI St Hlth & Eductnl Facs Auth Rev Ref Marshfield Clinic Hlth Sys Inc, Ser B1 (Mandatory put 02/15/25)
| | 5.00% | | 02/15/52 | | $574,790 |
| | | | | 3,138,749 |
| | | Wyoming – 0.3% | | | | | | |
| 200,000 | | Laramie Cnty WY Hosp Rev Ref Cheyenne Regl Med Ctr Proj
| | 4.00% | | 05/01/26 | | 235,818 |
| | Total Investments – 99.0%
| | 81,615,288 |
| | (Cost $79,540,056) (d) | | |
| | Net Other Assets and Liabilities – 1.0%
| | 825,429 |
| | Net Assets – 100.0%
| | $82,440,717 |
| Futures Contracts | | Position | | Number of
Contracts | | Expiration
Date | | Notional
Value | | Unrealized
Appreciation
(Depreciation)/
Value |
| U.S. Treasury Long Bonds | | Short | | 1 | | Mar 2021 | | $ 168,719 | | $1,813 |
| U.S. Treasury Ultra 10-Year Notes | | Short | | 4 | | Mar 2021 | | 615,312 | | 6,187 |
| Total Futures Contracts | | | | | | | | $784,031 | | $8,000 |
|
| (a) | This security, sold within the terms of a private placement memorandum, is exempt from registration upon resale under Rule 144A under the Securities Act of 1933, as amended, and may be resold in transactions exempt from registration, normally to qualified institutional buyers. Pursuant to procedures adopted by the Trust’s Board of Trustees, this security has been determined to be liquid by First Trust Advisors L.P. (the “Advisor”). Although market instability can result in periods of increased overall market illiquidity, liquidity for each security is determined based on security specific factors and assumptions, which require subjective judgment. At January 31, 2021, securities noted as such amounted to $5,341,205 or 6.5% of net assets. |
| (b) | Variable Rate Demand bond. Interest rate is reset periodically by the agent based on current market conditions. |
| (c) | Zero coupon bond. |
| (d) | Aggregate cost for financial reporting purposes approximates the aggregate cost for federal income tax purposes. As of January 31, 2021, the aggregate gross unrealized appreciation for all investments in which there was an excess of value over tax cost was $2,098,474 and the aggregate gross unrealized depreciation for all investments in which there was an excess of tax cost over value was $15,242. The net unrealized appreciation was $2,083,232. The unrealized amounts presented are inclusive of derivative contracts. |
| AGM | Assured Guaranty Municipal Corp. |
| AMBAC | American Municipal Bond Assurance Corp. |
| AMT | Alternative Minimum Tax |
| BAM | Build America Mutual |
| BANS | Bond Anticipation Notes |
| CABS | Capital Appreciation Bonds |
| COPS | Certificates of Participation |
| GARVEE | Grant Anticipation Revenue Vehicle |
| NATL-RE | National Public Finance Guarantee Corp. |
| TANS | Tax Anticipation Notes |
See Notes to Financial Statements
Page 17
First Trust Short Duration Managed Municipal ETF (FSMB)
Portfolio of Investments (Continued)
January 31, 2021 (Unaudited)
| | Total
Value at
1/31/2021 | Level 1
Quoted
Prices | Level 2
Significant
Observable
Inputs | Level 3
Significant
Unobservable
Inputs |
Municipal Bonds*
| $ 81,615,288 | $ — | $ 81,615,288 | $ — |
Futures Contracts**
| 8,000 | 8,000 | — | — |
Total
| $ 81,623,288 | $ 8,000 | $ 81,615,288 | $— |
| * | See Portfolio of Investments for state and territory breakout. |
| ** | Includes cumulative appreciation/depreciation on futures contracts as reported in the Futures Contracts table. Only the current day’s variation margin is presented on the Statements of Assets and Liabilities. |
Page 18
See Notes to Financial Statements
First Trust Ultra Short Duration Municipal ETF (FUMB)
Portfolio of Investments
January 31, 2021 (Unaudited)
Principal
Value | | Description | | Stated
Coupon | | Stated
Maturity | | Value |
| MUNICIPAL BONDS – 98.3% |
| | | Alabama – 7.0% | | | | | | |
| $1,000,000 | | Black Belt Energy Gas Dist AL Gas Sply Rev, Ser A (Mandatory put 06/01/21)
| | 4.00% | | 07/01/46 | | $1,009,040 |
| 500,000 | | Chatom AL Indl Dev Brd Gulf Opportunity Zone Ref Gulf Opportunity Zone Pwr South Energy Corp Proj, AGM
| | 5.00% | | 08/01/21 | | 510,830 |
| 2,450,000 | | Hlth Care Auth for Baptist Hlth AL Var Ref, Ser B (a)
| | 0.23% | | 11/01/42 | | 2,450,000 |
| 770,000 | | Jefferson Cnty AL Ref Warrants, Ser B
| | 5.00% | | 04/01/21 | | 776,052 |
| 200,000 | | Lower AL Gas Dist Gas Proj Rev Gas Proj, Rev Bonds Proj 2 (Mandatory put 12/01/25)
| | 4.00% | | 12/01/50 | | 231,874 |
| 1,425,000 | | Mizuho Floater Residual Trust Various States Floaters Miz 9024, Ser 2020 (a) (b)
| | 0.44% | | 12/01/48 | | 1,425,000 |
| 700,000 | | Mobile AL Indl Dev Brd Sol Wst Disp Rev Var AL Pwr Barry Plant (a)
| | 0.04% | | 06/01/34 | | 700,000 |
| 325,000 | | SE AL St Gas Sply Dist Gas Sply Rev Proj #2, Ser A
| | 4.00% | | 06/01/23 | | 352,229 |
| 260,000 | | SE AL St Gas Sply Dist Gas Sply Rev Proj #2, Ser A (Mandatory put 06/01/24)
| | 4.00% | | 06/01/49 | | 289,068 |
| | | | | 7,744,093 |
| | | Arizona – 2.7% | | | | | | |
| 1,000,000 | | AZ St Indl Dev Auth Rev Lincoln South Beltway Proj
| | 5.00% | | 05/01/23 | | 1,102,540 |
| 280,000 | | Maricopa Cnty AZ Indl Dev Auth Edu Rev Legacy Traditional Sch Proj
| | 5.00% | | 07/01/22 | | 296,867 |
| 300,000 | | Maricopa Cnty AZ Indl Dev Auth Edu Rev Legacy Traditional Sch Proj
| | 5.00% | | 07/01/23 | | 330,309 |
| 500,000 | | Maricopa Cnty AZ Poll Controlcorp Poll Control Rev Var Ref Pub Svc Co of NM Palo Verde Proj, Ser A (Mandatory put 06/01/22)
| | 1.05% | | 01/01/38 | | 505,230 |
| 750,000 | | Vistancia AZ Cmnty Facs Dist Ref, BAM
| | 3.00% | | 07/15/21 | | 759,255 |
| | | | | 2,994,201 |
| | | California – 3.4% | | | | | | |
| 135,000 | | CA Cnty CA Tobacco Securitization Agy Tobacco Settle Ref Sr Bonds Merced Cnty Tobacco Funding Corp, Ser A
| | 3.00% | | 06/01/21 | | 136,262 |
| 150,000 | | CA Cnty CA Tobacco Securitization Agy Tobacco Settle Sr Ref, Ser A
| | 3.00% | | 06/01/21 | | 151,407 |
| 225,000 | | Cathedral City CA Redev Agy Successor Agy Tax Allocation Rev Ref Sub Hsg Merged Redev Proj Area, Ser C
| | 4.00% | | 08/01/21 | | 228,769 |
| 180,000 | | Cathedral City CA Redev Agy Successor Agy Tax Allocation Rev Ref Sub Hsg Merged Redev Proj Area, Ser C
| | 4.00% | | 08/01/22 | | 188,777 |
| 150,000 | | Golden St Tobacco Securitization Corp CA Tobacco Settlement Ref Enhanced Asset Bkd, Ser A
| | 5.00% | | 06/01/22 | | 159,633 |
| 250,000 | | Golden St Tobacco Securitization Corp CA Tobacco Settlement Ref, Ser A-1
| | 5.00% | | 06/01/22 | | 266,145 |
| 200,000 | | Long Beach CA Bond Fin Auth Nat Gas Purchase Rev, Ser A
| | 5.25% | | 11/15/23 | | 227,590 |
| 180,000 | | Port of Oakland CA Ref Sr Lien, Ser P, AMT
| | 5.00% | | 05/01/26 | | 190,640 |
| 2,200,000 | | Tender Option Bond Trust Receipts / Ctfs Various States Floaters, Ser 2019-XF2835 (a) (b)
| | 0.24% | | 07/01/42 | | 2,200,000 |
| | | | | 3,749,223 |
| | | Colorado – 0.7% | | | | | | |
| 200,000 | | Breckenridge CO Ref, Ser B, COPS
| | 4.00% | | 12/01/21 | | 206,168 |
| 170,000 | | CO St Hlth Facs Auth Hosp Rev Ref Commonspirit Hlth, Ser B-1 (Mandatory put 08/01/25)
| | 5.00% | | 08/01/49 | | 198,931 |
| 100,000 | | Copperleaf CO Met Dist #2 Ref, BAM
| | 4.00% | | 12/01/21 | | 103,041 |
| 200,000 | | Park Creek CO Met Dist Rev Ref Sr Limited Property Tax Supported, Ser A
| | 5.00% | | 12/01/21 | | 207,398 |
See Notes to Financial Statements
Page 19
First Trust Ultra Short Duration Municipal ETF (FUMB)
Portfolio of Investments (Continued)
January 31, 2021 (Unaudited)
Principal
Value | | Description | | Stated
Coupon | | Stated
Maturity | | Value |
| MUNICIPAL BONDS (Continued) |
| | | Colorado (Continued) | | | | | | |
| $100,000 | | Vauxmont Met Dist CO Ref Ltd Tax Conv Unltd Sub, AGM
| | 5.00% | | 12/15/21 | | $103,685 |
| | | | | 819,223 |
| | | Connecticut – 3.3% | | | | | | |
| 3,000,000 | | Capital City CT Econ Dev Auth Pkg & Energy Fee Rev Adj, Ser B (a)
| | 0.16% | | 06/15/34 | | 3,000,000 |
| 150,000 | | CT St Hlth & Eductnl Facs Auth Rev Ref Fairfield Univ Issue, Ser T
| | 5.00% | | 07/01/21 | | 152,888 |
| 165,000 | | CT St Ref, Ser B
| | 5.00% | | 04/15/23 | | 182,196 |
| 55,000 | | CT St, Ser F
| | 5.00% | | 11/15/21 | | 57,108 |
| 170,000 | | Univ Of CT CT Ref, Ser A
| | 5.00% | | 11/01/22 | | 184,130 |
| 100,000 | | Univ Of CT CT Rev, Ser A
| | 4.00% | | 11/15/21 | | 102,983 |
| | | | | 3,679,305 |
| | | Florida – 6.1% | | | | | | |
| 425,000 | | Citizens Property Insurance Corp FL, Ser A1
| | 5.00% | | 06/01/22 | | 442,030 |
| 1,000,000 | | FL St Hsg Fin Corp Mf Mtge Rev Adj Parrish Oaks, Ser A (Mandatory put 02/01/22)
| | 1.25% | | 02/01/23 | | 1,010,650 |
| 445,000 | | Hollywood Beach FL Cmnty Dev Dist Rev Cdd Ref Pub Pkg Fac Proj, Ser I
| | 5.00% | | 10/01/23 | | 498,008 |
| 575,000 | | Jacksonville FL Spl Rev Ref, Ser C
| | 5.00% | | 10/01/21 | | 593,457 |
| 125,000 | | Jacksonville FL Spl Rev, Ser B-1
| | 5.00% | | 10/01/21 | | 129,012 |
| 100,000 | | Jea FL Elec Sys Rev Sub, Ser B
| | 5.00% | | 10/01/21 | | 103,060 |
| 425,000 | | Jea FL Elec Sys Rev Sub, Ser B
| | 5.00% | | 10/01/22 | | 457,385 |
| 280,000 | | Lakewood Ranch FL Stewardship Dist Spl Assmnt Rev Ref Country Club East Proj, AGM
| | 5.00% | | 05/01/21 | | 283,016 |
| 175,000 | | Lakewood Ranch FL Stewardship Dist Spl Assmnt Rev Ref Country Club East Proj, AGM
| | 5.00% | | 05/01/25 | | 205,777 |
| 65,000 | | Miami-Dade Cnty FL Bldg Better Cmntys Prog, Ser A
| | 5.00% | | 07/01/30 | | 66,329 |
| 265,000 | | Miami-Dade Cnty FL Spl Oblig Ref Sub, Ser A
| | 5.00% | | 10/01/27 | | 286,582 |
| 1,100,000 | | Orange Cnty FL Hsg Fin Auth Hsg Willow Key Apts, Ser A (Mandatory put 04/01/21)
| | 1.90% | | 04/01/22 | | 1,103,058 |
| 600,000 | | Orlando & Orange Cnty FL Expressway Auth Ref, Ser B, AGM
| | 5.00% | | 07/01/22 | | 641,442 |
| 115,000 | | Palm Beach Cnty FL Sch Brd Ref, Ser B, COPS
| | 5.00% | | 08/01/21 | | 117,766 |
| 300,000 | | Pembroke Pines FL Capital Impt Rev Ref, AGM
| | 5.00% | | 12/01/21 | | 312,123 |
| 250,000 | | Sarasota National FL Cdd Spl Assmnt Ref
| | 3.00% | | 05/01/21 | | 251,247 |
| 245,000 | | Tampa FL Hosp Rev Ref H. Lee Moffitt Cancer Ctr Proj, Ser B
| | 5.00% | | 07/01/21 | | 249,469 |
| | | | | 6,750,411 |
| | | Illinois – 5.5% | | | | | | |
| 30,000 | | Chicago IL Brd of Edu Cap Apprec Sch Reform, Ser B-1, NATL-RE
| | (c) | | 12/01/22 | | 29,503 |
| 240,000 | | Chicago IL Wtrwks Rev 2nd Lien Proj
| | 5.00% | | 11/01/21 | | 247,915 |
| 1,000,000 | | Cook Cnty IL Ref, Ser A
| | 3.00% | | 11/15/21 | | 1,022,780 |
| 150,000 | | Cook Cnty IL Ref, Ser C
| | 5.00% | | 11/15/23 | | 162,756 |
| 100,000 | | IL St
| | 4.88% | | 05/01/21 | | 101,084 |
| 150,000 | | IL St
| | 5.00% | | 03/01/22 | | 156,943 |
| 125,000 | | IL St
| | 5.00% | | 07/01/22 | | 132,441 |
| 110,000 | | IL St
| | 5.00% | | 05/01/23 | | 120,073 |
| 130,000 | | IL St
| | 4.00% | | 03/01/26 | | 133,851 |
| 1,000,000 | | IL St Dev Fin Auth Sol Wst Disp Rev Wst Mgmt Inc Proj, Ser A, AMT (Mandatory put 11/01/21)
| | 1.60% | | 11/01/44 | | 1,002,610 |
| 180,000 | | IL St Fin Auth Hlth Svcs Facs Lease Rev Univ Of IL Hlth Svcs Fac Proj
| | 5.00% | | 10/01/23 | | 199,616 |
| 2,000,000 | | IL St Fin Auth Rev Var Univ Chicago Med Ctr, Ser A (a)
| | 0.01% | | 08/01/44 | | 2,000,000 |
Page 20
See Notes to Financial Statements
First Trust Ultra Short Duration Municipal ETF (FUMB)
Portfolio of Investments (Continued)
January 31, 2021 (Unaudited)
Principal
Value | | Description | | Stated
Coupon | | Stated
Maturity | | Value |
| MUNICIPAL BONDS (Continued) |
| | | Illinois (Continued) | | | | | | |
| $165,000 | | IL St Ref
| | 5.00% | | 02/01/22 | | $172,088 |
| 200,000 | | IL St, Ser A
| | 5.00% | | 04/01/22 | | 209,914 |
| 125,000 | | IL St, Ser D
| | 5.00% | | 11/01/22 | | 132,849 |
| 170,000 | | Montgomery IL Ref Alt Rev Source
| | 2.63% | | 12/01/21 | | 170,277 |
| 70,000 | | Railsplitter IL Tobacco Settlement Auth
| | 5.38% | | 06/01/21 | | 71,166 |
| | | | | 6,065,866 |
| | | Indiana – 4.8% | | | | | | |
| 500,000 | | Greater Clark IN Bldg Corp
| | 4.00% | | 07/15/21 | | 508,435 |
| 500,000 | | Greater Clark IN Bldg Corp
| | 4.00% | | 01/15/22 | | 517,490 |
| 80,000 | | Greater Clark IN Bldg Corp Greater Clark Sch Corp 1st Mtge Bonds, Ser 2019
| | 4.00% | | 07/15/21 | | 81,350 |
| 170,000 | | Greater Clark IN Bldg Corp Greater Clark Sch Corp 1st Mtge Bonds, Ser 2019
| | 4.00% | | 01/15/22 | | 175,947 |
| 750,000 | | Hamilton IN S Estrn Schs, Ser B
| | 3.00% | | 06/30/21 | | 758,092 |
| 150,000 | | IN St Bond Bank Spl Program Gas Rev, Ser A
| | 5.25% | | 10/15/21 | | 154,699 |
| 1,500,000 | | Indianapolis IN Loc Pub Impt Bond Bank Fieldhouse Proj, Ser C
| | 1.40% | | 06/01/21 | | 1,500,075 |
| 45,000 | | La Porte IN Wtrwks Rev, AGM
| | 4.00% | | 07/01/22 | | 47,059 |
| 100,000 | | La Porte IN Wtrwks Rev, AGM
| | 4.00% | | 07/01/23 | | 107,716 |
| 1,400,000 | | Noblesville IN Multi Sch Bldg Corp Ref 1st Mtge
| | 5.00% | | 07/15/22 | | 1,479,996 |
| | | | | 5,330,859 |
| | | Iowa – 0.9% | | | | | | |
| 1,030,000 | | IA St Fin Auth Midwestern Econ Dev Rev Var Cj Bio Amer Inc Proj (a)
| | 0.14% | | 04/01/22 | | 1,030,000 |
| | | Kansas – 0.3% | | | | | | |
| 50,000 | | Univ Of KS KS Hosp Auth Hlth Facs Rev Ref Univ Of KS Hlth Sys, Ser B
| | 5.00% | | 03/01/21 | | 50,188 |
| 225,000 | | Wyandotte Cnty KS Unif Sch Dist #202, Ser A, AGM
| | 2.00% | | 09/01/21 | | 227,309 |
| | | | | 277,497 |
| | | Kentucky – 0.8% | | | | | | |
| 385,000 | | Ashland KY Med Ctr Rev Ref Ashland Hosp Corp Dba Kings Daughters Med Ctr
| | 5.00% | | 02/01/21 | | 385,000 |
| 150,000 | | KY St Pub Energy Auth Gas Sply Rev Var, Ser C
| | 4.00% | | 08/01/21 | | 152,695 |
| 70,000 | | Lewis Cnty KY Sch Dist Fin Corp, Ser B
| | 2.25% | | 06/01/22 | | 71,111 |
| 300,000 | | Owen Cnty KY Pub Properties Corp 1st Mtge Rev Ref Court Facs Proj
| | 4.00% | | 11/01/21 | | 307,935 |
| | | | | 916,741 |
| | | Louisiana – 2.1% | | | | | | |
| 1,000,000 | | LA St Gas & Fuels Tax Rev Var Ref Second Lien, Ser D-2
| | 0.55% | | 05/01/43 | | 1,000,320 |
| 150,000 | | New Orleans LA Sewage Svc Rev Ref
| | 5.00% | | 06/01/21 | | 152,226 |
| 500,000 | | Saint John the Baptist Parish LA Rev Ref Marathon Oil Corp Proj, Ser A-1 (Mandatory put 04/01/23)
| | 2.00% | | 06/01/37 | | 509,595 |
| 150,000 | | Shreveport LA Wtr & Swr Rev Junior Lien, Ser C, BAM
| | 5.00% | | 12/01/23 | | 167,789 |
| 200,000 | | Shreveport LA Wtr & Swr Rev Ref
| | 5.00% | | 12/01/21 | | 208,066 |
| 255,000 | | Shreveport LA Wtr & Swr Rev Ref, Ser A, BAM
| | 5.00% | | 12/01/22 | | 276,713 |
| | | | | 2,314,709 |
| | | Maryland – 0.2% | | | | | | |
| 100,000 | | Harford Cnty MD Spl Oblg Ref Beechtree Estates Proj
| | 3.00% | | 07/01/21 | | 101,066 |
| 100,000 | | Harford Cnty MD Spl Oblg Ref Beechtree Estates Proj
| | 3.00% | | 07/01/22 | | 103,359 |
| | | | | 204,425 |
See Notes to Financial Statements
Page 21
First Trust Ultra Short Duration Municipal ETF (FUMB)
Portfolio of Investments (Continued)
January 31, 2021 (Unaudited)
Principal
Value | | Description | | Stated
Coupon | | Stated
Maturity | | Value |
| MUNICIPAL BONDS (Continued) |
| | | Massachusetts – 3.9% | | | | | | |
| $1,831,211 | | Blue Hills Regl Tech High Sch Dist MA, BANS
| | 1.00% | | 05/20/21 | | $1,835,258 |
| 750,000 | | Ludlow MA, BANS
| | 1.00% | | 09/23/21 | | 753,960 |
| 150,000 | | MA St Eductnl Fing Auth, Ser B, AMT
| | 5.00% | | 07/01/23 | | 166,301 |
| 1,610,750 | | Randolph MA, BANS
| | 2.00% | | 06/11/21 | | 1,618,449 |
| | | | | 4,373,968 |
| | | Michigan – 0.4% | | | | | | |
| 285,000 | | Detroit MI Wtr Sply Sys Rev Sr Lien, Ser A
| | 5.25% | | 07/01/41 | | 291,119 |
| 100,000 | | Great Lakes MI Wtr Auth Wtr Sply Sys Rev Ref 2nd Lien, Ser A
| | 5.00% | | 07/01/21 | | 102,002 |
| | | | | 393,121 |
| | | Minnesota – 0.9% | | | | | | |
| 1,000,000 | | Brooklyn Ctr MN Mf Hsg Dev Rev Var Sonder House Apartments Proj (Mandatory put 07/01/22)
| | 1.35% | | 01/01/37 | | 1,000,860 |
| | | Mississippi – 0.5% | | | | | | |
| 500,000 | | MS St Business Fin Corp Sol Wst Disp Rev Waste Mgmt Inc Proj (Mandatory put 09/01/21)
| | 1.35% | | 03/01/29 | | 501,045 |
| | | Missouri – 0.9% | | | | | | |
| 1,000,000 | | Saint Louis MO Gen Fnd Rev Trans
| | 2.00% | | 06/01/21 | | 1,006,060 |
| | | Montana – 0.2% | | | | | | |
| 220,000 | | MT Fac Fin Auth Hlth Facs Rev Bozeman Deaconess Hlth Svcs
| | 4.00% | | 06/01/21 | | 222,664 |
| | | Nebraska – 3.1% | | | | | | |
| 300,000 | | Centrl Plains Energy Proj NE Gas Proj Rev Proj #3
| | 5.00% | | 09/01/22 | | 321,768 |
| 295,000 | | Centrl Plains Energy Proj NE Gas Proj Rev Proj #3
| | 5.00% | | 09/01/32 | | 315,095 |
| 410,000 | | Centrl Plains Energy Proj NE Gas Proj Rev Proj #3
| | 5.25% | | 09/01/37 | | 439,541 |
| 100,000 | | Centrl Plains Energy Proj NE Gas Proj Rev Proj No 1, Ser A
| | 5.25% | | 12/01/21 | | 104,094 |
| 125,000 | | Centrl Plains Energy Proj NE Gas Proj Rev Proj No. 4
| | 5.00% | | 01/01/24 | | 141,645 |
| 1,840,000 | | Centrl Plains Energy Proj NE Gas Proj Rev Proj No. 4 (Mandatory put 01/01/24)
| | 5.00% | | 03/01/50 | | 2,069,908 |
| | | | | 3,392,051 |
| | | Nevada – 4.4% | | | | | | |
| 625,000 | | Clark Cnty NV Sch Dist Ref Bldg, Ser A
| | 5.00% | | 06/15/23 | | 691,688 |
| 135,000 | | Clark Cnty NV Sch Dist Ref Ltd Tax, Ser A
| | 5.00% | | 06/15/21 | | 137,376 |
| 100,000 | | Clark Cnty NV Sch Dist Ref, Ser B
| | 5.00% | | 06/15/21 | | 101,760 |
| 160,000 | | Clark Cnty NV Sch Dist Ref, Ser D
| | 5.00% | | 06/15/21 | | 162,816 |
| 800,000 | | Clark Cnty NV Sch Dist Various Purpose Medium Term, Ser F
| | 5.00% | | 06/15/22 | | 832,624 |
| 1,000,000 | | Director of the St of NV Dept of Business & Industry Var Brightline West Passenger Rail Proj, Ser A, AMT (Mandatory put 07/01/21) (b)
| | 0.50% | | 01/01/50 | | 1,000,500 |
| 405,000 | | Las Vegas NV Redev Agy Tax Incr Rev Ref
| | 4.00% | | 06/15/21 | | 409,949 |
| 1,500,000 | | Yerington NV USDA Interim Debs
| | 1.63% | | 11/01/23 | | 1,520,505 |
| | | | | 4,857,218 |
| | | New Jersey – 5.7% | | | | | | |
| 125,000 | | Hamilton Twp NJ Sch Dist, AGM
| | 3.00% | | 07/15/22 | | 129,981 |
| 1,755,000 | | Jersey City NJ Muni Utilities Auth Wtr Proj Notes
| | 3.00% | | 07/01/22 | | 1,820,532 |
| 1,500,000 | | Newark NJ Prom Nts
| | 3.50% | | 07/27/21 | | 1,521,645 |
| 700,000 | | NJ St Covid-19 Go Emergency Bonds, Ser A
| | 4.00% | | 06/01/23 | | 759,157 |
| 100,000 | | NJ St Econ Dev Auth Rev Ref, Ser BBB
| | 5.00% | | 06/15/21 | | 101,741 |
| 55,000 | | NJ St Econ Dev Auth Rev Ref, Ser XX
| | 5.00% | | 06/15/21 | | 55,958 |
Page 22
See Notes to Financial Statements
First Trust Ultra Short Duration Municipal ETF (FUMB)
Portfolio of Investments (Continued)
January 31, 2021 (Unaudited)
Principal
Value | | Description | | Stated
Coupon | | Stated
Maturity | | Value |
| MUNICIPAL BONDS (Continued) |
| | | New Jersey (Continued) | | | | | | |
| $500,000 | | NJ St Hgr Edu Assistance Auth Student Loan Rev Sr Bonds, Ser B, AMT
| | 5.00% | | 12/01/22 | | $542,530 |
| 150,000 | | NJ St Transprtn Trust Fund Auth Ref Fed Highway Reimbursement Nts, Ser A, GARVEE
| | 5.00% | | 06/15/21 | | 152,675 |
| 225,000 | | NJ St Transprtn Trust Fund Auth Transprtn Program, Ser AA
| | 5.00% | | 06/15/23 | | 239,053 |
| 1,000,000 | | Prospect Park NJ, BANS
| | 2.00% | | 11/10/21 | | 1,012,130 |
| | | | | 6,335,402 |
| | | New Mexico – 1.1% | | | | | | |
| 500,000 | | Farmington NM Poll Control Rev Ref Pub Svc Company Proj, Ser B (Mandatory put 06/01/22)
| | 2.13% | | 06/01/40 | | 511,055 |
| 750,000 | | Farmington NM Poll Control Rev Var Ref Pub Svc Co of NM Ser F, AMT (Mandatory put 06/01/22)
| | 1.20% | | 06/01/40 | | 759,465 |
| | | | | 1,270,520 |
| | | New York – 13.0% | | | | | | |
| 285,000 | | Broome Cnty NY, Ser A, BANS
| | 2.00% | | 04/30/21 | | 286,240 |
| 2,000,000 | | Center Moriches NY Union Freesch Dist, TANS
| | 1.50% | | 06/25/21 | | 2,009,340 |
| 600,000 | | Long Beach NY, BAM
| | 2.00% | | 09/15/22 | | 611,172 |
| 190,000 | | Met Transprtn Auth NY Rev Subser, Ser B-2A, BANS
| | 5.00% | | 05/15/21 | | 192,202 |
| 335,000 | | Met Transprtn Auth NY Rev, Ser A-2S, BANS
| | 4.00% | | 02/01/22 | | 344,980 |
| 500,000 | | Met Transprtn Auth NY Rev, Ser B-1, BANS
| | 5.00% | | 05/15/22 | | 525,830 |
| 1,695,000 | | New York City NY Muni Wtr Fin Auth Wtr & Swr Sys Rev Var Gen Resolution Sub FF-1 (a)
| | 0.01% | | 06/15/44 | | 1,695,000 |
| 2,150,000 | | NY NY Adj Fiscal 2020, Subser B-3 (a)
| | 0.30% | | 10/01/46 | | 2,150,000 |
| 1,000,000 | | NY NY Adjustable Fiscal 2017, Subser A-5 (a)
| | 0.01% | | 08/01/44 | | 1,000,000 |
| 300,000 | | NY St Dorm Auth Revs Non St Supported Debt Mount Sinai Hosp, Ser A
| | 5.00% | | 07/01/35 | | 306,030 |
| 1,000,000 | | NY St Dorm Auth St Personal Income Tax Rev Rans Subordinate, Ser B
| | 5.00% | | 03/31/21 | | 1,008,200 |
| 125,000 | | NY St Hsg Fin Agy Affordable Hsg, Ser E
| | 2.13% | | 11/01/23 | | 126,136 |
| 200,000 | | NY St Hsg Fin Agy Sustainability Bonds, Ser N
| | 1.45% | | 05/01/23 | | 201,340 |
| 500,000 | | NY St Mtge Agy Homeowner Mtge Rev, Ser 183, AMT
| | 3.75% | | 04/01/23 | | 530,780 |
| 125,000 | | NY St Mtge Agy Rev Mtge, 55th Ser, AMT
| | 2.65% | | 10/01/23 | | 131,376 |
| 300,000 | | NY St Transprtn Dev Corpspl Fac Rev Rev Ref Terminal 4 JFK Intl Arpt Proj, Ser C
| | 5.00% | | 12/01/21 | | 312,072 |
| 1,000,000 | | Suffolk Cnty NY, Ser I, TANS
| | 2.00% | | 07/22/21 | | 1,008,020 |
| 1,000,000 | | Suffolk Cnty NY, Ser LI, TANS
| | 2.00% | | 08/19/21 | | 1,008,950 |
| 1,012,000 | | Syracuse NY, Ser B, RANS
| | 2.00% | | 07/30/21 | | 1,020,794 |
| | | | | 14,468,462 |
| | | North Dakota – 2.4% | | | | | | |
| 1,000,000 | | Horace ND Ref & Impt, Ser A
| | 1.90% | | 08/01/22 | | 1,000,940 |
| 110,000 | | ND St Hsg Fin Agy Hsg Fin Program Home Mtge Fin Program, Ser A
| | 2.30% | | 01/01/22 | | 111,935 |
| 250,000 | | W Fargo ND Ref, Ser A
| | 2.00% | | 05/01/21 | | 251,093 |
| 350,000 | | W Fargo ND Ref, Ser A
| | 2.00% | | 05/01/22 | | 357,269 |
| 500,000 | | Watford City ND St Aid Ctfs Indebtedness Ref, AGM
| | 3.00% | | 12/01/21 | | 509,590 |
| 440,000 | | Williston ND Cnty Wide Pub Safety Sales Tax Rev Ref, Ser A
| | 5.00% | | 07/15/22 | | 465,516 |
| | | | | 2,696,343 |
| | | Ohio – 1.6% | | | | | | |
| 1,000,000 | | Euclid OH, BANS
| | 2.25% | | 04/29/21 | | 1,004,090 |
| 245,000 | | Montgomery Cnty OH Hosp Rev Ref Kettering Hlth Network Oblig Grp Proj
| | 5.00% | | 08/01/23 | | 273,829 |
See Notes to Financial Statements
Page 23
First Trust Ultra Short Duration Municipal ETF (FUMB)
Portfolio of Investments (Continued)
January 31, 2021 (Unaudited)
Principal
Value | | Description | | Stated
Coupon | | Stated
Maturity | | Value |
| MUNICIPAL BONDS (Continued) |
| | | Ohio (Continued) | | | | | | |
| $500,000 | | OH St Air Quality Dev Auth Ref American Elec Pwr Company Proj, Ser B, AMT (Mandatory put 10/01/24)
| | 2.10% | | 07/01/28 | | $526,295 |
| | | | | 1,804,214 |
| | | Oklahoma – 1.9% | | | | | | |
| 700,000 | | OK St Dev Fin Auth Gilcrease Expressway West Proj P3 Proj, AMT
| | 1.63% | | 07/06/23 | | 701,820 |
| 930,000 | | OK St Dev Fin Auth Var Solid Waste Disp, Ser A
| | 2.38% | | 12/01/21 | | 946,387 |
| 465,000 | | Tulsa OK Arpts Impt Trust Ref, Ser A, AMT, BAM
| | 5.00% | | 06/01/22 | | 491,942 |
| | | | | 2,140,149 |
| | | Pennsylvania – 7.0% | | | | | | |
| 200,000 | | Berks Cnty PA Indl Dev Auth Hlth Sys Rev Ref Tower Hlth Proj
| | 5.00% | | 11/01/22 | | 211,262 |
| 900,000 | | Berks Cnty PA Muni Auth Ref Tower Hlth Proj, Ser A
| | 5.00% | | 02/01/22 | | 926,613 |
| 175,000 | | Hermitage PA Muni Auth Ref, Ser C
| | 2.00% | | 02/01/21 | | 175,000 |
| 165,000 | | Hermitage PA Muni Auth Ref, Ser C
| | 3.00% | | 02/01/22 | | 169,432 |
| 150,000 | | Mckeesport PA Area Sch Dist Ref, Ser A, AGM
| | 3.00% | | 10/01/21 | | 152,000 |
| 1,500,000 | | PA St Econ Dev Fingauth Solid Waste Disposal Rev RePub Svcs Inc Proj, Ser B-1, AMT (Mandatory put 04/15/21)
| | 0.20% | | 04/01/49 | | 1,500,180 |
| 750,000 | | PA St Econ Dev Fingauth Solid Waste Disposal Rev Waste Mgmt Inc Proj, Ser A, AMT (Mandatory put 08/02/21)
| | 0.70% | | 08/01/37 | | 751,950 |
| 235,000 | | PA St Turnpike Commn Oil Franchise Tax Rev Ref Sub, Ser B
| | 5.00% | | 12/01/21 | | 243,993 |
| 160,000 | | Philadelphia PA Ref, Ser A
| | 5.00% | | 07/15/21 | | 163,296 |
| 1,265,000 | | Philadelphia PA Ref, Ser A
| | 5.00% | | 08/01/21 | | 1,293,614 |
| 100,000 | | Philadelphia PA Ref, Ser A
| | 5.00% | | 08/01/21 | | 102,262 |
| 100,000 | | Philadelphia PA Ref, Ser A
| | 5.00% | | 09/15/21 | | 102,817 |
| 1,585,000 | | Philadelphia PA Sch Dist Trans, Ser A
| | 4.00% | | 06/30/21 | | 1,610,772 |
| 210,000 | | Philadelphia PA Wtr & Wstwtr Rev, Ser A
| | 5.13% | | 01/01/43 | | 219,557 |
| 100,000 | | Philadelphia PA, Ser B
| | 5.00% | | 02/01/21 | | 100,000 |
| | | | | 7,722,748 |
| | | Tennessee – 1.7% | | | | | | |
| 100,000 | | Met Govt Nashville & Davidson Cnty TN Hlth & Eductnl Fac Brd Ref Lipscomb Univ Proj, Ser A
| | 5.00% | | 10/01/21 | | 101,946 |
| 100,000 | | Met Nashville TN Arpt Auth Arpt Rev, Ser B, AMT
| | 5.00% | | 07/01/21 | | 101,887 |
| 300,000 | | TN St Energy Acquisition Corp Gas Rev
| | 5.00% | | 11/01/22 | | 324,150 |
| 690,000 | | TN St Energy Acquisition Corp Gas Rev, Ser A
| | 5.25% | | 09/01/22 | | 742,896 |
| 155,000 | | TN St Energy Acquisition Corp Gas Rev, Ser A
| | 5.25% | | 09/01/23 | | 173,848 |
| 50,000 | | TN St Energy Acquisition Corp Gas Rev, Ser C
| | 5.00% | | 02/01/21 | | 50,000 |
| 340,000 | | TN St Energy Acquisition Corp Gas Rev, Ser C
| | 5.00% | | 02/01/23 | | 370,100 |
| | | | | 1,864,827 |
| | | Texas – 4.3% | | | | | | |
| 200,000 | | Bexar Cnty TX Hlth Facs Dev Corp Ref Army Retmnt Residence Fndtn Proj
| | 5.00% | | 07/15/23 | | 213,446 |
| 1,000,000 | | Denton TX Indep Sch Dist Var Sch Bldg, Ser B (a)
| | 0.04% | | 08/01/35 | | 1,000,000 |
| 200,000 | | Gulfgate Redev Auth TX Tax Incr Contract Rev Ref, AGM
| | 4.00% | | 09/01/22 | | 211,332 |
| 500,000 | | Lower Colorado River TX Auth Transmission Contract Rev Ref Lcra Transmission Svcs Corp Proj
| | 5.00% | | 05/15/21 | | 506,960 |
| 265,000 | | Mclendon Chisholm TX Spl Assmnt Rev Ref Sonoma Pub Impt Dt Phase 1 Proj, BAM
| | 4.00% | | 09/15/23 | | 285,699 |
| 130,000 | | Newark Hgr Edu Fin Corp TX Edu Rev The Hughen Ctr Inc, Ser A
| | 4.00% | | 08/15/23 | | 141,497 |
| 350,000 | | TX St Muni Gas Acquisition & Sply Corp Gas Sply Rev Ref, Ser LII
| | 5.00% | | 12/15/21 | | 363,310 |
Page 24
See Notes to Financial Statements
First Trust Ultra Short Duration Municipal ETF (FUMB)
Portfolio of Investments (Continued)
January 31, 2021 (Unaudited)
Principal
Value | | Description | | Stated
Coupon | | Stated
Maturity | | Value |
| MUNICIPAL BONDS (Continued) |
| | | Texas (Continued) | | | | | | |
| $235,000 | | TX St Muni Gas Acquisition & Sply Corp Gas Sply Rev Ref, Ser LII
| | 5.00% | | 12/15/22 | | $254,536 |
| 35,000 | | TX St Muni Gas Acquisition & Sply Corp I Gas Sply Rev Sr Lien, Ser A
| | 5.25% | | 12/15/21 | | 36,494 |
| 1,100,000 | | TX St Muni Gas Acquisition & Sply Corp I Gas Sply Rev Sr Lien, Ser A
| | 5.25% | | 12/15/22 | | 1,200,221 |
| 110,000 | | TX St Muni Gas Acquisition & Sply Corp I Gas Sply Rev Sr Lien, Ser A
| | 5.25% | | 12/15/23 | | 124,975 |
| 150,000 | | Viridian TX Muni Mgmt Dist Unlimited Tax Road Impt Bonds, BAM
| | 4.00% | | 12/01/22 | | 159,072 |
| 250,000 | | Viridian TX Muni Mgmt Dist Unlimited Tax Road Impt Bonds, BAM
| | 4.00% | | 12/01/23 | | 273,028 |
| | | | | 4,770,570 |
| | | Utah – 0.2% | | | | | | |
| 100,000 | | UT St Chrt Sch Fin Auth Chrt Sch Rev Ref Spectrum Academy Proj
| | 4.00% | | 04/15/21 | | 100,712 |
| 100,000 | | UT St Chrt Sch Fin Auth Chrt Sch Rev Ref Spectrum Academy Proj
| | 4.00% | | 04/15/22 | | 104,204 |
| | | | | 204,916 |
| | | Virginia – 1.1% | | | | | | |
| 900,000 | | Amelia Cnty VA Indl Dev Auth Sol Wst Disp Rev Var Ref Waste Mgmt Pj, AMT (Mandatory put 04/01/21)
| | 3.00% | | 04/01/27 | | 904,167 |
| 350,000 | | VA St Small Business Fing Auth Rev Ref National Sr Campuses Inc
| | 5.00% | | 01/01/22 | | 364,637 |
| | | | | 1,268,804 |
| | | Washington – 0.1% | | | | | | |
| 120,000 | | WA St Mtr Vehcl Tax Sr 520 Corridor Prog Toll, Ser C
| | 5.00% | | 06/01/24 | | 121,898 |
| | | Wisconsin – 6.1% | | | | | | |
| 1,475,000 | | Cambridge WI Sch Dist, NANS
| | 1.00% | | 05/03/21 | | 1,477,670 |
| 110,000 | | Milwaukee WI Corp Purp, Ser B4
| | 5.00% | | 05/15/22 | | 111,474 |
| 725,000 | | Milwaukee WI Promissory & Corporate Notes, Ser N2
| | 5.00% | | 05/01/22 | | 767,289 |
| 545,000 | | Milwaukee WI Promissory Notes, Ser N1
| | 5.00% | | 02/01/23 | | 594,480 |
| 100,000 | | Milwaukee WI Promissory Notes, Ser N2
| | 4.00% | | 03/15/22 | | 104,132 |
| 390,000 | | Milwaukee WI Ref Prom Nts, Ser N2
| | 4.00% | | 03/15/25 | | 445,961 |
| 380,000 | | Milwaukee WI Ref Promissory Nts, Ser N4
| | 5.00% | | 04/01/22 | | 400,733 |
| 750,000 | | Pub Fin Auth WI Sol Wst Disp Rev Var Ref Waste Mgmt Inc Proj, Ser A-3, AMT (Mandatory put 06/01/21)
| | 2.00% | | 07/01/29 | | 754,530 |
| 2,037,000 | | Tender Option Bond Trust Receipts / Ctfs Various States Floaters, Ser 2020-XF2869 (a) (b)
| | 0.29% | | 11/01/25 | | 2,037,000 |
| 100,000 | | WI St Transprtn Rev Prerefunded, Ser 1
| | 5.00% | | 07/01/25 | | 111,604 |
| | | | | 6,804,873 |
| | Total Investments – 98.3%
| | 109,097,266 |
| | (Cost $108,590,767) (d) | | |
| | Net Other Assets and Liabilities – 1.7%
| | 1,875,887 |
| | Net Assets – 100.0%
| | $110,973,153 |
|
| (a) | Variable Rate Demand bond. Interest rate is reset periodically by the agent based on current market conditions. |
See Notes to Financial Statements
Page 25
First Trust Ultra Short Duration Municipal ETF (FUMB)
Portfolio of Investments (Continued)
January 31, 2021 (Unaudited)
| (b) | This security, sold within the terms of a private placement memorandum, is exempt from registration upon resale under Rule 144A under the Securities Act of 1933, as amended, and may be resold in transactions exempt from registration, normally to qualified institutional buyers. Pursuant to procedures adopted by the Trust’s Board of Trustees, this security has been determined to be liquid by First Trust Advisors L.P. (the “Advisor”). Although market instability can result in periods of increased overall market illiquidity, liquidity for each security is determined based on security specific factors and assumptions, which require subjective judgment. At January 31, 2021, securities noted as such amounted to $6,662,500 or 6.0% of net assets. |
| (c) | Zero coupon bond. |
| (d) | Aggregate cost for financial reporting purposes approximates the aggregate cost for federal income tax purposes. As of January 31, 2021, the aggregate gross unrealized appreciation for all investments in which there was an excess of value over tax cost was $519,719 and the aggregate gross unrealized depreciation for all investments in which there was an excess of tax cost over value was $10,220. The net unrealized appreciation was $509,499. |
| AGM | Assured Guaranty Municipal Corp. |
| AMT | Alternative Minimum Tax |
| BAM | Build America Mutual |
| BANS | Bond Anticipation Notes |
| COPS | Certificates of Participation |
| GARVEE | Grant Anticipation Revenue Vehicle |
| NANS | Note Anticipation Notes |
| NATL-RE | National Public Finance Guarantee Corp. |
| RANS | Revenue Anticipation Notes |
| TANS | Tax Anticipation Notes |
| | Total
Value at
1/31/2021 | Level 1
Quoted
Prices | Level 2
Significant
Observable
Inputs | Level 3
Significant
Unobservable
Inputs |
Municipal Bonds*
| $ 109,097,266 | $ — | $ 109,097,266 | $ — |
| * | See Portfolio of Investments for state breakout. |
Page 26
See Notes to Financial Statements
First Trust Exchange-Traded Fund III
Statements of Assets and Liabilities
January 31, 2021 (Unaudited)
| | First Trust
Short Duration
Managed
Municipal
ETF (FSMB) | | First Trust
Ultra Short
Duration
Municipal
ETF (FUMB) |
| ASSETS: | | | |
Investments, at value
| $ 81,615,288 | | $ 109,097,266 |
Cash
| 4,017,199 | | 2,495,331 |
Cash segregated as collateral for open futures contracts
| 13,420 | | — |
| Receivables: | | | |
Interest
| 706,882 | | 743,209 |
Investment securities sold
| 167,940 | | — |
Variation margin
| 2,844 | | — |
Total Assets
| 86,523,573 | | 112,335,806 |
| LIABILITIES: | | | |
| Payables: | | | |
Investment securities purchased
| 4,052,807 | | 1,339,556 |
Investment advisory fees
| 30,049 | | 23,097 |
Total Liabilities
| 4,082,856 | | 1,362,653 |
NET ASSETS
| $82,440,717 | | $110,973,153 |
| NET ASSETS consist of: | | | |
Paid-in capital
| $ 80,496,998 | | $ 110,395,345 |
Par value
| 39,500 | | 55,000 |
Accumulated distributable earnings (loss)
| 1,904,219 | | 522,808 |
NET ASSETS
| $82,440,717 | | $110,973,153 |
NET ASSET VALUE, per share
| $20.87 | | $20.18 |
Number of shares outstanding (unlimited number of shares authorized, par value $0.01 per share)
| 3,950,002 | | 5,500,002 |
Investments, at cost
| $79,540,056 | | $108,590,767 |
See Notes to Financial Statements
Page 27
First Trust Exchange-Traded Fund III
Statements of Operations
For the Six Months Ended January 31, 2021 (Unaudited)
| | First Trust
Short Duration
Managed
Municipal
ETF (FSMB) | | First Trust
Ultra Short
Duration
Municipal
ETF (FUMB) |
| INVESTMENT INCOME: | | | |
Interest
| $ 676,038 | | $ 508,104 |
Total investment income
| 676,038 | | 508,104 |
| EXPENSES: | | | |
Investment advisory fees
| 187,802 | | 225,287 |
Total expenses
| 187,802 | | 225,287 |
Fees waived by the investment advisor
| (34,146) | | (89,196) |
Net expenses
| 153,656 | | 136,091 |
NET INVESTMENT INCOME (LOSS)
| 522,382 | | 372,013 |
| NET REALIZED AND UNREALIZED GAIN (LOSS): | | | |
| Net realized gain (loss) on: | | | |
Investments
| 47,379 | | (13,621) |
Futures contracts
| 4,811 | | — |
Net realized gain (loss)
| 52,190 | | (13,621) |
| Net change in unrealized appreciation (depreciation) on: | | | |
Investments
| 748,389 | | 102,245 |
Futures contracts
| 8,000 | | — |
Net change in unrealized appreciation (depreciation)
| 756,389 | | 102,245 |
NET REALIZED AND UNREALIZED GAIN (LOSS)
| 808,579 | | 88,624 |
NET INCREASE (DECREASE) IN NET ASSETS RESULTING FROM OPERATIONS
| $ 1,330,961 | | $ 460,637 |
Page 28
See Notes to Financial Statements
First Trust Exchange-Traded Fund III
Statements of Changes in Net Assets
| | First Trust Short
Duration Managed
Municipal ETF (FSMB) | | First Trust Ultra
Short Duration
Municipal ETF (FUMB) |
| | Six Months
Ended
1/31/2021
(Unaudited) | | Year
Ended
7/31/2020 | | Six Months
Ended
1/31/2021
(Unaudited) | | Year
Ended
7/31/2020 |
| OPERATIONS: | | | | | | | |
Net investment income (loss)
| $ 522,382 | | $ 630,654 | | $ 372,013 | | $ 547,918 |
Net realized gain (loss)
| 52,190 | | (222,557) | | (13,621) | | 2,199 |
Net change in unrealized appreciation (depreciation)
| 756,389 | | 916,311 | | 102,245 | | 336,188 |
Net increase (decrease) in net assets resulting from operations
| 1,330,961 | | 1,324,408 | | 460,637 | | 886,305 |
| DISTRIBUTIONS TO SHAREHOLDERS FROM: | | | | | | | |
Investment operations
| (559,200) | | (637,095) | | (365,900) | | (536,002) |
Return of capital
| — | | (18,716) | | — | | (2,449) |
Total distributions to shareholders
| (559,200) | | (655,811) | | (365,900) | | (538,451) |
| SHAREHOLDER TRANSACTIONS: | | | | | | | |
Proceeds from shares sold
| 26,933,713 | | 47,999,296 | | 27,217,356 | | 70,260,944 |
Cost of shares redeemed
| (7,231,530) | | (6,154,805) | | — | | (7,045,546) |
Net increase (decrease) in net assets resulting from shareholder transactions
| 19,702,183 | | 41,844,491 | | 27,217,356 | | 63,215,398 |
Total increase (decrease) in net assets
| 20,473,944 | | 42,513,088 | | 27,312,093 | | 63,563,252 |
| NET ASSETS: | | | | | | | |
Beginning of period
| 61,966,773 | | 19,453,685 | | 83,661,060 | | 20,097,808 |
End of period
| $82,440,717 | | $61,966,773 | | $110,973,153 | | $83,661,060 |
| CHANGES IN SHARES OUTSTANDING: | | | | | | | |
Shares outstanding, beginning of period
| 3,000,002 | | 950,002 | | 4,150,002 | | 1,000,002 |
Shares sold
| 1,300,000 | | 2,350,000 | | 1,350,000 | | 3,500,000 |
Shares redeemed
| (350,000) | | (300,000) | | — | | (350,000) |
Shares outstanding, end of period
| 3,950,002 | | 3,000,002 | | 5,500,002 | | 4,150,002 |
See Notes to Financial Statements
Page 29
First Trust Exchange-Traded Fund III
Financial Highlights
For a share outstanding throughout each period
First Trust Short Duration Managed Municipal ETF (FSMB)
| | Six Months
Ended
1/31/2021
(Unaudited) | | Year Ended
7/31/2020 | | Period
Ended
7/31/2019 (a) |
Net asset value, beginning of period
| $ 20.66 | | $ 20.48 | | $ 20.00 |
| Income from investment operations: | | | | | |
Net investment income (loss)
| 0.16 | | 0.38 | | 0.34 |
Net realized and unrealized gain (loss)
| 0.22 | | 0.22 | | 0.45 |
Total from investment operations
| 0.38 | | 0.60 | | 0.79 |
| Distributions paid to shareholders from: | | | | | |
Net investment income
| (0.17) | | (0.41) | | (0.31) |
Return of capital
| — | | (0.01) | | — |
Total distributions
| (0.17) | | (0.42) | | (0.31) |
Net asset value, end of period
| $20.87 | | $20.66 | | $20.48 |
Total return (b)
| 1.84% | | 2.98% | | 3.98% |
| Ratios to average net assets/supplemental data: | | | | | |
Net assets, end of period (in 000’s)
| $ 82,441 | | $ 61,967 | | $ 19,454 |
Ratio of total expenses to average net assets
| 0.55% (c) | | 0.55% | | 0.55% (c) |
Ratio of net expenses to average net assets
| 0.45% (c) | | 0.45% | | 0.45% (c) |
Ratio of net investment income (loss) to average net assets
| 1.53% (c) | | 2.00% | | 2.23% (c) |
Portfolio turnover rate (d)
| 16% | | 58% | | 66% |
| (a) | Inception date is November 1, 2018, which is consistent with the commencement of operations and is the date the initial creation units were established. |
| (b) | Total return is calculated assuming an initial investment made at the net asset value at the beginning of the period, reinvestment of all distributions at net asset value during the period, and redemption at net asset value on the last day of the period. The returns presented do not reflect the deduction of taxes that a shareholder would pay on Fund distributions or the redemption or sale of Fund shares. Total return is calculated for the time period presented and is not annualized for periods of less than a year. The total return would have been lower if certain fees had not been waived by the investment advisor. |
| (c) | Annualized. |
| (d) | Portfolio turnover is calculated for the time period presented and is not annualized for periods of less than a year and does not include securities received or delivered from processing creations or redemptions and in-kind transactions. |
Page 30
See Notes to Financial Statements
First Trust Exchange-Traded Fund III
Financial Highlights (Continued)
For a share outstanding throughout each period
First Trust Ultra Short Duration Municipal ETF (FUMB)
| | Six Months
Ended
1/31/2021
(Unaudited) | | Year Ended
7/31/2020 | | Period
Ended
7/31/2019 (a) |
Net asset value, beginning of period
| $ 20.16 | | $ 20.10 | | $ 20.00 |
| Income from investment operations: | | | | | |
Net investment income (loss)
| 0.07 | | 0.25 | | 0.26 |
Net realized and unrealized gain (loss)
| 0.02 | | 0.07 | | 0.09 |
Total from investment operations
| 0.09 | | 0.32 | | 0.35 |
| Distributions paid to shareholders from: | | | | | |
Net investment income
| (0.07) | | (0.26) | | (0.25) |
Net realized gain
| — | | (0.00) (b) | | — |
Return of capital
| — | | (0.00) (b) | | — |
Total distributions
| (0.07) | | (0.26) | | (0.25) |
Net asset value, end of period
| $20.18 | | $20.16 | | $20.10 |
Total return (c)
| 0.47% | | 1.61% | | 1.75% |
Total return (c)
| 0.47% | | 1.61% | | 1.75% |
| Ratios to average net assets/supplemental data: | | | | | |
Net assets, end of period (in 000’s)
| $ 110,973 | | $ 83,661 | | $ 20,098 |
Ratio of total expenses to average net assets
| 0.45% (d) | | 0.45% | | 0.45% (d) |
Ratio of net expenses to average net assets
| 0.27% (d) | | 0.35% | | 0.35% (d) |
Ratio of net investment income (loss) to average net assets
| 0.74% (d) | | 1.20% | | 1.73% (d) |
Portfolio turnover rate (e)
| 29% | | 149% | | 145% |
| (a) | Inception date is November 1, 2018, which is consistent with the commencement of operations and is the date the initial creation units were established. |
| (b) | Amount is less than $0.01. |
| (c) | Total return is calculated assuming an initial investment made at the net asset value at the beginning of the period, reinvestment of all distributions at net asset value during the period, and redemption at net asset value on the last day of the period. The returns presented do not reflect the deduction of taxes that a shareholder would pay on Fund distributions or the redemption or sale of Fund shares. Total return is calculated for the time period presented and is not annualized for periods of less than a year. The total return would have been lower if certain fees had not been waived by the investment advisor. |
| (d) | Annualized. |
| (e) | Portfolio turnover is calculated for the time period presented and is not annualized for periods of less than a year and does not include securities received or delivered from processing creations or redemptions and in-kind transactions. |
See Notes to Financial Statements
Page 31
Notes to Financial Statements
First Trust Exchange-Traded Fund III
January 31, 2021 (Unaudited)
1. Organization
First Trust Exchange-Traded Fund III (the “Trust”) is an open-end management investment company organized as a Massachusetts business trust on January 9, 2008, and is registered with the Securities and Exchange Commission (“SEC”) under the Investment Company Act of 1940, as amended (the “1940 Act”).
The Trust currently consists of seventeen funds that are offering shares. This report covers the following funds (each a “Fund” and collectively, the “Funds”), each a non-diversified series of the Trust:
First Trust Short Duration Managed Municipal ETF – (NYSE Arca, Inc. (“NYSE Arca”) ticker “FSMB”)
First Trust Ultra Short Duration Municipal ETF – (NYSE Arca ticker “FUMB”)
Each Fund represents a separate series of shares of beneficial interest in the Trust. Unlike conventional mutual funds, each Fund issues and redeems shares on a continuous basis, at net asset value (“NAV”), only in large blocks of shares known as “Creation Units”.
Each Fund is an actively managed exchange-traded fund. The investment objective of each Fund is to seek to provide federally tax-exempt income consistent with capital preservation. Under normal market conditions, each Fund seeks to achieve its investment objective by investing at least 80% of its net assets (including investment borrowings) in municipal debt securities that pay interest that is exempt from regular federal income taxes.
There can be no assurance that a Fund will achieve its investment objective. The Funds may not be appropriate for all investors.
2. Significant Accounting Policies
The Funds are each considered an investment company and follow accounting and reporting guidance under Financial Accounting Standards Board Accounting Standards Codification Topic 946, “Financial Services-Investment Companies.” The following is a summary of significant accounting policies consistently followed by the Funds in the preparation of the financial statements. The preparation of the financial statements in accordance with accounting principles generally accepted in the United States of America (“U.S. GAAP”) requires management to make estimates and assumptions that affect the reported amounts and disclosures in the financial statements. Actual results could differ from those estimates.
A. Portfolio Valuation
Each Fund’s NAV is determined daily as of the close of regular trading on the New York Stock Exchange (“NYSE”), normally 4:00 p.m. Eastern time, on each day the NYSE is open for trading. If the NYSE closes early on a valuation day, the NAV is determined as of that time. Each Fund’s NAV is calculated by dividing the value of all assets of each Fund (including accrued interest and dividends), less all liabilities (including accrued expenses and dividends declared but unpaid), by the total number of shares outstanding.
Each Fund’s investments are valued daily at market value or, in the absence of market value with respect to any portfolio securities, at fair value. Market value prices represent last sale or official closing prices from a national or foreign exchange (i.e., a regulated market) and are primarily obtained from third-party pricing services. Fair value prices represent any prices not considered market value prices and are either obtained from a third-party pricing service or are determined by the Pricing Committee of the Funds’ investment advisor, First Trust Advisors L.P. (“First Trust” or the “Advisor”), in accordance with valuation procedures adopted by the Trust’s Board of Trustees, and in accordance with provisions of the 1940 Act. Investments valued by the Advisor’s Pricing Committee, if any, are footnoted as such in the footnotes to the Portfolio of Investments. Each Fund’s investments are valued as follows:
Municipal securities and other debt securities are fair valued on the basis of fair valuations provided by dealers who make markets in such securities or by a third-party pricing service approved by the Trust’s Board of Trustees, which may use the following valuation inputs when available:
| 1) | benchmark yields; |
| 2) | reported trades; |
| 3) | broker/dealer quotes; |
| 4) | issuer spreads; |
| 5) | benchmark securities; |
| 6) | bids and offers; and |
| 7) | reference data including market research publications. |
Notes to Financial Statements (Continued)
First Trust Exchange-Traded Fund III
January 31, 2021 (Unaudited)
Exchange-traded futures contracts are valued at the closing price in the market where such contracts are principally traded. If no closing price is available, exchange-traded futures contracts are fair valued at the mean of their most recent bid and asked price, if available, and otherwise at their closing bid price.
Fixed income and other debt securities having a remaining maturity of sixty days or less when purchased are fair valued at cost adjusted for amortization of premiums and accretion of discounts (amortized cost), provided the Advisor’s Pricing Committee has determined that the use of amortized cost is an appropriate reflection of fair value given market and issuer-specific conditions existing at the time of the determination. Factors that may be considered in determining the appropriateness of the use of amortized cost include, but are not limited to, the following:
| 1) | the credit conditions in the relevant market and changes thereto; |
| 2) | the liquidity conditions in the relevant market and changes thereto; |
| 3) | the interest rate conditions in the relevant market and changes thereto (such as significant changes in interest rates); |
| 4) | issuer-specific conditions (such as significant credit deterioration); and |
| 5) | any other market-based data the Advisor’s Pricing Committee considers relevant. In this regard, the Advisor’s Pricing Committee may use last-obtained market-based data to assist it when valuing portfolio securities using amortized cost. |
Certain securities may not be able to be priced by pre-established pricing methods. Such securities may be valued by the Trust’s Board of Trustees or its delegate, the Advisor’s Pricing Committee, at fair value. These securities generally include, but are not limited to, restricted securities (securities which may not be publicly sold without registration under the Securities Act of 1933, as amended) for which a third-party pricing service is unable to provide a market price; securities whose trading has been formally suspended; a security whose market or fair value price is not available from a pre-established pricing source; a security with respect to which an event has occurred that is likely to materially affect the value of the security after the market has closed but before the calculation of a Fund’s NAV or make it difficult or impossible to obtain a reliable market quotation; and a security whose price, as provided by the third-party pricing service, does not reflect the security’s fair value. As a general principle, the current fair value of a security would appear to be the amount which the owner might reasonably expect to receive for the security upon its current sale. When fair value prices are used, generally they will differ from market quotations or official closing prices on the applicable exchanges. A variety of factors may be considered in determining the fair value of such securities, including, but not limited to, the following:
| 1) | the fundamental business data relating to the issuer; |
| 2) | an evaluation of the forces which influence the market in which these securities are purchased and sold; |
| 3) | the type, size and cost of the security; |
| 4) | the financial statements of the issuer; |
| 5) | the credit quality and cash flow of the issuer, based on the Advisor’s or external analysis; |
| 6) | the information as to any transactions in or offers for the security; |
| 7) | the price and extent of public trading in similar securities (or equity securities) of the issuer/borrower, or comparable companies; |
| 8) | the coupon payments; |
| 9) | the quality, value and salability of collateral, if any, securing the security; and |
| 10) | other relevant factors. |
The Funds are subject to fair value accounting standards that define fair value, establish the framework for measuring fair value and provide a three-level hierarchy for fair valuation based upon the inputs to the valuation as of the measurement date. The three levels of the fair value hierarchy are as follows:
| • | Level 1 – Level 1 inputs are quoted prices in active markets for identical investments. An active market is a market in which transactions for the investment occur with sufficient frequency and volume to provide pricing information on an ongoing basis. |
| • | Level 2 – Level 2 inputs are observable inputs, either directly or indirectly, and include the following: |
| o | Quoted prices for similar investments in active markets. |
| o | Quoted prices for identical or similar investments in markets that are non-active. A non-active market is a market where there are few transactions for the investment, the prices are not current, or price quotations vary substantially either over time or among market makers, or in which little information is released publicly. |
| o | Inputs other than quoted prices that are observable for the investment (for example, interest rates and yield curves observable at commonly quoted intervals, volatilities, prepayment speeds, loss severities, credit risks, and default rates). |
| o | Inputs that are derived principally from or corroborated by observable market data by correlation or other means. |
Notes to Financial Statements (Continued)
First Trust Exchange-Traded Fund III
January 31, 2021 (Unaudited)
| • | Level 3 – Level 3 inputs are unobservable inputs. Unobservable inputs may reflect the reporting entity’s own assumptions about the assumptions that market participants would use in pricing the investment. |
The inputs or methodologies used for valuing investments are not necessarily an indication of the risk associated with investing in those investments. A summary of the inputs used to value each Fund’s investments as of January 31, 2021, is included with each Fund’s Portfolio of Investments.
B. Securities Transactions and Investment Income
Securities transactions are recorded as of the trade date. Realized gains and losses from securities transactions are recorded on the identified cost basis. Interest income is recorded daily on the accrual basis. Amortization of premiums and accretion of discounts are recorded using the effective interest method.
C. Futures Contracts
FSMB may purchase or sell (i.e., is long or short) exchange-listed futures contracts to hedge against changes in interest rates (interest rate risk). Futures contracts are agreements between the Fund and a counterparty to buy or sell a specific quantity of an underlying instrument at a specified price and at a specified date. Depending on the terms of the contract, futures contracts are settled either through physical delivery of the underlying instrument on the settlement date or by payment of a cash settlement amount on the settlement date. Open futures contracts can also be closed out prior to settlement by entering into an offsetting transaction in a matching futures contract. If the Fund is not able to enter into an offsetting transaction, the Fund will continue to be required to maintain margin deposits on the futures contract. When the contract is closed or expires, the Fund records a realized gain or loss equal to the difference between the value of the contract at the time it was opened and the value at the time it was closed or expired. This gain or loss is included in “Net realized gain (loss) on futures contracts” on the Statements of Operations.
Upon entering into a futures contract, the Fund must deposit funds, called margin, with its custodian in the name of the clearing broker equal to a specified percentage of the current value of the contract. Open futures contracts are marked to market daily with the change in value recognized as a component of “Net change in unrealized appreciation (depreciation) on futures contracts” on the Statements of Operations. Pursuant to the contract, the Fund agrees to receive from or pay to the broker an amount of cash equal to the daily fluctuation in value of the contract. Such receipts or payments are known as variation margin and are included in “Variation margin” payable or receivable on the Statements of Assets and Liabilities.
If market conditions change unexpectedly, the Fund may not achieve the anticipated benefits of the futures contract and may realize a loss. The use of futures contracts involves the risk of imperfect correlation in movements in the price of the futures contracts, interest rates and the underlying instruments.
Restricted cash segregated as collateral for futures contracts in the amount of $13,420 is shown as “Cash segregated as collateral for open futures contracts” on the Statements of Assets and Liabilities.
D. Dividends and Distributions to Shareholders
Dividends from net investment income, if any, are declared and paid monthly by each Fund, or as the Board of Trustees may determine from time to time. Distributions of net realized capital gains earned by each Fund, if any, are distributed at least annually.
Distributions from net investment income and realized capital gains are determined in accordance with federal income tax regulations, which may differ from U.S. GAAP. Certain capital accounts in the financial statements are periodically adjusted for permanent differences in order to reflect their tax character. These permanent differences are primarily due to the varying treatment of income and gain/loss on portfolio securities held by the Funds and have no impact on net assets or NAV per share. Temporary differences, which arise from recognizing certain items of income, expense and gain/loss in different periods for financial statement and tax purposes, will reverse at some time in the future.
The tax character of distributions paid by each Fund during the fiscal year ended July 31, 2020, was as follows:
| | Distributions
paid from
Tax-Exempt
Income | | Distributions
paid from
Ordinary
Income | | Distributions
paid from
Capital
Gains | | Distributions
paid from
Return of
Capital |
First Trust Short Duration Managed Municipal ETF
| $ 636,236 | | $ 859 | | $— | | $ 18,716 |
First Trust Ultra Short Duration Municipal ETF
| 526,947 | | 8,438 | | 617 | | 2,449 |
Notes to Financial Statements (Continued)
First Trust Exchange-Traded Fund III
January 31, 2021 (Unaudited)
As of July 31, 2020, the components of distributable earnings on a tax basis for each Fund were as follows:
| | Undistributed
Ordinary
Income | | Accumulated
Capital and
Other
Gain (Loss) | | Net
Unrealized
Appreciation
(Depreciation) |
First Trust Short Duration Managed Municipal ETF
| $ — | | $ (222,307) | | $ 1,354,765 |
First Trust Ultra Short Duration Municipal ETF
| — | | — | | 428,071 |
E. Income Taxes
Each Fund intends to continue to qualify as a regulated investment company by complying with the requirements under Subchapter M of the Internal Revenue Code of 1986, as amended (the “Code”), which includes distributing substantially all of its net investment income and net realized gains to shareholders. Accordingly, no provision has been made for federal and state income taxes. However, due to the timing and amount of distributions, each Fund may be subject to an excise tax of 4% of the amount by which approximately 98% of each Fund’s taxable income exceeds the distributions from such taxable income for the calendar year.
In addition, each Fund intends to invest in municipal securities to allow it to pay shareholders “exempt dividends” as defined in the Code.
The Funds are subject to accounting standards that establish a minimum threshold for recognizing, and a system for measuring, the benefits of a tax position taken or expected to be taken in a tax return. Taxable years ended 2019 and 2020 remain open to federal and state audit. As of January 31, 2021, management has evaluated the application of these standards to the Funds and has determined that no provision for income tax is required in the Funds’ financial statements for uncertain tax positions.
The Funds intend to utilize provisions of the federal income tax laws, which allow them to carry a realized capital loss forward indefinitely following the year of the loss and offset such loss against any future realized capital gains. The Funds are subject to certain limitations under U.S. tax rules on the use of capital loss carryforwards and net unrealized built-in losses. These limitations apply when there has been a 50% change in ownership. At July 31, 2020, the Funds had non-expiring capital loss carryforwards for federal income tax purposes as follows:
| | Non-Expiring
Capital Loss
Carryforward |
First Trust Short Duration Managed Municipal ETF
| $ 222,307 |
First Trust Ultra Short Duration Municipal ETF
| — |
Certain losses realized during the current fiscal year may be deferred and treated as occurring on the first day of the following fiscal year for federal income tax purposes. For the fiscal year ended July 31, 2020, the Fund did not incur any net ordinary losses.
F. Expenses
Expenses, other than the investment advisory fee and other excluded expenses, are paid by the Advisor (See Note 3).
3. Investment Advisory Fee, Affiliated Transactions and Other Fee Arrangements
First Trust, the investment advisor to the Funds, is a limited partnership with one limited partner, Grace Partners of DuPage L.P., and one general partner, The Charger Corporation. The Charger Corporation is an Illinois corporation controlled by James A. Bowen, Chief Executive Officer of First Trust. First Trust is responsible for the selection and ongoing monitoring of the securities in each Fund’s portfolio, managing the Funds’ business affairs and providing certain administrative services necessary for the management of the Funds.
FSMB and FUMB have agreed to pay First Trust an annual unitary management fee of 0.55% and 0.45% of FSMB’s and FUMB’s average daily net assets, respectively. Pursuant to the Investment Management Agreement between First Trust and the Trust, First Trust manages the investment of the Funds’ assets and is responsible for the expenses of each Fund, including the cost of transfer agency, custody, fund administration, legal, audit and other services, but excluding fee payments under the Investment Management Agreement, interest, taxes, brokerage commissions and other expenses connected with the execution of portfolio transactions, distribution and service fees payable pursuant to a Rule 12b-1 plan, if any, and extraordinary expenses, which are paid by each
Notes to Financial Statements (Continued)
First Trust Exchange-Traded Fund III
January 31, 2021 (Unaudited)
respective Fund. First Trust also provides fund reporting services to each Fund for a flat annual fee in the amount of $9,250, which is covered under the annual unitary management fee.
The Trust’s Board of Trustees and the Advisor have entered into a Fee Waiver Agreement for the Funds pursuant to which the Advisor contractually agreed to waive management fees of 0.10% of each Fund’s average daily net assets until November 30, 2021. The Board also approved an additional fee waiver for FUMB of 0.10% of average daily net assets which will continue through November 30, 2021.The waiver agreement may be terminated by action of the Trust’s Board of Trustees at any time upon 60 days’ written notice by the Trust on behalf of the Funds or by the Funds’ investment advisor only after November 30, 2021. First Trust does not have the right to recover the fees waived. During the six months ended January 31, 2021, the Advisor waived fees of $34,146 and $89,196 for FSMB and FUMB, respectively.
The Trust has multiple service agreements with Brown Brothers Harriman & Co. (“BBH”). Under the service agreements, BBH performs custodial, fund accounting, certain administrative services, and transfer agency services for the Funds. As custodian, BBH is responsible for custody of each Fund’s assets. As fund accountant and administrator, BBH is responsible for maintaining the books and records of each Fund’s securities and cash. As transfer agent, BBH is responsible for maintaining shareholder records for each Fund.
Each Trustee who is not an officer or employee of First Trust, any sub-advisor or any of their affiliates (“Independent Trustees”) is paid a fixed annual retainer that is allocated equally among each fund in the First Trust Fund Complex. Each Independent Trustee is also paid an annual per fund fee that varies based on whether the fund is a closed-end or other actively managed fund, a defined-outcome fund or an index fund.
Additionally, the Lead Independent Trustee and the Chairmen of the Audit Committee, Nominating and Governance Committee and Valuation Committee are paid annual fees to serve in such capacities, with such compensation allocated pro rata among each fund in the First Trust Fund Complex based on net assets. Independent Trustees are reimbursed for travel and out-of-pocket expenses in connection with all meetings. The Lead Independent Trustee and Committee Chairmen rotate every three years. The officers and “Interested” Trustee receive no compensation from the Trust for acting in such capacities.
4. Purchases and Sales of Securities
For the six months ended January 31, 2021, the cost of purchases and proceeds from sales of investment securities for each Fund, excluding short-term investments and in-kind transactions, were as follows:
| | Purchases | | Sales |
| First Trust Short Duration Managed Municipal ETF | $ 32,648,162 | | $ 10,442,917 |
| First Trust Ultra Short Duration Municipal ETF | 44,336,119 | | 22,536,071 |
| | | | |
For the six months ended January 31, 2021, the Funds had no in-kind transactions.
5. Derivative Transactions
The following table presents the type of derivatives held by FSMB at January 31, 2021, the primary underlying risk exposure and the location of these instruments as presented on the Statements of Assets and Liabilities.
| | | | | Asset Derivatives | | Liability Derivatives |
Derivative
Instrument | | Risk
Exposure | | Statements of Assets and
Liabilities Location | | Value | | Statements of Assets and
Liabilities Location | | Value |
| Futures contracts | | Interest Rate Risk | | Unrealized appreciation
on futures contracts* | | $ 8,000 | | Unrealized depreciation
on futures contracts* | | $ — |
*Includes cumulative appreciation/depreciation on futures contracts as reported in the Portfolio of Investments. Only the current day’s variation margin is presented on the Statements of Assets and Liabilities.
The following table presents the amount of net realized gain (loss) and change in net unrealized appreciation (depreciation) recognized for the six months ended January 31, 2021, on derivative instruments, as well as the primary underlying risk exposure associated with each instrument.
Notes to Financial Statements (Continued)
First Trust Exchange-Traded Fund III
January 31, 2021 (Unaudited)
| Statement of Operations Location | |
| Interest Rate Risk Exposure | |
| Net realized gain (loss) on futures contracts | $4,811 |
| Net change in unrealized appreciation (depreciation) on futures contracts | 8,000 |
During the six months ended January 31, 2021, the notional value of futures contracts opened and closed were $1,576,359 and $784,328, respectively.
The Funds do not have the right to offset financial assets and liabilities related to futures contracts on the Statements of Assets and Liabilities.
6. Creations, Redemptions and Transaction Fees
Each Fund generally issues and redeems its shares in primary market transactions through a creation and redemption mechanism and does not sell or redeem individual shares. Instead, financial entities known as “Authorized Participants” have contractual arrangements with a Fund or one of the Fund’s service providers to purchase and redeem Fund shares directly with the Fund in large blocks of shares known as “Creation Units.” Prior to the start of trading on every business day, a Fund publishes through the National Securities Clearing Corporation (“NSCC”) the “basket” of securities, cash or other assets that it will accept in exchange for a Creation Unit of the Fund’s shares. An Authorized Participant that wishes to effectuate a creation of a Fund’s shares deposits with the Fund the “basket” of securities, cash or other assets identified by the Fund that day, and then receives the Creation Unit of the Fund’s shares in return for those assets. After purchasing a Creation Unit, the Authorized Participant may continue to hold the Fund’s shares or sell them in the secondary market. The redemption process is the reverse of the purchase process: the authorized participant redeems a Creation Unit of a Fund’s shares for a basket of securities, cash or other assets. The combination of the creation and redemption process with secondary market trading in a Fund’s shares and underlying securities provides arbitrage opportunities that are designed to help keep the market price of a Fund’s shares at or close to the NAV per share of the Fund.
Each Fund imposes fees in connection with the purchase of Creation Units. These fees may vary based upon various fact-based circumstances, including, but not limited to, the composition of the securities included in the Creation Unit or the countries in which the transactions are settled. The price for each Creation Unit will equal the daily NAV per share of a Fund times the number of shares in a Creation Unit, plus the fees described above and, if applicable, any operational processing and brokerage costs, transfer fees, stamp taxes and part or all of the spread between the expected bid and offer side of the market related to the securities comprising the creation basket.
Each Fund also imposes fees in connection with the redemption of Creation Units. These fees may vary based upon various fact-based circumstances, including, but not limited to, the composition of the securities included in the Creation Unit or the countries in which the transactions are settled. The price received for each Creation Unit will equal the daily NAV per share of a Fund times the number of shares in a Creation Unit, minus the fees described above and, if applicable, any operational processing and brokerage costs, transfer fees, stamp taxes and part or all of the spread between the expected bid and offer side of the market related to the securities comprising the redemption basket. Investors who use the services of a broker or other such intermediary in addition to an Authorized Participant to effect a redemption of a Creation Unit may also be assessed an amount to cover the cost of such services. The redemption fee charged by a Fund will comply with Rule 22c-2 of the 1940 Act which limits redemption fees to no more than 2% of the value of the shares redeemed.
7. Distribution Plan
The Board of Trustees adopted a Distribution and Service Plan pursuant to Rule 12b-1 under the 1940 Act. In accordance with the Rule 12b-1 plan, each Fund is authorized to pay an amount up to 0.25% of its average daily net assets each year to reimburse First Trust Portfolios L.P. (“FTP”), the distributor of the Funds, for amounts expended to finance activities primarily intended to result in the sale of Creation Units or to provide investor services. FTP may also use this amount to compensate securities dealers or other persons that are Authorized Participants for providing distribution assistance, including broker-dealer and shareholder support and educational and promotional services.
No 12b-1 fees are currently paid by the Funds, and pursuant to a contractual arrangement, no 12b-1 fees will be paid any time before November 30, 2021.
Notes to Financial Statements (Continued)
First Trust Exchange-Traded Fund III
January 31, 2021 (Unaudited)
8. Indemnification
The Trust, on behalf of the Funds, has a variety of indemnification obligations under contracts with its service providers. The Trust’s maximum exposure under these arrangements is unknown. However, the Trust has not had prior claims or losses pursuant to these contracts and expects the risk of loss to be remote.
9. Subsequent Events
Management has evaluated the impact of all subsequent events to the Funds through the date the financial statements were issued, and has determined that there were no subsequent events requiring recognition or disclosure in the financial statements that have not already been disclosed.
Additional Information
First Trust Exchange-Traded Fund III
January 31, 2021 (Unaudited)
Proxy Voting Policies and Procedures
A description of the policies and procedures that the Trust uses to determine how to vote proxies and information on how each Fund voted proxies relating to portfolio securities during the most recent 12-month period ended June 30 is available (1) without charge, upon request, by calling (800) 988-5891; (2) on each Fund’s website at www.ftportfolios.com; and (3) on the Securities and Exchange Commission’s (“SEC”) website at www.sec.gov.
Portfolio Holdings
Each Fund files portfolio holdings information for each month in a fiscal quarter within 60 days after the end of the relevant fiscal quarter on Form N-PORT. Portfolio holdings information for the third month of each fiscal quarter will be publicly available on the SEC’s website at www.sec.gov. Each Fund’s complete schedule of portfolio holdings for the second and fourth quarters of each fiscal year is included in the semi-annual and annual reports to shareholders, respectively, and is filed with the SEC on Form N-CSR. The semi-annual and annual report for each Fund is available to investors within 60 days after the period to which it relates. Each Fund’s Forms N-PORT and Forms N-CSR are available on the SEC’s website listed above.
Risk Considerations
Risks are inherent in all investing. Certain general risks that may be applicable to a Fund are identified below, but not all of the material risks relevant to each Fund are included in this report and not all of the risks below apply to each Fund. The material risks of investing in each Fund are spelled out in its prospectus, statement of additional information and other regulatory filings. Before investing, you should consider each Fund’s investment objective, risks, charges and expenses, and read each Fund’s prospectus and statement of additional information carefully. You can download each Fund’s prospectus at www.ftportfolios.com or contact First Trust Portfolios L.P. at (800) 621-1675 to request a prospectus, which contains this and other information about each Fund.
Concentration Risk. To the extent that a fund is able to invest a large percentage of its assets in a single asset class or the securities of issuers within the same country, state, region, industry or sector, an adverse economic, business or political development may affect the value of the fund’s investments more than if the fund were more broadly diversified. A fund that tracks an index will be concentrated to the extent the fund’s corresponding index is concentrated. A concentration makes a fund more susceptible to any single occurrence and may subject the fund to greater market risk than a fund that is not concentrated.
Credit Risk. Credit risk is the risk that an issuer of a security will be unable or unwilling to make dividend, interest and/or principal payments when due and the related risk that the value of a security may decline because of concerns about the issuer’s ability to make such payments.
Cyber Security Risk. The funds are susceptible to potential operational risks through breaches in cyber security. A breach in cyber security refers to both intentional and unintentional events that may cause a fund to lose proprietary information, suffer data corruption or lose operational capacity. Such events could cause a fund to incur regulatory penalties, reputational damage, additional compliance costs associated with corrective measures and/or financial loss. In addition, cyber security breaches of a fund’s third-party service providers, such as its administrator, transfer agent, custodian, or sub-advisor, as applicable, or issuers in which the fund invests, can also subject a fund to many of the same risks associated with direct cyber security breaches.
Derivatives Risk. To the extent a fund uses derivative instruments such as futures contracts, options contracts and swaps, the fund may experience losses because of adverse movements in the price or value of the underlying asset, index or rate, which may be magnified by certain features of the derivative. These risks are heightened when a fund’s portfolio managers use derivatives to enhance the fund’s return or as a substitute for a position or security, rather than solely to hedge (or offset) the risk of a position or security held by the fund.
Equity Securities Risk. To the extent a fund invests in equity securities, the value of the fund’s shares will fluctuate with changes in the value of the equity securities. Equity securities prices fluctuate for several reasons, including changes in investors’ perceptions of the financial condition of an issuer or the general condition of the relevant stock market, such as market volatility, or when political or economic events affecting the issuers occur. In addition, common stock prices may be particularly sensitive to rising interest rates, as the cost of capital rises and borrowing costs increase. Equity securities may decline significantly in price over short or extended periods of time, and such declines may occur in the equity market as a whole, or they may occur in only a particular country, company, industry or sector of the market.
ETF Risk. The shares of an ETF trade like common stock and represent an interest in a portfolio of securities. The risks of owning an ETF generally reflect the risks of owning the underlying securities, although lack of liquidity in an ETF could result in it being more volatile and ETFs have management fees that increase their costs. Shares of an ETF trade on an exchange at market prices rather than
Additional Information (Continued)
First Trust Exchange-Traded Fund III
January 31, 2021 (Unaudited)
net asset value, which may cause the shares to trade at a price greater than net asset value (premium) or less than net asset value (discount). In times of market stress, decisions by market makers to reduce or step away from their role of providing a market for an ETF’s shares, or decisions by an ETF’s authorized participants that they are unable or unwilling to proceed with creation and/or redemption orders of an ETF’s shares, could result in shares of the ETF trading at a discount to net asset value and in greater than normal intraday bid-ask spreads.
Fixed Income Securities Risk. To the extent a fund invests in fixed income securities, the fund will be subject to credit risk, income risk, interest rate risk, liquidity risk and prepayment risk. Income risk is the risk that income from a fund’s fixed income investments could decline during periods of falling interest rates. Interest rate risk is the risk that the value of a fund’s fixed income securities will decline because of rising interest rates. Liquidity risk is the risk that a security cannot be purchased or sold at the time desired, or cannot be purchased or sold without adversely affecting the price. Prepayment risk is the risk that the securities will be redeemed or prepaid by the issuer, resulting in lower interest payments received by the fund. In addition to these risks, high yield securities, or “junk” bonds, are subject to greater market fluctuations and risk of loss than securities with higher ratings, and the market for high yield securities is generally smaller and less liquid than that for investment grade securities.
Index Constituent Risk. Certain funds may be a constituent of one or more indices. As a result, such a fund may be included in one or more index-tracking exchange-traded funds or mutual funds. Being a component security of such a vehicle could greatly affect the trading activity involving a fund, the size of the fund and the market volatility of the fund. Inclusion in an index could significantly increase demand for the fund and removal from an index could result in outsized selling activity in a relatively short period of time. As a result, a fund’s net asset value could be negatively impacted and the fund’s market price may be significantly below its net asset value during certain periods.
Index Provider Risk. To the extent a fund seeks to track an index, it is subject to Index Provider Risk. There is no assurance that the Index Provider will compile the Index accurately, or that the Index will be determined, maintained, constructed, reconstituted, rebalanced, composed, calculated or disseminated accurately. To correct any such error, the Index Provider may carry out an unscheduled rebalance or other modification of the Index constituents or weightings, which may increase the fund’s costs. The Index Provider does not provide any representation or warranty in relation to the quality, accuracy or completeness of data in the Index, and it does not guarantee that the Index will be calculated in accordance with its stated methodology. Losses or costs associated with any Index Provider errors generally will be borne by the fund and its shareholders.
Investment Companies Risk. To the extent a fund invests in the securities of other investment vehicles, the fund will incur additional fees and expenses that would not be present in a direct investment in those investment vehicles. Furthermore, the fund’s investment performance and risks are directly related to the investment performance and risks of the investment vehicles in which the fund invests.
LIBOR Risk. To the extent a fund invests in floating or variable rate obligations that use the London Interbank Offered Rate (“LIBOR”) as a reference interest rate, it is subject to LIBOR Risk. The United Kingdom’s Financial Conduct Authority, which regulates LIBOR, will cease making LIBOR available as a reference rate over a phase-out period that will begin immediately after December 31, 2021. The unavailability or replacement of LIBOR may affect the value, liquidity or return on certain fund investments and may result in costs incurred in connection with closing out positions and entering into new trades. Any potential effects of the transition away from LIBOR on the fund or on certain instruments in which the fund invests can be difficult to ascertain, and they may vary depending on a variety of factors, and they could result in losses to the fund.
Management Risk. To the extent that a fund is actively managed, it is subject to management risk. In managing an actively-managed fund’s investment portfolio, the fund’s portfolio managers will apply investment techniques and risk analyses that may not have the desired result. There can be no guarantee that a fund will meet its investment objective.
Market Risk. Securities held by a fund, as well as shares of a fund itself, are subject to market fluctuations caused by factors such as general economic conditions, political events, regulatory or market developments, changes in interest rates and perceived trends in securities prices. Shares of a fund could decline in value or underperform other investments as a result of the risk of loss associated with these market fluctuations. In addition, local, regional or global events such as war, acts of terrorism, spread of infectious diseases or other public health issues, recessions, or other events could have a significant negative impact on a fund and its investments. Such events may affect certain geographic regions, countries, sectors and industries more significantly than others. The outbreak of the respiratory disease designated as COVID-19 in December 2019 has caused significant volatility and declines in global financial markets, which have caused losses for investors. The COVID-19 pandemic may last for an extended period of time and will continue to impact the economy for the foreseeable future.
Non-U.S. Securities Risk. To the extent a fund invests in non-U.S. securities, it is subject to additional risks not associated with securities of domestic issuers. Non-U.S. securities are subject to higher volatility than securities of domestic issuers due to: possible adverse political, social or economic developments; restrictions on foreign investment or exchange of securities; lack of liquidity;
Additional Information (Continued)
First Trust Exchange-Traded Fund III
January 31, 2021 (Unaudited)
currency exchange rates; excessive taxation; government seizure of assets; different legal or accounting standards; and less government supervision and regulation of exchanges in foreign countries. Investments in non-U.S. securities may involve higher costs than investments in U.S. securities, including higher transaction and custody costs, as well as additional taxes imposed by non-U.S. governments. These risks may be heightened for securities of companies located, or with significant operations, in emerging market countries.
Operational Risk. Each fund is subject to risks arising from various operational factors, including, but not limited to, human error, processing and communication errors, errors of a fund’s service providers, counterparties or other third-parties, failed or inadequate processes and technology or systems failures. Although the funds and the Advisor seek to reduce these operational risks through controls and procedures, there is no way to completely protect against such risks.
Passive Investment Risk. To the extent a fund seeks to track an index, the fund will invest in the securities included in, or representative of, the index regardless of their investment merit. A fund generally will not attempt to take defensive positions in declining markets.
| NOT FDIC INSURED | NOT BANK GUARANTEED | MAY LOSE VALUE |
This page intentionally left blank
This page intentionally left blank
This page intentionally left blank
First Trust Exchange-Traded Fund III
INVESTMENT ADVISOR
First Trust Advisors L.P.
120 East Liberty Drive, Suite 400
Wheaton, IL 60187
ADMINISTRATOR, CUSTODIAN,
FUND ACCOUNTANT &
TRANSFER AGENT
Brown Brothers Harriman & Co.
50 Post Office Square
Boston, MA 02110
INDEPENDENT REGISTERED
PUBLIC ACCOUNTING FIRM
Deloitte & Touche LLP
111 S. Wacker Drive
Chicago, IL 60606
LEGAL COUNSEL
Chapman and Cutler LLP
111 W. Monroe Street
Chicago, IL 60603
First Trust Exchange-Traded Fund III
First Trust Merger Arbitrage ETF (MARB)
Semi-Annual Report
For the Six Months Ended
January 31, 2021
First Trust Merger Arbitrage ETF (MARB)
Semi-Annual Report
January 31, 2021
Caution Regarding Forward-Looking Statements
This report contains certain forward-looking statements within the meaning of the Securities Act of 1933, as amended, and the Securities Exchange Act of 1934, as amended. Forward-looking statements include statements regarding the goals, beliefs, plans or current expectations of First Trust Advisors L.P. (“First Trust” or the “Advisor”) and/or Vivaldi Asset Management, LLC (“Vivaldi” or the “Sub-Advisor”) and their respective representatives, taking into account the information currently available to them. Forward-looking statements include all statements that do not relate solely to current or historical fact. For example, forward-looking statements include the use of words such as “anticipate,” “estimate,” “intend,” “expect,” “believe,” “plan,” “may,” “should,” “would” or other words that convey uncertainty of future events or outcomes.
Forward-looking statements involve known and unknown risks, uncertainties and other factors that may cause the actual results, performance or achievements of the series of First Trust Exchange-Traded Fund III (the “Trust”) described in this report (First Trust Merger Arbitrage ETF; hereinafter referred to as the “Fund”) to be materially different from any future results, performance or achievements expressed or implied by the forward-looking statements. When evaluating the information included in this report, you are cautioned not to place undue reliance on these forward-looking statements, which reflect the judgment of the Advisor and/or Sub-Advisor and their respective representatives only as of the date hereof. We undertake no obligation to publicly revise or update these forward-looking statements to reflect events and circumstances that arise after the date hereof.
Performance and Risk Disclosure
There is no assurance that the Fund will achieve its investment objective. The Fund is subject to market risk, which is the possibility that the market values of securities owned by the Fund will decline and that the value of the Fund’s shares may therefore be less than what you paid for them. Accordingly, you can lose money by investing in the Fund. See “Risk Considerations” in the Additional Information section of this report for a discussion of certain other risks of investing in the Fund.
Performance data quoted represents past performance, which is no guarantee of future results, and current performance may be lower or higher than the figures shown. For the most recent month-end performance figures, please visit www.ftportfolios.com or speak with your financial advisor. Investment returns, net asset value and share price will fluctuate and Fund shares, when sold, may be worth more or less than their original cost.
The Advisor may also periodically provide additional information on Fund performance on the Fund’s web page at www.ftportfolios.com.
How to Read This Report
This report contains information that may help you evaluate your investment in the Fund. It includes details about the Fund and presents data and analysis that provide insight into the Fund’s performance and investment approach.
The statistical information that follows may help you understand the Fund’s performance compared to that of relevant market benchmarks.
It is important to keep in mind that the opinions expressed by personnel of the Advisor and/or Sub-Advisor are just that: informed opinions. They should not be considered to be promises or advice. The opinions, like the statistics, cover the period through the date on the cover of this report. The material risks of investing in the Fund are spelled out in the prospectus, the statement of additional information, and other Fund regulatory filings.
First Trust Merger Arbitrage ETF (MARB)
Semi-Annual Letter from the Chairman and CEO
January 31, 2021
Dear Shareholders,
First Trust is pleased to provide you with the semi-annual report for the First Trust Merger Arbitrage ETF (the “Fund”), which contains detailed information about the Fund for the six months ended January 31, 2021.
There is so much to talk about, yet so little space. Rather than drill down on politics or belabor the coronavirus (“COVID-19”) pandemic, I would like to take this opportunity to convey a brief message on the current economic/business/investment climate in the U.S. The one thing I feel compelled to point out, however, is that unlike the Trump Administration’s approach of delegating the lion’s share of the responsibility of executing the medical ground assault against COVID-19 to the states, the Biden Administration has communicated its intention to play more of an integral role at the federal level. The distribution of the FDA-approved vaccines, of which there are currently three, and the push for a huge bump up in the next round of fiscal stimulus to help millions of Americans cope with the economic fallout stemming from the pandemic are just two examples. While he was hoping to make it a bipartisan effort, President Joe Biden was prepared to utilize a tactic in Congress, particularly in the Senate, known as reconciliation to pass his $1.9 trillion stimulus bill. Reconciliation would only require a simple majority of Senate votes to pass the bill. In the end, Congress did just that and the Senate passed the bill with a 50-49 count. President Biden signed the “American Rescue Plan Act” into law on March 11, 2021. Not one Republican in Congress voted for the bill.
The current climate strikes me as one where “Cash is King.” A recent survey by Money and Morning Consult found that 68% of adults said they need another stimulus check from the government to get by, and 39% of those polled claimed they need the additional financial support “a lot,” according to their own release. Overall, respondents said that the $600 checks sent out this past December were not enough. Seventy-seven percent of adults say they need the checks to exceed $1,000 and 36% say they need more than $2,000 to make ends meet. President Joe Biden’s American Rescue Plan will make payments of up to $1,400 to those who are eligible. Suffice it to say, cash tends to be an urgent priority for those who do not have it.
While most investors are likely hunting for opportunities to generate higher returns on their capital, many Americans are sitting on their cash. Brian Wesbury, Chief Economist at First Trust, recently noted that, as of the third quarter of 2020, the amount of capital held by Americans in checking accounts, savings accounts, time deposits and money market funds stood $2.8 trillion higher than their combined total in the third quarter of 2019. If you have listened to what Federal Reserve Chairman Jerome Powell has said about keeping short-term interest rates low for two or three more years if need be to significantly lower unemployment and generate inflationary pressure beyond the Federal Reserve’s 2.0% target, it makes the thought of harboring such an extraordinary volume of capital in these low-paying, interest-bearing accounts even harder to fathom, in my opinion.
The state of the U.S. economy is on the mend, but likely won’t make a full recovery for at least a couple more years, according to Wesbury. In our opinion, most of the weakness in the economy is stemming from some key service-oriented sectors, such as hotels and airlines, that remain sheltered or lightly used. Wesbury believes that a full recovery requires the reopening of the entire U.S. economy. The speed of the vaccine rollout in the weeks ahead could help determine when the economy is ready to fully reopen.
We believe investors should take solace in how upbeat our top executives are about the near future. The Conference Board’s Measure of CEO Confidence™ rose to a 17-year high in the first quarter of 2021, according to Fox Business. The measure currently stands at 73. A reading above 50 points reflects more positive than negative responses from CEOs. Its quarterly survey revealed that 82% of CEOs expect economic conditions to improve over the next six months, up from 63% in the prior survey. Forty-five percent of them expect to increase capital spending, up from 25% in the prior survey. The good news is that Corporate America’s largest companies have the cash to fund projects. In the third quarter of 2020 (most recent data), S&P 500 Industrials (Old) cash and equivalents, which excludes cash held by Financials, Utilities and Transportation companies, stood at a near-record high of $1.88 trillion, according to S&P Dow Jones Indices. The all-time high was $1.89 trillion, set in the second quarter of 2020.
It seems the economy is on the cusp of another major cash injection from the government. We encourage investors to stay the course.
Thank you for giving First Trust the opportunity to play a role in your financial future. We value our relationship with you and will report on the Fund again in six months.
Sincerely,
James A. Bowen
Chairman of the Board of Trustees
Chief Executive Officer of First Trust Advisors L.P.
Fund Performance Overview (Unaudited)
First Trust Merger Arbitrage ETF (MARB)
The First Trust Merger Arbitrage ETF’s (the “Fund”) investment objective is to seek to provide investors with capital appreciation. Under normal market conditions, the Fund seeks to achieve its investment objective by establishing long and short positions in the equity securities of companies that are involved in a publicly-announced significant corporate event, such as a merger or acquisition. The Fund’s portfolio may include equity securities issued by U.S. and non-U.S. companies, including American Depositary Receipts (“ADRs”), and derivatives, including total return swaps. The Fund may invest in securities issued by small, mid and large capitalization issuers. The Fund lists and principally trades its shares on NYSE Arca, Inc. under the ticker symbol “MARB.”
| Performance | | |
| | | Cumulative
Total Returns |
| | 6 Months Ended
1/31/21 | Inception (2/4/20)
to 1/31/21 |
| Fund Performance | | |
| NAV | 0.46% | -2.30% |
| Market Price | 0.51% | -2.25% |
| Index Performance | | |
| Hedge Fund Research Merger Arbitrage Index | 7.73% | 6.39% |
| S&P 500® Index | 14.47% | 14.68% |
Total returns for the period since inception are calculated from the inception date of the Fund. “Cumulative Total Returns” represent the total change in value of an investment over the period indicated.
The Fund’s per share net asset value (“NAV”) is the value of one share of the Fund and is computed by dividing the value of all assets of the Fund (including accrued interest and dividends), less all liabilities (including accrued expenses and dividends declared but unpaid), by the total number of outstanding shares. The price used to calculate market return (“Market Price”) is determined by using the midpoint of the national best bid and offer price (“NBBO”) as of the time that the Fund’s NAV is calculated. Under SEC rules, the NBBO consists of the highest displayed buy and lowest sell prices among the various exchanges trading the Fund at the time the Fund’s NAV is calculated. Since shares of the Fund did not trade in the secondary market until after its inception, for the period from inception to the first day of secondary market trading in shares of the Fund, the NAV of the Fund is used as a proxy for the secondary market trading price to calculate market returns. NAV and market returns assume that all distributions have been reinvested in the Fund at NAV and Market Price, respectively.
An index is a statistical composite that tracks a specified financial market or sector. Unlike the Fund, the indices do not actually hold a portfolio of securities and therefore do not incur the expenses incurred by the Fund. These expenses negatively impact the performance of the Fund. Also, market returns do not include brokerage commissions that may be payable on secondary market transactions. If brokerage commissions were included, market returns would be lower. The total returns presented reflect the reinvestment of dividends on securities in the index. The returns presented do not reflect the deduction of taxes that a shareholder would pay on Fund distributions or the redemption or sale of Fund shares. The investment return and principal value of shares of the Fund will vary with changes in market conditions. Shares of the Fund may be worth more or less than their original cost when they are redeemed or sold in the market. The Fund’s past performance is no guarantee of future performance.
Fund Performance Overview (Unaudited) (Continued)
First Trust Merger Arbitrage ETF (MARB)
| Portfolio Sector Allocation | % of Total
Long-Term
Investments |
| Financials | 32.6% |
| Information Technology | 30.8 |
| Energy | 17.7 |
| Health Care | 11.8 |
| Utilities | 4.3 |
| Industrials | 2.8 |
| Total | 100.0% |
| Portfolio Sector Allocation | % of
Investments
Sold Short |
| Financials | 33.5% |
| Energy | 32.1 |
| Information Technology | 29.3 |
| Industrials | 5.1 |
| Total | 100.0% |
| Top Ten Long-Term Investments | % of
Net Assets |
| Willis Towers Watson PLC | 8.3% |
| Pioneer Natural Resources Co. | 7.9 |
| Anworth Mortgage Asset Corp. | 7.7 |
| ConocoPhillips | 6.4 |
| Slack Technologies, Inc., Class A | 5.9 |
| Watford Holdings Ltd. | 5.3 |
| Endurance International Group Holdings, Inc. | 5.2 |
| Cellular Biomedicine Group, Inc. | 5.0 |
| Varian Medical Systems, Inc. | 4.5 |
| Maxim Integrated Products, Inc. | 4.1 |
| Total | 60.3% |
| Top Investments Sold Short | % of
Net Assets |
| Aon PLC, Class A | -8.9% |
| Pioneer Natural Resources Co. | -7.9 |
| ConocoPhillips | -6.4 |
| Ready Capital Corp. | -6.0 |
| Analog Devices, Inc. | -4.4 |
| Advanced Micro Devices, Inc. | -4.0 |
| salesforce.com, Inc. | -2.4 |
| Builders FirstSource, Inc. | -2.2 |
| Marvell Technology Group Ltd. | -2.2 |
| Total | -44.4% |
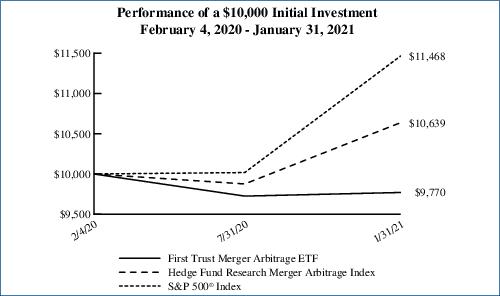
Performance figures assume reinvestment of all distributions and do not reflect the deduction of taxes that a shareholder would pay on Fund distributions or the redemption or sale of Fund shares. An index is a statistical composite that tracks a specified financial market or sector. Unlike the Fund, the indices do not actually hold a portfolio of securities and therefore do not incur the expenses incurred by the Fund. These expenses negatively impact the performance of the Fund. The Fund’s past performance does not predict future performance.
Frequency Distribution of Discounts and Premiums
Information showing the number of days the market price of the Fund’s shares was greater (at a premium) and less (at a discount) than the Fund’s net asset value for the most recently completed year, and the most recently completed calendar quarters since that year (or life of the Fund, if shorter), is available at https://www.ftportfolios.com/Retail/etf/home.aspx.
Portfolio Management
First Trust Merger Arbitrage ETF (MARB)
Semi-Annual Report
January 31, 2021 (Unaudited)
Advisor
First Trust Advisors L.P. (“First Trust”) serves as the investment advisor to the First Trust Merger Arbitrage ETF (the “Fund” or “MARB”). First Trust is responsible for the ongoing monitoring of the Fund’s investment portfolio, managing the Fund’s business affairs and providing certain administrative services necessary for the management of the Fund.
Sub-Advisor
Vivaldi Asset Management, LLC
Vivaldi Asset Management, LLC (“Vivaldi” or the “Sub-Advisor”) serves as the Fund’s investment sub-advisor. Vivaldi is an SEC registered investment advisor, founded in 2013 and headquartered in Chicago, Illinois, that specializes in structuring and managing alternative investment, multi-manager, and multi-strategy mutual funds. Vivaldi prides itself on its ability to combine rigorous research and risk management processes with disciplined portfolio construction and management.
Portfolio Management Team
Michael Peck – CFA, President and Co-Chief Investment Officer, Vivaldi
Scott Hergott – Co-Chief Investment Officer, Vivaldi
Brian Murphy – Portfolio Manager, Vivaldi
Jeff O’Brien – Portfolio Manager, Vivaldi
Daniel Lancz – Portfolio Manager, Vivaldi
Michael Grayson – Portfolio Manager, Vivaldi
First Trust Merger Arbitrage ETF (MARB)
Understanding Your Fund Expenses
January 31, 2021 (Unaudited)
As a shareholder of the First Trust Merger Arbitrage ETF (the “Fund”), you incur two types of costs: (1) transaction costs; and (2) ongoing costs, including management fees, distribution and/or service (12b-1) fees, if any, and other Fund expenses. This Example is intended to help you understand your ongoing costs of investing in the Fund and to compare these costs with the ongoing costs of investing in other funds.
The Example is based on an investment of $1,000 invested at the beginning of the period and held through the six-month period ended January 31, 2021.
Actual Expenses
The first line in the following table provides information about actual account values and actual expenses. You may use the information in this line, together with the amount you invested, to estimate the expenses that you paid over the period. Simply divide your account value by $1,000 (for example, an $8,600 account value divided by $1,000 = 8.6), then multiply the result by the number in the first line under the heading entitled “Expenses Paid During the Six-Month Period” to estimate the expenses you paid on your account during this period.
Hypothetical Example for Comparison Purposes
The second line in the following table provides information about hypothetical account values and hypothetical expenses based on the Fund’s actual expense ratio and an assumed rate of return of 5% per year before expenses, which is not the Fund’s actual return. The hypothetical account values and expenses may not be used to estimate the actual ending account balance or expenses you paid for the period. You may use this information to compare the ongoing costs of investing in the Fund and other funds. To do so, compare this 5% hypothetical example with the 5% hypothetical examples that appear in the shareholder reports of the other funds.
Please note that the expenses shown in the table are meant to highlight your ongoing costs only and do not reflect any transactional costs such as brokerage commissions. Therefore, the second line in the table is useful in comparing ongoing costs only, and will not help you determine the relative total costs of owning different funds. In addition, if these transactional costs were included, your costs would have been higher.
| | Beginning
Account Value
August 1, 2020 | Ending
Account Value
January 31, 2021 | Annualized
Expense Ratio
Based on the
Six-Month
Period | Expenses Paid
During the
Six-Month
Period (a) |
| First Trust Merger Arbitrage ETF (MARB) |
| Actual | $1,000.00 | $1,004.60 | 2.18% | $11.01 |
| Hypothetical (5% return before expenses) | $1,000.00 | $1,014.22 | 2.18% | $11.07 |
| (a) | Expenses are equal to the annualized expense ratios as indicated in the table multiplied by the average account value over the period (August 1, 2020 through January 31, 2021), multiplied by 184/365 (to reflect the six-month period). |
First Trust Merger Arbitrage ETF (MARB)
Portfolio of Investments
January 31, 2021 (Unaudited)
| Shares | | Description | | Value |
| COMMON STOCKS – 73.0% |
| | | Biotechnology – 5.0% | | |
| 32,688 | | Cellular Biomedicine Group, Inc. (a) (b) | | $640,685 |
| | | Building Products – 2.2% | | |
| 7,378 | | Builders FirstSource, Inc. (a) (b) | | 282,209 |
| | | Capital Markets – 3.1% | | |
| 15,627 | | Waddell & Reed Financial, Inc., Class A | | 395,207 |
| | | Electric Utilities – 3.5% | | |
| 9,092 | | PNM Resources, Inc. (b) | | 441,144 |
| | | Health Care Equipment &
Supplies – 4.5% | | |
| 3,244 | | Varian Medical Systems, Inc. (a) (b) | | 569,549 |
| | | Insurance – 13.6% | | |
| 19,480 | | Watford Holdings Ltd. (a) (b) | | 673,229 |
| 5,210 | | Willis Towers Watson PLC (b) | | 1,057,317 |
| | | | | 1,730,546 |
| | | IT Services – 8.2% | | |
| 69,882 | | Endurance International Group Holdings, Inc. (a) (b) | | 662,481 |
| 7,458 | | Virtusa Corp. (a) (b) | | 380,731 |
| | | | | 1,043,212 |
| | | Oil, Gas & Consumable Fuels – 14.3% | | |
| 20,330 | | ConocoPhillips (b) | | 813,810 |
| 8,275 | | Pioneer Natural Resources Co. (b) | | 1,000,447 |
| | | | | 1,814,257 |
| | | Semiconductors &
Semiconductor Equipment – 10.8% | | |
| 2,342 | | Inphi, Corp. (a) (b) | | 394,885 |
| 6,002 | | Maxim Integrated Products, Inc. (b) | | 526,435 |
| 3,467 | | Xilinx, Inc. (b) | | 452,686 |
| | | | | 1,374,006 |
| | | Software – 5.9% | | |
| 17,614 | | Slack Technologies, Inc., Class A (a) (b) | | 742,782 |
| | | Thrifts & Mortgage Finance – 1.9% | | |
| 7,375 | | Standard AVB Financial Corp. (b) | | 241,974 |
| | | Total Common Stocks | | 9,275,571 |
| | | (Cost $9,072,259) | | |
| Shares | | Description | | Value |
| REAL ESTATE INVESTMENT TRUSTS – 7.7% |
| | | Mortgage Real Estate
Investment Trusts – 7.7% | | |
| 399,418 | | Anworth Mortgage Asset Corp. (b) | | $974,580 |
| | | (Cost $1,088,414) | | |
| | | Total Investments – 80.7% | | 10,250,151 |
| | | (Cost $10,160,673) (c) | | |
| COMMON STOCKS SOLD SHORT – (38.4)% |
| | | Building Products – (2.2)% | | |
| (7,432) | | Builders FirstSource, Inc. (a) | | (284,274) |
| | | Insurance – (8.9)% | | |
| (5,548) | | Aon PLC, Class A | | (1,126,799) |
| | | Oil, Gas & Consumable Fuels – (14.3)% | | |
| (20,303) | | ConocoPhillips | | (812,729) |
| (8,258) | | Pioneer Natural Resources Co. | | (998,392) |
| | | | | (1,811,121) |
| | | Semiconductors &
Semiconductor Equipment – (10.6)% | | |
| (5,934) | | Advanced Micro Devices, Inc. (a) | | (508,188) |
| (3,780) | | Analog Devices, Inc. | | (556,907) |
| (5,454) | | Marvell Technology Group Ltd. | | (280,663) |
| | | | | (1,345,758) |
| | | Software – (2.4)% | | |
| (1,366) | | salesforce.com, Inc. (a) | | (308,115) |
| | | Total Common Stocks Sold Short | | (4,876,067) |
| | | (Proceeds $4,688,647) | | |
REAL ESTATE INVESTMENT TRUSTS SOLD SHORT –
(6.0)% |
| | | Mortgage Real Estate
Investment Trusts – (6.0)% | | |
| (67,140) | | Ready Capital Corp. | | (764,053) |
| | | (Proceeds $834,867) | | |
| | | Total Investments Sold Short – (44.4)% | | (5,640,120) |
| | | (Proceeds $5,523,514) | | |
| | | Net Other Assets and Liabilities – 63.7% | | 8,097,839 |
| | | Net Assets – 100.0% | | $12,707,870 |
|
| (a) | Non-income producing security. |
| (b) | This security or a portion of this security is segregated as collateral for investments sold short. |
Page 6
See Notes to Financial Statements
First Trust Merger Arbitrage ETF (MARB)
Portfolio of Investments (Continued)
January 31, 2021 (Unaudited)
| (c) | Aggregate cost for financial reporting purposes approximates the aggregate cost for federal income tax purposes. As of January 31, 2021, the aggregate gross unrealized appreciation for all investments in which there was an excess of value over tax cost was $392,474 and the aggregate gross unrealized depreciation for all investments in which there was an excess of tax cost over value was $419,602. The net unrealized depreciation was $27,128. The unrealized amounts presented are inclusive of investments sold short. |
Valuation Inputs
A summary of the inputs used to value the Fund’s investments as of January 31, 2021 is as follows (see Note 2A - Portfolio Valuation in the Notes to Financial Statements):
| ASSETS TABLE |
| | Total
Value at
1/31/2021 | Level 1
Quoted
Prices | Level 2
Significant
Observable
Inputs | Level 3
Significant
Unobservable
Inputs |
| Common Stocks* | $ 9,275,571 | $ 9,275,571 | $ — | $ — |
| Real Estate Investment Trusts* | 974,580 | 974,580 | — | — |
| Total Investments | $ 10,250,151 | $ 10,250,151 | $— | $— |
| LIABILITIES TABLE |
| | Total
Value at
1/31/2021 | Level 1
Quoted
Prices | Level 2
Significant
Observable
Inputs | Level 3
Significant
Unobservable
Inputs |
| Common Stocks Sold Short* | $ (4,876,067) | $ (4,876,067) | $ — | $ — |
| Real Estate Investment Trusts Sold Short* | (764,053) | (764,053) | — | — |
| Total | $ (5,640,120) | $ (5,640,120) | $— | $— |
| * | See Portfolio of Investments for industry breakout. |
See Notes to Financial Statements
Page 7
First Trust Merger Arbitrage ETF (MARB)
Statement of Assets and Liabilities
January 31, 2021 (Unaudited)
| ASSETS: | |
Investments, at value
(Cost $10,160,673)
| $ 10,250,151 |
Cash
| 2,051,827 |
Restricted Cash
| 6,049,512 |
Dividends receivable
| 13,892 |
Total Assets
| 18,365,382 |
| LIABILITIES: | |
Investments sold short, at value (proceeds $5,523,514)
| 5,640,120 |
| Payables: | |
Investment advisory fees
| 13,470 |
Dividends on investments sold short
| 2,552 |
Margin interest expense
| 1,370 |
Total Liabilities
| 5,657,512 |
NET ASSETS
| $12,707,870 |
| NET ASSETS consist of: | |
Paid-in capital
| $ 12,700,874 |
Par value
| 6,500 |
Accumulated distributable earnings (loss)
| 496 |
NET ASSETS
| $12,707,870 |
NET ASSET VALUE, per share
| $19.55 |
Number of shares outstanding (unlimited number of shares authorized, par value $0.01 per share)
| 650,002 |
Page 8
See Notes to Financial Statements
First Trust Merger Arbitrage ETF (MARB)
Statement of Operations
For the Six Months Ended January 31, 2021 (Unaudited)
| INVESTMENT INCOME: | |
Dividends
| $ 115,860 |
Interest
| 110 |
Other
| 444 |
Total investment income
| 116,414 |
| EXPENSES: | |
Investment advisory fees
| 80,097 |
Dividend expense on investments sold short
| 54,118 |
Margin interest expense
| 5,310 |
Total expenses
| 139,525 |
NET INVESTMENT INCOME (LOSS)
| (23,111) |
| NET REALIZED AND UNREALIZED GAIN (LOSS): | |
| Net realized gain (loss) on: | |
Investments
| 46,462 |
In-kind redemptions
| 161,537 |
Investments sold short
| (125,947) |
Net realized gain (loss)
| 82,052 |
| Net change in unrealized appreciation (depreciation) on: | |
Investments
| 83,631 |
Investments sold short
| (84,489) |
Net change in unrealized appreciation (depreciation)
| (858) |
NET REALIZED AND UNREALIZED GAIN (LOSS)
| 81,194 |
NET INCREASE (DECREASE) IN NET ASSETS RESULTING FROM OPERATIONS
| $ 58,083 |
See Notes to Financial Statements
Page 9
First Trust Merger Arbitrage ETF (MARB)
Statements of Changes in Net Assets
| | Six Months
Ended
1/31/2021
(Unaudited) | | Period
Ended
7/31/2020 (a) |
| OPERATIONS: | | | |
Net investment income (loss)
| $ (23,111) | | $ (46,812) |
Net realized gain (loss)
| 82,052 | | 49,574 |
Net change in unrealized appreciation (depreciation)
| (858) | | (26,270) |
Net increase (decrease) in net assets resulting from operations
| 58,083 | | (23,508) |
| SHAREHOLDER TRANSACTIONS: | | | |
Proceeds from shares sold
| 3,900,479 | | 14,621,923 |
Cost of shares redeemed
| (3,899,444) | | (1,949,663) |
Net increase (decrease) in net assets resulting from shareholder transactions
| 1,035 | | 12,672,260 |
Total increase (decrease) in net assets
| 59,118 | | 12,648,752 |
| NET ASSETS: | | | |
Beginning of period
| 12,648,752 | | — |
End of period
| $12,707,870 | | $12,648,752 |
| CHANGES IN SHARES OUTSTANDING: | | | |
Shares outstanding, beginning of period
| 650,002 | | — |
Shares sold
| 200,000 | | 750,002 |
Shares redeemed
| (200,000) | | (100,000) |
Shares outstanding, end of period
| 650,002 | | 650,002 |
| (a) | Inception date is February 4, 2020, which is consistent with the commencement of investment operations and is the date the initial creation units were established. |
Page 10
See Notes to Financial Statements
First Trust Merger Arbitrage ETF (MARB)
Financial Highlights
For a share outstanding throughout each period
| | Six Months
Ended
1/31/2021
(Unaudited) | | Period
Ended
7/31/2020 (a) |
Net asset value, beginning of period
| $ 19.46 | | $ 20.01 |
| Income from investment operations: | | | |
Net investment income (loss)
| (0.04) | | (0.07) |
Net realized and unrealized gain (loss)
| 0.13 | | (0.48) |
Total from investment operations
| 0.09 | | (0.55) |
Net asset value, end of period
| $19.55 | | $19.46 |
Total return (b)
| 0.46% | | (2.75)% |
| Ratios to average net assets/supplemental data: | | | |
Net assets, end of period (in 000’s)
| $ 12,708 | | $ 12,649 |
Ratio of total expenses to average net assets
| 2.18% (c) | | 2.30% (c) |
Ratio of total expenses to average net assets excluding dividend expense and margin interest expense
| 1.25% (c) | | 1.25% (c) |
Ratio of net investment income (loss) to average net assets
| (0.36)% (c) | | (1.71)% (c) |
Portfolio turnover rate (d)
| 140% | | 137% |
| (a) | Inception date is February 4, 2020, which is consistent with the commencement of investment operations and is the date the initial creation units were established. |
| (b) | Total return is calculated assuming an initial investment made at the net asset value at the beginning of the period, reinvestment of all distributions at net asset value during the period, and redemption at net asset value on the last day of the period. The returns presented do not reflect the deduction of taxes that a shareholder would pay on Fund distributions or the redemption or sale of Fund shares. Total return is calculated for the time period presented and is not annualized for periods of less than a year. |
| (c) | Annualized. |
| (d) | Portfolio turnover is calculated for the time period presented and is not annualized for periods of less than a year and does not include securities received or delivered from processing creations or redemptions and in-kind transactions. |
Notes to Financial Statements
First Trust Merger Arbitrage ETF (MARB)
January 31, 2021 (Unaudited)
1. Organization
First Trust Exchange-Traded Fund III (the “Trust”) is an open-end management investment company organized as a Massachusetts business trust on January 9, 2008, and is registered with the Securities and Exchange Commission under the Investment Company Act of 1940, as amended (the “1940 Act”).
The Trust currently consists of seventeen funds that are offering shares. This report covers the First Trust Merger Arbitrage ETF (the “Fund”), a non-diversified series of the Trust, which trades under the ticker “MARB” on NYSE Arca, Inc. The Fund represents a separate series of beneficial interest in the Trust. Unlike conventional mutual funds, the Fund issues and redeems shares on a continuous basis, at net asset value (“NAV”), only in large blocks of shares known as “Creation Units.”
The Fund is an actively managed exchange-traded fund. The investment objective of the Fund is to seek to provide investors with capital appreciation. Under normal market conditions, the Fund seeks to achieve its investment objective by establishing long and short positions in the equity securities of companies that are involved in a publicly-announced significant corporate event, such as a merger or acquisition. The Fund’s portfolio may include equity securities issued by U.S. and non-U.S. companies, including American Depositary Receipts (“ADRs”), and derivatives, including total return swaps. The Fund may invest in securities issued by small, mid and large capitalization issuers.
2. Significant Accounting Policies
The Fund is considered an investment company and follows accounting and reporting guidance under Financial Accounting Standards Board Accounting Standards Codification Topic 946, “Financial Services-Investment Companies.” The following is a summary of significant accounting policies consistently followed by the Fund in the preparation of the financial statements. The preparation of the financial statements in accordance with accounting principles generally accepted in the United States of America (“U.S. GAAP”) requires management to make estimates and assumptions that affect the reported amounts and disclosures in the financial statements. Actual results could differ from those estimates.
A. Portfolio Valuation
The Fund’s NAV is determined daily as of the close of regular trading on the New York Stock Exchange (“NYSE”), normally 4:00 p.m. Eastern time, on each day the NYSE is open for trading. If the NYSE closes early on a valuation day, the NAV is determined as of that time. Foreign securities are priced using data reflecting the earlier closing of the principal markets for those securities. The Fund’s NAV is calculated by dividing the value of all assets of the Fund (including accrued interest and dividends), less all liabilities (including accrued expenses and dividends declared but unpaid), by the total number of shares outstanding.
The Fund’s investments are valued daily at market value or, in the absence of market value with respect to any portfolio securities, at fair value. Market value prices represent last sale or official closing prices from a national or foreign exchange (i.e., a regulated market) and are primarily obtained from third-party pricing services. Fair value prices represent any prices not considered market value prices and are either obtained from a third-party pricing service or are determined by the Pricing Committee of the Fund’s investment advisor, First Trust Advisors L.P. (“First Trust” or the “Advisor”), in accordance with valuation procedures adopted by the Trust’s Board of Trustees, and in accordance with provisions of the 1940 Act. Investments valued by the Advisor’s Pricing Committee, if any, are footnoted as such in the footnotes to the Portfolio of Investments. The Fund’s investments are valued as follows:
Common stocks and other equity securities listed on any national or foreign exchange (excluding Nasdaq and the London Stock Exchange Alternative Investment Market (“AIM”)) are valued at the last sale price on the exchange on which they are principally traded or, for Nasdaq and AIM securities, the official closing price. Securities traded on more than one securities exchange are valued at the last sale price or official closing price, as applicable, at the close of the securities exchange representing the principal market for such securities.
Securities traded in an over-the-counter market are fair valued at the mean of their most recent bid and asked price, if available, and otherwise at their closing bid price.
Certain securities may not be able to be priced by pre-established pricing methods. Such securities may be valued by the Trust’s Board of Trustees or its delegate, the Advisor’s Pricing Committee, at fair value. These securities generally include, but are not limited to, restricted securities (securities which may not be publicly sold without registration under the Securities Act of 1933, as amended) for which a third-party pricing service is unable to provide a market price; securities whose trading has been formally suspended; a security whose market or fair value price is not available from a pre-established pricing source; a security with respect to which an event has occurred that is likely to materially affect the value of the security after the market has closed but before the calculation of the Fund’s NAV or make it difficult or impossible to obtain a reliable market quotation; and a security whose price, as provided by the third-party pricing service, does not reflect the security’s fair value. As a general principle, the current fair value of a security would appear to be the amount which the owner might reasonably expect to receive for the security upon its current sale. When fair value
Notes to Financial Statements (Continued)
First Trust Merger Arbitrage ETF (MARB)
January 31, 2021 (Unaudited)
prices are used, generally they will differ from market quotations or official closing prices on the applicable exchanges. A variety of factors may be considered in determining the fair value of such securities, including, but not limited to, the following:
| 1) | the type of security; |
| 2) | the size of the holding; |
| 3) | the initial cost of the security; |
| 4) | transactions in comparable securities; |
| 5) | price quotes from dealers and/or third-party pricing services; |
| 6) | relationships among various securities; |
| 7) | information obtained by contacting the issuer, analysts, or the appropriate stock exchange; |
| 8) | an analysis of the issuer’s financial statements; and |
| 9) | the existence of merger proposals or tender offers that might affect the value of the security. |
The Fund is subject to fair value accounting standards that define fair value, establish the framework for measuring fair value and provide a three-level hierarchy for fair valuation based upon the inputs to the valuation as of the measurement date. The three levels of the fair value hierarchy are as follows:
| • | Level 1 – Level 1 inputs are quoted prices in active markets for identical investments. An active market is a market in which transactions for the investment occur with sufficient frequency and volume to provide pricing information on an ongoing basis. |
| • | Level 2 – Level 2 inputs are observable inputs, either directly or indirectly, and include the following: |
| o | Quoted prices for similar investments in active markets. |
| o | Quoted prices for identical or similar investments in markets that are non-active. A non-active market is a market where there are few transactions for the investment, the prices are not current, or price quotations vary substantially either over time or among market makers, or in which little information is released publicly. |
| o | Inputs other than quoted prices that are observable for the investment (for example, interest rates and yield curves observable at commonly quoted intervals, volatilities, prepayment speeds, loss severities, credit risks, and default rates). |
| o | Inputs that are derived principally from or corroborated by observable market data by correlation or other means. |
| • | Level 3 – Level 3 inputs are unobservable inputs. Unobservable inputs may reflect the reporting entity’s own assumptions about the assumptions that market participants would use in pricing the investment. |
The inputs or methodologies used for valuing investments are not necessarily an indication of the risk associated with investing in those investments. A summary of the inputs used to value the Fund’s investments as of January 31, 2021, is included with the Fund’s Portfolio of Investments.
B. Securities Transactions and Investment Income
Securities transactions are recorded as of the trade date. Realized gains and losses from securities transactions are recorded on the identified cost basis. Dividend income is recorded on the ex-dividend date. Interest income, if any, is recorded daily on the accrual basis.
Distributions received from the Fund’s investments in real estate investment trusts (“REITs”) may be comprised of return of capital, capital gains, and income. The actual character of the amounts received during the year are not known until after the REITs’ fiscal year end. The Fund records the character of distributions received from the REITs during the year based on estimates available. The characterization of distributions received by the Fund may be subsequently revised based on information received from the REITs after their tax reporting periods conclude.
C. Short Sales
Short sales are utilized for investment and risk management purposes and are transactions in which securities or other instruments (such as options, forwards, futures or other derivative contracts) are sold by the Fund, but are not currently owned in the Fund’s portfolio. When the Fund engages in a short sale, the Fund must borrow the security sold short and deliver the security to the counterparty. Short selling allows the Fund to profit from a decline in a market price to the extent such decline exceeds the transaction costs and the costs of borrowing the securities. The Fund will pay a fee or premium to borrow the securities sold short and is obligated to repay the lenders of the securities. Any dividends or interest that accrues on the securities during the period of the loan are due to the lenders. A gain, limited to the price at which the security was sold short, or a loss, unlimited in size, will be recognized upon the termination of the short sale; which is affected by the Fund purchasing the security sold short and delivering the security to the lender.
Notes to Financial Statements (Continued)
First Trust Merger Arbitrage ETF (MARB)
January 31, 2021 (Unaudited)
Any such gain or loss may be offset, completely or in part, by the change in the value of the long portion of the Fund’s portfolio. The Fund is subject to the risk that it may be unable to reacquire a security to terminate a short position except at a price substantially in excess of the last quoted price. Also, there is the risk that the counterparty to a short sale may fail to honor its contractual terms, causing a loss to the Fund.
The Fund has established an account with BNP Paribas Prime Brokerage International, Ltd. for the purpose of borrowing securities that the Fund intends to sell short. The Fund is charged interest on debit margin balances at a rate equal to 1-Month LIBOR plus 75 basis points. With regard to securities held short, the Fund is credited a rebate equal to the market value of its short positions at a rate equal to the Overnight Bank Funding Rate less 35 basis points. This rebate rate applies to easy to borrow securities. Securities that are hard to borrow may earn a rebate that is less than the foregoing or may be subject to a premium charge on a security by security basis. The different rebate rate is determined at the time of a short sale request. For the six months ended January 31, 2021, the Fund had margin interest expense of $5,310, as shown on the Statement of Operations. Restricted cash in the amount of $6,049,512, as shown on the Statement of Assets and Liabilities, is associated with collateral at the broker as of January 31, 2021.
D. Dividends and Distributions to Shareholders
Dividends from net investment income, if any, are declared and paid quarterly by the Fund, or as the Board of Trustees may determine from time to time. Distributions of net realized capital gains earned by the Fund, if any, are distributed at least annually.
Distributions from net investment income and realized capital gains are determined in accordance with federal income tax regulations, which may differ from U.S. GAAP. Certain capital accounts in the financial statements are periodically adjusted for permanent differences in order to reflect their tax character. These permanent differences are primarily due to the varying treatment of income and gain/loss on portfolio securities held by the Fund and have no impact on net assets or NAV per share. Temporary differences, which arise from recognizing certain items of income, expense and gain/loss in different periods for financial statement and tax purposes, will reverse at some time in the future.
During the fiscal period ended July 31, 2020, no distributions were paid by the Fund.
As of July 31, 2020, the components of distributable earnings on a tax basis were as follows:
Undistributed ordinary income
| $— |
Accumulated capital and other gain (loss)
| (31,307) |
Net unrealized appreciation (depreciation)
| (26,280) |
E. Income Taxes
The Fund intends to continue to qualify as a regulated investment company by complying with the requirements under Subchapter M of the Internal Revenue Code of 1986, as amended, which includes distributing substantially all of its net investment income and net realized gains to shareholders. Accordingly, no provision has been made for federal and state income taxes. However, due to the timing and amount of distributions, the Fund may be subject to an excise tax of 4% of the amount by which approximately 98% of the Fund’s taxable income exceeds the distributions from such taxable income for the calendar year.
The Fund is subject to accounting standards that establish a minimum threshold for recognizing, and a system for measuring, the benefits of a tax position taken or expected to be taken in a tax return. The taxable period ended 2020 remains open to federal and state audit. As of January 31, 2021, management has evaluated the application of these standards to the Fund and has determined that no provision for income tax is required in the Fund’s financial statements for uncertain tax positions.
The Fund intends to utilize provisions of the federal income tax laws, which allow it to carry a realized capital loss forward indefinitely following the year of the loss and offset such loss against any future realized capital gains. The Fund is subject to certain limitations under U.S. tax rules on the use of capital loss carryforwards and net unrealized built-in losses. These limitations apply when there has been a 50% change in ownership. At July 31, 2020, the Fund had $31,307 of non-expiring capital loss carryforwards for federal income tax purposes.
F. Expenses
Expenses, other than the investment advisory fee, dividend and interest expenses on investments sold short and other excluded expenses, are paid by the Advisor (See Note 3).
Notes to Financial Statements (Continued)
First Trust Merger Arbitrage ETF (MARB)
January 31, 2021 (Unaudited)
3. Investment Advisory Fee, Affiliated Transactions and Other Fee Arrangements
First Trust, the investment advisor to the Fund, is a limited partnership with one limited partner, Grace Partners of DuPage L.P., and one general partner, The Charger Corporation. The Charger Corporation is an Illinois corporation controlled by James A. Bowen, Chief Executive Officer of First Trust. First Trust is responsible for supervising the selection and ongoing monitoring of the securities in the Fund’s portfolio, managing the Fund’s business affairs and providing certain administrative services necessary for the management of the Fund.
Pursuant to an investment management agreement between First Trust and the Trust, on behalf of the Fund (the “Investment Management Agreement”), First Trust oversees Vivaldi Asset Management, LLC’s (“Vivaldi” or the “Sub-Advisor”) management of the Fund’s assets and pays Vivaldi for its services as Sub-Advisor. First Trust is paid an annual unitary management fee by the Fund equal to 1.25% of the Fund’s average daily net assets and is responsible for the expenses of the Fund including the cost of transfer agency, custody, fund administration, legal, audit and other services, but excluding fee payments under the Investment Management Agreement, interest, taxes, acquired fund fees and expenses, if any, brokerage commissions and other expenses connected with the execution of portfolio transactions, expenses associated with short sales transactions, distribution and service fees pursuant to a Rule 12b-1 plan, if any, and extraordinary expenses. First Trust also provides fund reporting services to the Fund for a flat annual fee in the amount of $9,250, which is covered under the annual unitary management fee.
The Trust has multiple service agreements with Brown Brothers Harriman & Co. (“BBH”). Under the service agreements, BBH performs custodial, fund accounting, certain administrative services, and transfer agency services for the Fund. As custodian, BBH is responsible for custody of the Fund’s assets. As fund accountant and administrator, BBH is responsible for maintaining the books and records of the Fund’s securities and cash. As transfer agent, BBH is responsible for maintaining shareholder records for the Fund.
Each Trustee who is not an officer or employee of First Trust, any sub-advisor or any of their affiliates (“Independent Trustees”) is paid a fixed annual retainer that is allocated equally among each fund in the First Trust Fund Complex. Each Independent Trustee is also paid an annual per fund fee that varies based on whether the fund is a closed-end or other actively managed fund, a defined-outcome fund or an index fund.
Additionally, the Lead Independent Trustee and the Chairmen of the Audit Committee, Nominating and Governance Committee and Valuation Committee are paid annual fees to serve in such capacities, with such compensation allocated pro rata among each fund in the First Trust Fund Complex based on net assets. Independent Trustees are reimbursed for travel and out-of-pocket expenses in connection with all meetings. The Lead Independent Trustee and Committee Chairmen rotate every three years. The officers and “Interested” Trustee receive no compensation from the Trust for acting in such capacities.
4. Purchases and Sales of Securities
For the six months ended January 31, 2021, the cost of purchases and proceeds from sales of investments, excluding short term investments, investments sold short and in-kind transactions were $15,129,539 and $10,869,219, respectively. The cost of purchases to cover short sales and the proceeds of short sales were $4,828,506 and $7,737,886, respectively.
For the six months ended January 31, 2021, the cost of in-kind purchases and proceeds from in-kind sales were $1,453,311 and $3,297,564, respectively.
5. Creations, Redemptions and Transaction Fees
The Fund generally issues and redeems its shares in primary market transactions through a creation and redemption mechanism and does not sell or redeem individual shares. Instead, financial entities known as “Authorized Participants” have contractual arrangements with the Fund or one of the Fund’s service providers to purchase and redeem Fund shares directly with the Fund in large blocks of shares known as “Creation Units.” Prior to the start of trading on every business day, the Fund publishes through the National Securities Clearing Corporation (“NSCC”) the “basket” of securities, cash or other assets that it will accept in exchange for a Creation Unit of the Fund’s shares. An Authorized Participant that wishes to effectuate a creation of the Fund’s shares deposits with the Fund the “basket” of securities, cash or other assets identified by the Fund that day, and then receives the Creation Unit of the Fund’s shares in return for those assets. After purchasing a Creation Unit, the Authorized Participant may continue to hold the Fund’s shares or sell them in the secondary market. The redemption process is the reverse of the purchase process: the authorized participant redeems a Creation Unit of the Fund’s shares for a basket of securities, cash or other assets. The combination of the creation and redemption process with secondary market trading in the Fund’s shares and underlying securities provides arbitrage opportunities that are designed to help keep the market price of the Fund’s shares at or close to the NAV per share of the Fund.
The Fund imposes fees in connection with the purchase of Creation Units. These fees may vary based upon various fact-based circumstances, including, but not limited to, the composition of the securities included in the Creation Unit or the countries in which
Notes to Financial Statements (Continued)
First Trust Merger Arbitrage ETF (MARB)
January 31, 2021 (Unaudited)
the transactions are settled. The price for each Creation Unit will equal the daily NAV per share of the Fund times the number of shares in a Creation Unit, plus the fees described above and, if applicable, any operational processing and brokerage costs, transfer fees, stamp taxes and part or all of the spread between the expected bid and offer side of the market related to the securities comprising the creation basket.
The Fund also imposes fees in connection with the redemption of Creation Units. These fees may vary based upon various fact-based circumstances, including, but not limited to, the composition of the securities included in the Creation Unit or the countries in which the transactions are settled. The price received for each Creation Unit will equal the daily NAV per share of the Fund times the number of shares in a Creation Unit, minus the fees described above and, if applicable, any operational processing and brokerage costs, transfer fees, stamp taxes and part or all of the spread between the expected bid and offer side of the market related to the securities comprising the redemption basket. Investors who use the services of a broker or other such intermediary in addition to an Authorized Participant to effect a redemption of a Creation Unit may also be assessed an amount to cover the cost of such services. The redemption fee charged by the Fund will comply with Rule 22c-2 of the 1940 Act which limits redemption fees to no more than 2% of the value of the shares redeemed.
6. Distribution Plan
The Board of Trustees adopted a Distribution and Service Plan pursuant to Rule 12b-1 under the 1940 Act. In accordance with the Rule 12b-1 plan, the Fund is authorized to pay an amount up to 0.25% of its average daily net assets each year to reimburse First Trust Portfolios L.P. (“FTP”), the distributor of the Fund, for amounts expended to finance activities primarily intended to result in the sale of Creation Units or to provide investor services. FTP may also use this amount to compensate securities dealers or other persons that are Authorized Participants for providing distribution assistance, including broker-dealer and shareholder support and educational and promotional services.
No 12b-1 fees are currently paid by the Fund, and pursuant to a contractual arrangement, no 12b-1 fees will be paid any time before February 3, 2022.
7. Indemnification
The Trust, on behalf of the Fund, has a variety of indemnification obligations under contracts with its service providers. The Trust’s maximum exposure under these arrangements is unknown. However, the Trust has not had prior claims or losses pursuant to these contracts and expects the risk of loss to be remote.
8. Subsequent Events
Management has evaluated the impact of all subsequent events to the Fund through the date the financial statements were issued, and has determined that there was the following subsequent event:
On March 8, 2021, the Fund’s Board of Trustees approved a change in the Fund’s investment strategy by authorizing the Fund to invest up to 10% of its net assets in stock, warrants and other securities of special purpose acquisition companies (“SPACs”).
A SPAC is a publicly listed acquisition vehicle, whereby one or more sponsors raise a pool of capital with the special purpose of acquiring a private operating company. SPACs often have pre-determined time frames to merge with an operating company (typically two years), and if no merger takes place during that time frame the SPAC will liquidate. A SPAC generally offers units, each comprised of one share of common stock and a warrant (or portion of a warrant) to purchase common stock. A warrant is a security that allows its holder to purchase a specified amount of common stock at a specified price for a specified time. Unless and until an acquisition is completed, a SPAC generally invests its assets (less a portion retained to cover expenses) in U.S. government securities, money market securities and cash. If an acquisition that meets the requirements for the SPAC is not completed within a pre-established period, the invested funds are returned to the entity’s shareholders.
The Fund will generally dispose of SPAC interests held by the Fund prior to the completion of an acquisition. Depending on the relative market price of the SPAC securities and the net asset value of the underlying U.S. government securities, money market securities and cash held by the SPAC, the Fund may either sell the securities at their current market price or redeem them with the SPAC in accordance with the redemption terms applicable to such securities.
Additional Information
First Trust Merger Arbitrage ETF (MARB)
January 31, 2021 (Unaudited)
Proxy Voting Policies and Procedures
A description of the policies and procedures that the Trust uses to determine how to vote proxies and information on how the Fund voted proxies relating to portfolio securities during the most recent 12-month period ended June 30 is available (1) without charge, upon request, by calling (800) 988-5891; (2) on the Fund’s website at www.ftportfolios.com; and (3) on the Securities and Exchange Commission’s (“SEC”) website at www.sec.gov.
Portfolio Holdings
The Fund files portfolio holdings information for each month in a fiscal quarter within 60 days after the end of the relevant fiscal quarter on Form N-PORT. Portfolio holdings information for the third month of each fiscal quarter will be publicly available on the SEC’s website at www.sec.gov. The Fund’s complete schedule of portfolio holdings for the second and fourth quarters of each fiscal year is included in the semi-annual and annual reports to shareholders, respectively, and is filed with the SEC on Form N-CSR. The semi-annual and annual report for the Fund is available to investors within 60 days after the period to which it relates. The Fund’s Forms N-PORT and Forms N-CSR are available on the SEC’s website listed above.
Risk Considerations
Risks are inherent in all investing. Certain general risks that may be applicable to a Fund are identified below, but not all of the material risks relevant to each Fund are included in this report and not all of the risks below apply to each Fund. The material risks of investing in each Fund are spelled out in its prospectus, statement of additional information and other regulatory filings. Before investing, you should consider each Fund’s investment objective, risks, charges and expenses, and read each Fund’s prospectus and statement of additional information carefully. You can download each Fund’s prospectus at www.ftportfolios.com or contact First Trust Portfolios L.P. at (800) 621-1675 to request a prospectus, which contains this and other information about each Fund.
Concentration Risk. To the extent that a fund is able to invest a large percentage of its assets in a single asset class or the securities of issuers within the same country, state, region, industry or sector, an adverse economic, business or political development may affect the value of the fund’s investments more than if the fund were more broadly diversified. A fund that tracks an index will be concentrated to the extent the fund’s corresponding index is concentrated. A concentration makes a fund more susceptible to any single occurrence and may subject the fund to greater market risk than a fund that is not concentrated.
Credit Risk. Credit risk is the risk that an issuer of a security will be unable or unwilling to make dividend, interest and/or principal payments when due and the related risk that the value of a security may decline because of concerns about the issuer’s ability to make such payments.
Cyber Security Risk. The funds are susceptible to potential operational risks through breaches in cyber security. A breach in cyber security refers to both intentional and unintentional events that may cause a fund to lose proprietary information, suffer data corruption or lose operational capacity. Such events could cause a fund to incur regulatory penalties, reputational damage, additional compliance costs associated with corrective measures and/or financial loss. In addition, cyber security breaches of a fund’s third-party service providers, such as its administrator, transfer agent, custodian, or sub-advisor, as applicable, or issuers in which the fund invests, can also subject a fund to many of the same risks associated with direct cyber security breaches.
Derivatives Risk. To the extent a fund uses derivative instruments such as futures contracts, options contracts and swaps, the fund may experience losses because of adverse movements in the price or value of the underlying asset, index or rate, which may be magnified by certain features of the derivative. These risks are heightened when a fund’s portfolio managers use derivatives to enhance the fund’s return or as a substitute for a position or security, rather than solely to hedge (or offset) the risk of a position or security held by the fund.
Equity Securities Risk. To the extent a fund invests in equity securities, the value of the fund’s shares will fluctuate with changes in the value of the equity securities. Equity securities prices fluctuate for several reasons, including changes in investors’ perceptions of the financial condition of an issuer or the general condition of the relevant stock market, such as market volatility, or when political or economic events affecting the issuers occur. In addition, common stock prices may be particularly sensitive to rising interest rates, as the cost of capital rises and borrowing costs increase. Equity securities may decline significantly in price over short or extended periods of time, and such declines may occur in the equity market as a whole, or they may occur in only a particular country, company, industry or sector of the market.
ETF Risk. The shares of an ETF trade like common stock and represent an interest in a portfolio of securities. The risks of owning an ETF generally reflect the risks of owning the underlying securities, although lack of liquidity in an ETF could result in it being more volatile and ETFs have management fees that increase their costs. Shares of an ETF trade on an exchange at market prices rather than
Additional Information (Continued)
First Trust Merger Arbitrage ETF (MARB)
January 31, 2021 (Unaudited)
net asset value, which may cause the shares to trade at a price greater than net asset value (premium) or less than net asset value (discount). In times of market stress, decisions by market makers to reduce or step away from their role of providing a market for an ETF’s shares, or decisions by an ETF’s authorized participants that they are unable or unwilling to proceed with creation and/or redemption orders of an ETF’s shares, could result in shares of the ETF trading at a discount to net asset value and in greater than normal intraday bid-ask spreads.
Fixed Income Securities Risk. To the extent a fund invests in fixed income securities, the fund will be subject to credit risk, income risk, interest rate risk, liquidity risk and prepayment risk. Income risk is the risk that income from a fund’s fixed income investments could decline during periods of falling interest rates. Interest rate risk is the risk that the value of a fund’s fixed income securities will decline because of rising interest rates. Liquidity risk is the risk that a security cannot be purchased or sold at the time desired, or cannot be purchased or sold without adversely affecting the price. Prepayment risk is the risk that the securities will be redeemed or prepaid by the issuer, resulting in lower interest payments received by the fund. In addition to these risks, high yield securities, or “junk” bonds, are subject to greater market fluctuations and risk of loss than securities with higher ratings, and the market for high yield securities is generally smaller and less liquid than that for investment grade securities.
Index Constituent Risk. Certain funds may be a constituent of one or more indices. As a result, such a fund may be included in one or more index-tracking exchange-traded funds or mutual funds. Being a component security of such a vehicle could greatly affect the trading activity involving a fund, the size of the fund and the market volatility of the fund. Inclusion in an index could significantly increase demand for the fund and removal from an index could result in outsized selling activity in a relatively short period of time. As a result, a fund’s net asset value could be negatively impacted and the fund’s market price may be significantly below its net asset value during certain periods.
Index Provider Risk. To the extent a fund seeks to track an index, it is subject to Index Provider Risk. There is no assurance that the Index Provider will compile the Index accurately, or that the Index will be determined, maintained, constructed, reconstituted, rebalanced, composed, calculated or disseminated accurately. To correct any such error, the Index Provider may carry out an unscheduled rebalance or other modification of the Index constituents or weightings, which may increase the fund’s costs. The Index Provider does not provide any representation or warranty in relation to the quality, accuracy or completeness of data in the Index, and it does not guarantee that the Index will be calculated in accordance with its stated methodology. Losses or costs associated with any Index Provider errors generally will be borne by the fund and its shareholders.
Investment Companies Risk. To the extent a fund invests in the securities of other investment vehicles, the fund will incur additional fees and expenses that would not be present in a direct investment in those investment vehicles. Furthermore, the fund’s investment performance and risks are directly related to the investment performance and risks of the investment vehicles in which the fund invests.
LIBOR Risk. To the extent a fund invests in floating or variable rate obligations that use the London Interbank Offered Rate (“LIBOR”) as a reference interest rate, it is subject to LIBOR Risk. The United Kingdom’s Financial Conduct Authority, which regulates LIBOR, will cease making LIBOR available as a reference rate over a phase-out period that will begin immediately after December 31, 2021. The unavailability or replacement of LIBOR may affect the value, liquidity or return on certain fund investments and may result in costs incurred in connection with closing out positions and entering into new trades. Any potential effects of the transition away from LIBOR on the fund or on certain instruments in which the fund invests can be difficult to ascertain, and they may vary depending on a variety of factors, and they could result in losses to the fund.
Management Risk. To the extent that a fund is actively managed, it is subject to management risk. In managing an actively-managed fund’s investment portfolio, the fund’s portfolio managers will apply investment techniques and risk analyses that may not have the desired result. There can be no guarantee that a fund will meet its investment objective.
Market Risk. Securities held by a fund, as well as shares of a fund itself, are subject to market fluctuations caused by factors such as general economic conditions, political events, regulatory or market developments, changes in interest rates and perceived trends in securities prices. Shares of a fund could decline in value or underperform other investments as a result of the risk of loss associated with these market fluctuations. In addition, local, regional or global events such as war, acts of terrorism, spread of infectious diseases or other public health issues, recessions, or other events could have a significant negative impact on a fund and its investments. Such events may affect certain geographic regions, countries, sectors and industries more significantly than others. The outbreak of the respiratory disease designated as COVID-19 in December 2019 has caused significant volatility and declines in global financial markets, which have caused losses for investors. The COVID-19 pandemic may last for an extended period of time and will continue to impact the economy for the foreseeable future.
Non-U.S. Securities Risk. To the extent a fund invests in non-U.S. securities, it is subject to additional risks not associated with securities of domestic issuers. Non-U.S. securities are subject to higher volatility than securities of domestic issuers due to: possible adverse political, social or economic developments; restrictions on foreign investment or exchange of securities; lack of liquidity;
Additional Information (Continued)
First Trust Merger Arbitrage ETF (MARB)
January 31, 2021 (Unaudited)
currency exchange rates; excessive taxation; government seizure of assets; different legal or accounting standards; and less government supervision and regulation of exchanges in foreign countries. Investments in non-U.S. securities may involve higher costs than investments in U.S. securities, including higher transaction and custody costs, as well as additional taxes imposed by non-U.S. governments. These risks may be heightened for securities of companies located, or with significant operations, in emerging market countries.
Operational Risk. Each fund is subject to risks arising from various operational factors, including, but not limited to, human error, processing and communication errors, errors of a fund’s service providers, counterparties or other third-parties, failed or inadequate processes and technology or systems failures. Although the funds and the Advisor seek to reduce these operational risks through controls and procedures, there is no way to completely protect against such risks.
Passive Investment Risk. To the extent a fund seeks to track an index, the fund will invest in the securities included in, or representative of, the index regardless of their investment merit. A fund generally will not attempt to take defensive positions in declining markets.
| NOT FDIC INSURED | NOT BANK GUARANTEED | MAY LOSE VALUE |
This page intentionally left blank
First Trust Exchange-Traded Fund III
INVESTMENT ADVISOR
First Trust Advisors L.P.
120 East Liberty Drive, Suite 400
Wheaton, IL 60187
INVESTMENT SUB-ADVISOR
Vivaldi Asset Management, LLC
225 West Wacker Drive, Suite 2100
Chicago, IL 60606
ADMINISTRATOR, CUSTODIAN,
FUND ACCOUNTANT &
TRANSFER AGENT
Brown Brothers Harriman & Co.
50 Post Office Square
Boston, MA 02110
INDEPENDENT REGISTERED
PUBLIC ACCOUNTING FIRM
Deloitte & Touche LLP
111 S. Wacker Drive
Chicago, IL 60606
LEGAL COUNSEL
Chapman and Cutler LLP
111 W. Monroe Street
Chicago, IL 60603
(b) Not applicable.
Item 2. Code of Ethics.
Not applicable.
Item 3. Audit Committee Financial Expert.
Not applicable.
Item 4. Principal Accountant Fees and Services.
Not applicable.
Item 5. Audit Committee of Listed Registrants.
Not applicable.
Item 6. Schedule of Investments.
| (a) | Schedules of Investments in securities of unaffiliated issuers as of the close of the reporting period are included as part of the report to shareholders filed under Item 1 of this form. |
Item 7. Disclosure of Proxy Voting Policies and Procedures for Closed-End Management Investment Companies.
Not applicable.
Item 8. Portfolio Managers of Closed-End Management Investment Companies.
Not applicable.
Item 9. Purchases of Equity Securities by Closed-End Management Investment Company and Affiliated Purchasers.
Not applicable.
Item 10. Submission of Matters to a Vote of Security Holders.
There have been no material changes to the procedures by which the shareholders may recommend nominees to the registrant's board of directors, where those changes were implemented after the registrant last provided disclosure in response to the requirements of Item 407(c)(2)(iv) of Regulation S-K (17 CFR 229.407) (as required by Item 22(b)(15) of Schedule 14A (17 CFR 240.14a-101)),or this Item.
Item 11. Controls and Procedures.
| (a) | The registrant's principal executive and principal financial officers, or persons performing similar functions, have concluded that the registrant's disclosure controls and procedures (as defined in Rule 30a-3(c) under the Investment Company Act of 1940, as amended (the “1940 Act”) (17 CFR 270.30a-3 (c))) are effective, as of a date within 90 days of the filing date of the report that includes the disclosure required by this paragraph, based on their evaluation of these controls and procedures required by Rule 30a-3(b) under the 1940 Act (17 CFR 270.30a-3(b)) and Rules 13a-15(b) or 15d-15(b) under the Securities Exchange Act of 1934, as amended (17 CFR 240.13a-15(b) or 240.15d-15 (b)). |
| (b) | There were no changes in the registrant's internal control over financial reporting (as defined in Rule 30a-3(d) under the 1940 Act (17 CFR 270.30a-3(d)) that occurred during the period covered by this report that have materially affected, or are reasonably likely to materially affect, the registrant's internal control over financial reporting. |
Item 12. Disclosure of Securities Lending Activities for Closed-End Management Investment Companies.
Not applicable.
Item 13. Exhibits.
SIGNATURES
Pursuant to the requirements of the Securities Exchange Act of 1934 and the Investment Company Act of 1940, the registrant has duly caused this report to be signed on its behalf by the undersigned, thereunto duly authorized.
| (registrant) | | First Trust Exchange-Traded Fund III |
| By (Signature and Title)* | | /s/ James M. Dykas |
| | | James M. Dykas, President and Chief Executive Officer
(principal executive officer) |
Pursuant to the requirements of the Securities Exchange Act of 1934 and the Investment Company Act of 1940, this report has been signed below by the following persons on behalf of the registrant and in the capacities and on the dates indicated.
| By (Signature and Title)* | | /s/ James M. Dykas |
| | | James M. Dykas, President and Chief Executive Officer
(principal executive officer) |
| By (Signature and Title)* | | /s/ Donald P. Swade |
| | | Donald P. Swade, Treasurer, Chief Financial Officer
and Chief Accounting Officer
(principal financial officer) |
* Print the name and title of each signing officer under his or her signature.