UNITED STATES
SECURITIES AND EXCHANGE COMMISSION
Washington, D.C. 20549
FORM N-CSR
CERTIFIED SHAREHOLDER REPORT OF REGISTERED MANAGEMENT INVESTMENT COMPANIES
Investment Company Act file number 811-22245
First Trust Exchange-Traded Fund III
(Exact name of registrant as specified in charter)
120 East Liberty Drive, Suite 400
Wheaton, IL 60187
(Address of principal executive offices) (Zip code)
W. Scott Jardine, Esq.
First Trust Portfolios L.P.
120 East Liberty Drive, Suite 400
Wheaton, IL 60187
(Name and address of agent for service)
Registrant’s telephone number, including area code: (630) 765-8000
Date of fiscal year end: October 31
Date of reporting period: April 30, 2022
Form N-CSR is to be used by management investment companies to file reports with the Commission not later than 10 days after the transmission to stockholders of any report that is required to be transmitted to stockholders under Rule 30e-1 under the Investment Company Act of 1940 (17 CFR 270.30e-1). The Commission may use the information provided on Form N-CSR in its regulatory, disclosure review, inspection, and policymaking roles.
A registrant is required to disclose the information specified by Form N-CSR, and the Commission will make this information public. A registrant is not required to respond to the collection of information contained in Form N-CSR unless the Form displays a currently valid Office of Management and Budget (“OMB”) control number. Please direct comments concerning the accuracy of the information collection burden estimate and any suggestions for reducing the burden to Secretary, Securities and Exchange Commission, 100 F Street, NE, Washington, DC 20549. The OMB has reviewed this collection of information under the clearance requirements of 44 U.S.C. § 3507.
Item 1. Report to Stockholders.
The registrant's semi-annual report transmitted to shareholders pursuant to Rule 30e-1 under the Investment Company Act of 1940 is as follows:
First Trust Exchange-Traded Fund III
First Trust Preferred Securities and Income ETF (FPE)
First Trust Institutional Preferred Securities and Income
ETF (FPEI)
Semi-Annual Report
For the Six Months Ended
April 30, 2022
First Trust Exchange-Traded Fund III
Semi-Annual Report
April 30, 2022
Caution Regarding Forward-Looking Statements
This report contains certain forward-looking statements within the meaning of the Securities Act of 1933, as amended, and the Securities Exchange Act of 1934, as amended. Forward-looking statements include statements regarding the goals, beliefs, plans or current expectations of First Trust Advisors L.P. (“First Trust” or the “Advisor”) and/or Stonebridge Advisors LLC (“Stonebridge” or the “Sub-Advisor”) and their respective representatives, taking into account the information currently available to them. Forward-looking statements include all statements that do not relate solely to current or historical fact. For example, forward-looking statements include the use of words such as “anticipate,” “estimate,” “intend,” “expect,” “believe,” “plan,” “may,” “should,” “would” or other words that convey uncertainty of future events or outcomes.
Forward-looking statements involve known and unknown risks, uncertainties and other factors that may cause the actual results, performance or achievements of any series of First Trust Exchange-Traded Fund III (the “Trust”) described in this report (each such series is referred to as a “Fund” and collectively, the “Funds”) to be materially different from any future results, performance or achievements expressed or implied by the forward-looking statements. When evaluating the information included in this report, you are cautioned not to place undue reliance on these forward-looking statements, which reflect the judgment of the Advisor and/or Sub-Advisor and their respective representatives only as of the date hereof. We undertake no obligation to publicly revise or update these forward-looking statements to reflect events and circumstances that arise after the date hereof.
Performance and Risk Disclosure
There is no assurance that any Fund described in this report will achieve its investment objective. Each Fund is subject to market risk, which is the possibility that the market values of securities owned by the Fund will decline and that the value of the Fund’s shares may therefore be less than what you paid for them. Accordingly, you can lose money by investing in a Fund. See “Risk Considerations” in the Additional Information section of this report for a discussion of certain other risks of investing in the Funds.
Performance data quoted represents past performance, which is no guarantee of future results, and current performance may be lower or higher than the figures shown. For the most recent month-end performance figures, please visit www.ftportfolios.com or speak with your financial advisor. Investment returns, net asset value and share price will fluctuate and Fund shares, when sold, may be worth more or less than their original cost.
The Advisor may also periodically provide additional information on Fund performance on each Fund’s web page at www.ftportfolios.com.
How to Read This Report
This report contains information that may help you evaluate your investment. It includes details about each Fund and presents data and analysis that provide insight into each Fund’s performance and investment approach.
The statistical information that follows may help you understand each Fund’s performance compared to that of relevant market
benchmarks.
It is important to keep in mind that the opinions expressed by personnel of the Advisor and/or Sub-Advisor are just that: informed opinions. They should not be considered to be promises or advice. The opinions, like the statistics, cover the period through the date on the cover of this report. The material risks of investing in each Fund are spelled out in the prospectus, the statement of additional information, and other Fund regulatory filings.
First Trust Exchange-Traded Fund III
Semi-Annual Letter from the Chairman and CEO
April 30, 2022
Dear Shareholders,
First Trust is pleased to provide you with the semi-annual report for certain series of First Trust Exchange-Traded Fund III (the “Funds”), which contains detailed information about the Funds for the six months ended April 30, 2022.
A couple of famous financial industry quotes came to mind recently as I was sizing up the current business climate: “There’s no such thing as a free lunch” and “Don’t fight the Fed!” It seems that for some, the trillions of dollars of financial stimulus funneled into U.S. households and businesses by the Federal government and its agencies to help mitigate the fallout stemming from the coronavirus (“COVID-19”) pandemic, which commenced sometime around February 2020, was for all intents and purposes “free money.” It was not free. From the close of February 2020 through March 2022, the Federal Reserve (the “Fed”) expanded the U.S. money supply, known as M2, by 41% to $21.81 trillion to boost liquidity in the financial system. Normally, M2 grows around 6.0% on a year-over-year basis. When you factor in that all this new capital was accompanied by a breakdown of the global supply chain, there is little wonder why inflation is rampant.
One of the more common definitions of inflation is too many dollars chasing too few goods. The biggest downside to the supply chain bottlenecks, such as the severe backup of container ships at some U.S. ports, is that they have markedly reduced the flow of imported goods to retailers. The Fed has been signaling to Americans and the rest of the globe that, after many years of artificially low interest rates, tighter monetary policy will likely rule the day for the foreseeable future. Higher interest rates make borrowing capital more expensive and that should slow consumption over time, which, in turn, should bring down inflation. Don’t fight the Fed is code for don’t bet against the Fed, in my opinion. Stay tuned!
The primary job of the Fed is price stability. Its standard inflation target rate is 2.0%. The most recent Consumer Price Index release showed that prices were up 8.3% on a year-over-year basis as of April 30, 2022, according to data from the U.S. Bureau of Labor Statistics. While down from 8.5% the prior month, it is clearly elevated and that means the Fed has some work to do to with respect to mitigating inflation. The war between Russia and Ukraine is making the Fed’s job even tougher, particularly in the areas of food and energy. Rising costs and potential shortages could become even bigger if the COVID-19 outbreak in China grows. These are important events to monitor. Fed Chairman Jerome Powell has stated that the Fed is poised to raise the Federal Funds target rate (upper bound) by 50 basis points at each of its next two meetings (set for June and July), which would take the rate up to 2.00%. Data from CME Group indicates that current market pricing has the rate rising to 2.75% or 3.00% by year-end.
Securities markets do not go up in a straight line and they do not just go up year in and year out. In fact, what we have witnessed over the past couple of decades are often referred to as boom and bust cycles. Thankfully, it has ended up more boom than bust. Simply put, investors, not traders of the market, need to be willing to take the bad with the good. As the various stages of an economic cycle come and go (expansion to contraction), the markets tend to reprice securities to reflect the current narrative. In other words, we believe the markets essentially heal themselves − if you let them. That is an accurate depiction of how the markets have behaved so far in 2022, in my opinion. In response to a softening economy, the stock and bond markets have experienced some serious downside through the first four months of this year, as measured by the broader market indices. As of today, Brian Wesbury, Chief Economist at First Trust, is not forecasting a recession for the U.S. in 2022 or 2023. Whether he is proven right or wrong, we encourage investors to stay the course.
Thank you for giving First Trust the opportunity to play a role in your financial future. We value our relationship with you and will report on the Funds again in six months.
Sincerely,
James A. Bowen
Chairman of the Board of Trustees
Chief Executive Officer of First Trust Advisors L.P.
Fund Performance Overview (Unaudited)
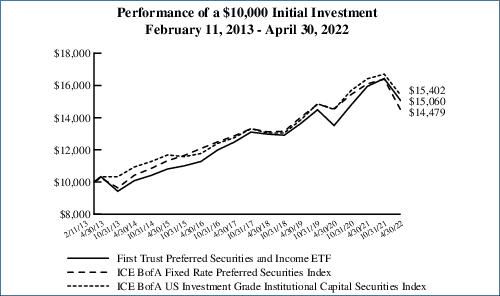
First Trust Preferred Securities and Income ETF (FPE)
The First Trust Preferred Securities and Income ETF’s (the “Fund”) investment objective is to seek total return and to provide current income. Under normal market conditions, the Fund invests at least 80% of its net assets (including investment borrowings) in preferred securities (“Preferred Securities”) and income-producing debt securities (“Income Securities”). The Fund invests in securities that are traded over-the-counter or listed on an exchange. For purposes of the 80% test set forth above, securities of open-end funds, closed-end funds or other exchange-traded funds (“ETFs”) registered under the Investment Company Act of 1940, as amended, that invest primarily in Preferred Securities or Income Securities are deemed to be Preferred Securities or Income Securities.
Preferred Securities held by the Fund generally pay fixed or adjustable-rate distributions to investors and have preference over common stock in the payment of distributions and the liquidation of a company’s assets, but are generally junior to all forms of the company’s debt, including both senior and subordinated debt. Certain of the Preferred Securities may be issued by trusts or other special purpose entities created by companies specifically for the purpose of issuing such securities. Income Securities that may be held by the Fund include corporate bonds, high yield securities (commonly referred to as “junk” bonds) and convertible securities. The broad category of corporate debt securities includes debt issued by U.S. and non-U.S. companies of all kinds, including those with small, mid and large capitalizations. Corporate debt may carry fixed or floating rates of interest.
| Performance | | | | | | | |
| | | | Average Annual Total Returns | | Cumulative Total Returns |
| | 6 Months
Ended
4/30/22 | 1 Year
Ended
4/30/22 | 5 Years
Ended
4/30/22 | Inception
(2/11/13)
to 4/30/22 | | 5 Years
Ended
4/30/22 | Inception
(2/11/13)
to 4/30/22 |
| Fund Performance | | | | | | | |
| NAV | -8.37% | -5.59% | 3.83% | 4.54% | | 20.68% | 50.60% |
| Market Price | -8.90% | -6.28% | 3.72% | 4.49% | | 20.02% | 49.90% |
| Index Performance | | | | | | | |
| ICE BofA US Investment Grade Institutional Capital Securities Index | -7.82% | -6.20% | 3.84% | 4.80% | | 20.73% | 54.02% |
| Blended Index(1)(2)(3) | -10.15% | -8.15% | 3.56% | N/A | | 19.12% | N/A |
| ICE BofA Fixed Rate Preferred Securities Index | -11.70% | -10.10% | 2.39% | 4.10% | | 12.52% | 44.79% |
| Prior Blended Index(4) | -9.89% | -8.16% | 3.19% | 4.44% | | 16.99% | 49.22% |
(See Notes to Fund Performance Overview Page 8.)
| (1) | On July 6, 2021, the Fund’s benchmark changed from the Prior Blended Index to the Blended Index because the Advisor believes that the Blended Index better reflects the investment strategies of the Fund. |
| (2) | The Blended Index consists of a 30/30/30/10 blend of the ICE BofA Core Plus Fixed Rate Preferred Securities Index, the ICE BofA US Investment Grade Institutional Capital Securities Index, the ICE USD Contingent Capital Index and the ICE BofA US High Yield Institutional Capital Securities Index. The Blended Index is intended to reflect the proportional market cap of each segment of the preferred and hybrid securities market. The indices do not charge management fees or brokerage expenses, and no such fees or expenses were deducted from the performance shown. Indices are unmanaged and an investor cannot invest directly in an index. The Blended Index returns are calculated by using the monthly returns of the four indices during each period shown above. At the beginning of each month the four indices are rebalanced to a 30/30/30/10 ratio to account for divergence from that ratio that occurred during the course of each month. The monthly returns are then compounded for each period shown above, giving the performance for the Blended Index for each period shown above. |
| (3) | Since the ICE USD Contingent Capital Index had an inception date of December 31, 2013, the performance of the Blended Index is not available for all of the periods disclosed. |
| (4) | The Prior Blended Index consists of a 50/50 blend of the ICE BofA Fixed Rate Preferred Securities Index and the ICE BofA U.S. Capital Securities Index. The indices do not charge management fees or brokerage expenses, and no such fees or expenses were deducted from the performance shown. Indices are unmanaged and an investor cannot invest directly in an index. The Prior Blended Index returns are calculated by using the monthly returns of the two indices during each period shown above. At the beginning of each month the two indices are rebalanced to a 50/50 ratio to account for divergence from that ratio that occurred during the course of each month. The monthly returns are then compounded for each period shown above, giving the performance for the Blended Index for each period shown above. |
Fund Performance Overview (Unaudited) (Continued)
First Trust Preferred Securities and Income ETF (FPE) (Continued)
| Sector Allocation | % of Total
Investments |
| Financials | 70.3% |
| Utilities | 9.5 |
| Energy | 8.4 |
| Industrials | 4.0 |
| Consumer Staples | 3.1 |
| Real Estate | 2.6 |
| Communication Services | 2.1 |
| Total | 100.0% |
| Credit Rating(5) | % of Total
Fixed-Income
Investments |
| A | 0.5% |
| A- | 0.3 |
| BBB+ | 10.3 |
| BBB | 21.6 |
| BBB- | 27.4 |
| BB+ | 22.4 |
| BB | 8.9 |
| BB- | 3.4 |
| B+ | 0.2 |
| B | 1.0 |
| Not Rated | 4.0 |
| Total | 100.0% |
| Top Ten Holdings | % of Total
Investments |
| Barclays PLC | 2.1% |
| AerCap Holdings N.V. | 1.9 |
| Emera, Inc., Series 16-A | 1.5 |
| Wells Fargo & Co., Series L | 1.4 |
| Highlands Holdings Bond Issuer Ltd./Highlands Holdings Bond Co-Issuer, Inc. | 1.4 |
| Credit Suisse Group AG | 1.1 |
| Global Atlantic Fin Co. | 1.1 |
| Bank of America Corp., Series L | 1.0 |
| BNP Paribas S.A. | 1.0 |
| Enbridge, Inc., Series 16-A | 0.9 |
| Total | 13.4% |
| Country Allocation | % of Total
Investments |
| United States | 57.9% |
| Canada | 6.9 |
| United Kingdom | 6.8 |
| Bermuda | 5.0 |
| France | 4.9 |
| Switzerland | 4.4 |
| Netherlands | 3.4 |
| Australia | 1.7 |
| Italy | 1.6 |
| Spain | 1.5 |
| Germany | 1.4 |
| Multinational | 1.4 |
| Mexico | 1.1 |
| Denmark | 0.9 |
| Finland | 0.4 |
| Japan | 0.4 |
| Sweden | 0.3 |
| Total | 100.0% |
| (5) | The credit quality and ratings information presented above reflect the ratings assigned by one or more nationally recognized statistical rating organizations (NRSROs), including S&P Global Ratings, Moody’s Investors Service, Inc., Fitch Ratings or a comparably rated NRSRO. For situations in which a security is rated by more than one NRSRO and the ratings are not equivalent, the highest rating is used. Sub-investment grade ratings are those rated BB+/Ba1 or lower. Investment grade ratings are those rated BBB-/Baa3 or higher. The credit ratings shown relate to the creditworthiness of the issuers of the underlying securities in the Fund, and not to the Fund or its shares. Credit ratings are subject to change. |
Fund Performance Overview (Unaudited) (Continued)
First Trust Preferred Securities and Income ETF (FPE) (Continued)
Performance figures assume reinvestment of all distributions and do not reflect the deduction of taxes that a shareholder would pay on Fund distributions or the redemption or sale of Fund shares. An index is a statistical composite that tracks a specified financial market or sector. Unlike the Fund, the indices do not actually hold a portfolio of securities and therefore do not incur the expenses incurred by the Fund. These expenses negatively impact the performance of the Fund. The Fund’s past performance does not predict future performance.
Frequency Distribution of Discounts and Premiums
Information showing the number of days the market price of the Fund’s shares was greater (at a premium) and less (at a discount) than the Fund’s net asset value for the most recently completed year, and the most recently completed calendar quarters since that year (or life of the Fund, if shorter), is available at https://www.ftportfolios.com/Retail/etf/home.aspx.
Fund Performance Overview (Unaudited) (Continued)
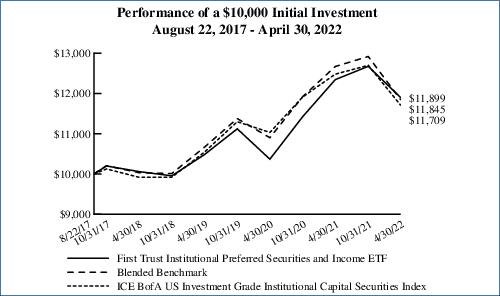
First Trust Institutional Preferred Securities and Income ETF (FPEI)
The First Trust Institutional Preferred Securities and Income ETF’s (the “Fund”) investment objective is to seek total return and to provide current income. Under normal market conditions, the Fund invests at least 80% of its net assets (including investment borrowings) in institutional preferred securities (“Preferred Securities”) and income-producing debt securities (“Income Securities”). Preferred Securities are a type of equity security that have preference over common stock in the payment of distributions and the liquidation of a company’s assets, but are generally junior to all forms of the company’s debt, including both senior and subordinated debt. The Fund’s investments in Preferred Securities will primarily be in institutional preferred securities. Institutional preferred securities are targeted to institutional, rather than retail, investors, are generally traded over-the-counter and may also be known as “$1,000 par preferred securities.” They are typically issued in large, institutional lot sized by U.S. and non-U.S. financial services companies and other companies. While all income-producing debt securities will be categorized as “Income Securities” for purposes of the 80% test above, the Income Securities in which the Fund intends to invest as part of its principal investment strategy include hybrid capital securities, contingent capital securities, U.S. and non-U.S. corporate bonds and convertible securities.
| Performance | | | | |
| | | | Average Annual
Total Returns | Cumulative
Total Returns |
| | 6 Months Ended
4/30/22 | 1 Year Ended
4/30/22 | Inception (8/22/17)
to 4/30/22 | Inception (8/22/17)
to 4/30/22 |
| Fund Performance | | | | |
| NAV | -6.14% | -3.63% | 3.78% | 18.99% |
| Market Price | -6.22% | -3.77% | 3.80% | 19.12% |
| Index Performance | | | | |
| Blended Benchmark(1)(2) | -8.33% | -6.53% | 3.68% | 18.45% |
| ICE BofA US Investment Grade Institutional Capital Securities Index | -7.82% | -6.20% | 3.42% | 17.09% |
(See Notes to Fund Performance Overview Page 8.)
| (1) | On July 6, 2021, the Fund’s benchmark changed from the ICE BofA US Investment Grade Institutional Capital Securities Index to the Blended Benchmark because the Advisor believes that the Blended Benchmark better reflects the investment strategies of the Fund. |
| (2) | The Blended Benchmark consists of a 45/40/15 blend of the ICE BofA US Investment Grade Institutional Capital Securities Index, the ICE USD Contingent Capital Index and the ICE BofA US High Yield Institutional Capital Securities Index. The Blended Benchmark is intended to reflect the proportional market cap of each segment within the institutional market. The Blended Benchmark returns are calculated by using the monthly returns of the three indices during each period shown above. At the beginning of each month the three indices are rebalanced to a 45/40/15 ratio to account for divergence from that ratio that occurred during the course of each month. The monthly returns are then compounded for each period shown above, giving the performance for the Blended Benchmark for each period shown above. |
Fund Performance Overview (Unaudited) (Continued)
First Trust Institutional Preferred Securities and Income ETF (FPEI) (Continued)
| Sector Allocation | % of Total
Investments |
| Financials | 77.2% |
| Energy | 8.3 |
| Utilities | 8.3 |
| Industrials | 3.2 |
| Consumer Staples | 2.3 |
| Communication Services | 0.7 |
| Total | 100.0% |
| Credit Quality(3) | % of Total
Investments |
| A | 0.4% |
| BBB+ | 12.0 |
| BBB | 24.4 |
| BBB- | 27.9 |
| BB+ | 20.5 |
| BB | 7.8 |
| BB- | 4.1 |
| B+ | 0.5 |
| Not Rated | 2.4 |
| Total | 100.0% |
| Top Ten Holdings | % of Total
Investments |
| Barclays PLC | 2.5% |
| Highlands Holdings Bond Issuer Ltd./Highlands Holdings Bond Co-Issuer, Inc. | 2.3 |
| Bank of America Corp., Series TT | 1.8 |
| Enstar Finance LLC | 1.8 |
| AerCap Holdings N.V. | 1.8 |
| Wells Fargo & Co., Series L | 1.5 |
| Citigroup, Inc., Series D | 1.5 |
| First Citizens BancShares, Inc., Series B | 1.5 |
| Global Atlantic Fin Co. | 1.5 |
| Enbridge, Inc., Series 16-A | 1.4 |
| Total | 17.6% |
| Country Allocation | % of Total
Investments |
| United States | 55.6% |
| United Kingdom | 8.4 |
| Canada | 6.2 |
| Switzerland | 5.9 |
| France | 5.2 |
| Netherlands | 3.2 |
| Australia | 2.4 |
| Multinational | 2.3 |
| Italy | 2.2 |
| Germany | 2.1 |
| Spain | 1.7 |
| Bermuda | 1.7 |
| Denmark | 1.1 |
| Mexico | 0.9 |
| Finland | 0.5 |
| Japan | 0.4 |
| Sweden | 0.2 |
| Total | 100.0% |
| (3) | The credit quality and ratings information presented above reflect the ratings assigned by one or more nationally recognized statistical rating organizations (NRSROs), including S&P Global Ratings, Moody’s Investors Service, Inc., Fitch Ratings or a comparably rated NRSRO. For situations in which a security is rated by more than one NRSRO and the ratings are not equivalent, the highest rating is used. Sub-investment grade ratings are those rated BB+/Ba1 or lower. Investment grade ratings are those rated BBB-/Baa3 or higher. The credit ratings shown relate to the creditworthiness of the issuers of the underlying securities in the Fund, and not to the Fund or its shares. Credit ratings are subject to change. |
Fund Performance Overview (Unaudited) (Continued)
First Trust Institutional Preferred Securities and Income ETF (FPEI) (Continued)
Performance figures assume reinvestment of all distributions and do not reflect the deduction of taxes that a shareholder would pay on Fund distributions or the redemption or sale of Fund shares. An index is a statistical composite that tracks a specified financial market or sector. Unlike the Fund, the indices do not actually hold a portfolio of securities and therefore do not incur the expenses incurred by the Fund. These expenses negatively impact the performance of the Fund. The Fund’s past performance does not predict future performance.
Frequency Distribution of Discounts and Premiums
Information showing the number of days the market price of the Fund’s shares was greater (at a premium) and less (at a discount) than the Fund’s net asset value for the most recently completed year, and the most recently completed calendar quarters since that year (or life of the Fund, if shorter), is available at https://www.ftportfolios.com/Retail/etf/home.aspx.
Notes to Fund Performance Overview (Unaudited)
Total returns for the periods since inception are calculated from the inception date of each Fund. “Average Annual Total Returns” represent the average annual change in value of an investment over the periods indicated. “Cumulative Total Returns” represent the total change in value of an investment over the periods indicated.
Each Fund’s per share net asset value (“NAV”) is the value of one share of the Fund and is computed by dividing the value of all assets of the Fund (including accrued interest and dividends), less all liabilities (including accrued expenses and dividends declared but unpaid), by the total number of outstanding shares. The price used to calculate market return (“Market Price”) is determined by using the midpoint of the national best bid and offer price (“NBBO”) as of the time that the Fund’s NAV is calculated. Under SEC rules, the NBBO consists of the highest displayed buy and lowest sell prices among the various exchanges trading the Fund at the time the Fund’s NAV is calculated. Prior to January 1, 2019, the price used was the midpoint between the highest bid and the lowest offer on the stock exchange on which shares of the Fund were listed for trading as of the time that the Fund’s NAV was calculated. Since shares of each Fund did not trade in the secondary market until after the Fund’s inception, for the period from inception to the first day of secondary market trading in shares of the Fund, the NAV of each Fund is used as a proxy for the secondary market trading price to calculate market returns. NAV and market returns assume that all distributions have been reinvested in each Fund at NAV and Market Price, respectively.
An index is a statistical composite that tracks a specified financial market or sector. Unlike each Fund, the indices do not actually hold a portfolio of securities and therefore do not incur the expenses incurred by each Fund. These expenses negatively impact the performance of each Fund. Also, market returns do not include brokerage commissions that may be payable on secondary market transactions. If brokerage commissions were included, market returns would be lower. The total returns presented reflect the reinvestment of dividends on securities in the indices. The returns presented do not reflect the deduction of taxes that a shareholder would pay on Fund distributions or the redemption or sale of Fund shares. The investment return and principal value of shares of each Fund will vary with changes in market conditions. Shares of each Fund may be worth more or less than their original cost when they are redeemed or sold in the market. Each Fund’s past performance is no guarantee of future performance.
Portfolio Management
First Trust Exchange-Traded Fund III
Semi-Annual Report
April 30, 2022 (Unaudited)
Advisor
First Trust Advisors L.P. (“First Trust”) serves as the investment advisor to the First Trust Preferred Securities and Income ETF and the First Trust Institutional Preferred Securities and Income ETF (each a “Fund” and collectively the “Funds”). First Trust is responsible for the ongoing monitoring of each Fund’s investment portfolio, managing each Fund’s business affairs and providing certain administrative services necessary for the management of each Fund.
Sub-Advisor
Stonebridge Advisors LLC
Stonebridge Advisors LLC (“Stonebridge” or the “Sub-Advisor”) is the sub-advisor to the Funds and is a registered investment advisor based in Wilton, Connecticut. Stonebridge specializes in the management of preferred and hybrid securities.
Stonebridge Advisors LLC Portfolio Management Team
Scott T. Fleming - Chief Executive Officer and President
Robert Wolf - Chief Investment Officer, Executive Vice President and Senior Portfolio Manager
Eric Weaver - Executive Vice President, Chief Strategist and Portfolio Manager
Angelo Graci, CFA - Executive Vice President, Head of Credit Research and Portfolio Manager
First Trust Exchange-Traded Fund III
Understanding Your Fund Expenses
April 30, 2022 (Unaudited)
As a shareholder of First Trust Preferred Securities and Income ETF or First Trust Institutional Preferred Securities and Income ETF (each a “Fund” and collectively, the “Funds”), you incur two types of costs: (1) transaction costs; and (2) ongoing costs, including management fees, distribution and/or service (12b-1) fees, if any, and other Fund expenses. This Example is intended to help you understand your ongoing costs of investing in the Funds and to compare these costs with the ongoing costs of investing in other funds.
The Example is based on an investment of $1,000 invested at the beginning of the period and held through the six-month period ended April 30, 2022.
Actual Expenses
The first line in the following table provides information about actual account values and actual expenses. You may use the information in this line, together with the amount you invested, to estimate the expenses that you paid over the period. Simply divide your account value by $1,000 (for example, an $8,600 account value divided by $1,000 = 8.6), then multiply the result by the number in the first line under the heading entitled “Expenses Paid During the Six-Month Period” to estimate the expenses you paid on your account during this six-month period.
Hypothetical Example for Comparison Purposes
The second line in the following table provides information about hypothetical account values and hypothetical expenses based on each Fund’s actual expense ratio and an assumed rate of return of 5% per year before expenses, which is not each Fund’s actual return. The hypothetical account values and expenses may not be used to estimate the actual ending account balance or expenses you paid for the period. You may use this information to compare the ongoing costs of investing in the Funds and other funds. To do so, compare this 5% hypothetical example with the 5% hypothetical examples that appear in the shareholder reports of the other funds.
Please note that the expenses shown in the table are meant to highlight your ongoing costs only and do not reflect any transactional costs such as brokerage commissions. Therefore, the second line in the table is useful in comparing ongoing costs only, and will not help you determine the relative total costs of owning different funds. In addition, if these transactional costs were included, your costs would have been higher.
| | Beginning
Account Value
November 1, 2021 | Ending
Account Value
April 30, 2022 | Annualized
Expense Ratio
Based on the
Six-Month
Period | Expenses Paid
During the
Six-Month
Period (a) |
| First Trust Preferred Securities and Income ETF (FPE) |
| Actual | $1,000.00 | $916.30 | 0.85% | $4.04 |
| Hypothetical (5% return before expenses) | $1,000.00 | $1,020.58 | 0.85% | $4.26 |
| First Trust Institutional Preferred Securities and Income ETF (FPEI) |
| Actual | $1,000.00 | $938.60 | 0.85% | $4.09 |
| Hypothetical (5% return before expenses) | $1,000.00 | $1,020.58 | 0.85% | $4.26 |
| (a) | Expenses are equal to the annualized expense ratios as indicated in the table multiplied by the average account value over the period (November 1, 2021 through April 30, 2022), multiplied by 181/365 (to reflect the six-month period). |
First Trust Preferred Securities and Income ETF (FPE)
Portfolio of Investments
April 30, 2022 (Unaudited)
| Shares | | Description | | Stated
Rate | | Stated
Maturity | | Value |
| $25 PAR PREFERRED SECURITIES – 24.1% |
| | | Banks – 3.8% | | | | | | |
| 11,623 | | Atlantic Union Bankshares Corp., Series A
| | 6.88% | | (a) | | $298,944 |
| 369,973 | | Bank of America Corp., Series GG
| | 6.00% | | (a) | | 9,256,724 |
| 7,004 | | Bank of America Corp., Series HH
| | 5.88% | | (a) | | 171,458 |
| 150,152 | | Bank of America Corp., Series KK
| | 5.38% | | (a) | | 3,375,417 |
| 112,368 | | Bank of America Corp., Series LL
| | 5.00% | | (a) | | 2,375,460 |
| 1,432,104 | | Bank of America Corp., Series NN
| | 4.38% | | (a) | | 26,322,072 |
| 401,545 | | Citizens Financial Group, Inc., Series D (b)
| | 6.35% | | (a) | | 10,387,969 |
| 8 | | Fifth Third Bancorp, Series A
| | 6.00% | | (a) | | 204 |
| 140,174 | | Fifth Third Bancorp, Series I (b)
| | 6.63% | | (a) | | 3,629,105 |
| 886,828 | | First Republic Bank, Series M
| | 4.00% | | (a) | | 15,519,490 |
| 519,468 | | Fulton Financial Corp., Series A
| | 5.13% | | (a) | | 10,945,191 |
| 68,150 | | Huntington Bancshares, Inc., Series H
| | 4.50% | | (a) | | 1,277,131 |
| 222,804 | | JPMorgan Chase & Co., Series DD
| | 5.75% | | (a) | | 5,469,838 |
| 496,879 | | JPMorgan Chase & Co., Series LL
| | 4.63% | | (a) | | 9,629,515 |
| 226,625 | | KeyCorp, Series F
| | 5.65% | | (a) | | 5,352,882 |
| 244,673 | | M&T Bank Corp., Series H (b)
| | 5.63% | | (a) | | 5,896,619 |
| 162,828 | | Old National Bancorp, Series A
| | 7.00% | | (a) | | 4,261,209 |
| 874,221 | | Pinnacle Financial Partners, Inc., Series B
| | 6.75% | | (a) | | 22,371,315 |
| 36,767 | | PNC Financial Services Group (The), Inc., Series P (b)
| | 6.13% | | (a) | | 923,219 |
| 1,819,590 | | Signature Bank, Series A
| | 5.00% | | (a) | | 34,808,757 |
| 116,076 | | Texas Capital Bancshares, Inc., Series B
| | 5.75% | | (a) | | 2,573,405 |
| 144,876 | | Truist Financial Corp., Series R
| | 4.75% | | (a) | | 2,942,432 |
| 9,341 | | US Bancorp, Series K
| | 5.50% | | (a) | | 225,492 |
| 115,187 | | Valley National Bancorp, Series B (b)
| | 5.50% | | (a) | | 2,757,577 |
| 83,272 | | Wells Fargo & Co., Series DD
| | 4.25% | | (a) | | 1,475,580 |
| 605,014 | | Wells Fargo & Co., Series Q (b)
| | 5.85% | | (a) | | 14,756,291 |
| 5,257 | | Wells Fargo & Co., Series R (b)
| | 6.63% | | (a) | | 137,996 |
| 819,602 | | Wells Fargo & Co., Series Y
| | 5.63% | | (a) | | 19,342,607 |
| 712,941 | | WesBanco, Inc., Series A (b)
| | 6.75% | �� | (a) | | 19,256,536 |
| 593,720 | | Western Alliance Bancorp, Series A (b)
| | 4.25% | | (a) | | 13,044,028 |
| 585 | | Wintrust Financial Corp., Series D (b)
| | 6.50% | | (a) | | 15,321 |
| 919,112 | | Wintrust Financial Corp., Series E (b)
| | 6.88% | | (a) | | 24,439,188 |
| | | | | 273,238,972 |
| | | Capital Markets – 1.6% | | | | | | |
| 140,906 | | Affiliated Managers Group, Inc.
| | 5.88% | | 03/30/59 | | 3,436,697 |
| 346,175 | | Affiliated Managers Group, Inc.
| | 4.75% | | 09/30/60 | | 6,819,648 |
| 980,305 | | Affiliated Managers Group, Inc.
| | 4.20% | | 09/30/61 | | 17,527,853 |
| 1,505,547 | | Carlyle Finance LLC
| | 4.63% | | 05/15/61 | | 28,244,062 |
| 62,762 | | Goldman Sachs Group (The), Inc., Series J (b)
| | 5.50% | | (a) | | 1,596,665 |
| 1,202,370 | | KKR Group Finance Co., IX LLC
| | 4.63% | | 04/01/61 | | 23,169,670 |
| 10 | | Morgan Stanley, Series E (b)
| | 7.13% | | (a) | | 261 |
| 496,152 | | Oaktree Capital Group LLC, Series A
| | 6.63% | | (a) | | 12,686,607 |
| 813,527 | | Oaktree Capital Group LLC, Series B
| | 6.55% | | (a) | | 20,297,499 |
| 109,350 | | State Street Corp., Series D (b)
| | 5.90% | | (a) | | 2,755,620 |
| | | | | 116,534,582 |
| | | Consumer Finance – 0.1% | | | | | | |
| 155,063 | | Capital One Financial Corp., Series I
| | 5.00% | | (a) | | 3,222,209 |
| 90,138 | | Capital One Financial Corp., Series J
| | 4.80% | | (a) | | 1,787,437 |
| | | | | 5,009,646 |
| | | Diversified Financial Services – 0.6% | | | | | | |
| 568,686 | | Apollo Asset Management, Inc., Series B
| | 6.38% | | (a) | | 14,490,119 |
| 1,344,688 | | Equitable Holdings, Inc., Series A
| | 5.25% | | (a) | | 29,260,411 |
See Notes to Financial Statements
Page 11
First Trust Preferred Securities and Income ETF (FPE)
Portfolio of Investments (Continued)
April 30, 2022 (Unaudited)
| Shares | | Description | | Stated
Rate | | Stated
Maturity | | Value |
| $25 PAR PREFERRED SECURITIES (Continued) |
| | | Diversified Financial Services (Continued) | | | | | | |
| 4,441 | | National Rural Utilities Cooperative Finance Corp.
| | 5.50% | | 05/15/64 | | $106,806 |
| | | | | 43,857,336 |
| | | Diversified Telecommunication Services – 1.0% | | | | | | |
| 420,589 | | AT&T, Inc.
| | 5.35% | | 11/01/66 | | 10,426,401 |
| 691,846 | | AT&T, Inc., Series C
| | 4.75% | | (a) | | 13,428,731 |
| 1,028,483 | | Qwest Corp.
| | 6.50% | | 09/01/56 | | 22,986,595 |
| 1,120,503 | | Qwest Corp.
| | 6.75% | | 06/15/57 | | 25,144,088 |
| | | | | 71,985,815 |
| | | Electric Utilities – 1.6% | | | | | | |
| 15,905 | | BIP Bermuda Holdings I Ltd.
| | 5.13% | | (a) | | 321,122 |
| 891,011 | | Brookfield BRP Holdings Canada, Inc.
| | 4.63% | | (a) | | 15,570,417 |
| 691,617 | | Brookfield Infrastructure Finance ULC
| | 5.00% | | 05/24/81 | | 13,451,951 |
| 221,092 | | SCE Trust III, Series H (b)
| | 5.75% | | (a) | | 5,182,396 |
| 485,580 | | SCE Trust IV, Series J (b)
| | 5.38% | | (a) | | 10,585,644 |
| 1,067,764 | | SCE Trust V, Series K (b)
| | 5.45% | | (a) | | 25,487,527 |
| 669,954 | | Southern (The) Co., Series 2020A
| | 4.95% | | 01/30/80 | | 14,149,429 |
| 1,501,663 | | Southern (The) Co., Series C
| | 4.20% | | 10/15/60 | | 29,447,611 |
| | | | | 114,196,097 |
| | | Equity Real Estate Investment Trusts – 1.3% | | | | | | |
| 470,685 | | Agree Realty Corp., Series A
| | 4.25% | | (a) | | 8,844,171 |
| 132,457 | | Digital Realty Trust, Inc., Series L
| | 5.20% | | (a) | | 3,119,362 |
| 106,021 | | DigitalBridge Group, Inc., Series I
| | 7.15% | | (a) | | 2,431,062 |
| 44,770 | | DigitalBridge Group, Inc., Series J
| | 7.13% | | (a) | | 1,009,564 |
| 880,918 | | Global Net Lease, Inc., Series A
| | 7.25% | | (a) | | 22,322,462 |
| 1,149,673 | | Hudson Pacific Properties, Inc., Series C
| | 4.75% | | (a) | | 21,809,297 |
| 63,847 | | National Storage Affiliates Trust, Series A
| | 6.00% | | (a) | | 1,605,752 |
| 33,840 | | PS Business Parks, Inc., Series Z
| | 4.88% | | (a) | | 622,656 |
| 1,080,296 | | Public Storage, Series P
| | 4.00% | | (a) | | 20,428,397 |
| 339,713 | | Vornado Realty Trust, Series N
| | 5.25% | | (a) | | 6,539,475 |
| | | | | 88,732,198 |
| | | Food Products – 1.2% | | | | | | |
| 1,155,300 | | CHS, Inc., Series 2 (b)
| | 7.10% | | (a) | | 30,557,685 |
| 1,473,516 | | CHS, Inc., Series 3 (b)
| | 6.75% | | (a) | | 39,018,704 |
| 479,923 | | CHS, Inc., Series 4
| | 7.50% | | (a) | | 13,255,473 |
| | | | | 82,831,862 |
| | | Gas Utilities – 0.2% | | | | | | |
| 870,240 | | South Jersey Industries, Inc.
| | 5.63% | | 09/16/79 | | 15,229,200 |
| 54,298 | | Spire, Inc., Series A
| | 5.90% | | (a) | | 1,356,364 |
| | | | | 16,585,564 |
| | | Independent Power & Renewable Electricity Producers – 0.2% | | | | | | |
| 724,715 | | Brookfield Renewable Partners L.P., Series 17
| | 5.25% | | (a) | | 15,117,555 |
| | | Insurance – 5.5% | | | | | | |
| 2,330,431 | | Aegon Funding Co., LLC
| | 5.10% | | 12/15/49 | | 49,288,616 |
| 494,147 | | Allstate (The) Corp. (b)
| | 5.10% | | 01/15/53 | | 12,452,504 |
| 19,724 | | Allstate (The) Corp., Series H
| | 5.10% | | (a) | | 440,437 |
| 2,008,562 | | American Equity Investment Life Holding Co., Series A (b)
| | 5.95% | | (a) | | 49,591,396 |
| 989,600 | | American Equity Investment Life Holding Co., Series B (b)
| | 6.63% | | (a) | | 25,620,744 |
| 312,756 | | AmTrust Financial Services, Inc.
| | 7.25% | | 06/15/55 | | 5,942,364 |
| 363,925 | | AmTrust Financial Services, Inc.
| | 7.50% | | 09/15/55 | | 6,823,594 |
Page 12
See Notes to Financial Statements
First Trust Preferred Securities and Income ETF (FPE)
Portfolio of Investments (Continued)
April 30, 2022 (Unaudited)
| Shares | | Description | | Stated
Rate | | Stated
Maturity | | Value |
| $25 PAR PREFERRED SECURITIES (Continued) |
| | | Insurance (Continued) | | | | | | |
| 26,342 | | Arch Capital Group Ltd., Series F
| | 5.45% | | (a) | | $596,646 |
| 638,374 | | Arch Capital Group Ltd., Series G
| | 4.55% | | (a) | | 12,314,234 |
| 303,682 | | Aspen Insurance Holdings Ltd.
| | 5.63% | | (a) | | 7,072,754 |
| 1,800,186 | | Aspen Insurance Holdings Ltd.
| | 5.63% | | (a) | | 41,674,306 |
| 330,729 | | Aspen Insurance Holdings Ltd. (b)
| | 5.95% | | (a) | | 8,099,553 |
| 887,116 | | Assurant, Inc.
| | 5.25% | | 01/15/61 | | 19,392,356 |
| 826,625 | | Athene Holding Ltd., Series A (b)
| | 6.35% | | (a) | | 21,037,606 |
| 73,594 | | Athene Holding Ltd., Series B
| | 5.63% | | (a) | | 1,674,264 |
| 238,277 | | Athene Holding Ltd., Series C (b)
| | 6.38% | | (a) | | 6,285,747 |
| 102,676 | | Athene Holding Ltd., Series D
| | 4.88% | | (a) | | 2,047,359 |
| 467,792 | | Axis Capital Holdings Ltd., Series E
| | 5.50% | | (a) | | 10,455,151 |
| 645,186 | | CNO Financial Group, Inc.
| | 5.13% | | 11/25/60 | | 13,226,313 |
| 1,243,506 | | Delphi Financial Group, Inc., 3 Mo. LIBOR + 3.19% (c)
| | 3.70% | | 05/15/37 | | 25,802,749 |
| 686,090 | | Enstar Group Ltd., Series D (b)
| | 7.00% | | (a) | | 17,632,513 |
| 817,668 | | Globe Life, Inc.
| | 4.25% | | 06/15/61 | | 16,157,120 |
| 209,334 | | Phoenix Cos. (The), Inc.
| | 7.45% | | 01/15/32 | | 3,827,149 |
| 138,023 | | Prudential Financial, Inc.
| | 4.13% | | 09/01/60 | | 2,844,654 |
| 113,878 | | RenaissanceRe Holdings Ltd., Series F
| | 5.75% | | (a) | | 2,739,905 |
| 1,428,023 | | RenaissanceRe Holdings Ltd., Series G
| | 4.20% | | (a) | | 26,818,272 |
| 21,531 | | Selective Insurance Group, Inc., Series B
| | 4.60% | | (a) | | 415,979 |
| 314,714 | | W.R. Berkley Corp.
| | 5.10% | | 12/30/59 | | 6,785,234 |
| | | | | 397,059,519 |
| | | Mortgage Real Estate Investment Trusts – 1.0% | | | | | | |
| 662,602 | | AGNC Investment Corp., Series C (b)
| | 7.00% | | (a) | | 16,313,261 |
| 300,285 | | AGNC Investment Corp., Series D (b)
| | 6.88% | | (a) | | 7,170,806 |
| 147,664 | | AGNC Investment Corp., Series E (b)
| | 6.50% | | (a) | | 3,538,029 |
| 715,633 | | AGNC Investment Corp., Series F (b)
| | 6.13% | | (a) | | 16,545,435 |
| 850,585 | | Annaly Capital Management, Inc., Series F (b)
| | 6.95% | | (a) | | 21,120,026 |
| 298,402 | | Annaly Capital Management, Inc., Series I (b)
| | 6.75% | | (a) | | 7,382,465 |
| | | | | 72,070,022 |
| | | Multi-Utilities – 1.8% | | | | | | |
| 434,689 | | Algonquin Power & Utilities Corp. (b)
| | 6.88% | | 10/17/78 | | 11,245,404 |
| 530,461 | | Algonquin Power & Utilities Corp., Series 19-A (b)
| | 6.20% | | 07/01/79 | | 13,579,802 |
| 667,823 | | Brookfield Infrastructure Partners L.P., Series 13
| | 5.13% | | (a) | | 12,982,412 |
| 66,449 | | Brookfield Infrastructure Partners L.P., Series 14
| | 5.00% | | (a) | | 1,257,880 |
| 186,795 | | CMS Energy Corp.
| | 5.88% | | 10/15/78 | | 4,699,762 |
| 122,964 | | CMS Energy Corp.
| | 5.88% | | 03/01/79 | | 3,080,248 |
| 384,589 | | CMS Energy Corp., Series C
| | 4.20% | | (a) | | 7,191,814 |
| 596,582 | | DTE Energy Co.
| | 4.38% | | 12/01/81 | | 11,830,221 |
| 873,213 | | DTE Energy Co., Series E
| | 5.25% | | 12/01/77 | | 20,284,738 |
| 955,325 | | Integrys Holding, Inc. (b)
| | 6.00% | | 08/01/73 | | 24,121,956 |
| 853,349 | | Sempra Energy
| | 5.75% | | 07/01/79 | | 20,437,709 |
| | | | | 130,711,946 |
| | | Oil, Gas & Consumable Fuels – 1.5% | | | | | | |
| 94,037 | | Energy Transfer L.P., Series C (b)
| | 7.38% | | (a) | | 2,235,259 |
| 2,316,785 | | Energy Transfer L.P., Series E (b)
| | 7.60% | | (a) | | 56,066,197 |
| 786,757 | | NuStar Energy L.P., Series A, 3 Mo. LIBOR + 6.77% (c)
| | 7.65% | | (a) | | 18,882,168 |
| 31,373 | | NuStar Energy L.P., Series C (b)
| | 9.00% | | (a) | | 768,639 |
| 1,037,948 | | NuStar Logistics L.P., 3 Mo. LIBOR + 6.73% (c)
| | 7.78% | | 01/15/43 | | 26,249,705 |
| | | | | 104,201,968 |
See Notes to Financial Statements
Page 13
First Trust Preferred Securities and Income ETF (FPE)
Portfolio of Investments (Continued)
April 30, 2022 (Unaudited)
| Shares | | Description | | Stated
Rate | | Stated
Maturity | | Value |
| $25 PAR PREFERRED SECURITIES (Continued) |
| | | Real Estate Management & Development – 1.3% | | | | | | |
| 1,493,207 | | Brookfield Property Partners L.P., Series A
| | 5.75% | | (a) | | $29,490,838 |
| 178,349 | | Brookfield Property Partners L.P., Series A-1
| | 6.50% | | (a) | | 3,912,977 |
| 1,294,215 | | Brookfield Property Partners L.P., Series A2
| | 6.38% | | (a) | | 27,294,994 |
| 1,663,989 | | Brookfield Property Preferred L.P.
| | 6.25% | | 07/26/81 | | 34,727,451 |
| | | | | 95,426,260 |
| | | Thrifts & Mortgage Finance – 0.3% | | | | | | |
| 752,851 | | New York Community Bancorp, Inc., Series A (b)
| | 6.38% | | (a) | | 19,363,328 |
| 93,981 | | Washington Federal, Inc., Series A
| | 4.88% | | (a) | | 1,799,736 |
| | | | | 21,163,064 |
| | | Trading Companies & Distributors – 0.6% | | | | | | |
| 708,465 | | Air Lease Corp., Series A (b)
| | 6.15% | | (a) | | 17,711,625 |
| 948,406 | | WESCO International, Inc., Series A (b)
| | 10.63% | | (a) | | 27,076,991 |
| | | | | 44,788,616 |
| | | Wireless Telecommunication Services – 0.5% | | | | | | |
| 259,030 | | United States Cellular Corp.
| | 6.25% | | 09/01/69 | | 5,613,180 |
| 267,143 | | United States Cellular Corp.
| | 5.50% | | 03/01/70 | | 5,364,232 |
| 1,018,903 | | United States Cellular Corp.
| | 5.50% | | 06/01/70 | | 20,546,179 |
| | | | | 31,523,591 |
| | | Total $25 Par Preferred Securities
| | 1,725,034,613 |
| | | (Cost $1,929,808,733) | | | | | | |
| $100 PAR PREFERRED SECURITIES – 0.5% |
| | | Banks – 0.5% | | | | | | |
| 88,231 | | AgriBank FCB (b)
| | 6.88% | | (a) | | 9,286,313 |
| 63,800 | | CoBank ACB, Series F (b)
| | 6.25% | | (a) | | 6,443,800 |
| 49,330 | | CoBank ACB, Series H (b)
| | 6.20% | | (a) | | 5,167,318 |
| 120,015 | | Farm Credit Bank of Texas (b) (d)
| | 6.75% | | (a) | | 12,451,556 |
| | | | | 33,348,987 |
| | | Food Products – 0.0% | | | | | | |
| 700 | | Dairy Farmers of America, Inc. (d)
| | 7.88% | | (a) | | 71,225 |
| | | Total $100 Par Preferred Securities
| | 33,420,212 |
| | | (Cost $33,683,129) | | | | | | |
| $1,000 PAR PREFERRED SECURITIES – 2.5% |
| | | Banks – 2.4% | | | | | | |
| 56,530 | | Bank of America Corp., Series L
| | 7.25% | | (a) | | 68,786,835 |
| 83,323 | | Wells Fargo & Co., Series L
| | 7.50% | | (a) | | 100,944,981 |
| | | | | 169,731,816 |
| | | Diversified Financial Services – 0.1% | | | | | | |
| 7,900 | | Compeer Financial ACA (b) (d)
| | 6.75% | | (a) | | 8,058,000 |
| | | Total $1,000 Par Preferred Securities
| | 177,789,816 |
| | | (Cost $202,456,674) | | | | | | |
Par
Amount | | Description | | Stated
Rate | | Stated
Maturity | | Value |
| CAPITAL PREFERRED SECURITIES – 69.5% |
| | | Banks – 29.4% | | | | | | |
| $35,549,000 | | Australia & New Zealand Banking Group Ltd. (b) (d) (e)
| | 6.75% | | (a) | | 37,267,261 |
| 30,500,000 | | Banco Bilbao Vizcaya Argentaria S.A., Series 9 (b) (e)
| | 6.50% | | (a) | | 29,623,125 |
Page 14
See Notes to Financial Statements
First Trust Preferred Securities and Income ETF (FPE)
Portfolio of Investments (Continued)
April 30, 2022 (Unaudited)
Par
Amount | | Description | | Stated
Rate | | Stated
Maturity | | Value |
| CAPITAL PREFERRED SECURITIES (Continued) |
| | | Banks (Continued) | | | | | | |
| $7,200,000 | | Banco Mercantil del Norte S.A. (b) (d) (e)
| | 6.88% | | (a) | | $7,132,644 |
| 11,250,000 | | Banco Mercantil del Norte S.A. (b) (d) (e)
| | 7.50% | | (a) | | 10,786,219 |
| 15,700,000 | | Banco Mercantil del Norte S.A. (b) (d) (e)
| | 7.63% | | (a) | | 15,571,810 |
| 21,630,000 | | Banco Mercantil del Norte S.A. (b) (d) (e)
| | 8.38% | | (a) | | 22,360,553 |
| 10,600,000 | | Banco Mercantil del Norte S.A. (b) (d) (e)
| | 5.75% | | 10/04/31 | | 10,262,390 |
| 35,600,000 | | Banco Santander S.A. (b) (e)
| | 4.75% | | (a) | | 31,535,150 |
| 43,800,000 | | Banco Santander S.A. (b) (e) (f)
| | 7.50% | | (a) | | 44,279,084 |
| 23,261,000 | | Bank of America Corp., Series RR (b)
| | 4.38% | | (a) | | 20,644,138 |
| 37,500,000 | | Bank of America Corp., Series TT (b)
| | 6.13% | | (a) | | 37,575,000 |
| 15,898,000 | | Bank of America Corp., Series X (b)
| | 6.25% | | (a) | | 16,133,290 |
| 42,800,000 | | Bank of Nova Scotia (The) (b)
| | 4.90% | | (a) | | 42,100,648 |
| 3,000,000 | | Bank of Nova Scotia (The), Series 2 (b)
| | 3.63% | | 10/27/81 | | 2,399,031 |
| 24,300,000 | | Barclays PLC (b) (e)
| | 4.38% | | (a) | | 20,320,875 |
| 30,400,000 | | Barclays PLC (b) (e)
| | 6.13% | | (a) | | 29,848,848 |
| 5,760,000 | | Barclays PLC (b) (e)
| | 7.75% | | (a) | | 5,824,800 |
| 144,765,000 | | Barclays PLC (b) (e)
| | 8.00% | | (a) | | 149,560,341 |
| 11,600,000 | | BBVA Bancomer S.A. (b) (d) (e)
| | 5.88% | | 09/13/34 | | 11,072,548 |
| 74,000,000 | | BNP Paribas S.A. (b) (d) (e)
| | 4.63% | | (a) | | 67,120,960 |
| 12,540,000 | | BNP Paribas S.A. (b) (d) (e)
| | 6.63% | | (a) | | 12,679,049 |
| 42,000,000 | | BNP Paribas S.A. (b) (d) (e)
| | 7.38% | | (a) | | 43,747,410 |
| 46,133,000 | | Citigroup, Inc. (b)
| | 3.88% | | (a) | | 41,788,194 |
| 781,000 | | Citigroup, Inc. (b)
| | 5.90% | | (a) | | 795,972 |
| 23,272,000 | | Citigroup, Inc. (b)
| | 5.95% | | (a) | | 23,272,000 |
| 48,429,000 | | Citigroup, Inc., Series D (b)
| | 5.35% | | (a) | | 47,823,637 |
| 16,200,000 | | Citigroup, Inc., Series P (b)
| | 5.95% | | (a) | | 15,858,990 |
| 34,250,000 | | Citigroup, Inc., Series T (b)
| | 6.25% | | (a) | | 34,678,125 |
| 34,393,000 | | Citigroup, Inc., Series W (b)
| | 4.00% | | (a) | | 31,297,630 |
| 29,875,000 | | Citigroup, Inc., Series Y (b)
| | 4.15% | | (a) | | 26,502,113 |
| 6,560,000 | | Citizens Financial Group, Inc., Series B (b)
| | 6.00% | | (a) | | 6,273,328 |
| 8,279,000 | | Citizens Financial Group, Inc., Series F (b)
| | 5.65% | | (a) | | 8,504,596 |
| 21,030,000 | | Citizens Financial Group, Inc., Series G (b)
| | 4.00% | | (a) | | 18,716,700 |
| 20,474,000 | | CoBank ACB, Series I (b)
| | 6.25% | | (a) | | 20,627,555 |
| 11,200,000 | | Commerzbank AG (b) (e) (f)
| | 7.00% | | (a) | | 11,076,800 |
| 38,310,000 | | Credit Agricole S.A. (b) (d) (e)
| | 6.88% | | (a) | | 38,568,593 |
| 43,500,000 | | Credit Agricole S.A. (b) (d) (e)
| | 8.13% | | (a) | | 46,885,257 |
| 26,200,000 | | Danske Bank A.S. (b) (e) (f)
| | 4.38% | | (a) | | 23,743,750 |
| 21,313,000 | | Danske Bank A.S. (b) (e) (f)
| | 6.13% | | (a) | | 21,115,471 |
| 15,960,000 | | Danske Bank A.S. (b) (e) (f)
| | 7.00% | | (a) | | 15,904,108 |
| 7,650,000 | | Farm Credit Bank of Texas, Series 3 (b) (d)
| | 6.20% | | (a) | | 8,109,000 |
| 20,300,000 | | Farm Credit Bank of Texas, Series 4 (b) (d)
| | 5.70% | | (a) | | 21,315,000 |
| 18,009,000 | | Fifth Third Bancorp, Series H (b)
| | 5.10% | | (a) | | 17,536,264 |
| 2,071,000 | | Fifth Third Bancorp, Series L (b)
| | 4.50% | | (a) | | 2,013,876 |
| 4,812,000 | | First Citizens BancShares, Inc., Series B (b)
| | 5.80% | | (a) | | 4,837,263 |
| 12,800,000 | | HSBC Holdings PLC (b) (e)
| | 4.60% | | (a) | | 10,880,000 |
| 49,619,000 | | HSBC Holdings PLC (b) (e)
| | 6.38% | | (a) | | 49,899,595 |
| 13,300,000 | | Huntington Bancshares, Inc., Series G (b)
| | 4.45% | | (a) | | 12,769,104 |
| 35,836,000 | | ING Groep N.V. (b) (e)
| | 5.75% | | (a) | | 34,432,483 |
| 21,579,000 | | ING Groep N.V. (b) (e)
| | 6.50% | | (a) | | 21,574,684 |
| 40,125,000 | | Intesa Sanpaolo S.p.A. (b) (d) (e)
| | 7.70% | | (a) | | 40,526,250 |
| 15,300,000 | | JPMorgan Chase & Co., Series I, 3 Mo. LIBOR + 3.47% (c)
| | 4.71% | | (a) | | 15,156,455 |
| 42,896,000 | | JPMorgan Chase & Co., Series Q (b)
| | 5.15% | | (a) | | 42,306,180 |
| 12,861,000 | | JPMorgan Chase & Co., Series R (b)
| | 6.00% | | (a) | | 12,925,305 |
| 33,108,000 | | JPMorgan Chase & Co., Series V, 3 Mo. LIBOR + 3.32% (c)
| | 4.29% | | (a) | | 32,776,920 |
| 32,100,000 | | Lloyds Banking Group PLC (b) (e)
| | 6.75% | | (a) | | 32,357,924 |
| 62,814,000 | | Lloyds Banking Group PLC (b) (e)
| | 7.50% | | (a) | | 64,187,742 |
See Notes to Financial Statements
Page 15
First Trust Preferred Securities and Income ETF (FPE)
Portfolio of Investments (Continued)
April 30, 2022 (Unaudited)
Par
Amount | | Description | | Stated
Rate | | Stated
Maturity | | Value |
| CAPITAL PREFERRED SECURITIES (Continued) |
| | | Banks (Continued) | | | | | | |
| $17,800,000 | | M&T Bank Corp. (b)
| | 3.50% | | (a) | | $14,996,728 |
| 16,900,000 | | M&T Bank Corp., Series G (b)
| | 5.00% | | (a) | | 16,414,125 |
| 8,500,000 | | NatWest Group PLC (b) (e)
| | 6.00% | | (a) | | 8,398,425 |
| 21,325,000 | | NatWest Group PLC (b) (e)
| | 8.00% | | (a) | | 22,483,801 |
| 27,000,000 | | Nordea Bank Abp (b) (d) (e)
| | 6.63% | | (a) | | 27,472,500 |
| 21,550,000 | | PNC Financial Services Group (The), Inc., Series T (b)
| | 3.40% | | (a) | | 18,586,875 |
| 18,250,000 | | PNC Financial Services Group (The), Inc., Series U (b)
| | 6.00% | | (a) | | 18,180,650 |
| 17,400,000 | | Regions Financial Corp., Series D (b)
| | 5.75% | | (a) | | 17,791,500 |
| 2,400,000 | | Skandinaviska Enskilda Banken AB (b) (e) (f)
| | 5.13% | | (a) | | 2,305,500 |
| 73,600,000 | | Societe Generale S.A. (b) (d) (e)
| | 5.38% | | (a) | | 64,804,800 |
| 31,389,000 | | Societe Generale S.A. (b) (d) (e)
| | 7.88% | | (a) | | 32,202,146 |
| 20,000,000 | | Societe Generale S.A. (b) (e) (f)
| | 7.88% | | (a) | | 20,518,109 |
| 11,500,000 | | Societe Generale S.A. (b) (d) (e)
| | 8.00% | | (a) | | 11,993,638 |
| 68,460,000 | | Standard Chartered PLC (b) (d) (e)
| | 4.30% | | (a) | | 56,821,800 |
| 25,600,000 | | Standard Chartered PLC (b) (d) (e)
| | 6.00% | | (a) | | 25,504,000 |
| 29,959,000 | | SVB Financial Group, Series C (b)
| | 4.00% | | (a) | | 26,092,791 |
| 50,341,000 | | SVB Financial Group, Series D (b)
| | 4.25% | | (a) | | 43,670,817 |
| 17,000,000 | | Swedbank AB, Series NC5 (b) (e) (f)
| | 5.63% | | (a) | | 16,861,875 |
| 5,695,000 | | Texas Capital Bancshares, Inc. (b)
| | 4.00% | | 05/06/31 | | 5,464,821 |
| 5,000,000 | | Truist Financial Corp., Series L (b)
| | 5.05% | | (a) | | 4,775,000 |
| 5,000,000 | | Truist Financial Corp., Series N (b)
| | 4.80% | | (a) | | 4,737,500 |
| 56,950,000 | | UniCredit S.p.A. (b) (e) (f)
| | 8.00% | | (a) | | 57,555,948 |
| 4,400,000 | | UniCredit S.p.A. (b) (d)
| | 7.30% | | 04/02/34 | | 4,453,513 |
| 13,500,000 | | UniCredit S.p.A. (b) (d)
| | 5.46% | | 06/30/35 | | 12,207,874 |
| 57,377,000 | | Wells Fargo & Co., Series BB (b)
| | 3.90% | | (a) | | 52,389,504 |
| | | | | 2,111,566,278 |
| | | Capital Markets – 9.6% | | | | | | |
| 40,096,000 | | Apollo Management Holdings L.P. (b) (d)
| | 4.95% | | 01/14/50 | | 37,281,092 |
| 13,000,000 | | Bank of New York Mellon (The) Corp., Series G (b)
| | 4.70% | | (a) | | 13,000,000 |
| 28,560,000 | | Bank of New York Mellon (The) Corp., Series I (b)
| | 3.75% | | (a) | | 25,489,800 |
| 15,800,000 | | Charles Schwab (The) Corp. (b)
| | 5.00% | | (a) | | 15,262,326 |
| 2,000,000 | | Charles Schwab (The) Corp., Series E, 3 Mo. LIBOR + 3.32% (c)
| | 3.84% | | (a) | | 1,982,800 |
| 55,007,000 | | Charles Schwab (The) Corp., Series G (b)
| | 5.38% | | (a) | | 55,625,829 |
| 53,069,000 | | Charles Schwab (The) Corp., Series I (b)
| | 4.00% | | (a) | | 48,186,652 |
| 66,525,000 | | Credit Suisse Group AG (b) (d) (e)
| | 5.25% | | (a) | | 58,625,156 |
| 22,300,000 | | Credit Suisse Group AG (b) (d) (e)
| | 6.25% | | (a) | | 21,697,878 |
| 31,775,000 | | Credit Suisse Group AG (b) (d) (e)
| | 6.38% | | (a) | | 29,992,105 |
| 9,407,000 | | Credit Suisse Group AG (b) (d) (e)
| | 7.50% | | (a) | | 9,445,522 |
| 76,900,000 | | Credit Suisse Group AG (b) (d) (e)
| | 7.50% | | (a) | | 76,346,320 |
| 62,200,000 | | Deutsche Bank AG (b) (e)
| | 6.00% | | (a) | | 58,157,000 |
| 15,000,000 | | Deutsche Bank AG (b) (e)
| | 7.50% | | (a) | | 14,756,250 |
| 28,725,000 | | EFG International AG (b) (e) (f)
| | 5.50% | | (a) | | 27,559,023 |
| 24,875,000 | | Goldman Sachs Group (The), Inc., Series R (b)
| | 4.95% | | (a) | | 24,004,375 |
| 13,870,000 | | Goldman Sachs Group (The), Inc., Series T (b)
| | 3.80% | | (a) | | 12,240,055 |
| 43,611,000 | | Goldman Sachs Group (The), Inc., Series U (b)
| | 3.65% | | (a) | | 37,941,570 |
| 27,653,000 | | Morgan Stanley, Series M (b)
| | 5.88% | | (a) | | 28,199,856 |
| 38,000,000 | | UBS Group AG (b) (d) (e)
| | 4.88% | | (a) | | 35,007,500 |
| 26,389,000 | | UBS Group AG (b) (e) (f)
| | 6.88% | | (a) | | 26,804,891 |
| 28,500,000 | | UBS Group AG (b) (d) (e)
| | 7.00% | | (a) | | 29,034,375 |
| | | | | 686,640,375 |
| | | Consumer Finance – 1.2% | | | | | | |
| 13,500,000 | | Ally Financial, Inc., Series B (b)
| | 4.70% | | (a) | | 11,699,438 |
| 47,679,000 | | American Express Co. (b)
| | 3.55% | | (a) | | 41,187,504 |
Page 16
See Notes to Financial Statements
First Trust Preferred Securities and Income ETF (FPE)
Portfolio of Investments (Continued)
April 30, 2022 (Unaudited)
Par
Amount | | Description | | Stated
Rate | | Stated
Maturity | | Value |
| CAPITAL PREFERRED SECURITIES (Continued) |
| | | Consumer Finance (Continued) | | | | | | |
| $35,077,000 | | Capital One Financial Corp., Series M (b)
| | 3.95% | | (a) | | $30,516,990 |
| | | | | 83,403,932 |
| | | Diversified Financial Services – 2.7% | | | | | | |
| 64,250,000 | | American AgCredit Corp. (b) (d)
| | 5.25% | | (a) | | 58,708,439 |
| 40,400,000 | | Ares Finance Co. III LLC (b) (d)
| | 4.13% | | 06/30/51 | | 37,643,415 |
| 28,250,000 | | Capital Farm Credit ACA, Series 1 (b) (d)
| | 5.00% | | (a) | | 25,848,750 |
| 13,950,000 | | Compeer Financial ACA (b) (d)
| | 4.88% | | (a) | | 12,398,063 |
| 8,300,000 | | Depository Trust & Clearing (The) Corp., Series D (b) (d)
| | 3.38% | | (a) | | 7,387,000 |
| 32,708,000 | | Voya Financial, Inc. (b)
| | 5.65% | | 05/15/53 | | 32,585,509 |
| 16,548,000 | | Voya Financial, Inc., Series A (b)
| | 6.13% | | (a) | | 16,506,630 |
| | | | | 191,077,806 |
| | | Diversified Telecommunication Services – 0.6% | | | | | | |
| 12,882,000 | | Koninklijke KPN N.V. (b) (d)
| | 7.00% | | 03/28/73 | | 13,043,025 |
| 32,310,000 | | Koninklijke KPN N.V. (b) (f)
| | 7.00% | | 03/28/73 | | 32,713,875 |
| | | | | 45,756,900 |
| | | Electric Utilities – 2.7% | | | | | | |
| 18,918,000 | | Duke Energy Corp. (b)
| | 4.88% | | (a) | | 18,776,115 |
| 17,965,000 | | Edison International, Series B (b)
| | 5.00% | | (a) | | 16,305,457 |
| 101,667,000 | | Emera, Inc., Series 16-A (b)
| | 6.75% | | 06/15/76 | | 103,446,172 |
| 25,726,000 | | Southern (The) Co., Series 21-A (b)
| | 3.75% | | 09/15/51 | | 23,217,715 |
| 32,516,000 | | Southern California Edison Co., Series E, 3 Mo. LIBOR + 4.20% (c)
| | 4.52% | | (a) | | 32,028,260 |
| | | | | 193,773,719 |
| | | Energy Equipment & Services – 0.4% | | | | | | |
| 3,524,000 | | Transcanada Trust (b)
| | 5.63% | | 05/20/75 | | 3,522,238 |
| 25,600,000 | | Transcanada Trust (b)
| | 5.50% | | 09/15/79 | | 24,736,000 |
| | | | | 28,258,238 |
| | | Food Products – 1.9% | | | | | | |
| 10,700,000 | | Dairy Farmers of America, Inc. (g)
| | 7.13% | | (a) | | 10,499,377 |
| 25,362,000 | | Land O’Lakes Capital Trust I (g)
| | 7.45% | | 03/15/28 | | 28,535,928 |
| 44,888,000 | | Land O’Lakes, Inc. (d)
| | 7.00% | | (a) | | 45,852,194 |
| 14,010,000 | | Land O’Lakes, Inc. (d)
| | 7.25% | | (a) | | 14,693,688 |
| 31,520,000 | | Land O’Lakes, Inc. (d)
| | 8.00% | | (a) | | 33,214,988 |
| | | | | 132,796,175 |
| | | Insurance – 8.5% | | | | | | |
| 16,400,000 | | Allianz SE (b) (d)
| | 3.50% | | (a) | | 14,883,000 |
| 25,817,000 | | Asahi Mutual Life Insurance Co. (b) (f)
| | 6.50% | | (a) | | 26,365,611 |
| 31,900,000 | | Assurant, Inc. (b)
| | 7.00% | | 03/27/48 | | 32,995,924 |
| 12,999,000 | | Assured Guaranty Municipal Holdings, Inc. (b) (d)
| | 6.40% | | 12/15/66 | | 13,148,489 |
| 38,875,000 | | AXIS Specialty Finance LLC (b)
| | 4.90% | | 01/15/40 | | 36,207,009 |
| 23,688,000 | | Enstar Finance LLC (b)
| | 5.75% | | 09/01/40 | | 23,342,733 |
| 52,717,000 | | Enstar Finance LLC (b)
| | 5.50% | | 01/15/42 | | 49,119,330 |
| 13,700,000 | | Fortegra Financial Corp. (b) (g)
| | 8.50% | | 10/15/57 | | 16,391,218 |
| 82,895,000 | | Global Atlantic Fin Co. (b) (d)
| | 4.70% | | 10/15/51 | | 75,381,397 |
| 18,871,000 | | Hartford Financial Services Group (The), Inc., 3 Mo. LIBOR + 2.13% (c) (d)
| | 2.63% | | 02/12/47 | | 16,626,666 |
| 26,429,000 | | Kuvare US Holdings, Inc. (b) (d)
| | 7.00% | | 02/17/51 | | 27,440,102 |
| 9,310,000 | | La Mondiale SAM (b) (f)
| | 5.88% | | 01/26/47 | | 9,428,647 |
| 40,630,000 | | Lancashire Holdings Ltd. (b) (f)
| | 5.63% | | 09/18/41 | | 36,343,535 |
See Notes to Financial Statements
Page 17
First Trust Preferred Securities and Income ETF (FPE)
Portfolio of Investments (Continued)
April 30, 2022 (Unaudited)
Par
Amount | | Description | | Stated
Rate | | Stated
Maturity | | Value |
| CAPITAL PREFERRED SECURITIES (Continued) |
| | | Insurance (Continued) | | | | | | |
| $35,910,000 | | Liberty Mutual Group, Inc. (b) (d)
| | 4.13% | | 12/15/51 | | $32,643,806 |
| 36,974,000 | | Markel Corp. (b)
| | 6.00% | | (a) | | 37,852,132 |
| 3,000,000 | | Phoenix Group Holdings PLC (b) (f)
| | 5.63% | | (a) | | 2,953,155 |
| 28,059,000 | | Principal Financial Group, Inc., 3 Mo. LIBOR + 3.04% (c)
| | 3.55% | | 05/15/55 | | 27,006,788 |
| 27,670,000 | | Progressive (The) Corp., Series B (b)
| | 5.38% | | (a) | | 26,494,025 |
| 7,564,308 | | Prudential Financial, Inc. (b)
| | 5.88% | | 09/15/42 | | 7,553,907 |
| 41,900,000 | | QBE Insurance Group Ltd. (b) (d)
| | 5.88% | | (a) | | 42,214,250 |
| 24,999,000 | | QBE Insurance Group Ltd. (b) (f)
| | 6.75% | | 12/02/44 | | 25,880,590 |
| 16,000,000 | | QBE Insurance Group Ltd. (b) (f)
| | 5.88% | | 06/17/46 | | 16,281,831 |
| 13,610,000 | | Reinsurance Group of America, Inc., 3 Mo. LIBOR + 2.67% (c)
| | 3.49% | | 12/15/65 | | 12,180,950 |
| | | | | 608,735,095 |
| | | Multi-Utilities – 2.8% | | | | | | |
| 64,818,000 | | Algonquin Power & Utilities Corp. (b)
| | 4.75% | | 01/18/82 | | 59,371,343 |
| 51,658,000 | | CenterPoint Energy, Inc., Series A (b)
| | 6.13% | | (a) | | 49,738,647 |
| 17,052,000 | | CMS Energy Corp. (b)
| | 3.75% | | 12/01/50 | | 14,366,310 |
| 2,400,000 | | Dominion Energy, Inc., Series B (b)
| | 4.65% | | (a) | | 2,304,000 |
| 14,520,000 | | NiSource, Inc. (b)
| | 5.65% | | (a) | | 14,084,400 |
| 9,031,000 | | Sempra Energy (b)
| | 4.88% | | (a) | | 8,918,113 |
| 59,610,000 | | Sempra Energy (b)
| | 4.13% | | 04/01/52 | | 52,670,419 |
| | | | | 201,453,232 |
| | | Oil, Gas & Consumable Fuels – 6.4% | | | | | | |
| 16,188,000 | | Buckeye Partners L.P. (b)
| | 6.38% | | 01/22/78 | | 13,390,390 |
| 62,609,000 | | DCP Midstream L.P., Series A (b)
| | 7.38% | | (a) | | 59,635,072 |
| 39,136,000 | | DCP Midstream Operating L.P. (b) (d)
| | 5.85% | | 05/21/43 | | 35,644,873 |
| 57,082,000 | | Enbridge, Inc. (b)
| | 6.25% | | 03/01/78 | | 57,692,489 |
| 65,166,000 | | Enbridge, Inc., Series 16-A (b)
| | 6.00% | | 01/15/77 | | 65,599,307 |
| 41,574,000 | | Enbridge, Inc., Series 20-A (b)
| | 5.75% | | 07/15/80 | | 41,366,130 |
| 32,460,000 | | Energy Transfer L.P., 3 Mo. LIBOR + 3.02% (c)
| | 3.33% | | 11/01/66 | | 26,779,500 |
| 9,660,000 | | Energy Transfer L.P., Series A (b)
| | 6.25% | | (a) | | 8,223,075 |
| 18,821,000 | | Energy Transfer L.P., Series F (b)
| | 6.75% | | (a) | | 18,162,265 |
| 22,500,000 | | Energy Transfer L.P., Series G (b)
| | 7.13% | | (a) | | 21,287,250 |
| 8,045,000 | | Energy Transfer L.P., Series H (b)
| | 6.50% | | (a) | | 7,663,747 |
| 55,280,000 | | Enterprise Products Operating LLC, 3 Mo. LIBOR + 2.78% (c)
| | 3.30% | | 06/01/67 | | 48,309,468 |
| 26,636,000 | | Enterprise Products Operating LLC, Series D (b)
| | 4.88% | | 08/16/77 | | 23,842,078 |
| 34,700,000 | | Transcanada Trust (b)
| | 5.60% | | 03/07/82 | | 33,615,625 |
| | | | | 461,211,269 |
| | | Trading Companies & Distributors – 2.6% | | | | | | |
| 145,883,000 | | AerCap Holdings N.V. (b)
| | 5.88% | | 10/10/79 | | 136,978,302 |
| 15,700,000 | | Air Lease Corp., Series B (b)
| | 4.65% | | (a) | | 14,169,250 |
| 42,300,000 | | Aircastle Ltd. (b) (d)
| | 5.25% | | (a) | | 37,705,843 |
| | | | | 188,853,395 |
| | | Transportation Infrastructure – 0.7% | | | | | | |
| 39,000,000 | | AerCap Global Aviation Trust (b) (d)
| | 6.50% | | 06/15/45 | | 37,969,620 |
| 11,000,000 | | BNSF Funding Trust I (b)
| | 6.61% | | 12/15/55 | | 11,330,000 |
| | | | | 49,299,620 |
| | | Total Capital Preferred Securities
| | 4,982,826,034 |
| | | (Cost $5,250,239,948) | | | | | | |
Page 18
See Notes to Financial Statements
First Trust Preferred Securities and Income ETF (FPE)
Portfolio of Investments (Continued)
April 30, 2022 (Unaudited)
Principal
Value | | Description | | Stated
Coupon | | Stated
Maturity | | Value |
| FOREIGN CORPORATE BONDS AND NOTES – 1.3% |
| | | Insurance – 1.3% | | | | | | |
| $94,408,028 | | Highlands Holdings Bond Issuer Ltd./Highlands Holdings Bond Co-Issuer, Inc. (d) (h)
| | 7.63% | | 10/15/25 | | $96,006,356 |
| | | (Cost $99,614,492) | | | | | | |
| CORPORATE BONDS AND NOTES – 0.2% |
| | | Insurance – 0.2% | | | | | | |
| 16,000,000 | | AmTrust Financial Services, Inc.
| | 6.13% | | 08/15/23 | | 15,959,764 |
| | | (Cost $16,054,602) | | | | | | |
| Shares | | Description | | Value |
| EXCHANGE-TRADED FUNDS – 0.2% |
| | | Capital Markets – 0.2% | | |
| 1,430,420 | | Invesco Preferred ETF
| | 17,837,337 |
| | | (Cost $19,753,345) | | |
| | | Total Investments – 98.3%
| | 7,048,874,132 |
| | | (Cost $7,551,610,923) | | |
| | | Net Other Assets and Liabilities – 1.7%
| | 124,208,242 |
| | | Net Assets – 100.0%
| | $7,173,082,374 |
| (a) | Perpetual maturity. |
| (b) | Fixed-to-floating or fixed-to-variable rate security. The interest rate shown reflects the fixed rate in effect at April 30, 2022. At a predetermined date, the fixed rate will change to a floating rate or a variable rate. |
| (c) | Floating or variable rate security. |
| (d) | This security, sold within the terms of a private placement memorandum, is exempt from registration upon resale under Rule 144A of the Securities Act of 1933, as amended (the “1933 Act”), and may be resold in transactions exempt from registration, normally to qualified institutional buyers. Pursuant to procedures adopted by the Trust’s Board of Trustees, this security has been determined to be liquid by the Advisor. Although market instability can result in periods of increased overall market illiquidity, liquidity for each security is determined based on security specific factors and assumptions, which require subjective judgment. At April 30, 2022, securities noted as such amounted to $1,625,329,908 or 22.7% of net assets. |
| (e) | This security is a contingent convertible capital security which may be subject to conversion into common stock of the issuer under certain circumstances. At April 30, 2022, securities noted as such amounted to $1,694,494,286 or 23.6% of net assets. Of these securities, 4.6% originated in emerging markets, and 95.4% originated in foreign markets. |
| (f) | This security may be resold to qualified foreign investors and foreign institutional buyers under Regulation S of the 1933 Act. |
| (g) | This security, sold within the terms of a private placement memorandum, is exempt from registration upon resale under Rule 144A of the 1933 Act, and may be resold in transactions exempt from registration, normally to qualified institutional buyers (see Note 2C - Restricted Securities in the Notes to Financial Statements). |
| (h) | These notes are Senior Payment-in-kind (“PIK”) Toggle Notes whereby the issuer may, at its option, elect to pay interest on the notes (1) entirely in cash or (2) entirely in PIK interest. Interest paid in cash will accrue on the notes at a rate of 7.63% per annum (“Cash Interest Rate”) and PIK interest will accrue on the notes at a rate per annum equal to the Cash Interest Rate plus 75 basis points. For the six months ended April 30, 2022, this security paid all of its interest in cash. |
| LIBOR | London Interbank Offered Rate |
See Notes to Financial Statements
Page 19
First Trust Preferred Securities and Income ETF (FPE)
Portfolio of Investments (Continued)
April 30, 2022 (Unaudited)
Valuation Inputs
A summary of the inputs used to value the Fund’s investments as of April 30, 2022 is as follows (see Note 2A - Portfolio Valuation in the Notes to Financial Statements):
| | Total
Value at
4/30/2022 | Level 1
Quoted
Prices | Level 2
Significant
Observable
Inputs | Level 3
Significant
Unobservable
Inputs |
| $25 Par Preferred Securities: | | | | |
Insurance
| $ 397,059,519 | $ 354,663,663 | $ 42,395,856 | $ — |
Multi-Utilities
| 130,711,946 | 106,589,990 | 24,121,956 | — |
Other industry categories*
| 1,197,263,148 | 1,197,263,148 | — | — |
$100 Par Preferred Securities*
| 33,420,212 | — | 33,420,212 | — |
| $1,000 Par Preferred Securities: | | | | |
Banks
| 169,731,816 | 169,731,816 | — | — |
Diversified Financial Services
| 8,058,000 | — | 8,058,000 | — |
Capital Preferred Securities*
| 4,982,826,034 | — | 4,982,826,034 | — |
Foreign Corporate Bonds and Notes*
| 96,006,356 | — | 96,006,356 | — |
Corporate Bonds and Notes*
| 15,959,764 | — | 15,959,764 | — |
Exchange-Traded Funds*
| 17,837,337 | 17,837,337 | — | — |
Total Investments
| $ 7,048,874,132 | $ 1,846,085,954 | $ 5,202,788,178 | $— |
| * | See Portfolio of Investments for industry breakout. |
Page 20
See Notes to Financial Statements
First Trust Institutional Preferred Securities and Income ETF (FPEI)
Portfolio of Investments
April 30, 2022 (Unaudited)
| Shares | | Description | | Stated
Rate | | Stated
Maturity | | Value |
| $1,000 PAR PREFERRED SECURITIES – 2.6% |
| | | Banks – 2.5% | | | | | | |
| 5,079 | | Bank of America Corp., Series L
| | 7.25% | | (a) | | $6,180,229 |
| 6,593 | | Wells Fargo & Co., Series L
| | 7.50% | | (a) | | 7,987,353 |
| | | | | 14,167,582 |
| | | Food Products – 0.1% | | | | | | |
| 400,000 | | Land O’ Lakes, Inc. (b)
| | 7.25% | | (a) | | 419,520 |
| | | Total $1,000 Par Preferred Securities
| | 14,587,102 |
| | | (Cost $16,997,638) | | | | | | |
Par
Amount | | Description | | Stated
Rate | | Stated
Maturity | | Value |
| CAPITAL PREFERRED SECURITIES – 87.7% |
| | | Banks – 38.6% | | | | | | |
| $4,950,000 | | Australia & New Zealand Banking Group Ltd. (c) (d) (e)
| | 6.75% | | (a) | | 5,189,258 |
| 1,145,000 | | Australia & New Zealand Banking Group Ltd. (b) (d) (e)
| | 6.75% | | (a) | | 1,200,344 |
| 2,400,000 | | Banco Bilbao Vizcaya Argentaria S.A., Series 9 (d) (e)
| | 6.50% | | (a) | | 2,331,000 |
| 500,000 | | Banco Mercantil del Norte S.A. (c) (d) (e)
| | 6.88% | | (a) | | 495,323 |
| 400,000 | | Banco Mercantil del Norte S.A. (b) (d) (e)
| | 6.88% | | (a) | | 396,258 |
| 900,000 | | Banco Mercantil del Norte S.A. (c) (d) (e)
| | 7.50% | | (a) | | 862,898 |
| 842,000 | | Banco Mercantil del Norte S.A. (c) (d) (e)
| | 7.63% | | (a) | | 835,125 |
| 1,400,000 | | Banco Mercantil del Norte S.A. (c) (d) (e)
| | 8.38% | | (a) | | 1,447,285 |
| 2,000,000 | | Banco Santander S.A. (d) (e)
| | 4.75% | | (a) | | 1,771,638 |
| 4,600,000 | | Banco Santander S.A. (b) (d) (e)
| | 7.50% | | (a) | | 4,650,315 |
| 1,656,000 | | Bank of America Corp., Series RR (e)
| | 4.38% | | (a) | | 1,469,700 |
| 9,368,000 | | Bank of America Corp., Series TT (e)
| | 6.13% | | (a) | | 9,386,736 |
| 5,400,000 | | Bank of America Corp., Series X (e)
| | 6.25% | | (a) | | 5,479,920 |
| 3,700,000 | | Bank of Nova Scotia (The) (e)
| | 4.90% | | (a) | | 3,639,542 |
| 1,000,000 | | Bank of Nova Scotia (The), Series 2 (e)
| | 3.63% | | 10/27/81 | | 799,677 |
| 2,300,000 | | Barclays PLC (d) (e)
| | 4.38% | | (a) | | 1,923,375 |
| 1,450,000 | | Barclays PLC (d) (e)
| | 6.13% | | (a) | | 1,423,712 |
| 2,000,000 | | Barclays PLC (d) (e)
| | 7.75% | | (a) | | 2,022,500 |
| 12,729,000 | | Barclays PLC (d) (e)
| | 8.00% | | (a) | | 13,150,648 |
| 700,000 | | BBVA Bancomer S.A. (c) (d) (e)
| | 5.88% | | 09/13/34 | | 668,171 |
| 8,000,000 | | BNP Paribas S.A. (c) (d) (e)
| | 4.63% | | (a) | | 7,256,320 |
| 2,300,000 | | BNP Paribas S.A. (c) (d) (e)
| | 6.63% | | (a) | | 2,325,503 |
| 2,000,000 | | BNP Paribas S.A. (c) (d) (e)
| | 7.38% | | (a) | | 2,083,210 |
| 3,195,000 | | Citigroup, Inc. (e)
| | 3.88% | | (a) | | 2,894,095 |
| 345,000 | | Citigroup, Inc. (e)
| | 5.90% | | (a) | | 351,614 |
| 1,281,000 | | Citigroup, Inc. (e)
| | 5.95% | | (a) | | 1,281,000 |
| 8,066,000 | | Citigroup, Inc., Series D (e)
| | 5.35% | | (a) | | 7,965,175 |
| 2,485,000 | | Citigroup, Inc., Series M (e)
| | 6.30% | | (a) | | 2,466,363 |
| 3,414,000 | | Citigroup, Inc., Series P (e)
| | 5.95% | | (a) | | 3,342,135 |
| 1,000,000 | | Citigroup, Inc., Series V (e)
| | 4.70% | | (a) | | 918,000 |
| 3,049,000 | | Citigroup, Inc., Series W (e)
| | 4.00% | | (a) | | 2,774,590 |
| 2,979,000 | | Citigroup, Inc., Series Y (e)
| | 4.15% | | (a) | | 2,642,671 |
| 493,000 | | Citizens Financial Group, Inc., Series B (e)
| | 6.00% | | (a) | | 471,456 |
| 1,170,000 | | Citizens Financial Group, Inc., Series G (e)
| | 4.00% | | (a) | | 1,041,300 |
| 1,358,000 | | CoBank ACB, Series I (e)
| | 6.25% | | (a) | | 1,368,185 |
| 400,000 | | Commerzbank AG (b) (d) (e)
| | 7.00% | | (a) | | 395,600 |
| 2,806,000 | | Credit Agricole S.A. (c) (d) (e)
| | 6.88% | | (a) | | 2,824,940 |
| 2,200,000 | | Credit Agricole S.A. (c) (d) (e)
| | 8.13% | | (a) | | 2,371,208 |
| 4,800,000 | | Danske Bank A.S. (b) (d) (e)
| | 4.38% | | (a) | | 4,350,000 |
| 550,000 | | Danske Bank A.S. (b) (d) (e)
| | 6.13% | | (a) | | 544,903 |
| 850,000 | | Danske Bank A.S. (b) (d) (e)
| | 7.00% | | (a) | | 847,023 |
See Notes to Financial Statements
Page 21
First Trust Institutional Preferred Securities and Income ETF (FPEI)
Portfolio of Investments (Continued)
April 30, 2022 (Unaudited)
Par
Amount | | Description | | Stated
Rate | | Stated
Maturity | | Value |
| CAPITAL PREFERRED SECURITIES (Continued) |
| | | Banks (Continued) | | | | | | |
| $800,000 | | Farm Credit Bank of Texas, Series 3 (c) (e)
| | 6.20% | | (a) | | $848,000 |
| 1,100,000 | | Farm Credit Bank of Texas, Series 4 (c) (e)
| | 5.70% | | (a) | | 1,155,000 |
| 5,264,000 | | Fifth Third Bancorp, Series H (e)
| | 5.10% | | (a) | | 5,125,820 |
| 7,854,000 | | First Citizens BancShares, Inc., Series B (e)
| | 5.80% | | (a) | | 7,895,233 |
| 400,000 | | HSBC Holdings PLC (d) (e)
| | 4.60% | | (a) | | 340,000 |
| 5,000,000 | | HSBC Holdings PLC (d) (e)
| | 6.00% | | (a) | | 4,812,500 |
| 3,070,000 | | HSBC Holdings PLC (d) (e)
| | 6.38% | | (a) | | 3,087,361 |
| 1,200,000 | | Huntington Bancshares, Inc., Series G (e)
| | 4.45% | | (a) | | 1,152,100 |
| 2,950,000 | | ING Groep N.V. (d) (e)
| | 5.75% | | (a) | | 2,834,463 |
| 1,200,000 | | ING Groep N.V. (d) (e)
| | 6.50% | | (a) | | 1,199,760 |
| 6,570,000 | | Intesa Sanpaolo S.p.A. (c) (d) (e)
| | 7.70% | | (a) | | 6,635,700 |
| 5,200,000 | | JPMorgan Chase & Co., Series I, 3 Mo. LIBOR + 3.47% (f)
| | 4.71% | | (a) | | 5,151,214 |
| 7,241,000 | | JPMorgan Chase & Co., Series Q (e)
| | 5.15% | | (a) | | 7,141,436 |
| 605,000 | | JPMorgan Chase & Co., Series R (e)
| | 6.00% | | (a) | | 608,025 |
| 1,550,000 | | Lloyds Banking Group PLC (d) (e)
| | 6.75% | | (a) | | 1,562,454 |
| 5,638,000 | | Lloyds Banking Group PLC (d) (e)
| | 7.50% | | (a) | | 5,761,303 |
| 1,000,000 | | M&T Bank Corp. (e)
| | 3.50% | | (a) | | 842,513 |
| 2,341,000 | | M&T Bank Corp., Series G (e)
| | 5.00% | | (a) | | 2,273,696 |
| 693,000 | | Macquarie Bank Ltd. (c) (d) (e)
| | 6.13% | | (a) | | 667,938 |
| 600,000 | | NatWest Group PLC (d) (e)
| | 6.00% | | (a) | | 592,830 |
| 1,550,000 | | NatWest Group PLC (d) (e)
| | 8.00% | | (a) | | 1,634,227 |
| 2,425,000 | | Nordea Bank Abp (c) (d) (e)
| | 6.63% | | (a) | | 2,467,437 |
| 1,200,000 | | PNC Financial Services Group (The), Inc., Series T (e)
| | 3.40% | | (a) | | 1,035,000 |
| 3,186,000 | | PNC Financial Services Group (The), Inc., Series U (e)
| | 6.00% | | (a) | | 3,173,893 |
| 1,000,000 | | Regions Financial Corp., Series D (e)
| | 5.75% | | (a) | | 1,022,500 |
| 200,000 | | Skandinaviska Enskilda Banken AB (b) (d) (e)
| | 5.13% | | (a) | | 192,125 |
| 3,800,000 | | Societe Generale S.A. (c) (d) (e)
| | 5.38% | | (a) | | 3,345,900 |
| 2,711,000 | | Societe Generale S.A. (c) (d) (e)
| | 7.88% | | (a) | | 2,781,230 |
| 400,000 | | Societe Generale S.A. (b) (d) (e)
| | 7.88% | | (a) | | 410,362 |
| 2,639,000 | | Societe Generale S.A. (c) (d) (e)
| | 8.00% | | (a) | | 2,752,279 |
| 3,800,000 | | Standard Chartered PLC (c) (d) (e)
| | 4.30% | | (a) | | 3,154,000 |
| 1,500,000 | | Standard Chartered PLC (c) (d) (e)
| | 6.00% | | (a) | | 1,494,375 |
| 1,400,000 | | SVB Financial Group, Series C (e)
| | 4.00% | | (a) | | 1,219,330 |
| 3,185,000 | | SVB Financial Group, Series D (e)
| | 4.25% | | (a) | | 2,762,987 |
| 1,200,000 | | Swedbank AB, Series NC5 (b) (d) (e)
| | 5.63% | | (a) | | 1,190,250 |
| 463,000 | | Texas Capital Bancshares, Inc. (e)
| | 4.00% | | 05/06/31 | | 444,287 |
| 3,500,000 | | Truist Financial Corp., Series L (e)
| | 5.05% | | (a) | | 3,342,500 |
| 7,800,000 | | Truist Financial Corp., Series N (e)
| | 4.80% | | (a) | | 7,390,500 |
| 3,850,000 | | UniCredit S.p.A. (b) (d) (e)
| | 8.00% | | (a) | | 3,890,964 |
| 600,000 | | UniCredit S.p.A. (c) (e)
| | 7.30% | | 04/02/34 | | 607,297 |
| 750,000 | | UniCredit S.p.A. (c) (e)
| | 5.46% | | 06/30/35 | | 678,215 |
| 4,630,000 | | Wells Fargo & Co., Series BB (e)
| | 3.90% | | (a) | | 4,227,537 |
| | | | | 218,563,257 |
| | | Capital Markets – 11.1% | | | | | | |
| 4,820,000 | | Apollo Management Holdings L.P. (c) (e)
| | 4.95% | | 01/14/50 | | 4,481,616 |
| 1,870,000 | | Bank of New York Mellon (The) Corp., Series I (e)
| | 3.75% | | (a) | | 1,668,975 |
| 250,000 | | Charles Schwab (The) Corp. (e)
| | 5.00% | | (a) | | 241,492 |
| 4,000,000 | | Charles Schwab (The) Corp., Series E, 3 Mo. LIBOR + 3.32% (f)
| | 3.84% | | (a) | | 3,965,600 |
| 3,511,000 | | Charles Schwab (The) Corp., Series I (e)
| | 4.00% | | (a) | | 3,187,988 |
| 4,900,000 | | Credit Suisse Group AG (c) (d) (e)
| | 5.25% | | (a) | | 4,318,125 |
| 3,900,000 | | Credit Suisse Group AG (c) (d) (e)
| | 6.25% | | (a) | | 3,794,696 |
| 2,370,000 | | Credit Suisse Group AG (c) (d) (e)
| | 6.38% | | (a) | | 2,237,019 |
| 1,314,000 | | Credit Suisse Group AG (c) (d) (e)
| | 7.50% | | (a) | | 1,319,381 |
| 4,150,000 | | Credit Suisse Group AG (c) (d) (e)
| | 7.50% | | (a) | | 4,120,120 |
Page 22
See Notes to Financial Statements
First Trust Institutional Preferred Securities and Income ETF (FPEI)
Portfolio of Investments (Continued)
April 30, 2022 (Unaudited)
Par
Amount | | Description | | Stated
Rate | | Stated
Maturity | | Value |
| CAPITAL PREFERRED SECURITIES (Continued) |
| | | Capital Markets (Continued) | | | | | | |
| $5,450,000 | | Deutsche Bank AG (d) (e)
| | 6.00% | | (a) | | $5,095,750 |
| 4,400,000 | | Deutsche Bank AG (d) (e)
| | 7.50% | | (a) | | 4,328,500 |
| 4,730,000 | | EFG International AG (b) (d) (e)
| | 5.50% | | (a) | | 4,538,005 |
| 1,200,000 | | Goldman Sachs Group (The), Inc., Series R (e)
| | 4.95% | | (a) | | 1,158,000 |
| 765,000 | | Goldman Sachs Group (The), Inc., Series T (e)
| | 3.80% | | (a) | | 675,100 |
| 3,185,000 | | Goldman Sachs Group (The), Inc., Series U (e)
| | 3.65% | | (a) | | 2,770,950 |
| 904,000 | | Morgan Stanley, Series M (e)
| | 5.88% | | (a) | | 921,877 |
| 3,334,000 | | State Street Corp., Series F, 3 Mo. LIBOR + 3.60% (f)
| | 3.80% | | (a) | | 3,332,163 |
| 5,500,000 | | UBS Group AG (c) (d) (e)
| | 4.88% | | (a) | | 5,066,875 |
| 2,500,000 | | UBS Group AG (b) (d) (e)
| | 6.88% | | (a) | | 2,539,400 |
| 1,425,000 | | UBS Group AG (c) (d) (e)
| | 7.00% | | (a) | | 1,451,719 |
| 1,500,000 | | UBS Group AG (b) (d) (e)
| | 7.00% | | (a) | | 1,528,125 |
| | | | | 62,741,476 |
| | | Consumer Finance – 1.2% | | | | | | |
| 3,500,000 | | Ally Financial, Inc., Series B (e)
| | 4.70% | | (a) | | 3,033,188 |
| 2,497,000 | | American Express Co. (e)
| | 3.55% | | (a) | | 2,157,033 |
| 1,932,000 | | Capital One Financial Corp., Series M (e)
| | 3.95% | | (a) | | 1,680,840 |
| | | | | 6,871,061 |
| | | Diversified Financial Services – 2.1% | | | | | | |
| 3,000,000 | | American AgCredit Corp. (c) (e)
| | 5.25% | | (a) | | 2,741,250 |
| 2,775,000 | | Ares Finance Co. III LLC (c) (e)
| | 4.13% | | 06/30/51 | | 2,585,655 |
| 2,250,000 | | Capital Farm Credit ACA, Series 1 (c) (e)
| | 5.00% | | (a) | | 2,058,750 |
| 650,000 | | Compeer Financial ACA (c) (e)
| | 4.88% | | (a) | | 577,688 |
| 650,000 | | Depository Trust & Clearing (The) Corp., Series D (c) (e)
| | 3.38% | | (a) | | 578,500 |
| 2,712,000 | | Voya Financial, Inc. (e)
| | 5.65% | | 05/15/53 | | 2,701,844 |
| 755,000 | | Voya Financial, Inc., Series A (e)
| | 6.13% | | (a) | | 753,112 |
| | | | | 11,996,799 |
| | | Diversified Telecommunication Services – 0.7% | | | | | | |
| 1,365,000 | | Koninklijke KPN N.V. (c) (e)
| | 7.00% | | 03/28/73 | | 1,382,062 |
| 2,326,000 | | Koninklijke KPN N.V. (b) (e)
| | 7.00% | | 03/28/73 | | 2,355,075 |
| | | | | 3,737,137 |
| | | Electric Utilities – 3.7% | | | | | | |
| 830,000 | | Duke Energy Corp. (e)
| | 4.88% | | (a) | | 823,775 |
| 1,158,000 | | Edison International, Series B (e)
| | 5.00% | | (a) | | 1,051,028 |
| 6,962,000 | | Emera, Inc., Series 16-A (e)
| | 6.75% | | 06/15/76 | | 7,083,835 |
| 1,428,000 | | Southern (The) Co., Series 21-A (e)
| | 3.75% | | 09/15/51 | | 1,288,770 |
| 3,100,000 | | Southern (The) Co., Series B, 3 Mo. LIBOR + 3.63% (f)
| | 4.46% | | 03/15/57 | | 3,046,570 |
| 7,500,000 | | Southern California Edison Co., Series E, 3 Mo. LIBOR + 4.20% (f)
| | 4.52% | | (a) | | 7,387,500 |
| | | | | 20,681,478 |
| | | Energy Equipment & Services – 0.3% | | | | | | |
| 276,000 | | Transcanada Trust (e)
| | 5.63% | | 05/20/75 | | 275,862 |
| 1,250,000 | | Transcanada Trust (e)
| | 5.50% | | 09/15/79 | | 1,207,813 |
| | | | | 1,483,675 |
| | | Food Products – 2.1% | | | | | | |
| 1,200,000 | | Dairy Farmers of America, Inc. (g)
| | 7.13% | | (a) | | 1,177,500 |
| 1,400,000 | | Land O’Lakes Capital Trust I (g)
| | 7.45% | | 03/15/28 | | 1,575,203 |
| 6,146,000 | | Land O’Lakes, Inc. (c)
| | 7.00% | | (a) | | 6,278,016 |
| 2,220,000 | | Land O’Lakes, Inc. (c)
| | 7.25% | | (a) | | 2,328,336 |
See Notes to Financial Statements
Page 23
First Trust Institutional Preferred Securities and Income ETF (FPEI)
Portfolio of Investments (Continued)
April 30, 2022 (Unaudited)
Par
Amount | | Description | | Stated
Rate | | Stated
Maturity | | Value |
| CAPITAL PREFERRED SECURITIES (Continued) |
| | | Food Products (Continued) | | | | | | |
| $535,000 | | Land O’Lakes, Inc. (c)
| | 8.00% | | (a) | | $563,770 |
| | | | | 11,922,825 |
| | | Insurance – 13.5% | | | | | | |
| 1,500,000 | | Allianz SE (c) (e)
| | 3.50% | | (a) | | 1,361,250 |
| 2,000,000 | | Asahi Mutual Life Insurance Co. (b) (e)
| | 6.50% | | (a) | | 2,042,500 |
| 3,858,000 | | Assurant, Inc. (e)
| | 7.00% | | 03/27/48 | | 3,990,542 |
| 2,300,000 | | Assured Guaranty Municipal Holdings, Inc. (c) (e)
| | 6.40% | | 12/15/66 | | 2,326,450 |
| 1,700,000 | | Assured Guaranty Municipal Holdings, Inc. (b) (e)
| | 6.40% | | 12/15/66 | | 1,721,675 |
| 4,170,000 | | AXIS Specialty Finance LLC (e)
| | 4.90% | | 01/15/40 | | 3,883,813 |
| 1,332,000 | | Enstar Finance LLC (e)
| | 5.75% | | 09/01/40 | | 1,312,585 |
| 10,038,000 | | Enstar Finance LLC (e)
| | 5.50% | | 01/15/42 | | 9,352,957 |
| 8,545,000 | | Global Atlantic Fin Co. (c) (e)
| | 4.70% | | 10/15/51 | | 7,770,481 |
| 1,000,000 | | Hartford Financial Services Group (The), Inc., 3 Mo. LIBOR + 2.13% (c) (f)
| | 2.63% | | 02/12/47 | | 881,070 |
| 2,464,000 | | Kuvare US Holdings, Inc. (c) (e)
| | 7.00% | | 02/17/51 | | 2,558,266 |
| 1,000,000 | | La Mondiale SAM (b) (e)
| | 5.88% | | 01/26/47 | | 1,012,744 |
| 6,850,000 | | Lancashire Holdings Ltd. (b) (e)
| | 5.63% | | 09/18/41 | | 6,127,325 |
| 5,300,000 | | Liberty Mutual Group, Inc. (c) (e)
| | 4.13% | | 12/15/51 | | 4,817,939 |
| 4,001,000 | | Markel Corp. (e)
| | 6.00% | | (a) | | 4,096,024 |
| 2,900,000 | | MetLife, Inc. (c)
| | 9.25% | | 04/08/38 | | 3,589,042 |
| 3,200,000 | | Phoenix Group Holdings PLC (b) (e)
| | 5.63% | | (a) | | 3,150,032 |
| 3,500,000 | | Principal Financial Group, Inc., 3 Mo. LIBOR + 3.04% (f)
| | 3.55% | | 05/15/55 | | 3,368,750 |
| 7,247,000 | | Progressive (The) Corp., Series B (e)
| | 5.38% | | (a) | | 6,939,002 |
| 2,200,000 | | QBE Insurance Group Ltd. (c) (e)
| | 5.88% | | (a) | | 2,216,500 |
| 2,850,000 | | QBE Insurance Group Ltd. (b) (e)
| | 6.75% | | 12/02/44 | | 2,950,505 |
| 300,000 | | QBE Insurance Group Ltd. (b) (e)
| | 5.88% | | 06/17/46 | | 305,284 |
| 999,000 | | Reinsurance Group of America, Inc., 3 Mo. LIBOR + 2.67% (f)
| | 3.49% | | 12/15/65 | | 894,105 |
| | | | | 76,668,841 |
| | | Multi-Utilities – 4.0% | | | | | | |
| 6,927,000 | | Algonquin Power & Utilities Corp. (e)
| | 4.75% | | 01/18/82 | | 6,344,924 |
| 6,286,000 | | CenterPoint Energy, Inc., Series A (e)
| | 6.13% | | (a) | | 6,052,444 |
| 948,000 | | CMS Energy Corp. (e)
| | 3.75% | | 12/01/50 | | 798,690 |
| 180,000 | | Dominion Energy, Inc., Series B (e)
| | 4.65% | | (a) | | 172,800 |
| 906,000 | | NiSource, Inc. (e)
| | 5.65% | | (a) | | 878,820 |
| 2,381,000 | | Sempra Energy (e)
| | 4.88% | | (a) | | 2,351,237 |
| 6,973,000 | | Sempra Energy (e)
| | 4.13% | | 04/01/52 | | 6,161,229 |
| | | | | 22,760,144 |
| | | Oil, Gas & Consumable Fuels – 7.4% | | | | | | |
| 3,388,000 | | Buckeye Partners L.P. (e)
| | 6.38% | | 01/22/78 | | 2,802,486 |
| 6,474,000 | | DCP Midstream L.P., Series A (e)
| | 7.38% | | (a) | | 6,166,485 |
| 2,662,000 | | DCP Midstream Operating L.P. (c) (e)
| | 5.85% | | 05/21/43 | | 2,424,536 |
| 1,026,000 | | Enbridge, Inc. (e)
| | 6.25% | | 03/01/78 | | 1,036,973 |
| 7,398,000 | | Enbridge, Inc., Series 16-A (e)
| | 6.00% | | 01/15/77 | | 7,447,191 |
| 2,000,000 | | Enbridge, Inc., Series 20-A (e)
| | 5.75% | | 07/15/80 | | 1,990,000 |
| 1,395,000 | | Energy Transfer L.P., 3 Mo. LIBOR + 3.02% (f)
| | 3.33% | | 11/01/66 | | 1,150,875 |
| 1,878,000 | | Energy Transfer L.P., Series A (e)
| | 6.25% | | (a) | | 1,598,648 |
| 100,000 | | Energy Transfer L.P., Series B (e)
| | 6.63% | | (a) | | 86,875 |
| 4,938,000 | | Energy Transfer L.P., Series F (e)
| | 6.75% | | (a) | | 4,765,170 |
| 3,000,000 | | Energy Transfer L.P., Series G (e)
| | 7.13% | | (a) | | 2,838,300 |
| 948,000 | | Energy Transfer L.P., Series H (e)
| | 6.50% | | (a) | | 903,074 |
| 4,715,000 | | Enterprise Products Operating LLC, 3 Mo. LIBOR + 2.78% (f)
| | 3.30% | | 06/01/67 | | 4,120,462 |
| 2,341,000 | | Enterprise Products Operating LLC, Series D (e)
| | 4.88% | | 08/16/77 | | 2,095,446 |
Page 24
See Notes to Financial Statements
First Trust Institutional Preferred Securities and Income ETF (FPEI)
Portfolio of Investments (Continued)
April 30, 2022 (Unaudited)
Par
Amount | | Description | | Stated
Rate | | Stated
Maturity | | Value |
| CAPITAL PREFERRED SECURITIES (Continued) |
| | | Oil, Gas & Consumable Fuels (Continued) | | | | | | |
| $2,650,000 | | Transcanada Trust (e)
| | 5.60% | | 03/07/82 | | $2,567,188 |
| | | | | 41,993,709 |
| | | Trading Companies & Distributors – 2.3% | | | | | | |
| 9,900,000 | | AerCap Holdings N.V. (e)
| | 5.88% | | 10/10/79 | | 9,295,704 |
| 1,127,000 | | Air Lease Corp., Series B (e)
| | 4.65% | | (a) | | 1,017,117 |
| 2,940,000 | | Aircastle Ltd. (c) (e)
| | 5.25% | | (a) | | 2,620,690 |
| | | | | 12,933,511 |
| | | Transportation Infrastructure – 0.7% | | | | | | |
| 3,950,000 | | AerCap Global Aviation Trust (c) (e)
| | 6.50% | | 06/15/45 | | 3,845,641 |
| | | Total Capital Preferred Securities
| | 496,199,554 |
| | | (Cost $522,962,133) | | | | | | |
Principal
Value | | Description | | Stated
Coupon | | Stated
Maturity | | Value |
| FOREIGN CORPORATE BONDS AND NOTES – 2.1% |
| | | Insurance – 2.1% | | | | | | |
| 11,900,342 | | Highlands Holdings Bond Issuer Ltd./Highlands Holdings Bond Co-Issuer, Inc. (c) (h)
| | 7.63% | | 10/15/25 | | 12,101,815 |
| | | (Cost $12,569,549) | | | | | | |
| CORPORATE BONDS AND NOTES – 0.4% |
| | | Insurance – 0.4% | | | | | | |
| 2,360,000 | | AmTrust Financial Services, Inc.
| | 6.13% | | 08/15/23 | | 2,354,065 |
| | | (Cost $2,385,171) | | | | | | |
| Total Investments – 92.8%
| | 525,242,536 |
| | (Cost $554,914,491) | | |
| | Net Other Assets and Liabilities – 7.2%
| | 40,698,485 |
| | Net Assets – 100.0%
| | $565,941,021 |
| (a) | Perpetual maturity. |
| (b) | This security may be resold to qualified foreign investors and foreign institutional buyers under Regulation S of the Securities Act of 1933, as amended (the “1933 Act”). |
| (c) | This security, sold within the terms of a private placement memorandum, is exempt from registration upon resale under Rule 144A of the 1933 Act, and may be resold in transactions exempt from registration, normally to qualified institutional buyers. Pursuant to procedures adopted by the Trust’s Board of Trustees, this security has been determined to be liquid by First Trust Advisors L.P., the Fund’s advisor. Although market instability can result in periods of increased overall market illiquidity, liquidity for each security is determined based on security specific factors and assumptions, which require subjective judgment. At April 30, 2022, securities noted as such amounted to $145,343,870 or 25.7% of net assets. |
| (d) | This security is a contingent convertible capital security which may be subject to conversion into common stock of the issuer under certain circumstances. At April 30, 2022, securities noted as such amounted to $152,511,730 or 26.9% of net assets. Of these securities, 3.1% originated in emerging markets, and 96.9% originated in foreign markets. |
| (e) | Fixed-to-floating or fixed-to-variable rate security. The interest rate shown reflects the fixed rate in effect at April 30, 2022. At a predetermined date, the fixed rate will change to a floating rate or a variable rate. |
| (f) | Floating or variable rate security. |
| (g) | This security, sold within the terms of a private placement memorandum, is exempt from registration upon resale under Rule 144A of the 1933 Act, and may be resold in transactions exempt from registration, normally to qualified institutional buyers (see Note 2C - Restricted Securities in the Notes to Financial Statements). |
| (h) | These notes are Senior Payment-in-kind (“PIK”) Toggle Notes whereby the issuer may, at its option, elect to pay interest on the notes (1) entirely in cash or (2) entirely in PIK interest. Interest paid in cash will accrue on the notes at a rate of 7.63% per annum (“Cash Interest Rate”) and PIK interest will accrue on the notes at a rate per annum equal to the Cash Interest Rate plus 75 basis points. For the six months ended April 30, 2022, this security paid all of its interest in cash. |
See Notes to Financial Statements
Page 25
First Trust Institutional Preferred Securities and Income ETF (FPEI)
Portfolio of Investments (Continued)
April 30, 2022 (Unaudited)
| LIBOR | London Interbank Offered Rate |
Valuation Inputs
A summary of the inputs used to value the Fund’s investments as of April 30, 2022 is as follows (see Note 2A - Portfolio Valuation in the Notes to Financial Statements):
| | Total
Value at
4/30/2022 | Level 1
Quoted
Prices | Level 2
Significant
Observable
Inputs | Level 3
Significant
Unobservable
Inputs |
$1,000 Par Preferred Securities*
| $ 14,587,102 | $ 14,587,102 | $ — | $ — |
Capital Preferred Securities*
| 496,199,554 | — | 496,199,554 | — |
Foreign Corporate Bonds and Notes*
| 12,101,815 | — | 12,101,815 | — |
Corporate Bonds and Notes*
| 2,354,065 | — | 2,354,065 | — |
Total Investments
| $ 525,242,536 | $ 14,587,102 | $ 510,655,434 | $— |
| * | See Portfolio of Investments for industry breakout. |
Page 26
See Notes to Financial Statements
First Trust Exchange-Traded Fund III
Statements of Assets and Liabilities
April 30, 2022 (Unaudited)
| | First Trust
Preferred
Securities
and Income
ETF
(FPE) | | First Trust
Institutional
Preferred
Securities
and Income
ETF
(FPEI) |
| ASSETS: | | | |
Investments, at value
| $ 7,048,874,132 | | $ 525,242,536 |
Cash
| 41,642,668 | | 33,796,554 |
| Receivables: | | | |
Interest
| 68,227,275 | | 7,281,058 |
Investment securities sold
| 54,022,114 | | 370,421 |
Dividends
| 4,953,446 | | 92,057 |
Interest reclaims
| 2,068,182 | | 193,281 |
Dividend reclaims
| 172,625 | | — |
Fund shares sold
| 51,204 | | — |
Total Assets
| 7,220,011,646 | | 566,975,907 |
| LIABILITIES: | | | |
| Payables: | | | |
Capital shares redeemed
| 33,957,009 | | — |
Investment securities purchased
| 7,783,812 | | 645,767 |
Investment advisory fees
| 5,188,451 | | 389,119 |
Total Liabilities
| 46,929,272 | | 1,034,886 |
NET ASSETS
| $7,173,082,374 | | $565,941,021 |
| NET ASSETS consist of: | | | |
Paid-in capital
| $ 7,767,539,537 | | $ 598,207,409 |
Par value
| 3,918,050 | | 300,500 |
Accumulated distributable earnings (loss)
| (598,375,213) | | (32,566,888) |
NET ASSETS
| $7,173,082,374 | | $565,941,021 |
NET ASSET VALUE, per share
| $18.31 | | $18.83 |
Number of shares outstanding (unlimited number of shares authorized, par value $0.01 per share)
| 391,805,000 | | 30,050,002 |
Investments, at cost
| $7,551,610,923 | | $554,914,491 |
See Notes to Financial Statements
Page 27
First Trust Exchange-Traded Fund III
Statements of Operations
For the Six Months Ended April 30, 2022 (Unaudited)
| | First Trust
Preferred
Securities
and Income
ETF
(FPE) | | First Trust
Institutional
Preferred
Securities
and Income
ETF
(FPEI) |
| INVESTMENT INCOME: | | | |
Interest
| $ 151,394,201 | | $ 14,216,505 |
Dividends
| 59,985,333 | | 385,310 |
Foreign withholding tax
| (984) | | 1,283 |
Total investment income
| 211,378,550 | | 14,603,098 |
| EXPENSES: | | | |
Investment advisory fees
| 32,537,857 | | 2,314,219 |
Total expenses
| 32,537,857 | | 2,314,219 |
NET INVESTMENT INCOME (LOSS)
| 178,840,693 | | 12,288,879 |
| NET REALIZED AND UNREALIZED GAIN (LOSS): | | | |
| Net realized gain (loss) on: | | | |
Investments
| (9,191,943) | | (472,739) |
In-kind redemptions
| 1,412,123 | | — |
Foreign currency transactions
| 22 | | — |
Net realized gain (loss)
| (7,779,798) | | (472,739) |
Net change in unrealized appreciation (depreciation) on investments
| (843,602,877) | | (48,339,256) |
NET REALIZED AND UNREALIZED GAIN (LOSS)
| (851,382,675) | | (48,811,995) |
NET INCREASE (DECREASE) IN NET ASSETS RESULTING FROM OPERATIONS
| $(672,541,982) | | $(36,523,116) |
Page 28
See Notes to Financial Statements
First Trust Exchange-Traded Fund III
Statements of Changes in Net Assets
| | First Trust Preferred Securities
and Income ETF (FPE) | | First Trust Institutional Preferred
Securities and Income ETF (FPEI) |
| | Six Months
Ended
4/30/2022
(Unaudited) | | Year
Ended
10/31/2021 | | Six Months
Ended
4/30/2022
(Unaudited) | | Year
Ended
10/31/2021 |
| OPERATIONS: | | | | | | | |
Net investment income (loss)
| $ 178,840,693 | | $ 299,216,791 | | $ 12,288,879 | | $ 16,636,653 |
Net realized gain (loss)
| (7,779,798) | | 57,939,076 | | (472,739) | | 2,321,122 |
Net change in unrealized appreciation (depreciation)
| (843,602,877) | | 290,784,331 | | (48,339,256) | | 14,036,111 |
Net increase (decrease) in net assets resulting from operations
| (672,541,982) | | 647,940,198 | | (36,523,116) | | 32,993,886 |
| DISTRIBUTIONS TO SHAREHOLDERS FROM: | | | | | | | |
Investment operations
| (178,141,833) | | (286,189,376) | | (12,459,276) | | (15,669,405) |
Return of capital
| — | | (12,681,882) | | — | | (847,307) |
Total distributions to shareholders
| (178,141,833) | | (298,871,258) | | (12,459,276) | | (16,516,712) |
| SHAREHOLDER TRANSACTIONS: | | | | | | | |
Proceeds from shares sold
| 556,849,619 | | 1,987,661,883 | | 159,041,114 | | 191,421,574 |
Cost of shares redeemed
| (231,329,566) | | (60,917,203) | | (36,535,358) | | — |
Net increase (decrease) in net assets resulting from shareholder transactions
| 325,520,053 | | 1,926,744,680 | | 122,505,756 | | 191,421,574 |
Total increase (decrease) in net assets
| (525,163,762) | | 2,275,813,620 | | 73,523,364 | | 207,898,748 |
| NET ASSETS: | | | | | | | |
Beginning of period
| 7,698,246,136 | | 5,422,432,516 | | 492,417,657 | | 284,518,909 |
End of period
| $7,173,082,374 | | $7,698,246,136 | | $565,941,021 | | $492,417,657 |
| CHANGES IN SHARES OUTSTANDING: | | | | | | | |
Shares outstanding, beginning of period
| 376,405,000 | | 281,905,000 | | 24,000,002 | | 14,700,002 |
Shares sold
| 27,700,000 | | 97,550,000 | | 7,950,000 | | 9,300,000 |
Shares redeemed
| (12,300,000) | | (3,050,000) | | (1,900,000) | | — |
Shares outstanding, end of period
| 391,805,000 | | 376,405,000 | | 30,050,002 | | 24,000,002 |
See Notes to Financial Statements
Page 29
First Trust Exchange-Traded Fund III
Financial Highlights
For a share outstanding throughout each period
First Trust Preferred Securities and Income ETF (FPE)
| | Six Months
Ended
4/30/2022
(Unaudited) | | Year Ended October 31, |
| | 2021 | | 2020 | | 2019 | | 2018 | | 2017 | |
Net asset value, beginning of period
| $ 20.45 | | $ 19.23 | | $ 19.89 | | $ 18.76 | | $ 20.13 | | $ 19.47 |
| Income from investment operations: | | | | | | | | | | | |
Net investment income (loss)
| 0.45 | | 0.90 | | 1.00 | | 1.08 | | 1.08 | | 1.08 |
Net realized and unrealized gain (loss)
| (2.14) | | 1.24 | | (0.66) | | 1.14 | | (1.37) | | 0.66 |
Total from investment operations
| (1.69) | | 2.14 | | 0.34 | | 2.22 | | (0.29) | | 1.74 |
| Distributions paid to shareholders from: | | | | | | | | | | | |
Net investment income
| (0.45) | | (0.88) | | (0.94) | | (1.07) | | (1.08) | | (1.08) |
Return of capital
| — | | (0.04) | | (0.06) | | (0.02) | | (0.00) (a) | | (0.00) (a) |
Total distributions
| (0.45) | | (0.92) | | (1.00) | | (1.09) | | (1.08) | | (1.08) |
Net asset value, end of period
| $18.31 | | $20.45 | | $19.23 | | $19.89 | | $18.76 | | $20.13 |
Total return (b)
| (8.37)% | | 11.26% | | 1.94% | | 12.25% | | (1.47)% | | 9.24% |
| Ratios to average net assets/supplemental data: | | | | | | | | | | | |
Net assets, end of period (in 000’s)
| $ 7,173,082 | | $ 7,698,246 | | $ 5,422,433 | | $ 4,678,519 | | $ 3,374,372 | | $ 3,026,083 |
Ratio of total expenses to average net assets
| 0.85% (c) | | 0.85% | | 0.85% | | 0.85% | | 0.85% | | 0.85% |
Ratio of net investment income (loss) to average net assets
| 4.67% (c) | | 4.54% | | 5.24% | | 5.69% | | 5.56% | | 5.54% |
Portfolio turnover rate (d)
| 13% | | 27% | | 43% | | 28% | | 24% | | 13% |
| (a) | Amount is less than $0.01. |
| (b) | Total return is calculated assuming an initial investment made at the net asset value at the beginning of the period, reinvestment of all distributions at net asset value during the period, and redemption at net asset value on the last day of the period. The returns presented do not reflect the deduction of taxes that a shareholder would pay on Fund distributions or the redemption or sale of Fund shares. Total return is calculated for the time period presented and is not annualized for periods of less than a year. |
| (c) | Annualized. |
| (d) | Portfolio turnover is calculated for the time period presented and is not annualized for periods of less than a year and does not include securities received or delivered from processing creations or redemptions and in-kind transactions. |
Page 30
See Notes to Financial Statements
First Trust Exchange-Traded Fund III
Financial Highlights (Continued)
For a share outstanding throughout each period
First Trust Institutional Preferred Securities and Income ETF (FPEI)
| | Six Months
Ended
4/30/2022
(Unaudited) | | Year Ended October 31, | | Period
Ended
10/31/2017 (a) |
| | 2021 | | 2020 | | 2019 | | 2018 | |
Net asset value, beginning of period
| $ 20.52 | | $ 19.36 | | $ 19.85 | | $ 18.75 | | $ 20.26 | | $ 20.00 |
| Income from investment operations: | | | | | | | | | | | |
Net investment income (loss)
| 0.43 | | 0.90 | | 1.01 | | 1.01 | | 0.99 | | 0.18 |
Net realized and unrealized gain (loss)
| (1.67) | | 1.19 | | (0.50) | | 1.12 | | (1.47) | | 0.22 |
Total from investment operations
| (1.24) | | 2.09 | | 0.51 | | 2.13 | | (0.48) | | 0.40 |
| Distributions paid to shareholders from: | | | | | | | | | | | |
Net investment income
| (0.45) | | (0.88) | | (0.97) | | (1.00) | | (1.03) | | (0.14) |
Return of capital
| — | | (0.05) | | (0.03) | | (0.03) | | — | | — |
Total distributions
| (0.45) | | (0.93) | | (1.00) | | (1.03) | | (1.03) | | (0.14) |
Net asset value, end of period
| $18.83 | | $20.52 | | $19.36 | | $19.85 | | $18.75 | | $20.26 |
Total return (b)
| (6.14)% | | 10.91% | | 2.76% | | 11.75% | | (2.42)% | | 2.00% |
| Ratios to average net assets/supplemental data: | | | | | | | | | | | |
Net assets, end of period (in 000’s)
| $ 565,941 | | $ 492,418 | | $ 284,519 | | $ 235,178 | | $ 93,757 | | $ 24,313 |
Ratio of total expenses to average net assets
| 0.85% (c) | | 0.85% | | 0.85% | | 0.85% | | 0.85% | | 0.85% (c) |
Ratio of net investment income (loss) to average net assets
| 4.51% (c) | | 4.60% | | 5.22% | | 5.39% | | 5.36% | | 4.93% (c) |
Portfolio turnover rate (d)
| 15% | | 22% | | 48% | | 28% | | 25% | | 13% |
| (a) | Inception date is August 22, 2017, which is consistent with the commencement of investment operations and is the date the initial creation units were established. |
| (b) | Total return is calculated assuming an initial investment made at the net asset value at the beginning of the period, reinvestment of all distributions at net asset value during the period, and redemption at net asset value on the last day of the period. The returns presented do not reflect the deduction of taxes that a shareholder would pay on Fund distributions or the redemption or sale of Fund shares. Total return is calculated for the time period presented and is not annualized for periods of less than a year. |
| (c) | Annualized. |
| (d) | Portfolio turnover is calculated for the time period presented and is not annualized for periods of less than a year and does not include securities received or delivered from processing creations or redemptions and in-kind transactions. |
See Notes to Financial Statements
Page 31
Notes to Financial Statements
First Trust Exchange-Traded Fund III
April 30, 2022 (Unaudited)
1. Organization
First Trust Exchange-Traded Fund III (the “Trust”) is a diversified open-end management investment company organized as a Massachusetts business trust on January 9, 2008, and is registered with the Securities and Exchange Commission (“SEC”) under the Investment Company Act of 1940, as amended (the “1940 Act”).
The Trust currently consists of seventeen funds that are offering shares. This report covers the two funds (each a “Fund” and collectively, the “Funds”) listed below, each a diversified series of the Trust and listed and traded on NYSE Arca, Inc.
First Trust Preferred Securities and Income ETF – (ticker “FPE”)
First Trust Institutional Preferred Securities and Income ETF – (ticker “FPEI”)
Each Fund represents a separate series of shares of beneficial interest in the Trust. Unlike conventional mutual funds, each Fund issues and redeems shares on a continuous basis, at net asset value (“NAV”), only in large blocks of shares known as “Creation Units.”
Each Fund is an actively managed exchange-traded fund. The investment objective of each Fund is to seek total return and to provide current income.
Under normal market conditions, FPE seeks to achieve its investment objective by investing at least 80% of its net assets (including investment borrowings) in preferred securities and income-producing debt securities, including corporate bonds, high-yield securities (commonly referred to as “junk” bonds) and convertible securities.
Under normal market conditions, FPEI seeks to achieve its investment objective by investing at least 80% of its net assets (including investment borrowings) in institutional preferred securities and income-producing debt securities, including hybrid capital securities, contingent capital securities, U.S. and non-U.S. corporate bonds and convertible securities.
There can be no assurance that a Fund will achieve its investment objective. The Funds may not be appropriate for all investors.
2. Significant Accounting Policies
The Funds are each considered an investment company and follow accounting and reporting guidance under Financial Accounting Standards Board Accounting Standards Codification Topic 946, “Financial Services-Investment Companies.” The following is a summary of significant accounting policies consistently followed by the Funds in the preparation of the financial statements. The preparation of the financial statements in accordance with accounting principles generally accepted in the United States of America (“U.S. GAAP”) requires management to make estimates and assumptions that affect the reported amounts and disclosures in the financial statements. Actual results could differ from those estimates.
A. Portfolio Valuation
Each Fund’s NAV is determined daily as of the close of regular trading on the New York Stock Exchange (“NYSE”), normally 4:00 p.m. Eastern time, on each day the NYSE is open for trading. If the NYSE closes early on a valuation day, the NAV is determined as of that time. Domestic debt securities and foreign securities are priced using data reflecting the earlier closing of the principal markets for those securities. Each Fund’s NAV is calculated by dividing the value of all assets of each Fund (including accrued interest and dividends), less all liabilities (including accrued expenses and dividends declared but unpaid), by the total number of shares outstanding.
Each Fund’s investments are valued daily at market value or, in the absence of market value with respect to any portfolio securities, at fair value. Market value prices represent last sale or official closing prices from a national or foreign exchange (i.e., a regulated market) and are primarily obtained from third-party pricing services. Fair value prices represent any prices not considered market value prices and are either obtained from a third-party pricing service or are determined by the Pricing Committee of the Funds’ investment advisor, First Trust Advisors L.P. (“First Trust” or the “Advisor”), in accordance with valuation procedures adopted by the Trust’s Board of Trustees, and in accordance with provisions of the 1940 Act. Investments valued by the Advisor’s Pricing Committee, if any, are footnoted as such in the footnotes to the Portfolio of Investments. Each Fund’s investments are valued as follows:
Preferred stocks, real estate investment trusts (“REITs”), exchange-traded funds and other equity securities listed on any national or foreign exchange (excluding The Nasdaq Stock Market LLC (“Nasdaq”) and the London Stock Exchange Alternative Investment Market (“AIM”)) are valued at the last sale price on the exchange on which they are principally traded or, for Nasdaq and AIM securities, the official closing price. Securities traded on more than one securities exchange are valued at the last sale price or official closing price, as applicable, at the close of the securities exchange representing the principal market for such securities.
Notes to Financial Statements (Continued)
First Trust Exchange-Traded Fund III
April 30, 2022 (Unaudited)
Bonds, notes, capital preferred securities, and other debt securities are fair valued on the basis of valuations provided by dealers who make markets in such securities or by a third-party pricing service approved by the Trust’s Board of Trustees, which may use the following valuation inputs when available:
| 1) | benchmark yields; |
| 2) | reported trades; |
| 3) | broker/dealer quotes; |
| 4) | issuer spreads; |
| 5) | benchmark securities; |
| 6) | bids and offers; and |
| 7) | reference data including market research publications. |
Securities trading on foreign exchanges or over-the-counter markets that close prior to the NYSE close may be valued using a systematic fair valuation model provided by a third-party pricing service. If these foreign securities meet certain criteria in relation to the valuation model, their valuation is systematically adjusted to reflect the impact of movement in the U.S. market after the close of the foreign markets.
Securities traded in an over-the-counter market are fair valued at the mean of their most recent bid and asked price, if available, and otherwise at their closing bid price.
Fixed income and other debt securities having a remaining maturity of sixty days or less when purchased are fair valued at cost adjusted for amortization of premiums and accretion of discounts (amortized cost), provided the Advisor’s Pricing Committee has determined that the use of amortized cost is an appropriate reflection of fair value given market and issuer-specific conditions existing at the time of the determination. Factors that may be considered in determining the appropriateness of the use of amortized cost include, but are not limited to, the following:
| 1) | the credit conditions in the relevant market and changes thereto; |
| 2) | the liquidity conditions in the relevant market and changes thereto; |
| 3) | the interest rate conditions in the relevant market and changes thereto (such as significant changes in interest rates); |
| 4) | issuer-specific conditions (such as significant credit deterioration); and |
| 5) | any other market-based data the Advisor’s Pricing Committee considers relevant. In this regard, the Advisor’s Pricing Committee may use last-obtained market-based data to assist it when valuing portfolio securities using amortized cost. |
Certain securities may not be able to be priced by pre-established pricing methods. Such securities may be valued by the Trust’s Board of Trustees or its delegate, the Advisor’s Pricing Committee, at fair value. These securities generally include, but are not limited to, restricted securities (securities which may not be publicly sold without registration under the Securities Act of 1933, as amended (the “1933 Act”)) for which a third-party pricing service is unable to provide a market price; securities whose trading has been formally suspended; a security whose market or fair value price is not available from a pre-established pricing source; a security with respect to which an event has occurred that is likely to materially affect the value of the security after the market has closed but before the calculation of a Fund’s NAV or make it difficult or impossible to obtain a reliable market quotation; and a security whose price, as provided by the third-party pricing service, does not reflect the security’s fair value. As a general principle, the current fair value of a security would appear to be the amount which the owner might reasonably expect to receive for the security upon its current sale. When fair value prices are used, generally they will differ from market quotations or official closing prices on the applicable exchanges. A variety of factors may be considered in determining the fair value of such securities, including, but not limited to, the following:
| 1) | the type of security; |
| 2) | the size of the holding; |
| 3) | the initial cost of the security; |
| 4) | transactions in comparable securities; |
| 5) | price quotes from dealers and/or third-party pricing services; |
| 6) | relationships among various securities; |
| 7) | information obtained by contacting the issuer, analysts, or the appropriate stock exchange; |
| 8) | an analysis of the issuer’s financial statements; and |
| 9) | the existence of merger proposals or tender offers that might affect the value of the security. |
Notes to Financial Statements (Continued)
First Trust Exchange-Traded Fund III
April 30, 2022 (Unaudited)
If the securities in question are foreign securities, the following additional information may be considered:
| 1) | the value of similar foreign securities traded on other foreign markets; |
| 2) | ADR trading of similar securities; |
| 3) | closed-end fund or exchange-traded fund trading of similar securities; |
| 4) | foreign currency exchange activity; |
| 5) | the trading prices of financial products that are tied to baskets of foreign securities; |
| 6) | factors relating to the event that precipitated the pricing problem; |
| 7) | whether the event is likely to recur; and |
| 8) | whether the effects of the event are isolated or whether they affect entire markets, countries or regions. |
The Funds are subject to fair value accounting standards that define fair value, establish the framework for measuring fair value and provide a three-level hierarchy for fair valuation based upon the inputs to the valuation as of the measurement date. The three levels of the fair value hierarchy are as follows:
| • | Level 1 – Level 1 inputs are quoted prices in active markets for identical investments. An active market is a market in which transactions for the investment occur with sufficient frequency and volume to provide pricing information on an ongoing basis. |
| • | Level 2 – Level 2 inputs are observable inputs, either directly or indirectly, and include the following: |
| o | Quoted prices for similar investments in active markets. |
| o | Quoted prices for identical or similar investments in markets that are non-active. A non-active market is a market where there are few transactions for the investment, the prices are not current, or price quotations vary substantially either over time or among market makers, or in which little information is released publicly. |
| o | Inputs other than quoted prices that are observable for the investment (for example, interest rates and yield curves observable at commonly quoted intervals, volatilities, prepayment speeds, loss severities, credit risks, and default rates). |
| o | Inputs that are derived principally from or corroborated by observable market data by correlation or other means. |
| • | Level 3 – Level 3 inputs are unobservable inputs. Unobservable inputs may reflect the reporting entity’s own assumptions about the assumptions that market participants would use in pricing the investment. |
The inputs or methodologies used for valuing investments are not necessarily an indication of the risk associated with investing in those investments. A summary of the inputs used to value each Fund’s investments as of April 30, 2022, is included with each Fund’s Portfolio of Investments.
B. Securities Transactions and Investment Income
Securities transactions are recorded as of the trade date. Realized gains and losses from securities transactions are recorded on the identified cost basis. Dividend income is recorded on the ex-dividend date. Interest income is recorded daily on the accrual basis. Amortization of premiums and accretion of discounts are recorded using the effective interest method.
Distributions received from a Fund’s investments in REITs may be comprised of return of capital, capital gains, and income. The actual character of the amounts received during the year are not known until after the REITs’ fiscal year end. A Fund records the character of distributions received from the REITs during the year based on estimates available. The characterization of distributions received by a Fund may be subsequently revised based on information received from the REITs after their tax reporting periods conclude.
The United Kingdom’s Financial Conduct Authority (the “FCA”), which regulates the London Interbank Offered Rates (“LIBOR”) announced on March 5, 2021 that it intended to phase-out all LIBOR reference rates, beginning December 31, 2021. Since that announcement, the FCA has ceased publication of all non-USD LIBOR reference rates and the 1-week and 2-month USD LIBOR reference rates as of December 31, 2021. The remaining USD LIBOR settings will cease to be published or no longer be representative immediately after June 30, 2023. The International Swaps and Derivatives Association, Inc. (“ISDA”) confirmed that the FCA’s March 5, 2021 announcement of its intention to cease providing LIBOR reference rates, constituted an index cessation event under the Interbank Offered Rates (“IBOR”) Fallbacks Supplement and the ISDA 2020 IBOR Fallbacks Protocol for all 35 LIBOR settings and confirmed that the spread adjustment to be used in ISDA fallbacks was fixed as of the date of the announcement.
In the United States, the Alternative Reference Rates Committee (the “ARRC”), a group of market participants convened by the Board of Governors of the Federal Reserve System and the Federal Reserve Bank of New York in cooperation with other federal and state government agencies, has since 2014 undertaken efforts to identify U.S. dollar reference interest rates as alternatives to LIBOR and to
Notes to Financial Statements (Continued)
First Trust Exchange-Traded Fund III
April 30, 2022 (Unaudited)
facilitate the mitigation of LIBOR-related risks. In June 2017, the ARRC identified the Secured Overnight Financing Rate (“SOFR”), a broad measure of the cost of cash overnight borrowing collateralized by U.S. Treasury securities, as the preferred alternative for U.S. dollar LIBOR. The Federal Reserve Bank of New York began daily publishing of SOFR in April 2018. There is no assurance that any alternative reference rate, including SOFR, will be similar to or produce the same value or economic equivalence as LIBOR or that instruments using an alternative rate will have the same volume or liquidity.
At this time, it is not possible to predict the full impact of the elimination of LIBOR and the establishment of an alternative reference rate on each Fund or its investments.
C. Restricted Securities
The Funds invest in restricted securities, which are securities that may not be offered for public sale without first being registered under the 1933 Act. Prior to registration, restricted securities may only be resold in transactions exempt from registration under Rule 144A under the 1933 Act, normally to qualified institutional buyers. As of April 30, 2022, the Funds held restricted securities as shown in the following table that the Advisor has deemed illiquid pursuant to procedures adopted by the Trust’s Board of Trustees. Although market instability can result in periods of increased overall market illiquidity, liquidity for each security is determined based on security-specific factors and assumptions, which require subjective judgment. The Funds do not have the right to demand that such securities be registered. These securities are valued according to the valuation procedures as stated in the Portfolio Valuation note (Note 2A) and are not expressed as a discount to the carrying value of a comparable unrestricted security. There are no unrestricted securities with the same maturity dates and yields for these issuers.
| Security | Acquisition
Date | Par Amount | Current Price | Carrying
Cost | | Value | | % of
Net
Assets |
| FPE | | | | | | | | |
| Dairy Farmers of America, Inc., 7.13% | 09/15/16-12/10/21 | $10,700,000 | $98.13 | $10,903,500 | | $10,499,377 | | 0.15% |
| Fortegra Financial Corp., 8.50%, 10/15/57 | 10/12/17-03/12/18 | 13,700,000 | 119.64 | 13,718,816 | | 16,391,218 | | 0.23 |
| Land O’Lakes Capital Trust I, 7.45%, 03/15/28 | 03/20/15-07/23/21 | 25,362,000 | 112.51 | 27,430,984 | | 28,535,928 | | 0.40 |
| | | | | $52,053,300 | | $55,426,523 | | 0.78% |
| FPEI | | | | | | | | |
| Dairy Farmers of America, Inc., 7.13% | 01/22/21-12/10/21 | $1,200,000 | $98.13 | $1,222,750 | | $1,177,500 | | 0.21% |
| Land O’Lakes Capital Trust I, 7.45%, 03/15/28 | 05/04/18-07/21/21 | 1,400,000 | 112.51 | 1,545,519 | | 1,575,203 | | 0.28 |
| | | | | $2,768,269 | | $2,752,703 | | 0.49% |
D. Foreign Currency
The books and records of the Funds are maintained in U.S. dollars. Foreign currencies, investments and other assets and liabilities are translated into U.S. dollars at the exchange rates prevailing at the end of the period. Purchases and sales of investments and items of income and expense are translated on the respective dates of such transactions. Unrealized gains and losses on assets and liabilities, other than investments in securities, which result from changes in foreign currency exchange rates have been included in “Net change in unrealized appreciation (depreciation) on foreign currency translation” on the Statements of Operations. Unrealized gains and losses on investments in securities which result from changes in foreign exchange rates are included with fluctuations arising from changes in market price and are shown in “Net change in unrealized appreciation (depreciation) on investments” on the Statements of Operations. Net realized foreign currency gains and losses include the effect of changes in exchange rates between trade date and settlement date on investment security transactions, foreign currency transactions and interest and dividends received and are shown in “Net realized gain (loss) on foreign currency transactions” on the Statements of Operations. The portion of foreign currency gains and losses related to fluctuation in exchange rates between the initial purchase settlement date and subsequent sale trade date is included in “Net realized gain (loss) on investments” on the Statements of Operations.
Notes to Financial Statements (Continued)
First Trust Exchange-Traded Fund III
April 30, 2022 (Unaudited)
E. Dividends and Distributions to Shareholders
Dividends from net investment income, if any, are declared and paid monthly by each Fund, or as the Board of Trustees may determine from time to time. Distributions of net realized capital gains earned by each Fund, if any, are distributed at least annually.
Distributions from net investment income and realized capital gains are determined in accordance with federal income tax regulations, which may differ from U.S. GAAP. Certain capital accounts in the financial statements are periodically adjusted for permanent differences in order to reflect their tax character. These permanent differences are primarily due to the varying treatment of income and gain/loss on portfolio securities held by the Funds and have no impact on net assets or NAV per share. Temporary differences, which arise from recognizing certain items of income, expense and gain/loss in different periods for financial statement and tax purposes, will reverse at some time in the future.
The tax character of distributions paid by each Fund during the fiscal year ended October 31, 2021, was as follows:
| | Distributions
paid from
Ordinary
Income | | Distributions
paid from
Capital
Gains | | Distributions
paid from
Return of
Capital |
First Trust Preferred Securities and Income ETF
| $ 286,189,376 | | $ — | | $ 12,681,882 |
First Trust Institutional Preferred Securities and Income ETF
| 15,669,405 | | — | | 847,307 |
As of October 31, 2021, the components of distributable earnings on a tax basis for each Fund were as follows:
| | Undistributed
Ordinary
Income | | Accumulated
Capital and
Other
Gain (Loss) | | Net
Unrealized
Appreciation
(Depreciation) |
First Trust Preferred Securities and Income ETF
| $ — | | $ (115,168,522) | | $ 367,477,124 |
First Trust Institutional Preferred Securities and Income ETF
| — | | (3,557,835) | | 19,973,339 |
F. Income Taxes
Each Fund intends to continue to qualify as a regulated investment company by complying with the requirements under Subchapter M of the Internal Revenue Code of 1986, as amended, which includes distributing substantially all of its net investment income and net realized gains to shareholders. Accordingly, no provision has been made for federal and state income taxes. However, due to the timing and amount of distributions, each Fund may be subject to an excise tax of 4% of the amount by which approximately 98% of each Fund’s taxable income exceeds the distributions from such taxable income for the calendar year.
The Funds are subject to accounting standards that establish a minimum threshold for recognizing, and a system for measuring, the benefits of a tax position taken or expected to be taken in a tax return. Taxable years ended 2018, 2019, 2020, and 2021 remain open to federal and state audit. As of April 30, 2022, management has evaluated the application of these standards to the Funds and has determined that no provision for income tax is required in the Funds’ financial statements for uncertain tax positions.
The Funds intend to utilize provisions of the federal income tax laws, which allow them to carry a realized capital loss forward indefinitely following the year of the loss and offset such loss against any future realized capital gains. The Funds are subject to certain limitations under U.S. tax rules on the use of capital loss carryforwards and net unrealized built-in losses. These limitations apply when there has been a 50% change in ownership. At October 31, 2021, for federal income tax purposes, the Funds had a capital loss carryforward available that is shown in the table below, to the extent provided by regulations, to offset future capital gains.
| | Non-Expiring
Capital Loss
Carryforward |
First Trust Preferred Securities and Income ETF
| $ 115,168,522 |
First Trust Institutional Preferred Securities and Income ETF
| 3,557,835 |
Notes to Financial Statements (Continued)
First Trust Exchange-Traded Fund III
April 30, 2022 (Unaudited)
As of April 30, 2022, the aggregate cost, gross unrealized appreciation, gross unrealized depreciation, and net unrealized appreciation/(depreciation) on investments (including short positions and derivatives, if any) for federal income tax purposes were as follows:
| | Tax Cost | | Gross
Unrealized
Appreciation | | Gross
Unrealized
(Depreciation) | | Net Unrealized
Appreciation
(Depreciation) |
First Trust Preferred Securities and Income ETF
| $ 7,551,610,923 | | $ 46,278,360 | | $ (549,015,151) | | $ (502,736,791) |
First Trust Institutional Preferred Securities and Income ETF
| 554,914,491 | | 2,895,202 | | (32,567,157) | | (29,671,955) |
G. Expenses
Expenses, other than the investment advisory fee and other excluded expenses, are paid by the Advisor (See Note 3).
3. Investment Advisory Fee, Affiliated Transactions and Other Fee Arrangements
First Trust, the investment advisor to the Funds, is a limited partnership with one limited partner, Grace Partners of DuPage L.P., and one general partner, The Charger Corporation. The Charger Corporation is an Illinois corporation controlled by James A. Bowen, Chief Executive Officer of First Trust. First Trust is responsible for the ongoing monitoring of the securities in each Fund’s portfolio, managing the Funds’ business affairs and providing certain administrative services necessary for the management of the Funds.
Stonebridge Advisors LLC (“Stonebridge” or the “Sub-Advisor”), a majority-owned affiliate of First Trust, serves as each Fund’s sub-advisor and manages each Fund’s portfolio subject to First Trust’s supervision. Pursuant to the Investment Management Agreement between the Trust and the Advisor, First Trust will supervise Stonebridge and its management of the investment of each Fund’s assets and will pay Stonebridge for its services as each Fund’s sub-advisor. First Trust is responsible for each Fund’s expenses, including the cost of transfer agency, sub-advisory, custody, fund administration, legal, audit and other services, but excluding fee payments under the Investment Management Agreement, interest, taxes, acquired fund fees and expenses, brokerage commissions and other expenses connected with the execution of portfolio transactions, distribution and service fees pursuant to a 12b-1 plan, if any, and extraordinary expenses. Each Fund has agreed to pay First Trust an annual unitary management fee equal to 0.85% of its average daily net assets. Stonebridge receives a sub-advisory fee equal to 0.425% of the average daily net assets of each Fund less Stonebridge’s share of the Fund’s expenses. The Sub-Advisor’s fee is paid by the Advisor out of the Advisor’s management fee. First Trust also provides fund reporting services to each Fund for a flat annual fee in the amount of $9,250, which is covered under the annual unitary management fee.
First Trust Capital Partners, LLC (“FTCP”), an affiliate of First Trust, owns a 51% ownership interest in Stonebridge.
The Trust has multiple service agreements with Brown Brothers Harriman & Co. (“BBH”). Under the service agreements, BBH performs custodial, fund accounting, certain administrative services, and transfer agency services for the Funds. As custodian, BBH is responsible for custody of each Fund’s assets. As fund accountant and administrator, BBH is responsible for maintaining the books and records of each Fund’s securities and cash. As transfer agent, BBH is responsible for maintaining shareholder records for each Fund.
Each Trustee who is not an officer or employee of First Trust, any sub-advisor or any of their affiliates (“Independent Trustees”) is paid a fixed annual retainer that is allocated equally among each fund in the First Trust Fund Complex. Each Independent Trustee is also paid an annual per fund fee that varies based on whether the fund is a closed-end or other actively managed fund, a defined-outcome fund or an index fund.
Additionally, the Lead Independent Trustee and the Chairs of the Audit Committee, Nominating and Governance Committee and Valuation Committee are paid annual fees to serve in such capacities, with such compensation allocated pro rata among each fund in the First Trust Fund Complex based on net assets. Independent Trustees are reimbursed for travel and out-of-pocket expenses in connection with all meetings. The Lead Independent Trustee and Committee Chairs rotate every three years. The officers and “Interested” Trustee receive no compensation from the Trust for acting in such capacities.
Notes to Financial Statements (Continued)
First Trust Exchange-Traded Fund III
April 30, 2022 (Unaudited)
4. Purchases and Sales of Securities
For the six months ended April 30, 2022, the cost of purchases and proceeds from sales of investment securities for each Fund, excluding short-term investments and in-kind transactions, were as follows:
| | Purchases | | Sales |
| First Trust Preferred Securities and Income ETF | $ 1,334,830,585 | | $ 967,464,010 |
| First Trust Institutional Preferred Securities and Income ETF | 176,806,306 | | 75,584,673 |
| | | | |
For the six months ended April 30, 2022, the cost of in-kind purchases and proceeds from in-kind sales for each Fund were as follows:
| | Purchases | | Sales |
| First Trust Preferred Securities and Income ETF | $ 52,336,129 | | $ 31,186,897 |
| First Trust Institutional Preferred Securities and Income ETF | — | | — |
5. Creations, Redemptions and Transaction Fees
Each Fund generally issues and redeems its shares in primary market transactions through a creation and redemption mechanism and does not sell or redeem individual shares. Instead, financial entities known as “Authorized Participants” have contractual arrangements with a Fund or one of the Fund’s service providers to purchase and redeem Fund shares directly with the Fund in large blocks of shares known as “Creation Units.” Prior to the start of trading on every business day, a Fund publishes through the National Securities Clearing Corporation (“NSCC”) the “basket” of securities, cash or other assets that it will accept in exchange for a Creation Unit of the Fund’s shares. An Authorized Participant that wishes to effectuate a creation of a Fund’s shares deposits with the Fund the “basket” of securities, cash or other assets identified by the Fund that day, and then receives the Creation Unit of the Fund’s shares in return for those assets. After purchasing a Creation Unit, the Authorized Participant may continue to hold the Fund’s shares or sell them in the secondary market. The redemption process is the reverse of the purchase process: the Authorized Participant redeems a Creation Unit of a Fund’s shares for a basket of securities, cash or other assets. The combination of the creation and redemption process with secondary market trading in a Fund’s shares and underlying securities provides arbitrage opportunities that are designed to help keep the market price of a Fund’s shares at or close to the NAV per share of the Fund.
Each Fund imposes fees in connection with the purchase of Creation Units. These fees may vary based upon various fact-based circumstances, including, but not limited to, the composition of the securities included in the Creation Unit or the countries in which the transactions are settled. The price for each Creation Unit will equal the daily NAV per share of a Fund times the number of shares in a Creation Unit, plus the fees described above and, if applicable, any operational processing and brokerage costs, transfer fees, stamp taxes and part or all of the spread between the expected bid and offer side of the market related to the securities comprising the creation basket.
Each Fund also imposes fees in connection with the redemption of Creation Units. These fees may vary based upon various fact-based circumstances, including, but not limited to, the composition of the securities included in the Creation Unit or the countries in which the transactions are settled. The price received for each Creation Unit will equal the daily NAV per share of a Fund times the number of shares in a Creation Unit, minus the fees described above and, if applicable, any operational processing and brokerage costs, transfer fees, stamp taxes and part or all of the spread between the expected bid and offer side of the market related to the securities comprising the redemption basket. Investors who use the services of a broker or other such intermediary in addition to an Authorized Participant to effect a redemption of a Creation Unit may also be assessed an amount to cover the cost of such services. The redemption fee charged by a Fund will comply with Rule 22c-2 of the 1940 Act which limits redemption fees to no more than 2% of the value of the shares redeemed.
6. Distribution Plan
The Board of Trustees adopted a Distribution and Service Plan pursuant to Rule 12b-1 under the 1940 Act. In accordance with the Rule 12b-1 plan, each Fund is authorized to pay an amount up to 0.25% of its average daily net assets each year to reimburse First Trust Portfolios L.P. (“FTP”), the distributor of the Funds, for amounts expended to finance activities primarily intended to result in the sale of Creation Units or to provide investor services. FTP may also use this amount to compensate securities dealers or other persons that are Authorized Participants for providing distribution assistance, including broker-dealer and shareholder support and educational and promotional services.
Notes to Financial Statements (Continued)
First Trust Exchange-Traded Fund III
April 30, 2022 (Unaudited)
No 12b-1 fees are currently paid by the Funds, and pursuant to a contractual arrangement, no 12b-1 fees will be paid any time before February 28, 2023.
7. Borrowings
The Trust, on behalf of First Trust Preferred Securities and Income ETF, along with First Trust Series Fund and First Trust Exchange-Traded Fund IV, have a $280 million Credit Agreement with The Bank of Nova Scotia (“Scotia”) as administrative agent for a group of lenders. Prior to March 2, 2022, the commitment amount was $355 million. Scotia charges a commitment fee of 0.25% of the daily amount of the excess of the commitment amount over the outstanding principal balance of the loans, and an agency fee. First Trust allocates the commitment fee and agency fee amongst the funds that have access to the credit line. To the extent that the Fund accesses the credit line, there would also be an interest fee charged. The Fund did not have any borrowings outstanding during the six months ended April 30, 2022.
8. Indemnification
The Trust, on behalf of the Funds, has a variety of indemnification obligations under contracts with its service providers. The Trust’s maximum exposure under these arrangements is unknown. However, the Trust has not had prior claims or losses pursuant to these contracts and expects the risk of loss to be remote.
9. Subsequent Events
Management has evaluated the impact of all subsequent events to the Funds through the date the financial statements were issued and has determined that there were no subsequent events requiring recognition or disclosure in the financial statements that have not already been disclosed.
Additional Information
First Trust Exchange-Traded Fund III
April 30, 2022 (Unaudited)
Proxy Voting Policies and Procedures
A description of the policies and procedures that the Trust uses to determine how to vote proxies and information on how each Fund voted proxies relating to portfolio securities during the most recent 12-month period ended June 30 is available (1) without charge, upon request, by calling (800) 988-5891; (2) on each Fund’s website at www.ftportfolios.com; and (3) on the Securities and Exchange Commission’s (“SEC”) website at www.sec.gov.
Portfolio Holdings
Each Fund files portfolio holdings information for each month in a fiscal quarter within 60 days after the end of the relevant fiscal quarter on Form N-PORT. Portfolio holdings information for the third month of each fiscal quarter will be publicly available on the SEC’s website at www.sec.gov. Each Fund’s complete schedule of portfolio holdings for the second and fourth quarters of each fiscal year is included in the semi-annual and annual reports to shareholders, respectively, and is filed with the SEC on Form N-CSR. The semi-annual and annual report for each Fund is available to investors within 60 days after the period to which it relates. Each Fund’s Forms N-PORT and Forms N-CSR are available on the SEC’s website listed above.
Risk Considerations
Risks are inherent in all investing. Certain general risks that may be applicable to a Fund are identified below, but not all of the material risks relevant to each Fund are included in this report and not all of the risks below apply to each Fund. The material risks of investing in each Fund are spelled out in its prospectus, statement of additional information and other regulatory filings. Before investing, you should consider each Fund’s investment objective, risks, charges and expenses, and read each Fund’s prospectus and statement of additional information carefully. You can download each Fund’s prospectus at www.ftportfolios.com or contact First Trust Portfolios L.P. at (800) 621-1675 to request a prospectus, which contains this and other information about each Fund.
Concentration Risk. To the extent that a fund is able to invest a significant percentage of its assets in a single asset class or the securities of issuers within the same country, state, region, industry or sector, an adverse economic, business or political development may affect the value of the fund’s investments more than if the fund were more broadly diversified. A fund that tracks an index will be concentrated to the extent the fund’s corresponding index is concentrated. A concentration makes a fund more susceptible to any single occurrence and may subject the fund to greater market risk than a fund that is more broadly diversified.
Credit Risk. Credit risk is the risk that an issuer of a security will be unable or unwilling to make dividend, interest and/or principal payments when due and the related risk that the value of a security may decline because of concerns about the issuer’s ability to make such payments.
Cyber Security Risk. The funds are susceptible to potential operational risks through breaches in cyber security. A breach in cyber security refers to both intentional and unintentional events that may cause a fund to lose proprietary information, suffer data corruption or lose operational capacity. Such events could cause a fund to incur regulatory penalties, reputational damage, additional compliance costs associated with corrective measures and/or financial loss. In addition, cyber security breaches of a fund’s third-party service providers, such as its administrator, transfer agent, custodian, or sub-advisor, as applicable, or issuers in which the fund invests, can also subject a fund to many of the same risks associated with direct cyber security breaches.
Defined Outcome Funds Risk. To the extent a fund’s investment strategy is designed to deliver returns tied to the price performance of an underlying ETF, an investor may not realize the returns the fund seeks to achieve if that investor does not hold shares for the entire target outcome period. In the event an investor purchases shares after the first day of the target outcome period or sells shares prior to the end of the target outcome period, the buffer that the fund seeks to provide against a decline in the value of the underlying ETF may not be available, the enhanced returns that the fund seeks to provide (if any) may not be available and the investor may not participate in a gain in the value of the underlying ETF up to the cap for the investor’s investment period. Additionally, the fund will not participate in gains of the underlying ETF above the cap and a shareholder may lose their entire investment. If the fund seeks enhanced returns, there are certain time periods when the value of the fund may fall faster than the value of the underlying ETF, and it is very unlikely that, on any given day during which the underlying ETF share price increases in value, the fund’s share price will increase at the same rate as the enhanced returns sought by the fund, which is designed for an entire target outcome period. Trading flexible exchange options involves risks different from, or possibly greater than, the risks associated with investing directly in securities, such as less liquidity and correlation and valuation risks. A fund may experience substantial downside from specific flexible exchange option positions and certain positions may expire worthless.
Derivatives Risk. To the extent a fund uses derivative instruments such as futures contracts, options contracts and swaps, the fund may experience losses because of adverse movements in the price or value of the underlying asset, index or rate, which may be magnified
Additional Information (Continued)
First Trust Exchange-Traded Fund III
April 30, 2022 (Unaudited)
by certain features of the derivative. These risks are heightened when a fund’s portfolio managers use derivatives to enhance the fund’s return or as a substitute for a position or security, rather than solely to hedge (or offset) the risk of a position or security held by the fund.
Equity Securities Risk. To the extent a fund invests in equity securities, the value of the fund’s shares will fluctuate with changes in the value of the equity securities. Equity securities prices fluctuate for several reasons, including changes in investors’ perceptions of the financial condition of an issuer or the general condition of the relevant stock market, such as market volatility, or when political or economic events affecting the issuers occur. In addition, common stock prices may be particularly sensitive to rising interest rates, as the cost of capital rises and borrowing costs increase. Equity securities may decline significantly in price over short or extended periods of time, and such declines may occur in the equity market as a whole, or they may occur in only a particular country, company, industry or sector of the market.
ETF Risk. The shares of an ETF trade like common stock and represent an interest in a portfolio of securities. The risks of owning an ETF generally reflect the risks of owning the underlying securities, although lack of liquidity in an ETF could result in it being more volatile and ETFs have management fees that increase their costs. Shares of an ETF trade on an exchange at market prices rather than net asset value, which may cause the shares to trade at a price greater than net asset value (premium) or less than net asset value (discount). In times of market stress, decisions by market makers to reduce or step away from their role of providing a market for an ETF’s shares, or decisions by an ETF’s authorized participants that they are unable or unwilling to proceed with creation and/or redemption orders of an ETF’s shares, could result in shares of the ETF trading at a discount to net asset value and in greater than normal intraday bid-ask spreads.
Fixed Income Securities Risk. To the extent a fund invests in fixed income securities, the fund will be subject to credit risk, income risk, interest rate risk, liquidity risk and prepayment risk. Income risk is the risk that income from a fund’s fixed income investments could decline during periods of falling interest rates. Interest rate risk is the risk that the value of a fund’s fixed income securities will decline because of rising interest rates. Liquidity risk is the risk that a security cannot be purchased or sold at the time desired, or cannot be purchased or sold without adversely affecting the price. Prepayment risk is the risk that the securities will be redeemed or prepaid by the issuer, resulting in lower interest payments received by the fund. In addition to these risks, high yield securities, or “junk” bonds, are subject to greater market fluctuations and risk of loss than securities with higher ratings, and the market for high yield securities is generally smaller and less liquid than that for investment grade securities.
Index or Model Constituent Risk. Certain funds may be a constituent of one or more indices or ETF models. As a result, such a fund may be included in one or more index-tracking exchange-traded funds or mutual funds. Being a component security of such a vehicle could greatly affect the trading activity involving a fund, the size of the fund and the market volatility of the fund. Inclusion in an index could increase demand for the fund and removal from an index could result in outsized selling activity in a relatively short period of time. As a result, a fund’s net asset value could be negatively impacted and the fund’s market price may be significantly below its net asset value during certain periods. In addition, index rebalances may potentially result in increased trading activity in a fund’s shares.
Index Provider Risk. To the extent a fund seeks to track an index, it is subject to Index Provider Risk. There is no assurance that the Index Provider will compile the Index accurately, or that the Index will be determined, maintained, constructed, reconstituted, rebalanced, composed, calculated or disseminated accurately. To correct any such error, the Index Provider may carry out an unscheduled rebalance or other modification of the Index constituents or weightings, which may increase the fund’s costs. The Index Provider does not provide any representation or warranty in relation to the quality, accuracy or completeness of data in the Index, and it does not guarantee that the Index will be calculated in accordance with its stated methodology. Losses or costs associated with any Index Provider errors generally will be borne by the fund and its shareholders.
Investment Companies Risk. To the extent a fund invests in the securities of other investment vehicles, the fund will incur additional fees and expenses that would not be present in a direct investment in those investment vehicles. Furthermore, the fund’s investment performance and risks are directly related to the investment performance and risks of the investment vehicles in which the fund invests.
LIBOR Risk. To the extent a fund invests in floating or variable rate obligations that use the London Interbank Offered Rate (“LIBOR”) as a reference interest rate, it is subject to LIBOR Risk. The United Kingdom’s Financial Conduct Authority, which regulates LIBOR has ceased making LIBOR available as a reference rate over a phase-out period that began December 31, 2021. There is no assurance that any alternative reference rate, including the Secured Overnight Financing Rate (“SOFR”) will be similar to or produce the same value or economic equivalence as LIBOR or that instruments using an alternative rate will have the same volume or liquidity. The unavailability or replacement of LIBOR may affect the value, liquidity or return on certain fund investments and may result in costs incurred in connection with closing out positions and entering into new trades. Any potential effects of the transition away from LIBOR on the fund or on certain instruments in which the fund invests can be difficult to ascertain, and they may vary depending on a variety of factors, and they could result in losses to the fund.
Additional Information (Continued)
First Trust Exchange-Traded Fund III
April 30, 2022 (Unaudited)
Management Risk. To the extent that a fund is actively managed, it is subject to management risk. In managing an actively-managed fund’s investment portfolio, the fund’s portfolio managers will apply investment techniques and risk analyses that may not have the desired result. There can be no guarantee that a fund will meet its investment objective.
Market Risk. Securities held by a fund, as well as shares of a fund itself, are subject to market fluctuations caused by factors such as general economic conditions, political events, regulatory or market developments, changes in interest rates and perceived trends in securities prices. Shares of a fund could decline in value or underperform other investments as a result of the risk of loss associated with these market fluctuations. In addition, local, regional or global events such as war, acts of terrorism, spread of infectious diseases or other public health issues, recessions, or other events could have a significant negative impact on a fund and its investments. Such events may affect certain geographic regions, countries, sectors and industries more significantly than others. In February 2022, Russia invaded Ukraine which has caused and could continue to cause significant market disruptions and volatility within the markets in Russia, Europe, and the United States. The hostilities and sanctions resulting from those hostilities could have a significant impact on certain fund investments as well as fund performance. The outbreak of the respiratory disease designated as COVID-19 in December 2019 has caused significant volatility and declines in global financial markets, which have caused losses for investors. While the development of vaccines has slowed the spread of the virus and allowed for the resumption of “reasonably” normal business activity in the United States, many countries continue to impose lockdown measures in an attempt to slow the spread. Additionally, there is no guarantee that vaccines will be effective against emerging variants of the disease.
Non-U.S. Securities Risk. To the extent a fund invests in non-U.S. securities, it is subject to additional risks not associated with securities of domestic issuers. Non-U.S. securities are subject to higher volatility than securities of domestic issuers due to: possible adverse political, social or economic developments; restrictions on foreign investment or exchange of securities; capital controls; lack of liquidity; currency exchange rates; excessive taxation; government seizure of assets; the imposition of sanctions by foreign governments; different legal or accounting standards; and less government supervision and regulation of exchanges in foreign countries. Investments in non-U.S. securities may involve higher costs than investments in U.S. securities, including higher transaction and custody costs, as well as additional taxes imposed by non-U.S. governments. These risks may be heightened for securities of companies located, or with significant operations, in emerging market countries.
Operational Risk. Each fund is subject to risks arising from various operational factors, including, but not limited to, human error, processing and communication errors, errors of a fund’s service providers, counterparties or other third-parties, failed or inadequate processes and technology or systems failures. Each fund relies on third-parties for a range of services, including custody. Any delay or failure relating to engaging or maintaining such service providers may affect a fund’s ability to meet its investment objective. Although the funds and the funds’ investment advisor seek to reduce these operational risks through controls and procedures, there is no way to completely protect against such risks.
Passive Investment Risk. To the extent a fund seeks to track an index, the fund will invest in the securities included in, or representative of, the index regardless of their investment merit. A fund generally will not attempt to take defensive positions in declining markets.
| NOT FDIC INSURED | NOT BANK GUARANTEED | MAY LOSE VALUE |
Liquidity Risk Management Program
In accordance with Rule 22e-4 under the Investment Company Act of 1940, as amended (the “1940 Act”), the Funds and each other fund in the First Trust Fund Complex, other than the closed-end funds, have adopted and implemented a liquidity risk management program (the “Program”) reasonably designed to assess and manage the funds’ liquidity risk, i.e., the risk that a fund could not meet requests to redeem shares issued by the fund without significant dilution of remaining investors’ interests in the fund. The Board of Trustees of the First Trust Funds has appointed First Trust Advisors L.P. (the “Advisor”) as the person designated to administer the Program, and in this capacity the Advisor performs its duties primarily through the activities and efforts of the First Trust Liquidity Committee (the “Liquidity Committee”).
Pursuant to the Program, the Liquidity Committee classifies the liquidity of each fund’s portfolio investments into one of the four liquidity categories specified by Rule 22e-4: highly liquid investments, moderately liquid investments, less liquid investments and illiquid investments. The Liquidity Committee determines certain of the inputs for this classification process, including reasonably anticipated trade sizes and significant investor dilution thresholds. The Liquidity Committee also determines and periodically reviews a highly liquid investment minimum for certain funds, monitors the funds’ holdings of assets classified as illiquid investments to seek to ensure they do not exceed 15% of a fund’s net assets and establishes policies and procedures regarding redemptions in kind.
At the April 18, 2022 meeting of the Board of Trustees, as required by Rule 22e-4 and the Program, the Advisor provided the Board with a written report prepared by the Advisor that addressed the operation of the Program during the period from March 16, 2021
Additional Information (Continued)
First Trust Exchange-Traded Fund III
April 30, 2022 (Unaudited)
through the Liquidity Committee’s annual meeting held on March 17, 2022 and assessed the Program’s adequacy and effectiveness of implementation during this period, including the operation of the highly liquid investment minimum for each fund that is required under the Program to have one, and any material changes to the Program. Note that because the Funds primarily hold assets that are highly liquid investments, the Funds have not adopted any highly liquid investment minimums.
As stated in the written report, during the review period, no fund breached the 15% limitation on illiquid investments, no fund with a highly liquid investment minimum breached that minimum and no fund filed a Form N-LIQUID. The Advisor concluded that each fund’s investment strategy is appropriate for an open-end fund; that the Program operated effectively in all material respects during the review period; and that the Program is reasonably designed to assess and manage the liquidity risk of each fund and to maintain compliance with Rule 22e-4.
This page intentionally left blank
First Trust Exchange-Traded Fund III
INVESTMENT ADVISOR
First Trust Advisors L.P.
120 East Liberty Drive, Suite 400
Wheaton, IL 60187
INVESTMENT SUB-ADVISOR
Stonebridge Advisors LLC
10 Westport Road, Suite C101
Wilton, CT 06897
ADMINISTRATOR, CUSTODIAN,
FUND ACCOUNTANT &
TRANSFER AGENT
Brown Brothers Harriman & Co.
50 Post Office Square
Boston, MA 02110
INDEPENDENT REGISTERED
PUBLIC ACCOUNTING FIRM
Deloitte & Touche LLP
111 S. Wacker Drive
Chicago, IL 60606
LEGAL COUNSEL
Chapman and Cutler LLP
320 South Canal Street
Chicago, IL 60606
First Trust Exchange-Traded Fund III
First Trust Managed Municipal ETF (FMB)
Semi-Annual Report
For the Six Months Ended
April 30, 2022
First Trust Managed Municipal ETF (FMB)
Semi-Annual Report
April 30, 2022
Caution Regarding Forward-Looking Statements
This report contains certain forward-looking statements within the meaning of the Securities Act of 1933, as amended, and the Securities Exchange Act of 1934, as amended. Forward-looking statements include statements regarding the goals, beliefs, plans or current expectations of First Trust Advisors L.P. (“First Trust” or the “Advisor”) and its representatives, taking into account the information currently available to them. Forward-looking statements include all statements that do not relate solely to current or historical fact. For example, forward-looking statements include the use of words such as “anticipate,” “estimate,” “intend,” “expect,” “believe,” “plan,” “may,” “should,” “would” or other words that convey uncertainty of future events or outcomes.
Forward-looking statements involve known and unknown risks, uncertainties and other factors that may cause the actual results, performance or achievements of the series of First Trust Exchange-Traded Fund III (the “Trust”) described in this report (First Trust Managed Municipal ETF; hereinafter referred to as the “Fund”) to be materially different from any future results, performance or achievements expressed or implied by the forward-looking statements. When evaluating the information included in this report, you are cautioned not to place undue reliance on these forward-looking statements, which reflect the judgment of the Advisor and its representatives only as of the date hereof. We undertake no obligation to publicly revise or update these forward-looking statements to reflect events and circumstances that arise after the date hereof.
Performance and Risk Disclosure
There is no assurance that the Fund will achieve its investment objectives. The Fund is subject to market risk, which is the possibility that the market values of securities owned by the Fund will decline and that the value of the Fund’s shares may therefore be less than what you paid for them. Accordingly, you can lose money by investing in the Fund. See “Risk Considerations” in the Additional Information section of this report for a discussion of certain other risks of investing in the Fund.
Performance data quoted represents past performance, which is no guarantee of future results, and current performance may be lower or higher than the figures shown. For the most recent month-end performance figures, please visit www.ftportfolios.com or speak with your financial advisor. Investment returns, net asset value and share price will fluctuate and Fund shares, when sold, may be worth more or less than their original cost.
The Advisor may also periodically provide additional information on Fund performance on the Fund’s web page at www.ftportfolios.com.
How to Read This Report
This report contains information that may help you evaluate your investment in the Fund. It includes details about the Fund and presents data and analysis that provide insight into the Fund’s performance and investment approach.
The statistical information that follows may help you understand the Fund’s performance compared to that of a relevant market benchmark.
It is important to keep in mind that the opinions expressed by personnel of the Advisor are just that: informed opinions. They should not be considered to be promises or advice. The opinions, like the statistics, cover the period through the date on the cover of this report. The material risks of investing in the Fund are spelled out in the prospectus, the statement of additional information, and other Fund regulatory filings.
First Trust Managed Municipal ETF (FMB)
Semi-Annual Letter from the Chairman and CEO
April 30, 2022
Dear Shareholders,
First Trust is pleased to provide you with the semi-annual report for the First Trust Managed Municipal ETF (the “Fund”), which contains detailed information about the Fund for the six months ended April 30, 2022.
A couple of famous financial industry quotes came to mind recently as I was sizing up the current business climate: “There’s no such thing as a free lunch” and “Don’t fight the Fed!” It seems that for some, the trillions of dollars of financial stimulus funneled into U.S. households and businesses by the Federal government and its agencies to help mitigate the fallout stemming from the coronavirus (“COVID-19”) pandemic, which commenced sometime around February 2020, was for all intents and purposes “free money.” It was not free. From the close of February 2020 through March 2022, the Federal Reserve (the “Fed”) expanded the U.S. money supply, known as M2, by 41% to $21.81 trillion to boost liquidity in the financial system. Normally, M2 grows around 6.0% on a year-over-year basis. When you factor in that all this new capital was accompanied by a breakdown of the global supply chain, there is little wonder why inflation is rampant.
One of the more common definitions of inflation is too many dollars chasing too few goods. The biggest downside to the supply chain bottlenecks, such as the severe backup of container ships at some U.S. ports, is that they have markedly reduced the flow of imported goods to retailers. The Fed has been signaling to Americans and the rest of the globe that, after many years of artificially low interest rates, tighter monetary policy will likely rule the day for the foreseeable future. Higher interest rates make borrowing capital more expensive and that should slow consumption over time, which, in turn, should bring down inflation. Don’t fight the Fed is code for don’t bet against the Fed, in my opinion. Stay tuned!
The primary job of the Fed is price stability. Its standard inflation target rate is 2.0%. The most recent Consumer Price Index release showed that prices were up 8.3% on a year-over-year basis as of April 30, 2022, according to data from the U.S. Bureau of Labor Statistics. While down from 8.5% the prior month, it is clearly elevated and that means the Fed has some work to do to with respect to mitigating inflation. The war between Russia and Ukraine is making the Fed’s job even tougher, particularly in the areas of food and energy. Rising costs and potential shortages could become even bigger if the COVID-19 outbreak in China grows. These are important events to monitor. Fed Chairman Jerome Powell has stated that the Fed is poised to raise the Federal Funds target rate (upper bound) by 50 basis points at each of its next two meetings (set for June and July), which would take the rate up to 2.00%. Data from CME Group indicates that current market pricing has the rate rising to 2.75% or 3.00% by year-end.
Securities markets do not go up in a straight line and they do not just go up year in and year out. In fact, what we have witnessed over the past couple of decades are often referred to as boom and bust cycles. Thankfully, it has ended up more boom than bust. Simply put, investors, not traders of the market, need to be willing to take the bad with the good. As the various stages of an economic cycle come and go (expansion to contraction), the markets tend to reprice securities to reflect the current narrative. In other words, we believe the markets essentially heal themselves − if you let them. That is an accurate depiction of how the markets have behaved so far in 2022, in my opinion. In response to a softening economy, the stock and bond markets have experienced some serious downside through the first four months of this year, as measured by the broader market indices. As of today, Brian Wesbury, Chief Economist at First Trust, is not forecasting a recession for the U.S. in 2022 or 2023. Whether he is proven right or wrong, we encourage investors to stay the course.
Thank you for giving First Trust the opportunity to play a role in your financial future. We value our relationship with you and will report on the Fund again in six months.
Sincerely,
James A. Bowen
Chairman of the Board of Trustees
Chief Executive Officer of First Trust Advisors L.P.
Fund Performance Overview (Unaudited)
First Trust Managed Municipal ETF (FMB)
The First Trust Managed Municipal ETF’s (the “Fund”) primary investment objective is to generate current income that is exempt from regular federal income taxes and its secondary objective is long term capital appreciation. The Fund lists and principally trades its shares on The Nasdaq Stock Market, LLC under the ticker symbol “FMB.” Under normal market conditions, the Fund seeks to achieve its investment objectives by investing at least 80% of its net assets (including investment borrowings) in municipal debt securities that pay interest that is exempt from regular federal income taxes.
| Performance | | | | | | | |
| | | | Average Annual Total Returns | | Cumulative Total Returns |
| | 6 Months
Ended
4/30/22 | 1 Year
Ended
4/30/22 | 5 Years
Ended
4/30/22 | Inception
(5/13/14)
to 4/30/22 | | 5 Years
Ended
4/30/22 | Inception
(5/13/14)
to 4/30/22 |
| Fund Performance | | | | | | | |
| NAV | -8.11% | -7.80% | 2.13% | 2.92% | | 11.09% | 25.79% |
| Market Price | -8.23% | -7.95% | 2.09% | 2.91% | | 10.88% | 25.67% |
| Index Performance | | | | | | | |
| Bloomberg Revenue 10 Year (8-12) Index | -7.95% | -8.08% | 1.82% | 2.44% | | 9.44% | 21.15% |
Total returns for the period since inception are calculated from the inception date of the Fund. “Average Annual Total Returns” represent the average annual change in value of an investment over the periods indicated. “Cumulative Total Returns” represent the total change in value of an investment over the periods indicated. The total returns would have been lower if certain fees had not been waived by the Advisor.
The Fund’s per share net asset value (“NAV”) is the value of one share of the Fund and is computed by dividing the value of all assets of the Fund (including accrued interest and dividends), less all liabilities (including accrued expenses and dividends declared but unpaid), by the total number of outstanding shares. The price used to calculate market return (“Market Price”) is determined by using the midpoint of the national best bid and offer price (“NBBO”) as of the time that the Fund’s NAV is calculated. Under SEC rules, the NBBO consists of the highest displayed buy and lowest sell prices among the various exchanges trading the Fund at the time the Fund’s NAV is calculated. Prior to January 1, 2019, the price used was the midpoint between the highest bid and the lowest offer on the stock exchange on which shares of the Fund were listed for trading as of the time that the Fund’s NAV was calculated. Since shares of the Fund did not trade in the secondary market until after its inception, for the period from inception to the first day of secondary market trading in shares of the Fund, the NAV of the Fund is used as a proxy for the secondary market trading price to calculate market returns. NAV and market returns assume that all distributions have been reinvested in the Fund at NAV and Market Price, respectively.
An index is a statistical composite that tracks a specified financial market or sector. Unlike the Fund, the index does not actually hold a portfolio of securities and therefore does not incur the expenses incurred by the Fund. These expenses negatively impact the performance of the Fund. Also, market returns do not include brokerage commissions that may be payable on secondary market transactions. If brokerage commissions were included, market returns would be lower. The total returns presented reflect the reinvestment of dividends on securities in the index. The returns presented do not reflect the deduction of taxes that a shareholder would pay on Fund distributions or the redemption or sale of Fund shares. The investment return and principal value of shares of the Fund will vary with changes in market conditions. Shares of the Fund may be worth more or less than their original cost when they are redeemed or sold in the market. The Fund’s past performance is no guarantee of future performance.
Fund Performance Overview (Unaudited) (Continued)
First Trust Managed Municipal ETF (FMB) (Continued)
| Sector Allocation | % of Total
Investments
(including cash) |
| Hospital | 14.0% |
| Insured | 9.2 |
| Government Obligation Bond - Unlimited Tax | 8.1 |
| Certificates of Participation | 6.0 |
| Water & Sewer | 5.4 |
| Dedicated Tax | 5.1 |
| Gas | 5.1 |
| Higher Education | 5.0 |
| Government Obligation Bond - Limited Tax | 4.5 |
| Utility | 4.3 |
| Airport | 4.3 |
| Education | 4.2 |
| Continuing Care Retirement Communities | 4.1 |
| Special Assessment | 3.9 |
| Toll Road | 2.9 |
| Industrial Development Bond | 2.8 |
| Pre-refunded/Escrowed-to-maturity | 2.6 |
| Tobacco | 2.0 |
| Mass Transit | 1.5 |
| Housing | 0.7 |
| Tax Increment | 0.7 |
| Student Housing | 0.7 |
| Local Housing | 0.3 |
| Hotel | 0.2 |
| Other Health | 0.1 |
| Port | 0.1 |
| Pool | 0.0* |
| Stadium | 0.0* |
| Cash | 2.2 |
| Total | 100.0% |
| * | Amount is less than 0.1%. |
| Credit Quality(1) | % of Total
Investments
(including cash) |
| AAA | 5.2% |
| AA | 35.7 |
| A | 32.6 |
| BBB | 8.8 |
| BB | 2.9 |
| B | 1.0 |
| CCC | 0.4 |
| Not Rated | 10.3 |
| Short Rated only | 0.9 |
| Cash | 2.2 |
| Total | 100.0% |
| Fund Allocation | % of Net Assets |
| Municipal Bonds | 96.3% |
| Net Other Assets and Liabilities** | 3.7 |
| Total | 100.0% |
| ** | Includes variation margin on futures contracts. |
| (1) | The credit quality and ratings information presented above reflect the ratings assigned by one or more nationally recognized statistical rating organizations (NRSROs), including S&P Global Ratings, Moody’s Investors Service, Inc., Fitch Ratings or a comparably rated NRSRO. For situations in which a security is rated by more than one NRSRO and the ratings are not equivalent, the highest rating is used. Sub-investment grade ratings are those rated BB+/Ba1 or lower. Investment grade ratings are those rated BBB-/Baa3 or higher. The credit ratings shown relate to the creditworthiness of the issuers of the underlying securities in the Fund, and not to the Fund or its shares. Credit ratings are subject to change. |
Fund Performance Overview (Unaudited) (Continued)
First Trust Managed Municipal ETF (FMB) (Continued)
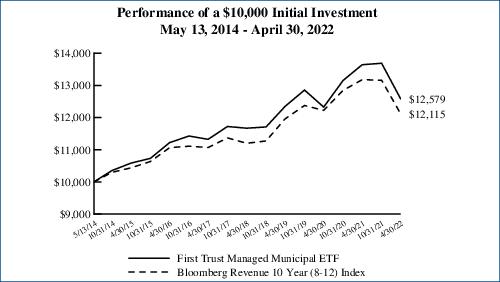
Performance figures assume reinvestment of all distributions and do not reflect the deduction of taxes that a shareholder would pay on Fund distributions or the redemption or sale of Fund shares. An index is a statistical composite that tracks a specified financial market or sector. Unlike the Fund, the index does not actually hold a portfolio of securities and therefore does not incur the expenses incurred by the Fund. These expenses negatively impact the performance of the Fund. The Fund’s past performance does not predict future performance. Performance in municipal bond investment strategies can be impacted from the benefits of purchasing odd lot positions. The impact of these investments can be particularly meaningful when funds have limited assets under management and may not be a sustainable source of performance as a fund grows in size.
Frequency Distribution of Discounts and Premiums
Information showing the number of days the market price of the Fund’s shares was greater (at a premium) and less (at a discount) than the Fund’s net asset value for the most recently completed year, and the most recently completed calendar quarters since that year (or life of the Fund, if shorter), is available at https://www.ftportfolios.com/Retail/etf/home.aspx.
Portfolio Management
First Trust Managed Municipal ETF (FMB)
Semi-Annual Report
April 30, 2022 (Unaudited)
Advisor
First Trust Advisors L.P. (“First Trust” or the “Advisor”) serves as the investment advisor to the First Trust Managed Municipal ETF (the “Fund”). First Trust is responsible for the ongoing monitoring of the Fund’s investment portfolio, managing the Fund’s business affairs and providing certain administrative services necessary for the management of the Fund.
Portfolio Management Team
Tom Futrell, CFA, Senior Vice President, Senior Portfolio Manager
Johnathan N. Wilhelm, Senior Vice President, Senior Portfolio Manager
Tom Byron, Senior Vice President, Portfolio Manager
The portfolio managers are primarily and jointly responsible for the day-to-day management of the Fund. Each portfolio manager has served as part of the portfolio management team of the Fund since 2014, except for Tom Byron, who has served as a portfolio manager since March 2022.
First Trust Managed Municipal ETF (FMB)
Understanding Your Fund Expenses
April 30, 2022 (Unaudited)
As a shareholder of the First Trust Managed Municipal ETF (the “Fund”), you incur two types of costs: (1) transaction costs; and (2) ongoing costs, including management fees, distribution and/or service (12b-1) fees, if any, and other Fund expenses. This Example is intended to help you understand your ongoing costs of investing in the Fund and to compare these costs with the ongoing costs of investing in other funds.
The Example is based on an investment of $1,000 invested at the beginning of the period and held through the six-month period ended April 30, 2022.
Actual Expenses
The first line in the following table provides information about actual account values and actual expenses. You may use the information in this line, together with the amount you invested, to estimate the expenses that you paid over the period. Simply divide your account value by $1,000 (for example, an $8,600 account value divided by $1,000 = 8.6), then multiply the result by the number in the first line under the heading entitled “Expenses Paid During the Six-Month Period” to estimate the expenses you paid on your account during this six-month period.
Hypothetical Example for Comparison Purposes
The second line in the following table provides information about hypothetical account values and hypothetical expenses based on the Fund’s actual expense ratio and an assumed rate of return of 5% per year before expenses, which is not the Fund’s actual return. The hypothetical account values and expenses may not be used to estimate the actual ending account balance or expenses you paid for the period. You may use this information to compare the ongoing costs of investing in the Fund and other funds. To do so, compare this 5% hypothetical example with the 5% hypothetical examples that appear in the shareholder reports of the other funds.
Please note that the expenses shown in the table are meant to highlight your ongoing costs only and do not reflect any transactional costs such as brokerage commissions. Therefore, the second line in the table is useful in comparing ongoing costs only, and will not help you determine the relative total costs of owning different funds. In addition, if these transactional costs were included, your costs would have been higher.
| | Beginning
Account Value
November 1, 2021 | Ending
Account Value
April 30, 2022 | Annualized
Expense Ratio
Based on the
Six-Month
Period (a) | Expenses Paid
During the
Six-Month
Period (b) |
| First Trust Managed Municipal ETF (FMB) |
| Actual | $1,000.00 | $918.90 | 0.50% | $2.38 |
| Hypothetical (5% return before expenses) | $1,000.00 | $1,022.32 | 0.50% | $2.51 |
| (a) | These expense ratios reflect expense waivers. See Note 3 in the Notes to Financial Statements. |
| (b) | Expenses are equal to the annualized expense ratios as indicated in the table multiplied by the average account value over the period (November 1, 2021 through April 30, 2022), multiplied by 181/365 (to reflect the six-month period). |
First Trust Managed Municipal ETF (FMB)
Portfolio of Investments
April 30, 2022 (Unaudited)
Principal
Value | | Description | | Stated
Coupon | | Stated
Maturity | | Value |
| MUNICIPAL BONDS – 96.3% |
| | | Alabama – 2.9% | | | | | | |
| $225,000 | | AL Cmnty Clg Sys Brd of Trustees Rev Bishop St Cmnty Clg, BAM
| | 4.00% | | 01/01/35 | | $233,113 |
| 775,000 | | AL Federal Aid Hwy Fin Auth Spl Oblig Rev, GARVEE, Ser A
| | 5.00% | | 09/01/32 | | 868,473 |
| 500,000 | | AL St Port Auth Docks Facs Rev Ref Docks Facs Rev, Ser A, AGM, AMT
| | 5.00% | | 10/01/25 | | 533,749 |
| 2,380,000 | | AL St Port Auth Docks Facs Rev Ref Docks Facs Rev, Ser A, AGM, AMT
| | 5.00% | | 10/01/29 | | 2,593,369 |
| 940,000 | | Birmingham AL Wtrwks Brd Wtr Rev Ref Sr, Ser A
| | 4.00% | | 01/01/34 | | 1,000,905 |
| 2,325,000 | | Birmingham AL Wtrwks Brd Wtr Rev Ref, Subser B
| | 5.00% | | 01/01/43 | | 2,582,686 |
| 370,000 | | Black Belt Energy Gas Dist AL Gas Prepay Rev Proj #5, Ser A-1
| | 4.00% | | 04/01/26 | | 377,956 |
| 7,070,000 | | Black Belt Energy Gas Dist AL Gas Prepay Rev Proj #5, Ser A-1 (Mandatory put 10/01/26)
| | 4.00% | | 10/01/49 | | 7,187,870 |
| 1,945,000 | | Black Belt Energy Gas Dist AL Gas Prepay Rev, Ser A (Mandatory put 12/01/23)
| | 4.00% | | 12/01/48 | | 1,968,783 |
| 13,000,000 | | Black Belt Energy Gas Dist AL Gas Proj Rev, Ser B-1 (Mandatory put 10/01/27)
| | 4.00% | | 04/01/53 | | 13,227,569 |
| 4,600,000 | | Columbia AL Indl Dev Brd Poll Control Rev Var Ref AL Pwr Co Proj, Ser B (a)
| | 0.39% | | 12/01/37 | | 4,600,000 |
| 415,000 | | Gulf Shores AL Ref Warrants, Ser A
| | 5.00% | | 12/15/35 | | 459,036 |
| 310,000 | | Gulf Shores AL Ref Warrants, Ser A
| | 5.00% | | 12/15/38 | | 342,061 |
| 400,000 | | Homewood AL Eductnl Bldg Auth Rev Ref Samford Univ Proj, Ser A
| | 4.00% | | 12/01/33 | | 406,582 |
| 950,000 | | Homewood AL Eductnl Bldg Auth Rev Ref Samford Univ Proj, Ser A
| | 4.00% | | 12/01/34 | | 961,858 |
| 450,000 | | Infirmary Hlth Sys AL Spl Care Facs Fing Auth Rev Infirmary Hlth Sys Inc, Ser A
| | 5.00% | | 02/01/36 | | 478,014 |
| 930,000 | | Leeds AL Pub Eductnl Bldg Auth Eductnl Facs Rev Ref Edu, AGM
| | 4.00% | | 04/01/29 | | 972,688 |
| 695,000 | | Leeds AL Pub Eductnl Bldg Auth Eductnl Facs Rev Ref Edu, AGM
| | 4.00% | | 04/01/30 | | 728,154 |
| 1,445,000 | | Lower AL Gas Dist Gas Proj Rev, Ser A
| | 5.00% | | 09/01/31 | | 1,588,943 |
| 1,000,000 | | Midcity Impt Dist AL Spl Assmnt Rev
| | 4.50% | | 11/01/42 | | 822,705 |
| 440,000 | | Mobile AL Impt Dist Sales Tax Rev McGowin Park Proj, Ser A
| | 5.00% | | 08/01/25 | | 439,705 |
| 500,000 | | Mobile Cnty AL Impt Warrants
| | 5.00% | | 08/01/30 | | 539,037 |
| 1,105,000 | | Prichard AL Wtrwks & Swr Brd Wtr & Swr Rev Ref
| | 4.00% | | 11/01/30 | | 991,149 |
| 1,565,000 | | Prichard AL Wtrwks & Swr Brd Wtr & Swr Rev Ref
| | 4.00% | | 11/01/31 | | 1,383,473 |
| 1,605,000 | | Prichard AL Wtrwks & Swr Brd Wtr & Swr Rev Ref
| | 4.00% | | 11/01/32 | | 1,399,461 |
| 1,395,000 | | Prichard AL Wtrwks & Swr Brd Wtr & Swr Rev Ref
| | 4.00% | | 11/01/33 | | 1,200,204 |
| 1,765,000 | | Prichard AL Wtrwks & Swr Brd Wtr & Swr Rev Ref
| | 4.00% | | 11/01/34 | | 1,499,472 |
| 1,840,000 | | Prichard AL Wtrwks & Swr Brd Wtr & Swr Rev Ref
| | 4.00% | | 11/01/35 | | 1,542,441 |
| 110,000 | | SE AL St Gas Sply Dist Gas Sply Rev Proj #1, Ser A (Mandatory put 04/01/24)
| | 4.00% | | 04/01/49 | | 111,295 |
| 3,000,000 | | SE AL St Gas Sply Dist Gas Sply Rev Proj #2, Ser A (Mandatory put 06/01/24)
| | 4.00% | | 06/01/49 | | 3,043,744 |
| 1,040,000 | | Troy AL Ref Warrants, BAM
| | 4.00% | | 07/01/35 | | 1,049,830 |
| 105,000 | | UAB Medicine Fin Auth AL Rev Ref UAB Medicine, Ser B
| | 5.00% | | 09/01/34 | | 113,419 |
| 5,000,000 | | UAB Medicine Fin Auth AL Rev Ref UAB Medicine, Ser B2
| | 5.00% | | 09/01/41 | | 5,414,195 |
| 300,000 | | UAB Medicine Fin Auth AL Rev UAB Medicine Oblig Grp, Ser B
| | 5.00% | | 09/01/31 | | 342,259 |
| 1,000,000 | | UAB Medicine Fin Auth AL Rev UAB Medicine Oblig Grp, Ser B
| | 4.00% | | 09/01/38 | | 1,007,192 |
| | | | | 62,011,390 |
| | | Alaska – 0.2% | | | | | | |
| 1,880,000 | | AK St Indl Dev & Export Auth Pwr Rev Ref Snettisham Hydroelectric Proj, AMT
| | 4.00% | | 01/01/28 | | 1,882,130 |
See Notes to Financial Statements
Page 7
First Trust Managed Municipal ETF (FMB)
Portfolio of Investments (Continued)
April 30, 2022 (Unaudited)
Principal
Value | | Description | | Stated
Coupon | | Stated
Maturity | | Value |
| MUNICIPAL BONDS (Continued) |
| | | Alaska (Continued) | | | | | | |
| $450,000 | | Nthrn AK Tobacco Securitization Corp Tobacco Stlmt Rev Ref Sr, Ser A, Class 1
| | 4.00% | | 06/01/39 | | $451,262 |
| 1,500,000 | | Nthrn AK Tobacco Securitization Corp Tobacco Stlmt Rev Ref Sr, Ser A, Class 1
| | 4.00% | | 06/01/40 | | 1,500,492 |
| | | | | 3,833,884 |
| | | Arizona – 2.8% | | | | | | |
| 1,205,000 | | AZ Brd of Rgts Univ AZ Sys Rev Green Bond, Ser B
| | 5.00% | | 06/01/28 | | 1,318,355 |
| 1,000,000 | | AZ St Indl Dev Auth Edu Rev Acads of Math & Science Proj (b)
| | 5.00% | | 07/01/49 | | 1,008,919 |
| 625,000 | | AZ St Indl Dev Auth Edu Rev Cadence Cmps Proj, Ser A (b)
| | 4.00% | | 07/15/30 | | 608,753 |
| 925,000 | | AZ St Indl Dev Auth Edu Rev Cadence Cmps Proj, Ser A (b)
| | 4.00% | | 07/15/40 | | 837,896 |
| 175,000 | | AZ St Indl Dev Auth Edu Rev Doral Acdmy NV Fire Mesa & Red Rock Cmps Proj, Ser A (b)
| | 5.00% | | 07/15/39 | | 179,658 |
| 500,000 | | AZ St Indl Dev Auth Edu Rev Macombs Fac Proj Social Bonds, Ser A
| | 4.00% | | 07/01/41 | | 458,219 |
| 375,000 | | AZ St Indl Dev Auth Edu Rev Ref Basis Sch Projs, Ser D (b)
| | 5.00% | | 07/01/37 | | 388,066 |
| 1,055,000 | | AZ St Indl Dev Auth Edu Rev Ref Basis Schs Projs, Ser A (b)
| | 5.00% | | 07/01/26 | | 1,085,815 |
| 1,030,000 | | AZ St Indl Dev Auth Edu Rev Ref Basis Schs Projs, Ser G (b)
| | 5.00% | | 07/01/37 | | 1,065,887 |
| 500,000 | | AZ St Indl Dev Auth Edu Rev Ref Doral Acdmy of Northern NV Proj, Ser A (b)
| | 4.00% | | 07/15/51 | | 427,026 |
| 950,000 | | AZ St Indl Dev Auth Edu Rev Ref Doral Acdmy of Northern NV Proj, Ser A (b)
| | 4.00% | | 07/15/56 | | 788,299 |
| 800,000 | | AZ St Indl Dev Auth Edu Rev Somerset Acdmy of LV Aliante & Skye Canyon Cmps Proj, Ser A (b)
| | 4.00% | | 12/15/51 | | 682,510 |
| 500,000 | | AZ St Indl Dev Auth Edu Rev, Ser A (b)
| | 4.00% | | 07/15/30 | | 492,417 |
| 415,000 | | AZ St Indl Dev Auth Natl Chrt Sch Revolving Loan Fd Social Bonds Equitable Sch Revolving Fund, Ser A
| | 5.00% | | 11/01/31 | | 449,378 |
| 1,005,000 | | AZ St Indl Dev Auth Natl Chrt Sch Revolving Loan Fd Social Bonds Equitable Sch Revolving Fund, Ser A
| | 5.00% | | 11/01/33 | | 1,083,037 |
| 465,000 | | AZ St Indl Dev Auth Natl Chrt Sch Revolving Loan Fd Social Bonds Equitable Sch Revolving Fund, Ser A
| | 5.00% | | 11/01/37 | | 499,314 |
| 595,000 | | AZ St Indl Dev Auth Natl Chrt Sch Revolving Loan Fd Social Bonds Equitable Sch Revolving Fund, Ser A
| | 4.00% | | 11/01/38 | | 595,186 |
| 750,000 | | AZ St Indl Dev Auth Natl Chrt Sch Revolving Loan Fd Social Bonds Equitable Sch Revolving Fund, Ser A
| | 4.00% | | 11/01/39 | | 748,117 |
| 3,850,000 | | AZ St Indl Dev Auth Natl Chrt Sch Revolving Loan Fd Social Bonds Equitable Sch Revolving Fund, Ser A
| | 4.00% | | 11/01/45 | | 3,750,959 |
| 1,000,000 | | AZ St Indl Dev Auth Rev Lincoln S Beltway Proj
| | 5.00% | | 08/01/27 | | 1,109,734 |
| 1,985,000 | | AZ St Indl Dev Auth Rev Lincoln S Beltway Proj
| | 5.00% | | 11/01/27 | | 2,210,263 |
| 1,000,000 | | AZ St Indl Dev Auth Rev Lincoln S Beltway Proj
| | 5.00% | | 05/01/28 | | 1,120,602 |
| 1,000,000 | | AZ St Indl Dev Auth Rev Lincoln S Beltway Proj
| | 5.00% | | 08/01/28 | | 1,124,409 |
| 4,000,000 | | Glendale AZ Indl Dev Auth Sr Living Facs Rev Ref Sun Hlth Svcs, Ser A
| | 5.00% | | 11/15/42 | | 4,259,481 |
| 1,300,000 | | Maricopa Cnty AZ Elem Sch Dist #25 Liberty, Ser A, AGM
| | 5.00% | | 07/01/31 | | 1,472,593 |
| 1,350,000 | | Maricopa Cnty AZ Elem Sch Dist #25 Liberty, Ser A, AGM
| | 5.00% | | 07/01/32 | | 1,526,541 |
| 200,000 | | Maricopa Cnty AZ Indl Dev Auth Edu Rev Greathearts AZ Projs, Ser C
| | 5.00% | | 07/01/25 | | 213,303 |
| 830,000 | | Maricopa Cnty AZ Indl Dev Auth Edu Rev Legacy Trad Schs Proj
| | 4.00% | | 07/01/30 | | 859,039 |
| 435,000 | | Maricopa Cnty AZ Indl Dev Auth Edu Rev Legacy Trad Schs Proj
| | 4.00% | | 07/01/31 | | 448,639 |
| 450,000 | | Maricopa Cnty AZ Indl Dev Auth Edu Rev Legacy Trad Schs Proj
| | 4.00% | | 07/01/32 | | 462,704 |
| 700,000 | | Maricopa Cnty AZ Indl Dev Auth Edu Rev Legacy Trad Schs Proj
| | 4.00% | | 07/01/33 | | 719,324 |
| 985,000 | | Maricopa Cnty AZ Indl Dev Auth Edu Rev Legacy Trad Schs Proj
| | 4.00% | | 07/01/34 | | 1,010,874 |
| 1,025,000 | | Maricopa Cnty AZ Indl Dev Auth Edu Rev Legacy Trad Schs Proj
| | 4.00% | | 07/01/35 | | 1,050,042 |
| 750,000 | | Maricopa Cnty AZ Indl Dev Auth Edu Rev Ref Greathearts AZ Projs, Ser A
| | 5.00% | | 07/01/37 | | 802,270 |
Page 8
See Notes to Financial Statements
First Trust Managed Municipal ETF (FMB)
Portfolio of Investments (Continued)
April 30, 2022 (Unaudited)
Principal
Value | | Description | | Stated
Coupon | | Stated
Maturity | | Value |
| MUNICIPAL BONDS (Continued) |
| | | Arizona (Continued) | | | | | | |
| $500,000 | | Maricopa Cnty AZ Indl Dev Auth Edu Rev Ref Horizon Cmnty Learning Ctr Proj
| | 5.00% | | 07/01/35 | | $509,015 |
| 500,000 | | Maricopa Cnty AZ Indl Dev Auth Edu Rev Ref Legacy Trad Sch Proj
| | 4.00% | | 07/01/34 | | 513,134 |
| 1,100,000 | | Maricopa Cnty AZ Indl Dev Auth Edu Rev Ref Legacy Trad Schs Proj Auth, Ser B (b)
| | 5.00% | | 07/01/39 | | 1,140,786 |
| 1,000,000 | | Maricopa Cnty AZ Indl Dev Auth Edu Rev Ref Legacy Trad Schs Proj Auth, Ser B (b)
| | 5.00% | | 07/01/49 | | 1,022,272 |
| 500,000 | | Maricopa Cnty AZ Indl Dev Auth Edu Rev Ref Paradise Schs Projs Paragon Mgmt Inc (b)
| | 4.00% | | 07/01/26 | | 508,680 |
| 1,475,000 | | Maricopa Cnty AZ Spl Hlthcare Dist Aka Maricopa Integrated Hlth Sys, Ser C
| | 5.00% | | 07/01/27 | | 1,632,167 |
| 1,450,000 | | Maricopa Cnty AZ Unif Sch Dist #48 Scottsdale, Ser D
| | 4.00% | | 07/01/34 | | 1,553,112 |
| 350,000 | | Phoenix AZ Indl Dev Auth Edu Rev Fac Legacy Trad Schs Projs, Ser A (b)
| | 4.00% | | 07/01/26 | | 352,543 |
| 3,655,000 | | Phoenix AZ Indl Dev Auth Edu Rev Ref Basis Schs Projs, Ser A (b)
| | 5.00% | | 07/01/35 | | 3,749,220 |
| 5,000,000 | | Phoenix AZ Indl Dev Auth Hotel Rev Sr Falcon Properties LLC Proj, Ser A (b)
| | 4.00% | | 12/01/41 | | 4,195,539 |
| 300,000 | | Phoenix AZ Indl Dev Auth Stdt Hsg Rev Downtown Phoenix Stdt Hsg II LLC AZ St Univ Proj, Ser A
| | 5.00% | | 07/01/32 | | 323,345 |
| 300,000 | | Phoenix AZ Indl Dev Auth Stdt Hsg Rev Downtown Phoenix Stdt Hsg II LLC AZ St Univ Proj, Ser A
| | 5.00% | | 07/01/33 | | 323,345 |
| 300,000 | | Phoenix AZ Indl Dev Auth Stdt Hsg Rev Downtown Phoenix Stdt Hsg II LLC AZ St Univ Proj, Ser A
| | 5.00% | | 07/01/34 | | 323,150 |
| 350,000 | | Phoenix AZ Indl Dev Auth Stdt Hsg Rev Downtown Phoenix Stdt Hsg II LLC AZ St Univ Proj, Ser A
| | 5.00% | | 07/01/35 | | 376,553 |
| 700,000 | | Phoenix AZ Indl Dev Auth Stdt Hsg Rev Downtown Phoenix Stdt Hsg II LLC AZ St Univ Proj, Ser A
| | 5.00% | | 07/01/44 | | 740,943 |
| 200,000 | | Phoenix AZ Indl Dev Auth Stdt Hsg Rev Ref Downtown Phoenix Stdt Hsg LLC AZ St Univ Proj, Ser A
| | 5.00% | | 07/01/26 | | 215,530 |
| 140,000 | | Pima Cnty AZ Indl Dev Auth Edu Rev Fac American Leadership Acdmy Proj (b)
| | 4.00% | | 06/15/22 | | 140,426 |
| 250,000 | | Pima Cnty AZ Indl Dev Auth Edu Rev Ref Fac American Leadership Acdmy Proj (b)
| | 4.60% | | 06/15/25 | | 252,879 |
| 1,230,000 | | Salt River AZ Proj Agric Impt & Pwr Dist Elec Sys Rev Ref, Ser A
| | 5.00% | | 12/01/31 | | 1,233,638 |
| 3,500,000 | | Salt River AZ Proj Agric Impt & Pwr Dist Elec Sys Rev Salt River Proj Elect Sys, Ser A
| | 5.00% | | 01/01/23 | | 3,570,652 |
| 1,000,000 | | Tempe AZ Indl Dev Auth Rev Ref Friendship Vlg of Tempe Proj, Ser A
| | 4.00% | | 12/01/38 | | 939,762 |
| 1,435,000 | | Yavapai Cnty AZ Jail Dist Rev, BAM
| | 5.00% | | 07/01/31 | | 1,605,842 |
| 1,030,000 | | Yavapai Cnty AZ Jail Dist Rev, BAM
| | 4.00% | | 07/01/32 | | 1,081,689 |
| | | | | 61,161,851 |
| | | Arkansas – 0.1% | | | | | | |
| 610,000 | | AR Dev Fin Auth Hlthcare Rev Baptist Hlth
| | 4.00% | | 12/01/44 | | 605,232 |
| 750,000 | | AR St Dev Fin Auth Hlthcare Facs Rev Carti Surgery Ctr Proj, Ser B
| | 4.25% | | 07/01/41 | | 721,954 |
| 350,000 | | Univ of Central Arkansas AR Rev, Ser A, AGM
| | 5.00% | | 11/01/34 | | 376,073 |
| | | | | 1,703,259 |
| | | California – 8.5% | | | | | | |
| 790,000 | | Anaheim CA Pub Fin Auth Lease Rev Pub Imps Proj, Ser A
| | 5.00% | | 09/01/28 | | 862,115 |
See Notes to Financial Statements
Page 9
First Trust Managed Municipal ETF (FMB)
Portfolio of Investments (Continued)
April 30, 2022 (Unaudited)
Principal
Value | | Description | | Stated
Coupon | | Stated
Maturity | | Value |
| MUNICIPAL BONDS (Continued) |
| | | California (Continued) | | | | | | |
| $225,000 | | CA Cnty CA Tobacco Securitization Agy Tobacco Settle Ref Sonoma Cnty Securitization Corp, Ser A
| | 5.00% | | 06/01/31 | | $246,950 |
| 200,000 | | CA Cnty CA Tobacco Securitization Agy Tobacco Settle Ref Sonoma Cnty Securitization Corp, Ser A
| | 5.00% | | 06/01/32 | | 218,976 |
| 230,000 | | CA Cnty CA Tobacco Securitization Agy Tobacco Settle Ref Sonoma Cnty Securitization Corp, Ser A
| | 5.00% | | 06/01/33 | | 251,142 |
| 150,000 | | CA Cnty CA Tobacco Securitization Agy Tobacco Settle Ref Sonoma Cnty Securitization Corp, Ser A
| | 4.00% | | 06/01/34 | | 152,206 |
| 250,000 | | CA Cnty CA Tobacco Securitization Agy Tobacco Settle Ref Sonoma Cnty Securitization Corp, Ser A
| | 4.00% | | 06/01/36 | | 252,707 |
| 450,000 | | CA Cnty CA Tobacco Securitization Agy Tobacco Stlmt Sr Ref, Ser A
| | 5.00% | | 06/01/32 | | 490,559 |
| 1,000,000 | | CA Sch Fin Auth Sch Fac Rev Alliance Clg Ready Pub Schs Proj, Ser C
| | 4.50% | | 07/01/26 | | 1,031,979 |
| 460,000 | | CA Sch Fin Auth Sch Fac Rev Granada Hills Chrt Oblig Grp (b)
| | 5.00% | | 07/01/32 | | 478,173 |
| 480,000 | | CA Sch Fin Auth Sch Fac Rev Granada Hills Chrt Oblig Grp (b)
| | 5.00% | | 07/01/33 | | 498,780 |
| 1,950,000 | | CA Sch Fin Auth Sch Fac Rev Granada Hills Chrt Oblig Grp (b)
| | 5.00% | | 07/01/49 | | 1,988,928 |
| 1,325,000 | | CA Sch Fin Auth Sch Fac Rev Kipp SoCal Pub Schs, Ser A (b)
| | 5.00% | | 07/01/39 | | 1,385,718 |
| 455,000 | | CA Sch Fin Auth Sch Fac Rev Ref Hlth Learning Proj, Ser A (b)
| | 4.00% | | 07/01/26 | | 456,887 |
| 800,000 | | CA Sch Fin Auth Sch Fac Rev Ref Hlth Learning Proj, Ser A (b)
| | 5.00% | | 07/01/32 | | 819,302 |
| 655,000 | | CA Sch Fin Auth Sch Fac Rev, Ser A (b)
| | 5.00% | | 07/01/40 | | 671,193 |
| 750,000 | | CA St
| | 5.00% | | 08/01/32 | | 826,997 |
| 225,000 | | CA St Ent Dev Auth Lease Rev Riverside Cnty Library Fac Proj
| | 4.00% | | 11/01/37 | | 229,104 |
| 2,190,000 | | CA St Ent Dev Auth Lease Rev Riverside Cnty Library Fac Proj
| | 4.00% | | 11/01/49 | | 2,158,581 |
| 480,000 | | CA St Hlth Facs Fing Auth Rev Adventist Hlth Sys W, Ser A
| | 4.00% | | 03/01/33 | | 481,453 |
| 400,000 | | CA St Hlth Facs Fing Auth Rev Ref Sutter Hlth, Ser B
| | 5.00% | | 11/15/33 | | 434,719 |
| 600,000 | | CA St Hlth Facs Fing Auth Rev Sutter Hlth, Ser A
| | 5.00% | | 11/15/33 | | 656,916 |
| 8,100,000 | | CA St Infra & Econ Dev Bank Lease Rev Green Bond
| | 5.00% | | 08/01/44 | | 8,934,893 |
| 445,000 | | CA St Muni Fin Auth Chrt Sch Lease Rev Vista Chrt Middle Sch Proj (c)
| | 5.38% | | 07/01/34 | | 457,151 |
| 600,000 | | CA St Muni Fin Auth Chrt Sch Rev Palmdale Aerospace Acdmy Proj (b)
| | 4.00% | | 07/01/26 | | 600,736 |
| 1,515,000 | | CA St Muni Fin Auth Mobile Home Park Rev Sr Caritas Affordable Hsg Inc Projs, Ser A
| | 5.25% | | 08/15/39 | | 1,561,513 |
| 1,805,000 | | CA St Muni Fin Auth Mobile Home Park Rev Sr Caritas Affordable Hsg Inc Projs, Ser A
| | 5.25% | | 08/15/49 | | 1,853,364 |
| 200,000 | | CA St Muni Fin Auth Rev Channing House Proj, Ser B
| | 5.00% | | 05/15/37 | | 215,893 |
| 1,000,000 | | CA St Muni Fin Auth Rev Cmnty Hlth Sys, Ser A
| | 4.00% | | 02/01/40 | | 995,777 |
| 1,000,000 | | CA St Muni Fin Auth Rev Cmnty Hlth Sys, Ser A
| | 4.00% | | 02/01/41 | | 999,432 |
| 500,000 | | CA St Muni Fin Auth Rev Ref Eisenhower Med Ctr, Ser A
| | 5.00% | | 07/01/34 | | 538,038 |
| 1,250,000 | | CA St Muni Fin Auth Rev Ref HumanGood Oblig Grp, Ser A
| | 4.00% | | 10/01/33 | | 1,292,129 |
| 600,000 | | CA St Muni Fin Auth Rev Ref HumanGood Oblig Grp, Ser A
| | 4.00% | | 10/01/34 | | 618,211 |
| 1,000,000 | | CA St Muni Fin Auth Rev Ref HumanGood Oblig Grp, Ser A
| | 4.00% | | 10/01/35 | | 1,027,125 |
| 1,000,000 | | CA St Muni Fin Auth Rev Ref HumanGood Oblig Grp, Ser A
| | 4.00% | | 10/01/36 | | 1,025,600 |
| 2,130,000 | | CA St Muni Fin Auth Rev Ref HumanGood Oblig Grp, Ser A
| | 4.00% | | 10/01/39 | | 2,163,530 |
| 3,420,000 | | CA St Muni Fin Auth Rev Ref HumanGood Oblig Grp, Ser A
| | 5.00% | | 10/01/44 | | 3,647,640 |
| 680,000 | | CA St Muni Fin Auth Rev Ref Retmnt Hsg Fdtn Oblig Grp, Ser A
| | 5.00% | | 11/15/27 | | 735,523 |
| 650,000 | | CA St Muni Fin Auth Rev Sr Lien Linxs APM Proj, Ser A, AMT
| | 5.00% | | 06/30/28 | | 700,735 |
| 200,000 | | CA St Muni Fin Auth Sr Living Rev Ref Mt San Antonio Gardens Proj
| | 4.00% | | 11/15/27 | | 202,376 |
| 4,000,000 | | CA St Muni Fin Auth Stdt Hsg Rev Chf Davis I LLC W Vlg Stdt Hsg Proj, BAM
| | 5.00% | | 05/15/36 | | 4,332,372 |
| 1,000,000 | | CA St Muni Fin Auth Stdt Hsg Rev Green Bond Orchard Park Stdt Hsg Proj, BAM
| | 4.00% | | 05/15/40 | | 1,005,029 |
Page 10
See Notes to Financial Statements
First Trust Managed Municipal ETF (FMB)
Portfolio of Investments (Continued)
April 30, 2022 (Unaudited)
Principal
Value | | Description | | Stated
Coupon | | Stated
Maturity | | Value |
| MUNICIPAL BONDS (Continued) |
| | | California (Continued) | | | | | | |
| $1,000,000 | | CA St Poll Control Fin Auth Sol Wst Disp Rev Ref Wst Mgmt Inc, Ser A1, AMT
| | 3.38% | | 07/01/25 | | $1,004,594 |
| 4,990,000 | | CA St Poll Control Fin Auth Wtr Furnishing Rev, AMT (b)
| | 5.00% | | 07/01/37 | | 5,043,553 |
| 1,125,000 | | CA St Pub Wks Brd Lease Rev Various Capital Proj, Ser B
| | 4.00% | | 05/01/38 | | 1,149,272 |
| 775,000 | | CA St Ref
| | 5.00% | | 04/01/29 | | 880,142 |
| 1,960,000 | | CA St Ref
| | 5.00% | | 11/01/39 | | 2,162,973 |
| 2,000,000 | | CA St Ref Various Purp
| | 5.00% | | 04/01/36 | | 2,085,021 |
| 500,000 | | CA St Ref, Ser C
| | 5.00% | | 09/01/32 | | 535,476 |
| 2,000,000 | | CA St Sch Fin Auth Chrt Sch Rev Arts in Action Chrt Schs, Ser A (b)
| | 5.00% | | 06/01/40 | | 2,033,976 |
| 1,865,000 | | CA St Sch Fin Auth Chrt Sch Rev Classical Academies Proj, Ser A-1
| | 7.38% | | 10/01/43 | | 1,908,879 |
| 500,000 | | CA St Sch Fin Auth Chrt Sch Rev Summit Pub Schs (b)
| | 5.00% | | 06/01/37 | | 513,712 |
| 2,315,000 | | CA St Stwd Cmntys Dev Auth Transprtn Rev Total Road Impt Prog, Ser B, COPS, AGM
| | 5.00% | | 12/01/41 | | 2,603,591 |
| 745,000 | | CA St Various Purp
| | 5.00% | | 10/01/27 | | 812,592 |
| 1,000,000 | | CA Stwd Cmntys Dev Auth Rev Loma Linda Univ Med Ctr, Ser A (b)
| | 5.00% | | 12/01/30 | | 1,052,048 |
| 450,000 | | CA Stwd Cmntys Dev Auth Rev Loma Linda Univ Med Ctr, Ser A (b)
| | 5.00% | | 12/01/33 | | 478,842 |
| 50,000 | | CA Stwd Cmntys Dev Auth Rev Ref CA Baptist Univ, Ser A (b)
| | 3.00% | | 11/01/22 | | 50,110 |
| 500,000 | | CA Stwd Cmntys Dev Auth Rev Ref CA Baptist Univ, Ser A (b)
| | 5.00% | | 11/01/32 | | 537,451 |
| 100,000 | | CA Stwd Cmntys Dev Auth Rev Ref Front Porch Cmntys & Svcs, Ser A
| | 5.00% | | 04/01/30 | | 109,685 |
| 195,000 | | CA Stwd Cmntys Dev Auth Rev Ref Front Porch Cmntys & Svcs, Ser A
| | 5.00% | | 04/01/31 | | 213,224 |
| 300,000 | | Cathedral City CA Redev Agy Successor Agy Tax Allocation Rev Ref Sub Hsg Merged Redev Proj Area, Ser C, BAM
| | 4.00% | | 08/01/27 | | 313,614 |
| 500,000 | | Cathedral City CA Redev Agy Successor Agy Tax Allocation Rev Ref Sub Hsg Merged Redev Proj Area, Ser C, BAM
| | 4.00% | | 08/01/28 | | 523,033 |
| 370,000 | | Chino CA Cmnty Facs Dist Spl Tax #2003-3 Impt Area #7
| | 5.00% | | 09/01/30 | | 401,189 |
| 300,000 | | Chino Vly CA Unif Sch Dist, Ser B
| | 5.00% | | 08/01/38 | | 339,878 |
| 250,000 | | Chino Vly CA Unif Sch Dist, Ser B
| | 5.00% | | 08/01/39 | | 282,369 |
| 1,000,000 | | CSCDA Cmnty Impt Auth CA Essential Hsg Rev the Link Glendale Social Bonds, Ser A-2 (b)
| | 4.00% | | 07/01/56 | | 818,708 |
| 1,000,000 | | CSCDA Cmnty Impt Auth CA Essential Hsg Rev Union S Bay Social Bonds, Ser A-2 (b)
| | 4.00% | | 07/01/56 | | 866,253 |
| 2,160,000 | | Etiwanda CA Sch Dist Cmnty Facs Dist #9 Spl Tax Ref
| | 5.00% | | 09/01/35 | | 2,285,417 |
| 130,000 | | Folsom Ranch CA Fing Auth Spl Tax Rev Cmnty Facs Dist No 19 Mangini
| | 4.00% | | 09/01/24 | | 132,339 |
| 155,000 | | Folsom Ranch CA Fing Auth Spl Tax Rev Cmnty Facs Dist No 19 Mangini
| | 4.00% | | 09/01/25 | | 158,619 |
| 165,000 | | Folsom Ranch CA Fing Auth Spl Tax Rev White Rock Springs Ranch
| | 4.00% | | 09/01/39 | | 161,155 |
| 170,000 | | Folsom Ranch CA Fing Auth Spl Tax Rev White Rock Springs Ranch
| | 4.00% | | 09/01/40 | | 164,552 |
| 175,000 | | Folsom Ranch CA Fing Auth Spl Tax Rev White Rock Springs Ranch
| | 4.00% | | 09/01/41 | | 168,728 |
| 250,000 | | Fontana CA Spl Tax Spl Tax the Meadows
| | 4.00% | | 09/01/27 | | 256,840 |
| 265,000 | | Fontana CA Spl Tax Spl Tax the Meadows
| | 4.00% | | 09/01/28 | | 272,385 |
| 280,000 | | Fontana CA Spl Tax Spl Tax the Meadows
| | 4.00% | | 09/01/29 | | 287,909 |
| 535,000 | | Fontana CA Spl Tax Spl Tax the Meadows
| | 4.00% | | 09/01/36 | | 528,741 |
| 500,000 | | Foothill-De Anza CA Cmnty Clg Dist Ref, COPS
| | 5.00% | | 04/01/32 | | 531,278 |
| 300,000 | | Gilroy CA Unif Sch Dist Election 2016
| | 4.00% | | 08/01/39 | | 302,461 |
| 1,200,000 | | Gilroy CA Unif Sch Dist Election 2016
| | 4.00% | | 08/01/40 | | 1,205,005 |
See Notes to Financial Statements
Page 11
First Trust Managed Municipal ETF (FMB)
Portfolio of Investments (Continued)
April 30, 2022 (Unaudited)
Principal
Value | | Description | | Stated
Coupon | | Stated
Maturity | | Value |
| MUNICIPAL BONDS (Continued) |
| | | California (Continued) | | | | | | |
| $380,000 | | Golden St Tobacco Securitization Corp CA Tobacco Stlmt Asset Backed Ref, Ser A
| | 3.25% | | 06/01/34 | | $388,587 |
| 1,360,000 | | Hawthorne CA Cmnty Redev Agy Successor Agy Tax Allocation Ref Sub, AGM
| | 5.00% | | 09/01/32 | | 1,460,898 |
| 1,500,000 | | Hayward CA Unif Sch Dist, AGM
| | 4.00% | | 08/01/45 | | 1,485,834 |
| 175,000 | | Irvine CA Unif Sch Dist Spl Tax Cmnty Facs Dist No 09-1, Ser A
| | 5.00% | | 09/01/31 | | 192,479 |
| 365,000 | | Irvine CA Unif Sch Dist Spl Tax Cmnty Facs Dist No 09-1, Ser A
| | 5.00% | | 09/01/32 | | 400,726 |
| 125,000 | | Irvine CA Unif Sch Dist Spl Tax Cmnty Facs Dist No 09-1, Ser A
| | 5.00% | | 09/01/34 | | 136,653 |
| 2,885,000 | | Kaweah CA Delta Hlthcare Dist Rev, Ser B
| | 5.00% | | 06/01/40 | | 3,053,155 |
| 210,000 | | La Verne CA Ref Brethren Hillcrest Homes, COPS
| | 5.00% | | 05/15/22 | | 210,264 |
| 825,000 | | Lammersville CA Jt Unif Sch Dist Spl Tax Cmnty Facs Dist #2014-1 Impt Area #1 Mountain House Sch Facs
| | 5.00% | | 09/01/42 | | 868,967 |
| 1,045,000 | | Lammersville CA Jt Unif Sch Dist Spl Tax Cmnty Facs Dist #2014-1 Mountain House Sch Facs
| | 4.00% | | 09/01/49 | | 959,349 |
| 835,000 | | Live Oak CA Sch Dist Santa Cruz Cnty Ref
| | 5.00% | | 08/01/30 | | 913,438 |
| 45,000 | | Long Beach CA Bond Fin Auth Nat Gas Pur Rev, Ser A
| | 5.25% | | 11/15/23 | | 46,605 |
| 405,000 | | Long Beach CA Bond Fin Auth Nat Gas Pur Rev, Ser A
| | 5.00% | | 11/15/29 | | 442,402 |
| 4,000,000 | | Long Beach CA Cmnty Clg Dist 2016 Election, Ser B
| | 4.00% | | 08/01/41 | | 4,041,230 |
| 400,000 | | Los Angeles CA Dept of Arpts Arpt Rev Sub Los Angeles Intl Arpt, Ser B, AMT
| | 5.00% | | 05/15/31 | | 421,966 |
| 100,000 | | Marina CA Redev Agy Successor Agy Tax Allocation Hsg, Ser B
| | 5.00% | | 09/01/33 | | 107,004 |
| 1,260,000 | | Marina Coast CA Wtr Dist Enterprise Rev, COPS
| | 4.00% | | 06/01/44 | | 1,268,240 |
| 1,675,000 | | Marysville CA Jt Unif Sch Dist Green Bond 2021 Energy Efficiency Proj, COPS, BAM
| | 4.00% | | 06/01/36 | | 1,722,434 |
| 325,000 | | Menifee CA Union Sch Dist Pub Fing Auth Spl Tax Rev Ref, Ser A
| | 5.00% | | 09/01/28 | | 340,872 |
| 175,000 | | Menifee CA Union Sch Dist Spl Tax Cmnty Facs Dist #2011-1
| | 5.00% | | 09/01/30 | | 188,328 |
| 150,000 | | Menifee CA Union Sch Dist Spl Tax Cmnty Facs Dist #2011-1
| | 5.00% | | 09/01/31 | | 161,405 |
| 145,000 | | Menifee CA Union Sch Dist Spl Tax Cmnty Facs Dist #2011-1
| | 5.00% | | 09/01/32 | | 155,604 |
| 165,000 | | Menifee CA Union Sch Dist Spl Tax Cmnty Facs Dist #2011-1
| | 5.00% | | 09/01/33 | | 176,942 |
| 1,710,000 | | Menifee CA Union Sch Dist Spl Tax Cmnty Facs Dist #2011-1
| | 5.00% | | 09/01/44 | | 1,813,913 |
| 1,450,000 | | Menifee CA Union Sch Dist Spl Tax Cmnty Facs Dist #2011-1
| | 5.00% | | 09/01/48 | | 1,529,193 |
| 2,515,000 | | Napa Vly CA Unif Sch Dist, Ser C, AGM
| | 4.00% | | 08/01/38 | | 2,550,634 |
| 1,315,000 | | Oak Vly CA Hosp Dist Hlth Facs Rev Ref, Ser A
| | 4.00% | | 11/01/36 | | 1,196,385 |
| 1,000,000 | | Orange CA Pub Facs Fing Auth Lease Rev, Ser A
| | 4.00% | | 11/01/37 | | 1,021,187 |
| 1,040,000 | | Orange CA Pub Facs Fing Auth Lease Rev, Ser A
| | 4.00% | | 11/01/38 | | 1,060,539 |
| 110,000 | | Rancho Cordova CA Cmnty Facs Dist Spl Tax #2018-1 Grantline 208
| | 5.00% | | 09/01/26 | | 117,942 |
| 200,000 | | Rancho Cordova CA Cmnty Facs Dist Spl Tax Rev Grantline 208 Cmnty Fac Dt #2018-1
| | 4.00% | | 09/01/50 | | 181,796 |
| 500,000 | | River Islands CA Pub Fing Auth Spl Tax Cmnty Facs Dist #2003-1, Ser A
| | 5.00% | | 09/01/43 | | 529,652 |
| 500,000 | | River Islands CA Pub Fing Auth Spl Tax Cmnty Facs Dist #2019-1 Phase 2 Pub Impts
| | 4.00% | | 09/01/33 | | 498,497 |
| 560,000 | | River Islands CA Pub Fing Auth Spl Tax Ref Cmnty Facs Dist #2003-1
| | 5.38% | | 09/01/31 | | 574,388 |
| 215,000 | | Riverside CA Unif Sch Dist Cmnty Facs Dt #33 Citrus Heights II Spl Tax
| | 4.00% | | 09/01/27 | | 220,040 |
| 225,000 | | Riverside CA Unif Sch Dist Cmnty Facs Dt #33 Citrus Heights II Spl Tax
| | 4.00% | | 09/01/28 | | 230,371 |
| 500,000 | | Riverside CA Unif Sch Dist Election of 2016, Ser B
| | 4.00% | | 08/01/35 | | 513,541 |
| 1,340,000 | | Riverside Cnty CA Transprtn Commn Toll Rev Ref Sr Lien RCTC 91 Express Lanes, Ser B-1
| | 4.00% | | 06/01/46 | | 1,279,782 |
| 865,000 | | Rocklin CA Unif Sch Dist Cmnty Facs Dist Subord, Ser 2019, BAM
| | 5.00% | | 09/15/34 | | 971,599 |
Page 12
See Notes to Financial Statements
First Trust Managed Municipal ETF (FMB)
Portfolio of Investments (Continued)
April 30, 2022 (Unaudited)
Principal
Value | | Description | | Stated
Coupon | | Stated
Maturity | | Value |
| MUNICIPAL BONDS (Continued) |
| | | California (Continued) | | | | | | |
| $625,000 | | Rocklin CA Unif Sch Dist Cmnty Facs Dist Subord, Ser 2019, BAM
| | 4.00% | | 09/15/35 | | $647,897 |
| 1,080,000 | | Rocklin CA Unif Sch Dist Cmnty Facs Dist Subord, Ser 2019, BAM
| | 4.00% | | 09/15/36 | | 1,111,281 |
| 520,000 | | Roseville CA Nat Gas Fin Auth Gas Rev
| | 5.00% | | 02/15/28 | | 563,312 |
| 110,000 | | Roseville CA Spl Tax
| | 5.00% | | 09/01/30 | | 118,377 |
| 100,000 | | Roseville CA Spl Tax
| | 5.00% | | 09/01/31 | | 107,352 |
| 350,000 | | Roseville CA Spl Tax Svsp Westpark Federico Cmnty Facs Dt
No 1
| | 4.00% | | 09/01/37 | | 342,486 |
| 640,000 | | Roseville CA Spl Tax Svsp Westpark Federico Cmnty Facs Dt
No 1
| | 4.00% | | 09/01/46 | | 580,553 |
| 205,000 | | Roseville CA Spl Tax Vlg CFD #1
| | 4.00% | | 09/01/32 | | 203,368 |
| 225,000 | | Roseville CA Spl Tax Vlg CFD #1
| | 4.00% | | 09/01/37 | | 219,672 |
| 310,000 | | Roseville CA Spl Tax Vlg CFD #1
| | 4.00% | | 09/01/41 | | 296,136 |
| 520,000 | | Roseville CA Spl Tax Vlg CFD #1
| | 4.00% | | 09/01/46 | | 476,517 |
| 710,000 | | Roseville CA Spl Tax Vlg CFD #1
| | 4.00% | | 09/01/51 | | 637,938 |
| 340,000 | | S San Francisco CA Pub Facs Fing Auth Lease Rev Police Station Proj, Ser A
| | 4.00% | | 06/01/33 | | 359,530 |
| 400,000 | | S San Francisco CA Pub Facs Fing Auth Lease Rev Police Station Proj, Ser A
| | 4.00% | | 06/01/34 | | 419,454 |
| 260,000 | | Sacramento CA Spl Tax
| | 4.00% | | 09/01/30 | | 261,227 |
| 220,000 | | Sacramento CA Spl Tax
| | 4.00% | | 09/01/31 | | 219,730 |
| 315,000 | | Sacramento CA Spl Tax
| | 4.00% | | 09/01/32 | | 313,806 |
| 515,000 | | Sacramento CA Spl Tax
| | 4.00% | | 09/01/33 | | 509,297 |
| 615,000 | | Sacramento CA Spl Tax
| | 4.00% | | 09/01/35 | | 599,952 |
| 500,000 | | Sacramento CA Transient Occupancy Tax Rev Sub Convention Ctr Complex, Ser C
| | 5.00% | | 06/01/35 | | 547,089 |
| 645,000 | | San Diego Cnty CA Ltd Rev Obligs Ref Sanford Burnham Prebys Med Discovery Institute, Ser A
| | 5.00% | | 11/01/25 | | 697,963 |
| 750,000 | | San Diego Cnty CA Ltd Rev Obligs Ref Sanford Burnham Prebys Med Discovery Institute, Ser A
| | 5.00% | | 11/01/26 | | 810,801 |
| 945,000 | | San Diego Cnty CA Regl Arpt Auth Sr, Ser B, AMT
| | 5.00% | | 07/01/30 | | 975,386 |
| 1,250,000 | | San Diego Cnty CA Regl Transprtn Commn Sales Tax Rev, Ser A
| | 5.00% | | 04/01/35 | | 1,348,892 |
| 4,975,000 | | San Francisco CA Bay Area Rapid Transit Dist Ref Election 2004, Ser D
| | 4.00% | | 08/01/34 | | 5,085,441 |
| 1,365,000 | | San Francisco CA Bay Area Rapid Transit Dist Sales Tax Rev, Ser A
| | 4.00% | | 07/01/36 | | 1,393,988 |
| 1,330,000 | | San Francisco CA Bay Area Rapid Transit Dist Sales Tax Rev, Ser A
| | 4.00% | | 07/01/37 | | 1,354,751 |
| 1,000,000 | | San Francisco CA City & Cnty Arpts Commn Intl Arpt Rev Ref, Ser D, AMT
| | 5.00% | | 05/01/22 | | 1,000,000 |
| 1,000,000 | | San Francisco CA City & Cnty Arpts Commn Intl Arpt Rev, Ser A, AMT
| | 5.00% | | 05/01/39 | | 1,074,362 |
| 7,765,000 | | San Francisco CA City & Cnty Arpts Commn Intl Arpt Rev, Ser A, AMT
| | 5.00% | | 05/01/44 | | 8,267,340 |
| 5,285,000 | | San Francisco CA City & Cnty Arpts Commn Intl Arpt Rev, Ser A, AMT
| | 5.00% | | 05/01/49 | | 5,598,937 |
| 700,000 | | San Francisco CA City & Cnty Dcnty Dev Spl Tax Dist No Mission Rock Fac & Svcs, Ser A (b)
| | 4.00% | | 09/01/41 | | 661,677 |
| 185,000 | | San Francisco City & Cnty CA Cmnty Facs Dist #2016-1
| | 4.00% | | 09/01/29 | | 185,832 |
| 145,000 | | San Francisco City & Cnty CA Cmnty Facs Dist #2016-1
| | 4.00% | | 09/01/30 | | 144,664 |
| 335,000 | | San Francisco City & Cnty CA Cmnty Facs Dist #2016-1
| | 4.00% | | 09/01/31 | | 332,786 |
| 245,000 | | San Francisco City & Cnty CA Cmnty Facs Dist #2016-1
| | 4.00% | | 09/01/32 | | 242,440 |
| 300,000 | | San Francisco City & Cnty CA Cmnty Facs Dist #2016-1
| | 4.00% | | 09/01/33 | | 295,876 |
| 525,000 | | San Francisco City & Cnty CA Cmnty Facs Dist #2016-1
| | 4.00% | | 09/01/42 | | 485,891 |
See Notes to Financial Statements
Page 13
First Trust Managed Municipal ETF (FMB)
Portfolio of Investments (Continued)
April 30, 2022 (Unaudited)
Principal
Value | | Description | | Stated
Coupon | | Stated
Maturity | | Value |
| MUNICIPAL BONDS (Continued) |
| | | California (Continued) | | | | | | |
| $1,000,000 | | San Francisco City & Cnty CA Cmnty Facs Dist #2016-1, Ser 2021
| | 4.00% | | 09/01/46 | | $893,490 |
| 5,000,000 | | San Francisco City & Cnty CA Pub Utils Commn Wstwtr Green Bond, Ser A
| | 4.00% | | 10/01/43 | | 5,053,560 |
| 280,000 | | San Francisco City & Cnty CA Redev Agy Successor Agy Tax Ref Mission Bay N Redev Proj, Ser A
| | 5.00% | | 08/01/35 | | 305,059 |
| 800,000 | | San Luis Obispo CA Cmnty Facs Dist #2019-1 Spl Tax
| | 4.00% | | 09/01/36 | | 788,084 |
| 4,310,000 | | San Mateo Foster City CA Pub Fing Auth Wstwtr Rev Clean Wtr Prog
| | 4.00% | | 08/01/44 | | 4,276,518 |
| 150,000 | | Simi Vly CA Unif Sch Dist, Ser B
| | 4.00% | | 08/01/32 | | 156,541 |
| 375,000 | | Simi Vly CA Unif Sch Dist, Ser B
| | 4.00% | | 08/01/39 | | 382,812 |
| 1,715,000 | | Simi Vly CA Unif Sch Dist, Ser C
| | 4.00% | | 08/01/42 | | 1,747,986 |
| 860,000 | | Sonoma Vly CA Unif Sch Dist
| | 4.00% | | 08/01/40 | | 873,597 |
| 160,000 | | Tahoe Truckee CA Unif Sch Dist, COPS, BAM
| | 4.00% | | 06/01/35 | | 163,636 |
| 255,000 | | Tahoe Truckee CA Unif Sch Dist, COPS, BAM
| | 4.00% | | 06/01/36 | | 259,764 |
| 1,000,000 | | Tahoe Truckee CA Unif Sch Dist, COPS, BAM
| | 4.00% | | 06/01/43 | | 1,002,384 |
| 100,000 | | Temecula Vly Unif Sch Dist Fing Auth CA Spl Tax Rev, BAM
| | 5.00% | | 09/01/34 | | 105,834 |
| 385,000 | | Temescal Vly CA Wtr Dist Spl Tax Terramor Cmnty Facs Dist #4 Impt Area #1
| | 4.00% | | 09/01/23 | | 390,164 |
| 1,300,000 | | Tobacco Securitization Auth Nthrn CA Tobacco Stlmt Rev Ref Sr Bonds Sacramento Co Tobacco Secur Corp A, Class 1
| | 4.00% | | 06/01/38 | | 1,316,928 |
| 1,000,000 | | Tobacco Securitization Auth Sthrn CA Tobacco Stlmt Rev Ref San Diego Co Tobacco Securitization Corp, Ser A, Class 1
| | 5.00% | | 06/01/35 | | 1,076,673 |
| 1,600,000 | | Tobacco Securitization Auth Sthrn CA Tobacco Stlmt Rev Ref San Diego Co Tobacco Securitization Corp, Ser A, Class 1
| | 5.00% | | 06/01/36 | | 1,720,000 |
| 1,000,000 | | Tobacco Securitization Auth Sthrn CA Tobacco Stlmt Rev Ref San Diego Co Tobacco Securitization Corp, Ser A, Class 1
| | 5.00% | | 06/01/37 | | 1,073,926 |
| 650,000 | | Tulare CA Loc Hlthcare Dist Ref, BAM
| | 4.00% | | 08/01/35 | | 673,995 |
| 4,500,000 | | Univ of California CA Revs Ref Ltd Proj, Ser O
| | 5.00% | | 05/15/48 | | 4,854,625 |
| 2,500,000 | | Univ of California CA Revs Ref, Ser AO
| | 3.25% | | 05/15/29 | | 2,516,415 |
| 300,000 | | Vacaville CA Unif Sch Dist, Ser D
| | 4.00% | | 08/01/35 | | 309,518 |
| 600,000 | | Vacaville CA Unif Sch Dist, Ser D
| | 4.00% | | 08/01/37 | | 612,250 |
| 500,000 | | Vacaville CA Unif Sch Dist, Ser D
| | 4.00% | | 08/01/38 | | 509,514 |
| 1,050,000 | | Victor CA Elem Sch Dist Cmnty Facs Dist Spl Tax Ref 2005-1, BAM
| | 5.00% | | 09/01/46 | | 1,142,015 |
| | | | | 184,806,196 |
| | | Colorado – 6.8% | | | | | | |
| 1,125,000 | | Allison Vly Met Dist #2 CO Ref
| | 4.70% | | 12/01/47 | | 973,988 |
| 1,625,000 | | Bennett Ranch Met Dist #1 CO, Ser A
| | 5.00% | | 12/01/41 | | 1,556,765 |
| 1,000,000 | | Bennett Ranch Met Dist #1 CO, Ser A
| | 5.00% | | 12/01/51 | | 909,804 |
| 225,000 | | Breckenridge CO Ref, Ser B, COPS
| | 5.00% | | 12/01/32 | | 257,477 |
| 1,240,000 | | Breckenridge CO Ref, Ser B, COPS
| | 4.00% | | 12/01/39 | | 1,289,294 |
| 515,000 | | Brighton Crossing Met Dist #6 CO, Ser A
| | 5.00% | | 12/01/40 | | 515,265 |
| 1,340,000 | | Brighton Crossing Met Dist #6 CO, Ser A
| | 5.00% | | 12/01/50 | | 1,251,300 |
| 455,000 | | Buffalo Ridge CO Met Dist Ref & Impt Sr, Ser A, BAM
| | 5.00% | | 12/01/25 | | 490,236 |
| 250,000 | | Buffalo Ridge CO Met Dist Ref & Impt Sr, Ser A, BAM
| | 5.00% | | 12/01/26 | | 273,890 |
| 750,000 | | Cascade Ridge Met Dist CO
| | 5.00% | | 12/01/51 | | 630,121 |
| 400,000 | | CO Eductnl & Cultural Auth Rev Ref W Ridge Acdmy Chrt Sch Proj, Ser A
| | 5.00% | | 06/01/49 | | 409,915 |
| 5,480,000 | | CO St Bldg Excellent Schs Today, Ser N, COPS
| | 5.00% | | 03/15/37 | | 6,077,566 |
| 700,000 | | CO St Bldg Excellent Schs Today, Ser O, COPS
| | 5.00% | | 03/15/31 | | 792,320 |
| 3,615,000 | | CO St Bldg Excellent Schs Today, Ser O, COPS
| | 4.00% | | 03/15/37 | | 3,755,522 |
| 4,890,000 | | CO St Bldg Excellent Schs Today, Ser O, COPS
| | 4.00% | | 03/15/38 | | 5,072,550 |
| 1,250,000 | | CO St Bldg Excellent Schs Today, Ser O, COPS
| | 4.00% | | 03/15/44 | | 1,261,701 |
Page 14
See Notes to Financial Statements
First Trust Managed Municipal ETF (FMB)
Portfolio of Investments (Continued)
April 30, 2022 (Unaudited)
Principal
Value | | Description | | Stated
Coupon | | Stated
Maturity | | Value |
| MUNICIPAL BONDS (Continued) |
| | | Colorado (Continued) | | | | | | |
| $1,920,000 | | CO St Eductnl & Cultural Facs Auth Rev Chrt Sch Loveland Classical Schs Proj (b)
| | 5.00% | | 07/01/36 | | $1,934,925 |
| 540,000 | | CO St Eductnl & Cultural Facs Auth Rev Ref & Impt Chrt Sch Univ Lab Bldg Corp
| | 4.00% | | 12/15/25 | | 543,708 |
| 660,000 | | CO St Eductnl & Cultural Facs Auth Rev Ref & Impt Chrt Sch Univ Lab Bldg Corp
| | 5.00% | | 12/15/28 | | 687,416 |
| 2,245,000 | | CO St Eductnl & Cultural Facs Auth Rev Ref & Impt Chrt Sch Univ Lab Bldg Corp
| | 5.00% | | 12/15/35 | | 2,318,557 |
| 4,000,000 | | CO St Eductnl & Cultural Facs Auth Rev Ref & Impt Chrt Sch Univ Lab Bldg Corp
| | 5.00% | | 12/15/45 | | 4,094,985 |
| 1,020,000 | | CO St Eductnl & Cultural Facs Auth Rev Univ Denver Proj, Ser A
| | 4.00% | | 03/01/35 | | 1,050,514 |
| 1,750,000 | | CO St Hlth Facs Auth Hosp Rev Parkview Med Ctr Proj, Ser A
| | 4.00% | | 09/01/50 | | 1,619,630 |
| 3,000,000 | | CO St Hlth Facs Auth Hosp Rev Ref Adventhealth Oblig, Ser A
| | 4.00% | | 11/15/38 | | 2,987,160 |
| 250,000 | | CO St Hlth Facs Auth Hosp Rev Ref Commonspirit Hlth, Ser A-1
| | 5.00% | | 08/01/35 | | 272,289 |
| 4,500,000 | | CO St Hlth Facs Auth Hosp Rev Ref Commonspirit Hlth, Ser A-1
| | 4.00% | | 08/01/38 | | 4,371,007 |
| 8,060,000 | | CO St Hlth Facs Auth Hosp Rev Ref Commonspirit Hlth, Ser B
| | 4.00% | | 01/01/40 | | 7,995,936 |
| 300,000 | | CO St Hlth Facs Auth Hosp Rev Ref Frasier Meadows Retmnt Cmnty Proj, Ser A
| | 5.00% | | 05/15/25 | | 315,577 |
| 350,000 | | CO St Hlth Facs Auth Hosp Rev Ref Frasier Meadows Retmnt Cmnty Proj, Ser A
| | 5.00% | | 05/15/26 | | 372,022 |
| 2,590,000 | | CO St Hlth Facs Auth Hosp Rev Ref Sanford Hlth, Ser A
| | 5.00% | | 11/01/31 | | 2,900,294 |
| 2,950,000 | | CO St Hlth Facs Auth Hosp Rev Ref Sanford Hlth, Ser A
| | 5.00% | | 11/01/32 | | 3,293,017 |
| 3,655,000 | | CO St Hlth Facs Auth Hosp Rev Ref Sanford Hlth, Ser A
| | 5.00% | | 11/01/33 | | 4,068,068 |
| 2,165,000 | | CO St Hlth Facs Auth Hosp Rev Ref Sanford Hlth, Ser A
| | 5.00% | | 11/01/34 | | 2,403,538 |
| 1,800,000 | | CO St Hlth Facs Auth Hosp Rev Ref Sanford Hlth, Ser A
| | 5.00% | | 11/01/44 | | 1,951,569 |
| 625,000 | | CO St Hlth Facs Auth Hosp Rev Sr Living Ralston Creek Arvada Proj, Ser A
| | 5.25% | | 11/01/32 | | 461,363 |
| 1,000,000 | | CO St Hlth Facs Auth Hosp Rev Temps 50 Aberdeen Ridge, Ser B-3
| | 2.13% | | 05/15/28 | | 934,099 |
| 525,000 | | CO St Hlth Facs Auth Rev Ref Covenant Retmnt Cmntys, Ser A
| | 5.00% | | 12/01/33 | | 534,882 |
| 325,000 | | CO St Ref, COPS
| | 4.00% | | 06/15/37 | | 337,298 |
| 1,000,000 | | CO St Ref, COPS
| | 4.00% | | 06/15/38 | | 1,036,064 |
| 495,000 | | Colorado Springs CO Pikes Peak Americas Mountain Enterprise Pikes Peak
| | 5.00% | | 12/01/25 | | 530,711 |
| 1,200,000 | | Colorado Springs CO Pikes Peak Americas Mountain Enterprise Pikes Peak
| | 5.25% | | 12/01/48 | | 1,327,021 |
| 180,000 | | Crystal Vly CO Met Dist #2 Ref, Ser A, AGM
| | 4.00% | | 12/01/32 | | 193,202 |
| 325,000 | | Crystal Vly CO Met Dist #2 Ref, Ser A, AGM
| | 4.00% | | 12/01/33 | | 348,189 |
| 500,000 | | Crystal Vly CO Met Dist #2 Ref, Ser A, AGM
| | 4.00% | | 12/01/34 | | 534,884 |
| 330,000 | | Crystal Vly CO Met Dist #2 Ref, Ser A, AGM
| | 4.00% | | 12/01/35 | | 347,490 |
| 500,000 | | Crystal Vly CO Met Dist #2 Ref, Ser A, AGM
| | 4.00% | | 12/01/36 | | 525,833 |
| 5,000,000 | | Denver City & Cnty CO Arpt Rev Ref Sub Sys, Ser A, AMT
| | 5.00% | | 12/01/35 | | 5,341,466 |
| 4,000,000 | | Denver City & Cnty CO Arpt Rev Ref Sub Sys, Ser A, AMT
| | 5.00% | | 12/01/37 | | 4,267,142 |
| 975,000 | | Denver City & Cnty CO Arpt Rev Ref Sub Sys, Ser A, AMT
| | 5.00% | | 12/01/38 | | 1,038,671 |
| 1,000,000 | | Denver CO City & Cnty Dedicated Tax Rev, Ser A-1
| | 5.00% | | 08/01/41 | | 1,074,781 |
| 600,000 | | Denver CO Hlth & Hosp Auth 550 Acoma Inc, COPS
| | 5.00% | | 12/01/26 | | 648,746 |
| 1,790,000 | | Denver CO Intl Busn Ctr CO Met Dist #1 Subord, Ser B
| | 6.00% | | 12/01/48 | | 1,816,790 |
| 2,000,000 | | Elbert & Hwy 86 CO Comml Spl Rev & Tax Supported Ref Sr Bonds, Ser A (b)
| | 5.00% | | 12/01/51 | | 1,780,559 |
| 525,000 | | Firestone CO Wtr Enterprise Rev Ref, BAM
| | 4.00% | | 12/01/37 | | 551,815 |
| 600,000 | | Firestone CO Wtr Enterprise Rev Ref, BAM
| | 4.00% | | 12/01/39 | | 628,393 |
| 375,000 | | Flying Horse CO Met Dist #2 Ref, Ser A, AGM
| | 5.00% | | 12/01/33 | | 428,353 |
| 225,000 | | Flying Horse CO Met Dist #2 Ref, Ser A, AGM
| | 4.00% | | 12/01/38 | | 232,668 |
| 200,000 | | Flying Horse CO Met Dist #2 Ref, Ser A, AGM
| | 4.00% | | 12/01/39 | | 206,450 |
| 900,000 | | Hunters Overlook Metro Dist #5 CO Sr Bonds, Ser A
| | 5.00% | | 12/01/39 | | 918,914 |
See Notes to Financial Statements
Page 15
First Trust Managed Municipal ETF (FMB)
Portfolio of Investments (Continued)
April 30, 2022 (Unaudited)
Principal
Value | | Description | | Stated
Coupon | | Stated
Maturity | | Value |
| MUNICIPAL BONDS (Continued) |
| | | Colorado (Continued) | | | | | | |
| $2,735,000 | | Hunters Overlook Metro Dist #5 CO Sr Bonds, Ser A
| | 5.00% | | 12/01/49 | | $2,762,826 |
| 1,000,000 | | Independence Met Dist #3 CO, Ser A
| | 6.25% | | 12/01/49 | | 909,755 |
| 1,000,000 | | Jefferson Ctr CO Met Dist # 1 Spl Rev, Ser A-2
| | 4.38% | | 12/01/47 | | 907,628 |
| 860,000 | | Lakes at Centerra Met Dist No 2 CO Impt, Ser A
| | 4.63% | | 12/01/27 | | 862,969 |
| 1,000,000 | | Lanterns Met Dist #1 CO Sr, Ser A
| | 5.00% | | 12/01/49 | | 977,811 |
| 300,000 | | Larimer Weld & Boulder Cnty CO Sch Dist #R-2J Thompson
| | 5.00% | | 12/15/30 | | 342,384 |
| 100,000 | | Lorson Ranch Met Dist #2 CO
| | 4.00% | | 12/01/24 | | 102,941 |
| 170,000 | | Lorson Ranch Met Dist #2 CO
| | 5.00% | | 12/01/27 | | 183,131 |
| 3,260,000 | | Mirabelle Met Dist #2 CO Sr, Ser A
| | 5.00% | | 12/01/39 | | 3,196,371 |
| 520,000 | | Nexus N at DIA Met Dist CO
| | 5.00% | | 12/01/41 | | 487,567 |
| 1,130,000 | | Nexus N at DIA Met Dist CO
| | 5.00% | | 12/01/51 | | 1,004,353 |
| 2,460,000 | | Park Creek CO Met Dist Rev Ref Sr Ltd Property Tax Supported, Ser A
| | 5.00% | | 12/01/24 | | 2,602,534 |
| 150,000 | | Park Creek CO Met Dist Rev Ref Sr Ltd Property Tax Supported, Ser A
| | 5.00% | | 12/01/31 | | 159,665 |
| 150,000 | | Park Creek CO Met Dist Rev Ref Sr Ltd Property Tax Supported, Ser A
| | 5.00% | | 12/01/34 | | 158,986 |
| 155,000 | | Park Creek CO Met Dist Rev Ref Sr Ltd Property Tax Supported, Ser A
| | 5.00% | | 12/01/35 | | 164,177 |
| 2,000,000 | | Park Creek CO Met Dist Rev Ref Sr Ltd Property Tax Supported, Ser A
| | 5.00% | | 12/01/45 | | 2,099,774 |
| 1,120,000 | | Park Creek CO Met Dist Rev Sr Lien, Ser A, AGM
| | 4.00% | | 12/01/34 | | 1,174,580 |
| 1,455,000 | | Park Creek CO Met Dist Rev Sr Lien, Ser A, AGM
| | 4.00% | | 12/01/35 | | 1,524,190 |
| 1,040,000 | | Park Creek CO Met Dist Rev Sr Lien, Ser A, AGM
| | 4.00% | | 12/01/36 | | 1,088,215 |
| 420,000 | | Park Creek CO Met Dist Rev Sr, Ser A
| | 5.00% | | 12/01/30 | | 469,664 |
| 30,000 | | Park Creek CO Met Dist Rev Sr, Ser A, NATL-RE
| | 5.00% | | 12/01/24 | | 31,777 |
| 1,150,000 | | Peak Met Dist #1 CO, Ser A (b)
| | 5.00% | | 12/01/51 | | 1,067,990 |
| 920,000 | | Pinon Pines Met Dist #2 CO MDD
| | 5.00% | | 12/01/40 | | 917,756 |
| 1,195,000 | | Pinon Pines Met Dist #2 CO MDD
| | 5.00% | | 12/01/50 | | 1,127,812 |
| 1,000,000 | | Prairie Ctr CO Met Dist #3 Ltd Property Tax Supported Pri Ref, Ser A (b)
| | 4.13% | | 12/15/27 | | 998,721 |
| 700,000 | | Prairie Ctr Met Dist #7 CO
| | 4.88% | | 12/15/44 | | 636,647 |
| 5,235,000 | | Rampart Range CO Met Dist #1 Ltd Tax Supported & Spl Rev Ref & Impt, AGM
| | 5.00% | | 12/01/42 | | 5,590,430 |
| 850,000 | | Regl CO Transprtn Dist Priv Activity Rev Ref Denver Transit Partners Eagle P3 Proj, Ser A
| | 5.00% | | 07/15/29 | | 915,845 |
| 1,000,000 | | Ridgeline Vista Met Dist CO, Ser A
| | 5.25% | | 12/01/60 | | 1,008,438 |
| 2,500,000 | | Riverwalk Metro Dist #2 CO, Ser A
| | 5.00% | | 12/01/42 | | 2,307,661 |
| 2,015,000 | | S Suburban Park & Recreation Dist CO, COPS
| | 4.00% | | 12/15/35 | | 2,069,633 |
| 550,000 | | Serenity Ridge CO Met Dist #2 Ref, Ser A (c)
| | 5.13% | | 12/01/37 | | 589,597 |
| 1,900,000 | | Siena Lake Met Dist CO
| | 3.75% | | 12/01/41 | | 1,578,428 |
| 175,000 | | Sterling Hills CO W Met Dist Ref
| | 5.00% | | 12/01/32 | | 190,293 |
| 1,205,000 | | Sterling Ranch Met Dist #1 CO
| | 5.00% | | 12/01/40 | | 1,208,158 |
| 1,800,000 | | Takoda CO Met Dist Ref
| | 6.00% | | 12/01/36 | | 1,998,311 |
| 825,000 | | Third Creek Met Dist #1 CO, Ser A-1
| | 4.50% | | 12/01/37 | | 729,891 |
| 825,000 | | Third Creek Met Dist #1 CO, Ser A-1
| | 4.50% | | 12/01/42 | | 692,266 |
| 1,400,000 | | Thompson Crossing Met Dist #4 CO Ref
| | 5.00% | | 12/01/39 | | 1,414,900 |
| 500,000 | | Trails at Crowfoot Met Dist #3 CO Sr Ser, Ser A
| | 5.00% | | 12/01/39 | | 497,666 |
| 1,500,000 | | Transport Met Dist #3 CO MDD, Ser 2021-A-1
| | 5.00% | | 12/01/41 | | 1,524,437 |
| 1,210,000 | | Transport Met Dist #3 CO MDD, Ser 2021-A-1
| | 5.00% | | 12/01/51 | | 1,187,894 |
| 1,500,000 | | Westerly Met Dist #4 CO Sr, Ser A
| | 5.00% | | 12/01/50 | | 1,387,081 |
| 600,000 | | Willow Bend Met Dist CO Sr, Ser A
| | 5.00% | | 12/01/39 | | 596,507 |
| 1,455,000 | | Willow Bend Met Dist CO Sr, Ser A
| | 5.00% | | 12/01/49 | | 1,412,562 |
| | | | | 147,603,932 |
Page 16
See Notes to Financial Statements
First Trust Managed Municipal ETF (FMB)
Portfolio of Investments (Continued)
April 30, 2022 (Unaudited)
Principal
Value | | Description | | Stated
Coupon | | Stated
Maturity | | Value |
| MUNICIPAL BONDS (Continued) |
| | | Connecticut – 3.0% | | | | | | |
| $1,250,000 | | CT St Hlth & Eductnl Facs Auth Rev Fairfield Univ, Ser Q-1
| | 5.00% | | 07/01/46 | | $1,309,064 |
| 4,700,000 | | CT St Hlth & Eductnl Facs Auth Rev Hartford Hlthcare Proj, Ser A
| | 4.00% | | 07/01/38 | | 4,696,690 |
| 1,000,000 | | CT St Hlth & Eductnl Facs Auth Rev Quinnipiac Univ Ref, Ser M
| | 5.00% | | 07/01/36 | | 1,063,736 |
| 225,000 | | CT St Hlth & Eductnl Facs Auth Rev Ref Fairfield Univ Issue, Ser T
| | 5.00% | | 07/01/28 | | 248,856 |
| 6,160,000 | | CT St Hlth & Eductnl Facs Auth Rev Ref Fairfield Univ, Ser R
| | 4.00% | | 07/01/47 | | 6,168,077 |
| 1,000,000 | | CT St Hlth & Eductnl Facs Auth Rev Ref Fairfield Univ, Ser S
| | 5.00% | | 07/01/26 | | 1,079,679 |
| 2,250,000 | | CT St Hlth & Eductnl Facs Auth Rev Ref Quinnipiac Univ, Ser L
| | 5.00% | | 07/01/31 | | 2,372,095 |
| 200,000 | | CT St Hlth & Eductnl Facs Auth Rev Ref Quinnipiac Univ, Ser L
| | 4.00% | | 07/01/33 | | 202,725 |
| 500,000 | | CT St Hlth & Eductnl Facs Auth Rev, Ser A
| | 5.00% | | 07/01/34 | | 551,045 |
| 1,000,000 | | CT St Hlth & Eductnl Facs Auth Rev, Ser A
| | 5.00% | | 07/01/35 | | 1,100,755 |
| 1,000,000 | | CT St Hlth & Eductnl Facs Auth Rev, Ser A
| | 4.00% | | 07/01/36 | | 1,002,231 |
| 300,000 | | CT St Hsg Fin Auth Hsg Fin Mtge Prog Ref, Subser A-1
| | 3.65% | | 11/15/32 | | 299,074 |
| 1,550,000 | | CT St Spl Tax Oblig Rev Spl Tax Oblig Bonds
| | 5.00% | | 05/01/40 | | 1,725,407 |
| 2,345,000 | | CT St Spl Tax Oblig Rev Transprtn Infra, Ser A
| | 5.00% | | 08/01/34 | | 2,489,651 |
| 1,445,000 | | CT St, Ser A
| | 5.00% | | 04/15/29 | | 1,589,324 |
| 500,000 | | CT St, Ser A
| | 4.00% | | 01/15/36 | | 517,150 |
| 10,000,000 | | CT St, Ser A
| | 4.00% | | 01/15/37 | | 10,327,137 |
| 3,125,000 | | CT St, Ser A
| | 4.00% | | 04/15/37 | | 3,238,027 |
| 4,625,000 | | CT St, Ser A
| | 4.00% | | 04/15/38 | | 4,785,102 |
| 790,000 | | CT St, Ser B
| | 5.00% | | 03/01/26 | | 807,019 |
| 2,295,000 | | CT St, Ser D, BAM
| | 4.00% | | 08/15/31 | | 2,407,549 |
| 905,000 | | CT St, Ser E
| | 5.00% | | 10/15/33 | | 979,627 |
| 560,000 | | CT St, Ser E
| | 4.00% | | 10/15/35 | | 580,651 |
| 700,000 | | CT St, Ser F
| | 5.00% | | 11/15/34 | | 746,799 |
| 625,000 | | Hamden CT, BAM
| | 6.00% | | 08/15/33 | | 723,401 |
| 500,000 | | Harbor Point CT Infra Impt Dist Spl Oblig Rev Ref Harbor Point Proj Ltd (b)
| | 5.00% | | 04/01/39 | | 530,544 |
| 500,000 | | Univ of Connecticut CT, Ser A
| | 5.00% | | 03/15/28 | | 541,068 |
| 1,970,000 | | Univ of Connecticut CT, Ser A
| | 5.00% | | 01/15/29 | | 2,149,201 |
| 1,250,000 | | Univ of Connecticut CT, Ser A
| | 5.00% | | 11/01/32 | | 1,387,185 |
| 3,820,000 | | Univ of Connecticut CT, Ser A
| | 5.00% | | 11/01/34 | | 4,223,438 |
| 1,500,000 | | Univ of Connecticut CT, Ser A
| | 5.00% | | 11/01/36 | | 1,655,204 |
| 4,000,000 | | Univ of Connecticut CT, Ser A
| | 5.00% | | 02/15/39 | | 4,416,942 |
| | | | | 65,914,453 |
| | | Delaware – 0.5% | | | | | | |
| 325,000 | | DE St Hlth Facs Auth Rev Beebe Med Ctr
| | 5.00% | | 06/01/26 | | 351,902 |
| 4,335,000 | | DE St Hlth Facs Auth Rev Ref Christiana Hlthcare Sys Oblig Grp, Ser A
| | 5.00% | | 10/01/36 | | 4,894,900 |
| 4,000,000 | | Delaware River & Bay Auth De Rev, Ser A
| | 5.00% | | 01/01/42 | | 4,075,683 |
| 2,324,000 | | Millsboro DE Spl Oblig Ref Plantation Lakes Spl Dev Dist (b)
| | 5.00% | | 07/01/28 | | 2,379,066 |
| | | | | 11,701,551 |
| | | District of Columbia – 0.1% | | | | | | |
| 1,000,000 | | Washington DC Met Area Transit Auth Gross Rev
| | 5.00% | | 07/01/33 | | 1,093,961 |
| 885,000 | | Washington DC Met Area Transit Auth Gross Rev Ref, Ser A-1
| | 5.00% | | 07/01/29 | | 978,403 |
| | | | | 2,072,364 |
| | | Florida – 8.2% | | | | | | |
| 500,000 | | Academical Vlg CDD FL Spl Assmnt Rev CDD
| | 2.88% | | 05/01/25 | | 491,049 |
| 1,000,000 | | Academical Vlg CDD FL Spl Assmnt Rev CDD
| | 3.63% | | 05/01/40 | | 886,319 |
| 545,000 | | Alachua Cnty FL Hlth Facs Auth CCRC Ref Oak Hammock at the Univ of FL Inc Proj
| | 4.00% | | 10/01/40 | | 518,332 |
See Notes to Financial Statements
Page 17
First Trust Managed Municipal ETF (FMB)
Portfolio of Investments (Continued)
April 30, 2022 (Unaudited)
Principal
Value | | Description | | Stated
Coupon | | Stated
Maturity | | Value |
| MUNICIPAL BONDS (Continued) |
| | | Florida (Continued) | | | | | | |
| $1,000,000 | | Babcock Ranch Cmnty Indep Spl Dist FL Spl Assmnt Rev Proj, Ser 2022
| | 4.13% | | 05/01/27 | | $991,100 |
| 50,000 | | Belle Isle FL Chrt Sch Lease Rev Cornerstone Chrt Acdmy & Cornerstone Chrt High Sch
| | 5.50% | | 10/01/22 | | 50,616 |
| 1,250,000 | | Berry Bay CDD FL Spl Assmnt Rev Assmnt Area 1
| | 4.00% | | 05/01/51 | | 1,097,872 |
| 300,000 | | Bexley CDD FL Spl Assmnt Rev
| | 4.10% | | 05/01/26 | | 301,647 |
| 185,000 | | Brookstone CDD FL Spl Assmnt Rev CDD (d)
| | 3.88% | | 11/01/23 | | 184,880 |
| 2,305,000 | | Broward Cnty FL Arpt Sys Rev, Ser A, AMT
| | 5.00% | | 10/01/31 | | 2,510,440 |
| 1,350,000 | | Broward Cnty FL Port Facs Rev Ref Subord Bond, Ser D, AMT
| | 5.00% | | 09/01/27 | | 1,493,679 |
| 2,830,000 | | Centrl FL Expressway Auth Sr Lien Rev Ref Sr Lien
| | 4.00% | | 07/01/41 | | 2,894,920 |
| 2,000,000 | | Coco Palms FL CDD Spl Assmnt
| | 4.50% | | 05/01/32 | | 2,011,926 |
| 2,500,000 | | Collier Cnty FL Eductnl Facs Auth Rev Eductnl Facs Hodges Univ Inc
| | 6.13% | | 11/01/43 | | 2,638,863 |
| 500,000 | | Creekview CDD FL Spl Assmnt Rev Phase I Proj
| | 3.88% | | 05/01/27 | | 485,142 |
| 1,000,000 | | Cross Creek N CDD FL Spl Assmnt
| | 4.50% | | 05/01/52 | | 945,541 |
| 515,000 | | Edgewater E CDD FL Spl Assmnt Rev Assmnt Area One
| | 2.50% | | 05/01/26 | | 491,275 |
| 1,000,000 | | Edgewater E CDD FL Spl Assmnt Rev Assmnt Area One
| | 4.00% | | 05/01/51 | | 881,201 |
| 1,000,000 | | Edgewater E CDD FL Spl Assmnt Rev Assmnt Area Two
| | 4.00% | | 05/01/52 | | 876,961 |
| 250,000 | | Epperson N CDD FL Capital Impt Rev Assmnt Area #2
| | 2.50% | | 05/01/26 | | 232,017 |
| 1,250,000 | | Epperson N CDD FL Capital Impt Rev Assmnt Area Three, Ser A
| | 3.40% | | 11/01/41 | | 1,025,576 |
| 1,250,000 | | Fallschase Cmnty Dev Dist FL Spl Assmnt
| | 3.38% | | 05/01/41 | | 1,042,099 |
| 4,500,000 | | FL Dev Fin Corp Surface Tranprtn Fac Rev Green Bond Brightline Passenger Rail Remk, Ser B, AMT (b)
| | 7.38% | | 01/01/49 | | 4,609,545 |
| 200,000 | | FL St Dev Fin Corp Eductnl Facs Rev River City Science Acdmy Projs, Ser A
| | 4.00% | | 07/01/26 | | 200,371 |
| 155,000 | | FL St Dev Fin Corp Eductnl Facs Rev River City Science Acdmy Projs, Ser A
| | 4.00% | | 07/01/29 | | 153,105 |
| 310,000 | | FL St Dev Fin Corp Eductnl Facs Rev River City Science Acdmy Projs, Ser A
| | 4.00% | | 07/01/35 | | 289,758 |
| 450,000 | | FL St Dev Fin Corp Eductnl Facs Rev River City Science Acdmy Projs, Ser A
| | 4.00% | | 07/01/45 | | 398,661 |
| 750,000 | | FL St Dev Fin Corp Eductnl Facs Rev River City Science Acdmy Projs, Ser A
| | 4.00% | | 07/01/55 | | 623,839 |
| 725,000 | | FL St Govtl Util Auth Rev Ref, AGM
| | 4.00% | | 10/01/37 | | 751,304 |
| 825,000 | | FL St Govtl Util Auth Rev Ref, AGM
| | 4.00% | | 10/01/38 | | 853,578 |
| 1,615,000 | | FL St Govtl Util Auth Rev Ref, AGM
| | 4.00% | | 10/01/39 | | 1,668,327 |
| 1,900,000 | | Fort Myers FL Util Rev Ref Rev, Ser A
| | 4.00% | | 10/01/44 | | 1,944,978 |
| 7,350,000 | | Gtr Orlando FL Aviation Auth Arpt Facs Rev Priority, Subser A, AMT
| | 5.00% | | 10/01/42 | | 7,754,706 |
| 6,750,000 | | Gtr Orlando FL Aviation Auth Arpt Facs Rev, Ser A, AMT
| | 5.00% | | 10/01/44 | | 7,249,302 |
| 1,000,000 | | Gulfstream Polo Cmnty Dev Dist FL Spl Assmnt Phase 2 Proj
| | 4.38% | | 11/01/49 | | 923,292 |
| 280,000 | | Harmony FL CDD Capital Impt Rev Ref, Ser 2015
| | 4.75% | | 05/01/25 | | 281,532 |
| 365,000 | | Heritage Harbour FL N CDD Capital Impt Rev Ref Sr Lien, Ser A-1, AGM
| | 5.00% | | 05/01/25 | | 386,952 |
| 8,600,000 | | Hillsborough Cnty FL Indl Devauth Hlth Sys Rev Ref Baycare Hlth Sys, Ser B (a)
| | 0.32% | | 11/01/38 | | 8,600,000 |
| 495,000 | | Hollywood Beach FL Cmnty Dev Dist Rev CDD Ref Pub Pkg Fac Proj, Ser I
| | 5.00% | | 10/01/25 | | 523,951 |
| 545,000 | | Hollywood Beach FL Cmnty Dev Dist Rev CDD Ref Pub Pkg Fac Proj, Ser I
| | 5.00% | | 10/01/27 | | 588,879 |
| 1,150,000 | | Hollywood Beach FL Cmnty Dev Dist Rev CDD Ref Pub Pkg Fac Proj, Ser I
| | 5.00% | | 10/01/28 | | 1,251,097 |
| 2,970,000 | | Hollywood Beach FL Cmnty Dev Dist Rev CDD Ref Pub Pkg Fac Proj, Ser I
| | 4.00% | | 10/01/35 | | 2,979,807 |
Page 18
See Notes to Financial Statements
First Trust Managed Municipal ETF (FMB)
Portfolio of Investments (Continued)
April 30, 2022 (Unaudited)
Principal
Value | | Description | | Stated
Coupon | | Stated
Maturity | | Value |
| MUNICIPAL BONDS (Continued) |
| | | Florida (Continued) | | | | | | |
| $2,860,000 | | Hollywood Beach FL Cmnty Dev Dist Rev CDD Ref Pub Pkg Fac Proj, Ser I
| | 5.00% | | 10/01/35 | | $3,089,390 |
| 125,000 | | Hollywood FL Cmnty Redev Agy Redev Rev Ref
| | 5.00% | | 03/01/23 | | 127,859 |
| 1,000,000 | | Jacksonville FL Hlthcare Facs Rev Ref Baptist Hlth
| | 5.00% | | 08/15/35 | | 1,092,941 |
| 3,700,000 | | Jacksonville FL Spl Rev Ref Spl Rev, Ser A
| | 5.00% | | 10/01/31 | | 4,039,693 |
| 1,000,000 | | Jacksonville FL Spl Rev Ref Spl Rev, Ser B
| | 5.00% | | 10/01/28 | | 1,100,539 |
| 760,000 | | Jacksonville FL Spl Rev Ref, Ser A
| | 5.00% | | 10/01/25 | | 819,247 |
| 2,980,000 | | Jea FL Wtr & Swr Rev Ref, Ser A
| | 4.00% | | 10/01/39 | | 3,061,724 |
| 750,000 | | Jea FL Wtr & Swr Rev Ref, Ser A
| | 4.00% | | 10/01/39 | | 762,193 |
| 480,000 | | Jea FL Wtr & Swr Rev Subord Ref, Ser A
| | 4.00% | | 10/01/37 | | 492,743 |
| 500,000 | | Jea FL Wtr & Swr Rev Subord Ref, Ser A
| | 4.00% | | 10/01/38 | | 510,690 |
| 500,000 | | Jea FL Wtr & Swr Rev Subord Ref, Ser A
| | 4.00% | | 10/01/39 | | 508,129 |
| 1,230,000 | | Lakeland FL Hosp Sys Rev Lakeland Regl Hlth
| | 5.00% | | 11/15/33 | | 1,308,058 |
| 155,000 | | Lakewood Ranch FL Stewardship Dist Spl Assmnt Rev Ref Country Club E Proj, AGM
| | 4.50% | | 05/01/26 | | 163,267 |
| 755,000 | | Lee Cnty FL Indl Dev Auth Cypress Cove Healthpark FL Inc Memory Care Proj
| | 4.00% | | 10/01/24 | | 777,468 |
| 1,000,000 | | Lee Cnty FL Indl Dev Auth Shell Point/Waterside Hlth Proj
| | 5.00% | | 11/15/39 | | 1,077,441 |
| 1,500,000 | | Lee Cnty FL Indl Dev Auth Shell Point/Waterside Hlth Proj
| | 5.00% | | 11/15/44 | | 1,605,706 |
| 1,325,000 | | Mediterra FL S CDD Capital Impt Rev Ref
| | 5.10% | | 05/01/31 | | 1,325,000 |
| 400,000 | | Miami FL Spl Oblg Prerefunded Ref (b)
| | 5.00% | | 03/01/30 | | 407,954 |
| 1,265,000 | | Miami FL Spl Oblg Ref Street & Sidewalk Impt Prog, Ser A, AGM (b)
| | 5.00% | | 01/01/35 | | 1,402,719 |
| 100,000 | | Miami FL Spl Oblg Unrefunded Ref (b)
| | 5.00% | | 03/01/30 | | 102,387 |
| 190,000 | | Miami World Ctr CDD FL Spl Assmnt
| | 4.00% | | 11/01/23 | | 191,173 |
| 275,000 | | Miami World Ctr CDD FL Spl Assmnt
| | 4.75% | | 11/01/27 | | 285,036 |
| 2,000,000 | | Miami World Ctr CDD FL Spl Assmnt
| | 5.13% | | 11/01/39 | | 2,093,756 |
| 1,000,000 | | Miami-Dade Cnty FL Aviation Rev Ref, Ser A
| | 4.00% | | 10/01/34 | | 1,016,768 |
| 1,015,000 | | Miami-Dade Cnty FL Aviation Rev Ref, Ser A, AMT
| | 5.00% | | 10/01/27 | | 1,029,273 |
| 2,000,000 | | Miami-Dade Cnty FL Eductnl Facs Auth Rev Ref Univ Miami, Ser A
| | 5.00% | | 04/01/31 | | 2,096,879 |
| 445,000 | | Miami-Dade Cnty FL Indl Dev Auth Doral Acdmy Proj
| | 5.00% | | 01/15/25 | | 458,122 |
| 550,000 | | Miami-Dade Cnty FL Indl Dev Auth Doral Acdmy Proj
| | 5.00% | | 01/15/32 | | 567,116 |
| 1,210,000 | | Miami-Dade Cnty FL Indl Dev Auth Doral Acdmy Proj
| | 5.00% | | 01/15/37 | | 1,239,379 |
| 2,430,000 | | Miami-Dade Cnty FL Remk, Ser A
| | 5.00% | | 07/01/43 | | 2,656,517 |
| 1,080,000 | | Miami-Dade Cnty FL Spl Oblig Sub Ref
| | 5.00% | | 10/01/35 | | 1,175,875 |
| 2,500,000 | | Miami-Dade Cnty FL Wtr & Swr Rev Ref Sys, Ser B
| | 4.00% | | 10/01/34 | | 2,589,816 |
| 2,130,000 | | Miami-Dade Cnty FL Wtr & Swr Rev Sys, Ser A
| | 4.00% | | 10/01/40 | | 2,179,951 |
| 6,000,000 | | Miami-Dade Cnty FL Wtr & Swr Rev, Ser B
| | 4.00% | | 10/01/44 | | 6,060,091 |
| 335,000 | | N Park Isle Cmnty Dev Dist FL Spl Assmnt Rev Assmnt Area One
| | 3.63% | | 05/01/24 | | 333,577 |
| 800,000 | | N Park Isle Cmnty Dev Dist FL Spl Assmnt Rev Assmnt Area One
| | 4.00% | | 05/01/30 | | 779,679 |
| 225,000 | | N Park Isle Cmnty Dev Dist FL Spl Assmnt Rev Assmnt Area One
| | 4.50% | | 05/01/40 | | 222,446 |
| 780,000 | | N Sumter Cnty FL Util Dependent Dist Util Rev Sumter Wtr Conservation Auth Proj, AGM
| | 4.00% | | 10/01/41 | | 778,519 |
| 355,000 | | Nthrn Palm Beach Cnty FL Impt Dist
| | 5.00% | | 08/01/37 | | 370,769 |
| 680,000 | | Orange Cnty FL Hlth Facs Auth Rev Presbyterian Retmnt Cmntys Proj
| | 5.00% | | 08/01/29 | | 710,280 |
| 345,000 | | Orange Cnty FL Hlth Facs Auth Rev Presbyterian Retmnt Cmntys Proj
| | 5.00% | | 08/01/34 | | 359,000 |
| 6,000,000 | | Orange Cnty FL Hlth Facs Auth Rev Ref Orlando Hlth Inc, Ser A
| | 5.00% | | 10/01/36 | | 6,491,222 |
| 2,000,000 | | Orange Cnty FL Hlth Facs Auth Rev Ref Orlando Hlth Inc, Ser A
| | 5.00% | | 10/01/39 | | 2,159,448 |
See Notes to Financial Statements
Page 19
First Trust Managed Municipal ETF (FMB)
Portfolio of Investments (Continued)
April 30, 2022 (Unaudited)
Principal
Value | | Description | | Stated
Coupon | | Stated
Maturity | | Value |
| MUNICIPAL BONDS (Continued) |
| | | Florida (Continued) | | | | | | |
| $825,000 | | Orange Cnty FL Hlth Facs Auth Rev Ref Presbyterian Retmnt Cmntys
| | 5.00% | | 08/01/31 | | $877,539 |
| 1,000,000 | | Orange Cnty FL Hlth Facs Auth Rev Ref Presbyterian Retmnt Cmntys
| | 5.00% | | 08/01/41 | | 1,063,683 |
| 800,000 | | Palm Beach Cnty FL Hlth Facs Auth Hosp Rev Baptist Hlth S FL Oblig Grp
| | 5.00% | | 08/15/23 | | 827,686 |
| 200,000 | | Panama City Beach FL Capital Impt Rev Front Beach Road Proj
| | 5.00% | | 11/01/32 | | 229,960 |
| 685,000 | | Panama City Beach FL Capital Impt Rev Front Beach Road Proj
| | 5.00% | | 11/01/33 | | 785,598 |
| 1,645,000 | | Panama City Beach FL Capital Impt Rev Front Beach Road Proj
| | 5.00% | | 11/01/36 | | 1,858,288 |
| 6,500,000 | | Polk Cnty FL Indl Dev Auth Mineral Dev LLC Secondary Phosphate Tailings Recovery Proj (b)
| | 5.88% | | 01/01/33 | | 6,926,351 |
| 125,000 | | Rhodine Road N CDD FL Spl Assmnt
| | 3.50% | | 05/01/24 | | 124,768 |
| 815,000 | | Rhodine Road N CDD FL Spl Assmnt
| | 4.50% | | 05/01/40 | | 802,873 |
| 350,000 | | Rivington CDD FL Spl Assmnt Rev 2022 Assmnt Area
| | 3.25% | | 05/01/27 | | 335,006 |
| 405,000 | | Rivington CDD FL Spl Assmnt Rev Assmnt Area
| | 2.88% | | 05/01/25 | | 394,490 |
| 205,000 | | Saint Johns Cnty FL Indl Dev Auth Sr Living Rev Ref Vicar’s Landing Proj, Ser A
| | 4.00% | | 12/15/31 | | 197,683 |
| 500,000 | | Saint Johns Cnty FL Indl Dev Auth Sr Living Rev Ref Vicar’s Landing Proj, Ser A
| | 4.00% | | 12/15/36 | | 465,271 |
| 3,175,000 | | Saint Johns Cnty FL Indl Dev Auth Sr Living Rev Ref Vicar’s Landing Proj, Ser A
| | 4.00% | | 12/15/41 | | 2,832,067 |
| 10,000,000 | | Saint Lucie Cnty FL Sol Wst Disp Ref FL Pwr & Light Co Pj (a)
| | 0.76% | | 05/01/24 | | 10,000,000 |
| 335,000 | | San Simeon Cmnty Dev Dist FL Spl Assmnt (b)
| | 4.13% | | 06/15/39 | | 321,650 |
| 1,745,000 | | Sarasota Natl FL CDD Spl Assmnt Ref
| | 4.00% | | 05/01/39 | | 1,628,333 |
| 3,500,000 | | Sawyers Landing CDD FL Spl Assmnt Rev
| | 4.25% | | 05/01/53 | | 3,179,935 |
| 2,250,000 | | SE Overtown Park W Cmnty Redev Agy FL Tax, Ser A-1 (b)
| | 5.00% | | 03/01/30 | | 2,327,485 |
| 310,000 | | Shell Point Cmnty Dev Dist FL Spl Assmnt (b)
| | 4.00% | | 11/01/24 | | 310,421 |
| 2,730,000 | | Stoneybrook FL S CDD Spl Assmnt Rev Assmnt Area Two, A Proj
| | 5.13% | | 11/01/34 | | 2,867,545 |
| 1,315,000 | | Summer Woods CDD FL Spl Assmnt Area Two 2020 Proj
| | 4.00% | | 05/01/50 | | 1,161,282 |
| 500,000 | | Tallahassee FL Energy Sys Rev Energy Sys
| | 5.00% | | 10/01/29 | | 527,661 |
| 1,500,000 | | Tallahassee FL Energy Sys Rev Energy Sys
| | 5.00% | | 10/01/30 | | 1,581,182 |
| 125,000 | | Tampa FL Hosp Rev H Lee Moffitt Cancer Ctr Proj, Ser B
| | 5.00% | | 07/01/27 | | 137,561 |
| 120,000 | | Tampa FL Hosp Rev H Lee Moffitt Cancer Ctr Proj, Ser B
| | 5.00% | | 07/01/31 | | 134,572 |
| 200,000 | | Tampa FL Hosp Rev H Lee Moffitt Cancer Ctr Proj, Ser B
| | 5.00% | | 07/01/32 | | 223,544 |
| 250,000 | | Tampa FL Hosp Rev H Lee Moffitt Cancer Ctr Proj, Ser B
| | 5.00% | | 07/01/33 | | 278,489 |
| 250,000 | | Tampa FL Hosp Rev H Lee Moffitt Cancer Ctr Proj, Ser B
| | 5.00% | | 07/01/34 | | 277,717 |
| 455,000 | | Tampa FL Hosp Rev H Lee Moffitt Cancer Ctr Proj, Ser B
| | 5.00% | | 07/01/35 | | 504,117 |
| 400,000 | | Tampa FL Hosp Rev H Lee Moffitt Cancer Ctr Proj, Ser B
| | 4.00% | | 07/01/38 | | 403,158 |
| 300,000 | | Tampa FL Hosp Rev H Lee Moffitt Cancer Ctr Proj, Ser B
| | 4.00% | | 07/01/39 | | 301,856 |
| 230,000 | | Tampa FL Rev Ref The Univ of Tampa Proj, Ser A
| | 5.00% | | 04/01/34 | | 255,412 |
| 5,035,000 | | Tampa FL Rev Ref The Univ of Tampa Proj, Ser A
| | 5.00% | | 04/01/45 | | 5,471,997 |
| 1,000,000 | | Tern Bay CDD FL Spl Assmnt
| | 3.13% | | 06/15/27 | | 956,940 |
| 1,250,000 | | Tern Bay CDD FL Spl Assmnt
| | 4.00% | | 06/15/42 | | 1,138,418 |
| 135,000 | | Timber Creek CDD FL Spl Assmnt Rev (d)
| | 4.13% | | 11/01/24 | | 135,443 |
| 100,000 | | UCF Stadium Corp FL Rev Ref, Ser A
| | 5.00% | | 03/01/24 | | 103,499 |
| 110,000 | | Villamar CDD FL Spl Assmnt (c)
| | 3.75% | | 05/01/24 | | 109,760 |
| 70,000 | | Vlg FL CDD #6 Spl Assmnt Rev Ref
| | 4.00% | | 05/01/25 | | 71,831 |
| 500,000 | | Volusia Cnty FL Eductnl Fac Auth Ref Embry Riddle Aeronautical Univ Inc Proj, Ser A
| | 4.00% | | 10/15/37 | | 509,328 |
| 1,250,000 | | W Vlgs FL Impt Dist Spl Assmt Rev Unit of Dev #7
| | 4.00% | | 05/01/51 | | 1,108,818 |
| 835,000 | | Westside FL CDD Spl Assmnt Rev Ref (b)
| | 4.10% | | 05/01/37 | | 796,228 |
| 310,000 | | WildBlue CDD FL Spl Assmnt (b)
| | 3.50% | | 06/15/24 | | 308,558 |
| | | | | 178,558,282 |
Page 20
See Notes to Financial Statements
First Trust Managed Municipal ETF (FMB)
Portfolio of Investments (Continued)
April 30, 2022 (Unaudited)
Principal
Value | | Description | | Stated
Coupon | | Stated
Maturity | | Value |
| MUNICIPAL BONDS (Continued) |
| | | Georgia – 3.6% | | | | | | |
| $1,040,000 | | Athens GA Hsg Auth Rev Univ of Georgia Proj
| | 5.00% | | 06/15/32 | | $1,187,695 |
| 1,090,000 | | Athens GA Hsg Auth Rev Univ of Georgia Proj
| | 5.00% | | 06/15/33 | | 1,242,124 |
| 1,145,000 | | Athens GA Hsg Auth Rev Univ of Georgia Proj
| | 5.00% | | 06/15/34 | | 1,302,847 |
| 2,500,000 | | Atlanta GA Arpt Passenger Fac Charge Rev Arpt Rev Subord, Ser C
| | 5.00% | | 07/01/37 | | 2,755,438 |
| 9,040,000 | | Atlanta GA Arpt Passenger Fac Charge Rev Arpt Rev Subord, Ser D, AMT
| | 4.00% | | 07/01/38 | | 8,969,858 |
| 650,000 | | Atlanta GA Tax Allocation Ref Eastside Proj
| | 5.00% | | 01/01/30 | | 706,091 |
| 3,100,000 | | Atlanta GA Wtr & Wstwtr Rev Ref, Ser A
| | 5.00% | | 11/01/41 | | 3,394,811 |
| 4,400,000 | | Atlanta GA Wtr & Wstwtr Rev Ref, Ser C
| | 4.00% | | 11/01/37 | | 4,506,700 |
| 625,000 | | De Kalb GA Priv Hosp Auth Children’s Hlthcare of Atlanta, Ser B
| | 4.00% | | 07/01/37 | | 635,856 |
| 500,000 | | Etowah GA Wtr & Swr Auth Rev Ref, BAM
| | 4.00% | | 03/01/34 | | 521,114 |
| 350,000 | | Etowah GA Wtr & Swr Auth Rev Ref, BAM
| | 4.00% | | 03/01/35 | | 364,348 |
| 400,000 | | Etowah GA Wtr & Swr Auth Rev Ref, BAM
| | 4.00% | | 03/01/36 | | 414,263 |
| 10,000,000 | | Floyd Cnty GA Dev Auth Var Ref GA Pwr Company Plt Hammond Remk (a)
| | 0.54% | | 07/01/22 | | 10,000,000 |
| 1,000,000 | | Fulton Cnty GA Dev Auth Rev Ref Children’s Hlthcare of Atlanta, Ser C
| | 5.00% | | 07/01/35 | | 1,106,977 |
| 3,775,000 | | Fulton Cnty GA Rsdl Care Facs Elderly Auth Retmnt Fac Rev Ref Lenbrook Sq Fdtn Inc
| | 5.00% | | 07/01/31 | | 3,926,997 |
| 750,000 | | GA St Hgr Edu Facs Auth Rev Ref USG Real Estate Fdtn II LLC Projs
| | 5.00% | | 06/15/34 | | 832,292 |
| 890,000 | | GA St Hgr Edu Facs Auth Rev Ref USG Real Estate Fdtn II LLC Projs
| | 5.00% | | 06/15/35 | | 986,516 |
| 2,525,000 | | GA St Hsg & Fin Auth Rev SF Mtge, Ser C
| | 3.25% | | 12/01/33 | | 2,442,310 |
| 5,000,000 | | GA St, Ser A-2
| | 4.00% | | 02/01/36 | | 5,199,567 |
| 40,000 | | Gainesville & Hall Cnty GA Hosp Auth Ref NE GA Hlth Sys Inc Proj, Ser A
| | 5.00% | | 02/15/26 | | 43,118 |
| 5,800,000 | | Gainesville & Hall Cnty GA Hosp Auth Ref NE GA Hlth Sys Inc Proj, Ser A
| | 4.00% | | 02/15/39 | | 5,830,549 |
| 250,000 | | Geo L Smith II GA Congress Ctr Auth Convention Ctr Hotel First Tier, Ser A
| | 4.00% | | 01/01/36 | | 237,900 |
| 1,000,000 | | Geo L Smith II GA Congress Ctr Auth Convention Ctr Hotel First Tier, Ser A
| | 4.00% | | 01/01/54 | | 903,487 |
| 1,000,000 | | Glynn-Brunswick GA Memorial Hosp Auth Anticipation Ctfs SE GA Hlth Sys Proj
| | 5.00% | | 08/01/47 | | 1,059,408 |
| 985,000 | | Glynn-Brunswick GA Memorial Hosp Auth Ref Rev Anticipation Ctfs SE GA Hlth Sys Proj
| | 4.00% | | 08/01/37 | | 986,956 |
| 1,750,000 | | Madison Cnty GA Sch Dist Ref Capital Impt Proj, COPS
| | 4.00% | | 05/01/32 | | 1,822,493 |
| 175,000 | | Main Street Nat Gas Inc GA Gas Rev, Ser A
| | 5.50% | | 09/15/23 | | 181,423 |
| 1,000,000 | | Main Street Nat Gas Inc GA Gas Sply Rev, Ser A
| | 5.00% | | 05/15/27 | | 1,061,592 |
| 2,630,000 | | Main Street Nat Gas Inc GA Gas Sply Rev, Ser A
| | 5.00% | | 05/15/30 | | 2,828,599 |
| 2,850,000 | | Main Street Nat Gas Inc GA Gas Sply Rev, Ser C (Mandatory put 11/01/27) (b)
| | 4.00% | | 08/01/52 | | 2,843,020 |
| 3,500,000 | | Main Street Nat Gas Inc GA Gas Sply Rev, Ser C (Mandatory put 12/01/28)
| | 4.00% | | 05/01/52 | | 3,566,848 |
| 1,000,000 | | Muni Elec Auth of GA Plant Vogtle Units 3 & 4 Proj M Bonds, Ser A
| | 5.00% | | 01/01/56 | | 1,067,007 |
| 350,000 | | Muni Elec Auth of GA Ref Plant Vogtle Units 3 & 4 Proj J, Ser A, AGM
| | 4.00% | | 01/01/39 | | 353,206 |
| 320,000 | | Muni Elec Auth of GA Ref Plant Vogtle Units 3 & 4 Proj J, Ser A, AGM
| | 4.00% | | 01/01/40 | | 322,444 |
| 560,000 | | Priv Clgs & Univs Auth GA Mercer Univ Proj, Ser C
| | 5.25% | | 10/01/27 | | 566,148 |
| 1,175,000 | | Priv Clgs & Univs Auth GA Savannah Clg of Art & Design Proj
| | 5.00% | | 04/01/33 | | 1,233,028 |
| 500,000 | | Priv Clgs & Univs Auth GA Savannah Clg of Art & Design Proj
| | 5.00% | | 04/01/44 | | 524,693 |
See Notes to Financial Statements
Page 21
First Trust Managed Municipal ETF (FMB)
Portfolio of Investments (Continued)
April 30, 2022 (Unaudited)
Principal
Value | | Description | | Stated
Coupon | | Stated
Maturity | | Value |
| MUNICIPAL BONDS (Continued) |
| | | Georgia (Continued) | | | | | | |
| $2,865,000 | | S Regl GA Jt Dev Auth Rev Ref Valdosta St Univ VSU ASRE GA Reade Hopper LLC
| | 5.00% | | 08/01/35 | | $3,180,223 |
| | | | | 79,107,946 |
| | | Guam – 0.4% | | | | | | |
| 2,000,000 | | Guam Govt Wtrwks Auth Wtr & Wstwtr Sys Rev, Ser A
| | 5.00% | | 01/01/50 | | 2,163,197 |
| 5,000,000 | | Guam Intl Arpt Auth Prerefunded Gen, Sec C, AGM, AMT
| | 6.13% | | 10/01/43 | | 5,259,220 |
| 300,000 | | Guam Port Auth Port Rev, Ser B, AMT
| | 5.00% | | 07/01/32 | | 321,989 |
| | | | | 7,744,406 |
| | | Hawaii – 0.4% | | | | | | |
| 4,980,000 | | HI St, Ser FG
| | 4.00% | | 10/01/33 | | 5,208,603 |
| 2,450,000 | | Honolulu City & Cnty HI Wstwtr Sys Rev Ref Sr First Bd Resolution, Ser B
| | 4.00% | | 07/01/32 | | 2,540,846 |
| 2,000,000 | | Honolulu City & Cnty HI Wstwtr Sys Rev Sr First Bd Resolution, Ser A
| | 4.00% | | 07/01/42 | | 2,078,822 |
| | | | | 9,828,271 |
| | | Idaho – 0.1% | | | | | | |
| 1,000,000 | | ID St Hlth Facs Auth Rev Ref Madison Memorial Hosp
| | 5.00% | | 09/01/37 | | 1,058,026 |
| 500,000 | | ID St Hlth Facs Auth Rev Trinity Hlth Ref, Ser D
| | 5.00% | | 12/01/33 | | 501,479 |
| | | | | 1,559,505 |
| | | Illinois – 2.5% | | | | | | |
| 1,210,000 | | Bolingbrook IL Ref, Ser A
| | 4.00% | | 01/01/35 | | 1,239,525 |
| 1,000,000 | | Bolingbrook IL Ref, Ser A, AGM
| | 5.00% | | 01/01/30 | | 1,118,465 |
| 1,000,000 | | Bolingbrook IL Ref, Ser A, AGM
| | 5.00% | | 01/01/31 | | 1,116,665 |
| 1,500,000 | | Boone McHenry & DeKalb Cntys IL Cmnty Unit Sch Dist #100 Ref, Ser B
| | 4.00% | | 01/01/27 | | 1,580,285 |
| 130,000 | | Chicago IL Brd of Edu Cap Apprec Sch Reform, Ser B-1, NATL-RE
| | (e) | | 12/01/22 | | 128,199 |
| 500,000 | | Chicago IL Brd of Edu Ref Dedicated, Ser C
| | 5.00% | | 12/01/30 | | 528,343 |
| 500,000 | | Chicago IL Brd of Edu, Ser A
| | 5.00% | | 12/01/33 | | 527,435 |
| 305,000 | | Chicago IL O’Hare Intl Arpt Rev Ref Gen Sr Lien, Ser A, AMT
| | 5.00% | | 01/01/30 | | 320,506 |
| 600,000 | | Chicago IL O’Hare Intl Arpt Rev Ref Sr Lien, Ser A, AMT
| | 5.00% | | 01/01/37 | | 637,967 |
| 400,000 | | Chicago IL O’Hare Intl Arpt Rev, Ser C, AMT
| | 5.00% | | 01/01/34 | | 413,558 |
| 450,000 | | Chicago IL Ref 2003B Remk
| | 5.25% | | 01/01/29 | | 472,864 |
| 185,000 | | Chicago IL Ref Proj, Ser A
| | 5.00% | | 01/01/27 | | 190,610 |
| 1,155,000 | | Chicago IL Ref Proj, Ser A
| | 5.00% | | 01/01/35 | | 1,188,323 |
| 500,000 | | Chicago IL Ref, Ser A
| | 5.63% | | 01/01/29 | | 542,735 |
| 500,000 | | Chicago IL Ref, Ser C
| | 5.00% | | 01/01/25 | | 523,825 |
| 645,000 | | Chicago IL Ref, Ser C
| | 5.00% | | 01/01/26 | | 680,303 |
| 270,000 | | Chicago IL Ref, Ser C
| | 5.00% | | 01/01/38 | | 282,072 |
| 145,000 | | Chicago IL Ref, Ser C, CABS
| | (e) | | 01/01/24 | | 136,737 |
| 125,000 | | Chicago IL Ref, Ser C, CABS
| | (e) | | 01/01/25 | | 113,101 |
| 2,060,000 | | Chicago IL, Ser A
| | 5.00% | | 01/01/27 | | 2,189,334 |
| 1,530,000 | | Cook Cnty IL Sch Dist #69 Skokie Ref
| | 4.00% | | 12/01/33 | | 1,593,920 |
| 2,425,000 | | DuPage & Cook Cntys IL Twp High Sch Dist #86 Hinsdale
| | 4.00% | | 01/15/36 | | 2,507,658 |
| 505,000 | | Hampshire IL Spl Svc Area #14 Spl Tax Ref Lakewood Crossing, BAM
| | 4.00% | | 03/01/25 | | 522,368 |
| 170,000 | | Hillside IL Tax Incr Rev Ref
| | 5.00% | | 01/01/24 | | 172,191 |
| 305,000 | | IL St
| | 5.00% | | 05/01/23 | | 312,271 |
| 240,000 | | IL St
| | 5.00% | | 05/01/24 | | 249,683 |
| 125,000 | | IL St
| | 5.00% | | 06/01/27 | | 133,079 |
Page 22
See Notes to Financial Statements
First Trust Managed Municipal ETF (FMB)
Portfolio of Investments (Continued)
April 30, 2022 (Unaudited)
Principal
Value | | Description | | Stated
Coupon | | Stated
Maturity | | Value |
| MUNICIPAL BONDS (Continued) |
| | | Illinois (Continued) | | | | | | |
| $325,000 | | IL St Fin Auth Acad Facs Lease Rev Univ of Illinois at Urbana-Champaign Proj, Ser A
| | 5.00% | | 10/01/33 | | $364,579 |
| 850,000 | | IL St Fin Auth Acad Facs Lease Rev Univ of Illinois at Urbana-Champaign Proj, Ser A
| | 5.00% | | 10/01/34 | | 952,287 |
| 970,000 | | IL St Fin Auth Acad Facs Lease Rev Univ of Illinois at Urbana-Champaign Proj, Ser A
| | 5.00% | | 10/01/35 | | 1,085,511 |
| 300,000 | | IL St Fin Auth Acad Facs Lease Rev Univ of Illinois at Urbana-Champaign Proj, Ser A
| | 5.00% | | 10/01/36 | | 335,370 |
| 1,000,000 | | IL St Fin Auth Rev Centegra Hlth Sys, Ser A
| | 5.00% | | 09/01/39 | | 1,058,713 |
| 500,000 | | IL St Fin Auth Rev Loc Govt Prog E Prairie Sch Dist #73 Proj, BAM
| | 5.00% | | 12/01/30 | | 561,004 |
| 845,000 | | IL St Fin Auth Rev Ref Mercy Hlth Sys Oblig Grp
| | 5.00% | | 12/01/33 | | 901,509 |
| 35,000 | | IL St Fin Auth Rev Ref Presbyterian Homes Oblig Grp, Ser A
| | 5.00% | | 11/01/24 | | 36,892 |
| 1,010,000 | | IL St Fin Auth Rev Sthrn IL Hlthcare, Ser A
| | 5.00% | | 03/01/47 | | 1,088,034 |
| 500,000 | | IL St Fin Auth Stdt Hsg & Acad Fac Rev Chf Chicago LLC Univ IL Chicago Proj, Ser A
| | 5.00% | | 02/15/27 | | 521,100 |
| 95,000 | | IL St Fin Auth Stdt Hsg & Acad Fac Rev Chf Chicago LLC Univ IL Chicago Proj, Ser A
| | 5.00% | | 02/15/31 | | 97,790 |
| 465,000 | | IL St Fin Auth Stdt Hsg & Acad Fac Rev Chf Chicago LLC Univ IL Chicago Proj, Ser A
| | 5.00% | | 02/15/32 | | 477,113 |
| 320,000 | | IL St Ref
| | 4.00% | | 08/01/25 | | 321,741 |
| 115,000 | | IL St Ref, Ser B
| | 5.00% | | 10/01/24 | | 120,379 |
| 100,000 | | IL St Sales Tax Rev Ref Junior Oblig Build IL Bonds, Ser C
| | 5.00% | | 06/15/29 | | 108,392 |
| 510,000 | | IL St, Ser A
| | 4.00% | | 01/01/25 | | 510,863 |
| 1,500,000 | | IL St, Ser A
| | 5.00% | | 12/01/26 | | 1,609,462 |
| 2,000,000 | | IL St, Ser B
| | 4.00% | | 12/01/37 | | 1,895,806 |
| 6,200,000 | | IL St, Ser C
| | 5.00% | | 11/01/29 | | 6,623,000 |
| 1,250,000 | | IL St, Ser D
| | 5.00% | | 11/01/23 | | 1,291,633 |
| 1,005,000 | | IL St, Ser D
| | 5.00% | | 11/01/24 | | 1,053,207 |
| 325,000 | | IL St, Ser D
| | 5.00% | | 11/01/26 | | 348,464 |
| 1,500,000 | | Lincolnwood IL Tax Incr Allocation Rev Nts Dist 1860 Dev Proj, Ser A, COPS (b)
| | 4.82% | | 01/01/41 | | 1,292,188 |
| 500,000 | | Macon Cnty IL Sch Dist #61 Ref, Ser C, AGM
| | 4.00% | | 01/01/28 | | 524,750 |
| 1,850,000 | | Macon Cnty IL Sch Dist #61 Ref, Ser C, AGM
| | 4.00% | | 01/01/32 | | 1,906,474 |
| 3,635,000 | | Morton Grove-Niles Wtr Commn IL Wtr, Ser A
| | 5.00% | | 12/01/41 | | 4,018,875 |
| 405,000 | | Peoria IL Ref, Ser C, AGM
| | 4.00% | | 01/01/33 | | 419,172 |
| 1,000,000 | | Piatt Champaign & De Witt Cntys IL Cmnty Unit Sch Dist #25 Ref, Ser B, BAM
| | 5.00% | | 11/01/33 | | 1,081,831 |
| 145,000 | | Railsplitter IL Tobacco Stlmt Auth
| | 5.00% | | 06/01/26 | | 155,442 |
| 690,000 | | Railsplitter IL Tobacco Stlmt Auth
| | 5.00% | | 06/01/27 | | 737,858 |
| 645,000 | | Rockford IL Ref Wtrwks Sys, Ser B, BAM
| | 5.00% | | 12/15/26 | | 706,470 |
| 110,000 | | Romeoville IL Rev Ref Lewis Univ Proj
| | 5.00% | | 10/01/24 | | 115,244 |
| 125,000 | | Romeoville IL Rev Ref Lewis Univ Proj
| | 5.00% | | 10/01/25 | | 131,893 |
| 1,560,000 | | Woodford McLean & Livingston Cntys IL Cmnty United Sch Dist, Ser B, BAM
| | 4.00% | | 11/01/36 | | 1,620,255 |
| | | | | 53,495,323 |
| | | Indiana – 1.9% | | | | | | |
| 1,920,000 | | Carmel IN Loc Pub Impt Bond Bank Multipurpose, Ser 2016
| | 5.00% | | 07/15/34 | | 2,078,094 |
| 1,425,000 | | Carmel IN Loc Pub Impt Bond Bank Spl Prog Wtrwks
| | 5.00% | | 06/01/26 | | 1,545,241 |
| 5,820,000 | | Carmel IN Loc Pub Impt Bond Bank, Ser A
| | 4.00% | | 07/15/36 | | 6,157,004 |
| 6,050,000 | | Carmel IN Loc Pub Impt Bond Bank, Ser A
| | 4.00% | | 07/15/37 | | 6,378,419 |
| 250,000 | | Fort Wayne IN Mf Hsg Rev Silver Birch at Cook Road (b)
| | 5.30% | | 01/01/32 | | 231,237 |
| 930,000 | | IN St Fin Auth Hosp Rev Goshen Hlth, Ser A
| | 4.00% | | 11/01/36 | | 940,670 |
| 1,330,000 | | IN St Fin Auth Hosp Rev Goshen Hlth, Ser A
| | 4.00% | | 11/01/37 | | 1,340,437 |
See Notes to Financial Statements
Page 23
First Trust Managed Municipal ETF (FMB)
Portfolio of Investments (Continued)
April 30, 2022 (Unaudited)
Principal
Value | | Description | | Stated
Coupon | | Stated
Maturity | | Value |
| MUNICIPAL BONDS (Continued) |
| | | Indiana (Continued) | | | | | | |
| $700,000 | | IN St Fin Auth Rev Eductnl Facs Rock Creek Cmnty Acdmy Proj, Ser A (d)
| | 5.25% | | 07/01/28 | | $723,367 |
| 1,000,000 | | IN St Fin Auth Rev Eductnl Facs Rock Creek Cmnty Acdmy Proj, Ser A (d)
| | 5.88% | | 07/01/38 | | 1,040,991 |
| 460,000 | | IN St Fin Auth Rev Greencroft Oblig Grp, Ser A
| | 5.75% | | 11/15/28 | | 483,403 |
| 55,000 | | IN St Fin Auth Rev Greencroft Oblig Grp, Ser A
| | 6.00% | | 11/15/28 | | 57,987 |
| 500,000 | | IN St Fin Auth Rev Marian Univ Proj, Ser A
| | 5.00% | | 09/15/34 | | 536,410 |
| 275,000 | | IN St Fin Auth Rev Ref Rev Cmnty Fdtn of NW IN
| | 5.00% | | 09/01/31 | | 297,165 |
| 6,000,000 | | IN St Muni Pwr Agy Ref, Ser A
| | 5.00% | | 01/01/42 | | 6,376,462 |
| 5,000,000 | | IN St Muni Pwr Agy, Ser A
| | 4.00% | | 01/01/39 | | 5,207,553 |
| 800,000 | | Indianapolis IN Loc Pub Impt Bond Bank Ref Cityway 1 Proj, Ser B
| | 5.00% | | 02/01/34 | | 830,467 |
| 550,000 | | NW Hendricks IN Multi-Bldg Corp
| | 4.00% | | 07/15/30 | | 584,537 |
| 450,000 | | NW Hendricks IN Multi-Bldg Corp
| | 4.00% | | 07/15/31 | | 477,057 |
| 400,000 | | NW Hendricks IN Multi-Bldg Corp
| | 4.00% | | 07/15/32 | | 422,213 |
| 500,000 | | NW Hendricks IN Multi-Bldg Corp
| | 4.00% | | 07/15/33 | | 526,916 |
| 1,700,000 | | Plainfield IN Mf Hsg Rev Glasswater Creek Proj
| | 5.38% | | 09/01/38 | | 1,512,278 |
| 1,025,000 | | Westfield Washington IN Multi Sch Bldg Corp Rev
| | 4.00% | | 07/15/31 | | 1,091,134 |
| 765,000 | | Westfield Washington IN Multi Sch Bldg Corp Rev
| | 4.00% | | 07/15/33 | | 804,439 |
| 600,000 | | Zionsville IN Cmnty Schs Bldgcorp
| | 4.00% | | 07/15/31 | | 633,400 |
| 330,000 | | Zionsville IN Cmnty Schs Bldgcorp
| | 4.00% | | 07/15/33 | | 346,451 |
| 700,000 | | Zionsville IN Cmnty Schs Bldgcorp
| | 4.00% | | 07/15/35 | | 733,413 |
| | | | | 41,356,745 |
| | | Iowa – 1.0% | | | | | | |
| 1,000,000 | | Altoona IA, Ser A, COPS, BAM
| | 5.00% | | 06/01/33 | | 1,114,014 |
| 720,000 | | Altoona IA, Ser A, COPS, BAM
| | 5.00% | | 06/01/34 | | 801,194 |
| 2,385,000 | | Coralville IA Ref, Ser A
| | 5.00% | | 05/01/38 | | 2,486,942 |
| 2,000,000 | | IA St Fin Auth Midwstrn Disaster Area Rev Ref IA Fertilizer Company Proj (Mandatory put 12/01/42)
| | 5.00% | | 12/01/50 | | 2,054,402 |
| 13,190,000 | | Pefa Inc IA Gas Proj Rev (Mandatory put 09/01/26)
| | 5.00% | | 09/01/49 | | 13,924,712 |
| 200,000 | | Tobacco Stlmt Auth IA Tobacco Stlmt Rev Ref Sr, Ser A-2,
Class 1
| | 5.00% | | 06/01/32 | | 219,855 |
| 300,000 | | Tobacco Stlmt Auth IA Tobacco Stlmt Rev Ref Sr, Ser A-2,
Class 1
| | 4.00% | | 06/01/35 | | 303,906 |
| 200,000 | | Tobacco Stlmt Auth IA Tobacco Stlmt Rev Ref Sr, Ser A-2,
Class 1
| | 4.00% | | 06/01/38 | | 201,471 |
| 300,000 | | Tobacco Stlmt Auth IA Tobacco Stlmt Rev Ref Sr, Ser A-2,
Class 1
| | 4.00% | | 06/01/39 | | 301,661 |
| | | | | 21,408,157 |
| | | Kansas – 0.9% | | | | | | |
| 1,275,000 | | Goddard KS Sales Tax Spl Oblg Rev Ref Olympic Park Star Bond Proj
| | 3.60% | | 06/01/30 | | 1,197,968 |
| 4,210,000 | | Johnson & Miami Cntys KS Unif Sch Dist #230 Spring Hill, Ser A
| | 5.00% | | 09/01/35 | | 4,715,544 |
| 1,240,000 | | KS Muni Energy Agy Pwr Proj Rev Dogwood Proj, Ser A, BAM
| | 5.00% | | 04/01/29 | | 1,348,163 |
| 1,470,000 | | KS Muni Energy Agy Pwr Proj Rev Dogwood Proj, Ser A, BAM
| | 5.00% | | 04/01/30 | | 1,597,655 |
| 500,000 | | Leavenworth Cnty KS Unif Sch Dist #464 Ref, Ser A
| | 4.00% | | 09/01/31 | | 527,639 |
| 625,000 | | Leavenworth Cnty KS Unif Sch Dist #464 Ref, Ser A
| | 4.00% | | 09/01/32 | | 657,338 |
| 575,000 | | Leavenworth Cnty KS Unif Sch Dist #464 Ref, Ser A
| | 4.00% | | 09/01/33 | | 602,725 |
| 500,000 | | Leavenworth Cnty KS Unif Sch Dist #464 Ref, Ser A
| | 4.00% | | 09/01/34 | | 519,609 |
| 525,000 | | Leavenworth Cnty KS Unif Sch Dist #464 Ref, Ser A
| | 4.00% | | 09/01/35 | | 544,807 |
| 600,000 | | Leavenworth Cnty KS Unif Sch Dist #464 Ref, Ser A
| | 4.00% | | 09/01/36 | | 622,040 |
| 1,045,000 | | Lenexa KS Hlthcare Fac Rev Ref Lakeview Vlg Inc, Ser A
| | 5.00% | | 05/15/26 | | 1,103,876 |
Page 24
See Notes to Financial Statements
First Trust Managed Municipal ETF (FMB)
Portfolio of Investments (Continued)
April 30, 2022 (Unaudited)
Principal
Value | | Description | | Stated
Coupon | | Stated
Maturity | | Value |
| MUNICIPAL BONDS (Continued) |
| | | Kansas (Continued) | | | | | | |
| $2,800,000 | | Sedgwick Cnty KS Unif Sch Dist #260 Ref & Sch Bldg, Ser B
| | 4.00% | | 10/01/38 | | $2,909,679 |
| 475,000 | | Wyandotte Cnty Kansas City KS Unif Govt Util Sys Rev Ref & Impt, Ser A
| | 5.00% | | 09/01/29 | | 501,119 |
| 2,000,000 | | Wyandotte Cnty KS Kansas City Unif Govt Spl Oblg Rev Ref Vlg E Proj Areas 2B 3 5 (b)
| | 5.75% | | 09/01/39 | | 1,978,235 |
| 150,000 | | Wyandotte Cnty KS Unif Sch Dist #202, Ser A, AGM
| | 5.00% | | 09/01/32 | | 167,063 |
| | | | | 18,993,460 |
| | | Kentucky – 2.3% | | | | | | |
| 6,025,000 | | Berea KY Eductnl Facs Rev Var Berea Clg Proj, Ser A (a)
| | 0.70% | | 06/01/32 | | 6,025,000 |
| 2,350,000 | | Bowling Green KY Wtr & Swr Rev, AGM
| | 4.00% | | 06/01/32 | | 2,445,431 |
| 1,000,000 | | Estrn KY Univ Gen Recpts, Ser A
| | 5.00% | | 04/01/25 | | 1,067,341 |
| 500,000 | | Hazard KY Hlthcare Rev Ref Appalachian Regl Hlthcare Proj
| | 4.00% | | 07/01/39 | | 492,648 |
| 1,260,000 | | Hazard KY Hlthcare Rev Ref Appalachian Regl Hlthcare Proj
| | 4.00% | | 07/01/40 | | 1,239,160 |
| 3,755,000 | | KY Bond Dev Corp Indl Bldg Rev KY Commns Network Auth Proj, BAM
| | 5.00% | | 09/01/38 | | 4,245,791 |
| 3,500,000 | | KY Bond Dev Corp Indl Bldg Rev KY Commns Network Auth Proj, BAM
| | 5.00% | | 09/01/49 | | 3,900,372 |
| 145,000 | | KY St Econ Dev Fin Auth Baptist Hlthcare Sys, Ser B
| | 5.00% | | 08/15/28 | | 161,166 |
| 275,000 | | KY St Econ Dev Fin Auth Baptist Hlthcare Sys, Ser B
| | 5.00% | | 08/15/36 | | 300,559 |
| 3,000,000 | | KY St Econ Dev Fin Auth Baptist Hlthcare Sys, Ser B
| | 5.00% | | 08/15/41 | | 3,262,039 |
| 160,000 | | KY St Econ Dev Fin Auth Hlth Sys Rev Norton Hlthcare Inc, Ser B, NATL-RE
| | (e) | | 10/01/25 | | 142,827 |
| 625,000 | | KY St Econ Dev Fin Auth Ref Commonspirit Hlth, Ser A-1
| | 4.00% | | 08/01/38 | | 607,084 |
| 730,000 | | KY St Econ Dev Fin Auth Ref Commonspirit Hlth, Ser A-2
| | 5.00% | | 08/01/35 | | 795,085 |
| 895,000 | | KY St Econ Dev Fin Auth Ref Commonspirit Hlth, Ser A-2
| | 5.00% | | 08/01/36 | | 973,821 |
| 300,000 | | KY St Muni Pwr Agy Pwr Sys Rev Ref, Ser A, NATL-RE
| | 5.00% | | 09/01/22 | | 303,087 |
| 5,620,000 | | KY St Office Building Proj, Ser A, COPS
| | 5.00% | | 04/15/38 | | 6,146,319 |
| 3,000,000 | | KY St Property & Bldgs Commn Revs Proj #106, Ser A
| | 5.00% | | 10/01/31 | | 3,117,057 |
| 5,395,000 | | KY St Pub Energy Auth Gas Sply Rev Gas Sply, Ser B (Mandatory put 01/01/25)
| | 4.00% | | 01/01/49 | | 5,505,828 |
| 450,000 | | KY St Pub Energy Auth Gas Sply Rev, Ser A (Mandatory put 04/01/24)
| | 4.00% | | 04/01/48 | | 456,464 |
| 1,580,000 | | KY St Pub Energy Auth Gas Sply Rev, Ser A-1 (Mandatory put 06/01/25)
| | 4.00% | | 12/01/49 | | 1,602,948 |
| 440,000 | | KY St Univ Proj, COPS, BAM
| | 4.00% | | 11/01/46 | | 445,510 |
| 1,000,000 | | Louisville & Jefferson Cnty KY Met Govt Hlth Sys Rev Norton Hlthcare Inc, Ser A
| | 5.00% | | 10/01/38 | | 1,116,808 |
| 500,000 | | Louisville & Jefferson Cnty KY Met Govt Hlth Sys Rev Norton Hlthcare Inc, Ser A
| | 4.00% | | 10/01/40 | | 500,203 |
| 3,315,000 | | Louisville & Jefferson Cnty KY Met Govt Hlth Sys Rev Ref Norton Hlthcare Inc, Ser A
| | 5.00% | | 10/01/30 | | 3,612,154 |
| 550,000 | | Louisville & Jefferson Cnty KY Met Govt Hlth Sys Rev Ref Norton Hlthcare Inc, Ser A
| | 5.00% | | 10/01/31 | | 598,825 |
| 45,000 | | Warren Cnty KY Hosp Rev Ref Bowling Green Warren Cnty Cmnty Hosp Corp
| | 5.00% | | 04/01/23 | | 46,184 |
| | | | | 49,109,711 |
| | | Louisiana – 1.0% | | | | | | |
| 1,260,000 | | E Baton Rouge Parish LA Capital Impts Dist MOVEBR Sales, Ser T
| | 4.00% | | 08/01/35 | | 1,334,668 |
| 1,520,000 | | E Baton Rouge Parish LA Capital Impts Dist MOVEBR Sales, Ser T
| | 4.00% | | 08/01/36 | | 1,608,416 |
| 2,530,000 | | E Baton Rouge Parish LA Capital Impts Dist MOVEBR Sales, Ser T
| | 4.00% | | 08/01/38 | | 2,670,648 |
See Notes to Financial Statements
Page 25
First Trust Managed Municipal ETF (FMB)
Portfolio of Investments (Continued)
April 30, 2022 (Unaudited)
Principal
Value | | Description | | Stated
Coupon | | Stated
Maturity | | Value |
| MUNICIPAL BONDS (Continued) |
| | | Louisiana (Continued) | | | | | | |
| $1,000,000 | | LA Pub Facs Auth Rev Ref Ochsner Clinic Fdtn Proj
| | 5.00% | | 05/15/36 | | $1,085,522 |
| 250,000 | | LA St Loc Govt Envrnmntl Facs & Cmnty Dev Auth Rev Ascension Psh Courthouse Proj
| | 5.00% | | 11/01/31 | | 273,869 |
| 1,135,000 | | LA St Loc Govt Envrnmntl Facs & Cmnty Dev Auth Rev City of Gretna Pub Impt Bonds
| | 4.00% | | 02/01/38 | | 1,181,325 |
| 1,700,000 | | LA St Loc Govt Envrnmntl Facs & Cmnty Dev Auth Rev Ref Hosp Womans Fdtn Proj, Ser A
| | 5.00% | | 10/01/37 | | 1,853,556 |
| 380,000 | | LA Stadium & Exposition Dist LA Ref Sr, Ser A
| | 5.00% | | 07/01/31 | | 392,352 |
| 750,000 | | New Orleans LA Aviation Brd Gen Arpt N Term, Ser B, AMT
| | 5.00% | | 01/01/28 | | 803,293 |
| 750,000 | | New Orleans LA Aviation Brd Gen Arpt N Term, Ser B, AMT
| | 5.00% | | 01/01/29 | | 801,228 |
| 200,000 | | New Orleans LA Aviation Brd Gen Arpt N Term, Ser B, AMT
| | 5.00% | | 01/01/31 | | 211,826 |
| 1,160,000 | | New Orleans LA Aviation Brd, Ser B, AMT
| | 5.00% | | 01/01/31 | | 1,205,015 |
| 1,305,000 | | New Orleans LA Wtr Rev
| | 5.00% | | 12/01/34 | | 1,415,344 |
| 1,050,000 | | New Orleans LA Wtr Rev Ref
| | 5.00% | | 12/01/28 | | 1,118,949 |
| 1,500,000 | | Saint Charles Parish LA Gulf Zone Opportunity Zone Rev Valero Energy Corp Conv (Mandatory put 06/01/22)
| | 4.00% | | 12/01/40 | | 1,502,362 |
| 625,000 | | Shreveport LA Wtr & Swr Rev Junior Lien, Ser A, AGM
| | 5.00% | | 12/01/32 | | 697,417 |
| 700,000 | | Shreveport LA Wtr & Swr Rev, Ser A, AGM
| | 4.00% | | 12/01/41 | | 719,966 |
| 1,650,000 | | Shreveport LA Wtr & Swr Rev, Ser B, BAM
| | 5.00% | | 12/01/30 | | 1,748,990 |
| 2,000,000 | | Shreveport LA Wtr & Swr Rev, Ser B, BAM
| | 5.00% | | 12/01/33 | | 2,183,917 |
| | | | | 22,808,663 |
| | | Maine – 0.0% | | | | | | |
| 1,000,000 | | ME St Fin Auth Green Bond Go Lab Madison, LLC Proj, AMT (b)
| | 8.00% | | 12/01/51 | | 810,242 |
| | | Maryland – 0.9% | | | | | | |
| 565,000 | | Baltimore Cnty MD Rev Ref Oak Crest Vlg Inc Fac
| | 4.00% | | 01/01/39 | | 588,445 |
| 650,000 | | Baltimore Cnty MD Rev Ref Oak Crest Vlg Inc Fac
| | 4.00% | | 01/01/40 | | 675,946 |
| 600,000 | | Baltimore Cnty MD Rev Ref Riderwood Vlg Inc Proj
| | 4.00% | | 01/01/33 | | 631,310 |
| 685,000 | | Baltimore Cnty MD Rev Ref Riderwood Vlg Inc Proj
| | 4.00% | | 01/01/34 | | 719,574 |
| 650,000 | | Baltimore Cnty MD Rev Ref Riderwood Vlg Inc Proj
| | 4.00% | | 01/01/36 | | 680,244 |
| 700,000 | | Baltimore Cnty MD Rev Ref Riderwood Vlg Inc Proj
| | 4.00% | | 01/01/38 | | 729,264 |
| 1,120,000 | | Baltimore MD Rev Ref Sr, Ser B
| | 5.00% | | 07/01/33 | | 1,180,091 |
| 1,000,000 | | Baltimore MD Spl Oblig Ref E Baltimore Rsrch Park Proj, Ser A
| | 5.00% | | 09/01/38 | | 1,029,596 |
| 100,000 | | Baltimore MD Spl Oblig Ref Sr Lien Harbor Point Proj, Ser A (b)
| | 2.75% | | 06/01/24 | | 98,390 |
| 125,000 | | Baltimore MD Spl Oblig Ref Sr Lien Harbor Point Proj, Ser A (b)
| | 2.80% | | 06/01/25 | | 122,073 |
| 135,000 | | Baltimore MD Spl Oblig Ref Sr Lien Harbor Point Proj, Ser A (b)
| | 2.85% | | 06/01/26 | | 130,890 |
| 1,000,000 | | Gaithersburg MD Econ Dev Rev Ref Proj Asbury MD Oblig Grp, Ser A
| | 4.50% | | 01/01/25 | | 1,041,617 |
| 325,000 | | Harford Cnty MD Spl Oblg Ref Beechtree Estates Proj
| | 4.00% | | 07/01/25 | | 338,956 |
| 550,000 | | Harford Cnty MD Spl Oblg Ref Beechtree Estates Proj
| | 4.00% | | 07/01/36 | | 567,568 |
| 500,000 | | MD St Econ Dev Corp Stdt Hsg Rev Bowie St Univ Proj
| | 4.00% | | 07/01/40 | | 484,885 |
| 1,650,000 | | MD St Econ Dev Corp Stdt Hsg Rev Bowie St Univ Proj
| | 5.00% | | 07/01/55 | | 1,722,426 |
| 600,000 | | MD St Econ Dev Corp Stdt Hsg Rev Ref Sr Univ MD Proj
| | 4.00% | | 07/01/24 | | 609,046 |
| 2,490,000 | | MD St Econ Dev Corp Stdt Hsg Rev Ref Univ MD Clg Park Projs, AGM
| | 5.00% | | 06/01/35 | | 2,691,886 |
| 500,000 | | MD St Hlth & Hgr Eductnl Facs Auth Rev Adventist Hlthcare Oblig Grp, Ser A
| | 5.50% | | 01/01/26 | | 537,495 |
| 555,000 | | MD St Hlth & Hgr Eductnl Facs Auth Rev Ref Adventist Hlthcare
| | 4.00% | | 01/01/27 | | 569,525 |
| 800,000 | | MD St Hlth & Hgr Eductnl Facs Auth Rev Ref Anne Arundel Hlth Sys, Ser A
| | 5.00% | | 07/01/30 | | 879,182 |
| 1,000,000 | | MD St Hlth & Hgr Eductnl Facs Auth Rev Ref Anne Arundel Hlth Sys, Ser A
| | 5.00% | | 07/01/32 | | 1,093,961 |
Page 26
See Notes to Financial Statements
First Trust Managed Municipal ETF (FMB)
Portfolio of Investments (Continued)
April 30, 2022 (Unaudited)
Principal
Value | | Description | | Stated
Coupon | | Stated
Maturity | | Value |
| MUNICIPAL BONDS (Continued) |
| | | Maryland (Continued) | | | | | | |
| $250,000 | | MD St Hlth & Hgr Eductnl Facs Auth Rev Ref Stevenson Univ Proj, Ser A
| | 4.00% | | 06/01/35 | | $247,785 |
| 225,000 | | MD St Hlth & Hgr Eductnl Facs Auth Rev Ref Stevenson Univ Proj, Ser A
| | 4.00% | | 06/01/36 | | 222,517 |
| 750,000 | | MD St Hlth & Hgr Eductnl Facs Auth Rev Ref Stevenson Univ Proj, Ser A
| | 4.00% | | 06/01/46 | | 708,761 |
| 790,000 | | MD St Ref, Ser B
| | 5.00% | | 08/01/24 | | 836,652 |
| | | | | 19,138,085 |
| | | Massachusetts – 1.0% | | | | | | |
| 925,000 | | Ludlow MA
| | 4.00% | | 02/01/32 | | 961,552 |
| 960,000 | | Ludlow MA
| | 4.00% | | 02/01/33 | | 994,467 |
| 2,000,000 | | MA St Bay Transprtn Auth Sales Tax Rev Ref Sr, Ser B
| | 5.25% | | 07/01/30 | | 2,294,003 |
| 250,000 | | MA St Dev Fin Agy Rev Linden Ponds Inc Fac (b)
| | 5.00% | | 11/15/28 | | 272,241 |
| 2,000,000 | | MA St Port Auth Spl Facs Rev Ref Bosfuel Proj, Ser A, AMT
| | 5.00% | | 07/01/33 | | 2,166,177 |
| 10,757,000 | | Pittsfield MA, BANS
| | 2.00% | | 02/24/23 | | 10,753,429 |
| 4,325,000 | | Worcester MA, AGM
| | 4.00% | | 02/01/35 | | 4,523,699 |
| | | | | 21,965,568 |
| | | Michigan – 3.3% | | | | | | |
| 240,000 | | Detroit MI Downtown Dev Auth Tax Incr Rev Ref Catalyst Dev Proj, Ser A, AGM
| | 5.00% | | 07/01/32 | | 250,792 |
| 500,000 | | Detroit MI Downtown Dev Auth Tax Incr Rev Ref Catalyst Dev Proj, Ser A, AGM
| | 5.00% | | 07/01/33 | | 522,377 |
| 250,000 | | Genesee Cnty MI Swr Disp Sys Rev, Ser A, BAM
| | 4.00% | | 06/01/30 | | 265,343 |
| 150,000 | | Genesee Cnty MI Swr Disp Sys Rev, Ser A, BAM
| | 4.00% | | 06/01/32 | | 156,993 |
| 155,000 | | Genesee Cnty MI Swr Disp Sys Rev, Ser A, BAM
| | 4.00% | | 06/01/36 | | 161,361 |
| 100,000 | | Genesee Cnty MI Swr Disp Sys Rev, Ser A, BAM
| | 4.00% | | 06/01/37 | | 103,675 |
| 150,000 | | Genesee Cnty MI Swr Disp Sys Rev, Ser A, BAM
| | 4.00% | | 06/01/38 | | 155,276 |
| 525,000 | | Grand Rapids MI Santn Swr Sys Rev Ref
| | 5.00% | | 01/01/45 | | 576,280 |
| 735,000 | | Grand Traverse Cnty MI Hosp Fin Auth Munson Hlthcare Oblig Grp, Ser A
| | 5.00% | | 07/01/44 | | 795,466 |
| 1,510,000 | | Grand Traverse Cnty MI Hosp Fin Auth Ref Munson Hlthcare Oblig Grp
| | 5.00% | | 07/01/34 | | 1,696,181 |
| 1,125,000 | | Great Lakes MI Wtr Auth Wtr Sply Sys Rev Ref Sr Lien, Ser C
| | 5.00% | | 07/01/28 | | 1,233,119 |
| 575,000 | | Kalamazoo MI Econ Dev Corp Heritage Cmnty of Kalamazoo Revel Creek Proj Temps 60, Ser B2
| | 2.63% | | 05/15/25 | | 560,151 |
| 1,000,000 | | Marquette MI Brd of Light & Pwr Elec Util Sys Rev Ref, Ser A
| | 5.00% | | 07/01/29 | | 1,092,797 |
| 1,915,000 | | Mattawan MI Consol Sch Dist, Ser I
| | 5.00% | | 05/01/31 | | 2,055,801 |
| 1,225,000 | | MI St Bldg Auth Rev Ref, Ser I
| | 5.00% | | 10/15/30 | | 1,339,366 |
| 890,000 | | MI St Fin Auth Ltd Oblig Rev Ref Clg for Creative Studies Proj
| | 5.00% | | 12/01/25 | | 908,343 |
| 325,000 | | MI St Fin Auth Rev Loc Govt Loan Prog Great Lakes Wtr Auth Ref, Ser C
| | 5.00% | | 07/01/27 | | 348,862 |
| 2,000,000 | | MI St Fin Auth Rev Multi Modal McLaren Hlthcare, Ser A
| | 4.00% | | 02/15/50 | | 1,945,631 |
| 375,000 | | MI St Fin Auth Rev Prerefunded Che Trinity Hlth Credit Grp Ref, Ser 2013-5
| | 4.00% | | 12/01/40 | | 406,804 |
| 2,460,000 | | MI St Fin Auth Rev Ref 2nd Lien Great Lakes Wtr Auth, Ser C-7, NATL-RE
| | 5.00% | | 07/01/29 | | 2,580,656 |
| 750,000 | | MI St Fin Auth Rev Ref Beaumont Hlth Credit Grp
| | 5.00% | | 08/01/32 | | 785,548 |
| 1,070,000 | | MI St Fin Auth Rev Ref Beaumont Spectrum Consolidation, Ser A
| | 5.00% | | 04/15/33 | | 1,211,775 |
| 2,155,000 | | MI St Fin Auth Rev Ref Che Trinity Hlth Credit Grp Remk, Ser 2013-4
| | 5.00% | | 12/01/39 | | 2,341,546 |
| 4,050,000 | | MI St Fin Auth Rev Ref Henry Ford Hlth Sys
| | 4.00% | | 11/15/35 | | 4,084,231 |
| 2,565,000 | | MI St Fin Auth Rev Ref Henry Ford Hlth Sys
| | 4.00% | | 11/15/36 | | 2,584,838 |
| 7,905,000 | | MI St Fin Auth Rev Ref Henry Ford Hlth Sys
| | 5.00% | | 11/15/41 | | 8,511,092 |
See Notes to Financial Statements
Page 27
First Trust Managed Municipal ETF (FMB)
Portfolio of Investments (Continued)
April 30, 2022 (Unaudited)
Principal
Value | | Description | | Stated
Coupon | | Stated
Maturity | | Value |
| MUNICIPAL BONDS (Continued) |
| | | Michigan (Continued) | | | | | | |
| $2,500,000 | | MI St Fin Auth Rev Ref Hosp Trinity Hlth Credit Grp, Ser A-MI
| | 5.00% | | 12/01/47 | | $2,547,789 |
| 1,000,000 | | MI St Fin Auth Rev Ref Loc Govt Loan Prog Great Lakes Wtr Auth, Ser D-1
| | 5.00% | | 07/01/34 | | 1,059,047 |
| 5,500,000 | | MI St Fin Auth Rev Ref Loc Govt Loan Prog Great Lakes Wtr Auth, Ser D4
| | 5.00% | | 07/01/29 | | 5,741,436 |
| 500,000 | | MI St Fin Auth Rev Ref Loc Govt Loan Prog, Ser F1
| | 3.80% | | 10/01/22 | | 501,991 |
| 125,000 | | MI St Fin Auth Rev Ref Loc Govt Loan Prog, Ser F1
| | 3.88% | | 10/01/23 | | 125,661 |
| 145,000 | | MI St Fin Auth Rev Ref Trinity Hlth Corp, Ser 2016MI
| | 5.00% | | 12/01/33 | | 155,729 |
| 1,000,000 | | MI St Hosp Fin Auth Ref Ascension Hlth Sr Cr Grp Remk, Ser F-4
| | 5.00% | | 11/15/47 | | 1,091,745 |
| 565,000 | | MI St Hosp Fin Auth Ref Ascension Sr Credit Remk, Ser F7
| | 5.00% | | 11/15/47 | | 604,132 |
| 1,000,000 | | MI St Univ Revs Brd of Trustees, Ser B
| | 5.00% | | 02/15/34 | | 1,113,919 |
| 1,000,000 | | MI St Univ Revs Brd of Trustees, Ser B
| | 4.00% | | 02/15/44 | | 996,637 |
| 12,575,000 | | MI St Univ Revs Ref, Ser C
| | 4.00% | | 02/15/44 | | 12,532,709 |
| 650,000 | | Midland MI Pub Schs Sch Bldg & Site, Ser II
| | 5.00% | | 05/01/35 | | 737,764 |
| 1,990,000 | | Utica MI Cmnty Schs Ref Sch Bldg & Site
| | 5.00% | | 05/01/31 | | 2,163,704 |
| 1,350,000 | | Walled Lake MI Consol Sch Dist
| | 5.00% | | 05/01/38 | | 1,530,842 |
| 2,800,000 | | Wayne Cnty MI Arpt Auth Rev Ref, Ser F, AMT
| | 5.00% | | 12/01/25 | | 2,977,474 |
| 1,445,000 | | Wayne Cnty MI Arpt Auth Rev, Ser B, AMT
| | 5.00% | | 12/01/36 | | 1,582,705 |
| | | | | 72,137,588 |
| | | Minnesota – 0.3% | | | | | | |
| 370,000 | | Duluth MN Indep Sch Dist #709 Ref, Ser B, COPS
| | 5.00% | | 02/01/27 | | 406,397 |
| 580,000 | | Saint Paul MN Hsg & Redev Auth Hlthcare Fac Rev Ref HealthPartners Oblig Grp, Ser A
| | 5.00% | | 07/01/30 | | 616,590 |
| 500,000 | | Saint Paul MN Hsg & Redev Auth Hlthcare Fac Rev Ref HealthPartners Oblig Grp, Ser A
| | 5.00% | | 07/01/32 | | 529,833 |
| 3,420,000 | | Saint Paul MN Hsg & Redev Auth Hlthcare Fac Rev Ref HealthPartners Oblig Grp, Ser A
| | 5.00% | | 07/01/33 | | 3,618,761 |
| 500,000 | | Saint Paul Park MN Sr Hsg & Hlthcare Rev Ref Presbyterian Homes Bloomington Proj
| | 3.00% | | 09/01/24 | | 495,767 |
| 400,000 | | Saint Paul Park MN Sr Hsg & Hlthcare Rev Ref Presbyterian Homes Bloomington Proj
| | 3.13% | | 09/01/25 | | 395,438 |
| | | | | 6,062,786 |
| | | Mississippi – 0.3% | | | | | | |
| 2,000,000 | | MS St, Ser A
| | 5.00% | | 11/01/33 | | 2,210,562 |
| 985,000 | | MS St, Ser B
| | 5.00% | | 12/01/32 | | 1,090,294 |
| 1,000,000 | | MS St, Ser C
| | 4.00% | | 10/01/39 | | 1,024,991 |
| 500,000 | | W Rankin MS Util Auth Rev, AGM
| | 5.00% | | 01/01/32 | | 532,441 |
| 1,215,000 | | W Rankin MS Util Auth Rev, AGM
| | 5.00% | | 01/01/33 | | 1,293,832 |
| | | | | 6,152,120 |
| | | Missouri – 1.0% | | | | | | |
| 285,000 | | Bridgeton MO Spl Oblig Rev Ref, Ser A
| | 4.00% | | 12/01/30 | | 301,283 |
| 300,000 | | Bridgeton MO Spl Oblig Rev Ref, Ser A
| | 4.00% | | 12/01/31 | | 316,088 |
| 220,000 | | Jackson Cnty MO Spl Oblig Ref Truman Sports Complex Proj
| | 5.00% | | 12/01/22 | | 223,859 |
| 700,000 | | Jackson Cnty MO Spl Oblig Ref Truman Sports Complex Proj
| | 5.00% | | 12/01/31 | | 744,158 |
| 1,670,000 | | Joplin MO Indl Dev Auth Hlth Facs Rev Ref Freeman Hlth Sys
| | 5.00% | | 02/15/26 | | 1,736,579 |
| 2,000,000 | | Kansas City MO Indl Dev Auth Arpt Spl Oblig Kansas City Intrnl Arpt Terminal Mod Proj, Ser B, AMT
| | 5.00% | | 03/01/46 | | 2,108,416 |
| 220,000 | | Lincoln Cnty MO Pub Wtr Sply Dist #1 Ref, COPS
| | 4.00% | | 07/01/30 | | 227,927 |
| 415,000 | | Lincoln Cnty MO Pub Wtr Sply Dist #1 Ref, COPS
| | 4.00% | | 07/01/31 | | 429,460 |
| 1,000,000 | | Lincoln Cnty MO Pub Wtr Sply Dist #1 Ref, COPS
| | 4.00% | | 07/01/38 | | 1,017,999 |
| 3,000,000 | | MO Jt Muni Elec Util Commn Pwr Proj Rev Ref, Ser A
| | 5.00% | | 12/01/40 | | 3,207,725 |
Page 28
See Notes to Financial Statements
First Trust Managed Municipal ETF (FMB)
Portfolio of Investments (Continued)
April 30, 2022 (Unaudited)
Principal
Value | | Description | | Stated
Coupon | | Stated
Maturity | | Value |
| MUNICIPAL BONDS (Continued) |
| | | Missouri (Continued) | | | | | | |
| $440,000 | | MO St Hlth & Eductnl Facs Auth Hlth Facs Rev Bethesda Hlth Grp Inc Ref
| | 4.00% | | 08/01/36 | | $444,730 |
| 410,000 | | MO St Hlth & Eductnl Facs Auth Hlth Facs Rev Bethesda Hlth Grp Inc Ref
| | 4.00% | | 08/01/41 | | 408,344 |
| 1,200,000 | | MO St Hlth & Eductnl Facs Auth Hlth Facs Rev Ref Coxhealth, Ser A
| | 5.00% | | 11/15/32 | | 1,288,983 |
| 750,000 | | MO St Hlth & Eductnl Facs Auth Hlth Facs Rev Ref Mosaic Hlth Sys, Ser A
| | 5.00% | | 02/15/32 | | 829,850 |
| 710,000 | | MO St Hlth & Eductnl Facs Auth Hlth Facs Rev Ref Mosaic Hlth Sys, Ser A
| | 4.00% | | 02/15/39 | | 705,662 |
| 160,000 | | MO St Hlth & Eductnl Facs Auth Lutheran Sr Svcs
| | 5.00% | | 02/01/23 | | 162,592 |
| 245,000 | | MO St Hlth & Eductnl Facs Auth Lutheran Sr Svcs
| | 5.00% | | 02/01/25 | | 253,130 |
| 1,000,000 | | MO St Hlth & Eductnl Facs Auth Lutheran Sr Svcs Projs
| | 4.00% | | 02/01/27 | | 1,018,571 |
| 650,000 | | MO St Hlth & Eductnl Facs Auth Lutheran Sr Svcs Projs
| | 4.00% | | 02/01/28 | | 660,990 |
| 1,960,000 | | MO St Hlth & Eductnl Facs Auth Lutheran Sr Svcs Projs
| | 4.00% | | 02/01/29 | | 1,986,535 |
| 2,120,000 | | MO St Hlth & Eductnl Facs Auth Lutheran Sr Svcs Projs
| | 4.00% | | 02/01/31 | | 2,132,351 |
| 1,105,000 | | MO St Hlth & Eductnl Facs Auth Lutheran Sr Svcs Projs
| | 4.00% | | 02/01/32 | | 1,103,178 |
| 1,040,000 | | Saint Louis MO Muni Fin Corp Sales Tax Leasehold Rev Ref
| | 5.00% | | 02/15/28 | | 1,122,626 |
| | | | | 22,431,036 |
| | | Montana – 0.5% | | | | | | |
| 1,080,000 | | MT St Fac Fin Auth Hlthcare Facs Rev Montana Children’s Home and Hosp Proj, Ser A
| | 4.00% | | 07/01/35 | | 1,085,250 |
| 2,395,000 | | MT St Fac Fin Auth Hlthcare Facs Rev Montana Children’s Home and Hosp Proj, Ser A
| | 4.00% | | 07/01/40 | | 2,366,501 |
| 770,000 | | MT St Fac Fin Auth Hlthcare Facs Rev Montana Children’s Home and Hosp Proj, Ser B
| | 5.00% | | 07/01/31 | | 876,497 |
| 1,105,000 | | MT St Fac Fin Auth Hlthcare Facs Rev Montana Children’s Home and Hosp Proj, Ser B
| | 5.00% | | 07/01/32 | | 1,255,363 |
| 1,165,000 | | MT St Fac Fin Auth Hlthcare Facs Rev Montana Children’s Home and Hosp Proj, Ser B
| | 5.00% | | 07/01/33 | | 1,320,850 |
| 740,000 | | MT St Fac Fin Auth Rev Ref
| | 5.00% | | 02/15/25 | | 785,433 |
| 130,000 | | MT St Fac Fin Auth Rev Ref
| | 5.00% | | 02/15/29 | | 142,079 |
| 2,000,000 | | MT St Fac Fin Auth Rev Ref Scl Hlth Sys, Ser A
| | 4.00% | | 01/01/36 | | 2,016,093 |
| | | | | 9,848,066 |
| | | Nebraska – 0.4% | | | | | | |
| 1,745,000 | | Centrl Plains Energy Proj NE Gas Proj Rev Proj #3
| | 5.00% | | 09/01/27 | | 1,762,201 |
| 300,000 | | Centrl Plains Energy Proj NE Gas Proj Rev Proj No. 4
| | 5.00% | | 01/01/24 | | 308,393 |
| 5,870,000 | | Centrl Plains Energy Proj NE Gas Proj Rev Ref Proj #3, Ser A
| | 5.00% | | 09/01/29 | | 6,431,302 |
| 500,000 | | NE St Pub Pwr Dist Rev Gen, Ser C
| | 5.00% | | 01/01/35 | | 538,242 |
| | | | | 9,040,138 |
| | | Nevada – 0.4% | | | | | | |
| 750,000 | | Carson City NV Hosp Rev Ref Carson Tahoe Regl Med Ctr, Ser A
| | 5.00% | | 09/01/30 | | 810,539 |
| 1,685,000 | | Clark Cnty NV Detention Ctr
| | 4.00% | | 06/01/35 | | 1,772,151 |
| 870,000 | | Clark Cnty NV Impt Dist Ref Spl Loc Impt #151
| | 4.50% | | 08/01/23 | | 881,524 |
| 275,000 | | Clark Cnty NV Sch Dist Ref Bldg, Ser A, BAM
| | 5.00% | | 06/15/30 | | 302,599 |
| 250,000 | | Las Vegas NV Spl Impt Dist #616 Spl Impt Dist No 816 Summerlin Vlg 22
| | 2.25% | | 06/01/27 | | 230,288 |
| 250,000 | | Las Vegas NV Spl Impt Dist #616 Spl Impt Dist No 816 Summerlin Vlg 22
| | 2.50% | | 06/01/28 | | 228,669 |
| 385,000 | | Las Vegas NV Spl Impt Dist #808 & #810 Ref
| | 5.00% | | 06/01/22 | | 385,643 |
| 120,000 | | N Las Vegas NV Loc Impt Vly Vista Spl Impt Dist #64
| | 3.50% | | 06/01/24 | | 120,445 |
| 140,000 | | N Las Vegas NV Loc Impt Vly Vista Spl Impt Dist #64
| | 3.75% | | 06/01/25 | | 141,341 |
See Notes to Financial Statements
Page 29
First Trust Managed Municipal ETF (FMB)
Portfolio of Investments (Continued)
April 30, 2022 (Unaudited)
Principal
Value | | Description | | Stated
Coupon | | Stated
Maturity | | Value |
| MUNICIPAL BONDS (Continued) |
| | | Nevada (Continued) | | | | | | |
| $175,000 | | N Las Vegas NV Loc Impt Vly Vista Spl Impt Dist #64
| | 3.75% | | 06/01/26 | | $176,397 |
| 245,000 | | N Las Vegas NV Loc Impt Vly Vista Spl Impt Dist #64
| | 3.75% | | 06/01/27 | | 245,703 |
| 335,000 | | NV Dept of Busn & Ind NV Doral Acdmy, Ser A (b)
| | 5.00% | | 07/15/27 | | 351,728 |
| 300,000 | | Reno NV Capital Impt Rev Ref, Ser A-1, AGM
| | 5.00% | | 06/01/29 | | 329,205 |
| 950,000 | | Reno NV Capital Impt Rev Ref, Ser A-1, AGM
| | 5.00% | | 06/01/30 | | 1,040,135 |
| 275,000 | | Reno NV Capital Impt Rev Ref, Ser A-1, AGM
| | 5.00% | | 06/01/31 | | 299,738 |
| 825,000 | | Sparks NV Tourism Impt Dist #1 Rev Ref Sales Tax Sr, Ser A (b)
| | 2.50% | | 06/15/24 | | 810,770 |
| | | | | 8,126,875 |
| | | New Hampshire – 0.2% | | | | | | |
| 1,000,000 | | Natl Fin Auth NH Sol Wst Disp Rev Var Ref Wst Mgmt Inc Proj, Ser A-1, AMT (Mandatory put 07/01/24)
| | 2.15% | | 09/01/25 | | 976,794 |
| 2,740,000 | | NH St Hlth & Edu Facs Auth Rev Concord Hosp Trust
| | 5.00% | | 10/01/42 | | 2,998,907 |
| | | | | 3,975,701 |
| | | New Jersey – 2.0% | | | | | | |
| 2,155,000 | | NJ St COVID-19 Go Emergency Bonds, Ser A
| | 5.00% | | 06/01/27 | | 2,358,400 |
| 1,500,000 | | NJ St COVID-19 Go Emergency Bonds, Ser A
| | 5.00% | | 06/01/29 | | 1,677,414 |
| 450,000 | | NJ St Econ Dev Auth Mtr Vehcl Surcharge Rev Ref, Subser A, BAM
| | 5.00% | | 07/01/28 | | 491,067 |
| 500,000 | | NJ St Econ Dev Auth Ref, Ser A, BAM
| | 5.00% | | 06/15/23 | | 515,881 |
| 5,000,000 | | NJ St Econ Dev Auth Rev NJ Transit Transprtn Proj, Ser A
| | 5.00% | | 11/01/44 | | 5,248,615 |
| 350,000 | | NJ St Econ Dev Auth Rev Self Designated Social Bonds, Ser QQQ
| | 4.00% | | 06/15/35 | | 345,538 |
| 490,000 | | NJ St Econ Dev Auth Spl Fac Rev Ref Port Newark Container Terminal LLC Proj, AMT
| | 5.00% | | 10/01/25 | | 523,343 |
| 1,000,000 | | NJ St Hlthcare Facs Fing Auth Rev Ref Hackensack Meridian Hlth, Ser A
| | 5.00% | | 07/01/24 | | 1,049,047 |
| 1,290,000 | | NJ St Transprtn Trust Fund Auth Cap Apprec Transprtn Sys, Ser C, AMBAC
| | (e) | | 12/15/25 | | 1,144,557 |
| 165,000 | | NJ St Transprtn Trust Fund Auth Fed Hwy Reimb Nts, Ser A-1, GARVEE
| | 5.00% | | 06/15/28 | | 177,860 |
| 1,750,000 | | NJ St Transprtn Trust Fund Auth Ref Transprtn Sys Bonds, Ser A
| | 5.00% | | 12/15/28 | | 1,918,263 |
| 3,040,000 | | NJ St Transprtn Trust Fund Auth Ref Transprtn Sys, Ser A
| | 5.00% | | 12/15/26 | | 3,289,758 |
| 500,000 | | NJ St Transprtn Trust Fund Auth Ref Transprtn Sys, Ser A
| | 5.00% | | 12/15/30 | | 543,209 |
| 1,000,000 | | NJ St Transprtn Trust Fund Auth Transprtn Prog Bonds, Ser AA
| | 5.00% | | 06/15/34 | | 1,072,788 |
| 400,000 | | NJ St Transprtn Trust Fund Auth Transprtn Prog, Ser AA
| | 4.00% | | 06/15/27 | | 401,263 |
| 2,615,000 | | NJ St Transprtn Trust Fund Auth Transprtn Sys, Ser A, AGM
| | 5.25% | | 12/15/22 | | 2,671,285 |
| 1,400,000 | | NJ St Transprtn Trust Fund Auth Transprtn Sys, Ser D
| | 5.25% | | 12/15/23 | | 1,457,412 |
| 105,000 | | NJ St Transprtn Trust Fund Auth Transprtn Sys, Ser D
| | 5.00% | | 12/15/24 | | 110,672 |
| 220,000 | | NJ St Transprtn Trust Fund Auth, Ser BB
| | 5.00% | | 06/15/31 | | 238,471 |
| 1,000,000 | | NJ St Transprtn Trust Fund Auth, Ser BB
| | 5.00% | | 06/15/33 | | 1,076,375 |
| 2,465,000 | | NJ St Turnpike Auth Turnpike Rev Ref, Ser G
| | 4.00% | | 01/01/43 | | 2,472,898 |
| 500,000 | | Tobacco Stlmt Fing Corp NJ Ref, Ser A
| | 5.00% | | 06/01/27 | | 538,218 |
| 1,850,000 | | Tobacco Stlmt Fing Corp NJ Ref, Ser A
| | 5.00% | | 06/01/37 | | 1,970,694 |
| 5,505,000 | | Tobacco Stlmt Fing Corp NJ Ref, Ser A
| | 5.25% | | 06/01/46 | | 5,882,027 |
| 6,010,000 | | Tobacco Stlmt Fing Corp NJ Ref, Subser B
| | 5.00% | | 06/01/46 | | 6,275,182 |
| | | | | 43,450,237 |
| | | New Mexico – 0.5% | | | | | | |
| 325,000 | | Albuquerque NM Muni Sch Dist #12, Ser A
| | 4.00% | | 08/01/32 | | 346,836 |
| 500,000 | | Albuquerque NM Muni Sch Dist #12, Ser A
| | 4.00% | | 08/01/35 | | 531,300 |
| 400,000 | | Albuquerque NM Muni Sch Dist #12, Ser A
| | 4.00% | | 08/01/36 | | 424,602 |
| 265,000 | | Albuquerque NM Refuse Removal & Disp Rev
| | 5.00% | | 07/01/31 | | 306,621 |
| 185,000 | | Albuquerque NM Refuse Removal & Disp Rev
| | 5.00% | | 07/01/32 | | 213,635 |
Page 30
See Notes to Financial Statements
First Trust Managed Municipal ETF (FMB)
Portfolio of Investments (Continued)
April 30, 2022 (Unaudited)
Principal
Value | | Description | | Stated
Coupon | | Stated
Maturity | | Value |
| MUNICIPAL BONDS (Continued) |
| | | New Mexico (Continued) | | | | | | |
| $290,000 | | Albuquerque NM Refuse Removal & Disp Rev
| | 5.00% | | 07/01/33 | | $334,208 |
| 1,500,000 | | Farmington NM Poll Control Rev Ref Pub Svc NM San Juan Remk, Ser E (Mandatory put 06/01/24)
| | 1.15% | | 06/01/40 | | 1,438,298 |
| 565,000 | | Los Ranchos De Albuquerque NM Eductnl Facs Rev Ref Albuquerque Acdmy Proj
| | 4.00% | | 09/01/33 | | 583,465 |
| 375,000 | | Los Ranchos De Albuquerque NM Eductnl Facs Rev Ref Albuquerque Acdmy Proj
| | 4.00% | | 09/01/34 | | 386,689 |
| 300,000 | | Los Ranchos De Albuquerque NM Eductnl Facs Rev Ref Albuquerque Acdmy Proj
| | 4.00% | | 09/01/35 | | 308,954 |
| 300,000 | | Lower Petroglyphs Pub Impt Dist NM Spl Levy Rev Ref
| | 4.00% | | 10/01/23 | | 299,137 |
| 230,000 | | Lower Petroglyphs Pub Impt Dist NM Spl Levy Rev Ref
| | 4.20% | | 10/01/24 | | 228,951 |
| 240,000 | | Lower Petroglyphs Pub Impt Dist NM Spl Levy Rev Ref
| | 4.30% | | 10/01/25 | | 238,564 |
| 250,000 | | Lower Petroglyphs Pub Impt Dist NM Spl Levy Rev Ref
| | 4.45% | | 10/01/26 | | 247,919 |
| 260,000 | | Lower Petroglyphs Pub Impt Dist NM Spl Levy Rev Ref
| | 4.55% | | 10/01/27 | | 257,168 |
| 365,000 | | Lower Petroglyphs Pub Impt Dist NM Spl Levy Rev Ref
| | 5.00% | | 10/01/33 | | 366,701 |
| 825,000 | | NM St Hosp Equipment Loan Council Hosp Rev Ref
| | 5.00% | | 06/01/32 | | 924,534 |
| 1,000,000 | | NM St Hosp Equipment Loan Council Hosp Rev Ref
| | 4.00% | | 06/01/33 | | 1,007,019 |
| 1,360,000 | | NM St Hosp Equipment Loan Council Hosp Rev Ref
| | 4.00% | | 06/01/34 | | 1,367,563 |
| 520,000 | | Santa Fe NM Retmnt Fac Rev El Castillo Retmnt Proj, Ser A
| | 5.00% | | 05/15/34 | | 541,883 |
| | | | | 10,354,047 |
| | | New York – 5.5% | | | | | | |
| 460,000 | | Buffalo NY Muni Wtr Fin Auth, Ser A, AGM
| | 4.00% | | 07/01/49 | | 469,898 |
| 715,000 | | Hempstead Town NY Loc Dev Corp Rev Ref Hofstra Univ Proj, Ser A
| | 4.00% | | 07/01/40 | | 706,492 |
| 175,000 | | Long Island NY Pwr Auth Elec Sys Rev Ref, Ser A
| | 5.00% | | 09/01/38 | | 196,425 |
| 500,000 | | Long Island NY Pwr Auth Elec Sys Rev Ref, Ser A
| | 4.00% | | 09/01/39 | | 502,793 |
| 5,000,000 | | Met Transprtn Auth NY Rev Green Bond Grp 1 Cr, Ser C, AGM
| | 5.00% | | 11/15/40 | | 5,434,526 |
| 2,150,000 | | Met Transprtn Auth NY Rev Ref Transprtn, Subser C-1
| | 5.00% | | 11/15/34 | | 2,252,839 |
| 4,000,000 | | Met Transprtn Auth NY Rev Transprtn, Subser D-1
| | 5.00% | | 11/15/39 | | 4,144,189 |
| 8,200,000 | | Met Transprtn Auth NY Rev, Ser B-1, BANS
| | 5.00% | | 05/15/22 | | 8,209,322 |
| 840,000 | | Monroe Cnty NY Indl Dev Corp Rev Ref Nazareth Clg of Rochester Proj, Ser A
| | 5.00% | | 10/01/23 | | 868,497 |
| 750,000 | | New York City NY Muni Wtr Fin Auth Wtr & Swr Sys Rev 2nd Gen Resolution, Sec CC-1
| | 4.00% | | 06/15/42 | | 751,835 |
| 2,500,000 | | New York City NY Muni Wtr Fin Auth Wtr & Swr Sys Rev 2nd Gen Resolution, Ser BB-1
| | 5.00% | | 06/15/49 | | 2,731,716 |
| 3,550,000 | | New York City NY Muni Wtr Fin Auth Wtr & Swr Sys Rev 2nd Gen Resolution, Ser DD-1
| | 4.00% | | 06/15/37 | | 3,619,243 |
| 915,000 | | New York City NY Muni Wtr Fin Auth Wtr & Swr Sys Rev Ref 2nd Gen Resolution Fiscal 2018, Ser FF
| | 5.00% | | 06/15/39 | | 996,780 |
| 4,285,000 | | New York City NY Muni Wtr Fin Auth Wtr & Swr Sys Rev Ref 2nd Gen Resolution, Subser CC-1
| | 4.00% | | 06/15/33 | | 4,473,029 |
| 2,450,000 | | New York City NY Muni Wtr Fin Auth Wtr & Swr Sys Rev Ref Subord, Subser FF-2
| | 4.00% | | 06/15/41 | | 2,456,852 |
| 1,000,000 | | New York City NY Transitional Fin Auth Rev Future Tax Secured Sub Fiscal 2016, Ser A-1
| | 5.00% | | 08/01/37 | | 1,062,960 |
| 1,500,000 | | New York City NY Transitional Fin Auth Rev Future Tax Sub, Subser E-1
| | 5.00% | | 02/01/37 | | 1,607,615 |
| 1,350,000 | | New York City NY Transitional Fin Auth Rev Sub Future Tax Secured Fiscal 1999, Ser A, Subser E-1
| | 5.00% | | 02/01/36 | | 1,458,460 |
| 5,415,000 | | New York City NY Transitional Fin Auth Rev Sub Future Tax Secured Fiscal 1999, Ser A, Subser E-1
| | 5.00% | | 02/01/40 | | 5,830,252 |
| 13,000,000 | | New York City NY Transitional Fin Auth Rev Sub, Ser B-1
| | 4.00% | | 11/01/39 | | 13,100,490 |
| 3,605,000 | | New York City NY Transitional Fin Auth Rev Sub, Ser B-1
| | 4.00% | | 11/01/43 | | 3,581,606 |
See Notes to Financial Statements
Page 31
First Trust Managed Municipal ETF (FMB)
Portfolio of Investments (Continued)
April 30, 2022 (Unaudited)
Principal
Value | | Description | | Stated
Coupon | | Stated
Maturity | | Value |
| MUNICIPAL BONDS (Continued) |
| | | New York (Continued) | | | | | | |
| $2,055,000 | | New York City NY Transitional Fin Auth Rev Subord, Ser A-3
| | 4.00% | | 05/01/43 | | $2,041,862 |
| 10,400,000 | | NY NY Adj Fiscal 2020, Subser B-3 (a)
| | 0.64% | | 10/01/46 | | 10,400,000 |
| 415,000 | | NY NY Fiscal 2020, Ser B-1
| | 4.00% | | 10/01/37 | | 418,414 |
| 5,690,000 | | NY NY Fiscal 2020, Ser B-1
| | 4.00% | | 10/01/40 | | 5,706,818 |
| 1,015,000 | | NY NY, Subser F-1
| | 5.00% | | 04/01/36 | | 1,104,059 |
| 300,000 | | NY St Dorm Auth Revs Non St Supported Debt Ref Orange Regl Med Ctr (b)
| | 5.00% | | 12/01/25 | | 323,233 |
| 475,000 | | NY St Dorm Auth Revs Non St Supported Debt, Ser A, AGM
| | 4.00% | | 10/01/35 | | 505,919 |
| 8,020,000 | | NY St Dorm Auth Sales Tax Rev Ref Sales & Use Tax, Ser C Bid Grp 3
| | 5.00% | | 03/15/36 | | 8,723,571 |
| 2,850,000 | | NY St Dorm Auth St Personal Income Tax Rev Ref, Ser E
| | 5.00% | | 03/15/34 | | 3,054,318 |
| 2,000,000 | | NY St Transprtn Dev Corp Spl Fac Rev Delta Air Lines Inc LaGuardia Arpt Terminals C&D Redev, AMT
| | 4.00% | | 10/01/30 | | 1,973,235 |
| 2,720,000 | | NY St Transprtn Dev Corp Spl Fac Rev Delta Air Lines Inc LaGuardia Arpt Terminals C&D Redev, AMT
| | 5.00% | | 10/01/35 | | 2,881,671 |
| 200,000 | | NY St Urban Dev Corp Rev Ref St Personal Income Tax Rev, Ser C
| | 5.00% | | 03/15/44 | | 219,868 |
| 2,000,000 | | Onondaga Cnty NY Trust Cultural Res Rev Ref Syracuse Univ Proj
| | 5.00% | | 12/01/39 | | 2,216,348 |
| 500,000 | | Port Auth of NY & NJ NY Consol One Hundred Eighty Fifth Ref, AMT
| | 5.00% | | 09/01/23 | | 517,873 |
| 465,000 | | Port Auth of NY & NJ NY Ref Consol, Ser 186, AMT
| | 5.00% | | 10/15/35 | | 484,348 |
| 5,000,000 | | Port Auth of NY & NJ NY Ref Consol, Ser 198
| | 5.25% | | 11/15/56 | | 5,350,681 |
| 700,000 | | Suffolk NY Tobacco Asset Securitization Corp Tobacco Stlmt Ref Tobacco Stlmt Asset Backed Sr Bonds, Ser A-2
| | 4.00% | | 06/01/50 | | 679,272 |
| 8,000,000 | | Tsasc Inc NY Tsasc Inc Rev Ref Turbo, Subser B
| | 5.00% | | 06/01/45 | | 8,103,393 |
| 400,000 | | Yonkers NY Econ Dev Corp Eductnl Rev Chrt Sch Edu Excellence Proj, Ser A
| | 4.00% | | 10/15/29 | | 391,912 |
| | | | | 119,552,614 |
| | | North Carolina – 1.1% | | | | | | |
| 250,000 | | Buncombe Cnty NC Ltd Oblig Ref Rev, Ser A
| | 5.00% | | 06/01/29 | | 286,919 |
| 375,000 | | Buncombe Cnty NC Ltd Oblig Ref Rev, Ser A
| | 5.00% | | 06/01/30 | | 434,861 |
| 930,000 | | Charlotte NC Ref, Ser C, COPS
| | 4.00% | | 06/01/36 | | 968,164 |
| 575,000 | | Charlotte-Mecklenburg NC Hosp Auth Hlthcare Sys Rev Ref Carolinas Hlthcare Sys, Ser A
| | 5.00% | | 01/15/34 | | 617,498 |
| 750,000 | | Greenville NC Comb Enterprise Sys Rev Ref
| | 5.00% | | 04/01/28 | | 817,958 |
| 1,330,000 | | Monroe NC Comb Enterprise Sys Rev Ref
| | 5.00% | | 03/01/28 | | 1,450,425 |
| 1,000,000 | | NC St Agric & Tech Univ Ref Gen, Ser A
| | 5.00% | | 10/01/40 | | 1,076,939 |
| 400,000 | | NC St Capital Facs Fin Agy Eductnl Facs Rev Ref High Point Univ
| | 5.00% | | 05/01/28 | | 439,745 |
| 775,000 | | NC St Capital Facs Fin Agy Eductnl Facs Rev Ref High Point Univ
| | 5.00% | | 05/01/29 | | 860,815 |
| 900,000 | | NC St Capital Facs Fin Agy Stdt Rev Ref Hsg NC A&T Univ Fdtn Proj, Ser A, AGC
| | 5.00% | | 06/01/26 | | 960,657 |
| 1,270,000 | | NC St Med Care Commn Hlthcare Facs Rev the Presbyterian Homes Oblig Grp, Ser A
| | 5.00% | | 10/01/45 | | 1,333,058 |
| 1,500,000 | | NC St Med Care Commn Retmnt Facs Rev Pennybyrn at Maryfield Proj, Ser A
| | 5.00% | | 10/01/50 | | 1,484,215 |
| 630,000 | | NC St Med Care Commn Retmnt Facs Rev Ref United Methodist Retmnt Homes, Ser A
| | 5.00% | | 10/01/29 | | 671,535 |
| 470,000 | | NC St Med Care Commn Retmnt Facs Rev Ref United Methodist Retmnt Homes, Ser A
| | 5.00% | | 10/01/32 | | 500,987 |
| 750,000 | | NC St Med Care Commn Retmnt Facs Rev Ref United Methodist Retmnt Homes, Ser A
| | 5.00% | | 10/01/37 | | 799,447 |
Page 32
See Notes to Financial Statements
First Trust Managed Municipal ETF (FMB)
Portfolio of Investments (Continued)
April 30, 2022 (Unaudited)
Principal
Value | | Description | | Stated
Coupon | | Stated
Maturity | | Value |
| MUNICIPAL BONDS (Continued) |
| | | North Carolina (Continued) | | | | | | |
| $500,000 | | NC St Med Care Commn Retmnt Facs Rev Ref United Methodist Retmnt Homes, Ser A
| | 5.00% | | 10/01/47 | | $532,965 |
| 3,000,000 | | NC St Turnpike Auth Ref Sr Lien, AGM
| | 5.00% | | 01/01/38 | | 3,341,391 |
| 5,715,000 | | NC St Turnpike Auth Sr Lien Triangle Expressway Sys, AGM
| | 5.00% | | 01/01/49 | | 6,287,519 |
| | | | | 22,865,098 |
| | | North Dakota – 0.0% | | | | | | |
| 500,000 | | Grand Forks ND Hlthcare Sys Rev Altru Hlth Sys Ref
| | 4.00% | | 12/01/36 | | 499,269 |
| | | Ohio – 3.8% | | | | | | |
| 750,000 | | Akron Bath Copley Jt Twp OH Hosp Dist Ref Summa Hlth Oblig Grp Hosp Facs Rev
| | 4.00% | | 11/15/35 | | 742,643 |
| 900,000 | | Akron Bath Copley Jt Twp OH Hosp Dist Ref Summa Hlth Oblig Grp Hosp Facs Rev
| | 4.00% | | 11/15/36 | | 889,011 |
| 2,600,000 | | Allen Cnty OH Hosp Facs Rev Ref, Ser A
| | 5.00% | | 08/01/42 | | 2,788,361 |
| 1,500,000 | | American Muni Pwr OH Inc OH Rev Ref Fremont Energy Ctr Proj, Ser A
| | 4.00% | | 02/15/36 | | 1,551,758 |
| 500,000 | | American Muni Pwr OH Inc OH Rev Ref Fremont Energy Ctr Proj, Ser A
| | 4.00% | | 02/15/37 | | 512,618 |
| 5,000,000 | | American Muni Pwr OH Inc OH Rev Ref Prairie St Energy Cmps Proj, Ser A
| | 4.00% | | 02/15/36 | | 5,155,436 |
| 100,000 | | Bowling Green OH St Univ Ref, Ser A
| | 4.00% | | 06/01/38 | | 102,177 |
| 195,000 | | Bowling Green OH St Univ Ref, Ser A
| | 4.00% | | 06/01/39 | | 198,910 |
| 1,000,000 | | Buckeye OH Tobacco Stlmt Fing Auth Ref Sr, Ser A-2, Class 1
| | 4.00% | | 06/01/38 | | 977,907 |
| 1,850,000 | | Buckeye OH Tobacco Stlmt Fing Auth Ref Sr, Ser A-2, Class 1
| | 4.00% | | 06/01/39 | | 1,802,970 |
| 4,900,000 | | Buckeye OH Tobacco Stlmt Fing Auth Ref Sr, Ser B-2, Class 2
| | 5.00% | | 06/01/55 | | 4,772,843 |
| 135,000 | | Butler Cnty OH Hosp Facs Ref UC Hlth
| | 5.00% | | 11/15/30 | | 148,166 |
| 1,500,000 | | Butler Cnty OH Hosp Facs Ref UC Hlth
| | 5.00% | | 11/15/31 | | 1,642,290 |
| 1,000,000 | | Butler Cnty OH Hosp Facs Ref UC Hlth
| | 5.00% | | 11/15/32 | | 1,093,796 |
| 370,000 | | Butler Cnty OH Port Auth Econdev Lease Rev Ref Cmnty First Solutions Oblg Grp Proj, Ser A
| | 4.00% | | 05/15/46 | | 380,421 |
| 1,000,000 | | Chillicothe OH City Sch Dist Ref, AGM
| | 4.00% | | 12/01/31 | | 1,030,164 |
| 80,000 | | Cleveland OH Pub Pwr Sys Rev Prerefunded Ref, Ser A, AGM
| | 5.00% | | 11/15/24 | | 85,077 |
| 1,000,000 | | Cleveland OH Pub Pwr Sys Rev Ref, Ser A, AGM
| | 4.00% | | 11/15/35 | | 1,054,195 |
| 420,000 | | Cleveland OH Pub Pwr Sys Rev Unrefunded Ref, Ser A, AGM
| | 5.00% | | 11/15/24 | | 446,089 |
| 1,255,000 | | Columbus OH Swr Rev Ref Sys
| | 5.00% | | 06/01/26 | | 1,335,789 |
| 1,485,000 | | Cuyahoga Falls OH City Sch Dist, BAM
| | 4.00% | | 12/01/51 | | 1,532,459 |
| 5,000,000 | | Gallia Cnty OH Hosp Facs Rev Ref & Impt Holzer Hlth Sys Oblig Grp, Ser A
| | 8.00% | | 07/01/42 | | 5,051,484 |
| 700,000 | | Hamilton Cnty OH Hlthcare Facs Rev Christ Hosp Proj
| | 5.25% | | 06/01/27 | | 702,205 |
| 310,000 | | Hamilton Cnty OH Hosp Facs Rev Ref Trihealth Inc Oblig Grp Proj, Ser A
| | 5.00% | | 08/15/31 | | 350,931 |
| 250,000 | | Hamilton Cnty OH Hosp Facs Rev Ref Trihealth Inc Oblig Grp Proj, Ser A
| | 5.00% | | 08/15/32 | | 282,439 |
| 380,000 | | Hamilton Cnty OH Hosp Facs Rev Ref Trihealth Inc Oblig Grp Proj, Ser A
| | 5.00% | | 08/15/33 | | 428,467 |
| 2,100,000 | | Hamilton Cnty OH Hosp Facs Rev UC Hlth
| | 4.00% | | 09/15/50 | | 2,025,352 |
| 1,000,000 | | Lancaster OH Port Auth Gas Rev Ref, Ser A (Mandatory put 02/01/25)
| | 5.00% | | 08/01/49 | | 1,045,616 |
| 960,000 | | Miami Cnty OH Hosp Facs Rev Ref & Impt Kettering Hlth Network Oblig Grp
| | 5.00% | | 08/01/32 | | 1,059,797 |
| 1,000,000 | | Miami Cnty OH Hosp Facs Rev Ref & Impt Kettering Hlth Network Oblig Grp
| | 5.00% | | 08/01/33 | | 1,102,231 |
| 3,000,000 | | Miami Cnty OH Hosp Facs Rev Ref & Impt Kettering Hlth Network Oblig Grp
| | 5.00% | | 08/01/36 | | 3,296,743 |
See Notes to Financial Statements
Page 33
First Trust Managed Municipal ETF (FMB)
Portfolio of Investments (Continued)
April 30, 2022 (Unaudited)
Principal
Value | | Description | | Stated
Coupon | | Stated
Maturity | | Value |
| MUNICIPAL BONDS (Continued) |
| | | Ohio (Continued) | | | | | | |
| $575,000 | | Miamisburg OH City Sch Dist Ref
| | 5.00% | | 12/01/35 | | $624,646 |
| 400,000 | | Montgomery Cnty OH Hosp Rev Ref Kettering Hlth Network Oblig Grp Proj
| | 4.00% | | 08/01/37 | | 401,717 |
| 760,000 | | Montgomery Cnty OH Hosp Rev Ref Kettering Hlth Network Oblig Grp Proj
| | 4.00% | | 08/01/41 | | 756,531 |
| 600,000 | | NE OH Med Univ Gen Recpts Ref, Ser A
| | 4.00% | | 12/01/35 | | 604,949 |
| 5,250,000 | | OH St Air Quality Dev Auth Exempt Facs Rev AMG Vanadium Proj, AMT (b)
| | 5.00% | | 07/01/49 | | 5,172,912 |
| 1,000,000 | | OH St Air Quality Dev Auth Ref American Elec Pwr Company Proj Remk, Ser B, AMT (Mandatory put 10/01/24)
| | 2.10% | | 07/01/28 | | 970,441 |
| 2,225,000 | | OH St Air Quality Dev Auth Ref OH Vly Elec Corp Proj, Ser A
| | 3.25% | | 09/01/29 | | 2,071,670 |
| 1,000,000 | | OH St Hgr Edu, Ser A
| | 5.00% | | 05/01/33 | | 1,061,915 |
| 1,000,000 | | OH St Hgr Eductnl Fac Commn Denison Univ Proj
| | 5.00% | | 11/01/38 | | 1,111,635 |
| 1,000,000 | | OH St Hgr Eductnl Fac Commn Ref Rev Judson Oblig Grp 2020 Proj, Ser A
| | 5.00% | | 12/01/45 | | 1,052,673 |
| 700,000 | | OH St Hgr Eductnl Fac Commn Ref Univ of Dayton 2020 Proj
| | 5.00% | | 02/01/35 | | 773,066 |
| 2,700,000 | | OH St Hosp Rev Ref Univ Hosps Hlth Sys Inc, Ser E
| | 4.00% | | 01/15/38 | | 2,711,609 |
| 2,455,000 | | OH St Hosp Rev Ref Univ Hosps Hlth Sys Inc, Ser E
| | 4.00% | | 01/15/40 | | 2,444,656 |
| 150,000 | | OH St Hosp Rev Ref, Ser A
| | 5.00% | | 01/15/33 | | 165,314 |
| 325,000 | | OH St Hosp Rev Ref, Ser A
| | 5.00% | | 01/15/35 | | 355,096 |
| 500,000 | | OH St Hosp Rev Ref, Ser A
| | 4.00% | | 01/15/38 | | 502,428 |
| 2,000,000 | | OH St Spl Oblig, Ser A-2
| | 5.00% | | 04/01/30 | | 2,129,470 |
| 500,000 | | OH St Wtr Dev Auth Wtr Poll Control Rev, Ser B
| | 5.00% | | 12/01/26 | | 553,905 |
| 2,500,000 | | OH St, Ser T
| | 5.00% | | 05/01/32 | | 2,762,569 |
| 6,325,000 | | Ross Cnty OH Hosp Rev Ref Adena Hlth Sys Oblig Grp Proj
| | 5.00% | | 12/01/39 | | 6,898,727 |
| 550,000 | | Sharonville OH Spl Oblg Rev
| | 4.00% | | 12/01/39 | | 574,705 |
| 500,000 | | Sharonville OH Spl Oblg Rev
| | 4.00% | | 12/01/40 | | 521,630 |
| 2,000,000 | | Sthrn OH Port Exempt Fac Rev Purecycle Proj, Ser A, AMT (b)
| | 6.50% | | 12/01/30 | | 1,906,493 |
| 1,800,000 | | Sthrn OH Port Exempt Fac Rev Purecycle Proj, Ser A, AMT (b)
| | 7.00% | | 12/01/42 | | 1,662,083 |
| | | | | 81,379,185 |
| | | Oklahoma – 0.8% | | | | | | |
| 900,000 | | Catoosa OK Indl Auth Sales Tax Rev
| | 4.50% | | 10/01/32 | | 827,996 |
| 6,000,000 | | OK St Dev Fin Auth Sr OK Proton Ctr, Ser A1 (b)
| | 7.25% | | 09/01/51 | | 6,358,955 |
| 500,000 | | OK St Wtr Res Brd Revolving Fund Rev 2019 Master Trust
| | 4.00% | | 04/01/33 | | 531,954 |
| 2,815,000 | | Oklahoma City OK Arpt Trust Junior Lien, AMT
| | 5.00% | | 07/01/34 | | 3,013,184 |
| 1,040,000 | | Oklahoma City OK Arpt Trust Junior Lien, AMT
| | 5.00% | | 07/01/47 | | 1,096,198 |
| 1,000,000 | | Oklahoma Cnty OK Fin Auth Eductnl Facs Lease Rev Midwest City De City Pub Schs Proj
| | 5.00% | | 10/01/25 | | 1,070,185 |
| 1,000,000 | | Oklahoma Cnty OK Fin Auth Eductnl Facs Lease Rev Midwest City De City Pub Schs Proj
| | 5.00% | | 10/01/26 | | 1,087,475 |
| 1,000,000 | | Tulsa Cnty OK Indl Auth Sr Living Cmnty Rev Ref Montereau Inc Proj
| | 5.00% | | 11/15/25 | | 1,067,259 |
| 250,000 | | Tulsa Cnty OK Indl Auth Sr Living Cmnty Rev Ref Montereau Inc Proj
| | 5.00% | | 11/15/26 | | 269,832 |
| 1,000,000 | | Weatherford OK Indl Trust Eductnl Facs Lease Rev Weatherford Pub Schs Proj
| | 5.00% | | 03/01/31 | | 1,124,739 |
| | | | | 16,447,777 |
| | | Oregon – 1.7% | | | | | | |
| 500,000 | | Clackamas Cnty OR Hosp Fac Auth Rev Ref Rose Villa Proj, Ser A
| | 5.25% | | 11/15/50 | | 508,140 |
| 170,000 | | Clackamas Cnty OR Hosp Fac Auth Rev Ref Sr Living Willamette View Proj, Ser A
| | 4.00% | | 05/15/26 | | 170,816 |
Page 34
See Notes to Financial Statements
First Trust Managed Municipal ETF (FMB)
Portfolio of Investments (Continued)
April 30, 2022 (Unaudited)
Principal
Value | | Description | | Stated
Coupon | | Stated
Maturity | | Value |
| MUNICIPAL BONDS (Continued) |
| | | Oregon (Continued) | | | | | | |
| $250,000 | | Clackamas Cnty OR Hosp Fac Auth Rev Ref Sr Living Willamette View Proj, Ser A
| | 5.00% | | 11/15/32 | | $257,416 |
| 3,000,000 | | Marion & Polk Cntys OR Sch Dist #24J Salem, Ser C
| | 4.00% | | 06/15/37 | | 3,124,311 |
| 1,500,000 | | Medford OR Hosp Facs Auth Rev Ref Asante Proj, Ser A
| | 5.00% | | 08/15/35 | | 1,672,939 |
| 1,000,000 | | Medford OR Hosp Facs Auth Rev Ref Asante Proj, Ser A
| | 5.00% | | 08/15/36 | | 1,112,505 |
| 1,080,000 | | Medford OR Hosp Facs Auth Rev Ref Asante Proj, Ser A
| | 5.00% | | 08/15/45 | | 1,178,288 |
| 4,000,000 | | OR St Dept of Admin Svcs Lottery Rev, Ser A
| | 5.00% | | 04/01/34 | | 4,404,712 |
| 2,035,000 | | OR St Dept of Admin Svcs Lottery Rev, Ser A
| | 5.00% | | 04/01/35 | | 2,234,034 |
| 1,100,000 | | OR St Facs Auth Rev Ref Univ Portland, Ser A
| | 5.00% | | 04/01/32 | | 1,169,655 |
| 500,000 | | Oregon City OR
| | 4.00% | | 06/01/37 | | 521,620 |
| 1,060,000 | | Oregon City OR
| | 4.00% | | 06/01/38 | | 1,104,360 |
| 2,450,000 | | Port of Portland OR Arpt Rev Portland Intl Arpt, Ser 25B, AMT
| | 5.00% | | 07/01/37 | | 2,646,911 |
| 2,350,000 | | Port of Portland OR Arpt Rev, Ser 24B, AMT
| | 5.00% | | 07/01/33 | | 2,491,017 |
| 2,500,000 | | Portland OR Swr Sys Rev 2nd Lien, Ser A
| | 4.50% | | 05/01/31 | | 2,667,260 |
| 725,000 | | Tri-Cnty OR Met Transprtn Dist, Ser A
| | 4.00% | | 09/01/39 | | 747,745 |
| 7,975,000 | | Tri-Cnty OR Met Transprtn Dist, Ser A, GARVEE
| | 5.00% | | 10/01/31 | | 8,920,986 |
| 1,000,000 | | Yamhill Cnty OR Hosp Auth Ref Friendsview, Ser A
| | 5.00% | | 11/15/46 | | 943,342 |
| | | | | 35,876,057 |
| | | Pennsylvania – 7.3% | | | | | | |
| 1,500,000 | | Allegheny Cnty PA Hosp Dev Auth Ref Allegheny Hlth Network Oblig Grp Issue, Ser A
| | 5.00% | | 04/01/32 | | 1,640,787 |
| 1,200,000 | | Allegheny Cnty PA Hosp Dev Auth Ref Univ Pittsburgh Med Ctr, Ser A
| | 5.00% | | 07/15/32 | | 1,334,545 |
| 505,000 | | Allegheny Cnty PA Hosp Dev Auth Ref Univ Pittsburgh Med Ctr, Ser A
| | 5.00% | | 07/15/34 | | 559,899 |
| 2,300,000 | | Allegheny Cnty PA Hosp Dev Auth Ref Univ Pittsburgh Med Ctr, Ser A
| | 4.00% | | 07/15/36 | | 2,327,760 |
| 1,095,000 | | Allegheny Cnty PA Hosp Dev Auth Ref Univ Pittsburgh Med Ctr, Ser A
| | 4.00% | | 07/15/37 | | 1,103,765 |
| 7,070,000 | | Allegheny Cnty PA Hosp Dev Auth Ref Univ Pittsburgh Med Ctr, Ser A
| | 4.00% | | 07/15/38 | | 7,115,630 |
| 1,075,000 | | Allegheny Vly PA Jt Sewage Auth Green Bond, BAM
| | 4.00% | | 08/01/47 | | 1,077,028 |
| 900,000 | | Armstrong PA Sch Dist Ref, Ser A, BAM
| | 5.00% | | 03/15/31 | | 1,022,903 |
| 1,055,000 | | Armstrong PA Sch Dist Ref, Ser A, BAM
| | 4.00% | | 03/15/36 | | 1,084,306 |
| 500,000 | | Armstrong PA Sch Dist Ref, Ser A, BAM
| | 4.00% | | 03/15/37 | | 513,255 |
| 460,000 | | Berks Cnty PA Indl Dev Auth Hlthcare Facs Rev Ref Highlands at Wyomissing, Ser A
| | 5.00% | | 05/15/32 | | 484,420 |
| 735,000 | | Bucks Cnty PA Indl Dev Auth Hosp Rev St Luke’s Univ Hlth Network Proj
| | 4.00% | | 08/15/38 | | 737,171 |
| 1,050,000 | | Bucks Cnty PA Indl Dev Auth Hosp Rev St Luke’s Univ Hlth Network Proj
| | 4.00% | | 08/15/44 | | 1,041,835 |
| 1,185,000 | | Bucks Cnty PA Indl Dev Auth Ref Pennswood Vlg Proj, Ser A
| | 5.00% | | 10/01/32 | | 1,258,703 |
| 415,000 | | Bucks Cnty PA Indl Dev Auth Ref Pennswood Vlg Proj, Ser A
| | 5.00% | | 10/01/33 | | 440,512 |
| 765,000 | | Chester Cnty PA Indl Dev Auth Renaissance Acdmy Chrt Sch
| | 5.00% | | 10/01/34 | | 796,593 |
| 2,000,000 | | Cmwlth Fing Auth PA Ref of 2020, Ser A, BAM
| | 5.00% | | 06/01/31 | | 2,263,817 |
| 1,000,000 | | Cmwlth Fing Auth PA Tobacco Master Stlmt Payment Rev Tobacco Master Stlmt Payment Bonds
| | 5.00% | | 06/01/25 | | 1,060,706 |
| 410,000 | | Cmwlth Fing Auth PA Tobacco Master Stlmt Payment Rev Tobacco Master Stlmt Payment Bonds
| | 5.00% | | 06/01/26 | | 440,990 |
| 500,000 | | Colonial PA Sch Dist
| | 5.00% | | 02/15/36 | | 529,870 |
| 300,000 | | Colonial PA Sch Dist, Ser A
| | 5.00% | | 02/15/34 | | 321,616 |
| 270,000 | | Conestoga Vly PA Sch Dist
| | 4.00% | | 02/01/31 | | 283,188 |
| 300,000 | | Conestoga Vly PA Sch Dist
| | 4.00% | | 02/01/32 | | 311,989 |
| 2,910,000 | | Cumberland Cnty PA Muni Auth Penn St Hlth
| | 4.00% | | 11/01/35 | | 2,931,693 |
See Notes to Financial Statements
Page 35
First Trust Managed Municipal ETF (FMB)
Portfolio of Investments (Continued)
April 30, 2022 (Unaudited)
Principal
Value | | Description | | Stated
Coupon | | Stated
Maturity | | Value |
| MUNICIPAL BONDS (Continued) |
| | | Pennsylvania (Continued) | | | | | | |
| $50,000 | | Cumberland Cnty PA Muni Auth Prerefunded Ref Diakon Lutheran Ministries Proj
| | 5.00% | | 01/01/30 | | $53,178 |
| 105,000 | | Cumberland Cnty PA Muni Auth Prerefunded Ref Diakon Lutheran Ministries Proj
| | 5.00% | | 01/01/30 | | 111,673 |
| 145,000 | | Cumberland Cnty PA Muni Auth Prerefunded Ref Diakon Lutheran Ministries Proj
| | 5.00% | | 01/01/30 | | 151,149 |
| 65,000 | | Cumberland Cnty PA Muni Auth Prerefunded Ref Diakon Lutheran Ministries Proj
| | 5.00% | | 01/01/38 | | 69,131 |
| 285,000 | | Cumberland Cnty PA Muni Auth Prerefunded Ref Diakon Lutheran Ministries Proj
| | 5.00% | | 01/01/38 | | 303,112 |
| 350,000 | | Cumberland Cnty PA Muni Auth Prerefunded Ref Diakon Lutheran Ministries Proj
| | 5.00% | | 01/01/38 | | 362,943 |
| 1,150,000 | | Cumberland Cnty PA Muni Auth Ref Diakon Lutheran Social Ministries
| | 5.00% | | 01/01/25 | | 1,216,573 |
| 1,000,000 | | Cumberland Cnty PA Muni Auth Ref Diakon Lutheran Social Ministries
| | 5.00% | | 01/01/33 | | 1,051,781 |
| 1,660,000 | | Cumberland Cnty PA Muni Auth Ref Messiah Vlg Proj
| | 5.00% | | 07/01/28 | | 1,755,868 |
| 490,000 | | Dauphin Cnty PA Gen Auth Hlth sys Rev Ref Pinnacle Hlth Sys Proj, Ser A
| | 5.00% | | 06/01/29 | | 525,091 |
| 280,000 | | Deer Creek PA Drain Basin Allegheny Cnty Swr Rev Ref, AGM
| | 4.00% | | 12/01/34 | | 291,353 |
| 390,000 | | Deer Creek PA Drain Basin Allegheny Cnty Swr Rev Ref, AGM
| | 4.00% | | 12/01/35 | | 404,566 |
| 1,165,000 | | Dover PA Area Sch Dist, BAM
| | 4.00% | | 04/01/32 | | 1,208,034 |
| 100,000 | | Dubois PA Hosp Auth Penn Highlands Hlthcare
| | 5.00% | | 07/15/32 | | 109,746 |
| 115,000 | | Dubois PA Hosp Auth Penn Highlands Hlthcare
| | 5.00% | | 07/15/33 | | 126,009 |
| 245,000 | | Dubois PA Hosp Auth Penn Highlands Hlthcare
| | 5.00% | | 07/15/34 | | 268,153 |
| 290,000 | | Dubois PA Hosp Auth Penn Highlands Hlthcare
| | 5.00% | | 07/15/35 | | 317,087 |
| 1,910,000 | | E Hempfield Twp PA Indl Dev Auth Ref Willow Vly Cmntys Proj
| | 5.00% | | 12/01/27 | | 2,040,421 |
| 715,000 | | E Hempfield Twp PA Indl Dev Auth Ref Willow Vly Cmntys Proj
| | 5.00% | | 12/01/28 | | 762,465 |
| 770,000 | | E Hempfield Twp PA Indl Dev Auth Ref Willow Vly Cmntys Proj
| | 5.00% | | 12/01/29 | | 820,453 |
| 760,000 | | Hermitage PA Muni Auth Ref, Ser C
| | 4.00% | | 02/01/31 | | 806,366 |
| 1,110,000 | | Hermitage PA Muni Auth Ref, Ser C
| | 4.00% | | 02/01/32 | | 1,159,403 |
| 515,000 | | Hermitage PA Muni Auth Ref, Ser C
| | 4.00% | | 02/01/33 | | 537,009 |
| 1,730,000 | | Kiski Vly PA Wtr Poll Control Auth Ref, AGM
| | 4.00% | | 09/01/42 | | 1,751,741 |
| 930,000 | | Kutztown PA Area Sch Dist, AGM
| | 4.00% | | 03/15/35 | | 962,494 |
| 655,000 | | Kutztown PA Area Sch Dist, AGM
| | 4.00% | | 03/15/36 | | 673,195 |
| 480,000 | | Lancaster Cnty PA Hosp Auth Hlthcare Facs Rev Moravian Manors Inc Proj, Ser A
| | 5.00% | | 06/15/30 | | 506,714 |
| 1,110,000 | | Lancaster Cnty PA Hosp Auth Hlthcare Facs Rev Moravian Manors Inc Proj, Ser A
| | 5.00% | | 06/15/38 | | 1,148,892 |
| 1,000,000 | | Lancaster Cnty PA Hosp Auth Penn St Hlth
| | 5.00% | | 11/01/38 | | 1,086,072 |
| 1,000,000 | | Lancaster Cnty PA Hosp Auth Penn St Hlth
| | 5.00% | | 11/01/39 | | 1,082,360 |
| 1,700,000 | | Lancaster Cnty PA Hosp Auth Penn St Hlth
| | 5.00% | | 11/01/41 | | 1,828,062 |
| 2,950,000 | | Lancaster Cnty PA Hosp Auth Penn St Hlth
| | 5.00% | | 11/01/46 | | 3,137,174 |
| 750,000 | | Lancaster Cnty PA Hosp Auth Ref, St Annes Retmnt Cmnty Inc Proj
| | 5.00% | | 03/01/45 | | 731,014 |
| 860,000 | | Lancaster PA Swr Auth Ref
| | 4.00% | | 04/01/30 | | 919,075 |
| 750,000 | | Latrobe PA Indl Dev Auth Univ Rev Ref Seton Hill Univ
| | 4.00% | | 03/01/46 | | 638,636 |
| 2,415,000 | | Latrobe PA Indl Dev Auth Univ Rev Ref Seton Hill Univ
| | 4.00% | | 03/01/51 | | 1,999,193 |
| 405,000 | | Lebanon PA Auth Swr Rev Ref Green Bond, BAM
| | 4.00% | | 12/15/29 | | 426,887 |
| 420,000 | | Lebanon PA Auth Swr Rev Ref Green Bond, BAM
| | 4.00% | | 12/15/30 | | 441,766 |
| 1,550,000 | | Mechanicsburg PA Area Sch Dist, Ser A
| | 4.00% | | 03/01/36 | | 1,588,869 |
| 1,090,000 | | Mechanicsburg PA Area Sch Dist, Ser A
| | 4.00% | | 03/01/38 | | 1,109,500 |
| 300,000 | | Mifflinburg PA Area Sch Dist Ref, Ser A
| | 4.00% | | 06/15/35 | | 311,056 |
| 550,000 | | Mifflinburg PA Area Sch Dist Ref, Ser A
| | 4.00% | | 06/15/36 | | 569,161 |
| 610,000 | | Mifflinburg PA Area Sch Dist Ref, Ser A
| | 4.00% | | 06/15/38 | | 627,133 |
Page 36
See Notes to Financial Statements
First Trust Managed Municipal ETF (FMB)
Portfolio of Investments (Continued)
April 30, 2022 (Unaudited)
Principal
Value | | Description | | Stated
Coupon | | Stated
Maturity | | Value |
| MUNICIPAL BONDS (Continued) |
| | | Pennsylvania (Continued) | | | | | | |
| $1,000,000 | | Montgomery Cnty PA Hgr Edu & Hlth Auth Ref Thomas Jefferson Univ Proj
| | 4.00% | | 09/01/34 | | $1,009,455 |
| 1,000,000 | | Montgomery Cnty PA Hgr Edu & Hlth Auth Ref Thomas Jefferson Univ Proj
| | 4.00% | | 09/01/35 | | 1,008,070 |
| 2,000,000 | | Montgomery Cnty PA Hgr Edu & Hlth Auth Ref Thomas Jefferson Univ Proj
| | 4.00% | | 09/01/44 | | 1,972,859 |
| 50,000 | | Montgomery Cnty PA Indl Dev Auth Acts Retmnt Life Cmntys Ref
| | 5.00% | | 11/15/29 | | 50,064 |
| 480,000 | | Montgomery Cnty PA Indl Dev Auth Ref Meadowood Sr Living Proj, Ser A
| | 5.00% | | 12/01/26 | | 517,357 |
| 100,000 | | Montgomery Cnty PA Indl Dev Auth Ref Waverly Heights Ltd Proj
| | 4.00% | | 12/01/33 | | 104,298 |
| 200,000 | | Montgomery Cnty PA Indl Dev Auth Ref Waverly Heights Ltd Proj
| | 4.00% | | 12/01/34 | | 208,112 |
| 580,000 | | Montgomery Cnty PA Indl Dev Auth Ref Waverly Heights Ltd Proj
| | 5.00% | | 12/01/44 | | 622,472 |
| 140,000 | | Northampton Cnty PA Gen Purp Auth Clg Rev Ref Moravian Clg
| | 5.00% | | 10/01/25 | | 147,031 |
| 225,000 | | Northampton Cnty PA Gen Purp Auth Clg Rev Ref Moravian Clg
| | 5.00% | | 10/01/26 | | 238,359 |
| 540,000 | | Northampton Cnty PA Gen Purp Auth Clg Rev Ref Moravian Clg
| | 5.00% | | 10/01/31 | | 567,467 |
| 1,800,000 | | Northampton Cnty PA Gen Purp Auth Hosp Rev Ref St Luke’s Univ Hlth Network Proj, Ser A
| | 5.00% | | 08/15/28 | | 1,944,602 |
| 500,000 | | PA St 2nd, Ser CR, AGM
| | 4.00% | | 09/15/31 | | 523,826 |
| 50,000 | | PA St Econ Dev Fin Auth Rev UPMC Rev, Ser B
| | 4.00% | | 03/15/40 | | 50,040 |
| 1,000,000 | | PA St Hgr Eductnl Facs Auth Rev Ref Drexel Univ
| | 5.00% | | 05/01/25 | | 1,060,733 |
| 1,105,000 | | PA St Hgr Eductnl Facs Auth Rev Ref Drexel Univ
| | 5.00% | | 05/01/34 | | 1,170,641 |
| 2,810,000 | | PA St Hsg Fin Agy SF Mtge Rev Non Ace, Ser 123B
| | 3.45% | | 10/01/32 | | 2,781,465 |
| 1,105,000 | | PA St Hsg Fin Agy SF Mtge Rev Non Ace, Ser 125B, AMT
| | 3.70% | | 10/01/47 | | 1,104,205 |
| 5,410,000 | | PA St Hsg Fin Agy SF Mtge Rev, Ser 127B
| | 3.55% | | 10/01/33 | | 5,418,716 |
| 565,000 | | PA St Turnpike Commn Turnpike Rev Conv Cap Apprec, Subser E
| | 6.38% | | 12/01/38 | | 656,166 |
| 1,000,000 | | PA St Turnpike Commn Turnpike Rev Ref
| | 5.00% | | 12/01/33 | | 1,053,339 |
| 4,940,000 | | PA St Turnpike Commn Turnpike Rev Ref Sub Mtr License Fund, 2nd Ser
| | 5.00% | | 12/01/41 | | 5,389,952 |
| 2,500,000 | | PA St Turnpike Commn Turnpike Rev Ref, Subser B
| | 5.00% | | 06/01/36 | | 2,676,069 |
| 3,950,000 | | PA St Turnpike Commn Turnpike Rev Subord, Ser A
| | 4.00% | | 12/01/44 | | 3,811,346 |
| 4,500,000 | | PA St Turnpike Commn Turnpike Rev Subord, Ser A
| | 4.00% | | 12/01/46 | | 4,295,392 |
| 550,000 | | PA St Turnpike Commn Turnpike Rev Subord, Ser A-1
| | 5.00% | | 12/01/30 | | 589,099 |
| 200,000 | | Parkland PA Sch Dist, Ser B
| | 4.00% | | 02/01/34 | | 208,663 |
| 300,000 | | Parkland PA Sch Dist, Ser B
| | 4.00% | | 02/01/35 | | 312,601 |
| 600,000 | | Parkland PA Sch Dist, Ser B
| | 4.00% | | 02/01/36 | | 624,554 |
| 1,085,000 | | Philadelphia PA Arpt Rev Ref Priv Activity, AGM, AMT
| | 4.00% | | 07/01/37 | | 1,083,629 |
| 750,000 | | Philadelphia PA Arpt Rev Ref Priv Activity, AGM, AMT
| | 4.00% | | 07/01/40 | | 737,298 |
| 620,000 | | Philadelphia PA Auth for Indl Dev Chrt Sch Rev Mast Chrt Sch Proj
| | 5.00% | | 08/01/40 | | 639,684 |
| 375,000 | | Philadelphia PA Auth for Indl Dev Chrt Sch Rev Mast Chrt Sch Proj
| | 5.00% | | 08/01/50 | | 381,415 |
| 2,250,000 | | Philadelphia PA Auth for Indl Dev Chrt Sch Rev Philadelphia E&T Chrt High Sch, Ser A
| | 4.00% | | 06/01/41 | | 1,987,999 |
| 1,000,000 | | Philadelphia PA Auth for Indl Dev City Svc Agreement Rev
| | 5.00% | | 05/01/35 | | 1,103,407 |
| 1,000,000 | | Philadelphia PA Auth for Indl Dev City Svc Agreement Rev, BAM
| | 5.00% | | 05/01/30 | | 1,110,978 |
| 290,000 | | Philadelphia PA Gas Wks Rev Ref
| | 5.00% | | 08/01/25 | | 311,890 |
| 1,625,000 | | Philadelphia PA Gas Wks Rev Ref
| | 5.00% | | 08/01/29 | | 1,736,145 |
| 1,000,000 | | Philadelphia PA Gas Wks Rev Ref 1998 General Ordinance, 14th Ser
| | 5.00% | | 10/01/29 | | 1,092,243 |
| 455,000 | | Philadelphia PA Gas Wks Rev Ref 1998 General Ordinance, 14th Ser
| | 5.00% | | 10/01/32 | | 496,378 |
See Notes to Financial Statements
Page 37
First Trust Managed Municipal ETF (FMB)
Portfolio of Investments (Continued)
April 30, 2022 (Unaudited)
Principal
Value | | Description | | Stated
Coupon | | Stated
Maturity | | Value |
| MUNICIPAL BONDS (Continued) |
| | | Pennsylvania (Continued) | | | | | | |
| $2,000,000 | | Philadelphia PA Gas Wks Rev Ref 1998 General Ordinance, 14th Ser
| | 5.00% | | 10/01/34 | | $2,178,412 |
| 5,235,000 | | Philadelphia PA Gas Wks Rev Ref 1998 General Ordinance, 15th Ser
| | 5.00% | | 08/01/42 | | 5,655,870 |
| 1,400,000 | | Philadelphia PA Gas Wks Rev Ref Sixteenth, Ser B, AGM
| | 4.00% | | 08/01/39 | | 1,413,650 |
| 1,200,000 | | Philadelphia PA Gas Wks Rev Sixteenth, Ser A, AGM
| | 4.00% | | 08/01/45 | | 1,178,033 |
| 3,355,000 | | Philadelphia PA Ref, AGM
| | 5.00% | | 08/01/30 | | 3,727,049 |
| 500,000 | | Philadelphia PA Ref, Ser A
| | 5.00% | | 08/01/26 | | 546,338 |
| 500,000 | | Philadelphia PA Ref, Ser A
| | 5.00% | | 08/01/27 | | 554,157 |
| 225,000 | | Philadelphia PA Ref, Ser A
| | 5.00% | | 08/01/27 | | 249,371 |
| 750,000 | | Philadelphia PA Ref, Ser A
| | 5.25% | | 07/15/28 | | 787,764 |
| 1,250,000 | | Philadelphia PA Sch Dist, Ser A
| | 5.00% | | 09/01/38 | | 1,367,000 |
| 500,000 | | Philadelphia PA Wtr & Wstwtr Rev, Ser A
| | 5.00% | | 11/01/36 | | 564,433 |
| 1,500,000 | | Philadelphia PA Wtr & Wstwtr Rev, Ser A
| | 5.00% | | 11/01/45 | | 1,656,809 |
| 100,000 | | Philadelphia PA, Ser B
| | 5.00% | | 02/01/28 | | 111,388 |
| 2,245,000 | | Philadelphia PA, Ser B
| | 5.00% | | 02/01/36 | | 2,504,610 |
| 1,275,000 | | Philadelphia PA, Ser B
| | 5.00% | | 02/01/39 | | 1,416,183 |
| 3,260,000 | | Philadelphia PA, Ser B, BAM
| | 5.00% | | 02/01/34 | | 3,706,180 |
| 2,235,000 | | Pittsburgh PA Sch Dist, Ser A
| | 4.00% | | 09/01/38 | | 2,295,076 |
| 1,885,000 | | Pittsburgh PA Sch Dist, Ser A, AGM
| | 4.00% | | 09/01/34 | | 1,959,343 |
| 310,000 | | Pittsburgh PA Wtr & Swr Auth, Ser B, AGM
| | 5.00% | | 09/01/31 | | 352,066 |
| 300,000 | | Pittsburgh PA Wtr & Swr Auth, Ser B, AGM
| | 5.00% | | 09/01/32 | | 340,017 |
| 400,000 | | Pittsburgh PA Wtr & Swr Auth, Ser B, AGM
| | 5.00% | | 09/01/33 | | 452,478 |
| 205,000 | | Pittsburgh PA Wtr & Swr Auth, Ser B, AGM
| | 5.00% | | 09/01/34 | | 231,563 |
| 300,000 | | S Wayne Cnty PA Wtr & Swr Auth Wtr & Swr Rev Ref, BAM
| | 4.00% | | 02/15/34 | | 313,195 |
| 325,000 | | S Wayne Cnty PA Wtr & Swr Auth Wtr & Swr Rev Ref, BAM
| | 4.00% | | 02/15/35 | | 337,714 |
| 235,000 | | S Wayne Cnty PA Wtr & Swr Auth Wtr & Swr Rev Ref, BAM
| | 4.00% | | 02/15/36 | | 242,305 |
| 1,835,000 | | Scranton PA Sch Dist
| | 4.00% | | 12/01/42 | | 1,863,414 |
| 405,000 | | Southcentrl PA General Auth Rev Ref Hanover Hosp Inc
| | 5.00% | | 12/01/23 | | 421,279 |
| 390,000 | | Upper Darby PA Sch Dist, AGM
| | 4.00% | | 04/01/31 | | 414,414 |
| 250,000 | | Upper Darby PA Sch Dist, AGM
| | 4.00% | | 04/01/34 | | 259,223 |
| 300,000 | | Upper Darby PA Sch Dist, AGM
| | 4.00% | | 04/01/35 | | 309,847 |
| 250,000 | | Upper Darby PA Sch Dist, AGM
| | 4.00% | | 04/01/36 | | 256,526 |
| 200,000 | | Upper Darby PA Sch Dist, Ser A, BAM
| | 4.00% | | 04/01/39 | | 205,026 |
| 300,000 | | Upper Darby PA Sch Dist, Ser A, BAM
| | 4.00% | | 04/01/40 | | 307,087 |
| 300,000 | | Upper Darby PA Sch Dist, Ser A, BAM
| | 4.00% | | 04/01/42 | | 305,157 |
| 245,000 | | Upper Darby PA Sch Dist, Ser A, BAM
| | 4.00% | | 04/01/43 | | 248,679 |
| 105,000 | | W Cornwall Twp PA Muni Auth Ref Lebanon Vly Brethren Home Proj, Ser A
| | 4.00% | | 11/15/28 | | 108,912 |
| 135,000 | | W Cornwall Twp PA Muni Auth Ref Lebanon Vly Brethren Home Proj, Ser A
| | 4.00% | | 11/15/29 | | 139,887 |
| 215,000 | | W Cornwall Twp PA Muni Auth Ref Lebanon Vly Brethren Home Proj, Ser A
| | 4.00% | | 11/15/36 | | 218,065 |
| 1,970,000 | | Westmoreland Cnty PA Muni Auth Ref, BAM
| | 5.00% | | 08/15/42 | | 2,094,706 |
| | | | | 158,764,784 |
| | | Puerto Rico – 0.7% | | | | | | |
| 9,023,000 | | Puerto Rico Sales Tax Fing Corp Sales Tax Rev Restructured, Ser A-1
| | 4.50% | | 07/01/34 | | 9,253,424 |
| 429,000 | | Puerto Rico Sales Tax Fing Corp Sales Tax Rev Restructured, Ser A-1, CABS
| | (e) | | 07/01/27 | | 366,949 |
| 3,092,000 | | Puerto Rico Sales Tax Fing Corp Sales Tax Rev Restructured, Ser A-1, CABS
| | (e) | | 07/01/29 | | 2,474,686 |
| 2,753,000 | | Puerto Rico Sales Tax Fing Corp Sales Tax Rev Restructured, Ser A-1, CABS
| | (e) | | 07/01/31 | | 2,046,486 |
Page 38
See Notes to Financial Statements
First Trust Managed Municipal ETF (FMB)
Portfolio of Investments (Continued)
April 30, 2022 (Unaudited)
Principal
Value | | Description | | Stated
Coupon | | Stated
Maturity | | Value |
| MUNICIPAL BONDS (Continued) |
| | | Puerto Rico (Continued) | | | | | | |
| $963,000 | | Puerto Rico Sales Tax Fing Corp Sales Tax Rev Restructured, Ser A-2 Converted
| | 4.33% | | 07/01/40 | | $954,461 |
| | | | | 15,096,006 |
| | | Rhode Island – 0.2% | | | | | | |
| 150,000 | | Providence RI Pub Bldgs Auth Rev, Ser B, AGM
| | 5.00% | | 06/15/31 | | 166,761 |
| 320,000 | | Providence RI Pub Bldgs Auth Rev, Ser B, AGM
| | 5.00% | | 06/15/33 | | 352,358 |
| 230,000 | | Providence RI Pub Bldgs Auth Rev, Ser B, AGM
| | 5.00% | | 06/15/35 | | 251,278 |
| 1,125,000 | | RI St Hlth & Eductnl Bldg Corp Rev Ref Hosp Fing Lifespan Oblig Grp
| | 5.00% | | 05/15/29 | | 1,207,582 |
| 1,460,000 | | RI St Hlth & Eductnl Bldg Corp Rev Ref Hosp Fing Lifespan Oblig Grp
| | 5.00% | | 05/15/32 | | 1,556,095 |
| 1,700,000 | | RI St Hlth & Eductnl Bldg Corp Rev Ref Hosp Fing Lifespan Oblig Grp
| | 5.00% | | 05/15/39 | | 1,795,117 |
| | | | | 5,329,191 |
| | | South Carolina – 0.5% | | | | | | |
| 2,250,000 | | Berkeley Cnty SC Assmnt Rev Nexton Impt Dist
| | 4.25% | | 11/01/40 | | 2,245,524 |
| 1,000,000 | | Greenville SC Hosp Sys Brd Hosp Facs Rev, Ser B
| | 5.00% | | 05/01/30 | | 1,045,239 |
| 25,000 | | Lancaster Cnty SC Assmnt Rev Ref Walnut Creek Impt Dist, Ser A-1
| | 3.13% | | 12/01/22 | | 24,932 |
| 1,310,000 | | Lancaster Cnty SC Assmnt Rev Ref Walnut Creek Impt Dist, Ser A-1
| | 5.00% | | 12/01/26 | | 1,327,445 |
| 1,000,000 | | Lancaster Cnty SC Assmnt Rev Ref Walnut Creek Impt Dist, Ser A-1
| | 5.00% | | 12/01/31 | | 1,006,606 |
| 1,075,000 | | SC St Jobs Econ Dev Auth Econ Dev Rev Woodlands at Furman Proj, Ser A
| | 5.00% | | 11/15/54 | | 1,017,274 |
| 1,000,000 | | SC St Jobs Econ Dev Auth Eductnl Facs Rev Ref Green Chrt Schs Proj, Ser A (b)
| | 4.00% | | 06/01/36 | | 931,456 |
| 1,650,000 | | SC St Jobs Econ Dev Auth Eductnl Facs Rev Ref Green Chrt Schs Proj, Ser A (b)
| | 4.00% | | 06/01/46 | | 1,435,648 |
| 500,000 | | SC St Jobs Econ Dev Auth Hlth Facs Rev Ref Lutheran Homes of SC Inc
| | 5.00% | | 05/01/42 | | 443,817 |
| 30,000 | | SC St Jobs Econ Dev Auth Hosp Rev Ref Palmetto Hlth, Ser A
| | 5.00% | | 08/01/23 | | 31,053 |
| 2,000,000 | | SC St Pub Svc Auth Rev Ref, Ser A
| | 4.00% | | 12/01/34 | | 2,048,376 |
| 355,000 | | SC St Pub Svc Auth Rev Ref, Ser A
| | 4.00% | | 12/01/35 | | 361,825 |
| | | | | 11,919,195 |
| | | South Dakota – 0.3% | | | | | | |
| 1,000,000 | | Lincoln Cnty SD Econ Dev Rev Ref Augustana Clg Assoc Proj, Ser A
| | 4.00% | | 08/01/51 | | 888,868 |
| 510,000 | | SD St Brd of Rgts Hsg & Auxiliary Fac Sys Rev
| | 5.00% | | 04/01/31 | | 557,044 |
| 505,000 | | SD St Brd of Rgts Hsg & Auxiliary Fac Sys Rev
| | 5.00% | | 04/01/32 | | 550,706 |
| 1,000,000 | | SD St Brd of Rgts Hsg & Auxiliary Fac Sys Rev Ref Hsg & Auxiliary Facs Sys
| | 5.00% | | 04/01/30 | | 1,116,601 |
| 420,000 | | SD St Brd of Rgts Hsg & Auxiliary Fac Sys Rev, Ser B
| | 5.00% | | 04/01/29 | | 443,740 |
| 170,000 | | SD St Hlth & Eductnl Facs Auth Ref Sanford Oblig Grp
| | 5.00% | | 11/01/26 | | 183,073 |
| 105,000 | | SD St Hlth & Eductnl Facs Auth Ref Sanford Oblig Grp
| | 5.00% | | 11/01/35 | | 112,098 |
| 200,000 | | SD St Hlth & Eductnl Facs Auth Ref Westhills Vlg Retmnt Cmnty Issue
| | 3.00% | | 09/01/28 | | 194,645 |
| 640,000 | | SD St Hlth & Eductnl Facs Auth Ref Westhills Vlg Retmnt Cmnty Issue
| | 3.00% | | 09/01/32 | | 589,094 |
| 1,090,000 | | SD St Hlth & Eductnl Facs Auth Sanford Oblig Grp, Ser B
| | 5.00% | | 11/01/34 | | 1,139,276 |
| | | | | 5,775,145 |
See Notes to Financial Statements
Page 39
First Trust Managed Municipal ETF (FMB)
Portfolio of Investments (Continued)
April 30, 2022 (Unaudited)
Principal
Value | | Description | | Stated
Coupon | | Stated
Maturity | | Value |
| MUNICIPAL BONDS (Continued) |
| | | Tennessee – 1.5% | | | | | | |
| $250,000 | | Chattanooga TN Hlth Eductnl & Hsg Fac Brd Rev Ref Commonspirit Hlth, Ser A-1
| | 5.00% | | 08/01/34 | | $272,599 |
| 200,000 | | Chattanooga TN Hlth Eductnl & Hsg Fac Brd Rev Ref Commonspirit Hlth, Ser A-1
| | 4.00% | | 08/01/37 | | 194,842 |
| 825,000 | | Chattanooga TN Hlth Eductnl & Hsg Fac Brd Rev Ref Commonspirit Hlth, Ser A-2
| | 5.00% | | 08/01/34 | | 899,575 |
| 3,090,000 | | Chattanooga TN Hlth Eductnl & Hsg Fac Brd Rev Ref Commonspirit Hlth, Ser A-2
| | 5.00% | | 08/01/44 | | 3,332,265 |
| 325,000 | | Chattanooga TN Hlth Eductnl & Hsg Fac Brd Rev Ref Stdt Hsg CDFI Phase I
| | 5.00% | | 10/01/23 | | 333,861 |
| 865,000 | | Met Govt Nashville & Davidson Cnty TN Elec Rev Sys, Ser A
| | 5.00% | | 05/15/35 | | 948,338 |
| 1,385,000 | | Met Govt Nashville & Davidson Cnty TN Hlth & Eductnl Fac Brd Ref Lipscomb Univ Proj, Ser A
| | 5.00% | | 10/01/29 | | 1,466,130 |
| 600,000 | | Met Govt Nashville & Davidson Cnty TN Hlth & Eductnl Fac Brd Ref Trevecca Nazarene Univ Proj
| | 5.00% | | 10/01/29 | | 623,900 |
| 400,000 | | Met Govt Nashville & Davidson Cnty TN Hlth & Eductnl Fac Brd Ref Trevecca Nazarene Univ Proj
| | 5.00% | | 10/01/34 | | 416,173 |
| 700,000 | | Met Govt Nashville & Davidson Cnty TN Hlth & Eductnl Fac Brd Ref Trevecca Nazarene Univ Proj
| | 5.00% | | 10/01/39 | | 724,047 |
| 10,450,000 | | Tennergy Corp TN Gas Rev, Ser A (Mandatory put 09/01/28)
| | 4.00% | | 12/01/51 | | 10,629,204 |
| 2,000,000 | | TN Energy Acq Corp Cmdy Proj Rev, Ser A (Mandatory put 11/01/31)
| | 5.00% | | 05/01/52 | | 2,176,463 |
| 4,000,000 | | TN St Energy Acq Corp Gas Rev (Mandatory put 11/01/25)
| | 4.00% | | 11/01/49 | | 4,078,794 |
| 3,435,000 | | TN St Energy Acq Corp Gas Rev Proj, Ser A (Mandatory put 05/01/23)
| | 4.00% | | 05/01/48 | | 3,463,100 |
| 50,000 | | TN St Energy Acq Corp Gas Rev, Ser A
| | 5.25% | | 09/01/22 | | 50,520 |
| 2,660,000 | | TN St Energy Acq Corp Gas Rev, Ser A
| | 5.25% | | 09/01/26 | | 2,833,289 |
| | | | | 32,443,100 |
| | | Texas – 7.9% | | | | | | |
| 930,000 | | Arlington TX Hgr Edu Fin Corp Edu Rev
| | 5.00% | | 08/15/31 | | 1,065,182 |
| 975,000 | | Arlington TX Hgr Edu Fin Corp Edu Rev
| | 5.00% | | 08/15/32 | | 1,114,473 |
| 415,000 | | Arlington TX Hgr Edu Fin Corp Edu Rev
| | 5.00% | | 08/15/33 | | 471,159 |
| 525,000 | | Arlington TX Hgr Edu Fin Corp Edu Rev
| | 5.00% | | 08/15/34 | | 594,784 |
| 565,000 | | Arlington TX Hgr Edu Fin Corp Edu Rev
| | 4.00% | | 08/15/35 | | 590,472 |
| 875,000 | | Arlington TX Hgr Edu Fin Corp Edu Rev
| | 4.00% | | 08/15/36 | | 910,175 |
| 230,000 | | Arlington TX Hgr Edu Fin Corp Edu Rev Kipp TX Inc
| | 5.00% | | 08/15/28 | | 258,223 |
| 2,685,000 | | Arlington TX Hgr Edu Fin Corp Edu Rev Lifeschool Dallas, Ser A
| | 5.00% | | 08/15/31 | | 2,837,008 |
| 1,645,000 | | Arlington TX Hgr Edu Fin Corp Edu Rev Ref Legacy Trad Schs TX Proj, Ser A
| | 4.13% | | 02/15/41 | | 1,348,504 |
| 450,000 | | Austin TX Arpt Sys Rev, AMT
| | 5.00% | | 11/15/33 | | 465,148 |
| 350,000 | | Austin TX Arpt Sys Rev, AMT
| | 5.00% | | 11/15/35 | | 385,583 |
| 4,150,000 | | Austin TX Arpt Sys Rev, Ser B, AMT
| | 5.00% | | 11/15/37 | | 4,470,484 |
| 900,000 | | Bexar Cnty TX Ref
| | 4.00% | | 06/15/38 | | 933,318 |
| 910,000 | | Bexar Cnty Tx Rev Ref Tax Exempt Venue Proj
| | 4.00% | | 08/15/38 | | 914,703 |
| 1,000,000 | | Bexar Cnty TX Rev Ref Tax Exempt Venue Proj
| | 4.00% | | 08/15/36 | | 1,010,058 |
| 2,255,000 | | Brazoria Cnty TX Toll Road Auth Toll Road Rev Sub Lien, Ser A
| | 5.00% | | 03/01/36 | | 2,481,064 |
| 600,000 | | Brd of Managers TX Jt Guadalupe Cnty City of Seguin Hosp Mtg Ref
| | 5.00% | | 12/01/24 | | 620,357 |
| 305,000 | | Celina TX Spl Assmnt Rev Ref the Lakes at Mustang Ranch Pub Impt Dt Phase #1 Proj, BAM
| | 4.00% | | 09/01/29 | | 305,019 |
| 350,000 | | Centrl TX Regl Mobility Auth Rev Ref
| | 5.00% | | 01/01/27 | | 372,741 |
| 600,000 | | Centrl TX Regl Mobility Auth Rev Ref Sub Lien
| | 5.00% | | 01/01/33 | | 612,632 |
| 850,000 | | Centrl TX Regl Mobility Auth Rev Sr Lien, Ser A
| | 5.00% | | 01/01/29 | | 915,628 |
Page 40
See Notes to Financial Statements
First Trust Managed Municipal ETF (FMB)
Portfolio of Investments (Continued)
April 30, 2022 (Unaudited)
Principal
Value | | Description | | Stated
Coupon | | Stated
Maturity | | Value |
| MUNICIPAL BONDS (Continued) |
| | | Texas (Continued) | | | | | | |
| $130,000 | | Centrl TX Regl Mobility Auth Rev, Ser B
| | 5.00% | | 01/01/35 | | $142,722 |
| 700,000 | | Centrl TX Regl Mobility Auth Rev, Ser B
| | 5.00% | | 01/01/38 | | 763,322 |
| 600,000 | | Centrl TX Regl Mobility Auth Rev, Ser B
| | 4.00% | | 01/01/40 | | 602,894 |
| 640,000 | | Centrl TX Regl Mobility Auth Rev, Ser B
| | 4.00% | | 01/01/41 | | 641,650 |
| 490,000 | | Clifton TX Hgr Edu Fin Corp Edu Rev Idea Pub Sch, Ser T
| | 5.00% | | 08/15/28 | | 546,248 |
| 500,000 | | Clifton TX Hgr Edu Fin Corp Edu Rev Idea Pub Schs
| | 5.00% | | 08/15/32 | | 503,431 |
| 840,000 | | Clifton TX Hgr Edu Fin Corp Edu Rev, Ser A
| | 4.00% | | 12/01/25 | | 841,442 |
| 5,705,000 | | Collin Cnty TX Permanent Imp
| | 4.00% | | 02/15/36 | | 6,002,828 |
| 4,425,000 | | Corpus Christi TX Util Sys Rev Ref Jr Lien
| | 5.00% | | 07/15/33 | | 4,964,635 |
| 2,365,000 | | Corpus Christi TX Util Sys Rev Ref Jr Lien
| | 5.00% | | 07/15/35 | | 2,647,754 |
| 750,000 | | Dallas TX Hotel Occupancy Tax Rev Ref
| | 4.00% | | 08/15/36 | | 769,970 |
| 490,000 | | Dallas TX Hotel Occupancy Tax Rev Ref
| | 4.00% | | 08/15/37 | | 502,850 |
| 4,350,000 | | Dallas-Fort Worth TX Intl Arpt Rev Ref, Ser A
| | 4.00% | | 11/01/36 | | 4,412,162 |
| 1,430,000 | | El Paso TX Ctfs Oblig, Ser A
| | 4.00% | | 08/15/39 | | 1,464,397 |
| 1,000,000 | | El Paso TX Ref, Ser A
| | 4.00% | | 08/15/34 | | 1,047,414 |
| 500,000 | | El Paso TX Ref, Ser A
| | 4.00% | | 08/15/36 | | 519,269 |
| 1,215,000 | | El Paso TX Wtr & Swr Rev
| | 4.00% | | 03/01/33 | | 1,288,659 |
| 1,000,000 | | El Paso TX Wtr & Swr Rev
| | 4.00% | | 03/01/34 | | 1,055,377 |
| 1,170,000 | | Galveston Cnty TX Muni Util Dist #54 Ref
| | 2.50% | | 12/01/31 | | 973,783 |
| 535,000 | | Gregory Portland TX Indep Sch Dist, Ser A
| | 4.00% | | 02/15/32 | | 567,037 |
| 1,000,000 | | Harris Cnty TX Cultural Edu Facs Fin Corp Med Facs Rev Ref Baylor Clg of Med
| | 4.00% | | 11/15/30 | | 1,031,827 |
| 1,640,000 | | Harris Cnty TX Flood Control Dist Ref Flood Control Dist, Ser A
| | 4.00% | | 10/01/37 | | 1,708,013 |
| 5,000,000 | | Harris Cnty TX Flood Control Dist, Ser A
| | 4.00% | | 10/01/34 | | 5,302,222 |
| 1,000,000 | | Harris Cnty TX Flood Control Dist, Ser A
| | 4.00% | | 10/01/45 | | 1,027,573 |
| 1,100,000 | | Harris Cnty TX Ref Sr Lien Toll Road, Ser B
| | 5.00% | | 08/15/36 | | 1,178,900 |
| 2,600,000 | | Harris Cnty TX Ref Sr Lien, Ser A
| | 5.00% | | 08/15/36 | | 2,835,097 |
| 1,500,000 | | Hidalgo Cnty TX Regl Mobility Auth Toll & Vehcl Registration Sr Lien, Ser A
| | 4.00% | | 12/01/37 | | 1,455,885 |
| 1,770,000 | | Houston TX Arpt Sys Rev Ref United Airls Inc Terminal E Proj, Ser A, AMT
| | 5.00% | | 07/01/27 | | 1,876,296 |
| 2,750,000 | | Houston TX Arpt Sys Rev Ref United Airls Inc Terminal Impt Proj, Ser B-2, AMT
| | 5.00% | | 07/15/27 | | 2,915,862 |
| 2,500,000 | | Houston TX Arpt Sys Rev Sub, Ser A, AMT
| | 4.00% | | 07/01/39 | | 2,478,394 |
| 250,000 | | Houston TX Arpt Sys Rev Sub, Ser A, AMT
| | 4.00% | | 07/01/40 | | 247,025 |
| 2,000,000 | | Houston TX Arpt Sys Rev United Airls Inc Terminal E Proj, Ser A, AMT
| | 4.00% | | 07/01/41 | | 1,822,431 |
| 1,730,000 | | Houston TX Cmnty Clg Ref
| | 4.00% | | 02/15/37 | | 1,776,873 |
| 500,000 | | Houston TX Hgr Edu Fin Corp Edu Rev Ref Harmony Pub Schs, Ser A
| | 5.00% | | 02/15/26 | | 520,823 |
| 1,000,000 | | Houston TX Hotel Occupancy Tax & Spl Rev Ref Convention & Entertainment Facs Dept
| | 5.00% | | 09/01/32 | | 1,113,550 |
| 1,000,000 | | Houston TX Util Sys Rev Ref 1st Lien Subord, Ser D
| | 5.00% | | 11/15/29 | | 1,076,948 |
| 225,000 | | Imperial Redev Dist TX, BAM
| | 4.50% | | 05/01/24 | | 232,830 |
| 225,000 | | Imperial Redev Dist TX, BAM
| | 4.50% | | 05/01/26 | | 237,520 |
| 225,000 | | Imperial Redev Dist TX, BAM
| | 4.50% | | 05/01/27 | | 238,767 |
| 500,000 | | Kyle TX Spl Assmnt Rev 6 Creeks Pid #1 (b)
| | 4.63% | | 09/01/39 | | 487,399 |
| 570,000 | | La Vernia TX Hgr Edu Fin Corp Edu Rev Meridian World Sch (b)
| | 4.35% | | 08/15/25 | | 587,394 |
| 545,000 | | La Vernia TX Hgr Edu Fin Corp Edu Rev Meridian World Sch, Ser A (b)
| | 4.20% | | 08/15/25 | | 560,664 |
| 1,250,000 | | Laredo TX Cmnty Clg Dist Combined Fee Rev Ref, BAM
| | 4.00% | | 08/01/33 | | 1,289,274 |
| 1,290,000 | | Leander TX Spl Assmnt Rev Crystal Springs Pub Impt Dist Proj Accd Inv (d)
| | 5.13% | | 09/01/38 | | 1,210,183 |
| 500,000 | | Liberty Hill TX Indep Sch Dist Ref
| | 5.00% | | 08/01/30 | | 546,338 |
| 1,800,000 | | Lower Colorado River TX Auth Rev Ref
| | 5.00% | | 05/15/35 | | 2,002,660 |
See Notes to Financial Statements
Page 41
First Trust Managed Municipal ETF (FMB)
Portfolio of Investments (Continued)
April 30, 2022 (Unaudited)
Principal
Value | | Description | | Stated
Coupon | | Stated
Maturity | | Value |
| MUNICIPAL BONDS (Continued) |
| | | Texas (Continued) | | | | | | |
| $1,000,000 | | Lower Colorado River TX Auth Trans Contract Rev Ref LCRA Trans Svcs Corp Proj
| | 5.00% | | 05/15/28 | | $1,117,270 |
| 1,265,000 | | Lower Colorado River TX Auth Trans Contract Rev Ref LCRA Trans Svcs Corp Proj
| | 5.00% | | 05/15/29 | | 1,426,769 |
| 500,000 | | Lower Colorado River TX Auth Trans Contract Rev Ref LCRA Trans Svcs Corp Proj
| | 5.00% | | 05/15/30 | | 566,110 |
| 1,000,000 | | Lower Colorado River TX Auth Trans Contract Rev Ref LCRA Trans Svcs Corp Proj
| | 5.00% | | 05/15/31 | | 1,126,836 |
| 1,500,000 | | Lower Colorado River TX Auth Trans Contract Rev Ref LCRA Trans Svcs Corp Proj
| | 5.00% | | 05/15/32 | | 1,682,322 |
| 700,000 | | Lower Colorado River TX Auth Trans Contract Rev Ref LCRA Trans Svcs Corp Proj
| | 5.00% | | 05/15/33 | | 759,087 |
| 1,035,000 | | Lower Colorado River TX Auth Trans Contract Rev Ref LCRA Trans Svcs Corp Proj
| | 5.00% | | 05/15/33 | | 1,155,178 |
| 500,000 | | Lower Colorado River TX Auth Trans Contract Rev Ref LCRA Trans Svcs Corp Proj
| | 5.00% | | 05/15/34 | | 555,683 |
| 1,595,000 | | Lower Colorado River TX Auth Trans Contract Rev Ref LCRA Trans Svcs Corp Proj
| | 5.00% | | 05/15/35 | | 1,766,344 |
| 400,000 | | Lower Colorado River TX Auth Trans Contract Rev Ref LCRA Trans Svcs Corp Proj
| | 5.00% | | 05/15/37 | | 435,764 |
| 610,000 | | Lower Colorado River TX Auth Trans Contract Rev Ref LCRA Trans Svcs Corp Proj
| | 5.00% | | 05/15/38 | | 663,650 |
| 1,080,000 | | Lower Colorado River TX Auth Trans Contract Rev Ref LCRA Trans Svcs Corp Proj
| | 5.00% | | 05/15/38 | | 1,195,322 |
| 1,000,000 | | Lower Colorado River TX Auth Trans Contract Rev Ref LCRA Trans Svcs Corp Proj
| | 5.00% | | 05/15/40 | | 1,085,523 |
| 2,610,000 | | Lower Colorado River TX Auth Trans Contract Rev Ref LCRA Trans Svcs Corp Proj
| | 5.00% | | 05/15/45 | | 2,833,063 |
| 370,000 | | Mission TX Ctfs Oblig, AGM
| | 5.00% | | 02/15/30 | | 414,133 |
| 1,105,000 | | Montgomery TX Indep Sch Dist Ref Sch Bldg
| | 5.00% | | 02/15/28 | | 1,175,902 |
| 1,450,000 | | N Fort Bend TX Wtr Auth Wtr Sys Rev Ref, Ser A
| | 4.00% | | 12/15/36 | | 1,512,473 |
| 700,000 | | N Parkway Muni Mgmt Dist #1 TX Contract Rev Legacy Hills Pub Impt Dt Phase #1A-1B Impts (b)
| | 4.25% | | 09/15/51 | | 616,653 |
| 2,003,000 | | N Parkway Muni Mgmt Dist #1 TX Spl Assmnt Rev Major Impts Proj (b)
| | 4.75% | | 09/15/41 | | 1,926,769 |
| 4,000,000 | | N TX Tollway Auth Rev Ref 1st Tier, Ser A
| | 5.00% | | 01/01/38 | | 4,064,532 |
| 3,895,000 | | N TX Tollway Auth Rev Ref 1st Tier, Ser A
| | 5.00% | | 01/01/43 | | 4,185,168 |
| 250,000 | | N TX Tollway Auth Rev Ref 2nd Tier, Ser B
| | 5.00% | | 01/01/27 | | 269,031 |
| 2,250,000 | | N TX Tollway Auth Rev Ref 2nd Tier, Ser B
| | 5.00% | | 01/01/31 | | 2,400,254 |
| 5,950,000 | | N TX Tollway Auth Rev Ref First Tier Bonds, Ser A
| | 4.00% | | 01/01/37 | | 6,142,757 |
| 170,000 | | N TX Tollway Auth Rev Ref Second Tier, Ser B
| | 5.00% | | 01/01/29 | | 190,909 |
| 1,525,000 | | N TX Tollway Auth Rev Ref Sys Second Tier, Ser B
| | 5.00% | | 01/01/31 | | 1,579,441 |
| 250,000 | | N TX Tollway Auth Rev Ref, Ser A
| | 5.00% | | 01/01/33 | | 266,159 |
| 1,330,000 | | N TX Tollway Auth Rev Second Tier, Ser B
| | 4.00% | | 01/01/40 | | 1,346,169 |
| 1,500,000 | | N TX Tollway Auth Rev Second Tier, Ser B
| | 4.00% | | 01/01/41 | | 1,510,437 |
| 1,415,000 | | New Hope Cultural Edu Facs Fin Corp TX Retmnt Fac Rev Ref Longhorn Vlg Proj
| | 5.00% | | 01/01/31 | | 1,460,576 |
| 1,200,000 | | New Hope Cultural Edu Facs Fin Corp TX Retmnt Fac Rev Ref Longhorn Vlg Proj
| | 5.00% | | 01/01/32 | | 1,235,069 |
| 250,000 | | New Hope Cultural Edu Facs Fin Corp TX Retmnt Fac Rev Ref Wesleyan Homes Inc Proj Fin Corp
| | 5.00% | | 01/01/50 | | 211,983 |
| 2,000,000 | | New Hope Cultural Edu Facs Fincorp TX Edu Rev Ref Jubilee Acad Ctr (b)
| | 4.00% | | 08/15/36 | | 1,869,282 |
| 505,000 | | Newark Hgr Edu Fin Corp TX Edu Rev Austin Achieve Pub Schs Inc, Ser A
| | 5.00% | | 06/15/32 | | 507,180 |
Page 42
See Notes to Financial Statements
First Trust Managed Municipal ETF (FMB)
Portfolio of Investments (Continued)
April 30, 2022 (Unaudited)
Principal
Value | | Description | | Stated
Coupon | | Stated
Maturity | | Value |
| MUNICIPAL BONDS (Continued) |
| | | Texas (Continued) | | | | | | |
| $700,000 | | Newark Hgr Edu Fin Corp TX Edu Rev Austin Achieve Pub Schs Inc, Ser A
| | 5.00% | | 06/15/42 | | $703,022 |
| 1,150,000 | | Plano TX Ref
| | 4.00% | | 09/01/30 | | 1,225,436 |
| 110,000 | | SA Energy Acq Pub Fac Corp TX Gas Sply Rev Gas Sply Rev
| | 5.50% | | 08/01/27 | | 122,085 |
| 3,195,000 | | San Antonio TX Wtr Rev Ref Junior Lien, Ser A
| | 4.00% | | 05/15/38 | | 3,348,077 |
| 2,010,000 | | San Antonio TX Wtr Rev Ref Wtr Sys Junior Lien, Ser C
| | 5.00% | | 05/15/38 | | 2,274,087 |
| 2,690,000 | | Tarrant Cnty TX Cultural Edu Facs Fin Corp Hosp Rev Ref Baylor Scott & White Hlth Proj, Ser A
| | 5.00% | | 11/15/45 | | 2,887,289 |
| 750,000 | | Tarrant Cnty TX Cultural Edu Facs Fin Corp Hosp Rev Ref Cook Children’s Med Ctr
| | 4.00% | | 12/01/35 | | 755,073 |
| 2,180,000 | | Tarrant Cnty TX Cultural Edu Facs Fin Corp Rev Christus Hlth, Ser B
| | 5.00% | | 07/01/43 | | 2,345,124 |
| 1,635,000 | | TX St Muni Gas Acq & Sply Corp I Gas Sply Rev Sr Lien, Ser A
| | 5.25% | | 12/15/26 | | 1,767,151 |
| 1,030,000 | | TX St Muni Gas Acq & Sply Corp III Gas Sply Rev Ref
| | 5.00% | | 12/15/26 | | 1,090,113 |
| 250,000 | | TX St Muni Gas Acq & Sply Corp III Gas Sply Rev Ref
| | 5.00% | | 12/15/29 | | 268,738 |
| 2,750,000 | | TX St Priv Activity Bond Surface Transprtn Corp Rev Segment 3C Proj, AMT
| | 5.00% | | 06/30/58 | | 2,841,691 |
| 865,000 | | TX St Transprtn Commn Central TX Turnpike Sys Rev Ref, Ser B
| | 5.00% | | 08/15/37 | | 904,871 |
| 2,130,000 | | TX St Univ Sys Fing Rev Ref, Ser A
| | 4.00% | | 03/15/35 | | 2,217,666 |
| 785,000 | | TX St Wtr Dev Brd St Wtr Implementation Fund, Ser A
| | 5.00% | | 04/15/30 | | 872,851 |
| 405,000 | | TX St Wtr Dev Brd St Wtr Implementation Fund, Ser A
| | 5.00% | | 04/15/32 | | 460,942 |
| 250,000 | | TX St Wtr Dev Brd St Wtr Implementation Rev Fund for TX
| | 4.00% | | 10/15/32 | | 261,230 |
| 150,000 | | Univ of Houston TX Univ Revs Ref, Ser A
| | 5.00% | | 02/15/26 | | 163,269 |
| 125,000 | | Univ of Houston TX Univ Revs Ref, Ser A
| | 5.00% | | 02/15/28 | | 135,493 |
| 3,250,000 | | Univ of Houston TX Univ Revs Ref, Ser A
| | 5.00% | | 02/15/31 | | 3,516,717 |
| 1,900,000 | | Univ of Houston TX Univ Revs Ref, Ser A
| | 5.00% | | 02/15/35 | | 2,050,952 |
| 1,560,000 | | Uptown Dev Auth TX Incr Contract Rev, Ser A
| | 5.00% | | 09/01/36 | | 1,632,175 |
| 500,000 | | Viridian TX Muni Mgmt Dist Ref Util Impt, BAM
| | 6.00% | | 12/01/26 | | 545,003 |
| 155,000 | | Viridian TX Muni Mgmt Dist Road Impt, BAM
| | 5.00% | | 12/01/26 | | 161,083 |
| 125,000 | | Viridian TX Muni Mgmt Dist Util Impt, BAM
| | 5.00% | | 12/01/26 | | 129,906 |
| | | | | 170,629,149 |
| | | Utah – 1.1% | | | | | | |
| 1,000,000 | | Black Desert Pub Infra Dist Sr Bonds, Ser A (b)
| | 3.50% | | 03/01/36 | | 856,040 |
| 3,500,000 | | Black Desert Pub Infra Dist Sr Bonds, Ser A (b)
| | 3.75% | | 03/01/41 | | 2,953,415 |
| 1,180,000 | | Grand Cnty Sch Dist Loc Bldg Auth UT, AGM
| | 5.00% | | 12/15/27 | | 1,272,247 |
| 1,370,000 | | Grand Cnty Sch Dist Loc Bldg Auth UT, AGM
| | 5.00% | | 12/15/30 | | 1,473,182 |
| 1,400,000 | | Grand Cnty Sch Dist Loc Bldg Auth UT, AGM
| | 5.00% | | 12/15/31 | | 1,499,957 |
| 1,515,000 | | Grand Cnty Sch Dist Loc Bldg Auth UT, AGM
| | 5.00% | | 12/15/32 | | 1,627,481 |
| 1,500,000 | | Military Installation Dev Auth UT Tax Allocation Rev, Ser A-2
| | 4.00% | | 06/01/41 | | 1,236,159 |
| 3,000,000 | | Military Installation Dev Auth UT Tax Allocation Rev, Ser A-2
| | 4.00% | | 06/01/52 | | 2,270,558 |
| 1,000,000 | | Salt Lake City UT Arpt Rev, Ser A, AMT
| | 5.00% | | 07/01/38 | | 1,066,697 |
| 400,000 | | UT St Chrt Sch Fin Auth Chrt Sch Rev Ref Quest Acdmy
| | 5.00% | | 04/15/32 | | 423,171 |
| 325,000 | | UT St Chrt Sch Fin Auth Chrt Sch Rev Ref Quest Acdmy
| | 5.00% | | 04/15/37 | | 342,720 |
| 1,590,000 | | UT St Chrt Sch Fin Auth Chrt Sch Rev Wallace Stegner Acdmy Proj, Ser A (b)
| | 5.00% | | 06/15/49 | | 1,543,888 |
| 4,875,000 | | UT St Transit Auth Sales Tax Rev Ref Sub, BAM
| | 5.00% | | 12/15/40 | | 5,420,856 |
| 1,145,000 | | UT St Transit Auth Sales Tax Rev Ref, Subser A
| | 5.00% | | 06/15/35 | | 1,234,127 |
| | | | | 23,220,498 |
| | | Vermont – 0.3% | | | | | | |
| 550,000 | | Burlington VT Ref Lakeview Garage Proj, Ser A, COPS
| | 5.00% | | 12/01/24 | | 581,867 |
| 745,000 | | VT St Econ Dev Auth Mtge Rev Ref Wake Robin Corp Proj, Ser A
| | 5.00% | | 05/01/25 | | 773,498 |
See Notes to Financial Statements
Page 43
First Trust Managed Municipal ETF (FMB)
Portfolio of Investments (Continued)
April 30, 2022 (Unaudited)
Principal
Value | | Description | | Stated
Coupon | | Stated
Maturity | | Value |
| MUNICIPAL BONDS (Continued) |
| | | Vermont (Continued) | | | | | | |
| $585,000 | | VT St Econ Dev Auth Mtge Rev Ref Wake Robin Corp Proj, Ser A
| | 5.00% | | 05/01/26 | | $611,230 |
| 2,000,000 | | VT St Econ Dev Auth Solid Wst Disp Rev Var Casella Wst Sys Inc Remk, AMT (Mandatory put 04/03/28) (b)
| | 4.63% | | 04/01/36 | | 2,096,359 |
| 2,500,000 | | VT St Eductnl & Hlth Bldgs Fing Agy Rev Ref Univ of VT Med Ctr, Ser A
| | 5.00% | | 12/01/33 | | 2,703,930 |
| | | | | 6,766,884 |
| | | Virginia – 1.4% | | | | | | |
| 1,000,000 | | Chesapeake VA Hosp Auth Hosp Fac Rev Ref Chesapeake Regl Med Ctr
| | 4.00% | | 07/01/35 | | 1,010,569 |
| 1,100,000 | | Norfolk VA Redev & Hsg Auth Rev Ft Norfolk Retmnt Cmnty Harbors Edge Proj, Ser A
| | 4.00% | | 01/01/29 | | 1,081,010 |
| 200,000 | | VA Clg Bldg Auth Eductnl Facs Rev Ref Regent Univ Proj
| | 4.00% | | 06/01/36 | | 196,952 |
| 350,000 | | VA Clg Bldg Auth Eductnl Facs Rev Ref Regent Univ Proj
| | 4.00% | | 06/01/46 | | 328,768 |
| 5,000,000 | | VA St Clg Bldg Auth Eductnl Facs Rev 21 St Century, Ser A
| | 4.00% | | 02/01/34 | | 5,237,110 |
| 5,000,000 | | VA St Pub Bldg Auth Pub Facs Rev, Ser A
| | 4.00% | | 08/01/39 | | 5,135,925 |
| 2,000,000 | | VA St Pub Bldg Auth Pub Facs Rev, Ser C, AMT
| | 5.00% | | 08/01/33 | | 2,133,970 |
| 1,000,000 | | VA St Res Auth Infra Rev Ref Infra VA Pooled Fing Prog, Ser C
| | 4.00% | | 11/01/33 | | 1,046,971 |
| 6,305,000 | | VA St Small Busn Fing Auth Rev Sr Lien Elizabeth River Crossings Opco LLC Proj
| | 5.50% | | 01/01/42 | | 6,344,100 |
| 1,570,000 | | Virginia Beach VA Dev Auth Rsdl Care Fac Rev Ref Westminster Canterbury on Chesapeake Bay
| | 5.00% | | 09/01/32 | | 1,652,436 |
| 1,000,000 | | Virginia Beach VA Dev Auth Rsdl Care Fac Rev Ref Westminster Canterbury on Chesapeake Bay
| | 5.00% | | 09/01/33 | | 1,049,660 |
| 1,210,000 | | Virginia Beach VA Dev Auth Rsdl Care Fac Rev Ref Westminster Canterbury on Chesapeake Bay
| | 5.00% | | 09/01/35 | | 1,265,969 |
| 275,000 | | Virginia Beach VA Dev Auth Rsdl Care Fac Rev Ref Westminster Canterbury on Chesapeake Bay
| | 5.00% | | 09/01/36 | | 287,253 |
| 1,185,000 | | Wstrn VA Regl Jail Auth Regl Jail Facs Rev Prerefunded Ref
| | 5.00% | | 12/01/34 | | 1,308,973 |
| 1,180,000 | | Wstrn VA Regl Jail Auth Regl Jail Facs Rev Unrefunded Ref
| | 5.00% | | 12/01/34 | | 1,293,291 |
| | | | | 29,372,957 |
| | | Washington – 2.1% | | | | | | |
| 1,235,000 | | Benton Cnty WA Pub Util Dist #1 Ref
| | 4.00% | | 11/01/36 | | 1,271,442 |
| 1,090,000 | | Centrl Puget Sound WA Regl Transit Auth Green Bond, Ser S-1
| | 5.00% | | 11/01/36 | | 1,191,172 |
| 1,250,000 | | Centrl Puget Sound WA Regl Transit Auth Sales & Use Tax Green Bond Ref & Impt, Ser S-1
| | 5.00% | | 11/01/35 | | 1,355,695 |
| 1,250,000 | | Energy NW WA Elec Rev Ref Columbia Generating Sys, Ser A
| | 5.00% | | 07/01/38 | | 1,330,025 |
| 1,500,000 | | Energy NW WA Elec Rev Ref, Ser A
| | 5.00% | | 07/01/24 | | 1,583,620 |
| 1,500,000 | | Fyi Properties WA Lease Rev Ref Green Bond WA Dis Proj
| | 5.00% | | 06/01/38 | | 1,620,002 |
| 530,000 | | Kalispel Tribe of Indians Priority Dist WA Rev, Ser A (b)
| | 5.00% | | 01/01/32 | | 572,361 |
| 1,500,000 | | King Cnty WA Swr Rev Ref & Impt, Ser B
| | 5.00% | | 07/01/39 | | 1,549,634 |
| 3,000,000 | | Seattle WA Drain & Wstwtr Rev Ref
| | 4.00% | | 07/01/36 | | 3,135,142 |
| 270,000 | | Skagit Cnty WA Pub Hosp Dist #1 Ref & Impt Skagit Regl Hlth
| | 4.00% | | 12/01/24 | | 277,805 |
| 110,000 | | Skagit Cnty WA Pub Hosp Dist #1 Ref & Impt, Ser A
| | 5.00% | | 12/01/22 | | 111,942 |
| 500,000 | | Snohomish Cnty WA Hsg Auth
| | 5.00% | | 04/01/34 | | 549,690 |
| 5,000,000 | | WA St Convention Ctr Pub Facs Dist Sub
| | 4.00% | | 07/01/58 | | 4,293,395 |
| 525,000 | | WA St Hgr Edu Facs Auth Seattle Univ Proj Rev
| | 4.00% | | 05/01/45 | | 520,099 |
| 6,000,000 | | WA St Hlth Care Facs Auth Ref Commonspirit Hlth, Ser A-2
| | 5.00% | | 08/01/44 | | 6,470,417 |
| 1,850,000 | | WA St Hlthcare Facs Auth Overlake Hosp Med Ctr, Ser A
| | 5.00% | | 07/01/35 | | 2,015,182 |
| 1,625,000 | | WA St Hlthcare Facs Auth Ref Overlake Hosp Med Ctr, Ser B
| | 5.00% | | 07/01/31 | | 1,782,294 |
| 1,090,000 | | WA St Hlthcare Facs Auth Ref Seattle Cancer Care Alliance
| | 5.00% | | 09/01/45 | | 1,183,963 |
| 305,000 | | WA St Hlthcare Facs Auth Seattle Cancer Care Alliance (b)
| | 5.00% | | 12/01/28 | | 339,476 |
| 170,000 | | WA St Hlthcare Facs Auth Seattle Cancer Care Alliance (b)
| | 5.00% | | 12/01/29 | | 190,903 |
Page 44
See Notes to Financial Statements
First Trust Managed Municipal ETF (FMB)
Portfolio of Investments (Continued)
April 30, 2022 (Unaudited)
Principal
Value | | Description | | Stated
Coupon | | Stated
Maturity | | Value |
| MUNICIPAL BONDS (Continued) |
| | | Washington (Continued) | | | | | | |
| $225,000 | | WA St Hlthcare Facs Auth Seattle Cancer Care Alliance (b)
| | 5.00% | | 12/01/32 | | $250,122 |
| 35,000 | | WA St Hsg Fin Commn Nonprofit Hsg Rev Ref Emerald Heights Proj
| | 5.00% | | 07/01/22 | | 35,188 |
| 50,000 | | WA St Hsg Fin Commn Nonprofit Hsg Rev Ref Emerald Heights Proj
| | 5.00% | | 07/01/28 | | 51,099 |
| 1,000,000 | | WA St Hsg Fin Commn Nonprofit Hsg Rev Transforming Age Proj, Ser A (b)
| | 5.00% | | 01/01/44 | | 961,553 |
| 2,467,489 | | WA St Hsg Fin Commn Social Ctf, Ser A-1
| | 3.50% | | 12/20/35 | | 2,253,294 |
| 2,500,000 | | WA St Ref R-2015D
| | 5.00% | | 07/01/32 | | 2,642,990 |
| 1,100,000 | | WA St, Ser 2020A
| | 5.00% | | 08/01/35 | | 1,247,570 |
| 3,000,000 | | WA St, Ser 2020A
| | 5.00% | | 08/01/44 | | 3,337,743 |
| 4,000,000 | | WA St, Ser B
| | 5.00% | | 02/01/36 | | 4,226,310 |
| | | | | 46,350,128 |
| | | West Virginia – 0.0% | | | | | | |
| 1,000,000 | | S Charleston WV Spl Dist Excise Tax Ref S Charleston Park Place Proj, Ser A (b)
| | 4.25% | | 06/01/42 | | 824,750 |
| | | Wisconsin – 2.1% | | | | | | |
| 825,000 | | Fond Du Lac WI Sch Dist, Ser A, BAM
| | 4.00% | | 04/01/35 | | 854,643 |
| 1,255,000 | | Fond Du Lac WI Sch Dist, Ser A, BAM
| | 4.00% | | 04/01/36 | | 1,301,058 |
| 1,050,000 | | Milwaukee WI Ref Promissory Nts, Ser N-4
| | 5.00% | | 04/01/29 | | 1,182,619 |
| 1,375,000 | | Pub Fin Auth WI Chrt Sch Rev Eno River Acdmy Proj, Ser A (b)
| | 5.00% | | 06/15/54 | | 1,351,178 |
| 500,000 | | Pub Fin Auth WI Chrt Sch Rev Founders of Acdmy Las Vegas Proj, Ser A (b)
| | 5.00% | | 07/01/40 | | 506,311 |
| 1,315,000 | | Pub Fin Auth WI Chrt Sch Rev Ltd American Prep Acdmy Las Vegas Proj, Ser A (b)
| | 4.20% | | 07/15/27 | | 1,325,428 |
| 1,250,000 | | Pub Fin Auth WI Chrt Sch Rev Ltd American Prep Acdmy Las Vegas Proj, Ser A (b)
| | 5.13% | | 07/15/37 | | 1,292,278 |
| 2,000,000 | | Pub Fin Auth WI Edu Rev Coral Acdmy of Science Las Vegas, Ser A
| | 4.00% | | 07/01/51 | | 1,712,994 |
| 1,515,000 | | Pub Fin Auth WI Edu Rev Ref Mountain Island Chrt Sch Ltd
| | 4.00% | | 07/01/27 | | 1,518,067 |
| 1,730,000 | | Pub Fin Auth WI Edu Rev Ref Mountain Island Chrt Sch Ltd
| | 5.00% | | 07/01/37 | | 1,761,405 |
| 1,000,000 | | Pub Fin Auth WI Edu Rev Ref Mountain Island Chrt Sch Ltd
| | 5.00% | | 07/01/47 | | 1,012,785 |
| 1,000,000 | | Pub Fin Auth WI Edu Rev Ref Mountain Island Chrt Sch Ltd
| | 5.00% | | 07/01/52 | | 1,011,768 |
| 1,275,000 | | Pub Fin Auth WI Edu Rev Triad Eductnl Sers Inc, Ser A
| | 4.00% | | 06/15/41 | | 1,165,600 |
| 425,000 | | Pub Fin Auth WI Eductnl Rev Piedmont Cmnty Chrt Sch
| | 5.00% | | 06/15/34 | | 442,539 |
| 1,000,000 | | Pub Fin Auth WI Exempt Facs Rev Ref Celanese Proj, Ser B, AMT
| | 5.00% | | 12/01/25 | | 1,070,505 |
| 1,250,000 | | Pub Fin Auth WI Hosp Rev Ref Renown Regl Med Ctr Proj, Ser A
| | 4.00% | | 06/01/35 | | 1,268,273 |
| 2,000,000 | | Pub Fin Auth WI Hosp Rev Ref Renown Regl Med Ctr Proj, Ser A
| | 4.00% | | 06/01/39 | | 2,010,921 |
| 600,000 | | Pub Fin Auth WI Retmnt Cmntys Rev Acts Retmnt Life Cmntys Inc Oblig Grp, Ser A
| | 4.00% | | 11/15/37 | | 609,107 |
| 1,450,000 | | Pub Fin Auth WI Retmnt Fac Rev Ref Penick Vlg Oblig Grp (b)
| | 5.00% | | 09/01/49 | | 1,306,448 |
| 1,000,000 | | Pub Fin Auth WI Retmnt Fac Rev Southminster (b)
| | 5.00% | | 10/01/43 | | 1,009,234 |
| 2,000,000 | | Pub Fin Auth WI Rev Green Bond Fargo Moorhead Met Area Flood Mgmnt, AMT
| | 4.00% | | 09/30/51 | | 1,893,024 |
| 1,500,000 | | Pub Fin Auth WI Rev Sr Proton Intl AR LLC, Ser A (b)
| | 6.50% | | 01/01/41 | | 1,273,419 |
| 600,000 | | Pub Fin Auth WI Rev TX Biomedical Rsrch Institute Proj, Ser A
| | 4.00% | | 06/01/37 | | 601,308 |
| 535,000 | | Pub Fin Auth WI Rev TX Biomedical Rsrch Institute Proj, Ser A
| | 4.00% | | 06/01/38 | | 535,164 |
| 1,300,000 | | WI St Gen Fund Annual Approp Rev Ref, Ser B
| | 5.00% | | 05/01/34 | | 1,407,833 |
| 100,000 | | WI St Hlth & Eductnl Facs Auth Rev Marshfield Clinic Hlth Sys, Ser A
| | 4.00% | | 02/15/36 | | 100,628 |
See Notes to Financial Statements
Page 45
First Trust Managed Municipal ETF (FMB)
Portfolio of Investments (Continued)
April 30, 2022 (Unaudited)
Principal
Value | | Description | | Stated
Coupon | | Stated
Maturity | | Value |
| MUNICIPAL BONDS (Continued) |
| | | Wisconsin (Continued) | | | | | | |
| $3,650,000 | | WI St Hlth & Eductnl Facs Auth Rev Ref Ascension Hlth Credit Grp, Ser A
| | 5.00% | | 11/15/36 | | $3,916,263 |
| 1,000,000 | | WI St Hlth & Eductnl Facs Auth Rev Ref Ascension Hlth Credit Grp, Ser A
| | 5.00% | | 11/15/39 | | 1,070,595 |
| 1,780,000 | | WI St Hlth & Eductnl Facs Auth Rev Ref Beloit Hlth Sys Inc
| | 4.00% | | 07/01/36 | | 1,801,474 |
| 1,135,000 | | WI St Hlth & Eductnl Facs Auth Rev Ref Froedtert Hlth Inc Oblg, Ser A
| | 4.00% | | 04/01/39 | | 1,146,568 |
| 500,000 | | WI St Hlth & Eductnl Facs Auth Rev Ref Marquette Univ
| | 5.00% | | 10/01/28 | | 507,135 |
| 500,000 | | WI St Hlth & Eductnl Facs Auth Rev Ref Marshfield Clinic Hlth Sys Inc, Ser B1 (Mandatory put 02/15/25)
| | 5.00% | | 02/15/52 | | 526,562 |
| 1,500,000 | | WI St Hlth & Eductnl Facs Auth Rev Ref Marshfield Clinic Hlth Sys Inc, Ser B2 (Mandatory put 02/15/27)
| | 5.00% | | 02/15/51 | | 1,627,416 |
| 1,175,000 | | WI St Hlth & Eductnl Facs Auth Rev Ref Prohealth Care Oblig Grp
| | 5.00% | | 08/15/31 | | 1,238,759 |
| 175,000 | | WI St Hlth & Eductnl Facs Auth Rev Ref Prohealth Care Oblig Grp
| | 5.00% | | 08/15/33 | | 184,257 |
| 700,000 | | WI St Hlth & Eductnl Facs Auth Rev Ref Rogers Memorial Hosp Inc, Ser A
| | 5.00% | | 07/01/44 | | 751,233 |
| 800,000 | | WI St Hlth & Eductnl Facs Auth Rev Ref Rogers Memorial Hosp Inc, Ser A
| | 5.00% | | 07/01/49 | | 855,326 |
| 435,000 | | WI St Hlth & Eductnl Facs Auth Rev St Johns Cmntys Inc Proj, Ser A
| | 5.00% | | 09/15/30 | | 449,213 |
| 2,000,000 | | WI St Ref, Ser 3
| | 4.00% | | 11/01/34 | | 2,078,388 |
| | | | | 45,677,726 |
| | | Wyoming – 0.0% | | | | | | |
| 250,000 | | Laramie Cnty WY Hosp Rev Ref Cheyenne Regl Med Ctr Proj
| | 4.00% | | 05/01/29 | | 265,354 |
| 500,000 | | Laramie Cnty WY Hosp Rev Ref Cheyenne Regl Med Ctr Proj
| | 4.00% | | 05/01/34 | | 508,817 |
| | | | | 774,171 |
| Total Investments – 96.3%
| | 2,087,835,522 |
| | (Cost $2,196,617,215) | | |
| | Net Other Assets and Liabilities – 3.7%
| | 79,609,510 |
| | Net Assets – 100.0%
| | $2,167,445,032 |
Futures Contracts (See Note 2D - Futures Contracts in the Notes to Financial Statements):
| Futures Contracts | | Position | | Number of
Contracts | | Expiration
Date | | Notional
Value | | Unrealized
Appreciation
(Depreciation)/
Value |
| U.S. Treasury Long Bonds | | Short | | 353 | | Jun 2022 | | $ (49,662,688) | | $4,782,938 |
| Ultra 10-Year U.S. Treasury Notes | | Short | | 627 | | Jun 2022 | | (80,883,000) | | 376,412 |
| | | | | | | | | $(130,545,688) | | $5,159,350 |
| (a) | Variable Rate Demand bond. Interest rate is reset periodically by the agent based on current market conditions. |
| (b) | This security, sold within the terms of a private placement memorandum, is exempt from registration upon resale under Rule 144A of the Securities Act of 1933, as amended (the “1933 Act”), and may be resold in transactions exempt from registration, normally to qualified institutional buyers. Pursuant to procedures adopted by the Trust’s Board of Trustees, this security has been determined to be liquid by First Trust Advisors L.P. (the “Advisor”). Although market instability can result in periods of increased overall market illiquidity, liquidity for each security is determined based on security specific factors and assumptions, which require subjective judgment. At April 30, 2022, securities noted as such amounted to $115,521,859 or 5.3% of net assets. |
| (c) | Pursuant to procedures adopted by the Trust’s Board of Trustees, this security has been determined to be illiquid by the Advisor. |
Page 46
See Notes to Financial Statements
First Trust Managed Municipal ETF (FMB)
Portfolio of Investments (Continued)
April 30, 2022 (Unaudited)
| (d) | This security, sold within the terms of a private placement memorandum, is exempt from registration upon resale under Rule 144A of the 1933 Act, and may be resold in transactions exempt from registration, normally to qualified institutional buyers (see Note 2C - Restricted Securities in the Notes to Financial Statements). |
| (e) | Zero coupon bond. |
| AGC | Assured Guaranty Corp. |
| AGM | Assured Guaranty Municipal Corp. |
| AMBAC | American Municipal Bond Assurance Corp. |
| AMT | Alternative Minimum Tax |
| BAM | Build America Mutual |
| BANS | Bond Anticipation Notes |
| CABS | Capital Appreciation Bonds |
| COPS | Certificates of Participation |
| GARVEE | Grant Anticipation Revenue Vehicle |
| NATL-RE | National Public Finance Guarantee Corp. |
Valuation Inputs
A summary of the inputs used to value the Fund’s investments as of April 30, 2022 is as follows (see Note 2A - Portfolio Valuation in the Notes to Financial Statements):
| | Total
Value at
4/30/2022 | Level 1
Quoted
Prices | Level 2
Significant
Observable
Inputs | Level 3
Significant
Unobservable
Inputs |
Municipal Bonds*
| $ 2,087,835,522 | $ — | $ 2,087,835,522 | $ — |
Futures Contracts
| 5,159,350 | 5,159,350 | — | — |
Total
| $ 2,092,994,872 | $ 5,159,350 | $ 2,087,835,522 | $— |
| * | See Portfolio of Investments for state and territory breakout. |
See Notes to Financial Statements
Page 47
First Trust Managed Municipal ETF (FMB)
Statement of Assets and Liabilities
April 30, 2022 (Unaudited)
| ASSETS: | |
Investments, at value
(Cost $2,196,617,215)
| $ 2,087,835,522 |
Cash
| 40,419,014 |
Cash segregated as collateral for open futures contracts
| 7,272,091 |
| Receivables: | |
Investment securities sold
| 36,207,208 |
Interest
| 27,477,129 |
Variation margin
| 307,758 |
Total Assets
| 2,199,518,722 |
| LIABILITIES: | |
| Payables: | |
Investment securities purchased
| 31,125,586 |
Investment advisory fees
| 948,104 |
Total Liabilities
| 32,073,690 |
NET ASSETS
| $2,167,445,032 |
| NET ASSETS consist of: | |
Paid-in capital
| $ 2,328,789,247 |
Par value
| 421,500 |
Accumulated distributable earnings (loss)
| (161,765,715) |
NET ASSETS
| $2,167,445,032 |
NET ASSET VALUE, per share
| $51.42 |
Number of shares outstanding (unlimited number of shares authorized, par value $0.01 per share)
| 42,150,002 |
Page 48
See Notes to Financial Statements
First Trust Managed Municipal ETF (FMB)
Statement of Operations
For the Six Months Ended April 30, 2022 (Unaudited)
| INVESTMENT INCOME: | |
Interest
| $ 29,854,066 |
Total investment income
| 29,854,066 |
| EXPENSES: | |
Investment advisory fees
| 7,866,467 |
Total expenses
| 7,866,467 |
Fees waived by the investment advisor
| (1,815,339) |
Net expenses
| 6,051,128 |
NET INVESTMENT INCOME (LOSS)
| 23,802,938 |
| NET REALIZED AND UNREALIZED GAIN (LOSS): | |
| Net realized gain (loss) on: | |
Investments
| (42,005,178) |
Futures contracts
| 6,640,610 |
Net realized gain (loss)
| (35,364,568) |
| Net change in unrealized appreciation (depreciation) on: | |
Investments
| (199,001,777) |
Futures contracts
| 5,898,785 |
Net change in unrealized appreciation (depreciation)
| (193,102,992) |
NET REALIZED AND UNREALIZED GAIN (LOSS)
| (228,467,560) |
NET INCREASE (DECREASE) IN NET ASSETS RESULTING FROM OPERATIONS
| $(204,664,622) |
See Notes to Financial Statements
Page 49
First Trust Managed Municipal ETF (FMB)
Statements of Changes in Net Assets
| | Six Months
Ended
4/30/2022
(Unaudited) | | Year
Ended
10/31/2021 |
| OPERATIONS: | | | |
Net investment income (loss)
| $ 23,802,938 | | $ 41,667,232 |
Net realized gain (loss)
| (35,364,568) | | 575,194 |
Net increase from payment by the advisor
| — | | 4,688 |
Net change in unrealized appreciation (depreciation)
| (193,102,992) | | 29,567,010 |
Net increase (decrease) in net assets resulting from operations
| (204,664,622) | | 71,814,124 |
| DISTRIBUTIONS TO SHAREHOLDERS FROM: | | | |
Investment operations
| (23,854,501) | | (41,343,498) |
Return of capital
| — | | (653,379) |
Total distributions to shareholders
| (23,854,501) | | (41,996,877) |
| SHAREHOLDER TRANSACTIONS: | | | |
Proceeds from shares sold
| 265,087,471 | | 683,145,950 |
Cost of shares redeemed
| (262,528,725) | | (34,043,084) |
Net increase (decrease) in net assets resulting from shareholder transactions
| 2,558,746 | | 649,102,866 |
Total increase (decrease) in net assets
| (225,960,377) | | 678,920,113 |
| NET ASSETS: | | | |
Beginning of period
| 2,393,405,409 | | 1,714,485,296 |
End of period
| $2,167,445,032 | | $2,393,405,409 |
| CHANGES IN SHARES OUTSTANDING: | | | |
Shares outstanding, beginning of period
| 42,350,002 | | 30,950,002 |
Shares sold
| 4,750,000 | | 12,000,000 |
Shares redeemed
| (4,950,000) | | (600,000) |
Shares outstanding, end of period
| 42,150,002 | | 42,350,002 |
Page 50
See Notes to Financial Statements
First Trust Managed Municipal ETF (FMB)
Financial Highlights
For a share outstanding throughout each period
| | Six Months
Ended
4/30/2022
(Unaudited) | | Year Ended October 31, |
| | 2021 | | 2020 | | 2019 | | 2018 | | 2017 | |
Net asset value, beginning of period
| $ 56.51 | | $ 55.40 | | $ 55.38 | | $ 51.75 | | $ 53.16 | | $ 53.32 |
| Income from investment operations: | | | | | | | | | | | |
Net investment income (loss)
| 0.54 | | 1.13 | | 1.23 | | 1.35 | | 1.35 | | 1.34 |
Net realized and unrealized gain (loss)
| (5.09) | | 1.12 | | 0.05 | | 3.67 | | (1.41) | | (0.01) |
Total from investment operations
| (4.55) | | 2.25 | | 1.28 | | 5.02 | | (0.06) | | 1.33 |
| Distributions paid to shareholders from: | | | | | | | | | | | |
Net investment income
| (0.54) | | (1.12) | | (1.23) | | (1.36) | | (1.35) | | (1.33) |
Net realized gain
| — | | — | | — | | — | | — | | (0.16) |
Return of capital
| — | | (0.02) | | (0.03) | | (0.03) | | — | | — |
Total distributions
| (0.54) | | (1.14) | | (1.26) | | (1.39) | | (1.35) | | (1.49) |
Net asset value, end of period
| $51.42 | | $56.51 | | $55.40 | | $55.38 | | $51.75 | | $53.16 |
Total return (a)
| (8.11)% | | 4.06% (b) | | 2.33% | | 9.79% | | (0.12)% | | 2.59% |
| Ratios to average net assets/supplemental data: | | | | | | | | | | | |
Net assets, end of period (in 000’s)
| $ 2,167,445 | | $ 2,393,405 | | $ 1,714,485 | | $ 1,135,258 | | $ 455,371 | | $ 220,605 |
Ratio of total expenses to average net assets
| 0.65% (c) | | 0.65% | | 0.65% | | 0.65% | | 0.65% | | 0.65% |
Ratio of net expenses to average net assets
| 0.50% (c) | | 0.50% | | 0.50% | | 0.50% | | 0.50% | | 0.50% |
Ratio of net investment income (loss) to average net assets
| 1.97% (c) | | 1.99% | | 2.24% | | 2.53% | | 2.60% | | 2.63% |
Portfolio turnover rate (d)
| 29% | | 9% | | 35% | | 26% | | 42% | | 85% |
| (a) | Total return is calculated assuming an initial investment made at the net asset value at the beginning of the period, reinvestment of all distributions at net asset value during the period, and redemption at net asset value on the last day of the period. The returns presented do not reflect the deduction of taxes that a shareholder would pay on Fund distributions or the redemption or sale of Fund shares. Total return is calculated for the time period presented and is not annualized for periods of less than a year. For some periods, the total returns would have been lower if certain fees had not been waived by the advisor. |
| (b) | The Fund received a reimbursement from the advisor in the amount of $4,688, which represents less than $0.01 per share. Since the advisor reimbursed the Fund, there was no effect on the Fund’s total return. |
| (c) | Annualized. |
| (d) | Portfolio turnover is calculated for the time period presented and is not annualized for periods of less than a year and does not include securities received or delivered from processing creations or redemptions and in-kind transactions. |
See Notes to Financial Statements
Page 51
Notes to Financial Statements
First Trust Managed Municipal ETF (FMB)
April 30, 2022 (Unaudited)
1. Organization
First Trust Exchange-Traded Fund III (the “Trust”) is an open-end management investment company organized as a Massachusetts business trust on January 9, 2008, and is registered with the Securities and Exchange Commission (the “SEC”) under the Investment Company Act of 1940, as amended (the “1940 Act”).
The Trust currently consists of seventeen funds that are offering shares. This report covers the First Trust Managed Municipal ETF (the “Fund”), a diversified series of the Trust, which trades under the ticker “FMB” on The Nasdaq Stock Market LLC. Unlike conventional mutual funds, the Fund issues and redeems shares on a continuous basis, at net asset value (“NAV”), only in large blocks of shares known as “Creation Units.”
The primary investment objective of the Fund is to generate current income that is exempt from regular federal income taxes and its secondary objective is long term capital appreciation. Under normal market conditions, the Fund seeks to achieve its investment objectives by investing at least 80% of its net assets (including investment borrowings) in municipal debt securities that pay interest that is exempt from regular federal income taxes. There can be no assurance that the Fund will achieve its investment objectives. The Fund may not be appropriate for all investors.
2. Significant Accounting Policies
The Fund is considered an investment company and follows accounting and reporting guidance under Financial Accounting Standards Board Accounting Standards Codification Topic 946, “Financial Services-Investment Companies.” The following is a summary of significant accounting policies consistently followed by the Fund in the preparation of the financial statements. The preparation of the financial statements in accordance with accounting principles generally accepted in the United States of America (“U.S. GAAP”) requires management to make estimates and assumptions that affect the reported amounts and disclosures in the financial statements. Actual results could differ from those estimates.
A. Portfolio Valuation
The Fund’s NAV is determined daily as of the close of regular trading on the New York Stock Exchange (“NYSE”), normally 4:00 p.m. Eastern time, on each day the NYSE is open for trading. If the NYSE closes early on a valuation day, the NAV is determined as of that time. Domestic debt securities are priced using data reflecting the earlier closing of the principal markets for those securities. The Fund’s NAV is calculated by dividing the value of all assets of the Fund (including accrued interest and dividends), less all liabilities (including accrued expenses and dividends declared but unpaid), by the total number of shares outstanding.
The Fund’s investments are valued daily at market value or, in the absence of market value with respect to any portfolio securities, at fair value. Market value prices represent last sale or official closing prices from a national or foreign exchange (i.e., a regulated market) and are primarily obtained from third-party pricing services. Fair value prices represent any prices not considered market value prices and are either obtained from a third-party pricing service or are determined by the Pricing Committee of the Fund’s investment advisor, First Trust Advisors L.P. (“First Trust” or the “Advisor”), in accordance with valuation procedures adopted by the Trust’s Board of Trustees, and in accordance with provisions of the 1940 Act. Investments valued by the Advisor’s Pricing Committee, if any, are footnoted as such in the footnotes to the Portfolio of Investments. The Fund’s investments are valued as follows:
Municipal securities and other debt securities are fair valued on the basis of fair valuations provided by dealers who make markets in such securities or by a third-party pricing service approved by the Trust’s Board of Trustees, which may use the following valuation inputs when available:
| 1) | benchmark yields; |
| 2) | reported trades; |
| 3) | broker/dealer quotes; |
| 4) | issuer spreads; |
| 5) | benchmark securities; |
| 6) | bids and offers; and |
| 7) | reference data including market research publications. |
Pricing services generally value fixed-income securities assuming orderly transactions of an institutional round lot size, but a Fund may hold or transact in such securities in smaller, odd lot sizes. Odd lots may trade at lower prices than institutional round lots.
Exchange-traded futures contracts are valued at the closing price in the market where such contracts are principally traded. If no closing price is available, exchange-traded futures contracts are fair valued at the mean of their most recent bid and asked price, if available, and otherwise at their closing bid price.
Notes to Financial Statements (Continued)
First Trust Managed Municipal ETF (FMB)
April 30, 2022 (Unaudited)
Fixed income and other debt securities having a remaining maturity of sixty days or less when purchased are fair valued at cost adjusted for amortization of premiums and accretion of discounts (amortized cost), provided the Advisor’s Pricing Committee has determined that the use of amortized cost is an appropriate reflection of fair value given market and issuer-specific conditions existing at the time of the determination. Factors that may be considered in determining the appropriateness of the use of amortized cost include, but are not limited to, the following:
| 1) | the credit conditions in the relevant market and changes thereto; |
| 2) | the liquidity conditions in the relevant market and changes thereto; |
| 3) | the interest rate conditions in the relevant market and changes thereto (such as significant changes in interest rates); |
| 4) | issuer-specific conditions (such as significant credit deterioration); and |
| 5) | any other market-based data the Advisor’s Pricing Committee considers relevant. In this regard, the Advisor’s Pricing Committee may use last-obtained market-based data to assist it when valuing portfolio securities using amortized cost. |
Certain securities may not be able to be priced by pre-established pricing methods. Such securities may be valued by the Trust’s Board of Trustees or its delegate, the Advisor’s Pricing Committee, at fair value. These securities generally include, but are not limited to, restricted securities (securities which may not be publicly sold without registration under the Securities Act of 1933, as amended (the “1933 Act”)) for which a third-party pricing service is unable to provide a market price; securities whose trading has been formally suspended; a security whose market or fair value price is not available from a pre-established pricing source; a security with respect to which an event has occurred that is likely to materially affect the value of the security after the market has closed but before the calculation of the Fund’s NAV or make it difficult or impossible to obtain a reliable market quotation; and a security whose price, as provided by the third-party pricing service, does not reflect the security’s fair value. As a general principle, the current fair value of a security would appear to be the amount which the owner might reasonably expect to receive for the security upon its current sale. When fair value prices are used, generally they will differ from market quotations or official closing prices on the applicable exchanges. A variety of factors may be considered in determining the fair value of such securities, including, but not limited to, the following:
| 1) | the fundamental business data relating to the issuer; |
| 2) | an evaluation of the forces which influence the market in which these securities are purchased and sold; |
| 3) | the type, size and cost of the security; |
| 4) | the financial statements of the issuer; |
| 5) | the credit quality and cash flow of the issuer, based on the Advisor’s or external analysis; |
| 6) | the information as to any transactions in or offers for the security; |
| 7) | the price and extent of public trading in similar securities (or equity securities) of the issuer/borrower, or comparable companies; |
| 8) | the coupon payments; |
| 9) | the quality, value and salability of collateral, if any, securing the security; and |
| 10) | other relevant factors. |
The Fund is subject to fair value accounting standards that define fair value, establish the framework for measuring fair value and provide a three-level hierarchy for fair valuation based upon the inputs to the valuation as of the measurement date. The three levels of the fair value hierarchy are as follows:
| • | Level 1 – Level 1 inputs are quoted prices in active markets for identical investments. An active market is a market in which transactions for the investment occur with sufficient frequency and volume to provide pricing information on an ongoing basis. |
| • | Level 2 – Level 2 inputs are observable inputs, either directly or indirectly, and include the following: |
| o | Quoted prices for similar investments in active markets. |
| o | Quoted prices for identical or similar investments in markets that are non-active. A non-active market is a market where there are few transactions for the investment, the prices are not current, or price quotations vary substantially either over time or among market makers, or in which little information is released publicly. |
| o | Inputs other than quoted prices that are observable for the investment (for example, interest rates and yield curves observable at commonly quoted intervals, volatilities, prepayment speeds, loss severities, credit risks, and default rates). |
| o | Inputs that are derived principally from or corroborated by observable market data by correlation or other means. |
| • | Level 3 – Level 3 inputs are unobservable inputs. Unobservable inputs may reflect the reporting entity’s own assumptions about the assumptions that market participants would use in pricing the investment. |
Notes to Financial Statements (Continued)
First Trust Managed Municipal ETF (FMB)
April 30, 2022 (Unaudited)
The inputs or methodologies used for valuing investments are not necessarily an indication of the risk associated with investing in those investments. A summary of the inputs used to value the Fund’s investments as of April 30, 2022, is included with the Fund’s Portfolio of Investments.
B. Securities Transactions and Investment Income
Securities transactions are recorded as of the trade date. Realized gains and losses from securities transactions are recorded on the identified cost basis. Dividend income is recorded on the ex-dividend date. Interest income is recorded daily on the accrual basis. Amortization of premiums and accretion of discounts are recorded using the effective interest method.
C. Restricted Securities
The Fund invests in restricted securities, which are securities that may not be offered for public sale without first being registered under the 1933 Act. Prior to registration, restricted securities may only be resold in transactions exempt from registration under Rule 144A under the 1933 Act, normally to qualified institutional buyers. As of April 30, 2022, the Fund held restricted securities as shown in the following table that the Advisor has deemed illiquid pursuant to procedures adopted by the Trust’s Board of Trustees. Although market instability can result in periods of increased overall market illiquidity, liquidity for each security is determined based on security-specific factors and assumptions, which require subjective judgment. The Fund does not have the right to demand that such securities be registered. These securities are valued according to the valuation procedures as stated in the Portfolio Valuation note (Note 2A) and are not expressed as a discount to the carrying value of a comparable unrestricted security. There are no unrestricted securities with the same maturity dates and yields for these issuers.
| Security | Acquisition
Date | Principal
Value | Current Price | Carrying
Cost | | Value | | % of
Net
Assets |
| Brookstone CDD FL Spl Assmnt Rev CDD, 3.88%, 11/01/23 | 01/24/18 | $185,000 | $99.94 | $185,000 | | $184,880 | | 0.01% |
| IN St Fin Auth Rev Eductnl Facs Rock Creek Cmnty Acdmy Proj, Ser A, 5.25%, 07/01/28 | 09/04/18 | $700,000 | 103.34 | 705,421 | | 723,367 | | 0.03 |
| IN St Fin Auth Rev Eductnl Facs Rock Creek Cmnty Acdmy Proj, Ser A, 5.88%, 07/01/38 | 09/04/18 | $1,000,000 | 104.10 | 1,003,699 | | 1,040,991 | | 0.05 |
| Leander TX Spl Assmnt Rev Crystal Springs Pub Impt Dist Proj Accd Inv, 5.13%, 09/01/38 | 05/04/18 | $1,290,000 | 93.81 | 1,290,000 | | 1,210,183 | | 0.06 |
| Timber Creek CDD FL Spl Assmnt Rev, 4.13%, 11/01/24 | 06/21/18 | $135,000 | 100.33 | 135,000 | | 135,443 | | 0.01 |
| | | | | $3,319,120 | | $3,294,864 | | 0.16% |
D. Futures Contracts
The Fund may purchase or sell (i.e., is long or short) exchange-listed futures contracts to hedge against changes in interest rates (interest rate risk). Futures contracts are agreements between the Fund and a counterparty to buy or sell a specific quantity of an underlying instrument at a specified price and at a specified date. Depending on the terms of the contract, futures contracts are settled either through physical delivery of the underlying instrument on the settlement date or by payment of a cash settlement amount on the settlement date. Open futures contracts can also be closed out prior to settlement by entering into an offsetting transaction in a matching futures contract. If the Fund is not able to enter into an offsetting transaction, the Fund will continue to be required to maintain margin deposits on the futures contract. When the contract is closed or expires, the Fund records a realized gain or loss equal to the difference between the value of the contract at the time it was opened and the value at the time it was closed or expired. This gain or loss is included in “Net realized gain (loss) on futures contracts” on the Statement of Operations.
Upon entering into a futures contract, the Fund must deposit funds, called margin, with its custodian in the name of the clearing broker equal to a specified percentage of the current value of the contract. Open futures contracts are marked to market daily with the change in value recognized as a component of “Net change in unrealized appreciation (depreciation) on futures contracts” on the Statement of Operations. This daily fluctuation in the value of the contracts is also known as variation margin and is included in “Variation margin” payable or receivable on the Statement of Assets and Liabilities.
If market conditions change unexpectedly, the Fund may not achieve the anticipated benefits of the futures contract and may realize a loss. The use of futures contracts involves the risk of imperfect correlation in movements in the price of the futures contracts, interest rates and the underlying instruments.
Notes to Financial Statements (Continued)
First Trust Managed Municipal ETF (FMB)
April 30, 2022 (Unaudited)
Restricted cash segregated as collateral for futures contracts in the amount of $7,272,091 is shown as “Cash segregated as collateral for open futures contracts” on the Statement of Assets and Liabilities.
E. Dividends and Distributions to Shareholders
Dividends from net investment income, if any, are declared and paid monthly by the Fund, or as the Board of Trustees may determine from time to time. Distributions of net realized capital gains earned by the Fund, if any, are distributed at least annually.
Distributions from net investment income and realized capital gains are determined in accordance with federal income tax regulations, which may differ from U.S. GAAP. Certain capital accounts in the financial statements are periodically adjusted for permanent differences in order to reflect their tax character. These permanent differences are primarily due to the varying treatment of income and gain/loss on portfolio securities held by the Fund and have no impact on net assets or NAV per share. Temporary differences, which arise from recognizing certain items of income, expense and gain/loss in different periods for financial statement and tax purposes, will reverse at some time in the future.
The tax character of distributions paid by the Fund during the fiscal year ended October 31, 2021, was as follows:
| Distributions paid from: | |
Ordinary income
| $1,652 |
Capital gains
| — |
Tax-exempt income
| 41,341,846 |
Return of capital
| 653,379 |
As of October 31, 2021, the components of distributable earnings on a tax basis were as follows:
Undistributed ordinary income
| $— |
Accumulated capital and other gain (loss)
| (22,956,610) |
Net unrealized appreciation (depreciation)
| 89,710,018 |
F. Income Taxes
The Fund intends to continue to qualify as a regulated investment company by complying with the requirements under Subchapter M of the Internal Revenue Code of 1986, as amended (the “Code”), which includes distributing substantially all of its net investment income and net realized gains to shareholders. Accordingly, no provision has been made for federal and state income taxes. However, due to the timing and amount of distributions, the Fund may be subject to an excise tax of 4% of the amount by which approximately 98% of the Fund’s taxable income exceeds the distributions from such taxable income for the calendar year.
In addition, the Fund intends to invest in such municipal securities to allow it to pay shareholders “exempt dividends” as defined in the Code.
The Fund is subject to accounting standards that establish a minimum threshold for recognizing, and a system for measuring, the benefits of a tax position taken or expected to be taken in a tax return. Taxable years ended 2018, 2019, 2020, and 2021 remain open to federal and state audit. As of April 30, 2022, management has evaluated the application of these standards to the Fund and has determined that no provision for income tax is required in the Fund’s financial statements for uncertain tax positions.
The Fund intends to utilize provisions of the federal income tax laws, which allow it to carry a realized capital loss forward indefinitely following the year of the loss and offset such loss against any future realized capital gains. The Fund is subject to certain limitations under U.S. tax rules on the use of capital loss carryforwards and net unrealized built-in losses. These limitations apply when there has been a 50% change in ownership. At October 31, 2021, for federal income tax purposes, the Fund had $22,956,610 of capital loss carryforwards available, to the extent provided by regulations, to offset future capital gains.
Certain losses realized during the current fiscal year may be deferred and treated as occurring on the first day of the following fiscal year for federal income tax purposes. For the fiscal period ended October 31, 2021, the Fund had no net ordinary losses.
Notes to Financial Statements (Continued)
First Trust Managed Municipal ETF (FMB)
April 30, 2022 (Unaudited)
As of April 30, 2022, the aggregate cost, gross unrealized appreciation, gross unrealized depreciation, and net unrealized appreciation/(depreciation) on investments (including short positions and derivatives, if any) for federal income tax purposes were as follows:
| Tax Cost | | Gross
Unrealized
Appreciation | | Gross
Unrealized
(Depreciation) | | Net Unrealized
Appreciation
(Depreciation) |
| $2,196,617,215 | | $11,215,274 | | $(114,837,617) | | $(103,622,343) |
G. Expenses
Expenses, other than the investment advisory fee and other excluded expenses, are paid by the Advisor (See Note 3).
3. Investment Advisory Fee, Affiliated Transactions and Other Fee Arrangements
First Trust, the investment advisor to the Fund, is a limited partnership with one limited partner, Grace Partners of DuPage L.P., and one general partner, The Charger Corporation. The Charger Corporation is an Illinois corporation controlled by James A. Bowen, Chief Executive Officer of First Trust. First Trust is responsible for the selection and ongoing monitoring of the securities in the Fund’s portfolio, managing the Fund’s business affairs and providing certain administrative services necessary for the management of the Fund.
Pursuant to the Investment Management Agreement between the Trust and the Advisor, First Trust manages the investment of the Fund’s assets and is responsible for the Fund’s expenses, including the cost of transfer agency, custody, fund administration, legal, audit and other services, but excluding fee payments under the Investment Management Agreement, interest, taxes, acquired fund fees and expenses, if any, brokerage commissions and other expenses connected with the execution of portfolio transactions, distribution and service fees pursuant to a Rule 12b-1 plan, if any, and extraordinary expenses. The Fund has agreed to pay First Trust an annual unitary management fee equal to 0.65% of its average daily net assets. First Trust also provides fund reporting services to the Fund for a flat annual fee in the amount of $9,250, which is covered under the annual unitary management fee.
The Trust’s Board of Trustees and the Advisor have entered into a Fee Waiver Agreement for the Fund pursuant to which the Advisor contractually agreed to waive management fees of 0.15% of average daily net assets until March 1, 2023. The waiver agreement may be terminated by action of the Trust’s Board of Trustees at any time upon 60 days’ written notice by the Trust on behalf of the Fund or by the Fund’s investment advisor only after March 1, 2023. First Trust does not have the right to recover the fees waived. During the six months ended April 30, 2022, the Advisor waived fees of $1,815,339.
During the fiscal year ended October 31, 2021, the Fund received a payment from the Advisor of $4,688 in connection with a trade error.
The Trust has multiple service agreements with Brown Brothers Harriman & Co. (“BBH”). Under the service agreements, BBH performs custodial, fund accounting, certain administrative services, and transfer agency services for the Fund. As custodian, BBH is responsible for custody of the Fund’s assets. As fund accountant and administrator, BBH is responsible for maintaining the books and records of the Fund’s securities and cash. As transfer agent, BBH is responsible for maintaining shareholder records for the Fund.
Each Trustee who is not an officer or employee of First Trust, any sub-advisor or any of their affiliates (“Independent Trustees”) is paid a fixed annual retainer that is allocated equally among each fund in the First Trust Fund Complex. Each Independent Trustee is also paid an annual per fund fee that varies based on whether the fund is a closed-end or other actively managed fund, a defined-outcome fund or an index fund.
Additionally, the Lead Independent Trustee and the Chairs of the Audit Committee, Nominating and Governance Committee and Valuation Committee are paid annual fees to serve in such capacities, with such compensation allocated pro rata among each fund in the First Trust Fund Complex based on net assets. Independent Trustees are reimbursed for travel and out-of-pocket expenses in connection with all meetings. The Lead Independent Trustee and Committee Chairs rotate every three years. The officers and “Interested” Trustee receive no compensation from the Trust for acting in such capacities.
4. Purchases and Sales of Securities
For the six months ended April 30, 2022, the cost of purchases and proceeds from sales of investments, excluding short term investments and in-kind transactions, were $689,568,706 and $673,326,470, respectively.
For the six months ended April 30, 2022, the Fund had no in-kind transactions.
Notes to Financial Statements (Continued)
First Trust Managed Municipal ETF (FMB)
April 30, 2022 (Unaudited)
5. Derivative Transactions
The following table presents the type of derivatives held by the Fund at April 30, 2022, the primary underlying risk exposure and the location of these instruments as presented on the Statement of Assets and Liabilities.
| | | | | Asset Derivatives | | Liability Derivatives |
Derivative
Instrument | | Risk
Exposure | | Statement of Assets and
Liabilities Location | | Value | | Statement of Assets and
Liabilities Location | | Value |
| Futures contracts | | Interest Rate Risk | | Unrealized appreciation
on futures contracts* | | $ 307,758 | | Unrealized depreciation
on futures contracts* | | $ — |
*Includes cumulative appreciation/depreciation on futures contracts as reported in the Futures Contracts table. Only the current day’s variation margin is presented on the Statement of Assets and Liabilities.
The following table presents the amount of net realized gain (loss) and change in net unrealized appreciation (depreciation) recognized for the six months ended April 30, 2022, on derivative instruments, as well as the primary underlying risk exposure associated with each instrument.
| Statement of Operations Location | |
| Interest Rate Risk Exposure | |
| Net realized gain (loss) on futures contracts | $6,640,610 |
| Net change in unrealized appreciation (depreciation) on futures contracts | 5,898,785 |
During the six months ended April 30, 2022, the notional value of futures contracts opened and closed were $938,172,885 and $921,209,912, respectively.
The Fund does not have the right to offset financial assets and liabilities related to futures contracts on the Statement of Assets and Liabilities.
6. Creations, Redemptions and Transaction Fees
The Fund generally issues and redeems its shares in primary market transactions through a creation and redemption mechanism and does not sell or redeem individual shares. Instead, financial entities known as “Authorized Participants” have contractual arrangements with the Fund or one of the Fund’s service providers to purchase and redeem Fund shares directly with the Fund in large blocks of shares known as “Creation Units.” Prior to the start of trading on every business day, the Fund publishes through the National Securities Clearing Corporation (“NSCC”) the “basket” of securities, cash or other assets that it will accept in exchange for a Creation Unit of the Fund’s shares. An Authorized Participant that wishes to effectuate a creation of the Fund’s shares deposits with the Fund the “basket” of securities, cash or other assets identified by the Fund that day, and then receives the Creation Unit of the Fund’s shares in return for those assets. After purchasing a Creation Unit, the Authorized Participant may continue to hold the Fund’s shares or sell them in the secondary market. The redemption process is the reverse of the purchase process: the Authorized Participant redeems a Creation Unit of the Fund’s shares for a basket of securities, cash or other assets. The combination of the creation and redemption process with secondary market trading in the Fund’s shares and underlying securities provides arbitrage opportunities that are designed to help keep the market price of the Fund’s shares at or close to the NAV per share of the Fund.
The Fund imposes fees in connection with the purchase of Creation Units. These fees may vary based upon various fact-based circumstances, including, but not limited to, the composition of the securities included in the Creation Unit or the countries in which the transactions are settled. The price for each Creation Unit will equal the daily NAV per share of the Fund times the number of shares in a Creation Unit, plus the fees described above and, if applicable, any operational processing and brokerage costs, transfer fees, stamp taxes and part or all of the spread between the expected bid and offer side of the market related to the securities comprising the creation basket.
The Fund also imposes fees in connection with the redemption of Creation Units. These fees may vary based upon various fact-based circumstances, including, but not limited to, the composition of the securities included in the Creation Unit or the countries in which the transactions are settled. The price received for each Creation Unit will equal the daily NAV per share of the Fund times the number of shares in a Creation Unit, minus the fees described above and, if applicable, any operational processing and brokerage costs, transfer fees, stamp taxes and part or all of the spread between the expected bid and offer side of the market related to the securities comprising the redemption basket. Investors who use the services of a broker or other such intermediary in addition to an Authorized Participant to effect a redemption of a Creation Unit may also be assessed an amount to cover the cost of such services. The redemption fee
Notes to Financial Statements (Continued)
First Trust Managed Municipal ETF (FMB)
April 30, 2022 (Unaudited)
charged by the Fund will comply with Rule 22c-2 of the 1940 Act which limits redemption fees to no more than 2% of the value of the shares redeemed.
7. Distribution Plan
The Board of Trustees adopted a Distribution and Service Plan pursuant to Rule 12b-1 under the 1940 Act. In accordance with the Rule 12b-1 plan, the Fund is authorized to pay an amount up to 0.25% of its average daily net assets each year to reimburse First Trust Portfolios L.P. (“FTP”), the distributor of the Fund, for amounts expended to finance activities primarily intended to result in the sale of Creation Units or to provide investor services. FTP may also use this amount to compensate securities dealers or other persons that are Authorized Participants for providing distribution assistance, including broker-dealer and shareholder support and educational and promotional services.
No 12b-1 fees are currently paid by the Fund, and pursuant to a contractual arrangement, no 12b-1 fees will be paid any time before February 28, 2023.
8. Borrowings
The Trust, on behalf of the Fund, along with First Trust Series Fund and First Trust Exchange-Traded Fund IV has a $280 million Credit Agreement with The Bank of Nova Scotia (“Scotia”) as administrative agent for a group of lenders. Prior to March 2, 2022, the commitment amount was $355 million. Scotia charges a commitment fee of 0.25% of the daily amount of the excess of the commitment amount over the outstanding principal balance of the loans and an agency fee. First Trust allocates the commitment fee and agency fee amongst the funds that have access to the credit line. To the extent that the Fund accesses the credit line, there would also be an interest fee charged. The Fund did not have any borrowings outstanding during the six months ended April 30, 2022.
9. Indemnification
The Trust, on behalf of the Fund, has a variety of indemnification obligations under contracts with its service providers. The Trust’s maximum exposure under these arrangements is unknown. However, the Trust has not had prior claims or losses pursuant to these contracts and expects the risk of loss to be remote.
10. Subsequent Events
Management has evaluated the impact of all subsequent events to the Fund through the date the financial statements were issued, and has determined that there was the following subsequent event:
Effective June 30, 2022, Tom Futrell will retire from the Fund’s investment advisor and will no longer serve as a portfolio manager of the Fund.
Additional Information
First Trust Managed Municipal ETF (FMB)
April 30, 2022 (Unaudited)
Proxy Voting Policies and Procedures
A description of the policies and procedures that the Trust uses to determine how to vote proxies and information on how the Fund voted proxies relating to portfolio securities during the most recent 12-month period ended June 30 is available (1) without charge, upon request, by calling (800) 988-5891; (2) on the Fund’s website at www.ftportfolios.com; and (3) on the Securities and Exchange Commission’s (“SEC”) website at www.sec.gov.
Portfolio Holdings
The Fund files portfolio holdings information for each month in a fiscal quarter within 60 days after the end of the relevant fiscal quarter on Form N-PORT. Portfolio holdings information for the third month of each fiscal quarter will be publicly available on the SEC’s website at www.sec.gov. The Fund’s complete schedule of portfolio holdings for the second and fourth quarters of each fiscal year is included in the semi-annual and annual reports to shareholders, respectively, and is filed with the SEC on Form N-CSR. The semi-annual and annual report for the Fund is available to investors within 60 days after the period to which it relates. The Fund’s Forms N-PORT and Forms N-CSR are available on the SEC’s website listed above.
Risk Considerations
Risks are inherent in all investing. Certain general risks that may be applicable to a Fund are identified below, but not all of the material risks relevant to each Fund are included in this report and not all of the risks below apply to each Fund. The material risks of investing in each Fund are spelled out in its prospectus, statement of additional information and other regulatory filings. Before investing, you should consider each Fund’s investment objective, risks, charges and expenses, and read each Fund’s prospectus and statement of additional information carefully. You can download each Fund’s prospectus at www.ftportfolios.com or contact First Trust Portfolios L.P. at (800) 621-1675 to request a prospectus, which contains this and other information about each Fund.
Concentration Risk. To the extent that a fund is able to invest a significant percentage of its assets in a single asset class or the securities of issuers within the same country, state, region, industry or sector, an adverse economic, business or political development may affect the value of the fund’s investments more than if the fund were more broadly diversified. A fund that tracks an index will be concentrated to the extent the fund’s corresponding index is concentrated. A concentration makes a fund more susceptible to any single occurrence and may subject the fund to greater market risk than a fund that is more broadly diversified.
Credit Risk. Credit risk is the risk that an issuer of a security will be unable or unwilling to make dividend, interest and/or principal payments when due and the related risk that the value of a security may decline because of concerns about the issuer’s ability to make such payments.
Cyber Security Risk. The funds are susceptible to potential operational risks through breaches in cyber security. A breach in cyber security refers to both intentional and unintentional events that may cause a fund to lose proprietary information, suffer data corruption or lose operational capacity. Such events could cause a fund to incur regulatory penalties, reputational damage, additional compliance costs associated with corrective measures and/or financial loss. In addition, cyber security breaches of a fund’s third-party service providers, such as its administrator, transfer agent, custodian, or sub-advisor, as applicable, or issuers in which the fund invests, can also subject a fund to many of the same risks associated with direct cyber security breaches.
Defined Outcome Funds Risk. To the extent a fund’s investment strategy is designed to deliver returns tied to the price performance of an underlying ETF, an investor may not realize the returns the fund seeks to achieve if that investor does not hold shares for the entire target outcome period. In the event an investor purchases shares after the first day of the target outcome period or sells shares prior to the end of the target outcome period, the buffer that the fund seeks to provide against a decline in the value of the underlying ETF may not be available, the enhanced returns that the fund seeks to provide (if any) may not be available and the investor may not participate in a gain in the value of the underlying ETF up to the cap for the investor’s investment period. Additionally, the fund will not participate in gains of the underlying ETF above the cap and a shareholder may lose their entire investment. If the fund seeks enhanced returns, there are certain time periods when the value of the fund may fall faster than the value of the underlying ETF, and it is very unlikely that, on any given day during which the underlying ETF share price increases in value, the fund’s share price will increase at the same rate as the enhanced returns sought by the fund, which is designed for an entire target outcome period. Trading flexible exchange options involves risks different from, or possibly greater than, the risks associated with investing directly in securities, such as less liquidity and correlation and valuation risks. A fund may experience substantial downside from specific flexible exchange option positions and certain positions may expire worthless.
Derivatives Risk. To the extent a fund uses derivative instruments such as futures contracts, options contracts and swaps, the fund may experience losses because of adverse movements in the price or value of the underlying asset, index or rate, which may be magnified
Additional Information (Continued)
First Trust Managed Municipal ETF (FMB)
April 30, 2022 (Unaudited)
by certain features of the derivative. These risks are heightened when a fund’s portfolio managers use derivatives to enhance the fund’s return or as a substitute for a position or security, rather than solely to hedge (or offset) the risk of a position or security held by the fund.
Equity Securities Risk. To the extent a fund invests in equity securities, the value of the fund’s shares will fluctuate with changes in the value of the equity securities. Equity securities prices fluctuate for several reasons, including changes in investors’ perceptions of the financial condition of an issuer or the general condition of the relevant stock market, such as market volatility, or when political or economic events affecting the issuers occur. In addition, common stock prices may be particularly sensitive to rising interest rates, as the cost of capital rises and borrowing costs increase. Equity securities may decline significantly in price over short or extended periods of time, and such declines may occur in the equity market as a whole, or they may occur in only a particular country, company, industry or sector of the market.
ETF Risk. The shares of an ETF trade like common stock and represent an interest in a portfolio of securities. The risks of owning an ETF generally reflect the risks of owning the underlying securities, although lack of liquidity in an ETF could result in it being more volatile and ETFs have management fees that increase their costs. Shares of an ETF trade on an exchange at market prices rather than net asset value, which may cause the shares to trade at a price greater than net asset value (premium) or less than net asset value (discount). In times of market stress, decisions by market makers to reduce or step away from their role of providing a market for an ETF’s shares, or decisions by an ETF’s authorized participants that they are unable or unwilling to proceed with creation and/or redemption orders of an ETF’s shares, could result in shares of the ETF trading at a discount to net asset value and in greater than normal intraday bid-ask spreads.
Fixed Income Securities Risk. To the extent a fund invests in fixed income securities, the fund will be subject to credit risk, income risk, interest rate risk, liquidity risk and prepayment risk. Income risk is the risk that income from a fund’s fixed income investments could decline during periods of falling interest rates. Interest rate risk is the risk that the value of a fund’s fixed income securities will decline because of rising interest rates. Liquidity risk is the risk that a security cannot be purchased or sold at the time desired, or cannot be purchased or sold without adversely affecting the price. Prepayment risk is the risk that the securities will be redeemed or prepaid by the issuer, resulting in lower interest payments received by the fund. In addition to these risks, high yield securities, or “junk” bonds, are subject to greater market fluctuations and risk of loss than securities with higher ratings, and the market for high yield securities is generally smaller and less liquid than that for investment grade securities.
Index or Model Constituent Risk. Certain funds may be a constituent of one or more indices or ETF models. As a result, such a fund may be included in one or more index-tracking exchange-traded funds or mutual funds. Being a component security of such a vehicle could greatly affect the trading activity involving a fund, the size of the fund and the market volatility of the fund. Inclusion in an index could increase demand for the fund and removal from an index could result in outsized selling activity in a relatively short period of time. As a result, a fund’s net asset value could be negatively impacted and the fund’s market price may be significantly below its net asset value during certain periods. In addition, index rebalances may potentially result in increased trading activity in a fund’s shares.
Index Provider Risk. To the extent a fund seeks to track an index, it is subject to Index Provider Risk. There is no assurance that the Index Provider will compile the Index accurately, or that the Index will be determined, maintained, constructed, reconstituted, rebalanced, composed, calculated or disseminated accurately. To correct any such error, the Index Provider may carry out an unscheduled rebalance or other modification of the Index constituents or weightings, which may increase the fund’s costs. The Index Provider does not provide any representation or warranty in relation to the quality, accuracy or completeness of data in the Index, and it does not guarantee that the Index will be calculated in accordance with its stated methodology. Losses or costs associated with any Index Provider errors generally will be borne by the fund and its shareholders.
Investment Companies Risk. To the extent a fund invests in the securities of other investment vehicles, the fund will incur additional fees and expenses that would not be present in a direct investment in those investment vehicles. Furthermore, the fund’s investment performance and risks are directly related to the investment performance and risks of the investment vehicles in which the fund invests.
LIBOR Risk. To the extent a fund invests in floating or variable rate obligations that use the London Interbank Offered Rate (“LIBOR”) as a reference interest rate, it is subject to LIBOR Risk. The United Kingdom’s Financial Conduct Authority, which regulates LIBOR has ceased making LIBOR available as a reference rate over a phase-out period that began December 31, 2021. There is no assurance that any alternative reference rate, including the Secured Overnight Financing Rate (“SOFR”) will be similar to or produce the same value or economic equivalence as LIBOR or that instruments using an alternative rate will have the same volume or liquidity. The unavailability or replacement of LIBOR may affect the value, liquidity or return on certain fund investments and may result in costs incurred in connection with closing out positions and entering into new trades. Any potential effects of the transition away from LIBOR on the fund or on certain instruments in which the fund invests can be difficult to ascertain, and they may vary depending on a variety of factors, and they could result in losses to the fund.
Additional Information (Continued)
First Trust Managed Municipal ETF (FMB)
April 30, 2022 (Unaudited)
Management Risk. To the extent that a fund is actively managed, it is subject to management risk. In managing an actively-managed fund’s investment portfolio, the fund’s portfolio managers will apply investment techniques and risk analyses that may not have the desired result. There can be no guarantee that a fund will meet its investment objective.
Market Risk. Securities held by a fund, as well as shares of a fund itself, are subject to market fluctuations caused by factors such as general economic conditions, political events, regulatory or market developments, changes in interest rates and perceived trends in securities prices. Shares of a fund could decline in value or underperform other investments as a result of the risk of loss associated with these market fluctuations. In addition, local, regional or global events such as war, acts of terrorism, spread of infectious diseases or other public health issues, recessions, or other events could have a significant negative impact on a fund and its investments. Such events may affect certain geographic regions, countries, sectors and industries more significantly than others. In February 2022, Russia invaded Ukraine which has caused and could continue to cause significant market disruptions and volatility within the markets in Russia, Europe, and the United States. The hostilities and sanctions resulting from those hostilities could have a significant impact on certain fund investments as well as fund performance. The outbreak of the respiratory disease designated as COVID-19 in December 2019 has caused significant volatility and declines in global financial markets, which have caused losses for investors. While the development of vaccines has slowed the spread of the virus and allowed for the resumption of “reasonably” normal business activity in the United States, many countries continue to impose lockdown measures in an attempt to slow the spread. Additionally, there is no guarantee that vaccines will be effective against emerging variants of the disease.
Non-U.S. Securities Risk. To the extent a fund invests in non-U.S. securities, it is subject to additional risks not associated with securities of domestic issuers. Non-U.S. securities are subject to higher volatility than securities of domestic issuers due to: possible adverse political, social or economic developments; restrictions on foreign investment or exchange of securities; capital controls; lack of liquidity; currency exchange rates; excessive taxation; government seizure of assets; the imposition of sanctions by foreign governments; different legal or accounting standards; and less government supervision and regulation of exchanges in foreign countries. Investments in non-U.S. securities may involve higher costs than investments in U.S. securities, including higher transaction and custody costs, as well as additional taxes imposed by non-U.S. governments. These risks may be heightened for securities of companies located, or with significant operations, in emerging market countries.
Operational Risk. Each fund is subject to risks arising from various operational factors, including, but not limited to, human error, processing and communication errors, errors of a fund’s service providers, counterparties or other third-parties, failed or inadequate processes and technology or systems failures. Each fund relies on third-parties for a range of services, including custody. Any delay or failure relating to engaging or maintaining such service providers may affect a fund’s ability to meet its investment objective. Although the funds and the funds’ investment advisor seek to reduce these operational risks through controls and procedures, there is no way to completely protect against such risks.
Passive Investment Risk. To the extent a fund seeks to track an index, the fund will invest in the securities included in, or representative of, the index regardless of their investment merit. A fund generally will not attempt to take defensive positions in declining markets.
Valuation Risk. The valuation of municipal bonds or securitized assets may carry more risk than that of common stock. Uncertainties in the conditions of the financial markets, unreliable reference data, lack of transparency and inconsistency of valuation models and processes may lead to inaccurate asset pricing. The Fund may hold investments in sizes smaller than institutionally sized round lot positions (sometimes referred to as odd lots). However, third-party pricing services generally provide evaluations on the basis of institutionally-sized round lots. If the Fund sells certain of its investments in an odd lot transaction, the sale price may be less than the value at which such securities have been held by the Fund. Odd lots often trade at lower prices than institutional round lots. There is no assurance that the Fund will be able to sell a portfolio security at the price established by the pricing service, which could result in a loss to the Fund.
| NOT FDIC INSURED | NOT BANK GUARANTEED | MAY LOSE VALUE |
Liquidity Risk Management Program
In accordance with Rule 22e-4 under the Investment Company Act of 1940, as amended (the “1940 Act”), the Fund and each other fund in the First Trust Fund Complex, other than the closed-end funds, have adopted and implemented a liquidity risk management program (the “Program”) reasonably designed to assess and manage the funds’ liquidity risk, i.e., the risk that a fund could not meet requests to redeem shares issued by the fund without significant dilution of remaining investors’ interests in the fund. The Board of Trustees of the First Trust Funds has appointed First Trust Advisors L.P. (the “Advisor”) as the person designated to administer the Program, and in this capacity the Advisor performs its duties primarily through the activities and efforts of the First Trust Liquidity Committee (the “Liquidity Committee”).
Additional Information (Continued)
First Trust Managed Municipal ETF (FMB)
April 30, 2022 (Unaudited)
Pursuant to the Program, the Liquidity Committee classifies the liquidity of each fund’s portfolio investments into one of the four liquidity categories specified by Rule 22e-4: highly liquid investments, moderately liquid investments, less liquid investments and illiquid investments. The Liquidity Committee determines certain of the inputs for this classification process, including reasonably anticipated trade sizes and significant investor dilution thresholds. The Liquidity Committee also determines and periodically reviews a highly liquid investment minimum for certain funds, monitors the funds’ holdings of assets classified as illiquid investments to seek to ensure they do not exceed 15% of a fund’s net assets and establishes policies and procedures regarding redemptions in kind.
At the April 18, 2022 meeting of the Board of Trustees, as required by Rule 22e-4 and the Program, the Advisor provided the Board with a written report prepared by the Advisor that addressed the operation of the Program during the period from March 16, 2021 through the Liquidity Committee’s annual meeting held on March 17, 2022 and assessed the Program’s adequacy and effectiveness of implementation during this period, including the operation of the highly liquid investment minimum for each fund that is required under the Program to have one, and any material changes to the Program. Note that because the Fund primarily holds assets that are highly liquid investments, the Fund has not adopted any highly liquid investment minimum.
As stated in the written report, during the review period, no fund breached the 15% limitation on illiquid investments, no fund with a highly liquid investment minimum breached that minimum and no fund filed a Form N-LIQUID. The Advisor concluded that each fund’s investment strategy is appropriate for an open-end fund; that the Program operated effectively in all material respects during the review period; and that the Program is reasonably designed to assess and manage the liquidity risk of each fund and to maintain compliance with Rule 22e-4.
This page intentionally left blank
This page intentionally left blank
First Trust Exchange-Traded Fund III
INVESTMENT ADVISOR
First Trust Advisors L.P.
120 East Liberty Drive, Suite 400
Wheaton, IL 60187
ADMINISTRATOR, CUSTODIAN,
FUND ACCOUNTANT &
TRANSFER AGENT
Brown Brothers Harriman & Co.
50 Post Office Square
Boston, MA 02110
INDEPENDENT REGISTERED
PUBLIC ACCOUNTING FIRM
Deloitte & Touche LLP
111 S. Wacker Drive
Chicago, IL 60606
LEGAL COUNSEL
Chapman and Cutler LLP
320 South Canal Street
Chicago, IL 60606
First Trust Exchange-Traded Fund III
First Trust Long/Short Equity ETF (FTLS)
Semi-Annual Report
For the Six Months Ended
April 30, 2022
First Trust Long/Short Equity ETF (FTLS)
Semi-Annual Report
April 30, 2022
Caution Regarding Forward-Looking Statements
This report contains certain forward-looking statements within the meaning of the Securities Act of 1933, as amended, and the Securities Exchange Act of 1934, as amended. Forward-looking statements include statements regarding the goals, beliefs, plans or current expectations of First Trust Advisors L.P. (“First Trust” or the “Advisor”) and its representatives, taking into account the information currently available to them. Forward-looking statements include all statements that do not relate solely to current or historical fact. For example, forward-looking statements include the use of words such as “anticipate,” “estimate,” “intend,” “expect,” “believe,” “plan,” “may,” “should,” “would” or other words that convey uncertainty of future events or outcomes.
Forward-looking statements involve known and unknown risks, uncertainties and other factors that may cause the actual results, performance or achievements of the series of First Trust Exchange-Traded Fund III (the “Trust”) described in this report (First Trust Long/Short Equity ETF; hereinafter referred to as the “Fund”) to be materially different from any future results, performance or achievements expressed or implied by the forward-looking statements. When evaluating the information included in this report, you are cautioned not to place undue reliance on these forward-looking statements, which reflect the judgment of the Advisor and its representatives only as of the date hereof. We undertake no obligation to publicly revise or update these forward-looking statements to reflect events and circumstances that arise after the date hereof.
Performance and Risk Disclosure
There is no assurance that the Fund will achieve its investment objective. The Fund is subject to market risk, which is the possibility that the market values of securities owned by the Fund will decline and that the value of the Fund’s shares may therefore be less than what you paid for them. Accordingly, you can lose money by investing in the Fund. See “Risk Considerations” in the Additional Information section of this report for a discussion of certain other risks of investing in the Fund.
Performance data quoted represents past performance, which is no guarantee of future results, and current performance may be lower or higher than the figures shown. For the most recent month-end performance figures, please visit www.ftportfolios.com or speak with your financial advisor. Investment returns, net asset value and share price will fluctuate and Fund shares, when sold, may be worth more or less than their original cost.
The Advisor may also periodically provide additional information on Fund performance on the Fund’s web page at www.ftportfolios.com.
How to Read This Report
This report contains information that may help you evaluate your investment in the Fund. It includes details about the Fund and presents data and analysis that provide insight into the Fund’s performance and investment approach.
The statistical information that follows may help you understand the Fund’s performance compared to that of a relevant market benchmark.
It is important to keep in mind that the opinions expressed by personnel of the Advisor are just that: informed opinions. They should not be considered to be promises or advice. The opinions, like the statistics, cover the period through the date on the cover of this report. The material risks of investing in the Fund are spelled out in the prospectus, the statement of additional information, and other Fund regulatory filings.
First Trust Long/Short Equity ETF (FTLS)
Semi-Annual Letter from the Chairman and CEO
April 30, 2022
Dear Shareholders,
First Trust is pleased to provide you with the semi-annual report for the First Trust Long/Short Equity ETF (the “Fund”), which contains detailed information about the Fund for the six months ended April 30, 2022.
A couple of famous financial industry quotes came to mind recently as I was sizing up the current business climate: “There’s no such thing as a free lunch” and “Don’t fight the Fed!” It seems that for some, the trillions of dollars of financial stimulus funneled into U.S. households and businesses by the Federal government and its agencies to help mitigate the fallout stemming from the coronavirus (“COVID-19”) pandemic, which commenced sometime around February 2020, was for all intents and purposes “free money.” It was not free. From the close of February 2020 through March 2022, the Federal Reserve (the “Fed”) expanded the U.S. money supply, known as M2, by 41% to $21.81 trillion to boost liquidity in the financial system. Normally, M2 grows around 6.0% on a year-over-year basis. When you factor in that all this new capital was accompanied by a breakdown of the global supply chain, there is little wonder why inflation is rampant.
One of the more common definitions of inflation is too many dollars chasing too few goods. The biggest downside to the supply chain bottlenecks, such as the severe backup of container ships at some U.S. ports, is that they have markedly reduced the flow of imported goods to retailers. The Fed has been signaling to Americans and the rest of the globe that, after many years of artificially low interest rates, tighter monetary policy will likely rule the day for the foreseeable future. Higher interest rates make borrowing capital more expensive and that should slow consumption over time, which, in turn, should bring down inflation. Don’t fight the Fed is code for don’t bet against the Fed, in my opinion. Stay tuned!
The primary job of the Fed is price stability. Its standard inflation target rate is 2.0%. The most recent Consumer Price Index release showed that prices were up 8.3% on a year-over-year basis as of April 30, 2022, according to data from the U.S. Bureau of Labor Statistics. While down from 8.5% the prior month, it is clearly elevated and that means the Fed has some work to do to with respect to mitigating inflation. The war between Russia and Ukraine is making the Fed’s job even tougher, particularly in the areas of food and energy. Rising costs and potential shortages could become even bigger if the COVID-19 outbreak in China grows. These are important events to monitor. Fed Chairman Jerome Powell has stated that the Fed is poised to raise the Federal Funds target rate (upper bound) by 50 basis points at each of its next two meetings (set for June and July), which would take the rate up to 2.00%. Data from CME Group indicates that current market pricing has the rate rising to 2.75% or 3.00% by year-end.
Securities markets do not go up in a straight line and they do not just go up year in and year out. In fact, what we have witnessed over the past couple of decades are often referred to as boom and bust cycles. Thankfully, it has ended up more boom than bust. Simply put, investors, not traders of the market, need to be willing to take the bad with the good. As the various stages of an economic cycle come and go (expansion to contraction), the markets tend to reprice securities to reflect the current narrative. In other words, we believe the markets essentially heal themselves − if you let them. That is an accurate depiction of how the markets have behaved so far in 2022, in my opinion. In response to a softening economy, the stock and bond markets have experienced some serious downside through the first four months of this year, as measured by the broader market indices. As of today, Brian Wesbury, Chief Economist at First Trust, is not forecasting a recession for the U.S. in 2022 or 2023. Whether he is proven right or wrong, we encourage investors to stay the course.
Thank you for giving First Trust the opportunity to play a role in your financial future. We value our relationship with you and will report on the Fund again in six months.
Sincerely,
James A. Bowen
Chairman of the Board of Trustees
Chief Executive Officer of First Trust Advisors L.P.
Fund Performance Overview (Unaudited)
First Trust Long/Short Equity ETF (FTLS)
The First Trust Long/Short Equity ETF’s (the “Fund”) investment objective is to seek to provide investors with long-term total return. Under normal conditions, the Fund will expose at least 80% of its net assets (including investment borrowings) to U.S. exchange-listed equity securities and/or U.S. exchange-traded funds (“ETFs”) that provide exposure to U.S. exchange-listed equity securities. The Fund pursues its investment objective by establishing long and short positions in a portfolio of U.S. exchange-listed equity securities and ETFs. The Fund’s portfolio may include U.S. exchange-listed equity securities of non-U.S. issuers, including the securities of non-U.S. issuers traded on U.S. exchanges in the form of depositary receipts.
The Fund’s portfolio is composed of both long and short positions in equity securities and ETFs. As opposed to taking long positions in which an investor seeks to profit from increases in the price of a security, short selling is a technique that will be used by the Fund to try and profit from the falling price of a security. Short selling involves selling a security that has been borrowed from a third party with the intention of buying an identical security back at a later date to return to that third party.
Having both long and short positions in an equity security portfolio is a common way to create returns that are independent of market moves. One advantage of a long and short portfolio is that the long and short positions may offset one another in a manner that results in a lower net exposure to the direction of the market. In addition, cash balances arising from the use of short selling typically will be held in money market instruments.
| Performance | | | | | | | |
| | | | Average Annual Total Returns | | Cumulative Total Returns |
| | 6 Months
Ended
4/30/22 | 1 Year
Ended
4/30/22 | 5 Years
Ended
4/30/22 | Inception
(9/8/14)
to 4/30/22 | | 5 Years
Ended
4/30/22 | Inception
(9/8/14)
to 4/30/22 |
| Fund Performance | | | | | | | |
| NAV | -0.67% | 6.61% | 7.61% | 7.55% | | 44.32% | 74.44% |
| Market Price | -0.71% | 6.60% | 7.62% | 7.56% | | 44.35% | 74.47% |
| Index Performance | | | | | | | |
| S&P 500® Index | -9.65% | 0.21% | 13.66% | 12.07% | | 89.68% | 138.81% |
Total returns for the period since inception are calculated from the inception date of the Fund. “Average Annual Total Returns” represent the average annual change in value of an investment over the periods indicated. “Cumulative Total Returns” represent the total change in value of an investment over the periods indicated.
The Fund’s per share net asset value (“NAV”) is the value of one share of the Fund and is computed by dividing the value of all assets of the Fund (including accrued interest and dividends), less all liabilities (including accrued expenses and dividends declared but unpaid), by the total number of outstanding shares. The price used to calculate market return (“Market Price”) is determined by using the midpoint of the national best bid and offer price (“NBBO”) as of the time that the Fund’s NAV is calculated. Under SEC rules, the NBBO consists of the highest displayed buy and lowest sell prices among the various exchanges trading the Fund at the time the Fund’s NAV is calculated. Prior to January 1, 2019, the price used was the midpoint between the highest bid and the lowest offer on the stock exchange on which shares of the Fund were listed for trading as of the time that the Fund’s NAV was calculated. Since shares of the Fund did not trade in the secondary market until after its inception, for the period from inception to the first day of secondary market trading in shares of the Fund, the NAV of the Fund is used as a proxy for the secondary market trading price to calculate market returns. NAV and market returns assume that all distributions have been reinvested in the Fund at NAV and Market Price, respectively.
An index is a statistical composite that tracks a specified financial market or sector. Unlike the Fund, the index does not actually hold a portfolio of securities and therefore does not incur the expenses incurred by the Fund. These expenses negatively impact the performance of the Fund. Also, market returns do not include brokerage commissions that may be payable on secondary market transactions. If brokerage commissions were included, market returns would be lower. The total returns presented reflect the reinvestment of dividends on securities in the index. The returns presented do not reflect the deduction of taxes that a shareholder would pay on Fund distributions or the redemption or sale of Fund shares. The investment return and principal value of shares of the Fund will vary with changes in market conditions. Shares of the Fund may be worth more or less than their original cost when they are redeemed or sold in the market. The Fund’s past performance is no guarantee of future performance.
Fund Performance Overview (Unaudited) (Continued)
First Trust Long/Short Equity ETF (FTLS)
| Portfolio Sector Allocation | % of Total
Investments –
Long Positions |
| Information Technology | 21.1% |
| Health Care | 14.2 |
| Consumer Staples | 12.1 |
| Financials | 12.0 |
| Industrials | 11.1 |
| Materials | 11.0 |
| Energy | 8.5 |
| Consumer Discretionary | 4.8 |
| Communication Services | 3.6 |
| Utilities | 1.6 |
| Total | 100.0% |
| Portfolio Sector Allocation | % of Total
Investments
Sold Short |
| Information Technology | 26.5% |
| Financials | 16.4 |
| Industrials | 12.7 |
| Consumer Discretionary | 12.0 |
| Health Care | 11.0 |
| Communication Services | 8.8 |
| Materials | 5.2 |
| Consumer Staples | 3.7 |
| Energy | 3.2 |
| Real Estate | 0.5 |
| Total | 100.0% |
| Top Ten Investments – Long Positions | % of
Net Assets |
| Apple, Inc. | 4.0% |
| Microsoft Corp. | 2.8 |
| Vertex Pharmaceuticals, Inc. | 2.6 |
| Altria Group, Inc. | 2.5 |
| CF Industries Holdings, Inc. | 2.2 |
| AbbVie, Inc. | 2.0 |
| Hershey (The) Co. | 1.9 |
| TransDigm Group, Inc. | 1.7 |
| Amazon.com, Inc. | 1.6 |
| Builders FirstSource, Inc. | 1.6 |
| Total | 22.9% |
| Top Ten Investments Sold Short | % of
Net Assets |
| SPDR S&P 500 ETF Trust | -2.0% |
| Kimberly-Clark Corp. | -0.8% |
| Air Products & Chemicals, Inc. | -0.7% |
| Paychex, Inc. | -0.7% |
| Northrop Grumman Corp. | -0.7% |
| Zimmer Biomet Holdings, Inc. | -0.7% |
| Oracle Corp. | -0.7% |
| Johnson Controls International PLC | -0.7% |
| Intel Corp. | -0.7% |
| Las Vegas Sands Corp. | -0.7% |
| Total | -8.4% |
| Fund Allocation | % of Net Assets |
| Common Stocks | 89.0% |
| Exchange-Traded Funds | 2.5 |
| Common Stocks Sold Short | (25.1) |
| Exchange-Traded Funds Sold Short | (2.0) |
| Net Other Assets and Liabilities* | 35.6 |
| Total | 100.0% |
| * | Includes variation margin on futures contracts. |
Fund Performance Overview (Unaudited) (Continued)
First Trust Long/Short Equity ETF (FTLS)
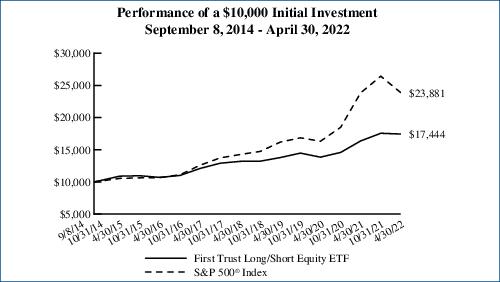
Performance figures assume reinvestment of all distributions and do not reflect the deduction of taxes that a shareholder would pay on Fund distributions or the redemption or sale of Fund shares. An index is a statistical composite that tracks a specified financial market or sector. Unlike the Fund, the index does not actually hold a portfolio of securities and therefore does not incur the expenses incurred by the Fund. These expenses negatively impact the performance of the Fund. The Fund’s past performance does not predict future performance.
Frequency Distribution of Discounts and Premiums
Information showing the number of days the market price of the Fund’s shares was greater (at a premium) and less (at a discount) than the Fund’s net asset value for the most recently completed year, and the most recently completed calendar quarters since that year (or life of the Fund, if shorter), is available at https://www.ftportfolios.com/Retail/etf/home.aspx.
Portfolio Management
First Trust Long/Short Equity ETF (FTLS)
Semi-Annual Report
April 30, 2022 (Unaudited)
Investment Advisor
First Trust Advisors L.P. (“First Trust”) is the investment advisor to First Trust Long/Short Equity ETF (the “Fund” or “FTLS”). In this capacity, First Trust is responsible for the selection and ongoing monitoring of the investments in the Fund’s portfolio and certain other services necessary for the management of the portfolio.
Portfolio Management Team
John Gambla – CFA, FRM, PRM, Senior Portfolio Manager of First Trust, FTA- Alternatives Investment Team
Rob A. Guttschow – CFA, Senior Portfolio Manager of First Trust, FTA- Alternatives Investment Team
The portfolio managers are primarily and jointly responsible for the day to day management of the Fund. Each portfolio manager has served in such capacity for the Fund since 2014.
First Trust Long/Short Equity ETF (FTLS)
Understanding Your Fund Expenses
April 30, 2022 (Unaudited)
As a shareholder of the First Trust Long/Short Equity ETF (the “Fund”), you incur two types of costs: (1) transaction costs; and (2) ongoing costs, including management fees, distribution and/or service (12b-1) fees, if any, and other Fund expenses. This Example is intended to help you understand your ongoing costs of investing in the Fund and to compare these costs with the ongoing costs of investing in other funds.
The Example is based on an investment of $1,000 invested at the beginning of the period and held through the six-month period ended April 30, 2022.
Actual Expenses
The first line in the following table provides information about actual account values and actual expenses. You may use the information in this line, together with the amount you invested, to estimate the expenses that you paid over the period. Simply divide your account value by $1,000 (for example, an $8,600 account value divided by $1,000 = 8.6), then multiply the result by the number in the first line under the heading entitled “Expenses Paid During the Six-Month Period” to estimate the expenses you paid on your account during this six-month period.
Hypothetical Example for Comparison Purposes
The second line in the following table provides information about hypothetical account values and hypothetical expenses based on the Fund’s actual expense ratio and an assumed rate of return of 5% per year before expenses, which is not the Fund’s actual return. The hypothetical account values and expenses may not be used to estimate the actual ending account balance or expenses you paid for the period. You may use this information to compare the ongoing costs of investing in the Fund and other funds. To do so, compare this 5% hypothetical example with the 5% hypothetical examples that appear in the shareholder reports of the other funds.
Please note that the expenses shown in the table are meant to highlight your ongoing costs only and do not reflect any transactional costs such as brokerage commissions. Therefore, the second line in the table is useful in comparing ongoing costs only, and will not help you determine the relative total costs of owning different funds. In addition, if these transactional costs were included, your costs would have been higher.
| | Beginning
Account Value
November 1, 2021 | Ending
Account Value
April 30, 2022 | Annualized
Expense Ratio
Based on the
Six-Month
Period (a) | Expenses Paid
During the
Six-Month
Period (a)(b) |
| First Trust Long/Short Equity ETF (FTLS) |
| Actual | $1,000.00 | $993.30 | 1.46% | $7.22 |
| Hypothetical (5% return before expenses) | $1,000.00 | $1,017.55 | 1.46% | $7.30 |
| (a) | Annualized expense ratio and expenses paid during the six-month period do not include fees and expenses of the underlying funds in which the Fund invests. |
| (b) | Expenses are equal to the annualized expense ratios as indicated in the table multiplied by the average account value over the period (November 1, 2021 through April 30, 2022), multiplied by 181/365 (to reflect the six-month period). |
First Trust Long/Short Equity ETF (FTLS)
Portfolio of Investments
April 30, 2022 (Unaudited)
Shares/
Units | | Description | | Value |
| COMMON STOCKS – 89.0% |
| | | Aerospace & Defense – 2.1% | | |
| 14,943 | | Hexcel Corp.
| | $812,301 |
| 5,132 | | Huntington Ingalls Industries, Inc.
| | 1,091,782 |
| 13,477 | | TransDigm Group, Inc. (a) (b)
| | 8,016,254 |
| | | | | 9,920,337 |
| | | Air Freight & Logistics – 0.4% | | |
| 27,778 | | Atlas Air Worldwide Holdings, Inc, (a)
| | 1,915,015 |
| | | Airlines – 0.4% | | |
| 22,762 | | Copa Holdings S.A., Class A (a)
| | 1,715,572 |
| | | Auto Components – 0.4% | | |
| 10,269 | | Aptiv PLC (a)
| | 1,092,622 |
| 12,586 | | Patrick Industries, Inc.
| | 783,478 |
| | | | | 1,876,100 |
| | | Automobiles – 0.5% | | |
| 70,977 | | Harley-Davidson, Inc. (b)
| | 2,587,112 |
| | | Banks – 1.7% | | |
| 34,483 | | Columbia Banking System, Inc.
| | 968,283 |
| 44,954 | | Fulton Financial Corp.
| | 681,952 |
| 9,780 | | Independent Bank Corp.
| | 754,625 |
| 10,417 | | International Bancshares Corp.
| | 414,492 |
| 22,327 | | JPMorgan Chase & Co. (b)
| | 2,664,951 |
| 38,474 | | Regions Financial Corp.
| | 797,181 |
| 2,001 | | SVB Financial Group (a)
| | 975,768 |
| 13,269 | | Zions Bancorp N.A.
| | 749,831 |
| | | | | 8,007,083 |
| | | Biotechnology – 5.5% | | |
| 64,576 | | AbbVie, Inc. (b)
| | 9,484,923 |
| 53,688 | | Gilead Sciences, Inc.
| | 3,185,846 |
| 25,479 | | iTeos Therapeutics, Inc. (a)
| | 680,035 |
| 45,275 | | Vertex Pharmaceuticals, Inc. (a) (b)
| | 12,370,035 |
| | | | | 25,720,839 |
| | | Building Products – 3.3% | | |
| 117,863 | | Builders FirstSource, Inc. (a) (b)
| | 7,256,825 |
| 107,358 | | Masco Corp. (b)
| | 5,656,693 |
| 13,525 | | UFP Industries, Inc.
| | 1,046,429 |
| 43,653 | | Zurn Water Solutions Corp.
| | 1,362,847 |
| | | | | 15,322,794 |
| | | Capital Markets – 2.2% | | |
| 3,748 | | CME Group, Inc.
| | 822,086 |
| 37,721 | | Franklin Resources, Inc.
| | 927,560 |
| 53,587 | | Invesco, Ltd.
| | 984,929 |
| 2,189 | | MSCI, Inc.
| | 922,116 |
| 47,709 | | T Rowe Price Group, Inc.
| | 5,870,115 |
| 9,630 | | Tradeweb Markets, Inc., Class A
| | 685,560 |
| | | | | 10,212,366 |
| | | Chemicals – 3.6% | | |
| 4,406 | | Albemarle Corp.
| | 849,609 |
| 107,416 | | CF Industries Holdings, Inc. (b)
| | 10,401,091 |
See Notes to Financial Statements
Page 7
First Trust Long/Short Equity ETF (FTLS)
Portfolio of Investments (Continued)
April 30, 2022 (Unaudited)
Shares/
Units | | Description | | Value |
| COMMON STOCKS (Continued) |
| | | Chemicals (Continued) | | |
| 17,947 | | Dow, Inc.
| | $1,193,475 |
| 38,009 | | Element Solutions, Inc.
| | 783,746 |
| 6,841 | | FMC Corp.
| | 906,706 |
| 22,119 | | Huntsman Corp.
| | 749,171 |
| 8,291 | | LyondellBasell Industries N.V., Class A
| | 879,095 |
| 7,187 | | Westlake Corp.
| | 909,515 |
| | | | | 16,672,408 |
| | | Communications Equipment – 0.3% | | |
| 8,909 | | Arista Networks, Inc. (a)
| | 1,029,613 |
| 18,974 | | NetScout Systems, Inc. (a)
| | 584,399 |
| | | | | 1,614,012 |
| | | Construction & Engineering – 0.7% | | |
| 14,601 | | AECOM
| | 1,030,246 |
| 41,709 | | MDU Resources Group, Inc.
| | 1,074,424 |
| 9,121 | | Quanta Services, Inc.
| | 1,057,854 |
| | | | | 3,162,524 |
| | | Construction Materials – 0.4% | | |
| 14,917 | | Eagle Materials, Inc.
| | 1,839,564 |
| | | Consumer Finance – 0.4% | | |
| 5,088 | | American Express Co.
| | 888,925 |
| 6,512 | | Capital One Financial Corp.
| | 811,525 |
| | | | | 1,700,450 |
| | | Containers & Packaging – 0.4% | | |
| 25,513 | | International Paper Co.
| | 1,180,741 |
| 13,940 | | Silgan Holdings, Inc.
| | 618,518 |
| | | | | 1,799,259 |
| | | Diversified Financial Services – 0.8% | | |
| 11,635 | | Berkshire Hathaway, Inc., Class B (a)
| | 3,756,127 |
| | | Diversified Telecommunication Services – 0.3% | | |
| 44,466 | | Iridium Communications, Inc. (a)
| | 1,587,881 |
| | | Electric Utilities – 0.6% | | |
| 16,355 | | Edison International
| | 1,125,060 |
| 24,660 | | Exelon Corp.
| | 1,153,595 |
| 15,783 | | Hawaiian Electric Industries, Inc.
| | 648,839 |
| | | | | 2,927,494 |
| | | Electronic Equipment, Instruments & Components – 1.9% | | |
| 9,133 | | Arrow Electronics, Inc. (a)
| | 1,076,415 |
| 27,159 | | Avnet, Inc.
| | 1,185,762 |
| 9,124 | | Insight Enterprises, Inc. (a)
| | 906,652 |
| 72,710 | | Trimble, Inc. (a)
| | 4,849,757 |
| 2,695 | | Zebra Technologies Corp., Class A (a)
| | 996,234 |
| | | | | 9,014,820 |
| | | Energy Equipment & Services – 0.7% | | |
| 32,273 | | Baker Hughes Co.
| | 1,001,108 |
| 31,364 | | Halliburton Co.
| | 1,117,186 |
Page 8
See Notes to Financial Statements
First Trust Long/Short Equity ETF (FTLS)
Portfolio of Investments (Continued)
April 30, 2022 (Unaudited)
Shares/
Units | | Description | | Value |
| COMMON STOCKS (Continued) |
| | | Energy Equipment & Services (Continued) | | |
| 25,590 | | Schlumberger N.V.
| | $998,266 |
| | | | | 3,116,560 |
| | | Food & Staples Retailing – 0.5% | | |
| 74,907 | | Sprouts Farmers Market, Inc. (a)
| | 2,232,229 |
| | | Food Products – 5.3% | | |
| 13,224 | | Archer-Daniels-Midland Co.
| | 1,184,341 |
| 10,002 | | Bunge Ltd.
| | 1,131,426 |
| 39,250 | | Hershey (The) Co. (b)
| | 8,861,473 |
| 89,919 | | Hormel Foods Corp.
| | 4,710,856 |
| 12,418 | | Ingredion, Inc.
| | 1,056,896 |
| 69,799 | | McCormick & Co., Inc.
| | 7,019,685 |
| 23,085 | | TreeHouse Foods, Inc. (a)
| | 727,178 |
| | | | | 24,691,855 |
| | | Gas Utilities – 0.4% | | |
| 12,970 | | Spire, Inc.
| | 943,568 |
| 30,791 | | UGI Corp.
| | 1,056,131 |
| | | | | 1,999,699 |
| | | Health Care Equipment & Supplies – 0.9% | | |
| 2,438 | | Align Technology, Inc. (a)
| | 706,801 |
| 57,103 | | Envista Holdings Corp. (a)
| | 2,262,421 |
| 3,899 | | Intuitive Surgical, Inc. (a) (b)
| | 933,031 |
| 21,838 | | Meridian Bioscience, Inc. (a)
| | 558,834 |
| | | | | 4,461,087 |
| | | Health Care Providers & Services – 4.3% | | |
| 14,066 | | Amedisys, Inc. (a)
| | 1,795,525 |
| 7,399 | | AmerisourceBergen Corp.
| | 1,119,395 |
| 2,310 | | Anthem, Inc. (b)
| | 1,159,458 |
| 4,643 | | Cigna Corp.
| | 1,145,800 |
| 61,645 | | CVS Health Corp.
| | 5,925,934 |
| 12,562 | | Henry Schein, Inc. (a)
| | 1,018,778 |
| 3,874 | | McKesson Corp.
| | 1,199,429 |
| 12,162 | | Molina Healthcare, Inc. (a) (b)
| | 3,812,179 |
| 6,217 | | UnitedHealth Group, Inc.
| | 3,161,655 |
| | | | | 20,338,153 |
| | | Household Durables – 0.6% | | |
| 7,874 | | Mohawk Industries, Inc. (a)
| | 1,110,707 |
| 36,982 | | Toll Brothers, Inc.
| | 1,714,855 |
| | | | | 2,825,562 |
| | | Household Products – 1.0% | | |
| 17,777 | | Procter & Gamble (The) Co.
| | 2,854,097 |
| 19,027 | | Spectrum Brands Holdings, Inc.
| | 1,618,627 |
| | | | | 4,472,724 |
| | | Independent Power & Renewable Electricity Producers – 0.2% | | |
| 48,660 | | AES (The) Corp.
| | 993,637 |
| | | Insurance – 2.6% | | |
| 14,211 | | Aflac, Inc.
| | 814,006 |
| 8,782 | | Allstate (The) Corp.
| | 1,111,274 |
See Notes to Financial Statements
Page 9
First Trust Long/Short Equity ETF (FTLS)
Portfolio of Investments (Continued)
April 30, 2022 (Unaudited)
Shares/
Units | | Description | | Value |
| COMMON STOCKS (Continued) |
| | | Insurance (Continued) | | |
| 14,811 | | American International Group, Inc.
| | $866,592 |
| 5,107 | | Assurant, Inc.
| | 928,861 |
| 13,580 | | Brown & Brown, Inc.
| | 841,688 |
| 4,225 | | Chubb Ltd.
| | 872,251 |
| 7,063 | | Cincinnati Financial Corp.
| | 866,347 |
| 3,131 | | Everest Re Group Ltd.
| | 860,117 |
| 8,810 | | Globe Life, Inc.
| | 864,085 |
| 9,690 | | Mercury General Corp.
| | 488,667 |
| 13,332 | | MetLife, Inc.
| | 875,646 |
| 10,068 | | Prudential Financial, Inc.
| | 1,092,479 |
| 5,018 | | Travelers (The) Cos., Inc.
| | 858,379 |
| 14,088 | | W.R. Berkley Corp.
| | 936,711 |
| | | | | 12,277,103 |
| | | Interactive Media & Services – 2.5% | | |
| 1,932 | | Alphabet, Inc., Class A (a) (b)
| | 4,409,191 |
| 1,798 | | Alphabet, Inc., Class C (a) (b)
| | 4,134,196 |
| 16,777 | | Meta Platforms, Inc., Class A (a) (b)
| | 3,363,285 |
| | | | | 11,906,672 |
| | | Internet & Direct Marketing Retail – 1.6% | | |
| 2,942 | | Amazon.com, Inc. (a) (b)
| | 7,312,723 |
| | | IT Services – 2.2% | | |
| 13,641 | | Amdocs Ltd.
| | 1,087,051 |
| 7,337 | | Broadridge Financial Solutions, Inc.
| | 1,057,482 |
| 12,206 | | Cognizant Technology Solutions Corp., Class A
| | 987,466 |
| 3,852 | | Gartner, Inc. (a)
| | 1,119,199 |
| 25,886 | | Genpact Ltd.
| | 1,042,429 |
| 8,506 | | International Business Machines Corp.
| | 1,124,578 |
| 14,374 | | Maximus, Inc.
| | 1,047,577 |
| 12,947 | | Visa, Inc., Class A (b)
| | 2,759,394 |
| | | | | 10,225,176 |
| | | Machinery – 1.9% | | |
| 26,112 | | AGCO Corp.
| | 3,326,669 |
| 20,542 | | Allison Transmission Holdings, Inc.
| | 769,092 |
| 19,721 | | IDEX Corp.
| | 3,743,440 |
| 10,047 | | Oshkosh Corp.
| | 928,745 |
| | | | | 8,767,946 |
| | | Metals & Mining – 4.8% | | |
| 13,565 | | Agnico Eagle Mines Ltd.
| | 789,890 |
| 10,458 | | Alcoa Corp.
| | 709,052 |
| 33,066 | | AngloGold Ashanti Ltd., ADR
| | 675,208 |
| 34,056 | | Barrick Gold Corp.
| | 759,789 |
| 33,186 | | Century Aluminum Co. (a)
| | 559,848 |
| 77,745 | | Cia de Minas Buenaventura SAA, ADR
| | 733,913 |
| 33,916 | | Cleveland-Cliffs, Inc. (a)
| | 864,519 |
| 72,045 | | Eldorado Gold Corp. (a)
| | 700,277 |
| 65,618 | | First Majestic Silver Corp.
| | 675,865 |
| 5,173 | | Franco-Nevada Corp.
| | 781,951 |
| 17,408 | | Freeport-McMoRan, Inc.
| | 705,894 |
| 120,532 | | Hecla Mining Co.
| | 627,972 |
| 148,322 | | Kinross Gold Corp.
| | 753,476 |
Page 10
See Notes to Financial Statements
First Trust Long/Short Equity ETF (FTLS)
Portfolio of Investments (Continued)
April 30, 2022 (Unaudited)
Shares/
Units | | Description | | Value |
| COMMON STOCKS (Continued) |
| | | Metals & Mining (Continued) | | |
| 44,748 | | MAG Silver Corp. (a)
| | $659,586 |
| 10,946 | | Newmont Corp.
| | 797,416 |
| 6,394 | | Nucor Corp.
| | 989,663 |
| 30,709 | | Pan American Silver Corp.
| | 760,662 |
| 4,363 | | Reliance Steel & Aluminum Co.
| | 864,965 |
| 6,280 | | Royal Gold, Inc.
| | 819,414 |
| 102,272 | | Sandstorm Gold Ltd.
| | 757,835 |
| 86,888 | | SilverCrest Metals, Inc. (a)
| | 655,136 |
| 10,981 | | Southern Copper Corp.
| | 683,787 |
| 38,428 | | SSR Mining, Inc.
| | 845,800 |
| 11,428 | | Steel Dynamics, Inc.
| | 979,951 |
| 26,428 | | United States Steel Corp.
| | 805,790 |
| 83,555 | | Wheaton Precious Metals Corp.
| | 3,748,277 |
| | | | | 22,705,936 |
| | | Multi-Utilities – 0.2% | | |
| 8,616 | | DTE Energy Co.
| | 1,129,041 |
| | | Oil, Gas & Consumable Fuels – 7.1% | | |
| 80,651 | | Antero Midstream Corp.
| | 828,286 |
| 28,470 | | APA Corp.
| | 1,165,277 |
| 5,946 | | Arch Resources, Inc.
| | 989,295 |
| 6,550 | | Chevron Corp.
| | 1,026,189 |
| 11,304 | | ConocoPhillips
| | 1,079,758 |
| 42,826 | | Coterra Energy, Inc.
| | 1,232,961 |
| 18,594 | | Devon Energy Corp.
| | 1,081,613 |
| 8,480 | | Diamondback Energy, Inc. (b)
| | 1,070,430 |
| 9,546 | | EOG Resources, Inc.
| | 1,114,591 |
| 13,085 | | Exxon Mobil Corp.
| | 1,115,496 |
| 11,246 | | Hess Corp.
| | 1,159,125 |
| 59,151 | | Kinder Morgan, Inc.
| | 1,073,591 |
| 46,984 | | Marathon Oil Corp.
| | 1,170,841 |
| 14,402 | | Marathon Petroleum Corp.
| | 1,256,719 |
| 67,973 | | Murphy Oil Corp.
| | 2,588,412 |
| 44,675 | | Occidental Petroleum Corp.
| | 2,461,146 |
| 16,266 | | ONEOK, Inc.
| | 1,030,126 |
| 92,417 | | PBF Energy, Inc., Class A (a)
| | 2,685,638 |
| 40,364 | | Peabody Energy Corp. (a)
| | 913,841 |
| 13,662 | | Phillips 66
| | 1,185,315 |
| 4,790 | | Pioneer Natural Resources Co.
| | 1,113,531 |
| 45,647 | | Targa Resources Corp.
| | 3,350,946 |
| 12,349 | | Valero Energy Corp.
| | 1,376,667 |
| 33,243 | | Williams (The) Cos., Inc.
| | 1,139,902 |
| | | | | 33,209,696 |
| | | Paper & Forest Products – 0.9% | | |
| 55,201 | | Louisiana-Pacific Corp.
| | 3,561,569 |
| 18,651 | | Sylvamo Corp. (a)
| | 832,767 |
| | | | | 4,394,336 |
| | | Personal Products – 0.5% | | |
| 3,848 | | Estee Lauder (The) Cos., Inc., Class A
| | 1,016,103 |
| 30,505 | | Nu Skin Enterprises, Inc., Class A
| | 1,300,733 |
| | | | | 2,316,836 |
See Notes to Financial Statements
Page 11
First Trust Long/Short Equity ETF (FTLS)
Portfolio of Investments (Continued)
April 30, 2022 (Unaudited)
Shares/
Units | | Description | | Value |
| COMMON STOCKS (Continued) |
| | | Pharmaceuticals – 2.2% | | |
| 15,816 | | Bristol-Myers Squibb Co.
| | $1,190,470 |
| 58,999 | | Corcept Therapeutics, Inc. (a)
| | 1,269,069 |
| 11,778 | | Harmony Biosciences Holdings, Inc. (a)
| | 530,481 |
| 34,986 | | Innoviva, Inc. (a)
| | 596,861 |
| 23,189 | | Jazz Pharmaceuticals PLC (a)
| | 3,715,342 |
| 17,326 | | Johnson & Johnson (b)
| | 3,126,650 |
| | | | | 10,428,873 |
| | | Professional Services – 0.6% | | |
| 4,812 | | Equifax, Inc.
| | 979,338 |
| 9,500 | | Insperity, Inc.
| | 1,007,475 |
| 12,220 | | Science Applications International Corp.
| | 1,017,071 |
| | | | | 3,003,884 |
| | | Semiconductors & Semiconductor Equipment – 4.1% | | |
| 9,722 | | Advanced Micro Devices, Inc. (a)
| | 831,426 |
| 8,357 | | Applied Materials, Inc.
| | 922,195 |
| 10,155 | | Broadcom, Inc.
| | 5,629,831 |
| 3,174 | | KLA Corp.
| | 1,013,331 |
| 28,405 | | Microchip Technology, Inc.
| | 1,852,006 |
| 8,789 | | Nova, Ltd. (a)
| | 866,683 |
| 28,122 | | NVIDIA Corp.
| | 5,215,787 |
| 5,850 | | NXP Semiconductors N.V.
| | 999,765 |
| 8,306 | | Qorvo, Inc. (a)
| | 945,057 |
| 3,315 | | SolarEdge Technologies, Inc. (a)
| | 830,109 |
| | | | | 19,106,190 |
| | | Software – 6.8% | | |
| 2,394 | | Adobe, Inc. (a)
| | 947,904 |
| 3,468 | | ANSYS, Inc. (a)
| | 956,093 |
| 7,129 | | Cadence Design Systems, Inc. (a)
| | 1,075,410 |
| 16,256 | | Ceridian HCM Holding, Inc. (a)
| | 912,449 |
| 11,759 | | Fair Isaac Corp. (a)
| | 4,392,104 |
| 3,752 | | Fortinet, Inc. (a)
| | 1,084,366 |
| 2,306 | | Intuit, Inc.
| | 965,637 |
| 46,636 | | Microsoft Corp. (b)
| | 12,942,423 |
| 180,026 | | NortonLifeLock, Inc.
| | 4,507,851 |
| 5,308 | | salesforce.com, Inc. (a)
| | 933,890 |
| 3,498 | | Synopsys, Inc. (a)
| | 1,003,191 |
| 2,573 | | Tyler Technologies, Inc. (a)
| | 1,015,589 |
| 21,877 | | Verint Systems, Inc. (a)
| | 1,193,609 |
| | | | | 31,930,516 |
| | | Specialty Retail – 1.2% | | |
| 11,948 | | Asbury Automotive Group, Inc. (a)
| | 2,194,967 |
| 7,478 | | Group 1 Automotive, Inc.
| | 1,302,219 |
| 12,121 | | Ross Stores, Inc.
| | 1,209,312 |
| 2,885 | | Ulta Beauty, Inc. (a)
| | 1,144,768 |
| | | | | 5,851,266 |
| | | Technology Hardware, Storage & Peripherals – 4.0% | | |
| 117,948 | | Apple, Inc. (b)
| | 18,594,502 |
| | | Thrifts & Mortgage Finance – 0.8% | | |
| 302,344 | | New York Community Bancorp, Inc.
| | 2,793,659 |
Page 12
See Notes to Financial Statements
First Trust Long/Short Equity ETF (FTLS)
Portfolio of Investments (Continued)
April 30, 2022 (Unaudited)
Shares/
Units | | Description | | Value |
| COMMON STOCKS (Continued) |
| | | Thrifts & Mortgage Finance (Continued) | | |
| 19,052 | | PennyMac Financial Services, Inc.
| | $925,165 |
| | | | | 3,718,824 |
| | | Tobacco – 3.9% | | |
| 210,933 | | Altria Group, Inc. (b)
| | 11,721,547 |
| 57,588 | | Philip Morris International, Inc. (b)
| | 5,758,800 |
| 61,407 | | Vector Group Ltd.
| | 781,097 |
| | | | | 18,261,444 |
| | | Trading Companies & Distributors – 0.9% | | |
| 5,217 | | BlueLinx Holdings, Inc. (a)
| | 347,817 |
| 15,868 | | Boise Cascade Co.
| | 1,199,304 |
| 27,785 | | Univar Solutions, Inc. (a)
| | 809,099 |
| 6,405 | | Watsco, Inc.
| | 1,708,726 |
| | | | | 4,064,946 |
| | | Wireless Telecommunication Services – 0.4% | | |
| 15,814 | | T-Mobile US, Inc. (a)
| | 1,947,336 |
| | | Total Common Stocks
| | 417,636,509 |
| | | (Cost $409,016,097) | | |
| EXCHANGE-TRADED FUNDS – 2.5% |
| | | Capital Markets – 2.5% | | |
| 15,238 | | iShares Rusell 1000 Value ETF
| | 2,383,680 |
| 16,276 | | iShares S&P 500 Value ETF
| | 2,408,523 |
| 35,366 | | Schwab U.S. Large-Cap Value ETF
| | 2,384,376 |
| 60,672 | | SPDR Portfolio S&P 500 Value ETF
| | 2,408,678 |
| 23,491 | | Vanguard Mega Cap Value ETF
| | 2,398,431 |
| | | Total Exchange-Traded Funds
| | 11,983,688 |
| | | (Cost $12,531,001) | | |
| | Total Investments – 91.5%
| 429,620,197 |
| | (Cost $421,547,098) | | | |
| Shares | | Description | | Value |
| COMMON STOCKS SOLD SHORT – (25.1)% |
| | | Aerospace & Defense – (1.1)% | | |
| (8,138) | | Mercury Systems, Inc. (a)
| | (454,019) |
| (7,575) | | Northrop Grumman Corp.
| | (3,328,455) |
| (7,378) | | Textron, Inc.
| | (510,927) |
| (34,423) | | Virgin Galactic Holdings, Inc. (a)
| | (257,828) |
| (4,144) | | Woodward, Inc.
| | (457,829) |
| | | | | (5,009,058) |
| | | Auto Components – (0.4)% | | |
| (18,198) | | Gentex Corp.
| | (534,111) |
| (9,098) | | Lear Corp.
| | (1,163,998) |
| | | | | (1,698,109) |
| | | Automobiles – (0.0)% | | |
| (23,045) | | Fisker, Inc. (a)
| | (231,833) |
| | | Banks – (1.7)% | | |
| (15,793) | | Associated Banc-Corp.
| | (315,070) |
See Notes to Financial Statements
Page 13
First Trust Long/Short Equity ETF (FTLS)
Portfolio of Investments (Continued)
April 30, 2022 (Unaudited)
| Shares | | Description | | Value |
| COMMON STOCKS SOLD SHORT (Continued) |
| | | Banks (Continued) | | |
| (7,923) | | Comerica, Inc.
| | $(648,894) |
| (4,709) | | Cullen/Frost Bankers, Inc.
| | (622,954) |
| (2,367) | | First Citizens BancShares, Inc., Class A
| | (1,513,412) |
| (16,543) | | M&T Bank Corp.
| | (2,756,725) |
| (43,359) | | Old National Bancorp
| | (657,322) |
| (2,152) | | Silvergate Capital Corp., Class A (a)
| | (251,698) |
| (4,042) | | UMB Financial Corp.
| | (364,508) |
| (29,964) | | Valley National Bancorp
| | (358,969) |
| (5,637) | | Wintrust Financial Corp.
| | (492,223) |
| | | | | (7,981,775) |
| | | Beverages – (0.1)% | | |
| (6,857) | | Celsius Holdings, Inc. (a)
| | (356,564) |
| | | Building Products – (0.7)% | | |
| (53,402) | | Johnson Controls International PLC
| | (3,197,178) |
| | | Capital Markets – (0.7)% | | |
| (64,503) | | Bank of New York Mellon (The) Corp.
| | (2,712,996) |
| (1,211) | | Goldman Sachs Group (The), Inc.
| | (369,949) |
| | | | | (3,082,945) |
| | | Chemicals – (1.0)% | | |
| (14,767) | | Air Products & Chemicals, Inc.
| | (3,456,512) |
| (5,987) | | Ashland Global Holdings, Inc.
| | (628,455) |
| (7,252) | | Scotts Miracle-Gro (The) Co.
| | (753,700) |
| | | | | (4,838,667) |
| | | Commercial Services & Supplies – (0.1)% | | |
| (24,264) | | KAR Auction Services, Inc. (a)
| | (355,710) |
| | | Communications Equipment – (0.5)% | | |
| (57,824) | | Juniper Networks, Inc.
| | (1,822,612) |
| (29,479) | | Viavi Solutions, Inc. (a)
| | (422,729) |
| | | | | (2,245,341) |
| | | Construction & Engineering – (0.1)% | | |
| (16,648) | | Fluor Corp. (a)
| | (412,038) |
| | | Consumer Finance – (0.1)% | | |
| (17,162) | | LendingClub Corp. (a)
| | (261,720) |
| | | Containers & Packaging – (0.2)% | | |
| (34,409) | | Graphic Packaging Holding Co.
| | (750,116) |
| | | Distributors – (0.1)% | | |
| (9,149) | | LKQ Corp.
| | (454,065) |
| | | Diversified Consumer Services – (0.1)% | | |
| (8,681) | | Chegg, Inc. (a)
| | (214,768) |
| (16,896) | | Laureate Education, Inc., Class A
| | (191,432) |
| | | | | (406,200) |
| | | Diversified Telecommunication Services – (1.1)% | | |
| (129,786) | | AT&T, Inc.
| | (2,447,764) |
| (62,936) | | Verizon Communications, Inc.
| | (2,913,937) |
| | | | | (5,361,701) |
Page 14
See Notes to Financial Statements
First Trust Long/Short Equity ETF (FTLS)
Portfolio of Investments (Continued)
April 30, 2022 (Unaudited)
| Shares | | Description | | Value |
| COMMON STOCKS SOLD SHORT (Continued) |
| | | Electrical Equipment – (0.9)% | | |
| (59,445) | | Array Technologies, Inc. (a)
| | $(388,176) |
| (11,242) | | Bloom Energy Corp., Class A (a)
| | (208,651) |
| (137,351) | | ChargePoint Holdings, Inc. (a)
| | (1,777,322) |
| (22,597) | | Fluence Energy, Inc. (a)
| | (207,214) |
| (29,807) | | Sunrun, Inc. (a)
| | (595,544) |
| (67,013) | | Vertiv Holdings Co.
| | (839,673) |
| (6,230) | | Vicor Corp. (a)
| | (377,040) |
| | | | | (4,393,620) |
| | | Energy Equipment & Services – (0.1)% | | |
| (22,990) | | NexTier Oilfield Solutions, Inc. (a)
| | (253,580) |
| (21,737) | | Patterson-UTI Energy, Inc.
| | (357,356) |
| | | | | (610,936) |
| | | Entertainment – (0.2)% | | |
| (2,264) | | Take-Two Interactive Software, Inc. (a)
| | (270,571) |
| (31,397) | | Warner Bros Discovery, Inc. (a)
| | (569,855) |
| | | | | (840,426) |
| | | Food Products – (0.1)% | | |
| (11,991) | | B&G Foods, Inc.
| | (322,918) |
| (7,467) | | Beyond Meat, Inc. (a)
| | (275,383) |
| | | | | (598,301) |
| | | Health Care Equipment & Supplies – (1.9)% | | |
| (5,970) | | Becton Dickinson and Co.
| | (1,475,724) |
| (61,011) | | Butterfly Network, Inc. (a)
| | (203,167) |
| (4,799) | | Cooper (The) Cos., Inc.
| | (1,732,631) |
| (1,194) | | Embecta Corp. (a)
| | (36,333) |
| (6,974) | | Haemonetics Corp. (a)
| | (353,373) |
| (2,513) | | iRhythm Technologies, Inc. (a)
| | (310,029) |
| (10,364) | | Nevro Corp. (a)
| | (639,355) |
| (4,699) | | Novocure Ltd. (a)
| | (359,849) |
| (7,557) | | NuVasive, Inc. (a)
| | (388,732) |
| (27,009) | | Zimmer Biomet Holdings, Inc.
| | (3,261,337) |
| | | | | (8,760,530) |
| | | Health Care Providers & Services – (0.5)% | | |
| (34,569) | | 1Life Healthcare, Inc. (a)
| | (243,711) |
| (16,375) | | Accolade, Inc. (a)
| | (91,045) |
| (12,537) | | Encompass Health Corp.
| | (862,922) |
| (13,566) | | Oak Street Health, Inc. (a)
| | (245,409) |
| (12,464) | | Tenet Healthcare Corp. (a)
| | (903,765) |
| | | | | (2,346,852) |
| | | Health Care Technology – (0.1)% | | |
| (8,792) | | Phreesia, Inc. (a)
| | (201,161) |
| (11,129) | | Schrodinger, Inc. (a)
| | (275,109) |
| (5,113) | | Teladoc Health, Inc. (a)
| | (172,615) |
| | | | | (648,885) |
| | | Hotels, Restaurants & Leisure – (0.8)% | | |
| (14,948) | | DraftKings, Inc., Class A (a)
| | (204,489) |
| (24,005) | | International Game Technology PLC
| | (524,029) |
| (85,817) | | Las Vegas Sands Corp. (a)
| | (3,040,496) |
| | | | | (3,769,014) |
See Notes to Financial Statements
Page 15
First Trust Long/Short Equity ETF (FTLS)
Portfolio of Investments (Continued)
April 30, 2022 (Unaudited)
| Shares | | Description | | Value |
| COMMON STOCKS SOLD SHORT (Continued) |
| | | Household Products – (0.8)% | | |
| (26,921) | | Kimberly-Clark Corp.
| | $(3,737,442) |
| | | Insurance – (0.0)% | | |
| (3,071) | | Trupanion, Inc. (a)
| | (195,377) |
| | | Interactive Media & Services – (0.2)% | | |
| (35,542) | | fuboTV, Inc. (a)
| | (134,704) |
| (21,094) | | Vimeo, Inc. (a)
| | (214,948) |
| (5,814) | | Ziff Davis, Inc. (a)
| | (513,725) |
| | | | | (863,377) |
| | | Internet & Direct Marketing Retail – (0.4)% | | |
| (2,915) | | DoorDash, Inc., Class A (a)
| | (237,368) |
| (26,408) | | Stitch Fix, Inc., Class A (a)
| | (250,876) |
| (17,619) | | Wayfair, Inc., Class A (a)
| | (1,355,606) |
| (8,178) | | Xometry, Inc., Class A (a)
| | (268,402) |
| | | | | (2,112,252) |
| | | IT Services – (1.3)% | | |
| (12,269) | | BigCommerce Holdings, Inc., Series 1 (a)
| | (219,247) |
| (95,030) | | Fastly, Inc., Class A (a)
| | (1,510,977) |
| (806) | | MongoDB, Inc. (a)
| | (286,074) |
| (26,273) | | Paychex, Inc.
| | (3,329,577) |
| (1,292) | | Snowflake, Inc., Class A (a)
| | (221,500) |
| (1,868) | | Twilio, Inc., Class A (a)
| | (208,880) |
| (3,362) | | Wix.com Ltd. (a)
| | (253,697) |
| | | | | (6,029,952) |
| | | Leisure Products – (0.2)% | | |
| (44,612) | | Mattel, Inc. (a)
| | (1,084,518) |
| | | Machinery – (0.3)% | | |
| (8,041) | | Cummins, Inc.
| | (1,521,277) |
| | | Media – (0.9)% | | |
| (4,946) | | Cardlytics, Inc. (a)
| | (168,807) |
| (46,481) | | Fox Corp., Class A
| | (1,665,879) |
| (21,532) | | Magnite, Inc. (a)
| | (207,784) |
| (27,357) | | Omnicom Group, Inc.
| | (2,082,688) |
| | | | | (4,125,158) |
| | | Metals & Mining – (0.2)% | | |
| (22,518) | | Allegheny Technologies, Inc. (a)
| | (612,039) |
| (6,515) | | Compass Minerals International, Inc.
| | (385,232) |
| | | | | (997,271) |
| | | Multiline Retail – (0.4)% | | |
| (77,609) | | Nordstrom, Inc.
| | (1,994,551) |
| | | Oil, Gas & Consumable Fuels – (0.7)% | | |
| (14,438) | | Chesapeake Energy Corp.
| | (1,184,205) |
| (6,751) | | DT Midstream, Inc.
| | (362,866) |
| (95,484) | | Equitrans Midstream Corp.
| | (750,504) |
| (11,504) | | PDC Energy, Inc.
| | (802,289) |
| (8,861) | | SM Energy Co.
| | (314,832) |
| | | | | (3,414,696) |
Page 16
See Notes to Financial Statements
First Trust Long/Short Equity ETF (FTLS)
Portfolio of Investments (Continued)
April 30, 2022 (Unaudited)
| Shares | | Description | | Value |
| COMMON STOCKS SOLD SHORT (Continued) |
| | | Pharmaceuticals – (0.5)% | | |
| (55,747) | | Elanco Animal Health, Inc. (a)
| | $(1,410,957) |
| (23,795) | | Organon & Co.
| | (769,292) |
| | | | | (2,180,249) |
| | | Professional Services – (0.2)% | | |
| (8,974) | | Booz Allen Hamilton Holding Corp.
| | (732,548) |
| | | Real Estate Management & Development – (0.1)% | | |
| (35,867) | | Opendoor Technologies, Inc. (a)
| | (250,711) |
| (13,415) | | Redfin Corp. (a)
| | (149,577) |
| (5,474) | | Zillow Group, Inc., Class A (a)
| | (211,570) |
| | | | | (611,858) |
| | | Road & Rail – (0.1)% | | |
| (24,455) | | TuSimple Holdings, Inc., Class A (a)
| | (253,598) |
| | | Semiconductors & Semiconductor Equipment – (3.0)% | | |
| (2,915) | | Ambarella, Inc. (a)
| | (239,263) |
| (7,817) | | Cirrus Logic, Inc. (a)
| | (592,529) |
| (19,684) | | First Solar, Inc. (a)
| | (1,437,523) |
| (4,364) | | Impinj, Inc. (a)
| | (214,971) |
| (70,595) | | Intel Corp.
| | (3,077,236) |
| (42,233) | | Micron Technology, Inc.
| | (2,879,868) |
| (20,415) | | QUALCOMM, Inc.
| | (2,851,771) |
| (24,184) | | Skyworks Solutions, Inc.
| | (2,740,047) |
| (2,728) | | Wolfspeed, Inc. (a)
| | (250,185) |
| | | | | (14,283,393) |
| | | Software – (2.3)% | | |
| (4,766) | | Appian Corp. (a)
| | (227,815) |
| (5,503) | | Asana, Inc., Class A (a)
| | (147,480) |
| (28,856) | | Avaya Holdings Corp. (a)
| | (266,918) |
| (12,494) | | C3.ai, Inc., Class A (a)
| | (212,273) |
| (8,806) | | Dolby Laboratories, Inc., Class A
| | (682,201) |
| (6,150) | | Domo, Inc., Class B (a)
| | (254,733) |
| (3,292) | | Elastic NV (a)
| | (250,653) |
| (7,227) | | Everbridge, Inc. (a)
| | (311,484) |
| (9,050) | | Guidewire Software, Inc. (a)
| | (786,807) |
| (10,527) | | Marathon Digital Holdings, Inc. (a)
| | (164,221) |
| (7,679) | | MicroStrategy, Inc., Class A (a)
| | (2,719,672) |
| (20,833) | | NCR Corp. (a)
| | (729,780) |
| (4,342) | | New Relic, Inc. (a)
| | (274,718) |
| (43,910) | | Oracle Corp.
| | (3,222,994) |
| (2,310) | | RingCentral, Inc., Class A (a)
| | (196,004) |
| (4,255) | | Sprout Social, Inc., Class A (a)
| | (260,746) |
| (3,076) | | Unity Software, Inc. (a)
| | (204,277) |
| | | | | (10,912,776) |
| | | Specialty Retail – (0.5)% | | |
| (2,322) | | Carvana Co. (a)
| | (134,583) |
| (174,471) | | Gap (The), Inc.
| | (2,166,930) |
| | | | | (2,301,513) |
| | | Technology Hardware, Storage & Peripherals – (0.0)% | | |
| (11,268) | | Stratasys Ltd. (a)
| | (218,486) |
See Notes to Financial Statements
Page 17
First Trust Long/Short Equity ETF (FTLS)
Portfolio of Investments (Continued)
April 30, 2022 (Unaudited)
| Shares | | Description | | Value |
| COMMON STOCKS SOLD SHORT (Continued) |
| | | Textiles, Apparel & Luxury Goods – (0.3)% | | |
| (4,699) | | Carter’s, Inc.
| | $(395,844) |
| (21,425) | | Skechers U.S.A., Inc., Class A (a)
| | (820,577) |
| | | | | (1,216,421) |
| | | Trading Companies & Distributors – (0.1)% | | |
| (5,309) | | Triton International Ltd.
| | (324,327) |
| | | Total Common Stocks Sold Short
| | (117,722,624) |
| | | (Proceeds $132,836,200) | | |
| EXCHANGE-TRADED FUNDS SOLD SHORT – (2.0)% |
| | | Capital Markets – (2.0)% | | |
| (22,500) | | SPDR S&P 500 ETF Trust
| | (9,270,000) |
| | | (Proceeds $9,484,521) | | |
| | | Total Investments Sold Short – (27.1)%
| | (126,992,624) |
| | | (Proceeds $142,320,721) | | |
| | | Net Other Assets and Liabilities – 35.6%
| | 166,656,074 |
| | | Net Assets – 100.0%
| | $469,283,647 |
Futures Contracts (See Note 2C - Futures Contracts in the Notes to Financial Statements):
| Futures Contracts | | Position | | Number of
Contracts | | Expiration
Date | | Notional
Value | | Unrealized
Appreciation
(Depreciation)/
Value |
| NASDAQ 100 E-mini Futures | | Short | | 155 | | Jun 2022 | | $ (39,841,200) | | $682,734 |
| Russell 2000 E-mini Futures | | Short | | 254 | | Jun 2022 | | (23,638,510) | | 967,200 |
| | | | | | | | | $(63,479,710) | | $1,649,934 |
| (a) | Non-income producing security. |
| (b) | This security or a portion of this security is segregated as collateral for investments sold short. |
| ADR | American Depositary Receipt |
Page 18
See Notes to Financial Statements
First Trust Long/Short Equity ETF (FTLS)
Portfolio of Investments (Continued)
April 30, 2022 (Unaudited)
Valuation Inputs
A summary of the inputs used to value the Fund’s investments as of April 30, 2022 is as follows (see Note 2A - Portfolio Valuation in the Notes to Financial Statements):
| ASSETS TABLE |
| | Total
Value at
4/30/2022 | Level 1
Quoted
Prices | Level 2
Significant
Observable
Inputs | Level 3
Significant
Unobservable
Inputs |
Common Stocks*
| $ 417,636,509 | $ 417,636,509 | $ — | $ — |
Exchange-Traded Funds*
| 11,983,688 | 11,983,688 | — | — |
Total Investments
| 429,620,197 | 429,620,197 | — | — |
Futures Contracts**
| 1,649,934 | 1,649,934 | — | — |
Total
| $ 431,270,131 | $ 431,270,131 | $— | $— |
| |
| LIABILITIES TABLE |
| | Total
Value at
4/30/2022 | Level 1
Quoted
Prices | Level 2
Significant
Observable
Inputs | Level 3
Significant
Unobservable
Inputs |
Common Stocks Sold Short*
| $ (117,722,624) | $ (117,722,624) | $ — | $ — |
Exchange-Traded Funds Sold Short*
| (9,270,000) | (9,270,000) | — | — |
Total Investments
| $ (126,992,624) | $ (126,992,624) | $— | $— |
| * | See Portfolio of Investments for industry breakout. |
| ** | Includes cumulative appreciation/depreciation on futures contracts as reported in the Futures Contracts table. Only the current day’s variation margin is presented on the Statement of Assets and Liabilities. |
See Notes to Financial Statements
Page 19
First Trust Long/Short Equity ETF (FTLS)
Statement of Assets and Liabilities
April 30, 2022 (Unaudited)
| ASSETS: | |
Investments, at value
(Cost $421,547,098)
| $ 429,620,197 |
Cash
| 12,911,147 |
Cash held at broker as collateral for open futures contracts
| 4,122,325 |
Restricted Cash
| 147,341,023 |
| Receivables: | |
Variation margin
| 2,353,420 |
Dividends
| 299,067 |
Dividend reclaims
| 7,353 |
Total Assets
| 596,654,532 |
| LIABILITIES: | |
Investments sold short, at value (proceeds $142,320,721)
| 126,992,624 |
| Payables: | |
Investment advisory fees
| 375,157 |
Margin interest expense
| 3,104 |
Total Liabilities
| 127,370,885 |
NET ASSETS
| $469,283,647 |
| NET ASSETS consist of: | |
Paid-in capital
| $ 521,253,994 |
Par value
| 94,000 |
Accumulated distributable earnings (loss)
| (52,064,347) |
NET ASSETS
| $469,283,647 |
NET ASSET VALUE, per share
| $49.92 |
Number of shares outstanding (unlimited number of shares authorized, par value $0.01 per share)
| 9,400,002 |
Page 20
See Notes to Financial Statements
First Trust Long/Short Equity ETF (FTLS)
Statement of Operations
For the Six Months Ended April 30, 2022 (Unaudited)
| INVESTMENT INCOME: | |
Dividends
| $ 3,192,833 |
Interest
| 1,872 |
Foreign withholding tax
| (12,332) |
Other
| 11 |
Total investment income
| 3,182,384 |
| EXPENSES: | |
Investment advisory fees
| 2,188,337 |
Dividend expense on investments sold short
| 1,020,426 |
Margin interest expense
| 164,590 |
Total expenses
| 3,373,353 |
NET INVESTMENT INCOME (LOSS)
| (190,969) |
| NET REALIZED AND UNREALIZED GAIN (LOSS): | |
| Net realized gain (loss) on: | |
Investments
| (9,243,205) |
In-kind redemptions
| 3,714,676 |
Futures contracts
| 2,534,490 |
Investments sold short
| 7,250,159 |
Net realized gain (loss)
| 4,256,120 |
| Net change in unrealized appreciation (depreciation) on: | |
Investments
| (29,062,985) |
Futures contracts
| 1,432,069 |
Investments sold short
| 19,167,660 |
Net change in unrealized appreciation (depreciation)
| (8,463,256) |
NET REALIZED AND UNREALIZED GAIN (LOSS)
| (4,207,136) |
NET INCREASE (DECREASE) IN NET ASSETS RESULTING FROM OPERATIONS
| $(4,398,105) |
See Notes to Financial Statements
Page 21
First Trust Long/Short Equity ETF (FTLS)
Statements of Changes in Net Assets
| | Six Months
Ended
4/30/2022
(Unaudited) | | Year
Ended
10/31/2021 |
| OPERATIONS: | | | |
Net investment income (loss)
| $ (190,969) | | $ (1,003,242) |
Net realized gain (loss)
| 4,256,120 | | 40,742,569 |
Net change in unrealized appreciation (depreciation)
| (8,463,256) | | 19,551,117 |
Net increase (decrease) in net assets resulting from operations
| (4,398,105) | | 59,290,444 |
| DISTRIBUTIONS TO SHAREHOLDERS FROM: | | | |
Investment operations
| (29,370) | | (895,180) |
| SHAREHOLDER TRANSACTIONS: | | | |
Proceeds from shares sold
| 76,411,152 | | 547,568,213 |
Cost of shares redeemed
| (32,454,786) | | (477,583,820) |
Net increase (decrease) in net assets resulting from shareholder transactions
| 43,956,366 | | 69,984,393 |
Total increase (decrease) in net assets
| 39,528,891 | | 128,379,657 |
| NET ASSETS: | | | |
Beginning of period
| 429,754,756 | | 301,375,099 |
End of period
| $469,283,647 | | $429,754,756 |
| CHANGES IN SHARES OUTSTANDING: | | | |
Shares outstanding, beginning of period
| 8,550,002 | | 7,200,002 |
Shares sold
| 1,500,000 | | 12,000,000 |
Shares redeemed
| (650,000) | | (10,650,000) |
Shares outstanding, end of period
| 9,400,002 | | 8,550,002 |
Page 22
See Notes to Financial Statements
First Trust Long/Short Equity ETF (FTLS)
Financial Highlights
For a share outstanding throughout each period
| | Six Months
Ended
4/30/2022
(Unaudited) | | Year Ended October 31, |
| | 2021 | | 2020 | | 2019 | | 2018 | | 2017 | |
Net asset value, beginning of period
| $ 50.26 | | $ 41.86 | | $ 41.67 | | $ 38.47 | | $ 37.78 | | $ 32.49 |
| Income from investment operations: | | | | | | | | | | | |
Net investment income (loss)
| (0.02) | | (0.10) | | 0.05 | | 0.39 | | 0.26 | | 0.24 |
Net realized and unrealized gain (loss)
| (0.32) | | 8.63 | | 0.25 | | 3.23 | | 0.67 | | 5.34 |
Total from investment operations
| (0.34) | | 8.53 | | 0.30 | | 3.62 | | 0.93 | | 5.58 |
| Distributions paid to shareholders from: | | | | | | | | | | | |
Net investment income
| (0.00) (a) | | (0.13) | | (0.11) | | (0.42) | | (0.24) | | (0.29) |
Net asset value, end of period
| $49.92 | | $50.26 | | $41.86 | | $41.67 | | $38.47 | | $37.78 |
Total return (b)
| (0.67)% | | 20.41% | | 0.74% | | 9.49% | | 2.45% | | 17.23% |
| Ratios to average net assets/supplemental data: | | | | | | | | | | | |
Net assets, end of period (in 000’s)
| $ 469,284 | | $ 429,755 | | $ 301,375 | | $ 245,867 | | $ 155,803 | | $ 120,892 |
Ratio of total expenses to average net assets (c)
| 1.46% (d) | | 1.36% | | 1.55% | | 1.60% | | 1.59% | | 1.47% |
Ratio of total expenses to average net assets excluding dividend expense and margin interest expense (c)
| 0.95% (d) | | 0.95% | | 0.95% | | 0.95% | | 0.95% | | 0.95% |
Ratio of net investment income (loss) to average net assets
| (0.08)% (d) | | (0.28)% | | 0.09% | | 1.03% | | 0.71% | | 0.67% |
Portfolio turnover rate (e)
| 98% | | 250% | | 250% | | 210% | | 249% | | 176% |
| (a) | Amount is less than $0.01. |
| (b) | Total return is calculated assuming an initial investment made at the net asset value at the beginning of the period, reinvestment of all distributions at net asset value during the period, and redemption at net asset value on the last day of the period. The returns presented do not reflect the deduction of taxes that a shareholder would pay on Fund distributions or the redemption or sale of Fund shares. Total return is calculated for the time period presented and is not annualized for periods of less than a year. |
| (c) | The Fund indirectly bears its proportionate share of fees and expenses incurred by the underlying funds in which the Fund invests. This ratio does not include these indirect fees and expenses. |
| (d) | Annualized. |
| (e) | Portfolio turnover is calculated for the time period presented and is not annualized for periods of less than a year and does not include securities received or delivered from processing creations or redemptions and in-kind transactions. |
Notes to Financial Statements
First Trust Long/Short Equity ETF (FTLS)
April 30, 2022 (Unaudited)
1. Organization
First Trust Exchange-Traded Fund III (the “Trust”) is an open-end management investment company organized as a Massachusetts business trust on January 9, 2008, and is registered with the Securities and Exchange Commission under the Investment Company Act of 1940, as amended (the “1940 Act”).
The Trust currently consists of seventeen funds that are offering shares. This report covers the First Trust Long/Short Equity ETF (the “Fund”), a diversified series of the Trust, which trades under the ticker “FTLS” on the NYSE Arca, Inc. Unlike conventional mutual funds, the Fund issues and redeems shares on a continuous basis, at net asset value (“NAV”), only in large blocks of shares known as “Creation Units.”
The investment objective of the Fund is to seek to provide investors with long-term total return. Under normal conditions, the Fund will expose at least 80% of its net assets (including investment borrowings) to U.S. exchange-listed equity securities and/or U.S. exchange-traded funds (“ETFs”) that provide exposure to U.S. exchange-traded equity securities. The Fund pursues its investment objective by establishing long and short positions in a portfolio of U.S. exchange-listed equity securities and ETFs. The Fund’s portfolio may include U.S. exchange-listed equity securities of non-U.S. issuers, including the securities of non-U.S. issuers traded on U.S. exchanges in the form of depositary receipts. There can be no assurance that the Fund will achieve its investment objective. The Fund may not be appropriate for all investors.
2. Significant Accounting Policies
The Fund is considered an investment company and follows accounting and reporting guidance under Financial Accounting Standards Board Accounting Standards Codification Topic 946, “Financial Services-Investment Companies.” The following is a summary of significant accounting policies consistently followed by the Fund in the preparation of the financial statements. The preparation of the financial statements in accordance with accounting principles generally accepted in the United States of America (“U.S. GAAP”) requires management to make estimates and assumptions that affect the reported amounts and disclosures in the financial statements. Actual results could differ from those estimates.
A. Portfolio Valuation
The Fund’s NAV is determined daily as of the close of regular trading on the New York Stock Exchange (“NYSE”), normally 4:00 p.m. Eastern time, on each day the NYSE is open for trading. If the NYSE closes early on a valuation day, the NAV is determined as of that time. Foreign securities are priced using data reflecting the earlier closing of the principal markets for those securities. The Fund’s NAV is calculated by dividing the value of all assets of the Fund (including accrued interest and dividends), less all liabilities (including accrued expenses and dividends declared but unpaid), by the total number of shares outstanding.
The Fund’s investments are valued daily at market value or, in the absence of market value with respect to any portfolio securities, at fair value. Market value prices represent last sale or official closing prices from a national or foreign exchange (i.e., a regulated market) and are primarily obtained from third-party pricing services. Fair value prices represent any prices not considered market value prices and are either obtained from a third-party pricing service or are determined by the Pricing Committee of the Fund’s investment advisor, First Trust Advisors L.P. (“First Trust” or the “Advisor”), in accordance with valuation procedures adopted by the Trust’s Board of Trustees, and in accordance with provisions of the 1940 Act. Investments valued by the Advisor’s Pricing Committee, if any, are footnoted as such in the footnotes to the Portfolio of Investments. The Fund’s investments are valued as follows:
Common stocks, master limited partnerships (“MLPs”), real estate investment trusts (“REITs”), exchange-traded funds and other equity securities listed on any national or foreign exchange (excluding The Nasdaq Stock Market LLC (“Nasdaq”) and the London Stock Exchange Alternative Investment Market (“AIM”)) are valued at the last sale price on the exchange on which they are principally traded or, for Nasdaq and AIM securities, the official closing price. Securities traded on more than one securities exchange are valued at the last sale price or official closing price, as applicable, at the close of the securities exchange representing the principal market for such securities.
Securities traded in an over-the-counter market are fair valued at the mean of their most recent bid and asked price, if available, and otherwise at their closing bid price.
Certain securities may not be able to be priced by pre-established pricing methods. Such securities may be valued by the Trust’s Board of Trustees or its delegate, the Advisor’s Pricing Committee, at fair value. These securities generally include, but are not limited to, restricted securities (securities which may not be publicly sold without registration under the Securities Act of 1933, as amended) for which a third-party pricing service is unable to provide a market price; securities whose trading has been formally suspended; a security whose market or fair value price is not available from a pre-established pricing source; a security with respect to which an event has occurred that is likely to materially affect the value of the security after the market has closed but before the calculation of the Fund’s NAV or make it difficult or impossible to obtain a reliable market quotation; and a security whose price, as provided by the
Notes to Financial Statements (Continued)
First Trust Long/Short Equity ETF (FTLS)
April 30, 2022 (Unaudited)
third-party pricing service, does not reflect the security’s fair value. As a general principle, the current fair value of a security would appear to be the amount which the owner might reasonably expect to receive for the security upon its current sale. When fair value prices are used, generally they will differ from market quotations or official closing prices on the applicable exchanges. A variety of factors may be considered in determining the fair value of such securities, including, but not limited to, the following:
| 1) | the type of security; |
| 2) | the size of the holding; |
| 3) | the initial cost of the security; |
| 4) | transactions in comparable securities; |
| 5) | price quotes from dealers and/or third-party pricing services; |
| 6) | relationships among various securities; |
| 7) | information obtained by contacting the issuer, analysts, or the appropriate stock exchange; |
| 8) | an analysis of the issuer’s financial statements; and |
| 9) | the existence of merger proposals or tender offers that might affect the value of the security. |
The Fund is subject to fair value accounting standards that define fair value, establish the framework for measuring fair value and provide a three-level hierarchy for fair valuation based upon the inputs to the valuation as of the measurement date. The three levels of the fair value hierarchy are as follows:
| • | Level 1 – Level 1 inputs are quoted prices in active markets for identical investments. An active market is a market in which transactions for the investment occur with sufficient frequency and volume to provide pricing information on an ongoing basis. |
| • | Level 2 – Level 2 inputs are observable inputs, either directly or indirectly, and include the following: |
| o | Quoted prices for similar investments in active markets. |
| o | Quoted prices for identical or similar investments in markets that are non-active. A non-active market is a market where there are few transactions for the investment, the prices are not current, or price quotations vary substantially either over time or among market makers, or in which little information is released publicly. |
| o | Inputs other than quoted prices that are observable for the investment (for example, interest rates and yield curves observable at commonly quoted intervals, volatilities, prepayment speeds, loss severities, credit risks, and default rates). |
| o | Inputs that are derived principally from or corroborated by observable market data by correlation or other means. |
| • | Level 3 – Level 3 inputs are unobservable inputs. Unobservable inputs may reflect the reporting entity’s own assumptions about the assumptions that market participants would use in pricing the investment. |
The inputs or methodologies used for valuing investments are not necessarily an indication of the risk associated with investing in those investments. A summary of the inputs used to value the Fund’s investments as of April 30, 2022, is included with the Fund’s Portfolio of Investments.
B. Securities Transactions and Investment Income
Securities transactions are recorded as of the trade date. Realized gains and losses from securities transactions are recorded on the identified cost basis. Dividend income is recorded on the ex-dividend date. Interest income, if any, is recorded daily on the accrual basis.
Distributions received from the Fund’s investments in REITs may be comprised of return of capital, capital gains, and income. The actual character of the amounts received during the year are not known until after the REITs’ fiscal year end. The Fund records the character of distributions received from the REITs during the year based on estimates available. The characterization of distributions received by the Fund may be subsequently revised based on information received from the REITs after their tax reporting periods conclude.
Distributions received from the Fund’s investments in MLPs generally are comprised of return of capital and investment income. The Fund records estimated return of capital and investment income based on historical information available from each MLP. These estimates may subsequently be revised based on information received from the MLPs after their tax reporting periods are concluded.
C. Futures Contracts
The Fund may purchase or sell (i.e., is long or short) exchange-listed futures contracts to gain long or short exposure to broad based equity indexes. Futures contracts are agreements between the Fund and a counterparty to buy or sell a specific quantity of an
Notes to Financial Statements (Continued)
First Trust Long/Short Equity ETF (FTLS)
April 30, 2022 (Unaudited)
underlying instrument at a specified price and at a specified date. Depending on the terms of the contract, futures contracts are settled either through physical delivery of the underlying instrument on the settlement date or by payment of a cash settlement amount on the settlement date. Open futures contracts can also be closed out prior to settlement by entering into an offsetting transaction in a matching futures contract. If the Fund is not able to enter into an offsetting transaction, the Fund will continue to be required to maintain margin deposits on the futures contract. When the contract is closed or expires, the Fund records a realized gain or loss equal to the difference between the value of the contract at the time it was opened and the value at the time it was closed or expired. This gain or loss is included in “Net realized gain (loss) on futures contracts” on the Statement of Operations.
Upon entering into a futures contract, the Fund must deposit funds, called margin, with its custodian in the name of the clearing broker equal to a specified percentage of the current value of the contract. Open futures contracts are marked to market daily with the change in value recognized as a component of “Net change in unrealized appreciation (depreciation) on futures contracts” on the Statement of Operations. This daily fluctuation in the value of the contracts is also known as variation margin and is included in “Variation margin” payable or receivable on the Statement of Assets and Liabilities.
If market conditions change unexpectedly, the Fund may not achieve the anticipated benefits of the futures contract and may realize a loss. The use of futures contracts involves the risk of imperfect correlation in movements in the price of the futures contracts, interest rates and the underlying instruments.
Restricted cash segregated as collateral for futures contracts in the amount of $4,122,325 is shown as “Cash held at broker as collateral for open futures contracts” on the Statement of Assets and Liabilities.
D. Short Sales
Short sales are utilized for investment and risk management purposes and are transactions in which securities or other instruments (such as options, forwards, futures or other derivative contracts) are sold by the Fund, but are not currently owned in the Fund’s portfolio. When the Fund engages in a short sale, the Fund must borrow the security sold short and deliver the security to the counterparty. Short selling allows the Fund to profit from a decline in a market price to the extent such decline exceeds the transaction costs and the costs of borrowing the securities. The Fund will pay a fee or premium to borrow the securities sold short and is obligated to repay the lenders of the securities. Any dividends or interest that accrues on the securities during the period of the loan are due to the lenders. A gain, limited to the price at which the security was sold short, or a loss, unlimited in size, will be recognized upon the termination of the short sale; which is affected by the Fund purchasing the security sold short and delivering the security to the lender. Any such gain or loss may be offset, completely or in part, by the change in the value of the long portion of the Fund’s portfolio. The Fund is subject to the risk that it may be unable to reacquire a security to terminate a short position except at a price substantially in excess of the last quoted price. Also, there is the risk that the counterparty to a short sale may fail to honor its contractual terms, causing a loss to the Fund.
The Fund has established an account with Pershing, LLC for the purpose of borrowing securities that the Fund intends to sell short. The Fund is charged interest on debit margin balances at a rate equal to the Overnight Bank Funding Rate plus 40 basis points. With regard to securities held short, the Fund is credited a rebate equal to the market value of its short positions at a rate equal to the Overnight Bank Funding Rate less 25 basis points. This rebate rate applies to easy to borrow securities. Securities that are hard to borrow may earn a rebate that is less than the foregoing or may be subject to a premium charge on a security by security basis. The different rebate rate is determined at the time of a short sale request. For the six months ended April 30, 2022, the Fund had margin interest expense of $164,590, as shown on the Statement of Operations. Restricted cash in the amount of $147,341,023, as shown on the Statement of Assets and Liabilities, is associated with collateral at the broker as of April 30, 2022.
E. Dividends and Distributions to Shareholders
Dividends from net investment income, if any, are declared and paid quarterly by the Fund, or as the Board of Trustees may determine from time to time. Distributions of net realized capital gains earned by the Fund, if any, are distributed at least annually.
Distributions from net investment income and realized capital gains are determined in accordance with federal income tax regulations, which may differ from U.S. GAAP. Certain capital accounts in the financial statements are periodically adjusted for permanent differences in order to reflect their tax character. These permanent differences are primarily due to the varying treatment of income and gain/loss on portfolio securities held by the Fund and have no impact on net assets or NAV per share. Temporary differences, which arise from recognizing certain items of income, expense and gain/loss in different periods for financial statement and tax purposes, will reverse at some time in the future.
The tax character of distributions paid by the Fund during the fiscal year ended October 31, 2021, was as follows:
Notes to Financial Statements (Continued)
First Trust Long/Short Equity ETF (FTLS)
April 30, 2022 (Unaudited)
| Distributions paid from: | |
Ordinary income
| $895,180 |
Capital gains
| — |
Return of capital
| — |
As of October 31, 2021, the components of distributable earnings on a tax basis were as follows:
Undistributed ordinary income
| $— |
Accumulated capital and other gain (loss)
| (76,181,495) |
Net unrealized appreciation (depreciation)
| 28,544,623 |
F. Income Taxes
The Fund intends to continue to qualify as a regulated investment company by complying with the requirements under Subchapter M of the Internal Revenue Code of 1986, as amended, which includes distributing substantially all of its net investment income and net realized gains to shareholders. Accordingly, no provision has been made for federal and state income taxes. However, due to the timing and amount of distributions, the Fund may be subject to an excise tax of 4% of the amount by which approximately 98% of the Fund’s taxable income exceeds the distributions from such taxable income for the calendar year.
The Fund is subject to accounting standards that establish a minimum threshold for recognizing, and a system for measuring, the benefits of a tax position taken or expected to be taken in a tax return. Taxable years ended 2018, 2019, 2020, and 2021 remain open to federal and state audit. As of April 30, 2022, management has evaluated the application of these standards to the Fund and has determined that no provision for income tax is required in the Fund’s financial statements for uncertain tax positions.
The Fund intends to utilize provisions of the federal income tax laws, which allow it to carry a realized capital loss forward indefinitely following the year of the loss and offset such loss against any future realized capital gains. The Fund is subject to certain limitations under U.S. tax rules on the use of capital loss carryforwards and net unrealized built-in losses. These limitations apply when there has been a 50% change in ownership. At October 31, 2021, for federal income tax purposes, the Fund had $76,181,495 of non-expiring capital loss carryforwards available, to the extent provided by regulations, to offset future capital gains.
As of April 30, 2022, the aggregate cost, gross unrealized appreciation, gross unrealized depreciation, and net unrealized appreciation/(depreciation) on investments (including short positions and derivatives, if any) for federal income tax purposes were as follows:
| | Tax Cost | | Gross
Unrealized
Appreciation | | Gross
Unrealized
(Depreciation) | | Net Unrealized
Appreciation
(Depreciation) |
First Trust Long/Short Equity ETF
| $ 279,226,377 | | $ 50,476,680 | | $ (25,425,550) | | $ 25,051,130 |
G. Expenses
Expenses, other than the investment advisory fee, dividend and interest expenses on investments sold short and other excluded expenses, are paid by the Advisor (See Note 3).
3. Investment Advisory Fee, Affiliated Transactions and Other Fee Arrangements
First Trust, the investment advisor to the Fund, is a limited partnership with one limited partner, Grace Partners of DuPage L.P., and one general partner, The Charger Corporation. The Charger Corporation is an Illinois corporation controlled by James A. Bowen, Chief Executive Officer of First Trust. First Trust is responsible for the selection and ongoing monitoring of the securities in the Fund’s portfolio, managing the Fund’s business affairs and providing certain administrative services necessary for the management of the Fund.
Pursuant to the Investment Management Agreement, First Trust manages the investment of the Fund’s assets and is responsible for the Fund’s expenses, including the cost of transfer agency, custody, fund administration, legal, audit and other services, but excluding fee payments under the Investment Management Agreement, interest, taxes, brokerage commissions and other expenses connected with the execution of portfolio transactions, distribution and service fees pursuant to a Rule 12b-1 plan, if any, acquired fund fees and expenses, dividend expenses on investments sold short, and extraordinary expenses. The Fund has agreed to pay First Trust an annual unitary management fee equal to 0.95% of its average daily net assets. In addition, the Fund incurs acquired fund fees and expenses.
Notes to Financial Statements (Continued)
First Trust Long/Short Equity ETF (FTLS)
April 30, 2022 (Unaudited)
The total of the unitary management fee and acquired fund fees and expenses represents the Fund’s total annual operating expenses. First Trust also provides fund reporting services to the Fund for a flat annual fee in the amount of $9,250, which is covered under the annual unitary management fee.
The Trust has multiple service agreements with Brown Brothers Harriman & Co. (“BBH”). Under the service agreements, BBH performs custodial, fund accounting, certain administrative services, and transfer agency services for the Fund. As custodian, BBH is responsible for custody of the Fund’s assets. As fund accountant and administrator, BBH is responsible for maintaining the books and records of the Fund’s securities and cash. As transfer agent, BBH is responsible for maintaining shareholder records for the Fund.
Each Trustee who is not an officer or employee of First Trust, any sub-advisor or any of their affiliates (“Independent Trustees”) is paid a fixed annual retainer that is allocated equally among each fund in the First Trust Fund Complex. Each Independent Trustee is also paid an annual per fund fee that varies based on whether the fund is a closed-end or other actively managed fund, a defined-outcome fund or an index fund.
Additionally, the Lead Independent Trustee and the Chairs of the Audit Committee, Nominating and Governance Committee and Valuation Committee are paid annual fees to serve in such capacities, with such compensation allocated pro rata among each fund in the First Trust Fund Complex based on net assets. Independent Trustees are reimbursed for travel and out-of-pocket expenses in connection with all meetings. The Lead Independent Trustee and Committee Chairs rotate every three years. The officers and “Interested” Trustee receive no compensation from the Trust for acting in such capacities.
4. Purchases and Sales of Securities
For the six months ended April 30, 2022, the cost of purchases and proceeds from sales of investments, excluding short term investments, investments sold short and in-kind transactions, were $318,478,886 and $317,490,420, respectively. The cost of purchases to cover short sales and the proceeds of short sales were $233,153,476 and $251,489,040, respectively.
For the six months ended April 30, 2022, the cost of in-kind purchases and proceeds from in-kind sales were $72,581,228 and $30,762,410, respectively.
5. Derivative Transactions
The following table presents the type of derivatives held by the Fund at April 30, 2022, the primary underlying risk exposure and the location of these instruments as presented on the Statement of Assets and Liabilities.
| | | | | Asset Derivatives | | Liability Derivatives |
Derivative
Instrument | | Risk
Exposure | | Statement of Assets and
Liabilities Location | | Value | | Statement of Assets and
Liabilities Location | | Value |
| Futures contracts | | Equity Risk | | Variation Margin Receivable* | | $ 1,649,934 | | Variation Margin Payable* | | $ — |
*Includes cumulative appreciation/depreciation on futures contracts as reported in the Futures Contracts table. Only the current day’s variation margin is presented on the Statement of Assets and Liabilities.
The following table presents the amount of net realized gain (loss) and change in net unrealized appreciation (depreciation) recognized for the six months ended April 30, 2022, on derivative instruments, as well as the primary underlying risk exposure associated with each instrument.
| Statement of Operations Location | |
| Equity Risk Exposure | |
| Net realized gain (loss) on futures contracts | $2,534,490 |
| Net change in unrealized appreciation (depreciation) on futures contracts | 1,432,069 |
During the six months ended April 30, 2022, the notional value of futures contracts opened and closed were $132,117,546 and $74,918,352, respectively.
The Fund does not have the right to offset financial assets and liabilities related to futures contracts on the Statement of Assets and Liabilities.
Notes to Financial Statements (Continued)
First Trust Long/Short Equity ETF (FTLS)
April 30, 2022 (Unaudited)
6. Creations, Redemptions and Transaction Fees
The Fund generally issues and redeems its shares in primary market transactions through a creation and redemption mechanism and does not sell or redeem individual shares. Instead, financial entities known as “Authorized Participants” have contractual arrangements with the Fund or one of the Fund’s service providers to purchase and redeem Fund shares directly with the Fund in large blocks of shares known as “Creation Units.” Prior to the start of trading on every business day, the Fund publishes through the National Securities Clearing Corporation (“NSCC”) the “basket” of securities, cash or other assets that it will accept in exchange for a Creation Unit of the Fund’s shares. An Authorized Participant that wishes to effectuate a creation of the Fund’s shares deposits with the Fund the “basket” of securities, cash or other assets identified by the Fund that day, and then receives the Creation Unit of the Fund’s shares in return for those assets. After purchasing a Creation Unit, the Authorized Participant may continue to hold the Fund’s shares or sell them in the secondary market. The redemption process is the reverse of the purchase process: the Authorized Participant redeems a Creation Unit of the Fund’s shares for a basket of securities, cash or other assets. The combination of the creation and redemption process with secondary market trading in the Fund’s shares and underlying securities provides arbitrage opportunities that are designed to help keep the market price of the Fund’s shares at or close to the NAV per share of the Fund.
The Fund imposes fees in connection with the purchase of Creation Units. These fees may vary based upon various fact-based circumstances, including, but not limited to, the composition of the securities included in the Creation Unit or the countries in which the transactions are settled. The price for each Creation Unit will equal the daily NAV per share of the Fund times the number of shares in a Creation Unit, plus the fees described above and, if applicable, any operational processing and brokerage costs, transfer fees, stamp taxes and part or all of the spread between the expected bid and offer side of the market related to the securities comprising the creation basket.
The Fund also imposes fees in connection with the redemption of Creation Units. These fees may vary based upon various fact-based circumstances, including, but not limited to, the composition of the securities included in the Creation Unit or the countries in which the transactions are settled. The price received for each Creation Unit will equal the daily NAV per share of the Fund times the number of shares in a Creation Unit, minus the fees described above and, if applicable, any operational processing and brokerage costs, transfer fees, stamp taxes and part or all of the spread between the expected bid and offer side of the market related to the securities comprising the redemption basket. Investors who use the services of a broker or other such intermediary in addition to an Authorized Participant to effect a redemption of a Creation Unit may also be assessed an amount to cover the cost of such services. The redemption fee charged by the Fund will comply with Rule 22c-2 of the 1940 Act which limits redemption fees to no more than 2% of the value of the shares redeemed.
7. Distribution Plan
The Board of Trustees adopted a Distribution and Service Plan pursuant to Rule 12b-1 under the 1940 Act. In accordance with the Rule 12b-1 plan, the Fund is authorized to pay an amount up to 0.25% of its average daily net assets each year to reimburse First Trust Portfolios L.P. (“FTP”), the distributor of the Fund, for amounts expended to finance activities primarily intended to result in the sale of Creation Units or to provide investor services. FTP may also use this amount to compensate securities dealers or other persons that are Authorized Participants for providing distribution assistance, including broker-dealer and shareholder support and educational and promotional services.
No 12b-1 fees are currently paid by the Fund, and pursuant to a contractual arrangement, no 12b-1 fees will be paid any time before February 28, 2023.
8. Indemnification
The Trust, on behalf of the Fund, has a variety of indemnification obligations under contracts with its service providers. The Trust’s maximum exposure under these arrangements is unknown. However, the Trust has not had prior claims or losses pursuant to these contracts and expects the risk of loss to be remote.
9. Subsequent Events
Management has evaluated the impact of all subsequent events to the Fund through the date the financial statements were issued and has determined that there were no subsequent events requiring recognition or disclosure in the financial statements that have not already been disclosed.
Additional Information
First Trust Long/Short Equity ETF (FTLS)
April 30, 2022 (Unaudited)
Proxy Voting Policies and Procedures
A description of the policies and procedures that the Trust uses to determine how to vote proxies and information on how the Fund voted proxies relating to portfolio securities during the most recent 12-month period ended June 30 is available (1) without charge, upon request, by calling (800) 988-5891; (2) on the Fund’s website at www.ftportfolios.com; and (3) on the Securities and Exchange Commission’s (“SEC”) website at www.sec.gov.
Portfolio Holdings
The Fund files portfolio holdings information for each month in a fiscal quarter within 60 days after the end of the relevant fiscal quarter on Form N-PORT. Portfolio holdings information for the third month of each fiscal quarter will be publicly available on the SEC’s website at www.sec.gov. The Fund’s complete schedule of portfolio holdings for the second and fourth quarters of each fiscal year is included in the semi-annual and annual reports to shareholders, respectively, and is filed with the SEC on Form N-CSR. The semi-annual and annual report for the Fund is available to investors within 60 days after the period to which it relates. The Fund’s Forms N-PORT and Forms N-CSR are available on the SEC’s website listed above.
Risk Considerations
Risks are inherent in all investing. Certain general risks that may be applicable to a Fund are identified below, but not all of the material risks relevant to each Fund are included in this report and not all of the risks below apply to each Fund. The material risks of investing in each Fund are spelled out in its prospectus, statement of additional information and other regulatory filings. Before investing, you should consider each Fund’s investment objective, risks, charges and expenses, and read each Fund’s prospectus and statement of additional information carefully. You can download each Fund’s prospectus at www.ftportfolios.com or contact First Trust Portfolios L.P. at (800) 621-1675 to request a prospectus, which contains this and other information about each Fund.
Concentration Risk. To the extent that a fund is able to invest a significant percentage of its assets in a single asset class or the securities of issuers within the same country, state, region, industry or sector, an adverse economic, business or political development may affect the value of the fund’s investments more than if the fund were more broadly diversified. A fund that tracks an index will be concentrated to the extent the fund’s corresponding index is concentrated. A concentration makes a fund more susceptible to any single occurrence and may subject the fund to greater market risk than a fund that is more broadly diversified.
Credit Risk. Credit risk is the risk that an issuer of a security will be unable or unwilling to make dividend, interest and/or principal payments when due and the related risk that the value of a security may decline because of concerns about the issuer’s ability to make such payments.
Cyber Security Risk. The funds are susceptible to potential operational risks through breaches in cyber security. A breach in cyber security refers to both intentional and unintentional events that may cause a fund to lose proprietary information, suffer data corruption or lose operational capacity. Such events could cause a fund to incur regulatory penalties, reputational damage, additional compliance costs associated with corrective measures and/or financial loss. In addition, cyber security breaches of a fund’s third-party service providers, such as its administrator, transfer agent, custodian, or sub-advisor, as applicable, or issuers in which the fund invests, can also subject a fund to many of the same risks associated with direct cyber security breaches.
Defined Outcome Funds Risk. To the extent a fund’s investment strategy is designed to deliver returns tied to the price performance of an underlying ETF, an investor may not realize the returns the fund seeks to achieve if that investor does not hold shares for the entire target outcome period. In the event an investor purchases shares after the first day of the target outcome period or sells shares prior to the end of the target outcome period, the buffer that the fund seeks to provide against a decline in the value of the underlying ETF may not be available, the enhanced returns that the fund seeks to provide (if any) may not be available and the investor may not participate in a gain in the value of the underlying ETF up to the cap for the investor’s investment period. Additionally, the fund will not participate in gains of the underlying ETF above the cap and a shareholder may lose their entire investment. If the fund seeks enhanced returns, there are certain time periods when the value of the fund may fall faster than the value of the underlying ETF, and it is very unlikely that, on any given day during which the underlying ETF share price increases in value, the fund’s share price will increase at the same rate as the enhanced returns sought by the fund, which is designed for an entire target outcome period. Trading flexible exchange options involves risks different from, or possibly greater than, the risks associated with investing directly in securities, such as less liquidity and correlation and valuation risks. A fund may experience substantial downside from specific flexible exchange option positions and certain positions may expire worthless.
Derivatives Risk. To the extent a fund uses derivative instruments such as futures contracts, options contracts and swaps, the fund may experience losses because of adverse movements in the price or value of the underlying asset, index or rate, which may be magnified
Additional Information (Continued)
First Trust Long/Short Equity ETF (FTLS)
April 30, 2022 (Unaudited)
by certain features of the derivative. These risks are heightened when a fund’s portfolio managers use derivatives to enhance the fund’s return or as a substitute for a position or security, rather than solely to hedge (or offset) the risk of a position or security held by the fund.
Equity Securities Risk. To the extent a fund invests in equity securities, the value of the fund’s shares will fluctuate with changes in the value of the equity securities. Equity securities prices fluctuate for several reasons, including changes in investors’ perceptions of the financial condition of an issuer or the general condition of the relevant stock market, such as market volatility, or when political or economic events affecting the issuers occur. In addition, common stock prices may be particularly sensitive to rising interest rates, as the cost of capital rises and borrowing costs increase. Equity securities may decline significantly in price over short or extended periods of time, and such declines may occur in the equity market as a whole, or they may occur in only a particular country, company, industry or sector of the market.
ETF Risk. The shares of an ETF trade like common stock and represent an interest in a portfolio of securities. The risks of owning an ETF generally reflect the risks of owning the underlying securities, although lack of liquidity in an ETF could result in it being more volatile and ETFs have management fees that increase their costs. Shares of an ETF trade on an exchange at market prices rather than net asset value, which may cause the shares to trade at a price greater than net asset value (premium) or less than net asset value (discount). In times of market stress, decisions by market makers to reduce or step away from their role of providing a market for an ETF’s shares, or decisions by an ETF’s authorized participants that they are unable or unwilling to proceed with creation and/or redemption orders of an ETF’s shares, could result in shares of the ETF trading at a discount to net asset value and in greater than normal intraday bid-ask spreads.
Fixed Income Securities Risk. To the extent a fund invests in fixed income securities, the fund will be subject to credit risk, income risk, interest rate risk, liquidity risk and prepayment risk. Income risk is the risk that income from a fund’s fixed income investments could decline during periods of falling interest rates. Interest rate risk is the risk that the value of a fund’s fixed income securities will decline because of rising interest rates. Liquidity risk is the risk that a security cannot be purchased or sold at the time desired, or cannot be purchased or sold without adversely affecting the price. Prepayment risk is the risk that the securities will be redeemed or prepaid by the issuer, resulting in lower interest payments received by the fund. In addition to these risks, high yield securities, or “junk” bonds, are subject to greater market fluctuations and risk of loss than securities with higher ratings, and the market for high yield securities is generally smaller and less liquid than that for investment grade securities.
Index or Model Constituent Risk. Certain funds may be a constituent of one or more indices or ETF models. As a result, such a fund may be included in one or more index-tracking exchange-traded funds or mutual funds. Being a component security of such a vehicle could greatly affect the trading activity involving a fund, the size of the fund and the market volatility of the fund. Inclusion in an index could increase demand for the fund and removal from an index could result in outsized selling activity in a relatively short period of time. As a result, a fund’s net asset value could be negatively impacted and the fund’s market price may be significantly below its net asset value during certain periods. In addition, index rebalances may potentially result in increased trading activity in a fund’s shares.
Index Provider Risk. To the extent a fund seeks to track an index, it is subject to Index Provider Risk. There is no assurance that the Index Provider will compile the Index accurately, or that the Index will be determined, maintained, constructed, reconstituted, rebalanced, composed, calculated or disseminated accurately. To correct any such error, the Index Provider may carry out an unscheduled rebalance or other modification of the Index constituents or weightings, which may increase the fund’s costs. The Index Provider does not provide any representation or warranty in relation to the quality, accuracy or completeness of data in the Index, and it does not guarantee that the Index will be calculated in accordance with its stated methodology. Losses or costs associated with any Index Provider errors generally will be borne by the fund and its shareholders.
Investment Companies Risk. To the extent a fund invests in the securities of other investment vehicles, the fund will incur additional fees and expenses that would not be present in a direct investment in those investment vehicles. Furthermore, the fund’s investment performance and risks are directly related to the investment performance and risks of the investment vehicles in which the fund invests.
LIBOR Risk. To the extent a fund invests in floating or variable rate obligations that use the London Interbank Offered Rate (“LIBOR”) as a reference interest rate, it is subject to LIBOR Risk. The United Kingdom’s Financial Conduct Authority, which regulates LIBOR has ceased making LIBOR available as a reference rate over a phase-out period that began December 31, 2021. There is no assurance that any alternative reference rate, including the Secured Overnight Financing Rate (“SOFR”) will be similar to or produce the same value or economic equivalence as LIBOR or that instruments using an alternative rate will have the same volume or liquidity. The unavailability or replacement of LIBOR may affect the value, liquidity or return on certain fund investments and may result in costs incurred in connection with closing out positions and entering into new trades. Any potential effects of the transition away from LIBOR on the fund or on certain instruments in which the fund invests can be difficult to ascertain, and they may vary depending on a variety of factors, and they could result in losses to the fund.
Additional Information (Continued)
First Trust Long/Short Equity ETF (FTLS)
April 30, 2022 (Unaudited)
Management Risk. To the extent that a fund is actively managed, it is subject to management risk. In managing an actively-managed fund’s investment portfolio, the fund’s portfolio managers will apply investment techniques and risk analyses that may not have the desired result. There can be no guarantee that a fund will meet its investment objective.
Market Risk. Securities held by a fund, as well as shares of a fund itself, are subject to market fluctuations caused by factors such as general economic conditions, political events, regulatory or market developments, changes in interest rates and perceived trends in securities prices. Shares of a fund could decline in value or underperform other investments as a result of the risk of loss associated with these market fluctuations. In addition, local, regional or global events such as war, acts of terrorism, spread of infectious diseases or other public health issues, recessions, or other events could have a significant negative impact on a fund and its investments. Such events may affect certain geographic regions, countries, sectors and industries more significantly than others. In February 2022, Russia invaded Ukraine which has caused and could continue to cause significant market disruptions and volatility within the markets in Russia, Europe, and the United States. The hostilities and sanctions resulting from those hostilities could have a significant impact on certain fund investments as well as fund performance. The outbreak of the respiratory disease designated as COVID-19 in December 2019 has caused significant volatility and declines in global financial markets, which have caused losses for investors. While the development of vaccines has slowed the spread of the virus and allowed for the resumption of “reasonably” normal business activity in the United States, many countries continue to impose lockdown measures in an attempt to slow the spread. Additionally, there is no guarantee that vaccines will be effective against emerging variants of the disease.
Non-U.S. Securities Risk. To the extent a fund invests in non-U.S. securities, it is subject to additional risks not associated with securities of domestic issuers. Non-U.S. securities are subject to higher volatility than securities of domestic issuers due to: possible adverse political, social or economic developments; restrictions on foreign investment or exchange of securities; capital controls; lack of liquidity; currency exchange rates; excessive taxation; government seizure of assets; the imposition of sanctions by foreign governments; different legal or accounting standards; and less government supervision and regulation of exchanges in foreign countries. Investments in non-U.S. securities may involve higher costs than investments in U.S. securities, including higher transaction and custody costs, as well as additional taxes imposed by non-U.S. governments. These risks may be heightened for securities of companies located, or with significant operations, in emerging market countries.
Operational Risk. Each fund is subject to risks arising from various operational factors, including, but not limited to, human error, processing and communication errors, errors of a fund’s service providers, counterparties or other third-parties, failed or inadequate processes and technology or systems failures. Each fund relies on third-parties for a range of services, including custody. Any delay or failure relating to engaging or maintaining such service providers may affect a fund’s ability to meet its investment objective. Although the funds and the funds’ investment advisor seek to reduce these operational risks through controls and procedures, there is no way to completely protect against such risks.
Passive Investment Risk. To the extent a fund seeks to track an index, the fund will invest in the securities included in, or representative of, the index regardless of their investment merit. A fund generally will not attempt to take defensive positions in declining markets.
Liquidity Risk Management Program
In accordance with Rule 22e-4 under the Investment Company Act of 1940, as amended (the “1940 Act”), the Fund and each other fund in the First Trust Fund Complex, other than the closed-end funds, have adopted and implemented a liquidity risk management program (the “Program”) reasonably designed to assess and manage the funds’ liquidity risk, i.e., the risk that a fund could not meet requests to redeem shares issued by the fund without significant dilution of remaining investors’ interests in the fund. The Board of Trustees of the First Trust Funds has appointed First Trust Advisors L.P. (the “Advisor”) as the person designated to administer the Program, and in this capacity the Advisor performs its duties primarily through the activities and efforts of the First Trust Liquidity Committee (the “Liquidity Committee”).
Pursuant to the Program, the Liquidity Committee classifies the liquidity of each fund’s portfolio investments into one of the four liquidity categories specified by Rule 22e-4: highly liquid investments, moderately liquid investments, less liquid investments and illiquid investments. The Liquidity Committee determines certain of the inputs for this classification process, including reasonably anticipated trade sizes and significant investor dilution thresholds. The Liquidity Committee also determines and periodically reviews a highly liquid investment minimum for certain funds, monitors the funds’ holdings of assets classified as illiquid investments to seek to ensure they do not exceed 15% of a fund’s net assets and establishes policies and procedures regarding redemptions in kind.
At the April 18, 2022 meeting of the Board of Trustees, as required by Rule 22e-4 and the Program, the Advisor provided the Board with a written report prepared by the Advisor that addressed the operation of the Program during the period from March 16, 2021 through the Liquidity Committee’s annual meeting held on March 17, 2022 and assessed the Program’s adequacy and effectiveness of implementation during this period, including the operation of the highly liquid investment minimum for each fund that is required
Additional Information (Continued)
First Trust Long/Short Equity ETF (FTLS)
April 30, 2022 (Unaudited)
under the Program to have one, and any material changes to the Program. Note that because the Fund primarily holds assets that are highly liquid investments, the Fund has not adopted any highly liquid investment minimum.
As stated in the written report, during the review period, no fund breached the 15% limitation on illiquid investments, no fund with a highly liquid investment minimum breached that minimum and no fund filed a Form N-LIQUID. The Advisor concluded that each fund’s investment strategy is appropriate for an open-end fund; that the Program operated effectively in all material respects during the review period; and that the Program is reasonably designed to assess and manage the liquidity risk of each fund and to maintain compliance with Rule 22e-4.
This page intentionally left blank
This page intentionally left blank
This page intentionally left blank
First Trust Exchange-Traded Fund III
INVESTMENT ADVISOR
First Trust Advisors L.P.
120 East Liberty Drive, Suite 400
Wheaton, IL 60187
ADMINISTRATOR, CUSTODIAN,
FUND ACCOUNTANT &
TRANSFER AGENT
Brown Brothers Harriman & Co.
50 Post Office Square
Boston, MA 02110
INDEPENDENT REGISTERED
PUBLIC ACCOUNTING FIRM
Deloitte & Touche LLP
111 S. Wacker Drive
Chicago, IL 60606
LEGAL COUNSEL
Chapman and Cutler LLP
320 South Canal Street
Chicago, IL 60606
First Trust Exchange-Traded Fund III
First Trust Emerging Markets Local Currency Bond ETF (FEMB)
Semi-Annual Report
For the Six Months Ended
April 30, 2022
First Trust Emerging Markets Local Currency Bond ETF (FEMB)
Semi-Annual Report
April 30, 2022
Caution Regarding Forward-Looking Statements
This report contains certain forward-looking statements within the meaning of the Securities Act of 1933, as amended, and the Securities Exchange Act of 1934, as amended. Forward-looking statements include statements regarding the goals, beliefs, plans or current expectations of First Trust Advisors L.P. (“First Trust” or the “Advisor”) and/or First Trust Global Portfolios Limited (“FTGP” or the “Sub-Advisor”) and their respective representatives, taking into account the information currently available to them. Forward-looking statements include all statements that do not relate solely to current or historical fact. For example, forward-looking statements include the use of words such as “anticipate,” “estimate,” “intend,” “expect,” “believe,” “plan,” “may,” “should,” “would” or other words that convey uncertainty of future events or outcomes.
Forward-looking statements involve known and unknown risks, uncertainties and other factors that may cause the actual results, performance or achievements of the series of First Trust Exchange-Traded Fund III (the “Trust”) described in this report (First Trust Emerging Markets Local Currency Bond ETF; hereinafter referred to as the “Fund”) to be materially different from any future results, performance or achievements expressed or implied by the forward-looking statements. When evaluating the information included in this report, you are cautioned not to place undue reliance on these forward-looking statements, which reflect the judgment of the Advisor and/or Sub-Advisor and their respective representatives only as of the date hereof. We undertake no obligation to publicly revise or update these forward-looking statements to reflect events and circumstances that arise after the date hereof.
Performance and Risk Disclosure
There is no assurance that the Fund will achieve its investment objective. The Fund is subject to market risk, which is the possibility that the market values of securities owned by the Fund will decline and that the value of the Fund’s shares may therefore be less than what you paid for them. Accordingly, you can lose money by investing in the Fund. See “Risk Considerations” in the Additional Information section of this report for a discussion of certain other risks of investing in the Fund.
Performance data quoted represents past performance, which is no guarantee of future results, and current performance may be lower or higher than the figures shown. For the most recent month-end performance figures, please visit www.ftportfolios.com or speak with your financial advisor. Investment returns, net asset value and share price will fluctuate and Fund shares, when sold, may be worth more or less than their original cost.
The Advisor may also periodically provide additional information on Fund performance on the Fund’s web page at www.ftportfolios.com.
How to Read This Report
This report contains information that may help you evaluate your investment in the Fund. It includes details about the Fund and presents data and analysis that provide insight into the Fund’s performance and investment approach.
The statistical information that follows may help you understand the Fund’s performance compared to that of relevant market benchmarks.
It is important to keep in mind that the opinions expressed by personnel of the Advisor and/or Sub-Advisor are just that: informed opinions. They should not be considered to be promises or advice. The opinions, like the statistics, cover the period through the date on the cover of this report. The material risks of investing in the Fund are spelled out in the prospectus, the statement of additional information, and other Fund regulatory filings.
First Trust Emerging Markets Local Currency Bond ETF (FEMB)
Semi-Annual Letter from the Chairman and CEO
April 30, 2022
Dear Shareholders,
First Trust is pleased to provide you with the semi-annual report for the First Trust Emerging Markets Local Currency Bond ETF (the “Fund”), which contains detailed information about the Fund for the six months ended April 30, 2022.
A couple of famous financial industry quotes came to mind recently as I was sizing up the current business climate: “There’s no such thing as a free lunch” and “Don’t fight the Fed!” It seems that for some, the trillions of dollars of financial stimulus funneled into U.S. households and businesses by the Federal government and its agencies to help mitigate the fallout stemming from the coronavirus (“COVID-19”) pandemic, which commenced sometime around February 2020, was for all intents and purposes “free money.” It was not free. From the close of February 2020 through March 2022, the Federal Reserve (the “Fed”) expanded the U.S. money supply, known as M2, by 41% to $21.81 trillion to boost liquidity in the financial system. Normally, M2 grows around 6.0% on a year-over-year basis. When you factor in that all this new capital was accompanied by a breakdown of the global supply chain, there is little wonder why inflation is rampant.
One of the more common definitions of inflation is too many dollars chasing too few goods. The biggest downside to the supply chain bottlenecks, such as the severe backup of container ships at some U.S. ports, is that they have markedly reduced the flow of imported goods to retailers. The Fed has been signaling to Americans and the rest of the globe that, after many years of artificially low interest rates, tighter monetary policy will likely rule the day for the foreseeable future. Higher interest rates make borrowing capital more expensive and that should slow consumption over time, which, in turn, should bring down inflation. Don’t fight the Fed is code for don’t bet against the Fed, in my opinion. Stay tuned!
The primary job of the Fed is price stability. Its standard inflation target rate is 2.0%. The most recent Consumer Price Index release showed that prices were up 8.3% on a year-over-year basis as of April 30, 2022, according to data from the U.S. Bureau of Labor Statistics. While down from 8.5% the prior month, it is clearly elevated and that means the Fed has some work to do to with respect to mitigating inflation. The war between Russia and Ukraine is making the Fed’s job even tougher, particularly in the areas of food and energy. Rising costs and potential shortages could become even bigger if the COVID-19 outbreak in China grows. These are important events to monitor. Fed Chairman Jerome Powell has stated that the Fed is poised to raise the Federal Funds target rate (upper bound) by 50 basis points at each of its next two meetings (set for June and July), which would take the rate up to 2.00%. Data from CME Group indicates that current market pricing has the rate rising to 2.75% or 3.00% by year-end.
Securities markets do not go up in a straight line and they do not just go up year in and year out. In fact, what we have witnessed over the past couple of decades are often referred to as boom and bust cycles. Thankfully, it has ended up more boom than bust. Simply put, investors, not traders of the market, need to be willing to take the bad with the good. As the various stages of an economic cycle come and go (expansion to contraction), the markets tend to reprice securities to reflect the current narrative. In other words, we believe the markets essentially heal themselves − if you let them. That is an accurate depiction of how the markets have behaved so far in 2022, in my opinion. In response to a softening economy, the stock and bond markets have experienced some serious downside through the first four months of this year, as measured by the broader market indices. As of today, Brian Wesbury, Chief Economist at First Trust, is not forecasting a recession for the U.S. in 2022 or 2023. Whether he is proven right or wrong, we encourage investors to stay the course.
Thank you for giving First Trust the opportunity to play a role in your financial future. We value our relationship with you and will report on the Fund again in six months.
Sincerely,
James A. Bowen
Chairman of the Board of Trustees
Chief Executive Officer of First Trust Advisors L.P.
Fund Performance Overview (Unaudited)
First Trust Emerging Markets Local Currency Bond ETF (FEMB)
The First Trust Emerging Markets Local Currency Bond ETF’s (the “Fund”) investment objective is to seek maximum total return and current income. The Fund lists and principally trades its shares on The Nasdaq Stock Market LLC (“Nasdaq”) under the ticker symbol “FEMB.” Under normal market conditions, the Fund seeks to achieve its investment objective by investing at least 80% of its net assets (including investment borrowings) in bonds, notes and bills issued or guaranteed by entities incorporated or domiciled in emerging market countries that are denominated in the local currency of the issuer. In implementing the Fund’s investment strategy, First Trust Global Portfolios Limited (the “Sub-Advisor”) seeks to provide current income and enhance capital, while minimizing volatility.
| Performance | | | | | | | |
| | | | Average Annual Total Returns | | Cumulative Total Returns |
| | 6 Months
Ended
4/30/22 | 1 Year
Ended
4/30/22 | 5 Years
Ended
4/30/22 | Inception
(11/4/14)
to 4/30/22 | | 5 Years
Ended
4/30/22 | Inception
(11/4/14)
to 4/30/22 |
| Fund Performance | | | | | | | |
| NAV | -9.64% | -14.32% | -2.26% | -2.14% | | -10.82% | -14.96% |
| Market Price | -9.92% | -14.86% | -2.48% | -2.20% | | -11.82% | -15.31% |
| Index Performance | | | | | | | |
| Bloomberg Emerging Markets Local Currency Government - 10% Country Capped Index | -10.51% | -13.37% | -0.11% | -0.62% | | -0.56% | -4.54% |
| JP Morgan GBI-EM Global Diversified Index | -13.17% | -15.95% | -1.28% | -1.65% | | -6.26% | -11.70% |
Total returns for the period since inception are calculated from the inception date of the Fund. “Average Annual Total Returns” represent the average annual change in value of an investment over the periods indicated. “Cumulative Total Returns” represent the total change in value of an investment over the periods indicated.
The Fund’s per share net asset value (“NAV”) is the value of one share of the Fund and is computed by dividing the value of all assets of the Fund (including accrued interest and dividends), less all liabilities (including accrued expenses and dividends declared but unpaid), by the total number of outstanding shares. The price used to calculate market return (“Market Price”) is determined by using the midpoint of the national best bid and offer price (“NBBO”) as of the time that the Fund’s NAV is calculated. Under SEC rules, the NBBO consists of the highest displayed buy and lowest sell prices among the various exchanges trading the Fund at the time the Fund’s NAV is calculated. Prior to January 1, 2019, the price used was the midpoint between the highest bid and the lowest offer on the stock exchange on which shares of the Fund were listed for trading as of the time that the Fund’s NAV was calculated. Since shares of the Fund did not trade in the secondary market until after its inception, for the period from inception to the first day of secondary market trading in shares of the Fund, the NAV of the Fund is used as a proxy for the secondary market trading price to calculate market returns. NAV and market returns assume that all distributions have been reinvested in the Fund at NAV and Market Price, respectively.
An index is a statistical composite that tracks a specified financial market or sector. Unlike the Fund, the indices do not actually hold a portfolio of securities and therefore do not incur the expenses incurred by the Fund. These expenses negatively impact the performance of the Fund. Also, market returns do not include brokerage commissions that may be payable on secondary market transactions. If brokerage commissions were included, market returns would be lower. The total returns presented reflect the reinvestment of dividends on securities in the indices. The returns presented do not reflect the deduction of taxes that a shareholder would pay on Fund distributions or the redemption or sale of Fund shares. The investment return and principal value of shares of the Fund will vary with changes in market conditions. Shares of the Fund may be worth more or less than their original cost when they are redeemed or sold in the market. The Fund’s past performance is no guarantee of future performance.
Fund Performance Overview (Unaudited) (Continued)
First Trust Emerging Markets Local Currency Bond ETF (FEMB)
| Industry Classification | % of Total
Investments |
| Sovereigns | 93.3% |
| Supranationals | 6.7 |
| Total | 100.0% |
| Fund Allocation | % of Net Assets |
| Foreign Sovereign Bonds and Notes | 86.0% |
| Foreign Corporate Bonds and Notes | 6.2 |
| Net Other Assets and Liabilities(1) | 7.8 |
| Total | 100.0% |
| Credit Quality(2) | % of Total
Investments
(including cash) |
| AAA | 6.5% |
| AA | 1.3 |
| AA- | 0.1 |
| A+ | 3.1 |
| A | 10.0 |
| A- | 4.9 |
| BBB+ | 12.3 |
| BBB | 25.8 |
| BBB- | 5.1 |
| BB | 26.2 |
| B+ | 1.1 |
| Cash | 3.6 |
| Total | 100.0% |
| Top Ten Holdings | % of Total
Investments |
| Republic of South Africa Government Bond, 10.50%, 12/21/26 | 5.9% |
| Brazil Notas do Tesouro Nacional, Series F, 10.00%, 1/01/25 | 5.8 |
| Brazil Notas do Tesouro Nacional, Series F, 10.00%, 1/01/27 | 5.2 |
| Indonesia Treasury Bond, 9.00%, 3/15/29 | 4.0 |
| Republic of South Africa Government Bond, 8.88%, 2/28/35 | 4.0 |
| Asian Development Bank, 6.20%, 10/06/26 | 3.9 |
| Indonesia Treasury Bond, 8.38%, 3/15/34 | 3.8 |
| Indonesia Treasury Bond, 8.38%, 9/15/26 | 3.7 |
| Colombian TES, 7.50%, 8/26/26 | 3.5 |
| Romania Government Bond, 4.50%, 6/17/24 | 3.3 |
| Total | 43.1% |
| (1) | Includes forward foreign currency contracts. |
| (2) | The credit quality and ratings information presented above reflect the ratings assigned by one or more nationally recognized statistical rating organizations (NRSROs), including S&P Global Ratings, Moody’s Investors Service, Inc., Fitch Ratings or a comparably rated NRSRO. For situations in which a security is rated by more than one NRSRO and the ratings are not equivalent, the highest rating is used. Sub-investment grade ratings are those rated BB+/Ba1 or lower. Investment grade ratings are those rated BBB-/Baa3 or higher. The credit ratings shown relate to the creditworthiness of the issuers of the underlying securities in the Fund, and not to the Fund or its shares. Credit ratings are subject to change. |
Fund Performance Overview (Unaudited) (Continued)
First Trust Emerging Markets Local Currency Bond ETF (FEMB)
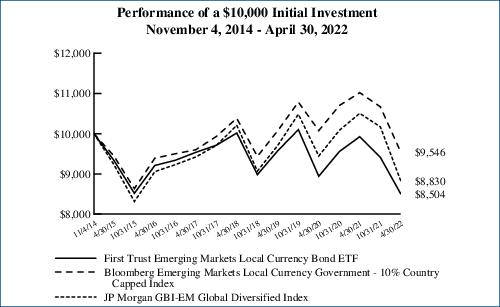
Performance figures assume reinvestment of all distributions and do not reflect the deduction of taxes that a shareholder would pay on Fund distributions or the redemption or sale of Fund shares. An index is a statistical composite that tracks a specified financial market or sector. Unlike the Fund, the indices do not actually hold a portfolio of securities and therefore do not incur the expenses incurred by the Fund. These expenses negatively impact the performance of the Fund. The Fund’s past performance does not predict future performance.
Frequency Distribution of Discounts and Premiums
Information showing the number of days the market price of the Fund’s shares was greater (at a premium) and less (at a discount) than the Fund’s net asset value for the most recently completed year, and the most recently completed calendar quarters since that year (or life of the Fund, if shorter), is available at https://www.ftportfolios.com/Retail/etf/home.aspx.
Portfolio Management
First Trust Emerging Markets Local Currency Bond ETF (FEMB)
Semi-Annual Report
April 30, 2022 (Unaudited)
Advisor
First Trust Advisors L.P. (“First Trust” or the “Advisor”) serves as the investment advisor to the First Trust Emerging Markets Local Currency Bond ETF (the “Fund”). First Trust is responsible for the ongoing monitoring of the Fund’s investment portfolio, managing the Fund’s business affairs and providing certain administrative services necessary for the management of the Fund.
Investment Sub-Advisor
First Trust Global Portfolios Limited (“FTGP”), an affiliate of First Trust, serves as investment sub-advisor to the Fund. Derek Fulton, Leonardo Da Costa and Anthony Beevers are the Fund’s portfolio managers and are jointly and primarily responsible for the day-to-day management of the Fund’s investment portfolio. Established in December 2011, FTGP is an SEC-registered investment advisor based in London. FTGP was established as a United Kingdom-based distributor, advisor and affiliate of First Trust and First Trust Portfolios L.P. and advises on global fixed income and currency portfolios. The global fixed income team at FTGP has experience in managing developing and emerging market fixed income portfolios for high profile European institutions.
Portfolio Management Team
Derek Fulton, Director, Chief Executive Officer, FTGP
Leonardo Da Costa, Director, Portfolio Manager, FTGP
Anthony Beevers, Portfolio Manager, FTGP
The portfolio managers are primarily and jointly responsible for the day-to-day management of the Fund. Each portfolio manager has managed the Fund since 2014, except for Anthony Beevers, who has served as a member of the portfolio management team since 2019.
First Trust Emerging Markets Local Currency Bond ETF (FEMB)
Understanding Your Fund Expenses
April 30, 2022 (Unaudited)
As a shareholder of the First Trust Emerging Markets Local Currency Bond ETF (the “Fund”), you incur two types of costs: (1) transaction costs; and (2) ongoing costs, including management fees, distribution and/or service (12b-1) fees, if any, and other Fund expenses. This Example is intended to help you understand your ongoing costs of investing in the Fund and to compare these costs with the ongoing costs of investing in other funds.
The Example is based on an investment of $1,000 invested at the beginning of the period and held through the six-month period ended April 30, 2022.
Actual Expenses
The first line in the following table provides information about actual account values and actual expenses. You may use the information in this line, together with the amount you invested, to estimate the expenses that you paid over the period. Simply divide your account value by $1,000 (for example, an $8,600 account value divided by $1,000 = 8.6), then multiply the result by the number in the first line under the heading entitled “Expenses Paid During the Six-Month Period” to estimate the expenses you paid on your account during this six-month period.
Hypothetical Example for Comparison Purposes
The second line in the following table provides information about hypothetical account values and hypothetical expenses based on the Fund’s actual expense ratio and an assumed rate of return of 5% per year before expenses, which is not the Fund’s actual return. The hypothetical account values and expenses may not be used to estimate the actual ending account balance or expenses you paid for the period. You may use this information to compare the ongoing costs of investing in the Fund and other funds. To do so, compare this 5% hypothetical example with the 5% hypothetical examples that appear in the shareholder reports of the other funds.
Please note that the expenses shown in the table are meant to highlight your ongoing costs only and do not reflect any transactional costs such as brokerage commissions. Therefore, the second line in the table is useful in comparing ongoing costs only, and will not help you determine the relative total costs of owning different funds. In addition, if these transactional costs were included, your costs would have been higher.
| | Beginning
Account Value
November 1, 2021 | Ending
Account Value
April 30, 2022 | Annualized
Expense Ratio
Based on the
Six-Month
Period | Expenses Paid
During the
Six-Month
Period (a) |
| First Trust Emerging Markets Local Currency Bond ETF (FEMB) |
| Actual | $1,000.00 | $903.60 | 0.85% | $4.01 |
| Hypothetical (5% return before expenses) | $1,000.00 | $1,020.58 | 0.85% | $4.26 |
| (a) | Expenses are equal to the annualized expense ratios as indicated in the table multiplied by the average account value over the period (November 1, 2021 through April 30, 2022), multiplied by 181/365 (to reflect the six-month period). |
First Trust Emerging Markets Local Currency Bond ETF (FEMB)
Portfolio of Investments
April 30, 2022 (Unaudited)
Principal
Value
(Local
Currency) | | Description | | Stated
Coupon | | Stated
Maturity | | Value
(US Dollars) |
| FOREIGN SOVEREIGN BONDS AND NOTES – 86.0% |
| | | Brazil – 13.0% | | | | | | |
| 28,000,000 | | Brazil Notas do Tesouro Nacional, Series F (BRL)
| | 10.00% | | 01/01/23 | | $5,557,474 |
| 71,950,000 | | Brazil Notas do Tesouro Nacional, Series F (BRL)
| | 10.00% | | 01/01/25 | | 13,849,587 |
| 65,450,000 | | Brazil Notas do Tesouro Nacional, Series F (BRL)
| | 10.00% | | 01/01/27 | | 12,310,887 |
| 9,200,000 | | Brazil Notas do Tesouro Nacional, Series F (BRL)
| | 10.00% | | 01/01/29 | | 1,686,870 |
| | | | | 33,404,818 |
| | | Chile – 3.0% | | | | | | |
| 5,660,000,000 | | Bonos de la Tesoreria de la Republica en Pesos (CLP)
| | 4.50% | | 03/01/26 | | 6,117,207 |
| 730,000,000 | | Bonos de la Tesoreria de la Republica en Pesos (CLP) (a) (b)
| | 4.70% | | 09/01/30 | | 753,052 |
| 810,000,000 | | Bonos de la Tesoreria de la Republica en Pesos (CLP)
| | 5.00% | | 03/01/35 | | 829,262 |
| | | | | 7,699,521 |
| | | Colombia – 7.8% | | | | | | |
| 4,201,000,000 | | Colombian TES (COP)
| | 7.00% | | 05/04/22 | | 1,059,296 |
| 35,924,000,000 | | Colombian TES (COP)
| | 7.50% | | 08/26/26 | | 8,361,127 |
| 24,500,000,000 | | Colombian TES (COP)
| | 6.00% | | 04/28/28 | | 5,079,210 |
| 25,920,000,000 | | Colombian TES (COP)
| | 7.75% | | 09/18/30 | | 5,679,014 |
| | | | | 20,178,647 |
| | | Czech Republic – 1.2% | | | | | | |
| 81,070,000 | | Czech Republic Government Bond (CZK) (b)
| | 2.40% | | 09/17/25 | | 3,206,601 |
| | | Hungary – 4.0% | | | | | | |
| 806,000,000 | | Hungary Government Bond (HUF)
| | 5.50% | | 06/24/25 | | 2,154,475 |
| 2,066,000,000 | | Hungary Government Bond (HUF)
| | 6.75% | | 10/22/28 | | 5,672,099 |
| 1,130,000,000 | | Hungary Government Bond (HUF)
| | 3.00% | | 08/21/30 | | 2,382,642 |
| | | | | 10,209,216 |
| | | India – 0.2% | | | | | | |
| 40,000,000 | | India Government Bond (INR)
| | 6.10% | | 07/12/31 | | 485,123 |
| | | Indonesia – 12.9% | | | | | | |
| 119,090,000,000 | | Indonesia Treasury Bond (IDR)
| | 8.38% | | 09/15/26 | | 8,832,009 |
| 122,542,000,000 | | Indonesia Treasury Bond (IDR)
| | 9.00% | | 03/15/29 | | 9,439,405 |
| 43,540,000,000 | | Indonesia Treasury Bond (IDR)
| | 7.00% | | 09/15/30 | | 2,995,721 |
| 118,493,000,000 | | Indonesia Treasury Bond (IDR)
| | 8.38% | | 03/15/34 | | 8,895,967 |
| 40,076,000,000 | | Indonesia Treasury Bond (IDR)
| | 8.25% | | 05/15/36 | | 2,970,193 |
| | | | | 33,133,295 |
| | | Israel – 0.1% | | | | | | |
| 500,000 | | Israel Government Bond - Fixed (ILS)
| | 6.25% | | 10/30/26 | | 177,729 |
| | | Malaysia – 4.9% | | | | | | |
| 16,750,000 | | Malaysia Government Bond (MYR)
| | 3.90% | | 11/30/26 | | 3,845,806 |
| 32,480,000 | | Malaysia Government Bond (MYR)
| | 3.89% | | 08/15/29 | | 7,163,137 |
| 7,500,000 | | Malaysia Government Bond (MYR)
| | 2.63% | | 04/15/31 | | 1,484,306 |
| | | | | 12,493,249 |
| | | Mexico – 4.7% | | | | | | |
| 156,470,000 | | Mexican Bonos (MXN)
| | 7.50% | | 06/03/27 | | 7,192,560 |
| 51,250,000 | | Mexican Bonos (MXN)
| | 8.50% | | 05/31/29 | | 2,438,244 |
| 40,920,000 | | Mexican Bonos (MXN)
| | 7.75% | | 05/29/31 | | 1,840,112 |
| 13,660,000 | | Mexican Bonos (MXN)
| | 10.00% | | 11/20/36 | | 714,934 |
| | | | | 12,185,850 |
See Notes to Financial Statements
Page 7
First Trust Emerging Markets Local Currency Bond ETF (FEMB)
Portfolio of Investments (Continued)
April 30, 2022 (Unaudited)
Principal
Value
(Local
Currency) | | Description | | Stated
Coupon | | Stated
Maturity | | Value
(US Dollars) |
| FOREIGN SOVEREIGN BONDS AND NOTES (Continued) |
| | | Peru – 4.8% | | | | | | |
| 6,670,000 | | Peru Government Bond (PEN)
| | 8.20% | | 08/12/26 | | $1,816,988 |
| 20,975,000 | | Peru Government Bond (PEN)
| | 6.95% | | 08/12/31 | | 5,133,095 |
| 5,850,000 | | Peru Government Bond (PEN)
| | 6.15% | | 08/12/32 | | 1,330,583 |
| 18,060,000 | | Peru Government Bond (PEN)
| | 6.90% | | 08/12/37 | | 4,172,295 |
| | | | | 12,452,961 |
| | | Philippines – 2.2% | | | | | | |
| 60,000,000 | | Philippine Government International Bond (PHP)
| | 3.90% | | 11/26/22 | | 1,132,029 |
| 226,000,000 | | Philippine Government International Bond (PHP)
| | 6.25% | | 01/14/36 | | 4,490,828 |
| | | | | 5,622,857 |
| | | Poland – 4.8% | | | | | | |
| 545,000 | | Republic of Poland Government Bond (PLN)
| | 4.00% | | 10/25/23 | | 119,065 |
| 31,370,000 | | Republic of Poland Government Bond (PLN)
| | 2.50% | | 07/25/26 | | 5,969,997 |
| 33,350,000 | | Republic of Poland Government Bond (PLN)
| | 2.75% | | 04/25/28 | | 6,124,074 |
| | | | | 12,213,136 |
| | | Romania – 4.6% | | | | | | |
| 2,480,000 | | Romania Government Bond (RON)
| | 5.85% | | 04/26/23 | | 529,198 |
| 38,465,000 | | Romania Government Bond (RON)
| | 4.50% | | 06/17/24 | | 7,914,420 |
| 17,060,000 | | Romania Government Bond (RON)
| | 4.75% | | 02/24/25 | | 3,484,194 |
| | | | | 11,927,812 |
| | | South Africa – 12.1% | | | | | | |
| 204,500,000 | | Republic of South Africa Government Bond (ZAR)
| | 10.50% | | 12/21/26 | | 14,017,492 |
| 100,210,000 | | Republic of South Africa Government Bond (ZAR)
| | 8.25% | | 03/31/32 | | 5,530,031 |
| 170,170,000 | | Republic of South Africa Government Bond (ZAR)
| | 8.88% | | 02/28/35 | | 9,393,427 |
| 14,640,000 | | Republic of South Africa Government Bond (ZAR)
| | 8.50% | | 01/31/37 | | 766,416 |
| 24,950,000 | | Republic of South Africa Government Bond (ZAR)
| | 9.00% | | 01/31/40 | | 1,337,434 |
| | | | | 31,044,800 |
| | | Thailand – 4.7% | | | | | | |
| 6,100,000 | | Thailand Government Bond (THB)
| | 3.63% | | 06/16/23 | | 183,597 |
| 153,100,000 | | Thailand Government Bond (THB)
| | 2.13% | | 12/17/26 | | 4,452,454 |
| 53,400,000 | | Thailand Government Bond (THB)
| | 1.60% | | 12/17/29 | | 1,448,212 |
| 190,360,000 | | Thailand Government Bond (THB)
| | 3.65% | | 06/20/31 | | 5,991,071 |
| | | | | 12,075,334 |
| | | Turkey – 1.0% | | | | | | |
| 21,800,000 | | Turkey Government Bond (TRY)
| | 9.00% | | 05/04/22 | | 1,469,581 |
| 23,800,000 | | Turkey Government Bond (TRY)
| | 10.60% | | 02/11/26 | | 1,206,971 |
| | | | | 2,676,552 |
| | | Total Foreign Sovereign Bonds and Notes
| | 221,187,501 |
| | | (Cost $260,700,818) | | | | | | |
| FOREIGN CORPORATE BONDS AND NOTES – 6.2% |
| | | Supranationals – 6.2% | | | | | | |
| 100,000,000 | | African Development Bank (ZAR)
| | (c) | | 04/05/46 | | 837,739 |
| 723,500,000 | | Asian Development Bank (INR)
| | 6.20% | | 10/06/26 | | 9,161,289 |
| 51,050,000 | | International Finance Corp. (INR)
| | 5.85% | | 11/25/22 | | 666,752 |
Page 8
See Notes to Financial Statements
First Trust Emerging Markets Local Currency Bond ETF (FEMB)
Portfolio of Investments (Continued)
April 30, 2022 (Unaudited)
Principal
Value
(Local
Currency) | | Description | | Stated
Coupon | | Stated
Maturity | | Value
(US Dollars) |
| FOREIGN CORPORATE BONDS AND NOTES (Continued) |
| | | Supranationals (Continued) | | | | | | |
| 337,000,000 | | International Finance Corp. (INR)
| | 6.30% | | 11/25/24 | | $4,338,557 |
| 83,500,000 | | International Finance Corp. (MXN)
| | (c) | | 02/22/38 | | 943,168 |
| | | Total Foreign Corporate Bonds and Notes
| | 15,947,505 |
| | | (Cost $18,398,403) | | | | | | |
| Total Investments – 92.2%
| 237,135,006 |
| | (Cost $279,099,221) | |
| | Net Other Assets and Liabilities – 7.8%
| 20,021,872 |
| | Net Assets – 100.0%
| $257,156,878 |
| Forward Foreign Currency Contracts |
Settlement
Date | | Counterparty | | Amount
Purchased | | Amount
Sold | | Purchase
Value as of
4/30/2022 | | Sale
Value as of
4/30/2022 | | Unrealized
Appreciation/
(Depreciation) |
| 05/20/22 | | BBH | | CNH | 29,550,000 | | USD | 4,668,392 | | $ 4,484,834 | | $ 4,668,392 | | $ (183,558) |
| 05/20/22 | | BNS | | COP | 5,500,000,000 | | USD | 1,472,360 | | 1,385,441 | | 1,472,360 | | (86,919) |
| 05/20/22 | | BBH | | HUF | 500,000,000 | | USD | 1,429,221 | | 1,391,279 | | 1,429,221 | | (37,942) |
| 05/20/22 | | SG | | IDR | 76,000,000,000 | | USD | 5,299,423 | | 5,246,782 | | 5,299,423 | | (52,641) |
| 05/20/22 | | SG | | INR | 250,300,000 | | USD | 3,276,849 | | 3,267,953 | | 3,276,849 | | (8,896) |
| 05/20/22 | | SG | | KRW | 6,000,000,000 | | USD | 4,880,181 | | 4,776,923 | | 4,880,181 | | (103,258) |
| 05/20/22 | | BBH | | MXN | 187,000,000 | | USD | 9,381,774 | | 9,132,636 | | 9,381,774 | | (249,138) |
| 05/20/22 | | BNS | | PEN | 5,300,000 | | USD | 1,409,949 | | 1,378,075 | | 1,409,949 | | (31,874) |
| 05/20/22 | | SG | | PHP | 248,530,000 | | USD | 4,751,540 | | 4,757,044 | | 4,751,540 | | 5,504 |
| 05/20/22 | | BBH | | THB | 50,000,000 | | USD | 1,514,360 | | 1,483,262 | | 1,514,360 | | (31,098) |
| 05/20/22 | | BBH | | ZAR | 64,500,000 | | USD | 4,504,216 | | 4,172,792 | | 4,504,216 | | (331,424) |
| 05/20/22 | | BNS | | USD | 1,356,852 | | CLP | 1,100,000,000 | | 1,356,852 | | 1,285,576 | | 71,276 |
| 05/20/22 | | BBH | | USD | 1,356,297 | | RON | 6,200,000 | | 1,356,297 | | 1,318,802 | | 37,495 |
Net Unrealized Appreciation / (Depreciation)
| | $(1,002,473) |
| Counterparty Abbreviations |
| BBH | Brown Brothers Harriman and Co. |
| BNS | Bank of Nova Scotia |
| SG | Societe Generale |
| (a) | This security, sold within the terms of a private placement memorandum, is exempt from registration upon resale under Rule 144A of the Securities Act of 1933, as amended (the “1933 Act”), and may be resold in transactions exempt from registration, normally to qualified institutional buyers. Pursuant to procedures adopted by the Trust’s Board of Trustees, this security has been determined to be liquid by First Trust Advisors L.P. (the “Advisor”). Although market instability can result in periods of increased overall market illiquidity, liquidity for each security is determined based on security specific factors and assumptions, which require subjective judgment. At April 30, 2022, securities noted as such amounted to $753,052 or 0.3% of net assets. |
| (b) | This security may be resold to qualified foreign investors and foreign institutional buyers under Regulation S of the 1933 Act. |
| (c) | Zero coupon bond. |
See Notes to Financial Statements
Page 9
First Trust Emerging Markets Local Currency Bond ETF (FEMB)
Portfolio of Investments (Continued)
April 30, 2022 (Unaudited)
Currency Exposure
Diversification | % of Total
Investments
(including cash)† |
| IDR | 15.7% |
| ZAR | 14.7 |
| BRL | 13.6 |
| MXN | 10.1 |
| COP | 8.8 |
| INR | 7.3 |
| PEN | 5.7 |
| THB | 5.5 |
| MYR | 5.1 |
| PLN | 5.1 |
| HUF | 4.7 |
| RON | 4.4 |
| PHP | 4.2 |
| CLP | 2.7 |
| KRW | 2.0 |
| CNH | 1.8 |
| CZK | 1.3 |
| TRY | 1.1 |
| ILS | 0.1 |
| EUR | 0.0* |
| USD | (13.9) |
| Total | 100.0% |
| † | The weightings include the impact of currency forwards. |
| * | Amount is less than 0.1%. |
| Currency Abbreviations |
| BRL | Brazilian Real |
| CLP | Chilean Peso |
| CNH | Chinese Yuan |
| COP | Colombian Peso |
| CZK | Czech Republic Koruna |
| EUR | Euro |
| HUF | Hungarian Forint |
| IDR | Indonesian Rupiah |
| ILS | Israeli Shekel |
| INR | Indian Rupee |
| KRW | South Korean Won |
| MXN | Mexican Peso |
| MYR | Malaysian Ringgit |
| PEN | Peruvian Nuevo Sol |
| PHP | Philippine Peso |
| PLN | Polish Zloty |
| RON | Romanian New Leu |
| THB | Thai Baht |
| TRY | Turkish Lira |
| USD | United States Dollar |
| ZAR | South African Rand |
Page 10
See Notes to Financial Statements
First Trust Emerging Markets Local Currency Bond ETF (FEMB)
Portfolio of Investments (Continued)
April 30, 2022 (Unaudited)
Valuation Inputs
A summary of the inputs used to value the Fund’s investments as of April 30, 2022 is as follows (see Note 2A - Portfolio Valuation in the Notes to Financial Statements):
| ASSETS TABLE |
| | Total
Value at
4/30/2022 | Level 1
Quoted
Prices | Level 2
Significant
Observable
Inputs | Level 3
Significant
Unobservable
Inputs |
Foreign Sovereign Bonds and Notes*
| $ 221,187,501 | $ — | $ 221,187,501 | $ — |
Foreign Corporate Bonds and Notes*
| 15,947,505 | — | 15,947,505 | — |
Total Investments
| 237,135,006 | — | 237,135,006 | — |
Forward Foreign Currency Contracts**
| 114,275 | — | 114,275 | — |
Total
| $ 237,249,281 | $— | $ 237,249,281 | $— |
| |
| LIABILITIES TABLE |
| | Total
Value at
4/30/2022 | Level 1
Quoted
Prices | Level 2
Significant
Observable
Inputs | Level 3
Significant
Unobservable
Inputs |
Forward Foreign Currency Contracts**
| $ (1,116,748) | $ — | $ (1,116,748) | $ — |
| * | See Portfolio of Investments for country breakout. |
| ** | See the Schedule of Forward Foreign Currency Contracts for contract and currency detail. |
See Notes to Financial Statements
Page 11
First Trust Emerging Markets Local Currency Bond ETF (FEMB)
Statement of Assets and Liabilities
April 30, 2022 (Unaudited)
| ASSETS: | |
Investments, at value
(Cost $279,099,221)
| $ 237,135,006 |
Cash
| 5,853,598 |
Foreign currency (Cost $3,073,482)
| 3,063,229 |
Unrealized appreciation on forward foreign currency contracts
| 114,275 |
| Receivables: | |
Investment securities sold
| 6,774,809 |
Interest
| 5,566,719 |
Interest reclaims
| 169,938 |
Total Assets
| 258,677,574 |
| LIABILITIES: | |
Unrealized depreciation on forward foreign currency contracts
| 1,116,748 |
Due to broker
| 172,911 |
| Payables: | |
Investment advisory fees
| 190,110 |
Deferred foreign capital gains tax
| 40,927 |
Total Liabilities
| 1,520,696 |
NET ASSETS
| $257,156,878 |
| NET ASSETS consist of: | |
Paid-in capital
| $ 336,864,393 |
Par value
| 91,500 |
Accumulated distributable earnings (loss)
| (79,799,015) |
NET ASSETS
| $257,156,878 |
NET ASSET VALUE, per share
| $28.10 |
Number of shares outstanding (unlimited number of shares authorized, par value $0.01 per share)
| 9,150,002 |
Page 12
See Notes to Financial Statements
First Trust Emerging Markets Local Currency Bond ETF (FEMB)
Statement of Operations
For the Six Months Ended April 30, 2022 (Unaudited)
| INVESTMENT INCOME: | |
Interest
| $ 7,346,222 |
Foreign withholding tax
| (218,020) |
Other
| 65 |
Total investment income
| 7,128,267 |
| EXPENSES: | |
Investment advisory fees
| 1,129,352 |
Total expenses
| 1,129,352 |
NET INVESTMENT INCOME (LOSS)
| 5,998,915 |
| NET REALIZED AND UNREALIZED GAIN (LOSS): | |
| Net realized gain (loss) on: | |
Investments
| (10,185,096) |
Forward foreign currency contracts
| (11,160,045) |
Foreign currency transactions
| (266,116) |
Foreign capital gains tax
| (850) |
Net realized gain (loss)
| (21,612,107) |
| Net change in unrealized appreciation (depreciation) on: | |
Investments
| (10,983,063) |
Forward foreign currency contracts
| (1,354,245) |
Foreign currency translation
| 110,211 |
Deferred foreign capital gains tax
| 79,482 |
Net change in unrealized appreciation (depreciation)
| (12,147,615) |
NET REALIZED AND UNREALIZED GAIN (LOSS)
| (33,759,722) |
NET INCREASE (DECREASE) IN NET ASSETS RESULTING FROM OPERATIONS
| $(27,760,807) |
See Notes to Financial Statements
Page 13
First Trust Emerging Markets Local Currency Bond ETF (FEMB)
Statements of Changes in Net Assets
| | Six Months
Ended
4/30/2022
(Unaudited) | | Year
Ended
10/31/2021 |
| OPERATIONS: | | | |
Net investment income (loss)
| $ 5,998,915 | | $ 11,957,035 |
Net realized gain (loss)
| (21,612,107) | | (6,348,806) |
Net change in unrealized appreciation (depreciation)
| (12,147,615) | | (18,292,516) |
Net increase (decrease) in net assets resulting from operations
| (27,760,807) | | (12,684,287) |
| DISTRIBUTIONS TO SHAREHOLDERS FROM: | | | |
Investment operations
| (7,575,147) | | (11,218,417) |
Return of capital
| — | | (3,557,692) |
Total distributions to shareholders
| (7,575,147) | | (14,776,109) |
| SHAREHOLDER TRANSACTIONS: | | | |
Proceeds from shares sold
| 48,517,948 | | 139,192,070 |
Cost of shares redeemed
| (15,255,205) | | (32,886,326) |
Net increase (decrease) in net assets resulting from shareholder transactions
| 33,262,743 | | 106,305,744 |
Total increase (decrease) in net assets
| (2,073,211) | | 78,845,348 |
| NET ASSETS: | | | |
Beginning of period
| 259,230,089 | | 180,384,741 |
End of period
| $257,156,878 | | $259,230,089 |
| CHANGES IN SHARES OUTSTANDING: | | | |
Shares outstanding, beginning of period
| 8,100,002 | | 5,250,002 |
Shares sold
| 1,550,000 | | 3,800,000 |
Shares redeemed
| (500,000) | | (950,000) |
Shares outstanding, end of period
| 9,150,002 | | 8,100,002 |
Page 14
See Notes to Financial Statements
First Trust Emerging Markets Local Currency Bond ETF (FEMB)
Financial Highlights
For a share outstanding throughout each period
| | Six Months
Ended
4/30/2022
(Unaudited) | | Year Ended October 31, |
| | 2021 | | 2020 | | 2019 | | 2018 | | 2017 | |
Net asset value, beginning of period
| $ 32.00 | | $ 34.36 | | $ 38.45 | | $ 36.11 | | $ 41.55 | | $ 42.32 |
| Income from investment operations: | | | | | | | | | | | |
Net investment income (loss)
| 0.78 | | 1.84 | | 1.66 | | 2.25 | | 1.80 | | 2.30 |
Net realized and unrealized gain (loss)
| (3.81) | | (2.25) | | (3.72) | | 2.16 | | (4.76) | | (0.65) |
Total from investment operations
| (3.03) | | (0.41) | | (2.06) | | 4.41 | | (2.96) | | 1.65 |
| Distributions paid to shareholders from: | | | | | | | | | | | |
Net investment income
| (0.87) | | (1.48) | | (0.04) | | (1.94) | | (0.79) | | (2.42) |
Return of capital
| — | | (0.47) | | (1.99) | | (0.13) | | (1.69) | | — |
Total distributions
| (0.87) | | (1.95) | | (2.03) | | (2.07) | | (2.48) | | (2.42) |
Net asset value, end of period
| $28.10 | | $32.00 | | $34.36 | | $38.45 | | $36.11 | | $41.55 |
Total return (a)
| (9.64)% | | (1.53)% | | (5.37)% | | 12.46% | | (7.55)% | | 4.00% |
| Ratios to average net assets/supplemental data: | | | | | | | | | | | |
Net assets, end of period (in 000’s)
| $ 257,157 | | $ 259,230 | | $ 180,385 | | $ 148,045 | | $ 55,976 | | $ 49,862 |
Ratio of total expenses to average net assets
| 0.85% (b) | | 0.85% | | 0.85% | | 0.85% | | 0.85% (c) | | 0.85% |
Ratio of net investment income (loss) to average net assets
| 4.52% (b) | | 4.55% | | 4.82% | | 4.91% | | 4.63% (c) | | 4.95% |
Portfolio turnover rate (d)
| 21% | | 42% | | 59% | | 25% | | 61% | | 16% |
| (a) | Total return is calculated assuming an initial investment made at the net asset value at the beginning of the period, reinvestment of all distributions at net asset value during the period, and redemption at net asset value on the last day of the period. The returns presented do not reflect the deduction of taxes that a shareholder would pay on Fund distributions or the redemption or sale of Fund shares. Total return is calculated for the time period presented and is not annualized for periods of less than a year. |
| (b) | Annualized. |
| (c) | Includes excise tax. |
| (d) | Portfolio turnover is calculated for the time period presented and is not annualized for periods of less than a year and does not include securities received or delivered from processing creations or redemptions and in-kind transactions. |
See Notes to Financial Statements
Page 15
Notes to Financial Statements
First Trust Emerging Markets Local Currency Bond ETF (FEMB)
April 30, 2022 (Unaudited)
1. Organization
First Trust Exchange-Traded Fund III (the “Trust”) is an open-end management investment company organized as a Massachusetts business trust on January 9, 2008, and is registered with the Securities and Exchange Commission under the Investment Company Act of 1940, as amended (the “1940 Act”).
The Trust currently consists of seventeen funds that are offering shares. This report covers the First Trust Emerging Markets Local Currency Bond ETF (the “Fund”), a non-diversified series of the Trust, which trades under the ticker “FEMB” on The Nasdaq Stock Market LLC (“Nasdaq”). Unlike conventional mutual funds, the Fund issues and redeems shares on a continuous basis, at net asset value (“NAV”), only in large specified blocks of shares called “Creation Units.”
The Fund is an actively managed exchange-traded fund. The investment objective of the Fund is to seek maximum total return and current income. Under normal market conditions, the Fund seeks to achieve its investment objective by investing at least 80% of its net assets (including investment borrowings) in bonds, notes and bills issued or guaranteed by entities incorporated or domiciled in emerging market countries that are denominated in the local currency of the issuer. There can be no assurance the Fund will achieve its investment objective. The Fund may not be appropriate for all investors.
2. Significant Accounting Policies
The Fund is considered an investment company and follows accounting and reporting guidance under Financial Accounting Standards Board (“FASB”) Accounting Standards Codification Topic 946, “Financial Services-Investment Companies.” The following is a summary of significant accounting policies consistently followed by the Fund in the preparation of the financial statements. The preparation of the financial statements in accordance with accounting principles generally accepted in the United States of America (“U.S. GAAP”) requires management to make estimates and assumptions that affect the reported amounts and disclosures in the financial statements. Actual results could differ from those estimates.
A. Portfolio Valuation
The Fund’s NAV is determined daily as of the close of regular trading on the New York Stock Exchange (“NYSE”), normally 4:00 p.m. Eastern time, on each day the NYSE is open for trading. If the NYSE closes early on a valuation day, the NAV is determined as of that time. Domestic debt securities and foreign securities are priced using data reflecting the earlier closing of the principal markets for those securities. The Fund’s NAV is calculated by dividing the value of all assets of the Fund (including accrued interest and dividends), less all liabilities (including accrued expenses and dividends declared but unpaid), by the total number of shares outstanding.
The Fund’s investments are valued daily at market value or, in the absence of market value with respect to any portfolio securities, at fair value. Market value prices represent last sale or official closing prices from a national or foreign exchange (i.e., a regulated market) and are primarily obtained from third-party pricing services. Fair value prices represent any prices not considered market value prices and are either obtained from a third-party pricing service or are determined by the Pricing Committee of the Fund’s investment advisor, First Trust Advisors L.P. (“First Trust” or the “Advisor”), in accordance with valuation procedures adopted by the Trust’s Board of Trustees, and in accordance with provisions of the 1940 Act. Investments valued by the Advisor’s Pricing Committee, if any, are footnoted as such in the footnotes to the Portfolio of Investments. The Fund’s investments are valued as follows:
Corporate bonds, notes and other debt securities are fair valued on the basis of valuations provided by dealers who make markets in such securities or by a third-party pricing service approved by the Fund’s Board of Trustees, which may use the following valuation inputs when available:
| 1) | benchmark yields; |
| 2) | reported trades; |
| 3) | broker/dealer quotes; |
| 4) | issuer spreads; |
| 5) | benchmark securities; |
| 6) | bids and offers; and |
| 7) | reference data including market research publications. |
Fixed income and other debt securities having a remaining maturity of sixty days or less when purchased are fair valued at cost adjusted for amortization of premiums and accretion of discounts (amortized cost), provided the Advisor’s Pricing Committee has determined that the use of amortized cost is an appropriate reflection of fair value given market and issuer-specific
Notes to Financial Statements (Continued)
First Trust Emerging Markets Local Currency Bond ETF (FEMB)
April 30, 2022 (Unaudited)
conditions existing at the time of the determination. Factors that may be considered in determining the appropriateness of the use of amortized cost include, but are not limited to, the following:
| 1) | the credit conditions in the relevant market and changes thereto; |
| 2) | the liquidity conditions in the relevant market and changes thereto; |
| 3) | the interest rate conditions in the relevant market and changes thereto (such as significant changes in interest rates); |
| 4) | issuer-specific conditions (such as significant credit deterioration); and |
| 5) | any other market-based data the Advisor’s Pricing Committee considers relevant. In this regard, the Advisor’s Pricing Committee may use last-obtained market-based data to assist it when valuing portfolio securities using amortized cost. |
Forward foreign currency contracts are fair valued at the current day’s interpolated foreign exchange rate, as calculated using the current day’s spot rate, and the thirty, sixty, ninety, and one-hundred eighty day forward rates provided by a third-party pricing service.
Certain securities may not be able to be priced by pre-established pricing methods. Such securities may be valued by the Trust’s Board of Trustees or its delegate, the Advisor’s Pricing Committee, at fair value. These securities generally include, but are not limited to, restricted securities (securities which may not be publicly sold without registration under the Securities Act of 1933, as amended) for which a third-party pricing service is unable to provide a market price; securities whose trading has been formally suspended; a security whose market or fair value price is not available from a pre-established pricing source; a security with respect to which an event has occurred that is likely to materially affect the value of the security after the market has closed but before the calculation of the Fund’s NAV or make it difficult or impossible to obtain a reliable market quotation; and a security whose price, as provided by the third-party pricing service, does not reflect the security’s fair value. As a general principle, the current fair value of a security would appear to be the amount which the owner might reasonably expect to receive for the security upon its current sale. When fair value prices are used, generally they will differ from market quotations or official closing prices on the applicable exchanges. A variety of factors may be considered in determining the fair value of such securities, including, but not limited to, the following:
| 1) | the fundamental business data relating to the issuer, or economic data relating to the country of issue; |
| 2) | an evaluation of the forces which influence the market in which these securities are purchased and sold; |
| 3) | the type, size and cost of the security; |
| 4) | the financial statements of the issuer, or the financial condition of the country of issue; |
| 5) | the credit quality and cash flow of the issuer, or country of issue, based on the Advisor’s or external analysis; |
| 6) | the information as to any transactions in or offers for the security; |
| 7) | the price and extent of public trading in similar securities (or equity securities) of the issuer/borrower, or comparable companies; |
| 8) | the coupon payments; |
| 9) | the quality, value and salability of collateral, if any, securing the security; |
| 10) | the business prospects of the issuer, including any ability to obtain money or resources from a parent or affiliate and an assessment of the issuer’s management (for corporate debt only); |
| 11) | the economic, political and social prospects/developments of the country of issue and the assessment of the country’s governmental leaders/officials (for sovereign debt only); |
| 12) | the prospects for the issuer’s industry, and multiples (of earnings and/or cash flows) being paid for similar businesses in that industry (for corporate debt only); and |
| 13) | other relevant factors. |
The Fund is subject to fair value accounting standards that define fair value, establish the framework for measuring fair value and provide a three-level hierarchy for fair valuation based upon the inputs to the valuation as of the measurement date. The three levels of the fair value hierarchy are as follows:
| • | Level 1 – Level 1 inputs are quoted prices in active markets for identical investments. An active market is a market in which transactions for the investment occur with sufficient frequency and volume to provide pricing information on an ongoing basis. |
| • | Level 2 – Level 2 inputs are observable inputs, either directly or indirectly, and include the following: |
| o | Quoted prices for similar investments in active markets. |
| o | Quoted prices for identical or similar investments in markets that are non-active. A non-active market is a market where there are few transactions for the investment, the prices are not current, or price quotations vary substantially either over time or among market makers, or in which little information is released publicly. |
Notes to Financial Statements (Continued)
First Trust Emerging Markets Local Currency Bond ETF (FEMB)
April 30, 2022 (Unaudited)
| o | Inputs other than quoted prices that are observable for the investment (for example, interest rates and yield curves observable at commonly quoted intervals, volatilities, prepayment speeds, loss severities, credit risks, and default rates). |
| o | Inputs that are derived principally from or corroborated by observable market data by correlation or other means. |
| • | Level 3 – Level 3 inputs are unobservable inputs. Unobservable inputs may reflect the reporting entity’s own assumptions about the assumptions that market participants would use in pricing the investment. |
The inputs or methodologies used for valuing investments are not necessarily an indication of the risk associated with investing in those investments. A summary of the inputs used to value the Fund’s investments as of April 30, 2022, is included with the Fund’s Portfolio of Investments.
B. Securities Transactions and Investment Income
Securities transactions are recorded as of the trade date. Realized gains and losses from securities transactions are recorded on the identified cost basis. Dividend income is recorded on the ex-dividend date. Interest income, if any, is recorded daily on the accrual basis. Amortization of premiums and accretion of discounts are recorded using the effective interest method.
C. Forward Foreign Currency Contracts
The Fund is subject to foreign currency risk in the normal course of pursuing its investment objective. Forward foreign currency contracts are agreements between two parties (“Counterparties”) to exchange one currency for another at a future date and at a specified price. The Fund uses forward foreign currency contracts to facilitate transactions in foreign securities and to manage the Fund’s foreign currency exposure. These contracts are valued daily, and the Fund’s net equity therein, representing unrealized gain or loss on the contracts as measured by the difference between the forward foreign exchange rates at the dates of entry into the contracts and the forward rates at the reporting date, is included in “Unrealized appreciation on forward foreign currency contracts” and “Unrealized depreciation on forward foreign currency contracts” on the Statement of Assets and Liabilities. The change in unrealized appreciation (depreciation) is included in “Net change in unrealized appreciation (depreciation) on forward foreign currency contracts” on the Statement of Operations. When the forward contract is closed, the Fund records a realized gain or loss equal to the difference between the proceeds from (or the cost of) the closing transaction and the Fund’s basis in the contract. This realized gain or loss is included in “Net realized gain (loss) on forward foreign currency contracts” on the Statement of Operations. Risks arise from the possible inability of Counterparties to meet the terms of their contracts and from movement in currency, securities values and interest rates. Due to the risks, the Fund could incur losses in excess of the net unrealized value shown on the Forward Foreign Currency Contracts table in the Portfolio of Investments. In the event of default by the Counterparty, the Fund will provide notice to the Counterparty of the Fund’s intent to convert the currency held by the Fund into the currency that the Counterparty agreed to exchange with the Fund. If a Counterparty becomes bankrupt or otherwise fails to perform its obligations due to financial difficulties, the Fund may experience significant delays in obtaining any recovery in a bankruptcy or other reorganization proceeding. The Fund may obtain only limited recovery or may obtain no recovery in such circumstances.
D. Foreign Currency
The books and records of the Fund are maintained in U.S. dollars. Foreign currencies, investments and other assets and liabilities are translated into U.S. dollars at the exchange rates prevailing at the end of the period. Purchases and sales of investments and items of income and expense are translated on the respective dates of such transactions. Unrealized gains and losses on assets and liabilities, other than investments in securities, which result from changes in foreign currency exchange rates have been included in “Net change in unrealized appreciation (depreciation) on foreign currency translation” on the Statement of Operations. Unrealized gains and losses on investments in securities which result from changes in foreign exchange rates are included with fluctuations arising from changes in market price and are included in “Net change in unrealized appreciation (depreciation) on investments” on the Statement of Operations. Net realized foreign currency gains and losses include the effect of changes in exchange rates between trade date and settlement date on investment security transactions, foreign currency transactions and interest and dividends received and are included in “Net realized gain (loss) on foreign currency transactions” on the Statement of Operations. The portion of foreign currency gains and losses related to fluctuations in exchange rates between the initial purchase settlement date and subsequent sale trade date is included in “Net realized gain (loss) on investments” on the Statement of Operations.
E. Offsetting on the Statement of Assets and Liabilities
Offsetting assets and liabilities requires entities to disclose both gross and net information about instruments and transactions eligible for offset on the Statement of Assets and Liabilities, and disclose instruments and transactions subject to master netting or similar agreements. These disclosure requirements are intended to help investors and other financial statement users better assess the effect or potential effect of offsetting arrangements on the Fund’s financial position. The transactions subject to offsetting disclosures are derivative instruments, repurchase agreements and reverse repurchase agreements, and securities borrowing and securities lending transactions.
Notes to Financial Statements (Continued)
First Trust Emerging Markets Local Currency Bond ETF (FEMB)
April 30, 2022 (Unaudited)
This disclosure, if applicable, is included within each Fund’s Portfolio of Investments under the heading “Offsetting Assets and Liabilities.” For financial reporting purposes, the Fund does not offset financial assets and financial liabilities that are subject to master netting arrangements (“MNAs”) or similar agreements on the Statement of Assets and Liabilities. MNAs provide the right, in the event of default (including bankruptcy and insolvency), for the non-defaulting counterparty to liquidate the collateral and calculate the net exposure to the defaulting party or request additional collateral.
At April 30, 2022, derivative assets and liabilities (by type) on a gross basis are as follows:
| | | | | | | | Gross Amounts not Offset
in the Statement of
Assets and Liabilities | | |
| | Gross
Amounts of
Recognized
Assets | | Gross Amounts
Offset in the
Statement of
Assets
and Liabilities | | Net Amounts of
Assets
Presented
in the Statement
of Assets and
Liabilities | | Financial
Instruments | | Collateral
Amounts
Received | | Net
Amount |
Forward Foreign
Currency Contracts* | $ 114,275 | | $ — | | $ 114,275 | | $ (114,275) | | $ — | | $ — |
| | | | | | | | Gross Amounts not Offset
in the Statement of
Assets and Liabilities | | |
| | Gross
Amounts of
Recognized
Liabilities | | Gross Amounts
Offset in the
Statement of
Assets
and Liabilities | | Net Amounts of
Liabilities
Presented
in the Statement
of Assets and
Liabilities | | Financial
Instruments | | Collateral
Amounts
Pledged | | Net
Amount |
| Forward Foreign Currency Contracts* | $ (1,116,748) | | $ — | | $ (1,116,748) | | $ 114,275 | | $ — | | $ (1,002,473) |
* The respective Counterparties for each contract are disclosed in the Forward Foreign Currency Contracts table in the Portfolio of Investments.
F. Dividends and Distributions to Shareholders
Dividends from net investment income, if any, are declared and paid monthly by the Fund, or as the Board of Trustees may determine from time to time. Distributions of net realized capital gains earned by the Fund, if any, are distributed at least annually.
Distributions from net investment income and realized capital gains are determined in accordance with federal income tax regulations, which may differ from U.S. GAAP. Certain capital accounts in the financial statements are periodically adjusted for permanent differences in order to reflect their tax character. These permanent differences are primarily due to the varying treatment of income and gain/loss on portfolio securities held by the Fund and have no impact on net assets or NAV per share. Temporary differences, which arise from recognizing certain items of income, expense and gain/loss in different periods for financial statement and tax purposes, will reverse at some time in the future.
The tax character of distributions paid by the Fund during the fiscal year ended October 31, 2021, was as follows:
| Distributions paid from: | |
Ordinary income
| $11,218,417 |
Capital gains
| — |
Return of capital
| 3,557,692 |
Notes to Financial Statements (Continued)
First Trust Emerging Markets Local Currency Bond ETF (FEMB)
April 30, 2022 (Unaudited)
As of October 31, 2021, the components of distributable earnings on a tax basis were as follows:
Undistributed ordinary income
| $— |
Accumulated capital and other gain (loss)
| (6,107,269) |
Net unrealized appreciation (depreciation)
| (38,355,792) |
G. Income Taxes
The Fund intends to continue to qualify as a regulated investment company by complying with the requirements under Subchapter M of the Internal Revenue Code of 1986, as amended, which includes distributing substantially all of its net investment income and net realized gains to shareholders. Accordingly, no provision has been made for federal and state income taxes. However, due to the timing and amount of distributions, the Fund may be subject to an excise tax of 4% of the amount by which approximately 98% of the Fund’s taxable income exceeds the distributions from such taxable income for the calendar year.
The Fund is subject to accounting standards that establish a minimum threshold for recognizing, and a system for measuring, the benefits of a tax position taken or expected to be taken in a tax return. Taxable years ended 2018, 2019, 2020, and 2021 remain open to federal and state audit. As of April 30, 2022, management has evaluated the application of these standards to the Fund, and has determined that no provision for income tax is required in the Fund’s financial statements for uncertain tax positions.
The Fund intends to utilize provisions of the federal income tax laws, which allow it to carry a realized capital loss forward indefinitely following the year of the loss and offset such loss against any future realized capital gains. The Fund is subject to certain limitations under U.S. tax rules on the use of capital loss carryforwards and net unrealized built-in losses. These limitations apply when there has been a 50% change in ownership. At October 31, 2021, the Fund had $6,107,269 of capital loss carryforward available to the extent provided by regulations to offset future capital gains.
As of April 30, 2022, the aggregate cost, gross unrealized appreciation, gross unrealized depreciation, and net unrealized appreciation/(depreciation) on investments (including short positions and derivatives, if any) for federal income tax purposes were as follows:
| Tax Cost | | Gross
Unrealized
Appreciation | | Gross
Unrealized
(Depreciation) | | Net Unrealized
Appreciation
(Depreciation) |
| $279,099,221 | | $915,368 | | $(43,882,056) | | $(42,966,688) |
H. Expenses
Expenses, other than the investment advisory fee and other excluded expenses, are paid by the Advisor (See Note 3).
3. Investment Advisory Fee, Affiliated Transactions and Other Fee Arrangements
First Trust, the investment advisor to the Fund, is a limited partnership with one limited partner, Grace Partners of DuPage L.P., and one general partner, The Charger Corporation. The Charger Corporation is an Illinois corporation controlled by James A. Bowen, Chief Executive Officer of First Trust. First Trust is responsible for supervising the selection and ongoing monitoring of the securities in the Fund’s portfolio, managing the Fund’s business affairs and providing certain administrative services necessary for the management of the Fund.
The Trust, on behalf of the Fund, and First Trust have retained First Trust Global Portfolios Limited (“FTGP” or the “Sub-Advisor”), an affiliate of First Trust, to serve as investment sub-advisor. In this capacity, FTGP is responsible for the selection and ongoing monitoring of the securities in the Fund’s investment portfolio. First Trust is paid an annual unitary management fee of 0.85% of the Fund’s average daily net assets. FTGP receives a sub-advisory fee equal to 40% of any remaining monthly unitary fee paid to the Advisor after the Fund’s average expenses accrued during the most recent twelve months are subtracted from the unitary fee for that month. First Trust is responsible for the expenses of the Fund including the cost of transfer agency, custody, fund administration, legal, audit and other services, but excluding fee payments under the Investment Management Agreement, Rule 12b-1 distribution and service fees, if any, brokerage expenses, taxes, interest, acquired fund fees and expenses, and extraordinary expenses. First Trust also provides fund reporting services to the Fund for a flat annual fee in the amount of $9,250, which is covered under the annual unitary management fee.
The Trust has multiple service agreements with Brown Brothers Harriman & Co. (“BBH”). Under the service agreements, BBH performs custodial, fund accounting, certain administrative services, and transfer agency services for the Fund. As custodian, BBH is
Notes to Financial Statements (Continued)
First Trust Emerging Markets Local Currency Bond ETF (FEMB)
April 30, 2022 (Unaudited)
responsible for custody of the Fund’s assets. As fund accountant and administrator, BBH is responsible for maintaining the books and records of the Fund’s securities and cash. As transfer agent, BBH is responsible for maintaining shareholder records for the Fund.
Each Trustee who is not an officer or employee of First Trust, any sub-advisor or any of their affiliates (“Independent Trustees”) is paid a fixed annual retainer that is allocated equally among each fund in the First Trust Fund Complex. Each Independent Trustee is also paid an annual per fund fee that varies based on whether the fund is a closed-end or other actively managed fund, a defined-outcome fund or an index fund.
Additionally, the Lead Independent Trustee and the Chairs of the Audit Committee, Nominating and Governance Committee and Valuation Committee are paid annual fees to serve in such capacities, with such compensation allocated pro rata among each fund in the First Trust Fund Complex based on net assets. Independent Trustees are reimbursed for travel and out-of-pocket expenses in connection with all meetings. The Lead Independent Trustee and Committee Chairs rotate every three years. The officers and “Interested” Trustee receive no compensation from the Trust for acting in such capacities.
4. Purchases and Sales of Securities
For the six months ended April 30, 2022, the cost of purchases and proceeds from sales of investments, excluding short term investments and in-kind transactions, were $78,521,263 and $52,638,374, respectively.
For the six months ended April 30, 2022, the Fund had no in-kind transactions.
5. Derivative Transactions
The following table presents the type of derivatives held by the Fund at April 30, 2022, the primary underlying risk exposure and the location of these instruments as presented on the Statement of Assets and Liabilities.
| | | | | Asset Derivatives | | Liability Derivatives |
Derivative
Instrument | | Risk
Exposure | | Statement of Assets and
Liabilities Location | | Value | | Statement of Assets and
Liabilities Location | | Value |
Forward foreign
currency
contracts | | Currency Risk | | Unrealized appreciation
on forward foreign
currency contracts | | $ 114,275 | | Unrealized depreciation
on forward foreign
currency contracts | | $ 1,116,748 |
The following table presents the amount of net realized gain (loss) and change in net unrealized appreciation (depreciation) recognized for the six months ended April 30, 2022, on derivative instruments, as well as the primary underlying risk exposure associated with each instrument.
| Statement of Operations Location | |
| Currency Risk Exposure | |
| Net realized gain (loss) on forward foreign currency contracts | $(11,160,045) |
| Net change in unrealized appreciation (depreciation) on forward foreign currency contracts | (1,354,245) |
For the six months ended April 30, 2022, the notional values of forward foreign currency contracts opened and closed were $766,085,080 and $780,394,842, respectively.
6. Creations, Redemptions and Transaction Fees
The Fund generally issues and redeems its shares in primary market transactions through a creation and redemption mechanism and does not sell or redeem individual shares. Instead, financial entities known as “Authorized Participants” have contractual arrangements with the Fund or one of the Fund’s service providers to purchase and redeem Fund shares directly with the Fund in large blocks of shares known as “Creation Units.” Prior to the start of trading on every business day, the Fund publishes through the National Securities Clearing Corporation (“NSCC”) the “basket” of securities, cash or other assets that it will accept in exchange for a Creation Unit of the Fund’s shares. An Authorized Participant that wishes to effectuate a creation of the Fund’s shares deposits with the Fund the “basket” of securities, cash or other assets identified by the Fund that day, and then receives the Creation Unit of the Fund’s shares in return for those assets. After purchasing a Creation Unit, the Authorized Participant may continue to hold the Fund’s shares or sell them in the secondary market. The redemption process is the reverse of the purchase process: the Authorized Participant redeems a Creation Unit of the Fund’s shares for a basket of securities, cash or other assets. The combination of the creation and redemption process with secondary market trading in the Fund’s shares and underlying securities provides arbitrage opportunities that are designed to help keep the market price of the Fund’s shares at or close to the NAV per share of the Fund.
Notes to Financial Statements (Continued)
First Trust Emerging Markets Local Currency Bond ETF (FEMB)
April 30, 2022 (Unaudited)
The Fund imposes fees in connection with the purchase of Creation Units. These fees may vary based upon various fact-based circumstances, including, but not limited to, the composition of the securities included in the Creation Unit or the countries in which the transactions are settled. The price for each Creation Unit will equal the daily NAV per share of the Fund times the number of shares in a Creation Unit, plus the fees described above and, if applicable, any operational processing and brokerage costs, transfer fees, stamp taxes and part or all of the spread between the expected bid and offer side of the market related to the securities comprising the creation basket.
The Fund also imposes fees in connection with the redemption of Creation Units. These fees may vary based upon various fact-based circumstances, including, but not limited to, the composition of the securities included in the Creation Unit or the countries in which the transactions are settled. The price received for each Creation Unit will equal the daily NAV per share of the Fund times the number of shares in a Creation Unit, minus the fees described above and, if applicable, any operational processing and brokerage costs, transfer fees, stamp taxes and part or all of the spread between the expected bid and offer side of the market related to the securities comprising the redemption basket. Investors who use the services of a broker or other such intermediary in addition to an Authorized Participant to effect a redemption of a Creation Unit may also be assessed an amount to cover the cost of such services. The redemption fee charged by the Fund will comply with Rule 22c-2 of the 1940 Act which limits redemption fees to no more than 2% of the value of the shares redeemed.
7. Distribution Plan
The Board of Trustees adopted a Distribution and Service Plan pursuant to Rule 12b-1 under the 1940 Act. In accordance with the Rule 12b-1 plan, the Fund is authorized to pay an amount up to 0.25% of its average daily net assets each year to reimburse First Trust Portfolios L.P. (“FTP”), the distributor of the Fund, for amounts expended to finance activities primarily intended to result in the sale of Creation Units or to provide investor services. FTP may also use this amount to compensate securities dealers or other persons that are Authorized Participants for providing distribution assistance, including broker-dealer and shareholder support and educational and promotional services.
No 12b-1 fees are currently paid by the Fund, and pursuant to a contractual arrangement, no 12b-1 fees will be paid any time before February 28, 2023.
8. Borrowings
The Trust, on behalf of the Fund, along with First Trust Series Fund and First Trust Exchange-Traded Fund IV has a $280 million Credit Agreement with The Bank of Nova Scotia (“Scotia”) as administrative agent for a group of lenders. Prior to March 2, 2022, the commitment amount was $355 million. Scotia charges a commitment fee of 0.25% of the daily amount of the excess of the commitment amount over the outstanding principal balance of the loans, and an agency fee. First Trust allocates the commitment fee and agency fee amongst the funds that have access to the credit line. To the extent that the Fund accesses the credit line, there would also be an interest fee charged. The Fund did not have any borrowings outstanding during the six months ended April 30, 2022.
9. Indemnification
The Trust, on behalf of the Fund, has a variety of indemnification obligations under contracts with its service providers. The Trust’s maximum exposure under these arrangements is unknown. However, the Trust has not had prior claims or losses pursuant to these contracts and expects the risk of loss to be remote.
10. Subsequent Events
Management has evaluated the impact of all subsequent events to the Fund through the date the financial statements were issued and has determined that there were no subsequent events requiring recognition or disclosure in the financial statements that have not already been disclosed.
Additional Information
First Trust Emerging Markets Local Currency Bond ETF (FEMB)
April 30, 2022 (Unaudited)
Proxy Voting Policies and Procedures
A description of the policies and procedures that the Trust uses to determine how to vote proxies and information on how the Fund voted proxies relating to portfolio securities during the most recent 12-month period ended June 30 is available (1) without charge, upon request, by calling (800) 988-5891; (2) on the Fund’s website at www.ftportfolios.com; and (3) on the Securities and Exchange Commission’s (“SEC”) website at www.sec.gov.
Portfolio Holdings
The Fund files portfolio holdings information for each month in a fiscal quarter within 60 days after the end of the relevant fiscal quarter on Form N-PORT. Portfolio holdings information for the third month of each fiscal quarter will be publicly available on the SEC’s website at www.sec.gov. The Fund’s complete schedule of portfolio holdings for the second and fourth quarters of each fiscal year is included in the semi-annual and annual reports to shareholders, respectively, and is filed with the SEC on Form N-CSR. The semi-annual and annual report for the Fund is available to investors within 60 days after the period to which it relates. The Fund’s Forms N-PORT and Forms N-CSR are available on the SEC’s website listed above.
Risk Considerations
Risks are inherent in all investing. Certain general risks that may be applicable to a Fund are identified below, but not all of the material risks relevant to each Fund are included in this report and not all of the risks below apply to each Fund. The material risks of investing in each Fund are spelled out in its prospectus, statement of additional information and other regulatory filings. Before investing, you should consider each Fund’s investment objective, risks, charges and expenses, and read each Fund’s prospectus and statement of additional information carefully. You can download each Fund’s prospectus at www.ftportfolios.com or contact First Trust Portfolios L.P. at (800) 621-1675 to request a prospectus, which contains this and other information about each Fund.
Concentration Risk. To the extent that a fund is able to invest a significant percentage of its assets in a single asset class or the securities of issuers within the same country, state, region, industry or sector, an adverse economic, business or political development may affect the value of the fund’s investments more than if the fund were more broadly diversified. A fund that tracks an index will be concentrated to the extent the fund’s corresponding index is concentrated. A concentration makes a fund more susceptible to any single occurrence and may subject the fund to greater market risk than a fund that is more broadly diversified.
Credit Risk. Credit risk is the risk that an issuer of a security will be unable or unwilling to make dividend, interest and/or principal payments when due and the related risk that the value of a security may decline because of concerns about the issuer’s ability to make such payments.
Cyber Security Risk. The funds are susceptible to potential operational risks through breaches in cyber security. A breach in cyber security refers to both intentional and unintentional events that may cause a fund to lose proprietary information, suffer data corruption or lose operational capacity. Such events could cause a fund to incur regulatory penalties, reputational damage, additional compliance costs associated with corrective measures and/or financial loss. In addition, cyber security breaches of a fund’s third-party service providers, such as its administrator, transfer agent, custodian, or sub-advisor, as applicable, or issuers in which the fund invests, can also subject a fund to many of the same risks associated with direct cyber security breaches.
Defined Outcome Funds Risk. To the extent a fund’s investment strategy is designed to deliver returns tied to the price performance of an underlying ETF, an investor may not realize the returns the fund seeks to achieve if that investor does not hold shares for the entire target outcome period. In the event an investor purchases shares after the first day of the target outcome period or sells shares prior to the end of the target outcome period, the buffer that the fund seeks to provide against a decline in the value of the underlying ETF may not be available, the enhanced returns that the fund seeks to provide (if any) may not be available and the investor may not participate in a gain in the value of the underlying ETF up to the cap for the investor’s investment period. Additionally, the fund will not participate in gains of the underlying ETF above the cap and a shareholder may lose their entire investment. If the fund seeks enhanced returns, there are certain time periods when the value of the fund may fall faster than the value of the underlying ETF, and it is very unlikely that, on any given day during which the underlying ETF share price increases in value, the fund’s share price will increase at the same rate as the enhanced returns sought by the fund, which is designed for an entire target outcome period. Trading flexible exchange options involves risks different from, or possibly greater than, the risks associated with investing directly in securities, such as less liquidity and correlation and valuation risks. A fund may experience substantial downside from specific flexible exchange option positions and certain positions may expire worthless.
Derivatives Risk. To the extent a fund uses derivative instruments such as futures contracts, options contracts and swaps, the fund may experience losses because of adverse movements in the price or value of the underlying asset, index or rate, which may be magnified
Additional Information (Continued)
First Trust Emerging Markets Local Currency Bond ETF (FEMB)
April 30, 2022 (Unaudited)
by certain features of the derivative. These risks are heightened when a fund’s portfolio managers use derivatives to enhance the fund’s return or as a substitute for a position or security, rather than solely to hedge (or offset) the risk of a position or security held by the fund.
Equity Securities Risk. To the extent a fund invests in equity securities, the value of the fund’s shares will fluctuate with changes in the value of the equity securities. Equity securities prices fluctuate for several reasons, including changes in investors’ perceptions of the financial condition of an issuer or the general condition of the relevant stock market, such as market volatility, or when political or economic events affecting the issuers occur. In addition, common stock prices may be particularly sensitive to rising interest rates, as the cost of capital rises and borrowing costs increase. Equity securities may decline significantly in price over short or extended periods of time, and such declines may occur in the equity market as a whole, or they may occur in only a particular country, company, industry or sector of the market.
ETF Risk. The shares of an ETF trade like common stock and represent an interest in a portfolio of securities. The risks of owning an ETF generally reflect the risks of owning the underlying securities, although lack of liquidity in an ETF could result in it being more volatile and ETFs have management fees that increase their costs. Shares of an ETF trade on an exchange at market prices rather than net asset value, which may cause the shares to trade at a price greater than net asset value (premium) or less than net asset value (discount). In times of market stress, decisions by market makers to reduce or step away from their role of providing a market for an ETF’s shares, or decisions by an ETF’s authorized participants that they are unable or unwilling to proceed with creation and/or redemption orders of an ETF’s shares, could result in shares of the ETF trading at a discount to net asset value and in greater than normal intraday bid-ask spreads.
Fixed Income Securities Risk. To the extent a fund invests in fixed income securities, the fund will be subject to credit risk, income risk, interest rate risk, liquidity risk and prepayment risk. Income risk is the risk that income from a fund’s fixed income investments could decline during periods of falling interest rates. Interest rate risk is the risk that the value of a fund’s fixed income securities will decline because of rising interest rates. Liquidity risk is the risk that a security cannot be purchased or sold at the time desired, or cannot be purchased or sold without adversely affecting the price. Prepayment risk is the risk that the securities will be redeemed or prepaid by the issuer, resulting in lower interest payments received by the fund. In addition to these risks, high yield securities, or “junk” bonds, are subject to greater market fluctuations and risk of loss than securities with higher ratings, and the market for high yield securities is generally smaller and less liquid than that for investment grade securities.
Index or Model Constituent Risk. Certain funds may be a constituent of one or more indices or ETF models. As a result, such a fund may be included in one or more index-tracking exchange-traded funds or mutual funds. Being a component security of such a vehicle could greatly affect the trading activity involving a fund, the size of the fund and the market volatility of the fund. Inclusion in an index could increase demand for the fund and removal from an index could result in outsized selling activity in a relatively short period of time. As a result, a fund’s net asset value could be negatively impacted and the fund’s market price may be significantly below its net asset value during certain periods. In addition, index rebalances may potentially result in increased trading activity in a fund’s shares.
Index Provider Risk. To the extent a fund seeks to track an index, it is subject to Index Provider Risk. There is no assurance that the Index Provider will compile the Index accurately, or that the Index will be determined, maintained, constructed, reconstituted, rebalanced, composed, calculated or disseminated accurately. To correct any such error, the Index Provider may carry out an unscheduled rebalance or other modification of the Index constituents or weightings, which may increase the fund’s costs. The Index Provider does not provide any representation or warranty in relation to the quality, accuracy or completeness of data in the Index, and it does not guarantee that the Index will be calculated in accordance with its stated methodology. Losses or costs associated with any Index Provider errors generally will be borne by the fund and its shareholders.
Investment Companies Risk. To the extent a fund invests in the securities of other investment vehicles, the fund will incur additional fees and expenses that would not be present in a direct investment in those investment vehicles. Furthermore, the fund’s investment performance and risks are directly related to the investment performance and risks of the investment vehicles in which the fund invests.
LIBOR Risk. To the extent a fund invests in floating or variable rate obligations that use the London Interbank Offered Rate (“LIBOR”) as a reference interest rate, it is subject to LIBOR Risk. The United Kingdom’s Financial Conduct Authority, which regulates LIBOR has ceased making LIBOR available as a reference rate over a phase-out period that began December 31, 2021. There is no assurance that any alternative reference rate, including the Secured Overnight Financing Rate (“SOFR”) will be similar to or produce the same value or economic equivalence as LIBOR or that instruments using an alternative rate will have the same volume or liquidity. The unavailability or replacement of LIBOR may affect the value, liquidity or return on certain fund investments and may result in costs incurred in connection with closing out positions and entering into new trades. Any potential effects of the transition away from LIBOR on the fund or on certain instruments in which the fund invests can be difficult to ascertain, and they may vary depending on a variety of factors, and they could result in losses to the fund.
Additional Information (Continued)
First Trust Emerging Markets Local Currency Bond ETF (FEMB)
April 30, 2022 (Unaudited)
Management Risk. To the extent that a fund is actively managed, it is subject to management risk. In managing an actively-managed fund’s investment portfolio, the fund’s portfolio managers will apply investment techniques and risk analyses that may not have the desired result. There can be no guarantee that a fund will meet its investment objective.
Market Risk. Securities held by a fund, as well as shares of a fund itself, are subject to market fluctuations caused by factors such as general economic conditions, political events, regulatory or market developments, changes in interest rates and perceived trends in securities prices. Shares of a fund could decline in value or underperform other investments as a result of the risk of loss associated with these market fluctuations. In addition, local, regional or global events such as war, acts of terrorism, spread of infectious diseases or other public health issues, recessions, or other events could have a significant negative impact on a fund and its investments. Such events may affect certain geographic regions, countries, sectors and industries more significantly than others. In February 2022, Russia invaded Ukraine which has caused and could continue to cause significant market disruptions and volatility within the markets in Russia, Europe, and the United States. The hostilities and sanctions resulting from those hostilities could have a significant impact on certain fund investments as well as fund performance. The outbreak of the respiratory disease designated as COVID-19 in December 2019 has caused significant volatility and declines in global financial markets, which have caused losses for investors. While the development of vaccines has slowed the spread of the virus and allowed for the resumption of “reasonably” normal business activity in the United States, many countries continue to impose lockdown measures in an attempt to slow the spread. Additionally, there is no guarantee that vaccines will be effective against emerging variants of the disease.
Non-U.S. Securities Risk. To the extent a fund invests in non-U.S. securities, it is subject to additional risks not associated with securities of domestic issuers. Non-U.S. securities are subject to higher volatility than securities of domestic issuers due to: possible adverse political, social or economic developments; restrictions on foreign investment or exchange of securities; capital controls; lack of liquidity; currency exchange rates; excessive taxation; government seizure of assets; the imposition of sanctions by foreign governments; different legal or accounting standards; and less government supervision and regulation of exchanges in foreign countries. Investments in non-U.S. securities may involve higher costs than investments in U.S. securities, including higher transaction and custody costs, as well as additional taxes imposed by non-U.S. governments. These risks may be heightened for securities of companies located, or with significant operations, in emerging market countries.
Operational Risk. Each fund is subject to risks arising from various operational factors, including, but not limited to, human error, processing and communication errors, errors of a fund’s service providers, counterparties or other third-parties, failed or inadequate processes and technology or systems failures. Each fund relies on third-parties for a range of services, including custody. Any delay or failure relating to engaging or maintaining such service providers may affect a fund’s ability to meet its investment objective. Although the funds and the funds’ investment advisor seek to reduce these operational risks through controls and procedures, there is no way to completely protect against such risks.
Passive Investment Risk. To the extent a fund seeks to track an index, the fund will invest in the securities included in, or representative of, the index regardless of their investment merit. A fund generally will not attempt to take defensive positions in declining markets.
| NOT FDIC INSURED | NOT BANK GUARANTEED | MAY LOSE VALUE |
Liquidity Risk Management Program
In accordance with Rule 22e-4 under the Investment Company Act of 1940, as amended (the “1940 Act”), the Fund and each other fund in the First Trust Fund Complex, other than the closed-end funds, have adopted and implemented a liquidity risk management program (the “Program”) reasonably designed to assess and manage the funds’ liquidity risk, i.e., the risk that a fund could not meet requests to redeem shares issued by the fund without significant dilution of remaining investors’ interests in the fund. The Board of Trustees of the First Trust Funds has appointed First Trust Advisors L.P. (the “Advisor”) as the person designated to administer the Program, and in this capacity the Advisor performs its duties primarily through the activities and efforts of the First Trust Liquidity Committee (the “Liquidity Committee”).
Pursuant to the Program, the Liquidity Committee classifies the liquidity of each fund’s portfolio investments into one of the four liquidity categories specified by Rule 22e-4: highly liquid investments, moderately liquid investments, less liquid investments and illiquid investments. The Liquidity Committee determines certain of the inputs for this classification process, including reasonably anticipated trade sizes and significant investor dilution thresholds. The Liquidity Committee also determines and periodically reviews a highly liquid investment minimum for certain funds, monitors the funds’ holdings of assets classified as illiquid investments to seek to ensure they do not exceed 15% of a fund’s net assets and establishes policies and procedures regarding redemptions in kind.
At the April 18, 2022 meeting of the Board of Trustees, as required by Rule 22e-4 and the Program, the Advisor provided the Board with a written report prepared by the Advisor that addressed the operation of the Program during the period from March 16, 2021
Additional Information (Continued)
First Trust Emerging Markets Local Currency Bond ETF (FEMB)
April 30, 2022 (Unaudited)
through the Liquidity Committee’s annual meeting held on March 17, 2022 and assessed the Program’s adequacy and effectiveness of implementation during this period, including the operation of the highly liquid investment minimum for each fund that is required under the Program to have one, and any material changes to the Program. Note that because the Fund primarily holds assets that are highly liquid investments, the Fund has not adopted any highly liquid investment minimum.
As stated in the written report, during the review period, no fund breached the 15% limitation on illiquid investments, no fund with a highly liquid investment minimum breached that minimum and no fund filed a Form N-LIQUID. The Advisor concluded that each fund’s investment strategy is appropriate for an open-end fund; that the Program operated effectively in all material respects during the review period; and that the Program is reasonably designed to assess and manage the liquidity risk of each fund and to maintain compliance with Rule 22e-4.
This page intentionally left blank
This page intentionally left blank
First Trust Exchange-Traded Fund III
INVESTMENT ADVISOR
First Trust Advisors L.P.
120 East Liberty Drive, Suite 400
Wheaton, IL 60187
INVESTMENT SUB-ADVISOR
First Trust Global Portfolios Limited
Floor 2
8 Angel Court
London EC2R 7HJ
England
ADMINISTRATOR, CUSTODIAN,
FUND ACCOUNTANT &
TRANSFER AGENT
Brown Brothers Harriman & Co.
50 Post Office Square
Boston, MA 02110
INDEPENDENT REGISTERED
PUBLIC ACCOUNTING FIRM
Deloitte & Touche LLP
111 S. Wacker Drive
Chicago, IL 60606
LEGAL COUNSEL
Chapman and Cutler LLP
320 South Canal Street
Chicago, IL 60606
First Trust Exchange-Traded Fund III
First Trust RiverFront Dynamic Developed International ETF (RFDI)
First Trust RiverFront Dynamic Europe ETF (RFEU)
First Trust RiverFront Dynamic Emerging Markets ETF (RFEM)
Semi-Annual Report
For the Six Months Ended
April 30, 2022
First Trust Exchange-Traded Fund III
Semi-Annual Report
April 30, 2022
Caution Regarding Forward-Looking Statements
This report contains certain forward-looking statements within the meaning of the Securities Act of 1933, as amended, and the Securities Exchange Act of 1934, as amended. Forward-looking statements include statements regarding the goals, beliefs, plans or current expectations of First Trust Advisors L.P. (“First Trust” or the “Advisor”) and/or RiverFront Investment Group, LLC (“RIG” or the “Sub-Advisor”) and their respective representatives, taking into account the information currently available to them. Forward-looking statements include all statements that do not relate solely to current or historical fact. For example, forward-looking statements include the use of words such as “anticipate,” “estimate,” “intend,” “expect,” “believe,” “plan,” “may,” “should,” “would” or other words that convey uncertainty of future events or outcomes.
Forward-looking statements involve known and unknown risks, uncertainties and other factors that may cause the actual results, performance or achievements of any series of First Trust Exchange-Traded Fund III (the “Trust”) described in this report (each such series is referred to as a “Fund” and collectively, the “Funds”) to be materially different from any future results, performance or achievements expressed or implied by the forward-looking statements. When evaluating the information included in this report, you are cautioned not to place undue reliance on these forward-looking statements, which reflect the judgment of the Advisor and/or Sub-Advisor and their respective representatives only as of the date hereof. We undertake no obligation to publicly revise or update these forward-looking statements to reflect events and circumstances that arise after the date hereof.
Performance and Risk Disclosure
There is no assurance that any Fund described in this report will achieve its investment objective. Each Fund is subject to market risk, which is the possibility that the market values of securities owned by the Fund will decline and that the value of the Fund’s shares may therefore be less than what you paid for them. Accordingly, you can lose money by investing in a Fund. See “Risk Considerations” in the Additional Information section of this report for a discussion of certain other risks of investing in the Funds.
Performance data quoted represents past performance, which is no guarantee of future results, and current performance may be lower or higher than the figures shown. For the most recent month-end performance figures, please visit www.ftportfolios.com or speak with your financial advisor. Investment returns, net asset value and share price will fluctuate and Fund shares, when sold, may be worth more or less than their original cost.
The Advisor may also periodically provide additional information on Fund performance on each Fund’s web page at www.ftportfolios.com.
How to Read This Report
This report contains information that may help you evaluate your investment. It includes details about each Fund and presents data and analysis that provide insight into each Fund’s performance and investment approach.
The statistical information that follows may help you understand each Fund’s performance compared to that of a relevant market benchmark.
It is important to keep in mind that the opinions expressed by personnel of the Advisor and/or Sub-Advisor are just that: informed opinions. They should not be considered to be promises or advice. The opinions, like the statistics, cover the period through the date on the cover of this report. The material risks of investing in each Fund are spelled out in the prospectus, the statement of additional information, and other Fund regulatory filings.
First Trust Exchange-Traded Fund III
Semi-Annual Letter from the Chairman and CEO
April 30, 2022
Dear Shareholders,
First Trust is pleased to provide you with the semi-annual report for the First Trust RiverFront Dynamic International ETFs (the “Funds”), which contains detailed information about the Funds for the six months ended April 30, 2022.
A couple of famous financial industry quotes came to mind recently as I was sizing up the current business climate: “There’s no such thing as a free lunch” and “Don’t fight the Fed!” It seems that for some, the trillions of dollars of financial stimulus funneled into U.S. households and businesses by the Federal government and its agencies to help mitigate the fallout stemming from the coronavirus (“COVID-19”) pandemic, which commenced sometime around February 2020, was for all intents and purposes “free money.” It was not free. From the close of February 2020 through March 2022, the Federal Reserve (the “Fed”) expanded the U.S. money supply, known as M2, by 41% to $21.81 trillion to boost liquidity in the financial system. Normally, M2 grows around 6.0% on a year-over-year basis. When you factor in that all this new capital was accompanied by a breakdown of the global supply chain, there is little wonder why inflation is rampant.
One of the more common definitions of inflation is too many dollars chasing too few goods. The biggest downside to the supply chain bottlenecks, such as the severe backup of container ships at some U.S. ports, is that they have markedly reduced the flow of imported goods to retailers. The Fed has been signaling to Americans and the rest of the globe that, after many years of artificially low interest rates, tighter monetary policy will likely rule the day for the foreseeable future. Higher interest rates make borrowing capital more expensive and that should slow consumption over time, which, in turn, should bring down inflation. Don’t fight the Fed is code for don’t bet against the Fed, in my opinion. Stay tuned!
The primary job of the Fed is price stability. Its standard inflation target rate is 2.0%. The most recent Consumer Price Index release showed that prices were up 8.3% on a year-over-year basis as of April 30, 2022, according to data from the U.S. Bureau of Labor Statistics. While down from 8.5% the prior month, it is clearly elevated and that means the Fed has some work to do to with respect to mitigating inflation. The war between Russia and Ukraine is making the Fed’s job even tougher, particularly in the areas of food and energy. Rising costs and potential shortages could become even bigger if the COVID-19 outbreak in China grows. These are important events to monitor. Fed Chairman Jerome Powell has stated that the Fed is poised to raise the Federal Funds target rate (upper bound) by 50 basis points at each of its next two meetings (set for June and July), which would take the rate up to 2.00%. Data from CME Group indicates that current market pricing has the rate rising to 2.75% or 3.00% by year-end.
Securities markets do not go up in a straight line and they do not just go up year in and year out. In fact, what we have witnessed over the past couple of decades are often referred to as boom and bust cycles. Thankfully, it has ended up more boom than bust. Simply put, investors, not traders of the market, need to be willing to take the bad with the good. As the various stages of an economic cycle come and go (expansion to contraction), the markets tend to reprice securities to reflect the current narrative. In other words, we believe the markets essentially heal themselves − if you let them. That is an accurate depiction of how the markets have behaved so far in 2022, in my opinion. In response to a softening economy, the stock and bond markets have experienced some serious downside through the first four months of this year, as measured by the broader market indices. As of today, Brian Wesbury, Chief Economist at First Trust, is not forecasting a recession for the U.S. in 2022 or 2023. Whether he is proven right or wrong, we encourage investors to stay the course.
Thank you for giving First Trust the opportunity to play a role in your financial future. We value our relationship with you and will report on the Funds again in six months.
Sincerely,
James A. Bowen
Chairman of the Board of Trustees
Chief Executive Officer of First Trust Advisors L.P.
Fund Performance Overview (Unaudited)
First Trust RiverFront Dynamic Developed International ETF (RFDI)
The investment objective of First Trust RiverFront Dynamic Developed International ETF (the “Fund”) is to provide capital appreciation. Under normal market conditions, the Fund seeks to achieve its investment objective by investing at least 80% of its net assets (including investment borrowings) in a portfolio of equity securities of developed market companies, including through investments in common stock, depositary receipts, and common and preferred shares of real estate investment trusts (“REITs”), and forward foreign currency exchange contracts and currency spot transactions used to hedge the Fund’s exposure to the currencies in which the equity securities of such developed market companies are denominated (each, a “Developed Market currency” and, collectively, the “Developed Market currencies”). Developed market companies are those companies (i) whose securities are traded principally on a stock exchange in a developed market country, (ii) that have a primary business office in a developed market country, or (iii) that have at least 50% of their assets in, or derive at least 50% of their revenues or profits from, a developed market country. Developed market countries currently include the countries comprising the Morgan Stanley Capital International World Index or countries considered to be developed by the World Bank, the International Finance Corporation or the United Nations. Under normal market conditions, the Fund invests in at least three countries and at least 40% of its net assets in countries other than the United States. Shares of the Fund are listed on The Nasdaq Stock Market LLC under the ticker symbol “RFDI.”
The Fund utilizes a dynamic currency hedging strategy through the use of forward foreign currency exchange contracts and currency spot transactions to hedge up to 100% of the Fund’s currency exposure. As a result of this hedging strategy, the portion of the Fund’s portfolio securities which are subject to currency hedging transactions may vary widely, from 0% to 100% of the portfolio securities. A forward contract on foreign currency is an obligation to purchase or sell a specific currency at a future date, which may be any fixed number of days agreed upon by the parties from the date of the contract, at a price set on the date of the contract. A forward foreign currency exchange contract may reduce the Fund’s exposure to changes in the value of the currency it will deliver and increase its exposure to changes in the value of the currency it will receive for the duration of the contract. The effect on the value of the Fund is similar to selling securities denominated in one currency and purchasing securities denominated in another currency. The Fund also may enter into currency spot transactions as part of its dynamic currency hedging strategy. A currency spot transaction is an agreement between two parties to buy or sell a specific currency for delivery on a date that is typically two business days from the date of the agreement, as opposed to a date set in the future. The underlying currencies of the forward foreign currency exchange contracts and currency spot transactions included in the Fund’s policy relating to the investment of at least 80% of its net assets (including investment borrowings) will be limited to Developed Market currencies.
| Performance | | | | | | | |
| | | | Average Annual Total Returns | | Cumulative Total Returns |
| | 6 Months
Ended
4/30/22 | 1 Year
Ended
4/30/22 | 5 Years
Ended
4/30/22 | Inception
(4/13/16)
to 4/30/22 | | 5 Years
Ended
4/30/22 | Inception
(4/13/16)
to 4/30/22 |
| Fund Performance | | | | | | | |
| NAV | -13.85% | -7.47% | 3.41% | 5.54% | | 18.28% | 38.52% |
| Market Price | -14.83% | -7.81% | 3.26% | 5.46% | | 17.40% | 37.93% |
| Index Performance | | | | | | | |
| MSCI EAFE Index | -11.80% | -8.15% | 4.77% | 6.10% | | 26.25% | 43.07% |
(See Notes to Fund Performance Overview on page 9.)
Fund Performance Overview (Unaudited) (Continued)
First Trust RiverFront Dynamic Developed International ETF (RFDI) (Continued)
| Sector Allocation | % of Total
Investments |
| Industrials | 17.6% |
| Health Care | 17.0 |
| Financials | 14.0 |
| Materials | 13.3 |
| Consumer Discretionary | 9.6 |
| Communication Services | 7.9 |
| Consumer Staples | 6.1 |
| Real Estate | 5.3 |
| Utilities | 4.4 |
| Information Technology | 3.4 |
| Energy | 1.4 |
| Total | 100.0% |
| Fund Allocation | % of Net Assets |
| Common Stocks | 85.2% |
| Real Estate Investment Trusts | 4.7 |
| Net Other Assets and Liabilities(1) | 10.1 |
| Total | 100.0% |
| Top Ten Holdings | % of Total
Investments |
| Nestle S.A. | 3.6% |
| Roche Holding AG | 3.1 |
| Novartis AG | 3.0 |
| Hapag-Lloyd AG | 2.5 |
| GlaxoSmithKline PLC | 2.3 |
| Novo Nordisk A.S., Class B | 2.2 |
| BHP Group Ltd. | 2.1 |
| Rio Tinto PLC | 2.0 |
| Mercedes-Benz Group AG | 1.9 |
| Anglo American PLC | 1.8 |
| Total | 24.5% |
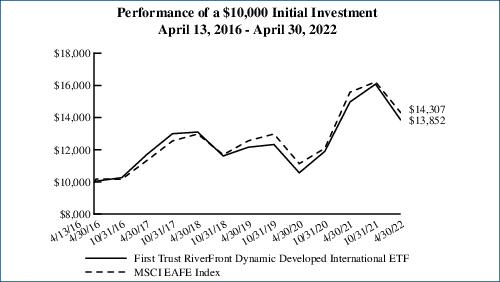
Performance figures assume reinvestment of all distributions and do not reflect the deduction of taxes that a shareholder would pay on Fund distributions or the redemption or sale of Fund shares. An index is a statistical composite that tracks a specified financial market or sector. Unlike the Fund, the index does not actually hold a portfolio of securities and therefore does not incur the expenses incurred by the Fund. These expenses negatively impact the performance of the Fund. The Fund’s past performance does not predict future performance.
Frequency Distribution of Discounts and Premiums
Information showing the number of days the market price of the Fund’s shares was greater (at a premium) and less (at a discount) than the Fund’s net asset value for the most recently completed year, and the most recently completed calendar quarters since that year (or life of the Fund, if shorter), is available at https://www.ftportfolios.com/Retail/etf/home.aspx.
| (1) | Includes forward foreign currency contracts. |
Fund Performance Overview (Unaudited) (Continued)
First Trust RiverFront Dynamic Europe ETF (RFEU)
The investment objective of First Trust RiverFront Dynamic Europe ETF (the “Fund”) is to provide capital appreciation. Under normal market conditions, the Fund seeks to achieve its investment objective by investing at least 80% of its net assets (including investment borrowings) in a portfolio of equity securities of European companies, including through investments in common stock, depositary receipts, and common and preferred shares of real estate investment trusts (“REITs”), and forward foreign currency exchange contracts and currency spot transactions used to hedge the Fund’s exposure to the currencies in which the equity securities of such European companies are denominated (each, a “European currency” and, collectively, the “European currencies”). European companies are those companies (i) whose securities are traded principally on a stock exchange in a European country, (ii) that have a primary business office in a European country, or (iii) that have at least 50% of their assets in, or derive at least 50% of their revenues or profits from, a European country. The Fund considers a European country to be any member country of the European Union or any country included in the FTSE Developed Europe Index or the FTSE Emerging Europe All Cap Index. The Fund generally focuses its European company investments in Austria, Belgium, Denmark, Finland, France, Germany, Ireland, Italy, Luxembourg, the Netherlands, Norway, Portugal, Spain, Sweden, Switzerland and/or the United Kingdom. Shares of the Fund are listed on The Nasdaq Stock Market LLC under the ticker symbol “RFEU.”
The Fund utilizes a dynamic currency hedging strategy through the use of forward foreign currency exchange contracts and currency spot transactions to hedge up to 100% of the Fund’s currency exposure. As a result of this hedging strategy, the portion of the Fund’s portfolio securities which are subject to currency hedging transactions may vary widely, from 0% to 100% of the portfolio securities. A forward contract on foreign currency is an obligation to purchase or sell a specific currency at a future date, which may be any fixed number of days agreed upon by the parties from the date of the contract, at a price set on the date of the contract. A forward foreign currency exchange contract may reduce the Fund’s exposure to changes in the value of the currency it will deliver and increase its exposure to changes in the value of the currency it will receive for the duration of the contract. The effect on the value of the Fund is similar to selling securities denominated in one currency and purchasing securities denominated in another currency. The Fund also may enter into currency spot transactions as part of its dynamic currency hedging strategy. A currency spot transaction is an agreement between two parties to buy or sell a specific currency for delivery on a date that is typically two business days from the date of the agreement, as opposed to a date set in the future. The underlying currencies of the forward foreign currency exchange contracts and currency spot transactions included in the Fund’s policy relating to the investment of at least 80% of its net assets (including investment borrowings) will be limited to European currencies.
| Performance | | | | | | | |
| | | | Average Annual Total Returns | | Cumulative Total Returns |
| | 6 Months
Ended
4/30/22 | 1 Year
Ended
4/30/22 | 5 Years
Ended
4/30/22 | Inception
(4/13/16)
to 4/30/22 | | 5 Years
Ended
4/30/22 | Inception
(4/13/16)
to 4/30/22 |
| Fund Performance | | | | | | | |
| NAV | -14.35% | -7.82% | 4.26% | 6.81% | | 23.17% | 48.94% |
| Market Price | -14.56% | -7.50% | 4.19% | 6.82% | | 22.76% | 48.99% |
| Index Performance | | | | | | | |
| MSCI Europe Index | -11.73% | -6.69% | 4.93% | 6.11% | | 27.21% | 43.11% |
(See Notes to Fund Performance Overview on page 9.)
Fund Performance Overview (Unaudited) (Continued)
First Trust RiverFront Dynamic Europe ETF (RFEU) (Continued)
| Sector Allocation | % of Total
Investments |
| Health Care | 19.3% |
| Industrials | 17.9 |
| Consumer Discretionary | 13.0 |
| Financials | 11.8 |
| Consumer Staples | 9.8 |
| Materials | 8.8 |
| Information Technology | 5.3 |
| Energy | 5.0 |
| Real Estate | 3.5 |
| Utilities | 3.1 |
| Communication Services | 2.5 |
| Total | 100.0% |
| Fund Allocation | % of Net Assets |
| Common Stocks | 96.6% |
| Real Estate Investment Trusts | 3.1 |
| Net Other Assets and Liabilities(1) | 0.3 |
| Total | 100.0% |
| Top Ten Holdings | % of Total
Investments |
| Novo Nordisk A.S., Class B | 3.8% |
| Novartis AG | 3.4 |
| LVMH Moet Hennessy Louis Vuitton SE | 3.0 |
| Shell PLC | 2.8 |
| ASML Holding N.V. | 2.5 |
| Nestle S.A. | 2.5 |
| Rio Tinto PLC | 2.5 |
| GlaxoSmithKline PLC | 2.5 |
| Mercedes-Benz Group AG | 2.4 |
| British American Tobacco PLC | 2.3 |
| Total | 27.7% |
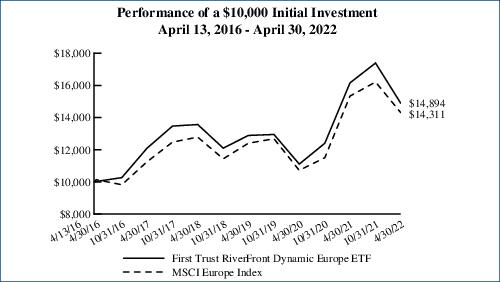
Performance figures assume reinvestment of all distributions and do not reflect the deduction of taxes that a shareholder would pay on Fund distributions or the redemption or sale of Fund shares. An index is a statistical composite that tracks a specified financial market or sector. Unlike the Fund, the index does not actually hold a portfolio of securities and therefore does not incur the expenses incurred by the Fund. These expenses negatively impact the performance of the Fund. The Fund’s past performance does not predict future performance.
Frequency Distribution of Discounts and Premiums
Information showing the number of days the market price of the Fund’s shares was greater (at a premium) and less (at a discount) than the Fund’s net asset value for the most recently completed year, and the most recently completed calendar quarters since that year (or life of the Fund, if shorter), is available at https://www.ftportfolios.com/Retail/etf/home.aspx.
| (1) | Includes forward foreign currency contracts. |
Fund Performance Overview (Unaudited) (Continued)
First Trust RiverFront Dynamic Emerging Markets ETF (RFEM)
The investment objective of First Trust RiverFront Dynamic Emerging Markets ETF (the “Fund”) is to provide capital appreciation. Under normal market conditions, the Fund seeks to achieve its investment objective by investing at least 80% of its net assets (including investment borrowings) in a portfolio of equity securities of emerging market companies, including through investments in common stock, depositary receipts, and common and preferred shares of real estate investment trusts (“REITs”), and forward foreign currency exchange contracts and currency spot transactions used to hedge the Fund’s exposure to the currencies in which the equity securities of such emerging market companies are denominated (each, an “Emerging Market currency” and, collectively, the “Emerging Market currencies”). The Fund considers an emerging market company to be one (i) domiciled or with a principal place of business or primary securities trading market in an emerging market country, or (ii) that derives a substantial portion of its total revenues or profits from emerging market countries. The Fund considers an emerging market country to be any country whose issuers are included in the Morgan Stanley Capital International Emerging Markets Index and/or those countries considered to be developing by the World Bank, the International Finance Corporation or the United Nations. The Fund generally focuses its emerging market company investments in Brazil, Chile, China, Colombia, the Czech Republic, Egypt, Greece, Hungary, India, Indonesia, Malaysia, Mexico, Morocco, Nigeria, Peru, the Philippines, Poland, Qatar, Russia, South Africa, South Korea, Taiwan, Thailand, Turkey and/or the United Arab Emirates. Shares of the Fund are listed on The Nasdaq Stock Exchange LLC under the ticker symbol “RFEM.”
The Fund utilizes a dynamic currency hedging strategy through the use of forward foreign currency exchange contracts and currency spot transactions to hedge up to 100% of the Fund’s currency exposure. As a result of this hedging strategy, the portion of the Fund’s portfolio securities which are subject to currency hedging transactions may vary widely, from 0% to 100% of the portfolio securities. A forward contract on foreign currency is an obligation to purchase or sell a specific currency at a future date, which may be any fixed number of days agreed upon by the parties from the date of the contract, at a price set on the date of the contract. A forward foreign currency exchange contract may reduce the Fund’s exposure to changes in the value of the currency it will deliver and increase its exposure to changes in the value of the currency it will receive for the duration of the contract. The effect on the value of the Fund is similar to selling securities denominated in one currency and purchasing securities denominated in another currency. The Fund also may enter into currency spot transactions as part of its dynamic currency hedging strategy. A currency spot transaction is an agreement between two parties to buy or sell a specific currency for delivery on a date that is typically two business days from the date of the agreement, as opposed to a date set in the future. The underlying currencies of the forward foreign currency exchange contracts and currency spot transactions included in the Fund’s policy relating to the investment of at least 80% of its net assets (including investment borrowings) will be limited to Emerging Market currencies.
| Performance | | | | | | | |
| | | | Average Annual Total Returns | | Cumulative Total Returns |
| | 6 Months
Ended
4/30/22 | 1 Year
Ended
4/30/22 | 5 Years
Ended
4/30/22 | Inception
(6/14/16)
to 4/30/22 | | 5 Years
Ended
4/30/22 | Inception
(6/14/16)
to 4/30/22 |
| Fund Performance | | | | | | | |
| NAV | -8.06% | -14.75% | 2.86% | 6.52% | | 15.13% | 44.95% |
| Market Price | -8.55% | -15.49% | 2.50% | 6.28% | | 13.12% | 43.01% |
| Index Performance | | | | | | | |
| MSCI Emerging Markets Index | -14.15% | -18.33% | 4.32% | 7.56% | | 23.53% | 53.46% |
(See Notes to Fund Performance Overview on page 9.)
Fund Performance Overview (Unaudited) (Continued)
First Trust RiverFront Dynamic Emerging Markets ETF (RFEM) (Continued)
| Sector Allocation | % of Total
Investments |
| Information Technology | 26.6% |
| Materials | 14.5 |
| Energy | 10.1 |
| Financials | 9.9 |
| Communication Services | 8.5 |
| Industrials | 8.3 |
| Consumer Discretionary | 6.5 |
| Consumer Staples | 6.1 |
| Health Care | 4.4 |
| Utilities | 3.1 |
| Real Estate | 1.1 |
| Other * | 0.9 |
| Total | 100.0% |
| * | Exchange-traded fund with holdings representing multiple sectors. |
| Top Ten Holdings | % of Total
Investments |
| Taiwan Semiconductor Manufacturing Co., Ltd. | 5.7% |
| Tencent Holdings Ltd. | 2.7 |
| Samsung Electronics Co., Ltd. | 2.7 |
| Infosys Ltd. | 2.0 |
| SK Hynix, Inc. | 1.8 |
| Tata Consultancy Services Ltd. | 1.7 |
| Petroleo Brasileiro S.A. (Preference Shares) | 1.7 |
| Petroleo Brasileiro S.A. | 1.6 |
| Capitec Bank Holdings Ltd. | 1.4 |
| Alibaba Group Holding Ltd. | 1.4 |
| Total | 22.7% |
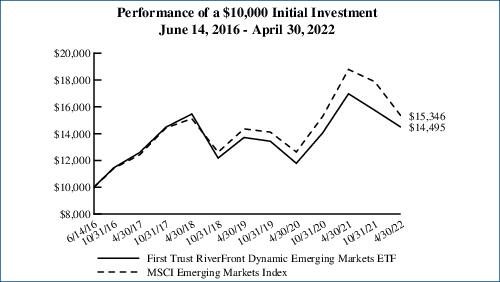
Performance figures assume reinvestment of all distributions and do not reflect the deduction of taxes that a shareholder would pay on Fund distributions or the redemption or sale of Fund shares. An index is a statistical composite that tracks a specified financial market or sector. Unlike the Fund, the index does not actually hold a portfolio of securities and therefore does not incur the expenses incurred by the Fund. These expenses negatively impact the performance of the Fund. The Fund’s past performance does not predict future performance.
Frequency Distribution of Discounts and Premiums
Information showing the number of days the market price of the Fund’s shares was greater (at a premium) and less (at a discount) than the Fund’s net asset value for the most recently completed year, and the most recently completed calendar quarters since that year (or life of the Fund, if shorter), is available at https://www.ftportfolios.com/Retail/etf/home.aspx.
(1)Includes forward foreign currency contracts.
(1)Includes forward foreign currency contracts.
Notes to Fund Performance Overview (Unaudited)
Total returns for the periods since inception are calculated from the inception date of each Fund. “Average Annual Total Returns” represent the average annual change in value of an investment over the periods indicated. “Cumulative Total Returns” represent the total change in value of an investment over the periods indicated.
Each Fund’s per share net asset value (“NAV”) is the value of one share of the Fund and is computed by dividing the value of all assets of the Fund (including accrued interest and dividends), less all liabilities (including accrued expenses and dividends declared but unpaid), by the total number of outstanding shares. The price used to calculate market return (“Market Price”) is determined by using the midpoint of the national best bid and offer price (“NBBO”) as of the time that the Fund’s NAV is calculated. Under SEC rules, the NBBO consists of the highest displayed buy and lowest sell prices among the various exchanges trading the Fund at the time the Fund’s NAV is calculated. Prior to January 1, 2019, the price used was the midpoint between the highest bid and the lowest offer on the stock exchange on which shares of the Fund were listed for trading as of the time that the Fund’s NAV was calculated. Since shares of each Fund did not trade in the secondary market until after the Fund’s inception, for the period from inception to the first day of secondary market trading in shares of the Fund, the NAV of each Fund is used as a proxy for the secondary market trading price to calculate market returns. NAV and market returns assume that all distributions have been reinvested in each Fund at NAV and Market Price, respectively.
An index is a statistical composite that tracks a specified financial market or sector. Unlike each Fund, the indices do not actually hold a portfolio of securities and therefore do not incur the expenses incurred by each Fund. These expenses negatively impact the performance of each Fund. Also, market returns do not include brokerage commissions that may be payable on secondary market transactions. If brokerage commissions were included, market returns would be lower. The total returns presented reflect the reinvestment of dividends on securities in the indices. The returns presented do not reflect the deduction of taxes that a shareholder would pay on Fund distributions or the redemption or sale of Fund shares. The investment return and principal value of shares of each Fund will vary with changes in market conditions. Shares of each Fund may be worth more or less than their original cost when they are redeemed or sold in the market. Each Fund’s past performance is no guarantee of future performance.
Portfolio Management
First Trust Exchange-Traded Fund III
Semi-Annual Report
April 30, 2022 (Unaudited)
Advisor
First Trust Advisors L.P. (“First Trust”) serves as the investment advisor to the First Trust RiverFront Dynamic Developed International ETF (“RFDI”), the First Trust RiverFront Dynamic Europe ETF (“RFEU”), and the First Trust RiverFront Dynamic Emerging Markets ETF (“RFEM”) (each a “Fund” and collectively, the “Funds”). First Trust is responsible for the ongoing monitoring of each Fund’s investment portfolio, managing each Fund’s business affairs and providing certain administrative services necessary for the management of each Fund.
Sub-Advisor
RiverFront Investment Group, LLC
RiverFront Investment Group, LLC (“RIG”) is an SEC-registered investment advisor located in Richmond, Virginia. It is majority owned by its employees, and Baird Financial Corporation is a minority owner of RiverFront Investment Holding Group, LLC. The firm provides asset management services to a series of global tactical asset allocation portfolios and registered investment companies, including mutual funds and exchange-traded products.
Portfolio Management Team
Adam Grossman, CFA, Portfolio Manager of RIG
Chris Konstantinos, CFA, Portfolio Manager of RIG
First Trust Exchange-Traded Fund III
Understanding Your Fund Expenses
April 30, 2022 (Unaudited)
As a shareholder of First Trust RiverFront Dynamic Developed International ETF, First Trust RiverFront Dynamic Europe ETF or First Trust RiverFront Dynamic Emerging Markets ETF (each a “Fund” and collectively, the “Funds”), you incur two types of costs: (1) transaction costs; and (2) ongoing costs, including management fees, distribution and/or service (12b-1) fees, if any, and other Fund expenses. This Example is intended to help you understand your ongoing costs of investing in the Funds and to compare these costs with the ongoing costs (in U.S. dollars) of investing in other funds.
The Example is based on an investment of $1,000 invested at the beginning of the period and held through the six-month period ended April 30, 2022.
Actual Expenses
The first line in the following table provides information about actual account values and actual expenses. You may use the information in this line, together with the amount you invested, to estimate the expenses that you paid over the period. Simply divide your account value by $1,000 (for example, an $8,600 account value divided by $1,000 = 8.6), then multiply the result by the number in the first line under the heading entitled “Expenses Paid During the Six-Month Period” to estimate the expenses you paid on your account during this six-month period.
Hypothetical Example for Comparison Purposes
The second line in the following table provides information about hypothetical account values and hypothetical expenses based on each Fund’s actual expense ratio and an assumed rate of return of 5% per year before expenses, which is not each Fund’s actual return. The hypothetical account values and expenses may not be used to estimate the actual ending account balance or expenses you paid for the period. You may use this information to compare the ongoing costs of investing in the Funds and other funds. To do so, compare this 5% hypothetical example with the 5% hypothetical examples that appear in the shareholder reports of the other funds.
Please note that the expenses shown in the table are meant to highlight your ongoing costs only and do not reflect any transactional costs such as brokerage commissions. Therefore, the second line in the table is useful in comparing ongoing costs only, and will not help you determine the relative total costs of owning different funds. In addition, if these transactional costs were included, your costs would have been higher.
| | Beginning
Account Value
November 1, 2021 | Ending
Account Value
April 30, 2022 | Annualized
Expense Ratio
Based on the
Six-Month
Period | Expenses Paid
During the
Six-Month
Period (a) |
| First Trust RiverFront Dynamic Developed International ETF (RFDI) |
| Actual | $1,000.00 | $861.50 | 0.83% | $3.83 |
| Hypothetical (5% return before expenses) | $1,000.00 | $1,020.68 | 0.83% | $4.16 |
| First Trust RiverFront Dynamic Europe ETF (RFEU) |
| Actual | $1,000.00 | $856.50 | 0.83% | $3.82 |
| Hypothetical (5% return before expenses) | $1,000.00 | $1,020.68 | 0.83% | $4.16 |
| First Trust RiverFront Dynamic Emerging Markets ETF (RFEM) |
| Actual | $1,000.00 | $919.40 | 0.95% | $4.52 |
| Hypothetical (5% return before expenses) | $1,000.00 | $1,020.08 | 0.95% | $4.76 |
| (a) | Expenses are equal to the annualized expense ratios as indicated in the table multiplied by the average account value over the period (November 1, 2021 through April 30, 2022), multiplied by 181/365 (to reflect the six-month period). |
First Trust RiverFront Dynamic Developed International ETF (RFDI)
Portfolio of Investments
April 30, 2022 (Unaudited)
| Shares | | Description | | Value |
| COMMON STOCKS (a) – 85.2% |
| | | Australia – 11.0% | | |
| 94,257 | | ALS Ltd. (b) | | $853,506 |
| 88,905 | | BHP Group Ltd. (b) | | 2,970,799 |
| 11,642 | | Commonwealth Bank of Australia (b) | | 846,181 |
| 320,038 | | Endeavour Group Ltd. (b) | | 1,751,907 |
| 161,951 | | Fortescue Metals Group Ltd. (b) | | 2,447,578 |
| 443,844 | | Harvey Norman Holdings Ltd. (b) | | 1,581,001 |
| 42,983 | | JB Hi-Fi Ltd. (b) | | 1,591,934 |
| 338,777 | | Nufarm Ltd. (b) | | 1,524,057 |
| 16,860 | | Rio Tinto Ltd. (b) | | 1,333,692 |
| 77,570 | | Sonic Healthcare Ltd. (b) | | 2,003,341 |
| | | | | 16,903,996 |
| | | Austria – 0.3% | | |
| 18,913 | | EVN AG (b) | | 481,455 |
| | | Belgium – 1.3% | | |
| 6,355 | | Sofina S.A. (b) | | 1,947,534 |
| | | Bermuda – 1.3% | | |
| 70,500 | | Orient Overseas International Ltd. (b) | | 1,945,384 |
| | | Canada – 1.0% | | |
| 17,738 | | West Fraser Timber Co., Ltd. | | 1,559,022 |
| | | Cayman Islands – 1.3% | | |
| 489,564 | | Xinyi Glass Holdings Ltd. (b) | | 1,083,313 |
| 654,876 | | Xinyi Solar Holdings Ltd. (b) | | 973,425 |
| | | | | 2,056,738 |
| | | Denmark – 4.8% | | |
| 728 | | AP Moller - Maersk A.S., Class A (b) | | 2,060,706 |
| 742 | | AP Moller - Maersk A.S., Class B (b) | | 2,147,517 |
| 27,041 | | Novo Nordisk A.S., Class B (b) | | 3,088,793 |
| | | | | 7,297,016 |
| | | France – 6.7% | | |
| 14,907 | | BioMerieux (b) | | 1,419,174 |
| 6,436 | | Casino Guichard Perrachon S.A. (b) (c) | | 112,765 |
| 3,054 | | Christian Dior SE (b) | | 1,869,972 |
| 8,883 | | Dassault Aviation S.A. (b) | | 1,490,613 |
| 225,838 | | Electricite de France S.A. (b) | | 2,053,104 |
| 89,510 | | Metropole Television S.A. (b) | | 1,661,051 |
| 6,003 | | Vinci S.A. (b) | | 582,494 |
| 94,833 | | Vivendi SE (b) | | 1,089,212 |
| | | | | 10,278,385 |
| | | Germany – 6.9% | | |
| 15,261 | | Aurubis AG (b) | | 1,734,251 |
| 8,548 | | Hapag-Lloyd AG (b) (d) (e) | | 3,402,845 |
| 37,079 | | Mercedes-Benz Group AG (b) | | 2,588,159 |
| 11,620 | | Nemetschek SE (b) | | 922,098 |
| Shares | | Description | | Value |
|
| | | Germany (Continued) | | |
| 9,027 | | Volkswagen AG (b) | | $1,957,610 |
| | | | | 10,604,963 |
| | | Israel – 0.8% | | |
| 10,252 | | Check Point Software Technologies Ltd. (c) | | 1,294,725 |
| | | Italy – 1.6% | | |
| 49,491 | | Azimut Holding S.p.A. (b) | | 1,050,490 |
| 129,597 | | BPER Banca (b) | | 216,504 |
| 227,646 | | Snam S.p.A. (b) | | 1,248,548 |
| | | | | 2,515,542 |
| | | Japan – 10.7% | | |
| 37,200 | | Chugai Pharmaceutical Co., Ltd. (b) | | 1,114,704 |
| 243,800 | | Daiwa Securities Group, Inc. (b) | | 1,194,895 |
| 61,100 | | ITOCHU Corp. (b) | | 1,844,058 |
| 81,600 | | Mitsubishi Chemical Holdings Corp. (b) | | 497,568 |
| 20,900 | | NEC Corp. (b) | | 810,834 |
| 2,225 | | Nintendo Co., Ltd. (b) | | 1,015,469 |
| 18,500 | | Nissan Chemical Corp. (b) | | 977,218 |
| 102,900 | | ORIX Corp. (b) | | 1,876,790 |
| 43,900 | | Recruit Holdings Co., Ltd. (b) | | 1,592,763 |
| 59,200 | | SBI Holdings, Inc. (b) | | 1,324,134 |
| 5,700 | | Shimano, Inc. (b) | | 1,009,951 |
| 51,900 | | SoftBank Group Corp. (b) | | 2,134,660 |
| 52,100 | | Yamaha Motor Co., Ltd. (b) | | 1,075,641 |
| | | | | 16,468,685 |
| | | Jersey – 2.1% | | |
| 15,411 | | Ferguson PLC (b) | | 1,933,297 |
| 447,434 | | Man Group PLC (b) | | 1,304,059 |
| | | | | 3,237,356 |
| | | Luxembourg – 2.0% | | |
| 167,789 | | B&M European Value Retail S.A. (b) | | 1,028,058 |
| 21,557 | | Eurofins Scientific SE (b) | | 2,003,460 |
| | | | | 3,031,518 |
| | | Netherlands – 1.0% | | |
| 1,882 | | Airbus SE (b) | | 206,026 |
| 1,340 | | ASML Holding N.V. (b) | | 760,502 |
| 2,755 | | Ferrari N.V. (b) | | 580,078 |
| | | | | 1,546,606 |
| | | New Zealand – 0.7% | | |
| 353,343 | | Spark New Zealand Ltd. (b) | | 1,117,515 |
| | | Norway – 1.4% | | |
| 516,790 | | DNO ASA (b) | | 783,425 |
| 71,951 | | TGS NOPEC Geophysical Co., ASA (b) | | 1,109,972 |
Page 12
See Notes to Financial Statements
First Trust RiverFront Dynamic Developed International ETF (RFDI)
Portfolio of Investments (Continued)
April 30, 2022 (Unaudited)
| Shares | | Description | | Value |
| COMMON STOCKS (a) (Continued) |
| | | Norway (Continued) | | |
| 39,049 | | Wallenius Wilhelmsen ASA (b) | | $245,102 |
| | | | | 2,138,499 |
| | | Spain – 3.5% | | |
| 548,195 | | CaixaBank S.A. (b) | | 1,769,517 |
| 7,566 | | EDP Renovaveis S.A. (b) | | 179,066 |
| 436,651 | | Telefonica S.A. (b) | | 2,124,151 |
| 267,266 | | Telefonica S.A., ADR (c) | | 1,277,531 |
| | | | | 5,350,265 |
| | | Sweden – 3.2% | | |
| 94,890 | | Investor AB, Class A (b) | | 1,981,922 |
| 105,573 | | Investor AB, Class B (b) | | 2,031,531 |
| 41,638 | | Swedish Orphan Biovitrum AB (b) (c) | | 875,931 |
| | | | | 4,889,384 |
| | | Switzerland – 10.8% | | |
| 6,299 | | Kuehne + Nagel International AG (b) | | 1,762,122 |
| 38,666 | | Nestle S.A. (b) | | 4,991,552 |
| 46,147 | | Novartis AG (b) | | 4,077,979 |
| 11,538 | | Roche Holding AG (b) | | 4,278,452 |
| 3,770 | | Roche Holding AG (b) | | 1,514,581 |
| | | | | 16,624,686 |
| | | United Kingdom – 12.8% | | |
| 129,315 | | 3i Group PLC (b) | | 2,116,271 |
| 55,362 | | Anglo American PLC (b) | | 2,452,038 |
| 75,587 | | BAE Systems PLC (b) | | 698,171 |
| 36,267 | | British American Tobacco PLC (b) | | 1,520,035 |
| 74,354 | | Evraz PLC (b) (f) | | 75,629 |
| 141,227 | | GlaxoSmithKline PLC (b) | | 3,183,620 |
| Shares | | Description | | Value |
|
| | | United Kingdom (Continued) | | |
| 161,519 | | IG Group Holdings PLC (b) | | $1,650,736 |
| 15,104 | | Intertek Group PLC (b) | | 941,205 |
| 49,493 | | RELX PLC (b) | | 1,474,420 |
| 70,574 | | Rightmove PLC (b) | | 542,509 |
| 40,060 | | Rio Tinto PLC (b) | | 2,830,486 |
| 92,801 | | SSE PLC (b) | | 2,155,380 |
| | | | | 19,640,500 |
| | | Total Common Stocks | | 130,929,774 |
| | | (Cost $129,787,680) | | |
| REAL ESTATE INVESTMENT TRUSTS (a) – 4.7% |
| | | Australia – 1.5% | | |
| 108,875 | | Goodman Group (b) | | 1,812,104 |
| 186,538 | | Growthpoint Properties Australia Ltd. (b) | | 573,760 |
| | | | | 2,385,864 |
| | | Belgium – 0.9% | | |
| 34,133 | | Warehouses De Pauw CVA (b) | | 1,313,103 |
| | | United Kingdom – 2.3% | | |
| 94,630 | | Safestore Holdings PLC (b) | | 1,488,698 |
| 123,969 | | Segro PLC (b) | | 2,075,501 |
| | | | | 3,564,199 |
| | | Total Real Estate Investment Trusts | | 7,263,166 |
| | | (Cost $6,135,545) | | |
| | | Total Investments – 89.9% | | 138,192,940 |
| | | (Cost $135,923,225) | | |
| | | Net Other Assets and Liabilities – 10.1% | | 15,583,751 |
| | | Net Assets – 100.0% | | $153,776,691 |
| Forward Foreign Currency Contracts |
Settlement
Date | | Counterparty | | Amount
Purchased | | Amount
Sold | | Purchase
Value as of
4/30/2022 | | Sale
Value as of
4/30/2022 | | Unrealized
Appreciation/
(Depreciation) |
| 05/31/22 | | BBH | | USD | 6,975,000 | | EUR | 6,604,988 | | $ 6,975,000 | | $ 6,976,398 | | $ (1,398) |
| 05/31/22 | | BBH | | USD | 5,300,000 | | JPY | 687,357,000 | | 5,300,000 | | 5,301,397 | | (1,397) |
Net Unrealized Appreciation / (Depreciation)
| | $(2,795) |
| Counterparty Abbreviations |
| BBH | Brown Brothers Harriman and Co. |
See Notes to Financial Statements
Page 13
First Trust RiverFront Dynamic Developed International ETF (RFDI)
Portfolio of Investments (Continued)
April 30, 2022 (Unaudited)
| (a) | Portfolio securities are categorized based upon their country of incorporation. For a breakdown of the portfolio securities by sector, please see the Fund Performance Overview. |
| (b) | This security is fair valued by the Advisor’s Pricing Committee in accordance with procedures adopted by the Trust’s Board of Trustees and in accordance with provisions of the Investment Company Act of 1940, as amended. At April 30, 2022, securities noted as such are valued at $134,061,662 or 87.2% of net assets. Certain of these securities are fair valued using a factor provided by a third-party pricing service due to the change in value between the foreign markets’ close and the New York Stock Exchange close exceeding a certain threshold. On days when this threshold is not exceeded, these securities are typically valued at the last sale price on the exchange on which they are principally traded. |
| (c) | Non-income producing security. |
| (d) | This security may be resold to qualified foreign investors and foreign institutional buyers under Regulation S of the Securities Act of 1933, as amended (the “1933 Act”). |
| (e) | This security is exempt from registration upon resale under Rule 144A of the 1933 Act and may be resold in transactions exempt from registration, normally to qualified institutional buyers. This security is not restricted on the foreign exchange where it trades freely without any additional registration. As such, it does not require the additional disclosure required of restricted securities. |
| (f) | Pursuant to procedures adopted by the Trust’s Board of Trustees, this security has been determined to be illiquid by First Trust Advisors L.P., the Fund’s advisor. |
| ADR | American Depositary Receipt |
Currency Exposure
Diversification | % of Total
Investments† |
| EUR | 24.6% |
| JPY | 16.8 |
| GBP | 16.2 |
| AUD | 11.4 |
| CHF | 9.8 |
| USD | 9.7 |
| DKK | 4.3 |
| SEK | 2.9 |
| HKD | 2.4 |
| NOK | 1.3 |
| NZD | 0.6 |
| Total | 100.0% |
| † | The weightings include the impact of currency forwards. |
| Currency Abbreviations |
| AUD | Australian Dollar |
| CHF | Swiss Franc |
| DKK | Danish Krone |
| EUR | Euro |
| GBP | British Pound Sterling |
| HKD | Hong Kong Dollar |
| JPY | Japanese Yen |
| NOK | Norwegian Krone |
| NZD | New Zealand Dollar |
| SEK | Swedish Krona |
| USD | United States Dollar |
Page 14
See Notes to Financial Statements
First Trust RiverFront Dynamic Developed International ETF (RFDI)
Portfolio of Investments (Continued)
April 30, 2022 (Unaudited)
Valuation Inputs
A summary of the inputs used to value the Fund’s investments as of April 30, 2022 is as follows (see Note 2A - Portfolio Valuation in the Notes to Financial Statements):
| ASSETS TABLE |
| | Total
Value at
4/30/2022 | Level 1
Quoted
Prices | Level 2
Significant
Observable
Inputs | Level 3
Significant
Unobservable
Inputs |
| Common Stocks: | | | | |
Canada
| $ 1,559,022 | $ 1,559,022 | $ — | $ — |
Israel
| 1,294,725 | 1,294,725 | — | — |
Spain
| 5,350,265 | 1,277,531 | 4,072,734 | — |
Other Country Categories*
| 122,725,762 | — | 122,725,762 | — |
Real Estate Investment Trusts*
| 7,263,166 | — | 7,263,166 | — |
Total Investments
| $ 138,192,940 | $ 4,131,278 | $ 134,061,662 | $— |
| |
| LIABILITIES TABLE |
| | Total
Value at
4/30/2022 | Level 1
Quoted
Prices | Level 2
Significant
Observable
Inputs | Level 3
Significant
Unobservable
Inputs |
Forward Foreign Currency Contracts**
| $ (2,795) | $ — | $ (2,795) | $ — |
| * | See Portfolio of Investments for country breakout. |
| ** | See the Schedule of Forward Foreign Currency Contracts for contract and currency detail. |
See Notes to Financial Statements
Page 15
First Trust RiverFront Dynamic Europe ETF (RFEU)
Portfolio of Investments
April 30, 2022 (Unaudited)
| Shares | | Description | | Value |
| COMMON STOCKS (a) – 96.6% |
| | | Australia – 1.4% | | |
| 3,924 | | Rio Tinto Ltd. (b) | | $310,404 |
| | | Belgium – 1.0% | | |
| 744 | | Sofina S.A. (b) | | 228,004 |
| | | Denmark – 8.4% | | |
| 147 | | AP Moller - Maersk A.S., Class A (b) | | 416,104 |
| 151 | | AP Moller - Maersk A.S., Class B (b) | | 437,028 |
| 7,545 | | Novo Nordisk A.S., Class B (b) | | 861,838 |
| 2,854 | | Novozymes A.S., Class B (b) | | 198,951 |
| | | | | 1,913,921 |
| | | France – 16.7% | | |
| 3,124 | | Amundi S.A. (b) (c) (d) | | 187,846 |
| 1,740 | | Arkema S.A. (b) | | 198,263 |
| 2,280 | | BioMerieux (b) | | 217,060 |
| 3,686 | | Bureau Veritas S.A. (b) | | 105,887 |
| 14,727 | | Carrefour S.A. (b) | | 312,324 |
| 357 | | Christian Dior SE (b) | | 218,592 |
| 9,882 | | Electricite de France S.A. (b) | | 89,838 |
| 256 | | Hermes International (b) | | 315,663 |
| 3,020 | | Ipsen S.A. (b) | | 313,065 |
| 428 | | Kering S.A. (b) | | 227,727 |
| 2,990 | | Legrand S.A. (b) | | 264,956 |
| 1,042 | | LVMH Moet Hennessy Louis Vuitton SE (b) | | 674,315 |
| 2,550 | | Sanofi (b) | | 269,522 |
| 460 | | Sartorius Stedim Biotech (b) | | 150,525 |
| 1,183 | | Schneider Electric SE (b) | | 169,724 |
| 549 | | Thales S.A. (b) | | 70,286 |
| | | | | 3,785,593 |
| | | Germany – 14.4% | | |
| 3,042 | | Bechtle AG (b) | | 140,570 |
| 4,854 | | Covestro AG (b) (c) (d) | | 208,992 |
| 24,414 | | Deutsche Bank AG (b) (e) | | 244,124 |
| 5,725 | | Deutsche Post AG (b) | | 244,586 |
| 26,086 | | E.ON SE (b) | | 271,476 |
| 8,381 | | Fresenius SE & Co., KGaA (b) | | 296,251 |
| 9,809 | | Infineon Technologies AG (b) | | 278,411 |
| 7,719 | | Mercedes-Benz Group AG (b) | | 538,796 |
| 835 | | Nemetschek SE (b) | | 66,261 |
| 1,246 | | Rheinmetall AG (b) | | 280,878 |
| 4,245 | | TAG Immobilien AG (b) | | 84,838 |
| 1,825 | | Volkswagen AG (b) | | 395,772 |
| 1,188 | | Volkswagen AG (Preference Shares) (b) | | 183,981 |
| 722 | | Zalando SE (b) (c) (d) (e) | | 28,408 |
| | | | | 3,263,344 |
| | | Italy – 0.7% | | |
| 7,233 | | Azimut Holding S.p.A. (b) | | 153,527 |
| Shares | | Description | | Value |
|
| | | Jersey – 2.3% | | |
| 6,432 | | Experian PLC (b) | | $222,125 |
| 2,452 | | Ferguson PLC (b) | | 307,601 |
| | | | | 529,726 |
| | | Luxembourg – 2.7% | | |
| 35,999 | | B&M European Value Retail S.A. (b) | | 220,569 |
| 2,272 | | Eurofins Scientific SE (b) | | 211,155 |
| 20,822 | | Subsea 7 S.A. (b) | | 170,663 |
| | | | | 602,387 |
| | | Netherlands – 6.4% | | |
| 1,007 | | ASML Holding N.V. (b) | | 571,511 |
| 3,929 | | ASR Nederland N.V. (b) | | 178,568 |
| 312 | | Ferrari N.V. (b) | | 65,693 |
| 11,811 | | Koninklijke Ahold Delhaize N.V. (b) | | 348,377 |
| 1,551 | | OCI N.V. (b) (e) | | 58,772 |
| 2,263 | | Wolters Kluwer N.V. (b) | | 228,524 |
| | | | | 1,451,445 |
| | | Norway – 1.4% | | |
| 9,530 | | Equinor ASA (b) | | 322,110 |
| | | Spain – 2.5% | | |
| 78,730 | | Telefonica S.A. (b) | | 382,993 |
| 39,920 | | Telefonica S.A., ADR (e) | | 190,818 |
| | | | | 573,811 |
| | | Sweden – 2.8% | | |
| 14,130 | | Investor AB, Class A (b) | | 295,126 |
| 16,126 | | Investor AB, Class B (b) | | 310,311 |
| 2,047 | | Kinnevik AB, Class B (b) (e) | | 40,065 |
| | | | | 645,502 |
| | | Switzerland – 11.0% | | |
| 902 | | Kuehne + Nagel International AG (b) | | 252,331 |
| 2,177 | | Logitech International S.A. (b) | | 141,676 |
| 4,408 | | Nestle S.A. (b) | | 569,047 |
| 8,663 | | Novartis AG (b) | | 765,543 |
| 1,026 | | Roche Holding AG (b) | | 380,455 |
| 471 | | Roche Holding AG (b) | | 189,222 |
| 72 | | SGS S.A. (b) | | 185,006 |
| | | | | 2,483,280 |
| | | United Kingdom – 24.9% | | |
| 20,090 | | 3i Group PLC (b) | | 328,778 |
| 88,009 | | abrdn PLC (b) | | 206,656 |
| 9,123 | | Anglo American PLC (b) | | 404,067 |
| 370 | | AstraZeneca PLC (b) | | 49,373 |
| 137,732 | | Barclays PLC (b) | | 253,171 |
| 12,569 | | British American Tobacco PLC (b) | | 526,796 |
| 6,554 | | Dunelm Group PLC (b) | | 80,256 |
| 44,089 | | Evraz PLC (b) (f) | | 44,845 |
Page 16
See Notes to Financial Statements
First Trust RiverFront Dynamic Europe ETF (RFEU)
Portfolio of Investments (Continued)
April 30, 2022 (Unaudited)
| Shares | | Description | | Value |
| COMMON STOCKS (a) (Continued) |
| | | United Kingdom (Continued) | | |
| 25,033 | | GlaxoSmithKline PLC (b) | | $564,308 |
| 3,980 | | Hikma Pharmaceuticals PLC (b) | | 93,492 |
| 24,034 | | IG Group Holdings PLC (b) | | 245,629 |
| 8,146 | | IMI PLC (b) | | 137,136 |
| 15,676 | | Imperial Brands PLC (b) | | 326,304 |
| 2,394 | | Intertek Group PLC (b) | | 149,182 |
| 71,691 | | Marks & Spencer Group PLC (b) (e) | | 122,385 |
| 12,854 | | RELX PLC (b) | | 382,927 |
| 7,998 | | Rio Tinto PLC (b) | | 565,108 |
| 46,298 | | Royal Mail PLC (b) | | 198,447 |
| 23,474 | | Shell PLC (b) | | 630,181 |
| 14,138 | | SSE PLC (b) | | 328,367 |
| | | | | 5,637,408 |
| | | Total Common Stocks | | 21,900,462 |
| | | (Cost $25,242,732) | | |
| Shares | | Description | | Value |
| REAL ESTATE INVESTMENT TRUSTS (a) – 3.1% |
| | | Belgium – 0.6% | | |
| 3,767 | | Warehouses De Pauw CVA (b) | | $144,918 |
| | | United Kingdom – 2.5% | | |
| 20,982 | | Segro PLC (b) | | 351,283 |
| 67,866 | | Tritax Big Box REIT PLC (b) | | 207,172 |
| | | | | 558,455 |
| | | Total Real Estate Investment Trusts | | 703,373 |
| | | (Cost $739,964) | | |
| | | Total Investments – 99.7% | | 22,603,835 |
| | | (Cost $25,982,696) | | |
| | | Net Other Assets and Liabilities – 0.3% | | 72,257 |
| | | Net Assets – 100.0% | | $22,676,092 |
| Forward Foreign Currency Contracts |
Settlement
Date | | Counterparty | | Amount
Purchased | | Amount
Sold | | Purchase
Value as of
4/30/2022 | | Sale
Value as of
4/30/2022 | | Unrealized
Appreciation/
(Depreciation) |
| 05/31/22 | | BBH | | USD | 1,970,000 | | EUR | 1,865,494 | | $ 1,970,000 | | $ 1,970,395 | | $ (395) |
| Counterparty Abbreviations |
| BBH | Brown Brothers Harriman and Co. |
| (a) | Portfolio securities are categorized based upon their country of incorporation. For a breakdown of the portfolio securities by sector, please see the Fund Performance Overview. |
| (b) | This security is fair valued by the Advisor’s Pricing Committee in accordance with procedures adopted by the Trust’s Board of Trustees and in accordance with provisions of the Investment Company Act of 1940, as amended. At April 30, 2022, securities noted as such are valued at $22,413,017 or 98.8% of net assets. Certain of these securities are fair valued using a factor provided by a third-party pricing service due to the change in value between the foreign markets’ close and the New York Stock Exchange close exceeding a certain threshold. On days when this threshold is not exceeded, these securities are typically valued at the last sale price on the exchange on which they are principally traded. |
| (c) | This security may be resold to qualified foreign investors and foreign institutional buyers under Regulation S of the Securities Act of 1933, as amended (the “1933 Act”). |
| (d) | This security is exempt from registration upon resale under Rule 144A of the 1933 Act and may be resold in transactions exempt from registration, normally to qualified institutional buyers. This security is not restricted on the foreign exchange where it trades freely without any additional registration. As such, it does not require the additional disclosure required of restricted securities. |
| (e) | Non-income producing security. |
| (f) | Pursuant to procedures adopted by the Trust’s Board of Trustees, this security has been determined to be illiquid by First Trust Advisors L.P., the Fund’s advisor. |
| ADR | American Depositary Receipt |
See Notes to Financial Statements
Page 17
First Trust RiverFront Dynamic Europe ETF (RFEU)
Portfolio of Investments (Continued)
April 30, 2022 (Unaudited)
Currency Exposure
Diversification | % of Total
Investments† |
| EUR | 33.8% |
| GBP | 30.7 |
| CHF | 11.0 |
| USD | 9.6 |
| DKK | 8.4 |
| SEK | 2.9 |
| NOK | 2.2 |
| AUD | 1.4 |
| Total | 100.0% |
| † | The weightings include the impact of currency forwards. |
| Currency Abbreviations |
| AUD | Australian Dollar |
| CHF | Swiss Franc |
| DKK | Danish Krone |
| EUR | Euro |
| GBP | British Pound Sterling |
| NOK | Norwegian Krone |
| SEK | Swedish Krona |
| USD | United States Dollar |
Valuation Inputs
A summary of the inputs used to value the Fund’s investments as of April 30, 2022 is as follows (see Note 2A - Portfolio Valuation in the Notes to Financial Statements):
| ASSETS TABLE |
| | Total
Value at
4/30/2022 | Level 1
Quoted
Prices | Level 2
Significant
Observable
Inputs | Level 3
Significant
Unobservable
Inputs |
| Common Stocks: | | | | |
Spain
| $ 573,811 | $ 190,818 | $ 382,993 | $ — |
Other Country Categories*
| 21,326,651 | — | 21,326,651 | — |
Real Estate Investment Trusts*
| 703,373 | — | 703,373 | — |
Total Investments
| $ 22,603,835 | $ 190,818 | $ 22,413,017 | $— |
| |
| LIABILITIES TABLE |
| | Total
Value at
4/30/2022 | Level 1
Quoted
Prices | Level 2
Significant
Observable
Inputs | Level 3
Significant
Unobservable
Inputs |
Forward Foreign Currency Contracts**
| $ (395) | $ — | $ (395) | $ — |
| * | See Portfolio of Investments for country breakout. |
| ** | See the Schedule of Forward Foreign Currency Contracts for contract and currency detail. |
Page 18
See Notes to Financial Statements
First Trust RiverFront Dynamic Emerging Markets ETF (RFEM)
Portfolio of Investments
April 30, 2022 (Unaudited)
| Shares | | Description | | Value |
| COMMON STOCKS (a) – 99.9% |
| | | Argentina – 0.7% | | |
| 26,330 | | Grupo Financiero Galicia S.A., ADR | | $239,340 |
| | | Bermuda – 1.2% | | |
| 610,164 | | Gemdale Properties & Investment Corp., Ltd. (b) | | 64,716 |
| 1,060,858 | | Sinopec Kantons Holdings Ltd. (b) | | 360,925 |
| | | | | 425,641 |
| | | Brazil – 14.1% | | |
| 75,296 | | Cia Siderurgica Nacional S.A., ADR | | 316,996 |
| 61,581 | | CPFL Energia S.A. | | 450,278 |
| 65,756 | | Equatorial Energia S.A. | | 341,020 |
| 62,284 | | JBS S.A. | | 476,835 |
| 79,786 | | Marfrig Global Foods S.A. | | 302,590 |
| 86,896 | | Petroleo Brasileiro S.A. | | 587,749 |
| 99,485 | | Petroleo Brasileiro S.A. (Preference Shares) | | 609,312 |
| 37,027 | | Petroleo Brasileiro S.A., ADR | | 502,456 |
| 36,892 | | Petroleo Brasileiro S.A., ADR | | 452,665 |
| 28,834 | | Suzano S.A. | | 289,334 |
| 22,215 | | Vale S.A. | | 374,253 |
| 27,480 | | Vale S.A., ADR | | 464,137 |
| | | | | 5,167,625 |
| | | Cayman Islands – 7.5% | | |
| 28,486 | | ANTA Sports Products Ltd. (b) | | 327,375 |
| 167,563 | | Asia Cement China Holdings Corp. (b) | | 108,081 |
| 431,711 | | Country Garden Holdings Co., Ltd. (b) | | 298,604 |
| 26,260 | | ENN Energy Holdings Ltd. (b) | | 351,755 |
| 567,572 | | Sino Biopharmaceutical Ltd. (b) | | 297,710 |
| 67,045 | | Sunac China Holdings Ltd. (b) (c) | | 39,132 |
| 21,447 | | Tencent Holdings Ltd. (b) | | 1,010,687 |
| 103,213 | | Wisdom Marine Lines Co., Ltd. (b) | | 317,596 |
| | | | | 2,750,940 |
| | | Chile – 1.3% | | |
| 4,125,706 | | Cia Sud Americana de Vapores S.A. | | 466,389 |
| | | China – 2.1% | | |
| 42,800 | | Alibaba Group Holding Ltd. (b) (d) | | 522,061 |
| 43,371 | | Anhui Conch Cement Co., Ltd., Class H (b) | | 235,680 |
| | | | | 757,741 |
| | | Colombia – 0.7% | | |
| 317,552 | | Ecopetrol S.A. | | 257,219 |
| Shares | | Description | | Value |
|
| | | Hong Kong – 1.2% | | |
| 470,000 | | Lenovo Group Ltd. (b) | | $456,371 |
| | | India – 17.3% | | |
| 11,582 | | Asian Paints Ltd. (b) | | 488,207 |
| 26,299 | | Aurobindo Pharma Ltd. (b) | | 215,036 |
| 77,957 | | Bharat Petroleum Corp., Ltd. (b) | | 366,864 |
| 49,829 | | Chambal Fertilisers and Chemicals Ltd. (b) | | 295,395 |
| 39,649 | | Dabur India Ltd. (b) | | 287,034 |
| 6,841 | | Divi’s Laboratories Ltd. (b) | | 400,458 |
| 30,797 | | HCL Technologies Ltd. (b) | | 431,359 |
| 5,014 | | HDFC Asset Management Co., Ltd. (b) (e) (f) | | 132,764 |
| 16,585 | | Hindustan Unilever Ltd. (b) | | 481,856 |
| 36,501 | | Infosys Ltd. (b) | | 739,773 |
| 18,879 | | Infosys Ltd., ADR | | 375,126 |
| 53,606 | | Jindal Steel & Power Ltd. (b) | | 373,797 |
| 16,790 | | Jubilant Foodworks Ltd. (b) | | 118,567 |
| 3,299 | | Mindtree Ltd. (b) | | 150,960 |
| 3,455 | | Reliance Industries Ltd. (b) | | 125,183 |
| 42,177 | | Sun Pharmaceutical Industries Ltd. (b) | | 509,835 |
| 31,895 | | Sun TV Network Ltd. (b) | | 200,108 |
| 13,558 | | Tata Consultancy Services Ltd. (b) | | 624,866 |
| | | | | 6,317,188 |
| | | Indonesia – 2.1% | | |
| 441,815 | | Indofood CBP Sukses Makmur Tbk PT (b) (c) | | 232,426 |
| 1,069,886 | | Indosat Tbk PT (b) (c) | | 516,912 |
| | | | | 749,338 |
| | | Israel – 1.2% | | |
| 11,807 | | Mizrahi Tefahot Bank Ltd. (b) | | 436,737 |
| | | Malaysia – 0.5% | | |
| 130,057 | | Supermax Corp. Bhd | | 33,160 |
| 385,600 | | Top Glove Corp. Bhd | | 148,802 |
| | | | | 181,962 |
| | | Mexico – 2.7% | | |
| 110,170 | | Grupo Mexico S.A.B. de C.V., Series B | | 516,068 |
| 136,464 | | Wal-Mart de Mexico S.A.B. de C.V. | | 483,691 |
| | | | | 999,759 |
| | | Netherlands – 0.2% | | |
| 504,911 | | Steinhoff International Holdings N.V. (b) (d) | | 83,459 |
| | | Poland – 0.6% | | |
| 12,536 | | Asseco Poland S.A. (b) | | 220,287 |
| | | Russia – 0.1% | | |
| 59,735 | | Rosneft Oil Co. PJSC (b) (c) (g) | | 16,139 |
See Notes to Financial Statements
Page 19
First Trust RiverFront Dynamic Emerging Markets ETF (RFEM)
Portfolio of Investments (Continued)
April 30, 2022 (Unaudited)
| Shares | | Description | | Value |
| COMMON STOCKS (a) (Continued) |
| | | Russia (Continued) | | |
| 23,602 | | Severstal PAO (b) (c) (g) | | $29,192 |
| | | | | 45,331 |
| | | South Africa – 5.8% | | |
| 3,810 | | Capitec Bank Holdings Ltd. (b) | | 531,837 |
| 32,088 | | Exxaro Resources Ltd. (b) | | 458,543 |
| 33,881 | | Impala Platinum Holdings Ltd. (b) | | 438,265 |
| 12,468 | | Kumba Iron Ore Ltd. (b) | | 413,919 |
| 29,917 | | Vodacom Group Ltd. (b) | | 287,346 |
| | | | | 2,129,910 |
| | | South Korea – 18.0% | | |
| 3,631 | | Coway Co., Ltd. (b) | | 203,373 |
| 21,883 | | Daishin Securities Co., Ltd (b) | | 304,697 |
| 22,503 | | HMM Co., Ltd. (b) | | 498,795 |
| 6,980 | | Kia Corp. (b) | | 457,820 |
| 4,078 | | KIWOOM Securities Co., Ltd. (b) | | 304,339 |
| 5,747 | | Korea Investment Holdings Co., Ltd. (b) | | 318,620 |
| 16,045 | | KT Corp. (b) | | 451,767 |
| 2,785 | | Kumho Petrochemical Co., Ltd. (b) | | 336,749 |
| 7,124 | | LF Corp. (b) | | 110,120 |
| 854 | | LG Chem Ltd. (b) | | 349,769 |
| 2,837 | | LX Semicon Co., Ltd. (b) | | 292,718 |
| 61,920 | | Mirae Asset Securities Co., Ltd. (b) | | 391,686 |
| 30,078 | | NH Investment & Securities Co., Ltd. (b) | | 256,707 |
| 18,450 | | Samsung Electronics Co., Ltd. (b) | | 983,266 |
| 10,264 | | Samsung Securities Co., Ltd. (b) | | 320,564 |
| 6,329 | | SIMMTECH Co., Ltd. (b) | | 243,921 |
| 7,383 | | SK Hynix, Inc. (b) | | 646,958 |
| 8,854 | | Tongyang Life Insurance Co., Ltd. (b) | | 47,129 |
| 108,872 | | Woori Investment Bank Co., Ltd. (b) | | 74,311 |
| | | | | 6,593,309 |
| | | Spain – 1.2% | | |
| 89,304 | | Telefonica S.A. (b) | | 434,432 |
| | | Taiwan – 16.7% | | |
| 848,199 | | AU Optronics Corp. (b) | | 484,482 |
| 73,357 | | Elite Semiconductor Microelectronics Technology, Inc. (b) | | 301,027 |
| 107,251 | | Evergreen Marine Corp. Taiwan Ltd. (b) | | 515,549 |
| 82,570 | | Gigabyte Technology Co., Ltd. (b) | | 296,235 |
| 232,059 | | Macronix International (b) | | 295,270 |
| Shares | | Description | | Value |
|
| | | Taiwan (Continued) | | |
| 14,002 | | MediaTek, Inc. (b) | | $386,007 |
| 39,158 | | Novatek Microelectronics Corp. (b) | | 518,004 |
| 116,581 | | Taiwan Semiconductor Manufacturing Co., Ltd. (b) | | 2,108,095 |
| 2,783 | | Taiwan Semiconductor Manufacturing Co., Ltd., ADR | | 258,624 |
| 94,034 | | Wan Hai Lines Ltd. (b) | | 455,804 |
| 117,558 | | Yang Ming Marine Transport Corp. (b) (d) | | 490,443 |
| | | | | 6,109,540 |
| | | Thailand – 0.7% | | |
| 207,600 | | Com7 PCL | | 250,805 |
| | | Turkey – 4.0% | | |
| 1,312,337 | | Dogan Sirketler Grubu Holding A.S. (b) | | 304,794 |
| 219,366 | | Haci Omer Sabanci Holding A.S. (b) | | 295,306 |
| 465,183 | | Petkim Petrokimya Holding A.S. (b) (d) | | 298,639 |
| 357,899 | | Turk Telekomunikasyon A.S. | | 242,966 |
| 268,319 | | Turkiye Sise ve Cam Fabrikalari A.S. | | 327,442 |
| | | | | 1,469,147 |
| | | Total Common Stocks | | 36,542,470 |
| | | (Cost $35,808,303) | | |
| EXCHANGE-TRADED FUNDS (a) – 0.9% |
| | | United States – 0.9% | | |
| 6,581 | | iShares Core MSCI Emerging Markets ETF | | 343,857 |
| | | (Cost $348,859) | | |
| | | Total Investments – 100.8% | | 36,886,327 |
| | | (Cost $36,157,162) | | |
| | | Net Other Assets and Liabilities – (0.8)% | | (302,772) |
| | | Net Assets – 100.0% | | $36,583,555 |
Page 20
See Notes to Financial Statements
First Trust RiverFront Dynamic Emerging Markets ETF (RFEM)
Portfolio of Investments (Continued)
April 30, 2022 (Unaudited)
| (a) | Portfolio securities are categorized based upon their country of incorporation. For a breakdown of the portfolio securities by sector, please see the Fund Performance Overview. |
| (b) | This security is fair valued by the Advisor’s Pricing Committee in accordance with procedures adopted by the Trust’s Board of Trustees and in accordance with provisions of the Investment Company Act of 1940, as amended. At April 30, 2022, securities noted as such are valued at $27,775,213 or 75.9% of net assets. Certain of these securities are fair valued using a factor provided by a third-party pricing service due to the change in value between the foreign markets’ close and the New York Stock Exchange close exceeding a certain threshold. On days when this threshold is not exceeded, these securities are typically valued at the last sale price on the exchange on which they are principally traded. |
| (c) | Pursuant to procedures adopted by the Trust’s Board of Trustees, this security has been determined to be illiquid by First Trust Advisors L.P., the Fund’s advisor. |
| (d) | Non-income producing security. |
| (e) | This security may be resold to qualified foreign investors and foreign institutional buyers under Regulation S of the Securities Act of 1933, as amended (the “1933 Act”). |
| (f) | This security is exempt from registration upon resale under Rule 144A of the 1933 Act and may be resold in transactions exempt from registration, normally to qualified institutional buyers. This security is not restricted on the foreign exchange where it trades freely without any additional registration. As such, it does not require the additional disclosure required of restricted securities. |
| (g) | This security’s value was determined using significant unobservable inputs (see Note 2A – Portfolio Valuation in the Notes to Financial Statements). |
| ADR | American Depositary Receipt |
Currency Exposure
Diversification | % of Total
Investments |
| South Korean Won | 17.9% |
| New Taiwan Dollar | 16.7 |
| Indian Rupee | 16.1 |
| Hong Kong Dollar | 11.0 |
| Brazilian Real | 9.3 |
| United States Dollar | 8.0 |
| South African Rand | 5.8 |
| Turkish Lira | 4.0 |
| Mexican Peso | 2.7 |
| Indonesian Rupiah | 2.0 |
| Euro | 1.4 |
| Chilean Peso | 1.3 |
| Israeli Shekel | 1.2 |
| Colombian Peso | 0.7 |
| Thai Baht | 0.7 |
| Polish Zloty | 0.6 |
| Malaysian Ringgit | 0.5 |
| Russian Ruble | 0.1 |
| Total | 100.0% |
Valuation Inputs
A summary of the inputs used to value the Fund’s investments as of April 30, 2022 is as follows (see Note 2A - Portfolio Valuation in the Notes to Financial Statements):
| | Total
Value at
4/30/2022 | Level 1
Quoted
Prices | Level 2
Significant
Observable
Inputs | Level 3
Significant
Unobservable
Inputs |
| Common Stocks: | | | | |
| Argentina | $ 239,340 | $ 239,340 | $ — | $ — |
| Brazil | 5,167,625 | 5,167,625 | — | — |
| Chile | 466,389 | 466,389 | — | — |
| Colombia | 257,219 | 257,219 | — | — |
| India | 6,317,188 | 375,126 | 5,942,062 | — |
| Malaysia | 181,962 | 181,962 | — | — |
| Mexico | 999,759 | 999,759 | — | — |
| Russia | 45,331 | — | — | 45,331 |
| Taiwan | 6,109,540 | 258,624 | 5,850,916 | — |
| Thailand | 250,805 | 250,805 | — | — |
| Turkey | 1,469,147 | 570,408 | 898,739 | — |
| Other Country Categories* | 15,038,165 | — | 15,038,165 | — |
| Exchange-Traded Funds* | 343,857 | 343,857 | — | — |
| Total Investments | $ 36,886,327 | $ 9,111,114 | $ 27,729,882 | $ 45,331 |
| * | See Portfolio of Investments for country breakout. |
Level 3 Common Stocks are fair valued by the Advisor’s Pricing Committee and are footnoted in the Portfolio of Investments. All Level 3 Common Stocks values are based on unobservable and non-quantitative inputs.
See Notes to Financial Statements
Page 21
First Trust Exchange-Traded Fund III
Statements of Assets and Liabilities
April 30, 2022 (Unaudited)
| | First Trust
RiverFront
Dynamic
Developed
International
ETF
(RFDI) | | First Trust
RiverFront
Dynamic
Europe
ETF
(RFEU) | | First Trust
RiverFront
Dynamic
Emerging
Markets
ETF
(RFEM) |
| ASSETS: | | | | | |
Investments, at value
| $ 138,192,940 | | $ 22,603,835 | | $ 36,886,327 |
Cash
| 1,272,678 | | 129,220 | | 138,646 |
Foreign currency
| 34,512 | | 19,965 | | 61,452 |
Due from broker
| 99,325 | | — | | — |
| Receivables: | | | | | |
Investment securities sold
| 42,118,592 | | 2,768,546 | | 9,635,486 |
Dividend reclaims
| 557,540 | | 144,018 | | 1,711 |
Dividends
| 306,360 | | 61,415 | | 311,269 |
Fund shares sold
| — | | — | | 16,055 |
Prepaid foreign capital gains tax
| — | | — | | 590 |
Total Assets
| 182,581,947 | | 25,726,999 | | 47,051,536 |
| LIABILITIES: | | | | | |
Unrealized depreciation on forward foreign currency contracts
| 2,795 | | 395 | | — |
| Payables: | | | | | |
Investment securities purchased
| 28,692,601 | | 3,032,594 | | 10,303,456 |
Investment advisory fees
| 109,860 | | 17,918 | | 34,314 |
Deferred foreign capital gains tax
| — | | — | | 130,211 |
Total Liabilities
| 28,805,256 | | 3,050,907 | | 10,467,981 |
NET ASSETS
| $153,776,691 | | $22,676,092 | | $36,583,555 |
| NET ASSETS consist of: | | | | | |
Paid-in capital
| $ 220,573,534 | | $ 42,706,557 | | $ 56,283,698 |
Par value
| 25,174 | | 3,500 | | 6,000 |
Accumulated distributable earnings (loss)
| (66,822,017) | | (20,033,965) | | (19,706,143) |
NET ASSETS
| $153,776,691 | | $22,676,092 | | $36,583,555 |
NET ASSET VALUE, per share
| $61.09 | | $64.79 | | $60.97 |
Number of shares outstanding (unlimited number of shares authorized, par value $0.01 per share)
| 2,517,387 | | 350,002 | | 600,002 |
Investments, at cost
| $135,923,225 | | $25,982,696 | | $36,157,162 |
Foreign currency, at cost (proceeds)
| $34,428 | | $19,917 | | $61,069 |
Page 22
See Notes to Financial Statements
First Trust Exchange-Traded Fund III
Statements of Operations
For the Six Months Ended April 30, 2022 (Unaudited)
| | First Trust
RiverFront
Dynamic
Developed
International
ETF
(RFDI) | | First Trust
RiverFront
Dynamic
Europe
ETF
(RFEU) | | First Trust
RiverFront
Dynamic
Emerging
Markets
ETF
(RFEM) |
| INVESTMENT INCOME: | | | | | |
Dividends
| $ 3,227,786 | | $ 547,062 | | $ 985,024 |
Interest
| 135 | | 31 | | 39 |
Foreign withholding tax
| (249,580) | | (42,853) | | (94,015) |
Other
| 764 | | 19 | | 57 |
Total investment income
| 2,979,105 | | 504,259 | | 891,105 |
| EXPENSES: | | | | | |
Investment advisory fees
| 699,374 | | 100,970 | | 218,487 |
Total expenses
| 699,374 | | 100,970 | | 218,487 |
NET INVESTMENT INCOME (LOSS)
| 2,279,731 | | 403,289 | | 672,618 |
| NET REALIZED AND UNREALIZED GAIN (LOSS): | | | | | |
| Net realized gain (loss) on: | | | | | |
Investments
| (593,864) | | (1,045,791) | | 2,330,285 |
In-kind redemptions
| — | | (25,453) | | 19,624 |
Forward foreign currency contracts
| 507,670 | | 41,731 | | — |
Foreign currency transactions
| 178,454 | | 1,739 | | (102,292) |
Foreign capital gains tax
| — | | — | | (130,265) |
Net realized gain (loss)
| 92,260 | | (1,027,774) | | 2,117,352 |
| Net change in unrealized appreciation (depreciation) on: | | | | | |
Investments
| (26,985,674) | | (3,106,825) | | (6,893,178) |
Forward foreign currency contracts
| (70,419) | | (10,285) | | — |
Foreign currency translation
| (71,802) | | (18,262) | | (9,236) |
Deferred foreign capital gains tax
| — | | — | | 137,985 |
Net change in unrealized appreciation (depreciation)
| (27,127,895) | | (3,135,372) | | (6,764,429) |
NET REALIZED AND UNREALIZED GAIN (LOSS)
| (27,035,635) | | (4,163,146) | | (4,647,077) |
NET INCREASE (DECREASE) IN NET ASSETS RESULTING FROM OPERATIONS
| $(24,755,904) | | $(3,759,857) | | $(3,974,459) |
See Notes to Financial Statements
Page 23
First Trust Exchange-Traded Fund III
Statements of Changes in Net Assets
| | First Trust RiverFront Dynamic
Developed International ETF (RFDI) | | First Trust RiverFront
Dynamic Europe ETF (RFEU) |
| | Six Months
Ended
4/30/2022
(Unaudited) | | Year
Ended
10/31/2021 | | Six Months
Ended
4/30/2022
(Unaudited) | | Year
Ended
10/31/2021 |
| OPERATIONS: | | | | | | | |
Net investment income (loss)
| $ 2,279,731 | | $ 2,920,667 | | $ 403,289 | | $ 264,761 |
Net realized gain (loss)
| 92,260 | | 19,871,112 | | (1,027,774) | | 7,437,295 |
Net change in unrealized appreciation (depreciation)
| (27,127,895) | | 22,666,834 | | (3,135,372) | | (1,019,540) |
Net increase (decrease) in net assets resulting from operations
| (24,755,904) | | 45,458,613 | | (3,759,857) | | 6,682,516 |
| DISTRIBUTIONS TO SHAREHOLDERS FROM: | | | | | | | |
Investment operations
| (3,941,895) | | (2,850,031) | | (254,302) | | (420,473) |
| SHAREHOLDER TRANSACTIONS: | | | | | | | |
Proceeds from shares sold
| 7,157,610 | | 12,917,390 | | 7,163,510 | | 62,017,714 |
Proceeds from shares issued through reorganization
| — | | 8,762,219 | | — | | — |
Cost of shares redeemed
| — | | (20,020,290) | | (3,439,455) | | (62,042,949) |
Net increase (decrease) in net assets resulting from shareholder transactions
| 7,157,610 | | 1,659,319 | | 3,724,055 | | (25,235) |
Total increase (decrease) in net assets
| (21,540,189) | | 44,267,901 | | (290,104) | | 6,236,808 |
| NET ASSETS: | | | | | | | |
Beginning of period
| 175,316,880 | | 131,048,979 | | 22,966,196 | | 16,729,388 |
End of period
| $ 153,776,691 | | $ 175,316,880 | | $ 22,676,092 | | $ 22,966,196 |
| CHANGES IN SHARES OUTSTANDING: | | | | | | | |
Shares outstanding, beginning of period
| 2,417,387 | | 2,400,002 | | 300,002 | | 300,002 |
Shares sold
| 100,000 | | 200,000 | | 100,000 | | 800,000 |
Shares issued through reorganization
| — | | 117,432 | | — | | — |
Shares redeemed
| — | | (300,047) | | (50,000) | | (800,000) |
Shares outstanding, end of period
| 2,517,387 | | 2,417,387 | | 350,002 | | 300,002 |
Page 24
See Notes to Financial Statements
First Trust RiverFront Dynamic
Emerging Markets ETF (RFEM) |
Six Months
Ended
4/30/2022
(Unaudited) | | Year
Ended
10/31/2021 |
| | | |
| $ 672,618 | | $ 1,162,686 |
| 2,117,352 | | 3,314,598 |
| (6,764,429) | | 1,310,373 |
| (3,974,459) | | 5,787,657 |
| | | |
| (627,831) | | (990,423) |
| | | |
| — | | — |
| — | | — |
| (6,186,633) | | (3,602,441) |
| (6,186,633) | | (3,602,441) |
| (10,788,923) | | 1,194,793 |
| | | |
| 47,372,478 | | 46,177,685 |
| $36,583,555 | | $ 47,372,478 |
| | | |
| 700,002 | | 750,002 |
| — | | — |
| — | | — |
| (100,000) | | (50,000) |
| 600,002 | | 700,002 |
See Notes to Financial Statements
Page 25
First Trust Exchange-Traded Fund III
Financial Highlights
For a share outstanding throughout each period
First Trust RiverFront Dynamic Developed International ETF (RFDI)
| | Six Months
Ended
4/30/2022
(Unaudited) | | Year Ended October 31, |
| | 2021 | | 2020 | | 2019 | | 2018 | | 2017 | |
Net asset value, beginning of period
| $ 72.52 | | $ 54.60 | | $ 57.70 | | $ 55.84 | | $ 63.96 | | $ 51.36 |
| Income from investment operations: | | | | | | | | | | | |
Net investment income (loss)
| 0.90 | | 1.21 | | 0.85 | | 1.54 | | 1.34 | | 0.82 |
Net realized and unrealized gain (loss)
| (10.74) | | 17.89 | | (2.84) | | 1.81 | | (8.00) | | 12.73 |
Total from investment operations
| (9.84) | | 19.10 | | (1.99) | | 3.35 | | (6.66) | | 13.55 |
| Distributions paid to shareholders from: | | | | | | | | | | | |
Net investment income
| (1.59) | | (1.18) | | (1.11) | | (1.49) | | (1.44) | | (0.71) |
Net realized gain
| — | | — | | — | | — | | (0.02) | | (0.24) |
Total distributions
| (1.59) | | (1.18) | | (1.11) | | (1.49) | | (1.46) | | (0.95) |
Net asset value, end of period
| $61.09 | | $72.52 | | $54.60 | | $57.70 | | $55.84 | | $63.96 |
Total return (a)
| (13.85)% | | 35.11% | | (3.45)% | | 6.12% | | (10.65)% | | 26.60% (b) |
| Ratios to average net assets/supplemental data: | | | | | | | | | | | |
Net assets, end of period (in 000’s)
| $ 153,777 | | $ 175,317 | | $ 131,049 | | $ 245,234 | | $ 499,726 | | $ 444,522 |
Ratio of total expenses to average net assets
| 0.83% (c) | | 0.83% | | 0.83% | | 0.83% | | 0.83% | | 0.83% |
Ratio of net investment income (loss) to average net assets
| 2.71% (c) | | 1.79% | | 1.43% | | 2.51% | | 2.28% | | 1.86% |
Portfolio turnover rate (d)
| 46% | | 45% | | 96% | | 87% | | 133% | | 106% |
| (a) | Total return is calculated assuming an initial investment made at the net asset value at the beginning of the period, reinvestment of all distributions at net asset value during the period, and redemption at net asset value on the last day of the period. The returns presented do not reflect the deduction of taxes that a shareholder would pay on Fund distributions or the redemption or sale of Fund shares. Total return is calculated for the time period presented and is not annualized for periods of less than a year. |
| (b) | The Fund received a reimbursement from the advisor in the amount of $35,978, which represents less than $0.01 per share. Since the advisor reimbursed the Fund, there was no effect on the Fund’s total return. |
| (c) | Annualized. |
| (d) | Portfolio turnover is calculated for the time period presented and is not annualized for periods of less than a year and does not include securities received or delivered from processing creations or redemptions and in-kind transactions. |
Page 26
See Notes to Financial Statements
First Trust Exchange-Traded Fund III
Financial Highlights (Continued)
For a share outstanding throughout each period
First Trust RiverFront Dynamic Europe ETF (RFEU)
| | Six Months
Ended
4/30/2022
(Unaudited) | | Year Ended October 31, |
| | 2021 | | 2020 | | 2019 | | 2018 | | 2017 | |
Net asset value, beginning of period
| $ 76.55 | | $ 55.76 | | $ 59.49 | | $ 57.23 | | $ 65.25 | | $ 51.17 |
| Income from investment operations: | | | | | | | | | | | |
Net investment income (loss)
| 1.18 | | 0.98 | | 0.96 | | 1.78 | | 1.48 | | 0.82 |
Net realized and unrealized gain (loss)
| (12.17) | | 21.31 | | (3.50) | | 2.20 | | (7.97) | | 14.86 |
Total from investment operations
| (10.99) | | 22.29 | | (2.54) | | 3.98 | | (6.49) | | 15.68 |
| Distributions paid to shareholders from: | | | | | | | | | | | |
Net investment income
| (0.77) | | (1.50) | | (1.19) | | (1.72) | | (1.53) | | (0.79) |
Net realized gain
| — | | — | | — | | — | | — | | (0.81) |
Total distributions
| (0.77) | | (1.50) | | (1.19) | | (1.72) | | (1.53) | | (1.60) |
Net asset value, end of period
| $64.79 | | $76.55 | | $55.76 | | $59.49 | | $57.23 | | $65.25 |
Total return (a)
| (14.35)% | | 40.20% | | (4.22)% | | 7.01% | | (10.16)% | | 31.21% |
| Ratios to average net assets/supplemental data: | | | | | | | | | | | |
Net assets, end of period (in 000’s)
| $ 22,676 | | $ 22,966 | | $ 16,729 | | $ 38,666 | | $ 88,706 | | $ 123,980 |
Ratio of total expenses to average net assets
| 0.83% (b) | | 0.83% | | 0.83% | | 0.83% | | 0.83% | | 0.83% |
Ratio of net investment income (loss) to average net assets
| 3.32% (b) | | 1.29% | | 1.59% | | 2.77% | | 2.45% | | 1.71% |
Portfolio turnover rate (c)
| 33% | | 50% | | 87% | | 81% | | 130% | | 110% |
| (a) | Total return is calculated assuming an initial investment made at the net asset value at the beginning of the period, reinvestment of all distributions at net asset value during the period, and redemption at net asset value on the last day of the period. The returns presented do not reflect the deduction of taxes that a shareholder would pay on Fund distributions or the redemption or sale of Fund shares. Total return is calculated for the time period presented and is not annualized for periods of less than a year. |
| (b) | Annualized. |
| (c) | Portfolio turnover is calculated for the time period presented and is not annualized for periods of less than a year and does not include securities received or delivered from processing creations or redemptions and in-kind transactions. |
See Notes to Financial Statements
Page 27
First Trust Exchange-Traded Fund III
Financial Highlights (Continued)
For a share outstanding throughout each period
First Trust RiverFront Dynamic Emerging Markets ETF (RFEM)
| | Six Months
Ended
4/30/2022
(Unaudited) | | Year Ended October 31, |
| | 2021 | | 2020 | | 2019 | | 2018 | | 2017 | |
Net asset value, beginning of period
| $ 67.67 | | $ 61.57 | | $ 60.76 | | $ 56.40 | | $ 68.64 | | $ 56.27 |
| Income from investment operations: | | | | | | | | | | | |
Net investment income (loss)
| 1.02 | | 1.61 | | 1.10 | | 1.79 | | 1.20 | | 0.71 |
Net realized and unrealized gain (loss)
| (6.82) | | 5.85 | | 1.81 | | 3.94 | | (11.87) | | 13.70 |
Total from investment operations
| (5.80) | | 7.46 | | 2.91 | | 5.73 | | (10.67) | | 14.41 |
| Distributions paid to shareholders from: | | | | | | | | | | | |
Net investment income
| (0.90) | | (1.36) | | (1.73) | | (1.37) | | (1.18) | | (0.77) |
Net realized gain
| — | | — | | — | | — | | (0.30) | | (1.27) |
Return of capital
| — | | — | | (0.37) | | — | | (0.09) | | — |
Total distributions
| (0.90) | | (1.36) | | (2.10) | | (1.37) | | (1.57) | | (2.04) |
Net asset value, end of period
| $60.97 | | $67.67 | | $61.57 | | $60.76 | | $56.40 | | $68.64 |
Total return (a)
| (8.06)% | | 12.01% | | 4.74% | | 10.32% | | (15.92)% | | 26.49% |
| Ratios to average net assets/supplemental data: | | | | | | | | | | | |
Net assets, end of period (in 000’s)
| $ 36,584 | | $ 47,372 | | $ 46,178 | | $ 72,917 | | $ 101,512 | | $ 75,506 |
Ratio of total expenses to average net assets
| 0.95% (b) | | 0.95% | | 0.95% | | 0.95% | | 0.95% | | 0.95% |
Ratio of net investment income (loss) to average net assets
| 2.92% (b) | | 2.19% | | 1.92% | | 2.60% | | 1.90% | | 1.56% |
Portfolio turnover rate (c)
| 50% | | 32% | | 89% | | 116% | | 126% | | 87% |
| (a) | Total return is calculated assuming an initial investment made at the net asset value at the beginning of the period, reinvestment of all distributions at net asset value during the period, and redemption at net asset value on the last day of the period. The returns presented do not reflect the deduction of taxes that a shareholder would pay on Fund distributions or the redemption or sale of Fund shares. Total return is calculated for the time period presented and is not annualized for periods of less than a year. |
| (b) | Annualized. |
| (c) | Portfolio turnover is calculated for the time period presented and is not annualized for periods of less than a year and does not include securities received or delivered from processing creations or redemptions and in-kind transactions. |
Page 28
See Notes to Financial Statements
Notes to Financial Statements
First Trust Exchange-Traded Fund III
April 30, 2022 (Unaudited)
1. Organization
First Trust Exchange-Traded Fund III (the “Trust”) is an open-end management investment company organized as a Massachusetts business trust on January 9, 2008, and is registered with the Securities and Exchange Commission under the Investment Company Act of 1940, as amended (the “1940 Act”).
The Trust consists of seventeen funds that are currently offering shares. This report covers the three funds (each a “Fund” and collectively, the “Funds”) listed below. The shares of each Fund are listed and traded on The Nasdaq Stock Market LLC (“Nasdaq”).
First Trust RiverFront Dynamic Developed International ETF – (ticker “RFDI”)
First Trust RiverFront Dynamic Europe ETF – (ticker “RFEU”)
First Trust RiverFront Dynamic Emerging Markets ETF – (ticker “RFEM”)
Each Fund represents a separate series of shares of beneficial interest in the Trust. Unlike conventional mutual funds, each Fund issues and redeems shares on a continuous basis, at net asset value (“NAV”), only in large blocks of shares known as “Creation Units.”
Each Fund is an actively managed exchange-traded fund. The investment objective of each Fund is to provide capital appreciation.
Under normal market conditions, RFDI seeks to achieve its investment objective by investing at least 80% of its net assets (including investment borrowings) in a portfolio of equity securities of developed market companies, including through investments in common stocks, depositary receipts, common and preferred shares of real estate investment trusts (“REITs”), and forward foreign currency contracts and currency spot transactions used to hedge the Fund’s exposure to the currencies in which the equity securities of such developed market companies are denominated.
Under normal market conditions, RFEU seeks to achieve its investment objective by investing at least 80% of its net assets (including investment borrowings) in a portfolio of equity securities of European companies, including through investments in common stocks, depositary receipts, common and preferred shares of REITs, and forward foreign currency contracts and currency spot transactions used to hedge the Fund’s exposure to the currencies in which the equity securities of such European companies are denominated.
Under normal market conditions, RFEM seeks to achieve its investment objective by investing at least 80% of its net assets (including investment borrowings) in a portfolio of equity securities of emerging market companies, including through investments in common stocks, depositary receipts, common and preferred shares of REITs, and forward foreign currency contracts and currency spot transactions used to hedge the Fund’s exposure to the currencies in which the equity securities of such emerging market companies are denominated.
There can be no assurance that a Fund will achieve its investment objective. The Funds may not be appropriate for all investors.
2. Significant Accounting Policies
The Funds are each considered an investment company and follow accounting and reporting guidance under Financial Accounting Standards Board Accounting Standards Codification Topic 946, “Financial Services-Investment Companies.” The following is a summary of significant accounting policies consistently followed by the Funds in the preparation of the financial statements. The preparation of the financial statements in accordance with accounting principles generally accepted in the United States of America (“U.S. GAAP”) requires management to make estimates and assumptions that affect the reported amounts and disclosures in the financial statements. Actual results could differ from those estimates.
A. Portfolio Valuation
Each Fund’s NAV is determined daily as of the close of regular trading on the New York Stock Exchange (“NYSE”), normally 4:00 p.m. Eastern time, on each day the NYSE is open for trading. If the NYSE closes early on a valuation day, the NAV is determined as of that time. Foreign securities are priced using data reflecting the earlier closing of the principal markets for those securities. Each Fund’s NAV is calculated by dividing the value of all assets of each Fund (including accrued interest and dividends), less all liabilities (including accrued expenses and dividends declared but unpaid), by the total number of shares outstanding.
Each Fund’s investments are valued daily at market value or, in the absence of market value with respect to any portfolio securities, at fair value. Market value prices represent last sale or official closing prices from a national or foreign exchange (i.e., a regulated market) and are primarily obtained from third-party pricing services. Fair value prices represent any prices not considered market value prices and are either obtained from a third-party pricing service or are determined by the Pricing Committee of the Funds’ investment advisor, First Trust Advisors L.P. (“First Trust” or the “Advisor”), in accordance with valuation procedures adopted by the
Notes to Financial Statements (Continued)
First Trust Exchange-Traded Fund III
April 30, 2022 (Unaudited)
Trust’s Board of Trustees, and in accordance with provisions of the 1940 Act. Investments valued by the Advisor’s Pricing Committee, if any, are footnoted as such in the footnotes to the Portfolio of Investments. Each Fund’s investments are valued as follows:
Common stocks, REITs, and other equity securities listed on any national or foreign exchange (excluding Nasdaq and the London Stock Exchange Alternative Investment Market (“AIM”)) are valued at the last sale price on the exchange on which they are principally traded or, for Nasdaq and AIM securities, the official closing price. Securities traded on more than one securities exchange are valued at the last sale price or official closing price, as applicable, at the close of the securities exchange representing the principal market for such securities.
Securities trading on foreign exchanges or over-the-counter markets that close prior to the NYSE close may be valued using a systematic fair valuation model provided by a third-party pricing service. If these foreign securities meet certain criteria in relation to the valuation model, their valuation is systematically adjusted to reflect the impact of movement in the U.S. market after the close of the foreign markets.
Forward foreign currency contracts are fair valued at the current day’s interpolated foreign exchange rate, as calculated using the current day’s spot rate, and the thirty, sixty, ninety, and one-hundred eighty day forward rates provided by a third-party pricing service.
Securities traded in an over-the-counter market are fair valued at the mean of their most recent bid and asked price, if available, and otherwise at their closing bid price.
Certain securities may not be able to be priced by pre-established pricing methods. Such securities may be valued by the Trust’s Board of Trustees or its delegate, the Advisor’s Pricing Committee, at fair value. These securities generally include, but are not limited to, restricted securities (securities which may not be publicly sold without registration under the Securities Act of 1933, as amended) for which a third-party pricing service is unable to provide a market price; securities whose trading has been formally suspended; a security whose market or fair value price is not available from a pre-established pricing source; a security with respect to which an event has occurred that is likely to materially affect the value of the security after the market has closed but before the calculation of a Fund’s NAV or make it difficult or impossible to obtain a reliable market quotation; and a security whose price, as provided by the third-party pricing service, does not reflect the security’s fair value. As a general principle, the current fair value of a security would appear to be the amount which the owner might reasonably expect to receive for the security upon its current sale. When fair value prices are used, generally they will differ from market quotations or official closing prices on the applicable exchanges. A variety of factors may be considered in determining the fair value of such securities, including, but not limited to, the following:
| 1) | the type of security; |
| 2) | the size of the holding; |
| 3) | the initial cost of the security; |
| 4) | transactions in comparable securities; |
| 5) | price quotes from dealers and/or third-party pricing services; |
| 6) | relationships among various securities; |
| 7) | information obtained by contacting the issuer, analysts, or the appropriate stock exchange; |
| 8) | an analysis of the issuer’s financial statements; and |
| 9) | the existence of merger proposals or tender offers that might affect the value of the security. |
If the securities in question are foreign securities, the following additional information may be considered:
| 1) | the value of similar foreign securities traded on other foreign markets; |
| 2) | ADR trading of similar securities; |
| 3) | closed-end fund or exchange-traded fund trading of similar securities; |
| 4) | foreign currency exchange activity; |
| 5) | the trading prices of financial products that are tied to baskets of foreign securities; |
| 6) | factors relating to the event that precipitated the pricing problem; |
| 7) | whether the event is likely to recur; and |
| 8) | whether the effects of the event are isolated or whether they affect entire markets, countries or regions. |
Because foreign markets may be open on different days than the days during which investors may transact in the shares of a Fund, the value of the Fund’s securities may change on the days when investors are not able to transact in the shares of the Fund. The value of securities denominated in foreign currencies is converted into U.S. dollars using exchange rates determined daily as of the close of regular trading on the NYSE.
Notes to Financial Statements (Continued)
First Trust Exchange-Traded Fund III
April 30, 2022 (Unaudited)
The Funds are subject to fair value accounting standards that define fair value, establish the framework for measuring fair value and provide a three-level hierarchy for fair valuation based upon the inputs to the valuation as of the measurement date. The three levels of the fair value hierarchy are as follows:
| • | Level 1 – Level 1 inputs are quoted prices in active markets for identical investments. An active market is a market in which transactions for the investment occur with sufficient frequency and volume to provide pricing information on an ongoing basis. |
| • | Level 2 – Level 2 inputs are observable inputs, either directly or indirectly, and include the following: |
| o | Quoted prices for similar investments in active markets. |
| o | Quoted prices for identical or similar investments in markets that are non-active. A non-active market is a market where there are few transactions for the investment, the prices are not current, or price quotations vary substantially either over time or among market makers, or in which little information is released publicly. |
| o | Inputs other than quoted prices that are observable for the investment (for example, interest rates and yield curves observable at commonly quoted intervals, volatilities, prepayment speeds, loss severities, credit risks, and default rates). |
| o | Inputs that are derived principally from or corroborated by observable market data by correlation or other means. |
| • | Level 3 – Level 3 inputs are unobservable inputs. Unobservable inputs may reflect the reporting entity’s own assumptions about the assumptions that market participants would use in pricing the investment. |
The inputs or methodologies used for valuing investments are not necessarily an indication of the risk associated with investing in those investments. A summary of the inputs used to value each Fund’s investments as of April 30, 2022, is included with each Fund’s Portfolio of Investments.
B. Securities Transactions and Investment Income
Securities transactions are recorded as of the trade date. Realized gains and losses from securities transactions are recorded on the identified cost basis. Dividend income is recorded on the ex-dividend date except that certain dividends from foreign securities are recorded as soon as the information becomes available after the ex-dividend date. Interest income, if any, is recorded on the accrual basis.
Withholding taxes and tax reclaims on foreign dividends have been provided for in accordance with each Fund’s understanding of the applicable country’s tax rules and rates.
Distributions received from a Fund’s investments in REITs may be comprised of return of capital, capital gains, and income. The actual character of the amounts received during the year are not known until after the REITs’ fiscal year end. A Fund records the character of distributions received from the REITs during the year based on estimates available. The characterization of distributions received by a Fund may be subsequently revised based on information received from the REITs after their tax reporting periods conclude.
C. Forward Foreign Currency Contracts
The Funds are subject to foreign currency risk in the normal course of pursuing their investment objectives. Forward foreign currency contracts are agreements between two parties (“Counterparties”) to exchange one currency for another at a future date and at a specified price. The Funds use forward foreign currency contracts to facilitate transactions in foreign securities and to manage each Fund’s foreign currency exposure. These contracts are valued daily, and each Fund’s net equity therein, representing unrealized gain or loss on the contracts as measured by the difference between the forward foreign exchange rates at the dates of entry into the contracts and the forward rates at the reporting date, is included in “Unrealized appreciation on forward foreign currency contracts” and “Unrealized depreciation on forward foreign currency contracts” on the Statements of Assets and Liabilities. The change in unrealized appreciation (depreciation) is included in “Net change in unrealized appreciation (depreciation) on forward foreign currency contracts” on the Statements of Operations. When the forward contract is closed, a Fund records a realized gain or loss equal to the difference between the proceeds from (or the cost of) the closing transaction and the Fund’s basis in the contract. This realized gain or loss is included in “Net realized gain (loss) on forward foreign currency contracts” on the Statements of Operations. Risks arise from the possible inability of Counterparties to meet the terms of their contracts and from movement in currency, securities values and interest rates. Due to the risks, the Funds could incur losses in excess of the net unrealized value shown on the Forward Foreign Currency Contracts table in each Fund’s Portfolio of Investments. In the event of default by the Counterparty, a Fund will provide notice to the Counterparty of the Fund’s intent to convert the currency held by the Fund into the currency that the Counterparty agreed to exchange with that Fund. If a Counterparty becomes bankrupt or otherwise fails to perform its obligations due to financial difficulties, the Funds
Notes to Financial Statements (Continued)
First Trust Exchange-Traded Fund III
April 30, 2022 (Unaudited)
may experience significant delays in obtaining any recovery in a bankruptcy or other reorganization proceeding. The Funds may obtain only limited recovery or may obtain no recovery in such circumstances.
D. Foreign Currency
The books and records of the Funds are maintained in U.S. dollars. Foreign currencies, investments and other assets and liabilities are translated into U.S. dollars at the exchange rates prevailing at the end of the period. Purchases and sales of investments and items of income and expense are translated on the respective dates of such transactions. Unrealized gains and losses on assets and liabilities, other than investments in securities, which result from changes in foreign currency exchange rates have been included in “Net change in unrealized appreciation (depreciation) on foreign currency translation” on the Statements of Operations. Unrealized gains and losses on investments in securities which result from changes in foreign exchange rates are included with fluctuations arising from changes in market price and are included in “Net change in unrealized appreciation (depreciation) on investments” on the Statements of Operations. Net realized foreign currency gains and losses include the effect of changes in exchange rates between trade date and settlement date on investment security transactions, foreign currency transactions and interest and dividends received and are included in “Net realized gain (loss) on foreign currency transactions” on the Statements of Operations. The portion of foreign currency gains and losses related to fluctuations in exchange rates between the initial purchase settlement date and subsequent sale trade date is included in “Net realized gain (loss) on investments” on the Statements of Operations.
E. Dividends and Distributions to Shareholders
Dividends from net investment income, if any, are declared and paid quarterly by each Fund, or as the Board of Trustees may determine from time to time. Distributions of net realized capital gains earned by each Fund, if any, are distributed at least annually.
Distributions from net investment income and realized capital gains are determined in accordance with federal income tax regulations, which may differ from U.S. GAAP. Certain capital accounts in the financial statements are periodically adjusted for permanent differences in order to reflect their tax character. These permanent differences are primarily due to the varying treatment of income and gain/loss on portfolio securities held by the Funds and have no impact on net assets or NAV per share. Temporary differences, which arise from recognizing certain items of income, expense and gain/loss in different periods for financial statement and tax purposes, will reverse at some time in the future.
The tax character of distributions paid by each Fund during the fiscal year ended October 31, 2021, was as follows:
| | Distributions
paid from
Ordinary
Income | | Distributions
paid from
Capital
Gains | | Distributions
paid from
Return of
Capital |
First Trust RiverFront Dynamic Developed International ETF
| $ 2,850,031 | | $ — | | $ — |
First Trust RiverFront Dynamic Europe ETF
| 420,473 | | — | | — |
First Trust RiverFront Dynamic Emerging Markets ETF
| 990,423 | | — | | — |
As of October 31, 2021, the components of distributable earnings on a tax basis for each Fund were as follows:
| | Undistributed
Ordinary
Income | | Accumulated
Capital and
Other
Gain (Loss) | | Net
Unrealized
Appreciation
(Depreciation) |
First Trust RiverFront Dynamic Developed International ETF
| $ 2,592,643 | | $ (68,361,413) | | $ 27,644,552 |
First Trust RiverFront Dynamic Europe ETF
| 42,150 | | (15,787,044) | | (274,912) |
First Trust RiverFront Dynamic Emerging Markets ETF
| 176,153 | | (22,554,889) | | 7,274,883 |
F. Income and Other Taxes
Each Fund intends to continue to qualify as a regulated investment company by complying with the requirements under Subchapter M of the Internal Revenue Code of 1986, as amended, which includes distributing substantially all of its net investment income and net realized gains to shareholders. Accordingly, no provision has been made for federal and state income taxes. However, due to the timing and amount of distributions, each Fund may be subject to an excise tax of 4% of the amount by which approximately 98% of each Fund’s taxable income exceeds the distributions from such taxable income for the calendar year.
Notes to Financial Statements (Continued)
First Trust Exchange-Traded Fund III
April 30, 2022 (Unaudited)
Certain countries assess a capital gains tax on securities sold in their local markets. This tax is accrued as the securities in these foreign markets appreciate in value and is paid at the time of sale to the extent a capital gain is realized. Taxes accrued on securities in an unrealized appreciation position are included in “Net change in unrealized appreciation (depreciation) on deferred foreign capital gains tax” on the Statements of Operations. The capital gains tax paid on securities sold is included in “Net realized gain (loss) on foreign capital gains tax” on the Statements of Operations.
India’s Finance Bill, 2018 (“Finance Bill, 2018”) was enacted into law on March 29, 2018 and amongst other provisions, it introduced a long-term capital gains tax beginning April 1, 2018. Long-term capital gains on the sale of listed shares in excess of INR 0.1 million are taxed at the rate of 10% (plus applicable surcharge and cess (which is a type of tax)) subject to satisfaction of certain conditions. Long-term capital gains accruing as of January 31, 2018 are considered exempt due to a grandfather clause in the provision. The aforesaid exemption from long-term capital gains tax is available with respect to shares acquired between October 1, 2004 and March 31, 2018 only if on such acquisitions Securities Transaction Tax (“STT”) was chargeable. Certain exceptions in this regard, such as acquisition of shares in a public offer, bonus, rights issued, etc. for which the condition of chargeability of STT on acquisition is not applicable, have been notified.
In the case of the sale of listed shares held by a Fund for one year or less, the income is classified as short-term capital gains and is taxable at 15% (plus applicable surcharge and cess) provided the shares are sold on the stock exchange and subjected to STT. For above purposes, the applicable rate of surcharge is 2% or 5% (depending on the level of income of the Fund). The Finance Bill, 2018 increases the cess imposed on the sum of tax and surcharge from 3% to 4%. The cess 4% rate is applied to the capital gains tax, resulting in a higher effective rate of capital gains tax.
Where the sale of shares is outside the stock exchange and not subject to STT, the long-term capital gains are taxed at 10% (plus applicable surcharge and cess) and short-term capital gains are taxed at 30% (plus applicable surcharge and cess). The Finance Bill, 2018, approves the carry forward of long-term capital losses to be offset against long-term capital gains. Short-term losses can be netted against both short-term gains and long-term gains.
Until March 31, 2020, dividends received by a Fund from Indian companies were exempt from tax in India because Indian companies were required to pay dividend distribution tax. The Indian Finance Act, 2020 has amended the dividend taxation framework effective April 1, 2020 and accordingly dividends would now be taxable in the hands of the shareholders at 20%, plus applicable surcharge and cess. Subsequent to the Indian Finance Act, 2020, “The Taxation and Other Laws (Relaxation and Amendment of Certain Provisions) Bill, 2020” (the “Bill”) was enacted into law and is effective retroactively to April 1, 2020. The Bill caps the maximum surcharge at 15% of the tax on dividend income earned by the Fund. The highest effective tax rate proposed for non-corporate entities on dividends will be 23.92%. Note, the Fund will not obtain relief under the US-India tax treaty as the treaty rate of 25% is higher than the domestic rate. Any excess taxes withheld can be off-set against capital gains tax liability during the year or claimed as a refund in the annual tax return.
Please note that the above description is based on current provisions of Indian law, and any change or modification made by subsequent legislation, regulation, or administrative or judicial decision could increase the Indian tax liability of a Fund and thus reduce the return to a Fund’s shareholders. There can be no assurance that the Indian tax authorities and/or regulators will not take a position contrary to the views expressed herein. If the Indian tax authorities and/or regulators take a position contrary to the views expressed herein, adverse unpredictable consequences may follow.
The Funds are subject to accounting standards that establish a minimum threshold for recognizing, and a system for measuring, the benefits of a tax position taken or expected to be taken in a tax return. Taxable years ended 2018, 2019, 2020, and 2021 remain open to federal and state audit. As of April 30, 2022, management has evaluated the application of these standards to the Funds and has determined that no provision for income tax is required in the Funds’ financial statements for uncertain tax positions.
The Funds intend to utilize provisions of the federal income tax laws, which allow them to carry a realized capital loss forward indefinitely following the year of the loss and offset such loss against any future realized capital gains. The Funds are subject to certain limitations under U.S. tax rules on the use of capital loss carryforwards and net unrealized built-in losses. These limitations apply when there has been a 50% change in ownership. At October 31, 2021, for federal income tax purposes, each applicable Fund had a capital loss carryforward available that is shown in the table below, to the extent provided by regulations, to offset future capital gains.
Notes to Financial Statements (Continued)
First Trust Exchange-Traded Fund III
April 30, 2022 (Unaudited)
| | Non-Expiring
Capital Loss
Carryforward |
First Trust RiverFront Dynamic Developed International ETF
| $ 68,361,413 |
First Trust RiverFront Dynamic Europe ETF
| 15,787,044 |
First Trust RiverFront Dynamic Emerging Markets ETF
| 22,554,889 |
As of April 30, 2022, the aggregate cost, gross unrealized appreciation, gross unrealized depreciation, and net unrealized appreciation/(depreciation) on investments (including short positions and derivatives, if any) for federal income tax purposes were as follows:
| | Tax Cost | | Gross
Unrealized
Appreciation | | Gross
Unrealized
(Depreciation) | | Net Unrealized
Appreciation
(Depreciation) |
First Trust RiverFront Dynamic Developed International ETF
| $ 135,923,225 | | $ 11,749,282 | | $ (9,482,362) | | $ 2,266,920 |
First Trust RiverFront Dynamic Europe ETF
| 25,982,696 | | 364,050 | | (3,743,306) | | (3,379,256) |
First Trust RiverFront Dynamic Emerging Markets ETF
| 36,157,162 | | 4,314,172 | | (3,585,007) | | 729,165 |
G. Expenses
Expenses, other than the investment advisory fee and other excluded expenses, are paid by the Advisor (See Note 3).
3. Investment Advisory Fee, Affiliated Transactions and Other Fee Arrangements
First Trust, the investment advisor to the Funds, is a limited partnership with one limited partner, Grace Partners of DuPage L.P., and one general partner, The Charger Corporation. The Charger Corporation is an Illinois corporation controlled by James A. Bowen, Chief Executive Officer of First Trust. First Trust is responsible for supervising the selection and ongoing monitoring of the securities in each Fund’s portfolio, managing the Funds’ business affairs and providing certain administrative services necessary for the management of the Funds.
Pursuant to the Investment Management Agreement between First Trust and the Trust, First Trust supervises the investment of the Funds’ assets and is responsible for the expenses of each Fund including the cost of transfer agency, sub-advisory, custody, fund administration, legal, audit and other services, but excluding fee payments under the Investment Management Agreement, interest, taxes, brokerage commissions, acquired fund fees and expenses, if any, distribution and service fees payable pursuant to a Rule 12b-1 plan, if any, expenses associated with the execution of portfolio transactions, and extraordinary expenses, which are paid by each respective Fund. RFDI and RFEU have each agreed to pay First Trust an annual unitary management fee equal to 0.83% its average daily net assets. RFEM has agreed to pay First Trust an annual unitary management fee equal to 0.95% of its average daily net assets. First Trust also provides fund reporting services to each Fund for a flat annual fee in the amount of $9,250, which is covered under the annual unitary management fee.
RiverFront Investment Group, LLC (“RIG” or the “Sub-Advisor”) serves as the Funds’ sub-advisor and manages each Fund’s portfolio subject to First Trust’s supervision. The Sub-Advisor receives a monthly portfolio management fee calculated at an annual rate of 0.35% of each Fund’s average daily net assets that is paid by First Trust out of its investment advisory fee.
The Trust has multiple service agreements with Brown Brothers Harriman & Co. (“BBH”). Under the service agreements, BBH performs custodial, fund accounting, certain administrative services, and transfer agency services for the Funds. As custodian, BBH is responsible for custody of each Fund’s assets. As fund accountant and administrator, BBH is responsible for maintaining the books and records of each Fund’s securities and cash. As transfer agent, BBH is responsible for maintaining shareholder records for each Fund.
Each Trustee who is not an officer or employee of First Trust, any sub-advisor or any of their affiliates (“Independent Trustees”) is paid a fixed annual retainer that is allocated equally among each fund in the First Trust Fund Complex. Each Independent Trustee is also paid an annual per fund fee that varies based on whether the fund is a closed-end or other actively managed fund, a defined-outcome fund or an index fund.
Additionally, the Lead Independent Trustee and the Chairs of the Audit Committee, Nominating and Governance Committee and Valuation Committee are paid annual fees to serve in such capacities, with such compensation allocated pro rata among each fund in the First Trust Fund Complex based on net assets. Independent Trustees are reimbursed for travel and out-of-pocket expenses in
Notes to Financial Statements (Continued)
First Trust Exchange-Traded Fund III
April 30, 2022 (Unaudited)
connection with all meetings. The Lead Independent Trustee and Committee Chairs rotate every three years. The officers and “Interested” Trustee receive no compensation from the Trust for acting in such capacities.
4. Reorganization
On January 15, 2021, the Board of Trustees of RFDI approved a reorganization of RFDI with the First Trust RiverFront Dynamic Asia Pacific ETF (“RFAP”). The merger was completed on August 27, 2021. RFDI was the surviving fund. Under the terms of the reorganization, which was tax-free, the assets of RFAP were transferred to, and the liabilities of RFAP were assumed by, RFDI in exchange for shares of RFDI. The cost of the investments received from RFAP was carried forward to RFDI for U.S. GAAP and tax purposes. The RFDI shares were then distributed to RFAP shareholders and the separate existence of RFAP ceased. When the reorganization occurred, the transactions were based on the relative NAVs of RFAP and RFDI.
The following table summarizes the asset transfers and conversion ratios for the reorganization.
Acquired
Fund | | Shares
Redeemed | | Net Assets on
August 27, 2021 | | Unrealized
Appreciation
(Depreciation) | | Accumulated
Net Realized
Gain (Loss) | | Share
Conversion
Ratio | | Acquiring
(Surviving)
Fund | | Shares
Issued | | Net Assets on
August 27, 2021* |
| RFAP | | 150,002 | | $8,762,219 | | $514,662 | | $(8,654,877) | | 0.782867 | | RFDI | | 117,432 | | $171,615,711 |
* Amount reflects net assets of RFDI prior to the reorganization.
The following table summarizes the operations of the Acquired Fund for the period November 1, 2020 to August 27, 2021, and the operations of RFDI, the Acquiring (Surviving) Fund, for the fiscal year ended October 31, 2021, as presented in the Statements of Operations and the combined Acquired and Acquiring (Surviving) Funds’ pro-forma results of operations for the year ended October 31, 2021, assuming the acquisition had been completed on November 1, 2020.
Because the combined investment portfolios have been managed as a single integrated portfolio since the reorganization was completed, it is not practicable to separate the amounts of revenue and earnings of RFAP that have been included in RFDI’s Statement of Operations since August 27, 2021.
| | Net Investment
Income | | Net Realized and
Change in Unrealized
Gain (Loss)
on Investments | | Net Increase
(Decrease) from
Operations |
Acquired Fund for the period November 1, 2020 to August 27, 2021
RFAP | $89,635 | | $1,793,143 | | $1,882,778 |
Acquiring Fund for the fiscal year ended October 31, 2021
RFDI | 2,920,667 | | 43,052,608 | | 45,973,275 |
| Combined Total | $3,010,302 | | $44,845,751 | | $47,856,053 |
5. Purchases and Sales of Securities
For the six months ended April 30, 2022, the cost of purchases and proceeds from sales of investment securities for each Fund, excluding short-term investments and in-kind transactions, were as follows:
| | Purchases | | Sales |
| First Trust RiverFront Dynamic Developed International ETF | $ 76,983,115 | | $ 92,199,134 |
| First Trust RiverFront Dynamic Europe ETF | 8,399,580 | | 7,953,036 |
| First Trust RiverFront Dynamic Emerging Markets ETF | 22,430,546 | | 25,558,529 |
| | | | |
Notes to Financial Statements (Continued)
First Trust Exchange-Traded Fund III
April 30, 2022 (Unaudited)
For the six months ended April 30, 2022, the cost of in-kind purchases and proceeds from in-kind sales for each Fund were as follows:
| | Purchases | | Sales |
| First Trust RiverFront Dynamic Developed International ETF | $ 6,887,982 | | $ — |
| First Trust RiverFront Dynamic Europe ETF | 7,048,680 | | 3,385,062 |
| First Trust RiverFront Dynamic Emerging Markets ETF | — | | 3,002,772 |
6. Derivative Transactions
The following table presents the type of derivatives held by each fund at April 30, 2022, the primary underlying risk exposure and the location of these instruments as presented on the Statements of Assets and Liabilities.
| | | | | | | Asset Derivatives | | Liability Derivatives |
| Fund | | Derivative
Instrument | | Risk
Exposure | | Statements of Assets and
Liabilities Location | | Value | | Statements of Assets and
Liabilities Location | | Value |
| RFDI | | Forward foreign
currency
contracts | | Currency Risk | | Unrealized appreciation
on forward foreign
currency contracts | | $ — | | Unrealized depreciation
on forward foreign
currency contracts | | $ 2,795 |
| RFEU | | Forward foreign
currency
contracts | | Currency Risk | | Unrealized appreciation
on forward foreign
currency contracts | | — | | Unrealized depreciation
on forward currency
currency contracts | | 395 |
The following table presents the amount of net realized gain (loss) and change in net unrealized appreciation (depreciation) recognized for the six months ended April 30, 2022, on derivative instruments, as well as the primary underlying risk exposure associated with each instrument.
| | Equity Risk |
| Statements of Operations Location | RFDI | RFEU |
| Currency Risk Exposure | | |
| Net realized gain (loss) on forward foreign currency contracts | $507,670 | $41,731 |
| Net change in unrealized appreciation (depreciation) on forward foreign currency contracts | (70,419) | (10,285) |
For the six months ended April 30, 2022, the notional values of forward foreign currency contracts opened and closed were as follows:
| | Opened | | Closed |
| First Trust RiverFront Dynamic Developed International ETF | $ 103,168,291 | | $ 103,336,361 |
| First Trust RiverFront Dynamic Europe ETF | 12,847,564 | | 13,123,564 |
The Funds do not have the right to offset financial assets and liabilities related to forward foreign currency contracts on the Statements of Assets and Liabilities.
7. Creations, Redemptions and Transaction Fees
Each Fund generally issues and redeems its shares in primary market transactions through a creation and redemption mechanism and does not sell or redeem individual shares. Instead, financial entities known as “Authorized Participants” have contractual arrangements with a Fund or one of the Fund’s service providers to purchase and redeem Fund shares directly with the Fund in large blocks of shares known as “Creation Units.” Prior to the start of trading on every business day, a Fund publishes through the National Securities Clearing Corporation (“NSCC”) the “basket” of securities, cash or other assets that it will accept in exchange for a Creation Unit of the Fund’s shares. An Authorized Participant that wishes to effectuate a creation of a Fund’s shares deposits with the Fund the “basket” of securities, cash or other assets identified by the Fund that day, and then receives the Creation Unit of the Fund’s shares in return for those assets. After purchasing a Creation Unit, the Authorized Participant may continue to hold the Fund’s shares or sell them in the secondary market. The redemption process is the reverse of the purchase process: the Authorized Participant redeems a Creation Unit of a Fund’s shares for a basket of securities, cash or other assets. The combination of the creation and redemption process with secondary market trading in a Fund’s shares and underlying securities provides arbitrage opportunities that are designed to help keep the market price of a Fund’s shares at or close to the NAV per share of the Fund.
Notes to Financial Statements (Continued)
First Trust Exchange-Traded Fund III
April 30, 2022 (Unaudited)
Each Fund imposes fees in connection with the purchase of Creation Units. These fees may vary based upon various fact-based circumstances, including, but not limited to, the composition of the securities included in the Creation Unit or the countries in which the transactions are settled. The price for each Creation Unit will equal the daily NAV per share of a Fund times the number of shares in a Creation Unit, plus the fees described above and, if applicable, any operational processing and brokerage costs, transfer fees, stamp taxes and part or all of the spread between the expected bid and offer side of the market related to the securities comprising the creation basket.
Each Fund also imposes fees in connection with the redemption of Creation Units. These fees may vary based upon various fact-based circumstances, including, but not limited to, the composition of the securities included in the Creation Unit or the countries in which the transactions are settled. The price received for each Creation Unit will equal the daily NAV per share of a Fund times the number of shares in a Creation Unit, minus the fees described above and, if applicable, any operational processing and brokerage costs, transfer fees, stamp taxes and part or all of the spread between the expected bid and offer side of the market related to the securities comprising the redemption basket. Investors who use the services of a broker or other such intermediary in addition to an Authorized Participant to effect a redemption of a Creation Unit may also be assessed an amount to cover the cost of such services. The redemption fee charged by a Fund will comply with Rule 22c-2 of the 1940 Act which limits redemption fees to no more than 2% of the value of the shares redeemed.
8. Distribution Plan
The Board of Trustees adopted a Distribution and Service Plan pursuant to Rule 12b-1 under the 1940 Act. In accordance with the Rule 12b-1 plan, each Fund is authorized to pay an amount up to 0.25% of its average daily net assets each year to reimburse First Trust Portfolios L.P. (“FTP”), the distributor of the Funds, for amounts expended to finance activities primarily intended to result in the sale of Creation Units or to provide investor services. FTP may also use this amount to compensate securities dealers or other persons that are Authorized Participants for providing distribution assistance, including broker-dealer and shareholder support and educational and promotional services.
No 12b-1 fees are currently paid by the Funds, and pursuant to a contractual arrangement, no 12b-1 fees will be paid any time before February 28, 2023.
9. Indemnification
The Trust, on behalf of the Funds, has a variety of indemnification obligations under contracts with its service providers. The Trust’s maximum exposure under these arrangements is unknown. However, the Trust has not had prior claims or losses pursuant to these contracts and expects the risk of loss to be remote.
10. Subsequent Events
Management has evaluated the impact of all subsequent events to the Funds through the date the financial statements were issued and has determined that there were no subsequent events requiring recognition or disclosure in the financial statements that have not already been disclosed.
Additional Information
First Trust Exchange-Traded Fund III
April 30, 2022 (Unaudited)
Proxy Voting Policies and Procedures
A description of the policies and procedures that the Trust uses to determine how to vote proxies and information on how each Fund voted proxies relating to portfolio securities during the most recent 12-month period ended June 30 is available (1) without charge, upon request, by calling (800) 988-5891; (2) on each Fund’s website at www.ftportfolios.com; and (3) on the Securities and Exchange Commission’s (“SEC”) website at www.sec.gov.
Portfolio Holdings
Each Fund files portfolio holdings information for each month in a fiscal quarter within 60 days after the end of the relevant fiscal quarter on Form N-PORT. Portfolio holdings information for the third month of each fiscal quarter will be publicly available on the SEC’s website at www.sec.gov. Each Fund’s complete schedule of portfolio holdings for the second and fourth quarters of each fiscal year is included in the semi-annual and annual reports to shareholders, respectively, and is filed with the SEC on Form N-CSR. The semi-annual and annual report for each Fund is available to investors within 60 days after the period to which it relates. Each Fund’s Forms N-PORT and Forms N-CSR are available on the SEC’s website listed above.
Risk Considerations
Risks are inherent in all investing. Certain general risks that may be applicable to a Fund are identified below, but not all of the material risks relevant to each Fund are included in this report and not all of the risks below apply to each Fund. The material risks of investing in each Fund are spelled out in its prospectus, statement of additional information and other regulatory filings. Before investing, you should consider each Fund’s investment objective, risks, charges and expenses, and read each Fund’s prospectus and statement of additional information carefully. You can download each Fund’s prospectus at www.ftportfolios.com or contact First Trust Portfolios L.P. at (800) 621-1675 to request a prospectus, which contains this and other information about each Fund.
Concentration Risk. To the extent that a fund is able to invest a significant percentage of its assets in a single asset class or the securities of issuers within the same country, state, region, industry or sector, an adverse economic, business or political development may affect the value of the fund’s investments more than if the fund were more broadly diversified. A fund that tracks an index will be concentrated to the extent the fund’s corresponding index is concentrated. A concentration makes a fund more susceptible to any single occurrence and may subject the fund to greater market risk than a fund that is more broadly diversified.
Credit Risk. Credit risk is the risk that an issuer of a security will be unable or unwilling to make dividend, interest and/or principal payments when due and the related risk that the value of a security may decline because of concerns about the issuer’s ability to make such payments.
Cyber Security Risk. The funds are susceptible to potential operational risks through breaches in cyber security. A breach in cyber security refers to both intentional and unintentional events that may cause a fund to lose proprietary information, suffer data corruption or lose operational capacity. Such events could cause a fund to incur regulatory penalties, reputational damage, additional compliance costs associated with corrective measures and/or financial loss. In addition, cyber security breaches of a fund’s third-party service providers, such as its administrator, transfer agent, custodian, or sub-advisor, as applicable, or issuers in which the fund invests, can also subject a fund to many of the same risks associated with direct cyber security breaches.
Defined Outcome Funds Risk. To the extent a fund’s investment strategy is designed to deliver returns tied to the price performance of an underlying ETF, an investor may not realize the returns the fund seeks to achieve if that investor does not hold shares for the entire target outcome period. In the event an investor purchases shares after the first day of the target outcome period or sells shares prior to the end of the target outcome period, the buffer that the fund seeks to provide against a decline in the value of the underlying ETF may not be available, the enhanced returns that the fund seeks to provide (if any) may not be available and the investor may not participate in a gain in the value of the underlying ETF up to the cap for the investor’s investment period. Additionally, the fund will not participate in gains of the underlying ETF above the cap and a shareholder may lose their entire investment. If the fund seeks enhanced returns, there are certain time periods when the value of the fund may fall faster than the value of the underlying ETF, and it is very unlikely that, on any given day during which the underlying ETF share price increases in value, the fund’s share price will increase at the same rate as the enhanced returns sought by the fund, which is designed for an entire target outcome period. Trading flexible exchange options involves risks different from, or possibly greater than, the risks associated with investing directly in securities, such as less liquidity and correlation and valuation risks. A fund may experience substantial downside from specific flexible exchange option positions and certain positions may expire worthless.
Derivatives Risk. To the extent a fund uses derivative instruments such as futures contracts, options contracts and swaps, the fund may experience losses because of adverse movements in the price or value of the underlying asset, index or rate, which may be magnified
Additional Information (Continued)
First Trust Exchange-Traded Fund III
April 30, 2022 (Unaudited)
by certain features of the derivative. These risks are heightened when a fund’s portfolio managers use derivatives to enhance the fund’s return or as a substitute for a position or security, rather than solely to hedge (or offset) the risk of a position or security held by the fund.
Equity Securities Risk. To the extent a fund invests in equity securities, the value of the fund’s shares will fluctuate with changes in the value of the equity securities. Equity securities prices fluctuate for several reasons, including changes in investors’ perceptions of the financial condition of an issuer or the general condition of the relevant stock market, such as market volatility, or when political or economic events affecting the issuers occur. In addition, common stock prices may be particularly sensitive to rising interest rates, as the cost of capital rises and borrowing costs increase. Equity securities may decline significantly in price over short or extended periods of time, and such declines may occur in the equity market as a whole, or they may occur in only a particular country, company, industry or sector of the market.
ETF Risk. The shares of an ETF trade like common stock and represent an interest in a portfolio of securities. The risks of owning an ETF generally reflect the risks of owning the underlying securities, although lack of liquidity in an ETF could result in it being more volatile and ETFs have management fees that increase their costs. Shares of an ETF trade on an exchange at market prices rather than net asset value, which may cause the shares to trade at a price greater than net asset value (premium) or less than net asset value (discount). In times of market stress, decisions by market makers to reduce or step away from their role of providing a market for an ETF’s shares, or decisions by an ETF’s authorized participants that they are unable or unwilling to proceed with creation and/or redemption orders of an ETF’s shares, could result in shares of the ETF trading at a discount to net asset value and in greater than normal intraday bid-ask spreads.
Fixed Income Securities Risk. To the extent a fund invests in fixed income securities, the fund will be subject to credit risk, income risk, interest rate risk, liquidity risk and prepayment risk. Income risk is the risk that income from a fund’s fixed income investments could decline during periods of falling interest rates. Interest rate risk is the risk that the value of a fund’s fixed income securities will decline because of rising interest rates. Liquidity risk is the risk that a security cannot be purchased or sold at the time desired, or cannot be purchased or sold without adversely affecting the price. Prepayment risk is the risk that the securities will be redeemed or prepaid by the issuer, resulting in lower interest payments received by the fund. In addition to these risks, high yield securities, or “junk” bonds, are subject to greater market fluctuations and risk of loss than securities with higher ratings, and the market for high yield securities is generally smaller and less liquid than that for investment grade securities.
Index or Model Constituent Risk. Certain funds may be a constituent of one or more indices or ETF models. As a result, such a fund may be included in one or more index-tracking exchange-traded funds or mutual funds. Being a component security of such a vehicle could greatly affect the trading activity involving a fund, the size of the fund and the market volatility of the fund. Inclusion in an index could increase demand for the fund and removal from an index could result in outsized selling activity in a relatively short period of time. As a result, a fund’s net asset value could be negatively impacted and the fund’s market price may be significantly below its net asset value during certain periods. In addition, index rebalances may potentially result in increased trading activity in a fund’s shares.
Index Provider Risk. To the extent a fund seeks to track an index, it is subject to Index Provider Risk. There is no assurance that the Index Provider will compile the Index accurately, or that the Index will be determined, maintained, constructed, reconstituted, rebalanced, composed, calculated or disseminated accurately. To correct any such error, the Index Provider may carry out an unscheduled rebalance or other modification of the Index constituents or weightings, which may increase the fund’s costs. The Index Provider does not provide any representation or warranty in relation to the quality, accuracy or completeness of data in the Index, and it does not guarantee that the Index will be calculated in accordance with its stated methodology. Losses or costs associated with any Index Provider errors generally will be borne by the fund and its shareholders.
Investment Companies Risk. To the extent a fund invests in the securities of other investment vehicles, the fund will incur additional fees and expenses that would not be present in a direct investment in those investment vehicles. Furthermore, the fund’s investment performance and risks are directly related to the investment performance and risks of the investment vehicles in which the fund invests.
LIBOR Risk. To the extent a fund invests in floating or variable rate obligations that use the London Interbank Offered Rate (“LIBOR”) as a reference interest rate, it is subject to LIBOR Risk. The United Kingdom’s Financial Conduct Authority, which regulates LIBOR has ceased making LIBOR available as a reference rate over a phase-out period that began December 31, 2021. There is no assurance that any alternative reference rate, including the Secured Overnight Financing Rate (“SOFR”) will be similar to or produce the same value or economic equivalence as LIBOR or that instruments using an alternative rate will have the same volume or liquidity. The unavailability or replacement of LIBOR may affect the value, liquidity or return on certain fund investments and may result in costs incurred in connection with closing out positions and entering into new trades. Any potential effects of the transition away from LIBOR on the fund or on certain instruments in which the fund invests can be difficult to ascertain, and they may vary depending on a variety of factors, and they could result in losses to the fund.
Additional Information (Continued)
First Trust Exchange-Traded Fund III
April 30, 2022 (Unaudited)
Management Risk. To the extent that a fund is actively managed, it is subject to management risk. In managing an actively-managed fund’s investment portfolio, the fund’s portfolio managers will apply investment techniques and risk analyses that may not have the desired result. There can be no guarantee that a fund will meet its investment objective.
Market Risk. Securities held by a fund, as well as shares of a fund itself, are subject to market fluctuations caused by factors such as general economic conditions, political events, regulatory or market developments, changes in interest rates and perceived trends in securities prices. Shares of a fund could decline in value or underperform other investments as a result of the risk of loss associated with these market fluctuations. In addition, local, regional or global events such as war, acts of terrorism, spread of infectious diseases or other public health issues, recessions, or other events could have a significant negative impact on a fund and its investments. Such events may affect certain geographic regions, countries, sectors and industries more significantly than others. In February 2022, Russia invaded Ukraine which has caused and could continue to cause significant market disruptions and volatility within the markets in Russia, Europe, and the United States. The hostilities and sanctions resulting from those hostilities could have a significant impact on certain fund investments as well as fund performance. The outbreak of the respiratory disease designated as COVID-19 in December 2019 has caused significant volatility and declines in global financial markets, which have caused losses for investors. While the development of vaccines has slowed the spread of the virus and allowed for the resumption of “reasonably” normal business activity in the United States, many countries continue to impose lockdown measures in an attempt to slow the spread. Additionally, there is no guarantee that vaccines will be effective against emerging variants of the disease.
Non-U.S. Securities Risk. To the extent a fund invests in non-U.S. securities, it is subject to additional risks not associated with securities of domestic issuers. Non-U.S. securities are subject to higher volatility than securities of domestic issuers due to: possible adverse political, social or economic developments; restrictions on foreign investment or exchange of securities; capital controls; lack of liquidity; currency exchange rates; excessive taxation; government seizure of assets; the imposition of sanctions by foreign governments; different legal or accounting standards; and less government supervision and regulation of exchanges in foreign countries. Investments in non-U.S. securities may involve higher costs than investments in U.S. securities, including higher transaction and custody costs, as well as additional taxes imposed by non-U.S. governments. These risks may be heightened for securities of companies located, or with significant operations, in emerging market countries.
Operational Risk. Each fund is subject to risks arising from various operational factors, including, but not limited to, human error, processing and communication errors, errors of a fund’s service providers, counterparties or other third-parties, failed or inadequate processes and technology or systems failures. Each fund relies on third-parties for a range of services, including custody. Any delay or failure relating to engaging or maintaining such service providers may affect a fund’s ability to meet its investment objective. Although the funds and the funds’ investment advisor seek to reduce these operational risks through controls and procedures, there is no way to completely protect against such risks.
Passive Investment Risk. To the extent a fund seeks to track an index, the fund will invest in the securities included in, or representative of, the index regardless of their investment merit. A fund generally will not attempt to take defensive positions in declining markets.
Variable Interest Entities Risk. In order to gain exposure to certain Chinese companies that have been selected by a Fund’s Advisor or Sub-Advisor but are unavailable to direct investment by foreign investors, certain Funds invest significantly in non-Chinese shell companies that have created structures known as variable interest entities (“VIEs”) in order to gain exposure to such Chinese companies. In China, direct ownership of companies in certain sectors by foreign individuals and entities is prohibited. In order to allow for foreign investment in these businesses, many Chinese companies have created VIE structures to enable indirect foreign ownership. In such an arrangement, a Chinese operating company typically establishes an offshore shell company in another jurisdiction, such as the Cayman Islands. That shell company enters into service and other contracts with the Chinese issuer or operating company to obtain economic exposure to the Chinese company, then issues shares on an exchange outside of mainland China, and U.S. investors hold stock in the non-Chinese shell company rather than directly in the Chinese issuer or operating company. This arrangement allows U.S. investors, such as the Fund, to obtain economic exposure to the Chinese issuer or operating company through contractual means rather than through formal equity ownership. Because neither the shell company nor the Fund owns actual equity interests in the Chinese operating company, they do not have the voting rights or other types of control that an equity holder would expect to benefit from. Although VIEs are a longstanding industry practice and well known to officials and regulators in China, VIEs are not formally recognized under Chinese law. Intervention by the Chinese government with respect to VIEs could significantly affect the Chinese company’s performance and the enforceability of the VIE’s contractual arrangements that establish the links between the Chinese company and the shell company in which the Fund invests. This could considerably impact the financial condition of the shell company in which the Fund invests by limiting its ability to consolidate the financial results of the Chinese operating company into its own financial statements, as well as make the value of the shares held by the Fund effectively worthless. Further, if Chinese officials prohibit the existence of VIEs, the market value of the Fund’s associated holdings would likely suffer significant, and possibly permanent effects, which could negatively impact the Fund’s net asset value and could result in substantial
Additional Information (Continued)
First Trust Exchange-Traded Fund III
April 30, 2022 (Unaudited)
losses. Further, it is uncertain whether any new laws, rules or regulations relating to VIE structures will be adopted or, if adopted, what impact they would have on the value of the Fund’s shares.
VIEs are also subject to the investment risks associated with the underlying Chinese issuer or operating company. Chinese companies are not subject to the same degree of regulatory requirements or accounting standards and oversight as companies in more developed countries. As a result, information about the Chinese securities and VIEs in which the Fund invests may be less reliable and incomplete. There also may be significant obstacles to obtaining information necessary for investigations into or litigation against Chinese companies and VIEs, and shareholders may have limited legal remedies, which could negatively impact the Fund. Additionally, U.S.-listed VIEs may be delisted if they do not meet U.S. accounting standards and auditor oversight requirements. Delisting would significantly decrease the liquidity and value of the securities, decrease the ability of the Fund to invest in such securities and may increase the cost of the Fund if required to seek alternative markets in which to invest in such securities.
| NOT FDIC INSURED | NOT BANK GUARANTEED | MAY LOSE VALUE |
Liquidity Risk Management Program
In accordance with Rule 22e-4 under the Investment Company Act of 1940, as amended (the “1940 Act”), the Funds and each other fund in the First Trust Fund Complex, other than the closed-end funds, have adopted and implemented a liquidity risk management program (the “Program”) reasonably designed to assess and manage the funds’ liquidity risk, i.e., the risk that a fund could not meet requests to redeem shares issued by the fund without significant dilution of remaining investors’ interests in the fund. The Board of Trustees of the First Trust Funds has appointed First Trust Advisors L.P. (the “Advisor”) as the person designated to administer the Program, and in this capacity the Advisor performs its duties primarily through the activities and efforts of the First Trust Liquidity Committee (the “Liquidity Committee”).
Pursuant to the Program, the Liquidity Committee classifies the liquidity of each fund’s portfolio investments into one of the four liquidity categories specified by Rule 22e-4: highly liquid investments, moderately liquid investments, less liquid investments and illiquid investments. The Liquidity Committee determines certain of the inputs for this classification process, including reasonably anticipated trade sizes and significant investor dilution thresholds. The Liquidity Committee also determines and periodically reviews a highly liquid investment minimum for certain funds, monitors the funds’ holdings of assets classified as illiquid investments to seek to ensure they do not exceed 15% of a fund’s net assets and establishes policies and procedures regarding redemptions in kind.
At the April 18, 2022 meeting of the Board of Trustees, as required by Rule 22e-4 and the Program, the Advisor provided the Board with a written report prepared by the Advisor that addressed the operation of the Program during the period from March 16, 2021 through the Liquidity Committee’s annual meeting held on March 17, 2022 and assessed the Program’s adequacy and effectiveness of implementation during this period, including the operation of the highly liquid investment minimum for each fund that is required under the Program to have one, and any material changes to the Program. Note that because the Funds primarily hold assets that are highly liquid investments, the Funds have not adopted any highly liquid investment minimums.
As stated in the written report, during the review period, no fund breached the 15% limitation on illiquid investments, no fund with a highly liquid investment minimum breached that minimum and no fund filed a Form N-LIQUID. The Advisor concluded that each fund’s investment strategy is appropriate for an open-end fund; that the Program operated effectively in all material respects during the review period; and that the Program is reasonably designed to assess and manage the liquidity risk of each fund and to maintain compliance with Rule 22e-4.
This page intentionally left blank
This page intentionally left blank
This page intentionally left blank
First Trust Exchange-Traded Fund III
INVESTMENT ADVISOR
First Trust Advisors L.P.
120 East Liberty Drive, Suite 400
Wheaton, IL 60187
INVESTMENT SUB-ADVISOR
RiverFront Investment Group, LLC
1214 E. Cary Street
Richmond, VA 23219
ADMINISTRATOR, CUSTODIAN,
FUND ACCOUNTANT &
TRANSFER AGENT
Brown Brothers Harriman & Co.
50 Post Office Square
Boston, MA 02110
INDEPENDENT REGISTERED
PUBLIC ACCOUNTING FIRM
Deloitte & Touche LLP
111 S. Wacker Drive
Chicago, IL 60606
LEGAL COUNSEL
Chapman and Cutler LLP
320 South Canal Street
Chicago, IL 60606
Item 2. Code of Ethics.
Not applicable.
Item 3. Audit Committee Financial Expert.
Not applicable.
Item 4. Principal Accountant Fees and Services.
Not applicable.
Item 5. Audit Committee of Listed Registrants.
Not applicable.
Item 6. Investments.
| (a) | | Schedules of Investments in securities of unaffiliated issuers as of the close of the reporting period are included as part of the reports to shareholders filed under Item 1 of this form. |
Item 7. Disclosure of Proxy Voting Policies and Procedures for Closed-End Management Investment Companies.
Not applicable.
Item 8. Portfolio Managers of Closed-End Management Investment Companies.
Not applicable.
Item 9. Purchases of Equity Securities by Closed-End Management Investment Company and Affiliated Purchasers.
Not applicable.
Item 10. Submission of Matters to a Vote of Security Holders.
There have been no material changes to the procedures by which the shareholders may recommend nominees to the registrant's board of directors, where those changes were implemented after the registrant last provided disclosure in response to the requirements of Item 407(c)(2)(iv) of Regulation S-K (17 CFR 229.407) (as required by Item 22(b)(15) of Schedule 14A (17 CFR 240.14a-101)),or this Item.
Item 11. Controls and Procedures.
| (a) | | The registrant's principal executive and principal financial officers, or persons performing similar functions, have concluded that the registrant's disclosure controls and procedures (as defined in Rule 30a-3(c) under the Investment Company Act of 1940, as amended (the "1940 Act") (17 CFR 270.30a-3 (c))) are effective, as of a date within 90 days of the filing date of the report that includes the disclosure required by this paragraph, based on their evaluation of these controls and procedures required by Rule 30a-3(b) under the 1940 Act (17 CFR 270.30a-3(b)) and Rules 13a-15(b) or 15d-15(b) under the Securities Exchange Act of 1934, as amended (17 CFR 240.13a-15(b) or 240.15d-15 (b)). |
| (b) | | There were no changes in the registrant's internal control over financial reporting (as defined in Rule 30a-3(d) under the 1940 Act (17 CFR 270.30a-3(d)) that occurred during the period covered by this report that have materially affected, or are reasonably likely to materially affect, the registrant's internal control over financial reporting. |
Item 12. Disclosure of Securities Lending Activities for Closed-End Management Investment Companies.
Item 13. Exhibits.
SIGNATURES
Pursuant to the requirements of the Securities Exchange Act of 1934 and the Investment Company Act of 1940, the registrant has duly caused this report to be signed on its behalf by the undersigned, thereunto duly authorized.
| (registrant) | | First Trust Exchange-Traded Fund III |
| By (Signature and Title)* | | /s/ James M. Dykas |
| | | James M. Dykas, President and Chief Executive Officer
(principal executive officer) |
Pursuant to the requirements of the Securities Exchange Act of 1934 and the Investment Company Act of 1940, this report has been signed below by the following persons on behalf of the registrant and in the capacities and on the dates indicated.
| By (Signature and Title)* | | /s/ James M. Dykas |
| | | James M. Dykas, President and Chief Executive Officer
(principal executive officer) |
| By (Signature and Title)* | | /s/ Donald P. Swade |
| | | Donald P. Swade, Treasurer, Chief Financial Officer
and Chief Accounting Officer
(principal financial officer) |
* Print the name and title of each signing officer under his or her signature.