UNITED STATES
SECURITIES AND EXCHANGE COMMISSION
Washington, D.C. 20549
FORM N-CSR
CERTIFIED SHAREHOLDER REPORT OF REGISTERED MANAGEMENT INVESTMENT COMPANIES
Investment Company Act file number 811-22245
First Trust Exchange-Traded Fund III
(Exact name of registrant as specified in charter)
120 East Liberty Drive, Suite 400
Wheaton, IL 60187
(Address of principal executive offices) (Zip code)
W. Scott Jardine, Esq.
First Trust Portfolios L.P.
120 East Liberty Drive, Suite 400
Wheaton, IL 60187
(Name and address of agent for service)
Registrant’s telephone number, including area code: (630) 765-8000
Date of fiscal year end: July 31
Date of reporting period: January 31, 2023
Form N-CSR is to be used by management investment companies to file reports with the Commission not later than 10 days after the transmission to stockholders of any report that is required to be transmitted to stockholders under Rule 30e-1 under the Investment Company Act of 1940 (17 CFR 270.30e-1). The Commission may use the information provided on Form N-CSR in its regulatory, disclosure review, inspection, and policymaking roles.
A registrant is required to disclose the information specified by Form N-CSR, and the Commission will make this information public. A registrant is not required to respond to the collection of information contained in Form N-CSR unless the Form displays a currently valid Office of Management and Budget (“OMB”) control number. Please direct comments concerning the accuracy of the information collection burden estimate and any suggestions for reducing the burden to Secretary, Securities and Exchange Commission, 100 F Street, NE, Washington, DC 20549. The OMB has reviewed this collection of information under the clearance requirements of 44 U.S.C. § 3507.
Item 1. Report to Stockholders.
| (a) | The registrant’s semi-annual report transmitted to shareholders pursuant to Rule 30e-1 under the Investment Company Act of 1940 is as follows: |
First Trust Exchange-Traded Fund III
First Trust Horizon Managed Volatility Domestic ETF (HUSV)
First Trust Horizon Managed Volatility Developed International ETF (HDMV)
First Trust Horizon Managed Volatility Small/Mid ETF (HSMV)
Semi-Annual Report
For the Six Months Ended
January 31, 2023
First Trust Exchange-Traded Fund III
Semi-Annual Report
January 31, 2023
Caution Regarding Forward-Looking Statements
This report contains certain forward-looking statements within the meaning of the Securities Act of 1933, as amended, and the Securities Exchange Act of 1934, as amended. Forward-looking statements include statements regarding the goals, beliefs, plans or current expectations of First Trust Advisors L.P. (“First Trust” or the “Advisor”) and/or Horizon Investments, LLC (“Horizon” or the “Sub-Advisor”) and their respective representatives, taking into account the information currently available to them. Forward-looking statements include all statements that do not relate solely to current or historical fact. For example, forward-looking statements include the use of words such as “anticipate,” “estimate,” “intend,” “expect,” “believe,” “plan,” “may,” “should,” “would” or other words that convey uncertainty of future events or outcomes.
Forward-looking statements involve known and unknown risks, uncertainties and other factors that may cause the actual results, performance or achievements of any series of First Trust Exchange-Traded Fund III (the “Trust”) described in this report (each such series is referred to as a “Fund” and collectively, the “Funds”) to be materially different from any future results, performance or achievements expressed or implied by the forward-looking statements. When evaluating the information included in this report, you are cautioned not to place undue reliance on these forward-looking statements, which reflect the judgment of the Advisor and/or Sub-Advisor and their respective representatives only as of the date hereof. We undertake no obligation to publicly revise or update these forward-looking statements to reflect events and circumstances that arise after the date hereof.
Performance and Risk Disclosure
There is no assurance that any Fund described in this report will achieve its investment objective. Each Fund is subject to market risk, which is the possibility that the market values of securities owned by the Fund will decline and that the value of the Fund’s shares may therefore be less than what you paid for them. Accordingly, you can lose money by investing in a Fund. See “Risk Considerations” in the Additional Information section of this report for a discussion of certain other risks of investing in the Funds.
Performance data quoted represents past performance, which is no guarantee of future results, and current performance may be lower or higher than the figures shown. For the most recent month-end performance figures, please visit www.ftportfolios.com or speak with your financial advisor. Investment returns, net asset value and share price will fluctuate and Fund shares, when sold, may be worth more or less than their original cost.
The Advisor may also periodically provide additional information on Fund performance on each Fund’s web page at www.ftportfolios.com.
How to Read This Report
This report contains information that may help you evaluate your investment. It includes details about each Fund and presents data and analysis that provide insight into each Fund’s performance and investment approach.
The statistical information that follows may help you understand each Fund’s performance compared to that of a relevant market benchmark.
It is important to keep in mind that the opinions expressed by personnel of the Advisor and/or Sub-Advisor are just that: informed opinions. They should not be considered to be promises or advice. The opinions, like the statistics, cover the period through the date on the cover of this report. The material risks of investing in each Fund are spelled out in the prospectus, the statement of additional information, and other Fund regulatory filings.
First Trust Exchange-Traded Fund III
Semi-Annual Letter from the Chairman and CEO
January 31, 2023
Dear Shareholders,
First Trust is pleased to provide you with the semi-annual report for the Managed Volatility Funds of First Trust Exchange-Traded Fund III (the “Funds”), which contains detailed information about the Funds for the six-month period ended January 31, 2023.
Given recent inflation data, the Federal Reserve’s (the “Fed”) monetary policy remains front and center in most discussions regarding the outlook of the U.S. economy. Annual revisions to the Consumer Price Index released on February 10, 2023, showed that prices climbed at a 3.3% annual rate in the last three months of 2022, not the 1.8% rate reported four weeks prior, according to Brian Wesbury, Chief Economist at First Trust. Additionally, “core” inflation, which excludes volatile food and energy prices, was also revised upwards from 3.1% to 4.3% over the period. Furthermore, January’s 2023 jobs data came in better than expected, with non-farm payroll employment rising by 517,000. It is precisely this situation: stubbornly high inflation, strong jobs growth and increasing interest rates, which has many pundits debating whether the typical U.S. consumer can remain healthy enough to help ward off an economic recession.
As many investors know, the consumer is an essential driver of economic growth in the U.S. On average, over the 15-year period ended October 1, 2022, consumer spending accounted for 67.8% of the U.S. gross domestic product (“GDP”). Crucially, recent data regarding consumer health has been mixed, in my opinion. On one hand, the Commerce Department reported that in December 2022, the U.S. savings rate rose to its highest level in seven months, coming in at 3.4%. On the other hand, while December’s savings rate was a welcome reversal from the declines suffered throughout 2021 and 2022, it could indicate that consumers are beginning to pull back on discretionary spending amidst a cloudier economic outlook, according to Bloomberg. Recent data shows that the average interest rate on U.S. credit cards rose to 19.07% in the fourth quarter of 2022, its highest level in over 50 years. Additionally, U.S. credit card debt reached a record $930.6 billion in the fourth quarter, jumping 18.5% year-over-year. Even so, debt service payments accounted for just 9.75% of disposable personal income in the third quarter of 2022. This figure is higher than its historic low of 8.33% set in 2021 but is also well below its peak of 13.17% set in 2007. In my view, it is worth keeping an eye on debt service payments. If higher payments lead to a decline in discretionary spending, it could negatively impact GDP.
I would like to take a moment to remind you that even though nearly three years have passed since the World Health Organization initially declared the coronavirus outbreak a global pandemic, the economic impact of worldwide lockdowns and the subsequent governmental stimulus is still very real. China, for example, only recently dropped its requirement that incoming travelers must quarantine before entering the country. In addition, the global economy has yet to fully absorb the impact of the fiscal policies enacted to jump start consumer spending in 2020, in my view. As evidence of this, each of the countries that comprise the G-10 currently has a headline inflation rate that stands well above its stated target. Central banks likely have more work to do, in my opinion.
Thank you for giving First Trust the opportunity to play a role in your financial future. We value our relationship with you and will report on the Funds again in six months.
Sincerely,
James A. Bowen
Chairman of the Board of Trustees
Chief Executive Officer of First Trust Advisors L.P.
Fund Performance Overview (Unaudited)
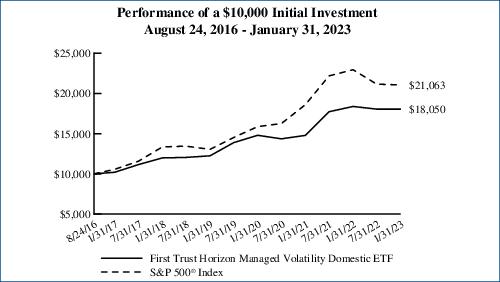
First Trust Horizon Managed Volatility Domestic ETF (HUSV)
The investment objective of First Trust Horizon Managed Volatility Domestic ETF (the “Fund”) is to provide capital appreciation. Under normal market conditions, the Fund seeks to achieve its investment objective by investing at least 80% of its net assets (including investment borrowings) in common stocks of domestic companies listed and traded on U.S. national securities exchanges that Horizon Investments, LLC (“Horizon” or the “Sub-Advisor”) believes exhibit low future expected volatility. The goal of this strategy is to capture upside price movements in rising markets and reduce downside risk when markets decline. To implement this strategy, the Sub-Advisor employs volatility forecasting models to forecast future expected volatility. The strategy is largely quantitative and rules-based, but also includes multiple parameters over which the Sub-Advisor may exercise discretion (including, but not limited to, the number of holdings and the weightings of particular holdings) in connection with its active management of the Fund. Shares of the Fund are listed and trade on the NYSE Arca, Inc. under the ticker symbol “HUSV.” The first day of secondary market trading in shares of the Fund was August 25, 2016.
| Performance | | | | | | | |
| | | | Average Annual Total Returns | | Cumulative Total Returns |
| | 6 Months
Ended
1/31/23 | 1 Year
Ended
1/31/23 | 5 Years
Ended
1/31/23 | Inception
(8/24/16)
to 1/31/23 | | 5 Years
Ended
1/31/23 | Inception
(8/24/16)
to 1/31/23 |
| Fund Performance | | | | | | | |
| NAV | 0.00% | -1.81% | 8.53% | 9.61% | | 50.57% | 80.50% |
| Market Price | -0.04% | -1.78% | 8.52% | 9.60% | | 50.53% | 80.44% |
| Index Performance | | | | | | | |
| S&P 500® Index | -0.44% | -8.22% | 9.54% | 12.27% | | 57.71% | 110.63% |
(See Notes to Fund Performance Overview on page 9.)
Fund Performance Overview (Unaudited) (Continued)
First Trust Horizon Managed Volatility Domestic ETF (HUSV) (Continued)
| Sector Allocation | % of Total
Investments |
| Consumer Staples | 18.0% |
| Health Care | 14.5 |
| Information Technology | 14.0 |
| Financials | 13.1 |
| Utilities | 12.6 |
| Industrials | 12.3 |
| Consumer Discretionary | 8.0 |
| Real Estate | 3.7 |
| Communication Services | 2.2 |
| Materials | 0.8 |
| Energy | 0.8 |
| Total | 100.0% |
| Top Ten Holdings | % of Total
Investments |
| Cisco Systems, Inc. | 2.6% |
| Automatic Data Processing, Inc. | 2.4 |
| International Business Machines Corp. | 2.4 |
| Johnson & Johnson | 2.3 |
| Jack Henry & Associates, Inc. | 2.3 |
| Merck & Co., Inc. | 2.2 |
| McDonald’s Corp. | 2.2 |
| Roper Technologies, Inc. | 2.2 |
| Paychex, Inc. | 2.2 |
| Bristol-Myers Squibb Co. | 2.1 |
| Total | 22.9% |
Performance figures assume reinvestment of all distributions and do not reflect the deduction of taxes that a shareholder would pay on Fund distributions or the redemption or sale of Fund shares. An index is a statistical composite that tracks a specified financial market or sector. Unlike the Fund, the index does not actually hold a portfolio of securities and therefore does not incur the expenses incurred by the Fund. These expenses negatively impact the performance of the Fund. The Fund’s past performance does not predict future performance.
Frequency Distribution of Discounts and Premiums
Information showing the number of days the market price of the Fund’s shares was greater (at a premium) and less (at a discount) than the Fund’s net asset value for the most recently completed year, and the most recently completed calendar quarters since that year (or life of the Fund, if shorter), is available at https://www.ftportfolios.com/Retail/etf/home.aspx.
Fund Performance Overview (Unaudited) (Continued)
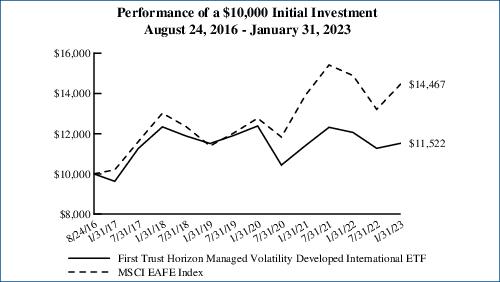
First Trust Horizon Managed Volatility Developed International ETF (HDMV)
The investment objective of First Trust Horizon Managed Volatility Developed International ETF (the “Fund”) is to provide capital appreciation. Under normal market conditions, the Fund seeks to achieve its investment objective by investing at least 80% of its net assets (including investment borrowings) in common stocks and depositary receipts of developed market companies listed and traded on non-U.S. exchanges that Horizon Investments, LLC (“Horizon” or the “Sub-Advisor”) believes exhibit low future expected volatility. The term “developed market companies” means those companies (i) whose securities are traded principally on a stock exchange in a developed market country, (ii) with a primary business office in a developed market country, or (iii) that have at least 50% of their assets in, or derive at least 50% of their revenues or profits from, a developed market country. The Sub-Advisor considers Australia, Austria, Belgium, Canada, Denmark, Finland, France, Germany, Hong Kong, Ireland, Israel, Italy, Japan, Luxembourg, the Netherlands, New Zealand, Norway, Portugal, Singapore, Spain, Sweden, Switzerland, the United Kingdom and the United States to be developed market countries. However, this list may change in response to market and geopolitical events. Under normal market conditions, the Fund will invest in at least three countries and at least 40% of its net assets in countries other than the United States. Shares of the Fund are listed and trade on the NYSE Arca, Inc. under the ticker symbol “HDMV.” The first day of secondary market trading in shares of the Fund was August 25, 2016.
| Performance | | | | | | | |
| | | | Average Annual Total Returns | | Cumulative Total Returns |
| | 6 Months
Ended
1/31/23 | 1 Year
Ended
1/31/23 | 5 Years
Ended
1/31/23 | Inception
(8/24/16)
to 1/31/23 | | 5 Years
Ended
1/31/23 | Inception
(8/24/16)
to 1/31/23 |
| Fund Performance | | | | | | | |
| NAV | 2.23% | -4.46% | -1.36% | 2.23% | | -6.62% | 15.22% |
| Market Price | 2.17% | -4.70% | -1.48% | 2.20% | | -7.19% | 15.04% |
| Index Performance | | | | | | | |
| MSCI EAFE Index | 9.52% | -2.83% | 2.13% | 5.90% | | 11.12% | 44.67% |
(See Notes to Fund Performance Overview on page 9.)
Fund Performance Overview (Unaudited) (Continued)
First Trust Horizon Managed Volatility Developed International ETF (HDMV) (Continued)
| Sector Allocation | % of Total
Investments |
| Industrials | 20.7% |
| Financials | 20.0 |
| Consumer Staples | 15.4 |
| Communication Services | 13.5 |
| Utilities | 7.0 |
| Real Estate | 6.8 |
| Health Care | 6.1 |
| Consumer Discretionary | 4.5 |
| Information Technology | 3.5 |
| Materials | 1.8 |
| Energy | 0.7 |
| Total | 100.0% |
| Top Ten Holdings | % of Total
Investments |
| Singapore Airlines Ltd. | 2.0% |
| Oversea-Chinese Banking Corp., Ltd. | 2.0 |
| MTR Corp., Ltd. | 2.0 |
| McDonald’s Holdings Co., Japan Ltd. | 2.0 |
| Singapore Exchange Ltd. | 1.9 |
| Singapore Technologies Engineering Ltd. | 1.9 |
| Power Assets Holdings Ltd. | 1.7 |
| Orange S.A. | 1.6 |
| Swisscom AG | 1.5 |
| Novartis AG | 1.5 |
| Total | 18.1% |
Performance figures assume reinvestment of all distributions and do not reflect the deduction of taxes that a shareholder would pay on Fund distributions or the redemption or sale of Fund shares. An index is a statistical composite that tracks a specified financial market or sector. Unlike the Fund, the index does not actually hold a portfolio of securities and therefore does not incur the expenses incurred by the Fund. These expenses negatively impact the performance of the Fund. The Fund’s past performance does not predict future performance.
Frequency Distribution of Discounts and Premiums
Information showing the number of days the market price of the Fund’s shares was greater (at a premium) and less (at a discount) than the Fund’s net asset value for the most recently completed year, and the most recently completed calendar quarters since that year (or life of the Fund, if shorter), is available at https://www.ftportfolios.com/Retail/etf/home.aspx.
Fund Performance Overview (Unaudited) (Continued)
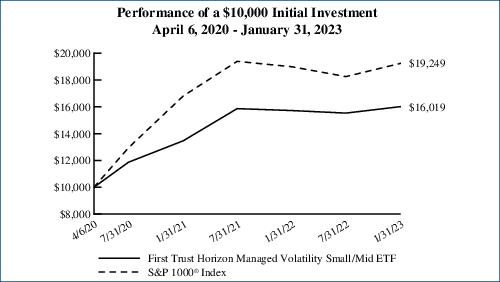
First Trust Horizon Managed Volatility Small/Mid ETF (HSMV)
The investment objective of First Trust Horizon Managed Volatility Small/Mid ETF (the “Fund”) is to seek to provide investors with capital appreciation. Under normal market conditions, the Fund seeks to achieve its investment objective by investing at least 80% of its net assets (including investment borrowings) in small- and/or mid-capitalization common stocks listed and traded on U.S. national securities exchanges that Horizon Investments, LLC (“Horizon” or the “Sub-Advisor”) believes exhibit low future expected volatility. The goal of this strategy is to capture upside price movements in rising markets and reduce downside risk when markets decline. To implement this strategy, the Sub-Advisor employs volatility forecasting models to forecast future expected volatility. The strategy is largely quantitative and rules-based, but also includes multiple parameters over which the Sub-Advisor may exercise discretion (including, but not limited to, the number of holdings and the weightings of particular holdings) in connection with its active management of the Fund. Shares of the Fund are listed and trade on the NYSE Arca, Inc. under the ticker symbol “HSMV.” The first day of secondary market trading in shares of the Fund was April 7, 2020.
| Performance | | | | |
| | | | Average Annual
Total Returns | Cumulative
Total Returns |
| | 6 Months Ended
1/31/23 | 1 Year Ended
1/31/23 | Inception (4/6/20)
to 1/31/23 | Inception (4/6/20)
to 1/31/23 |
| Fund Performance | | | | |
| NAV | 3.13% | 1.88% | 18.17% | 60.19% |
| Market Price | 3.10% | 1.69% | 18.15% | 60.09% |
| Index Performance | | | | |
| S&P 1000® Index | 5.43% | 1.35% | 26.12% | 92.49% |
(See Notes to Fund Performance Overview on page 9.)
Fund Performance Overview (Unaudited) (Continued)
First Trust Horizon Managed Volatility Small/Mid ETF (HSMV) (Continued)
| Sector Allocation | % of Total
Investments |
| Financials | 21.1% |
| Industrials | 19.6 |
| Real Estate | 16.7 |
| Utilities | 9.6 |
| Information Technology | 7.8 |
| Health Care | 6.8 |
| Consumer Discretionary | 6.5 |
| Materials | 5.3 |
| Consumer Staples | 5.1 |
| Communication Services | 1.5 |
| Energy | 0.0* |
| Total | 100.0% |
| * | Amount is less than 0.01%. |
| Top Ten Holdings | % of Total
Investments |
| Envista Holdings Corp. | 0.6% |
| Timken (The) Co. | 0.6 |
| Lamar Advertising Co., Class A | 0.6 |
| Columbia Sportswear Co. | 0.6 |
| Kilroy Realty Corp. | 0.6 |
| CommVault Systems, Inc. | 0.6 |
| H&R Block, Inc. | 0.6 |
| ITT, Inc. | 0.6 |
| Healthcare Realty Trust, Inc. | 0.6 |
| Knight-Swift Transportation Holdings, Inc. | 0.6 |
| Total | 6.0% |
Performance figures assume reinvestment of all distributions and do not reflect the deduction of taxes that a shareholder would pay on Fund distributions or the redemption or sale of Fund shares. An index is a statistical composite that tracks a specified financial market or sector. Unlike the Fund, the index does not actually hold a portfolio of securities and therefore does not incur the expenses incurred by the Fund. These expenses negatively impact the performance of the Fund. The Fund’s past performance does not predict future performance.
Frequency Distribution of Discounts and Premiums
Information showing the number of days the market price of the Fund’s shares was greater (at a premium) and less (at a discount) than the Fund’s net asset value for the most recently completed year, and the most recently completed calendar quarters since that year (or life of the Fund, if shorter), is available at https://www.ftportfolios.com/Retail/etf/home.aspx.
Notes to Fund Performance Overview (Unaudited)
Total returns for the periods since inception are calculated from the inception date of each Fund. “Average Annual Total Returns” represent the average annual change in value of an investment over the periods indicated. “Cumulative Total Returns” represent the total change in value of an investment over the periods indicated.
Each Fund’s per share net asset value (“NAV”) is the value of one share of the Fund and is computed by dividing the value of all assets of the Fund (including accrued interest and dividends), less all liabilities (including accrued expenses and dividends declared but unpaid), by the total number of outstanding shares. The price used to calculate market return (“Market Price”) is determined by using the midpoint of the national best bid and offer price (“NBBO”) as of the time that the Fund’s NAV is calculated. Under SEC rules, the NBBO consists of the highest displayed buy and lowest sell prices among the various exchanges trading the Fund at the time the Fund’s NAV is calculated. Prior to January 1, 2019, the price used was the midpoint between the highest bid and the lowest offer on the stock exchange on which shares of the Fund were listed for trading as of the time that the Fund’s NAV was calculated. Since shares of each Fund did not trade in the secondary market until after the Fund’s inception, for the period from inception to the first day of secondary market trading in shares of the Fund, the NAV of each Fund is used as a proxy for the secondary market trading price to calculate market returns. NAV and market returns assume that all distributions have been reinvested in each Fund at NAV and Market Price, respectively.
An index is a statistical composite that tracks a specified financial market or sector. Unlike each Fund, the indices do not actually hold a portfolio of securities and therefore do not incur the expenses incurred by each Fund. These expenses negatively impact the performance of each Fund. Also, market returns do not include brokerage commissions that may be payable on secondary market transactions. If brokerage commissions were included, market returns would be lower. The total returns presented reflect the reinvestment of dividends on securities in the indices. The returns presented do not reflect the deduction of taxes that a shareholder would pay on Fund distributions or the redemption or sale of Fund shares. The investment return and principal value of shares of each Fund will vary with changes in market conditions. Shares of each Fund may be worth more or less than their original cost when they are redeemed or sold in the market. Each Fund’s past performance is no guarantee of future performance.
Portfolio Management
First Trust Exchange-Traded Fund III
Semi-Annual Report
January 31, 2023 (Unaudited)
Advisor
First Trust Advisors L.P. (“First Trust” or the “Advisor”) serves as the investment advisor to the First Trust Horizon Managed Volatility Domestic ETF (“HUSV”), the First Trust Horizon Managed Volatility Developed International ETF (“HDMV”), and the First Trust Horizon Managed Volatility Small/Mid ETF (“HSMV”) (each a “Fund” and collectively, the “Funds”). First Trust is responsible for the ongoing monitoring of each Fund’s investment portfolio, managing each Fund’s business affairs and providing certain administrative services necessary for the management of each Fund.
Sub-Advisor
Horizon Investments, LLC (“Horizon” or the “Sub-Advisor”) serves as the investment sub-advisor to the Funds.
Portfolio Management Team
The following persons serve as portfolio managers of the Funds:
Michael Dickson, PhD, Head of Research and Product Development and Portfolio Manager of Horizon
Scott Ladner, Chief Investment Officer and Portfolio Manager of Horizon
Steven Clark, PhD, Portfolio Manager of Horizon
The portfolio managers are primarily and jointly responsible for the day-to-day management of the Funds. Each portfolio manager has served as part of the portfolio management team of the Funds since each Fund’s inception.
First Trust Exchange-Traded Fund III
Understanding Your Fund Expenses
January 31, 2023 (Unaudited)
As a shareholder of First Trust Horizon Managed Volatility Domestic ETF, First Trust Horizon Managed Volatility Developed International ETF or First Trust Horizon Managed Volatility Small/Mid ETF (each a “Fund” and collectively, the “Funds”), you incur two types of costs: (1) transaction costs; and (2) ongoing costs, including management fees, distribution and/or service (12b-1) fees, if any, and other Fund expenses. This Example is intended to help you understand your ongoing costs (in U.S. dollars) of investing in the Funds and to compare these costs with the ongoing costs of investing in other funds.
The Example is based on an investment of $1,000 invested at the beginning of the period and held through the six-month period ended January 31, 2023.
Actual Expenses
The first line in the following table provides information about actual account values and actual expenses. You may use the information in this line, together with the amount you invested, to estimate the expenses that you paid over the period. Simply divide your account value by $1,000 (for example, an $8,600 account value divided by $1,000 = 8.6), then multiply the result by the number in the first line under the heading entitled “Expenses Paid During the Six-Month Period” to estimate the expenses you paid on your account during this six-month period.
Hypothetical Example for Comparison Purposes
The second line in the following table provides information about hypothetical account values and hypothetical expenses based on each Fund’s actual expense ratio and an assumed rate of return of 5% per year before expenses, which is not each Fund’s actual return. The hypothetical account values and expenses may not be used to estimate the actual ending account balance or expenses you paid for the period. You may use this information to compare the ongoing costs of investing in the Funds and other funds. To do so, compare this 5% hypothetical example with the 5% hypothetical examples that appear in the shareholder reports of the other funds.
Please note that the expenses shown in the table are meant to highlight your ongoing costs only and do not reflect any transactional costs such as brokerage commissions. Therefore, the second line in the table is useful in comparing ongoing costs only, and will not help you determine the relative total costs of owning different funds. In addition, if these transactional costs were included, your costs would have been higher.
| | Beginning
Account Value
August 1, 2022 | Ending
Account Value
January 31, 2023 | Annualized
Expense Ratio
Based on the
Six-Month
Period | Expenses Paid
During the
Six-Month
Period (a) |
| First Trust Horizon Managed Volatility Domestic ETF (HUSV) |
| Actual | $1,000.00 | $1,000.00 | 0.70% | $3.53 |
| Hypothetical (5% return before expenses) | $1,000.00 | $1,021.68 | 0.70% | $3.57 |
| First Trust Horizon Managed Volatility Developed International ETF (HDMV) |
| Actual | $1,000.00 | $1,022.30 | 0.80% | $4.08 |
| Hypothetical (5% return before expenses) | $1,000.00 | $1,021.17 | 0.80% | $4.08 |
| First Trust Horizon Managed Volatility Small/Mid ETF (HSMV) |
| Actual | $1,000.00 | $1,031.30 | 0.80% | $4.10 |
| Hypothetical (5% return before expenses) | $1,000.00 | $1,021.17 | 0.80% | $4.08 |
| (a) | Expenses are equal to the annualized expense ratios as indicated in the table multiplied by the average account value over the period (August 1, 2022 through January 31, 2023), multiplied by 184/365 (to reflect the six-month period). |
First Trust Horizon Managed Volatility Domestic ETF (HUSV)
Portfolio of Investments
January 31, 2023 (Unaudited)
| Shares | | Description | | Value |
| COMMON STOCKS – 96.1% |
| | | Aerospace & Defense – 3.2% | | |
| 5,147 | | General Dynamics Corp. | | $1,199,560 |
| 2,307 | | Lockheed Martin Corp. | | 1,068,741 |
| 9,712 | | Raytheon Technologies Corp. | | 969,743 |
| | | | | 3,238,044 |
| | | Beverages – 4.9% | | |
| 30,355 | | Coca-Cola (The) Co. | | 1,861,369 |
| 34,198 | | Keurig Dr. Pepper, Inc. | | 1,206,505 |
| 10,893 | | PepsiCo, Inc. | | 1,862,921 |
| | | | | 4,930,795 |
| | | Biotechnology – 2.9% | | |
| 7,769 | | AbbVie, Inc. | | 1,147,870 |
| 6,841 | | Amgen, Inc. | | 1,726,668 |
| | | | | 2,874,538 |
| | | Capital Markets – 1.3% | | |
| 7,521 | | CME Group, Inc. | | 1,328,660 |
| | | Commercial Services &
Supplies – 3.8% | | |
| 14,335 | | Republic Services, Inc. | | 1,789,295 |
| 12,885 | | Waste Management, Inc. | | 1,993,696 |
| | | | | 3,782,991 |
| | | Communications Equipment – 2.6% | | |
| 52,912 | | Cisco Systems, Inc. | | 2,575,227 |
| | | Containers & Packaging – 0.8% | | |
| 69,702 | | Amcor PLC | | 840,606 |
| | | Distributors – 1.3% | | |
| 8,001 | | Genuine Parts Co. | | 1,342,728 |
| | | Diversified Financial Services – 1.5% | | |
| 4,963 | | Berkshire Hathaway, Inc., Class B (a) | | 1,546,074 |
| | | Diversified Telecommunication
Services – 1.3% | | |
| 32,070 | | Verizon Communications, Inc. | | 1,333,150 |
| | | Electric Utilities – 6.3% | | |
| 14,063 | | Duke Energy Corp. | | 1,440,754 |
| 13,289 | | Evergy, Inc. | | 832,556 |
| 35,527 | | FirstEnergy Corp. | | 1,454,830 |
| 38,258 | | PPL Corp. | | 1,132,437 |
| 21,235 | | Southern (The) Co. | | 1,437,185 |
| | | | | 6,297,762 |
| | | Electrical Equipment – 1.1% | | |
| 7,316 | | AMETEK, Inc. | | 1,060,235 |
| | | Food Products – 9.3% | | |
| 12,813 | | Campbell Soup Co. | | 665,379 |
| Shares | | Description | | Value |
|
| | | Food Products (Continued) | | |
| 12,029 | | Conagra Brands, Inc. | | $447,359 |
| 11,773 | | General Mills, Inc. | | 922,532 |
| 7,728 | | Hershey (The) Co. | | 1,735,709 |
| 29,664 | | Hormel Foods Corp. | | 1,344,076 |
| 9,189 | | J.M. Smucker (The) Co. | | 1,404,079 |
| 12,092 | | Kellogg Co. | | 829,269 |
| 10,102 | | Kraft Heinz (The) Co. | | 409,434 |
| 23,867 | | Mondelez International, Inc., Class A | | 1,561,856 |
| | | | | 9,319,693 |
| | | Health Care Equipment &
Supplies – 1.1% | | |
| 4,409 | | Becton Dickinson and Co. | | 1,112,038 |
| | | Health Care Providers &
Services – 3.9% | | |
| 3,474 | | McKesson Corp. | | 1,315,534 |
| 8,301 | | Quest Diagnostics, Inc. | | 1,232,533 |
| 2,632 | | UnitedHealth Group, Inc. | | 1,313,868 |
| | | | | 3,861,935 |
| | | Hotels, Restaurants &
Leisure – 3.6% | | |
| 8,344 | | McDonald’s Corp. | | 2,231,186 |
| 10,685 | | Yum! Brands, Inc. | | 1,394,499 |
| | | | | 3,625,685 |
| | | Household Products – 2.5% | | |
| 11,022 | | Kimberly-Clark Corp. | | 1,432,970 |
| 7,623 | | Procter & Gamble (The) Co. | | 1,085,363 |
| | | | | 2,518,333 |
| | | Industrial Conglomerates – 1.0% | | |
| 4,818 | | Honeywell International, Inc. | | 1,004,457 |
| | | Insurance – 10.2% | | |
| 20,794 | | Aflac, Inc. | | 1,528,359 |
| 5,501 | | Chubb Ltd. | | 1,251,422 |
| 11,036 | | Globe Life, Inc. | | 1,333,701 |
| 24,127 | | Loews Corp. | | 1,483,328 |
| 16,693 | | MetLife, Inc. | | 1,218,923 |
| 8,120 | | Progressive (The) Corp. | | 1,107,162 |
| 6,395 | | Travelers (The) Cos., Inc. | | 1,222,212 |
| 4,190 | | Willis Towers Watson PLC | | 1,065,056 |
| | | | | 10,210,163 |
| | | IT Services – 9.2% | | |
| 10,534 | | Automatic Data Processing, Inc. | | 2,378,683 |
| 17,607 | | International Business Machines Corp. | | 2,372,191 |
| 12,776 | | Jack Henry & Associates, Inc. | | 2,300,830 |
| 18,784 | | Paychex, Inc. | | 2,176,314 |
| | | | | 9,228,018 |
Page 12
See Notes to Financial Statements
First Trust Horizon Managed Volatility Domestic ETF (HUSV)
Portfolio of Investments (Continued)
January 31, 2023 (Unaudited)
| Shares | | Description | | Value |
| COMMON STOCKS (Continued) |
| | | Machinery – 2.1% | | |
| 9,834 | | PACCAR, Inc. | | $1,074,955 |
| 3,987 | | Snap-on, Inc. | | 991,686 |
| | | | | 2,066,641 |
| | | Multi-Utilities – 6.3% | | |
| 14,069 | | Ameren Corp. | | 1,222,174 |
| 34,598 | | CenterPoint Energy, Inc. | | 1,042,092 |
| 13,969 | | CMS Energy Corp. | | 882,701 |
| 15,295 | | Consolidated Edison, Inc. | | 1,457,766 |
| 8,034 | | DTE Energy Co. | | 934,917 |
| 8,378 | | WEC Energy Group, Inc. | | 787,448 |
| | | | | 6,327,098 |
| | | Oil, Gas & Consumable Fuels – 0.8% | | |
| 44,322 | | Kinder Morgan, Inc. | | 811,092 |
| | | Pharmaceuticals – 6.7% | | |
| 28,737 | | Bristol-Myers Squibb Co. | | 2,087,743 |
| 14,310 | | Johnson & Johnson | | 2,338,540 |
| 20,878 | | Merck & Co., Inc. | | 2,242,506 |
| | | | | 6,668,789 |
| | | Professional Services – 1.1% | | |
| 11,577 | | Leidos Holdings, Inc. | | 1,144,271 |
| | | Software – 2.2% | | |
| 5,112 | | Roper Technologies, Inc. | | 2,181,546 |
| | | Specialty Retail – 3.0% | | |
| 370 | | AutoZone, Inc. (a) | | 902,375 |
| 1,468 | | O’Reilly Automotive, Inc. (a) | | 1,163,170 |
| 11,376 | | TJX (The) Cos., Inc. | | 931,239 |
| | | | | 2,996,784 |
| | | Tobacco – 1.3% | | |
| 19,637 | | Altria Group, Inc. | | 884,450 |
| 3,496 | | Philip Morris International, Inc. | | 364,423 |
| | | | | 1,248,873 |
| | | Wireless Telecommunication
Services – 0.8% | | |
| 5,515 | | T-Mobile US, Inc. (a) | | 823,445 |
| | | Total Common Stocks | | 96,299,671 |
| | | (Cost $92,419,959) | | |
| REAL ESTATE INVESTMENT TRUSTS – 3.7% |
| | | Equity Real Estate Investment
Trusts – 3.7% | | |
| 8,284 | | Camden Property Trust | | 1,020,672 |
| 22,338 | | Realty Income Corp. | | 1,515,186 |
| Shares | | Description | | Value |
|
| | | Equity Real Estate Investment
Trusts (Continued) | | |
| 33,755 | | VICI Properties, Inc. | | $1,153,746 |
| | | Total Real Estate Investment Trusts | | 3,689,604 |
| | | (Cost $3,662,760) | | |
| | | Total Investments – 99.8% | | 99,989,275 |
| | | (Cost $96,082,719) | | |
| | | Net Other Assets and Liabilities – 0.2% | | 234,653 |
| | | Net Assets – 100.0% | | $100,223,928 |
| (a) | Non-income producing security. |
Valuation Inputs
A summary of the inputs used to value the Fund’s investments as of January 31, 2023 is as follows (see Note 2A - Portfolio Valuation in the Notes to Financial Statements):
| | Total
Value at
1/31/2023 | Level 1
Quoted
Prices | Level 2
Significant
Observable
Inputs | Level 3
Significant
Unobservable
Inputs |
| Common Stocks* | $ 96,299,671 | $ 96,299,671 | $ — | $ — |
| Real Estate Investment Trusts* | 3,689,604 | 3,689,604 | — | — |
| Total Investments | $ 99,989,275 | $ 99,989,275 | $— | $— |
| * | See Portfolio of Investments for industry breakout. |
See Notes to Financial Statements
Page 13
First Trust Horizon Managed Volatility Developed International ETF (HDMV)
Portfolio of Investments
January 31, 2023 (Unaudited)
| Shares | | Description | | Value |
| COMMON STOCKS (a) – 98.2% |
| | | Australia – 7.7% | | |
| 67,959 | | Aurizon Holdings Ltd. (b) | | $177,629 |
| 28,859 | | Brambles Ltd. (b) | | 245,404 |
| 33,306 | | Coles Group Ltd. (b) | | 418,911 |
| 2,300 | | Commonwealth Bank of Australia (b) | | 179,543 |
| 1,087 | | CSL Ltd. (b) | | 229,521 |
| 29,806 | | Endeavour Group Ltd. (b) | | 139,956 |
| 54,739 | | Insurance Australia Group Ltd. (b) | | 190,096 |
| 10,613 | | National Australia Bank Ltd. (b) | | 239,473 |
| 107,973 | | Telstra Corp., Ltd. (b) | | 312,062 |
| 20,506 | | Treasury Wine Estates Ltd. (b) | | 211,228 |
| 9,745 | | Washington H Soul Pattinson & Co., Ltd. (b) | | 198,476 |
| 13,379 | | Westpac Banking Corp. (b) | | 225,113 |
| 13,528 | | Woolworths Group Ltd. (b) | | 345,741 |
| | | | | 3,113,153 |
| | | Belgium – 0.7% | | |
| 1,725 | | Groupe Bruxelles Lambert S.A. (b) | | 147,566 |
| 1,868 | | UCB S.A. (b) | | 153,371 |
| | | | | 300,937 |
| | | Bermuda – 0.6% | | |
| 41,606 | | CK Infrastructure Holdings Ltd. (b) | | 231,477 |
| | | Cayman Islands – 1.4% | | |
| 42,675 | | CK Asset Holdings Ltd. (b) | | 272,843 |
| 45,975 | | CK Hutchison Holdings Ltd. (b) | | 292,583 |
| | | | | 565,426 |
| | | Denmark – 1.0% | | |
| 1,234 | | Carlsberg A.S., Class B (b) | | 175,181 |
| 9,951 | | Tryg A.S. (b) | | 228,356 |
| | | | | 403,537 |
| | | France – 7.2% | | |
| 964 | | Air Liquide S.A. (b) | | 153,494 |
| 6,544 | | Bouygues S.A. (b) | | 215,585 |
| 5,897 | | Bureau Veritas S.A. (b) | | 168,604 |
| 9,507 | | Carrefour S.A. (b) | | 180,833 |
| 4,018 | | Edenred (b) | | 218,858 |
| 1,651 | | Eiffage S.A. (b) | | 176,344 |
| 11,022 | | Getlink SE (b) | | 186,424 |
| 3,895 | | La Francaise des Jeux SAEM (b) (c) (d) | | 166,659 |
| 60,365 | | Orange S.A. (b) | | 638,828 |
| 548 | | Pernod Ricard S.A. (b) | | 113,453 |
| 1,586 | | Sanofi (b) | | 155,308 |
| 1,921 | | Sodexo S.A. (b) | | 190,434 |
| 1,515 | | Vinci S.A. (b) | | 171,179 |
| 15,678 | | Vivendi SE (b) | | 168,378 |
| | | | | 2,904,381 |
| Shares | | Description | | Value |
|
| | | Germany – 5.3% | | |
| 714 | | Allianz SE (b) | | $170,727 |
| 1,858 | | Beiersdorf AG (b) | | 225,891 |
| 1,008 | | Deutsche Boerse AG (b) | | 180,374 |
| 13,789 | | Deutsche Telekom AG (b) | | 307,202 |
| 13,012 | | E.ON SE (b) | | 141,869 |
| 930 | | Hannover Rueck SE (b) | | 188,854 |
| 6,491 | | Henkel AG & Co., KGaA (b) | | 433,717 |
| 554 | | Muenchener Rueckversicherungs-Gesellschaft AG in Muenchen (b) | | 200,109 |
| 1,209 | | SAP SE (b) | | 143,315 |
| 1,146 | | Symrise AG (b) | | 121,831 |
| | | | | 2,113,889 |
| | | Hong Kong – 7.3% | | |
| 74,500 | | BOC Hong Kong Holdings Ltd. (b) | | 260,369 |
| 41,438 | | CLP Holdings, Ltd. (b) | | 307,882 |
| 15,596 | | Hang Seng Bank Ltd. (b) | | 259,724 |
| 286,145 | | Hong Kong & China Gas Co., Ltd. (b) | | 287,295 |
| 147,580 | | MTR Corp., Ltd. (b) | | 789,776 |
| 119,959 | | Power Assets Holdings Ltd. (b) | | 678,748 |
| 25,039 | | Sun Hung Kai Properties Ltd. (b) | | 355,094 |
| | | | | 2,938,888 |
| | | Ireland – 0.3% | | |
| 1,302 | | Kerry Group PLC, Class A (b) | | 121,998 |
| | | Israel – 0.9% | | |
| 82,949 | | Bezeq Israeli Telecommunication Corp., Ltd. (b) | | 137,464 |
| 1,632 | | Check Point Software Technologies Ltd. (e) | | 207,591 |
| | | | | 345,055 |
| | | Italy – 1.6% | | |
| 5,852 | | Assicurazioni Generali S.p.A. (b) | | 114,239 |
| 17,491 | | Infrastrutture Wireless Italiane S.p.A. (b) (c) (d) | | 191,680 |
| 32,253 | | Snam S.p.A. (b) | | 164,282 |
| 21,938 | | Terna-Rete Elettrica Nazionale S.p.A. (b) | | 173,570 |
| | | | | 643,771 |
| | | Japan – 24.3% | | |
| 4,400 | | Aeon Co., Ltd. (b) | | 90,207 |
| 2,600 | | Ajinomoto Co., Inc. (b) | | 85,718 |
| 6,300 | | ANA Holdings, Inc. (b) (e) | | 139,436 |
| 16,700 | | Asahi Kasei Corp. (b) | | 126,546 |
| 7,000 | | Astellas Pharma, Inc. (b) | | 103,041 |
| 4,500 | | Canon, Inc. (b) | | 99,866 |
| 1,700 | | Central Japan Railway Co. (b) | | 207,357 |
| 8,300 | | Chubu Electric Power Co., Inc. (b) | | 89,400 |
Page 14
See Notes to Financial Statements
First Trust Horizon Managed Volatility Developed International ETF (HDMV)
Portfolio of Investments (Continued)
January 31, 2023 (Unaudited)
| Shares | | Description | | Value |
| COMMON STOCKS (a) (Continued) |
| | | Japan (Continued) | | |
| 4,500 | | Dai Nippon Printing Co., Ltd. (b) | | $106,243 |
| 800 | | Daito Trust Construction Co., Ltd. (b) | | 79,055 |
| 7,700 | | Daiwa House Industry Co., Ltd. (b) | | 184,916 |
| 29,400 | | Daiwa Securities Group, Inc. (b) | | 138,741 |
| 3,500 | | East Japan Railway Co. (b) | | 195,154 |
| 26,800 | | ENEOS Holdings, Inc. (b) | | 95,949 |
| 7,000 | | Hankyu Hanshin Holdings, Inc. (b) | | 208,057 |
| 15,700 | | Hulic Co., Ltd. (b) | | 129,051 |
| 12,300 | | Japan Post Bank Co., Ltd. (b) | | 109,284 |
| 30,100 | | Japan Post Holdings Co., Ltd. (b) | | 264,262 |
| 8,000 | | Japan Tobacco, Inc. (b) | | 163,135 |
| 2,000 | | Kao Corp. (b) | | 80,844 |
| 7,900 | | KDDI Corp. (b) | | 246,823 |
| 3,100 | | Keio Corp. (b) | | 113,784 |
| 3,000 | | Kintetsu Group Holdings Co., Ltd. (b) | | 97,695 |
| 11,300 | | Kirin Holdings Co., Ltd. (b) | | 174,130 |
| 1,200 | | Kobayashi Pharmaceutical Co., Ltd. (b) | | 86,151 |
| 2,900 | | Kyocera Corp. (b) | | 150,485 |
| 19,900 | | McDonald’s Holdings Co., Japan Ltd. (b) | | 786,197 |
| 4,200 | | MEIJI Holdings Co., Ltd. (b) | | 216,605 |
| 9,600 | | Mitsubishi Electric Corp. (b) | | 105,799 |
| 10,100 | | Mitsubishi Estate Co., Ltd. (b) | | 129,817 |
| 40,500 | | Mitsubishi HC Capital, Inc. (b) | | 206,718 |
| 4,400 | | Mitsui Fudosan Co., Ltd. (b) | | 82,472 |
| 10,900 | | Mizuho Financial Group, Inc. (b) | | 170,263 |
| 6,000 | | NGK Insulators Ltd. (b) | | 83,048 |
| 1,800 | | Nintendo Co., Ltd. (b) | | 78,044 |
| 9,900 | | Nippon Telegraph & Telephone Corp. (b) | | 296,857 |
| 13,200 | | Nisshin Seifun Group, Inc. (b) | | 165,336 |
| 1,900 | | Nissin Foods Holdings Co., Ltd. (b) | | 148,538 |
| 60,000 | | Nomura Holdings, Inc. (b) | | 239,450 |
| 4,100 | | Nomura Real Estate Holdings, Inc. (b) | | 90,366 |
| 29,400 | | Obayashi Corp. (b) | | 228,048 |
| 8,400 | | Odayku Electric Railway Co., Ltd. (b) | | 110,438 |
| 21,900 | | Oji Holdings Corp. (b) | | 90,507 |
| 4,100 | | Otsuka Holdings Co., Ltd. (b) | | 131,530 |
| 5,000 | | SBI Holdings, Inc. (b) | | 105,997 |
| 6,400 | | SCSK Corp. (b) | | 104,240 |
| 2,800 | | Secom Co., Ltd. (b) | | 166,812 |
| 8,000 | | Sekisui Chemical Co., Ltd. (b) | | 112,066 |
| 9,600 | | Sekisui House Ltd. (b) | | 181,433 |
| 34,900 | | Shimizu Corp. (b) | | 195,639 |
| 41,900 | | Softbank Corp. (b) | | 479,424 |
| Shares | | Description | | Value |
|
| | | Japan (Continued) | | |
| 27,800 | | Sumitomo Chemical Co., Ltd. (b) | | $106,714 |
| 1,900 | | Sumitomo Mitsui Financial Group, Inc. (b) | | 82,576 |
| 4,000 | | Taisei Corp. (b) | | 138,088 |
| 6,900 | | Takeda Pharmaceutical Co., Ltd. (b) | | 216,918 |
| 8,600 | | Tobu Railway Co., Ltd. (b) | | 201,783 |
| 15,400 | | Tokyu Corp. (b) | | 198,035 |
| 5,700 | | Toppan, Inc. (b) | | 91,839 |
| 7,600 | | Tosoh Corp. (b) | | 99,434 |
| 3,200 | | West Japan Railway Co. (b) | | 134,011 |
| 1,900 | | Yakult Honsha Co., Ltd. (b) | | 135,637 |
| 4,900 | | Yamato Holdings Co., Ltd. (b) | | 85,735 |
| | | | | 9,761,744 |
| | | Netherlands – 3.7% | | |
| 1,865 | | Heineken Holding N.V. (b) | | 153,985 |
| 2,114 | | Heineken N.V. (b) | | 211,271 |
| 6,946 | | Koninklijke Ahold Delhaize N.V. (b) | | 207,317 |
| 162,308 | | Koninklijke KPN N.V. (b) | | 554,906 |
| 4,083 | | QIAGEN N.V. (b) (e) | | 199,182 |
| 1,562 | | Wolters Kluwer N.V. (b) | | 170,294 |
| | | | | 1,496,955 |
| | | New Zealand – 0.8% | | |
| 94,612 | | Spark New Zealand Ltd. (b) | | 319,007 |
| | | Norway – 1.3% | | |
| 8,429 | | Gjensidige Forsikring ASA (b) | | 151,498 |
| 26,828 | | Orkla ASA (b) | | 200,290 |
| 15,221 | | Telenor ASA (b) | | 159,343 |
| | | | | 511,131 |
| | | Singapore – 16.0% | | |
| 37,300 | | City Developments Ltd. (b) | | 236,737 |
| 19,500 | | DBS Group Holdings Ltd. (b) | | 533,837 |
| 85,500 | | Keppel Corp., Ltd. (b) | | 493,648 |
| 80,800 | | Oversea-Chinese Banking Corp., Ltd. (b) | | 798,333 |
| 178,500 | | Singapore Airlines Ltd. (b) | | 807,153 |
| 109,500 | | Singapore Exchange Ltd. (b) | | 771,266 |
| 273,200 | | Singapore Technologies Engineering Ltd. (b) | | 768,113 |
| 181,700 | | Singapore Telecommunications Ltd. (b) | | 347,985 |
| 23,600 | | United Overseas Bank Ltd. (b) | | 536,443 |
| 80,400 | | UOL Group Ltd. (b) | | 428,980 |
| 34,900 | | Venture Corp., Ltd. (b) | | 492,835 |
| 69,000 | | Wilmar International Ltd. (b) | | 214,523 |
| | | | | 6,429,853 |
See Notes to Financial Statements
Page 15
First Trust Horizon Managed Volatility Developed International ETF (HDMV)
Portfolio of Investments (Continued)
January 31, 2023 (Unaudited)
| Shares | | Description | | Value |
| COMMON STOCKS (a) (Continued) |
| | | Spain – 2.3% | | |
| 6,044 | | ACS Actividades de Construccion y Servicios S.A. (b) | | $178,865 |
| 8,908 | | Enagas S.A. (b) | | 159,732 |
| 17,403 | | Iberdrola S.A. (b) | | 204,168 |
| 9,956 | | Red Electrica Corp. S.A. (b) | | 176,210 |
| 55,118 | | Telefonica S.A. (b) | | 209,394 |
| | | | | 928,369 |
| | | Sweden – 1.2% | | |
| 4,496 | | Essity AB, Class B (b) | | 117,454 |
| 12,984 | | Svenska Handelsbanken AB, Class A (b) | | 135,397 |
| 13,408 | | Tele2 AB, Class B (b) | | 115,799 |
| 45,349 | | Telia Co., AB (b) | | 117,120 |
| | | | | 485,770 |
| | | Switzerland – 8.9% | | |
| 1,939 | | Baloise Holding AG (b) | | 318,913 |
| 3,069 | | Banque Cantonale Vaudoise (b) | | 291,730 |
| 3,768 | | Nestle S.A. (b) | | 459,730 |
| 6,467 | | Novartis AG (b) | | 584,675 |
| 790 | | Roche Holding AG (b) | | 246,615 |
| 674 | | Roche Holding AG (b) | | 246,712 |
| 3,075 | | Swiss Prime Site AG (b) | | 274,008 |
| 1,832 | | Swiss Re AG (b) | | 191,831 |
| 1,003 | | Swisscom AG (b) | | 592,628 |
| 771 | | Zurich Insurance Group AG (b) | | 381,282 |
| | | | | 3,588,124 |
| | | United Kingdom – 5.7% | | |
| 5,115 | | Bunzl PLC (b) | | 187,778 |
| 3,024 | | Coca-Cola Europacific Partners PLC | | 170,009 |
| 14,573 | | Compass Group PLC (b) | | 348,120 |
| 9,491 | | GSK PLC (b) | | 166,710 |
| 1,662 | | Intertek Group PLC (b) | | 89,328 |
| 14,423 | | National Grid PLC (b) | | 183,358 |
| 2,954 | | Reckitt Benckiser Group PLC (b) | | 210,505 |
| 6,255 | | RELX PLC (b) | | 185,829 |
| 7,374 | | Smiths Group PLC (b) | | 157,413 |
| 49,800 | | Tesco PLC (b) | | 151,361 |
| 6,394 | | Unilever PLC (b) | | 325,449 |
| 107,304 | | Vodafone Group PLC (b) | | 123,809 |
| | | | | 2,299,669 |
| | | Total Common Stocks | | 39,503,134 |
| | | (Cost $39,355,381) | | |
| REAL ESTATE INVESTMENT TRUSTS (a) – 1.2% |
| | | Singapore – 1.2% | | |
| 139,200 | | CapitaLand Ascendas REIT (b) | | 306,328 |
| Shares | | Description | | Value |
|
| | | Singapore (Continued) | | |
| 100,700 | | CapitaLand Integrated Commercial Trust (b) | | $164,758 |
| | | Total Real Estate Investment Trusts | | 471,086 |
| | | (Cost $453,867) | | |
| | | Total Investments – 99.4% | | 39,974,220 |
| | | (Cost $39,809,248) | | |
| | | Net Other Assets and Liabilities – 0.6% | | 252,484 |
| | | Net Assets – 100.0% | | $40,226,704 |
| (a) | Portfolio securities are categorized based upon their country of incorporation. For a breakdown of the portfolio securities by sector, please see the Fund Performance Overview. |
| (b) | This security is fair valued by the Advisor’s Pricing Committee in accordance with procedures approved by the Trust’s Board of Trustees and in accordance with provisions of the Investment Company Act of 1940 and rules thereunder, as amended. At January 31, 2023, securities noted as such are valued at $39,596,620 or 98.4% of net assets. Certain of these securities are fair valued using a factor provided by a third-party pricing service due to the change in value between the foreign markets’ close and the New York Stock Exchange close exceeding a certain threshold. On days when this threshold is not exceeded, these securities are typically valued at the last sale price on the exchange on which they are principally traded. |
| (c) | This security may be resold to qualified foreign investors and foreign institutional buyers under Regulation S of the Securities Act of 1933, as amended (the “1933 Act”). |
| (d) | This security is exempt from registration upon resale under Rule 144A of the 1933 Act and may be resold in transactions exempt from registration, normally to qualified institutional buyers. This security is not restricted on the foreign exchange where it trades freely without any additional registration. As such, it does not require the additional disclosure required of restricted securities. |
| (e) | Non-income producing security. |
Page 16
See Notes to Financial Statements
First Trust Horizon Managed Volatility Developed International ETF (HDMV)
Portfolio of Investments (Continued)
January 31, 2023 (Unaudited)
Currency Exposure
Diversification | % of Total
Investments |
| Japanese Yen | 24.4% |
| Euro | 21.3 |
| Singapore Dollar | 17.3 |
| Hong Kong Dollar | 9.4 |
| Swiss Franc | 9.0 |
| Australian Dollar | 7.8 |
| British Pound Sterling | 5.3 |
| Norwegian Krone | 1.3 |
| Swedish Krona | 1.2 |
| Danish Krone | 1.0 |
| United States Dollar | 0.9 |
| New Zealand Dollar | 0.8 |
| Israeli Shekel | 0.3 |
| Total | 100.0% |
Valuation Inputs
A summary of the inputs used to value the Fund’s investments as of January 31, 2023 is as follows (see Note 2A - Portfolio Valuation in the Notes to Financial Statements):
| | Total
Value at
1/31/2023 | Level 1
Quoted
Prices | Level 2
Significant
Observable
Inputs | Level 3
Significant
Unobservable
Inputs |
| Common Stocks: | | | | |
| Israel | $ 345,055 | $ 207,591 | $ 137,464 | $ — |
| United Kingdom | 2,299,669 | 170,009 | 2,129,660 | — |
| Other Country Categories* | 36,858,410 | — | 36,858,410 | — |
| Real Estate Investment Trusts* | 471,086 | — | 471,086 | — |
| Total Investments | $ 39,974,220 | $ 377,600 | $ 39,596,620 | $— |
| * | See Portfolio of Investments for country breakout. |
See Notes to Financial Statements
Page 17
First Trust Horizon Managed Volatility Small/Mid ETF (HSMV)
Portfolio of Investments
January 31, 2023 (Unaudited)
| Shares | | Description | | Value |
| COMMON STOCKS – 83.1% |
| | | Aerospace & Defense – 0.6% | | |
| 1,081 | | Woodward, Inc. | | $110,543 |
| | | Auto Components – 0.5% | | |
| 3,602 | | Gentex Corp. | | 106,295 |
| | | Banks – 12.7% | | |
| 3,788 | | Associated Banc-Corp. | | 84,889 |
| 1,255 | | Bank of Hawaii Corp. | | 95,995 |
| 1,641 | | Bank OZK | | 74,944 |
| 1,608 | | Banner Corp. | | 104,247 |
| 2,361 | | Cathay General Bancorp | | 103,789 |
| 1,475 | | Commerce Bancshares, Inc. | | 98,176 |
| 1,580 | | Community Bank System, Inc. | | 91,182 |
| 813 | | Cullen/Frost Bankers, Inc. | | 105,918 |
| 4,099 | | CVB Financial Corp. | | 99,278 |
| 2,914 | | First Financial Bankshares, Inc. | | 103,797 |
| 7,656 | | FNB Corp. | | 109,251 |
| 6,036 | | Fulton Financial Corp. | | 100,982 |
| 1,891 | | Glacier Bancorp, Inc. | | 86,211 |
| 1,263 | | Independent Bank Corp. | | 100,648 |
| 2,244 | | International Bancshares Corp. | | 105,176 |
| 5,533 | | Old National Bancorp | | 96,827 |
| 1,373 | | Prosperity Bancshares, Inc. | | 104,156 |
| 1,072 | | ServisFirst Bancshares, Inc. | | 73,089 |
| 4,931 | | Simmons First National Corp., Class A | | 110,011 |
| 2,902 | | Trustmark Corp. | | 84,506 |
| 1,040 | | UMB Financial Corp. | | 93,798 |
| 2,513 | | United Bankshares, Inc. | | 101,023 |
| 3,118 | | United Community Banks, Inc. | | 101,460 |
| 6,283 | | Valley National Bancorp | | 74,642 |
| 2,936 | | Washington Federal, Inc. | | 104,110 |
| 1,769 | | Westamerica BanCorp | | 98,286 |
| | | | | 2,506,391 |
| | | Biotechnology – 0.5% | | |
| 384 | | United Therapeutics Corp. (a) | | 101,057 |
| | | Building Products – 1.1% | | |
| 444 | | Carlisle Cos., Inc. | | 111,382 |
| 379 | | Lennox International, Inc. | | 98,775 |
| | | | | 210,157 |
| | | Capital Markets – 1.7% | | |
| 244 | | Affiliated Managers Group, Inc. | | 42,149 |
| 334 | | Evercore, Inc., Class A | | 43,357 |
| 1,551 | | Janus Henderson Group PLC | | 40,202 |
| 1,141 | | Jefferies Financial Group, Inc. | | 44,818 |
| 1,652 | | SEI Investments Co. | | 103,134 |
| 875 | | Stifel Financial Corp. | | 58,984 |
| | | | | 332,644 |
| | | Chemicals – 2.1% | | |
| 917 | | Ashland, Inc. | | 100,201 |
| 816 | | Balchem Corp. | | 106,594 |
| 292 | | NewMarket Corp. | | 100,597 |
| Shares | | Description | | Value |
|
| | | Chemicals (Continued) | | |
| 1,145 | | RPM International, Inc. | | $102,947 |
| | | | | 410,339 |
| | | Commercial Services &
Supplies – 2.6% | | |
| 2,229 | | ABM Industries, Inc. | | 104,562 |
| 842 | | Clean Harbors, Inc. (a) | | 109,713 |
| 1,932 | | Stericycle, Inc. (a) | | 103,961 |
| 652 | | Tetra Tech, Inc. | | 101,399 |
| 509 | | UniFirst Corp. | | 101,006 |
| | | | | 520,641 |
| | | Communications Equipment – 0.4% | | |
| 7,173 | | Viavi Solutions, Inc. (a) | | 81,055 |
| | | Construction & Engineering – 1.6% | | |
| 1,221 | | AECOM | | 106,557 |
| 685 | | EMCOR Group, Inc. | | 101,551 |
| 3,329 | | MDU Resources Group, Inc. | | 102,899 |
| | | | | 311,007 |
| | | Construction Materials – 0.5% | | |
| 707 | | Eagle Materials, Inc. | | 103,279 |
| | | Consumer Finance – 0.2% | | |
| 2,429 | | SLM Corp. | | 42,678 |
| | | Containers & Packaging – 1.6% | | |
| 892 | | AptarGroup, Inc. | | 103,151 |
| 1,944 | | Silgan Holdings, Inc. | | 104,762 |
| 1,701 | | Sonoco Products Co. | | 103,948 |
| | | | | 311,861 |
| | | Diversified Consumer
Services – 1.6% | | |
| 890 | | Grand Canyon Education, Inc. (a) | | 103,738 |
| 2,909 | | H&R Block, Inc. | | 113,393 |
| 1,431 | | Service Corp. International | | 106,109 |
| | | | | 323,240 |
| | | Electric Utilities – 3.0% | | |
| 1,545 | | ALLETE, Inc. | | 95,574 |
| 2,413 | | Hawaiian Electric Industries, Inc. | | 101,997 |
| 943 | | IDACORP, Inc. | | 99,779 |
| 2,525 | | OGE Energy Corp. | | 99,283 |
| 2,069 | | PNM Resources, Inc. | | 102,374 |
| 2,043 | | Portland General Electric Co. | | 97,206 |
| | | | | 596,213 |
| | | Electrical Equipment – 1.5% | | |
| 429 | | Hubbell, Inc. | | 98,202 |
| 2,588 | | nVent Electric PLC | | 102,873 |
Page 18
See Notes to Financial Statements
First Trust Horizon Managed Volatility Small/Mid ETF (HSMV)
Portfolio of Investments (Continued)
January 31, 2023 (Unaudited)
| Shares | | Description | | Value |
| COMMON STOCKS (Continued) |
| | | Electrical
Equipment (Continued) | | |
| 648 | | Regal Rexnord Corp. | | $90,202 |
| | | | | 291,277 |
| | | Electronic Equipment,
Instruments & Components – 4.2% | | |
| 907 | | Arrow Electronics, Inc. (a) | | 106,563 |
| 2,324 | | Avnet, Inc. | | 106,625 |
| 928 | | Insight Enterprises, Inc. (a) | | 104,604 |
| 1,349 | | Jabil, Inc. | | 106,072 |
| 5,755 | | Knowles Corp. (a) | | 110,669 |
| 409 | | Littelfuse, Inc. | | 104,986 |
| 924 | | Plexus Corp. (a) | | 88,695 |
| 924 | | TD SYNNEX Corp. | | 94,387 |
| | | | | 822,601 |
| | | Entertainment – 0.5% | | |
| 1,169 | | World Wrestling Entertainment, Inc., Class A | | 98,921 |
| | | Food & Staples Retailing – 1.4% | | |
| 461 | | Casey’s General Stores, Inc. | | 108,754 |
| 3,023 | | Grocery Outlet Holding Corp. (a) | | 91,869 |
| 2,527 | | Sprouts Farmers Market, Inc. (a) | | 80,738 |
| | | | | 281,361 |
| | | Food Products – 3.1% | | |
| 1,700 | | Cal-Maine Foods, Inc. | | 97,274 |
| 3,640 | | Flowers Foods, Inc. | | 100,791 |
| 4,574 | | Hostess Brands, Inc. (a) | | 105,797 |
| 1,023 | | Ingredion, Inc. | | 105,164 |
| 512 | | Lancaster Colony Corp. | | 98,258 |
| 1,083 | | Post Holdings, Inc. (a) | | 102,831 |
| | | | | 610,115 |
| | | Gas Utilities – 3.1% | | |
| 1,658 | | National Fuel Gas Co. | | 96,263 |
| 1,993 | | New Jersey Resources Corp. | | 99,491 |
| 2,090 | | Northwest Natural Holding Co. | | 104,793 |
| 1,104 | | ONE Gas, Inc. | | 90,925 |
| 1,399 | | Spire, Inc. | | 101,036 |
| 2,714 | | UGI Corp. | | 108,099 |
| | | | | 600,607 |
| | | Health Care Equipment &
Supplies – 2.2% | | |
| 1,576 | | Enovis Corp. (a) | | 99,209 |
| 3,193 | | Envista Holdings Corp. (a) | | 124,495 |
| 1,389 | | Globus Medical, Inc., Class A (a) | | 104,869 |
| 1,772 | | Integra LifeSciences Holdings Corp. (a) | | 101,536 |
| | | | | 430,109 |
| Shares | | Description | | Value |
|
| | | Health Care Providers &
Services – 2.1% | | |
| 1,233 | | Acadia Healthcare Co., Inc. (a) | | $103,597 |
| 205 | | Chemed Corp. | | 103,554 |
| 1,688 | | Encompass Health Corp. | | 105,415 |
| 3,544 | | Patterson Cos., Inc. | | 106,993 |
| | | | | 419,559 |
| | | Health Care Technology – 0.4% | | |
| 4,876 | | Allscripts Healthcare Solutions, Inc. (a) | | 87,329 |
| | | Hotels, Restaurants &
Leisure – 2.2% | | |
| 867 | | Choice Hotels International, Inc. | | 106,545 |
| 938 | | Cracker Barrel Old Country Store, Inc. | | 104,662 |
| 1,188 | | Papa John’s International, Inc. | | 106,552 |
| 1,415 | | Wyndham Hotels & Resorts, Inc. | | 109,677 |
| | | | | 427,436 |
| | | Household Products – 0.5% | | |
| 2,895 | | Energizer Holdings, Inc. | | 107,405 |
| | | Insurance – 4.4% | | |
| 723 | | American Financial Group, Inc. | | 103,093 |
| 1,010 | | First American Financial Corp. | | 62,489 |
| 754 | | Hanover Insurance Group (The), Inc. | | 101,473 |
| 759 | | Kemper Corp. | | 44,576 |
| 146 | | Kinsale Capital Group, Inc. | | 40,652 |
| 1,196 | | Mercury General Corp. | | 42,733 |
| 4,167 | | Old Republic International Corp. | | 109,967 |
| 641 | | Reinsurance Group of America, Inc. | | 97,285 |
| 274 | | RenaissanceRe Holdings Ltd. | | 53,619 |
| 745 | | RLI Corp. | | 98,675 |
| 1,107 | | Selective Insurance Group, Inc. | | 105,165 |
| | | | | 859,727 |
| | | Interactive Media & Services – 0.5% | | |
| 1,153 | | Ziff Davis, Inc. (a) | | 103,170 |
| | | IT Services – 1.6% | | |
| 1,763 | | CSG Systems International, Inc. | | 105,198 |
| 2,177 | | Genpact Ltd. | | 102,929 |
| 1,391 | | Maximus, Inc. | | 104,116 |
| | | | | 312,243 |
| | | Leisure Products – 0.5% | | |
| 5,072 | | Mattel, Inc. (a) | | 103,773 |
| | | Machinery – 5.9% | | |
| 670 | | AGCO Corp. | | 92,547 |
| 963 | | Crane Holdings Co. | | 111,621 |
| 1,666 | | Donaldson Co., Inc. | | 103,875 |
See Notes to Financial Statements
Page 19
First Trust Horizon Managed Volatility Small/Mid ETF (HSMV)
Portfolio of Investments (Continued)
January 31, 2023 (Unaudited)
| Shares | | Description | | Value |
| COMMON STOCKS (Continued) |
| | | Machinery (Continued) | | |
| 2,938 | | Flowserve Corp. | | $101,126 |
| 1,445 | | Graco, Inc. | | 98,723 |
| 1,236 | | ITT, Inc. | | 113,205 |
| 647 | | Lincoln Electric Holdings, Inc. | | 107,965 |
| 607 | | Middleby (The) Corp. (a) | | 94,358 |
| 1,088 | | Oshkosh Corp. | | 109,649 |
| 1,500 | | Timken (The) Co. | | 123,525 |
| 879 | | Toro (The) Co. | | 98,026 |
| | | | | 1,154,620 |
| | | Media – 0.5% | | |
| 2,787 | | New York Times (The) Co., Class A | | 97,099 |
| | | Metals & Mining – 1.1% | | |
| 485 | | Reliance Steel & Aluminum Co. | | 110,313 |
| 769 | | Royal Gold, Inc. | | 97,686 |
| | | | | 207,999 |
| | | Multi-Utilities – 1.5% | | |
| 2,407 | | Avista Corp. | | 96,039 |
| 1,411 | | Black Hills Corp. | | 102,128 |
| 1,731 | | NorthWestern Corp. | | 98,321 |
| | | | | 296,488 |
| | | Oil, Gas & Consumable Fuels – 0.0% | | |
| 134 | | Vitesse Energy Inc. | | 2,139 |
| | | Pharmaceuticals – 1.6% | | |
| 661 | | Jazz Pharmaceuticals PLC (a) | | 103,552 |
| 2,614 | | Pacira BioSciences, Inc. (a) | | 102,652 |
| 1,549 | | Prestige Consumer Healthcare, Inc. (a) | | 101,862 |
| | | | | 308,066 |
| | | Professional Services – 3.6% | | |
| 1,017 | | ASGN, Inc. (a) | | 92,496 |
| 347 | | CACI International, Inc., Class A (a) | | 106,907 |
| 1,020 | | Exponent, Inc. | | 104,591 |
| 638 | | FTI Consulting, Inc. (a) | | 101,774 |
| 2,039 | | KBR, Inc. | | 104,458 |
| 1,233 | | ManpowerGroup, Inc. | | 107,468 |
| 955 | | Science Applications International Corp. | | 99,110 |
| | | | | 716,804 |
| | | Real Estate Management &
Development – 0.5% | | |
| 497 | | Jones Lang LaSalle, Inc. (a) | | 91,880 |
| | | Road & Rail – 1.6% | | |
| 1,911 | | Knight-Swift Transportation Holdings, Inc. | | 112,940 |
| 583 | | Landstar System, Inc. | | 100,760 |
| Shares | | Description | | Value |
|
| | | Road & Rail (Continued) | | |
| 2,324 | | Werner Enterprises, Inc. | | $109,158 |
| | | | | 322,858 |
| | | Semiconductors &
Semiconductor Equipment – 0.5% | | |
| 1,065 | | Cirrus Logic, Inc. (a) | | 96,265 |
| | | Software – 1.1% | | |
| 1,826 | | CommVault Systems, Inc. (a) | | 113,632 |
| 1,922 | | Progress Software Corp. | | 101,943 |
| | | | | 215,575 |
| | | Specialty Retail – 0.5% | | |
| 388 | | Murphy USA, Inc. | | 105,548 |
| | | Textiles, Apparel & Luxury
Goods – 1.1% | | |
| 1,184 | | Carter’s, Inc. | | 98,710 |
| 1,229 | | Columbia Sportswear Co. | | 117,861 |
| | | | | 216,571 |
| | | Thrifts & Mortgage Finance – 1.6% | | |
| 2,233 | | Essent Group Ltd. | | 98,319 |
| 7,399 | | MGIC Investment Corp. | | 104,474 |
| 944 | | Mr Cooper Group, Inc. (a) | | 43,415 |
| 6,087 | | New York Community Bancorp, Inc. | | 60,809 |
| | | | | 307,017 |
| | | Trading Companies &
Distributors – 1.1% | | |
| 1,255 | | MSC Industrial Direct Co., Inc., Class A | | 103,789 |
| 371 | | Watsco, Inc. | | 106,614 |
| | | | | 210,403 |
| | | Water Utilities – 2.0% | | |
| 1,066 | | American States Water Co. | | 100,385 |
| 1,636 | | California Water Service Group | | 100,074 |
| 2,077 | | Essential Utilities, Inc. | | 97,058 |
| 1,270 | | SJW Group | | 98,311 |
| | | | | 395,828 |
| | | Total Common Stocks | | 16,368,193 |
| | | (Cost $15,232,877) | | |
| REAL ESTATE INVESTMENT TRUSTS – 16.7% |
| | | Equity Real Estate Investment
Trusts – 16.2% | | |
| 1,390 | | Agree Realty Corp. | | 103,736 |
| 2,834 | | Apartment Income REIT Corp. | | 108,429 |
| 14,353 | | Brandywine Realty Trust | | 94,156 |
| 3,801 | | Corporate Office Properties Trust | | 106,694 |
| 4,010 | | Cousins Properties, Inc. | | 109,954 |
| 6,004 | | Douglas Emmett, Inc. | | 100,567 |
Page 20
See Notes to Financial Statements
First Trust Horizon Managed Volatility Small/Mid ETF (HSMV)
Portfolio of Investments (Continued)
January 31, 2023 (Unaudited)
| Shares | | Description | | Value |
| REAL ESTATE INVESTMENT TRUSTS (Continued) |
| | | Equity Real Estate Investment
Trusts (Continued) | | |
| 6,670 | | Easterly Government Properties, Inc. | | $108,321 |
| 653 | | EastGroup Properties, Inc. | | 109,867 |
| 4,231 | | Essential Properties Realty Trust, Inc. | | 107,806 |
| 2,027 | | First Industrial Realty Trust, Inc. | | 108,140 |
| 3,667 | | Four Corners Property Trust, Inc. | | 105,463 |
| 2,883 | | Getty Realty Corp. | | 105,028 |
| 5,248 | | Healthcare Realty Trust, Inc. | | 112,989 |
| 3,479 | | Highwoods Properties, Inc. | | 105,657 |
| 5,843 | | Independence Realty Trust, Inc. | | 110,024 |
| 5,183 | | JBG SMITH Properties | | 104,386 |
| 2,794 | | Kilroy Realty Corp. | | 114,666 |
| 1,117 | | Lamar Advertising Co., Class A | | 119,005 |
| 995 | | Life Storage, Inc. | | 107,500 |
| 2,771 | | LTC Properties, Inc. | | 105,714 |
| 6,452 | | Medical Properties Trust, Inc. | | 83,553 |
| 2,164 | | National Retail Properties, Inc. | | 102,465 |
| 2,712 | | National Storage Affiliates Trust | | 110,650 |
| 3,627 | | Omega Healthcare Investors, Inc. | | 106,779 |
| 6,668 | | Physicians Realty Trust | | 105,754 |
| 2,906 | | Rayonier, Inc. | | 105,749 |
| 6,866 | | Retail Opportunity Investments Corp. | | 108,689 |
| 1,740 | | Rexford Industrial Realty, Inc. | | 110,438 |
| 7,479 | | Sabra Health Care REIT, Inc. | | 100,967 |
| 2,463 | | Spirit Realty Capital, Inc. | | 108,076 |
| | | | | 3,191,222 |
| | | Mortgage Real Estate
Investment Trusts – 0.5% | | |
| 6,902 | | ARMOUR Residential REIT, Inc. | | 43,344 |
| 3,039 | | PennyMac Mortgage Investment Trust | | 46,345 |
| | | | | 89,689 |
| | | Total Real Estate Investment Trusts | | 3,280,911 |
| | | (Cost $3,398,467) | | |
| | | Total Investments – 99.8% | | 19,649,104 |
| | | (Cost $18,631,344) | | |
| | | Net Other Assets and Liabilities – 0.2% | | 40,737 |
| | | Net Assets – 100.0% | | $19,689,841 |
| (a) | Non-income producing security. |
Valuation Inputs
A summary of the inputs used to value the Fund’s investments as of January 31, 2023 is as follows (see Note 2A - Portfolio Valuation in the Notes to Financial Statements):
| | Total
Value at
1/31/2023 | Level 1
Quoted
Prices | Level 2
Significant
Observable
Inputs | Level 3
Significant
Unobservable
Inputs |
| Common Stocks* | $ 16,368,193 | $ 16,368,193 | $ — | $ — |
| Real Estate Investment Trusts* | 3,280,911 | 3,280,911 | — | — |
| Total Investments | $ 19,649,104 | $ 19,649,104 | $— | $— |
| * | See Portfolio of Investments for industry breakout. |
See Notes to Financial Statements
Page 21
First Trust Exchange-Traded Fund III
Statements of Assets and Liabilities
January 31, 2023 (Unaudited)
| | First Trust
Horizon
Managed
Volatility
Domestic
ETF
(HUSV) | | First Trust
Horizon
Managed
Volatility
Developed
International
ETF
(HDMV) | | First Trust
Horizon
Managed
Volatility
Small/Mid
ETF
(HSMV) |
| ASSETS: | | | | | |
Investments, at value
| $ 99,989,275 | | $ 39,974,220 | | $ 19,649,104 |
Cash
| 175,331 | | 4,871 | | 45,592 |
| Receivables: | | | | | |
Dividends
| 119,961 | | 41,829 | | 6,925 |
Dividend reclaims
| — | | 233,914 | | 160 |
Total Assets
| 100,284,567 | | 40,254,834 | | 19,701,781 |
| LIABILITIES: | | | | | |
Due to custodian foreign currency
| — | | 841 | | — |
Investment advisory fees payable
| 60,639 | | 27,289 | | 11,940 |
Total Liabilities
| 60,639 | | 28,130 | | 11,940 |
NET ASSETS
| $100,223,928 | | $40,226,704 | | $19,689,841 |
| NET ASSETS consist of: | | | | | |
Paid-in capital
| $ 137,758,346 | | $ 70,766,160 | | $ 19,971,998 |
Par value
| 30,500 | | 14,000 | | 6,000 |
Accumulated distributable earnings (loss)
| (37,564,918) | | (30,553,456) | | (288,157) |
NET ASSETS
| $100,223,928 | | $40,226,704 | | $19,689,841 |
NET ASSET VALUE, per share
| $32.86 | | $28.73 | | $32.82 |
Number of shares outstanding (unlimited number of shares authorized, par value $0.01 per share)
| 3,050,002 | | 1,400,002 | | 600,002 |
Investments, at cost
| $96,082,719 | | $39,809,248 | | $18,631,344 |
Foreign currency, at cost (proceeds)
| $— | | $(835) | | $— |
Page 22
See Notes to Financial Statements
First Trust Exchange-Traded Fund III
Statements of Operations
For the Six Months Ended January 31, 2023 (Unaudited)
| | First Trust
Horizon
Managed
Volatility
Domestic
ETF
(HUSV) | | First Trust
Horizon
Managed
Volatility
Developed
International
ETF
(HDMV) | | First Trust
Horizon
Managed
Volatility
Small/Mid
ETF
(HSMV) |
| INVESTMENT INCOME: | | | | | |
Dividends
| $ 1,250,229 | | $ 539,336 | | $ 200,859 |
Interest
| 2,592 | | 814 | | — |
Foreign withholding tax
| — | | (28,169) | | — |
Other
| — | | 167 | | 25 |
Total investment income
| 1,252,821 | | 512,148 | | 200,884 |
| EXPENSES: | | | | | |
Investment advisory fees
| 340,793 | | 156,871 | | 63,721 |
Total expenses
| 340,793 | | 156,871 | | 63,721 |
NET INVESTMENT INCOME (LOSS)
| 912,028 | | 355,277 | | 137,163 |
| NET REALIZED AND UNREALIZED GAIN (LOSS): | | | | | |
| Net realized gain (loss) on: | | | | | |
Investments
| (1,506,731) | | (2,160,539) | | (485,840) |
In-kind redemptions
| 1,613,355 | | (22,091) | | — |
Foreign currency transactions
| — | | 9,870 | | — |
Net realized gain (loss)
| 106,624 | | (2,172,760) | | (485,840) |
| Net change in unrealized appreciation (depreciation) on: | | | | | |
Investments
| (225,025) | | 2,587,051 | | 936,925 |
Foreign currency translation
| — | | 12,571 | | — |
Net change in unrealized appreciation (depreciation)
| (225,025) | | 2,599,622 | | 936,925 |
NET REALIZED AND UNREALIZED GAIN (LOSS)
| (118,401) | | 426,862 | | 451,085 |
NET INCREASE (DECREASE) IN NET ASSETS RESULTING FROM OPERATIONS
| $ 793,627 | | $ 782,139 | | $ 588,248 |
See Notes to Financial Statements
Page 23
First Trust Exchange-Traded Fund III
Statements of Changes in Net Assets
| | First Trust Horizon Managed
Volatility Domestic ETF
(HUSV) | | First Trust Horizon Managed
Volatility Developed International ETF
(HDMV) |
| | Six Months
Ended
1/31/2023
(Unaudited) | | Year
Ended
7/31/2022 | | Six Months
Ended
1/31/2023
(Unaudited) | | Year
Ended
7/31/2022 |
| OPERATIONS: | | | | | | | |
Net investment income (loss)
| $ 912,028 | | $ 1,753,621 | | $ 355,277 | | $ 1,837,495 |
Net realized gain (loss)
| 106,624 | | 10,719,961 | | (2,172,760) | | (571,567) |
Net change in unrealized appreciation (depreciation)
| (225,025) | | (10,221,164) | | 2,599,622 | | (8,141,611) |
Net increase (decrease) in net assets resulting from operations
| 793,627 | | 2,252,418 | | 782,139 | | (6,875,683) |
| DISTRIBUTIONS TO SHAREHOLDERS FROM: | | | | | | | |
Investment operations
| (987,796) | | (1,660,766) | | (635,681) | | (1,931,942) |
| SHAREHOLDER TRANSACTIONS: | | | | | | | |
Proceeds from shares sold
| 18,777,582 | | 20,067,842 | | — | | 1,508,580 |
Cost of shares redeemed
| (18,024,066) | | (41,752,654) | | (5,676,657) | | (33,905,829) |
Net increase (decrease) in net assets resulting from shareholder transactions
| 753,516 | | (21,684,812) | | (5,676,657) | | (32,397,249) |
Total increase (decrease) in net assets
| 559,347 | | (21,093,160) | | (5,530,199) | | (41,204,874) |
| NET ASSETS: | | | | | | | |
Beginning of period
| 99,664,581 | | 120,757,741 | | 45,756,903 | | 86,961,777 |
End of period
| $100,223,928 | | $99,664,581 | | $40,226,704 | | $45,756,903 |
| CHANGES IN SHARES OUTSTANDING: | | | | | | | |
Shares outstanding, beginning of period
| 3,000,002 | | 3,650,002 | | 1,600,002 | | 2,700,002 |
Shares sold
| 600,000 | | 600,000 | | — | | 50,000 |
Shares redeemed
| (550,000) | | (1,250,000) | | (200,000) | | (1,150,000) |
Shares outstanding, end of period
| 3,050,002 | | 3,000,002 | | 1,400,002 | | 1,600,002 |
Page 24
See Notes to Financial Statements
First Trust Horizon Managed
Volatility Small/Mid ETF
(HSMV) |
Six Months
Ended
1/31/2023
(Unaudited) | | Year
Ended
7/31/2022 |
| | | |
| $ 137,163 | | $ 167,247 |
| (485,840) | | 366,910 |
| 936,925 | | (864,174) |
| 588,248 | | (330,017) |
| | | |
| (146,851) | | (133,705) |
| | | |
| 3,180,198 | | 6,741,624 |
| — | | (5,115,847) |
| 3,180,198 | | 1,625,777 |
| 3,621,595 | | 1,162,055 |
| | | |
| 16,068,246 | | 14,906,191 |
| $19,689,841 | | $16,068,246 |
| | | |
| 500,002 | | 450,002 |
| 100,000 | | 200,000 |
| — | | (150,000) |
| 600,002 | | 500,002 |
See Notes to Financial Statements
Page 25
First Trust Exchange-Traded Fund III
Financial Highlights
For a share outstanding throughout each period
First Trust Horizon Managed Volatility Domestic ETF (HUSV)
| | Six Months
Ended
1/31/2023
(Unaudited) | | Year Ended July 31, |
| | 2022 | | 2021 | | 2020 | | 2019 | | 2018 | |
Net asset value, beginning of period
| $ 33.22 | | $ 33.08 | | $ 27.19 | | $ 26.71 | | $ 23.49 | | $ 22.03 |
| Income from investment operations: | | | | | | | | | | | |
Net investment income (loss)
| 0.31 | | 0.51 | | 0.46 | | 0.37 | | 0.37 | | 0.30 |
Net realized and unrealized gain (loss)
| (0.33) | | 0.10 | | 5.87 | | 0.52 | | 3.17 | | 1.46 |
Total from investment operations
| (0.02) | | 0.61 | | 6.33 | | 0.89 | | 3.54 | | 1.76 |
| Distributions paid to shareholders from: | | | | | | | | | | | |
Net investment income
| (0.34) | | (0.47) | | (0.44) | | (0.41) | | (0.32) | | (0.30) |
Net asset value, end of period
| $32.86 | | $33.22 | | $33.08 | | $27.19 | | $26.71 | | $23.49 |
Total return (a)
| 0.00 % | | 1.82% | | 23.48% | | 3.41% | | 15.24% | | 8.04% |
| Ratios to average net assets/supplemental data: | | | | | | | | | | | |
Net assets, end of period (in 000’s)
| $ 100,224 | | $ 99,665 | | $ 120,758 | | $ 214,822 | | $ 224,389 | | $ 133,888 |
Ratio of total expenses to average net assets
| 0.70% (b) | | 0.70% | | 0.70% | | 0.70% | | 0.70% | | 0.70% |
Ratio of net investment income (loss) to average net assets
| 1.87% (b) | | 1.46% | | 1.42% | | 1.39% | | 1.58% | | 1.37% |
Portfolio turnover rate (c)
| 72% | | 76% | | 152% | | 211% | | 147% | | 157% |
| (a) | Total return is calculated assuming an initial investment made at the net asset value at the beginning of the period, reinvestment of all distributions at net asset value during the period, and redemption at net asset value on the last day of the period. The returns presented do not reflect the deduction of taxes that a shareholder would pay on Fund distributions or the redemption or sale of Fund shares. Total return is calculated for the time period presented and is not annualized for periods of less than a year. |
| (b) | Annualized. |
| (c) | Portfolio turnover is calculated for the time period presented and is not annualized for periods of less than a year and does not include securities received or delivered from processing creations or redemptions and in-kind transactions. |
Page 26
See Notes to Financial Statements
First Trust Exchange-Traded Fund III
Financial Highlights (Continued)
For a share outstanding throughout each period
First Trust Horizon Managed Volatility Developed International ETF (HDMV)
| | Six Months
Ended
1/31/2023
(Unaudited) | | Year Ended July 31, |
| | 2022 | | 2021 | | 2020 | | 2019 | | 2018 | |
Net asset value, beginning of period
| $ 28.60 | | $ 32.21 | | $ 28.12 | | $ 32.92 | | $ 33.72 | | $ 33.05 |
| Income from investment operations: | | | | | | | | | | | |
Net investment income (loss)
| 0.26 | | 0.90 | | 0.89 | | 0.65 | | 0.86 | | 0.91 |
Net realized and unrealized gain (loss)
| 0.31 | | (3.62) | | 4.13 | | (4.61) | | (0.79) | | 0.87 |
Total from investment operations
| 0.57 | | (2.72) | | 5.02 | | (3.96) | | 0.07 | | 1.78 |
| Distributions paid to shareholders from: | | | | | | | | | | | |
Net investment income
| (0.44) | | (0.89) | | (0.93) | | (0.84) | | (0.87) | | (1.11) |
Net asset value, end of period
| $28.73 | | $28.60 | | $32.21 | | $28.12 | | $32.92 | | $33.72 |
Total return (a)
| 2.23% | | (8.50)% | | 18.01% (b) | | (12.37)% | | 0.21% | | 5.48% |
| Ratios to average net assets/supplemental data: | | | | | | | | | | | |
Net assets, end of period (in 000’s)
| $ 40,227 | | $ 45,757 | | $ 86,962 | | $ 123,714 | | $ 128,394 | | $ 59,010 |
Ratio of total expenses to average net assets
| 0.80% (c) | | 0.80% | | 0.80% | | 0.80% | | 0.80% | | 0.80% |
Ratio of net investment income (loss) to average net assets
| 1.81% (c) | | 2.53% | | 2.68% | | 2.08% | | 2.74% | | 2.73% |
Portfolio turnover rate (d)
| 48% | | 65% | | 127% | | 196% | | 99% | | 133% |
| (a) | Total return is calculated assuming an initial investment made at the net asset value at the beginning of the period, reinvestment of all distributions at net asset value during the period, and redemption at net asset value on the last day of the period. The returns presented do not reflect the deduction of taxes that a shareholder would pay on Fund distributions or the redemption or sale of Fund shares. Total return is calculated for the time period presented and is not annualized for periods of less than a year. |
| (b) | The Fund received a reimbursement from the advisor in the amount of $6,254, which represents less than $0.01 per share. Since the advisor reimbursed the Fund, there was no effect on the Fund’s total return. |
| (c) | Annualized. |
| (d) | Portfolio turnover is calculated for the time period presented and is not annualized for periods of less than a year and does not include securities received or delivered from processing creations or redemptions and in-kind transactions. |
See Notes to Financial Statements
Page 27
First Trust Exchange-Traded Fund III
Financial Highlights (Continued)
For a share outstanding throughout each period
First Trust Horizon Managed Volatility Small/Mid ETF (HSMV)
| | Six Months
Ended
1/31/2023
(Unaudited) | | Year Ended July 31, | | Period
Ended
7/31/2020 (a) |
| | 2022 | | 2021 | |
Net asset value, beginning of period
| $ 32.14 | | $ 33.12 | | $ 25.03 | | $ 21.10 |
| Income from investment operations: | | | | | | | |
Net investment income (loss)
| 0.26 | | 0.36 | | 0.29 | | 0.02 |
Net realized and unrealized gain (loss)
| 0.71 | | (1.05) | | 8.09 | | 3.92 |
Total from investment operations
| 0.97 | | (0.69) | | 8.38 | | 3.94 |
| Distributions paid to shareholders from: | | | | | | | |
Net investment income
| (0.29) | | (0.29) | | (0.29) | | (0.01) |
Net realized gain
| — | | — | | (0.00) (b) | | — |
Total distributions
| (0.29) | | (0.29) | | (0.29) | | (0.01) |
Net asset value, end of period
| $32.82 | | $32.14 | | $33.12 | | $25.03 |
Total return (c)
| 3.13% | | (2.11)% | | 33.72% | | 18.67% |
| Ratios to average net assets/supplemental data: | | | | | | | |
Net assets, end of period (in 000’s)
| $ 19,690 | | $ 16,068 | | $ 14,906 | | $ 20,023 |
Ratio of total expenses to average net assets
| 0.80% (d) | | 0.80% | | 0.80% | | 0.80% (d) |
Ratio of net investment income (loss) to average net assets
| 1.72% (d) | | 1.09% | | 1.02% | | 0.60% (d) |
Portfolio turnover rate (e)
| 29% | | 71% | | 118% | | 5% |
| (a) | Inception date is April 6, 2020, which is consistent with the commencement of investment operations and is the date the initial creation units were established. |
| (b) | Amount represents less than $0.01 per share. |
| (c) | Total return is calculated assuming an initial investment made at the net asset value at the beginning of the period, reinvestment of all distributions at net asset value during the period, and redemption at net asset value on the last day of the period. The returns presented do not reflect the deduction of taxes that a shareholder would pay on Fund distributions or the redemption or sale of Fund shares. Total return is calculated for the time period presented and is not annualized for periods of less than a year. |
| (d) | Annualized. |
| (e) | Portfolio turnover is calculated for the time period presented and is not annualized for periods of less than a year and does not include securities received or delivered from processing creations or redemptions and in-kind transactions. |
Page 28
See Notes to Financial Statements
Notes to Financial Statements
First Trust Exchange-Traded Fund III
January 31, 2023 (Unaudited)
1. Organization
First Trust Exchange-Traded Fund III (the “Trust”) is an open-end management investment company organized as a Massachusetts business trust on January 9, 2008, and is registered with the Securities and Exchange Commission under the Investment Company Act of 1940, as amended (the “1940 Act”).
The Trust currently consists of seventeen funds that are offering shares. This report covers the following funds (each a “Fund” and collectively, the “Funds”). The shares of each Fund are listed and traded on the NYSE Arca, Inc.
First Trust Horizon Managed Volatility Domestic ETF – (ticker “HUSV”)
First Trust Horizon Managed Volatility Developed International ETF – (ticker “HDMV”)
First Trust Horizon Managed Volatility Small/Mid ETF – (ticker “HSMV”)
HUSV and HDMV are diversified series of the Trust. HSMV is a non-diversified series of the Trust.
Each Fund represents a separate series of shares of beneficial interest in the Trust. Unlike conventional mutual funds, each Fund issues and redeems shares on a continuous basis, at net asset value (“NAV”), only in large blocks of shares known as “Creation Units.”
Each Fund is an actively managed exchange-traded fund. The investment objective of each Fund is to provide capital appreciation.
Under normal market conditions, HUSV seeks to achieve its investment objective by investing at least 80% of its net assets (including investment borrowings) in common stocks of domestic companies listed and traded on U.S. national securities exchanges that Horizon Investments, LLC (“Horizon” or the “Sub-Advisor”) believes exhibit low future expected volatility.
Under normal market conditions, HDMV seeks to achieve its investment objective by investing at least 80% of its net assets (including investment borrowings) in common stocks and depositary receipts of developed market companies listed and traded on non-U.S. exchanges that Horizon believes exhibit low future expected volatility.
Under normal market conditions, HSMV seeks to achieve its investment objective by investing at least 80% of its net assets (including investment borrowings) in small- and/or mid-capitalization common stocks listed and traded on U.S. national securities exchanges that Horizon believes exhibit low future expected volatility.
There can be no assurance that a Fund will achieve its investment objective. The Funds may not be appropriate for all investors.
2. Significant Accounting Policies
The Funds are each considered an investment company and follow accounting and reporting guidance under Financial Accounting Standards Board Accounting Standards Codification Topic 946, “Financial Services-Investment Companies.” The following is a summary of significant accounting policies consistently followed by the Funds in the preparation of the financial statements. The preparation of the financial statements in accordance with accounting principles generally accepted in the United States of America (“U.S. GAAP”) requires management to make estimates and assumptions that affect the reported amounts and disclosures in the financial statements. Actual results could differ from those estimates.
A. Portfolio Valuation
Each Fund’s NAV is determined daily as of the close of regular trading on the New York Stock Exchange (“NYSE”), normally 4:00 p.m. Eastern time, on each day the NYSE is open for trading. If the NYSE closes early on a valuation day, the NAV is determined as of that time. Foreign securities are priced using data reflecting the earlier closing of the principal markets for those securities. Each Fund’s NAV is calculated by dividing the value of all assets of each Fund (including accrued interest and dividends), less all liabilities (including accrued expenses and dividends declared but unpaid), by the total number of shares outstanding.
Each Fund’s investments are valued daily at market value or, in the absence of market value with respect to any portfolio securities, at fair value. Market value prices represent readily available market quotations such as last sale or official closing prices from a national or foreign exchange (i.e., a regulated market) and are primarily obtained from third-party pricing services. Fair value prices represent any prices not considered market value prices and are either obtained from a third-party pricing service or are determined by the Pricing Committee of the Funds’ investment advisor, First Trust Advisors L.P. (“First Trust” or the “Advisor”), in accordance with valuation procedures approved by the Trust’s Board of Trustees, and in accordance with provisions of the 1940 Act and rules thereunder. Investments valued by the Advisor’s Pricing Committee, if any, are footnoted as such in the footnotes to the Portfolio of Investments. Each Fund’s investments are valued as follows:
Common stocks, real estate investment trusts (“REITs”) and other equity securities listed on any national or foreign exchange (excluding The Nasdaq Stock Market LLC (“Nasdaq”) and the London Stock Exchange Alternative Investment Market (“AIM”))
Notes to Financial Statements (Continued)
First Trust Exchange-Traded Fund III
January 31, 2023 (Unaudited)
are valued at the last sale price on the exchange on which they are principally traded or, for Nasdaq and AIM securities, the official closing price. Securities traded on more than one securities exchange are valued at the last sale price or official closing price, as applicable, at the close of the securities exchange representing the primary exchange for such securities.
Securities trading on foreign exchanges or over-the-counter markets that close prior to the NYSE close may be valued using a systematic fair valuation model provided by a third-party pricing service. If these foreign securities meet certain criteria in relation to the valuation model, their valuation is systematically adjusted to reflect the impact of movement in the U.S. market after the close of the foreign markets.
Securities traded in an over-the-counter market are valued at the mean of their most recent bid and asked price, if available, and otherwise at their last trade price.
Certain securities may not be able to be priced by pre-established pricing methods. Such securities may be valued by the Advisor’s Pricing Committee at fair value. These securities generally include, but are not limited to, restricted securities (securities which may not be publicly sold without registration under the Securities Act of 1933, as amended) for which a third-party pricing service is unable to provide a market price; securities whose trading has been formally suspended; a security whose market or fair value price is not available from a pre-established pricing source; a security with respect to which an event has occurred that is likely to materially affect the value of the security after the market has closed but before the calculation of a Fund’s NAV or make it difficult or impossible to obtain a reliable market quotation; and a security whose price, as provided by the third-party pricing service, does not reflect the security’s fair value. As a general principle, the current fair value of a security would appear to be the amount which the owner might reasonably expect to receive for the security upon its current sale. When fair value prices are used, generally they will differ from market quotations or official closing prices on the applicable exchanges. A variety of factors may be considered in determining the fair value of such securities, including, but not limited to, the following:
| 1) | the last sale price on the exchange on which they are principally traded or, for Nasdaq and AIM securities, the official closing price; |
| 2) | the type of security; |
| 3) | the size of the holding; |
| 4) | the initial cost of the security; |
| 5) | transactions in comparable securities; |
| 6) | price quotes from dealers and/or third-party pricing services; |
| 7) | relationships among various securities; |
| 8) | information obtained by contacting the issuer, analysts, or the appropriate stock exchange; |
| 9) | an analysis of the issuer’s financial statements; |
| 10) | the existence of merger proposals or tender offers that might affect the value of the security; and |
| 11) | other relevant factors. |
If the securities in question are foreign securities, the following additional information may be considered:
| 1) | the value of similar foreign securities traded on other foreign markets; |
| 2) | ADR trading of similar securities; |
| 3) | closed-end fund or exchange-traded fund trading of similar securities; |
| 4) | foreign currency exchange activity; |
| 5) | the trading prices of financial products that are tied to baskets of foreign securities; |
| 6) | factors relating to the event that precipitated the pricing problem; |
| 7) | whether the event is likely to recur; |
| 8) | whether the effects of the event are isolated or whether they affect entire markets, countries or regions; and |
| 9) | other relevant factors. |
Because foreign markets may be open on different days than the days during which investors may transact in the shares of a Fund, the value of the Fund’s securities may change on the days when investors are not able to transact in the shares of the Fund. The value of securities denominated in foreign currencies is converted into U.S. dollars using exchange rates determined daily as of the close of regular trading on the NYSE.
Notes to Financial Statements (Continued)
First Trust Exchange-Traded Fund III
January 31, 2023 (Unaudited)
The Funds are subject to fair value accounting standards that define fair value, establish the framework for measuring fair value and provide a three-level hierarchy for fair valuation based upon the inputs to the valuation as of the measurement date. The three levels of the fair value hierarchy are as follows:
| • | Level 1 – Level 1 inputs are quoted prices in active markets for identical investments. An active market is a market in which transactions for the investment occur with sufficient frequency and volume to provide pricing information on an ongoing basis. |
| • | Level 2 – Level 2 inputs are observable inputs, either directly or indirectly, and include the following: |
| o | Quoted prices for similar investments in active markets. |
| o | Quoted prices for identical or similar investments in markets that are non-active. A non-active market is a market where there are few transactions for the investment, the prices are not current, or price quotations vary substantially either over time or among market makers, or in which little information is released publicly. |
| o | Inputs other than quoted prices that are observable for the investment (for example, interest rates and yield curves observable at commonly quoted intervals, volatilities, prepayment speeds, loss severities, credit risks, and default rates). |
| o | Inputs that are derived principally from or corroborated by observable market data by correlation or other means. |
| • | Level 3 – Level 3 inputs are unobservable inputs. Unobservable inputs may reflect the reporting entity’s own assumptions about the assumptions that market participants would use in pricing the investment. |
The inputs or methodologies used for valuing investments are not necessarily an indication of the risk associated with investing in those investments. A summary of the inputs used to value each Fund’s investments as of January 31, 2023, is included with each Fund’s Portfolio of Investments.
B. Securities Transactions and Investment Income
Securities transactions are recorded as of the trade date. Realized gains and losses from securities transactions are recorded on the identified cost basis. Dividend income is recorded on the ex-dividend date. Interest income, if any, is recorded daily on the accrual basis.
Withholding taxes and tax reclaims on foreign dividends have been provided for in accordance with each Fund’s understanding of the applicable country’s tax rules and rates.
Distributions received from a Fund’s investments in REITs may be comprised of return of capital, capital gains, and income. The actual character of the amounts received during the year are not known until after the REITs’ fiscal year end. A Fund records the character of distributions received from the REITs during the year based on estimates available. The characterization of distributions received by a Fund may be subsequently revised based on information received from the REITs after their tax reporting periods conclude.
C. Foreign Currency
The books and records of the Funds are maintained in U.S. dollars. Foreign currencies, investments and other assets and liabilities are translated into U.S. dollars at the exchange rates prevailing at the end of the period. Purchases and sales of investments and items of income and expense are translated on the respective dates of such transactions. Unrealized gains and losses on assets and liabilities, other than investments in securities, which result from changes in foreign currency exchange rates have been included in “Net change in unrealized appreciation (depreciation) on foreign currency translation” on the Statements of Operations. Unrealized gains and losses on investments in securities which result from changes in foreign exchange rates are included with fluctuations arising from changes in market price and are included in “Net change in unrealized appreciation (depreciation) on investments” on the Statements of Operations. Net realized foreign currency gains and losses include the effect of changes in exchange rates between trade date and settlement date on investment security transactions, foreign currency transactions and interest and dividends received and are included in “Net realized gain (loss) on foreign currency transactions” on the Statements of Operations. The portion of foreign currency gains and losses related to fluctuations in exchange rates between the initial purchase settlement date and subsequent sale trade date is included in “Net realized gain (loss) on investments” on the Statements of Operations.
D. Dividends and Distributions to Shareholders
Dividends from net investment income, if any, are declared and paid quarterly by each Fund, or as the Board of Trustees may determine from time to time. Distributions of net realized capital gains earned by each Fund, if any, are distributed at least annually.
Notes to Financial Statements (Continued)
First Trust Exchange-Traded Fund III
January 31, 2023 (Unaudited)
Distributions from net investment income and realized capital gains are determined in accordance with federal income tax regulations, which may differ from U.S. GAAP. Certain capital accounts in the financial statements are periodically adjusted for permanent differences in order to reflect their tax character. These permanent differences are primarily due to the varying treatment of income and gain/loss on portfolio securities held by the Funds and have no impact on net assets or NAV per share. Temporary differences, which arise from recognizing certain items of income, expense and gain/loss in different periods for financial statement and tax purposes, will reverse at some time in the future.
The tax character of distributions paid by each Fund during the fiscal year ended July 31, 2022, was as follows:
| | Distributions
paid from
Ordinary
Income | | Distributions
paid from
Capital
Gains | | Distributions
paid from
Return of
Capital |
First Trust Horizon Managed Volatility Domestic ETF
| $ 1,660,766 | | $ — | | $ — |
First Trust Horizon Managed Volatility Developed International ETF
| 1,931,942 | | — | | — |
First Trust Horizon Managed Volatility Small/Mid ETF
| 133,705 | | — | | — |
As of July 31, 2022, the components of distributable earnings on a tax basis for each Fund were as follows:
| | Undistributed
Ordinary
Income | | Accumulated
Capital and
Other
Gain (Loss) | | Net
Unrealized
Appreciation
(Depreciation) |
First Trust Horizon Managed Volatility Domestic ETF
| $ 255,958 | | $ (41,741,623) | | $ 4,114,916 |
First Trust Horizon Managed Volatility Developed International ETF
| 290,248 | | (28,457,956) | | (2,532,206) |
First Trust Horizon Managed Volatility Small/Mid ETF
| 38,219 | | (729,173) | | (38,600) |
E. Income Taxes
Each Fund intends to continue to qualify as a regulated investment company by complying with the requirements under Subchapter M of the Internal Revenue Code of 1986, as amended, which includes distributing substantially all of its net investment income and net realized gains to shareholders. Accordingly, no provision has been made for federal and state income taxes. However, due to the timing and amount of distributions, each Fund may be subject to an excise tax of 4% of the amount by which approximately 98% of each Fund’s taxable income exceeds the distributions from such taxable income for the calendar year.
The Funds are subject to accounting standards that establish a minimum threshold for recognizing, and a system for measuring, the benefits of a tax position taken or expected to be taken in a tax return. For HUSV and HDMV, taxable years ended 2019, 2020, 2021, and 2022 remain open to federal and state audit. For HSMV, the taxable years ended 2020, 2021, and 2022 remain open to federal and state audit. As of January 31, 2023, management has evaluated the application of these standards to the Funds and has determined that no provision for income tax is required in the Funds’ financial statements for uncertain tax positions.
The Funds intend to utilize provisions of the federal income tax laws, which allow them to carry a realized capital loss forward indefinitely following the year of the loss and offset such loss against any future realized capital gains. The Funds are subject to certain limitations under U.S. tax rules on the use of capital loss carryforwards and net unrealized built-in losses. These limitations apply when there has been a 50% change in ownership. At July 31, 2022, for federal income tax purposes, the Funds had a capital loss carryforward available that is shown in the following table, to the extent provided by regulations, to offset future capital gains.
| | Non-Expiring
Capital Loss
Carryforward |
First Trust Horizon Managed Volatility Domestic ETF
| $ 41,741,623 |
First Trust Horizon Managed Volatility Developed International ETF
| 28,457,956 |
First Trust Horizon Managed Volatility Small/Mid ETF
| 729,173 |
Notes to Financial Statements (Continued)
First Trust Exchange-Traded Fund III
January 31, 2023 (Unaudited)
As of January 31, 2023, the aggregate cost, gross unrealized appreciation, gross unrealized depreciation, and net unrealized appreciation/(depreciation) on investments (including short positions and derivatives, if any) for federal income tax purposes were as follows:
| | Tax Cost | | Gross
Unrealized
Appreciation | | Gross
Unrealized
(Depreciation) | | Net Unrealized
Appreciation
(Depreciation) |
First Trust Horizon Managed Volatility Domestic ETF
| $ 96,082,719 | | $ 5,319,918 | | $ (1,413,362) | | $ 3,906,556 |
First Trust Horizon Managed Volatility Developed International ETF
| 39,809,248 | | 2,343,431 | | (2,178,459) | | 164,972 |
First Trust Horizon Managed Volatility Small/Mid ETF
| 18,631,344 | | 1,533,954 | | (516,194) | | 1,017,760 |
F. Expenses
Expenses, other than the investment advisory fee and other excluded expenses, are paid by the Advisor (See Note 3).
3. Investment Advisory Fee, Affiliated Transactions and Other Fee Arrangements
First Trust, the investment advisor to the Funds, is a limited partnership with one limited partner, Grace Partners of DuPage L.P., and one general partner, The Charger Corporation. The Charger Corporation is an Illinois corporation controlled by James A. Bowen, Chief Executive Officer of First Trust. First Trust is responsible for supervising the selection and ongoing monitoring of the securities in each Fund’s portfolio, managing the Funds’ business affairs and providing certain administrative services necessary for the management of the Funds.
First Trust is paid an annual unitary management fee for each Fund. Pursuant to the Investment Management Agreement between First Trust and the Trust, First Trust manages the investment of the Funds’ assets and is responsible for the expenses of each Fund, including the cost of transfer agency, sub-advisory, custody, fund administration, legal, audit and other services, but excluding fee payments under the Investment Management Agreement, interest, taxes, brokerage commissions and other expenses connected with the execution of portfolio transactions, distribution and service fees payable pursuant to a Rule 12b-1 plan, if any, and extraordinary expenses, which are paid by each respective Fund. Effective November 1, 2022, the annual unitary management fee payable by each Fund to First Trust for these services will be reduced at certain levels of each Fund’s net assets (“breakpoints”) and calculated pursuant to the following schedules:
| Breakpoints | | HUSV | | HSMV |
| Fund net assets up to and including $2.5 billion | | 0.7000% | | 0.80% |
| Fund net assets greater than $2.5 billion up to and including $5 billion | | 0.6825% | | 0.78% |
| Fund net assets greater than $5 billion up to and including $7.5 billion | | 0.6650% | | 0.76% |
| Fund net assets greater than $7.5 billion up to and including $10 billion | | 0.6475% | | 0.74% |
| Fund net assets greater than $10 billion up to and including $15 billion | | 0.6300% | | 0.72% |
| Fund net assets greater than $15 billion | | 0.5950% | | 0.68% |
| | | | | |
| Breakpoints | | HDMV | | |
| Fund net assets up to and including $2.5 billion | | 0.80% | | |
| Fund net assets greater than $2.5 billion up to and including $5 billion | | 0.78% | | |
| Fund net assets greater than $5 billion up to and including $7.5 billion | | 0.76% | | |
| Fund net assets greater than $7.5 billion up to and including $10 billion | | 0.74% | | |
| Fund net assets greater than $10 billion | | 0.72% | | |
Prior to November 1, 2022, HUSV paid First Trust an annual unitary management fee equal to 0.70% of the Fund’s average daily net assets and HDMV and HSMV each paid First Trust an annual unitary management fee of 0.80% of their average daily net assets. First Trust also provides fund reporting services to the Funds for a flat annual fee in the amount of $9,250, which is covered under the annual unitary management fee.
Notes to Financial Statements (Continued)
First Trust Exchange-Traded Fund III
January 31, 2023 (Unaudited)
Horizon serves as the Funds’ sub-advisor and manages each Fund’s portfolio subject to First Trust’s supervision. The Sub-Advisor receives a sub-advisory fee from First Trust equal to 50% of any remaining monthly unitary management fee paid to the Advisor after the average Fund’s expenses accrued during the most recent twelve months are subtracted from the unitary management fee for that month.
The Trust has multiple service agreements with Brown Brothers Harriman & Co. (“BBH”). Under the service agreements, BBH performs custodial, fund accounting, certain administrative services, and transfer agency services for the Funds. As custodian, BBH is responsible for custody of each Fund’s assets. As fund accountant and administrator, BBH is responsible for maintaining the books and records of each Fund’s securities and cash. As transfer agent, BBH is responsible for maintaining shareholder records for each Fund.
Each Trustee who is not an officer or employee of First Trust, any sub-advisor or any of their affiliates (“Independent Trustees”) is paid a fixed annual retainer that is allocated equally among each fund in the First Trust Fund Complex. Each Independent Trustee is also paid an annual per fund fee that varies based on whether the fund is a closed-end or other actively managed fund, a target outcome fund or an index fund.
Additionally, the Lead Independent Trustee and the Chairs of the Audit Committee, Nominating and Governance Committee and Valuation Committee are paid annual fees to serve in such capacities, with such compensation allocated pro rata among each fund in the First Trust Fund Complex based on net assets. Independent Trustees are reimbursed for travel and out-of-pocket expenses in connection with all meetings. The Lead Independent Trustee and Committee Chairs rotate every three years. The officers and “Interested” Trustee receive no compensation from the Trust for acting in such capacities.
4. Purchases and Sales of Securities
For the six months ended January 31, 2023, the cost of purchases and proceeds from sales of investment securities for each Fund, excluding short-term investments and in-kind transactions, were as follows:
| | Purchases | | Sales |
| First Trust Horizon Managed Volatility Domestic ETF | $ 69,806,224 | | $ 69,867,975 |
| First Trust Horizon Managed Volatility Developed International ETF | 18,874,498 | | 19,052,211 |
| First Trust Horizon Managed Volatility Small/Mid ETF | 4,650,617 | | 4,570,071 |
| | | | |
For the six months ended January 31, 2023, the cost of in-kind purchases and proceeds from in-kind sales for each Fund were as follows:
| | Purchases | | Sales |
| First Trust Horizon Managed Volatility Domestic ETF | $ 18,738,399 | | $ 17,969,065 |
| First Trust Horizon Managed Volatility Developed International ETF | — | | 5,602,890 |
| First Trust Horizon Managed Volatility Small/Mid ETF | 3,172,586 | | — |
5. Creations, Redemptions and Transaction Fees
Each Fund generally issues and redeems its shares in primary market transactions through a creation and redemption mechanism and does not sell or redeem individual shares. Instead, financial entities known as “Authorized Participants” have contractual arrangements with a Fund or one of the Fund’s service providers to purchase and redeem Fund shares directly with the Fund in large blocks of shares known as “Creation Units.” Prior to the start of trading on every business day, a Fund publishes through the National Securities Clearing Corporation (“NSCC”) the “basket” of securities, cash or other assets that it will accept in exchange for a Creation Unit of the Fund’s shares. An Authorized Participant that wishes to effectuate a creation of a Fund’s shares deposits with the Fund the “basket” of securities, cash or other assets identified by the Fund that day, and then receives the Creation Unit of the Fund’s shares in return for those assets. After purchasing a Creation Unit, the Authorized Participant may continue to hold the Fund’s shares or sell them in the secondary market. The redemption process is the reverse of the purchase process: the Authorized Participant redeems a Creation Unit of a Fund’s shares for a basket of securities, cash or other assets. The combination of the creation and redemption process with secondary market trading in a Fund’s shares and underlying securities provides arbitrage opportunities that are designed to help keep the market price of a Fund’s shares at or close to the NAV per share of the Fund.
Each Fund imposes fees in connection with the purchase of Creation Units. These fees may vary based upon various fact-based circumstances, including, but not limited to, the composition of the securities included in the Creation Unit or the countries in which
Notes to Financial Statements (Continued)
First Trust Exchange-Traded Fund III
January 31, 2023 (Unaudited)
the transactions are settled. The price for each Creation Unit will equal the daily NAV per share of a Fund times the number of shares in a Creation Unit, plus the fees described above and, if applicable, any operational processing and brokerage costs, transfer fees, stamp taxes and part or all of the spread between the expected bid and offer side of the market related to the securities comprising the creation basket.
Each Fund also imposes fees in connection with the redemption of Creation Units. These fees may vary based upon various fact-based circumstances, including, but not limited to, the composition of the securities included in the Creation Unit or the countries in which the transactions are settled. The price received for each Creation Unit will equal the daily NAV per share of a Fund times the number of shares in a Creation Unit, minus the fees described above and, if applicable, any operational processing and brokerage costs, transfer fees, stamp taxes and part or all of the spread between the expected bid and offer side of the market related to the securities comprising the redemption basket. Investors who use the services of a broker or other such intermediary in addition to an Authorized Participant to effect a redemption of a Creation Unit may also be assessed an amount to cover the cost of such services. The redemption fee charged by a Fund will comply with Rule 22c-2 of the 1940 Act which limits redemption fees to no more than 2% of the value of the shares redeemed.
6. Distribution Plan
The Board of Trustees adopted a Distribution and Service Plan pursuant to Rule 12b-1 under the 1940 Act. In accordance with the Rule 12b-1 plan, each Fund is authorized to pay an amount up to 0.25% of its average daily net assets each year to reimburse First Trust Portfolios L.P. (“FTP”), the distributor of the Funds, for amounts expended to finance activities primarily intended to result in the sale of Creation Units or to provide investor services. FTP may also use this amount to compensate securities dealers or other persons that are Authorized Participants for providing distribution assistance, including broker-dealer and shareholder support and educational and promotional services.
No 12b-1 fees are currently paid by the Funds, and pursuant to a contractual arrangement, no 12b-1 fees will be paid any time before November 30, 2023.
7. Indemnification
The Trust, on behalf of the Funds, has a variety of indemnification obligations under contracts with its service providers. The Trust’s maximum exposure under these arrangements is unknown. However, the Trust has not had prior claims or losses pursuant to these contracts and expects the risk of loss to be remote.
8. Subsequent Events
Management has evaluated the impact of all subsequent events to the Funds through the date the financial statements were issued and has determined that there were no subsequent events requiring recognition or disclosure in the financial statements that have not already been disclosed.
Additional Information
First Trust Exchange-Traded Fund III
January 31, 2023 (Unaudited)
Proxy Voting Policies and Procedures
A description of the policies and procedures that the Trust uses to determine how to vote proxies and information on how each Fund voted proxies relating to portfolio securities during the most recent 12-month period ended June 30 is available (1) without charge, upon request, by calling (800) 988-5891; (2) on each Fund’s website at www.ftportfolios.com; and (3) on the Securities and Exchange Commission’s (“SEC”) website at www.sec.gov.
Portfolio Holdings
Each Fund files portfolio holdings information for each month in a fiscal quarter within 60 days after the end of the relevant fiscal quarter on Form N-PORT. Portfolio holdings information for the third month of each fiscal quarter will be publicly available on the SEC’s website at www.sec.gov. Each Fund’s complete schedule of portfolio holdings for the second and fourth quarters of each fiscal year is included in the semi-annual and annual reports to shareholders, respectively, and is filed with the SEC on Form N-CSR. The semi-annual and annual report for each Fund is available to investors within 60 days after the period to which it relates. Each Fund’s Forms N-PORT and Forms N-CSR are available on the SEC’s website listed above.
Risk Considerations
Risks are inherent in all investing. Certain general risks that may be applicable to a Fund are identified below, but not all of the material risks relevant to each Fund are included in this report and not all of the risks below apply to each Fund. The material risks of investing in each Fund are spelled out in its prospectus, statement of additional information and other regulatory filings. Before investing, you should consider each Fund’s investment objective, risks, charges and expenses, and read each Fund’s prospectus and statement of additional information carefully. You can download each Fund’s prospectus at www.ftportfolios.com or contact First Trust Portfolios L.P. at (800) 621-1675 to request a prospectus, which contains this and other information about each Fund.
Concentration Risk. To the extent that a fund is able to invest a significant percentage of its assets in a single asset class or the securities of issuers within the same country, state, region, industry or sector, an adverse economic, business or political development may affect the value of the fund’s investments more than if the fund were more broadly diversified. A fund that tracks an index will be concentrated to the extent the fund’s corresponding index is concentrated. A concentration makes a fund more susceptible to any single occurrence and may subject the fund to greater market risk than a fund that is more broadly diversified.
Credit Risk. Credit risk is the risk that an issuer of a security will be unable or unwilling to make dividend, interest and/or principal payments when due and the related risk that the value of a security may decline because of concerns about the issuer’s ability to make such payments.
Cyber Security Risk. The funds are susceptible to potential operational risks through breaches in cyber security. A breach in cyber security refers to both intentional and unintentional events that may cause a fund to lose proprietary information, suffer data corruption or lose operational capacity. Such events could cause a fund to incur regulatory penalties, reputational damage, additional compliance costs associated with corrective measures and/or financial loss. In addition, cyber security breaches of a fund’s third-party service providers, such as its administrator, transfer agent, custodian, or sub-advisor, as applicable, or issuers in which the fund invests, can also subject a fund to many of the same risks associated with direct cyber security breaches.
Defined Outcome Funds Risk. To the extent a fund’s investment strategy is designed to deliver returns tied to the price performance of an underlying ETF, an investor may not realize the returns the fund seeks to achieve if that investor does not hold shares for the entire target outcome period. In the event an investor purchases shares after the first day of the target outcome period or sells shares prior to the end of the target outcome period, the buffer that the fund seeks to provide against a decline in the value of the underlying ETF may not be available, the enhanced returns that the fund seeks to provide (if any) may not be available and the investor may not participate in a gain in the value of the underlying ETF up to the cap for the investor’s investment period. Additionally, the fund will not participate in gains of the underlying ETF above the cap and a shareholder may lose their entire investment. If the fund seeks enhanced returns, there are certain time periods when the value of the fund may fall faster than the value of the underlying ETF, and it is very unlikely that, on any given day during which the underlying ETF share price increases in value, the fund’s share price will increase at the same rate as the enhanced returns sought by the fund, which is designed for an entire target outcome period. Trading flexible exchange options involves risks different from, or possibly greater than, the risks associated with investing directly in securities, such as less liquidity and correlation and valuation risks. A fund may experience substantial downside from specific flexible exchange option positions and certain positions may expire worthless.
Derivatives Risk. To the extent a fund uses derivative instruments such as futures contracts, options contracts and swaps, the fund may experience losses because of adverse movements in the price or value of the underlying asset, index or rate, which may be magnified
Additional Information (Continued)
First Trust Exchange-Traded Fund III
January 31, 2023 (Unaudited)
by certain features of the derivative. These risks are heightened when a fund’s portfolio managers use derivatives to enhance the fund’s return or as a substitute for a position or security, rather than solely to hedge (or offset) the risk of a position or security held by the fund.
Equity Securities Risk. To the extent a fund invests in equity securities, the value of the fund’s shares will fluctuate with changes in the value of the equity securities. Equity securities prices fluctuate for several reasons, including changes in investors’ perceptions of the financial condition of an issuer or the general condition of the relevant stock market, such as market volatility, or when political or economic events affecting the issuers occur. In addition, common stock prices may be particularly sensitive to rising interest rates, as the cost of capital rises and borrowing costs increase. Equity securities may decline significantly in price over short or extended periods of time, and such declines may occur in the equity market as a whole, or they may occur in only a particular country, company, industry or sector of the market.
ETF Risk. The shares of an ETF trade like common stock and represent an interest in a portfolio of securities. The risks of owning an ETF generally reflect the risks of owning the underlying securities, although lack of liquidity in an ETF could result in it being more volatile and ETFs have management fees that increase their costs. Shares of an ETF trade on an exchange at market prices rather than net asset value, which may cause the shares to trade at a price greater than net asset value (premium) or less than net asset value (discount). In times of market stress, decisions by market makers to reduce or step away from their role of providing a market for an ETF’s shares, or decisions by an ETF’s authorized participants that they are unable or unwilling to proceed with creation and/or redemption orders of an ETF’s shares, could result in shares of the ETF trading at a discount to net asset value and in greater than normal intraday bid-ask spreads.
Fixed Income Securities Risk. To the extent a fund invests in fixed income securities, the fund will be subject to credit risk, income risk, interest rate risk, liquidity risk and prepayment risk. Income risk is the risk that income from a fund’s fixed income investments could decline during periods of falling interest rates. Interest rate risk is the risk that the value of a fund’s fixed income securities will decline because of rising interest rates. Liquidity risk is the risk that a security cannot be purchased or sold at the time desired, or cannot be purchased or sold without adversely affecting the price. Prepayment risk is the risk that the securities will be redeemed or prepaid by the issuer, resulting in lower interest payments received by the fund. In addition to these risks, high yield securities, or “junk” bonds, are subject to greater market fluctuations and risk of loss than securities with higher ratings, and the market for high yield securities is generally smaller and less liquid than that for investment grade securities.
Index or Model Constituent Risk. Certain funds may be a constituent of one or more indices or ETF models. As a result, such a fund may be included in one or more index-tracking exchange-traded funds or mutual funds. Being a component security of such a vehicle could greatly affect the trading activity involving a fund, the size of the fund and the market volatility of the fund. Inclusion in an index could increase demand for the fund and removal from an index could result in outsized selling activity in a relatively short period of time. As a result, a fund’s net asset value could be negatively impacted and the fund’s market price may be significantly below its net asset value during certain periods. In addition, index rebalances may potentially result in increased trading activity in a fund’s shares.
Index Provider Risk. To the extent a fund seeks to track an index, it is subject to Index Provider Risk. There is no assurance that the Index Provider will compile the Index accurately, or that the Index will be determined, maintained, constructed, reconstituted, rebalanced, composed, calculated or disseminated accurately. To correct any such error, the Index Provider may carry out an unscheduled rebalance or other modification of the Index constituents or weightings, which may increase the fund’s costs. The Index Provider does not provide any representation or warranty in relation to the quality, accuracy or completeness of data in the Index, and it does not guarantee that the Index will be calculated in accordance with its stated methodology. Losses or costs associated with any Index Provider errors generally will be borne by the fund and its shareholders.
Investment Companies Risk. To the extent a fund invests in the securities of other investment vehicles, the fund will incur additional fees and expenses that would not be present in a direct investment in those investment vehicles. Furthermore, the fund’s investment performance and risks are directly related to the investment performance and risks of the investment vehicles in which the fund invests.
LIBOR Risk. To the extent a fund invests in floating or variable rate obligations that use the London Interbank Offered Rate (“LIBOR”) as a reference interest rate, it is subject to LIBOR Risk. The United Kingdom’s Financial Conduct Authority, which regulates LIBOR has ceased making LIBOR available as a reference rate over a phase-out period that began December 31, 2021. There is no assurance that any alternative reference rate, including the Secured Overnight Financing Rate (“SOFR”) will be similar to or produce the same value or economic equivalence as LIBOR or that instruments using an alternative rate will have the same volume or liquidity. The unavailability or replacement of LIBOR may affect the value, liquidity or return on certain fund investments and may result in costs incurred in connection with closing out positions and entering into new trades. Any potential effects of the transition away from LIBOR on the fund or on certain instruments in which the fund invests can be difficult to ascertain, and they may vary depending on a variety of factors, and they could result in losses to the fund.
Additional Information (Continued)
First Trust Exchange-Traded Fund III
January 31, 2023 (Unaudited)
Management Risk. To the extent that a fund is actively managed, it is subject to management risk. In managing an actively-managed fund’s investment portfolio, the fund’s portfolio managers will apply investment techniques and risk analyses that may not have the desired result. There can be no guarantee that a fund will meet its investment objective.
Market Risk. Market risk is the risk that a particular security, or shares of a fund in general, may fall in value. Securities held by a fund, as well as shares of a fund itself, are subject to market fluctuations caused by factors such as general economic conditions, political events, regulatory or market developments, changes in interest rates and perceived trends in securities prices. Shares of a fund could decline in value or underperform other investments as a result of the risk of loss associated with these market fluctuations. In addition, local, regional or global events such as war, acts of terrorism, spread of infectious diseases or other public health issues, recessions, or other events could have a significant negative impact on a fund and its investments. Such events may affect certain geographic regions, countries, sectors and industries more significantly than others. In February 2022, Russia invaded Ukraine which has caused and could continue to cause significant market disruptions and volatility within the markets in Russia, Europe, and the United States. The hostilities and sanctions resulting from those hostilities could have a significant impact on certain fund investments as well as fund performance. The COVID-19 global pandemic and the ensuing policies enacted by governments and central banks have caused and may continue to cause significant volatility and uncertainty in global financial markets. While the U.S. has resumed “reasonably” normal business activity, many countries continue to impose lockdown measures. Additionally, there is no guarantee that vaccines will be effective against emerging variants of the disease. These events also adversely affect the prices and liquidity of a fund’s portfolio securities or other instruments and could result in disruptions in the trading markets. Any of such circumstances could have a materially negative impact on the value of a fund’s shares and result in increased market volatility. During any such events, a fund’s shares may trade at increased premiums or discounts to their net asset value and the bid/ask spread on a fund’s shares may widen.
Non-U.S. Securities Risk. To the extent a fund invests in non-U.S. securities, it is subject to additional risks not associated with securities of domestic issuers. Non-U.S. securities are subject to higher volatility than securities of domestic issuers due to: possible adverse political, social or economic developments; restrictions on foreign investment or exchange of securities; capital controls; lack of liquidity; currency exchange rates; excessive taxation; government seizure of assets; the imposition of sanctions by foreign governments; different legal or accounting standards; and less government supervision and regulation of exchanges in foreign countries. Investments in non-U.S. securities may involve higher costs than investments in U.S. securities, including higher transaction and custody costs, as well as additional taxes imposed by non-U.S. governments. These risks may be heightened for securities of companies located, or with significant operations, in emerging market countries.
Operational Risk. Each fund is subject to risks arising from various operational factors, including, but not limited to, human error, processing and communication errors, errors of a fund’s service providers, counterparties or other third-parties, failed or inadequate processes and technology or systems failures. Each fund relies on third-parties for a range of services, including custody. Any delay or failure relating to engaging or maintaining such service providers may affect a fund’s ability to meet its investment objective. Although the funds and the funds’ investment advisor seek to reduce these operational risks through controls and procedures, there is no way to completely protect against such risks.
Passive Investment Risk. To the extent a fund seeks to track an index, the fund will invest in the securities included in, or representative of, the index regardless of their investment merit. A fund generally will not attempt to take defensive positions in declining markets.
Preferred Securities Risk. Preferred securities combine some of the characteristics of both common stocks and bonds. Preferred securities are typically subordinated to bonds and other debt securities in a company’s capital structure in terms of priority to corporate income, subjecting them to greater credit risk than those debt securities. Generally, holders of preferred securities have no voting rights with respect to the issuing company unless preferred dividends have been in arrears for a specified number of periods, at which time the preferred security holders may obtain limited rights. In certain circumstances, an issuer of preferred securities may defer payment on the securities and, in some cases, redeem the securities prior to a specified date. Preferred securities may also be substantially less liquid than other securities, including common stock.
Valuation Risk. The valuation of certain securities may carry more risk than that of common stock. Uncertainties in the conditions of the financial markets, unreliable reference data, lack of transparency and inconsistency of valuation models and processes may lead to inaccurate asset pricing. A fund may hold investments in sizes smaller than institutionally sized round lot positions (sometimes referred to as odd lots). However, third-party pricing services generally provide evaluations on the basis of institutionally-sized round lots. If a fund sells certain of its investments in an odd lot transaction, the sale price may be less than the value at which such securities
Additional Information (Continued)
First Trust Exchange-Traded Fund III
January 31, 2023 (Unaudited)
have been held by the fund. Odd lots often trade at lower prices than institutional round lots. There is no assurance that the fund will be able to sell a portfolio security at the price established by the pricing service, which could result in a loss to the fund.
| NOT FDIC INSURED | NOT BANK GUARANTEED | MAY LOSE VALUE |
Advisory and Sub-Advisory Agreements
Board Considerations Regarding Approval of Amendments to the Investment Management and Sub-Advisory Agreements
First Trust Horizon Managed Volatility Domestic ETF
First Trust Horizon Managed Volatility Developed International ETF
First Trust Horizon Managed Volatility Small/Mid ETF
The Board of Trustees of First Trust Exchange-Traded Fund III (the “Trust”), including the Independent Trustees, unanimously approved the amendment (as applicable to a specific Fund, the “Advisory Agreement Amendment” and collectively, the “Advisory Agreement Amendments”) of the Investment Management Agreements (as applicable to a specific Fund, the “Advisory Agreement” and collectively, the “Advisory Agreements”) with First Trust Advisors L.P. (the “Advisor”) and the amendment (the “Sub-Advisory Agreement Amendment” and together with the Advisory Agreement Amendments, the “Amendments”) of the Investment Sub-Advisory Agreement (the “Sub-Advisory Agreement” and together with the Advisory Agreements, the “Agreements”) among the Trust, the Advisor and Horizon Investments, LLC (the “Sub-Advisor”) on behalf of the following three series of the Trust (each a “Fund” and collectively, the “Funds”):
First Trust Horizon Managed Volatility Domestic ETF (HUSV)
First Trust Horizon Managed Volatility Developed International ETF (HDMV)
First Trust Horizon Managed Volatility Small/Mid ETF (HSMV)
The Board approved the applicable Amendments for each Fund at a meeting held on October 24, 2022. As part of the review process, the Board reviewed information and had preliminary discussions with the Advisor regarding the proposed Amendments at meetings held on April 18, 2022, June 12–13, 2022 and September 18–19, 2022. Following those preliminary discussions, the Board requested and received information from the Advisor regarding the proposed Amendments, and that information was considered at an executive session of the Independent Trustees and their counsel held prior to the October 24, 2022 meeting, as well as at the October meeting.
In reviewing the Advisory Agreement Amendment for each Fund, the Board considered that the purpose of the Advisory Agreement Amendments is to modify the unitary fee rate for each Fund under the applicable Advisory Agreement by introducing a breakpoint schedule pursuant to which the unitary fee rate paid by each Fund to the Advisor will be reduced as assets of such Fund meet certain thresholds. In reviewing the Sub-Advisory Agreement Amendment for each Fund, the Board considered that the purpose of the Sub-Advisory Agreement Amendment is to modify the sub-advisory fee rate for each Fund under the Sub-Advisory Agreement to reflect the modification of the unitary fee rate schedule under the applicable Advisory Agreement Amendment. The Board noted the Advisor’s representations that the quality and quantity of the services provided to each Fund by the Advisor under the applicable Advisory Agreement and by the Sub-Advisor under the Sub-Advisory Agreement will not be reduced or modified as a result of the applicable Advisory Agreement Amendment and the Sub-Advisory Agreement Amendment, and that the obligations of the Advisor under each Advisory Agreement and the obligations of the Sub-Advisor under the Sub-Advisory Agreement will remain the same in all respects.
The Board noted that it, including the Independent Trustees, last approved the continuation of the applicable Advisory Agreement for each Fund for a one-year period ending June 30, 2023 at a meeting held on June 12–13, 2022. The Board noted that in connection with such approval it had determined for each Fund, based upon the information provided, that the terms of the applicable Advisory Agreement were fair and reasonable and that the continuation of the applicable Advisory Agreement was in the best interests of the Fund in light of the nature, extent and quality of the services provided and such other matters as the Board considered to be relevant in the exercise of its business judgment.
The Board also noted that it, including the Independent Trustees, approved the Sub-Advisory Agreement for HSMV, HUSV and HDMV for an initial two-year period ending December 6, 2023, March 31, 2024 and April 11, 2024, respectively, at a meeting held on September 12–13, 2021 and that shareholders of each of HSMV, HUSV and HDMV approved the Sub-Advisory Agreement for their respective Fund at meetings held on December 6, 2021, March 31, 2022 and April 11, 2022, respectively. The Board noted that in connection with its approval it had determined for each Fund, based upon the information provided, that the terms of the Sub-Advisory Agreement were fair and reasonable and that the approval of the Sub-Advisory Agreement was in the best interests of the Fund in light of the nature, extent and quality of the services provided and such other matters as the Board considered to be relevant in the exercise of its business judgment.
Additional Information (Continued)
First Trust Exchange-Traded Fund III
January 31, 2023 (Unaudited)
Based on all of the information considered, the Board, including the Independent Trustees, unanimously determined that the terms of the Amendments are fair and reasonable and that the Amendments are in the best interests of each Fund.
First Trust Exchange-Traded Fund III
INVESTMENT ADVISOR
First Trust Advisors L.P.
120 East Liberty Drive, Suite 400
Wheaton, IL 60187
INVESTMENT SUB-ADVISOR
Horizon Investments, LLC
6210 Ardrey Kell Road, Suite 300
Charlotte, NC 28277
ADMINISTRATOR, CUSTODIAN,
FUND ACCOUNTANT &
TRANSFER AGENT
Brown Brothers Harriman & Co.
50 Post Office Square
Boston, MA 02110
INDEPENDENT REGISTERED
PUBLIC ACCOUNTING FIRM
Deloitte & Touche LLP
111 S. Wacker Drive
Chicago, IL 60606
LEGAL COUNSEL
Chapman and Cutler LLP
320 South Canal Street
Chicago, IL 60606
First Trust Exchange-Traded Fund III
First Trust California Municipal High Income ETF (FCAL)
First Trust New York Municipal High Income ETF (FMNY)
Semi-Annual Report
For the Six Months Ended
January 31, 2023
First Trust Exchange-Traded Fund III
Semi-Annual Report
January 31, 2023
Caution Regarding Forward-Looking Statements
This report contains certain forward-looking statements within the meaning of the Securities Act of 1933, as amended, and the Securities Exchange Act of 1934, as amended. Forward-looking statements include statements regarding the goals, beliefs, plans or current expectations of First Trust Advisors L.P. (“First Trust” or the “Advisor”) and its representatives, taking into account the information currently available to them. Forward-looking statements include all statements that do not relate solely to current or historical fact. For example, forward-looking statements include the use of words such as “anticipate,” “estimate,” “intend,” “expect,” “believe,” “plan,” “may,” “should,” “would” or other words that convey uncertainty of future events or outcomes.
Forward-looking statements involve known and unknown risks, uncertainties and other factors that may cause the actual results, performance or achievements of any series of First Trust Exchange-Traded Fund III (the “Trust”) described in this report (each such series is referred to as a “Fund” and collectively, the “Funds”) to be materially different from any future results, performance or achievements expressed or implied by the forward-looking statements. When evaluating the information included in this report, you are cautioned not to place undue reliance on these forward-looking statements, which reflect the judgment of the Advisor and its representatives only as of the date hereof. We undertake no obligation to publicly revise or update these forward-looking statements to reflect events and circumstances that arise after the date hereof.
Performance and Risk Disclosure
There is no assurance that any Fund described in this report will achieve its investment objectives. Each Fund is subject to market risk, which is the possibility that the market values of securities owned by the Fund will decline and that the value of the Fund’s shares may therefore be less than what you paid for them. Accordingly, you can lose money by investing in a Fund. See “Risk Considerations” in the Additional Information section of this report for a discussion of certain other risks of investing in the Funds.
Performance data quoted represents past performance, which is no guarantee of future results, and current performance may be lower or higher than the figures shown. For the most recent month-end performance figures, please visit www.ftportfolios.com or speak with your financial advisor. Investment returns, net asset value and share price will fluctuate and Fund shares, when sold, may be worth more or less than their original cost.
The Advisor may also periodically provide additional information on Fund performance on each Fund’s web page at www.ftportfolios.com.
How to Read This Report
This report contains information that may help you evaluate your investment. It includes details about each Fund and presents data and analysis that provide insight into each Fund’s performance and investment approach.
The statistical information that follows may help you understand each Fund’s performance compared to that of a relevant market benchmark.
It is important to keep in mind that the opinions expressed by personnel of the Advisor are just that: informed opinions. They should not be considered to be promises or advice. The opinions, like the statistics, cover the period through the date on the cover of this report. The material risks of investing in each Fund are spelled out in the prospectus, the statement of additional information, and other Fund regulatory filings.
First Trust Exchange-Traded Fund III
Semi-Annual Letter from the Chairman and CEO
January 31, 2023
Dear Shareholders,
First Trust is pleased to provide you with the semi-annual report for certain series of First Trust Exchange-Traded Fund III (the “Funds”), which contains detailed information about the Funds for the six-month period ended January 31, 2023.
Given recent inflation data, the Federal Reserve’s (the “Fed”) monetary policy remains front and center in most discussions regarding the outlook of the U.S. economy. Annual revisions to the Consumer Price Index released on February 10, 2023, showed that prices climbed at a 3.3% annual rate in the last three months of 2022, not the 1.8% rate reported four weeks prior, according to Brian Wesbury, Chief Economist at First Trust. Additionally, “core” inflation, which excludes volatile food and energy prices, was also revised upwards from 3.1% to 4.3% over the period. Furthermore, January’s 2023 jobs data came in better than expected, with non-farm payroll employment rising by 517,000. It is precisely this situation: stubbornly high inflation, strong jobs growth and increasing interest rates, which has many pundits debating whether the typical U.S. consumer can remain healthy enough to help ward off an economic recession.
As many investors know, the consumer is an essential driver of economic growth in the U.S. On average, over the 15-year period ended October 1, 2022, consumer spending accounted for 67.8% of the U.S. gross domestic product (“GDP”). Crucially, recent data regarding consumer health has been mixed, in my opinion. On one hand, the Commerce Department reported that in December 2022, the U.S. savings rate rose to its highest level in seven months, coming in at 3.4%. On the other hand, while December’s savings rate was a welcome reversal from the declines suffered throughout 2021 and 2022, it could indicate that consumers are beginning to pull back on discretionary spending amidst a cloudier economic outlook, according to Bloomberg. Recent data shows that the average interest rate on U.S. credit cards rose to 19.07% in the fourth quarter of 2022, its highest level in over 50 years. Additionally, U.S. credit card debt reached a record $930.6 billion in the fourth quarter, jumping 18.5% year-over-year. Even so, debt service payments accounted for just 9.75% of disposable personal income in the third quarter of 2022. This figure is higher than its historic low of 8.33% set in 2021 but is also well below its peak of 13.17% set in 2007. In my view, it is worth keeping an eye on debt service payments. If higher payments lead to a decline in discretionary spending, it could negatively impact GDP.
I would like to take a moment to remind you that even though nearly three years have passed since the World Health Organization initially declared the coronavirus outbreak a global pandemic, the economic impact of worldwide lockdowns and the subsequent governmental stimulus is still very real. China, for example, only recently dropped its requirement that incoming travelers must quarantine before entering the country. In addition, the global economy has yet to fully absorb the impact of the fiscal policies enacted to jump start consumer spending in 2020, in my view. As evidence of this, each of the countries that comprise the G-10 currently has a headline inflation rate that stands well above its stated target. Central banks likely have more work to do, in my opinion.
Thank you for giving First Trust the opportunity to play a role in your financial future. We value our relationship with you and will report on the Funds again in six months.
Sincerely,
James A. Bowen
Chairman of the Board of Trustees
Chief Executive Officer of First Trust Advisors L.P.
Fund Performance Overview (Unaudited)
First Trust California Municipal High Income ETF (FCAL)
The First Trust California Municipal High Income ETF’s (the “Fund”) primary investment objective is to seek to provide current income that is exempt from regular federal income taxes and California income taxes, and its secondary objective is long-term capital appreciation. Under normal market conditions, the Fund seeks to achieve its investment objectives by investing at least 80% of its net assets (including investment borrowings) in municipal debt securities that pay interest that is exempt from regular federal income taxes and California income taxes (“Municipal Securities”). Municipal Securities will be issued by or on behalf of the State of California or territories or possessions of the U.S. (including but not limited to Puerto Rico, the U.S. Virgin Islands and Guam) and/or the political subdivisions, agencies, authorities and other instrumentalities of such State, territories or possessions. The Fund lists and principally trades its shares on The Nasdaq Stock Market LLC under the ticker symbol “FCAL.”
| Performance | | | | | | | |
| | | | Average Annual Total Returns | | Cumulative Total Returns |
| | 6 Months
Ended
1/31/23 | 1 Year
Ended
1/31/23 | 5 Years
Ended
1/31/23 | Inception
(6/20/17)
to 1/31/23 | | 5 Years
Ended
1/31/23 | Inception
(6/20/17)
to 1/31/23 |
| Fund Performance | | | | | | | |
| NAV | 1.13% | -4.38% | 2.23% | 2.35% | | 11.68% | 13.94% |
| Market Price | 1.33% | -4.38% | 2.20% | 2.34% | | 11.51% | 13.86% |
| Index Performance | | | | | | | |
| Bloomberg 10 Year California Exempt Index | 1.74% | -0.89% | 2.34% | 1.96% | | 12.28% | 11.55% |
(See Notes to Fund Performance Overview on page 8.)
Fund Performance Overview (Unaudited) (Continued)
First Trust California Municipal High Income ETF (FCAL) (Continued)
| Sector Allocation | % of Total
Investments
(including cash) |
| Special Assessment | 13.7% |
| Education | 9.9 |
| Government Obligation Bond - Unlimited Tax | 8.6 |
| Insured | 8.6 |
| Water & Sewer | 7.8 |
| Airport | 6.2 |
| Industrial Development Bond | 5.8 |
| Hospital | 5.2 |
| Continuing Care Retirement Communities | 4.6 |
| Pre-refunded/Escrowed-to-maturity | 4.1 |
| Gas | 3.7 |
| Local Housing | 2.9 |
| Utility | 2.7 |
| Higher Education | 2.7 |
| Dedicated Tax | 2.3 |
| Tobacco | 2.1 |
| Certificates of Participation | 1.4 |
| Tax Increment | 1.3 |
| Student Housing | 1.3 |
| Toll Road | 1.1 |
| Housing | 1.0 |
| Other Health | 0.5 |
| Cash | 2.5 |
| Total | 100.0% |
| Fund Allocation | % of Net Assets |
| Municipal Bonds | 97.7% |
| Net Other Assets and Liabilities(1) | 2.3 |
| Total | 100.0% |
| Credit Rating(2) | % of Total
Investments
(including cash) |
| AAA | 5.3% |
| AA | 30.0 |
| A | 21.8 |
| BBB | 14.2 |
| BB | 3.3 |
| B | 1.0 |
| Not Rated | 21.9 |
| Cash | 2.5 |
| Total | 100.0% |
| (1) | Includes variation margin on futures contracts. |
| (2) | The credit quality and ratings information presented above reflect the ratings assigned by one or more nationally recognized statistical rating organizations (NRSROs), including S&P Global Ratings, Moody’s Investors Service, Inc., Fitch Ratings or a comparably rated NRSRO. For situations in which a security is rated by more than one NRSRO and the ratings are not equivalent, the highest rating is used. Sub-investment grade ratings are those rated BB+/Ba1 or lower. Investment grade ratings are those rated BBB-/Baa3 or higher. The credit ratings shown relate to the creditworthiness of the issuers of the underlying securities in the Fund, and not to the Fund or its shares. Credit ratings are subject to change. |
Fund Performance Overview (Unaudited) (Continued)
First Trust California Municipal High Income ETF (FCAL) (Continued)
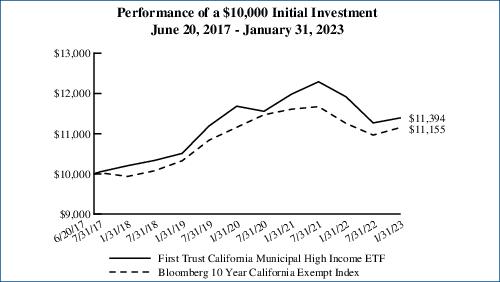
Performance figures assume reinvestment of all distributions and do not reflect the deduction of taxes that a shareholder would pay on Fund distributions or the redemption or sale of Fund shares. An index is a statistical composite that tracks a specified financial market or sector. Unlike the Fund, the index does not actually hold a portfolio of securities and therefore does not incur the expenses incurred by the Fund. These expenses negatively impact the performance of the Fund. The Fund’s past performance does not predict future performance.
Performance in municipal bonds investment strategies can be impacted from the benefits of purchasing odd lot positions. The impact of these investments can be particularly meaningful when funds have limited assets under management and may not be a sustainable source of performance as a fund grows in size.
Frequency Distribution of Discounts and Premiums
Information showing the number of days the market price of the Fund’s shares was greater (at a premium) and less (at a discount) than the Fund’s net asset value for the most recently completed year, and the most recently completed calendar quarters since that year (or life of the Fund, if shorter), is available at https://www.ftportfolios.com/Retail/etf/home.aspx.
Fund Performance Overview (Unaudited) (Continued)
First Trust New York Municipal High Income ETF (FMNY)
The First Trust New York Municipal High Income ETF’s (the “Fund”) primary investment objective is to seek to provide current income that is exempt from regular federal income taxes and New York income taxes, and its secondary objective is long-term capital appreciation. Under normal market conditions, the Fund seeks to achieve its investment objectives by investing at least 80% of its net assets (including investment borrowings) in municipal debt securities that pay interest that is exempt from regular federal income taxes and New York State and New York City income taxes (collectively, “Municipal Securities”). Municipal Securities will be issued by or on behalf of the State of New York or territories or possessions of the U.S. (including, but not limited to, Puerto Rico, the U.S. Virgin Islands and Guam), and/or the political subdivisions, agencies, authorities and other instrumentalities of such State, territories or possessions. The Fund lists and principally trades its shares on The NYSE Arca, Inc. under the ticker symbol “FMNY.”
| Performance | | | | |
| | | | Average Annual
Total Returns | Cumulative
Total Returns |
| | 6 Months Ended
1/31/23 | 1 Year Ended
1/31/23 | Inception (5/12/21)
to 1/31/23 | Inception (5/12/21)
to 1/31/23 |
| Fund Performance | | | | |
| NAV | 1.31% | -4.83% | -3.97% | -6.74% |
| Market Price | 1.43% | -5.06% | -3.95% | -6.71% |
| Index Performance | | | | |
| Bloomberg Municipal New York 12-17 Years Index | 1.65% | -3.03% | -2.89% | -4.93% |
(See Notes to Fund Performance Overview on page 8.)
Fund Performance Overview (Unaudited) (Continued)
First Trust New York Municipal High Income ETF (FMNY) (Continued)
| Sector Allocation | % of Total
Investments
(including cash) |
| Insured | 11.1% |
| Government Obligation Bond - Limited Tax | 10.5 |
| Dedicated Tax | 10.1 |
| Higher Education | 10.1 |
| Education | 9.2 |
| Hospital | 6.2 |
| Water & Sewer | 6.1 |
| Government Obligation Bond - Unlimited Tax | 5.8 |
| Airport | 4.2 |
| Special Assessment | 4.1 |
| Mass Transit | 4.1 |
| Toll Road | 3.8 |
| Utility | 3.0 |
| Housing | 2.3 |
| Certificates of Participation | 2.3 |
| Tobacco | 1.9 |
| Pre-refunded/Escrowed-to-maturity | 1.9 |
| Industrial Development Bond | 1.9 |
| Cash | 1.4 |
| Total | 100.0% |
| Fund Allocation | % of Net Assets |
| Municipal Bonds | 97.5% |
| Net Other Assets and Liabilities(1) | 2.5 |
| Total | 100.0% |
| Credit Quality(2) | % of Total
Investments
(including cash) |
| AAA | 6.6% |
| AA | 50.3 |
| A | 17.1 |
| BBB | 11.0 |
| BB | 1.8 |
| B | 1.9 |
| Not Rated | 6.2 |
| MIG1 (short-term) | 3.7 |
| Cash | 1.4 |
| Total | 100.0% |
| (1) | Includes variation margin on futures contracts. |
| (2) | The credit quality and ratings information presented above reflect the ratings assigned by one or more nationally recognized statistical rating organizations (NRSROs), including S&P Global Ratings, Moody’s Investors Service, Inc., Fitch Ratings or a comparably rated NRSRO. For situations in which a security is rated by more than one NRSRO and the ratings are not equivalent, the highest rating is used. Sub-investment grade ratings are those rated BB+/Ba1 or lower. Investment grade ratings are those rated BBB-/Baa3 or higher. The credit ratings shown relate to the creditworthiness of the issuers of the underlying securities in the Fund, and not to the Fund or its shares. Credit ratings are subject to change. |
Fund Performance Overview (Unaudited) (Continued)
First Trust New York Municipal High Income ETF (FMNY) (Continued)
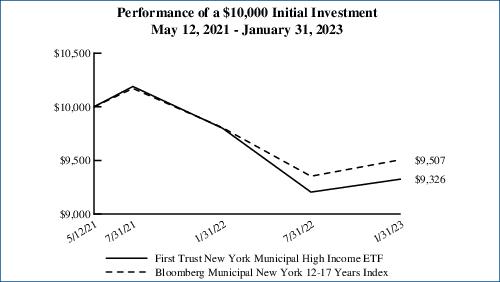
Performance figures assume reinvestment of all distributions and do not reflect the deduction of taxes that a shareholder would pay on Fund distributions or the redemption or sale of Fund shares. An index is a statistical composite that tracks a specified financial market or sector. Unlike the Fund, the index does not actually hold a portfolio of securities and therefore does not incur the expenses incurred by the Fund. These expenses negatively impact the performance of the Fund. The Fund’s past performance does not predict future performance.
Performance in municipal bond investment strategies can be impacted from the benefits of purchasing odd lot positions. The impact of these investments can be particularly meaningful when funds have limited assets under management and may not be a sustainable source of performance as a fund grows in size.
Frequency Distribution of Discounts and Premiums
Information showing the number of days the market price of the Fund’s shares was greater (at a premium) and less (at a discount) than the Fund’s net asset value for the most recently completed year, and the most recently completed calendar quarters since that year (or life of the Fund, if shorter), is available at https://www.ftportfolios.com/Retail/etf/home.aspx.
Notes to Fund Performance Overview (Unaudited)
Total returns for the periods since inception are calculated from the inception date of each Fund. “Average Annual Total Returns” represent the average annual change in value of an investment over the periods indicated. “Cumulative Total Returns” represent the total change in value of an investment over the periods indicated. The total returns would have been lower if certain fees had not been waived by the Advisor.
Each Fund’s per share net asset value (“NAV”) is the value of one share of the Fund and is computed by dividing the value of all assets of the Fund (including accrued interest and dividends), less all liabilities (including accrued expenses and dividends declared but unpaid), by the total number of outstanding shares. The price used to calculate market return (“Market Price”) is determined by using the midpoint of the national best bid and offer price (“NBBO”) as of the time that the Fund’s NAV is calculated. Under SEC rules, the NBBO consists of the highest displayed buy and lowest sell prices among the various exchanges trading the Fund at the time the Fund’s NAV is calculated. Prior to January 1, 2019, the price used was the midpoint between the highest bid and the lowest offer on the stock exchange on which shares of the Fund were listed for trading as of the time that the Fund’s NAV was calculated. Since shares of each Fund did not trade in the secondary market until after the Fund’s inception, for the period from inception to the first day of secondary market trading in shares of the Fund, the NAV of each Fund is used as a proxy for the secondary market trading price to calculate market returns. NAV and market returns assume that all distributions have been reinvested in each Fund at NAV and Market Price, respectively.
An index is a statistical composite that tracks a specified financial market or sector. Unlike each Fund, the indices do not actually hold a portfolio of securities and therefore do not incur the expenses incurred by each Fund. These expenses negatively impact the performance of each Fund. Also, market returns do not include brokerage commissions that may be payable on secondary market transactions. If brokerage commissions were included, market returns would be lower. The total returns presented reflect the reinvestment of dividends on securities in the indices. The returns presented do not reflect the deduction of taxes that a shareholder would pay on Fund distributions or the redemption or sale of Fund shares. The investment return and principal value of shares of each Fund will vary with changes in market conditions. Shares of each Fund may be worth more or less than their original cost when they are redeemed or sold in the market. Each Fund’s past performance is no guarantee of future performance.
Portfolio Management
First Trust Exchange-Traded Fund III
Semi-Annual Report
January 31, 2023 (Unaudited)
Advisor
First Trust Advisors L.P. (“First Trust”) serves as the investment advisor to the First Trust California Municipal High Income ETF (“FCAL”) and the First Trust New York Municipal High Income ETF (“FMNY”) (each a “Fund” and collectively, the “Funds”). First Trust is responsible for the ongoing monitoring of each Fund’s investment portfolio, managing each Fund’s business affairs and providing certain administrative services necessary for the management of each Fund.
Portfolio Management Team
Tom Byron, Senior Vice President, Senior Portfolio Manager
Johnathan N. Wilhelm, Senior Vice President, Senior Portfolio Manager
The portfolio managers are primarily and jointly responsible for the day-to-day management of the Funds. Tom Byron has served as portfolio manager since 2022 and Johnathan N. Wilhelm has served as portfolio manager for FCAL since 2017 and for FMNY since 2021.
First Trust Exchange-Traded Fund III
Understanding Your Fund Expenses
January 31, 2023 (Unaudited)
As a shareholder of First Trust California Municipal High Income ETF or First Trust New York Municipal High Income ETF (each a “Fund” and collectively, the “Funds”), you incur two types of costs: (1) transaction costs; and (2) ongoing costs, including management fees, distribution and/or service (12b-1) fees, if any, and other Fund expenses. This Example is intended to help you understand your ongoing costs of investing in the Funds and to compare these costs with the ongoing costs of investing in other funds.
The Example is based on an investment of $1,000 invested at the beginning of the period and held through the six-month period ended January 31, 2023.
Actual Expenses
The first line in the following table provides information about actual account values and actual expenses. You may use the information in this line, together with the amount you invested, to estimate the expenses that you paid over the period. Simply divide your account value by $1,000 (for example, an $8,600 account value divided by $1,000 = 8.6), then multiply the result by the number in the first line under the heading entitled “Expenses Paid During the Six-Month Period” to estimate the expenses you paid on your account during this six-month period.
Hypothetical Example for Comparison Purposes
The second line in the following table provides information about hypothetical account values and hypothetical expenses based on each Fund’s actual expense ratio and an assumed rate of return of 5% per year before expenses, which is not each Fund’s actual return. The hypothetical account values and expenses may not be used to estimate the actual ending account balance or expenses you paid for the period. You may use this information to compare the ongoing costs of investing in the Funds and other funds. To do so, compare this 5% hypothetical example with the 5% hypothetical examples that appear in the shareholder reports of the other funds.
Please note that the expenses shown in the table are meant to highlight your ongoing costs only and do not reflect any transactional costs such as brokerage commissions. Therefore, the second line in the table is useful in comparing ongoing costs only, and will not help you determine the relative total costs of owning different funds. In addition, if these transactional costs were included, your costs would have been higher.
| | Beginning
Account Value
August 1, 2022 | Ending
Account Value
January 31, 2023 | Annualized
Expense Ratio
Based on the
Six-Month
Period (a) | Expenses Paid
During the
Six-Month
Period (b) |
| First Trust California Municipal High Income ETF (FCAL) |
| Actual | $1,000.00 | $1,011.30 | 0.55% | $2.79 |
| Hypothetical (5% return before expenses) | $1,000.00 | $1,022.43 | 0.55% | $2.80 |
| First Trust New York Municipal High Income ETF (FMNY) |
| Actual | $1,000.00 | $1,013.10 | 0.50% | $2.54 |
| Hypothetical (5% return before expenses) | $1,000.00 | $1,022.68 | 0.50% | $2.55 |
| (a) | These expense ratios reflect expense waivers. See Note 3 in the Notes to Financial Statements. |
| (b) | Expenses are equal to the annualized expense ratios as indicated in the table multiplied by the average account value over the period (August 1, 2022 through January 31, 2023), multiplied by 184/365 (to reflect the six-month period). |
First Trust California Municipal High Income ETF (FCAL)
Portfolio of Investments
January 31, 2023 (Unaudited)
Principal
Value | | Description | | Stated
Coupon | | Stated
Maturity | | Value |
| MUNICIPAL BONDS – 97.7% |
| | | California – 93.5% | | | | | | |
| $215,000 | | Antelope Vly E Kern CA Wtr Agy Wtr Rev Ref
| | 5.00% | | 06/01/35 | | $232,226 |
| 100,000 | | Beaumont CA Spl Tax Cmnty Facs Dist No 93-1 Impt Area No 8F
| | 4.00% | | 09/01/33 | | 101,852 |
| 175,000 | | Beaumont CA Spl Tax Cmnty Facs Dist No 93-1 Impt Area No 8F
| | 4.00% | | 09/01/34 | | 177,389 |
| 330,000 | | Beaumont CA Spl Tax Cmnty Facs Dist No 93-1 Impt Area No 8F
| | 4.00% | | 09/01/36 | | 328,082 |
| 620,000 | | Beaumont CA Spl Tax Cmnty Facs Dist No 93-1 Impt Area No 8F
| | 4.00% | | 09/01/40 | | 593,741 |
| 1,080,000 | | Beverly Hills CA Pub Fing Auth Wtr Rev, Ser A
| | 4.00% | | 06/01/40 | | 1,120,497 |
| 2,220,000 | | CA Cmnty Choice Fing Auth Clean Energy Proj Rev Green Bond, Ser B-1 (Mandatory put 08/01/31)
| | 4.00% | | 02/01/52 | | 2,251,794 |
| 20,000 | | CA Cmnty Choice Fing Auth Green Bd Clean Energy Proj Rev, Ser A (Mandatory put 12/01/27)
| | 4.00% | | 10/01/52 | | 20,306 |
| 200,000 | | CA Cnty CA Tobacco Securitization Agy Tobacco Stlmt Ref, Sonoma Cnty Securitization Corp, Ser A
| | 4.00% | | 06/01/35 | | 202,679 |
| 200,000 | | CA Cnty CA Tobacco Securitization Agy Tobacco Stlmt Sr Ref, Ser A
| | 4.00% | | 06/01/35 | | 202,530 |
| 200,000 | | CA Cnty CA Tobacco Securitization Agy Tobacco Stlmt Sr Ref, Ser A
| | 4.00% | | 06/01/39 | | 196,925 |
| 426,938 | | CA Hsg Fin Agy Muni Ctfs, Ser A
| | 4.25% | | 01/15/35 | | 426,902 |
| 360,000 | | CA Pub Fin Auth Rev Ref Henry Mayo Newhall Hosp, Ser A
| | 4.00% | | 10/15/28 | | 373,036 |
| 290,000 | | CA Pub Fin Auth Sr Living Rev ENSO Vlg Proj Green Bond, Ser A (a)
| | 5.00% | | 11/15/36 | | 281,543 |
| 250,000 | | CA Pub Fin Auth Sr Living Rev ENSO Vlg Proj Green Bond, Ser A (a)
| | 5.00% | | 11/15/56 | | 217,516 |
| 750,000 | | CA Pub Fin Auth Sr Living Rev Green Bond Temps 70 ENSO Vlg Proj, Ser B-2 (a)
| | 2.38% | | 11/15/28 | | 707,263 |
| 255,000 | | CA Sch Fin Auth Sch Fac Rev Alliance Clg Ready Pub Schs Proj, Ser A (a)
| | 5.00% | | 07/01/30 | | 264,904 |
| 1,055,000 | | CA Sch Fin Auth Sch Fac Rev Alliance Clg Ready Pub Schs Proj, Ser C (a)
| | 4.50% | | 07/01/26 | | 1,082,438 |
| 505,000 | | CA Sch Fin Auth Sch Fac Rev Granada Hills Chrt Oblig Grp (a)
| | 5.00% | | 07/01/34 | | 525,513 |
| 105,000 | | CA Sch Fin Auth Sch Fac Rev Kipp SoCal Pub Schs, Ser A (a)
| | 5.00% | | 07/01/27 | | 112,454 |
| 400,000 | | CA Sch Fin Auth Sch Fac Rev Kipp SoCal Pub Schs, Ser A (a)
| | 5.00% | | 07/01/39 | | 419,232 |
| 675,000 | | CA Sch Fin Auth Sch Fac Rev Ref Granada Hills Chrt Oblig Grp, Ser A (a)
| | 4.00% | | 07/01/48 | | 601,827 |
| 200,000 | | CA Sch Fin Auth Sch Fac Rev Ref HTH Learning Proj, Ser A (a)
| | 4.00% | | 07/01/25 | | 199,040 |
| 200,000 | | CA Sch Fin Auth Sch Fac Rev Ref HTH Learning Proj, Ser A (a)
| | 5.00% | | 07/01/32 | | 201,171 |
| 650,000 | | CA Sch Fin Auth Sch Fac Rev, Ser A (a)
| | 5.00% | | 07/01/40 | | 663,665 |
| 1,000,000 | | CA St Hlth Facs Fing Auth Rev Ref Commonspirit Hlth, Ser A
| | 4.00% | | 04/01/36 | | 1,014,377 |
| 220,000 | | CA St Hlth Facs Fing Auth Rev Ref Sutter Hlth, Ser B
| | 5.00% | | 11/15/33 | | 238,812 |
| 250,000 | | CA St Hlth Facs Fing Auth Rev Sutter Hlth, Ser A
| | 5.00% | | 11/15/30 | | 278,462 |
| 1,000,000 | | CA St Hlth Facs Fing Auth Rev Var Ref Stanford Hlth Care, Ser A (Mandatory put 08/15/25)
| | 3.00% | | 08/15/54 | | 1,008,112 |
| 1,000,000 | | CA St Infra & Econ Dev Bank Natl Chrt Equitable Sch Revolving Fund Social Bonds, Ser B
| | 5.00% | | 11/01/38 | | 1,086,192 |
| 500,000 | | CA St Infra & Econ Dev Bank Natl Chrt Social Bond Equity Sch Revolving Fund, Ser B
| | 4.00% | | 11/01/39 | | 494,662 |
| 250,000 | | CA St Muni Fin Auth Chrt Sch Lease Rev Sycamore Acdmy Proj (b)
| | 5.38% | | 07/01/34 | | 253,673 |
| 250,000 | | CA St Muni Fin Auth Chrt Sch Lease Rev Vista Chrt Middle Sch Proj
| | 5.38% | | 07/01/34 | | 251,761 |
| 900,000 | | CA St Muni Fin Auth Chrt Sch Rev John Adams Acdmys Lincoln Proj, Ser A (a)
| | 5.00% | | 10/01/39 | | 894,909 |
| 200,000 | | CA St Muni Fin Auth Chrt Sch Rev Palmdale Aerospace Acdmy Proj (a)
| | 4.00% | | 07/01/26 | | 196,242 |
| 450,000 | | CA St Muni Fin Auth Chrt Sch Rev Palmdale Aerospace Acdmy Proj, Ser A (a)
| | 5.00% | | 07/01/38 | | 438,191 |
See Notes to Financial Statements
Page 11
First Trust California Municipal High Income ETF (FCAL)
Portfolio of Investments (Continued)
January 31, 2023 (Unaudited)
Principal
Value | | Description | | Stated
Coupon | | Stated
Maturity | | Value |
| MUNICIPAL BONDS (Continued) |
| | | California (Continued) | | | | | | |
| $250,000 | | CA St Muni Fin Auth Chrt Sch Rev, Ser A (a)
| | 5.50% | | 06/01/38 | | $253,161 |
| 605,000 | | CA St Muni Fin Auth Mobile Home Park Rev Sr Caritas Affordable Hsg Inc Projs, Ser A
| | 5.25% | | 08/15/49 | | 616,029 |
| 295,000 | | CA St Muni Fin Auth Mobile Home Park Rev Sub Ref Caritas Proj, Ser B
| | 4.00% | | 08/15/41 | | 279,161 |
| 435,000 | | CA St Muni Fin Auth Mobile Home Park Rev Sub Ref Caritas Proj, Ser B
| | 4.00% | | 08/15/51 | | 392,261 |
| 500,000 | | CA St Muni Fin Auth Ref Palomar Hlth, Ser A, COPS, AGM
| | 5.25% | | 11/01/34 | | 577,249 |
| 500,000 | | CA St Muni Fin Auth Ref Palomar Hlth, Ser A, COPS, AGM
| | 5.25% | | 11/01/36 | | 562,003 |
| 1,500,000 | | CA St Muni Fin Auth Rev Bethany Home Proj
| | 5.00% | | 11/15/42 | | 1,662,210 |
| 155,000 | | CA St Muni Fin Auth Rev Ref Biola Univ
| | 5.00% | | 10/01/37 | | 162,499 |
| 225,000 | | CA St Muni Fin Auth Rev Ref CA Lutheran Univ
| | 5.00% | | 10/01/30 | | 240,733 |
| 225,000 | | CA St Muni Fin Auth Rev Ref CA Lutheran Univ
| | 5.00% | | 10/01/32 | | 239,901 |
| 675,000 | | CA St Muni Fin Auth Rev Ref CA Lutheran Univ
| | 5.00% | | 10/01/33 | | 717,488 |
| 475,000 | | CA St Muni Fin Auth Rev Ref Cmnty Med Ctrs, Ser A
| | 5.00% | | 02/01/36 | | 501,480 |
| 200,000 | | CA St Muni Fin Auth Rev Ref Eisenhower Med Ctr, Ser A
| | 5.00% | | 07/01/32 | | 214,428 |
| 250,000 | | CA St Muni Fin Auth Rev Ref Emerson Clg, Ser B
| | 5.00% | | 01/01/33 | | 266,062 |
| 1,080,000 | | CA St Muni Fin Auth Rev Ref HumanGood Oblig Grp, Ser A
| | 4.00% | | 10/01/34 | | 1,102,677 |
| 500,000 | | CA St Muni Fin Auth Rev Ref HumanGood Oblig Grp, Ser A
| | 4.00% | | 10/01/36 | | 505,533 |
| 110,000 | | CA St Muni Fin Auth Rev Ref Retmnt Hsg Fdtn Oblig Grp, Ser A
| | 5.00% | | 11/15/26 | | 121,300 |
| 435,000 | | CA St Muni Fin Auth Rev Ref Retmnt Hsg Fdtn Oblig Grp, Ser A
| | 5.00% | | 11/15/27 | | 491,182 |
| 575,000 | | CA St Muni Fin Auth Rev Ref Southwestern Law Sch
| | 4.00% | | 11/01/41 | | 531,429 |
| 700,000 | | CA St Muni Fin Auth Spl Fac Rev United Airls Inc Proj, AMT
| | 4.00% | | 07/15/29 | | 694,488 |
| 500,000 | | CA St Muni Fin Auth Sr Living Rev Ref Mt San Antonio Gardens Proj
| | 5.00% | | 11/15/49 | | 471,810 |
| 615,000 | | CA St Muni Fin Auth Sr Living Rev Temps 50 Mt San Antonio Gardens Proj, Ser B-2
| | 2.13% | | 11/15/26 | | 567,687 |
| 550,000 | | CA St Muni Fin Auth Stdt Hsg Rev Chf Davis I, LLC W Vlg Stdt Hsg Proj
| | 5.00% | | 05/15/27 | | 581,386 |
| 350,000 | | CA St Muni Fin Auth Stdt Hsg Rev Chf Davis I, LLC W Vlg Stdt Hsg Proj
| | 5.00% | | 05/15/40 | | 361,324 |
| 600,000 | | CA St Poll Control Fin Auth Sol Wst Disp Rev Ref Wst Mgmt Inc, Ser A1, AMT
| | 3.38% | | 07/01/25 | | 597,991 |
| 1,000,000 | | CA St Poll Control Fin Auth Sol Wst Disp Rev Ref Wst Mgmt Inc, Ser A3, AMT
| | 4.30% | | 07/01/40 | | 1,012,091 |
| 1,000,000 | | CA St Poll Control Fin Auth Sol Wst Disp Rev Var Ref Rep Svcs Remk, Ser A, AMT (Mandatory put 05/01/23) (a)
| | 4.10% | | 08/01/23 | | 1,000,019 |
| 150,000 | | CA St Poll Control Fin Auth Sol Wst Disp Rev Waste Mgmt Inc Proj Remk, Ser C (Mandatory put 06/03/24)
| | 3.25% | | 12/01/27 | | 149,665 |
| 1,500,000 | | CA St Poll Control Fin Auth Wtr Furnishing Rev Plant Bonds, AMT (a)
| | 5.00% | | 07/01/37 | | 1,504,157 |
| 5,000 | | CA St Prerefunded Various Purp (Pre-refunded maturity 04/01/26)
| | 5.00% | | 10/01/35 | | 5,438 |
| 15,000 | | CA St Pub Wks Brd Lease Rev Judicial Council CA, Ser B
| | 5.00% | | 06/01/34 | | 15,931 |
| 310,000 | | CA St Pub Wks Brd Lease Rev Various Corr Facs, Ser C
| | 5.00% | | 11/01/26 | | 343,063 |
| 75,000 | | CA St Ref
| | 4.00% | | 08/01/34 | | 77,945 |
| 1,000,000 | | CA St Ref
| | 4.00% | | 03/01/36 | | 1,059,782 |
| 1,000,000 | | CA St Ref
| | 5.00% | | 11/01/39 | | 1,113,295 |
| 200,000 | | CA St Ref Various Purp
| | 4.00% | | 09/01/33 | | 209,638 |
| 565,000 | | CA St Sch Fin Auth Chrt Sch Rev Arts in Action Chrt Schs, Ser A (a)
| | 5.00% | | 06/01/30 | | 578,424 |
| 335,000 | | CA St Sch Fin Auth Chrt Sch Rev Arts in Action Chrt Schs, Ser A (a)
| | 5.00% | | 06/01/40 | | 335,623 |
| 600,000 | | CA St Sch Fin Auth Chrt Sch Rev Fenton Chrt Schs Social Bonds, Ser A (a)
| | 4.00% | | 07/01/30 | | 571,773 |
Page 12
See Notes to Financial Statements
First Trust California Municipal High Income ETF (FCAL)
Portfolio of Investments (Continued)
January 31, 2023 (Unaudited)
Principal
Value | | Description | | Stated
Coupon | | Stated
Maturity | | Value |
| MUNICIPAL BONDS (Continued) |
| | | California (Continued) | | | | | | |
| $700,000 | | CA St Sch Fin Auth Chrt Sch Rev Ref Classical Academies Oceanside Proj, Ser A (a)
| | 5.00% | | 10/01/32 | | $771,662 |
| 300,000 | | CA St Sch Fin Auth Chrt Sch Rev Rocketship Pub Schs, Ser G (b)
| | 5.00% | | 06/01/37 | | 296,055 |
| 100,000 | | CA St Sch Fin Auth Chrt Sch Rev Summit Pub Schs (a)
| | 5.00% | | 06/01/25 | | 103,699 |
| 210,000 | | CA St Sch Fin Auth Chrt Sch Rev Summit Pub Schs (a)
| | 5.00% | | 06/01/31 | | 222,450 |
| 1,000,000 | | CA St Stwd Cmntys Dev Auth Mfh Rev Var Adams Boulevard & Harvard Gardens Apartments Sub, Ser L-1 (Mandatory put 03/01/24)
| | 3.50% | | 03/01/26 | | 1,000,650 |
| 245,000 | | CA St Stwd Cmntys Dev Auth Rev Ref Front Porch Cmntys & Svcs, Ser A
| | 5.00% | | 04/01/27 | | 265,310 |
| 50,000 | | CA St Stwd Cmntys Dev Auth Rev Ref Front Porch Cmntys & Svcs, Ser A
| | 4.00% | | 04/01/32 | | 51,306 |
| 50,000 | | CA St Stwd Cmntys Dev Auth Rev Ref Insd Enloe Med Ctr, CA MTG INS (Pre-refunded maturity 02/15/26)
| | 5.00% | | 08/15/33 | | 54,378 |
| 500,000 | | CA St Stwd Cmntys Dev Auth Spl Tax Rev Impt Area No 1
| | 4.00% | | 09/01/41 | | 470,686 |
| 200,000 | | CA St Stwd Cmntys Dev Auth Stdt Hsg Rev Ref Chf Irvine LLC
| | 5.00% | | 05/15/30 | | 208,905 |
| 280,000 | | CA St Stwd Cmntys Dev Auth Stdt Hsg Rev Ref Chf Irvine LLC
| | 5.00% | | 05/15/35 | | 288,700 |
| 1,170,000 | | CA St Stwd Cmntys Dev Auth Stwd Rev Stwd Cmnty Infra Prog, Ser C-1
| | 4.00% | | 09/02/31 | | 1,183,847 |
| 95,000 | | CA St Unrefunded Various Purp
| | 5.00% | | 10/01/35 | | 102,071 |
| 705,000 | | CA Stwd Cmntys Dev Auth Rev Kaiser Permanente J Remk, Ser 2004 (Mandatory put 11/01/29)
| | 5.00% | | 04/01/36 | | 822,615 |
| 250,000 | | CA Stwd Cmntys Dev Auth Rev Loma Linda Univ Med Ctr, Ser A (a)
| | 5.00% | | 12/01/30 | | 259,900 |
| 300,000 | | CA Stwd Cmntys Dev Auth Rev Loma Linda Univ Med Ctr, Ser A (a)
| | 5.00% | | 12/01/33 | | 311,707 |
| 250,000 | | CA Stwd Cmntys Dev Auth Rev Ref CA Baptist Univ, Ser A (a)
| | 5.00% | | 11/01/32 | | 257,968 |
| 100,000 | | CA Stwd Cmntys Dev Auth Rev Ref Front Porch Cmntys & Svcs, Ser A
| | 5.00% | | 04/01/30 | | 108,340 |
| 175,000 | | CA Stwd Cmntys Dev Auth Rev Ref Front Porch Cmntys & Svcs, Ser A
| | 5.00% | | 04/01/31 | | 189,257 |
| 385,000 | | CA Stwd Cmntys Dev Auth Rev Var Adventist Hlth Sys W A Remk, Ser 2007 (Mandatory put 03/01/27)
| | 5.00% | | 03/01/37 | | 414,858 |
| 305,000 | | Camarillo CA Cmnty Dev Commn Successor Agy Tax Allocation Ref Sub Lien, Ser B, BAM
| | 5.00% | | 09/01/30 | | 332,573 |
| 450,000 | | Chino CA Cmnty Facs Dist Spl Tax #2003-3 Impt Area #7
| | 5.00% | | 09/01/31 | | 488,293 |
| 250,000 | | Compton CA Unif Sch Dist Los Angeles Co Schs Fing Prog, Ser A, COPS, BAM
| | 4.00% | | 06/01/35 | | 260,242 |
| 200,000 | | Compton CA Unif Sch Dist Los Angeles Co Schs Fing Prog, Ser A, COPS, BAM
| | 4.00% | | 06/01/36 | | 206,251 |
| 210,000 | | Cotati-Rohnert Park CA Unif Sch Dist 2016 Election, Ser C, AGM
| | 5.00% | | 08/01/32 | | 229,053 |
| 2,000,000 | | CSCDA Cmnty Impt Auth CA Essential Hsg Rev Union S Bay Social Bonds, Ser A-2 (a)
| | 4.00% | | 07/01/56 | | 1,576,536 |
| 295,000 | | Del Mar CA Union Sch Dist Spl Tax Ref
| | 4.00% | | 09/01/34 | | 299,026 |
| 150,000 | | Dinuba CA Jt Unif Sch Dist, COPS, AGM
| | 4.00% | | 02/01/35 | | 156,165 |
| 920,000 | | E Bay CA Muni Util Dist Wtr Sys Rev Green Bond, Ser A
| | 5.00% | | 06/01/38 | | 1,040,262 |
| 755,000 | | El Dorado CA Irr Dist Rev Ref, Ser C
| | 4.00% | | 03/01/34 | | 787,000 |
| 1,450,000 | | Elk Grove CA Fin Auth Spl Tax Rev Laguna Ridge CFD #2005-1
| | 4.00% | | 09/01/50 | | 1,300,543 |
| 350,000 | | Folsom Ranch CA Fing Auth Spl Tax Rev Cmnty Facs Dist No 19 Mangini
| | 5.00% | | 09/01/32 | | 370,829 |
| 155,000 | | Fontana CA Spl Tax Cmnty Facs Dist #80 Bella Strada
| | 5.00% | | 09/01/29 | | 167,956 |
| 500,000 | | Fontana CA Spl Tax Cmnty Facs Dist #80 Bella Strada
| | 5.00% | | 09/01/46 | | 514,638 |
| 240,000 | | Fontana CA Spl Tax Spl Tax, The Meadows
| | 4.00% | | 09/01/32 | | 246,810 |
| 165,000 | | Fontana CA Unif Sch Dist Unrefunded, AGM
| | (c) | | 02/01/33 | | 120,533 |
See Notes to Financial Statements
Page 13
First Trust California Municipal High Income ETF (FCAL)
Portfolio of Investments (Continued)
January 31, 2023 (Unaudited)
Principal
Value | | Description | | Stated
Coupon | | Stated
Maturity | | Value |
| MUNICIPAL BONDS (Continued) |
| | | California (Continued) | | | | | | |
| $140,000 | | Fresno CA Jt Pwrs Fing Auth Lease Rev Ref Master Lease Proj, Ser A, AGM
| | 5.00% | | 04/01/32 | | $155,321 |
| 340,000 | | Golden St Tobacco Securitization Corp CA Tobacco Stlmt Ref, Ser A-1
| | 5.00% | | 06/01/26 | | 371,935 |
| 750,000 | | Golden St Tobacco Securitization Corp CA Tobacco Stlmt Ref, Ser A-1 (Pre-refunded maturity 06/01/28)
| | 5.00% | | 06/01/34 | | 863,831 |
| 1,000,000 | | Golden St Tobacco Securitization Corp CA Tobacco Stlmt Ref, Tobacco Stlmt Asset Backed Bonds, Ser A-1
| | 5.00% | | 06/01/51 | | 1,063,773 |
| 150,000 | | Irvine CA Unif Sch Dist Spl Tax Cmnty Facs Dist #09-1, Ser C
| | 5.00% | | 09/01/31 | | 160,909 |
| 1,000,000 | | Kern CA Cmnty Clg Dist, Ser D
| | 5.25% | | 08/01/39 | | 1,177,675 |
| 485,000 | | King City CA Union Sch Dist Cap Apprec Election 1998-C, CABS, AMBAC
| | (c) | | 08/01/29 | | 399,314 |
| 25,000 | | Lammersville CA Jt Unif Sch Dist Spl Tax Cmnty Facs Dist #2014-1 Mountain House Sch Facs
| | 4.00% | | 09/01/33 | | 25,574 |
| 25,000 | | Lammersville CA Jt Unif Sch Dist Spl Tax Cmnty Facs Dist #2014-1 Mountain House Sch Facs
| | 4.00% | | 09/01/34 | | 25,403 |
| 200,000 | | Lammersville CA Jt Unif Sch Dist Spl Tax Cmnty Facs Dist #2014-1 Mountain House Sch Facs
| | 4.00% | | 09/01/40 | | 193,201 |
| 225,000 | | Long Beach CA Arpt Rev Ref, Ser A, AGM
| | 5.00% | | 06/01/30 | | 266,912 |
| 500,000 | | Long Beach CA Arpt Rev, Sec C, AMT, AGM
| | 5.25% | | 06/01/47 | | 545,560 |
| 750,000 | | Long Beach CA Bond Fin Auth Nat Gas Pur Rev, Ser A
| | 5.50% | | 11/15/30 | | 845,268 |
| 50,000 | | Los Angeles CA Dept of Arpts Arpt Rev Prerefunded Subord Ref, Ser D, AMT (Pre-refunded maturity 11/15/31)
| | 5.00% | | 05/15/33 | | 58,047 |
| 460,000 | | Los Angeles CA Dept of Arpts Arpt Rev Ref Sub Los Angeles Intl Arpt, Ser D, AMT
| | 5.00% | | 05/15/32 | | 512,682 |
| 950,000 | | Los Angeles CA Dept of Arpts Arpt Rev Unrefunded Subord Ref, Ser D, AMT
| | 5.00% | | 05/15/33 | | 1,089,200 |
| 10,000 | | Los Angeles CA Dept of Arpts, Ser E
| | 5.00% | | 05/15/28 | | 10,652 |
| 1,000,000 | | Los Angeles CA Dept of Wtr & Pwr Wtrwks Rev, Ser A
| | 5.00% | | 07/01/48 | | 1,079,900 |
| 1,500,000 | | Los Angeles CA Dept Wtr & Pwr Rev Ref Var Pwr Sys Subser A 3 Remk (d)
| | 1.28% | | 07/01/35 | | 1,500,000 |
| 410,000 | | Los Osos CA Cmnty Svcs Wstwtr Assmnt Dist #1 Ref Reassmnt
| | 3.13% | | 09/02/32 | | 411,977 |
| 100,000 | | Marina CA Redev Agy Successor Agy Tax Allocation Hsg, Ser B
| | 5.00% | | 09/01/27 | | 107,948 |
| 250,000 | | Marina CA Redev Agy Successor Agy Tax Allocation Hsg, Ser B
| | 5.00% | | 09/01/33 | | 267,252 |
| 245,000 | | Menifee CA Union Sch Dist Spl Tax Cmnty Facs Dist #2011-1
| | 5.00% | | 09/01/34 | | 263,375 |
| 500,000 | | Menifee CA Union Sch Dist Spl Tax Cmnty Facs Dist #2011-1
| | 5.00% | | 09/01/44 | | 518,400 |
| 100,000 | | Modesto CA Spl Tax Ref Cmnty Facs Dist # 2004-1 Vlg 1 #2
| | 5.00% | | 09/01/27 | | 103,726 |
| 200,000 | | Morongo Band of Mission Indians CA Rev Ref, Ser B (a)
| | 5.00% | | 10/01/42 | | 202,059 |
| 1,115,000 | | Natomas CA Unif Sch Dist, AGM
| | 3.00% | | 08/01/36 | | 1,056,563 |
| 250,000 | | Norco CA Spl Tax Ref Norco Ridge Ranch, BAM
| | 5.00% | | 09/01/32 | | 278,042 |
| 1,000,000 | | Northern CA Energy Auth Cmnty Spl Rev, Ser A (Mandatory put 07/01/24)
| | 4.00% | | 07/01/49 | | 1,006,083 |
| 100,000 | | Ontario CA Cmnty Facs Dist #40 Spl Tax Emeral Park Fac
| | 4.00% | | 09/01/34 | | 101,084 |
| 65,000 | | Ontario CA Cmnty Facs Dist #40 Spl Tax Emeral Park Fac
| | 4.00% | | 09/01/35 | | 64,672 |
| 275,000 | | Ontario CA Cmnty Facs Dist #40 Spl Tax Emeral Park Fac
| | 4.00% | | 09/01/39 | | 261,265 |
| 650,000 | | Palm Desert CA Spl Tax Ref Univ Park
| | 4.00% | | 09/01/51 | | 588,949 |
| 250,000 | | Palomar Hlth CA Rev Ref
| | 5.00% | | 11/01/31 | | 264,399 |
| 750,000 | | Pleasanton CA Unif Sch Dist
| | 3.00% | | 08/01/36 | | 710,692 |
| 210,000 | | Rancho Cordova CA Cmnty Facs Dist Spl Tax No 2018-1 Grantline 208
| | 5.00% | | 09/01/33 | | 227,262 |
| 220,000 | | Rancho Cordova CA Cmnty Facs Dist Spl Tax No 2018-1 Grantline 208
| | 5.00% | | 09/01/34 | | 237,277 |
| 340,000 | | Rancho Cordova CA Cmnty Facs Dist Spl Tax No 2018-1 Grantline 208
| | 5.00% | | 09/01/39 | | 359,125 |
| 525,000 | | Ripon CA Redev Agy Successor Agy Tax Allocation Ref, BAM
| | 4.00% | | 11/01/31 | | 576,158 |
Page 14
See Notes to Financial Statements
First Trust California Municipal High Income ETF (FCAL)
Portfolio of Investments (Continued)
January 31, 2023 (Unaudited)
Principal
Value | | Description | | Stated
Coupon | | Stated
Maturity | | Value |
| MUNICIPAL BONDS (Continued) |
| | | California (Continued) | | | | | | |
| $500,000 | | River Islands CA Pub Fing Auth Spl Tax Cmnty Facs Dist #2019-1 Phase 2 Pub Impts
| | 5.00% | | 09/01/40 | | $498,426 |
| 575,000 | | Riverside CA Unif Sch Dist Election of 2016, Ser B
| | 3.00% | | 08/01/38 | | 529,068 |
| 185,000 | | Riverside CA Unif Sch Dist Fing Auth Spl Tax Ref, BAM
| | 5.00% | | 09/01/34 | | 195,074 |
| 750,000 | | Riverside CA Wtr Rev, Ser A
| | 5.00% | | 10/01/47 | | 851,017 |
| 1,035,000 | | Riverside Cnty CA Transprtn Commn Toll Rev Ref, Sr Lien, RCTC 91 Express Lanes, Ser B-1
| | 4.00% | | 06/01/40 | | 1,038,100 |
| 185,000 | | Roseville CA Spl Tax Fiddyment Ranch Cmnty Fac
| | 5.00% | | 09/01/32 | | 200,542 |
| 160,000 | | Roseville CA Spl Tax Fiddyment Ranch Cmnty Fac
| | 5.00% | | 09/01/33 | | 172,811 |
| 170,000 | | Roseville CA Spl Tax Fiddyment Ranch Cmnty Fac
| | 4.00% | | 09/01/34 | | 172,916 |
| 150,000 | | Roseville CA Spl Tax Fiddyment Ranch Cmnty Fac
| | 4.00% | | 09/01/35 | | 151,108 |
| 225,000 | | Roseville CA Spl Tax Vlg CFD #1
| | 4.00% | | 09/01/33 | | 229,918 |
| 200,000 | | Sacramento CA Spl Tax Natomas Meadows Cmnty Facs Dist #2007-01 (a)
| | 5.00% | | 09/01/32 | | 210,985 |
| 500,000 | | Sacramento CA Transient Occupancy Tax Rev Sub Convention Ctr Complex, Ser C
| | 5.00% | | 06/01/32 | | 558,323 |
| 1,000,000 | | Sacramento Cnty CA Arpt Sys Rev Ref, Ser C, AMT
| | 5.00% | | 07/01/37 | | 1,063,749 |
| 1,000,000 | | San Diego CA Pub Fac Fing Auth Swr Rev Subord, Ser A
| | 5.00% | | 05/15/47 | | 1,135,317 |
| 1,075,000 | | San Diego CA Pub Fac Fing Auth Wtr Rev, Ser A
| | 5.00% | | 08/01/41 | | 1,152,989 |
| 1,500,000 | | San Diego CA Unif Sch Dist Green Bond, Ser F2
| | 5.00% | | 07/01/42 | | 1,708,229 |
| 510,000 | | San Diego Cnty CA Ltd Rev Obligs Ref Sanford Burnham Prebys Med Discovery Institute, Ser A
| | 5.00% | | 11/01/28 | | 549,580 |
| 350,000 | | San Diego Cnty CA Regl Arpt Auth Arpt Rev Ref Sub Rev, Ser A
| | 5.00% | | 07/01/30 | | 390,513 |
| 130,000 | | San Diego Cnty CA Regl Arpt Auth Arpt Rev Subord Ref, Ser A
| | 5.00% | | 07/01/39 | | 141,829 |
| 1,000,000 | | San Diego Cnty CA Regl Arpt Auth Arpt Rev Subord, Ser B, AMT
| | 5.00% | | 07/01/34 | | 1,124,689 |
| 85,000 | | San Diego Cnty CA Spl Tax Harmony Grove Vlg Impt Area No 2, Ser A
| | 4.00% | | 09/01/33 | | 87,527 |
| 140,000 | | San Francisco CA City & Cnty Arpts Commn Intl Arpt Rev Ref Second Ser, Ser 2020A, AMT
| | 5.00% | | 05/01/37 | | 152,221 |
| 2,000,000 | | San Francisco CA City & Cnty Arpts Commn Intl Arpt Rev Ref, Ser A, AMT
| | 5.00% | | 05/01/34 | | 2,253,112 |
| 500,000 | | San Francisco CA City & Cnty Dcnty Dev Spl Tax Dist No 2020-1 Mission Rock Facs & Svcs, Ser A (a)
| | 4.00% | | 09/01/46 | | 437,579 |
| 100,000 | | San Francisco City & Cnty CA Redev Agy Successor Agy Tax Ref Mission Bay N Redev Proj, Ser A
| | 5.00% | | 08/01/35 | | 107,257 |
| 935,000 | | San Francisco City & Cnty CA, Ser B
| | 2.00% | | 06/15/29 | | 906,123 |
| 175,000 | | San Joaquin Hills CA Transprtn Corridor Agy Toll Road Rev Cap Apprec Ref, Ser A, NATL-RE
| | (c) | | 01/15/29 | | 143,604 |
| 120,000 | | San Joaquin Hills CA Transprtn Corridor Agy Toll Road Rev Ref Sr Lien Toll Road, Ser A
| | 4.00% | | 01/15/37 | | 123,004 |
| 1,500,000 | | San Joaquin Hills CA Transprtn Corridor Agy Toll Road Rev Sr Lien Ref, Ser A (Pre-refunded maturity 01/15/25)
| | 5.00% | | 01/15/29 | | 1,581,505 |
| 1,145,000 | | San Jose CA Arpt Rev Ref, Ser A, AMT, BAM
| | 4.00% | | 03/01/34 | | 1,187,754 |
| 1,000,000 | | San Luis Obispo Cnty CA Fing Auth Lease Rev Multiple Capital Projs Ref, Ser A
| | 5.25% | | 11/15/40 | | 1,143,291 |
| 1,000,000 | | San Mateo Cnty CA Transprtn Auth Sales Tax Rev Var Subord, Ser B (d)
| | 0.40% | | 06/01/49 | | 1,000,000 |
| 1,500,000 | | Sanger CA Fing Auth Wstwtr Rev Ref, AGM (Pre-refunded maturity 06/15/24)
| | 5.00% | | 06/15/34 | | 1,577,000 |
| 500,000 | | Santa Clara Vly CA Wtr Dist Safe Clean Wtr Rev Green Bond, Ser A
| | 5.00% | | 08/01/40 | | 587,220 |
| 500,000 | | Santa Clara Vly CA Wtr Dist Safe Clean Wtr Rev Green Bond, Ser A
| | 5.00% | | 08/01/41 | | 584,925 |
| 800,000 | | Santa Clarita CA Cmnty Facs Dist Vista Canyon #2016-1 (a)
| | 4.00% | | 09/01/35 | | 803,138 |
See Notes to Financial Statements
Page 15
First Trust California Municipal High Income ETF (FCAL)
Portfolio of Investments (Continued)
January 31, 2023 (Unaudited)
Principal
Value | | Description | | Stated
Coupon | | Stated
Maturity | | Value |
| MUNICIPAL BONDS (Continued) |
| | | California (Continued) | | | | | | |
| $740,000 | | Simi Vly CA Unif Sch Dist, Ser B
| | 4.00% | | 08/01/38 | | $755,672 |
| 150,000 | | Temecula Vly CA Unif Sch Dist Cmnty Facs Dist #2014-1
| | 5.00% | | 09/01/32 | | 160,122 |
| 400,000 | | Temecula Vly Unif Sch Dist Fing Auth CA Spl Tax Rev, BAM
| | 5.00% | | 09/01/34 | | 419,449 |
| 500,000 | | Temescal Vly CA Wtr Dist Spl Tax Terramor Cmnty Facs Dist #4 Impt Area #1
| | 5.00% | | 09/01/31 | | 535,196 |
| 250,000 | | Tracy CA Cmnty Facs Dist
| | 5.00% | | 09/01/33 | | 266,800 |
| 525,000 | | Transbay Jt Powers Auth CA Green Bond Sr Tax Alloc Bonds, Ser A
| | 5.00% | | 10/01/33 | | 583,810 |
| 850,000 | | Tustin CA Cmnty Fac Dist Spl Tax Ref #06-1 Legacy Columbus Vlgs, Ser A
| | 5.00% | | 09/01/35 | | 891,647 |
| 500,000 | | Univ of California CA Rgts Med Center Pooled Ref Var Ref Remk, Ser B-1 (d)
| | 0.45% | | 05/15/32 | | 500,000 |
| 1,295,000 | | Western Placer Wst Mgmt Auth CA Solid Wst Rev Landfiel Impt Proj, Ser B
| | 5.00% | | 06/01/42 | | 1,399,715 |
| | | | | 102,043,627 |
| | | Florida – 0.3% | | | | | | |
| 105,000 | | Parkland Preserve CDD FL Spl Assmnt Rev, Ser A
| | 4.50% | | 05/01/24 | | 105,224 |
| 245,000 | | Rhodine Road N CDD FL Spl Assmnt
| | 4.00% | | 05/01/30 | | 237,961 |
| | | | | 343,185 |
| | | Guam – 0.1% | | | | | | |
| 100,000 | | Guam Govt Busn Privilege Tax Rev Ref, Ser D
| | 5.00% | | 11/15/32 | | 103,466 |
| | | Illinois – 0.1% | | | | | | |
| 135,000 | | Chicago IL Ref, Ser C, CABS
| | (c) | | 01/01/24 | | 130,701 |
| | | Louisiana – 0.7% | | | | | | |
| 750,000 | | Saint James Parish LA Rev Var Nustar Logistics LP Proj, Ser 2008 (Mandatory put 06/01/30) (a)
| | 6.10% | | 06/01/38 | | 814,400 |
| | | Ohio – 0.6% | | | | | | |
| 650,000 | | Buckeye OH Tobacco Stlmt Fing Auth Ref Sr, Ser B-2, Class 2
| | 5.00% | | 06/01/55 | | 620,752 |
| | | Puerto Rico – 1.6% | | | | | | |
| 1,000,000 | | Puerto Rico Cmwlth Restructured, Ser A1
| | 4.00% | | 07/01/33 | | 937,345 |
| 560,000 | | Puerto Rico Sales Tax Fing Corp Sales Tax Rev Restructured, Ser A-1
| | 4.55% | | 07/01/40 | | 552,161 |
| 305,000 | | Puerto Rico Sales Tax Fing Corp Sales Tax Rev Restructured, Ser A-2
| | 4.33% | | 07/01/40 | | 292,746 |
| | | | | 1,782,252 |
| | | Texas – 0.4% | | | | | | |
| 370,000 | | Houston TX Arpt Sys Rev Ref United Airls Inc Terminal Impt Proj, Ser B-2, AMT
| | 5.00% | | 07/15/27 | | 380,344 |
| | | Utah – 0.4% | | | | | | |
| 500,000 | | Military Installation Dev Auth UT Tax Allocation Rev, Ser A-2
| | 4.00% | | 06/01/52 | | 378,899 |
| Total Investments – 97.7%
| | 106,597,626 |
| | (Cost $107,286,358) | | |
| | Net Other Assets and Liabilities – 2.3%
| | 2,558,002 |
| | Net Assets – 100.0%
| | $109,155,628 |
Page 16
See Notes to Financial Statements
First Trust California Municipal High Income ETF (FCAL)
Portfolio of Investments (Continued)
January 31, 2023 (Unaudited)
Futures Contracts (See Note 2D - Futures Contracts in the Notes to Financial Statements):
| Futures Contracts | | Position | | Number of
Contracts | | Expiration
Date | | Notional
Value | | Unrealized
Appreciation
(Depreciation)/
Value |
| 10-Year U.S. Treasury Notes | | Short | | 13 | | Mar 2023 | | $ (1,488,703) | | $(16,250) |
| Ultra 10-Year U.S. Treasury Notes | | Short | | 49 | | Mar 2023 | | (5,938,953) | | (49,435) |
| | | | | | | | | $(7,427,656) | | $(65,685) |
| (a) | This security, sold within the terms of a private placement memorandum, is exempt from registration upon resale under Rule 144A of the Securities Act of 1933, as amended (the “1933 Act”), and may be resold in transactions exempt from registration, normally to qualified institutional buyers. Pursuant to procedures adopted by the Trust’s Board of Trustees, this security has been determined to be liquid by First Trust Advisors L.P. (the “Advisor”). Although market instability can result in periods of increased overall market illiquidity, liquidity for each security is determined based on security specific factors and assumptions, which require subjective judgment. At January 31, 2023, securities noted as such amounted to $17,021,148 or 15.6% of net assets. |
| (b) | This security, sold within the terms of a private placement memorandum, is exempt from registration upon resale under Rule 144A of the 1933 Act, and may be resold in transactions exempt from registration, normally to qualified institutional buyers (see Note 2C - Restricted Securities in the Notes to Financial Statements). |
| (c) | Zero coupon bond. |
| (d) | Variable Rate Demand bond. Interest rate is reset periodically by the agent based on current market conditions. |
| AGM | Assured Guaranty Municipal Corp. |
| AMBAC | American Municipal Bond Assurance Corp. |
| AMT | Alternative Minimum Tax |
| BAM | Build America Mutual |
| CA MTG INS | California Mortgage Insurance |
| CABS | Capital Appreciation Bonds |
| COPS | Certificates of Participation |
| NATL-RE | National Public Finance Guarantee Corp. |
Valuation Inputs
A summary of the inputs used to value the Fund’s investments as of January 31, 2023 is as follows (see Note 2A - Portfolio Valuation in the Notes to Financial Statements):
| ASSETS TABLE |
| | Total
Value at
1/31/2023 | Level 1
Quoted
Prices | Level 2
Significant
Observable
Inputs | Level 3
Significant
Unobservable
Inputs |
Municipal Bonds*
| $ 106,597,626 | $ — | $ 106,597,626 | $ — |
| |
| LIABILITIES TABLE |
| | Total
Value at
1/31/2023 | Level 1
Quoted
Prices | Level 2
Significant
Observable
Inputs | Level 3
Significant
Unobservable
Inputs |
Futures Contracts**
| $ (65,685) | $ (65,685) | $ — | $ — |
| * | See Portfolio of Investments for state and territory breakout. |
| ** | Includes cumulative appreciation/depreciation on futures contracts as reported in the Futures Contracts table. Only the current day’s variation margin is presented on the Statements of Assets and Liabilities. |
See Notes to Financial Statements
Page 17
First Trust New York Municipal High Income ETF (FMNY)
Portfolio of Investments
January 31, 2023 (Unaudited)
Principal
Value | | Description | | Stated
Coupon | | Stated
Maturity | | Value |
| MUNICIPAL BONDS – 97.5% |
| | | Florida – 1.8% | | | | | | |
| $250,000 | | Ridge at Apopka CDD Fl Spl Assmnt
| | 5.38% | | 05/01/42 | | $250,994 |
| | | Guam – 1.9% | | | | | | |
| 250,000 | | Guam Intl Arpt Auth Prerefunded Gen, Ser C, AMT, AGM (Pre-refunded maturity 10/01/23)
| | 6.13% | | 10/01/43 | | 255,382 |
| | | New York – 90.3% | | | | | | |
| 300,000 | | Build NYC Res Corp NY Rev Acad Leadership Chrt Sch Proj
| | 4.00% | | 06/15/31 | | 302,124 |
| 250,000 | | Build NYC Res Corp NY Rev Global Cmnty Chrt Sch Proj, Ser A
| | 5.00% | | 06/15/42 | | 247,842 |
| 100,000 | | Build NYC Res Corp NY Rev Social Bond E Harlem Scholars Acdmy Chrt Sch Proj (a)
| | 5.75% | | 06/01/42 | | 104,548 |
| 300,000 | | Build NYC Res Corp NY Rev Social Bond Kipp NYC Pub Sch Facs Canal W Proj
| | 5.00% | | 07/01/42 | | 316,482 |
| 250,000 | | Dutchess Cnty NY Loc Dev Corp Rev Marist Clg Proj
| | 5.00% | | 07/01/52 | | 266,589 |
| 250,000 | | Erie Cnty NY Indl Dev Agy Schfac Rev Ref City Sch Dist Buffalo Proj, Ser A
| | 5.00% | | 05/01/25 | | 265,058 |
| 250,000 | | Harrison NY Wtr Dist #2 Fire Prot Dist #2
| | 4.00% | | 08/01/34 | | 271,248 |
| 245,000 | | Horseheads NY Centrl Sch Dist, BANS
| | 3.00% | | 06/22/23 | | 245,015 |
| 250,000 | | Hudson Yards Infra Corp NY 2nd Indenture Rev Ref, Ser A
| | 5.00% | | 02/15/38 | | 270,389 |
| 250,000 | | Irondequoit NY, Ser B, BANS
| | 4.00% | | 12/15/23 | | 253,141 |
| 295,000 | | Livingston Cnty NY Ref
| | 4.00% | | 05/01/33 | | 321,950 |
| 300,000 | | Long Beach NY, Ser B, BAM
| | 5.25% | | 07/15/32 | | 342,751 |
| 350,000 | | Long Island NY Pwr Auth Elec Sys Rev Ref, Ser A
| | 5.00% | | 09/01/35 | | 402,479 |
| 255,000 | | Met Transprtn Auth NY Dedicated Tax Fund Green Bond, Ser B-1
| | 5.00% | | 11/15/36 | | 274,341 |
| 275,000 | | Met Transprtn Auth NY Rev Green Bond Ref, Sec C-1
| | 4.00% | | 11/15/37 | | 266,536 |
| 250,000 | | Monroe Cnty NY Indl Dev Corp Rev Ref Rochester Regl Hlth Proj, Ser A
| | 5.00% | | 12/01/30 | | 277,049 |
| 200,000 | | Nassau Cnty NY Indl Dev Agy Var Ref & Impt Cold Spring (b)
| | 1.00% | | 01/01/34 | | 200,000 |
| 305,000 | | Nassau Cnty NY, Ser A, AGM
| | 5.00% | | 04/01/29 | | 353,911 |
| 300,000 | | New York City NY Hsg Dev Corp Mf Hsg Rev Sustainable Dev Bonds, Ser F-2A (Mandatory put 12/22/26)
| | 3.40% | | 11/01/62 | | 302,603 |
| 250,000 | | New York City NY Muni Wtr Fin Auth Wtr & Swr Sys Rev Ref 2nd Gen Resolution, Ser EE
| | 5.00% | | 06/15/41 | | 278,154 |
| 200,000 | | New York City NY Muni Wtr Fin Auth Wtr & Swr Sys Rev Ref 2nd Gen Resolution, Subser EE-2
| | 5.00% | | 06/15/40 | | 220,022 |
| 250,000 | | New York City NY Transitional Fin Auth Bldg Aid Rev Ref-Sub, Ser S-1A
| | 5.00% | | 07/15/35 | | 300,707 |
| 250,000 | | New York City NY Transitional FIn Auth Rev Multi Modal Bonds Subord, Ser B-1
| | 5.00% | | 08/01/34 | | 281,611 |
| 250,000 | | New York St Dorm Auth Revs Non St Supported Debt Memorial Sloan Kettering Cancer Ctr, Ser 1
| | 5.00% | | 07/01/39 | | 273,501 |
| 250,000 | | New York St Dorm Auth Revs Non St Supported Debt Ref-Northwell Hlth Oblig Grp, Ser A
| | 5.00% | | 05/01/38 | | 274,290 |
| 250,000 | | New York St Dorm Auth Revs Non St Supported Debt Sch Dists Rev Bond Fing Prog, Ser A, BAM
| | 5.00% | | 10/01/29 | | 292,775 |
| 265,000 | | New York St Dorm Auth Revs Non St Supported Debt Trustees Of Columbia Univ
| | 5.00% | | 10/01/25 | | 285,135 |
| 245,000 | | New York St Dorm Auth Revs Non St Supported Debt, Ser A
| | 5.00% | | 07/01/40 | | 268,583 |
| 250,000 | | NY NY Fiscal 2020, Ser B-1
| | 5.00% | | 10/01/32 | | 291,266 |
| 280,000 | | NY St Dorm Auth Revs Non St Supported Debt Ref New Sch, Ser A
| | 5.00% | | 07/01/31 | | 327,649 |
| 290,000 | | NY St Envrnmntl Facs Corp St Clean Wtr & Drinking Wtr Ref Subord, Ser B
| | 5.00% | | 06/15/44 | | 317,923 |
| 250,000 | | NY St Thruway Auth Gen Rev Jr Indebtedness Obl Subord, Ser B
| | 4.00% | | 01/01/45 | | 244,780 |
Page 18
See Notes to Financial Statements
First Trust New York Municipal High Income ETF (FMNY)
Portfolio of Investments (Continued)
January 31, 2023 (Unaudited)
Principal
Value | | Description | | Stated
Coupon | | Stated
Maturity | | Value |
| MUNICIPAL BONDS (Continued) |
| | | New York (Continued) | | | | | | |
| $250,000 | | NY St Transprtn Dev Corp Spl Fac Rev Ref American Airls Inc John F Kennedy Intl Arpt Proj, AMT
| | 5.00% | | 08/01/31 | | $250,002 |
| 290,000 | | NY St Transprtn Dev Corp Spl Rev Terminal 4 JFK Intl Arpt Proj, AMT
| | 5.00% | | 12/01/30 | | 320,957 |
| 250,000 | | NY St Urban Dev Corp Rev Personal Income Tax, Ser A
| | 5.00% | | 03/15/35 | | 290,073 |
| 250,000 | | Oyster Bay NY, Ser A, AGM
| | 2.00% | | 03/01/35 | | 216,053 |
| 250,000 | | Port Auth Of NY & NJ NY Ref Two Hundred Ninth Ser
| | 5.00% | | 07/15/32 | | 284,073 |
| 270,000 | | Rockland Cnty NY Sol Wst Mgmt Auth Green Bond, Ser A, AMT
| | 5.00% | | 12/15/28 | | 302,422 |
| 290,000 | | Southampton Vlg NY Ambulance Bldg
| | 2.13% | | 03/01/29 | | 286,138 |
| 250,000 | | Syracuse Regl Arpt Auth NY Sr Arpt Rev Ref, AMT
| | 4.00% | | 07/01/36 | | 244,381 |
| 250,000 | | Triborough NY Bridge & Tunnel Auth Revs Ref, Ser B
| | 5.00% | | 11/15/38 | | 269,683 |
| 250,000 | | Westchester Cnty NY Green Bond, Ser B
| | 4.00% | | 12/15/34 | | 278,471 |
| 250,000 | | Westchester NY Tobacco Asset Securitization Ref Sr, Ser B
| | 5.00% | | 06/01/41 | | 258,801 |
| 250,000 | | Yonkers NY, Ser F, BAM
| | 5.00% | | 11/15/41 | | 276,954 |
| | | | | 12,218,460 |
| | | Puerto Rico – 3.5% | | | | | | |
| 250,000 | | Puerto Rico Cmwlth Restructured, Ser A1
| | 4.00% | | 07/01/33 | | 234,336 |
| 250,000 | | Puerto Rico Sales Tax Fing Corp Sales Tax Rev Restructured, Ser A-2
| | 4.33% | | 07/01/40 | | 239,956 |
| | | | | 474,292 |
| Total Investments – 97.5%
| | 13,199,128 |
| | (Cost $12,915,880) | | |
| | Net Other Assets and Liabilities – 2.5%
| | 333,485 |
| | Net Assets – 100.0%
| | $13,532,613 |
Futures Contracts (See Note 2D - Futures Contracts in the Notes to Financial Statements):
| Futures Contracts | | Position | | Number of
Contracts | | Expiration
Date | | Notional
Value | | Unrealized
Appreciation
(Depreciation)/
Value |
| Ultra 10-Year U.S. Treasury Notes | | Short | | 1 | | Mar 2023 | | $ (121,203) | | $(1,459) |
| (a) | This security, sold within the terms of a private placement memorandum, is exempt from registration upon resale under Rule 144A of the Securities Act of 1933, as amended, and may be resold in transactions exempt from registration, normally to qualified institutional buyers. Pursuant to procedures adopted by the Trust’s Board of Trustees, this security has been determined to be liquid by First Trust Advisors L.P. (the “Advisor”). Although market instability can result in periods of increased overall market illiquidity, liquidity for each security is determined based on security specific factors and assumptions, which require subjective judgment. At January 31, 2023, securities noted as such amounted to $104,548 or 0.8% of net assets. |
| (b) | Variable Rate Demand bond. Interest rate is reset periodically by the agent based on current market conditions. |
| AGM | Assured Guaranty Municipal Corp. |
| AMT | Alternative Minimum Tax |
| BAM | Build America Mutual |
| BANS | Bond Anticipation Notes |
See Notes to Financial Statements
Page 19
First Trust New York Municipal High Income ETF (FMNY)
Portfolio of Investments (Continued)
January 31, 2023 (Unaudited)
Valuation Inputs
A summary of the inputs used to value the Fund’s investments as of January 31, 2023 is as follows (see Note 2A - Portfolio Valuation in the Notes to Financial Statements):
| ASSETS TABLE |
| | Total
Value at
1/31/2023 | Level 1
Quoted
Prices | Level 2
Significant
Observable
Inputs | Level 3
Significant
Unobservable
Inputs |
Municipal Bonds*
| $ 13,199,128 | $ — | $ 13,199,128 | $ — |
| |
| LIABILITIES TABLE |
| | Total
Value at
1/31/2023 | Level 1
Quoted
Prices | Level 2
Significant
Observable
Inputs | Level 3
Significant
Unobservable
Inputs |
Futures Contract**
| $ (1,459) | $ (1,459) | $ — | $ — |
| * | See Portfolio of Investments for state and territory breakout. |
| ** | Includes cumulative appreciation/depreciation on futures contracts as reported in the Futures Contracts table. Only the current day’s variation margin is presented on the Statements of Assets and Liabilities. |
Page 20
See Notes to Financial Statements
First Trust Exchange-Traded Fund III
Statements of Assets and Liabilities
January 31, 2023 (Unaudited)
| | First Trust
California
Municipal
High Income
ETF
(FCAL) | | First Trust
New York
Municipal
High Income
ETF
(FMNY) |
| ASSETS: | | | |
Investments, at value
| $ 106,597,626 | | $ 13,199,128 |
Cash
| 2,532,287 | | 189,681 |
Cash segregated as collateral for open futures contracts
| 160,100 | | 2,750 |
Due from advisor
| — | | 1,094 |
Interest receivable
| 1,146,179 | | 140,179 |
Total Assets
| 110,436,192 | | 13,532,832 |
| LIABILITIES: | | | |
| Payables: | | | |
Investment securities purchased
| 1,208,259 | | — |
Investment advisory fees
| 58,540 | | — |
Variation margin
| 13,765 | | 219 |
Total Liabilities
| 1,280,564 | | 219 |
NET ASSETS
| $109,155,628 | | $13,532,613 |
| NET ASSETS consist of: | | | |
Paid-in capital
| $ 118,343,875 | | $ 14,712,564 |
Par value
| 22,000 | | 5,000 |
Accumulated distributable earnings (loss)
| (9,210,247) | | (1,184,951) |
NET ASSETS
| $109,155,628 | | $13,532,613 |
NET ASSET VALUE, per share
| $49.62 | | $27.07 |
Number of shares outstanding (unlimited number of shares authorized, par value $0.01 per share)
| 2,200,002 | | 500,002 |
Investments, at cost
| $107,286,358 | | $12,915,880 |
See Notes to Financial Statements
Page 21
First Trust Exchange-Traded Fund III
Statements of Operations
For the Six Months Ended January 31, 2023 (Unaudited)
| | First Trust
California
Municipal
High Income
ETF
(FCAL) | | First Trust
New York
Municipal
High Income
ETF
(FMNY) |
| INVESTMENT INCOME: | | | |
Interest
| $ 1,777,461 | | $ 204,168 |
Total investment income
| 1,777,461 | | 204,168 |
| EXPENSES: | | | |
Investment advisory fees
| 366,573 | | 36,641 |
Total expenses
| 366,573 | | 36,641 |
Fees waived by the investment advisor
| (57,858) | | (8,456) |
Net expenses
| 308,715 | | 28,185 |
NET INVESTMENT INCOME (LOSS)
| 1,468,746 | | 175,983 |
| NET REALIZED AND UNREALIZED GAIN (LOSS): | | | |
| Net realized gain (loss) on: | | | |
Investments
| (5,038,603) | | (287,891) |
Futures contracts
| 411,807 | | 30,048 |
Net realized gain (loss)
| (4,626,796) | | (257,843) |
| Net change in unrealized appreciation (depreciation) on: | | | |
Investments
| 3,004,591 | | 286,274 |
Futures contracts
| 146,737 | | 8,752 |
Net change in unrealized appreciation (depreciation)
| 3,151,328 | | 295,026 |
NET REALIZED AND UNREALIZED GAIN (LOSS)
| (1,475,468) | | 37,183 |
NET INCREASE (DECREASE) IN NET ASSETS RESULTING FROM OPERATIONS
| $(6,722) | | $ 213,166 |
Page 22
See Notes to Financial Statements
First Trust Exchange-Traded Fund III
Statements of Changes in Net Assets
| | First Trust
California Municipal
High Income
ETF (FCAL) | | First Trust
New York
Municipal High
Income
ETF (FMNY) |
| | Six Months
Ended
1/31/2023
(Unaudited) | | Year
Ended
7/31/2022 | | Six Months
Ended
1/31/2023
(Unaudited) | | Year
Ended
7/31/2022 |
| OPERATIONS: | | | | | | | |
Net investment income (loss)
| $ 1,468,746 | | $ 2,451,597 | | $ 175,983 | | $ 283,942 |
Net realized gain (loss)
| (4,626,796) | | (2,312,252) | | (257,843) | | (1,342,835) |
Net change in unrealized appreciation (depreciation)
| 3,151,328 | | (10,447,640) | | 295,026 | | (217,582) |
Net increase (decrease) in net assets resulting from operations
| (6,722) | | (10,308,295) | | 213,166 | | (1,276,475) |
| DISTRIBUTIONS TO SHAREHOLDERS FROM: | | | | | | | |
Investment operations
| (1,445,926) | | (2,432,622) | | (170,001) | | (202,851) |
Return of capital
| — | | (15,880) | | — | | — |
Total distributions to shareholders
| (1,445,926) | | (2,448,502) | | (170,001) | | (202,851) |
| SHAREHOLDER TRANSACTIONS: | | | | | | | |
Proceeds from shares sold
| 7,450,085 | | 41,720,854 | | 3,959,149 | | 2,621,647 |
Cost of shares redeemed
| (18,620,004) | | (12,384,469) | | (1,318,023) | | (5,549,769) |
Net increase (decrease) in net assets resulting from shareholder transactions
| (11,169,919) | | 29,336,385 | | 2,641,126 | | (2,928,122) |
Total increase (decrease) in net assets
| (12,622,567) | | 16,579,588 | | 2,684,291 | | (4,407,448) |
| NET ASSETS: | | | | | | | |
Beginning of period
| 121,778,195 | | 105,198,607 | | 10,848,322 | | 15,255,770 |
End of period
| $ 109,155,628 | | $ 121,778,195 | | $ 13,532,613 | | $ 10,848,322 |
| CHANGES IN SHARES OUTSTANDING: | | | | | | | |
Shares outstanding, beginning of period
| 2,450,002 | | 1,900,002 | | 400,002 | | 500,002 |
Shares sold
| 150,000 | | 800,000 | | 150,000 | | 100,000 |
Shares redeemed
| (400,000) | | (250,000) | | (50,000) | | (200,000) |
Shares outstanding, end of period
| 2,200,002 | | 2,450,002 | | 500,002 | | 400,002 |
See Notes to Financial Statements
Page 23
First Trust Exchange-Traded Fund III
Financial Highlights
For a share outstanding throughout each period
First Trust California Municipal High Income ETF (FCAL)
| | Six Months
Ended
1/31/2023
(Unaudited) | | Year Ended July 31, |
| | 2022 | | 2021 | | 2020 | | 2019 | | 2018 | |
Net asset value, beginning of period
| $ 49.71 | | $ 55.37 | | $ 53.16 | | $ 52.70 | | $ 50.11 | | $ 50.14 |
| Income from investment operations: | | | | | | | | | | | |
Net investment income (loss)
| 0.65 | | 1.08 | | 1.16 | | 1.17 | | 1.49 | | 1.45 |
Net realized and unrealized gain (loss)
| (0.11) | | (5.65) | | 2.19 (a) | | 0.51 | | 2.60 | | (0.04) |
Total from investment operations
| 0.54 | | (4.57) | | 3.35 | | 1.68 | | 4.09 | | 1.41 |
| Distributions paid to shareholders from: | | | | | | | | | | | |
Net investment income
| (0.63) | | (1.08) | | (1.14) | | (1.17) | | (1.50) | | (1.40) |
Net realized gain
| — | | — | | — | | — | | — | | (0.04) |
Return of capital
| — | | (0.01) | | — | | (0.05) | | — | | — |
Total distributions
| (0.63) | | (1.09) | | (1.14) | | (1.22) | | (1.50) | | (1.44) |
Net asset value, end of period
| $49.62 | | $49.71 | | $55.37 | | $53.16 | | $52.70 | | $50.11 |
Total return (b)
| 1.13% | | (8.33)% | | 6.37% (a) | | 3.23% | | 8.32% | | 2.83% |
| Ratios to average net assets/supplemental data: | | | | | | | | | | | |
Net assets, end of period (in 000’s)
| $ 109,156 | | $ 121,778 | | $ 105,199 | | $ 87,706 | | $ 34,257 | | $ 17,539 |
Ratio of total expenses to average net assets
| 0.65% (c) | | 0.65% | | 0.65% | | 0.65% | | 0.65% | | 0.65% |
Ratio of net expenses to average net assets
| 0.55% (c) | | 0.50% | | 0.50% | | 0.50% | | 0.50% | | 0.50% |
Ratio of net investment income (loss) to average net assets
| 2.60% (c) | | 2.09% | | 2.16% | | 2.28% | | 3.01% | | 2.97% |
Portfolio turnover rate (d)
| 33% | | 30% | | 25% | | 81% | | 69% | | 91% |
| (a) | The Fund received a reimbursement from the advisor in the amount of $219, which represents less than $0.01 per share. Since the advisor reimbursed the Fund, there was no effect on the Fund’s total return. |
| (b) | Total return is calculated assuming an initial investment made at the net asset value at the beginning of the period, reinvestment of all distributions at net asset value during the period, and redemption at net asset value on the last day of the period. The returns presented do not reflect the deduction of taxes that a shareholder would pay on Fund distributions or the redemption or sale of Fund shares. Total return is calculated for the time period presented and is not annualized for periods of less than a year. The total return would have been lower if certain fees had not been waived by the investment advisor. |
| (c) | Annualized. |
| (d) | Portfolio turnover is calculated for the time period presented and is not annualized for periods of less than a year and does not include securities received or delivered from processing creations or redemptions and in-kind transactions. |
Page 24
See Notes to Financial Statements
First Trust Exchange-Traded Fund III
Financial Highlights (Continued)
For a share outstanding throughout each period
First Trust New York Municipal High Income ETF (FMNY)
| | Six Months
Ended
1/31/2023
(Unaudited) | | Year Ended
7/31/2022 | | Period
Ended
7/31/2021 (a) |
Net asset value, beginning of period
| $ 27.12 | | $ 30.51 | | $ 30.00 |
| Income from investment operations: | | | | | |
Net investment income (loss)
| 0.35 | | 0.68 | | 0.09 |
Net realized and unrealized gain (loss)
| (0.01) | | (3.61) | | 0.48 |
Total from investment operations
| 0.34 | | (2.93) | | 0.57 |
| Distributions paid to shareholders from: | | | | | |
Net investment income
| (0.39) | | (0.46) | | (0.04) |
Net realized gain
| — | | — | | (0.02) |
Total distributions
| (0.39) | | (0.46) | | (0.06) |
Net asset value, end of period
| $27.07 | | $27.12 | | $30.51 |
Total return (b)
| 1.31% | | (9.66)% | | 1.90% |
| Ratios to average net assets/supplemental data: | | | | | |
Net assets, end of period (in 000’s)
| $ 13,533 | | $ 10,848 | | $ 15,256 |
Ratio of total expenses to average net assets
| 0.65% (c) | | 0.65% | | 0.65% (c) |
Ratio of net expenses to average net assets
| 0.50% (c) | | 0.50% | | 0.50% (c) |
Ratio of net investment income (loss) to average net assets
| 3.12% (c) | | 2.18% | | 1.41% (c) |
Portfolio turnover rate (d)
| 23% | | 154% | | 16% |
| (a) | Inception date is May 12, 2021, which is consistent with the commencement of investment operations and is the date the initial creation units were established. |
| (b) | Total return is calculated assuming an initial investment made at the net asset value at the beginning of the period, reinvestment of all distributions at net asset value during the period, and redemption at net asset value on the last day of the period. The returns presented do not reflect the deduction of taxes that a shareholder would pay on Fund distributions or the redemption or sale of Fund shares. Total return is calculated for the time period presented and is not annualized for periods of less than a year. The total return would have been lower if certain fees had not been waived by the investment advisor. |
| (c) | Annualized. |
| (d) | Portfolio turnover is calculated for the time period presented and is not annualized for periods of less than a year and does not include securities received or delivered from processing creations or redemptions and in-kind transactions. |
See Notes to Financial Statements
Page 25
Notes to Financial Statements
First Trust Exchange-Traded Fund III
January 31, 2023 (Unaudited)
1. Organization
First Trust Exchange-Traded Fund III (the “Trust”) is an open-end management investment company organized as a Massachusetts business trust on January 9, 2008, and is registered with the Securities and Exchange Commission under the Investment Company Act of 1940, as amended (the “1940 Act”).
The Trust currently consists of seventeen funds that are offering shares. This report covers the following funds, (each a “Fund” and collectively, the “Funds”):
First Trust California Municipal High Income ETF – (The Nasdaq Stock Market LLC ticker “FCAL”)
First Trust New York Municipal High Income ETF – (NYSE Arca, Inc. ticker “FMNY”)
FCAL is a diversified series of the Trust. FMNY is a non-diversified series of the Trust.
Each Fund represents a separate series of shares of beneficial interest in the Trust. Unlike conventional mutual funds, each Fund issues and redeems shares on a continuous basis, at net asset value (“NAV”), only in large blocks of shares known as “Creation Units.”
Each Fund is an actively managed exchange-traded fund. The primary investment objective of each Fund is to seek to provide current income that is exempt from regular federal income taxes and, for FCAL, California income taxes and, for FMNY, New York income taxes. The secondary investment objective of each Fund is long-term capital appreciation. Under normal market conditions, each Fund seeks to achieve its investment objectives by investing at least 80% of its net assets (including investment borrowings) in municipal debt securities that pay interest that is exempt from regular federal income taxes and, for FCAL, California income taxes and, for FMNY, New York State and New York City income taxes. There can be no assurance that a Fund will achieve its investment objectives. The Funds may not be appropriate for all investors.
2. Significant Accounting Policies
The Funds are each considered an investment company and follow accounting and reporting guidance under Financial Accounting Standards Board Accounting Standards Codification Topic 946, “Financial Services-Investment Companies.” The following is a summary of significant accounting policies consistently followed by the Funds in the preparation of the financial statements. The preparation of the financial statements in accordance with accounting principles generally accepted in the United States of America (“U.S. GAAP”) requires management to make estimates and assumptions that affect the reported amounts and disclosures in the financial statements. Actual results could differ from those estimates.
A. Portfolio Valuation
Each Fund’s NAV is determined daily as of the close of regular trading on the New York Stock Exchange (“NYSE”), normally 4:00 p.m. Eastern time, on each day the NYSE is open for trading. If the NYSE closes early on a valuation day, the NAV is determined as of that time. Domestic debt securities are priced using data reflecting the earlier closing of the principal markets for those securities. Each Fund’s NAV is calculated by dividing the value of all assets of each Fund (including accrued interest and dividends), less all liabilities (including accrued expenses and dividends declared but unpaid), by the total number of shares outstanding.
Each Fund’s investments are valued daily at market value or, in the absence of market value with respect to any portfolio securities, at fair value. Market value prices represent readily available market quotations such as last sale or official closing prices from a national or foreign exchange (i.e., a regulated market) and are primarily obtained from third-party pricing services. Fair value prices represent any prices not considered market value prices and are either obtained from a third-party pricing service or are determined by the Pricing Committee of the Funds’ investment advisor, First Trust Advisors L.P. (“First Trust” or the “Advisor”), in accordance with valuation procedures approved by the Trust’s Board of Trustees, and in accordance with provisions of the 1940 Act and rules thereunder. Investments valued by the Advisor’s Pricing Committee, if any, are footnoted as such in the footnotes to the Portfolio of Investments. Each Fund’s investments are valued as follows:
Municipal securities and other debt securities are fair valued on the basis of fair valuations provided by a third-party pricing service approved by the Advisor’s Pricing Committee, which may use the following valuation inputs when available:
| 1) | benchmark yields; |
| 2) | reported trades; |
| 3) | broker/dealer quotes; |
| 4) | issuer spreads; |
| 5) | benchmark securities; |
| 6) | bids and offers; and |
| 7) | reference data including market research publications. |
Notes to Financial Statements (Continued)
First Trust Exchange-Traded Fund III
January 31, 2023 (Unaudited)
Pricing services generally value fixed-income securities assuming orderly transactions of an institutional round lot size, but a Fund may hold or transact in such securities in smaller, odd lot sizes. Odd lots may trade at lower prices than institutional round lots.
Exchange-traded futures contracts are valued at the closing price in the market where such contracts are principally traded. If no closing price is available, exchange-traded futures contracts are valued at the mean of their most recent bid and asked price, if available, and otherwise at their closing bid price.
Fixed income and other debt securities having a remaining maturity of sixty days or less when purchased are fair valued at cost adjusted for amortization of premiums and accretion of discounts (amortized cost), provided the Advisor’s Pricing Committee has determined that the use of amortized cost is an appropriate reflection of fair value given market and issuer-specific conditions existing at the time of the determination. Factors that may be considered in determining the appropriateness of the use of amortized cost include, but are not limited to, the following:
| 1) | the credit conditions in the relevant market and changes thereto; |
| 2) | the liquidity conditions in the relevant market and changes thereto; |
| 3) | the interest rate conditions in the relevant market and changes thereto (such as significant changes in interest rates); |
| 4) | issuer-specific conditions (such as significant credit deterioration); and |
| 5) | any other market-based data the Advisor’s Pricing Committee considers relevant. In this regard, the Advisor’s Pricing Committee may use last-obtained market-based data to assist it when valuing portfolio securities using amortized cost. |
Certain securities may not be able to be priced by pre-established pricing methods. Such securities may be valued by the Advisor’s Pricing Committee at fair value. These securities generally include, but are not limited to, restricted securities (securities which may not be publicly sold without registration under the Securities Act of 1933, as amended (the “1933 Act”)) for which a third-party pricing service is unable to provide a market price; securities whose trading has been formally suspended; a security whose market or fair value price is not available from a pre-established pricing source; a security with respect to which an event has occurred that is likely to materially affect the value of the security after the market has closed but before the calculation of a Fund’s NAV or make it difficult or impossible to obtain a reliable market quotation; and a security whose price, as provided by the third-party pricing service, does not reflect the security’s fair value. As a general principle, the current fair value of a security would appear to be the amount which the owner might reasonably expect to receive for the security upon its current sale. When fair value prices are used, generally they will differ from market quotations or official closing prices on the applicable exchanges. A variety of factors may be considered in determining the fair value of such securities, including, but not limited to, the following:
| 1) | the fundamental business data relating to the issuer; |
| 2) | an evaluation of the forces which influence the market in which these securities are purchased and sold; |
| 3) | the type, size and cost of the security; |
| 4) | the financial statements of the issuer; |
| 5) | the credit quality and cash flow of the issuer, based on the Advisor’s or external analysis; |
| 6) | the information as to any transactions in or offers for the security; |
| 7) | the price and extent of public trading in similar securities (or equity securities) of the issuer/borrower, or comparable companies; |
| 8) | the coupon payments; |
| 9) | the quality, value and salability of collateral, if any, securing the security; and |
| 10) | other relevant factors. |
The Funds are subject to fair value accounting standards that define fair value, establish the framework for measuring fair value and provide a three-level hierarchy for fair valuation based upon the inputs to the valuation as of the measurement date. The three levels of the fair value hierarchy are as follows:
| • | Level 1 – Level 1 inputs are quoted prices in active markets for identical investments. An active market is a market in which transactions for the investment occur with sufficient frequency and volume to provide pricing information on an ongoing basis. |
| • | Level 2 – Level 2 inputs are observable inputs, either directly or indirectly, and include the following: |
| o | Quoted prices for similar investments in active markets. |
Notes to Financial Statements (Continued)
First Trust Exchange-Traded Fund III
January 31, 2023 (Unaudited)
| o | Quoted prices for identical or similar investments in markets that are non-active. A non-active market is a market where there are few transactions for the investment, the prices are not current, or price quotations vary substantially either over time or among market makers, or in which little information is released publicly. |
| o | Inputs other than quoted prices that are observable for the investment (for example, interest rates and yield curves observable at commonly quoted intervals, volatilities, prepayment speeds, loss severities, credit risks, and default rates). |
| o | Inputs that are derived principally from or corroborated by observable market data by correlation or other means. |
| • | Level 3 – Level 3 inputs are unobservable inputs. Unobservable inputs may reflect the reporting entity’s own assumptions about the assumptions that market participants would use in pricing the investment. |
The inputs or methodologies used for valuing investments are not necessarily an indication of the risk associated with investing in those investments. A summary of the inputs used to value each Fund’s investments as of January 31, 2023, is included with each Fund’s Portfolio of Investments.
B. Securities Transactions and Investment Income
Securities transactions are recorded as of the trade date. Realized gains and losses from securities transactions are recorded on the identified cost basis. Interest income is recorded daily on the accrual basis. Amortization of premiums and accretion of discounts are recorded using the effective interest method.
C. Restricted Securities
FCAL invests in restricted securities, which are securities that may not be offered for public sale without first being registered under the 1933 Act. Prior to registration, restricted securities may only be resold in transactions exempt from registration under Rule 144A under the 1933 Act, normally to qualified institutional buyers. As of January 31, 2023, FCAL held restricted securities as shown in the following table that the Advisor has deemed illiquid pursuant to procedures adopted by the Trust’s Board of Trustees. Although market instability can result in periods of increased overall market illiquidity, liquidity for each security is determined based on security-specific factors and assumptions, which require subjective judgment. FCAL does not have the right to demand that such securities be registered. These securities are valued according to the valuation procedures as stated in the Portfolio Valuation note (Note 2A) and are not expressed as a discount to the carrying value of a comparable unrestricted security. There are no unrestricted securities with the same maturity dates and yields for these issuers.
| Security | Acquisition
Date | Principal
Value | Current Price | Carrying
Cost | | Value | | % of
Net
Assets |
| CA St Muni Fin Auth Chrt Sch Lease Rev Sycamore Acdmy Proj, 5.38%, 07/01/34 | 06/14/18 | $250,000 | $101.47 | $251,158 | | $253,673 | | 0.23% |
| CA St Sch Fin Auth Chrt Sch Rev Rocketship Pub Schs, Ser G, 5.00%, 06/01/37 | 12/05/17 | 300,000 | 98.69 | 307,944 | | 296,055 | | 0.27 |
| | | | | $559,102 | | $549,728 | | 0.50% |
D. Futures Contracts
The Funds may purchase or sell (i.e., are long or short) exchange-listed futures contracts to hedge against changes in interest rates (interest rate risk). Futures contracts are agreements between the Funds and a counterparty to buy or sell a specific quantity of an underlying instrument at a specified price and at a specified date. Depending on the terms of the contract, futures contracts are settled either through physical delivery of the underlying instrument on the settlement date or by payment of a cash settlement amount on the settlement date. Open futures contracts can also be closed out prior to settlement by entering into an offsetting transaction in a matching futures contract. If the Funds are not able to enter into an offsetting transaction, the Funds will continue to be required to maintain margin deposits on the futures contract. When the contract is closed or expires, the Funds record a realized gain or loss equal to the difference between the value of the contract at the time it was opened and the value at the time it was closed or expired. This gain or loss is included in “Net realized gain (loss) on futures contracts” on the Statements of Operations.
Upon entering into a futures contract, the Funds must deposit funds, called margin, with its custodian in the name of the clearing broker equal to a specified percentage of the current value of the contract. Open futures contracts are marked to market daily with the change in value recognized as a component of “Net change in unrealized appreciation (depreciation) on futures contracts” on the Statements of Operations. This daily fluctuation in the value of the contracts is also known as variation margin and is included in “Variation margin” payable or receivable on the Statements of Assets and Liabilities.
Notes to Financial Statements (Continued)
First Trust Exchange-Traded Fund III
January 31, 2023 (Unaudited)
If market conditions change unexpectedly, the Funds may not achieve the anticipated benefits of the futures contract and may realize a loss. The use of futures contracts involves the risk of imperfect correlation in movements in the price of the futures contracts, interest rates and the underlying instruments.
Restricted cash segregated as collateral for futures contracts in the amounts of $160,100 and $2,750 for FCAL and FMNY, respectively, is shown as “Cash segregated as collateral for open futures contracts” on the Statements of Assets and Liabilities.
E. Dividends and Distributions to Shareholders
Dividends from net investment income, if any, are declared and paid monthly by each Fund, or as the Board of Trustees may determine from time to time. Distributions of net realized capital gains earned by each Fund, if any, are distributed at least annually.
Distributions from net investment income and realized capital gains are determined in accordance with federal income tax regulations, which may differ from U.S. GAAP. Certain capital accounts in the financial statements are periodically adjusted for permanent differences in order to reflect their tax character. These permanent differences are primarily due to the varying treatment of income and gain/loss on portfolio securities held by the Funds and have no impact on net assets or NAV per share. Temporary differences, which arise from recognizing certain items of income, expense and gain/loss in different periods for financial statement and tax purposes, will reverse at some time in the future.
The tax character of distributions paid by each Fund during the fiscal year ended July 31, 2022, was as follows:
| | Distributions
paid from
Ordinary
Income | | Distributions
paid from
Capital
Gains | | Distributions
paid from
Tax-exempt
Income | | Distributions
paid from
Return of
Capital |
First Trust California Municipal High Income ETF
| $ 19,131 | | $ — | | $ 2,413,491 | | $ 15,880 |
First Trust New York Municipal High Income ETF
| — | | — | | 202,851 | | — |
As of July 31, 2022, the components of distributable earnings on a tax basis for each Fund were as follows:
| | Undistributed
Ordinary
Income | | Accumulated
Capital and
Other
Gain (Loss) | | Net
Unrealized
Appreciation
(Depreciation) |
First Trust California Municipal High Income ETF
| $ — | | $ (4,189,198) | | $ (3,568,401) |
First Trust New York Municipal High Income ETF
| 97,135 | | (1,330,937) | | 5,686 |
F. Income Taxes
Each Fund intends to continue to qualify as a regulated investment company by complying with the requirements under Subchapter M of the Internal Revenue Code of 1986, as amended (the “Code”), which includes distributing substantially all of its net investment income and net realized gains to shareholders. Accordingly, no provision has been made for federal and state income taxes. However, due to the timing and amount of distributions, each Fund may be subject to an excise tax of 4% of the amount by which approximately 98% of each Fund’s taxable income exceeds the distributions from such taxable income for the calendar year.
In addition, each Fund intends to invest in municipal securities to allow it to pay shareholders “exempt dividends” as defined in the Code.
The Funds are subject to accounting standards that establish a minimum threshold for recognizing, and a system for measuring, the benefits of a tax position taken or expected to be taken in a tax return. For FCAL, taxable years ended 2019, 2020, 2021, and 2022 remain open to federal and state audit. For FMNY, the taxable period ended 2021 and the taxable year ended 2022 remain open to federal and state audit. As of January 31, 2023, management has evaluated the application of these standards to the Funds and has determined that no provision for income tax is required in the Funds’ financial statements for uncertain tax positions.
The Funds intend to utilize provisions of the federal income tax laws, which allow them to carry a realized capital loss forward indefinitely following the year of the loss and offset such loss against any future realized capital gains. The Funds are subject to certain limitations under U.S. tax rules on the use of capital loss carryforwards and net unrealized built-in losses. These limitations apply when there has been a 50% change in ownership. At July 31, 2022, for federal income tax purposes, each applicable Fund had a capital loss carryforward available that is shown in the table below, to the extent provided by regulations, to offset future capital gains.
Notes to Financial Statements (Continued)
First Trust Exchange-Traded Fund III
January 31, 2023 (Unaudited)
| | Non-Expiring
Capital Loss
Carryforward |
First Trust California Municipal High Income ETF
| $ 4,189,198 |
First Trust New York Municipal High Income ETF
| 1,330,937 |
Certain losses realized during the current fiscal year may be deferred and treated as occurring on the first day of the following fiscal year for federal income tax purposes. For the fiscal year ended July 31, 2022, the Funds did not incur any net ordinary losses.
As of January 31, 2023, the aggregate cost, gross unrealized appreciation, gross unrealized depreciation, and net unrealized appreciation/(depreciation) on investments (including short positions and derivatives, if any) for federal income tax purposes were as follows:
| | Tax Cost | | Gross
Unrealized
Appreciation | | Gross
Unrealized
(Depreciation) | | Net Unrealized
Appreciation
(Depreciation) |
First Trust California Municipal High Income ETF
| $ 107,286,358 | | $ 2,163,771 | | $ (2,918,188) | | $ (754,417) |
First Trust New York Municipal High Income ETF
| 12,915,880 | | 337,866 | | (56,077) | | 281,789 |
G. Expenses
Expenses, other than the investment advisory fee and other excluded expenses, are paid by the Advisor (See Note 3).
3. Investment Advisory Fee, Affiliated Transactions and Other Fee Arrangements
First Trust, the investment advisor to the Funds, is a limited partnership with one limited partner, Grace Partners of DuPage L.P., and one general partner, The Charger Corporation. The Charger Corporation is an Illinois corporation controlled by James A. Bowen, Chief Executive Officer of First Trust. First Trust is responsible for the selection and ongoing monitoring of the securities in each Fund’s portfolio, managing the Funds’ business affairs and providing certain administrative services necessary for the management of the Funds.
Pursuant to the Investment Management Agreements between the Trust and the Advisor, First Trust manages the investment of the Funds’ assets and is responsible for the Funds’ expenses, including the cost of transfer agency, custody, fund administration, legal, audit and other services, but excluding fee payments under the Investment Management Agreements, interest, taxes, acquired fund fees and expenses, if any, brokerage commissions and other expenses connected with the execution of portfolio transactions, distribution and service fees pursuant to a Rule 12b-1 plan, if any, and extraordinary expenses. Effective November 1, 2022, the annual unitary management fee payable by each Fund to First Trust for these services will be reduced at certain levels of each Fund’s net assets (“breakpoints”) and calculated pursuant to the following schedule, provided that FMNY is not eligible for any breakpoints until the termination of the Fee Waiver Agreement discussed below.
| Breakpoints | |
| Fund net assets up to and including $2.5 billion | 0.65000% |
| Fund net assets greater than $2.5 billion up to and including $5 billion | 0.63375% |
| Fund net assets greater than $5 billion up to and including $7.5 billion | 0.61750% |
| Fund net assets greater than $7.5 billion up to and including $10 billion | 0.60125% |
| Fund net assets greater than $10 billion | 0.58500% |
Prior to November 1, 2022, First Trust was paid an annual unitary management fee equal to 0.65% of each Fund’s average daily net assets. First Trust also provides fund reporting services to each Fund for a flat annual fee in the amount of $9,250, which is covered under the annual unitary management fee.
The Trust’s Board of Trustees and the Advisor have entered into Fee Waiver Agreements for the Funds pursuant to which the Advisor contractually agreed to waive management fees of 0.15% of average daily net assets until November 30, 2022 and May 11, 2023, for FCAL and FMNY, respectively. As of November 30, 2022, the Fee Waiver Agreement for FCAL terminated. The Fee Waiver Agreement for FMNY may be terminated by action of the Trust’s Board of Trustees at any time upon 60 days’ written notice by the Trust on behalf of FMNY or by the Advisor only after May 11, 2023. First Trust does not have the right to recover the fees waived
Notes to Financial Statements (Continued)
First Trust Exchange-Traded Fund III
January 31, 2023 (Unaudited)
under the Fee Waiver Agreements. During the six months ended January 31, 2023, the Advisor waived fees of $57,858 and $8,456 for FCAL and FMNY, respectively.
The Trust has multiple service agreements with Brown Brothers Harriman & Co. (“BBH”). Under the service agreements, BBH performs custodial, fund accounting, certain administrative services, and transfer agency services for the Funds. As custodian, BBH is responsible for custody of the Funds’ assets. As fund accountant and administrator, BBH is responsible for maintaining the books and records of the Funds’ securities and cash. As transfer agent, BBH is responsible for maintaining shareholder records for the Funds.
Each Trustee who is not an officer or employee of First Trust, any sub-advisor or any of their affiliates (“Independent Trustees”) is paid a fixed annual retainer that is allocated equally among each fund in the First Trust Fund Complex. Each Independent Trustee is also paid an annual per fund fee that varies based on whether the fund is a closed-end or other actively managed fund, a target outcome fund or an index fund.
Additionally, the Lead Independent Trustee and the Chairs of the Audit Committee, Nominating and Governance Committee and Valuation Committee are paid annual fees to serve in such capacities, with such compensation allocated pro rata among each fund in the First Trust Fund Complex based on net assets. Independent Trustees are reimbursed for travel and out-of-pocket expenses in connection with all meetings. The Lead Independent Trustee and Committee Chairs rotate every three years. The officers and “Interested” Trustee receive no compensation from the Trust for acting in such capacities.
4. Purchases and Sales of Securities
For the six months ended January 31, 2023, the cost of purchases and proceeds from sales of investment securities for each Fund, excluding short-term investments and in-kind transactions, were as follows:
| | Purchases | | Sales |
| First Trust California Municipal High Income ETF | $ 35,568,936 | | $ 44,611,498 |
| First Trust New York Municipal High Income ETF | 4,606,382 | | 2,472,786 |
| | | | |
For the six months ended January 31, 2023, the Funds had no in-kind transactions.
5. Derivative Transactions
The following tables present the type of derivatives held by each Fund at January 31, 2023, the primary underlying risk exposure and the location of these instruments as presented on the Statements of Assets and Liabilities.
FCAL
| | | | | Asset Derivatives | | Liability Derivatives |
Derivative
Instrument | | Risk
Exposure | | Statements of Assets and
Liabilities Location | | Value | | Statements of Assets and
Liabilities Location | | Value |
| Futures contracts | | Interest Rate
Risk | | Unrealized appreciation
on futures contracts* | | $ — | | Unrealized depreciation
on futures contracts* | | $ 65,685 |
FMNY
| | | | | Asset Derivatives | | Liability Derivatives |
Derivative
Instrument | | Risk
Exposure | | Statements of Assets and
Liabilities Location | | Value | | Statements of Assets and
Liabilities Location | | Value |
| Futures contracts | | Interest Rate
Risk | | Unrealized appreciation
on futures contracts* | | $ — | | Unrealized depreciation
on futures contracts* | | $ 1,459 |
*Includes cumulative appreciation/depreciation on futures contracts as reported in the Futures Contracts table. Only the current day’s variation margin is presented on the Statements of Assets and Liabilities.
Notes to Financial Statements (Continued)
First Trust Exchange-Traded Fund III
January 31, 2023 (Unaudited)
The following table presents the amount of net realized gain (loss) and change in net unrealized appreciation (depreciation) recognized for the six months ended January 31, 2023, on derivative instruments, as well as the primary underlying risk exposure associated with each instrument.
| | Interest Rate Risk |
| Statements of Operations Location | FCAL | FMNY |
| Net realized gain (loss) on futures contracts | $411,807 | $30,048 |
| Net change in unrealized appreciation (depreciation) on futures contracts | 146,737 | 8,752 |
During the six months ended January 31, 2023, for FCAL, the notional value of futures contracts opened and closed were $36,420,487 and $35,248,094, respectively.
During the six months ended January 31, 2023, for FMNY, the notional value of futures contracts opened and closed were $1,942,002 and $2,218,547, respectively.
The Funds do not have the right to offset financial assets and liabilities related to futures contracts on the Statements of Assets and Liabilities.
6. Creations, Redemptions and Transaction Fees
Each Fund generally issues and redeems its shares in primary market transactions through a creation and redemption mechanism and does not sell or redeem individual shares. Instead, financial entities known as “Authorized Participants” have contractual arrangements with a Fund or one of the Fund’s service providers to purchase and redeem Fund shares directly with the Fund in large blocks of shares known as “Creation Units.” Prior to the start of trading on every business day, a Fund publishes through the National Securities Clearing Corporation (“NSCC”) the “basket” of securities, cash or other assets that it will accept in exchange for a Creation Unit of the Fund’s shares. An Authorized Participant that wishes to effectuate a creation of a Fund’s shares deposits with the Fund the “basket” of securities, cash or other assets identified by the Fund that day, and then receives the Creation Unit of the Fund’s shares in return for those assets. After purchasing a Creation Unit, the Authorized Participant may continue to hold the Fund’s shares or sell them in the secondary market. The redemption process is the reverse of the purchase process: the Authorized Participant redeems a Creation Unit of a Fund’s shares for a basket of securities, cash or other assets. The combination of the creation and redemption process with secondary market trading in a Fund’s shares and underlying securities provides arbitrage opportunities that are designed to help keep the market price of a Fund’s shares at or close to the NAV per share of the Fund.
Each Fund imposes fees in connection with the purchase of Creation Units. These fees may vary based upon various fact-based circumstances, including, but not limited to, the composition of the securities included in the Creation Unit or the countries in which the transactions are settled. The price for each Creation Unit will equal the daily NAV per share of a Fund times the number of shares in a Creation Unit, plus the fees described above and, if applicable, any operational processing and brokerage costs, transfer fees, stamp taxes and part or all of the spread between the expected bid and offer side of the market related to the securities comprising the creation basket.
Each Fund also imposes fees in connection with the redemption of Creation Units. These fees may vary based upon various fact-based circumstances, including, but not limited to, the composition of the securities included in the Creation Unit or the countries in which the transactions are settled. The price received for each Creation Unit will equal the daily NAV per share of a Fund times the number of shares in a Creation Unit, minus the fees described above and, if applicable, any operational processing and brokerage costs, transfer fees, stamp taxes and part or all of the spread between the expected bid and offer side of the market related to the securities comprising the redemption basket. Investors who use the services of a broker or other such intermediary in addition to an Authorized Participant to effect a redemption of a Creation Unit may also be assessed an amount to cover the cost of such services. The redemption fee charged by a Fund will comply with Rule 22c-2 of the 1940 Act which limits redemption fees to no more than 2% of the value of the shares redeemed.
7. Distribution Plan
The Board of Trustees adopted a Distribution and Service Plan pursuant to Rule 12b-1 under the 1940 Act. In accordance with the Rule 12b-1 plan, each Fund is authorized to pay an amount up to 0.25% of its average daily net assets each year to reimburse First Trust Portfolios L.P. (“FTP”), the distributor of the Funds, for amounts expended to finance activities primarily intended to result in the sale of Creation Units or to provide investor services. FTP may also use this amount to compensate securities dealers or other persons that are Authorized Participants for providing distribution assistance, including broker-dealer and shareholder support and educational and promotional services.
Notes to Financial Statements (Continued)
First Trust Exchange-Traded Fund III
January 31, 2023 (Unaudited)
No 12b-1 fees are currently paid by the Funds, and pursuant to a contractual arrangement, no 12b-1 fees will be paid any time before November 30, 2023.
8. Borrowings
The Trust, on behalf of FCAL, along with First Trust Series Fund and First Trust Exchange-Traded Fund IV have a $305 million Credit Agreement with The Bank of Nova Scotia (“Scotia”) as administrative agent for a group of lenders. Prior to October 30, 2022, the commitment amount was $280 million. Scotia charges a commitment fee of 0.25% of the daily amount of the excess of the commitment amount over the outstanding principal balance of the loans and an agency fee. First Trust allocates the commitment fee and agency fee amongst the funds that have access to the credit line. To the extent that the Fund accesses the credit line, there would also be an interest fee charged. The Fund did not have any borrowings outstanding during the six months ended January 31, 2023.
9. Indemnification
The Trust, on behalf of the Funds, has a variety of indemnification obligations under contracts with its service providers. The Trust’s maximum exposure under these arrangements is unknown. However, the Trust has not had prior claims or losses pursuant to these contracts and expects the risk of loss to be remote.
10. Subsequent Events
Management has evaluated the impact of all subsequent events to the Funds through the date the financial statements were issued and has determined that there was the following subsequent event:
Effective March 1, 2023, the credit agreement with Scotia was amended, and the maximum commitment amount changed from $305,000,000 to $550,000,000.
Additional Information
First Trust Exchange-Traded Fund III
January 31, 2023 (Unaudited)
Proxy Voting Policies and Procedures
A description of the policies and procedures that the Trust uses to determine how to vote proxies and information on how each Fund voted proxies relating to portfolio securities during the most recent 12-month period ended June 30 is available (1) without charge, upon request, by calling (800) 988-5891; (2) on each Fund’s website at www.ftportfolios.com; and (3) on the Securities and Exchange Commission’s (“SEC”) website at www.sec.gov.
Portfolio Holdings
Each Fund files portfolio holdings information for each month in a fiscal quarter within 60 days after the end of the relevant fiscal quarter on Form N-PORT. Portfolio holdings information for the third month of each fiscal quarter will be publicly available on the SEC’s website at www.sec.gov. Each Fund’s complete schedule of portfolio holdings for the second and fourth quarters of each fiscal year is included in the semi-annual and annual reports to shareholders, respectively, and is filed with the SEC on Form N-CSR. The semi-annual and annual report for each Fund is available to investors within 60 days after the period to which it relates. Each Fund’s Forms N-PORT and Forms N-CSR are available on the SEC’s website listed above.
Risk Considerations
Risks are inherent in all investing. Certain general risks that may be applicable to a Fund are identified below, but not all of the material risks relevant to each Fund are included in this report and not all of the risks below apply to each Fund. The material risks of investing in each Fund are spelled out in its prospectus, statement of additional information and other regulatory filings. Before investing, you should consider each Fund’s investment objective, risks, charges and expenses, and read each Fund’s prospectus and statement of additional information carefully. You can download each Fund’s prospectus at www.ftportfolios.com or contact First Trust Portfolios L.P. at (800) 621-1675 to request a prospectus, which contains this and other information about each Fund.
Concentration Risk. To the extent that a fund is able to invest a significant percentage of its assets in a single asset class or the securities of issuers within the same country, state, region, industry or sector, an adverse economic, business or political development may affect the value of the fund’s investments more than if the fund were more broadly diversified. A fund that tracks an index will be concentrated to the extent the fund’s corresponding index is concentrated. A concentration makes a fund more susceptible to any single occurrence and may subject the fund to greater market risk than a fund that is more broadly diversified.
Credit Risk. Credit risk is the risk that an issuer of a security will be unable or unwilling to make dividend, interest and/or principal payments when due and the related risk that the value of a security may decline because of concerns about the issuer’s ability to make such payments.
Cyber Security Risk. The funds are susceptible to potential operational risks through breaches in cyber security. A breach in cyber security refers to both intentional and unintentional events that may cause a fund to lose proprietary information, suffer data corruption or lose operational capacity. Such events could cause a fund to incur regulatory penalties, reputational damage, additional compliance costs associated with corrective measures and/or financial loss. In addition, cyber security breaches of a fund’s third-party service providers, such as its administrator, transfer agent, custodian, or sub-advisor, as applicable, or issuers in which the fund invests, can also subject a fund to many of the same risks associated with direct cyber security breaches.
Defined Outcome Funds Risk. To the extent a fund’s investment strategy is designed to deliver returns tied to the price performance of an underlying ETF, an investor may not realize the returns the fund seeks to achieve if that investor does not hold shares for the entire target outcome period. In the event an investor purchases shares after the first day of the target outcome period or sells shares prior to the end of the target outcome period, the buffer that the fund seeks to provide against a decline in the value of the underlying ETF may not be available, the enhanced returns that the fund seeks to provide (if any) may not be available and the investor may not participate in a gain in the value of the underlying ETF up to the cap for the investor’s investment period. Additionally, the fund will not participate in gains of the underlying ETF above the cap and a shareholder may lose their entire investment. If the fund seeks enhanced returns, there are certain time periods when the value of the fund may fall faster than the value of the underlying ETF, and it is very unlikely that, on any given day during which the underlying ETF share price increases in value, the fund’s share price will increase at the same rate as the enhanced returns sought by the fund, which is designed for an entire target outcome period. Trading flexible exchange options involves risks different from, or possibly greater than, the risks associated with investing directly in securities, such as less liquidity and correlation and valuation risks. A fund may experience substantial downside from specific flexible exchange option positions and certain positions may expire worthless.
Derivatives Risk. To the extent a fund uses derivative instruments such as futures contracts, options contracts and swaps, the fund may experience losses because of adverse movements in the price or value of the underlying asset, index or rate, which may be magnified
Additional Information (Continued)
First Trust Exchange-Traded Fund III
January 31, 2023 (Unaudited)
by certain features of the derivative. These risks are heightened when a fund’s portfolio managers use derivatives to enhance the fund’s return or as a substitute for a position or security, rather than solely to hedge (or offset) the risk of a position or security held by the fund.
Equity Securities Risk. To the extent a fund invests in equity securities, the value of the fund’s shares will fluctuate with changes in the value of the equity securities. Equity securities prices fluctuate for several reasons, including changes in investors’ perceptions of the financial condition of an issuer or the general condition of the relevant stock market, such as market volatility, or when political or economic events affecting the issuers occur. In addition, common stock prices may be particularly sensitive to rising interest rates, as the cost of capital rises and borrowing costs increase. Equity securities may decline significantly in price over short or extended periods of time, and such declines may occur in the equity market as a whole, or they may occur in only a particular country, company, industry or sector of the market.
ETF Risk. The shares of an ETF trade like common stock and represent an interest in a portfolio of securities. The risks of owning an ETF generally reflect the risks of owning the underlying securities, although lack of liquidity in an ETF could result in it being more volatile and ETFs have management fees that increase their costs. Shares of an ETF trade on an exchange at market prices rather than net asset value, which may cause the shares to trade at a price greater than net asset value (premium) or less than net asset value (discount). In times of market stress, decisions by market makers to reduce or step away from their role of providing a market for an ETF’s shares, or decisions by an ETF’s authorized participants that they are unable or unwilling to proceed with creation and/or redemption orders of an ETF’s shares, could result in shares of the ETF trading at a discount to net asset value and in greater than normal intraday bid-ask spreads.
Fixed Income Securities Risk. To the extent a fund invests in fixed income securities, the fund will be subject to credit risk, income risk, interest rate risk, liquidity risk and prepayment risk. Income risk is the risk that income from a fund’s fixed income investments could decline during periods of falling interest rates. Interest rate risk is the risk that the value of a fund’s fixed income securities will decline because of rising interest rates. Liquidity risk is the risk that a security cannot be purchased or sold at the time desired, or cannot be purchased or sold without adversely affecting the price. Prepayment risk is the risk that the securities will be redeemed or prepaid by the issuer, resulting in lower interest payments received by the fund. In addition to these risks, high yield securities, or “junk” bonds, are subject to greater market fluctuations and risk of loss than securities with higher ratings, and the market for high yield securities is generally smaller and less liquid than that for investment grade securities.
Index or Model Constituent Risk. Certain funds may be a constituent of one or more indices or ETF models. As a result, such a fund may be included in one or more index-tracking exchange-traded funds or mutual funds. Being a component security of such a vehicle could greatly affect the trading activity involving a fund, the size of the fund and the market volatility of the fund. Inclusion in an index could increase demand for the fund and removal from an index could result in outsized selling activity in a relatively short period of time. As a result, a fund’s net asset value could be negatively impacted and the fund’s market price may be significantly below its net asset value during certain periods. In addition, index rebalances may potentially result in increased trading activity in a fund’s shares.
Index Provider Risk. To the extent a fund seeks to track an index, it is subject to Index Provider Risk. There is no assurance that the Index Provider will compile the Index accurately, or that the Index will be determined, maintained, constructed, reconstituted, rebalanced, composed, calculated or disseminated accurately. To correct any such error, the Index Provider may carry out an unscheduled rebalance or other modification of the Index constituents or weightings, which may increase the fund’s costs. The Index Provider does not provide any representation or warranty in relation to the quality, accuracy or completeness of data in the Index, and it does not guarantee that the Index will be calculated in accordance with its stated methodology. Losses or costs associated with any Index Provider errors generally will be borne by the fund and its shareholders.
Investment Companies Risk. To the extent a fund invests in the securities of other investment vehicles, the fund will incur additional fees and expenses that would not be present in a direct investment in those investment vehicles. Furthermore, the fund’s investment performance and risks are directly related to the investment performance and risks of the investment vehicles in which the fund invests.
LIBOR Risk. To the extent a fund invests in floating or variable rate obligations that use the London Interbank Offered Rate (“LIBOR”) as a reference interest rate, it is subject to LIBOR Risk. The United Kingdom’s Financial Conduct Authority, which regulates LIBOR has ceased making LIBOR available as a reference rate over a phase-out period that began December 31, 2021. There is no assurance that any alternative reference rate, including the Secured Overnight Financing Rate (“SOFR”) will be similar to or produce the same value or economic equivalence as LIBOR or that instruments using an alternative rate will have the same volume or liquidity. The unavailability or replacement of LIBOR may affect the value, liquidity or return on certain fund investments and may result in costs incurred in connection with closing out positions and entering into new trades. Any potential effects of the transition away from LIBOR on the fund or on certain instruments in which the fund invests can be difficult to ascertain, and they may vary depending on a variety of factors, and they could result in losses to the fund.
Additional Information (Continued)
First Trust Exchange-Traded Fund III
January 31, 2023 (Unaudited)
Management Risk. To the extent that a fund is actively managed, it is subject to management risk. In managing an actively-managed fund’s investment portfolio, the fund’s portfolio managers will apply investment techniques and risk analyses that may not have the desired result. There can be no guarantee that a fund will meet its investment objective.
Market Risk. Market risk is the risk that a particular security, or shares of a fund in general, may fall in value. Securities held by a fund, as well as shares of a fund itself, are subject to market fluctuations caused by factors such as general economic conditions, political events, regulatory or market developments, changes in interest rates and perceived trends in securities prices. Shares of a fund could decline in value or underperform other investments as a result of the risk of loss associated with these market fluctuations. In addition, local, regional or global events such as war, acts of terrorism, spread of infectious diseases or other public health issues, recessions, or other events could have a significant negative impact on a fund and its investments. Such events may affect certain geographic regions, countries, sectors and industries more significantly than others. In February 2022, Russia invaded Ukraine which has caused and could continue to cause significant market disruptions and volatility within the markets in Russia, Europe, and the United States. The hostilities and sanctions resulting from those hostilities could have a significant impact on certain fund investments as well as fund performance. The COVID-19 global pandemic and the ensuing policies enacted by governments and central banks have caused and may continue to cause significant volatility and uncertainty in global financial markets. While the U.S. has resumed “reasonably” normal business activity, many countries continue to impose lockdown measures. Additionally, there is no guarantee that vaccines will be effective against emerging variants of the disease. These events also adversely affect the prices and liquidity of a fund’s portfolio securities or other instruments and could result in disruptions in the trading markets. Any of such circumstances could have a materially negative impact on the value of a fund’s shares and result in increased market volatility. During any such events, a fund’s shares may trade at increased premiums or discounts to their net asset value and the bid/ask spread on a fund’s shares may widen.
Non-U.S. Securities Risk. To the extent a fund invests in non-U.S. securities, it is subject to additional risks not associated with securities of domestic issuers. Non-U.S. securities are subject to higher volatility than securities of domestic issuers due to: possible adverse political, social or economic developments; restrictions on foreign investment or exchange of securities; capital controls; lack of liquidity; currency exchange rates; excessive taxation; government seizure of assets; the imposition of sanctions by foreign governments; different legal or accounting standards; and less government supervision and regulation of exchanges in foreign countries. Investments in non-U.S. securities may involve higher costs than investments in U.S. securities, including higher transaction and custody costs, as well as additional taxes imposed by non-U.S. governments. These risks may be heightened for securities of companies located, or with significant operations, in emerging market countries.
Operational Risk. Each fund is subject to risks arising from various operational factors, including, but not limited to, human error, processing and communication errors, errors of a fund’s service providers, counterparties or other third-parties, failed or inadequate processes and technology or systems failures. Each fund relies on third-parties for a range of services, including custody. Any delay or failure relating to engaging or maintaining such service providers may affect a fund’s ability to meet its investment objective. Although the funds and the funds’ investment advisor seek to reduce these operational risks through controls and procedures, there is no way to completely protect against such risks.
Passive Investment Risk. To the extent a fund seeks to track an index, the fund will invest in the securities included in, or representative of, the index regardless of their investment merit. A fund generally will not attempt to take defensive positions in declining markets.
Preferred Securities Risk. Preferred securities combine some of the characteristics of both common stocks and bonds. Preferred securities are typically subordinated to bonds and other debt securities in a company’s capital structure in terms of priority to corporate income, subjecting them to greater credit risk than those debt securities. Generally, holders of preferred securities have no voting rights with respect to the issuing company unless preferred dividends have been in arrears for a specified number of periods, at which time the preferred security holders may obtain limited rights. In certain circumstances, an issuer of preferred securities may defer payment on the securities and, in some cases, redeem the securities prior to a specified date. Preferred securities may also be substantially less liquid than other securities, including common stock.
Valuation Risk. The valuation of certain securities may carry more risk than that of common stock. Uncertainties in the conditions of the financial markets, unreliable reference data, lack of transparency and inconsistency of valuation models and processes may lead to inaccurate asset pricing. A fund may hold investments in sizes smaller than institutionally sized round lot positions (sometimes referred to as odd lots). However, third-party pricing services generally provide evaluations on the basis of institutionally-sized round lots. If a fund sells certain of its investments in an odd lot transaction, the sale price may be less than the value at which such securities
Additional Information (Continued)
First Trust Exchange-Traded Fund III
January 31, 2023 (Unaudited)
have been held by the fund. Odd lots often trade at lower prices than institutional round lots. There is no assurance that the fund will be able to sell a portfolio security at the price established by the pricing service, which could result in a loss to the fund.
| NOT FDIC INSURED | NOT BANK GUARANTEED | MAY LOSE VALUE |
Advisory Agreements
Board Considerations Regarding Approval of Amendments to the Investment Management Agreements
The Board of Trustees of First Trust Exchange-Traded Fund III (the “Trust”), including the Independent Trustees, unanimously approved the amendment (as applicable to a specific Fund, the “Amendment” and collectively, the “Amendments”) of the Investment Management Agreements (as applicable to a specific Fund, the “Agreement” and collectively, the “Agreements”) with First Trust Advisors L.P. (the “Advisor”) on behalf of the following two series of the Trust (each a “Fund” and collectively, the “Funds”):
First Trust California Municipal High Income ETF (FCAL)
First Trust New York Municipal High Income ETF (FMNY)
The Board approved the Amendment for each Fund at a meeting held on October 24, 2022. As part of the review process, the Board reviewed information and had preliminary discussions with the Advisor regarding the proposed Amendments at meetings held on April 18, 2022, June 12–13, 2022 and September 18–19, 2022. Following those preliminary discussions, the Board requested and received information from the Advisor regarding the proposed Amendments, and that information was considered at an executive session of the Independent Trustees and their counsel held prior to the October 24, 2022 meeting, as well as at the October meeting.
In reviewing the Amendment for each Fund, the Board considered that the purpose of the Amendments is to modify the unitary fee rate for each Fund under the applicable Agreement by introducing a breakpoint schedule pursuant to which the unitary fee rate paid by each Fund to the Advisor will be reduced as assets of such Fund meet certain thresholds. The Board noted the Advisor’s representations that the quality and quantity of the services provided to each Fund by the Advisor under the applicable Agreement will not be reduced or modified as a result of the applicable Amendment, and that the obligations of the Advisor under each Agreement will remain the same in all respects.
The Board noted that it, including the Independent Trustees, last approved the continuation of the applicable Agreement for each Fund for a one-year period ending June 30, 2023 at a meeting held on June 12–13, 2022. The Board noted that in connection with such approval it had determined for each Fund, based upon the information provided, that the terms of the applicable Agreement were fair and reasonable and that the continuation of the applicable Agreement was in the best interests of the Fund in light of the nature, extent and quality of the services provided and such other matters as the Board considered to be relevant in the exercise of its business judgment.
The Board noted that the Advisor had previously agreed to waive a portion of its unitary fee for each Fund and that the modified unitary fee rate schedule for each Fund under the applicable Amendment would not be implemented until the expiration of the Fund’s contractual fee waiver. The Board considered that the effective unitary fee rate paid by each Fund under the applicable Agreement after taking into account the contractual fee waiver is less than the effective unitary fee rate that the Fund would pay pursuant to the modified unitary fee rate schedule under the applicable Amendment.
Based on all of the information considered, the Board, including the Independent Trustees, unanimously determined that the terms of the Amendments are fair and reasonable and that the Amendments are in the best interests of each Fund.
This page intentionally left blank
This page intentionally left blank
This page intentionally left blank
First Trust Exchange-Traded Fund III
INVESTMENT ADVISOR
First Trust Advisors L.P.
120 East Liberty Drive, Suite 400
Wheaton, IL 60187
ADMINISTRATOR, CUSTODIAN,
FUND ACCOUNTANT &
TRANSFER AGENT
Brown Brothers Harriman & Co.
50 Post Office Square
Boston, MA 02110
INDEPENDENT REGISTERED
PUBLIC ACCOUNTING FIRM
Deloitte & Touche LLP
111 S. Wacker Drive
Chicago, IL 60606
LEGAL COUNSEL
Chapman and Cutler LLP
320 South Canal Street
Chicago, IL 60606
First Trust Exchange-Traded Fund III
First Trust Municipal High Income ETF (FMHI)
Semi-Annual Report
For the Six Months Ended
January 31, 2023
First Trust Municipal High Income ETF (FMHI)
Semi-Annual Report
January 31, 2023
Caution Regarding Forward-Looking Statements
This report contains certain forward-looking statements within the meaning of the Securities Act of 1933, as amended, and the Securities Exchange Act of 1934, as amended. Forward-looking statements include statements regarding the goals, beliefs, plans or current expectations of First Trust Advisors L.P. (“First Trust” or the “Advisor”) and its representatives, taking into account the information currently available to them. Forward-looking statements include all statements that do not relate solely to current or historical fact. For example, forward-looking statements include the use of words such as “anticipate,” “estimate,” “intend,” “expect,” “believe,” “plan,” “may,” “should,” “would” or other words that convey uncertainty of future events or outcomes.
Forward-looking statements involve known and unknown risks, uncertainties and other factors that may cause the actual results, performance or achievements of the series of First Trust Exchange-Traded Fund III (the “Trust”) described in this report (First Trust Municipal High Income ETF; hereinafter referred to as the “Fund”) to be materially different from any future results, performance or achievements expressed or implied by the forward-looking statements. When evaluating the information included in this report, you are cautioned not to place undue reliance on these forward-looking statements, which reflect the judgment of the Advisor and its representatives only as of the date hereof. We undertake no obligation to publicly revise or update these forward-looking statements to reflect events and circumstances that arise after the date hereof.
Performance and Risk Disclosure
There is no assurance that the Fund will achieve its investment objectives. The Fund is subject to market risk, which is the possibility that the market values of securities owned by the Fund will decline and that the value of the Fund’s shares may therefore be less than what you paid for them. Accordingly, you can lose money by investing in the Fund. See “Risk Considerations” in the Additional Information section of this report for a discussion of certain other risks of investing in the Fund.
Performance data quoted represents past performance, which is no guarantee of future results, and current performance may be lower or higher than the figures shown. For the most recent month-end performance figures, please visit www.ftportfolios.com or speak with your financial advisor. Investment returns, net asset value and share price will fluctuate and Fund shares, when sold, may be worth more or less than their original cost.
The Advisor may also periodically provide additional information on Fund performance on the Fund’s web page at www.ftportfolios.com.
How to Read This Report
This report contains information that may help you evaluate your investment in the Fund. It includes details about the Fund and presents data and analysis that provide insight into the Fund’s performance and investment approach.
The statistical information that follows may help you understand the Fund’s performance compared to that of relevant market benchmarks.
It is important to keep in mind that the opinions expressed by personnel of the Advisor are just that: informed opinions. They should not be considered to be promises or advice. The opinions, like the statistics, cover the period through the date on the cover of this report. The material risks of investing in the Fund are spelled out in the prospectus, the statement of additional information, and other Fund regulatory filings.
First Trust Municipal High Income ETF (FMHI)
Semi-Annual Letter from the Chairman and CEO
January 31, 2023
Dear Shareholders,
First Trust is pleased to provide you with the semi-annual report for the First Trust Municipal High Income ETF (the “Fund”), which contains detailed information about the Fund for the six-month period ended January 31, 2023.
Given recent inflation data, the Federal Reserve’s (the “Fed”) monetary policy remains front and center in most discussions regarding the outlook of the U.S. economy. Annual revisions to the Consumer Price Index released on February 10, 2023, showed that prices climbed at a 3.3% annual rate in the last three months of 2022, not the 1.8% rate reported four weeks prior, according to Brian Wesbury, Chief Economist at First Trust. Additionally, “core” inflation, which excludes volatile food and energy prices, was also revised upwards from 3.1% to 4.3% over the period. Furthermore, January’s 2023 jobs data came in better than expected, with non-farm payroll employment rising by 517,000. It is precisely this situation: stubbornly high inflation, strong jobs growth and increasing interest rates, which has many pundits debating whether the typical U.S. consumer can remain healthy enough to help ward off an economic recession.
As many investors know, the consumer is an essential driver of economic growth in the U.S. On average, over the 15-year period ended October 1, 2022, consumer spending accounted for 67.8% of the U.S. gross domestic product (“GDP”). Crucially, recent data regarding consumer health has been mixed, in my opinion. On one hand, the Commerce Department reported that in December 2022, the U.S. savings rate rose to its highest level in seven months, coming in at 3.4%. On the other hand, while December’s savings rate was a welcome reversal from the declines suffered throughout 2021 and 2022, it could indicate that consumers are beginning to pull back on discretionary spending amidst a cloudier economic outlook, according to Bloomberg. Recent data shows that the average interest rate on U.S. credit cards rose to 19.07% in the fourth quarter of 2022, its highest level in over 50 years. Additionally, U.S. credit card debt reached a record $930.6 billion in the fourth quarter, jumping 18.5% year-over-year. Even so, debt service payments accounted for just 9.75% of disposable personal income in the third quarter of 2022. This figure is higher than its historic low of 8.33% set in 2021 but is also well below its peak of 13.17% set in 2007. In my view, it is worth keeping an eye on debt service payments. If higher payments lead to a decline in discretionary spending, it could negatively impact GDP.
I would like to take a moment to remind you that even though nearly three years have passed since the World Health Organization initially declared the coronavirus outbreak a global pandemic, the economic impact of worldwide lockdowns and the subsequent governmental stimulus is still very real. China, for example, only recently dropped its requirement that incoming travelers must quarantine before entering the country. In addition, the global economy has yet to fully absorb the impact of the fiscal policies enacted to jump start consumer spending in 2020, in my view. As evidence of this, each of the countries that comprise the G-10 currently has a headline inflation rate that stands well above its stated target. Central banks likely have more work to do, in my opinion.
Thank you for giving First Trust the opportunity to play a role in your financial future. We value our relationship with you and will report on the Fund again in six months.
Sincerely,
James A. Bowen
Chairman of the Board of Trustees
Chief Executive Officer of First Trust Advisors L.P.
Fund Performance Overview (Unaudited)
First Trust Municipal High Income ETF (FMHI)
The First Trust Municipal High Income ETF’s (the “Fund”) primary investment objective is to provide federally tax-exempt income, and its secondary objective is long-term capital appreciation. Under normal market conditions, the Fund seeks to achieve its investment objectives by investing at least 80% of its net assets (including investment borrowings) in municipal debt securities that pay interest that is exempt from regular federal income taxes (“Municipal Securities”). Under normal market conditions, the Fund invests at least 50% of its net assets in Municipal Securities that are, at the time of investment, rated below investment grade by at least one nationally recognized statistical rating organization rating such securities (or Municipal Securities that are unrated and determined by the Fund’s advisor to be of comparable quality), commonly referred to as “high yield” or “junk” bonds. The Fund lists and principally trades its shares on The Nasdaq Stock Market LLC under the ticker symbol “FMHI.”
| Performance | | | | | | | |
| | | | Average Annual Total Returns | | Cumulative Total Returns |
| | 6 Months
Ended
1/31/23 | 1 Year
Ended
1/31/23 | 5 Years
Ended
1/31/23 | Inception
(11/1/17)
to 1/31/23 | | 5 Years
Ended
1/31/23 | Inception
(11/1/17)
to 1/31/23 |
| Fund Performance | | | | | | | |
| NAV | -1.00% | -8.99% | 2.36% | 2.38% | | 12.39% | 13.12% |
| Market Price | -1.00% | -9.02% | 2.39% | 2.38% | | 12.55% | 13.14% |
| Index Performance | | | | | | | |
| Bloomberg Municipal Bond Index | 0.73% | -3.25% | 2.07% | 1.84% | | 10.77% | 10.05% |
| Blended Benchmark(1) | 0.82% | -2.75% | 3.06% | 2.84% | | 16.28% | 15.85% |
Total returns for the period since inception are calculated from the inception date of the Fund. “Average Annual Total Returns” represent the average annual change in value of an investment over the periods indicated. “Cumulative Total Returns” represent the total change in value of an investment over the periods indicated. The total returns would have been lower if certain fees had not been waived by the Advisor.
The Fund’s per share net asset value (“NAV”) is the value of one share of the Fund and is computed by dividing the value of all assets of the Fund (including accrued interest and dividends), less all liabilities (including accrued expenses and dividends declared but unpaid), by the total number of outstanding shares. The price used to calculate market return (“Market Price”) is determined by using the midpoint of the national best bid and offer price (“NBBO”) as of the time that the Fund’s NAV is calculated. Under SEC rules, the NBBO consists of the highest displayed buy and lowest sell prices among the various exchanges trading the Fund at the time the Fund’s NAV is calculated. Prior to January 1, 2019, the price used was the midpoint between the highest bid and the lowest offer on the stock exchange on which shares of the Fund were listed for trading as of the time that the Fund’s NAV was calculated. Since shares of the Fund did not trade in the secondary market until after its inception, for the period from inception to the first day of secondary market trading in shares of the Fund, the NAV of the Fund is used as a proxy for the secondary market trading price to calculate market returns. NAV and market returns assume that all distributions have been reinvested in the Fund at NAV and Market Price, respectively.
An index is a statistical composite that tracks a specified financial market or sector. Unlike the Fund, the indices that make up the Blended Benchmark do not actually hold a portfolio of securities and therefore do not incur the expenses incurred by the Fund. These expenses negatively impact the performance of the Fund. Also, market returns do not include brokerage commissions that may be payable on secondary market transactions. If brokerage commissions were included, market returns would be lower. The total returns presented reflect the reinvestment of dividends on securities in the indices. The returns presented do not reflect the deduction of taxes that a shareholder would pay on Fund distributions or the redemption or sale of Fund shares. The investment return and principal value of shares of the Fund will vary with changes in market conditions. Shares of the Fund may be worth more or less than their original cost when they are redeemed or sold in the market. The Fund’s past performance is no guarantee of future performance.
| (1) | The Blended Benchmark consists of the following two indexes: 50% of the Bloomberg High Yield 10-Year Municipal Index (8-12 years) which is comprised of bonds with a final maturity between 8 and 12 years that are part of the Bloomberg Municipal Bond High Yield Index; and 50% of the Bloomberg Revenue 10-Year Municipal Index (8-12 years), which is comprised of revenue bonds that have a final maturity between 8 and 12 years that are part of the Bloomberg Municipal Bond Index. Indexes do not charge management fees or brokerage expenses, and no such fees or expenses were deducted from the index performance shown. Indexes are unmanaged and an investor cannot invest directly in an index. The Blended Benchmark returns are calculated by using the monthly return of the two indices during each period shown above. At the beginning of each month the two indices are rebalanced to a 50-50 ratio to account for divergence from that ratio that occurred during the course of each month. The monthly returns are then compounded for each period shown above, giving the performance for the Blended Benchmark for each period shown above. |
Fund Performance Overview (Unaudited) (Continued)
First Trust Municipal High Income ETF (FMHI) (Continued)
| Sector Allocation | % of Total
Investments
(including cash) |
| Special Assessment | 10.7% |
| Continuing Care Retirement Communities | 10.3 |
| Industrial Development Bond | 10.1 |
| Education | 8.7 |
| Airport | 6.6 |
| Government Obligation Bond - Limited Tax | 6.4 |
| Dedicated Tax | 6.3 |
| Gas | 6.1 |
| Government Obligation Bond - Unlimited Tax | 5.8 |
| Hospital | 5.2 |
| Tax Increment | 2.8 |
| Tobacco | 2.8 |
| Utility | 2.2 |
| Certificates of Participation | 2.1 |
| Higher Education | 1.9 |
| Student Housing | 1.8 |
| Water & Sewer | 1.4 |
| Insured | 1.4 |
| Toll Road | 1.0 |
| Local Housing | 0.9 |
| Pre-refunded/Escrowed-to-maturity | 0.8 |
| Hotel | 0.6 |
| Skilled Nursing | 0.6 |
| Port | 0.4 |
| Housing | 0.3 |
| Student Loan | 0.1 |
| Cash | 2.7 |
| Total | 100.0% |
| Credit Rating(2) | % of Total
Investments
(including cash) |
| AAA | 1.4% |
| AA | 12.1 |
| A | 16.1 |
| BBB | 11.3 |
| BB | 13.6 |
| B | 3.0 |
| Not Rated | 39.8 |
| Cash | 2.7 |
| Total | 100.0% |
| Fund Allocation | % of Net Assets |
| Municipal Bonds | 97.8% |
| Net Other Assets and Liabilities* | 2.2 |
| Total | 100.0% |
| * | Includes variation margin on futures contracts. |
| (2) | The credit quality and ratings information presented above reflect the ratings assigned by one or more nationally recognized statistical rating organizations (NRSROs), including S&P Global Ratings, Moody’s Investors Service, Inc., Fitch Ratings or a comparably rated NRSRO. For situations in which a security is rated by more than one NRSRO and the ratings are not equivalent, the highest rating is used. Sub-investment grade ratings are those rated BB+/Ba1 or lower. Investment grade ratings are those rated BBB-/Baa3 or higher. The credit ratings shown relate to the creditworthiness of the issuers of the underlying securities in the Fund, and not to the Fund or its shares. Credit ratings are subject to change. |
Fund Performance Overview (Unaudited) (Continued)
First Trust Municipal High Income ETF (FMHI) (Continued)
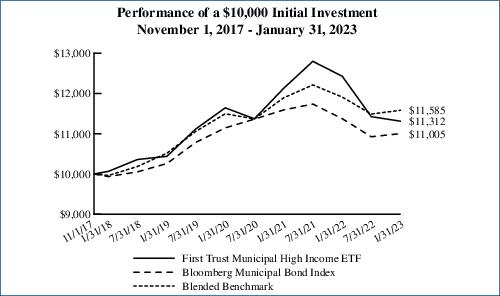
Performance figures assume reinvestment of all distributions and do not reflect the deduction of taxes that a shareholder would pay on Fund distributions or the redemption or sale of Fund shares. An index is a statistical composite that tracks a specified financial market or sector. Unlike the Fund, the indices do not actually hold a portfolio of securities and therefore do not incur the expenses incurred by the Fund. These expenses negatively impact the performance of the Fund. The Fund’s past performance does not predict future performance.
Performance in municipal bond investment strategies can be impacted from the benefits of purchasing odd lot positions. The impact of these investments can be particularly meaningful when funds have limited assets under management and may not be a sustainable source of performance as a fund grows in size.
Frequency Distribution of Discounts and Premiums
Information showing the number of days the market price of the Fund’s shares was greater (at a premium) and less (at a discount) than the Fund’s net asset value for the most recently completed year, and the most recently completed calendar quarters since that year (or life of the Fund, if shorter), is available at https://www.ftportfolios.com/Retail/etf/home.aspx.
Portfolio Management
First Trust Municipal High Income ETF (FMHI)
Semi-Annual Report
January 31, 2023 (Unaudited)
Advisor
First Trust Advisors L.P. (“First Trust” or the “Advisor”) is the investment advisor to the First Trust Municipal High Income ETF (the “Fund”). First Trust is responsible for the ongoing monitoring of the Fund’s investment portfolio, managing the Fund’s business affairs and providing certain administrative services necessary for the management of the Fund.
Portfolio Management Team
Tom Byron, Senior Vice President, Senior Portfolio Manager
Johnathan N. Wilhelm, Senior Vice President, Senior Portfolio Manager
The portfolio managers are primarily and jointly responsible for the day-to-day management of the Fund. Tom Byron has served as portfolio manager since 2022 and Johnathan N. Wilhelm has served as portfolio manager since 2017.
First Trust Municipal High Income ETF (FMHI)
Understanding Your Fund Expenses
January 31, 2023 (Unaudited)
As a shareholder of the First Trust Municipal High Income ETF (the “Fund”), you incur two types of costs: (1) transaction costs; and (2) ongoing costs, including management fees, distribution and/or service (12b-1) fees, if any, and other Fund expenses. This Example is intended to help you understand your ongoing costs of investing in the Fund and to compare these costs with the ongoing costs of investing in other funds.
The Example is based on an investment of $1,000 invested at the beginning of the period and held through the six-month period ended January 31, 2023.
Actual Expenses
The first line in the following table provides information about actual account values and actual expenses. You may use the information in this line, together with the amount you invested, to estimate the expenses that you paid over the period. Simply divide your account value by $1,000 (for example, an $8,600 account value divided by $1,000 = 8.6), then multiply the result by the number in the first line under the heading entitled “Expenses Paid During the Six-Month Period” to estimate the expenses you paid on your account during this six-month period.
Hypothetical Example for Comparison Purposes
The second line in the following table provides information about hypothetical account values and hypothetical expenses based on the Fund’s actual expense ratio and an assumed rate of return of 5% per year before expenses, which is not the Fund’s actual return. The hypothetical account values and expenses may not be used to estimate the actual ending account balance or expenses you paid for the period. You may use this information to compare the ongoing costs of investing in the Fund and other funds. To do so, compare this 5% hypothetical example with the 5% hypothetical examples that appear in the shareholder reports of the other funds.
Please note that the expenses shown in the table are meant to highlight your ongoing costs only and do not reflect any transactional costs such as brokerage commissions. Therefore, the second line in the table is useful in comparing ongoing costs only, and will not help you determine the relative total costs of owning different funds. In addition, if these transactional costs were included, your costs would have been higher.
| | Beginning
Account Value
August 1, 2022 | Ending
Account Value
January 31, 2023 | Annualized
Expense Ratio
Based on the
Six-Month
Period (a) | Expenses Paid
During the
Six-Month
Period (b) |
| First Trust Municipal High Income ETF (FMHI) |
| Actual | $1,000.00 | $990.00 | 0.60% | $3.01 |
| Hypothetical (5% return before expenses) | $1,000.00 | $1,022.18 | 0.60% | $3.06 |
| (a) | These expense ratios reflect expense waivers. See Note 3 in the Notes to Financial Statements. |
| (b) | Expenses are equal to the annualized expense ratios as indicated in the table multiplied by the average account value over the period (August 1, 2022 through January 31, 2023), multiplied by 184/365 (to reflect the six-month period). |
First Trust Municipal High Income ETF (FMHI)
Portfolio of Investments
January 31, 2023 (Unaudited)
Principal
Value | | Description | | Stated
Coupon | | Stated
Maturity | | Value |
| MUNICIPAL BONDS – 97.8% |
| | | Alabama – 2.6% | | | | | | |
| $1,250,000 | | Black Belt Energy Gas Dist AL Gas Proj Rev Gas Proj, Ser F (Mandatory put 12/01/28)
| | 5.50% | | 11/01/53 | | $1,343,195 |
| 2,000,000 | | Black Belt Energy Gas Dist AL Gas Proj Rev Proj No. 6, Ser B (Mandatory put 12/01/26)
| | 4.00% | | 10/01/52 | | 2,004,058 |
| 500,000 | | Black Belt Energy Gas Dist AL Gas Proj Rev, Ser C-1 (Mandatory put 6/01/29)
| | 5.25% | | 02/01/53 | | 536,535 |
| 1,000,000 | | Columbia AL Indl Dev Brd Pollcontrol Rev Var Ref AL Pwr Co Proj, Ser A (a)
| | 1.35% | | 12/01/37 | | 1,000,000 |
| 2,425,000 | | SE Energy Auth AL Cmdy Sply Rev Proj #1, Ser A (Mandatory put 10/01/28)
| | 4.00% | | 11/01/51 | | 2,428,148 |
| 800,000 | | SE Energy Auth AL Cmdy Sply Rev Proj #4, Ser B-1 (Mandatory put 08/01/28)
| | 5.00% | | 05/01/53 | | 838,753 |
| | | | | 8,150,689 |
| | | Arizona – 3.1% | | | | | | |
| 780,000 | | AZ St Indl Dev Auth Edu Rev Acads of Math & Science Proj (b)
| | 5.00% | | 07/01/39 | | 782,087 |
| 750,000 | | AZ St Indl Dev Auth Edu Rev Doral Acdmy NV Fire Mesa & Red Rock Cmps Proj, Ser A (b)
| | 5.00% | | 07/15/39 | | 734,877 |
| 400,000 | | AZ St Indl Dev Auth Edu Rev Lone Mountain Cmps Proj, Ser A (b)
| | 5.00% | | 12/15/39 | | 402,207 |
| 1,255,000 | | AZ St Indl Dev Auth Edu Rev Ref Basis Sch Projs, Ser D (b)
| | 4.00% | | 07/01/27 | | 1,227,147 |
| 500,000 | | AZ St Indl Dev Auth Edu Rev Ref Doral Acdmy of Northern NV Proj, Ser A (b)
| | 4.00% | | 07/15/51 | | 390,357 |
| 1,000,000 | | AZ St Indl Dev Auth Edu Rev Somerset Acdmy of LV Aliante & Skye Canyon Cmps Proj, Ser A (b)
| | 4.00% | | 12/15/41 | | 856,778 |
| 1,000,000 | | AZ St Indl Dev Auth Edu Rev Somerset Acdmy of LV Aliante & Skye Canyon Cmps Proj, Ser A (b)
| | 4.00% | | 12/15/51 | | 784,166 |
| 500,000 | | AZ St Indl Dev Auth Edu Rev, Ser A (b)
| | 5.00% | | 07/15/40 | | 486,928 |
| 500,000 | | Glendale AZ Indl Dev Auth Sr Living Facs Rev Royal Oaks Inspirata Pointe Proj, Ser A
| | 5.00% | | 05/15/41 | | 475,229 |
| 1,000,000 | | Maricopa Cnty AZ Indl Dev Auth Edu Rev Ref Legacy Trad Schs Proj Auth, Ser B (b)
| | 5.00% | | 07/01/54 | | 934,053 |
| 2,000,000 | | Phoenix AZ Indl Dev Auth Hotel Rev Sr Falcon Properties LLC Proj, Ser A (b)
| | 4.00% | | 12/01/51 | | 1,592,128 |
| 100,000 | | Phoenix AZ Indl Dev Auth Stdt Hsg Rev Ref Downtown Phoenix Stdt Hsg LLC AZ St Univ Proj, Ser A
| | 5.00% | | 07/01/27 | | 104,417 |
| 1,000,000 | | Pima Cnty AZ Indl Dev Auth Sr Living Rev La Posada at Pusch Ridge Proj, Ser A (b)
| | 6.75% | | 11/15/42 | | 1,046,499 |
| | | | | 9,816,873 |
| | | Arkansas – 0.9% | | | | | | |
| 3,000,000 | | AR Dev Fin Auth Envrnmntl Rev Green Bond United States Steel Corp Proj, AMT (b)
| | 5.45% | | 09/01/52 | | 3,001,695 |
| | | California – 5.7% | | | | | | |
| 1,250,000 | | CA Cmnty Choice Fing Auth Clean Energy Proj Rev Green Bond, Ser B-1 (Mandatory put 08/01/31)
| | 4.00% | | 02/01/52 | | 1,267,902 |
| 250,000 | | CA Pub Fin Auth Sr Living Rev Enso Vlg Proj Green Bond, Ser A (b)
| | 5.00% | | 11/15/46 | | 224,941 |
| 250,000 | | CA Pub Fin Auth Sr Living Rev Enso Vlg Proj Green Bond, Ser A (b)
| | 5.00% | | 11/15/51 | | 221,510 |
| 850,000 | | CA St Muni Fin Auth Chrt Sch Rev Palmdale Aerospace Acdmy Proj, Ser A (b)
| | 5.00% | | 07/01/38 | | 827,694 |
| 450,000 | | CA St Muni Fin Auth Chrt Sch Rev, Ser A (b)
| | 5.50% | | 06/01/38 | | 455,690 |
| 205,000 | | CA St Muni Fin Auth Rev Ref Eisenhower Med Ctr, Ser A
| | 5.00% | | 07/01/32 | | 219,789 |
See Notes to Financial Statements
Page 7
First Trust Municipal High Income ETF (FMHI)
Portfolio of Investments (Continued)
January 31, 2023 (Unaudited)
Principal
Value | | Description | | Stated
Coupon | | Stated
Maturity | | Value |
| MUNICIPAL BONDS (Continued) |
| | | California (Continued) | | | | | | |
| $1,250,000 | | CA St Muni Fin Auth Rev Ref HumanGood Oblig Grp, Ser A
| | 5.00% | | 10/01/44 | | $1,304,258 |
| 1,000,000 | | CA St Muni Fin Auth Spl Fac Rev United Airls Inc Proj, AMT
| | 4.00% | | 07/15/29 | | 992,125 |
| 1,250,000 | | CA St Poll Control Fin Auth Wtr Furnishing Rev Plant Bonds, AMT (b)
| | 5.00% | | 07/01/37 | | 1,253,464 |
| 1,000,000 | | CA St Sch Fin Auth Chrt Sch Rev Ref Classical Academies Oceanside Proj, Ser A (b)
| | 5.00% | | 10/01/42 | | 1,052,865 |
| 550,000 | | CA Stwd Cmntys Dev Auth Rev Loma Linda Univ Med Ctr, Ser A (b)
| | 5.00% | | 12/01/33 | | 571,463 |
| 1,500,000 | | CSCDA Cmnty Impt Auth CA Essential Hsg Rev The Link Glendale Social Bonds, Ser A-2 (b)
| | 4.00% | | 07/01/56 | | 1,220,122 |
| 500,000 | | CSCDA Cmnty Impt Auth CA Essential Hsg Rev Union S Bay Social Bonds, Ser A-2 (b)
| | 4.00% | | 07/01/56 | | 394,134 |
| 1,000,000 | | Golden St Tobacco Securitization Corp CA Tobacco Stlmt Ref, Tobacco Stlmt Asset Backed Bonds, Ser A-1
| | 5.00% | | 06/01/51 | | 1,063,774 |
| 300,000 | | Morongo Band of Mission Indians CA Rev Ref, Ser B (b)
| | 5.00% | | 10/01/42 | | 303,088 |
| 450,000 | | Palm Desert CA Spl Tax Ref Univ Park
| | 4.00% | | 09/01/41 | | 427,987 |
| 400,000 | | Roseville CA Spl Tax Svsp Westpark Federico Cmnty Facs Dt
No. 1
| | 4.00% | | 09/01/41 | | 379,945 |
| 1,000,000 | | San Diego Cnty CA Regl Arpt Auth Arpt Rev Subord, Ser B, AMT
| | 5.00% | | 07/01/46 | | 1,060,663 |
| 2,000,000 | | San Francisco CA City & Cnty Arpts Commn Intl Arpt Rev, Ser A, AMT
| | 5.00% | | 05/01/44 | | 2,101,543 |
| 1,000,000 | | San Francisco City & Cnty CA Cmnty Facs Dist #2016-1, Ser 2021
| | 4.00% | | 09/01/46 | | 911,701 |
| 1,615,000 | | San Luis Obispo Cnty CA Fing Auth Lease Rev Multiple Capital Projs Ref, Ser A
| | 5.25% | | 11/15/42 | | 1,843,922 |
| | | | | 18,098,580 |
| | | Colorado – 8.6% | | | | | | |
| 1,125,000 | | Allison Vly Met Dist #2 CO Ref
| | 4.70% | | 12/01/47 | | 941,120 |
| 1,000,000 | | Baseline Met Dist #1 CO Spl Rev, Ser A
| | 5.00% | | 12/01/51 | | 884,646 |
| 525,000 | | Brighton Crossing Met Dist #6 CO, Ser A
| | 5.00% | | 12/01/35 | | 509,103 |
| 1,000,000 | | Cascade Ridge Met Dist CO
| | 5.00% | | 12/01/51 | | 852,415 |
| 515,000 | | Chambers Highpoint Met Dist #2 CO
| | 5.00% | | 12/01/41 | | 479,753 |
| 1,000,000 | | CO St Eductnl & Cultural Facs Auth Rev Ref & Impt Chrt Sch Univ Lab Bldg Corp (b)
| | 5.00% | | 12/15/45 | | 1,020,314 |
| 1,500,000 | | CO St Hlth Facs Auth Hosp Rev Aberdeen Ridge, Ser A
| | 5.00% | | 05/15/49 | | 1,227,834 |
| 500,000 | | CO St Hlth Facs Auth Hosp Rev Aberdeen Ridge, Ser A
| | 5.00% | | 05/15/58 | | 389,884 |
| 1,400,000 | | CO St Hlth Facs Auth Rev Ref Christian Living Neighborhoods Proj
| | 5.00% | | 01/01/37 | | 1,287,703 |
| 950,000 | | CO St Hlth Facs Auth Rev Ref Commonspirit Hlth, Ser A-1
| | 4.00% | | 08/01/39 | | 938,898 |
| 625,000 | | CO St Hlth Facs Auth Rev Sr Living Ralston Creek Arvada Proj, Ser A (c) (d)
| | 5.25% | | 11/01/32 | | 306,250 |
| 1,120,000 | | Denver City & Cnty CO Arpt Rev Ref, Ser D, AMT
| | 5.75% | | 11/15/40 | | 1,321,443 |
| 1,100,000 | | Denver City & Cnty CO Arpt Rev Ref, Ser D, AMT
| | 5.75% | | 11/15/45 | | 1,272,041 |
| 1,220,000 | | Denver City & Cnty CO Arpt Rev, Ser A, AMT
| | 5.00% | | 11/15/41 | | 1,327,461 |
| 1,000,000 | | Denver CO City & Cnty Var Ref, Ser A3, COPS (a)
| | 1.25% | | 12/01/31 | | 1,000,000 |
| 500,000 | | Denver CO Intl Busn Ctr CO Met Dist #1 Subord, Ser B
| | 6.00% | | 12/01/48 | | 502,319 |
| 1,700,000 | | Elbert & Hwy 86 CO Comml Spl Rev & Tax Supported Ref Sr Bonds, Ser A (b)
| | 5.00% | | 12/01/41 | | 1,562,890 |
| 1,510,000 | | Elbert & Hwy 86 CO Comml Spl Rev & Tax Supported Ref Sr Bonds, Ser A (b)
| | 5.00% | | 12/01/51 | | 1,291,261 |
| 1,500,000 | | Four Corners Busn Impt Dist CO Ltd Tax Supported
| | 6.00% | | 12/01/52 | | 1,406,233 |
| 1,000,000 | | Grandview Reserve Met Dist #3 CO Sr Bonds, Ser A
| | 6.25% | | 12/01/52 | | 964,585 |
| 500,000 | | Independence Met Dist #3 CO, Ser A
| | 6.25% | | 12/01/49 | | 465,528 |
| 575,000 | | Jefferson Ctr CO Met Dist #1 Spl Rev, Ser A-2
| | 4.13% | | 12/01/40 | | 492,640 |
Page 8
See Notes to Financial Statements
First Trust Municipal High Income ETF (FMHI)
Portfolio of Investments (Continued)
January 31, 2023 (Unaudited)
Principal
Value | | Description | | Stated
Coupon | | Stated
Maturity | | Value |
| MUNICIPAL BONDS (Continued) |
| | | Colorado (Continued) | | | | | | |
| $1,000,000 | | Meridian Ranch Met Dist 2018 Subdistrict CO
| | 6.75% | | 12/01/52 | | $1,003,487 |
| 905,000 | | Mountain Brook Met Dist CO
| | 4.50% | | 12/01/41 | | 740,606 |
| 500,000 | | Murphy Creek Met Dist #5 CO Sr Bonds, Ser A
| | 6.00% | | 12/01/52 | | 497,200 |
| 500,000 | | Peak Met Dist #1 CO, Ser A (b)
| | 4.00% | | 12/01/35 | | 431,583 |
| 1,000,000 | | Peak Met Dist #1 CO, Ser A (b)
| | 5.00% | | 12/01/41 | | 936,978 |
| 1,500,000 | | Prairie Ctr CO Met Dist #3 Ltd Property Tax Supported Pri Ref, Ser A (b)
| | 5.00% | | 12/15/41 | | 1,499,903 |
| 500,000 | | Prairie Ctr Met Dist #7 CO
| | 4.13% | | 12/15/36 | | 447,875 |
| 785,000 | | Siena Lake Met Dist CO
| | 3.25% | | 12/01/31 | | 670,436 |
| 500,000 | | Siena Lake Met Dist CO
| | 4.00% | | 12/01/51 | | 378,050 |
| 500,000 | | Trails at Crowfoot Met Dist #3 CO Sr Ser, Ser A
| | 5.00% | | 12/01/39 | | 487,197 |
| | | | | 27,537,636 |
| | | Connecticut – 3.5% | | | | | | |
| 250,000 | | Bridgeport CT, Ser A, BAM
| | 5.00% | | 02/01/31 | | 286,348 |
| 2,000,000 | | CT St Hlth & Eductnl Facs Auth Rev Covenant Home Inc, Ser B
| | 5.00% | | 12/01/40 | | 2,039,682 |
| 540,000 | | CT St Hlth & Eductnl Facs Auth Rev McLean Issue, Ser A (b)
| | 5.00% | | 01/01/55 | | 506,499 |
| 2,725,000 | | CT St Hlth & Eductnl Facs Auth Rev Trinity Hlth Corp
| | 5.00% | | 12/01/45 | | 2,804,858 |
| 800,000 | | CT St Hlth & Eductnl Facs Auth Rev, Ser A
| | 4.00% | | 07/01/37 | | 807,710 |
| 1,250,000 | | CT St Spl Tax Oblig Rev, Ser A
| | 5.00% | | 05/01/41 | | 1,413,114 |
| 2,500,000 | | Harbor Point CT Infra Impt Dist Spl Oblig Rev Ref Harbor Point Proj Ltd (b)
| | 5.00% | | 04/01/39 | | 2,502,900 |
| 480,000 | | Steel Point Infra Impt Dist CT Spl Oblig Rev Steelpointe Harbor Proj (b)
| | 4.00% | | 04/01/36 | | 434,085 |
| 550,000 | | Steel Point Infra Impt Dist CT Spl Oblig Rev Steelpointe Harbor Proj (b)
| | 4.00% | | 04/01/41 | | 469,642 |
| | | | | 11,264,838 |
| | | Delaware – 0.2% | | | | | | |
| 473,000 | | Millsboro DE Spl Oblig Ref Plantation Lakes Spl Dev Dist (b)
| | 5.00% | | 07/01/28 | | 478,198 |
| | | District of Columbia – 0.3% | | | | | | |
| 880,000 | | DC Rev Rocketship DC Oblig Grp, Ser A (b)
| | 5.00% | | 06/01/41 | | 872,641 |
| | | Florida – 14.0% | | | | | | |
| 500,000 | | Alachua Cnty FL Hlth Facs Auth CCRC Ref Oak Hammock at The Univ of FL Inc Proj
| | 4.00% | | 10/01/40 | | 426,523 |
| 445,000 | | Capital Trust Agy FL Eductnl Facs Rev Academir Chrt Schs Inc Proj, Ser A (b)
| | 4.00% | | 07/01/41 | | 374,243 |
| 525,000 | | Capital Trust Agy FL Eductnl Facs Rev Academir Chrt Schs Inc Proj, Ser A (b)
| | 4.00% | | 07/01/51 | | 403,752 |
| 200,000 | | Capital Trust Agy FL Eductnl Facs Rev Liza Jackson Preparatory Sch Inc Proj, Ser A
| | 4.00% | | 08/01/30 | | 202,795 |
| 300,000 | | Capital Trust Agy FL Eductnl Facs Rev Liza Jackson Preparatory Sch Inc Proj, Ser A
| | 5.00% | | 08/01/40 | | 309,903 |
| 750,000 | | Charlotte Cnty FL Indl Dev Auth Util Sys Rev Town & Country Utils Proj, Ser A, AMT (b)
| | 4.00% | | 10/01/41 | | 627,634 |
| 1,000,000 | | Charlotte Cnty FL Indl Dev Auth Util Sys Rev Town & Country Utils Proj, Ser A, AMT (b)
| | 4.00% | | 10/01/51 | | 772,501 |
| 650,000 | | Coco Palms FL CDD Spl Assmnt
| | 4.50% | | 05/01/32 | | 648,764 |
| 600,000 | | Cypress Bluff CDD FL Spl Assmnt Del Web Proj, Ser A (b)
| | 3.63% | | 05/01/40 | | 490,226 |
| 2,650,000 | | Edgewater E CDD FL Spl Assmnt Rev Assmnt Area Two
| | 4.00% | | 05/01/42 | | 2,271,154 |
| 2,855,000 | | Epperson N CDD FL Capital Impt Rev Assmnt Area #2
| | 4.00% | | 05/01/51 | | 2,274,417 |
| 1,250,000 | | Fallschase Cmnty Dev Dist FL Spl Assmnt
| | 3.38% | | 05/01/41 | | 981,907 |
| 1,385,000 | | FL St Dev Fin Corp Eductnl Facs Rev Ref Global Outreach Chrt Acdmy Proj, Ser A (b)
| | 4.00% | | 06/30/56 | | 1,018,746 |
See Notes to Financial Statements
Page 9
First Trust Municipal High Income ETF (FMHI)
Portfolio of Investments (Continued)
January 31, 2023 (Unaudited)
Principal
Value | | Description | | Stated
Coupon | | Stated
Maturity | | Value |
| MUNICIPAL BONDS (Continued) |
| | | Florida (Continued) | | | | | | |
| $1,005,000 | | FL St Dev Fin Corp Sr Living Rev Ref Mayflower Retmnt Cmnty Proj, Ser A (b)
| | 4.00% | | 06/01/41 | | $791,809 |
| 500,000 | | Forest Lake Cmnty Dev Dist FL Spl Assmnt Assmnt Area 1 Proj (b)
| | 4.00% | | 05/01/40 | | 435,320 |
| 2,175,000 | | Gainesville FL Utilities Sys Rev Var Ref Remk, Ser A (a)
| | 1.22% | | 10/01/26 | | 2,175,000 |
| 1,060,000 | | Gulfstream Polo Cmnty Dev Dist FL Spl Assmnt Phase 2 Proj
| | 4.38% | | 11/01/49 | | 944,170 |
| 1,000,000 | | Hills Minneola Cmnty Dev Dist FL Spl Assmnt Rev S Parcel Assmnt Area (b)
| | 4.00% | | 05/01/40 | | 872,334 |
| 750,000 | | Lakewood Ranch FL Stewardship Dist Spl Assmnt Rev N E Sector Proj Phase 1A
| | 5.00% | | 05/01/38 | | 754,425 |
| 1,325,000 | | Lakewood Ranch FL Stewardship Dist Spl Assmnt Rev Stewardship Dist Azario Proj
| | 4.00% | | 05/01/50 | | 1,065,027 |
| 2,575,000 | | Lee Cnty FL Indl Dev Auth Hlthcr Facs Rev Shell Point Waterside Hlth Proj
| | 5.00% | | 11/15/49 | | 2,567,264 |
| 1,500,000 | | LTC Ranch West Rsdl Cmnty Dev Dist Spl Assmnt Rev Assmnt Area One Proj, Ser A
| | 4.00% | | 05/01/52 | | 1,190,170 |
| 2,570,000 | | Miami-Dade Cnty FL Aviation Rev Ref, Ser A, AMT
| | 5.00% | | 10/01/38 | | 2,631,817 |
| 2,625,000 | | Miami-Dade Cnty FL Aviation Rev Ref, Ser B, AMT
| | 5.00% | | 10/01/40 | | 2,739,306 |
| 1,000,000 | | Miami-Dade Cnty FL Seaport Rev Ref Sr Bonds, Ser A, AMT (e)
| | 5.00% | | 10/01/36 | | 1,103,634 |
| 2,245,000 | | Miami-Dade Cnty FL Wtr & Swr Rev Sub
| | 5.00% | | 10/01/46 | | 2,449,394 |
| 1,250,000 | | Mirada II Cmnty Dev Dist FL Cap Impt Rev
| | 4.00% | | 05/01/51 | | 997,038 |
| 1,520,000 | | N Park Isle Cmnty Dev Dist FL Spl Assmnt Rev Assmnt Area One
| | 4.50% | | 05/01/40 | | 1,417,632 |
| 1,300,000 | | Old Hickory CDD FL Spl Assmnt Spl Asmt
| | 4.00% | | 06/15/40 | | 1,136,283 |
| 465,000 | | Parkland Preserve CDD FL Spl Assmnt Rev, Ser A
| | 5.25% | | 05/01/39 | | 471,120 |
| 1,500,000 | | Polk Cnty FL Indl Dev Auth Mineral Dev LLC Secondary Phosphate Tailings Recovery Proj (b)
| | 5.88% | | 01/01/33 | | 1,529,828 |
| 500,000 | | Saint Johns Cnty FL Indl Dev Auth Sr Living Rev Ref Vicar’s Landing Proj, Ser A
| | 4.00% | | 12/15/36 | | 433,139 |
| 750,000 | | Saint Johns Cnty FL Indl Dev Auth Sr Living Rev Ref Vicar’s Landing Proj, Ser A
| | 4.00% | | 12/15/41 | | 606,725 |
| 2,055,000 | | Sawyers Landing CDD FL Spl Assmnt Rev
| | 4.13% | | 05/01/41 | | 1,792,128 |
| 250,000 | | SE Overtown Park W Cmnty Redev Agy FL Tax, Ser A-1 (b)
| | 5.00% | | 03/01/30 | | 254,977 |
| 490,000 | | Shell Point Cmnty Dev Dist FL Spl Assmnt (b)
| | 5.25% | | 11/01/39 | | 495,490 |
| 750,000 | | Six Mile Creek FL CDD Capital Impt Rev Assmnt Area 3 Phase 1
| | 4.00% | | 05/01/51 | | 598,223 |
| 2,580,000 | | Stillwater CDD FL Sp Assmnt Spl Assmt 2021 Proj (b)
| | 3.50% | | 06/15/41 | | 2,049,231 |
| 1,250,000 | | Tern Bay CDD FL Spl Assmnt
| | 4.00% | | 06/15/42 | | 1,070,869 |
| 230,000 | | Villamar CDD FL Spl Assmnt (d)
| | 4.00% | | 05/01/29 | | 226,200 |
| 1,190,000 | | Wildblue CDD FL Spl Assmnt (b)
| | 4.25% | | 06/15/39 | | 1,070,005 |
| | | | | 44,671,123 |
| | | Georgia – 4.3% | | | | | | |
| 1,000,000 | | Atlanta GA Arpt Passenger Fac Charge Rev Arpt Rev Subord, Ser D, AMT
| | 4.00% | | 07/01/37 | | 1,006,756 |
| 1,775,000 | | Atlanta GA Arpt Rev, Ser A
| | 5.00% | | 07/01/42 | | 1,996,901 |
| 1,100,000 | | Burke Cnty GA Dev Auth Poll Control Rev Var GA Pwr Co Vogtle, Ser 1 (a)
| | 1.45% | | 07/01/49 | | 1,100,000 |
| 55,000 | | Fulton Cnty GA Rsdl Care Facs Elderly Auth Retmnt Fac Rev Ref Lenbrook Sq Fdtn Inc
| | 5.00% | | 07/01/31 | | 55,340 |
| 1,500,000 | | Fulton Cnty GA Rsdl Care Facs Elderly Auth Retmnt Fac Rev Ref Lenbrook Sq Fdtn Inc
| | 5.00% | | 07/01/42 | | 1,470,720 |
| 500,000 | | Geo L Smith II GA Congress Ctr Auth Convention Ctr Hotel Second Tier, Ser B (b)
| | 5.00% | | 01/01/36 | | 467,884 |
| 400,000 | | Main Street Nat Gas Inc GA Gas Sply Rev, Ser A
| | 5.00% | | 05/15/30 | | 426,117 |
| 2,500,000 | | Main Street Nat Gas Inc GA Gas Sply Rev, Ser A (Mandatory put 06/01/30) (e)
| | 5.00% | | 06/01/53 | | 2,654,996 |
Page 10
See Notes to Financial Statements
First Trust Municipal High Income ETF (FMHI)
Portfolio of Investments (Continued)
January 31, 2023 (Unaudited)
Principal
Value | | Description | | Stated
Coupon | | Stated
Maturity | | Value |
| MUNICIPAL BONDS (Continued) |
| | | Georgia (Continued) | | | | | | |
| $1,750,000 | | Main Street Nat Gas Inc GA Gas Sply Rev, Ser A (Mandatory put 12/01/29)
| | 4.00% | | 09/01/52 | | $1,753,954 |
| 1,285,000 | | Main Street Nat Gas Inc GA Gas Sply Rev, Ser C (Mandatory put 09/01/26)
| | 4.00% | | 03/01/50 | | 1,293,147 |
| 1,000,000 | | Main Street Nat Gas Inc GA Gas Sply Rev, Ser C (Mandatory put 12/01/28)
| | 4.00% | | 05/01/52 | | 1,002,477 |
| 350,000 | | Muni Elec Auth Of GA Plant Vogtle Units 3&4 Proj J, Ser A, AGM
| | 5.00% | | 07/01/30 | | 404,993 |
| | | | | 13,633,285 |
| | | Guam – 0.1% | | | | | | |
| 250,000 | | Guam Govt Busn Privilege Tax Rev Ref, Ser-D
| | 5.00% | | 11/15/35 | | 256,000 |
| 155,000 | | Guam Govt Wtrwks Auth Wtr & Wstwtr Sys Rev, Ser A
| | 5.00% | | 01/01/50 | | 159,557 |
| | | | | 415,557 |
| | | Illinois – 4.1% | | | | | | |
| 300,000 | | Chicago IL Brd of Edu Ref Dedicated, Ser C
| | 5.00% | | 12/01/30 | | 312,909 |
| 3,500,000 | | Chicago IL Brd of Edu Ref, Ser B
| | 5.00% | | 12/01/30 | | 3,740,406 |
| 1,000,000 | | Chicago IL Brd of Edu, Ser A
| | 5.00% | | 12/01/35 | | 1,039,320 |
| 750,000 | | Chicago IL Chicago Works, Ser A
| | 5.50% | | 01/01/40 | | 815,647 |
| 400,000 | | Chicago IL O’Hare Intl Arpt Rev Ref Sr Lien, Ser A, AMT
| | 5.00% | | 01/01/37 | | 428,354 |
| 400,000 | | Chicago IL Ref 2003B Remk
| | 5.25% | | 01/01/29 | | 410,224 |
| 515,000 | | Chicago IL Ref, Ser C, CABS
| | (f) | | 01/01/25 | | 481,247 |
| 65,000 | | Hillside IL Tax Incr Rev Ref
| | 5.00% | | 01/01/24 | | 65,395 |
| 100,000 | | IL St
| | 5.00% | | 04/01/24 | | 102,462 |
| 250,000 | | IL St
| | 5.50% | | 05/01/26 | | 268,835 |
| 200,000 | | IL St
| | 5.00% | | 06/01/27 | | 211,512 |
| 250,000 | | IL St Fin Auth Chrt Sch Rev Ref & Impt Chicago Intl Chrt Sch Proj
| | 5.00% | | 12/01/30 | | 264,890 |
| 250,000 | | IL St Fin Auth Chrt Sch Rev Ref & Impt Chicago Intl Chrt Sch Proj
| | 5.00% | | 12/01/31 | | 264,334 |
| 100,000 | | IL St Fin Auth Stdt Hsg & Acad Fac Rev Chf Chicago LLC Univ IL Chicago Proj, Ser A
| | 5.00% | | 02/15/26 | | 103,641 |
| 300,000 | | IL St Fin Auth Stdt Hsg & Acad Fac Rev Chf Chicago LLC Univ IL Chicago Proj, Ser A
| | 5.00% | | 02/15/27 | | 313,692 |
| 145,000 | | IL St Fin Auth Stdt Hsg & Acad Fac Rev Chf Chicago LLC Univ IL Chicago Proj, Ser A
| | 5.00% | | 02/15/28 | | 152,062 |
| 2,000,000 | | IL St, Ser C
| | 5.00% | | 11/01/29 | | 2,136,894 |
| 545,000 | | IL St, Ser D
| | 5.00% | | 11/01/24 | | 564,528 |
| 1,660,000 | | Lincolnwood IL Tax Incr Allocation Rev Nts Dist 1860 Dev Proj, Ser A, COPS (b)
| | 4.82% | | 01/01/41 | | 1,540,803 |
| | | | | 13,217,155 |
| | | Indiana – 2.4% | | | | | | |
| 250,000 | | Fort Wayne IN Mf Hsg Rev Silver Birch at Cook Road (b)
| | 5.30% | | 01/01/32 | | 225,377 |
| 2,000,000 | | IN Fin Auth Midwestern Disaster Relief Rev OH Vly Elec Corp Proj Remk, Ser A
| | 4.25% | | 11/01/30 | | 1,989,099 |
| 1,360,000 | | IN St Fin Auth Envrnmntl Rev Ref Var Duke Energy IN Inc Proj Remk, Ser A-1, AMT (Mandatory put 06/01/32)
| | 4.50% | | 05/01/35 | | 1,402,696 |
| 750,000 | | IN St Fin Auth Hosp Rev Reid Hlth, AGM
| | 5.00% | | 01/01/41 | | 825,980 |
| 2,000,000 | | IN St Fin Auth Hosp Rev Var Parkview Hlth Sys Remk, Ser B (a)
| | 1.30% | | 11/01/39 | | 2,000,000 |
| 200,000 | | IN St Fin Auth Rev Eductnl Facs Rock Creek Cmnty Acdmy Proj, Ser A (g)
| | 5.25% | | 07/01/28 | | 202,905 |
| 595,000 | | Plainfield IN Mf Hsg Rev Glasswater Creek Proj
| | 5.38% | | 09/01/38 | | 500,139 |
See Notes to Financial Statements
Page 11
First Trust Municipal High Income ETF (FMHI)
Portfolio of Investments (Continued)
January 31, 2023 (Unaudited)
Principal
Value | | Description | | Stated
Coupon | | Stated
Maturity | | Value |
| MUNICIPAL BONDS (Continued) |
| | | Indiana (Continued) | | | | | | |
| $600,000 | | Terre Haute IN Mf Hsg Rev Silver Birch of Terre Haute Proj
| | 5.10% | | 01/01/32 | | $531,138 |
| | | | | 7,677,334 |
| | | Kansas – 0.7% | | | | | | |
| 650,000 | | Goddard KS Sales Tax Spl Oblg Rev Ref Olympic Park Star Bond Proj
| | 3.60% | | 06/01/30 | | 619,652 |
| 175,000 | | Shawnee Cnty KS Pub Bldg Commn Rev Corrections and Parks & Rec Projs
| | 5.50% | | 09/01/34 | | 214,238 |
| 1,250,000 | | Wyandotte Cnty KS Kansas City Unif Govt Spl Oblg Rev Ref Vlg E Proj Areas 2B 3 5 (b)
| | 5.75% | | 09/01/39 | | 1,218,680 |
| | | | | 2,052,570 |
| | | Kentucky – 0.3% | | | | | | |
| 875,000 | | Henderson KY Exempt Facs Rev Pratt Paper LLC Proj, Ser A, AMT (b)
| | 4.45% | | 01/01/42 | | 845,627 |
| 230,000 | | KY St Univ KY St Univ Proj, COPS, BAM
| | 4.00% | | 11/01/41 | | 233,158 |
| | | | | 1,078,785 |
| | | Louisiana – 1.0% | | | | | | |
| 1,500,000 | | LA St Loc Govt Envrnmntl Facs & Cmnty Dev Auth Rev Ref Westlake Chemical Corp Proj Remk
| | 3.50% | | 11/01/32 | | 1,434,037 |
| 200,000 | | Monroe LA Wtr Rev, BAM
| | 5.00% | | 11/01/32 | | 227,456 |
| 1,000,000 | | Saint James Parish LA Rev NuStar Logistics LP Proj Remk, Ser 2010 (b)
| | 6.35% | | 07/01/40 | | 1,088,315 |
| 500,000 | | Saint James Parish LA Rev Var NuStar Logistics LP Proj Remk, Ser 2010B (Mandatory put 06/01/30) (b)
| | 6.10% | | 12/01/40 | | 542,946 |
| | | | | 3,292,754 |
| | | Maine – 0.2% | | | | | | |
| 1,000,000 | | ME St Fin Auth Green Bond Go Lab Madison, LLC Proj, AMT (b)
| | 8.00% | | 12/01/51 | | 702,030 |
| | | Maryland – 1.5% | | | | | | |
| 1,020,000 | | Baltimore MD Spl Oblig Ref E Baltimore Rsrch Park Proj, Ser A
| | 5.00% | | 09/01/38 | | 1,034,488 |
| 175,000 | | Baltimore MD Spl Oblig Ref Sr Lien Harbor Point Proj, Ser A (b)
| | 2.95% | | 06/01/27 | | 164,078 |
| 185,000 | | Baltimore MD Spl Oblig Ref Sr Lien Harbor Point Proj, Ser A (b)
| | 3.05% | | 06/01/28 | | 170,090 |
| 200,000 | | Baltimore MD Spl Oblig Ref Sr Lien Harbor Point Proj, Ser A (b)
| | 3.15% | | 06/01/29 | | 182,334 |
| 190,000 | | Baltimore MD Spl Oblig Ref Sr Lien Harbor Point Proj, Ser A (b)
| | 3.20% | | 06/01/30 | | 171,011 |
| 900,000 | | Frederick Cnty MD Tax Incr & Spl Tax Ref Jefferson Technology Park Proj, Ser B (b)
| | 4.63% | | 07/01/43 | | 879,521 |
| 1,150,000 | | MD St Econ Dev Corp Stdt Hsg Rev Morgan St Univ Proj
| | 5.00% | | 07/01/50 | | 1,188,060 |
| 1,000,000 | | MD St Econ Dev Corp Stdt Hsg Rev Morgan St Univ Proj, Ser A
| | 5.38% | | 07/01/38 | | 1,115,254 |
| | | | | 4,904,836 |
| | | Massachusetts – 1.4% | | | | | | |
| 2,000,000 | | MA St Bay Transprtn Auth Sales Tax Rev Sr, Ser A
| | 5.00% | | 07/01/45 | | 2,078,741 |
| 500,000 | | MA St Dev Fin Agy Rev Linden Ponds Inc Fac (b)
| | 5.00% | | 11/15/28 | | 533,225 |
| 1,020,000 | | MA St Dev Fin Agy Rev Ref Salem Cmnty Corp
| | 5.13% | | 01/01/40 | | 959,987 |
| 1,000,000 | | MA St Dev Fin Agy Rev Umass Dartmouth Stdt Hsg Proj
| | 5.00% | | 10/01/48 | | 950,045 |
| | | | | 4,521,998 |
| | | Michigan – 0.1% | | | | | | |
| 300,000 | | Detroit MI Downtown Dev Auth Tax Incr Rev Ref Catalyst Dev Proj, Ser A, AGM
| | 5.00% | | 07/01/31 | | 308,512 |
| 100,000 | | Detroit MI Social Bonds, Ser A
| | 5.00% | | 04/01/46 | | 99,472 |
| | | | | 407,984 |
Page 12
See Notes to Financial Statements
First Trust Municipal High Income ETF (FMHI)
Portfolio of Investments (Continued)
January 31, 2023 (Unaudited)
Principal
Value | | Description | | Stated
Coupon | | Stated
Maturity | | Value |
| MUNICIPAL BONDS (Continued) |
| | | Minnesota – 0.5% | | | | | | |
| $150,000 | | Minneapolis MN Stdt Hsg Rev Riverton Cmnty Hsg Proj (g)
| | 3.80% | | 08/01/27 | | $146,065 |
| 105,000 | | Saint Paul MN Hsg & Redev Auth Chrt Sch Lease Rev Ref, Ser A
| | 5.00% | | 12/01/30 | | 106,955 |
| 850,000 | | Woodbury MN Chrt Sch Lease Rev Woodbury Leadership Proj, Ser A
| | 4.00% | | 07/01/41 | | 708,712 |
| 660,000 | | Woodbury MN Chrt Sch Lease Rev Woodbury Leadership Proj, Ser A
| | 4.00% | | 07/01/51 | | 505,277 |
| | | | | 1,467,009 |
| | | Missouri – 0.2% | | | | | | |
| 80,000 | | MO St Hlth & Eductnl Facs Auth Lutheran Sr Svcs
| | 5.00% | | 02/01/35 | | 80,092 |
| 550,000 | | MO St Hlth & Eductnl Facs Auth Lutheran Sr Svcs Projs
| | 4.00% | | 02/01/32 | | 515,474 |
| 10,000 | | MO St Hlth & Eductnl Facs Auth Med Rsrch Lutheran Svcs, Ser A
| | 5.00% | | 02/01/29 | | 10,147 |
| | | | | 605,713 |
| | | Nebraska – 0.5% | | | | | | |
| 1,425,000 | | Centrl Plains Energy Proj NE Gas Proj Rev Proj No. 4 (Mandatory put 01/01/24)
| | 5.00% | | 03/01/50 | | 1,440,706 |
| | | Nevada – 0.3% | | | | | | |
| 195,000 | | N Las Vegas NV Loc Impt Vly Vista Spl Impt Dist #64
| | 4.00% | | 06/01/29 | | 191,055 |
| 700,000 | | NV Dept of Busn & Ind NV Doral Acdmy, Ser A (b)
| | 5.00% | | 07/15/37 | | 702,864 |
| | | | | 893,919 |
| | | New Hampshire – 0.5% | | | | | | |
| 2,000,000 | | Natl Fin Auth NH Rev Ref Green Bond, Ser B, AMT (Mandatory put 07/02/40) (b)
| | 3.75% | | 07/01/45 | | 1,616,730 |
| | | New Jersey – 0.5% | | | | | | |
| 100,000 | | NJ St Econ Dev Auth Spl Fac Rev Ref Port Newark Container Terminal LLC Proj, AMT
| | 5.00% | | 10/01/25 | | 102,829 |
| 430,000 | | NJ St Hgr Edu Asst Auth Stdt Loan Rev, Ser 1A, AMT
| | 4.00% | | 12/01/30 | | 430,054 |
| 560,000 | | NJ St Transprtn Trust Fund Auth Fun Auth Transprtn Prog Bonds, Ser CC
| | 5.25% | | 06/15/41 | | 615,753 |
| 500,000 | | NJ St Transprtn Trust Fund Auth Ref Transprtn Sys, Ser A
| | 5.00% | | 12/15/30 | | 560,197 |
| | | | | 1,708,833 |
| | | New Mexico – 0.4% | | | | | | |
| 535,000 | | Winrock Town Ctr NM Tax Incr Dev Dist #1 Ref Sr Lien (b)
| | 3.75% | | 05/01/28 | | 507,041 |
| 500,000 | | Winrock Town Ctr NM Tax Incr Dev Dist #1 Ref Sr Lien (b)
| | 4.00% | | 05/01/33 | | 446,476 |
| 500,000 | | Winrock Town Ctr NM Tax Incr Dev Dist #1 Ref Sr Lien (b)
| | 4.25% | | 05/01/40 | | 426,617 |
| | | | | 1,380,134 |
| | | New York – 5.1% | | | | | | |
| 1,000,000 | | Build NYC Resource Corp NY Rev Social Bond Kipp NYC Pub Sch Facs Canal W Proj
| | 5.25% | | 07/01/52 | | 1,055,336 |
| 1,250,000 | | Dutchess Cnty NY Loc Dev Corp Rev Ref Bard Clg Proj, Ser A (b)
| | 5.00% | | 07/01/40 | | 1,257,639 |
| 595,000 | | New York City NY Muni Wtr Fin Auth Wtr & Swr Sys Rev Ref 2nd Gen Resolution Fiscal 2018 Block 4, Ser AA
| | 5.00% | | 06/15/38 | | 641,188 |
| 2,625,000 | | New York City NY Transitional Fin Auth Rev Future Tax Secured Subord Bonds, Ser C-1
| | 4.00% | | 02/01/42 | | 2,628,115 |
| 2,000,000 | | NY NY, Ser B, Subser B-1
| | 5.25% | | 10/01/41 | | 2,313,649 |
| 1,925,000 | | NY St Dorm Auth St Personal Income Tax Rev Ref, Ser A
| | 3.00% | | 03/15/42 | | 1,637,028 |
| 500,000 | | NY St Transprtn Dev Corp Exempt Fac Rev NY St Thruway Srvc Areas Proj, AMT
| | 4.00% | | 10/31/46 | | 447,682 |
See Notes to Financial Statements
Page 13
First Trust Municipal High Income ETF (FMHI)
Portfolio of Investments (Continued)
January 31, 2023 (Unaudited)
Principal
Value | | Description | | Stated
Coupon | | Stated
Maturity | | Value |
| MUNICIPAL BONDS (Continued) |
| | | New York (Continued) | | | | | | |
| $1,000,000 | | NY St Transprtn Dev Corp Spl Fac Rev Ref American Airls Inc John F Kennedy Intl Arpt Proj, AMT
| | 5.00% | | 08/01/31 | | $1,000,010 |
| 865,000 | | NY St Transprtn Dev Corp Spl Fac Rev Ref John F. Kennedy Intl Arpt Proj, AMT
| | 5.25% | | 08/01/31 | | 892,081 |
| 500,000 | | Oyster Bay NY, Ser A, AGM
| | 2.00% | | 03/01/35 | | 432,105 |
| 2,810,000 | | Tsasc Inc NY Tsasc Inc Rev Ref Turbo Sub, Ser B
| | 5.00% | | 06/01/48 | | 2,644,545 |
| 100,000 | | Westchester Cnty NY Loc Dev Corp Rev Ref Miriam Osborn Memorial Home Assn Proj
| | 5.00% | | 07/01/34 | | 106,130 |
| 1,000,000 | | Westchester Cnty NY Loc Dev Corp Rev Ref Pur Sr Learning Cmnty Inc Proj, Ser A (b)
| | 5.00% | | 07/01/56 | | 775,349 |
| 460,000 | | Westchester NY Tobacco Asset Securitization Ref Sr, Ser B
| | 5.00% | | 06/01/41 | | 476,194 |
| | | | | 16,307,051 |
| | | North Carolina – 2.1% | | | | | | |
| 2,250,000 | | NC St Med Care Commn Hlth Care Facs Rev Lutheran Svcs For The Aging Ref, Ser A
| | 4.00% | | 03/01/41 | | 1,817,384 |
| 690,000 | | NC St Med Care Commn Retmnt Facs Rev Pennybyrn at Maryfield Proj, Ser A
| | 5.00% | | 10/01/45 | | 653,253 |
| 2,850,000 | | NC St Med Care Commn Retmnt Facs Rev Ref Southminster Inc
| | 5.00% | | 10/01/37 | | 2,749,310 |
| 715,000 | | NC St Med Care Commn Retmnt Facs Rev The Forest at Duke Proj
| | 4.00% | | 09/01/46 | | 600,008 |
| 1,000,000 | | Wake Cnty NC Indl Facs & Poll Control Fing Auth Ref Duke Energy Progress
| | 4.00% | | 06/01/41 | | 1,000,510 |
| | | | | 6,820,465 |
| | | North Dakota – 0.2% | | | | | | |
| 520,000 | | Horace ND Ref
| | 3.00% | | 05/01/36 | | 454,506 |
| | | Ohio – 3.4% | | | | | | |
| 4,920,000 | | Buckeye OH Tobacco Stlmt Fing Auth Ref Sr, Ser B-2, Class 2
| | 5.00% | | 06/01/55 | | 4,698,618 |
| 1,000,000 | | Cleveland Cuyahoga Cnty OH Port Auth Tax Incr Fing Rev Ref Sr Flats E Bank Proj, Ser A (b)
| | 4.00% | | 12/01/55 | | 850,239 |
| 2,000,000 | | OH St Air Quality Dev Auth Exempt Facs Rev AMG Vanadium Proj, AMT (b)
| | 5.00% | | 07/01/49 | | 1,827,735 |
| 1,000,000 | | OH St Hgr Eductnl Fac Commn Ref Rev Judson Oblig Grp 2020 Proj, Ser A
| | 5.00% | | 12/01/45 | | 956,643 |
| 1,300,000 | | OH St Hosp Rev Ref Var Univ Hosps Hlth Sys Inc, Ser C (a)
| | 1.95% | | 01/15/51 | | 1,300,000 |
| 490,000 | | Port of Gtr Cincinnati Dev Auth OH Rev (b)
| | 3.75% | | 12/01/31 | | 428,741 |
| 900,000 | | Washington Cnty OH Hosp Rev Ref Memorial Hlth Sys Obligated Grp
| | 6.63% | | 12/01/42 | | 922,142 |
| | | | | 10,984,118 |
| | | Oklahoma – 0.8% | | | | | | |
| 2,500,000 | | OK St Dev Fin Auth Sr OK Proton Ctr, Ser A1 (b)
| | 7.25% | | 09/01/51 | | 2,624,296 |
| | | Oregon – 1.3% | | | | | | |
| 290,000 | | Clackamas Cnty OR Hosp Fac Auth Rev Mary’s Woods at Marylhurst Inc Proj, Ser A
| | 5.00% | | 05/15/26 | | 290,239 |
| 500,000 | | Clackamas Cnty OR Hosp Fac Auth Rev Ref Rose Villa Proj, Ser A
| | 5.13% | | 11/15/40 | | 480,499 |
| 2,250,000 | | Clackamas Cnty OR Hosp Fac Auth Rev Ref Rose Villa Proj, Ser A
| | 5.38% | | 11/15/55 | | 2,094,681 |
| 500,000 | | OR St Facs Auth Rev Legacy Hlth Proj, Ser A
| | 4.13% | | 06/01/52 | | 486,186 |
| 750,000 | | Union Cnty OR Hosp Fac Auth Grande Ronde Hosp
| | 5.00% | | 07/01/42 | | 782,344 |
| | | | | 4,133,949 |
Page 14
See Notes to Financial Statements
First Trust Municipal High Income ETF (FMHI)
Portfolio of Investments (Continued)
January 31, 2023 (Unaudited)
Principal
Value | | Description | | Stated
Coupon | | Stated
Maturity | | Value |
| MUNICIPAL BONDS (Continued) |
| | | Pennsylvania – 2.8% | | | | | | |
| $300,000 | | Allegheny Cnty PA Hosp Dev Auth Ref Allegheny Hlth Network Oblig Grp Issue, Ser A
| | 5.00% | | 04/01/32 | | $329,059 |
| 1,000,000 | | Allegheny Cnty PA Hosp Dev Auth Ref Univ Pittsburgh Med Ctr, Ser A
| | 4.00% | | 07/15/36 | | 1,014,512 |
| 500,000 | | Allegheny Cnty PA Indl Dev Auth Envrnmtl Impt Rev Ref United States Steel Corp Proj
| | 4.88% | | 11/01/24 | | 503,167 |
| 1,030,000 | | Berks Cnty PA Muni Auth Univ Rev Alvernia Univ Proj
| | 5.00% | | 10/01/39 | | 1,006,030 |
| 100,000 | | Chester Cnty PA Indl Dev Auth Renaissance Acdmy Chrt Sch
| | 5.00% | | 10/01/34 | | 100,875 |
| 250,000 | | Lancaster Cnty PA Hosp Auth Hlthcare Facs Rev Moravian Manors Inc Proj, Ser A
| | 5.00% | | 06/15/28 | | 251,622 |
| 1,110,000 | | Lancaster Cnty PA Hosp Auth Hlthcare Facs Rev Moravian Manors Inc Proj, Ser A
| | 5.00% | | 06/15/38 | | 1,061,724 |
| 250,000 | | Latrobe PA Indl Dev Auth Univ Rev Ref Seton Hill Univ
| | 4.00% | | 03/01/38 | | 229,046 |
| 1,700,000 | | Latrobe PA Indl Dev Auth Univ Rev Ref Seton Hill Univ
| | 4.00% | | 03/01/46 | | 1,429,950 |
| 1,000,000 | | PA St Turnpike Commn Oil Franchise Tax Rev Ref, Ser A
| | 5.00% | | 12/01/46 | | 1,089,385 |
| 10,000 | | PA St Turnpike Commn Turnpike Rev Ref Sub, Ser B
| | 5.00% | | 06/01/39 | | 10,429 |
| 1,000,000 | | Philadelphia PA Arpt Rev Ref Priv Activity, AGM, AMT
| | 4.00% | | 07/01/38 | | 998,104 |
| 850,000 | | Philadelphia PA Auth For Indl Dev Chrt Sch Rev Philadelphia E&T Chrt High Sch, Ser A
| | 4.00% | | 06/01/56 | | 635,370 |
| 215,000 | | Philadelphia PA Auth for Indl Dev Revs Kipp Philadelphia Chrt Sch Proj, Ser A
| | 5.00% | | 04/01/36 | | 213,552 |
| 125,000 | | W Cornwall Twp PA Muni Auth Ref Lebanon Vly Brethren Home Proj, Ser A
| | 4.00% | | 11/15/41 | | 109,879 |
| | | | | 8,982,704 |
| | | Puerto Rico – 3.2% | | | | | | |
| 2,000,000 | | Puerto Rico Cmwlth Hwy & Transprtn Auth Restructured Tol Restructured, Ser A
| | 5.00% | | 07/01/62 | | 1,930,000 |
| 2,900,000 | | Puerto Rico Cmwlth Restructured, Ser A1
| | 4.00% | | 07/01/33 | | 2,718,299 |
| 2,500,000 | | Puerto Rico Cmwlth Restructured, Ser A1
| | 4.00% | | 07/01/35 | | 2,277,252 |
| 1,559,000 | | Puerto Rico Sales Tax Fing Corp Sales Tax Rev Restructured, Ser A-1
| | 4.50% | | 07/01/34 | | 1,566,486 |
| 1,605,000 | | Puerto Rico Sales Tax Fing Corp Sales Tax Rev Restructured, Ser A-1
| | 4.55% | | 07/01/40 | | 1,582,534 |
| | | | | 10,074,571 |
| | | South Carolina – 0.4% | | | | | | |
| 425,000 | | Berkeley Cnty SC Assmnt Rev Nexton Impt Dist
| | 4.00% | | 11/01/30 | | 401,349 |
| 230,000 | | Lancaster Cnty SC Assmnt Rev Ref Walnut Creek Impt Dist, Ser A-1
| | 5.00% | | 12/01/31 | | 230,524 |
| 245,000 | | SC St Jobs Econ Dev Auth Econ Dev Rev Ref The Woodlands at Furman
| | 4.00% | | 11/15/32 | | 219,174 |
| 580,000 | | SC St Jobs Econ Dev Auth Econ Dev Rev Woodlands at Furman Proj, Ser A
| | 5.00% | | 11/15/42 | | 542,592 |
| | | | | 1,393,639 |
| | | South Dakota – 0.2% | | | | | | |
| 700,000 | | Lincoln Cnty SD Econ Dev Rev Ref Augustana Clg Assoc Proj, Ser A
| | 4.00% | | 08/01/41 | | 622,569 |
| | | Tennessee – 0.8% | | | | | | |
| 25,000 | | Chattanooga TN Hlth Eductnl & Hsg Fac Brd Rev Ref Stdt Hsg CDFI Phase I
| | 5.00% | | 10/01/23 | | 25,202 |
| 2,500,000 | | TN St Energy Acq Corp Gas Rev (Mandatory put 11/01/25)
| | 4.00% | | 11/01/49 | | 2,512,600 |
| | | | | 2,537,802 |
See Notes to Financial Statements
Page 15
First Trust Municipal High Income ETF (FMHI)
Portfolio of Investments (Continued)
January 31, 2023 (Unaudited)
Principal
Value | | Description | | Stated
Coupon | | Stated
Maturity | | Value |
| MUNICIPAL BONDS (Continued) |
| | | Texas – 6.2% | | | | | | |
| $1,200,000 | | Arlington TX Hgr Edu Fin Corp Edu Rev Ref Legacy Trad Schs TX Proj, Ser A
| | 4.00% | | 02/15/31 | | $1,089,420 |
| 1,645,000 | | Arlington TX Hgr Edu Fin Corp Edu Rev Ref Legacy Trad Schs TX Proj, Ser A
| | 4.13% | | 02/15/41 | | 1,289,515 |
| 610,000 | | Arlington TX Hgr Edu Fin Corp Edu Rev Ref, Ser A
| | 4.00% | | 08/15/41 | | 513,912 |
| 2,000,000 | | Austin TX Arpt Sys Rev, Ser B, AMT
| | 5.00% | | 11/15/46 | | 2,056,166 |
| 625,000 | | Corpus Christi TX Util Sys Rev Junior Lien, Ser B
| | 5.00% | | 07/15/42 | | 705,569 |
| 556,000 | | Crandall TX Spl Assmnt Rev Cartwright Ranch Pub Impt Dt Impt Area #1 Proj (b)
| | 4.25% | | 09/15/41 | | 496,231 |
| 1,000,000 | | Houston TX Arpt Sys Rev Ref United Airls Inc Arpt Impt Proj, Ser C, AMT
| | 5.00% | | 07/15/27 | | 1,027,958 |
| 1,250,000 | | Houston TX Arpt Sys Rev Ref United Airls Inc Terminal E Proj, Ser A, AMT
| | 5.00% | | 07/01/27 | | 1,284,791 |
| 1,035,000 | | Houston TX Arpt Sys Rev United Airls Inc Terminal Impt Proj, Ser B-1, AMT
| | 4.00% | | 07/15/41 | | 932,803 |
| 250,000 | | Kyle TX Spl Assmnt Rev 6 Creeks Pid #1 (b)
| | 4.13% | | 09/01/29 | | 246,388 |
| 500,000 | | Kyle TX Spl Assmnt Rev 6 Creeks Pid #1 (b)
| | 4.63% | | 09/01/39 | | 483,888 |
| 690,000 | | Kyle TX Spl Assmnt Rev 6 Creeks Pub Impt Dist Area #4 (b) (e)
| | 4.50% | | 09/01/33 | | 690,945 |
| 225,000 | | La Vernia TX Hgr Edu Fin Corp Edu Rev Meridian World Sch (b)
| | 4.35% | | 08/15/25 | | 230,769 |
| 1,350,000 | | Liberty Hill TX Spl Assmnt Rev Butler Farms Pub Imp Dt Areas #1 and 2 Proj (b)
| | 4.00% | | 09/01/52 | | 1,001,472 |
| 2,000,000 | | Lower Neches Vly TX Auth Indl Dev Corp Var Ref ExxonMobil Proj, Ser A (a)
| | 1.20% | | 11/01/29 | | 2,000,000 |
| 285,000 | | New Hope Cultural Edu Facs Fin Corp TX Retmnt Fac Rev Ref Longhorn Vlg Proj
| | 5.00% | | 01/01/32 | | 283,773 |
| 205,000 | | New Hope Cultural Edu Facs Fin Corp TX Retmnt Fac Rev Ref Wesleyan Homes Inc Proj Fin Corp
| | 5.00% | | 01/01/39 | | 173,538 |
| 600,000 | | Newark Hgr Edu Fin Corp TX Edu Rev Hughen Ctr Inc Proj, Ser A
| | 5.00% | | 08/15/42 | | 661,977 |
| 2,750,000 | | North Parkway Muni Mgmt Dist #1 TX Spl Assmnt Rev Major Impts Proj (b)
| | 5.00% | | 09/15/51 | | 2,620,833 |
| 500,000 | | Princeton TX Spl Assmnt Rev Winchester Pub Impr Dt #2 Proj (b)
| | 5.13% | | 09/01/42 | | 498,448 |
| 223,000 | | Rowlett TX Spl Assmnt Rev Trails at Cottonwood Creek Pub Imp Dist Major Imp Area Proj (b)
| | 3.75% | | 09/15/31 | | 207,126 |
| 500,000 | | Rowlett TX Spl Assmnt Rev Trails at Cottonwood Creek Pub Imp Dist Major Imp Area Proj (b)
| | 4.13% | | 09/15/41 | | 446,279 |
| 765,000 | | Rowlett TX Spl Assmnt Rev Trails at Cottonwood Creek Pub Imp Dist Major Imp Area Proj (b)
| | 4.25% | | 09/15/51 | | 658,883 |
| 250,000 | | TX St Transprtn Commn Central TX Turnpike Sys Rev Ref, Ser B
| | 5.00% | | 08/15/37 | | 256,776 |
| | | | | 19,857,460 |
| | | Utah – 4.8% | | | | | | |
| 3,000,000 | | Black Desert Pub Infra Dist Sr Bonds, Ser A (b)
| | 4.00% | | 03/01/51 | | 2,324,508 |
| 500,000 | | Downtown E Streetcar Swr Pub Infra Dist Sr Lien, Ser A (b)
| | 5.75% | | 03/01/42 | | 509,110 |
| 1,000,000 | | Med Sch Cmps Pub Infra Dist UT, Ser A (b)
| | 5.25% | | 02/01/40 | | 893,926 |
| 1,000,000 | | Mida Golf & Equestrian Ctr Pub Infra Dist UT Ltd (b)
| | 4.25% | | 06/01/41 | | 819,621 |
| 3,000,000 | | Mida Golf & Equestrian Ctr Pub Infra Dist UT Ltd (b)
| | 4.50% | | 06/01/51 | | 2,350,198 |
| 3,000,000 | | Military Installation Dev Auth UT Tax Allocation Rev, Ser A-2
| | 4.00% | | 06/01/52 | | 2,273,391 |
| 2,000,000 | | Murray City UT Hosp Rev Var IHC Hlth Svcs Inc, Ser A (a)
| | 1.20% | | 05/15/37 | | 2,000,000 |
| 500,000 | | Red Bridge Pub Infra Dist #1 UT Sr Infra Dist, Ser 1-A (b)
| | 4.13% | | 02/01/41 | | 397,200 |
| 1,500,000 | | Red Bridge Pub Infra Dist #1 UT Sr Infra Dist, Ser 1-A (b)
| | 4.38% | | 02/01/51 | | 1,153,043 |
| 475,000 | | UT St Chrt Sch Fin Auth Chrt Sch Rev Mountain W Montessori Acdmy Proj, Ser A (b)
| | 5.00% | | 06/15/39 | | 462,035 |
| 675,000 | | UT St Chrt Sch Fin Auth Chrt Sch Rev Wallace Stegner Acdmy Proj, Ser A (b)
| | 5.00% | | 06/15/39 | | 645,858 |
Page 16
See Notes to Financial Statements
First Trust Municipal High Income ETF (FMHI)
Portfolio of Investments (Continued)
January 31, 2023 (Unaudited)
Principal
Value | | Description | | Stated
Coupon | | Stated
Maturity | | Value |
| MUNICIPAL BONDS (Continued) |
| | | Utah (Continued) | | | | | | |
| $1,605,000 | | UT St Chrt Sch Fin Auth Chrt Sch Rev Wallace Stegner Acdmy, Ser A (b)
| | 5.63% | | 06/15/42 | | $1,614,491 |
| | | | | 15,443,381 |
| | | Virginia – 0.9% | | | | | | |
| 1,000,000 | | Henrico Cnty VA Econ Dev Auth Rsdl Care Fac Rev Westminster Cantebury Richmond, Ser A
| | 5.00% | | 10/01/42 | | 1,078,270 |
| 750,000 | | VA St Small Busn Fing Auth Rsdl Fac Care Rev Ref Lifespire of VA
| | 4.00% | | 12/01/31 | | 720,239 |
| 1,000,000 | | Virginia Beach VA Dev Auth Rsdl Care Fac Rev Ref Westminster Canterbury on Chesapeake Bay
| | 5.00% | | 09/01/29 | | 1,029,368 |
| | | | | 2,827,877 |
| | | Washington – 2.9% | | | | | | |
| 560,000 | | Kalispel Tribe of Indians Priority Dist WA Rev, Ser A (b)
| | 5.00% | | 01/01/32 | | 585,327 |
| 2,000,000 | | Port of Seattle WA Rev Ref Intermediate Lein Priv Activity, Ser C, AMT
| | 5.00% | | 08/01/46 | | 2,115,059 |
| 1,000,000 | | Port of Seattle WA Rev Ref Intermediate Lien Priv Activity, Ser C, AMT
| | 5.00% | | 08/01/39 | | 1,082,811 |
| 875,000 | | WA St Hgr Edu Facs Auth Seattle Univ Proj Rev
| | 4.00% | | 05/01/45 | | 854,920 |
| 2,100,000 | | WA St Hsg Fin Commn Nonprofit Hsg Rev Heron’s Key, Ser A (Pre-refunded maturity 07/01/25) (b)
| | 7.00% | | 07/01/45 | | 2,292,863 |
| 710,000 | | WA St Hsg Fin Commn Nonprofit Rev Spokane Int Acad Proj, Ser A (b)
| | 5.00% | | 07/01/50 | | 676,598 |
| 975,929 | | WA St Hsg Fin Commn Social Ctf, Ser A-1
| | 3.50% | | 12/20/35 | | 920,425 |
| 700,000 | | WA St Mvft Vrf Go Bonds, Ser F
| | 5.00% | | 06/01/43 | | 786,923 |
| | | | | 9,314,926 |
| | | West Virginia – 0.8% | | | | | | |
| 2,000,000 | | S Charleston WV Spl Dist Excise Tax Ref S Charleston Park Place Proj, Ser A (b)
| | 4.50% | | 06/01/50 | | 1,578,946 |
| 1,000,000 | | WV St Econ Dev Auth Sol Wst Disp Facs Var Sr Arch Res Proj, AMT (Mandatory put 07/01/25)
| | 5.00% | | 07/01/45 | | 1,007,026 |
| | | | | 2,585,972 |
| | | Wisconsin – 4.0% | | | | | | |
| 470,000 | | Pub Fin Auth WI Chrt Sch Rev Eno River Acdmy Proj, Ser A (b)
| | 4.00% | | 06/15/30 | | 455,092 |
| 810,000 | | Pub Fin Auth WI Chrt Sch Rev Eno River Acdmy Proj, Ser A (b)
| | 5.00% | | 06/15/40 | | 799,773 |
| 685,000 | | Pub Fin Auth WI Chrt Sch Rev Eno River Acdmy Proj, Ser A (b)
| | 5.00% | | 06/15/54 | | 634,997 |
| 500,000 | | Pub Fin Auth WI Chrt Sch Rev Founders of Acdmy Las Vegas Proj, Ser A (b)
| | 4.00% | | 07/01/30 | | 467,849 |
| 470,000 | | Pub Fin Auth WI Chrt Sch Rev Ltd American Prep Acdmy Las Vegas Proj, Ser A (b)
| | 4.20% | | 07/15/27 | | 462,127 |
| 375,000 | | Pub Fin Auth WI Chrt Sch Rev Ltd American Prep Acdmy Las Vegas Proj, Ser A (b)
| | 5.13% | | 07/15/37 | | 376,394 |
| 250,000 | | Pub Fin Auth WI Edu Rev Coral Acdmy Science Las Vegas, Ser A
| | 5.00% | | 07/01/45 | | 251,772 |
| 200,000 | | Pub Fin Auth WI Edu Rev Ref Mountain Island Chrt Sch Ltd
| | 5.00% | | 07/01/52 | | 200,258 |
| 160,000 | | Pub Fin Auth WI Eductnl Rev Piedmont Cmnty Chrt Sch
| | 5.00% | | 06/15/27 | | 168,578 |
| 1,500,000 | | Pub Fin Auth WI Hosp Rev Ref Carson Vly Med Ctr, Ser A
| | 4.00% | | 12/01/41 | | 1,299,083 |
| 1,000,000 | | Pub Fin Auth WI Hotel Rev Sr Lien Grand Hyatt San Antonio Hotel Acq Proj, Ser A
| | 5.00% | | 02/01/42 | | 1,004,014 |
| 1,310,000 | | Pub Fin Auth WI Retmnt Cmntys Rev Acts Retmnt Life Cmntys Inc Oblig Grp, Ser A
| | 5.00% | | 11/15/41 | | 1,318,299 |
| 1,000,000 | | Pub Fin Auth WI Rev Ref Roseman Univ of Hlth Sciences Proj (b)
| | 4.00% | | 04/01/42 | | 836,172 |
| 2,000,000 | | Pub Fin Auth WI Rev Sr Proton Intl AR LLC, Ser A (b)
| | 6.85% | | 01/01/51 | | 1,549,903 |
See Notes to Financial Statements
Page 17
First Trust Municipal High Income ETF (FMHI)
Portfolio of Investments (Continued)
January 31, 2023 (Unaudited)
Principal
Value | | Description | | Stated
Coupon | | Stated
Maturity | | Value |
| MUNICIPAL BONDS (Continued) |
| | | Wisconsin (Continued) | | | | | | |
| $1,900,000 | | Pub Fin Auth WI Stdt Hsg Rev NC A&T Real Estate Fdtn LLC Proj, Ser B
| | 5.00% | | 06/01/44 | | $1,865,644 |
| 1,000,000 | | WI St Hlth & Eductnl Facs Auth Rev Bellin Memorial Hosp Inc, Ser A
| | 5.50% | | 12/01/52 | | 1,110,466 |
| | | | | 12,800,421 |
| Total Investments – 97.8%
| | 312,675,312 |
| | (Cost $324,245,906) | | |
| | Net Other Assets and Liabilities – 2.2%
| | 7,007,549 |
| | Net Assets – 100.0%
| | $319,682,861 |
Futures Contracts (See Note 2D - Futures Contracts in the Notes to Financial Statements):
| Futures Contracts | | Position | | Number of
Contracts | | Expiration
Date | | Notional
Value | | Unrealized
Appreciation
(Depreciation)/
Value |
| Ultra 10-Year U.S. Treasury Notes | | Short | | 119 | | Mar 2023 | | $ (14,423,172) | | $(79,753) |
| (a) | Variable Rate Demand bond. Interest rate is reset periodically by the agent based on current market conditions. |
| (b) | This security, sold within the terms of a private placement memorandum, is exempt from registration upon resale under Rule 144A of the Securities Act of 1933, as amended (the “1933 Act”), and may be resold in transactions exempt from registration, normally to qualified institutional buyers. Pursuant to procedures adopted by the Trust’s Board of Trustees, this security has been determined to be liquid by First Trust Advisors L.P. (the “Advisor”). Although market instability can result in periods of increased overall market illiquidity, liquidity for each security is determined based on security specific factors and assumptions, which require subjective judgment. At January 31, 2023, securities noted as such amounted to $91,619,824 or 28.7% of net assets. |
| (c) | This issuer is in default and interest is not being accrued by the Fund. |
| (d) | Pursuant to procedures adopted by the Trust’s Board of Trustees, this security has been determined to be illiquid by the Advisor. |
| (e) | When-issued security. The interest rate shown reflects the rate in effect at January 31, 2023. Interest will begin accruing on the security’s first settlement date. |
| (f) | Zero coupon bond. |
| (g) | This security, sold within the terms of a private placement memorandum, is exempt from registration upon resale under Rule 144A of the 1933 Act, and may be resold in transactions exempt from registration, normally to qualified institutional buyers (see Note 2C - Restricted Securities in the Notes to Financial Statements). |
| AGM | Assured Guaranty Municipal Corp. |
| AMT | Alternative Minimum Tax |
| BAM | Build America Mutual |
| CABS | Capital Appreciation Bonds |
| COPS | Certificates of Participation |
Page 18
See Notes to Financial Statements
First Trust Municipal High Income ETF (FMHI)
Portfolio of Investments (Continued)
January 31, 2023 (Unaudited)
Valuation Inputs
A summary of the inputs used to value the Fund’s investments as of January 31, 2023 is as follows (see Note 2A - Portfolio Valuation in the Notes to Financial Statements):
| ASSETS TABLE |
| | Total
Value at
1/31/2023 | Level 1
Quoted
Prices | Level 2
Significant
Observable
Inputs | Level 3
Significant
Unobservable
Inputs |
Municipal Bonds*
| $ 312,675,312 | $ — | $ 312,675,312 | $ — |
| |
| LIABILITIES TABLE |
| | Total
Value at
1/31/2023 | Level 1
Quoted
Prices | Level 2
Significant
Observable
Inputs | Level 3
Significant
Unobservable
Inputs |
Futures Contracts**
| $ (79,753) | $ (79,753) | $ — | $ — |
| * | See Portfolio of Investments for state and territory breakout. |
| ** | Includes cumulative appreciation/depreciation on futures contracts as reported in the Futures Contracts table. Only the current day’s variation margin is presented on the Statement of Assets and Liabilities. |
See Notes to Financial Statements
Page 19
First Trust Municipal High Income ETF (FMHI)
Statement of Assets and Liabilities
January 31, 2023 (Unaudited)
| ASSETS: | |
Investments, at value
(Cost $324,245,906)
| $ 312,675,312 |
Cash
| 8,240,573 |
Cash segregated as collateral for open futures contracts
| 327,250 |
| Receivables: | |
Interest
| 3,252,300 |
Investment securities sold
| 1,772,239 |
Total Assets
| 326,267,674 |
| LIABILITIES: | |
| Payables: | |
Investment securities purchased
| 6,370,487 |
Investment advisory fees
| 188,295 |
Variation margin
| 26,031 |
Total Liabilities
| 6,584,813 |
NET ASSETS
| $319,682,861 |
| NET ASSETS consist of: | |
Paid-in capital
| $ 362,753,673 |
Par value
| 67,000 |
Accumulated distributable earnings (loss)
| (43,137,812) |
NET ASSETS
| $319,682,861 |
NET ASSET VALUE, per share
| $47.71 |
Number of shares outstanding (unlimited number of shares authorized, par value $0.01 per share)
| 6,700,002 |
Page 20
See Notes to Financial Statements
First Trust Municipal High Income ETF (FMHI)
Statement of Operations
For the Six Months Ended January 31, 2023 (Unaudited)
| INVESTMENT INCOME: | |
Interest
| $ 6,823,008 |
Total investment income
| 6,823,008 |
| EXPENSES: | |
Investment advisory fees
| 1,092,783 |
Total expenses
| 1,092,783 |
Fees waived by the investment advisor
| (155,286) |
Net expenses
| 937,497 |
NET INVESTMENT INCOME (LOSS)
| 5,885,511 |
| NET REALIZED AND UNREALIZED GAIN (LOSS): | |
| Net realized gain (loss) on: | |
Investments
| (13,113,568) |
Futures contracts
| 1,290,310 |
Net realized gain (loss)
| (11,823,258) |
| Net change in unrealized appreciation (depreciation) on: | |
Investments
| 1,583,964 |
Futures contracts
| 516,560 |
Net change in unrealized appreciation (depreciation)
| 2,100,524 |
NET REALIZED AND UNREALIZED GAIN (LOSS)
| (9,722,734) |
NET INCREASE (DECREASE) IN NET ASSETS RESULTING FROM OPERATIONS
| $(3,837,223) |
See Notes to Financial Statements
Page 21
First Trust Municipal High Income ETF (FMHI)
Statements of Changes in Net Assets
| | Six Months
Ended
1/31/2023
(Unaudited) | | Year
Ended
7/31/2022 |
| OPERATIONS: | | | |
Net investment income (loss)
| $ 5,885,511 | | $ 9,675,790 |
Net realized gain (loss)
| (11,823,258) | | (17,058,308) |
Net change in unrealized appreciation (depreciation)
| 2,100,524 | | (32,136,292) |
Net increase (decrease) in net assets resulting from operations
| (3,837,223) | | (39,518,810) |
| DISTRIBUTIONS TO SHAREHOLDERS FROM: | | | |
Investment operations
| (5,813,552) | | (9,560,177) |
Return of capital
| — | | (505,451) |
Total distributions to shareholders
| (5,813,552) | | (10,065,628) |
| SHAREHOLDER TRANSACTIONS: | | | |
Proceeds from shares sold
| 81,024,511 | | 234,880,882 |
Cost of shares redeemed
| (90,645,849) | | (129,802,313) |
Net increase (decrease) in net assets resulting from shareholder transactions
| (9,621,338) | | 105,078,569 |
Total increase (decrease) in net assets
| (19,272,113) | | 55,494,131 |
| NET ASSETS: | | | |
Beginning of period
| 338,954,974 | | 283,460,843 |
End of period
| $ 319,682,861 | | $ 338,954,974 |
| CHANGES IN SHARES OUTSTANDING: | | | |
Shares outstanding, beginning of period
| 6,900,002 | | 5,000,002 |
Shares sold
| 1,750,000 | | 4,450,000 |
Shares redeemed
| (1,950,000) | | (2,550,000) |
Shares outstanding, end of period
| 6,700,002 | | 6,900,002 |
Page 22
See Notes to Financial Statements
First Trust Municipal High Income ETF (FMHI)
Financial Highlights
For a share outstanding throughout each period
| | Six Months
Ended
1/31/2023
(Unaudited) | | Year Ended July 31, | | Period
Ended
7/31/2018 (a) |
| | 2022 | | 2021 | | 2020 | | 2019 | |
Net asset value, beginning of period
| $ 49.12 | | $ 56.69 | | $ 51.93 | | $ 52.48 | | $ 50.32 | | $ 50.00 |
| Income from investment operations: | | | | | | | | | | | |
Net investment income (loss)
| 0.90 | | 1.50 | | 1.59 | | 1.64 | | 1.69 | | 1.15 |
Net realized and unrealized gain (loss)
| (1.42) | | (7.50) | | 4.83 (b) | | (0.48) | | 2.27 | | 0.30 |
Total from investment operations
| (0.52) | | (6.00) | | 6.42 | | 1.16 | | 3.96 | | 1.45 |
| Distributions paid to shareholders from: | | | | | | | | | | | |
Net investment income
| (0.89) | | (1.49) | | (1.59) | | (1.62) | | (1.67) | | (1.13) |
Return of capital
| — | | (0.08) | | (0.07) | | (0.09) | | (0.13) | | — |
Total distributions
| (0.89) | | (1.57) | | (1.66) | | (1.71) | | (1.80) | | (1.13) |
Net asset value, end of period
| $47.71 | | $49.12 | | $56.69 | | $51.93 | | $52.48 | | $50.32 |
Total return (c)
| (1.00)% | | (10.74)% | | 12.57% (b) | | 2.25% | | 8.05% | | 2.93% |
| Ratios to average net assets/supplemental data: | | | | | | | | | | | |
Net assets, end of period (in 000’s)
| $ 319,683 | | $ 338,955 | | $ 283,461 | | $ 111,650 | | $ 62,979 | | $ 27,677 |
Ratio of total expenses to average net assets
| 0.70% (d) | | 0.70% | | 0.70% | | 0.70% | | 0.70% | | 0.70% (d) |
Ratio of net expenses to average net assets
| 0.60% (d) | | 0.55% | | 0.55% | | 0.55% | | 0.55% | | 0.55% (d) |
Ratio of net investment income (loss) to average net assets
| 3.77% (d) | | 2.87% | | 3.00% | | 3.22% | | 3.44% | | 3.13% (d) |
Portfolio turnover rate (e)
| 52% | | 79% | | 19% | | 89% | | 71% | | 74% |
| (a) | Inception date is November 1, 2017, which is consistent with the commencement of investment operations and is the date the initial creation units were established. |
| (b) | The Fund received a reimbursement from the advisor in the amount of $469 in connection with a trade error, which represents less than $0.01 per share. Since the advisor reimbursed the Fund, there was no effect on the Fund’s total return. |
| (c) | Total return is calculated assuming an initial investment made at the net asset value at the beginning of the period, reinvestment of all distributions at net asset value during the period, and redemption at net asset value on the last day of the period. The returns presented do not reflect the deduction of taxes that a shareholder would pay on Fund distributions or the redemption or sale of Fund shares. Total return is calculated for the time period presented and is not annualized for periods of less than a year. The total returns would have been lower if certain fees had not been waived by the investment advisor. |
| (d) | Annualized. |
| (e) | Portfolio turnover is calculated for the time period presented and is not annualized for periods of less than a year and does not include securities received or delivered from processing creations or redemptions and in-kind transactions. |
See Notes to Financial Statements
Page 23
Notes to Financial Statements
First Trust Municipal High Income ETF (FMHI)
January 31, 2023 (Unaudited)
1. Organization
First Trust Exchange-Traded Fund III (the “Trust”) is an open-end management investment company organized as a Massachusetts business trust on January 9, 2008, and is registered with the Securities and Exchange Commission under the Investment Company Act of 1940, as amended (the “1940 Act”).
The Trust currently consists of seventeen funds that are offering shares. This report covers the First Trust Municipal High Income ETF (the “Fund”), a diversified series of the Trust, which trades under the ticker “FMHI” on The Nasdaq Stock Market LLC (“Nasdaq”). The Fund represents a separate series of beneficial interest in the Trust. Unlike conventional mutual funds, the Fund issues and redeems shares on a continuous basis, at net asset value (“NAV”), only in large blocks of shares known as “Creation Units.”
The primary investment objective of the Fund is to provide federally tax-exempt income, and its secondary objective is long-term capital appreciation. Under normal market conditions, the Fund seeks to achieve its investment objectives by investing at least 80% of its net assets (including investment borrowings) in municipal debt securities that pay interest that is exempt from regular federal income taxes. There can be no assurance that the Fund will achieve its investment objectives. The Fund may not be appropriate for all investors.
2. Significant Accounting Policies
The Fund is considered an investment company and follows accounting and reporting guidance under Financial Accounting Standards Board (“FASB”) Accounting Standards Codification Topic 946, “Financial Services-Investment Companies.” The following is a summary of significant accounting policies consistently followed by the Fund in the preparation of the financial statements. The preparation of the financial statements in accordance with accounting principles generally accepted in the United States of America (“U.S. GAAP”) requires management to make estimates and assumptions that affect the reported amounts and disclosures in the financial statements. Actual results could differ from those estimates.
A. Portfolio Valuation
The Fund’s NAV is determined daily as of the close of regular trading on the New York Stock Exchange (“NYSE”), normally 4:00 p.m. Eastern time, on each day the NYSE is open for trading. If the NYSE closes early on a valuation day, the NAV is determined as of that time. Domestic debt securities are priced using data reflecting the earlier closing of the principal markets for those securities. The Fund’s NAV is calculated by dividing the value of all assets of the Fund (including accrued interest and dividends), less all liabilities (including accrued expenses and dividends declared but unpaid), by the total number of shares outstanding.
The Fund’s investments are valued daily at market value or, in the absence of market value with respect to any portfolio securities, at fair value. Market value prices represent readily available market quotations such as last sale or official closing prices from a national or foreign exchange (i.e., a regulated market) and are primarily obtained from third-party pricing services. Fair value prices represent any prices not considered market value prices and are either obtained from a third-party pricing service or are determined by the Pricing Committee of the Fund’s investment advisor, First Trust Advisors L.P. (“First Trust” or the “Advisor”), in accordance with valuation procedures approved by the Trust’s Board of Trustees, and in accordance with provisions of the 1940 Act and rules thereunder. Investments valued by the Advisor’s Pricing Committee, if any, are footnoted as such in the footnotes to the Portfolio of Investments. The Fund’s investments are valued as follows:
Municipal securities and other debt securities are fair valued on the basis of fair valuations provided by a third-party pricing service approved by the Advisor’s Pricing Committee, which may use the following valuation inputs when available:
| 1) | benchmark yields; |
| 2) | reported trades; |
| 3) | broker/dealer quotes; |
| 4) | issuer spreads; |
| 5) | benchmark securities; |
| 6) | bids and offers; and |
| 7) | reference data including market research publications. |
Pricing services generally value fixed-income securities assuming orderly transactions of an institutional round lot size, but a Fund may hold or transact in such securities in smaller, odd lot sizes. Odd lots may trade at lower prices than institutional round lots.
Exchange-traded futures contracts are valued at the closing price in the market where such contracts are principally traded. If no closing price is available, exchange-traded futures contracts are valued at the mean of their most recent bid and asked price, if available, and otherwise at their closing bid price.
Notes to Financial Statements (Continued)
First Trust Municipal High Income ETF (FMHI)
January 31, 2023 (Unaudited)
Fixed income and other debt securities having a remaining maturity of sixty days or less when purchased are fair valued at cost adjusted for amortization of premiums and accretion of discounts (amortized cost), provided the Advisor’s Pricing Committee has determined that the use of amortized cost is an appropriate reflection of fair value given market and issuer-specific conditions existing at the time of the determination. Factors that may be considered in determining the appropriateness of the use of amortized cost include, but are not limited to, the following:
| 1) | the credit conditions in the relevant market and changes thereto; |
| 2) | the liquidity conditions in the relevant market and changes thereto; |
| 3) | the interest rate conditions in the relevant market and changes thereto (such as significant changes in interest rates); |
| 4) | issuer-specific conditions (such as significant credit deterioration); and |
| 5) | any other market-based data the Advisor’s Pricing Committee considers relevant. In this regard, the Advisor’s Pricing Committee may use last-obtained market-based data to assist it when valuing portfolio securities using amortized cost. |
Certain securities may not be able to be priced by pre-established pricing methods. Such securities may be valued by the Advisor’s Pricing Committee at fair value. These securities generally include, but are not limited to, restricted securities (securities which may not be publicly sold without registration under the Securities Act of 1933, as amended (the “1933 Act”)) for which a third-party pricing service is unable to provide a market price; securities whose trading has been formally suspended; a security whose market or fair value price is not available from a pre-established pricing source; a security with respect to which an event has occurred that is likely to materially affect the value of the security after the market has closed but before the calculation of the Fund’s NAV or make it difficult or impossible to obtain a reliable market quotation; and a security whose price, as provided by the third-party pricing service, does not reflect the security’s fair value. As a general principle, the current fair value of a security would appear to be the amount which the owner might reasonably expect to receive for the security upon its current sale. When fair value prices are used, generally they will differ from market quotations or official closing prices on the applicable exchanges. A variety of factors may be considered in determining the fair value of such securities, including, but not limited to, the following:
| 1) | the fundamental business data relating to the issuer; |
| 2) | an evaluation of the forces which influence the market in which these securities are purchased and sold; |
| 3) | the type, size and cost of the security; |
| 4) | the financial statements of the issuer; |
| 5) | the credit quality and cash flow of the issuer, based on the Advisor’s or external analysis; |
| 6) | the information as to any transactions in or offers for the security; |
| 7) | the price and extent of public trading in similar securities (or equity securities) of the issuer/borrower, or comparable companies; |
| 8) | the coupon payments; |
| 9) | the quality, value and salability of collateral, if any, securing the security; and |
| 10) | other relevant factors. |
The Fund is subject to fair value accounting standards that define fair value, establish the framework for measuring fair value and provide a three-level hierarchy for fair valuation based upon the inputs to the valuation as of the measurement date. The three levels of the fair value hierarchy are as follows:
| • | Level 1 – Level 1 inputs are quoted prices in active markets for identical investments. An active market is a market in which transactions for the investment occur with sufficient frequency and volume to provide pricing information on an ongoing basis. |
| • | Level 2 – Level 2 inputs are observable inputs, either directly or indirectly, and include the following: |
| o | Quoted prices for similar investments in active markets. |
| o | Quoted prices for identical or similar investments in markets that are non-active. A non-active market is a market where there are few transactions for the investment, the prices are not current, or price quotations vary substantially either over time or among market makers, or in which little information is released publicly. |
| o | Inputs other than quoted prices that are observable for the investment (for example, interest rates and yield curves observable at commonly quoted intervals, volatilities, prepayment speeds, loss severities, credit risks, and default rates). |
| o | Inputs that are derived principally from or corroborated by observable market data by correlation or other means. |
| • | Level 3 – Level 3 inputs are unobservable inputs. Unobservable inputs may reflect the reporting entity’s own assumptions about the assumptions that market participants would use in pricing the investment. |
Notes to Financial Statements (Continued)
First Trust Municipal High Income ETF (FMHI)
January 31, 2023 (Unaudited)
The inputs or methodologies used for valuing investments are not necessarily an indication of the risk associated with investing in those investments. A summary of the inputs used to value the Fund’s investments as of January 31, 2023, is included with the Fund’s Portfolio of Investments.
B. Securities Transactions and Investment Income
Securities transactions are recorded as of the trade date. Realized gains and losses from securities transactions are recorded on the identified cost basis. Interest income is recorded daily on the accrual basis. Amortization of premiums and accretion of discounts are recorded using the effective interest method.
Securities purchased or sold on a when-issued or delayed-delivery basis may have extended settlement periods. The value of the security so purchased is subject to market fluctuations during this period. The Fund maintains liquid assets with a current value at least equal to the amount of its when-issued or delayed-delivery securities. At January 31, 2023, the Fund held $4,449,575 of when-issued or delayed-delivery securities.
C. Restricted Securities
The Fund invests in restricted securities, which are securities that may not be offered for public sale without first being registered under the 1933 Act. Prior to registration, restricted securities may only be resold in transactions exempt from registration under Rule 144A under the 1933 Act, normally to qualified institutional buyers. As of January 31, 2023, the Fund held restricted securities as shown in the following table that the Advisor has deemed illiquid pursuant to procedures adopted by the Trust’s Board of Trustees. Although market instability can result in periods of increased overall market illiquidity, liquidity for each security is determined based on security-specific factors and assumptions, which require subjective judgment. The Fund does not have the right to demand that such securities be registered. These securities are valued according to the valuation procedures as stated in the Portfolio Valuation note (Note 2A) and are not expressed as a discount to the carrying value of a comparable unrestricted security. There are no unrestricted securities with the same maturity dates and yields for these issuers.
| Security | Acquisition
Date | Principal
Value | Current Price | Carrying
Cost | | Value | | % of
Net
Assets |
| IN St Fin Auth Rev Eductnl Facs Rock Creek Cmnty Acdmy Proj, Ser A, 5.25%, 07/01/28 | 08/31/18 | $200,000 | $101.45 | $201,395 | | $202,905 | | 0.06% |
| Minneapolis MN Stdt Hsg Rev Riverton Cmnty Hsg Proj, 3.80%, 08/01/27 | 05/31/18 | 150,000 | 97.38 | 150,000 | | 146,065 | | 0.05 |
| | | | | $351,395 | | $348,970 | | 0.11% |
D. Futures Contracts
The Fund may purchase or sell (i.e., is long or short) exchange-listed futures contracts to hedge against changes in interest rates (interest rate risk). Futures contracts are agreements between the Fund and a counterparty to buy or sell a specific quantity of an underlying instrument at a specified price and at a specified date. Depending on the terms of the contract, futures contracts are settled either through physical delivery of the underlying instrument on the settlement date or by payment of a cash settlement amount on the settlement date. Open futures contracts can also be closed out prior to settlement by entering into an offsetting transaction in a matching futures contract. If the Fund is not able to enter into an offsetting transaction, the Fund will continue to be required to maintain margin deposits on the futures contract. When the contract is closed or expires, the Fund records a realized gain or loss equal to the difference between the value of the contract at the time it was opened and the value at the time it was closed or expired. This gain or loss is included in “Net realized gain (loss) on futures contracts” on the Statement of Operations.
Upon entering into a futures contract, the Fund must deposit funds, called margin, with its custodian in the name of the clearing broker equal to a specified percentage of the current value of the contract. Open futures contracts are marked to market daily with the change in value recognized as a component of “Net change in unrealized appreciation (depreciation) on futures contracts” on the Statement of Operations. This daily fluctuation in the value of the contracts is also known as variation margin and is included in “Variation margin” payable or receivable on the Statement of Assets and Liabilities.
If market conditions change unexpectedly, the Fund may not achieve the anticipated benefits of the futures contract and may realize a loss. The use of futures contracts involves the risk of imperfect correlation in movements in the price of the futures contracts, interest rates and the underlying instruments.
Notes to Financial Statements (Continued)
First Trust Municipal High Income ETF (FMHI)
January 31, 2023 (Unaudited)
Restricted cash segregated as collateral for futures contracts in the amount of $327,250 is shown as “Cash segregated as collateral for open futures contracts” on the Statement of Assets and Liabilities.
E. Dividends and Distributions to Shareholders
Dividends from net investment income, if any, are declared and paid monthly by the Fund, or as the Board of Trustees may determine from time to time. Distributions of net realized capital gains earned by the Fund, if any, are distributed at least annually. The Fund may also designate a portion of the amount paid to redeeming shareholders as a distribution for tax purposes.
Distributions from net investment income and realized capital gains are determined in accordance with federal income tax regulations, which may differ from U.S. GAAP. Certain capital accounts in the financial statements are periodically adjusted for permanent differences in order to reflect their tax character. These permanent differences are primarily due to the varying treatment of income and gain/loss on portfolio securities held by the Fund and have no impact on net assets or NAV per share. Temporary differences, which arise from recognizing certain items of income, expense and gain/loss in different periods for financial statement and tax purposes, will reverse at some time in the future.
The tax character of distributions paid by the Fund during the fiscal year ended July 31, 2022, was as follows:
| Distributions paid from: | |
Ordinary income
| $19,097 |
Capital gains
| — |
Tax-exempt income
| 9,541,080 |
Return of capital
| 505,451 |
As of July 31, 2022, the components of distributable earnings on a tax basis were as follows:
Undistributed ordinary income
| $— |
Accumulated capital and other gain (loss)
| (20,197,363) |
Net unrealized appreciation (depreciation)
| (13,289,674) |
F. Income Taxes
The Fund intends to continue to qualify as a regulated investment company by complying with the requirements under Subchapter M of the Internal Revenue Code of 1986, as amended (the “Code”), which includes distributing substantially all of its net investment income and net realized gains to shareholders. Accordingly, no provision has been made for federal and state income taxes. However, due to the timing and amount of distributions, the Fund may be subject to an excise tax of 4% of the amount by which approximately 98% of the Fund’s taxable income exceeds the distributions from such taxable income for the calendar year.
In addition, the Fund intends to invest in such municipal securities to allow it to pay shareholders “exempt dividends” as defined in the Code.
The Fund is subject to accounting standards that establish a minimum threshold for recognizing, and a system for measuring, the benefits of a tax position taken or expected to be taken in a tax return. Taxable years ended 2019, 2020, 2021 and 2022 remain open to federal and state audit. As of January 31, 2023, management has evaluated the application of these standards to the Fund, and has determined that no provision for income tax is required in the Fund’s financial statements for uncertain tax positions.
The Fund intends to utilize provisions of the federal income tax laws, which allow it to carry a realized capital loss forward indefinitely following the year of the loss and offset such loss against any future realized capital gains. The Fund is subject to certain limitations under U.S. tax rules on the use of capital loss carryforwards and net unrealized built-in losses. These limitations apply when there has been a 50% change in ownership. At July 31, 2022, for federal income tax purposes, the Fund had $20,197,363 of capital loss carryforwards available, to the extent provided by regulations, to offset future capital gains.
Certain losses realized during the current fiscal year may be deferred and treated as occurring on the first day of the following fiscal year for federal income tax purposes. For the fiscal year ended July 31, 2022, the Fund had no net ordinary losses.
Notes to Financial Statements (Continued)
First Trust Municipal High Income ETF (FMHI)
January 31, 2023 (Unaudited)
As of January 31, 2023, the aggregate cost, gross unrealized appreciation, gross unrealized depreciation, and net unrealized appreciation/(depreciation) on investments (including short positions and derivatives, if any) for federal income tax purposes were as follows:
| Tax Cost | | Gross
Unrealized
Appreciation | | Gross
Unrealized
(Depreciation) | | Net Unrealized
Appreciation
(Depreciation) |
| $324,245,906 | | $5,788,515 | | $(17,438,862) | | $(11,650,347) |
G. Expenses
Expenses, other than the investment advisory fee and other excluded expenses, are paid by the Advisor (See Note 3).
3. Investment Advisory Fee, Affiliated Transactions and Other Fee Arrangements
First Trust, the investment advisor to the Fund, is a limited partnership with one limited partner, Grace Partners of DuPage L.P., and one general partner, The Charger Corporation. The Charger Corporation is an Illinois corporation controlled by James A. Bowen, Chief Executive Officer of First Trust. First Trust is responsible for the selection and ongoing monitoring of the securities in the Fund’s portfolio, managing the Fund’s business affairs and providing certain administrative services necessary for the management of the Fund.
Pursuant to the Investment Management Agreement between the Trust and the Advisor, First Trust manages the investment of the Fund’s assets and is responsible for the Fund’s expenses, including the cost of transfer agency, custody, fund administration, legal, audit and other services, but excluding fee payments under the Investment Management Agreement, interest, taxes, acquired fund fees and expenses, if any, brokerage commissions and other expenses connected with the execution of portfolio transactions, distribution and service fees pursuant to a Rule 12b-1 plan, if any, and extraordinary expenses. Effective November 1, 2022, the annual unitary management fee payable by the Fund to First Trust for these services will be reduced at certain levels of the Fund’s net assets (“breakpoints”) and calculated pursuant to the schedule below.
| Breakpoints | |
| Fund net assets up to and including $2.5 billion | 0.7000% |
| Fund net assets greater than $2.5 billion up to and including $5 billion | 0.6825% |
| Fund net assets greater than $5 billion up to and including $7.5 billion | 0.6650% |
| Fund net assets greater than $7.5 billion up to and including $10 billion | 0.6475% |
| Fund net assets greater than $10 billion | 0.6300% |
Prior to November 1, 2022, the Fund paid First Trust an annual unitary management fee equal to 0.70% of its average daily net assets. First Trust also provides fund reporting services to the Fund for a flat annual fee in the amount of $9,250, which is covered under the annual unitary management fee.
The Trust’s Board of Trustees and the Advisor have entered into a Fee Waiver Agreement for the Fund pursuant to which the Advisor contractually agreed to waive management fees of 0.15% of average daily net assets until November 30, 2022. First Trust does not have the right to recover the fees waived. The Fee Waiver Agreement terminated on November 30, 2022. During the six months ended January 31, 2023, the Advisor waived fees of $155,286.
The Trust has multiple service agreements with Brown Brothers Harriman & Co. (“BBH”). Under the service agreements, BBH performs custodial, fund accounting, certain administrative services, and transfer agency services for the Fund. As custodian, BBH is responsible for custody of the Fund’s assets. As fund accountant and administrator, BBH is responsible for maintaining the books and records of the Fund’s securities and cash. As transfer agent, BBH is responsible for maintaining shareholder records for the Fund.
Each Trustee who is not an officer or employee of First Trust, any sub-advisor or any of their affiliates (“Independent Trustees”) is paid a fixed annual retainer that is allocated equally among each fund in the First Trust Fund Complex. Each Independent Trustee is also paid an annual per fund fee that varies based on whether the fund is a closed-end or other actively managed fund, a target outcome fund or an index fund.
Additionally, the Lead Independent Trustee and the Chairs of the Audit Committee, Nominating and Governance Committee and Valuation Committee are paid annual fees to serve in such capacities, with such compensation allocated pro rata among each fund in the First Trust Fund Complex based on net assets. Independent Trustees are reimbursed for travel and out-of-pocket expenses in
Notes to Financial Statements (Continued)
First Trust Municipal High Income ETF (FMHI)
January 31, 2023 (Unaudited)
connection with all meetings. The Lead Independent Trustee and Committee Chairs rotate every three years. The officers and “Interested” Trustee receive no compensation from the Trust for acting in such capacities.
4. Purchases and Sales of Securities
For the six months ended January 31, 2023, the cost of purchases and proceeds from sales of investments, excluding short term investments and in-kind transactions, were $154,114,240 and $164,220,781, respectively.
For the six months ended January 31, 2023, the Fund had no in-kind transactions.
5. Derivative Transactions
The following table presents the type of derivatives held by the Fund at January 31, 2023, the primary underlying risk exposure and the location of these instruments as presented on the Statement of Assets and Liabilities.
| | | | | Asset Derivatives | | Liability Derivatives |
Derivative
Instrument | | Risk
Exposure | | Statement of Assets and
Liabilities Location | | Value | | Statement of Assets and
Liabilities Location | | Value |
| Futures contracts | | Interest Rate
Risk | | Unrealized appreciation
on futures contracts* | | $ — | | Unrealized depreciation
on futures contracts* | | $ 79,753 |
*Includes cumulative appreciation/depreciation on futures contracts as reported in the Futures Contracts table. Only the current day’s variation margin is presented on the Statement of Assets and Liabilities.
The following table presents the amount of net realized gain (loss) and change in net unrealized appreciation (depreciation) recognized for the six months ended January 31, 2023, on derivative instruments, as well as the primary underlying risk exposure associated with each instrument.
| Statement of Operations Location | |
| Interest Rate Risk Exposure | |
| Net realized gain (loss) on futures contracts | $1,290,310 |
| Net change in unrealized appreciation (depreciation) on futures contracts | 516,560 |
During the six months ended January 31, 2023, the notional value of futures contracts opened and closed were $99,638,251 and $104,539,019, respectively.
The Fund does not have the right to offset financial assets and liabilities related to futures contracts on the Statement of Assets and Liabilities.
6. Creations, Redemptions and Transaction Fees
The Fund generally issues and redeems its shares in primary market transactions through a creation and redemption mechanism and does not sell or redeem individual shares. Instead, financial entities known as “Authorized Participants” have contractual arrangements with the Fund or one of the Fund’s service providers to purchase and redeem Fund shares directly with the Fund in large blocks of shares known as “Creation Units.” Prior to the start of trading on every business day, the Fund publishes through the National Securities Clearing Corporation (“NSCC”) the “basket” of securities, cash or other assets that it will accept in exchange for a Creation Unit of the Fund’s shares. An Authorized Participant that wishes to effectuate a creation of the Fund’s shares deposits with the Fund the “basket” of securities, cash or other assets identified by the Fund that day, and then receives the Creation Unit of the Fund’s shares in return for those assets. After purchasing a Creation Unit, the Authorized Participant may continue to hold the Fund’s shares or sell them in the secondary market. The redemption process is the reverse of the purchase process: the Authorized Participant redeems a Creation Unit of the Fund’s shares for a basket of securities, cash or other assets. The combination of the creation and redemption process with secondary market trading in the Fund’s shares and underlying securities provides arbitrage opportunities that are designed to help keep the market price of the Fund’s shares at or close to the NAV per share of the Fund.
The Fund imposes fees in connection with the purchase of Creation Units. These fees may vary based upon various fact-based circumstances, including, but not limited to, the composition of the securities included in the Creation Unit or the countries in which the transactions are settled. The price for each Creation Unit will equal the daily NAV per share of the Fund times the number of shares in a Creation Unit, plus the fees described above and, if applicable, any operational processing and brokerage costs, transfer fees,
Notes to Financial Statements (Continued)
First Trust Municipal High Income ETF (FMHI)
January 31, 2023 (Unaudited)
stamp taxes and part or all of the spread between the expected bid and offer side of the market related to the securities comprising the creation basket.
The Fund also imposes fees in connection with the redemption of Creation Units. These fees may vary based upon various fact-based circumstances, including, but not limited to, the composition of the securities included in the Creation Unit or the countries in which the transactions are settled. The price received for each Creation Unit will equal the daily NAV per share of the Fund times the number of shares in a Creation Unit, minus the fees described above and, if applicable, any operational processing and brokerage costs, transfer fees, stamp taxes and part or all of the spread between the expected bid and offer side of the market related to the securities comprising the redemption basket. Investors who use the services of a broker or other such intermediary in addition to an Authorized Participant to effect a redemption of a Creation Unit may also be assessed an amount to cover the cost of such services. The redemption fee charged by the Fund will comply with Rule 22c-2 of the 1940 Act which limits redemption fees to no more than 2% of the value of the shares redeemed.
7. Distribution Plan
The Board of Trustees adopted a Distribution and Service Plan pursuant to Rule 12b-1 under the 1940 Act. In accordance with the Rule 12b-1 plan, the Fund is authorized to pay an amount up to 0.25% of its average daily net assets each year to reimburse First Trust Portfolios L.P. (“FTP”), the distributor of the Fund, for amounts expended to finance activities primarily intended to result in the sale of Creation Units or to provide investor services. FTP may also use this amount to compensate securities dealers or other persons that are Authorized Participants for providing distribution assistance, including broker-dealer and shareholder support and educational and promotional services.
No 12b-1 fees are currently paid by the Fund, and pursuant to a contractual arrangement, no 12b-1 fees will be paid any time before November 30, 2023.
8. Borrowings
The Trust, on behalf of the Fund, along with First Trust Series Fund and First Trust Exchange-Traded Fund IV have a $305 million Credit Agreement with The Bank of Nova Scotia (“Scotia”) as administrative agent for a group of lenders. Prior to October 30, 2022, the commitment amount was $280 million. Scotia charges a commitment fee of 0.25% of the daily amount of the excess of the commitment amount over the outstanding principal balance of the loans and an agency fee. First Trust allocates the commitment fee and agency fee amongst the funds that have access to the credit line. To the extent that the Fund accesses the credit line, there would also be an interest fee charged. The Fund did not have any borrowings outstanding during the six months ended January 31, 2023.
9. Indemnification
The Trust, on behalf of the Fund, has a variety of indemnification obligations under contracts with its service providers. The Trust’s maximum exposure under these arrangements is unknown. However, the Trust has not had prior claims or losses pursuant to these contracts and expects the risk of loss to be remote.
10. Subsequent Events
Management has evaluated the impact of all subsequent events to the Fund through the date the financial statements were issued and has determined that there was the following subsequent event:
Effective March 1, 2023, the credit agreement with Scotia was amended, and the maximum commitment amount changed from $305,000,000 to $550,000,000.
Additional Information
First Trust Municipal High Income ETF (FMHI)
January 31, 2023 (Unaudited)
Proxy Voting Policies and Procedures
A description of the policies and procedures that the Trust uses to determine how to vote proxies and information on how the Fund voted proxies relating to portfolio securities during the most recent 12-month period ended June 30 is available (1) without charge, upon request, by calling (800) 988-5891; (2) on the Fund’s website at www.ftportfolios.com; and (3) on the Securities and Exchange Commission’s (“SEC”) website at www.sec.gov.
Portfolio Holdings
The Fund files portfolio holdings information for each month in a fiscal quarter within 60 days after the end of the relevant fiscal quarter on Form N-PORT. Portfolio holdings information for the third month of each fiscal quarter will be publicly available on the SEC’s website at www.sec.gov. The Fund’s complete schedule of portfolio holdings for the second and fourth quarters of each fiscal year is included in the semi-annual and annual reports to shareholders, respectively, and is filed with the SEC on Form N-CSR. The semi-annual and annual report for the Fund is available to investors within 60 days after the period to which it relates. The Fund’s Forms N-PORT and Forms N-CSR are available on the SEC’s website listed above.
Risk Considerations
Risks are inherent in all investing. Certain general risks that may be applicable to a Fund are identified below, but not all of the material risks relevant to each Fund are included in this report and not all of the risks below apply to each Fund. The material risks of investing in each Fund are spelled out in its prospectus, statement of additional information and other regulatory filings. Before investing, you should consider each Fund’s investment objective, risks, charges and expenses, and read each Fund’s prospectus and statement of additional information carefully. You can download each Fund’s prospectus at www.ftportfolios.com or contact First Trust Portfolios L.P. at (800) 621-1675 to request a prospectus, which contains this and other information about each Fund.
Concentration Risk. To the extent that a fund is able to invest a significant percentage of its assets in a single asset class or the securities of issuers within the same country, state, region, industry or sector, an adverse economic, business or political development may affect the value of the fund’s investments more than if the fund were more broadly diversified. A fund that tracks an index will be concentrated to the extent the fund’s corresponding index is concentrated. A concentration makes a fund more susceptible to any single occurrence and may subject the fund to greater market risk than a fund that is more broadly diversified.
Credit Risk. Credit risk is the risk that an issuer of a security will be unable or unwilling to make dividend, interest and/or principal payments when due and the related risk that the value of a security may decline because of concerns about the issuer’s ability to make such payments.
Cyber Security Risk. The funds are susceptible to potential operational risks through breaches in cyber security. A breach in cyber security refers to both intentional and unintentional events that may cause a fund to lose proprietary information, suffer data corruption or lose operational capacity. Such events could cause a fund to incur regulatory penalties, reputational damage, additional compliance costs associated with corrective measures and/or financial loss. In addition, cyber security breaches of a fund’s third-party service providers, such as its administrator, transfer agent, custodian, or sub-advisor, as applicable, or issuers in which the fund invests, can also subject a fund to many of the same risks associated with direct cyber security breaches.
Defined Outcome Funds Risk. To the extent a fund’s investment strategy is designed to deliver returns tied to the price performance of an underlying ETF, an investor may not realize the returns the fund seeks to achieve if that investor does not hold shares for the entire target outcome period. In the event an investor purchases shares after the first day of the target outcome period or sells shares prior to the end of the target outcome period, the buffer that the fund seeks to provide against a decline in the value of the underlying ETF may not be available, the enhanced returns that the fund seeks to provide (if any) may not be available and the investor may not participate in a gain in the value of the underlying ETF up to the cap for the investor’s investment period. Additionally, the fund will not participate in gains of the underlying ETF above the cap and a shareholder may lose their entire investment. If the fund seeks enhanced returns, there are certain time periods when the value of the fund may fall faster than the value of the underlying ETF, and it is very unlikely that, on any given day during which the underlying ETF share price increases in value, the fund’s share price will increase at the same rate as the enhanced returns sought by the fund, which is designed for an entire target outcome period. Trading flexible exchange options involves risks different from, or possibly greater than, the risks associated with investing directly in securities, such as less liquidity and correlation and valuation risks. A fund may experience substantial downside from specific flexible exchange option positions and certain positions may expire worthless.
Derivatives Risk. To the extent a fund uses derivative instruments such as futures contracts, options contracts and swaps, the fund may experience losses because of adverse movements in the price or value of the underlying asset, index or rate, which may be magnified
Additional Information (Continued)
First Trust Municipal High Income ETF (FMHI)
January 31, 2023 (Unaudited)
by certain features of the derivative. These risks are heightened when a fund’s portfolio managers use derivatives to enhance the fund’s return or as a substitute for a position or security, rather than solely to hedge (or offset) the risk of a position or security held by the fund.
Equity Securities Risk. To the extent a fund invests in equity securities, the value of the fund’s shares will fluctuate with changes in the value of the equity securities. Equity securities prices fluctuate for several reasons, including changes in investors’ perceptions of the financial condition of an issuer or the general condition of the relevant stock market, such as market volatility, or when political or economic events affecting the issuers occur. In addition, common stock prices may be particularly sensitive to rising interest rates, as the cost of capital rises and borrowing costs increase. Equity securities may decline significantly in price over short or extended periods of time, and such declines may occur in the equity market as a whole, or they may occur in only a particular country, company, industry or sector of the market.
ETF Risk. The shares of an ETF trade like common stock and represent an interest in a portfolio of securities. The risks of owning an ETF generally reflect the risks of owning the underlying securities, although lack of liquidity in an ETF could result in it being more volatile and ETFs have management fees that increase their costs. Shares of an ETF trade on an exchange at market prices rather than net asset value, which may cause the shares to trade at a price greater than net asset value (premium) or less than net asset value (discount). In times of market stress, decisions by market makers to reduce or step away from their role of providing a market for an ETF’s shares, or decisions by an ETF’s authorized participants that they are unable or unwilling to proceed with creation and/or redemption orders of an ETF’s shares, could result in shares of the ETF trading at a discount to net asset value and in greater than normal intraday bid-ask spreads.
Fixed Income Securities Risk. To the extent a fund invests in fixed income securities, the fund will be subject to credit risk, income risk, interest rate risk, liquidity risk and prepayment risk. Income risk is the risk that income from a fund’s fixed income investments could decline during periods of falling interest rates. Interest rate risk is the risk that the value of a fund’s fixed income securities will decline because of rising interest rates. Liquidity risk is the risk that a security cannot be purchased or sold at the time desired, or cannot be purchased or sold without adversely affecting the price. Prepayment risk is the risk that the securities will be redeemed or prepaid by the issuer, resulting in lower interest payments received by the fund. In addition to these risks, high yield securities, or “junk” bonds, are subject to greater market fluctuations and risk of loss than securities with higher ratings, and the market for high yield securities is generally smaller and less liquid than that for investment grade securities.
Index or Model Constituent Risk. Certain funds may be a constituent of one or more indices or ETF models. As a result, such a fund may be included in one or more index-tracking exchange-traded funds or mutual funds. Being a component security of such a vehicle could greatly affect the trading activity involving a fund, the size of the fund and the market volatility of the fund. Inclusion in an index could increase demand for the fund and removal from an index could result in outsized selling activity in a relatively short period of time. As a result, a fund’s net asset value could be negatively impacted and the fund’s market price may be significantly below its net asset value during certain periods. In addition, index rebalances may potentially result in increased trading activity in a fund’s shares.
Index Provider Risk. To the extent a fund seeks to track an index, it is subject to Index Provider Risk. There is no assurance that the Index Provider will compile the Index accurately, or that the Index will be determined, maintained, constructed, reconstituted, rebalanced, composed, calculated or disseminated accurately. To correct any such error, the Index Provider may carry out an unscheduled rebalance or other modification of the Index constituents or weightings, which may increase the fund’s costs. The Index Provider does not provide any representation or warranty in relation to the quality, accuracy or completeness of data in the Index, and it does not guarantee that the Index will be calculated in accordance with its stated methodology. Losses or costs associated with any Index Provider errors generally will be borne by the fund and its shareholders.
Investment Companies Risk. To the extent a fund invests in the securities of other investment vehicles, the fund will incur additional fees and expenses that would not be present in a direct investment in those investment vehicles. Furthermore, the fund’s investment performance and risks are directly related to the investment performance and risks of the investment vehicles in which the fund invests.
LIBOR Risk. To the extent a fund invests in floating or variable rate obligations that use the London Interbank Offered Rate (“LIBOR”) as a reference interest rate, it is subject to LIBOR Risk. The United Kingdom’s Financial Conduct Authority, which regulates LIBOR has ceased making LIBOR available as a reference rate over a phase-out period that began December 31, 2021. There is no assurance that any alternative reference rate, including the Secured Overnight Financing Rate (“SOFR”) will be similar to or produce the same value or economic equivalence as LIBOR or that instruments using an alternative rate will have the same volume or liquidity. The unavailability or replacement of LIBOR may affect the value, liquidity or return on certain fund investments and may result in costs incurred in connection with closing out positions and entering into new trades. Any potential effects of the transition away from LIBOR on the fund or on certain instruments in which the fund invests can be difficult to ascertain, and they may vary depending on a variety of factors, and they could result in losses to the fund.
Additional Information (Continued)
First Trust Municipal High Income ETF (FMHI)
January 31, 2023 (Unaudited)
Management Risk. To the extent that a fund is actively managed, it is subject to management risk. In managing an actively-managed fund’s investment portfolio, the fund’s portfolio managers will apply investment techniques and risk analyses that may not have the desired result. There can be no guarantee that a fund will meet its investment objective.
Market Risk. Market risk is the risk that a particular security, or shares of a fund in general, may fall in value. Securities held by a fund, as well as shares of a fund itself, are subject to market fluctuations caused by factors such as general economic conditions, political events, regulatory or market developments, changes in interest rates and perceived trends in securities prices. Shares of a fund could decline in value or underperform other investments as a result of the risk of loss associated with these market fluctuations. In addition, local, regional or global events such as war, acts of terrorism, spread of infectious diseases or other public health issues, recessions, or other events could have a significant negative impact on a fund and its investments. Such events may affect certain geographic regions, countries, sectors and industries more significantly than others. In February 2022, Russia invaded Ukraine which has caused and could continue to cause significant market disruptions and volatility within the markets in Russia, Europe, and the United States. The hostilities and sanctions resulting from those hostilities could have a significant impact on certain fund investments as well as fund performance. The COVID-19 global pandemic and the ensuing policies enacted by governments and central banks have caused and may continue to cause significant volatility and uncertainty in global financial markets. While the U.S. has resumed “reasonably” normal business activity, many countries continue to impose lockdown measures. Additionally, there is no guarantee that vaccines will be effective against emerging variants of the disease. These events also adversely affect the prices and liquidity of a fund’s portfolio securities or other instruments and could result in disruptions in the trading markets. Any of such circumstances could have a materially negative impact on the value of a fund’s shares and result in increased market volatility. During any such events, a fund’s shares may trade at increased premiums or discounts to their net asset value and the bid/ask spread on a fund’s shares may widen.
Non-U.S. Securities Risk. To the extent a fund invests in non-U.S. securities, it is subject to additional risks not associated with securities of domestic issuers. Non-U.S. securities are subject to higher volatility than securities of domestic issuers due to: possible adverse political, social or economic developments; restrictions on foreign investment or exchange of securities; capital controls; lack of liquidity; currency exchange rates; excessive taxation; government seizure of assets; the imposition of sanctions by foreign governments; different legal or accounting standards; and less government supervision and regulation of exchanges in foreign countries. Investments in non-U.S. securities may involve higher costs than investments in U.S. securities, including higher transaction and custody costs, as well as additional taxes imposed by non-U.S. governments. These risks may be heightened for securities of companies located, or with significant operations, in emerging market countries.
Operational Risk. Each fund is subject to risks arising from various operational factors, including, but not limited to, human error, processing and communication errors, errors of a fund’s service providers, counterparties or other third-parties, failed or inadequate processes and technology or systems failures. Each fund relies on third-parties for a range of services, including custody. Any delay or failure relating to engaging or maintaining such service providers may affect a fund’s ability to meet its investment objective. Although the funds and the funds’ investment advisor seek to reduce these operational risks through controls and procedures, there is no way to completely protect against such risks.
Passive Investment Risk. To the extent a fund seeks to track an index, the fund will invest in the securities included in, or representative of, the index regardless of their investment merit. A fund generally will not attempt to take defensive positions in declining markets.
Preferred Securities Risk. Preferred securities combine some of the characteristics of both common stocks and bonds. Preferred securities are typically subordinated to bonds and other debt securities in a company’s capital structure in terms of priority to corporate income, subjecting them to greater credit risk than those debt securities. Generally, holders of preferred securities have no voting rights with respect to the issuing company unless preferred dividends have been in arrears for a specified number of periods, at which time the preferred security holders may obtain limited rights. In certain circumstances, an issuer of preferred securities may defer payment on the securities and, in some cases, redeem the securities prior to a specified date. Preferred securities may also be substantially less liquid than other securities, including common stock.
Valuation Risk. The valuation of certain securities may carry more risk than that of common stock. Uncertainties in the conditions of the financial markets, unreliable reference data, lack of transparency and inconsistency of valuation models and processes may lead to inaccurate asset pricing. A fund may hold investments in sizes smaller than institutionally sized round lot positions (sometimes referred to as odd lots). However, third-party pricing services generally provide evaluations on the basis of institutionally-sized round lots. If a fund sells certain of its investments in an odd lot transaction, the sale price may be less than the value at which such securities
Additional Information (Continued)
First Trust Municipal High Income ETF (FMHI)
January 31, 2023 (Unaudited)
have been held by the fund. Odd lots often trade at lower prices than institutional round lots. There is no assurance that the fund will be able to sell a portfolio security at the price established by the pricing service, which could result in a loss to the fund.
| NOT FDIC INSURED | NOT BANK GUARANTEED | MAY LOSE VALUE |
Advisory Agreement
Board Considerations Regarding Approval of Amendment to the Investment Management Agreement
The Board of Trustees of First Trust Exchange-Traded Fund III (the “Trust”), including the Independent Trustees, unanimously approved the amendment (the “Amendment”) of the Investment Management Agreement (the “Agreement”) with First Trust Advisors L.P. (the “Advisor”) on behalf of the First Trust Municipal High Income ETF (the “Fund”).
The Board approved the Amendment at a meeting held on October 24, 2022. As part of the review process, the Board reviewed information and had preliminary discussions with the Advisor regarding the proposed Amendment at meetings held on April 18, 2022, June 12–13, 2022 and September 18–19, 2022. Following those preliminary discussions, the Board requested and received information from the Advisor regarding the proposed Amendment, and that information was considered at an executive session of the Independent Trustees and their counsel held prior to the October 24, 2022 meeting, as well as at the October meeting.
In reviewing the Amendment, the Board considered that the purpose of the Amendment is to modify the unitary fee rate for the Fund under the Agreement by introducing a breakpoint schedule pursuant to which the unitary fee rate paid by the Fund to the Advisor will be reduced as assets of the Fund meet certain thresholds. The Board noted the Advisor’s representations that the quality and quantity of the services provided to the Fund by the Advisor under the Agreement will not be reduced or modified as a result of the Amendment, and that the obligations of the Advisor under the Agreement will remain the same in all respects.
The Board noted that it, including the Independent Trustees, last approved the continuation of the Agreement for a one-year period ending June 30, 2023 at a meeting held on June 12–13, 2022. The Board noted that in connection with such approval it had determined, based upon the information provided, that the terms of the Agreement were fair and reasonable and that the continuation of the Agreement was in the best interests of the Fund in light of the nature, extent and quality of the services provided and such other matters as the Board considered to be relevant in the exercise of its business judgment.
The Board noted that the Advisor had previously agreed to waive a portion of its unitary fee for the Fund and that the modified unitary fee rate schedule for the Fund under the Amendment would not be implemented until the expiration of the Fund’s contractual fee waiver. The Board considered that the effective unitary fee rate paid by the Fund under the Agreement after taking into account the contractual fee waiver is less than the effective unitary fee rate that the Fund would pay pursuant to the modified unitary fee rate schedule under the Amendment.
Based on all of the information considered, the Board, including the Independent Trustees, unanimously determined that the terms of the Amendment are fair and reasonable and that the Amendment is in the best interests of the Fund.
This page intentionally left blank
This page intentionally left blank
First Trust Exchange-Traded Fund III
INVESTMENT ADVISOR
First Trust Advisors L.P.
120 East Liberty Drive, Suite 400
Wheaton, IL 60187
ADMINISTRATOR, CUSTODIAN,
FUND ACCOUNTANT &
TRANSFER AGENT
Brown Brothers Harriman & Co.
50 Post Office Square
Boston, MA 02110
INDEPENDENT REGISTERED
PUBLIC ACCOUNTING FIRM
Deloitte & Touche LLP
111 S. Wacker Drive
Chicago, IL 60606
LEGAL COUNSEL
Chapman and Cutler LLP
320 South Canal Street
Chicago, IL 60606
First Trust Exchange-Traded Fund III
First Trust Short Duration Managed Municipal ETF (FSMB)
First Trust Ultra Short Duration Municipal ETF (FUMB)
Semi-Annual Report
For the Six Months Ended
January 31, 2023
First Trust Exchange-Traded Fund III
Semi-Annual Report
January 31, 2023
Caution Regarding Forward-Looking Statements
This report contains certain forward-looking statements within the meaning of the Securities Act of 1933, as amended, and the Securities Exchange Act of 1934, as amended. Forward-looking statements include statements regarding the goals, beliefs, plans or current expectations of First Trust Advisors L.P. (“First Trust” or the “Advisor”) and its representatives, taking into account the information currently available to them. Forward-looking statements include all statements that do not relate solely to current or historical fact. For example, forward-looking statements include the use of words such as “anticipate,” “estimate,” “intend,” “expect,” “believe,” “plan,” “may,” “should,” “would” or other words that convey uncertainty of future events or outcomes.
Forward-looking statements involve known and unknown risks, uncertainties and other factors that may cause the actual results, performance or achievements of any series of First Trust Exchange-Traded Fund III (the “Trust”) described in this report (each such series is referred to as a “Fund” and collectively, the “Funds”) to be materially different from any future results, performance or achievements expressed or implied by the forward-looking statements. When evaluating the information included in this report, you are cautioned not to place undue reliance on these forward-looking statements, which reflect the judgment of the Advisor and its representatives only as of the date hereof. We undertake no obligation to publicly revise or update these forward-looking statements to reflect events and circumstances that arise after the date hereof.
Performance and Risk Disclosure
There is no assurance that any Fund described in this report will achieve its investment objective. Each Fund is subject to market risk, which is the possibility that the market values of securities owned by the Fund will decline and that the value of the Fund’s shares may therefore be less than what you paid for them. Accordingly, you can lose money by investing in a Fund. See “Risk Considerations” in the Additional Information section of this report for a discussion of certain other risks of investing in the Funds.
Performance data quoted represents past performance, which is no guarantee of future results, and current performance may be lower or higher than the figures shown. For the most recent month-end performance figures, please visit www.ftportfolios.com or speak with your financial advisor. Investment returns, net asset value and share price will fluctuate and Fund shares, when sold, may be worth more or less than their original cost.
The Advisor may also periodically provide additional information on Fund performance on each Fund’s web page at www.ftportfolios.com.
How to Read This Report
This report contains information that may help you evaluate your investment. It includes details about each Fund and presents data and analysis that provide insight into each Fund’s performance and investment approach.
The statistical information that follows may help you understand each Fund’s performance compared to that of a relevant market benchmark.
It is important to keep in mind that the opinions expressed by personnel of the Advisor are just that: informed opinions. They should not be considered to be promises or advice. The opinions, like the statistics, cover the period through the date on the cover of this report. The material risks of investing in each Fund are spelled out in the prospectus, the statement of additional information, and other Fund regulatory filings.
First Trust Exchange-Traded Fund III
Semi-Annual Letter from the Chairman and CEO
January 31, 2023
Dear Shareholders,
First Trust is pleased to provide you with the semi-annual report for certain series of First Trust Exchange-Traded Fund III (the “Funds”), which contains detailed information about the Funds for the six-month period ended January 31, 2023.
Given recent inflation data, the Federal Reserve’s (the “Fed”) monetary policy remains front and center in most discussions regarding the outlook of the U.S. economy. Annual revisions to the Consumer Price Index released on February 10, 2023, showed that prices climbed at a 3.3% annual rate in the last three months of 2022, not the 1.8% rate reported four weeks prior, according to Brian Wesbury, Chief Economist at First Trust. Additionally, “core” inflation, which excludes volatile food and energy prices, was also revised upwards from 3.1% to 4.3% over the period. Furthermore, January’s 2023 jobs data came in better than expected, with non-farm payroll employment rising by 517,000. It is precisely this situation: stubbornly high inflation, strong jobs growth and increasing interest rates, which has many pundits debating whether the typical U.S. consumer can remain healthy enough to help ward off an economic recession.
As many investors know, the consumer is an essential driver of economic growth in the U.S. On average, over the 15-year period ended October 1, 2022, consumer spending accounted for 67.8% of the U.S. gross domestic product (“GDP”). Crucially, recent data regarding consumer health has been mixed, in my opinion. On one hand, the Commerce Department reported that in December 2022, the U.S. savings rate rose to its highest level in seven months, coming in at 3.4%. On the other hand, while December’s savings rate was a welcome reversal from the declines suffered throughout 2021 and 2022, it could indicate that consumers are beginning to pull back on discretionary spending amidst a cloudier economic outlook, according to Bloomberg. Recent data shows that the average interest rate on U.S. credit cards rose to 19.07% in the fourth quarter of 2022, its highest level in over 50 years. Additionally, U.S. credit card debt reached a record $930.6 billion in the fourth quarter, jumping 18.5% year-over-year. Even so, debt service payments accounted for just 9.75% of disposable personal income in the third quarter of 2022. This figure is higher than its historic low of 8.33% set in 2021 but is also well below its peak of 13.17% set in 2007. In my view, it is worth keeping an eye on debt service payments. If higher payments lead to a decline in discretionary spending, it could negatively impact GDP.
I would like to take a moment to remind you that even though nearly three years have passed since the World Health Organization initially declared the coronavirus outbreak a global pandemic, the economic impact of worldwide lockdowns and the subsequent governmental stimulus is still very real. China, for example, only recently dropped its requirement that incoming travelers must quarantine before entering the country. In addition, the global economy has yet to fully absorb the impact of the fiscal policies enacted to jump start consumer spending in 2020, in my view. As evidence of this, each of the countries that comprise the G-10 currently has a headline inflation rate that stands well above its stated target. Central banks likely have more work to do, in my opinion.
Thank you for giving First Trust the opportunity to play a role in your financial future. We value our relationship with you and will report on the Funds again in six months.
Sincerely,
James A. Bowen
Chairman of the Board of Trustees
Chief Executive Officer of First Trust Advisors L.P.
Fund Performance Overview (Unaudited)
First Trust Short Duration Managed Municipal ETF (FSMB)
The First Trust Short Duration Managed Municipal ETF (the “Fund”) seeks to provide federally tax-exempt income consistent with capital preservation. Under normal market conditions, the Fund seeks to achieve its investment objective by investing at least 80% of its net assets (including investment borrowings) in municipal debt securities that pay interest that is exempt from regular federal income taxes. The Fund’s investment advisor seeks to construct a portfolio that has a weighted average duration of 1-3 years. The Fund lists and principally trades its shares on NYSE Arca, Inc. under the ticker symbol “FSMB.”
| Performance | | | | |
| | | | Average Annual
Total Returns | Cumulative
Total Returns |
| | 6 Months Ended
1/31/23 | 1 Year Ended
1/31/23 | Inception (11/1/18)
to 1/31/23 | Inception (11/1/18)
to 1/31/23 |
| Fund Performance | | | | |
| NAV | 0.38% | -1.12% | 1.63% | 7.10% |
| Market Price | 0.38% | -1.07% | 1.64% | 7.15% |
| Index Performance | | | | |
| Bloomberg Municipal Short (1-5) Year Index | 0.32% | -0.35% | 1.43% | 6.20% |
(See Notes to Fund Performance Overview on page 6.)
| Sector Allocation | % of Total
Investments
(including cash) |
| Insured | 10.2% |
| Government Obligation Bond - Unlimited Tax | 9.3 |
| Hospital | 9.2 |
| Gas | 9.1 |
| Pre-refunded/Escrowed-to-maturity | 8.9 |
| Utility | 8.8 |
| Certificates of Participation | 4.9 |
| Industrial Development Bond | 4.7 |
| Water & Sewer | 4.4 |
| Airport | 4.3 |
| Higher Education | 3.8 |
| Dedicated Tax | 3.5 |
| Special Assessment | 3.1 |
| Continuing Care Retirement Communities | 2.7 |
| Government Obligation Bond - Limited Tax | 2.1 |
| Port | 1.4 |
| Education | 1.3 |
| Local Housing | 1.2 |
| Toll Road | 1.1 |
| Housing | 1.1 |
| Tobacco | 0.6 |
| Tax Increment | 0.6 |
| Student Loan | 0.5 |
| Mass Transit | 0.4 |
| Student Housing | 0.0* |
| Cash | 2.8 |
| Total | 100.0% |
| * | Amount is less than 0.1%. |
| Credit Quality(1) | % of Total
Investments
(including cash) |
| AAA | 11.8% |
| AA | 36.5 |
| A | 27.0 |
| BBB | 9.7 |
| BB | 2.3 |
| B | 0.3 |
| Not Rated | 7.6 |
| SP-1+ (short-term) | 0.1 |
| SP-1/MIG1 (short-term) | 1.2 |
| SP-2/MIG2 (short-term) | 0.7 |
| Cash | 2.8 |
| Total | 100.0% |
| (1) | The credit quality and ratings information presented above reflect the ratings assigned by one or more nationally recognized statistical rating organizations (NRSROs), including S&P Global Ratings, Moody’s Investors Service, Inc., Fitch Ratings or a comparably rated NRSRO. For situations in which a security is rated by more than one NRSRO and the ratings are not equivalent, the highest rating is used. Sub-investment grade ratings are those rated BB+/Ba1 or lower. Investment grade ratings are those rated BBB-/Baa3 or higher. The credit ratings shown relate to the creditworthiness of the issuers of the underlying securities in the Fund, and not to the Fund or its shares. Credit ratings are subject to change. |
Fund Performance Overview (Unaudited) (Continued)
First Trust Short Duration Managed Municipal ETF (FSMB) (Continued)
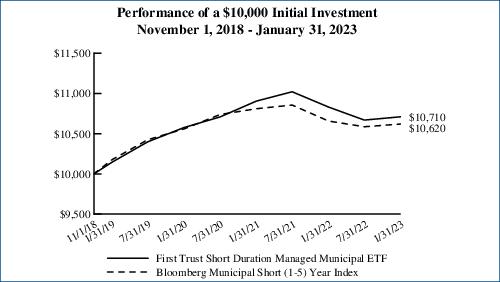
Performance figures assume reinvestment of all distributions and do not reflect the deduction of taxes that a shareholder would pay on Fund distributions or the redemption or sale of Fund shares. An index is a statistical composite that tracks a specified financial market or sector. Unlike the Fund, the index does not actually hold a portfolio of securities and therefore does not incur the expenses incurred by the Fund. These expenses negatively impact the performance of the Fund. The Fund’s past performance does not predict future performance.
Performance in municipal bond investment strategies can be impacted from the benefits of purchasing odd lot positions. The impact of these investments can be particularly meaningful when funds have limited assets under management and may not be a sustainable source of performance as a fund grows in size.
Frequency Distribution of Discounts and Premiums
Information showing the number of days the market price of the Fund’s shares was greater (at a premium) and less (at a discount) than the Fund’s net asset value for the most recently completed year, and the most recently completed calendar quarters since that year (or life of the Fund, if shorter), is available at https://www.ftportfolios.com/Retail/etf/home.aspx.
Fund Performance Overview (Unaudited) (Continued)
First Trust Ultra Short Duration Municipal ETF (FUMB)
The First Trust Ultra Short Duration Municipal ETF (the “Fund”) seeks to provide federally tax-exempt income consistent with capital preservation. Under normal market conditions, the Fund seeks to achieve its investment objective by investing at least 80% of its net assets (including investment borrowings) in municipal debt securities that pay interest that is exempt from regular federal income taxes. Under normal market conditions, the weighted average duration of the Fund’s portfolio is expected to be less than one year. The Fund lists and principally trades its shares on NYSE Arca, Inc. under the ticker symbol “FUMB.”
| Performance | | | | |
| | | | Average Annual
Total Returns | Cumulative
Total Returns |
| | 6 Months Ended
1/31/23 | 1 Year Ended
1/31/23 | Inception (11/1/18)
to 1/31/23 | Inception (11/1/18)
to 1/31/23 |
| Fund Performance | | | | |
| NAV | 0.76% | 0.70% | 1.03% | 4.44% |
| Market Price | 0.71% | 0.70% | 1.02% | 4.39% |
| Index Performance | | | | |
| Bloomberg Municipal Short-Term Index | 0.82% | 1.24% | 1.08% | 4.65% |
(See Notes to Fund Performance Overview on page 6.)
| Sector Allocation | % of Total
Investments
(including cash) |
| Government Obligation Bond - Unlimited Tax | 20.6% |
| Pre-refunded/Escrowed-to-maturity | 15.9 |
| Gas | 8.5 |
| Insured | 6.2 |
| Industrial Development Bond | 6.1 |
| Government Obligation Bond - Limited Tax | 5.6 |
| Certificates of Participation | 5.4 |
| Dedicated Tax | 5.1 |
| Hospital | 4.7 |
| Utility | 4.4 |
| Water & Sewer | 3.7 |
| Housing | 3.6 |
| Airport | 2.5 |
| Higher Education | 1.8 |
| Mass Transit | 1.8 |
| Student Loan | 0.6 |
| Port | 0.3 |
| Education | 0.3 |
| Continuing Care Retirement Communities | 0.2 |
| Tobacco | 0.2 |
| Local Housing | 0.1 |
| Special Assessment | 0.1 |
| Toll Road | 0.1 |
| Tax Increment | 0.1 |
| Cash | 2.1 |
| Total | 100.0% |
| Credit Quality(1) | % of Total
Investments
(including cash) |
| AAA | 10.1% |
| AA | 31.2 |
| A | 24.3 |
| BBB | 9.1 |
| BB | 0.3 |
| Not Rated | 5.3 |
| SP-1+ (short-term) | 7.5 |
| SP-1/MIG1 (short-term) | 8.5 |
| SP-2/MIG2 (short-term) | 1.6 |
| Cash | 2.1 |
| Total | 100.0% |
| (1) | The credit quality and ratings information presented above reflect the ratings assigned by one or more nationally recognized statistical rating organizations (NRSROs), including S&P Global Ratings, Moody’s Investors Service, Inc., Fitch Ratings or a comparably rated NRSRO. For situations in which a security is rated by more than one NRSRO and the ratings are not equivalent, the highest rating is used. Sub-investment grade ratings are those rated BB+/Ba1 or lower. Investment grade ratings are those rated BBB-/Baa3 or higher. The credit ratings shown relate to the creditworthiness of the issuers of the underlying securities in the Fund, and not to the Fund or its shares. Credit ratings are subject to change. |
Fund Performance Overview (Unaudited) (Continued)
First Trust Ultra Short Duration Municipal ETF (FUMB) (Continued)
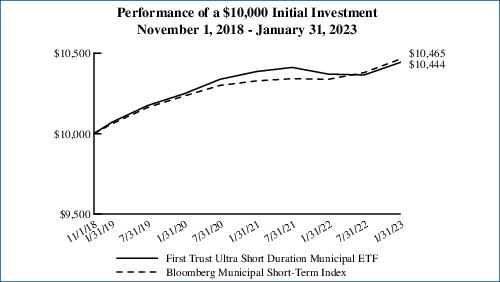
Performance figures assume reinvestment of all distributions and do not reflect the deduction of taxes that a shareholder would pay on Fund distributions or the redemption or sale of Fund shares. An index is a statistical composite that tracks a specified financial market or sector. Unlike the Fund, the index does not actually hold a portfolio of securities and therefore does not incur the expenses incurred by the Fund. These expenses negatively impact the performance of the Fund. The Fund’s past performance does not predict future performance.
Performance in municipal bond investment strategies can be impacted from the benefits of purchasing odd lot positions. The impact of these investments can be particularly meaningful when funds have limited assets under management and may not be a sustainable source of performance as a fund grows in size.
Frequency Distribution of Discounts and Premiums
Information showing the number of days the market price of the Fund’s shares was greater (at a premium) and less (at a discount) than the Fund’s net asset value for the most recently completed year, and the most recently completed calendar quarters since that year (or life of the Fund, if shorter), is available at https://www.ftportfolios.com/Retail/etf/home.aspx.
Notes to Fund Performance Overview (Unaudited)
Total returns for the period since inception are calculated from the inception date of each Fund. “Average Annual Total Returns” represent the average annual change in value of an investment over the periods indicated. “Cumulative Total Returns” represent the total change in value of an investment over the periods indicated. The total returns would have been lower if certain fees had not been waived by the Advisor.
Each Fund’s per share net asset value (“NAV”) is the value of one share of the Fund and is computed by dividing the value of all assets of the Fund (including accrued interest and dividends), less all liabilities (including accrued expenses and dividends declared but unpaid), by the total number of outstanding shares. The price used to calculate market return (“Market Price”) is determined by using the midpoint of the national best bid and offer price (“NBBO”) as of the time that the Fund’s NAV is calculated. Under SEC rules, the NBBO consists of the highest displayed buy and lowest sell prices among the various exchanges trading the Fund at the time the Fund’s NAV is calculated. Prior to January 1, 2019, the price used was the midpoint between the highest bid and the lowest offer on the stock exchange on which shares of the Fund were listed for trading as of the time that the Fund’s NAV was calculated. Since shares of each Fund did not trade in the secondary market until after the Fund’s inception, for the period from inception to the first day of secondary market trading in shares of the Fund, the NAV of each Fund is used as a proxy for the secondary market trading price to calculate market returns. NAV and market returns assume that all distributions have been reinvested in each Fund at NAV and Market Price, respectively.
An index is a statistical composite that tracks a specified financial market or sector. Unlike each Fund, the indices do not actually hold a portfolio of securities and therefore do not incur the expenses incurred by each Fund. These expenses negatively impact the performance of each Fund. Also, market returns do not include brokerage commissions that may be payable on secondary market transactions. If brokerage commissions were included, market returns would be lower. The total returns presented reflect the reinvestment of dividends on securities in the indices. The returns presented do not reflect the deduction of taxes that a shareholder would pay on Fund distributions or the redemption or sale of Fund shares. The investment return and principal value of shares of each Fund will vary with changes in market conditions. Shares of each Fund may be worth more or less than their original cost when they are redeemed or sold in the market. Each Fund’s past performance is no guarantee of future performance.
Portfolio Management
First Trust Exchange-Traded Fund III
Semi-Annual Report
January 31, 2023 (Unaudited)
Advisor
First Trust Advisors L.P. (“First Trust”) serves as the investment advisor to the First Trust Short Duration Managed Municipal ETF (“FSMB”) and the First Trust Ultra Short Duration Municipal ETF (“FUMB”) (each a “Fund” and collectively, the “Funds”). First Trust is responsible for the ongoing monitoring of each Fund’s investment portfolio, managing each Fund’s business affairs and providing certain administrative services necessary for the management of each Fund.
Portfolio Management Team
Tom Byron, Senior Vice President, Senior Portfolio Manager
Johnathan N. Wilhelm, Senior Vice President, Senior Portfolio Manager
The portfolio managers are primarily and jointly responsible for the day-to-day management of the Funds. Tom Byron has served as portfolio manager since 2022 and Johnathan N. Wilhelm has served as portfolio manager since 2018.
First Trust Exchange-Traded Fund III
Understanding Your Fund Expenses
January 31, 2023 (Unaudited)
As a shareholder of First Trust Short Duration Managed Municipal ETF or First Trust Ultra Short Duration Municipal ETF (each a “Fund” and collectively, the “Funds”), you incur two types of costs: (1) transaction costs; and (2) ongoing costs, including management fees, distribution and/or service (12b-1) fees, if any, and other Fund expenses. This Example is intended to help you understand your ongoing costs of investing in the Funds and to compare these costs with the ongoing costs of investing in other funds.
The Example is based on an investment of $1,000 invested at the beginning of the period and held through the six-month period ended January 31, 2023.
Actual Expenses
The first line in the following table provides information about actual account values and actual expenses. You may use the information in this line, together with the amount you invested, to estimate the expenses that you paid over the period. Simply divide your account value by $1,000 (for example, an $8,600 account value divided by $1,000 = 8.6), then multiply the result by the number in the first line under the heading entitled “Expenses Paid During the Six-Month Period” to estimate the expenses you paid on your account during this six-month period.
Hypothetical Example for Comparison Purposes
The second line in the following table provides information about hypothetical account values and hypothetical expenses based on each Fund’s actual expense ratio and an assumed rate of return of 5% per year before expenses, which is not each Fund’s actual return. The hypothetical account values and expenses may not be used to estimate the actual ending account balance or expenses you paid for the period. You may use this information to compare the ongoing costs of investing in the Funds and other funds. To do so, compare this 5% hypothetical example with the 5% hypothetical examples that appear in the shareholder reports of the other funds.
Please note that the expenses shown in the table are meant to highlight your ongoing costs only and do not reflect any transactional costs such as brokerage commissions. Therefore, the second line in the table is useful in comparing ongoing costs only, and will not help you determine the relative total costs of owning different funds. In addition, if these transactional costs were included, your costs would have been higher.
| | Beginning
Account Value
August 1, 2022 | Ending
Account Value
January 31, 2023 | Annualized
Expense Ratio
Based on the
Six-Month
Period (a) | Expenses Paid
During the
Six-Month
Period (b) |
| First Trust Short Duration Managed Municipal ETF (FSMB) |
| Actual | $1,000.00 | $1,003.80 | 0.43% | $2.17 |
| Hypothetical (5% return before expenses) | $1,000.00 | $1,023.04 | 0.43% | $2.19 |
| First Trust Ultra Short Duration Municipal ETF (FUMB) |
| Actual | $1,000.00 | $1,007.60 | 0.32% | $1.62 |
| Hypothetical (5% return before expenses) | $1,000.00 | $1,023.59 | 0.32% | $1.63 |
| (a) | These expense ratios reflect expense waivers. See Note 3 in the Notes to Financial Statements. |
| (b) | Expenses are equal to the annualized expense ratios as indicated in the table multiplied by the average account value over the period (August 1, 2022 through January 31, 2023), multiplied by 184/365 (to reflect the six-month period). |
First Trust Short Duration Managed Municipal ETF (FSMB)
Portfolio of Investments
January 31, 2023 (Unaudited)
Principal
Value | | Description | | Stated
Coupon | | Stated
Maturity | | Value |
| MUNICIPAL BONDS – 97.6% |
| | | Alabama – 3.0% | | | | | | |
| $140,000 | | Birmingham AL Spl Care Facs Fing Auth Hlthcare Fac Ref Children’s Hosp of AL
| | 5.00% | | 06/01/26 | | $148,112 |
| 130,000 | | Birmingham AL Spl Care Facs Fing Auth Hlthcare Fac Ref Children’s Hosp of AL
| | 5.00% | | 06/01/27 | | 137,581 |
| 250,000 | | Black Belt Energy Gas Dist AL Gas Prepay Rev Proj #5, Ser A-1
| | 4.00% | | 04/01/25 | | 252,545 |
| 130,000 | | Black Belt Energy Gas Dist AL Gas Prepay Rev Proj No. 4, Ser A-1 (Mandatory put 12/01/25)
| | 4.00% | | 12/01/49 | | 130,467 |
| 330,000 | | Black Belt Energy Gas Dist AL Gas Prepay Rev, Ser A (Mandatory put 12/01/23)
| | 4.00% | | 12/01/48 | | 330,956 |
| 1,035,000 | | Black Belt Energy Gas Dist AL Gas Proj Rev Gas Proj Rev Bonds, Proj No. 7, Ser C-1 (Mandatory put 12/01/26)
| | 4.00% | | 10/01/52 | | 1,037,100 |
| 1,500,000 | | Black Belt Energy Gas Dist AL Gas Proj Rev Gas Proj, Ser E
| | 5.00% | | 06/01/26 | | 1,584,772 |
| 490,000 | | Black Belt Energy Gas Dist AL Gas Proj Rev Proj No. 6, Ser B (Mandatory put 12/01/26)
| | 4.00% | | 10/01/52 | | 490,994 |
| 1,165,000 | | Black Belt Energy Gas Dist AL Gas Proj Rev, Ser C-1
| | 5.25% | | 12/01/27 | | 1,247,637 |
| 100,000 | | Greenville AL Pub Impt Cooperative Pub Impt Rev Greenville Funding, BAM
| | 5.00% | | 03/01/25 | | 105,419 |
| 245,000 | | Infirmary Hlth Sys AL Spl Care Facs Fing Auth Rev Infirmary Hlth Sys Inc, Ser A
| | 5.00% | | 02/01/28 | | 258,424 |
| 500,000 | | Infirmary Hlth Sys AL Spl Care Facs Fing Auth Rev Infirmary Hlth Sys Inc, Ser A
| | 5.00% | | 02/01/36 | | 517,799 |
| 1,815,000 | | Lower AL Gas Dist Gas Proj Rev Gas Proj Rev Bonds Proj 2 (Mandatory put 12/01/25)
| | 4.00% | | 12/01/50 | | 1,823,699 |
| 300,000 | | Midcity Impt Dist AL Spl Assmnt Rev
| | 3.88% | | 11/01/27 | | 275,502 |
| 225,000 | | SE AL St Gas Sply Dist Gas Sply Rev Proj #1, Ser A (Mandatory put 04/01/24)
| | 4.00% | | 04/01/49 | | 225,617 |
| 10,000 | | SE AL St Gas Sply Dist Gas Sply Rev Proj #2, Ser A
| | 4.00% | | 06/01/23 | | 10,021 |
| 1,335,000 | | SE AL St Gas Sply Dist Gas Sply Rev Proj #2, Ser A (Mandatory put 06/01/24)
| | 4.00% | | 06/01/49 | | 1,338,149 |
| 500,000 | | SE Energy Auth AL Cmdy Sply Rev Proj #1, Ser A
| | 4.00% | | 10/01/25 | | 504,468 |
| 2,000,000 | | SE Energy Auth AL Cmdy Sply Rev Proj #1, Ser A (Mandatory put 10/01/28)
| | 4.00% | | 11/01/51 | | 2,002,596 |
| 500,000 | | SE Energy Auth AL Cmdy Sply Rev Proj No. 3, Ser A-1
| | 5.00% | | 12/01/26 | | 526,875 |
| | | | | 12,948,733 |
| | | Arizona – 1.4% | | | | | | |
| 155,000 | | AZ St Indl Dev Auth Edu Rev Jerome Fac Proj Social Bonds, Ser B
| | 5.00% | | 07/01/27 | | 163,543 |
| 155,000 | | AZ St Indl Dev Auth Edu Rev Jerome Fac Proj Social Bonds, Ser B
| | 5.00% | | 07/01/29 | | 163,141 |
| 115,000 | | AZ St Indl Dev Auth Edu Rev Ref Doral Acdmy of Northern NV Proj, Ser A (a)
| | 4.00% | | 07/15/26 | | 113,684 |
| 310,000 | | AZ St Indl Dev Auth Rev Lincoln S Beltway Proj
| | 5.00% | | 11/01/25 | | 332,795 |
| 1,000,000 | | AZ St Indl Dev Auth Rev Lincoln S Beltway Proj
| | 5.00% | | 05/01/27 | | 1,114,034 |
| 1,250,000 | | Chandler AZ Indl Dev Auth Indl Dev Rev Var Intel Corp Proj, Ser 2022-2, AMT (Mandatory put 09/01/27)
| | 5.00% | | 09/01/52 | | 1,324,614 |
| 1,000,000 | | Coconino Cnty AZ Poll Controlcorp Ref NV Pwr Company Remk, Ser A, AMT (Mandatory put 03/31/23)
| | 1.88% | | 09/01/32 | | 997,968 |
| 95,000 | | Glendale AZ Indl Dev Auth Sr Living Facs Rev Ref Royal Oaks Life Care Cmnty
| | 4.00% | | 05/15/29 | | 89,874 |
| 580,000 | | Phoenix AZ Indl Dev Auth Edu Rev Ref Basis Sch (a)
| | 5.00% | | 07/01/35 | | 583,022 |
| 665,000 | | Pima Cnty AZ Indl Dev Auth Sr Living Rev La Posada at Pusch Ridge Proj, Ser A (a)
| | 5.75% | | 11/15/25 | | 673,798 |
See Notes to Financial Statements
Page 9
First Trust Short Duration Managed Municipal ETF (FSMB)
Portfolio of Investments (Continued)
January 31, 2023 (Unaudited)
Principal
Value | | Description | | Stated
Coupon | | Stated
Maturity | | Value |
| MUNICIPAL BONDS (Continued) |
| | | Arizona (Continued) | | | | | | |
| $280,000 | | Santa Cruz Cnty AZ Pledged Rev Ref, AGM
| | 4.00% | | 07/01/34 | | $291,238 |
| | | | | 5,847,711 |
| | | California – 4.4% | | | | | | |
| 200,000 | | CA Cmnty Choice Fing Auth Clean Energy Proj Rev Green Bond, Ser A-1
| | 4.00% | | 02/01/24 | | 201,500 |
| 250,000 | | CA Cmnty Choice Fing Auth Clean Energy Proj Rev Green Bond, Ser A-1
| | 4.00% | | 08/01/24 | | 253,128 |
| 250,000 | | CA Cmnty Choice Fing Auth Clean Energy Proj Rev Green Bond, Ser A-1 (Mandatory put 08/01/28)
| | 4.00% | | 05/01/53 | | 253,968 |
| 200,000 | | CA Sch Fin Auth Sch Fac Rev Kipp L.A. Proj, Ser A (a)
| | 4.00% | | 07/01/23 | | 200,540 |
| 25,000 | | CA St Enterprise Dev Auth Stdt Hsg Rev M@College Proj, Ser A
| | 5.00% | | 08/01/23 | | 25,221 |
| 50,000 | | CA St Enterprise Dev Auth Stdt Hsg Rev M@College Proj, Ser A
| | 5.00% | | 08/01/24 | | 51,283 |
| 605,000 | | CA St Hlth Facs Fing Auth Rev Adventist Hlth Sys W, Ser A
| | 4.00% | | 03/01/33 | | 605,357 |
| 385,000 | | CA St Hlth Facs Fing Auth Rev El Camino Hosp
| | 5.00% | | 02/01/33 | | 417,945 |
| 1,000,000 | | CA St Hlth Facs Fing Auth Rev Var Ref Stanford Hlth Care, Ser A (Mandatory put 08/15/25)
| | 3.00% | | 08/15/54 | | 1,008,112 |
| 100,000 | | CA St Muni Fin Auth Ref Palomar Hlth, Ser A, COPS, AGM
| | 5.00% | | 11/01/27 | | 108,344 |
| 1,500,000 | | CA St Muni Fin Auth Rev Bethany Home Proj
| | 5.00% | | 11/15/42 | | 1,662,210 |
| 105,000 | | CA St Muni Fin Auth Sr Living Rev Mt San Antonio Gardens Proj, Ser A
| | 5.00% | | 11/15/26 | | 107,352 |
| 300,000 | | CA St Poll Control Fin Auth Sol Wst Disp Rev Ref Wst Mgmt Inc, Ser A1, AMT
| | 3.38% | | 07/01/25 | | 298,995 |
| 1,000,000 | | CA St Poll Control Fin Auth Sol Wst Disp Rev Var Ref Rep Svcs Remk, Ser A, AMT (Mandatory put 05/01/23) (a)
| | 4.10% | | 08/01/23 | | 1,000,019 |
| 500,000 | | CA St Sch Fin Auth Chrt Sch Rev Ref Classical Academies Oceanside Proj, Ser A (a)
| | 4.00% | | 10/01/27 | | 509,052 |
| 40,000 | | CA St Stwd Cmntys Dev Auth Spl Tax Rev Impt Area No. 1
| | 4.00% | | 09/01/23 | | 40,113 |
| 50,000 | | CA St Stwd Cmntys Dev Auth Spl Tax Rev Impt Area No. 1
| | 4.00% | | 09/01/24 | | 50,333 |
| 80,000 | | CA St Stwd Cmntys Dev Auth Spl Tax Rev Impt Area No. 1
| | 4.00% | | 09/01/25 | | 80,792 |
| 325,000 | | CA St Stwd Cmntys Dev Auth Stwd Rev Dev Auth, Ser 2021A
| | 4.00% | | 09/02/24 | | 325,532 |
| 355,000 | | CA St Stwd Cmntys Dev Auth Stwd Rev Dev Auth, Ser 2021A
| | 4.00% | | 09/02/25 | | 356,696 |
| 265,000 | | Cathedral City CA Redev Agy Successor Agy Tax Allocation Rev Ref Sub Hsg Merged Redev Proj Area, Ser C
| | 4.00% | | 08/01/23 | | 266,529 |
| 115,000 | | Folsom Ranch CA Fing Auth Spl Tax Rev White Rock Springs Ranch
| | 3.00% | | 09/01/23 | | 114,527 |
| 100,000 | | Folsom Ranch CA Fing Auth Spl Tax Rev White Rock Springs Ranch
| | 4.00% | | 09/01/26 | | 101,998 |
| 195,000 | | Hemet CA Unif Sch Dist Facs Dist Spl Tax Ref
| | 4.00% | | 09/01/25 | | 197,700 |
| 200,000 | | Long Beach CA Arpt Rev Ref, Ser A, AGM
| | 5.00% | | 06/01/26 | | 217,908 |
| 1,490,000 | | Los Angeles CA Dept of Arpts Arpt Rev Sub Los Angeles Intl Arpt, Ser B, AMT
| | 5.00% | | 05/15/26 | | 1,591,342 |
| 730,000 | | Los Angeles CA Dept of Arpts Arpt Rev Subord Ref, Ser A, AMT
| | 5.00% | | 05/15/29 | | 819,921 |
| 95,000 | | March Jt Pwrs Redev Agy Successor Agy CA Tax Allocation Ref March Air Force Base Redev Proj, Ser A, BAM
| | 4.00% | | 08/01/27 | | 99,730 |
| 1,705,000 | | Milpitas CA Redev Agy Successor Agy Tax Allocation Ref Redev Proj Area #1
| | 5.00% | | 09/01/28 | | 1,819,375 |
| 200,000 | | Ontario Pub Fing Auth Lease Rev Capital Projs, AGM (Pre-refunded maturity 10/01/23)
| | 5.38% | | 10/01/40 | | 204,047 |
| 85,000 | | Rancho Cordova CA Cmnty Facs Dist Spl Tax Rev Grantline 208 Cmnty Fac Dt #2018-1
| | 3.00% | | 09/01/23 | | 84,751 |
| 90,000 | | Rancho Cordova CA Cmnty Facs Dist Spl Tax Rev Grantline 208 Cmnty Fac Dt #2018-1
| | 3.00% | | 09/01/24 | | 89,229 |
| 150,000 | | River Islands CA Pub Fing Auth Spl Tax Ref Cmnty Facs Dt #2003-1, Ser A-1, AGM
| | 5.00% | | 09/01/26 | | 163,346 |
Page 10
See Notes to Financial Statements
First Trust Short Duration Managed Municipal ETF (FSMB)
Portfolio of Investments (Continued)
January 31, 2023 (Unaudited)
Principal
Value | | Description | | Stated
Coupon | | Stated
Maturity | | Value |
| MUNICIPAL BONDS (Continued) |
| | | California (Continued) | | | | | | |
| $195,000 | | Riverside CA Unif Sch Dist Cmnty Facs Dt #33 Citrus Heights II Spl Tax
| | 3.00% | | 09/01/24 | | $192,197 |
| 240,000 | | Roseville CA Fin Auth Spl Tax Rev Ref, Ser A
| | 5.00% | | 09/01/25 | | 256,118 |
| 60,000 | | Roseville CA Spl Tax Svsp Westpark Federico Cmnty Facs Dt No. 1
| | 3.00% | | 09/01/24 | | 59,097 |
| 70,000 | | Roseville CA Spl Tax Svsp Westpark Federico Cmnty Facs Dt No. 1
| | 3.00% | | 09/01/25 | | 68,508 |
| 85,000 | | Roseville CA Spl Tax Svsp Westpark Federico Cmnty Facs Dt No. 1
| | 4.00% | | 09/01/26 | | 86,097 |
| 65,000 | | San Diego CA Unif Sch Dist Ref Election 1998, Ser C-2, AGM
| | 5.50% | | 07/01/25 | | 70,263 |
| 100,000 | | San Diego Cnty CA Regl Arpt Auth Subord Ref, Ser A
| | 5.00% | | 07/01/24 | | 103,698 |
| 140,000 | | San Francisco CA City & Cnty Arpts Commn Intl Arpt Rev Ref 2nd Ser, Ser A
| | 4.00% | | 05/01/26 | | 147,817 |
| 200,000 | | San Francisco CA City & Cnty Dcnty Dev Spl Tax Dist No Mission Rock Fac and Svcs, Ser A (a)
| | 4.00% | | 09/01/26 | | 202,107 |
| 150,000 | | San Francisco City & Cnty CA Cmnty Facs Dist #2016-1, Ser 2021
| | 4.00% | | 09/01/25 | | 152,003 |
| 400,000 | | San Francisco City & Cnty CA Cmnty Facs Dist #2016-1, Ser 2021
| | 4.00% | | 09/01/26 | | 407,587 |
| 1,500,000 | | San Joaquin Hills CA Transprtn Corridor Agy Toll Road Rev Sr Lien Ref, Ser A (Pre-refunded maturity 01/15/25)
| | 5.00% | | 01/15/29 | | 1,581,505 |
| 175,000 | | San Luis Obispo CA Cmnty Facs Dist #2019-1 Spl Tax
| | 4.00% | | 09/01/25 | | 177,900 |
| 100,000 | | San Luis Obispo CA Cmnty Facs Dist #2019-1 Spl Tax
| | 4.00% | | 09/01/26 | | 102,337 |
| 1,500,000 | | Sanger CA Fing Auth Wstwtr Rev Ref, AGM (Pre-refunded maturity 06/15/24)
| | 5.00% | | 06/15/34 | | 1,577,000 |
| 225,000 | | Western Placer Wst Mgmt Auth CA Solid Wst Rev Landfiel Impt Proj, Ser B
| | 5.00% | | 06/01/34 | | 250,293 |
| | | | | 18,761,422 |
| | | Colorado – 2.7% | | | | | | |
| 500,000 | | CO St Eductnl & Cultural Facs Auth Rev Ref & Impt Chrt Sch Univ Lab Bldg Corp (a)
| | 5.00% | | 12/15/28 | | 522,391 |
| 110,000 | | CO St Eductnl & Cultural Facs Auth Rev Ref Chrt Sch Stargate Chrt Sch Proj, Ser A
| | 5.00% | | 12/01/25 | | 116,099 |
| 100,000 | | CO St Eductnl & Cultural Facs Auth Rev Ref N Star Acdmy Chrt Sch Proj
| | 4.00% | | 11/01/23 | | 100,827 |
| 2,590,000 | | CO St Hlth Facs Auth Hosp Rev Frasier Meadows Retmnt Cmnty Proj, Ser B (Forward refunding maturity 05/15/23)
| | 5.00% | | 05/15/48 | | 2,607,360 |
| 130,000 | | CO St Hlth Facs Auth Hosp Rev Ref Commonspirit Hlth, Ser B-1 (Mandatory put 08/01/25)
| | 5.00% | | 08/01/49 | | 134,706 |
| 1,000,000 | | CO St Hlth Facs Auth Hosp Rev Ref Sanford Hlth, Ser A
| | 5.00% | | 11/01/23 | | 1,018,591 |
| 125,000 | | CO St Hlth Facs Auth Hosp Rev Var Ref Intermountain Hlthcare, Ser B (Mandatory put 08/17/26)
| | 5.00% | | 05/15/62 | | 135,871 |
| 400,000 | | CO St Hlth Facs Auth Rev Commonspirit Hlth Oblig Grp, Ser A
| | 5.00% | | 11/01/26 | | 429,917 |
| 80,000 | | CO St Hlth Facs Auth Rev Ref Parkview Med Cntr, Ser A
| | 3.25% | | 09/01/25 | | 80,227 |
| 275,000 | | CO St Hlth Facs Auth Rev Ref Parkview Med Cntr, Ser B
| | 5.00% | | 09/01/28 | | 287,740 |
| 2,000,000 | | CO St Hlth Facs Auth Rev Var Ref Intermountain Hlthcare, Ser C (Mandatory put 08/15/28)
| | 5.00% | | 05/15/62 | | 2,257,658 |
| 1,000,000 | | Copperleaf CO Met Dist #6, Ser A (Pre-refunded maturity 12/01/23)
| | 5.25% | | 12/01/48 | | 1,050,142 |
| 220,000 | | Denver City & Cnty CO Arpt Rev Ref Sub Sys, Ser A, AMT
| | 5.00% | | 12/01/25 | | 232,628 |
| 770,000 | | Denver City & Cnty CO Arpt Rev, Ser A, AMT
| | 5.00% | | 11/15/25 | | 815,326 |
| 1,000,000 | | Denver City & Cnty CO Arpt Rev, Ser A, AMT
| | 5.00% | | 11/15/26 | | 1,076,672 |
| 500,000 | | Eagle Cnty CO Sch Dist Re50 Jt Garfield & Routt Cnty
| | 5.00% | | 12/01/30 | | 549,456 |
See Notes to Financial Statements
Page 11
First Trust Short Duration Managed Municipal ETF (FSMB)
Portfolio of Investments (Continued)
January 31, 2023 (Unaudited)
Principal
Value | | Description | | Stated
Coupon | | Stated
Maturity | | Value |
| MUNICIPAL BONDS (Continued) |
| | | Colorado (Continued) | | | | | | |
| $270,000 | | Gold Hill Mesa Met Dist #2 CO Ltd Tax & Spl Rev Ref, Ser A, BAM
| | 5.00% | | 12/01/25 | | $282,871 |
| | | | | 11,698,482 |
| | | Connecticut – 2.4% | | | | | | |
| 100,000 | | CT St
| | 5.00% | | 08/01/31 | | 106,279 |
| 235,000 | | CT St Green Bond, Ser F
| | 5.00% | | 10/15/30 | | 257,106 |
| 50,000 | | CT St Hlth & Eductnl Facs Auth Rev Hartford Hlthcare, Ser E
| | 5.00% | | 07/01/25 | | 51,588 |
| 170,000 | | CT St Hlth & Eductnl Facs Auth Rev Ref
| | 5.00% | | 07/01/29 | | 180,558 |
| 100,000 | | CT St Hlth & Eductnl Facs Auth Rev Ref Yale Univ, Ser A-2 (Mandatory put 07/01/26)
| | 2.00% | | 07/01/42 | | 96,289 |
| 1,000,000 | | CT St Hlth & Eductnl Facs Auth Rev Var Remk, Ser A (Mandatory put 02/10/26)
| | 2.80% | | 07/01/48 | | 998,912 |
| 215,000 | | CT St Hlth & Eductnl Facs Auth Rev, Ser A
| | 5.00% | | 07/01/30 | | 241,646 |
| 365,000 | | CT St Spl Tax Oblig Rev Ref Transprtn Infra, Ser B
| | 5.00% | | 08/01/27 | | 389,623 |
| 165,000 | | CT St Spl Tax Oblig Rev Transprtn Infra, Ser A
| | 5.00% | | 09/01/33 | | 171,481 |
| 2,000,000 | | CT St Spl Tax Oblig Rev Transptrn Infra, Ser A
| | 5.00% | | 09/01/30 | | 2,188,012 |
| 140,000 | | CT St Spl Tax Oblig Rev, Ser B
| | 5.00% | | 10/01/27 | | 157,503 |
| 1,000,000 | | CT St, Ser 2021A
| | 4.00% | | 01/15/26 | | 1,048,445 |
| 1,000,000 | | CT St, Ser D
| | 4.00% | | 08/15/29 | | 1,054,655 |
| 1,500,000 | | E Hartford CT Hsg Auth Mf Hmultifamily Hsg Rev Var Summerfield Townhouses Proj, Ser A (Mandatory put 02/01/25)
| | 4.25% | | 02/01/27 | | 1,520,949 |
| 315,000 | | Hamden CT Ref, Ser A, BAM
| | 5.00% | | 08/01/23 | | 318,674 |
| 145,000 | | Hamden CT Ref, Ser A, BAM
| | 5.00% | | 08/01/24 | | 149,974 |
| 200,000 | | Hamden CT Ref, Ser A, BAM
| | 5.00% | | 08/01/25 | | 211,563 |
| 25,000 | | Univ of CT CT Ref, Ser A
| | 5.00% | | 03/15/27 | | 26,981 |
| 970,000 | | Univ of CT CT, Ser A
| | 5.00% | | 11/01/26 | | 1,066,453 |
| 75,000 | | Univ of CT CT, Ser A
| | 5.00% | | 02/15/28 | | 78,805 |
| 25,000 | | Univ of CT CT, Ser A
| | 5.00% | | 11/01/35 | | 27,801 |
| | | | | 10,343,297 |
| | | District of Columbia – 0.4% | | | | | | |
| 480,000 | | DC Wtr & Swr Auth Pub Util Rev Ref Sub Lien, Ser C
| | 5.00% | | 10/01/26 | | 501,071 |
| 1,060,000 | | Met Washington DC Arpts Auth Arpt Sys Rev Ref, Ser A, AMT
| | 5.00% | | 10/01/30 | | 1,171,821 |
| 250,000 | | Met Washington DC Arpts Auth Arpt Sys Rev Ref, Ser B, AMT
| | 5.00% | | 10/01/25 | | 263,992 |
| | | | | 1,936,884 |
| | | Florida – 7.2% | | | | | | |
| 110,000 | | Alachua Cnty FL Hlth Facs Auth Ccrc Ref Oak Hammock at the Univ of FL Inc Proj
| | 4.00% | | 10/01/24 | | 108,897 |
| 200,000 | | Alachua Cnty FL Hlth Facs Auth Ccrc Ref Oak Hammock at the Univ of FL Inc Proj
| | 4.00% | | 10/01/25 | | 196,375 |
| 105,000 | | Alachua Cnty FL Hlth Facs Auth Ccrc Ref Oak Hammock at the Univ of FL Inc Proj
| | 4.00% | | 10/01/26 | | 102,100 |
| 500,000 | | Babcock Ranch Cmnty Indep Spl Dist FL Spl Assmnt Rev Proj, Ser 2021
| | 2.38% | | 05/01/26 | | 469,785 |
| 205,000 | | Berry Bay CDD FL Spl Assmt Rev Assmt Area 1
| | 2.63% | | 05/01/26 | | 193,670 |
| 250,000 | | Black Creek FL CDD Spl Assmnt Expansion Area Proj
| | 4.80% | | 06/15/27 | | 252,340 |
| 1,125,000 | | Broward Cnty FL Arpt Sys Rev, Ser A, AMT
| | 5.25% | | 10/01/24 | | 1,142,034 |
| 400,000 | | Broward Cnty FL Port Facs Rev, AMT
| | 5.00% | | 09/01/24 | | 413,498 |
| 2,000,000 | | Collier Cnty FL Eductnl Facs Auth Rev Eductnl Facs Hodges Univ Inc (Pre-refunded maturity 11/01/23)
| | 6.13% | | 11/01/43 | | 2,053,722 |
| 565,000 | | Cross Creek N CDD FL Spl Assmnt
| | 3.40% | | 05/01/27 | | 544,593 |
| 1,000,000 | | Edgewater E CDD FL Spl Assmnt Rev Assmnt Area Two
| | 3.00% | | 05/01/27 | | 946,881 |
| 265,000 | | Epperson N CDD FL Capital Impt Rev Assmnt Area Three, Ser A
| | 2.45% | | 11/01/26 | | 247,073 |
Page 12
See Notes to Financial Statements
First Trust Short Duration Managed Municipal ETF (FSMB)
Portfolio of Investments (Continued)
January 31, 2023 (Unaudited)
Principal
Value | | Description | | Stated
Coupon | | Stated
Maturity | | Value |
| MUNICIPAL BONDS (Continued) |
| | | Florida (Continued) | | | | | | |
| $550,000 | | FL St Brd of Governors FL Intl Univ Dorm Rev Ref, Ser A, BAM
| | 5.00% | | 07/01/27 | | $608,581 |
| 500,000 | | FL St Dept Gen Svcs Div Facs Mgmt Rev Ref FL Facs Pool, Ser A
| | 4.00% | | 09/01/30 | | 537,830 |
| 110,000 | | FL St Dev Fin Corp Eductnl Facs Rev River City Science Acdmy Projs, Ser A
| | 4.00% | | 07/01/24 | | 110,335 |
| 330,000 | | FL St Dev Fin Corp Eductnl Facs Rev River City Science Acdmy Projs, Ser A
| | 4.00% | | 07/01/25 | | 332,375 |
| 155,000 | | FL St Dev Fin Corp Eductnl Facs Rev River City Science Acdmy Projs, Ser A
| | 4.00% | | 07/01/26 | | 156,599 |
| 150,000 | | FL St Dev Fin Corp Eductnl Facs Rev River City Science Acdmy Projs, Ser A
| | 4.00% | | 07/01/28 | | 151,852 |
| 105,000 | | FL St Dev Fin Corp Sr Living Rev Ref Glenridge on Palmer Ranch Proj
| | 4.00% | | 06/01/24 | | 103,566 |
| 100,000 | | FL St Dev Fin Corp Sr Living Rev Ref Glenridge on Palmer Ranch Proj
| | 4.00% | | 06/01/25 | | 97,563 |
| 1,500,000 | | FL St Dev Fin Corp Var Brightline Passngr Rail Expan Proj Remk, Ser A, AMT (Mandatory put 04/04/23)
| | 2.90% | | 12/01/56 | | 1,499,122 |
| 220,000 | | FL St Muni Pwr Agy Ref, Ser A
| | 5.00% | | 10/01/30 | | 238,649 |
| 785,000 | | Gtr Orlando FL Aviation Auth Arpt Facs Rev Prerefunded Priority Sub, Ser A, AMT
| | 5.00% | | 10/01/24 | | 813,582 |
| 125,000 | | Gulfstream Polo Cmnty Dev Dist FL Spl Assmnt Phase 2 Proj
| | 3.00% | | 11/01/24 | | 122,640 |
| 310,000 | | Hills Minneola Cmnty Dev Dist FL Spl Assmnt Rev S Parcel Assmnt Area (a)
| | 3.00% | | 05/01/25 | | 301,269 |
| 1,500,000 | | Hillsborough Cnty FL Aviation Auth Tampa Intl, Ser A, AMT (Pre-refunded maturity 10/01/24)
| | 5.00% | | 10/01/44 | | 1,552,135 |
| 100,000 | | Lakeland FL Hosp Sys Rev Lakeland Regl Hlth (Pre-refunded maturity 11/15/24)
| | 5.00% | | 11/15/33 | | 104,628 |
| 145,000 | | Lakes of Sarasota CDD FL Impt Rev Phase 1 Proj, Ser A-1
| | 2.75% | | 05/01/26 | | 138,335 |
| 255,000 | | Lakewood Ranch FL Stewardship Dist Spl Assmnt Rev Ref Country Club E Proj, AGM
| | 5.00% | | 05/01/25 | | 267,323 |
| 460,000 | | Lee Cnty FL Indl Dev Auth Hlthcr Facs Rev Shell Point Oblig Grp
| | 4.00% | | 11/15/30 | | 443,250 |
| 720,000 | | Ltc Ranch W Rsdl Cmnty Dev Dist Spl Assmnt Rev Assmnt Area One Proj, Ser A
| | 2.50% | | 05/01/26 | | 678,554 |
| 1,890,000 | | Miami-Dade Cnty FL Sch Brd Ref, Ser C, COPS
| | 5.00% | | 02/01/32 | | 2,009,179 |
| 4,000,000 | | Miami-Dade Cnty FL Seaport Rev Ref Sr Bonds, Ser A, AMT (b)
| | 5.00% | | 10/01/30 | | 4,499,539 |
| 405,000 | | Mirada II Cmnty Dev Dist FL Cap Impt Rev
| | 2.50% | | 05/01/26 | | 381,687 |
| 370,000 | | N Springs FL Impt Dist Heron Bay Wtr Mgmt Proj, Ser 2021-1, AGM
| | 2.00% | | 05/01/24 | | 366,655 |
| 380,000 | | N Springs FL Impt Dist Heron Bay Wtr Mgmt Proj, Ser 2021-1, AGM
| | 2.00% | | 05/01/25 | | 369,902 |
| 385,000 | | N Springs FL Impt Dist Heron Bay Wtr Mgmt Proj, Ser 2021-1, AGM
| | 2.00% | | 05/01/26 | | 372,102 |
| 25,000 | | Orange Cnty FL Hlth Facs Auth Rev Ref Presbyterian Retmnt Cmntys (Forward refunding maturity 08/01/23)
| | 5.00% | | 08/01/31 | | 25,983 |
| 1,770,000 | | Palm Beach Cnty FL Hlth Facs Auth Ref Acts Retmnt Life Cmntys Inc Oblig Grp
| | 5.00% | | 11/15/32 | | 1,818,980 |
| 165,000 | | Pine Isle Cmnty Dev Dist FL Spl Assmnt 2021 Proj (a)
| | 2.38% | | 12/15/26 | | 153,059 |
| 100,000 | | Poinciana FL W CDD Spl Assmnt Ref Sr, Ser 1, AGM
| | 3.60% | | 05/01/26 | | 103,282 |
| 2,000,000 | | Reedy Creek FL Impt Dist, Ser A (Pre-refunded maturity 06/01/23)
| | 5.00% | | 06/01/38 | | 2,017,201 |
| 80,000 | | Rhodine Road N CDD FL Spl Assmnt
| | 3.50% | | 05/01/24 | | 79,265 |
| 115,000 | | Saint Johns Cnty FL Indl Dev Auth Sr Living Rev Ref Vicar’s Landing Proj, Ser A
| | 4.00% | | 12/15/23 | | 114,278 |
| 145,000 | | Saint Johns Cnty FL Indl Dev Auth Sr Living Rev Ref Vicar’s Landing Proj, Ser A
| | 4.00% | | 12/15/24 | | 142,968 |
| 385,000 | | Sarasota Natl FL CDD Spl Assmnt Ref
| | 3.00% | | 05/01/23 | | 383,779 |
See Notes to Financial Statements
Page 13
First Trust Short Duration Managed Municipal ETF (FSMB)
Portfolio of Investments (Continued)
January 31, 2023 (Unaudited)
Principal
Value | | Description | | Stated
Coupon | | Stated
Maturity | | Value |
| MUNICIPAL BONDS (Continued) |
| | | Florida (Continued) | | | | | | |
| $375,000 | | Sarasota Natl FL CDD Spl Assmnt Ref
| | 3.00% | | 05/01/24 | | $369,150 |
| 240,000 | | Sarasota Natl FL CDD Spl Assmnt Ref
| | 3.00% | | 05/01/25 | | 233,241 |
| 200,000 | | Shingle Creek at Bronson CDD FL Spl Assmnt
| | 2.50% | | 06/15/26 | | 188,077 |
| 375,000 | | Silver Palms W CDD FL Spl Assmnt 2022 Proj
| | 2.60% | | 06/15/27 | | 348,469 |
| 285,000 | | Six Mile Creek FL CDD Capital Impt Rev Assmnt Area 3 Phase 1
| | 2.50% | | 05/01/26 | | 268,594 |
| 30,000 | | Tampa FL Capital Impt Cigarette Tax Allocation H Lee Moffitt Cancer Ctr Proj, Ser A
| | 5.00% | | 09/01/24 | | 31,116 |
| 425,000 | | Timber Creek SW CDD FL Spl Assmnt Area Two Proj
| | 2.35% | | 12/15/26 | | 394,756 |
| 735,000 | | Tolomato FL CDD Ref, Ser A, AGM
| | 3.00% | | 05/01/24 | | 736,245 |
| 375,000 | | V Dana CDD FL Spl Assmnt CDD Assmnt Area One 2021 Proj
| | 2.60% | | 05/01/26 | | 354,427 |
| 120,000 | | Vlg FL CDD #6 Spl Assmnt Rev Ref
| | 4.00% | | 05/01/25 | | 123,430 |
| 250,000 | | Westside Haines City CDD Spl Assmnt Assmnt Area One Proj
| | 2.50% | | 05/01/26 | | 236,357 |
| | | | | 31,050,877 |
| | | Georgia – 3.5% | | | | | | |
| 915,000 | | Atlanta GA Arpt Rev, Ser B, AMT
| | 5.00% | | 07/01/25 | | 960,894 |
| 1,500,000 | | Bartow Cnty GA Dev Auth Var GA Pwr Comp Plant Bowen Proj Remk (Mandatory put 08/19/25)
| | 2.88% | | 08/01/43 | | 1,475,253 |
| 100,000 | | Burke Cnty GA Dev Auth Poll Control Rev Var GA Pwr Co Plant Vogtle Proj Remk (Mandatory put 06/13/24)
| | 2.15% | | 10/01/32 | | 98,035 |
| 100,000 | | Clayton Cnty GA & Clayton Cnty Wtr Auth Wtr & Sewage Rev Ref
| | 5.00% | | 05/01/23 | | 100,222 |
| 735,000 | | GA St Ref Bid Grp 3, Ser C
| | 4.00% | | 07/01/25 | | 766,376 |
| 175,000 | | Gainesville & Hall Cnty GA Hosp Auth Ref NE GA Hlth Sys Inc Proj, Ser A
| | 5.00% | | 02/15/24 | | 178,083 |
| 715,000 | | Madison Cnty GA Sch Dist Ref Capital Impt Proj, COPS
| | 4.00% | | 05/01/25 | | 735,976 |
| 120,000 | | Main Street Nat Gas Inc GA Gas Rev, Ser A
| | 5.50% | | 09/15/23 | | 121,474 |
| 240,000 | | Main Street Nat Gas Inc GA Gas Sply Rev, Ser A
| | 5.00% | | 05/15/25 | | 247,190 |
| 2,000,000 | | Main Street Nat Gas Inc GA Gas Sply Rev, Ser A (b)
| | 5.00% | | 06/01/29 | | 2,128,461 |
| 2,815,000 | | Main Street Nat Gas Inc GA Gas Sply Rev, Ser A (Mandatory put 09/01/27)
| | 4.00% | | 07/01/52 | | 2,870,300 |
| 800,000 | | Main Street Nat Gas Inc GA Gas Sply Rev, Ser B
| | 5.00% | | 06/01/26 | | 836,192 |
| 500,000 | | Main Street Nat Gas Inc GA Gas Sply Rev, Ser C
| | 5.00% | | 09/01/26 | | 521,564 |
| 1,290,000 | | Main Street Nat Gas Inc GA Gas Sply Rev, Ser C (Mandatory put 09/01/26)
| | 4.00% | | 03/01/50 | | 1,298,178 |
| 1,000,000 | | Monroe Cnty GA Dev Auth Poll Control Rev GA Pwr Co Plant Scherer Proj Remk 1st Ser
| | 2.25% | | 07/01/25 | | 964,902 |
| 200,000 | | Muni Elec Auth of GA Plant Vogtle Units 3&4 Proj J Bonds, Ser A, AGM
| | 5.00% | | 07/01/30 | | 231,425 |
| 200,000 | | Muni Elec Auth of GA Plant Vogtle Units 3&4 Proj J, Ser A, AGM
| | 5.00% | | 07/01/26 | | 216,363 |
| 405,000 | | Muni Elec Auth of GA Plant Vogtle Units 3&4 Proj M, Ser A, AGM
| | 5.00% | | 07/01/28 | | 456,062 |
| 150,000 | | Muni Elec Auth of GA Ref Subord General Resolution Projs, Ser A
| | 4.00% | | 01/01/25 | | 153,235 |
| 285,000 | | Priv Clgs & Univs Auth GA Ref Mercer Univ Proj
| | 5.00% | | 10/01/24 | | 295,660 |
| 225,000 | | Priv Clgs & Univs Auth GA Ref Mercer Univ Proj
| | 5.00% | | 10/01/25 | | 238,485 |
| | | | | 14,894,330 |
| | | Guam – 0.2% | | | | | | |
| 85,000 | | Guam Govt Wtrwks Auth Wtr & Wstwtr Sys Rev
| | 5.00% | | 07/01/23 | | 85,432 |
| 785,000 | | Guam Intl Arpt Auth Prerefunded Gen, Ser C, AMT, AGM (Pre-refunded maturity 10/01/23)
| | 6.13% | | 10/01/43 | | 801,901 |
| | | | | 887,333 |
Page 14
See Notes to Financial Statements
First Trust Short Duration Managed Municipal ETF (FSMB)
Portfolio of Investments (Continued)
January 31, 2023 (Unaudited)
Principal
Value | | Description | | Stated
Coupon | | Stated
Maturity | | Value |
| MUNICIPAL BONDS (Continued) |
| | | Hawaii – 0.7% | | | | | | |
| $3,000,000 | | HI St Dept of Budget & Fin Spl Purp Rev Ref Hawaiian Elec Co Inc, Ser A, AMT
| | 3.10% | | 05/01/26 | | $2,969,926 |
| 150,000 | | Honolulu City & Cnty HI Wstwtr Sys Rev Ref Sr First Bd Resolution, Ser B
| | 4.00% | | 07/01/32 | | 155,248 |
| | | | | 3,125,174 |
| | | Illinois – 9.1% | | | | | | |
| 150,000 | | Chicago IL Brd of Edu Cap Apprec Sch Reform, Ser B-1, NATL-RE
| | (c) | | 12/01/23 | | 145,923 |
| 115,000 | | Chicago IL Brd of Edu Chicago Sch Reform Brd, Ser A, NATL-RE
| | 5.50% | | 12/01/26 | | 120,074 |
| 175,000 | | Chicago IL Brd of Edu Green Bond, Ser E
| | 5.13% | | 12/01/32 | | 176,095 |
| 110,000 | | Chicago IL Brd of Edu Ref, Ser A
| | 5.00% | | 12/01/26 | | 114,460 |
| 190,000 | | Chicago IL Brd of Edu Ref, Ser A, AMBAC
| | 5.50% | | 12/01/23 | | 193,992 |
| 1,000,000 | | Chicago IL Met Wtr Reclamation Dist Greater Chicago Ref, Ser C
| | 5.00% | | 12/01/24 | | 1,046,622 |
| 500,000 | | Chicago IL Mf Hsg Rev Var Covent Apartments Proj (Mandatory put 09/01/24)
| | 4.00% | | 09/01/25 | | 506,871 |
| 520,000 | | Chicago IL O’Hare Intl Arpt Rev Gen Sr Lien, Ser D, AMT
| | 5.00% | | 01/01/29 | | 556,555 |
| 500,000 | | Chicago IL O’Hare Intl Arpt Rev Ref Sr Lien Ohare Intl Arpt, Ser C, AMT
| | 5.00% | | 01/01/26 | | 526,371 |
| 100,000 | | Chicago IL O’Hare Intl Arpt Rev Ref, Ser B
| | 5.00% | | 01/01/26 | | 105,078 |
| 580,000 | | Chicago IL O’Hare Intl Arpt Rev Ref, Ser B
| | 5.00% | | 01/01/27 | | 608,745 |
| 140,000 | | Chicago IL O’Hare Intl Arpt Rev Sr Lien, Ser E
| | 5.00% | | 01/01/25 | | 146,811 |
| 540,000 | | Chicago IL Park Dist Ref Ltd Tax, Ser B
| | 5.00% | | 01/01/28 | | 549,095 |
| 125,000 | | Chicago IL Ref Proj, Ser A
| | 5.00% | | 01/01/27 | | 125,872 |
| 210,000 | | Chicago IL Ref Remk, 2003B
| | 5.00% | | 01/01/26 | | 214,587 |
| 100,000 | | Chicago IL Ref Remk, 2003B
| | 5.13% | | 01/01/27 | | 102,418 |
| 110,000 | | Chicago IL Ref, Ser C
| | 5.00% | | 01/01/26 | | 113,941 |
| 260,000 | | Chicago IL Ref, Ser C
| | 5.00% | | 01/01/35 | | 265,793 |
| 65,000 | | Chicago IL Ref, Ser C, CABS
| | (c) | | 01/01/25 | | 60,740 |
| 390,000 | | Chicago IL Wtrwks Rev 2nd Lien Proj
| | 5.00% | | 11/01/27 | | 402,117 |
| 1,500,000 | | Chicago IL Wtrwks Rev 2nd Lien Remk, BAM
| | 5.00% | | 11/01/30 | | 1,618,069 |
| 150,000 | | Chicago IL, Ser A
| | 5.00% | | 01/01/26 | | 153,276 |
| 675,000 | | Cook Cnty IL Sales Tax Rev Ref, Ser A
| | 5.00% | | 11/15/29 | | 771,310 |
| 2,311,000 | | Gilberts IL Spl Svc Area #15 Spl Svc Area #15 Ref, AGM
| | 5.00% | | 03/01/29 | | 2,359,416 |
| 205,000 | | Glencoe IL, Ser A
| | 3.00% | | 12/15/28 | | 209,656 |
| 15,000 | | Hillside IL Tax Incr Rev Ref
| | 5.00% | | 01/01/24 | | 15,091 |
| 395,000 | | IL St
| | 5.00% | | 05/01/23 | | 397,142 |
| 125,000 | | IL St
| | 5.00% | | 05/01/24 | | 128,283 |
| 150,000 | | IL St
| | 5.00% | | 05/01/27 | | 153,352 |
| 195,000 | | IL St
| | 5.00% | | 06/01/27 | | 206,224 |
| 520,000 | | IL St
| | 4.00% | | 01/01/31 | | 526,816 |
| 345,000 | | IL St Fin Auth Hlth Svcs Facs Lease Rev Univ of IL Hlth Svcs Fac Proj
| | 5.00% | | 10/01/24 | | 355,797 |
| 1,265,000 | | IL St Fin Auth Rev Centegra Hlth Sys, Ser A (Pre-refunded maturity 09/01/24)
| | 5.00% | | 09/01/39 | | 1,315,667 |
| 1,975,000 | | IL St Fin Auth Rev Ref Ascension Hlth Credit Grp, Ser C
| | 5.00% | | 02/15/27 | | 2,172,675 |
| 2,000,000 | | IL St Fin Auth Rev Ref Ascension Hlth Credit Grp, Ser C
| | 5.00% | | 02/15/30 | | 2,187,616 |
| 1,695,000 | | IL St Fin Auth Rev Ref Rush Univ Med Ctr, Ser A
| | 5.00% | | 11/15/30 | | 1,775,688 |
| 1,500,000 | | IL St Fin Auth Rev Var Uchicago Medecine, Ser B2 (Mandatory put 08/15/27)
| | 5.00% | | 08/15/52 | | 1,644,363 |
| 1,000,000 | | IL St Hsg Dev Auth Mf Hsg Rev Var Berry Manor (Mandatory put 09/01/24)
| | 4.00% | | 09/01/25 | | 1,012,815 |
| 2,000,000 | | IL St Muni Elec Agy Pwr Sply Ref, Ser A
| | 5.00% | | 02/01/26 | | 2,120,109 |
| 215,000 | | IL St Ref
| | 4.00% | | 08/01/25 | | 215,183 |
| 415,000 | | IL St Ref, Ser B
| | 5.00% | | 03/01/25 | | 431,866 |
See Notes to Financial Statements
Page 15
First Trust Short Duration Managed Municipal ETF (FSMB)
Portfolio of Investments (Continued)
January 31, 2023 (Unaudited)
Principal
Value | | Description | | Stated
Coupon | | Stated
Maturity | | Value |
| MUNICIPAL BONDS (Continued) |
| | | Illinois (Continued) | | | | | | |
| $80,000 | | IL St Sales Tax Rev First Ser, NATL-RE
| | 6.00% | | 06/15/23 | | $80,798 |
| 500,000 | | IL St Sales Tax Rev Ref, Subser C, BAM
| | 4.00% | | 06/15/27 | | 517,196 |
| 180,000 | | IL St Toll Hwy Auth Sr, Ser B
| | 5.00% | | 01/01/33 | | 194,251 |
| 700,000 | | IL St, Ser C
| | 5.00% | | 11/01/29 | | 747,913 |
| 280,000 | | IL St, Ser D
| | 5.00% | | 11/01/23 | | 284,581 |
| 370,000 | | IL St, Ser D
| | 5.00% | | 11/01/24 | | 383,258 |
| 725,000 | | Macon Cnty IL Sch Dist #61 Ref, Ser C, AGM
| | 4.00% | | 01/01/30 | | 764,533 |
| 700,000 | | Macon Cnty IL Sch Dist #61, AGM
| | 4.00% | | 12/01/25 | | 728,829 |
| 1,045,000 | | Peoria IL Ref, Ser C, AGM
| | 5.00% | | 01/01/27 | | 1,135,464 |
| 495,000 | | Railsplitter IL Tobacco Stlmt Auth
| | 5.00% | | 06/01/27 | | 534,122 |
| 1,055,000 | | Rock Island Cnty IL Sch Dist #41 Rock Island, BAM
| | 5.00% | | 12/01/29 | | 1,186,500 |
| 585,000 | | Sales Tax Securitization Corp IL Ref Sales Tax Securitiztn, Ser A
| | 5.00% | | 01/01/29 | | 644,564 |
| 2,750,000 | | Schaumburg IL Ref
| | 4.00% | | 12/01/24 | | 2,822,276 |
| 355,000 | | Springfield IL Elec Rev Ref Sr Lien
| | 5.00% | | 03/01/26 | | 372,095 |
| 910,000 | | Springfield IL Elec Rev Ref Sr Lien
| | 5.00% | | 03/01/27 | | 951,561 |
| 1,000,000 | | Springfield IL Elec Rev Ref Sr Lien
| | 5.00% | | 03/01/28 | | 1,043,399 |
| 570,000 | | Springfield IL Elec Rev Ref Sr Lien
| | 5.00% | | 03/01/31 | | 591,808 |
| 400,000 | | Univ of Illinois IL Revs Ref Auxiliary Facs Sys, Ser A
| | 5.00% | | 04/01/27 | | 418,891 |
| | | | | 39,254,613 |
| | | Indiana – 3.5% | | | | | | |
| 125,000 | | IN Bond Bank Rev Hamilton Co Projs, CABS
| | (c) | | 01/15/26 | | 115,223 |
| 2,000,000 | | IN St Fin Auth Envrnmntl Facs Rev Var Ref IN Pwr & Light Co Proj, Ser A
| | 1.40% | | 08/01/29 | | 1,791,397 |
| 3,000,000 | | IN St Fin Auth Envrnmntl Rev Var Ref Fulcrum Centerpoint LLC Proj, AMT (Mandatory put 11/15/23)
| | 4.50% | | 12/15/46 | | 3,003,832 |
| 105,000 | | IN St Fin Auth Rev Bhi Sr Living, Ser A
| | 4.00% | | 11/15/26 | | 104,013 |
| 100,000 | | La Porte IN Wtrwks Rev, AGM
| | 4.00% | | 01/01/24 | | 100,926 |
| 105,000 | | La Porte IN Wtrwks Rev, AGM
| | 4.00% | | 07/01/24 | | 106,550 |
| 1,000,000 | | Rockport IN Poll Control Rev Ref Aep Generating Comp Proj Remk, Ser A
| | 3.13% | | 07/01/25 | | 992,870 |
| 1,000,000 | | Rockport IN Poll Control Rev Ref Aep Generating Company Proj Remk, Ser B
| | 3.13% | | 07/01/25 | | 992,870 |
| 3,610,000 | | Rockport IN Poll Control Rev Ref IN Mi Pwr Co Proj Remk, Ser A
| | 3.05% | | 06/01/25 | | 3,631,369 |
| 2,000,000 | | Whiting IN Envrnmntl Facs Rev BP Products N America Inc Proj, Ser A, AMT (Mandatory put 03/01/23)
| | 5.00% | | 03/01/46 | | 2,001,980 |
| 2,000,000 | | Whiting IN Envrnmntl Facs Rev Ref BP Products N America Inc Proj, Ser A, AMT (Mandatory put 06/05/26)
| | 5.00% | | 12/01/44 | | 2,072,009 |
| | | | | 14,913,039 |
| | | Iowa – 1.5% | | | | | | |
| 2,305,000 | | Johnston IA Cmnty Sch Dist Infra Sales Svcs & Ref, AGM
| | 8.35% | | 07/01/24 | | 2,491,943 |
| 110,000 | | Pefa Inc IA Gas Proj Rev
| | 5.00% | | 09/01/26 | | 114,594 |
| 3,810,000 | | Pefa Inc IA Gas Proj Rev (Mandatory put 09/01/26)
| | 5.00% | | 09/01/49 | | 3,956,001 |
| | | | | 6,562,538 |
| | | Kansas – 0.7% | | | | | | |
| 280,000 | | Brown Cnty KS Horton Unif Sch Dist #430, BAM
| | 4.00% | | 09/01/25 | | 291,043 |
| 2,660,000 | | Johnson Cnty KS Unif Sch Dist#512 Shawnee Mission Ref, Ser A
| | 3.25% | | 10/01/28 | | 2,695,435 |
| | | | | 2,986,478 |
| | | Kentucky – 1.1% | | | | | | |
| 165,000 | | Estrn KY Univ Gen Recpts, Ser A
| | 5.00% | | 04/01/28 | | 178,866 |
Page 16
See Notes to Financial Statements
First Trust Short Duration Managed Municipal ETF (FSMB)
Portfolio of Investments (Continued)
January 31, 2023 (Unaudited)
Principal
Value | | Description | | Stated
Coupon | | Stated
Maturity | | Value |
| MUNICIPAL BONDS (Continued) |
| | | Kentucky (Continued) | | | | | | |
| $240,000 | | KY St Econ Dev Fin Auth Hlth Sys Rev Norton Hlthcare Inc, Ser B, CABS, NATL-RE
| | (c) | | 10/01/25 | | $220,634 |
| 20,000 | | KY St Econ Dev Fin Auth Ref Owensboro Hlth, Ser A
| | 5.00% | | 06/01/25 | | 20,905 |
| 355,000 | | KY St Hgr Edu Stdt Loan Corp Sr, Ser A, AMT
| | 5.00% | | 06/01/26 | | 377,373 |
| 300,000 | | KY St Muni Pwr Agy Pwr Sys Rev Ref, Ser A, NATL-RE
| | 5.00% | | 09/01/25 | | 317,053 |
| 125,000 | | KY St Muni Pwr Agy Pwr Sys Rev Ref, Ser A, NATL-RE
| | 5.00% | | 09/01/30 | | 131,467 |
| 255,000 | | KY St Pub Energy Auth Gas Sply Rev Gas Sply, Ser B (Mandatory put 01/01/25)
| | 4.00% | | 01/01/49 | | 255,024 |
| 325,000 | | KY St Pub Energy Auth Gas Sply Rev Var, Ser C (Mandatory put 02/01/28)
| | 4.00% | | 02/01/50 | | 326,050 |
| 745,000 | | KY St Pub Energy Auth Gas Sply Rev, Ser A (Mandatory put 06/01/26)
| | 4.00% | | 12/01/50 | | 746,623 |
| 125,000 | | KY St Univ KY St Univ Proj, COPS, BAM
| | 5.00% | | 11/01/26 | | 136,347 |
| 325,000 | | Louisville & Jefferson Cnty KY Met Govt Hlth Sys Rev Ref Norton Hlthcare Inc, Ser A
| | 5.00% | | 10/01/28 | | 347,881 |
| 160,000 | | Louisville & Jefferson Cnty KY Met Govt Hlth Sys Rev Ref Norton Hlthcare Inc, Ser A
| | 5.00% | | 10/01/30 | | 170,890 |
| 570,000 | | Louisville & Jefferson Cnty KY Met Govt Hlth Sys Rev Ref Norton Hlthcare Inc, Ser A
| | 5.00% | | 10/01/31 | | 608,061 |
| 200,000 | | Louisville & Jefferson Cnty KY Met Govt Hlth Sys Rev Var Norton Hlthcare Inc, Ser C (Mandatory put 10/01/26)
| | 5.00% | | 10/01/47 | | 213,055 |
| 380,000 | | Louisville & Jefferson Cnty KY Met Swr Dist Swr & Drain Sys Sub Safe Clean Waterways, BANS
| | 4.00% | | 10/06/23 | | 383,524 |
| 210,000 | | Paducah KY Elec Plant Brd Rev Ref, Ser A, AGM
| | 5.00% | | 10/01/34 | | 225,895 |
| | | | | 4,659,648 |
| | | Louisiana – 1.2% | | | | | | |
| 500,000 | | E Baton Rouge Parish LA Sales Tax Rev Ref Road & Street Impt
| | 5.00% | | 08/01/28 | | 527,168 |
| 150,000 | | LA St Univ & Agric & Mech Clg Ref Auxiliary, Ser A
| | 5.00% | | 07/01/26 | | 160,494 |
| 495,000 | | LA St, Ser A (Forward refunding maturity 02/01/24)
| | 4.00% | | 02/01/29 | | 501,781 |
| 20,000 | | New Orleans LA Aviation Brd Gen Arpt N Term, Ser B, AMT
| | 5.00% | | 01/01/28 | | 21,418 |
| 455,000 | | New Orleans LA Aviation Brd, Ser B, AMT
| | 5.00% | | 01/01/31 | | 470,989 |
| 100,000 | | New Orleans LA Aviation Brd, Ser B, AMT, AGM
| | 5.00% | | 01/01/32 | | 103,608 |
| 150,000 | | New Orleans LA Wtr Rev Wtr Rev
| | 5.00% | | 12/01/26 | | 159,240 |
| 550,000 | | New Orleans LA Wtr Rev Wtr Rev
| | 5.00% | | 12/01/28 | | 582,954 |
| 2,100,000 | | Saint John the Baptist Parish LA Rev Var Ref Marathon Oil Corp Proj Remk, Subser 2017B-1 (Mandatory put 07/01/24)
| | 2.13% | | 06/01/37 | | 2,057,926 |
| 550,000 | | Saint John the Baptist Parish LA Rev Var Ref Marathon Oil Corp Proj Remk, Subser 2017B-2 (Mandatory put 07/01/26)
| | 2.38% | | 06/01/37 | | 520,891 |
| | | | | 5,106,469 |
| | | Maryland – 0.9% | | | | | | |
| 115,000 | | Harford Cnty MD Spl Oblg Ref Beechtree Estates Proj
| | 4.00% | | 07/01/23 | | 115,714 |
| 300,000 | | Harford Cnty MD Spl Oblg Ref Beechtree Estates Proj
| | 4.00% | | 07/01/24 | | 306,608 |
| 480,000 | | Howard Cnty MD Ref, Ser A
| | 5.00% | | 08/15/24 | | 499,783 |
| 1,000,000 | | MD St First Ser
| | 4.00% | | 06/01/29 | | 1,022,308 |
| 585,000 | | MD St Hlth & Hgr Eductnl Facs Auth Rev Adventist Hlthcare Oblig Grp, Ser A
| | 5.50% | | 01/01/26 | | 619,752 |
| 1,000,000 | | MD St Hlth & Hgr Eductnl Facs Auth Rev Johns Hopkins Hlth, Ser C (Pre-refunded maturity 05/15/23)
| | 5.00% | | 05/15/38 | | 1,007,136 |
| 100,000 | | MD St Hlth & Hgr Eductnl Facs Auth Rev Ref Stevenson Univ Proj, Ser A
| | 5.00% | | 06/01/28 | | 109,138 |
| | | | | 3,680,439 |
See Notes to Financial Statements
Page 17
First Trust Short Duration Managed Municipal ETF (FSMB)
Portfolio of Investments (Continued)
January 31, 2023 (Unaudited)
Principal
Value | | Description | | Stated
Coupon | | Stated
Maturity | | Value |
| MUNICIPAL BONDS (Continued) |
| | | Massachusetts – 1.3% | | | | | | |
| $575,000 | | Chelmsford MA Wtr Dist Ref
| | 3.00% | | 01/15/24 | | $578,166 |
| 645,000 | | Deerfield MA, BANS
| | 2.25% | | 06/08/23 | | 643,396 |
| 2,000,000 | | MA St Bay Transprtn Auth Sales Tax Rev Subord Sustainability Bonds, BANS
| | 4.00% | | 05/01/25 | | 2,075,544 |
| 1,000,000 | | MA St Dev Fin Agy Rev N Hill Cmntys, Ser A (Pre-refunded maturity 11/15/23) (a)
| | 6.50% | | 11/15/43 | | 1,029,162 |
| 575,000 | | MA St Eductnl Fing Auth Sr, Ser B, AMT
| | 5.00% | | 07/01/24 | | 589,383 |
| 500,000 | | MA St Eductnl Fing Auth Sr, Ser B, AMT
| | 5.00% | | 07/01/25 | | 521,628 |
| | | | | 5,437,279 |
| | | Michigan – 2.0% | | | | | | |
| 70,000 | | Detroit MI Downtown Dev Auth Tax Incr Rev Ref Catalyst Dev Proj, Ser A, AGM
| | 5.00% | | 07/01/30 | | 72,065 |
| 20,000 | | Detroit MI Downtown Dev Auth Tax Incr Rev Ref Catalyst Dev Proj, Ser A, AGM
| | 5.00% | | 07/01/31 | | 20,567 |
| 375,000 | | Great Lakes MI Wtr Auth Sewage Disposal Sys Rev Ref 2nd Lien, Ser C
| | 5.00% | | 07/01/36 | | 396,894 |
| 100,000 | | Great Lakes MI Wtr Auth Wtr Sply Sys Rev Sr Lien Bond, Ser A
| | 5.00% | | 07/01/25 | | 106,074 |
| 60,000 | | Kalamazoo MI Econ Dev Corp Heritage Cmnty of Kalamazoo Revel Creek Proj Temps 60, Ser B2
| | 2.63% | | 05/15/25 | | 57,473 |
| 110,000 | | MI St Fin Auth Rev Ref Ascension Sr Credit Grp Remk, Ser E-1 (Mandatory put 08/15/24)
| | 4.00% | | 11/15/44 | | 112,832 |
| 85,000 | | MI St Fin Auth Rev Ref Henry Ford Hlth Sys
| | 4.00% | | 11/15/36 | | 86,176 |
| 155,000 | | MI St Fin Auth Rev Ref Hosp Mclaren Hlth Care, Ser A
| | 5.00% | | 05/15/27 | | 163,054 |
| 350,000 | | MI St Fin Auth Rev Ref Loc Govt Loan Prog Great Lakes Wtr Auth, Ser D1, AGM
| | 5.00% | | 07/01/28 | | 368,980 |
| 1,000,000 | | MI St Fin Auth Rev Ref Loc Govt Loan Prog Great Lakes Wtr Auth, Ser D4
| | 5.00% | | 07/01/30 | | 1,029,636 |
| 500,000 | | MI St Fin Auth Rev Ref Sr Lien Great Lakes Wtr Auth, Ser C-6
| | 5.00% | | 07/01/32 | | 514,396 |
| 1,680,000 | | MI St Fin Auth Rev Sr Lien Great Lakes Wtr Auth, Ser C-3, AGM
| | 5.00% | | 07/01/29 | | 1,735,229 |
| 1,500,000 | | MI St Strategic Fund Ltd Oblg Rev Var Green Bond Recycled Brd Machine Proj, AMT (Mandatory put 10/01/26)
| | 4.00% | | 10/01/61 | | 1,485,826 |
| 2,000,000 | | Oakland Univ MI Rev Gen, Ser A (Forward refunding maturity 03/01/23)
| | 5.00% | | 03/01/38 | | 2,003,088 |
| 235,000 | | Wayne Cnty MI Arpt Auth Rev Detroit Met Wayne Cnty Arpt, Ser C, AMT
| | 5.00% | | 12/01/29 | | 242,469 |
| 270,000 | | Wayne Cnty MI Arpt Auth Rev Detroit Met Wayne Cnty Arpt, Ser C, AMT
| | 5.00% | | 12/01/30 | | 278,548 |
| 90,000 | | Wayne Cnty MI Arpt Auth Rev Ref, Ser F, AMT
| | 5.00% | | 12/01/25 | | 95,166 |
| | | | | 8,768,473 |
| | | Minnesota – 2.7% | | | | | | |
| 650,000 | | Alexandria MN Indep Sch Dist #206 Ref Sch Bldg, Ser B
| | 5.00% | | 02/01/24 | | 666,169 |
| 2,250,000 | | Buffalo MN Indep Sch Dist #877
| | 3.00% | | 02/01/29 | | 2,256,002 |
| 200,000 | | Duluth MN Econ Dev Auth Rev Ref Benedictine Hlth Sys, Ser A
| | 3.00% | | 07/01/24 | | 196,492 |
| 3,510,000 | | Hennepin Cnty MN Sales Tax Rev Ref 1st Lien Ballpark Proj, Ser A
| | 5.00% | | 12/15/30 | | 3,874,377 |
| 1,000,000 | | Minneapolis MN Mf Rev Var Greenway Apartments Proj (Mandatory put 08/01/24)
| | 2.70% | | 08/01/25 | | 988,950 |
| 2,500,000 | | MN Muni Gas Agy Cmdy Sply Rev, Ser A
| | 4.00% | | 12/01/25 | | 2,550,046 |
| 1,250,000 | | MN St Rural Wtr Fin Auth Pub Projs Constr Notes
| | 2.63% | | 12/01/23 | | 1,241,933 |
| | | | | 11,773,969 |
Page 18
See Notes to Financial Statements
First Trust Short Duration Managed Municipal ETF (FSMB)
Portfolio of Investments (Continued)
January 31, 2023 (Unaudited)
Principal
Value | | Description | | Stated
Coupon | | Stated
Maturity | | Value |
| MUNICIPAL BONDS (Continued) |
| | | Mississippi – 0.4% | | | | | | |
| $225,000 | | MS St Busn Fin Corp Sol Wst Disp Rev Waste Mgmt Inc Proj Remk, AMT (Mandatory put 06/03/24)
| | 2.20% | | 03/01/27 | | $219,719 |
| 1,500,000 | | MS St Hosp Equipment & Facs Auth Ref Adj Baptist Memorial Hlth Care Corp Remk, Ser A-2 (Mandatory put 08/30/23)
| | 3.15% | | 09/01/36 | | 1,499,874 |
| | | | | 1,719,593 |
| | | Missouri – 1.5% | | | | | | |
| 375,000 | | Bridgeton MO Spl Oblig Rev Ref, Ser A
| | 4.00% | | 12/01/25 | | 389,594 |
| 385,000 | | Bridgeton MO Spl Oblig Rev Ref, Ser A
| | 4.00% | | 12/01/26 | | 405,319 |
| 200,000 | | Jackson Cnty MO Spl Oblg Rirr Right of Way Proj
| | 4.00% | | 12/01/27 | | 209,162 |
| 635,000 | | Met Saint Louis MO Swr Dist Wstwtr Sys Rev Ref & Impt, Ser B (Forward refunding maturity 05/01/25)
| | 5.00% | | 05/01/33 | | 666,112 |
| 140,000 | | MO St Hlth & Eductnl Facs Auth Hlth Facs Rev Bethesda Hlth Grp Inc Ref
| | 3.00% | | 08/01/23 | | 138,864 |
| 305,000 | | MO St Hlth & Eductnl Facs Auth Hlth Facs Rev Bethesda Hlth Grp Inc Ref
| | 4.00% | | 08/01/25 | | 299,883 |
| 350,000 | | MO St Hlth & Eductnl Facs Auth Hlth Facs Rev Ref Saint Lukes Hlth Sys Inc
| | 4.00% | | 11/15/33 | | 357,971 |
| 2,000,000 | | MO St Hlth & Eductnl Facs Auth Hlth Facs Rev Ref Ssm Hlth Care, Ser A (Pre-refunded maturity 06/01/24)
| | 5.00% | | 06/01/29 | | 2,061,727 |
| 235,000 | | MO St Hlth & Eductnl Facs Auth Lutheran Sr Svcs
| | 5.00% | | 02/01/23 | | 235,000 |
| 1,000,000 | | MO St Hlth & Eductnl Facs Auth Lutheran Sr Svcs Projs
| | 4.00% | | 02/01/25 | | 992,995 |
| 235,000 | | MO St Hlth & Eductnl Facs Auth Lutheran Sr Svcs Projs
| | 4.00% | | 02/01/27 | | 230,156 |
| 200,000 | | Plaza at Noah’s Ark Cmnty Impt Dist MO Tax Incr & Impt Ref
| | 3.00% | | 05/01/24 | | 196,725 |
| 250,000 | | Springfield MO Spl Oblg Ref
| | 4.00% | | 04/01/26 | | 262,280 |
| | | | | 6,445,788 |
| | | Montana – 0.1% | | | | | | |
| 240,000 | | Forsyth MT Poll Control Rev Ref Puget Sound Energy Proj, Ser A (Mandatory put 03/01/23)
| | 3.90% | | 03/01/31 | | 240,063 |
| | | Nebraska – 1.0% | | | | | | |
| 70,000 | | Centrl Plains Energy Proj NE Gas Proj Rev Proj No. 4
| | 5.00% | | 01/01/24 | | 70,838 |
| 2,290,000 | | Centrl Plains Energy Proj NE Gas Proj Rev Proj No. 4 (Mandatory put 01/01/24)
| | 5.00% | | 03/01/50 | | 2,315,239 |
| 330,000 | | Centrl Plains Energy Proj NE Gas Proj Rev Ref Proj #3, Ser A
| | 5.00% | | 09/01/26 | | 347,401 |
| 400,000 | | Muni Energy Agy of NE Ref
| | 5.00% | | 04/01/28 | | 436,544 |
| 1,235,000 | | Omaha NE Pub Facs Corp Lease Rev, Ser A
| | 4.00% | | 04/15/25 | | 1,274,953 |
| | | | | 4,444,975 |
| | | Nevada – 0.5% | | | | | | |
| 120,000 | | Clark Cnty NV Sch Dist Bldg Cr, Ser B, AGM
| | 5.00% | | 06/15/31 | | 136,915 |
| 500,000 | | Clark Cnty NV Sch Dist Ref Bldg, Ser A, BAM
| | 5.00% | | 06/15/30 | | 554,265 |
| 300,000 | | Las Vegas NV Spl Impt Dist #616 Spl Impt Dist No 816 Summerlin Vlg 22
| | 2.00% | | 06/01/24 | | 290,679 |
| 225,000 | | Las Vegas NV Spl Impt Dist #616 Spl Impt Dist No 816 Summerlin Vlg 22
| | 2.00% | | 06/01/26 | | 206,988 |
| 285,000 | | Las Vegas NV Spl Impt Dist #808 & #810 Ref
| | 5.00% | | 06/01/28 | | 288,558 |
| 275,000 | | Reno NV Capital Impt Rev Ref, Ser A-1, AGM
| | 5.00% | | 06/01/25 | | 289,919 |
| 500,000 | | Yerington NV USDA Interim Debs
| | 1.63% | | 11/01/23 | | 494,212 |
| | | | | 2,261,536 |
| | | New Hampshire – 0.0% | | | | | | |
| 220,000 | | Natl Fin Auth NH Sr Living Rev Ref Springpoint Sr Living
| | 4.00% | | 01/01/24 | | 219,622 |
See Notes to Financial Statements
Page 19
First Trust Short Duration Managed Municipal ETF (FSMB)
Portfolio of Investments (Continued)
January 31, 2023 (Unaudited)
Principal
Value | | Description | | Stated
Coupon | | Stated
Maturity | | Value |
| MUNICIPAL BONDS (Continued) |
| | | New Jersey – 4.7% | | | | | | |
| $1,000,000 | | Casino Reinvestment Dev Auth NJ Luxury Tax Rev Ref, AGM
| | 5.00% | | 11/01/29 | | $1,039,050 |
| 1,880,000 | | Cherry Hill Twp NJ
| | 3.00% | | 08/15/25 | | 1,914,601 |
| 3,000,000 | | Newark NJ, Ser D, BANS
| | 4.00% | | 09/29/23 | | 3,016,416 |
| 1,000,000 | | NJ St
| | 2.00% | | 06/01/24 | | 991,880 |
| 2,000,000 | | NJ St
| | 2.00% | | 06/01/29 | | 1,888,872 |
| 250,000 | | NJ St Covid-19 Go Emergency Bonds, Ser A
| | 4.00% | | 06/01/30 | | 274,678 |
| 1,000,000 | | NJ St Econ Dev Auth Ref Sch Facs Constr, Ser N-1, NATL-RE
| | 5.50% | | 09/01/23 | | 1,015,869 |
| 255,000 | | NJ St Econ Dev Auth Ref, Ser A
| | 4.13% | | 06/15/27 | | 262,569 |
| 580,000 | | NJ St Econ Dev Auth Rev Portal N Bridge Proj NJ Transit Transprtn Proj Bonds, Ser A
| | 5.00% | | 11/01/26 | | 629,180 |
| 110,000 | | NJ St Econ Dev Auth Rev Ref Sch Facs Constr, Ser PP
| | 3.50% | | 06/15/27 | | 110,583 |
| 275,000 | | NJ St Econ Dev Auth Rev Ref, Ser XX
| | 4.38% | | 06/15/27 | | 284,727 |
| 335,000 | | NJ St Econ Dev Auth Rev, Ser WW (Pre-refunded maturity 06/15/25)
| | 5.00% | | 06/15/34 | | 348,212 |
| 1,000,000 | | NJ St Econ Dev Auth Spl Fac Rev Continental Airls Inc Pj
| | 5.13% | | 09/15/23 | | 1,004,819 |
| 1,000,000 | | NJ St Econ Dev Auth Spl Fac Rev Ref Port Newark Container Terminal LLC Proj, AMT
| | 5.00% | | 10/01/23 | | 1,008,595 |
| 655,000 | | NJ St Hgr Edu Asst Auth Stdt Loan Rev, Ser B, AMT
| | 5.00% | | 12/01/25 | | 688,401 |
| 2,000,000 | | NJ St Hlth Care Facs Fing Auth Rev Ref Rwj Barnabas Hlth Oblig Grp Issue, Ser B-2 (Mandatory put 07/01/25)
| | 5.00% | | 07/01/42 | | 2,111,823 |
| 200,000 | | NJ St Hlth Care Facs Fing Auth Rev Ref Rwj Barnabas Hlth Oblig Grp Issue, Ser B-3 (Mandatory put 07/01/26)
| | 5.00% | | 07/01/45 | | 215,207 |
| 1,000,000 | | NJ St Hsg & Mtge Fin Agy Rev Ref Sf Hsg, Ser D, AMT
| | 4.00% | | 04/01/24 | | 1,007,145 |
| 85,000 | | NJ St Transprtn Trust Fund Auth Cap Apprec Transprtn Sys, Ser C, AMBAC
| | (c) | | 12/15/25 | | 78,177 |
| 225,000 | | NJ St Transprtn Trust Fund Auth Fed Hwy Reimb Nts, Ser A-1, GARVEE
| | 5.00% | | 06/15/27 | | 242,684 |
| 260,000 | | NJ St Transprtn Trust Fund Auth Ref Fed Hwy Reimb Nts, Ser A, GARVEE
| | 5.00% | | 06/15/29 | | 279,763 |
| 875,000 | | Tobacco Stlmt Fing Corp NJ Ref, Ser A
| | 5.00% | | 06/01/23 | | 881,467 |
| 1,000,000 | | Tobacco Stlmt Fing Corp NJ Ref, Ser A
| | 5.00% | | 06/01/24 | | 1,021,916 |
| | | | | 20,316,634 |
| | | New Mexico – 0.7% | | | | | | |
| 1,000,000 | | Farmington NM Poll Control Rev Var Ref Pub Svc Co of NM San Juan Proj Remk, Ser D (Mandatory put 06/01/23)
| | 1.10% | | 06/01/40 | | 991,202 |
| 2,000,000 | | NM Fin Auth Rev Sub, Ser B
| | 5.00% | | 06/15/24 | | 2,072,656 |
| | | | | 3,063,858 |
| | | New York – 3.6% | | | | | | |
| 1,275,000 | | Hempstead NY Union Free Sch Dist for 2022-2023 St Aid, RANS
| | 3.75% | | 06/30/23 | | 1,278,615 |
| 155,000 | | Hudson Yards Infra Corp NY 2nd Indenture Rev Ref, Ser A
| | 5.00% | | 02/15/30 | | 171,107 |
| 350,000 | | Lackawanna NY Ref, Ser B, BAM
| | 5.00% | | 11/01/25 | | 374,398 |
| 125,000 | | Long Beach NY, Ser B
| | 5.50% | | 07/15/25 | | 132,184 |
| 200,000 | | New York City NY Hsg Dev Corp Mf Hsg Rev Sustainable Dev Bond, Ser E-1
| | 1.55% | | 05/01/23 | | 199,390 |
| 2,000,000 | | New York City NY Hsg Dev Corp Mf Hsg Rev Sustainable Dev Bonds, Ser F-2A (Mandatory put 12/22/26)
| | 3.40% | | 11/01/62 | | 2,017,354 |
| 1,350,000 | | New York City NY Muni Wtr Fin Auth Wtr & Swr Sys Rev 2nd General Resolution, Ser DD
| | 5.00% | | 06/15/35 | | 1,390,538 |
| 3,000,000 | | New York City NY Muni Wtr Fin Auth Wtr & Swr Sys Rev Var Ref Sub 2nd General Resolution, Ser DD (d)
| | 1.50% | | 06/15/33 | | 3,000,000 |
| 340,000 | | New York City NY Transitional Fin Auth Bldg Aid Rev Ref Fiscal 2018, Ser S-1
| | 5.00% | | 07/15/35 | | 374,107 |
Page 20
See Notes to Financial Statements
First Trust Short Duration Managed Municipal ETF (FSMB)
Portfolio of Investments (Continued)
January 31, 2023 (Unaudited)
Principal
Value | | Description | | Stated
Coupon | | Stated
Maturity | | Value |
| MUNICIPAL BONDS (Continued) |
| | | New York (Continued) | | | | | | |
| $735,000 | | New York City NY Transitional Fin Auth Rev Ref Sub Future Tax Secured, Ser F, Subser F-1
| | 5.00% | | 11/01/23 | | $749,490 |
| 200,000 | | New York City NY Transitional Fin Auth Rev Sub Future Tax Secured Fiscal 2017, Subser A-1
| | 4.00% | | 05/01/31 | | 209,236 |
| 1,000,000 | | NY NY Adj Fiscal 2020, Subser B-3 (d)
| | 1.50% | | 10/01/46 | | 1,000,000 |
| 570,000 | | NY NY Prerefunded, Subser F-1 (Pre-refunded maturity 03/01/23)
| | 5.00% | | 03/01/37 | | 571,185 |
| 1,000,000 | | NY NY Ref, Ser B-1
| | 5.00% | | 08/01/24 | | 1,039,094 |
| 270,000 | | NY St Transprtn Dev Corp Spl Fac Rev Laguardia Arpt Term B Redev Proj, Ser A-P3, AMT, AGM
| | 4.00% | | 07/01/35 | | 270,721 |
| 405,000 | | NY St Transprtn Dev Corp Spl Fac Rev Ref American Airls Inc John F Kennedy Intl Arpt Proj, AMT
| | 2.25% | | 08/01/26 | | 382,692 |
| 125,000 | | NY St Transprtn Dev Corp Spl Fac Rev Rev Ref Terminal 4 JFK Intl Arpt Proj, Ser C
| | 5.00% | | 12/01/25 | | 132,805 |
| 180,000 | | Onondaga NY Civic Dev Corp Le Moyne Clg Proj
| | 5.00% | | 07/01/26 | | 188,820 |
| 340,000 | | Port Auth of NY & NJ NY Consol One Hundred Eighty Fifth Ref, AMT
| | 4.00% | | 09/01/34 | | 343,610 |
| 1,180,000 | | Port Auth of NY & NJ NY Ref, 194th Ser
| | 5.00% | | 10/15/34 | | 1,260,796 |
| 375,000 | | Westhill NY Centrl Sch Dist, BANS
| | 4.00% | | 06/28/23 | | 376,975 |
| | | | | 15,463,117 |
| | | North Carolina – 2.6% | | | | | | |
| 3,035,000 | | Charlotte Mecklenburg NC Hosp Auth Hlth Care Sys Rev Var Atrium Hlth, Ser C (Mandatory put 03/01/23)
| | 5.00% | | 01/15/48 | | 3,040,859 |
| 1,000,000 | | Columbus Cnty NC Indl Facs & Poll Control Fing Auth Rev Var Ref Intl Paper CO Proj, Ser A (Mandatory put 06/16/25)
| | 1.38% | | 05/01/34 | | 941,138 |
| 400,000 | | NC St Capital Facs Fin Agy Eductnl Facs Rev Ref High Point Univ
| | 5.00% | | 05/01/28 | | 443,593 |
| 3,215,000 | | NC St Med Care Commn Hosp Rev Caromont Hlth, Ser B (Mandatory put 02/01/26)
| | 5.00% | | 02/01/51 | | 3,438,770 |
| 865,000 | | NC St Med Care Commn Retmnt Facs Rev Ref 1st Mtge Aldersgate
| | 5.13% | | 07/01/23 | | 873,699 |
| 1,500,000 | | NC St Turnpike Auth, BANS
| | 5.00% | | 02/01/24 | | 1,535,221 |
| 170,000 | | Raleigh Durham NC Arpt Auth Arpt Rev Ref Ser A, AMT
| | 5.00% | | 05/01/29 | | 190,830 |
| 580,000 | | Raleigh Durham NC Arpt Auth Arpt Rev Ref, Ser A, AMT
| | 5.00% | | 05/01/35 | | 615,361 |
| | | | | 11,079,471 |
| | | North Dakota – 0.6% | | | | | | |
| 1,400,000 | | Cass Cnty ND Jt Wtr Res Dist, Ser A
| | 0.48% | | 05/01/24 | | 1,345,615 |
| 50,000 | | Grand Forks ND Hlthcare Sys Rev Altru Hlth Sys Ref
| | 5.00% | | 12/01/25 | | 52,550 |
| 50,000 | | Grand Forks ND Hlthcare Sys Rev Altru Hlth Sys Ref
| | 5.00% | | 12/01/26 | | 53,409 |
| 200,000 | | Horace ND Ref
| | 3.00% | | 05/01/25 | | 195,609 |
| 1,000,000 | | Larimore ND Loan Anticipation Temp Impt Bonds
| | 0.85% | | 05/01/24 | | 963,493 |
| | | | | 2,610,676 |
| | | Ohio – 2.5% | | | | | | |
| 75,000 | | NE OH Med Univ Gen Recpts Ref, Ser A
| | 5.00% | | 12/01/24 | | 77,446 |
| 1,000,000 | | NW OH Loc Sch Dist Hamilton & Butler Cntys Sch Impt (Pre-refunded maturity 12/01/23)
| | 5.00% | | 12/01/45 | | 1,021,258 |
| 1,000,000 | | OH St Air Quality Dev Auth American Elec Pwr Co Proj Remk, Ser A (Mandatory put 10/01/29)
| | 2.40% | | 12/01/38 | | 911,430 |
| 1,000,000 | | OH St Air Quality Dev Auth OH Vly Elec Corp Proj Remk, Ser C (Mandatory put 11/04/25)
| | 1.50% | | 02/01/26 | | 928,399 |
| 750,000 | | OH St Air Quality Dev Auth Ref American Elec Pwr Company Proj Remk, Ser B, AMT (Mandatory put 10/01/24)
| | 2.10% | | 07/01/28 | | 728,271 |
See Notes to Financial Statements
Page 21
First Trust Short Duration Managed Municipal ETF (FSMB)
Portfolio of Investments (Continued)
January 31, 2023 (Unaudited)
Principal
Value | | Description | | Stated
Coupon | | Stated
Maturity | | Value |
| MUNICIPAL BONDS (Continued) |
| | | Ohio (Continued) | | | | | | |
| $2,700,000 | | OH St Air Quality Dev Auth Var OH Vly Elec Corp Proj Remk, Ser B (Mandatory put 11/01/24)
| | 1.38% | | 02/01/26 | | $2,569,807 |
| 870,000 | | OH St Air Quality Dev Auth Var Ref Duke Energy Corp Proj, Ser A, AMT (Mandatory put 06/01/27)
| | 4.25% | | 11/01/39 | | 891,734 |
| 1,000,000 | | OH St Hgr Eductnl Fac Commn Kenyon Clg Proj (Forward refunding maturity 07/01/23)
| | 5.00% | | 07/01/37 | | 1,009,131 |
| 1,500,000 | | OH St Hgr Eductnl Fac Commn Ref Case Western Reserve Univ Proj
| | 5.00% | | 12/01/23 | | 1,531,886 |
| 200,000 | | OH St Hosp Fac Rev Ref Cleveland Clinic Hlth Sys, Ser A
| | 5.00% | | 01/01/25 | | 209,500 |
| 235,000 | | OH St Hosp Fac Rev Ref Cleveland Clinic Hlth Sys, Ser A
| | 5.00% | | 01/01/33 | | 262,897 |
| 500,000 | | OH St Hosp Rev Ref Var Univ Hosps Hlth Sys Inc, Ser C (d)
| | 1.95% | | 01/15/51 | | 500,000 |
| | | | | 10,641,759 |
| | | Oklahoma – 0.4% | | | | | | |
| 300,000 | | Oklahoma Cnty OK Fin Auth Eductnl Facs Lease Rev Midwest City De City Pub Schs Proj
| | 5.00% | | 10/01/26 | | 325,431 |
| 1,000,000 | | Tahlequah OK Pub Facs Auth Sales Tax Rev, Ser B
| | 3.25% | | 04/01/28 | | 994,747 |
| 200,000 | | Tulsa OK Arpts Impt Trust Arpt, Ser A, AMT, AGM
| | 4.00% | | 06/01/25 | | 204,079 |
| | | | | 1,524,257 |
| | | Oregon – 0.4% | | | | | | |
| 260,000 | | Port of Portland OR Arpt Rev Portland Intl Arpt, Ser 25B, AMT
| | 5.00% | | 07/01/27 | | 282,693 |
| 130,000 | | Port of Portland OR Arpt Rev, Ser 24B, AMT
| | 5.00% | | 07/01/33 | | 138,835 |
| 260,000 | | Salem OR Hosp Fac Auth Rev Ref Capital Manor Proj
| | 5.00% | | 05/15/25 | | 261,934 |
| 265,000 | | Salem OR Hosp Fac Auth Rev Ref Capital Manor Proj
| | 5.00% | | 05/15/26 | | 266,975 |
| 100,000 | | Union Cnty OR Hosp Fac Auth Grande Ronde Hosp
| | 5.00% | | 07/01/25 | | 103,994 |
| 100,000 | | Union Cnty OR Hosp Fac Auth Grande Ronde Hosp
| | 5.00% | | 07/01/26 | | 105,494 |
| 680,000 | | Yamhill Cnty OR Hosp Auth Friendsview Temps 50, Ser B-3
| | 1.75% | | 11/15/26 | | 630,121 |
| | | | | 1,790,046 |
| | | Pennsylvania – 5.5% | | | | | | |
| 1,500,000 | | Allegheny Cnty PA Indl Dev Auth Envrnmtl Impt Rev Ref United States Steel Corp Proj
| | 4.88% | | 11/01/24 | | 1,509,500 |
| 315,000 | | Allegheny Vly PA Jt Sewage Auth Green Bond, BAM
| | 4.00% | | 08/01/25 | | 326,991 |
| 495,000 | | Cmwlth Fing Auth PA Tobacco Master Stlmt Payment Rev Tobacco Master Stlmt Payment Bonds
| | 5.00% | | 06/01/23 | | 498,762 |
| 235,000 | | Cmwlth Fing Auth PA Tobacco Master Stlmt Payment Rev Tobacco Master Stlmt Payment Bonds
| | 5.00% | | 06/01/26 | | 252,437 |
| 295,000 | | Cumberland Cnty PA Muni Auth Ref Messiah Vlg Proj
| | 5.00% | | 07/01/23 | | 295,540 |
| 660,000 | | Dauphin Cnty PA Gen Auth Hlth Sys Rev Ref Pinnacle Hlth Sys Proj, Ser A
| | 4.00% | | 06/01/32 | | 676,131 |
| 265,000 | | Deer Creek PA Drain Basin Allegheny Cnty Swr Rev Ref, AGM
| | 5.00% | | 12/01/26 | | 290,395 |
| 90,000 | | E Hempfield Twp PA Indl Dev Auth Ref Willow Vly Cmntys Proj
| | 5.00% | | 12/01/24 | | 93,440 |
| 175,000 | | E Hempfield Twp PA Indl Dev Auth Ref Willow Vly Cmntys Proj
| | 5.00% | | 12/01/25 | | 185,191 |
| 390,000 | | E Hempfield Twp PA Indl Dev Auth Ref Willow Vly Cmntys Proj
| | 5.00% | | 12/01/28 | | 411,778 |
| 170,000 | | E Hempfield Twp PA Indl Dev Auth Ref Willow Vly Cmntys Proj
| | 5.00% | | 12/01/30 | | 179,092 |
| 50,000 | | Erie PA Hgr Edu Bldg Auth Aicup Fing Prog Gannon Uni Proj Ref, Ser TT1
| | 5.00% | | 05/01/24 | | 50,759 |
| 75,000 | | Erie PA Hgr Edu Bldg Auth Aicup Fing Prog Gannon Uni Proj Ref, Ser TT1
| | 5.00% | | 05/01/25 | | 77,153 |
| 75,000 | | Erie PA Hgr Edu Bldg Auth Aicup Fing Prog Gannon Uni Proj Ref, Ser TT1
| | 5.00% | | 05/01/26 | | 78,075 |
| 500,000 | | Lancaster PA Ref, BAM
| | 5.00% | | 05/01/25 | | 527,185 |
| 80,000 | | Latrobe PA Indl Dev Auth Univ Rev Ref Seton Hill Univ
| | 5.00% | | 03/01/24 | | 81,087 |
| 150,000 | | Latrobe PA Indl Dev Auth Univ Rev Ref Seton Hill Univ
| | 5.00% | | 03/01/25 | | 153,818 |
Page 22
See Notes to Financial Statements
First Trust Short Duration Managed Municipal ETF (FSMB)
Portfolio of Investments (Continued)
January 31, 2023 (Unaudited)
Principal
Value | | Description | | Stated
Coupon | | Stated
Maturity | | Value |
| MUNICIPAL BONDS (Continued) |
| | | Pennsylvania (Continued) | | | | | | |
| $255,000 | | Lehigh Cnty PA Gen Purp Auth Revs Ref Lehigh Carbon Cmnty Clg, Ser 2016, BAM
| | 5.00% | | 11/01/26 | | $275,013 |
| 1,000,000 | | Lehigh Cnty PA Indl Dev Auth Ref Ppl Ele Util Corp Proj 2016 Remk, Ser B
| | 2.63% | | 02/15/27 | | 984,114 |
| 175,000 | | Montgomery Cnty PA Indl Dev Auth Ref Waverly Heights Ltd Proj
| | 4.00% | | 12/01/26 | | 180,211 |
| 2,000,000 | | N Wales PA Wtr Auth Ref
| | 3.00% | | 11/01/23 | | 2,006,004 |
| 400,000 | | Northampton Cnty PA Gen Purp Auth Clg Rev Ref Moravian Clg
| | 5.00% | | 10/01/25 | | 416,115 |
| 210,000 | | Northampton Cnty PA Gen Purp Auth Clg Rev Ref Moravian Clg
| | 5.00% | | 10/01/27 | | 221,426 |
| 150,000 | | Northampton Cnty PA Gen Purp Auth Clg Rev Ref Moravian Clg
| | 5.00% | | 10/01/30 | | 158,077 |
| 185,000 | | PA St 1st, Ser 2020
| | 5.00% | | 05/01/29 | | 214,904 |
| 180,000 | | PA St Econ Dev Fing Auth Rev Ref Upmc
| | 4.00% | | 03/15/35 | | 183,143 |
| 2,100,000 | | PA St Econ Dev Fing Auth T/E Priv Activity Rev The Penndot Major Bridges Package One Proj P3 Proj, AMT
| | 5.00% | | 12/31/29 | | 2,308,163 |
| 545,000 | | PA St Econ Dev Fing Auth Upmc Rev Ref, Ser A
| | 5.00% | | 11/15/29 | | 604,643 |
| 465,000 | | PA St Hsg Fin Agy SF Mtge Rev Non Ace, Ser 123B
| | 3.45% | | 10/01/32 | | 463,375 |
| 405,000 | | PA St Ref, Ser 1
| | 5.00% | | 09/15/27 | | 444,664 |
| 720,000 | | PA St Turnpike Commn Turnpike Rev Ref Sub, Ser B
| | 5.00% | | 06/01/28 | | 773,934 |
| 80,000 | | PA St Turnpike Commn Turnpike Rev Ref Sub, Ser B
| | 5.00% | | 06/01/39 | | 83,435 |
| 200,000 | | PA St Turnpike Commn Turnpike Rev Subord, Ser A-1
| | 5.00% | | 12/01/30 | | 213,445 |
| 500,000 | | Philadelphia PA Arpt Rev Ref, Ser A
| | 5.00% | | 07/01/23 | | 504,877 |
| 825,000 | | Philadelphia PA Auth for Indl Dev Chrt Sch Rev Ref String Theory Chrt Sch Proj (a)
| | 4.00% | | 06/15/23 | | 825,421 |
| 570,000 | | Philadelphia PA Auth for Indl Dev Chrt Sch Rev Ref String Theory Chrt Sch Proj (a)
| | 5.00% | | 06/15/24 | | 578,332 |
| 300,000 | | Philadelphia PA Auth for Indl Dev Chrt Sch Rev Ref String Theory Chrt Sch Proj (a)
| | 5.00% | | 06/15/25 | | 307,113 |
| 330,000 | | Philadelphia PA Auth for Indl Dev Temple Univ Rev Ref 1st, Ser 2015
| | 5.00% | | 04/01/27 | | 347,150 |
| 35,000 | | Philadelphia PA Ref, Ser A
| | 5.00% | | 08/01/27 | | 38,939 |
| 435,000 | | Philadelphia PA, Ser B
| | 4.00% | | 08/01/35 | | 442,694 |
| 1,200,000 | | Pittsburgh PA Wtr & Swr Auth Ref 1st Lien, Ser A
| | 5.00% | | 09/01/23 | | 1,217,007 |
| 1,000,000 | | Scranton PA Sch Dist Ref (b)
| | 5.00% | | 12/01/23 | | 1,016,025 |
| 820,000 | | Scranton PA Sch Dist Ref, Ser D
| | 5.00% | | 06/01/27 | | 868,115 |
| 325,000 | | Westmoreland Cnty PA Muni Auth Ref, BAM
| | 5.00% | | 08/15/25 | | 344,521 |
| 1,240,000 | | Wilkes-Barre PA Area Sch Dist, Ser B, BAM
| | 5.00% | | 08/01/27 | | 1,363,752 |
| 375,000 | | Wyoming PA Area Sch Dist Ref, Ser A, AGM
| | 4.00% | | 11/01/24 | | 385,522 |
| | | | | 23,457,468 |
| | | Puerto Rico – 0.3% | | | | | | |
| 798,657 | | Puerto Rico Cmwlth Restructured, Ser A, CABS
| | (c) | | 07/01/24 | | 748,297 |
| 299,000 | | Puerto Rico Sales Tax Fing Corp Sales Tax Rev Restructured, Ser A-1, CABS
| | (c) | | 07/01/24 | | 281,817 |
| 328,000 | | Puerto Rico Sales Tax Fing Corp Sales Tax Rev Restructured, Ser A-1, CABS
| | (c) | | 07/01/27 | | 270,862 |
| | | | | 1,300,976 |
| | | Rhode Island – 0.5% | | | | | | |
| 1,670,000 | | Providence RI Pub Bldgs Auth Rev, Ser A, AGM
| | 5.00% | | 09/15/30 | | 1,896,784 |
| 445,000 | | RI St Hlth & Eductnl Bldg Corp Pub Schs Rev Ref Providence Pub Bldg Auth, AGM
| | 5.00% | | 05/15/28 | | 470,163 |
| | | | | 2,366,947 |
| | | South Carolina – 0.6% | | | | | | |
| 1,000,000 | | Saxe Gotha Lexington Pub Facs Corp SC Rev Corley Mill Redev Proj Area, BANS
| | 2.00% | | 03/17/23 | | 998,668 |
See Notes to Financial Statements
Page 23
First Trust Short Duration Managed Municipal ETF (FSMB)
Portfolio of Investments (Continued)
January 31, 2023 (Unaudited)
Principal
Value | | Description | | Stated
Coupon | | Stated
Maturity | | Value |
| MUNICIPAL BONDS (Continued) |
| | | South Carolina (Continued) | | | | | | |
| $850,000 | | SC St Jobs Econ Dev Auth Econ Dev Rev Ref The Woodlands at Furman
| | 4.00% | | 11/15/27 | | $823,651 |
| 250,000 | | SC St Pub Svc Auth Rev Ref, Ser A
| | 5.00% | | 12/01/24 | | 260,010 |
| 625,000 | | SC St Pub Svc Auth Rev Ref, Ser A
| | 5.00% | | 12/01/30 | | 663,232 |
| | | | | 2,745,561 |
| | | South Dakota – 0.5% | | | | | | |
| 355,000 | | SD St Hlth & Eductnl Facs Auth Ref Sanford Oblig Grp
| | 5.00% | | 11/01/27 | | 377,868 |
| 330,000 | | SD St Hlth & Eductnl Facs Auth Ref Sanford Oblig Grp
| | 5.00% | | 11/01/35 | | 344,688 |
| 100,000 | | SD St Hlth & Eductnl Facs Auth Ref Westhills Vlg Retmnt Cmnty Issue
| | 3.00% | | 09/01/25 | | 99,547 |
| 150,000 | | SD St Hlth & Eductnl Facs Auth Ref Westhills Vlg Retmnt Cmnty Issue
| | 3.00% | | 09/01/26 | | 149,534 |
| 990,000 | | SD St Hsg Dev Auth Ref Homeownership Mtge, Ser E, AMT
| | 2.80% | | 11/01/25 | | 978,276 |
| | | | | 1,949,913 |
| | | Tennessee – 2.2% | | | | | | |
| 145,000 | | Met Govt Nashville & Davidson Cnty TN Hlth & Eductnl Fac Brd Trevecca Nazarene Univ Proj, Ser B
| | 4.00% | | 10/01/26 | | 145,335 |
| 450,000 | | Met Nashville TN Arpt Auth Arpt Rev, Ser B, AMT
| | 5.00% | | 07/01/27 | | 488,304 |
| 2,000,000 | | Montgomery Cnty TN Ref, Ser A
| | 5.00% | | 04/01/24 | | 2,060,773 |
| 300,000 | | Tennergy Corp TN Gas Rev, Ser A
| | 4.00% | | 09/01/25 | | 304,748 |
| 500,000 | | Tennergy Corp TN Gas Rev, Ser A
| | 4.00% | | 03/01/26 | | 509,416 |
| 1,500,000 | | TN St Energy Acq Corp Gas Rev (Mandatory put 11/01/25)
| | 4.00% | | 11/01/49 | | 1,507,560 |
| 3,450,000 | | TN St Energy Acq Corp Gas Rev Proj, Ser A (Mandatory put 05/01/23)
| | 4.00% | | 05/01/48 | | 3,453,690 |
| 765,000 | | TN St Energy Acq Corp Gas Rev, Ser A
| | 5.25% | | 09/01/26 | | 797,829 |
| | | | | 9,267,655 |
| | | Texas – 12.0% | | | | | | |
| 250,000 | | Arlington TX Hgr Edu Fin Corp Edu Rev Ref Uplift Edu, Ser A
| | 4.00% | | 12/01/30 | | 262,492 |
| 150,000 | | Arlington Tx Hgr Edu Fin Corp Edu Rev Trinity Basin Preparatory Inc
| | 5.00% | | 08/15/28 | | 166,600 |
| 150,000 | | Arlington TX Hgr Edu Fin Corp Edu Rev Trinity Basin Preparatory Inc
| | 5.00% | | 08/15/27 | | 163,777 |
| 500,000 | | Austin TX Arpt Sys Rev, AMT
| | 5.00% | | 11/15/25 | | 528,193 |
| 250,000 | | Austin TX Arpt Sys Rev, AMT
| | 5.00% | | 11/15/28 | | 258,277 |
| 500,000 | | Austin TX Arpt Sys Rev, AMT
| | 5.00% | | 11/15/33 | | 514,494 |
| 2,000,000 | | Austin TX Ref
| | 3.15% | | 09/01/28 | | 2,030,431 |
| 125,000 | | Bexar Cnty TX Hlth Facs Dev Corp Ref Army Retmnt Residence Fndtn Proj
| | 5.00% | | 07/15/23 | | 125,271 |
| 320,000 | | Brazoria Cnty TX Muni Util Dist #55, BAM
| | 4.00% | | 09/01/25 | | 328,258 |
| 240,000 | | Brazoria Cnty TX Ref
| | 5.00% | | 03/01/27 | | 259,081 |
| 295,000 | | Celina TX Spl Assmt Rev Ref The Lakes at Mustang Ranch Pub Impt Dt Phase #1 Proj, BAM
| | 4.00% | | 09/01/24 | | 300,172 |
| 290,000 | | Centrl TX Regl Mobility Auth Rev Ref
| | 5.00% | | 01/01/27 | | 309,269 |
| 250,000 | | Centrl TX Regl Mobility Auth Rev, Ser C
| | 5.00% | | 01/01/27 | | 265,960 |
| 150,000 | | Chisum TX Indep Sch Dist Ref Sch Bldg
| | 5.00% | | 08/15/23 | | 152,045 |
| 35,000 | | Clifton TX Hgr Edu Fin Corp Edu Rev Idea Pub Schs, Ser B
| | 5.00% | | 08/15/24 | | 36,035 |
| 150,000 | | Club Muni Mgmt Dist #1 TX Spl Assmnt Rev Impt Area #2 Proj (a)
| | 2.50% | | 09/01/26 | | 138,183 |
| 1,000,000 | | Collin Cnty TX Ref
| | 4.00% | | 02/15/27 | | 1,050,353 |
| 400,000 | | Corpus Christi TX Util Sys Rev Junior Lien, Ser B
| | 5.00% | | 07/15/26 | | 434,341 |
| 207,000 | | Crandall TX Spl Assmnt Rev Cartwright Ranch Pub Impt Dt Impt Area #1 Proj (a)
| | 3.38% | | 09/15/26 | | 192,519 |
Page 24
See Notes to Financial Statements
First Trust Short Duration Managed Municipal ETF (FSMB)
Portfolio of Investments (Continued)
January 31, 2023 (Unaudited)
Principal
Value | | Description | | Stated
Coupon | | Stated
Maturity | | Value |
| MUNICIPAL BONDS (Continued) |
| | | Texas (Continued) | | | | | | |
| $100,000 | | Cypress Fairbanks TX Indep Sch Dist Ref Sch Bldg
| | 5.00% | | 02/15/27 | | $108,175 |
| 1,000,000 | | Dallas TX Hotel Occupancy Tax Rev Ref
| | 4.00% | | 08/15/30 | | 1,024,818 |
| 1,000,000 | | Denton Cnty TX Hsg Fin Corp Var Pathway on Woodrow Apts (Mandatory put 02/01/25)
| | 5.00% | | 02/01/26 | | 1,036,987 |
| 1,005,000 | | Fort Bend Cnty TX Muni Util Dist #182, BAM
| | 5.25% | | 09/01/26 | | 1,094,327 |
| 280,000 | | Fort Bend Cnty TX Muni Util Dist #184, BAM
| | 6.00% | | 04/01/27 | | 316,001 |
| 295,000 | | Fort Bend Cnty TX Muni Util Dist #184, BAM
| | 6.00% | | 04/01/28 | | 332,419 |
| 265,000 | | Fort Bend Cnty TX Muni Util Dist #58, AGM
| | 4.00% | | 04/01/25 | | 273,901 |
| 840,000 | | Fort Bend TX Indep Sch Dist Ref
| | 5.00% | | 08/15/26 | | 921,011 |
| 1,250,000 | | Fort Bend TX Indep Sch Dist Var Remk, Ser A (Mandatory put 08/01/24)
| | 2.38% | | 08/01/49 | | 1,238,321 |
| 585,000 | | Fort Bend TX Muni Util Dist #169 Contract Rev Road Facs, Ser B, BAM
| | 4.00% | | 12/01/25 | | 610,725 |
| 585,000 | | Fort Bend TX Muni Util Dist #169 Contract Rev Road Facs, Ser B, BAM
| | 4.00% | | 12/01/26 | | 619,246 |
| 465,000 | | Galveston Cnty TX Muni Util Dist #54 Ref
| | 2.00% | | 12/01/25 | | 435,756 |
| 560,000 | | Galveston Cnty TX Muni Util Dist #54 Ref
| | 2.00% | | 12/01/27 | | 506,377 |
| 1,500,000 | | Grayson Cnty TX Ref
| | 3.00% | | 01/01/26 | | 1,498,143 |
| 1,475,000 | | Harris Cnty TX Cultural Edu Facs Fin Corp Med Facs Rev Ref Baylor Clg of Med
| | 5.00% | | 11/15/23 | | 1,502,114 |
| 1,000,000 | | Harris Cnty TX Cultural Edu Facs Fin Corp Rev Memorial Herman Hlth Sys, Ser A
| | 5.00% | | 12/01/26 | | 1,044,657 |
| 1,340,000 | | Harris Cnty TX Cultural Edu Facs Fin Corp Rev Var Memorial Hermann Hlth System, Ser B-2 (Mandatory put 12/01/24)
| | 5.00% | | 07/01/49 | | 1,392,191 |
| 1,000,000 | | Harris Cnty TX Cultural Edu Facs Fin Corp Thermal Util Re Ref Teco Proj
| | 5.00% | | 11/15/29 | | 1,120,931 |
| 230,000 | | Harris Cnty TX Muni Util Dist #536, BAM
| | 5.50% | | 09/01/26 | | 251,736 |
| 240,000 | | Harris Cnty TX Muni Util Dist #536, BAM
| | 5.50% | | 09/01/27 | | 267,698 |
| 100,000 | | Houston TX Arpt Sys Rev Ref Sub, Ser B
| | 5.00% | | 07/01/26 | | 108,970 |
| 900,000 | | Houston TX Arpt Sys Rev Ref United Airls Inc Terminal Impt Proj, Ser B-2, AMT
| | 5.00% | | 07/15/27 | | 925,162 |
| 200,000 | | Houston TX Arpt Sys Rev Sub, Ser A, AMT
| | 5.00% | | 07/01/28 | | 220,104 |
| 625,000 | | Kingsville TX Ctfs Oblig, BAM
| | 2.00% | | 08/01/23 | | 622,083 |
| 975,000 | | La Vernia TX Hgr Edu Fin Corp Edu Rev Meridian World Sch, Ser A (Pre-refunded maturity 08/15/24) (a)
| | 5.25% | | 08/15/35 | | 1,015,031 |
| 1,300,000 | | Love Field TX Arpt Modernization Corp Gen Arpt Rev, AMT
| | 5.00% | | 11/01/23 | | 1,318,348 |
| 405,000 | | Love Field TX Arpt Modernization Corp Gen Arpt Rev, AMT
| | 5.00% | | 11/01/31 | | 431,856 |
| 435,000 | | Lower CO River TX Auth Trans Contract Rev Ref
| | 5.00% | | 05/15/23 | | 437,830 |
| 1,500,000 | | Matagorda Cnty TX Nav Dist #1 Var Rev Cent Pwr & Lt Ref Remk, AMT (Mandatory put 09/01/23)
| | 0.90% | | 05/01/30 | | 1,470,788 |
| 200,000 | | Mcallen TX Indep Sch Dist Ref, Ser A
| | 5.00% | | 02/15/23 | | 200,187 |
| 275,000 | | Mclendon Chisholm TX Spl Assmnt Rev Ref Sonoma Pub Impt Dt Phase 1 Proj, BAM
| | 4.00% | | 09/15/24 | | 280,605 |
| 440,000 | | Montgomery Cnty TX Muni Util Dist #105, BAM
| | 4.63% | | 09/01/25 | | 463,745 |
| 450,000 | | Montgomery Cnty TX Muni Util Dist #105, BAM
| | 4.63% | | 09/01/26 | | 482,650 |
| 400,000 | | N Parkway Muni Mgmt Dist #1 TX Contract Rev Legacy Hills Pub Impt Dt Phase #1A-1B Impts (a)
| | 3.00% | | 09/15/26 | | 377,160 |
| 140,000 | | N TX Tollway Auth Rev Ref 1st Tier, Ser A
| | 5.00% | | 01/01/36 | | 150,000 |
| 45,000 | | N TX Tollway Auth Rev Ref 2nd Tier, Ser B
| | 5.00% | | 01/01/31 | | 47,941 |
| 1,000,000 | | N TX Tollway Auth Rev Ref First Tier Bonds, Ser A
| | 5.00% | | 01/01/26 | | 1,072,373 |
| 150,000 | | N TX Tollway Auth Rev Ref Second Tier Bonds, Ser C
| | 5.00% | | 01/01/27 | | 163,978 |
| 105,000 | | N TX Tollway Auth Rev Ref Sys 1st Tier, Ser A
| | 5.00% | | 01/01/25 | | 107,371 |
| 1,000,000 | | N TX Tollway Auth Rev Ref, Ser A
| | 5.00% | | 01/01/25 | | 1,022,580 |
| 300,000 | | N TX Tollway Auth Rev Second Tier, Ser B
| | 5.00% | | 01/01/27 | | 327,957 |
| 10,000 | | N TX Tollway Auth Rev Unrefunded Ref 2nd Tier, Ser B
| | 5.00% | | 01/01/24 | | 10,023 |
See Notes to Financial Statements
Page 25
First Trust Short Duration Managed Municipal ETF (FSMB)
Portfolio of Investments (Continued)
January 31, 2023 (Unaudited)
Principal
Value | | Description | | Stated
Coupon | | Stated
Maturity | | Value |
| MUNICIPAL BONDS (Continued) |
| | | Texas (Continued) | | | | | | |
| $635,000 | | New Hope Cultural Edu Facs Fin Corp TX Edu Rev Ref Jubilee Acad Ctr (a)
| | 4.00% | | 08/15/25 | | $633,628 |
| 40,000 | | New Hope Cultural Edu Facs Fin Corp TX Retmnt Fac Rev Ref Wesleyan Homes Inc Proj Fin Corp
| | 3.00% | | 01/01/24 | | 39,063 |
| 1,490,000 | | New Hope Cultural Edu Facs Fin Corp TX Stdt Hsg Rev Chf Clegiate Hsg San Antonio I-Tx A&M Univ-San Antonio, Ser A (Pre-refunded maturity 04/01/26)
| | 5.00% | | 04/01/48 | | 1,607,814 |
| 50,000 | | Oak Point TX Spl Assmnt Rev Wildridge Pub Impt Dist #1 Impt Area #2 Proj Accd Inv (a)
| | 3.50% | | 09/01/23 | | 49,841 |
| 1,280,000 | | Pasadena TX Indep Sch Dist Ref
| | 5.00% | | 02/15/24 | | 1,313,899 |
| 1,180,000 | | SA Energy Acq Pub Fac Corp TX Gas Sply Rev Gas Sply Rev
| | 5.50% | | 08/01/25 | | 1,231,822 |
| 1,000,000 | | Tarrant Cnty TX Cultural Edu Facs Fin Corp Hosp Rev Ref Baylor Scott & White Hlth Proj, Ser A
| | 5.00% | | 11/15/28 | | 1,075,475 |
| 500,000 | | Tarrant Cnty TX Cultural Edu Facs Fin Corp Hosp Rev Var Baylor Scott and White Hlth Proj, Ser E (Mandatory put 05/15/26)
| | 5.00% | | 11/15/52 | | 533,195 |
| 700,000 | | TX St Muni Gas Acq & Sply Corp III Gas Sply Rev Ref
| | 5.00% | | 12/15/25 | | 726,895 |
| 480,000 | | TX St Wtr Dev Brd St Wtr Implementation Fund, Ser A
| | 5.00% | | 04/15/25 | | 507,874 |
| 340,000 | | Univ of Houston TX Univ Revs Ref Consol, Ser C
| | 5.00% | | 02/15/30 | | 365,201 |
| 4,000,000 | | Univ of Texas TX Permanent Univ Fnd Permanent Univ Fund Bonds, Ser A
| | 5.00% | | 07/01/26 | | 4,372,572 |
| 1,650,000 | | Univ of Texas TX Univ Revs Ref, Ser H
| | 5.00% | | 08/15/25 | | 1,765,066 |
| 1,580,000 | | Univ of Texas TX Univ Revs, Ser D
| | 5.00% | | 08/15/26 | | 1,733,092 |
| 630,000 | | Viridian TX Muni Mgmt Dist Unlimited Tax Road Impt Bonds, BAM
| | 4.00% | | 12/01/29 | | 667,261 |
| 385,000 | | Wilbarger Creek TX Muni Util Dist #2, AGM
| | 4.00% | | 09/01/26 | | 406,502 |
| | | | | 51,397,227 |
| | | Utah – 0.4% | | | | | | |
| 1,745,000 | | Utah Cnty UT Hosp Rev Ihc Hlth Svcs Inc, Ser B-1 (Mandatory put 08/01/24)
| | 5.00% | | 05/15/60 | | 1,801,999 |
| | | Virginia – 2.1% | | | | | | |
| 850,000 | | Chesapeake VA Econ Dev Auth Poll Control Rev VA Elec & Pwr Co Remk, Ser 2008A (Mandatory put 06/01/23)
| | 1.90% | | 02/01/32 | | 845,115 |
| 310,000 | | Hampton Roads VA Santn Dist Wstwtr Rev Prerefunded Sub, Ser A (Pre-refunded maturity 08/01/26)
| | 5.00% | | 08/01/28 | | 339,795 |
| 1,490,000 | | Loudoun Cnty VA, Ser B
| | 4.00% | | 12/01/28 | | 1,534,887 |
| 1,525,000 | | Norfolk VA Wtr Rev Ref
| | 5.00% | | 11/01/31 | | 1,719,351 |
| 125,000 | | VA Clg Bldg Auth Eductnl Facs Rev Ref Regent Univ Proj
| | 5.00% | | 06/01/25 | | 128,548 |
| 125,000 | | VA Clg Bldg Auth Eductnl Facs Rev Ref Regent Univ Proj
| | 5.00% | | 06/01/26 | | 130,096 |
| 1,585,000 | | VA St Pub Bldg Auth Pub Facs Rev, Ser C, AMT
| | 5.00% | | 08/01/29 | | 1,689,526 |
| 2,000,000 | | VA St Ref, Ser B
| | 5.00% | | 06/01/23 | | 2,017,402 |
| 445,000 | | VA St Res Auth Clean Wtr Rev Ref Revolving Fund, Ser B
| | 4.00% | | 10/01/27 | | 459,288 |
| 200,000 | | Wise Cnty VA Indl Dev Auth Sol Wst & Sewage Disp Rev VA Elec & Pwr Co Remk, Ser A (Mandatory put 05/31/24)
| | 1.20% | | 11/01/40 | | 193,258 |
| | | | | 9,057,266 |
| | | Washington – 1.8% | | | | | | |
| 1,315,000 | | King Cnty WA Swr Rev Ref, Ser B
| | 5.00% | | 07/01/26 | | 1,362,880 |
| 1,500,000 | | Port of Seattle WA Rev Ref Intermediate Lien, Ser B, AMT
| | 5.00% | | 08/01/26 | | 1,608,520 |
| 150,000 | | Seattle WA Wtr Sys Rev Ref & Impt
| | 5.00% | | 05/01/28 | | 159,137 |
| 310,000 | | Tobacco Stlmt Auth WA Tobacco Stlmt Rev Ref
| | 5.00% | | 06/01/23 | | 312,446 |
| 100,000 | | WA St Hlth Care Facs Auth Ref Seattle Cancer Care Alliance
| | 5.00% | | 09/01/27 | | 109,046 |
| 300,000 | | WA St Hlthcare Facs Auth Seattle Cancer Care Alliance (a)
| | 5.00% | | 12/01/26 | | 323,946 |
Page 26
See Notes to Financial Statements
First Trust Short Duration Managed Municipal ETF (FSMB)
Portfolio of Investments (Continued)
January 31, 2023 (Unaudited)
Principal
Value | | Description | | Stated
Coupon | | Stated
Maturity | | Value |
| MUNICIPAL BONDS (Continued) |
| | | Washington (Continued) | | | | | | |
| $2,120,000 | | WA St Hsg Fin Commn Nonprofit Hsg Rev Heron’s Key, Ser A (Pre-refunded maturity 07/01/25) (a)
| | 7.00% | | 07/01/45 | | $2,314,700 |
| 1,555,000 | | WA St, Ser B, COPS
| | 5.00% | | 07/01/24 | | 1,611,397 |
| | | | | 7,802,072 |
| | | West Virginia – 0.7% | | | | | | |
| 1,650,000 | | Kanawha Cnty WV Cnty Commn Stdt Hsg Rev WV Univ Fndtn Proj (Pre-refunded maturity 07/01/23) (a)
| | 6.75% | | 07/01/45 | | 1,678,097 |
| 1,500,000 | | WV St Econ Dev Auth Sol Wst Disp Facs Var Sr Arch Res Proj, AMT (Mandatory put 07/01/25)
| | 5.00% | | 07/01/45 | | 1,510,539 |
| | | | | 3,188,636 |
| | | Wisconsin – 1.8% | | | | | | |
| 100,000 | | Pub Fin Auth WI Edu Rev Coral Acdmy of Science Las Vegas, Ser A
| | 4.00% | | 07/01/26 | | 99,856 |
| 185,000 | | Pub Fin Auth WI Eductnl Rev Piedmont Cmnty Chrt Sch
| | 5.00% | | 06/15/25 | | 190,656 |
| 4,000,000 | | Pub Fin Auth WI Poll Control Rev Var Ref Duke Engery Progress Proj, Ser A-1 (Mandatory put 10/01/26)
| | 3.30% | | 10/01/46 | | 4,071,828 |
| 285,000 | | Pub Fin Auth WI Retmnt Fac Rev Ref United Methodist Retmnt Homes, Ser A
| | 4.00% | | 10/01/25 | | 282,362 |
| 605,000 | | Pub Fin Auth WI Retmnt Fac Rev Ref United Methodist Retmnt Homes, Ser A
| | 4.00% | | 10/01/26 | | 596,462 |
| 325,000 | | Pub Fin Auth WI Retmnt Fac Rev Ref United Methodist Retmnt Homes, Ser A
| | 4.00% | | 10/01/29 | | 315,899 |
| 325,000 | | Pub Fin Auth WI Rev Roseman Univ of Hlth Sciences Proj (a)
| | 3.00% | | 04/01/25 | | 314,653 |
| 465,000 | | Racine Cnty WI Ref, Ser A
| | 1.00% | | 03/01/23 | | 464,093 |
| 275,000 | | WI St Clean Wtr Rev Ref (Pre-refunded maturity 06/01/24)
| | 5.00% | | 06/01/26 | | 284,219 |
| 810,000 | | WI St Hlth & Eductnl Facs Auth Rev Ref Ascension Hlth Credit Grp, Ser A
| | 5.00% | | 11/15/36 | | 845,970 |
| 155,000 | | WI St Hlth & Eductnl Facs Auth Rev Three Pillars Sr Living Cmntys, Ser A
| | 4.00% | | 08/15/24 | | 154,482 |
| | | | | 7,620,480 |
| | | Wyoming – 0.3% | | | | | | |
| 250,000 | | Consol Muni Elec Pwr Sys Wy Jt Pwrs Brd Sys Jt Powers Brd Ref Electrical System Proj
| | 5.00% | | 06/01/26 | | 270,710 |
| 755,000 | | Consol Muni Elec Pwr Sys Wy Jt Pwrs Brd Sys Jt Powers Brd Ref Electrical System Proj
| | 5.25% | | 06/01/37 | | 870,784 |
| | | | | 1,141,494 |
| Total Investments – 97.6%
| | 419,556,277 |
| | (Cost $422,081,276) | | |
| | Net Other Assets and Liabilities – 2.4%
| | 10,398,375 |
| | Net Assets – 100.0%
| | $429,954,652 |
| (a) | This security, sold within the terms of a private placement memorandum, is exempt from registration upon resale under Rule 144A of the Securities Act of 1933, as amended, and may be resold in transactions exempt from registration, normally to qualified institutional buyers. Pursuant to procedures adopted by the Trust’s Board of Trustees, this security has been determined to be liquid by First Trust Advisors L.P. (the “Advisor”). Although market instability can result in periods of increased overall market illiquidity, liquidity for each security is determined based on security specific factors and assumptions, which require subjective judgment. At January 31, 2023, securities noted as such amounted to $14,036,727 or 3.3% of net assets. |
| (b) | When-issued security. The interest rate shown reflects the rate in effect at January 31, 2023. Interest will begin accruing on the security’s first settlement date. |
| (c) | Zero coupon bond. |
| (d) | Variable Rate Demand bond. Interest rate is reset periodically by the agent based on current market conditions. |
See Notes to Financial Statements
Page 27
First Trust Short Duration Managed Municipal ETF (FSMB)
Portfolio of Investments (Continued)
January 31, 2023 (Unaudited)
| AGM | Assured Guaranty Municipal Corp. |
| AMBAC | American Municipal Bond Assurance Corp. |
| AMT | Alternative Minimum Tax |
| BAM | Build America Mutual |
| BANS | Bond Anticipation Notes |
| CABS | Capital Appreciation Bonds |
| COPS | Certificates of Participation |
| GARVEE | Grant Anticipation Revenue Vehicle |
| NATL-RE | National Public Finance Guarantee Corp. |
| RANS | Revenue Anticipation Notes |
Valuation Inputs
A summary of the inputs used to value the Fund’s investments as of January 31, 2023 is as follows (see Note 2A - Portfolio Valuation in the Notes to Financial Statements):
| | Total
Value at
1/31/2023 | Level 1
Quoted
Prices | Level 2
Significant
Observable
Inputs | Level 3
Significant
Unobservable
Inputs |
Municipal Bonds*
| $ 419,556,277 | $ — | $ 419,556,277 | $ — |
| * | See Portfolio of Investments for state and territory breakout. |
Page 28
See Notes to Financial Statements
First Trust Ultra Short Duration Municipal ETF (FUMB)
Portfolio of Investments
January 31, 2023 (Unaudited)
Principal
Value | | Description | | Stated
Coupon | | Stated
Maturity | | Value |
| MUNICIPAL BONDS – 98.8% |
| | | Alabama – 3.0% | | | | | | |
| $480,000 | | Black Belt Energy Gas Dist AL Gas Prepay Rev Proj No. 4, Ser A-1
| | 4.00% | | 06/01/24 | | $483,189 |
| 300,000 | | Black Belt Energy Gas Dist AL Gas Prepay Rev, Ser A
| | 5.00% | | 12/01/23 | | 303,525 |
| 1,955,000 | | Black Belt Energy Gas Dist AL Gas Prepay Rev, Ser A (Mandatory put 12/01/23)
| | 4.00% | | 12/01/48 | | 1,960,661 |
| 400,000 | | Black Belt Energy Gas Dist AL Gas Proj Rev Gas Proj, Ser E
| | 5.00% | | 06/01/23 | | 402,283 |
| 525,000 | | Black Belt Energy Gas Dist AL Gas Proj Rev, Ser C-1
| | 5.25% | | 12/01/23 | | 532,578 |
| 385,000 | | Black Belt Energy Gas Dist AL Gas Proj Rev, Ser C-1
| | 5.25% | | 06/01/24 | | 393,505 |
| 625,000 | | Black Belt Energy Gas Dist AL Gas Proj Rev, Ser C-1
| | 5.25% | | 12/01/24 | | 643,188 |
| 200,000 | | Black Belt Energy Gas Dist AL Gas Sply Rev Ref, Ser D1
| | 4.00% | | 06/01/23 | | 200,484 |
| 2,750,000 | | Hlthcare Auth for Baptist Hlth AL Var Ref, Ser B (a)
| | 2.33% | | 11/01/42 | | 2,750,000 |
| 1,155,000 | | Lower AL Gas Dist Gas Proj Rev Gas Proj Rev Bonds Proj 2 (Mandatory put 12/01/25)
| | 4.00% | | 12/01/50 | | 1,160,536 |
| 350,000 | | SE AL St Gas Sply Dist Gas Sply Rev Proj #2, Ser A
| | 4.00% | | 06/01/23 | | 350,732 |
| 1,095,000 | | SE AL St Gas Sply Dist Gas Sply Rev Proj #2, Ser A (Mandatory put 06/01/24)
| | 4.00% | | 06/01/49 | | 1,097,583 |
| 500,000 | | SE Energy Auth AL Cmdy Sply Rev Proj #4, Ser B-1
| | 5.00% | | 08/01/23 | | 503,484 |
| | | | | 10,781,748 |
| | | Alaska – 0.2% | | | | | | |
| 500,000 | | AK St Indl Dev & Export Auth Rev Gtr Fairbanks Cmnty Hosp Fndtn Proj
| | 5.00% | | 04/01/23 | | 501,838 |
| 300,000 | | AK St, Ser A
| | 5.00% | | 08/01/23 | | 303,514 |
| | | | | 805,352 |
| | | Arizona – 1.5% | | | | | | |
| 2,000,000 | | AZ St Indl Dev Auth Rev Lincoln S Beltway Proj
| | 5.00% | | 05/01/23 | | 2,011,632 |
| 1,740,000 | | Chandler AZ Indl Dev Auth Indl Dev Rev Var Intel Corp Proj Remk, AMT (Mandatory put 08/14/23)
| | 2.70% | | 12/01/37 | | 1,734,216 |
| 180,000 | | Glendale AZ Transprtn Excise Tax Rev Ref, AGM
| | 5.00% | | 07/01/23 | | 181,943 |
| 300,000 | | Maricopa Cnty AZ Indl Dev Auth Edu Rev Legacy Trad Sch Proj
| | 5.00% | | 07/01/23 | | 302,280 |
| 150,000 | | Nthrn AZ Univ Ref Sys, BAM
| | 5.00% | | 06/01/23 | | 151,180 |
| 180,000 | | Pima Cnty AZ Indl Dev Auth Sr Living Rev La Posada at Pusch Ridge Proj, Ser A (b)
| | 5.75% | | 11/15/23 | | 180,847 |
| 520,000 | | Salt Verde AZ Finl Corp Sr Gas Rev Sr
| | 5.25% | | 12/01/23 | | 526,438 |
| 255,000 | | Univ Med Ctr Corp AZ Hosp Rev (Pre-refunded maturity 07/01/23)
| | 5.50% | | 07/01/26 | | 258,220 |
| | | | | 5,346,756 |
| | | California – 3.9% | | | | | | |
| 3,000,000 | | CA St Infra & Econ Dev Bank Rev Var Brightline W Passenger Rail Proj Remk, Ser A, AMT, (Mandatory put 01/31/24)
| | 3.65% | | 01/01/50 | | 2,999,951 |
| 1,500,000 | | CA St Poll Control Fin Auth Sol Wst Disp Rev Var Ref Rep Svcs Remk, Ser A, AMT (Mandatory put 05/01/23) (b)
| | 4.10% | | 08/01/23 | | 1,500,029 |
| 235,000 | | CA St Ref Various Purp
| | 2.38% | | 02/01/23 | | 235,000 |
| 425,000 | | Golden St Tobacco Securitization Corp CA Tobacco Stlmt Ref, Ser A-1
| | 5.00% | | 06/01/23 | | 428,783 |
| 335,000 | | Long Beach CA Bond Fin Auth Nat Gas Pur Rev, Ser A
| | 5.25% | | 11/15/23 | | 339,653 |
| 2,000,000 | | Los Angeles CA Trans
| | 4.00% | | 06/29/23 | | 2,013,399 |
| 2,000,000 | | Los Angeles Cnty CA Trans
| | 4.00% | | 06/30/23 | | 2,015,894 |
| 710,000 | | Riverside Cnty CA Trans
| | 5.00% | | 06/30/23 | | 717,723 |
| 1,000,000 | | San Diego CA Unif Sch Dist Trans, Ser A
| | 4.00% | | 06/30/23 | | 1,006,289 |
| 1,700,000 | | Sch Proj for Util Rate Reduction CA Nat Gas Pur Prog, RANS
| | 4.00% | | 08/01/23 | | 1,709,686 |
| 1,000,000 | | Univ of California CA Rev Gen, Ser AK (Mandatory put 05/15/23)
| | 5.00% | | 05/15/48 | | 1,007,460 |
| | | | | 13,973,867 |
See Notes to Financial Statements
Page 29
First Trust Ultra Short Duration Municipal ETF (FUMB)
Portfolio of Investments (Continued)
January 31, 2023 (Unaudited)
Principal
Value | | Description | | Stated
Coupon | | Stated
Maturity | | Value |
| MUNICIPAL BONDS (Continued) |
| | | Colorado – 3.4% | | | | | | |
| $350,000 | | Adams & Arapahoe Cntys CO Jt Sch Dist #28J Aurora Ref
| | 5.00% | | 12/01/23 | | $357,586 |
| 1,275,000 | | Arapahoe Cnty CO Sch Dist #5 Cherry Creek Ref & Impt, AGM
| | 2.00% | | 12/15/23 | | 1,271,011 |
| 400,000 | | CO St Hlth Facs Auth Rev Commonspirit Hlth Oblig Grp, Ser A
| | 5.00% | | 11/01/23 | | 406,092 |
| 2,750,000 | | CO St Hlth Facs Auth Rev Frasier Meadows Retmnt Cmnty Proj, Ser B (Forward refunding maturity 05/15/23)
| | 5.00% | | 05/15/48 | | 2,768,433 |
| 635,000 | | CO St Hlth Facs Auth Rev Frasier Meadows Retmnt Cmnty Proj, Ser B (Pre-refunded maturity 05/15/23)
| | 5.00% | | 05/15/25 | | 639,257 |
| 185,000 | | CO St Hlth Facs Auth Rev Ref Commonspirit Hlth, Ser B-1 (Mandatory put 08/01/25)
| | 5.00% | | 08/01/49 | | 191,697 |
| 2,355,000 | | CO St Ref UCDHSC Fitzsimons Academic Projs, Ser A, COPS (Pre-refunded maturity 11/01/23)
| | 5.00% | | 11/01/28 | | 2,400,016 |
| 700,000 | | Denver City & Cnty CO Arpt Rev Ref, Ser C
| | 5.00% | | 11/15/23 | | 713,639 |
| 2,000,000 | | Denver CO Convention Ctr Hotel Auth Rev Ref Sr
| | 5.00% | | 12/01/23 | | 2,023,831 |
| 250,000 | | Leyden Rock Met Dist CO Ref, AGM
| | 5.00% | | 12/01/23 | | 254,961 |
| 1,000,000 | | Regl Transprtn Dist CO, Ser A, COPS (Pre-refunded maturity 06/01/23)
| | 4.38% | | 06/01/39 | | 1,006,060 |
| | | | | 12,032,583 |
| | | Connecticut – 3.7% | | | | | | |
| 1,100,000 | | Bridgeport CT Ref, Ser C
| | 5.00% | | 02/15/23 | | 1,100,955 |
| 900,000 | | CT St Hgr Edu Supplement Loan Auth Rev Chesla Ln Prog, Ser A, AMT
| | 5.00% | | 11/15/23 | | 917,030 |
| 100,000 | | CT St Hlth & Eductnl Facs Auth Rev Ref Fairfield Univ, Ser S
| | 5.00% | | 07/01/23 | | 101,004 |
| 225,000 | | CT St Ref, Ser B
| | 5.00% | | 04/15/23 | | 226,150 |
| 1,755,000 | | CT St Ref, Ser B
| | 5.00% | | 04/15/23 | | 1,763,968 |
| 2,500,000 | | CT St Ref, Ser H
| | 5.00% | | 11/15/23 | | 2,551,075 |
| 2,250,000 | | CT St Spl Tax Oblig Rev Ref Transprtn Infra Purp, Ser B
| | 5.00% | | 01/01/24 | | 2,304,316 |
| 630,000 | | CT St Spl Tax Oblig Rev Transn Infra, Ser A
| | 5.00% | | 08/01/23 | | 638,288 |
| 2,500,000 | | Danbury CT, BANS
| | 3.00% | | 07/13/23 | | 2,503,339 |
| 30,000 | | Hamden CT, BAM
| | 5.00% | | 08/15/23 | | 30,377 |
| 1,080,000 | | New Haven CT, Ser A, AGM
| | 5.00% | | 08/01/23 | | 1,092,328 |
| | | | | 13,228,830 |
| | | District of Columbia – 0.0% | | | | | | |
| 125,000 | | DC Hosp Rev Ref Children’s Hosp
| | 5.00% | | 07/15/23 | | 126,365 |
| | | Florida – 5.2% | | | | | | |
| 85,000 | | Alachua Cnty FL Hlth Facs Auth CCRC Ref Oak Hammock at the Univ of FL Inc Proj
| | 4.00% | | 10/01/23 | | 84,704 |
| 2,065,000 | | Broward Cnty FL Arpt Sys Rev, Ser A, AMT (Pre-refunded maturity 10/01/23)
| | 5.13% | | 10/01/38 | | 2,098,317 |
| 1,500,000 | | Collier Cnty FL Eductnl Facs Auth Rev Eductnl Facs Hodges Univ Inc (Pre-refunded maturity 11/01/23)
| | 6.13% | | 11/01/43 | | 1,540,291 |
| 500,000 | | Duval Cnty FL Sch Brd, Ser A, COPS
| | 5.00% | | 07/01/23 | | 504,960 |
| 1,500,000 | | FL St Dev Fin Corp Var Brightline Passngr Rail Expan Proj Remk, Ser A, AMT (Mandatory put 04/04/23)
| | 2.90% | | 12/01/56 | | 1,499,122 |
| 100,000 | | Gtr Orlando FL Aviation Auth Arpt Facs Rev Ref Priority Sub Arpt Facs, AMT
| | 5.00% | | 10/01/23 | | 101,306 |
| 445,000 | | Hollywood Beach FL Cmnty Dev Dist Rev CDD Ref Pub Pkg Fac Proj, Ser I
| | 5.00% | | 10/01/23 | | 452,201 |
| 325,000 | | Hollywood FL Cmnty Redev Agy Redev Rev Ref
| | 5.00% | | 03/01/23 | | 325,582 |
| 730,000 | | Jacksonville FL Spl Rev Ref, Ser D
| | 5.00% | | 10/01/23 | | 741,958 |
| 175,000 | | Lakewood Ranch FL Stewardship Dist Spl Assmnt Rev Ref Country Club E Proj, AGM
| | 5.00% | | 05/01/25 | | 183,457 |
Page 30
See Notes to Financial Statements
First Trust Ultra Short Duration Municipal ETF (FUMB)
Portfolio of Investments (Continued)
January 31, 2023 (Unaudited)
Principal
Value | | Description | | Stated
Coupon | | Stated
Maturity | | Value |
| MUNICIPAL BONDS (Continued) |
| | | Florida (Continued) | | | | | | |
| $2,000,000 | | Miami FL Spl Oblg Prerefunded Ref (Pre-refunded maturity 03/01/23) (b)
| | 5.00% | | 03/01/30 | | $2,003,993 |
| 100,000 | | Miami-Dade Cnty FL Eductnl Facs Auth Rev Univ of Miami, Ser A
| | 4.00% | | 04/01/23 | | 100,228 |
| 95,000 | | Miami-Dade Cnty FL Sch Brd, Ser B, COPS (Pre-refunded maturity 02/01/23)
| | 5.00% | | 02/01/30 | | 95,000 |
| 1,000,000 | | Miami-Dade Cnty FL Seaport Rev Ref Sr Bonds, Ser A, AMT (c)
| | 5.00% | | 10/01/25 | | 1,054,651 |
| 2,500,000 | | Miami-Dade Cnty FL Seaport Rev, Ser B, AMT (Pre-refunded maturity 10/01/23)
| | 6.25% | | 10/01/38 | | 2,559,205 |
| 400,000 | | Monroe Cnty FL Sch Dist Sales Tax Rev, AGM
| | 5.00% | | 10/01/23 | | 406,233 |
| 2,650,000 | | Orange Cnty FL Hlth Facs Auth Rev Ref Presbyterian Retmnt Cmntys (Forward refunding maturity 08/01/23)
| | 5.00% | | 08/01/41 | | 2,754,247 |
| 750,000 | | Palm Beach Cnty FL Sch Brd, Ser B, COPS
| | 5.00% | | 08/01/23 | | 759,232 |
| 145,000 | | Sarasota Cnty FL Util Sys Rev (Pre-refunded maturity 10/01/23)
| | 5.00% | | 10/01/38 | | 147,510 |
| 515,000 | | Seminole Cnty FL Wtr & Swr Rev Ref, Ser A
| | 5.00% | | 10/01/23 | | 523,745 |
| 700,000 | | Tolomato FL CDD Ref, Ser A, AGM
| | 3.00% | | 05/01/23 | | 700,252 |
| | | | | 18,636,194 |
| | | Georgia – 4.3% | | | | | | |
| 1,025,000 | | Atlanta GA Arpt Rev, Ser B, AMT
| | 5.00% | | 07/01/23 | | 1,033,425 |
| 480,000 | | Atlanta GA Wtr & Wstwtr Rev Ref, Ser B
| | 5.00% | | 11/01/23 | | 489,355 |
| 1,800,000 | | Burke Cnty GA Dev Auth Poll Control Rev GA Pwr Co Plant Vogtle Proj Remk, 4th Ser (Mandatory put 05/25/23)
| | 2.25% | | 10/01/32 | | 1,796,469 |
| 2,600,000 | | Burke Cnty GA Dev Auth Poll Control Rev Var Ref GA Pwr Co Plant Vogtle Proj (a)
| | 1.75% | | 11/01/52 | | 2,600,000 |
| 500,000 | | Main Street Nat Gas Inc GA Gas Sply Rev, Ser A
| | 4.00% | | 12/01/23 | | 502,967 |
| 650,000 | | Main Street Nat Gas Inc GA Gas Sply Rev, Ser A (c)
| | 5.00% | | 06/01/24 | | 661,418 |
| 550,000 | | Main Street Nat Gas Inc GA Gas Sply Rev, Ser A (c)
| | 5.00% | | 06/01/25 | | 565,985 |
| 2,000,000 | | Main Street Nat Gas Inc GA Gas Sply Rev, Ser A (Mandatory put 09/01/23)
| | 4.00% | | 04/01/48 | | 2,008,079 |
| 500,000 | | Main Street Nat Gas Inc GA Gas Sply Rev, Ser B
| | 5.00% | | 06/01/24 | | 510,090 |
| 1,105,000 | | Main Street Nat Gas Inc GA Gas Sply Rev, Subser C (Mandatory put 12/01/23)
| | 4.00% | | 08/01/48 | | 1,111,355 |
| 2,000,000 | | Met Atlanta GA Rapid Transit Auth Sales Tax Rev Ref, Ser A
| | 4.00% | | 07/01/24 | | 2,043,494 |
| 2,090,000 | | Richmond Cnty GA Brd of Edu
| | 5.00% | | 10/01/23 | | 2,127,299 |
| | | | | 15,449,936 |
| | | Hawaii – 0.2% | | | | | | |
| 575,000 | | Honolulu City & Cnty HI, Ser A
| | 5.00% | | 10/01/23 | | 584,955 |
| | | Illinois – 5.1% | | | | | | |
| 230,000 | | Chicago IL O’Hare Intl Arpt Rev Ref Sr Lien O’Hare Intl Arpt, Ser C, AMT
| | 5.00% | | 01/01/24 | | 233,791 |
| 600,000 | | Chicago IL Ref, Ser A
| | 5.00% | | 01/01/24 | | 607,447 |
| 1,500,000 | | Chicago IL Transit Auth Capital Grant Recpts Rev Ref 5337 St of Good Repair Formula Funds
| | 5.00% | | 06/01/23 | | 1,510,802 |
| 165,000 | | Chicago IL Wtr Rev Second Lien
| | 5.00% | | 11/01/23 | | 165,311 |
| 1,250,000 | | Cook Cnty IL Ref, Ser A
| | 5.00% | | 11/15/23 | | 1,269,546 |
| 450,000 | | DuPage Cnty IL High Sch Dist #88 Ref
| | 4.00% | | 01/15/24 | | 456,690 |
| 460,000 | | IL St
| | 5.00% | | 05/01/23 | | 462,495 |
| 180,000 | | IL St Fin Auth Hlth Svcs Facs Lease Rev Univ of IL Hlth Svcs Fac Proj
| | 5.00% | | 10/01/23 | | 182,435 |
| 250,000 | | IL St Fin Auth Hlth Svcs Facs Lease Rev Univ of IL Hlth Svcs Fac Proj
| | 5.00% | | 10/01/24 | | 257,824 |
See Notes to Financial Statements
Page 31
First Trust Ultra Short Duration Municipal ETF (FUMB)
Portfolio of Investments (Continued)
January 31, 2023 (Unaudited)
Principal
Value | | Description | | Stated
Coupon | | Stated
Maturity | | Value |
| MUNICIPAL BONDS (Continued) |
| | | Illinois (Continued) | | | | | | |
| $2,000,000 | | IL St Fin Auth Rev Rehab Institute of Chicago, Ser A (Forward refunding maturity 07/01/23)
| | 6.00% | | 07/01/43 | | $2,023,929 |
| 1,500,000 | | IL St Hsg Dev Auth Rev Var Social Bonds, Ser H (Mandatory put 12/01/23)
| | 3.47% | | 10/01/53 | | 1,505,628 |
| 100,000 | | IL St Ref
| | 4.00% | | 08/01/25 | | 100,085 |
| 440,000 | | IL St, BAM
| | 5.50% | | 07/01/24 | | 445,933 |
| 1,290,000 | | IL St, Ser A
| | 5.00% | | 03/01/23 | | 1,292,305 |
| 250,000 | | IL St, Ser A
| | 5.00% | | 04/01/23 | | 250,907 |
| 290,000 | | IL St, Ser D
| | 5.00% | | 11/01/24 | | 300,391 |
| 1,240,000 | | McLean & Woodford Cntys IL Cmnty Unit Sch Dist #5 Ref, Ser A
| | 4.00% | | 12/01/23 | | 1,253,262 |
| 1,805,000 | | Mount Vernon IL Ref, BAM
| | 4.00% | | 12/15/23 | | 1,827,097 |
| 2,500,000 | | Schaumburg IL Ref
| | 4.00% | | 12/01/23 | | 2,525,708 |
| 1,465,000 | | Springfield IL Elec Rev Ref Sr Lien
| | 5.00% | | 03/01/23 | | 1,467,720 |
| | | | | 18,139,306 |
| | | Indiana – 3.2% | | | | | | |
| 2,250,000 | | IN St Fin Auth Econ Dev Rev Ref Rep Svcs Inc Proj Remk, Ser A, AMT (Mandatory put 03/01/23)
| | 3.40% | | 05/01/34 | | 2,250,127 |
| 3,500,000 | | IN St Fin Auth Envrnmntl Rev Var Ref Fulcrum Centerpoint LLC Proj, AMT (Mandatory put 11/15/23)
| | 4.50% | | 12/15/46 | | 3,504,470 |
| 1,000,000 | | IN St Fin Auth Rev Priv Activity OH River Bridges E End Xing P3 Proj, Ser A (Pre-refunded maturity 07/01/23)
| | 5.00% | | 07/01/40 | | 1,008,923 |
| 2,000,000 | | IN St Fin Auth Rev Priv Activity OH River Bridges E End Xing P3 Proj, Ser A (Pre-refunded maturity 07/01/23)
| | 5.00% | | 07/01/48 | | 2,017,847 |
| 275,000 | | IN St Muni Pwr Agy Ref, Ser A
| | 5.00% | | 01/01/24 | | 281,336 |
| 2,325,000 | | Johnson Cnty IN
| | 5.50% | | 12/31/23 | | 2,379,217 |
| 100,000 | | La Porte IN Wtrwks Rev, AGM
| | 4.00% | | 07/01/23 | | 100,414 |
| | | | | 11,542,334 |
| | | Iowa – 1.0% | | | | | | |
| 1,000,000 | | IA St Fin Auth Sol Wst Facs Rev Var Green Bond Gevo Nw Rng LLC Renewable Natrl Gas Proj, AMT (Mandatory put 04/01/24)
| | 1.50% | | 01/01/42 | | 983,567 |
| 2,500,000 | | Sioux City IA Cmnty Sch Dist Sch Infra Sales Svcs & Ref, BAM
| | 3.00% | | 10/01/23 | | 2,507,446 |
| | | | | 3,491,013 |
| | | Kansas – 2.0% | | | | | | |
| 150,000 | | Burlington KS Envrn Impt Rev Ref Kansas City Pwr & Light Co Proj Remk, Ser A
| | 2.95% | | 12/01/23 | | 149,953 |
| 1,500,000 | | KS St Dept of Transprtn Hwy Rev Ref, Ser A
| | 2.75% | | 09/01/23 | | 1,499,955 |
| 150,000 | | KS St Dev Fin Auth Rev, Ser G (Pre-refunded maturity 04/01/23)
| | 5.00% | | 04/01/29 | | 150,599 |
| 2,045,000 | | Lawrence KS Nts, Ser I
| | 5.00% | | 05/01/23 | | 2,057,824 |
| 3,000,000 | | Leawood KS Temp Nts, Ser 1
| | 3.00% | | 09/01/23 | | 3,003,529 |
| 320,000 | | Wichita KS Hlthcare Facs Rev Ref & Impt Larksfield Place, Ser III (Pre-refunded maturity 12/15/23)
| | 5.50% | | 12/15/25 | | 328,208 |
| | | | | 7,190,068 |
| | | Kentucky – 4.1% | | | | | | |
| 1,130,000 | | KY St Asset/Liability Commn Agy Fund Rev Ref Proj Nts Hwy Trust Fund 1st, Ser A, GARVEE
| | 5.00% | | 09/01/23 | | 1,146,409 |
| 505,000 | | KY St Muni Pwr Agy Pwr Sys Rev Ref, Ser A, NATL-RE
| | 5.00% | | 09/01/23 | | 511,717 |
| 2,500,000 | | KY St Property & Bldgs Commn Rev Ref Proj #112, Ser B
| | 5.00% | | 11/01/23 | | 2,542,737 |
| 2,500,000 | | KY St Pub Energy Auth Gas Sply Rev Gas Sply, Ser C-1
| | 4.00% | | 12/01/23 | | 2,512,790 |
| 165,000 | | KY St Pub Energy Auth Gas Sply Rev Gas Sply, Ser C-1 (Mandatory put 06/01/25)
| | 4.00% | | 12/01/49 | | 165,491 |
Page 32
See Notes to Financial Statements
First Trust Ultra Short Duration Municipal ETF (FUMB)
Portfolio of Investments (Continued)
January 31, 2023 (Unaudited)
Principal
Value | | Description | | Stated
Coupon | | Stated
Maturity | | Value |
| MUNICIPAL BONDS (Continued) |
| | | Kentucky (Continued) | | | | | | |
| $2,500,000 | | KY St Pub Energy Auth Gas Sply Rev, Ser A (Mandatory put 04/01/24)
| | 4.00% | | 04/01/48 | | $2,505,595 |
| 650,000 | | KY St Turnpike Auth Econ Dev Road Rev Revitalization Projs, Ser A (Pre-refunded maturity 07/01/23)
| | 5.00% | | 07/01/27 | | 656,880 |
| 1,595,000 | | Louisville & Jefferson Cnty KY Met Govt Hlth Sys Rev Var Norton Hlthcare Inc, Ser B (Mandatory put 10/01/23)
| | 5.00% | | 10/01/47 | | 1,610,369 |
| 2,255,000 | | Louisville & Jefferson Cnty KY Met Swr Dist Swr & Drain Sys Sub Safe Clean Waterways, BANS
| | 4.00% | | 10/06/23 | | 2,275,912 |
| 610,000 | | Univ of Louisville KY Rev, Ser B, BAM
| | 5.00% | | 09/01/23 | | 617,795 |
| | | | | 14,545,695 |
| | | Louisiana – 3.1% | | | | | | |
| 1,000,000 | | LA St Loc Govt Envrnmntl Facs & Cmnty Dev Auth Rev Var American Biocarbon Ct LLC Proj Remk, AMT (Mandatory put 08/01/23)
| | 3.85% | | 12/01/46 | | 1,000,484 |
| 480,000 | | LA St, Ser A
| | 5.00% | | 03/01/23 | | 480,994 |
| 1,540,000 | | LA St, Ser A (Pre-refunded maturity 05/15/23)
| | 4.00% | | 05/15/30 | | 1,547,081 |
| 125,000 | | LA Stadium & Exposition Dist LA Ref Sr, Ser A
| | 5.00% | | 07/01/28 | | 125,888 |
| 2,400,000 | | LA Stadium & Exposition Dist LA, BANS
| | 4.00% | | 07/03/23 | | 2,402,658 |
| 15,000 | | New Orleans LA Wtr Rev Ref (Pre-refunded maturity 12/01/24)
| | 5.00% | | 12/01/29 | | 15,727 |
| 35,000 | | New Orleans LA Wtr Rev Ref (Pre-refunded maturity 12/01/24)
| | 5.00% | | 12/01/34 | | 36,696 |
| 280,000 | | New Orleans LA Wtr Rev Ref (Pre-refunded maturity 12/01/24)
| | 5.00% | | 12/01/44 | | 293,568 |
| 1,245,000 | | Port New Orleans LA Brd of Commissioners Port Fac Rev Ref, Ser B (Pre-refunded maturity 04/01/23)
| | 5.00% | | 04/01/31 | | 1,249,868 |
| 2,845,000 | | Saint John the Baptist Parish LA Rev Ref Marathon Oil Corp Proj Remk, Ser A-1 (Mandatory put 04/01/23)
| | 2.00% | | 06/01/37 | | 2,839,987 |
| 1,175,000 | | Shreveport LA Wtr & Swr Rev Junior Lien, Ser C, BAM
| | 5.00% | | 12/01/23 | | 1,195,879 |
| | | | | 11,188,830 |
| | | Maine – 0.2% | | | | | | |
| 730,000 | | ME St Hlth & Hgr Eductnl Facs Auth Rev Estrn Maine Med Ctr Oblig Grp (Pre-refunded maturity 07/01/23)
| | 5.00% | | 07/01/33 | | 737,271 |
| | | Maryland – 1.8% | | | | | | |
| 1,200,000 | | MD St Dept of Transprtn Consol Transprtn
| | 5.00% | | 10/01/23 | | 1,221,016 |
| 350,000 | | MD St Hlth & Hgr Eductnl Facs Auth Rev Johns Hopkins Hlth, Ser C (Pre-refunded maturity 05/15/23)
| | 5.00% | | 05/15/43 | | 352,498 |
| 1,225,000 | | MD St Ref, Ser 2-C
| | 5.00% | | 08/01/23 | | 1,241,116 |
| 1,450,000 | | MD St Ref, Ser B
| | 4.00% | | 08/01/23 | | 1,461,948 |
| 2,000,000 | | Tender Option Bond Trust Recpts / Ctfs Various States Floaters, Ser 2017-Zf2407 (a) (b)
| | 1.96% | | 01/01/25 | | 2,000,000 |
| | | | | 6,276,578 |
| | | Massachusetts – 1.5% | | | | | | |
| 250,000 | | MA St Dev Fin Agy Hosp Rev Ref Cape Cod Hlthcare Oblig Grp (Pre-refunded maturity 11/15/23)
| | 5.25% | | 11/15/41 | | 255,509 |
| 1,025,000 | | MA St Dev Fin Agy Rev N Hill Cmntys, Ser A (Pre-refunded maturity 11/15/23) (b)
| | 6.50% | | 11/15/43 | | 1,054,891 |
| 1,500,000 | | MA St Eductnl Fing Auth Ref Issue, Ser J, AMT
| | 5.00% | | 07/01/23 | | 1,513,883 |
| 150,000 | | MA St Eductnl Fing Auth Sr, Ser B, AMT
| | 5.00% | | 07/01/23 | | 151,388 |
| 500,000 | | MA St Port Auth Ref, Ser A, AMT
| | 5.00% | | 07/01/23 | | 504,918 |
| 2,000,370 | | Pittsfield MA, BANS
| | 2.00% | | 02/24/23 | | 2,000,118 |
| | | | | 5,480,707 |
See Notes to Financial Statements
Page 33
First Trust Ultra Short Duration Municipal ETF (FUMB)
Portfolio of Investments (Continued)
January 31, 2023 (Unaudited)
Principal
Value | | Description | | Stated
Coupon | | Stated
Maturity | | Value |
| MUNICIPAL BONDS (Continued) |
| | | Michigan – 0.8% | | | | | | |
| $560,000 | | MI St Hosp Fin Auth Ascension Hlth Credit Grp Remk, Ser A-4
| | 5.00% | | 11/01/23 | | $570,369 |
| 300,000 | | MI St Hsg Dev Auth Sf Mtge Rev Social Bond, Ser A
| | 0.30% | | 06/01/23 | | 296,960 |
| 1,490,000 | | Oakland Univ MI Rev Gen, Ser A (Forward refunding maturity 03/01/23)
| | 5.00% | | 03/01/38 | | 1,492,301 |
| 545,000 | | Wayne Cnty MI Arpt Auth Rev Ref Junior Lien, Ser A
| | 5.00% | | 12/01/23 | | 555,362 |
| | | | | 2,914,992 |
| | | Minnesota – 2.3% | | | | | | |
| 600,000 | | Forest Lake MN Indep Sch Dist #831 Ref, Ser A, COPS
| | 4.00% | | 04/01/23 | | 601,306 |
| 305,000 | | Mankato MN, Ser A
| | 5.00% | | 02/01/23 | | 305,000 |
| 250,000 | | MN St Hsg Fin Agy Rental Hsg Bonds, Ser B
| | 0.35% | | 02/01/23 | | 250,000 |
| 1,250,000 | | MN St Rural Wtr Fin Auth Pub Projs Constr Notes
| | 2.63% | | 12/01/23 | | 1,241,933 |
| 2,500,000 | | MN St, Ser A
| | 5.00% | | 09/01/23 | | 2,538,339 |
| 2,220,000 | | Ramsey Cnty MN Ref, Ser A
| | 5.00% | | 02/01/23 | | 2,220,000 |
| 1,000,000 | | Saint Paul MN Hsg & Redev Auth Mf Hsg Rev Var Dale Street Proj (Mandatory put 06/01/24)
| | 3.50% | | 12/01/25 | | 1,000,928 |
| | | | | 8,157,506 |
| | | Mississippi – 0.7% | | | | | | |
| 400,000 | | MS St Dev Bank Spl Oblg Jackson Wtr & Swr Sys Proj, AGM
| | 6.75% | | 12/01/26 | | 412,000 |
| 100,000 | | MS St Dev Bank Spl Oblg Jackson Wtr & Swr Sys Proj, AGM
| | 6.75% | | 12/01/32 | | 102,940 |
| 2,000,000 | | MS St Hosp Equipment & Facs Auth Ref Adj Baptist Memorial Hlth Care Corp Remk, Ser A-2 (Mandatory put 08/30/23)
| | 3.15% | | 09/01/36 | | 1,999,832 |
| | | | | 2,514,772 |
| | | Nebraska – 0.5% | | | | | | |
| 150,000 | | Centrl Plains Energy Proj NE Gas Proj Rev Proj No. 4
| | 5.00% | | 01/01/24 | | 151,795 |
| 1,425,000 | | Centrl Plains Energy Proj NE Gas Proj Rev Proj No. 4 (Mandatory put 01/01/24)
| | 5.00% | | 03/01/50 | | 1,440,706 |
| | | | | 1,592,501 |
| | | Nevada – 1.1% | | | | | | |
| 200,000 | | Clark Cnty NV Passenger Fac Charge Rev Ref Las Vegas McCarran Intl Arpt, Ser E
| | 5.00% | | 07/01/23 | | 202,059 |
| 1,000,000 | | Clark Cnty NV Sch Dist Ref Bldg, Ser A
| | 5.00% | | 06/15/23 | | 1,009,176 |
| 735,000 | | Clark Cnty NV Sch Dist Ref, Ser A
| | 5.00% | | 06/15/23 | | 741,744 |
| 1,885,000 | | Yerington NV USDA Interim Debs
| | 1.63% | | 11/01/23 | | 1,863,180 |
| | | | | 3,816,159 |
| | | New Jersey – 7.7% | | | | | | |
| 100,000 | | Atlantic City NJ Brd of Edu Ref Sch Bd Res Fd, AGM
| | 4.00% | | 04/01/23 | | 100,242 |
| 1,352,000 | | Atlantic Cnty NJ
| | 3.00% | | 03/15/23 | | 1,352,884 |
| 2,660,000 | | Hudson Cnty NJ Impt Auth Loc Unit Loan Prog, Ser B-1
| | 3.00% | | 08/04/23 | | 2,666,888 |
| 2,500,000 | | Jersey City NJ, Ser A, BANS
| | 5.00% | | 10/26/23 | | 2,544,622 |
| 2,694,350 | | Kinnelon NJ, BANS
| | 4.00% | | 09/29/23 | | 2,714,384 |
| 2,000,000 | | Margate City NJ, BANS
| | 4.50% | | 11/29/23 | | 2,030,000 |
| 610,000 | | Newark NJ Ref, Ser A, AGM
| | 5.00% | | 10/01/23 | | 619,263 |
| 340,000 | | Newark NJ Ref, Ser B, AGM
| | 5.00% | | 10/01/23 | | 345,163 |
| 3,000,000 | | Newark NJ, Ser D, BANS
| | 4.00% | | 09/29/23 | | 3,016,416 |
| 700,000 | | NJ St Covid-19 Go Emergency Bonds, Ser A
| | 4.00% | | 06/01/23 | | 703,501 |
| 1,000,000 | | NJ St Econ Dev Auth Mtr Vehcl Surcharge Rev Ref, Subser A, BAM
| | 5.00% | | 07/01/23 | | 1,009,131 |
| 1,000,000 | | NJ St Econ Dev Auth Ref Sch Facs Constr, Ser N-1, NATL-RE
| | 5.50% | | 09/01/23 | | 1,015,870 |
| 25,000 | | NJ St Econ Dev Auth Ref, Ser A, BAM
| | 5.00% | | 06/15/23 | | 25,215 |
Page 34
See Notes to Financial Statements
First Trust Ultra Short Duration Municipal ETF (FUMB)
Portfolio of Investments (Continued)
January 31, 2023 (Unaudited)
Principal
Value | | Description | | Stated
Coupon | | Stated
Maturity | | Value |
| MUNICIPAL BONDS (Continued) |
| | | New Jersey (Continued) | | | | | | |
| $630,000 | | NJ St Econ Dev Auth Rev Portal N Bridge Proj NJ Transit Transprtn Proj Bonds, Ser A
| | 5.00% | | 11/01/23 | | $640,534 |
| 1,100,000 | | NJ St Econ Dev Auth Rev Prerefunded Ref Sch Facs Constr, Ser NN (Pre-refunded maturity 03/01/23)
| | 5.00% | | 03/01/27 | | 1,102,286 |
| 300,000 | | NJ St Econ Dev Auth Rev Ref, Ser XX
| | 5.00% | | 06/15/23 | | 302,530 |
| 50,000 | | NJ St Econ Dev Auth Rev Sch Facs Constr, Ser KK
| | 5.00% | | 03/01/23 | | 50,073 |
| 100,000 | | NJ St Hgr Edu Asst Auth Stdt Loan Rev Sr, Ser 2015-1A, AMT
| | 5.00% | | 12/01/24 | | 103,442 |
| 255,000 | | NJ St Hgr Edu Asst Auth Stdt Loan Rev, Ser B, AMT
| | 5.00% | | 12/01/23 | | 259,320 |
| 565,000 | | NJ St Transprtn Trust Fund Auth Transn Sys, Ser A
| | 5.50% | | 12/15/23 | | 578,414 |
| 180,000 | | NJ St Transprtn Trust Fund Auth Transn Sys, Ser B, AMBAC
| | 5.25% | | 12/15/23 | | 183,890 |
| 525,000 | | NJ St Transprtn Trust Fund Auth Transn Sys, Ser D
| | 5.00% | | 12/15/23 | | 535,225 |
| 2,500,000 | | Ocean City NJ, BANS
| | 4.50% | | 10/17/23 | | 2,532,423 |
| 875,000 | | Tobacco Stlmt Fing Corp NJ Ref, Ser A
| | 5.00% | | 06/01/23 | | 881,467 |
| 2,000,000 | | Verona Twp NJ, BANS
| | 5.00% | | 10/26/23 | | 2,035,697 |
| | | | | 27,348,880 |
| | | New Mexico – 0.6% | | | | | | |
| 300,000 | | Albuquerque NM Met Arroyo Flood Control Auth
| | 5.00% | | 08/01/23 | | 303,887 |
| 2,000,000 | | Farmington NM Poll Control Rev Var Ref Pub Svc Co of NM San Juan Proj Remk, Ser D (Mandatory put 06/01/23)
| | 1.10% | | 06/01/40 | | 1,982,404 |
| | | | | 2,286,291 |
| | | New York – 9.6% | | | | | | |
| 100,000 | | Build NYC Res Corp NY Rev Acad Leadership Chrt Sch Proj
| | 4.00% | | 06/15/23 | | 100,074 |
| 2,000,000 | | Deposit NY Centrl Sch Dist, BANS
| | 3.75% | | 09/08/23 | | 2,012,887 |
| 2,000,000 | | E Ramapo NY Centrl Sch Dist, Ser A, RANS
| | 3.00% | | 05/31/23 | | 2,001,755 |
| 2,065,000 | | Elmira City NY Sch Dist, BANS
| | 4.00% | | 06/23/23 | | 2,077,053 |
| 2,400,000 | | Hempstead NY Union Free Sch Dist for 2022-2023 St Aid, RANS
| | 3.75% | | 06/30/23 | | 2,406,804 |
| 2,000,000 | | Indian River NY Centrl Sch Dist at Philadelphia, BANS
| | 4.00% | | 06/28/23 | | 2,009,801 |
| 250,000 | | Long Island NY Pwr Auth Elec Sys Rev Ref, Ser A
| | 5.00% | | 09/01/23 | | 253,572 |
| 370,000 | | Met Transprtn Auth NY Rev Transprtn, Ser A-1
| | 5.00% | | 11/15/23 | | 374,922 |
| 2,750,000 | | Met Transprtn Auth NY Rev, Ser A-1, BANS
| | 5.00% | | 02/01/23 | | 2,750,000 |
| 2,000,000 | | New York City NY Hsg Dev Corp Mf Hsg Rev Sustainable Dev Bonds Var, Ser F-2 (Mandatory put 07/01/25)
| | 0.60% | | 05/01/61 | | 1,869,738 |
| 650,000 | | New York City NY Hsg Dev Corp Mf Hsg Rev Sustainable Neighborhood Bonds, Ser E-2 (Mandatory put 07/03/23)
| | 1.75% | | 05/01/59 | | 645,267 |
| 1,630,000 | | New York City NY Hsg Dev Corp Rev, Ser A (Pre-refunded maturity 07/03/23)
| | 5.00% | | 07/01/25 | | 1,646,800 |
| 250,000 | | New York City NY Hsg Dev Corp Rev, Ser B2 (Pre-refunded maturity 07/03/23)
| | 5.00% | | 07/01/25 | | 252,577 |
| 2,000,000 | | New York City NY Muni Wtr Fin Auth Wtr & Swr Sys Rev Var Ref Sub 2nd General Resolution, Ser DD (a)
| | 1.50% | | 06/15/33 | | 2,000,000 |
| 1,965,000 | | NY NY Adj Fiscal 2020, Subser B-3 (a)
| | 1.50% | | 10/01/46 | | 1,965,000 |
| 2,000,000 | | NY NY Prerefunded, Subser F-1 (Pre-refunded maturity 03/01/23)
| | 5.00% | | 03/01/37 | | 2,004,157 |
| 100,000 | | NY NY, Ser C
| | 5.00% | | 08/01/23 | | 100,221 |
| 1,185,000 | | NY St Dorm Auth Sales Tax Rev Ref Bidding Group 1, Ser C
| | 5.00% | | 03/15/23 | | 1,188,745 |
| 125,000 | | NY St Hsg Fin Agy Affordable Hsg, Ser E
| | 2.13% | | 11/01/23 | | 124,315 |
| 65,000 | | NY St Hsg Fin Agy Sustainability Bonds, Ser N
| | 1.45% | | 05/01/23 | | 64,786 |
| 180,000 | | NY St Hsg Fin Agy Sustainability Bonds, Ser Q
| | 1.35% | | 11/01/23 | | 178,122 |
| 2,250,000 | | NY St Mtge Agy Homeowner Mtge Rev, Ser 183, AMT
| | 3.75% | | 04/01/23 | | 2,251,568 |
| 175,000 | | NY St Mtge Agy Rev Mtge, 55th Ser, AMT
| | 2.65% | | 10/01/23 | | 174,401 |
| 265,000 | | NY St Mtge Agy Rev, Ser 51
| | 2.25% | | 10/01/23 | | 264,092 |
| 245,000 | | Onondaga NY Civic Dev Corp Le Moyne Clg Proj
| | 5.00% | | 07/01/23 | | 246,679 |
| 255,000 | | Onondaga NY Civic Dev Corp Le Moyne Clg Proj
| | 5.00% | | 07/01/24 | | 260,916 |
| 580,000 | | Port Auth of NY & NJ NY Ref, Ser 207, AMT
| | 5.00% | | 09/15/23 | | 586,719 |
See Notes to Financial Statements
Page 35
First Trust Ultra Short Duration Municipal ETF (FUMB)
Portfolio of Investments (Continued)
January 31, 2023 (Unaudited)
Principal
Value | | Description | | Stated
Coupon | | Stated
Maturity | | Value |
| MUNICIPAL BONDS (Continued) |
| | | New York (Continued) | | | | | | |
| $1,030,000 | | Rochester NY, Ser I, BANS
| | 2.50% | | 03/01/23 | | $1,029,875 |
| 1,155,000 | | Triborough NY Bridge & Tunnel Auth Payroll Mobility Tax, Ser A, BANS
| | 5.00% | | 08/15/24 | | 1,197,979 |
| 2,095,525 | | Wappingers NY Centrl Sch Dist, BANS
| | 4.00% | | 08/10/23 | | 2,109,580 |
| | | | | 34,148,405 |
| | | North Carolina – 1.6% | | | | | | |
| 1,500,000 | | Charlotte Mecklenburg NC Hosp Auth Hlth Care Sys Rev Var Atrium Hlth, Ser C (Mandatory put 03/01/23)
| | 5.00% | | 01/15/48 | | 1,502,896 |
| 3,205,000 | | NC St Turnpike Auth, BANS
| | 5.00% | | 02/01/24 | | 3,280,256 |
| 900,000 | | Raleigh Durham NC Arpt Auth Arpt Rev Ref, Ser B
| | 5.00% | | 05/01/23 | | 905,612 |
| | | | | 5,688,764 |
| | | North Dakota – 0.4% | | | | | | |
| 1,500,000 | | Cass Cnty ND Jt Wtr Res Dist, Ser A
| | 0.48% | | 05/01/24 | | 1,441,731 |
| 50,000 | | Grand Forks ND Hlthcare Sys Rev Altru Hlth System Ref
| | 5.00% | | 12/01/23 | | 50,764 |
| | | | | 1,492,495 |
| | | Ohio – 3.2% | | | | | | |
| 135,000 | | American Muni Pwr OH Inc OH Rev Ref Combined Hydroelec Proj, Ser A
| | 5.00% | | 02/15/23 | | 135,112 |
| 175,000 | | American Muni Pwr OH Inc OH Rev Ref Prairie St Energy Cmps Proj, Ser A
| | 5.00% | | 02/15/23 | | 175,145 |
| 150,000 | | Butler Cnty OH Hosp Facs Ref UC Hlth
| | 4.00% | | 11/15/23 | | 151,365 |
| 555,000 | | Cloverleaf OH Local Sch Dist, COPS, BAM
| | 3.00% | | 12/01/23 | | 556,957 |
| 1,500,000 | | Franklin Cnty OH Rev Var Che Trinity Hlth Cred Grp Remk, Ser OH (Mandatory put 05/01/23)
| | 3.30% | | 12/01/46 | | 1,499,882 |
| 280,000 | | Montgomery Cnty OH Hosp Rev Ref Kettering Hlth Network Oblig Grp Proj
| | 5.00% | | 08/01/23 | | 282,988 |
| 1,000,000 | | NW OH Loc Sch Dist Hamilton & Butler Cntys Sch Impt (Pre-refunded maturity 12/01/23)
| | 5.00% | | 12/01/45 | | 1,021,258 |
| 500,000 | | OH St Air Quality Dev Auth Ref American Elec Pwr Company Proj Remk, Ser B, AMT (Mandatory put 10/01/24)
| | 2.10% | | 07/01/28 | | 485,514 |
| 1,500,000 | | OH St Air Quality Dev Auth Ref American Elec Pwr Company Proj Remk, Ser C, AMT (Mandatory put 10/01/24)
| | 2.10% | | 04/01/28 | | 1,456,542 |
| 1,000,000 | | OH St Hgr Eductnl Fac Commn Kenyon Clg Proj (Forward refunding maturity 07/01/23)
| | 5.00% | | 07/01/37 | | 1,009,131 |
| 645,000 | | OH St Hosp Fac Rev Ref Cleveland Clinic Hlth Sys, Ser A
| | 5.00% | | 01/01/24 | | 659,449 |
| 1,500,000 | | OH St Turnpike Commn Junior Lien Infra Projs, Ser A-1
| | 5.25% | | 02/15/39 | | 1,501,474 |
| 2,500,000 | | Plain City OH, BANS
| | 4.00% | | 09/28/23 | | 2,517,044 |
| | | | | 11,451,861 |
| | | Oklahoma – 0.5% | | | | | | |
| 1,315,000 | | Tulsa OK
| | 5.00% | | 03/01/23 | | 1,317,690 |
| 500,000 | | Tulsa OK Arpts Impt Trust, Ser A, AMT, BAM (Pre-refunded maturity 06/01/23)
| | 5.63% | | 06/01/43 | | 504,903 |
| | | | | 1,822,593 |
| | | Oregon – 1.4% | | | | | | |
| 3,500,000 | | Crook Cnty OR Sch Dist (Pre-refunded maturity 06/15/23)
| | 5.00% | | 06/15/37 | | 3,531,720 |
| 1,360,000 | | OR St Dept of Transprtn Hwy User Tax Rev Sr Lien, Ser A
| | 5.00% | | 11/15/23 | | 1,388,536 |
| 105,000 | | Salem OR Hosp Fac Auth Rev Ref Capital Manor Proj
| | 5.00% | | 05/15/23 | | 105,179 |
| | | | | 5,025,435 |
Page 36
See Notes to Financial Statements
First Trust Ultra Short Duration Municipal ETF (FUMB)
Portfolio of Investments (Continued)
January 31, 2023 (Unaudited)
Principal
Value | | Description | | Stated
Coupon | | Stated
Maturity | | Value |
| MUNICIPAL BONDS (Continued) |
| | | Pennsylvania – 3.0% | | | | | | |
| $285,000 | | Cmwlth Fing Auth PA Tobacco Master Stlmt Payment Rev Tobacco Master Stlmt Payment Bonds
| | 5.00% | | 06/01/24 | | $293,531 |
| 55,000 | | Erie PA Hgr Edu Bldg Auth Aicup Fing Prog Gannon Uni Proj Ref, Ser TT1
| | 5.00% | | 05/01/23 | | 55,165 |
| 1,250,000 | | Lancaster Cnty PA Sol Wst Mgmt Auth Sol Wst Disp Rev, Ser A (Pre-refunded maturity 12/15/23)
| | 5.25% | | 12/15/28 | | 1,280,483 |
| 235,000 | | Monroeville PA Fin Auth Upmc Rev Ref, Ser B
| | 5.00% | | 02/15/23 | | 235,182 |
| 180,000 | | Monroeville PA Fin Auth Upmc Rev Ref, Ser B
| | 3.50% | | 07/01/23 | | 180,527 |
| 1,340,000 | | N Wales PA Wtr Auth Ref
| | 3.00% | | 11/01/23 | | 1,344,023 |
| 1,250,000 | | PA St
| | 5.00% | | 10/01/23 | | 1,270,809 |
| 2,000,000 | | PA St Econ Dev Fing Auth Solid Waste Disposal Rev Var Waste Mgmt Inc Proj Remk, AMT (Mandatory put 05/01/23)
| | 4.00% | | 08/01/45 | | 2,000,038 |
| 335,000 | | PA St Turnpike Commn Oil Franchise Tax Rev Ref, Subser B
| | 4.00% | | 12/01/23 | | 339,191 |
| 100,000 | | Philadelphia PA Gas Wks Rev Ref
| | 5.00% | | 08/01/23 | | 100,983 |
| 215,000 | | Philadelphia PA Ref, Ser A
| | 5.00% | | 08/01/23 | | 217,689 |
| 1,430,000 | | Philadelphia PA Sch Dist Ref, Ser F
| | 5.00% | | 09/01/23 | | 1,449,021 |
| 260,000 | | Philadelphia PA Sch Dist, Ser A
| | 5.00% | | 09/01/23 | | 263,458 |
| 255,000 | | Riverside PA Sch Dist Ref, BAM
| | 3.00% | | 10/15/23 | | 255,753 |
| 300,000 | | Riverside PA Sch Dist Ref, BAM
| | 4.00% | | 10/15/24 | | 307,443 |
| 275,000 | | Riverside PA Sch Dist Ref, BAM
| | 4.00% | | 10/15/25 | | 286,013 |
| 785,000 | | Scranton PA Sch Dist Ref (c)
| | 5.00% | | 12/01/24 | | 814,433 |
| | | | | 10,693,742 |
| | | Rhode Island – 0.7% | | | | | | |
| 1,500,000 | | RI St & Providence Plantations Ref Cons Cap Dev Ln, Ser 1
| | 4.00% | | 10/15/23 | | 1,516,268 |
| 1,000,000 | | RI St Convention Ctr Auth Rev Ref, Ser A
| | 4.00% | | 05/15/23 | | 1,004,022 |
| | | | | 2,520,290 |
| | | South Carolina – 2.6% | | | | | | |
| 2,500,000 | | Cnty Sq Redev Corp SC Installment Pur Rev Greenville Co SC Proj, BANS (c)
| | 5.00% | | 02/09/24 | | 2,554,566 |
| 2,750,000 | | Patriots Energy Grp Fing Agy SC Gas Sply Rev, Ser A (Mandatory put 02/01/24)
| | 4.00% | | 10/01/48 | | 2,767,979 |
| 1,475,000 | | Saxe Gotha Lexington Pub Facs Corp SC Rev Corley Mill Redev Proj Area, BANS
| | 2.00% | | 03/17/23 | | 1,473,035 |
| 2,500,000 | | SC St Hsg Fin & Dev Auth Mtge Rev Mtge Rev Notes, Ser C
| | 2.60% | | 09/01/23 | | 2,498,942 |
| | | | | 9,294,522 |
| | | South Dakota – 0.3% | | | | | | |
| 980,000 | | SD St Eductnl Enhancement Funding Corp Tobacco Set, Ser B (Pre-refunded maturity 06/01/23)
| | 5.00% | | 06/01/24 | | 988,102 |
| | | Tennessee – 2.0% | | | | | | |
| 5,000 | | Jackson TN Hosp Rev Prerefunded Ref Jackson Madison Cnty Hosp
| | 5.00% | | 04/01/23 | | 5,020 |
| 220,000 | | Jackson TN Hosp Rev Unrefunded Ref Jackson Madison Cnty Hosp
| | 5.00% | | 04/01/23 | | 220,761 |
| 500,000 | | Memphis TN Hlth Eductnl & Hsg Fac Brd Mf Hsg Rev Var Memphis Towers Apts Proj Remk
| | 3.40% | | 12/01/23 | | 500,734 |
| 135,000 | | Met Govt Nashville & Davidson Cnty TN Hlth & Eductnl Fac Brd Trevecca Nazarene Univ Proj, Ser B
| | 4.00% | | 10/01/23 | | 135,283 |
| 1,500,000 | | Tender Option Bond Trust Recpts / Ctfs Various States Floaters, Ser 2016-Xf1054 (a) (b)
| | 1.74% | | 07/01/46 | | 1,500,000 |
| 2,500,000 | | TN St Energy Acq Corp Gas Rev Proj, Ser A (Mandatory put 05/01/23)
| | 4.00% | | 05/01/48 | | 2,502,674 |
See Notes to Financial Statements
Page 37
First Trust Ultra Short Duration Municipal ETF (FUMB)
Portfolio of Investments (Continued)
January 31, 2023 (Unaudited)
Principal
Value | | Description | | Stated
Coupon | | Stated
Maturity | | Value |
| MUNICIPAL BONDS (Continued) |
| | | Tennessee (Continued) | | | | | | |
| $610,000 | | TN St Energy Acq Corp Gas Rev, Ser A
| | 5.25% | | 09/01/23 | | $615,285 |
| 910,000 | | TN St Energy Acq Corp Gas Rev, Ser A
| | 5.25% | | 09/01/24 | | 929,170 |
| 860,000 | | TN St Energy Acq Corp Gas Rev, Ser C
| | 5.00% | | 02/01/23 | | 860,000 |
| | | | | 7,268,927 |
| | | Texas – 7.3% | | | | | | |
| 295,000 | | Aldine TX Indep Sch Dist Ref
| | 5.00% | | 02/15/23 | | 295,276 |
| 240,000 | | Arlington TX Hgr Edu Fin Corp Edu Rev Kipp TX Inc
| | 5.00% | | 08/15/23 | | 243,144 |
| 1,020,000 | | Arlington TX Wtr & Wstwtr Sys Rev, Ser A
| | 5.00% | | 06/01/23 | | 1,028,705 |
| 2,500,000 | | Austin TX Arpt Sys Rev Ref, AMT
| | 5.00% | | 11/15/23 | | 2,537,136 |
| 200,000 | | Bexar Cnty TX Hlth Facs Dev Corp Ref Army Retmnt Residence Fndtn Proj
| | 5.00% | | 07/15/23 | | 200,434 |
| 1,235,000 | | Bexar Cnty TX Hosp Dist Ctfs Oblig
| | 5.00% | | 02/15/23 | | 1,236,108 |
| 305,000 | | Brazoria Cnty TX Muni Util Dist #55, BAM
| | 4.00% | | 09/01/23 | | 307,049 |
| 700,000 | | Corpus Christi TX Util Sys Rev Junior Lien, Ser B
| | 5.00% | | 07/15/23 | | 707,832 |
| 150,000 | | Corsicana TX Ctfs Oblig
| | 4.00% | | 02/15/23 | | 150,054 |
| 250,000 | | Cotulla TX Indep Sch Dist
| | 5.00% | | 02/15/23 | | 250,223 |
| 965,000 | | Cypress Fairbanks TX Indep Sch Dist (Pre-refunded maturity 02/15/23)
| | 5.00% | | 02/15/25 | | 965,898 |
| 1,100,000 | | Dallas Cnty TX Util & Reclamation Dist Ref
| | 5.00% | | 02/15/23 | | 1,100,906 |
| 1,000,000 | | Dallas Fort Worth TX Intl Arpt Rev Ref, Ser A
| | 5.00% | | 11/01/23 | | 1,018,441 |
| 805,000 | | Fort Bend Cnty TX Muni Util Dist #182, BAM
| | 5.25% | | 09/01/23 | | 817,092 |
| 1,320,000 | | Fort Bend TX Indep Sch Dist Var Remk, Ser A (Mandatory put 08/01/24)
| | 2.38% | | 08/01/49 | | 1,307,667 |
| 490,000 | | Fort Worth TX Ref & Impt Gen Purp
| | 5.00% | | 03/01/23 | | 491,022 |
| 1,265,000 | | Harris Cnty TX Cultural Edu Facs Fin Corp Med Facs Rev Ref Baylor Clg of Med
| | 5.00% | | 11/15/23 | | 1,288,254 |
| 150,000 | | Houston TX Ref Pub Impt, Ser A
| | 5.00% | | 03/01/24 | | 154,194 |
| 385,000 | | Houston TX Util Sys Rev Ref Comb 1st Lien, Ser C
| | 5.00% | | 05/15/23 | | 387,828 |
| 175,000 | | Houston TX Util Sys Rev Ref Comb 1st Lien, Ser D
| | 5.00% | | 11/15/23 | | 178,548 |
| 425,000 | | Kaufman Cnty TX Muni Util Dist #5, BAM
| | 4.00% | | 03/01/23 | | 425,399 |
| 1,135,000 | | Lower CO River TX Auth Trans Contract Rev Lcra Trans Svcs Corp Proj, Ser A
| | 5.00% | | 05/15/23 | | 1,142,385 |
| 195,000 | | Lower CO River TX Auth Trans Contract Rev Ref Lcra Trans Svcs Corp Proj
| | 5.00% | | 05/15/23 | | 196,269 |
| 575,000 | | Lower CO River TX Auth Trans Contract Rev Ref Lcra Trans Svcs Corp Proj
| | 5.00% | | 05/15/23 | | 578,741 |
| 280,000 | | Lower CO River TX Auth Trans Contract Rev Ref Lcra Trans Svcs Corp Proj
| | 5.00% | | 05/15/23 | | 281,822 |
| 500,000 | | Lower CO River TX Auth Trans Contract Rev Ref Lcra Trans Svcs Corp Proj, Ser A
| | 5.00% | | 05/15/23 | | 503,253 |
| 1,000,000 | | Matagorda Cnty TX Nav Dist #1 Var Rev Cent Pwr & Lt Ref Remk, AMT (Mandatory put 09/01/23)
| | 0.90% | | 05/01/30 | | 980,525 |
| 265,000 | | McLendon Chisholm TX Spl Assmnt Rev Ref Sonoma Pub Impt Dt Phase 1 Proj, BAM
| | 4.00% | | 09/15/23 | | 266,328 |
| 1,000,000 | | Mission TX Econ Dev Corp Sol Wst Disp Rev Var Waste Mgmt Inc Proj Remk, Ser A, AMT (Mandatory put 03/01/23)
| | 3.50% | | 05/01/46 | | 1,000,100 |
| 420,000 | | Montgomery Cnty TX Muni Util Dist #105, BAM
| | 4.63% | | 09/01/23 | | 424,759 |
| 430,000 | | Montgomery Cnty TX Muni Util Dist #105, BAM
| | 4.63% | | 09/01/24 | | 444,091 |
| 130,000 | | Newark Hgr Edu Fin Corp TX Edu Rev The Hughen Ctr Inc, Ser A
| | 4.00% | | 08/15/23 | | 130,669 |
| 300,000 | | NW Harris Cnty TX Muni Util Dist #5 Ref, BAM
| | 4.00% | | 05/01/23 | | 301,071 |
| 125,000 | | Splendora TX Indep Sch Dist Ref Sch Bldg, Ser B
| | 5.00% | | 02/15/23 | | 125,116 |
| 395,000 | | Stafford TX Econ Dev Corp Sales Tax Rev Ref, BAM
| | 5.00% | | 09/01/23 | | 400,552 |
Page 38
See Notes to Financial Statements
First Trust Ultra Short Duration Municipal ETF (FUMB)
Portfolio of Investments (Continued)
January 31, 2023 (Unaudited)
Principal
Value | | Description | | Stated
Coupon | | Stated
Maturity | | Value |
| MUNICIPAL BONDS (Continued) |
| | | Texas (Continued) | | | | | | |
| $375,000 | | Tarrant Cnty TX Cultural Edu Facs Fin Corp Hosp Rev Baylor Hlth Care Sys Proj, Ser A (Pre-refunded maturity 05/15/23)
| | 4.00% | | 11/15/43 | | $376,670 |
| 220,000 | | Trinity River TX Auth Red Oak Creek Sys Rev Red Oak Creek System
| | 5.00% | | 02/01/23 | | 220,000 |
| 1,250,000 | | TX St A&M Univ Rev
| | 5.00% | | 05/15/23 | | 1,259,361 |
| 335,000 | | TX St Muni Gas Acq & Sply Corp I Gas Sply Rev Sr Lien, Ser A
| | 5.25% | | 12/15/23 | | 341,077 |
| 1,800,000 | | Univ of Texas TX Univ Rev Ref, Ser H
| | 5.00% | | 08/15/23 | | 1,826,093 |
| 250,000 | | Viridian TX Muni Mgmt Dist Unlimited Tax Road Impt Bonds, BAM
| | 4.00% | | 12/01/23 | | 252,983 |
| | | | | 26,143,075 |
| | | Utah – 0.2% | | | | | | |
| 715,000 | | UT Cnty UT Hosp Rev Ref IHC Hlth Svcs Inc, Ser A
| | 5.00% | | 05/15/23 | | 719,526 |
| 105,000 | | UT St Chrt Sch Fin Auth Chrt Sch Rev Ref Quest Acdmy
| | 4.00% | | 04/15/23 | | 105,290 |
| | | | | 824,816 |
| | | Virginia – 0.4% | | | | | | |
| 850,000 | | Chesapeake VA Econ Dev Auth Poll Control Rev VA Elec & Pwr Co Remk, Ser 2008A (Mandatory put 06/01/23)
| | 1.90% | | 02/01/32 | | 845,115 |
| 100,000 | | VA Clg Bldg Auth Eductnl Facs Rev Ref Regent Univ Proj
| | 5.00% | | 06/01/23 | | 100,405 |
| 175,000 | | VA Clg Bldg Auth Eductnl Facs Rev Ref Regent Univ Proj
| | 5.00% | | 06/01/24 | | 177,846 |
| 385,000 | | VA St Pub Bldg Auth Pub Facs Rev, Ser A
| | 5.00% | | 08/01/23 | | 390,084 |
| | | | | 1,513,450 |
| | | Washington – 1.7% | | | | | | |
| 200,000 | | Centrl WA Univ Sys Rev, AGM
| | 5.00% | | 05/01/23 | | 201,187 |
| 1,865,000 | | King Cnty WA Rural Library Dist Ref
| | 4.00% | | 12/01/23 | | 1,890,955 |
| 1,500,000 | | King Cnty WA Swr Rev Ref & Impt, Ser B (Pre-refunded maturity 07/01/23)
| | 5.00% | | 07/01/39 | | 1,516,188 |
| 1,100,000 | | Port of Seattle WA Rev Intermediate Lien, AMT
| | 5.00% | | 04/01/23 | | 1,104,118 |
| 1,500,000 | | Tender Option Bond Trust Recpts / Ctfs Various States Putters, Ser 2020-Xm0883 (a) (b)
| | 1.81% | | 03/01/28 | | 1,500,000 |
| | | | | 6,212,448 |
| | | Wisconsin – 2.7% | | | | | | |
| 1,650,000 | | Fox Point & Bayside WI Jt Sch Dist #2 Prm Nts
| | 3.50% | | 09/05/23 | | 1,656,421 |
| 910,000 | | Milwaukee WI Promissory Nts, Ser N1
| | 5.00% | | 02/01/23 | | 910,000 |
| 410,000 | | Milwaukee WI Ref Prom Nts, Ser N2
| | 4.00% | | 03/15/25 | | 421,455 |
| 380,000 | | Milwaukee WI Ref Promissory Nts, Ser N4
| | 5.00% | | 04/01/23 | | 381,264 |
| 490,000 | | Milwaukee WI Ref Promissory Nts, Ser N4
| | 5.00% | | 04/01/24 | | 501,813 |
| 1,000,000 | | Onalaska WI Sch Dist, BANS
| | 4.00% | | 07/26/23 | | 1,002,663 |
| 65,000 | | Pub Fin Auth WI Edu Rev Coral Acdmy of Science Las Vegas, Ser A
| | 4.00% | | 07/01/23 | | 65,042 |
| 1,794,000 | | Tender Option Bond Trust Recpts / Ctfs Various States Putters, Ser 2020-Xf2869 (a) (b)
| | 1.88% | | 11/01/25 | | 1,794,000 |
| 2,000,000 | | Waukesha WI, Ser C, NANS
| | 3.00% | | 07/01/23 | | 2,001,831 |
| 165,000 | | WI St Hlth & Eductnl Facs Auth Rev Ref Saint John’s Cmntys Inc, Ser B
| | 3.00% | | 09/15/23 | | 163,926 |
| 150,000 | | WI St Hlth & Eductnl Facs Auth Rev Three Pillars Sr Living Cmntys, Ser A
| | 4.00% | | 08/15/23 | | 149,935 |
| 100,000 | | WI St Transprtn Rev Prerefunded, Ser 1 (Pre-refunded maturity 07/01/23)
| | 5.00% | | 07/01/25 | | 101,059 |
| 550,000 | | WI St, Ser A (Pre-refunded maturity 05/01/23)
| | 5.00% | | 05/01/34 | | 553,526 |
| | | | | 9,702,935 |
See Notes to Financial Statements
Page 39
First Trust Ultra Short Duration Municipal ETF (FUMB)
Portfolio of Investments (Continued)
January 31, 2023 (Unaudited)
Principal
Value | | Description | | Stated
Coupon | | Stated
Maturity | | Value |
| MUNICIPAL BONDS (Continued) |
| | | Wyoming – 0.1% | | | | | | |
| $470,000 | | Consol Muni Elec Pwr Sys WY Jt Pwrs Brd Sys Jt Pwrs Brd Ref Electrical Sys Proj
| | 5.00% | | 06/01/23 | | $473,729 |
| Total Investments – 98.8%
| | 353,455,078 |
| | (Cost $354,201,299) | | |
| | Net Other Assets and Liabilities – 1.2%
| | 4,202,958 |
| | Net Assets – 100.0%
| | $357,658,036 |
| (a) | Variable Rate Demand bond. Interest rate is reset periodically by the agent based on current market conditions. |
| (b) | This security, sold within the terms of a private placement memorandum, is exempt from registration upon resale under Rule 144A of the Securities Act of 1933, as amended, and may be resold in transactions exempt from registration, normally to qualified institutional buyers. Pursuant to procedures adopted by the Trust’s Board of Trustees, this security has been determined to be liquid by First Trust Advisors L.P. (the “Advisor”). Although market instability can result in periods of increased overall market illiquidity, liquidity for each security is determined based on security specific factors and assumptions, which require subjective judgment. At January 31, 2023, securities noted as such amounted to $11,533,760 or 3.2% of net assets. |
| (c) | When-issued security. The interest rate shown reflects the rate in effect at January 31, 2023. Interest will begin accruing on the security’s first settlement date. |
| AGM | Assured Guaranty Municipal Corp. |
| AMBAC | American Municipal Bond Assurance Corp. |
| AMT | Alternative Minimum Tax |
| BAM | Build America Mutual |
| BANS | Bond Anticipation Notes |
| COPS | Certificates of Participation |
| GARVEE | Grant Anticipation Revenue Vehicle |
| NANS | Note Anticipation Notes |
| NATL-RE | National Public Finance Guarantee Corp. |
| RANS | Revenue Anticipation Notes |
Valuation Inputs
A summary of the inputs used to value the Fund’s investments as of January 31, 2023 is as follows (see Note 2A - Portfolio Valuation in the Notes to Financial Statements):
| | Total
Value at
1/31/2023 | Level 1
Quoted
Prices | Level 2
Significant
Observable
Inputs | Level 3
Significant
Unobservable
Inputs |
Municipal Bonds*
| $ 353,455,078 | $ — | $ 353,455,078 | $ — |
| * | See Portfolio of Investments for state breakout. |
Page 40
See Notes to Financial Statements
First Trust Exchange-Traded Fund III
Statements of Assets and Liabilities
January 31, 2023 (Unaudited)
| | First Trust
Short Duration
Managed
Municipal
ETF (FSMB) | | First Trust
Ultra Short
Duration
Municipal
ETF (FUMB) |
| ASSETS: | | | |
Investments, at value
| $ 419,556,277 | | $ 353,455,078 |
Cash
| 12,276,980 | | 7,492,752 |
| Receivables: | | | |
Interest
| 4,469,274 | | 4,203,029 |
Fund shares sold
| 3,991,084 | | — |
Investment securities sold
| 756,972 | | — |
Total Assets
| 441,050,587 | | 365,150,859 |
| LIABILITIES: | | | |
| Payables: | | | |
Investment securities purchased
| 10,900,646 | | 7,357,932 |
Investment advisory fees
| 195,289 | | 134,891 |
Total Liabilities
| 11,095,935 | | 7,492,823 |
NET ASSETS
| $429,954,652 | | $357,658,036 |
| NET ASSETS consist of: | | | |
Paid-in capital
| $ 435,423,379 | | $ 358,264,681 |
Par value
| 215,500 | | 179,000 |
Accumulated distributable earnings (loss)
| (5,684,227) | | (785,645) |
NET ASSETS
| $429,954,652 | | $357,658,036 |
NET ASSET VALUE, per share
| $19.95 | | $19.98 |
Number of shares outstanding (unlimited number of shares authorized, par value $0.01 per share)
| 21,550,002 | | 17,900,002 |
Investments, at cost
| $422,081,276 | | $354,201,299 |
See Notes to Financial Statements
Page 41
First Trust Exchange-Traded Fund III
Statements of Operations
For the Six Months Ended January 31, 2023 (Unaudited)
| | First Trust
Short Duration
Managed
Municipal
ETF (FSMB) | | First Trust
Ultra Short
Duration
Municipal
ETF (FUMB) |
| INVESTMENT INCOME: | | | |
Interest
| $ 4,391,942 | | $ 3,281,071 |
Total investment income
| 4,391,942 | | 3,281,071 |
| EXPENSES: | | | |
Investment advisory fees
| 1,026,313 | | 735,221 |
Total expenses
| 1,026,313 | | 735,221 |
Fees waived by the investment advisor
| (232,733) | | (208,049) |
Net expenses
| 793,580 | | 527,172 |
NET INVESTMENT INCOME (LOSS)
| 3,598,362 | | 2,753,899 |
| NET REALIZED AND UNREALIZED GAIN (LOSS): | | | |
Net realized gain (loss) on investments
| (2,498,495) | | 50,607 |
Net change in unrealized appreciation (depreciation) on investments
| 2,537,051 | | 48,030 |
NET REALIZED AND UNREALIZED GAIN (LOSS)
| 38,556 | | 98,637 |
NET INCREASE (DECREASE) IN NET ASSETS RESULTING FROM OPERATIONS
| $ 3,636,918 | | $ 2,852,536 |
Page 42
See Notes to Financial Statements
First Trust Exchange-Traded Fund III
Statements of Changes in Net Assets
| | First Trust Short
Duration Managed
Municipal ETF (FSMB) | | First Trust Ultra
Short Duration
Municipal ETF (FUMB) |
| | Six Months
Ended
1/31/2023
(Unaudited) | | Year
Ended
7/31/2022 | | Six Months
Ended
1/31/2023
(Unaudited) | | Year
Ended
7/31/2022 |
| OPERATIONS: | | | | | | | |
Net investment income (loss)
| $ 3,598,362 | | $ 2,383,019 | | $ 2,753,899 | | $ 1,091,207 |
Net realized gain (loss)
| (2,498,495) | | (715,285) | | 50,607 | | (222,475) |
Net change in unrealized appreciation (depreciation)
| 2,537,051 | | (7,616,372) | | 48,030 | | (1,308,746) |
Net increase (decrease) in net assets resulting from operations
| 3,636,918 | | (5,948,638) | | 2,852,536 | | (440,014) |
| DISTRIBUTIONS TO SHAREHOLDERS FROM: | | | | | | | |
Investment operations
| (3,524,000) | | (2,336,031) | | (2,673,750) | | (1,061,950) |
Return of capital
| — | | (174,270) | | — | | — |
Total distributions to shareholders
| (3,524,000) | | (2,510,301) | | (2,673,750) | | (1,061,950) |
| SHAREHOLDER TRANSACTIONS: | | | | | | | |
Proceeds from shares sold
| 138,655,261 | | 199,500,283 | | 71,672,570 | | 157,813,719 |
Cost of shares redeemed
| (11,780,529) | | (18,005,523) | | — | | (35,979,272) |
Net increase (decrease) in net assets resulting from shareholder transactions
| 126,874,732 | | 181,494,760 | | 71,672,570 | | 121,834,447 |
Total increase (decrease) in net assets
| 126,987,650 | | 173,035,821 | | 71,851,356 | | 120,332,483 |
| NET ASSETS: | | | | | | | |
Beginning of period
| 302,967,002 | | 129,931,181 | | 285,806,680 | | 165,474,197 |
End of period
| $429,954,652 | | $302,967,002 | | $357,658,036 | | $285,806,680 |
| CHANGES IN SHARES OUTSTANDING: | | | | | | | |
Shares outstanding, beginning of period
| 15,100,002 | | 6,200,002 | | 14,300,002 | | 8,200,002 |
Shares sold
| 7,050,000 | | 9,800,000 | | 3,600,000 | | 7,900,000 |
Shares redeemed
| (600,000) | | (900,000) | | — | | (1,800,000) |
Shares outstanding, end of period
| 21,550,002 | | 15,100,002 | | 17,900,002 | | 14,300,002 |
See Notes to Financial Statements
Page 43
First Trust Exchange-Traded Fund III
Financial Highlights
For a share outstanding throughout each period
First Trust Short Duration Managed Municipal ETF (FSMB)
| | Six Months
Ended
1/31/2023
(Unaudited) | | Year Ended July 31, | | Period
Ended
7/31/2019 (a) |
| | 2022 | | 2021 | | 2020 | |
Net asset value, beginning of period
| $ 20.06 | | $ 20.96 | | $ 20.66 | | $ 20.48 | | $ 20.00 |
| Income from investment operations: | | | | | | | | | |
Net investment income (loss)
| 0.18 | | 0.21 | | 0.27 | | 0.38 | | 0.34 |
Net realized and unrealized gain (loss)
| (0.11) (b) | | (0.88) | | 0.33 | | 0.22 | | 0.45 |
Total from investment operations
| 0.07 | | (0.67) | | 0.60 | | 0.60 | | 0.79 |
| Distributions paid to shareholders from: | | | | | | | | | |
Net investment income
| (0.18) | | (0.21) | | (0.27) | | (0.41) | | (0.31) |
Return of capital
| — | | (0.02) | | (0.03) | | (0.01) | | — |
Total distributions
| (0.18) | | (0.23) | | (0.30) | | (0.42) | | (0.31) |
Net asset value, end of period
| $19.95 | | $20.06 | | $20.96 | | $20.66 | | $20.48 |
Total return (c)
| 0.38% | | (3.19)% | | 2.92% | | 2.98% | | 3.98% |
| Ratios to average net assets/supplemental data: | | | | | | | | | |
Net assets, end of period (in 000’s)
| $ 429,955 | | $ 302,967 | | $ 129,931 | | $ 61,967 | | $ 19,454 |
Ratio of total expenses to average net assets
| 0.55% (d) | | 0.55% | | 0.55% | | 0.55% | | 0.55% (d) |
Ratio of net expenses to average net assets
| 0.43% (d) | | 0.35% | | 0.43% | | 0.45% | | 0.45% (d) |
Ratio of net investment income (loss) to average net assets
| 1.93% (d) | | 1.14% | | 1.33% | | 2.00% | | 2.23% (d) |
Portfolio turnover rate (e)
| 24% | | 35% | | 16% | | 58% | | 66% |
| (a) | Inception date is November 1, 2018, which is consistent with the commencement of operations and is the date the initial creation units were established. |
| (b) | The per share amount does not correlate with the aggregate realized and unrealized gain (loss) due to the timing of the Fund share sales and repurchases in relation to market value fluctuation of the underlying investments. |
| (c) | Total return is calculated assuming an initial investment made at the net asset value at the beginning of the period, reinvestment of all distributions at net asset value during the period, and redemption at net asset value on the last day of the period. The returns presented do not reflect the deduction of taxes that a shareholder would pay on Fund distributions or the redemption or sale of Fund shares. Total return is calculated for the time period presented and is not annualized for periods of less than a year. The total returns would have been lower if certain fees had not been waived by the investment advisor. |
| (d) | Annualized. |
| (e) | Portfolio turnover is calculated for the time period presented and is not annualized for periods of less than a year and does not include securities received or delivered from processing creations or redemptions and in-kind transactions. |
Page 44
See Notes to Financial Statements
First Trust Exchange-Traded Fund III
Financial Highlights (Continued)
For a share outstanding throughout each period
First Trust Ultra Short Duration Municipal ETF (FUMB)
| | Six Months
Ended
1/31/2023
(Unaudited) | | Year Ended July 31, | | Period
Ended
7/31/2019 (a) |
| | 2022 | | 2021 | | 2020 | |
Net asset value, beginning of period
| $ 19.99 | | $ 20.18 | | $ 20.16 | | $ 20.10 | | $ 20.00 |
| Income from investment operations: | | | | | | | | | |
Net investment income (loss)
| 0.16 | | 0.10 | | 0.12 | | 0.25 | | 0.26 |
Net realized and unrealized gain (loss)
| (0.01) (b) | | (0.19) | | 0.02 | | 0.07 | | 0.09 |
Total from investment operations
| 0.15 | | (0.09) | | 0.14 | | 0.32 | | 0.35 |
| Distributions paid to shareholders from: | | | | | | | | | |
Net investment income
| (0.16) | | (0.10) | | (0.12) | | (0.26) | | (0.25) |
Net realized gain
| — | | — | | — | | (0.00) (c) | | — |
Return of capital
| — | | — | | — | | (0.00) (c) | | — |
Total distributions
| (0.16) | | (0.10) | | (0.12) | | (0.26) | | (0.25) |
Net asset value, end of period
| $19.98 | | $19.99 | | $20.18 | | $20.16 | | $20.10 |
Total return (d)
| 0.76% | | (0.45)% | | 0.72% | | 1.61% | | 1.75% |
| Ratios to average net assets/supplemental data: | | | | | | | | | |
Net assets, end of period (in 000’s)
| $ 357,658 | | $ 285,807 | | $ 165,474 | | $ 83,661 | | $ 20,098 |
Ratio of total expenses to average net assets
| 0.45% (e) | | 0.45% | | 0.45% | | 0.45% | | 0.45% (e) |
Ratio of net expenses to average net assets
| 0.32% (e) | | 0.25% | | 0.26% | | 0.35% | | 0.35% (e) |
Ratio of net investment income (loss) to average net assets
| 1.69% (e) | | 0.56% | | 0.61% | | 1.20% | | 1.73% (e) |
Portfolio turnover rate (f)
| 69% | | 79% | | 44% | | 149% | | 145% |
| (a) | Inception date is November 1, 2018, which is consistent with the commencement of operations and is the date the initial creation units were established. |
| (b) | The per share amount does not correlate with the aggregate realized and unrealized gain (loss) due to the timing of the Fund share sales and repurchases in relation to market value fluctuation of the underlying investments. |
| (c) | Amount is less than $0.01. |
| (d) | Total return is calculated assuming an initial investment made at the net asset value at the beginning of the period, reinvestment of all distributions at net asset value during the period, and redemption at net asset value on the last day of the period. The returns presented do not reflect the deduction of taxes that a shareholder would pay on Fund distributions or the redemption or sale of Fund shares. Total return is calculated for the time period presented and is not annualized for periods of less than a year. The total returns would have been lower if certain fees had not been waived by the investment advisor. |
| (e) | Annualized. |
| (f) | Portfolio turnover is calculated for the time period presented and is not annualized for periods of less than a year and does not include securities received or delivered from processing creations or redemptions and in-kind transactions. |
See Notes to Financial Statements
Page 45
Notes to Financial Statements
First Trust Exchange-Traded Fund III
January 31, 2023 (Unaudited)
1. Organization
First Trust Exchange-Traded Fund III (the “Trust”) is an open-end management investment company organized as a Massachusetts business trust on January 9, 2008, and is registered with the Securities and Exchange Commission under the Investment Company Act of 1940, as amended (the “1940 Act”).
The Trust currently consists of seventeen funds that are offering shares. This report covers the following funds (each a “Fund” and collectively, the “Funds”), each a diversified series of the Trust:
First Trust Short Duration Managed Municipal ETF – (NYSE Arca, Inc. (“NYSE Arca”) ticker “FSMB”)
First Trust Ultra Short Duration Municipal ETF – (NYSE Arca ticker “FUMB”)
Each Fund represents a separate series of shares of beneficial interest in the Trust. Unlike conventional mutual funds, each Fund issues and redeems shares on a continuous basis, at net asset value (“NAV”), only in large blocks of shares known as “Creation Units.”
Each Fund is an actively managed exchange-traded fund. The investment objective of each Fund is to seek to provide federally tax-exempt income consistent with capital preservation. Under normal market conditions, each Fund seeks to achieve its investment objective by investing at least 80% of its net assets (including investment borrowings) in municipal debt securities that pay interest that is exempt from regular federal income taxes.
There can be no assurance that a Fund will achieve its investment objective. The Funds may not be appropriate for all investors.
2. Significant Accounting Policies
The Funds are each considered an investment company and follow accounting and reporting guidance under Financial Accounting Standards Board Accounting Standards Codification Topic 946, “Financial Services-Investment Companies.” The following is a summary of significant accounting policies consistently followed by the Funds in the preparation of the financial statements. The preparation of the financial statements in accordance with accounting principles generally accepted in the United States of America (“U.S. GAAP”) requires management to make estimates and assumptions that affect the reported amounts and disclosures in the financial statements. Actual results could differ from those estimates.
A. Portfolio Valuation
Each Fund’s NAV is determined daily as of the close of regular trading on the New York Stock Exchange (“NYSE”), normally 4:00 p.m. Eastern time, on each day the NYSE is open for trading. If the NYSE closes early on a valuation day, the NAV is determined as of that time. Each Fund’s NAV is calculated by dividing the value of all assets of each Fund (including accrued interest and dividends), less all liabilities (including accrued expenses and dividends declared but unpaid), by the total number of shares outstanding.
Each Fund’s investments are valued daily at market value or, in the absence of market value with respect to any portfolio securities, at fair value. Market value prices represent readily available market quotations such as last sale or official closing prices from a national or foreign exchange (i.e., a regulated market) and are primarily obtained from third-party pricing services. Fair value prices represent any prices not considered market value prices and are either obtained from a third-party pricing service or are determined by the Pricing Committee of the Funds’ investment advisor, First Trust Advisors L.P. (“First Trust” or the “Advisor”), in accordance with valuation procedures approved by the Trust’s Board of Trustees, and in accordance with provisions of the 1940 Act and rules thereunder. Investments valued by the Advisor’s Pricing Committee, if any, are footnoted as such in the footnotes to the Portfolio of Investments. Each Fund’s investments are valued as follows:
Municipal securities and other debt securities are fair valued on the basis of fair valuations provided by a third-party pricing service approved by the Advisor’s Pricing Committee, which may use the following valuation inputs when available:
| 1) | benchmark yields; |
| 2) | reported trades; |
| 3) | broker/dealer quotes; |
| 4) | issuer spreads; |
| 5) | benchmark securities; |
| 6) | bids and offers; and |
| 7) | reference data including market research publications. |
Notes to Financial Statements (Continued)
First Trust Exchange-Traded Fund III
January 31, 2023 (Unaudited)
Pricing services generally value fixed-income securities assuming orderly transactions of an institutional round lot size, but a Fund may hold or transact in such securities in smaller, odd lot sizes. Odd lots may trade at lower prices than institutional round lots.
Exchange-traded futures contracts are valued at the closing price in the market where such contracts are principally traded. If no closing price is available, exchange-traded futures contracts are valued at the mean of their most recent bid and asked price, if available, and otherwise at their closing bid price.
Fixed income and other debt securities having a remaining maturity of sixty days or less when purchased are fair valued at cost adjusted for amortization of premiums and accretion of discounts (amortized cost), provided the Advisor’s Pricing Committee has determined that the use of amortized cost is an appropriate reflection of fair value given market and issuer-specific conditions existing at the time of the determination. Factors that may be considered in determining the appropriateness of the use of amortized cost include, but are not limited to, the following:
| 1) | the credit conditions in the relevant market and changes thereto; |
| 2) | the liquidity conditions in the relevant market and changes thereto; |
| 3) | the interest rate conditions in the relevant market and changes thereto (such as significant changes in interest rates); |
| 4) | issuer-specific conditions (such as significant credit deterioration); and |
| 5) | any other market-based data the Advisor’s Pricing Committee considers relevant. In this regard, the Advisor’s Pricing Committee may use last-obtained market-based data to assist it when valuing portfolio securities using amortized cost. |
Certain securities may not be able to be priced by pre-established pricing methods. Such securities may be valued by the Advisor’s Pricing Committee at fair value. These securities generally include, but are not limited to, restricted securities (securities which may not be publicly sold without registration under the Securities Act of 1933, as amended) for which a third-party pricing service is unable to provide a market price; securities whose trading has been formally suspended; a security whose market or fair value price is not available from a pre-established pricing source; a security with respect to which an event has occurred that is likely to materially affect the value of the security after the market has closed but before the calculation of a Fund’s NAV or make it difficult or impossible to obtain a reliable market quotation; and a security whose price, as provided by the third-party pricing service, does not reflect the security’s fair value. As a general principle, the current fair value of a security would appear to be the amount which the owner might reasonably expect to receive for the security upon its current sale. When fair value prices are used, generally they will differ from market quotations or official closing prices on the applicable exchanges. A variety of factors may be considered in determining the fair value of such securities, including, but not limited to, the following:
| 1) | the fundamental business data relating to the issuer; |
| 2) | an evaluation of the forces which influence the market in which these securities are purchased and sold; |
| 3) | the type, size and cost of the security; |
| 4) | the financial statements of the issuer; |
| 5) | the credit quality and cash flow of the issuer, based on the Advisor’s or external analysis; |
| 6) | the information as to any transactions in or offers for the security; |
| 7) | the price and extent of public trading in similar securities (or equity securities) of the issuer/borrower, or comparable companies; |
| 8) | the coupon payments; |
| 9) | the quality, value and salability of collateral, if any, securing the security; and |
| 10) | other relevant factors. |
The Funds are subject to fair value accounting standards that define fair value, establish the framework for measuring fair value and provide a three-level hierarchy for fair valuation based upon the inputs to the valuation as of the measurement date. The three levels of the fair value hierarchy are as follows:
| • | Level 1 – Level 1 inputs are quoted prices in active markets for identical investments. An active market is a market in which transactions for the investment occur with sufficient frequency and volume to provide pricing information on an ongoing basis. |
| • | Level 2 – Level 2 inputs are observable inputs, either directly or indirectly, and include the following: |
| o | Quoted prices for similar investments in active markets. |
Notes to Financial Statements (Continued)
First Trust Exchange-Traded Fund III
January 31, 2023 (Unaudited)
| o | Quoted prices for identical or similar investments in markets that are non-active. A non-active market is a market where there are few transactions for the investment, the prices are not current, or price quotations vary substantially either over time or among market makers, or in which little information is released publicly. |
| o | Inputs other than quoted prices that are observable for the investment (for example, interest rates and yield curves observable at commonly quoted intervals, volatilities, prepayment speeds, loss severities, credit risks, and default rates). |
| o | Inputs that are derived principally from or corroborated by observable market data by correlation or other means. |
| • | Level 3 – Level 3 inputs are unobservable inputs. Unobservable inputs may reflect the reporting entity’s own assumptions about the assumptions that market participants would use in pricing the investment. |
The inputs or methodologies used for valuing investments are not necessarily an indication of the risk associated with investing in those investments. A summary of the inputs used to value each Fund’s investments as of January 31, 2023, is included with each Fund’s Portfolio of Investments.
B. Securities Transactions and Investment Income
Securities transactions are recorded as of the trade date. Realized gains and losses from securities transactions are recorded on the identified cost basis. Interest income is recorded daily on the accrual basis. Amortization of premiums and accretion of discounts are recorded using the effective interest method.
Securities purchased or sold on a when-issued or delayed-delivery basis may have extended settlement periods. The value of the security so purchased is subject to market fluctuations during this period. The Funds maintain liquid assets with a current value at least equal to the amount of its when-issued or delayed-delivery securities. At January 31, 2023, FSMB and FUMB held $7,644,025 and $5,651,053, respectively, of when-issued or delayed-delivery securities.
C. Futures Contracts
FSMB may purchase or sell (i.e., is long or short) exchange-listed futures contracts to hedge against changes in interest rates (interest rate risk). Futures contracts are agreements between the Fund and a counterparty to buy or sell a specific quantity of an underlying instrument at a specified price and at a specified date. Depending on the terms of the contract, futures contracts are settled either through physical delivery of the underlying instrument on the settlement date or by payment of a cash settlement amount on the settlement date. Open futures contracts can also be closed out prior to settlement by entering into an offsetting transaction in a matching futures contract. If the Fund is not able to enter into an offsetting transaction, the Fund will continue to be required to maintain margin deposits on the futures contract. When the contract is closed or expires, the Fund records a realized gain or loss equal to the difference between the value of the contract at the time it was opened and the value at the time it was closed or expired. This gain or loss is included in “Net realized gain (loss) on futures contracts” on the Statements of Operations.
Upon entering into a futures contract, the Fund must deposit funds, called margin, with its custodian in the name of the clearing broker equal to a specified percentage of the current value of the contract. Open futures contracts are marked to market daily with the change in value recognized as a component of “Net change in unrealized appreciation (depreciation) on futures contracts” on the Statements of Operations. Pursuant to the contract, the Fund agrees to receive from or pay to the broker an amount of cash equal to the daily fluctuation in value of the contract. Such receipts or payments are known as variation margin and are included in “Variation margin” payable or receivable on the Statements of Assets and Liabilities.
If market conditions change unexpectedly, the Fund may not achieve the anticipated benefits of the futures contract and may realize a loss. The use of futures contracts involves the risk of imperfect correlation in movements in the price of the futures contracts, interest rates and the underlying instruments. The Fund did not hold any futures contracts at January 31, 2023.
D. Dividends and Distributions to Shareholders
Dividends from net investment income, if any, are declared and paid monthly by each Fund, or as the Board of Trustees may determine from time to time. Distributions of net realized capital gains earned by each Fund, if any, are distributed at least annually. A Fund may also designate a portion of the amount paid to redeeming shareholders as a distribution for tax purposes.
Distributions from net investment income and realized capital gains are determined in accordance with federal income tax regulations, which may differ from U.S. GAAP. Certain capital accounts in the financial statements are periodically adjusted for permanent differences in order to reflect their tax character. These permanent differences are primarily due to the varying treatment of income and gain/loss on portfolio securities held by the Funds and have no impact on net assets or NAV per share. Temporary differences, which arise from recognizing certain items of income, expense and gain/loss in different periods for financial statement and tax purposes, will reverse at some time in the future.
Notes to Financial Statements (Continued)
First Trust Exchange-Traded Fund III
January 31, 2023 (Unaudited)
The tax character of distributions paid by each Fund during the fiscal year ended July 31, 2022, was as follows:
| | Distributions
paid from
Tax-Exempt
Income | | Distributions
paid from
Ordinary
Income | | Distributions
paid from
Capital
Gains | | Distributions
paid from
Return of
Capital |
First Trust Short Duration Managed Municipal ETF
| $2,331,384 | | $ 4,647 | | $ — | | $ 174,270 |
First Trust Ultra Short Duration Municipal ETF
| 1,060,324 | | 1,626 | | — | | — |
As of July 31, 2022, the components of distributable earnings on a tax basis for each Fund were as follows:
| | Undistributed
Ordinary
Income | | Accumulated
Capital and
Other
Gain (Loss) | | Net
Unrealized
Appreciation
(Depreciation) |
First Trust Short Duration Managed Municipal ETF
| $ — | | $ (843,738) | | $ (4,953,407) |
First Trust Ultra Short Duration Municipal ETF
| 35,776 | | (220,145) | | (780,062) |
E. Income Taxes
Each Fund intends to continue to qualify as a regulated investment company by complying with the requirements under Subchapter M of the Internal Revenue Code of 1986, as amended (the “Code”), which includes distributing substantially all of its net investment income and net realized gains to shareholders. Accordingly, no provision has been made for federal and state income taxes. However, due to the timing and amount of distributions, each Fund may be subject to an excise tax of 4% of the amount by which approximately 98% of each Fund’s taxable income exceeds the distributions from such taxable income for the calendar year.
In addition, each Fund intends to invest in municipal securities to allow it to pay shareholders “exempt dividends” as defined in the Code.
The Funds are subject to accounting standards that establish a minimum threshold for recognizing, and a system for measuring, the benefits of a tax position taken or expected to be taken in a tax return. Taxable years ended 2019, 2020, 2021, and 2022 remain open to federal and state audit. As of January 31, 2023, management has evaluated the application of these standards to the Funds and has determined that no provision for income tax is required in the Funds’ financial statements for uncertain tax positions.
The Funds intend to utilize provisions of the federal income tax laws, which allow them to carry a realized capital loss forward indefinitely following the year of the loss and offset such loss against any future realized capital gains. The Funds are subject to certain limitations under U.S. tax rules on the use of capital loss carryforwards and net unrealized built-in losses. These limitations apply when there has been a 50% change in ownership. At July 31, 2022, for federal income tax purposes, each Fund had a capital loss carryforward available that is shown in the table below, to the extent provided by regulations, to offset future capital gains.
| | Non-Expiring
Capital Loss
Carryforward |
First Trust Short Duration Managed Municipal ETF
| $ 843,738 |
First Trust Ultra Short Duration Municipal ETF
| 220,145 |
Certain losses realized during the current fiscal year may be deferred and treated as occurring on the first day of the following fiscal year for federal income tax purposes. For the fiscal year ended July 31, 2022, the Funds did not incur any net late year ordinary losses.
Notes to Financial Statements (Continued)
First Trust Exchange-Traded Fund III
January 31, 2023 (Unaudited)
As of January 31, 2023, the aggregate cost, gross unrealized appreciation, gross unrealized depreciation, and net unrealized appreciation/(depreciation) on investments (including short positions and derivatives, if any) for federal income tax purposes were as follows:
| | Tax Cost | | Gross
Unrealized
Appreciation | | Gross
Unrealized
(Depreciation) | | Net Unrealized
Appreciation
(Depreciation) |
First Trust Short Duration Managed Municipal ETF
| $ 422,081,276 | | $ 2,966,763 | | $ (5,491,762) | | $ (2,524,999) |
First Trust Ultra Short Duration Municipal ETF
| 354,201,299 | | 407,226 | | (1,153,447) | | (746,221) |
F. Expenses
Expenses, other than the investment advisory fee and other excluded expenses, are paid by the Advisor (See Note 3).
3. Investment Advisory Fee, Affiliated Transactions and Other Fee Arrangements
First Trust, the investment advisor to the Funds, is a limited partnership with one limited partner, Grace Partners of DuPage L.P., and one general partner, The Charger Corporation. The Charger Corporation is an Illinois corporation controlled by James A. Bowen, Chief Executive Officer of First Trust. First Trust is responsible for the selection and ongoing monitoring of the securities in each Fund’s portfolio, managing the Funds’ business affairs and providing certain administrative services necessary for the management of the Funds.
Pursuant to the Investment Management Agreement between First Trust and the Trust, First Trust manages the investment of the Funds’ assets and is responsible for the expenses of each Fund, including the cost of transfer agency, custody, fund administration, legal, audit and other services, but excluding fee payments under the Investment Management Agreement, interest, taxes, brokerage commissions and other expenses connected with the execution of portfolio transactions, distribution and service fees payable pursuant to a Rule 12b-1 plan, if any, and extraordinary expenses, which are paid by each respective Fund. Effective November 1, 2022, the annual unitary management fee payable by each Fund to First Trust for these services will be reduced at certain levels of each Fund’s net assets (“breakpoints”) and calculated pursuant to the schedules below.
| Breakpoints | | FSMB | | FUMB |
| Fund net assets up to and including $2.5 billion | | 0.55000% | | 0.45000% |
| Fund net assets greater than $2.5 billion up to and including $5 billion | | 0.53625% | | 0.43875% |
| Fund net assets greater than $5 billion up to and including $7.5 billion | | 0.52250% | | 0.42750% |
| Fund net assets greater than $7.5 billion up to and including $10 billion | | 0.50875% | | 0.41625% |
| Fund net assets greater than $10 billion | | 0.49500% | | 0.40500% |
Prior to November 1, 2022, FSMB and FUMB paid First Trust an annual unitary management fee of 0.55% and 0.45% of FSMB’s and FUMB’s average daily net assets, respectively. First Trust also provides fund reporting services to each Fund for a flat annual fee in the amount of $9,250, which is covered under the annual unitary management fee.
Pursuant to two separate contractual agreements for each Fund, First Trust agreed to waive management fees of 0.20% of average daily net assets for each Fund until November 30, 2022. As of November 30, 2022, the waiver agreements terminated. First Trust does not have the right to recover the fees waived. During the six months ended January 31, 2023, the Advisor waived fees of $232,733 and $208,049 for FSMB and FUMB, respectively.
The Trust has multiple service agreements with Brown Brothers Harriman & Co. (“BBH”). Under the service agreements, BBH performs custodial, fund accounting, certain administrative services, and transfer agency services for the Funds. As custodian, BBH is responsible for custody of each Fund’s assets. As fund accountant and administrator, BBH is responsible for maintaining the books and records of each Fund’s securities and cash. As transfer agent, BBH is responsible for maintaining shareholder records for each Fund.
Each Trustee who is not an officer or employee of First Trust, any sub-advisor or any of their affiliates (“Independent Trustees”) is paid a fixed annual retainer that is allocated equally among each fund in the First Trust Fund Complex. Each Independent Trustee is also paid an annual per fund fee that varies based on whether the fund is a closed-end or other actively managed fund, a target outcome fund or an index fund.
Additionally, the Lead Independent Trustee and the Chairs of the Audit Committee, Nominating and Governance Committee and Valuation Committee are paid annual fees to serve in such capacities, with such compensation allocated pro rata among each fund in
Notes to Financial Statements (Continued)
First Trust Exchange-Traded Fund III
January 31, 2023 (Unaudited)
the First Trust Fund Complex based on net assets. Independent Trustees are reimbursed for travel and out-of-pocket expenses in connection with all meetings. The Lead Independent Trustee and Committee Chairs rotate every three years. The officers and “Interested” Trustee receive no compensation from the Trust for acting in such capacities.
4. Purchases and Sales of Securities
For the six months ended January 31, 2023, the cost of purchases and proceeds from sales of investment securities for each Fund, excluding short-term investments and in-kind transactions, were as follows:
| | Purchases | | Sales |
| First Trust Short Duration Managed Municipal ETF | $ 214,510,843 | | $ 84,314,199 |
| First Trust Ultra Short Duration Municipal ETF | 182,138,342 | | 158,034,392 |
| | | | |
For the six months ended January 31, 2023, the Funds had no in-kind transactions.
5. Creations, Redemptions and Transaction Fees
Each Fund generally issues and redeems its shares in primary market transactions through a creation and redemption mechanism and does not sell or redeem individual shares. Instead, financial entities known as “Authorized Participants” have contractual arrangements with a Fund or one of the Fund’s service providers to purchase and redeem Fund shares directly with the Fund in large blocks of shares known as “Creation Units.” Prior to the start of trading on every business day, a Fund publishes through the National Securities Clearing Corporation (“NSCC”) the “basket” of securities, cash or other assets that it will accept in exchange for a Creation Unit of the Fund’s shares. An Authorized Participant that wishes to effectuate a creation of a Fund’s shares deposits with the Fund the “basket” of securities, cash or other assets identified by the Fund that day, and then receives the Creation Unit of the Fund’s shares in return for those assets. After purchasing a Creation Unit, the Authorized Participant may continue to hold the Fund’s shares or sell them in the secondary market. The redemption process is the reverse of the purchase process: the Authorized Participant redeems a Creation Unit of a Fund’s shares for a basket of securities, cash or other assets. The combination of the creation and redemption process with secondary market trading in a Fund’s shares and underlying securities provides arbitrage opportunities that are designed to help keep the market price of a Fund’s shares at or close to the NAV per share of the Fund.
Each Fund imposes fees in connection with the purchase of Creation Units. These fees may vary based upon various fact-based circumstances, including, but not limited to, the composition of the securities included in the Creation Unit or the countries in which the transactions are settled. The price for each Creation Unit will equal the daily NAV per share of a Fund times the number of shares in a Creation Unit, plus the fees described above and, if applicable, any operational processing and brokerage costs, transfer fees, stamp taxes and part or all of the spread between the expected bid and offer side of the market related to the securities comprising the creation basket.
Each Fund also imposes fees in connection with the redemption of Creation Units. These fees may vary based upon various fact-based circumstances, including, but not limited to, the composition of the securities included in the Creation Unit or the countries in which the transactions are settled. The price received for each Creation Unit will equal the daily NAV per share of a Fund times the number of shares in a Creation Unit, minus the fees described above and, if applicable, any operational processing and brokerage costs, transfer fees, stamp taxes and part or all of the spread between the expected bid and offer side of the market related to the securities comprising the redemption basket. Investors who use the services of a broker or other such intermediary in addition to an Authorized Participant to effect a redemption of a Creation Unit may also be assessed an amount to cover the cost of such services. The redemption fee charged by a Fund will comply with Rule 22c-2 of the 1940 Act which limits redemption fees to no more than 2% of the value of the shares redeemed.
6. Distribution Plan
The Board of Trustees adopted a Distribution and Service Plan pursuant to Rule 12b-1 under the 1940 Act. In accordance with the Rule 12b-1 plan, each Fund is authorized to pay an amount up to 0.25% of its average daily net assets each year to reimburse First Trust Portfolios L.P. (“FTP”), the distributor of the Funds, for amounts expended to finance activities primarily intended to result in the sale of Creation Units or to provide investor services. FTP may also use this amount to compensate securities dealers or other persons that are Authorized Participants for providing distribution assistance, including broker-dealer and shareholder support and educational and promotional services.
No 12b-1 fees are currently paid by the Funds, and pursuant to a contractual arrangement, no 12b-1 fees will be paid any time before November 30, 2023.
Notes to Financial Statements (Continued)
First Trust Exchange-Traded Fund III
January 31, 2023 (Unaudited)
7. Indemnification
The Trust, on behalf of the Funds, has a variety of indemnification obligations under contracts with its service providers. The Trust’s maximum exposure under these arrangements is unknown. However, the Trust has not had prior claims or losses pursuant to these contracts and expects the risk of loss to be remote.
8. Subsequent Events
Management has evaluated the impact of all subsequent events to the Funds through the date the financial statements were issued and has determined that there were no subsequent events requiring recognition or disclosure in the financial statements that have not already been disclosed.
Additional Information
First Trust Exchange-Traded Fund III
January 31, 2023 (Unaudited)
Proxy Voting Policies and Procedures
A description of the policies and procedures that the Trust uses to determine how to vote proxies and information on how each Fund voted proxies relating to portfolio securities during the most recent 12-month period ended June 30 is available (1) without charge, upon request, by calling (800) 988-5891; (2) on each Fund’s website at www.ftportfolios.com; and (3) on the Securities and Exchange Commission’s (“SEC”) website at www.sec.gov.
Portfolio Holdings
Each Fund files portfolio holdings information for each month in a fiscal quarter within 60 days after the end of the relevant fiscal quarter on Form N-PORT. Portfolio holdings information for the third month of each fiscal quarter will be publicly available on the SEC’s website at www.sec.gov. Each Fund’s complete schedule of portfolio holdings for the second and fourth quarters of each fiscal year is included in the semi-annual and annual reports to shareholders, respectively, and is filed with the SEC on Form N-CSR. The semi-annual and annual report for each Fund is available to investors within 60 days after the period to which it relates. Each Fund’s Forms N-PORT and Forms N-CSR are available on the SEC’s website listed above.
Risk Considerations
Risks are inherent in all investing. Certain general risks that may be applicable to a Fund are identified below, but not all of the material risks relevant to each Fund are included in this report and not all of the risks below apply to each Fund. The material risks of investing in each Fund are spelled out in its prospectus, statement of additional information and other regulatory filings. Before investing, you should consider each Fund’s investment objective, risks, charges and expenses, and read each Fund’s prospectus and statement of additional information carefully. You can download each Fund’s prospectus at www.ftportfolios.com or contact First Trust Portfolios L.P. at (800) 621-1675 to request a prospectus, which contains this and other information about each Fund.
Concentration Risk. To the extent that a fund is able to invest a significant percentage of its assets in a single asset class or the securities of issuers within the same country, state, region, industry or sector, an adverse economic, business or political development may affect the value of the fund’s investments more than if the fund were more broadly diversified. A fund that tracks an index will be concentrated to the extent the fund’s corresponding index is concentrated. A concentration makes a fund more susceptible to any single occurrence and may subject the fund to greater market risk than a fund that is more broadly diversified.
Credit Risk. Credit risk is the risk that an issuer of a security will be unable or unwilling to make dividend, interest and/or principal payments when due and the related risk that the value of a security may decline because of concerns about the issuer’s ability to make such payments.
Cyber Security Risk. The funds are susceptible to potential operational risks through breaches in cyber security. A breach in cyber security refers to both intentional and unintentional events that may cause a fund to lose proprietary information, suffer data corruption or lose operational capacity. Such events could cause a fund to incur regulatory penalties, reputational damage, additional compliance costs associated with corrective measures and/or financial loss. In addition, cyber security breaches of a fund’s third-party service providers, such as its administrator, transfer agent, custodian, or sub-advisor, as applicable, or issuers in which the fund invests, can also subject a fund to many of the same risks associated with direct cyber security breaches.
Defined Outcome Funds Risk. To the extent a fund’s investment strategy is designed to deliver returns tied to the price performance of an underlying ETF, an investor may not realize the returns the fund seeks to achieve if that investor does not hold shares for the entire target outcome period. In the event an investor purchases shares after the first day of the target outcome period or sells shares prior to the end of the target outcome period, the buffer that the fund seeks to provide against a decline in the value of the underlying ETF may not be available, the enhanced returns that the fund seeks to provide (if any) may not be available and the investor may not participate in a gain in the value of the underlying ETF up to the cap for the investor’s investment period. Additionally, the fund will not participate in gains of the underlying ETF above the cap and a shareholder may lose their entire investment. If the fund seeks enhanced returns, there are certain time periods when the value of the fund may fall faster than the value of the underlying ETF, and it is very unlikely that, on any given day during which the underlying ETF share price increases in value, the fund’s share price will increase at the same rate as the enhanced returns sought by the fund, which is designed for an entire target outcome period. Trading flexible exchange options involves risks different from, or possibly greater than, the risks associated with investing directly in securities, such as less liquidity and correlation and valuation risks. A fund may experience substantial downside from specific flexible exchange option positions and certain positions may expire worthless.
Derivatives Risk. To the extent a fund uses derivative instruments such as futures contracts, options contracts and swaps, the fund may experience losses because of adverse movements in the price or value of the underlying asset, index or rate, which may be magnified
Additional Information (Continued)
First Trust Exchange-Traded Fund III
January 31, 2023 (Unaudited)
by certain features of the derivative. These risks are heightened when a fund’s portfolio managers use derivatives to enhance the fund’s return or as a substitute for a position or security, rather than solely to hedge (or offset) the risk of a position or security held by the fund.
Equity Securities Risk. To the extent a fund invests in equity securities, the value of the fund’s shares will fluctuate with changes in the value of the equity securities. Equity securities prices fluctuate for several reasons, including changes in investors’ perceptions of the financial condition of an issuer or the general condition of the relevant stock market, such as market volatility, or when political or economic events affecting the issuers occur. In addition, common stock prices may be particularly sensitive to rising interest rates, as the cost of capital rises and borrowing costs increase. Equity securities may decline significantly in price over short or extended periods of time, and such declines may occur in the equity market as a whole, or they may occur in only a particular country, company, industry or sector of the market.
ETF Risk. The shares of an ETF trade like common stock and represent an interest in a portfolio of securities. The risks of owning an ETF generally reflect the risks of owning the underlying securities, although lack of liquidity in an ETF could result in it being more volatile and ETFs have management fees that increase their costs. Shares of an ETF trade on an exchange at market prices rather than net asset value, which may cause the shares to trade at a price greater than net asset value (premium) or less than net asset value (discount). In times of market stress, decisions by market makers to reduce or step away from their role of providing a market for an ETF’s shares, or decisions by an ETF’s authorized participants that they are unable or unwilling to proceed with creation and/or redemption orders of an ETF’s shares, could result in shares of the ETF trading at a discount to net asset value and in greater than normal intraday bid-ask spreads.
Fixed Income Securities Risk. To the extent a fund invests in fixed income securities, the fund will be subject to credit risk, income risk, interest rate risk, liquidity risk and prepayment risk. Income risk is the risk that income from a fund’s fixed income investments could decline during periods of falling interest rates. Interest rate risk is the risk that the value of a fund’s fixed income securities will decline because of rising interest rates. Liquidity risk is the risk that a security cannot be purchased or sold at the time desired, or cannot be purchased or sold without adversely affecting the price. Prepayment risk is the risk that the securities will be redeemed or prepaid by the issuer, resulting in lower interest payments received by the fund. In addition to these risks, high yield securities, or “junk” bonds, are subject to greater market fluctuations and risk of loss than securities with higher ratings, and the market for high yield securities is generally smaller and less liquid than that for investment grade securities.
Index or Model Constituent Risk. Certain funds may be a constituent of one or more indices or ETF models. As a result, such a fund may be included in one or more index-tracking exchange-traded funds or mutual funds. Being a component security of such a vehicle could greatly affect the trading activity involving a fund, the size of the fund and the market volatility of the fund. Inclusion in an index could increase demand for the fund and removal from an index could result in outsized selling activity in a relatively short period of time. As a result, a fund’s net asset value could be negatively impacted and the fund’s market price may be significantly below its net asset value during certain periods. In addition, index rebalances may potentially result in increased trading activity in a fund’s shares.
Index Provider Risk. To the extent a fund seeks to track an index, it is subject to Index Provider Risk. There is no assurance that the Index Provider will compile the Index accurately, or that the Index will be determined, maintained, constructed, reconstituted, rebalanced, composed, calculated or disseminated accurately. To correct any such error, the Index Provider may carry out an unscheduled rebalance or other modification of the Index constituents or weightings, which may increase the fund’s costs. The Index Provider does not provide any representation or warranty in relation to the quality, accuracy or completeness of data in the Index, and it does not guarantee that the Index will be calculated in accordance with its stated methodology. Losses or costs associated with any Index Provider errors generally will be borne by the fund and its shareholders.
Investment Companies Risk. To the extent a fund invests in the securities of other investment vehicles, the fund will incur additional fees and expenses that would not be present in a direct investment in those investment vehicles. Furthermore, the fund’s investment performance and risks are directly related to the investment performance and risks of the investment vehicles in which the fund invests.
LIBOR Risk. To the extent a fund invests in floating or variable rate obligations that use the London Interbank Offered Rate (“LIBOR”) as a reference interest rate, it is subject to LIBOR Risk. The United Kingdom’s Financial Conduct Authority, which regulates LIBOR has ceased making LIBOR available as a reference rate over a phase-out period that began December 31, 2021. There is no assurance that any alternative reference rate, including the Secured Overnight Financing Rate (“SOFR”) will be similar to or produce the same value or economic equivalence as LIBOR or that instruments using an alternative rate will have the same volume or liquidity. The unavailability or replacement of LIBOR may affect the value, liquidity or return on certain fund investments and may result in costs incurred in connection with closing out positions and entering into new trades. Any potential effects of the transition away from LIBOR on the fund or on certain instruments in which the fund invests can be difficult to ascertain, and they may vary depending on a variety of factors, and they could result in losses to the fund.
Additional Information (Continued)
First Trust Exchange-Traded Fund III
January 31, 2023 (Unaudited)
Management Risk. To the extent that a fund is actively managed, it is subject to management risk. In managing an actively-managed fund’s investment portfolio, the fund’s portfolio managers will apply investment techniques and risk analyses that may not have the desired result. There can be no guarantee that a fund will meet its investment objective.
Market Risk. Market risk is the risk that a particular security, or shares of a fund in general, may fall in value. Securities held by a fund, as well as shares of a fund itself, are subject to market fluctuations caused by factors such as general economic conditions, political events, regulatory or market developments, changes in interest rates and perceived trends in securities prices. Shares of a fund could decline in value or underperform other investments as a result of the risk of loss associated with these market fluctuations. In addition, local, regional or global events such as war, acts of terrorism, spread of infectious diseases or other public health issues, recessions, or other events could have a significant negative impact on a fund and its investments. Such events may affect certain geographic regions, countries, sectors and industries more significantly than others. In February 2022, Russia invaded Ukraine which has caused and could continue to cause significant market disruptions and volatility within the markets in Russia, Europe, and the United States. The hostilities and sanctions resulting from those hostilities could have a significant impact on certain fund investments as well as fund performance. The COVID-19 global pandemic and the ensuing policies enacted by governments and central banks have caused and may continue to cause significant volatility and uncertainty in global financial markets. While the U.S. has resumed “reasonably” normal business activity, many countries continue to impose lockdown measures. Additionally, there is no guarantee that vaccines will be effective against emerging variants of the disease. These events also adversely affect the prices and liquidity of a fund’s portfolio securities or other instruments and could result in disruptions in the trading markets. Any of such circumstances could have a materially negative impact on the value of a fund’s shares and result in increased market volatility. During any such events, a fund’s shares may trade at increased premiums or discounts to their net asset value and the bid/ask spread on a fund’s shares may widen.
Non-U.S. Securities Risk. To the extent a fund invests in non-U.S. securities, it is subject to additional risks not associated with securities of domestic issuers. Non-U.S. securities are subject to higher volatility than securities of domestic issuers due to: possible adverse political, social or economic developments; restrictions on foreign investment or exchange of securities; capital controls; lack of liquidity; currency exchange rates; excessive taxation; government seizure of assets; the imposition of sanctions by foreign governments; different legal or accounting standards; and less government supervision and regulation of exchanges in foreign countries. Investments in non-U.S. securities may involve higher costs than investments in U.S. securities, including higher transaction and custody costs, as well as additional taxes imposed by non-U.S. governments. These risks may be heightened for securities of companies located, or with significant operations, in emerging market countries.
Operational Risk. Each fund is subject to risks arising from various operational factors, including, but not limited to, human error, processing and communication errors, errors of a fund’s service providers, counterparties or other third-parties, failed or inadequate processes and technology or systems failures. Each fund relies on third-parties for a range of services, including custody. Any delay or failure relating to engaging or maintaining such service providers may affect a fund’s ability to meet its investment objective. Although the funds and the funds’ investment advisor seek to reduce these operational risks through controls and procedures, there is no way to completely protect against such risks.
Passive Investment Risk. To the extent a fund seeks to track an index, the fund will invest in the securities included in, or representative of, the index regardless of their investment merit. A fund generally will not attempt to take defensive positions in declining markets.
Preferred Securities Risk. Preferred securities combine some of the characteristics of both common stocks and bonds. Preferred securities are typically subordinated to bonds and other debt securities in a company’s capital structure in terms of priority to corporate income, subjecting them to greater credit risk than those debt securities. Generally, holders of preferred securities have no voting rights with respect to the issuing company unless preferred dividends have been in arrears for a specified number of periods, at which time the preferred security holders may obtain limited rights. In certain circumstances, an issuer of preferred securities may defer payment on the securities and, in some cases, redeem the securities prior to a specified date. Preferred securities may also be substantially less liquid than other securities, including common stock.
Valuation Risk. The valuation of certain securities may carry more risk than that of common stock. Uncertainties in the conditions of the financial markets, unreliable reference data, lack of transparency and inconsistency of valuation models and processes may lead to inaccurate asset pricing. A fund may hold investments in sizes smaller than institutionally sized round lot positions (sometimes referred to as odd lots). However, third-party pricing services generally provide evaluations on the basis of institutionally-sized round lots. If a fund sells certain of its investments in an odd lot transaction, the sale price may be less than the value at which such securities
Additional Information (Continued)
First Trust Exchange-Traded Fund III
January 31, 2023 (Unaudited)
have been held by the fund. Odd lots often trade at lower prices than institutional round lots. There is no assurance that the fund will be able to sell a portfolio security at the price established by the pricing service, which could result in a loss to the fund.
| NOT FDIC INSURED | NOT BANK GUARANTEED | MAY LOSE VALUE |
Advisory Agreement
Board Considerations Regarding Approval of Amendment to the Investment Management Agreement
The Board of Trustees of First Trust Exchange-Traded Fund III (the “Trust”), including the Independent Trustees, unanimously approved the amendment (the “Amendment”) of the Investment Management Agreement (the “Agreement”) with First Trust Advisors L.P. (the “Advisor”) on behalf of the following two series of the Trust (each a “Fund” and collectively, the “Funds”):
First Trust Short Duration Managed Municipal ETF (FSMB)
First Trust Ultra Short Duration Municipal ETF (FUMB)
The Board approved the Amendment for each Fund at a meeting held on October 24, 2022. As part of the review process, the Board reviewed information and had preliminary discussions with the Advisor regarding the proposed Amendment at meetings held on April 18, 2022, June 12–13, 2022 and September 18–19, 2022. Following those preliminary discussions, the Board requested and received information from the Advisor regarding the proposed Amendment, and that information was considered at an executive session of the Independent Trustees and their counsel held prior to the October 24, 2022 meeting, as well as at the October meeting.
In reviewing the Amendment for each Fund, the Board considered that the purpose of the Amendment is to modify the unitary fee rate for each Fund under the Agreement by introducing a breakpoint schedule pursuant to which the unitary fee rate paid by each Fund to the Advisor will be reduced as assets of such Fund meet certain thresholds. The Board noted the Advisor’s representations that the quality and quantity of the services provided to each Fund by the Advisor under the Agreement will not be reduced or modified as a result of the Amendment, and that the obligations of the Advisor under the Agreement will remain the same in all respects.
The Board noted that it, including the Independent Trustees, last approved the continuation of the Agreement for each Fund for a one-year period ending June 30, 2023 at a meeting held on June 12–13, 2022. The Board noted that in connection with such approval it had determined for each Fund, based upon the information provided, that the terms of the Agreement were fair and reasonable and that the continuation of the Agreement was in the best interests of the Fund in light of the nature, extent and quality of the services provided and such other matters as the Board considered to be relevant in the exercise of its business judgment.
The Board noted that the Advisor had previously agreed to waive a portion of its unitary fee for each Fund and that the modified unitary fee rate schedule for each Fund under the Amendment would not be implemented until the expiration of the Fund’s contractual fee waiver. The Board considered that the effective unitary fee rate paid by each Fund under the Agreement after taking into account the contractual fee waiver is less than the effective unitary fee rate that the Fund would pay pursuant to the modified unitary fee rate schedule under the Amendment.
Based on all of the information considered, the Board, including the Independent Trustees, unanimously determined that the terms of the Amendment are fair and reasonable and that the Amendment is in the best interests of each Fund.
First Trust Exchange-Traded Fund III
INVESTMENT ADVISOR
First Trust Advisors L.P.
120 East Liberty Drive, Suite 400
Wheaton, IL 60187
ADMINISTRATOR, CUSTODIAN,
FUND ACCOUNTANT &
TRANSFER AGENT
Brown Brothers Harriman & Co.
50 Post Office Square
Boston, MA 02110
INDEPENDENT REGISTERED
PUBLIC ACCOUNTING FIRM
Deloitte & Touche LLP
111 S. Wacker Drive
Chicago, IL 60606
LEGAL COUNSEL
Chapman and Cutler LLP
320 South Canal Street
Chicago, IL 60606
First Trust Exchange-Traded Fund III
First Trust Merger Arbitrage ETF (MARB)
Semi-Annual Report
For the Six Months Ended
January 31, 2023
First Trust Merger Arbitrage ETF (MARB)
Semi-Annual Report
January 31, 2023
Caution Regarding Forward-Looking Statements
This report contains certain forward-looking statements within the meaning of the Securities Act of 1933, as amended, and the Securities Exchange Act of 1934, as amended. Forward-looking statements include statements regarding the goals, beliefs, plans or current expectations of First Trust Advisors L.P. (“First Trust” or the “Advisor”) and/or First Trust Capital Management L.P. (“First Trust Capital Management” or the “Sub-Advisor”) and their respective representatives, taking into account the information currently available to them. Forward-looking statements include all statements that do not relate solely to current or historical fact. For example, forward-looking statements include the use of words such as “anticipate,” “estimate,” “intend,” “expect,” “believe,” “plan,” “may,” “should,” “would” or other words that convey uncertainty of future events or outcomes.
Forward-looking statements involve known and unknown risks, uncertainties and other factors that may cause the actual results, performance or achievements of the series of First Trust Exchange-Traded Fund III (the “Trust”) described in this report (First Trust Merger Arbitrage ETF; hereinafter referred to as the “Fund”) to be materially different from any future results, performance or achievements expressed or implied by the forward-looking statements. When evaluating the information included in this report, you are cautioned not to place undue reliance on these forward-looking statements, which reflect the judgment of the Advisor and/or Sub-Advisor and their respective representatives only as of the date hereof. We undertake no obligation to publicly revise or update these forward-looking statements to reflect events and circumstances that arise after the date hereof.
Performance and Risk Disclosure
There is no assurance that the Fund will achieve its investment objective. The Fund is subject to market risk, which is the possibility that the market values of securities owned by the Fund will decline and that the value of the Fund’s shares may therefore be less than what you paid for them. Accordingly, you can lose money by investing in the Fund. See “Risk Considerations” in the Additional Information section of this report for a discussion of certain other risks of investing in the Fund.
Performance data quoted represents past performance, which is no guarantee of future results, and current performance may be lower or higher than the figures shown. For the most recent month-end performance figures, please visit www.ftportfolios.com or speak with your financial advisor. Investment returns, net asset value and share price will fluctuate and Fund shares, when sold, may be worth more or less than their original cost.
The Advisor may also periodically provide additional information on Fund performance on the Fund’s web page at www.ftportfolios.com.
How to Read This Report
This report contains information that may help you evaluate your investment in the Fund. It includes details about the Fund and presents data and analysis that provide insight into the Fund’s performance and investment approach.
The statistical information that follows may help you understand the Fund’s performance compared to that of relevant market benchmarks.
It is important to keep in mind that the opinions expressed by personnel of the Advisor and/or Sub-Advisor are just that: informed opinions. They should not be considered to be promises or advice. The opinions, like the statistics, cover the period through the date on the cover of this report. The material risks of investing in the Fund are spelled out in the prospectus, the statement of additional information, and other Fund regulatory filings.
First Trust Merger Arbitrage ETF (MARB)
Semi-Annual Letter from the Chairman and CEO
January 31, 2023
Dear Shareholders,
First Trust is pleased to provide you with the semi-annual report for the First Trust Merger Arbitrage ETF (the “Fund”), which contains detailed information about the Fund for the six-month period ended January 31, 2023.
Given recent inflation data, the Federal Reserve’s (the “Fed”) monetary policy remains front and center in most discussions regarding the outlook of the U.S. economy. Annual revisions to the Consumer Price Index released on February 10, 2023, showed that prices climbed at a 3.3% annual rate in the last three months of 2022, not the 1.8% rate reported four weeks prior, according to Brian Wesbury, Chief Economist at First Trust. Additionally, “core” inflation, which excludes volatile food and energy prices, was also revised upwards from 3.1% to 4.3% over the period. Furthermore, January’s 2023 jobs data came in better than expected, with non-farm payroll employment rising by 517,000. It is precisely this situation: stubbornly high inflation, strong jobs growth and increasing interest rates, which has many pundits debating whether the typical U.S. consumer can remain healthy enough to help ward off an economic recession.
As many investors know, the consumer is an essential driver of economic growth in the U.S. On average, over the 15-year period ended October 1, 2022, consumer spending accounted for 67.8% of the U.S. gross domestic product (“GDP”). Crucially, recent data regarding consumer health has been mixed, in my opinion. On one hand, the Commerce Department reported that in December 2022, the U.S. savings rate rose to its highest level in seven months, coming in at 3.4%. On the other hand, while December’s savings rate was a welcome reversal from the declines suffered throughout 2021 and 2022, it could indicate that consumers are beginning to pull back on discretionary spending amidst a cloudier economic outlook, according to Bloomberg. Recent data shows that the average interest rate on U.S. credit cards rose to 19.07% in the fourth quarter of 2022, its highest level in over 50 years. Additionally, U.S. credit card debt reached a record $930.6 billion in the fourth quarter, jumping 18.5% year-over-year. Even so, debt service payments accounted for just 9.75% of disposable personal income in the third quarter of 2022. This figure is higher than its historic low of 8.33% set in 2021 but is also well below its peak of 13.17% set in 2007. In my view, it is worth keeping an eye on debt service payments. If higher payments lead to a decline in discretionary spending, it could negatively impact GDP.
I would like to take a moment to remind you that even though nearly three years have passed since the World Health Organization initially declared the coronavirus outbreak a global pandemic, the economic impact of worldwide lockdowns and the subsequent governmental stimulus is still very real. China, for example, only recently dropped its requirement that incoming travelers must quarantine before entering the country. In addition, the global economy has yet to fully absorb the impact of the fiscal policies enacted to jump start consumer spending in 2020, in my view. As evidence of this, each of the countries that comprise the G-10 currently has a headline inflation rate that stands well above its stated target. Central banks likely have more work to do, in my opinion.
Thank you for giving First Trust the opportunity to play a role in your financial future. We value our relationship with you and will report on the Fund again in six months.
Sincerely,
James A. Bowen
Chairman of the Board of Trustees
Chief Executive Officer of First Trust Advisors L.P.
Fund Performance Overview (Unaudited)
First Trust Merger Arbitrage ETF (MARB)
The First Trust Merger Arbitrage ETF’s (the “Fund”) investment objective is to seek to provide investors with capital appreciation. Under normal market conditions, the Fund seeks to achieve its investment objective by establishing long and short positions in the equity securities of companies that are involved in a publicly-announced significant corporate event, such as a merger or acquisition. The Fund’s portfolio may include equity securities issued by U.S. and non-U.S. companies, including American Depositary Receipts, and derivatives, including total return swaps. The Fund may invest in securities issued by small, mid and large capitalization issuers. The Fund lists and principally trades its shares on NYSE Arca, Inc. under the ticker symbol “MARB.”
| Performance | | | | |
| | | | Average Annual
Total Returns | Cumulative
Total Returns |
| | 6 Months Ended
1/31/23 | 1 Year Ended
1/31/23 | Inception (2/4/20)
to 1/31/23 | Inception (2/4/20)
to 1/31/23 |
| Fund Performance | | | | |
| NAV | 1.30% | 2.58% | 0.43% | 1.30% |
| Market Price | 1.24% | 2.63% | 0.43% | 1.29% |
| Index Performance | | | | |
| Hedge Fund Research Merger Arbitrage Index | 1.74% | -0.09% | 2.37% | 7.26% |
| S&P 500® Index | -0.44% | -8.22% | 9.11% | 29.78% |
Total returns for the period since inception are calculated from the inception date of the Fund. “Average Annual Total Returns” represent the average annual change in value of an investment over the period indicated. “Cumulative Total Returns” represent the total change in value of an investment over the period indicated.
The Fund’s per share net asset value (“NAV”) is the value of one share of the Fund and is computed by dividing the value of all assets of the Fund (including accrued interest and dividends), less all liabilities (including accrued expenses and dividends declared but unpaid), by the total number of outstanding shares. The price used to calculate market return (“Market Price”) is determined by using the midpoint of the national best bid and offer price (“NBBO”) as of the time that the Fund’s NAV is calculated. Under SEC rules, the NBBO consists of the highest displayed buy and lowest sell prices among the various exchanges trading the Fund at the time the Fund’s NAV is calculated. Since shares of the Fund did not trade in the secondary market until after its inception, for the period from inception to the first day of secondary market trading in shares of the Fund, the NAV of the Fund is used as a proxy for the secondary market trading price to calculate market returns. NAV and market returns assume that all distributions have been reinvested in the Fund at NAV and Market Price, respectively.
An index is a statistical composite that tracks a specified financial market or sector. Unlike the Fund, the indices do not actually hold a portfolio of securities and therefore do not incur the expenses incurred by the Fund. These expenses negatively impact the performance of the Fund. Also, market returns do not include brokerage commissions that may be payable on secondary market transactions. If brokerage commissions were included, market returns would be lower. The total returns presented reflect the reinvestment of dividends on securities in the indices. The returns presented do not reflect the deduction of taxes that a shareholder would pay on Fund distributions or the redemption or sale of Fund shares. The investment return and principal value of shares of the Fund will vary with changes in market conditions. Shares of the Fund may be worth more or less than their original cost when they are redeemed or sold in the market. The Fund’s past performance is no guarantee of future performance.
Fund Performance Overview (Unaudited) (Continued)
First Trust Merger Arbitrage ETF (MARB)
| Portfolio Sector Allocation | % of Total
Investments -
Long Positions |
| Financials | 24.9% |
| Health Care | 22.8 |
| Information Technology | 16.0 |
| Communication Services | 10.3 |
| Real Estate | 8.8 |
| Industrials | 7.9 |
| Consumer Discretionary | 4.9 |
| Utilities | 4.4 |
| Energy | 0.0* |
| Total | 100.0% |
| * | Amount is less than 0.1%. |
| Portfolio Sector Allocation | % of Total
Investments
Sold Short |
| Financials | 100.0% |
| Energy | 0.0* |
| Total | 100.0% |
| * | Amount is less than 0.1%. |
| Top Ten Investments - Long Positions | % of
Net Assets |
| Umpqua Holdings Corp. | 4.8% |
| Meridian Bioscience, Inc. | 4.2 |
| STORE Capital Corp. | 4.1 |
| First Horizon Corp. | 3.7 |
| ForgeRock, Inc., Class A | 3.6 |
| Cowen, Inc., Class A | 3.0 |
| MoneyGram International, Inc. | 2.9 |
| 1Life Healthcare, Inc. | 2.8 |
| LHC Group, Inc. | 2.7 |
| Activision Blizzard, Inc. | 2.6 |
| Total | 34.4% |
| Top Investments Sold Short | % of
Net Assets |
| Columbia Banking System, Inc. | -4.8% |
| Sitio Royalties Corp., Class A | -0.0* |
| Total | -4.8% |
| * | Amount is less than 0.1%. |

Performance figures assume reinvestment of all distributions and do not reflect the deduction of taxes that a shareholder would pay on Fund distributions or the redemption or sale of Fund shares. An index is a statistical composite that tracks a specified financial market or sector. Unlike the Fund, the indices do not actually hold a portfolio of securities and therefore do not incur the expenses incurred by the Fund. These expenses negatively impact the performance of the Fund. The Fund’s past performance does not predict future performance.
Frequency Distribution of Discounts and Premiums
Information showing the number of days the market price of the Fund’s shares was greater (at a premium) and less (at a discount) than the Fund’s net asset value for the most recently completed year, and the most recently completed calendar quarters since that year (or life of the Fund, if shorter), is available at https://www.ftportfolios.com/Retail/etf/home.aspx.
Portfolio Management
First Trust Merger Arbitrage ETF (MARB)
Semi-Annual Report
January 31, 2023 (Unaudited)
Advisor
First Trust Advisors L.P. (“First Trust”) serves as the investment advisor to the First Trust Merger Arbitrage ETF (the “Fund” or “MARB”). First Trust is responsible for the ongoing monitoring of the Fund’s investment portfolio, managing the Fund’s business affairs and providing certain administrative services necessary for the management of the Fund.
Sub-Advisor
First Trust Capital Management L.P.
First Trust Capital Management L.P. (“First Trust Capital Management” or the “Sub-Advisor”) serves as the Fund’s investment sub-advisor. First Trust Capital Management is an SEC registered investment advisor, founded in 2013 and headquartered in Chicago, Illinois, that specializes in structuring and managing alternative investment, multi-manager, and multi-strategy mutual funds. First Trust Capital Management prides itself on its ability to combine rigorous research and risk management processes with disciplined portfolio construction and management.
Portfolio Management Team
Michael Peck, CFA – Chief Executive Officer and Co-Chief Investment Officer, First Trust Capital Management
Brian Murphy – Co-Chief Investment Officer and Portfolio Manager, First Trust Capital Management
Michael Grayson – Portfolio Manager, First Trust Capital Management
The portfolio managers are primarily and jointly responsible for the day to day management of the Fund. Each portfolio manager has served in such capacity for the Fund since 2020.
First Trust Merger Arbitrage ETF (MARB)
Understanding Your Fund Expenses
January 31, 2023 (Unaudited)
As a shareholder of the First Trust Merger Arbitrage ETF (the “Fund”), you incur two types of costs: (1) transaction costs; and (2) ongoing costs, including management fees, distribution and/or service (12b-1) fees, if any, and other Fund expenses. This Example is intended to help you understand your ongoing costs of investing in the Fund and to compare these costs with the ongoing costs of investing in other funds.
The Example is based on an investment of $1,000 invested at the beginning of the period and held through the six-month period ended January 31, 2023.
Actual Expenses
The first line in the following table provides information about actual account values and actual expenses. You may use the information in this line, together with the amount you invested, to estimate the expenses that you paid over the period. Simply divide your account value by $1,000 (for example, an $8,600 account value divided by $1,000 = 8.6), then multiply the result by the number in the first line under the heading entitled “Expenses Paid During the Six-Month Period” to estimate the expenses you paid on your account during this six-month period.
Hypothetical Example for Comparison Purposes
The second line in the following table provides information about hypothetical account values and hypothetical expenses based on the Fund’s actual expense ratio and an assumed rate of return of 5% per year before expenses, which is not the Fund’s actual return. The hypothetical account values and expenses may not be used to estimate the actual ending account balance or expenses you paid for the period. You may use this information to compare the ongoing costs of investing in the Fund and other funds. To do so, compare this 5% hypothetical example with the 5% hypothetical examples that appear in the shareholder reports of the other funds.
Please note that the expenses shown in the table are meant to highlight your ongoing costs only and do not reflect any transactional costs such as brokerage commissions. Therefore, the second line in the table is useful in comparing ongoing costs only, and will not help you determine the relative total costs of owning different funds. In addition, if these transactional costs were included, your costs would have been higher.
| | Beginning
Account Value
August 1, 2022 | Ending
Account Value
January 31, 2023 | Annualized
Expense Ratio
Based on the
Six-Month
Period | Expenses Paid
During the
Six-Month
Period (a) |
| First Trust Merger Arbitrage ETF (MARB) |
| Actual | $1,000.00 | $1,013.00 | 1.81% | $9.18 |
| Hypothetical (5% return before expenses) | $1,000.00 | $1,016.08 | 1.81% | $9.20 |
| (a) | Expenses are equal to the annualized expense ratios as indicated in the table multiplied by the average account value over the period (August 1, 2022 through January 31, 2023), multiplied by 184/365 (to reflect the six-month period). |
First Trust Merger Arbitrage ETF (MARB)
Portfolio of Investments
January 31, 2023 (Unaudited)
| Shares | | Description | | Value |
| COMMON STOCKS – 42.2% |
| | | Air Freight & Logistics – 2.1% | | |
| 20,070 | | Atlas Air Worldwide Holdings, Inc. (a) (b) | | $2,051,355 |
| | | Banks – 8.5% | | |
| 147,616 | | First Horizon Corp. (b) | | 3,650,543 |
| 259,409 | | Umpqua Holdings Corp. (b) | | 4,721,244 |
| | | | | 8,371,787 |
| | | Biotechnology – 0.1% | | |
| 4,631 | | Biohaven Ltd. (a) | | 88,406 |
| | | Capital Markets – 3.0% | | |
| 75,965 | | Cowen, Inc., Class A (b) | | 2,953,519 |
| | | Electronic Equipment,
Instruments & Components – 0.9% | | |
| 6,010 | | Rogers Corp. (a) (b) | | 838,936 |
| | | Entertainment – 2.6% | | |
| 33,097 | | Activision Blizzard, Inc. | | 2,534,237 |
| | | Gas Utilities – 2.0% | | |
| 55,463 | | South Jersey Industries, Inc. (b) | | 2,001,660 |
| | | Health Care Equipment &
Supplies – 4.2% | | |
| 122,580 | | Meridian Bioscience, Inc. (a) (b) (c) | | 4,164,043 |
| | | Health Care Providers &
Services – 6.2% | | |
| 170,391 | | 1Life Healthcare, Inc. (a) (b) | | 2,724,552 |
| 16,955 | | LHC Group, Inc. (a) (b) | | 2,689,063 |
| 25,057 | | Signify Health, Inc., Class A (a) (b) | | 713,122 |
| | | | | 6,126,737 |
| | | Household Durables – 2.3% | | |
| 49,278 | | iRobot Corp. (a) | | 2,217,510 |
| | | IT Services – 2.9% | | |
| 266,263 | | MoneyGram International, Inc. (a) (b) | | 2,867,653 |
| | | Machinery – 1.6% | | |
| 25,192 | | Altra Industrial Motion Corp. | | 1,538,475 |
| | | Media – 2.2% | | |
| 108,686 | | TEGNA, Inc. (b) | | 2,166,112 |
| | | Oil, Gas & Consumable Fuels – 0.0% | | |
| 635 | | PBF Energy, Inc., Class A | | 26,664 |
| | | Software – 3.6% | | |
| 179,869 | | ForgeRock, Inc., Class A (a) | | 3,572,198 |
| Shares | | Description | | Value |
|
| | | Thrifts & Mortgage Finance – 0.0% | | |
| 926 | | New York Community Bancorp, Inc. | | $9,251 |
| | | Total Common Stocks | | 41,528,543 |
| | | (Cost $42,503,736) | | |
| REAL ESTATE INVESTMENT TRUSTS – 4.1% |
| | | Equity Real Estate Investment
Trusts – 4.1% | | |
| 124,859 | | STORE Capital Corp. | | 4,021,708 |
| | | (Cost $3,942,002) | | |
| RIGHTS – 0.0% |
| | | Pharmaceuticals – 0.0% | | |
| 7,137 | | Contra Abiomed, Inc. (a) (c) (d) (e) | | 0 |
| | | (Cost $0) | | |
| | | Total Investments – 46.3% | | 45,550,251 |
| | | (Cost $46,445,738) | | |
| COMMON STOCKS SOLD SHORT – (4.8)% |
| | | Banks – (4.8)% | | |
| (153,882) | | Columbia Banking System, Inc. | | (4,756,493) |
| | | Oil, Gas & Consumable Fuels – (0.0)% | | |
| (1) | | Sitio Royalties Corp., Class A | | (26) |
| | | Total Investments Sold Short – (4.8)% | | (4,756,519) |
| | | (Proceeds $4,722,888) | | |
| | | Net Other Assets and Liabilities – 58.5% | | 57,689,071 |
| | | Net Assets – 100.0% | | $98,482,803 |
| (a) | Non-income producing security. |
| (b) | This security or a portion of this security is segregated as collateral for investments sold short. At January 31, 2023, the segregated value of these securities amounts to $9,915,663. |
| (c) | This security is fair valued by the Advisor’s Pricing Committee in accordance with procedures approved by the Trust’s Board of Trustees, and in accordance with the provisions of the Investment Company Act of 1940 and rules thereunder, as amended. At January 31, 2023, securities noted as such are valued at $4,164,043 or 4.2% of net assets. |
| (d) | Pursuant to procedures adopted by the Trust’s Board of Trustees, this security has been determined to be illiquid by First Trust Advisors L.P., the Fund’s advisor. |
| (e) | This security’s value was determined using significant unobservable inputs (see Note 2A – Portfolio Valuation in the Notes to Financial Statements). |
Page 6
See Notes to Financial Statements
First Trust Merger Arbitrage ETF (MARB)
Portfolio of Investments (Continued)
January 31, 2023 (Unaudited)
Valuation Inputs
A summary of the inputs used to value the Fund’s investments as of January 31, 2023 is as follows (see Note 2A - Portfolio Valuation in the Notes to Financial Statements):
| ASSETS TABLE |
| | Total
Value at
1/31/2023 | Level 1
Quoted
Prices | Level 2
Significant
Observable
Inputs | Level 3
Significant
Unobservable
Inputs |
| Common Stocks: | | | | |
| Health Care Equipment & Supplies | $ 4,164,043 | $ — | $ 4,164,043 | $ — |
| Other Industry Categories* | 37,364,500 | 37,364,500 | — | — |
| Real Estate Investment Trusts* | 4,021,708 | 4,021,708 | — | — |
| Rights* | —** | — | — | —** |
| Total Investments | $ 45,550,251 | $ 41,386,208 | $ 4,164,043 | $— |
| |
| LIABILITIES TABLE |
| | Total
Value at
1/31/2023 | Level 1
Quoted
Prices | Level 2
Significant
Observable
Inputs | Level 3
Significant
Unobservable
Inputs |
| Common Stocks Sold Short* | $ (4,756,519) | $ (4,756,519) | $ — | $ — |
| * | See Portfolio of Investments for industry breakout. |
| ** | Investment is valued at $0. |
Level 3 investments are fair valued by the Advisor’s Pricing Committee and are footnoted in the Portfolio of Investments. Level 3 investments values are based on unobservable and non-quantitative inputs.
See Notes to Financial Statements
Page 7
First Trust Merger Arbitrage ETF (MARB)
Statement of Assets and Liabilities
January 31, 2023 (Unaudited)
| ASSETS: | |
Investments, at value
(Cost $46,445,738)
| $ 45,550,251 |
Cash
| 40,407,967 |
Restricted Cash
| 17,283,169 |
| Receivables: | |
Dividends
| 62,790 |
Margin interest rebate
| 39,618 |
Total Assets
| 103,343,795 |
| LIABILITIES: | |
Investments sold short, at value (proceeds $4,722,888)
| 4,756,519 |
Investment advisory fees payable
| 104,473 |
Total Liabilities
| 4,860,992 |
NET ASSETS
| $98,482,803 |
| NET ASSETS consist of: | |
Paid-in capital
| $ 98,382,756 |
Par value
| 49,000 |
Accumulated distributable earnings (loss)
| 51,047 |
NET ASSETS
| $98,482,803 |
NET ASSET VALUE, per share
| $20.10 |
Number of shares outstanding (unlimited number of shares authorized, par value $0.01 per share)
| 4,900,002 |
Page 8
See Notes to Financial Statements
First Trust Merger Arbitrage ETF (MARB)
Statement of Operations
For the Six Months Ended January 31, 2023 (Unaudited)
| INVESTMENT INCOME: | |
Dividends
| $ 821,299 |
Interest
| 428,334 |
Margin interest rebate
| 153,784 |
Other
| 82 |
Total investment income
| 1,403,499 |
| EXPENSES: | |
Investment advisory fees
| 499,134 |
Dividend expense on investments sold short
| 225,621 |
Total expenses
| 724,755 |
NET INVESTMENT INCOME (LOSS)
| 678,744 |
| NET REALIZED AND UNREALIZED GAIN (LOSS): | |
| Net realized gain (loss) on: | |
Investments
| 1,322,708 |
In-kind redemptions
| 138,394 |
Investments sold short
| (92,641) |
Net realized gain (loss)
| 1,368,461 |
| Net change in unrealized appreciation (depreciation) on: | |
Investments
| (1,246,939) |
Investments sold short
| 136,884 |
Net change in unrealized appreciation (depreciation)
| (1,110,055) |
NET REALIZED AND UNREALIZED GAIN (LOSS)
| 258,406 |
NET INCREASE (DECREASE) IN NET ASSETS RESULTING FROM OPERATIONS
| $ 937,150 |
See Notes to Financial Statements
Page 9
First Trust Merger Arbitrage ETF (MARB)
Statements of Changes in Net Assets
| | Six Months
Ended
1/31/2023
(Unaudited) | | Year
Ended
7/31/2022 |
| OPERATIONS: | | | |
Net investment income (loss)
| $ 678,744 | | $ (171,542) |
Net realized gain (loss)
| 1,368,461 | | 237,811 |
Net change in unrealized appreciation (depreciation)
| (1,110,055) | | 381,649 |
Net increase (decrease) in net assets resulting from operations
| 937,150 | | 447,918 |
| DISTRIBUTIONS TO SHAREHOLDERS FROM: | | | |
Investment operations
| (920,000) | | — |
| SHAREHOLDER TRANSACTIONS: | | | |
Proceeds from shares sold
| 65,508,992 | | 41,694,635 |
Cost of shares redeemed
| (11,074,392) | | (8,863,931) |
Net increase (decrease) in net assets resulting from shareholder transactions
| 54,434,600 | | 32,830,704 |
Total increase (decrease) in net assets
| 54,451,750 | | 33,278,622 |
| NET ASSETS: | | | |
Beginning of period
| 44,031,053 | | 10,752,431 |
End of period
| $98,482,803 | | $44,031,053 |
| CHANGES IN SHARES OUTSTANDING: | | | |
Shares outstanding, beginning of period
| 2,200,002 | | 550,002 |
Shares sold
| 3,250,000 | | 2,100,000 |
Shares redeemed
| (550,000) | | (450,000) |
Shares outstanding, end of period
| 4,900,002 | | 2,200,002 |
Page 10
See Notes to Financial Statements
First Trust Merger Arbitrage ETF (MARB)
Financial Highlights
For a share outstanding throughout each period
| | Six Months
Ended
1/31/2023
(Unaudited) | | Year Ended | | Period
Ended
7/31/2020 (a) |
| | 7/31/2022 | | 7/31/2021 | |
Net asset value, beginning of period
| $ 20.01 | | $ 19.55 | | $ 19.46 | | $ 20.01 |
| Income from investment operations: | | | | | | | |
Net investment income (loss)
| 0.17 | | (0.24) (b) | | (0.26) | | (0.07) |
Net realized and unrealized gain (loss)
| 0.12 | | 0.70 | | 0.35 | | (0.48) |
Total from investment operations
| 0.29 | | 0.46 | | 0.09 | | (0.55) |
| Distributions paid to shareholders from: | | | | | | | |
Net investment income
| (0.20) | | — | | — | | — |
Net asset value, end of period
| $20.10 | | $20.01 | | $19.55 | | $19.46 |
Total return (c)
| 1.30% | | 2.35% | | 0.46% | | (2.75)% |
| Ratios to average net assets/supplemental data: | | | | | | | |
Net assets, end of period (in 000’s)
| $ 98,483 | | $ 44,031 | | $ 10,752 | | $ 12,649 |
Ratio of total expenses to average net assets
| 1.81% (d) | | 1.87% | | 2.23% | | 2.30% (d) |
Ratio of total expenses to average net assets excluding dividend expense and margin interest expense
| 1.25% (d) | | 1.25% | | 1.25% | | 1.25% (d) |
Ratio of net investment income (loss) to average net assets
| 1.70% (d) | | (1.23)% | | (1.15)% | | (1.71)% (d) |
Portfolio turnover rate (e)
| 136% | | 246% | | 280% | | 137% |
| (a) | Inception date is February 4, 2020, which is consistent with the commencement of investment operations and is the date the initial creation units were established. |
| (b) | Based on average shares outstanding. |
| (c) | Total return is calculated assuming an initial investment made at the net asset value at the beginning of the period, reinvestment of all distributions at net asset value during the period, and redemption at net asset value on the last day of the period. The returns presented do not reflect the deduction of taxes that a shareholder would pay on Fund distributions or the redemption or sale of Fund shares. Total return is calculated for the time period presented and is not annualized for periods of less than a year. |
| (d) | Annualized. |
| (e) | Portfolio turnover is calculated for the time period presented and is not annualized for periods of less than a year and does not include securities received or delivered from processing creations or redemptions and in-kind transactions. |
Notes to Financial Statements
First Trust Merger Arbitrage ETF (MARB)
January 31, 2023 (Unaudited)
1. Organization
First Trust Exchange-Traded Fund III (the “Trust”) is an open-end management investment company organized as a Massachusetts business trust on January 9, 2008, and is registered with the Securities and Exchange Commission under the Investment Company Act of 1940, as amended (the “1940 Act”).
The Trust currently consists of seventeen funds that are offering shares. This report covers the First Trust Merger Arbitrage ETF (the “Fund”), a non-diversified series of the Trust, which trades under the ticker “MARB” on NYSE Arca, Inc. The Fund represents a separate series of beneficial interest in the Trust. Unlike conventional mutual funds, the Fund issues and redeems shares on a continuous basis, at net asset value (“NAV”), only in large blocks of shares known as “Creation Units.”
The Fund is an actively managed exchange-traded fund. The investment objective of the Fund is to seek to provide investors with capital appreciation. Under normal market conditions, the Fund seeks to achieve its investment objective by establishing long and short positions in the equity securities of companies that are involved in a publicly-announced significant corporate event, such as a merger or acquisition. The Fund’s portfolio may include equity securities issued by U.S. and non-U.S. companies, including American Depositary Receipts, and derivatives, including total return swaps. The Fund may invest in securities issued by small, mid and large capitalization issuers.
2. Significant Accounting Policies
The Fund is considered an investment company and follows accounting and reporting guidance under Financial Accounting Standards Board Accounting Standards Codification Topic 946, “Financial Services-Investment Companies.” The following is a summary of significant accounting policies consistently followed by the Fund in the preparation of the financial statements. The preparation of the financial statements in accordance with accounting principles generally accepted in the United States of America (“U.S. GAAP”) requires management to make estimates and assumptions that affect the reported amounts and disclosures in the financial statements. Actual results could differ from those estimates.
A. Portfolio Valuation
The Fund’s NAV is determined daily as of the close of regular trading on the New York Stock Exchange (“NYSE”), normally 4:00 p.m. Eastern time, on each day the NYSE is open for trading. If the NYSE closes early on a valuation day, the NAV is determined as of that time. Foreign securities are priced using data reflecting the earlier closing of the principal markets for those securities. The Fund’s NAV is calculated by dividing the value of all assets of the Fund (including accrued interest and dividends), less all liabilities (including accrued expenses and dividends declared but unpaid), by the total number of shares outstanding.
The Fund’s investments are valued daily at market value or, in the absence of market value with respect to any portfolio securities, at fair value. Market value prices represent readily available market quotations such as last sale or official closing prices from a national or foreign exchange (i.e., a regulated market) and are primarily obtained from third-party pricing services. Fair value prices represent any prices not considered market value prices and are either obtained from a third-party pricing service or are determined by the Pricing Committee of the Fund’s investment advisor, First Trust Advisors L.P. (“First Trust” or the “Advisor”), in accordance with valuation procedures approved by the Trust’s Board of Trustees, and in accordance with provisions of the 1940 Act and rules thereunder. Investments valued by the Advisor’s Pricing Committee, if any, are footnoted as such in the footnotes to the Portfolio of Investments. The Fund’s investments are valued as follows:
Common stocks and other equity securities listed on any national or foreign exchange (excluding The Nasdaq Stock Market LLC (“Nasdaq”) and the London Stock Exchange Alternative Investment Market (“AIM”)) are valued at the last sale price on the exchange on which they are principally traded or, for Nasdaq and AIM securities, the official closing price. Securities traded on more than one securities exchange are valued at the last sale price or official closing price, as applicable, at the close of the securities exchange representing the primary exchange for such securities.
Securities traded in an over-the-counter market are valued at the mean of their most recent bid and asked price, if available, and otherwise at their last trade price.
Certain securities may not be able to be priced by pre-established pricing methods. Such securities may be valued by the Advisor’s Pricing Committee at fair value. These securities generally include, but are not limited to, restricted securities (securities which may not be publicly sold without registration under the Securities Act of 1933, as amended) for which a third-party pricing service is unable to provide a market price; securities whose trading has been formally suspended; a security whose market or fair value price is not available from a pre-established pricing source; a security with respect to which an event has occurred that is likely to materially affect the value of the security after the market has closed but before the calculation of the Fund’s NAV or make it difficult or impossible to obtain a reliable market quotation; and a security whose price, as provided by the third-party pricing service, does not reflect the security’s fair value. As a general principle, the current fair value of a security would appear to be the amount which the owner might
Notes to Financial Statements (Continued)
First Trust Merger Arbitrage ETF (MARB)
January 31, 2023 (Unaudited)
reasonably expect to receive for the security upon its current sale. When fair value prices are used, generally they will differ from market quotations or official closing prices on the applicable exchanges. A variety of factors may be considered in determining the fair value of such securities, including, but not limited to, the following:
| 1) | the last sale price on the exchange on which they are principally traded or, for Nasdaq and AIM securities, the official closing price; |
| 2) | the type of security; |
| 3) | the size of the holding; |
| 4) | the initial cost of the security; |
| 5) | transactions in comparable securities; |
| 6) | price quotes from dealers and/or third-party pricing services; |
| 7) | relationships among various securities; |
| 8) | information obtained by contacting the issuer, analysts, or the appropriate stock exchange; |
| 9) | an analysis of the issuer’s financial statements; |
| 10) | the existence of merger proposals or tender offers that might affect the value of the security; and |
| 11) | other relevant factors. |
The Fund is subject to fair value accounting standards that define fair value, establish the framework for measuring fair value and provide a three-level hierarchy for fair valuation based upon the inputs to the valuation as of the measurement date. The three levels of the fair value hierarchy are as follows:
| • | Level 1 – Level 1 inputs are quoted prices in active markets for identical investments. An active market is a market in which transactions for the investment occur with sufficient frequency and volume to provide pricing information on an ongoing basis. |
| • | Level 2 – Level 2 inputs are observable inputs, either directly or indirectly, and include the following: |
| o | Quoted prices for similar investments in active markets. |
| o | Quoted prices for identical or similar investments in markets that are non-active. A non-active market is a market where there are few transactions for the investment, the prices are not current, or price quotations vary substantially either over time or among market makers, or in which little information is released publicly. |
| o | Inputs other than quoted prices that are observable for the investment (for example, interest rates and yield curves observable at commonly quoted intervals, volatilities, prepayment speeds, loss severities, credit risks, and default rates). |
| o | Inputs that are derived principally from or corroborated by observable market data by correlation or other means. |
| • | Level 3 – Level 3 inputs are unobservable inputs. Unobservable inputs may reflect the reporting entity’s own assumptions about the assumptions that market participants would use in pricing the investment. |
The inputs or methodologies used for valuing investments are not necessarily an indication of the risk associated with investing in those investments. A summary of the inputs used to value the Fund’s investments as of January 31, 2023, is included with the Fund’s Portfolio of Investments.
B. Securities Transactions and Investment Income
Securities transactions are recorded as of the trade date. Realized gains and losses from securities transactions are recorded on the identified cost basis. Dividend income is recorded on the ex-dividend date. Interest income, if any, is recorded daily on the accrual basis.
Distributions received from the Fund’s investments in real estate investment trusts (“REITs”) may be comprised of return of capital, capital gains, and income. The actual character of the amounts received during the year are not known until after the REITs’ fiscal year end. The Fund records the character of distributions received from the REITs during the year based on estimates available. The characterization of distributions received by the Fund may be subsequently revised based on information received from the REITs after their tax reporting periods conclude.
The United Kingdom’s Financial Conduct Authority (the “FCA”), which regulates the London Interbank Offered Rates (“LIBOR”), announced on March 5, 2021 that it intended to phase-out all LIBOR reference rates, beginning December 31, 2021. Since that announcement, the FCA has ceased publication of all non-USD LIBOR reference rates and the 1-week and 2-month USD LIBOR reference rates as of December 31, 2021. The remaining USD LIBOR settings will cease to be published or no longer be representative immediately after June 30, 2023. The International Swaps and Derivatives Association, Inc. (“ISDA”) confirmed that the FCA’s
Notes to Financial Statements (Continued)
First Trust Merger Arbitrage ETF (MARB)
January 31, 2023 (Unaudited)
March 5, 2021 announcement of its intention to cease providing LIBOR reference rates, constituted an index cessation event under the Interbank Offered Rates (“IBOR”) Fallbacks Supplement and the ISDA 2020 IBOR Fallbacks Protocol for all 35 LIBOR settings and confirmed that the spread adjustment to be used in ISDA fallbacks was fixed as of the date of the announcement.
In the United States, the Alternative Reference Rates Committee (the “ARRC”), a group of market participants convened by the Board of Governors of the Federal Reserve System and the Federal Reserve Bank of New York in cooperation with other federal and state government agencies, has since 2014 undertaken efforts to identify U.S. dollar reference interest rates as alternatives to LIBOR and to facilitate the mitigation of LIBOR-related risks. In June 2017, the ARRC identified the Secured Overnight Financing Rate (“SOFR”), a broad measure of the cost of cash overnight borrowing collateralized by U.S. Treasury securities, as the preferred alternative for U.S. dollar LIBOR. The Federal Reserve Bank of New York began daily publishing of SOFR in April 2018. There is no assurance that any alternative reference rate, including SOFR, will be similar to or produce the same value or economic equivalence as LIBOR or that instruments using an alternative rate will have the same volume or liquidity.
At this time, it is not possible to predict the full impact of the elimination of LIBOR and the establishment of an alternative reference rate on the Fund or its investments.
C. Short Sales
Short sales are utilized for investment and risk management purposes and are transactions in which securities or other instruments (such as options, forwards, futures or other derivative contracts) are sold by the Fund, but are not currently owned in the Fund’s portfolio. When the Fund engages in a short sale, the Fund must borrow the security sold short and deliver the security to the counterparty. Short selling allows the Fund to profit from a decline in a market price to the extent such decline exceeds the transaction costs and the costs of borrowing the securities. The Fund will pay a fee or premium to borrow the securities sold short and is obligated to repay the lenders of the securities. Any dividends or interest that accrues on the securities during the period of the loan are due to the lenders. A gain, limited to the price at which the security was sold short, or a loss, unlimited in size, will be recognized upon the termination of the short sale; which is affected by the Fund purchasing the security sold short and delivering the security to the lender. Any such gain or loss may be offset, completely or in part, by the change in the value of the long portion of the Fund’s portfolio. The Fund is subject to the risk that it may be unable to reacquire a security to terminate a short position except at a price substantially in excess of the last quoted price. Also, there is the risk that the counterparty to a short sale may fail to honor its contractual terms, causing a loss to the Fund.
The Fund has established an account with BNP Paribas Prime Brokerage International, Ltd. for the purpose of borrowing securities that the Fund intends to sell short. The Fund is charged interest on debit margin balances at a rate equal to the Overnight Bank Funding Rate plus 85 basis points. With regard to securities held short, the Fund is credited a rebate equal to the market value of its short positions at a rate equal to the Overnight Bank Funding Rate less 35 basis points. This rebate rate applies to easy to borrow securities. Securities that are hard to borrow may earn a rebate that is less than the foregoing or may be subject to a premium charge on a security by security basis. The different rebate rate is determined at the time of a short sale request. For the six months ended January 31, 2023, the Fund had margin interest rebate of $153,784 as shown on the Statement of Operations. Restricted cash in the amount of $17,283,169, as shown on the Statement of Assets and Liabilities, is associated with collateral at the broker as of January 31, 2023.
D. Dividends and Distributions to Shareholders
Dividends from net investment income, if any, are declared and paid quarterly by the Fund, or as the Board of Trustees may determine from time to time. Distributions of net realized capital gains earned by the Fund, if any, are distributed at least annually. The Fund may also designate a portion of the amount paid to redeeming shareholders as a distribution for tax purposes.
Distributions from net investment income and realized capital gains are determined in accordance with federal income tax regulations, which may differ from U.S. GAAP. Certain capital accounts in the financial statements are periodically adjusted for permanent differences in order to reflect their tax character. These permanent differences are primarily due to the varying treatment of income and gain/loss on portfolio securities held by the Fund and have no impact on net assets or NAV per share. Temporary differences, which arise from recognizing certain items of income, expense and gain/loss in different periods for financial statement and tax purposes, will reverse at some time in the future.
During the fiscal year ended July 31, 2022, no distributions were paid by the Fund.
Notes to Financial Statements (Continued)
First Trust Merger Arbitrage ETF (MARB)
January 31, 2023 (Unaudited)
As of July 31, 2022, the components of distributable earnings on a tax basis were as follows:
Undistributed ordinary income
| $— |
Accumulated capital and other gain (loss)
| (130,900) |
Net unrealized appreciation (depreciation)
| 164,797 |
E. Income Taxes
The Fund intends to continue to qualify as a regulated investment company by complying with the requirements under Subchapter M of the Internal Revenue Code of 1986, as amended, which includes distributing substantially all of its net investment income and net realized gains to shareholders. Accordingly, no provision has been made for federal and state income taxes. However, due to the timing and amount of distributions, the Fund may be subject to an excise tax of 4% of the amount by which approximately 98% of the Fund’s taxable income exceeds the distributions from such taxable income for the calendar year.
The Fund is subject to accounting standards that establish a minimum threshold for recognizing, and a system for measuring, the benefits of a tax position taken or expected to be taken in a tax return. Taxable periods ended 2020, 2021, and 2022 remain open to federal and state audit. As of January 31, 2023, management has evaluated the application of these standards to the Fund and has determined that no provision for income tax is required in the Fund’s financial statements for uncertain tax positions.
The Fund intends to utilize provisions of the federal income tax laws, which allow it to carry a realized capital loss forward indefinitely following the year of the loss and offset such loss against any future realized capital gains. The Fund is subject to certain limitations under U.S. tax rules on the use of capital loss carryforwards and net unrealized built-in losses. These limitations apply when there has been a 50% change in ownership. At July 31, 2022, for federal income tax purposes, the Fund had $52,719 of capital loss carryforward available, to the extent provided by regulations, to offset future capital gains.
During the fiscal year ended July 31, 2022, the Fund utilized $215,101 of capital loss carryforwards.
Certain losses realized during the current fiscal year may be deferred and treated as occurring on the first day of the following fiscal year for federal income tax purposes. For the fiscal year ended July 31, 2022, the Fund incurred and elected to defer net ordinary losses of $78,181.
As of January 31, 2023, the aggregate cost, gross unrealized appreciation, gross unrealized depreciation, and net unrealized appreciation/(depreciation) on investments (including short positions and derivatives, if any) for federal income tax purposes were as follows:
| Tax Cost | | Gross
Unrealized
Appreciation | | Gross
Unrealized
(Depreciation) | | Net Unrealized
Appreciation
(Depreciation) |
| $41,722,850 | | $965,325 | | $(1,894,443) | | $(929,118) |
F. Expenses
Expenses, other than the investment advisory fee, dividend and interest expenses on investments sold short and other excluded expenses, are paid by the Advisor (See Note 3).
3. Investment Advisory Fee, Affiliated Transactions and Other Fee Arrangements
First Trust, the investment advisor to the Fund, is a limited partnership with one limited partner, Grace Partners of DuPage L.P., and one general partner, The Charger Corporation. The Charger Corporation is an Illinois corporation controlled by James A. Bowen, Chief Executive Officer of First Trust. First Trust is responsible for supervising the selection and ongoing monitoring of the securities in the Fund’s portfolio, managing the Fund’s business affairs and providing certain administrative services necessary for the management of the Fund.
Pursuant to an investment management agreement between First Trust and the Trust, on behalf of the Fund (the “Investment Management Agreement”), First Trust oversees First Trust Capital Management L.P.’s (“First Trust Capital Management” or the “Sub-Advisor”) management of the Fund’s assets. First Trust is responsible for the expenses of the Fund including the cost of transfer agency, custody, fund administration, legal, audit and other services, but excluding fee payments under the Investment Management Agreement, interest, taxes, acquired fund fees and expenses, if any, brokerage commissions and other expenses connected with the execution of portfolio transactions, expenses associated with short sales transactions, distribution and service fees pursuant to a Rule 12b-1 plan, if any, and extraordinary expenses. Effective November 1, 2022, the annual unitary management fee payable by the
Notes to Financial Statements (Continued)
First Trust Merger Arbitrage ETF (MARB)
January 31, 2023 (Unaudited)
Fund to First Trust for these services will be reduced at certain levels of the Fund’s net assets (“breakpoints”) and calculated pursuant to the schedule below.
| Breakpoints | |
| Fund net assets up to and including $2.5 billion | 1.25000% |
| Fund net assets greater than $2.5 billion up to and including $5 billion | 1.21875% |
| Fund net assets greater than $5 billion up to and including $7.5 billion | 1.18750% |
| Fund net assets greater than $7.5 billion up to and including $10 billion | 1.15625% |
| Fund net assets greater than $10 billion | 1.12500% |
Prior to November 1, 2022, the Fund agreed to pay First Trust an annual unitary management fee equal to 1.25% of its average daily net assets. First Trust also provides fund reporting services to the Fund for a flat annual fee in the amount of $9,250, which is covered under the annual unitary management fee.
In connection with the introduction of the breakpoints discussed above, the Fund’s investment sub-advisory agreement has been amended to reflect that the investment sub-advisory fee paid to First Trust Capital Management L.P., the Fund’s investment sub-adviser, is based on First Trust’s management fee. Accordingly, during any period in which First Trust’s management fee is reduced in accordance with the breakpoints described above, the investment sub-advisory fee will be reduced to reflect the reduction in First Trust’s management fee.
First Trust Capital Partners, LLC, an affiliate of First Trust, owns a 50% ownership interest in First Trust Capital Management L.P. through First Trust Capital Solutions L.P.
The Trust has multiple service agreements with Brown Brothers Harriman & Co. (“BBH”). Under the service agreements, BBH performs custodial, fund accounting, certain administrative services, and transfer agency services for the Fund. As custodian, BBH is responsible for custody of the Fund’s assets. As fund accountant and administrator, BBH is responsible for maintaining the books and records of the Fund’s investments and cash. As transfer agent, BBH is responsible for maintaining shareholder records for the Fund.
Each Trustee who is not an officer or employee of First Trust, any sub-advisor or any of their affiliates (“Independent Trustees”) is paid a fixed annual retainer that is allocated equally among each fund in the First Trust Fund Complex. Each Independent Trustee is also paid an annual per fund fee that varies based on whether the fund is a closed-end or other actively managed fund, a target outcome fund or an index fund.
Additionally, the Lead Independent Trustee and the Chairs of the Audit Committee, Nominating and Governance Committee and Valuation Committee are paid annual fees to serve in such capacities, with such compensation allocated pro rata among each fund in the First Trust Fund Complex based on net assets. Independent Trustees are reimbursed for travel and out-of-pocket expenses in connection with all meetings. The Lead Independent Trustee and Committee Chairs rotate every three years. The officers and “Interested” Trustee receive no compensation from the Trust for acting in such capacities.
4. Purchases and Sales of Securities
For the six months ended January 31, 2023, the cost of purchases and proceeds from sales of investments, excluding short term investments, investments sold short and in-kind transactions were $64,331,045 and $68,779,814, respectively. The cost of purchases to cover short sales and the proceeds of short sales were $11,427,234 and $11,291,589, respectively.
For the six months ended January 31, 2023, the cost of in-kind purchases and proceeds from in-kind sales were $28,051,836 and $5,152,946, respectively.
5. Creations, Redemptions and Transaction Fees
The Fund generally issues and redeems its shares in primary market transactions through a creation and redemption mechanism and does not sell or redeem individual shares. Instead, financial entities known as “Authorized Participants” have contractual arrangements with the Fund or one of the Fund’s service providers to purchase and redeem Fund shares directly with the Fund in large blocks of shares known as “Creation Units.” Prior to the start of trading on every business day, the Fund publishes through the National Securities Clearing Corporation (“NSCC”) the “basket” of securities, cash or other assets that it will accept in exchange for a Creation Unit of the Fund’s shares. An Authorized Participant that wishes to effectuate a creation of the Fund’s shares deposits with the Fund the “basket” of securities, cash or other assets identified by the Fund that day, and then receives the Creation Unit of the Fund’s shares in return for those assets. After purchasing a Creation Unit, the Authorized Participant may continue to hold the Fund’s shares or sell them in the secondary market. The redemption process is the reverse of the purchase process: the Authorized Participant redeems a
Notes to Financial Statements (Continued)
First Trust Merger Arbitrage ETF (MARB)
January 31, 2023 (Unaudited)
Creation Unit of the Fund’s shares for a basket of securities, cash or other assets. The combination of the creation and redemption process with secondary market trading in the Fund’s shares and underlying securities provides arbitrage opportunities that are designed to help keep the market price of the Fund’s shares at or close to the NAV per share of the Fund.
The Fund imposes fees in connection with the purchase of Creation Units. These fees may vary based upon various fact-based circumstances, including, but not limited to, the composition of the securities included in the Creation Unit or the countries in which the transactions are settled. The price for each Creation Unit will equal the daily NAV per share of the Fund times the number of shares in a Creation Unit, plus the fees described above and, if applicable, any operational processing and brokerage costs, transfer fees, stamp taxes and part or all of the spread between the expected bid and offer side of the market related to the securities comprising the creation basket.
The Fund also imposes fees in connection with the redemption of Creation Units. These fees may vary based upon various fact-based circumstances, including, but not limited to, the composition of the securities included in the Creation Unit or the countries in which the transactions are settled. The price received for each Creation Unit will equal the daily NAV per share of the Fund times the number of shares in a Creation Unit, minus the fees described above and, if applicable, any operational processing and brokerage costs, transfer fees, stamp taxes and part or all of the spread between the expected bid and offer side of the market related to the securities comprising the redemption basket. Investors who use the services of a broker or other such intermediary in addition to an Authorized Participant to effect a redemption of a Creation Unit may also be assessed an amount to cover the cost of such services. The redemption fee charged by the Fund will comply with Rule 22c-2 of the 1940 Act which limits redemption fees to no more than 2% of the value of the shares redeemed.
6. Distribution Plan
The Board of Trustees adopted a Distribution and Service Plan pursuant to Rule 12b-1 under the 1940 Act. In accordance with the Rule 12b-1 plan, the Fund is authorized to pay an amount up to 0.25% of its average daily net assets each year to reimburse First Trust Portfolios L.P. (“FTP”), the distributor of the Fund, for amounts expended to finance activities primarily intended to result in the sale of Creation Units or to provide investor services. FTP may also use this amount to compensate securities dealers or other persons that are Authorized Participants for providing distribution assistance, including broker-dealer and shareholder support and educational and promotional services.
No 12b-1 fees are currently paid by the Fund, and pursuant to a contractual arrangement, no 12b-1 fees will be paid any time before November 30, 2023.
7. Indemnification
The Trust, on behalf of the Fund, has a variety of indemnification obligations under contracts with its service providers. The Trust’s maximum exposure under these arrangements is unknown. However, the Trust has not had prior claims or losses pursuant to these contracts and expects the risk of loss to be remote.
8. Subsequent Events
Management has evaluated the impact of all subsequent events to the Fund through the date the financial statements were issued and has determined that there were no subsequent events requiring recognition or disclosure in the financial statements that have not already been disclosed.
Additional Information
First Trust Merger Arbitrage ETF (MARB)
January 31, 2023 (Unaudited)
Proxy Voting Policies and Procedures
A description of the policies and procedures that the Trust uses to determine how to vote proxies and information on how the Fund voted proxies relating to portfolio securities during the most recent 12-month period ended June 30 is available (1) without charge, upon request, by calling (800) 988-5891; (2) on the Fund’s website at www.ftportfolios.com; and (3) on the Securities and Exchange Commission’s (“SEC”) website at www.sec.gov.
Portfolio Holdings
The Fund files portfolio holdings information for each month in a fiscal quarter within 60 days after the end of the relevant fiscal quarter on Form N-PORT. Portfolio holdings information for the third month of each fiscal quarter will be publicly available on the SEC’s website at www.sec.gov. The Fund’s complete schedule of portfolio holdings for the second and fourth quarters of each fiscal year is included in the semi-annual and annual reports to shareholders, respectively, and is filed with the SEC on Form N-CSR. The semi-annual and annual report for the Fund is available to investors within 60 days after the period to which it relates. The Fund’s Forms N-PORT and Forms N-CSR are available on the SEC’s website listed above.
Risk Considerations
Risks are inherent in all investing. Certain general risks that may be applicable to a Fund are identified below, but not all of the material risks relevant to each Fund are included in this report and not all of the risks below apply to each Fund. The material risks of investing in each Fund are spelled out in its prospectus, statement of additional information and other regulatory filings. Before investing, you should consider each Fund’s investment objective, risks, charges and expenses, and read each Fund’s prospectus and statement of additional information carefully. You can download each Fund’s prospectus at www.ftportfolios.com or contact First Trust Portfolios L.P. at (800) 621-1675 to request a prospectus, which contains this and other information about each Fund.
Concentration Risk. To the extent that a fund is able to invest a significant percentage of its assets in a single asset class or the securities of issuers within the same country, state, region, industry or sector, an adverse economic, business or political development may affect the value of the fund’s investments more than if the fund were more broadly diversified. A fund that tracks an index will be concentrated to the extent the fund’s corresponding index is concentrated. A concentration makes a fund more susceptible to any single occurrence and may subject the fund to greater market risk than a fund that is more broadly diversified.
Credit Risk. Credit risk is the risk that an issuer of a security will be unable or unwilling to make dividend, interest and/or principal payments when due and the related risk that the value of a security may decline because of concerns about the issuer’s ability to make such payments.
Cyber Security Risk. The funds are susceptible to potential operational risks through breaches in cyber security. A breach in cyber security refers to both intentional and unintentional events that may cause a fund to lose proprietary information, suffer data corruption or lose operational capacity. Such events could cause a fund to incur regulatory penalties, reputational damage, additional compliance costs associated with corrective measures and/or financial loss. In addition, cyber security breaches of a fund’s third-party service providers, such as its administrator, transfer agent, custodian, or sub-advisor, as applicable, or issuers in which the fund invests, can also subject a fund to many of the same risks associated with direct cyber security breaches.
Defined Outcome Funds Risk. To the extent a fund’s investment strategy is designed to deliver returns tied to the price performance of an underlying ETF, an investor may not realize the returns the fund seeks to achieve if that investor does not hold shares for the entire target outcome period. In the event an investor purchases shares after the first day of the target outcome period or sells shares prior to the end of the target outcome period, the buffer that the fund seeks to provide against a decline in the value of the underlying ETF may not be available, the enhanced returns that the fund seeks to provide (if any) may not be available and the investor may not participate in a gain in the value of the underlying ETF up to the cap for the investor’s investment period. Additionally, the fund will not participate in gains of the underlying ETF above the cap and a shareholder may lose their entire investment. If the fund seeks enhanced returns, there are certain time periods when the value of the fund may fall faster than the value of the underlying ETF, and it is very unlikely that, on any given day during which the underlying ETF share price increases in value, the fund’s share price will increase at the same rate as the enhanced returns sought by the fund, which is designed for an entire target outcome period. Trading flexible exchange options involves risks different from, or possibly greater than, the risks associated with investing directly in securities, such as less liquidity and correlation and valuation risks. A fund may experience substantial downside from specific flexible exchange option positions and certain positions may expire worthless.
Derivatives Risk. To the extent a fund uses derivative instruments such as futures contracts, options contracts and swaps, the fund may experience losses because of adverse movements in the price or value of the underlying asset, index or rate, which may be magnified
Additional Information (Continued)
First Trust Merger Arbitrage ETF (MARB)
January 31, 2023 (Unaudited)
by certain features of the derivative. These risks are heightened when a fund’s portfolio managers use derivatives to enhance the fund’s return or as a substitute for a position or security, rather than solely to hedge (or offset) the risk of a position or security held by the fund.
Equity Securities Risk. To the extent a fund invests in equity securities, the value of the fund’s shares will fluctuate with changes in the value of the equity securities. Equity securities prices fluctuate for several reasons, including changes in investors’ perceptions of the financial condition of an issuer or the general condition of the relevant stock market, such as market volatility, or when political or economic events affecting the issuers occur. In addition, common stock prices may be particularly sensitive to rising interest rates, as the cost of capital rises and borrowing costs increase. Equity securities may decline significantly in price over short or extended periods of time, and such declines may occur in the equity market as a whole, or they may occur in only a particular country, company, industry or sector of the market.
ETF Risk. The shares of an ETF trade like common stock and represent an interest in a portfolio of securities. The risks of owning an ETF generally reflect the risks of owning the underlying securities, although lack of liquidity in an ETF could result in it being more volatile and ETFs have management fees that increase their costs. Shares of an ETF trade on an exchange at market prices rather than net asset value, which may cause the shares to trade at a price greater than net asset value (premium) or less than net asset value (discount). In times of market stress, decisions by market makers to reduce or step away from their role of providing a market for an ETF’s shares, or decisions by an ETF’s authorized participants that they are unable or unwilling to proceed with creation and/or redemption orders of an ETF’s shares, could result in shares of the ETF trading at a discount to net asset value and in greater than normal intraday bid-ask spreads.
Fixed Income Securities Risk. To the extent a fund invests in fixed income securities, the fund will be subject to credit risk, income risk, interest rate risk, liquidity risk and prepayment risk. Income risk is the risk that income from a fund’s fixed income investments could decline during periods of falling interest rates. Interest rate risk is the risk that the value of a fund’s fixed income securities will decline because of rising interest rates. Liquidity risk is the risk that a security cannot be purchased or sold at the time desired, or cannot be purchased or sold without adversely affecting the price. Prepayment risk is the risk that the securities will be redeemed or prepaid by the issuer, resulting in lower interest payments received by the fund. In addition to these risks, high yield securities, or “junk” bonds, are subject to greater market fluctuations and risk of loss than securities with higher ratings, and the market for high yield securities is generally smaller and less liquid than that for investment grade securities.
Index or Model Constituent Risk. Certain funds may be a constituent of one or more indices or ETF models. As a result, such a fund may be included in one or more index-tracking exchange-traded funds or mutual funds. Being a component security of such a vehicle could greatly affect the trading activity involving a fund, the size of the fund and the market volatility of the fund. Inclusion in an index could increase demand for the fund and removal from an index could result in outsized selling activity in a relatively short period of time. As a result, a fund’s net asset value could be negatively impacted and the fund’s market price may be significantly below its net asset value during certain periods. In addition, index rebalances may potentially result in increased trading activity in a fund’s shares.
Index Provider Risk. To the extent a fund seeks to track an index, it is subject to Index Provider Risk. There is no assurance that the Index Provider will compile the Index accurately, or that the Index will be determined, maintained, constructed, reconstituted, rebalanced, composed, calculated or disseminated accurately. To correct any such error, the Index Provider may carry out an unscheduled rebalance or other modification of the Index constituents or weightings, which may increase the fund’s costs. The Index Provider does not provide any representation or warranty in relation to the quality, accuracy or completeness of data in the Index, and it does not guarantee that the Index will be calculated in accordance with its stated methodology. Losses or costs associated with any Index Provider errors generally will be borne by the fund and its shareholders.
Investment Companies Risk. To the extent a fund invests in the securities of other investment vehicles, the fund will incur additional fees and expenses that would not be present in a direct investment in those investment vehicles. Furthermore, the fund’s investment performance and risks are directly related to the investment performance and risks of the investment vehicles in which the fund invests.
LIBOR Risk. To the extent a fund invests in floating or variable rate obligations that use the London Interbank Offered Rate (“LIBOR”) as a reference interest rate, it is subject to LIBOR Risk. The United Kingdom’s Financial Conduct Authority, which regulates LIBOR has ceased making LIBOR available as a reference rate over a phase-out period that began December 31, 2021. There is no assurance that any alternative reference rate, including the Secured Overnight Financing Rate (“SOFR”) will be similar to or produce the same value or economic equivalence as LIBOR or that instruments using an alternative rate will have the same volume or liquidity. The unavailability or replacement of LIBOR may affect the value, liquidity or return on certain fund investments and may result in costs incurred in connection with closing out positions and entering into new trades. Any potential effects of the transition away from LIBOR on the fund or on certain instruments in which the fund invests can be difficult to ascertain, and they may vary depending on a variety of factors, and they could result in losses to the fund.
Additional Information (Continued)
First Trust Merger Arbitrage ETF (MARB)
January 31, 2023 (Unaudited)
Management Risk. To the extent that a fund is actively managed, it is subject to management risk. In managing an actively-managed fund’s investment portfolio, the fund’s portfolio managers will apply investment techniques and risk analyses that may not have the desired result. There can be no guarantee that a fund will meet its investment objective.
Market Risk. Market risk is the risk that a particular security, or shares of a fund in general, may fall in value. Securities held by a fund, as well as shares of a fund itself, are subject to market fluctuations caused by factors such as general economic conditions, political events, regulatory or market developments, changes in interest rates and perceived trends in securities prices. Shares of a fund could decline in value or underperform other investments as a result of the risk of loss associated with these market fluctuations. In addition, local, regional or global events such as war, acts of terrorism, spread of infectious diseases or other public health issues, recessions, or other events could have a significant negative impact on a fund and its investments. Such events may affect certain geographic regions, countries, sectors and industries more significantly than others. In February 2022, Russia invaded Ukraine which has caused and could continue to cause significant market disruptions and volatility within the markets in Russia, Europe, and the United States. The hostilities and sanctions resulting from those hostilities could have a significant impact on certain fund investments as well as fund performance. The COVID-19 global pandemic and the ensuing policies enacted by governments and central banks have caused and may continue to cause significant volatility and uncertainty in global financial markets. While the U.S. has resumed “reasonably” normal business activity, many countries continue to impose lockdown measures. Additionally, there is no guarantee that vaccines will be effective against emerging variants of the disease. These events also adversely affect the prices and liquidity of a fund’s portfolio securities or other instruments and could result in disruptions in the trading markets. Any of such circumstances could have a materially negative impact on the value of a fund’s shares and result in increased market volatility. During any such events, a fund’s shares may trade at increased premiums or discounts to their net asset value and the bid/ask spread on a fund’s shares may widen.
Non-U.S. Securities Risk. To the extent a fund invests in non-U.S. securities, it is subject to additional risks not associated with securities of domestic issuers. Non-U.S. securities are subject to higher volatility than securities of domestic issuers due to: possible adverse political, social or economic developments; restrictions on foreign investment or exchange of securities; capital controls; lack of liquidity; currency exchange rates; excessive taxation; government seizure of assets; the imposition of sanctions by foreign governments; different legal or accounting standards; and less government supervision and regulation of exchanges in foreign countries. Investments in non-U.S. securities may involve higher costs than investments in U.S. securities, including higher transaction and custody costs, as well as additional taxes imposed by non-U.S. governments. These risks may be heightened for securities of companies located, or with significant operations, in emerging market countries.
Operational Risk. Each fund is subject to risks arising from various operational factors, including, but not limited to, human error, processing and communication errors, errors of a fund’s service providers, counterparties or other third-parties, failed or inadequate processes and technology or systems failures. Each fund relies on third-parties for a range of services, including custody. Any delay or failure relating to engaging or maintaining such service providers may affect a fund’s ability to meet its investment objective. Although the funds and the funds’ investment advisor seek to reduce these operational risks through controls and procedures, there is no way to completely protect against such risks.
Passive Investment Risk. To the extent a fund seeks to track an index, the fund will invest in the securities included in, or representative of, the index regardless of their investment merit. A fund generally will not attempt to take defensive positions in declining markets.
Preferred Securities Risk. Preferred securities combine some of the characteristics of both common stocks and bonds. Preferred securities are typically subordinated to bonds and other debt securities in a company’s capital structure in terms of priority to corporate income, subjecting them to greater credit risk than those debt securities. Generally, holders of preferred securities have no voting rights with respect to the issuing company unless preferred dividends have been in arrears for a specified number of periods, at which time the preferred security holders may obtain limited rights. In certain circumstances, an issuer of preferred securities may defer payment on the securities and, in some cases, redeem the securities prior to a specified date. Preferred securities may also be substantially less liquid than other securities, including common stock.
Valuation Risk. The valuation of certain securities may carry more risk than that of common stock. Uncertainties in the conditions of the financial markets, unreliable reference data, lack of transparency and inconsistency of valuation models and processes may lead to inaccurate asset pricing. A fund may hold investments in sizes smaller than institutionally sized round lot positions (sometimes referred to as odd lots). However, third-party pricing services generally provide evaluations on the basis of institutionally-sized round lots. If a fund sells certain of its investments in an odd lot transaction, the sale price may be less than the value at which such securities
Additional Information (Continued)
First Trust Merger Arbitrage ETF (MARB)
January 31, 2023 (Unaudited)
have been held by the fund. Odd lots often trade at lower prices than institutional round lots. There is no assurance that the fund will be able to sell a portfolio security at the price established by the pricing service, which could result in a loss to the fund.
| NOT FDIC INSURED | NOT BANK GUARANTEED | MAY LOSE VALUE |
Advisory and Sub-Advisory Agreements
Board Considerations Regarding Approval of Amendments to the Investment Management and Investment Sub-Advisory Agreements
The Board of Trustees of First Trust Exchange-Traded Fund III (the “Trust”), including the Independent Trustees, unanimously approved the amendment (the “Advisory Agreement Amendment”) of the Investment Management Agreement (the “Advisory Agreement”) with First Trust Advisors L.P. (the “Advisor”) and the amendment (the “Sub-Advisory Agreement Amendment” and together with the Advisory Agreement Amendment, the “Amendments”) of the Investment Sub-Advisory Agreement (the “Sub-Advisory Agreement” and together with the Advisory Agreement, the “Agreements”) among the Trust, the Advisor and First Trust Capital Management L.P. (the “Sub-Advisor”) on behalf of the First Trust Merger Arbitrage ETF (the “Fund”).
The Board approved the Amendments at a meeting held on October 24, 2022. As part of the review process, the Board reviewed information and had preliminary discussions with the Advisor regarding the proposed Amendments at meetings held on April 18, 2022, June 12–13, 2022 and September 18–19, 2022. Following those preliminary discussions, the Board requested and received information from the Advisor regarding the proposed Amendments, and that information was considered at an executive session of the Independent Trustees and their counsel held prior to the October 24, 2022 meeting, as well as at the October meeting.
In reviewing the Advisory Agreement Amendment, the Board considered that the purpose of the Advisory Agreement Amendment is to modify the unitary fee rate for the Fund under the Advisory Agreement by introducing a breakpoint schedule pursuant to which the unitary fee rate paid by the Fund to the Advisor will be reduced as assets of the Fund meet certain thresholds. In reviewing the Sub-Advisory Agreement Amendment, the Board considered that the purpose of the Sub-Advisory Agreement Amendment is to modify the sub-advisory fee rate for the Fund under the Sub-Advisory Agreement to reflect the modification of the unitary fee rate schedule under the Advisory Agreement Amendment. The Board noted the Advisor’s representations that the quality and quantity of the services provided to the Fund by the Advisor under the Advisory Agreement and by the Sub-Advisor under the Sub-Advisory Agreement will not be reduced or modified as a result of the Advisory Agreement Amendment and the Sub-Advisory Agreement Amendment, and that the obligations of the Advisor under the Advisory Agreement and the obligations of the Sub-Advisor under the Sub-Advisory Agreement will remain the same in all respects.
The Board noted that it, including the Independent Trustees, last approved the continuation of the Advisory Agreement for a one-year period ending June 30, 2023 at a meeting held on June 12–13, 2022. The Board noted that in connection with such approval it had determined, based upon the information provided, that the terms of the Advisory Agreement were fair and reasonable and that the continuation of the Advisory Agreement was in the best interests of the Fund in light of the nature, extent and quality of the services provided and such other matters as the Board considered to be relevant in the exercise of its business judgment.
The Board also noted that it, including the Independent Trustees, approved the Sub-Advisory Agreement for an initial two-year period ending February 22, 2024 at a meeting held on September 12–13, 2021 and that shareholders of the Fund approved the Sub-Advisory Agreement at a meeting held on February 22, 2022. The Board noted that in connection with its approval it had determined, based upon the information provided, that the terms of the Sub-Advisory Agreement were fair and reasonable and that the approval of the Sub-Advisory Agreement was in the best interests of the Fund in light of the nature, extent and quality of the services provided and such other matters as the Board considered to be relevant in the exercise of its business judgment.
Based on all of the information considered, the Board, including the Independent Trustees, unanimously determined that the terms of the Amendments are fair and reasonable and that the Amendments are in the best interests of the Fund.
This page intentionally left blank
This page intentionally left blank
This page intentionally left blank
First Trust Exchange-Traded Fund III
INVESTMENT ADVISOR
First Trust Advisors L.P.
120 East Liberty Drive, Suite 400
Wheaton, IL 60187
INVESTMENT SUB-ADVISOR
First Trust Capital Management L.P.
225 West Wacker Drive, Suite 2100
Chicago, IL 60606
ADMINISTRATOR, CUSTODIAN,
FUND ACCOUNTANT &
TRANSFER AGENT
Brown Brothers Harriman & Co.
50 Post Office Square
Boston, MA 02110
INDEPENDENT REGISTERED
PUBLIC ACCOUNTING FIRM
Deloitte & Touche LLP
111 S. Wacker Drive
Chicago, IL 60606
LEGAL COUNSEL
Chapman and Cutler LLP
320 South Canal Street
Chicago, IL 60606
Item 2. Code of Ethics.
Not applicable.
Item 3. Audit Committee Financial Expert.
Not applicable.
Item 4. Principal Accountant Fees and Services.
Not applicable.
Item 5. Audit Committee of Listed Registrants.
Not applicable.
Item 6. Schedule of Investments.
| (a) | | Schedules of Investments in securities of unaffiliated issuers as of the close of the reporting period are included as part of the report to shareholders filed under Item 1 of this form. |
Item 7. Disclosure of Proxy Voting Policies and Procedures for Closed-End Management Investment Companies.
Not applicable.
Item 8. Portfolio Managers of Closed-End Management Investment Companies.
Not applicable.
Item 9. Purchases of Equity Securities by Closed-End Management Investment Company and Affiliated Purchasers.
Not applicable.
Item 10. Submission of Matters to a Vote of Security Holders.
There have been no material changes to the procedures by which the shareholders may recommend nominees to the registrant's board of directors, where those changes were implemented after the registrant last provided disclosure in response to the requirements of Item 407(c)(2)(iv) of Regulation S-K (17 CFR 229.407) (as required by Item 22(b)(15) of Schedule 14A (17 CFR 240.14a-101)),or this Item.
Item 11. Controls and Procedures.
| (a) | | The registrant's principal executive and principal financial officers, or persons performing similar functions, have concluded that the registrant's disclosure controls and procedures (as defined in Rule 30a-3(c) under the Investment Company Act of 1940, as amended (the “1940 Act”) (17 CFR 270.30a-3 (c))) are effective, as of a date within 90 days of the filing date of the report that includes the disclosure required by this paragraph, based on their evaluation of these controls and procedures required by Rule 30a-3(b) under the 1940 Act (17 CFR 270.30a-3(b)) and Rules 13a-15(b) or 15d-15(b) under the Securities Exchange Act of 1934, as amended (17 CFR 240.13a-15(b) or 240.15d-15 (b)). |
| (b) | | There were no changes in the registrant's internal control over financial reporting (as defined in Rule 30a-3(d) under the 1940 Act (17 CFR 270.30a-3(d)) that occurred during the period covered by this report that have materially affected, or are reasonably likely to materially affect, the registrant's internal control over financial reporting. |
Item 12. Disclosure of Securities Lending Activities for Closed-End Management Investment Companies.
Item 13. Exhibits.
SIGNATURES
Pursuant to the requirements of the Securities Exchange Act of 1934 and the Investment Company Act of 1940, the registrant has duly caused this report to be signed on its behalf by the undersigned, thereunto duly authorized.
| (registrant) | | First Trust Exchange-Traded Fund III |
| By (Signature and Title)* | | /s/ James M. Dykas |
| | | James M. Dykas, President and Chief Executive Officer
(principal executive officer) |
Pursuant to the requirements of the Securities Exchange Act of 1934 and the Investment Company Act of 1940, this report has been signed below by the following persons on behalf of the registrant and in the capacities and on the dates indicated.
| By (Signature and Title)* | | /s/ James M. Dykas |
| | | James M. Dykas, President and Chief Executive Officer
(principal executive officer) |
| By (Signature and Title)* | | /s/ Donald P. Swade |
| | | Donald P. Swade, Treasurer, Chief Financial Officer
and Chief Accounting Officer
(principal financial officer) |
* Print the name and title of each signing officer under his or her signature.