UNITED STATES
SECURITIES AND EXCHANGE COMMISSION
Washington, D.C. 20549
FORM N-CSR
CERTIFIED SHAREHOLDER REPORT OF REGISTERED MANAGEMENT INVESTMENT COMPANIES
Investment Company Act file number 811-22245
First Trust Exchange-Traded Fund III
(Exact name of registrant as specified in charter)
120 East Liberty Drive, Suite 400
Wheaton, IL 60187
(Address of principal executive offices) (Zip code)
W. Scott Jardine, Esq.
First Trust Portfolios L.P.
120 East Liberty Drive, Suite 400
Wheaton, IL 60187
(Name and address of agent for service)
registrant’s telephone number, including area code: (630) 765-8000
Date of fiscal year end: October 31
Date of reporting period: October 31, 2020
Form N-CSR is to be used by management investment companies to file reports with the Commission not later than 10 days after the transmission to stockholders of any report that is required to be transmitted to stockholders under Rule 30e-1 under the Investment Company Act of 1940 (17 CFR 270.30e-1). The Commission may use the information provided on Form N-CSR in its regulatory, disclosure review, inspection, and policymaking roles.
A registrant is required to disclose the information specified by Form N-CSR, and the Commission will make this information public. A registrant is not required to respond to the collection of information contained in Form N-CSR unless the Form displays a currently valid Office of Management and Budget (“OMB”) control number. Please direct comments concerning the accuracy of the information collection burden estimate and any suggestions for reducing the burden to Secretary, Securities and Exchange Commission, 450 Fifth Street, NW, Washington, DC 20549-0609. The OMB has reviewed this collection of information under the clearance requirements of 44 U.S.C. § 3507.
Item 1. Report to Stockholders.
The registrant’s annual report transmitted to shareholders pursuant to Rule 30e-1 under the Investment Company Act of 1940 is as follows:

For the Year Ended
October 31, 2020
| 1 | |
| 2 | |
| 5 | |
| 7 | |
| 8 | |
| 17 | |
| 18 | |
| 19 | |
| 20 | |
| 21 | |
| 28 | |
| 29 | |
| 35 | |
| 37 |

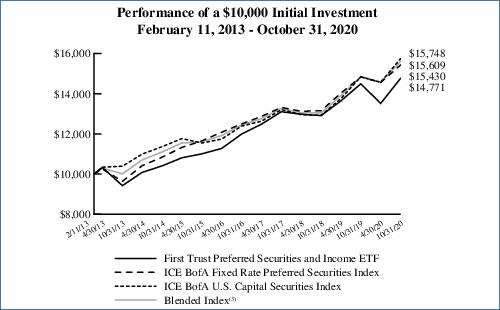
| Performance | ||||||
| Average Annual Total Returns | Cumulative Total Returns | |||||
| 1 Year Ended 10/31/20 | 5 Years Ended 10/31/20 | Inception (2/11/13) to 10/31/20 | 5 Years Ended 10/31/20 | Inception (2/11/13) to 10/31/20 | ||
| Fund Performance | ||||||
| NAV | 1.94% | 6.06% | 5.18% | 34.20% | 47.71% | |
| Market Price | 1.57% | 5.92% | 5.13% | 33.34% | 47.14% | |
| Index Performance | ||||||
| ICE BofA Fixed Rate Preferred Securities Index | 4.03% | 5.78% | 5.78% | 32.42% | 54.30% | |
| ICE BofA U.S. Capital Securities Index | 6.15% | 6.41% | 6.06% | 36.42% | 57.48% | |
| Blended Index(1) | 5.13% | 6.11% | 5.94% | 34.52% | 56.09% | |
| (1) | The Blended Index consists of a 50/50 blend of the ICE BofA Fixed Rate Preferred Securities Index and the ICE BofA U.S. Capital Securities Index. The Blended Index reflects the diverse allocation of institutional preferred and hybrid securities in the Fund’s portfolio. The indexes do not charge management fees or brokerage expenses, and no such fees or expenses were deducted from the performance shown. Indexes are unmanaged and an investor cannot invest directly in an index. The Blended Index returns are calculated by using the monthly return of the two indices during each period shown above. At the beginning of each month the two indices are rebalanced to a 50-50 ratio to account for divergence from that ratio that occurred during the course of each month. The monthly returns are then compounded for each period shown above, giving the performance for the Blended Index for each period shown above. |
| Sector Allocation | % of Total Investments |
| Financials | 73.2% |
| Utilities | 9.3 |
| Energy | 7.1 |
| Consumer Staples | 3.5 |
| Industrials | 3.0 |
| Communication Services | 2.2 |
| Real Estate | 1.7 |
| Total | 100.0% |
| Credit Rating(2) | % of Total Fixed-Income Investments |
| A | 0.1% |
| A- | 0.6 |
| BBB+ | 8.9 |
| BBB | 23.7 |
| BBB- | 29.0 |
| BB+ | 21.0 |
| BB | 8.0 |
| BB- | 3.1 |
| B+ | 1.2 |
| B | 0.7 |
| Not Rated | 3.7 |
| Total | 100.0% |
| Country Allocation | % of Total Investments |
| United States | 50.2% |
| United Kingdom | 10.1 |
| Canada | 8.7 |
| France | 5.9 |
| Switzerland | 4.6 |
| Bermuda | 4.6 |
| Netherlands | 4.2 |
| Italy | 3.3 |
| Australia | 2.9 |
| Spain | 1.5 |
| Mexico | 1.2 |
| Denmark | 0.8 |
| Japan | 0.7 |
| Finland | 0.6 |
| Chile | 0.4 |
| Sweden | 0.3 |
| Jersey | 0.0* |
| Total | 100.0% |
| * | Amount is less than 0.1%. |
| Top Ten Holdings | % of Total Investments |
| Emera, Inc., Series 16-A | 3.0% |
| Barclays PLC | 2.0 |
| AerCap Holdings N.V. | 1.9 |
| Barclays PLC | 1.7 |
| GMAC Capital Trust I, Series 2 | 1.5 |
| Wells Fargo & Co., Series L | 1.4 |
| Lloyds Banking Group PLC | 1.3 |
| Enel S.p.A. | 1.2 |
| Charles Schwab (The) Corp., Series G | 1.1 |
| UniCredit S.p.A. | 1.1 |
| Total | 16.2% |
| (2) | The credit quality and ratings information presented above reflect the ratings assigned by one or more nationally recognized statistical rating organizations (NRSROs), including Standard & Poor’s Ratings Group, a division of the McGraw Hill Companies, Inc., Moody’s Investors Service, Inc., Fitch Ratings or a comparably rated NRSRO. For situations in which a security is rated by more than one NRSRO and the ratings are not equivalent, the highest rating is used. Sub-investment grade ratings are those rated BB+/Ba1 or lower. Investment grade ratings are those rated BBB-/Baa3 or higher. The credit ratings shown relate to the creditworthiness of the issuers of the underlying securities in the Fund, and not to the Fund or its shares. Credit ratings are subject to change. |
Performance figures assume reinvestment of all distributions and do not reflect the deduction of taxes that a shareholder would pay on Fund distributions or the redemption or sale of Fund shares. An index is a statistical composite that tracks a specified financial market or sector. Unlike the Fund, the indices do not actually hold a portfolio of securities and therefore do not incur the expenses incurred by the Fund. These expenses negatively impact the performance of the Fund. The Fund’s past performance does not predict future performance.
| (3) | The Blended Index consists of a 50/50 blend of the ICE BofA Fixed Rate Preferred Securities Index and the ICE BofA U.S. Capital Securities Index. The Blended Index reflects the diverse allocation of institutional preferred and hybrid securities in the Fund’s portfolio. The indexes do not charge management fees or brokerage expenses, and no such fees or expenses were deducted from the performance shown. Indexes are unmanaged and an investor cannot invest directly in an index. The Blended Index returns are calculated by using the monthly return of the two indices during each period shown above. At the beginning of each month the two indices are rebalanced to a 50-50 ratio to account for divergence from that ratio that occurred during the course of each month. The monthly returns are then compounded for each period shown above, giving the performance for the Blended Index for each period shown above. |
| Beginning Account Value May 1, 2020 | Ending Account Value October 31, 2020 | Annualized Expense Ratio Based on the Six-Month Period | Expenses Paid During the Six-Month Period (a) | |
| First Trust Preferred Securities and Income ETF (FPE) | ||||
| Actual | $1,000.00 | $1,093.00 | 0.85% | $4.47 |
| Hypothetical (5% return before expenses) | $1,000.00 | $1,020.86 | 0.85% | $4.32 |
| (a) | Expenses are equal to the annualized expense ratios as indicated in the table multiplied by the average account value over the period (May 1, 2020 through October 31, 2020), multiplied by 184/366 (to reflect the six-month period). |
| Shares | Description | Stated Rate | Stated Maturity | Value | ||||
| $25 PAR PREFERRED SECURITIES – 26.4% | ||||||||
| Banks – 6.0% | ||||||||
| 23,218 | Banco Santander S.A., Series 6, 3 Mo. LIBOR + 0.52%, minimum 4.00% (a) | 4.00% | (b) | $586,254 | ||||
| 7 | Bank of America Corp., Series GG | 6.00% | (b) | 188 | ||||
| 170 | Bank of America Corp., Series HH | 5.88% | (b) | 4,571 | ||||
| 610,175 | Bank of America Corp., Series NN | 4.38% | (b) | 15,254,375 | ||||
| 991,768 | Citigroup Capital XIII, 3 Mo. LIBOR + 6.37% (a) | 6.58% | 10/30/40 | 27,174,443 | ||||
| 108,258 | Citizens Financial Group, Inc., Series E | 5.00% | (b) | 2,738,927 | ||||
| 649,312 | Fifth Third Bancorp, Series A | 6.00% | (b) | 17,245,727 | ||||
| 106,289 | Fifth Third Bancorp, Series I (c) | 6.63% | (b) | 3,005,853 | ||||
| 251,386 | First Midwest Bancorp, Inc., Series A | 7.00% | (b) | 6,855,296 | ||||
| 566,586 | First Republic Bank, Series K | 4.13% | (b) | 14,260,970 | ||||
| 565,259 | Fulton Financial Corp., Series A | 5.13% | (b) | 14,329,316 | ||||
| 3,156,132 | GMAC Capital Trust I, Series 2, 3 Mo. LIBOR + 5.79% (a) | 6.07% | 02/15/40 | 81,238,838 | ||||
| 207,249 | Huntington Bancshares, Inc., Series D | 6.25% | (b) | 5,309,719 | ||||
| 33,164 | KeyCorp, Series F | 5.65% | (b) | 878,514 | ||||
| 207,608 | KeyCorp, Series G | 5.63% | (b) | 5,615,796 | ||||
| 1,044,076 | People’s United Financial, Inc., Series A (c) | 5.63% | (b) | 28,325,782 | ||||
| 477,166 | Pinnacle Financial Partners, Inc., Series B | 6.75% | (b) | 12,788,049 | ||||
| 590,163 | Regions Financial Corp., Series A | 6.38% | (b) | 15,131,779 | ||||
| 41,112 | Synovus Financial Corp., Series D (c) | 6.30% | (b) | 1,056,989 | ||||
| 155,514 | Truist Financial Corp., Series R | 4.75% | (b) | 4,057,360 | ||||
| 33,783 | Valley National Bancorp, Series A (c) | 6.25% | (b) | 893,223 | ||||
| 103,342 | Valley National Bancorp, Series B (c) | 5.50% | (b) | 2,493,642 | ||||
| 39,990 | Wells Fargo & Co., Series O | 5.13% | (b) | 1,006,948 | ||||
| 7 | Wells Fargo & Co., Series P | 5.25% | (b) | 176 | ||||
| 136,999 | Wells Fargo & Co., Series V | 6.00% | (b) | 3,470,185 | ||||
| 640,157 | Wells Fargo & Co., Series X | 5.50% | (b) | 16,304,799 | ||||
| 297,283 | Wells Fargo & Co., Series Y | 5.63% | (b) | 7,702,603 | ||||
| 570,092 | WesBanco, Inc., Series A (c) | 6.75% | (b) | 15,067,532 | ||||
| 2,144 | Wintrust Financial Corp., Series D (c) | 6.50% | (b) | 56,023 | ||||
| 790,016 | Wintrust Financial Corp., Series E (c) | 6.88% | (b) | 21,030,226 | ||||
| 323,884,103 | ||||||||
| Capital Markets – 2.0% | ||||||||
| 485,604 | Affiliated Managers Group, Inc. | 5.88% | 03/30/59 | 13,019,043 | ||||
| 281,070 | Affiliated Managers Group, Inc. | 4.75% | 09/30/60 | 7,385,114 | ||||
| 53,893 | Apollo Global Management, Inc., Series A | 6.38% | (b) | 1,399,601 | ||||
| 601,421 | Apollo Global Management, Inc., Series B | 6.38% | (b) | 15,931,642 | ||||
| 130,705 | Legg Mason, Inc. | 5.45% | 09/15/56 | 3,360,426 | ||||
| 1,247,549 | Morgan Stanley, Series F (c) | 6.88% | (b) | 34,856,519 | ||||
| 118,694 | Morgan Stanley, Series K (c) | 5.85% | (b) | 3,344,797 | ||||
| 344,132 | Oaktree Capital Group LLC, Series A | 6.63% | (b) | 9,195,207 | ||||
| 570,258 | Oaktree Capital Group LLC, Series B | 6.55% | (b) | 15,277,212 | ||||
| 528 | State Street Corp., Series G (c) | 5.35% | (b) | 14,974 | ||||
| 98,106 | Stifel Financial Corp., Series A | 6.25% | (b) | 2,544,870 | ||||
| 106,329,405 | ||||||||
| Consumer Finance – 0.6% | ||||||||
| 38,772 | Capital One Financial Corp., Series G | 5.20% | (b) | 991,012 | ||||
| 859,477 | Capital One Financial Corp., Series I | 5.00% | (b) | 21,615,847 | ||||
| 349,395 | Capital One Financial Corp., Series J | 4.80% | (b) | 8,654,514 | ||||
| 31,261,373 | ||||||||
| Diversified Financial Services – 0.5% | ||||||||
| 703,774 | Equitable Holdings, Inc., Series A | 5.25% | (b) | 17,798,445 | ||||
| Shares | Description | Stated Rate | Stated Maturity | Value | ||||
| $25 PAR PREFERRED SECURITIES (Continued) | ||||||||
| Diversified Financial Services (Continued) | ||||||||
| 247,792 | National Rural Utilities Cooperative Finance Corp. | 5.50% | 05/15/64 | $6,739,942 | ||||
| 24,538,387 | ||||||||
| Diversified Telecommunication Services – 1.1% | ||||||||
| 969,284 | AT&T, Inc., Series C | 4.75% | (b) | 24,513,192 | ||||
| 378,144 | Qwest Corp. | 6.50% | 09/01/56 | 9,608,639 | ||||
| 901,351 | Qwest Corp. | 6.75% | 06/15/57 | 23,552,302 | ||||
| 57,674,133 | ||||||||
| Electric Utilities – 0.8% | ||||||||
| 106,982 | PPL Capital Funding, Inc., Series B | 5.90% | 04/30/73 | 2,717,343 | ||||
| 310,078 | SCE Trust V, Series K (c) | 5.45% | (b) | 7,038,771 | ||||
| 1,417,544 | Southern (The) Co., Series C | 4.20% | 10/15/60 | 36,069,407 | ||||
| 45,825,521 | ||||||||
| Equity Real Estate Investment Trusts – 0.9% | ||||||||
| 495,829 | American Homes 4 Rent, Series D | 6.50% | (b) | 12,832,055 | ||||
| 891,624 | American Homes 4 Rent, Series E | 6.35% | (b) | 22,968,234 | ||||
| 206,985 | Digital Realty Trust, Inc., Series L | 5.20% | (b) | 5,505,801 | ||||
| 346,077 | Global Net Lease, Inc., Series A | 7.25% | (b) | 8,894,179 | ||||
| 36,531 | Public Storage, Series M | 4.13% | (b) | 944,326 | ||||
| 51,144,595 | ||||||||
| Food Products – 1.3% | ||||||||
| 204,575 | CHS, Inc., Series 1 | 7.88% | (b) | 5,721,963 | ||||
| 1,072,525 | CHS, Inc., Series 2 (c) | 7.10% | (b) | 29,430,086 | ||||
| 890,013 | CHS, Inc., Series 3 (c) | 6.75% | (b) | 23,576,444 | ||||
| 386,162 | CHS, Inc., Series 4 | 7.50% | (b) | 10,820,259 | ||||
| 69,548,752 | ||||||||
| Gas Utilities – 0.3% | ||||||||
| 471,752 | South Jersey Industries, Inc. | 5.63% | 09/16/79 | 12,015,523 | ||||
| 107,393 | Spire, Inc., Series A | 5.90% | (b) | 2,938,273 | ||||
| 14,953,796 | ||||||||
| Independent Power & Renewable Electricity Producers – 0.2% | ||||||||
| 428,598 | Brookfield Renewable Partners L.P., Series 17 | 5.25% | (b) | 11,126,404 | ||||
| Insurance – 7.1% | ||||||||
| 1,494,025 | Aegon Funding Co., LLC | 5.10% | 12/15/49 | 38,934,292 | ||||
| 1,709,529 | American Equity Investment Life Holding Co., Series A (c) | 5.95% | (b) | 42,567,272 | ||||
| 662,214 | American Equity Investment Life Holding Co., Series B (c) | 6.63% | (b) | 17,257,297 | ||||
| 966 | American Financial Group, Inc. | 4.50% | 09/15/60 | 25,862 | ||||
| 211,856 | AmTrust Financial Services, Inc. | 7.25% | 06/15/55 | 3,792,222 | ||||
| 250,540 | AmTrust Financial Services, Inc. | 7.50% | 09/15/55 | 4,462,117 | ||||
| 56 | Arch Capital Group Ltd., Series E | 5.25% | (b) | 1,427 | ||||
| 28 | Arch Capital Group Ltd., Series F | 5.45% | (b) | 731 | ||||
| 244,281 | Aspen Insurance Holdings Ltd. | 5.63% | (b) | 6,238,937 | ||||
| 1,017,388 | Aspen Insurance Holdings Ltd. | 5.63% | (b) | 25,485,569 | ||||
| 1,195,297 | Aspen Insurance Holdings Ltd. (c) | 5.95% | (b) | 31,304,828 | ||||
| 111,745 | Assured Guaranty Municipal Holdings, Inc. | 6.25% | 11/01/02 | 2,950,068 | ||||
| 1,440,302 | Athene Holding Ltd., Series A (c) | 6.35% | (b) | 38,571,288 | ||||
| 572,244 | Athene Holding Ltd., Series C (c) | 6.38% | (b) | 15,393,364 | ||||
| 233,574 | Axis Capital Holdings Ltd., Series E | 5.50% | (b) | 5,951,466 | ||||
| 949,986 | Delphi Financial Group, Inc., 3 Mo. LIBOR + 3.19% (a) | 3.47% | 05/15/37 | 18,524,727 | ||||
| 936,613 | Enstar Group Ltd., Series D (c) | 7.00% | (b) | 24,932,638 | ||||
| Shares | Description | Stated Rate | Stated Maturity | Value | ||||
| $25 PAR PREFERRED SECURITIES (Continued) | ||||||||
| Insurance (Continued) | ||||||||
| 471,220 | Global Indemnity Group LLC | 7.88% | 04/15/47 | $12,181,037 | ||||
| 388,956 | National General Holdings Corp. | 7.63% | 09/15/55 | 9,937,826 | ||||
| 136,571 | National General Holdings Corp., Series B | 7.50% | (b) | 3,456,612 | ||||
| 223,709 | National General Holdings Corp., Series C | 7.50% | (b) | 5,823,145 | ||||
| 6,614 | PartnerRe Ltd., Series I | 5.88% | (b) | 170,178 | ||||
| 156,940 | Phoenix Cos. (The), Inc. | 7.45% | 01/15/32 | 2,206,969 | ||||
| 1,702,482 | Prudential Financial, Inc. | 4.13% | 09/01/60 | 43,081,137 | ||||
| 1,021,253 | Reinsurance Group of America, Inc. (c) | 5.75% | 06/15/56 | 27,798,507 | ||||
| 68,091 | W.R. Berkley Corp. | 5.75% | 06/01/56 | 1,752,662 | ||||
| 116,365 | W.R. Berkley Corp. | 4.25% | 09/30/60 | 2,989,999 | ||||
| 385,792,177 | ||||||||
| Mortgage Real Estate Investment Trusts – 1.0% | ||||||||
| 533,060 | AGNC Investment Corp., Series C (c) | 7.00% | (b) | 12,180,421 | ||||
| 293,109 | AGNC Investment Corp., Series D (c) | 6.88% | (b) | 6,548,055 | ||||
| 49,840 | AGNC Investment Corp., Series E (c) | 6.50% | (b) | 1,104,953 | ||||
| 575,588 | AGNC Investment Corp., Series F (c) | 6.13% | (b) | 12,461,480 | ||||
| 684,137 | Annaly Capital Management, Inc., Series F (c) | 6.95% | (b) | 15,399,924 | ||||
| 239,935 | Annaly Capital Management, Inc., Series I (c) | 6.75% | (b) | 5,403,336 | ||||
| 53,098,169 | ||||||||
| Multi-Utilities – 1.3% | ||||||||
| 526,704 | Algonquin Power & Utilities Corp. (c) | 6.88% | 10/17/78 | 14,068,264 | ||||
| 815,149 | Algonquin Power & Utilities Corp., Series 19-A (c) | 6.20% | 07/01/79 | 21,943,811 | ||||
| 566,625 | Brookfield Infrastructure Partners L.P., Series 13 | 5.13% | (b) | 14,579,261 | ||||
| 757,853 | Integrys Holding, Inc. (c) | 6.00% | 08/01/73 | 20,689,387 | ||||
| 71,280,723 | ||||||||
| Oil, Gas & Consumable Fuels – 1.3% | ||||||||
| 90,140 | DCP Midstream L.P., Series B (c) | 7.88% | (b) | 1,563,028 | ||||
| 550,362 | Enbridge, Inc., Series B (c) | 6.38% | 04/15/78 | 14,045,238 | ||||
| 14,337 | Energy Transfer Operating L.P., Series C (c) | 7.38% | (b) | 262,224 | ||||
| 39,364 | Energy Transfer Operating L.P., Series D (c) | 7.63% | (b) | 737,681 | ||||
| 1,820,315 | Energy Transfer Operating L.P., Series E (c) | 7.60% | (b) | 35,405,127 | ||||
| 305,640 | NuStar Energy L.P., Series A (c) | 8.50% | (b) | 5,724,637 | ||||
| 831,260 | NuStar Logistics, L.P., 3 Mo. LIBOR + 6.73% (a) | 6.97% | 01/15/43 | 15,577,812 | ||||
| 73,315,747 | ||||||||
| Real Estate Management & Development – 0.7% | ||||||||
| 801,452 | Brookfield Property Partners L.P., Series A | 5.75% | (b) | 15,548,169 | ||||
| 143,541 | Brookfield Property Partners L.P., Series A-1 | 6.50% | (b) | 2,997,136 | ||||
| 951,214 | Brookfield Property Partners L.P., Series A2 | 6.38% | (b) | 19,214,523 | ||||
| 37,759,828 | ||||||||
| Thrifts & Mortgage Finance – 0.5% | ||||||||
| 983,302 | New York Community Bancorp, Inc., Series A (c) | 6.38% | (b) | 25,497,021 | ||||
| Trading Companies & Distributors – 0.6% | ||||||||
| 817,136 | Air Lease Corp., Series A (c) | 6.15% | (b) | 18,745,100 | ||||
| 501,368 | WESCO International, Inc., Series A (c) | 10.63% | (b) | 14,529,644 | ||||
| 33,274,744 | ||||||||
| Wireless Telecommunication Services – 0.2% | ||||||||
| 281,451 | United States Cellular Corp. | 7.25% | 12/01/63 | 7,244,549 | ||||
| 500 | United States Cellular Corp. | 7.25% | 12/01/64 | 12,690 | ||||
| Shares | Description | Stated Rate | Stated Maturity | Value | ||||
| $25 PAR PREFERRED SECURITIES (Continued) | ||||||||
| Wireless Telecommunication Services (Continued) | ||||||||
| 206,585 | United States Cellular Corp. | 6.25% | 09/01/69 | $5,435,251 | ||||
| 12,692,490 | ||||||||
Total $25 Par Preferred Securities | 1,428,997,368 | |||||||
| (Cost $1,416,028,583) | ||||||||
| $100 PAR PREFERRED SECURITIES – 1.1% | ||||||||
| Banks – 0.8% | ||||||||
| 88,231 | AgriBank FCB (c) | 6.88% | (b) | 9,573,064 | ||||
| 62,100 | CoBank ACB, Series F (c) | 6.25% | (b) | 6,520,500 | ||||
| 118,243 | CoBank ACB, Series G | 6.13% | (b) | 12,001,664 | ||||
| 49,330 | CoBank ACB, Series H (c) | 6.20% | (b) | 5,228,980 | ||||
| 116,015 | Farm Credit Bank of Texas (c) (d) | 6.75% | (b) | 12,529,620 | ||||
| 45,853,828 | ||||||||
| Consumer Finance – 0.3% | ||||||||
| 339,477 | SLM Corp., Series B, 3 Mo. LIBOR + 1.70% (a) | 1.95% | (b) | 15,507,309 | ||||
Total $100 Par Preferred Securities | 61,361,137 | |||||||
| (Cost $64,685,860) | ||||||||
| $1,000 PAR PREFERRED SECURITIES – 1.5% | ||||||||
| Banks – 1.4% | ||||||||
| 56,384 | Wells Fargo & Co., Series L | 7.50% | (b) | 76,048,484 | ||||
| Diversified Financial Services – 0.1% | ||||||||
| 5,500 | Compeer Financial ACA (c) (d) | 6.75% | (b) | 5,775,000 | ||||
Total $1,000 Par Preferred Securities | 81,823,484 | |||||||
| (Cost $81,042,656) | ||||||||
| Par Amount | Description | Stated Rate | Stated Maturity | Value | ||||
| CAPITAL PREFERRED SECURITIES – 66.9% | ||||||||
| Banks – 32.3% | ||||||||
| $38,949,000 | Australia & New Zealand Banking Group Ltd. (c) (d) (e) | 6.75% | (b) | 44,210,815 | ||||
| 39,900,000 | Banco Bilbao Vizcaya Argentaria S.A., Series 9 (c) (e) | 6.50% | (b) | 39,402,545 | ||||
| 9,000,000 | Banco Mercantil del Norte S.A. (c) (d) (e) | 7.50% | (b) | 8,973,450 | ||||
| 8,500,000 | Banco Mercantil del Norte S.A. (c) (d) (e) | 7.63% | (b) | 8,500,000 | ||||
| 20,400,000 | Banco Mercantil del Norte S.A. (c) (d) (e) | 8.38% | (b) | 21,680,304 | ||||
| 10,600,000 | Banco Mercantil del Norte S.A. (c) (d) (e) | 5.75% | 10/04/31 | 10,750,520 | ||||
| 37,800,000 | Banco Santander S.A. (c) (e) (f) | 7.50% | (b) | 39,372,480 | ||||
| 9,528,000 | Bank of America Corp., Series X (c) | 6.25% | (b) | 10,399,104 | ||||
| 42,800,000 | Bank of Nova Scotia (The) (c) | 4.90% | (b) | 44,781,640 | ||||
| 30,400,000 | Barclays PLC (c) (e) | 6.13% | (b) | 31,004,468 | ||||
| 84,190,000 | Barclays PLC (c) (e) (f) | 7.88% | (b) | 87,077,717 | ||||
| 95,850,000 | Barclays PLC (c) (e) | 8.00% | (b) | 102,847,707 | ||||
| 11,600,000 | BBVA Bancomer S.A. (c) (d) (e) | 5.88% | 09/13/34 | 12,058,896 | ||||
| 12,540,000 | BNP Paribas S.A. (c) (d) (e) | 6.63% | (b) | 13,351,338 | ||||
| 42,500,000 | BNP Paribas S.A. (c) (d) (e) | 7.38% | (b) | 47,470,162 | ||||
| 12,000,000 | Citigroup, Inc. (c) | 5.90% | (b) | 12,438,000 | ||||
| 4,750,000 | Citigroup, Inc. (c) | 5.95% | (b) | 4,910,788 | ||||
| 15,000,000 | Citigroup, Inc., Series P (c) | 5.95% | (b) | 15,716,373 | ||||
| 4,000,000 | Citigroup, Inc., Series Q, 3 Mo. LIBOR + 4.10% (a) | 4.38% | (b) | 3,931,640 | ||||
| 31,723,000 | Citigroup, Inc., Series R (c) | 6.13% | (b) | 31,492,541 | ||||
| 34,250,000 | Citigroup, Inc., Series T (c) | 6.25% | (b) | 38,288,589 | ||||
| 10,116,000 | Citizens Financial Group, Inc., Series A, 3 Mo. LIBOR + 3.96% (a) | 4.19% | (b) | 9,797,801 | ||||
| Par Amount | Description | Stated Rate | Stated Maturity | Value | ||||
| CAPITAL PREFERRED SECURITIES (Continued) | ||||||||
| Banks (Continued) | ||||||||
| $27,200,000 | Citizens Financial Group, Inc., Series F (c) | 5.65% | (b) | $29,002,000 | ||||
| 20,474,000 | CoBank ACB, Series I (c) | 6.25% | (b) | 21,907,180 | ||||
| 14,400,000 | Comerica, Inc. (c) | 5.63% | (b) | 15,408,000 | ||||
| 38,310,000 | Credit Agricole S.A. (c) (d) (e) | 6.88% | (b) | 41,042,078 | ||||
| 47,100,000 | Credit Agricole S.A. (c) (d) (e) | 7.88% | (b) | 52,053,036 | ||||
| 3,000,000 | Credit Agricole S.A. (c) (e) (f) | 7.88% | (b) | 3,315,480 | ||||
| 47,100,000 | Credit Agricole S.A. (c) (d) (e) | 8.13% | (b) | 55,422,570 | ||||
| 21,313,000 | Danske Bank A.S. (c) (e) (f) | 6.13% | (b) | 21,979,585 | ||||
| 15,960,000 | Danske Bank A.S. (c) (e) (f) | 7.00% | (b) | 17,174,077 | ||||
| 7,650,000 | Farm Credit Bank of Texas, Series 3 (c) (d) | 6.20% | (b) | 7,656,235 | ||||
| 20,300,000 | Farm Credit Bank of Texas, Series 4 (c) (d) | 5.70% | (b) | 21,893,550 | ||||
| 26,000,000 | Fifth Third Bancorp, Series L (c) | 4.50% | (b) | 26,325,000 | ||||
| 2,000,000 | HBOS Capital Funding L.P. (f) | 6.85% | (b) | 2,026,250 | ||||
| 49,619,000 | HSBC Holdings PLC (c) (e) | 6.38% | (b) | 51,685,543 | ||||
| 19,500,000 | Huntington Bancshares, Inc., Series F (c) | 5.63% | (b) | 21,864,375 | ||||
| 23,300,000 | Huntington Bancshares, Inc., Series G (c) | 4.45% | (b) | 23,241,750 | ||||
| 21,596,000 | ING Groep N.V. (c) (e) | 5.75% | (b) | 22,518,473 | ||||
| 25,179,000 | ING Groep N.V. (c) (e) | 6.50% | (b) | 26,752,688 | ||||
| 27,063,000 | ING Groep N.V. (c) (e) (f) | 6.88% | (b) | 28,054,453 | ||||
| 34,125,000 | Intesa Sanpaolo S.p.A. (c) (d) (e) | 7.70% | (b) | 36,016,456 | ||||
| 12,888,000 | JPMorgan Chase & Co., Series R (c) | 6.00% | (b) | 13,220,838 | ||||
| 26,378,000 | JPMorgan Chase & Co., Series V, 3 Mo. LIBOR + 3.32% (a) | 3.55% | (b) | 24,588,482 | ||||
| 19,651,000 | JPMorgan Chase & Co., Series Z, 3 Mo. LIBOR + 3.80% (a) | 4.05% | (b) | 19,288,537 | ||||
| 7,438,000 | Lloyds Bank PLC (c) (f) | 12.00% | (b) | 8,340,155 | ||||
| 22,000,000 | Lloyds Banking Group PLC (c) (e) | 6.75% | (b) | 23,090,870 | ||||
| 62,814,000 | Lloyds Banking Group PLC (c) (e) | 7.50% | (b) | 66,408,217 | ||||
| 21,800,000 | Lloyds Banking Group PLC (c) (e) | 7.50% | (b) | 23,508,149 | ||||
| 13,000,000 | M&T Bank Corp., Series G (c) | 5.00% | (b) | 13,302,055 | ||||
| 8,500,000 | Natwest Group PLC (c) (e) | 6.00% | (b) | 8,816,200 | ||||
| 21,325,000 | Natwest Group PLC (c) (e) | 8.00% | (b) | 23,918,120 | ||||
| 38,975,000 | Natwest Group PLC (c) (e) | 8.63% | (b) | 40,313,012 | ||||
| 27,000,000 | Nordea Bank Abp (c) (d) (e) | 6.63% | (b) | 30,228,795 | ||||
| 17,400,000 | Regions Financial Corp., Series D (c) | 5.75% | (b) | 18,683,250 | ||||
| 2,400,000 | Skandinaviska Enskilda Banken AB (c) (e) (f) | 5.63% | (b) | 2,462,832 | ||||
| 35,700,000 | Societe Generale S.A. (c) (d) (e) | 7.38% | (b) | 36,750,294 | ||||
| 22,679,000 | Societe Generale S.A. (c) (d) (e) | 7.88% | (b) | 24,211,533 | ||||
| 20,000,000 | Societe Generale S.A. (c) (e) (f) | 7.88% | (b) | 21,351,500 | ||||
| 3,500,000 | Societe Generale S.A. (c) (d) (e) | 8.00% | (b) | 3,934,598 | ||||
| 25,600,000 | Standard Chartered PLC (c) (d) (e) | 6.00% | (b) | 26,368,000 | ||||
| 12,310,000 | Standard Chartered PLC (c) (d) (e) | 7.75% | (b) | 13,100,794 | ||||
| 13,600,000 | Swedbank AB (c) (e) (f) | 6.00% | (b) | 13,927,882 | ||||
| 20,400,000 | Truist Financial Corp., Series P (c) | 4.95% | (b) | 21,675,000 | ||||
| 30,400,000 | Truist Financial Corp., Series Q (c) | 5.10% | (b) | 33,343,024 | ||||
| 56,950,000 | UniCredit S.p.A. (c) (e) (f) | 8.00% | (b) | 60,072,796 | ||||
| 13,500,000 | UniCredit S.p.A. (c) (d) | 5.46% | 06/30/35 | 13,698,711 | ||||
| 1,748,399,301 | ||||||||
| Capital Markets – 9.3% | ||||||||
| 29,226,000 | Apollo Management Holdings L.P. (c) (d) | 4.95% | 01/14/50 | 29,270,838 | ||||
| 23,900,000 | Bank of New York Mellon (The) Corp., Series G (c) | 4.70% | (b) | 25,632,750 | ||||
| 17,043,000 | Bank of New York Mellon (The) Corp., Series H (c) | 3.70% | (b) | 16,954,861 | ||||
| 55,000,000 | Charles Schwab (The) Corp., Series G (c) | 5.38% | (b) | 60,324,000 | ||||
| 38,800,000 | Credit Suisse Group AG (c) (d) (e) | 5.25% | (b) | 39,160,840 | ||||
| 48,900,000 | Credit Suisse Group AG (c) (d) (e) | 6.38% | (b) | 52,547,206 | ||||
| 5,175,000 | Credit Suisse Group AG (c) (e) (f) | 7.13% | (b) | 5,378,067 | ||||
| Par Amount | Description | Stated Rate | Stated Maturity | Value | ||||
| CAPITAL PREFERRED SECURITIES (Continued) | ||||||||
| Capital Markets (Continued) | ||||||||
| $9,000,000 | Credit Suisse Group AG (c) (d) (e) | 7.25% | (b) | $9,759,645 | ||||
| 23,681,000 | Credit Suisse Group AG (c) (d) (e) | 7.50% | (b) | 25,786,241 | ||||
| 47,450,000 | Credit Suisse Group AG (c) (d) (e) | 7.50% | (b) | 50,416,099 | ||||
| 20,158,000 | Goldman Sachs Group (The), Inc., Series M, 3 Mo. LIBOR + 3.92% (a) | 4.17% | (b) | 19,880,828 | ||||
| 54,467,000 | Goldman Sachs Group (The), Inc., Series Q (c) | 5.50% | (b) | 58,465,705 | ||||
| 9,600,000 | Goldman Sachs Group (The), Inc., Series R (c) | 4.95% | (b) | 9,846,503 | ||||
| 2,856,000 | Morgan Stanley, Series H, 3 Mo. LIBOR + 3.61% (a) | 3.85% | (b) | 2,748,847 | ||||
| 5,300,000 | Morgan Stanley, Series J, 3 Mo. LIBOR + 3.81% (a) | 4.05% | (b) | 5,201,460 | ||||
| 29,453,000 | Morgan Stanley, Series M (c) | 5.88% | (b) | 32,508,749 | ||||
| 26,389,000 | UBS Group AG (c) (e) (f) | 6.88% | (b) | 29,200,748 | ||||
| 28,500,000 | UBS Group AG (c) (d) (e) | 7.00% | (b) | 30,692,932 | ||||
| 503,776,319 | ||||||||
| Diversified Financial Services – 0.8% | ||||||||
| 26,571,000 | Voya Financial, Inc. (c) | 5.65% | 05/15/53 | 27,447,976 | ||||
| 16,548,000 | Voya Financial, Inc., Series A (c) | 6.13% | (b) | 17,014,571 | ||||
| 44,462,547 | ||||||||
| Diversified Telecommunication Services – 0.9% | ||||||||
| 12,882,000 | Koninklijke KPN N.V. (c) (d) | 7.00% | 03/28/73 | 13,511,194 | ||||
| 32,310,000 | Koninklijke KPN N.V. (c) (f) | 7.00% | 03/28/73 | 33,888,114 | ||||
| 47,399,308 | ||||||||
| Electric Utilities – 5.0% | ||||||||
| 21,410,000 | Duke Energy Corp. (c) | 4.88% | (b) | 22,689,408 | ||||
| 141,743,000 | Emera, Inc., Series 16-A (c) | 6.75% | 06/15/76 | 157,227,714 | ||||
| 56,644,000 | Enel S.p.A. (c) (d) | 8.75% | 09/24/73 | 65,565,430 | ||||
| 27,000,000 | Southern (The) Co., Series B (c) | 4.00% | 01/15/51 | 27,469,530 | ||||
| 272,952,082 | ||||||||
| Energy Equipment & Services – 1.3% | ||||||||
| 6,600,000 | Transcanada Trust (c) | 5.63% | 05/20/75 | 6,756,738 | ||||
| 38,000,000 | Transcanada Trust (c) | 5.50% | 09/15/79 | 38,987,179 | ||||
| 22,604,000 | Transcanada Trust, Series 16-A (c) | 5.88% | 08/15/76 | 24,044,841 | ||||
| 69,788,758 | ||||||||
| Food Products – 2.1% | ||||||||
| 6,700,000 | Dairy Farmers of America, Inc. (g) | 7.13% | (b) | 6,138,640 | ||||
| 23,748,000 | Land O’Lakes Capital Trust I (g) | 7.45% | 03/15/28 | 27,072,720 | ||||
| 41,821,000 | Land O’Lakes, Inc. (d) | 7.00% | (b) | 37,736,970 | ||||
| 12,720,000 | Land O’Lakes, Inc. (d) | 7.25% | (b) | 11,884,232 | ||||
| 31,000,000 | Land O’Lakes, Inc. (d) | 8.00% | (b) | 30,845,000 | ||||
| 113,677,562 | ||||||||
| Independent Power & Renewable Electricity Producers – 0.3% | ||||||||
| 17,986,000 | AES Gener S.A. (c) (d) | 6.35% | 10/07/79 | 18,150,122 | ||||
| Insurance – 7.4% | ||||||||
| 25,677,000 | Asahi Mutual Life Insurance Co. (c) (f) | 6.50% | (b) | 27,410,198 | ||||
| 11,000,000 | Asahi Mutual Life Insurance Co. (c) (f) | 7.25% | (b) | 11,563,685 | ||||
| 31,900,000 | Assurant, Inc. (c) | 7.00% | 03/27/48 | 34,777,816 | ||||
| 8,354,000 | Assured Guaranty Municipal Holdings, Inc. (c) (d) | 6.40% | 12/15/66 | 8,195,045 | ||||
| 36,220,000 | AXIS Specialty Finance LLC (c) | 4.90% | 01/15/40 | 36,745,016 | ||||
| 23,688,000 | Enstar Finance LLC (c) | 5.75% | 09/01/40 | 24,125,026 | ||||
| 13,700,000 | Fortegra Financial Corp. (c) (g) | 8.50% | 10/15/57 | 14,937,803 | ||||
| Par Amount | Description | Stated Rate | Stated Maturity | Value | ||||
| CAPITAL PREFERRED SECURITIES (Continued) | ||||||||
| Insurance (Continued) | ||||||||
| $15,106,000 | Hartford Financial Services Group (The), Inc., 3 Mo. LIBOR + 2.13% (a) (d) | 2.41% | 02/12/47 | $13,207,127 | ||||
| 9,310,000 | La Mondiale SAM (c) (f) | 5.88% | 01/26/47 | 10,496,113 | ||||
| 13,825,000 | Lincoln National Corp., 3 Mo. LIBOR + 2.36% (a) | 2.64% | 05/17/66 | 9,839,875 | ||||
| 52,400,000 | Markel Corp. (c) | 6.00% | (b) | 55,740,500 | ||||
| 3,397,000 | MetLife, Inc. | 6.40% | 12/15/36 | 4,215,587 | ||||
| 17,000,000 | MetLife, Inc., Series G (c) | 3.85% | (b) | 17,091,120 | ||||
| 13,500,000 | PartnerRe Finance B LLC (c) | 4.50% | 10/01/50 | 13,556,926 | ||||
| 41,900,000 | QBE Insurance Group Ltd. (c) (d) | 5.88% | (b) | 44,833,000 | ||||
| 24,900,000 | QBE Insurance Group Ltd. (c) (d) | 7.50% | 11/24/43 | 27,992,033 | ||||
| 605,000 | QBE Insurance Group Ltd. (c) (f) | 7.50% | 11/24/43 | 680,128 | ||||
| 30,649,000 | QBE Insurance Group Ltd. (c) (f) | 6.75% | 12/02/44 | 34,200,453 | ||||
| 16,200,000 | Reinsurance Group of America, Inc., 3 Mo. LIBOR + 2.67% (a) | 2.92% | 12/15/65 | 13,689,000 | ||||
| 403,296,451 | ||||||||
| Multi-Utilities – 1.0% | ||||||||
| 22,623,000 | CenterPoint Energy, Inc., Series A (c) | 6.13% | (b) | 22,900,800 | ||||
| 14,520,000 | NiSource, Inc. (c) | 5.65% | (b) | 14,527,115 | ||||
| 17,000,000 | Sempra Energy (c) | 4.88% | (b) | 17,722,500 | ||||
| 55,150,415 | ||||||||
| Oil, Gas & Consumable Fuels – 4.2% | ||||||||
| 23,800,000 | BP Capital Markets PLC (c) | 4.88% | (b) | 24,919,552 | ||||
| 6,192,000 | DCP Midstream L.P., Series A (c) | 7.38% | (b) | 4,029,185 | ||||
| 25,423,000 | DCP Midstream Operating L.P. (c) (d) | 5.85% | 05/21/43 | 19,008,904 | ||||
| 10,905,000 | Enbridge, Inc. (c) | 5.50% | 07/15/77 | 10,426,818 | ||||
| 41,800,000 | Enbridge, Inc. (c) | 6.25% | 03/01/78 | 41,894,231 | ||||
| 50,224,000 | Enbridge, Inc., Series 16-A (c) | 6.00% | 01/15/77 | 50,024,001 | ||||
| 30,400,000 | Enbridge, Inc., Series 20-A (c) | 5.75% | 07/15/80 | 31,054,228 | ||||
| 32,460,000 | Energy Transfer Operating L.P., 3 Mo. LIBOR + 3.02% (a) | 3.27% | 11/01/66 | 16,822,395 | ||||
| 11,900,000 | Energy Transfer Operating L.P., Series G (c) | 7.13% | (b) | 9,741,459 | ||||
| 24,400,000 | Enterprise Products Operating LLC, 3 Mo. LIBOR + 2.78% (a) | 3.02% | 06/01/67 | 18,665,878 | ||||
| 226,586,651 | ||||||||
| Trading Companies & Distributors – 1.8% | ||||||||
| 122,386,000 | AerCap Holdings N.V. (c) | 5.88% | 10/10/79 | 97,101,664 | ||||
| Transportation Infrastructure – 0.5% | ||||||||
| 33,100,000 | AerCap Global Aviation Trust (c) (d) | 6.50% | 06/15/45 | 29,376,250 | ||||
Total Capital Preferred Securities | 3,630,117,430 | |||||||
| (Cost $3,589,333,497) | ||||||||
| Principal Value | Description | Stated Coupon | Stated Maturity | Value | ||||
| CORPORATE BONDS AND NOTES – 0.7% | ||||||||
| Insurance – 0.7% | ||||||||
| 10,200,000 | AmTrust Financial Services, Inc. | 6.13% | 08/15/23 | 9,392,686 | ||||
| 27,400,000 | Highlands Holdings Bond Issuer Ltd./Highlands Holdings Bond Co-Issuer, Inc. (d) (h) | 7.63% | 10/15/25 | 27,331,500 | ||||
Total Corporate Bonds and Notes | 36,724,186 | |||||||
| (Cost $37,857,374) | ||||||||
| Shares | Description | Value | ||
| EXCHANGE-TRADED FUNDS – 0.2% | ||||
| Capital Markets – 0.2% | ||||
| 168,400 | iShares Short Maturity Bond ETF | $8,443,576 | ||
| (Cost $8,437,456) | ||||
Total Investments – 96.8% | 5,247,467,181 | |||
| (Cost $5,197,385,426) (i) | ||||
Net Other Assets and Liabilities – 3.2% | 174,965,335 | |||
Net Assets – 100.0% | $5,422,432,516 | |||
| (a) | Floating or variable rate security. |
| (b) | Perpetual maturity. |
| (c) | Fixed-to-floating or fixed-to-variable rate security. The interest rate shown reflects the fixed rate in effect at October 31, 2020. At a predetermined date, the fixed rate will change to a floating rate or a variable rate. |
| (d) | This security, sold within the terms of a private placement memorandum, is exempt from registration upon resale under Rule 144A under the Securities Act of 1933, as amended (the “1933 Act”), and may be resold in transactions exempt from registration, normally to qualified institutional buyers. Pursuant to procedures adopted by the Trust’s Board of Trustees, this security has been determined to be liquid by First Trust Advisors L.P., the Fund’s advisor (the “Advisor”). Although market instability can result in periods of increased overall market illiquidity, liquidity for each security is determined based on security specific factors and assumptions, which require subjective judgment. At October 31, 2020, securities noted as such amounted to $1,132,947,363 or 20.9% of net assets. |
| (e) | This security is a contingent convertible capital security which may be subject to conversion into common stock of the issuer under certain circumstances. At October 31, 2020, securities noted as such amounted to $1,484,120,211 or 27.4% of net assets. Of these securities, 4.2% originated in emerging markets, and 95.8% originated in foreign markets. |
| (f) | This security may be resold to qualified foreign investors and foreign institutional buyers under Regulation S of the 1933 Act. |
| (g) | This security, sold within the terms of a private placement memorandum, is exempt from registration upon resale under Rule 144A under the 1933 Act, and may be resold in transactions exempt from registration, normally to qualified institutional buyers (see Note 2C - Restricted Securities in the Notes to Financial Statements). |
| (h) | These notes are Senior Payment-in-kind (“PIK”) Toggle Notes whereby the issuer may, at its option, elect to pay interest on the notes (1) entirely in cash or (2) entirely in PIK interest. Interest paid in cash will accrue on the notes at a rate of 7.63% per annum (“Cash Interest Rate”) and PIK interest will accrue on the notes at a rate per annum equal to the Cash Interest Rate plus 75 basis points. There were no PIK interest distributions received during the fiscal year ended October 31, 2020. |
| (i) | Aggregate cost for federal income tax purposes was $5,182,215,509. As of October 31, 2020, the aggregate gross unrealized appreciation for all investments in which there was an excess of value over tax cost was $167,173,912 and the aggregate gross unrealized depreciation for all investments in which there was an excess of tax cost over value was $101,922,240. The net unrealized appreciation was $65,251,672. |
| LIBOR | London Interbank Offered Rate |
| Total Value at 10/31/2020 | Level 1 Quoted Prices | Level 2 Significant Observable Inputs | Level 3 Significant Unobservable Inputs | |
| $25 Par Preferred Securities: | ||||
Capital Markets | $ 106,329,405 | $ 102,968,979 | $ 3,360,426 | $ — |
Insurance | 385,792,177 | 356,806,142 | 28,986,035 | — |
Multi-Utilities | 71,280,723 | 50,591,336 | 20,689,387 | — |
Other industry categories* | 865,595,063 | 865,595,063 | — | — |
| $100 Par Preferred Securities: | ||||
Banks | 45,853,828 | — | 45,853,828 | — |
Consumer Finance | 15,507,309 | 15,507,309 | — | — |
| $1,000 Par Preferred Securities: | ||||
Banks | 76,048,484 | 76,048,484 | — | — |
Diversified Financial Services | 5,775,000 | — | 5,775,000 | — |
Capital Preferred Securities* | 3,630,117,430 | — | 3,630,117,430 | — |
Corporate Bonds and Notes* | 36,724,186 | — | 36,724,186 | — |
Exchange-Traded Funds* | 8,443,576 | 8,443,576 | — | — |
Total Investments | $ 5,247,467,181 | $ 1,475,960,889 | $ 3,771,506,292 | $— |
| * | See Portfolio of Investments for industry breakout. |
| ASSETS: | |
Investments, at value (Cost $5,197,385,426) | $ 5,247,467,181 |
Cash | 159,328,753 |
| Receivables: | |
Interest | 45,102,335 |
Investment securities sold | 4,459,421 |
Dividends | 2,025,835 |
Interest reclaims | 1,119,147 |
Dividend reclaims | 198,027 |
Total Assets | 5,459,700,699 |
| LIABILITIES: | |
| Payables: | |
Investment securities purchased | 17,043,000 |
Capital shares redeemed | 16,318,265 |
Investment advisory fees | 3,906,918 |
Total Liabilities | 37,268,183 |
NET ASSETS | $5,422,432,516 |
| NET ASSETS consist of: | |
Paid-in capital | $ 5,531,202,675 |
Par value | 2,819,050 |
Accumulated distributable earnings (loss) | (111,589,209) |
NET ASSETS | $5,422,432,516 |
NET ASSET VALUE, per share | $19.23 |
Number of shares outstanding (unlimited number of shares authorized, par value $0.01 per share) | 281,905,000 |
| INVESTMENT INCOME: | ||
Interest | $ 216,673,792 | |
Dividends | 91,628,101 | |
Foreign withholding tax | (19,677) | |
Total investment income | 308,282,216 | |
| EXPENSES: | ||
Investment advisory fees | 43,030,408 | |
Total expenses | 43,030,408 | |
NET INVESTMENT INCOME (LOSS) | 265,251,808 | |
| NET REALIZED AND UNREALIZED GAIN (LOSS): | ||
| Net realized gain (loss) on: | ||
Investments | (136,939,547) | |
In-kind redemptions | (1,360,930) | |
Foreign currency transactions | (67) | |
Net realized gain (loss) | (138,300,544) | |
Net change in unrealized appreciation (depreciation) on investments | (60,836,239) | |
NET REALIZED AND UNREALIZED GAIN (LOSS) | (199,136,783) | |
NET INCREASE (DECREASE) IN NET ASSETS RESULTING FROM OPERATIONS | $ 66,115,025 | |
| Year Ended 10/31/2020 | Year Ended 10/31/2019 | ||
| OPERATIONS: | |||
Net investment income (loss) | $ 265,251,808 | $ 206,863,149 | |
Net realized gain (loss) | (138,300,544) | (15,996,305) | |
Net change in unrealized appreciation (depreciation) | (60,836,239) | 228,190,107 | |
Net increase (decrease) in net assets resulting from operations | 66,115,025 | 419,056,951 | |
| DISTRIBUTIONS TO SHAREHOLDERS FROM: | |||
Investment operations | (249,230,037) | (203,753,030) | |
Return of capital | (17,657,142) | (3,977,192) | |
Total distributions to shareholders | (266,887,179) | (207,730,222) | |
| SHAREHOLDER TRANSACTIONS: | |||
Proceeds from shares sold | 1,414,541,333 | 1,376,507,572 | |
Cost of shares redeemed | (469,855,741) | (283,687,184) | |
Net increase (decrease) in net assets resulting from shareholder transactions | 944,685,592 | 1,092,820,388 | |
Total increase (decrease) in net assets | 743,913,438 | 1,304,147,117 | |
| NET ASSETS: | |||
Beginning of period | 4,678,519,078 | 3,374,371,961 | |
End of period | $5,422,432,516 | $4,678,519,078 | |
| CHANGES IN SHARES OUTSTANDING: | |||
Shares outstanding, beginning of period | 235,205,000 | 179,855,000 | |
Shares sold | 73,400,000 | 70,900,000 | |
Shares redeemed | (26,700,000) | (15,550,000) | |
Shares outstanding, end of period | 281,905,000 | 235,205,000 |
| Year Ended October 31, | |||||||||
| 2020 | 2019 | 2018 | 2017 | 2016 | |||||
Net asset value, beginning of period | $ 19.89 | $ 18.76 | $ 20.13 | $ 19.47 | $ 18.97 | ||||
| Income from investment operations: | |||||||||
Net investment income (loss) | 1.00 | 1.08 | 1.08 | 1.08 | 1.12 | ||||
Net realized and unrealized gain (loss) | (0.66) | 1.14 | (1.37) | 0.66 | 0.52 | ||||
Total from investment operations | 0.34 | 2.22 | (0.29) | 1.74 | 1.64 | ||||
| Distributions paid to shareholders from: | |||||||||
Net investment income | (0.94) | (1.07) | (1.08) | (1.08) | (1.13) | ||||
Return of capital | (0.06) | (0.02) | (0.00) (a) | (0.00) (a) | (0.01) | ||||
Total distributions | (1.00) | (1.09) | (1.08) | (1.08) | (1.14) | ||||
Net asset value, end of period | $19.23 | $19.89 | $18.76 | $20.13 | $19.47 | ||||
Total return (b) | 1.94% | 12.25% | (1.47)% | 9.24% | 8.97% | ||||
Total return (b) | 1.94% | 12.25% | (1.47)% | 9.24% | 8.97% | ||||
| Ratios to average net assets/supplemental data: | |||||||||
Net assets, end of period (in 000’s) | $ 5,422,433 | $ 4,678,519 | $ 3,374,372 | $ 3,026,083 | $ 1,375,398 | ||||
Ratio of total expenses to average net assets | 0.85% | 0.85% | 0.85% | 0.85% | 0.85% | ||||
Ratio of net investment income (loss) to average net assets | 5.24% | 5.69% | 5.56% | 5.54% | 5.97% | ||||
Portfolio turnover rate (c) | 43% | 28% | 24% | 13% | 32% | ||||
| (a) | Amount is less than $0.01. |
| (b) | Total return is calculated assuming an initial investment made at the net asset value at the beginning of the period, reinvestment of all distributions at net asset value during the period, and redemption at net asset value on the last day of the period. The returns presented do not reflect the deduction of taxes that a shareholder would pay on Fund distributions or the redemption or sale of Fund shares. Total return is calculated for the time period presented and is not annualized for periods of less than a year. |
| (c) | Portfolio turnover is calculated for the time period presented and is not annualized for periods of less than a year and does not include securities received or delivered from processing creations or redemptions and in-kind transactions. |
| 1) | benchmark yields; |
| 2) | reported trades; |
| 3) | broker/dealer quotes; |
| 4) | issuer spreads; |
| 5) | benchmark securities; |
| 6) | bids and offers; and |
| 7) | reference data including market research publications. |
| 1) | the credit conditions in the relevant market and changes thereto; |
| 2) | the liquidity conditions in the relevant market and changes thereto; |
| 3) | the interest rate conditions in the relevant market and changes thereto (such as significant changes in interest rates); |
| 4) | issuer-specific conditions (such as significant credit deterioration); and |
| 5) | any other market-based data the Advisor’s Pricing Committee considers relevant. In this regard, the Advisor’s Pricing Committee may use last-obtained market-based data to assist it when valuing portfolio securities using amortized cost. |
| 1) | the type of security; |
| 2) | the size of the holding; |
| 3) | the initial cost of the security; |
| 4) | transactions in comparable securities; |
| 5) | price quotes from dealers and/or third-party pricing services; |
| 6) | relationships among various securities; |
| 7) | information obtained by contacting the issuer, analysts, or the appropriate stock exchange; |
| 8) | an analysis of the issuer’s financial statements; and |
| 9) | the existence of merger proposals or tender offers that might affect the value of the security. |
| 1) | the value of similar foreign securities traded on other foreign markets; |
| 2) | ADR trading of similar securities; |
| 3) | closed-end fund or exchange-traded fund trading of similar securities; |
| 4) | foreign currency exchange activity; |
| 5) | the trading prices of financial products that are tied to baskets of foreign securities; |
| 6) | factors relating to the event that precipitated the pricing problem; |
| 7) | whether the event is likely to recur; and |
| 8) | whether the effects of the event are isolated or whether they affect entire markets, countries or regions. |
| • | Level 1 – Level 1 inputs are quoted prices in active markets for identical investments. An active market is a market in which transactions for the investment occur with sufficient frequency and volume to provide pricing information on an ongoing basis. |
| • | Level 2 – Level 2 inputs are observable inputs, either directly or indirectly, and include the following: |
| o | Quoted prices for similar investments in active markets. |
| o | Quoted prices for identical or similar investments in markets that are non-active. A non-active market is a market where there are few transactions for the investment, the prices are not current, or price quotations vary substantially either over time or among market makers, or in which little information is released publicly. |
| o | Inputs other than quoted prices that are observable for the investment (for example, interest rates and yield curves observable at commonly quoted intervals, volatilities, prepayment speeds, loss severities, credit risks, and default rates). |
| o | Inputs that are derived principally from or corroborated by observable market data by correlation or other means. |
| • | Level 3 – Level 3 inputs are unobservable inputs. Unobservable inputs may reflect the reporting entity’s own assumptions about the assumptions that market participants would use in pricing the investment. |
| Security | Acquisition Date | Principal Value | Current Price | Carrying Cost | Value | % of Net Assets | ||
| Dairy Farmers of America, Inc., 7.13% | 09/15/16-08/10/17 | $6,700,000 | $91.62 | $6,788,500 | $6,138,640 | 0.11% | ||
| Fortegra Financial Corp., 8.50%, 10/15/57 | 10/12/17-03/12/18 | 13,700,000 | 109.04 | 13,718,939 | 14,937,803 | 0.28 | ||
| Land O’Lakes Capital Trust I, 7.45%, 03/15/28 | 03/20/15-05/09/18 | 23,748,000 | 114.00 | 25,969,931 | 27,072,720 | 0.50 | ||
| $46,477,370 | $48,149,163 | 0.89% |
| Distributions paid from: | 2020 | 2019 |
Ordinary income | $249,230,037 | $203,753,030 |
Capital gains | — | — |
Return of capital | 17,657,142 | 3,977,192 |
Undistributed ordinary income | $— |
Accumulated capital and other gain (loss) | (176,840,881) |
Net unrealized appreciation (depreciation) | 65,251,672 |
| Accumulated Net Investment Income (Loss) | Accumulated Net Realized Gain (Loss) on Investments | Paid-in Capital | ||
| $708,922 | $1,751,288 | $(2,460,210) |

| Dividends Received Deduction | Qualified Dividend Income | |
| 28.94% | 68.23% |
| NOT FDIC INSURED | NOT BANK GUARANTEED | MAY LOSE VALUE |
| Name, Year of Birth and Position with the Trust | Term of Office and Year First Elected or Appointed | Principal Occupations During Past 5 Years | Number of Portfolios in the First Trust Fund Complex Overseen by Trustee | Other Trusteeships or Directorships Held by Trustee During Past 5 Years |
| INDEPENDENT TRUSTEES | ||||
| Richard E. Erickson, Trustee (1951) | • Indefinite Term • Since Inception | Physician; Officer, Wheaton Orthopedics; Limited Partner, Gundersen Real Estate Limited Partnership (June 1992 to December 2016); Member, Sportsmed LLC (April 2007 to November 2015) | 189 | None |
| Thomas R. Kadlec, Trustee (1957) | • Indefinite Term • Since Inception | President, ADM Investor Services, Inc. (Futures Commission Merchant) | 189 | Director of ADM Investor Services, Inc., ADM Investor Services International, Futures Industry Association, and National Futures Association |
| Robert F. Keith, Trustee (1956) | • Indefinite Term • Since Inception | President, Hibs Enterprises (Financial and Management Consulting) | 189 | Director of Trust Company of Illinois |
| Niel B. Nielson, Trustee (1954) | • Indefinite Term • Since Inception | Senior Advisor (August 2018 to Present), Managing Director and Chief Operating Officer (January 2015 to August 2018), Pelita Harapan Educational Foundation (Educational Products and Services) | 189 | None |
| INTERESTED TRUSTEE | ||||
| James A. Bowen(1), Trustee and Chairman of the Board (1955) | • Indefinite Term • Since Inception | Chief Executive Officer, First Trust Advisors L.P. and First Trust Portfolios L.P.; Chairman of the Board of Directors, BondWave LLC (Software Development Company) and Stonebridge Advisors LLC (Investment Advisor) | 189 | None |
| (1) | Mr. Bowen is deemed an “interested person” of the Trust due to his position as CEO of First Trust Advisors L.P., investment advisor of the Trust. |
| Name and Year of Birth | Position and Offices with Trust | Term of Office and Length of Service | Principal Occupations During Past 5 Years |
| OFFICERS(2) | |||
| James M. Dykas (1966) | President and Chief Executive Officer | • Indefinite Term • Since January 2016 | Managing Director and Chief Financial Officer (January 2016 to Present), Controller (January 2011 to January 2016), Senior Vice President (April 2007 to January 2016), First Trust Advisors L.P. and First Trust Portfolios L.P.; Chief Financial Officer (January 2016 to Present), BondWave LLC (Software Development Company) and Stonebridge Advisors LLC (Investment Advisor) |
| Donald P. Swade (1972) | Treasurer, Chief Financial Officer and Chief Accounting Officer | • Indefinite Term • Since January 2016 | Senior Vice President (July 2016 to Present), Vice President (April 2012 to July 2016), First Trust Advisors L.P. and First Trust Portfolios L.P. |
| W. Scott Jardine (1960) | Secretary and Chief Legal Officer | • Indefinite Term • Since Inception | General Counsel, First Trust Advisors L.P. and First Trust Portfolios L.P.; Secretary and General Counsel, BondWave LLC; Secretary, Stonebridge Advisors LLC |
| Daniel J. Lindquist (1970) | Vice President | • Indefinite Term • Since Inception | Managing Director, First Trust Advisors L.P. and First Trust Portfolios L.P. |
| Kristi A. Maher (1966) | Chief Compliance Officer and Assistant Secretary | • Indefinite Term • Since Inception | Deputy General Counsel, First Trust Advisors L.P. and First Trust Portfolios L.P. |
| Roger F. Testin (1966) | Vice President | • Indefinite Term • Since Inception | Senior Vice President, First Trust Advisors L.P. and First Trust Portfolios L.P. |
| Stan Ueland (1970) | Vice President | • Indefinite Term • Since Inception | Senior Vice President, First Trust Advisors L.P. and First Trust Portfolios L.P |
| (2) | The term “officer” means the president, vice president, secretary, treasurer, controller or any other officer who performs a policy making function. |
| • | Information we receive from you and your broker-dealer, investment advisor or financial representative through interviews, applications, agreements or other forms; |
| • | Information about your transactions with us, our affiliates or others; |
| • | Information we receive from your inquiries by mail, e-mail or telephone; and |
| • | Information we collect on our website through the use of “cookies”. For example, we may identify the pages on our website that your browser requests or visits. |
| • | In order to provide you with products and services and to effect transactions that you request or authorize, we may disclose your personal information as described above to unaffiliated financial service providers and other companies that perform administrative or other services on our behalf, such as transfer agents, custodians and trustees, or that assist us in the distribution of investor materials such as trustees, banks, financial representatives, proxy services, solicitors and printers. |
| • | We may release information we have about you if you direct us to do so, if we are compelled by law to do so, or in other legally limited circumstances (for example to protect your account from fraud). |
FUND ACCOUNTANT &
TRANSFER AGENT
PUBLIC ACCOUNTING FIRM

For the Year Ended
October 31, 2020
| 1 | |
| 2 | |
| 5 | |
| 8 | |
| 9 | |
| 42 | |
| 43 | |
| 44 | |
| 45 | |
| 46 | |
| 53 | |
| 54 | |
| 59 | |
| 61 |

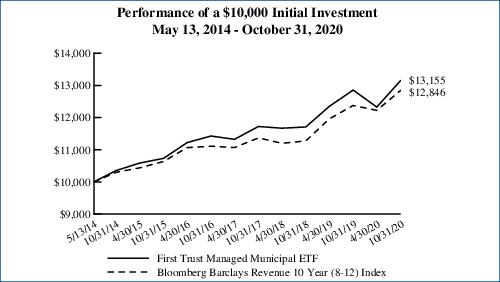
| Performance | ||||||
| Average Annual Total Returns | Cumulative Total Returns | |||||
| 1 Year Ended 10/31/20 | 5 Years Ended 10/31/20 | Inception (5/13/14) to 10/31/20 | 5 Years Ended 10/31/20 | Inception (5/13/14) to 10/31/20 | ||
| Fund Performance | ||||||
| NAV | 2.33% | 4.15% | 4.33% | 22.57% | 31.55% | |
| Market Price | 2.24% | 4.11% | 4.33% | 22.29% | 31.57% | |
| Index Performance | ||||||
| Bloomberg Barclays Revenue 10 Year (8-12) Index | 3.80% | 3.85% | 3.95% | 20.80% | 28.46% | |
| Sector Allocation | % of Total Investments (including cash) |
| Hospital | 14.1% |
| Government Obligation Bond - Unlimited Tax | 9.9 |
| Insured | 9.6 |
| Water & Sewer | 7.4 |
| Gas | 5.1 |
| Dedicated Tax | 5.0 |
| Continuing Care Retirement Communities | 5.0 |
| Certificates of Participation | 4.9 |
| Higher Education | 4.7 |
| Education | 4.6 |
| Airport | 3.9 |
| Utility | 3.7 |
| Special Assessment | 3.7 |
| Government Obligation Bond - Limited Tax | 3.0 |
| Industrial Development Bond | 2.7 |
| Tobacco | 2.3 |
| Toll Road | 1.9 |
| Mass Transit | 1.6 |
| Tax Increment | 1.2 |
| Housing | 1.1 |
| Student Housing | 0.8 |
| Pre-refunded/Escrowed-to-maturity | 0.7 |
| Local Housing | 0.5 |
| Port | 0.1 |
| Hotel | 0.1 |
| Other Health | 0.1 |
| Pool | 0.1 |
| Transportation | 0.1 |
| Stadium | 0.0* |
| Cash | 2.1 |
| Total | 100.0% |
| * | Amount is less than 0.1%. |
| Credit Quality(1) | % of Total Investments (including cash) |
| AAA | 6.8% |
| AA | 33.0 |
| A | 32.7 |
| BBB | 10.2 |
| BB | 3.6 |
| B | 0.6 |
| CCC | 0.2 |
| Not Rated | 9.8 |
| Short Rated only | 1.0 |
| Cash | 2.1 |
| Total | 100.0% |
| Fund Allocation | % of Net Assets |
| Municipal Bonds | 97.2% |
| Net Other Assets and Liabilities** | 2.8 |
| Total | 100.0% |
| ** | Includes variation margin on futures contracts. |
| (1) | The credit quality and ratings information presented above reflect the ratings assigned by one or more nationally recognized statistical rating organizations (NRSROs), including Standard & Poor’s Ratings Group, a division of the McGraw Hill Companies, Inc., Moody’s Investors Service, Inc., Fitch Ratings or a comparably rated NRSRO. For situations in which a security is rated by more than one NRSRO and the ratings are not equivalent, the highest rating is used. Sub-investment grade ratings are those rated BB+/Ba1 or lower. Investment grade ratings are those rated BBB-/Baa3 or higher. The credit ratings shown relate to the creditworthiness of the issuers of the underlying securities in the Fund, and not to the Fund or its shares. Credit ratings are subject to change. |
Performance figures assume reinvestment of all distributions and do not reflect the deduction of taxes that a shareholder would pay on Fund distributions or the redemption or sale of Fund shares. An index is a statistical composite that tracks a specified financial market or sector. Unlike the Fund, the index does not actually hold a portfolio of securities and therefore does not incur the expenses incurred by the Fund. These expenses negatively impact the performance of the Fund. The Fund’s past performance does not predict future performance.
| • | The coronavirus (“COVID-19”) pandemic led to a broad recalibration of how investors perceive municipal bond credit quality and risk, especially in certain sectors such as airports, convention centers, dedicated tax bonds (such as hotel tax financings), hospitals, toll roads and senior living facilities. During March of 2020, as the breadth of the pandemic became apparent, bonds with lower credit ratings generally underperformed bonds with very high credit quality and stronger balance sheets. As the economic effects of the pandemic became extremely challenging, passage of the Coronavirus Aid, Relief, and Economic Security Act (the “CARES Act”) occurred on March 27, 2020, which along with the Federal Reserve’s (the “Fed”) creation of the Municipal Liquidity Facility (“MLF”) bolstered confidence in municipal bond credit quality and the ability of the vast majority of municipal borrowers to manage through the COVID-19 crisis, supporting municipal bond prices and positive total returns. |
| • | Municipal fund flows were down year-over-year and have experienced tremendous volatility. According to data gathered by Barclay’s and ICI, municipal fund flows have totaled approximately $41.8 billion for the trailing 12 months ended October 31, 2020, versus $68.9 billion for the 12 months ended October 31, 2019, a decrease of 39.3%. The municipal market experienced record setting fund outflows totaling $42 billion in March 2020 which helped drive yields higher, steepened the yield curve with longer maturing bonds underperforming, and led to much wider credit spreads for “A”, “BBB” and high yield municipal securities. While fund outflows continued into April, May through October witnessed a return to healthy mutual fund and ETF inflows. This provided an important source of market stabilization (along with the actions taken by Congress and the Fed). |
| • | Total new issue supply increased dramatically year-over-year through October 31, 2020 increasing 31.0% from $386.0 billion for the 12 months ended October 31, 2019 to approximately $505.7 billion for the 12 months ended October 2020 (SIFMA and Bloomberg Barclays). Despite this increase, a large number of municipal issuers were unable to access the primary market in March due to the record setting outflows for the month. However, the municipal new issue market has since stabilized and experienced significantly higher year-over-year new issue supply in the months following. Of note, a significant portion of total new issue supply is coming as a taxable municipal bond, as municipal borrowers take advantage of very low rates in the taxable |
| bond markets. The ability for municipal borrowers to tap into the primary market to meet cash flow needs and finance budget gaps due to lower sales and income taxes during the COVID-19 shutdown of local area economies has provided another source of municipal market stabilization. | |
| • | As a result of the factors noted above, including legislative and regulatory support for the U.S. economy and direct support to the municipal bond market, consistent mutual fund and ETF inflows in June through October, and a return to relative strength, and perhaps record setting 2020 supply in the muni new issue market, with perhaps record setting taxable muni supply, credit spreads for “A”, “BBB” and high yield municipal securities tightened during much of the third quarter after widening dramatically in March-April. |
| • | The CARES Act stimulus package provided financial assistance to municipalities, including state and local government aid of approximately $150 billion, not for profit hospitals’ receipt of $120 billion, mass transit’s receipt of $25 billion, and airports’ receipt of $10 billion. |
| • | The Fed announced the establishment of the MLF, which will buy state and local municipal debt. The MLF is a $500 billion purchase program seeded by a $35 billion equity investment from the U.S. Treasury per the CARES Act. The Facility will purchase new issue Tax Anticipation Notes, Tax and Revenue Anticipation Notes, and Bond Anticipation Notes with a final maturity of 36 months or less. This program is designed to reduce liquidity pressures municipal units of government are facing given the forced shut-down of large parts of the U.S. economy. |
| Beginning Account Value May 1, 2020 | Ending Account Value October 31, 2020 | Annualized Expense Ratio Based on the Six-Month Period (a) | Expenses Paid During the Six-Month Period (b) | |
| First Trust Managed Municipal ETF (FMB) | ||||
| Actual | $1,000.00 | $1,067.10 | 0.50% | $2.60 |
| Hypothetical (5% return before expenses) | $1,000.00 | $1,022.62 | 0.50% | $2.54 |
| (a) | These expense ratios reflect expense waivers. See Note 3 in the Notes to Financial Statements. |
| (b) | Expenses are equal to the annualized expense ratios as indicated in the table multiplied by the average account value over the period (May 1, 2020 through October 31, 2020), multiplied by 184/366 (to reflect the six-month period). |
| Principal Value | Description | Stated Coupon | Stated Maturity | Value | ||||
| MUNICIPAL BONDS – 97.2% | ||||||||
| Alabama – 3.7% | ||||||||
| $225,000 | AL Cmnty Clg Sys Brd of Trustees Rev Bishop St Cmnty Clg, BAM | 4.00% | 01/01/35 | $259,088 | ||||
| 2,045,000 | AL Federal Aid Highway Fin Auth Spl Oblig Rev, GARVEE | 5.00% | 09/01/30 | 2,361,934 | ||||
| 775,000 | AL Federal Aid Highway Fin Auth Spl Oblig Rev, GARVEE, Ser A | 5.00% | 09/01/32 | 971,648 | ||||
| 500,000 | AL St Port Auth Docks Facs Rev Ref Docks Facs Rev, Ser A, AGM, AMT | 5.00% | 10/01/25 | 597,985 | ||||
| 1,100,000 | Birmingham AL Wtrwks Brd Wtr Rev Ref Sr, Ser A | 5.00% | 01/01/32 | 1,353,528 | ||||
| 940,000 | Birmingham AL Wtrwks Brd Wtr Rev Ref Sr, Ser A | 4.00% | 01/01/34 | 1,068,658 | ||||
| 2,325,000 | Birmingham AL Wtrwks Brd Wtr Rev Ref Sub, Ser B | 5.00% | 01/01/43 | 2,772,865 | ||||
| 7,070,000 | Black Belt Energy Gas Dist AL Gas Prepay Rev Proj #5, Ser A-1 (Mandatory put 10/01/26) | 4.00% | 10/01/49 | 8,183,808 | ||||
| 1,530,000 | Black Belt Energy Gas Dist AL Gas Prepay Rev, Ser A (Mandatory put 12/01/23) | 4.00% | 12/01/48 | 1,667,180 | ||||
| 415,000 | Gulf Shores AL Ref Warrants, Ser A | 5.00% | 12/15/35 | 511,633 | ||||
| 310,000 | Gulf Shores AL Ref Warrants, Ser A | 5.00% | 12/15/38 | 378,898 | ||||
| 400,000 | Homewood AL Eductnl Bldg Auth Rev Ref Samford Univ Proj, Ser A | 4.00% | 12/01/33 | 453,276 | ||||
| 950,000 | Homewood AL Eductnl Bldg Auth Rev Ref Samford Univ Proj, Ser A | 4.00% | 12/01/34 | 1,073,680 | ||||
| 450,000 | Infirmary Hlth Sys AL Spl Care Facs Fing Auth Rev Infirmary Hlth Sys Inc, Ser A | 5.00% | 02/01/36 | 505,885 | ||||
| 930,000 | Leeds AL Pub Eductnl Bldg Auth Eductnl Facs Rev Ref Edu, AGM | 4.00% | 04/01/29 | 1,054,676 | ||||
| 695,000 | Leeds AL Pub Eductnl Bldg Auth Eductnl Facs Rev Ref Edu, AGM | 4.00% | 04/01/30 | 785,913 | ||||
| 1,500,000 | Lower AL Gas Dist Gas Proj Rev Gas Proj, Rev Bonds Proj 2 (Mandatory put 12/01/25) | 4.00% | 12/01/50 | 1,715,355 | ||||
| 1,445,000 | Lower AL Gas Dist Gas Proj Rev, Ser A | 5.00% | 09/01/31 | 1,860,307 | ||||
| 600,000 | Mobile AL Impt Dist Sales Tax Rev Mcgowin Park Proj, Ser A | 5.00% | 08/01/25 | 610,014 | ||||
| 500,000 | Mobile Cnty AL Impt Warrants | 5.00% | 08/01/30 | 609,830 | ||||
| 1,105,000 | Prichard AL Wtrwks & Swr Brd Wtr & Swr Rev Ref | 4.00% | 11/01/30 | 1,279,026 | ||||
| 1,565,000 | Prichard AL Wtrwks & Swr Brd Wtr & Swr Rev Ref | 4.00% | 11/01/31 | 1,797,434 | ||||
| 1,605,000 | Prichard AL Wtrwks & Swr Brd Wtr & Swr Rev Ref | 4.00% | 11/01/32 | 1,827,934 | ||||
| 1,395,000 | Prichard AL Wtrwks & Swr Brd Wtr & Swr Rev Ref | 4.00% | 11/01/33 | 1,577,201 | ||||
| 1,765,000 | Prichard AL Wtrwks & Swr Brd Wtr & Swr Rev Ref | 4.00% | 11/01/34 | 1,987,549 | ||||
| 1,840,000 | Prichard AL Wtrwks & Swr Brd Wtr & Swr Rev Ref | 4.00% | 11/01/35 | 2,058,463 | ||||
| 110,000 | SE AL St Gas Sply Dist Gas Sply Rev Proj #1, Ser A (Mandatory put 04/01/24) | 4.00% | 04/01/49 | 120,736 | ||||
| 6,300,000 | SE AL St Gas Sply Dist Gas Sply Rev Proj #2, Ser A (Mandatory put 06/01/24) | 4.00% | 06/01/49 | 6,956,775 | ||||
| 1,040,000 | Troy AL Ref Warrants, BAM | 4.00% | 07/01/35 | 1,131,718 | ||||
| 105,000 | UAB Medicine Fin Auth AL Rev Ref UAB Medicine, Ser B | 5.00% | 09/01/34 | 124,431 | ||||
| 1,000,000 | UAB Medicine Fin Auth AL Rev Ref UAB Medicine, Ser B2 | 5.00% | 09/01/30 | 1,211,950 | ||||
| 5,000,000 | UAB Medicine Fin Auth AL Rev Ref UAB Medicine, Ser B2 | 5.00% | 09/01/41 | 5,857,600 | ||||
| 8,890,000 | Wilsonville AL Indl Dev Brd Sol Wst Disp Rev Var AL Plt Gaston Plt (a) | 0.16% | 12/01/30 | 8,890,000 | ||||
| 63,616,978 | ||||||||
| Alaska – 0.1% | ||||||||
| 1,880,000 | AK St Indl Dev & Export Auth Pwr Rev Ref Snettisham Hydroelectric Proj, AMT | 4.00% | 01/01/28 | 1,997,331 | ||||
| Arizona – 3.1% | ||||||||
| 1,205,000 | AZ Brd of Rgts Univ AZ Sys Rev Green Bond, Ser B | 5.00% | 06/01/28 | 1,479,005 | ||||
| Principal Value | Description | Stated Coupon | Stated Maturity | Value | ||||
| MUNICIPAL BONDS (Continued) | ||||||||
| Arizona (Continued) | ||||||||
| $1,000,000 | AZ St Indl Dev Auth Edu Rev Academics of Math & Science Proj (b) | 5.00% | 07/01/49 | $1,054,560 | ||||
| 625,000 | AZ St Indl Dev Auth Edu Rev Cadence Campus Proj, Ser A (b) | 4.00% | 07/15/30 | 654,313 | ||||
| 925,000 | AZ St Indl Dev Auth Edu Rev Cadence Campus Proj, Ser A (b) | 4.00% | 07/15/40 | 923,705 | ||||
| 175,000 | AZ St Indl Dev Auth Edu Rev Doral Academy NV Fire Mesa & Red Rock Campus Proj, Ser A (b) | 5.00% | 07/15/39 | 191,861 | ||||
| 375,000 | AZ St Indl Dev Auth Edu Rev Ref Basis Sch Projs, Ser D (b) | 5.00% | 07/01/37 | 404,910 | ||||
| 290,000 | AZ St Indl Dev Auth Edu Rev Ref Basis Schs Projs, Ser A (b) | 4.00% | 07/01/21 | 292,749 | ||||
| 1,055,000 | AZ St Indl Dev Auth Edu Rev Ref Basis Schs Projs, Ser A (b) | 5.00% | 07/01/26 | 1,144,728 | ||||
| 1,030,000 | AZ St Indl Dev Auth Edu Rev Ref Basis Schs Projs, Ser G (b) | 5.00% | 07/01/37 | 1,112,153 | ||||
| 500,000 | AZ St Indl Dev Auth Edu Rev, Ser A (b) | 4.00% | 07/15/30 | 533,255 | ||||
| 415,000 | AZ St Indl Dev Auth National Chrt Sch Revolving Loan Fd Equitable Sch Revolving Fund, Ser A | 5.00% | 11/01/31 | 515,102 | ||||
| 1,005,000 | AZ St Indl Dev Auth National Chrt Sch Revolving Loan Fd Equitable Sch Revolving Fund, Ser A | 5.00% | 11/01/33 | 1,234,351 | ||||
| 465,000 | AZ St Indl Dev Auth National Chrt Sch Revolving Loan Fd Equitable Sch Revolving Fund, Ser A | 5.00% | 11/01/37 | 565,045 | ||||
| 595,000 | AZ St Indl Dev Auth National Chrt Sch Revolving Loan Fd Social Bond Equitable Sch Revolving Fund, Ser A | 4.00% | 11/01/38 | 683,197 | ||||
| 750,000 | AZ St Indl Dev Auth National Chrt Sch Revolving Loan Fd Social Bond Equitable Sch Revolving Fund, Ser A | 4.00% | 11/01/39 | 858,210 | ||||
| 3,350,000 | AZ St Indl Dev Auth National Chrt Sch Revolving Loan Fd Social Bond Equitable Sch Revolving Fund, Ser A | 4.00% | 11/01/45 | 3,770,257 | ||||
| 1,000,000 | AZ St Indl Dev Auth Rev Lincoln South Beltway Proj | 5.00% | 08/01/27 | 1,255,290 | ||||
| 1,985,000 | AZ St Indl Dev Auth Rev Lincoln South Beltway Proj | 5.00% | 11/01/27 | 2,505,527 | ||||
| 1,000,000 | AZ St Indl Dev Auth Rev Lincoln South Beltway Proj | 5.00% | 05/01/28 | 1,275,200 | ||||
| 1,000,000 | AZ St Indl Dev Auth Rev Lincoln South Beltway Proj | 5.00% | 08/01/28 | 1,281,390 | ||||
| 4,000,000 | Glendale AZ Indl Dev Auth Sr Living Facs Rev Ref Sun Hlth Svcs, Ser A | 5.00% | 11/15/42 | 4,492,440 | ||||
| 1,300,000 | Maricopa Cnty AZ Elem Sch Dist #25 Liberty, Ser A, AGM | 5.00% | 07/01/31 | 1,683,396 | ||||
| 1,350,000 | Maricopa Cnty AZ Elem Sch Dist #25 Liberty, Ser A, AGM | 5.00% | 07/01/32 | 1,737,072 | ||||
| 200,000 | Maricopa Cnty AZ Indl Dev Auth Edu Rev Greathearts AZ Projs, Ser C | 5.00% | 07/01/25 | 237,184 | ||||
| 830,000 | Maricopa Cnty AZ Indl Dev Auth Edu Rev Legacy Traditional Schs Proj | 4.00% | 07/01/30 | 963,862 | ||||
| 435,000 | Maricopa Cnty AZ Indl Dev Auth Edu Rev Legacy Traditional Schs Proj | 4.00% | 07/01/31 | 500,280 | ||||
| 450,000 | Maricopa Cnty AZ Indl Dev Auth Edu Rev Legacy Traditional Schs Proj | 4.00% | 07/01/32 | 514,575 | ||||
| 700,000 | Maricopa Cnty AZ Indl Dev Auth Edu Rev Legacy Traditional Schs Proj | 4.00% | 07/01/33 | 793,730 | ||||
| 985,000 | Maricopa Cnty AZ Indl Dev Auth Edu Rev Legacy Traditional Schs Proj | 4.00% | 07/01/34 | 1,111,671 | ||||
| 1,025,000 | Maricopa Cnty AZ Indl Dev Auth Edu Rev Legacy Traditional Schs Proj | 4.00% | 07/01/35 | 1,151,854 | ||||
| 750,000 | Maricopa Cnty AZ Indl Dev Auth Edu Rev Ref Greathearts AZ Projs, Ser A | 5.00% | 07/01/37 | 886,485 | ||||
| 500,000 | Maricopa Cnty AZ Indl Dev Auth Edu Rev Ref Horizon Cmnty Learning Ctr Proj | 5.00% | 07/01/35 | 520,700 | ||||
| 500,000 | Maricopa Cnty AZ Indl Dev Auth Edu Rev Ref Legacy Traditional Sch Proj | 4.00% | 07/01/34 | 556,010 | ||||
| 1,100,000 | Maricopa Cnty AZ Indl Dev Auth Edu Rev Ref Legacy Traditional Sch Proj Auth, Ser B (b) | 5.00% | 07/01/39 | 1,190,431 | ||||
| 1,000,000 | Maricopa Cnty AZ Indl Dev Auth Edu Rev Ref Legacy Traditional Sch Proj Auth, Ser B (b) | 5.00% | 07/01/49 | 1,065,750 | ||||
| Principal Value | Description | Stated Coupon | Stated Maturity | Value | ||||
| MUNICIPAL BONDS (Continued) | ||||||||
| Arizona (Continued) | ||||||||
| $500,000 | Maricopa Cnty AZ Indl Dev Auth Edu Rev Ref Paradise Schs Projs Paragon Mgmt Inc (b) | 4.00% | 07/01/26 | $530,120 | ||||
| 1,475,000 | Maricopa Cnty AZ Spl Healthcare Dist Aka Maricopa Integrated Hlth Sys, Ser C | 5.00% | 07/01/27 | 1,846,493 | ||||
| 425,000 | Phoenix AZ Indl Dev Auth Edu Rev Fac Legacy Traditional Schs Projs, Ser A (b) | 4.00% | 07/01/26 | 438,286 | ||||
| 3,655,000 | Phoenix AZ Indl Dev Auth Edu Rev Ref Basis Schs Projs, Ser A (b) | 5.00% | 07/01/35 | 3,880,733 | ||||
| 300,000 | Phoenix AZ Indl Dev Auth Student Hsg Rev Downtown Phoenix Student Hsg II LLC AZ St Univ Proj, Ser A | 5.00% | 07/01/32 | 327,267 | ||||
| 300,000 | Phoenix AZ Indl Dev Auth Student Hsg Rev Downtown Phoenix Student Hsg II LLC AZ St Univ Proj, Ser A | 5.00% | 07/01/33 | 325,419 | ||||
| 300,000 | Phoenix AZ Indl Dev Auth Student Hsg Rev Downtown Phoenix Student Hsg II LLC AZ St Univ Proj, Ser A | 5.00% | 07/01/34 | 324,273 | ||||
| 350,000 | Phoenix AZ Indl Dev Auth Student Hsg Rev Downtown Phoenix Student Hsg II LLC AZ St Univ Proj, Ser A | 5.00% | 07/01/35 | 376,982 | ||||
| 700,000 | Phoenix AZ Indl Dev Auth Student Hsg Rev Downtown Phoenix Student Hsg II LLC AZ St Univ Proj, Ser A | 5.00% | 07/01/44 | 734,566 | ||||
| 200,000 | Phoenix AZ Indl Dev Auth Student Hsg Rev Ref Downtown Phoenix Student Hsg LLC AZ St Univ Proj, Ser A | 5.00% | 07/01/26 | 219,366 | ||||
| 265,000 | Pima Cnty AZ Indl Dev Auth Edu Rev Fac American Leadership Academy Proj (b) | 4.00% | 06/15/22 | 267,083 | ||||
| 300,000 | Pima Cnty AZ Indl Dev Auth Edu Rev Ref Fac American Leadership Academy Proj (b) | 4.60% | 06/15/25 | 309,696 | ||||
| 1,230,000 | Salt River AZ Proj Agric Impt & Pwr Dist Elec Sys Rev Ref, Ser A | 5.00% | 12/01/31 | 1,317,883 | ||||
| 1,435,000 | Yavapai Cnty AZ Jail Dist Rev, BAM | 5.00% | 07/01/31 | 1,811,429 | ||||
| 1,030,000 | Yavapai Cnty AZ Jail Dist Rev, BAM | 4.00% | 07/01/32 | 1,191,895 | ||||
| 53,041,739 | ||||||||
| Arkansas – 0.1% | ||||||||
| 610,000 | AR Dev Fin Auth Healthcare Rev Baptist Hlth | 4.00% | 12/01/44 | 671,866 | ||||
| 1,250,000 | AR St Dev Fin Auth Indl Dev Rev Big River Steel Proj Green Bond, AMT (b) | 4.75% | 09/01/49 | 1,244,237 | ||||
| 350,000 | Univ of Central Arkansas AR Rev, Ser A, AGM | 5.00% | 11/01/34 | 406,536 | ||||
| 2,322,639 | ||||||||
| California – 7.4% | ||||||||
| 1,000,000 | Bakersfield CA Wstwtr Rev Ref, Ser A | 5.00% | 09/15/30 | 1,206,010 | ||||
| 450,000 | CA Cnty CA Tobacco Securitization Agy Tobacco Settlement Sr Ref, Ser A | 5.00% | 06/01/32 | 583,043 | ||||
| 1,000,000 | CA Sch Fin Auth Sch Fac Rev Alliance Clg Ready Pub Schs Proj, Ser C | 4.50% | 07/01/26 | 1,122,060 | ||||
| 460,000 | CA Sch Fin Auth Sch Fac Rev Granada Hills Chrt Oblig Grp (b) | 5.00% | 07/01/32 | 518,963 | ||||
| 480,000 | CA Sch Fin Auth Sch Fac Rev Granada Hills Chrt Oblig Grp (b) | 5.00% | 07/01/33 | 539,006 | ||||
| 1,950,000 | CA Sch Fin Auth Sch Fac Rev Granada Hills Chrt Oblig Grp (b) | 5.00% | 07/01/49 | 2,132,598 | ||||
| 1,325,000 | CA Sch Fin Auth Sch Fac Rev Kipp Socal Pub Schs, Ser A (b) | 5.00% | 07/01/39 | 1,579,625 | ||||
| 455,000 | CA Sch Fin Auth Sch Fac Rev Ref Hlth Learning Proj, Ser A (b) | 4.00% | 07/01/26 | 495,322 | ||||
| 800,000 | CA Sch Fin Auth Sch Fac Rev Ref Hlth Learning Proj, Ser A (b) | 5.00% | 07/01/32 | 895,920 | ||||
| 655,000 | CA Sch Fin Auth Sch Fac Rev, Ser A (b) | 5.00% | 07/01/40 | 713,079 | ||||
| 1,000,000 | CA St | 5.00% | 11/01/31 | 1,292,980 | ||||
| 750,000 | CA St | 5.00% | 08/01/32 | 936,825 | ||||
| 1,250,000 | CA St | 4.00% | 11/01/35 | 1,517,500 | ||||
| 225,000 | CA St Enterprise Dev Auth Lease Rev Riverside Cnty Library Fac Proj | 4.00% | 11/01/37 | 253,823 | ||||
| Principal Value | Description | Stated Coupon | Stated Maturity | Value | ||||
| MUNICIPAL BONDS (Continued) | ||||||||
| California (Continued) | ||||||||
| $1,865,000 | CA St Enterprise Dev Auth Lease Rev Riverside Cnty Library Fac Proj | 4.00% | 11/01/49 | $2,048,068 | ||||
| 480,000 | CA St Hlth Facs Fing Auth Rev Adventist Hlth Sys West, Ser A | 4.00% | 03/01/33 | 507,970 | ||||
| 400,000 | CA St Hlth Facs Fing Auth Rev Ref Sutter Hlth, Ser B | 5.00% | 11/15/33 | 480,728 | ||||
| 600,000 | CA St Hlth Facs Fing Auth Rev Sutter Hlth, Ser A | 5.00% | 11/15/33 | 737,886 | ||||
| 445,000 | CA St Muni Fin Auth Chrt Sch Lease Rev Vista Chrt Middle Sch Proj (c) | 5.38% | 07/01/34 | 472,946 | ||||
| 700,000 | CA St Muni Fin Auth Chrt Sch Rev Palmdale Aerospace Academy Proj (b) | 4.00% | 07/01/26 | 722,337 | ||||
| 1,515,000 | CA St Muni Fin Auth Mobile Home Park Rev Sr Caritas Affordable Hsg Inc Projs, Ser A | 5.25% | 08/15/39 | 1,666,758 | ||||
| 1,805,000 | CA St Muni Fin Auth Mobile Home Park Rev Sr Caritas Affordable Hsg Inc Projs, Ser A | 5.25% | 08/15/49 | 1,970,753 | ||||
| 200,000 | CA St Muni Fin Auth Rev Channing House Proj, Ser B | 5.00% | 05/15/37 | 238,020 | ||||
| 500,000 | CA St Muni Fin Auth Rev Ref Eisenhower Med Ctr, Ser A | 5.00% | 07/01/34 | 579,905 | ||||
| 1,250,000 | CA St Muni Fin Auth Rev Ref HumanGood Oblig Grp, Ser A | 4.00% | 10/01/33 | 1,384,287 | ||||
| 600,000 | CA St Muni Fin Auth Rev Ref HumanGood Oblig Grp, Ser A | 4.00% | 10/01/34 | 661,650 | ||||
| 1,000,000 | CA St Muni Fin Auth Rev Ref HumanGood Oblig Grp, Ser A | 4.00% | 10/01/35 | 1,099,830 | ||||
| 1,000,000 | CA St Muni Fin Auth Rev Ref HumanGood Oblig Grp, Ser A | 4.00% | 10/01/36 | 1,097,500 | ||||
| 2,130,000 | CA St Muni Fin Auth Rev Ref HumanGood Oblig Grp, Ser A | 4.00% | 10/01/39 | 2,322,871 | ||||
| 3,420,000 | CA St Muni Fin Auth Rev Ref HumanGood Oblig Grp, Ser A | 5.00% | 10/01/44 | 3,935,736 | ||||
| 680,000 | CA St Muni Fin Auth Rev Ref Retmnt Hsg Fdtn Oblig Grp, Ser A | 5.00% | 11/15/27 | 779,103 | ||||
| 650,000 | CA St Muni Fin Auth Rev Sr Lien Linxs APM Proj, Ser A, AMT | 5.00% | 06/30/28 | 793,442 | ||||
| 200,000 | CA St Muni Fin Auth Sr Living Rev Ref Mt San Antonio Gardens Proj | 4.00% | 11/15/27 | 216,938 | ||||
| 1,000,000 | CA St Poll Control Fin Auth Sol Wst Disp Rev Ref Wst Mgmt Inc, Ser A1, AMT | 3.38% | 07/01/25 | 1,103,080 | ||||
| 1,500,000 | CA St Poll Control Fin Auth Sol Wst Disp Rev Rialto Bioenergy Fac LLC Proj Green Bond, AMT (b) | 6.75% | 12/01/28 | 1,457,295 | ||||
| 4,250,000 | CA St Poll Control Fin Auth Sol Wst Disp Rev Rialto Bioenergy Fac LLC Proj Green Bond, AMT (b) | 7.50% | 12/01/40 | 4,117,145 | ||||
| 4,990,000 | CA St Poll Control Fin Auth Wtr Furnishing Rev, AMT (b) | 5.00% | 07/01/37 | 5,197,384 | ||||
| 775,000 | CA St Ref | 5.00% | 04/01/29 | 1,027,262 | ||||
| 2,000,000 | CA St Ref Various Purpose | 5.00% | 04/01/36 | 2,286,860 | ||||
| 500,000 | CA St Ref, Ser C | 5.00% | 09/01/32 | 598,050 | ||||
| 2,000,000 | CA St Sch Fin Auth Chrt Sch Rev Arts in Action Chrt Schs, Ser A (b) | 5.00% | 06/01/40 | 2,139,660 | ||||
| 500,000 | CA St Sch Fin Auth Chrt Sch Rev Summit Pub Schs (b) | 5.00% | 06/01/37 | 565,075 | ||||
| 300,000 | CA St Stwd Cmntys Dev Auth Clg Hsg Rev NCCD Hooper Street LLC CA Clg of the Arts Projs (b) | 5.00% | 07/01/29 | 300,147 | ||||
| 700,000 | CA St Stwd Cmntys Dev Auth Clg Hsg Rev NCCD Hooper Street LLC CA Clg of the Arts Projs (b) | 5.25% | 07/01/39 | 678,258 | ||||
| 2,315,000 | CA St Stwd Cmntys Dev Auth Transprtn Rev Total Road Impt Program, Ser B, AGM, COPS | 5.00% | 12/01/41 | 2,830,041 | ||||
| 1,595,000 | CA St Univ Rev Systemwide, Ser A | 5.00% | 11/01/21 | 1,671,512 | ||||
| 745,000 | CA St Various Purpose | 5.00% | 10/01/27 | 915,836 | ||||
| 1,000,000 | CA Stwd Cmntys Dev Auth Rev Loma Linda Univ Med Ctr, Ser A (b) | 5.00% | 12/01/30 | 1,125,030 | ||||
| 450,000 | CA Stwd Cmntys Dev Auth Rev Loma Linda Univ Med Ctr, Ser A (b) | 5.00% | 12/01/33 | 513,500 | ||||
| 450,000 | CA Stwd Cmntys Dev Auth Rev Ref CA Baptist Univ, Ser A (b) | 3.00% | 11/01/22 | 450,491 | ||||
| 500,000 | CA Stwd Cmntys Dev Auth Rev Ref CA Baptist Univ, Ser A (b) | 5.00% | 11/01/32 | 542,300 | ||||
| 100,000 | CA Stwd Cmntys Dev Auth Rev Ref Front Porch Cmntys & Svcs, Ser A | 5.00% | 04/01/30 | 117,796 | ||||
| Principal Value | Description | Stated Coupon | Stated Maturity | Value | ||||
| MUNICIPAL BONDS (Continued) | ||||||||
| California (Continued) | ||||||||
| $195,000 | CA Stwd Cmntys Dev Auth Rev Ref Front Porch Cmntys & Svcs, Ser A | 5.00% | 04/01/31 | $228,041 | ||||
| 225,000 | California Cnty CA Tobacco Securitization Agy Tobacco Settle Ref Sonoma Cnty Securitization Corp, Ser A | 5.00% | 06/01/31 | 294,228 | ||||
| 200,000 | California Cnty CA Tobacco Securitization Agy Tobacco Settle Ref Sonoma Cnty Securitization Corp, Ser A | 5.00% | 06/01/32 | 259,812 | ||||
| 230,000 | California Cnty CA Tobacco Securitization Agy Tobacco Settle Ref Sonoma Cnty Securitization Corp, Ser A | 5.00% | 06/01/33 | 295,596 | ||||
| 150,000 | California Cnty CA Tobacco Securitization Agy Tobacco Settle Ref Sonoma Cnty Securitization Corp, Ser A | 4.00% | 06/01/34 | 176,060 | ||||
| 250,000 | California Cnty CA Tobacco Securitization Agy Tobacco Settle Ref Sonoma Cnty Securitization Corp, Ser A | 4.00% | 06/01/36 | 288,518 | ||||
| 370,000 | Chino CA Cmnty Facs Dist Spl Tax #2003-3 Impt Area #7 | 5.00% | 09/01/30 | 446,816 | ||||
| 300,000 | Chino Vly CA Unif Sch Dist, Ser B | 5.00% | 08/01/38 | 392,370 | ||||
| 250,000 | Chino Vly CA Unif Sch Dist, Ser B | 5.00% | 08/01/39 | 325,885 | ||||
| 2,160,000 | Etiwanda CA Sch Dist Cmnty Facs Dist #9 Spl Tax Ref | 5.00% | 09/01/35 | 2,530,332 | ||||
| 130,000 | Folsom Ranch CA Fing Auth Spl Tax Rev Cmnty Facs Dist No 19 Mangini | 4.00% | 09/01/24 | 142,635 | ||||
| 155,000 | Folsom Ranch CA Fing Auth Spl Tax Rev Cmnty Facs Dist No 19 Mangini | 4.00% | 09/01/25 | 172,782 | ||||
| 250,000 | Fontana CA Spl Tax Spl Tax the Meadows | 4.00% | 09/01/27 | 281,063 | ||||
| 265,000 | Fontana CA Spl Tax Spl Tax the Meadows | 4.00% | 09/01/28 | 298,896 | ||||
| 280,000 | Fontana CA Spl Tax Spl Tax the Meadows | 4.00% | 09/01/29 | 316,470 | ||||
| 535,000 | Fontana CA Spl Tax Spl Tax the Meadows | 4.00% | 09/01/36 | 589,212 | ||||
| 500,000 | Foothill-De Anza CA Cmnty Clg Dist Ref, COPS | 5.00% | 04/01/32 | 582,470 | ||||
| 1,360,000 | Hawthorne CA Cmnty Redev Agy Successor Agy Tax Allocation Ref Sub, AGM | 5.00% | 09/01/32 | 1,598,326 | ||||
| 175,000 | Irvine CA Unif Sch Dist Spl Tax Cmnty Facs Dist No 09-1, Ser A | 5.00% | 09/01/31 | 223,144 | ||||
| 365,000 | Irvine CA Unif Sch Dist Spl Tax Cmnty Facs Dist No 09-1, Ser A | 5.00% | 09/01/32 | 462,378 | ||||
| 125,000 | Irvine CA Unif Sch Dist Spl Tax Cmnty Facs Dist No 09-1, Ser A | 5.00% | 09/01/34 | 156,638 | ||||
| 2,885,000 | Kaweah CA Delta Healthcare Dist Rev, Ser B | 5.00% | 06/01/40 | 3,225,084 | ||||
| 210,000 | La Verne CA Ref Brethren Hillcrest Homes, COPS | 5.00% | 05/15/22 | 224,954 | ||||
| 1,045,000 | Lammersville CA Jt Unif Sch Dist Spl Tax | 4.00% | 09/01/49 | 1,115,788 | ||||
| 825,000 | Lammersville CA Jt Unif Sch Dist Spl Tax Cmnty Facs Dist #2014-1 Impt Area #1 Mountain House Sch Facs | 5.00% | 09/01/42 | 928,735 | ||||
| 835,000 | Live Oak CA Sch Dist Santa Cruz Cnty Ref | 5.00% | 08/01/30 | 1,039,800 | ||||
| 45,000 | Long Beach CA Bond Fin Auth Nat Gas Purchase Rev, Ser A | 5.25% | 11/15/23 | 51,024 | ||||
| 400,000 | Los Angeles CA Dept of Arpts Arpt Rev Sub Los Angeles Intl Arpt, Ser B, AMT | 5.00% | 05/15/31 | 469,524 | ||||
| 100,000 | Marina CA Redev Agy Successor Agy Tax Allocation Hsg, Ser B | 5.00% | 09/01/33 | 113,627 | ||||
| 1,260,000 | Marina Coast CA Wtr Dist Enterprise Rev, COPS | 4.00% | 06/01/44 | 1,451,104 | ||||
| 325,000 | Menifee CA Union Sch Dist Pub Fing Auth Spl Tax Rev Ref, Ser A | 5.00% | 09/01/28 | 373,506 | ||||
| 175,000 | Menifee CA Union Sch Dist Spl Tax Cmnty Facs Dist #2011-1 | 5.00% | 09/01/30 | 205,660 | ||||
| 150,000 | Menifee CA Union Sch Dist Spl Tax Cmnty Facs Dist #2011-1 | 5.00% | 09/01/31 | 174,648 | ||||
| 145,000 | Menifee CA Union Sch Dist Spl Tax Cmnty Facs Dist #2011-1 | 5.00% | 09/01/32 | 167,546 | ||||
| 165,000 | Menifee CA Union Sch Dist Spl Tax Cmnty Facs Dist #2011-1 | 5.00% | 09/01/33 | 189,783 | ||||
| 1,710,000 | Menifee CA Union Sch Dist Spl Tax Cmnty Facs Dist #2011-1 | 5.00% | 09/01/44 | 1,910,976 | ||||
| 1,450,000 | Menifee CA Union Sch Dist Spl Tax Cmnty Facs Dist #2011-1 | 5.00% | 09/01/48 | 1,614,227 | ||||
| 2,515,000 | Napa Vly CA Unif Sch Dist, Ser C, AGM | 4.00% | 08/01/38 | 2,842,252 | ||||
| 1,315,000 | Oak Vly CA Hosp Dist Hlth Facs Rev Ref, Ser A | 4.00% | 11/01/36 | 1,380,671 | ||||
| 1,000,000 | Orange CA Pub Facs Fing Auth Lease Rev, Ser A | 4.00% | 11/01/37 | 1,154,560 | ||||
| 1,040,000 | Orange CA Pub Facs Fing Auth Lease Rev, Ser A | 4.00% | 11/01/38 | 1,195,532 | ||||
| 110,000 | Rancho Cordova CA Cmnty Facs Dist Spl Tax No 2018-1 Grantline 208 | 5.00% | 09/01/26 | 127,749 | ||||
| Principal Value | Description | Stated Coupon | Stated Maturity | Value | ||||
| MUNICIPAL BONDS (Continued) | ||||||||
| California (Continued) | ||||||||
| $500,000 | River Islands CA Pub Fing Auth Spl Tax Cmnty Facs Dist #2003-1, Ser A | 5.00% | 09/01/43 | $553,895 | ||||
| 500,000 | River Islands CA Pub Fing Auth Spl Tax Cmnty Facs Dist #2019-1 Phase 2 Pub Impts | 4.00% | 09/01/33 | 540,900 | ||||
| 560,000 | River Islands CA Pub Fing Auth Spl Tax Ref Cmnty Facs Dist #2003-1 | 5.38% | 09/01/31 | 599,172 | ||||
| 500,000 | Riverside CA Unif Sch Dist Election of 2016, Ser B | 4.00% | 08/01/35 | 583,285 | ||||
| 865,000 | Rocklin CA Unif Sch Dist Cmnty Facs Dist Subordinate, Ser 2019, BAM | 5.00% | 09/15/34 | 1,111,594 | ||||
| 625,000 | Rocklin CA Unif Sch Dist Cmnty Facs Dist Subordinate, Ser 2019, BAM | 4.00% | 09/15/35 | 737,788 | ||||
| 1,080,000 | Rocklin CA Unif Sch Dist Cmnty Facs Dist Subordinate, Ser 2019, BAM | 4.00% | 09/15/36 | 1,269,508 | ||||
| 110,000 | Roseville CA Spl Tax | 5.00% | 09/01/30 | 128,214 | ||||
| 100,000 | Roseville CA Spl Tax | 5.00% | 09/01/31 | 115,658 | ||||
| 500,000 | Sacramento CA Transient Occupancy Tax Rev Sub Convention Ctr Complex, Ser C | 5.00% | 06/01/35 | 574,500 | ||||
| 645,000 | San Diego Cnty CA Ltd Rev Obligs Ref Sanford Burnham Prebys Med Discovery Institute, Ser A | 5.00% | 11/01/25 | 788,506 | ||||
| 750,000 | San Diego Cnty CA Ltd Rev Obligs Ref Sanford Burnham Prebys Med Discovery Institute, Ser A | 5.00% | 11/01/26 | 914,377 | ||||
| 945,000 | San Diego Cnty CA Regl Arpt Auth Sr, Ser B, AMT | 5.00% | 07/01/30 | 1,035,040 | ||||
| 1,250,000 | San Diego Cnty CA Regl Transprtn Commn, Ser A | 5.00% | 04/01/35 | 1,521,037 | ||||
| 4,975,000 | San Francisco CA Bay Area Rapid Transit Dist Ref Election 2004, Ser D | 4.00% | 08/01/34 | 5,607,472 | ||||
| 1,365,000 | San Francisco CA Bay Area Rapid Transit Dist Sales Tax Rev, Ser A | 4.00% | 07/01/36 | 1,583,004 | ||||
| 1,330,000 | San Francisco CA Bay Area Rapid Transit Dist Sales Tax Rev, Ser A | 4.00% | 07/01/37 | 1,538,025 | ||||
| 1,000,000 | San Francisco CA City & Cnty Arpts Commn Intl Arpt Rev Ref, Ser D, AMT | 5.00% | 05/01/22 | 1,065,210 | ||||
| 185,000 | San Francisco City & Cnty CA Cmnty Facs Dist #2016-1 | 4.00% | 09/01/29 | 205,574 | ||||
| 145,000 | San Francisco City & Cnty CA Cmnty Facs Dist #2016-1 | 4.00% | 09/01/30 | 160,025 | ||||
| 335,000 | San Francisco City & Cnty CA Cmnty Facs Dist #2016-1 | 4.00% | 09/01/31 | 367,696 | ||||
| 245,000 | San Francisco City & Cnty CA Cmnty Facs Dist #2016-1 | 4.00% | 09/01/32 | 267,486 | ||||
| 300,000 | San Francisco City & Cnty CA Cmnty Facs Dist #2016-1 | 4.00% | 09/01/33 | 325,956 | ||||
| 525,000 | San Francisco City & Cnty CA Cmnty Facs Dist #2016-1 | 4.00% | 09/01/42 | 555,954 | ||||
| 280,000 | San Francisco City & Cnty CA Redev Agy Successor Agy Tax Ref Mission Bay N Redev Proj, Ser A | 5.00% | 08/01/35 | 331,156 | ||||
| 150,000 | Simi Vly CA Unif Sch Dist, Ser B | 4.00% | 08/01/32 | 178,086 | ||||
| 375,000 | Simi Vly CA Unif Sch Dist, Ser B | 4.00% | 08/01/39 | 431,801 | ||||
| 1,715,000 | Simi Vly CA Unif Sch Dist, Ser C | 4.00% | 08/01/42 | 1,967,980 | ||||
| 340,000 | South San Francisco CA Pub Facs Fing Auth Lease Rev Police Station Proj, Ser A | 4.00% | 06/01/33 | 412,821 | ||||
| 400,000 | South San Francisco CA Pub Facs Fing Auth Lease Rev Police Station Proj, Ser A | 4.00% | 06/01/34 | 482,280 | ||||
| 160,000 | Tahoe Truckee CA Unif Sch Dist, COPS, BAM | 4.00% | 06/01/35 | 180,746 | ||||
| 255,000 | Tahoe Truckee CA Unif Sch Dist, COPS, BAM | 4.00% | 06/01/36 | 286,962 | ||||
| 1,000,000 | Tahoe Truckee CA Unif Sch Dist, COPS, BAM | 4.00% | 06/01/43 | 1,104,160 | ||||
| 100,000 | Temecula Vly Unif Sch Dist Fing Auth CA Spl Tax Rev, BAM | 5.00% | 09/01/34 | 113,373 | ||||
| 385,000 | Temescal Vly CA Wtr Dist Spl Tax Terramor Cmnty Facs Dist #4 Impt Area #1 | 4.00% | 09/01/23 | 413,055 | ||||
| 500,000 | Tobacco Securitization Auth Nthrn CA Tobacco Settlement Rev Asset Bkd Bds, Ser A-1 | 5.50% | 06/01/45 | 502,495 | ||||
| Principal Value | Description | Stated Coupon | Stated Maturity | Value | ||||
| MUNICIPAL BONDS (Continued) | ||||||||
| California (Continued) | ||||||||
| $1,000,000 | Tobacco Securitization Auth Sthrn CA Tobacco Settlement Rev Ref San Diego Co Tobacco Securitization Corp Class 1, Ser A | 5.00% | 06/01/37 | $1,267,840 | ||||
| 650,000 | Tulare CA Loc Healthcare Dist Ref, BAM | 4.00% | 08/01/35 | 762,508 | ||||
| 300,000 | Vacaville CA Unif Sch Dist, Ser D | 4.00% | 08/01/35 | 356,988 | ||||
| 600,000 | Vacaville CA Unif Sch Dist, Ser D | 4.00% | 08/01/37 | 705,180 | ||||
| 500,000 | Vacaville CA Unif Sch Dist, Ser D | 4.00% | 08/01/38 | 585,945 | ||||
| 1,050,000 | Victor CA Elem Sch Dist Cmnty Facs Dist Spl Tax Ref 2005-1, BAM | 5.00% | 09/01/46 | 1,220,824 | ||||
| 126,612,702 | ||||||||
| Colorado – 8.3% | ||||||||
| 500,000 | Base Vlg Met Dist #2 CO Ref, Ser A | 5.50% | 12/01/36 | 518,420 | ||||
| 225,000 | Breckenridge CO Ref, Ser B, COPS | 5.00% | 12/01/32 | 297,203 | ||||
| 1,240,000 | Breckenridge CO Ref, Ser B, COPS | 4.00% | 12/01/39 | 1,467,379 | ||||
| 1,000,000 | Broadway Station Met Dist No 3 CO Sr Cib Lmtd Tax Convertible to Unlimited Tax | 5.00% | 12/01/49 | 1,033,060 | ||||
| 455,000 | Buffalo Ridge CO Met Dist Ref & Impt Sr, Ser A, BAM | 5.00% | 12/01/25 | 549,654 | ||||
| 250,000 | Buffalo Ridge CO Met Dist Ref & Impt Sr, Ser A, BAM | 5.00% | 12/01/26 | 308,393 | ||||
| 500,000 | Castle Oaks CO Met Dist #3 Ref | 5.00% | 12/01/37 | 516,840 | ||||
| 400,000 | CO Eductnl & Cultural Auth Rev Ref West Ridge Academy Chrt Sch Proj, Ser A | 5.00% | 06/01/49 | 430,636 | ||||
| 5,480,000 | CO St Bldg Excellent Schs Today, Ser N, COPS | 5.00% | 03/15/37 | 6,719,083 | ||||
| 700,000 | CO St Building Excellent Schs Today, Ser O, COPS | 5.00% | 03/15/31 | 894,978 | ||||
| 1,750,000 | CO St Building Excellent Schs Today, Ser O, COPS | 4.00% | 03/15/37 | 1,993,967 | ||||
| 2,390,000 | CO St Building Excellent Schs Today, Ser O, COPS | 4.00% | 03/15/38 | 2,704,906 | ||||
| 1,920,000 | CO St Eductnl & Cultural Facs Auth Rev Chrt Sch Loveland Classical Schs Proj (b) | 5.00% | 07/01/36 | 1,962,586 | ||||
| 545,000 | CO St Eductnl & Cultural Facs Auth Rev Ref & Impt Chrt Sch Univ Lab Bldg Corp | 4.00% | 12/15/25 | 570,304 | ||||
| 660,000 | CO St Eductnl & Cultural Facs Auth Rev Ref & Impt Chrt Sch Univ Lab Bldg Corp | 5.00% | 12/15/28 | 735,530 | ||||
| 2,245,000 | CO St Eductnl & Cultural Facs Auth Rev Ref & Impt Chrt Sch Univ Lab Bldg Corp | 5.00% | 12/15/35 | 2,450,485 | ||||
| 4,000,000 | CO St Eductnl & Cultural Facs Auth Rev Ref & Impt Chrt Sch Univ Lab Bldg Corp | 5.00% | 12/15/45 | 4,280,600 | ||||
| 1,020,000 | CO St Eductnl & Cultural Facs Auth Rev Univ Denver Proj, Ser A | 4.00% | 03/01/35 | 1,133,648 | ||||
| 1,750,000 | CO St Hlth Facs Auth Hosp Rev Parkview Med Ctr Proj, Ser A | 4.00% | 09/01/50 | 1,877,102 | ||||
| 250,000 | CO St Hlth Facs Auth Hosp Rev Ref Commonspirit Hlth, Ser A-1 | 5.00% | 08/01/35 | 306,008 | ||||
| 3,000,000 | CO St Hlth Facs Auth Hosp Rev Ref Commonspirit Hlth, Ser A-1 | 4.00% | 08/01/38 | 3,364,350 | ||||
| 7,000,000 | CO St Hlth Facs Auth Hosp Rev Ref Commonspirit Hlth, Ser B | 4.00% | 01/01/40 | 8,004,640 | ||||
| 300,000 | CO St Hlth Facs Auth Hosp Rev Ref Frasier Meadows Retmnt Cmnty Proj, Ser A | 5.00% | 05/15/25 | 328,047 | ||||
| 350,000 | CO St Hlth Facs Auth Hosp Rev Ref Frasier Meadows Retmnt Cmnty Proj, Ser A | 5.00% | 05/15/26 | 389,025 | ||||
| 2,500,000 | CO St Hlth Facs Auth Hosp Rev Ref Sanford Hlth, Ser A | 5.00% | 11/01/31 | 3,172,725 | ||||
| 2,950,000 | CO St Hlth Facs Auth Hosp Rev Ref Sanford Hlth, Ser A | 5.00% | 11/01/32 | 3,710,303 | ||||
| 3,655,000 | CO St Hlth Facs Auth Hosp Rev Ref Sanford Hlth, Ser A | 5.00% | 11/01/33 | 4,564,291 | ||||
| 1,965,000 | CO St Hlth Facs Auth Hosp Rev Ref Sanford Hlth, Ser A | 5.00% | 11/01/34 | 2,442,436 | ||||
| 1,800,000 | CO St Hlth Facs Auth Hosp Rev Ref Sanford Hlth, Ser A | 5.00% | 11/01/44 | 2,172,024 | ||||
| 625,000 | CO St Hlth Facs Auth Hosp Rev Sr Living Ralston Creek Arvada Proj, Ser A | 5.25% | 11/01/32 | 507,750 | ||||
| 525,000 | CO St Hlth Facs Auth Rev Ref Covenant Retmnt Cmntys, Ser A | 5.00% | 12/01/33 | 575,379 | ||||
| 325,000 | CO St Ref, COPS | 4.00% | 06/15/37 | 383,786 | ||||
| 1,000,000 | CO St Ref, COPS | 4.00% | 06/15/38 | 1,174,830 | ||||
| 3,315,000 | CO St, Ser A, COPS | 4.00% | 12/15/35 | 4,002,564 | ||||
| Principal Value | Description | Stated Coupon | Stated Maturity | Value | ||||
| MUNICIPAL BONDS (Continued) | ||||||||
| Colorado (Continued) | ||||||||
| $495,000 | Colorado Springs CO Pikes Peak Americas Mountain Enterprise Pikes Peak | 5.00% | 12/01/25 | $579,927 | ||||
| 1,200,000 | Colorado Springs CO Pikes Peak Americas Mountain Enterprise Pikes Peak | 5.25% | 12/01/48 | 1,370,172 | ||||
| 500,000 | Copperleaf CO Met Dist #2 Ref | 5.25% | 12/01/30 | 516,940 | ||||
| 180,000 | Crystal Vly CO Met Dist #2 Ref, Ser A, AGM | 4.00% | 12/01/32 | 214,727 | ||||
| 325,000 | Crystal Vly CO Met Dist #2 Ref, Ser A, AGM | 4.00% | 12/01/33 | 384,995 | ||||
| 500,000 | Crystal Vly CO Met Dist #2 Ref, Ser A, AGM | 4.00% | 12/01/34 | 590,580 | ||||
| 330,000 | Crystal Vly CO Met Dist #2 Ref, Ser A, AGM | 4.00% | 12/01/35 | 388,275 | ||||
| 500,000 | Crystal Vly CO Met Dist #2 Ref, Ser A, AGM | 4.00% | 12/01/36 | 585,580 | ||||
| 5,000,000 | Denver City & Cnty CO Arpt Rev Ref Sub Sys, Ser A, AMT | 5.00% | 12/01/35 | 6,030,300 | ||||
| 4,000,000 | Denver City & Cnty CO Arpt Rev Ref Sub Sys, Ser A, AMT | 5.00% | 12/01/37 | 4,791,960 | ||||
| 975,000 | Denver City & Cnty CO Arpt Rev Ref Sub Sys, Ser A, AMT | 5.00% | 12/01/38 | 1,164,667 | ||||
| 1,000,000 | Denver CO City & Cnty Dedicated Tax Rev, Ser A-1 | 5.00% | 08/01/41 | 1,187,450 | ||||
| 600,000 | Denver CO Hlth & Hosp Auth 550 Acoma Inc, COPS | 5.00% | 12/01/26 | 713,640 | ||||
| 1,790,000 | Denver CO Intl Business Ctr CO Met Dist #1 Subordinate, Ser B | 6.00% | 12/01/48 | 1,862,405 | ||||
| 525,000 | Firestone CO Wtr Enterprise Rev Ref, BAM | 4.00% | 12/01/37 | 633,696 | ||||
| 600,000 | Firestone CO Wtr Enterprise Rev Ref, BAM | 4.00% | 12/01/39 | 719,112 | ||||
| 375,000 | Flying Horse CO Met Dist #2 Ref, Ser A, AGM | 5.00% | 12/01/33 | 486,701 | ||||
| 225,000 | Flying Horse CO Met Dist #2 Ref, Ser A, AGM | 4.00% | 12/01/38 | 266,056 | ||||
| 200,000 | Flying Horse CO Met Dist #2 Ref, Ser A, AGM | 4.00% | 12/01/39 | 235,674 | ||||
| 1,500,000 | Fourth Street Crossing Business Impt Dist CO Sr, Ser A (b) | 5.13% | 12/01/38 | 1,532,595 | ||||
| 2,735,000 | Hunters Overlook Metro Dist #5 Co Sr Bonds, Ser A | 5.00% | 12/01/49 | 2,819,320 | ||||
| 900,000 | Hunters Overlook Metro Dist #5 CO Sr Bonds, Ser A | 5.00% | 12/01/39 | 935,370 | ||||
| 1,000,000 | Independence Met Dist #3 CO, Ser A | 6.25% | 12/01/49 | 1,052,530 | ||||
| 1,000,000 | Jefferson Ctr CO Met Dist # 1 Spl Rev, Ser A-2 | 4.38% | 12/01/47 | 1,017,870 | ||||
| 860,000 | Lakes at Centerra Met Dist No 2 CO Impt, Ser A | 4.63% | 12/01/27 | 885,164 | ||||
| 1,000,000 | Lanterns Met Dist #1 CO Sr, Ser A | 5.00% | 12/01/49 | 1,020,130 | ||||
| 100,000 | Lorson Ranch Met Dist #2 CO | 4.00% | 12/01/24 | 112,159 | ||||
| 170,000 | Lorson Ranch Met Dist #2 CO | 5.00% | 12/01/27 | 202,479 | ||||
| 3,260,000 | Mirabelle Met Dist #2 CO Sr, Ser A | 5.00% | 12/01/39 | 3,342,739 | ||||
| 3,000,000 | Painted Prairie Pub Impt Auth CO | 5.00% | 12/01/39 | 3,162,450 | ||||
| 2,460,000 | Park Creek CO Met Dist Rev Ref Sr Ltd Property Tax Supported, Ser A | 5.00% | 12/01/24 | 2,883,145 | ||||
| 150,000 | Park Creek CO Met Dist Rev Ref Sr Ltd Property Tax Supported, Ser A | 5.00% | 12/01/31 | 177,267 | ||||
| 150,000 | Park Creek CO Met Dist Rev Ref Sr Ltd Property Tax Supported, Ser A | 5.00% | 12/01/34 | 175,256 | ||||
| 155,000 | Park Creek CO Met Dist Rev Ref Sr Ltd Property Tax Supported, Ser A | 5.00% | 12/01/35 | 180,603 | ||||
| 2,000,000 | Park Creek CO Met Dist Rev Ref Sr Ltd Property Tax Supported, Ser A | 5.00% | 12/01/45 | 2,293,520 | ||||
| 1,000,000 | Park Creek CO Met Dist Rev Sr Lien, Ser A, AGM | 4.00% | 12/01/34 | 1,192,710 | ||||
| 1,455,000 | Park Creek CO Met Dist Rev Sr Lien, Ser A, AGM | 4.00% | 12/01/35 | 1,728,656 | ||||
| 1,040,000 | Park Creek CO Met Dist Rev Sr Lien, Ser A, AGM | 4.00% | 12/01/36 | 1,229,862 | ||||
| 420,000 | Park Creek CO Met Dist Rev Sr, Ser A | 5.00% | 12/01/30 | 530,393 | ||||
| 30,000 | Park Creek CO Met Dist Rev Sr, Ser A, NATL-RE | 5.00% | 12/01/24 | 35,226 | ||||
| 500,000 | Parker Homestead Met Dist CO Ref (c) | 5.63% | 12/01/44 | 543,405 | ||||
| 920,000 | Pinon Pines Met Dist #2 CO MDD | 5.00% | 12/01/40 | 950,627 | ||||
| 1,195,000 | Pinon Pines Met Dist #2 CO MDD | 5.00% | 12/01/50 | 1,215,040 | ||||
| 1,000,000 | Prairie Ctr CO Met Dist #3 Ltd Property Tax Supported Pri Ref, Ser A (b) | 4.13% | 12/15/27 | 1,018,570 | ||||
| 700,000 | Prairie Ctr Met Dist #7 CO | 4.88% | 12/15/44 | 704,627 | ||||
| 5,000,000 | Rampart Range CO Met Dist #1 Ltd Tax Supported & Spl Rev Ref & Impt, AGM | 5.00% | 12/01/42 | 5,981,150 | ||||
| Principal Value | Description | Stated Coupon | Stated Maturity | Value | ||||
| MUNICIPAL BONDS (Continued) | ||||||||
| Colorado (Continued) | ||||||||
| $550,000 | Serenity Ridge CO Met Dist #2 Ref, Ser A (c) | 5.13% | 12/01/37 | $569,784 | ||||
| 750,000 | Sierra Ridge Met Dist No 2 CO Sr, Ser A | 4.50% | 12/01/31 | 763,110 | ||||
| 2,015,000 | South Suburban Park & Recreation Dist CO, COPS | 4.00% | 12/15/35 | 2,306,812 | ||||
| 2,065,000 | Stc Met Dist #2 CO Ref, Ser A | 4.00% | 12/01/29 | 2,076,089 | ||||
| 5,000,000 | Stc Met Dist #2 CO Ref, Ser A | 5.00% | 12/01/38 | 5,131,500 | ||||
| 1,000,000 | Stc Met Dist #2 CO Ref, Ser A | 5.00% | 12/01/49 | 1,014,200 | ||||
| 175,000 | Sterling Hills CO W Met Dist Ref | 5.00% | 12/01/32 | 205,840 | ||||
| 1,800,000 | Takoda CO Met Dist Ref | 6.00% | 12/01/36 | 2,142,666 | ||||
| 1,400,000 | Thompson Crossing Met Dist #4 CO Ref | 5.00% | 12/01/39 | 1,470,042 | ||||
| 500,000 | Trails at Crowfoot Met Dist #3 CO Sr Series, Ser A | 5.00% | 12/01/39 | 511,870 | ||||
| 600,000 | Willow Bend Met Dist CO Sr, Ser A | 5.00% | 12/01/39 | 617,784 | ||||
| 1,000,000 | Willow Bend Met Dist CO Sr, Ser A | 5.00% | 12/01/49 | 1,020,800 | ||||
| 143,019,149 | ||||||||
| Connecticut – 3.4% | ||||||||
| 1,250,000 | CT St Hlth & Eductnl Facs Auth Rev Fairfield Univ, Ser Q-1 | 5.00% | 07/01/46 | 1,405,787 | ||||
| 1,000,000 | CT St Hlth & Eductnl Facs Auth Rev Quinnipiac Univ Ref, Ser M | 5.00% | 07/01/36 | 1,154,940 | ||||
| 225,000 | CT St Hlth & Eductnl Facs Auth Rev Ref Fairfield Univ Issue, Ser T | 5.00% | 07/01/28 | 284,189 | ||||
| 5,160,000 | CT St Hlth & Eductnl Facs Auth Rev Ref Fairfield Univ, Ser R | 4.00% | 07/01/47 | 5,540,344 | ||||
| 1,000,000 | CT St Hlth & Eductnl Facs Auth Rev Ref Fairfield Univ, Ser S | 5.00% | 07/01/26 | 1,220,860 | ||||
| 2,250,000 | CT St Hlth & Eductnl Facs Auth Rev Ref Quinnipiac Univ, Ser L | 5.00% | 07/01/31 | 2,578,500 | ||||
| 200,000 | CT St Hlth & Eductnl Facs Auth Rev Ref Quinnipiac Univ, Ser L | 4.00% | 07/01/33 | 216,446 | ||||
| 1,210,000 | CT St Hlth & Eductnl Facs Auth Rev Yale Univ Issue, Ser U-2 (Mandatory put 02/08/22) | 2.00% | 07/01/33 | 1,235,168 | ||||
| 500,000 | CT St Hlth & Eductnl Facs Auth Rev, Ser A | 5.00% | 07/01/34 | 625,930 | ||||
| 1,000,000 | CT St Hlth & Eductnl Facs Auth Rev, Ser A | 5.00% | 07/01/35 | 1,247,300 | ||||
| 1,000,000 | CT St Hlth & Eductnl Facs Auth Rev, Ser A | 4.00% | 07/01/36 | 1,145,570 | ||||
| 1,120,000 | CT St Hsg Fin Auth Hsg Fin Mtge Program Ref, Subser A-1 | 3.65% | 11/15/32 | 1,217,507 | ||||
| 3,000,000 | CT St Hsg Fin Auth Hsg Fin Mtge Program Ref, Subser B-1 | 3.55% | 11/15/33 | 3,262,380 | ||||
| 2,345,000 | CT St Spl Tax Oblig Rev Transprtn Infrastructure, Ser A | 5.00% | 08/01/34 | 2,761,730 | ||||
| 1,445,000 | CT St, Ser A | 5.00% | 04/15/29 | 1,791,179 | ||||
| 500,000 | CT St, Ser A | 4.00% | 01/15/36 | 581,440 | ||||
| 5,000,000 | CT St, Ser A | 4.00% | 01/15/37 | 5,790,250 | ||||
| 1,225,000 | CT St, Ser A | 4.00% | 04/15/37 | 1,407,157 | ||||
| 790,000 | CT St, Ser B | 5.00% | 03/01/26 | 871,725 | ||||
| 2,295,000 | CT St, Ser D, BAM | 4.00% | 08/15/31 | 2,609,461 | ||||
| 905,000 | CT St, Ser E | 5.00% | 10/15/33 | 1,084,326 | ||||
| 560,000 | CT St, Ser E | 4.00% | 10/15/35 | 625,386 | ||||
| 700,000 | CT St, Ser F | 5.00% | 11/15/34 | 821,940 | ||||
| 500,000 | Hamden CT, BAM | 6.00% | 08/15/33 | 631,340 | ||||
| 500,000 | Harbor Point CT Infrastructure Impt Dist Spl Oblig Rev Ref Harbor Point Proj Ltd (b) | 5.00% | 04/01/39 | 536,485 | ||||
| 500,000 | Univ of Connecticut CT, Ser A | 5.00% | 03/15/28 | 599,750 | ||||
| 1,970,000 | Univ of Connecticut CT, Ser A | 5.00% | 01/15/29 | 2,398,002 | ||||
| 4,635,000 | Univ of Connecticut CT, Ser A | 5.00% | 01/15/30 | 5,607,423 | ||||
| 1,250,000 | Univ of Connecticut CT, Ser A | 5.00% | 11/01/32 | 1,558,925 | ||||
| 3,820,000 | Univ of Connecticut CT, Ser A | 5.00% | 11/01/34 | 4,732,560 | ||||
| 1,500,000 | Univ of Connecticut CT, Ser A | 5.00% | 11/01/36 | 1,844,340 | ||||
| 57,388,340 | ||||||||
| Delaware – 0.2% | ||||||||
| 325,000 | DE St Hlth Facs Auth Rev Beebe Med Ctr | 5.00% | 06/01/26 | 385,349 | ||||
| 2,467,000 | Millsboro DE Spl Oblig Ref Plantation Lakes Spl Dev Dist (b) | 5.00% | 07/01/28 | 2,571,700 | ||||
| 2,957,049 | ||||||||
| Principal Value | Description | Stated Coupon | Stated Maturity | Value | ||||
| MUNICIPAL BONDS (Continued) | ||||||||
| District of Columbia – 0.1% | ||||||||
| $1,000,000 | Washington DC Met Area Transit Auth Gross Rev | 5.00% | 07/01/33 | $1,226,990 | ||||
| 885,000 | Washington DC Met Area Transit Auth Gross Rev Ref, Ser A-1 | 5.00% | 07/01/29 | 1,109,162 | ||||
| 2,336,152 | ||||||||
| Florida – 7.8% | ||||||||
| 500,000 | Academical Vlg CDD FL Spl Assmnt Rev CDD | 2.88% | 05/01/25 | 505,730 | ||||
| 1,000,000 | Academical Vlg CDD FL Spl Assmnt Rev CDD | 3.63% | 05/01/40 | 1,004,590 | ||||
| 75,000 | Belle Isle FL Chrt Sch Lease Rev Cornerstone Chrt Academy & Cornerstone Chrt High Sch | 5.50% | 10/01/22 | 78,712 | ||||
| 300,000 | Bexley CDD FL Spl Assmnt Rev | 4.10% | 05/01/26 | 312,201 | ||||
| 330,000 | Brookstone CDD FL Spl Assmnt Rev CDD (d) | 3.88% | 11/01/23 | 333,825 | ||||
| 2,305,000 | Broward Cnty FL Arpt Sys Rev, Ser A, AMT | 5.00% | 10/01/31 | 2,891,115 | ||||
| 605,000 | Broward Cnty FL Fuel Sys Rev Ft Lauderdale Fuel Facs, Ser A, AGM, AMT | 5.00% | 04/01/22 | 644,385 | ||||
| 1,350,000 | Broward Cnty FL Port Facs Rev Ref Subordinate Bond, Ser D, AMT | 5.00% | 09/01/27 | 1,623,388 | ||||
| 250,000 | Citizens Property Insurance Corp FL, Ser A1 | 5.00% | 06/01/22 | 262,550 | ||||
| 2,000,000 | Coco Palms FL CDD Spl Assmnt | 4.50% | 05/01/32 | 2,150,680 | ||||
| 400,000 | Escambia Cnty FL Sol Wst Disp Var Gulf Pwr Co Proj, 2nd Ser (a) | 0.15% | 04/01/39 | 400,000 | ||||
| 725,000 | FL St Govtl Utility Auth Rev Ref, AGM | 4.00% | 10/01/37 | 860,176 | ||||
| 825,000 | FL St Govtl Utility Auth Rev Ref, AGM | 4.00% | 10/01/38 | 971,916 | ||||
| 1,615,000 | FL St Govtl Utility Auth Rev Ref, AGM | 4.00% | 10/01/39 | 1,889,388 | ||||
| 3,370,000 | FL St Muni Pwr Agy Ref, Ser A | 5.00% | 10/01/31 | 4,101,526 | ||||
| 1,900,000 | Fort Myers FL Utility Rev Ref Rev, Ser A | 4.00% | 10/01/44 | 2,192,543 | ||||
| 6,850,000 | Gtr Orlando FL Aviation Auth Arpt Facs Rev Priority Sub, Ser A, AMT | 5.00% | 10/01/42 | 7,895,036 | ||||
| 1,000,000 | Gulfstream Polo Cmnty Dev Dist FL Spl Assmnt Phase 2 Proj | 4.38% | 11/01/49 | 1,045,390 | ||||
| 360,000 | Harmony FL CDD Capital Impt Rev Ref, Ser 2015 | 4.75% | 05/01/25 | 368,158 | ||||
| 365,000 | Heritage Harbour FL N CDD Capital Impt Rev Ref Sr Lien, Ser A-1, AGM | 5.00% | 05/01/25 | 426,094 | ||||
| 495,000 | Hollywood Beach FL Cmnty Dev Dist Rev CDD Ref Pub Pkg Fac Proj, Ser I | 5.00% | 10/01/25 | 592,792 | ||||
| 545,000 | Hollywood Beach FL Cmnty Dev Dist Rev CDD Ref Pub Pkg Fac Proj, Ser I | 5.00% | 10/01/27 | 680,716 | ||||
| 1,150,000 | Hollywood Beach FL Cmnty Dev Dist Rev CDD Ref Pub Pkg Fac Proj, Ser I | 5.00% | 10/01/28 | 1,462,823 | ||||
| 2,970,000 | Hollywood Beach FL Cmnty Dev Dist Rev CDD Ref Pub Pkg Fac Proj, Ser I | 4.00% | 10/01/35 | 3,400,412 | ||||
| 125,000 | Hollywood FL Cmnty Redev Agy Redev Rev Ref | 5.00% | 03/01/23 | 137,663 | ||||
| 1,000,000 | Jacksonville FL Healthcare Facs Rev Ref Baptist Hlth | 5.00% | 08/15/35 | 1,198,160 | ||||
| 3,700,000 | Jacksonville FL Spl Rev Ref Spl Rev, Ser A | 5.00% | 10/01/31 | 4,473,559 | ||||
| 1,000,000 | Jacksonville FL Spl Rev Ref Spl Rev, Ser B | 5.00% | 10/01/28 | 1,221,160 | ||||
| 760,000 | Jacksonville FL Spl Rev Ref, Ser A | 5.00% | 10/01/25 | 924,031 | ||||
| 2,980,000 | Jea FL Wtr & Swr Rev Ref, Ser A | 4.00% | 10/01/39 | 3,419,520 | ||||
| 750,000 | Jea FL Wtr & Swr Rev Ref, Ser A | 4.00% | 10/01/39 | 897,502 | ||||
| 480,000 | Jea FL Wtr & Swr Rev Subordinate Ref, Ser A | 4.00% | 10/01/37 | 567,264 | ||||
| 500,000 | Jea FL Wtr & Swr Rev Subordinate Ref, Ser A | 4.00% | 10/01/38 | 588,890 | ||||
| 500,000 | Jea FL Wtr & Swr Rev Subordinate Ref, Ser A | 4.00% | 10/01/39 | 586,950 | ||||
| 1,230,000 | Lakeland FL Hosp Sys Rev Lakeland Regl Hlth | 5.00% | 11/15/33 | 1,396,849 | ||||
| 155,000 | Lakewood Ranch FL Stewardship Dist Spl Assmnt Rev Ref Country Club East Proj, AGM | 4.50% | 05/01/26 | 182,289 | ||||
| 985,000 | Lee Cnty FL Indl Dev Auth Cypress Cove Healthpark FL Inc Memory Care Proj | 4.00% | 10/01/24 | 1,041,667 | ||||
| 1,000,000 | Lee Cnty FL Indl Dev Auth Shell Point/Waterside Hlth Proj | 5.00% | 11/15/39 | 1,094,900 | ||||
| 1,500,000 | Lee Cnty FL Indl Dev Auth Shell Point/Waterside Hlth Proj | 5.00% | 11/15/44 | 1,628,670 | ||||
| Principal Value | Description | Stated Coupon | Stated Maturity | Value | ||||
| MUNICIPAL BONDS (Continued) | ||||||||
| Florida (Continued) | ||||||||
| $1,345,000 | Mediterra FL S CDD Capital Impt Rev Ref | 5.10% | 05/01/31 | $1,415,828 | ||||
| 2,500,000 | Miami Dade Cnty FL Wtr & Swr Rev Ref Sys, Ser B | 4.00% | 10/01/34 | 2,912,750 | ||||
| 2,130,000 | Miami Dade Cnty FL Wtr & Swr Rev Sys, Ser A | 4.00% | 10/01/40 | 2,439,638 | ||||
| 400,000 | Miami FL Spl Oblg Prerefunded Ref (b) | 5.00% | 03/01/30 | 442,984 | ||||
| 100,000 | Miami FL Spl Oblg Unrefunded Ref (b) | 5.00% | 03/01/30 | 110,204 | ||||
| 375,000 | Miami World Ctr CDD FL Spl Assmnt | 4.00% | 11/01/23 | 381,000 | ||||
| 275,000 | Miami World Ctr CDD FL Spl Assmnt | 4.75% | 11/01/27 | 294,932 | ||||
| 2,000,000 | Miami World Ctr CDD FL Spl Assmnt | 5.13% | 11/01/39 | 2,172,940 | ||||
| 1,015,000 | Miami-Dade Cnty FL Aviation Rev Ref, Ser A, AMT | 5.00% | 10/01/27 | 1,104,005 | ||||
| 3,000,000 | Miami-Dade Cnty FL Aviation Rev Ref, Ser A, AMT | 5.00% | 10/01/38 | 3,369,540 | ||||
| 2,000,000 | Miami-Dade Cnty FL Eductnl Facs Auth Rev Ref Univ Miami, Ser A | 5.00% | 04/01/31 | 2,265,140 | ||||
| 445,000 | Miami-Dade Cnty FL Indl Dev Auth Doral Academy Proj | 5.00% | 01/15/25 | 495,855 | ||||
| 550,000 | Miami-Dade Cnty FL Indl Dev Auth Doral Academy Proj | 5.00% | 01/15/32 | 618,767 | ||||
| 1,210,000 | Miami-Dade Cnty FL Indl Dev Auth Doral Academy Proj | 5.00% | 01/15/37 | 1,338,248 | ||||
| 1,080,000 | Miami-Dade Cnty FL Spl Oblig Sub Ref | 5.00% | 10/01/35 | 1,296,972 | ||||
| 6,000,000 | Miami-Dade Cnty FL Wtr & Swr Rev, Ser B | 4.00% | 10/01/44 | 6,956,400 | ||||
| 2,430,000 | Miami-Dade Cnty FL, Ser A | 5.00% | 07/01/43 | 3,053,514 | ||||
| 440,000 | North Park Isle Cmnty Dev Dist FL Spl Assmnt Rev Assmnt Area One | 3.63% | 05/01/24 | 445,104 | ||||
| 800,000 | North Park Isle Cmnty Dev Dist FL Spl Assmnt Rev Assmnt Area One | 4.00% | 05/01/30 | 823,960 | ||||
| 225,000 | North Park Isle Cmnty Dev Dist FL Spl Assmnt Rev Assmnt Area One | 4.50% | 05/01/40 | 233,966 | ||||
| 355,000 | Nthrn Palm Beach Cnty FL Impt Dist | 5.00% | 08/01/37 | 393,592 | ||||
| 680,000 | Orange Cnty FL Hlth Facs Auth Rev Presbyterian Retmnt Cmntys Proj | 5.00% | 08/01/29 | 756,085 | ||||
| 345,000 | Orange Cnty FL Hlth Facs Auth Rev Presbyterian Retmnt Cmntys Proj | 5.00% | 08/01/34 | 377,706 | ||||
| 6,000,000 | Orange Cnty FL Hlth Facs Auth Rev Ref Orlando Hlth Inc, Ser A | 5.00% | 10/01/36 | 7,065,480 | ||||
| 2,000,000 | Orange Cnty FL Hlth Facs Auth Rev Ref Orlando Hlth Inc, Ser A | 5.00% | 10/01/39 | 2,339,380 | ||||
| 825,000 | Orange Cnty FL Hlth Facs Auth Rev Ref Presbyterian Retmnt Cmntys | 5.00% | 08/01/31 | 912,062 | ||||
| 1,000,000 | Orange Cnty FL Hlth Facs Auth Rev Ref Presbyterian Retmnt Cmntys | 5.00% | 08/01/41 | 1,090,240 | ||||
| 800,000 | Palm Beach Cnty FL Hlth Facs Auth Hosp Rev Baptist Hlth South FL Oblig Grp | 5.00% | 08/15/23 | 896,216 | ||||
| 305,000 | Palm Beach Cnty FL Hlth Facs Auth Rev Lifespace Cmntys Inc, Ser B | 5.00% | 05/15/31 | 336,564 | ||||
| 200,000 | Panama City Beach FL Capital Impt Rev Front Beach Road Proj | 5.00% | 11/01/32 | 259,512 | ||||
| 685,000 | Panama City Beach FL Capital Impt Rev Front Beach Road Proj | 5.00% | 11/01/33 | 884,068 | ||||
| 1,645,000 | Panama City Beach FL Capital Impt Rev Front Beach Road Proj | 5.00% | 11/01/36 | 2,098,214 | ||||
| 3,500,000 | Polk Cnty FL Indl Dev Auth Mineral Dev LLC Secondary Phosphate Tailings Recovery Proj (b) | 5.88% | 01/01/33 | 3,509,835 | ||||
| 195,000 | Rhodine Road North CDD FL Spl Assmnt | 3.50% | 05/01/24 | 198,405 | ||||
| 975,000 | Rhodine Road North CDD FL Spl Assmnt | 4.50% | 05/01/40 | 1,031,920 | ||||
| 545,000 | Rivington CDD FL Spl Assmnt Rev Assmnt Area | 2.88% | 05/01/25 | 549,147 | ||||
| 1,000,000 | Saint Johns Cnty FL Indl Dev Auth Rev Ref Presbyterian Retmnt Cmntys, Ser A | 4.00% | 08/01/55 | 1,057,970 | ||||
| 335,000 | San Simeon Cmnty Dev Dist FL Spl Assmnt (b) | 4.13% | 06/15/39 | 354,799 | ||||
| 1,750,000 | Sarasota National FL CDD Spl Assmnt Ref | 4.00% | 05/01/39 | 1,821,592 | ||||
| 2,250,000 | SE Overtown Park W Cmnty Redev Agy FL Tax, Ser A-1 (b) | 5.00% | 03/01/30 | 2,491,560 | ||||
| 500,000 | Shell Point Cmnty Dev Dist FL Spl Assmnt (b) | 4.00% | 11/01/24 | 508,275 | ||||
| 2,730,000 | Stoneybrook FL S CDD Spl Assmnt Rev Assmnt Area Two, A Proj | 5.13% | 11/01/34 | 3,170,349 | ||||
| 1,400,000 | Summer Woods CDD FL Spl Assmnt Area Two 2020 Proj | 4.00% | 05/01/50 | 1,410,192 | ||||
| Principal Value | Description | Stated Coupon | Stated Maturity | Value | ||||
| MUNICIPAL BONDS (Continued) | ||||||||
| Florida (Continued) | ||||||||
| $500,000 | Tallahassee FL Energy Sys Rev Energy Sys | 5.00% | 10/01/29 | $584,790 | ||||
| 1,500,000 | Tallahassee FL Energy Sys Rev Energy Sys | 5.00% | 10/01/30 | 1,750,560 | ||||
| 125,000 | Tampa FL Hosp Rev H Lee Moffitt Cancer Ctr Proj, Ser B | 5.00% | 07/01/27 | 153,863 | ||||
| 120,000 | Tampa FL Hosp Rev H Lee Moffitt Cancer Ctr Proj, Ser B | 5.00% | 07/01/31 | 152,981 | ||||
| 200,000 | Tampa FL Hosp Rev H Lee Moffitt Cancer Ctr Proj, Ser B | 5.00% | 07/01/32 | 253,208 | ||||
| 250,000 | Tampa FL Hosp Rev H Lee Moffitt Cancer Ctr Proj, Ser B | 5.00% | 07/01/33 | 314,665 | ||||
| 250,000 | Tampa FL Hosp Rev H Lee Moffitt Cancer Ctr Proj, Ser B | 5.00% | 07/01/34 | 313,588 | ||||
| 300,000 | Tampa FL Hosp Rev H Lee Moffitt Cancer Ctr Proj, Ser B | 5.00% | 07/01/35 | 374,874 | ||||
| 400,000 | Tampa FL Hosp Rev H Lee Moffitt Cancer Ctr Proj, Ser B | 4.00% | 07/01/38 | 455,816 | ||||
| 300,000 | Tampa FL Hosp Rev H Lee Moffitt Cancer Ctr Proj, Ser B | 4.00% | 07/01/39 | 340,707 | ||||
| 230,000 | Tampa FL Rev Ref The Univ of Tampa Proj, Ser A | 5.00% | 04/01/34 | 289,552 | ||||
| 3,750,000 | Tampa FL Rev Ref The Univ of Tampa Proj, Ser A | 5.00% | 04/01/45 | 4,534,950 | ||||
| 215,000 | Timber Creek CDD FL Spl Assmnt Rev (d) | 4.13% | 11/01/24 | 218,520 | ||||
| 100,000 | UCF Stadium Corp FL Rev Ref, Ser A | 5.00% | 03/01/24 | 111,516 | ||||
| 160,000 | Villamar CDD FL Spl Assmnt (c) | 3.75% | 05/01/24 | 162,155 | ||||
| 70,000 | Vlg FL CDD #6 Spl Assmnt Rev Ref | 4.00% | 05/01/25 | 78,464 | ||||
| 500,000 | Volusia Cnty FL Eductnl Fac Auth Ref Embry Riddle Aeronautical Univ Inc Proj, Ser A | 4.00% | 10/15/37 | 569,935 | ||||
| 835,000 | Westside FL CDD Spl Assmnt Rev Ref (b) | 4.10% | 05/01/37 | 867,799 | ||||
| 410,000 | WildBlue CDD FL Spl Assmnt (b) | 3.50% | 06/15/24 | 418,323 | ||||
| 133,084,396 | ||||||||
| Georgia – 3.4% | ||||||||
| 9,040,000 | Atlanta GA Arpt Passenger Fac Charge Rev Arpt Rev Subordinate, Ser D, AMT | 4.00% | 07/01/38 | 10,191,334 | ||||
| 650,000 | Atlanta GA Tax Allocation Ref Eastside Proj | 5.00% | 01/01/30 | 802,581 | ||||
| 3,100,000 | Atlanta GA Wtr & Wstwtr Rev Ref, Ser A | 5.00% | 11/01/41 | 3,817,960 | ||||
| 4,400,000 | Atlanta GA Wtr & Wstwtr Rev Ref, Ser C | 4.00% | 11/01/37 | 5,128,948 | ||||
| 625,000 | De Kalb GA Priv Hosp Auth Children’s Healthcare of Atlanta, Ser B | 4.00% | 07/01/37 | 726,544 | ||||
| 315,000 | East Point GA Tax Allocation Ref | 5.00% | 08/01/21 | 325,181 | ||||
| 500,000 | Etowah GA Wtr & Swr Auth Rev Ref, BAM | 4.00% | 03/01/34 | 578,875 | ||||
| 350,000 | Etowah GA Wtr & Swr Auth Rev Ref, BAM | 4.00% | 03/01/35 | 404,044 | ||||
| 400,000 | Etowah GA Wtr & Swr Auth Rev Ref, BAM | 4.00% | 03/01/36 | 459,916 | ||||
| 1,000,000 | Fulton Cnty GA Dev Auth Rev Ref Children’s Healthcare of Atlanta, Ser C | 5.00% | 07/01/35 | 1,263,050 | ||||
| 3,775,000 | Fulton Cnty GA Rsdl Care Facs Elderly Auth Retmnt Fac Rev Ref Lenbrook Sq Fdtn Inc | 5.00% | 07/01/31 | 4,044,875 | ||||
| 1,050,000 | GA St Grp 1, Ser A | 5.00% | 08/01/27 | 1,356,411 | ||||
| 750,000 | GA St Hgr Edu Facs Auth Rev Ref USG Real Estate Fdtn II LLC Projs | 5.00% | 06/15/34 | 918,705 | ||||
| 890,000 | GA St Hgr Edu Facs Auth Rev Ref USG Real Estate Fdtn II LLC Projs | 5.00% | 06/15/35 | 1,086,512 | ||||
| 2,525,000 | GA St Hsg & Fin Auth Rev Sf Mtge, Ser C | 3.25% | 12/01/33 | 2,713,592 | ||||
| 5,000,000 | GA St, Ser A-2 | 4.00% | 02/01/36 | 5,819,950 | ||||
| 40,000 | Gainesville & Hall Cnty GA Hosp Auth Ref NE GA Hlth Sys Inc Proj, Ser A | 5.00% | 02/15/26 | 48,452 | ||||
| 1,000,000 | Glynn-Brunswick GA Memorial Hosp Auth Anticipation Ctfs South East GA Hlth Sys Proj | 5.00% | 08/01/47 | 1,132,280 | ||||
| 985,000 | Glynn-Brunswick GA Memorial Hosp Auth Ref Rev Anticipation Ctfs Southeast GA Hlth Sys Proj | 4.00% | 08/01/37 | 1,097,132 | ||||
| 1,750,000 | Madison Cnty GA Sch Dist Ref, COPS | 4.00% | 05/01/32 | 1,999,252 | ||||
| 175,000 | Main Street Nat Gas Inc GA Gas Rev, Ser A | 5.50% | 09/15/23 | 198,240 | ||||
| 1,000,000 | Main Street Nat Gas Inc GA Gas Sply Rev, Ser A | 5.00% | 05/15/27 | 1,208,900 | ||||
| 2,330,000 | Main Street Nat Gas Inc GA Gas Sply Rev, Ser A | 5.00% | 05/15/30 | 2,876,758 | ||||
| Principal Value | Description | Stated Coupon | Stated Maturity | Value | ||||
| MUNICIPAL BONDS (Continued) | ||||||||
| Georgia (Continued) | ||||||||
| $2,160,000 | Main Street Nat Gas Inc GA Gas Sply Rev, Ser C | 5.00% | 09/01/25 | $2,579,062 | ||||
| 1,170,000 | Main Street Nat Gas Inc GA Gas Sply Rev, Ser C | 5.00% | 09/01/26 | 1,427,482 | ||||
| 560,000 | Priv Clgs & Univs Auth GA Mercer Univ Proj, Ser C | 5.25% | 10/01/27 | 591,130 | ||||
| 1,175,000 | Priv Clgs & Univs Auth GA Savannah Clg of Art & Design Proj | 5.00% | 04/01/33 | 1,289,421 | ||||
| 500,000 | Priv Clgs & Univs Auth GA Savannah Clg of Art & Design Proj | 5.00% | 04/01/44 | 540,360 | ||||
| 2,865,000 | S Regl GA Jt Dev Auth Rev Ref Valdosta St Univ VSU ASRE GA Reade Hopper LLC | 5.00% | 08/01/35 | 3,529,938 | ||||
| 58,156,885 | ||||||||
| Guam – 0.2% | ||||||||
| 400,000 | Guam Govt Business Privilege Tax Rev, Ser B-1 | 5.00% | 01/01/37 | 410,712 | ||||
| 2,000,000 | Guam Govt Wtrwks Auth Wtr & Wstwtr Sys Rev, Ser A | 5.00% | 01/01/50 | 2,393,340 | ||||
| 300,000 | Guam Port Auth Port Rev, Ser B, AMT | 5.00% | 07/01/32 | 358,611 | ||||
| 3,162,663 | ||||||||
| Hawaii – 0.6% | ||||||||
| 4,980,000 | HI St, Ser FG | 4.00% | 10/01/33 | 5,695,925 | ||||
| 2,450,000 | Honolulu City & Cnty HI Wstwtr Sys Rev Ref Sr First Bd Resolution, Ser B | 4.00% | 07/01/32 | 2,762,056 | ||||
| 2,000,000 | Honolulu City & Cnty HI Wstwtr Sys Rev Sr First Bd Resolution, Ser A | 4.00% | 07/01/42 | 2,287,720 | ||||
| 10,745,701 | ||||||||
| Idaho – 0.1% | ||||||||
| 1,000,000 | ID St Hlth Facs Auth Rev Ref Madison Memorial Hosp | 5.00% | 09/01/37 | 1,111,300 | ||||
| 500,000 | ID St Hlth Facs Auth Rev Trinity Hlth Ref, Ser D | 5.00% | 12/01/33 | 536,220 | ||||
| 1,647,520 | ||||||||
| Illinois – 2.7% | ||||||||
| 1,210,000 | Bolingbrook IL Ref, Ser A | 4.00% | 01/01/35 | 1,363,791 | ||||
| 1,000,000 | Bolingbrook IL Ref, Ser A, AGM | 5.00% | 01/01/30 | 1,248,630 | ||||
| 1,000,000 | Bolingbrook IL Ref, Ser A, AGM | 5.00% | 01/01/31 | 1,242,520 | ||||
| 130,000 | Chicago IL Brd of Edu Cap Apprec Sch Reform, Ser B-1, NATL-RE | (e) | 12/01/22 | 123,972 | ||||
| 500,000 | Chicago IL Brd of Edu Ref Dedicated, Ser C | 5.00% | 12/01/30 | 550,210 | ||||
| 1,975,000 | Chicago IL Brd of Edu Ref, Ser F | 5.00% | 12/01/31 | 1,977,172 | ||||
| 625,000 | Chicago IL Brd of Edu, Ser A | 5.50% | 12/01/39 | 633,388 | ||||
| 305,000 | Chicago IL O’Hare Intl Arpt Rev Ref Gen Sr Lien, Ser A, AMT | 5.00% | 01/01/30 | 352,302 | ||||
| 600,000 | Chicago IL O’Hare Intl Arpt Rev Ref Sr Lien, Ser A, AMT | 5.00% | 01/01/37 | 719,916 | ||||
| 400,000 | Chicago IL O’Hare Intl Arpt Rev, Ser C, AMT | 5.00% | 01/01/34 | 454,572 | ||||
| 450,000 | Chicago IL Ref 2003B | 5.25% | 01/01/29 | 470,106 | ||||
| 185,000 | Chicago IL Ref Proj, Ser A | 5.00% | 01/01/27 | 192,104 | ||||
| 1,155,000 | Chicago IL Ref Proj, Ser A | 5.00% | 01/01/35 | 1,175,282 | ||||
| 500,000 | Chicago IL Ref, Ser A | 5.63% | 01/01/29 | 547,885 | ||||
| 150,000 | Chicago IL Ref, Ser C | 4.00% | 01/01/22 | 156,285 | ||||
| 500,000 | Chicago IL Ref, Ser C | 5.00% | 01/01/25 | 526,760 | ||||
| 645,000 | Chicago IL Ref, Ser C | 5.00% | 01/01/26 | 682,900 | ||||
| 270,000 | Chicago IL Ref, Ser C | 5.00% | 01/01/38 | 276,515 | ||||
| 285,000 | Chicago IL Ref, Ser C, CABS | (e) | 01/01/22 | 274,959 | ||||
| 145,000 | Chicago IL Ref, Ser C, CABS | (e) | 01/01/24 | 131,037 | ||||
| 125,000 | Chicago IL Ref, Ser C, CABS | (e) | 01/01/25 | 109,140 | ||||
| 2,060,000 | Chicago IL, Ser A | 5.00% | 01/01/27 | 2,184,527 | ||||
| 2,425,000 | DuPage & Cook Cntys IL Twp High Sch Dist #86 Hinsdale | 4.00% | 01/15/36 | 2,819,596 | ||||
| 505,000 | Hampshire IL Spl Svc Area #14 Spl Tax Ref Lakewood Crossing, BAM | 4.00% | 03/01/25 | 561,807 | ||||
| 300,000 | Hillside IL Tax Incr Rev Ref | 5.00% | 01/01/24 | 306,132 | ||||
| Principal Value | Description | Stated Coupon | Stated Maturity | Value | ||||
| MUNICIPAL BONDS (Continued) | ||||||||
| Illinois (Continued) | ||||||||
| $305,000 | IL St | 5.00% | 05/01/23 | $323,754 | ||||
| 240,000 | IL St | 5.00% | 05/01/24 | 258,161 | ||||
| 125,000 | IL St | 5.00% | 06/01/27 | 135,358 | ||||
| 325,000 | IL St Fin Auth Academic Facs Lease Rev Univ of Illinois at Urbana-Champaign Proj, Ser A | 5.00% | 10/01/33 | 392,334 | ||||
| 600,000 | IL St Fin Auth Academic Facs Lease Rev Univ of Illinois at Urbana-Champaign Proj, Ser A | 5.00% | 10/01/34 | 722,442 | ||||
| 970,000 | IL St Fin Auth Academic Facs Lease Rev Univ of Illinois at Urbana-Champaign Proj, Ser A | 5.00% | 10/01/35 | 1,160,741 | ||||
| 300,000 | IL St Fin Auth Academic Facs Lease Rev Univ of Illinois at Urbana-Champaign Proj, Ser A | 5.00% | 10/01/36 | 357,522 | ||||
| 1,000,000 | IL St Fin Auth Rev Centegra Hlth Sys, Ser A | 5.00% | 09/01/39 | 1,115,730 | ||||
| 500,000 | IL St Fin Auth Rev Loc Govt Program E Prairie Sch Dist #73 Proj, BAM | 5.00% | 12/01/30 | 627,450 | ||||
| 70,000 | IL St Fin Auth Rev Ref Lifespace Cmntys, Ser A | 5.00% | 05/15/24 | 75,636 | ||||
| 845,000 | IL St Fin Auth Rev Ref Mercy Hlth System Oblig Grp | 5.00% | 12/01/33 | 975,206 | ||||
| 35,000 | IL St Fin Auth Rev Ref Presbyterian Homes Oblig Grp, Ser A | 5.00% | 11/01/24 | 39,384 | ||||
| 1,010,000 | IL St Fin Auth Rev Sthrn IL Healthcare, Ser A | 5.00% | 03/01/47 | 1,164,884 | ||||
| 500,000 | IL St Fin Auth Student Hsg & Academic Fac Rev Chf Chicago LLC Univ IL Chicago Proj, Ser A | 5.00% | 02/15/27 | 508,315 | ||||
| 95,000 | IL St Fin Auth Student Hsg & Academic Fac Rev Chf Chicago LLC Univ IL Chicago Proj, Ser A | 5.00% | 02/15/31 | 94,540 | ||||
| 465,000 | IL St Fin Auth Student Hsg & Academic Fac Rev Chf Chicago LLC Univ IL Chicago Proj, Ser A | 5.00% | 02/15/32 | 459,443 | ||||
| 320,000 | IL St Ref | 4.00% | 08/01/25 | 325,904 | ||||
| 115,000 | IL St Ref, Ser B | 5.00% | 10/01/24 | 124,492 | ||||
| 510,000 | IL St, Ser A | 4.00% | 01/01/25 | 517,982 | ||||
| 1,500,000 | IL St, Ser A | 5.00% | 12/01/26 | 1,640,220 | ||||
| 4,500,000 | IL St, Ser C | 5.00% | 11/01/29 | 4,814,685 | ||||
| 1,250,000 | IL St, Ser D | 5.00% | 11/01/23 | 1,321,262 | ||||
| 1,005,000 | IL St, Ser D | 5.00% | 11/01/24 | 1,075,521 | ||||
| 325,000 | IL St, Ser D | 5.00% | 11/01/26 | 351,221 | ||||
| 1,500,000 | Morton Grove IL Tax Incr Rev Sawmill Station Redev Proj | 5.00% | 01/01/39 | 1,429,335 | ||||
| 3,635,000 | Morton Grove-Niles Wtr Commn IL Wtr, Ser A | 5.00% | 12/01/41 | 4,390,498 | ||||
| 1,000,000 | Piatt Champaign & De Witt Cntys IL Cmnty Unit Sch Dist #25 Ref, Ser B, BAM | 5.00% | 11/01/33 | 1,229,130 | ||||
| 145,000 | Railsplitter IL Tobacco Settlement Auth | 5.00% | 06/01/26 | 176,870 | ||||
| 145,000 | Railsplitter IL Tobacco Settlement Auth | 5.00% | 06/01/27 | 175,315 | ||||
| 645,000 | Rockford IL Ref Wtrwks Sys, Ser B, BAM | 5.00% | 12/15/26 | 784,855 | ||||
| 110,000 | Romeoville IL Rev Ref Lewis Univ Proj | 5.00% | 10/01/24 | 122,065 | ||||
| 125,000 | Romeoville IL Rev Ref Lewis Univ Proj | 5.00% | 10/01/25 | 139,966 | ||||
| 46,111,729 | ||||||||
| Indiana – 1.3% | ||||||||
| 1,370,000 | Anderson IN Mf Rev Sweet Galilee at the Wigwam Proj, Ser A | 5.38% | 01/01/40 | 1,383,864 | ||||
| 1,920,000 | Carmel IN Loc Pub Impt Bond Bank Multipurpose, Ser 2016 | 5.00% | 07/15/34 | 2,298,375 | ||||
| 1,425,000 | Carmel IN Loc Pub Impt Bond Bank Spl Program Wtrwks | 5.00% | 06/01/26 | 1,754,745 | ||||
| 1,000,000 | Evansville IN Mf Hsg Rev Silver Birch Evansville Proj | 5.45% | 01/01/38 | 990,030 | ||||
| 250,000 | Fort Wayne IN Mf Hsg Rev Silver Birch at Cook Road (b) | 5.30% | 01/01/32 | 251,600 | ||||
| 930,000 | IN St Fin Auth Hosp Rev Goshen Hlth, Ser A | 4.00% | 11/01/36 | 1,045,841 | ||||
| 1,330,000 | IN St Fin Auth Hosp Rev Goshen Hlth, Ser A | 4.00% | 11/01/37 | 1,490,864 | ||||
| 110,000 | IN St Fin Auth Rev BHI Sr Living | 5.50% | 11/15/31 | 112,663 | ||||
| 800,000 | IN St Fin Auth Rev Eductnl Facs Rock Creek Cmnty Academy Proj, Ser A (d) | 5.25% | 07/01/28 | 863,192 | ||||
| Principal Value | Description | Stated Coupon | Stated Maturity | Value | ||||
| MUNICIPAL BONDS (Continued) | ||||||||
| Indiana (Continued) | ||||||||
| $1,000,000 | IN St Fin Auth Rev Eductnl Facs Rock Creek Cmnty Academy Proj, Ser A (d) | 5.88% | 07/01/38 | $1,076,790 | ||||
| 460,000 | IN St Fin Auth Rev Greencroft Oblig Grp, Ser A | 5.75% | 11/15/28 | 485,732 | ||||
| 55,000 | IN St Fin Auth Rev Greencroft Oblig Grp, Ser A | 6.00% | 11/15/28 | 58,484 | ||||
| 500,000 | IN St Fin Auth Rev Marian Univ Proj, Ser A | 5.00% | 09/15/34 | 571,195 | ||||
| 275,000 | IN St Fin Auth Rev Ref Rev Cmnty Fdtn of NW IN | 5.00% | 09/01/31 | 326,829 | ||||
| 6,000,000 | IN St Muni Pwr Agy Ref, Ser A | 5.00% | 01/01/42 | 7,040,760 | ||||
| 1,700,000 | Plainfield IN Mf Hsg Rev Glasswater Creek Proj | 5.38% | 09/01/38 | 1,705,236 | ||||
| 21,456,200 | ||||||||
| Iowa – 0.3% | ||||||||
| 1,000,000 | Altoona IA, Ser A, COPS, BAM | 5.00% | 06/01/33 | 1,256,230 | ||||
| 720,000 | Altoona IA, Ser A, COPS, BAM | 5.00% | 06/01/34 | 901,778 | ||||
| 2,385,000 | Coralville IA Ref, Ser A | 5.00% | 05/01/38 | 2,529,627 | ||||
| 4,687,635 | ||||||||
| Kansas – 1.1% | ||||||||
| 1,775,000 | Goddard KS Sales Tax Spl Oblg Rev Ref Olympic Park Star Bond Proj | 3.60% | 06/01/30 | 1,743,884 | ||||
| 4,210,000 | Johnson & Miami Cntys KS Unif Sch Dist #230 Spring Hill, Ser A | 5.00% | 09/01/35 | 5,440,836 | ||||
| 1,240,000 | KS Muni Energy Agy Pwr Proj Rev Dogwood Proj, Ser A, BAM | 5.00% | 04/01/29 | 1,505,571 | ||||
| 1,470,000 | KS Muni Energy Agy Pwr Proj Rev Dogwood Proj, Ser A, BAM | 5.00% | 04/01/30 | 1,776,730 | ||||
| 500,000 | Leavenworth Cnty KS Unif Sch Dist #464 Ref, Ser A | 4.00% | 09/01/31 | 590,085 | ||||
| 625,000 | Leavenworth Cnty KS Unif Sch Dist #464 Ref, Ser A | 4.00% | 09/01/32 | 733,206 | ||||
| 575,000 | Leavenworth Cnty KS Unif Sch Dist #464 Ref, Ser A | 4.00% | 09/01/33 | 671,295 | ||||
| 500,000 | Leavenworth Cnty KS Unif Sch Dist #464 Ref, Ser A | 4.00% | 09/01/34 | 582,050 | ||||
| 525,000 | Leavenworth Cnty KS Unif Sch Dist #464 Ref, Ser A | 4.00% | 09/01/35 | 608,858 | ||||
| 600,000 | Leavenworth Cnty KS Unif Sch Dist #464 Ref, Ser A | 4.00% | 09/01/36 | 693,492 | ||||
| 1,045,000 | Lenexa KS Healthcare Fac Rev Ref Lakeview Vlg Inc, Ser A | 5.00% | 05/15/26 | 1,131,965 | ||||
| 2,800,000 | Sedgwick Cnty KS Unif Sch Dist #260 Ref & Sch Bldg, Ser B | 4.00% | 10/01/38 | 3,190,180 | ||||
| 150,000 | Wyandotte Cnty KS Unif Sch Dist #202, Ser A, AGM | 5.00% | 09/01/32 | 186,500 | ||||
| 475,000 | Wyandotte Cnty/Kansas City KS Unif Govt Utility Sys Rev Ref & Impt, Ser A | 5.00% | 09/01/29 | 546,117 | ||||
| 19,400,769 | ||||||||
| Kentucky – 2.8% | ||||||||
| 2,350,000 | Bowling Green KY Wtr & Swr Rev, AGM | 4.00% | 06/01/32 | 2,655,735 | ||||
| 1,000,000 | Estrn KY Univ Gen Recpts, Ser A | 5.00% | 04/01/25 | 1,151,070 | ||||
| 3,755,000 | KY Bond Dev Corp Indl Bldg Rev KY Commns Network Auth Proj, BAM | 5.00% | 09/01/38 | 4,704,827 | ||||
| 3,500,000 | KY Bond Dev Corp Indl Bldg Rev KY Commns Network Auth Proj, BAM | 5.00% | 09/01/49 | 4,252,710 | ||||
| 145,000 | KY St Econ Dev Fin Auth Baptist Healthcare Sys, Ser B | 5.00% | 08/15/28 | 177,132 | ||||
| 275,000 | KY St Econ Dev Fin Auth Baptist Healthcare Sys, Ser B | 5.00% | 08/15/36 | 324,393 | ||||
| 3,000,000 | KY St Econ Dev Fin Auth Baptist Healthcare Sys, Ser B | 5.00% | 08/15/41 | 3,473,430 | ||||
| 160,000 | KY St Econ Dev Fin Auth Hlth Sys Rev Norton Healthcare Inc, Ser B, NATL-RE | (e) | 10/01/25 | 147,376 | ||||
| 625,000 | KY St Econ Dev Fin Auth Ref Commonspirit Hlth, Ser A-1 | 4.00% | 08/01/38 | 700,906 | ||||
| 730,000 | KY St Econ Dev Fin Auth Ref Commonspirit Hlth, Ser A-2 | 5.00% | 08/01/35 | 893,542 | ||||
| 895,000 | KY St Econ Dev Fin Auth Ref Commonspirit Hlth, Ser A-2 | 5.00% | 08/01/36 | 1,091,068 | ||||
| 300,000 | KY St Muni Pwr Agy Pwr Sys Rev Ref, Ser A, NATL-RE | 5.00% | 09/01/22 | 323,271 | ||||
| 5,395,000 | KY St Pub Energy Auth Gas Sply Rev Gas Sply, Ser B (Mandatory put 01/01/25) | 4.00% | 01/01/49 | 6,015,533 | ||||
| 12,025,000 | KY St Pub Energy Auth Gas Sply Rev Var, Ser C (Mandatory put 02/01/28) | 4.00% | 02/01/50 | 14,041,592 | ||||
| Principal Value | Description | Stated Coupon | Stated Maturity | Value | ||||
| MUNICIPAL BONDS (Continued) | ||||||||
| Kentucky (Continued) | ||||||||
| $1,580,000 | KY St Pub Energy Auth Gas Sply Rev, Ser A-1 (Mandatory put 06/01/25) | 4.00% | 12/01/49 | $1,782,793 | ||||
| 1,000,000 | Louisville & Jefferson Cnty KY Met Govt Hlth Sys Rev Norton Healthcare Inc, Ser A | 5.00% | 10/01/38 | 1,226,760 | ||||
| 500,000 | Louisville & Jefferson Cnty KY Met Govt Hlth Sys Rev Norton Healthcare Inc, Ser A | 4.00% | 10/01/40 | 563,110 | ||||
| 3,315,000 | Louisville & Jefferson Cnty KY Met Govt Hlth Sys Rev Ref Norton Healthcare Inc, Ser A | 5.00% | 10/01/30 | 3,934,839 | ||||
| 550,000 | Louisville & Jefferson Cnty KY Met Govt Hlth Sys Rev Ref Norton Healthcare Inc, Ser A | 5.00% | 10/01/31 | 650,078 | ||||
| 130,000 | Warren Cnty KY Hosp Rev Ref Bowling Green Warren Cnty Cmnty Hosp Corp | 5.00% | 04/01/23 | 138,138 | ||||
| 48,248,303 | ||||||||
| Louisiana – 2.0% | ||||||||
| 1,260,000 | East Baton Rouge Parish LA Capital Impts Dist Movebr Sales, Ser T | 4.00% | 08/01/35 | 1,523,806 | ||||
| 1,520,000 | East Baton Rouge Parish LA Capital Impts Dist Movebr Sales, Ser T | 4.00% | 08/01/36 | 1,830,521 | ||||
| 2,530,000 | East Baton Rouge Parish LA Capital Impts Dist Movebr Sales, Ser T | 4.00% | 08/01/38 | 3,026,259 | ||||
| 1,000,000 | LA Pub Facs Auth Rev Ref Ochsner Clinic Fdtn Proj | 5.00% | 05/15/36 | 1,187,810 | ||||
| 2,000,000 | LA Pub Facs Auth Rev Var Ref Ochsner Clinic Fdtn Proj, Ser B (Mandatory put 05/15/25) | 5.00% | 05/15/50 | 2,371,260 | ||||
| 3,880,000 | LA St | 4.00% | 05/01/33 | 4,354,718 | ||||
| 3,000,000 | LA St | 4.00% | 05/01/35 | 3,356,850 | ||||
| 250,000 | LA St Loc Govt Envrnmntl Facs & Cmnty Dev Auth Rev Ascension Psh Courthouse Proj | 5.00% | 11/01/31 | 308,645 | ||||
| 1,135,000 | LA St Loc Govt Envrnmntl Facs & Cmnty Dev Auth Rev City Of Gretna Pub Impt Bonds | 4.00% | 02/01/38 | 1,300,211 | ||||
| 1,700,000 | LA St Loc Govt Envrnmntl Facs & Cmnty Dev Auth Rev Ref Hosp Womans Fdtn Proj, Ser A | 5.00% | 10/01/37 | 2,010,454 | ||||
| 380,000 | LA Stadium & Exposition Dist LA Ref Sr, Ser A | 5.00% | 07/01/31 | 410,974 | ||||
| 750,000 | New Orleans LA Aviation Brd Gen Arpt N Term, Ser B, AMT | 5.00% | 01/01/28 | 892,725 | ||||
| 750,000 | New Orleans LA Aviation Brd Gen Arpt N Term, Ser B, AMT | 5.00% | 01/01/29 | 885,435 | ||||
| 200,000 | New Orleans LA Aviation Brd Gen Arpt N Term, Ser B, AMT | 5.00% | 01/01/31 | 233,282 | ||||
| 1,160,000 | New Orleans LA Aviation Brd, Ser B, AMT | 5.00% | 01/01/31 | 1,314,257 | ||||
| 1,305,000 | New Orleans LA Wtr Rev | 5.00% | 12/01/34 | 1,522,243 | ||||
| 1,050,000 | New Orleans LA Wtr Rev Ref | 5.00% | 12/01/28 | 1,217,790 | ||||
| 625,000 | Shreveport LA Wtr & Swr Rev Junior Lien, Ser A, AGM | 5.00% | 12/01/32 | 782,269 | ||||
| 700,000 | Shreveport LA Wtr & Swr Rev, Ser A, AGM | 4.00% | 12/01/41 | 796,271 | ||||
| 1,650,000 | Shreveport LA Wtr & Swr Rev, Ser B, BAM | 5.00% | 12/01/30 | 1,905,288 | ||||
| 2,000,000 | Shreveport LA Wtr & Swr Rev, Ser B, BAM | 5.00% | 12/01/33 | 2,405,000 | ||||
| 33,636,068 | ||||||||
| Maryland – 1.2% | ||||||||
| 2,375,000 | Anne Arundel Cnty MD Consldtd Wtr & Swr Bond | 5.00% | 10/01/26 | 2,993,212 | ||||
| 565,000 | Baltimore Cnty MD Rev Ref Oak Crest Vlg Inc Fac | 4.00% | 01/01/39 | 609,946 | ||||
| 650,000 | Baltimore Cnty MD Rev Ref Oak Crest Vlg Inc Fac | 4.00% | 01/01/40 | 699,550 | ||||
| 600,000 | Baltimore Cnty MD Rev Ref Riderwood Vlg Inc Proj | 4.00% | 01/01/33 | 665,424 | ||||
| 685,000 | Baltimore Cnty MD Rev Ref Riderwood Vlg Inc Proj | 4.00% | 01/01/34 | 756,363 | ||||
| 650,000 | Baltimore Cnty MD Rev Ref Riderwood Vlg Inc Proj | 4.00% | 01/01/36 | 713,785 | ||||
| 700,000 | Baltimore Cnty MD Rev Ref Riderwood Vlg Inc Proj | 4.00% | 01/01/38 | 763,651 | ||||
| 1,120,000 | Baltimore MD Rev Ref Sr, Ser B | 5.00% | 07/01/33 | 1,295,347 | ||||
| Principal Value | Description | Stated Coupon | Stated Maturity | Value | ||||
| MUNICIPAL BONDS (Continued) | ||||||||
| Maryland (Continued) | ||||||||
| $1,000,000 | Baltimore MD Spl Oblig Ref E Baltimore Research Park Proj, Ser A | 5.00% | 09/01/38 | $1,048,210 | ||||
| 100,000 | Baltimore MD Spl Oblig Ref Sr Lien Harbor Point Proj, Ser A (b) | 2.75% | 06/01/24 | 99,358 | ||||
| 125,000 | Baltimore MD Spl Oblig Ref Sr Lien Harbor Point Proj, Ser A (b) | 2.80% | 06/01/25 | 123,989 | ||||
| 135,000 | Baltimore MD Spl Oblig Ref Sr Lien Harbor Point Proj, Ser A (b) | 2.85% | 06/01/26 | 133,897 | ||||
| 1,000,000 | Gaithersburg MD Econ Dev Rev Ref Proj Asbury MD Oblig Grp, Ser A | 4.50% | 01/01/25 | 1,070,690 | ||||
| 500,000 | MD St Econ Dev Corp Student Hsg Rev Bowie St Univ Proj | 4.00% | 07/01/40 | 503,415 | ||||
| 1,650,000 | MD St Econ Dev Corp Student Hsg Rev Bowie St Univ Proj | 5.00% | 07/01/55 | 1,753,554 | ||||
| 600,000 | MD St Econ Dev Corp Student Hsg Rev Ref Sr Univ MD Proj | 4.00% | 07/01/24 | 622,740 | ||||
| 2,490,000 | MD St Econ Dev Corp Student Hsg Rev Ref Univ MD Clg Park Projs, AGM | 5.00% | 06/01/35 | 2,857,798 | ||||
| 500,000 | MD St Hlth & Hgr Eductnl Facs Auth Rev Adventist Healthcare Oblig Grp, Ser A | 5.50% | 01/01/26 | 585,550 | ||||
| 800,000 | MD St Hlth & Hgr Eductnl Facs Auth Rev Ref Anne Arundel Hlth System, Ser A | 5.00% | 07/01/30 | 961,920 | ||||
| 1,000,000 | MD St Hlth & Hgr Eductnl Facs Auth Rev Ref Anne Arundel Hlth System, Ser A | 5.00% | 07/01/32 | 1,190,790 | ||||
| 790,000 | MD St Ref, Ser B | 5.00% | 08/01/24 | 928,400 | ||||
| 20,377,589 | ||||||||
| Massachusetts – 0.6% | ||||||||
| 925,000 | Ludlow MA | 4.00% | 02/01/32 | 1,081,834 | ||||
| 960,000 | Ludlow MA | 4.00% | 02/01/33 | 1,114,377 | ||||
| 2,000,000 | MA St Bay Transprtn Auth Sales Tax Rev Ref Sr, Ser B | 5.25% | 07/01/30 | 2,652,000 | ||||
| 250,000 | MA St Dev Fin Agy Rev Linden Ponds Inc Fac (b) | 5.00% | 11/15/28 | 276,290 | ||||
| 700,000 | MA St Dev Fin Agy Rev Umass Boston Student Hsg Proj (c) | 5.00% | 10/01/24 | 702,681 | ||||
| 2,000,000 | MA St Port Auth Spl Facs Rev Ref Bosfuel Proj, Ser A, AMT | 5.00% | 07/01/33 | 2,418,900 | ||||
| 2,500,000 | MA St Sch Bldg Auth Sales Tax Rev Ref Sr, Ser A | 5.00% | 08/15/30 | 2,711,625 | ||||
| 10,957,707 | ||||||||
| Michigan – 3.1% | ||||||||
| 240,000 | Detroit MI Downtown Dev Auth Tax Incr Rev Ref Catalyst Dev Proj, Ser A, AGM | 5.00% | 07/01/32 | 271,550 | ||||
| 500,000 | Detroit MI Downtown Dev Auth Tax Incr Rev Ref Catalyst Dev Proj, Ser A, AGM | 5.00% | 07/01/33 | 564,775 | ||||
| 250,000 | Genesee Cnty MI Swr Disp Sys Rev, Ser A, BAM | 4.00% | 06/01/30 | 299,707 | ||||
| 150,000 | Genesee Cnty MI Swr Disp Sys Rev, Ser A, BAM | 4.00% | 06/01/32 | 177,617 | ||||
| 155,000 | Genesee Cnty MI Swr Disp Sys Rev, Ser A, BAM | 4.00% | 06/01/36 | 180,529 | ||||
| 100,000 | Genesee Cnty MI Swr Disp Sys Rev, Ser A, BAM | 4.00% | 06/01/37 | 116,050 | ||||
| 150,000 | Genesee Cnty MI Swr Disp Sys Rev, Ser A, BAM | 4.00% | 06/01/38 | 173,522 | ||||
| 525,000 | Grand Rapids MI Santn Swr Sys Rev Ref | 5.00% | 01/01/45 | 662,077 | ||||
| 1,000,000 | Grand Rapids MI Santn Swr Sys Rev Ref | 4.00% | 01/01/50 | 1,156,130 | ||||
| 735,000 | Grand Traverse Cnty MI Hosp Fin Auth Munson Healthcare Oblig Grp, Ser A | 5.00% | 07/01/44 | 872,798 | ||||
| 1,125,000 | Great Lakes MI Wtr Auth Wtr Sply Sys Rev Ref Sr Lien, Ser C | 5.00% | 07/01/28 | 1,393,762 | ||||
| 575,000 | Kalamazoo MI Econ Dev Corp Heritage Cmnty of Kalamazoo Revel Creek Proj Temps 60, Ser B2 | 2.63% | 05/15/25 | 574,873 | ||||
| 1,000,000 | Marquette MI Brd of Light & Pwr Elec Utility Sys Rev Ref, Ser A | 5.00% | 07/01/29 | 1,218,840 | ||||
| 1,225,000 | MI St Bldg Auth Rev Ref, Ser I | 5.00% | 10/15/30 | 1,513,806 | ||||
| 890,000 | MI St Fin Auth Ltd Oblig Rev Ref Clg for Creative Studies Proj | 5.00% | 12/01/25 | 927,238 | ||||
| 325,000 | MI St Fin Auth Rev Loc Govt Loan Program Great Lakes Wtr Auth Ref, Ser C | 5.00% | 07/01/27 | 386,734 | ||||
| 1,200,000 | MI St Fin Auth Rev Ref 2nd Lien Great Lakes Wtr Auth, Ser C-7, NATL-RE | 5.00% | 07/01/23 | 1,342,140 | ||||
| Principal Value | Description | Stated Coupon | Stated Maturity | Value | ||||
| MUNICIPAL BONDS (Continued) | ||||||||
| Michigan (Continued) | ||||||||
| $2,895,000 | MI St Fin Auth Rev Ref 2nd Lien Great Lakes Wtr Auth, Ser C-7, NATL-RE | 5.00% | 07/01/24 | $3,357,824 | ||||
| 2,460,000 | MI St Fin Auth Rev Ref 2nd Lien Great Lakes Wtr Auth, Ser C-7, NATL-RE | 5.00% | 07/01/29 | 2,834,904 | ||||
| 4,050,000 | MI St Fin Auth Rev Ref Henry Ford Hlth Sys | 4.00% | 11/15/35 | 4,508,460 | ||||
| 2,565,000 | MI St Fin Auth Rev Ref Henry Ford Hlth Sys | 4.00% | 11/15/36 | 2,846,842 | ||||
| 7,905,000 | MI St Fin Auth Rev Ref Henry Ford Hlth Sys | 5.00% | 11/15/41 | 9,206,795 | ||||
| 2,500,000 | MI St Fin Auth Rev Ref Hosp Trinity Hlth Credit Grp, Ser A-MI | 5.00% | 12/01/47 | 2,739,900 | ||||
| 1,000,000 | MI St Fin Auth Rev Ref Loc Govt Loan Program Great Lakes Wtr Auth, Ser D-1 | 5.00% | 07/01/34 | 1,175,910 | ||||
| 500,000 | MI St Fin Auth Rev Ref Loc Govt Loan Program, Ser F1 | 3.80% | 10/01/22 | 511,615 | ||||
| 125,000 | MI St Fin Auth Rev Ref Loc Govt Loan Program, Ser F1 | 3.88% | 10/01/23 | 129,174 | ||||
| 2,000,000 | MI St Fin Auth Rev Sr Lien Great Lakes Wtr Auth, Ser C-3, AGM | 5.00% | 07/01/21 | 2,062,020 | ||||
| 565,000 | MI St Hosp Fin Auth Ref Ascenion Sr Credit, Ser F7 | 5.00% | 11/15/47 | 664,920 | ||||
| 1,000,000 | MI St Hosp Fin Auth Ref Ascension Hlth Sr Cr Grp, Ser F-4 | 5.00% | 11/15/47 | 1,240,090 | ||||
| 1,000,000 | MI St Univ Rev Brd of Trustees, Ser B | 5.00% | 02/15/34 | 1,265,600 | ||||
| 650,000 | Midland MI Pub Schs Sch Bldg & Site, Ser II | 5.00% | 05/01/35 | 828,503 | ||||
| 1,990,000 | Utica MI Cmnty Schs Ref Sch Bldg & Site | 5.00% | 05/01/31 | 2,427,482 | ||||
| 1,350,000 | Walled Lake MI Consol Sch Dist | 5.00% | 05/01/38 | 1,753,137 | ||||
| 2,800,000 | Wayne Cnty MI Arpt Auth Rev Ref, Ser F, AMT | 5.00% | 12/01/25 | 3,325,644 | ||||
| 52,710,968 | ||||||||
| Minnesota – 0.4% | ||||||||
| 370,000 | Duluth MN Indep Sch Dist #709 Ref, Ser B, COPS | 5.00% | 02/01/27 | 456,976 | ||||
| 480,000 | Hugo MN Chtr Sch Lease Rev Noble Academy Proj, Ser A | 4.00% | 07/01/22 | 493,925 | ||||
| 580,000 | Saint Paul MN Hsg & Redev Auth Healthcare Fac Rev Ref HealthPartners Oblig Grp, Ser A | 5.00% | 07/01/30 | 668,351 | ||||
| 500,000 | Saint Paul MN Hsg & Redev Auth Healthcare Fac Rev Ref HealthPartners Oblig Grp, Ser A | 5.00% | 07/01/32 | 572,105 | ||||
| 3,420,000 | Saint Paul MN Hsg & Redev Auth Healthcare Fac Rev Ref HealthPartners Oblig Grp, Ser A | 5.00% | 07/01/33 | 3,901,091 | ||||
| 500,000 | Saint Paul Park MN Sr Hsg & Healthcare Rev Ref Presbyterian Homes Bloomington Proj | 3.00% | 09/01/24 | 505,225 | ||||
| 400,000 | Saint Paul Park MN Sr Hsg & Healthcare Rev Ref Presbyterian Homes Bloomington Proj | 3.13% | 09/01/25 | 404,824 | ||||
| 7,002,497 | ||||||||
| Mississippi – 0.3% | ||||||||
| 2,000,000 | MS St, Ser A | 5.00% | 11/01/33 | 2,455,400 | ||||
| 985,000 | MS St, Ser B | 5.00% | 12/01/32 | 1,214,899 | ||||
| 500,000 | West Rankin MS Utility Auth Rev, AGM | 5.00% | 01/01/32 | 571,020 | ||||
| 1,215,000 | West Rankin MS Utility Auth Rev, AGM | 5.00% | 01/01/33 | 1,383,059 | ||||
| 5,624,378 | ||||||||
| Missouri – 1.2% | ||||||||
| 220,000 | Jackson Cnty MO Spl Oblig Ref Truman Sports Complex Proj | 5.00% | 12/01/22 | 237,679 | ||||
| 700,000 | Jackson Cnty MO Spl Oblig Ref Truman Sports Complex Proj | 5.00% | 12/01/31 | 795,046 | ||||
| 1,670,000 | Joplin MO Indl Dev Auth Hlth Facs Rev Ref Freeman Hlth System | 5.00% | 02/15/26 | 1,884,278 | ||||
| 3,385,000 | Kansas City MO Indl Dev Auth Arpt Spl Oblig Kansas City Intrnl Arpt Terminal Mod Proj, Ser B, AMT | 5.00% | 03/01/37 | 3,998,870 | ||||
| 220,000 | Lincoln Cnty MO Pub Wtr Sply Dist #1 Ref, COPS | 4.00% | 07/01/30 | 249,927 | ||||
| 415,000 | Lincoln Cnty MO Pub Wtr Sply Dist #1 Ref, COPS | 4.00% | 07/01/31 | 468,552 | ||||
| 1,000,000 | Lincoln Cnty MO Pub Wtr Sply Dist #1 Ref, COPS | 4.00% | 07/01/38 | 1,104,000 | ||||
| 3,000,000 | MO Jt Muni Elec Utility Commn Pwr Proj Rev Ref, Ser A | 5.00% | 12/01/40 | 3,480,570 | ||||
| 1,200,000 | MO St Hlth & Eductnl Facs Auth Hlth Facs Rev Ref Coxhealth, Ser A | 5.00% | 11/15/32 | 1,394,292 | ||||
| Principal Value | Description | Stated Coupon | Stated Maturity | Value | ||||
| MUNICIPAL BONDS (Continued) | ||||||||
| Missouri (Continued) | ||||||||
| $750,000 | MO St Hlth & Eductnl Facs Auth Hlth Facs Rev Ref Mosaic Hlth Sys, Ser A | 5.00% | 02/15/32 | $941,812 | ||||
| 685,000 | MO St Hlth & Eductnl Facs Auth Hlth Facs Rev Ref Mosaic Hlth Sys, Ser A | 4.00% | 02/15/39 | 777,269 | ||||
| 160,000 | MO St Hlth & Eductnl Facs Auth Lutheran Sr Svcs | 5.00% | 02/01/23 | 172,200 | ||||
| 3,500,000 | Saint Louis MO Gen Fnd Rev Trans | 2.00% | 06/01/21 | 3,527,930 | ||||
| 1,040,000 | Saint Louis MO Muni Fin Corp Sales Tax Leasehold Rev Ref | 5.00% | 02/15/28 | 1,204,965 | ||||
| 20,237,390 | ||||||||
| Montana – 0.3% | ||||||||
| 2,395,000 | MT St Fac Fin Auth Hlth Care Facs Rev Montana Children’s Home and Hosp Proj, Ser A | 4.00% | 07/01/40 | 2,523,133 | ||||
| 740,000 | MT St Fac Fin Auth Rev Ref | 5.00% | 02/15/25 | 867,709 | ||||
| 130,000 | MT St Fac Fin Auth Rev Ref | 5.00% | 02/15/29 | 158,077 | ||||
| 2,000,000 | MT St Fac Fin Auth Rev Ref Scl Hlth Sys, Ser A | 4.00% | 01/01/36 | 2,323,120 | ||||
| 5,872,039 | ||||||||
| Nebraska – 0.6% | ||||||||
| 1,745,000 | Centrl Plains Energy Proj NE Gas Proj Rev Proj #3 | 5.00% | 09/01/27 | 1,869,767 | ||||
| 5,870,000 | Centrl Plains Energy Proj NE Gas Proj Rev Ref Proj #3, Ser A | 5.00% | 09/01/29 | 7,389,743 | ||||
| 500,000 | NE St Pub Pwr Dist Rev Gen, Ser C | 5.00% | 01/01/35 | 590,400 | ||||
| 9,849,910 | ||||||||
| Nevada – 0.5% | ||||||||
| 750,000 | Carson City NV Hosp Rev Ref Carson Tahoe Regl Med Ctr, Ser A | 5.00% | 09/01/30 | 888,780 | ||||
| 1,685,000 | Clark Cnty NV Detention Ctr | 4.00% | 06/01/35 | 1,989,648 | ||||
| 1,010,000 | Clark Cnty NV Impt Dist Ref Spl Loc Impt #151 | 4.50% | 08/01/23 | 1,052,026 | ||||
| 275,000 | Clark Cnty NV Sch Dist Ref Bldg Tcrs, Ser A, BAM | 5.00% | 06/15/30 | 337,502 | ||||
| 410,000 | Las Vegas NV Spl Impt Dist #808 & #810 Ref | 5.00% | 06/01/22 | 427,142 | ||||
| 120,000 | North Las Vegas NV Loc Impt Vly Vista Spl Impt Dist #64 | 3.50% | 06/01/24 | 121,235 | ||||
| 150,000 | North Las Vegas NV Loc Impt Vly Vista Spl Impt Dist #64 | 3.75% | 06/01/25 | 152,925 | ||||
| 185,000 | North Las Vegas NV Loc Impt Vly Vista Spl Impt Dist #64 | 3.75% | 06/01/26 | 188,558 | ||||
| 260,000 | North Las Vegas NV Loc Impt Vly Vista Spl Impt Dist #64 | 3.75% | 06/01/27 | 263,897 | ||||
| 335,000 | NV Dept of Business & Industry NV Doral Academy, Ser A (b) | 5.00% | 07/15/27 | 371,438 | ||||
| 300,000 | Reno NV Capital Impt Rev Ref, Ser A-1, AGM | 5.00% | 06/01/29 | 367,800 | ||||
| 950,000 | Reno NV Capital Impt Rev Ref, Ser A-1, AGM | 5.00% | 06/01/30 | 1,158,259 | ||||
| 275,000 | Reno NV Capital Impt Rev Ref, Ser A-1, AGM | 5.00% | 06/01/31 | 333,743 | ||||
| 1,075,000 | Sparks NV Tourism Impt Dist #1 Rev Ref Sales Tax Sr, Ser A (b) | 2.50% | 06/15/24 | 1,065,787 | ||||
| 8,718,740 | ||||||||
| New Hampshire – 0.2% | ||||||||
| 1,000,000 | National Fin Auth NH Sol Wst Disp Rev Var Ref Wst Mgmt Inc Proj, Ser A-1, AMT (Mandatory put 07/01/24) | 2.15% | 09/01/25 | 1,036,450 | ||||
| 2,740,000 | NH St Hlth & Edu Facs Auth Rev Concord Hosp Trust | 5.00% | 10/01/42 | 3,199,553 | ||||
| 4,236,003 | ||||||||
| New Jersey – 1.7% | ||||||||
| 450,000 | NJ St Econ Dev Auth Mtr Vehcl Surcharge Rev Ref Sub, Ser A, BAM | 5.00% | 07/01/28 | 539,235 | ||||
| 500,000 | NJ St Econ Dev Auth Ref, Ser A, BAM | 5.00% | 06/15/23 | 549,630 | ||||
| 490,000 | NJ St Econ Dev Auth Spl Fac Rev Ref Port Newark Container Terminal LLC Proj, AMT | 5.00% | 10/01/25 | 545,556 | ||||
| 1,000,000 | NJ St Healthcare Facs Fing Auth Rev Ref Hackensack Meridian Hlth, Ser A | 5.00% | 07/01/24 | 1,159,870 | ||||
| 1,290,000 | NJ St Transprtn Trust Fund Auth Cap Apprec Transprtn Sys, Ser C, AMBAC | (e) | 12/15/25 | 1,146,578 | ||||
| Principal Value | Description | Stated Coupon | Stated Maturity | Value | ||||
| MUNICIPAL BONDS (Continued) | ||||||||
| New Jersey (Continued) | ||||||||
| $165,000 | NJ St Transprtn Trust Fund Auth Fed Hwy Reimbursement Nts, Ser A-1, GARVEE | 5.00% | 06/15/28 | $191,591 | ||||
| 1,500,000 | NJ St Transprtn Trust Fund Auth Ref Transprtn Sys Bonds, Ser A | 5.00% | 12/15/28 | 1,768,455 | ||||
| 500,000 | NJ St Transprtn Trust Fund Auth Ref Transprtn Sys, Ser A | 5.00% | 12/15/30 | 582,085 | ||||
| 3,040,000 | NJ St Transprtn Trust Fund Auth Ref Transptrn Sys, Ser A | 5.00% | 12/15/26 | 3,507,522 | ||||
| 400,000 | NJ St Transprtn Trust Fund Auth Transprtn Program, Ser AA | 4.00% | 06/15/27 | 410,340 | ||||
| 1,400,000 | NJ St Transprtn Trust Fund Auth Transprtn Sys, Ser D | 5.25% | 12/15/23 | 1,570,646 | ||||
| 105,000 | NJ St Transprtn Trust Fund Auth Transprtn Sys, Ser D | 5.00% | 12/15/24 | 118,946 | ||||
| 220,000 | NJ St Transprtn Trust Fund Auth, Ser BB | 5.00% | 06/15/31 | 255,369 | ||||
| 1,000,000 | NJ St Transprtn Trust Fund Auth, Ser BB | 5.00% | 06/15/33 | 1,145,710 | ||||
| 6,010,000 | Tobacco Settlement Fing Corp NJ Ref Sub, Ser B | 5.00% | 06/01/46 | 6,801,817 | ||||
| 500,000 | Tobacco Settlement Fing Corp NJ Ref, Ser A | 5.00% | 06/01/27 | 623,100 | ||||
| 1,850,000 | Tobacco Settlement Fing Corp NJ Ref, Ser A | 5.00% | 06/01/37 | 2,232,229 | ||||
| 5,505,000 | Tobacco Settlement Fing Corp NJ Ref, Ser A | 5.25% | 06/01/46 | 6,444,759 | ||||
| 29,593,438 | ||||||||
| New Mexico – 0.6% | ||||||||
| 265,000 | Albuquerque NM Refuse Removal & Disp Rev | 5.00% | 07/01/31 | 350,190 | ||||
| 185,000 | Albuquerque NM Refuse Removal & Disp Rev | 5.00% | 07/01/32 | 242,774 | ||||
| 290,000 | Albuquerque NM Refuse Removal & Disp Rev | 5.00% | 07/01/33 | 378,331 | ||||
| 1,500,000 | Farmington NM Poll Control Rev Ref Pub Svc NM San Juan, Ser E (Mandatory put 06/01/24) | 1.15% | 06/01/40 | 1,506,120 | ||||
| 565,000 | Los Ranchos De Albuquerque NM Eductnl Facs Rev Ref Albuquerque Academy Proj | 4.00% | 09/01/33 | 646,496 | ||||
| 375,000 | Los Ranchos De Albuquerque NM Eductnl Facs Rev Ref Albuquerque Academy Proj | 4.00% | 09/01/34 | 424,245 | ||||
| 300,000 | Los Ranchos De Albuquerque NM Eductnl Facs Rev Ref Albuquerque Academy Proj | 4.00% | 09/01/35 | 335,181 | ||||
| 450,000 | Lower Petroglyphs Pub Impt Dist NM Spl Levy Rev Ref | 4.00% | 10/01/23 | 455,346 | ||||
| 230,000 | Lower Petroglyphs Pub Impt Dist NM Spl Levy Rev Ref | 4.20% | 10/01/24 | 235,239 | ||||
| 240,000 | Lower Petroglyphs Pub Impt Dist NM Spl Levy Rev Ref | 4.30% | 10/01/25 | 246,840 | ||||
| 250,000 | Lower Petroglyphs Pub Impt Dist NM Spl Levy Rev Ref | 4.45% | 10/01/26 | 259,195 | ||||
| 260,000 | Lower Petroglyphs Pub Impt Dist NM Spl Levy Rev Ref | 4.55% | 10/01/27 | 270,943 | ||||
| 365,000 | Lower Petroglyphs Pub Impt Dist NM Spl Levy Rev Ref | 5.00% | 10/01/33 | 385,933 | ||||
| 825,000 | NM St Hosp Equipment Loan Council Hosp Rev Ref | 5.00% | 06/01/32 | 996,905 | ||||
| 1,000,000 | NM St Hosp Equipment Loan Council Hosp Rev Ref | 4.00% | 06/01/33 | 1,100,070 | ||||
| 1,360,000 | NM St Hosp Equipment Loan Council Hosp Rev Ref | 4.00% | 06/01/34 | 1,489,390 | ||||
| 520,000 | Santa Fe NM Retmnt Fac Rev El Castillo Retmnt Proj, Ser A | 5.00% | 05/15/34 | 559,218 | ||||
| 9,882,416 | ||||||||
| New York – 5.6% | ||||||||
| 175,000 | Long Island NY Pwr Auth Elec Sys Rev Ref, Ser A | 5.00% | 09/01/38 | 225,743 | ||||
| 500,000 | Long Island NY Pwr Auth Elec Sys Rev Ref, Ser A | 4.00% | 09/01/39 | 592,570 | ||||
| 1,975,000 | Met Transprtn Auth NY Rev Ref Transptrn, Subser C-1 | 5.00% | 11/15/34 | 2,078,924 | ||||
| 1,500,000 | Met Transprtn Auth NY Rev Transprtn, Ser A-2S, BANS | 4.00% | 02/01/22 | 1,499,025 | ||||
| 3,180,000 | Met Transprtn Auth NY Rev Transprtn, Ser B-1, BANS | 5.00% | 05/15/22 | 3,226,778 | ||||
| 4,000,000 | Met Transprtn Auth NY Rev Transptrn, Subser D-1 | 5.00% | 11/15/39 | 4,156,640 | ||||
| 840,000 | Monroe Cnty NY Indl Dev Corp Rev Ref Nazareth Clg of Rochester Proj, Ser A | 5.00% | 10/01/23 | 910,300 | ||||
| 4,285,000 | New York City NY Muni Wtr Fin Auth Wtr & Swr Sys Rev Ref 2nd Gen Resolution, Subser CC-1 | 4.00% | 06/15/33 | 4,896,941 | ||||
| 5,000,000 | New York City NY Muni Wtr Fin Auth Wtr & Swr Sys Rev Ref, Ser GG | 5.00% | 06/15/39 | 5,867,050 | ||||
| 3,550,000 | New York City NY Muni Wtr Fin Auth Wtr & Swr Sys Rev, Ser DD-1 | 4.00% | 06/15/37 | 4,073,589 | ||||
| Principal Value | Description | Stated Coupon | Stated Maturity | Value | ||||
| MUNICIPAL BONDS (Continued) | ||||||||
| New York (Continued) | ||||||||
| $1,000,000 | New York City NY Transitional Fin Auth Rev Future Tax Secured Sub Fiscal 2016, Ser A-1 | 5.00% | �� | 08/01/37 | $1,178,220 | |||
| 1,500,000 | New York City NY Transitional Fin Auth Rev Future Tax Sub, Subser E-1 | 5.00% | 02/01/37 | 1,778,085 | ||||
| 1,350,000 | New York City NY Transitional Fin Auth Rev Sub Future Tax Secured Fiscal 1999, Ser A, Subser E-1 | 5.00% | 02/01/36 | 1,635,944 | ||||
| 5,415,000 | New York City NY Transitional Fin Auth Rev Sub Future Tax Secured Fiscal 1999, Ser A, Subser E-1 | 5.00% | 02/01/40 | 6,497,675 | ||||
| 10,400,000 | New York NY Adj Fiscal 2020, Subser B-3 (a) | 0.36% | 10/01/46 | 10,400,000 | ||||
| 1,000,000 | New York NY Fiscal 2020, Ser B-1 | 4.00% | 10/01/35 | 1,149,110 | ||||
| 415,000 | New York NY Fiscal 2020, Ser B-1 | 4.00% | 10/01/37 | 472,162 | ||||
| 2,750,000 | New York NY, Ser D-1 | 4.00% | 03/01/42 | 3,097,875 | ||||
| 3,500,000 | New York NY, Ser D-1 | 4.00% | 03/01/44 | 3,924,515 | ||||
| 1,015,000 | New York NY, Subser F-1 | 5.00% | 04/01/36 | 1,226,100 | ||||
| 300,000 | NY St Dorm Auth Revs Non St Supported Debt Ref Orange Regl Med Ctr (b) | 5.00% | 12/01/25 | 352,434 | ||||
| 85,000 | NY St Dorm Auth Revs Non St Supported Debt Unrefunded Pace Univ, Ser A | 5.00% | 05/01/23 | 91,754 | ||||
| 9,000,000 | NY St Dorm Auth St Personal Income Tax Rev Rans Subordinate, Ser B | 5.00% | 03/31/21 | 9,178,200 | ||||
| 2,850,000 | NY St Dorm Auth St Personal Income Tax Rev Ref, Ser E | 5.00% | 03/15/34 | 3,366,619 | ||||
| 1,000,000 | NY St Dorm Auth St Personal Income Tax Rev, Ser B | 5.00% | 03/15/30 | 1,058,570 | ||||
| 1,800,000 | NY St Mtge Agy Homeowner Mtge Rev Var, Ser 142, AMT (a) | 0.14% | 10/01/37 | 1,800,000 | ||||
| 2,000,000 | NY St Transprtn Dev Corpspl Fac Rev Delta Air Lines Inc Laguardia Arpt Terminals C&D Redev, AMT | 4.00% | 10/01/30 | 2,054,380 | ||||
| 2,500,000 | NY St Transprtn Dev Corpspl Fac Rev Delta Air Lines Inc Laguardia Arpt Terminals C&D Redev, AMT | 5.00% | 10/01/35 | 2,730,625 | ||||
| 500,000 | Port Auth of New York & New Jersey NY Consol One Hundred Eighty Fifth Ref, AMT | 5.00% | 09/01/23 | 561,535 | ||||
| 465,000 | Port Auth of New York & New Jersey NY Ref Consol, Ser 186, AMT | 5.00% | 10/15/35 | 528,975 | ||||
| 5,000,000 | Port Auth of New York & New Jersey NY Ref Consol, Ser 198 | 5.25% | 11/15/56 | 5,900,150 | ||||
| 3,500,000 | Tsasc Inc NY Tsasc Inc Rev Ref Turbo Sub, Ser B | 5.00% | 06/01/45 | 3,636,885 | ||||
| 4,475,000 | Utility Debt Securitization Auth NY Restructuring Bonds Ref | 5.00% | 12/15/33 | 5,431,218 | ||||
| 400,000 | Yonkers NY Econ Dev Corp Eductnl Rev Chrt Sch Edu Excellence Proj, Ser A | 4.00% | 10/15/29 | 423,336 | ||||
| 96,001,927 | ||||||||
| North Carolina – 1.2% | ||||||||
| 250,000 | Buncombe Cnty NC Ltd Oblig Ref Rev, Ser A | 5.00% | 06/01/29 | 333,400 | ||||
| 225,000 | Buncombe Cnty NC Ltd Oblig Ref Rev, Ser A | 5.00% | 06/01/30 | 306,050 | ||||
| 300,000 | Buncombe Cnty NC Ltd Oblig Ref Rev, Ser A | 5.00% | 06/01/32 | 402,672 | ||||
| 575,000 | Charlotte-Mecklenburg NC Hosp Auth Healthcare Sys Rev Ref Carolinas Healthcare Sys, Ser A | 5.00% | 01/15/34 | 679,242 | ||||
| 750,000 | Greenville NC Comb Enterprise Sys Rev Ref | 5.00% | 04/01/28 | 916,462 | ||||
| 1,330,000 | Monroe NC Comb Enterprise Sys Rev Ref | 5.00% | 03/01/28 | 1,602,238 | ||||
| 1,000,000 | NC St Agric & Tech Univ Ref Gen, Ser A | 5.00% | 10/01/40 | 1,121,390 | ||||
| 900,000 | NC St Capital Facs Fin Agy Student Rev Ref Hsg NC A&T Univ Fdtn Proj, Ser A, AGC | 5.00% | 06/01/26 | 1,067,544 | ||||
| 3,700,000 | NC St Med Care Commn Healthcare Facs Rev Rex Healthcare, Ser A | 4.00% | 07/01/49 | 4,088,352 | ||||
| 1,270,000 | NC St Med Care Commn Hlth Care Facs Rev the Presbyterian Homes Oblig Grp, Ser A | 5.00% | 10/01/45 | 1,473,238 | ||||
| 1,500,000 | NC St Med Care Commn Retmnt Facs Rev Pennybyrn at Maryfield Proj, Ser A | 5.00% | 10/01/50 | 1,610,250 | ||||
| Principal Value | Description | Stated Coupon | Stated Maturity | Value | ||||
| MUNICIPAL BONDS (Continued) | ||||||||
| North Carolina (Continued) | ||||||||
| $630,000 | NC St Med Care Commn Retmnt Facs Rev Ref United Methodist Retmnt Homes, Ser A | 5.00% | 10/01/29 | $682,189 | ||||
| 470,000 | NC St Med Care Commn Retmnt Facs Rev Ref United Methodist Retmnt Homes, Ser A | 5.00% | 10/01/32 | 504,399 | ||||
| 750,000 | NC St Med Care Commn Retmnt Facs Rev Ref United Methodist Retmnt Homes, Ser A | 5.00% | 10/01/37 | 798,165 | ||||
| 500,000 | NC St Med Care Commn Retmnt Facs Rev Ref United Methodist Retmnt Homes, Ser A | 5.00% | 10/01/47 | 527,690 | ||||
| 3,000,000 | NC St Turnpike Auth Ref Sr Lien, AGM | 5.00% | 01/01/38 | 3,683,760 | ||||
| 19,797,041 | ||||||||
| Ohio – 4.2% | ||||||||
| 750,000 | Akron Bath Copley Jt Twp OH Hosp Dist Ref Summa Hlth Oblig Grp Hosp Facs Rev | 4.00% | 11/15/35 | 838,762 | ||||
| 900,000 | Akron Bath Copley Jt Twp OH Hosp Dist Ref Summa Hlth Oblig Grp Hosp Facs Rev | 4.00% | 11/15/36 | 1,001,880 | ||||
| 2,600,000 | Allen Cnty OH Hosp Facs Rev Ref, Ser A | 5.00% | 08/01/42 | 3,113,994 | ||||
| 100,000 | Bowling Green OH St Univ Ref, Ser A | 4.00% | 06/01/38 | 113,057 | ||||
| 195,000 | Bowling Green OH St Univ Ref, Ser A | 4.00% | 06/01/39 | 219,720 | ||||
| 13,500,000 | Buckeye OH Tobacco Settlement Fing Auth Ref Sr, Class 2, Ser B-2 | 5.00% | 06/01/55 | 14,454,045 | ||||
| 1,000,000 | Buckeye OH Tobacco Settlement Fing Auth Ref Sr, Ser A-2, Class 1 | 5.00% | 06/01/27 | 1,250,590 | ||||
| 135,000 | Butler Cnty OH Hosp Facs Ref UC Hlth | 5.00% | 11/15/30 | 166,173 | ||||
| 1,500,000 | Butler Cnty OH Hosp Facs Ref UC Hlth | 5.00% | 11/15/31 | 1,837,200 | ||||
| 1,000,000 | Butler Cnty OH Hosp Facs Ref UC Hlth | 5.00% | 11/15/32 | 1,218,200 | ||||
| 1,000,000 | Chillicothe OH City Sch Dist Ref, AGM | 4.00% | 12/01/31 | 1,102,250 | ||||
| 80,000 | Cleveland OH Pub Pwr Sys Rev Prerefunded Ref Ser A, AGM | 5.00% | 11/15/24 | 94,850 | ||||
| 420,000 | Cleveland OH Pub Pwr Sys Rev Unrefunded Ref Ser A, AGM | 5.00% | 11/15/24 | 497,032 | ||||
| 1,255,000 | Columbus OH Swr Rev Ref Sys | 5.00% | 06/01/26 | 1,489,798 | ||||
| 650,000 | Franklin Cnty OH Convention Facs Auth Hotel Proj Rev Grtr Columbus Convention Cntr Hotel Exp Proj | 5.00% | 12/01/37 | 656,117 | ||||
| 1,500,000 | Franklin Cnty OH Convention Facs Auth Hotel Proj Rev Grtr Columbus Convention Cntr Hotel Exp Proj | 5.00% | 12/01/44 | 1,507,470 | ||||
| 700,000 | Hamilton Cnty OH Healthcare Facs Rev Christ Hosp Proj | 5.25% | 06/01/27 | 742,777 | ||||
| 310,000 | Hamilton Cnty OH Hosp Facs Rev Ref Trihealth Inc Oblig Grp Proj, Ser A | 5.00% | 08/15/31 | 403,915 | ||||
| 250,000 | Hamilton Cnty OH Hosp Facs Rev Ref Trihealth Inc Oblig Grp Proj, Ser A | 5.00% | 08/15/32 | 323,430 | ||||
| 380,000 | Hamilton Cnty OH Hosp Facs Rev Ref Trihealth Inc Oblig Grp Proj, Ser A | 5.00% | 08/15/33 | 488,828 | ||||
| 1,000,000 | Lancaster OH Port Auth Gas Rev Ref, Ser A (Mandatory put 02/01/25) | 5.00% | 08/01/49 | 1,173,500 | ||||
| 960,000 | Miami Cnty OH Hosp Facs Rev Ref & Impt Kettering Hlth Network Oblig Grp | 5.00% | 08/01/32 | 1,189,680 | ||||
| 1,000,000 | Miami Cnty OH Hosp Facs Rev Ref & Impt Kettering Hlth Network Oblig Grp | 5.00% | 08/01/33 | 1,233,410 | ||||
| 3,000,000 | Miami Cnty OH Hosp Facs Rev Ref & Impt Kettering Hlth Network Oblig Grp | 5.00% | 08/01/36 | 3,664,710 | ||||
| 575,000 | Miamisburg OH City Sch Dist Ref | 5.00% | 12/01/35 | 689,856 | ||||
| 5,250,000 | OH St Air Quality Dev Auth Exempt Facs Rev AMG Vanadium Proj, AMT (b) | 5.00% | 07/01/49 | 5,353,162 | ||||
| 1,000,000 | OH St Air Quality Dev Auth Ref American Elec Pwr Company Proj, Ser B, AMT (Mandatory put 10/01/24) | 2.10% | 07/01/28 | 1,034,250 | ||||
| 2,225,000 | OH St Air Quality Dev Auth Ref OH Vly Elec Corp Proj, Ser A | 3.25% | 09/01/29 | 2,248,340 | ||||
| Principal Value | Description | Stated Coupon | Stated Maturity | Value | ||||
| MUNICIPAL BONDS (Continued) | ||||||||
| Ohio (Continued) | ||||||||
| $1,000,000 | OH St Hgr Edu, Ser A | 5.00% | 05/01/33 | $1,186,680 | ||||
| 1,000,000 | OH St Hgr Eductnl Fac Commn Denison Univ Proj | 5.00% | 11/01/38 | 1,258,280 | ||||
| 1,000,000 | OH St Hgr Eductnl Fac Commn Ref Rev Judson Oblig Grp 2020 Proj, Ser A | 5.00% | 12/01/45 | 1,081,350 | ||||
| 150,000 | OH St Hosp Rev Ref, Ser A | 5.00% | 01/15/33 | 188,981 | ||||
| 325,000 | OH St Hosp Rev Ref, Ser A | 5.00% | 01/15/35 | 406,478 | ||||
| 500,000 | OH St Hosp Rev Ref, Ser A | 4.00% | 01/15/38 | 562,365 | ||||
| 2,000,000 | OH St Spl Oblig, Ser A-2 | 5.00% | 04/01/30 | 2,362,220 | ||||
| 1,880,000 | OH St Univ Gen Recpts Spl Purpose, Ser A | 5.00% | 06/01/28 | 2,085,597 | ||||
| 1,000,000 | OH St Wtr Dev Auth Rev Wtr Dev Fresh Wtr, Ser A | 5.00% | 12/01/21 | 1,051,650 | ||||
| 2,500,000 | OH St, Ser T | 5.00% | 05/01/32 | 3,127,625 | ||||
| 5,325,000 | Ross Cnty OH Hosp Rev Ref Adena Hlth Sys Oblig Grp Proj | 5.00% | 12/01/39 | 6,456,190 | ||||
| 2,000,000 | Sthrn OH Port Exempt Fac Rev Purecycle Proj, Ser A, AMT | 6.50% | 12/01/30 | 2,004,840 | ||||
| 1,500,000 | Sthrn OH Port Exempt Fac Rev Purecycle Proj, Ser A, AMT | 7.00% | 12/01/42 | 1,504,170 | ||||
| 71,383,422 | ||||||||
| Oklahoma – 0.7% | ||||||||
| 900,000 | Catoosa OK Indl Auth Sales Tax Rev | 4.50% | 10/01/32 | 866,799 | ||||
| 750,000 | OK St Dev Fin Auth Hlth Sys Rev OU Medicine Proj, Ser B | 5.25% | 08/15/48 | 866,558 | ||||
| 2,815,000 | Oklahoma City OK Arpt Trust Junior Lien, AMT | 5.00% | 07/01/34 | 3,381,012 | ||||
| 1,040,000 | Oklahoma City OK Arpt Trust Junior Lien, AMT | 5.00% | 07/01/47 | 1,209,218 | ||||
| 1,000,000 | Oklahoma Cnty OK Fin Auth Eductnl Facs Lease Rev Midwest City De City Pub Schs Proj | 5.00% | 10/01/25 | 1,212,050 | ||||
| 1,000,000 | Oklahoma Cnty OK Fin Auth Eductnl Facs Lease Rev Midwest City De City Pub Schs Proj | 5.00% | 10/01/26 | 1,243,820 | ||||
| 1,000,000 | Tulsa Cnty OK Indl Auth Sr Living Cmnty Rev Ref Montereau Inc Proj | 5.00% | 11/15/25 | 1,077,270 | ||||
| 250,000 | Tulsa Cnty OK Indl Auth Sr Living Cmnty Rev Ref Montereau Inc Proj | 5.00% | 11/15/26 | 271,650 | ||||
| 1,000,000 | Weatherford OK Indl Trust Eductnl Facs Lease Rev Weatherford Pub Schs Proj | 5.00% | 03/01/31 | 1,261,520 | ||||
| 11,389,897 | ||||||||
| Oregon – 1.7% | ||||||||
| 500,000 | Clackamas Cnty OR Hosp Fac Auth Rev Ref Rose Villa Proj, Ser A | 5.25% | 11/15/50 | 528,560 | ||||
| 170,000 | Clackamas Cnty OR Hosp Fac Auth Rev Ref Sr Living Willamette View Proj, Ser A | 4.00% | 05/15/26 | 179,318 | ||||
| 250,000 | Clackamas Cnty OR Hosp Fac Auth Rev Ref Sr Living Willamette View Proj, Ser A | 5.00% | 11/15/32 | 271,485 | ||||
| 1,500,000 | Medford OR Hosp Facs Auth Rev Ref Asante Proj, Ser A | 5.00% | 08/15/35 | 1,915,635 | ||||
| 1,000,000 | Medford OR Hosp Facs Auth Rev Ref Asante Proj, Ser A | 5.00% | 08/15/36 | 1,271,390 | ||||
| 1,080,000 | Medford OR Hosp Facs Auth Rev Ref Asante Proj, Ser A | 5.00% | 08/15/45 | 1,312,751 | ||||
| 75,000 | Multnomah Cnty OR Hosp Facs Auth Rev Ref Terwilliger Plaza | 5.00% | 12/01/20 | 75,158 | ||||
| 4,000,000 | OR St Dept of Admin Svcs Lottery Rev, Ser A | 5.00% | 04/01/34 | 4,956,960 | ||||
| 2,035,000 | OR St Dept of Admin Svcs Lottery Rev, Ser A | 5.00% | 04/01/35 | 2,515,871 | ||||
| 1,100,000 | OR St Facs Auth Rev Ref Univ Portland, Ser A | 5.00% | 04/01/32 | 1,231,703 | ||||
| 500,000 | Oregon City OR | 4.00% | 06/01/37 | 582,285 | ||||
| 1,060,000 | Oregon City OR | 4.00% | 06/01/38 | 1,230,904 | ||||
| 2,450,000 | Port of Portland OR Arpt Rev Portland Intl Arpt, Ser 25B, AMT | 5.00% | 07/01/37 | 2,940,784 | ||||
| 1,500,000 | Port of Portland OR Arpt Rev, Ser 24B, AMT | 5.00% | 07/01/33 | 1,749,495 | ||||
| 2,500,000 | Portland OR Swr Sys Rev 2nd Lien, Ser A | 4.50% | 05/01/31 | 2,972,200 | ||||
| 4,925,000 | Tri-Cnty OR Met Transprtn Dist, Ser A, GARVEE | 5.00% | 10/01/31 | 6,131,132 | ||||
| 29,865,631 | ||||||||
| Principal Value | Description | Stated Coupon | Stated Maturity | Value | ||||
| MUNICIPAL BONDS (Continued) | ||||||||
| Pennsylvania – 6.6% | ||||||||
| $500,000 | Allegheny Cnty PA Hosp Dev Auth Ref Allegheny Hlth Network Oblig Grp Issue, Ser A | 5.00% | 04/01/26 | $604,885 | ||||
| 1,500,000 | Allegheny Cnty PA Hosp Dev Auth Ref Allegheny Hlth Network Oblig Grp Issue, Ser A | 5.00% | 04/01/32 | 1,819,950 | ||||
| 1,200,000 | Allegheny Cnty PA Hosp Dev Auth Ref Univ Pittsburgh Med Ctr, Ser A | 5.00% | 07/15/32 | 1,518,216 | ||||
| 505,000 | Allegheny Cnty PA Hosp Dev Auth Ref Univ Pittsburgh Med Ctr, Ser A | 5.00% | 07/15/34 | 632,679 | ||||
| 2,300,000 | Allegheny Cnty PA Hosp Dev Auth Ref Univ Pittsburgh Med Ctr, Ser A | 4.00% | 07/15/36 | 2,611,305 | ||||
| 1,820,000 | Allegheny Cnty PA Hosp Dev Auth Ref Univ Pittsburgh Med Ctr, Ser A | 4.00% | 07/15/38 | 2,046,372 | ||||
| 900,000 | Armstrong PA Sch Dist Ref, Ser A, BAM | 5.00% | 03/15/31 | 1,151,505 | ||||
| 1,055,000 | Armstrong PA Sch Dist Ref, Ser A, BAM | 4.00% | 03/15/36 | 1,237,420 | ||||
| 500,000 | Armstrong PA Sch Dist Ref, Ser A, BAM | 4.00% | 03/15/37 | 584,280 | ||||
| 460,000 | Berks Cnty PA Indl Dev Auth Healthcare Facs Rev Ref Highlands at Wyomissing, Ser A | 5.00% | 05/15/32 | 501,382 | ||||
| 500,000 | Berks Cnty PA Muni Auth Ref Tower Hlth Proj, Ser B-1 (Mandatory put 02/01/25) | 5.00% | 02/01/40 | 538,105 | ||||
| 735,000 | Bucks Cnty PA Indl Dev Auth Hosp Rev St Luke’s Univ Hlth Network Proj | 4.00% | 08/15/38 | 814,159 | ||||
| 1,050,000 | Bucks Cnty PA Indl Dev Auth Hosp Rev St Luke’s Univ Hlth Network Proj | 4.00% | 08/15/44 | 1,136,016 | ||||
| 1,185,000 | Bucks Cnty PA Indl Dev Auth Ref Pennswood Vlg Proj, Ser A | 5.00% | 10/01/32 | 1,290,512 | ||||
| 415,000 | Bucks Cnty PA Indl Dev Auth Ref Pennswood Vlg Proj, Ser A | 5.00% | 10/01/33 | 450,346 | ||||
| 765,000 | Chester Cnty PA Indl Dev Auth Renaissance Academy Chrt Sch | 5.00% | 10/01/34 | 819,063 | ||||
| 2,000,000 | Cmwlth Fing Auth PA Ref of 2020, Ser A, BAM | 5.00% | 06/01/31 | 2,666,640 | ||||
| 1,000,000 | Cmwlth Fing Auth PA Tobacco Master Settlement Payment Rev Tobacco Master Settlement Payment Bonds | 5.00% | 06/01/25 | 1,196,310 | ||||
| 410,000 | Cmwlth Fing Auth PA Tobacco Master Settlement Payment Rev Tobacco Master Settlement Payment Bonds | 5.00% | 06/01/26 | 504,370 | ||||
| 500,000 | Colonial PA Sch Dist | 5.00% | 02/15/36 | 590,450 | ||||
| 300,000 | Colonial PA Sch Dist, Ser A | 5.00% | 02/15/34 | 361,623 | ||||
| 270,000 | Conestoga Vly PA Sch Dist | 4.00% | 02/01/31 | 315,554 | ||||
| 300,000 | Conestoga Vly PA Sch Dist | 4.00% | 02/01/32 | 347,190 | ||||
| 300,000 | Cumberland Cnty PA Muni Auth Ref Diakon Lutheran Ministries Proj | 5.00% | 01/01/30 | 325,743 | ||||
| 700,000 | Cumberland Cnty PA Muni Auth Ref Diakon Lutheran Ministries Proj | 5.00% | 01/01/38 | 745,325 | ||||
| 1,150,000 | Cumberland Cnty PA Muni Auth Ref Diakon Lutheran Social Ministries | 5.00% | 01/01/25 | 1,273,475 | ||||
| 1,000,000 | Cumberland Cnty PA Muni Auth Ref Diakon Lutheran Social Ministries | 5.00% | 01/01/33 | 1,091,430 | ||||
| 1,660,000 | Cumberland Cnty PA Muni Auth Ref Messiah Vlg Proj | 5.00% | 07/01/28 | 1,828,424 | ||||
| 1,165,000 | Dover PA Area Sch Dist, BAM | 4.00% | 04/01/32 | 1,339,261 | ||||
| 100,000 | Dubois PA Hosp Auth Penn Highlands Healthcare | 5.00% | 07/15/32 | 119,385 | ||||
| 115,000 | Dubois PA Hosp Auth Penn Highlands Healthcare | 5.00% | 07/15/33 | 136,557 | ||||
| 245,000 | Dubois PA Hosp Auth Penn Highlands Healthcare | 5.00% | 07/15/34 | 289,943 | ||||
| 290,000 | Dubois PA Hosp Auth Penn Highlands Healthcare | 5.00% | 07/15/35 | 342,104 | ||||
| 1,910,000 | E Hempfield Twp PA Indl Dev Auth Ref Willow Vly Cmntys Proj | 5.00% | 12/01/27 | 2,202,287 | ||||
| 715,000 | E Hempfield Twp PA Indl Dev Auth Ref Willow Vly Cmntys Proj | 5.00% | 12/01/28 | 821,800 | ||||
| 770,000 | E Hempfield Twp PA Indl Dev Auth Ref Willow Vly Cmntys Proj | 5.00% | 12/01/29 | 882,197 | ||||
| 760,000 | Hermitage PA Muni Auth Ref, Ser C | 4.00% | 02/01/31 | 888,600 | ||||
| 1,110,000 | Hermitage PA Muni Auth Ref, Ser C | 4.00% | 02/01/32 | 1,290,508 | ||||
| 515,000 | Hermitage PA Muni Auth Ref, Ser C | 4.00% | 02/01/33 | 595,366 | ||||
| Principal Value | Description | Stated Coupon | Stated Maturity | Value | ||||
| MUNICIPAL BONDS (Continued) | ||||||||
| Pennsylvania (Continued) | ||||||||
| $1,730,000 | Kiski Vly PA Wtr Poll Control Auth Ref, AGM | 4.00% | 09/01/42 | $1,858,677 | ||||
| 480,000 | Lancaster Cnty PA Hosp Auth Healthcare Facs Rev Moravian Manors Inc Proj, Ser A | 5.00% | 06/15/30 | 517,464 | ||||
| 1,110,000 | Lancaster Cnty PA Hosp Auth Healthcare Facs Rev Moravian Manors Inc Proj, Ser A | 5.00% | 06/15/38 | 1,152,435 | ||||
| 750,000 | Lancaster Cnty PA Hosp Auth Ref, St Annes Retmnt Cmnty Inc Proj | 5.00% | 03/01/45 | 777,870 | ||||
| 1,000,000 | Lancaster Cnty PA Hosp Auth Ref, St Annes Retmnt Cmnty Inc Proj | 5.00% | 03/01/50 | 1,032,940 | ||||
| 1,355,000 | Lancaster PA Swr Auth Ref | 5.00% | 04/01/27 | 1,712,503 | ||||
| 860,000 | Lancaster PA Swr Auth Ref | 4.00% | 04/01/30 | 1,046,586 | ||||
| 405,000 | Lebanon PA Auth Swr Rev Ref, BAM | 4.00% | 12/15/29 | 464,401 | ||||
| 420,000 | Lebanon PA Auth Swr Rev Ref, BAM | 4.00% | 12/15/30 | 477,670 | ||||
| 1,550,000 | Mechanicsburg PA Area Sch Dist, Ser A | 4.00% | 03/01/36 | 1,807,951 | ||||
| 1,090,000 | Mechanicsburg PA Area Sch Dist, Ser A | 4.00% | 03/01/38 | 1,263,593 | ||||
| 500,000 | Middletown PA Sch Dist, Ser A | 5.00% | 03/01/28 | 531,600 | ||||
| 300,000 | Mifflinburg PA Area Sch Dist Ref, Ser A | 4.00% | 06/15/35 | 346,182 | ||||
| 550,000 | Mifflinburg PA Area Sch Dist Ref, Ser A | 4.00% | 06/15/36 | 630,635 | ||||
| 610,000 | Mifflinburg PA Area Sch Dist Ref, Ser A | 4.00% | 06/15/38 | 694,717 | ||||
| 1,000,000 | Montgomery Cnty PA Hgr Edu & Hlth Auth Ref Thomas Jefferson Univ Proj | 4.00% | 09/01/34 | 1,110,990 | ||||
| 1,000,000 | Montgomery Cnty PA Hgr Edu & Hlth Auth Ref Thomas Jefferson Univ Proj | 4.00% | 09/01/35 | 1,106,660 | ||||
| 50,000 | Montgomery Cnty PA Indl Dev Auth Acts Retmnt Life Cmntys Ref | 5.00% | 11/15/29 | 53,649 | ||||
| 480,000 | Montgomery Cnty PA Indl Dev Auth Ref Meadowood Sr Living Proj, Ser A | 5.00% | 12/01/26 | 541,162 | ||||
| 100,000 | Montgomery Cnty PA Indl Dev Auth Ref Waverly Heights Ltd Proj | 4.00% | 12/01/33 | 107,997 | ||||
| 200,000 | Montgomery Cnty PA Indl Dev Auth Ref Waverly Heights Ltd Proj | 4.00% | 12/01/34 | 215,300 | ||||
| 580,000 | Montgomery Cnty PA Indl Dev Auth Ref Waverly Heights Ltd Proj | 5.00% | 12/01/44 | 640,761 | ||||
| 140,000 | Northampton Cnty PA Gen Purpose Auth Clg Rev Ref Moravian Clg | 5.00% | 10/01/25 | 152,828 | ||||
| 225,000 | Northampton Cnty PA Gen Purpose Auth Clg Rev Ref Moravian Clg | 5.00% | 10/01/26 | 248,177 | ||||
| 540,000 | Northampton Cnty PA Gen Purpose Auth Clg Rev Ref Moravian Clg | 5.00% | 10/01/31 | 581,402 | ||||
| 1,800,000 | Northampton Cnty PA Gen Purpose Auth Hosp Rev Ref St Luke’s Univ Hlth Network Proj, Ser A | 5.00% | 08/15/28 | 2,142,666 | ||||
| 500,000 | PA St 2nd, Ser CR, AGM | 4.00% | 09/15/31 | 579,600 | ||||
| 1,000,000 | PA St Hgr Eductnl Facs Auth Rev Ref Drexel Univ | 5.00% | 05/01/25 | 1,173,610 | ||||
| 1,105,000 | PA St Hgr Eductnl Facs Auth Rev Ref Drexel Univ | 5.00% | 05/01/34 | 1,281,380 | ||||
| 3,000,000 | PA St Hsg Fin Agy SF Mtge Rev Non Ace, Ser 123B | 3.45% | 10/01/32 | 3,243,840 | ||||
| 5,455,000 | PA St Hsg Fin Agy Sf Mtge Rev, Ser 127B | 3.55% | 10/01/33 | 5,824,631 | ||||
| 565,000 | PA St Turnpike Commn Turnpike Rev Conv Cap Apprec, Subser E | 6.38% | 12/01/38 | 728,556 | ||||
| 1,000,000 | PA St Turnpike Commn Turnpike Rev Ref | 5.00% | 12/01/33 | 1,139,160 | ||||
| 4,940,000 | PA St Turnpike Commn Turnpike Rev Ref Sub Mtr License Fund, 2nd Ser | 5.00% | 12/01/41 | 5,830,237 | ||||
| 2,500,000 | PA St Turnpike Commn Turnpike Rev Ref Sub, Ser B | 5.00% | 06/01/36 | 2,918,500 | ||||
| 550,000 | PA St Turnpike Commn Turnpike Rev Subordinate, Ser A-1 | 5.00% | 12/01/30 | 642,933 | ||||
| 620,000 | Philadelphia PA Auth for Indl Dev Chrt Sch Rev Mast Chrt Sch Proj | 5.00% | 08/01/40 | 712,752 | ||||
| 375,000 | Philadelphia PA Auth for Indl Dev Chrt Sch Rev Mast Chrt Sch Proj | 5.00% | 08/01/50 | 421,943 | ||||
| 1,000,000 | Philadelphia PA Auth for Indl Dev City Svc Agreement Rev TCRS, BAM | 5.00% | 05/01/30 | 1,248,640 | ||||
| 290,000 | Philadelphia PA Gas Wks Rev Ref | 5.00% | 08/01/25 | 346,576 | ||||
| Principal Value | Description | Stated Coupon | Stated Maturity | Value | ||||
| MUNICIPAL BONDS (Continued) | ||||||||
| Pennsylvania (Continued) | ||||||||
| $1,625,000 | Philadelphia PA Gas Wks Rev Ref | 5.00% | 08/01/29 | $1,913,779 | ||||
| 1,000,000 | Philadelphia PA Gas Wks Rev Ref 1998 General Ordinance, 14th Ser | 5.00% | 10/01/29 | 1,212,240 | ||||
| 455,000 | Philadelphia PA Gas Wks Rev Ref 1998 General Ordinance, 14th Ser | 5.00% | 10/01/32 | 545,540 | ||||
| 2,000,000 | Philadelphia PA Gas Wks Rev Ref 1998 General Ordinance, 14th Ser | 5.00% | 10/01/34 | 2,381,760 | ||||
| 5,235,000 | Philadelphia PA Gas Wks Rev Ref 1998 General Ordinance, 15th Ser | 5.00% | 08/01/42 | 6,192,429 | ||||
| 500,000 | Philadelphia PA Ref, Ser A | 5.00% | 08/01/26 | 613,760 | ||||
| 500,000 | Philadelphia PA Ref, Ser A | 5.00% | 08/01/27 | 628,210 | ||||
| 750,000 | Philadelphia PA Ref, Ser A | 5.25% | 07/15/28 | 856,770 | ||||
| 500,000 | Philadelphia PA Wtr & Wstwtr Rev, Ser A | 5.00% | 11/01/36 | 652,555 | ||||
| 1,500,000 | Philadelphia PA Wtr & Wstwtr Rev, Ser A | 5.00% | 11/01/45 | 1,885,905 | ||||
| 2,245,000 | Philadelphia PA, Ser B | 5.00% | 02/01/36 | 2,788,784 | ||||
| 3,260,000 | Philadelphia PA, Ser B, BAM | 5.00% | 02/01/34 | 4,208,236 | ||||
| 405,000 | Southcentrl PA General Auth Rev Ref Hanover Hosp Inc | 5.00% | 12/01/23 | 457,443 | ||||
| 390,000 | Upper Darby PA Sch Dist, AGM | 4.00% | 04/01/31 | 461,015 | ||||
| 250,000 | Upper Darby PA Sch Dist, AGM | 4.00% | 04/01/34 | 290,545 | ||||
| 300,000 | Upper Darby PA Sch Dist, AGM | 4.00% | 04/01/35 | 347,643 | ||||
| 250,000 | Upper Darby PA Sch Dist, AGM | 4.00% | 04/01/36 | 288,593 | ||||
| 1,970,000 | Westmoreland Cnty PA Muni Auth Ref, BAM | 5.00% | 08/15/42 | 2,305,609 | ||||
| 113,250,727 | ||||||||
| Puerto Rico – 0.8% | ||||||||
| 9,023,000 | Puerto Rico Sales Tax Fing Corp Sales Tax Rev Restructured, Ser A-1 | 4.50% | 07/01/34 | 9,447,081 | ||||
| 387,000 | Puerto Rico Sales Tax Fing Corp Sales Tax Rev Restructured, Ser A-1, CABS | (e) | 07/01/27 | 327,928 | ||||
| 3,092,000 | Puerto Rico Sales Tax Fing Corp Sales Tax Rev Restructured, Ser A-1, CABS | (e) | 07/01/29 | 2,426,695 | ||||
| 2,736,000 | Puerto Rico Sales Tax Fing Corp Sales Tax Rev Restructured, Ser A-1, CABS | (e) | 07/01/31 | 1,976,021 | ||||
| 14,177,725 | ||||||||
| Rhode Island – 0.3% | ||||||||
| 150,000 | Providence RI Pub Bldgs Auth Rev, Ser B, AGM | 5.00% | 06/15/31 | 188,388 | ||||
| 320,000 | Providence RI Pub Bldgs Auth Rev, Ser B, AGM | 5.00% | 06/15/33 | 397,235 | ||||
| 230,000 | Providence RI Pub Bldgs Auth Rev, Ser B, AGM | 5.00% | 06/15/35 | 283,629 | ||||
| 1,125,000 | RI St Hlth & Eductnl Bldg Corp Rev Ref Hosp Fing Lifespan Oblig Grp | 5.00% | 05/15/29 | 1,295,404 | ||||
| 1,460,000 | RI St Hlth & Eductnl Bldg Corp Rev Ref Hosp Fing Lifespan Oblig Grp | 5.00% | 05/15/32 | 1,654,633 | ||||
| 1,700,000 | RI St Hlth & Eductnl Bldg Corp Rev Ref Hosp Fing Lifespan Oblig Grp | 5.00% | 05/15/39 | 1,880,251 | ||||
| 5,699,540 | ||||||||
| South Carolina – 0.6% | ||||||||
| 2,250,000 | Berkeley Cnty SC Assmnt Rev Nexton Impt Dist | 4.25% | 11/01/40 | 2,269,597 | ||||
| 1,000,000 | Greenville SC Hosp Sys Brd Hosp Facs Rev, Ser B | 5.00% | 05/01/30 | 1,112,130 | ||||
| 100,000 | Lancaster Cnty SC Assmnt Rev Ref Walnut Creek Impt Dist, Ser A-1 | 3.13% | 12/01/22 | 100,469 | ||||
| 1,310,000 | Lancaster Cnty SC Assmnt Rev Ref Walnut Creek Impt Dist, Ser A-1 | 5.00% | 12/01/26 | 1,371,112 | ||||
| 1,000,000 | Lancaster Cnty SC Assmnt Rev Ref Walnut Creek Impt Dist, Ser A-1 | 5.00% | 12/01/31 | 1,033,850 | ||||
| Principal Value | Description | Stated Coupon | Stated Maturity | Value | ||||
| MUNICIPAL BONDS (Continued) | ||||||||
| South Carolina (Continued) | ||||||||
| $745,000 | Piedmont SC Muni Pwr Agy Elec Rev Ref, Ser A-3 | 5.00% | 01/01/23 | $750,178 | ||||
| 1,000,000 | SC St Jobs Econ Dev Auth Econ Dev Rev Woodlands at Furman Proj, Ser A | 5.00% | 11/15/54 | 1,014,960 | ||||
| 500,000 | SC St Jobs Econ Dev Auth Hlth Facs Rev Ref Lutheran Homes of SC Inc | 5.00% | 05/01/42 | 474,745 | ||||
| 30,000 | SC St Jobs Econ Dev Auth Hosp Rev Ref Palmetto Hlth, Ser A | 5.00% | 08/01/23 | 33,833 | ||||
| 2,000,000 | SC St Pub Svc Auth Rev Ref, Ser A | 4.00% | 12/01/34 | 2,334,340 | ||||
| 355,000 | SC St Pub Svc Auth Rev Ref, Ser A | 4.00% | 12/01/35 | 411,704 | ||||
| 10,906,918 | ||||||||
| South Dakota – 0.3% | ||||||||
| 1,000,000 | SD St Brd of Rgts Hsg & Auxiliary Fac Sys Rev Ref Hsg & Auxiliary Facs Sys | 5.00% | 04/01/30 | 1,216,070 | ||||
| 420,000 | SD St Brd of Rgts Hsg & Auxiliary Fac Sys Rev, Ser B | 5.00% | 04/01/29 | 489,980 | ||||
| 510,000 | SD St Brd of Rgts Hsg & Auxiliary Fac Sys Rev, Ser B | 5.00% | 04/01/31 | 605,661 | ||||
| 505,000 | SD St Brd of Rgts Hsg & Auxiliary Fac Sys Rev, Ser B | 5.00% | 04/01/32 | 596,445 | ||||
| 105,000 | SD St Hlth & Eductnl Facs Auth Ref Sanford Oblig Grp | 5.00% | 11/01/35 | 122,474 | ||||
| 1,090,000 | SD St Hlth & Eductnl Facs Auth Sanford Oblig Grp, Ser B | 5.00% | 11/01/34 | 1,245,990 | ||||
| 4,276,620 | ||||||||
| Tennessee – 0.9% | ||||||||
| 250,000 | Chattanooga TN Hlth Eductnl & Hsg Fac Brd Rev Ref Commonspirit Hlth, Ser A-1 | 5.00% | 08/01/34 | 307,125 | ||||
| 200,000 | Chattanooga TN Hlth Eductnl & Hsg Fac Brd Rev Ref Commonspirit Hlth, Ser A-1 | 4.00% | 08/01/37 | 225,346 | ||||
| 825,000 | Chattanooga TN Hlth Eductnl & Hsg Fac Brd Rev Ref Commonspirit Hlth, Ser A-2 | 5.00% | 08/01/34 | 1,013,512 | ||||
| 325,000 | Chattanooga TN Hlth Eductnl & Hsg Fac Brd Rev Ref Student Hsg CDFI Phase I | 5.00% | 10/01/23 | 338,188 | ||||
| 1,245,000 | Greeneville TN Hlth & Eductnl Facs Brd Hosp Rev Ref Ballad Hlth Oblig Grp, Ser A | 5.00% | 07/01/33 | 1,346,791 | ||||
| 865,000 | Met Govt Nashville & Davidson Cnty TN Elec Rev Sys, Ser A | 5.00% | 05/15/35 | 1,060,525 | ||||
| 1,385,000 | Met Govt Nashville & Davidson Cnty TN Hlth & Eductnl Fac Brd Ref Lipscomb Univ Proj, Ser A | 5.00% | 10/01/29 | 1,512,572 | ||||
| 375,000 | Met Govt Nashville & Davidson Cnty TN Hlth & Eductnl Fac Brd Ref Lipscomb Univ Proj, Ser A | 5.00% | 10/01/37 | 407,471 | ||||
| 600,000 | Met Govt Nashville & Davidson Cnty TN Hlth & Eductnl Fac Brd Ref Trevecca Nazarene Univ Proj | 5.00% | 10/01/29 | 677,328 | ||||
| 400,000 | Met Govt Nashville & Davidson Cnty TN Hlth & Eductnl Fac Brd Ref Trevecca Nazarene Univ Proj | 5.00% | 10/01/34 | 444,732 | ||||
| 700,000 | Met Govt Nashville & Davidson Cnty TN Hlth & Eductnl Fac Brd Ref Trevecca Nazarene Univ Proj | 5.00% | 10/01/39 | 764,085 | ||||
| 3,435,000 | TN St Energy Acquisition Corp Gas Rev Proj, Ser A (Mandatory put 05/01/23) | 4.00% | 05/01/48 | 3,687,095 | ||||
| 50,000 | TN St Energy Acquisition Corp Gas Rev, Ser A | 5.25% | 09/01/22 | 54,168 | ||||
| 2,660,000 | TN St Energy Acquisition Corp Gas Rev, Ser A | 5.25% | 09/01/26 | 3,259,857 | ||||
| 15,098,795 | ||||||||
| Texas – 7.5% | ||||||||
| 930,000 | Arlington TX Hgr Edu Fin Corp Edu Rev | 5.00% | 08/15/31 | 1,243,522 | ||||
| 975,000 | Arlington TX Hgr Edu Fin Corp Edu Rev | 5.00% | 08/15/32 | 1,293,357 | ||||
| 415,000 | Arlington TX Hgr Edu Fin Corp Edu Rev | 5.00% | 08/15/33 | 546,489 | ||||
| 525,000 | Arlington TX Hgr Edu Fin Corp Edu Rev | 5.00% | 08/15/34 | 688,044 | ||||
| 565,000 | Arlington TX Hgr Edu Fin Corp Edu Rev | 4.00% | 08/15/35 | 684,209 | ||||
| 875,000 | Arlington TX Hgr Edu Fin Corp Edu Rev | 4.00% | 08/15/36 | 1,051,242 | ||||
| 2,685,000 | Arlington TX Hgr Edu Fin Corp Edu Rev Lifeschool Dallas, Ser A | 5.00% | 08/15/31 | 3,043,850 | ||||
| Principal Value | Description | Stated Coupon | Stated Maturity | Value | ||||
| MUNICIPAL BONDS (Continued) | ||||||||
| Texas (Continued) | ||||||||
| $450,000 | Austin TX Arpt Sys Rev, AMT | 5.00% | 11/15/33 | $508,208 | ||||
| 3,870,000 | Austin TX Arpt Sys Rev, Ser B, AMT | 5.00% | 11/15/39 | 4,706,694 | ||||
| 455,000 | Bexar Cnty TX Hlth Facs Dev Corp Ref Army Retmnt Residence Fdtn Proj | 5.00% | 07/15/25 | 495,845 | ||||
| 900,000 | Bexar Cnty TX Ref | 4.00% | 06/15/38 | 1,054,791 | ||||
| 2,255,000 | Brazoria Cnty TX Toll Road Auth Toll Road Rev Sub Lien, Ser A | 5.00% | 03/01/36 | 2,725,889 | ||||
| 600,000 | Brd of Managers TX Jt Guadalupe Cnty City of Seguin Hosp Mtg Ref | 5.00% | 12/01/24 | 677,358 | ||||
| 305,000 | Celina TX Spl Assmnt Rev Ref The Lakes at Mustang Ranch Pub Impt Dt Phase #1 Proj, BAM | 4.00% | 09/01/29 | 343,506 | ||||
| 350,000 | Centrl TX Regl Mobility Auth Rev Ref | 5.00% | 01/01/27 | 416,840 | ||||
| 600,000 | Centrl TX Regl Mobility Auth Rev Ref Sub Lien | 5.00% | 01/01/33 | 659,190 | ||||
| 850,000 | Centrl TX Regl Mobility Auth Rev Sr Lien, Ser A | 5.00% | 01/01/29 | 990,454 | ||||
| 500,000 | Clifton TX Hgr Edu Fin Corp Edu Rev Idea Pub Schs | 5.00% | 08/15/32 | 526,005 | ||||
| 1,215,000 | Clifton TX Hgr Edu Fin Corp Edu Rev, Ser A | 4.00% | 12/01/25 | 1,272,858 | ||||
| 4,425,000 | Corpus Christi TX Utility Sys Rev Ref Jr Lien | 5.00% | 07/15/33 | 5,580,456 | ||||
| 2,365,000 | Corpus Christi TX Utility Sys Rev Ref Jr Lien | 5.00% | 07/15/35 | 2,960,814 | ||||
| 1,000,000 | El Paso TX Ref, Ser A | 4.00% | 08/15/34 | 1,211,960 | ||||
| 500,000 | El Paso TX Ref, Ser A | 4.00% | 08/15/36 | 600,195 | ||||
| 455,000 | Flower Mound TX Spl Assmnt Rev River Walk Pub Impt Dist #1 | 6.13% | 09/01/28 | 461,971 | ||||
| 1,000,000 | Harris Cnty TX Cultural Edu Facs Fin Corp Med Facs Rev Ref Baylor Clg of Med | 4.00% | 11/15/30 | 1,111,180 | ||||
| 1,640,000 | Harris Cnty TX Flood Control Dist Ref Flood Control Dist, Ser A | 4.00% | 10/01/37 | 1,899,694 | ||||
| 1,100,000 | Harris Cnty TX Ref Sr Lien Toll Road, Ser B | 5.00% | 08/15/36 | 1,301,421 | ||||
| 2,600,000 | Harris Cnty TX Ref Sr Lien, Ser A | 5.00% | 08/15/36 | 3,140,566 | ||||
| 1,500,000 | Houston TS Utility Sys Rev Ref, Ser C | 4.00% | 11/15/35 | 1,835,745 | ||||
| 2,750,000 | Houston TX Arpt Sys Rev Ref United Airls Inc Term Improv Proj, Ser B-2, AMT | 5.00% | 07/15/27 | 2,883,485 | ||||
| 100,000 | Houston TX Arpt Sys Rev Ref United Airls Inc Terminal E Proj, AMT | 4.75% | 07/01/24 | 101,716 | ||||
| 1,770,000 | Houston TX Arpt Sys Rev Ref United Airls Inc Terminal E Proj, Ser A, AMT | 5.00% | 07/01/27 | 1,855,969 | ||||
| 1,730,000 | Houston TX Cmnty Clg Ref | 4.00% | 02/15/37 | 1,974,760 | ||||
| 500,000 | Houston TX Hgr Edu Fin Corp Edu Rev Ref Harmony Pub Schs, Ser A | 5.00% | 02/15/26 | 564,750 | ||||
| 1,000,000 | Houston TX Hotel Occupancy Tax & Spl Rev Ref Convention & Entertainment Facs Dept | 5.00% | 09/01/32 | 1,075,070 | ||||
| 2,000,000 | Houston TX Ref Pub Impt, Ser A | 4.00% | 03/01/33 | 2,194,320 | ||||
| 1,000,000 | Houston TX Utility Sys Rev Ref 1st Lien, Ser D | 5.00% | 11/15/29 | 1,212,700 | ||||
| 500,000 | Kyle TX Spl Assmnt Rev 6 Creeks Pid #1 (b) | 4.63% | 09/01/39 | 545,515 | ||||
| 710,000 | La Vernia TX Hgr Edu Fin Corp Edu Rev Meridian World Sch (b) | 4.35% | 08/15/25 | 740,551 | ||||
| 680,000 | La Vernia TX Hgr Edu Fin Corp Edu Rev Meridian World Sch, Ser A (b) | 4.20% | 08/15/25 | 707,581 | ||||
| 1,250,000 | Laredo TX Cmnty Clg Dist Combined Fee Rev Ref, BAM | 4.00% | 08/01/33 | 1,416,912 | ||||
| 1,290,000 | Leander TX Spl Assmnt Rev Crystal Springs Pub Impt Dist Proj Accd Inv (d) | 5.13% | 09/01/38 | 1,298,166 | ||||
| 500,000 | Liberty Hill TX Indep Sch Dist Ref | 5.00% | 08/01/30 | 614,075 | ||||
| 1,000,000 | Lower Colorado River TX Auth Transmission Contract Rev Ref LCRA Transmission Svcs Corp Proj | 5.00% | 05/15/28 | 1,293,300 | ||||
| 500,000 | Lower Colorado River TX Auth Transmission Contract Rev Ref LCRA Transmission Svcs Corp Proj | 5.00% | 05/15/29 | 656,645 | ||||
| 500,000 | Lower Colorado River TX Auth Transmission Contract Rev Ref LCRA Transmission Svcs Corp Proj | 5.00% | 05/15/30 | 649,645 | ||||
| 1,000,000 | Lower Colorado River TX Auth Transmission Contract Rev Ref LCRA Transmission Svcs Corp Proj | 5.00% | 05/15/31 | 1,286,220 | ||||
| Principal Value | Description | Stated Coupon | Stated Maturity | Value | ||||
| MUNICIPAL BONDS (Continued) | ||||||||
| Texas (Continued) | ||||||||
| $500,000 | Lower Colorado River TX Auth Transmission Contract Rev Ref LCRA Transmission Svcs Corp Proj | 5.00% | 05/15/32 | $639,600 | ||||
| 700,000 | Lower Colorado River TX Auth Transmission Contract Rev Ref LCRA Transmission Svcs Corp Proj | 5.00% | 05/15/33 | 837,102 | ||||
| 500,000 | Lower Colorado River TX Auth Transmission Contract Rev Ref LCRA Transmission Svcs Corp Proj | 5.00% | 05/15/33 | 635,620 | ||||
| 500,000 | Lower Colorado River TX Auth Transmission Contract Rev Ref LCRA Transmission Svcs Corp Proj | 5.00% | 05/15/34 | 633,000 | ||||
| 400,000 | Lower Colorado River TX Auth Transmission Contract Rev Ref LCRA Transmission Svcs Corp Proj | 5.00% | 05/15/37 | 486,092 | ||||
| 610,000 | Lower Colorado River TX Auth Transmission Contract Rev Ref LCRA Transmission Svcs Corp Proj | 5.00% | 05/15/38 | 738,612 | ||||
| 1,000,000 | Lower Colorado River TX Auth Transmission Contract Rev Ref LCRA Transmission Svcs Corp Proj | 5.00% | 05/15/40 | 1,202,430 | ||||
| 370,000 | Mission TX Ctfs Oblig, AGM | 5.00% | 02/15/30 | 464,653 | ||||
| 1,105,000 | Montgomery TX Indep Sch Dist Ref Sch Bldg | 5.00% | 02/15/28 | 1,311,071 | ||||
| 1,450,000 | N Fort Bend TX Wtr Auth Wtr Sys Rev Ref, Ser A | 4.00% | 12/15/36 | 1,740,319 | ||||
| 4,000,000 | N TX Tollway Auth Rev Ref 1st Tier, Ser A | 5.00% | 01/01/38 | 4,308,160 | ||||
| 2,250,000 | N TX Tollway Auth Rev Ref 2nd Tier, Ser B | 5.00% | 01/01/31 | 2,662,335 | ||||
| 1,500,000 | N TX Tollway Auth Rev Ref Sys Second Tier, Ser B | 5.00% | 01/01/31 | 1,687,785 | ||||
| 250,000 | N TX Tollway Auth Rev Ref, Ser A | 5.00% | 01/01/33 | 295,150 | ||||
| 1,415,000 | New Hope Cultural Edu Facs Fin Corp TX Retmnt Fac Rev Ref Longhorn Vlg Proj | 5.00% | 01/01/31 | 1,534,723 | ||||
| 1,200,000 | New Hope Cultural Edu Facs Fin Corp TX Retmnt Fac Rev Ref Longhorn Vlg Proj | 5.00% | 01/01/32 | 1,298,868 | ||||
| 250,000 | New Hope Cultural Edu Facs Fin Corp TX Retmnt Fac Rev Ref Wesleyan Homes Inc Proj Fin Corp | 5.00% | 01/01/50 | 250,815 | ||||
| 500,000 | New Hope Cultural Edu Facs Fin Corp TX Student Hsg Rev Chf TX A&M Univ Corpus Christi Island Campus Proj, Ser A (c) | 5.00% | 04/01/29 | 493,355 | ||||
| 505,000 | Newark Hgr Edu Fin Corp TX Edu Rev Austin Achieve Pub Schs Inc, Ser A | 5.00% | 06/15/32 | 516,388 | ||||
| 700,000 | Newark Hgr Edu Fin Corp TX Edu Rev Austin Achieve Pub Schs Inc, Ser A | 5.00% | 06/15/42 | 710,822 | ||||
| 1,870,000 | Northside TX Indep Sch Dist Sch Bldg, Ser A | 4.00% | 06/01/29 | 1,968,773 | ||||
| 495,000 | Red River TX Hlth Facs Dev Corp Retmnt Fac Rev MRC Crestview, Ser A | 7.75% | 11/15/31 | 532,481 | ||||
| 2,690,000 | Tarrant Cnty TX Cultural Edu Facs Fin Corp Hosp Rev Ref Baylor Scott & White Hlth Proj, Ser A | 5.00% | 11/15/45 | 3,106,251 | ||||
| 750,000 | Tarrant Cnty TX Cultural Edu Facs Fin Corp Hosp Rev Ref Cook Children’s Med Ctr | 4.00% | 12/01/35 | 880,658 | ||||
| 1,485,000 | TX St Muni Gas Acquisition & Sply Corp I Gas Sply Rev Sr Lien, Ser A | 5.25% | 12/15/26 | 1,829,743 | ||||
| 600,000 | TX St Muni Gas Acquisition & Sply Corp III Gas Sply Rev | 5.00% | 12/15/24 | 651,126 | ||||
| 2,850,000 | TX St Muni Gas Acquisition & Sply Corp III Gas Sply Rev | 5.00% | 12/15/30 | 3,044,569 | ||||
| 1,180,000 | TX St Muni Gas Acquisition & Sply Corp III Gas Sply Rev | 5.00% | 12/15/31 | 1,257,951 | ||||
| 3,000,000 | TX St Priv Activity Bond Surface Transprtn Corp Rev Segment 3C Proj, AMT | 5.00% | 06/30/58 | 3,417,600 | ||||
| 865,000 | TX St Transprtn Commn Central TX Turnpike Sys Rev Ref, Ser B | 5.00% | 08/15/37 | 978,211 | ||||
| 2,130,000 | TX St Univ Sys Fing Rev Ref, Ser A | 4.00% | 03/15/35 | 2,533,997 | ||||
| 1,000,000 | TX St Wtr Dev Brd St Wtr Implementation Fund, Ser A | 5.00% | 04/15/25 | 1,204,440 | ||||
| 785,000 | TX St Wtr Dev Brd St Wtr Implementation Fund, Ser A | 5.00% | 04/15/30 | 1,004,455 | ||||
| 4,000,000 | TX St Wtr Dev Brd St Wtr Implementation Fund, Ser A | 4.00% | 10/15/38 | 4,687,840 | ||||
| 4,975,000 | TX St Wtr Dev Brd St Wtr Implementation Fund, Ser A | 4.00% | 10/15/44 | 5,868,560 | ||||
| 250,000 | TX St Wtr Dev Brd St Wtr Implementation Rev Fund for TX | 4.00% | 10/15/32 | 294,180 | ||||
| 150,000 | Univ of Houston TX Univ Revs Ref, Ser A | 5.00% | 02/15/26 | 185,540 | ||||
| Principal Value | Description | Stated Coupon | Stated Maturity | Value | ||||
| MUNICIPAL BONDS (Continued) | ||||||||
| Texas (Continued) | ||||||||
| $3,250,000 | Univ of Houston TX Univ Revs Ref, Ser A | 5.00% | 02/15/31 | $3,905,135 | ||||
| 1,900,000 | Univ of Houston TX Univ Revs Ref, Ser A | 5.00% | 02/15/35 | 2,253,818 | ||||
| 1,560,000 | Uptown Dev Auth TX Incr Contract Rev, Ser A | 5.00% | 09/01/36 | 1,763,627 | ||||
| 500,000 | Viridian TX Muni Mgmt Dist Ref Utility Impt, BAM | 6.00% | 12/01/26 | 606,965 | ||||
| 155,000 | Viridian TX Muni Mgmt Dist Road Impt, BAM | 5.00% | 12/01/26 | 174,868 | ||||
| 125,000 | Viridian TX Muni Mgmt Dist Utility Impt, BAM | 5.00% | 12/01/26 | 141,023 | ||||
| 128,842,444 | ||||||||
| Utah – 1.0% | ||||||||
| 1,180,000 | Grand Cnty Sch Dist Loc Bldg Auth UT, AGM | 5.00% | 12/15/27 | 1,434,125 | ||||
| 1,370,000 | Grand Cnty Sch Dist Loc Bldg Auth UT, AGM | 5.00% | 12/15/30 | 1,653,549 | ||||
| 1,400,000 | Grand Cnty Sch Dist Loc Bldg Auth UT, AGM | 5.00% | 12/15/31 | 1,683,528 | ||||
| 1,515,000 | Grand Cnty Sch Dist Loc Bldg Auth UT, AGM | 5.00% | 12/15/32 | 1,818,470 | ||||
| 400,000 | UT St Chrt Sch Fin Auth Chrt Sch Rev Ref Quest Academy | 5.00% | 04/15/32 | 468,336 | ||||
| 325,000 | UT St Chrt Sch Fin Auth Chrt Sch Rev Ref Quest Academy | 5.00% | 04/15/37 | 375,395 | ||||
| 1,590,000 | UT St Chrt Sch Fin Auth Chrt Sch Rev Wallace Stegner Academy Proj, Ser A (b) | 5.00% | 06/15/49 | 1,624,932 | ||||
| 4,875,000 | UT St Transit Auth Sales Tax Rev Ref Sub, BAM | 5.00% | 12/15/40 | 5,989,815 | ||||
| 1,145,000 | UT St Transit Auth Sales Tax Rev Ref Sub, Ser A | 5.00% | 06/15/35 | 1,390,957 | ||||
| 16,439,107 | ||||||||
| Vermont – 0.4% | ||||||||
| 550,000 | Burlington VT Ref Lakeview Garage Proj, Ser A, COPS | 5.00% | 12/01/24 | 642,186 | ||||
| 745,000 | VT St Econ Dev Auth Mtge Rev Ref Wake Robin Corp Proj, Ser A | 5.00% | 05/01/25 | 777,236 | ||||
| 585,000 | VT St Econ Dev Auth Mtge Rev Ref Wake Robin Corp Proj, Ser A | 5.00% | 05/01/26 | 613,302 | ||||
| 2,000,000 | VT St Econ Dev Auth Solid Wst Disp Rev Variable-Casella Wst Sys Inc, AMT (Mandatory put 04/03/28) (b) | 4.63% | 04/01/36 | 2,211,820 | ||||
| 2,500,000 | VT St Eductnl & Hlth Bldgs Fing Agy Rev Ref Univ of VT Med Ctr, Ser A | 5.00% | 12/01/33 | 2,911,000 | ||||
| 7,155,544 | ||||||||
| Virginia – 1.0% | ||||||||
| 1,000,000 | Amelia Cnty VA Indl Dev Auth Sol Wst Disp Rev Var Ref Waste Mgmt Pj, AMT (Mandatory put 04/01/21) | 3.00% | 04/01/27 | 1,009,300 | ||||
| 1,000,000 | Chesapeake VA Hosp Auth Hosp Fac Rev Ref Chesapeake Regl Med Ctr | 4.00% | 07/01/35 | 1,143,080 | ||||
| 1,350,000 | Norfolk VA Redev & Hsg Auth Rev Ft Norfolk Retmnt Cmnty Harbors Edge Proj, Ser A (c) | 4.00% | 01/01/29 | 1,367,064 | ||||
| 1,000,000 | Norfolk VA Redev & Hsg Auth Rev Ft Norfolk Retmnt Cmnty Harbors Edge Proj, Ser A (c) | 5.00% | 01/01/49 | 1,025,950 | ||||
| 1,000,000 | Norfolk VA Redev & Hsg Auth Rev Ft Norfolk Retmnt Cmnty Harbors Edge Proj, Ser A (c) | 5.25% | 01/01/54 | 1,037,980 | ||||
| 2,000,000 | VA St Pub Bldg Auth Pub Facs Rev, Ser C, AMT | 5.00% | 08/01/33 | 2,443,760 | ||||
| 1,000,000 | VA St Resources Auth Infrastructure Rev Ref Infrastructure VA Pooled Fing Program, Ser C | 4.00% | 11/01/33 | 1,157,820 | ||||
| 1,570,000 | Virginia Beach VA Dev Auth Rsdl Care Fac Rev Ref Westminster Canterbury on Chesapeake Bay | 5.00% | 09/01/32 | 1,762,262 | ||||
| 1,000,000 | Virginia Beach VA Dev Auth Rsdl Care Fac Rev Ref Westminster Canterbury on Chesapeake Bay | 5.00% | 09/01/33 | 1,120,040 | ||||
| 1,210,000 | Virginia Beach VA Dev Auth Rsdl Care Fac Rev Ref Westminster Canterbury on Chesapeake Bay | 5.00% | 09/01/35 | 1,347,662 | ||||
| 275,000 | Virginia Beach VA Dev Auth Rsdl Care Fac Rev Ref Westminster Canterbury on Chesapeake Bay | 5.00% | 09/01/36 | 305,624 | ||||
| 2,365,000 | Wstrn VA Regl Jail Auth Regl Jail Facs Rev Ref | 5.00% | 12/01/34 | 2,925,268 | ||||
| 16,645,810 | ||||||||
| Principal Value | Description | Stated Coupon | Stated Maturity | Value | ||||
| MUNICIPAL BONDS (Continued) | ||||||||
| Washington – 2.0% | ||||||||
| $1,235,000 | Benton Cnty WA Pub Utility Dist #1 Ref | 4.00% | 11/01/36 | $1,388,572 | ||||
| 1,090,000 | Centrl Puget Sound WA Regl Transit Auth Green Bond, Ser S-1 | 5.00% | 11/01/36 | 1,321,396 | ||||
| 1,250,000 | Centrl Puget Sound WA Regl Transit Auth Sales & Use Tax Green Bond Ref & Impt, Ser S-1 | 5.00% | 11/01/35 | 1,502,750 | ||||
| 1,250,000 | Energy NW WA Elec Rev Ref Columbia Generating Sys, Ser A | 5.00% | 07/01/38 | 1,464,300 | ||||
| 1,500,000 | Energy NW WA Elec Rev Ref, Ser A | 5.00% | 07/01/24 | 1,756,485 | ||||
| 575,000 | Kalispel Tribe of Indians Priority Dist WA Rev, Ser A (b) | 5.00% | 01/01/32 | 644,655 | ||||
| 3,000,000 | Seattle WA Drain & Wstwtr Rev Ref | 4.00% | 07/01/36 | 3,472,920 | ||||
| 270,000 | Skagit Cnty WA Pub Hosp Dist #1 Ref & Impt Skagit Regl Hlth | 4.00% | 12/01/24 | 295,337 | ||||
| 110,000 | Skagit Cnty WA Pub Hosp Dist #1 Ref & Impt, Ser A | 5.00% | 12/01/22 | 117,756 | ||||
| 165,000 | Skagit Cnty WA Pub Hosp Dist #1 Skagit Vly Hosp | 5.00% | 12/01/20 | 165,609 | ||||
| 500,000 | Snohomish Cnty WA Hsg Auth | 5.00% | 04/01/34 | 616,810 | ||||
| 1,850,000 | WA St Healthcare Facs Auth Overlake Hosp Med Ctr, Ser A | 5.00% | 07/01/35 | 2,214,709 | ||||
| 1,625,000 | WA St Healthcare Facs Auth Ref, Overlake Hosp Med Ctr, Ser B | 5.00% | 07/01/31 | 1,975,789 | ||||
| 525,000 | WA St Hgr Edu Facs Auth Seattle Univ Proj Rev | 4.00% | 05/01/45 | 567,488 | ||||
| 35,000 | WA St Hsg Fin Commn Ref Emerald Heights Proj | 5.00% | 07/01/22 | 36,223 | ||||
| 50,000 | WA St Hsg Fin Commn Ref Emerald Heights Proj | 5.00% | 07/01/28 | 52,420 | ||||
| 1,000,000 | WA St Hsg Fin Commn Transforming Age Proj, Ser A (b) | 5.00% | 01/01/44 | 1,034,750 | ||||
| 2,500,000 | WA St Ref R-2015D | 5.00% | 07/01/32 | 2,951,650 | ||||
| 1,100,000 | WA St, Ser 2020A | 5.00% | 08/01/35 | 1,426,645 | ||||
| 3,000,000 | WA St, Ser 2020A | 5.00% | 08/01/44 | 3,782,220 | ||||
| 4,000,000 | WA St, Ser B | 5.00% | 02/01/36 | 4,708,440 | ||||
| 2,425,000 | WA St, Ser D | 5.00% | 02/01/30 | 3,033,626 | ||||
| 34,530,550 | ||||||||
| West Virginia – 0.4% | ||||||||
| 2,250,000 | Roane Cnty Bldg Commn WV Ref Roane General Hosp, BANS | 2.55% | 11/01/21 | 2,252,655 | ||||
| 4,200,000 | WV St Hosp Fin Auth Impt, W Va Univ Hlth Sys Oblig Grp, Ser A, AGM | 4.00% | 06/01/51 | 4,652,802 | ||||
| 6,905,457 | ||||||||
| Wisconsin – 2.6% | ||||||||
| 825,000 | Fond Du Lac WI Sch Dist, Ser A, BAM | 4.00% | 04/01/35 | 967,626 | ||||
| 1,255,000 | Fond Du Lac WI Sch Dist, Ser A, BAM | 4.00% | 04/01/36 | 1,466,618 | ||||
| 1,050,000 | Milwaukee WI Ref Promissory Nts, Ser N-4 | 5.00% | 04/01/29 | 1,367,121 | ||||
| 1,375,000 | Pub Fin Auth WI Chrt Sch Rev Eno River Academy Proj, Ser A (b) | 5.00% | 06/15/54 | 1,452,316 | ||||
| 500,000 | Pub Fin Auth WI Chrt Sch Rev Founders of Academy Las Vegas Proj, Ser A | 5.00% | 07/01/40 | 523,275 | ||||
| 1,315,000 | Pub Fin Auth WI Chrt Sch Rev Ltd American Prep Academy Las Vegas Proj, Ser A (b) | 4.20% | 07/15/27 | 1,340,721 | ||||
| 1,250,000 | Pub Fin Auth WI Chrt Sch Rev Ltd American Prep Academy Las Vegas Proj, Ser A (b) | 5.13% | 07/15/37 | 1,308,663 | ||||
| 1,735,000 | Pub Fin Auth WI Edu Rev Ref Mountain Island Chrt Sch Ltd | 4.00% | 07/01/27 | 1,852,321 | ||||
| 1,440,000 | Pub Fin Auth WI Edu Rev Ref Mountain Island Chrt Sch Ltd | 5.00% | 07/01/37 | 1,538,496 | ||||
| 1,000,000 | Pub Fin Auth WI Edu Rev Ref Mountain Island Chrt Sch Ltd | 5.00% | 07/01/47 | 1,057,430 | ||||
| 1,000,000 | Pub Fin Auth WI Edu Rev Ref Mountain Island Chrt Sch Ltd | 5.00% | 07/01/52 | 1,055,160 | ||||
| 425,000 | Pub Fin Auth WI Eductnl Rev Piedmont Cmnty Chrt Sch | 5.00% | 06/15/34 | 495,474 | ||||
| 1,000,000 | Pub Fin Auth WI Exempt Facs Rev Ref Celanese Proj, Ser B, AMT | 5.00% | 12/01/25 | 1,151,980 | ||||
| 1,250,000 | Pub Fin Auth WI Hosp Rev Ref Renown Regl Med Ctr Proj, Ser A | 4.00% | 06/01/35 | 1,433,637 | ||||
| 2,000,000 | Pub Fin Auth WI Hosp Rev Ref Renown Regl Med Ctr Proj, Ser A | 4.00% | 06/01/39 | 2,257,180 | ||||
| 600,000 | Pub Fin Auth WI Retmnt Cmntys Rev Acts Retmnt Life Cmntys Inc Oblig Grp, Ser A | 4.00% | 11/15/37 | 661,698 | ||||
| 1,450,000 | Pub Fin Auth WI Retmnt Fac Rev Ref Penick Vlg Oblig Grp (b) | 5.00% | 09/01/49 | 1,447,694 | ||||
| 1,000,000 | Pub Fin Auth WI Retmnt Fac Rev Southminster (b) | 5.00% | 10/01/43 | 1,020,250 | ||||
| Principal Value | Description | Stated Coupon | Stated Maturity | Value | ||||
| MUNICIPAL BONDS (Continued) | ||||||||
| Wisconsin (Continued) | ||||||||
| $1,300,000 | WI St Gen Fund Annual Approp Rev Ref, Ser B | 5.00% | 05/01/34 | $1,576,471 | ||||
| 100,000 | WI St Hlth & Eductnl Facs Auth Rev Marshfield Clinic Hlth Sys, Ser A | 4.00% | 02/15/36 | 106,800 | ||||
| 3,650,000 | WI St Hlth & Eductnl Facs Auth Rev Ref Ascension Hlth Credit Grp, Ser A | 5.00% | 11/15/36 | 4,325,031 | ||||
| 1,000,000 | WI St Hlth & Eductnl Facs Auth Rev Ref Ascension Hlth Credit Grp, Ser A | 5.00% | 11/15/39 | 1,177,510 | ||||
| 1,780,000 | WI St Hlth & Eductnl Facs Auth Rev Ref Beloit Hlth Sys Inc | 4.00% | 07/01/36 | 2,026,299 | ||||
| 1,000,000 | WI St Hlth & Eductnl Facs Auth Rev Ref Froedtert Hlth Inc Oblg, Ser A | 4.00% | 04/01/39 | 1,119,380 | ||||
| 500,000 | WI St Hlth & Eductnl Facs Auth Rev Ref Marquette Univ | 5.00% | 10/01/28 | 531,755 | ||||
| 1,500,000 | WI St Hlth & Eductnl Facs Auth Rev Ref Marshfield Clinic Hlth Sys Inc, Ser B2 (Mandatory put 02/15/27) | 5.00% | 02/15/51 | 1,801,650 | ||||
| 500,000 | WI St Hlth & Eductnl Facs Auth Rev Ref Marshfield Clinic Hlth System Inc, Ser B1 (Mandatory put 02/15/25) | 5.00% | 02/15/52 | 575,010 | ||||
| 1,175,000 | WI St Hlth & Eductnl Facs Auth Rev Ref Prohealth Care Oblig Grp | 5.00% | 08/15/31 | 1,333,296 | ||||
| 175,000 | WI St Hlth & Eductnl Facs Auth Rev Ref Prohealth Care Oblig Grp | 5.00% | 08/15/33 | 197,477 | ||||
| 700,000 | WI St Hlth & Eductnl Facs Auth Rev Ref Rogers Memorial Hosp Inc, Ser A | 5.00% | 07/01/44 | 801,969 | ||||
| 800,000 | WI St Hlth & Eductnl Facs Auth Rev Ref Rogers Memorial Hosp Inc, Ser A | 5.00% | 07/01/49 | 912,248 | ||||
| 435,000 | WI St Hlth & Eductnl Facs Auth Rev St Johns Cmntys Inc Proj, Ser A | 5.00% | 09/15/30 | 455,054 | ||||
| 2,000,000 | WI St Ref, Ser 3 | 4.00% | 11/01/34 | 2,350,120 | ||||
| 2,500,000 | WI St, Ser B | 4.00% | 05/01/31 | 2,973,500 | ||||
| 44,661,230 | ||||||||
Total Investments – 97.2% | 1,665,721,408 | ||
| (Cost $1,606,214,332) (f) | |||
Net Other Assets and Liabilities – 2.8% | 48,763,888 | ||
Net Assets – 100.0% | $1,714,485,296 |
| Futures Contracts | Position | Number of Contracts | Expiration Date | Notional Value | Unrealized Appreciation (Depreciation)/ Value | |||||
| U.S. Treasury Long Bonds | Short | 102 | Dec 2020 | $ (17,591,813) | $210,063 | |||||
| U.S. Treasury Ultra 10-Year Notes | Short | 220 | Dec 2020 | (34,601,875) | 196,500 | |||||
| Total Futures Contracts | $(52,193,688) | $406,563 |
| (a) | Variable Rate Demand bond. Interest rate is reset periodically by the agent based on current market conditions. |
| (b) | This security, sold within the terms of a private placement memorandum, is exempt from registration upon resale under Rule 144A under the Securities Act of 1933, as amended (the “1933 Act”), and may be resold in transactions exempt from registration, normally to qualified institutional buyers. Pursuant to procedures adopted by the Trust’s Board of Trustees, this security has been determined to be liquid by First Trust Advisors L.P. (the “Advisor”). Although market instability can result in periods of increased overall market illiquidity, liquidity for each security is determined based on security specific factors and assumptions, which require subjective judgment. At October 31, 2020, securities noted as such amounted to $78,354,823 or 4.6% of net assets. |
| (c) | Pursuant to procedures adopted by the Trust’s Board of Trustees, this security has been determined to be illiquid by the Advisor. |
| (d) | This security, sold within the terms of a private placement memorandum, is exempt from registration upon resale under Rule 144A under the 1933 Act, and may be resold in transactions exempt from registration, normally to qualified institutional buyers (see Note 2C - Restricted Securities in the Notes to Financial Statements). |
| (e) | Zero coupon bond. |
| (f) | Aggregate cost for federal income tax purposes was $1,607,903,663. As of October 31, 2020, the aggregate gross unrealized appreciation for all investments in which there was an excess of value over tax cost was $64,860,057 and the aggregate gross unrealized depreciation for all investments in which there was an excess of tax cost over value was $6,635,749. The net unrealized appreciation was $58,224,308. The amounts presented are inclusive of derivative contracts. |
| AGC | Assured Guaranty Corp. |
| AGM | Assured Guaranty Municipal Corp. |
| AMBAC | American Municipal Bond Assurance Corp. |
| AMT | Alternative Minimum Tax |
| BAM | Build America Mutual |
| BANS | Bond Anticipation Notes |
| CABS | Capital Appreciation Bonds |
| COPS | Certificates of Participation |
| GARVEE | Grant Anticipation Revenue Vehicle |
| NATL-RE | National Public Finance Guarantee Corp. |
| Total Value at 10/31/2020 | Level 1 Quoted Prices | Level 2 Significant Observable Inputs | Level 3 Significant Unobservable Inputs | |
Municipal Bonds* | $ 1,665,721,408 | $ — | $ 1,665,721,408 | $ — |
Futures Contracts | 406,563 | 406,563 | — | — |
Total | $ 1,666,127,971 | $ 406,563 | $ 1,665,721,408 | $— |
| * | See Portfolio of Investments for state and territory breakout. |
| ASSETS: | |
Investments, at value (Cost $1,606,214,332) | $ 1,665,721,408 |
Cash | 34,930,462 |
Cash segregated as collateral for open futures contracts | 839,652 |
| Receivables: | |
Interest | 20,156,701 |
Fund shares sold | 5,541,183 |
Variation margin | 406,563 |
Total Assets | 1,727,595,969 |
| LIABILITIES: | |
| Payables: | |
Investment securities purchased | 12,395,039 |
Investment advisory fees | 715,634 |
Total Liabilities | 13,110,673 |
NET ASSETS | $1,714,485,296 |
| NET ASSETS consist of: | |
Paid-in capital | $ 1,677,893,014 |
Par value | 309,500 |
Accumulated distributable earnings (loss) | 36,282,782 |
NET ASSETS | $1,714,485,296 |
NET ASSET VALUE, per share | $55.40 |
Number of shares outstanding (unlimited number of shares authorized, par value $0.01 per share) | 30,950,002 |
| INVESTMENT INCOME: | ||
Interest | $ 39,707,990 | |
Total investment income | 39,707,990 | |
| EXPENSES: | ||
Investment advisory fees | 9,432,231 | |
Total expenses | 9,432,231 | |
Fees waived by the investment advisor | (2,176,669) | |
Net expenses | 7,255,562 | |
NET INVESTMENT INCOME (LOSS) | 32,452,428 | |
| NET REALIZED AND UNREALIZED GAIN (LOSS): | ||
| Net realized gain (loss) on: | ||
Investments | (15,634,527) | |
Futures contracts | (5,579,571) | |
Net realized gain (loss) | (21,214,098) | |
| Net change in unrealized appreciation (depreciation) on: | ||
Investments | 20,345,102 | |
Futures contracts | 595,516 | |
Net change in unrealized appreciation (depreciation) | 20,940,618 | |
NET REALIZED AND UNREALIZED GAIN (LOSS) | (273,480) | |
NET INCREASE (DECREASE) IN NET ASSETS RESULTING FROM OPERATIONS | $ 32,178,948 | |
| Year Ended 10/31/2020 | Year Ended 10/31/2019 | ||
| OPERATIONS: | |||
Net investment income (loss) | $ 32,452,428 | $ 18,421,711 | |
Net realized gain (loss) | (21,214,098) | (383,923) | |
Net change in unrealized appreciation (depreciation) | 20,940,618 | 43,706,637 | |
Net increase (decrease) in net assets resulting from operations | 32,178,948 | 61,744,425 | |
| DISTRIBUTIONS TO SHAREHOLDERS FROM: | |||
Investment operations | (32,252,217) | (18,404,821) | |
Return of capital | (917,161) | (424,682) | |
Total distributions to shareholders | (33,169,378) | (18,829,503) | |
| SHAREHOLDER TRANSACTIONS: | |||
Proceeds from shares sold | 639,451,461 | 647,355,139 | |
Cost of shares redeemed | (59,233,572) | (10,383,218) | |
Net increase (decrease) in net assets resulting from shareholder transactions | 580,217,889 | 636,971,921 | |
Total increase (decrease) in net assets | 579,227,459 | 679,886,843 | |
| NET ASSETS: | |||
Beginning of period | 1,135,257,837 | 455,370,994 | |
End of period | $1,714,485,296 | $1,135,257,837 | |
| CHANGES IN SHARES OUTSTANDING: | |||
Shares outstanding, beginning of period | 20,500,002 | 8,800,002 | |
Shares sold | 11,550,000 | 11,900,000 | |
Shares redeemed | (1,100,000) | (200,000) | |
Shares outstanding, end of period | 30,950,002 | 20,500,002 |
| Year Ended October 31, | |||||||||
| 2020 | 2019 | 2018 | 2017 | 2016 | |||||
Net asset value, beginning of period | $ 55.38 | $ 51.75 | $ 53.16 | $ 53.32 | $ 51.58 | ||||
| Income from investment operations: | |||||||||
Net investment income (loss) | 1.23 | 1.35 | 1.35 | 1.34 | 1.32 | ||||
Net realized and unrealized gain (loss) | 0.05 | 3.67 | (1.41) | (0.01) | 1.99 | ||||
Total from investment operations | 1.28 | 5.02 | (0.06) | 1.33 | 3.31 | ||||
| Distributions paid to shareholders from: | |||||||||
Net investment income | (1.23) | (1.36) | (1.35) | (1.33) | (1.35) | ||||
Net realized gain | — | — | — | (0.16) | (0.22) | ||||
Return of capital | (0.03) | (0.03) | — | — | — | ||||
Total distributions | (1.26) | (1.39) | (1.35) | (1.49) | (1.57) | ||||
Net asset value, end of period | $55.40 | $55.38 | $51.75 | $53.16 | $53.32 | ||||
Total return (a) | 2.33% | 9.79% | (0.12)% | 2.59% | 6.47% | ||||
| Ratios to average net assets/supplemental data: | |||||||||
Net assets, end of period (in 000’s) | $ 1,714,485 | $ 1,135,258 | $ 455,371 | $ 220,605 | $ 82,650 | ||||
Ratio of total expenses to average net assets | 0.65% | 0.65% | 0.65% | 0.65% | 0.65% | ||||
Ratio of net expenses to average net assets | 0.50% | 0.50% | 0.50% | 0.50% | 0.52% | ||||
Ratio of net investment income (loss) to average net assets | 2.24% | 2.53% | 2.60% | 2.63% | 2.52% | ||||
Portfolio turnover rate (b) | 35% | 26% | 42% | 85% | 85% | ||||
| (a) | Total return is calculated assuming an initial investment made at the net asset value at the beginning of the period, reinvestment of all distributions at net asset value during the period, and redemption at net asset value on the last day of the period. The returns presented do not reflect the deduction of taxes that a shareholder would pay on Fund distributions or the redemption or sale of Fund shares. Total return is calculated for the time period presented and is not annualized for periods of less than a year. For some periods, the total returns would have been lower if certain fees had not been waived by the advisor. |
| (b) | Portfolio turnover is calculated for the time period presented and is not annualized for periods of less than a year and does not include securities received or delivered from processing creations or redemptions and in-kind transactions. |
| 1) | benchmark yields; |
| 2) | reported trades; |
| 3) | broker/dealer quotes; |
| 4) | issuer spreads; |
| 5) | benchmark securities; |
| 6) | bids and offers; and |
| 7) | reference data including market research publications. |
| 1) | the credit conditions in the relevant market and changes thereto; |
| 2) | the liquidity conditions in the relevant market and changes thereto; |
| 3) | the interest rate conditions in the relevant market and changes thereto (such as significant changes in interest rates); |
| 4) | issuer-specific conditions (such as significant credit deterioration); and |
| 5) | any other market-based data the Advisor’s Pricing Committee considers relevant. In this regard, the Advisor’s Pricing Committee may use last-obtained market-based data to assist it when valuing portfolio securities using amortized cost. |
| 1) | the fundamental business data relating to the issuer; |
| 2) | an evaluation of the forces which influence the market in which these securities are purchased and sold; |
| 3) | the type, size and cost of the security; |
| 4) | the financial statements of the issuer; |
| 5) | the credit quality and cash flow of the issuer, based on the Advisor’s or external analysis; |
| 6) | the information as to any transactions in or offers for the security; |
| 7) | the price and extent of public trading in similar securities (or equity securities) of the issuer/borrower, or comparable companies; |
| 8) | the coupon payments; |
| 9) | the quality, value and salability of collateral, if any, securing the security; and |
| 10) | other relevant factors. |
| • | Level 1 – Level 1 inputs are quoted prices in active markets for identical investments. An active market is a market in which transactions for the investment occur with sufficient frequency and volume to provide pricing information on an ongoing basis. |
| • | Level 2 – Level 2 inputs are observable inputs, either directly or indirectly, and include the following: |
| o | Quoted prices for similar investments in active markets. |
| o | Quoted prices for identical or similar investments in markets that are non-active. A non-active market is a market where there are few transactions for the investment, the prices are not current, or price quotations vary substantially either over time or among market makers, or in which little information is released publicly. |
| o | Inputs other than quoted prices that are observable for the investment (for example, interest rates and yield curves observable at commonly quoted intervals, volatilities, prepayment speeds, loss severities, credit risks, and default rates). |
| o | Inputs that are derived principally from or corroborated by observable market data by correlation or other means. |
| • | Level 3 – Level 3 inputs are unobservable inputs. Unobservable inputs may reflect the reporting entity’s own assumptions about the assumptions that market participants would use in pricing the investment. |
| Security | Acquisition Date | Principal Value | Current Price | Carrying Cost | Value | % of Net Assets | ||
| Brookstone CDD FL Spl Assmnt Rev CDD, 3.88%, 11/01/23 | 01/24/18 | $330,000 | $101.16 | $330,000 | $333,825 | 0.02% | ||
| IN St Fin Auth Rev Eductnl Facs Rock Creek Cmnty Academy Proj, Ser A, 5.25%, 07/01/28 | 09/04/18 | $800,000 | 107.90 | 807,431 | 863,192 | 0.05 | ||
| IN St Fin Auth Rev Eductnl Facs Rock Creek Cmnty Academy Proj, Ser A, 5.88%, 07/01/38 | 09/04/18 | $1,000,000 | 107.68 | 1,004,417 | 1,076,790 | 0.06 | ||
| Leander TX Spl Assmnt Rev Crystal Springs Pub Impt Dist Proj Accd Inv, 5.13%, 09/01/38 | 05/04/18 | $1,290,000 | 100.63 | 1,290,000 | 1,298,166 | 0.08 | ||
| Timber Creek CDD FL Spl Assmnt Rev, 4.13%, 11/01/24 | 06/21/18 | $215,000 | 101.64 | 215,000 | 218,520 | 0.01 | ||
| $3,646,848 | $3,790,493 | 0.22% |
| Distributions paid from: | 2020 | 2019 |
Ordinary income | $9,278 | $2,058 |
Capital gains | — | — |
Tax-exempt income | 32,242,939 | 18,402,763 |
Return of capital | 917,161 | 424,682 |
Undistributed ordinary income | $— |
Accumulated capital and other gain (loss) | (21,941,526) |
Net unrealized appreciation (depreciation) | 58,224,308 |
| Accumulated Net Investment Income (Loss) | Accumulated Net Realized Gain (Loss) on Investments | Paid-in Capital | ||
| $(73,811) | $73,811 | $— |
| Asset Derivatives | Liability Derivatives | |||||||||
| Derivative Instrument | Risk Exposure | Statement of Assets and Liabilities Location | Value | Statement of Assets and Liabilities Location | Value | |||||
| Futures | Interest Rate Risk | Variation Margin Receivable | $ 406,563 | Variation Margin Payable | $ — | |||||
| Statement of Operations Location | |
| Interest Rate Risk Exposure | |
| Net realized gain (loss) on futures contracts | $(5,579,571) |
| Net change in unrealized appreciation (depreciation) on futures contracts | 595,516 |

| Federal and State Income Tax | Percentages | |
| Tax-Exempt Interest Dividends | 99.97% | |
| Alternative Minimum Tax (AMT) | 8.45% |
| NOT FDIC INSURED | NOT BANK GUARANTEED | MAY LOSE VALUE |
| Name, Year of Birth and Position with the Trust | Term of Office and Year First Elected or Appointed | Principal Occupations During Past 5 Years | Number of Portfolios in the First Trust Fund Complex Overseen by Trustee | Other Trusteeships or Directorships Held by Trustee During Past 5 Years |
| INDEPENDENT TRUSTEES | ||||
| Richard E. Erickson, Trustee (1951) | • Indefinite Term • Since Inception | Physician; Officer, Wheaton Orthopedics; Limited Partner, Gundersen Real Estate Limited Partnership (June 1992 to December 2016); Member, Sportsmed LLC (April 2007 to November 2015) | 189 | None |
| Thomas R. Kadlec, Trustee (1957) | • Indefinite Term • Since Inception | President, ADM Investor Services, Inc. (Futures Commission Merchant) | 189 | Director of ADM Investor Services, Inc., ADM Investor Services International, Futures Industry Association, and National Futures Association |
| Robert F. Keith, Trustee (1956) | • Indefinite Term • Since Inception | President, Hibs Enterprises (Financial and Management Consulting) | 189 | Director of Trust Company of Illinois |
| Niel B. Nielson, Trustee (1954) | • Indefinite Term • Since Inception | Senior Advisor (August 2018 to Present), Managing Director and Chief Operating Officer (January 2015 to August 2018), Pelita Harapan Educational Foundation (Educational Products and Services) | 189 | None |
| INTERESTED TRUSTEE | ||||
| James A. Bowen(1), Trustee and Chairman of the Board (1955) | • Indefinite Term • Since Inception | Chief Executive Officer, First Trust Advisors L.P. and First Trust Portfolios L.P.; Chairman of the Board of Directors, BondWave LLC (Software Development Company) and Stonebridge Advisors LLC (Investment Advisor) | 189 | None |
| (1) | Mr. Bowen is deemed an “interested person” of the Trust due to his position as CEO of First Trust Advisors L.P., investment advisor of the Trust. |
| Name and Year of Birth | Position and Offices with Trust | Term of Office and Length of Service | Principal Occupations During Past 5 Years |
| OFFICERS(2) | |||
| James M. Dykas (1966) | President and Chief Executive Officer | • Indefinite Term • Since January 2016 | Managing Director and Chief Financial Officer (January 2016 to Present), Controller (January 2011 to January 2016), Senior Vice President (April 2007 to January 2016), First Trust Advisors L.P. and First Trust Portfolios L.P.; Chief Financial Officer (January 2016 to Present), BondWave LLC (Software Development Company) and Stonebridge Advisors LLC (Investment Advisor) |
| Donald P. Swade (1972) | Treasurer, Chief Financial Officer and Chief Accounting Officer | • Indefinite Term • Since January 2016 | Senior Vice President (July 2016 to Present), Vice President (April 2012 to July 2016), First Trust Advisors L.P. and First Trust Portfolios L.P. |
| W. Scott Jardine (1960) | Secretary and Chief Legal Officer | • Indefinite Term • Since Inception | General Counsel, First Trust Advisors L.P. and First Trust Portfolios L.P.; Secretary and General Counsel, BondWave LLC; Secretary, Stonebridge Advisors LLC |
| Daniel J. Lindquist (1970) | Vice President | • Indefinite Term • Since Inception | Managing Director, First Trust Advisors L.P. and First Trust Portfolios L.P. |
| Kristi A. Maher (1966) | Chief Compliance Officer and Assistant Secretary | • Indefinite Term • Since Inception | Deputy General Counsel, First Trust Advisors L.P. and First Trust Portfolios L.P. |
| Roger F. Testin (1966) | Vice President | • Indefinite Term • Since Inception | Senior Vice President, First Trust Advisors L.P. and First Trust Portfolios L.P. |
| Stan Ueland (1970) | Vice President | • Indefinite Term • Since Inception | Senior Vice President, First Trust Advisors L.P. and First Trust Portfolios L.P |
| (2) | The term “officer” means the president, vice president, secretary, treasurer, controller or any other officer who performs a policy making function. |
| • | Information we receive from you and your broker-dealer, investment advisor or financial representative through interviews, applications, agreements or other forms; |
| • | Information about your transactions with us, our affiliates or others; |
| • | Information we receive from your inquiries by mail, e-mail or telephone; and |
| • | Information we collect on our website through the use of “cookies”. For example, we may identify the pages on our website that your browser requests or visits. |
| • | In order to provide you with products and services and to effect transactions that you request or authorize, we may disclose your personal information as described above to unaffiliated financial service providers and other companies that perform administrative or other services on our behalf, such as transfer agents, custodians and trustees, or that assist us in the distribution of investor materials such as trustees, banks, financial representatives, proxy services, solicitors and printers. |
| • | We may release information we have about you if you direct us to do so, if we are compelled by law to do so, or in other legally limited circumstances (for example to protect your account from fraud). |
FUND ACCOUNTANT &
TRANSFER AGENT
PUBLIC ACCOUNTING FIRM

For the Year Ended
October 31, 2020
| 1 | |
| 2 | |
| 5 | |
| 7 | |
| 8 | |
| 18 | |
| 19 | |
| 20 | |
| 21 | |
| 22 | |
| 28 | |
| 29 | |
| 34 | |
| 36 |

| Performance | ||||||
| Average Annual Total Returns | Cumulative Total Returns | |||||
| 1 Year Ended 10/31/20 | 5 Years Ended 10/31/20 | Inception (9/8/14) to 10/31/20 | 5 Years Ended 10/31/20 | Inception (9/8/14) to 10/31/20 | ||
| Fund Performance | ||||||
| NAV | 0.74% | 5.88% | 6.33% | 33.07% | 45.85% | |
| Market Price | 0.59% | 5.83% | 6.31% | 32.75% | 45.67% | |
| Index Performance | ||||||
| S&P 500® Index | 9.71% | 11.71% | 10.52% | 73.97% | 84.94% | |
| Portfolio Sector Allocation | % of Total Long-Term Investments |
| Health Care | 23.0% |
| Information Technology | 20.7 |
| Communication Services | 10.8 |
| Consumer Staples | 9.8 |
| Consumer Discretionary | 9.0 |
| Financials | 8.7 |
| Materials | 6.6 |
| Industrials | 5.2 |
| Utilities | 3.3 |
| Energy | 2.5 |
| Real Estate | 0.4 |
| Total | 100.0% |
| Portfolio Sector Allocation | % of Investments Sold Short |
| Information Technology | 18.9% |
| Industrials | 16.8 |
| Consumer Discretionary | 16.1 |
| Health Care | 12.0 |
| Materials | 10.3 |
| Consumer Staples | 8.6 |
| Financials | 7.1 |
| Communication Services | 5.3 |
| Energy | 2.9 |
| Real Estate | 1.3 |
| Utilities | 0.7 |
| Total | 100.0% |
| Top Ten Long-Term Investments | % of Net Assets |
| Apple, Inc. | 5.7% |
| Microsoft Corp. | 4.3 |
| Amazon.com, Inc. | 4.2 |
| Alphabet, Inc., Class A | 3.1 |
| Centene Corp. | 2.4 |
| Etsy, Inc. | 2.3 |
| Anthem, Inc. | 2.3 |
| Conagra Brands, Inc. | 2.2 |
| Zoom Video Communications, Inc., Class A | 2.1 |
| Facebook, Inc., Class A | 1.8 |
| Total | 30.4% |
| Top Ten Investments Sold Short | % of Net Assets |
| SPDR S&P 500 ETF Trust | -1.0% |
| Ball Corp. | -0.8% |
| General Electric Co. | -0.8% |
| Coca-Cola (The) Co. | -0.7% |
| Liberty Broadband Corp., Class C | -0.7% |
| Burlington Stores, Inc. | -0.7% |
| McDonald’s Corp. | -0.7% |
| Oracle Corp. | -0.7% |
| Norfolk Southern Corp. | -0.7% |
| Verisk Analytics, Inc. | -0.7% |
| Total | -7.5% |
| Fund Allocation | % of Net Assets |
| Common Stocks | 92.4% |
| Exchange-Traded Funds | 3.5 |
| Master Limited Partnerships | 0.3 |
| Common Stocks Sold Short | (27.8) |
| Exchange-Traded Funds Sold Short | (1.0) |
| Real Estate Investment Trusts Sold Short | (0.4) |
| Net Other Assets and Liabilities* | 33.0 |
| Total | 100.0% |
| * | Includes variation margin on futures contracts. |
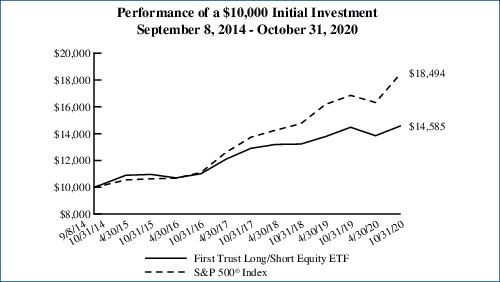
Performance figures assume reinvestment of all distributions and do not reflect the deduction of taxes that a shareholder would pay on Fund distributions or the redemption or sale of Fund shares. An index is a statistical composite that tracks a specified financial market or sector. Unlike the Fund, the index does not actually hold a portfolio of securities and therefore does not incur the expenses incurred by the Fund. These expenses negatively impact the performance of the Fund. The Fund’s past performance does not predict future performance.
| Beginning Account Value May 1, 2020 | Ending Account Value October 31, 2020 | Annualized Expense Ratio Based on the Six-Month Period (a) | Expenses Paid During the Six-Month Period (a)(b) | |
| First Trust Long/Short Equity ETF (FTLS) | ||||
| Actual | $1,000.00 | $1,053.30 | 1.41% | $7.28 |
| Hypothetical (5% return before expenses) | $1,000.00 | $1,018.05 | 1.41% | $7.15 |
| (a) | Annualized expense ratio and expenses paid during the six-month period do not include fees and expenses of the underlying funds in which the Fund invests. |
| (b) | Expenses are equal to the annualized expense ratios as indicated in the table multiplied by the average account value over the period (May 1, 2020 through October 31, 2020), multiplied by 184/366 (to reflect the six-month period). |
| Shares/ Units | Description | Value | ||
| COMMON STOCKS – 92.4% | ||||
| Air Freight & Logistics – 0.8% | ||||
| 41,227 | Atlas Air Worldwide Holdings, Inc, (a) | $2,438,989 | ||
| Auto Components – 0.1% | ||||
| 16,651 | Gentex Corp. | 460,733 | ||
| Banks – 3.2% | ||||
| 19,146 | Bank OZK | 474,438 | ||
| 11,391 | Commerce Bancshares, Inc. | 709,090 | ||
| 7,529 | JPMorgan Chase & Co. | 738,143 | ||
| 3,033 | PNC Financial Services Group (The), Inc. | 339,332 | ||
| 41,512 | Signature Bank (b) | 3,351,679 | ||
| 153,868 | Synovus Financial Corp. | 4,000,568 | ||
| 9,613,250 | ||||
| Beverages – 0.1% | ||||
| 5,414 | Monster Beverage Corp. (a) | 414,550 | ||
| Biotechnology – 5.1% | ||||
| 12,821 | AbbVie, Inc. | 1,091,067 | ||
| 14,754 | Amgen, Inc. (b) | 3,200,733 | ||
| 2,155 | Biogen, Inc. (a) | 543,211 | ||
| 41,795 | Bluebird Bio, Inc. (a) | 2,161,219 | ||
| 11,547 | Gilead Sciences, Inc. | 671,458 | ||
| 4,153 | Incyte Corp. (a) | 359,816 | ||
| 38,504 | Neurocrine Biosciences, Inc. (a) (b) | 3,799,190 | ||
| 2,270 | Regeneron Pharmaceuticals, Inc. (a) | 1,233,881 | ||
| 17,247 | Ultragenyx Pharmaceutical, Inc. (a) | 1,733,324 | ||
| 2,540 | Vertex Pharmaceuticals, Inc. (a) | 529,234 | ||
| 15,323,133 | ||||
| Building Products – 0.5% | ||||
| 14,070 | Allegion PLC | 1,385,895 | ||
| Capital Markets – 0.3% | ||||
| 18,620 | Charles Schwab (The) Corp. | 765,468 | ||
| Chemicals – 1.0% | ||||
| 5,381 | Scotts Miracle-Gro (The) Co. | 807,419 | ||
| 3,394 | Sherwin-Williams (The) Co. | 2,335,004 | ||
| 3,142,423 | ||||
| Communications Equipment – 0.1% | ||||
| 13,494 | AudioCodes Ltd. | 391,191 | ||
| Construction & Engineering – 0.2% | ||||
| 7,743 | EMCOR Group, Inc. | 527,995 | ||
| Construction Materials – 0.2% | ||||
| 8,873 | Eagle Materials, Inc. | 756,423 | ||
| Consumer Finance – 0.2% | ||||
| 6,728 | Capital One Financial Corp. | 491,682 | ||
| Diversified Financial Services – 0.8% | ||||
| 11,256 | Berkshire Hathaway, Inc., Class B (a) | 2,272,586 | ||
| Diversified Telecommunication Services – 1.8% | ||||
| 15,119 | AT&T, Inc. | 408,515 | ||
| 17,477 | Bandwidth, Inc., Class A (a) | 2,802,524 | ||
| 24,621 | Iridium Communications, Inc. (a) | 650,241 | ||
| Shares/ Units | Description | Value | ||
| COMMON STOCKS (Continued) | ||||
| Diversified Telecommunication Services (Continued) | ||||
| 7,617 | Verizon Communications, Inc. | $434,093 | ||
| 102,720 | Vonage Holdings Corp. (a) | 1,086,778 | ||
| 5,382,151 | ||||
| Electric Utilities – 1.7% | ||||
| 5,666 | American Electric Power Co., Inc. | 509,543 | ||
| 5,595 | Duke Energy Corp. | 515,356 | ||
| 8,704 | Edison International | 487,772 | ||
| 4,620 | Entergy Corp. | 467,636 | ||
| 5,309 | Eversource Energy | 463,316 | ||
| 12,191 | Exelon Corp. | 486,299 | ||
| 16,147 | FirstEnergy Corp. | 479,889 | ||
| 6,447 | NextEra Energy, Inc. | 471,985 | ||
| 16,093 | PPL Corp. | 442,558 | ||
| 8,617 | Southern (The) Co. | 495,047 | ||
| 6,527 | Xcel Energy, Inc. | 457,086 | ||
| 5,276,487 | ||||
| Electrical Equipment – 0.7% | ||||
| 15,067 | Hubbell, Inc. | 2,192,399 | ||
| Energy Equipment & Services – 0.3% | ||||
| 37,780 | Cactus, Inc., Class A | 642,260 | ||
| 57,361 | Solaris Oilfield Infrastructure, Inc., Class A | 340,151 | ||
| 982,411 | ||||
| Entertainment – 2.2% | ||||
| 21,732 | Electronic Arts, Inc. (a) | 2,604,145 | ||
| 22,627 | Take-Two Interactive Software, Inc. (a) | 3,505,375 | ||
| 65,324 | Zynga, Inc., Class A (a) | 587,263 | ||
| 6,696,783 | ||||
| Food & Staples Retailing – 1.5% | ||||
| 21,314 | BJ’s Wholesale Club Holdings, Inc. (a) | 816,113 | ||
| 26,930 | Walmart, Inc. (b) | 3,736,538 | ||
| 4,552,651 | ||||
| Food Products – 4.3% | ||||
| 96,530 | B&G Foods, Inc. | 2,563,837 | ||
| 11,182 | Cal-Maine Foods, Inc. (a) | 428,830 | ||
| 71,679 | Campbell Soup Co. (b) | 3,345,259 | ||
| 189,616 | Conagra Brands, Inc. (b) | 6,653,625 | ||
| 12,991,551 | ||||
| Health Care Equipment & Supplies – 3.4% | ||||
| 12,279 | Abbott Laboratories | 1,290,646 | ||
| 1,203 | ABIOMED, Inc. (a) | 303,012 | ||
| 1,431 | Align Technology, Inc. (a) | 609,720 | ||
| 2,768 | Becton Dickinson and Co. | 639,768 | ||
| 15,324 | Boston Scientific Corp. (a) | 525,153 | ||
| 4,794 | Danaher Corp. | 1,100,415 | ||
| 8,030 | DENTSPLY SIRONA, Inc. | 378,936 | ||
| 1,210 | DexCom, Inc. (a) | 386,692 | ||
| 6,993 | Edwards Lifesciences Corp. (a) | 501,328 | ||
| 5,969 | Hologic, Inc. (a) | 410,787 | ||
| 2,129 | IDEXX Laboratories, Inc. (a) | 904,442 | ||
| Shares/ Units | Description | Value | ||
| COMMON STOCKS (Continued) | ||||
| Health Care Equipment & Supplies (Continued) | ||||
| 9,978 | Medtronic PLC | $1,003,487 | ||
| 2,459 | ResMed, Inc. | 471,980 | ||
| 3,316 | Stryker Corp. | 669,865 | ||
| 1,676 | Teleflex, Inc. | 533,353 | ||
| 1,495 | West Pharmaceutical Services, Inc. | 406,745 | ||
| 10,136,329 | ||||
| Health Care Providers & Services – 8.9% | ||||
| 3,918 | AmerisourceBergen Corp. | 376,402 | ||
| 24,897 | Anthem, Inc. (b) | 6,791,902 | ||
| 7,600 | Cardinal Health, Inc. | 348,004 | ||
| 120,729 | Centene Corp. (a) (b) | 7,135,084 | ||
| 9,067 | Chemed Corp. | 4,336,927 | ||
| 3,747 | Cigna Corp. | 625,637 | ||
| 25,610 | CVS Health Corp. (b) | 1,436,465 | ||
| 3,866 | DaVita, Inc. (a) | 333,443 | ||
| 3,695 | HCA Healthcare, Inc. | 457,958 | ||
| 5,354 | Henry Schein, Inc. (a) | 340,407 | ||
| 2,208 | Humana, Inc. | 881,610 | ||
| 2,226 | Laboratory Corp of America Holdings (a) | 444,688 | ||
| 2,892 | McKesson Corp. | 426,541 | ||
| 3,261 | Quest Diagnostics, Inc. | 398,299 | ||
| 7,162 | UnitedHealth Group, Inc. | 2,185,413 | ||
| 3,177 | Universal Health Services, Inc., Class B | 348,040 | ||
| 26,866,820 | ||||
| Health Care Technology – 0.2% | ||||
| 16,307 | Vocera Communications, Inc. (a) | 534,543 | ||
| Household Durables – 1.2% | ||||
| 34,185 | Century Communities, Inc. (a) | 1,327,745 | ||
| 19,873 | Lennar Corp., Class A (b) | 1,395,681 | ||
| 18,930 | PulteGroup, Inc. | 771,587 | ||
| 3,495,013 | ||||
| Household Products – 1.5% | ||||
| 27,546 | Church & Dwight Co., Inc. (b) | 2,434,791 | ||
| 14,604 | Procter & Gamble (The) Co. | 2,002,208 | ||
| 4,436,999 | ||||
| Insurance – 0.1% | ||||
| 8,899 | Athene Holding Ltd., Class A (a) | 285,480 | ||
| Interactive Media & Services – 6.3% | ||||
| 5,688 | Alphabet, Inc., Class A (a) (b) | 9,192,434 | ||
| 2,676 | Alphabet, Inc., Class C (a) | 4,337,823 | ||
| 21,093 | Facebook, Inc., Class A (a) (b) | 5,549,779 | ||
| 19,080,036 | ||||
| Internet & Direct Marketing Retail – 6.4% | ||||
| 4,136 | Amazon.com, Inc. (a) (b) | 12,557,516 | ||
| 56,238 | Etsy, Inc. (a) (b) | 6,837,979 | ||
| 19,395,495 | ||||
| IT Services – 4.4% | ||||
| 31,042 | Broadridge Financial Solutions, Inc. (b) | 4,271,379 | ||
| 51,480 | GoDaddy, Inc., Class A (a) (b) | 3,641,695 | ||
| Shares/ Units | Description | Value | ||
| COMMON STOCKS (Continued) | ||||
| IT Services (Continued) | ||||
| 9,753 | Visa, Inc., Class A | $1,772,218 | ||
| 15,087 | Wix.com Ltd. (a) (b) | 3,731,317 | ||
| 13,416,609 | ||||
| Life Sciences Tools & Services – 1.7% | ||||
| 4,700 | Agilent Technologies, Inc. | 479,823 | ||
| 698 | Bio-Rad Laboratories, Inc., Class A (a) | 409,321 | ||
| 1,643 | Illumina, Inc. (a) | 480,906 | ||
| 2,884 | IQVIA Holdings, Inc. (a) | 444,107 | ||
| 440 | Mettler-Toledo International, Inc. (a) | 439,081 | ||
| 3,178 | PerkinElmer, Inc. | 411,710 | ||
| 5,135 | Thermo Fisher Scientific, Inc. | 2,429,471 | ||
| 5,094,419 | ||||
| Machinery – 0.8% | ||||
| 9,992 | AGCO Corp. | 769,684 | ||
| 16,005 | Allison Transmission Holdings, Inc. | 578,581 | ||
| 3,933 | Snap-on, Inc. | 619,565 | ||
| 4,726 | Watts Water Technologies, Inc., Class A | 523,499 | ||
| 2,491,329 | ||||
| Metals & Mining – 5.1% | ||||
| 19,049 | Agnico Eagle Mines Ltd. | 1,510,395 | ||
| 54,245 | AngloGold Ashanti Ltd., ADR | 1,255,229 | ||
| 53,034 | Barrick Gold Corp. | 1,417,599 | ||
| 10,408 | Franco-Nevada Corp. | 1,421,212 | ||
| 175,179 | Kinross Gold Corp. | 1,396,177 | ||
| 29,436 | Kirkland Lake Gold Ltd. | 1,342,870 | ||
| 23,413 | Newmont Corp. | 1,471,273 | ||
| 85,887 | Osisko Gold Royalties Ltd. | 960,217 | ||
| 4,300 | Reliance Steel & Aluminum Co. (b) | 468,657 | ||
| 11,154 | Royal Gold, Inc. | 1,325,207 | ||
| 177,034 | Sandstorm Gold Ltd. (a) | 1,310,052 | ||
| 29,820 | Wheaton Precious Metals Corp. | 1,375,000 | ||
| 15,253,888 | ||||
| Multi-Utilities – 1.3% | ||||
| 5,645 | Ameren Corp. | 457,922 | ||
| 7,482 | CMS Energy Corp. | 473,835 | ||
| 6,163 | Consolidated Edison, Inc. | 483,734 | ||
| 5,756 | Dominion Energy, Inc. | 462,437 | ||
| 3,862 | DTE Energy Co. | 476,648 | ||
| 8,486 | Public Service Enterprise Group, Inc. | 493,461 | ||
| 3,582 | Sempra Energy | 449,040 | ||
| 4,897 | WEC Energy Group, Inc. | 492,393 | ||
| 3,789,470 | ||||
| Oil, Gas & Consumable Fuels – 1.8% | ||||
| 326,045 | DHT Holdings, Inc. | 1,568,277 | ||
| 17,479 | HollyFrontier Corp. | 323,536 | ||
| 33,204 | International Seaways, Inc. | 449,582 | ||
| 249,661 | Kinder Morgan, Inc. | 2,970,966 | ||
| 5,312,361 | ||||
| Personal Products – 1.0% | ||||
| 22,484 | Medifast, Inc. | 3,158,777 | ||
| Shares/ Units | Description | Value | ||
| COMMON STOCKS (Continued) | ||||
| Pharmaceuticals – 2.9% | ||||
| 17,052 | Bristol-Myers Squibb Co. | $996,689 | ||
| 6,567 | Eli Lilly & Co. | 856,731 | ||
| 22,058 | Johnson & Johnson | 3,024,372 | ||
| 16,849 | Merck & Co, Inc. (b) | 1,267,213 | ||
| 21,075 | Mylan N.V. (a) | 306,431 | ||
| 6,508 | Perrigo Co. PLC | 285,506 | ||
| 37,671 | Pfizer, Inc. | 1,336,567 | ||
| 4,452 | Zoetis, Inc. | 705,865 | ||
| 8,779,374 | ||||
| Real Estate Management & Development – 0.4% | ||||
| 29,080 | eXp World Holdings, Inc. (a) | 1,232,701 | ||
| Semiconductors & Semiconductor Equipment – 1.0% | ||||
| 6,104 | NVIDIA Corp. | 3,060,301 | ||
| Software – 8.7% | ||||
| 64,024 | Dropbox, Inc., Class A (a) | 1,169,078 | ||
| 4,688 | Intuit, Inc. | 1,475,220 | ||
| 63,931 | Microsoft Corp. (b) | 12,944,110 | ||
| 17,512 | SS&C Technologies Holdings, Inc. | 1,037,061 | ||
| 14,503 | Workday, Inc., Class A (a) | 3,047,370 | ||
| 13,996 | Zoom Video Communications, Inc., Class A (a) (b) | 6,450,896 | ||
| 26,123,735 | ||||
| Specialty Retail – 0.9% | ||||
| 6,928 | Home Depot (The), Inc. | 1,847,767 | ||
| 29,184 | MarineMax, Inc. (a) | 874,936 | ||
| 2,722,703 | ||||
| Technology Hardware, Storage & Peripherals – 5.7% | ||||
| 156,525 | Apple, Inc. (b) | 17,039,312 | ||
| Thrifts & Mortgage Finance – 0.4% | ||||
| 43,917 | Flagstar Bancorp, Inc. | 1,288,964 | ||
| Tobacco – 1.0% | ||||
| 51,209 | Altria Group, Inc. | 1,847,621 | ||
| 113,920 | Vector Group Ltd. | 1,046,925 | ||
| 2,894,546 | ||||
| Trading Companies & Distributors – 2.0% | ||||
| 44,189 | Beacon Roofing Supply, Inc. (a) | 1,356,602 | ||
| 17,749 | GMS, Inc. (a) | 401,127 | ||
| 6,995 | SiteOne Landscape Supply, Inc. (a) | 835,833 | ||
| 15,734 | Watsco, Inc. | 3,526,619 | ||
| 6,120,181 | ||||
| Water Utilities – 0.2% | ||||
| 3,153 | American Water Works Co., Inc. | 474,558 | ||
Total Common Stocks | 278,542,694 | |||
| (Cost $264,930,788) | ||||
| EXCHANGE-TRADED FUNDS – 3.5% | ||||
| Capital Markets – 3.5% | ||||
| 48,064 | iShares S&P Small-Cap 600 Value ETF | 3,049,661 | ||
| 14,641 | Schwab US Small-Cap ETF | 1,022,234 | ||
| Shares/ Units | Description | Value | ||
| EXCHANGE-TRADED FUNDS (Continued) | ||||
| Capital Markets (Continued) | ||||
| 58,747 | SPDR S&P 600 Small CapValue ETF | $3,051,907 | ||
| 2,800 | Vanguard Small-Cap ETF | 439,908 | ||
| 26,801 | Vanguard Small-Cap Value ETF | 3,057,994 | ||
Total Exchange-Traded Funds | 10,621,704 | |||
| (Cost $10,927,371) | ||||
| MASTER LIMITED PARTNERSHIPS – 0.3% | ||||
| Oil, Gas & Consumable Fuels – 0.3% | ||||
| 11,625 | Magellan Midstream Partners, L.P. | 413,152 | ||
| 15,465 | TC PipeLines, L.P. | 435,340 | ||
Total Master Limited Partnerships | 848,492 | |||
| (Cost $930,437) | ||||
Total Investments – 96.2% | 290,012,890 | ||
| (Cost $276,788,596) (c) |
| Shares | Description | Value | ||
| COMMON STOCKS SOLD SHORT – (27.8)% | ||||
| Aerospace & Defense – (0.9)% | ||||
| (6,170) | AeroVironment, Inc. (a) | (471,141) | ||
| (5,669) | Axon Enterprise, Inc. (a) | (560,664) | ||
| (11,732) | Cubic Corp. | (693,479) | ||
| (3,277) | Huntington Ingalls Industries, Inc. | (483,292) | ||
| (27,856) | Kratos Defense & Security Solutions, Inc. (a) | (526,200) | ||
| (2,734,776) | ||||
| Automobiles – (0.3)% | ||||
| (5,664) | Ferrari NV | (1,010,571) | ||
| Banks – (0.5)% | ||||
| (1,590) | First Citizens BancShares, Inc., Class A | (735,693) | ||
| (6,776) | First Financial Bankshares, Inc. | (201,993) | ||
| (4,524) | First Republic Bank | (570,657) | ||
| (1,508,343) | ||||
| Beverages – (1.3)% | ||||
| (44,995) | Coca-Cola (The) Co. | (2,162,460) | ||
| (46,613) | Coca-Cola European Partners PLC | (1,664,550) | ||
| (3,827,010) | ||||
| Chemicals – (1.6)% | ||||
| (7,439) | Air Products & Chemicals, Inc. | (2,054,949) | ||
| (15,572) | Albemarle Corp. | (1,451,466) | ||
| (12,505) | Ashland Global Holdings, Inc. | (872,474) | ||
| (1,365) | NewMarket Corp. | (488,247) | ||
| (4,867,136) | ||||
| Commercial Services & Supplies – (1.1)% | ||||
| (7,557) | MSA Safety, Inc. | (996,919) | ||
| (6,692) | U.S. Ecology, Inc. | (204,240) | ||
| (19,002) | Waste Management, Inc. | (2,050,506) | ||
| (3,251,665) | ||||
| Construction & Engineering – (0.2)% | ||||
| (4,228) | Valmont Industries, Inc. | (600,165) | ||
| Shares | Description | Value | ||
| COMMON STOCKS SOLD SHORT (Continued) | ||||
| Consumer Finance – (0.5)% | ||||
| (17,623) | American Express Co. | $(1,607,923) | ||
| Containers & Packaging – (0.8)% | ||||
| (27,804) | Ball Corp. | (2,474,556) | ||
| Diversified Financial Services – (0.1)% | ||||
| (4,121) | Voya Financial, Inc. | (197,520) | ||
| Electric Utilities – (0.1)% | ||||
| (3,964) | ALLETE, Inc. | (204,463) | ||
| (2,890) | Pinnacle West Capital Corp. | (235,737) | ||
| (440,200) | ||||
| Electrical Equipment – (0.2)% | ||||
| (42,186) | Vertiv Holdings Co. | (744,583) | ||
| Electronic Equipment, Instruments & Components – (1.1)% | ||||
| (10,812) | Belden, Inc. | (333,875) | ||
| (23,963) | Flex Ltd. (a) | (339,076) | ||
| (11,092) | IPG Photonics Corp. (a) | (2,062,668) | ||
| (8,146) | Itron, Inc. (a) | (553,521) | ||
| (3,289,140) | ||||
| Entertainment – (0.7)% | ||||
| (26,388) | Live Nation Entertainment, Inc. (a) | (1,287,735) | ||
| (5,241) | Madison Square Garden (The) Co., Class A (a) | (742,335) | ||
| (2,030,070) | ||||
| Food Products – (1.0)% | ||||
| (2,761) | J&J Snack Foods Corp. | (374,309) | ||
| (31,063) | Kellogg Co. | (1,953,552) | ||
| (3,576) | Lancaster Colony Corp. | (594,117) | ||
| (2,921,978) | ||||
| Health Care Equipment & Supplies – (2.2)% | ||||
| (8,756) | CONMED Corp. | (682,705) | ||
| (16,623) | Globus Medical, Inc., Class A (a) | (866,391) | ||
| (15,354) | LivaNova PLC (a) | (772,921) | ||
| (5,657) | Neogen Corp (a) | (394,519) | ||
| (30,861) | NuVasive, Inc. (a) | (1,371,154) | ||
| (5,687) | Penumbra, Inc. (a) | (1,484,478) | ||
| (9,329) | Shockwave Medical, Inc. (a) | (637,357) | ||
| (9,021) | Tactile Systems Technology, Inc. (a) | (329,988) | ||
| (6,539,513) | ||||
| Health Care Providers & Services – (0.5)% | ||||
| (9,721) | Guardant Health, Inc. (a) | (1,036,842) | ||
| (14,246) | Premier, Inc., Class A | (466,271) | ||
| (1,503,113) | ||||
| Hotels, Restaurants & Leisure – (1.3)% | ||||
| (36,905) | Las Vegas Sands Corp. | (1,773,654) | ||
| (10,038) | McDonald’s Corp. | (2,138,094) | ||
| (3,911,748) | ||||
| Household Products-(0.2)% | ||||
| (3,259) | WD-40 Co. | (793,175) | ||
| Shares | Description | Value | ||
| COMMON STOCKS SOLD SHORT (Continued) | ||||
| Industrial Conglomerates – (0.8)% | ||||
| (329,564) | General Electric Co. | $(2,445,365) | ||
| Internet & Direct Marketing Retail – (0.6)% | ||||
| (865) | Booking Holdings, Inc. (a) | (1,403,462) | ||
| (37,226) | Magnite, Inc. (a) | (336,151) | ||
| (1,739,613) | ||||
| IT Services – (1.0)% | ||||
| (8,686) | Akamai Technologies, Inc. (a) | (826,212) | ||
| (15,004) | Fidelity National Information Services, Inc. | (1,869,348) | ||
| (35,778) | Verra Mobility Corp. (a) | (343,827) | ||
| (3,039,387) | ||||
| Life Sciences Tools & Services – (0.8)% | ||||
| (3,862) | 10X Genomics, Inc., Class A (a) | (528,708) | ||
| (13,922) | Adaptive Biotechnologies Corp. (a) | (641,526) | ||
| (11,369) | NanoString Technologies, Inc. (a) | (416,674) | ||
| (22,266) | NeoGenomics, Inc. (a) | (873,495) | ||
| (2,460,403) | ||||
| Machinery – (0.1)% | ||||
| (2,482) | ESCO Technologies, Inc. | (207,719) | ||
| Media – (0.8)% | ||||
| (8,138) | Altice USA, Inc., Class A (a) | (219,319) | ||
| (15,161) | Liberty Broadband Corp., Class C (a) | (2,148,465) | ||
| (2,367,784) | ||||
| Metals & Mining – (0.6)% | ||||
| (72,510) | Freeport-McMoRan, Inc. | (1,257,323) | ||
| (8,541) | Southern Copper Corp. | (447,036) | ||
| (1,704,359) | ||||
| Oil, Gas & Consumable Fuels – (0.8)% | ||||
| (53,856) | Cabot Oil & Gas Corp. | (958,098) | ||
| (5,187) | Chevron Corp. | (360,497) | ||
| (15,077) | Concho Resources, Inc. | (625,846) | ||
| (43,289) | Marathon Oil Corp. | (171,425) | ||
| (7,987) | ONEOK, Inc. | (231,623) | ||
| (36,176) | WPX Energy, Inc. (a) | (166,771) | ||
| (2,514,260) | ||||
| Professional Services – (0.7)% | ||||
| (11,619) | Verisk Analytics, Inc. | (2,067,833) | ||
| Road & Rail – (0.8)% | ||||
| (12,501) | Heartland Express, Inc. | (228,893) | ||
| (10,074) | Norfolk Southern Corp. | (2,106,675) | ||
| (8,196) | Schneider National, Inc., Class B | (180,804) | ||
| (2,516,372) | ||||
| Semiconductors & Semiconductor Equipment – (0.6)% | ||||
| (19,564) | Cree, Inc. (a) | (1,244,271) | ||
| (13,856) | Micron Technology, Inc. (a) | (697,511) | ||
| (1,941,782) | ||||
| Software – (2.8)% | ||||
| (45,766) | Avaya Holdings Corp. (a) | (787,175) | ||
| Shares | Description | Value | ||
| COMMON STOCKS SOLD SHORT (Continued) | ||||
| Software (Continued) | ||||
| (7,670) | Ceridian HCM Holding, Inc. (a) | $(661,307) | ||
| (11,765) | Guidewire Software, Inc. (a) | (1,130,734) | ||
| (7,733) | Medallia, Inc. (a) | (220,004) | ||
| (38,081) | Oracle Corp. | (2,136,725) | ||
| (3,029) | Palo Alto Networks, Inc. (a) | (669,985) | ||
| (8,442) | Pegasystems, Inc. | (978,259) | ||
| (5,785) | Q2 Holdings, Inc. (a) | (527,823) | ||
| (20,586) | Tenable Holdings, Inc. (a) | (702,189) | ||
| (30,837) | Yext, Inc. (a) | (511,277) | ||
| (8,325,478) | ||||
| Specialty Retail – (2.4)% | ||||
| (11,089) | Burlington Stores, Inc. (a) | (2,146,609) | ||
| (8,485) | Five Below, Inc. (a) | (1,131,390) | ||
| (23,409) | Ross Stores, Inc. | (1,993,744) | ||
| (39,789) | TJX (The) Cos., Inc. | (2,021,281) | ||
| (7,293,024) | ||||
| Textiles, Apparel & Luxury Goods – (0.1)% | ||||
| (5,166) | Oxford Industries, Inc. | (212,684) | ||
| Trading Companies & Distributors – (0.1)% | ||||
| (4,506) | Fastenal Co. | (194,794) | ||
| Water Utilities – (0.1)% | ||||
| (4,549) | California Water Service Group | (202,749) | ||
| Wireless Telecommunication Services – (0.1)% | ||||
| (4,552) | Shenandoah Telecommunications Co. | (198,558) | ||
| (3,434) | United States Cellular Corp. (a) | (99,998) | ||
| (298,556) | ||||
Total Common Stocks Sold Short | (83,785,347) | |||
| (Proceeds $83,887,119) | ||||
| EXCHANGE-TRADED FUNDS SOLD SHORT – (1.0)% | ||||
| Capital Markets – (1.0)% | ||||
| (9,091) | SPDR S&P 500 ETF Trust | (2,968,575) | ||
| (Proceeds $3,130,344) | ||||
| REAL ESTATE INVESTMENT TRUSTS SOLD SHORT – (0.4)% | ||||
| Equity Real Estate Investment Trusts – (0.4)% | ||||
| (10,953) | Equity Commonwealth | (289,378) | ||
| (113,354) | Sunstone Hotel Investors, Inc. | (841,087) | ||
Total Real Estate Investment Trusts Sold Short | (1,130,465) | |||
| (Proceeds $1,282,167) | ||||
Total Investments Sold Short – (29.2)% | (87,884,387) | |||
| (Proceeds $88,299,630) | ||||
Net Other Assets and Liabilities – 33.0% | 99,246,596 | |||
Net Assets – 100.0% | $301,375,099 | |||
| Futures Contracts | Position | Number of Contracts | Expiration Date | Notional Value | Unrealized Appreciation (Depreciation)/ Value | |||||
| NASDAQ 100 E-mini Futures | Short | 74 | Dec 2020 | $ (16,348,450) | $401,067 | |||||
| Russell 2000 E-mini Futures | Long | 19 | Dec 2020 | 1,459,960 | (83,880) | |||||
| S&P 500 E-mini Futures | Short | 2 | Dec 2020 | (326,475) | 6,545 | |||||
| Total Futures Contracts | $(15,214,965) | $323,732 |
| (a) | Non-income producing security. |
| (b) | This security or a portion of this security is segregated as collateral for investments sold short. |
| (c) | Aggregate cost for federal income tax purposes was $278,662,320. As of October 31, 2020, the aggregate gross unrealized appreciation for all investments in which there was an excess of value over tax cost was $28,771,805 and the aggregate gross unrealized depreciation for all investments in which there was an excess of tax cost over value was $17,421,235. The net unrealized appreciation was $11,350,570. The amounts presented are inclusive of investments sold short and derivative contracts. |
| ADR | American Depositary Receipt |
| ASSETS TABLE | ||||
| Total Value at 10/31/2020 | Level 1 Quoted Prices | Level 2 Significant Observable Inputs | Level 3 Significant Unobservable Inputs | |
Common Stocks* | $ 278,542,694 | $ 278,542,694 | $ — | $ — |
Exchange-Traded Funds* | 10,621,704 | 10,621,704 | — | — |
Master Limited Partnerships* | 848,492 | 848,492 | — | — |
Total Investments | 290,012,890 | 290,012,890 | — | — |
Futures Contracts | 407,612 | 407,612 | — | — |
Total | $ 290,420,502 | $ 290,420,502 | $— | $— |
LIABILITIES TABLE | ||||
| Total Value at 10/31/2020 | Level 1 Quoted Prices | Level 2 Significant Observable Inputs | Level 3 Significant Unobservable Inputs | |
Common Stocks Sold Short* | $ (83,785,347) | $ (83,785,347) | $ — | $ — |
Exchange-Traded Funds Sold Short* | (2,968,575) | (2,968,575) | — | — |
Real Estate Investment Trusts Sold Short* | (1,130,465) | (1,130,465) | — | — |
Total Investments | (87,884,387) | (87,884,387) | — | — |
Futures Contract | (83,880) | (83,880) | — | — |
Total | $ (87,968,267) | $ (87,968,267) | $— | $— |
| * | See Portfolio of Investments for industry breakout. |
| ASSETS: | |
Investments, at value (Cost $276,788,596) | $ 290,012,890 |
Cash | 10,542,113 |
Cash held at broker as collateral for open futures contracts | 1,351,498 |
Restricted Cash | 87,083,844 |
| Receivables: | |
Investment securities sold | 2,014,507 |
Variation margin | 407,612 |
Dividends | 283,412 |
Dividend reclaims | 6,949 |
Total Assets | 391,702,825 |
| LIABILITIES: | |
Investments sold short, at value (proceeds $88,299,630) | 87,884,387 |
| Payables: | |
Fund shares redeemed | 2,092,891 |
Investment advisory fees | 250,036 |
Variation margin | 83,880 |
Dividends on investments sold short | 9,867 |
Margin interest expense | 6,665 |
Total Liabilities | 90,327,726 |
NET ASSETS | $301,375,099 |
| NET ASSETS consist of: | |
Paid-in capital | $ 330,961,276 |
Par value | 72,000 |
Accumulated distributable earnings (loss) | (29,658,177) |
NET ASSETS | $301,375,099 |
NET ASSET VALUE, per share | $41.86 |
Number of shares outstanding (unlimited number of shares authorized, par value $0.01 per share) | 7,200,002 |
| INVESTMENT INCOME: | ||
Dividends | $ 4,098,931 | |
Margin interest rebate | 367,522 | |
Interest | 17,786 | |
Foreign withholding tax | (32,224) | |
Total investment income | 4,452,015 | |
| EXPENSES: | ||
Investment advisory fees | 2,579,257 | |
Dividend expense on investments sold short | 1,433,357 | |
Margin interest expense | 189,556 | |
Excise tax expense | 2,771 | |
Total expenses | 4,204,941 | |
NET INVESTMENT INCOME (LOSS) | 247,074 | |
| NET REALIZED AND UNREALIZED GAIN (LOSS): | ||
| Net realized gain (loss) on: | ||
Investments | (13,470,976) | |
In-kind redemptions | 20,925,526 | |
Futures contracts | 74,325 | |
Investments sold short | (6,177,571) | |
Net realized gain (loss) | 1,351,304 | |
| Net change in unrealized appreciation (depreciation) on: | ||
Investments | (6,831,493) | |
Futures contracts | 323,732 | |
Investments sold short | 2,794,235 | |
Net change in unrealized appreciation (depreciation) | (3,713,526) | |
NET REALIZED AND UNREALIZED GAIN (LOSS) | (2,362,222) | |
NET INCREASE (DECREASE) IN NET ASSETS RESULTING FROM OPERATIONS | $(2,115,148) | |
| Year Ended 10/31/2020 | Year Ended 10/31/2019 | ||
| OPERATIONS: | |||
Net investment income (loss) | $ 247,074 | $ 2,002,699 | |
Net realized gain (loss) | 1,351,304 | 500,185 | |
Net change in unrealized appreciation (depreciation) | (3,713,526) | 17,508,556 | |
Net increase (decrease) in net assets resulting from operations | (2,115,148) | 20,011,440 | |
| DISTRIBUTIONS TO SHAREHOLDERS FROM: | |||
Investment operations | (722,995) | (2,024,101) | |
| SHAREHOLDER TRANSACTIONS: | |||
Proceeds from shares sold | 270,053,673 | 186,912,930 | |
Cost of shares redeemed | (211,707,816) | (114,835,735) | |
Net increase (decrease) in net assets resulting from shareholder transactions | 58,345,857 | 72,077,195 | |
Total increase (decrease) in net assets | 55,507,714 | 90,064,534 | |
| NET ASSETS: | |||
Beginning of period | 245,867,385 | 155,802,851 | |
End of period | $301,375,099 | $245,867,385 | |
| CHANGES IN SHARES OUTSTANDING: | |||
Shares outstanding, beginning of period | 5,900,002 | 4,050,002 | |
Shares sold | 6,450,000 | 4,800,000 | |
Shares redeemed | (5,150,000) | (2,950,000) | |
Shares outstanding, end of period | 7,200,002 | 5,900,002 |
| Year Ended October 31, | |||||||||
| 2020 | 2019 | 2018 | 2017 | 2016 | |||||
Net asset value, beginning of period | $ 41.67 | $ 38.47 | $ 37.78 | $ 32.49 | $ 32.61 | ||||
| Income from investment operations: | |||||||||
Net investment income (loss) | 0.05 | 0.39 | 0.26 | 0.24 | 0.32 | ||||
Net realized and unrealized gain (loss) | 0.25 | 3.23 | 0.67 | 5.34 | (0.17) | ||||
Total from investment operations | 0.30 | 3.62 | 0.93 | 5.58 | 0.15 | ||||
| Distributions paid to shareholders from: | |||||||||
Net investment income | (0.11) | (0.42) | (0.24) | (0.29) | (0.27) | ||||
Net asset value, end of period | $41.86 | $41.67 | $38.47 | $37.78 | $32.49 | ||||
Total return (a) | 0.74% | 9.49% | 2.45% | 17.23% | 0.45% | ||||
| Ratios to average net assets/supplemental data: | |||||||||
Net assets, end of period (in 000’s) | $ 301,375 | $ 245,867 | $ 155,803 | $ 120,892 | $ 120,231 | ||||
Ratio of total expenses to average net assets (b) | 1.55% | 1.60% | 1.59% | 1.47% | 1.40% | ||||
Ratio of total expenses to average net assets excluding dividend expense and margin interest expense (b) | 0.95% | 0.95% | 0.95% | 0.95% | 0.95% | ||||
Ratio of net investment income (loss) to average net assets | 0.09% | 1.03% | 0.71% | 0.67% | 1.00% | ||||
Portfolio turnover rate (c) | 250% | 210% | 249% | 176% | 201% | ||||
| (a) | Total return is calculated assuming an initial investment made at the net asset value at the beginning of the period, reinvestment of all distributions at net asset value during the period, and redemption at net asset value on the last day of the period. The returns presented do not reflect the deduction of taxes that a shareholder would pay on Fund distributions or the redemption or sale of Fund shares. Total return is calculated for the time period presented and is not annualized for periods of less than a year. |
| (b) | The Fund indirectly bears its proportionate share of fees and expenses incurred by the underlying funds in which the Fund invests. This ratio does not include these indirect fees and expenses. |
| (c) | Portfolio turnover is calculated for the time period presented and is not annualized for periods of less than a year and does not include securities received or delivered from processing creations or redemptions and in-kind transactions. |
| 1) | the type of security; |
| 2) | the size of the holding; |
| 3) | the initial cost of the security; |
| 4) | transactions in comparable securities; |
| 5) | price quotes from dealers and/or third-party pricing services; |
| 6) | relationships among various securities; |
| 7) | information obtained by contacting the issuer, analysts, or the appropriate stock exchange; |
| 8) | an analysis of the issuer’s financial statements; and |
| 9) | the existence of merger proposals or tender offers that might affect the value of the security. |
| • | Level 1 – Level 1 inputs are quoted prices in active markets for identical investments. An active market is a market in which transactions for the investment occur with sufficient frequency and volume to provide pricing information on an ongoing basis. |
| • | Level 2 – Level 2 inputs are observable inputs, either directly or indirectly, and include the following: |
| o | Quoted prices for similar investments in active markets. |
| o | Quoted prices for identical or similar investments in markets that are non-active. A non-active market is a market where there are few transactions for the investment, the prices are not current, or price quotations vary substantially either over time or among market makers, or in which little information is released publicly. |
| o | Inputs other than quoted prices that are observable for the investment (for example, interest rates and yield curves observable at commonly quoted intervals, volatilities, prepayment speeds, loss severities, credit risks, and default rates). |
| o | Inputs that are derived principally from or corroborated by observable market data by correlation or other means. |
| • | Level 3 – Level 3 inputs are unobservable inputs. Unobservable inputs may reflect the reporting entity’s own assumptions about the assumptions that market participants would use in pricing the investment. |
| Distributions paid from: | 2020 | 2019 |
Ordinary income | $722,995 | $2,024,101 |
Capital gains | — | — |
Return of capital | — | — |
Undistributed ordinary income | $614,766 |
Accumulated capital and other gain (loss) | (42,038,756) |
Net unrealized appreciation (depreciation) | 11,765,813 |
| Accumulated Net Investment Income (Loss) | Accumulated Net Realized Gain (Loss) on Investments | Paid-in Capital | ||
| $1,021,603 | $(19,623,486) | $18,601,883 |
| Asset Derivatives | Liability Derivatives | |||||||||
| Derivative Instrument | Risk Exposure | Statement of Assets and Liabilities Location | Value | Statement of Assets and Liabilities Location | Value | |||||
| Futures | Equity Risk | Variation Margin Receivable | $ 407,612 | Variation Margin Payable | $ 83,880 | |||||
| Statement of Operations Location | |
| Equity Risk Exposure | |
| Net realized gain (loss) on futures contracts | $74,325 |
| Net change in unrealized appreciation (depreciation) on futures contracts | 323,732 |

| Dividends Received Deduction | Qualified Dividend Income | |
| 100.00% | 100.00% |
| Name, Year of Birth and Position with the Trust | Term of Office and Year First Elected or Appointed | Principal Occupations During Past 5 Years | Number of Portfolios in the First Trust Fund Complex Overseen by Trustee | Other Trusteeships or Directorships Held by Trustee During Past 5 Years |
| INDEPENDENT TRUSTEES | ||||
| Richard E. Erickson, Trustee (1951) | • Indefinite Term • Since Inception | Physician; Officer, Wheaton Orthopedics; Limited Partner, Gundersen Real Estate Limited Partnership (June 1992 to December 2016); Member, Sportsmed LLC (April 2007 to November 2015) | 189 | None |
| Thomas R. Kadlec, Trustee (1957) | • Indefinite Term • Since Inception | President, ADM Investor Services, Inc. (Futures Commission Merchant) | 189 | Director of ADM Investor Services, Inc., ADM Investor Services International, Futures Industry Association, and National Futures Association |
| Robert F. Keith, Trustee (1956) | • Indefinite Term • Since Inception | President, Hibs Enterprises (Financial and Management Consulting) | 189 | Director of Trust Company of Illinois |
| Niel B. Nielson, Trustee (1954) | • Indefinite Term • Since Inception | Senior Advisor (August 2018 to Present), Managing Director and Chief Operating Officer (January 2015 to August 2018), Pelita Harapan Educational Foundation (Educational Products and Services) | 189 | None |
| INTERESTED TRUSTEE | ||||
| James A. Bowen(1), Trustee and Chairman of the Board (1955) | • Indefinite Term • Since Inception | Chief Executive Officer, First Trust Advisors L.P. and First Trust Portfolios L.P.; Chairman of the Board of Directors, BondWave LLC (Software Development Company) and Stonebridge Advisors LLC (Investment Advisor) | 189 | None |
| (1) | Mr. Bowen is deemed an “interested person” of the Trust due to his position as CEO of First Trust Advisors L.P., investment advisor of the Trust. |
| Name and Year of Birth | Position and Offices with Trust | Term of Office and Length of Service | Principal Occupations During Past 5 Years |
| OFFICERS(2) | |||
| James M. Dykas (1966) | President and Chief Executive Officer | • Indefinite Term • Since January 2016 | Managing Director and Chief Financial Officer (January 2016 to Present), Controller (January 2011 to January 2016), Senior Vice President (April 2007 to January 2016), First Trust Advisors L.P. and First Trust Portfolios L.P.; Chief Financial Officer (January 2016 to Present), BondWave LLC (Software Development Company) and Stonebridge Advisors LLC (Investment Advisor) |
| Donald P. Swade (1972) | Treasurer, Chief Financial Officer and Chief Accounting Officer | • Indefinite Term • Since January 2016 | Senior Vice President (July 2016 to Present), Vice President (April 2012 to July 2016), First Trust Advisors L.P. and First Trust Portfolios L.P. |
| W. Scott Jardine (1960) | Secretary and Chief Legal Officer | • Indefinite Term • Since Inception | General Counsel, First Trust Advisors L.P. and First Trust Portfolios L.P.; Secretary and General Counsel, BondWave LLC; Secretary, Stonebridge Advisors LLC |
| Daniel J. Lindquist (1970) | Vice President | • Indefinite Term • Since Inception | Managing Director, First Trust Advisors L.P. and First Trust Portfolios L.P. |
| Kristi A. Maher (1966) | Chief Compliance Officer and Assistant Secretary | • Indefinite Term • Since Inception | Deputy General Counsel, First Trust Advisors L.P. and First Trust Portfolios L.P. |
| Roger F. Testin (1966) | Vice President | • Indefinite Term • Since Inception | Senior Vice President, First Trust Advisors L.P. and First Trust Portfolios L.P. |
| Stan Ueland (1970) | Vice President | • Indefinite Term • Since Inception | Senior Vice President, First Trust Advisors L.P. and First Trust Portfolios L.P |
| (2) | The term “officer” means the president, vice president, secretary, treasurer, controller or any other officer who performs a policy making function. |
| • | Information we receive from you and your broker-dealer, investment advisor or financial representative through interviews, applications, agreements or other forms; |
| • | Information about your transactions with us, our affiliates or others; |
| • | Information we receive from your inquiries by mail, e-mail or telephone; and |
| • | Information we collect on our website through the use of “cookies”. For example, we may identify the pages on our website that your browser requests or visits. |
| • | In order to provide you with products and services and to effect transactions that you request or authorize, we may disclose your personal information as described above to unaffiliated financial service providers and other companies that perform administrative or other services on our behalf, such as transfer agents, custodians and trustees, or that assist us in the distribution of investor materials such as trustees, banks, financial representatives, proxy services, solicitors and printers. |
| • | We may release information we have about you if you direct us to do so, if we are compelled by law to do so, or in other legally limited circumstances (for example to protect your account from fraud). |
FUND ACCOUNTANT &
TRANSFER AGENT
PUBLIC ACCOUNTING FIRM

For the Year Ended
October 31, 2020
| 1 | |
| 2 | |
| 5 | |
| 7 | |
| 8 | |
| 13 | |
| 14 | |
| 15 | |
| 16 | |
| 17 | |
| 25 | |
| 26 | |
| 32 | |
| 34 |

| Performance | ||||||
| Average Annual Total Returns | Cumulative Total Returns | |||||
| 1 Year Ended 10/31/20 | 5 Years Ended 10/31/20 | Inception (11/4/14) to 10/31/20 | 5 Years Ended 10/31/20 | Inception (11/4/14) to 10/31/20 | ||
| Fund Performance | ||||||
| NAV | -5.37% | 2.33% | -0.75% | 12.21% | -4.43% | |
| Market Price | -5.54% | 2.22% | -0.77% | 11.59% | -4.52% | |
| Index Performance | ||||||
| Bloomberg Barclays Emerging Markets Local Currency Government - 10% Country Capped Index | -0.77% | 4.39% | 1.14% | 23.94% | 7.01% | |
| Industry Classification | % of Long-Term Investments |
| Sovereigns | 93.1% |
| Supranationals | 6.8 |
| Central Bank | 0.1 |
| Total | 100.0% |
| Fund Allocation | % of Net Assets |
| Foreign Sovereign Bonds and Notes | 87.6% |
| Foreign Corporate Bonds and Notes | 6.4 |
| Net Other Assets and Liabilities(1) | 6.0 |
| Total | 100.0% |
| Credit Quality(2) | % of Total Investments (including cash) |
| AAA | 6.8% |
| AA | 1.9 |
| AA- | 9.4 |
| A | 8.7 |
| A- | 11.7 |
| BBB+ | 8.5 |
| BBB | 18.0 |
| BBB- | 3.9 |
| BB+ | 16.0 |
| BB | 12.0 |
| BB- | 2.4 |
| Cash | 0.7 |
| Total | 100.0% |
| Top Ten Holdings | % of Total Investments |
| Brazil Notas do Tesouro Nacional, Series F, 10.00%, 1/01/25 | 5.9% |
| Republic of South Africa Government Bond, 8.88%, 2/28/35 | 5.8 |
| Peru Government Bond, 6.95%, 8/12/31 | 5.7 |
| Indonesia Treasury Bond, 8.38%, 3/15/34 | 3.6 |
| Brazil Notas do Tesouro Nacional, Series F, 10.00%, 1/01/27 | 3.5 |
| Bonos de la Tesoreria de la Republica en Pesos, 4.50%, 3/01/26 | 3.5 |
| Republic of South Africa Government Bond, 10.50%, 12/21/26 | 3.4 |
| Hungary Government Bond, 6.75%, 10/22/28 | 3.4 |
| Republic of Poland Government Bond, 2.75%, 4/25/28 | 3.1 |
| Colombian TES, 7.50%, 8/26/26 | 2.9 |
| Total | 40.8% |
| (1) | Includes forward foreign currency contracts. |
| (2) | The credit quality and ratings information presented above reflect the ratings assigned by one or more nationally recognized statistical rating organizations (NRSROs), including Standard & Poor’s Ratings Group, a division of the McGraw Hill Companies, Inc., Moody’s Investors Service, Inc., Fitch Ratings or a comparably rated NRSRO. For situations in which a security is rated by more than one NRSRO and the ratings are not equivalent, the highest rating is used. Sub-investment grade ratings are those rated BB+/Ba1 or lower. Investment grade ratings are those rated BBB-/Baa3 or higher. The credit ratings shown relate to the creditworthiness of the issuers of the underlying securities in the Fund, and not to the Fund or its shares. Credit ratings are subject to change. |
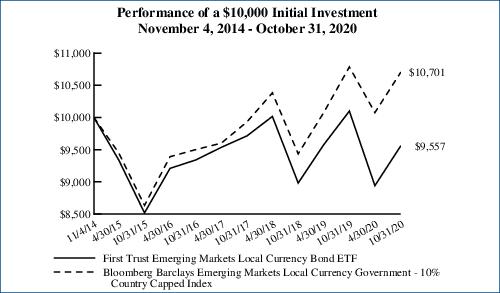
Performance figures assume reinvestment of all distributions and do not reflect the deduction of taxes that a shareholder would pay on Fund distributions or the redemption or sale of Fund shares. An index is a statistical composite that tracks a specified financial market or sector. Unlike the Fund, the index does not actually hold a portfolio of securities and therefore does not incur the expenses incurred by the Fund. These expenses negatively impact the performance of the Fund. The Fund’s past performance does not predict future performance.
| Beginning Account Value May 1, 2020 | Ending Account Value October 31, 2020 | Annualized Expense Ratio Based on the Six-Month Period | Expenses Paid During the Six-Month Period (a) | |
| First Trust Emerging Markets Local Currency Bond ETF (FEMB) | ||||
| Actual | $1,000.00 | $1,069.00 | 0.85% | $4.42 |
| Hypothetical (5% return before expenses) | $1,000.00 | $1,020.86 | 0.85% | $4.32 |
| (a) | Expenses are equal to the annualized expense ratios as indicated in the table multiplied by the average account value over the period (May 1, 2020 through October 31, 2020), multiplied by 184/366 (to reflect the six-month period). |
| Principal Value (Local Currency) | Description | Stated Coupon | Stated Maturity | Value (US Dollars) | ||||
| FOREIGN SOVEREIGN BONDS AND NOTES – 87.6% | ||||||||
| Brazil – 11.3% | ||||||||
| 2,600,000 | Brazil Notas do Tesouro Nacional, Series F (BRL) | 10.00% | 01/01/21 | $458,839 | ||||
| 10,000,000 | Brazil Notas do Tesouro Nacional, Series F (BRL) | 10.00% | 01/01/23 | 1,909,388 | ||||
| 50,950,000 | Brazil Notas do Tesouro Nacional, Series F (BRL) | 10.00% | 01/01/25 | 9,948,653 | ||||
| 30,150,000 | Brazil Notas do Tesouro Nacional, Series F (BRL) | 10.00% | 01/01/27 | 5,922,977 | ||||
| 11,200,000 | Brazil Notas do Tesouro Nacional, Series F (BRL) | 10.00% | 01/01/29 | 2,220,495 | ||||
| 20,460,352 | ||||||||
| Chile – 4.7% | ||||||||
| 3,955,000,000 | Bonos de la Tesoreria de la Republica en Pesos (CLP) | 4.50% | 03/01/26 | 5,902,052 | ||||
| 1,595,000,000 | Bonos de la Tesoreria de la Republica en Pesos (CLP) (a) (b) | 4.70% | 09/01/30 | 2,433,324 | ||||
| 120,000,000 | Bonos del Banco Central de Chile en Pesos (CLP) | 6.00% | 02/01/21 | 157,318 | ||||
| 8,492,694 | ||||||||
| Colombia – 8.3% | ||||||||
| 4,201,000,000 | Colombian TES (COP) | 7.00% | 05/04/22 | 1,155,973 | ||||
| 16,420,000,000 | Colombian TES (COP) | 7.50% | 08/26/26 | 4,856,373 | ||||
| 17,600,000,000 | Colombian TES (COP) | 6.00% | 04/28/28 | 4,752,290 | ||||
| 14,080,000,000 | Colombian TES (COP) | 7.75% | 09/18/30 | 4,166,744 | ||||
| 14,931,380 | ||||||||
| Czech Republic – 1.8% | ||||||||
| 18,000,000 | Czech Republic Government Bond (CZK) | 0.75% | 02/23/21 | 772,864 | ||||
| 17,080,000 | Czech Republic Government Bond (CZK) (b) | 2.40% | 09/17/25 | 795,660 | ||||
| 36,270,000 | Czech Republic Government Bond (CZK) (b) | 2.50% | 08/25/28 | 1,747,396 | ||||
| 3,315,920 | ||||||||
| Hungary – 3.2% | ||||||||
| 1,343,000,000 | Hungary Government Bond (HUF) | 6.75% | 10/22/28 | 5,806,841 | ||||
| Indonesia – 5.6% | ||||||||
| 11,830,000,000 | Indonesia Treasury Bond (IDR) | 9.00% | 03/15/29 | 924,601 | ||||
| 82,503,000,000 | Indonesia Treasury Bond (IDR) | 8.38% | 03/15/34 | 6,141,890 | ||||
| 40,076,000,000 | Indonesia Treasury Bond (IDR) | 8.25% | 05/15/36 | 2,946,305 | ||||
| 10,012,796 | ||||||||
| Israel – 4.2% | ||||||||
| 8,190,000 | Israel Government Bond - Fixed (ILS) | 6.25% | 10/30/26 | 3,224,723 | ||||
| 13,475,000 | Israel Government Bond - Fixed (ILS) | 2.25% | 09/28/28 | 4,427,205 | ||||
| 7,651,928 | ||||||||
| Malaysia – 4.1% | ||||||||
| 8,250,000 | Malaysia Government Bond (MYR) | 4.05% | 09/30/21 | 2,030,561 | ||||
| 13,360,000 | Malaysia Government Bond (MYR) | 4.18% | 07/15/24 | 3,473,366 | ||||
| 7,400,000 | Malaysia Government Bond (MYR) | 3.89% | 08/15/29 | 1,953,731 | ||||
| 7,457,658 | ||||||||
| Mexico – 4.7% | ||||||||
| 48,020,000 | Mexican Bonos (MXN) | 8.50% | 05/31/29 | 2,643,290 | ||||
| 42,970,000 | Mexican Bonos (MXN) | 7.75% | 05/29/31 | 2,257,822 | ||||
| 56,510,000 | Mexican Bonos (MXN) | 10.00% | 11/20/36 | 3,487,441 | ||||
| 8,388,553 | ||||||||
| Peru – 8.5% | ||||||||
| 6,670,000 | Peru Government Bond (PEN) | 8.20% | 08/12/26 | 2,481,789 | ||||
| 28,435,000 | Peru Government Bond (PEN) | 6.95% | 08/12/31 | 9,711,508 | ||||
| Principal Value (Local Currency) | Description | Stated Coupon | Stated Maturity | Value (US Dollars) | ||||
| FOREIGN SOVEREIGN BONDS AND NOTES (Continued) | ||||||||
| Peru (Continued) | ||||||||
| 9,860,000 | Peru Government Bond (PEN) | 6.90% | 08/12/37 | $3,229,695 | ||||
| 15,422,992 | ||||||||
| Philippines – 3.4% | ||||||||
| 150,000,000 | Philippine Government International Bond (PHP) | 4.95% | 01/15/21 | 3,108,471 | ||||
| 60,000,000 | Philippine Government International Bond (PHP) | 3.90% | 11/26/22 | 1,269,096 | ||||
| 64,000,000 | Philippine Government International Bond (PHP) | 6.25% | 01/14/36 | 1,706,186 | ||||
| 6,083,753 | ||||||||
| Poland – 4.1% | ||||||||
| 545,000 | Republic of Poland Government Bond (PLN) | 4.00% | 10/25/23 | 153,921 | ||||
| 18,455,000 | Republic of Poland Government Bond (PLN) | 2.75% | 04/25/28 | 5,273,656 | ||||
| 5,465,000 | Republic of Poland Government Bond (PLN) | 5.75% | 04/25/29 | 1,927,784 | ||||
| 7,355,361 | ||||||||
| Romania – 3.7% | ||||||||
| 8,400,000 | Romania Government Bond (RON) | 5.85% | 04/26/23 | 2,157,321 | ||||
| 12,475,000 | Romania Government Bond (RON) | 4.50% | 06/17/24 | 3,151,205 | ||||
| 4,690,000 | Romania Government Bond (RON) | 5.80% | 07/26/27 | 1,298,558 | ||||
| 6,607,084 | ||||||||
| South Africa – 15.2% | ||||||||
| 4,000,000 | Republic of South Africa Government Bond (ZAR) | 6.75% | 03/31/21 | 249,138 | ||||
| 81,435,000 | Republic of South Africa Government Bond (ZAR) | 10.50% | 12/21/26 | 5,822,737 | ||||
| 30,000,000 | Republic of South Africa Government Bond (ZAR) | 8.25% | 03/31/32 | 1,585,300 | ||||
| 192,270,000 | Republic of South Africa Government Bond (ZAR) | 8.88% | 02/28/35 | 9,883,894 | ||||
| 80,105,000 | Republic of South Africa Government Bond (ZAR) | 6.25% | 03/31/36 | 3,233,609 | ||||
| 37,640,000 | Republic of South Africa Government Bond (ZAR) | 8.50% | 01/31/37 | 1,814,956 | ||||
| 97,000,000 | Republic of South Africa Government Bond (ZAR) | 9.00% | 01/31/40 | 4,768,505 | ||||
| 27,358,139 | ||||||||
| Thailand – 2.5% | ||||||||
| 48,470,000 | Thailand Government Bond (THB) | 3.63% | 06/16/23 | 1,677,545 | ||||
| 73,300,000 | Thailand Government Bond (THB) | 3.65% | 06/20/31 | 2,864,966 | ||||
| 4,542,511 | ||||||||
| Turkey – 2.3% | ||||||||
| 39,580,000 | Turkey Government Bond (TRY) | 10.60% | 02/11/26 | 4,166,067 | ||||
Total Foreign Sovereign Bonds and Notes | 158,054,029 | |||||||
| (Cost $170,353,878) | ||||||||
| FOREIGN CORPORATE BONDS AND NOTES – 6.4% | ||||||||
| Supranationals – 6.4% | ||||||||
| 100,000,000 | African Development Bank (ZAR) | (c) | 04/05/46 | 734,773 | ||||
| 323,500,000 | Asian Development Bank (INR) | 6.20% | 10/06/26 | 4,509,116 | ||||
| 51,050,000 | International Finance Corp. (INR) | 5.85% | 11/25/22 | 703,545 | ||||
| 337,000,000 | International Finance Corp. (INR) | 6.30% | 11/25/24 | 4,697,287 | ||||
| Principal Value (Local Currency) | Description | Stated Coupon | Stated Maturity | Value (US Dollars) | ||||
| FOREIGN CORPORATE BONDS AND NOTES (Continued) | ||||||||
| Supranationals (Continued) | ||||||||
| 67,000,000 | International Finance Corp. (MXN) | (c) | 02/22/38 | $937,334 | ||||
Total Foreign Corporate Bonds and Notes | 11,582,055 | |||||||
| (Cost $12,224,069) | ||||||||
Total Investments – 94.0% | 169,636,084 | ||
| (Cost $182,577,947) (d) | |||
Net Other Assets and Liabilities – 6.0% | 10,748,657 | ||
Net Assets – 100.0% | $180,384,741 |
| Forward Foreign Currency Contracts | ||||||||||||||
| Settlement Date | Counterparty | Amount Purchased | Amount Sold | Purchase Value as of 10/31/2020 | Sale Value as of 10/31/2020 | Unrealized Appreciation/ (Depreciation) | ||||||||
| 11/20/20 | SG | CNY | 50,000,000 | USD | 7,417,804 | $ 7,452,310 | $ 7,417,804 | $ 34,506 | ||||||
| 11/20/20 | SG | INR | 459,400,000 | USD | 6,245,012 | 6,189,897 | 6,245,012 | (55,115) | ||||||
| 11/20/20 | SG | KRW | 8,600,000,000 | USD | 7,503,315 | 7,578,579 | 7,503,315 | 75,264 | ||||||
| 11/20/20 | BBH | MXN | 78,400,000 | USD | 3,684,301 | 3,688,846 | 3,684,301 | 4,545 | ||||||
| 11/20/20 | SG | PHP | 87,350,000 | USD | 1,791,306 | 1,805,489 | 1,791,306 | 14,183 | ||||||
| 11/20/20 | BBH | RON | 33,055,025 | USD | 7,917,688 | 7,909,892 | 7,917,688 | (7,796) | ||||||
| 11/20/20 | BNS | RUB | 1,135,900,000 | USD | 14,488,520 | 14,273,652 | 14,488,520 | (214,868) | ||||||
| 11/20/20 | BBH | ZAR | 82,000,000 | USD | 4,939,131 | 5,028,849 | 4,939,131 | 89,718 | ||||||
| 11/20/20 | BNS | USD | 7,400,869 | BRL | 41,715,000 | 7,400,869 | 7,263,773 | 137,096 | ||||||
| 11/20/20 | BNS | USD | 5,298,701 | COP | 20,400,000,000 | 5,298,701 | 5,266,519 | 32,182 | ||||||
| 11/20/20 | BBH | USD | 1,977,223 | HUF | 615,270,740 | 1,977,223 | 1,952,959 | 24,264 | ||||||
| 11/20/20 | BBH | USD | 4,927,567 | ILS | 16,640,000 | 4,927,567 | 4,877,487 | 50,080 | ||||||
| 11/20/20 | BNS | USD | 8,715,084 | PEN | 31,200,000 | 8,715,084 | 8,629,636 | 85,448 | ||||||
| 11/20/20 | BBH | USD | 1,797,264 | PLN | 7,000,000 | 1,797,264 | 1,768,380 | 28,884 | ||||||
| 11/20/20 | BBH | USD | 808,650 | TRY | 6,500,000 | 808,650 | 769,142 | 39,508 | ||||||
Net Unrealized Appreciation (Depreciation) | $337,899 | |||||||||||||
| Counterparty Abbreviations | |
| BBH | Brown Brothers Harriman and Co. |
| BNS | Bank of Nova Scotia |
| SG | Societe Generale |
| (a) | This security, sold within the terms of a private placement memorandum, is exempt from registration upon resale under Rule 144A under the Securities Act of 1933, as amended (the “1933 Act”), and may be resold in transactions exempt from registration, normally to qualified institutional buyers. Pursuant to procedures adopted by the Trust’s Board of Trustees, this security has been determined to be liquid by First Trust Advisors L.P. (the “Advisor”). Although market instability can result in periods of increased overall market illiquidity, liquidity for each security is determined based on security specific factors and assumptions, which require subjective judgment. At October 31, 2020, securities noted as such amounted to $2,433,324 or 1.3% of net assets. |
| (b) | This security may be resold to qualified foreign investors and foreign institutional buyers under Regulation S of the 1933 Act. |
| (c) | Zero coupon bond. |
| (d) | Aggregate cost for federal income tax purposes was $186,867,743. As of October 31, 2020, the aggregate gross unrealized appreciation for all investments in which there was an excess of value over tax cost was $1,567,672 and the aggregate gross unrealized depreciation for all investments in which there was an excess of tax cost over value was $18,461,432. The net unrealized depreciation was $16,893,760. The amounts presented are inclusive of derivative contracts. |
| ASSETS TABLE | ||||
| Total Value at 10/31/2020 | Level 1 Quoted Prices | Level 2 Significant Observable Inputs | Level 3 Significant Unobservable Inputs | |
Foreign Sovereign Bonds and Notes* | $ 158,054,029 | $ — | $ 158,054,029 | $ — |
Foreign Corporate Bonds and Notes* | 11,582,055 | — | 11,582,055 | — |
Total Investments | 169,636,084 | — | 169,636,084 | — |
Forward Foreign Currency Contracts** | 615,678 | — | 615,678 | — |
Total | $ 170,251,762 | $— | $ 170,251,762 | $— |
LIABILITIES TABLE | ||||
| Total Value at 10/31/2020 | Level 1 Quoted Prices | Level 2 Significant Observable Inputs | Level 3 Significant Unobservable Inputs | |
Forward Foreign Currency Contracts** | $ (277,779) | $ — | $ (277,779) | $ — |
| * | See Portfolio of Investments for country breakout. |
| ** | See the Schedule of Forward Foreign Currency Contracts for contract and currency detail. |
| Currency Exposure Diversification | % of Total Investments (including cash)† |
| ZAR | 19.5% |
| INR | 9.4 |
| RON | 8.5 |
| RUB | 8.3 |
| BRL | 7.7 |
| MXN | 7.6 |
| IDR | 5.8 |
| COP | 5.6 |
| CLP | 5.0 |
| PHP | 4.6 |
| KRW | 4.4 |
| MYR | 4.4 |
| CNY | 4.3 |
| PEN | 4.0 |
| PLN | 3.3 |
| THB | 2.7 |
| HUF | 2.4 |
| TRY | 2.0 |
| CZK | 1.9 |
| ILS | 1.8 |
| USD | (13.2) |
| Total | 100.0% |
| † | The weightings include the impact of currency forwards. |
| Currency Abbreviations | |
| BRL | Brazilian Real |
| CLP | Chilean Peso |
| CNY | Chinese Yuan Renminbi |
| COP | Colombian Peso |
| CZK | Czech Republic Koruna |
| HUF | Hungarian Forint |
| IDR | Indonesian Rupiah |
| ILS | Israeli Shekel |
| INR | Indian Rupee |
| KRW | South Korean Won |
| MXN | Mexican Peso |
| MYR | Malaysian Ringgit |
| PEN | Peruvian Nuevo Sol |
| PHP | Philippine Peso |
| PLN | Polish Zloty |
| RON | Romanian New Leu |
| RUB | Russian Ruble |
| THB | Thai Baht |
| TRY | Turkish Lira |
| USD | United States Dollar |
| ZAR | South African Rand |
| ASSETS: | |
Investments, at value (Cost $182,577,947) | $ 169,636,084 |
Cash | 409,043 |
Foreign currency (Cost $834,094) | 826,533 |
Unrealized appreciation on forward foreign currency contracts | 615,678 |
| Receivables: | |
Investment securities sold | 6,526,405 |
Interest | 2,831,099 |
Interest reclaims | 84,975 |
Total Assets | 180,929,817 |
| LIABILITIES: | |
Unrealized depreciation on forward foreign currency contracts | 277,779 |
| Payables: | |
Deferred foreign capital gains tax | 137,009 |
Investment advisory fees | 130,288 |
Total Liabilities | 545,076 |
NET ASSETS | $180,384,741 |
| NET ASSETS consist of: | |
Paid-in capital | $ 200,892,598 |
Par value | 52,500 |
Accumulated distributable earnings (loss) | (20,560,357) |
NET ASSETS | $180,384,741 |
NET ASSET VALUE, per share | $34.36 |
Number of shares outstanding (unlimited number of shares authorized, par value $0.01 per share) | 5,250,002 |
| INVESTMENT INCOME: | ||
Interest | $ 9,674,941 | |
Foreign withholding tax | (103,839) | |
Total investment income | 9,571,102 | |
| EXPENSES: | ||
Investment advisory fees | 1,435,495 | |
Total expenses | 1,435,495 | |
NET INVESTMENT INCOME (LOSS) | 8,135,607 | |
| NET REALIZED AND UNREALIZED GAIN (LOSS): | ||
| Net realized gain (loss) on: | ||
Investments | (13,616,521) | |
Forward foreign currency contracts | (284,998) | |
Foreign currency transactions | (734,999) | |
Foreign capital gains tax | (411) | |
Net realized gain (loss) | (14,636,929) | |
| Net change in unrealized appreciation (depreciation) on: | ||
Investments | (12,663,460) | |
Forward foreign currency contracts | 639,169 | |
Foreign currency translation | (15,288) | |
Deferred foreign capital gains tax | (33,650) | |
Net change in unrealized appreciation (depreciation) | (12,073,229) | |
NET REALIZED AND UNREALIZED GAIN (LOSS) | (26,710,158) | |
NET INCREASE (DECREASE) IN NET ASSETS RESULTING FROM OPERATIONS | $(18,574,551) | |
| Year Ended 10/31/2020 | Year Ended 10/31/2019 | ||
| OPERATIONS: | |||
Net investment income (loss) | $ 8,135,607 | $ 4,796,634 | |
Net realized gain (loss) | (14,636,929) | 369,517 | |
Net change in unrealized appreciation (depreciation) | (12,073,229) | 4,547,052 | |
Net increase (decrease) in net assets resulting from operations | (18,574,551) | 9,713,203 | |
| DISTRIBUTIONS TO SHAREHOLDERS FROM: | |||
Investment operations | (181,578) | (5,090,947) | |
Return of capital | (9,530,411) | (345,452) | |
Total distributions to shareholders | (9,711,989) | (5,436,399) | |
| SHAREHOLDER TRANSACTIONS: | |||
Proceeds from shares sold | 115,772,198 | 87,791,477 | |
Cost of shares redeemed | (55,145,671) | — | |
Net increase (decrease) in net assets resulting from shareholder transactions | 60,626,527 | 87,791,477 | |
Total increase (decrease) in net assets | 32,339,987 | 92,068,281 | |
| NET ASSETS: | |||
Beginning of period | 148,044,754 | 55,976,473 | |
End of period | $180,384,741 | $148,044,754 | |
| CHANGES IN SHARES OUTSTANDING: | |||
Shares outstanding, beginning of period | 3,850,002 | 1,550,002 | |
Shares sold | 3,100,000 | 2,300,000 | |
Shares redeemed | (1,700,000) | — | |
Shares outstanding, end of period | 5,250,002 | 3,850,002 |
| Year Ended October 31, | |||||||||
| 2020 | 2019 | 2018 | 2017 | 2016 | |||||
Net asset value, beginning of period | $ 38.45 | $ 36.11 | $ 41.55 | $ 42.32 | $ 40.77 | ||||
| Income from investment operations: | |||||||||
Net investment income (loss) | 1.66 | 2.25 | 1.80 | 2.30 | 1.74 | ||||
Net realized and unrealized gain (loss) | (3.72) | 2.16 | (4.76) | (0.65) | 2.09 | ||||
Total from investment operations | (2.06) | 4.41 | (2.96) | 1.65 | 3.83 | ||||
| Distributions paid to shareholders from: | |||||||||
Net investment income | (0.04) | (1.94) | (0.79) | (2.42) | (1.56) | ||||
Return of capital | (1.99) | (0.13) | (1.69) | — | (0.72) | ||||
Total distributions | (2.03) | (2.07) | (2.48) | (2.42) | (2.28) | ||||
Net asset value, end of period | $34.36 | $38.45 | $36.11 | $41.55 | $42.32 | ||||
Total return (a) | (5.37)% | 12.46% | (7.55)% | 4.00% | 9.66% | ||||
| Ratios to average net assets/supplemental data: | |||||||||
Net assets, end of period (in 000’s) | $ 180,385 | $ 148,045 | $ 55,976 | $ 49,862 | $ 14,812 | ||||
Ratio of total expenses to average net assets | 0.85% | 0.85% | 0.85% (b) | 0.85% | 0.85% | ||||
Ratio of net investment income (loss) to average net assets | 4.82% | 4.91% | 4.63% (b) | 4.95% | 4.70% | ||||
Portfolio turnover rate (c) | 59% | 25% | 61% | 16% | 23% | ||||
| (a) | Total return is calculated assuming an initial investment made at the net asset value at the beginning of the period, reinvestment of all distributions at net asset value during the period, and redemption at net asset value on the last day of the period. The returns presented do not reflect the deduction of taxes that a shareholder would pay on Fund distributions or the redemption or sale of Fund shares. Total return is calculated for the time period presented and is not annualized for periods of less than a year. |
| (b) | Includes excise tax. |
| (c) | Portfolio turnover is calculated for the time period presented and is not annualized for periods of less than a year and does not include securities received or delivered from processing creations or redemptions and in-kind transactions. |
| 1) | benchmark yields; |
| 2) | reported trades; |
| 3) | broker/dealer quotes; |
| 4) | issuer spreads; |
| 5) | benchmark securities; |
| 6) | bids and offers; and |
| 7) | reference data including market research publications. |
| 1) | the credit conditions in the relevant market and changes thereto; |
| 2) | the liquidity conditions in the relevant market and changes thereto; |
| 3) | the interest rate conditions in the relevant market and changes thereto (such as significant changes in interest rates); |
| 4) | issuer-specific conditions (such as significant credit deterioration); and |
| 5) | any other market-based data the Advisor’s Pricing Committee considers relevant. In this regard, the Advisor’s Pricing Committee may use last-obtained market-based data to assist it when valuing portfolio securities using amortized cost. |
| 1) | the fundamental business data relating to the issuer, or economic data relating to the country of issue; |
| 2) | an evaluation of the forces which influence the market in which these securities are purchased and sold; |
| 3) | the type, size and cost of the security; |
| 4) | the financial statements of the issuer, or the financial condition of the country of issue; |
| 5) | the credit quality and cash flow of the issuer, or country of issue, based on the Advisor’s or external analysis; |
| 6) | the information as to any transactions in or offers for the security; |
| 7) | the price and extent of public trading in similar securities (or equity securities) of the issuer/borrower, or comparable companies; |
| 8) | the coupon payments; |
| 9) | the quality, value and salability of collateral, if any, securing the security; |
| 10) | the business prospects of the issuer, including any ability to obtain money or resources from a parent or affiliate and an assessment of the issuer’s management (for corporate debt only); |
| 11) | the economic, political and social prospects/developments of the country of issue and the assessment of the country’s governmental leaders/officials (for sovereign debt only); |
| 12) | the prospects for the issuer’s industry, and multiples (of earnings and/or cash flows) being paid for similar businesses in that industry (for corporate debt only); and |
| 13) | other relevant factors. |
| • | Level 1 – Level 1 inputs are quoted prices in active markets for identical investments. An active market is a market in which transactions for the investment occur with sufficient frequency and volume to provide pricing information on an ongoing basis. |
| • | Level 2 – Level 2 inputs are observable inputs, either directly or indirectly, and include the following: |
| o | Quoted prices for similar investments in active markets. |
| o | Quoted prices for identical or similar investments in markets that are non-active. A non-active market is a market where there are few transactions for the investment, the prices are not current, or price quotations vary substantially either over time or among market makers, or in which little information is released publicly. |
| o | Inputs other than quoted prices that are observable for the investment (for example, interest rates and yield curves observable at commonly quoted intervals, volatilities, prepayment speeds, loss severities, credit risks, and default rates). |
| o | Inputs that are derived principally from or corroborated by observable market data by correlation or other means. |
| • | Level 3 – Level 3 inputs are unobservable inputs. Unobservable inputs may reflect the reporting entity’s own assumptions about the assumptions that market participants would use in pricing the investment. |
| Gross Amounts not Offset in the Statement of Assets and Liabilities | |||||||||||
| Gross Amounts of Recognized Assets | Gross Amounts Offset in the Statement of Assets and Liabilities | Net Amounts of Assets Presented in the Statement of Assets and Liabilities | Financial Instruments | Collateral Amounts Received | Net Amount | ||||||
| Forward Foreign Currency Contracts* | $ 615,678 | $ — | $ 615,678 | $ (277,779) | $ — | $ 337,899 | |||||
| Gross Amounts not Offset in the Statement of Assets and Liabilities | |||||||||||
| Gross Amounts of Recognized Liabilities | Gross Amounts Offset in the Statement of Assets and Liabilities | Net Amounts of Liabilities Presented in the Statement of Assets and Liabilities | Financial Instruments | Collateral Amounts Pledged | Net Amount | ||||||
| Forward Foreign Currency Contracts* | $ (277,779) | $ — | $ (277,779) | $ 277,779 | $ — | $ — | |||||
| Distributions paid from: | 2020 | 2019 |
Ordinary income | $181,578 | $5,090,947 |
Capital gains | — | — |
Return of capital | 9,530,411 | 345,452 |
Undistributed ordinary income | $— |
Accumulated capital and other gain (loss) | (3,548,643) |
Net unrealized appreciation (depreciation) | (17,011,714) |
| Accumulated Net Investment Income (Loss) | Accumulated Net Realized Gain (Loss) on Investments | Paid-in Capital | ||
| $(10,425,338) | $11,387,144 | $(961,806) |
| Asset Derivatives | Liability Derivatives | |||||||||
| Derivative Instrument | Risk Exposure | Statement of Assets and Liabilities Location | Value | Statement of Assets and Liabilities Location | Value | |||||
| Forward foreign currency contracts | Currency Risk | Unrealized appreciation on forward foreign currency contracts | $ 615,678 | Unrealized depreciation on forward foreign currency contracts | $ 277,779 | |||||
| Statement of Operations Location | |
| Currency Risk Exposure | |
| Net realized gain (loss) on forward foreign currency contracts | $(284,998) |
| Net change in unrealized appreciation (depreciation) on forward foreign currency contracts | 639,169 |

| NOT FDIC INSURED | NOT BANK GUARANTEED | MAY LOSE VALUE |
| Name, Year of Birth and Position with the Trust | Term of Office and Year First Elected or Appointed | Principal Occupations During Past 5 Years | Number of Portfolios in the First Trust Fund Complex Overseen by Trustee | Other Trusteeships or Directorships Held by Trustee During Past 5 Years |
| INDEPENDENT TRUSTEES | ||||
| Richard E. Erickson, Trustee (1951) | • Indefinite Term • Since Inception | Physician; Officer, Wheaton Orthopedics; Limited Partner, Gundersen Real Estate Limited Partnership (June 1992 to December 2016); Member, Sportsmed LLC (April 2007 to November 2015) | 189 | None |
| Thomas R. Kadlec, Trustee (1957) | • Indefinite Term • Since Inception | President, ADM Investor Services, Inc. (Futures Commission Merchant) | 189 | Director of ADM Investor Services, Inc., ADM Investor Services International, Futures Industry Association, and National Futures Association |
| Robert F. Keith, Trustee (1956) | • Indefinite Term • Since Inception | President, Hibs Enterprises (Financial and Management Consulting) | 189 | Director of Trust Company of Illinois |
| Niel B. Nielson, Trustee (1954) | • Indefinite Term • Since Inception | Senior Advisor (August 2018 to Present), Managing Director and Chief Operating Officer (January 2015 to August 2018), Pelita Harapan Educational Foundation (Educational Products and Services) | 189 | None |
| INTERESTED TRUSTEE | ||||
| James A. Bowen(1), Trustee and Chairman of the Board (1955) | • Indefinite Term • Since Inception | Chief Executive Officer, First Trust Advisors L.P. and First Trust Portfolios L.P.; Chairman of the Board of Directors, BondWave LLC (Software Development Company) and Stonebridge Advisors LLC (Investment Advisor) | 189 | None |
| (1) | Mr. Bowen is deemed an “interested person” of the Trust due to his position as CEO of First Trust Advisors L.P., investment advisor of the Trust. |
| Name and Year of Birth | Position and Offices with Trust | Term of Office and Length of Service | Principal Occupations During Past 5 Years |
| OFFICERS(2) | |||
| James M. Dykas (1966) | President and Chief Executive Officer | • Indefinite Term • Since January 2016 | Managing Director and Chief Financial Officer (January 2016 to Present), Controller (January 2011 to January 2016), Senior Vice President (April 2007 to January 2016), First Trust Advisors L.P. and First Trust Portfolios L.P.; Chief Financial Officer (January 2016 to Present), BondWave LLC (Software Development Company) and Stonebridge Advisors LLC (Investment Advisor) |
| Donald P. Swade (1972) | Treasurer, Chief Financial Officer and Chief Accounting Officer | • Indefinite Term • Since January 2016 | Senior Vice President (July 2016 to Present), Vice President (April 2012 to July 2016), First Trust Advisors L.P. and First Trust Portfolios L.P. |
| W. Scott Jardine (1960) | Secretary and Chief Legal Officer | • Indefinite Term • Since Inception | General Counsel, First Trust Advisors L.P. and First Trust Portfolios L.P.; Secretary and General Counsel, BondWave LLC; Secretary, Stonebridge Advisors LLC |
| Daniel J. Lindquist (1970) | Vice President | • Indefinite Term • Since Inception | Managing Director, First Trust Advisors L.P. and First Trust Portfolios L.P. |
| Kristi A. Maher (1966) | Chief Compliance Officer and Assistant Secretary | • Indefinite Term • Since Inception | Deputy General Counsel, First Trust Advisors L.P. and First Trust Portfolios L.P. |
| Roger F. Testin (1966) | Vice President | • Indefinite Term • Since Inception | Senior Vice President, First Trust Advisors L.P. and First Trust Portfolios L.P. |
| Stan Ueland (1970) | Vice President | • Indefinite Term • Since Inception | Senior Vice President, First Trust Advisors L.P. and First Trust Portfolios L.P |
| (2) | The term “officer” means the president, vice president, secretary, treasurer, controller or any other officer who performs a policy making function. |
| • | Information we receive from you and your broker-dealer, investment advisor or financial representative through interviews, applications, agreements or other forms; |
| • | Information about your transactions with us, our affiliates or others; |
| • | Information we receive from your inquiries by mail, e-mail or telephone; and |
| • | Information we collect on our website through the use of “cookies”. For example, we may identify the pages on our website that your browser requests or visits. |
| • | In order to provide you with products and services and to effect transactions that you request or authorize, we may disclose your personal information as described above to unaffiliated financial service providers and other companies that perform administrative or other services on our behalf, such as transfer agents, custodians and trustees, or that assist us in the distribution of investor materials such as trustees, banks, financial representatives, proxy services, solicitors and printers. |
| • | We may release information we have about you if you direct us to do so, if we are compelled by law to do so, or in other legally limited circumstances (for example to protect your account from fraud). |
FUND ACCOUNTANT &
TRANSFER AGENT
PUBLIC ACCOUNTING FIRM

First Trust RiverFront Dynamic Developed International ETF (RFDI)
First Trust RiverFront Dynamic Europe ETF (RFEU)
First Trust RiverFront Dynamic Emerging Markets ETF (RFEM)
For the Year Ended
October 31, 2020
| 2 | |
| Fund Performance Overview | |
| 3 | |
| 5 | |
| 7 | |
| 9 | |
| 11 | |
| 12 | |
| 14 | |
| Portfolio of Investments | |
| 15 | |
| 17 | |
| 20 | |
| 23 | |
| 26 | |
| 27 | |
| 28 | |
| 30 | |
| 34 | |
| 42 | |
| 43 | |
| 49 | |
| 51 |

| Performance | |||
| Average Annual Total Returns | Cumulative Total Returns | ||
| 1 Year Ended 10/31/20 | Inception (4/13/16) to 10/31/20 | Inception (4/13/16) to 10/31/20 | |
| Fund Performance | |||
| NAV | -2.73% | 1.62% | 7.58% |
| Market Price | -1.96% | 1.63% | 7.62% |
| Index Performance | |||
| MSCI Pacific Index | -2.81% | 6.39% | 32.58% |
| Sector Allocation | % of Total Investments |
| Industrials | 17.0% |
| Consumer Discretionary | 13.4 |
| Financials | 12.5 |
| Health Care | 10.4 |
| Communication Services | 9.8 |
| Materials | 9.7 |
| Information Technology | 9.4 |
| Consumer Staples | 8.8 |
| Real Estate | 7.2 |
| Utilities | 1.3 |
| Energy | 0.5 |
| Total | 100.0% |
| Top Ten Holdings | % of Total Investments |
| Sony Corp. | 2.9% |
| AIA Group Ltd. | 2.7 |
| CSL Ltd. | 2.6 |
| Nintendo Co., Ltd. | 2.2 |
| BHP Group Ltd. | 2.1 |
| Recruit Holdings Co., Ltd. | 1.9 |
| Toyota Motor Corp. | 1.8 |
| Hoya Corp. | 1.7 |
| Daikin Industries Ltd. | 1.7 |
| ITOCHU Corp. | 1.7 |
| Total | 21.3% |
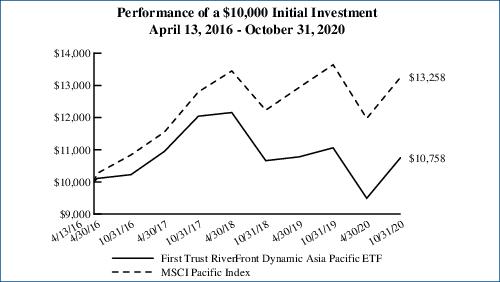
Performance figures assume reinvestment of all distributions and do not reflect the deduction of taxes that a shareholder would pay on Fund distributions or the redemption or sale of Fund shares. An index is a statistical composite that tracks a specified financial market or sector. Unlike the Fund, the index does not actually hold a portfolio of securities and therefore does not incur the expenses incurred by the Fund. These expenses negatively impact the performance of the Fund. The Fund’s past performance does not predict future performance.
| Performance | |||
| Average Annual Total Returns | Cumulative Total Returns | ||
| 1 Year Ended 10/31/20 | Inception (4/13/16) to 10/31/20 | Inception (4/13/16) to 10/31/20 | |
| Fund Performance | |||
| NAV | -3.45% | 3.90% | 19.00% |
| Market Price | -3.00% | 3.92% | 19.11% |
| Index Performance | |||
| MSCI EAFE Index | -6.86% | 4.26% | 20.89% |
| Sector Allocation | % of Total Investments |
| Industrials | 19.2% |
| Health Care | 14.6 |
| Information Technology | 12.0 |
| Financials | 11.5 |
| Materials | 10.5 |
| Consumer Discretionary | 10.3 |
| Consumer Staples | 8.7 |
| Communication Services | 5.4 |
| Real Estate | 3.9 |
| Utilities | 3.1 |
| Energy | 0.8 |
| Total | 100.0% |
| Top Ten Holdings | % of Total Investments |
| Nestle S.A. | 3.6% |
| Roche Holding AG | 2.7 |
| ASML Holding N.V. | 2.0 |
| Novartis AG | 2.0 |
| Novo Nordisk A.S., Class B | 1.7 |
| Sony Corp. | 1.7 |
| Partners Group Holding AG | 1.6 |
| Recruit Holdings Co., Ltd. | 1.4 |
| CSL Ltd. | 1.4 |
| Siemens AG | 1.4 |
| Total | 19.5% |
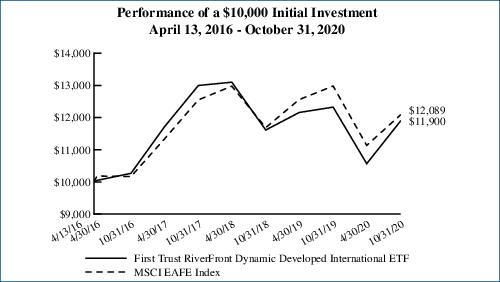
Performance figures assume reinvestment of all distributions and do not reflect the deduction of taxes that a shareholder would pay on Fund distributions or the redemption or sale of Fund shares. An index is a statistical composite that tracks a specified financial market or sector. Unlike the Fund, the index does not actually hold a portfolio of securities and therefore does not incur the expenses incurred by the Fund. These expenses negatively impact the performance of the Fund. The Fund’s past performance does not predict future performance.
| Performance | |||
| Average Annual Total Returns | Cumulative Total Returns | ||
| 1 Year Ended 10/31/20 | Inception (4/13/16) to 10/31/20 | Inception (4/13/16) to 10/31/20 | |
| Fund Performance | |||
| NAV | -4.22% | 4.85% | 24.04% |
| Market Price | -4.32% | 4.81% | 23.85% |
| Index Performance | |||
| MSCI Europe Index | -9.29% | 3.13% | 15.04% |
| Sector Allocation | % of Total Investments |
| Industrials | 26.3% |
| Health Care | 16.2 |
| Consumer Staples | 14.0 |
| Consumer Discretionary | 9.6 |
| Financials | 9.5 |
| Materials | 9.0 |
| Information Technology | 8.4 |
| Communication Services | 2.2 |
| Real Estate | 2.1 |
| Utilities | 1.7 |
| Energy | 1.0 |
| Total | 100.0% |
| Top Ten Holdings | % of Total Investments |
| Nestle S.A. | 5.0% |
| Roche Holding AG | 3.7 |
| ASML Holding N.V. | 3.0 |
| Novartis AG | 2.3 |
| Novo Nordisk A.S., Class B | 2.1 |
| GlaxoSmithKline PLC | 1.9 |
| Unilever N.V. | 1.9 |
| Diageo PLC | 1.7 |
| Unilever PLC | 1.6 |
| Rio Tinto PLC | 1.6 |
| Total | 24.8% |
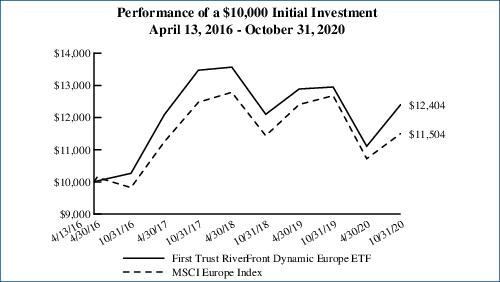
Performance figures assume reinvestment of all distributions and do not reflect the deduction of taxes that a shareholder would pay on Fund distributions or the redemption or sale of Fund shares. An index is a statistical composite that tracks a specified financial market or sector. Unlike the Fund, the index does not actually hold a portfolio of securities and therefore does not incur the expenses incurred by the Fund. These expenses negatively impact the performance of the Fund. The Fund’s past performance does not predict future performance.
| Performance | |||
| Average Annual Total Returns | Cumulative Total Returns | ||
| 1 Year Ended 10/31/20 | Inception (6/14/16) to 10/31/20 | Inception (6/14/16) to 10/31/20 | |
| Fund Performance | |||
| NAV | 4.74% | 8.12% | 40.75% |
| Market Price | 4.64% | 7.95% | 39.78% |
| Index Performance | |||
| MSCI Emerging Markets Index | 8.25% | 10.17% | 52.83% |
| Sector Allocation | % of Total Investments |
| Information Technology | 21.5% |
| Consumer Discretionary | 18.4 |
| Communication Services | 12.8 |
| Financials | 11.0 |
| Materials | 10.6 |
| Real Estate | 6.4 |
| Utilities | 4.5 |
| Health Care | 4.1 |
| Consumer Staples | 4.1 |
| Industrials | 3.8 |
| Energy | 2.8 |
| Total | 100.0% |
| Top Ten Holdings | % of Total Investments |
| Alibaba Group Holding Ltd., ADR | 9.9% |
| Tencent Holdings Ltd. | 7.3 |
| Taiwan Semiconductor Manufacturing Co., Ltd. | 6.2 |
| Samsung Electronics Co., Ltd. | 3.4 |
| JD.com, Inc., ADR | 1.9 |
| Ping An Insurance Group Co. of China Ltd., Class H | 1.8 |
| Infosys Ltd. | 1.8 |
| China Construction Bank Corp., Class H | 1.7 |
| Tata Consultancy Services Ltd. | 1.5 |
| NetEase, Inc., ADR | 1.4 |
| Total | 36.9% |
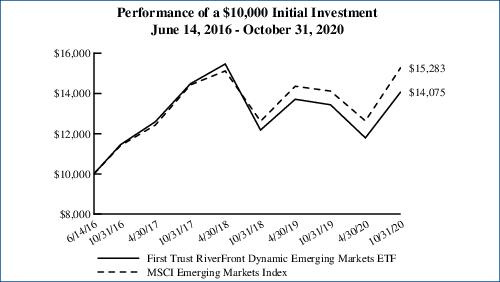
Performance figures assume reinvestment of all distributions and do not reflect the deduction of taxes that a shareholder would pay on Fund distributions or the redemption or sale of Fund shares. An index is a statistical composite that tracks a specified financial market or sector. Unlike the Fund, the index does not actually hold a portfolio of securities and therefore does not incur the expenses incurred by the Fund. These expenses negatively impact the performance of the Fund. The Fund’s past performance does not predict future performance.
| Beginning Account Value May 1, 2020 | Ending Account Value October 31, 2020 | Annualized Expense Ratio Based on the Six-Month Period | Expenses Paid During the Six-Month Period (a) | |
| First Trust RiverFront Dynamic Asia Pacific ETF (RFAP) | ||||
| Actual | $1,000.00 | $1,133.40 | 0.83% | $4.45 |
| Hypothetical (5% return before expenses) | $1,000.00 | $1,020.96 | 0.83% | $4.22 |
| First Trust RiverFront Dynamic Developed International ETF (RFDI) | ||||
| Actual | $1,000.00 | $1,126.20 | 0.83% | $4.44 |
| Hypothetical (5% return before expenses) | $1,000.00 | $1,020.96 | 0.83% | $4.22 |
| First Trust RiverFront Dynamic Europe ETF (RFEU) | ||||
| Actual | $1,000.00 | $1,116.70 | 0.83% | $4.42 |
| Hypothetical (5% return before expenses) | $1,000.00 | $1,020.96 | 0.83% | $4.22 |
| First Trust RiverFront Dynamic Emerging Markets ETF (RFEM) | ||||
| Actual | $1,000.00 | $1,193.80 | 0.95% | $5.24 |
| Hypothetical (5% return before expenses) | $1,000.00 | $1,020.36 | 0.95% | $4.82 |
| (a) | Expenses are equal to the annualized expense ratios as indicated in the table multiplied by the average account value over the period (May 1, 2020 through October 31, 2020), multiplied by 184/366 (to reflect the six-month period). |
| Shares | Description | Value | ||
| COMMON STOCKS (a) – 96.3% | ||||
| Australia – 20.7% | ||||
| 9,262 | ALS Ltd. (b) | $61,289 | ||
| 2,832 | ARB Corp., Ltd. (b) | 61,344 | ||
| 4,473 | Aristocrat Leisure Ltd. (b) | 90,072 | ||
| 1,698 | ASX Ltd. (b) | 95,079 | ||
| 26,502 | Aurizon Holdings Ltd. (b) | 70,274 | ||
| 8,801 | BHP Group Ltd. (b) | 210,974 | ||
| 15,616 | Brambles Ltd. (b) | 105,319 | ||
| 5,059 | Brickworks Ltd. (b) | 61,502 | ||
| 4,148 | carsales.com Ltd. (b) | 60,601 | ||
| 8,287 | Coca-Cola Amatil Ltd. (b) | 72,443 | ||
| 2,514 | Commonwealth Bank of Australia (b) | 122,059 | ||
| 1,248 | CSL Ltd. (b) | 252,667 | ||
| 17,364 | Evolution Mining Ltd. (b) | 68,074 | ||
| 9,776 | Fortescue Metals Group Ltd. (b) | 119,595 | ||
| 19,789 | Harvey Norman Holdings Ltd. (b) | 61,905 | ||
| 1,821 | JB Hi-Fi Ltd. (b) | 60,849 | ||
| 1,828 | Magellan Financial Group Ltd. (b) | 70,851 | ||
| 14,908 | Santos Ltd. (b) | 49,560 | ||
| 4,484 | Wesfarmers Ltd. (b) | 145,145 | ||
| 11,330 | Westpac Banking Corp. (b) | 143,402 | ||
| 3,408 | WiseTech Global Ltd. (b) | 69,508 | ||
| 2,052,512 | ||||
| Bermuda – 0.7% | ||||
| 31,500 | Kerry Logistics Network Ltd. (b) | 65,787 | ||
| Cayman Islands – 2.5% | ||||
| 8,189 | CK Hutchison Holdings Ltd. (b) | 49,461 | ||
| 53,066 | Xinyi Glass Holdings Ltd. (b) | 116,535 | ||
| 46,000 | Xinyi Solar Holdings Ltd. (b) | 84,035 | ||
| 250,031 | ||||
| Hong Kong – 7.5% | ||||
| 28,045 | AIA Group Ltd. (b) | 266,909 | ||
| 36,300 | BOC Hong Kong Holdings Ltd. (b) | 100,823 | ||
| 800 | Hong Kong Exchanges & Clearing Ltd. (b) | 38,335 | ||
| 17,000 | Power Assets Holdings Ltd. (b) | 87,545 | ||
| 31,000 | Swire Properties Ltd. (b) | 83,188 | ||
| 8,000 | Techtronic Industries Co., Ltd. (b) | 107,755 | ||
| 16,000 | Vitasoy International Holdings Ltd. (b) | 64,718 | ||
| 749,273 | ||||
| Japan – 58.4% | ||||
| 1,400 | Advantest Corp. (b) | 81,092 | ||
| 3,300 | Anritsu Corp. (b) | 72,245 | ||
| 9,100 | Astellas Pharma, Inc. (b) | 124,788 | ||
| 900 | Bandai Namco Holdings, Inc. (b) | 67,261 | ||
| 1,200 | Capcom Co., Ltd. (b) | 65,630 | ||
| 13,300 | Chiba Bank (The) Ltd. (b) | 68,698 | ||
| Shares | Description | Value | ||
| Japan (Continued) | ||||
| 3,300 | Chugai Pharmaceutical Co., Ltd. (b) | $127,380 | ||
| 3,600 | Chugoku Electric Power (The) Co., Inc. (b) | 45,230 | ||
| 3,100 | COMSYS Holdings Corp. (b) | 78,773 | ||
| 900 | Daifuku Co., Ltd. (b) | 92,806 | ||
| 900 | Daikin Industries Ltd. (b) | 168,420 | ||
| 3,800 | Daiwa House Industry Co., Ltd. (b) | 99,844 | ||
| 2,500 | Hitachi Construction Machinery Co., Ltd. (b) | 61,656 | ||
| 2,100 | Hitachi Transport System Ltd. (b) | 66,567 | ||
| 1,500 | Hoya Corp. (b) | 169,285 | ||
| 3,700 | Iida Group Holdings Co., Ltd. (b) | 66,941 | ||
| 7,000 | ITOCHU Corp. (b) | 168,130 | ||
| 4,900 | Japan Post Insurance Co., Ltd. (b) | 77,670 | ||
| 6,300 | Japan Tobacco, Inc. (b) | 118,611 | ||
| 2,200 | Kakaku.com, Inc. (b) | 58,140 | ||
| 2,200 | Kao Corp. (b) | 156,637 | ||
| 6,000 | KDDI Corp. (b) | 162,330 | ||
| 200 | Keyence Corp. (b) | 90,765 | ||
| 2,100 | M3, Inc. (b) | 141,825 | ||
| 2,100 | Makita Corp. (b) | 92,828 | ||
| 4,500 | Mitsubishi Estate Co., Ltd. (b) | 67,121 | ||
| 1,400 | NEC Corp. (b) | 70,518 | ||
| 2,200 | Nihon M&A Center, Inc. (b) | 129,187 | ||
| 400 | Nintendo Co., Ltd. (b) | 216,276 | ||
| 1,100 | Nippon Paint Holdings Co., Ltd. (b) | 99,088 | ||
| 1,500 | Nissan Chemical Corp. (b) | 79,606 | ||
| 3,300 | Nomura Research Institute Ltd. (b) | 97,276 | ||
| 4,600 | Obayashi Corp. (b) | 38,494 | ||
| 600 | Obic Co., Ltd. (b) | 106,226 | ||
| 8,600 | ORIX Corp. (b) | 100,579 | ||
| 2,100 | Otsuka Corp. (b) | 96,499 | ||
| 1,700 | Pigeon Corp. (b) | 78,288 | ||
| 4,800 | Recruit Holdings Co., Ltd. (b) | 182,643 | ||
| 10,400 | Renesas Electronics Corp. (b) (c) | 85,848 | ||
| 3,800 | SG Holdings Co., Ltd. (b) | 91,658 | ||
| 500 | Shimano, Inc. (b) | 114,358 | ||
| 1,200 | Shin-Etsu Chemical Co., Ltd. (b) | 160,280 | ||
| 6,200 | Shinsei Bank Ltd. (b) | 74,596 | ||
| 2,300 | Shionogi & Co., Ltd. (b) | 108,491 | ||
| 2,000 | SoftBank Group Corp. (b) | 130,268 | ||
| 3,400 | Sony Corp. (b) | 283,446 | ||
| 2,500 | Sumitomo Metal Mining Co., Ltd. (b) | 77,709 | ||
| 3,300 | Sumitomo Realty & Development Co., Ltd. (b) | 88,306 | ||
| 1,900 | Sundrug Co., Ltd. (b) | 70,550 | ||
| 1,100 | Sysmex Corp. (b) | 103,322 | ||
| 2,685 | Toyota Motor Corp. (b) | 176,262 | ||
| Shares | Description | Value | ||
| COMMON STOCKS (a) (Continued) | ||||
| Japan (Continued) | ||||
| 600 | Tsuruha Holdings, Inc. (b) | $84,015 | ||
| 1,900 | Welcia Holdings Co., Ltd. (b) | 74,464 | ||
| 16,600 | Z Holdings Corp. (b) | 115,753 | ||
| 3,100 | ZOZO, Inc. (b) | 78,641 | ||
| 5,803,320 | ||||
| Multinational – 0.8% | ||||
| 65,000 | HKT Trust & HKT Ltd. (b) | 84,063 | ||
| New Zealand – 0.7% | ||||
| 24,838 | Spark New Zealand Ltd. (b) | 73,711 | ||
| Singapore – 4.2% | ||||
| 43,200 | CapitaLand Ltd. (b) | 81,293 | ||
| 54,000 | Sheng Siong Group Ltd. (b) | 66,002 | ||
| 11,400 | Singapore Exchange Ltd. (b) | 72,303 | ||
| 16,600 | Singapore Technologies Engineering Ltd. (b) | 42,435 | ||
| 4,900 | Venture Corp Ltd. (b) | 69,074 | ||
| 28,300 | Wilmar International Ltd. (b) | 83,784 | ||
| 414,891 | ||||
| United Kingdom – 0.8% | ||||
| 4,303 | BHP Group PLC (b) | 83,359 | ||
| Total Common Stocks | 9,576,947 | |||
| (Cost $9,156,026) | ||||
| REAL ESTATE INVESTMENT TRUSTS (a) – 3.0% | ||||
| Australia – 2.5% | ||||
| 7,103 | Charter Hall Group (b) | 61,587 | ||
| 12,129 | Dexus (b) | 73,381 | ||
| 8,915 | Goodman Group (b) | 115,388 | ||
| 250,356 | ||||
| New Zealand – 0.5% | ||||
| 27,271 | Goodman Property Trust (b) | 44,731 | ||
| Total Real Estate Investment Trusts | 295,087 | |||
| (Cost $297,104) | ||||
| Total Investments – 99.3% | 9,872,034 | |||
| (Cost $9,453,130) (d) | ||||
| Net Other Assets and Liabilities – 0.7% | 68,067 | |||
| Net Assets – 100.0% | $9,940,101 | |||
| (a) | Portfolio securities are categorized based upon their country of incorporation. For a breakdown of the portfolio securities by sector, please see the Fund Performance Overview. |
| (b) | This security is fair valued by the Advisor’s Pricing Committee in accordance with procedures adopted by the Trust’s Board of Trustees and in accordance with provisions of the Investment Company Act of 1940, as amended. At October 31, 2020, securities noted as such are valued at $9,872,034 or 99.3% of net assets. Certain of these securities are fair valued using a factor provided by a third-party pricing service due to the change in value between the foreign markets’ close and the New York Stock Exchange close exceeding a certain threshold. On days when this threshold is not exceeded, these securities are typically valued at the last sale price on the exchange on which they are principally traded. |
| (c) | Non-income producing security. |
| (d) | Aggregate cost for federal income tax purposes was $9,460,101. As of October 31, 2020, the aggregate gross unrealized appreciation for all investments in which there was an excess of value over tax cost was $751,249 and the aggregate gross unrealized depreciation for all investments in which there was an excess of tax cost over value was $339,316. The net unrealized appreciation was $411,933. |
| Total Value at 10/31/2020 | Level 1 Quoted Prices | Level 2 Significant Observable Inputs | Level 3 Significant Unobservable Inputs | |
| Common Stocks* | $ 9,576,947 | $ — | $ 9,576,947 | $ — |
| Real Estate Investment Trusts* | 295,087 | — | 295,087 | — |
| Total Investments | $ 9,872,034 | $— | $ 9,872,034 | $— |
| * | See Portfolio of Investments for country breakout. |
| Currency Exposure Diversification | % of Total Investments |
| Japanese Yen | 58.8% |
| Australian Dollar | 23.3 |
| Hong Kong Dollar | 11.6 |
| Singapore Dollar | 4.2 |
| New Zealand Dollar | 1.2 |
| British Pound Sterling | 0.9 |
| Total | 100.0% |
| Shares | Description | Value | ||
| COMMON STOCKS (a) – 96.6% | ||||
| Australia – 6.7% | ||||
| 77,092 | ALS Ltd. (b) | $510,135 | ||
| 54,066 | Aristocrat Leisure Ltd. (b) | 1,088,712 | ||
| 71,358 | BHP Group Ltd. (b) | 1,710,567 | ||
| 8,730 | CSL Ltd. (b) | 1,767,453 | ||
| 131,281 | Fortescue Metals Group Ltd. (b) | 1,606,024 | ||
| 25,799 | JB Hi-Fi Ltd. (b) | 862,085 | ||
| 25,699 | Magellan Financial Group Ltd. (b) | 996,056 | ||
| 3,652 | Rio Tinto Ltd. (b) | 237,577 | ||
| 8,778,609 | ||||
| Austria – 0.6% | ||||
| 28,242 | EVN AG (b) | 451,069 | ||
| 6,954 | Verbund AG (b) | 401,066 | ||
| 852,135 | ||||
| Belgium – 0.4% | ||||
| 1,962 | Sofina S.A. (b) | 509,921 | ||
| Bermuda – 0.4% | ||||
| 272,500 | Kerry Logistics Network Ltd. (b) | 569,112 | ||
| Canada – 3.0% | ||||
| 11,082 | Canadian National Railway Co. | 1,100,880 | ||
| 30,766 | Dollarama, Inc. | 1,059,479 | ||
| 23,414 | Empire Co., Ltd., Class A | 638,820 | ||
| 27,676 | IGM Financial, Inc. | 607,613 | ||
| 20,321 | Quebecor, Inc., Class B | 471,457 | ||
| 3,878,249 | ||||
| Cayman Islands – 2.1% | ||||
| 42,780 | CK Hutchison Holdings Ltd. (b) | 258,390 | ||
| 557,040 | Xinyi Glass Holdings Ltd. (b) | 1,223,281 | ||
| 710,000 | Xinyi Solar Holdings Ltd. (b) | 1,297,061 | ||
| 2,778,732 | ||||
| Denmark – 3.1% | ||||
| 2,785 | Genmab A.S. (b) (c) | 930,260 | ||
| 34,517 | Novo Nordisk A.S., Class B (b) | 2,200,999 | ||
| 14,929 | Novozymes A.S., Class B (b) | 897,848 | ||
| 4,029,107 | ||||
| Finland – 3.0% | ||||
| 25,736 | Kesko OYJ, Class B (b) | 660,401 | ||
| 16,683 | Kone OYJ, Class B (b) | 1,328,186 | ||
| 18,857 | Neste OYJ (b) | 983,459 | ||
| 63,678 | Stora Enso OYJ, Class R (b) | 929,250 | ||
| 3,901,296 | ||||
| France – 3.8% | ||||
| 55,941 | Credit Agricole S.A. (b) (c) | 442,523 | ||
| 5,739 | Danone S.A. (b) | 318,315 | ||
| 1,120 | Hermes International (b) | 1,042,833 | ||
| 5,957 | Iliad S.A. (b) | 1,151,677 | ||
| 1,662 | Kering S.A. (b) | 1,004,373 | ||
| Shares | Description | Value | ||
| France (Continued) | ||||
| 13,636 | Worldline S.A. (b) (c) (d) (e) | $1,009,971 | ||
| 4,969,692 | ||||
| Germany – 4.9% | ||||
| 3,279 | adidas AG (b) (c) | 974,208 | ||
| 19,272 | HeidelbergCement AG (b) | 1,102,232 | ||
| 11,893 | SAP SE (b) | 1,268,800 | ||
| 15,063 | Siemens AG (b) | 1,767,132 | ||
| 20,868 | TAG Immobilien AG (b) | 614,972 | ||
| 36,140 | TLG Immobilien AG (b) | 646,716 | ||
| 6,374,060 | ||||
| Hong Kong – 0.9% | ||||
| 121,256 | AIA Group Ltd. (b) | 1,154,015 | ||
| Ireland – 1.4% | ||||
| 16,562 | CRH PLC (b) | 581,188 | ||
| 14,256 | Kingspan Group PLC (b) (c) | 1,244,111 | ||
| 1,825,299 | ||||
| Israel – 0.8% | ||||
| 9,831 | Check Point Software Technologies Ltd. (c) | 1,116,408 | ||
| Italy – 1.9% | ||||
| 237,983 | A2A S.p.A. (b) | 302,236 | ||
| 20,489 | Recordati Industria Chimica e Farmaceutica S.p.A. (b) | 1,062,244 | ||
| 222,291 | Snam S.p.A. (b) | 1,083,910 | ||
| 2,448,390 | ||||
| Japan – 14.8% | ||||
| 25,500 | Anritsu Corp. (b) | 558,258 | ||
| 21,200 | Capcom Co., Ltd. (b) | 1,159,461 | ||
| 37,100 | Chugai Pharmaceutical Co., Ltd. (b) | 1,432,060 | ||
| 2,500 | Hoya Corp. (b) | 282,142 | ||
| 8,100 | IR Japan Holdings Ltd. (b) | 896,808 | ||
| 58,700 | ITOCHU Corp. (b) | 1,409,887 | ||
| 22,200 | Kao Corp. (b) | 1,580,612 | ||
| 20,700 | NEC Corp. (b) | 1,042,663 | ||
| 21,400 | Nihon M&A Center, Inc. (b) | 1,256,642 | ||
| 2,100 | Nintendo Co., Ltd. (b) | 1,135,447 | ||
| 19,100 | Nissan Chemical Corp. (b) | 1,013,650 | ||
| 32,700 | Nomura Research Institute Ltd. (b) | 963,914 | ||
| 24,600 | Obayashi Corp. (b) | 205,861 | ||
| 20,300 | Pan Pacific International Holdings Corp. (b) | 430,734 | ||
| 49,400 | Recruit Holdings Co., Ltd. (b) | 1,879,704 | ||
| 26,200 | Sony Corp. (b) | 2,184,202 | ||
| 15,500 | Sumitomo Realty & Development Co., Ltd. (b) | 414,770 | ||
| 5,800 | Tokyo Electron Ltd. (b) | 1,556,783 | ||
| 19,403,598 | ||||
| Shares | Description | Value | ||
| COMMON STOCKS (a) (Continued) | ||||
| Jersey – 0.9% | ||||
| 873,496 | Man Group PLC (b) | $1,218,934 | ||
| Luxembourg – 1.5% | ||||
| 151,381 | B&M European Value Retail S.A. (b) | 950,054 | ||
| 1,330 | Eurofins Scientific SE (b) (c) | 1,059,106 | ||
| 2,009,160 | ||||
| Multinational – 0.4% | ||||
| 404,794 | HKT Trust & HKT Ltd. (b) | 523,507 | ||
| Netherlands – 4.6% | ||||
| 771 | Adyen N.V. (b) (c) (d) (e) | 1,295,854 | ||
| 7,198 | ASML Holding N.V. (b) | 2,604,259 | ||
| 120,068 | CNH Industrial N.V. (c) | 932,928 | ||
| 2,691 | Ferrari N.V. (b) | 480,053 | ||
| 8,144 | Wolters Kluwer N.V. (b) | 659,392 | ||
| 5,972,486 | ||||
| New Zealand – 1.7% | ||||
| 52,727 | Fisher & Paykel Healthcare Corp., Ltd. (b) | 1,219,807 | ||
| 350,528 | Spark New Zealand Ltd. (b) | 1,040,250 | ||
| 2,260,057 | ||||
| Singapore – 1.1% | ||||
| 271,900 | Sheng Siong Group Ltd. (b) | 332,332 | ||
| 135,300 | Singapore Exchange Ltd. (b) | 858,121 | ||
| 17,100 | Venture Corp Ltd. (b) | 241,055 | ||
| 1,431,508 | ||||
| Spain – 1.4% | ||||
| 43,601 | EDP Renovaveis S.A. (EUR) (b) | 828,886 | ||
| 57,806 | Red Electrica Corp. S.A. (b) | 1,018,223 | ||
| 1,847,109 | ||||
| Sweden – 7.3% | ||||
| 19,676 | Atlas Copco AB, Class A (b) | 868,522 | ||
| 18,225 | Atlas Copco AB, Class B (b) | 698,305 | ||
| 73,634 | Epiroc AB, Class A (b) | 1,099,474 | ||
| 18,355 | Indutrade AB (b) (c) | 929,295 | ||
| 18,063 | Investor AB, Class A (b) | 1,080,087 | ||
| 26,488 | Investor AB, Class B (b) | 1,587,664 | ||
| 26,787 | Kinnevik AB, Class B (b) | 1,096,899 | ||
| 20,995 | Lifco AB, Class B (b) | 1,536,868 | ||
| 39,244 | Swedish Orphan Biovitrum AB (b) (c) | 676,804 | ||
| 9,573,918 | ||||
| Switzerland – 14.7% | ||||
| 14,459 | Coca-Cola HBC AG (b) | 328,440 | ||
| 58,629 | Credit Suisse Group AG (b) | 552,952 | ||
| 1,303 | EMS-Chemie Holding AG (b) | 1,146,091 | ||
| 6,533 | Kuehne + Nagel International AG (b) | 1,305,706 | ||
| 17,266 | Logitech International S.A. (b) | 1,452,523 | ||
| 42,014 | Nestle S.A. (b) | 4,725,648 | ||
| Shares | Description | Value | ||
| Switzerland (Continued) | ||||
| 32,926 | Novartis AG (b) | $2,565,679 | ||
| 2,265 | Partners Group Holding AG (b) | 2,039,194 | ||
| 10,968 | Roche Holding AG (b) | 3,524,364 | ||
| 3,515 | Roche Holding AG (b) | 1,132,538 | ||
| 40,114 | UBS Group AG (b) | 467,006 | ||
| 19,240,141 | ||||
| United Kingdom – 15.2% | ||||
| 33,595 | Admiral Group PLC (b) | 1,196,784 | ||
| 19,859 | Ashtead Group PLC (b) | 717,651 | ||
| 5,399 | ASOS PLC (b) (c) | 308,033 | ||
| 3,131 | AstraZeneca PLC (b) | 314,370 | ||
| 142,891 | Auto Trader Group PLC (b) (d) (e) | 1,074,316 | ||
| 331,302 | Aviva PLC (b) | 1,105,083 | ||
| 180,923 | Balfour Beatty PLC (b) | 500,011 | ||
| 21,786 | BHP Group PLC (b) | 422,046 | ||
| 21,808 | Compass Group PLC (b) | 298,502 | ||
| 13,402 | Croda International PLC (b) | 1,047,489 | ||
| 71,834 | Evraz PLC (b) | 334,508 | ||
| 507,489 | G4S PLC (b) (c) | 1,338,209 | ||
| 6,005 | Games Workshop Group PLC (b) | 807,291 | ||
| 50,320 | GlaxoSmithKline PLC (b) | 840,268 | ||
| 14,000 | Intertek Group PLC (b) | 1,008,432 | ||
| 63,798 | JD Sports Fashion PLC (b) | 613,768 | ||
| 54,425 | KAZ Minerals PLC (b) | 444,059 | ||
| 26,934 | Mondi PLC (b) | 510,489 | ||
| 48,521 | RELX PLC (b) | 960,129 | ||
| 65,430 | Rightmove PLC (b) (c) | 523,648 | ||
| 29,065 | Rio Tinto PLC (b) | 1,643,958 | ||
| 67,287 | Sage Group (The) PLC (b) | 553,632 | ||
| 174,479 | Spirent Communications PLC (b) | 655,037 | ||
| 65,400 | Tate & Lyle PLC (b) | 504,155 | ||
| 29,867 | Unilever PLC (b) | 1,702,087 | ||
| 253,308 | Wm Morrison Supermarkets PLC (b) | 534,702 | ||
| 19,958,657 | ||||
| Total Common Stocks | 126,624,100 | |||
| (Cost $120,766,663) | ||||
| REAL ESTATE INVESTMENT TRUSTS (a) – 2.6% | ||||
| Australia – 1.0% | ||||
| 103,655 | Goodman Group (b) | 1,341,623 | ||
| Belgium – 0.8% | ||||
| 33,036 | Warehouses De Pauw CVA (b) | 1,106,814 | ||
| Shares | Description | Value | ||
| REAL ESTATE INVESTMENT TRUSTS (a) (Continued) | ||||
| United Kingdom – 0.8% | ||||
| 93,822 | Safestore Holdings PLC (b) | $976,685 | ||
| Total Real Estate Investment Trusts | 3,425,122 | |||
| (Cost $3,160,075) | ||||
| Total Investments – 99.2% | 130,049,222 | |||
| (Cost $123,926,738) (f) | ||||
| Net Other Assets and Liabilities – 0.8% | 999,757 | |||
| Net Assets – 100.0% | $131,048,979 | |||
| (a) | Portfolio securities are categorized based upon their country of incorporation. For a breakdown of the portfolio securities by sector, please see the Fund Performance Overview. |
| (b) | This security is fair valued by the Advisor’s Pricing Committee in accordance with procedures adopted by the Trust’s Board of Trustees and in accordance with provisions of the Investment Company Act of 1940, as amended. At October 31, 2020, securities noted as such are valued at $124,121,637 or 94.7% of net assets. Certain of these securities are fair valued using a factor provided by a third-party pricing service due to the change in value between the foreign markets’ close and the New York Stock Exchange close exceeding a certain threshold. On days when this threshold is not exceeded, these securities are typically valued at the last sale price on the exchange on which they are principally traded. |
| (c) | Non-income producing security. |
| (d) | This security may be resold to qualified foreign investors and foreign institutional buyers under Regulation S of the Securities Act of 1933, as amended (the “1933 Act”). |
| (e) | This security is exempt from registration upon resale under Rule 144A of the 1933 Act and may be resold in transactions exempt from registration, normally to qualified institutional buyers. This security is not restricted on the foreign exchange where it trades freely without any additional registration. As such, it does not require the additional disclosure required of restricted securities. |
| (f) | Aggregate cost for federal income tax purposes was $124,048,714. As of October 31, 2020, the aggregate gross unrealized appreciation for all investments in which there was an excess of value over tax cost was $11,887,178 and the aggregate gross unrealized depreciation for all investments in which there was an excess of tax cost over value was $5,886,670. The net unrealized appreciation was $6,000,508. |
| Total Value at 10/31/2020 | Level 1 Quoted Prices | Level 2 Significant Observable Inputs | Level 3 Significant Unobservable Inputs | |
| Common Stocks: | ||||
| Canada | $ 3,878,249 | $ 3,878,249 | $ — | $ — |
| Israel | 1,116,408 | 1,116,408 | — | — |
| Netherlands | 5,972,486 | 932,928 | 5,039,558 | — |
| Other Country Categories* | 115,656,957 | — | 115,656,957 | — |
| Real Estate Investment Trusts* | 3,425,122 | — | 3,425,122 | — |
| Total Investments | $ 130,049,222 | $ 5,927,585 | $ 124,121,637 | $— |
| * | See Portfolio of Investments for country breakout. |
| Currency Exposure Diversification | % of Total Investments |
| Euro | 23.0% |
| British Pound Sterling | 18.0 |
| Japanese Yen | 14.9 |
| Swiss Franc | 14.5 |
| Australian Dollar | 7.8 |
| Swedish Krona | 7.4 |
| Hong Kong Dollar | 3.9 |
| Danish Krone | 3.1 |
| Canadian Dollar | 3.0 |
| New Zealand Dollar | 1.7 |
| United States Dollar | 1.6 |
| Singapore Dollar | 1.1 |
| Total | 100.0% |
| Shares | Description | Value | ||
| COMMON STOCKS (a) – 97.3% | ||||
| Australia – 0.8% | ||||
| 1,941 | Rio Tinto Ltd. (b) | $126,270 | ||
| Austria – 0.5% | ||||
| 1,439 | Verbund AG (b) | 82,993 | ||
| Belgium – 0.5% | ||||
| 324 | Sofina S.A. (b) | 84,207 | ||
| Denmark – 4.7% | ||||
| 509 | Genmab A.S. (b) (c) | 170,019 | ||
| 5,418 | Novo Nordisk A.S., Class B (b) | 345,482 | ||
| 2,541 | Novozymes A.S., Class B (b) | 152,819 | ||
| 1,547 | Pandora A.S. (b) | 122,723 | ||
| 791,043 | ||||
| Finland – 4.5% | ||||
| 7,304 | Fortum OYJ (b) | 137,291 | ||
| 2,256 | Kone OYJ, Class B (b) | 179,607 | ||
| 3,141 | Neste OYJ (b) | 163,814 | ||
| 8,479 | Stora Enso OYJ, Class R (b) | 123,734 | ||
| 5,340 | UPM-Kymmene OYJ (b) | 150,903 | ||
| 755,349 | ||||
| France – 9.8% | ||||
| 1,041 | Arkema S.A. (b) | 101,955 | ||
| 200 | Hermes International (b) | 186,220 | ||
| 511 | Iliad S.A. (b) | 98,793 | ||
| 357 | Kering S.A. (b) | 215,741 | ||
| 464 | LVMH Moet Hennessy Louis Vuitton SE (b) | 217,499 | ||
| 49,294 | Natixis S.A. (b) (c) | 114,815 | ||
| 14,402 | Orange S.A. (b) | 161,729 | ||
| 1,032 | Sanofi (b) | 93,183 | ||
| 396 | Sartorius Stedim Biotech (b) | 150,227 | ||
| 985 | Schneider Electric SE (b) | 119,684 | ||
| 467 | Teleperformance (b) | 140,185 | ||
| 447 | Worldline S.A. (b) (c) (d) (e) | 33,108 | ||
| 1,633,139 | ||||
| Germany – 9.1% | ||||
| 15,081 | Commerzbank AG (b) (c) | 71,383 | ||
| 4,780 | Deutsche Post AG (b) | 211,935 | ||
| 2,366 | HeidelbergCement AG (b) | 135,320 | ||
| 1,714 | Henkel AG & Co., KGaA (b) | 154,952 | ||
| 1,764 | Henkel AG & Co., KGaA (Preference Shares) (b) | 171,656 | ||
| 1,556 | Puma SE (b) (c) | 136,217 | ||
| 1,013 | SAP SE (b) | 108,072 | ||
| 1,794 | Siemens AG (b) | 210,465 | ||
| 664 | Symrise AG (b) | 81,878 | ||
| 3,732 | TAG Immobilien AG (b) | 109,981 | ||
| 7,327 | TLG Immobilien AG (b) | 131,115 | ||
| 1,522,974 | ||||
| Ireland – 0.9% | ||||
| 1,779 | Kingspan Group PLC (b) (c) | 155,252 | ||
| Shares | Description | Value | ||
| Israel – 0.6% | ||||
| 5,355 | Plus500 Ltd. (b) | $102,627 | ||
| Italy – 1.0% | ||||
| 49,384 | A2A S.p.A. (b) | 62,717 | ||
| 2,570 | Moncler S.p.A. (b) (c) | 102,830 | ||
| 165,547 | ||||
| Jersey – 2.2% | ||||
| 5,551 | Experian PLC (b) | 203,355 | ||
| 1,715 | Ferguson PLC (b) | 170,335 | ||
| 373,690 | ||||
| Luxembourg – 1.1% | ||||
| 106 | Eurofins Scientific SE (b) (c) | 84,410 | ||
| 2,583 | RTL Group S.A. (b) (c) | 98,146 | ||
| 182,556 | ||||
| Netherlands – 9.9% | ||||
| 108 | Adyen N.V. (b) (c) (d) (e) | 181,520 | ||
| 1,337 | ASML Holding N.V. (b) | 483,731 | ||
| 3,426 | ASR Nederland N.V. (b) | 103,963 | ||
| 1,682 | BE Semiconductor Industries N.V. (b) | 67,774 | ||
| 946 | Euronext N.V. (b) (d) (e) | 98,499 | ||
| 276 | Ferrari N.V. (b) | 49,236 | ||
| 7,417 | Koninklijke Ahold Delhaize N.V. (b) | 203,343 | ||
| 1,702 | Randstad N.V. (b) (c) | 84,924 | ||
| 5,565 | Unilever N.V. (b) | 313,720 | ||
| 817 | Wolters Kluwer N.V. (b) | 66,150 | ||
| 1,652,860 | ||||
| Spain – 1.9% | ||||
| 83,453 | CaixaBank S.A. (b) | 152,267 | ||
| 6,847 | Industria de Diseno Textil S.A. (b) | 169,048 | ||
| 321,315 | ||||
| Sweden – 11.1% | ||||
| 4,924 | Alfa Laval AB (b) (c) | 100,015 | ||
| 6,464 | Assa Abloy AB, Class B (b) | 138,540 | ||
| 4,219 | Atlas Copco AB, Class A (b) | 186,232 | ||
| 4,073 | Atlas Copco AB, Class B (b) | 156,060 | ||
| 6,822 | Epiroc AB, Class A (b) | 101,863 | ||
| 2,307 | Hexagon AB, Class B (b) | 169,097 | ||
| 2,260 | Indutrade AB (b) (c) | 114,421 | ||
| 2,725 | Investor AB, Class A (b) | 162,943 | ||
| 3,606 | Investor AB, Class B (b) | 216,140 | ||
| 2,927 | Kinnevik AB, Class B (b) | 119,858 | ||
| 1,529 | Lifco AB, Class B (b) | 111,925 | ||
| 4,620 | Volvo AB, Class A (b) (c) | 89,690 | ||
| 9,352 | Volvo AB, Class B (b) (c) | 181,777 | ||
| 1,848,561 | ||||
| Switzerland – 19.5% | ||||
| 334 | Geberit AG (b) | 190,103 | ||
| Shares | Description | Value | ||
| COMMON STOCKS (a) (Continued) | ||||
| Switzerland (Continued) | ||||
| 744 | Kuehne + Nagel International AG (b) | $148,698 | ||
| 1,846 | Logitech International S.A. (b) | 155,297 | ||
| 7,265 | Nestle S.A. (b) | 817,152 | ||
| 4,943 | Novartis AG (b) | 385,171 | ||
| 177 | Partners Group Holding AG (b) | 159,354 | ||
| 1,913 | Roche Holding AG (b) | 614,707 | ||
| 401 | Roche Holding AG (b) | 129,203 | ||
| 339 | Schindler Holding AG (b) | 87,138 | ||
| 62 | SGS S.A. (b) | 154,865 | ||
| 807 | Sika AG (b) | 198,526 | ||
| 617 | Sonova Holding AG (b) (f) | 146,456 | ||
| 728 | Temenos AG (b) | 78,239 | ||
| 3,264,909 | ||||
| United Kingdom – 19.2% | ||||
| 4,321 | Ashtead Group PLC (b) | 156,149 | ||
| 1,057 | AstraZeneca PLC (b) | 106,129 | ||
| 9,743 | Barratt Developments PLC (b) | 60,899 | ||
| 12,464 | Compass Group PLC (b) | 170,604 | ||
| 8,678 | Diageo PLC (b) | 280,455 | ||
| 3,677 | Diploma PLC (b) | 105,881 | ||
| 5,136 | Dunelm Group PLC (b) | 86,829 | ||
| 14,909 | Evraz PLC (b) | 69,426 | ||
| 3,506 | Fevertree Drinks PLC (b) | 91,470 | ||
| 38,581 | G4S PLC (b) (c) | 101,735 | ||
| 19,052 | GlaxoSmithKline PLC (b) | 318,140 | ||
| 4,536 | Hargreaves Lansdown PLC (b) | 79,635 | ||
| 3,423 | Hikma Pharmaceuticals PLC (b) | 111,294 | ||
| 6,879 | IMI PLC (b) | 92,237 | ||
| 2,016 | Intertek Group PLC (b) | 145,214 | ||
| 62,448 | Melrose Industries PLC (b) (c) | 96,874 | ||
| 4,371 | Mondi PLC (b) | 82,845 | ||
| 10,168 | RELX PLC (b) | 201,203 | ||
| 4,527 | Rio Tinto PLC (b) | 256,054 | ||
| 15,216 | RSA Insurance Group PLC (b) | 83,560 | ||
| 66,511 | Serco Group PLC (b) (c) | 111,165 | ||
| 27,488 | Spirent Communications PLC (b) | 103,197 | ||
| 4,569 | Unilever PLC (b) | 260,382 | ||
| 13,493 | William Hill PLC (b) (c) | 47,920 | ||
| 3,219,297 | ||||
| Total Common Stocks | 16,282,589 | |||
| (Cost $15,555,718) | ||||
| REAL ESTATE INVESTMENT TRUSTS (a) – 0.7% | ||||
| Belgium – 0.7% | ||||
| 3,310 | Warehouses De Pauw CVA (b) | 110,896 | ||
| (Cost $85,950) | ||||
| Total Investments – 98.0% | 16,393,485 | |||
| (Cost $15,641,668) (g) | ||||
| Net Other Assets and Liabilities – 2.0% | 335,903 | |||
| Net Assets – 100.0% | $16,729,388 | |||
| (a) | Portfolio securities are categorized based upon their country of incorporation. For a breakdown of the portfolio securities by sector, please see the Fund Performance Overview. |
| (b) | This security is fair valued by the Advisor’s Pricing Committee in accordance with procedures adopted by the Trust’s Board of Trustees and in accordance with provisions of the Investment Company Act of 1940, as amended. At October 31, 2020, securities noted as such are valued at $16,393,485 or 98.0% of net assets. Certain of these securities are fair valued using a factor provided by a third-party pricing service due to the change in value between the foreign markets’ close and the New York Stock Exchange close exceeding a certain threshold. On days when this threshold is not exceeded, these securities are typically valued at the last sale price on the exchange on which they are principally traded. |
| (c) | Non-income producing security. |
| (d) | This security may be resold to qualified foreign investors and foreign institutional buyers under Regulation S of the Securities Act of 1933, as amended (the “1933 Act”). |
| (e) | This security is exempt from registration upon resale under Rule 144A of the 1933 Act and may be resold in transactions exempt from registration, normally to qualified institutional buyers. This security is not restricted on the foreign exchange where it trades freely without any additional registration. As such, it does not require the additional disclosure required of restricted securities. |
| (f) | Non-income producing security which makes payment-in-kind (“PIK”) distributions. For the fiscal year ended October 31, 2020, the Fund received 6 PIK shares of Sonova Holding AG. |
| (g) | Aggregate cost for federal income tax purposes was $15,656,870. As of October 31, 2020, the aggregate gross unrealized appreciation for all investments in which there was an excess of value over tax cost was $1,610,757 and the aggregate gross unrealized depreciation for all investments in which there was an excess of tax cost over value was $874,142. The net unrealized appreciation was $736,615. |
| Total Value at 10/31/2020 | Level 1 Quoted Prices | Level 2 Significant Observable Inputs | Level 3 Significant Unobservable Inputs | |
| Common Stocks* | $ 16,282,589 | $ — | $ 16,282,589 | $ — |
| Real Estate Investment Trusts* | 110,896 | — | 110,896 | — |
| Total Investments | $ 16,393,485 | $— | $ 16,393,485 | $— |
| * | See Portfolio of Investments for country breakout. |
| Currency Exposure Diversification | % of Total Investments |
| Euro | 40.7% |
| British Pound Sterling | 22.5 |
| Swiss Franc | 19.9 |
| Swedish Krona | 11.3 |
| Danish Krone | 4.8 |
| Australian Dollar | 0.8 |
| Total | 100.0% |
| Shares | Description | Value | ||
| COMMON STOCKS (a) – 98.5% | ||||
| Argentina – 1.0% | ||||
| 113,734 | Central Puerto S.A., ADR | $246,803 | ||
| 31,614 | Grupo Financiero Galicia S.A., ADR | 197,903 | ||
| 444,706 | ||||
| Bermuda – 2.2% | ||||
| 111,368 | China Gas Holdings Ltd. (b) | 342,240 | ||
| 2,433,060 | Gemdale Properties & Investment Corp., Ltd. (b) | 377,883 | ||
| 119,405 | Hopson Development Holdings Ltd. (b) | 305,471 | ||
| 1,025,594 | ||||
| Brazil – 6.0% | ||||
| 29,716 | Centrais Eletricas Brasileiras S.A. | 160,855 | ||
| 29,584 | Centrais Eletricas Brasileiras S.A., ADR | 161,825 | ||
| 27,148 | Centrais Eletricas Brasileiras S.A., Class B (Preference Shares) | 146,623 | ||
| 88,606 | Cia Siderurgica Nacional S.A., ADR | 316,324 | ||
| 55,274 | CPFL Energia S.A. | 268,473 | ||
| 85,927 | Equatorial Energia S.A. | 298,456 | ||
| 44,164 | Itau Unibanco Holding S.A., ADR | 180,631 | ||
| 93,896 | Magazine Luiza S.A. | 403,046 | ||
| 141,053 | Metalurgica Gerdau S.A. (Preference Shares) | 240,908 | ||
| 40,298 | Petroleo Brasileiro S.A., ADR | 267,176 | ||
| 69,133 | TIM S.A. | 142,773 | ||
| 16,670 | Vale S.A. | 175,911 | ||
| 2,763,001 | ||||
| Cayman Islands – 34.8% | ||||
| 14,815 | Alibaba Group Holding Ltd., ADR (c) | 4,513,982 | ||
| 293,294 | Asia Cement China Holdings Corp. (b) | 269,171 | ||
| 4,795 | Autohome, Inc., ADR | 458,162 | ||
| 61,180 | China Conch Venture Holdings Ltd. (b) | 272,423 | ||
| 369,614 | China Resources Cement Holdings Ltd. (b) | 483,984 | ||
| 300,530 | Country Garden Holdings Co., Ltd. (b) | 371,414 | ||
| 34,558 | ENN Energy Holdings Ltd. (b) | 437,370 | ||
| 10,741 | JD.com, Inc., ADR (c) | 875,606 | ||
| 202,976 | Logan Group Co., Ltd. (b) | 318,466 | ||
| 64,500 | Longfor Group Holdings Ltd. (b) (d) (e) | 353,403 | ||
| 16,612 | Meituan, Class B (b) (c) (d) | 619,282 | ||
| 11,544 | Momo, Inc., ADR | 173,160 | ||
| 7,203 | NetEase, Inc., ADR | 625,148 | ||
| 479,648 | Seazen Group Ltd. (b) | 359,596 | ||
| Shares | Description | Value | ||
| Cayman Islands (Continued) | ||||
| 25,600 | Shenzhou International Group Holdings Ltd. (b) | $445,424 | ||
| 103,092 | Sunac China Holdings Ltd. (b) | 382,075 | ||
| 30,542 | Sunny Optical Technology Group Co., Ltd. (b) | 507,092 | ||
| 43,274 | Tencent Holdings Ltd. (b) | 3,306,378 | ||
| 17,648 | Vipshop Holdings Ltd., ADR (c) | 377,667 | ||
| 7,058 | Weibo Corp., ADR (c) | 293,260 | ||
| 420,607 | Yuzhou Group Holdings Co., Ltd. (b) | 162,805 | ||
| 63,788 | Zhongsheng Group Holdings Ltd. (b) | 454,824 | ||
| 16,060,692 | ||||
| China – 6.3% | ||||
| 63,052 | Anhui Conch Cement Co., Ltd., Class H (b) | 394,421 | ||
| 1,150,136 | China Construction Bank Corp., Class H (b) | 792,574 | ||
| 62,078 | China Life Insurance Co., Ltd., Class H (b) | 135,450 | ||
| 35,818 | China Vanke Co., Ltd., Class H (b) | 111,178 | ||
| 146,116 | Guangzhou R&F Properties Co., Ltd., Class H (b) | 185,813 | ||
| 80,550 | Ping An Insurance Group Co. of China Ltd., Class H (b) | 832,861 | ||
| 54,330 | Shanghai Baosight Software Co., Ltd., Class B (b) | 212,175 | ||
| 125,734 | Weichai Power Co., Ltd., Class H (b) | 238,427 | ||
| 2,902,899 | ||||
| Colombia – 0.4% | ||||
| 390,724 | Ecopetrol S.A. | 180,807 | ||
| Cyprus – 0.7% | ||||
| 12,734 | TCS Group Holding PLC, GDR (b) (d) | 303,807 | ||
| Hong Kong – 2.4% | ||||
| 362,140 | CSPC Pharmaceutical Group Ltd. (b) | 384,566 | ||
| 600,000 | Lenovo Group Ltd. (b) | 376,724 | ||
| 140,098 | Sinotruk Hong Kong Ltd. (b) | 358,350 | ||
| 1,119,640 | ||||
| India – 14.1% | ||||
| 14,379 | Asian Paints Ltd. (b) | 428,881 | ||
| 31,748 | Aurobindo Pharma Ltd. (b) | 330,858 | ||
| 7,357 | Britannia Industries Ltd. (b) | 344,551 | ||
| 53,964 | Dabur India Ltd. (b) | 372,404 | ||
| 9,074 | Divi’s Laboratories Ltd. (b) | 384,537 | ||
| 37,693 | HCL Technologies Ltd. (b) | 428,856 | ||
| 6,354 | HDFC Asset Management Co., Ltd. (b) (d) (e) | 192,821 | ||
| 13,786 | Hindustan Unilever Ltd. (b) | 385,462 | ||
| Shares | Description | Value | ||
| COMMON STOCKS (a) (Continued) | ||||
| India (Continued) | ||||
| 42,648 | IndusInd Bank Ltd. (b) (c) | $335,806 | ||
| 56,431 | Infosys Ltd. (b) | 808,495 | ||
| 23,073 | Infosys Ltd., ADR | 329,252 | ||
| 3,732 | Jubilant Foodworks Ltd. (b) | 109,452 | ||
| 18,181 | Pidilite Industries Ltd. (b) | 385,017 | ||
| 6,213 | Reliance Industries Ltd. (b) | 172,254 | ||
| 41,752 | Sun TV Network Ltd. (b) | 237,603 | ||
| 19,492 | Tata Consultancy Services Ltd. (b) | 702,501 | ||
| 25,209 | UPL Ltd. (b) | 154,019 | ||
| 85,346 | Wipro Ltd. (b) | 391,396 | ||
| 6,494,165 | ||||
| Malaysia – 1.7% | ||||
| 152,500 | Supermax Corp. Bhd (b) (c) | 348,087 | ||
| 207,200 | Top Glove Corp. Bhd (b) | 427,355 | ||
| 775,442 | ||||
| Marshall Islands – 0.6% | ||||
| 32,481 | Atlas Corp. | 280,311 | ||
| Mexico – 1.8% | ||||
| 105,609 | Qualitas Controladora S.A.B. de C.V. | 423,253 | ||
| 169,918 | Wal-Mart de Mexico S.A.B. de C.V. | 411,427 | ||
| 834,680 | ||||
| Philippines – 0.6% | ||||
| 357,600 | Metropolitan Bank & Trust Co. (b) | 300,581 | ||
| Poland – 0.6% | ||||
| 15,902 | Asseco Poland S.A. (b) | 257,728 | ||
| Russia – 4.1% | ||||
| 1,532 | MMC Norilsk Nickel PJSC (b) | 364,628 | ||
| 13,507 | MMC Norilsk Nickel PJSC, ADR (b) | 321,931 | ||
| 79,489 | Rosneft Oil Co. PJSC (b) | 352,254 | ||
| 200,322 | Sberbank of Russia PJSC (b) | 507,708 | ||
| 26,634 | Severstal PAO (b) | 364,787 | ||
| 1,911,308 | ||||
| Singapore – 0.7% | ||||
| 52,400 | Singapore Exchange Ltd. (b) | 332,340 | ||
| South Africa – 3.5% | ||||
| 46,635 | Exxaro Resources Ltd. (b) | 314,605 | ||
| 40,712 | Impala Platinum Holdings Ltd. (b) | 362,350 | ||
| 12,588 | Kumba Iron Ore Ltd. (b) | 373,730 | ||
| 1,415 | Naspers Ltd., Class N (b) | 276,247 | ||
| 38,674 | Vodacom Group Ltd. (b) | 291,446 | ||
| 1,618,378 | ||||
| Shares | Description | Value | ||
| South Korea – 4.0% | ||||
| 4,976 | Coway Co., Ltd. (b) (c) | $304,693 | ||
| 30,637 | Samsung Electronics Co., Ltd. (b) | 1,539,988 | ||
| 1,844,681 | ||||
| Taiwan – 10.7% | ||||
| 32,443 | Accton Technology Corp. (b) | 235,708 | ||
| 729,279 | IBF Financial Holdings Co., Ltd. (b) | 299,993 | ||
| 10,803 | International Games System Co., Ltd. (b) | 284,279 | ||
| 33,025 | Realtek Semiconductor Corp. (b) | 411,407 | ||
| 186,235 | Taiwan Semiconductor Manufacturing Co., Ltd. (b) | 2,817,675 | ||
| 3,977 | Taiwan Semiconductor Manufacturing Co., Ltd., ADR | 333,551 | ||
| 22,870 | United Integrated Services Co., Ltd. (b) | 158,788 | ||
| 386,813 | United Microelectronics Corp. (b) | 415,727 | ||
| 4,957,128 | ||||
| Turkey – 1.6% | ||||
| 606,177 | Dogan Sirketler Grubu Holding A.S. (b) | 175,898 | ||
| 149,350 | Eregli Demir ve Celik Fabrikalari T.A.S. (b) | 170,789 | ||
| 348,877 | Turkiye Sise ve Cam Fabrikalari A.S. (b) | 254,539 | ||
| 328,476 | Turkiye Vakiflar Bankasi TAO, Class D (b) (c) | 149,432 | ||
| 750,658 | ||||
| United Kingdom – 0.7% | ||||
| 10,472 | British American Tobacco PLC (b) | 331,914 | ||
| Total Investments – 98.5% | 45,490,460 | |||
| (Cost $39,448,766) (f) | ||||
| Net Other Assets and Liabilities – 1.5% | 687,225 | |||
| Net Assets – 100.0% | $46,177,685 | |||
| (a) | Portfolio securities are categorized based upon their country of incorporation. For a breakdown of the portfolio securities by sector, please see the Fund Performance Overview. |
| (b) | This security is fair valued by the Advisor’s Pricing Committee in accordance with procedures adopted by the Trust’s Board of Trustees and in accordance with provisions of the Investment Company Act of 1940, as amended. At October 31, 2020, securities noted as such are valued at $33,007,167 or 71.5% of net assets. Certain of these securities are fair valued using a factor provided by a third-party pricing service due to the change in value between the foreign markets’ close and the New York Stock Exchange close exceeding a certain threshold. On days when this threshold is not exceeded, these securities are typically valued at the last sale price on the exchange on which they are principally traded. |
| (c) | Non-income producing security. |
| (d) | This security may be resold to qualified foreign investors and foreign institutional buyers under Regulation S of the Securities Act of 1933, as amended (the “1933 Act”). |
| (e) | This security is exempt from registration upon resale under Rule 144A of the 1933 Act and may be resold in transactions exempt from registration, normally to qualified institutional buyers. This security is not restricted on the foreign exchange where it trades freely without any additional registration. As such, it does not require the additional disclosure required of restricted securities. |
| (f) | Aggregate cost for federal income tax purposes was $39,672,110. As of October 31, 2020, the aggregate gross unrealized appreciation for all investments in which there was an excess of value over tax cost was $8,641,411 and the aggregate gross unrealized depreciation for all investments in which there was an excess of tax cost over value was $2,823,061. The net unrealized appreciation was $5,818,350. |
| ADR | American Depositary Receipt |
| GDR | Global Depositary Receipt |
| Total Value at 10/31/2020 | Level 1 Quoted Prices | Level 2 Significant Observable Inputs | Level 3 Significant Unobservable Inputs | |
| Common Stocks: | ||||
| Argentina | $ 444,706 | $ 444,706 | $ — | $ — |
| Brazil | 2,763,001 | 2,763,001 | — | — |
| Cayman Islands | 16,060,692 | 7,316,985 | 8,743,707 | — |
| Colombia | 180,807 | 180,807 | — | — |
| India | 6,494,165 | 329,252 | 6,164,913 | — |
| Marshall Islands | 280,311 | 280,311 | — | — |
| Mexico | 834,680 | 834,680 | — | — |
| Taiwan | 4,957,128 | 333,551 | 4,623,577 | — |
| Other Country Categories* | 13,474,970 | — | 13,474,970 | — |
| Total Investments | $ 45,490,460 | $ 12,483,293 | $ 33,007,167 | $— |
| * | See Portfolio of Investments for country breakout. |
| Currency Exposure Diversification | % of Total Investments |
| Hong Kong Dollar | 29.8% |
| United States Dollar | 23.0 |
| Indian Rupee | 13.6 |
| New Taiwan Dollar | 10.2 |
| South Korean Won | 4.1 |
| Brazilian Real | 4.0 |
| South African Rand | 3.6 |
| Russian Ruble | 3.5 |
| Mexican Peso | 1.8 |
| Malaysian Ringgit | 1.7 |
| Turkish Lira | 1.6 |
| Singapore Dollar | 0.7 |
| British Pound Sterling | 0.7 |
| Philippine Peso | 0.7 |
| Polish Zloty | 0.6 |
| Colombian Peso | 0.4 |
| Total | 100.0% |
| First Trust RiverFront Dynamic Asia Pacific ETF (RFAP) | First Trust RiverFront Dynamic Developed International ETF (RFDI) | First Trust RiverFront Dynamic Europe ETF (RFEU) | First Trust RiverFront Dynamic Emerging Markets ETF (RFEM) | ||||
| ASSETS: | |||||||
Investments, at value | $ 9,872,034 | $ 130,049,222 | $ 16,393,485 | $ 45,490,460 | |||
Cash | 36,621 | 46,615 | 639,963 | 1,012,727 | |||
Foreign currency | 46,542 | — | 2 | 3,448,895 | |||
| Receivables: | |||||||
Dividends | 38,366 | 230,482 | 19,846 | 92,335 | |||
Dividend reclaims | 232 | 758,218 | 282,303 | 6,645 | |||
Investment securities sold | — | 2,891,170 | 17,607 | 1,631,122 | |||
Total Assets | 9,993,795 | 133,975,707 | 17,353,206 | 51,682,184 | |||
| LIABILITIES: | |||||||
Due to custodian foreign currency | — | 1,059,213 | — | — | |||
| Payables: | |||||||
Investment securities purchased | 46,541 | 1,770,934 | 611,335 | 5,460,926 | |||
Investment advisory fees | 7,153 | 96,581 | 12,483 | 37,679 | |||
Deferred foreign capital gains tax | — | — | — | 5,736 | |||
Other liabilities | — | — | — | 158 | |||
Total Liabilities | 53,694 | 2,926,728 | 623,818 | 5,504,499 | |||
NET ASSETS | $9,940,101 | $131,048,979 | $16,729,388 | $46,177,685 | |||
| NET ASSETS consist of: | |||||||
Paid-in capital | $ 19,815,614 | $ 206,598,210 | $ 31,557,471 | $ 65,612,478 | |||
Par value | 2,000 | 24,000 | 3,000 | 7,500 | |||
Accumulated distributable earnings (loss) | (9,877,513) | (75,573,231) | (14,831,083) | (19,442,293) | |||
NET ASSETS | $9,940,101 | $131,048,979 | $16,729,388 | $46,177,685 | |||
NET ASSET VALUE, per share | $49.70 | $54.60 | $55.76 | $61.57 | |||
Number of shares outstanding (unlimited number of shares authorized, par value $0.01 per share) | 200,002 | 2,400,002 | 300,002 | 750,002 | |||
Investments, at cost | $9,453,130 | $123,926,738 | $15,641,668 | $39,448,766 | |||
Foreign currency, at cost (proceeds) | $46,611 | $(1,054,373) | $2 | $3,448,551 |
| First Trust RiverFront Dynamic Asia Pacific ETF (RFAP) | First Trust RiverFront Dynamic Developed International ETF (RFDI) | First Trust RiverFront Dynamic Europe ETF (RFEU) | First Trust RiverFront Dynamic Emerging Markets ETF (RFEM) | |||||
| INVESTMENT INCOME: | ||||||||
Dividends | $ 355,598 | $ 4,289,896 | $ 720,150 | $ 1,842,920 | ||||
Interest | 154 | 1,368 | 189 | 1,325 | ||||
Foreign withholding tax | (18,177) | (320,257) | (64,368) | (195,084) | ||||
Other | — | 281 | 188 | 43 | ||||
Total investment income | 337,575 | 3,971,288 | 656,159 | 1,649,204 | ||||
| EXPENSES: | ||||||||
Investment advisory fees | 123,102 | 1,459,791 | 224,808 | 545,932 | ||||
Total expenses | 123,102 | 1,459,791 | 224,808 | 545,932 | ||||
NET INVESTMENT INCOME (LOSS) | 214,473 | 2,511,497 | 431,351 | 1,103,272 | ||||
| NET REALIZED AND UNREALIZED GAIN (LOSS): | ||||||||
| Net realized gain (loss) on: | ||||||||
Investments | (2,017,804) | (23,770,015) | (4,563,910) | (6,415,066) | ||||
In-kind redemptions | (442,770) | 540,981 | 1,332,043 | 562,991 | ||||
Foreign currency transactions | (11,204) | (8,474) | 1,682 | (91,356) | ||||
Foreign capital gains tax | — | — | — | 1,787 | ||||
Net realized gain (loss) | (2,471,778) | (23,237,508) | (3,230,185) | (5,941,644) | ||||
| Net change in unrealized appreciation (depreciation) on: | ||||||||
Investments | 796,627 | 7,279,975 | 1,120,989 | 5,411,816 | ||||
Foreign currency translation | 252 | 44,727 | 16,468 | 5,126 | ||||
Deferred foreign capital gains tax | — | — | — | (4,153) | ||||
Net change in unrealized appreciation (depreciation) | 796,879 | 7,324,702 | 1,137,457 | 5,412,789 | ||||
NET REALIZED AND UNREALIZED GAIN (LOSS) | (1,674,899) | (15,912,806) | (2,092,728) | (528,855) | ||||
NET INCREASE (DECREASE) IN NET ASSETS RESULTING FROM OPERATIONS | $(1,460,426) | $(13,401,309) | $(1,661,377) | $ 574,417 | ||||
| First Trust RiverFront Dynamic Asia Pacific ETF (RFAP) | First Trust RiverFront Dynamic Developed International ETF (RFDI) | ||||||
| Year Ended 10/31/2020 | Year Ended 10/31/2019 | Year Ended 10/31/2020 | Year Ended 10/31/2019 | ||||
| OPERATIONS: | |||||||
Net investment income (loss) | $ 214,473 | $ 756,717 | $ 2,511,497 | $ 8,380,686 | |||
Net realized gain (loss) | (2,471,778) | (5,207,135) | (23,237,508) | (50,398,436) | |||
Net change in unrealized appreciation (depreciation) | 796,879 | 5,278,606 | 7,324,702 | 51,030,024 | |||
Net increase (decrease) in net assets resulting from operations | (1,460,426) | 828,188 | (13,401,309) | 9,012,274 | |||
| DISTRIBUTIONS TO SHAREHOLDERS FROM: | |||||||
Investment operations | (396,562) | (914,283) | (3,529,632) | (8,768,563) | |||
Return of capital | — | — | — | — | |||
Total distributions to shareholders | (396,562) | (914,283) | (3,529,632) | (8,768,563) | |||
| SHAREHOLDER TRANSACTIONS: | |||||||
Proceeds from shares sold | — | — | 7,194,088 | — | |||
Cost of shares redeemed | (14,406,917) | (17,746,758) | (104,447,692) | (254,736,487) | |||
Net increase (decrease) in net assets resulting from shareholder transactions | (14,406,917) | (17,746,758) | (97,253,604) | (254,736,487) | |||
Total increase (decrease) in net assets | (16,263,905) | (17,832,853) | (114,184,545) | (254,492,776) | |||
| NET ASSETS: | |||||||
Beginning of period | 26,204,006 | 44,036,859 | 245,233,524 | 499,726,300 | |||
End of period | $ 9,940,101 | $ 26,204,006 | $ 131,048,979 | $ 245,233,524 | |||
| CHANGES IN SHARES OUTSTANDING: | |||||||
Shares outstanding, beginning of period | 500,002 | 850,002 | 4,250,002 | 8,950,002 | |||
Shares sold | — | — | 150,000 | — | |||
Shares redeemed | (300,000) | (350,000) | (2,000,000) | (4,700,000) | |||
Shares outstanding, end of period | 200,002 | 500,002 | 2,400,002 | 4,250,002 | |||
| First Trust RiverFront Dynamic Europe ETF (RFEU) | First Trust RiverFront Dynamic Emerging Markets ETF (RFEM) | |||||
| Year Ended 10/31/2020 | Year Ended 10/31/2019 | Year Ended 10/31/2020 | Year Ended 10/31/2019 | |||
| $ 431,351 | $ 1,732,321 | $ 1,103,272 | $ 2,600,303 | |||
| (3,230,185) | (7,778,919) | (5,941,644) | (8,404,037) | |||
| 1,137,457 | 8,680,971 | 5,412,789 | 14,093,918 | |||
| (1,661,377) | 2,634,373 | 574,417 | 8,290,184 | |||
| (536,232) | (1,694,053) | (1,856,301) | (2,069,623) | |||
| — | — | (399,153) | — | |||
| (536,232) | (1,694,053) | (2,255,454) | (2,069,623) | |||
| — | 8,249,517 | 3,087,604 | 9,346,520 | |||
| (19,739,261) | (59,229,655) | (28,146,130) | (44,161,386) | |||
| (19,739,261) | (50,980,138) | (25,058,526) | (34,814,866) | |||
| (21,936,870) | (50,039,818) | (26,739,563) | (28,594,305) | |||
| 38,666,258 | 88,706,076 | 72,917,248 | 101,511,553 | |||
| $16,729,388 | $ 38,666,258 | $ 46,177,685 | $ 72,917,248 | |||
| 650,002 | 1,550,002 | 1,200,002 | 1,800,002 | |||
| — | 150,000 | 50,000 | 150,000 | |||
| (350,000) | (1,050,000) | (500,000) | (750,000) | |||
| 300,002 | 650,002 | 750,002 | 1,200,002 | |||
| Year Ended October 31, | Period Ended 10/31/2016 (a) | ||||||||
| 2020 | 2019 | 2018 | 2017 | ||||||
Net asset value, beginning of period | $ 52.41 | $ 51.81 | $ 59.82 | $ 52.14 | $ 51.31 | ||||
| Income from investment operations: | |||||||||
Net investment income (loss) | 0.89 | 1.22 | 1.27 | 1.42 | 0.55 | ||||
Net realized and unrealized gain (loss) | (2.31) | 0.65 | (7.99) | 7.66 | 0.60 | ||||
Total from investment operations | (1.42) | 1.87 | (6.72) | 9.08 | 1.15 | ||||
| Distributions paid to shareholders from: | |||||||||
Net investment income | (1.29) | (1.27) | (1.29) | (1.40) | (0.32) | ||||
Net asset value, end of period | $49.70 | $52.41 | $51.81 | $59.82 | $52.14 | ||||
Total return (b) | (2.73)% | 3.74% | (11.48)% | 17.77% (c) | 2.26% | ||||
| Ratios to average net assets/supplemental data: | |||||||||
Net assets, end of period (in 000’s) | $ 9,940 | $ 26,204 | $ 44,037 | $ 29,911 | $ 26,071 | ||||
Ratio of total expenses to average net assets | 0.83% | 0.83% | 0.83% | 0.83% | 0.83% (d) | ||||
Ratio of net investment income (loss) to average net assets | 1.45% | 2.11% | 2.28% | 1.93% | 1.96% (d) | ||||
Portfolio turnover rate (e) | 117% | 96% | 136% | 131% | 49% | ||||
| (a) | Inception date is April 13, 2016, which is consistent with the commencement of investment operations and is the date the initial creation units were established. |
| (b) | Total return is calculated assuming an initial investment made at the net asset value at the beginning of the period, reinvestment of all distributions at net asset value during the period, and redemption at net asset value on the last day of the period. The returns presented do not reflect the deduction of taxes that a shareholder would pay on Fund distributions or the redemption or sale of Fund shares. Total return is calculated for the time period presented and is not annualized for periods of less than a year. |
| (c) | The Fund received a reimbursement from the advisor in the amount of $7,644, which represents $0.02 per share. Since the advisor reimbursed the Fund, there was no effect on the Fund’s total return. |
| (d) | Annualized. |
| (e) | Portfolio turnover is calculated for the time period presented and is not annualized for periods of less than a year and does not include securities received or delivered from processing creations or redemptions and in-kind transactions. |
| Year Ended October 31, | Period Ended 10/31/2016 (a) | ||||||||
| 2020 | 2019 | 2018 | 2017 | ||||||
Net asset value, beginning of period | $ 57.70 | $ 55.84 | $ 63.96 | $ 51.36 | $ 50.73 | ||||
| Income from investment operations: | |||||||||
Net investment income (loss) | 0.85 | 1.54 | 1.34 | 0.82 | 0.83 | ||||
Net realized and unrealized gain (loss) | (2.84) | 1.81 | (8.00) | 12.73 | 0.50 | ||||
Total from investment operations | (1.99) | 3.35 | (6.66) | 13.55 | 1.33 | ||||
| Distributions paid to shareholders from: | |||||||||
Net investment income | (1.11) | (1.49) | (1.44) | (0.71) | (0.70) | ||||
Net realized gain | — | — | (0.02) | (0.24) | — | ||||
Total distributions | (1.11) | (1.49) | (1.46) | (0.95) | (0.70) | ||||
Net asset value, end of period | $54.60 | $57.70 | $55.84 | $63.96 | $51.36 | ||||
Total return (b) | (3.45)% | 6.12% | (10.65)% | 26.60% (c) | 2.68% | ||||
| Ratios to average net assets/supplemental data: | |||||||||
Net assets, end of period (in 000’s) | $ 131,049 | $ 245,234 | $ 499,726 | $ 444,522 | $ 25,679 | ||||
Ratio of total expenses to average net assets | 0.83% | 0.83% | 0.83% | 0.83% | 0.83% (d) | ||||
Ratio of net investment income (loss) to average net assets | 1.43% | 2.51% | 2.28% | 1.86% | 2.97% (d) | ||||
Portfolio turnover rate (e) | 96% | 87% | 133% | 106% | 44% | ||||
| (a) | Inception date is April 13, 2016, which is consistent with the commencement of investment operations and is the date the initial creation units were established. |
| (b) | Total return is calculated assuming an initial investment made at the net asset value at the beginning of the period, reinvestment of all distributions at net asset value during the period, and redemption at net asset value on the last day of the period. The returns presented do not reflect the deduction of taxes that a shareholder would pay on Fund distributions or the redemption or sale of Fund shares. Total return is calculated for the time period presented and is not annualized for periods of less than a year. |
| (c) | The Fund received a reimbursement from the advisor in the amount of $35,978, which represents less than $0.01 per share. Since the advisor reimbursed the Fund, there was no effect on the Fund’s total return. |
| (d) | Annualized. |
| (e) | Portfolio turnover is calculated for the time period presented and is not annualized for periods of less than a year and does not include securities received or delivered from processing creations or redemptions and in-kind transactions. |
| Year Ended October 31, | Period Ended 10/31/2016 (a) | ||||||||
| 2020 | 2019 | 2018 | 2017 | ||||||
Net asset value, beginning of period | $ 59.49 | $ 57.23 | $ 65.25 | $ 51.17 | $ 50.67 | ||||
| Income from investment operations: | |||||||||
Net investment income (loss) | 0.96 | 1.78 | 1.48 | 0.82 | 0.91 | ||||
Net realized and unrealized gain (loss) | (3.50) | 2.20 | (7.97) | 14.86 | 0.41 | ||||
Total from investment operations | (2.54) | 3.98 | (6.49) | 15.68 | 1.32 | ||||
| Distributions paid to shareholders from: | |||||||||
Net investment income | (1.19) | (1.72) | (1.53) | (0.79) | (0.82) | ||||
Net realized gain | — | — | — | (0.81) | — | ||||
Total distributions | (1.19) | (1.72) | (1.53) | (1.60) | (0.82) | ||||
Net asset value, end of period | $55.76 | $59.49 | $57.23 | $65.25 | $51.17 | ||||
Total return (b) | (4.22)% | 7.01% | (10.16)% | 31.21% | 2.66% | ||||
| Ratios to average net assets/supplemental data: | |||||||||
Net assets, end of period (in 000’s) | $ 16,729 | $ 38,666 | $ 88,706 | $ 123,980 | $ 25,585 | ||||
Ratio of total expenses to average net assets | 0.83% | 0.83% | 0.83% | 0.83% | 0.83% (c) | ||||
Ratio of net investment income (loss) to average net assets | 1.59% | 2.77% | 2.45% | 1.71% | 3.23% (c) | ||||
Portfolio turnover rate (d) | 87% | 81% | 130% | 110% | 41% | ||||
| (a) | Inception date is April 13, 2016, which is consistent with the commencement of investment operations and is the date the initial creation units were established. |
| (b) | Total return is calculated assuming an initial investment made at the net asset value at the beginning of the period, reinvestment of all distributions at net asset value during the period, and redemption at net asset value on the last day of the period. The returns presented do not reflect the deduction of taxes that a shareholder would pay on Fund distributions or the redemption or sale of Fund shares. Total return is calculated for the time period presented and is not annualized for periods of less than a year. |
| (c) | Annualized. |
| (d) | Portfolio turnover is calculated for the time period presented and is not annualized for periods of less than a year and does not include securities received or delivered from processing creations or redemptions and in-kind transactions. |
| Year Ended October 31, | Period Ended 10/31/2016 (a) | ||||||||
| 2020 | 2019 | 2018 | 2017 | ||||||
Net asset value, beginning of period | $ 60.76 | $ 56.40 | $ 68.64 | $ 56.27 | $ 49.61 | ||||
| Income from investment operations: | |||||||||
Net investment income (loss) | 1.10 | 1.79 | 1.20 | 0.71 | 0.55 | ||||
Net realized and unrealized gain (loss) | 1.81 | 3.94 | (11.87) | 13.70 | 6.66 | ||||
Total from investment operations | 2.91 | 5.73 | (10.67) | 14.41 | 7.21 | ||||
| Distributions paid to shareholders from: | |||||||||
Net investment income | (1.73) | (1.37) | (1.18) | (0.77) | (0.55) | ||||
Net realized gain | — | — | (0.30) | (1.27) | — | ||||
Return of capital | (0.37) | — | (0.09) | — | — | ||||
Total distributions | (2.10) | (1.37) | (1.57) | (2.04) | (0.55) | ||||
Net asset value, end of period | $61.57 | $60.76 | $56.40 | $68.64 | $56.27 | ||||
Total return (b) | 4.74% | 10.32% | (15.92)% | 26.49% | 14.52% | ||||
| Ratios to average net assets/supplemental data: | |||||||||
Net assets, end of period (in 000’s) | $ 46,178 | $ 72,917 | $ 101,512 | $ 75,506 | $ 5,628 | ||||
Ratio of total expenses to average net assets | 0.95% | 0.95% | 0.95% | 0.95% | 0.95% (c) | ||||
Ratio of net investment income (loss) to average net assets | 1.92% | 2.60% | 1.90% | 1.56% | 2.66% (c) | ||||
Portfolio turnover rate (d) | 89% | 116% | 126% | 87% | 81% | ||||
| (a) | Inception date is June 14, 2016, which is consistent with the commencement of operations and is the date the initial creation units were established. |
| (b) | Total return is calculated assuming an initial investment made at the net asset value at the beginning of the period, reinvestment of all distributions at net asset value during the period, and redemption at net asset value on the last day of the period. The returns presented do not reflect the deduction of taxes that a shareholder would pay on Fund distributions or the redemption or sale of Fund shares. Total return is calculated for the time period presented and is not annualized for periods of less than a year. |
| (c) | Annualized. |
| (d) | Portfolio turnover is calculated for the time period presented and is not annualized for periods of less than a year and does not include securities received or delivered from processing creations or redemptions and in-kind transactions. |
| 1) | the type of security; |
| 2) | the size of the holding; |
| 3) | the initial cost of the security; |
| 4) | transactions in comparable securities; |
| 5) | price quotes from dealers and/or third-party pricing services; |
| 6) | relationships among various securities; |
| 7) | information obtained by contacting the issuer, analysts, or the appropriate stock exchange; |
| 8) | an analysis of the issuer’s financial statements; and |
| 9) | the existence of merger proposals or tender offers that might affect the value of the security. |
| 1) | the value of similar foreign securities traded on other foreign markets; |
| 2) | ADR trading of similar securities; |
| 3) | closed-end fund or exchange-traded fund trading of similar securities; |
| 4) | foreign currency exchange activity; |
| 5) | the trading prices of financial products that are tied to baskets of foreign securities; |
| 6) | factors relating to the event that precipitated the pricing problem; |
| 7) | whether the event is likely to recur; and |
| 8) | whether the effects of the event are isolated or whether they affect entire markets, countries or regions. |
| • | Level 1 – Level 1 inputs are quoted prices in active markets for identical investments. An active market is a market in which transactions for the investment occur with sufficient frequency and volume to provide pricing information on an ongoing basis. |
| • | Level 2 – Level 2 inputs are observable inputs, either directly or indirectly, and include the following: |
| o | Quoted prices for similar investments in active markets. |
| o | Quoted prices for identical or similar investments in markets that are non-active. A non-active market is a market where there are few transactions for the investment, the prices are not current, or price quotations vary substantially either over time or among market makers, or in which little information is released publicly. |
| o | Inputs other than quoted prices that are observable for the investment (for example, interest rates and yield curves observable at commonly quoted intervals, volatilities, prepayment speeds, loss severities, credit risks, and default rates). |
| o | Inputs that are derived principally from or corroborated by observable market data by correlation or other means. |
| • | Level 3 – Level 3 inputs are unobservable inputs. Unobservable inputs may reflect the reporting entity’s own assumptions about the assumptions that market participants would use in pricing the investment. |
| Distributions paid from Ordinary Income | Distributions paid from Capital Gains | Distributions paid from Return of Capital | |||
First Trust RiverFront Dynamic Asia Pacific ETF | $ 396,562 | $ — | $ — | ||
First Trust RiverFront Dynamic Developed International ETF | 3,529,632 | — | — | ||
First Trust RiverFront Dynamic Europe ETF | 536,232 | — | — | ||
First Trust RiverFront Dynamic Emerging Markets ETF | 1,856,301 | — | 399,153 |
| Distributions paid from Ordinary Income | Distributions paid from Capital Gains | Distributions paid from Return of Capital | |||
First Trust RiverFront Dynamic Asia Pacific ETF | $ 914,283 | $ — | $ — | ||
First Trust RiverFront Dynamic Developed International ETF | 8,768,563 | — | — | ||
First Trust RiverFront Dynamic Europe ETF | 1,694,053 | — | — | ||
First Trust RiverFront Dynamic Emerging Markets ETF | 2,069,623 | — | — |
| Undistributed Ordinary Income | Accumulated Capital and Other Gain (Loss) | Net Unrealized Appreciation (Depreciation) | |||
First Trust RiverFront Dynamic Asia Pacific ETF | $ 56,707 | $ (10,346,588) | $ 412,368 | ||
First Trust RiverFront Dynamic Developed International ETF | 227,138 | (81,836,524) | 6,036,155 | ||
First Trust RiverFront Dynamic Europe ETF | 165,383 | (15,744,689) | 748,223 | ||
First Trust RiverFront Dynamic Emerging Markets ETF | — | (25,260,032) | 5,817,739 |
| Non-Expiring Capital Loss Carryforward | |
First Trust RiverFront Dynamic Asia Pacific ETF | $ 10,346,588 |
First Trust RiverFront Dynamic Developed International ETF | 81,836,524 |
First Trust RiverFront Dynamic Europe ETF | 15,744,689 |
First Trust RiverFront Dynamic Emerging Markets ETF | 25,260,032 |
| Accumulated Net Investment Income (Loss) | Accumulated Net Realized Gain (Loss) on Investments | Paid-in Capital | |||
First Trust RiverFront Dynamic Asia Pacific ETF | $ 66,575 | $ 423,984 | $ (490,559) | ||
First Trust RiverFront Dynamic Developed International ETF | 287,367 | (623,271) | 335,904 | ||
First Trust RiverFront Dynamic Europe ETF | 190,413 | (1,477,206) | 1,286,793 | ||
First Trust RiverFront Dynamic Emerging Markets ETF | 11,640 | (447,705) | 436,065 |
| Purchases | Sales | ||
| First Trust RiverFront Dynamic Asia Pacific ETF | $ 17,733,475 | $ 18,426,333 | |
| First Trust RiverFront Dynamic Developed International ETF | 167,315,344 | 168,232,252 | |
| First Trust RiverFront Dynamic Europe ETF | 23,193,775 | 23,197,723 | |
| First Trust RiverFront Dynamic Emerging Markets ETF | 50,732,863 | 61,084,194 | |
| Purchases | Sales | ||
| First Trust RiverFront Dynamic Asia Pacific ETF | $ — | $ 13,786,115 | |
| First Trust RiverFront Dynamic Developed International ETF | 6,777,932 | 102,309,499 | |
| First Trust RiverFront Dynamic Europe ETF | — | 19,499,168 | |
| First Trust RiverFront Dynamic Emerging Markets ETF | 961,693 | 16,946,689 |
| Individual Funds Included in the Trust | Financial Highlights |
| First Trust RiverFront Dynamic Asia Pacific ETF | For the years ended October 31, 2020, 2019, 2018, 2017 and the period from April 13, 2016 (commencement of operations) through October 31, 2016 |
| First Trust RiverFront Dynamic Developed International ETF | |
| First Trust RiverFront Dynamic Europe ETF | |
| First Trust RiverFront Dynamic Emerging Markets ETF | For the years ended October 31, 2020, 2019, 2018, 2017 and the period from June 14, 2016 (commencement of operations) through October 31, 2016 |

| Dividends Received Deduction | |
First Trust RiverFront Dynamic Asia Pacific ETF | 0.00% |
First Trust RiverFront Dynamic Developed International ETF | 0.00% |
First Trust RiverFront Dynamic Europe ETF | 0.00% |
First Trust RiverFront Dynamic Emerging Markets ETF | 0.00% |
| Qualified Dividend Income | |
First Trust RiverFront Dynamic Asia Pacific ETF | 100.00% |
First Trust RiverFront Dynamic Developed International ETF | 100.00% |
First Trust RiverFront Dynamic Europe ETF | 100.00% |
First Trust RiverFront Dynamic Emerging Markets ETF | 76.85% |
| Gross Foreign Income | Foreign Taxes Paid | ||||||
| Amount | Per Share | Amount | Per Share | ||||
First Trust RiverFront Dynamic Asia Pacific ETF | $ 355,332 | $ 1.78 | $ 18,157 | $ 0.09 | |||
First Trust RiverFront Dynamic Developed International ETF | 4,240,815 | 1.77 | 310,720 | 0.13 | |||
First Trust RiverFront Dynamic Europe ETF | 713,758 | 2.38 | 61,541 | 0.21 | |||
First Trust RiverFront Dynamic Emerging Markets ETF | 1,842,920 | 2.46 | 185,899 | 0.25 | |||
| NOT FDIC INSURED | NOT BANK GUARANTEED | MAY LOSE VALUE |
| Name, Year of Birth and Position with the Trust | Term of Office and Year First Elected or Appointed | Principal Occupations During Past 5 Years | Number of Portfolios in the First Trust Fund Complex Overseen by Trustee | Other Trusteeships or Directorships Held by Trustee During Past 5 Years |
| INDEPENDENT TRUSTEES | ||||
| Richard E. Erickson, Trustee (1951) | • Indefinite Term • Since Inception | Physician; Officer, Wheaton Orthopedics; Limited Partner, Gundersen Real Estate Limited Partnership (June 1992 to December 2016); Member, Sportsmed LLC (April 2007 to November 2015) | 189 | None |
| Thomas R. Kadlec, Trustee (1957) | • Indefinite Term • Since Inception | President, ADM Investor Services, Inc. (Futures Commission Merchant) | 189 | Director of ADM Investor Services, Inc., ADM Investor Services International, Futures Industry Association, and National Futures Association |
| Robert F. Keith, Trustee (1956) | • Indefinite Term • Since Inception | President, Hibs Enterprises (Financial and Management Consulting) | 189 | Director of Trust Company of Illinois |
| Niel B. Nielson, Trustee (1954) | • Indefinite Term • Since Inception | Senior Advisor (August 2018 to Present), Managing Director and Chief Operating Officer (January 2015 to August 2018), Pelita Harapan Educational Foundation (Educational Products and Services) | 189 | None |
| INTERESTED TRUSTEE | ||||
| James A. Bowen(1), Trustee and Chairman of the Board (1955) | • Indefinite Term • Since Inception | Chief Executive Officer, First Trust Advisors L.P. and First Trust Portfolios L.P.; Chairman of the Board of Directors, BondWave LLC (Software Development Company) and Stonebridge Advisors LLC (Investment Advisor) | 189 | None |
| (1) | Mr. Bowen is deemed an “interested person” of the Trust due to his position as CEO of First Trust Advisors L.P., investment advisor of the Trust. |
| Name and Year of Birth | Position and Offices with Trust | Term of Office and Length of Service | Principal Occupations During Past 5 Years |
| OFFICERS(2) | |||
| James M. Dykas (1966) | President and Chief Executive Officer | • Indefinite Term • Since January 2016 | Managing Director and Chief Financial Officer (January 2016 to Present), Controller (January 2011 to January 2016), Senior Vice President (April 2007 to January 2016), First Trust Advisors L.P. and First Trust Portfolios L.P.; Chief Financial Officer (January 2016 to Present), BondWave LLC (Software Development Company) and Stonebridge Advisors LLC (Investment Advisor) |
| Donald P. Swade (1972) | Treasurer, Chief Financial Officer and Chief Accounting Officer | • Indefinite Term • Since January 2016 | Senior Vice President (July 2016 to Present), Vice President (April 2012 to July 2016), First Trust Advisors L.P. and First Trust Portfolios L.P. |
| W. Scott Jardine (1960) | Secretary and Chief Legal Officer | • Indefinite Term • Since Inception | General Counsel, First Trust Advisors L.P. and First Trust Portfolios L.P.; Secretary and General Counsel, BondWave LLC; Secretary, Stonebridge Advisors LLC |
| Daniel J. Lindquist (1970) | Vice President | • Indefinite Term • Since Inception | Managing Director, First Trust Advisors L.P. and First Trust Portfolios L.P. |
| Kristi A. Maher (1966) | Chief Compliance Officer and Assistant Secretary | • Indefinite Term • Since Inception | Deputy General Counsel, First Trust Advisors L.P. and First Trust Portfolios L.P. |
| Roger F. Testin (1966) | Vice President | • Indefinite Term • Since Inception | Senior Vice President, First Trust Advisors L.P. and First Trust Portfolios L.P. |
| Stan Ueland (1970) | Vice President | • Indefinite Term • Since Inception | Senior Vice President, First Trust Advisors L.P. and First Trust Portfolios L.P |
| (2) | The term “officer” means the president, vice president, secretary, treasurer, controller or any other officer who performs a policy making function. |
| • | Information we receive from you and your broker-dealer, investment advisor or financial representative through interviews, applications, agreements or other forms; |
| • | Information about your transactions with us, our affiliates or others; |
| • | Information we receive from your inquiries by mail, e-mail or telephone; and |
| • | Information we collect on our website through the use of “cookies”. For example, we may identify the pages on our website that your browser requests or visits. |
| • | In order to provide you with products and services and to effect transactions that you request or authorize, we may disclose your personal information as described above to unaffiliated financial service providers and other companies that perform administrative or other services on our behalf, such as transfer agents, custodians and trustees, or that assist us in the distribution of investor materials such as trustees, banks, financial representatives, proxy services, solicitors and printers. |
| • | We may release information we have about you if you direct us to do so, if we are compelled by law to do so, or in other legally limited circumstances (for example to protect your account from fraud). |
FUND ACCOUNTANT &
TRANSFER AGENT
PUBLIC ACCOUNTING FIRM

For the Year Ended
October 31, 2020
| 1 | |
| 2 | |
| 5 | |
| 7 | |
| 8 | |
| 13 | |
| 14 | |
| 15 | |
| 16 | |
| 17 | |
| 23 | |
| 24 | |
| 30 | |
| 32 |

| Performance | |||
| Average Annual Total Returns | Cumulative Total Returns | ||
| 1 Year Ended 10/31/20 | Inception (8/22/17) to 10/31/20 | Inception (8/22/17) to 10/31/20 | |
| Fund Performance | |||
| NAV | 2.76% | 4.28% | 14.30% |
| Market Price | 2.65% | 4.30% | 14.38% |
| Index Performance | |||
| ICE BofA US Investment Grade Institutional Capital Securities Index | 5.48% | 5.65% | 19.19% |
| Sector Allocation | % of Total Investments |
| Financials | 76.1% |
| Utilities | 8.3 |
| Energy | 7.6 |
| Consumer Staples | 3.1 |
| Industrials | 3.1 |
| Communication Services | 1.8 |
| Total | 100.0% |
| Credit Quality(1) | % of Total Investments |
| A- | 0.5% |
| BBB+ | 8.9 |
| BBB | 30.3 |
| BBB- | 30.4 |
| BB+ | 19.4 |
| BB | 7.7 |
| BB- | 1.2 |
| B+ | 1.6 |
| Total | 100.0% |
| Top Ten Holdings | % of Total Investments |
| Emera, Inc., Series 16-A | 3.7% |
| Barclays PLC | 2.8 |
| Enbridge, Inc., Series 16-A | 2.6 |
| AXIS Specialty Finance LLC | 2.4 |
| Lloyds Banking Group PLC | 2.1 |
| Australia & New Zealand Banking Group Ltd. | 2.0 |
| Land O’Lakes, Inc. | 2.0 |
| AerCap Holdings N.V. | 1.8 |
| Markel Corp. | 1.7 |
| Apollo Management Holdings L.P. | 1.6 |
| Total | 22.7% |
| Country Allocation | % of Total Investments |
| United States | 40.4% |
| United Kingdom | 12.3 |
| Canada | 10.2 |
| France | 9.0 |
| Switzerland | 6.3 |
| Netherlands | 5.1 |
| Australia | 5.0 |
| Italy | 3.7 |
| Japan | 2.2 |
| Spain | 2.0 |
| Finland | 1.0 |
| Mexico | 0.8 |
| Chile | 0.6 |
| Denmark | 0.5 |
| Bermuda | 0.5 |
| Sweden | 0.4 |
| Total | 100.0% |
| (1) | The credit quality and ratings information presented above reflect the ratings assigned by one or more nationally recognized statistical rating organizations (NRSROs), including Standard & Poor’s Ratings Group, a division of the McGraw Hill Companies, Inc., Moody’s Investors Service, Inc., Fitch Ratings or a comparably rated NRSRO. For situations in which a security is rated by more than one NRSRO and the ratings are not equivalent, the highest rating is used. Sub-investment grade ratings are those rated BB+/Ba1 or lower. Investment grade ratings are those rated BBB-/Baa3 or higher. The credit ratings shown relate to the creditworthiness of the issuers of the underlying securities in the Fund, and not to the Fund or its shares. Credit ratings are subject to change. |
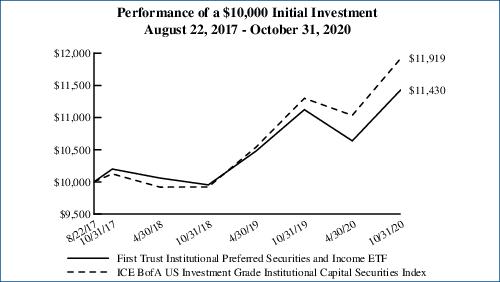
Performance figures assume reinvestment of all distributions and do not reflect the deduction of taxes that a shareholder would pay on Fund distributions or the redemption or sale of Fund shares. An index is a statistical composite that tracks a specified financial market or sector. Unlike the Fund, the index does not actually hold a portfolio of securities and therefore does not incur the expenses incurred by the Fund. These expenses negatively impact the performance of the Fund. The Fund’s past performance does not predict future performance.
| Beginning Account Value May 1, 2020 | Ending Account Value October 31, 2020 | Annualized Expense Ratio Based on the Six-Month Period | Expenses Paid During the Six-Month Period (a) | |
| First Trust Institutional Preferred Securities and Income ETF (FPEI) | ||||
| Actual | $1,000.00 | $1,102.40 | 0.85% | $4.49 |
| Hypothetical (5% return before expenses) | $1,000.00 | $1,020.86 | 0.85% | $4.32 |
| (a) | Expenses are equal to the annualized expense ratios as indicated in the table multiplied by the average account value over the period (May 1, 2020 through October 31, 2020), multiplied by 184/366 (to reflect the six-month period). |
| Shares | Description | Stated Rate | Stated Maturity | Value | ||||
| $1,000 PAR PREFERRED SECURITIES – 1.0% | ||||||||
| Banks – 1.0% | ||||||||
| 2,209 | Wells Fargo & Co., Series L | 7.50% | (a) | $2,979,411 | ||||
| (Cost $3,002,990) | ||||||||
| Par Amount | Description | Stated Rate | Stated Maturity | Value | ||||
| CAPITAL PREFERRED SECURITIES – 96.5% | ||||||||
| Banks – 43.7% | ||||||||
| $4,950,000 | Australia & New Zealand Banking Group Ltd. (b) (c) (d) | 6.75% | (a) | 5,618,720 | ||||
| 1,145,000 | Australia & New Zealand Banking Group Ltd. (c) (d) (e) | 6.75% | (a) | 1,299,684 | ||||
| 2,600,000 | Banco Bilbao Vizcaya Argentaria S.A., Series 9 (c) (d) | 6.50% | (a) | 2,567,584 | ||||
| 400,000 | Banco Mercantil del Norte S.A. (b) (c) (d) | 7.50% | (a) | 398,820 | ||||
| 1,100,000 | Banco Mercantil del Norte S.A. (b) (c) (d) | 8.38% | (a) | 1,169,036 | ||||
| 3,000,000 | Banco Santander S.A. (c) (d) (e) | 7.50% | (a) | 3,124,800 | ||||
| 2,400,000 | Bank of America Corp., Series X (d) | 6.25% | (a) | 2,619,422 | ||||
| 3,700,000 | Bank of Nova Scotia (The) (d) | 4.90% | (a) | 3,871,310 | ||||
| 1,450,000 | Barclays PLC (c) (d) | 6.13% | (a) | 1,478,831 | ||||
| 2,850,000 | Barclays PLC (c) (d) (e) | 7.88% | (a) | 2,947,755 | ||||
| 7,250,000 | Barclays PLC (c) (d) | 8.00% | (a) | 7,779,300 | ||||
| 700,000 | BBVA Bancomer S.A. (b) (c) (d) | 5.88% | 09/13/34 | 727,692 | ||||
| 2,300,000 | BNP Paribas S.A. (b) (c) (d) | 6.63% | (a) | 2,448,810 | ||||
| 4,000,000 | BNP Paribas S.A. (b) (c) (d) | 7.38% | (a) | 4,467,780 | ||||
| 1,416,000 | Citigroup, Inc. (d) | 5.90% | (a) | 1,467,684 | ||||
| 250,000 | Citigroup, Inc. (d) | 5.95% | (a) | 258,462 | ||||
| 3,314,000 | Citigroup, Inc., Series P (d) | 5.95% | (a) | 3,472,271 | ||||
| 1,470,000 | Citigroup, Inc., Series R (d) | 6.13% | (a) | 1,459,321 | ||||
| 1,900,000 | Citizens Financial Group, Inc., Series A, 3 Mo. LIBOR + 3.96% (f) | 4.19% | (a) | 1,840,235 | ||||
| 1,500,000 | Citizens Financial Group, Inc., Series F (d) | 5.65% | (a) | 1,599,375 | ||||
| 1,358,000 | CoBank ACB, Series I (d) | 6.25% | (a) | 1,453,060 | ||||
| 800,000 | Comerica, Inc. (d) | 5.63% | (a) | 856,000 | ||||
| 2,806,000 | Credit Agricole S.A. (b) (c) (d) | 6.88% | (a) | 3,006,110 | ||||
| 1,600,000 | Credit Agricole S.A. (b) (c) (d) | 7.88% | (a) | 1,768,256 | ||||
| 1,000,000 | Credit Agricole S.A. (c) (d) (e) | 7.88% | (a) | 1,105,160 | ||||
| 2,400,000 | Credit Agricole S.A. (b) (c) (d) | 8.13% | (a) | 2,824,080 | ||||
| 550,000 | Danske Bank A.S. (c) (d) (e) | 6.13% | (a) | 567,202 | ||||
| 850,000 | Danske Bank A.S. (c) (d) (e) | 7.00% | (a) | 914,659 | ||||
| 800,000 | Farm Credit Bank of Texas, Series 3 (b) (d) | 6.20% | (a) | 800,652 | ||||
| 1,100,000 | Farm Credit Bank of Texas, Series 4 (b) (d) | 5.70% | (a) | 1,186,350 | ||||
| 1,450,000 | Fifth Third Bancorp, Series L (d) | 4.50% | (a) | 1,468,125 | ||||
| 3,070,000 | HSBC Holdings PLC (c) (d) | 6.38% | (a) | 3,197,860 | ||||
| 1,100,000 | Huntington Bancshares, Inc., Series F (d) | 5.63% | (a) | 1,233,375 | ||||
| 2,200,000 | Huntington Bancshares, Inc., Series G (d) | 4.45% | (a) | 2,194,500 | ||||
| 1,070,000 | ING Groep N.V. (c) (d) | 5.75% | (a) | 1,115,705 | ||||
| 1,400,000 | ING Groep N.V. (c) (d) | 6.50% | (a) | 1,487,500 | ||||
| 1,520,000 | ING Groep N.V. (c) (d) (e) | 6.88% | (a) | 1,575,685 | ||||
| 1,970,000 | Intesa Sanpaolo S.p.A. (b) (c) (d) | 7.70% | (a) | 2,079,192 | ||||
| 620,000 | JPMorgan Chase & Co., Series R (d) | 6.00% | (a) | 636,012 | ||||
| 3,116,000 | JPMorgan Chase & Co., Series V, 3 Mo. LIBOR + 3.32% (f) | 3.55% | (a) | 2,904,606 | ||||
| 475,000 | JPMorgan Chase & Co., Series Z, 3 Mo. LIBOR + 3.80% (f) | 4.05% | (a) | 466,239 | ||||
| 1,000,000 | Lloyds Bank PLC (b) (d) | 12.00% | (a) | 1,121,290 | ||||
| 900,000 | Lloyds Bank PLC (d) (e) | 12.00% | (a) | 1,009,161 | ||||
| 1,550,000 | Lloyds Banking Group PLC (c) (d) | 6.75% | (a) | 1,626,857 | ||||
| 5,638,000 | Lloyds Banking Group PLC (c) (d) | 7.50% | (a) | 5,960,606 | ||||
| 2,000,000 | M&T Bank Corp., Series G (d) | 5.00% | (a) | 2,046,470 | ||||
| 600,000 | Natwest Group PLC (c) (d) | 6.00% | (a) | 622,320 | ||||
| 1,550,000 | Natwest Group PLC (c) (d) | 8.00% | (a) | 1,738,480 | ||||
| Par Amount | Description | Stated Rate | Stated Maturity | Value | ||||
| CAPITAL PREFERRED SECURITIES (Continued) | ||||||||
| Banks (Continued) | ||||||||
| $2,875,000 | Natwest Group PLC (c) (d) | 8.63% | (a) | $2,973,699 | ||||
| 2,425,000 | Nordea Bank Abp (b) (c) (d) | 6.63% | (a) | 2,714,994 | ||||
| 1,000,000 | Regions Financial Corp., Series D (d) | 5.75% | (a) | 1,073,750 | ||||
| 200,000 | Skandinaviska Enskilda Banken AB (c) (d) (e) | 5.63% | (a) | 205,236 | ||||
| 2,866,000 | Societe Generale S.A. (b) (c) (d) | 7.38% | (a) | 2,950,318 | ||||
| 500,000 | Societe Generale S.A. (c) (d) (e) | 7.38% | (a) | 514,710 | ||||
| 1,321,000 | Societe Generale S.A. (b) (c) (d) | 7.88% | (a) | 1,410,267 | ||||
| 400,000 | Societe Generale S.A. (c) (d) (e) | 7.88% | (a) | 427,030 | ||||
| 2,639,000 | Societe Generale S.A. (b) (c) (d) | 8.00% | (a) | 2,966,686 | ||||
| 1,500,000 | Standard Chartered PLC (b) (c) (d) | 6.00% | (a) | 1,545,000 | ||||
| 1,000,000 | Standard Chartered PLC (b) (c) (d) | 7.75% | (a) | 1,064,240 | ||||
| 1,000,000 | Swedbank AB (c) (d) (e) | 6.00% | (a) | 1,024,109 | ||||
| 1,200,000 | Truist Financial Corp., Series P (d) | 4.95% | (a) | 1,275,000 | ||||
| 1,700,000 | Truist Financial Corp., Series Q (d) | 5.10% | (a) | 1,864,577 | ||||
| 3,850,000 | UniCredit S.p.A. (c) (d) (e) | 8.00% | (a) | 4,061,111 | ||||
| 750,000 | UniCredit S.p.A. (b) (d) | 5.46% | 06/30/35 | 761,039 | ||||
| 124,414,170 | ||||||||
| Capital Markets – 13.1% | ||||||||
| 4,520,000 | Apollo Management Holdings L.P. (b) (d) | 4.95% | 01/14/50 | 4,526,934 | ||||
| 1,300,000 | Bank of New York Mellon (The) Corp., Series G (d) | 4.70% | (a) | 1,394,250 | ||||
| 906,000 | Bank of New York Mellon (The) Corp., Series H (d) | 3.70% | (a) | 901,315 | ||||
| 3,000,000 | Charles Schwab (The) Corp., Series G (d) | 5.38% | (a) | 3,290,400 | ||||
| 3,370,000 | Credit Suisse Group AG (b) (c) (d) | 5.25% | (a) | 3,401,341 | ||||
| 3,300,000 | Credit Suisse Group AG (b) (c) (d) | 6.38% | (a) | 3,546,131 | ||||
| 250,000 | Credit Suisse Group AG (b) (c) (d) | 7.25% | (a) | 271,101 | ||||
| 314,000 | Credit Suisse Group AG (b) (c) (d) | 7.50% | (a) | 341,915 | ||||
| 4,150,000 | Credit Suisse Group AG (b) (c) (d) | 7.50% | (a) | 4,409,416 | ||||
| 2,100,000 | Goldman Sachs Group (The), Inc., Series M, 3 Mo. LIBOR + 3.92% (f) | 4.17% | (a) | 2,071,125 | ||||
| 3,200,000 | Goldman Sachs Group (The), Inc., Series Q (d) | 5.50% | (a) | 3,434,929 | ||||
| 200,000 | Goldman Sachs Group (The), Inc., Series R (d) | 4.95% | (a) | 205,135 | ||||
| 1,000,000 | Morgan Stanley, Series H, 3 Mo. LIBOR + 3.61% (f) | 3.85% | (a) | 962,481 | ||||
| 368,000 | Morgan Stanley, Series J, 3 Mo. LIBOR + 3.81% (f) | 4.05% | (a) | 361,158 | ||||
| 2,204,000 | Morgan Stanley, Series M (d) | 5.88% | (a) | 2,432,665 | ||||
| 2,500,000 | UBS Group AG (c) (d) (e) | 6.88% | (a) | 2,766,375 | ||||
| 1,425,000 | UBS Group AG (b) (c) (d) | 7.00% | (a) | 1,534,647 | ||||
| 1,000,000 | UBS Group AG (c) (d) (e) | 7.00% | (a) | 1,076,945 | ||||
| 313,000 | UBS Group AG (c) (d) (e) | 7.13% | (a) | 321,021 | ||||
| 37,249,284 | ||||||||
| Diversified Financial Services – 0.7% | ||||||||
| 1,050,000 | Voya Financial, Inc. (d) | 5.65% | 05/15/53 | 1,084,655 | ||||
| 755,000 | Voya Financial, Inc., Series A (d) | 6.13% | (a) | 776,287 | ||||
| 1,860,942 | ||||||||
| Diversified Telecommunication Services – 1.8% | ||||||||
| 2,500,000 | Koninklijke KPN N.V. (b) (d) | 7.00% | 03/28/73 | 2,622,107 | ||||
| 2,326,000 | Koninklijke KPN N.V. (d) (e) | 7.00% | 03/28/73 | 2,439,609 | ||||
| 5,061,716 | ||||||||
| Electric Utilities – 5.9% | ||||||||
| 1,290,000 | Duke Energy Corp. (d) | 4.88% | (a) | 1,367,087 | ||||
| 9,342,000 | Emera, Inc., Series 16-A (d) | 6.75% | 06/15/76 | 10,362,567 | ||||
| 3,000,000 | Enel S.p.A. (b) (d) | 8.75% | 09/24/73 | 3,472,500 | ||||
| Par Amount | Description | Stated Rate | Stated Maturity | Value | ||||
| CAPITAL PREFERRED SECURITIES (Continued) | ||||||||
| Electric Utilities (Continued) | ||||||||
| $1,500,000 | Southern (The) Co., Series B (d) | 4.00% | 01/15/51 | $1,526,085 | ||||
| 16,728,239 | ||||||||
| Energy Equipment & Services – 1.6% | ||||||||
| 400,000 | Transcanada Trust (d) | 5.63% | 05/20/75 | 409,499 | ||||
| 2,000,000 | Transcanada Trust (d) | 5.50% | 09/15/79 | 2,051,957 | ||||
| 2,050,000 | Transcanada Trust, Series 16-A (d) | 5.88% | 08/15/76 | 2,180,673 | ||||
| 4,642,129 | ||||||||
| Food Products – 3.0% | ||||||||
| 1,000,000 | Land O’Lakes Capital Trust I (g) | 7.45% | 03/15/28 | 1,140,000 | ||||
| 6,146,000 | Land O’Lakes, Inc. (b) | 7.00% | (a) | 5,545,812 | ||||
| 1,490,000 | Land O’Lakes, Inc. (b) | 7.25% | (a) | 1,392,100 | ||||
| 535,000 | Land O’Lakes, Inc. (b) | 8.00% | (a) | 532,325 | ||||
| 8,610,237 | ||||||||
| Independent Power & Renewable Electricity Producers – 0.5% | ||||||||
| 1,500,000 | AES Gener S.A. (b) (d) | 6.35% | 10/07/79 | 1,513,688 | ||||
| Insurance – 15.6% | ||||||||
| 3,000,000 | Asahi Mutual Life Insurance Co. (d) (e) | 6.50% | (a) | 3,202,500 | ||||
| 2,700,000 | Asahi Mutual Life Insurance Co. (d) (e) | 7.25% | (a) | 2,838,359 | ||||
| 3,858,000 | Assurant, Inc. (d) | 7.00% | 03/27/48 | 4,206,044 | ||||
| 3,800,000 | Assured Guaranty Municipal Holdings, Inc. (b) (d) | 6.40% | 12/15/66 | 3,727,696 | ||||
| 1,700,000 | Assured Guaranty Municipal Holdings, Inc. (d) (e) | 6.40% | 12/15/66 | 1,671,787 | ||||
| 6,520,000 | AXIS Specialty Finance LLC (d) | 4.90% | 01/15/40 | 6,614,509 | ||||
| 1,332,000 | Enstar Finance LLC (d) | 5.75% | 09/01/40 | 1,356,574 | ||||
| 1,000,000 | La Mondiale SAM (d) (e) | 5.88% | 01/26/47 | 1,127,402 | ||||
| 531,000 | Lincoln National Corp., 3 Mo. LIBOR + 2.36% (f) | 2.64% | 05/17/66 | 377,937 | ||||
| 4,500,000 | Markel Corp. (d) | 6.00% | (a) | 4,786,875 | ||||
| 200,000 | MetLife, Inc. | 6.40% | 12/15/36 | 248,195 | ||||
| 2,900,000 | MetLife, Inc. (b) | 9.25% | 04/08/38 | 4,186,814 | ||||
| 1,350,000 | MetLife, Inc., Series G (d) | 3.85% | (a) | 1,357,236 | ||||
| 800,000 | PartnerRe Finance B LLC (d) | 4.50% | 10/01/50 | 803,373 | ||||
| 2,200,000 | QBE Insurance Group Ltd. (b) (d) | 5.88% | (a) | 2,354,000 | ||||
| 1,000,000 | QBE Insurance Group Ltd. (b) (d) | 7.50% | 11/24/43 | 1,124,178 | ||||
| 200,000 | QBE Insurance Group Ltd. (d) (e) | 7.50% | 11/24/43 | 224,836 | ||||
| 2,850,000 | QBE Insurance Group Ltd. (d) (e) | 6.75% | 12/02/44 | 3,180,244 | ||||
| 1,175,000 | Reinsurance Group of America, Inc., 3 Mo. LIBOR + 2.67% (f) | 2.92% | 12/15/65 | 992,875 | ||||
| 44,381,434 | ||||||||
| Multi-Utilities – 1.7% | ||||||||
| 2,848,000 | CenterPoint Energy, Inc., Series A (d) | 6.13% | (a) | 2,882,972 | ||||
| 906,000 | NiSource, Inc. (d) | 5.65% | (a) | 906,444 | ||||
| 1,000,000 | Sempra Energy (d) | 4.88% | (a) | 1,042,500 | ||||
| 4,831,916 | ||||||||
| Oil, Gas & Consumable Fuels – 5.9% | ||||||||
| 1,300,000 | BP Capital Markets PLC (d) | 4.88% | (a) | 1,361,152 | ||||
| 550,000 | Buckeye Partners L.P. (d) | 6.38% | 01/22/78 | 354,362 | ||||
| 650,000 | DCP Midstream L.P., Series A (d) | 7.38% | (a) | 422,960 | ||||
| 1,309,000 | DCP Midstream Operating L.P. (b) (d) | 5.85% | 05/21/43 | 978,746 | ||||
| 500,000 | Enbridge, Inc. (d) | 6.25% | 03/01/78 | 501,127 | ||||
| 7,236,000 | Enbridge, Inc., Series 16-A (d) | 6.00% | 01/15/77 | 7,207,185 | ||||
| 1,700,000 | Enbridge, Inc., Series 20-A (d) | 5.75% | 07/15/80 | 1,736,585 | ||||
| 1,395,000 | Energy Transfer Operating L.P., 3 Mo. LIBOR + 3.02% (f) | 3.27% | 11/01/66 | 722,959 | ||||
| Par Amount | Description | Stated Rate | Stated Maturity | Value | ||||
| CAPITAL PREFERRED SECURITIES (Continued) | ||||||||
| Oil, Gas & Consumable Fuels (Continued) | ||||||||
| $100,000 | Energy Transfer Operating L.P., Series B (d) | 6.63% | (a) | $71,175 | ||||
| 2,200,000 | Energy Transfer Operating L.P., Series G (d) | 7.13% | (a) | 1,800,942 | ||||
| 2,000,000 | Enterprise Products Operating LLC, 3 Mo. LIBOR + 2.78% (f) | 3.02% | 06/01/67 | 1,529,990 | ||||
| 16,687,183 | ||||||||
| Trading Companies & Distributors – 1.8% | ||||||||
| 6,400,000 | AerCap Holdings N.V. (d) | 5.88% | 10/10/79 | 5,077,792 | ||||
| Transportation Infrastructure – 1.2% | ||||||||
| 3,950,000 | AerCap Global Aviation Trust (b) (d) | 6.50% | 06/15/45 | 3,505,625 | ||||
Total Capital Preferred Securities | 274,564,355 | |||||||
| (Cost $269,892,362) | ||||||||
| Principal Value | Description | Stated Coupon | Stated Maturity | Value | ||||
| CORPORATE BONDS AND NOTES – 0.5% | ||||||||
| Insurance – 0.5% | ||||||||
| 1,400,000 | Highlands Holdings Bond Issuer Ltd./Highlands Holdings Bond Co-Issuer, Inc. (b) (h) | 7.63% | 10/15/25 | 1,396,500 | ||||
| (Cost $1,413,724) | ||||||||
Total Investments – 98.0% | 278,940,266 | ||
| (Cost $274,309,076) (i) | |||
Net Other Assets and Liabilities – 2.0% | 5,578,643 | ||
Net Assets – 100.0% | $284,518,909 |
| (a) | Perpetual maturity. |
| (b) | This security, sold within the terms of a private placement memorandum, is exempt from registration upon resale under Rule 144A under the Securities Act of 1933, as amended (the “1933 Act”), and may be resold in transactions exempt from registration, normally to qualified institutional buyers. Pursuant to procedures adopted by the Trust’s Board of Trustees, this security has been determined to be liquid by First Trust Advisors L.P., the Fund’s advisor. Although market instability can result in periods of increased overall market illiquidity, liquidity for each security is determined based on security specific factors and assumptions, which require subjective judgment. At October 31, 2020, securities noted as such amounted to $91,412,908 or 32.1% of net assets. |
| (c) | This security is a contingent convertible capital security which may be subject to conversion into common stock of the issuer under certain circumstances. At October 31, 2020, securities noted as such amounted to $103,144,776 or 36.3% of net assets. Of these securities, 2.2% originated in emerging markets, and 97.8% originated in foreign markets. |
| (d) | Fixed-to-floating or fixed-to-variable rate security. The interest rate shown reflects the fixed rate in effect at October 31, 2020. At a predetermined date, the fixed rate will change to a floating rate or a variable rate. |
| (e) | This security may be resold to qualified foreign investors and foreign institutional buyers under Regulation S of the 1933 Act. |
| (f) | Floating or variable rate security. |
| (g) | This security, sold within the terms of a private placement memorandum, is exempt from registration upon resale under Rule 144A under the 1933 Act, and may be resold in transactions exempt from registration, normally to qualified institutional buyers (see Note 2C - Restricted Securities in the Notes to Financial Statements). |
| (h) | These notes are Senior Payment-in-kind (“PIK”) Toggle Notes whereby the issuer may, at its option, elect to pay interest on the notes (1) entirely in cash or (2) entirely in PIK interest. Interest paid in cash will accrue on the notes at a rate of 7.63% per annum (“Cash Interest Rate”) and PIK interest will accrue on the notes at a rate per annum equal to the Cash Interest Rate plus 75 basis points. There were no PIK interest distributions received during the fiscal year ended October 31, 2020. |
| (i) | Aggregate cost for federal income tax purposes was $274,132,928. As of October 31, 2020, the aggregate gross unrealized appreciation for all investments in which there was an excess of value over tax cost was $9,490,058 and the aggregate gross unrealized depreciation for all investments in which there was an excess of tax cost over value was $4,682,720. The net unrealized appreciation was $4,807,338. |
| LIBOR | London Interbank Offered Rate |
| Total Value at 10/31/2020 | Level 1 Quoted Prices | Level 2 Significant Observable Inputs | Level 3 Significant Unobservable Inputs | |
$1,000 Par Preferred Securities* | $ 2,979,411 | $ 2,979,411 | $ — | $ — |
Capital Preferred Securities* | 274,564,355 | — | 274,564,355 | — |
Corporate Bonds and Notes* | 1,396,500 | — | 1,396,500 | — |
Total Investments | $ 278,940,266 | $ 2,979,411 | $ 275,960,855 | $— |
| * | See Portfolio of Investments for industry breakout. |
| ASSETS: | |
Investments, at value (Cost $274,309,076) | $ 278,940,266 |
Cash | 4,687,320 |
| Receivables: | |
Interest | 3,575,769 |
Investment securities sold | 2,213,095 |
Interest reclaims | 91,223 |
Fund shares sold | 7,748 |
Total Assets | 289,515,421 |
| LIABILITIES: | |
| Payables: | |
Fund shares redeemed | 3,873,728 |
Investment securities purchased | 906,000 |
Investment advisory fees | 216,784 |
Total Liabilities | 4,996,512 |
NET ASSETS | $284,518,909 |
| NET ASSETS consist of: | |
Paid-in capital | $ 285,279,126 |
Par value | 147,000 |
Accumulated distributable earnings (loss) | (907,217) |
NET ASSETS | $284,518,909 |
NET ASSET VALUE, per share | $19.36 |
Number of shares outstanding (unlimited number of shares authorized, par value $0.01 per share) | 14,700,002 |
| INVESTMENT INCOME: | ||
Interest | $ 16,922,922 | |
Dividends | 1,748 | |
Foreign withholding tax | (3,455) | |
Total investment income | 16,921,215 | |
| EXPENSES: | ||
Investment advisory fees | 2,368,429 | |
Total expenses | 2,368,429 | |
NET INVESTMENT INCOME (LOSS) | 14,552,786 | |
| NET REALIZED AND UNREALIZED GAIN (LOSS): | ||
Net realized gain (loss) on investments | (5,869,129) | |
Net change in unrealized appreciation (depreciation) on investments | (921,636) | |
NET REALIZED AND UNREALIZED GAIN (LOSS) | (6,790,765) | |
NET INCREASE (DECREASE) IN NET ASSETS RESULTING FROM OPERATIONS | $ 7,762,021 | |
| Year Ended 10/31/2020 | Year Ended 10/31/2019 | ||
| OPERATIONS: | |||
Net investment income (loss) | $ 14,552,786 | $ 8,281,677 | |
Net realized gain (loss) | (5,869,129) | 54,698 | |
Net change in unrealized appreciation (depreciation) | (921,636) | 10,673,383 | |
Net increase (decrease) in net assets resulting from operations | 7,762,021 | 19,009,758 | |
| DISTRIBUTIONS TO SHAREHOLDERS FROM: | |||
Investment operations | (14,004,420) | (8,164,160) | |
Return of capital | (507,892) | (204,397) | |
Total distributions to shareholders | (14,512,312) | (8,368,557) | |
| SHAREHOLDER TRANSACTIONS: | |||
Proceeds from shares sold | 98,406,079 | 132,683,600 | |
Cost of shares redeemed | (42,314,739) | (1,903,752) | |
Net increase (decrease) in net assets resulting from shareholder transactions | 56,091,340 | 130,779,848 | |
Total increase (decrease) in net assets | 49,341,049 | 141,421,049 | |
| NET ASSETS: | |||
Beginning of period | 235,177,860 | 93,756,811 | |
End of period | $284,518,909 | $235,177,860 | |
| CHANGES IN SHARES OUTSTANDING: | |||
Shares outstanding, beginning of period | 11,850,002 | 5,000,002 | |
Shares sold | 5,100,000 | 6,950,000 | |
Shares redeemed | (2,250,000) | (100,000) | |
Shares outstanding, end of period | 14,700,002 | 11,850,002 |
| Year Ended October 31, | Period Ended 10/31/2017 (a) | ||||||
| 2020 | 2019 | 2018 | |||||
Net asset value, beginning of period | $ 19.85 | $ 18.75 | $ 20.26 | $ 20.00 | |||
| Income from investment operations: | |||||||
Net investment income (loss) | 1.01 | 1.01 | 0.99 | 0.18 | |||
Net realized and unrealized gain (loss) | (0.50) | 1.12 | (1.47) | 0.22 | |||
Total from investment operations | 0.51 | 2.13 | (0.48) | 0.40 | |||
| Distributions paid to shareholders from: | |||||||
Net investment income | (0.97) | (1.00) | (1.03) | (0.14) | |||
Return of capital | (0.03) | (0.03) | — | — | |||
Total distributions | (1.00) | (1.03) | (1.03) | (0.14) | |||
Net asset value, end of period | $19.36 | $19.85 | $18.75 | $20.26 | |||
Total return (b) | 2.76% | 11.75% | (2.42)% | 2.00% | |||
| Ratios to average net assets/supplemental data: | |||||||
Net assets, end of period (in 000’s) | $ 284,519 | $ 235,178 | $ 93,757 | $ 24,313 | |||
Ratio of total expenses to average net assets | 0.85% | 0.85% | 0.85% | 0.85% (c) | |||
Ratio of net investment income (loss) to average net assets | 5.22% | 5.39% | 5.36% | 4.93% (c) | |||
Portfolio turnover rate (d) | 48% | 28% | 25% | 13% | |||
| (a) | Inception date is August 22, 2017, which is consistent with the commencement of investment operations and is the date the initial creation units were established. |
| (b) | Total return is calculated assuming an initial investment made at the net asset value at the beginning of the period, reinvestment of all distributions at net asset value during the period, and redemption at net asset value on the last day of the period. The returns presented do not reflect the deduction of taxes that a shareholder would pay on Fund distributions or the redemption or sale of Fund shares. Total return is calculated for the time period presented and is not annualized for periods of less than a year. |
| (c) | Annualized. |
| (d) | Portfolio turnover is calculated for the time period presented and is not annualized for periods of less than a year and does not include securities received or delivered from processing creations or redemptions and in-kind transactions. |
| 1) | benchmark yields; |
| 2) | reported trades; |
| 3) | broker/dealer quotes; |
| 4) | issuer spreads; |
| 5) | benchmark securities; |
| 6) | bids and offers; and |
| 7) | reference data including market research publications. |
| 1) | the credit conditions in the relevant market and changes thereto; |
| 2) | the liquidity conditions in the relevant market and changes thereto; |
| 3) | the interest rate conditions in the relevant market and changes thereto (such as significant changes in interest rates); |
| 4) | issuer-specific conditions (such as significant credit deterioration); and |
| 5) | any other market-based data the Advisor’s Pricing Committee considers relevant. In this regard, the Advisor’s Pricing Committee may use last-obtained market-based data to assist it when valuing portfolio securities using amortized cost. |
| 1) | the type of security; |
| 2) | the size of the holding; |
| 3) | the initial cost of the security; |
| 4) | transactions in comparable securities; |
| 5) | price quotes from dealers and/or third-party pricing services; |
| 6) | relationships among various securities; |
| 7) | information obtained by contacting the issuer, analysts, or the appropriate stock exchange; |
| 8) | an analysis of the issuer’s financial statements; and |
| 9) | the existence of merger proposals or tender offers that might affect the value of the security. |
| 1) | the value of similar foreign securities traded on other foreign markets; |
| 2) | ADR trading of similar securities; |
| 3) | closed-end fund or exchange-traded fund trading of similar securities; |
| 4) | foreign currency exchange activity; |
| 5) | the trading prices of financial products that are tied to baskets of foreign securities; |
| 6) | factors relating to the event that precipitated the pricing problem; |
| 7) | whether the event is likely to recur; and |
| 8) | whether the effects of the event are isolated or whether they affect entire markets, countries or regions. |
| • | Level 1 – Level 1 inputs are quoted prices in active markets for identical investments. An active market is a market in which transactions for the investment occur with sufficient frequency and volume to provide pricing information on an ongoing basis. |
| • | Level 2 – Level 2 inputs are observable inputs, either directly or indirectly, and include the following: |
| o | Quoted prices for similar investments in active markets. |
| o | Quoted prices for identical or similar investments in markets that are non-active. A non-active market is a market where there are few transactions for the investment, the prices are not current, or price quotations vary substantially either over time or among market makers, or in which little information is released publicly. |
| o | Inputs other than quoted prices that are observable for the investment (for example, interest rates and yield curves observable at commonly quoted intervals, volatilities, prepayment speeds, loss severities, credit risks, and default rates). |
| o | Inputs that are derived principally from or corroborated by observable market data by correlation or other means. |
| • | Level 3 – Level 3 inputs are unobservable inputs. Unobservable inputs may reflect the reporting entity’s own assumptions about the assumptions that market participants would use in pricing the investment. |
| Security | Acquisition Date | Par Amount | Current Price | Carrying Cost | Value | % of Net Assets |
| Land O’Lakes Capital Trust I, 7.45%, 03/15/28 | 05/04/18 | $1,000,000 | $114.00 | $1,107,684 | $1,140,000 | 0.40% |
| Distributions paid from: | 2020 | 2019 |
Ordinary income | $14,004,420 | $8,164,160 |
Capital gains | — | — |
Return of capital | 507,892 | 204,397 |
Undistributed ordinary income | $— |
Accumulated capital and other gain (loss) | (5,714,555) |
Net unrealized appreciation (depreciation) | 4,807,338 |
| Accumulated Net Investment Income (Loss) | Accumulated Net Realized Gain (Loss) on Investments | Paid-in Capital | ||
| $(19,067) | $(6,439) | $25,506 |

| Dividends Received Deduction | Qualified Dividend Income | |
| 14.83% | 61.11% |
| NOT FDIC INSURED | NOT BANK GUARANTEED | MAY LOSE VALUE |
| Name, Year of Birth and Position with the Trust | Term of Office and Year First Elected or Appointed | Principal Occupations During Past 5 Years | Number of Portfolios in the First Trust Fund Complex Overseen by Trustee | Other Trusteeships or Directorships Held by Trustee During Past 5 Years |
| INDEPENDENT TRUSTEES | ||||
| Richard E. Erickson, Trustee (1951) | • Indefinite Term • Since Inception | Physician; Officer, Wheaton Orthopedics; Limited Partner, Gundersen Real Estate Limited Partnership (June 1992 to December 2016); Member, Sportsmed LLC (April 2007 to November 2015) | 189 | None |
| Thomas R. Kadlec, Trustee (1957) | • Indefinite Term • Since Inception | President, ADM Investor Services, Inc. (Futures Commission Merchant) | 189 | Director of ADM Investor Services, Inc., ADM Investor Services International, Futures Industry Association, and National Futures Association |
| Robert F. Keith, Trustee (1956) | • Indefinite Term • Since Inception | President, Hibs Enterprises (Financial and Management Consulting) | 189 | Director of Trust Company of Illinois |
| Niel B. Nielson, Trustee (1954) | • Indefinite Term • Since Inception | Senior Advisor (August 2018 to Present), Managing Director and Chief Operating Officer (January 2015 to August 2018), Pelita Harapan Educational Foundation (Educational Products and Services) | 189 | None |
| INTERESTED TRUSTEE | ||||
| James A. Bowen(1), Trustee and Chairman of the Board (1955) | • Indefinite Term • Since Inception | Chief Executive Officer, First Trust Advisors L.P. and First Trust Portfolios L.P.; Chairman of the Board of Directors, BondWave LLC (Software Development Company) and Stonebridge Advisors LLC (Investment Advisor) | 189 | None |
| (1) | Mr. Bowen is deemed an “interested person” of the Trust due to his position as CEO of First Trust Advisors L.P., investment advisor of the Trust. |
| Name and Year of Birth | Position and Offices with Trust | Term of Office and Length of Service | Principal Occupations During Past 5 Years |
| OFFICERS(2) | |||
| James M. Dykas (1966) | President and Chief Executive Officer | • Indefinite Term • Since January 2016 | Managing Director and Chief Financial Officer (January 2016 to Present), Controller (January 2011 to January 2016), Senior Vice President (April 2007 to January 2016), First Trust Advisors L.P. and First Trust Portfolios L.P.; Chief Financial Officer (January 2016 to Present), BondWave LLC (Software Development Company) and Stonebridge Advisors LLC (Investment Advisor) |
| Donald P. Swade (1972) | Treasurer, Chief Financial Officer and Chief Accounting Officer | • Indefinite Term • Since January 2016 | Senior Vice President (July 2016 to Present), Vice President (April 2012 to July 2016), First Trust Advisors L.P. and First Trust Portfolios L.P. |
| W. Scott Jardine (1960) | Secretary and Chief Legal Officer | • Indefinite Term • Since Inception | General Counsel, First Trust Advisors L.P. and First Trust Portfolios L.P.; Secretary and General Counsel, BondWave LLC; Secretary, Stonebridge Advisors LLC |
| Daniel J. Lindquist (1970) | Vice President | • Indefinite Term • Since Inception | Managing Director, First Trust Advisors L.P. and First Trust Portfolios L.P. |
| Kristi A. Maher (1966) | Chief Compliance Officer and Assistant Secretary | • Indefinite Term • Since Inception | Deputy General Counsel, First Trust Advisors L.P. and First Trust Portfolios L.P. |
| Roger F. Testin (1966) | Vice President | • Indefinite Term • Since Inception | Senior Vice President, First Trust Advisors L.P. and First Trust Portfolios L.P. |
| Stan Ueland (1970) | Vice President | • Indefinite Term • Since Inception | Senior Vice President, First Trust Advisors L.P. and First Trust Portfolios L.P |
| (2) | The term “officer” means the president, vice president, secretary, treasurer, controller or any other officer who performs a policy making function. |
| • | Information we receive from you and your broker-dealer, investment advisor or financial representative through interviews, applications, agreements or other forms; |
| • | Information about your transactions with us, our affiliates or others; |
| • | Information we receive from your inquiries by mail, e-mail or telephone; and |
| • | Information we collect on our website through the use of “cookies”. For example, we may identify the pages on our website that your browser requests or visits. |
| • | In order to provide you with products and services and to effect transactions that you request or authorize, we may disclose your personal information as described above to unaffiliated financial service providers and other companies that perform administrative or other services on our behalf, such as transfer agents, custodians and trustees, or that assist us in the distribution of investor materials such as trustees, banks, financial representatives, proxy services, solicitors and printers. |
| • | We may release information we have about you if you direct us to do so, if we are compelled by law to do so, or in other legally limited circumstances (for example to protect your account from fraud). |
FUND ACCOUNTANT &
TRANSFER AGENT
PUBLIC ACCOUNTING FIRM
Item 2. Code of Ethics.
| (a) | The registrant, as of the end of the period covered by this report, has adopted a code of ethics that applies to the registrant’s principal executive officer, principal financial officer, principal accounting officer or controller, or persons performing similar functions, regardless of whether these individuals are employed by the registrant or a third party. |
| (c) | There have been no amendments, during the period covered by this report, to a provision of the code of ethics that applies to the registrant’s principal executive officer, principal financial officer, principal accounting officer or controller, or persons performing similar functions, regardless of whether these individuals are employed by the registrant or a third party, and that relates to any element of the code of ethics description. |
| (d) | The registrant, during the period covered by this report, has not granted any waivers, including an implicit waiver, from a provision of the code of ethics that applies to the registrant’s principal executive officer, principal financial officer, principal accounting officer or controller, or persons performing similar functions, regardless of whether these individuals are employed by the registrant or a third party, that relates to one or more of the items set forth in paragraph (b) of this item’s instructions. |
| (e) | Not applicable. |
Item 3. Audit Committee Financial Expert.
As of the end of the period covered by the report, the registrant’s Board of Trustees has determined that Thomas R. Kadlec and Robert F. Keith are qualified to serve as audit committee financial experts serving on its audit committee and that each of them is “independent,” as defined by Item 3 of Form N-CSR.
Item 4. Principal Accountant Fees and Services.
| (a) | Audit Fees (Registrant) -- The aggregate fees billed for each of the last two fiscal years for professional services rendered by the principal accountant for the audit of the registrant’s annual financial statements or services that are normally provided by the accountant in connection with statutory and regulatory filings or engagements were $228,500 for fiscal year ended October 31, 2019 and $223,500 for the fiscal year ended October 31, 2020. |
| (b) | Audit-Related Fees (Registrant) -- The aggregate fees billed in each of the last two fiscal years for assurance and related services by the principal accountant that are reasonably related to the performance of the audit of the registrant’s financial statements and are not reported under paragraph (a) of this Item were $0 for the fiscal year ended October 31, 2019, and $0 for the fiscal year ended October 31, 2020. |
Audit-Related Fees (Investment Adviser) -- The aggregate fees billed in each of the last two fiscal years for assurance and related services by the principal accountant that are reasonably related to the performance of the audit of the registrant’s financial statements and are not reported under paragraph (a) of this Item were $0 for the fiscal year ended October 31, 2019, and $0 for the fiscal year ended October 31, 2020.
| (c) | Tax Fees (Registrant) -- The aggregate fees billed in each of the last two fiscal years for professional services rendered by the principal accountant for tax compliance, tax advice, and tax planning to the registrant were $ $60,800 for fiscal year ended October 31, 2019 and $195,758 for the fiscal year ended October 31, 2020. These fees were for tax consultation and/or tax return preparation and professional services rendered for PFIC (Passive Foreign Investment Company) Identification Services. |
Tax Fees (Investment Adviser and Distributor) -- The aggregate fees billed in each of the last two fiscal years for professional services rendered by the principal accountant for tax compliance, tax advice, and tax planning to the registrant’s adviser and distributor were $0 for the fiscal year ended October 31, 2019, and $0 for the fiscal year ended October 31, 2020.
| (d) | All Other Fees (Registrant) -- The aggregate fees billed in each of the last two fiscal years for products and services provided by the principal accountant to the registrant, other than the services reported in paragraphs (a) through (c) of this Item were $0 for the fiscal year ended October 31, 2019, and $0 for the fiscal year ended October 31, 2020. |
All Other Fees (Investment Adviser and Distributor) -- The aggregate fees billed in each of the last two fiscal years for products and services provided by the principal accountant to the registrant’s investment adviser and distributor, other than the services reported in paragraphs (a) through (c) of this Item were $0 for the fiscal year ended October 31, 2018, and $0 for the fiscal year ended October 31, 2019.
| (e)(1) | Disclose the audit committee’s pre-approval policies and procedures described in paragraph (c) (7) of Rule 2-01 of Regulation S-X. |
Pursuant to its charter and its Audit and Non-Audit Services Pre-Approval Policy, the Audit Committee (the “Committee”) is responsible for the pre-approval of all audit services and permitted non-audit services (including the fees and terms thereof) to be performed for the registrant by its independent auditors. The Chairman of the Committee is authorized to give such pre-approvals on behalf of the Committee up to $25,000 and report any such pre-approval to the full Committee.
The Committee is also responsible for the pre-approval of the independent auditor’s engagements for non-audit services with the registrant’s adviser (not including a sub-adviser whose role is primarily portfolio management and is sub-contracted or overseen by another investment adviser) and any entity controlling, controlled by or under common control with the investment adviser that provides ongoing services to the registrant, if the engagement relates directly to the operations and financial reporting of the registrant, subject to the de minimis exceptions for non-audit services described in Rule 2-01 of Regulation S-X. If the independent auditor has provided non-audit services to the registrant’s adviser (other than any sub-adviser whose role is primarily portfolio management and is sub-contracted with or overseen by another investment adviser) and any entity controlling, controlled by or under common control with the investment adviser that provides ongoing services to the registrant that were not pre-approved pursuant to its policies, the Committee will consider whether the provision of such non-audit services is compatible with the auditor’s independence.
| (e)(2) | The percentage of services described in each of paragraphs (b) through (d) for the registrant and the registrant’s investment adviser and distributor of this Item that were approved by the audit committee pursuant to the pre-approval exceptions included in paragraph (c)(7)(i)(C) or paragraph(C)(7)(ii) of Rule 2-01 of Regulation S-X are as follows: |
Registrant: Adviser and Distributor:
(b) 0% (b) 0%
(c) 0% (c) 0%
(d) 0% (d) 0%
| (f) | The percentage of hours expended on the principal accountant’s engagement to audit the registrant’s financial statements for the most recent fiscal year that were attributed to work performed by persons other than the principal accountant’s full-time, permanent employees was less than fifty percent. |
| (g) | The aggregate non-audit fees billed by the registrant’s accountant for services rendered to the registrant, and rendered to the registrant’s investment adviser (not including any sub-adviser whose role is primarily portfolio management and is subcontracted with or overseen by another investment adviser), and any entity controlling, controlled by, or under common control with the adviser that provides ongoing services to the registrant for fiscal year ended October 31, 2019 were $60,800 for the registrant, $28,500 for the registrant’s investment adviser, $34,400 for the registrant’s distributor and $18,500 for Stonebridge Advisors LLC (“Stonebridge”), which is under common control with the registrant’s investment adviser and serves as the registrant’s investment sub-advisor for the First Trust Preferred Securities and Income ETF and the First Trust Institutional Preferred Securities and Income ETF, and for the fiscal year ended October 31, 2020 were $195,758 for the registrant, $70,370 for the registrant’s investment adviser, $99,830 for the registrant’s distributor and $18,000 for Stonebridge. |
| (h) | The registrant’s audit committee of its Board of Trustees has determined that the provision of non-audit services that were rendered to the registrant’s investment adviser (not including any sub-adviser whose role is primarily portfolio management and is subcontracted with or overseen by another investment adviser), and any entity controlling, controlled by, or under common control with the investment adviser that provides ongoing services to the registrant that were not pre-approved pursuant to paragraph (c)(7)(ii) of Rule 2-01 of Regulation S-X is compatible with maintaining the principal accountant’s independence. |
Items 5. Audit Committee of Listed Registrants.
The registrant has a separately designated standing audit committee established in accordance with Section 3(a)(58)(A) of the Securities Exchange Act of 1934. The audit committee of the registrant is comprised of:Richard E. Erickson, Thomas R. Kadlec, Robert F. Keith and Niel B. Nielson.
Item 6. Investments.
| (a) | Schedule of Investments in securities of unaffiliated issuers as of the close of the reporting period is included as part of the report to shareholders filed under Item 1 of this form. |
| (b) | Not applicable. |
Item 7. Disclosure of Proxy Voting Policies and Procedures for Closed-End Management Investment Companies.
Not applicable.
Item 8. Portfolio Managers of Closed-End Management Investment Companies.
Not applicable.
Item 9. Purchases of Equity Securities by Closed-End Management Investment Company and Affiliated Purchasers.
Not applicable.
Item 10. Submission of Matters to a Vote of Security Holders.
There have been no material changes to the procedures by which the shareholders may recommend nominees to the registrant’s board of directors, where those changes were implemented after the registrant last provided disclosure in response to the requirements of Item 407(c)(2)(iv) of Regulation S-K (17 CFR 229.407) (as required by Item 22(b)(15) of Schedule 14A (17 CFR 240.14a-101)), or this Item.
Item 11. Controls and Procedures.
| (a) | The registrant’s principal executive and principal financial officers, or persons performing similar functions, have concluded that the registrant’s disclosure controls and procedures (as defined in Rule 30a-3(c) under the Investment Company Act of 1940, as amended (the “1940 Act”) (17 CFR 270.30a-3 (c))) are effective, as of a date within 90 days of the filing date of the report that includes the disclosure required by this paragraph, based on their evaluation of these controls and procedures required by Rule 30a-3(b) under the 1940 Act (17 CFR 270.30a-3(b)) and Rules 13a-15(b) or 15d-15(b) under the Securities Exchange Act of 1934, as amended (17 CFR 240.13a-15(b) or 240.15d-15 (b)). |
| (b) | There were no changes in the registrant’s internal control over financial reporting (as defined in Rule 30a-3(d) under the 1940 Act (17 CFR 270.30a-3(d)) that occurred during the period covered by this report that have materially affected, or are reasonably likely to materially affect, the registrant’s internal control over financial reporting. |
Item 12. Disclosure of Securities Lending Activities for Closed-End Management Investment Companies.
| (a) | Not applicable. |
| (b) | Not applicable. |
Item 13. Exhibits.
| (a)(1) | Code of ethics, or any amendment thereto, that is the subject of disclosure required by Item 2 is attached hereto. |
| (a)(2) | Certifications pursuant to Rule 30a-2(a) under the 1940 Act and Section 302 of the Sarbanes-Oxley Act of 2002 are attached hereto. |
| (a)(3) | Not applicable. |
| (a)(4) | Not applicable. |
| (b) | Certifications pursuant to Rule 30a-2(b) under the 1940 Act and Section 906 of the Sarbanes-Oxley Act of 2002 are attached hereto. |
SIGNATURES
Pursuant to the requirements of the Securities Exchange Act of 1934 and the Investment Company Act of 1940, the registrant has duly caused this report to be signed on its behalf by the undersigned, thereunto duly authorized.
| (registrant) | First Trust Exchange-Traded Fund III |
| By (Signature and Title)* | /s/ James M. Dykas | |||
| James M. Dykas, President and Chief Executive Officer (principal executive officer) |
| Date | January 8, 2021 |
Pursuant to the requirements of the Securities Exchange Act of 1934 and the Investment Company Act of 1940, this report has been signed below by the following persons on behalf of the registrant and in the capacities and on the dates indicated.
| By (Signature and Title)* | /s/ James M. Dykas | |||
| James M. Dykas, President and Chief Executive Officer (principal executive officer) |
| Date | January 8, 2021 |
| By (Signature and Title)* | /s/ Donald P. Swade | |||
| Donald P. Swade, Treasurer, Chief Financial Officer and Chief Accounting Officer (principal financial officer) |
| Date | January 8, 2021 |
* Print the name and title of each signing officer under his or her signature.