UNITED STATES
SECURITIES AND EXCHANGE COMMISSION
Washington, D.C. 20549
FORM N-CSR
CERTIFIED SHAREHOLDER REPORT OF REGISTERED MANAGEMENT INVESTMENT COMPANIES
Investment Company Act file number 811-22245
First Trust Exchange-Traded Fund III
(Exact name of registrant as specified in charter)
120 East Liberty Drive, Suite 400
Wheaton, IL 60187
(Address of principal executive offices) (Zip code)
W. Scott Jardine, Esq.
First Trust Portfolios L.P.
120 East Liberty Drive, Suite 400
Wheaton, IL 60187
(Name and address of agent for service)
Registrant’s telephone number, including area code: (630) 765-8000
Date of fiscal year end: July 31
Date of reporting period: July 31, 2021
Form N-CSR is to be used by management investment companies to file reports with the Commission not later than 10 days after the transmission to stockholders of any report that is required to be transmitted to stockholders under Rule 30e-1 under the Investment Company Act of 1940 (17 CFR 270.30e-1). The Commission may use the information provided on Form N-CSR in its regulatory, disclosure review, inspection, and policymaking roles.
A registrant is required to disclose the information specified by Form N-CSR, and the Commission will make this information public. A registrant is not required to respond to the collection of information contained in Form N-CSR unless the Form displays a currently valid Office of Management and Budget (“OMB”) control number. Please direct comments concerning the accuracy of the information collection burden estimate and any suggestions for reducing the burden to Secretary, Securities and Exchange Commission, 100 F Street, NE, Washington, DC 20549. The OMB has reviewed this collection of information under the clearance requirements of 44 U.S.C. § 3507.
Item 1. Report to Stockholders.
The registrant’s annual report transmitted to shareholders pursuant to Rule 30e-1 under the Investment Company Act of 1940 is as follows:
First Trust Exchange-Traded Fund III
First Trust Horizon Managed Volatility Domestic ETF (HUSV)
First Trust Horizon Managed Volatility Developed International ETF (HDMV)
First Trust Horizon Managed Volatility Small/Mid ETF (HSMV)
Annual Report
For the Year Ended
July 31, 2021
First Trust Exchange-Traded Fund III
Annual Report
July 31, 2021
Caution Regarding Forward-Looking Statements
This report contains certain forward-looking statements within the meaning of the Securities Act of 1933, as amended, and the Securities Exchange Act of 1934, as amended. Forward-looking statements include statements regarding the goals, beliefs, plans or current expectations of First Trust Advisors L.P. (“First Trust” or the “Advisor”) and/or Horizon Investments, LLC (“Horizon” or the “Sub-Advisor”) and their respective representatives, taking into account the information currently available to them. Forward-looking statements include all statements that do not relate solely to current or historical fact. For example, forward-looking statements include the use of words such as “anticipate,” “estimate,” “intend,” “expect,” “believe,” “plan,” “may,” “should,” “would” or other words that convey uncertainty of future events or outcomes.
Forward-looking statements involve known and unknown risks, uncertainties and other factors that may cause the actual results, performance or achievements of any series of First Trust Exchange-Traded Fund III (the “Trust”) described in this report (each such series is referred to as a “Fund” and collectively, the “Funds”) to be materially different from any future results, performance or achievements expressed or implied by the forward-looking statements. When evaluating the information included in this report, you are cautioned not to place undue reliance on these forward-looking statements, which reflect the judgment of the Advisor and/or Sub-Advisor and their respective representatives only as of the date hereof. We undertake no obligation to publicly revise or update these forward-looking statements to reflect events and circumstances that arise after the date hereof.
Performance and Risk Disclosure
There is no assurance that any Fund described in this report will achieve its investment objective. Each Fund is subject to market risk, which is the possibility that the market values of securities owned by the Fund will decline and that the value of the Fund’s shares may therefore be less than what you paid for them. Accordingly, you can lose money by investing in a Fund. See “Risk Considerations” in the Additional Information section of this report for a discussion of certain other risks of investing in the Funds.
Performance data quoted represents past performance, which is no guarantee of future results, and current performance may be lower or higher than the figures shown. For the most recent month-end performance figures, please visit www.ftportfolios.com or speak with your financial advisor. Investment returns, net asset value and share price will fluctuate and Fund shares, when sold, may be worth more or less than their original cost.
The Advisor may also periodically provide additional information on Fund performance on each Fund’s web page at www.ftportfolios.com.
How to Read This Report
This report contains information that may help you evaluate your investment. It includes details about each Fund and presents data and analysis that provide insight into each Fund’s performance and investment approach.
By reading the portfolio commentary by the portfolio management team of each Fund, you may obtain an understanding of how the market environment affected each Fund. The statistical information that follows may help you understand each Fund’s performance compared to that of a relevant market benchmark.
It is important to keep in mind that the opinions expressed by personnel of the Advisor and/or Sub-Advisor are just that: informed opinions. They should not be considered to be promises or advice. The opinions, like the statistics, cover the period through the date on the cover of this report. The material risks of investing in each Fund are spelled out in the prospectus, the statement of additional information, and other Fund regulatory filings.
First Trust Exchange-Traded Fund III
Annual Letter from the Chairman and CEO
July 31, 2021
Dear Shareholders,
First Trust is pleased to provide you with the annual report for the Managed Volatility Funds of First Trust Exchange-Traded Fund III (the “Funds”), which contains detailed information about the Funds for the 12-month period ended July 31, 2021.
I often mention at the end of my shareholder letters that investors should stay the course. I do so because First Trust believes in the buy and hold investment philosophy, and the math supports our view. The S&P 500® Index (the “Index”) has never failed to fully recover the losses sustained in any correction or bear market. As of July 31, 2021, the Index stood just 0.61% below its all-time closing high set on July 26, 2021. Whether you believe that history repeats itself or simply rhymes, it provides us with valuable insight either way. When it comes to setting realistic expectations about equity returns over time, we know that the Index delivered an average annual total return of 10.28% from 1926-2020 (95 years), according to data from Morningstar/Ibbotson Associates. That is our long-term performance benchmark for stocks in the U.S. Why is that relevant in today’s climate? It is important to note that this very Index has posted a total return of 17.99% year-to-date and 36.45% for the 12-month period ended July 31, 2021, according to Bloomberg. Using industry jargon, these are sometimes referred to as “outsized” returns, or well-above the norm.
As previously noted, the stock market experiences selloffs of various degrees on an ongoing basis. The more severe declines are referred to as corrections and bear markets. Corrections are defined as a 10.00% to 19.99% decline in the price of an index or security from its most recent closing high. Bear markets entail price declines of 20% or more. Since 1950, the Index has endured 38 selloffs totaling 10% or more, with nine of them being bear markets, according to The Motley Fool, a private financial and investing advice company. Over that 71-year period, on average, the stock market experienced a correction every 1.84 years, compared to every 7.78 years for bear markets. The last major selloff occurred in the first quarter of 2020 (17 months ago), when the Index plunged 33.79%, due to the initial shock from the onset of the coronavirus (“COVID-19”) pandemic. While that qualified as a bear market, some investors may be thinking we are due for a correction in the coming months. Remember, these statistics represent averages. A June 2021 survey by the CFA Institute found that 45% of the chartered financial analysts it polled believe we will have a correction within 1-3 years. I offer this forecast to show investors how challenging it is to make such market calls, even for highly credentialled professionals. A 1-3 year projection isn’t exactly actionable information, in my opinion.
The bottom line is that those individuals who have remained invested in the stock and bond markets throughout the COVID-19 pandemic have likely prospered beyond what they might have imagined. Suffice it to say that the markets have exceeded expectations over the past 12 months. I think your average investor would have been content with just being in positive territory. Looking ahead, I see more tailwinds for the markets than headwinds, particularly with respect to the stock market. There is plenty of liquidity in the economy thanks to the accommodative monetary policy of the Federal Reserve (the “Fed”) and fiscal stimulus from Congress. We have the potential for another $4 to $5 trillion in fiscal stimulus from President Joe Biden’s bipartisan infrastructure bill and the Democrat-driven budget package, including funds earmarked for climate change projects (green energy), health care, education, and more. Perhaps the biggest headwind moving forward is rising inflation. We should know in the next few months if it is transitory, as Fed Chairman Jerome Powell believes, or if it will be with us for a sustained period. Stay tuned and stay the course!
Thank you for giving First Trust the opportunity to play a role in your financial future. We value our relationship with you and will report on the Funds again in six months.
Sincerely,
James A. Bowen
Chairman of the Board of Trustees
Chief Executive Officer of First Trust Advisors L.P.
Fund Performance Overview (Unaudited)
First Trust Horizon Managed Volatility Domestic ETF (HUSV)
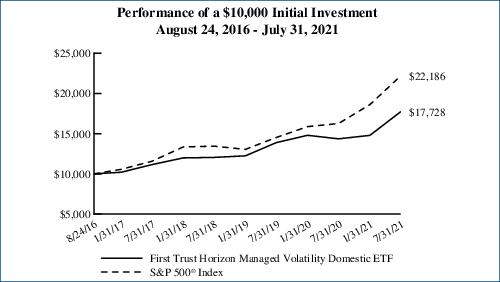
The investment objective of First Trust Horizon Managed Volatility Domestic ETF (the “Fund”) is to provide capital appreciation. Under normal market conditions, the Fund seeks to achieve its investment objective by investing at least 80% of its net assets (including investment borrowings) in common stocks of domestic companies listed and traded on U.S. national securities exchanges that Horizon Investments, LLC (“Horizon” or the “Sub-Advisor”) believes exhibit low future expected volatility. The goal of this strategy is to capture upside price movements in rising markets and reduce downside risk when markets decline. To implement this strategy, the Sub-Advisor employs volatility forecasting models to forecast future expected volatility. The strategy is largely quantitative and rules-based, but also includes multiple parameters over which the Sub-Advisor may exercise discretion (including, but not limited to, the number of holdings and the weightings of particular holdings) in connection with its active management of the Fund. Shares of the Fund are listed and trade on the NYSE Arca, Inc. under the ticker symbol “HUSV”. The first day of secondary market trading in shares of the Fund was August 25, 2016.
| Performance | | | |
| | | Average Annual
Total Returns | Cumulative
Total Returns |
| | 1 Year Ended
7/31/21 | Inception (8/24/16)
to 7/31/21 | Inception (8/24/16)
to 7/31/21 |
| Fund Performance | | | |
| NAV | 23.48% | 12.30% | 77.28% |
| Market Price | 23.48% | 12.30% | 77.28% |
| Index Performance | | | |
| S&P 500® Index | 36.45% | 17.53% | 121.86% |
(See Notes to Fund Performance Overview on page 9.)
Fund Performance Overview (Unaudited) (Continued)
First Trust Horizon Managed Volatility Domestic ETF (HUSV) (Continued)
| Sector Allocation | % of Total
Investments |
| Information Technology | 17.8% |
| Consumer Staples | 16.0 |
| Industrials | 12.8 |
| Health Care | 12.4 |
| Utilities | 11.5 |
| Financials | 10.5 |
| Consumer Discretionary | 9.4 |
| Real Estate | 4.2 |
| Communication Services | 3.9 |
| Materials | 1.5 |
| Total | 100.0% |
| Top Ten Holdings | % of Total
Investments |
| McDonald’s Corp. | 2.5% |
| Johnson & Johnson | 2.5 |
| Verizon Communications, Inc. | 2.4 |
| Cisco Systems, Inc. | 2.4 |
| Coca-Cola (The) Co. | 2.3 |
| Mondelez International, Inc., Class A | 2.3 |
| Colgate-Palmolive Co. | 2.2 |
| Procter & Gamble (The) Co. | 2.2 |
| Paychex, Inc. | 2.2 |
| VeriSign, Inc. | 2.0 |
| Total | 23.0% |
Performance figures assume reinvestment of all distributions and do not reflect the deduction of taxes that a shareholder would pay on Fund distributions or the redemption or sale of Fund shares. An index is a statistical composite that tracks a specified financial market or sector. Unlike the Fund, the index does not actually hold a portfolio of securities and therefore does not incur the expenses incurred by the Fund. These expenses negatively impact the performance of the Fund. The Fund’s past performance does not predict future performance.
Frequency Distribution of Discounts and Premiums
Information showing the number of days the market price of the Fund’s shares was greater (at a premium) and less (at a discount) than the Fund’s net asset value for the most recently completed year, and the most recently completed calendar quarters since that year (or life of the Fund, if shorter), is available at https://www.ftportfolios.com/Retail/etf/home.aspx.
Fund Performance Overview (Unaudited) (Continued)
First Trust Horizon Managed Volatility Developed International ETF (HDMV)
The investment objective of First Trust Horizon Managed Volatility Developed International ETF (the “Fund”) is to provide capital appreciation. Under normal market conditions, the Fund seeks to achieve its investment objective by investing at least 80% of its net assets (including investment borrowings) in common stocks and depositary receipts of developed market companies listed and traded on non-U.S. exchanges that Horizon Investments, LLC (“Horizon” or the “Sub-Advisor”) believes exhibit low future expected volatility. The term “developed market companies” means those companies (i) whose securities are traded principally on a stock exchange in a developed market country, (ii) with a primary business office in a developed market country, or (iii) that have at least 50% of their assets in, or derive at least 50% of their revenues or profits from, a developed market country. The Sub-Advisor considers Australia, Austria, Belgium, Canada, Denmark, Finland, France, Germany, Hong Kong, Ireland, Israel, Italy, Japan, Luxembourg, the Netherlands, New Zealand, Norway, Portugal, Singapore, Spain, Sweden, Switzerland, the United Kingdom and the United States to be developed market countries. However, this list may change in response to market and geopolitical events. Under normal market conditions, the Fund will invest in at least three countries and at least 40% of its net assets in countries other than the United States. Shares of the Fund are listed and trade on the NYSE Arca, Inc. under the ticker symbol “HDMV”. The first day of secondary market trading in shares of the Fund was August 25, 2016.
| Performance | | | |
| | | Average Annual
Total Returns | Cumulative
Total Returns |
| | 1 Year Ended
7/31/21 | Inception (8/24/16)
to 7/31/21 | Inception (8/24/16)
to 7/31/21 |
| Fund Performance | | | |
| NAV | 18.01% | 4.31% | 23.17% |
| Market Price | 18.55% | 4.33% | 23.29% |
| Index Performance | | | |
| MSCI EAFE Index | 30.31% | 9.17% | 54.17% |
(See Notes to Fund Performance Overview on page 9.)
Fund Performance Overview (Unaudited) (Continued)
First Trust Horizon Managed Volatility Developed International ETF (HDMV) (Continued)
| Sector Allocation | % of Total
Investments |
| Financials | 20.8% |
| Consumer Staples | 17.9 |
| Utilities | 15.8 |
| Industrials | 10.5 |
| Communication Services | 8.7 |
| Real Estate | 7.9 |
| Health Care | 7.4 |
| Consumer Discretionary | 4.7 |
| Materials | 4.0 |
| Energy | 1.2 |
| Information Technology | 1.1 |
| Total | 100.0% |
| Top Ten Holdings | % of Total
Investments |
| MTR Corp., Ltd. | 1.8% |
| CLP Holdings, Ltd. | 1.8 |
| Power Assets Holdings Ltd. | 1.8 |
| Swisscom AG | 1.8 |
| Nestle S.A. | 1.8 |
| McDonald’s Holdings Co., Japan Ltd. | 1.5 |
| Novartis AG | 1.5 |
| Hong Kong & China Gas Co., Ltd. | 1.4 |
| United Overseas Bank Ltd. | 1.3 |
| National Grid PLC | 1.2 |
| Total | 15.9% |

Performance figures assume reinvestment of all distributions and do not reflect the deduction of taxes that a shareholder would pay on Fund distributions or the redemption or sale of Fund shares. An index is a statistical composite that tracks a specified financial market or sector. Unlike the Fund, the index does not actually hold a portfolio of securities and therefore does not incur the expenses incurred by the Fund. These expenses negatively impact the performance of the Fund. The Fund’s past performance does not predict future performance.
Frequency Distribution of Discounts and Premiums
Information showing the number of days the market price of the Fund’s shares was greater (at a premium) and less (at a discount) than the Fund’s net asset value for the most recently completed year, and the most recently completed calendar quarters since that year (or life of the Fund, if shorter), is available at https://www.ftportfolios.com/Retail/etf/home.aspx.
Fund Performance Overview (Unaudited) (Continued)
First Trust Horizon Managed Volatility Small/Mid ETF (HSMV)
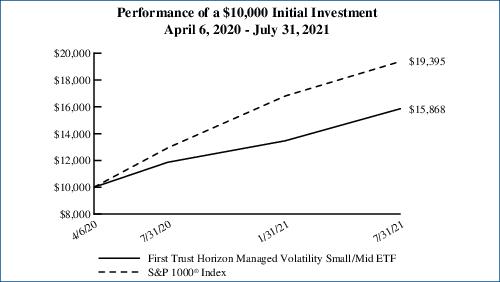
The investment objective of First Trust Horizon Managed Volatility Small/Mid ETF (the “Fund”) is to seek to provide investors with capital appreciation. Under normal market conditions, the Fund seeks to achieve its investment objective by investing at least 80% of its net assets (including investment borrowings) in small- and/or mid-capitalization common stocks listed and traded on U.S. national securities exchanges that Horizon Investments, LLC (“Horizon” or the “Sub-Advisor”) believes exhibit low future expected volatility. The goal of this strategy is to capture upside price movements in rising markets and reduce downside risk when markets decline. To implement this strategy, the Sub-Advisor employs volatility forecasting models to forecast future expected volatility. The strategy is largely quantitative and rules-based, but also includes multiple parameters over which the Sub-Advisor may exercise discretion (including, but not limited to, the number of holdings and the weightings of particular holdings) in connection with its active management of the Fund. Shares of the Fund are listed and trade on the NYSE Arca, Inc. under the ticker symbol “HSMV”. The first day of secondary market trading in shares of the Fund was April 7, 2020.
| Performance | | | |
| | | Average Annual
Total Returns | Cumulative
Total Returns |
| | 1 Year Ended
7/31/21 | Inception (4/6/20)
to 7/31/21 | Inception (4/6/20)
to 7/31/21 |
| Fund Performance | | | |
| NAV | 33.72% | 41.96% | 58.68% |
| Market Price | 33.94% | 41.92% | 58.63% |
| Index Performance | | | |
| S&P 1000® Index | 49.83% | 65.31% | 93.95% |
(See Notes to Fund Performance Overview on page 9.)
Fund Performance Overview (Unaudited) (Continued)
First Trust Horizon Managed Volatility Small/Mid ETF (HSMV) (Continued)
| Sector Allocation | % of Total
Investments |
| Industrials | 20.7% |
| Real Estate | 18.1 |
| Health Care | 11.1 |
| Consumer Discretionary | 10.4 |
| Financials | 10.2 |
| Information Technology | 9.6 |
| Utilities | 7.3 |
| Materials | 5.9 |
| Consumer Staples | 5.0 |
| Communication Services | 1.7 |
| Total | 100.0% |
| Top Ten Holdings | % of Total
Investments |
| Hill-Rom Holdings, Inc. | 0.9% |
| Service Corp. International | 0.8 |
| Southwest Gas Holdings, Inc. | 0.8 |
| Murphy USA, Inc. | 0.8 |
| Camden Property Trust | 0.8 |
| Perficient, Inc. | 0.7 |
| Life Storage, Inc. | 0.7 |
| Hubbell, Inc. | 0.7 |
| Knight-Swift Transportation Holdings, Inc. | 0.7 |
| IDACORP, Inc. | 0.7 |
| Total | 7.6% |
Performance figures assume reinvestment of all distributions and do not reflect the deduction of taxes that a shareholder would pay on Fund distributions or the redemption or sale of Fund shares. An index is a statistical composite that tracks a specified financial market or sector. Unlike the Fund, the index does not actually hold a portfolio of securities and therefore does not incur the expenses incurred by the Fund. These expenses negatively impact the performance of the Fund. The Fund’s past performance does not predict future performance.
Frequency Distribution of Discounts and Premiums
Information showing the number of days the market price of the Fund’s shares was greater (at a premium) and less (at a discount) than the Fund’s net asset value for the most recently completed year, and the most recently completed calendar quarters since that year (or life of the Fund, if shorter), is available at https://www.ftportfolios.com/Retail/etf/home.aspx.
Notes to Fund Performance Overview (Unaudited)
Total returns for the periods since inception are calculated from the inception date of each Fund. “Average Annual Total Returns” represent the average annual change in value of an investment over the periods indicated. “Cumulative Total Returns” represent the total change in value of an investment over the periods indicated.
Each Fund’s per share net asset value (“NAV”) is the value of one share of the Fund and is computed by dividing the value of all assets of the Fund (including accrued interest and dividends), less all liabilities (including accrued expenses and dividends declared but unpaid), by the total number of outstanding shares. The price used to calculate market return (“Market Price”) is determined by using the midpoint of the national best bid and offer price (“NBBO”) as of the time that the Fund’s NAV is calculated. Under SEC rules, the NBBO consists of the highest displayed buy and lowest sell prices among the various exchanges trading the Fund at the time the Fund’s NAV is calculated. Prior to January 1, 2019, the price used was the midpoint between the highest bid and the lowest offer on the stock exchange on which shares of the Fund were listed for trading as of the time that the Fund’s NAV was calculated. Since shares of each Fund did not trade in the secondary market until after the Fund’s inception, for the period from inception to the first day of secondary market trading in shares of the Fund, the NAV of each Fund is used as a proxy for the secondary market trading price to calculate market returns. NAV and market returns assume that all distributions have been reinvested in each Fund at NAV and Market Price, respectively.
An index is a statistical composite that tracks a specified financial market or sector. Unlike each Fund, the indices do not actually hold a portfolio of securities and therefore do not incur the expenses incurred by each Fund. These expenses negatively impact the performance of each Fund. Also, market returns do not include brokerage commissions that may be payable on secondary market transactions. If brokerage commissions were included, market returns would be lower. The total returns presented reflect the reinvestment of dividends on securities in the indices. The returns presented do not reflect the deduction of taxes that a shareholder would pay on Fund distributions or the redemption or sale of Fund shares. The investment return and principal value of shares of each Fund will vary with changes in market conditions. Shares of each Fund may be worth more or less than their original cost when they are redeemed or sold in the market. Each Fund’s past performance is no guarantee of future performance.
Portfolio Commentary
First Trust Exchange-Traded Fund III
Annual Report
July 31, 2021 (Unaudited)
Advisor
First Trust Advisors L.P. (“First Trust” or the “Advisor”) serves as the investment advisor to the First Trust Horizon Managed Volatility Domestic ETF (“HUSV”), the First Trust Horizon Managed Volatility Developed International ETF (“HDMV”), and the First Trust Horizon Managed Volatility Small/Mid ETF (“HSMV”) (each a “Fund” and collectively, the “Funds”). First Trust is responsible for the ongoing monitoring of each Fund’s investment portfolio, managing each Fund’s business affairs and providing certain administrative services necessary for the management of each Fund.
Sub-Advisor
Horizon Investments, LLC (“Horizon” or the “Sub-Advisor”) serves as the investment sub-advisor to the Funds.
Portfolio Management Team
The following persons serve as portfolio managers of the Funds:
Michael Dickson, PhD, Portfolio Manager of Horizon
Scott Ladner, Portfolio Manager of Horizon
Steven Clark, PhD, Portfolio Manager of Horizon
The portfolio managers are primarily and jointly responsible for the day-to-day management of the Funds. Each portfolio manager has served as part of the portfolio management team of the Funds since each Fund’s inception.
Commentary
First Trust Horizon Managed Volatility Domestic ETF (“HUSV” or the “Fund”)
Market Recap
For the 12-month period ended July 31, 2021, the S&P 500® Index gained 36.45%. During the period, low volatility as a factor lagged the S&P 500® Index, as the S&P 500® Low Volatility Index returned 20.76%.
During the same period, the S&P 500® Index experienced a strong expansion. As the period began, accommodative fiscal and monetary policy ensured that consumers and businesses were able to weather the storm as the fight against the coronavirus (“COVID-19”) continued. In November 2020, the market took a substantial risk-on transition as vaccines were approved for distribution. With the approval of vaccines, it pointed toward a potential end to COVID-19 and the related lockdowns. As vaccine distribution began, additional fiscal stimulus entered the market to ensure a smooth transition to a reopened economy. As the accommodative fiscal and monetary policy found its way through the economy, consumer spending skyrocketed. Driven by strong consumer spending and widespread vaccine distribution, the market saw strong earnings multiple expansion through the end of 2020 and into early 2021. To begin 2021, corporate earnings were highly anticipated due to the strong policy driven spending. Early 2021 earnings did not disappoint and provided much needed fundamental support for the market rally. As 2021 continued, many restrictions were lifted, and travel increased. The American consumer entered the summer of 2021 with pent-up demand and capital to spend. As spending and growth continued, the market rallied into the end of the 12-month period ended July 31, 2021.
The investment objective of the Fund is to provide capital appreciation. Under normal market conditions, the Fund seeks to achieve its investment objective by investing at least 80% of its net assets (including investment borrowings) in common stocks of domestic companies listed and traded on U.S. national securities exchanges that Horizon believes exhibit low future expected volatility. The goal of this strategy is to capture upside price movements in rising markets and reduce downside risk when markets decline. To implement this strategy, Horizon employs volatility forecasting models to forecast future expected volatility. The strategy is largely quantitative and rules-based, but also includes multiple parameters over which Horizon may exercise discretion (including, but not limited to, the number of holdings and the weightings of particular holdings) in connection with its active management of the Fund.
Performance Analysis
On a net asset value (“NAV”) basis for the 12-month period ended July 31, 2021, the Fund provided a total return of 23.48%, including the reinvestment of dividends. The S&P 500® Index returned 36.45% and the S&P 500® Low Volatility Index returned 20.76% over the same period.
Stocks selected within the information technology, financials, and industrials sectors contributed the most to the Fund’s return, while stocks selected within the utilities, communication services, and materials sectors contributed the least to the Fund’s return.
Portfolio Commentary (Continued)
First Trust Exchange-Traded Fund III
Annual Report
July 31, 2021 (Unaudited)
Single stock positions in Oracle Corp., Motorola Solutions, Inc., and Amphenol Corp. contributed the most to the Fund’s return for the period. Single stock positions in Juniper Networks, Inc., Alliant Energy Corp., and Norton LifeLock, Inc. contributed the least to the Fund’s return for the same period.
For the 12-month period ended July 31, 2021, the Fund realized lower volatility than the S&P 500® Index and had volatility in line with the S&P 500® Low Volatility Index. As a part of the Fund’s portfolio allocation process, Horizon overweights or underweights common stocks of domestic companies based on future expected volatility. An overweight allocation indicates that Horizon expects those stocks to be relatively low risk, while an underweight allocation indicates that Horizon expects those stocks to be relatively high risk. Due to the long-term defensive tilt of the strategy, it is expected that the Fund will underperform in strong positive markets. For the reporting period, this was the case and these tilts contributed largely to the relative performance for the period.
Market and Fund Outlook
At the end of the 12-month period ended July 31, 2021, Horizon believes that overall corporate and economic fundamentals have rebounded sufficiently and that financial markets will remain healthy over the course of the next year. Despite this, we do believe that there are risks that could generate high volatility in late 2021 and early 2022. Some of the risks we are looking at include: the possibility that goods inflation is, in fact, not transitory, that wage inflation materializes, a resurgence of COVID-19 through the winter of 2021, and that the Federal Reserve (the “Fed”) has a policy misstep. Horizon also believes that additional key risk factors for equity markets are related to trade policy, central bank policy, and global currency stability.
During time periods that contain bouts of volatility, Horizon believes it is important to continue to be responsive to current market conditions when picking stocks to create a portfolio of expected lower volatility stocks. The Fund continues to use a quantitative and rules-based investment process to mitigate volatility through enhanced security selection of targeted exposure to stocks that Horizon estimates will have forecasted future low volatility. Horizon also continues to use an active management approach when managing the Fund that provides the flexibility to limit sector concentration and business risk, without being limited to static rebalance requirements.
First Trust Horizon Managed Volatility Developed International ETF (“HDMV” or the “Fund”)
Market Recap
For the 12-month period ended July 31, 2021, the MSCI EAFE Index gained 30.31%. During the same period, low volatility underperformed the broad MSCI EAFE Index as the MSCI EAFE Minimum Volatility Index gained 17.51%.
We believe the following key developments were some of the biggest drivers of global markets during the period covered in this report. U.S. markets led Developed International markets broadly as the S&P 500® Index gained 36.45% over this time. Over the same period, the S&P 500® Index had a strong rally, hitting multiple new all-time highs. The rally was primarily driven by the vaccine approval and distribution, the lifting of COVID-19 related lockdowns and the presence of highly accommodative monetary and fiscal policy. Policy tailwinds and the extrication of pandemic risk through the introduction of a vaccine resulted in strong economic fundamentals and corporate earnings. Developed markets were generally exposed to more risk factors than the U.S. over the 12-month period ended July 31, 2021 as COVID-19 related shutdowns were more commonplace and fiscal and monetary accommodations proved less supportive and effective, respectively. Sweden and the Eurozone were the best performing regions in developed markets broadly. Within the Eurozone, the Netherlands posted strong gains while Germany posted the lowest gains for the same period.
The investment objective of the Fund is to provide capital appreciation. Under normal market conditions, the Fund seeks to achieve its investment objective by investing at least 80% of its net assets (including investment borrowings) in common stocks and depositary receipts of developed market companies listed and traded on non-U.S. exchanges that Horizon believes exhibit low future expected volatility. The goal of this strategy is to capture upside price movements in rising markets and reduce downside risk when markets decline. To implement this strategy, in selecting securities for the Fund from a portfolio of eligible securities, Horizon employs volatility forecasting models to forecast future expected volatility. The strategy is largely quantitative and rules-based, but also includes multiple parameters over which Horizon may exercise discretion (including, but not limited to, the number of holdings and the weightings of particular holdings) in connection with its active management of the Fund.
Performance Analysis
On a NAV basis for the 12-month period ended July 31, 2021, the Fund provided a total return of 18.01%, including the reinvestment of dividends. The MSCI EAFE Index gained 30.31% and the MSCI EAFE Minimum Volatility Index gained 17.51% over the same period.
Portfolio Commentary (Continued)
First Trust Exchange-Traded Fund III
Annual Report
July 31, 2021 (Unaudited)
For countries with an average allocation greater than 1%, stocks selected within Singapore, Japan, and Switzerland contributed the most to the Fund’s return, while stocks selected within Norway, Spain, and Belgium contributed the least to the Fund’s return for the same period.
Single stock positions in Oversea-Chinese Banking Corp., Ltd., United Overseas Bank Ltd., DBS Group Holdings Ltd., and Kuehne + Nagel International AG contributed the most to the Fund’s return for the fiscal year. Single stock positions in Chugoku Electric Power Co., Inc., MEIJI Holdings Co., Ltd., and Koninklijke Vopak N.V. contributed the least to the Fund’s return for the same period.
For the 12-month period ended July 31, 2021, the Fund realized lower volatility than the MSCI EAFE Index. As a part of the Fund’s portfolio allocation process, Horizon overweights or underweights common stocks and depositary receipts of large and mid-cap securities across developed markets based on future expected volatility. An overweight allocation indicates that Horizon expects those stocks to be relatively low risk, while an underweight allocation indicates that Horizon expects those stocks to be relatively high risk. Due to the long-term defensive tilt of the strategy, it is expected that the Fund will underperform in strong positive markets. For the period, this was the case and these tilts contributed largely to the relative performance for the period.
Market and Fund Outlook
At the end of the 12-month period ended July 31, 2021, Horizon believes that overall corporate and economic fundamentals have rebounded sufficiently and that financial markets will remain healthy over the course of the next year. Key risk factors to watch in international markets are COVID-19 related restrictions, trade policy, specifically in China and the Eurozone, the continuation of accommodative global monetary policy and lack of inflation in Japan.
Horizon believes it is important to continue to be more responsive to current market conditions when picking stocks to create a portfolio of expected lower volatility stocks when exposed to these risk factors. The Fund continues to use a quantitative and rules-based investment process to mitigate volatility through enhanced security selection of targeted exposure to stocks that Horizon estimates will have forecasted future low volatility. Horizon also continues to use an active management approach when managing the Fund that provides the flexibility to limit sector and country concentration and business risk, without being limited to static rebalance requirements.
First Trust Horizon Managed Volatility Small/Mid ETF (“HSMV” or the “Fund”)
Market Recap
For the 12-month period ended July 31, 2021, the S&P 1000® Index gained 49.83%. Over same period, volatility as a factor lagged the S&P 1000® Index, as the S&P MidCap 400® Low Volatility Index gained 29.76% and the S&P SmallCap 600® Low Volatility Index gained 40.55%.
During the same period, the S&P 1000® Index experienced a strong expansion. As this period began, accommodative fiscal and monetary policy ensured that consumers and businesses were able to weather the storm as the fight against COVID-19 continued. In November 2020, the market took a substantial risk-on transition as vaccines were approved for distribution. With the approval of vaccines, it pointed towards a potential end to COVID-19 and the related lockdowns. As vaccine distribution began, additional fiscal stimulus entered the market to ensure a smooth transition to a reopened economy. As the accommodative fiscal and monetary policy found its way through the economy, consumer spending skyrocketed. Driven by strong consumer spending and widespread vaccine distribution, the market saw strong earnings multiple expansion through the end of 2020 and into early 2021. To begin 2021, corporate earnings were highly anticipated due to the strong policy driven spending. Early 2021 earnings did not disappoint, providing much needed fundamental support for the market rally. As 2021 continued, many restrictions were lifted, and travel increased. The American consumer entered the summer of 2021 with pent-up demand and capital to spend. As spending and growth continued, the market rallied into the end of the 12-month period ended July 31, 2021.
The investment objective of the Fund is to seek to provide investors capital appreciation. Under normal market conditions, the Fund seeks to achieve its investment objective by investing at least 80% of its net assets (including investment borrowings) in small- and/or mid-capitalization common stocks listed and traded on U.S. national securities exchanges that Horizon believes exhibit low future expected volatility. The goal of this strategy is to capture upside price movements in rising markets and reduce downside risk when markets decline. To implement this strategy, Horizon employs volatility forecasting models to forecast future expected volatility. The strategy is largely quantitative and rules-based, but also includes multiple parameters over which Horizon may exercise discretion (including, but not limited to, the number of holdings and the weightings of particular holdings) in connection with its active management of the Fund.
Portfolio Commentary (Continued)
First Trust Exchange-Traded Fund III
Annual Report
July 31, 2021 (Unaudited)
Performance Analysis
On a NAV basis for the 12-month period ended July 31, 2021, the Fund provided a total return of 33.72%, including the reinvestment of dividends. S&P 1000® Index gained 49.83%. During the same period, low volatility as a factor lagged the S&P 1000® Index, as the S&P MidCap 400® Low Volatility Index gained 29.76% and the S&P SmallCap 600® Low Volatility Index gained 40.55%.
Stocks selected within the industrials, information technology, and consumer staples sectors contributed the most to the Fund’s return during the period, while stocks selected within the consumer discretionary, communication services, and utilities sectors contributed the least to the Fund’s return over the reporting period.
Single stock positions in National Beverage Corp. and Teradata Corp. contributed the most to the Fund’s return for same period. Single stock positions in Luminex Corp. and Energizer Holdings, Inc. contributed the least to the Fund’s return since inception.
For the 12-month period ended July 31, 2021, the Fund realized lower volatility than the S&P 1000® Index, higher volatility than the S&P MidCap 400® Low Volatility Index, and lower volatility than the S&P SmallCap 600® Low Volatility Index. As a part of the Fund’s portfolio allocation process, Horizon overweights or underweights common stocks of small and mid-cap domestic companies based on future expected volatility. An overweight allocation indicates that Horizon expects those stocks to be relatively low risk, while an underweight allocation indicates that Horizon expects those stocks to be relatively high risk. Due to the long-term defensive tilt of the strategy, it is expected that the Fund will underperform in strong positive markets. For the period covered by this report, this was the case and these tilts contributed largely to the relative performance for the period.
Market and Fund Outlook
At the end of the 12-month period ended July 31, 2021, Horizon believes that overall corporate and economic fundamentals have rebounded sufficiently and that financial markets will remain healthy over the course of the next year. Despite this, we do believe that there are risks that could generate high volatility in late 2021 and early 2022. Some of the risks we are looking at include: the possibility that goods inflation is, in fact, not transitory, that wage inflation materializes, a resurgence of COVID-19 through the winter of 2022, and that the Fed has a policy misstep. Horizon also believes that additional key risk factors for equity markets are related to trade policy, central bank policy, and global currency stability.
During time periods that contain bouts of volatility, Horizon believes it is important to continue to be responsive to current market conditions when picking stocks to create a portfolio of expected lower volatility stocks. The Fund continues to use a quantitative and rules-based investment process to mitigate volatility through enhanced security selection of targeted exposure to stocks that Horizon estimates will have forecasted future low volatility. Horizon also continues to use an active management approach when managing the Fund that provides the flexibility to limit sector concentration and business risk, without being limited to static rebalance requirements.
First Trust Exchange-Traded Fund III
Understanding Your Fund Expenses
July 31, 2021 (Unaudited)
As a shareholder of First Trust Horizon Managed Volatility Domestic ETF, First Trust Horizon Managed Volatility Developed International ETF or First Trust Horizon Managed Volatility Small/Mid ETF (each a “Fund” and collectively, the “Funds”), you incur two types of costs: (1) transaction costs; and (2) ongoing costs, including management fees, distribution and/or service (12b-1) fees, if any, and other Fund expenses. This Example is intended to help you understand your ongoing costs (in U.S. dollars) of investing in the Funds and to compare these costs with the ongoing costs of investing in other funds.
The Example is based on an investment of $1,000 invested at the beginning of the period and held through the six-month period ended July 31, 2021.
Actual Expenses
The first line in the following table provides information about actual account values and actual expenses. You may use the information in this line, together with the amount you invested, to estimate the expenses that you paid over the period. Simply divide your account value by $1,000 (for example, an $8,600 account value divided by $1,000 = 8.6), then multiply the result by the number in the first line under the heading entitled “Expenses Paid During the Six-Month Period” to estimate the expenses you paid on your account during this six-month period.
Hypothetical Example for Comparison Purposes
The second line in the following table provides information about hypothetical account values and hypothetical expenses based on each Fund’s actual expense ratio and an assumed rate of return of 5% per year before expenses, which is not each Fund’s actual return. The hypothetical account values and expenses may not be used to estimate the actual ending account balance or expenses you paid for the period. You may use this information to compare the ongoing costs of investing in the Funds and other funds. To do so, compare this 5% hypothetical example with the 5% hypothetical examples that appear in the shareholder reports of the other funds.
Please note that the expenses shown in the table are meant to highlight your ongoing costs only and do not reflect any transactional costs such as brokerage commissions. Therefore, the second line in the table is useful in comparing ongoing costs only, and will not help you determine the relative total costs of owning different funds. In addition, if these transactional costs were included, your costs would have been higher.
| | Beginning
Account Value
February 1, 2021 | Ending
Account Value
July 31, 2021 | Annualized
Expense Ratio
Based on the
Six-Month
Period | Expenses Paid
During the
Six-Month
Period (a) |
| First Trust Horizon Managed Volatility Domestic ETF (HUSV) |
| Actual | $1,000.00 | $1,198.80 | 0.70% | $3.82 |
| Hypothetical (5% return before expenses) | $1,000.00 | $1,021.32 | 0.70% | $3.51 |
| First Trust Horizon Managed Volatility Developed International ETF (HDMV) |
| Actual | $1,000.00 | $1,079.90 | 0.80% | $4.13 |
| Hypothetical (5% return before expenses) | $1,000.00 | $1,020.83 | 0.80% | $4.01 |
| First Trust Horizon Managed Volatility Small/Mid ETF (HSMV) |
| Actual | $1,000.00 | $1,178.10 | 0.80% | $4.32 |
| Hypothetical (5% return before expenses) | $1,000.00 | $1,020.83 | 0.80% | $4.01 |
| (a) | Expenses are equal to the annualized expense ratios as indicated in the table multiplied by the average account value over the period (February 1, 2021 through July 31, 2021), multiplied by 181/365 (to reflect the six-month period). |
First Trust Horizon Managed Volatility Domestic ETF (HUSV)
Portfolio of Investments
July 31, 2021
| Shares | | Description | | Value |
| COMMON STOCKS – 95.5% |
| | | Aerospace & Defense – 4.4% | | |
| 5,696 | | General Dynamics Corp. | | $1,116,587 |
| 4,168 | | L3Harris Technologies, Inc. | | 945,052 |
| 4,885 | | Lockheed Martin Corp. | | 1,815,608 |
| 3,894 | | Northrop Grumman Corp. | | 1,413,600 |
| | | | | 5,290,847 |
| | | Air Freight & Logistics – 0.7% | | |
| 7,000 | | Expeditors International of Washington, Inc. | | 897,750 |
| | | Beverages – 3.9% | | |
| 49,263 | | Coca-Cola (The) Co. | | 2,809,469 |
| 11,977 | | PepsiCo, Inc. | | 1,879,790 |
| | | | | 4,689,259 |
| | | Capital Markets – 3.2% | | |
| 12,987 | | Intercontinental Exchange, Inc. | | 1,556,232 |
| 2,576 | | Moody’s Corp. | | 968,576 |
| 7,468 | | Nasdaq, Inc. | | 1,394,500 |
| | | | | 3,919,308 |
| | | Chemicals – 1.5% | | |
| 2,658 | | Linde PLC | | 817,042 |
| 3,394 | | Sherwin-Williams (The) Co. | | 987,756 |
| | | | | 1,804,798 |
| | | Commercial Services &
Supplies – 3.6% | | |
| 16,447 | | Republic Services, Inc. | | 1,946,667 |
| 16,229 | | Waste Management, Inc. | | 2,406,111 |
| | | | | 4,352,778 |
| | | Communications Equipment – 4.1% | | |
| 51,386 | | Cisco Systems, Inc. | | 2,845,243 |
| 9,579 | | Motorola Solutions, Inc. | | 2,144,929 |
| | | | | 4,990,172 |
| | | Diversified Financial Services – 1.6% | | |
| 7,074 | | Berkshire Hathaway, Inc., Class B (a) | | 1,968,623 |
| | | Diversified Telecommunication
Services – 3.9% | | |
| 64,687 | | AT&T, Inc. | | 1,814,470 |
| 51,351 | | Verizon Communications, Inc. | | 2,864,359 |
| | | | | 4,678,829 |
| | | Electric Utilities – 5.2% | | |
| 26,814 | | American Electric Power Co., Inc. | | 2,362,849 |
| 16,125 | | Duke Energy Corp. | | 1,694,899 |
| 34,887 | | Southern (The) Co. | | 2,228,233 |
| | | | | 6,285,981 |
| Shares | | Description | | Value |
|
| | | Electronic Equipment,
Instruments & Components – 1.8% | | |
| 29,900 | | Amphenol Corp., Class A | | $2,167,451 |
| | | Food & Staples Retailing – 1.2% | | |
| 1,968 | | Costco Wholesale Corp. | | 845,689 |
| 4,603 | | Walmart, Inc. | | 656,158 |
| | | | | 1,501,847 |
| | | Food Products – 4.6% | | |
| 9,178 | | General Mills, Inc. | | 540,217 |
| 9,773 | | Hershey (The) Co. | | 1,748,194 |
| 12,067 | | Hormel Foods Corp. | | 559,668 |
| 43,369 | | Mondelez International, Inc., Class A | | 2,743,523 |
| | | | | 5,591,602 |
| | | Health Care Equipment &
Supplies – 3.3% | | |
| 18,330 | | Baxter International, Inc. | | 1,417,825 |
| 5,126 | | Becton Dickinson and Co. | | 1,310,975 |
| 9,967 | | Medtronic PLC | | 1,308,767 |
| | | | | 4,037,567 |
| | | Health Care Providers &
Services – 1.2% | | |
| 3,404 | | UnitedHealth Group, Inc. | | 1,403,197 |
| | | Health Care Technology – 1.6% | | |
| 23,286 | | Cerner Corp. | | 1,871,962 |
| | | Hotels, Restaurants &
Leisure – 4.9% | | |
| 2,540 | | Domino’s Pizza, Inc. | | 1,334,745 |
| 12,367 | | McDonald’s Corp. | | 3,001,594 |
| 12,471 | | Yum! Brands, Inc. | | 1,638,565 |
| | | | | 5,974,904 |
| | | Household Durables – 1.2% | | |
| 8,844 | | Garmin Ltd. | | 1,390,277 |
| | | Household Products – 5.7% | | |
| 6,640 | | Church & Dwight Co., Inc. | | 574,891 |
| 33,617 | | Colgate-Palmolive Co. | | 2,672,552 |
| 6,752 | | Kimberly-Clark Corp. | | 916,381 |
| 18,702 | | Procter & Gamble (The) Co. | | 2,659,986 |
| | | | | 6,823,810 |
| | | Industrial Conglomerates – 0.8% | | |
| 4,953 | | 3M Co. | | 980,397 |
| | | Insurance – 5.6% | | |
| 7,830 | | Allstate (The) Corp. | | 1,018,292 |
| 4,965 | | Aon PLC, Class A | | 1,291,049 |
| 9,666 | | Arthur J. Gallagher & Co. | | 1,346,570 |
See Notes to Financial Statements
Page 15
First Trust Horizon Managed Volatility Domestic ETF (HUSV)
Portfolio of Investments (Continued)
July 31, 2021
| Shares | | Description | | Value |
| COMMON STOCKS (Continued) |
| | | Insurance (Continued) | | |
| 14,536 | | Marsh & McLennan Cos., Inc. | | $2,139,990 |
| 9,527 | | Progressive (The) Corp. | | 906,589 |
| | | | | 6,702,490 |
| | | IT Services – 11.8% | | |
| 7,467 | | Accenture PLC, Class A | | 2,372,117 |
| 11,261 | | Automatic Data Processing, Inc. | | 2,360,643 |
| 13,999 | | Broadridge Financial Solutions, Inc. | | 2,428,687 |
| 22,926 | | Paychex, Inc. | | 2,609,437 |
| 11,370 | | VeriSign, Inc. (a) | | 2,460,127 |
| 8,355 | | Visa, Inc., Class A | | 2,058,588 |
| | | | | 14,289,599 |
| | | Leisure Products – 0.7% | | |
| 8,685 | | Hasbro, Inc. | | 863,636 |
| | | Machinery – 3.3% | | |
| 6,436 | | Dover Corp. | | 1,075,584 |
| 4,446 | | IDEX Corp. | | 1,007,864 |
| 8,165 | | Illinois Tool Works, Inc. | | 1,850,761 |
| | | | | 3,934,209 |
| | | Multiline Retail – 0.7% | | |
| 3,443 | | Dollar General Corp. | | 800,980 |
| | | Multi-Utilities – 6.2% | | |
| 16,072 | | Ameren Corp. | | 1,348,762 |
| 25,544 | | CMS Energy Corp. | | 1,578,364 |
| 20,853 | | Consolidated Edison, Inc. | | 1,538,326 |
| 21,504 | | Dominion Energy, Inc. | | 1,610,004 |
| 12,521 | | DTE Energy Co. | | 1,468,964 |
| | | | | 7,544,420 |
| | | Pharmaceuticals – 6.3% | | |
| 24,544 | | Bristol-Myers Squibb Co. | | 1,665,801 |
| 17,389 | | Johnson & Johnson | | 2,994,386 |
| 20,552 | | Merck & Co., Inc. | | 1,579,832 |
| 31,896 | | Pfizer, Inc. | | 1,365,468 |
| | | | | 7,605,487 |
| | | Specialty Retail – 1.9% | | |
| 3,649 | | Home Depot (The), Inc. | | 1,197,565 |
| 1,825 | | O’Reilly Automotive, Inc. (a) | | 1,102,008 |
| | | | | 2,299,573 |
| | | Tobacco – 0.6% | | |
| 7,042 | | Philip Morris International, Inc. | | 704,834 |
| | | Total Common Stocks | | 115,366,587 |
| | | (Cost $101,870,430) | | |
| REAL ESTATE INVESTMENT TRUSTS – 4.2% |
| | | Equity Real Estate Investment
Trusts – 4.2% | | |
| 6,447 | | Alexandria Real Estate Equities, Inc. | | 1,298,039 |
| Shares | | Description | | Value |
|
| | | Equity Real Estate Investment
Trusts (Continued) | | |
| 28,911 | | Duke Realty Corp. | | $1,470,992 |
| 3,888 | | Public Storage | | 1,214,922 |
| 15,293 | | Realty Income Corp. | | 1,074,945 |
| | | Total Real Estate Investment Trusts | | 5,058,898 |
| | | (Cost $4,202,310) | | |
| | | Total Investments – 99.7% | | 120,425,485 |
| | | (Cost $106,072,740) (b) | | |
| | | Net Other Assets and Liabilities – 0.3% | | 332,256 |
| | | Net Assets – 100.0% | | $120,757,741 |
|
| (a) | Non-income producing security. |
| (b) | Aggregate cost for federal income tax purposes was $106,123,423. As of July 31, 2021, the aggregate gross unrealized appreciation for all investments in which there was an excess of value over tax cost was $14,723,193 and the aggregate gross unrealized depreciation for all investments in which there was an excess of tax cost over value was $421,131. The net unrealized appreciation was $14,302,062. |
Valuation Inputs
A summary of the inputs used to value the Fund’s investments as of July 31, 2021 is as follows (see Note 2A - Portfolio Valuation in the Notes to Financial Statements):
| | Total
Value at
7/31/2021 | Level 1
Quoted
Prices | Level 2
Significant
Observable
Inputs | Level 3
Significant
Unobservable
Inputs |
| Common Stocks* | $ 115,366,587 | $ 115,366,587 | $ — | $ — |
| Real Estate Investment Trusts* | 5,058,898 | 5,058,898 | — | — |
| Total Investments | $ 120,425,485 | $ 120,425,485 | $— | $— |
| * | See Portfolio of Investments for industry breakout. |
Page 16
See Notes to Financial Statements
First Trust Horizon Managed Volatility Developed International ETF (HDMV)
Portfolio of Investments
July 31, 2021
| Shares | | Description | | Value |
| COMMON STOCKS (a) – 96.3% |
| | | Australia – 5.8% | | |
| 11,009 | | ASX Ltd. | | $621,191 |
| 284,074 | | AusNet Services Ltd. | | 380,454 |
| 15,625 | | Australia & New Zealand Banking Group Ltd. | | 317,734 |
| 82,130 | | Brambles Ltd. | | 700,350 |
| 23,262 | | Coles Group Ltd. | | 298,569 |
| 5,661 | | Commonwealth Bank of Australia | | 413,978 |
| 175,064 | | Medibank Pvt Ltd. | | 425,238 |
| 11,693 | | National Australia Bank Ltd. | | 222,503 |
| 9,915 | | Sonic Healthcare Ltd. | | 291,190 |
| 118,099 | | Telstra Corp., Ltd. | | 327,601 |
| 10,143 | | Wesfarmers Ltd. | | 455,092 |
| 13,473 | | Westpac Banking Corp. | | 242,433 |
| 13,334 | | Woolworths Group Ltd. | | 379,273 |
| | | | | 5,075,606 |
| | | Belgium – 1.5% | | |
| 8,063 | | Etablissements Franz Colruyt N.V. | | 458,534 |
| 6,985 | | Groupe Bruxelles Lambert S.A. | | 812,852 |
| | | | | 1,271,386 |
| | | Bermuda – 1.4% | | |
| 75,465 | | CK Infrastructure Holdings Ltd. | | 455,927 |
| 176,400 | | Hongkong Land Holdings Ltd. | | 800,856 |
| | | | | 1,256,783 |
| | | Denmark – 1.2% | | |
| 1,750 | | Carlsberg A.S., Class B | | 323,573 |
| 4,549 | | Novo Nordisk A.S., Class B | | 420,733 |
| 11,202 | | Tryg A.S. | | 276,969 |
| | | | | 1,021,275 |
| | | France – 8.6% | | |
| 4,667 | | Air Liquide S.A. | | 811,500 |
| 2,968 | | Arkema S.A. | | 377,605 |
| 28,213 | | Bureau Veritas S.A. | | 931,740 |
| 3,930 | | Danone S.A. | | 289,321 |
| 29,789 | | Engie S.A. | | 397,614 |
| 1,714 | | EssilorLuxottica S.A. | | 323,609 |
| 278 | | Hermes International | | 425,083 |
| 3,162 | | Legrand S.A. | | 356,038 |
| 1,392 | | L’Oreal S.A. | | 637,221 |
| 68,650 | | Orange S.A. | | 765,092 |
| 2,831 | | Pernod Ricard S.A. | | 624,975 |
| 1,731 | | Remy Cointreau S.A. | | 380,290 |
| 5,068 | | Sanofi | | 522,315 |
| 1,850 | | SEB S.A. | | 307,458 |
| 798 | | Teleperformance | | 336,621 |
| | | | | 7,486,482 |
| | | Germany – 8.7% | | |
| 2,755 | | Allianz SE | | 686,305 |
| 6,686 | | Beiersdorf AG | | 794,316 |
| Shares | | Description | | Value |
|
| | | Germany (Continued) | | |
| 3,112 | | Deutsche Boerse AG | | $519,594 |
| 35,571 | | Deutsche Telekom AG | | 738,685 |
| 53,089 | | E.ON SE | | 653,196 |
| 13,912 | | Evonik Industries AG | | 483,541 |
| 2,557 | | Hannover Rueck SE | | 430,417 |
| 7,956 | | Henkel AG & Co., KGaA | | 723,408 |
| 5,010 | | LEG Immobilien SE | | 792,514 |
| 1,965 | | Merck KGaA | | 402,444 |
| 3,159 | | Symrise AG | | 465,797 |
| 10,493 | | Uniper SE | | 410,139 |
| 6,922 | | Vonovia SE | | 461,307 |
| | | | | 7,561,663 |
| | | Hong Kong – 8.2% | | |
| 152,791 | | CLP Holdings, Ltd. | | 1,576,837 |
| 25,383 | | Hang Seng Bank Ltd. | | 487,007 |
| 68,698 | | Henderson Land Development Co., Ltd. | | 307,195 |
| 738,472 | | Hong Kong & China Gas Co., Ltd. | | 1,203,047 |
| 266,227 | | MTR Corp., Ltd. | | 1,577,598 |
| 243,736 | | Power Assets Holdings Ltd. | | 1,574,483 |
| 25,500 | | Sun Hung Kai Properties Ltd. | | 365,216 |
| | | | | 7,091,383 |
| | | Ireland – 0.3% | | |
| 2,048 | | Kerry Group PLC, Class A | | 303,680 |
| | | Israel – 0.7% | | |
| 43,129 | | Bank Hapoalim BM (b) | | 344,231 |
| 9,553 | | Mizrahi Tefahot Bank Ltd. (b) | | 290,033 |
| | | | | 634,264 |
| | | Italy – 2.5% | | |
| 21,907 | | Assicurazioni Generali S.p.A. | | 437,884 |
| 165,849 | | Snam S.p.A. | | 1,004,152 |
| 95,954 | | Terna-Rete Elettrica Nazionale S.p.A. | | 763,086 |
| | | | | 2,205,122 |
| | | Japan – 18.0% | | |
| 11,800 | | Astellas Pharma, Inc. | | 187,049 |
| 33,300 | | Chubu Electric Power Co., Inc. | | 399,612 |
| 45,500 | | Daiwa Securities Group, Inc. | | 238,066 |
| 54,200 | | ENEOS Holdings, Inc. | | 227,017 |
| 3,200 | | FUJIFILM Holdings Corp. | | 228,423 |
| 12,900 | | Idemitsu Kosan Co., Ltd. | | 302,672 |
| 11,800 | | ITOCHU Corp. | | 347,638 |
| 5,600 | | Itochu Techno-Solutions Corp. | | 171,259 |
| 36,400 | | Japan Post Bank Co., Ltd. | | 308,573 |
| 25,900 | | Japan Post Holdings Co., Ltd. | | 219,349 |
| 41,600 | | Japan Tobacco, Inc. | | 811,485 |
| 27,400 | | Kansai Electric Power (The) Co., Inc. | | 258,627 |
| 4,900 | | Kao Corp. | | 293,629 |
| 11,100 | | KDDI Corp. | | 337,133 |
See Notes to Financial Statements
Page 17
First Trust Horizon Managed Volatility Developed International ETF (HDMV)
Portfolio of Investments (Continued)
July 31, 2021
| Shares | | Description | | Value |
| COMMON STOCKS (a) (Continued) |
| | | Japan (Continued) | | |
| 9,200 | | Kirin Holdings Co., Ltd. | | $167,722 |
| 2,900 | | Kobayashi Pharmaceutical Co., Ltd. | | 230,509 |
| 3,600 | | Kyocera Corp. | | 221,076 |
| 6,000 | | Lawson, Inc. | | 300,260 |
| 29,100 | | McDonald’s Holdings Co., Japan Ltd. | | 1,310,369 |
| 11,400 | | Medipal Holdings Corp. | | 213,753 |
| 10,900 | | MEIJI Holdings Co., Ltd. | | 673,643 |
| 10,400 | | Mitsubishi Corp. | | 290,277 |
| 22,600 | | Mizuho Financial Group, Inc. | | 322,504 |
| 10,500 | | MS&AD Insurance Group Holdings, Inc. | | 323,504 |
| 6,300 | | NH Foods Ltd. | | 253,539 |
| 14,500 | | Nippon Telegraph & Telephone Corp. | | 370,414 |
| 18,500 | | Nisshin Seifun Group, Inc. | | 297,808 |
| 6,200 | | Nissin Foods Holdings Co., Ltd. | | 440,819 |
| 17,800 | | Osaka Gas Co., Ltd. | | 332,781 |
| 6,800 | | Otsuka Holdings Co., Ltd. | | 268,888 |
| 5,600 | | Secom Co., Ltd. | | 421,334 |
| 9,600 | | Sekisui House Ltd. | | 189,060 |
| 4,600 | | Shionogi & Co., Ltd. | | 241,185 |
| 37,000 | | Shizuoka Bank (The), Ltd. | | 266,442 |
| 75,300 | | Softbank Corp. | | 981,189 |
| 4,300 | | Sohgo Security Services Co., Ltd. | | 200,292 |
| 5,900 | | Sompo Holdings, Inc. | | 243,626 |
| 6,500 | | Sumitomo Mitsui Financial Group, Inc. | | 218,928 |
| 9,000 | | Suntory Beverage & Food Ltd. | | 314,616 |
| 4,700 | | Taisho Pharmaceutical Holdings Co., Ltd. | | 262,194 |
| 5,000 | | Takeda Pharmaceutical Co., Ltd. | | 167,814 |
| 34,600 | | Tohoku Electric Power Co., Inc. | | 262,090 |
| 12,800 | | Tokyo Gas Co., Ltd. | | 242,454 |
| 6,000 | | Toyo Suisan Kaisha Ltd. | | 228,887 |
| 2,600 | | Toyota Motor Corp. | | 232,378 |
| 1,800 | | Tsuruha Holdings, Inc. | | 211,823 |
| 4,900 | | Unicharm Corp. | | 195,723 |
| 9,500 | | USS Co., Ltd. | | 164,359 |
| 53,500 | | Yamada Holdings Co., Ltd. | | 251,638 |
| | | | | 15,644,430 |
| | | Netherlands – 3.9% | | |
| 3,681 | | Akzo Nobel N.V. | | 454,562 |
| 35,550 | | Davide Campari-Milano N.V. | | 500,150 |
| 21,571 | | Koninklijke Ahold Delhaize N.V. | | 670,293 |
| 2,520 | | Koninklijke DSM N.V. | | 508,040 |
| 12,498 | | Koninklijke Vopak N.V. | | 529,131 |
| 6,379 | | Wolters Kluwer N.V. | | 727,046 |
| | | | | 3,389,222 |
| | | New Zealand – 0.5% | | |
| 143,876 | | Spark New Zealand Ltd. | | 474,629 |
| Shares | | Description | | Value |
|
| | | Norway – 1.1% | | |
| 48,667 | | Orkla ASA | | $442,340 |
| 27,645 | | Telenor ASA | | 480,007 |
| | | | | 922,347 |
| | | Singapore – 7.1% | | |
| 16,400 | | DBS Group Holdings Ltd. | | 368,076 |
| 636,700 | | Genting Singapore Ltd. | | 380,624 |
| 104,400 | | Oversea-Chinese Banking Corp., Ltd. | | 947,725 |
| 108,800 | | Singapore Exchange Ltd. | | 953,942 |
| 318,500 | | Singapore Technologies Engineering Ltd. | | 942,607 |
| 323,600 | | Singapore Telecommunications Ltd. | | 542,140 |
| 58,800 | | United Overseas Bank Ltd. | | 1,140,458 |
| 91,200 | | UOL Group Ltd. | | 491,354 |
| 25,900 | | Venture Corp. Ltd. | | 363,569 |
| | | | | 6,130,495 |
| | | Spain – 2.2% | | |
| 22,039 | | Enagas S.A. | | 506,143 |
| 19,226 | | Endesa S.A. | | 467,769 |
| 36,275 | | Iberdrola S.A. | | 437,197 |
| 26,256 | | Red Electrica Corp. S.A. | | 520,920 |
| | | | | 1,932,029 |
| | | Sweden – 4.2% | | |
| 14,410 | | Essity AB, Class B | | 471,216 |
| 10,308 | | ICA Gruppen AB | | 509,508 |
| 5,802 | | Industrivarden AB, Class A | | 231,584 |
| 7,017 | | Industrivarden AB, Class C | | 268,750 |
| 18,494 | | Investor AB, Class B | | 458,246 |
| 6,846 | | L E Lundbergforetagen AB, Class B | | 488,614 |
| 24,671 | | Svenska Handelsbanken AB, Class A | | 278,281 |
| 26,429 | | Tele2 AB, Class B | | 388,219 |
| 132,067 | | Telia Co., AB | | 579,761 |
| | | | | 3,674,179 |
| | | Switzerland – 12.4% | | |
| 4,596 | | Baloise Holding AG | | 726,045 |
| 6,892 | | Banque Cantonale Vaudoise | | 615,513 |
| 732 | | Geberit AG | | 601,051 |
| 12,162 | | Nestle S.A. | | 1,541,312 |
| 13,946 | | Novartis AG | | 1,291,373 |
| 1,517 | | Roche Holding AG | | 586,721 |
| 1,167 | | Roche Holding AG | | 501,146 |
| 1,636 | | Schindler Holding AG | | 529,531 |
| 824 | | Swiss Life Holding AG | | 425,713 |
| 8,967 | | Swiss Prime Site AG | | 955,747 |
| 4,862 | | Swiss Re AG | | 440,229 |
| 2,565 | | Swisscom AG | | 1,543,219 |
| 2,487 | | Zurich Insurance Group AG | | 1,004,299 |
| | | | | 10,761,899 |
Page 18
See Notes to Financial Statements
First Trust Horizon Managed Volatility Developed International ETF (HDMV)
Portfolio of Investments (Continued)
July 31, 2021
| Shares | | Description | | Value |
| COMMON STOCKS (a) (Continued) |
| | | United Kingdom – 8.0% | | |
| 7,178 | | Admiral Group PLC | | $339,232 |
| 3,084 | | AstraZeneca PLC | | 354,429 |
| 55,983 | | BAE Systems PLC | | 448,222 |
| 3,079 | | Croda International PLC | | 360,360 |
| 6,877 | | Diageo PLC | | 341,305 |
| 63,161 | | Direct Line Insurance Group PLC | | 261,362 |
| 34,105 | | GlaxoSmithKline PLC | | 672,122 |
| 78,746 | | National Grid PLC | | 1,011,492 |
| 33,601 | | Phoenix Group Holdings PLC | | 317,316 |
| 3,680 | | Reckitt Benckiser Group PLC | | 282,513 |
| 10,616 | | RELX PLC | | 311,947 |
| 44,943 | | Rentokil Initial PLC | | 354,084 |
| 12,830 | | Severn Trent PLC | | 499,344 |
| 141,150 | | Tesco PLC | | 457,143 |
| 10,243 | | Unilever PLC | | 591,010 |
| 21,109 | | United Utilities Group PLC | | 314,834 |
| | | | | 6,916,715 |
| | | Total Common Stocks | | 83,753,589 |
| | | (Cost $78,272,526) | | |
| REAL ESTATE INVESTMENT TRUSTS (a) – 3.1% |
| | | Hong Kong – 0.7% | | |
| 64,180 | | Link REIT | | 613,625 |
| | | Singapore – 1.8% | | |
| 253,500 | | Ascendas Real Estate Investment Trust | | 583,726 |
| 250,900 | | Mapletree Commercial Trust | | 399,974 |
| 357,900 | | Mapletree Logistics Trust | | 557,341 |
| | | | | 1,541,041 |
| | | United Kingdom – 0.6% | | |
| 29,708 | | Segro PLC | | 502,756 |
| | | Total Real Estate Investment Trusts | | 2,657,422 |
| | | (Cost $2,445,609) | | |
| | | Total Investments – 99.4% | | 86,411,011 |
| | | (Cost $80,718,135) (c) | | |
| | | Net Other Assets and Liabilities – 0.6% | | 550,766 |
| | | Net Assets – 100.0% | | $86,961,777 |
|
| (a) | Portfolio securities are categorized based upon their country of incorporation. For a breakdown of the portfolio securities by sector, please see the Fund Performance Overview. |
| (b) | Non-income producing security. |
| (c) | Aggregate cost for federal income tax purposes was $81,044,366. As of July 31, 2021, the aggregate gross unrealized appreciation for all investments in which there was an excess of value over tax cost was $7,296,046 and the aggregate gross unrealized depreciation for all investments in which there was an excess of tax cost over value was $1,929,401. The net unrealized appreciation was $5,366,645. |
Valuation Inputs
A summary of the inputs used to value the Fund’s investments as of July 31, 2021 is as follows (see Note 2A - Portfolio Valuation in the Notes to Financial Statements):
| | Total
Value at
7/31/2021 | Level 1
Quoted
Prices | Level 2
Significant
Observable
Inputs | Level 3
Significant
Unobservable
Inputs |
| Common Stocks* | $ 83,753,589 | $ 83,753,589 | $ — | $ — |
| Real Estate Investment Trusts* | 2,657,422 | 2,657,422 | — | — |
| Total Investments | $ 86,411,011 | $ 86,411,011 | $— | $— |
| * | See Portfolio of Investments for country breakout. |
Currency Exposure
Diversification | % of Total
Investments |
| Euro | 27.9% |
| Japanese Yen | 18.1 |
| Swiss Franc | 12.5 |
| Hong Kong Dollar | 9.4 |
| Singapore Dollar | 8.9 |
| British Pound Sterling | 8.6 |
| Australian Dollar | 5.9 |
| Swedish Krona | 4.3 |
| Danish Krone | 1.2 |
| Norwegian Krone | 1.1 |
| United States Dollar | 0.9 |
| Israeli Shekel | 0.7 |
| New Zealand Dollar | 0.5 |
| Total | 100.0% |
See Notes to Financial Statements
Page 19
First Trust Horizon Managed Volatility Small/Mid ETF (HSMV)
Portfolio of Investments
July 31, 2021
| Shares | | Description | | Value |
| COMMON STOCKS – 81.2% |
| | | Aerospace & Defense – 0.5% | | |
| 364 | | Curtiss-Wright Corp. | | $43,061 |
| 448 | | Mercury Systems, Inc. (a) | | 29,568 |
| | | | | 72,629 |
| | | Auto Components – 1.1% | | |
| 3,056 | | Gentex Corp. | | 103,996 |
| 374 | | Lear Corp. | | 65,442 |
| | | | | 169,438 |
| | | Banks – 2.0% | | |
| 1,282 | | Commerce Bancshares, Inc. | | 90,676 |
| 418 | | Cullen/Frost Bankers, Inc. | | 44,860 |
| 839 | | First Financial Bankshares, Inc. | | 40,977 |
| 2,641 | | Investors Bancorp, Inc. | | 36,499 |
| 886 | | Prosperity Bancshares, Inc. | | 60,416 |
| 1,628 | | Umpqua Holdings Corp. | | 30,720 |
| | | | | 304,148 |
| | | Biotechnology – 0.3% | | |
| 251 | | United Therapeutics Corp. (a) | | 45,664 |
| | | Building Products – 2.0% | | |
| 538 | | Carlisle Cos., Inc. | | 108,805 |
| 306 | | Lennox International, Inc. | | 100,806 |
| 443 | | Owens Corning | | 42,599 |
| 590 | | UFP Industries, Inc. | | 43,813 |
| | | | | 296,023 |
| | | Capital Markets – 2.6% | | |
| 199 | | Affiliated Managers Group, Inc. | | 31,530 |
| 311 | | Evercore, Inc., Class A | | 41,114 |
| 306 | | FactSet Research Systems, Inc. | | 109,328 |
| 1,586 | | Jefferies Financial Group, Inc. | | 52,639 |
| 1,663 | | SEI Investments Co. | | 101,110 |
| 700 | | Stifel Financial Corp. | | 46,578 |
| | | | | 382,299 |
| | | Chemicals – 3.1% | | |
| 1,107 | | Ashland Global Holdings, Inc. | | 94,172 |
| 972 | | Cabot Corp. | | 53,518 |
| 1,232 | | HB Fuller Co. | | 79,612 |
| 1,147 | | RPM International, Inc. | | 99,319 |
| 206 | | Scotts Miracle-Gro (The) Co. | | 36,454 |
| 3,117 | | Valvoline, Inc. | | 95,630 |
| | | | | 458,705 |
| | | Commercial Services &
Supplies – 2.1% | | |
| 790 | | ABM Industries, Inc. | | 36,727 |
| 687 | | Clean Harbors, Inc. (a) | | 65,265 |
| 1,226 | | IAA, Inc. (a) | | 74,149 |
| 1,422 | | Stericycle, Inc. (a) | | 100,322 |
| 244 | | Tetra Tech, Inc. | | 32,579 |
| | | | | 309,042 |
| Shares | | Description | | Value |
|
| | | Communications Equipment – 0.9% | | |
| 696 | | Ciena Corp. (a) | | $40,465 |
| 5,794 | | Viavi Solutions, Inc. (a) | | 96,702 |
| | | | | 137,167 |
| | | Construction & Engineering – 1.1% | | |
| 1,135 | | AECOM (a) | | 71,460 |
| 371 | | EMCOR Group, Inc. | | 45,191 |
| 199 | | Valmont Industries, Inc. | | 47,153 |
| | | | | 163,804 |
| | | Construction Materials – 0.4% | | |
| 381 | | Eagle Materials, Inc. | | 53,843 |
| | | Consumer Finance – 0.2% | | |
| 1,707 | | SLM Corp. | | 32,143 |
| | | Containers & Packaging – 1.3% | | |
| 722 | | AptarGroup, Inc. | | 93,080 |
| 1,534 | | Sonoco Products Co. | | 97,854 |
| | | | | 190,934 |
| | | Diversified Consumer
Services – 1.8% | | |
| 801 | | Grand Canyon Education, Inc. (a) | | 73,988 |
| 2,803 | | H&R Block, Inc. | | 68,814 |
| 1,928 | | Service Corp. International | | 120,481 |
| | | | | 263,283 |
| | | Diversified Telecommunication
Services – 0.4% | | |
| 762 | | Cogent Communications Holdings, Inc. | | 59,139 |
| | | Electric Utilities – 2.1% | | |
| 2,412 | | Hawaiian Electric Industries, Inc. | | 104,536 |
| 1,038 | | IDACORP, Inc. | | 109,457 |
| 2,994 | | OGE Energy Corp. | | 101,048 |
| | | | | 315,041 |
| | | Electrical Equipment – 1.8% | | |
| 328 | | EnerSys | | 32,360 |
| 549 | | Hubbell, Inc. | | 110,053 |
| 1,591 | | nVent Electric PLC | | 50,292 |
| 466 | | Regal Beloit Corp. | | 68,609 |
| | | | | 261,314 |
| | | Electronic Equipment,
Instruments & Components – 3.8% | | |
| 894 | | Arrow Electronics, Inc. (a) | | 106,002 |
| 1,712 | | Avnet, Inc. | | 70,740 |
| 867 | | Cognex Corp. | | 78,385 |
| 672 | | Insight Enterprises, Inc. (a) | | 67,455 |
Page 20
See Notes to Financial Statements
First Trust Horizon Managed Volatility Small/Mid ETF (HSMV)
Portfolio of Investments (Continued)
July 31, 2021
| Shares | | Description | | Value |
| COMMON STOCKS (Continued) |
| | | Electronic Equipment,
Instruments & Components (Continued) | | |
| 869 | | Jabil, Inc. | | $51,740 |
| 2,318 | | National Instruments Corp. | | 102,247 |
| 389 | | SYNNEX Corp. | | 46,501 |
| 1,912 | | Vishay Intertechnology, Inc. | | 42,313 |
| | | | | 565,383 |
| | | Entertainment – 0.2% | | |
| 560 | | World Wrestling Entertainment, Inc., Class A | | 27,653 |
| | | Food & Staples Retailing – 1.3% | | |
| 631 | | BJ’s Wholesale Club Holdings, Inc. (a) | | 31,954 |
| 518 | | Casey’s General Stores, Inc. | | 102,414 |
| 857 | | Grocery Outlet Holding Corp. (a) | | 28,384 |
| 1,269 | | Sprouts Farmers Market, Inc. (a) | | 31,192 |
| | | | | 193,944 |
| | | Food Products – 2.9% | | |
| 4,228 | | Flowers Foods, Inc. | | 99,612 |
| 2,528 | | Hain Celestial Group (The), Inc. (a) | | 100,892 |
| 1,117 | | Ingredion, Inc. | | 98,084 |
| 938 | | Post Holdings, Inc. (a) | | 95,995 |
| 859 | | TreeHouse Foods, Inc. (a) | | 38,139 |
| | | | | 432,722 |
| | | Gas Utilities – 2.3% | | |
| 1,373 | | ONE Gas, Inc. | | 101,300 |
| 1,103 | | South Jersey Industries, Inc. | | 27,763 |
| 1,667 | | Southwest Gas Holdings, Inc. | | 116,573 |
| 2,161 | | UGI Corp. | | 99,384 |
| | | | | 345,020 |
| | | Health Care Equipment &
Supplies – 5.5% | | |
| 1,011 | | Avanos Medical, Inc. (a) | | 38,357 |
| 514 | | CONMED Corp. | | 70,901 |
| 1,598 | | Envista Holdings Corp. (a) | | 68,842 |
| 1,279 | | Globus Medical, Inc., Class A (a) | | 106,375 |
| 456 | | Haemonetics Corp. (a) | | 27,720 |
| 907 | | Hill-Rom Holdings, Inc. | | 125,583 |
| 490 | | ICU Medical, Inc. (a) | | 99,612 |
| 1,476 | | Integra LifeSciences Holdings Corp. (a) | | 106,848 |
| 331 | | Masimo Corp. (a) | | 90,161 |
| 1,273 | | NuVasive, Inc. (a) | | 81,408 |
| | | | | 815,807 |
| | | Health Care Providers &
Services – 3.1% | | |
| 221 | | Amedisys, Inc. (a) | | 57,597 |
| Shares | | Description | | Value |
|
| | | Health Care Providers &
Services (Continued) | | |
| 517 | | AMN Healthcare Services, Inc. (a) | | $51,990 |
| 210 | | Chemed Corp. | | 99,964 |
| 1,264 | | Encompass Health Corp. | | 105,228 |
| 289 | | LHC Group, Inc. (a) | | 62,187 |
| 205 | | Molina Healthcare, Inc. (a) | | 55,967 |
| 1,315 | | R1 RCM, Inc. (a) | | 28,154 |
| | | | | 461,087 |
| | | Health Care Technology – 0.3% | | |
| 2,367 | | Allscripts Healthcare Solutions, Inc. (a) | | 40,428 |
| | | Hotels, Restaurants &
Leisure – 3.5% | | |
| 837 | | Choice Hotels International, Inc. | | 100,356 |
| 478 | | Cracker Barrel Old Country Store, Inc. | | 65,094 |
| 694 | | Jack in the Box, Inc. | | 75,549 |
| 575 | | Papa John’s International, Inc. | | 65,619 |
| 773 | | Texas Roadhouse, Inc. | | 71,247 |
| 1,802 | | Wendy’s (The) Co. | | 41,825 |
| 1,405 | | Wyndham Hotels & Resorts, Inc. | | 101,244 |
| | | | | 520,934 |
| | | Household Durables – 0.5% | | |
| 341 | | Helen of Troy, Ltd. (a) | | 76,176 |
| | | Household Products – 0.5% | | |
| 1,550 | | Energizer Holdings, Inc. | | 66,418 |
| | | Insurance – 4.6% | | |
| 151 | | Alleghany Corp. (a) | | 100,128 |
| 294 | | American Financial Group, Inc. | | 37,188 |
| 1,902 | | Brown & Brown, Inc. | | 103,469 |
| 1,687 | | CNO Financial Group, Inc. | | 38,531 |
| 1,590 | | First American Financial Corp. | | 107,023 |
| 746 | | Hanover Insurance Group (The), Inc. | | 101,381 |
| 4,032 | | Old Republic International Corp. | | 99,429 |
| 684 | | RenaissanceRe Holdings Ltd. | | 104,440 |
| | | | | 691,589 |
| | | IT Services – 1.4% | | |
| 1,104 | | Maximus, Inc. | | 98,256 |
| 1,171 | | Perficient, Inc. (a) | | 110,414 |
| | | | | 208,670 |
| | | Leisure Products – 0.7% | | |
| 4,928 | | Mattel, Inc. (a) | | 107,036 |
| | | Life Sciences Tools &
Services – 1.4% | | |
| 76 | | Bio-Techne Corp. | | 36,650 |
See Notes to Financial Statements
Page 21
First Trust Horizon Managed Volatility Small/Mid ETF (HSMV)
Portfolio of Investments (Continued)
July 31, 2021
| Shares | | Description | | Value |
| COMMON STOCKS (Continued) |
| | | Life Sciences Tools &
Services (Continued) | | |
| 216 | | Charles River Laboratories International, Inc. (a) | | $87,895 |
| 173 | | Medpace Holdings Inc. (a) | | 30,437 |
| 601 | | Syneos Health, Inc. (a) | | 53,892 |
| | | | | 208,874 |
| | | Machinery – 6.5% | | |
| 230 | | AGCO Corp. | | 30,385 |
| 575 | | Crane Co. | | 55,907 |
| 1,626 | | Donaldson Co., Inc. | | 107,625 |
| 1,362 | | Graco, Inc. | | 106,345 |
| 937 | | ITT, Inc. | | 91,742 |
| 766 | | Lincoln Electric Holdings, Inc. | | 106,803 |
| 172 | | Middleby (The) Corp. (a) | | 32,936 |
| 461 | | Nordson Corp. | | 104,246 |
| 296 | | Oshkosh Corp. | | 35,387 |
| 413 | | Timken (The) Co. | | 32,833 |
| 935 | | Toro (The) Co. | | 106,347 |
| 709 | | Watts Water Technologies, Inc., Class A | | 106,889 |
| 367 | | Woodward, Inc. | | 44,613 |
| | | | | 962,058 |
| | | Media – 0.9% | | |
| 718 | | John Wiley & Sons, Inc., Class A | | 42,204 |
| 1,218 | | New York Times (The) Co., Class A | | 53,324 |
| 2,210 | | TEGNA, Inc. | | 39,161 |
| | | | | 134,689 |
| | | Metals & Mining – 1.1% | | |
| 438 | | Reliance Steel & Aluminum Co. | | 68,832 |
| 824 | | Royal Gold, Inc. | | 100,132 |
| | | | | 168,964 |
| | | Multi-Utilities – 2.1% | | |
| 1,502 | | Black Hills Corp. | | 101,610 |
| 3,224 | | MDU Resources Group, Inc. | | 102,265 |
| 1,664 | | NorthWestern Corp. | | 103,152 |
| | | | | 307,027 |
| | | Personal Products – 0.2% | | |
| 875 | | Edgewell Personal Care Co. | | 35,945 |
| | | Pharmaceuticals – 0.4% | | |
| 377 | | Jazz Pharmaceuticals PLC (a) | | 63,909 |
| | | Professional Services – 3.0% | | |
| 355 | | ASGN, Inc. (a) | | 35,901 |
| 394 | | CACI International, Inc., Class A (a) | | 105,182 |
| 744 | | FTI Consulting, Inc. (a) | | 108,401 |
| 402 | | Insperity, Inc. | | 39,818 |
| 1,265 | | KBR, Inc. | | 48,956 |
| Shares | | Description | | Value |
|
| | | Professional
Services (Continued) | | |
| 497 | | ManpowerGroup, Inc. | | $58,934 |
| 628 | | Science Applications International Corp. | | 54,825 |
| | | | | 452,017 |
| | | Real Estate Management &
Development – 0.2% | | |
| 162 | | Jones Lang LaSalle, Inc. (a) | | 36,056 |
| | | Road & Rail – 2.3% | | |
| 2,203 | | Knight-Swift Transportation Holdings, Inc. | | 109,467 |
| 638 | | Landstar System, Inc. | | 100,166 |
| 400 | | Ryder System, Inc. | | 30,460 |
| 2,276 | | Werner Enterprises, Inc. | | 104,036 |
| | | | | 344,129 |
| | | Semiconductors &
Semiconductor Equipment – 0.4% | | |
| 371 | | Cirrus Logic, Inc. (a) | | 30,641 |
| 134 | | Universal Display Corp. | | 31,422 |
| | | | | 62,063 |
| | | Software – 3.0% | | |
| 1,788 | | ACI Worldwide, Inc. (a) | | 61,328 |
| 548 | | Blackbaud, Inc. (a) | | 39,089 |
| 2,020 | | CDK Global, Inc. | | 96,940 |
| 669 | | CommVault Systems, Inc. (a) | | 50,570 |
| 100 | | Fair Isaac Corp. (a) | | 52,391 |
| 454 | | J2 Global, Inc. (a) | | 64,137 |
| 1,777 | | Progress Software Corp. | | 81,013 |
| | | | | 445,468 |
| | | Specialty Retail – 1.7% | | |
| 653 | | AutoNation, Inc. (a) | | 79,228 |
| 333 | | Five Below, Inc. (a) | | 64,742 |
| 768 | | Murphy USA, Inc. | | 113,288 |
| | | | | 257,258 |
| | | Textiles, Apparel & Luxury
Goods – 0.9% | | |
| 662 | | Carter’s, Inc. | | 64,704 |
| 178 | | Deckers Outdoor Corp. (a) | | 73,131 |
| | | | | 137,835 |
| | | Thrifts & Mortgage Finance – 0.6% | | |
| 737 | | Essent Group Ltd. | | 33,291 |
| 4,449 | | New York Community Bancorp, Inc. | | 52,409 |
| | | | | 85,700 |
Page 22
See Notes to Financial Statements
First Trust Horizon Managed Volatility Small/Mid ETF (HSMV)
Portfolio of Investments (Continued)
July 31, 2021
| Shares | | Description | | Value |
| COMMON STOCKS (Continued) |
| | | Trading Companies &
Distributors – 1.3% | | |
| 1,170 | | MSC Industrial Direct Co., Inc., Class A | | $104,329 |
| 299 | | Watsco, Inc. | | 84,450 |
| | | | | 188,779 |
| | | Water Utilities – 0.7% | | |
| 2,195 | | Essential Utilities, Inc. | | 107,818 |
| | | Wireless Telecommunication
Services – 0.2% | | |
| 1,603 | | Telephone & Data Systems, Inc. | | 35,827 |
| | | Total Common Stocks | | 12,101,899 |
| | | (Cost $11,374,088) | | |
| REAL ESTATE INVESTMENT TRUSTS – 17.7% |
| | | Equity Real Estate Investment
Trusts – 17.7% | | |
| 1,439 | | Agree Realty Corp. | | 108,141 |
| 2,115 | | American Campus Communities, Inc. | | 106,406 |
| 3,762 | | Brandywine Realty Trust | | 52,518 |
| 752 | | Camden Property Trust | | 112,341 |
| 772 | | CoreSite Realty Corp. | | 106,698 |
| 3,596 | | Corporate Office Properties Trust | | 105,866 |
| 1,712 | | Cousins Properties, Inc. | | 68,001 |
| 1,101 | | CyrusOne, Inc. | | 78,468 |
| 1,674 | | Douglas Emmett, Inc. | | 55,912 |
| 611 | | EastGroup Properties, Inc. | | 107,670 |
| 1,928 | | First Industrial Realty Trust, Inc. | | 105,616 |
| 3,308 | | Healthcare Realty Trust, Inc. | | 105,459 |
| 1,783 | | Highwoods Properties, Inc. | | 85,031 |
| 1,928 | | Hudson Pacific Properties, Inc. | | 52,557 |
| 1,172 | | Kilroy Realty Corp. | | 81,184 |
| 583 | | Lamar Advertising Co., Class A | | 62,148 |
| 8,279 | | Lexington Realty Trust | | 108,869 |
| 940 | | Life Storage, Inc. | | 110,318 |
| 4,930 | | Medical Properties Trust, Inc. | | 103,678 |
| 1,719 | | National Retail Properties, Inc. | | 84,008 |
| 1,991 | | National Storage Affiliates Trust | | 107,852 |
| 2,628 | | Omega Healthcare Investors, Inc. | | 95,344 |
| 5,346 | | Physicians Realty Trust | | 101,307 |
| 964 | | PotlatchDeltic Corp. | | 50,070 |
| 2,886 | | Rayonier, Inc. | | 108,831 |
| 1,736 | | Rexford Industrial Realty, Inc. | | 106,799 |
| 3,348 | | Sabra Health Care REIT, Inc. | | 62,239 |
| 2,062 | | Spirit Realty Capital, Inc. | | 103,554 |
| Shares | | Description | | Value |
|
| | | Equity Real Estate Investment
Trusts (Continued) | | |
| 2,765 | | STORE Capital Corp. | | $100,065 |
| | | Total Real Estate Investment Trusts | | 2,636,950 |
| | | (Cost $2,419,752) | | |
| | | Total Investments – 98.9% | | 14,738,849 |
| | | (Cost $13,793,840) (b) | | |
| | | Net Other Assets and Liabilities – 1.1% | | 167,342 |
| | | Net Assets – 100.0% | | $14,906,191 |
|
| (a) | Non-income producing security. |
| (b) | Aggregate cost for federal income tax purposes was $13,848,601. As of July 31, 2021, the aggregate gross unrealized appreciation for all investments in which there was an excess of value over tax cost was $1,075,899 and the aggregate gross unrealized depreciation for all investments in which there was an excess of tax cost over value was $185,651. The net unrealized appreciation was $890,248. |
Valuation Inputs
A summary of the inputs used to value the Fund’s investments as of July 31, 2021 is as follows (see Note 2A - Portfolio Valuation in the Notes to Financial Statements):
| | Total
Value at
7/31/2021 | Level 1
Quoted
Prices | Level 2
Significant
Observable
Inputs | Level 3
Significant
Unobservable
Inputs |
| Common Stocks* | $ 12,101,899 | $ 12,101,899 | $ — | $ — |
| Real Estate Investment Trusts* | 2,636,950 | 2,636,950 | — | — |
| Total Investments | $ 14,738,849 | $ 14,738,849 | $— | $— |
| * | See Portfolio of Investments for industry breakout. |
See Notes to Financial Statements
Page 23
First Trust Exchange-Traded Fund III
Statements of Assets and Liabilities
July 31, 2021
| | First Trust
Horizon
Managed
Volatility
Domestic
ETF
(HUSV) | | First Trust
Horizon
Managed
Volatility
Developed
International
ETF
(HDMV) | | First Trust
Horizon
Managed
Volatility
Small/Mid
ETF
(HSMV) |
| ASSETS: | | | | | |
Investments, at value
| $ 120,425,485 | | $ 86,411,011 | | $ 14,738,849 |
Cash
| 229,722 | | 302,276 | | 172,221 |
| Receivables: | | | | | |
Dividends
| 170,748 | | 95,935 | | 4,956 |
Dividend reclaims
| 2,260 | | 271,732 | | 116 |
Investment securities sold
| — | | 15,054 | | — |
Miscellaneous
| — | | 7,738 | | — |
Total Assets
| 120,828,215 | | 87,103,746 | | 14,916,142 |
| LIABILITIES: | | | | | |
Due to custodian foreign currency
| — | | 7,223 | | — |
Due to authorized participant
| — | | 61,250 | | — |
| Payables: | | | | | |
Investment advisory fees
| 70,474 | | 58,441 | | 9,951 |
Capital shares redeemed
| — | | 15,055 | | — |
Total Liabilities
| 70,474 | | 141,969 | | 9,951 |
NET ASSETS
| $120,757,741 | | $86,961,777 | | $14,906,191 |
| NET ASSETS consist of: | | | | | |
Paid-in capital
| $ 154,584,032 | | $ 109,212,817 | | $ 14,257,151 |
Par value
| 36,500 | | 27,000 | | 4,500 |
Accumulated distributable earnings (loss)
| (33,862,791) | | (22,278,040) | | 644,540 |
NET ASSETS
| $120,757,741 | | $86,961,777 | | $14,906,191 |
NET ASSET VALUE, per share
| $33.08 | | $32.21 | | $33.12 |
Number of shares outstanding (unlimited number of shares authorized, par value $0.01 per share)
| 3,650,002 | | 2,700,002 | | 450,002 |
Investments, at cost
| $106,072,740 | | $80,718,135 | | $13,793,840 |
Foreign currency, at cost (proceeds)
| $— | | $(7,237) | | $— |
Page 24
See Notes to Financial Statements
First Trust Exchange-Traded Fund III
Statements of Operations
For the Year Ended July 31, 2021
| | First Trust
Horizon
Managed
Volatility
Domestic
ETF
(HUSV) | | First Trust
Horizon
Managed
Volatility
Developed
International
ETF
(HDMV) | | First Trust
Horizon
Managed
Volatility
Small/Mid
ETF
(HSMV) |
| INVESTMENT INCOME: | | | | | |
Dividends
| $ 3,416,401 | | $ 3,661,990 | | $ 278,014 |
Interest
| 29 | | 16 | | — |
Foreign withholding tax
| — | | (272,020) | | — |
Other
| 16 | | 16 | | 52 |
Total investment income
| 3,416,446 | | 3,390,002 | | 278,066 |
| EXPENSES: | | | | | |
Investment advisory fees
| 1,125,676 | | 779,693 | | 122,260 |
Total expenses
| 1,125,676 | | 779,693 | | 122,260 |
NET INVESTMENT INCOME (LOSS)
| 2,290,770 | | 2,610,309 | | 155,806 |
| NET REALIZED AND UNREALIZED GAIN (LOSS): | | | | | |
| Net realized gain (loss) on: | | | | | |
Investments
| 6,890,317 | | 7,170,352 | | (417,781) |
In-kind redemptions
| 25,313,870 | | 3,279,608 | | 4,634,658 |
Foreign currency transactions
| — | | (34,175) | | — |
Net realized gain (loss)
| 32,204,187 | | 10,415,785 | | 4,216,877 |
Net increase from payment by the advisor
| — | | 6,254 | | — |
| Net change in unrealized appreciation (depreciation) on: | | | | | |
Investments
| (4,733,783) | | 3,600,634 | | (131,960) |
Foreign currency translation
| — | | 9,911 | | — |
Net change in unrealized appreciation (depreciation)
| (4,733,783) | | 3,610,545 | | (131,960) |
NET REALIZED AND UNREALIZED GAIN (LOSS)
| 27,470,404 | | 14,032,584 | | 4,084,917 |
NET INCREASE (DECREASE) IN NET ASSETS RESULTING FROM OPERATIONS
| $ 29,761,174 | | $ 16,642,893 | | $ 4,240,723 |
See Notes to Financial Statements
Page 25
First Trust Exchange-Traded Fund III
Statements of Changes in Net Assets
| | First Trust Horizon Managed
Volatility Domestic ETF
(HUSV) | | First Trust Horizon Managed
Volatility Developed International ETF
(HDMV) |
| | Year
Ended
7/31/2021 | | Year
Ended
7/31/2020 | | Year
Ended
7/31/2021 | | Year
Ended
7/31/2020 |
| OPERATIONS: | | | | | | | |
Net investment income (loss)
| $ 2,290,770 | | $ 3,252,411 | | $ 2,610,309 | | $ 2,996,449 |
Net realized gain (loss)
| 32,204,187 | | (4,596,249) | | 10,415,785 | | (24,727,414) |
Net increase from payment by the advisor
| — | | — | | 6,254 | | — |
Net change in unrealized appreciation (depreciation)
| (4,733,783) | | 1,915,698 | | 3,610,545 | | 956,053 |
Net increase (decrease) in net assets resulting from operations
| 29,761,174 | | 571,860 | | 16,642,893 | | (20,774,912) |
| DISTRIBUTIONS TO SHAREHOLDERS FROM: | | | | | | | |
Investment operations
| (2,308,451) | | (3,582,296) | | (2,737,667) | | (3,755,422) |
| SHAREHOLDER TRANSACTIONS: | | | | | | | |
Proceeds from shares sold
| 127,467,991 | | 355,667,495 | | — | | 87,535,588 |
Cost of shares redeemed
| (248,985,087) | | (362,223,485) | | (50,656,967) | | (67,686,203) |
Net increase (decrease) in net assets resulting from shareholder transactions
| (121,517,096) | | (6,555,990) | | (50,656,967) | | 19,849,385 |
Total increase (decrease) in net assets
| (94,064,373) | | (9,566,426) | | (36,751,741) | | (4,680,949) |
| NET ASSETS: | | | | | | | |
Beginning of period
| 214,822,114 | | 224,388,540 | | 123,713,518 | | 128,394,467 |
End of period
| $120,757,741 | | $214,822,114 | | $86,961,777 | | $123,713,518 |
| CHANGES IN SHARES OUTSTANDING: | | | | | | | |
Shares outstanding, beginning of period
| 7,900,002 | | 8,400,002 | | 4,400,002 | | 3,900,002 |
Shares sold
| 4,600,000 | | 13,500,000 | | — | | 2,750,000 |
Shares redeemed
| (8,850,000) | | (14,000,000) | | (1,700,000) | | (2,250,000) |
Shares outstanding, end of period
| 3,650,002 | | 7,900,002 | | 2,700,002 | | 4,400,002 |
| (a) | Inception date is April 6, 2020, which is consistent with the commencement of investment operations and is the date the initial creation units were established. |
Page 26
See Notes to Financial Statements
First Trust Horizon Managed
Volatility Small/Mid ETF
(HSMV) |
Year
Ended
7/31/2021 | | Period
Ended
7/31/2020 (a) |
| | | |
| $ 155,806 | | $ 14,506 |
| 4,216,877 | | 213,038 |
| — | | — |
| (131,960) | | 1,076,969 |
| 4,240,723 | | 1,304,513 |
| | | |
| (160,236) | | (6,225) |
| | | |
| 23,515,729 | | 19,986,223 |
| (32,712,721) | | (1,261,815) |
| (9,196,992) | | 18,724,408 |
| (5,116,505) | | 20,022,696 |
| | | |
| 20,022,696 | | — |
| $14,906,191 | | $ 20,022,696 |
| | | |
| 800,002 | | — |
| 800,000 | | 850,002 |
| (1,150,000) | | (50,000) |
| 450,002 | | 800,002 |
See Notes to Financial Statements
Page 27
First Trust Exchange-Traded Fund III
Financial Highlights
For a share outstanding throughout each period
First Trust Horizon Managed Volatility Domestic ETF (HUSV)
| | Year Ended July 31, | | Period
Ended
7/31/2017 (a) |
| 2021 | | 2020 | | 2019 | | 2018 | |
Net asset value, beginning of period
| $ 27.19 | | $ 26.71 | | $ 23.49 | | $ 22.03 | | $ 19.96 |
| Income from investment operations: | | | | | | | | | |
Net investment income (loss)
| 0.46 | | 0.37 | | 0.37 | | 0.30 | | 0.24 |
Net realized and unrealized gain (loss)
| 5.87 | | 0.52 | | 3.17 | | 1.46 | | 2.05 |
Total from investment operations
| 6.33 | | 0.89 | | 3.54 | | 1.76 | | 2.29 |
| Distributions paid to shareholders from: | | | | | | | | | |
Net investment income
| (0.44) | | (0.41) | | (0.32) | | (0.30) | | (0.22) |
Net asset value, end of period
| $33.08 | | $27.19 | | $26.71 | | $23.49 | | $22.03 |
Total return (b)
| 23.48% | | 3.41% | | 15.24% | | 8.04% | | 11.51% |
| Ratios to average net assets/supplemental data: | | | | | | | | | |
Net assets, end of period (in 000’s)
| $ 120,758 | | $ 214,822 | | $ 224,389 | | $ 133,888 | | $ 62,799 |
Ratio of total expenses to average net assets
| 0.70% | | 0.70% | | 0.70% | | 0.70% | | 0.70% (c) |
Ratio of net investment income (loss) to average net assets
| 1.42% | | 1.39% | | 1.58% | | 1.37% | | 1.50% (c) |
Portfolio turnover rate (d)
| 152% | | 211% | | 147% | | 157% | | 149% |
| (a) | Inception date is August 24, 2016, which is consistent with the commencement of investment operations and is the date the initial creation units were established. |
| (b) | Total return is calculated assuming an initial investment made at the net asset value at the beginning of the period, reinvestment of all distributions at net asset value during the period, and redemption at net asset value on the last day of the period. The returns presented do not reflect the deduction of taxes that a shareholder would pay on Fund distributions or the redemption or sale of Fund shares. Total return is calculated for the time period presented and is not annualized for periods of less than a year. |
| (c) | Annualized. |
| (d) | Portfolio turnover is calculated for the time period presented and is not annualized for periods of less than a year and does not include securities received or delivered from processing creations or redemptions and in-kind transactions. |
Page 28
See Notes to Financial Statements
First Trust Exchange-Traded Fund III
Financial Highlights (Continued)
For a share outstanding throughout each period
First Trust Horizon Managed Volatility Developed International ETF (HDMV)
| | Year Ended July 31, | | Period
Ended
7/31/2017 (a) |
| 2021 | | 2020 | | 2019 | | 2018 | |
Net asset value, beginning of period
| $ 28.12 | | $ 32.92 | | $ 33.72 | | $ 33.05 | | $ 29.89 |
| Income from investment operations: | | | | | | | | | |
Net investment income (loss)
| 0.89 | | 0.65 | | 0.86 | | 0.91 | | 0.63 |
Net realized and unrealized gain (loss)
| 4.13 | | (4.61) | | (0.79) | | 0.87 | | 3.13 |
Total from investment operations
| 5.02 | | (3.96) | | 0.07 | | 1.78 | | 3.76 |
| Distributions paid to shareholders from: | | | | | | | | | |
Net investment income
| (0.93) | | (0.84) | | (0.87) | | (1.11) | | (0.60) |
Net asset value, end of period
| $32.21 | | $28.12 | | $32.92 | | $33.72 | | $33.05 |
Total return (b)
| 18.01% (c) | | (12.37)% | | 0.21% | | 5.48% | | 12.68% |
| Ratios to average net assets/supplemental data: | | | | | | | | | |
Net assets, end of period (in 000’s)
| $ 86,962 | | $ 123,714 | | $ 128,394 | | $ 59,010 | | $ 29,745 |
Ratio of total expenses to average net assets
| 0.80% | | 0.80% | | 0.80% | | 0.80% | | 0.80% (d) |
Ratio of net investment income (loss) to average net assets
| 2.68% | | 2.08% | | 2.74% | | 2.73% | | 2.74% (d) |
Portfolio turnover rate (e)
| 127% | | 196% | | 99% | | 133% | | 150% |
| (a) | Inception date is August 24, 2016, which is consistent with the commencement of investment operations and is the date the initial creation units were established. |
| (b) | Total return is calculated assuming an initial investment made at the net asset value at the beginning of the period, reinvestment of all distributions at net asset value during the period, and redemption at net asset value on the last day of the period. The returns presented do not reflect the deduction of taxes that a shareholder would pay on Fund distributions or the redemption or sale of Fund shares. Total return is calculated for the time period presented and is not annualized for periods of less than a year. |
| (c) | The Fund received a reimbursement from the advisor in the amount of $6,254, which represents less than $0.01 per share. Since the advisor reimbursed the Fund, there was no effect on the Fund’s total return. |
| (d) | Annualized. |
| (e) | Portfolio turnover is calculated for the time period presented and is not annualized for periods of less than a year and does not include securities received or delivered from processing creations or redemptions and in-kind transactions. |
See Notes to Financial Statements
Page 29
First Trust Exchange-Traded Fund III
Financial Highlights (Continued)
For a share outstanding throughout each period
First Trust Horizon Managed Volatility Small/Mid ETF (HSMV)
| | Year Ended
7/31/2021 | | Period
Ended
7/31/2020 (a) |
Net asset value, beginning of period
| $ 25.03 | | $ 21.10 |
| Income from investment operations: | | | |
Net investment income (loss)
| 0.29 | | 0.02 |
Net realized and unrealized gain (loss)
| 8.09 | | 3.92 |
Total from investment operations
| 8.38 | | 3.94 |
| Distributions paid to shareholders from: | | | |
Net investment income
| (0.29) | | (0.01) |
Net realized gain
| (0.00) (b) | | — |
Total distributions
| (0.29) | | (0.01) |
Net asset value, end of period
| $33.12 | | $25.03 |
Total return (c)
| 33.72% | | 18.67% |
| Ratios to average net assets/supplemental data: | | | |
Net assets, end of period (in 000’s)
| $ 14,906 | | $ 20,023 |
Ratio of total expenses to average net assets
| 0.80% | | 0.80% (d) |
Ratio of net investment income (loss) to average net assets
| 1.02% | | 0.60% (d) |
Portfolio turnover rate (e)
| 118% | | 5% |
| (a) | Inception date is April 6, 2020, which is consistent with the commencement of investment operations and is the date the initial creation units were established. |
| (b) | Amount represents less than $0.01 per share. |
| (c) | Total return is calculated assuming an initial investment made at the net asset value at the beginning of the period, reinvestment of all distributions at net asset value during the period, and redemption at net asset value on the last day of the period. The returns presented do not reflect the deduction of taxes that a shareholder would pay on Fund distributions or the redemption or sale of Fund shares. Total return is calculated for the time period presented and is not annualized for periods of less than a year. |
| (d) | Annualized. |
| (e) | Portfolio turnover is calculated for the time period presented and is not annualized for periods of less than a year and does not include securities received or delivered from processing creations or redemptions and in-kind transactions. |
Page 30
See Notes to Financial Statements
Notes to Financial Statements
First Trust Exchange-Traded Fund III
July 31, 2021
1. Organization
First Trust Exchange-Traded Fund III (the “Trust”) is an open-end management investment company organized as a Massachusetts business trust on January 9, 2008, and is registered with the Securities and Exchange Commission under the Investment Company Act of 1940, as amended (the “1940 Act”).
The Trust currently consists of eighteen funds that are offering shares. This report covers the following funds (each a “Fund” and collectively, the “Funds”):
First Trust Horizon Managed Volatility Domestic ETF – (NYSE Arca, Inc. (“NYSE Arca”) ticker “HUSV”)
First Trust Horizon Managed Volatility Developed International ETF – (NYSE Arca ticker “HDMV”)
First Trust Horizon Managed Volatility Small/Mid ETF – (NYSE Arca ticker “HSMV”)
HUSV and HDMV are diversified series of the Trust. HSMV is a non-diversified series of the Trust.
Each Fund represents a separate series of shares of beneficial interest in the Trust. Unlike conventional mutual funds, each Fund issues and redeems shares on a continuous basis, at net asset value (“NAV”), only in large blocks of shares known as “Creation Units.”
Each Fund is an actively managed exchange-traded fund. The investment objective of each Fund is to provide capital appreciation.
Under normal market conditions, HUSV seeks to achieve its investment objective by investing at least 80% of its net assets (including investment borrowings) in common stocks of domestic companies listed and traded on U.S. national securities exchanges that Horizon Investments, LLC (“Horizon” or the “Sub-Advisor”) believes exhibit low future expected volatility.
Under normal market conditions, HDMV seeks to achieve its investment objective by investing at least 80% of its net assets (including investment borrowings) in common stocks and depositary receipts of developed market companies listed and traded on non-U.S. exchanges that Horizon believes exhibit low future expected volatility.
Under normal market conditions, HSMV seeks to achieve its investment objective by investing at least 80% of its net assets (including investment borrowings) in small- and/or mid-capitalization common stocks listed and traded on U.S. national securities exchanges that Horizon believes exhibit low future expected volatility.
There can be no assurance that a Fund will achieve its investment objective. The Funds may not be appropriate for all investors.
2. Significant Accounting Policies
The Funds are each considered an investment company and follow accounting and reporting guidance under Financial Accounting Standards Board Accounting Standards Codification Topic 946, “Financial Services-Investment Companies.” The following is a summary of significant accounting policies consistently followed by the Funds in the preparation of the financial statements. The preparation of the financial statements in accordance with accounting principles generally accepted in the United States of America (“U.S. GAAP”) requires management to make estimates and assumptions that affect the reported amounts and disclosures in the financial statements. Actual results could differ from those estimates.
A. Portfolio Valuation
Each Fund’s NAV is determined daily as of the close of regular trading on the New York Stock Exchange (“NYSE”), normally 4:00 p.m. Eastern time, on each day the NYSE is open for trading. If the NYSE closes early on a valuation day, the NAV is determined as of that time. Foreign securities are priced using data reflecting the earlier closing of the principal markets for those securities. Each Fund’s NAV is calculated by dividing the value of all assets of each Fund (including accrued interest and dividends), less all liabilities (including accrued expenses and dividends declared but unpaid), by the total number of shares outstanding.
Each Fund’s investments are valued daily at market value or, in the absence of market value with respect to any portfolio securities, at fair value. Market value prices represent last sale or official closing prices from a national or foreign exchange (i.e., a regulated market) and are primarily obtained from third-party pricing services. Fair value prices represent any prices not considered market value prices and are either obtained from a third-party pricing service or are determined by the Pricing Committee of the Funds’ investment advisor, First Trust Advisors L.P. (“First Trust” or the “Advisor”), in accordance with valuation procedures adopted by the Trust’s Board of Trustees, and in accordance with provisions of the 1940 Act. Investments valued by the Advisor’s Pricing Committee, if any, are footnoted as such in the footnotes to the Portfolio of Investments. Each Fund’s investments are valued as follows:
Common stocks, real estate investment trusts (“REITs”) and other equity securities listed on any national or foreign exchange (excluding The Nasdaq Stock Market LLC (“Nasdaq”) and the London Stock Exchange Alternative Investment Market (“AIM”)) are valued at the last sale price on the exchange on which they are principally traded or, for Nasdaq and AIM securities, the
Notes to Financial Statements (Continued)
First Trust Exchange-Traded Fund III
July 31, 2021
official closing price. Securities traded on more than one securities exchange are valued at the last sale price or official closing price, as applicable, at the close of the securities exchange representing the principal market for such securities.
Securities trading on foreign exchanges or over-the-counter markets that close prior to the NYSE close may be valued using a systematic fair valuation model provided by a third-party pricing service. If these foreign securities meet certain criteria in relation to the valuation model, their valuation is systematically adjusted to reflect the impact of movement in the U.S. market after the close of the foreign markets.
Securities traded in an over-the-counter market are fair valued at the mean of their most recent bid and asked price, if available, and otherwise at their closing bid price.
Certain securities may not be able to be priced by pre-established pricing methods. Such securities may be valued by the Trust’s Board of Trustees or its delegate, the Advisor’s Pricing Committee, at fair value. These securities generally include, but are not limited to, restricted securities (securities which may not be publicly sold without registration under the Securities Act of 1933, as amended) for which a third-party pricing service is unable to provide a market price; securities whose trading has been formally suspended; a security whose market or fair value price is not available from a pre-established pricing source; a security with respect to which an event has occurred that is likely to materially affect the value of the security after the market has closed but before the calculation of a Fund’s NAV or make it difficult or impossible to obtain a reliable market quotation; and a security whose price, as provided by the third-party pricing service, does not reflect the security’s fair value. As a general principle, the current fair value of a security would appear to be the amount which the owner might reasonably expect to receive for the security upon its current sale. When fair value prices are used, generally they will differ from market quotations or official closing prices on the applicable exchanges. A variety of factors may be considered in determining the fair value of such securities, including, but not limited to, the following:
| 1) | the type of security; |
| 2) | the size of the holding; |
| 3) | the initial cost of the security; |
| 4) | transactions in comparable securities; |
| 5) | price quotes from dealers and/or third-party pricing services; |
| 6) | relationships among various securities; |
| 7) | information obtained by contacting the issuer, analysts, or the appropriate stock exchange; |
| 8) | an analysis of the issuer’s financial statements; and |
| 9) | the existence of merger proposals or tender offers that might affect the value of the security. |
If the securities in question are foreign securities, the following additional information may be considered:
| 1) | the value of similar foreign securities traded on other foreign markets; |
| 2) | ADR trading of similar securities; |
| 3) | closed-end fund or exchange-traded fund trading of similar securities; |
| 4) | foreign currency exchange activity; |
| 5) | the trading prices of financial products that are tied to baskets of foreign securities; |
| 6) | factors relating to the event that precipitated the pricing problem; |
| 7) | whether the event is likely to recur; and |
| 8) | whether the effects of the event are isolated or whether they affect entire markets, countries or regions. |
Because foreign markets may be open on different days than the days during which investors may transact in the shares of a Fund, the value of the Fund’s securities may change on the days when investors are not able to transact in the shares of the Fund. The value of securities denominated in foreign currencies is converted into U.S. dollars using exchange rates determined daily as of the close of regular trading on the NYSE.
The Funds are subject to fair value accounting standards that define fair value, establish the framework for measuring fair value and provide a three-level hierarchy for fair valuation based upon the inputs to the valuation as of the measurement date. The three levels of the fair value hierarchy are as follows:
| • | Level 1 – Level 1 inputs are quoted prices in active markets for identical investments. An active market is a market in which transactions for the investment occur with sufficient frequency and volume to provide pricing information on an ongoing basis. |
Notes to Financial Statements (Continued)
First Trust Exchange-Traded Fund III
July 31, 2021
| • | Level 2 – Level 2 inputs are observable inputs, either directly or indirectly, and include the following: |
| o | Quoted prices for similar investments in active markets. |
| o | Quoted prices for identical or similar investments in markets that are non-active. A non-active market is a market where there are few transactions for the investment, the prices are not current, or price quotations vary substantially either over time or among market makers, or in which little information is released publicly. |
| o | Inputs other than quoted prices that are observable for the investment (for example, interest rates and yield curves observable at commonly quoted intervals, volatilities, prepayment speeds, loss severities, credit risks, and default rates). |
| o | Inputs that are derived principally from or corroborated by observable market data by correlation or other means. |
| • | Level 3 – Level 3 inputs are unobservable inputs. Unobservable inputs may reflect the reporting entity’s own assumptions about the assumptions that market participants would use in pricing the investment. |
The inputs or methodologies used for valuing investments are not necessarily an indication of the risk associated with investing in those investments. A summary of the inputs used to value each Fund’s investments as of July 31, 2021, is included with each Fund’s Portfolio of Investments.
B. Securities Transactions and Investment Income
Securities transactions are recorded as of the trade date. Realized gains and losses from securities transactions are recorded on the identified cost basis. Dividend income is recorded on the ex-dividend date. Interest income, if any, is recorded daily on the accrual basis.
Withholding taxes and tax reclaims on foreign dividends have been provided for in accordance with each Fund’s understanding of the applicable country’s tax rules and rates.
Distributions received from a Fund’s investments in REITs may be comprised of return of capital, capital gains, and income. The actual character of the amounts received during the year are not known until after the REITs’ fiscal year end. A Fund records the character of distributions received from the REITs during the year based on estimates available. The characterization of distributions received by a Fund may be subsequently revised based on information received from the REITs after their tax reporting periods conclude.
C. Foreign Currency
The books and records of the Funds are maintained in U.S. dollars. Foreign currencies, investments and other assets and liabilities are translated into U.S. dollars at the exchange rates prevailing at the end of the period. Purchases and sales of investments and items of income and expense are translated on the respective dates of such transactions. Unrealized gains and losses on assets and liabilities, other than investments in securities, which result from changes in foreign currency exchange rates have been included in “Net change in unrealized appreciation (depreciation) on foreign currency translation” on the Statements of Operations. Unrealized gains and losses on investments in securities which result from changes in foreign exchange rates are included with fluctuations arising from changes in market price and are included in “Net change in unrealized appreciation (depreciation) on investments” on the Statements of Operations. Net realized foreign currency gains and losses include the effect of changes in exchange rates between trade date and settlement date on investment security transactions, foreign currency transactions and interest and dividends received and are included in “Net realized gain (loss) on foreign currency transactions” on the Statements of Operations. The portion of foreign currency gains and losses related to fluctuations in exchange rates between the initial purchase settlement date and subsequent sale trade date is included in “Net realized gain (loss) on investments” on the Statements of Operations.
D. Dividends and Distributions to Shareholders
Dividends from net investment income, if any, are declared and paid quarterly by each Fund, or as the Board of Trustees may determine from time to time. Distributions of net realized capital gains earned by each Fund, if any, are distributed at least annually.
Distributions from net investment income and realized capital gains are determined in accordance with federal income tax regulations, which may differ from U.S. GAAP. Certain capital accounts in the financial statements are periodically adjusted for permanent differences in order to reflect their tax character. These permanent differences are primarily due to the varying treatment of income and gain/loss on portfolio securities held by the Funds and have no impact on net assets or NAV per share. Temporary differences, which arise from recognizing certain items of income, expense and gain/loss in different periods for financial statement and tax purposes, will reverse at some time in the future.
Notes to Financial Statements (Continued)
First Trust Exchange-Traded Fund III
July 31, 2021
The tax character of distributions paid by each Fund during the fiscal year ended July 31, 2021, was as follows:
| | Distributions
paid from
Ordinary
Income | | Distributions
paid from
Capital
Gains | | Distributions
paid from
Return of
Capital |
First Trust Horizon Managed Volatility Domestic ETF
| $ 2,308,451 | | $ — | | $ — |
First Trust Horizon Managed Volatility Developed International ETF
| 2,737,667 | | — | | — |
First Trust Horizon Managed Volatility Small/Mid ETF
| 160,081 | | 155 | | — |
The tax character of distributions paid by each Fund during the fiscal period ended July 31, 2020, was as follows:
| | Distributions
paid from
Ordinary
Income | | Distributions
paid from
Capital
Gains | | Distributions
paid from
Return of
Capital |
First Trust Horizon Managed Volatility Domestic ETF
| $ 3,582,296 | | $ — | | $ — |
First Trust Horizon Managed Volatility Developed International ETF
| 3,755,422 | | — | | — |
First Trust Horizon Managed Volatility Small/Mid ETF
| 6,225 | | — | | — |
As of July 31, 2021, the components of distributable earnings on a tax basis for each Fund were as follows:
| | Undistributed
Ordinary
Income | | Accumulated
Capital and
Other
Gain (Loss) | | Net
Unrealized
Appreciation
(Depreciation) |
First Trust Horizon Managed Volatility Domestic ETF
| $ 163,103 | | $ (48,327,956) | | $ 14,302,062 |
First Trust Horizon Managed Volatility Developed International ETF
| 512,282 | | (28,169,828) | | 5,379,506 |
First Trust Horizon Managed Volatility Small/Mid ETF
| 4,006 | | (249,714) | | 890,248 |
E. Income Taxes
Each Fund intends to continue to qualify as a regulated investment company by complying with the requirements under Subchapter M of the Internal Revenue Code of 1986, as amended, which includes distributing substantially all of its net investment income and net realized gains to shareholders. Accordingly, no provision has been made for federal and state income taxes. However, due to the timing and amount of distributions, each Fund may be subject to an excise tax of 4% of the amount by which approximately 98% of each Fund’s taxable income exceeds the distributions from such taxable income for the calendar year.
The Funds are subject to accounting standards that establish a minimum threshold for recognizing, and a system for measuring, the benefits of a tax position taken or expected to be taken in a tax return. For HUSV and HDMV, taxable years ended 2018, 2019, 2020, and 2021 remain open to federal and state audit. For HSMV, the taxable years ended 2020 and 2021 remain open to federal and state audit. As of July 31, 2021, management has evaluated the application of these standards to the Funds and has determined that no provision for income tax is required in the Funds’ financial statements for uncertain tax positions.
The Funds intend to utilize provisions of the federal income tax laws, which allow them to carry a realized capital loss forward indefinitely following the year of the loss and offset such loss against any future realized capital gains. The Funds are subject to certain limitations under U.S. tax rules on the use of capital loss carryforwards and net unrealized built-in losses. These limitations apply when there has been a 50% change in ownership. At July 31, 2021, for federal income tax purposes, the Funds had a capital loss carryforward available that is shown in the table below, to the extent provided by regulations, to offset future capital gains.
| | Non-Expiring
Capital Loss
Carryforward |
First Trust Horizon Managed Volatility Domestic ETF
| $ 48,327,956 |
First Trust Horizon Managed Volatility Developed International ETF
| 28,169,828 |
First Trust Horizon Managed Volatility Small/Mid ETF
| 249,714 |
Notes to Financial Statements (Continued)
First Trust Exchange-Traded Fund III
July 31, 2021
In order to present paid-in capital and accumulated distributable earnings (loss) (which consists of accumulated net investment income (loss), accumulated net realized gain (loss) on investments and net unrealized appreciation (depreciation) on investments) on the Statements of Assets and Liabilities that more closely represent their tax character, certain adjustments have been made to paid-in capital, accumulated net investment income (loss) and accumulated net realized gain (loss) on investments. These adjustments are primarily due to the difference between book and tax treatments of income and gains on various investment securities held by the Funds and in-kind transactions. The results of operations and net assets were not affected by these adjustments. For the fiscal year ended July 31, 2021, the adjustments for each Fund were as follows:
| | Accumulated
Net
Investment
Income (Loss) | | Accumulated
Net Realized
Gain (Loss)
on Investments | | Paid-in
Capital |
First Trust Horizon Managed Volatility Domestic ETF
| $ — | | $ (24,679,396) | | $ 24,679,396 |
First Trust Horizon Managed Volatility Developed International ETF
| 397,466 | | (3,612,266) | | 3,214,800 |
First Trust Horizon Managed Volatility Small/Mid ETF
| — | | (4,512,540) | | 4,512,540 |
F. Expenses
Expenses, other than the investment advisory fee and other excluded expenses, are paid by the Advisor (See Note 3).
3. Investment Advisory Fee, Affiliated Transactions and Other Fee Arrangements
First Trust, the investment advisor to the Funds, is a limited partnership with one limited partner, Grace Partners of DuPage L.P., and one general partner, The Charger Corporation. The Charger Corporation is an Illinois corporation controlled by James A. Bowen, Chief Executive Officer of First Trust. First Trust is responsible for supervising the selection and ongoing monitoring of the securities in each Fund’s portfolio, managing the Funds’ business affairs and providing certain administrative services necessary for the management of the Funds.
HUSV has agreed to pay First Trust an annual unitary management fee of 0.70% of its average daily net assets. HDMV and HSMV have agreed to pay First Trust an annual unitary management fee of 0.80% of their average daily net assets. Pursuant to the Investment Management Agreement between First Trust and the Trust, First Trust manages the investment of the Funds’ assets and is responsible for the expenses of each Fund, including the cost of transfer agency, sub-advisory, custody, fund administration, legal, audit and other services, but excluding fee payments under the Investment Management Agreement, interest, taxes, brokerage commissions and other expenses connected with the execution of portfolio transactions, distribution and service fees payable pursuant to a Rule 12b-1 plan, if any, and extraordinary expenses, which are paid by each respective Fund. First Trust also provides fund reporting services to each Fund for a flat annual fee in the amount of $9,250, which is covered under the annual unitary management fee.
During the fiscal year ended July 31, 2021, HDMV received a payment from the Advisor of $6,254 in connection with a trade error.
Horizon serves as the Funds’ sub-advisor and manages each Fund’s portfolio subject to First Trust’s supervision. The Sub-Advisor receives a sub-advisory fee from First Trust equal to 50% of any remaining monthly unitary management fee paid to the Advisor after the average Fund’s expenses accrued during the most recent twelve months are subtracted from the unitary management fee for that month.
The Trust has multiple service agreements with Brown Brothers Harriman & Co. (“BBH”). Under the service agreements, BBH performs custodial, fund accounting, certain administrative services, and transfer agency services for the Funds. As custodian, BBH is responsible for custody of each Fund’s assets. As fund accountant and administrator, BBH is responsible for maintaining the books and records of each Fund’s securities and cash. As transfer agent, BBH is responsible for maintaining shareholder records for each Fund.
Each Trustee who is not an officer or employee of First Trust, any sub-advisor or any of their affiliates (“Independent Trustees”) is paid a fixed annual retainer that is allocated equally among each fund in the First Trust Fund Complex. Each Independent Trustee is also paid an annual per fund fee that varies based on whether the fund is a closed-end or other actively managed fund, a defined-outcome fund or an index fund.
Additionally, the Lead Independent Trustee and the Chairmen of the Audit Committee, Nominating and Governance Committee and Valuation Committee are paid annual fees to serve in such capacities, with such compensation allocated pro rata among each fund in the First Trust Fund Complex based on net assets. Independent Trustees are reimbursed for travel and out-of-pocket expenses in connection with all meetings. The Lead Independent Trustee and Committee Chairmen rotate every three years. The officers and “Interested” Trustee receive no compensation from the Trust for acting in such capacities.
Notes to Financial Statements (Continued)
First Trust Exchange-Traded Fund III
July 31, 2021
4. Purchases and Sales of Securities
For the fiscal year ended July 31, 2021, the cost of purchases and proceeds from sales of investment securities for each Fund, excluding short-term investments and in-kind transactions, were as follows:
| | Purchases | | Sales |
| First Trust Horizon Managed Volatility Domestic ETF | $ 241,868,684 | | $ 241,423,738 |
| First Trust Horizon Managed Volatility Developed International ETF | 121,991,728 | | 123,393,902 |
| First Trust Horizon Managed Volatility Small/Mid ETF | 17,848,864 | | 17,536,991 |
| | | | |
For the fiscal year ended July 31, 2021, the cost of in-kind purchases and proceeds from in-kind sales for each Fund were as follows:
| | Purchases | | Sales |
| First Trust Horizon Managed Volatility Domestic ETF | $ 126,887,436 | | $ 248,711,414 |
| First Trust Horizon Managed Volatility Developed International ETF | — | | 49,642,308 |
| First Trust Horizon Managed Volatility Small/Mid ETF | 23,304,000 | | 32,554,938 |
5. Creations, Redemptions and Transaction Fees
Each Fund generally issues and redeems its shares in primary market transactions through a creation and redemption mechanism and does not sell or redeem individual shares. Instead, financial entities known as “Authorized Participants” have contractual arrangements with a Fund or one of the Fund’s service providers to purchase and redeem Fund shares directly with the Fund in large blocks of shares known as “Creation Units.” Prior to the start of trading on every business day, a Fund publishes through the National Securities Clearing Corporation (“NSCC”) the “basket” of securities, cash or other assets that it will accept in exchange for a Creation Unit of the Fund’s shares. An Authorized Participant that wishes to effectuate a creation of a Fund’s shares deposits with the Fund the “basket” of securities, cash or other assets identified by the Fund that day, and then receives the Creation Unit of the Fund’s shares in return for those assets. After purchasing a Creation Unit, the Authorized Participant may continue to hold the Fund’s shares or sell them in the secondary market. The redemption process is the reverse of the purchase process: the Authorized Participant redeems a Creation Unit of a Fund’s shares for a basket of securities, cash or other assets. The combination of the creation and redemption process with secondary market trading in a Fund’s shares and underlying securities provides arbitrage opportunities that are designed to help keep the market price of a Fund’s shares at or close to the NAV per share of the Fund.
Each Fund imposes fees in connection with the purchase of Creation Units. These fees may vary based upon various fact-based circumstances, including, but not limited to, the composition of the securities included in the Creation Unit or the countries in which the transactions are settled. The price for each Creation Unit will equal the daily NAV per share of a Fund times the number of shares in a Creation Unit, plus the fees described above and, if applicable, any operational processing and brokerage costs, transfer fees, stamp taxes and part or all of the spread between the expected bid and offer side of the market related to the securities comprising the creation basket.
Each Fund also imposes fees in connection with the redemption of Creation Units. These fees may vary based upon various fact-based circumstances, including, but not limited to, the composition of the securities included in the Creation Unit or the countries in which the transactions are settled. The price received for each Creation Unit will equal the daily NAV per share of a Fund times the number of shares in a Creation Unit, minus the fees described above and, if applicable, any operational processing and brokerage costs, transfer fees, stamp taxes and part or all of the spread between the expected bid and offer side of the market related to the securities comprising the redemption basket. Investors who use the services of a broker or other such intermediary in addition to an Authorized Participant to effect a redemption of a Creation Unit may also be assessed an amount to cover the cost of such services. The redemption fee charged by a Fund will comply with Rule 22c-2 of the 1940 Act which limits redemption fees to no more than 2% of the value of the shares redeemed.
6. Distribution Plan
The Board of Trustees adopted a Distribution and Service Plan pursuant to Rule 12b-1 under the 1940 Act. In accordance with the Rule 12b-1 plan, each Fund is authorized to pay an amount up to 0.25% of its average daily net assets each year to reimburse First Trust Portfolios L.P. (“FTP”), the distributor of the Funds, for amounts expended to finance activities primarily intended to result in the sale of Creation Units or to provide investor services. FTP may also use this amount to compensate securities dealers or other
Notes to Financial Statements (Continued)
First Trust Exchange-Traded Fund III
July 31, 2021
persons that are Authorized Participants for providing distribution assistance, including broker-dealer and shareholder support and educational and promotional services.
No 12b-1 fees are currently paid by the Funds, and pursuant to a contractual arrangement, no 12b-1 fees will be paid any time before November 30, 2022.
7. Indemnification
The Trust, on behalf of the Funds, has a variety of indemnification obligations under contracts with its service providers. The Trust’s maximum exposure under these arrangements is unknown. However, the Trust has not had prior claims or losses pursuant to these contracts and expects the risk of loss to be remote.
8. Other Matters
By operation of law, HUSV and HDMV now operate as diversified open-end management investment companies as defined in Section 5(b) of the 1940 Act.
9. Subsequent Events
Management has evaluated the impact of all subsequent events to the Funds through the date the financial statements were issued, and has determined that there was the following subsequent event:
Horizon, which has served as the investment sub-advisor to each Fund since its inception, has entered into an agreement pursuant to which ACP Horizon Holdings, L.P., an entity affiliated with Altamont Capital Partners, a private investment firm located in Palo Alto, California, will acquire a majority ownership interest in Horizon (the “Transaction”). Subject to satisfaction of certain conditions, the Transaction is expected to close in the fourth quarter of 2021 (the “Closing”). The Closing may operate as an “assignment” (as defined in the 1940 Act) of, for each Fund, the applicable existing investment sub-advisory agreement with Horizon (each a “Current Sub-Advisory Agreement” and collectively, the “Current Sub-Advisory Agreements”), which may result in the automatic termination of the Current Sub-Advisory Agreements in accordance with their respective terms. Therefore, in anticipation of the Closing, the Board approved a new investment sub-advisory agreement (the “New Sub-Advisory Agreement”) among the Trust, on behalf of each Fund, FTA and Horizon. The New Sub-Advisory Agreement will be submitted to shareholders of each Fund for approval at a joint special meeting of shareholders of the Funds that is expected to be held in the fourth quarter of 2021. In addition, to avoid any interruption of investment sub-advisory services for a Fund if the Closing occurs prior to receipt of shareholder approval of the New Sub-Advisory Agreement, the Board approved interim investment sub-advisory agreements with Horizon which would be effective upon the Closing and remain in effect for a maximum period of 150 days.
Report of Independent Registered Public Accounting Firm
To the Shareholders and the Board of Trustees of First Trust Exchange-Traded Fund III:
Opinion on the Financial Statements and Financial Highlights
We have audited the accompanying statements of assets and liabilities of First Trust Horizon Managed Volatility Domestic ETF, First Trust Horizon Managed Volatility Developed International ETF, and First Trust Horizon Managed Volatility Small/Mid ETF (the “Funds”), each a series of the First Trust Exchange-Traded Fund III, including the portfolios of investments, as of July 31, 2021, the related statements of operations, the statements of changes in net assets, and the financial highlights for the periods indicated in the table below, and the related notes. In our opinion, the financial statements and financial highlights present fairly, in all material respects, the financial position of each of the Funds as of July 31, 2021, and the results of their operations, the changes in their net assets, and the financial highlights for the periods listed in the table below in conformity with accounting principles generally accepted in the United States of America.
| Individual Funds Included in the Trust | Statements
of
Operations | Statements of
Changes in
Net Assets | Financial Highlights |
First Trust Horizon
Managed Volatility
Domestic ETF (HUSV)
First Trust Horizon
Managed Volatility
Developed International ETF (HDMV) | For the year ended
July 31, 2021 | For the years ended
July 31, 2021 and 2020 | For the years ended July 31,
2021, 2020, 2019, 2018, and for the
period from August 24, 2016
(commencement of operations)
through July 31, 2017. |
First Trust Horizon
Managed Volatility
Small/Mid ETF (HSMV) | For the year ended
July 31, 2021 | For the year ended
July 31, 2021 and the period from
April 6, 2020 (commencement of
operations) through July 31, 2020 | For the year ended
July 31, 2021 and for the period from
April 6, 2020 (commencement of
operations) through July 31, 2020 |
Basis for Opinion
These financial statements and financial highlights are the responsibility of the Funds’ management. Our responsibility is to express an opinion on the Funds’ financial statements and financial highlights based on our audits. We are a public accounting firm registered with the Public Company Accounting Oversight Board (United States) (PCAOB) and are required to be independent with respect to the Funds in accordance with the U.S. federal securities laws and the applicable rules and regulations of the Securities and Exchange Commission and the PCAOB.
We conducted our audits in accordance with the standards of the PCAOB. Those standards require that we plan and perform the audit to obtain reasonable assurance about whether the financial statements and financial highlights are free of material misstatement, whether due to error or fraud. The Funds are not required to have, nor were we engaged to perform, an audit of its internal control over financial reporting. As part of our audits we are required to obtain an understanding of internal control over financial reporting but not for the purpose of expressing an opinion on the effectiveness of the Funds’ internal control over financial reporting. Accordingly, we express no such opinion.
Our audits included performing procedures to assess the risks of material misstatement of the financial statements and financial highlights, whether due to error or fraud, and performing procedures that respond to those risks. Such procedures included examining, on a test basis, evidence regarding the amounts and disclosures in the financial statements and financial highlights. Our audits also included evaluating the accounting principles used and significant estimates made by management, as well as evaluating the overall presentation of the financial statements and financial highlights. Our procedures included confirmation of securities owned as of July 31, 2021, by correspondence with the custodian and brokers; when replies were not received from brokers, we performed other auditing procedures. We believe that our audits provide a reasonable basis for our opinion.
Chicago, Illinois
September 22, 2021
We have served as the auditor of one or more First Trust investment companies since 2001.
Additional Information
First Trust Exchange-Traded Fund III
July 31, 2021 (Unaudited)
Proxy Voting Policies and Procedures
A description of the policies and procedures that the Trust uses to determine how to vote proxies and information on how each Fund voted proxies relating to portfolio securities during the most recent 12-month period ended June 30 is available (1) without charge, upon request, by calling (800) 988-5891; (2) on each Fund’s website at www.ftportfolios.com; and (3) on the Securities and Exchange Commission’s (“SEC”) website at www.sec.gov.
Portfolio Holdings
Each Fund files portfolio holdings information for each month in a fiscal quarter within 60 days after the end of the relevant fiscal quarter on Form N-PORT. Portfolio holdings information for the third month of each fiscal quarter will be publicly available on the SEC’s website at www.sec.gov. Each Fund’s complete schedule of portfolio holdings for the second and fourth quarters of each fiscal year is included in the semi-annual and annual reports to shareholders, respectively, and is filed with the SEC on Form N-CSR. The semi-annual and annual report for each Fund is available to investors within 60 days after the period to which it relates. Each Fund’s Forms N-PORT and Forms N-CSR are available on the SEC’s website listed above.
Federal Tax Information
For the taxable year ended July 31, 2021, the following percentages of income dividend paid by the Funds qualify for the dividends received deduction available to corporations:
| | Dividends
Received Deduction |
First Trust Horizon Managed Volatility Domestic ETF
| 100.00% |
First Trust Horizon Managed Volatility Developed International ETF
| 0.00% |
First Trust Horizon Managed Volatility Small/Mid ETF
| 100.00% |
For the taxable year ended July 31, 2021, the following percentages of income dividend paid by the Funds are hereby designated as qualified dividend income:
| | Qualified
Dividend Income |
First Trust Horizon Managed Volatility Domestic ETF
| 100.00% |
First Trust Horizon Managed Volatility Developed International ETF
| 75.53% |
First Trust Horizon Managed Volatility Small/Mid ETF
| 100.00% |
A portion of the ordinary dividends (including short-term capital gains) that HUSV and HSMV paid to shareholders during the taxable year ended July 31, 2021, may be eligible for the Qualified Business Income (QBI) Deduction under the Internal Revenue Code of 1986, as amended (the “Code”), section 199A for the aggregate dividends the Funds received from the Underlying Real Estate Investment Trusts (REITs) they invest in.
The following Fund met the requirements of Section 853 of the Code and elects to pass through to its shareholders credit for foreign taxes paid. For the taxable year ended July 31, 2021, the total amounts of income received by the Fund from sources within foreign countries and possessions of the United States and of taxes paid to such countries are as follows:
| | Gross Foreign Income | | Foreign Taxes Paid |
| | Amount | | Per Share | | Amount | | Per Share |
First Trust Horizon Managed Volatility Developed International ETF
| $ 267,369 | | $ 0.10 | | $ 3,661,990 | | $ 1.36 |
The foreign taxes paid will be reported to shareholders on Form 1099-DIV which will be sent to shareholders shortly after the calendar year end. Gross foreign income and foreign taxes paid will be posted on the Fund’s website and disclosed in the tax letter.
Risk Considerations
Risks are inherent in all investing. Certain general risks that may be applicable to a Fund are identified below, but not all of the material risks relevant to each Fund are included in this report and not all of the risks below apply to each Fund. The material risks of investing in each Fund are spelled out in its prospectus, statement of additional information and other regulatory filings. Before investing, you should consider each Fund’s investment objective, risks, charges and expenses, and read each
Additional Information (Continued)
First Trust Exchange-Traded Fund III
July 31, 2021 (Unaudited)
Fund’s prospectus and statement of additional information carefully. You can download each Fund’s prospectus at www.ftportfolios.com or contact First Trust Portfolios L.P. at (800) 621-1675 to request a prospectus, which contains this and other information about each Fund.
Concentration Risk. To the extent that a fund is able to invest a significant percentage of its assets in a single asset class or the securities of issuers within the same country, state, region, industry or sector, an adverse economic, business or political development may affect the value of the fund’s investments more than if the fund were more broadly diversified. A fund that tracks an index will be concentrated to the extent the fund’s corresponding index is concentrated. A concentration makes a fund more susceptible to any single occurrence and may subject the fund to greater market risk than a fund that is more broadly diversified.
Credit Risk. Credit risk is the risk that an issuer of a security will be unable or unwilling to make dividend, interest and/or principal payments when due and the related risk that the value of a security may decline because of concerns about the issuer’s ability to make such payments.
Cyber Security Risk. The funds are susceptible to potential operational risks through breaches in cyber security. A breach in cyber security refers to both intentional and unintentional events that may cause a fund to lose proprietary information, suffer data corruption or lose operational capacity. Such events could cause a fund to incur regulatory penalties, reputational damage, additional compliance costs associated with corrective measures and/or financial loss. In addition, cyber security breaches of a fund’s third-party service providers, such as its administrator, transfer agent, custodian, or sub-advisor, as applicable, or issuers in which the fund invests, can also subject a fund to many of the same risks associated with direct cyber security breaches.
Defined Outcome Funds Risk. To the extent a fund’s investment strategy is designed to deliver returns tied to the price performance of an underlying ETF, an investor may not realize the returns the fund seeks to achieve if that investor does not hold shares for the entire target outcome period. In the event an investor purchases shares after the first day of the target outcome period or sells shares prior to the end of the target outcome period, the buffer that the fund seeks to provide against a decline in the value of the underlying ETF may not be available, the enhanced returns that the fund seeks to provide (if any) may not be available and the investor may not participate in a gain in the value of the underlying ETF up to the cap for the investor’s investment period. Additionally, the fund will not participate in gains of the underlying ETF above the cap and a shareholder may lose their entire investment. If the fund seeks enhanced returns, there are certain time periods when the value of the fund may fall faster than the value of the underlying ETF, and it is very unlikely that, on any given day during which the underlying ETF share price increases in value, the fund’s share price will increase at the same rate as the enhanced returns sought by the fund, which is designed for an entire target outcome period. Trading flexible exchange options involves risks different from, or possibly greater than, the risks associated with investing directly in securities, such as less liquidity and correlation and valuation risks. A fund may experience substantial downside from specific flexible exchange option positions and certain positions may expire worthless.
Derivatives Risk. To the extent a fund uses derivative instruments such as futures contracts, options contracts and swaps, the fund may experience losses because of adverse movements in the price or value of the underlying asset, index or rate, which may be magnified by certain features of the derivative. These risks are heightened when a fund’s portfolio managers use derivatives to enhance the fund’s return or as a substitute for a position or security, rather than solely to hedge (or offset) the risk of a position or security held by the fund.
Equity Securities Risk. To the extent a fund invests in equity securities, the value of the fund’s shares will fluctuate with changes in the value of the equity securities. Equity securities prices fluctuate for several reasons, including changes in investors’ perceptions of the financial condition of an issuer or the general condition of the relevant stock market, such as market volatility, or when political or economic events affecting the issuers occur. In addition, common stock prices may be particularly sensitive to rising interest rates, as the cost of capital rises and borrowing costs increase. Equity securities may decline significantly in price over short or extended periods of time, and such declines may occur in the equity market as a whole, or they may occur in only a particular country, company, industry or sector of the market.
ETF Risk. The shares of an ETF trade like common stock and represent an interest in a portfolio of securities. The risks of owning an ETF generally reflect the risks of owning the underlying securities, although lack of liquidity in an ETF could result in it being more volatile and ETFs have management fees that increase their costs. Shares of an ETF trade on an exchange at market prices rather than net asset value, which may cause the shares to trade at a price greater than net asset value (premium) or less than net asset value (discount). In times of market stress, decisions by market makers to reduce or step away from their role of providing a market for an ETF’s shares, or decisions by an ETF’s authorized participants that they are unable or unwilling to proceed with creation and/or redemption orders of an ETF’s shares, could result in shares of the ETF trading at a discount to net asset value and in greater than normal intraday bid-ask spreads.
Additional Information (Continued)
First Trust Exchange-Traded Fund III
July 31, 2021 (Unaudited)
Fixed Income Securities Risk. To the extent a fund invests in fixed income securities, the fund will be subject to credit risk, income risk, interest rate risk, liquidity risk and prepayment risk. Income risk is the risk that income from a fund’s fixed income investments could decline during periods of falling interest rates. Interest rate risk is the risk that the value of a fund’s fixed income securities will decline because of rising interest rates. Liquidity risk is the risk that a security cannot be purchased or sold at the time desired, or cannot be purchased or sold without adversely affecting the price. Prepayment risk is the risk that the securities will be redeemed or prepaid by the issuer, resulting in lower interest payments received by the fund. In addition to these risks, high yield securities, or “junk” bonds, are subject to greater market fluctuations and risk of loss than securities with higher ratings, and the market for high yield securities is generally smaller and less liquid than that for investment grade securities.
Index or Model Constituent Risk. Certain funds may be a constituent of one or more indices or ETF models. As a result, such a fund may be included in one or more index-tracking exchange-traded funds or mutual funds. Being a component security of such a vehicle could greatly affect the trading activity involving a fund, the size of the fund and the market volatility of the fund. Inclusion in an index could increase demand for the fund and removal from an index could result in outsized selling activity in a relatively short period of time. As a result, a fund’s net asset value could be negatively impacted and the fund’s market price may be significantly below its net asset value during certain periods. In addition, index rebalances may potentially result in increased trading activity in a fund’s shares.
Index Provider Risk. To the extent a fund seeks to track an index, it is subject to Index Provider Risk. There is no assurance that the Index Provider will compile the Index accurately, or that the Index will be determined, maintained, constructed, reconstituted, rebalanced, composed, calculated or disseminated accurately. To correct any such error, the Index Provider may carry out an unscheduled rebalance or other modification of the Index constituents or weightings, which may increase the fund’s costs. The Index Provider does not provide any representation or warranty in relation to the quality, accuracy or completeness of data in the Index, and it does not guarantee that the Index will be calculated in accordance with its stated methodology. Losses or costs associated with any Index Provider errors generally will be borne by the fund and its shareholders.
Investment Companies Risk. To the extent a fund invests in the securities of other investment vehicles, the fund will incur additional fees and expenses that would not be present in a direct investment in those investment vehicles. Furthermore, the fund’s investment performance and risks are directly related to the investment performance and risks of the investment vehicles in which the fund invests.
LIBOR Risk. To the extent a fund invests in floating or variable rate obligations that use the London Interbank Offered Rate (“LIBOR”) as a reference interest rate, it is subject to LIBOR Risk. The United Kingdom’s Financial Conduct Authority, which regulates LIBOR, will cease making LIBOR available as a reference rate over a phase-out period that will begin immediately after December 31, 2021. The unavailability or replacement of LIBOR may affect the value, liquidity or return on certain fund investments and may result in costs incurred in connection with closing out positions and entering into new trades. Any potential effects of the transition away from LIBOR on the fund or on certain instruments in which the fund invests can be difficult to ascertain, and they may vary depending on a variety of factors, and they could result in losses to the fund.
Management Risk. To the extent that a fund is actively managed, it is subject to management risk. In managing an actively-managed fund’s investment portfolio, the fund’s portfolio managers will apply investment techniques and risk analyses that may not have the desired result. There can be no guarantee that a fund will meet its investment objective.
Market Risk. Securities held by a fund, as well as shares of a fund itself, are subject to market fluctuations caused by factors such as general economic conditions, political events, regulatory or market developments, changes in interest rates and perceived trends in securities prices. Shares of a fund could decline in value or underperform other investments as a result of the risk of loss associated with these market fluctuations. In addition, local, regional or global events such as war, acts of terrorism, spread of infectious diseases or other public health issues, recessions, or other events could have a significant negative impact on a fund and its investments. Such events may affect certain geographic regions, countries, sectors and industries more significantly than others. The outbreak of the respiratory disease designated as COVID-19 in December 2019 has caused significant volatility and declines in global financial markets, which have caused losses for investors. While the development of vaccines has slowed the spread of the virus and allowed for the resumption of “reasonably” normal business activity in the United States, many countries continue to impose lockdown measures in an attempt to slow the spread. Additionally, there is no guarantee that vaccines will be effective against emerging variants of the disease.
Non-U.S. Securities Risk. To the extent a fund invests in non-U.S. securities, it is subject to additional risks not associated with securities of domestic issuers. Non-U.S. securities are subject to higher volatility than securities of domestic issuers due to: possible adverse political, social or economic developments; restrictions on foreign investment or exchange of securities; capital controls; lack of liquidity; currency exchange rates; excessive taxation; government seizure of assets; the imposition of sanctions by foreign governments; different legal or accounting standards; and less government supervision and regulation of exchanges in foreign countries. Investments in non-U.S. securities may involve higher costs than investments in U.S. securities, including higher transaction
Additional Information (Continued)
First Trust Exchange-Traded Fund III
July 31, 2021 (Unaudited)
and custody costs, as well as additional taxes imposed by non-U.S. governments. These risks may be heightened for securities of companies located, or with significant operations, in emerging market countries.
Operational Risk. Each fund is subject to risks arising from various operational factors, including, but not limited to, human error, processing and communication errors, errors of a fund’s service providers, counterparties or other third-parties, failed or inadequate processes and technology or systems failures. Each fund relies on third-parties for a range of services, including custody. Any delay or failure relating to engaging or maintaining such service providers may affect a fund’s ability to meet its investment objective. Although the funds and the funds’ investment advisor seek to reduce these operational risks through controls and procedures, there is no way to completely protect against such risks.
Passive Investment Risk. To the extent a fund seeks to track an index, the fund will invest in the securities included in, or representative of, the index regardless of their investment merit. A fund generally will not attempt to take defensive positions in declining markets.
| NOT FDIC INSURED | NOT BANK GUARANTEED | MAY LOSE VALUE |
Advisory and Sub-Advisory Agreements
Board Considerations Regarding Approval of Continuation of Investment Management and Investment Sub-Advisory Agreements
FIRST TRUST HORIZON MANAGED VOLATILITY DOMESTIC ETF
FIRST TRUST HORIZON MANAGED VOLATILITY DEVELOPED INTERNATIONAL ETF
FIRST TRUST HORIZON MANAGED VOLATILITY SMALL/MID ETF
The Board of Trustees of First Trust Exchange-Traded Fund III (the “Trust”), including the Independent Trustees, unanimously approved the continuation of the Investment Management Agreements (as applicable to a specific Fund, the “Advisory Agreement” and collectively, the “Advisory Agreements”) with First Trust Advisors L.P. (the “Advisor”) and the Investment Sub-Advisory Agreements (as applicable to a specific Fund, the “Sub-Advisory Agreement” and collectively, the “Sub-Advisory Agreements” and together with the Advisory Agreements, the “Agreements”) among the Trust, the Advisor and Horizon Investments, LLC (the “Sub-Advisor”) on behalf of the following three series of the Trust (each a “Fund” and collectively, the “Funds”):
First Trust Horizon Managed Volatility Domestic ETF (HUSV)
First Trust Horizon Managed Volatility Developed International ETF (HDMV)
First Trust Horizon Managed Volatility Small/Mid ETF (HSMV)
The Board approved the continuation of the applicable Agreements for each Fund for a one-year period ending June 30, 2022 at a meeting held on June 6–7, 2021. The Board determined for each Fund that the continuation of the applicable Agreements is in the best interests of the Fund in light of the nature, extent and quality of the services provided and such other matters as the Board considered to be relevant in the exercise of its business judgment.
To reach this determination for each Fund, the Board considered its duties under the Investment Company Act of 1940, as amended (the “1940 Act”), as well as under the general principles of state law, in reviewing and approving advisory contracts; the requirements of the 1940 Act in such matters; the fiduciary duty of investment advisors with respect to advisory agreements and compensation; the standards used by courts in determining whether investment company boards have fulfilled their duties; and the factors to be considered by the Board in voting on such agreements. At meetings held on April 26, 2021 and June 6–7, 2021, the Board, including the Independent Trustees, reviewed materials provided by the Advisor and the Sub-Advisor responding to requests for information from counsel to the Independent Trustees, submitted on behalf of the Independent Trustees, that, among other things, outlined: the services provided by the Advisor and the Sub-Advisor to each Fund (including the relevant personnel responsible for these services and their experience); the unitary fee rate payable by each Fund as compared to fees charged to a peer group of funds (the “Expense Group”) and a broad peer universe of funds (the “Expense Universe”), each assembled by Broadridge Financial Solutions, Inc. (“Broadridge”), an independent source, and as compared to fees charged to other clients of the Advisor, including other exchange-traded funds (“ETFs”) managed by the Advisor; the sub-advisory fee rate as compared to fees charged to other clients of the Sub-Advisor; the expense ratio of each Fund as compared to expense ratios of the funds in the Fund’s Expense Group and Expense Universe; performance information for each Fund, including comparisons of each Fund’s performance to that of one or more relevant benchmark indexes and to that of a performance group of funds and a broad performance universe of funds (the “Performance Universe”), each assembled by Broadridge; the nature of expenses incurred in providing services to each Fund and the potential for the Advisor and the Sub-Advisor to realize economies of scale, if any; profitability and other financial data for the Advisor; financial data for the Sub-Advisor; any fall-out benefits to the Advisor and its affiliate, First Trust Portfolios L.P. (“FTP”), and the Sub-Advisor; and information on the Advisor’s and the Sub-Advisor’s compliance programs. The Board reviewed initial materials with the Advisor at the
Additional Information (Continued)
First Trust Exchange-Traded Fund III
July 31, 2021 (Unaudited)
meeting held on April 26, 2021, prior to which the Independent Trustees and their counsel met separately to discuss the information provided by the Advisor and the Sub-Advisor. Following the April meeting, counsel to the Independent Trustees, on behalf of the Independent Trustees, requested certain clarifications and supplements to the materials provided, and the information provided in response to those requests was considered at an executive session of the Independent Trustees and their counsel held prior to the June 6–7, 2021 meeting, as well as at the June meeting. The Board applied its business judgment to determine whether the arrangements between the Trust and the Advisor and among the Trust, the Advisor and the Sub-Advisor continue to be reasonable business arrangements from each Fund’s perspective. The Board determined that, given the totality of the information provided with respect to the Agreements, the Board had received sufficient information to renew the Agreements. The Board considered that shareholders chose to invest or remain invested in a Fund knowing that the Advisor and the Sub-Advisor manage the Fund and knowing the Fund’s unitary fee.
In reviewing the applicable Agreements for each Fund, the Board considered the nature, extent and quality of the services provided by the Advisor and the Sub-Advisor under the applicable Agreements. With respect to the Advisory Agreements, the Board considered that the Advisor is responsible for the overall management and administration of the Trust and each Fund and reviewed all of the services provided by the Advisor to the Funds, including the oversight of the Sub-Advisor, as well as the background and experience of the persons responsible for such services. The Board noted that the Advisor oversees the Sub-Advisor’s day-to-day management of each Fund’s investments, including portfolio risk monitoring and performance review. The Board considered that the Sub-Advisor is responsible for the selection and ongoing monitoring of the securities in the Funds’ investment portfolios, but that the Advisor executes each Fund’s portfolio trades. In reviewing the services provided, the Board noted the compliance program that had been developed by the Advisor and considered that it includes a robust program for monitoring the Advisor’s, the Sub-Advisor’s and each Fund’s compliance with the 1940 Act, as well as each Fund’s compliance with its investment objective, policies and restrictions. The Board also considered a report from the Advisor with respect to its risk management functions related to the operation of the Funds. Finally, as part of the Board’s consideration of the Advisor’s services, the Advisor, in its written materials and at the April 26, 2021 meeting, described to the Board the scope of its ongoing investment in additional personnel and infrastructure to maintain and improve the quality of services provided to the Funds and the other funds in the First Trust Fund Complex. With respect to the Sub-Advisory Agreements, the Board noted that each Fund is an actively managed ETF and the Sub-Advisor actively manages the Fund’s investments. The Board reviewed the materials provided by the Sub-Advisor and considered the services that the Sub-Advisor provides to each Fund, including the Sub-Advisor’s day-to-day management of the Funds’ investments. In considering the Sub-Advisor’s management of the Funds, the Board noted the background and experience of the Sub-Advisor’s portfolio management team, including the Board’s prior meetings with members of the portfolio management team. In light of the information presented and the considerations made, the Board concluded that the nature, extent and quality of the services provided to the Trust and each Fund by the Advisor and the Sub-Advisor under the Agreements have been and are expected to remain satisfactory and that the Sub-Advisor, under the oversight of the Advisor, has managed each Fund consistent with its investment objective, policies and restrictions.
The Board considered the unitary fee rate payable by each Fund under the applicable Advisory Agreement for the services provided. The Board noted that the sub-advisory fee for each Fund is paid by the Advisor from the Fund’s unitary fee. The Board considered that as part of the unitary fee the Advisor is responsible for each Fund’s expenses, including the cost of sub-advisory, transfer agency, custody, fund administration, legal, audit and other services and license fees, if any, but excluding the fee payment under the applicable Advisory Agreement and interest, taxes, brokerage commissions and other expenses connected with the execution of portfolio transactions, distribution and service fees pursuant to a Rule 12b-1 plan, if any, and extraordinary expenses, if any. The Board received and reviewed information showing the advisory or unitary fee rates and expense ratios of the peer funds in the Expense Groups, as well as advisory and unitary fee rates charged by the Advisor and the Sub-Advisor to other fund (including ETFs) and non-fund clients, as applicable. Because each Fund pays a unitary fee, the Board determined that expense ratios were the most relevant comparative data point. Based on the information provided, the Board noted that the unitary fee rate for each of HUSV and HDMV was above the median total (net) expense ratio of the peer funds in its respective Expense Group and that the unitary fee rate for HSMV was below the median total (net) expense ratio of the peer funds in its Expense Group. With respect to the Expense Groups, the Board, at the April 26, 2021 meeting, discussed with the Advisor limitations in creating peer groups for actively-managed ETFs, including that the Expense Group for HUSV contained both actively-managed ETFs and open-end mutual funds and there were no other actively-managed ETFs in the Expense Groups for HDMV and HSMV, and different business models that may affect the pricing of services among ETF sponsors. The Board also noted that, for each Fund, not all peer funds employ an advisor/sub-advisor management structure. The Board took these limitations and differences into account in considering the peer data. With respect to fees charged to other non-ETF clients, the Board considered differences between the Funds and other non-ETF clients that limited their comparability. In considering the unitary fee rates overall, the Board also considered the Advisor’s statement that it seeks to meet investor needs through innovative and value-added investment solutions and the Advisor’s demonstrated long-term commitment to each Fund and the other funds in the First Trust Fund Complex.
The Board considered performance information for each Fund. The Board noted the process it has established for monitoring each Fund’s performance and portfolio risk on an ongoing basis, which includes quarterly performance reporting from the Advisor and
Additional Information (Continued)
First Trust Exchange-Traded Fund III
July 31, 2021 (Unaudited)
Sub-Advisor for the Funds. The Board determined that this process continues to be effective for reviewing each Fund’s performance. The Board received and reviewed information comparing each Fund’s performance for periods ended December 31, 2020 to the performance of the funds in its Performance Universe and to that of a benchmark index. Based on the information provided, the Board noted that each of HUSV and HDMV underperformed its Performance Universe median and benchmark index for the one- and three-year periods ended December 31, 2020. The Board noted the Advisor’s discussion of HUSV’s and HDMV’s performance at the April 26, 2021 meeting. Because HSMV commenced operations on April 6, 2020 and therefore has a limited performance history, comparative performance information for the Fund was not considered.
On the basis of all the information provided on the unitary fee and performance, as applicable, of each Fund and the ongoing oversight by the Board, the Board concluded that the unitary fee for each Fund (out of which the Sub-Advisor is compensated) continues to be reasonable and appropriate in light of the nature, extent and quality of the services provided by the Advisor and the Sub-Advisor to each Fund under the Agreements.
The Board considered information and discussed with the Advisor whether there were any economies of scale in connection with providing advisory services to the Funds and noted the Advisor’s statement that it believes its expenses will likely increase during the next twelve months as the Advisor continues to hire personnel and build infrastructure, including technology, to improve the services to the Funds. The Board noted that any reduction in fixed costs associated with the management of the Funds would benefit the Advisor, but that the unitary fee structure provides a level of certainty in expenses for the Funds. The Board considered the revenues and allocated costs (including the allocation methodology) of the Advisor in serving as investment advisor to each of HUSV and HDMV for the twelve months ended December 31, 2020 and to HSMV for the period from inception through December 31, 2020 and the estimated profitability level for each Fund calculated by the Advisor based on such data, as well as complex-wide and product-line profitability data, for the twelve months ended December 31, 2020. The Board noted the inherent limitations in the profitability analysis and concluded that, based on the information provided, the Advisor’s profitability level for each Fund was not unreasonable. In addition, the Board considered fall-out benefits described by the Advisor that may be realized from its relationship with the Funds. The Board considered that the Advisor had identified as a fall-out benefit to the Advisor and FTP their exposure to investors and brokers who, absent their exposure to the Funds, may have had no dealings with the Advisor or FTP, and noted that the Advisor does not utilize soft dollars in connection with the Funds. The Board also considered the Advisor’s compensation for fund reporting services provided to the Funds pursuant to a separate Fund Reporting Services Agreement, which is paid from the unitary fee. The Board concluded that the character and amount of potential fall-out benefits to the Advisor were not unreasonable.
The Board considered the Sub-Advisor’s statements to the effect that it is difficult to know if or precisely when measurable economies of scale will be achieved for the Sub-Advisor and that the Sub-Advisor presumes expenses related to providing services will remain approximately the same over the next twelve months. The Board did not review the profitability of the Sub-Advisor with respect to each Fund. The Board noted that the Advisor pays the Sub-Advisor for each Fund from its unitary fee and its understanding that each Fund’s sub-advisory fee rate was the product of an arm’s length negotiation. The Board concluded that the profitability analysis for the Advisor was more relevant. The Board considered the potential fall-out benefits to the Sub-Advisor from being associated with the Advisor and the Funds. The Board noted that the Sub-Advisor is not responsible for coordinating execution of Fund trades and that the only known fall-out benefit the Sub-Advisor receives from managing the Funds is publicity related to managing an ETF in a closely monitored sector of the ETF universe. The Board concluded that the character and amount of potential fall-out benefits to the Sub-Advisor were not unreasonable.
Based on all of the information considered and the conclusions reached, the Board, including the Independent Trustees, unanimously determined that the terms of the Agreements continue to be fair and reasonable and that the continuation of the Agreements is in the best interests of each Fund. No single factor was determinative in the Board’s analysis.
Liquidity Risk Management Program
In accordance with Rule 22e-4 under the Investment Company Act of 1940, as amended (the “1940 Act”), the Funds and each other fund in the First Trust Fund Complex, other than the closed-end funds, have adopted and implemented a liquidity risk management program (the “Program”) reasonably designed to assess and manage the funds’ liquidity risk, i.e., the risk that a fund could not meet requests to redeem shares issued by the fund without significant dilution of remaining investors’ interests in the fund. The Board of Trustees of the First Trust Funds has appointed First Trust Advisors, L.P. (the “Advisor”) as the person designated to administer the Program, and in this capacity the Advisor performs its duties primarily through the activities and efforts of the First Trust Liquidity Committee (the “Liquidity Committee”).
Pursuant to the Program, the Liquidity Committee classifies the liquidity of each fund’s portfolio investments into one of the four liquidity categories specified by Rule 22e-4: highly liquid investments, moderately liquid investments, less liquid investments and illiquid investments. The Liquidity Committee determines certain of the inputs for this classification process, including reasonably anticipated trade sizes and significant investor dilution thresholds. The Liquidity Committee also determines and periodically reviews
Additional Information (Continued)
First Trust Exchange-Traded Fund III
July 31, 2021 (Unaudited)
a highly liquid investment minimum for certain funds, monitors the funds’ holdings of assets classified as illiquid investments to seek to ensure they do not exceed 15% of a fund’s net assets and establishes policies and procedures regarding redemptions in kind.
At the April 26, 2021 meeting of the Board of Trustees, as required by Rule 22e-4 and the Program, the Advisor provided the Board with a written report prepared by the Advisor that addressed the operation of the Program during the period from March 20, 2020 through the Liquidity Committee’s annual meeting held on March 16, 2021 and assessed the Program’s adequacy and effectiveness of implementation during this period, including the operation of the highly liquid investment minimum for each fund that is required under the Program to have one, and any material changes to the Program. Note that because the Funds primarily hold assets that are highly liquid investments, the Funds have not adopted any highly liquid investment minimums.
As stated in the written report, during the review period, no fund breached the 15% limitation on illiquid investments, no fund with a highly liquid investment minimum breached that minimum and no fund filed a Form N-LIQUID. The Advisor concluded that each fund’s investment strategy is appropriate for an open-end fund; that the Program operated effectively in all material respects during the review period; and that the Program is reasonably designed to assess and manage the liquidity risk of each fund and to maintain compliance with Rule 22e-4.
Board of Trustees and Officers
First Trust Exchange-Traded Fund III
July 31, 2021 (Unaudited)
The following tables identify the Trustees and Officers of the Trust. Unless otherwise indicated, the address of all persons is 120 East Liberty Drive, Suite 400, Wheaton, IL 60187.
The Trust’s statement of additional information includes additional information about the Trustees and is available, without charge, upon request, by calling (800) 988-5891.
| Name, Year of Birth and Position with the Trust | Term of Office and Year First Elected or Appointed | Principal Occupations
During Past 5 Years | Number of Portfolios in the First Trust Fund Complex Overseen by Trustee | Other Trusteeships or Directorships Held by Trustee During Past 5 Years |
| INDEPENDENT TRUSTEES |
Richard E. Erickson, Trustee
(1951) | • Indefinite Term
• Since Inception | Physician; Officer, Wheaton Orthopedics; Limited Partner, Gundersen Real Estate Limited Partnership (June 1992 to December 2016) | 211 | None |
Thomas R. Kadlec, Trustee
(1957) | • Indefinite Term
• Since Inception | President, ADM Investor Services, Inc. (Futures Commission Merchant) | 211 | Director of ADM Investor Services, Inc., ADM Investor Services International, Futures Industry Association, and National Futures Association |
Robert F. Keith, Trustee
(1956) | • Indefinite Term
• Since Inception | President, Hibs Enterprises (Financial and Management Consulting) | 211 | Director of Trust Company of Illinois |
Niel B. Nielson, Trustee
(1954) | • Indefinite Term
• Since Inception | Senior Advisor (August 2018 to Present), Managing Director and Chief Operating Officer (January 2015 to August 2018), Pelita Harapan Educational Foundation (Educational Products and Services) | 211 | None |
| INTERESTED TRUSTEE |
James A. Bowen(1), Trustee and
Chairman of the Board
(1955) | • Indefinite Term
• Since Inception | Chief Executive Officer, First Trust Advisors L.P. and First Trust Portfolios L.P.; Chairman of the Board of Directors, BondWave LLC (Software Development Company) and Stonebridge Advisors LLC (Investment Advisor) | 211 | None |
| (1) | Mr. Bowen is deemed an “interested person” of the Trust due to his position as CEO of First Trust Advisors L.P., investment advisor of the Trust. |
Board of Trustees and Officers (Continued)
First Trust Exchange-Traded Fund III
July 31, 2021 (Unaudited)
| Name and Year of Birth | Position and Offices with Trust | Term of Office and Length of Service | Principal Occupations
During Past 5 Years |
| OFFICERS(2) |
James M. Dykas
(1966) | President and Chief Executive Officer | • Indefinite Term
• Since January 2016 | Managing Director and Chief Financial Officer (January 2016 to Present), Controller (January 2011 to January 2016), Senior Vice President (April 2007 to January 2016), First Trust Advisors L.P. and First Trust Portfolios L.P.; Chief Financial Officer (January 2016 to Present), BondWave LLC (Software Development Company) and Stonebridge Advisors LLC (Investment Advisor) |
Donald P. Swade
(1972) | Treasurer, Chief Financial Officer and Chief Accounting Officer | • Indefinite Term
• Since January 2016 | Senior Vice President (July 2016 to Present), Vice President (April 2012 to July 2016), First Trust Advisors L.P. and First Trust Portfolios L.P. |
W. Scott Jardine
(1960) | Secretary and Chief Legal Officer | • Indefinite Term
• Since Inception | General Counsel, First Trust Advisors L.P. and First Trust Portfolios L.P.; Secretary and General Counsel, BondWave LLC; Secretary, Stonebridge Advisors LLC |
Daniel J. Lindquist
(1970) | Vice President | • Indefinite Term
• Since Inception | Managing Director, First Trust Advisors L.P. and First Trust Portfolios L.P. |
Kristi A. Maher
(1966) | Chief Compliance Officer and Assistant Secretary | • Indefinite Term
• Since Inception | Deputy General Counsel, First Trust Advisors L.P. and First Trust Portfolios L.P. |
Roger F. Testin
(1966) | Vice President | • Indefinite Term
• Since Inception | Senior Vice President, First Trust Advisors L.P. and First Trust Portfolios L.P. |
Stan Ueland
(1970) | Vice President | • Indefinite Term
• Since Inception | Senior Vice President, First Trust Advisors L.P. and First Trust Portfolios L.P |
| (2) | The term “officer” means the president, vice president, secretary, treasurer, controller or any other officer who performs a policy making function. |
Privacy Policy
First Trust Exchange-Traded Fund III
July 31, 2021 (Unaudited)
Privacy Policy
First Trust values our relationship with you and considers your privacy an important priority in maintaining that relationship. We are committed to protecting the security and confidentiality of your personal information.
Sources of Information
We collect nonpublic personal information about you from the following sources:
| • | Information we receive from you and your broker-dealer, investment professional or financial representative through interviews, applications, agreements or other forms; |
| • | Information about your transactions with us, our affiliates or others; |
| • | Information we receive from your inquiries by mail, e-mail or telephone; and |
| • | Information we collect on our website through the use of “cookies”. For example, we may identify the pages on our website that your browser requests or visits. |
Information Collected
The type of data we collect may include your name, address, social security number, age, financial status, assets, income, tax information, retirement and estate plan information, transaction history, account balance, payment history, investment objectives, marital status, family relationships and other personal information.
Disclosure of Information
We do not disclose any nonpublic personal information about our customers or former customers to anyone, except as permitted by law. In addition to using this information to verify your identity (as required under law), the permitted uses may also include the disclosure of such information to unaffiliated companies for the following reasons:
| • | In order to provide you with products and services and to effect transactions that you request or authorize, we may disclose your personal information as described above to unaffiliated financial service providers and other companies that perform administrative or other services on our behalf, such as transfer agents, custodians and trustees, or that assist us in the distribution of investor materials such as trustees, banks, financial representatives, proxy services, solicitors and printers. |
| • | We may release information we have about you if you direct us to do so, if we are compelled by law to do so, or in other legally limited circumstances (for example to protect your account from fraud). |
In addition, in order to alert you to our other financial products and services, we may share your personal information within First Trust.
Use of Website Analytics
We currently use third party analytics tools, Google Analytics and AddThis, to gather information for purposes of improving First Trust’s website and marketing our products and services to you. These tools employ cookies, which are small pieces of text stored in a file by your web browser and sent to websites that you visit, to collect information, track website usage and viewing trends such as the number of hits, pages visited, videos and PDFs viewed and the length of user sessions in order to evaluate website performance and enhance navigation of the website. We may also collect other anonymous information, which is generally limited to technical and web navigation information such as the IP address of your device, internet browser type and operating system for purposes of analyzing the data to make First Trust’s website better and more useful to our users. The information collected does not include any personal identifiable information such as your name, address, phone number or email address unless you provide that information through the website for us to contact you in order to answer your questions or respond to your requests. To find out how to opt-out of these services click on: Google Analytics and AddThis.
Confidentiality and Security
With regard to our internal security procedures, First Trust restricts access to your nonpublic personal information to those First Trust employees who need to know that information to provide products or services to you. We maintain physical, electronic and procedural safeguards to protect your nonpublic personal information.
Policy Updates and Inquiries
As required by federal law, we will notify you of our privacy policy annually. We reserve the right to modify this policy at any time, however, if we do change it, we will tell you promptly. For questions about our policy, or for additional copies of this notice, please go to www.ftportfolios.com, or contact us at 1-800-621-1675 (First Trust Portfolios) or 1-800-222-6822 (First Trust Advisors).
March 2021
First Trust Exchange-Traded Fund III
INVESTMENT ADVISOR
First Trust Advisors L.P.
120 East Liberty Drive, Suite 400
Wheaton, IL 60187
INVESTMENT SUB-ADVISOR
Horizon Investments, LLC
6210 Ardrey Kell Road, Suite 300
Charlotte, NC 28277
ADMINISTRATOR, CUSTODIAN,
FUND ACCOUNTANT &
TRANSFER AGENT
Brown Brothers Harriman & Co.
50 Post Office Square
Boston, MA 02110
INDEPENDENT REGISTERED
PUBLIC ACCOUNTING FIRM
Deloitte & Touche LLP
111 S. Wacker Drive
Chicago, IL 60606
LEGAL COUNSEL
Chapman and Cutler LLP
111 W. Monroe Street
Chicago, IL 60603
First Trust Exchange-Traded Fund III
First Trust California Municipal High Income ETF (FCAL)
First Trust New York Municipal High Income ETF (FMNY)
Annual Report
For the Year Ended
July 31, 2021
First Trust Exchange-Traded Fund III
Annual Report
July 31, 2021
Caution Regarding Forward-Looking Statements
This report contains certain forward-looking statements within the meaning of the Securities Act of 1933, as amended, and the Securities Exchange Act of 1934, as amended. Forward-looking statements include statements regarding the goals, beliefs, plans or current expectations of First Trust Advisors L.P. (“First Trust” or the “Advisor”) and its representatives, taking into account the information currently available to them. Forward-looking statements include all statements that do not relate solely to current or historical fact. For example, forward-looking statements include the use of words such as “anticipate,” “estimate,” “intend,” “expect,” “believe,” “plan,” “may,” “should,” “would” or other words that convey uncertainty of future events or outcomes.
Forward-looking statements involve known and unknown risks, uncertainties and other factors that may cause the actual results, performance or achievements of any series of First Trust Exchange-Traded Fund III (the “Trust”) described in this report (each such series is referred to as a “Fund” and collectively, the “Funds”) to be materially different from any future results, performance or achievements expressed or implied by the forward-looking statements. When evaluating the information included in this report, you are cautioned not to place undue reliance on these forward-looking statements, which reflect the judgment of the Advisor and its representatives only as of the date hereof. We undertake no obligation to publicly revise or update these forward-looking statements to reflect events and circumstances that arise after the date hereof.
Performance and Risk Disclosure
There is no assurance that any Fund described in this report will achieve its investment objectives. Each Fund is subject to market risk, which is the possibility that the market values of securities owned by the Fund will decline and that the value of the Fund’s shares may therefore be less than what you paid for them. Accordingly, you can lose money by investing in a Fund. See “Risk Considerations” in the Additional Information section of this report for a discussion of certain other risks of investing in the Funds.
Performance data quoted represents past performance, which is no guarantee of future results, and current performance may be lower or higher than the figures shown. For the most recent month-end performance figures, please visit www.ftportfolios.com or speak with your financial advisor. Investment returns, net asset value and share price will fluctuate and Fund shares, when sold, may be worth more or less than their original cost.
The Advisor may also periodically provide additional information on Fund performance on each Fund’s web page at www.ftportfolios.com.
How to Read This Report
This report contains information that may help you evaluate your investment. It includes details about each Fund and presents data and analysis that provide insight into each Fund’s performance and investment approach.
By reading the portfolio commentary by the portfolio management team of each Fund, you may obtain an understanding of how the market environment affected each Fund. The statistical information that follows may help you understand each Fund’s performance compared to that of a relevant market benchmark.
It is important to keep in mind that the opinions expressed by personnel of the Advisor are just that: informed opinions. They should not be considered to be promises or advice. The opinions, like the statistics, cover the period through the date on the cover of this report. The material risks of investing in each Fund are spelled out in the prospectus, the statement of additional information, and other Fund regulatory filings.
First Trust Exchange-Traded Fund III
Annual Letter from the Chairman and CEO
July 31, 2021
Dear Shareholders,
First Trust is pleased to provide you with the annual report for certain series of First Trust Exchange-Traded Fund III (the “Funds”), which contains detailed information about the Funds for the 12-month period ended July 31, 2021. Please note that the First Trust New York Municipal High Income ETF was incepted on May 12, 2021, and so the information contained in this letter and the annual report prior to that date will not apply to this Fund.
I often mention at the end of my shareholder letters that investors should stay the course. I do so because First Trust believes in the buy and hold investment philosophy, and the math supports our view. The S&P 500® Index (the “Index”) has never failed to fully recover the losses sustained in any correction or bear market. As of July 31, 2021, the Index stood just 0.61% below its all-time closing high set on July 26, 2021. Whether you believe that history repeats itself or simply rhymes, it provides us with valuable insight either way. When it comes to setting realistic expectations about equity returns over time, we know that the Index delivered an average annual total return of 10.28% from 1926-2020 (95 years), according to data from Morningstar/Ibbotson Associates. That is our long-term performance benchmark for stocks in the U.S. Why is that relevant in today’s climate? It is important to note that this very Index has posted a total return of 17.99% year-to-date and 36.45% for the 12-month period ended July 31, 2021, according to Bloomberg. Using industry jargon, these are sometimes referred to as “outsized” returns, or well-above the norm.
As previously noted, the stock market experiences selloffs of various degrees on an ongoing basis. The more severe declines are referred to as corrections and bear markets. Corrections are defined as a 10.00% to 19.99% decline in the price of an index or security from its most recent closing high. Bear markets entail price declines of 20% or more. Since 1950, the Index has endured 38 selloffs totaling 10% or more, with nine of them being bear markets, according to The Motley Fool, a private financial and investing advice company. Over that 71-year period, on average, the stock market experienced a correction every 1.84 years, compared to every 7.78 years for bear markets. The last major selloff occurred in the first quarter of 2020 (17 months ago), when the Index plunged 33.79%, due to the initial shock from the onset of the coronavirus (“COVID-19”) pandemic. While that qualified as a bear market, some investors may be thinking we are due for a correction in the coming months. Remember, these statistics represent averages. A June 2021 survey by the CFA Institute found that 45% of the chartered financial analysts it polled believe we will have a correction within 1-3 years. I offer this forecast to show investors how challenging it is to make such market calls, even for highly credentialled professionals. A 1-3 year projection isn’t exactly actionable information, in my opinion.
The bottom line is that those individuals who have remained invested in the stock and bond markets throughout the COVID-19 pandemic have likely prospered beyond what they might have imagined. Suffice it to say that the markets have exceeded expectations over the past 12 months. I think your average investor would have been content with just being in positive territory. Looking ahead, I see more tailwinds for the markets than headwinds, particularly with respect to the stock market. There is plenty of liquidity in the economy thanks to the accommodative monetary policy of the Federal Reserve (the “Fed”) and fiscal stimulus from Congress. We have the potential for another $4 to $5 trillion in fiscal stimulus from President Joe Biden’s bipartisan infrastructure bill and the Democrat-driven budget package, including funds earmarked for climate change projects (green energy), health care, education, and more. Perhaps the biggest headwind moving forward is rising inflation. We should know in the next few months if it is transitory, as Fed Chairman Jerome Powell believes, or if it will be with us for a sustained period. Stay tuned and stay the course!
Thank you for giving First Trust the opportunity to play a role in your financial future. We value our relationship with you and will report on the Funds again in six months.
Sincerely,
James A. Bowen
Chairman of the Board of Trustees
Chief Executive Officer of First Trust Advisors L.P.
Fund Performance Overview (Unaudited)
First Trust California Municipal High Income ETF (FCAL)
The primary investment objective of First Trust California Municipal High Income ETF (the “Fund”) is to seek to provide current income that is exempt from regular federal income taxes and California income taxes, and its secondary objective is long-term capital appreciation. Under normal market conditions, the Fund seeks to achieve its investment objectives by investing at least 80% of its net assets (including investment borrowings) in municipal debt securities that pay interest that is exempt from regular federal income taxes and California income taxes (“Municipal Securities”). Municipal Securities will be issued by or on behalf of the State of California or territories or possessions of the U.S. (including but not limited to Puerto Rico, the U.S. Virgin Islands and Guam) and/or the political subdivisions, agencies, authorities and other instrumentalities of such State, territories or possessions. The Fund lists and principally trades its shares on The Nasdaq Stock Market LLC under the ticker symbol “FCAL.”
| Performance | | | |
| | | Average Annual
Total Returns | Cumulative
Total Returns |
| | 1 Year Ended
7/31/21 | Inception (6/20/17)
to 7/31/21 | Inception (6/20/17)
to 7/31/21 |
| Fund Performance | | | |
| NAV | 6.37% | 5.14% | 22.91% |
| Market Price | 6.45% | 5.16% | 22.97% |
| Index Performance | | | |
| Bloomberg Barclays 10 Year California Exempt Index | 1.76% | 3.83% | 16.72% |
(See Notes to Fund Performance Overview on page 9.)
Fund Performance Overview (Unaudited) (Continued)
First Trust California Municipal High Income ETF (FCAL) (Continued)
| Sector Allocation | % of Total
Investments
(including cash) |
| Special Assessment | 15.0% |
| Insured | 14.9 |
| Education | 10.3 |
| Government Obligation Bond - Unlimited Tax | 7.8 |
| Tobacco | 6.5 |
| Hospital | 6.2 |
| Certificates of Participation | 5.1 |
| Industrial Development Bond | 5.0 |
| Continuing Care Retirement Communities | 5.0 |
| Dedicated Tax | 4.7 |
| Student Housing | 3.0 |
| Water & Sewer | 2.9 |
| Higher Education | 2.8 |
| Local Housing | 2.7 |
| Tax Increment | 2.2 |
| Airport | 1.8 |
| Gas | 0.8 |
| Other Health | 0.6 |
| Government Obligation Bond - Limited Tax | 0.5 |
| Housing | 0.5 |
| Pre-refunded/Escrowed-to-maturity | 0.2 |
| Toll Road | 0.2 |
| Cash | 1.3 |
| Total | 100.0% |
| Fund Allocation | % of Net Assets |
| Municipal Bonds | 98.5% |
| Net Other Assets and Liabilities(1) | 1.5 |
| Total | 100.0% |
| Credit Rating(2) | % of Total
Investments
(including cash) |
| AAA | 0.1% |
| AA | 32.0 |
| A | 17.5 |
| BBB | 15.4 |
| BB | 7.3 |
| B | 1.2 |
| Not Rated | 25.2 |
| Cash | 1.3 |
| Total | 100.0% |
| (1) | Includes variation margin on futures. |
| (2) | The credit quality and ratings information presented above reflect the ratings assigned by one or more nationally recognized statistical rating organizations (NRSROs), including Standard & Poor’s Ratings Group, a division of the McGraw Hill Companies, Inc., Moody’s Investors Service, Inc., Fitch Ratings or a comparably rated NRSRO. For situations in which a security is rated by more than one NRSRO and the ratings are not equivalent, the highest rating is used. Sub-investment grade ratings are those rated BB+/Ba1 or lower. Investment grade ratings are those rated BBB-/Baa3 or higher. The credit ratings shown relate to the creditworthiness of the issuers of the underlying securities in the Fund, and not to the Fund or its shares. Credit ratings are subject to change. |
Fund Performance Overview (Unaudited) (Continued)
First Trust California Municipal High Income ETF (FCAL) (Continued)
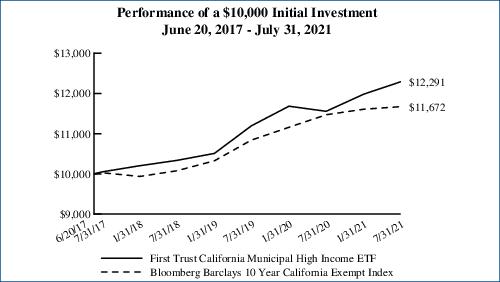
Performance figures assume reinvestment of all distributions and do not reflect the deduction of taxes that a shareholder would pay on Fund distributions or the redemption or sale of Fund shares. An index is a statistical composite that tracks a specified financial market or sector. Unlike the Fund, the index does not actually hold a portfolio of securities and therefore does not incur the expenses incurred by the Fund. These expenses negatively impact the performance of the Fund. The Fund’s past performance does not predict future performance.
Frequency Distribution of Discounts and Premiums
Information showing the number of days the market price of the Fund’s shares was greater (at a premium) and less (at a discount) than the Fund’s net asset value for the most recently completed year, and the most recently completed calendar quarters since that year (or life of the Fund, if shorter), is available at https://www.ftportfolios.com/Retail/etf/home.aspx.
Fund Performance Overview (Unaudited) (Continued)
First Trust New York Municipal High Income ETF (FMNY)
The First Trust New York Municipal High Income ETF’s (the “Fund”) primary investment objective is to seek to provide current income that is exempt from regular federal income taxes and New York income taxes, and its secondary objective is long-term capital appreciation. Under normal market conditions, the Fund seeks to achieve its investment objectives by investing at least 80% of its net assets (including investment borrowings) in municipal debt securities that pay interest that is exempt from regular federal income taxes and New York State and New York City income taxes (collectively, “Municipal Securities”). Municipal Securities will be issued by or on behalf of the State of New York or territories or possessions of the U.S. (including, but not limited to, Puerto Rico, the U.S. Virgin Islands and Guam), and/or the political subdivisions, agencies, authorities and other instrumentalities of such State, territories or possessions. The Fund lists and principally trades its shares on The NYSE Arca, Inc. under the ticker symbol “FMNY.”
| Performance | | |
| | | Cumulative
Total Returns |
| | | Inception (5/12/21)
to 7/31/21 |
| Fund Performance | | |
| NAV | | 1.90% |
| Market Value | | 1.90% |
| Index Performance | | |
| Bloomberg Barclays Municipal New York 12-17 Years Index | | 1.72% |
(See Notes to Fund Performance Overview on page 9.)
Fund Performance Overview (Unaudited) (Continued)
First Trust New York Municipal High Income ETF (FMNY) (Continued)
| Sector Allocation | % of Total
Investments
(including cash) |
| Government Obligation Bond - Unlimited Tax | 14.4% |
| Higher Education | 13.6 |
| Insured | 12.0 |
| Dedicated Tax | 9.7 |
| Toll Road | 8.1 |
| Education | 8.0 |
| Mass Transit | 7.6 |
| Housing | 3.5 |
| Utility | 3.4 |
| Water & Sewer | 2.7 |
| Tobacco | 2.4 |
| Hospital | 2.3 |
| Government Obligation Bond - Limited Tax | 1.9 |
| Continuing Care Retirement Communities | 1.7 |
| Special Assessment | 1.3 |
| Airport | 1.0 |
| Cash | 6.4 |
| Total | 100.0% |
| Fund Allocation | % of Net Assets |
| Municipal Bonds | 95.9% |
| Net Other Assets and Liabilities(1) | 4.1 |
| Total | 100.0% |
| Credit Quality(2) | % of Total
Investments
(including cash) |
| AAA | 3.6% |
| AA | 51.1 |
| A | 19.0 |
| BBB | 4.0 |
| BB | 2.0 |
| Not Rated | 13.9 |
| Cash | 6.4 |
| Total | 100.0% |
| (1) | Includes variation margin on futures. |
| (2) | The credit quality and ratings information presented above reflect the ratings assigned by one or more nationally recognized statistical rating organizations (NRSROs), including Standard & Poor’s Ratings Group, a division of the McGraw Hill Companies, Inc., Moody’s Investors Service, Inc., Fitch Ratings or a comparably rated NRSRO. For situations in which a security is rated by more than one NRSRO and the ratings are not equivalent, the highest rating is used. Sub-investment grade ratings are those rated BB+/Ba1 or lower. Investment grade ratings are those rated BBB-/Baa3 or higher. The credit ratings shown relate to the creditworthiness of the issuers of the underlying securities in the Fund, and not to the Fund or its shares. Credit ratings are subject to change. |
Fund Performance Overview (Unaudited) (Continued)
First Trust New York Municipal High Income ETF (FMNY) (Continued)
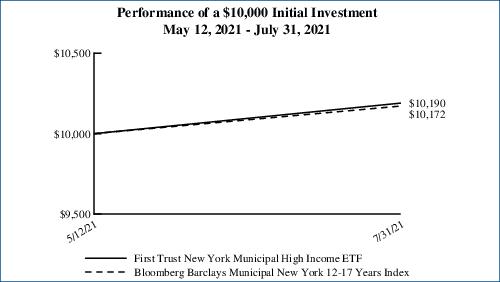
Performance figures assume reinvestment of all distributions and do not reflect the deduction of taxes that a shareholder would pay on Fund distributions or the redemption or sale of Fund shares. An index is a statistical composite that tracks a specified financial market or sector. Unlike the Fund, the index does not actually hold a portfolio of securities and therefore does not incur the expenses incurred by the Fund. These expenses negatively impact the performance of the Fund. The Fund’s past performance does not predict future performance.
Frequency Distribution of Discounts and Premiums
Information showing the number of days the market price of the Fund’s shares was greater (at a premium) and less (at a discount) than the Fund’s net asset value for the most recently completed year, and the most recently completed calendar quarters since that year (or life of the Fund, if shorter), is available at https://www.ftportfolios.com/Retail/etf/home.aspx.
Notes to Fund Performance Overview (Unaudited)
Total returns for the periods since inception are calculated from the inception date of each Fund. “Average Annual Total Returns” represent the average annual change in value of an investment over the periods indicated. “Cumulative Total Returns” represent the total change in value of an investment over the periods indicated. The total returns would have been lower if certain fees had not been waived by the Advisor.
Each Fund’s per share net asset value (“NAV”) is the value of one share of the Fund and is computed by dividing the value of all assets of the Fund (including accrued interest and dividends), less all liabilities (including accrued expenses and dividends declared but unpaid), by the total number of outstanding shares. The price used to calculate market return (“Market Price”) is determined by using the midpoint of the national best bid and offer price (“NBBO”) as of the time that the Fund’s NAV is calculated. Under SEC rules, the NBBO consists of the highest displayed buy and lowest sell prices among the various exchanges trading the Fund at the time the Fund’s NAV is calculated. Prior to January 1, 2019, the price used was the midpoint between the highest bid and the lowest offer on the stock exchange on which shares of the Fund were listed for trading as of the time that the Fund’s NAV was calculated. Since shares of each Fund did not trade in the secondary market until after the Fund’s inception, for the period from inception to the first day of secondary market trading in shares of the Fund, the NAV of each Fund is used as a proxy for the secondary market trading price to calculate market returns. NAV and market returns assume that all distributions have been reinvested in each Fund at NAV and Market Price, respectively.
An index is a statistical composite that tracks a specified financial market or sector. Unlike each Fund, the indices do not actually hold a portfolio of securities and therefore do not incur the expenses incurred by each Fund. These expenses negatively impact the performance of each Fund. Also, market returns do not include brokerage commissions that may be payable on secondary market transactions. If brokerage commissions were included, market returns would be lower. The total returns presented reflect the reinvestment of dividends on securities in the indices. The returns presented do not reflect the deduction of taxes that a shareholder would pay on Fund distributions or the redemption or sale of Fund shares. The investment return and principal value of shares of each Fund will vary with changes in market conditions. Shares of each Fund may be worth more or less than their original cost when they are redeemed or sold in the market. Each Fund’s past performance is no guarantee of future performance.
Portfolio Commentary
First Trust Exchange-Traded Fund III
Annual Report
July 31, 2021 (Unaudited)
Advisor
First Trust Advisors L.P. (“First Trust”) serves as the investment advisor to the First Trust California Municipal High Income ETF (“FCAL”) and the First Trust New York Municipal High Income ETF (“FMNY”) (each a “Fund” and collectively, the “Funds”). First Trust is responsible for the ongoing monitoring of each Fund’s investment portfolio, managing each Fund’s business affairs and providing certain administrative services necessary for the management of each Fund.
Portfolio Management Team
Tom Futrell, CFA, Senior Vice President, Senior Portfolio Manager
Johnathan N. Wilhelm, Senior Vice President, Senior Portfolio Manager
The First Trust Municipal Securities Team was formed in September of 2013 and is headed by Tom Futrell, CFA, and Johnathan N. Wilhelm who serve as senior portfolio managers of the Funds. Messrs. Futrell and Wilhelm have a combined 50+ years of investment experience and prior to joining First Trust, served as portfolio managers of municipal bonds at Nuveen Investments and Performance Trust Investment Advisors. In addition to the Funds, the team manages/consults for a variety of First Trust investment portfolios and separately managed accounts.
Commentary
First Trust California Municipal High Income ETF (FCAL)
The Fund is an actively managed exchange-traded fund. The Fund’s primary investment objective is to seek to provide current income that is exempt from regular federal income taxes and California income taxes. The Fund’s secondary investment objective is long-term capital appreciation. Under normal market conditions, the Fund seeks to achieve its investment objectives by investing at least 80% of its net assets (including investment borrowings) in municipal debt securities that pay interest that is exempt from regular federal income taxes and California income taxes (collectively, “Municipal Securities”). In addition, under normal market conditions, the Fund invests as least 50% of its net assets in Municipal Securities that are rated investment grade at the time of purchase and no more than 50% of its net assets in Municipal Securities that at the time of purchase are rated non-investment grade. This commentary discusses the market performance and the Fund’s performance for the 12-month period ended July 31, 2021.
Market Recap
For the 12-month period ended July 31, 2021, municipal bonds generated a total return of 3.29% as measured by the Bloomberg Barclays Municipal Bond Index. During the same period, the Bloomberg Barclays 10-Year California Exempt Index (the “Benchmark”) generated a total return of 1.76%. By comparison, the Bloomberg Barclays U.S. Treasury Index generated a total return of -3.01% during the same period. The following were major factors in explaining the municipal bond market’s performance:
| • | Robust mutual fund and exchange-traded fund inflows helped support municipal bond prices. According to Refinitiv Lipper and J.P. Morgan data, year-to-date fund flows through July 28, 2021 totaled approximately $69.5 billion. Over the same period, high yield municipal fund flows totaled approximately $16.4 billion. Fund inflows have also been consistent, with municipal bond funds having experienced inflows in 62 of the past 63 weeks. |
| • | New issue municipal bond supply has been nearly flat year to date. During the first seven months of 2021, new issue supply increased approximately 1.5% to $262.1 billion compared with $258.1 billion a year ago. Of note, when looking at municipal taxable new issue supply as a percentage of total new issue supply, over 23% of municipal bond supply has been brought to market as a taxable municipal bond from January 2020 through June 2021 compared to the previous five years when taxable municipals comprised less than 10% of total new issue municipal supply. |
| • | According to data from Municipal Market Analytics, Inc., the par value of defaults are lower year-to-date compared to the previous two years. The number of municipal bond defaults year-to-date through July 2021 total 36, compared to 50 defaults for the same year-to-date period in 2020 and 35 defaults for the same year-to-date period in 2019. Defaulting municipal securities have been especially centered in the senior living sector which has been particularly hard hit by the coronavirus (“COVID-19”) with many facilities experiencing lower occupancy and debt service coverage. |
| • | The CARES Act and American Rescue Plan Act legislation helped stabilize many municipal bond issuing borrowers, with tens of billions of dollars made available to states, cities, K-12 education, hospitals, mass transportation, and universities, among the many benefitted sectors. |
Portfolio Commentary (Continued)
First Trust Exchange-Traded Fund III
Annual Report
July 31, 2021 (Unaudited)
| • | As a result of these factors, municipal bond credit spreads have tightened dramatically from April of 2021 for all credit rating categories. In particular, credit spreads tightened substantially for BBB and high yield municipal securities whereby in many cases spreads are now tighter than pre-COVID-19 levels. |
Performance Analysis
The Fund’s net asset value (“NAV”) and market performance for the 12-month period ended July 31, 2021 was 6.37% and 6.45%, respectively, versus the Benchmark’s return of 1.76% during the same period.
At the end of the period, the Fund’s market price of $55.40 represented a premium of 0.05% to its NAV of $55.37. The market value of the Fund’s shares fluctuates from time to time and may be higher or lower than the Fund’s NAV. The distribution paid on July 30, 2021 of $0.09 represents a tax-exempt annualized distribution rate of 1.95% based on the Fund’s closing market price of $55.40 on July 30, 2021. The Fund’s distribution rate is not constant and is subject to change over time based on the performance of the Fund.
As of July 31, 2021, the Fund’s weighted-average credit quality (approximately BBB/Baa) is lower than the Bloomberg Barclays 10-Year California Exempt Index, which has a stated average credit rating of AA2/AA3. The Fund’s investments in “BBB” rated and non-rated municipal securities were the strongest contributors to the Fund’s performance for the period, as well as its under weight to the Benchmark for “AA” rated bonds. There were no rating categories that detracted from the Fund’s performance over the trailing 12-months ended July 31, 2021. Sectors within the municipal market that positively contributed to the Fund’s performance over the 12-month period ended July 31, 2021 included education, special tax, industrial development bonds, and health care. Transportation was the one sector that detracted from the Fund’s performance over the same period. The Fund’s modified duration on July 31, 2021 was 5.16 years versus 5.27 years for the Benchmark. The Fund’s effective duration on July 31, 2021 was 5.90 years. The Fund’s allocation to municipal securities with maturities of over 8 years was the strongest contributors to the Fund’s performance during the same period. There were no maturity categories that were detractors to the Fund’s performance over the period covered by this report. The Fund’s use of Treasury futures was a positive contributor to the Fund’s performance for the 12-month period ended July 31, 2021.
Market Outlook
As mentioned above, municipal market technical and fundamental factors have been favorable year-to-date. Record setting year-to-date inflows coupled with manageable new issue supply have been positive factors to the Fund’s performance. Additionally, the relatively unprecedented level of fiscal stimulus coupled with higher vaccination rates and robust growth in the U.S. gross domestic product (“GDP”) has helped improve overall municipal bond credit quality, as demonstrated by lower year-to-date defaults and many sectors outlook changes to stable. We believe these factors have driven credit spreads to considerably tighter levels. Looking ahead, given credit spread compression in “A” and “BBB” credit rating categories, we don’t expect much if any additional credit spread compression. While we do believe that high yield credit spreads could continue to tighten a bit further, we believe that municipal bonds are more in a “coupon clipping” environment. Thus, unlike the beginning of 2021 when we had a high degree of confidence that credit spreads would tighten thus supporting total returns for lower investment grade and high yield municipals, we believe municipal bonds are now in general more vulnerable to changes in U.S. Treasury rates that could occur due to the passage of new multi-trillion dollar spending programs by Congress, changes in commentary coming from the Federal Reserve (the “Fed”) regarding the tapering of its $120 billion monthly purchases of mortgage-backed securities and Treasuries, and any setback in the U.S. economic recovery, such as the COVID-19 Delta variant causing portions of the U.S. to curtail economic activity.
We believe yield curve positioning could also be a significant driver of total return by year-end 2021. We expect the U.S. Treasury curve to steepen during the second half of 2021, with the 10-year and 30-year portions of the Treasury curve underperforming the 1-5-year part of the curve. We believe that widespread vaccination rates in the U.S. coupled with incredible amounts of monetary and fiscal stimulus will lead to above trend GDP growth in the second half of 2021. Key factors leading us to believe that the yield curve will steepen include continued progress in vaccination rates thus leading to an even more “open” U.S. and global economy, K-12 students returning to full time, in-person education, and the elimination of Federal supplemental unemployment benefits by the end of the third quarter of 2021. We believe this will lead to greater gains in the labor market (higher monthly payrolls), while inflation remains well above the Fed’s long-term average goal of 2%.
Finally, we will be watching the President Biden’s infrastructure proposals carefully, as they could prove to be materially positive factors for the municipal bond market including: (1) direct Federal aid to rebuilding our nation’s roads, bridges, airports, and mass transit systems, (2) restart of the Build American Bond subsidy program which could reduce tax-exempt supply; and (3) higher tax rates to pay for such proposals could make municipal bonds tax-exempt interest more attractive for high income families as well as banks and insurance companies.
Portfolio Commentary (Continued)
First Trust Exchange-Traded Fund III
Annual Report
July 31, 2021 (Unaudited)
With this in mind, we continue to practice the discipline of our investment process where we perform fundamental credit analysis and quantitative total return scenario analysis on individual bonds and the portfolio as a whole, looking for bonds that we believe can provide both high income and attractive total return potential over time.
First Trust New York Municipal High Income ETF (“FMNY”)
The Fund is an actively managed exchange-traded fund. The Fund’s primary investment objective is to seek to provide current income that is exempt from regular federal income taxes and New York income taxes, and its secondary objective is long-term capital appreciation. Under normal market conditions, the Fund seeks to achieve its investment objectives by investing at least 80% of its net assets (including investment borrowings) in municipal debt securities that pay interest that is exempt from regular federal income taxes and New York State and New York City income taxes (collectively, “Municipal Securities”). In addition, under normal market conditions, the Fund invests as least 50% of its net assets in Municipal Securities that are rated investment grade at the time of purchase and no more than 50% of its net assets in Municipal Securities that at the time of purchase are rated non-investment grade. This commentary discusses the 3-month market performance and the Fund’s performance from the Fund’s inception on May 12, 2021 through July 31, 2021.
Market Recap
For the period from the Fund’s inception on May 12, 2021 through July 31, 2021, the Bloomberg Barclays Municipal New York 12-17 Years Index (the “Benchmark”) produced a total return of 1.72%. For the same period, the Bloomberg Barclays Municipal Bond Index generated a total return of 1.39%. By comparison, the Bloomberg Barclays U.S. Treasury Index generated a total return of 2.67% during the same period. The following have been major factors in explaining the municipal bond market’s performance:
| • | Robust mutual fund and exchange-traded fund inflows helped support municipal bond prices. According to Refinitiv Lipper and J.P. Morgan data, year-to-date fund flows through July 28, 2021 totaled approximately $69.5 billion. Over this same time-period, high yield municipal fund flows totaled approximately $16.4 billion. Fund inflows have also been consistent, with municipal bond funds having experienced inflows in 62 of the past 63 weeks. |
| • | New issue municipal bond supply has been nearly flat year to date. During the first seven months of 2021, new issue supply increased approximately 1.5% to $262.1 billion compared with $258.1 billion a year ago. Of note, when looking at municipal taxable new issue supply as a percentage of total new issue supply, over 23% of municipal bond supply has been brought to market as a taxable municipal bond from January 2020 through June 2021 compared to the previous five years when taxable municipals comprised less than 10% of total new issue municipal supply. |
| • | According to data from Municipal Market Analytics, Inc., the par value of defaults are lower year-to-date compared to the previous two years. The number of municipal bond defaults year-to-date through July 2021 total 36, compared to 50 defaults for the same year-to-date period in 2020 and 35 defaults for the same year-to-date period in 2019. Defaulting municipal securities have been especially centered in the senior living sector which has been particularly hard hit by COVID-19 with many facilities experiencing lower occupancy and debt service coverage. |
| • | The CARES Act and American Rescue Plan Act legislation helped stabilize many municipal bond issuing borrowers, with tens of billions of dollars made available to states, cities, K-12 education, hospitals, mass transportation, and universities, among the many benefitted sectors. |
| • | As a result of these factors, municipal bond credit spreads have tightened dramatically from April of 2021 for all credit rating categories. In particular, credit spreads tightened substantially for BBB and high yield municipal securities whereby in many cases spreads are now tighter than pre-COVID-19 levels. |
Performance Analysis
For the period from the Fund’s inception on May 12, 2021 through July 31, 2021, the Fund’s total return based on NAV and market price was 1.90% versus the Benchmark’s total return of 1.72%.
At the end of the period, the Fund’s market price of $30.51 represented no premium to its NAV of $30.51. The market value of the Fund’s shares fluctuates from time to time and may be higher or lower than the Fund’s NAV. The distribution paid on July 30, 2021 of $0.03 represents a tax-exempt annualized distribution rate of 1.18% based on the Fund’s closing market price of $30.51 on July 30, 2021. The Fund’s distribution rate is not constant and is subject to change over time based on the performance of the Fund.
Portfolio Commentary (Continued)
First Trust Exchange-Traded Fund III
Annual Report
July 31, 2021 (Unaudited)
From the Fund’s inception on May 12, 2021 to July 31, 2021, the Fund’s overweight to high yield municipal bonds was a positive contributor to performance, in particular non-rated high yield bonds performed well. The other rating categories that positively contributed to performance were “A” and “BBB” rated bonds. The Fund’s underweight relative to the Benchmark to “AAA” and “AA” rated securities were sources of underperformance compared to the Benchmark for the period ended July 31, 2021. Regarding sector exposure, the largest sources of outperformance were the Fund’s allocation to special tax, utilities, and health care. The largest source of underperformance relative to the Benchmark was the Fund’s allocation to local tax general obligation bonds. Regarding yield curve positioning, bonds with a stated maturity of 18+ years was the largest source of Fund outperformance from the Fund’s inception through July 31, 2021, while the largest source of underperformance was the Fund’s underweight to bonds with maturities of 0-2 years. The Fund’s use of Treasury futures detracted from the Fund’s performance from the period from May 12, 2021 (the Fund’s inception) through July 31, 2021.
Market Outlook
As mentioned above, municipal market technical and fundamental factors have been favorable year-to-date. Record setting year-to-date inflows coupled with manageable new issue supply have been positive factors to the Fund’s performance. Additionally, the relatively unprecedented level of fiscal stimulus coupled with higher vaccination rates and robust growth in the U.S. GDP has helped improve overall municipal bond credit quality, as demonstrated by lower year-to-date defaults and many sector outlooks changes to stable. We believe these factors have driven credit spreads to considerably tighter levels. Looking ahead, given credit spread compression in “A” and “BBB” credit rating categories, we don’t expect much if any additional credit spread compression. While we do believe that high yield credit spreads could continue to tighten a bit further, we believe that municipal bonds are more in a “coupon clipping” environment. Thus, unlike the beginning of 2021 when we had a high degree of confidence that credit spreads would tighten thus supporting total returns for lower investment grade and high yield municipals, we believe municipal bonds are now in general more vulnerable to changes in U.S. Treasury rates that could occur due to the passage of new multi-trillion dollar spending programs by Congress, changes in commentary coming from the Fed regarding the tapering of its $120 billion monthly purchases of mortgage-backed securities and Treasuries, and any setback in the U.S. economic recovery, such as the COVID-19 Delta variant causing portions of the U.S. to curtail economic activity.
We believe yield curve positioning could also be a significant driver of total return by year-end 2021. We expect the U.S. Treasury curve to steepen during the second half of 2021, with the 10-year and 30-year portions of the Treasury curve underperforming the 1-5-year part of the curve. We believe that widespread vaccination rates in the U.S. coupled with incredible amounts of monetary and fiscal stimulus will lead to above trend GDP growth in the second half of 2021. Key factors leading us to believe that the yield curve will steepen include continued progress in vaccination rates thus leading to an even more “open” U.S. and global economy, K-12 students returning to full time, in-person education, and the elimination of Federal supplemental unemployment benefits by the end of the third quarter of 2021. We believe this will lead to greater gains in the labor market (higher monthly payrolls), while inflation remains well above the Fed’s long-term average goal of 2%.
Finally, we will be watching President Biden’s infrastructure proposals carefully, as they could prove to be materially positive factors for the municipal bond market including: (1) direct Federal aid to rebuilding our nation’s roads, bridges, airports, and mass transit systems, (2) restart of the Build American Bond subsidy program which could reduce tax-exempt supply; and (3) higher tax rates to pay for such proposals could make municipal bonds tax-exempt interest more attractive for high income families as well as banks and insurance companies.
With this in mind, we continue to practice the discipline of our investment process where we perform fundamental credit analysis and quantitative total return scenario analysis on individual bonds and the portfolio as a whole, looking for bonds that we believe can provide both high income and attractive total return potential over time.
First Trust Exchange-Traded Fund III
Understanding Your Fund Expenses
July 31, 2021 (Unaudited)
As a shareholder of First Trust California Municipal High Income ETF or First Trust New York Municipal High Income ETF (each a “Fund” and collectively, the “Funds”), you incur two types of costs: (1) transaction costs; and (2) ongoing costs, including management fees, distribution and/or service (12b-1) fees, if any, and other Fund expenses. This Example is intended to help you understand your ongoing costs of investing in the Funds and to compare these costs with the ongoing costs of investing in other funds.
The Example is based on an investment of $1,000 invested at the beginning of the period (or since inception) and held through the six-month (or shorter) period ended July 31, 2021.
Actual Expenses
The first line in the following table provides information about actual account values and actual expenses. You may use the information in this line, together with the amount you invested, to estimate the expenses that you paid over the period. Simply divide your account value by $1,000 (for example, an $8,600 account value divided by $1,000 = 8.6), then multiply the result by the number in the first line under the heading entitled “Expenses Paid During the Six-Month Period” to estimate the expenses you paid on your account during this six-month period.
Hypothetical Example for Comparison Purposes
The second line in the following table provides information about hypothetical account values and hypothetical expenses based on each Fund’s actual expense ratio and an assumed rate of return of 5% per year before expenses, which is not each Fund’s actual return. The hypothetical account values and expenses may not be used to estimate the actual ending account balance or expenses you paid for the period. You may use this information to compare the ongoing costs of investing in the Funds and other funds. To do so, compare this 5% hypothetical example with the 5% hypothetical examples that appear in the shareholder reports of the other funds.
Please note that the expenses shown in the table are meant to highlight your ongoing costs only and do not reflect any transactional costs such as brokerage commissions. Therefore, the second line in the table is useful in comparing ongoing costs only, and will not help you determine the relative total costs of owning different funds. In addition, if these transactional costs were included, your costs would have been higher.
| | Beginning
Account Value
February 1, 2021 | Ending
Account Value
July 31, 2021 | Annualized
Expense Ratio
Based on the
Six-Month
Period (a) | Expenses Paid
During the
Six-Month
Period (b) |
| First Trust California Municipal High Income ETF (FCAL) |
| Actual | $1,000.00 | $1,025.80 | 0.50% | $2.51 |
| Hypothetical (5% return before expenses) | $1,000.00 | $1,022.32 | 0.50% | $2.51 |
| | | | | |
| | Beginning
Account Value
May 12, 2021 (c) | Ending
Account Value
July 31, 2021 | Annualized
Expense Ratio
Based on the
Number of Days
In the Period (a) | Expenses Paid
During the
Period
May 12, 2021 (c)
to
July 31, 2021 (d) |
| First Trust New York Municipal High Income ETF (FMNY) |
| Actual | $1,000.00 | $1,019.00 | 0.50% | $1.11 |
| Hypothetical (5% return before expenses) | $1,000.00 | $1,022.32 | 0.50% | $2.51 |
| (a) | These expense ratios reflect expense waivers. See Note 3 in the Notes to Financial Statements. |
| (b) | Expenses are equal to the annualized expense ratios as indicated in the table multiplied by the average account value over the period (February 1, 2021 through July 31, 2021), multiplied by 181/365 (to reflect the six-month period). |
| (c) | Inception date. |
| (d) | Actual expenses are equal to the annualized expense ratios as indicated in the table multiplied by the average account value over the period (May 12, 2021 through July 31, 2021), multiplied by 80/365. Hypothetical expenses are assumed for the most recent six-month period. |
First Trust California Municipal High Income ETF (FCAL)
Portfolio of Investments
July 31, 2021
Principal
Value | | Description | | Stated
Coupon | | Stated
Maturity | | Value |
| MUNICIPAL BONDS – 98.5% |
| | | American Samoa – 0.6% | | | | | | |
| $500,000 | | American Samoa AS Econ Dev Auth Gen Rev, Ser A (a)
| | 5.00% | | 09/01/38 | | $629,372 |
| | | California – 90.2% | | | | | | |
| 350,000 | | Alameda CA Corridor Transprtn Auth Ref 2nd Subord Lien, Ser B, AGM
| | 4.00% | | 10/01/37 | | 398,659 |
| 150,000 | | Alameda CA Corridor Transprtn Auth Ref Subord Lien, Ser A
| | 5.00% | | 10/01/25 | | 178,054 |
| 215,000 | | Antelope Vly E Kern CA Wtr Agy Wtr Rev Ref
| | 5.00% | | 06/01/35 | | 258,142 |
| 525,000 | | Azusa CA Spl Tax Cmnty Facs Dist No 2005-1 Impt
| | 4.00% | | 09/01/34 | | 605,586 |
| 100,000 | | Beaumont CA Spl Tax Cmnty Facs Dist No 93-1 Impt Area 8F
| | 4.00% | | 09/01/33 | | 114,218 |
| 175,000 | | Beaumont CA Spl Tax Cmnty Facs Dist No 93-1 Impt Area 8F
| | 4.00% | | 09/01/34 | | 199,320 |
| 330,000 | | Beaumont CA Spl Tax Cmnty Facs Dist No 93-1 Impt Area 8F
| | 4.00% | | 09/01/36 | | 375,071 |
| 620,000 | | Beaumont CA Spl Tax Cmnty Facs Dist No 93-1 Impt Area 8F
| | 4.00% | | 09/01/40 | | 700,940 |
| 200,000 | | CA Cnty CA Tobacco Securitization Agy Tobacco Stlmt Ref, Sonoma Cnty Securitization Corp, Ser A
| | 4.00% | | 06/01/35 | | 247,639 |
| 665,000 | | CA Cnty CA Tobacco Securitization Agy Tobacco Stlmt Sr Ref, Ser A
| | 5.00% | | 06/01/32 | | 886,170 |
| 200,000 | | CA Cnty CA Tobacco Securitization Agy Tobacco Stlmt Sr Ref, Ser A
| | 5.00% | | 06/01/33 | | 265,358 |
| 200,000 | | CA Cnty CA Tobacco Securitization Agy Tobacco Stlmt Sr Ref, Ser A
| | 4.00% | | 06/01/35 | | 247,025 |
| 200,000 | | CA Cnty CA Tobacco Securitization Agy Tobacco Stlmt Sr Ref, Ser A
| | 4.00% | | 06/01/39 | | 244,003 |
| 437,536 | | CA Hsg Fin Agy Muni Ctfs, Ser A
| | 4.25% | | 01/15/35 | | 542,419 |
| 360,000 | | CA Pub Fin Auth Rev Ref Henry Mayo Newhall Hosp, Ser A
| | 4.00% | | 10/15/27 | | 426,420 |
| 360,000 | | CA Pub Fin Auth Rev Ref Henry Mayo Newhall Hosp, Ser A
| | 4.00% | | 10/15/28 | | 433,558 |
| 290,000 | | CA Pub Fin Auth Sr Living Rev ENSO Vlg Proj Green Bond, Ser A (a)
| | 5.00% | | 11/15/36 | | 349,865 |
| 250,000 | | CA Pub Fin Auth Sr Living Rev ENSO Vlg Proj Green Bond, Ser A (a)
| | 5.00% | | 11/15/56 | | 291,332 |
| 750,000 | | CA Pub Fin Auth Sr Living Rev Green Bond Temps 70 Enso Vlg Proj, Ser B-2 (a)
| | 2.38% | | 11/15/28 | | 763,094 |
| 200,000 | | CA Sch Fin Auth Sch Fac Rev Alliance Clg Ready Pub Schs Proj, Ser C
| | 4.50% | | 07/01/26 | | 226,315 |
| 255,000 | | CA Sch Fin Auth Sch Fac Rev Alliance Clg Ready Pub Schs Projs, Ser A (a)
| | 5.00% | | 07/01/30 | | 293,576 |
| 505,000 | | CA Sch Fin Auth Sch Fac Rev Granada Hills Chrt Oblig Grp (a)
| | 5.00% | | 07/01/34 | | 592,443 |
| 105,000 | | CA Sch Fin Auth Sch Fac Rev Kipp Socal Pub Schs, Ser A (a)
| | 5.00% | | 07/01/26 | | 125,759 |
| 105,000 | | CA Sch Fin Auth Sch Fac Rev Kipp Socal Pub Schs, Ser A (a)
| | 5.00% | | 07/01/27 | | 129,271 |
| 400,000 | | CA Sch Fin Auth Sch Fac Rev Kipp Socal Pub Schs, Ser A (a)
| | 5.00% | | 07/01/39 | | 499,179 |
| 675,000 | | CA Sch Fin Auth Sch Fac Rev Ref Granada Hills Chrt Oblig Grp, Ser A (a)
| | 4.00% | | 07/01/48 | | 762,179 |
| 200,000 | | CA Sch Fin Auth Sch Fac Rev Ref Hlth Learning Proj, Ser A (a)
| | 4.00% | | 07/01/25 | | 223,201 |
| 200,000 | | CA Sch Fin Auth Sch Fac Rev Ref Hlth Learning Proj, Ser A (a)
| | 5.00% | | 07/01/32 | | 236,841 |
| 650,000 | | CA Sch Fin Auth Sch Fac Rev, Ser A (a)
| | 5.00% | | 07/01/40 | | 757,450 |
| 1,000,000 | | CA St Ent Dev Auth Lease Rev Riverside Cnty Library Fac Proj
| | 4.00% | | 11/01/37 | | 1,150,232 |
| 100,000 | | CA St Ent Dev Auth Stdt Hsg Rev M@Clg Proj, Ser A
| | 5.00% | | 08/01/35 | | 128,958 |
| 100,000 | | CA St Ent Dev Auth Stdt Hsg Rev M@Clg Proj, Ser A
| | 5.00% | | 08/01/40 | | 127,225 |
| 30,000 | | CA St Hlth Facs Fing Auth Rev El Camino Hosp
| | 5.00% | | 02/01/33 | | 37,099 |
| 220,000 | | CA St Hlth Facs Fing Auth Rev Ref Sutter Hlth, Ser B
| | 5.00% | | 11/15/33 | | 270,667 |
| 1,000,000 | | CA St Hlth Facs Fing Auth Rev Ref, Commonspirit Hlth, Ser A
| | 4.00% | | 04/01/36 | | 1,215,452 |
| 250,000 | | CA St Hlth Facs Fing Auth Rev Sutter Hlth, Ser A
| | 5.00% | | 11/15/30 | | 315,991 |
| 500,000 | | CA St Infra & Econ Dev Bank Natl Chrt Social Bond
| | 4.00% | | 11/01/39 | | 601,563 |
| 500,000 | | CA St Infra & Econ Dev Bank Rev Sr Bond WFCS Portfolio Projs, Ser A-1 (a)
| | 5.00% | | 01/01/56 | | 599,134 |
See Notes to Financial Statements
Page 15
First Trust California Municipal High Income ETF (FCAL)
Portfolio of Investments (Continued)
July 31, 2021
Principal
Value | | Description | | Stated
Coupon | | Stated
Maturity | | Value |
| MUNICIPAL BONDS (Continued) |
| | | California (Continued) | | | | | | |
| $250,000 | | CA St Muni Fin Auth Chrt Sch Lease Rev Sycamore Acdmy Proj (b)
| | 5.38% | | 07/01/34 | | $274,262 |
| 250,000 | | CA St Muni Fin Auth Chrt Sch Lease Rev Vista Chrt Middle Sch Proj (c)
| | 5.38% | | 07/01/34 | | 275,983 |
| 900,000 | | CA St Muni Fin Auth Chrt Sch Rev John Adams Acdmys Lincoln Proj, Ser A (a)
| | 5.00% | | 10/01/39 | | 1,002,139 |
| 200,000 | | CA St Muni Fin Auth Chrt Sch Rev Palmdale Aerospace Acdmy Proj (a)
| | 4.00% | | 07/01/26 | | 216,408 |
| 450,000 | | CA St Muni Fin Auth Chrt Sch Rev Palmdale Aerospace Acdmy Proj, Ser A (a)
| | 5.00% | | 07/01/38 | | 537,689 |
| 250,000 | | CA St Muni Fin Auth Chrt Sch Rev, Ser A (a)
| | 5.50% | | 06/01/38 | | 285,980 |
| 605,000 | | CA St Muni Fin Auth Mobile Home Park Rev Sr Caritas Affordable Hsg Inc Projs, Ser A
| | 5.25% | | 08/15/49 | | 662,501 |
| 155,000 | | CA St Muni Fin Auth Rev Ref Biola Univ
| | 5.00% | | 10/01/37 | | 186,277 |
| 225,000 | | CA St Muni Fin Auth Rev Ref CA Lutheran Univ
| | 5.00% | | 10/01/30 | | 283,480 |
| 225,000 | | CA St Muni Fin Auth Rev Ref CA Lutheran Univ
| | 5.00% | | 10/01/32 | | 281,415 |
| 675,000 | | CA St Muni Fin Auth Rev Ref CA Lutheran Univ
| | 5.00% | | 10/01/33 | | 841,443 |
| 475,000 | | CA St Muni Fin Auth Rev Ref Cmnty Med Ctrs, Ser A
| | 5.00% | | 02/01/36 | | 578,176 |
| 200,000 | | CA St Muni Fin Auth Rev Ref Eisenhower Med Ctr, Ser A
| | 5.00% | | 07/01/32 | | 245,313 |
| 400,000 | | CA St Muni Fin Auth Rev Ref Eisenhower Med Ctr, Ser A
| | 5.00% | | 07/01/34 | | 489,437 |
| 250,000 | | CA St Muni Fin Auth Rev Ref Emerson Clg, Ser B
| | 5.00% | | 01/01/33 | | 307,239 |
| 700,000 | | CA St Muni Fin Auth Rev Ref HumanGood Oblig Grp, Ser A
| | 4.00% | | 10/01/34 | | 804,552 |
| 500,000 | | CA St Muni Fin Auth Rev Ref HumanGood Oblig Grp, Ser A
| | 4.00% | | 10/01/36 | | 572,957 |
| 110,000 | | CA St Muni Fin Auth Rev Ref Retmnt Hsg Fdtn Oblig Grp, Ser A
| | 5.00% | | 11/15/26 | | 132,531 |
| 435,000 | | CA St Muni Fin Auth Rev Ref Retmnt Hsg Fdtn Oblig Grp, Ser A
| | 5.00% | | 11/15/27 | | 533,852 |
| 700,000 | | CA St Muni Fin Auth Spl Fac Rev United Airls Inc Proj, AMT
| | 4.00% | | 07/15/29 | | 823,332 |
| 500,000 | | CA St Muni Fin Auth Sr Living Rev Ref Mt San Antonio Gardens Proj
| | 5.00% | | 11/15/49 | | 588,896 |
| 500,000 | | CA St Muni Fin Auth Stdt Hsg Rev Chf Davis I, LLC W Vlg Stdt Hsg Proj
| | 5.00% | | 05/15/27 | | 617,172 |
| 1,000,000 | | CA St Muni Fin Auth Stdt Hsg Rev Chf Davis I, LLC W Vlg Stdt Hsg Proj
| | 5.00% | | 05/15/38 | | 1,265,037 |
| 350,000 | | CA St Muni Fin Auth Stdt Hsg Rev Chf Davis I, LLC W Vlg Stdt Hsg Proj
| | 5.00% | | 05/15/40 | | 441,371 |
| 75,000 | | CA St Muni Fin Auth Stdt Hsg Rev Chf Davis I, LLC W Vlg Stdt Hsg Proj TCRS, BAM
| | 5.00% | | 05/15/29 | | 96,557 |
| 600,000 | | CA St Poll Control Fin Auth Sol Wst Disp Rev Ref Wst Mgmt Inc, Ser A1, AMT
| | 3.38% | | 07/01/25 | | 669,696 |
| 250,000 | | CA St Poll Control Fin Auth Sol Wst Disp Rev Rialto Bioenergy Fac LLC Proj Green Bond, AMT (a)
| | 6.75% | | 12/01/28 | | 274,661 |
| 150,000 | | CA St Poll Control Fin Auth Sol Wst Disp Rev Waste Mgmt Inc Proj, Ser C (Mandatory put 06/03/24)
| | 3.25% | | 12/01/27 | | 162,608 |
| 1,000,000 | | CA St Poll Control Fin Auth Wtr Furnishing Rev, AMT (a)
| | 5.00% | | 07/01/37 | | 1,053,792 |
| 650,000 | | CA St Pub Wks Brd Lease Rev Dept Crrctns Rehab RJ, Ser E
| | 5.00% | | 10/01/25 | | 776,618 |
| 15,000 | | CA St Pub Wks Brd Lease Rev Judicial Council CA, Ser B
| | 5.00% | | 06/01/34 | | 17,561 |
| 175,000 | | CA St Pub Wks Brd Lease Rev Ref, Ser B
| | 5.00% | | 10/01/26 | | 216,129 |
| 165,000 | | CA St Pub Wks Brd Lease Rev Ref, Ser B
| | 5.00% | | 05/01/29 | | 217,846 |
| 125,000 | | CA St Pub Wks Brd Lease Rev Ref, Ser F
| | 5.00% | | 05/01/24 | | 141,601 |
| 100,000 | | CA St Pub Wks Brd Lease Rev Various Corr Facs, Ser A
| | 5.00% | | 09/01/27 | | 114,168 |
| 75,000 | | CA St Ref
| | 4.00% | | 09/01/32 | | 87,631 |
| 75,000 | | CA St Ref
| | 4.00% | | 08/01/34 | | 87,095 |
| 155,000 | | CA St Ref
| | 4.00% | | 09/01/35 | | 180,201 |
| 75,000 | | CA St Ref Various Purp
| | 4.00% | | 09/01/33 | | 87,452 |
| 275,000 | | CA St Ref Various Purp
| | 4.00% | | 09/01/35 | | 319,711 |
| 100,000 | | CA St Ref Various Purp
| | 5.00% | | 10/01/35 | | 119,730 |
Page 16
See Notes to Financial Statements
First Trust California Municipal High Income ETF (FCAL)
Portfolio of Investments (Continued)
July 31, 2021
Principal
Value | | Description | | Stated
Coupon | | Stated
Maturity | | Value |
| MUNICIPAL BONDS (Continued) |
| | | California (Continued) | | | | | | |
| $565,000 | | CA St Sch Fin Auth Chrt Sch Rev Arts in Action Chrt Schs, Ser A (a)
| | 5.00% | | 06/01/30 | | $654,755 |
| 335,000 | | CA St Sch Fin Auth Chrt Sch Rev Arts in Action Chrt Schs, Ser A (a)
| | 5.00% | | 06/01/40 | | 378,013 |
| 600,000 | | CA St Sch Fin Auth Chrt Sch Rev Fenton Chrt Schs, Ser A (a)
| | 4.00% | | 07/01/30 | | 680,541 |
| 600,000 | | CA St Sch Fin Auth Chrt Sch Rev Fenton Chrt Schs, Ser A (a)
| | 5.00% | | 07/01/40 | | 702,056 |
| 300,000 | | CA St Sch Fin Auth Chrt Sch Rev Rocketship Pub Schs, Ser G (b)
| | 5.00% | | 06/01/37 | | 345,878 |
| 100,000 | | CA St Sch Fin Auth Chrt Sch Rev Summit Pub Schs (a)
| | 5.00% | | 06/01/25 | | 116,450 |
| 210,000 | | CA St Sch Fin Auth Chrt Sch Rev Summit Pub Schs (a)
| | 5.00% | | 06/01/31 | | 251,886 |
| 500,000 | | CA St Stwd Cmntys Dev Auth Spl Tax Rev Impt Area No 1
| | 4.00% | | 09/01/41 | | 583,292 |
| 200,000 | | CA St Stwd Cmntys Dev Auth Stdt Hsg Rev Ref Chf Irvine LLC
| | 5.00% | | 05/15/30 | | 240,698 |
| 280,000 | | CA St Stwd Cmntys Dev Auth Stdt Hsg Rev Ref Chf Irvine LLC
| | 5.00% | | 05/15/35 | | 333,915 |
| 600,000 | | CA Stwd Cmntys Dev Auth Rev Loma Linda Univ Med Ctr, Ser A (a)
| | 5.00% | | 12/01/30 | | 695,277 |
| 300,000 | | CA Stwd Cmntys Dev Auth Rev Loma Linda Univ Med Ctr, Ser A (a)
| | 5.00% | | 12/01/33 | | 359,500 |
| 150,000 | | CA Stwd Cmntys Dev Auth Rev Ref CA Baptist Univ, Ser A (a)
| | 3.00% | | 11/01/22 | | 152,802 |
| 250,000 | | CA Stwd Cmntys Dev Auth Rev Ref CA Baptist Univ, Ser A (a)
| | 5.00% | | 11/01/32 | | 304,464 |
| 245,000 | | CA Stwd Cmntys Dev Auth Rev Ref Front Porch Cmntys & Svcs, Ser A
| | 5.00% | | 04/01/27 | | 295,657 |
| 50,000 | | CA Stwd Cmntys Dev Auth Rev Ref Front Porch Cmntys & Svcs, Ser A
| | 5.00% | | 04/01/30 | | 59,896 |
| 175,000 | | CA Stwd Cmntys Dev Auth Rev Ref Front Porch Cmntys & Svcs, Ser A
| | 5.00% | | 04/01/31 | | 209,157 |
| 50,000 | | CA Stwd Cmntys Dev Auth Rev Ref Front Porch Cmntys & Svcs, Ser A
| | 4.00% | | 04/01/32 | | 56,532 |
| 50,000 | | CA Stwd Cmntys Dev Auth Rev Ref Insd Enloe Med Ctr, CA MTG INS
| | 5.00% | | 08/15/33 | | 59,510 |
| 125,000 | | Camarillo CA Cmnty Dev Commn Successor Agy Tax Allocation Ref Camarillo Corridor Proj, AGM
| | 5.00% | | 09/01/25 | | 142,454 |
| 240,000 | | Camarillo CA Cmnty Dev Commn Successor Agy Tax Allocation Ref Sub Lien, Ser B, BAM
| | 5.00% | | 09/01/28 | | 289,894 |
| 305,000 | | Camarillo CA Cmnty Dev Commn Successor Agy Tax Allocation Ref Sub Lien, Ser B, BAM
| | 5.00% | | 09/01/30 | | 367,165 |
| 400,000 | | Casitas Muni Wtr Dist CA Spl Tax Cmnty Facs Dist No 2013-1, BAM
| | 4.00% | | 09/01/34 | | 476,485 |
| 450,000 | | Chino CA Cmnty Facs Dist Spl Tax #2003-3 Impt Area #7
| | 5.00% | | 09/01/31 | | 561,385 |
| 425,000 | | Chino Vly CA Unif Sch Dist, Ser B
| | 5.00% | | 08/01/36 | | 568,077 |
| 250,000 | | Compton CA Unif Sch Dist Los Angeles Co Schs Fing Prog, Ser A, COPS, BAM
| | 5.00% | | 06/01/31 | | 305,817 |
| 250,000 | | Compton CA Unif Sch Dist Los Angeles Co Schs Fing Prog, Ser A, COPS, BAM
| | 4.00% | | 06/01/35 | | 288,892 |
| 200,000 | | Compton CA Unif Sch Dist Los Angeles Co Schs Fing Prog, Ser A, COPS, BAM
| | 4.00% | | 06/01/36 | | 230,757 |
| 210,000 | | Cotati-Rohnert Park CA Unif Sch Dist 2016 Election, Ser C, AGM
| | 5.00% | | 08/01/32 | | 254,741 |
| 1,000,000 | | CSCDA Cmnty Impt Auth CA Essential Hsg Rev The Link Glendale Soc Bds, Ser A-2 (a)
| | 4.00% | | 07/01/56 | | 1,087,313 |
| 1,000,000 | | CSCDA Cmnty Impt Auth CA Essential Hsg Rev Union S Bay Social Bonds, Ser A-2 (a)
| | 4.00% | | 07/01/56 | | 1,096,819 |
| 175,000 | | Dana Point CA Cmnty Facs Distspl Tax Ref, Ser A, BAM
| | 4.00% | | 09/01/33 | | 217,550 |
| 180,000 | | Dana Point CA Cmnty Facs Distspl Tax Ref, Ser A, BAM
| | 4.00% | | 09/01/34 | | 222,880 |
| 200,000 | | Del Mar CA Union Sch Dist Spl Tax Ref
| | 4.00% | | 09/01/33 | | 235,919 |
| 300,000 | | Del Mar CA Union Sch Dist Spl Tax Ref
| | 4.00% | | 09/01/34 | | 352,124 |
| 270,000 | | Diablo CA Wtr Dist Wtr Rev Ref, COPS, BAM
| | 4.00% | | 01/01/32 | | 315,823 |
| 150,000 | | Dinuba CA Jt Unif Sch Dist, COPS, AGM
| | 4.00% | | 02/01/35 | | 169,381 |
See Notes to Financial Statements
Page 17
First Trust California Municipal High Income ETF (FCAL)
Portfolio of Investments (Continued)
July 31, 2021
Principal
Value | | Description | | Stated
Coupon | | Stated
Maturity | | Value |
| MUNICIPAL BONDS (Continued) |
| | | California (Continued) | | | | | | |
| $755,000 | | El Dorado CA Irr Dist Rev Ref, Ser C
| | 4.00% | | 03/01/34 | | $861,178 |
| 300,000 | | Estrn CA Muni Wtr Dist Wtr & Wstwtr Rev Sub Ref, Ser A
| | 5.00% | | 07/01/31 | | 363,657 |
| 350,000 | | Folsom Ranch CA Fing Auth Spl Tax Rev Cmnty Facs Dist No. 19 Mangini
| | 5.00% | | 09/01/32 | | 422,138 |
| 155,000 | | Fontana CA Spl Tax Cmnty Facs Dist #80 Bella Strada
| | 5.00% | | 09/01/29 | | 190,297 |
| 525,000 | | Fontana CA Spl Tax Spl Tax, Summit at Rosena Phase One
| | 4.00% | | 09/01/41 | | 609,085 |
| 240,000 | | Fontana CA Spl Tax Spl Tax, The Meadows
| | 4.00% | | 09/01/32 | | 278,464 |
| 165,000 | | Fontana CA Unif Sch Dist Prerefunded, AGM
| | (d) | | 02/01/33 | | 135,306 |
| 310,000 | | Fountain Vly CA Pub Fing Auth Lease Rev Ref, Ser A
| | 4.00% | | 11/01/29 | | 356,215 |
| 140,000 | | Fresno CA Jt Pwrs Fing Auth Lease Rev Ref Master Lease Proj, Ser A, AGM
| | 5.00% | | 04/01/32 | | 169,987 |
| 1,000,000 | | Fresno CA Uni Sch Dist, Ser A08/01/45
| | 4.00% | | 08/01/45 | | 1,181,315 |
| 500,000 | | Gilroy CA Unif Sch Dist
| | 4.00% | | 08/01/42 | | 585,374 |
| 230,000 | | Golden St Tobacco Securitization Corp CA Tobacco Stlmt Asset Bkd, Ref, Ser A
| | 3.25% | | 06/01/32 | | 251,520 |
| 100,000 | | Golden St Tobacco Securitization Corp CA Tobacco Stlmt Enhanced Asset Bkd, Ser A
| | 5.00% | | 06/01/29 | | 108,932 |
| 340,000 | | Golden St Tobacco Securitization Corp CA Tobacco Stlmt Ref, Ser A-1
| | 5.00% | | 06/01/26 | | 411,998 |
| 750,000 | | Golden St Tobacco Securitization Corp CA Tobacco Stlmt Ref, Ser A-1
| | 5.00% | | 06/01/34 | | 933,503 |
| 145,000 | | Golden W CA Schs Fing Auth Ref Beverly Hills Unif Sch Dist, NATL
| | 5.25% | | 08/01/23 | | 160,051 |
| 265,000 | | Imperial CA Pub Fing Auth Rev Ref, AGM
| | 4.00% | | 10/15/33 | | 316,287 |
| 360,000 | | Imperial CA Pub Fing Auth Rev Ref, AGM
| | 4.00% | | 10/15/35 | | 425,636 |
| 140,000 | | Inglewood CA Unif Sch Dist, Ser C, BAM
| | 4.00% | | 08/01/35 | | 160,432 |
| 960,000 | | Irvine CA Impt Bond Act 1915 Ref
| | 4.00% | | 09/02/35 | | 1,162,916 |
| 1,000,000 | | Irvine CA Impt Bond Act 1915 Ref
| | 4.00% | | 09/02/46 | | 1,220,648 |
| 150,000 | | Irvine CA Unif Sch Dist Spl Tax Cmnty Facs Dist #09-1, Ser C
| | 5.00% | | 09/01/31 | | 185,847 |
| 890,000 | | Jurupa CA Public Fing Auth Spl Tax Rev Ref, Ser A, AGM
| | 4.00% | | 09/01/34 | | 1,063,918 |
| 290,000 | | Kaweah CA Delta Hlthcare Dist Rev, Ser B
| | 5.00% | | 06/01/40 | | 328,282 |
| 100,000 | | Kern Cnty CA Wtr Agy Impt Dist #4 Wtr Rev Ref, Ser A, AGM
| | 5.00% | | 05/01/29 | | 121,020 |
| 485,000 | | King City CA Union Sch Dist Cap Apprec Election 1998-C, CABS, AMBAC
| | (d) | | 08/01/29 | | 432,935 |
| 250,000 | | La Verne CA Ref Brethren Hillcrest Homes, COPS
| | 5.00% | | 05/15/36 | | 262,047 |
| 25,000 | | Lammersville CA Jt Unif Sch Dist Spl Tax
| | 4.00% | | 09/01/33 | | 28,937 |
| 25,000 | | Lammersville CA Jt Unif Sch Dist Spl Tax
| | 4.00% | | 09/01/34 | | 28,873 |
| 200,000 | | Lammersville CA Jt Unif Sch Dist Spl Tax
| | 4.00% | | 09/01/40 | | 228,103 |
| 1,055,000 | | Lancaster CA Fing Auth Rev Measure M&R Street Impts Proj
| | 4.00% | | 06/01/35 | | 1,262,373 |
| 100,000 | | Long Beach CA Bond Fin Auth Nat Gas Pur Rev, Ser A
| | 5.25% | | 11/15/23 | | 111,414 |
| 540,000 | | Long Beach CA Bond Fin Auth Nat Gas Pur Rev, Ser A
| | 5.50% | | 11/15/30 | | 732,174 |
| 460,000 | | Los Angeles CA Dept of Arpts Arpt Rev Ref Sub Los Angeles Intl Arpt, Ser D, AMT
| | 5.00% | | 05/15/32 | | 593,339 |
| 700,000 | | Los Angeles CA Dept of Arpts Arpt Rev Sub Los Angeles Intl Arpt, Ser B, AMT
| | 5.00% | | 05/15/31 | | 842,491 |
| 250,000 | | Los Angeles CA Dept of Arpts Arpt Rev Subord Los Angeles Intl Arpt, Ser F, AMT
| | 5.00% | | 05/15/32 | | 322,467 |
| 10,000 | | Los Angeles CA Dept of Arpts, Ser E
| | 5.00% | | 05/15/28 | | 11,722 |
| 215,000 | | Los Angeles CA Muni Impt Corplease Rev Ref Real Property, Ser B
| | 4.00% | | 11/01/37 | | 247,722 |
| 500,000 | | Los Angeles CA Unif Sch Dist, Ser C
| | 4.00% | | 07/01/36 | | 615,841 |
| 410,000 | | Los Osos CA Cmnty Svcs Wstwtr Assmnt Dist #1 Ref Reassmnt
| | 3.13% | | 09/02/32 | | 450,763 |
| 100,000 | | Marina CA Redev Agy Successor Agy Tax Allocation Hsg, Ser B
| | 5.00% | | 09/01/27 | | 119,020 |
| 250,000 | | Marina CA Redev Agy Successor Agy Tax Allocation Hsg, Ser B
| | 5.00% | | 09/01/33 | | 291,550 |
| 250,000 | | Marina Coast CA Wtr Dist Enterprise Rev, COPS
| | 4.00% | | 06/01/35 | | 300,787 |
Page 18
See Notes to Financial Statements
First Trust California Municipal High Income ETF (FCAL)
Portfolio of Investments (Continued)
July 31, 2021
Principal
Value | | Description | | Stated
Coupon | | Stated
Maturity | | Value |
| MUNICIPAL BONDS (Continued) |
| | | California (Continued) | | | | | | |
| $310,000 | | Marina Coast CA Wtr Dist Enterprise Rev, COPS
| | 4.00% | | 06/01/36 | | $370,443 |
| 1,190,000 | | Marysville CA Jt Unif Sch Dist Green Bond, 2021 Energy Efficiency Proj, COPS, BAM
| | 4.00% | | 06/01/39 | | 1,394,119 |
| 245,000 | | Menifee CA Union Sch Dist Spl Tax Cmnty Facs Dist #2011-1
| | 5.00% | | 09/01/34 | | 292,650 |
| 500,000 | | Menifee CA Union Sch Dist Spl Tax Cmnty Facs Dist #2011-1
| | 5.00% | | 09/01/44 | | 589,460 |
| 100,000 | | Modesto CA Spl Tax Ref Cmnty Facs Dist # 2004-1 Vlg 1 #2
| | 5.00% | | 09/01/27 | | 113,345 |
| 200,000 | | Morongo Band of Mission Indians CA Rev Ref, Ser B (a)
| | 5.00% | | 10/01/42 | | 240,581 |
| 1,115,000 | | Natomas CA Unif Sch Dist, AGM
| | 3.00% | | 08/01/36 | | 1,189,365 |
| 250,000 | | Norco CA Spl Tax Ref Norco Ridge Ranch, BAM
| | 5.00% | | 09/01/32 | | 311,071 |
| 750,000 | | Oak Vly CA Hosp Dist Hlth Facs Rev Ref, Ser A
| | 4.00% | | 11/01/36 | | 809,227 |
| 405,000 | | Oakland CA Unif Sch Dist Alameda Cnty Election of 2012, Ser A, AGM
| | 4.00% | | 08/01/36 | | 471,547 |
| 100,000 | | Ontario CA Cmnty Facs Dist 40 Spl Tax Emeral Park Fac
| | 4.00% | | 09/01/34 | | 115,998 |
| 65,000 | | Ontario CA Cmnty Facs Dist 40 Spl Tax Emeral Park Fac
| | 4.00% | | 09/01/35 | | 75,347 |
| 275,000 | | Ontario CA Cmnty Facs Dist 40 Spl Tax Emeral Park Fac
| | 4.00% | | 09/01/39 | | 317,174 |
| 750,000 | | Oxnard CA Sch Dist Election of 2016, Ser C, AGM
| | 4.00% | | 08/01/49 | | 871,111 |
| 650,000 | | Palm Desert CA Spl Tax Ref Univ Park
| | 4.00% | | 09/01/51 | | 700,499 |
| 250,000 | | Palomar Hlth CA Rev Ref
| | 5.00% | | 11/01/31 | | 297,983 |
| 750,000 | | Pleasanton CA Unif Sch Dist
| | 3.00% | | 08/01/36 | | 801,438 |
| 210,000 | | Rancho Cordova CA Cmnty Facs Dist Spl Tax No 2018-1 Grantline 208
| | 5.00% | | 09/01/33 | | 249,936 |
| 220,000 | | Rancho Cordova CA Cmnty Facs Dist Spl Tax No 2018-1 Grantline 208
| | 5.00% | | 09/01/34 | | 261,829 |
| 340,000 | | Rancho Cordova CA Cmnty Facs Dist Spl Tax No 2018-1 Grantline 208
| | 5.00% | | 09/01/39 | | 401,797 |
| 200,000 | | Rancho Cordova CA Cmnty Facs Dist Spl Tax Ref #2004-1 Sunridge Park Area
| | 5.00% | | 09/01/25 | | 235,677 |
| 500,000 | | River Islands CA Pub Fing Auth Spl Tax Cmnty Facs Dist #2019-1 Phase 2 Pub Impts
| | 5.00% | | 09/01/40 | | 577,444 |
| 300,000 | | River Islands CA Pub Fing Auth Spl Tax Ref Cmnty Facs Dist #2003-1
| | 5.38% | | 09/01/31 | | 318,670 |
| 575,000 | | Riverside CA Unif Sch Dist Election of 2016, Ser B
| | 3.00% | | 08/01/38 | | 627,967 |
| 185,000 | | Riverside CA Unif Sch Dist Fing Auth Spl Tax Ref, BAM
| | 5.00% | | 09/01/34 | | 214,056 |
| 1,495,000 | | Rocklin CA Unif Sch Dist Cmnty Facs Dist Subord, Ser 2019, BAM
| | 4.00% | | 09/15/37 | | 1,774,239 |
| 185,000 | | Roseville CA Spl Tax
| | 5.00% | | 09/01/32 | | 220,421 |
| 160,000 | | Roseville CA Spl Tax
| | 5.00% | | 09/01/33 | | 190,427 |
| 170,000 | | Roseville CA Spl Tax
| | 4.00% | | 09/01/34 | | 192,193 |
| 150,000 | | Roseville CA Spl Tax
| | 4.00% | | 09/01/35 | | 169,404 |
| 200,000 | | Sacramento CA Spl Tax Natomas Meadows Cmnty Facs Dist #2007-01 (a)
| | 5.00% | | 09/01/32 | | 227,130 |
| 500,000 | | Sacramento CA Transient Occupancy Tax Rev Sub Convention Ctr Complex, Ser C
| | 5.00% | | 06/01/32 | | 613,709 |
| 385,000 | | San Bruno CA Park Sch Dist, Ser B
| | 4.00% | | 08/01/34 | | 458,882 |
| 200,000 | | San Bruno CA Park Sch Dist, Ser B
| | 4.00% | | 08/01/37 | | 236,981 |
| 35,000 | | San Diego Cnty CA Ltd Rev Obligs Ref Sanford Burnham Prebys Med Discovery Institute, Ser A
| | 5.00% | | 11/01/25 | | 41,710 |
| 510,000 | | San Diego Cnty CA Ltd Rev Obligs Ref Sanford Burnham Prebys Med Discovery Institute, Ser A
| | 5.00% | | 11/01/28 | | 605,879 |
| 125,000 | | San Diego Cnty CA Spl Tax Harmony Grove Vlg Impt Area No.2, Ser A
| | 4.00% | | 09/01/32 | | 142,931 |
| 85,000 | | San Diego Cnty CA Spl Tax Harmony Grove Vlg Impt Area No.2, Ser A
| | 4.00% | | 09/01/33 | | 96,996 |
| 100,000 | | San Diego Cnty CA Spl Tax Harmony Grove Vlg Impt Area No.2, Ser A
| | 4.00% | | 09/01/34 | | 113,897 |
See Notes to Financial Statements
Page 19
First Trust California Municipal High Income ETF (FCAL)
Portfolio of Investments (Continued)
July 31, 2021
Principal
Value | | Description | | Stated
Coupon | | Stated
Maturity | | Value |
| MUNICIPAL BONDS (Continued) |
| | | California (Continued) | | | | | | |
| $500,000 | | San Francisco CA Bay Area Rapid Transit Dist Sales Tax Rev, Ser A
| | 4.00% | | 07/01/36 | | $587,612 |
| 140,000 | | San Francisco CA City & Cnty Arpts Commn Intl Arpt Rev Ref, Ser D, AMT
| | 5.00% | | 05/01/22 | | 145,082 |
| 500,000 | | San Francisco CA City & Cnty Dcnty Dev Spl Tax Dist No 2020-1 Mission Rock Facs & Svcs, Ser A (a)
| | 4.00% | | 09/01/46 | | 577,314 |
| 100,000 | | San Francisco City & Cnty CA Redev Agy Successor Agy Tax Ref Mission Bay N Redev Proj, Ser A
| | 5.00% | | 08/01/35 | | 120,146 |
| 175,000 | | San Joaquin Hills CA Transprtn Corridor Agy Toll Road Rev Cap Apprec Ref, Ser A, NATL
| | (d) | | 01/15/29 | | 156,395 |
| 675,000 | | Santa Clarita CA Cmnty Facs Dist Vista Canyon #2016-1 (a)
| | 4.00% | | 09/01/35 | | 760,849 |
| 175,000 | | Simi Vly CA Unif Sch Dist, Ser B
| | 4.00% | | 08/01/33 | | 206,752 |
| 370,000 | | Simi Vly CA Unif Sch Dist, Ser B
| | 4.00% | | 08/01/38 | | 433,184 |
| 500,000 | | Simi Vly CA Unif Sch Dist, Ser C
| | 4.00% | | 08/01/43 | | 588,493 |
| 1,400,000 | | So San Fran CA Pub Facs Fing Auth Lease Rev Police St Proj, Ser A
| | 4.00% | | 06/01/43 | | 1,678,034 |
| 150,000 | | Soledad CA Unif Sch Dist Premium Ref Bans, CABS
| | (d) | | 08/01/21 | | 150,000 |
| 305,000 | | Tahoe-Truckee CA Unif Sch Dist, COPS, BAM
| | 4.00% | | 06/01/37 | | 346,894 |
| 260,000 | | Tahoe-Truckee CA Unif Sch Dist, COPS, BAM
| | 4.00% | | 06/01/39 | | 294,902 |
| 150,000 | | Temecula Vly CA Unif Sch Dist Cmnty Facs Dist #2014-1
| | 5.00% | | 09/01/32 | | 175,217 |
| 400,000 | | Temecula Vly Unif Sch Dist Fing Auth CA Spl Tax Rev, BAM
| | 5.00% | | 09/01/34 | | 462,516 |
| 500,000 | | Temescal Vly CA Wtr Dist Spl Tax Terramor Cmnty Facs Dist #4 Impt Area #1
| | 5.00% | | 09/01/31 | | 584,071 |
| 1,000,000 | | Tobacco Securitization Auth Sthrn CA Tobacco Stlmt Rev Ref San Diego Co Tobacco Securitization Corp Class 1, Ser A
| | 5.00% | | 06/01/37 | | 1,297,955 |
| 1,000,000 | | Tobacco Securitization Auth Sthrn CA Tobacco Stlmt Rev San Diego Co Asset Securitization Corp Class 1, Ser A
| | 5.00% | | 06/01/38 | | 1,294,571 |
| 250,000 | | Tracy CA Cmnty Facs Dist
| | 5.00% | | 09/01/33 | | 291,550 |
| 470,000 | | Transbay Jt Powers Auth CA Green Bond Sr Tax Alloc Bonds, Ser A
| | 5.00% | | 10/01/33 | | 615,929 |
| 900,000 | | Transbay Jt Powers Auth CA Green Bond Sr Tax Alloc Bonds, Ser A
| | 5.00% | | 10/01/39 | | 1,160,467 |
| 500,000 | | Univ of California CA Revs Ref Ltd Proj, Ser O
| | 5.00% | | 05/15/48 | | 624,908 |
| 100,000 | | W Contra Costa CA Unif Sch Dist Ref, Ser A
| | 5.00% | | 08/01/31 | | 117,726 |
| | | | | 94,844,326 |
| | | Colorado – 0.5% | | | | | | |
| 500,000 | | Willow Bend Met Dist CO Sr, Ser A
| | 5.00% | | 12/01/39 | | 545,044 |
| | | Florida – 0.9% | | | | | | |
| 500,000 | | FL Dev Fin Corp Surface Tranprtn Fac Rev Green Bond Brightline Passenger Rail Remk, Ser B, AMT (a)
| | 7.38% | | 01/01/49 | | 552,480 |
| 150,000 | | Parkland Preserve CDD FL Spl Assmnt Rev, Ser A
| | 4.50% | | 05/01/24 | | 155,988 |
| 250,000 | | Rhodine Road N CDD FL Spl Assmnt
| | 4.00% | | 05/01/30 | | 273,276 |
| | | | | 981,744 |
| | | Georgia – 0.5% | | | | | | |
| 500,000 | | Fulton Cnty GA Rsdl Care Facs Elderly Auth Retmnt Fac Rev Ref Lenbrook Sq Fdtn Inc
| | 5.00% | | 07/01/42 | | 540,931 |
| | | Guam – 1.3% | | | | | | |
| 100,000 | | Guam Govt Busn Privilege Tax Rev Ref, Ser D
| | 5.00% | | 11/15/32 | | 115,435 |
| 355,000 | | Guam Govt Busn Privilege Tax Rev, Ser B-1
| | 5.00% | | 01/01/37 | | 361,939 |
| 750,000 | | Guam Govt Wtrwks Auth Wtr & Wstwtr Sys Rev, Ser A
| | 5.00% | | 01/01/50 | | 929,555 |
| | | | | 1,406,929 |
Page 20
See Notes to Financial Statements
First Trust California Municipal High Income ETF (FCAL)
Portfolio of Investments (Continued)
July 31, 2021
Principal
Value | | Description | | Stated
Coupon | | Stated
Maturity | | Value |
| MUNICIPAL BONDS (Continued) |
| | | Illinois – 0.3% | | | | | | |
| $35,000 | | Chicago IL Ref, Ser C, CABS
| | (d) | | 01/01/22 | | $34,809 |
| 135,000 | | Chicago IL Ref, Ser C, CABS
| | (d) | | 01/01/24 | | 130,085 |
| 120,000 | | IL St, Ser A
| | 4.00% | | 01/01/25 | | 121,833 |
| | | | | 286,727 |
| | | Louisiana – 1.0% | | | | | | |
| 750,000 | | Saint James Parish LA Rev Var Nustar Logistics LP Proj, Ser 2008 (Mandatory put 06/01/30) (a)
| | 6.10% | | 06/01/38 | | 999,834 |
| | | Ohio – 0.8% | | | | | | |
| 750,000 | | Buckeye OH Tobacco Stlmt Fing Auth Ref Sr, Class 2, Ser B-2
| | 5.00% | | 06/01/55 | | 882,719 |
| | | Puerto Rico – 2.0% | | | | | | |
| 100,000 | | Puerto Rico Cmwlth Ref Pub Impt, Ser A, AGM
| | 5.00% | | 07/01/35 | | 102,969 |
| 1,295,000 | | Puerto Rico Sales Tax Fing Corp Sales Tax Rev Restructured, Ser A-1
| | 4.50% | | 07/01/34 | | 1,437,907 |
| 616,000 | | Puerto Rico Sales Tax Fing Corp Sales Tax Rev Restructured, Ser A-1, CABS
| | (d) | | 07/01/29 | | 538,790 |
| | | | | 2,079,666 |
| | | Texas – 0.4% | | | | | | |
| 370,000 | | Houston TX Arpt Sys Rev Ref United Airls Inc Terminal Impt Proj, Ser B-2, AMT
| | 5.00% | | 07/15/27 | | 444,061 |
| Total Investments – 98.5%
| | 103,641,353 |
| | (Cost $96,965,239) (e) | | |
| | Net Other Assets and Liabilities – 1.5%
| | 1,557,254 |
| | Net Assets – 100.0%
| | $105,198,607 |
Futures Contracts (See Note 2D - Futures Contracts in the Notes to Financial Statements):
| Futures Contracts | | Position | | Number of
Contracts | | Expiration
Date | | Notional
Value | | Unrealized
Appreciation
(Depreciation)/
Value |
| U.S. Treasury Long Bonds | | Short | | 11 | | Sep 2021 | | $ (1,811,906) | | $(78,375) |
| U.S. Treasury Ultra 10-Year Notes | | Short | | 16 | | Sep 2021 | | (2,404,000) | | (55,844) |
| Total Futures Contracts | | | | | | | | $(4,215,906) | | $(134,219) |
|
| (a) | This security, sold within the terms of a private placement memorandum, is exempt from registration upon resale under Rule 144A under the Securities Act of 1933, as amended (the “1933 Act”), and may be resold in transactions exempt from registration, normally to qualified institutional buyers. Pursuant to procedures adopted by the Trust’s Board of Trustees, this security has been determined to be liquid by First Trust Advisors L.P. (the “Advisor”). Although market instability can result in periods of increased overall market illiquidity, liquidity for each security is determined based on security specific factors and assumptions, which require subjective judgment. At July 31, 2021, securities noted as such amounted to $19,461,429 or 18.5% of net assets. |
| (b) | This security, sold within the terms of a private placement memorandum, is exempt from registration upon resale under Rule 144A under the 1933 Act, and may be resold in transactions exempt from registration, normally to qualified institutional buyers (see Note 2C - Restricted Securities in the Notes to Financial Statements). |
| (c) | Pursuant to procedures adopted by the Trust’s Board of Trustees, this security has been determined to be illiquid by the Advisor. |
| (d) | Zero coupon bond. |
See Notes to Financial Statements
Page 21
First Trust California Municipal High Income ETF (FCAL)
Portfolio of Investments (Continued)
July 31, 2021
| (e) | Aggregate cost for federal income tax purposes was $96,730,417. As of July 31, 2021, the aggregate gross unrealized appreciation for all investments in which there was an excess of value over tax cost was $6,776,717 and the aggregate gross unrealized depreciation for all investments in which there was an excess of tax cost over value was $0. The net unrealized appreciation was $6,776,717. The unrealized amounts presented are inclusive of derivative contracts. |
| AGM | Assured Guaranty Municipal Corp. |
| AMBAC | American Municipal Bond Assurance Corp. |
| AMT | Alternative Minimum Tax |
| BAM | Build America Mutual |
| CA MTG INS | California Mortgage Insurance |
| CABS | Capital Appreciation Bonds |
| COPS | Certificates of Participation |
| NATL | National Public Finance Guarantee Corp. |
Valuation Inputs
A summary of the inputs used to value the Fund’s investments as of July 31, 2021 is as follows (see Note 2A - Portfolio Valuation in the Notes to Financial Statements):
| ASSETS TABLE |
| | Total
Value at
7/31/2021 | Level 1
Quoted
Prices | Level 2
Significant
Observable
Inputs | Level 3
Significant
Unobservable
Inputs |
Municipal Bonds*
| $ 103,641,353 | $ — | $ 103,641,353 | $ — |
| |
| LIABILITIES TABLE |
| | Total
Value at
7/31/2021 | Level 1
Quoted
Prices | Level 2
Significant
Observable
Inputs | Level 3
Significant
Unobservable
Inputs |
Futures Contracts**
| $ (134,219) | $ (134,219) | $ — | $ — |
| * | See Portfolio of Investments for state and territory breakout. |
| ** | Includes cumulative appreciation/depreciation on futures contracts as reported in the Futures Contracts table. Only the current day’s variation margin is presented on the Statements of Assets and Liabilities. |
Page 22
See Notes to Financial Statements
First Trust New York Municipal High Income ETF (FMNY)
Portfolio of Investments
July 31, 2021
Principal
Value | | Description | | Stated
Coupon | | Stated
Maturity | | Value |
| MUNICIPAL BONDS – 95.9% |
| | | American Samoa – 2.1% | | | | | | |
| $250,000 | | American Samoa AS Econ Dev Auth Gen Rev, Ser A (a)
| | 5.00% | | 09/01/38 | | $314,686 |
| | | Florida – 1.7% | | | | | | |
| 225,000 | | FL St Dev Fin Corp Sr Living Rev Ref Glenridge on Palmer Ranch Proj
| | 5.00% | | 06/01/35 | | 266,580 |
| | | New York – 86.5% | | | | | | |
| 270,000 | | Albany Cnty NY Ref, Ser C
| | 5.00% | | 11/01/23 | | 299,643 |
| 280,000 | | Brentwood NY Union Free Sch Dist Ref
| | 4.00% | | 11/15/23 | | 305,070 |
| 465,000 | | Buffalo NY Muni Wtr Fin Auth, Ser A, AGM
| | 4.00% | | 07/01/49 | | 531,522 |
| 400,000 | | Build NYC Res Corp NY Rev Acad Leadership Chrt Sch Proj
| | 4.00% | | 06/15/36 | | 462,609 |
| 300,000 | | Build NYC Res Corp NY Rev NY Preparatory Chrt Sch Proj, Ser A
| | 4.00% | | 06/15/31 | | 339,625 |
| 375,000 | | Build NYC Res Corp NY Rev Shefa Sch Proj, Ser A (a)
| | 5.00% | | 06/15/51 | | 453,471 |
| 380,000 | | Glen Cove NY, Ser A, BAM
| | 5.00% | | 06/01/26 | | 456,451 |
| 500,000 | | Island Trees NY Union Free Sch Dist
| | 3.00% | | 05/15/31 | | 564,767 |
| 355,000 | | Long Island NY Pwr Auth Elec Sys Rev Ref, Ser A
| | 5.00% | | 09/01/37 | | 469,881 |
| 55,000 | | Long Island NY Pwr Auth Elec Sys Rev Ref, Ser A
| | 4.00% | | 09/01/39 | | 66,865 |
| 150,000 | | Met Transprtn Auth NY Rev Ref, Ser D
| | 3.00% | | 11/15/32 | | 160,448 |
| 315,000 | | Met Transprtn Auth NY Rev Ref, Ser D
| | 4.00% | | 11/15/42 | | 363,782 |
| 400,000 | | Monroe Cnty NY Indl Dev Corp Rev Univ of Rochester Proj, Ser A
| | 4.00% | | 07/01/50 | | 474,427 |
| 530,000 | | New York City NY Hsg Dev Corp Mf Hsg Rev Sustainable Dev Bonds, Ser A1
| | 1.35% | | 11/01/26 | | 546,205 |
| 350,000 | | New York City NY Muni Wtr Fin Auth Wtr & Swr Sys Rev Ref Wtr And Swr Sys Second General Resolution, Ser BB2
| | 4.00% | | 06/15/42 | | 423,595 |
| 135,000 | | New York City NY Transitional Fin Auth Rev Subord Future Tax Secured, Ser C-1
| | 4.00% | | 11/01/40 | | 161,006 |
| 345,000 | | New York City NY Transitional Fin Auth Rev Subord, Ser A-3
| | 4.00% | | 05/01/43 | | 408,924 |
| 250,000 | | Niagara Cnty NY Tobacco Asset Securitization Corp Tobacco As Ref Asset Bkd Bds
| | 5.00% | | 05/15/22 | | 259,405 |
| 300,000 | | NY NY Fiscal 2020, Ser B-1
| | 5.00% | | 10/01/32 | | 393,022 |
| 250,000 | | NY NY, Ser A, Subser A-1
| | 4.00% | | 08/01/38 | | 299,566 |
| 325,000 | | NY St Dorm Auth Revs Non St Supported Debt Grp 2 Memorial Sloan Kettering Cancer Ctr Rev, Ser 1
| | 3.00% | | 07/01/34 | | 366,551 |
| 500,000 | | NY St Dorm Auth Revs Non St Supported Debt Ref St Johns Univ, Ser A
| | 4.00% | | 07/01/34 | | 623,340 |
| 400,000 | | NY St Dorm Auth Revs Non St Supported Debt, Ser A, AGM
| | 4.00% | | 10/01/35 | | 485,943 |
| 500,000 | | NY St Thruway Auth Gen Rev Junior Indebtedness Oblig Subord, Ser B
| | 4.00% | | 01/01/50 | �� | 588,185 |
| 120,000 | | NY St Transprtn Dev Corp Spl Fac Rev Ref Terminal 4 JFK Intl Arpt Proj, Ser A, AMT
| | 5.00% | | 12/01/33 | | 157,532 |
| 250,000 | | NY St Urban Dev Corp Rev Ref Grp 3, Ser E
| | 4.00% | | 03/15/46 | | 294,177 |
| 350,000 | | Onondaga Cnty NY Trust Cultural Res Rev Ref Syracuse Univ Proj
| | 5.00% | | 12/01/40 | | 457,372 |
| 250,000 | | Port Auth of NY & NJ NY Consolidated Bonds Two Hundred Fourteenth Ser, AMT
| | 5.00% | | 09/01/30 | | 325,025 |
| 275,000 | | Port Auth of NY & NJ NY Ref Consolidated Bonds Two Hundred Twelfth Ser
| | 4.00% | | 09/01/37 | | 333,103 |
| 295,000 | | Port Chester Rye NY Union Free Sch Dist
| | 5.00% | | 06/01/27 | | 371,190 |
| 500,000 | | Triborough NY Bridge & Tunnel Auth Revs Remk, Ser D
| | 5.00% | | 11/15/34 | | 671,415 |
| 190,000 | | Troy NY Capital Res Corp Rev Rensselaer Polytechnic Institute Proj Ref
| | 4.00% | | 09/01/35 | | 230,488 |
| 280,000 | | Troy NY Capital Res Corp Rev Rensselaer Polytechnic Institute Proj Ref
| | 4.00% | | 09/01/36 | | 338,802 |
See Notes to Financial Statements
Page 23
First Trust New York Municipal High Income ETF (FMNY)
Portfolio of Investments (Continued)
July 31, 2021
Principal
Value | | Description | | Stated
Coupon | | Stated
Maturity | | Value |
| MUNICIPAL BONDS (Continued) |
| | | New York (Continued) | | | | | | |
| $100,000 | | Tsasc Inc NY Ref, Ser A
| | 5.00% | | 06/01/32 | | $121,703 |
| 325,000 | | Wayne Cnty NY Wtr & Swr Auth Wtr & Swr Sys Rev Green Bond, BAM
| | 4.00% | | 12/15/41 | | 390,574 |
| | | | | 13,195,684 |
| | | Puerto Rico – 4.3% | | | | | | |
| 153,000 | | Puerto Rico Sales Tax Fing Corp Sales Tax Rev Restructured, Ser A-1, CABS
| | (b) | | 07/01/29 | | 133,823 |
| 194,000 | | Puerto Rico Sales Tax Fing Corp Sales Tax Rev Restructured, Ser A-1, CABS
| | (b) | | 07/01/31 | | 156,942 |
| 317,000 | | Puerto Rico Sales Tax Fing Corp Sales Tax Rev Restructured, Ser A-2 Converted
| | 4.33% | | 07/01/40 | | 361,050 |
| | | | | 651,815 |
| | | Texas – 1.3% | | | | | | |
| 200,000 | | Crandall TX Spl Assmnt Rev Cartwright Ranch Pub Impt Dt Impt Area #1 Proj (a)
| | 4.00% | | 09/15/31 | | 201,943 |
| Total Investments – 95.9%
| | 14,630,708 |
| | (Cost $14,404,254) (c) | | |
| | Net Other Assets and Liabilities – 4.1%
| | 625,062 |
| | Net Assets – 100.0%
| | $15,255,770 |
Futures Contracts (See Note 2D - Futures Contracts in the Notes to Financial Statements):
| Futures Contracts | | Position | | Number of
Contracts | | Expiration
Date | | Notional
Value | | Unrealized
Appreciation
(Depreciation)/
Value |
| U.S. Treasury Long Bonds | | Short | | 2 | | Sep 2021 | | $ (329,438) | | $(16,906) |
| U.S. Treasury Ultra 10-Year Notes | | Short | | 1 | | Sep 2021 | | (150,250) | | (5,203) |
| Total Futures Contracts | | | | | | | | $(479,688) | | $(22,109) |
|
| (a) | This security, sold within the terms of a private placement memorandum, is exempt from registration upon resale under Rule 144A under the Securities Act of 1933, as amended, and may be resold in transactions exempt from registration, normally to qualified institutional buyers. Pursuant to procedures adopted by the Trust’s Board of Trustees, this security has been determined to be liquid by First Trust Advisors L.P. (the “Advisor”). Although market instability can result in periods of increased overall market illiquidity, liquidity for each security is determined based on security specific factors and assumptions, which require subjective judgment. At July 31, 2021, securities noted as such amounted to $970,100 or 6.4% of net assets. |
| (b) | Zero coupon bond. |
| (c) | Aggregate cost for federal income tax purposes was $14,380,724. As of July 31, 2021, the aggregate gross unrealized appreciation for all investments in which there was an excess of value over tax cost was $227,875 and the aggregate gross unrealized depreciation for all investments in which there was an excess of tax cost over value was $0. The net unrealized appreciation was $227,875. The unrealized amounts presented are inclusive of derivative contracts. |
| AGM | Assured Guaranty Municipal Corp. |
| AMT | Alternative Minimum Tax |
| BAM | Build America Mutual |
| CABS | Capital Appreciation Bonds |
Page 24
See Notes to Financial Statements
First Trust New York Municipal High Income ETF (FMNY)
Portfolio of Investments (Continued)
July 31, 2021
Valuation Inputs
A summary of the inputs used to value the Fund’s investments as of July 31, 2021 is as follows (see Note 2A - Portfolio Valuation in the Notes to Financial Statements):
| ASSETS TABLE |
| | Total
Value at
7/31/2021 | Level 1
Quoted
Prices | Level 2
Significant
Observable
Inputs | Level 3
Significant
Unobservable
Inputs |
Municipal Bonds*
| $ 14,630,708 | $ — | $ 14,630,708 | $ — |
| |
| LIABILITIES TABLE |
| | Total
Value at
7/31/2021 | Level 1
Quoted
Prices | Level 2
Significant
Observable
Inputs | Level 3
Significant
Unobservable
Inputs |
Futures Contracts**
| $ (22,109) | $ (22,109) | $ — | $ — |
| * | See Portfolio of Investments for state and territory breakout. |
| ** | Includes cumulative appreciation/depreciation on futures contracts as reported in the Futures Contracts table. Only the current day’s variation margin is presented on the Statements of Assets and Liabilities. |
See Notes to Financial Statements
Page 25
First Trust Exchange-Traded Fund III
Statements of Assets and Liabilities
July 31, 2021
| | First Trust
California
Municipal
High Income
ETF
(FCAL) | | First Trust
New York
Municipal
High Income
ETF
(FMNY) |
| ASSETS: | | | |
Investments, at value
| $ 103,641,353 | | $ 14,630,708 |
Cash
| 1,315,945 | | 969,762 |
Cash segregated as collateral for open futures contracts
| 85,470 | | 10,395 |
Interest receivable
| 975,973 | | 95,029 |
Total Assets
| 106,018,741 | | 15,705,894 |
| LIABILITIES: | | | |
| Payables: | | | |
Investment securities purchased
| 762,156 | | 442,121 |
Investment advisory fees
| 44,343 | | 6,472 |
Variation margin
| 12,688 | | 1,531 |
Other liabilities
| 947 | | — |
Total Liabilities
| 820,134 | | 450,124 |
NET ASSETS
| $105,198,607 | | $15,255,770 |
| NET ASSETS consist of: | | | |
Paid-in capital
| $ 100,196,289 | | $ 14,999,560 |
Par value
| 19,000 | | 5,000 |
Accumulated distributable earnings (loss)
| 4,983,318 | | 251,210 |
NET ASSETS
| $105,198,607 | | $15,255,770 |
NET ASSET VALUE, per share
| $55.37 | | $30.51 |
Number of shares outstanding (unlimited number of shares authorized, par value $0.01 per share)
| 1,900,002 | | 500,002 |
Investments, at cost
| $96,965,239 | | $14,404,254 |
Page 26
See Notes to Financial Statements
First Trust Exchange-Traded Fund III
Statements of Operations
For the Period Ended July 31, 2021
| | First Trust
California
Municipal
High Income
ETF
(FCAL) | | First Trust
New York
Municipal
High Income
ETF
(FMNY) (a) |
| INVESTMENT INCOME: | | | |
Interest
| $ 2,512,315 | | $ 63,554 |
Total investment income
| 2,512,315 | | 63,554 |
| EXPENSES: | | | |
Investment advisory fees
| 614,792 | | 21,590 |
Total expenses
| 614,792 | | 21,590 |
Fees waived by the investment advisor
| (141,875) | | (4,982) |
Net expenses
| 472,917 | | 16,608 |
NET INVESTMENT INCOME (LOSS)
| 2,039,398 | | 46,946 |
| NET REALIZED AND UNREALIZED GAIN (LOSS): | | | |
| Net realized gain (loss) on: | | | |
Investments
| 215,773 | | 30,932 |
Futures contracts
| 202,578 | | (1,013) |
Net realized gain (loss)
| 418,351 | | 29,919 |
Net increase from payment by the advisor
| 219 | | — |
| Net change in unrealized appreciation (depreciation) on: | | | |
Investments
| 3,493,527 | | 226,454 |
Futures contracts
| (38,281) | | (22,109) |
Net change in unrealized appreciation (depreciation)
| 3,455,246 | | 204,345 |
NET REALIZED AND UNREALIZED GAIN (LOSS)
| 3,873,816 | | 234,264 |
NET INCREASE (DECREASE) IN NET ASSETS RESULTING FROM OPERATIONS
| $ 5,913,214 | | $ 281,210 |
| (a) | Inception date is May 12, 2021, which is consistent with the commencement of investment operations and is the date the initial creation units were established. |
See Notes to Financial Statements
Page 27
First Trust Exchange-Traded Fund III
Statements of Changes in Net Assets
| | First Trust
California Municipal
High Income
ETF (FCAL) | | First Trust
New York
Municipal High
Income
ETF (FMNY) |
| | Year
Ended
7/31/2021 | | Year
Ended
7/31/2020 | | Period
Ended
7/31/2021 (a) |
| OPERATIONS: | | | | | |
Net investment income (loss)
| $ 2,039,398 | | $ 1,594,302 | | $ 46,946 |
Net realized gain (loss)
| 418,351 | | (1,928,615) | | 29,919 |
Net increase from payment by the advisor
| 219 | | — | | — |
Net change in unrealized appreciation (depreciation)
| 3,455,246 | | 1,613,667 | | 204,345 |
Net increase (decrease) in net assets resulting from operations
| 5,913,214 | | 1,279,354 | | 281,210 |
| DISTRIBUTIONS TO SHAREHOLDERS FROM: | | | | | |
Investment operations
| (1,990,252) | | (1,554,337) | | (30,000) |
Return of capital
| — | | (72,665) | | — |
Total distributions to shareholders
| (1,990,252) | | (1,627,002) | | (30,000) |
| SHAREHOLDER TRANSACTIONS: | | | | | |
Proceeds from shares sold
| 21,698,863 | | 56,172,036 | | 15,004,560 |
Cost of shares redeemed
| (8,129,605) | | (2,375,228) | | — |
Net increase (decrease) in net assets resulting from shareholder transactions
| 13,569,258 | | 53,796,808 | | 15,004,560 |
Total increase (decrease) in net assets
| 17,492,220 | | 53,449,160 | | 15,255,770 |
| NET ASSETS: | | | | | |
Beginning of period
| 87,706,387 | | 34,257,227 | | — |
End of period
| $ 105,198,607 | | $ 87,706,387 | | $ 15,255,770 |
| CHANGES IN SHARES OUTSTANDING: | | | | | |
Shares outstanding, beginning of period
| 1,650,002 | | 650,002 | | — |
Shares sold
| 400,000 | | 1,050,000 | | 500,002 |
Shares redeemed
| (150,000) | | (50,000) | | — |
Shares outstanding, end of period
| 1,900,002 | | 1,650,002 | | 500,002 |
| (a) | Inception date is May 12, 2021, which is consistent with the commencement of investment operations and is the date the initial creation units were established. |
Page 28
See Notes to Financial Statements
First Trust Exchange-Traded Fund III
Financial Highlights
For a share outstanding throughout each period
First Trust California Municipal High Income ETF (FCAL)
| | Year Ended | | Period
Ended
7/31/2017 (a) |
| 7/31/2021 | | 7/31/2020 | | 7/31/2019 | | 7/31/2018 | |
Net asset value, beginning of period
| $ 53.16 | | $ 52.70 | | $ 50.11 | | $ 50.14 | | $ 50.00 |
| Income from investment operations: | | | | | | | | | |
Net investment income (loss)
| 1.16 | | 1.17 | | 1.49 | | 1.45 | | 0.10 |
Net realized and unrealized gain (loss)
| 2.19 (b) | | 0.51 | | 2.60 | | (0.04) | | 0.14 |
Total from investment operations
| 3.35 | | 1.68 | | 4.09 | | 1.41 | | 0.24 |
| Distributions paid to shareholders from: | | | | | | | | | |
Net investment income
| (1.14) | | (1.17) | | (1.50) | | (1.40) | | (0.10) |
Net realized gain
| — | | — | | — | | (0.04) | | — |
Return of capital
| — | | (0.05) | | — | | — | | (0.00) (c) |
Total distributions
| (1.14) | | (1.22) | | (1.50) | | (1.44) | | (0.10) |
Net asset value, end of period
| $55.37 | | $53.16 | | $52.70 | | $50.11 | | $50.14 |
Total return (d)
| 6.37% (b) | | 3.23% | | 8.32% | | 2.83% | | 0.50% |
| Ratios to average net assets/supplemental data: | | | | | | | | | |
Net assets, end of period (in 000’s)
| $ 105,199 | | $ 87,706 | | $ 34,257 | | $ 17,539 | | $ 10,029 |
Ratio of total expenses to average net assets
| 0.65% | | 0.65% | | 0.65% | | 0.65% | | 0.65% (e) |
Ratio of net expenses to average net assets
| 0.50% | | 0.50% | | 0.50% | | 0.50% | | 0.50% (e) |
Ratio of net investment income (loss) to average net assets
| 2.16% | | 2.28% | | 3.01% | | 2.97% | | 1.74% (e) |
Portfolio turnover rate (f)
| 25% | | 81% | | 69% | | 91% | | 22% |
| (a) | Inception date is June 20, 2017, which is consistent with the commencement of investment operations and is the date the initial creation units were established. |
| (b) | The Fund received a reimbursement from the advisor in the amount of $219, which represents less than $0.01 per share. Since the advisor reimbursed the Fund, there was no effect on the Fund’s total return. |
| (c) | Amount is less than $0.01. |
| (d) | Total return is calculated assuming an initial investment made at the net asset value at the beginning of the period, reinvestment of all distributions at net asset value during the period, and redemption at net asset value on the last day of the period. The returns presented do not reflect the deduction of taxes that a shareholder would pay on Fund distributions or the redemption or sale of Fund shares. Total return is calculated for the time period presented and is not annualized for periods of less than a year. The total return would have been lower if certain fees had not been waived by the investment advisor. |
| (e) | Annualized. |
| (f) | Portfolio turnover is calculated for the time period presented and is not annualized for periods of less than a year and does not include securities received or delivered from processing creations or redemptions and in-kind transactions. |
See Notes to Financial Statements
Page 29
First Trust Exchange-Traded Fund III
Financial Highlights (Continued)
For a share outstanding throughout the period
First Trust New York Municipal High Income ETF (FMNY)
| | Period
Ended
7/31/2021 (a) |
Net asset value, beginning of period
| $ 30.00 |
| Income from investment operations: | |
Net investment income (loss)
| 0.09 |
Net realized and unrealized gain (loss)
| 0.48 |
Total from investment operations
| 0.57 |
| Distributions paid to shareholders from: | |
Net investment income
| (0.04) |
Net realized gain
| (0.02) |
Total distributions
| (0.06) |
Net asset value, end of period
| $30.51 |
Total return (b)
| 1.90% |
| Ratios to average net assets/supplemental data: | |
Net assets, end of period (in 000’s)
| $ 15,256 |
Ratio of total expenses to average net assets
| 0.65% (c) |
Ratio of net expenses to average net assets
| 0.50% (c) |
Ratio of net investment income (loss) to average net assets
| 1.41% (c) |
Portfolio turnover rate (d)
| 16% |
| (a) | Inception date is May 12, 2021, which is consistent with the commencement of investment operations and is the date the initial creation units were established. |
| (b) | Total return is calculated assuming an initial investment made at the net asset value at the beginning of the period, reinvestment of all distributions at net asset value during the period, and redemption at net asset value on the last day of the period. The return presented does not reflect the deduction of taxes that a shareholder would pay on Fund distributions or the redemption or sale of Fund shares. Total return is calculated for the time period presented and is not annualized for periods of less than a year. The total return would have been lower if certain fees had not been waived by the investment advisor. |
| (c) | Annualized. |
| (d) | Portfolio turnover is calculated for the time period presented and is not annualized for periods of less than a year and does not include securities received or delivered from processing creations or redemptions and in-kind transactions. |
Page 30
See Notes to Financial Statements
Notes to Financial Statements
First Trust Exchange-Traded Fund III
July 31, 2021
1. Organization
First Trust Exchange-Traded Fund III (the “Trust”) is an open-end management investment company organized as a Massachusetts business trust on January 9, 2008, and is registered with the Securities and Exchange Commission under the Investment Company Act of 1940, as amended (the “1940 Act”).
The Trust currently consists of eighteen funds that are offering shares. This report covers the following funds, (each a “Fund” and collectively, the “Funds”):
First Trust California Municipal High Income ETF – (The Nasdaq Stock Market LLC ticker “FCAL”)
First Trust New York Municipal High Income ETF – (NYSE Arca, Inc. ticker “FMNY”)(1)
| (1) | Commenced investment operations on May 12, 2021. |
FCAL is a diversified series of the Trust. FMNY is a non-diversified series of the Trust.
Each Fund represents a separate series of shares of beneficial interest in the Trust. Unlike conventional mutual funds, each Fund issues and redeems shares on a continuous basis, at net asset value (“NAV”), only in large blocks of shares known as “Creation Units.”
Each Fund is an actively managed exchange-traded fund. The primary investment objective of each Fund is to seek to provide current income that is exempt from regular federal income taxes and, for FCAL, California income taxes and, for FMNY, New York income taxes. The secondary investment objective of each Fund is long-term capital appreciation. Under normal market conditions, each Fund seeks to achieve its investment objectives by investing at least 80% of its net assets (including investment borrowings) in municipal debt securities that pay interest that is exempt from regular federal income taxes and, for FCAL, California income taxes and, for FMNY, New York State and New York City income taxes. There can be no assurance that a Fund will achieve its investment objectives. The Funds may not be appropriate for all investors.
2. Significant Accounting Policies
The Funds are each considered an investment company and follow accounting and reporting guidance under Financial Accounting Standards Board Accounting Standards Codification Topic 946, “Financial Services-Investment Companies.” The following is a summary of significant accounting policies consistently followed by the Funds in the preparation of the financial statements. The preparation of the financial statements in accordance with accounting principles generally accepted in the United States of America (“U.S. GAAP”) requires management to make estimates and assumptions that affect the reported amounts and disclosures in the financial statements. Actual results could differ from those estimates.
A. Portfolio Valuation
Each Fund’s NAV is determined daily as of the close of regular trading on the New York Stock Exchange (“NYSE”), normally 4:00 p.m. Eastern time, on each day the NYSE is open for trading. If the NYSE closes early on a valuation day, the NAV is determined as of that time. Domestic debt securities are priced using data reflecting the earlier closing of the principal markets for those securities. Each Fund’s NAV is calculated by dividing the value of all assets of each Fund (including accrued interest and dividends), less all liabilities (including accrued expenses and dividends declared but unpaid), by the total number of shares outstanding.
Each Fund’s investments are valued daily at market value or, in the absence of market value with respect to any portfolio securities, at fair value. Market value prices represent last sale or official closing prices from a national or foreign exchange (i.e., a regulated market) and are primarily obtained from third-party pricing services. Fair value prices represent any prices not considered market value prices and are either obtained from a third-party pricing service or are determined by the Pricing Committee of the Funds’ investment advisor, First Trust Advisors L.P. (“First Trust” or the “Advisor”), in accordance with valuation procedures adopted by the Trust’s Board of Trustees, and in accordance with provisions of the 1940 Act. Investments valued by the Advisor’s Pricing Committee, if any, are footnoted as such in the footnotes to the Portfolio of Investments. Each Fund’s investments are valued as follows:
Municipal securities and other debt securities are fair valued on the basis of fair valuations provided by dealers who make markets in such securities or by a third-party pricing service approved by the Trust’s Board of Trustees, which may use the following valuation inputs when available:
| 1) | benchmark yields; |
| 2) | reported trades; |
| 3) | broker/dealer quotes; |
| 4) | issuer spreads; |
| 5) | benchmark securities; |
Notes to Financial Statements (Continued)
First Trust Exchange-Traded Fund III
July 31, 2021
| 6) | bids and offers; and |
| 7) | reference data including market research publications. |
Exchange-traded futures contracts are valued at the closing price in the market where such contracts are principally traded. If no closing price is available, exchange-traded futures contracts are fair valued at the mean of their most recent bid and asked price, if available, and otherwise at their closing bid price.
Fixed income and other debt securities having a remaining maturity of sixty days or less when purchased are fair valued at cost adjusted for amortization of premiums and accretion of discounts (amortized cost), provided the Advisor’s Pricing Committee has determined that the use of amortized cost is an appropriate reflection of fair value given market and issuer-specific conditions existing at the time of the determination. Factors that may be considered in determining the appropriateness of the use of amortized cost include, but are not limited to, the following:
| 1) | the credit conditions in the relevant market and changes thereto; |
| 2) | the liquidity conditions in the relevant market and changes thereto; |
| 3) | the interest rate conditions in the relevant market and changes thereto (such as significant changes in interest rates); |
| 4) | issuer-specific conditions (such as significant credit deterioration); and |
| 5) | any other market-based data the Advisor’s Pricing Committee considers relevant. In this regard, the Advisor’s Pricing Committee may use last-obtained market-based data to assist it when valuing portfolio securities using amortized cost. |
Certain securities may not be able to be priced by pre-established pricing methods. Such securities may be valued by the Trust’s Board of Trustees or its delegate, the Advisor’s Pricing Committee, at fair value. These securities generally include, but are not limited to, restricted securities (securities which may not be publicly sold without registration under the Securities Act of 1933, as amended (the ”1933 Act“)) for which a third-party pricing service is unable to provide a market price; securities whose trading has been formally suspended; a security whose market or fair value price is not available from a pre-established pricing source; a security with respect to which an event has occurred that is likely to materially affect the value of the security after the market has closed but before the calculation of a Fund’s NAV or make it difficult or impossible to obtain a reliable market quotation; and a security whose price, as provided by the third-party pricing service, does not reflect the security’s fair value. As a general principle, the current fair value of a security would appear to be the amount which the owner might reasonably expect to receive for the security upon its current sale. When fair value prices are used, generally they will differ from market quotations or official closing prices on the applicable exchanges. A variety of factors may be considered in determining the fair value of such securities, including, but not limited to, the following:
| 1) | the fundamental business data relating to the issuer; |
| 2) | an evaluation of the forces which influence the market in which these securities are purchased and sold; |
| 3) | the type, size and cost of the security; |
| 4) | the financial statements of the issuer; |
| 5) | the credit quality and cash flow of the issuer, based on the Advisor’s or external analysis; |
| 6) | the information as to any transactions in or offers for the security; |
| 7) | the price and extent of public trading in similar securities (or equity securities) of the issuer/borrower, or comparable companies; |
| 8) | the coupon payments; |
| 9) | the quality, value and salability of collateral, if any, securing the security; and |
| 10) | other relevant factors. |
The Funds are subject to fair value accounting standards that define fair value, establish the framework for measuring fair value and provide a three-level hierarchy for fair valuation based upon the inputs to the valuation as of the measurement date. The three levels of the fair value hierarchy are as follows:
| • | Level 1 – Level 1 inputs are quoted prices in active markets for identical investments. An active market is a market in which transactions for the investment occur with sufficient frequency and volume to provide pricing information on an ongoing basis. |
| • | Level 2 – Level 2 inputs are observable inputs, either directly or indirectly, and include the following: |
| o | Quoted prices for similar investments in active markets. |
Notes to Financial Statements (Continued)
First Trust Exchange-Traded Fund III
July 31, 2021
| o | Quoted prices for identical or similar investments in markets that are non-active. A non-active market is a market where there are few transactions for the investment, the prices are not current, or price quotations vary substantially either over time or among market makers, or in which little information is released publicly. |
| o | Inputs other than quoted prices that are observable for the investment (for example, interest rates and yield curves observable at commonly quoted intervals, volatilities, prepayment speeds, loss severities, credit risks, and default rates). |
| o | Inputs that are derived principally from or corroborated by observable market data by correlation or other means. |
| • | Level 3 – Level 3 inputs are unobservable inputs. Unobservable inputs may reflect the reporting entity’s own assumptions about the assumptions that market participants would use in pricing the investment. |
The inputs or methodologies used for valuing investments are not necessarily an indication of the risk associated with investing in those investments. A summary of the inputs used to value each Fund’s investments as of July 31, 2021, is included with each Fund’s Portfolio of Investments.
B. Securities Transactions and Investment Income
Securities transactions are recorded as of the trade date. Realized gains and losses from securities transactions are recorded on the identified cost basis. Interest income is recorded daily on the accrual basis. Amortization of premiums and accretion of discounts are recorded using the effective interest method.
C. Restricted Securities
FCAL invests in restricted securities, which are securities that may not be offered for public sale without first being registered under the 1933 Act. Prior to registration, restricted securities may only be resold in transactions exempt from registration under Rule 144A under the 1933 Act, normally to qualified institutional buyers. As of July 31, 2021, FCAL held restricted securities as shown in the following table that the Advisor has deemed illiquid pursuant to procedures adopted by the Trust’s Board of Trustees. Although market instability can result in periods of increased overall market illiquidity, liquidity for each security is determined based on security-specific factors and assumptions, which require subjective judgment. The Fund does not have the right to demand that such securities be registered. These securities are valued according to the valuation procedures as stated in the Portfolio Valuation note (Note 2A) and are not expressed as a discount to the carrying value of a comparable unrestricted security. There are no unrestricted securities with the same maturity dates and yields for these issuers.
| Security | Acquisition
Date | Principal
Value | Current Price | Carrying
Cost | | Value | | % of
Net
Assets |
| CA St Muni Fin Auth Chrt Sch Lease Rev Sycamore Acdmy Proj, 5.38%, 07/01/34 | 06/14/18 | $250,000 | $109.70 | $252,302 | | $274,262 | | 0.28% |
| CA St Sch Fin Auth Chrt Sch Rev Rocketship Pub Schs, Ser G, 5.00%, 06/01/37 | 12/05/17 | $300,000 | 115.29 | 310,378 | | 345,878 | | 0.35 |
| | | | | $562,680 | | $620,140 | | 0.63% |
D. Futures Contracts
The Funds may purchase or sell (i.e., is long or short) exchange-listed futures contracts to hedge against changes in interest rates (interest rate risk). Futures contracts are agreements between the Funds and a counterparty to buy or sell a specific quantity of an underlying instrument at a specified price and at a specified date. Depending on the terms of the contract, futures contracts are settled either through physical delivery of the underlying instrument on the settlement date or by payment of a cash settlement amount on the settlement date. Open futures contracts can also be closed out prior to settlement by entering into an offsetting transaction in a matching futures contract. If the Funds are not able to enter into an offsetting transaction, the Funds will continue to be required to maintain margin deposits on the futures contract. When the contract is closed or expires, the Funds record a realized gain or loss equal to the difference between the value of the contract at the time it was opened and the value at the time it was closed or expired. This gain or loss is included in “Net realized gain (loss) on futures contracts” on the Statements of Operations.
Upon entering into a futures contract, the Funds must deposit funds, called margin, with its custodian in the name of the clearing broker equal to a specified percentage of the current value of the contract. Open futures contracts are marked to market daily with the change in value recognized as a component of “Net change in unrealized appreciation (depreciation) on futures contracts” on the Statements of Operations. This daily fluctuation in the value of the contracts is also known as variation margin and is included in “Variation margin” payable or receivable on the Statements of Assets and Liabilities.
Notes to Financial Statements (Continued)
First Trust Exchange-Traded Fund III
July 31, 2021
If market conditions change unexpectedly, the Funds may not achieve the anticipated benefits of the futures contract and may realize a loss. The use of futures contracts involves the risk of imperfect correlation in movements in the price of the futures contracts, interest rates and the underlying instruments.
Restricted cash segregated as collateral for futures contracts in the amounts of $85,470 and $10,395 for FCAL and FMNY, respectively, is shown as “Cash segregated as collateral for open futures contracts” on the Statements of Assets and Liabilities.
E. Dividends and Distributions to Shareholders
Dividends from net investment income, if any, are declared and paid monthly by each Fund, or as the Board of Trustees may determine from time to time. Distributions of net realized capital gains earned by each Fund, if any, are distributed at least annually.
Distributions from net investment income and realized capital gains are determined in accordance with federal income tax regulations, which may differ from U.S. GAAP. Certain capital accounts in the financial statements are periodically adjusted for permanent differences in order to reflect their tax character. These permanent differences are primarily due to the varying treatment of income and gain/loss on portfolio securities held by the Funds and have no impact on net assets or NAV per share. Temporary differences, which arise from recognizing certain items of income, expense and gain/loss in different periods for financial statement and tax purposes, will reverse at some time in the future.
The tax character of distributions paid by each Fund during the fiscal period ended July 31, 2021, was as follows:
| | Distributions
paid from
Tax-Exempt
Income | | Distributions
paid from
Ordinary
Income | | Distributions
paid from
Capital
Gains | | Distributions
paid from
Return of
Capital |
First Trust California Municipal High Income ETF
| $1,983,260 | | $ 6,992 | | $ — | | $ — |
First Trust New York Municipal High Income ETF
| 22,190 | | 7,810 | | — | | — |
The tax character of distributions paid by FCAL during the fiscal year ended July 31, 2020, was as follows:
| | Distributions
paid from
Tax-Exempt
Income | | Distributions
paid from
Ordinary
Income | | Distributions
paid from
Capital
Gains | | Distributions
paid from
Return of
Capital |
First Trust California Municipal High Income ETF
| $1,554,337 | | $ — | | $ — | | $ 72,665 |
As of July 31, 2021, the components of distributable earnings on a tax basis for each Fund were as follows:
| | Undistributed
Ordinary
Income | | Accumulated
Capital and
Other
Gain (Loss) | | Net
Unrealized
Appreciation
(Depreciation) |
First Trust California Municipal High Income ETF
| $ 6,826 | | $ (1,800,225) | | $ 6,776,717 |
First Trust New York Municipal High Income ETF
| 23,335 | | — | | 227,875 |
F. Income Taxes
Each Fund intends to qualify or continue to qualify as a regulated investment company by complying with the requirements under Subchapter M of the Internal Revenue Code of 1986, as amended (the “Code”), which includes distributing substantially all of its net investment income and net realized gains to shareholders. Accordingly, no provision has been made for federal and state income taxes. However, due to the timing and amount of distributions, each Fund may be subject to an excise tax of 4% of the amount by which approximately 98% of each Fund’s taxable income exceeds the distributions from such taxable income for the calendar year.
In addition, each Fund intends to invest in municipal securities to allow it to pay shareholders “exempt dividends” as defined in the Code.
The Funds are subject to accounting standards that establish a minimum threshold for recognizing, and a system for measuring, the benefits of a tax position taken or expected to be taken in a tax return. For FCAL, taxable years ended 2018, 2019, 2020, and 2021 remain open to federal and state audit. For FMNY, the taxable period ended 2021 remains open to federal and state audit. As of
Notes to Financial Statements (Continued)
First Trust Exchange-Traded Fund III
July 31, 2021
July 31, 2021, management has evaluated the application of these standards to the Funds and has determined that no provision for income tax is required in the Funds’ financial statements for uncertain tax positions.
The Funds intend to utilize provisions of the federal income tax laws, which allow them to carry a realized capital loss forward indefinitely following the year of the loss and offset such loss against any future realized capital gains. The Funds are subject to certain limitations under U.S. tax rules on the use of capital loss carryforwards and net unrealized built-in losses. These limitations apply when there has been a 50% change in ownership. At July 31, 2021, for federal income tax purposes, each applicable Fund had a capital loss carryforward available that is shown in the table below, to the extent provided by regulations, to offset future capital gains.
| | Non-Expiring
Capital Loss
Carryforward |
First Trust California Municipal High Income ETF
| $ 1,800,225 |
First Trust New York Municipal High Income ETF
| — |
Certain losses realized during the current fiscal period may be deferred and treated as occurring on the first day of the following fiscal year for federal income tax purposes. For the fiscal period ended July 31, 2021, the Funds did not incur any net ordinary losses.
In order to present paid-in capital and accumulated distributable earnings (loss) (which consists of accumulated net investment income (loss), accumulated net realized gain (loss) on investments and net unrealized appreciation (depreciation) on investments) on the Statements of Assets and Liabilities that more closely represent their tax character, certain adjustments have been made to paid-in capital, accumulated net investment income (loss) and accumulated net realized gain (loss) on investments. These adjustments are primarily due to the difference between book and tax treatments of income and gains on various investment securities held by the Funds. The results of operations and net assets were not affected by these adjustments. For the fiscal period ended July 31, 2021, the adjustments for each Fund were as follows:
| | Accumulated
Net
Investment
Income (Loss) | | Accumulated
Net Realized
Gain (Loss)
on Investments | | Paid-in
Capital |
First Trust California Municipal High Income ETF
| $ (2,119) | | $ 2,119 | | $ — |
First Trust New York Municipal High Income ETF
| — | | — | | — |
G. Expenses
Expenses, other than the investment advisory fee and other excluded expenses, are paid by the Advisor (See Note 3).
3. Investment Advisory Fee, Affiliated Transactions and Other Fee Arrangements
First Trust, the investment advisor to the Funds, is a limited partnership with one limited partner, Grace Partners of DuPage L.P., and one general partner, The Charger Corporation. The Charger Corporation is an Illinois corporation controlled by James A. Bowen, Chief Executive Officer of First Trust. First Trust is responsible for the selection and ongoing monitoring of the securities in each Fund’s portfolio, managing the Funds’ business affairs and providing certain administrative services necessary for the management of the Funds.
Pursuant to the Investment Management Agreements between the Trust and the Advisor, First Trust manages the investment of the Funds’ assets and is responsible for the Funds’ expenses, including the cost of transfer agency, custody, fund administration, legal, audit and other services, but excluding fee payments under the Investment Management Agreements, interest, taxes, acquired fund fees and expenses, if any, brokerage commissions and other expenses connected with the execution of portfolio transactions, distribution and service fees pursuant to a Rule 12b-1 plan, if any, and extraordinary expenses. The Funds have agreed to pay First Trust an annual unitary management fee equal to 0.65% of their average daily net assets. First Trust also provides fund reporting services to each Fund for a flat annual fee in the amount of $9,250, which is covered under the annual unitary management fee.
The Trust’s Board of Trustees and the Advisor have entered into Fee Waiver Agreements for the Funds pursuant to which the Advisor contractually agreed to waive management fees of 0.15% of average daily net assets until November 30, 2021 and May 11, 2023, for FCAL and FMNY, respectively. The waiver agreements may be terminated by action of the Trust’s Board of Trustees at any time upon 60 days’ written notice by the Trust on behalf of the Funds or by the Advisor only after November 30, 2021 and May 11, 2023, for
Notes to Financial Statements (Continued)
First Trust Exchange-Traded Fund III
July 31, 2021
FCAL and FMNY, respectively. First Trust does not have the right to recover the fees waived. During the fiscal period ended July 31, 2021, the Advisor waived fees of $141,875 and $4,982 for FCAL and FMNY, respectively.
During the fiscal year ended July 31, 2021, FCAL received a payment from the Advisor of $219 in connection with a trade error.
The Trust has multiple service agreements with Brown Brothers Harriman & Co. (“BBH”). Under the service agreements, BBH performs custodial, fund accounting, certain administrative services, and transfer agency services for the Funds. As custodian, BBH is responsible for custody of the Funds’ assets. As fund accountant and administrator, BBH is responsible for maintaining the books and records of the Funds’ securities and cash. As transfer agent, BBH is responsible for maintaining shareholder records for the Funds.
Each Trustee who is not an officer or employee of First Trust, any sub-advisor or any of their affiliates (“Independent Trustees”) is paid a fixed annual retainer that is allocated equally among each fund in the First Trust Fund Complex. Each Independent Trustee is also paid an annual per fund fee that varies based on whether the fund is a closed-end or other actively managed fund, a defined-outcome fund or an index fund.
Additionally, the Lead Independent Trustee and the Chairmen of the Audit Committee, Nominating and Governance Committee and Valuation Committee are paid annual fees to serve in such capacities, with such compensation allocated pro rata among each fund in the First Trust Fund Complex based on net assets. Independent Trustees are reimbursed for travel and out-of-pocket expenses in connection with all meetings. The Lead Independent Trustee and Committee Chairmen rotate every three years. The officers and “Interested” Trustee receive no compensation from the Trust for acting in such capacities.
4. Purchases and Sales of Securities
For the fiscal period ended July 31, 2021, the cost of purchases and proceeds from sales of investment securities for each Fund, excluding short-term investments and in-kind transactions, were as follows:
| | Purchases | | Sales |
| First Trust California Municipal High Income ETF | $ 38,441,365 | | $ 22,892,182 |
| First Trust New York Municipal High Income ETF | 16,633,823 | | 2,230,742 |
| | | | |
For the fiscal period ended July 31, 2021, the Funds had no in-kind transactions.
5. Derivative Transactions
The following table presents the type of derivatives held by each Fund at July 31, 2021, the primary underlying risk exposure and the location of these instruments as presented on the Statements of Assets and Liabilities.
FCAL
| | | | | Asset Derivatives | | Liability Derivatives |
Derivative
Instrument | | Risk
Exposure | | Statements of Assets and
Liabilities Location | | Value | | Statements of Assets and
Liabilities Location | | Value |
| Futures contracts | | Interest Rate Risk | | Unrealized appreciation
on futures contracts* | | $ — | | Unrealized depreciation
on futures contracts* | | $ 134,219 |
FMNY
| | | | | Asset Derivatives | | Liability Derivatives |
Derivative
Instrument | | Risk
Exposure | | Statements of Assets and
Liabilities Location | | Value | | Statements of Assets and
Liabilities Location | | Value |
| Futures contracts | | Interest Rate Risk | | Unrealized appreciation
on futures contracts* | | $ — | | Unrealized depreciation
on futures contracts* | | $ 22,109 |
* Includes cumulative appreciation/depreciation on futures contracts as reported in the Futures Contracts table. Only the current day’s variation margin is presented on the Statements of Assets and Liabilities.
Notes to Financial Statements (Continued)
First Trust Exchange-Traded Fund III
July 31, 2021
The following table presents the amount of net realized gain (loss) and change in net unrealized appreciation (depreciation) recognized for the fiscal period ended July 31, 2021, on derivative instruments, as well as the primary underlying risk exposure associated with each instrument.
| | Interest Rate Risk |
| Statements of Operations Location | FCAL | FMNY |
| Net realized gain (loss) on futures | $202,578 | $(1,013) |
| Net change in unrealized appreciation (depreciation) on futures | (38,281) | (22,109) |
During the fiscal year ended July 31, 2021, for FCAL, the notional value of futures contracts opened and closed were $50,077,492 and $51,360,430, respectively.
During the fiscal period ended July 31, 2021, for FMNY, the notional value of futures contracts opened and closed were $614,517 and $156,938, respectively.
The Funds do not have the right to offset financial assets and liabilities related to futures contracts on the Statements of Assets and Liabilities.
6. Creations, Redemptions and Transaction Fees
Each Fund generally issues and redeems its shares in primary market transactions through a creation and redemption mechanism and does not sell or redeem individual shares. Instead, financial entities known as “Authorized Participants” have contractual arrangements with a Fund or one of the Fund’s service providers to purchase and redeem Fund shares directly with the Fund in large blocks of shares known as “Creation Units.” Prior to the start of trading on every business day, a Fund publishes through the National Securities Clearing Corporation (“NSCC”) the “basket” of securities, cash or other assets that it will accept in exchange for a Creation Unit of the Fund’s shares. An Authorized Participant that wishes to effectuate a creation of a Fund’s shares deposits with the Fund the “basket” of securities, cash or other assets identified by the Fund that day, and then receives the Creation Unit of the Fund’s shares in return for those assets. After purchasing a Creation Unit, the Authorized Participant may continue to hold the Fund’s shares or sell them in the secondary market. The redemption process is the reverse of the purchase process: the Authorized Participant redeems a Creation Unit of a Fund’s shares for a basket of securities, cash or other assets. The combination of the creation and redemption process with secondary market trading in a Fund’s shares and underlying securities provides arbitrage opportunities that are designed to help keep the market price of a Fund’s shares at or close to the NAV per share of the Fund.
Each Fund imposes fees in connection with the purchase of Creation Units. These fees may vary based upon various fact-based circumstances, including, but not limited to, the composition of the securities included in the Creation Unit or the countries in which the transactions are settled. The price for each Creation Unit will equal the daily NAV per share of a Fund times the number of shares in a Creation Unit, plus the fees described above and, if applicable, any operational processing and brokerage costs, transfer fees, stamp taxes and part or all of the spread between the expected bid and offer side of the market related to the securities comprising the creation basket.
Each Fund also imposes fees in connection with the redemption of Creation Units. These fees may vary based upon various fact-based circumstances, including, but not limited to, the composition of the securities included in the Creation Unit or the countries in which the transactions are settled. The price received for each Creation Unit will equal the daily NAV per share of a Fund times the number of shares in a Creation Unit, minus the fees described above and, if applicable, any operational processing and brokerage costs, transfer fees, stamp taxes and part or all of the spread between the expected bid and offer side of the market related to the securities comprising the redemption basket. Investors who use the services of a broker or other such intermediary in addition to an Authorized Participant to effect a redemption of a Creation Unit may also be assessed an amount to cover the cost of such services. The redemption fee charged by a Fund will comply with Rule 22c-2 of the 1940 Act which limits redemption fees to no more than 2% of the value of the shares redeemed.
7. Distribution Plan
The Board of Trustees adopted a Distribution and Service Plan pursuant to Rule 12b-1 under the 1940 Act. In accordance with the Rule 12b-1 plan, each Fund is authorized to pay an amount up to 0.25% of its average daily net assets each year to reimburse First Trust Portfolios L.P. (“FTP”), the distributor of the Funds, for amounts expended to finance activities primarily intended to result in the sale of Creation Units or to provide investor services. FTP may also use this amount to compensate securities dealers or other persons that are Authorized Participants for providing distribution assistance, including broker-dealer and shareholder support and educational and promotional services.
Notes to Financial Statements (Continued)
First Trust Exchange-Traded Fund III
July 31, 2021
No 12b-1 fees are currently paid by the Funds, and pursuant to a contractual arrangement, no 12b-1 fees will be paid any time before November 30, 2021 for FCAL and May 11, 2023 for FMNY.
8. Borrowings
The Trust, on behalf of FCAL, along with First Trust Series Fund and First Trust Exchange-Traded Fund IV have a $330 million Credit Agreement with The Bank of Nova Scotia (“Scotia”) as administrative agent for a group of lenders. Prior to March 3, 2021, the commitment amount was $410 million. Scotia charges a commitment fee of 0.25% of the daily amount of the excess of the commitment amount over the outstanding principal balance of the loans and an agency fee. First Trust allocates the commitment fee and agency fee amongst the funds that have access to the credit line. To the extent that the Fund accesses the credit line, there would also be an interest fee charged. The Fund did not have any borrowings outstanding during the fiscal year ended July 31, 2021.
9. Indemnification
The Trust, on behalf of the Funds, has a variety of indemnification obligations under contracts with its service providers. The Trust’s maximum exposure under these arrangements is unknown. However, the Trust has not had prior claims or losses pursuant to these contracts and expects the risk of loss to be remote.
10. Other Matters
By operation of law, FCAL now operates as a diversified open-end management investment company as defined in Section 5(b) of the 1940 Act.
11. Subsequent Events
Management has evaluated the impact of all subsequent events to the Funds through the date the financial statements were issued, and has determined that there was the following subsequent event:
On September 13, 2021, the Board of Trustees approved the continuation of the fee waiver for FCAL of 0.15% of average daily net assets through November 30, 2022.
Report of Independent Registered Public Accounting Firm
To the Shareholders and the Board of Trustees of First Trust Exchange-Traded Fund III:
Opinion on the Financial Statements and Financial Highlights
We have audited the accompanying statements of assets and liabilities of First Trust California Municipal High Income ETF and First Trust New York Municipal High Income ETF (the “Funds”), each a series of the First Trust Exchange-Traded Fund III, including the portfolios of investments, as of July 31, 2021, the related statements of operations, the statements of changes in net assets, and the financial highlights for the periods indicated in the table below, and the related notes. In our opinion, the financial statements and financial highlights present fairly, in all material respects, the financial position of each of the Funds as of July 31, 2021, and the results of their operations, the changes in their net assets, and the financial highlights for the periods listed in the table below in conformity with accounting principles generally accepted in the United States of America.
Individual Funds Included
in the Trust | Statements of
Operations | Statements of
Changes in Net
Assets | Financial Highlights |
First Trust California
Municipal High Income
ETF (FCAL) | For the year ended
July 31, 2021 | For the years ended
July 31, 2021 and 2020 | For the years ended July 31,
2021, 2020, 2019, 2018, and for
the period from June 20, 2017
(commencement of operations)
through July 31, 2017. |
First Trust New York
Municipal High Income
ETF (FMNY) | For the period from May 12, 2021 (commencement of operations) through July 31, 2021 |
Basis for Opinion
These financial statements and financial highlights are the responsibility of the Funds’ management. Our responsibility is to express an opinion on the Funds’ financial statements and financial highlights based on our audits. We are a public accounting firm registered with the Public Company Accounting Oversight Board (United States) (PCAOB) and are required to be independent with respect to the Funds in accordance with the U.S. federal securities laws and the applicable rules and regulations of the Securities and Exchange Commission and the PCAOB.
We conducted our audits in accordance with the standards of the PCAOB. Those standards require that we plan and perform the audit to obtain reasonable assurance about whether the financial statements and financial highlights are free of material misstatement, whether due to error or fraud. The Funds are not required to have, nor were we engaged to perform, an audit of its internal control over financial reporting. As part of our audits we are required to obtain an understanding of internal control over financial reporting but not for the purpose of expressing an opinion on the effectiveness of the Funds’ internal control over financial reporting. Accordingly, we express no such opinion.
Our audits included performing procedures to assess the risks of material misstatement of the financial statements and financial highlights, whether due to error or fraud, and performing procedures that respond to those risks. Such procedures included examining, on a test basis, evidence regarding the amounts and disclosures in the financial statements and financial highlights. Our audits also included evaluating the accounting principles used and significant estimates made by management, as well as evaluating the overall presentation of the financial statements and financial highlights. Our procedures included confirmation of securities owned as of July 31, 2021, by correspondence with the custodian and brokers; when replies were not received from brokers, we performed other auditing procedures. We believe that our audits provide a reasonable basis for our opinion.
Chicago, Illinois
September 22, 2021
We have served as the auditor of one or more First Trust investment companies since 2001.
Additional Information
First Trust Exchange-Traded Fund III
July 31, 2021 (Unaudited)
Proxy Voting Policies and Procedures
A description of the policies and procedures that the Trust uses to determine how to vote proxies and information on how each Fund voted proxies relating to portfolio securities during the most recent 12-month period ended June 30 is available (1) without charge, upon request, by calling (800) 988-5891; (2) on each Fund’s website at www.ftportfolios.com; and (3) on the Securities and Exchange Commission’s (“SEC”) website at www.sec.gov.
Portfolio Holdings
Each Fund files portfolio holdings information for each month in a fiscal quarter within 60 days after the end of the relevant fiscal quarter on Form N-PORT. Portfolio holdings information for the third month of each fiscal quarter will be publicly available on the SEC’s website at www.sec.gov. Each Fund’s complete schedule of portfolio holdings for the second and fourth quarters of each fiscal year is included in the semi-annual and annual reports to shareholders, respectively, and is filed with the SEC on Form N-CSR. The semi-annual and annual report for each Fund is available to investors within 60 days after the period to which it relates. Each Fund’s Forms N-PORT and Forms N-CSR are available on the SEC’s website listed above.
Federal Tax Information
For the taxable period ended July 31, 2021, the following distribution information is being provided as required by the Internal Revenue Code of 1986, as amended, or to meet a specific state’s requirement. The Funds designate the following percentages or, if subsequently determined to be different, the maximum amount allowable for its fiscal period ended July 31, 2021:
| | Tax-Exempt
Interest Dividends | | Alternative Minimum
Tax (AMT) |
First Trust California Municipal High Income ETF
| 99.65% | | 8.45% |
First Trust New York Municipal High Income ETF
| 100.00% | | 5.84% |
Risk Considerations
Risks are inherent in all investing. Certain general risks that may be applicable to a Fund are identified below, but not all of the material risks relevant to each Fund are included in this report and not all of the risks below apply to each Fund. The material risks of investing in each Fund are spelled out in its prospectus, statement of additional information and other regulatory filings. Before investing, you should consider each Fund’s investment objective, risks, charges and expenses, and read each Fund’s prospectus and statement of additional information carefully. You can download each Fund’s prospectus at www.ftportfolios.com or contact First Trust Portfolios L.P. at (800) 621-1675 to request a prospectus, which contains this and other information about each Fund.
Concentration Risk. To the extent that a fund is able to invest a significant percentage of its assets in a single asset class or the securities of issuers within the same country, state, region, industry or sector, an adverse economic, business or political development may affect the value of the fund’s investments more than if the fund were more broadly diversified. A fund that tracks an index will be concentrated to the extent the fund’s corresponding index is concentrated. A concentration makes a fund more susceptible to any single occurrence and may subject the fund to greater market risk than a fund that is more broadly diversified.
Credit Risk. Credit risk is the risk that an issuer of a security will be unable or unwilling to make dividend, interest and/or principal payments when due and the related risk that the value of a security may decline because of concerns about the issuer’s ability to make such payments.
Cyber Security Risk. The funds are susceptible to potential operational risks through breaches in cyber security. A breach in cyber security refers to both intentional and unintentional events that may cause a fund to lose proprietary information, suffer data corruption or lose operational capacity. Such events could cause a fund to incur regulatory penalties, reputational damage, additional compliance costs associated with corrective measures and/or financial loss. In addition, cyber security breaches of a fund’s third-party service providers, such as its administrator, transfer agent, custodian, or sub-advisor, as applicable, or issuers in which the fund invests, can also subject a fund to many of the same risks associated with direct cyber security breaches.
Defined Outcome Funds Risk. To the extent a fund’s investment strategy is designed to deliver returns tied to the price performance of an underlying ETF, an investor may not realize the returns the fund seeks to achieve if that investor does not hold shares for the entire target outcome period. In the event an investor purchases shares after the first day of the target outcome period or sells shares prior to the end of the target outcome period, the buffer that the fund seeks to provide against a decline in the value of the underlying ETF may not be available, the enhanced returns that the fund seeks to provide (if any) may not be available and the investor may not participate in a gain in the value of the underlying ETF up to the cap for the investor’s investment period. Additionally, the fund will
Additional Information (Continued)
First Trust Exchange-Traded Fund III
July 31, 2021 (Unaudited)
not participate in gains of the underlying ETF above the cap and a shareholder may lose their entire investment. If the fund seeks enhanced returns, there are certain time periods when the value of the fund may fall faster than the value of the underlying ETF, and it is very unlikely that, on any given day during which the underlying ETF share price increases in value, the fund’s share price will increase at the same rate as the enhanced returns sought by the fund, which is designed for an entire target outcome period. Trading flexible exchange options involves risks different from, or possibly greater than, the risks associated with investing directly in securities, such as less liquidity and correlation and valuation risks. A fund may experience substantial downside from specific flexible exchange option positions and certain positions may expire worthless.
Derivatives Risk. To the extent a fund uses derivative instruments such as futures contracts, options contracts and swaps, the fund may experience losses because of adverse movements in the price or value of the underlying asset, index or rate, which may be magnified by certain features of the derivative. These risks are heightened when a fund’s portfolio managers use derivatives to enhance the fund’s return or as a substitute for a position or security, rather than solely to hedge (or offset) the risk of a position or security held by the fund.
Equity Securities Risk. To the extent a fund invests in equity securities, the value of the fund’s shares will fluctuate with changes in the value of the equity securities. Equity securities prices fluctuate for several reasons, including changes in investors’ perceptions of the financial condition of an issuer or the general condition of the relevant stock market, such as market volatility, or when political or economic events affecting the issuers occur. In addition, common stock prices may be particularly sensitive to rising interest rates, as the cost of capital rises and borrowing costs increase. Equity securities may decline significantly in price over short or extended periods of time, and such declines may occur in the equity market as a whole, or they may occur in only a particular country, company, industry or sector of the market.
ETF Risk. The shares of an ETF trade like common stock and represent an interest in a portfolio of securities. The risks of owning an ETF generally reflect the risks of owning the underlying securities, although lack of liquidity in an ETF could result in it being more volatile and ETFs have management fees that increase their costs. Shares of an ETF trade on an exchange at market prices rather than net asset value, which may cause the shares to trade at a price greater than net asset value (premium) or less than net asset value (discount). In times of market stress, decisions by market makers to reduce or step away from their role of providing a market for an ETF’s shares, or decisions by an ETF’s authorized participants that they are unable or unwilling to proceed with creation and/or redemption orders of an ETF’s shares, could result in shares of the ETF trading at a discount to net asset value and in greater than normal intraday bid-ask spreads.
Fixed Income Securities Risk. To the extent a fund invests in fixed income securities, the fund will be subject to credit risk, income risk, interest rate risk, liquidity risk and prepayment risk. Income risk is the risk that income from a fund’s fixed income investments could decline during periods of falling interest rates. Interest rate risk is the risk that the value of a fund’s fixed income securities will decline because of rising interest rates. Liquidity risk is the risk that a security cannot be purchased or sold at the time desired, or cannot be purchased or sold without adversely affecting the price. Prepayment risk is the risk that the securities will be redeemed or prepaid by the issuer, resulting in lower interest payments received by the fund. In addition to these risks, high yield securities, or “junk” bonds, are subject to greater market fluctuations and risk of loss than securities with higher ratings, and the market for high yield securities is generally smaller and less liquid than that for investment grade securities.
Index or Model Constituent Risk. Certain funds may be a constituent of one or more indices or ETF models. As a result, such a fund may be included in one or more index-tracking exchange-traded funds or mutual funds. Being a component security of such a vehicle could greatly affect the trading activity involving a fund, the size of the fund and the market volatility of the fund. Inclusion in an index could increase demand for the fund and removal from an index could result in outsized selling activity in a relatively short period of time. As a result, a fund’s net asset value could be negatively impacted and the fund’s market price may be significantly below its net asset value during certain periods. In addition, index rebalances may potentially result in increased trading activity in a fund’s shares.
Index Provider Risk. To the extent a fund seeks to track an index, it is subject to Index Provider Risk. There is no assurance that the Index Provider will compile the Index accurately, or that the Index will be determined, maintained, constructed, reconstituted, rebalanced, composed, calculated or disseminated accurately. To correct any such error, the Index Provider may carry out an unscheduled rebalance or other modification of the Index constituents or weightings, which may increase the fund’s costs. The Index Provider does not provide any representation or warranty in relation to the quality, accuracy or completeness of data in the Index, and it does not guarantee that the Index will be calculated in accordance with its stated methodology. Losses or costs associated with any Index Provider errors generally will be borne by the fund and its shareholders.
Investment Companies Risk. To the extent a fund invests in the securities of other investment vehicles, the fund will incur additional fees and expenses that would not be present in a direct investment in those investment vehicles. Furthermore, the fund’s investment performance and risks are directly related to the investment performance and risks of the investment vehicles in which the fund invests.
Additional Information (Continued)
First Trust Exchange-Traded Fund III
July 31, 2021 (Unaudited)
LIBOR Risk. To the extent a fund invests in floating or variable rate obligations that use the London Interbank Offered Rate (“LIBOR”) as a reference interest rate, it is subject to LIBOR Risk. The United Kingdom’s Financial Conduct Authority, which regulates LIBOR, will cease making LIBOR available as a reference rate over a phase-out period that will begin immediately after December 31, 2021. The unavailability or replacement of LIBOR may affect the value, liquidity or return on certain fund investments and may result in costs incurred in connection with closing out positions and entering into new trades. Any potential effects of the transition away from LIBOR on the fund or on certain instruments in which the fund invests can be difficult to ascertain, and they may vary depending on a variety of factors, and they could result in losses to the fund.
Management Risk. To the extent that a fund is actively managed, it is subject to management risk. In managing an actively-managed fund’s investment portfolio, the fund’s portfolio managers will apply investment techniques and risk analyses that may not have the desired result. There can be no guarantee that a fund will meet its investment objective.
Market Risk. Securities held by a fund, as well as shares of a fund itself, are subject to market fluctuations caused by factors such as general economic conditions, political events, regulatory or market developments, changes in interest rates and perceived trends in securities prices. Shares of a fund could decline in value or underperform other investments as a result of the risk of loss associated with these market fluctuations. In addition, local, regional or global events such as war, acts of terrorism, spread of infectious diseases or other public health issues, recessions, or other events could have a significant negative impact on a fund and its investments. Such events may affect certain geographic regions, countries, sectors and industries more significantly than others. The outbreak of the respiratory disease designated as COVID-19 in December 2019 has caused significant volatility and declines in global financial markets, which have caused losses for investors. While the development of vaccines has slowed the spread of the virus and allowed for the resumption of “reasonably” normal business activity in the United States, many countries continue to impose lockdown measures in an attempt to slow the spread. Additionally, there is no guarantee that vaccines will be effective against emerging variants of the disease.
Non-U.S. Securities Risk. To the extent a fund invests in non-U.S. securities, it is subject to additional risks not associated with securities of domestic issuers. Non-U.S. securities are subject to higher volatility than securities of domestic issuers due to: possible adverse political, social or economic developments; restrictions on foreign investment or exchange of securities; capital controls; lack of liquidity; currency exchange rates; excessive taxation; government seizure of assets; the imposition of sanctions by foreign governments; different legal or accounting standards; and less government supervision and regulation of exchanges in foreign countries. Investments in non-U.S. securities may involve higher costs than investments in U.S. securities, including higher transaction and custody costs, as well as additional taxes imposed by non-U.S. governments. These risks may be heightened for securities of companies located, or with significant operations, in emerging market countries.
Operational Risk. Each fund is subject to risks arising from various operational factors, including, but not limited to, human error, processing and communication errors, errors of a fund’s service providers, counterparties or other third-parties, failed or inadequate processes and technology or systems failures. Each fund relies on third-parties for a range of services, including custody. Any delay or failure relating to engaging or maintaining such service providers may affect a fund’s ability to meet its investment objective. Although the funds and the funds’ investment advisor seek to reduce these operational risks through controls and procedures, there is no way to completely protect against such risks.
Passive Investment Risk. To the extent a fund seeks to track an index, the fund will invest in the securities included in, or representative of, the index regardless of their investment merit. A fund generally will not attempt to take defensive positions in declining markets.
| NOT FDIC INSURED | NOT BANK GUARANTEED | MAY LOSE VALUE |
Advisory Agreement
Board Considerations Regarding Approval of Continuation of Investment Management Agreements
First Trust California Municipal High Income ETF (FCAL)
The Board of Trustees of First Trust Exchange-Traded Fund III (the “Trust”), including the Independent Trustees, unanimously approved the continuation of the Investment Management Agreement (the “Agreement”) with First Trust Advisors L.P. (the “Advisor”) on behalf of the First Trust California Municipal High Income ETF (the “Fund”). The Board approved the continuation of the Agreement for a one-year period ending June 30, 2022 at a meeting held on June 6–7, 2021. The Board determined that the continuation of the Agreement is in the best interests of the Fund in light of the nature, extent and quality of the services provided and such other matters as the Board considered to be relevant in the exercise of its business judgment.
Additional Information (Continued)
First Trust Exchange-Traded Fund III
July 31, 2021 (Unaudited)
To reach this determination, the Board considered its duties under the Investment Company Act of 1940, as amended (the “1940 Act”), as well as under the general principles of state law, in reviewing and approving advisory contracts; the requirements of the 1940 Act in such matters; the fiduciary duty of investment advisors with respect to advisory agreements and compensation; the standards used by courts in determining whether investment company boards have fulfilled their duties; and the factors to be considered by the Board in voting on such agreements. At meetings held on April 26, 2021 and June 6–7, 2021, the Board, including the Independent Trustees, reviewed materials provided by the Advisor responding to requests for information from counsel to the Independent Trustees, submitted on behalf of the Independent Trustees, that, among other things, outlined: the services provided by the Advisor to the Fund (including the relevant personnel responsible for these services and their experience); the unitary fee rate payable by the Fund as compared to fees charged to a peer group of funds (the “Expense Group”) and a broad peer universe of funds (the “Expense Universe”), each assembled by Broadridge Financial Solutions, Inc. (“Broadridge”), an independent source, and as compared to fees charged to other clients of the Advisor, including other exchange-traded funds (“ETFs”) managed by the Advisor; the expense ratio of the Fund as compared to expense ratios of the funds in the Fund’s Expense Group and Expense Universe; performance information for the Fund, including comparisons of the Fund’s performance to that of one or more relevant benchmark indexes and to that of a performance group of funds and a broad performance universe of funds (the “Performance Universe”), each assembled by Broadridge; the nature of expenses incurred in providing services to the Fund and the potential for the Advisor to realize economies of scale, if any; profitability and other financial data for the Advisor; any fall-out benefits to the Advisor and its affiliate, First Trust Portfolios L.P. (“FTP”); and information on the Advisor’s compliance program. The Board reviewed initial materials with the Advisor at the meeting held on April 26, 2021, prior to which the Independent Trustees and their counsel met separately to discuss the information provided by the Advisor. Following the April meeting, counsel to the Independent Trustees, on behalf of the Independent Trustees, requested certain clarifications and supplements to the materials provided, and the information provided in response to those requests was considered at an executive session of the Independent Trustees and their counsel held prior to the June 6–7, 2021 meeting, as well as at the June meeting. The Board applied its business judgment to determine whether the arrangement between the Trust and the Advisor continues to be a reasonable business arrangement from the Fund’s perspective. The Board determined that, given the totality of the information provided with respect to the Agreement, the Board had received sufficient information to renew the Agreement. The Board considered that shareholders chose to invest or remain invested in the Fund knowing that the Advisor manages the Fund and knowing the Fund’s unitary fee.
In reviewing the Agreement, the Board considered the nature, extent and quality of the services provided by the Advisor under the Agreement. The Board considered that the Advisor is responsible for the overall management and administration of the Trust and the Fund and reviewed all of the services provided by the Advisor to the Fund, as well as the background and experience of the persons responsible for such services. The Board noted that the Fund is an actively-managed ETF and noted that the Advisor’s Municipal Securities Team is responsible for the day-to-day management of the Fund’s investments. The Board considered the background and experience of the members of the Municipal Securities Team and noted the Board’s prior meetings with members of the Team. The Board considered the Advisor’s statement that it applies the same oversight model internally with its Municipal Securities Team as it uses for overseeing external sub-advisors, including portfolio risk monitoring and performance review. In reviewing the services provided, the Board noted the compliance program that had been developed by the Advisor and considered that it includes a robust program for monitoring the Advisor’s and the Fund’s compliance with the 1940 Act, as well as the Fund’s compliance with its investment objectives, policies and restrictions. The Board also considered a report from the Advisor with respect to its risk management functions related to the operation of the Fund. Finally, as part of the Board’s consideration of the Advisor’s services, the Advisor, in its written materials and at the April 26, 2021 meeting, described to the Board the scope of its ongoing investment in additional personnel and infrastructure to maintain and improve the quality of services provided to the Fund and the other funds in the First Trust Fund Complex. In light of the information presented and the considerations made, the Board concluded that the nature, extent and quality of the services provided to the Trust and the Fund by the Advisor under the Agreement have been and are expected to remain satisfactory and that the Advisor has managed the Fund consistent with its investment objectives, policies and restrictions.
The Board considered the unitary fee rate payable by the Fund under the Agreement for the services provided. The Board considered that as part of the unitary fee the Advisor is responsible for the Fund’s expenses, including the cost of transfer agency, custody, fund administration, legal, audit and other services and license fees, if any, but excluding the fee payment under the Agreement and interest, taxes, brokerage commissions and other expenses connected with the execution of portfolio transactions, distribution and service fees pursuant to a Rule 12b-1 plan, if any, and extraordinary expenses, if any. The Board noted that the Advisor had previously agreed to waive a portion of its unitary fee in an amount equal to 0.15% of the Fund’s average daily net assets until at least November 30, 2021. The Board received and reviewed information showing the advisory or unitary fee rates and expense ratios of the peer funds in the Expense Group, as well as advisory and unitary fee rates charged by the Advisor to other fund (including ETFs) and non-fund clients, as applicable. Because the Fund pays a unitary fee, the Board determined that expense ratios were the most relevant comparative data point. Based on the information provided, the Board noted that the unitary fee rate for the Fund, after taking into account the contractual fee waiver, was above the median total (net) expense ratio of the peer funds in the Expense Group. With respect to the Expense Group, the Board, at the April 26, 2021 meeting, discussed with the Advisor limitations in creating peer groups for
Additional Information (Continued)
First Trust Exchange-Traded Fund III
July 31, 2021 (Unaudited)
actively-managed ETFs, including that there were no other actively-managed ETFs in the Expense Group, and different business models that may affect the pricing of services among ETF sponsors. The Board took these limitations and differences into account in considering the peer data. With respect to fees charged to other non-ETF clients, the Board considered differences between the Fund and other non-ETF clients that limited their comparability. In considering the unitary fee rate overall, the Board also considered the Advisor’s statement that it seeks to meet investor needs through innovative and value-added investment solutions and the Advisor’s demonstrated long-term commitment to the Fund and the other funds in the First Trust Fund Complex.
The Board considered performance information for the Fund. The Board noted the process it has established for monitoring the Fund’s performance and portfolio risk on an ongoing basis, which includes quarterly performance reporting from the Advisor for the Fund. The Board determined that this process continues to be effective for reviewing the Fund’s performance. The Board received and reviewed information comparing the Fund’s performance for periods ended December 31, 2020 to the performance of the funds in the Performance Universe and to that of a benchmark index. Based on the information provided, the Board noted that the Fund underperformed the Performance Universe median and the benchmark index for the one-year period ended December 31, 2020 and outperformed the Performance Universe median and the benchmark index for the three-year period ended December 31, 2020.
On the basis of all the information provided on the unitary fee and performance of the Fund and the ongoing oversight by the Board, the Board concluded that the unitary fee for the Fund continues to be reasonable and appropriate in light of the nature, extent and quality of the services provided by the Advisor to the Fund under the Agreement.
The Board considered information and discussed with the Advisor whether there were any economies of scale in connection with providing advisory services to the Fund and noted the Advisor’s statement that it believes its expenses will likely increase during the next twelve months as the Advisor continues to hire personnel and build infrastructure, including technology, to improve the services to the Fund. The Board noted that any reduction in fixed costs associated with the management of the Fund would benefit the Advisor, but that the unitary fee structure provides a level of certainty in expenses for the Fund. The Board considered the revenues and allocated costs (including the allocation methodology) of the Advisor in serving as investment advisor to the Fund for the twelve months ended December 31, 2020 and the estimated profitability level for the Fund calculated by the Advisor based on such data, as well as complex-wide and product-line profitability data, for the same period. The Board noted the inherent limitations in the profitability analysis and concluded that, based on the information provided, the Advisor’s profitability level for the Fund was not unreasonable. In addition, the Board considered fall-out benefits described by the Advisor that may be realized from its relationship with the Fund. The Board considered that the Advisor had identified as a fall-out benefit to the Advisor and FTP their exposure to investors and brokers who, absent their exposure to the Fund, may have had no dealings with the Advisor or FTP, and noted that the Advisor does not utilize soft dollars in connection with the Fund. The Board also considered the Advisor’s compensation for fund reporting services provided to the Fund pursuant to a separate Fund Reporting Services Agreement, which is paid from the unitary fee. The Board concluded that the character and amount of potential fall-out benefits to the Advisor were not unreasonable.
Based on all of the information considered and the conclusions reached, the Board, including the Independent Trustees, unanimously determined that the terms of the Agreement continue to be fair and reasonable and that the continuation of the Agreement is in the best interests of the Fund. No single factor was determinative in the Board’s analysis.
First Trust New York Municipal High Income ETF (FMNY)
The Board of Trustees of First Trust Exchange-Traded Fund III (the “Trust”), including the Independent Trustees, approved the Investment Management Agreement (the “Agreement”) with First Trust Advisors L.P. (the “Advisor”), on behalf of First Trust New York Municipal High Income ETF (the “Fund”), for an initial two-year term at a meeting held on January 14, 2021. The Board determined that the Agreement is in the best interests of the Fund in light of the nature, extent and quality of the services expected to be provided and such other matters as the Board considered to be relevant in the exercise of its reasonable business judgment.
To reach this determination, the Board considered its duties under the Investment Company Act of 1940, as amended (the “1940 Act”), as well as under the general principles of state law, in reviewing and approving advisory contracts; the requirements of the 1940 Act in such matters; the fiduciary duty of investment advisors with respect to advisory agreements and compensation; the standards used by courts in determining whether investment company boards have fulfilled their duties; and the factors to be considered by the Board in voting on such agreements. To assist the Board in its evaluation of the Agreement for the Fund, the Independent Trustees received a report from the Advisor in advance of the Board meeting responding to a request for information from counsel to the Independent Trustees, submitted on behalf of the Independent Trustees, that, among other things, outlined: the services to be provided by the Advisor to the Fund (including the relevant personnel responsible for these services and their experience); the proposed unitary fee rate payable by the Fund as compared to fees charged to a peer group of funds (the “Expense Group”) and a broad peer universe of funds (the “Expense Universe”), each assembled by Broadridge Financial Solutions, Inc. (“Broadridge”), an independent source, and as compared to fees charged to other exchange-traded funds (“ETFs”) managed by the Advisor; the estimated expense ratio of the Fund as compared to expense ratios of the funds in the Fund’s Expense Group and Expense Universe; the nature of expenses to be
Additional Information (Continued)
First Trust Exchange-Traded Fund III
July 31, 2021 (Unaudited)
incurred in providing services to the Fund and the potential for the Advisor to realize economies of scale, if any; profitability and other financial data for the Advisor; any fall-out benefits to the Advisor and its affiliate, First Trust Portfolios L.P. (“FTP”); and information on the Advisor’s compliance program. The Independent Trustees and their counsel also met separately to discuss the information provided by the Advisor. The Board applied its business judgment to determine whether the arrangement between the Trust and the Advisor is a reasonable business arrangement from the Fund’s perspective.
In evaluating whether to approve the Agreement for the Fund, the Board considered the nature, extent and quality of the services to be provided by the Advisor under the Agreement and considered that employees of the Advisor provide management services to other ETFs and to other funds in the First Trust Fund Complex with diligence and care. The Board considered that the Advisor will be responsible for the overall management and administration of the Fund and reviewed all of the services to be provided by the Advisor to the Fund, as well as the background and experience of the persons responsible for such services. The Board noted that the Fund will be an actively-managed ETF and considered that the Advisor manages other ETFs with a similar structure in the First Trust Fund Complex. The Board noted that the Advisor’s Municipal Securities Team will be responsible for the day-to-day management of the Fund’s investments and considered the background and experience of the members of the Municipal Securities Team. The Board considered that the Advisor applies the same oversight model internally with the Municipal Securities Team as it uses for overseeing external sub-advisors, including portfolio risk monitoring and performance review. In reviewing the services to be provided, the Board noted the compliance program that had been developed by the Advisor and considered that it includes a robust program for monitoring the Advisor’s and the Fund’s compliance with the 1940 Act, as well as the Fund’s compliance with its investment objectives, policies and restrictions. At the meeting, the Trustees received a presentation from a representative of the Municipal Securities Team and were able to ask questions about the team and the proposed investment strategy for the Fund. Because the Fund had yet to commence investment operations, the Board could not consider the historical investment performance of the Fund. In light of the information presented and the considerations made, the Board concluded that the nature, extent and quality of the services to be provided to the Fund by the Advisor under the Agreement are expected to be satisfactory.
The Board considered the proposed unitary fee rate payable by the Fund under the Agreement for the services to be provided. The Board noted that, under the unitary fee arrangement, the Fund would pay the Advisor a unitary fee equal to an annual rate of 0.65% of its average daily net assets. The Board noted that the Advisor would be responsible for the Fund’s expenses, including the cost of transfer agency, custody, fund administration, legal, audit and other services and license fees, if any, but excluding the fee payment under the Agreement and interest, taxes, acquired fund fees and expenses, if any, brokerage commissions and other expenses connected with the execution of portfolio transactions, distribution and service fees pursuant to a Rule 12b-1 plan, if any, and extraordinary expenses, if any. The Board noted that the Advisor would contractually agree to waive fees in the amount of 0.15% of the Fund’s average daily net assets for at least a two-year period beginning upon the effectiveness of the Fund’s registration statement and also to reduce fees to the extent of acquired fund fees and expenses of funds managed by the Advisor that are held by the Fund. The Board received and reviewed information showing the advisory or unitary fee rates and expense ratios of the peer funds in the Expense Group, as well as advisory and unitary fee rates charged by the Advisor to other ETFs. Because the Fund will pay a unitary fee, the Board determined that expense ratios were the most relevant comparative data point. Based on the information provided, the Board noted that the unitary fee rate for the Fund (after fee waivers) was below the median total (net) expense ratio of the peer funds in the Expense Group. With respect to the Expense Group, the Board discussed with representatives of the Advisor how the Expense Group was assembled and how the Fund compared and differed from the peer funds. The Board took this information into account in considering the peer data. With respect to fees charged to other ETFs managed by the Advisor, the Board considered the Advisor’s statement that the Fund’s unitary fee is consistent with fees charged to other state-specific and national intermediate municipal bond ETFs in the First Trust Fund Complex and noted that the Advisor manages two other state-specific and national intermediate municipal bond ETFs that pay unitary fees equal to an annual rate of 0.65% of their respective average daily net assets and for which the Advisor has contractually agreed to waive fees in the amount of 0.15% of their respective average daily net assets for at least a one-year period from the respective dates of the funds’ currently effective registration statements. In light of the information considered and the nature, extent and quality of the services expected to be provided to the Fund under the Agreement, the Board determined that the proposed unitary fee was fair and reasonable.
The Board noted that the proposed unitary fee for the Fund was not structured to pass on to shareholders the benefits of any economies of scale as the Fund’s assets grow. The Board noted that any reduction in fixed costs associated with the management of the Fund would benefit the Advisor, but that the unitary fee structure provides a level of certainty in expenses for the Fund. The Board noted that the Advisor has continued to hire personnel and build infrastructure, including technology, to improve the services to the funds in the First Trust Fund Complex. The Board took into consideration the types of costs to be borne by the Advisor in connection with its services to be performed for the Fund under the Agreement. The Board considered the Advisor’s estimate of the asset level for the Fund at which the Advisor expects the Agreement to be profitable to the Advisor and the Advisor’s estimate of the profitability of the Agreement if the Fund’s assets reach $100 million. The Board noted the inherent limitations in the profitability analysis and concluded that, based on the information provided, the Advisor’s estimated profitability level for the Fund was not unreasonable. In addition, the Board considered fall-out benefits described by the Advisor that may be realized from its relationship with the Fund. The
Additional Information (Continued)
First Trust Exchange-Traded Fund III
July 31, 2021 (Unaudited)
Board considered that the Advisor had identified as a fall-out benefit to the Advisor and FTP their exposure to investors and brokers who, absent their exposure to the Fund, may have had no dealings with the Advisor or FTP. The Board noted that the Advisor will not utilize soft dollars in connection with the Fund. The Board also considered the Advisor’s compensation for fund reporting services to be provided to the Fund pursuant to a separate Fund Reporting Services Agreement, which would be paid from the unitary fee. The Board concluded that the character and amount of potential fall-out benefits to the Advisor were not unreasonable.
Based on all of the information considered and the conclusions reached, the Board, including the Independent Trustees, determined that the terms of the Agreement are fair and reasonable and that the approval of the Agreement is in the best interests of the Fund. No single factor was determinative in the Board’s analysis.
Liquidity Risk Management Program
In accordance with Rule 22e-4 under the Investment Company Act of 1940, as amended (the “1940 Act”), the Funds and each other fund in the First Trust Fund Complex, other than the closed-end funds, have adopted and implemented a liquidity risk management program (the “Program”) reasonably designed to assess and manage the funds’ liquidity risk, i.e., the risk that a fund could not meet requests to redeem shares issued by the fund without significant dilution of remaining investors’ interests in the fund. The Board of Trustees of the First Trust Funds has appointed First Trust Advisors, L.P. (the “Advisor”) as the person designated to administer the Program, and in this capacity the Advisor performs its duties primarily through the activities and efforts of the First Trust Liquidity Committee (the “Liquidity Committee”).
Pursuant to the Program, the Liquidity Committee classifies the liquidity of each fund’s portfolio investments into one of the four liquidity categories specified by Rule 22e-4: highly liquid investments, moderately liquid investments, less liquid investments and illiquid investments. The Liquidity Committee determines certain of the inputs for this classification process, including reasonably anticipated trade sizes and significant investor dilution thresholds. The Liquidity Committee also determines and periodically reviews a highly liquid investment minimum for certain funds, monitors the funds’ holdings of assets classified as illiquid investments to seek to ensure they do not exceed 15% of a fund’s net assets and establishes policies and procedures regarding redemptions in kind.
At the April 26, 2021 meeting of the Board of Trustees, as required by Rule 22e-4 and the Program, the Advisor provided the Board with a written report prepared by the Advisor that addressed the operation of the Program during the period from March 20, 2020 through the Liquidity Committee’s annual meeting held on March 16, 2021 and assessed the Program’s adequacy and effectiveness of implementation during this period, including the operation of the highly liquid investment minimum for each fund that is required under the Program to have one, and any material changes to the Program. Note that because the Funds primarily hold assets that are highly liquid investments, the Funds have not adopted any highly liquid investment minimums.
As stated in the written report, during the review period, no fund breached the 15% limitation on illiquid investments, no fund with a highly liquid investment minimum breached that minimum and no fund filed a Form N-LIQUID. The Advisor concluded that each fund’s investment strategy is appropriate for an open-end fund; that the Program operated effectively in all material respects during the review period; and that the Program is reasonably designed to assess and manage the liquidity risk of each fund and to maintain compliance with Rule 22e-4.
Board of Trustees and Officers
First Trust Exchange-Traded Fund III
July 31, 2021 (Unaudited)
The following tables identify the Trustees and Officers of the Trust. Unless otherwise indicated, the address of all persons is 120 East Liberty Drive, Suite 400, Wheaton, IL 60187.
The Trust’s statement of additional information includes additional information about the Trustees and is available, without charge, upon request, by calling (800) 988-5891.
| Name, Year of Birth and Position with the Trust | Term of Office and Year First Elected or Appointed | Principal Occupations
During Past 5 Years | Number of Portfolios in the First Trust Fund Complex Overseen by Trustee | Other Trusteeships or Directorships Held by Trustee During Past 5 Years |
| INDEPENDENT TRUSTEES |
Richard E. Erickson, Trustee
(1951) | • Indefinite Term
• Since Inception | Physician; Officer, Wheaton Orthopedics; Limited Partner, Gundersen Real Estate Limited Partnership (June 1992 to December 2016) | 211 | None |
Thomas R. Kadlec, Trustee
(1957) | • Indefinite Term
• Since Inception | President, ADM Investor Services, Inc. (Futures Commission Merchant) | 211 | Director of ADM Investor Services, Inc., ADM Investor Services International, Futures Industry Association, and National Futures Association |
Robert F. Keith, Trustee
(1956) | • Indefinite Term
• Since Inception | President, Hibs Enterprises (Financial and Management Consulting) | 211 | Director of Trust Company of Illinois |
Niel B. Nielson, Trustee
(1954) | • Indefinite Term
• Since Inception | Senior Advisor (August 2018 to Present), Managing Director and Chief Operating Officer (January 2015 to August 2018), Pelita Harapan Educational Foundation (Educational Products and Services) | 211 | None |
| INTERESTED TRUSTEE |
James A. Bowen(1), Trustee and
Chairman of the Board
(1955) | • Indefinite Term
• Since Inception | Chief Executive Officer, First Trust Advisors L.P. and First Trust Portfolios L.P.; Chairman of the Board of Directors, BondWave LLC (Software Development Company) and Stonebridge Advisors LLC (Investment Advisor) | 211 | None |
| (1) | Mr. Bowen is deemed an “interested person” of the Trust due to his position as CEO of First Trust Advisors L.P., investment advisor of the Trust. |
Board of Trustees and Officers (Continued)
First Trust Exchange-Traded Fund III
July 31, 2021 (Unaudited)
| Name and Year of Birth | Position and Offices with Trust | Term of Office and Length of Service | Principal Occupations
During Past 5 Years |
| OFFICERS(2) |
James M. Dykas
(1966) | President and Chief Executive Officer | • Indefinite Term
• Since January 2016 | Managing Director and Chief Financial Officer (January 2016 to Present), Controller (January 2011 to January 2016), Senior Vice President (April 2007 to January 2016), First Trust Advisors L.P. and First Trust Portfolios L.P.; Chief Financial Officer (January 2016 to Present), BondWave LLC (Software Development Company) and Stonebridge Advisors LLC (Investment Advisor) |
Donald P. Swade
(1972) | Treasurer, Chief Financial Officer and Chief Accounting Officer | • Indefinite Term
• Since January 2016 | Senior Vice President (July 2016 to Present), Vice President (April 2012 to July 2016), First Trust Advisors L.P. and First Trust Portfolios L.P. |
W. Scott Jardine
(1960) | Secretary and Chief Legal Officer | • Indefinite Term
• Since Inception | General Counsel, First Trust Advisors L.P. and First Trust Portfolios L.P.; Secretary and General Counsel, BondWave LLC; Secretary, Stonebridge Advisors LLC |
Daniel J. Lindquist
(1970) | Vice President | • Indefinite Term
• Since Inception | Managing Director, First Trust Advisors L.P. and First Trust Portfolios L.P. |
Kristi A. Maher
(1966) | Chief Compliance Officer and Assistant Secretary | • Indefinite Term
• Since Inception | Deputy General Counsel, First Trust Advisors L.P. and First Trust Portfolios L.P. |
Roger F. Testin
(1966) | Vice President | • Indefinite Term
• Since Inception | Senior Vice President, First Trust Advisors L.P. and First Trust Portfolios L.P. |
Stan Ueland
(1970) | Vice President | • Indefinite Term
• Since Inception | Senior Vice President, First Trust Advisors L.P. and First Trust Portfolios L.P |
| (2) | The term “officer” means the president, vice president, secretary, treasurer, controller or any other officer who performs a policy making function. |
Privacy Policy
First Trust Exchange-Traded Fund III
July 31, 2021 (Unaudited)
Privacy Policy
First Trust values our relationship with you and considers your privacy an important priority in maintaining that relationship. We are committed to protecting the security and confidentiality of your personal information.
Sources of Information
We collect nonpublic personal information about you from the following sources:
| • | Information we receive from you and your broker-dealer, investment professional or financial representative through interviews, applications, agreements or other forms; |
| • | Information about your transactions with us, our affiliates or others; |
| • | Information we receive from your inquiries by mail, e-mail or telephone; and |
| • | Information we collect on our website through the use of “cookies”. For example, we may identify the pages on our website that your browser requests or visits. |
Information Collected
The type of data we collect may include your name, address, social security number, age, financial status, assets, income, tax information, retirement and estate plan information, transaction history, account balance, payment history, investment objectives, marital status, family relationships and other personal information.
Disclosure of Information
We do not disclose any nonpublic personal information about our customers or former customers to anyone, except as permitted by law. In addition to using this information to verify your identity (as required under law), the permitted uses may also include the disclosure of such information to unaffiliated companies for the following reasons:
| • | In order to provide you with products and services and to effect transactions that you request or authorize, we may disclose your personal information as described above to unaffiliated financial service providers and other companies that perform administrative or other services on our behalf, such as transfer agents, custodians and trustees, or that assist us in the distribution of investor materials such as trustees, banks, financial representatives, proxy services, solicitors and printers. |
| • | We may release information we have about you if you direct us to do so, if we are compelled by law to do so, or in other legally limited circumstances (for example to protect your account from fraud). |
In addition, in order to alert you to our other financial products and services, we may share your personal information within First Trust.
Use of Website Analytics
We currently use third party analytics tools, Google Analytics and AddThis, to gather information for purposes of improving First Trust’s website and marketing our products and services to you. These tools employ cookies, which are small pieces of text stored in a file by your web browser and sent to websites that you visit, to collect information, track website usage and viewing trends such as the number of hits, pages visited, videos and PDFs viewed and the length of user sessions in order to evaluate website performance and enhance navigation of the website. We may also collect other anonymous information, which is generally limited to technical and web navigation information such as the IP address of your device, internet browser type and operating system for purposes of analyzing the data to make First Trust’s website better and more useful to our users. The information collected does not include any personal identifiable information such as your name, address, phone number or email address unless you provide that information through the website for us to contact you in order to answer your questions or respond to your requests. To find out how to opt-out of these services click on: Google Analytics and AddThis.
Confidentiality and Security
With regard to our internal security procedures, First Trust restricts access to your nonpublic personal information to those First Trust employees who need to know that information to provide products or services to you. We maintain physical, electronic and procedural safeguards to protect your nonpublic personal information.
Policy Updates and Inquiries
As required by federal law, we will notify you of our privacy policy annually. We reserve the right to modify this policy at any time, however, if we do change it, we will tell you promptly. For questions about our policy, or for additional copies of this notice, please go to www.ftportfolios.com, or contact us at 1-800-621-1675 (First Trust Portfolios) or 1-800-222-6822 (First Trust Advisors).
March 2021
This page intentionally left blank
This page intentionally left blank
This page intentionally left blank
First Trust Exchange-Traded Fund III
INVESTMENT ADVISOR
First Trust Advisors L.P.
120 East Liberty Drive, Suite 400
Wheaton, IL 60187
ADMINISTRATOR, CUSTODIAN,
FUND ACCOUNTANT &
TRANSFER AGENT
Brown Brothers Harriman & Co.
50 Post Office Square
Boston, MA 02110
INDEPENDENT REGISTERED
PUBLIC ACCOUNTING FIRM
Deloitte & Touche LLP
111 S. Wacker Drive
Chicago, IL 60606
LEGAL COUNSEL
Chapman and Cutler LLP
111 W. Monroe Street
Chicago, IL 60603
First Trust Exchange-Traded Fund III
First Trust Municipal High Income ETF (FMHI)
Annual Report
For the Ended
July 31, 2021
First Trust Municipal High Income ETF (FMHI)
Annual Report
July 31, 2021
Caution Regarding Forward-Looking Statements
This report contains certain forward-looking statements within the meaning of the Securities Act of 1933, as amended, and the Securities Exchange Act of 1934, as amended. Forward-looking statements include statements regarding the goals, beliefs, plans or current expectations of First Trust Advisors L.P. (“First Trust” or the “Advisor”) and its representatives, taking into account the information currently available to them. Forward-looking statements include all statements that do not relate solely to current or historical fact. For example, forward-looking statements include the use of words such as “anticipate,” “estimate,” “intend,” “expect,” “believe,” “plan,” “may,” “should,” “would” or other words that convey uncertainty of future events or outcomes.
Forward-looking statements involve known and unknown risks, uncertainties and other factors that may cause the actual results, performance or achievements of the series of First Trust Exchange-Traded Fund III (the “Trust”) described in this report (First Trust Municipal High Income ETF; hereinafter referred to as the “Fund”) to be materially different from any future results, performance or achievements expressed or implied by the forward-looking statements. When evaluating the information included in this report, you are cautioned not to place undue reliance on these forward-looking statements, which reflect the judgment of the Advisor and its representatives only as of the date hereof. We undertake no obligation to publicly revise or update these forward-looking statements to reflect events and circumstances that arise after the date hereof.
Performance and Risk Disclosure
There is no assurance that the Fund will achieve its investment objectives. The Fund is subject to market risk, which is the possibility that the market values of securities owned by the Fund will decline and that the value of the Fund’s shares may therefore be less than what you paid for them. Accordingly, you can lose money by investing in the Fund. See “Risk Considerations” in the Additional Information section of this report for a discussion of certain other risks of investing in the Fund.
Performance data quoted represents past performance, which is no guarantee of future results, and current performance may be lower or higher than the figures shown. For the most recent month-end performance figures, please visit www.ftportfolios.com or speak with your financial advisor. Investment returns, net asset value and share price will fluctuate and Fund shares, when sold, may be worth more or less than their original cost.
The Advisor may also periodically provide additional information on Fund performance on the Fund’s web page at www.ftportfolios.com.
How to Read This Report
This report contains information that may help you evaluate your investment in the Fund. It includes details about the Fund and presents data and analysis that provide insight into the Fund’s performance and investment approach.
By reading the portfolio commentary by the portfolio management team of the Fund, you may obtain an understanding of how the market environment affected the Fund’s performance. The statistical information that follows may help you understand the Fund’s performance compared to that of relevant market benchmarks.
It is important to keep in mind that the opinions expressed by personnel of the Advisor are just that: informed opinions. They should not be considered to be promises or advice. The opinions, like the statistics, cover the period through the date on the cover of this report. The material risks of investing in the Fund are spelled out in the prospectus, the statement of additional information, and other Fund regulatory filings.
First Trust Municipal High Income ETF (FMHI)
Annual Letter from the Chairman and CEO
July 31, 2021
Dear Shareholders,
First Trust is pleased to provide you with the annual report for the First Trust Municipal High Income ETF (the “Fund”), which contains detailed information about the Fund for the 12-month period ended July 31, 2021.
I often mention at the end of my shareholder letters that investors should stay the course. I do so because First Trust believes in the buy and hold investment philosophy, and the math supports our view. The S&P 500® Index (the “Index”) has never failed to fully recover the losses sustained in any correction or bear market. As of July 31, 2021, the Index stood just 0.61% below its all-time closing high set on July 26, 2021. Whether you believe that history repeats itself or simply rhymes, it provides us with valuable insight either way. When it comes to setting realistic expectations about equity returns over time, we know that the Index delivered an average annual total return of 10.28% from 1926-2020 (95 years), according to data from Morningstar/Ibbotson Associates. That is our long-term performance benchmark for stocks in the U.S. Why is that relevant in today’s climate? It is important to note that this very Index has posted a total return of 17.99% year-to-date and 36.45% for the 12-month period ended July 31, 2021, according to Bloomberg. Using industry jargon, these are sometimes referred to as “outsized” returns, or well-above the norm.
As previously noted, the stock market experiences selloffs of various degrees on an ongoing basis. The more severe declines are referred to as corrections and bear markets. Corrections are defined as a 10.00% to 19.99% decline in the price of an index or security from its most recent closing high. Bear markets entail price declines of 20% or more. Since 1950, the Index has endured 38 selloffs totaling 10% or more, with nine of them being bear markets, according to The Motley Fool, a private financial and investing advice company. Over that 71-year period, on average, the stock market experienced a correction every 1.84 years, compared to every 7.78 years for bear markets. The last major selloff occurred in the first quarter of 2020 (17 months ago), when the Index plunged 33.79%, due to the initial shock from the onset of the coronavirus (“COVID-19”) pandemic. While that qualified as a bear market, some investors may be thinking we are due for a correction in the coming months. Remember, these statistics represent averages. A June 2021 survey by the CFA Institute found that 45% of the chartered financial analysts it polled believe we will have a correction within 1-3 years. I offer this forecast to show investors how challenging it is to make such market calls, even for highly credentialled professionals. A 1-3 year projection isn’t exactly actionable information, in my opinion.
The bottom line is that those individuals who have remained invested in the stock and bond markets throughout the COVID-19 pandemic have likely prospered beyond what they might have imagined. Suffice it to say that the markets have exceeded expectations over the past 12 months. I think your average investor would have been content with just being in positive territory. Looking ahead, I see more tailwinds for the markets than headwinds, particularly with respect to the stock market. There is plenty of liquidity in the economy thanks to the accommodative monetary policy of the Federal Reserve (the “Fed”) and fiscal stimulus from Congress. We have the potential for another $4 to $5 trillion in fiscal stimulus from President Joe Biden’s bipartisan infrastructure bill and the Democrat-driven budget package, including funds earmarked for climate change projects (green energy), health care, education, and more. Perhaps the biggest headwind moving forward is rising inflation. We should know in the next few months if it is transitory, as Fed Chairman Jerome Powell believes, or if it will be with us for a sustained period. Stay tuned and stay the course!
Thank you for giving First Trust the opportunity to play a role in your financial future. We value our relationship with you and will report on the Fund again in six months.
Sincerely,
James A. Bowen
Chairman of the Board of Trustees
Chief Executive Officer of First Trust Advisors L.P.
Fund Performance Overview (Unaudited)
First Trust Municipal High Income ETF (FMHI)
The primary investment objective of the First Trust Municipal High Income ETF (the “Fund”) is to provide federally tax-exempt income, and its secondary objective is long-term capital appreciation. Under normal market conditions, the Fund seeks to achieve its investment objectives by investing at least 80% of its net assets (including investment borrowings) in municipal debt securities that pay interest that is exempt from regular federal income taxes (“Municipal Securities”). Under normal market conditions, the Fund invests at least 50% of its net assets in Municipal Securities that are, at the time of investment, rated below investment grade by at least one nationally recognized statistical rating organization rating such securities (or Municipal Securities that are unrated and determined by the Fund’s advisor to be of comparable quality), commonly referred to as “high yield” or “junk” bonds. The Fund lists and principally trades its shares on The Nasdaq Stock Market LLC under the ticker symbol “FMHI.”
| Performance | | | |
| | | Average Annual
Total Returns | Cumulative
Total Returns |
| | 1 Year Ended
7/31/21 | Inception (11/1/17)
to 7/31/21 | Inception (11/1/17)
to 7/31/21 |
| Fund Performance | | | |
| NAV | 12.57% | 6.82% | 28.02% |
| Market Price | 12.72% | 6.83% | 28.07% |
| Index Performance | | | |
| Bloomberg Barclays Municipal Bond Index | 3.29% | 4.37% | 17.39% |
| Blended Benchmark(1) | 7.43% | 5.49% | 22.15% |
Total returns for the period since inception are calculated from the inception date of the Fund. “Average Annual Total Returns” represent the average annual change in value of an investment over the period indicated. “Cumulative Total Returns” represent the total change in value of an investment over the period indicated. The total returns would have been lower if certain fees had not been waived by the Advisor.
The Fund’s per share net asset value (“NAV”) is the value of one share of the Fund and is computed by dividing the value of all assets of the Fund (including accrued interest and dividends), less all liabilities (including accrued expenses and dividends declared but unpaid), by the total number of outstanding shares. The price used to calculate market return (“Market Price”) is determined by using the midpoint of the national best bid and offer price (“NBBO”) as of the time that the Fund’s NAV is calculated. Under SEC rules, the NBBO consists of the highest displayed buy and lowest sell prices among the various exchanges trading the Fund at the time the Fund’s NAV is calculated. Prior to January 1, 2019, the price used was the midpoint between the highest bid and the lowest offer on the stock exchange on which shares of the Fund were listed for trading as of the time that the Fund’s NAV was calculated. Since shares of the Fund did not trade in the secondary market until after its inception, for the period from inception to the first day of secondary market trading in shares of the Fund, the NAV of the Fund is used as a proxy for the secondary market trading price to calculate market returns. NAV and market returns assume that all distributions have been reinvested in the Fund at NAV and Market Price, respectively.
An index is a statistical composite that tracks a specified financial market or sector. Unlike the Fund, the indices that make up the Blended Benchmark do not actually hold a portfolio of securities and therefore do not incur the expenses incurred by the Fund. These expenses negatively impact the performance of the Fund. Also, market returns do not include brokerage commissions that may be payable on secondary market transactions. If brokerage commissions were included, market returns would be lower. The total returns presented reflect the reinvestment of dividends on securities in the indices. The returns presented do not reflect the deduction of taxes that a shareholder would pay on Fund distributions or the redemption or sale of Fund shares. The investment return and principal value of shares of the Fund will vary with changes in market conditions. Shares of the Fund may be worth more or less than their original cost when they are redeemed or sold in the market. The Fund’s past performance is no guarantee of future performance.
| (1) | The Blended Benchmark consists of the following two indexes: 50% of the Bloomberg Barclays High Yield 10-Year Municipal Index (8-12 years) which is comprised of bonds with a final maturity between 8 and 12 years that are part of the Bloomberg Barclays Municipal Bond High Yield Index; and 50% of the Bloomberg Barclays Revenue 10-Year Municipal Index (8-12 years), which is comprised of revenue bonds that have a final maturity between 8 and 12 years that are part of the Bloomberg Barclays Municipal Bond Index. Indexes do not charge management fees or brokerage expenses, and no such fees or expenses were deducted from the index performance shown. Indexes are unmanaged and an investor cannot invest directly in an index. The Blended Index returns are calculated by using the monthly return of the two indices during each period shown above. At the beginning of each month the two indices are rebalanced to a 50-50 ratio to account for divergence from that ratio that occurred during the course of each month. The monthly returns are then compounded for each period shown above, giving the performance for the Blended Index for each period shown above. |
Fund Performance Overview (Unaudited) (Continued)
First Trust Municipal High Income ETF (FMHI) (Continued)
| Sector Allocation | % of Total
Investments
(including cash) |
| Education | 10.9% |
| Government Obligation Bond - Limited Tax | 10.7 |
| Special Assessment | 10.2 |
| Industrial Development Bond | 8.6 |
| Continuing Care Retirement Communities | 8.4 |
| Dedicated Tax | 6.1 |
| Hospital | 5.9 |
| Government Obligation Bond - Unlimited Tax | 5.2 |
| Higher Education | 5.0 |
| Tobacco | 4.4 |
| Insured | 2.8 |
| Tax Increment | 2.7 |
| Airport | 2.5 |
| Local Housing | 2.1 |
| Certificates of Participation | 2.1 |
| Student Housing | 1.6 |
| Gas | 1.5 |
| Utility | 1.0 |
| Skilled Nursing | 0.9 |
| Mass Transit | 0.6 |
| Housing | 0.4 |
| Toll Road | 0.3 |
| Water & Sewer | 0.2 |
| Hotel | 0.2 |
| Other Health | 0.2 |
| Port | 0.0* |
| Pre-refunded/Escrowed-to-maturity | 0.0* |
| Cash | 5.5 |
| Total | 100.0% |
| * | Amount is less than 0.1%. |
| Credit Rating(2) | % of Total
Investments
(including cash) |
| AAA | 1.6% |
| AA | 7.2 |
| A | 8.9 |
| BBB | 13.2 |
| BB | 13.1 |
| B | 2.8 |
| CCC | 0.8 |
| Not Rated | 46.5 |
| SP-2/MIG1 | 0.4 |
| Cash | 5.5 |
| Total | 100.0% |
| Fund Allocation | % of Net Assets |
| Municipal Bonds | 98.2% |
| Net Other Assets and Liabilities** | 1.8 |
| Total | 100.0% |
| ** | Includes variation margin on futures contracts. |
| (2) | The credit quality and ratings information presented above reflect the ratings assigned by one or more nationally recognized statistical rating organizations (NRSROs), including Standard & Poor’s Ratings Group, a division of the McGraw Hill Companies, Inc., Moody’s Investors Service, Inc., Fitch Ratings or a comparably rated NRSRO. For situations in which a security is rated by more than one NRSRO and the ratings are not equivalent, the highest rating is used. Sub-investment grade ratings are those rated BB+/Ba1 or lower. Investment grade ratings are those rated BBB-/Baa3 or higher. The credit ratings shown relate to the creditworthiness of the issuers of the underlying securities in the Fund, and not to the Fund or its shares. Credit ratings are subject to change. |
Fund Performance Overview (Unaudited) (Continued)
First Trust Municipal High Income ETF (FMHI) (Continued)

Performance figures assume reinvestment of all distributions and do not reflect the deduction of taxes that a shareholder would pay on Fund distributions or the redemption or sale of Fund shares. An index is a statistical composite that tracks a specified financial market or sector. Unlike the Fund, the index does not actually hold a portfolio of securities and therefore does not incur the expenses incurred by the Fund. These expenses negatively impact the performance of the Fund. The Fund’s past performance does not predict future performance.
Frequency Distribution of Discounts and Premiums
Information showing the number of days the market price of the Fund’s shares was greater (at a premium) and less (at a discount) than the Fund’s net asset value for the most recently completed year, and the most recently completed calendar quarters since that year (or life of the Fund, if shorter), is available at https://www.ftportfolios.com/Retail/etf/home.aspx.
Portfolio Commentary
First Trust Municipal High Income ETF (FMHI)
Annual Report
July 31, 2021 (Unaudited)
Advisor
First Trust Advisors L.P. (“First Trust” or the “Advisor”) is the investment advisor to the First Trust Municipal High Income ETF (the “Fund”). First Trust is responsible for the ongoing monitoring of the Fund’s investment portfolio, managing the Fund’s business affairs and providing certain administrative services necessary for the management of the Fund.
Portfolio Management Team
Tom Futrell, CFA, Senior Vice President, Senior Portfolio Manager
Johnathan N. Wilhelm, Senior Vice President, Senior Portfolio Manager
The First Trust Municipal Securities Team was formed in September of 2013 and is headed by Tom Futrell, CFA and Johnathan Wilhelm who serve as senior portfolio managers of the Fund. Messrs. Futrell and Wilhelm have a combined 50+ years of investment experience and prior to joining First Trust, served as portfolio managers of municipal bonds at Nuveen Investments and Performance Trust Investment Advisors. In addition to the Fund, the Team manages/consults for a variety of First Trust investment portfolios and separately managed accounts.
Commentary
The Fund is an actively managed exchange-traded fund. The Fund’s primary investment objective is to provide federally tax-exempt income. The Fund’s secondary investment objective is long-term capital appreciation. Under normal market conditions, the Fund seeks to achieve its investment objectives by investing at least 80% of its net assets (including investment borrowings) in municipal debt securities that pay interest that is exempt from regular federal income taxes (collectively, “Municipal Securities”). In addition, under normal market conditions, the Fund invests as least 50% of its net assets in Municipal Securities that are rated non-investment grade at the time of purchase and no more than 50% of its net assets in Municipal Securities that at the time of purchase are rated investment grade. This commentary discusses the market performance and the Fund’s performance for the 12-month period ended July 31, 2021.
Market Recap
For the 12-month period ended July 31, 2021, the Fund’s Blended Benchmark generated a total return of 7.43%. The Blended Benchmark consists of the following two indexes: 50% of the Bloomberg Barclays High Yield 10-Year Municipal Index (8-12 years), which generated a total return of 11.71% for the period; and, 50% of the Bloomberg Barclays Revenue 10-Year Municipal Index (8-12 years), which produced a return of 3.27%. For the same period, the Bloomberg Barclays Municipal Bond Index generated a total return of 3.29%. By comparison, the Bloomberg Barclays U.S. Treasury Index generated a return of -3.01% during the same period. The following have been major factors in explaining the municipal bond market’s performance:
| • | Robust mutual fund and exchange-traded fund inflows helped support municipal bond prices. According to Refinitiv Lipper and J.P. Morgan data, year-to-date fund flows through July 28, 2021 totaled approximately $69.5 billion. Over the same period, high yield municipal fund flows totaled approximately $16.4 billion. Fund inflows have also been consistent, with municipal bond funds having experienced inflows in 62 of the past 63 weeks. |
| • | New issue municipal bond supply has been nearly flat year to date. During the first seven months of 2021, new issue supply increased approximately 1.5% to $262.1 billion compared with $258.1 billion a year ago. Of note, when looking at municipal taxable new issue supply as a percentage of total new issue supply, over 23% of municipal bond supply has been brought to market as a taxable municipal bond from January 2020 through June 2021 compared to the previous five years when taxable municipals comprised less than 10% of total new issue municipal supply. |
| • | According to data from Municipal Market Analytics, Inc., the par value of defaults are lower year-to-date compared to the previous two years. The number of municipal bond defaults year-to-date through July 2021 total 36, compared to 50 defaults for the same year-to-date period in 2020 and 35 defaults for the same year-to-date period in 2019. Defaulting municipal securities have been especially centered in the senior living sector which has been particularly hard hit by the coronavirus (“COVID-19”) pandemic with many facilities experiencing lower occupancy and debt service coverage. |
| • | The CARES Act and American Rescue Plan Act legislation helped stabilize many municipal bond issuing borrowers, with tens of billions of dollars made available to states, cities, K-12 education, hospitals, mass transportation, and universities, among the many benefitted sectors. |
Portfolio Commentary (Continued)
First Trust Municipal High Income ETF (FMHI)
Annual Report
July 31, 2021 (Unaudited)
| • | As a result of these factors, municipal bond credit spreads have tightened dramatically from April of 2021 for all credit rating categories. In particular, credit spreads tightened substantially for BBB and high yield municipal securities whereby in many cases spreads are now tighter than pre-COVID-19 levels. |
Performance Analysis
The Fund’s net asset value (“NAV”) and market performance for the 12-month period ended July 31, 2021 was 12.57% and 12.72%, respectively, versus the Blended Benchmark’s return of 7.43%; the Bloomberg Barclays Municipal Bond Index total return was 3.29%.
At the end of the period, the Fund’s market price of $56.73 represented a premium of 0.07% to its NAV of $56.69. The market value of the Fund’s shares fluctuates from time to time and may be higher or lower than the Fund’s NAV. The distribution paid on July 30, 2021 of $0.13 represents a tax-exempt annualized distribution rate of 2.75% based on the Fund’s closing market price of $56.73 on July 30, 2021. The Fund’s distribution rate is not constant and is subject to change over time based on the performance of the Fund.
For the trailing 12-months ended July 31, 2021, regarding credit rating allocations, the Fund’s overweight relative to the Blended Benchmark to non-rated high yield municipal securities was the largest source of outperformance. The Fund’s underweight allocation relative to the Blended Benchmark to “AA” rated municipal securities was another significant positive contributor to the Fund’s performance for the 12-month period ended July 31, 2021. Other factors that led to the Fund’s outperformance relative to the Blended Benchmark were the Fund’s slight overweight to “BB” rated bonds. When looking at sectors that outperformed relative to the Blended Benchmark over the same period, the special tax, education, health care, industrial development bonds and local tax GO sectors were all positive contributors to the Fund’s performance. No single sector was a significant negative contributor to the Fund’s performance.
Regarding yield curve positioning, for the 12-month period ended July 31, 2021, the Fund’s significant overweight to bonds with stated maturities of 18+ years compared to the Blended Benchmark was a positive contributor to the Fund’s performance. The Fund’s exposure to bonds with stated maturities of 10-12 years was also a positive contributor to the Fund’s performance. The Fund’s holdings in the 0-2-year maturity range and 8-10-year maturity range were overall negative contributors to Fund performance. In general, over the past year, the Fund’s exposure to bonds with effective durations of 7-10 years and 5-7 years were significant positive contributors to the Fund’s performance. The Fund’s use of Treasury futures was a positive contributor to Fund performance during the 12-month period ended July 31, 2021.
Market Outlook
As mentioned above, municipal market technical and fundamental factors have been favorable for the 12-month period ended July 31, 2021. Record setting year-to-date inflows coupled with manageable new issue supply have been positive factors to the Fund’s performance. Additionally, the relatively unprecedented level of fiscal stimulus coupled with higher vaccination rates and robust growth in the U.S. gross domestic product (“GDP”) has helped improve overall municipal bond credit quality, as demonstrated by lower year-to-date defaults and many sectors outlook changes to stable. We believe these factors have driven credit spreads to considerably tighter levels. Looking ahead, given credit spread compression in “A” and “BBB” credit rating categories, we don’t expect much if any additional credit spread compression. While we do believe that high yield credit spreads could continue to tighten a bit further, we believe that municipal bonds are more in a “coupon clipping” environment. Thus, unlike the beginning of 2021 when we had a high degree of confidence that credit spreads would tighten thus supporting total returns for lower investment grade and high yield municipals, we believe municipal bonds are now in general more vulnerable to changes in U.S. Treasury rates that could occur due to the passage of new multi-trillion dollar spending programs by Congress, changes in commentary coming from the Federal Reserve (the “Fed”) regarding the tapering of its $120 billion monthly purchases of mortgage-backed securities and Treasuries, and any setback in the U.S. economic recovery, such as the COVID-19 Delta variant causing portions of the U.S. to curtail economic activity.
We believe yield curve positioning could also be a significant driver of total return by year-end of 2021. We expect the U.S. Treasury curve to steepen during the second half of 2021, with the 10-year and 30-year portions of the Treasury curve underperforming the 1-5-year part of the curve. We believe that widespread vaccination rates in the U.S. coupled with incredible amounts of monetary and fiscal stimulus will lead to above trend GDP growth in the second half of 2021. Key factors leading us to believe that the yield curve will steepen include continued progress in vaccination rates thus leading to an even more “open” U.S. and global economy, K-12 students returning to full time, in-person education, and the elimination of Federal supplemental unemployment benefits by the end of the third quarter of 2021. We believe this will lead to greater gains in the labor market (higher monthly payrolls), while inflation remains well above the Fed’s long-term average goal of 2%.
Finally, we will be watching President Biden’s infrastructure proposals carefully, as they could prove to be materially positive factors for the municipal bond market including: (1) direct Federal aid to rebuilding our nation’s roads, bridges, airports, and mass transit
Portfolio Commentary (Continued)
First Trust Municipal High Income ETF (FMHI)
Annual Report
July 31, 2021 (Unaudited)
systems, (2) restart of the Build American Bond subsidy program which could reduce tax-exempt supply; and (3) higher tax rates to pay for such proposals could make municipal bonds tax-exempt interest more attractive for high income families as well as banks and insurance companies.
With this in mind, we continue to practice the discipline of our investment process where we perform fundamental credit analysis and quantitative total return scenario analysis on individual bonds and the portfolio as a whole, looking for bonds that we believe can provide both high income and attractive total return potential over time.
First Trust Municipal High Income ETF (FMHI)
Understanding Your Fund Expenses
July 31, 2021 (Unaudited)
As a shareholder of the First Trust Municipal High Income ETF (the “Fund”), you incur two types of costs: (1) transaction costs; and (2) ongoing costs, including management fees, distribution and/or service (12b-1) fees, if any, and other Fund expenses. This Example is intended to help you understand your ongoing costs of investing in the Fund and to compare these costs with the ongoing costs of investing in other funds.
The Example is based on an investment of $1,000 invested at the beginning of the period and held through the six-month period ended July 31, 2021.
Actual Expenses
The first line in the following table provides information about actual account values and actual expenses. You may use the information in this line, together with the amount you invested, to estimate the expenses that you paid over the period. Simply divide your account value by $1,000 (for example, an $8,600 account value divided by $1,000 = 8.6), then multiply the result by the number in the first line under the heading entitled “Expenses Paid During the Six-Month Period” to estimate the expenses you paid on your account during this six-month period.
Hypothetical Example for Comparison Purposes
The second line in the following table provides information about hypothetical account values and hypothetical expenses based on the Fund’s actual expense ratio and an assumed rate of return of 5% per year before expenses, which is not the Fund’s actual return. The hypothetical account values and expenses may not be used to estimate the actual ending account balance or expenses you paid for the period. You may use this information to compare the ongoing costs of investing in the Fund and other funds. To do so, compare this 5% hypothetical example with the 5% hypothetical examples that appear in the shareholder reports of the other funds.
Please note that the expenses shown in the table are meant to highlight your ongoing costs only and do not reflect any transactional costs such as brokerage commissions. Therefore, the second line in the table is useful in comparing ongoing costs only, and will not help you determine the relative total costs of owning different funds. In addition, if these transactional costs were included, your costs would have been higher.
| | Beginning
Account Value
February 1, 2021 | Ending
Account Value
July 31, 2021 | Annualized
Expense Ratio
Based on the
Six-Month
Period (a) | Expenses Paid
During the
Six-Month
Period (b) |
| First Trust Municipal High Income ETF (FMHI) |
| Actual | $1,000.00 | $1,054.90 | 0.55% | $2.80 |
| Hypothetical (5% return before expenses) | $1,000.00 | $1,022.07 | 0.55% | $2.76 |
| (a) | These expense ratios reflect expense waivers. See Note 3 in the Notes to Financial Statements. |
| (b) | Expenses are equal to the annualized expense ratios as indicated in the table multiplied by the average account value over the period (February 1, 2021 through July 31, 2021), multiplied by 181/365 (to reflect the six-month period). |
First Trust Municipal High Income ETF (FMHI)
Portfolio of Investments
July 31, 2021
Principal
Value | | Description | | Stated
Coupon | | Stated
Maturity | | Value |
| MUNICIPAL BONDS – 98.2% |
| | | American Samoa – 0.3% | | | | | | |
| $750,000 | | American Samoa AS Econ Dev Auth Gen Rev, Ser A (a)
| | 5.00% | | 09/01/38 | | $944,058 |
| | | Arizona – 2.7% | | | | | | |
| 780,000 | | AZ St Indl Dev Auth Edu Rev Acads of Math & Science Proj (a)
| | 5.00% | | 07/01/39 | | 930,898 |
| 750,000 | | AZ St Indl Dev Auth Edu Rev Doral Acdmy NV Fire Mesa & Red Rock Cmps Proj, Ser A (a)
| | 5.00% | | 07/15/39 | | 869,685 |
| 400,000 | | AZ St Indl Dev Auth Edu Rev Lone Mountain Cmps Proj, Ser A (a)
| | 5.00% | | 12/15/39 | | 467,224 |
| 1,255,000 | | AZ St Indl Dev Auth Edu Rev Ref Basis Sch Projs, Ser D (a)
| | 4.00% | | 07/01/27 | | 1,390,982 |
| 500,000 | | AZ St Indl Dev Auth Edu Rev Somerset Acdmy of Lv Aliante & Skye Canyon Cmps Proj, Ser A (a)
| | 4.00% | | 12/15/41 | | 557,894 |
| 500,000 | | AZ St Indl Dev Auth Edu Rev, Ser A (a)
| | 5.00% | | 07/15/40 | | 578,579 |
| 710,000 | | AZ St Indl Dev Auth Natl Chrt Sch Revolving Loan Fd Social Bonds Equitable Sch Revolving Fund, Ser A
| | 4.00% | | 11/01/40 | | 843,816 |
| 500,000 | | Glendale AZ Indl Dev Auth Sr Living Facs Rev Royal Oaks Inspirata Pointe Proj, Ser A
| | 5.00% | | 05/15/41 | | 578,720 |
| 1,000,000 | | Maricopa Cnty AZ Indl Dev Auth Edu Rev Ref Legacy Trad Schs Proj Auth, Ser B (a)
| | 4.00% | | 07/01/29 | | 1,136,921 |
| 100,000 | | Phoenix AZ Indl Dev Auth Stdt Hsg Rev Ref Downtown Phoenix Stdt Hsg LLC AZ St Univ Proj, Ser A
| | 5.00% | | 07/01/27 | | 123,096 |
| 105,000 | | Pima Cnty AZ Indl Dev Auth Edu Rev Fac American Leadership Acdmy Proj (a)
| | 4.00% | | 06/15/22 | | 106,994 |
| | | | | 7,584,809 |
| | | Arkansas – 0.5% | | | | | | |
| 1,250,000 | | AR St Dev Fin Auth Hlthcare Facs Rev Carti Surgery Ctr Proj, Ser B
| | 4.00% | | 07/01/52 | | 1,346,370 |
| | | California – 8.1% | | | | | | |
| 250,000 | | CA Pub Fin Auth Sr Living Rev Enso Vlg Proj Green Bond, Ser A (a)
| | 5.00% | | 11/15/46 | | 293,964 |
| 250,000 | | CA Pub Fin Auth Sr Living Rev Enso Vlg Proj Green Bond, Ser A (a)
| | 5.00% | | 11/15/51 | | 292,948 |
| 750,000 | | CA Pub Fin Auth Sr Living Rev Green Bond Temps 70 Enso Vlg Proj, Ser B-2 (a)
| | 2.38% | | 11/15/28 | | 763,094 |
| 1,825,000 | | CA St Infra & Econ Dev Bank Lease Rev Green Bond
| | 5.00% | | 08/01/44 | | 2,319,143 |
| 450,000 | | CA St Muni Fin Auth Chrt Sch Rev, Ser A (a)
| | 5.50% | | 06/01/38 | | 514,764 |
| 205,000 | | CA St Muni Fin Auth Rev Ref Eisenhower Med Ctr, Ser A
| | 5.00% | | 07/01/32 | | 251,446 |
| 250,000 | | CA St Poll Control Fin Auth Sol Wst Disp Rev Rialto Bioenergy Fac LLC Proj Green Bond, AMT (a)
| | 6.75% | | 12/01/28 | | 274,661 |
| 500,000 | | CA St Poll Control Fin Auth Sol Wst Disp Rev Rialto Bioenergy Fac LLC Proj Green Bond, AMT (a)
| | 7.50% | | 12/01/40 | | 551,821 |
| 750,000 | | CA St Poll Control Fin Auth Wtr Furnishing Rev, AMT (a)
| | 5.00% | | 07/01/37 | | 790,344 |
| 125,000 | | CA St Stwd Cmntys Dev Auth Spl Tax Rev Impt Area No 1
| | 4.00% | | 09/01/28 | | 144,705 |
| 135,000 | | CA St Stwd Cmntys Dev Auth Spl Tax Rev Impt Area No 1
| | 4.00% | | 09/01/29 | | 157,849 |
| 1,400,000 | | CA St Stwd Cmntys Dev Auth Stwd Rev Dev Auth, Ser 2021A
| | 4.00% | | 09/02/41 | | 1,592,462 |
| 550,000 | | CA Stwd Cmntys Dev Auth Rev Loma Linda Univ Med Ctr, Ser A (a)
| | 5.00% | | 12/01/33 | | 659,084 |
| 2,000,000 | | CSCDA Cmnty Impt Auth CA Essential Hsg Rev Union S Bay Social Bonds, Ser A-2 (a)
| | 4.00% | | 07/01/56 | | 2,193,639 |
| 465,000 | | Folsom Ranch CA Fing Auth Spl Tax Rev White Rock Springs Ranch
| | 4.00% | | 09/01/46 | | 519,784 |
| 1,375,000 | | Los Angeles CA Dept of Arpts Arpt Rev Subord Ref, Ser A, AMT
| | 4.00% | | 05/15/44 | | 1,603,840 |
| 1,000,000 | | Marysville CA Jt Unif Sch Dist Green Bond, 2021 Energy Efficiency Proj, COPS, BAM
| | 4.00% | | 06/01/39 | | 1,171,528 |
| 300,000 | | Morongo Band of Mission Indians CA Rev Ref, Ser B (a)
| | 5.00% | | 10/01/42 | | 360,871 |
See Notes to Financial Statements
Page 9
First Trust Municipal High Income ETF (FMHI)
Portfolio of Investments (Continued)
July 31, 2021
Principal
Value | | Description | | Stated
Coupon | | Stated
Maturity | | Value |
| MUNICIPAL BONDS (Continued) |
| | | California (Continued) | | | | | | |
| $450,000 | | Palm Desert CA Spl Tax Ref Univ Park
| | 4.00% | | 09/01/41 | | $491,792 |
| 235,000 | | Riverside CA Unif Sch Dist Cmnty Facs Dt #33 Citrus Heights II Spl Tax
| | 4.00% | | 09/01/29 | | 271,932 |
| 285,000 | | Riverside CA Unif Sch Dist Cmnty Facs Dt #33 Citrus Heights II Spl Tax
| | 4.00% | | 09/01/34 | | 324,514 |
| 400,000 | | Roseville CA Spl Tax Svsp Westpark Federico Cmnty Facs Dt
No. 1
| | 4.00% | | 09/01/41 | | 454,885 |
| 1,000,000 | | Sacramento CA Spl Tax
| | 4.00% | | 09/01/41 | | 1,146,591 |
| 2,010,000 | | San Francisco CA City & Cnty, Ser B-1
| | 4.00% | | 06/15/39 | | 2,440,588 |
| 1,000,000 | | San Francisco City & Cnty CA Cmnty Facs Dist #2016-1, Ser 2021
| | 4.00% | | 09/01/41 | | 1,141,167 |
| 1,000,000 | | San Francisco City & Cnty CA Cmnty Facs Dist #2016-1, Ser 2021
| | 4.00% | | 09/01/51 | | 1,131,652 |
| 850,000 | | San Luis Obispo Ca Cmnty Facs Dist #2019-1 Spl Tax
| | 4.00% | | 09/01/39 | | 989,089 |
| | | | | 22,848,157 |
| | | Colorado – 14.7% | | | | | | |
| 1,125,000 | | Allison Vly Met Dist #2 CO Ref
| | 4.70% | | 12/01/47 | | 1,206,841 |
| 1,075,000 | | Aspen Street Met Dist CO, Ser A
| | 5.13% | | 12/01/50 | | 1,124,795 |
| 1,000,000 | | Baseline Met Dist #1 CO Spl Rev, Ser A
| | 5.00% | | 12/01/51 | | 1,076,051 |
| 1,000,000 | | Bennett Ranch Met Dist #1 CO, Ser A
| | 5.00% | | 12/01/51 | | 1,091,221 |
| 525,000 | | Brighton Crossing Met Dist #6 CO, Ser A
| | 5.00% | | 12/01/35 | | 592,880 |
| 1,030,000 | | Brighton Crossing Met Dist #6 CO, Ser A
| | 5.00% | | 12/01/40 | | 1,153,394 |
| 735,000 | | Broadway Station Met Dist No 2 CO, Ser A
| | 5.00% | | 12/01/35 | | 810,321 |
| 1,440,000 | | Broomfield Vlg CO Met Dist #2 Ref, Ser A-1 (a)
| | 5.00% | | 12/01/49 | | 1,597,935 |
| 3,500,000 | | Canyon Pines Met Dist CO Spl Impt Dist #1 Spl Assmnt Rev Spl Impt Dist No 1, Ser A-2
| | 3.75% | | 12/01/40 | | 3,429,051 |
| 1,000,000 | | Cascade Ridge Met Dist CO
| | 5.00% | | 12/01/51 | | 1,013,408 |
| 515,000 | | Chambers Highpoint Met Dist #2 CO
| | 5.00% | | 12/01/41 | | 554,919 |
| 835,000 | | Chambers Highpoint Met Dist #2 CO
| | 5.00% | | 12/01/51 | | 886,501 |
| 150,000 | | CO Eductnl & Cultural Auth Rev Ref W Ridge Acdmy Chrt Sch Proj, Ser A
| | 5.00% | | 06/01/27 | | 167,587 |
| 1,000,000 | | CO St Eductnl & Cultural Facs Auth Rev Ref & Impt Chrt Sch Univ Lab Bldg Corp
| | 5.00% | | 12/15/45 | | 1,095,098 |
| 850,000 | | CO St Hlth Facs Auth Hosp Rev Ref Commonspirit Hlth, Ser A-1
| | 4.00% | | 08/01/38 | | 1,004,410 |
| 625,000 | | CO St Hlth Facs Auth Hosp Rev Sr Living Ralston Creek Arvada Proj, Ser A
| | 5.25% | | 11/01/32 | | 598,327 |
| 500,000 | | Denver CO Intl Busn Ctr CO Met Dist #1 Subord, Ser B
| | 6.00% | | 12/01/48 | | 544,229 |
| 1,015,000 | | E-86 Met Dist CO, Ser A
| | 5.13% | | 12/01/51 | | 1,061,337 |
| 1,700,000 | | Elbert & Hwy 86 CO Comml Spl Rev & Tax Supported Ref Sr Bonds, Ser A (a)
| | 5.00% | | 12/01/41 | | 1,872,066 |
| 1,510,000 | | Elbert & Hwy 86 CO Comml Spl Rev & Tax Supported Ref Sr Bonds, Ser A (a)
| | 5.00% | | 12/01/51 | | 1,650,101 |
| 650,000 | | Highlands Met Dist #1 CO
| | 4.00% | | 12/01/31 | | 685,853 |
| 540,000 | | Highlands Met Dist #1 CO
| | 5.00% | | 12/01/41 | | 587,673 |
| 1,675,000 | | Horizon Met Dist #2 CO (a)
| | 4.50% | | 12/01/51 | | 1,723,558 |
| 900,000 | | Hunters Overlook Metro Dist #5 CO Sr Bonds, Ser A
| | 5.00% | | 12/01/39 | | 985,836 |
| 500,000 | | Independence Met Dist #3 CO, Ser A
| | 6.25% | | 12/01/49 | | 542,993 |
| 575,000 | | Jefferson Ctr CO Met Dist #1 Spl Rev, Ser A-2
| | 4.13% | | 12/01/40 | | 615,033 |
| 875,000 | | Lanterns Met Dist #1 CO, Ser A
| | 5.00% | | 12/01/39 | | 955,715 |
| 1,000,000 | | Painted Prairie Pub Impt Auth CO
| | 4.00% | | 12/01/29 | | 1,090,086 |
| 500,000 | | Park Creek CO Met Dist Rev Ref Sr Ltd Property Tax Supported, Ser A
| | 5.00% | | 12/01/34 | | 582,299 |
| 500,000 | | Peak Met Dist #1 CO, Ser A (a)
| | 4.00% | | 12/01/35 | | 541,526 |
| 500,000 | | Peak Met Dist #1 CO, Ser A (a)
| | 5.00% | | 12/01/41 | | 558,536 |
Page 10
See Notes to Financial Statements
First Trust Municipal High Income ETF (FMHI)
Portfolio of Investments (Continued)
July 31, 2021
Principal
Value | | Description | | Stated
Coupon | | Stated
Maturity | | Value |
| MUNICIPAL BONDS (Continued) |
| | | Colorado (Continued) | | | | | | |
| $890,000 | | Prairie Ctr Met Dist #7 CO
| | 4.13% | | 12/15/36 | | $970,627 |
| 1,500,000 | | Pueblo CO Urban Renewal Auth Tax Incr Rev Auth Evraz Proj Tax Incr Rev, Ser A, CIBS (a)
| | 4.75% | | 12/01/45 | | 1,735,749 |
| 500,000 | | Regl CO Transprtn Dist Priv Activity Rev Ref Denver Transit Partners Eagle P3 Proj, Ser A
| | 5.00% | | 07/15/27 | | 621,403 |
| 325,000 | | Regl CO Transprtn Dist Priv Activity Rev Ref Denver Transit Partners Eagle P3 Proj, Ser A
| | 5.00% | | 07/15/28 | | 413,622 |
| 300,000 | | Regl CO Transprtn Dist Priv Activity Rev Ref Denver Transit Partners Eagle P3 Proj, Ser A
| | 5.00% | | 07/15/29 | | 389,870 |
| 560,000 | | Stc Met Dist #2 CO Ref, Ser A
| | 3.00% | | 12/01/25 | | 591,338 |
| 1,000,000 | | Stc Met Dist #2 CO Ref, Ser A
| | 5.00% | | 12/01/38 | | 1,101,490 |
| 1,000,000 | | Sterling Ranch Met Dist #1 CO
| | 5.00% | | 12/01/40 | | 1,115,114 |
| 500,000 | | Trails at Crowfoot Met Dist #3 CO Sr Ser, Ser A
| | 5.00% | | 12/01/39 | | 544,420 |
| 1,200,000 | | Transport Met Dist #3 CO MDD, Ser 2021-A-1
| | 5.00% | | 12/01/41 | | 1,362,238 |
| 650,000 | | Westerly Met Dist #4 CO Sr, Ser A
| | 5.00% | | 12/01/40 | | 725,588 |
| 740,000 | | Willow Bend Met Dist CO Sr, Ser A
| | 5.00% | | 12/01/39 | | 806,665 |
| | | | | 41,777,704 |
| | | Connecticut – 1.6% | | | | | | |
| 250,000 | | Bridgeport CT, Ser A, BAM
| | 5.00% | | 02/01/31 | | 319,725 |
| 540,000 | | CT St Hlth & Eductnl Facs Auth Rev Mclean Issue, Ser A (a)
| | 5.00% | | 01/01/55 | | 605,478 |
| 250,000 | | CT St Hlth & Eductnl Facs Auth Rev Quinnipiac Univ Ref, Ser M
| | 5.00% | | 07/01/36 | | 294,715 |
| 250,000 | | CT St Hlth & Eductnl Facs Auth Rev Ref Quinnipiac Univ, Ser L
| | 5.00% | | 07/01/31 | | 288,299 |
| 1,500,000 | | Harbor Point CT Infra Impt Dist Spl Oblig Rev Ref Harbor Point Proj Ltd (a)
| | 5.00% | | 04/01/39 | | 1,747,548 |
| 1,000,000 | | Univ of CT CT, Ser A
| | 5.00% | | 11/01/35 | | 1,266,995 |
| | | | | 4,522,760 |
| | | Delaware – 0.2% | | | | | | |
| 529,000 | | Millsboro DE Spl Oblig Ref Plantation Lakes Spl Dev Dist (a)
| | 5.00% | | 07/01/28 | | 587,655 |
| | | District of Columbia – 0.6% | | | | | | |
| 1,500,000 | | DC Rev Rocketship DC Oblig Grp, Ser A (a)
| | 5.00% | | 06/01/51 | | 1,782,606 |
| | | Florida – 10.2% | | | | | | |
| 935,000 | | Alachua Cnty FL Hlth Facs Auth Shands Teaching Hosp & Clinics Inc, Ser A
| | 4.00% | | 12/01/49 | | 1,098,574 |
| 1,125,000 | | Babcock Ranch Cmnty Indep Spl Dist FL Spl Assmnt Rev Proj, Ser 2021
| | 4.00% | | 05/01/52 | | 1,193,978 |
| 200,000 | | Capital Region FL CDD Rev Ref Capital Impt, Ser A-1
| | 4.13% | | 05/01/23 | | 204,548 |
| 445,000 | | Capital Trust Agy FL Eductnl Facs Rev Academir Chrt Schs Inc Proj, Ser A (a)
| | 4.00% | | 07/01/41 | | 491,741 |
| 525,000 | | Capital Trust Agy FL Eductnl Facs Rev Academir Chrt Schs Inc Proj, Ser A (a)
| | 4.00% | | 07/01/51 | | 571,592 |
| 200,000 | | Capital Trust Agy FL Eductnl Facs Rev Liza Jackson Preparatory Sch Inc Proj, Ser A
| | 4.00% | | 08/01/30 | | 227,338 |
| 300,000 | | Capital Trust Agy FL Eductnl Facs Rev Liza Jackson Preparatory Sch Inc Proj, Ser A
| | 5.00% | | 08/01/40 | | 363,584 |
| 1,500,000 | | Capital Trust Agy FL Rev Sr Edu Growth Fund LLC Chrt Sch Port Proj, Ser A-1 (a)
| | 5.00% | | 07/01/56 | | 1,791,001 |
| 650,000 | | Coco Palms FL CDD Spl Assmnt
| | 4.50% | | 05/01/32 | | 720,764 |
| 1,000,000 | | Epperson N CDD FL Capital Impt Rev Assmnt Area #2
| | 4.00% | | 05/01/51 | | 1,054,471 |
| 580,000 | | Epperson Ranch CDD FL Capital Impt Rev, Ser A-1
| | 5.00% | | 11/01/28 | | 628,614 |
| 2,000,000 | | FL Dev Fin Corp Surface Tranprtn Fac Rev Green Bond Brightline Passenger Rail Remk, Ser B, AMT (a)
| | 7.38% | | 01/01/49 | | 2,209,921 |
See Notes to Financial Statements
Page 11
First Trust Municipal High Income ETF (FMHI)
Portfolio of Investments (Continued)
July 31, 2021
Principal
Value | | Description | | Stated
Coupon | | Stated
Maturity | | Value |
| MUNICIPAL BONDS (Continued) |
| | | Florida (Continued) | | | | | | |
| $1,385,000 | | FL St Dev Fin Corp Eductnl Facs Rev Ref Global Outreach Chrt Acdmy Proj, Ser A (a)
| | 4.00% | | 06/30/56 | | $1,490,504 |
| 1,000,000 | | FL St Dev Fin Corp Sr Living Rev Ref Glenridge on Palmer Ranch Proj
| | 5.00% | | 06/01/51 | | 1,161,320 |
| 1,000,000 | | FL St Dev Fin Corp Sr Living Rev Ref Mayflower Retmnt Cmnty Proj, Ser A (a)
| | 4.00% | | 06/01/55 | | 1,125,602 |
| 1,000,000 | | Hills Minneola Cmnty Dev Dist FL Spl Assmnt Rev S Parcel Assmnt Area (a)
| | 4.00% | | 05/01/40 | | 1,083,061 |
| 1,000,000 | | Martin Cnty FL Hlth Facs Auth Ref Cleveland Clinic Hlth Sys Oblig Grp Hosp Revs, Ser A
| | 4.00% | | 01/01/46 | | 1,170,990 |
| 85,000 | | Miami-Dade Cnty FL Eductnl Facs Auth Rev Ref Univ Miami, Ser A
| | 5.00% | | 04/01/31 | | 98,284 |
| 1,250,000 | | Mirada II Cmnty Dev Dist FL Cap Impt Rev
| | 4.00% | | 05/01/51 | | 1,319,154 |
| 200,000 | | N Park Isle Cmnty Dev Dist FL Spl Assmnt Rev Assmnt Area One
| | 4.50% | | 05/01/40 | | 219,957 |
| 210,000 | | Orange Cnty FL Hlth Facs Auth Rev Ref Orlando Hlth Inc, Ser A
| | 5.00% | | 10/01/36 | | 254,326 |
| 1,000,000 | | Palm Beach Cnty FL Rev Lynn Univ Hsg Proj, Ser A (a)
| | 5.00% | | 06/01/57 | | 1,210,791 |
| 465,000 | | Parkland Preserve CDD FL Spl Assmnt Rev, Ser A
| | 5.25% | | 05/01/39 | | 543,018 |
| 1,500,000 | | Polk Cnty FL Indl Dev Auth Mineral Dev LLC Secondary Phosphate Tailings Recovery Proj (a)
| | 5.88% | | 01/01/33 | | 1,935,935 |
| 1,200,000 | | Saint Johns Cnty FL Indl Dev Auth Sr Living Rev Ref Vicar’s Landing Proj, Ser A
| | 4.00% | | 12/15/46 | | 1,339,832 |
| 250,000 | | SE Overtown Park W Cmnty Redev Agy FL Tax, Ser A-1 (a)
| | 5.00% | | 03/01/30 | | 275,336 |
| 500,000 | | Shell Point Cmnty Dev Dist FL Spl Assmnt (a)
| | 5.25% | | 11/01/39 | | 578,028 |
| 1,000,000 | | Shingle Creek at Bronson CDD FL Spl Assmnt
| | 4.00% | | 06/15/51 | | 1,064,584 |
| 750,000 | | Six Mile Creek FL CDD Capital Impt Rev Assmnt Area 3 Phase 1
| | 4.00% | | 05/01/51 | | 788,301 |
| 1,000,000 | | V-Dana CDD FL Spl Assmnt CDD Assmnt Area One 2021 Proj
| | 4.00% | | 05/01/52 | | 1,055,323 |
| 230,000 | | Villamar CDD FL Spl Assmnt (b)
| | 4.00% | | 05/01/29 | | 249,149 |
| 1,250,000 | | Westside Haines City CDD Spl Assmnt Assmnt Area One Proj
| | 4.00% | | 05/01/52 | | 1,309,599 |
| | | | | 28,829,220 |
| | | Georgia – 1.0% | | | | | | |
| 1,000,000 | | Atlanta GA Arpt Passenger Fac Charge Rev Arpt Rev Subord, Ser D, AMT
| | 4.00% | | 07/01/38 | | 1,183,134 |
| 55,000 | | Fulton Cnty GA Rsdl Care Facs Elderly Auth Retmnt Fac Rev Ref Lenbrook Sq Fdtn Inc
| | 5.00% | | 07/01/31 | | 59,896 |
| 500,000 | | Fulton Cnty GA Rsdl Care Facs Elderly Auth Retmnt Fac Rev Ref Lenbrook Sq Fdtn Inc
| | 5.00% | | 07/01/42 | | 540,932 |
| 500,000 | | Geo L Smith II GA Congress Ctr Auth Convention Ctr Hotel Second Tier, Ser B (a)
| | 5.00% | | 01/01/36 | | 619,134 |
| 400,000 | | Main Street Nat Gas Inc GA Gas Sply Rev, Ser A
| | 5.00% | | 05/15/30 | | 516,435 |
| | | | | 2,919,531 |
| | | Guam – 0.4% | | | | | | |
| 250,000 | | Guam Govt Busn Privilege Tax Rev Ref, Ser-D
| | 5.00% | | 11/15/35 | | 287,401 |
| 235,000 | | Guam Govt Busn Privilege Tax Rev, Ser B-1
| | 5.00% | | 01/01/37 | | 239,593 |
| 500,000 | | Guam Govt Wtrwks Auth Wtr & Wstwtr Sys Rev, Ser A
| | 5.00% | | 01/01/50 | | 619,703 |
| | | | | 1,146,697 |
| | | Idaho – 0.1% | | | | | | |
| 260,000 | | ID St Hlth Facs Auth Rev Ref Vly Vista Care Corp, Ser A
| | 4.00% | | 11/15/27 | | 268,651 |
| | | Illinois – 4.4% | | | | | | |
| 275,000 | | Chicago IL Brd of Edu Cap Apprec Sch Reform, Ser B-1, NATL-RE
| | (c) | | 12/01/22 | | 273,066 |
| 300,000 | | Chicago IL Brd of Edu Ref Dedicated, Ser C
| | 5.00% | | 12/01/30 | | 370,971 |
Page 12
See Notes to Financial Statements
First Trust Municipal High Income ETF (FMHI)
Portfolio of Investments (Continued)
July 31, 2021
Principal
Value | | Description | | Stated
Coupon | | Stated
Maturity | | Value |
| MUNICIPAL BONDS (Continued) |
| | | Illinois (Continued) | | | | | | |
| $1,250,000 | | Chicago IL Brd of Edu Ref, Ser B
| | 5.00% | | 12/01/36 | | $1,621,974 |
| 1,000,000 | | Chicago IL Brd of Edu, Ser A
| | 5.00% | | 12/01/34 | | 1,302,922 |
| 250,000 | | Chicago IL Brd of Edu, Ser A
| | 5.00% | | 12/01/35 | | 324,909 |
| 100,000 | | Chicago IL Brd of Edu, Ser A
| | 5.50% | | 12/01/39 | | 101,598 |
| 400,000 | | Chicago IL O’Hare Intl Arpt Rev Ref Sr Lien, Ser A, AMT
| | 5.00% | | 01/01/37 | | 500,944 |
| 400,000 | | Chicago IL Ref 2003B Remk
| | 5.25% | | 01/01/29 | | 457,649 |
| 20,000 | | Chicago IL Ref, Ser C
| | 5.00% | | 01/01/25 | | 20,363 |
| 515,000 | | Chicago IL Ref, Ser C, CABS
| | (c) | | 01/01/25 | | 485,939 |
| 360,000 | | Hillside IL Tax Incr Rev Ref
| | 5.00% | | 01/01/24 | | 375,919 |
| 100,000 | | IL St
| | 5.00% | | 04/01/24 | | 112,192 |
| 500,000 | | IL St
| | 5.50% | | 05/01/26 | | 612,338 |
| 200,000 | | IL St
| | 5.00% | | 06/01/27 | | 239,700 |
| 250,000 | | IL St Fin Auth Chrt Sch Rev Ref & Impt Chicago Intl Chrt Sch Proj
| | 5.00% | | 12/01/30 | | 302,966 |
| 250,000 | | IL St Fin Auth Chrt Sch Rev Ref & Impt Chicago Intl Chrt Sch Proj
| | 5.00% | | 12/01/31 | | 301,732 |
| 100,000 | | IL St Fin Auth Stdt Hsg & Acad Fac Rev Chf Chicago LLC Univ IL Chicago Proj, Ser A
| | 5.00% | | 02/15/26 | | 116,814 |
| 300,000 | | IL St Fin Auth Stdt Hsg & Acad Fac Rev Chf Chicago LLC Univ IL Chicago Proj, Ser A
| | 5.00% | | 02/15/27 | | 359,076 |
| 145,000 | | IL St Fin Auth Stdt Hsg & Acad Fac Rev Chf Chicago LLC Univ IL Chicago Proj, Ser A
| | 5.00% | | 02/15/28 | | 174,913 |
| 2,500,000 | | IL St, Ser C
| | 5.00% | | 11/01/29 | | 3,074,921 |
| 650,000 | | IL St, Ser D
| | 5.00% | | 11/01/24 | | 744,920 |
| 500,000 | | Morton Grove IL Tax Incr Rev Sawmill Station Redev Proj
| | 5.00% | | 01/01/39 | | 520,840 |
| | | | | 12,396,666 |
| | | Indiana – 2.9% | | | | | | |
| 1,370,000 | | Anderson IN Mf Rev Sweet Galilee at the Wigwam Proj, Ser A
| | 5.38% | | 01/01/40 | | 1,459,881 |
| 1,000,000 | | Evansville IN Mf Hsg Rev Silver Birch Evansville Proj
| | 5.45% | | 01/01/38 | | 1,039,374 |
| 250,000 | | Fort Wayne IN Mf Hsg Rev Silver Birch at Cook Road (a)
| | 5.30% | | 01/01/32 | | 263,717 |
| 1,500,000 | | IN St Fin Auth Envrnmntl Rev Ref US Steel Corp Proj, Ser A
| | 4.13% | | 12/01/26 | | 1,642,008 |
| 665,000 | | IN St Fin Auth Hosp Rev Goshen Hlth, Ser A
| | 4.00% | | 11/01/37 | | 761,368 |
| 200,000 | | IN St Fin Auth Rev Eductnl Facs Rock Creek Cmnty Acdmy Proj, Ser A (d)
| | 5.25% | | 07/01/28 | | 232,637 |
| 1,200,000 | | IN St Fin Auth Rev Ref BHI Sr Living, Ser A
| | 4.00% | | 11/15/41 | | 1,412,856 |
| 600,000 | | Plainfield IN Mf Hsg Rev Glasswater Creek Proj
| | 5.38% | | 09/01/38 | | 621,371 |
| 700,000 | | Terre Haute IN Mf Hsg Rev Silver Birch of Terre Haute Proj
| | 5.10% | | 01/01/32 | | 727,103 |
| | | | | 8,160,315 |
| | | Iowa – 0.8% | | | | | | |
| 2,000,000 | | Tobacco Stlmt Auth LA Tobacco Stlmt Rev Ref Subord Sr, Class 2, Ser B-1
| | 4.00% | | 06/01/49 | | 2,363,006 |
| | | Kansas – 0.4% | | | | | | |
| 1,050,000 | | Goddard KS Sales Tax Spl Oblg Rev Ref Olympic Park Star Bond Proj
| | 3.60% | | 06/01/30 | | 1,064,415 |
| | | Kentucky – 1.0% | | | | | | |
| 1,515,000 | | Hazard KY Hlthcare Rev Ref Appalachian Regl Hlthcare Proj
| | 4.00% | | 07/01/39 | | 1,817,132 |
| 750,000 | | KY St Pub Energy Auth Gas Sply Rev Gas Sply, Ser B (Mandatory put 01/01/25)
| | 4.00% | | 01/01/49 | | 834,152 |
| 230,000 | | KY St Univ KY St Univ Proj, COPS, BAM
| | 4.00% | | 11/01/41 | | 273,768 |
| | | | | 2,925,052 |
See Notes to Financial Statements
Page 13
First Trust Municipal High Income ETF (FMHI)
Portfolio of Investments (Continued)
July 31, 2021
Principal
Value | | Description | | Stated
Coupon | | Stated
Maturity | | Value |
| MUNICIPAL BONDS (Continued) |
| | | Louisiana – 1.2% | | | | | | |
| $200,000 | | Monroe LA Wtr Rev, BAM
| | 5.00% | | 11/01/32 | | $256,210 |
| 900,000 | | New Orleans LA Aviation Brd Gen Arpt N Term, Ser B, AMT
| | 5.00% | | 01/01/30 | | 1,087,596 |
| 1,000,000 | | Saint James Parish LA Rev NuStar Logistics LP Proj Remk, Ser 2010 (a)
| | 6.35% | | 07/01/40 | | 1,353,277 |
| 500,000 | | Saint James Parish LA Rev Var NuStar Logistics LP Proj Remk, Ser 2010B (Mandatory put 06/01/30) (a)
| | 6.10% | | 12/01/40 | | 666,556 |
| | | | | 3,363,639 |
| | | Maryland – 1.7% | | | | | | |
| 175,000 | | Baltimore MD Spl Oblig Ref Sr Lien Harbor Point Proj, Ser A (a)
| | 2.95% | | 06/01/27 | | 186,084 |
| 185,000 | | Baltimore MD Spl Oblig Ref Sr Lien Harbor Point Proj, Ser A (a)
| | 3.05% | | 06/01/28 | | 196,607 |
| 200,000 | | Baltimore MD Spl Oblig Ref Sr Lien Harbor Point Proj, Ser A (a)
| | 3.15% | | 06/01/29 | | 214,484 |
| 190,000 | | Baltimore MD Spl Oblig Ref Sr Lien Harbor Point Proj, Ser A (a)
| | 3.20% | | 06/01/30 | | 202,744 |
| 900,000 | | Frederick Cnty MD Tax Incr & Spl Tax Ref Jefferson Technology Park Proj, Ser B (a)
| | 4.63% | | 07/01/43 | | 1,088,897 |
| 1,000,000 | | MD St Econ Dev Corp Spl Oblig Port Covington Proj
| | 4.00% | | 09/01/50 | | 1,156,749 |
| 1,150,000 | | MD St Econ Dev Corp Stdt Hsg Rev Morgan St Univ Proj
| | 5.00% | | 07/01/50 | | 1,431,358 |
| 300,000 | | MD St Hlth & Hgr Eductnl Facs Auth Rev Ref Adventist Hlthcare
| | 4.00% | | 01/01/38 | | 348,360 |
| | | | | 4,825,283 |
| | | Massachusetts – 1.1% | | | | | | |
| 1,000,000 | | MA St Bay Transprtn Auth Sales Tax Rev Ref Sr, Ser B
| | 5.25% | | 07/01/30 | | 1,317,081 |
| 500,000 | | MA St Dev Fin Agy Rev Linden Ponds Inc Fac (a)
| | 5.00% | | 11/15/28 | | 577,517 |
| 1,000,000 | | MA St Dev Fin Agy Rev Umass Dartmouth Stdt Hsg Proj
| | 5.00% | | 10/01/48 | | 1,156,567 |
| | | | | 3,051,165 |
| | | Michigan – 0.7% | | | | | | |
| 300,000 | | Detroit MI Downtown Dev Auth Tax Incr Rev Ref Catalyst Dev Proj, Ser A, AGM
| | 5.00% | | 07/01/31 | | 337,279 |
| 860,000 | | Detroit MI Social Bonds, Ser A
| | 5.00% | | 04/01/38 | | 1,074,222 |
| 635,000 | | MI St Fin Auth Rev Ref Henry Ford Hlth Sys
| | 4.00% | | 11/15/46 | | 714,689 |
| | | | | 2,126,190 |
| | | Minnesota – 1.8% | | | | | | |
| 1,500,000 | | Duluth MN Econ Dev Auth Rev Ref Benedictine Hlth Sys, Ser A
| | 4.00% | | 07/01/36 | | 1,647,605 |
| 930,000 | | Duluth MN Econ Dev Auth Rev Ref Benedictine Hlth Sys, Ser A
| | 4.00% | | 07/01/41 | | 1,014,678 |
| 350,000 | | Duluth MN Indep Sch Dist #709 Ref, Ser B, COPS
| | 5.00% | | 02/01/28 | | 435,463 |
| 150,000 | | Minneapolis MN Stdt Hsg Rev Riverton Cmnty Hsg Proj (a)
| | 3.80% | | 08/01/27 | | 159,231 |
| 105,000 | | Saint Paul MN Hsg & Redev Auth Chrt Sch Lease Rev Ref, Ser A
| | 5.00% | | 12/01/30 | | 117,061 |
| 850,000 | | Woodbury MN Chrt Sch Lease Rev Woodbury Leadership Proj, Ser A
| | 4.00% | | 07/01/41 | | 947,877 |
| 660,000 | | Woodbury MN Chrt Sch Lease Rev Woodbury Leadership Proj, Ser A
| | 4.00% | | 07/01/51 | | 728,428 |
| | | | | 5,050,343 |
| | | Missouri – 0.4% | | | | | | |
| 275,000 | | Bridgeton MO Spl Oblig Rev Ref, Ser A
| | 4.00% | | 12/01/29 | | 325,031 |
| 80,000 | | MO St Hlth & Eductnl Facs Auth Lutheran Sr Svcs
| | 5.00% | | 02/01/35 | | 87,015 |
| 10,000 | | MO St Hlth & Eductnl Facs Auth Med Rsrch Lutheran Svcs, Ser A
| | 5.00% | | 02/01/29 | | 11,720 |
| 725,000 | | Plaza at Noah’s Ark Cmnty Impt Dist Mo Tax Incr & Impt Ref
| | 3.00% | | 05/01/30 | | 744,177 |
| | | | | 1,167,943 |
| | | Nevada – 0.9% | | | | | | |
| 315,000 | | Carson City NV Hosp Rev Ref Carson Tahoe Regl Med Ctr, Ser A
| | 5.00% | | 09/01/25 | | 369,938 |
| 205,000 | | N Las Vegas NV Loc Impt Vly Vista Spl Impt Dist #64
| | 4.00% | | 06/01/29 | | 232,215 |
Page 14
See Notes to Financial Statements
First Trust Municipal High Income ETF (FMHI)
Portfolio of Investments (Continued)
July 31, 2021
Principal
Value | | Description | | Stated
Coupon | | Stated
Maturity | | Value |
| MUNICIPAL BONDS (Continued) |
| | | Nevada (Continued) | | | | | | |
| $700,000 | | NV Dept of Busn & Ind NV Doral Acdmy, Ser A (a)
| | 5.00% | | 07/15/37 | | $775,154 |
| 1,000,000 | | Sparks NV Tourism Impt Dist #1 Rev Ref Sales Tax Sr, Ser A (a)
| | 2.75% | | 06/15/28 | | 1,047,500 |
| | | | | 2,424,807 |
| | | New Hampshire – 0.6% | | | | | | |
| 1,000,000 | | Natl Fin Auth NH Rev Ref Green Bond, Ser B, AMT (Mandatory put 07/02/40) (a)
| | 3.75% | | 07/01/45 | | 1,076,455 |
| 500,000 | | NH St Hlth & Edu Facs Auth Rev Ref Sthrn NH Med Ctr
| | 5.00% | | 10/01/37 | | 593,075 |
| | | | | 1,669,530 |
| | | New Jersey – 2.5% | | | | | | |
| 1,000,000 | | NJ St Covid-19 Go Emergency Bonds, Ser A
| | 4.00% | | 06/01/30 | | 1,243,933 |
| 500,000 | | NJ St Econ Dev Auth Rev Social Bonds, Ser QQQ
| | 4.00% | | 06/15/36 | | 604,698 |
| 100,000 | | NJ St Econ Dev Auth Spl Fac Rev Ref Port Newark Container Terminal LLC Proj, AMT
| | 5.00% | | 10/01/25 | | 116,306 |
| 850,000 | | NJ St Transprtn Trust Fund Auth Cap Apprec Transprtn Sys, Ser C, AMBAC
| | (c) | | 12/15/25 | | 817,335 |
| 500,000 | | NJ St Transprtn Trust Fund Auth Ref Transprtn Sys, Ser A
| | 5.00% | | 12/15/30 | | 632,763 |
| 1,500,000 | | NJ St Transprtn Trust Fund Auth Ref, Ser A
| | 4.00% | | 06/15/36 | | 1,818,028 |
| 500,000 | | Tobacco Stlmt Fing Corp NJ Ref, Ser A
| | 5.00% | | 06/01/27 | | 625,333 |
| 1,000,000 | | Tobacco Stlmt Fing Corp NJ Ref, Subser B
| | 5.00% | | 06/01/46 | | 1,196,166 |
| | | | | 7,054,562 |
| | | New York – 6.5% | | | | | | |
| 785,000 | | Build NYC Res Corp NY Rev NY Preparatory Chrt Sch Proj, Ser A
| | 4.00% | | 06/15/41 | | 883,721 |
| 785,000 | | Build NYC Res Corp NY Rev NY Preparatory Chrt Sch Proj, Ser A
| | 4.00% | | 06/15/51 | | 869,269 |
| 375,000 | | Build NYC Res Corp NY Rev Shefa Sch Proj, Ser A (a)
| | 5.00% | | 06/15/51 | | 453,471 |
| 1,250,000 | | Dutchess Cnty NY Loc Dev Corp Rev Ref Bard Clg Proj, Ser A (a)
| | 5.00% | | 07/01/40 | | 1,577,948 |
| 1,500,000 | | Huntington NY Loc Dev Corp Rev Fountaingate Garden Proj, Ser A
| | 5.25% | | 07/01/56 | | 1,666,603 |
| 425,000 | | Met Transprtn Auth NY Rev Ref, Ser C-2A
| | 4.00% | | 11/15/38 | | 481,678 |
| 1,250,000 | | Met Transprtn Auth NY Rev, Ser A-2S, BANS
| | 4.00% | | 02/01/22 | | 1,273,209 |
| 2,000,000 | | New York City NY Transitional Fin Auth Rev Subord Future Tax Secured, Ser C-1
| | 4.00% | | 11/01/40 | | 2,385,268 |
| 500,000 | | NY St Transprtn Dev Corp Exempt Fac Rev NY St Thruway Srvc Areas Proj, AMT
| | 4.00% | | 10/31/46 | | 594,306 |
| 1,000,000 | | NY St Transprtn Dev Corp Spl Fac Rev Delta Air Lines Inc Laguardia Arpt Terminals C&D Redev, AMT
| | 5.00% | | 10/01/35 | | 1,303,497 |
| 500,000 | | NY St Transprtn Dev Corp Spl Fac Rev Ref American Airlines Inc John F. Kennedy Intl Arpt Proj, AMT
| | 3.00% | | 08/01/31 | | 542,719 |
| 1,000,000 | | NY St Transprtn Dev Corp Spl Fac Rev Ref John F. Kennedy Intl Arpt Proj, AMT
| | 5.25% | | 08/01/31 | | 1,218,769 |
| 400,000 | | NY St Transprtn Dev Corp Spl Fac Rev Ref Terminal 4 JFK Intl Arpt Proj, Ser A, AMT
| | 5.00% | | 12/01/31 | | 529,825 |
| 450,000 | | NY St Transprtn Dev Corp Spl Fac Rev Ref Terminal 4 JFK Intl Arpt Proj, Ser A, AMT
| | 5.00% | | 12/01/32 | | 592,743 |
| 450,000 | | NY St Transprtn Dev Corp Spl Fac Rev Ref Terminal 4 JFK Intl Arpt Proj, Ser A, AMT
| | 5.00% | | 12/01/33 | | 590,744 |
| 150,000 | | Troy NY Capital Res Corp Rev Rensselaer Polytechnic Institute Proj Ref
| | 4.00% | | 09/01/34 | | 182,143 |
| 2,000,000 | | Tsasc Inc NY Tsasc Inc Rev Ref Turbo, Subser B
| | 5.00% | | 06/01/45 | | 2,230,448 |
See Notes to Financial Statements
Page 15
First Trust Municipal High Income ETF (FMHI)
Portfolio of Investments (Continued)
July 31, 2021
Principal
Value | | Description | | Stated
Coupon | | Stated
Maturity | | Value |
| MUNICIPAL BONDS (Continued) |
| | | New York (Continued) | | | | | | |
| $100,000 | | Westchester Co NY Local Dev Corp Rev Ref Miriam Osborn Memorial Home Assn Proj
| | 5.00% | | 07/01/34 | | $114,530 |
| 840,000 | | Yonkers NY Econ Dev Corp Eductnl Rev Chrt Sch Edu Excellence Proj, Ser A
| | 5.00% | | 10/15/39 | | 1,004,423 |
| | | | | 18,495,314 |
| | | North Carolina – 1.8% | | | | | | |
| 1,000,000 | | NC St Agric & Tech Univ Ref Gen, Ser A
| | 5.00% | | 10/01/40 | | 1,180,111 |
| 2,500,000 | | NC St Med Care Commn Hlthcare Facs Rev Lutheran Svcs For The Aging Ref, Ser A
| | 4.00% | | 03/01/51 | | 2,757,498 |
| 690,000 | | NC St Med Care Commn Retmnt Facs Rev Pennybyrn at Maryfield Proj, Ser A
| | 5.00% | | 10/01/45 | | 787,257 |
| 450,000 | | NC St Med Care Commn Retmnt Facs Rev The Forest at Duke Proj
| | 4.00% | | 09/01/51 | | 523,782 |
| | | | | 5,248,648 |
| | | Ohio – 5.0% | | | | | | |
| 750,000 | | Allen Cnty OH Hosp Facs Rev Ref Bon Secours Mercy Hlth Inc, Ser A
| | 5.00% | | 12/01/35 | | 987,210 |
| 5,600,000 | | Buckeye OH Tobacco Stlmt Fing Auth Ref Sr, Class 2, Ser B-2
| | 5.00% | | 06/01/55 | | 6,590,972 |
| 750,000 | | OH St Air Quality Dev Auth Exempt Facs Rev AMG Vanadium Proj, AMT (a)
| | 5.00% | | 07/01/49 | | 884,403 |
| 1,200,000 | | OH St Air Quality Dev Auth Ref OH Vly Elec Corp Proj, Ser A
| | 3.25% | | 09/01/29 | | 1,344,215 |
| 1,000,000 | | OH St Hgr Eductnl Fac Commn Ref Rev Judson Oblig Grp 2020 Proj, Ser A
| | 5.00% | | 12/01/45 | | 1,180,090 |
| 750,000 | | OH St Hgr Eductnl Fac Commn Ref Univ of Dayton 2020 Proj
| | 4.00% | | 02/01/36 | | 900,009 |
| 490,000 | | Port of Gtr Cincinnati Dev Auth OH Rev (a)
| | 3.75% | | 12/01/31 | | 507,964 |
| 1,500,000 | | Sthrn OH Port Exempt Fac Rev Purecycle Proj, Ser A, AMT (a)
| | 7.00% | | 12/01/42 | | 1,752,889 |
| | | | | 14,147,752 |
| | | Oklahoma – 1.1% | | | | | | |
| 150,000 | | OK St Dev Fin Auth Hlthsys Rev Ou Medicine Proj, Ser B
| | 5.00% | | 08/15/26 | | 179,370 |
| 2,500,000 | | OK St Dev Fin Auth Sr OK Proton Ctr, Ser A1 (a)
| | 7.25% | | 09/01/51 | | 3,070,102 |
| | | | | 3,249,472 |
| | | Oregon – 1.9% | | | | | | |
| 290,000 | | Clackamas Cnty OR Hosp Fac Auth Rev Mary’s Woods at Marylhurst Inc Proj, Ser A
| | 5.00% | | 05/15/26 | | 324,765 |
| 500,000 | | Clackamas Cnty OR Hosp Fac Auth Rev Ref Rose Villa Proj, Ser A
| | 5.13% | | 11/15/40 | | 559,361 |
| 1,150,000 | | OR St Facs Auth Rev Ref Samaritan Hlth Svcs Proj, Ser A
| | 5.00% | | 10/01/40 | | 1,453,986 |
| 250,000 | | Yamhill Cnty OR Hosp Auth Ref Friendsview, Ser A
| | 5.00% | | 11/15/51 | | 294,863 |
| 2,450,000 | | Yamhill Cnty OR Hosp Auth Ref Friendsview, Ser A
| | 5.00% | | 11/15/56 | | 2,871,757 |
| | | | | 5,504,732 |
| | | Pennsylvania – 5.3% | | | | | | |
| 300,000 | | Allegheny Cnty PA Hosp Dev Auth Ref Allegheny Hlth Network Oblig Grp Issue, Ser A
| | 5.00% | | 04/01/32 | | 374,986 |
| 1,280,000 | | Berks Cnty PA Muni Auth Univ Rev Alvernia Univ Proj
| | 5.00% | | 10/01/39 | | 1,477,065 |
| 100,000 | | Chester Cnty PA Indl Dev Auth Renaissance Acdmy Chrt Sch
| | 5.00% | | 10/01/34 | | 108,020 |
| 240,000 | | Erie PA Hgr Edu Bldg Auth Aicup Fing Prog Gannon Univ Proj Ref, Ser TT1
| | 4.00% | | 05/01/36 | | 280,103 |
| 740,000 | | Kutztown PA Area Sch Dist, AGM
| | 4.00% | | 03/15/37 | | 883,684 |
| 250,000 | | Lancaster Cnty PA Hosp Auth Hlthcare Facs Rev Moravian Manors Inc Proj, Ser A
| | 5.00% | | 06/15/28 | | 294,502 |
Page 16
See Notes to Financial Statements
First Trust Municipal High Income ETF (FMHI)
Portfolio of Investments (Continued)
July 31, 2021
Principal
Value | | Description | | Stated
Coupon | | Stated
Maturity | | Value |
| MUNICIPAL BONDS (Continued) |
| | | Pennsylvania (Continued) | | | | | | |
| $515,000 | | Lancaster Cnty PA Hosp Auth Hlthcare Facs Rev Moravian Manors Inc Proj, Ser A
| | 5.00% | | 06/15/31 | | $599,267 |
| 300,000 | | Latrobe PA Indl Dev Auth Univ Rev Ref Seton Hill Univ
| | 4.00% | | 03/01/37 | | 335,870 |
| 250,000 | | Latrobe PA Indl Dev Auth Univ Rev Ref Seton Hill Univ
| | 4.00% | | 03/01/38 | | 279,436 |
| 1,700,000 | | Latrobe PA Indl Dev Auth Univ Rev Ref Seton Hill Univ
| | 4.00% | | 03/01/46 | | 1,879,528 |
| 665,000 | | Northampton Cnty PA Gen Purp Auth Clg Rev Ref Moravian Clg
| | 5.00% | | 10/01/36 | | 774,589 |
| 350,000 | | PA St Turnpike Commn Oil Franchise Tax Rev Ref Sub, Ser B
| | 5.00% | | 12/01/30 | | 428,956 |
| 10,000 | | PA St Turnpike Commn Turnpike Rev Ref Sub, Ser B
| | 5.00% | | 06/01/39 | | 11,889 |
| 1,000,000 | | Philadelphia PA Arpt Rev Ref Priv Activity, AMT, AGM
| | 4.00% | | 07/01/39 | | 1,217,665 |
| 900,000 | | Philadelphia PA Auth for Indl Dev Chrt Sch Rev Ref String Theory Chrt Sch Proj (a)
| | 5.00% | | 06/15/40 | | 1,072,408 |
| 215,000 | | Philadelphia PA Auth for Indl Dev Revs Kipp Philadelphia Chrt Sch Proj, Ser A
| | 5.00% | | 04/01/36 | | 241,423 |
| 2,250,000 | | Southcentrl PA Gen Auth Rev Ref Wellspan Hlth Obligated Grp, Ser A
| | 4.00% | | 06/01/44 | | 2,626,469 |
| 125,000 | | W Cornwall Twp PA Muni Auth Ref Lebanon Vly Brethren Home Proj, Ser A
| | 4.00% | | 11/15/41 | | 146,793 |
| 1,595,000 | | Wilkes-Barre PA Area Sch Dist, BAM
| | 4.00% | | 04/15/49 | | 1,865,645 |
| | | | | 14,898,298 |
| | | Puerto Rico – 1.8% | | | | | | |
| 250,000 | | Puerto Rico Cmwlth Ref Pub Impt, Ser A, AGM
| | 5.00% | | 07/01/35 | | 257,423 |
| 1,559,000 | | Puerto Rico Sales Tax Fing Corp Sales Tax Rev Restructured, Ser A-1
| | 4.50% | | 07/01/34 | | 1,731,040 |
| 177,000 | | Puerto Rico Sales Tax Fing Corp Sales Tax Rev Restructured, Ser A-1, CABS
| | (c) | | 07/01/29 | | 154,815 |
| 1,195,000 | | Puerto Rico Sales Tax Fing Corp Sales Tax Rev Restructured, Ser A-1, CABS
| | (c) | | 07/01/33 | | 898,672 |
| 205,000 | | Puerto Rico Sales Tax Fing Corp Sales Tax Rev Restructured, Ser A-2
| | 4.33% | | 07/01/40 | | 233,487 |
| 551,000 | | Puerto Rico Sales Tax Fing Corp Sales Tax Rev Restructured, Ser A-2 Converted
| | 4.33% | | 07/01/40 | | 627,566 |
| 1,050,000 | | Puerto Rico Sales Tax Fing Corp Sales Tax Rev Restructured, Ser A-2A
| | 4.55% | | 07/01/40 | | 1,210,727 |
| | | | | 5,113,730 |
| | | South Carolina – 1.6% | | | | | | |
| 425,000 | | Berkeley Cnty SC Assmnt Rev Nexton Impt Dist
| | 4.00% | | 11/01/30 | | 491,362 |
| 230,000 | | Lancaster Cnty SC Assmnt Rev Ref Walnut Creek Impt Dist, Ser A-1
| | 5.00% | | 12/01/31 | | 242,475 |
| 1,000,000 | | SC Jobs Econ Dev Auth Kiawah Life Plan Vlg Inc Proj, Ser A (a)
| | 8.75% | | 07/01/25 | | 999,980 |
| 580,000 | | SC St Jobs Econ Dev Auth Econ Dev Rev Woodlands at Furman Proj, Ser A
| | 5.00% | | 11/15/42 | | 665,089 |
| 830,000 | | SC St Jobs Econ Dev Auth Eductnl Facs Rev Green Chrt Schs Proj, Ser A (a)
| | 4.00% | | 06/01/36 | | 910,684 |
| 1,000,000 | | SC St Jobs Econ Dev Auth Eductnl Facs Rev Green Chrt Schs Proj, Ser A (a)
| | 4.00% | | 06/01/56 | | 1,060,460 |
| 135,000 | | SC St Jobs Econ Dev Auth Hlth Facs Rev Ref Lutheran Homes of SC Inc
| | 5.00% | | 05/01/42 | | 142,687 |
| | | | | 4,512,737 |
| | | South Dakota – 0.3% | | | | | | |
| 700,000 | | Lincoln Cnty SD Econ Dev Rev Ref Augustana Clg Assoc Proj, Ser A
| | 4.00% | | 08/01/41 | | 808,264 |
See Notes to Financial Statements
Page 17
First Trust Municipal High Income ETF (FMHI)
Portfolio of Investments (Continued)
July 31, 2021
Principal
Value | | Description | | Stated
Coupon | | Stated
Maturity | | Value |
| MUNICIPAL BONDS (Continued) |
| | | Tennessee – 1.7% | | | | | | |
| $25,000 | | Chattanooga TN Hlth Eductnl & Hsg Fac Brd Rev Ref Stdt Hsg CDFI Phase I
| | 5.00% | | 10/01/23 | | $27,324 |
| 440,000 | | Met Govt Nashville & Davidson Cnty TN Hlth & Eductnl Fac Brd Ref Lipscomb Univ Proj, Ser A
| | 5.00% | | 10/01/36 | | 546,600 |
| 1,215,000 | | Met Govt Nashville & Davidson Cnty TN Hlth & Eductnl Fac Brd Trevecca Nazarene Univ Proj, Ser B
| | 4.00% | | 10/01/51 | | 1,371,488 |
| 1,000,000 | | Tennergy Corp TN Gas Rev, Ser A (Mandatory put 09/01/28)
| | 4.00% | | 12/01/51 | | 1,203,362 |
| 250,000 | | TN Energy Acq Corp Cmdy Proj Rev The TN Energy Acq Corp Cmdy Proj, Ser A
| | 5.00% | | 11/01/30 | | 331,189 |
| 500,000 | | TN St Energy Acq Corp Gas Rev Proj, Ser A (Mandatory put 05/01/23)
| | 4.00% | | 05/01/48 | | 530,272 |
| 730,000 | | TN St Energy Acq Corp Gas Rev, Ser A
| | 5.25% | | 09/01/26 | | 879,770 |
| | | | | 4,890,005 |
| | | Texas – 4.6% | | | | | | |
| 610,000 | | Arlington TX Hgr Edu Fin Corp Edu Rev Ref, Ser A
| | 4.00% | | 08/15/41 | | 675,444 |
| 50,000 | | Centrl TX Regl Mobility Auth Rev Ref Sub Lien
| | 5.00% | | 01/01/33 | | 53,483 |
| 556,000 | | Crandall TX Spl Assmnt Rev Cartwright Ranch Pub Impt Dt Impt Area #1 Proj (a)
| | 4.25% | | 09/15/41 | | 558,706 |
| 1,555,000 | | Galveston Cnty TX Muni Util Dist #54 Ref
| | 3.00% | | 12/01/37 | | 1,564,423 |
| 420,000 | | Harris-Brazoria Cntys TX Muni Util Dist #509, AGM
| | 3.00% | | 09/01/32 | | 433,168 |
| 1,250,000 | | Houston TX Arpt Sys Rev Ref United Airls Inc Terminal E Proj, Ser A, AMT
| | 5.00% | | 07/01/27 | | 1,499,034 |
| 125,000 | | Houston TX Arpt Sys Rev Ref United Airls Inc Terminal Impt Proj, Ser B-2, AMT
| | 5.00% | | 07/15/27 | | 150,020 |
| 1,000,000 | | Houston TX Arpt Sys Rev Sub, Ser A, AMT
| | 4.00% | | 07/01/46 | | 1,189,006 |
| 250,000 | | Kyle TX Spl Assmnt Rev 6 Creeks Pid #1 (d)
| | 4.13% | | 09/01/29 | | 278,210 |
| 500,000 | | Kyle TX Spl Assmnt Rev 6 Creeks Pid #1 (a)
| | 4.63% | | 09/01/39 | | 565,511 |
| 375,000 | | La Vernia TX Hgr Edu Fin Corp Edu Rev Meridian World Sch (a)
| | 4.35% | | 08/15/25 | | 401,342 |
| 1,250,000 | | Lago Vista TX Spl Assmt Rev Ref Tessera On Lake Travis, Ser B (a)
| | 4.88% | | 09/01/50 | | 1,339,914 |
| 445,000 | | Leander TX Spl Assmnt Rev Crystal Springs Pub Impt Dist Proj Accd Inv (d)
| | 4.50% | | 09/01/28 | | 462,312 |
| 1,285,000 | | Lower Colorado River TX Auth Trans Contract Rev Ref LCRA Trans Svcs Corp Proj
| | 5.00% | | 05/15/39 | | 1,632,090 |
| 285,000 | | New Hope Cultural Edu Facs Fin Corp TX Retmnt Fac Rev Ref Longhorn Vlg Proj
| | 5.00% | | 01/01/32 | | 312,029 |
| 205,000 | | New Hope Cultural Edu Facs Fin Corp TX Retmnt Fac Rev Ref Wesleyan Homes Inc Proj Fin Corp
| | 5.00% | | 01/01/39 | | 220,368 |
| 223,000 | | Rowlett TX Spl Assmnt Rev Trails at Cottonwood Creek Pub Imp Dist Major Imp Area Proj (a)
| | 3.75% | | 09/15/31 | | 224,994 |
| 500,000 | | Rowlett TX Spl Assmnt Rev Trails at Cottonwood Creek Pub Imp Dist Major Imp Area Proj (a)
| | 4.13% | | 09/15/41 | | 505,315 |
| 765,000 | | Rowlett TX Spl Assmnt Rev Trails at Cottonwood Creek Pub Imp Dist Major Imp Area Proj (a)
| | 4.25% | | 09/15/51 | | 769,672 |
| 250,000 | | TX St Transprtn Commn Central TX Turnpike Sys Rev Ref, Ser B
| | 5.00% | | 08/15/37 | | 281,791 |
| | | | | 13,116,832 |
| | | Utah – 1.4% | | | | | | |
| 1,000,000 | | Med Sch Cmps Pub Infra Dist UT, Ser A (a)
| | 5.25% | | 02/01/40 | | 1,045,016 |
| 500,000 | | Red Bridge Pub Infra Dist #1 UT Sr Infra Dist, Ser 1-A (a)
| | 4.13% | | 02/01/41 | | 520,109 |
| 1,000,000 | | Red Bridge Pub Infra Dist #1 UT Sr Infra Dist, Ser 1-A (a)
| | 4.38% | | 02/01/51 | | 1,042,642 |
| 475,000 | | UT St Chrt Sch Fin Auth Chrt Sch Rev Mountain W Montessori Acdmy Proj, Ser A (a)
| | 5.00% | | 06/15/39 | | 549,381 |
Page 18
See Notes to Financial Statements
First Trust Municipal High Income ETF (FMHI)
Portfolio of Investments (Continued)
July 31, 2021
Principal
Value | | Description | | Stated
Coupon | | Stated
Maturity | | Value |
| MUNICIPAL BONDS (Continued) |
| | | Utah (Continued) | | | | | | |
| $675,000 | | UT St Chrt Sch Fin Auth Chrt Sch Rev Wallace Stegner Acdmy Proj, Ser A (a)
| | 5.00% | | 06/15/39 | | $750,173 |
| | | | | 3,907,321 |
| | | Virginia – 0.3% | | | | | | |
| 500,000 | | Norfolk VA Redev & Hsg Auth Rev Ft Norfolk Retmnt Cmnty Harbors Edge Proj, Ser A
| | 5.00% | | 01/01/34 | | 540,832 |
| 300,000 | | Norfolk VA Redev & Hsg Auth Rev Ft Norfolk Retmnt Cmnty Harbors Edge Proj, Ser A
| | 4.38% | | 01/01/39 | | 319,080 |
| | | | | 859,912 |
| | | Washington – 2.4% | | | | | | |
| 560,000 | | Kalispel Tribe of Indians Priority Dist WA Rev, Ser A (a)
| | 5.00% | | 01/01/32 | | 674,677 |
| 1,000,000 | | WA St Convention Ctr Pub Facs Dist Junior Lodging Tax Notes Green Bond
| | 4.00% | | 07/01/31 | | 1,194,237 |
| 1,000,000 | | WA St Hgr Edu Facs Auth Seattle Univ Proj Rev
| | 4.00% | | 05/01/45 | | 1,168,687 |
| 230,000 | | WA St Hlthcare Facs Auth Ref Fred Hutchinson Cancer Rsrch Ctr
| | 5.00% | | 01/01/26 | | 269,346 |
| 245,000 | | WA St Hlthcare Facs Auth Seattle Cancer Care Alliance (a)
| | 5.00% | | 12/01/33 | | 328,720 |
| 855,000 | | WA St Hlthcare Facs Auth Seattle Cancer Care Alliance (a)
| | 4.00% | | 12/01/40 | | 1,041,261 |
| 710,000 | | WA St Hsg Fin Commn Nonprofit Rev Spokane Int Acad Proj, Ser A (a)
| | 5.00% | | 07/01/50 | | 815,191 |
| 997,710 | | WA St Hsg Fin Commn Social Certificate, Ser A-1
| | 3.50% | | 12/20/35 | | 1,178,754 |
| | | | | 6,670,873 |
| | | West Virginia – 0.4% | | | | | | |
| 1,000,000 | | WV St Econ Dev Auth Sol Wst Disp Facs Var Arch Res Proj, AMT (Mandatory put 07/01/25)
| | 4.13% | | 07/01/45 | | 1,068,352 |
| | | Wisconsin – 1.3% | | | | | | |
| 470,000 | | Pub Fin Auth WI Chrt Sch Rev Eno River Acdmy Proj, Ser A (a)
| | 4.00% | | 06/15/30 | | 531,332 |
| 810,000 | | Pub Fin Auth WI Chrt Sch Rev Eno River Acdmy Proj, Ser A (a)
| | 5.00% | | 06/15/40 | | 949,035 |
| 500,000 | | Pub Fin Auth WI Chrt Sch Rev Founders of Acdmy Las Vegas Proj, Ser A (a)
| | 4.00% | | 07/01/30 | | 549,656 |
| 500,000 | | Pub Fin Auth WI Chrt Sch Rev Ltd American Prep Acdmy Las Vegas Proj, Ser A (a)
| | 4.20% | | 07/15/27 | | 544,853 |
| 375,000 | | Pub Fin Auth WI Chrt Sch Rev Ltd American Prep Acdmy Las Vegas Proj, Ser A (a)
| | 5.13% | | 07/15/37 | | 431,341 |
| 160,000 | | Pub Fin Auth WI Eductnl Rev Piedmont Cmnty Chrt Sch
| | 5.00% | | 06/15/27 | | 191,706 |
| 500,000 | | Pub Fin Auth WI Rev Sr Bond WFCS Portfolio Projs, Ser A-1 (a)
| | 5.00% | | 01/01/56 | | 593,626 |
| | | | | 3,791,549 |
| Total Investments – 98.2%
| | 278,484,925 |
| | (Cost $259,892,238) (e) | | |
| | Net Other Assets and Liabilities – 1.8%
| | 4,975,918 |
| | Net Assets – 100.0%
| | $283,460,843 |
See Notes to Financial Statements
Page 19
First Trust Municipal High Income ETF (FMHI)
Portfolio of Investments (Continued)
July 31, 2021
Futures Contracts (See Note 2D - Futures Contracts in the Notes to Financial Statements):
| Futures Contracts | | Position | | Number of
Contracts | | Expiration
Date | | Notional
Value | | Unrealized
Appreciation
(Depreciation)/
Value |
| U.S. Treasury Long Bonds | | Short | | 21 | | Sep 2021 | | $ (3,459,094) | | $(148,219) |
| U.S. Treasury Ultra 10-Year Notes | | Short | | 25 | | Sep 2021 | | (3,756,250) | | (59,047) |
| Total Futures Contracts | | | | | | | | $(7,215,344) | | $(207,266) |
|
| (a) | This security, sold within the terms of a private placement memorandum, is exempt from registration upon resale under Rule 144A under the Securities Act of 1933, as amended (the “1933 Act”), and may be resold in transactions exempt from registration, normally to qualified institutional buyers. Pursuant to procedures adopted by the Trust’s Board of Trustees, this security has been determined to be liquid by First Trust Advisors L.P. (the “Advisor”). Although market instability can result in periods of increased overall market illiquidity, liquidity for each security is determined based on security specific factors and assumptions, which require subjective judgment. At July 31, 2021, securities noted as such amounted to $76,294,828 or 26.9% of net assets. |
| (b) | Pursuant to procedures adopted by the Trust’s Board of Trustees, this security has been determined to be illiquid by the Advisor. |
| (c) | Zero coupon bond. |
| (d) | This security, sold within the terms of a private placement memorandum, is exempt from registration upon resale under Rule 144A under the 1933 Act, and may be resold in transactions exempt from registration, normally to qualified institutional buyers (see Note 2C - Restricted Securities in the Notes to Financial Statements). |
| (e) | Aggregate cost for federal income tax purposes was $259,708,783. As of July 31, 2021, the aggregate gross unrealized appreciation for all investments in which there was an excess of value over tax cost was $18,589,523 and the aggregate gross unrealized depreciation for all investments in which there was an excess of tax cost over value was $20,647. The net unrealized appreciation was $18,568,876. The unrealized amounts presented are inclusive of derivative contracts. |
| AGM | Assured Guaranty Municipal Corp. |
| AMBAC | American Municipal Bond Assurance Corp. |
| AMT | Alternative Minimum Tax |
| BAM | Build America Mutual |
| BANS | Bond Anticipation Notes |
| CABS | Capital Appreciation Bonds |
| CIBS | Current Interest Bonds |
| COPS | Certificates of Participation |
| NATL-RE | National Public Finance Guarantee Corp. |
Page 20
See Notes to Financial Statements
First Trust Municipal High Income ETF (FMHI)
Portfolio of Investments (Continued)
July 31, 2021
Valuation Inputs
A summary of the inputs used to value the Fund’s investments as of July 31, 2021 is as follows (see Note 2A - Portfolio Valuation in the Notes to Financial Statements):
| ASSETS TABLE |
| | Total
Value at
7/31/2021 | Level 1
Quoted
Prices | Level 2
Significant
Observable
Inputs | Level 3
Significant
Unobservable
Inputs |
Municipal Bonds*
| $ 278,484,925 | $ — | $ 278,484,925 | $ — |
| |
| LIABILITIES TABLE |
| | Total
Value at
7/31/2021 | Level 1
Quoted
Prices | Level 2
Significant
Observable
Inputs | Level 3
Significant
Unobservable
Inputs |
Futures Contracts**
| $ (207,266) | $ (207,266) | $ — | $ — |
| * | See Portfolio of Investments for state breakout. |
| |
| ** | Includes cumulative appreciation/depreciation on futures contracts as reported in the Futures Contracts table. Only the current day’s variation margin is presented on the Statement of Assets and Liabilities. |
See Notes to Financial Statements
Page 21
First Trust Municipal High Income ETF (FMHI)
Statement of Assets and Liabilities
July 31, 2021
| ASSETS: | |
Investments, at value
(Cost $259,892,238)
| $ 278,484,925 |
Cash
| 15,959,290 |
Cash segregated as collateral for open futures contracts
| 148,225 |
Interest receivable
| 2,062,559 |
Total Assets
| 296,654,999 |
| LIABILITIES: | |
| Payables: | |
Investment securities purchased
| 13,045,900 |
Investment advisory fees
| 126,287 |
Variation margin
| 21,969 |
Total Liabilities
| 13,194,156 |
NET ASSETS
| $283,460,843 |
| NET ASSETS consist of: | |
Paid-in capital
| $ 267,818,893 |
Par value
| 50,000 |
Accumulated distributable earnings (loss)
| 15,591,950 |
NET ASSETS
| $283,460,843 |
NET ASSET VALUE, per share
| $56.69 |
Number of shares outstanding (unlimited number of shares authorized, par value $0.01 per share)
| 5,000,002 |
Page 22
See Notes to Financial Statements
First Trust Municipal High Income ETF (FMHI)
Statement of Operations
For the Year Ended July 31, 2021
| INVESTMENT INCOME: | |
Interest
| $ 5,864,882 |
Total investment income
| 5,864,882 |
| EXPENSES: | |
Investment advisory fees
| 1,155,219 |
Total expenses
| 1,155,219 |
Fees waived by the investment advisor
| (247,547) |
Net expenses
| 907,672 |
NET INVESTMENT INCOME (LOSS)
| 4,957,210 |
| NET REALIZED AND UNREALIZED GAIN (LOSS): | |
| Net realized gain (loss) on: | |
Investments
| 204,921 |
Futures contracts
| 262,511 |
Net realized gain (loss)
| 467,432 |
Net increase from payment by the advisor
| 469 |
| Net change in unrealized appreciation (depreciation) on: | |
Investments
| 14,769,413 |
Futures contracts
| (91,969) |
Net change in unrealized appreciation (depreciation)
| 14,677,444 |
NET REALIZED AND UNREALIZED GAIN (LOSS)
| 15,145,345 |
NET INCREASE (DECREASE) IN NET ASSETS RESULTING FROM OPERATIONS
| $ 20,102,555 |
See Notes to Financial Statements
Page 23
First Trust Municipal High Income ETF (FMHI)
Statements of Changes in Net Assets
| | Year
Ended
7/31/2021 | | Year
Ended
7/31/2020 |
| OPERATIONS: | | | |
Net investment income (loss)
| $ 4,957,210 | | $ 2,881,986 |
Net realized gain (loss)
| 467,432 | | (3,389,878) |
Net increase from payment by the advisor
| 469 | | — |
Net change in unrealized appreciation (depreciation)
| 14,677,444 | | 1,303,058 |
Net increase (decrease) in net assets resulting from operations
| 20,102,555 | | 795,166 |
| DISTRIBUTIONS TO SHAREHOLDERS FROM: | | | |
Investment operations
| (4,856,433) | | (2,807,500) |
Return of capital
| (226,820) | | (155,753) |
Total distributions to shareholders
| (5,083,253) | | (2,963,253) |
| SHAREHOLDER TRANSACTIONS: | | | |
Proceeds from shares sold
| 156,791,601 | | 60,684,489 |
Cost of shares redeemed
| — | | (9,845,363) |
Net increase (decrease) in net assets resulting from shareholder transactions
| 156,791,601 | | 50,839,126 |
Total increase (decrease) in net assets
| 171,810,903 | | 48,671,039 |
| NET ASSETS: | | | |
Beginning of period
| 111,649,940 | | 62,978,901 |
End of period
| $ 283,460,843 | | $ 111,649,940 |
| CHANGES IN SHARES OUTSTANDING: | | | |
Shares outstanding, beginning of period
| 2,150,002 | | 1,200,002 |
Shares sold
| 2,850,000 | | 1,150,000 |
Shares redeemed
| — | | (200,000) |
Shares outstanding, end of period
| 5,000,002 | | 2,150,002 |
Page 24
See Notes to Financial Statements
First Trust Municipal High Income ETF (FMHI)
Financial Highlights
For a share outstanding throughout each period
| | Year Ended | | Period
Ended
7/31/2018 (a) |
| 7/31/2021 | | 7/31/2020 | | 7/31/2019 | |
Net asset value, beginning of period
| $ 51.93 | | $ 52.48 | | $ 50.32 | | $ 50.00 |
| Income from investment operations: | | | | | | | |
Net investment income (loss)
| 1.59 | | 1.64 | | 1.69 | | 1.15 |
Net realized and unrealized gain (loss)
| 4.83 (b) | | (0.48) | | 2.27 | | 0.30 |
Total from investment operations
| 6.42 | | 1.16 | | 3.96 | | 1.45 |
| Distributions paid to shareholders from: | | | | | | | |
Net investment income
| (1.59) | | (1.62) | | (1.67) | | (1.13) |
Return of capital
| (0.07) | | (0.09) | | (0.13) | | — |
Total distributions
| (1.66) | | (1.71) | | (1.80) | | (1.13) |
Net asset value, end of period
| $56.69 | | $51.93 | | $52.48 | | $50.32 |
Total return (c)
| 12.57% (b) | | 2.25% | | 8.05% | | 2.93% |
| Ratios to average net assets/supplemental data: | | | | | | | |
Net assets, end of period (in 000’s)
| $ 283,461 | | $ 111,650 | | $ 62,979 | | $ 27,677 |
Ratio of total expenses to average net assets
| 0.70% | | 0.70% | | 0.70% | | 0.70% (d) |
Ratio of net expenses to average net assets
| 0.55% | | 0.55% | | 0.55% | | 0.55% (d) |
Ratio of net investment income (loss) to average net assets
| 3.00% | | 3.22% | | 3.44% | | 3.13% (d) |
Portfolio turnover rate (e)
| 19% | | 89% | | 71% | | 74% |
| (a) | Inception date is November 1, 2017, which is consistent with the commencement of investment operations and is the date the initial creation units were established. |
| (b) | The Fund received a reimbursement from the advisor in the amount of $469 in connection with a trade error, which represents less than $0.01 per share. Since the advisor reimbursed the Fund, there was no effect on the Fund’s total return. |
| (c) | Total return is calculated assuming an initial investment made at the net asset value at the beginning of the period, reinvestment of all distributions at net asset value during the period, and redemption at net asset value on the last day of the period. The returns presented do not reflect the deduction of taxes that a shareholder would pay on Fund distributions or the redemption or sale of Fund shares. Total return is calculated for the time period presented and is not annualized for periods of less than a year. The total returns would have been lower if certain fees had not been waived by the investment advisor. |
| (d) | Annualized. |
| (e) | Portfolio turnover is calculated for the time period presented and is not annualized for periods of less than a year and does not include securities received or delivered from processing creations or redemptions and in-kind transactions. |
See Notes to Financial Statements
Page 25
Notes to Financial Statements
First Trust Municipal High Income ETF (FMHI)
July 31, 2021
1. Organization
First Trust Exchange-Traded Fund III (the “Trust”) is an open-end management investment company organized as a Massachusetts business trust on January 9, 2008, and is registered with the Securities and Exchange Commission (the “SEC”) under the Investment Company Act of 1940, as amended (the “1940 Act”).
The Trust currently consists of eighteen funds that are offering shares. This report covers the First Trust Municipal High Income ETF (the “Fund”), a diversified series of the Trust, which trades under the ticker “FMHI” on The Nasdaq Stock Market LLC (“Nasdaq”). The Fund represents a separate series of beneficial interest in the Trust. Unlike conventional mutual funds, the Fund issues and redeems shares on a continuous basis, at net asset value (“NAV”), only in large blocks of shares known as “Creation Units.”
The primary investment objective of the Fund is to provide federally tax-exempt income, and its secondary objective is long-term capital appreciation. Under normal market conditions, the Fund seeks to achieve its investment objectives by investing at least 80% of its net assets (including investment borrowings) in municipal debt securities that pay interest that is exempt from regular federal income taxes. There can be no assurance that the Fund will achieve its investment objectives. The Fund may not be appropriate for all investors.
2. Significant Accounting Policies
The Fund is considered an investment company and follows accounting and reporting guidance under Financial Accounting Standards Board (“FASB”) Accounting Standards Codification Topic 946, “Financial Services-Investment Companies.” The following is a summary of significant accounting policies consistently followed by the Fund in the preparation of the financial statements. The preparation of the financial statements in accordance with accounting principles generally accepted in the United States of America (“U.S. GAAP”) requires management to make estimates and assumptions that affect the reported amounts and disclosures in the financial statements. Actual results could differ from those estimates.
A. Portfolio Valuation
The Fund’s NAV is determined daily as of the close of regular trading on the New York Stock Exchange (“NYSE”), normally 4:00 p.m. Eastern time, on each day the NYSE is open for trading. If the NYSE closes early on a valuation day, the NAV is determined as of that time. Domestic debt securities are priced using data reflecting the earlier closing of the principal markets for those securities. The Fund’s NAV is calculated by dividing the value of all assets of the Fund (including accrued interest and dividends), less all liabilities (including accrued expenses and dividends declared but unpaid), by the total number of shares outstanding.
The Fund’s investments are valued daily at market value or, in the absence of market value with respect to any portfolio securities, at fair value. Market value prices represent last sale or official closing prices from a national or foreign exchange (i.e., a regulated market) and are primarily obtained from third-party pricing services. Fair value prices represent any prices not considered market value prices and are either obtained from a third-party pricing service or are determined by the Pricing Committee of the Fund’s investment advisor, First Trust Advisors L.P. (“First Trust” or the “Advisor”), in accordance with valuation procedures adopted by the Trust’s Board of Trustees, and in accordance with provisions of the 1940 Act. Investments valued by the Advisor’s Pricing Committee, if any, are footnoted as such in the footnotes to the Portfolio of Investments. The Fund’s investments are valued as follows:
Municipal securities and other debt securities are fair valued on the basis of fair valuations provided by dealers who make markets in such securities or by a third-party pricing service approved by the Trust’s Board of Trustees, which may use the following valuation inputs when available:
| 1) | benchmark yields; |
| 2) | reported trades; |
| 3) | broker/dealer quotes; |
| 4) | issuer spreads; |
| 5) | benchmark securities; |
| 6) | bids and offers; and |
| 7) | reference data including market research publications. |
Exchange-traded futures contracts are valued at the closing price in the market where such contracts are principally traded. If no closing price is available, exchange-traded futures contracts are fair valued at the mean of their most recent bid and asked price, if available, and otherwise at their closing bid price.
Fixed income and other debt securities having a remaining maturity of sixty days or less when purchased are fair valued at cost adjusted for amortization of premiums and accretion of discounts (amortized cost), provided the Advisor’s Pricing Committee has determined that the use of amortized cost is an appropriate reflection of fair value given market and issuer-specific
Notes to Financial Statements (Continued)
First Trust Municipal High Income ETF (FMHI)
July 31, 2021
conditions existing at the time of the determination. Factors that may be considered in determining the appropriateness of the use of amortized cost include, but are not limited to, the following:
| 1) | the credit conditions in the relevant market and changes thereto; |
| 2) | the liquidity conditions in the relevant market and changes thereto; |
| 3) | the interest rate conditions in the relevant market and changes thereto (such as significant changes in interest rates); |
| 4) | issuer-specific conditions (such as significant credit deterioration); and |
| 5) | any other market-based data the Advisor’s Pricing Committee considers relevant. In this regard, the Advisor’s Pricing Committee may use last-obtained market-based data to assist it when valuing portfolio securities using amortized cost. |
Certain securities may not be able to be priced by pre-established pricing methods. Such securities may be valued by the Trust’s Board of Trustees or its delegate, the Advisor’s Pricing Committee, at fair value. These securities generally include, but are not limited to, restricted securities (securities which may not be publicly sold without registration under the Securities Act of 1933, as amended (the “1933 Act”)) for which a third-party pricing service is unable to provide a market price; securities whose trading has been formally suspended; a security whose market or fair value price is not available from a pre-established pricing source; a security with respect to which an event has occurred that is likely to materially affect the value of the security after the market has closed but before the calculation of the Fund’s NAV or make it difficult or impossible to obtain a reliable market quotation; and a security whose price, as provided by the third-party pricing service, does not reflect the security’s fair value. As a general principle, the current fair value of a security would appear to be the amount which the owner might reasonably expect to receive for the security upon its current sale. When fair value prices are used, generally they will differ from market quotations or official closing prices on the applicable exchanges. A variety of factors may be considered in determining the fair value of such securities, including, but not limited to, the following:
| 1) | the fundamental business data relating to the issuer; |
| 2) | an evaluation of the forces which influence the market in which these securities are purchased and sold; |
| 3) | the type, size and cost of the security; |
| 4) | the financial statements of the issuer; |
| 5) | the credit quality and cash flow of the issuer, based on the Advisor’s or external analysis; |
| 6) | the information as to any transactions in or offers for the security; |
| 7) | the price and extent of public trading in similar securities (or equity securities) of the issuer/borrower, or comparable companies; |
| 8) | the coupon payments; |
| 9) | the quality, value and salability of collateral, if any, securing the security; and |
| 10) | other relevant factors. |
The Fund is subject to fair value accounting standards that define fair value, establish the framework for measuring fair value and provide a three-level hierarchy for fair valuation based upon the inputs to the valuation as of the measurement date. The three levels of the fair value hierarchy are as follows:
| • | Level 1 – Level 1 inputs are quoted prices in active markets for identical investments. An active market is a market in which transactions for the investment occur with sufficient frequency and volume to provide pricing information on an ongoing basis. |
| • | Level 2 – Level 2 inputs are observable inputs, either directly or indirectly, and include the following: |
| o | Quoted prices for similar investments in active markets. |
| o | Quoted prices for identical or similar investments in markets that are non-active. A non-active market is a market where there are few transactions for the investment, the prices are not current, or price quotations vary substantially either over time or among market makers, or in which little information is released publicly. |
| o | Inputs other than quoted prices that are observable for the investment (for example, interest rates and yield curves observable at commonly quoted intervals, volatilities, prepayment speeds, loss severities, credit risks, and default rates). |
| o | Inputs that are derived principally from or corroborated by observable market data by correlation or other means. |
| • | Level 3 – Level 3 inputs are unobservable inputs. Unobservable inputs may reflect the reporting entity’s own assumptions about the assumptions that market participants would use in pricing the investment. |
Notes to Financial Statements (Continued)
First Trust Municipal High Income ETF (FMHI)
July 31, 2021
The inputs or methodologies used for valuing investments are not necessarily an indication of the risk associated with investing in those investments. A summary of the inputs used to value the Fund’s investments as of July 31, 2021, is included with the Fund’s Portfolio of Investments.
B. Securities Transactions and Investment Income
Securities transactions are recorded as of the trade date. Realized gains and losses from securities transactions are recorded on the identified cost basis. Interest income is recorded daily on the accrual basis. Amortization of premiums and accretion of discounts are recorded using the effective interest method.
C. Restricted Securities
The Fund invests in restricted securities, which are securities that may not be offered for public sale without first being registered under the 1933 Act. Prior to registration, restricted securities may only be resold in transactions exempt from registration under Rule 144A under the 1933 Act, normally to qualified institutional buyers. As of July 31, 2021, the Fund held restricted securities as shown in the following table that the Advisor has deemed illiquid pursuant to procedures adopted by the Trust’s Board of Trustees. Although market instability can result in periods of increased overall market illiquidity, liquidity for each security is determined based on security-specific factors and assumptions, which require subjective judgment. The Fund does not have the right to demand that such securities be registered. These securities are valued according to the valuation procedures as stated in the Portfolio Valuation note (Note 2A) and are not expressed as a discount to the carrying value of a comparable unrestricted security. There are no unrestricted securities with the same maturity dates and yields for these issuers.
| Security | Acquisition
Date | Principal
Value | Current Price | Carrying
Cost | | Value | | % of
Net
Assets |
| IN St Fin Auth Rev Eductnl Facs Rock Creek Cmnty Acdmy Proj, Ser A, 5.25%, 07/01/28 | 08/31/18 | $200,000 | $116.32 | $201,719 | | $232,637 | | 0.08% |
| Kyle TX Spl Assmnt Rev 6 Creeks Pid #1, 4.13%, 09/01/29 | 05/08/19 | 250,000 | 111.28 | 250,000 | | 278,210 | | 0.10 |
| Leander TX Spl Assmnt Rev Crystal Springs Pub Impt Dist Proj Accd Inv, 4.50%, 09/01/28 | 05/04/18 | 445,000 | 103.89 | 441,635 | | 462,312 | | 0.16 |
| | | | | $893,354 | | $973,159 | | 0.34% |
D. Futures Contracts
The Fund may purchase or sell (i.e., is long or short) exchange-listed futures contracts to hedge against changes in interest rates (interest rate risk). Futures contracts are agreements between the Fund and a counterparty to buy or sell a specific quantity of an underlying instrument at a specified price and at a specified date. Depending on the terms of the contract, futures contracts are settled either through physical delivery of the underlying instrument on the settlement date or by payment of a cash settlement amount on the settlement date. Open futures contracts can also be closed out prior to settlement by entering into an offsetting transaction in a matching futures contract. If the Fund is not able to enter into an offsetting transaction, the Fund will continue to be required to maintain margin deposits on the futures contract. When the contract is closed or expires, the Fund records a realized gain or loss equal to the difference between the value of the contract at the time it was opened and the value at the time it was closed or expired. This gain or loss is included in “Net realized gain (loss) on futures contracts” on the Statement of Operations.
Upon entering into a futures contract, the Fund must deposit funds, called margin, with its custodian in the name of the clearing broker equal to a specified percentage of the current value of the contract. Open futures contracts are marked to market daily with the change in value recognized as a component of “Net change in unrealized appreciation (depreciation) on futures contracts” on the Statement of Operations. This daily fluctuation in the value of the contracts is also known as variation margin and is included in “Variation margin” payable or receivable on the Statement of Assets and Liabilities.
If market conditions change unexpectedly, the Fund may not achieve the anticipated benefits of the futures contract and may realize a loss. The use of futures contracts involves the risk of imperfect correlation in movements in the price of the futures contracts, interest rates and the underlying instruments.
Restricted cash segregated as collateral for futures contracts in the amount of $148,225 is shown as “Cash segregated as collateral for open futures contracts” on the Statement of Assets and Liabilities.
Notes to Financial Statements (Continued)
First Trust Municipal High Income ETF (FMHI)
July 31, 2021
E. Dividends and Distributions to Shareholders
Dividends from net investment income, if any, are declared and paid monthly by the Fund, or as the Board of Trustees may determine from time to time. Distributions of net realized capital gains earned by the Fund, if any, are distributed at least annually.
Distributions from net investment income and realized capital gains are determined in accordance with federal income tax regulations, which may differ from U.S. GAAP. Certain capital accounts in the financial statements are periodically adjusted for permanent differences in order to reflect their tax character. These permanent differences are primarily due to the varying treatment of income and gain/loss on portfolio securities held by the Fund and have no impact on net assets or NAV per share. Temporary differences, which arise from recognizing certain items of income, expense and gain/loss in different periods for financial statement and tax purposes, will reverse at some time in the future.
The tax character of distributions paid by the Fund during the fiscal years ended July 31, 2021 and 2020, was as follows:
| Distributions paid from: | 2021 | 2020 |
Ordinary income
| $— | $13,767 |
Capital gains
| — | — |
Tax-exempt income
| 4,856,433 | 2,793,733 |
Return of capital
| 226,820 | 155,753 |
As of July 31, 2021, the components of distributable earnings on a tax basis were as follows:
Undistributed ordinary income
| $— |
Accumulated capital and other gain (loss)
| (2,976,926) |
Net unrealized appreciation (depreciation)
| 18,568,876 |
F. Income Taxes
The Fund intends to continue to qualify as a regulated investment company by complying with the requirements under Subchapter M of the Internal Revenue Code of 1986, as amended (the “Code”), which includes distributing substantially all of its net investment income and net realized gains to shareholders. Accordingly, no provision has been made for federal and state income taxes. However, due to the timing and amount of distributions, the Fund may be subject to an excise tax of 4% of the amount by which approximately 98% of the Fund’s taxable income exceeds the distributions from such taxable income for the calendar year.
In addition, the Fund intends to invest in such municipal securities to allow it to pay shareholders “exempt dividends” as defined in the Code.
The Fund is subject to accounting standards that establish a minimum threshold for recognizing, and a system for measuring, the benefits of a tax position taken or expected to be taken in a tax return. Taxable years ended 2018, 2019, 2020 and 2021 remain open to federal and state audit. As of July 31, 2021, management has evaluated the application of these standards to the Fund, and has determined that no provision for income tax is required in the Fund’s financial statements for uncertain tax positions.
The Fund intends to utilize provisions of the federal income tax laws, which allow it to carry a realized capital loss forward indefinitely following the year of the loss and offset such loss against any future realized capital gains. The Fund is subject to certain limitations under U.S. tax rules on the use of capital loss carryforwards and net unrealized built-in losses. These limitations apply when there has been a 50% change in ownership. At July 31, 2021, for federal income tax purposes, the Fund had $2,976,926 of capital loss carryforwards available, to the extent provided by regulations, to offset future capital gains.
Certain losses realized during the current fiscal year may be deferred and treated as occurring on the first day of the following fiscal year for federal income tax purposes. For the fiscal year ended July 31, 2021, the Fund had no net ordinary losses.
In order to present paid-in capital and accumulated distributable earnings (loss) (which consists of accumulated net investment income (loss), accumulated net realized gain (loss) on investments and net unrealized appreciation (depreciation) on investments) on the Statement of Assets and Liabilities that more closely represent their tax character, certain adjustments have been made to paid-in capital, accumulated net investment income (loss) and accumulated net realized gain (loss) on investments. These adjustments are primarily due to the difference between book and tax treatments of income and gains on various investment securities held by the
Notes to Financial Statements (Continued)
First Trust Municipal High Income ETF (FMHI)
July 31, 2021
Fund. The results of operations and net assets were not affected by these adjustments. For the fiscal year ended July 31, 2021, the adjustments for the Fund were as follows:
Accumulated
Net Investment
Income (Loss) | | Accumulated
Net Realized
Gain (Loss)
on Investments | | Paid-in
Capital |
| $(3,462) | | $3,462 | | $— |
G. Expenses
Expenses, other than the investment advisory fee and other excluded expenses, are paid by the Advisor (See Note 3).
3. Investment Advisory Fee, Affiliated Transactions and Other Fee Arrangements
First Trust, the investment advisor to the Fund, is a limited partnership with one limited partner, Grace Partners of DuPage L.P., and one general partner, The Charger Corporation. The Charger Corporation is an Illinois corporation controlled by James A. Bowen, Chief Executive Officer of First Trust. First Trust is responsible for the selection and ongoing monitoring of the securities in the Fund’s portfolio, managing the Fund’s business affairs and providing certain administrative services necessary for the management of the Fund.
Pursuant to the Investment Management Agreement between the Trust and the Advisor, First Trust manages the investment of the Fund’s assets and is responsible for the Fund’s expenses, including the cost of transfer agency, custody, fund administration, legal, audit and other services, but excluding fee payments under the Investment Management Agreement, interest, taxes, acquired fund fees and expenses, if any, brokerage commissions and other expenses connected with the execution of portfolio transactions, distribution and service fees pursuant to a Rule 12b-1 plan, if any, and extraordinary expenses. The Fund has agreed to pay First Trust an annual unitary management fee equal to 0.70% of its average daily net assets. First Trust also provides fund reporting services to the Fund for a flat annual fee in the amount of $9,250, which is covered under the annual unitary management fee.
The Trust’s Board of Trustees and the Advisor have entered into a Fee Waiver Agreement for the Fund pursuant to which the Advisor contractually agreed to waive management fees of 0.15% of average daily net assets until November 30, 2021. The waiver agreement may be terminated by action of the Trust’s Board of Trustees at any time upon 60 days’ written notice by the Trust on behalf of the Fund or by the Advisor only after November 30, 2021. First Trust does not have the right to recover the fees waived. During the fiscal year ended July 31, 2021, the Advisor waived fees of $247,547.
During the fiscal year ended July 31, 2021, the Fund received a reimbursement from the Advisor of $469 in connection with a trade error.
The Trust has multiple service agreements with Brown Brothers Harriman & Co. (“BBH”). Under the service agreements, BBH performs custodial, fund accounting, certain administrative services, and transfer agency services for the Fund. As custodian, BBH is responsible for custody of the Fund’s assets. As fund accountant and administrator, BBH is responsible for maintaining the books and records of the Fund’s securities and cash. As transfer agent, BBH is responsible for maintaining shareholder records for the Fund.
Each Trustee who is not an officer or employee of First Trust, any sub-advisor or any of their affiliates (“Independent Trustees”) is paid a fixed annual retainer that is allocated equally among each fund in the First Trust Fund Complex. Each Independent Trustee is also paid an annual per fund fee that varies based on whether the fund is a closed-end or other actively managed fund, a defined-outcome fund or an index fund.
Additionally, the Lead Independent Trustee and the Chairmen of the Audit Committee, Nominating and Governance Committee and Valuation Committee are paid annual fees to serve in such capacities, with such compensation allocated pro rata among each fund in the First Trust Fund Complex based on net assets. Independent Trustees are reimbursed for travel and out-of-pocket expenses in connection with all meetings. The Lead Independent Trustee and Committee Chairmen rotate every three years. The officers and “Interested” Trustee receive no compensation from the Trust for acting in such capacities.
4. Purchases and Sales of Securities
For the fiscal year ended July 31, 2021, the cost of purchases and proceeds from sales of investments, excluding short term investments and in-kind transactions, were $186,299,142 and $30,296,069, respectively.
For the fiscal year ended July 31, 2021, the Fund had no in-kind transactions.
Notes to Financial Statements (Continued)
First Trust Municipal High Income ETF (FMHI)
July 31, 2021
5. Derivative Transactions
The following table presents the type of derivatives held by the Fund at July 31, 2021, the primary underlying risk exposure and the location of these instruments as presented on the Statement of Assets and Liabilities.
| | | | | Asset Derivatives | | Liability Derivatives |
Derivative
Instrument | | Risk
Exposure | | Statement of Assets and
Liabilities Location | | Value | | Statement of Assets and
Liabilities Location | | Value |
| Futures contracts | | Interest Rate Risk | | Unrealized appreciation
on futures contracts* | | $ — | | Unrealized depreciation
on futures contracts* | | $ 207,266 |
*Includes cumulative appreciation/depreciation on futures contracts as reported in the Portfolio of Investments. Only the current day’s variation margin is presented on the Statement of Assets and Liabilities.
The following table presents the amount of net realized gain (loss) and change in net unrealized appreciation (depreciation) recognized for the fiscal year ended July 31, 2021, on derivative instruments, as well as the primary underlying risk exposure associated with each instrument.
| Statement of Operations Location | |
| Interest Rate Risk Exposure | |
| Net realized gain (loss) on futures contracts | $262,511 |
| Net change in unrealized appreciation (depreciation) on futures contracts | (91,969) |
During the fiscal year ended July 31, 2021, the notional value of futures contracts opened and closed were $78,712,117 and $78,528,617, respectively.
The Fund does not have the right to offset financial assets and liabilities related to futures contracts on the Statement of Assets and Liabilities.
6. Creations, Redemptions and Transaction Fees
The Fund generally issues and redeems its shares in primary market transactions through a creation and redemption mechanism and does not sell or redeem individual shares. Instead, financial entities known as “Authorized Participants” have contractual arrangements with the Fund or one of the Fund’s service providers to purchase and redeem Fund shares directly with the Fund in large blocks of shares known as “Creation Units.” Prior to the start of trading on every business day, the Fund publishes through the National Securities Clearing Corporation (“NSCC”) the “basket” of securities, cash or other assets that it will accept in exchange for a Creation Unit of the Fund’s shares. An Authorized Participant that wishes to effectuate a creation of the Fund’s shares deposits with the Fund the “basket” of securities, cash or other assets identified by the Fund that day, and then receives the Creation Unit of the Fund’s shares in return for those assets. After purchasing a Creation Unit, the Authorized Participant may continue to hold the Fund’s shares or sell them in the secondary market. The redemption process is the reverse of the purchase process: the authorized participant redeems a Creation Unit of the Fund’s shares for a basket of securities, cash or other assets. The combination of the creation and redemption process with secondary market trading in the Fund’s shares and underlying securities provides arbitrage opportunities that are designed to help keep the market price of the Fund’s shares at or close to the NAV per share of the Fund.
The Fund imposes fees in connection with the purchase of Creation Units. These fees may vary based upon various fact-based circumstances, including, but not limited to, the composition of the securities included in the Creation Unit or the countries in which the transactions are settled. The price for each Creation Unit will equal the daily NAV per share of the Fund times the number of shares in a Creation Unit, plus the fees described above and, if applicable, any operational processing and brokerage costs, transfer fees, stamp taxes and part or all of the spread between the expected bid and offer side of the market related to the securities comprising the creation basket.
The Fund also imposes fees in connection with the redemption of Creation Units. These fees may vary based upon various fact-based circumstances, including, but not limited to, the composition of the securities included in the Creation Unit or the countries in which the transactions are settled. The price received for each Creation Unit will equal the daily NAV per share of the Fund times the number of shares in a Creation Unit, minus the fees described above and, if applicable, any operational processing and brokerage costs, transfer fees, stamp taxes and part or all of the spread between the expected bid and offer side of the market related to the securities comprising the redemption basket. Investors who use the services of a broker or other such intermediary in addition to an Authorized Participant to effect a redemption of a Creation Unit may also be assessed an amount to cover the cost of such services. The redemption fee
Notes to Financial Statements (Continued)
First Trust Municipal High Income ETF (FMHI)
July 31, 2021
charged by the Fund will comply with Rule 22c-2 of the 1940 Act which limits redemption fees to no more than 2% of the value of the shares redeemed.
7. Distribution Plan
The Board of Trustees adopted a Distribution and Service Plan pursuant to Rule 12b-1 under the 1940 Act. In accordance with the Rule 12b-1 plan, the Fund is authorized to pay an amount up to 0.25% of its average daily net assets each year to reimburse First Trust Portfolios L.P. (“FTP”), the distributor of the Fund, for amounts expended to finance activities primarily intended to result in the sale of Creation Units or to provide investor services. FTP may also use this amount to compensate securities dealers or other persons that are Authorized Participants for providing distribution assistance, including broker-dealer and shareholder support and educational and promotional services.
No 12b-1 fees are currently paid by the Fund, and pursuant to a contractual arrangement, no 12b-1 fees will be paid any time before November 30, 2022.
8. Borrowings
The Trust, on behalf of the Fund, along with First Trust Series Fund and First Trust Exchange-Traded Fund IV have a $330 million Credit Agreement with The Bank of Nova Scotia (“Scotia”) as administrative agent for a group of lenders. Prior to March 3, 2021, the commitment amount was $410 million. Scotia charges a commitment fee of 0.25% of the daily amount of the excess of the commitment amount over the outstanding principal balance of the loans and an agency fee. First Trust allocates the commitment fee and agency fee amongst the funds that have access to the credit line. To the extent that the Fund accesses the credit line, there would also be an interest fee charged. The Fund did not have any borrowings outstanding during the fiscal year ended July 31, 2021.
9. Indemnification
The Trust, on behalf of the Fund, has a variety of indemnification obligations under contracts with its service providers. The Trust’s maximum exposure under these arrangements is unknown. However, the Trust has not had prior claims or losses pursuant to these contracts and expects the risk of loss to be remote.
10. Other Matters
By operation of law, the Fund now operates as a diversified open-end management investment company as defined in Section 5(b) of the 1940 Act.
11. Subsequent Events
Management has evaluated the impact of all subsequent events to the Fund through the date the financial statements were issued, and has determined that there was the following subsequent event:
On September 13, 2021, the Board of Trustees approved the continuation of the fee waiver for FMHI of 0.15% of average daily net assets through November 30, 2022.
Report of Independent Registered Public Accounting Firm
To the Shareholders and the Board of Trustees of First Trust Exchange-Traded Fund III:
Opinion on the Financial Statements and Financial Highlights
We have audited the accompanying statement of assets and liabilities of First Trust Municipal High Income ETF (the “Fund”), a series of the First Trust Exchange-Traded Fund III, including the portfolio of investments, as of July 31, 2021, the related statement of operations for the year then ended, the statements of changes in net assets for each of the two years in the period then ended, the financial highlights for the years ended July 31, 2021, 2020, 2019, and the period from November 1, 2017 (commencement of operations) through July 31, 2018, and the related notes. In our opinion, the financial statements and financial highlights present fairly, in all material respects, the financial position of the Fund as of July 31, 2021, and the results of its operations for the year then ended, the changes in its net assets for each of the two years in the period then ended, and the financial highlights for the years ended July 31, 2021, 2020, 2019, and the period from November 1, 2017 (commencement of operations) through July 31, 2018 in conformity with accounting principles generally accepted in the United States of America.
Basis for Opinion
These financial statements and financial highlights are the responsibility of the Fund’s management. Our responsibility is to express an opinion on the Fund’s financial statements and financial highlights based on our audits. We are a public accounting firm registered with the Public Company Accounting Oversight Board (United States) (PCAOB) and are required to be independent with respect to the Fund in accordance with the U.S. federal securities laws and the applicable rules and regulations of the Securities and Exchange Commission and the PCAOB.
We conducted our audits in accordance with the standards of the PCAOB. Those standards require that we plan and perform the audit to obtain reasonable assurance about whether the financial statements and financial highlights are free of material misstatement, whether due to error or fraud. The Fund is not required to have, nor were we engaged to perform, an audit of its internal control over financial reporting. As part of our audits we are required to obtain an understanding of internal control over financial reporting but not for the purpose of expressing an opinion on the effectiveness of the Fund’s internal control over financial reporting. Accordingly, we express no such opinion.
Our audits included performing procedures to assess the risks of material misstatement of the financial statements and financial highlights, whether due to error or fraud, and performing procedures that respond to those risks. Such procedures included examining, on a test basis, evidence regarding the amounts and disclosures in the financial statements and financial highlights. Our audits also included evaluating the accounting principles used and significant estimates made by management, as well as evaluating the overall presentation of the financial statements and financial highlights. Our procedures included confirmation of securities owned as of July 31, 2021, by correspondence with the custodian and brokers; when replies were not received from brokers, we performed other auditing procedures. We believe that our audits provide a reasonable basis for our opinion.
Chicago, Illinois
September 22, 2021
We have served as the auditor of one or more First Trust investment companies since 2001.
Additional Information
First Trust Municipal High Income ETF (FMHI)
July 31, 2021 (Unaudited)
Proxy Voting Policies and Procedures
A description of the policies and procedures that the Trust uses to determine how to vote proxies and information on how the Fund voted proxies relating to portfolio securities during the most recent 12-month period ended June 30 is available (1) without charge, upon request, by calling (800) 988-5891; (2) on the Fund’s website at www.ftportfolios.com; and (3) on the Securities and Exchange Commission’s (“SEC”) website at www.sec.gov.
Portfolio Holdings
The Fund files portfolio holdings information for each month in a fiscal quarter within 60 days after the end of the relevant fiscal quarter on Form N-PORT. Portfolio holdings information for the third month of each fiscal quarter will be publicly available on the SEC’s website at www.sec.gov. The Fund’s complete schedule of portfolio holdings for the second and fourth quarters of each fiscal year is included in the semi-annual and annual reports to shareholders, respectively, and is filed with the SEC on Form N-CSR. The semi-annual and annual report for the Fund is available to investors within 60 days after the period to which it relates. The Fund’s Forms N-PORT and Forms N-CSR are available on the SEC’s website listed above.
Federal Tax Information
For the taxable year ended July 31, 2021, the following distribution information is being provided as required by the Internal Revenue Code of 1986, as amended, or to meet a specific state’s requirement. The Fund designates the following percentages or, if subsequently determined to be different, the maximum amount allowable for its fiscal year ended July 31, 2021:
| Federal and State Income Tax | | Percentages |
| Tax-Exempt Interest Dividends | | 100.00% |
| Alternative Minimum Tax (AMT) | | 12.56% |
Risk Considerations
Risks are inherent in all investing. Certain general risks that may be applicable to a Fund are identified below, but not all of the material risks relevant to each Fund are included in this report and not all of the risks below apply to each Fund. The material risks of investing in each Fund are spelled out in its prospectus, statement of additional information and other regulatory filings. Before investing, you should consider each Fund’s investment objective, risks, charges and expenses, and read each Fund’s prospectus and statement of additional information carefully. You can download each Fund’s prospectus at www.ftportfolios.com or contact First Trust Portfolios L.P. at (800) 621-1675 to request a prospectus, which contains this and other information about each Fund.
Concentration Risk. To the extent that a fund is able to invest a significant percentage of its assets in a single asset class or the securities of issuers within the same country, state, region, industry or sector, an adverse economic, business or political development may affect the value of the fund’s investments more than if the fund were more broadly diversified. A fund that tracks an index will be concentrated to the extent the fund’s corresponding index is concentrated. A concentration makes a fund more susceptible to any single occurrence and may subject the fund to greater market risk than a fund that is more broadly diversified.
Credit Risk. Credit risk is the risk that an issuer of a security will be unable or unwilling to make dividend, interest and/or principal payments when due and the related risk that the value of a security may decline because of concerns about the issuer’s ability to make such payments.
Cyber Security Risk. The funds are susceptible to potential operational risks through breaches in cyber security. A breach in cyber security refers to both intentional and unintentional events that may cause a fund to lose proprietary information, suffer data corruption or lose operational capacity. Such events could cause a fund to incur regulatory penalties, reputational damage, additional compliance costs associated with corrective measures and/or financial loss. In addition, cyber security breaches of a fund’s third-party service providers, such as its administrator, transfer agent, custodian, or sub-advisor, as applicable, or issuers in which the fund invests, can also subject a fund to many of the same risks associated with direct cyber security breaches.
Defined Outcome Funds Risk. To the extent a fund’s investment strategy is designed to deliver returns tied to the price performance of an underlying ETF, an investor may not realize the returns the fund seeks to achieve if that investor does not hold shares for the entire target outcome period. In the event an investor purchases shares after the first day of the target outcome period or sells shares prior to the end of the target outcome period, the buffer that the fund seeks to provide against a decline in the value of the underlying ETF may not be available, the enhanced returns that the fund seeks to provide (if any) may not be available and the investor may not participate in a gain in the value of the underlying ETF up to the cap for the investor’s investment period. Additionally, the fund will
Additional Information (Continued)
First Trust Municipal High Income ETF (FMHI)
July 31, 2021 (Unaudited)
not participate in gains of the underlying ETF above the cap and a shareholder may lose their entire investment. If the fund seeks enhanced returns, there are certain time periods when the value of the fund may fall faster than the value of the underlying ETF, and it is very unlikely that, on any given day during which the underlying ETF share price increases in value, the fund’s share price will increase at the same rate as the enhanced returns sought by the fund, which is designed for an entire target outcome period. Trading flexible exchange options involves risks different from, or possibly greater than, the risks associated with investing directly in securities, such as less liquidity and correlation and valuation risks. A fund may experience substantial downside from specific flexible exchange option positions and certain positions may expire worthless.
Derivatives Risk. To the extent a fund uses derivative instruments such as futures contracts, options contracts and swaps, the fund may experience losses because of adverse movements in the price or value of the underlying asset, index or rate, which may be magnified by certain features of the derivative. These risks are heightened when a fund’s portfolio managers use derivatives to enhance the fund’s return or as a substitute for a position or security, rather than solely to hedge (or offset) the risk of a position or security held by the fund.
Equity Securities Risk. To the extent a fund invests in equity securities, the value of the fund’s shares will fluctuate with changes in the value of the equity securities. Equity securities prices fluctuate for several reasons, including changes in investors’ perceptions of the financial condition of an issuer or the general condition of the relevant stock market, such as market volatility, or when political or economic events affecting the issuers occur. In addition, common stock prices may be particularly sensitive to rising interest rates, as the cost of capital rises and borrowing costs increase. Equity securities may decline significantly in price over short or extended periods of time, and such declines may occur in the equity market as a whole, or they may occur in only a particular country, company, industry or sector of the market.
ETF Risk. The shares of an ETF trade like common stock and represent an interest in a portfolio of securities. The risks of owning an ETF generally reflect the risks of owning the underlying securities, although lack of liquidity in an ETF could result in it being more volatile and ETFs have management fees that increase their costs. Shares of an ETF trade on an exchange at market prices rather than net asset value, which may cause the shares to trade at a price greater than net asset value (premium) or less than net asset value (discount). In times of market stress, decisions by market makers to reduce or step away from their role of providing a market for an ETF’s shares, or decisions by an ETF’s authorized participants that they are unable or unwilling to proceed with creation and/or redemption orders of an ETF’s shares, could result in shares of the ETF trading at a discount to net asset value and in greater than normal intraday bid-ask spreads.
Fixed Income Securities Risk. To the extent a fund invests in fixed income securities, the fund will be subject to credit risk, income risk, interest rate risk, liquidity risk and prepayment risk. Income risk is the risk that income from a fund’s fixed income investments could decline during periods of falling interest rates. Interest rate risk is the risk that the value of a fund’s fixed income securities will decline because of rising interest rates. Liquidity risk is the risk that a security cannot be purchased or sold at the time desired, or cannot be purchased or sold without adversely affecting the price. Prepayment risk is the risk that the securities will be redeemed or prepaid by the issuer, resulting in lower interest payments received by the fund. In addition to these risks, high yield securities, or “junk” bonds, are subject to greater market fluctuations and risk of loss than securities with higher ratings, and the market for high yield securities is generally smaller and less liquid than that for investment grade securities.
Index or Model Constituent Risk. Certain funds may be a constituent of one or more indices or ETF models. As a result, such a fund may be included in one or more index-tracking exchange-traded funds or mutual funds. Being a component security of such a vehicle could greatly affect the trading activity involving a fund, the size of the fund and the market volatility of the fund. Inclusion in an index could increase demand for the fund and removal from an index could result in outsized selling activity in a relatively short period of time. As a result, a fund’s net asset value could be negatively impacted and the fund’s market price may be significantly below its net asset value during certain periods. In addition, index rebalances may potentially result in increased trading activity in a fund’s shares.
Index Provider Risk. To the extent a fund seeks to track an index, it is subject to Index Provider Risk. There is no assurance that the Index Provider will compile the Index accurately, or that the Index will be determined, maintained, constructed, reconstituted, rebalanced, composed, calculated or disseminated accurately. To correct any such error, the Index Provider may carry out an unscheduled rebalance or other modification of the Index constituents or weightings, which may increase the fund’s costs. The Index Provider does not provide any representation or warranty in relation to the quality, accuracy or completeness of data in the Index, and it does not guarantee that the Index will be calculated in accordance with its stated methodology. Losses or costs associated with any Index Provider errors generally will be borne by the fund and its shareholders.
Investment Companies Risk. To the extent a fund invests in the securities of other investment vehicles, the fund will incur additional fees and expenses that would not be present in a direct investment in those investment vehicles. Furthermore, the fund’s investment performance and risks are directly related to the investment performance and risks of the investment vehicles in which the fund invests.
Additional Information (Continued)
First Trust Municipal High Income ETF (FMHI)
July 31, 2021 (Unaudited)
LIBOR Risk. To the extent a fund invests in floating or variable rate obligations that use the London Interbank Offered Rate (“LIBOR”) as a reference interest rate, it is subject to LIBOR Risk. The United Kingdom’s Financial Conduct Authority, which regulates LIBOR, will cease making LIBOR available as a reference rate over a phase-out period that will begin immediately after December 31, 2021. The unavailability or replacement of LIBOR may affect the value, liquidity or return on certain fund investments and may result in costs incurred in connection with closing out positions and entering into new trades. Any potential effects of the transition away from LIBOR on the fund or on certain instruments in which the fund invests can be difficult to ascertain, and they may vary depending on a variety of factors, and they could result in losses to the fund.
Management Risk. To the extent that a fund is actively managed, it is subject to management risk. In managing an actively-managed fund’s investment portfolio, the fund’s portfolio managers will apply investment techniques and risk analyses that may not have the desired result. There can be no guarantee that a fund will meet its investment objective.
Market Risk. Securities held by a fund, as well as shares of a fund itself, are subject to market fluctuations caused by factors such as general economic conditions, political events, regulatory or market developments, changes in interest rates and perceived trends in securities prices. Shares of a fund could decline in value or underperform other investments as a result of the risk of loss associated with these market fluctuations. In addition, local, regional or global events such as war, acts of terrorism, spread of infectious diseases or other public health issues, recessions, or other events could have a significant negative impact on a fund and its investments. Such events may affect certain geographic regions, countries, sectors and industries more significantly than others. The outbreak of the respiratory disease designated as COVID-19 in December 2019 has caused significant volatility and declines in global financial markets, which have caused losses for investors. While the development of vaccines has slowed the spread of the virus and allowed for the resumption of “reasonably” normal business activity in the United States, many countries continue to impose lockdown measures in an attempt to slow the spread. Additionally, there is no guarantee that vaccines will be effective against emerging variants of the disease.
Non-U.S. Securities Risk. To the extent a fund invests in non-U.S. securities, it is subject to additional risks not associated with securities of domestic issuers. Non-U.S. securities are subject to higher volatility than securities of domestic issuers due to: possible adverse political, social or economic developments; restrictions on foreign investment or exchange of securities; capital controls; lack of liquidity; currency exchange rates; excessive taxation; government seizure of assets; the imposition of sanctions by foreign governments; different legal or accounting standards; and less government supervision and regulation of exchanges in foreign countries. Investments in non-U.S. securities may involve higher costs than investments in U.S. securities, including higher transaction and custody costs, as well as additional taxes imposed by non-U.S. governments. These risks may be heightened for securities of companies located, or with significant operations, in emerging market countries.
Operational Risk. Each fund is subject to risks arising from various operational factors, including, but not limited to, human error, processing and communication errors, errors of a fund’s service providers, counterparties or other third-parties, failed or inadequate processes and technology or systems failures. Each fund relies on third-parties for a range of services, including custody. Any delay or failure relating to engaging or maintaining such service providers may affect a fund’s ability to meet its investment objective. Although the funds and the funds’ investment advisor seek to reduce these operational risks through controls and procedures, there is no way to completely protect against such risks.
Passive Investment Risk. To the extent a fund seeks to track an index, the fund will invest in the securities included in, or representative of, the index regardless of their investment merit. A fund generally will not attempt to take defensive positions in declining markets.
| NOT FDIC INSURED | NOT BANK GUARANTEED | MAY LOSE VALUE |
Advisory Agreement
Board Considerations Regarding Approval of Continuation of Investment Management Agreement
The Board of Trustees of First Trust Exchange-Traded Fund III (the “Trust”), including the Independent Trustees, unanimously approved the continuation of the Investment Management Agreement (the “Agreement”) with First Trust Advisors L.P. (the “Advisor”) on behalf of the First Trust Municipal High Income ETF (the “Fund”). The Board approved the continuation of the Agreement for a one-year period ending June 30, 2022 at a meeting held on June 6–7, 2021. The Board determined that the continuation of the Agreement is in the best interests of the Fund in light of the nature, extent and quality of the services provided and such other matters as the Board considered to be relevant in the exercise of its business judgment.
To reach this determination, the Board considered its duties under the Investment Company Act of 1940, as amended (the “1940 Act”), as well as under the general principles of state law, in reviewing and approving advisory contracts; the requirements of the 1940 Act in
Additional Information (Continued)
First Trust Municipal High Income ETF (FMHI)
July 31, 2021 (Unaudited)
such matters; the fiduciary duty of investment advisors with respect to advisory agreements and compensation; the standards used by courts in determining whether investment company boards have fulfilled their duties; and the factors to be considered by the Board in voting on such agreements. At meetings held on April 26, 2021 and June 6–7, 2021, the Board, including the Independent Trustees, reviewed materials provided by the Advisor responding to requests for information from counsel to the Independent Trustees, submitted on behalf of the Independent Trustees, that, among other things, outlined: the services provided by the Advisor to the Fund (including the relevant personnel responsible for these services and their experience); the unitary fee rate payable by the Fund as compared to fees charged to a peer group of funds (the “Expense Group”) and a broad peer universe of funds (the “Expense Universe”), each assembled by Broadridge Financial Solutions, Inc. (“Broadridge”), an independent source, and as compared to fees charged to other clients of the Advisor, including other exchange-traded funds (“ETFs”) managed by the Advisor; the expense ratio of the Fund as compared to expense ratios of the funds in the Fund’s Expense Group and Expense Universe; performance information for the Fund, including comparisons of the Fund’s performance to that of one or more relevant benchmark indexes and to that of a performance group of funds and a broad performance universe of funds (the “Performance Universe”), each assembled by Broadridge; the nature of expenses incurred in providing services to the Fund and the potential for the Advisor to realize economies of scale, if any; profitability and other financial data for the Advisor; any fall-out benefits to the Advisor and its affiliate, First Trust Portfolios L.P. (“FTP”); and information on the Advisor’s compliance program. The Board reviewed initial materials with the Advisor at the meeting held on April 26, 2021, prior to which the Independent Trustees and their counsel met separately to discuss the information provided by the Advisor. Following the April meeting, counsel to the Independent Trustees, on behalf of the Independent Trustees, requested certain clarifications and supplements to the materials provided, and the information provided in response to those requests was considered at an executive session of the Independent Trustees and their counsel held prior to the June 6–7, 2021 meeting, as well as at the June meeting. The Board applied its business judgment to determine whether the arrangement between the Trust and the Advisor continues to be a reasonable business arrangement from the Fund’s perspective. The Board determined that, given the totality of the information provided with respect to the Agreement, the Board had received sufficient information to renew the Agreement. The Board considered that shareholders chose to invest or remain invested in the Fund knowing that the Advisor manages the Fund and knowing the Fund’s unitary fee.
In reviewing the Agreement, the Board considered the nature, extent and quality of the services provided by the Advisor under the Agreement. The Board considered that the Advisor is responsible for the overall management and administration of the Trust and the Fund and reviewed all of the services provided by the Advisor to the Fund, as well as the background and experience of the persons responsible for such services. The Board noted that the Fund is an actively-managed ETF and noted that the Advisor’s Municipal Securities Team is responsible for the day-to-day management of the Fund’s investments. The Board considered the background and experience of the members of the Municipal Securities Team and noted the Board’s prior meetings with members of the Team. The Board considered the Advisor’s statement that it applies the same oversight model internally with its Municipal Securities Team as it uses for overseeing external sub-advisors, including portfolio risk monitoring and performance review. In reviewing the services provided, the Board noted the compliance program that had been developed by the Advisor and considered that it includes a robust program for monitoring the Advisor’s and the Fund’s compliance with the 1940 Act, as well as the Fund’s compliance with its investment objectives, policies and restrictions. The Board also considered a report from the Advisor with respect to its risk management functions related to the operation of the Fund. Finally, as part of the Board’s consideration of the Advisor’s services, the Advisor, in its written materials and at the April 26, 2021 meeting, described to the Board the scope of its ongoing investment in additional personnel and infrastructure to maintain and improve the quality of services provided to the Fund and the other funds in the First Trust Fund Complex. In light of the information presented and the considerations made, the Board concluded that the nature, extent and quality of the services provided to the Trust and the Fund by the Advisor under the Agreement have been and are expected to remain satisfactory and that the Advisor has managed the Fund consistent with its investment objectives, policies and restrictions.
The Board considered the unitary fee rate payable by the Fund under the Agreement for the services provided. The Board considered that as part of the unitary fee the Advisor is responsible for the Fund’s expenses, including the cost of transfer agency, custody, fund administration, legal, audit and other services and license fees, if any, but excluding the fee payment under the Agreement and interest, taxes, brokerage commissions and other expenses connected with the execution of portfolio transactions, distribution and service fees pursuant to a Rule 12b-1 plan, if any, and extraordinary expenses, if any. The Board noted that the Advisor had previously agreed to waive a portion of its unitary fee in an amount equal to 0.15% of the Fund’s average daily net assets until at least November 30, 2021. The Board received and reviewed information showing the advisory or unitary fee rates and expense ratios of the peer funds in the Expense Group, as well as advisory and unitary fee rates charged by the Advisor to other fund (including ETFs) and non-fund clients, as applicable. Because the Fund pays a unitary fee, the Board determined that expense ratios were the most relevant comparative data point. Based on the information provided, the Board noted that the unitary fee rate for the Fund, after taking into account the contractual fee waiver, was below the median total (net) expense ratio of the peer funds in the Expense Group. With respect to the Expense Group, the Board, at the April 26, 2021 meeting, discussed with the Advisor limitations in creating peer groups for actively-managed ETFs, including that the Expense Group contained both actively-managed ETFs and open-end mutual funds, and different business models that may affect the pricing of services among ETF sponsors. The Board took these limitations and
Additional Information (Continued)
First Trust Municipal High Income ETF (FMHI)
July 31, 2021 (Unaudited)
differences into account in considering the peer data. With respect to fees charged to other non-ETF clients, the Board considered differences between the Fund and other non-ETF clients that limited their comparability. In considering the unitary fee rate overall, the Board also considered the Advisor’s statement that it seeks to meet investor needs through innovative and value-added investment solutions and the Advisor’s demonstrated long-term commitment to the Fund and the other funds in the First Trust Fund Complex.
The Board considered performance information for the Fund. The Board noted the process it has established for monitoring the Fund’s performance and portfolio risk on an ongoing basis, which includes quarterly performance reporting from the Advisor for the Fund. The Board determined that this process continues to be effective for reviewing the Fund’s performance. The Board received and reviewed information comparing the Fund’s performance for periods ended December 31, 2020 to the performance of the funds in the Performance Universe and to that of a benchmark index. Based on the information provided, the Board noted that the Fund outperformed the Performance Universe median for the one- and three-year periods ended December 31, 2020. The Board also noted that the Fund underperformed the benchmark index for the one-year period ended December 31, 2020 and outperformed the benchmark index for the three-year period ended December 31, 2020.
On the basis of all the information provided on the unitary fee and performance of the Fund and the ongoing oversight by the Board, the Board concluded that the unitary fee for the Fund continues to be reasonable and appropriate in light of the nature, extent and quality of the services provided by the Advisor to the Fund under the Agreement.
The Board considered information and discussed with the Advisor whether there were any economies of scale in connection with providing advisory services to the Fund and noted the Advisor’s statement that it believes its expenses will likely increase during the next twelve months as the Advisor continues to hire personnel and build infrastructure, including technology, to improve the services to the Fund. The Board noted that any reduction in fixed costs associated with the management of the Fund would benefit the Advisor, but that the unitary fee structure provides a level of certainty in expenses for the Fund. The Board considered the revenues and allocated costs (including the allocation methodology) of the Advisor in serving as investment advisor to the Fund for the twelve months ended December 31, 2020 and the estimated profitability level for the Fund calculated by the Advisor based on such data, as well as complex-wide and product-line profitability data, for the same period. The Board noted the inherent limitations in the profitability analysis and concluded that, based on the information provided, the Advisor’s profitability level for the Fund was not unreasonable. In addition, the Board considered fall-out benefits described by the Advisor that may be realized from its relationship with the Fund. The Board considered that the Advisor had identified as a fall-out benefit to the Advisor and FTP their exposure to investors and brokers who, absent their exposure to the Fund, may have had no dealings with the Advisor or FTP, and noted that the Advisor does not utilize soft dollars in connection with the Fund. The Board also considered the Advisor’s compensation for fund reporting services provided to the Fund pursuant to a separate Fund Reporting Services Agreement, which is paid from the unitary fee. The Board concluded that the character and amount of potential fall-out benefits to the Advisor were not unreasonable.
Based on all of the information considered and the conclusions reached, the Board, including the Independent Trustees, unanimously determined that the terms of the Agreement continue to be fair and reasonable and that the continuation of the Agreement is in the best interests of the Fund. No single factor was determinative in the Board’s analysis.
Liquidity Risk Management Program
In accordance with Rule 22e-4 under the Investment Company Act of 1940, as amended (the “1940 Act”), the Fund and each other fund in the First Trust Fund Complex, other than the closed-end funds, have adopted and implemented a liquidity risk management program (the “Program”) reasonably designed to assess and manage the funds’ liquidity risk, i.e., the risk that a fund could not meet requests to redeem shares issued by the fund without significant dilution of remaining investors’ interests in the fund. The Board of Trustees of the First Trust Funds has appointed First Trust Advisors, L.P. (the “Advisor”) as the person designated to administer the Program, and in this capacity the Advisor performs its duties primarily through the activities and efforts of the First Trust Liquidity Committee (the “Liquidity Committee”).
Pursuant to the Program, the Liquidity Committee classifies the liquidity of each fund’s portfolio investments into one of the four liquidity categories specified by Rule 22e-4: highly liquid investments, moderately liquid investments, less liquid investments and illiquid investments. The Liquidity Committee determines certain of the inputs for this classification process, including reasonably anticipated trade sizes and significant investor dilution thresholds. The Liquidity Committee also determines and periodically reviews a highly liquid investment minimum for certain funds, monitors the funds’ holdings of assets classified as illiquid investments to seek to ensure they do not exceed 15% of a fund’s net assets and establishes policies and procedures regarding redemptions in kind.
At the April 26, 2021 meeting of the Board of Trustees, as required by Rule 22e-4 and the Program, the Advisor provided the Board with a written report prepared by the Advisor that addressed the operation of the Program during the period from March 20, 2020 through the Liquidity Committee’s annual meeting held on March 16, 2021 and assessed the Program’s adequacy and effectiveness of implementation during this period, including the operation of the highly liquid investment minimum for each fund that is required
Additional Information (Continued)
First Trust Municipal High Income ETF (FMHI)
July 31, 2021 (Unaudited)
under the Program to have one, and any material changes to the Program. Note that because the Fund primarily holds assets that are highly liquid investments, the Fund has not adopted any highly liquid investment minimum.
As stated in the written report, during the review period, no fund breached the 15% limitation on illiquid investments, no fund with a highly liquid investment minimum breached that minimum and no fund filed a Form N-LIQUID. The Advisor concluded that each fund’s investment strategy is appropriate for an open-end fund; that the Program operated effectively in all material respects during the review period; and that the Program is reasonably designed to assess and manage the liquidity risk of each fund and to maintain compliance with Rule 22e-4.
Board of Trustees and Officers
First Trust Municipal High Income ETF (FMHI)
July 31, 2021 (Unaudited)
The following tables identify the Trustees and Officers of the Trust. Unless otherwise indicated, the address of all persons is 120 East Liberty Drive, Suite 400, Wheaton, IL 60187.
The Trust’s statement of additional information includes additional information about the Trustees and is available, without charge, upon request, by calling (800) 988-5891.
| Name, Year of Birth and Position with the Trust | Term of Office and Year First Elected or Appointed | Principal Occupations
During Past 5 Years | Number of Portfolios in the First Trust Fund Complex Overseen by Trustee | Other Trusteeships or Directorships Held by Trustee During Past 5 Years |
| INDEPENDENT TRUSTEES |
Richard E. Erickson, Trustee
(1951) | • Indefinite Term
• Since Inception | Physician; Officer, Wheaton Orthopedics; Limited Partner, Gundersen Real Estate Limited Partnership (June 1992 to December 2016) | 211 | None |
Thomas R. Kadlec, Trustee
(1957) | • Indefinite Term
• Since Inception | President, ADM Investor Services, Inc. (Futures Commission Merchant) | 211 | Director of ADM Investor Services, Inc., ADM Investor Services International, Futures Industry Association, and National Futures Association |
Robert F. Keith, Trustee
(1956) | • Indefinite Term
• Since Inception | President, Hibs Enterprises (Financial and Management Consulting) | 211 | Director of Trust Company of Illinois |
Niel B. Nielson, Trustee
(1954) | • Indefinite Term
• Since Inception | Senior Advisor (August 2018 to Present), Managing Director and Chief Operating Officer (January 2015 to August 2018), Pelita Harapan Educational Foundation (Educational Products and Services) | 211 | None |
| INTERESTED TRUSTEE |
James A. Bowen(1), Trustee and
Chairman of the Board
(1955) | • Indefinite Term
• Since Inception | Chief Executive Officer, First Trust Advisors L.P. and First Trust Portfolios L.P.; Chairman of the Board of Directors, BondWave LLC (Software Development Company) and Stonebridge Advisors LLC (Investment Advisor) | 211 | None |
| (1) | Mr. Bowen is deemed an “interested person” of the Trust due to his position as CEO of First Trust Advisors L.P., investment advisor of the Trust. |
Board of Trustees and Officers (Continued)
First Trust Municipal High Income ETF (FMHI)
July 31, 2021 (Unaudited)
| Name and Year of Birth | Position and Offices with Trust | Term of Office and Length of Service | Principal Occupations
During Past 5 Years |
| OFFICERS(2) |
James M. Dykas
(1966) | President and Chief Executive Officer | • Indefinite Term
• Since January 2016 | Managing Director and Chief Financial Officer (January 2016 to Present), Controller (January 2011 to January 2016), Senior Vice President (April 2007 to January 2016), First Trust Advisors L.P. and First Trust Portfolios L.P.; Chief Financial Officer (January 2016 to Present), BondWave LLC (Software Development Company) and Stonebridge Advisors LLC (Investment Advisor) |
Donald P. Swade
(1972) | Treasurer, Chief Financial Officer and Chief Accounting Officer | • Indefinite Term
• Since January 2016 | Senior Vice President (July 2016 to Present), Vice President (April 2012 to July 2016), First Trust Advisors L.P. and First Trust Portfolios L.P. |
W. Scott Jardine
(1960) | Secretary and Chief Legal Officer | • Indefinite Term
• Since Inception | General Counsel, First Trust Advisors L.P. and First Trust Portfolios L.P.; Secretary and General Counsel, BondWave LLC; Secretary, Stonebridge Advisors LLC |
Daniel J. Lindquist
(1970) | Vice President | • Indefinite Term
• Since Inception | Managing Director, First Trust Advisors L.P. and First Trust Portfolios L.P. |
Kristi A. Maher
(1966) | Chief Compliance Officer and Assistant Secretary | • Indefinite Term
• Since Inception | Deputy General Counsel, First Trust Advisors L.P. and First Trust Portfolios L.P. |
Roger F. Testin
(1966) | Vice President | • Indefinite Term
• Since Inception | Senior Vice President, First Trust Advisors L.P. and First Trust Portfolios L.P. |
Stan Ueland
(1970) | Vice President | • Indefinite Term
• Since Inception | Senior Vice President, First Trust Advisors L.P. and First Trust Portfolios L.P |
| (2) | The term “officer” means the president, vice president, secretary, treasurer, controller or any other officer who performs a policy making function. |
Privacy Policy
First Trust Municipal High Income ETF (FMHI)
July 31, 2021 (Unaudited)
Privacy Policy
First Trust values our relationship with you and considers your privacy an important priority in maintaining that relationship. We are committed to protecting the security and confidentiality of your personal information.
Sources of Information
We collect nonpublic personal information about you from the following sources:
| • | Information we receive from you and your broker-dealer, investment professional or financial representative through interviews, applications, agreements or other forms; |
| • | Information about your transactions with us, our affiliates or others; |
| • | Information we receive from your inquiries by mail, e-mail or telephone; and |
| • | Information we collect on our website through the use of “cookies”. For example, we may identify the pages on our website that your browser requests or visits. |
Information Collected
The type of data we collect may include your name, address, social security number, age, financial status, assets, income, tax information, retirement and estate plan information, transaction history, account balance, payment history, investment objectives, marital status, family relationships and other personal information.
Disclosure of Information
We do not disclose any nonpublic personal information about our customers or former customers to anyone, except as permitted by law. In addition to using this information to verify your identity (as required under law), the permitted uses may also include the disclosure of such information to unaffiliated companies for the following reasons:
| • | In order to provide you with products and services and to effect transactions that you request or authorize, we may disclose your personal information as described above to unaffiliated financial service providers and other companies that perform administrative or other services on our behalf, such as transfer agents, custodians and trustees, or that assist us in the distribution of investor materials such as trustees, banks, financial representatives, proxy services, solicitors and printers. |
| • | We may release information we have about you if you direct us to do so, if we are compelled by law to do so, or in other legally limited circumstances (for example to protect your account from fraud). |
In addition, in order to alert you to our other financial products and services, we may share your personal information within First Trust.
Use of Website Analytics
We currently use third party analytics tools, Google Analytics and AddThis, to gather information for purposes of improving First Trust’s website and marketing our products and services to you. These tools employ cookies, which are small pieces of text stored in a file by your web browser and sent to websites that you visit, to collect information, track website usage and viewing trends such as the number of hits, pages visited, videos and PDFs viewed and the length of user sessions in order to evaluate website performance and enhance navigation of the website. We may also collect other anonymous information, which is generally limited to technical and web navigation information such as the IP address of your device, internet browser type and operating system for purposes of analyzing the data to make First Trust’s website better and more useful to our users. The information collected does not include any personal identifiable information such as your name, address, phone number or email address unless you provide that information through the website for us to contact you in order to answer your questions or respond to your requests. To find out how to opt-out of these services click on: Google Analytics and AddThis.
Confidentiality and Security
With regard to our internal security procedures, First Trust restricts access to your nonpublic personal information to those First Trust employees who need to know that information to provide products or services to you. We maintain physical, electronic and procedural safeguards to protect your nonpublic personal information.
Policy Updates and Inquiries
As required by federal law, we will notify you of our privacy policy annually. We reserve the right to modify this policy at any time, however, if we do change it, we will tell you promptly. For questions about our policy, or for additional copies of this notice, please go to www.ftportfolios.com, or contact us at 1-800-621-1675 (First Trust Portfolios) or 1-800-222-6822 (First Trust Advisors).
March 2021
This page intentionally left blank
This page intentionally left blank
First Trust Exchange-Traded Fund III
INVESTMENT ADVISOR
First Trust Advisors L.P.
120 East Liberty Drive, Suite 400
Wheaton, IL 60187
ADMINISTRATOR, CUSTODIAN,
FUND ACCOUNTANT &
TRANSFER AGENT
Brown Brothers Harriman & Co.
50 Post Office Square
Boston, MA 02110
INDEPENDENT REGISTERED
PUBLIC ACCOUNTING FIRM
Deloitte & Touche LLP
111 S. Wacker Drive
Chicago, IL 60606
LEGAL COUNSEL
Chapman and Cutler LLP
111 W. Monroe Street
Chicago, IL 60603
First Trust Exchange-Traded Fund III
First Trust Short Duration Managed Municipal ETF (FSMB)
First Trust Ultra Short Duration Municipal ETF (FUMB)
Annual Report
For the Year Ended
July 31, 2021
First Trust Exchange-Traded Fund III
Annual Report
July 31, 2021
Caution Regarding Forward-Looking Statements
This report contains certain forward-looking statements within the meaning of the Securities Act of 1933, as amended, and the Securities Exchange Act of 1934, as amended. Forward-looking statements include statements regarding the goals, beliefs, plans or current expectations of First Trust Advisors L.P. (“First Trust” or the “Advisor”) and its representatives, taking into account the information currently available to them. Forward-looking statements include all statements that do not relate solely to current or historical fact. For example, forward-looking statements include the use of words such as “anticipate,” “estimate,” “intend,” “expect,” “believe,” “plan,” “may,” “should,” “would” or other words that convey uncertainty of future events or outcomes.
Forward-looking statements involve known and unknown risks, uncertainties and other factors that may cause the actual results, performance or achievements of any series of First Trust Exchange-Traded Fund III (the “Trust”) described in this report (each such series is referred to as a “Fund” and collectively, the “Funds”) to be materially different from any future results, performance or achievements expressed or implied by the forward-looking statements. When evaluating the information included in this report, you are cautioned not to place undue reliance on these forward-looking statements, which reflect the judgment of the Advisor and its representatives only as of the date hereof. We undertake no obligation to publicly revise or update these forward-looking statements to reflect events and circumstances that arise after the date hereof.
Performance and Risk Disclosure
There is no assurance that any Fund described in this report will achieve its investment objective. Each Fund is subject to market risk, which is the possibility that the market values of securities owned by the Fund will decline and that the value of the Fund’s shares may therefore be less than what you paid for them. Accordingly, you can lose money by investing in a Fund. See “Risk Considerations” in the Additional Information section of this report for a discussion of certain other risks of investing in the Funds.
Performance data quoted represents past performance, which is no guarantee of future results, and current performance may be lower or higher than the figures shown. For the most recent month-end performance figures, please visit www.ftportfolios.com or speak with your financial advisor. Investment returns, net asset value and share price will fluctuate and Fund shares, when sold, may be worth more or less than their original cost.
The Advisor may also periodically provide additional information on Fund performance on each Fund’s web page at www.ftportfolios.com.
How to Read This Report
This report contains information that may help you evaluate your investment. It includes details about each Fund and presents data and analysis that provide insight into each Fund’s performance and investment approach.
By reading the portfolio commentary by the portfolio management team of each Fund, you may obtain an understanding of how the market environment affected each Fund’s performance. The statistical information that follows may help you understand each Fund’s performance compared to that of a relevant market benchmark.
It is important to keep in mind that the opinions expressed by personnel of the Advisor are just that: informed opinions. They should not be considered to be promises or advice. The opinions, like the statistics, cover the period through the date on the cover of this report. The material risks of investing in each Fund are spelled out in the prospectus, the statement of additional information, and other Fund regulatory filings.
First Trust Exchange-Traded Fund III
Annual Letter from the Chairman and CEO
July 31, 2021
Dear Shareholders,
First Trust is pleased to provide you with the annual report for certain series of First Trust Exchange-Traded Fund III (the “Funds”), which contains detailed information about the Funds for the 12-month period ended July 31, 2021.
I often mention at the end of my shareholder letters that investors should stay the course. I do so because First Trust believes in the buy and hold investment philosophy, and the math supports our view. The S&P 500® Index (the “Index”) has never failed to fully recover the losses sustained in any correction or bear market. As of July 31, 2021, the Index stood just 0.61% below its all-time closing high set on July 26, 2021. Whether you believe that history repeats itself or simply rhymes, it provides us with valuable insight either way. When it comes to setting realistic expectations about equity returns over time, we know that the Index delivered an average annual total return of 10.28% from 1926-2020 (95 years), according to data from Morningstar/Ibbotson Associates. That is our long-term performance benchmark for stocks in the U.S. Why is that relevant in today’s climate? It is important to note that this very Index has posted a total return of 17.99% year-to-date and 36.45% for the 12-month period ended July 31, 2021, according to Bloomberg. Using industry jargon, these are sometimes referred to as “outsized” returns, or well-above the norm.
As previously noted, the stock market experiences selloffs of various degrees on an ongoing basis. The more severe declines are referred to as corrections and bear markets. Corrections are defined as a 10.00% to 19.99% decline in the price of an index or security from its most recent closing high. Bear markets entail price declines of 20% or more. Since 1950, the Index has endured 38 selloffs totaling 10% or more, with nine of them being bear markets, according to The Motley Fool, a private financial and investing advice company. Over that 71-year period, on average, the stock market experienced a correction every 1.84 years, compared to every 7.78 years for bear markets. The last major selloff occurred in the first quarter of 2020 (17 months ago), when the Index plunged 33.79%, due to the initial shock from the onset of the coronavirus (“COVID-19”) pandemic. While that qualified as a bear market, some investors may be thinking we are due for a correction in the coming months. Remember, these statistics represent averages. A June 2021 survey by the CFA Institute found that 45% of the chartered financial analysts it polled believe we will have a correction within 1-3 years. I offer this forecast to show investors how challenging it is to make such market calls, even for highly credentialed professionals. A 1-3 year projection isn’t exactly actionable information, in my opinion.
The bottom line is that those individuals who have remained invested in the stock and bond markets throughout the COVID-19 pandemic have likely prospered beyond what they might have imagined. Suffice it to say that the markets have exceeded expectations over the past 12 months. I think your average investor would have been content with just being in positive territory. Looking ahead, I see more tailwinds for the markets than headwinds, particularly with respect to the stock market. There is plenty of liquidity in the economy thanks to the accommodative monetary policy of the Federal Reserve (the “Fed”) and fiscal stimulus from Congress. We have the potential for another $4 to $5 trillion in fiscal stimulus from President Joe Biden’s bipartisan infrastructure bill and the Democrat-driven budget package, including funds earmarked for climate change projects (green energy), health care, education, and more. Perhaps the biggest headwind moving forward is rising inflation. We should know in the next few months if it is transitory, as Fed Chairman Jerome Powell believes, or if it will be with us for a sustained period. Stay tuned and stay the course!
Thank you for giving First Trust the opportunity to play a role in your financial future. We value our relationship with you and will report on the Funds again in six months.
Sincerely,
James A. Bowen
Chairman of the Board of Trustees
Chief Executive Officer of First Trust Advisors L.P.
Fund Performance Overview (Unaudited)
First Trust Short Duration Managed Municipal ETF (FSMB)
The investment objective of First Trust Short Duration Managed Municipal ETF (the “Fund”) seeks to provide federally tax-exempt income consistent with capital preservation. Under normal market conditions, the Fund seeks to achieve its investment objective by investing at least 80% of its net assets (including investment borrowings) in municipal debt securities that pay interest that is exempt from regular federal income taxes. The Fund’s investment advisor seeks to construct a portfolio that has a weighted average duration of 1-3 years. The Fund lists and principally trades its shares on NYSE Arca, Inc. under the ticker symbol “FSMB.”
| Performance | | | |
| | | Average Annual
Total Returns | Cumulative
Total Returns |
| | 1 Year Ended
7/31/21 | Inception (11/1/18)
to 7/31/21 | Inception (11/1/18)
to 7/31/21 |
| Fund Performance | | | |
| NAV | 2.92% | 3.60% | 10.21% |
| Market Price | 2.87% | 3.60% | 10.21% |
| Index Performance | | | |
| Bloomberg Barclays Municipal Short (1-5) Year Index | 1.11% | 3.04% | 8.57% |
(See Notes to Fund Performance Overview on page 7.)
| Sector Allocation | % of Total
Investments
(including cash) |
| Special Assessment | 9.7% |
| Insured | 9.3 |
| Government Obligation Bond - Unlimited Tax | 9.1 |
| Gas | 9.0 |
| Hospital | 7.2 |
| Certificates of Participation | 6.1 |
| Continuing Care Retirement Communities | 5.7 |
| Industrial Development Bond | 5.1 |
| Education | 4.4 |
| Higher Education | 4.2 |
| Utility | 3.6 |
| Dedicated Tax | 3.5 |
| Airport | 3.2 |
| Water & Sewer | 3.1 |
| Government Obligation Bond - Limited Tax | 2.5 |
| Mass Transit | 2.3 |
| Toll Road | 2.2 |
| Student Loan | 1.9 |
| Tax Increment | 0.9 |
| Pre-refunded/Escrowed-to-maturity | 0.8 |
| Tobacco | 0.7 |
| Housing | 0.4 |
| Student Housing | 0.2 |
| Cash | 4.9 |
| Total | 100.0% |
| Credit Quality(1) | % of Total
Investments
(including cash) |
| AAA | 2.1% |
| AA | 24.0 |
| A | 32.3 |
| BBB | 15.9 |
| BB | 4.2 |
| B | 1.9 |
| Not Rated | 12.1 |
| SP-1+ (short-term) | 0.8 |
| SP-1/MIG1 (short-term) | 0.4 |
| SP-2/MIG2 (short-term) | 1.4 |
| Cash | 4.9 |
| Total | 100.0% |
| Fund Allocation | % of Net Assets |
| Municipal Bonds | 96.9% |
| Net Other Assets and Liabilities(2) | 3.1 |
| Total | 100.0% |
| (1) | The credit quality and ratings information presented above reflect the ratings assigned by one or more nationally recognized statistical rating organizations (NRSROs), including Standard & Poor’s Ratings Group, a division of the McGraw Hill Companies, Inc., Moody’s Investors Service, Inc., Fitch Ratings or a comparably rated NRSRO. For situations in which a security is rated by more than one NRSRO and the ratings are not equivalent, the highest rating is used. Sub-investment grade ratings are those rated BB+/Ba1 or lower. Investment grade ratings are those rated BBB-/Baa3 or higher. The credit ratings shown relate to the creditworthiness of the issuers of the underlying securities in the Fund, and not to the Fund or its shares. Credit ratings are subject to change. |
| (2) | Includes variation margin on futures. |
Fund Performance Overview (Unaudited) (Continued)
First Trust Short Duration Managed Municipal ETF (FSMB) (Continued)

Performance figures assume reinvestment of all distributions and do not reflect the deduction of taxes that a shareholder would pay on Fund distributions or the redemption or sale of Fund shares. An index is a statistical composite that tracks a specified financial market or sector. Unlike the Fund, the index does not actually hold a portfolio of securities and therefore does not incur the expenses incurred by the Fund. These expenses negatively impact the performance of the Fund. The Fund’s past performance does not predict future performance.
Frequency Distribution of Discounts and Premiums
Information showing the number of days the market price of the Fund’s shares was greater (at a premium) and less (at a discount) than the Fund’s net asset value for the most recently completed year, and the most recently completed calendar quarters since that year (or life of the Fund, if shorter), is available at https://www.ftportfolios.com/Retail/etf/home.aspx.
Fund Performance Overview (Unaudited) (Continued)
First Trust Ultra Short Duration Municipal ETF (FUMB)
The investment objective of First Trust Ultra Short Duration Municipal ETF (the “Fund”) seeks to provide federally tax-exempt income consistent with capital preservation. Under normal market conditions, the Fund seeks to achieve its investment objective by investing at least 80% of its net assets (including investment borrowings) in municipal debt securities that pay interest that is exempt from regular federal income taxes. Under normal market conditions, the weighted average duration of the Fund’s portfolio is expected to be less than one year. The Fund lists and principally trades its shares on NYSE Arca, Inc. under the ticker symbol “FUMB.”
| Performance | | | |
| | | Average Annual
Total Returns | Cumulative
Total Returns |
| | 1 Year Ended
7/31/21 | Inception (11/1/18)
to 7/31/21 | Inception (11/1/18)
to 7/31/21 |
| Fund Performance | | | |
| NAV | 0.72% | 1.48% | 4.12% |
| Market Price | 0.67% | 1.48% | 4.12% |
| Index Performance | | | |
| Bloomberg Barclays Municipal Short-Term Index | 0.41% | 1.23% | 3.42% |
(See Notes to Fund Performance Overview on page 7.)
| Sector Allocation | % of Total
Investments
(including cash) |
| Government Obligation Bond - Unlimited Tax | 16.9% |
| Industrial Development Bond | 11.0 |
| Pre-refunded/Escrowed-to-maturity | 9.4 |
| Insured | 8.1 |
| Gas | 7.1 |
| Government Obligation Bond - Limited Tax | 6.1 |
| Housing | 5.9 |
| Certificates of Participation | 5.4 |
| Hospital | 4.6 |
| Water & Sewer | 4.0 |
| Dedicated Tax | 3.7 |
| Education | 2.9 |
| Higher Education | 2.0 |
| Utility | 2.0 |
| Mass Transit | 1.8 |
| Airport | 1.4 |
| Student Loan | 0.7 |
| Continuing Care Retirement Communities | 0.6 |
| Tax Increment | 0.4 |
| Tobacco | 0.4 |
| Toll Road | 0.4 |
| Special Assessment | 0.3 |
| Cash | 4.9 |
| Total | 100.0% |
| Credit Quality(1) | % of Total
Investments
(including cash) |
| AAA | 5.3% |
| AA | 32.1 |
| A | 27.2 |
| BBB | 15.6 |
| BB | 2.1 |
| Not Rated | 6.2 |
| SP-1+ (short-term) | 0.7 |
| SP-1/MIG1 (short-term) | 4.4 |
| SP-2/MIG2 (short-term) | 1.5 |
| Cash | 4.9 |
| Total | 100.0% |
| (1) | The credit quality and ratings information presented above reflect the ratings assigned by one or more nationally recognized statistical rating organizations (NRSROs), including Standard & Poor’s Ratings Group, a division of the McGraw Hill Companies, Inc., Moody’s Investors Service, Inc., Fitch Ratings or a comparably rated NRSRO. For situations in which a security is rated by more than one NRSRO and the ratings are not equivalent, the highest rating is used. Sub-investment grade ratings are those rated BB+/Ba1 or lower. Investment grade ratings are those rated BBB-/Baa3 or higher. The credit ratings shown relate to the creditworthiness of the issuers of the underlying securities in the Fund, and not to the Fund or its shares. Credit ratings are subject to change. |
Fund Performance Overview (Unaudited) (Continued)
First Trust Ultra Short Duration Municipal ETF (FUMB) (Continued)
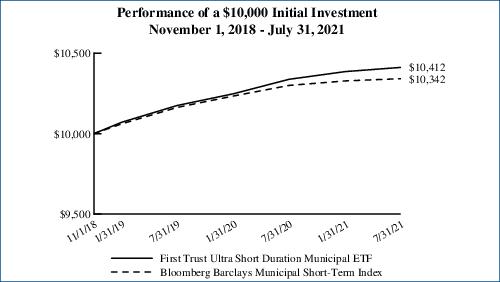
Performance figures assume reinvestment of all distributions and do not reflect the deduction of taxes that a shareholder would pay on Fund distributions or the redemption or sale of Fund shares. An index is a statistical composite that tracks a specified financial market or sector. Unlike the Fund, the index does not actually hold a portfolio of securities and therefore does not incur the expenses incurred by the Fund. These expenses negatively impact the performance of the Fund. The Fund’s past performance does not predict future performance.
Frequency Distribution of Discounts and Premiums
Information showing the number of days the market price of the Fund’s shares was greater (at a premium) and less (at a discount) than the Fund’s net asset value for the most recently completed year, and the most recently completed calendar quarters since that year (or life of the Fund, if shorter), is available at https://www.ftportfolios.com/Retail/etf/home.aspx.
Notes to Fund Performance Overview (Unaudited)
Total returns for the period since inception are calculated from the inception date of each Fund. “Average Annual Total Returns” represent the average annual change in value of an investment over the periods indicated. “Cumulative Total Returns” represent the total change in value of an investment over the periods indicated. The total returns would have been lower if certain fees had not been waived by the Advisor.
Each Fund’s per share net asset value (“NAV”) is the value of one share of the Fund and is computed by dividing the value of all assets of the Fund (including accrued interest and dividends), less all liabilities (including accrued expenses and dividends declared but unpaid), by the total number of outstanding shares. The price used to calculate market return (“Market Price”) is determined by using the midpoint of the national best bid and offer price (“NBBO”) as of the time that the Fund’s NAV is calculated. Under SEC rules, the NBBO consists of the highest displayed buy and lowest sell prices among the various exchanges trading the Fund at the time the Fund’s NAV is calculated. Prior to January 1, 2019, the price used was the midpoint between the highest bid and the lowest offer on the stock exchange on which shares of the Fund were listed for trading as of the time that the Fund’s NAV was calculated. Since shares of each Fund did not trade in the secondary market until after the Fund’s inception, for the period from inception to the first day of secondary market trading in shares of the Fund, the NAV of each Fund is used as a proxy for the secondary market trading price to calculate market returns. NAV and market returns assume that all distributions have been reinvested in each Fund at NAV and Market Price, respectively.
An index is a statistical composite that tracks a specified financial market or sector. Unlike each Fund, the indices do not actually hold a portfolio of securities and therefore do not incur the expenses incurred by each Fund. These expenses negatively impact the performance of each Fund. Also, market returns do not include brokerage commissions that may be payable on secondary market transactions. If brokerage commissions were included, market returns would be lower. The total returns presented reflect the reinvestment of dividends on securities in the indices. The returns presented do not reflect the deduction of taxes that a shareholder would pay on Fund distributions or the redemption or sale of Fund shares. The investment return and principal value of shares of each Fund will vary with changes in market conditions. Shares of each Fund may be worth more or less than their original cost when they are redeemed or sold in the market. Each Fund’s past performance is no guarantee of future performance.
Portfolio Commentary
First Trust Exchange-Traded Fund III
Annual Report
July 31, 2021 (Unaudited)
Advisor
First Trust Advisors L.P. (“First Trust”) serves as the investment advisor to the First Trust Short Duration Managed Municipal ETF (“FSMB”) and the First Trust Ultra Short Duration Municipal ETF (“FUMB”) (each a “Fund” and collectively, the “Funds”). First Trust is responsible for the ongoing monitoring of each Fund’s investment portfolio, managing each Fund’s business affairs and providing certain administrative services necessary for the management of each Fund.
Portfolio Management Team
Tom Futrell, CFA, Senior Vice President, Senior Portfolio Manager
Johnathan N. Wilhelm, Senior Vice President, Senior Portfolio Manager
The First Trust Municipal Securities Team was formed in September of 2013 and is headed by Tom Futrell, CFA, and Johnathan N. Wilhelm who serve as senior portfolio managers of the Funds. Messrs. Futrell and Wilhelm have a combined 50+ years of investment experience and prior to joining First Trust, served as portfolio managers of municipal bonds at Nuveen Investments and Performance Trust Investment Advisors. In addition to the Funds, the team manages/consults for a variety of First Trust investment portfolios and separately managed accounts.
Commentary
First Trust Short Duration Managed Municipal ETF
The First Trust Short Duration Managed Municipal ETF (“FSMB” or the “Fund”) is an actively managed exchange-traded fund. The Fund seeks to provide federally tax-exempt income consistent with capital preservation. Under normal market conditions, the Fund seeks to achieve its investment objective by investing at least 80% of its net assets (including investment borrowings) in municipal debt securities that pay interest that is exempt from regular federal income taxes (collectively, “Municipal Securities”). The Fund’s focus is on the short portion of the municipal yield curve with a weighted average duration of one to three years and an investment orientation focused on investment grade securities. Under normal market conditions, the Fund will primarily invest in Municipal Securities that are, at the time of investment, rated as investment grade by at least one nationally recognized statistical rating organization rating such securities or, if unrated, Municipal Securities determined by the Fund’s investment advisor to be of comparable quality. The Fund may invest up to 35% of its net assets in Municipal Securities rated below investment grade by at least one nationally recognized statistical rating organization rating such securities (or Municipal Securities that are unrated and determined by the Fund’s investment advisor to be of comparable quality), commonly referred to as “high-yield” or “junk” bonds. This commentary discusses the market performance and the Fund’s performance for the 12-month period ended July 31, 2021.
Market Recap
For the 12-month period ended July 31, 2021, the Bloomberg Barclays Municipal Short (1-5) Year Index (the “Benchmark”), produced a total return of 1.11%. For the same period, the Bloomberg Barclays Municipal Bond Index generated a total return of 3.29%. By comparison, the Bloomberg Barclays U.S. Treasury Index generated a total return of -3.01% during the same period. The following have been major factors in explaining the municipal bond market’s performance:
| • | Robust mutual fund and exchange-traded fund inflows helped support municipal bond prices. According to Refinitiv, Lipper, and J.P. Morgan data, year-to-date fund flows through July 31, 2021 totaled approximately $69.5 billion. Over the same period, high yield municipal fund flows totaled approximately $16.4 billion. Fund inflows have also been consistent, with municipal bond funds having experienced inflows in 62 of the past 63 weeks. |
| • | New issue municipal bond supply has been nearly flat year to date. During the first seven months of 2021, new issue supply increased approximately 1.5% to $262.1 billion compared with $258.1 billion a year ago. Of note, when looking at municipal taxable new issue supply as a percentage of total new issue supply, over 23% of municipal bond supply has been brought to market as a taxable municipal bond from January 2020 through June 2021 compared to the previous five years when taxable municipals comprised less than 10% of total new issue municipal supply. |
| • | According to data from Municipal Market Analytics, Inc., the par value of defaults are lower year-to-date compared to the previous two years. The number of municipal bond defaults year-to-date through July 2021 total 36, compared to 50 defaults for the same year-to-date period in 2020 and 35 defaults for the same year-to-date period in 2019. Defaulting municipal securities have been especially centered in the senior living sector which has been particularly hard hit by the coronavirus (“COVID-19”) pandemic with many facilities experiencing lower occupancy and debt service coverage. |
Portfolio Commentary (Continued)
First Trust Exchange-Traded Fund III
Annual Report
July 31, 2021 (Unaudited)
| • | The CARES Act and American Rescue Plan Act legislation helped stabilize many municipal bond issuing borrowers, with tens of billions of dollars made available to states, cities, K-12 education, hospitals, mass transportation, and universities, among the many benefitted sectors. |
| • | As a result of these factors, municipal bond credit spreads have tightened dramatically from April of 2021 for all credit rating categories. In particular, credit spreads tightened substantially for BBB and high yield municipal securities whereby in many cases spreads are now tighter than pre-COVID-19 levels. |
Performance Analysis
The Fund’s net asset value (“NAV”) and market performance for the 12-month period ended July 31, 2021 was 2.92% and 2.87%, respectively, versus the Benchmark’s return of 1.11%.
At the end of the period, the Fund’s market price of $20.95 represented a discount of 0.05% to its NAV of $20.96. The market value of the Fund’s shares fluctuates from time to time and may be higher or lower than the Fund’s NAV. The distribution paid on July 30, 2021 of $0.02 represents a tax-exempt annualized distribution rate of 1.15% based on the Fund’s closing market price of $20.95 on July 30, 2021. The Fund’s distribution rate is not constant and is subject to change over time based on the performance of the Fund.
For the trailing 12 months ended July 31, 2021, regarding credit rating allocations, the Fund’s overweight relative to its Benchmark to “A”, “BBB”, “BB” and non-rated municipal securities were all positive contributors to the Fund’s performance. The Fund’s underweight allocation relative to its Benchmark to “AA” rated municipal securities was another significant positive contributor to the Fund’s performance for the 12-month period ended July 31, 2021. Over the one-year horizon, no credit rating categories were a material negative contributor to the Fund’s performance. Regarding sector allocations, the Fund’s allocation to the industrial development bond, education (primarily charter school), health care and special tax sectors were all positive contributors to the Fund’s outperformance relative to its Benchmark. No sector allocations represented material negative contributors to the Fund’s performance.
As set forth in the Fund’s prospectus, the Fund has an effective duration limit of 3.0 years. As of July 30, 2021, including interest rate hedges, the Fund had a weighted average effective duration of approximately 2.54 years, versus its Benchmark duration of approximately 2.4 years. Regarding yield curve positioning, for the 12-month period ended July 31, 2021, the Fund’s significant overweight to bonds with stated maturities of 4-6 years, 6-8 years and 8-10 years compared to the Benchmark were positive contributors to the Fund’s performance. Bonds with effective durations of 3-7 years were positive contributors to the Fund’s performance for the period ended July 31, 2021. During the 12-month period ended July 31, 2021, no effective duration range was a material negative contributor to the Fund’s performance.
The Fund’s use of Treasury futures detracted from the Fund’s performance for the 12-month period ended July 31, 2021.
Market Outlook
As mentioned above, municipal market technical and fundamental factors have been favorable year-to-date. Record setting year-to-date inflows coupled with manageable new issue supply have been positive factors to the Fund’s performance. Additionally, the relatively unprecedented level of fiscal stimulus coupled with higher vaccination rates and robust growth for the U.S. gross domestic product (“GDP”) has helped improve overall municipal bond credit quality, as demonstrated by lower year-to-date defaults and many sector outlook changes to stable. We believe these factors have driven credit spreads to considerably tighter levels. Looking ahead, given credit spread compression in “A” and “BBB” credit rating categories, we don’t expect much if any additional credit spread compression. While we do believe that high yield credit spreads could continue to tighten a bit further, we believe that municipal bonds are more in a “coupon clipping” environment. Thus, unlike the beginning of 2021 when we had a high degree of confidence that credit spreads would tighten thus supporting total returns for lower investment grade and high yield municipals, municipal bonds are now in general more vulnerable to changes in U.S. Treasury rates that could occur due to the passage of new multi-trillion dollar spending programs by Congress, changes in commentary coming from the Federal Reserve (the “Fed”) regarding the tapering of its $120 billion monthly purchases of mortgage-backed securities and Treasuries, and any setback in the U.S. economic recovery, such as the COVID-19 Delta variant causing portions of the U.S. to curtail economic activity.
We believe yield curve positioning could also be a significant driver of total return by year-end 2021. We expect the U.S. Treasury curve to steepen during the second half of 2021, with the 10-year and 30-year portions of the Treasury curve underperforming the 1-5-year part of the curve. We believe that widespread vaccination rates in the U.S. coupled with incredible amounts of monetary and fiscal stimulus will lead to above trend GDP growth in the second half of 2021. Key factors leading us to believe that the yield curve will steepen include continued progress in vaccination rates thus leading to an even more “open” U.S. and global economy, K-12 students returning to full time, in-person education, and the elimination of Federal supplemental unemployment benefits by the end of
Portfolio Commentary (Continued)
First Trust Exchange-Traded Fund III
Annual Report
July 31, 2021 (Unaudited)
the third quarter of 2021. We believe this will lead to greater gains in the labor market (higher monthly payrolls), while inflation remains well above the Fed’s long-term average goal of 2%.
Finally, we will be watching President Biden’s infrastructure proposals carefully, as they could prove to be materially positive factors for the municipal bond market including: (1) direct Federal aid to rebuilding our nation’s roads, bridges, airports, and mass transit systems, (2) restart of the Build American Bond subsidy program which could reduce tax-exempt supply; and (3) higher tax rates to pay for such proposals could make municipal bonds tax-exempt interest more attractive for high income families as well as banks and insurance companies.
With this in mind, we continue to practice the discipline of our investment process where we perform fundamental credit analysis and quantitative total return scenario analysis on individual bonds and the portfolio as a whole, looking for bonds that we believe can provide both high income and attractive total return potential over time.
First Trust Ultra Short Duration Municipal ETF
The First Trust Ultra Short Duration Municipal ETF (“FUMB” or the “Fund”) is an actively managed exchange-traded fund. The Fund seeks to provide federally tax-exempt income consistent with capital preservation. Under normal market conditions, the Fund seeks to achieve its investment objective by investing at least 80% of its net assets (including investment borrowings) in municipal debt securities that pay interest that is exempt from regular federal income taxes (collectively, “Municipal Securities”). The Fund’s focus is on the short portion of the municipal yield curve with a weighted average duration of less than one year and an investment orientation focused on investment grade securities. Under normal market conditions, the Fund will invest at least 80% of its net assets in Municipal Securities that are, at the time of investment, rated as investment grade by at least one nationally recognized statistical rating organization rating such securities, or if unrated, determined by the Fund’s advisor to be of comparable quality. This commentary discusses the market performance and the Fund’s performance for the 12-month period ended July 31, 2021.
Market Recap
For the 12-month period ended July 31, 2021, the Bloomberg Barclays Municipal Short-Term Index (the “Benchmark”) produced a total return of 0.41%. During the same period, the Bloomberg Barclays Municipal Bond Index generated a total return of 3.29%. By comparison, the Bloomberg Barclays U.S. Treasury Index generated a total return of -3.01% during the same period. The following have been major factors in explaining the municipal bond market’s performance:
| • | Robust mutual fund and exchange-traded fund inflows helped support municipal bond prices. According to Refinitiv, Lipper, and J.P. Morgan data, year-to-date fund flows through July 31, 2021 totaled approximately $69.5 billion. Over the same period, high yield municipal fund flows totaled approximately $16.4 billion. Fund inflows have also been consistent, with municipal bond funds having experienced inflows in 62 of the past 63 weeks. |
| • | New issue municipal bond supply has been nearly flat year to date. During the first seven months of 2021, new issue supply increased approximately 1.5% to $262.1 billion compared with $258.1 billion a year ago. Of note, when looking at municipal taxable new issue supply as a percentage of total new issue supply, over 23% of municipal bond supply has been brought to market as a taxable municipal bond from January 2020 through June 2021 compared to the previous five years when taxable municipals comprised less than 10% of total new issue municipal supply. |
| • | According to data from Municipal Market Analytics, Inc., the par value of defaults are lower year-to-date compared to the previous two years. The number of municipal bond defaults year-to-date through July 2021 total 36, compared to 50 defaults for the same year-to-date period in 2020 and 35 defaults for the same year-to-date period in 2019. Defaulting municipal securities have been especially centered in the senior living sector which has been particularly hard hit by the COVID-19 pandemic with many facilities experiencing lower occupancy and debt service coverage. |
| • | The CARES Act and American Rescue Plan Act legislation helped stabilize many municipal bond issuing borrowers, with tens of billions of dollars made available to states, cities, K-12 education, hospitals, mass transportation, and universities, among the many benefitted sectors. |
| • | As a result of these factors, municipal bond credit spreads have tightened dramatically from April of 2021 for all credit rating categories. In particular, credit spreads tightened substantially for BBB and high yield municipal securities whereby in many cases spreads are now tighter than pre-COVID-19 levels. |
Portfolio Commentary (Continued)
First Trust Exchange-Traded Fund III
Annual Report
July 31, 2021 (Unaudited)
Performance Analysis
The Fund’s NAV and market performance for the 12-month period ended July 31, 2021 was 0.72% and 0.67%, respectively, versus the Benchmark return of 0.41%. The Benchmark is the Bloomberg Barclays Municipal Short-Term Index.
At the end of the period, the Fund’s market price of $20.18 represented a premium of 0.00% (no premium) to its NAV of $20.18. The market value of the Fund’s shares fluctuates from time to time and may be higher or lower than the Fund’s NAV. The distribution paid on July 30, 2021 of $0.006 represents a tax-exempt annualized distribution rate of 0.36% based on the Fund’s closing market price of $20.18 on July 30, 2021. The Fund’s distribution rate is not constant and is subject to change over time based on the performance of the Fund.
For the trailing 12-months ended July 31, 2021, the Fund’s investments in “BBB” rated and non-rated municipal securities generated outperformance for the period versus the Benchmark. The Fund’s investments in “A” and “AA” rated municipal securities also generated outperformance for the same period versus the Benchmark. The Fund’s underweight relative to the Benchmark in “AAA” rated municipal securities detracted from the Fund’s performance for the same period. Sectors within the municipal market that positively contributed to the Fund’s performance over the 12-month period ended July 31, 2021 included health care, education, general obligation, and industrial development bonds. The special tax sector detracted from the Fund’s performance during the reporting period. The Fund’s modified duration at July 31, 2021 was 0.82 years versus 0.52 years for the Benchmark; the Fund’s effective duration at July 31, 2021 was 0.77 years. The Fund’s allocation to bonds with maturities of 0 to 4 years was the strongest contributor to performance over the trailing 12 months. The Fund’s allocation to municipal securities with maturities between 4 to 6 years was a detractor to the Fund’s performance over the period. Bonds with effective durations of 0-4 years were positive contributors to the Fund’s performance for the period. During the same period, no effective duration range was a material negative contributor to the Fund’s performance.
Market Outlook
As mentioned above, municipal market technical and fundamental factors have been favorable year-to-date. Record setting year-to-date inflows coupled with manageable new issue supply have been positive factors to the Fund’s performance. Additionally, the relatively unprecedented level of fiscal stimulus coupled with higher vaccination rates and robust growth in U.S. GDP has helped improve overall municipal bond credit quality, as demonstrated by lower year-to-date defaults and many sectors outlook changes to stable. We believe these factors have driven credit spreads to considerably tighter levels. Looking ahead, given credit spread compression in “A” and “BBB” credit rating categories, we don’t expect much if any additional credit spread compression. While we do believe that high yield credit spreads could continue to tighten a bit further, we believe that municipal bonds are more in a “coupon clipping” environment. Thus, unlike the beginning of 2021 when we had a high degree of confidence that credit spreads would tighten thus supporting total returns for lower investment grade and high yield municipals, we believe municipal bonds are now in general more vulnerable to changes in U.S. Treasury rates that could occur due to the passage of new multi-trillion dollar spending programs by Congress, changes in commentary coming from the Fed regarding the tapering of its $120 billion monthly purchases of mortgage-backed securities and Treasuries, and any setback in the U.S. economic recovery, such as the COVID-19 Delta variant causing portions of the U.S. to curtail economic activity.
We believe yield curve positioning could also be a significant driver of total return by year-end 2021. We expect the U.S. Treasury curve to steepen during the second half of 2021, with the 10-year and 30-year portions of the Treasury curve underperforming the 1-5-year part of the curve. We believe that widespread vaccination rates in the U.S. coupled with incredible amounts of monetary and fiscal stimulus will lead to above trend GDP growth in the second half of 2021. Key factors leading us to believe that the yield curve will steepen include continued progress in vaccination rates thus leading to an even more “open” U.S. and global economy, K-12 students returning to full time, in-person education, and the elimination of Federal supplemental unemployment benefits by the end of the third quarter of 2021. We believe this will lead to greater gains in the labor market (higher monthly payrolls), while inflation remains well above the Fed’s long-term average goal of 2%.
Finally, we will be watching President Biden’s infrastructure proposals carefully, as they could prove to be materially positive factors for the municipal bond market including: (1) direct Federal aid to rebuilding our nation’s roads, bridges, airports, and mass transit systems, (2) restart of the Build American Bond subsidy program which could reduce tax-exempt supply; and (3) higher tax rates to pay for such proposals could make municipal bonds tax-exempt interest more attractive for high income families as well as banks and insurance companies.
Portfolio Commentary (Continued)
First Trust Exchange-Traded Fund III
Annual Report
July 31, 2021 (Unaudited)
With this in mind, we continue to practice the discipline of our investment process where we perform fundamental credit analysis and quantitative total return scenario analysis on individual bonds and the portfolio as a whole, looking for bonds that we believe can provide a high level of tax-exempt income consistent with capital preservation.
First Trust Exchange-Traded Fund III
Understanding Your Fund Expenses
July 31, 2021 (Unaudited)
As a shareholder of First Trust Short Duration Managed Municipal ETF or First Trust Ultra Short Duration Municipal ETF (each a “Fund” and collectively, the “Funds”), you incur two types of costs: (1) transaction costs; and (2) ongoing costs, including management fees, distribution and/or service (12b-1) fees, if any, and other Fund expenses. This Example is intended to help you understand your ongoing costs of investing in the Funds and to compare these costs with the ongoing costs of investing in other funds.
The Example is based on an investment of $1,000 invested at the beginning of the period and held through the six-month period ended July 31, 2021.
Actual Expenses
The first line in the following table provides information about actual account values and actual expenses. You may use the information in this line, together with the amount you invested, to estimate the expenses that you paid over the period. Simply divide your account value by $1,000 (for example, an $8,600 account value divided by $1,000 = 8.6), then multiply the result by the number in the first line under the heading entitled “Expenses Paid During the Six-Month Period” to estimate the expenses you paid on your account during this six-month period.
Hypothetical Example for Comparison Purposes
The second line in the following table provides information about hypothetical account values and hypothetical expenses based on each Fund’s actual expense ratio and an assumed rate of return of 5% per year before expenses, which is not each Fund’s actual return. The hypothetical account values and expenses may not be used to estimate the actual ending account balance or expenses you paid for the period. You may use this information to compare the ongoing costs of investing in the Funds and other funds. To do so, compare this 5% hypothetical example with the 5% hypothetical examples that appear in the shareholder reports of the other funds.
Please note that the expenses shown in the table are meant to highlight your ongoing costs only and do not reflect any transactional costs such as brokerage commissions. Therefore, the second line in the table is useful in comparing ongoing costs only, and will not help you determine the relative total costs of owning different funds. In addition, if these transactional costs were included, your costs would have been higher.
| | Beginning
Account Value
February 1, 2021 | Ending
Account Value
July 31, 2021 | Annualized
Expense Ratio
Based on the
Six-Month
Period (a) | Expenses Paid
During the
Six-Month
Period (b) |
| First Trust Short Duration Managed Municipal ETF (FSMB) |
| Actual | $1,000.00 | $1,010.60 | 0.41% | $2.04 |
| Hypothetical (5% return before expenses) | $1,000.00 | $1,022.76 | 0.41% | $2.06 |
| First Trust Ultra Short Duration Municipal ETF (FUMB) |
| Actual | $1,000.00 | $1,002.50 | 0.25% | $1.24 |
| Hypothetical (5% return before expenses) | $1,000.00 | $1,023.55 | 0.25% | $1.25 |
| (a) | These expense ratios reflect expense waivers. See Note 3 in the Notes to Financial Statements. |
| (b) | Expenses are equal to the annualized expense ratios as indicated in the table multiplied by the average account value over the period (February 1, 2021 through July 31, 2021), multiplied by 181/365 (to reflect the six-month period). |
First Trust Short Duration Managed Municipal ETF (FSMB)
Portfolio of Investments
July 31, 2021
Principal
Value | | Description | | Stated
Coupon | | Stated
Maturity | | Value |
| MUNICIPAL BONDS – 96.9% |
| | | Alabama – 4.7% | | | | | | |
| $1,000,000 | | AL Federal Aid Hwy Fin Auth Spl Oblig Rev, GARVEE
| | 5.00% | | 09/01/30 | | $1,143,674 |
| 50,000 | | Birmingham AL Spl Care Facs Fing Auth Hlthcare Fac Ref Children’s Hosp of AL
| | 5.00% | | 06/01/26 | | 58,163 |
| 65,000 | | Birmingham AL Spl Care Facs Fing Auth Hlthcare Fac Ref Children’s Hosp of AL
| | 5.00% | | 06/01/27 | | 75,532 |
| 210,000 | | Black Belt Energy Gas Dist AL Gas Prepay Rev Proj #5, Ser A-1 (Mandatory put 10/01/26)
| | 4.00% | | 10/01/49 | | 244,668 |
| 535,000 | | Black Belt Energy Gas Dist AL Gas Prepay Rev, Ser A (Mandatory put 12/01/23)
| | 4.00% | | 12/01/48 | | 578,089 |
| 275,000 | | Black Belt Energy Gas Dist AL Gas Sply Rev, Ser A (Mandatory put 07/01/22)
| | 4.00% | | 08/01/47 | | 283,356 |
| 100,000 | | Greenville AL Pub Impt Cooperative Pub Impt Rev Greenville Funding, BAM
| | 5.00% | | 03/01/25 | | 116,530 |
| 145,000 | | Infirmary Hlth Sys AL Spl Care Facs Fing Auth Rev Infirmary Hlth Sys Inc, Ser A
| | 5.00% | | 02/01/25 | | 167,256 |
| 160,000 | | Infirmary Hlth Sys AL Spl Care Facs Fing Auth Rev Infirmary Hlth Sys Inc, Ser A
| | 5.00% | | 02/01/28 | | 189,650 |
| 905,000 | | Lower AL Gas Dist Gas Proj Rev Gas Proj Rev Bonds Proj 2 (Mandatory put 12/01/25)
| | 4.00% | | 12/01/50 | | 1,033,584 |
| 500,000 | | Mizuho Floater Residual Trust Various States Floaters Miz 9024, Ser 2020 (a) (b)
| | 0.27% | | 12/01/48 | | 500,000 |
| 430,000 | | Prichard AL Wtrwks & Swr Brd Wtr & Swr Rev Ref
| | 5.00% | | 11/01/25 | | 497,874 |
| 40,000 | | SE AL St Gas Sply Dist Gas Sply Rev Proj #1, Ser A (Mandatory put 04/01/24)
| | 4.00% | | 04/01/49 | | 43,639 |
| 10,000 | | SE AL St Gas Sply Dist Gas Sply Rev Proj #2, Ser A
| | 4.00% | | 06/01/23 | | 10,702 |
| 150,000 | | SE AL St Gas Sply Dist Gas Sply Rev Proj #2, Ser A (Mandatory put 06/01/24)
| | 4.00% | | 06/01/49 | | 164,361 |
| 350,000 | | SE Energy Auth AL Cmdy Sply Rev Proj #1, Ser A
| | 4.00% | | 10/01/23 | | 377,832 |
| 500,000 | | SE Energy Auth AL Cmdy Sply Rev Proj #1, Ser A
| | 4.00% | | 10/01/25 | | 570,263 |
| | | | | 6,055,173 |
| | | Arizona – 3.0% | | | | | | |
| 110,000 | | AZ St Indl Dev Auth Edu Rev Greathearts AZ Proj, Ser A
| | 4.00% | | 07/01/23 | | 117,857 |
| 1,000,000 | | AZ St Indl Dev Auth Rev Lincoln S Beltway Proj
| | 5.00% | | 05/01/27 | | 1,240,071 |
| 1,000,000 | | Coconino Cnty AZ Poll Controlcorp Ref NV Pwr Company Remk, Ser A, AMT (Mandatory put 03/31/23)
| | 1.88% | | 09/01/32 | | 1,024,268 |
| 95,000 | | Glendale AZ Indl Dev Auth Sr Living Facs Rev Ref Royal Oaks Life Care Cmnty
| | 4.00% | | 05/15/29 | | 102,998 |
| 615,000 | | Maricopa Cnty AZ Indl Dev Auth Edu Rev Legacy Trad Sch Proj
| | 5.00% | | 07/01/24 | | 693,897 |
| 580,000 | | Phoenix AZ Indl Dev Auth Edu Rev Ref Basis Sch (a)
| | 5.00% | | 07/01/35 | | 651,885 |
| | | | | 3,830,976 |
| | | Arkansas – 0.2% | | | | | | |
| 110,000 | | AR St Dev Fin Auth Hlthcare Facs Rev Carti Surgery Ctr Proj, Ser B
| | 4.00% | | 07/01/23 | | 115,435 |
| 140,000 | | AR St Dev Fin Auth Hlthcare Facs Rev Carti Surgery Ctr Proj, Ser B
| | 4.00% | | 07/01/25 | | 152,239 |
| | | | | 267,674 |
| | | California – 7.1% | | | | | | |
| 25,000 | | CA St Enterprise Dev Auth Stdt Hsg Rev M@College Proj, Ser A
| | 5.00% | | 08/01/23 | | 27,372 |
| 50,000 | | CA St Enterprise Dev Auth Stdt Hsg Rev M@College Proj, Ser A
| | 5.00% | | 08/01/24 | | 56,823 |
| 205,000 | | CA St Hlth Facs Fing Auth Rev Adventist Hlth Sys W, Ser A
| | 5.00% | | 03/01/23 | | 220,811 |
| 405,000 | | CA St Hlth Facs Fing Auth Rev Adventist Hlth Sys W, Ser A
| | 4.00% | | 03/01/33 | | 428,720 |
| 385,000 | | CA St Hlth Facs Fing Auth Rev El Camino Hosp
| | 5.00% | | 02/01/33 | | 476,105 |
Page 14
See Notes to Financial Statements
First Trust Short Duration Managed Municipal ETF (FSMB)
Portfolio of Investments (Continued)
July 31, 2021
Principal
Value | | Description | | Stated
Coupon | | Stated
Maturity | | Value |
| MUNICIPAL BONDS (Continued) |
| | | California (Continued) | | | | | | |
| $300,000 | | CA St Poll Control Fin Auth Sol Wst Disp Rev Ref Wst Mgmt Inc, Ser A1, AMT
| | 3.38% | | 07/01/25 | | $334,848 |
| 900,000 | | CA St Ref Various Purp
| | 4.00% | | 11/01/24 | | 1,012,006 |
| 25,000 | | CA St Stwd Cmntys Dev Auth Spl Tax Rev Impt Area No. 1
| | 4.00% | | 09/01/22 | | 25,901 |
| 40,000 | | CA St Stwd Cmntys Dev Auth Spl Tax Rev Impt Area No. 1
| | 4.00% | | 09/01/23 | | 42,650 |
| 50,000 | | CA St Stwd Cmntys Dev Auth Spl Tax Rev Impt Area No. 1
| | 4.00% | | 09/01/24 | | 54,668 |
| 80,000 | | CA St Stwd Cmntys Dev Auth Spl Tax Rev Impt Area No. 1
| | 4.00% | | 09/01/25 | | 89,063 |
| 325,000 | | CA St Stwd Cmntys Dev Auth Stwd Rev Dev Auth, Ser 2021A
| | 4.00% | | 09/02/24 | | 352,368 |
| 355,000 | | CA St Stwd Cmntys Dev Auth Stwd Rev Dev Auth, Ser 2021A
| | 4.00% | | 09/02/25 | | 391,202 |
| 215,000 | | Cathedral City CA Redev Agy Successor Agy Tax Allocation Rev Ref Sub Hsg Merged Redev Proj Area, Ser C
| | 4.00% | | 08/01/23 | | 229,636 |
| 115,000 | | Folsom Ranch CA Fing Auth Spl Tax Rev White Rock Springs Ranch
| | 3.00% | | 09/01/23 | | 120,327 |
| 100,000 | | Folsom Ranch CA Fing Auth Spl Tax Rev White Rock Springs Ranch
| | 4.00% | | 09/01/26 | | 112,774 |
| 295,000 | | Fontana CA Spl Tax Summit at Rosena Phase One
| | 3.00% | | 09/01/24 | | 314,261 |
| 160,000 | | Golden St Tobacco Securitization Corp CA Tobacco Stlmt Enhanced Asset Bkd, Ser A
| | 5.00% | | 06/01/30 | | 174,209 |
| 195,000 | | Hemet CA Unif Sch Dist Facs Dist Spl Tax Ref
| | 4.00% | | 09/01/25 | | 217,421 |
| 25,000 | | Irvine CA Impt Bond Act 1915 Ltd Oblig Re-Assmnt Dist #13-1
| | 5.00% | | 09/02/23 | | 27,623 |
| 400,000 | | Long Beach CA Bond Fin Auth Nat Gas Pur Rev, Ser A
| | 5.25% | | 11/15/22 | | 425,974 |
| 290,000 | | Los Angeles CA Dept of Arpts Arpt Rev Sub, Ser A, AMT
| | 4.00% | | 05/15/36 | | 328,138 |
| 105,000 | | Rancho Cordova CA Cmnty Facs Dist Spl Tax Rev Grantline 208 Cmnty Fac Dt #2018-1
| | 3.00% | | 09/01/21 | | 105,205 |
| 85,000 | | Rancho Cordova CA Cmnty Facs Dist Spl Tax Rev Grantline 208 Cmnty Fac Dt #2018-1
| | 3.00% | | 09/01/23 | | 88,919 |
| 90,000 | | Rancho Cordova CA Cmnty Facs Dist Spl Tax Rev Grantline 208 Cmnty Fac Dt #2018-1
| | 3.00% | | 09/01/24 | | 95,820 |
| 365,000 | | Rio Vista CA Pub Fing Auth Spl Tax Rev Ref
| | 5.00% | | 09/01/24 | | 414,667 |
| 630,000 | | River Islands CA Pub Fing Auth Spl Tax Ref Cmnty Facs Dist #2003-1
| | 5.00% | | 09/01/27 | | 669,790 |
| 195,000 | | Riverside CA Unif Sch Dist Cmnty Facs Dt #33 Citrus Heights II Spl Tax
| | 3.00% | | 09/01/24 | | 206,326 |
| 240,000 | | Roseville CA Fin Auth Spl Tax Rev Ref, Ser A
| | 5.00% | | 09/01/25 | | 286,241 |
| 60,000 | | Roseville CA Spl Tax Svsp Westpark Federico Cmnty Facs Dt No. 1
| | 3.00% | | 09/01/24 | | 63,447 |
| 70,000 | | Roseville CA Spl Tax Svsp Westpark Federico Cmnty Facs Dt No. 1
| | 3.00% | | 09/01/25 | | 74,860 |
| 85,000 | | Roseville CA Spl Tax Svsp Westpark Federico Cmnty Facs Dt No. 1
| | 4.00% | | 09/01/26 | | 95,902 |
| 100,000 | | San Diego Cnty CA Regl Arpt Auth Subord Ref, Ser A
| | 5.00% | | 07/01/24 | | 113,921 |
| 140,000 | | San Francisco CA City & Cnty Arpts Commn Intl Arpt Rev Ref 2nd Ser, Ser A
| | 4.00% | | 05/01/26 | | 164,023 |
| 200,000 | | San Francisco CA City & Cnty Dcnty Dev Spl Tax Dist No Mission Rock Fac and Svcs, Ser A (a)
| | 4.00% | | 09/01/26 | | 225,716 |
| 150,000 | | San Francisco City & Cnty CA Cmnty Facs Dist #2016-1, Ser 2021
| | 4.00% | | 09/01/25 | | 166,137 |
| 400,000 | | San Francisco City & Cnty CA Cmnty Facs Dist #2016-1, Ser 2021
| | 4.00% | | 09/01/26 | | 450,019 |
| 175,000 | | San Luis Obispo CA Cmnty Facs Dist #2019-1 Spl Tax
| | 4.00% | | 09/01/25 | | 195,344 |
| 100,000 | | San Luis Obispo CA Cmnty Facs Dist #2019-1 Spl Tax
| | 4.00% | | 09/01/26 | | 113,721 |
| 50,000 | | Temecula CA Pub Fing Auth Spl Tax Ref, BAM
| | 5.00% | | 09/01/25 | | 59,634 |
See Notes to Financial Statements
Page 15
First Trust Short Duration Managed Municipal ETF (FSMB)
Portfolio of Investments (Continued)
July 31, 2021
Principal
Value | | Description | | Stated
Coupon | | Stated
Maturity | | Value |
| MUNICIPAL BONDS (Continued) |
| | | California (Continued) | | | | | | |
| $125,000 | | Tobacco Securitization Auth Sthrn CA Tobacco Stlmt Rev Ref San Diego Co Asset Securitization Corp Class 1, Ser A
| | 5.00% | | 06/01/25 | | $146,821 |
| | | | | 9,199,413 |
| | | Colorado – 1.3% | | | | | | |
| 500,000 | | CO St Eductnl & Cultural Facs Auth Rev Ref & Impt Chrt Sch Univ Lab Bldg Corp
| | 5.00% | | 12/15/28 | | 561,630 |
| 110,000 | | CO St Eductnl & Cultural Facs Auth Rev Ref Chrt Sch Stargate Chrt Sch Proj, Ser A
| | 5.00% | | 12/01/25 | | 130,567 |
| 100,000 | | CO St Eductnl & Cultural Facs Auth Rev Ref N Star Acdmy Chrt Sch Proj
| | 4.00% | | 11/01/23 | | 108,149 |
| 130,000 | | CO St Hlth Facs Auth Hosp Rev Ref Commonspirit Hlth, Ser B-1 (Mandatory put 08/01/25)
| | 5.00% | | 08/01/49 | | 150,659 |
| 80,000 | | CO St Hlth Facs Auth Rev Ref Parkview Med Cntr, Ser A
| | 3.25% | | 09/01/25 | | 88,397 |
| 190,000 | | CO St Hlth Facs Auth Rev Ref Parkview Med Cntr, Ser B
| | 5.00% | | 09/01/28 | | 220,769 |
| 100,000 | | Colorado Springs CO Pikes Peak Americas Mountain Enterprise Pikes Peak
| | 5.00% | | 12/01/21 | | 101,571 |
| 125,000 | | Crystal Vly CO Met Dist #2 Ref, Ser A, AGM
| | 5.00% | | 12/01/23 | | 138,655 |
| 15,000 | | E-470 CO Pub Hwy Auth Cap Apprec Sr, Ser B, NATL-RE
| | (c) | | 09/01/23 | | 14,879 |
| 105,000 | | Park Creek CO Met Dist Rev Ref Sr Ltd Property Tax Supported, Ser A
| | 5.00% | | 12/01/34 | | 122,283 |
| | | | | 1,637,559 |
| | | Connecticut – 2.7% | | | | | | |
| 100,000 | | CT St
| | 5.00% | | 08/01/31 | | 117,379 |
| 50,000 | | CT St Hlth & Eductnl Facs Auth Rev Hartford Hlthcare, Ser E
| | 5.00% | | 07/01/25 | | 56,679 |
| 170,000 | | CT St Hlth & Eductnl Facs Auth Rev Ref
| | 5.00% | | 07/01/29 | | 198,147 |
| 650,000 | | CT St Hlth & Eductnl Facs Auth Rev Temps 50 Mclean Issue, Ser B-2 (a)
| | 2.75% | | 01/01/26 | | 658,683 |
| 50,000 | | CT St Spl Tax Oblig Rev Ref Transprtn Infra, Ser B
| | 5.00% | | 08/01/27 | | 59,129 |
| 165,000 | | CT St Spl Tax Oblig Rev Transprtn Infra, Ser A
| | 5.00% | | 09/01/33 | | 187,942 |
| 130,000 | | CT St, Ser E
| | 5.00% | | 09/15/25 | | 155,022 |
| 100,000 | | CT St, Ser F
| | 2.00% | | 11/15/21 | | 100,557 |
| 315,000 | | Hamden CT Ref, Ser A, BAM
| | 5.00% | | 08/01/23 | | 344,333 |
| 145,000 | | Hamden CT Ref, Ser A, BAM
| | 5.00% | | 08/01/24 | | 164,658 |
| 200,000 | | Hamden CT Ref, Ser A, BAM
| | 5.00% | | 08/01/25 | | 234,602 |
| 25,000 | | Univ of CT CT Ref, Ser A
| | 5.00% | | 03/15/27 | | 29,982 |
| 970,000 | | Univ of CT CT, Ser A
| | 5.00% | | 11/01/26 | | 1,193,724 |
| 25,000 | | Univ of CT CT, Ser A
| | 5.00% | | 11/01/35 | | 31,675 |
| | | | | 3,532,512 |
| | | Florida – 7.8% | | | | | | |
| 150,000 | | Alachua Cnty FL Hlth Facs Auth Shands Teaching Hosp & Clinics, Ser A
| | 5.00% | | 12/01/26 | | 171,971 |
| 500,000 | | Babcock Ranch Cmnty Indep Spl Dist FL Spl Assmnt Rev Proj, Ser 2021
| | 2.38% | | 05/01/26 | | 502,196 |
| 250,000 | | Berry Bay Cdd FL Spl Assmt Rev Assmt Area 1
| | 2.63% | | 05/01/26 | | 253,581 |
| 250,000 | | Citizens Property Insurance Corp FL, Ser A1
| | 5.00% | | 06/01/22 | | 254,010 |
| 550,000 | | FL St Brd of Governors FL Intl Univ Dorm Rev Ref, Ser A, BAM
| | 5.00% | | 07/01/27 | | 687,172 |
| 110,000 | | FL St Dev Fin Corp Eductnl Facs Rev River City Science Acdmy Projs, Ser A
| | 4.00% | | 07/01/24 | | 119,274 |
| 330,000 | | FL St Dev Fin Corp Eductnl Facs Rev River City Science Acdmy Projs, Ser A
| | 4.00% | | 07/01/25 | | 365,321 |
| 155,000 | | FL St Dev Fin Corp Eductnl Facs Rev River City Science Acdmy Projs, Ser A
| | 4.00% | | 07/01/26 | | 174,785 |
Page 16
See Notes to Financial Statements
First Trust Short Duration Managed Municipal ETF (FSMB)
Portfolio of Investments (Continued)
July 31, 2021
Principal
Value | | Description | | Stated
Coupon | | Stated
Maturity | | Value |
| MUNICIPAL BONDS (Continued) |
| | | Florida (Continued) | | | | | | |
| $150,000 | | FL St Dev Fin Corp Eductnl Facs Rev River City Science Acdmy Projs, Ser A
| | 4.00% | | 07/01/28 | | $173,854 |
| 105,000 | | FL St Dev Fin Corp Sr Living Rev Ref Glenridge on Palmer Ranch Proj
| | 4.00% | | 06/01/24 | | 113,027 |
| 100,000 | | FL St Dev Fin Corp Sr Living Rev Ref Glenridge on Palmer Ranch Proj
| | 4.00% | | 06/01/25 | | 109,617 |
| 245,000 | | Gulfstream Polo Cmnty Dev Dist FL Spl Assmnt Phase 2 Proj
| | 3.00% | | 11/01/24 | | 250,377 |
| 405,000 | | Hills Minneola Cmnty Dev Dist FL Spl Assmnt Rev S Parcel Assmnt Area (a)
| | 3.00% | | 05/01/25 | | 415,831 |
| 450,000 | | Hollywood Beach FL Cmnty Dev Dist Rev Cdd Ref Pub Pkg Fac Proj, Ser I
| | 5.00% | | 10/01/23 | | 494,853 |
| 575,000 | | Hollywood Beach FL Cmnty Dev Dist Rev Cdd Ref Pub Pkg Fac Proj, Ser I
| | 5.00% | | 10/01/24 | | 656,931 |
| 210,000 | | Jea FL Elec Sys Rev Sub, Ser B
| | 5.00% | | 10/01/22 | | 221,913 |
| 100,000 | | Lakeland FL Hosp Sys Rev Lakeland Regl Hlth
| | 5.00% | | 11/15/33 | | 115,665 |
| 230,000 | | Lakes of Sarasota Cdd FL Impt Rev Phase 1 Proj, Ser A-1
| | 2.75% | | 05/01/26 | | 232,974 |
| 170,000 | | Lakewood Ranch FL Stewardship Dist Spl Assmnt Rev Ref Country Club E Proj, AGM
| | 5.00% | | 05/01/25 | | 197,833 |
| 635,000 | | Miami-Dade Cnty FL Aviation Rev Ref, Ser A, AMT
| | 5.00% | | 10/01/38 | | 740,887 |
| 500,000 | | Mirada Ii Cmnty Dev Dist FL Cap Impt Rev
| | 2.50% | | 05/01/26 | | 505,801 |
| 25,000 | | Orange Cnty FL Hlth Facs Auth Rev Ref Presbyterian Retmnt Cmntys
| | 5.00% | | 08/01/31 | | 27,779 |
| 160,000 | | Palm Beach Cnty FL Hlth Facs Auth Ref Acts Retmnt Life Cmntys Inc Oblig Grp
| | 5.00% | | 11/15/32 | | 191,849 |
| 230,000 | | Parkway Ctr FL Cdd Spl Assmnt Rev Ref Assmt Area, Ser 1
| | 3.50% | | 05/01/22 | | 233,193 |
| 100,000 | | Poinciana FL W Cdd Spl Assmnt Ref Sr, Ser 1, AGM
| | 3.60% | | 05/01/26 | | 111,672 |
| 125,000 | | Rhodine Road N CDD FL Spl Assmnt
| | 3.50% | | 05/01/24 | | 128,894 |
| 115,000 | | Saint Johns Cnty FL Indl Dev Auth Sr Living Rev Ref Vicar’s Landing Proj, Ser A
| | 4.00% | | 12/15/23 | | 123,104 |
| 145,000 | | Saint Johns Cnty FL Indl Dev Auth Sr Living Rev Ref Vicar’s Landing Proj, Ser A
| | 4.00% | | 12/15/24 | | 158,657 |
| 385,000 | | Sarasota Natl FL Cdd Spl Assmnt Ref
| | 3.00% | | 05/01/23 | | 397,330 |
| 375,000 | | Sarasota Natl FL Cdd Spl Assmnt Ref
| | 3.00% | | 05/01/24 | | 391,197 |
| 240,000 | | Sarasota Natl FL Cdd Spl Assmnt Ref
| | 3.00% | | 05/01/25 | | 251,804 |
| 250,000 | | Shingle Creek at Bronson Cdd FL Spl Assmnt
| | 2.50% | | 06/15/26 | | 253,025 |
| 350,000 | | Six Mile Creek FL Cdd Capital Impt Rev Assmnt Area 3 Phase 1
| | 2.50% | | 05/01/26 | | 353,318 |
| 30,000 | | Tampa FL Capital Impt Cigarette Tax Allocation H Lee Moffitt Cancer Ctr Proj, Ser A
| | 5.00% | | 09/01/24 | | 34,330 |
| 375,000 | | V Dana Cdd FL Spl Assmnt Cdd Assmnt Area One 2021 Proj
| | 2.60% | | 05/01/26 | | 380,196 |
| 130,000 | | Vlg FL CDD #6 Spl Assmnt Rev Ref
| | 4.00% | | 05/01/25 | | 144,024 |
| 250,000 | | Westside Haines City Cdd Spl Assmnt Assmnt Area One Proj
| | 2.50% | | 05/01/26 | | 250,230 |
| | | | | 10,188,475 |
| | | Georgia – 2.7% | | | | | | |
| 100,000 | | Burke Cnty GA Dev Auth Poll Control Rev Var GA Pwr Co Plant Vogtle Proj Remk (Mandatory put 06/13/24)
| | 2.15% | | 10/01/32 | | 105,008 |
| 155,000 | | Fulton Cnty GA Rsdl Care Facs Elderly Auth Retmnt Fac Rev Ref Lenbrook Sq Fdtn Inc
| | 4.00% | | 07/01/22 | | 159,378 |
| 175,000 | | Gainesville & Hall Cnty GA Hosp Auth Ref NE GA Hlth System Inc Proj, Ser A
| | 5.00% | | 02/15/24 | | 196,057 |
| 190,000 | | Glynn Brunswick GA Memorial Hosp Auth Ref Antic Ctfs SE GA Hlth
| | 5.00% | | 08/01/23 | | 207,214 |
| 715,000 | | Madison Cnty GA Sch Dist Ref Capital Impt Proj, COPS
| | 4.00% | | 05/01/25 | | 805,900 |
| 95,000 | | Main Street Nat Gas Inc GA Gas Rev, Ser A
| | 5.50% | | 09/15/23 | | 105,346 |
| 830,000 | | Main Street Nat Gas Inc GA Gas Rev, Ser B
| | 5.00% | | 03/15/22 | | 854,156 |
See Notes to Financial Statements
Page 17
First Trust Short Duration Managed Municipal ETF (FSMB)
Portfolio of Investments (Continued)
July 31, 2021
Principal
Value | | Description | | Stated
Coupon | | Stated
Maturity | | Value |
| MUNICIPAL BONDS (Continued) |
| | | Georgia (Continued) | | | | | | |
| $240,000 | | Main Street Nat Gas Inc GA Gas Sply Rev, Ser A
| | 5.00% | | 05/15/25 | | $280,839 |
| 500,000 | | Main Street Nat Gas Inc GA Gas Sply Rev, Ser C
| | 5.00% | | 09/01/26 | | 607,503 |
| 165,000 | | Muni Elec Auth of GA Ref Plant Vogtle Units 3&4 Proj J, Ser A, AGM
| | 5.00% | | 01/01/27 | | 203,473 |
| | | | | 3,524,874 |
| | | Hawaii – 0.1% | | | | | | |
| 100,000 | | Honolulu City & Cnty HI Wstwtr Sys Rev Ref Sr First Bd Resolution, Ser B
| | 4.00% | | 07/01/32 | | 113,380 |
| | | Illinois – 9.8% | | | | | | |
| 135,000 | | Chicago IL Brd of Edu Cap Apprec Sch Reform, Ser B-1, NATL-RE
| | (c) | | 12/01/22 | | 134,050 |
| 175,000 | | Chicago IL Brd of Edu Green Bond, Ser E
| | 5.13% | | 12/01/32 | | 197,800 |
| 1,000,000 | | Chicago IL Brd of Edu Ref, Ser A
| | 4.00% | | 12/01/21 | | 1,011,948 |
| 190,000 | | Chicago IL Brd of Edu Ref, Ser A, AMBAC
| | 5.50% | | 12/01/23 | | 210,796 |
| 400,000 | | Chicago IL Brd of Edu Ref, Ser C
| | 5.00% | | 12/01/22 | | 424,082 |
| 540,000 | | Chicago IL Park Dist Ref Ltd Tax, Ser B
| | 5.00% | | 01/01/28 | | 593,982 |
| 135,000 | | Chicago IL Park Dist Ref, Ser C
| | 5.00% | | 01/01/25 | | 137,531 |
| 50,000 | | Chicago IL Ref Proj, Ser A
| | 5.00% | | 01/01/27 | | 55,156 |
| 210,000 | | Chicago IL Ref, 2003B Remk
| | 5.00% | | 01/01/26 | | 240,525 |
| 100,000 | | Chicago IL Ref, 2003B Remk
| | 5.13% | | 01/01/27 | | 114,641 |
| 110,000 | | Chicago IL Ref, Ser C
| | 5.00% | | 01/01/26 | | 130,216 |
| 260,000 | | Chicago IL Ref, Ser C
| | 5.00% | | 01/01/35 | | 300,077 |
| 65,000 | | Chicago IL Ref, Ser C, CABS
| | (c) | | 01/01/25 | | 61,332 |
| 500,000 | | Chicago IL Wstwtr Trans Rev Ref Second Lien Remk, Ser C
| | 5.00% | | 01/01/27 | | 577,290 |
| 100,000 | | Chicago IL Wstwtr Trans Rev Ref Second Lien, Ser B
| | 5.00% | | 01/01/24 | | 111,067 |
| 325,000 | | Chicago IL Wtrwks Rev 2nd Lien Proj
| | 5.00% | | 11/01/27 | | 371,379 |
| 100,000 | | Chicago IL, Ser A
| | 5.00% | | 01/01/26 | | 114,536 |
| 90,000 | | Ford Champaign Etc Cntys IL Cmnty Unit Sch Dist #10 Sch Bldg, Ser A, AGM
| | 4.00% | | 12/01/25 | | 103,198 |
| 160,000 | | Hillside IL Tax Incr Rev Ref
| | 5.00% | | 01/01/24 | | 167,075 |
| 250,000 | | IL St
| | 5.00% | | 03/01/22 | | 256,995 |
| 395,000 | | IL St
| | 5.00% | | 05/01/23 | | 427,347 |
| 125,000 | | IL St
| | 5.00% | | 05/01/24 | | 140,678 |
| 90,000 | | IL St
| | 5.00% | | 06/01/27 | | 107,865 |
| 170,000 | | IL St
| | 4.00% | | 01/01/31 | | 189,650 |
| 195,000 | | IL St Fin Auth Hlth Svcs Facs Lease Rev Univ of IL Hlth Svcs Facility Proj
| | 5.00% | | 10/01/24 | | 221,860 |
| 50,000 | | IL St Ref
| | 5.00% | | 08/01/21 | | 50,000 |
| 85,000 | | IL St Ref
| | 4.00% | | 08/01/25 | | 88,041 |
| 70,000 | | IL St, Ser A
| | 5.25% | | 05/01/22 | | 72,643 |
| 100,000 | | IL St, Ser A
| | 4.00% | | 01/01/24 | | 101,582 |
| 15,000 | | IL St, Ser A
| | 4.00% | | 01/01/25 | | 15,229 |
| 700,000 | | IL St, Ser C
| | 5.00% | | 11/01/29 | | 860,978 |
| 280,000 | | IL St, Ser D
| | 5.00% | | 11/01/23 | | 309,135 |
| 370,000 | | IL St, Ser D
| | 5.00% | | 11/01/24 | | 424,031 |
| 700,000 | | Macon Cnty IL Sch Dist #61, AGM
| | 4.00% | | 12/01/25 | | 792,054 |
| 650,000 | | Northern IL Univ Revs Brd of Trustees Aux Facs Sys Rev N IL Univ Ref, BAM
| | 5.00% | | 10/01/25 | | 764,213 |
| 515,000 | | Railsplitter IL Tobacco Stlmt Auth
| | 5.00% | | 06/01/27 | | 622,445 |
| 495,000 | | Springfield IL Elec Rev Ref Sr Lien
| | 5.00% | | 03/01/27 | | 575,095 |
| 570,000 | | Springfield IL Elec Rev Ref Sr Lien
| | 5.00% | | 03/01/31 | | 659,147 |
| 600,000 | | Sthrn IL St Univ Ref Sthrn IL Univ Hsg and Aux Facs Sys, Ser A, BAM
| | 4.00% | | 04/01/25 | | 674,564 |
Page 18
See Notes to Financial Statements
First Trust Short Duration Managed Municipal ETF (FSMB)
Portfolio of Investments (Continued)
July 31, 2021
Principal
Value | | Description | | Stated
Coupon | | Stated
Maturity | | Value |
| MUNICIPAL BONDS (Continued) |
| | | Illinois (Continued) | | | | | | |
| $365,000 | | Univ of IL IL Rev Ref Auxiliary Facs Sys, Ser A
| | 5.00% | | 04/01/22 | | $376,835 |
| | | | | 12,787,068 |
| | | Indiana – 2.2% | | | | | | |
| 1,010,000 | | Brownsburg IN 1999 Sch Bldg Corp, BANS (a)
| | 1.50% | | 05/13/22 | | 1,012,478 |
| 125,000 | | IN Bond Bank Rev Hamilton Co Projs, CABS
| | (c) | | 01/15/26 | | 121,020 |
| 215,000 | | IN St Bond Bank Spl Prog Gas Rev, Ser A
| | 5.25% | | 10/15/21 | | 217,107 |
| 675,000 | | Indianapolis IN Loc Pub Impt Bond Bank Ref Cityway 1 Proj, Ser B
| | 5.00% | | 02/01/35 | | 750,316 |
| 100,000 | | La Porte IN Wtrwks Rev, AGM
| | 4.00% | | 01/01/24 | | 107,766 |
| 105,000 | | La Porte IN Wtrwks Rev, AGM
| | 4.00% | | 07/01/24 | | 114,708 |
| 545,000 | | Merrillville IN Conservancy Dist
| | 3.00% | | 01/15/23 | | 565,109 |
| | | | | 2,888,504 |
| | | Kentucky – 2.0% | | | | | | |
| 240,000 | | KY St Econ Dev Fin Auth Hlth Sys Rev Norton Hlthcare Inc, Ser B, NATL-RE
| | (c) | | 10/01/25 | | 226,865 |
| 20,000 | | KY St Econ Dev Fin Auth Ref Owensboro Hlth, Ser A
| | 5.00% | | 06/01/25 | | 22,873 |
| 355,000 | | KY St Hgr Edu Stdt Loan Corp Sr, Ser A, AMT
| | 5.00% | | 06/01/26 | | 417,559 |
| 255,000 | | KY St Pub Energy Auth Gas Sply Rev Gas Sply, Ser B (Mandatory put 01/01/25)
| | 4.00% | | 01/01/49 | | 283,611 |
| 350,000 | | KY St Pub Energy Auth Gas Sply Rev Gas Sply, Ser C-1
| | 4.00% | | 12/01/21 | | 354,444 |
| 75,000 | | KY St Pub Energy Auth Gas Sply Rev, Ser A (Mandatory put 06/01/26)
| | 4.00% | | 12/01/50 | | 86,750 |
| 105,000 | | KY St Pub Energy Auth Gas Sply Rev, Ser A-1 (Mandatory put 06/01/25)
| | 4.00% | | 12/01/49 | | 118,211 |
| 140,000 | | KY St Univ KY St Univ Proj, COPS, BAM
| | 5.00% | | 11/01/25 | | 165,156 |
| 125,000 | | KY St Univ KY St Univ Proj, COPS, BAM
| | 5.00% | | 11/01/26 | | 151,307 |
| 210,000 | | Paducah KY Elec Plant Brd Rev Ref, Ser A, AGM
| | 5.00% | | 10/01/34 | | 255,675 |
| 450,000 | | Univ of Louisville KY Ref, Ser A
| | 5.00% | | 03/01/27 | | 537,233 |
| | | | | 2,619,684 |
| | | Louisiana – 2.0% | | | | | | |
| 20,000 | | New Orleans LA Aviation Brd Gen Arpt N Term, Ser B, AMT
| | 5.00% | | 01/01/28 | | 24,434 |
| 455,000 | | New Orleans LA Aviation Brd, Ser B, AMT
| | 5.00% | | 01/01/31 | | 521,163 |
| 100,000 | | New Orleans LA Aviation Brd, Ser B, AMT, AGM
| | 5.00% | | 01/01/32 | | 114,724 |
| 150,000 | | New Orleans LA Wtr Rev Wtr Rev
| | 5.00% | | 12/01/26 | | 179,052 |
| 350,000 | | New Orleans LA Wtr Rev Wtr Rev
| | 5.00% | | 12/01/28 | | 415,681 |
| 500,000 | | Saint John the Baptist Parish LA Rev Var Ref Marathon Oil Corp Proj Remk, Subser 2017B-1 (Mandatory put 07/01/24)
| | 2.13% | | 06/01/37 | | 519,612 |
| 550,000 | | Saint John the Baptist Parish LA Rev Var Ref Marathon Oil Corp Proj Remk, Subser 2017B-2 (Mandatory put 07/01/26)
| | 2.38% | | 06/01/37 | | 583,433 |
| 250,000 | | Shreveport LA Wtr & Swr Rev Junior Lien, Ser C, BAM
| | 5.00% | | 12/01/24 | | 288,052 |
| | | | | 2,646,151 |
| | | Maryland – 0.6% | | | | | | |
| 115,000 | | Harford Cnty MD Spl Oblg Ref Beechtree Estates Proj
| | 4.00% | | 07/01/23 | | 123,305 |
| 300,000 | | Harford Cnty MD Spl Oblg Ref Beechtree Estates Proj
| | 4.00% | | 07/01/24 | | 332,319 |
| 150,000 | | Howard Cnty MD Ref Consol Pub Impt, Ser B
| | 5.00% | | 02/15/24 | | 168,619 |
| 100,000 | | Maryland St Hlth & Hgr Eductnl Facs Auth Rev Ref Stevenson Univ Proj, Ser A
| | 5.00% | | 06/01/28 | | 126,459 |
| | | | | 750,702 |
| | | Massachusetts – 1.5% | | | | | | |
| 350,000 | | MA St Clg Bldg Auth, Ser A
| | 5.00% | | 05/01/28 | | 380,012 |
See Notes to Financial Statements
Page 19
First Trust Short Duration Managed Municipal ETF (FSMB)
Portfolio of Investments (Continued)
July 31, 2021
Principal
Value | | Description | | Stated
Coupon | | Stated
Maturity | | Value |
| MUNICIPAL BONDS (Continued) |
| | | Massachusetts (Continued) | | | | | | |
| $200,000 | | MA St Dev Fin Agy Rev Umass Darthmouth Stdt Hsg Proj
| | 5.00% | | 10/01/21 | | $201,255 |
| 575,000 | | MA St Eductnl Fing Auth Sr, Ser B, AMT
| | 5.00% | | 07/01/24 | | 650,552 |
| 500,000 | | MA St Eductnl Fing Auth Sr, Ser B, AMT
| | 5.00% | | 07/01/25 | | 585,322 |
| 135,000 | | MA St Eductnl Fing Auth, Ser A, AMT
| | 5.00% | | 01/01/26 | | 154,631 |
| | | | | 1,971,772 |
| | | Michigan – 3.0% | | | | | | |
| 70,000 | | Detroit MI Downtown Dev Auth Tax Incr Rev Ref Catalyst Dev Proj, Ser A, AGM
| | 5.00% | | 07/01/30 | | 78,720 |
| 20,000 | | Detroit MI Downtown Dev Auth Tax Incr Rev Ref Catalyst Dev Proj, Ser A, AGM
| | 5.00% | | 07/01/31 | | 22,485 |
| 100,000 | | Great Lakes MI Wtr Auth Wtr Sply Sys Rev Sr Lien Bond, Ser A
| | 5.00% | | 07/01/25 | | 117,915 |
| 575,000 | | Kalamazoo MI Econ Dev Corp Heritage Cmnty of Kalamazoo Revel Creek Proj Temps 60, Ser B2
| | 2.63% | | 05/15/25 | | 576,975 |
| 110,000 | | MI St Fin Auth Rev Ref Ascension Sr Credit Grp Remk, Ser E-1 (Mandatory put 08/15/24)
| | 4.00% | | 11/15/44 | | 122,593 |
| 300,000 | | MI St Fin Auth Rev Ref Beaumont Hlth Credit Grp
| | 5.00% | | 08/01/28 | | 341,830 |
| 55,000 | | MI St Fin Auth Rev Ref Henry Ford Hlth Sys
| | 4.00% | | 11/15/36 | | 62,694 |
| 100,000 | | MI St Fin Auth Rev Ref Hosp Beaumont Hlth Credit Grp
| | 5.00% | | 11/01/21 | | 101,211 |
| 150,000 | | MI St Fin Auth Rev Ref Loc Govt Loan Prog Great Lakes Wtr Auth, Ser D1, AGM
| | 5.00% | | 07/01/28 | | 176,553 |
| 135,000 | | MI St Fin Auth Rev Ref Loc Govt Loan Prog Great Lakes Wtr Auth, Ser D2, AGM
| | 5.00% | | 07/01/24 | | 153,202 |
| 935,000 | | MI St Fin Auth Rev Ref Loc Govt Loan Prog Great Lakes Wtr Auth, Ser D2, AGM
| | 5.00% | | 07/01/28 | | 1,065,749 |
| 250,000 | | MI St Fin Auth Rev Sr Lien Great Lakes Wtr Auth, Ser C-3, AGM
| | 5.00% | | 07/01/27 | | 285,353 |
| 90,000 | | MI St Hosp Fin Auth Ref Mclaren Hlthcare, Ser A
| | 5.00% | | 06/01/24 | | 93,660 |
| 235,000 | | Wayne Cnty MI Arpt Auth Rev Detroit Met Wayne Cnty Arpt, Ser C, AMT
| | 5.00% | | 12/01/29 | | 269,002 |
| 270,000 | | Wayne Cnty MI Arpt Auth Rev Detroit Met Wayne Cnty Arpt, Ser C, AMT
| | 5.00% | | 12/01/30 | | 308,874 |
| 90,000 | | Wayne Cnty MI Arpt Auth Rev Ref, Ser F, AMT
| | 5.00% | | 12/01/25 | | 107,466 |
| | | | | 3,884,282 |
| | | Minnesota – 0.2% | | | | | | |
| 200,000 | | Duluth MN Econ Dev Auth Rev Ref Benedictine Hlth Sys, Ser A
| | 3.00% | | 07/01/24 | | 210,033 |
| | | Missouri – 2.0% | | | | | | |
| 375,000 | | Bridgeton MO Spl Oblig Rev Ref, Ser A
| | 4.00% | | 12/01/25 | | 426,197 |
| 385,000 | | Bridgeton MO Spl Oblig Rev Ref, Ser A
| | 4.00% | | 12/01/26 | | 446,439 |
| 200,000 | | Jackson Cnty MO Spl Oblg Rirr Right of Way Proj
| | 4.00% | | 12/01/27 | | 230,812 |
| 140,000 | | MO St Hlth & Eductnl Facs Auth Hlth Facs Rev Bethesda Hlth Grp Inc Ref
| | 3.00% | | 08/01/23 | | 147,770 |
| 305,000 | | MO St Hlth & Eductnl Facs Auth Hlth Facs Rev Bethesda Hlth Grp Inc Ref
| | 4.00% | | 08/01/25 | | 346,517 |
| 350,000 | | MO St Hlth & Eductnl Facs Auth Hlth Facs Rev Ref Saint Lukes Hlth Sys Inc
| | 4.00% | | 11/15/33 | | 397,201 |
| 235,000 | | MO St Hlth & Eductnl Facs Auth Lutheran Sr Svcs
| | 5.00% | | 02/01/23 | | 251,237 |
| 125,000 | | Plaza at Noahs Ark Cmnty Impt Dist MO Tax Incr & Impt Ref
| | 3.00% | | 05/01/22 | | 126,288 |
| 200,000 | | Plaza at Noahs Ark Cmnty Impt Dist MO Tax Incr & Impt Ref
| | 3.00% | | 05/01/24 | | 206,124 |
| | | | | 2,578,585 |
| | | Montana – 0.5% | | | | | | |
| 240,000 | | Forsyth MT Poll Control Rev Ref Puget Sound Energy Proj, Ser A (Mandatory put 03/01/23)
| | 3.90% | | 03/01/31 | | 250,766 |
Page 20
See Notes to Financial Statements
First Trust Short Duration Managed Municipal ETF (FSMB)
Portfolio of Investments (Continued)
July 31, 2021
Principal
Value | | Description | | Stated
Coupon | | Stated
Maturity | | Value |
| MUNICIPAL BONDS (Continued) |
| | | Montana (Continued) | | | | | | |
| $150,000 | | MT St Fac Fin Auth Hlthcare Facs Rev MT Children’s Home and Hosp Proj, Ser A
| | 4.00% | | 07/01/24 | | $162,736 |
| 155,000 | | MT St Fac Fin Auth Hlthcare Facs Rev MT Children’s Home and Hosp Proj, Ser A
| | 4.00% | | 07/01/25 | | 171,967 |
| | | | | 585,469 |
| | | Nebraska – 1.0% | | | | | | |
| 420,000 | | Centrl Plains Energy Proj NE Gas Proj Rev Proj #3
| | 5.00% | | 09/01/22 | | 441,841 |
| 150,000 | | Centrl Plains Energy Proj NE Gas Proj Rev Proj #3
| | 5.25% | | 09/01/37 | | 158,086 |
| 70,000 | | Centrl Plains Energy Proj NE Gas Proj Rev Proj No. 4
| | 5.00% | | 01/01/24 | | 78,197 |
| 175,000 | | Centrl Plains Energy Proj NE Gas Proj Rev Proj No. 4 (Mandatory put 01/01/24)
| | 5.00% | | 03/01/50 | | 193,589 |
| 330,000 | | Centrl Plains Energy Proj NE Gas Proj Rev Ref Proj #3, Ser A
| | 5.00% | | 09/01/26 | | 403,138 |
| | | | | 1,274,851 |
| | | Nevada – 1.8% | | | | | | |
| 500,000 | | Clark Cnty NV Sch Dist Ref Bldg, Ser A, BAM
| | 5.00% | | 06/15/30 | | 619,210 |
| 750,000 | | Director of the St of NV Dept of Busn & Ind Var Brightline W Psngr Rail Proj Remk, Ser A, AMT (Mandatory put 02/01/22) (a)
| | 0.25% | | 01/01/50 | | 750,172 |
| 315,000 | | Las Vegas NV Spl Impt Dist #808 & #810 Ref
| | 5.00% | | 06/01/28 | | 345,238 |
| 125,000 | | Reno NV Capital Impt Rev Ref, Ser A-1, AGM
| | 5.00% | | 06/01/25 | | 146,184 |
| 500,000 | | Yerington NV USDA Interim Debs
| | 1.63% | | 11/01/23 | | 505,149 |
| | | | | 2,365,953 |
| | | New Hampshire – 0.2% | | | | | | |
| 220,000 | | Natl Fin Auth NH Sr Living Rev Ref Springpoint Sr Living
| | 4.00% | | 01/01/24 | | 238,375 |
| | | New Jersey – 4.8% | | | | | | |
| 1,100,000 | | Middlesex Cnty NJ Ref Civic Square IV Redev, COPS
| | 5.00% | | 10/15/31 | | 1,281,830 |
| 1,000,000 | | NJ St Covid-19 Go Emergency Bonds, Ser A
| | 5.00% | | 06/01/25 | | 1,176,551 |
| 255,000 | | NJ St Econ Dev Auth Ref, Ser A
| | 4.13% | | 06/15/27 | | 288,098 |
| 110,000 | | NJ St Econ Dev Auth Rev Ref Sch Facs Constr, Ser PP
| | 3.50% | | 06/15/27 | | 117,838 |
| 35,000 | | NJ St Econ Dev Auth Rev Ref Sch Facs Constr, Ser PP
| | 5.00% | | 06/15/27 | | 39,572 |
| 590,000 | | NJ St Econ Dev Auth Rev Ref Sch Facs Construction, Ser NN
| | 5.00% | | 03/01/29 | | 633,436 |
| 265,000 | | NJ St Econ Dev Auth Rev Ref Sch Facs Construction, Ser PP, AGM
| | 5.00% | | 06/15/25 | | 300,824 |
| 220,000 | | NJ St Econ Dev Auth Rev, Ser WW
| | 5.00% | | 06/15/34 | | 256,563 |
| 655,000 | | NJ St Hgr Edu Asst Auth Stdt Loan Rev, Ser B, AMT
| | 5.00% | | 12/01/25 | | 774,080 |
| 50,000 | | NJ St Transprtn Trust Fund Auth Cap Apprec Transprtn Sys, Ser C, AMBAC
| | (c) | | 12/15/25 | | 48,079 |
| 170,000 | | NJ St Transprtn Trust Fund Auth Fed Hwy Reimb Nts, Ser A-1, GARVEE
| | 5.00% | | 06/15/27 | | 204,891 |
| 140,000 | | NJ St Transprtn Trust Fund Auth Ref Fed Hwy Reimb Nts, Ser A, GARVEE
| | 5.00% | | 06/15/29 | | 166,891 |
| 405,000 | | NJ St Transprtn Trust Fund Auth Sys Remk, Ser C
| | 5.25% | | 06/15/32 | | 468,284 |
| 260,000 | | NJ St Transprtn Trust Fund Auth Transprtn Prog, Ser AA
| | 5.00% | | 06/15/22 | | 270,837 |
| 160,000 | | NJ St Transprtn Trust Fund Auth Transprtn Prog, Ser AA
| | 5.00% | | 06/15/25 | | 181,066 |
| 60,000 | | NJ St Turnpike Auth, Ser E
| | 5.00% | | 01/01/31 | | 69,186 |
| | | | | 6,278,026 |
| | | New York – 4.8% | | | | | | |
| 150,000 | | Met Transprtn Auth NY Rev Ref, Ser F
| | 5.00% | | 11/15/26 | | 178,065 |
| 785,000 | | Met Transprtn Auth NY Rev Transprtn, Subser C-2, BANS
| | 5.00% | | 09/01/21 | | 787,946 |
| 750,000 | | Met Transprtn Auth NY Rev, Ser A-2S, BANS
| | 4.00% | | 02/01/22 | | 763,925 |
| 305,000 | | Met Transprtn Auth NY Rev, Ser D-1, BANS
| | 5.00% | | 09/01/22 | | 320,685 |
See Notes to Financial Statements
Page 21
First Trust Short Duration Managed Municipal ETF (FSMB)
Portfolio of Investments (Continued)
July 31, 2021
Principal
Value | | Description | | Stated
Coupon | | Stated
Maturity | | Value |
| MUNICIPAL BONDS (Continued) |
| | | New York (Continued) | | | | | | |
| $1,000,000 | | NY NY Adj Fiscal 2020, Subser B-3 (b)
| | 0.13% | | 10/01/46 | | $1,000,000 |
| 125,000 | | NY NY, Ser G
| | 4.00% | | 08/01/29 | | 136,664 |
| 460,000 | | NY NY, Ser J
| | 5.00% | | 08/01/21 | | 460,000 |
| 250,000 | | NY NY, Subser F-1
| | 5.00% | | 03/01/27 | | 268,744 |
| 255,000 | | NY St Dorm Auth St Personal Income Tax Rev, Ser B
| | 5.00% | | 03/15/30 | | 262,744 |
| 100,000 | | NY St Transprtn Dev Corp Spl Fac Rev Delta Airls Inc Laguardia Arpt Terminals C&D Redev, AMT
| | 5.00% | | 01/01/22 | | 101,942 |
| 500,000 | | NY St Transprtn Dev Corp Spl Fac Rev Ref American Airls Inc John F Kennedy Intl Arpt Proj, AMT
| | 2.25% | | 08/01/26 | | 519,204 |
| 200,000 | | NY St Transprtn Dev Corpspl Fac Rev Rev Ref Terminal 4 JFK Intl Arpt Proj, Ser C
| | 5.00% | | 12/01/24 | | 231,234 |
| 125,000 | | NY St Transprtn Dev Corpspl Fac Rev Rev Ref Terminal 4 JFK Intl Arpt Proj, Ser C
| | 5.00% | | 12/01/25 | | 149,556 |
| 15,000 | | Port Auth of NY & NJ NY Consol One Hundred Eighty Fifth Ref, AMT
| | 5.00% | | 09/01/23 | | 16,486 |
| 855,000 | | Port Auth of NY & NJ NY Ref, Ser 223, AMT
| | 5.00% | | 07/15/25 | | 1,005,854 |
| | | | | 6,203,049 |
| | | North Carolina – 0.5% | | | | | | |
| 415,000 | | NC St Agric & Tech Univ Ref Gen, Ser A
| | 5.00% | | 10/01/40 | | 489,746 |
| 190,000 | | NC St Capital Facs Fin Agy Eductnl Facs Rev Ref High Point Univ
| | 4.00% | | 05/01/24 | | 208,601 |
| | | | | 698,347 |
| | | North Dakota – 1.5% | | | | | | |
| 500,000 | | Horace ND Ref & Impt, Ser A
| | 1.90% | | 08/01/22 | | 500,517 |
| 1,000,000 | | Larimore ND Loan Anticipation Temp Impt Bonds
| | 0.85% | | 05/01/24 | | 1,001,340 |
| 460,000 | | Williston ND Cnty Wide Pub Safety Sales Tax Rev Ref, Ser A
| | 5.00% | | 07/15/22 | | 477,773 |
| | | | | 1,979,630 |
| | | Ohio – 0.5% | | | | | | |
| 75,000 | | NE OH Med Univ Gen Recpts Ref, Ser A
| | 5.00% | | 12/01/24 | | 85,372 |
| 500,000 | | OH St Air Quality Dev Auth Ref American Elec Pwr Company Proj Remk, Ser B, AMT (Mandatory put 10/01/24)
| | 2.10% | | 07/01/28 | | 523,556 |
| | | | | 608,928 |
| | | Oklahoma – 1.2% | | | | | | |
| 1,085,000 | | OK St Dev Fin Auth Gilcrease Expressway W Proj P3 Proj, AMT
| | 1.63% | | 07/06/23 | | 1,096,824 |
| 495,000 | | Oklahoma City OK Arpt Trust Junior Lien, AMT
| | 5.00% | | 07/01/22 | | 516,643 |
| | | | | 1,613,467 |
| | | Oregon – 1.3% | | | | | | |
| 500,000 | | Clackamas Cnty OR Hosp Fac Auth Rev Ref Temps 50 Rose Villa Proj, Ser B2
| | 2.75% | | 11/15/25 | | 502,521 |
| 130,000 | | Port of Portland OR Arpt Rev, Ser 24B, AMT
| | 5.00% | | 07/01/33 | | 157,080 |
| 1,000,000 | | Yamhill Cnty OR Hosp Auth Friendsview Temps 50, Ser B-3
| | 1.75% | | 11/15/26 | | 1,002,554 |
| | | | | 1,662,155 |
| | | Pennsylvania – 7.9% | | | | | | |
| 750,000 | | Allentown PA City Sch Dist Tax and Rev Antic Nts
| | 1.00% | | 03/31/22 | | 750,232 |
| 280,000 | | Cumberland Cnty PA Muni Auth Ref Messiah Vlg Proj
| | 4.00% | | 07/01/22 | | 287,909 |
| 295,000 | | Cumberland Cnty PA Muni Auth Ref Messiah Vlg Proj
| | 5.00% | | 07/01/23 | | 317,630 |
| 660,000 | | Dauphin Cnty PA Gen Auth Hlthsys Rev Ref Pinnacle Hlth Sys Proj, Ser A
| | 4.00% | | 06/01/32 | | 758,638 |
| 90,000 | | E Hempfield Twp PA Indl Dev Auth Ref Willow Vly Cmntys Proj
| | 5.00% | | 12/01/24 | | 103,537 |
Page 22
See Notes to Financial Statements
First Trust Short Duration Managed Municipal ETF (FSMB)
Portfolio of Investments (Continued)
July 31, 2021
Principal
Value | | Description | | Stated
Coupon | | Stated
Maturity | | Value |
| MUNICIPAL BONDS (Continued) |
| | | Pennsylvania (Continued) | | | | | | |
| $390,000 | | E Hempfield Twp PA Indl Dev Auth Ref Willow Vly Cmntys Proj
| | 5.00% | | 12/01/28 | | $456,982 |
| 140,000 | | E Hempfield Twp PA Indl Dev Auth Ref Willow Vly Cmntys Proj
| | 5.00% | | 12/01/30 | | 162,812 |
| 50,000 | | Erie PA Hgr Edu Bldg Auth Aicup Fing Prog Gannon Uni Proj Ref, Ser TT1
| | 5.00% | | 05/01/24 | | 55,763 |
| 75,000 | | Erie PA Hgr Edu Bldg Auth Aicup Fing Prog Gannon Uni Proj Ref, Ser TT1
| | 5.00% | | 05/01/25 | | 86,465 |
| 75,000 | | Erie PA Hgr Edu Bldg Auth Aicup Fing Prog Gannon Uni Proj Ref, Ser TT1
| | 5.00% | | 05/01/26 | | 89,058 |
| 500,000 | | Lancaster PA Ref, BAM
| | 5.00% | | 05/01/25 | | 584,500 |
| 80,000 | | Latrobe PA Indl Dev Auth Univ Rev Ref Seton Hill Univ
| | 5.00% | | 03/01/24 | | 87,915 |
| 150,000 | | Latrobe PA Indl Dev Auth Univ Rev Ref Seton Hill Univ
| | 5.00% | | 03/01/25 | | 169,637 |
| 255,000 | | Lehigh Cnty PA Gen Purp Auth Revs Ref Lehigh Carbon Cmnty Clg, Ser 2016, BAM
| | 5.00% | | 11/01/26 | | 311,007 |
| 245,000 | | Monroeville PA Fin Auth Upmc Rev
| | 5.00% | | 02/15/30 | | 257,454 |
| 100,000 | | Montgomery Cnty PA Indl Dev Auth Acts Retmnt Life Cmntys Ref
| | 5.00% | | 11/15/23 | | 103,884 |
| 200,000 | | Montgomery Cnty PA Indl Dev Auth Ref Meadowood Sr Living Proj, Ser A
| | 3.00% | | 12/01/21 | | 201,615 |
| 345,000 | | Montgomery Cnty PA Indl Dev Auth Ref Meadowood Sr Living Proj, Ser A
| | 4.00% | | 12/01/22 | | 360,581 |
| 400,000 | | Northampton Cnty PA Gen Purp Auth Clg Rev Ref Moravian Clg
| | 5.00% | | 10/01/25 | | 468,309 |
| 210,000 | | Northampton Cnty PA Gen Purp Auth Clg Rev Ref Moravian Clg
| | 5.00% | | 10/01/27 | | 251,613 |
| 180,000 | | PA St Econ Dev Fing Auth Rev Ref Upmc
| | 4.00% | | 03/15/35 | | 206,953 |
| 500,000 | | PA St Econ Dev Fing Auth Solid Waste Disposal Rev Repub Svcs Inc Proj Remk, Ser B-1, AMT (Mandatory put 10/15/21)
| | 0.20% | | 04/01/49 | | 500,037 |
| 460,000 | | PA St Econ Dev Fing Auth Upmc Rev Ref, Ser A
| | 5.00% | | 11/15/29 | | 578,917 |
| 495,000 | | PA St Hsg Fin Agy SF Mtge Rev Non Ace, Ser 123B
| | 3.45% | | 10/01/32 | | 536,374 |
| 475,000 | | PA St Turnpike Commn Turnpike Rev Ref Sub
| | 5.00% | | 06/01/27 | | 565,991 |
| 80,000 | | PA St Turnpike Commn Turnpike Rev Ref Sub, Ser B
| | 5.00% | | 06/01/39 | | 95,109 |
| 100,000 | | PA St Turnpike Commn Turnpike Rev Sub, Ser A
| | 5.00% | | 12/01/21 | | 101,607 |
| 30,000 | | PA St Turnpike Commn Turnpike Rev Subord, Ser A-1
| | 5.00% | | 12/01/30 | | 35,601 |
| 570,000 | | Philadelphia PA Auth for Indl Dev Chrt Sch Rev Ref String Theory Chrt Sch Proj (a)
| | 5.00% | | 06/15/24 | | 637,190 |
| 300,000 | | Philadelphia PA Auth for Indl Dev Chrt Sch Rev Ref String Theory Chrt Sch Proj (a)
| | 5.00% | | 06/15/25 | | 345,893 |
| 135,000 | | Philadelphia PA Gas Wks Rev Ref
| | 5.00% | | 08/01/29 | | 158,532 |
| 35,000 | | Philadelphia PA Ref, Ser A
| | 5.00% | | 08/01/27 | | 44,016 |
| 25,000 | | Philadelphia PA Ref, Ser A
| | 5.25% | | 07/15/28 | | 27,968 |
| 475,000 | | Scranton PA Sch Dist Ref, Ser D
| | 5.00% | | 06/01/27 | | 557,078 |
| | | | | 10,256,807 |
| | | Puerto Rico – 0.6% | | | | | | |
| 388,000 | | Puerto Rico Sales Tax Fing Corp Sales Tax Rev Restructured, Ser A-1, CABS
| | (c) | | 07/01/24 | | 374,069 |
| 328,000 | | Puerto Rico Sales Tax Fing Corp Sales Tax Rev Restructured, Ser A-1, CABS
| | (c) | | 07/01/27 | | 301,151 |
| 168,000 | | Puerto Rico Sales Tax Fing Corp Sales Tax Rev Restructured, Ser A-1, CABS
| | (c) | | 07/01/29 | | 146,943 |
| | | | | 822,163 |
| | | Rhode Island – 0.4% | | | | | | |
| 445,000 | | RI St Hlth & Eductnl Bldg Corp Pub Schs Rev Ref Providence Pub Bldg Auth, AGM
| | 5.00% | | 05/15/28 | | 519,261 |
| | | South Dakota – 0.4% | | | | | | |
| 295,000 | | SD St Hlth & Eductnl Facs Auth Ref Sanford Oblig Grp
| | 5.00% | | 11/01/35 | | 346,113 |
See Notes to Financial Statements
Page 23
First Trust Short Duration Managed Municipal ETF (FSMB)
Portfolio of Investments (Continued)
July 31, 2021
Principal
Value | | Description | | Stated
Coupon | | Stated
Maturity | | Value |
| MUNICIPAL BONDS (Continued) |
| | | South Dakota (Continued) | | | | | | |
| $100,000 | | SD St Hlth & Eductnl Facs Auth Ref Westhills Vlg Retmnt Cmnty Issue
| | 3.00% | | 09/01/25 | | $107,979 |
| 100,000 | | SD St Hlth & Eductnl Facs Auth Ref Westhills Vlg Retmnt Cmnty Issue
| | 3.00% | | 09/01/26 | | 109,327 |
| | | | | 563,419 |
| | | Tennessee – 2.6% | | | | | | |
| 145,000 | | Met Govt Nashville & Davidson Cnty TN Hlth & Eductnl Fac Brd Trevecca Nazarene Univ Proj, Ser B
| | 4.00% | | 10/01/26 | | 168,108 |
| 350,000 | | Met Govt Nashville & Davidson Cnty TN Hlth & Eductnl Fac Brd Vanderbilt Univ Med Ctr, Ser A
| | 5.00% | | 07/01/40 | | 420,285 |
| 300,000 | | Tennergy Corp TN Gas Rev, Ser A
| | 4.00% | | 09/01/25 | | 342,877 |
| 500,000 | | Tennergy Corp TN Gas Rev, Ser A
| | 4.00% | | 03/01/26 | | 577,579 |
| 210,000 | | TN Energy Acq Corp Cmdy Proj Rev the TN Energy Acq Corp Cmdy Proj, Ser A
| | 5.00% | | 11/01/24 | | 240,424 |
| 105,000 | | TN St Energy Acq Corp Gas Rev (Mandatory put 11/01/25)
| | 4.00% | | 11/01/49 | | 119,323 |
| 920,000 | | TN St Energy Acq Corp Gas Rev Proj, Ser A (Mandatory put 05/01/23)
| | 4.00% | | 05/01/48 | | 975,700 |
| 315,000 | | TN St Energy Acq Corp Gas Rev, Ser A
| | 5.25% | | 09/01/26 | | 379,627 |
| 100,000 | | TN St Energy Acq Corp Gas Rev, Ser C
| | 5.00% | | 02/01/22 | | 102,369 |
| | | | | 3,326,292 |
| | | Texas – 9.6% | | | | | | |
| 500,000 | | Austin TX Arpt Sys Rev, AMT
| | 5.00% | | 11/15/33 | | 569,357 |
| 125,000 | | Bexar Cnty TX Hlth Facs Dev Corp Ref Army Retmnt Residence Fndtn Proj
| | 5.00% | | 07/15/23 | | 134,783 |
| 505,000 | | Bexar Cnty TX Rev Ref Tax Exempt Venue Proj
| | 4.00% | | 08/15/35 | | 594,847 |
| 240,000 | | Brazoria Cnty TX Ref
| | 5.00% | | 03/01/27 | | 289,640 |
| 295,000 | | Celina TX Spl Assmt Rev Ref The Lakes at Mustang Ranch Pub Impt Dt Phase #1 Proj, BAM
| | 4.00% | | 09/01/24 | | 321,041 |
| 150,000 | | Centrl TX Regl Mobility Auth Rev Ref
| | 5.00% | | 01/01/22 | | 152,961 |
| 85,000 | | Centrl TX Regl Mobility Auth Rev Ref
| | 5.00% | | 01/01/27 | | 101,410 |
| 1,250,000 | | Centrl TX Regl Mobility Auth Rev Ref
| | 5.00% | | 01/01/46 | | 1,467,662 |
| 150,000 | | Centrl TX Regl Mobility Auth Rev Sr Lien, Ser A
| | 5.00% | | 01/01/25 | | 173,574 |
| 25,000 | | Centrl TX Regl Mobility Auth Rev Sr Lien, Ser A
| | 5.00% | | 01/01/29 | | 29,203 |
| 35,000 | | Clifton TX Hgr Edu Fin Corp Edu Rev Idea Pub Sch, Ser B
| | 5.00% | | 08/15/24 | | 39,802 |
| 207,000 | | Crandall TX Spl Assmnt Rev Cartwright Ranch Pub Impt Dt Impt Area #1 Proj (a)
| | 3.38% | | 09/15/26 | | 207,949 |
| 150,000 | | Dallas TX Ref
| | 5.00% | | 02/15/27 | | 167,724 |
| 465,000 | | Galveston Cnty TX Muni Util Dist #54 Ref
| | 2.00% | | 12/01/25 | | 467,922 |
| 560,000 | | Galveston Cnty TX Muni Util Dist #54 Ref
| | 2.00% | | 12/01/27 | | 556,888 |
| 380,000 | | Harris Cnty TX Cultural Edu Facs Fin Corp Med Facs Rev Ref Baylor Clg of Med
| | 5.00% | | 11/15/23 | | 420,751 |
| 1,275,000 | | Houston TX Arpt Sys Rev Ref United Airls Inc Terminal Impt Proj, Ser B-2, AMT
| | 5.00% | | 07/15/27 | | 1,530,209 |
| 200,000 | | Houston TX Hgr Edu Fin Corp Edu Rev Ref Harmony Pub Schs, Ser A
| | 5.00% | | 02/15/22 | | 205,209 |
| 365,000 | | Lower CO River TX Auth Trans Contract Rev Ref Lcra Trans Srvcs Corp Proj
| | 5.00% | | 05/15/29 | | 412,382 |
| 435,000 | | Lower Colorado River TX Auth Trans Contract Rev Ref
| | 5.00% | | 05/15/23 | | 473,219 |
| 500,000 | | Matagorda Cnty TX Nav Dist #1 Var Rev Cent Pwr & Lt Ref Remk, AMT (Mandatory put 09/01/23)
| | 0.90% | | 05/01/30 | | 504,391 |
| 275,000 | | Mclendon Chisholm TX Spl Assmnt Rev Ref Sonoma Pub Impt Dt Phase 1 Proj, BAM
| | 4.00% | | 09/15/24 | | 299,450 |
| 200,000 | | Mesquite TX Indep Sch Dist Ref, Ser A
| | 5.00% | | 08/15/27 | | 245,335 |
Page 24
See Notes to Financial Statements
First Trust Short Duration Managed Municipal ETF (FSMB)
Portfolio of Investments (Continued)
July 31, 2021
Principal
Value | | Description | | Stated
Coupon | | Stated
Maturity | | Value |
| MUNICIPAL BONDS (Continued) |
| | | Texas (Continued) | | | | | | |
| $1,000,000 | | Mission TX Econ Dev Corp Sol Wst Disp Rev Rep Svcs Inc Proj Remk, Ser A, AMT (Mandatory put 08/02/21)
| | 0.20% | | 05/01/50 | | $1,000,000 |
| 45,000 | | N TX Tollway Auth Rev Ref 2nd Tier, Ser B
| | 5.00% | | 01/01/31 | | 53,034 |
| 120,000 | | New Hope Cultural Ed Facs Fin Corp TX Retmnt Fac Rev Ref Wesleyan Homes Inc Proj Fin Corp
| | 3.00% | | 01/01/24 | | 120,805 |
| 155,000 | | Oak Point TX Spl Assmnt Rev Wildridge Pub Impt Dist #1 Impt Area #2 Proj Accd Inv (a)
| | 3.50% | | 09/01/23 | | 158,516 |
| 110,000 | | SA Energy Acq Pub Fac Corp TX Gas Sply Rev Gas Sply Rev
| | 5.50% | | 08/01/21 | | 110,000 |
| 130,000 | | SA Energy Acq Pub Fac Corp TX Gas Sply Rev Gas Sply Rev
| | 5.50% | | 08/01/25 | | 155,280 |
| 50,000 | | San Antonio TX Tax Nts
| | 5.00% | | 08/01/21 | | 50,000 |
| 700,000 | | TX St Muni Gas Acq & Sply Corp III Gas Sply Rev Ref
| | 5.00% | | 12/15/24 | | 807,171 |
| 500,000 | | TX St Pub Fin Auth Ref Sthrn Univ Fing Sys, BAM
| | 5.00% | | 11/01/21 | | 505,732 |
| 100,000 | | TX St Transprtn Commn Central TX Turnpike Sys Rev Ref, Ser B
| | 5.00% | | 08/15/37 | | 112,716 |
| | | | | 12,438,963 |
| | | Utah – 0.1% | | | | | | |
| 135,000 | | UT St Chrt Sch Fin Auth Chrt Sch Rev Ref Spectrum Acdmy Proj
| | 4.00% | | 04/15/24 | | 146,834 |
| | | Vermont – 0.1% | | | | | | |
| 140,000 | | Burlington VT, Ser B
| | 5.00% | | 11/01/21 | | 141,668 |
| | | Virginia – 0.2% | | | | | | |
| 100,000 | | VA Clg Bldg Auth Eductnl Facs Rev Ref Regent Univ Proj
| | 5.00% | | 06/01/25 | | 116,698 |
| 125,000 | | VA Clg Bldg Auth Eductnl Facs Rev Ref Regent Univ Proj
| | 5.00% | | 06/01/26 | | 150,148 |
| | | | | 266,846 |
| | | Washington – 0.4% | | | | | | |
| 150,000 | | Seattle WA Wtr Sys Rev Ref & Impt
| | 5.00% | | 05/01/28 | | 175,228 |
| 105,000 | | Tobacco Stlmt Auth WA Tobacco Stlmt Rev Ref
| | 5.00% | | 06/01/23 | | 114,116 |
| 195,000 | | WA St Hlthcare Facs Auth Seattle Cancer Care Alliance (a)
| | 5.00% | | 12/01/24 | | 225,243 |
| | | | | 514,587 |
| | | West Virginia – 0.4% | | | | | | |
| 500,000 | | WV St Econ Dev Auth Sol Wst Disp Facs Var Sr Arch Res Proj, AMT (Mandatory put 07/01/25)
| | 5.00% | | 07/01/45 | | 550,256 |
| | | Wisconsin – 3.0% | | | | | | |
| 185,000 | | Pub Fin Auth WI Eductnl Rev Piedmont Cmnty Chrt Sch
| | 5.00% | | 06/15/25 | | 211,282 |
| 425,000 | | Pub Fin Auth WI Rev Roseman Univ of Hlth Sciences Proj (a)
| | 3.00% | | 04/01/25 | | 442,406 |
| 1,435,000 | | Tender Option Bond Trust Recpts / Ctfs Various States Floaters, Ser 2020-XF2887 (a) (b)
| | 0.25% | | 06/15/38 | | 1,435,000 |
| 810,000 | | WI St Hlth & Eductnl Facs Auth Rev Ref Ascension Hlth Credit Grp, Ser A
| | 5.00% | | 11/15/36 | | 974,644 |
| 500,000 | | WI St Hlth & Eductnl Facs Auth Rev Ref Marshfield Clinic Hlth Sys Inc, Ser B1 (Mandatory put 02/15/25)
| | 5.00% | | 02/15/52 | | 568,757 |
| 85,000 | | WI St Hlth & Eductnl Facs Auth Rev Ref Prohealth Care Oblig Grp
| | 5.00% | | 08/15/30 | | 96,689 |
| 155,000 | | WI St Hlth & Eductnl Facs Auth Rev Three Pillars Sr Living Cmntys, Ser A
| | 4.00% | | 08/15/24 | | 170,620 |
| | | | | 3,899,398 |
See Notes to Financial Statements
Page 25
First Trust Short Duration Managed Municipal ETF (FSMB)
Portfolio of Investments (Continued)
July 31, 2021
Principal
Value | | Description | | Stated
Coupon | | Stated
Maturity | | Value |
| MUNICIPAL BONDS (Continued) |
| | | Wyoming – 0.2% | | | | | | |
| $200,000 | | Laramie Cnty WY Hosp Rev Ref Cheyenne Regl Med Ctr Proj
| | 4.00% | | 05/01/26 | | $231,759 |
| Total Investments – 96.9%
| | 125,873,320 |
| | (Cost $123,211,154) (d) | | |
| | Net Other Assets and Liabilities – 3.1%
| | 4,057,861 |
| | Net Assets – 100.0%
| | $129,931,181 |
| Futures Contracts | | Position | | Number of
Contracts | | Expiration
Date | | Notional
Value | | Unrealized
Appreciation
(Depreciation)/
Value |
| U.S. Treasury Long Bonds | | Short | | 4 | | Sep 2021 | | $ (658,875) | | $(31,938) |
| U.S. Treasury Ultra 10-Year Notes | | Short | | 14 | | Sep 2021 | | (2,103,500) | | (75,906) |
| Total Futures Contracts | | | | | | | | $(2,762,375) | | $(107,844) |
|
| (a) | This security, sold within the terms of a private placement memorandum, is exempt from registration upon resale under Rule 144A under the Securities Act of 1933, as amended, and may be resold in transactions exempt from registration, normally to qualified institutional buyers. Pursuant to procedures adopted by the Trust’s Board of Trustees, this security has been determined to be liquid by First Trust Advisors L.P. (the “Advisor”). Although market instability can result in periods of increased overall market illiquidity, liquidity for each security is determined based on security specific factors and assumptions, which require subjective judgment. At July 31, 2021, securities noted as such amounted to $7,666,962 or 5.9% of net assets. |
| (b) | Variable Rate Demand bond. Interest rate is reset periodically by the agent based on current market conditions. |
| (c) | Zero coupon bond. |
| (d) | Aggregate cost for federal income tax purposes was $123,040,201. As of July 31, 2021, the aggregate gross unrealized appreciation for all investments in which there was an excess of value over tax cost was $2,730,422 and the aggregate gross unrealized depreciation for all investments in which there was an excess of tax cost over value was $5,147. The net unrealized appreciation was $2,725,275. The unrealized amounts presented are inclusive of derivative contracts. |
| AGM | Assured Guaranty Municipal Corp. |
| AMBAC | American Municipal Bond Assurance Corp. |
| AMT | Alternative Minimum Tax |
| BAM | Build America Mutual |
| BANS | Bond Anticipation Notes |
| CABS | Capital Appreciation Bonds |
| COPS | Certificates of Participation |
| GARVEE | Grant Anticipation Revenue Vehicle |
| NATL-RE | National Public Finance Guarantee Corp. |
Page 26
See Notes to Financial Statements
First Trust Short Duration Managed Municipal ETF (FSMB)
Portfolio of Investments (Continued)
July 31, 2021
Valuation Inputs
A summary of the inputs used to value the Fund’s investments as of July 31, 2021 is as follows (see Note 2A - Portfolio Valuation in the Notes to Financial Statements):
| ASSETS TABLE |
| | Total
Value at
7/31/2021 | Level 1
Quoted
Prices | Level 2
Significant
Observable
Inputs | Level 3
Significant
Unobservable
Inputs |
Municipal Bonds*
| $ 125,873,320 | $ — | $ 125,873,320 | $ — |
| |
| LIABILITIES TABLE |
| | Total
Value at
7/31/2021 | Level 1
Quoted
Prices | Level 2
Significant
Observable
Inputs | Level 3
Significant
Unobservable
Inputs |
Futures Contracts**
| $ (107,844) | $ (107,844) | $ — | $ — |
| * | See Portfolio of Investments for state and territory breakout. |
| ** | Includes cumulative appreciation/depreciation on futures contracts as reported in the Futures Contracts table. Only the current day’s variation margin is presented on the Statements of Assets and Liabilities. |
See Notes to Financial Statements
Page 27
First Trust Ultra Short Duration Municipal ETF (FUMB)
Portfolio of Investments
July 31, 2021
Principal
Value | | Description | | Stated
Coupon | | Stated
Maturity | | Value |
| MUNICIPAL BONDS – 96.2% |
| | | Alabama – 4.5% | | | | | | |
| $50,000 | | Albertville AL Warrants, Ser A, BAM
| | 3.50% | | 06/01/35 | | $51,415 |
| 35,000 | | Albertville AL Warrants, Ser A, BAM
| | 3.75% | | 06/01/41 | | 36,063 |
| 500,000 | | Chatom AL Indl Dev Brd Gulf Opportunity Zone Ref Gulf Opportunity Zone Pwr S Energy Corp Proj, AGM
| | 5.00% | | 08/01/21 | | 500,000 |
| 2,750,000 | | Hlthcare Auth for Baptist Hlth AL Var Ref, Ser B (a)
| | 0.17% | | 11/01/42 | | 2,750,000 |
| 1,155,000 | | Lower AL Gas Dist Gas Proj Rev Gas Proj Rev Bonds Proj 2 (Mandatory put 12/01/25)
| | 4.00% | | 12/01/50 | | 1,319,104 |
| 1,425,000 | | Mizuho Floater Residual Trust Various States Floaters Miz 9024, Ser 2020 (a) (b)
| | 0.27% | | 12/01/48 | | 1,425,000 |
| 700,000 | | Mobile AL Indl Dev Brd Sol Wst Disp Rev Var AL Pwr Barry Plant (a)
| | 0.04% | | 06/01/34 | | 700,000 |
| 325,000 | | SE AL St Gas Sply Dist Gas Sply Rev Proj #2, Ser A
| | 4.00% | | 06/01/23 | | 347,829 |
| 270,000 | | SE AL St Gas Sply Dist Gas Sply Rev Proj #2, Ser A (Mandatory put 06/01/24)
| | 4.00% | | 06/01/49 | | 295,850 |
| | | | | 7,425,261 |
| | | Arizona – 1.5% | | | | | | |
| 1,000,000 | | AZ St Indl Dev Auth Rev Lincoln S Beltway Proj
| | 5.00% | | 05/01/23 | | 1,082,496 |
| 280,000 | | Maricopa Cnty AZ Indl Dev Auth Edu Rev Legacy Trad Sch Proj
| | 5.00% | | 07/01/22 | | 291,060 |
| 300,000 | | Maricopa Cnty AZ Indl Dev Auth Edu Rev Legacy Trad Sch Proj
| | 5.00% | | 07/01/23 | | 324,377 |
| 565,000 | | Maricopa Cnty AZ Poll Controlcorp Poll Control Rev Var Ref Pub Svc Co of NM Palo Verde Proj, Ser A (Mandatory put 06/01/22)
| | 1.05% | | 01/01/38 | | 569,144 |
| 245,000 | | Salt Verde AZ Finl Corp Sr Gas Rev Sr
| | 5.25% | | 12/01/23 | | 271,428 |
| | | | | 2,538,505 |
| | | Arkansas – 0.2% | | | | | | |
| 260,000 | | Sheridan AR Sch Dist #37 Construction Bonds
| | 3.38% | | 02/01/43 | | 264,182 |
| | | California – 3.1% | | | | | | |
| 40,000 | | Bay Area CA Toll Auth Toll Bridge Rev San Francisco Bay Area, Ser F-1
| | 5.00% | | 04/01/24 | | 41,317 |
| 20,000 | | Bay Area CA Toll Auth Toll Bridge Rev San Francisco Bay Area, Ser F-1
| | 5.00% | | 04/01/31 | | 20,658 |
| 210,000 | | CA Pub Fin Auth Rev Ref Henry Mayo Newhall Hosp, Ser A
| | 4.00% | | 10/15/21 | | 211,469 |
| 2,000,000 | | CA St Infra & Econ Dev Bank Rev Var Brightline W Psngrr Rail Proj Remk, Ser A, AMT (Mandatory put 02/01/22) (b)
| | 0.20% | | 01/01/50 | | 2,000,461 |
| 100,000 | | CA St Ref
| | 5.00% | | 08/01/21 | | 100,000 |
| 75,000 | | CA St Various Purp
| | 5.00% | | 10/01/21 | | 75,600 |
| 90,000 | | CA St Various Purp Bid Grp A
| | 5.00% | | 10/01/21 | | 90,720 |
| 225,000 | | Cathedral City CA Redev Agy Successor Agy Tax Allocation Rev Ref Sub Hsg Merged Redev Proj Area, Ser C
| | 4.00% | | 08/01/21 | | 225,000 |
| 180,000 | | Cathedral City CA Redev Agy Successor Agy Tax Allocation Rev Ref Sub Hsg Merged Redev Proj Area, Ser C
| | 4.00% | | 08/01/22 | | 185,954 |
| 90,000 | | Gilroy CA Unif Sch Dist Ref, AGM
| | 4.00% | | 08/01/21 | | 90,000 |
| 150,000 | | Golden St Tobacco Securitization Corp CA Tobacco Stlmt Ref Enhanced Asset Bkd, Ser A
| | 5.00% | | 06/01/22 | | 156,074 |
| 300,000 | | Golden St Tobacco Securitization Corp CA Tobacco Stlmt Ref, Ser A-1
| | 5.00% | | 06/01/22 | | 311,957 |
| 310,000 | | Long Beach CA Bond Fin Auth Nat Gas Pur Rev, Ser A
| | 5.25% | | 11/15/23 | | 345,384 |
| 125,000 | | Los Angeles CA Muni Impt Corp Lease Rev Ref Real Ppty, Ser C
| | 5.00% | | 03/01/24 | | 128,596 |
| 150,000 | | Oakland CA Unif Sch Dist Alameda Cnty, Ser A
| | 4.00% | | 08/01/21 | | 150,000 |
| 295,000 | | Port of Oakland CA Ref Sr Lien, Ser P, AMT
| | 5.00% | | 05/01/26 | | 305,709 |
| 80,000 | | Riverside CA Unif Sch Dist Election of 2016, Ser B
| | 4.00% | | 08/01/21 | | 80,000 |
| 185,000 | | San Diego CA Pub Facs Fing Auth Lease Rev Capital Impt Projs, Ser A
| | 4.50% | | 04/15/42 | | 190,801 |
Page 28
See Notes to Financial Statements
First Trust Ultra Short Duration Municipal ETF (FUMB)
Portfolio of Investments (Continued)
July 31, 2021
Principal
Value | | Description | | Stated
Coupon | | Stated
Maturity | | Value |
| MUNICIPAL BONDS (Continued) |
| | | California (Continued) | | | | | | |
| $90,000 | | San Diego CA Pub Facs Fing Auth Lease Rev Ref Ballpark
| | 5.00% | | 10/15/21 | | $90,857 |
| 100,000 | | San Francisco CA City & Cnty Arpts Commn Intl Arpt Rev Ref Spl Facs Lease SFO Fuel Co LLC, Ser A, AMT
| | 5.00% | | 01/01/23 | | 106,755 |
| 250,000 | | Sthrn CA Pub Pwr Auth Nat Gas Proj Rev Proj No 1, Ser A
| | 5.25% | | 11/01/22 | | 266,265 |
| | | | | 5,173,577 |
| | | Colorado – 2.9% | | | | | | |
| 200,000 | | Breckenridge CO Ref, Ser B, COPS
| | 4.00% | | 12/01/21 | | 202,466 |
| 185,000 | | CO St Hlth Facs Auth Hosp Rev Ref Commonspirit Hlth, Ser B-1 (Mandatory put 08/01/25)
| | 5.00% | | 08/01/49 | | 214,400 |
| 100,000 | | Copperleaf CO Met Dist #2 Ref, BAM
| | 4.00% | | 12/01/21 | | 101,267 |
| 90,000 | | Denver City & Cnty CO Arpt Rev Sys, Ser A, AMT
| | 5.00% | | 11/15/22 | | 95,664 |
| 215,000 | | Denver City & Cnty CO Arpt Rev Sys, Ser B
| | 5.00% | | 11/15/32 | | 228,479 |
| 850,000 | | Denver City & Cnty CO Arpt Rev, Ser A, AMT
| | 5.00% | | 11/15/21 | | 861,836 |
| 100,000 | | Denver City & Cnty CO Arpt Rev, Ser A, AMT
| | 5.25% | | 11/15/22 | | 101,461 |
| 375,000 | | Denver City & Cnty CO Elevate Denver, Ser A
| | 5.00% | | 08/01/21 | | 375,000 |
| 2,000,000 | | Denver CO Convention Ctr Hotel Auth Rev Ref Sr
| | 5.00% | | 12/01/23 | | 2,205,176 |
| 200,000 | | Park Creek CO Met Dist Rev Ref Sr Ltd Property Tax Supported, Ser A
| | 5.00% | | 12/01/21 | | 203,020 |
| 100,000 | | Vauxmont Met Dist CO Ref Ltd Tax Conv Unltd Sub, AGM
| | 5.00% | | 12/15/21 | | 101,667 |
| 170,000 | | Woodmen Road CO Met Dist Ref, BAM
| | 4.00% | | 12/01/22 | | 177,649 |
| | | | | 4,868,085 |
| | | Connecticut – 2.7% | | | | | | |
| 135,000 | | Bridgeport CT Ref, Ser C, NATL-RE
| | 5.50% | | 08/15/21 | | 135,241 |
| 3,000,000 | | Capital City CT Econ Dev Auth Pkg & Energy Fee Rev Adj, Ser B (a)
| | 0.05% | | 06/15/34 | | 3,000,000 |
| 100,000 | | CT St Hlth & Eductnl Facs Auth Rev Ref Fairfield Univ, Ser S
| | 5.00% | | 07/01/23 | | 108,826 |
| 225,000 | | CT St Ref, Ser B
| | 5.00% | | 04/15/23 | | 243,931 |
| 100,000 | | CT St, Ser D
| | 5.00% | | 11/01/22 | | 101,202 |
| 75,000 | | CT St, Ser F
| | 5.00% | | 11/15/21 | | 76,055 |
| 30,000 | | Hamden CT, BAM
| | 5.00% | | 08/15/23 | | 32,846 |
| 150,000 | | Naugatuck CT
| | 5.00% | | 09/15/21 | | 150,870 |
| 265,000 | | Univ of CT CT Ref, Ser A
| | 5.00% | | 11/01/22 | | 281,244 |
| 100,000 | | Univ of CT CT Rev, Ser A
| | 4.00% | | 11/15/21 | | 101,115 |
| 280,000 | | Univ of CT CT, Ser A
| | 5.00% | | 02/15/29 | | 312,029 |
| | | | | 4,543,359 |
| | | Florida – 4.8% | | | | | | |
| 565,000 | | Citizens Property Insurance Corp FL, Ser A1
| | 5.00% | | 06/01/22 | | 574,062 |
| 1,000,000 | | FL St Hsg Fin Corp Mf Mtge Rev Adj Parrish Oaks, Ser A (Mandatory put 02/01/22)
| | 1.25% | | 02/01/23 | | 1,005,766 |
| 125,000 | | Fort Pierce FL Redev Agy Redev Rev Ref, BAM
| | 4.00% | | 05/01/22 | | 128,223 |
| 100,000 | | Gtr Orlando FL Aviation Auth Arpt Facs Rev Ref Priority Sub Arpt Facs, AMT
| | 5.00% | | 10/01/23 | | 110,311 |
| 445,000 | | Hollywood Beach FL Cmnty Dev Dist Rev Cdd Ref Pub Pkg Fac Proj, Ser I
| | 5.00% | | 10/01/23 | | 489,354 |
| 160,000 | | Hollywood FL Cmnty Redev Agy Redev Rev Ref
| | 5.00% | | 03/01/23 | | 171,468 |
| 30,000 | | Jacksonville FL Spl Rev Ref
| | 5.00% | | 10/01/21 | | 30,240 |
| 575,000 | | Jacksonville FL Spl Rev Ref, Ser C
| | 5.00% | | 10/01/21 | | 579,602 |
| 100,000 | | Jacksonville FL Spl Rev Ref, Ser C
| | 5.00% | | 10/01/24 | | 105,636 |
| 125,000 | | Jacksonville FL Spl Rev, Ser B-1
| | 5.00% | | 10/01/21 | | 126,000 |
| 110,000 | | Jea FL Elec Sys Rev Ser Three, Ser A
| | 5.00% | | 10/01/22 | | 116,240 |
| 190,000 | | Jea FL Elec Sys Rev Sub, Ser A
| | 5.00% | | 10/01/21 | | 191,499 |
| 25,000 | | Jea FL Elec Sys Rev Sub, Ser A
| | 5.00% | | 10/01/22 | | 26,418 |
See Notes to Financial Statements
Page 29
First Trust Ultra Short Duration Municipal ETF (FUMB)
Portfolio of Investments (Continued)
July 31, 2021
Principal
Value | | Description | | Stated
Coupon | | Stated
Maturity | | Value |
| MUNICIPAL BONDS (Continued) |
| | | Florida (Continued) | | | | | | |
| $510,000 | | Jea FL Elec Sys Rev Sub, Ser B
| | 5.00% | | 10/01/21 | | $514,023 |
| 425,000 | | Jea FL Elec Sys Rev Sub, Ser B
| | 5.00% | | 10/01/22 | | 449,109 |
| 25,000 | | Jea FL Elec Sys Rev Sub, Ser D
| | 5.00% | | 10/01/22 | | 26,418 |
| 60,000 | | Jea FL Elec Sys Rev Unrefunded Sub, Ser B
| | 5.00% | | 10/01/23 | | 63,404 |
| 245,000 | | Jea FL Elec Sys Rev Unrefunded, Ser 3-A
| | 5.00% | | 10/01/23 | | 258,898 |
| 60,000 | | Jea FL Wtr & Swr Rev Ref, Ser A
| | 5.00% | | 10/01/21 | | 60,470 |
| 175,000 | | Lakewood Ranch FL Stewardship Dist Spl Assmnt Rev Ref Country Club E Proj, AGM
| | 5.00% | | 05/01/25 | | 203,652 |
| 95,000 | | Manatee Cnty FL Port Auth Ref, Ser B, AMT
| | 4.00% | | 10/01/37 | | 99,173 |
| 500,000 | | Miami-Dade Cnty FL Aviation Rev Ref, Ser A, AMT
| | 5.00% | | 10/01/28 | | 528,060 |
| 395,000 | | Miami-Dade Cnty FL Spl Oblig Ref Sub, Ser A
| | 5.00% | | 10/01/27 | | 417,645 |
| 105,000 | | Miami-Dade Cnty FL Spl Oblig Ref Sub, Ser B, AGM
| | 4.00% | | 10/01/37 | | 109,801 |
| 200,000 | | Miami-Dade Cnty FL Wtr & Swr Rev Ref
| | 5.00% | | 10/01/21 | | 201,594 |
| 695,000 | | Orlando & Orange Cnty FL Expressway Auth Ref, Ser B, AGM
| | 5.00% | | 07/01/22 | | 726,371 |
| 210,000 | | Palm Beach Cnty FL Sch Brd Ref, Ser B, COPS
| | 5.00% | | 08/01/21 | | 210,000 |
| 300,000 | | Pembroke Pines FL Capital Impt Rev Ref, AGM
| | 5.00% | | 12/01/21 | | 304,833 |
| 130,000 | | Sarasota Cnty FL Util Sys Rev
| | 5.00% | | 10/01/38 | | 143,778 |
| | | | | 7,972,048 |
| | | Georgia – 0.3% | | | | | | |
| 195,000 | | Atlanta GA Wtr & Wstwtr Rev Ref
| | 5.00% | | 11/01/21 | | 197,367 |
| 140,000 | | Priv Clgs & Univs Auth GA Mercer Univ, Ser A
| | 5.25% | | 10/01/27 | | 141,154 |
| 185,000 | | Priv Clgs & Univs Auth GA Mercer Univ, Ser A
| | 5.00% | | 10/01/32 | | 186,451 |
| | | | | 524,972 |
| | | Hawaii – 0.2% | | | | | | |
| 345,000 | | HI St Prerefunded, Ser DZ
| | 5.00% | | 12/01/22 | | 350,561 |
| | | Illinois – 8.3% | | | | | | |
| 120,000 | | Chicago IL Brd of Edu Cap Apprec Sch Reform, Ser B-1, NATL-RE
| | (c) | | 12/01/22 | | 119,156 |
| 100,000 | | Chicago IL Brd of Edu Cap Apprec Sch, Ser A, BHAC-CR FGIC
| | (c) | | 12/01/22 | | 99,626 |
| 1,500,000 | | Chicago IL Brd of Edu Ref, Ser A
| | 4.00% | | 12/01/21 | | 1,517,922 |
| 765,000 | | Chicago IL Brd of Edu Ref, Ser B
| | 5.00% | | 12/01/21 | | 776,644 |
| 80,000 | | Chicago IL O’Hare Intl Arpt Rev Ref Gen Sr Lien, Ser C
| | 5.00% | | 01/01/23 | | 85,510 |
| 300,000 | | Chicago IL Wtr Rev Second Lien
| | 5.00% | | 11/01/21 | | 303,552 |
| 340,000 | | Chicago IL Wtrwks Rev 2nd Lien Proj
| | 5.00% | | 11/01/21 | | 344,025 |
| 1,000,000 | | Cook Cnty IL Ref, Ser A
| | 3.00% | | 11/15/21 | | 1,008,318 |
| 150,000 | | Cook Cnty IL Ref, Ser C
| | 5.00% | | 11/15/23 | | 159,274 |
| 1,500,000 | | Grundy Kendall & Will Cntys IL Cmnty High Sch Dist #111 Ref
| | 4.00% | | 11/01/21 | | 1,513,982 |
| 100,000 | | IL St
| | 4.00% | | 09/01/21 | | 100,304 |
| 200,000 | | IL St
| | 5.00% | | 03/01/22 | | 205,596 |
| 220,000 | | IL St
| | 5.00% | | 06/01/22 | | 228,761 |
| 430,000 | | IL St
| | 5.00% | | 07/01/22 | | 448,806 |
| 405,000 | | IL St
| | 5.00% | | 05/01/23 | | 438,166 |
| 210,000 | | IL St
| | 4.00% | | 03/01/26 | | 214,309 |
| 1,000,000 | | IL St Dev Fin Auth Sol Wst Disp Rev Wst Mgmt Inc Proj Remk, Ser A, AMT (Mandatory put 11/01/21)
| | 0.55% | | 11/01/44 | | 1,001,043 |
| 180,000 | | IL St Fin Auth Hlth Svcs Facs Lease Rev Univ of IL Hlth Svcs Fac Proj
| | 5.00% | | 10/01/23 | | 197,326 |
| 150,000 | | IL St Fin Auth Rev Ref Osf Hlthcare Sys, Ser A
| | 5.00% | | 11/15/22 | | 159,220 |
| 475,000 | | IL St Fin Auth Rev Univ of Chicago, Ser A
| | 5.00% | | 10/01/51 | | 478,764 |
| 2,000,000 | | IL St Fin Auth Rev Var Univ Chicago Med Ctr, Ser A (a)
| | 0.02% | | 08/01/44 | | 2,000,000 |
| 385,000 | | IL St Ref
| | 5.00% | | 02/01/22 | | 394,239 |
| 50,000 | | IL St Ref
| | 4.00% | | 08/01/25 | | 51,789 |
Page 30
See Notes to Financial Statements
First Trust Ultra Short Duration Municipal ETF (FUMB)
Portfolio of Investments (Continued)
July 31, 2021
Principal
Value | | Description | | Stated
Coupon | | Stated
Maturity | | Value |
| MUNICIPAL BONDS (Continued) |
| | | Illinois (Continued) | | | | | | |
| $500,000 | | IL St, Ser A
| | 5.00% | | 03/01/22 | | $513,990 |
| 200,000 | | IL St, Ser A
| | 5.00% | | 04/01/22 | | 206,389 |
| 100,000 | | IL St, Ser A
| | 5.00% | | 04/01/23 | | 107,816 |
| 15,000 | | IL St, Ser A, AGM
| | 4.00% | | 01/01/22 | | 15,242 |
| 155,000 | | IL St, Ser D
| | 5.00% | | 11/01/22 | | 164,180 |
| 115,000 | | Kane Kendall Etc Cntys IL Cmnty Clg Dist #516, Ser A
| | 5.00% | | 12/15/22 | | 117,095 |
| 95,000 | | Montgomery IL Ref Alt Rev Source
| | 2.63% | | 12/01/21 | | 95,177 |
| 75,000 | | Springfield IL Elec Rev Ref Sr Lien
| | 5.00% | | 03/01/22 | | 77,023 |
| 500,000 | | Springfield IL Elec Rev Ref Sr Lien
| | 5.00% | | 03/01/23 | | 535,839 |
| | | | | 13,679,083 |
| | | Indiana – 3.6% | | | | | | |
| 1,015,000 | | Brownsburg IN 1999 Sch Bldg Corp, BANS (b)
| | 1.50% | | 05/13/22 | | 1,017,490 |
| 85,000 | | Carmel IN Redev Auth Lease Rental Rev Multipurpose, Ser A
| | 4.00% | | 08/01/30 | | 88,329 |
| 305,000 | | Carmel IN Redev Auth Lease Rental Rev Multipurpose, Ser A
| | 4.00% | | 08/01/35 | | 316,945 |
| 500,000 | | Greater Clark IN Bldg Corp
| | 4.00% | | 01/15/22 | | 508,419 |
| 170,000 | | Greater Clark IN Bldg Corp Greater Clark Sch Corp 1st Mtge Bonds, Ser 2019
| | 4.00% | | 01/15/22 | | 172,862 |
| 1,000,000 | | Hamilton IN S Estrn Schs
| | 3.00% | | 12/31/22 | | 1,038,226 |
| 70,000 | | IN Fin Auth IN Wstwtr Util Rev First Lien Cwa Auth, Ser A
| | 5.25% | | 10/01/25 | | 70,583 |
| 80,000 | | IN Fin Auth IN Wstwtr Util Rev First Lien Cwa Auth, Ser A
| | 5.25% | | 10/01/31 | | 80,666 |
| 85,000 | | IN Fin Auth IN Wstwtr Util Rev First Lien Cwa Auth, Ser A
| | 5.25% | | 10/01/38 | | 85,708 |
| 175,000 | | IN St Bond Bank Spl Prog Gas Rev, Ser A
| | 5.25% | | 10/15/21 | | 176,715 |
| 150,000 | | IN St Fin Auth Rev BHI Sr Living
| | 5.50% | | 11/15/26 | | 152,281 |
| 105,000 | | IN St Muni Pwr Agy Ref, Ser A
| | 5.00% | | 01/01/24 | | 116,863 |
| 45,000 | | La Porte IN Wtrwks Rev, AGM
| | 4.00% | | 07/01/22 | | 46,457 |
| 100,000 | | La Porte IN Wtrwks Rev, AGM
| | 4.00% | | 07/01/23 | | 106,231 |
| 1,400,000 | | Noblesville IN Multi Sch Bldg Corp Ref 1st Mtge
| | 5.00% | | 07/15/22 | | 1,447,311 |
| 470,000 | | Saint Joseph Cnty IN Arpt Auth Ref, AMT, BAM
| | 4.00% | | 01/01/23 | | 494,032 |
| | | | | 5,919,118 |
| | | Iowa – 2.0% | | | | | | |
| 1,030,000 | | IA St Fin Auth Midwestern Econ Dev Rev Var Cj Bio Amer Inc Proj (a)
| | 0.06% | | 04/01/22 | | 1,030,000 |
| 1,000,000 | | IA St Fin Auth Sol Wst Facs Rev Var Green Bond Gevo NW Rng LLC Renewable Natrl Gas Proj, AMT (Mandatory put 04/01/24)
| | 1.50% | | 01/01/42 | | 1,011,371 |
| 1,250,000 | | IA St Hgr Edu Loan Auth Priv Edu Working Capital Loan Prog, Ser A, RANS
| | 2.00% | | 05/19/22 | | 1,266,863 |
| | | | | 3,308,234 |
| | | Kansas – 0.1% | | | | | | |
| 225,000 | | Wyandotte Cnty KS Unif Sch Dist #202, Ser A, AGM
| | 2.00% | | 09/01/21 | | 225,318 |
| | | Kentucky – 0.3% | | | | | | |
| 50,000 | | KY St Pub Energy Auth Gas Sply Rev Gas Sply, Ser C-1 (Mandatory put 06/01/25)
| | 4.00% | | 12/01/49 | | 56,242 |
| 150,000 | | KY St Pub Energy Auth Gas Sply Rev Var, Ser C
| | 4.00% | | 08/01/21 | | 150,000 |
| 35,000 | | Lewis Cnty KY Sch Dist Fin Corp, Ser B
| | 2.25% | | 06/01/22 | | 35,583 |
| 300,000 | | Owen Cnty KY Pub Properties Corp 1st Mtge Rev Ref Court Facs Proj
| | 4.00% | | 11/01/21 | | 302,632 |
| | | | | 544,457 |
| | | Louisiana – 3.2% | | | | | | |
| 1,000,000 | | LA St Gas & Fuels Tax Rev Var Ref Second Lien Remk, Ser D-2 (Mandatory put 05/01/22)
| | 0.55% | | 05/01/43 | | 1,000,249 |
See Notes to Financial Statements
Page 31
First Trust Ultra Short Duration Municipal ETF (FUMB)
Portfolio of Investments (Continued)
July 31, 2021
Principal
Value | | Description | | Stated
Coupon | | Stated
Maturity | | Value |
| MUNICIPAL BONDS (Continued) |
| | | Louisiana (Continued) | | | | | | |
| $125,000 | | LA Stadium & Exposition Dist LA Ref Sr, Ser A
| | 5.00% | | 07/01/28 | | $136,204 |
| 2,400,000 | | LA Stadium & Exposition Dist LA, BANS
| | 4.00% | | 07/03/23 | | 2,539,123 |
| 15,000 | | New Orleans LA Wtr Rev Ref
| | 5.00% | | 12/01/29 | | 17,354 |
| 35,000 | | New Orleans LA Wtr Rev Ref
| | 5.00% | | 12/01/34 | | 40,493 |
| 280,000 | | New Orleans LA Wtr Rev Ref
| | 5.00% | | 12/01/44 | | 323,946 |
| 500,000 | | Saint John the Baptist Parish LA Rev Ref Marathon Oil Corp Proj Remk, Ser A-1 (Mandatory put 04/01/23)
| | 2.00% | | 06/01/37 | | 512,222 |
| 185,000 | | Shreveport LA Wtr & Swr Rev Junior Lien, Ser C, BAM
| | 5.00% | | 12/01/23 | | 205,073 |
| 200,000 | | Shreveport LA Wtr & Swr Rev Ref
| | 5.00% | | 12/01/21 | | 203,224 |
| 255,000 | | Shreveport LA Wtr & Swr Rev Ref, Ser A, BAM
| | 5.00% | | 12/01/22 | | 271,037 |
| | | | | 5,248,925 |
| | | Maryland – 0.1% | | | | | | |
| 100,000 | | Harford Cnty MD Spl Oblg Ref Beechtree Estates Proj
| | 3.00% | | 07/01/22 | | 102,219 |
| 80,000 | | Maryland St Second, Ser B
| | 5.00% | | 08/01/21 | | 80,000 |
| | | | | 182,219 |
| | | Massachusetts – 1.0% | | | | | | |
| 750,000 | | Ludlow MA, BANS
| | 1.00% | | 09/23/21 | | 750,898 |
| 100,000 | | MA St Eductnl Fing Auth Ref Issue L Sr, Ser B, AMT
| | 5.00% | | 07/01/22 | | 104,467 |
| 150,000 | | MA St Eductnl Fing Auth Sr, Ser B, AMT
| | 5.00% | | 07/01/23 | | 163,390 |
| 530,000 | | MA St Port Auth, Ser A, AMT
| | 5.00% | | 07/01/42 | | 553,394 |
| | | | | 1,572,149 |
| | | Michigan – 0.1% | | | | | | |
| 100,000 | | MI St Fin Auth Rev Second Lien Distrib St Aid Rev Chrt Cnty Wayne
| | 5.00% | | 11/01/22 | | 105,793 |
| 55,000 | | Port Huron MI, Ser B, AGM
| | 5.25% | | 10/01/40 | | 55,458 |
| | | | | 161,251 |
| | | Minnesota – 1.0% | | | | | | |
| 1,000,000 | | Brooklyn Ctr MN Mf Hsg Dev Rev Var Sonder House Apartments Proj (Mandatory put 07/01/22)
| | 1.35% | | 01/01/37 | | 1,000,881 |
| 600,000 | | Forest Lake MN Indep Sch Dist #831 Ref, Ser A, COPS
| | 4.00% | | 04/01/23 | | 634,719 |
| 60,000 | | MN St St Trunk Hwy, Ser B
| | 5.00% | | 10/01/22 | | 60,480 |
| | | | | 1,696,080 |
| | | Mississippi – 0.6% | | | | | | |
| 500,000 | | MS St Busn Fin Corp Sol Wst Disp Rev Waste Mgmt Inc Proj Remk (Mandatory put 09/01/21)
| | 0.55% | | 03/01/29 | | 500,166 |
| 400,000 | | MS St Dev Bank Spl Oblg Jackson Wtr & Swr Sys Proj, AGM
| | 6.75% | | 12/01/26 | | 455,697 |
| 100,000 | | MS St Dev Bank Spl Oblg Jackson Wtr & Swr Sys Proj, AGM
| | 6.75% | | 12/01/32 | | 113,475 |
| | | | | 1,069,338 |
| | | Missouri – 0.6% | | | | | | |
| 500,000 | | Bridgeton MO Spl Oblig Rev Ref, Ser A
| | 4.00% | | 12/01/22 | | 524,410 |
| 140,000 | | MO St Hlth & Eductnl Facs Auth Hlth Facs Rev Bethesda Hlth Grp Inc Ref
| | 3.00% | | 08/01/21 | | 140,000 |
| 250,000 | | Randolph Cnty MO Sch Dist #81 Moberly MO Direct Deposit Prog
| | 5.75% | | 03/01/26 | | 257,989 |
| | | | | 922,399 |
| | | Nebraska – 2.5% | | | | | | |
| 300,000 | | Centrl Plains Energy Proj NE Gas Proj Rev Proj #3
| | 5.00% | | 09/01/22 | | 315,600 |
| 325,000 | | Centrl Plains Energy Proj NE Gas Proj Rev Proj #3
| | 5.00% | | 09/01/27 | | 341,574 |
Page 32
See Notes to Financial Statements
First Trust Ultra Short Duration Municipal ETF (FUMB)
Portfolio of Investments (Continued)
July 31, 2021
Principal
Value | | Description | | Stated
Coupon | | Stated
Maturity | | Value |
| MUNICIPAL BONDS (Continued) |
| | | Nebraska (Continued) | | | | | | |
| $405,000 | | Centrl Plains Energy Proj NE Gas Proj Rev Proj #3
| | 5.00% | | 09/01/32 | | $425,744 |
| 410,000 | | Centrl Plains Energy Proj NE Gas Proj Rev Proj #3
| | 5.25% | | 09/01/37 | | 432,103 |
| 145,000 | | Centrl Plains Energy Proj NE Gas Proj Rev Proj #3
| | 5.00% | | 09/01/42 | | 152,427 |
| 165,000 | | Centrl Plains Energy Proj NE Gas Proj Rev Proj No 1, Ser A
| | 5.25% | | 12/01/21 | | 167,754 |
| 150,000 | | Centrl Plains Energy Proj NE Gas Proj Rev Proj No. 4
| | 5.00% | | 01/01/24 | | 167,564 |
| 1,855,000 | | Centrl Plains Energy Proj NE Gas Proj Rev Proj No. 4 (Mandatory put 01/01/24)
| | 5.00% | | 03/01/50 | | 2,052,047 |
| 50,000 | | NE St Pub Pwr Dist Rev Gen, Ser C
| | 5.00% | | 01/01/22 | | 50,991 |
| | | | | 4,105,804 |
| | | Nevada – 3.3% | | | | | | |
| 250,000 | | Carson City NV Hosp Rev Ref Carson Tahoe Regl Med Ctr, Ser A
| | 5.00% | | 09/01/21 | | 250,924 |
| 160,000 | | Clark Cnty NV Arpt Rev Ref Sys Sub Lien, Ser A-1, AMT
| | 5.00% | | 07/01/22 | | 167,117 |
| 200,000 | | Clark Cnty NV Passenger Fac Charge Rev Ref Las Vegas Mccarran Intl Arpt, Ser E
| | 5.00% | | 07/01/23 | | 218,741 |
| 835,000 | | Clark Cnty NV Sch Dist Ref Bldg, Ser A
| | 5.00% | | 06/15/23 | | 911,602 |
| 675,000 | | Clark Cnty NV Sch Dist Ref, Ser A
| | 5.00% | | 06/15/23 | | 736,924 |
| 800,000 | | Clark Cnty NV Sch Dist Various Purp Medium Term, Ser F
| | 5.00% | | 06/15/22 | | 814,534 |
| 750,000 | | Director of the St of NV Dept of Busn & Ind Var Brightline W Psngr Rail Proj Remk, Ser A, AMT (Mandatory put 02/01/22) (b)
| | 0.25% | | 01/01/50 | | 750,173 |
| 1,600,000 | | Yerington NV USDA Interim Debs
| | 1.63% | | 11/01/23 | | 1,616,476 |
| | | | | 5,466,491 |
| | | New Jersey – 5.2% | | | | | | |
| 100,000 | | Atlantic City NJ Brd of Edu Ref Sch Bd Res Fd, AGM
| | 4.00% | | 04/01/23 | | 105,701 |
| 125,000 | | Hamilton Twp NJ Sch Dist, AGM
| | 3.00% | | 07/15/22 | | 128,325 |
| 90,000 | | Hudson Cnty NJ Impt Auth Rev Cnty Gtd Spl Acq 830 Bergen Ave Acq Proj
| | 5.00% | | 11/15/31 | | 91,254 |
| 1,795,000 | | Jersey City NJ Muni Utilities Auth Wtr Proj Notes
| | 3.00% | | 07/01/22 | | 1,839,324 |
| 640,000 | | Jersey City NJ, Ser A, BANS
| | 1.50% | | 01/12/22 | | 644,197 |
| 700,000 | | NJ St Covid-19 Go Emergency Bonds, Ser A
| | 4.00% | | 06/01/23 | | 748,771 |
| 25,000 | | NJ St Econ Dev Auth Ref, Ser A, BAM
| | 5.00% | | 06/15/23 | | 27,284 |
| 30,000 | | NJ St Econ Dev Auth Rev Sch Facs Constr, Ser KK
| | 5.00% | | 03/01/23 | | 31,551 |
| 500,000 | | NJ St Hgr Edu Asst Auth Stdt Loan Rev Sr Bonds, Ser B, AMT
| | 5.00% | | 12/01/22 | | 531,099 |
| 100,000 | | NJ St Hgr Edu Asst Auth Stdt Loan Rev Sr, Ser 2015-1A, AMT
| | 5.00% | | 12/01/24 | | 114,970 |
| 255,000 | | NJ St Hgr Edu Asst Auth Stdt Loan Rev, Ser B, AMT
| | 5.00% | | 12/01/23 | | 282,227 |
| 360,000 | | NJ St Transprtn Trust Fund Auth Transn Sys, Ser A
| | 5.50% | | 12/15/21 | | 367,011 |
| 250,000 | | NJ St Transprtn Trust Fund Auth Transprtn Prog, Ser AA
| | 5.00% | | 06/15/23 | | 260,385 |
| 570,000 | | NJ St Transprtn Trust Fund Auth Transprtn Prog, Ser AA
| | 5.00% | | 06/15/28 | | 593,678 |
| 300,000 | | NJ St Transprtn Trust Fund Auth Transprtn Prog, Ser AA
| | 5.00% | | 06/15/32 | | 312,462 |
| 580,000 | | NJ St Transprtn Trust Fund Auth Transprtn Sys, Ser A
| | 5.00% | | 06/15/42 | | 604,094 |
| 1,000,000 | | Prospect Park NJ, BANS
| | 2.00% | | 11/10/21 | | 1,004,417 |
| 600,000 | | Ringwood NJ Brd of Edu Ref, BAM
| | 4.00% | | 09/01/22 | | 624,876 |
| 225,000 | | Ringwood NJ Brd of Edu Ref, BAM
| | 4.00% | | 09/01/23 | | 242,871 |
| | | | | 8,554,497 |
| | | New Mexico – 0.8% | | | | | | |
| 550,000 | | Farmington NM Poll Control Rev Ref Pub Svc Company Proj Remk, Ser B (Mandatory put 06/01/22)
| | 2.13% | | 06/01/40 | | 558,317 |
| 750,000 | | Farmington NM Poll Control Rev Var Ref Pub Svc Co of NM Remk, Ser F, AMT (Mandatory put 06/01/22)
| | 1.20% | | 06/01/40 | | 755,516 |
| | | | | 1,313,833 |
| | | New York – 13.4% | | | | | | |
| 100,000 | | Build NYC Res Corp NY Rev Acad Leadership Chrt Sch Proj
| | 4.00% | | 06/15/23 | | 106,474 |
See Notes to Financial Statements
Page 33
First Trust Ultra Short Duration Municipal ETF (FUMB)
Portfolio of Investments (Continued)
July 31, 2021
Principal
Value | | Description | | Stated
Coupon | | Stated
Maturity | | Value |
| MUNICIPAL BONDS (Continued) |
| | | New York (Continued) | | | | | | |
| $110,000 | | Ctr Moriches NY Union Freesch Dist
| | 5.00% | | 08/01/21 | | $110,000 |
| 1,364,700 | | E Hampton Town NY, Ser A, BANS
| | 1.25% | | 08/20/21 | | 1,365,411 |
| 2,000,000 | | Harpursville NY Centrl Sch Dist, BANS
| | 1.25% | | 06/28/22 | | 2,020,006 |
| 600,000 | | Long Beach NY, BAM
| | 2.00% | | 09/15/22 | | 612,113 |
| 285,000 | | Met Transprtn Auth NY Rev Transprtn, Ser A-1
| | 5.00% | | 11/15/23 | | 315,291 |
| 100,000 | | Met Transprtn Auth NY Rev Transprtn, Ser B
| | 5.00% | | 11/15/22 | | 106,130 |
| 120,000 | | Met Transprtn Auth NY Rev Transprtn, Ser E
| | 5.00% | | 11/15/22 | | 127,356 |
| 410,000 | | Met Transprtn Auth NY Rev, Ser A-2S, BANS
| | 4.00% | | 02/01/22 | | 417,612 |
| 100,000 | | Met Transprtn Auth NY Rev, Ser B, NATL-RE, FGIC
| | 5.25% | | 11/15/21 | | 101,438 |
| 1,090,000 | | Met Transprtn Auth NY Rev, Ser B-1, BANS
| | 5.00% | | 05/15/22 | | 1,130,741 |
| 180,000 | | Niagara Cnty NY Tobacco Asset Securitization Corp Tobacco As Ref Asset Bkd Bds
| | 5.00% | | 05/15/22 | | 186,771 |
| 2,000,000 | | NY City NY Hsg Dev Corp Mf Hsg Rev Sustainable Dev Bonds Var, Ser F-2 (Mandatory put 07/01/25)
| | 0.60% | | 05/01/61 | | 2,009,105 |
| 1,630,000 | | NY City NY Hsg Dev Corp Rev, Ser A
| | 5.00% | | 07/01/25 | | 1,770,923 |
| 1,695,000 | | NY City NY Muni Wtr Fin Auth Wtr & Swr Sys Rev Var Second Gen Resolution Sub FF-1 (a)
| | 0.02% | | 06/15/44 | | 1,695,000 |
| 1,000,000 | | NY NY Adj Fiscal 2017, Subser A-5 (a)
| | 0.04% | | 08/01/44 | | 1,000,000 |
| 2,150,000 | | NY NY Adj Fiscal 2020, Subser B-3 (a)
| | 0.13% | | 10/01/46 | | 2,150,000 |
| 75,000 | | NY NY Ref, Ser A
| | 5.00% | | 08/01/21 | | 75,000 |
| 1,000,000 | | NY NY Var Fiscal 2021 Remk, Ser 3 (a)
| | 0.12% | | 04/01/42 | | 1,000,000 |
| 100,000 | | NY NY, Ser C
| | 5.00% | | 08/01/23 | | 104,928 |
| 125,000 | | NY St Hsg Fin Agy Affordable Hsg, Ser E
| | 2.13% | | 11/01/23 | | 125,115 |
| 235,000 | | NY St Hsg Fin Agy Sustainability Bonds, Ser N
| | 1.45% | | 05/01/23 | | 235,245 |
| 180,000 | | NY St Hsg Fin Agy Sustainability Bonds, Ser Q
| | 1.35% | | 11/01/23 | | 183,689 |
| 895,000 | | NY St Mtge Agy Homeowner Mtge Rev, Ser 180, AMT
| | 3.90% | | 04/01/22 | | 913,955 |
| 1,000,000 | | NY St Mtge Agy Homeowner Mtge Rev, Ser 183, AMT
| | 3.75% | | 04/01/23 | | 1,052,537 |
| 175,000 | | NY St Mtge Agy Rev Mtge, 55th Ser, AMT
| | 2.65% | | 10/01/23 | | 182,401 |
| 265,000 | | NY St Mtge Agy Rev, Ser 51
| | 2.25% | | 10/01/23 | | 274,808 |
| 410,000 | | NY St Transprtn Dev Corp Spl Fac Rev Ref Terminal 4 JFK Intl Arpt Proj, Ser A, AMT
| | 5.00% | | 12/01/22 | | 435,841 |
| 300,000 | | NY St Transprtn Dev Corp Spl Fac Rev Ref Terminal 4 JFK Intl Arpt Proj, Ser C
| | 5.00% | | 12/01/21 | | 304,792 |
| 225,000 | | Port Auth of NY & NJ NY Ref 195th Ser, AMT
| | 5.00% | | 10/01/21 | | 226,760 |
| 100,000 | | Port Auth of NY & NJ NY Ref Consol Ser 186, AMT
| | 5.00% | | 10/15/22 | | 105,812 |
| 135,000 | | Port Auth of NY & NJ NY Ref Consolidated Bonds Two Hundred Second, AMT
| | 5.00% | | 10/15/21 | | 136,311 |
| 180,000 | | Port Auth of NY & NJ NY Ref Consolidated Bonds Two Hundred Second, AMT
| | 5.00% | | 10/15/22 | | 190,461 |
| 165,000 | | Port Auth of NY & NJ NY Ref, Ser 207, AMT
| | 5.00% | | 09/15/23 | | 181,638 |
| 155,000 | | Rochester NY, Ser II, BANS
| | 2.00% | | 08/03/22 | | 157,983 |
| 1,000,000 | | Suffolk Cnty NY, Ser II, TANS
| | 2.00% | | 08/19/21 | | 1,000,837 |
| | | | | 22,112,484 |
| | | North Carolina – 0.3% | | | | | | |
| 220,000 | | NC St Capital Facs Fin Agy Eductnl Facs Rev Ref High Point Univ
| | 3.00% | | 05/01/22 | | 224,523 |
| 105,000 | | NC St Estrn Muni Pwr Agy Pwr Sys Rev, Ser A
| | 5.00% | | 01/01/23 | | 109,734 |
| 40,000 | | NC St Estrn Muni Pwr Agy Pwr Sys Rev, Ser A
| | 5.00% | | 01/01/24 | | 41,803 |
| 75,000 | | Univ of NC NC at Charlotte, Ser A
| | 5.00% | | 04/01/37 | | 77,459 |
| | | | | 453,519 |
| | | North Dakota – 1.5% | | | | | | |
| 1,000,000 | | Horace ND Ref & Impt, Ser A
| | 1.90% | | 08/01/22 | | 1,001,034 |
| 110,000 | | ND St Hsg Fin Agy Hsg Fin Prog Home Mtge Fin Prog, Ser A
| | 2.30% | | 01/01/22 | | 110,929 |
Page 34
See Notes to Financial Statements
First Trust Ultra Short Duration Municipal ETF (FUMB)
Portfolio of Investments (Continued)
July 31, 2021
Principal
Value | | Description | | Stated
Coupon | | Stated
Maturity | | Value |
| MUNICIPAL BONDS (Continued) |
| | | North Dakota (Continued) | | | | | | |
| $350,000 | | W Fargo ND Ref, Ser A
| | 2.00% | | 05/01/22 | | $354,779 |
| 500,000 | | Watford City ND St Aid Ctfs Indebtedness Ref, AGM
| | 3.00% | | 12/01/21 | | 503,865 |
| 440,000 | | Williston ND Cnty Wide Pub Safety Sales Tax Rev Ref, Ser A
| | 5.00% | | 07/15/22 | | 457,000 |
| | | | | 2,427,607 |
| | | Ohio – 2.8% | | | | | | |
| 70,000 | | American Muni Pwr OH Inc OH Rev Ref Combined Hydroelec Proj, Ser A
| | 5.00% | | 02/15/23 | | 75,191 |
| 155,000 | | American Muni Pwr OH Inc OH Rev Ref Prairie St Energy Cmps Proj, Ser A
| | 5.00% | | 02/15/23 | | 166,495 |
| 150,000 | | Butler Cnty OH Hosp Facs Ref UC Hlth
| | 4.00% | | 11/15/23 | | 162,531 |
| 120,000 | | Franklin Cnty OH Hosp Rev Facs OH Hlth Corp, Ser A
| | 5.00% | | 11/15/41 | | 121,690 |
| 115,000 | | Miami Univ OH Ref
| | 4.00% | | 09/01/23 | | 115,351 |
| 280,000 | | Montgomery Cnty OH Hosp Rev Ref Kettering Hlth Network Oblig Grp Proj
| | 5.00% | | 08/01/23 | | 307,018 |
| 100,000 | | NE OH Med Univ Gen Recpts Ref, Ser A
| | 3.00% | | 12/01/22 | | 103,233 |
| 500,000 | | OH St Air Quality Dev Auth Ref American Elec Pwr Company Proj Remk, Ser B, AMT (Mandatory put 10/01/24)
| | 2.10% | | 07/01/28 | | 523,556 |
| 75,000 | | OH St Ref Common Schs, Ser A
| | 5.00% | | 09/15/21 | | 75,435 |
| 3,000,000 | | Olmsted Falls OH, BANS
| | 1.25% | | 06/09/22 | | 3,023,373 |
| | | | | 4,673,873 |
| | | Oklahoma – 2.6% | | | | | | |
| 2,700,000 | | OK St Dev Fin Auth Gilcrease Expressway W Proj P3 Proj, AMT
| | 1.63% | | 07/06/23 | | 2,729,423 |
| 930,000 | | OK St Dev Fin Auth Var Solid Waste Disp Remk, Ser A
| | 2.38% | | 12/01/21 | | 936,828 |
| 75,000 | | OK St Wtr Res Brd Revolving Fund Rev Master Trust, Ser A
| | 5.00% | | 04/01/25 | | 77,459 |
| 90,000 | | OK St Wtr Res Brd Revolving Fund Rev Master Trust, Ser A
| | 5.00% | | 04/01/28 | | 92,951 |
| 25,000 | | OK St Wtr Res Brd Revolving Fund Rev Master Trust, Ser B
| | 5.00% | | 04/01/23 | | 25,820 |
| 465,000 | | Tulsa OK Arpts Impt Trust Ref, Ser A, AMT, BAM
| | 5.00% | | 06/01/22 | | 483,393 |
| | | | | 4,345,874 |
| | | Pennsylvania – 5.8% | | | | | | |
| 200,000 | | Berks Cnty PA Indl Dev Auth Hlth Sys Rev Ref Tower Hlth Proj
| | 5.00% | | 11/01/22 | | 207,078 |
| 900,000 | | Berks Cnty PA Muni Auth Ref Tower Hlth Proj, Ser A
| | 5.00% | | 02/01/22 | | 912,799 |
| 50,000 | | Erie PA Hgr Edu Bldg Auth Aicup Fing Prog Gannon Uni Proj Ref, Ser TT1
| | 5.00% | | 05/01/22 | | 51,653 |
| 55,000 | | Erie PA Hgr Edu Bldg Auth Aicup Fing Prog Gannon Uni Proj Ref, Ser TT1
| | 5.00% | | 05/01/23 | | 59,234 |
| 165,000 | | Hermitage PA Muni Auth Ref, Ser C
| | 3.00% | | 02/01/22 | | 167,246 |
| 150,000 | | Mckeesport PA Area Sch Dist Ref, Ser A, AGM
| | 3.00% | | 10/01/21 | | 150,698 |
| 150,000 | | Monroeville PA Fin Auth Upmc Rev Ref, Ser B
| | 3.50% | | 07/01/23 | | 159,612 |
| 125,000 | | PA St Econ Dev Fing Auth Pkg Sys Rev Capitol Region Pkg Sys Sr, Ser A, AGM
| | 5.00% | | 01/01/23 | | 133,021 |
| 3,000,000 | | PA St Econ Dev Fing Auth Solid Waste Disposal Rev Var Ref Rep Svcs Inc Proj Remk, Ser A, AMT (Mandatory put 10/15/21)
| | 0.18% | | 04/01/34 | | 3,000,223 |
| 750,000 | | PA St Econ Dev Fing Auth Solid Waste Disposal Rev Waste Mgmt Inc Proj Remk, Ser A, AMT (Mandatory put 08/02/21)
| | 0.70% | | 08/01/37 | | 750,000 |
| 150,000 | | PA St First Ser
| | 4.00% | | 11/15/28 | | 151,687 |
| 235,000 | | PA St Turnpike Commn Oil Franchise Tax Rev Ref Sub, Ser B
| | 5.00% | | 12/01/21 | | 238,785 |
| 1,280,000 | | Philadelphia PA Ref, Ser A
| | 5.00% | | 08/01/21 | | 1,280,000 |
| 145,000 | | Philadelphia PA Ref, Ser A
| | 5.00% | | 08/01/21 | | 145,000 |
| 275,000 | | Philadelphia PA Ref, Ser A
| | 5.00% | | 09/15/21 | | 276,574 |
| 150,000 | | Philadelphia PA Ref, Ser A
| | 5.00% | | 07/15/22 | | 156,984 |
| 215,000 | | Philadelphia PA Ref, Ser A
| | 5.00% | | 08/01/23 | | 235,927 |
| 80,000 | | Philadelphia PA Wtr & Wstwtr Rev Ref, Ser B
| | 5.00% | | 11/01/21 | | 80,961 |
See Notes to Financial Statements
Page 35
First Trust Ultra Short Duration Municipal ETF (FUMB)
Portfolio of Investments (Continued)
July 31, 2021
Principal
Value | | Description | | Stated
Coupon | | Stated
Maturity | | Value |
| MUNICIPAL BONDS (Continued) |
| | | Pennsylvania (Continued) | | | | | | |
| $305,000 | | Philadelphia PA Wtr & Wstwtr Rev, Ser A
| | 5.13% | | 01/01/43 | | $311,310 |
| 200,000 | | Riverside PA Sch Dist Ref, BAM
| | 2.00% | | 10/15/22 | | 204,093 |
| 225,000 | | Riverside PA Sch Dist Ref, BAM
| | 3.00% | | 10/15/23 | | 238,166 |
| 300,000 | | Riverside PA Sch Dist Ref, BAM
| | 4.00% | | 10/15/24 | | 334,215 |
| 275,000 | | Riverside PA Sch Dist Ref, BAM
| | 4.00% | | 10/15/25 | | 313,948 |
| 70,000 | | W Cornwall Twp PA Muni Auth Ref Lebanon Vly Brethren Home Proj, Ser A
| | 4.00% | | 11/15/22 | | 73,121 |
| | | | | 9,632,335 |
| | | South Carolina – 0.9% | | | | | | |
| 500,000 | | Berkeley Cnty SC Sch Dist Installment Pur Rev Ref Securing Assets for Edu, Ser A
| | 5.00% | | 12/01/27 | | 554,621 |
| 50,000 | | SC St Pub Svc Auth Rev Ref Oblig Santee Cooper Proj, Ser B
| | 4.00% | | 12/01/21 | | 50,642 |
| 145,000 | | SC St Pub Svc Auth Rev Ref Obligs, Ser C
| | 5.00% | | 12/01/22 | | 154,260 |
| 60,000 | | SC St Pub Svc Auth Rev Ref Santee Cooper, Ser A
| | 5.00% | | 12/01/28 | | 60,967 |
| 90,000 | | SC St Pub Svc Auth Rev Ref Santee Cooper, Ser A
| | 5.00% | | 12/01/29 | | 91,451 |
| 100,000 | | SC St Pub Svc Auth Rev Ref, Ser B
| | 5.00% | | 12/01/22 | | 106,386 |
| 335,000 | | SC St Pub Svc Auth Rev Santee Cooper, Ser D
| | 5.00% | | 12/01/43 | | 348,722 |
| 90,000 | | SC St Pub Svc Auth Rev Unrefunded Ref Oblig, Ser B
| | 5.00% | | 12/01/21 | | 91,451 |
| 15,000 | | Scago SC Eductnl Facs Corp for Pickens Sch Dist Ref
| | 5.00% | | 12/01/21 | | 15,234 |
| | | | | 1,473,734 |
| | | Tennessee – 1.7% | | | | | | |
| 100,000 | | Met Govt Nashville & Davidson Cnty TN Hlth & Eductnl Fac Brd Ref Lipscomb Univ Proj, Ser A
| | 5.00% | | 10/01/21 | | 100,716 |
| 135,000 | | Met Govt Nashville & Davidson Cnty TN Hlth & Eductnl Fac Brd Trevecca Nazarene Univ Proj, Ser B
| | 4.00% | | 10/01/23 | | 145,112 |
| 300,000 | | TN St Energy Acq Corp Gas Rev
| | 5.00% | | 11/01/22 | | 317,884 |
| 970,000 | | TN St Energy Acq Corp Gas Rev, Ser A
| | 5.25% | | 09/01/22 | | 1,022,617 |
| 445,000 | | TN St Energy Acq Corp Gas Rev, Ser A
| | 5.25% | | 09/01/23 | | 490,405 |
| 710,000 | | TN St Energy Acq Corp Gas Rev, Ser C
| | 5.00% | | 02/01/23 | | 759,666 |
| | | | | 2,836,400 |
| | | Texas – 8.4% | | | | | | |
| 40,000 | | Arlington TX Hgr Edu Fin Corp Edu Rev Kipp TX Inc
| | 5.00% | | 08/15/23 | | 43,906 |
| 145,000 | | Arlington TX Hgr Edu Fin Corp Edu Rev Wayside Schs, Ser A
| | 4.38% | | 08/15/36 | | 145,205 |
| 200,000 | | Bexar Cnty TX Hlth Facs Dev Corp Ref Army Retmnt Residence Fndtn Proj
| | 5.00% | | 07/15/23 | | 215,652 |
| 250,000 | | Centrl TX Regl Mobility Auth Rev Ref
| | 5.00% | | 01/01/22 | | 254,935 |
| 180,000 | | Centrl TX Regl Mobility Auth Rev Ref Sr Lien, Ser A, AGM
| | 5.00% | | 01/01/43 | | 192,540 |
| 45,000 | | Dallas TX Wtrwks & Swr Sys Rev Prerefunded Ref
| | 5.00% | | 10/01/22 | | 45,356 |
| 75,000 | | Dallas TX Wtrwks & Swr Sys Rev Ref, Ser A
| | 5.00% | | 10/01/37 | | 79,300 |
| 65,000 | | Dallas TX Wtrwks & Swr Sys Rev Unrefunded Ref, Ser A
| | 5.00% | | 10/01/29 | | 68,726 |
| 50,000 | | Dallas-Fort Worth TX Intl Arpt Rev Jt Impt, Ser D, AMT
| | 5.00% | | 11/01/38 | | 50,595 |
| 325,000 | | Dallas-Fort Worth TX Intl Arpt Rev Jt Impt, Ser D, AMT
| | 5.00% | | 11/01/42 | | 328,866 |
| 115,000 | | Dallas-Fort Worth TX Intl Arpt Rev, Ser H, AMT
| | 4.00% | | 11/01/45 | | 116,087 |
| 1,000,000 | | Denton TX Indep Sch Dist Var Sch Bldg Remk, Ser B (a)
| | 0.02% | | 08/01/35 | | 1,000,000 |
| 75,000 | | Fort Worth TX Ref & Impt
| | 5.00% | | 03/01/32 | | 77,149 |
| 200,000 | | Gulfgate Redev Auth TX Tax Incr Contract Rev Ref, AGM
| | 4.00% | | 09/01/22 | | 207,871 |
| 145,000 | | Harris Cnty TX Muni Util Dist #397 Ref Green Bond, BAM
| | 4.00% | | 05/01/22 | | 149,048 |
| 370,000 | | Harris Cnty TX Muni Util Dist #457, AGM
| | 3.00% | | 09/01/21 | | 370,793 |
| 145,000 | | Harris Cnty TX Muni Util Dist #502, AGM
| | 4.00% | | 09/01/21 | | 145,423 |
| 15,000 | | Houston TX Util Sys Rev Comb First Lien, Ser D
| | 5.00% | | 11/15/40 | | 15,211 |
| 45,000 | | Houston TX Util Sys Rev Ref Comb 1st Lien, Ser F
| | 5.00% | | 11/15/31 | | 45,634 |
| 35,000 | | Houston TX Util Sys Rev Ref Comb First Lien, Ser F
| | 5.00% | | 11/15/28 | | 35,493 |
Page 36
See Notes to Financial Statements
First Trust Ultra Short Duration Municipal ETF (FUMB)
Portfolio of Investments (Continued)
July 31, 2021
Principal
Value | | Description | | Stated
Coupon | | Stated
Maturity | | Value |
| MUNICIPAL BONDS (Continued) |
| | | Texas (Continued) | | | | | | |
| $150,000 | | Lower CO River TX Auth Trans Contract Rev Ref Lcra Trans Svcs
| | 5.00% | | 05/15/25 | | $155,712 |
| 45,000 | | Lower CO River TX Auth Trans Contract Rev Ref Lcra Trans Svcs Corp Proj
| | 5.00% | | 05/15/23 | | 48,954 |
| 265,000 | | Mclendon Chisholm TX Spl Assmnt Rev Ref Sonoma Pub Impt Dt Phase 1 Proj, BAM
| | 4.00% | | 09/15/23 | | 282,056 |
| 2,000,000 | | Mission TX Econ Dev Corp Sol Wst Disp Rev Rep Svcs Inc Proj Remk, Ser A, AMT (Mandatory put 08/02/21)
| | 0.20% | | 05/01/50 | | 2,000,000 |
| 250,000 | | Mission TX Econ Dev Corp Sol Wst Disp Rev Var Wst Mgmt Inc Proj Remk, Ser B, AMT (Mandatory put 09/01/21)
| | 0.20% | | 07/01/40 | | 250,015 |
| 300,000 | | Montgomery Cnty TX Muni Util Dist #105 Road Bonds, AGM
| | 4.00% | | 09/01/21 | | 300,864 |
| 165,000 | | Montgomery Cnty TX Muni Util Dist #132, BAM
| | 4.50% | | 09/01/21 | | 165,539 |
| 75,000 | | N TX Tollway Auth Rev First Tier Ref, Ser A
| | 3.75% | | 01/01/28 | | 76,118 |
| 100,000 | | N TX Tollway Auth Rev First Tier Ref, Ser B
| | 5.00% | | 01/01/22 | | 102,018 |
| 50,000 | | N TX Tollway Auth Rev First Tier Ref, Ser B
| | 5.00% | | 01/01/36 | | 51,009 |
| 120,000 | | N TX Tollway Auth Rev Ref 1st Tier, Ser A
| | 5.00% | | 01/01/22 | | 122,414 |
| 145,000 | | N TX Tollway Auth Rev Spl Projs Sys, Ser D
| | 5.00% | | 09/01/24 | | 145,549 |
| 130,000 | | Newark Hgr Edu Fin Corp TX Edu Rev The Hughen Ctr Inc, Ser A
| | 4.00% | | 08/15/23 | | 139,479 |
| 145,000 | | SA Energy Acq Pub Fac Corp TX Gas Sply Rev Gas Sply Rev
| | 5.50% | | 08/01/21 | | 145,000 |
| 175,000 | | Sienna Plantation TX Muni Util Dist #5 Contract Rev, BAM
| | 4.50% | | 11/01/21 | | 176,797 |
| 210,000 | | Sienna Plantation TX Muni Util Dist #5 Contract Rev, BAM
| | 4.50% | | 11/01/21 | | 212,156 |
| 275,000 | | Stafford TX Econ Dev Corp Sales Tax Rev Ref, BAM
| | 5.00% | | 09/01/23 | | 301,818 |
| 120,000 | | Sunfield TX Muni Util Dist #3, Ser A, AGM
| | 4.50% | | 09/01/21 | | 120,392 |
| 2,000,000 | | Tender Option Bond Trust Recpts / Ctfs Various States Floaters, Ser 2021-XF1226 (a) (b)
| | 0.05% | | 08/15/27 | | 2,000,000 |
| 115,000 | | Titus Cnty TX Pass Thru Toll Ltd Tax, Ser B
| | 4.00% | | 03/01/34 | | 117,597 |
| 350,000 | | TX St Muni Gas Acq & Sply Corp Gas Sply Rev Ref, Ser III
| | 5.00% | | 12/15/21 | | 356,110 |
| 235,000 | | TX St Muni Gas Acq & Sply Corp Gas Sply Rev Ref, Ser III
| | 5.00% | | 12/15/22 | | 250,176 |
| 35,000 | | TX St Muni Gas Acq & Sply Corp I Gas Sply Rev Sr Lien, Ser A
| | 5.25% | | 12/15/21 | | 35,651 |
| 1,125,000 | | TX St Muni Gas Acq & Sply Corp I Gas Sply Rev Sr Lien, Ser A
| | 5.25% | | 12/15/22 | | 1,202,127 |
| 240,000 | | TX St Muni Gas Acq & Sply Corp I Gas Sply Rev Sr Lien, Ser A
| | 5.25% | | 12/15/23 | | 268,051 |
| 250,000 | | TX St Transprtn Commn Central TX Turnpike Sys Rev Ref 1st Tier, Ser A
| | 5.00% | | 08/15/41 | | 262,756 |
| 100,000 | | TX St Univ Sys Fing Rev Ref Sys
| | 4.10% | | 03/15/39 | | 102,503 |
| 170,000 | | TX St Univ Sys Fing Rev Ref, Ser A
| | 5.00% | | 03/15/22 | | 175,185 |
| 150,000 | | Viridian TX Muni Mgmt Dist Unlimited Tax Road Impt Bonds, BAM
| | 4.00% | | 12/01/22 | | 157,344 |
| 250,000 | | Viridian TX Muni Mgmt Dist Unlimited Tax Road Impt Bonds, BAM
| | 4.00% | | 12/01/23 | | 271,210 |
| 380,000 | | Viridian TX Muni Mgmt Dist Util Impt Bonds, BAM
| | 4.00% | | 12/01/21 | | 384,610 |
| | | | | 13,967,000 |
| | | Utah – 0.1% | | | | | | |
| 100,000 | | UT St Chrt Sch Fin Auth Chrt Sch Rev Ref Spectrum Acdmy Proj
| | 4.00% | | 04/15/22 | | 102,497 |
| | | Virginia – 0.6% | | | | | | |
| 100,000 | | VA Clg Bldg Auth Eductnl Facs Rev Ref Regent Univ Proj
| | 5.00% | | 06/01/22 | | 103,845 |
| 100,000 | | VA Clg Bldg Auth Eductnl Facs Rev Ref Regent Univ Proj
| | 5.00% | | 06/01/23 | | 108,445 |
| 175,000 | | VA Clg Bldg Auth Eductnl Facs Rev Ref Regent Univ Proj
| | 5.00% | | 06/01/24 | | 197,426 |
| 80,000 | | VA St Pub Bldg Auth Pub Facs Rev Ref, Ser C
| | 5.00% | | 08/01/21 | | 80,000 |
| 120,000 | | VA St Res Auth Clean Wtr Rev St Revolving Fd, Ser B
| | 4.00% | | 10/01/21 | | 120,765 |
| 350,000 | | VA St Small Busn Fing Auth Rev Ref Natl Sr Cmps Inc
| | 5.00% | | 01/01/22 | | 356,806 |
| | | | | 967,287 |
See Notes to Financial Statements
Page 37
First Trust Ultra Short Duration Municipal ETF (FUMB)
Portfolio of Investments (Continued)
July 31, 2021
Principal
Value | | Description | | Stated
Coupon | | Stated
Maturity | | Value |
| MUNICIPAL BONDS (Continued) |
| | | Washington – 0.2% | | | | | | |
| $100,000 | | Port of Seattle WA Rev Intermediate Lien, AMT
| | 5.00% | | 04/01/23 | | $107,977 |
| 160,000 | | WA St Hlthcare Facs Auth Seattle Cancer Care Alliance (b)
| | 5.00% | | 12/01/21 | | 162,540 |
| 50,000 | | WA St Mtr Veh Fuel Tax, Ser B-1
| | 4.25% | | 08/01/32 | | 50,000 |
| | | | | 320,517 |
| | | Wisconsin – 5.0% | | | | | | |
| 725,000 | | Milwaukee WI Promissory & Corporate Notes, Ser N2
| | 5.00% | | 05/01/22 | | 751,296 |
| 705,000 | | Milwaukee WI Promissory Nts, Ser N1
| | 5.00% | | 02/01/23 | | 756,189 |
| 100,000 | | Milwaukee WI Promissory Nts, Ser N2
| | 5.00% | | 05/15/22 | | 103,816 |
| 100,000 | | Milwaukee WI Ref Prom Nts, Ser N2
| | 4.00% | | 03/15/22 | | 102,389 |
| 410,000 | | Milwaukee WI Ref Prom Nts, Ser N2
| | 4.00% | | 03/15/25 | | 464,035 |
| 590,000 | | Milwaukee WI Ref Promissory Nts, Ser N4
| | 5.00% | | 04/01/22 | | 609,009 |
| 370,000 | | Milwaukee WI Ref Promissory Nts, Ser N4
| | 5.00% | | 04/01/23 | | 399,841 |
| 440,000 | | Milwaukee WI Ref Promissory Nts, Ser N4
| | 5.00% | | 04/01/24 | | 495,865 |
| 1,977,000 | | Tender Option Bond Trust Recpts / Ctfs Various States Floaters, Ser 2020-XF2869 (a) (b)
| | 0.25% | | 11/01/25 | | 1,977,000 |
| 2,000,000 | | WI Rapids WI Sch Dist, BANS
| | 2.00% | | 01/06/22 | | 2,003,415 |
| 150,000 | | WI St Hlth & Eductnl Facs Auth Rev Three Pillars Sr Living Cmntys, Ser A
| | 4.00% | | 08/15/23 | | 160,323 |
| 100,000 | | WI St Transprtn Rev Prerefunded, Ser 1
| | 5.00% | | 07/01/25 | | 109,272 |
| 50,000 | | WI St Unrefunded Ref, Ser 2
| | 5.00% | | 05/01/27 | | 51,846 |
| 50,000 | | WI St, Ser A
| | 5.00% | | 05/01/24 | | 51,846 |
| 105,000 | | WI St, Ser A
| | 4.00% | | 05/01/29 | | 108,094 |
| 110,000 | | WI St, Ser A
| | 5.00% | | 05/01/30 | | 114,061 |
| | | | | 8,258,297 |
| Total Investments – 96.2%
| | 159,201,170 |
| | (Cost $158,686,675) (d) | | |
| | Net Other Assets and Liabilities – 3.8%
| | 6,273,027 |
| | Net Assets – 100.0%
| | $165,474,197 |
|
| (a) | Variable Rate Demand bond. Interest rate is reset periodically by the agent based on current market conditions. |
| (b) | This security, sold within the terms of a private placement memorandum, is exempt from registration upon resale under Rule 144A under the Securities Act of 1933, as amended, and may be resold in transactions exempt from registration, normally to qualified institutional buyers. Pursuant to procedures adopted by the Trust’s Board of Trustees, this security has been determined to be liquid by First Trust Advisors L.P. (the “Advisor”). Although market instability can result in periods of increased overall market illiquidity, liquidity for each security is determined based on security specific factors and assumptions, which require subjective judgment. At July 31, 2021, securities noted as such amounted to $9,332,664 or 5.6% of net assets. |
| (c) | Zero coupon bond. |
| (d) | Aggregate cost for federal income tax purposes was $158,681,902. As of July 31, 2021, the aggregate gross unrealized appreciation for all investments in which there was an excess of value over tax cost was $538,722 and the aggregate gross unrealized depreciation for all investments in which there was an excess of tax cost over value was $19,454. The net unrealized appreciation was $519,268. |
Page 38
See Notes to Financial Statements
First Trust Ultra Short Duration Municipal ETF (FUMB)
Portfolio of Investments (Continued)
July 31, 2021
| AGM | Assured Guaranty Municipal Corp. |
| AMT | Alternative Minimum Tax |
| BAM | Build America Mutual |
| BANS | Bond Anticipation Notes |
| BHAC-CR | Berkshire Hathaway Assurance Corp. Custodial Receipts |
| COPS | Certificates of Participation |
| FGIC | Financial Guaranty Insurance Co. |
| NATL-RE | National Public Finance Guarantee Corp. |
| RANS | Revenue Anticipation Notes |
| TANS | Tax Anticipation Notes |
Valuation Inputs
A summary of the inputs used to value the Fund’s investments as of July 31, 2021 is as follows (see Note 2A - Portfolio Valuation in the Notes to Financial Statements):
| | Total
Value at
7/31/2021 | Level 1
Quoted
Prices | Level 2
Significant
Observable
Inputs | Level 3
Significant
Unobservable
Inputs |
Municipal Bonds*
| $ 159,201,170 | $ — | $ 159,201,170 | $ — |
| * | See Portfolio of Investments for state breakout. |
See Notes to Financial Statements
Page 39
First Trust Exchange-Traded Fund III
Statements of Assets and Liabilities
July 31, 2021
| | First Trust
Short Duration
Managed
Municipal
ETF (FSMB) | | First Trust
Ultra Short
Duration
Municipal
ETF (FUMB) |
| ASSETS: | | | |
Investments, at value
| $ 125,873,320 | | $ 159,201,170 |
Cash
| 6,301,707 | | 8,249,794 |
Cash segregated as collateral for open futures contracts
| 53,130 | | — |
Interest receivable
| 1,050,795 | | 1,180,171 |
Total Assets
| 133,278,952 | | 168,631,135 |
| LIABILITIES: | | | |
| Payables: | | | |
Investment securities purchased
| 3,302,319 | | 3,122,937 |
Investment advisory fees
| 37,514 | | 34,001 |
Variation margin
| 7,938 | | — |
Total Liabilities
| 3,347,771 | | 3,156,938 |
NET ASSETS
| $129,931,181 | | $165,474,197 |
| NET ASSETS consist of: | | | |
Paid-in capital
| $ 127,381,657 | | $ 164,854,664 |
Par value
| 62,000 | | 82,000 |
Accumulated distributable earnings (loss)
| 2,487,524 | | 537,533 |
NET ASSETS
| $129,931,181 | | $165,474,197 |
NET ASSET VALUE, per share
| $20.96 | | $20.18 |
Number of shares outstanding (unlimited number of shares authorized, par value $0.01 per share)
| 6,200,002 | | 8,200,002 |
Investments, at cost
| $123,211,154 | | $158,686,675 |
Page 40
See Notes to Financial Statements
First Trust Exchange-Traded Fund III
Statements of Operations
For the Year Ended July 31, 2021
| | First Trust
Short Duration
Managed
Municipal
ETF (FSMB) | | First Trust
Ultra Short
Duration
Municipal
ETF (FUMB) |
| INVESTMENT INCOME: | | | |
Interest
| $ 1,503,386 | | $ 1,023,885 |
Total investment income
| 1,503,386 | | 1,023,885 |
| EXPENSES: | | | |
Investment advisory fees
| 469,256 | | 527,269 |
Total expenses
| 469,256 | | 527,269 |
Fees waived by the investment advisor
| (103,613) | | (223,410) |
Net expenses
| 365,643 | | 303,859 |
NET INVESTMENT INCOME (LOSS)
| 1,137,743 | | 720,026 |
| NET REALIZED AND UNREALIZED GAIN (LOSS): | | | |
| Net realized gain (loss) on: | | | |
Investments
| 52,811 | | (23,155) |
Futures contracts
| 52,569 | | — |
Net realized gain (loss)
| 105,380 | | (23,155) |
| Net change in unrealized appreciation (depreciation) on: | | | |
Investments
| 1,335,323 | | 110,241 |
Futures contracts
| (107,844) | | — |
Net change in unrealized appreciation (depreciation)
| 1,227,479 | | 110,241 |
NET REALIZED AND UNREALIZED GAIN (LOSS)
| 1,332,859 | | 87,086 |
NET INCREASE (DECREASE) IN NET ASSETS RESULTING FROM OPERATIONS
| $ 2,470,602 | | $ 807,112 |
See Notes to Financial Statements
Page 41
First Trust Exchange-Traded Fund III
Statements of Changes in Net Assets
| | First Trust Short
Duration Managed
Municipal ETF (FSMB) | | First Trust Ultra
Short Duration
Municipal ETF (FUMB) |
| | Year
Ended
7/31/2021 | | Year
Ended
7/31/2020 | | Year
Ended
7/31/2021 | | Year
Ended
7/31/2020 |
| OPERATIONS: | | | | | | | |
Net investment income (loss)
| $ 1,137,743 | | $ 630,654 | | $ 720,026 | | $ 547,918 |
Net realized gain (loss)
| 105,380 | | (222,557) | | (23,155) | | 2,199 |
Net change in unrealized appreciation (depreciation)
| 1,227,479 | | 916,311 | | 110,241 | | 336,188 |
Net increase (decrease) in net assets resulting from operations
| 2,470,602 | | 1,324,408 | | 807,112 | | 886,305 |
| DISTRIBUTIONS TO SHAREHOLDERS FROM: | | | | | | | |
Investment operations
| (1,101,754) | | (637,095) | | (697,650) | | (536,002) |
Return of capital
| (105,072) | | (18,716) | | — | | (2,449) |
Total distributions to shareholders
| (1,206,826) | | (655,811) | | (697,650) | | (538,451) |
| SHAREHOLDER TRANSACTIONS: | | | | | | | |
Proceeds from shares sold
| 76,025,129 | | 47,999,296 | | 81,703,675 | | 70,260,944 |
Cost of shares redeemed
| (9,324,497) | | (6,154,805) | | — | | (7,045,546) |
Net increase (decrease) in net assets resulting from shareholder transactions
| 66,700,632 | | 41,844,491 | | 81,703,675 | | 63,215,398 |
Total increase (decrease) in net assets
| 67,964,408 | | 42,513,088 | | 81,813,137 | | 63,563,252 |
| NET ASSETS: | | | | | | | |
Beginning of period
| 61,966,773 | | 19,453,685 | | 83,661,060 | | 20,097,808 |
End of period
| $129,931,181 | | $61,966,773 | | $165,474,197 | | $83,661,060 |
| CHANGES IN SHARES OUTSTANDING: | | | | | | | |
Shares outstanding, beginning of period
| 3,000,002 | | 950,002 | | 4,150,002 | | 1,000,002 |
Shares sold
| 3,650,000 | | 2,350,000 | | 4,050,000 | | 3,500,000 |
Shares redeemed
| (450,000) | | (300,000) | | — | | (350,000) |
Shares outstanding, end of period
| 6,200,002 | | 3,000,002 | | 8,200,002 | | 4,150,002 |
Page 42
See Notes to Financial Statements
First Trust Exchange-Traded Fund III
Financial Highlights
For a share outstanding throughout each period
First Trust Short Duration Managed Municipal ETF (FSMB)
| | Year Ended | | Period
Ended
7/31/2019 (a) |
| 7/31/2021 | | 7/31/2020 | |
Net asset value, beginning of period
| $ 20.66 | | $ 20.48 | | $ 20.00 |
| Income from investment operations: | | | | | |
Net investment income (loss)
| 0.27 | | 0.38 | | 0.34 |
Net realized and unrealized gain (loss)
| 0.33 | | 0.22 | | 0.45 |
Total from investment operations
| 0.60 | | 0.60 | | 0.79 |
| Distributions paid to shareholders from: | | | | | |
Net investment income
| (0.27) | | (0.41) | | (0.31) |
Return of capital
| (0.03) | | (0.01) | | — |
Total distributions
| (0.30) | | (0.42) | | (0.31) |
Net asset value, end of period
| $20.96 | | $20.66 | | $20.48 |
Total return (b)
| 2.92% | | 2.98% | | 3.98% |
| Ratios to average net assets/supplemental data: | | | | | |
Net assets, end of period (in 000’s)
| $ 129,931 | | $ 61,967 | | $ 19,454 |
Ratio of total expenses to average net assets
| 0.55% | | 0.55% | | 0.55% (c) |
Ratio of net expenses to average net assets
| 0.43% | | 0.45% | | 0.45% (c) |
Ratio of net investment income (loss) to average net assets
| 1.33% | | 2.00% | | 2.23% (c) |
Portfolio turnover rate (d)
| 16% | | 58% | | 66% |
| (a) | Inception date is November 1, 2018, which is consistent with the commencement of operations and is the date the initial creation units were established. |
| (b) | Total return is calculated assuming an initial investment made at the net asset value at the beginning of the period, reinvestment of all distributions at net asset value during the period, and redemption at net asset value on the last day of the period. The returns presented do not reflect the deduction of taxes that a shareholder would pay on Fund distributions or the redemption or sale of Fund shares. Total return is calculated for the time period presented and is not annualized for periods of less than a year. The total return would have been lower if certain fees had not been waived by the investment advisor. |
| (c) | Annualized. |
| (d) | Portfolio turnover is calculated for the time period presented and is not annualized for periods of less than a year and does not include securities received or delivered from processing creations or redemptions and in-kind transactions. |
See Notes to Financial Statements
Page 43
First Trust Exchange-Traded Fund III
Financial Highlights (Continued)
For a share outstanding throughout each period
First Trust Ultra Short Duration Municipal ETF (FUMB)
| | Year Ended | | Period
Ended
7/31/2019 (a) |
| 7/31/2021 | | 7/31/2020 | |
Net asset value, beginning of period
| $ 20.16 | | $ 20.10 | | $ 20.00 |
| Income from investment operations: | | | | | |
Net investment income (loss)
| 0.12 | | 0.25 | | 0.26 |
Net realized and unrealized gain (loss)
| 0.02 | | 0.07 | | 0.09 |
Total from investment operations
| 0.14 | | 0.32 | | 0.35 |
| Distributions paid to shareholders from: | | | | | |
Net investment income
| (0.12) | | (0.26) | | (0.25) |
Net realized gain
| — | | (0.00) (b) | | — |
Return of capital
| — | | (0.00) (b) | | — |
Total distributions
| (0.12) | | (0.26) | | (0.25) |
Net asset value, end of period
| $20.18 | | $20.16 | | $20.10 |
Total return (c)
| 0.72% | | 1.61% | | 1.75% |
| Ratios to average net assets/supplemental data: | | | | | |
Net assets, end of period (in 000’s)
| $ 165,474 | | $ 83,661 | | $ 20,098 |
Ratio of total expenses to average net assets
| 0.45% | | 0.45% | | 0.45% (d) |
Ratio of net expenses to average net assets
| 0.26% | | 0.35% | | 0.35% (d) |
Ratio of net investment income (loss) to average net assets
| 0.61% | | 1.20% | | 1.73% (d) |
Portfolio turnover rate (e)
| 44% | | 149% | | 145% |
| (a) | Inception date is November 1, 2018, which is consistent with the commencement of operations and is the date the initial creation units were established. |
| (b) | Amount is less than $0.01. |
| (c) | Total return is calculated assuming an initial investment made at the net asset value at the beginning of the period, reinvestment of all distributions at net asset value during the period, and redemption at net asset value on the last day of the period. The returns presented do not reflect the deduction of taxes that a shareholder would pay on Fund distributions or the redemption or sale of Fund shares. Total return is calculated for the time period presented and is not annualized for periods of less than a year. The total return would have been lower if certain fees had not been waived by the investment advisor. |
| (d) | Annualized. |
| (e) | Portfolio turnover is calculated for the time period presented and is not annualized for periods of less than a year and does not include securities received or delivered from processing creations or redemptions and in-kind transactions. |
Page 44
See Notes to Financial Statements
Notes to Financial Statements
First Trust Exchange-Traded Fund III
July 31, 2021
1. Organization
First Trust Exchange-Traded Fund III (the “Trust”) is an open-end management investment company organized as a Massachusetts business trust on January 9, 2008, and is registered with the Securities and Exchange Commission (“SEC”) under the Investment Company Act of 1940, as amended (the “1940 Act”).
The Trust currently consists of eighteen funds that are offering shares. This report covers the following funds (each a “Fund” and collectively, the “Funds”), each a non-diversified series of the Trust:
First Trust Short Duration Managed Municipal ETF – (NYSE Arca, Inc. (“NYSE Arca”) ticker “FSMB”)
First Trust Ultra Short Duration Municipal ETF – (NYSE Arca ticker “FUMB”)
Each Fund represents a separate series of shares of beneficial interest in the Trust. Unlike conventional mutual funds, each Fund issues and redeems shares on a continuous basis, at net asset value (“NAV”), only in large blocks of shares known as “Creation Units”.
Each Fund is an actively managed exchange-traded fund. The investment objective of each Fund is to seek to provide federally tax-exempt income consistent with capital preservation. Under normal market conditions, each Fund seeks to achieve its investment objective by investing at least 80% of its net assets (including investment borrowings) in municipal debt securities that pay interest that is exempt from regular federal income taxes.
There can be no assurance that a Fund will achieve its investment objective. The Funds may not be appropriate for all investors.
2. Significant Accounting Policies
The Funds are each considered an investment company and follow accounting and reporting guidance under Financial Accounting Standards Board Accounting Standards Codification Topic 946, “Financial Services-Investment Companies.” The following is a summary of significant accounting policies consistently followed by the Funds in the preparation of the financial statements. The preparation of the financial statements in accordance with accounting principles generally accepted in the United States of America (“U.S. GAAP”) requires management to make estimates and assumptions that affect the reported amounts and disclosures in the financial statements. Actual results could differ from those estimates.
A. Portfolio Valuation
Each Fund’s NAV is determined daily as of the close of regular trading on the New York Stock Exchange (“NYSE”), normally 4:00 p.m. Eastern time, on each day the NYSE is open for trading. If the NYSE closes early on a valuation day, the NAV is determined as of that time. Each Fund’s NAV is calculated by dividing the value of all assets of each Fund (including accrued interest and dividends), less all liabilities (including accrued expenses and dividends declared but unpaid), by the total number of shares outstanding.
Each Fund’s investments are valued daily at market value or, in the absence of market value with respect to any portfolio securities, at fair value. Market value prices represent last sale or official closing prices from a national or foreign exchange (i.e., a regulated market) and are primarily obtained from third-party pricing services. Fair value prices represent any prices not considered market value prices and are either obtained from a third-party pricing service or are determined by the Pricing Committee of the Funds’ investment advisor, First Trust Advisors L.P. (“First Trust” or the “Advisor”), in accordance with valuation procedures adopted by the Trust’s Board of Trustees, and in accordance with provisions of the 1940 Act. Investments valued by the Advisor’s Pricing Committee, if any, are footnoted as such in the footnotes to the Portfolio of Investments. Each Fund’s investments are valued as follows:
Municipal securities and other debt securities are fair valued on the basis of fair valuations provided by dealers who make markets in such securities or by a third-party pricing service approved by the Trust’s Board of Trustees, which may use the following valuation inputs when available:
| 1) | benchmark yields; |
| 2) | reported trades; |
| 3) | broker/dealer quotes; |
| 4) | issuer spreads; |
| 5) | benchmark securities; |
| 6) | bids and offers; and |
| 7) | reference data including market research publications. |
Notes to Financial Statements (Continued)
First Trust Exchange-Traded Fund III
July 31, 2021
Exchange-traded futures contracts are valued at the closing price in the market where such contracts are principally traded. If no closing price is available, exchange-traded futures contracts are fair valued at the mean of their most recent bid and asked price, if available, and otherwise at their closing bid price.
Fixed income and other debt securities having a remaining maturity of sixty days or less when purchased are fair valued at cost adjusted for amortization of premiums and accretion of discounts (amortized cost), provided the Advisor’s Pricing Committee has determined that the use of amortized cost is an appropriate reflection of fair value given market and issuer-specific conditions existing at the time of the determination. Factors that may be considered in determining the appropriateness of the use of amortized cost include, but are not limited to, the following:
| 1) | the credit conditions in the relevant market and changes thereto; |
| 2) | the liquidity conditions in the relevant market and changes thereto; |
| 3) | the interest rate conditions in the relevant market and changes thereto (such as significant changes in interest rates); |
| 4) | issuer-specific conditions (such as significant credit deterioration); and |
| 5) | any other market-based data the Advisor’s Pricing Committee considers relevant. In this regard, the Advisor’s Pricing Committee may use last-obtained market-based data to assist it when valuing portfolio securities using amortized cost. |
Certain securities may not be able to be priced by pre-established pricing methods. Such securities may be valued by the Trust’s Board of Trustees or its delegate, the Advisor’s Pricing Committee, at fair value. These securities generally include, but are not limited to, restricted securities (securities which may not be publicly sold without registration under the Securities Act of 1933, as amended) for which a third-party pricing service is unable to provide a market price; securities whose trading has been formally suspended; a security whose market or fair value price is not available from a pre-established pricing source; a security with respect to which an event has occurred that is likely to materially affect the value of the security after the market has closed but before the calculation of a Fund’s NAV or make it difficult or impossible to obtain a reliable market quotation; and a security whose price, as provided by the third-party pricing service, does not reflect the security’s fair value. As a general principle, the current fair value of a security would appear to be the amount which the owner might reasonably expect to receive for the security upon its current sale. When fair value prices are used, generally they will differ from market quotations or official closing prices on the applicable exchanges. A variety of factors may be considered in determining the fair value of such securities, including, but not limited to, the following:
| 1) | the fundamental business data relating to the issuer; |
| 2) | an evaluation of the forces which influence the market in which these securities are purchased and sold; |
| 3) | the type, size and cost of the security; |
| 4) | the financial statements of the issuer; |
| 5) | the credit quality and cash flow of the issuer, based on the Advisor’s or external analysis; |
| 6) | the information as to any transactions in or offers for the security; |
| 7) | the price and extent of public trading in similar securities (or equity securities) of the issuer/borrower, or comparable companies; |
| 8) | the coupon payments; |
| 9) | the quality, value and salability of collateral, if any, securing the security; and |
| 10) | other relevant factors. |
The Funds are subject to fair value accounting standards that define fair value, establish the framework for measuring fair value and provide a three-level hierarchy for fair valuation based upon the inputs to the valuation as of the measurement date. The three levels of the fair value hierarchy are as follows:
| • | Level 1 – Level 1 inputs are quoted prices in active markets for identical investments. An active market is a market in which transactions for the investment occur with sufficient frequency and volume to provide pricing information on an ongoing basis. |
| • | Level 2 – Level 2 inputs are observable inputs, either directly or indirectly, and include the following: |
| o | Quoted prices for similar investments in active markets. |
| o | Quoted prices for identical or similar investments in markets that are non-active. A non-active market is a market where there are few transactions for the investment, the prices are not current, or price quotations vary substantially either over time or among market makers, or in which little information is released publicly. |
| o | Inputs other than quoted prices that are observable for the investment (for example, interest rates and yield curves observable at commonly quoted intervals, volatilities, prepayment speeds, loss severities, credit risks, and default rates). |
| o | Inputs that are derived principally from or corroborated by observable market data by correlation or other means. |
Notes to Financial Statements (Continued)
First Trust Exchange-Traded Fund III
July 31, 2021
| • | Level 3 – Level 3 inputs are unobservable inputs. Unobservable inputs may reflect the reporting entity’s own assumptions about the assumptions that market participants would use in pricing the investment. |
The inputs or methodologies used for valuing investments are not necessarily an indication of the risk associated with investing in those investments. A summary of the inputs used to value each Fund’s investments as of July 31, 2021, is included with each Fund’s Portfolio of Investments.
B. Securities Transactions and Investment Income
Securities transactions are recorded as of the trade date. Realized gains and losses from securities transactions are recorded on the identified cost basis. Interest income is recorded daily on the accrual basis. Amortization of premiums and accretion of discounts are recorded using the effective interest method.
C. Futures Contracts
FSMB may purchase or sell (i.e., is long or short) exchange-listed futures contracts to hedge against changes in interest rates (interest rate risk). Futures contracts are agreements between the Fund and a counterparty to buy or sell a specific quantity of an underlying instrument at a specified price and at a specified date. Depending on the terms of the contract, futures contracts are settled either through physical delivery of the underlying instrument on the settlement date or by payment of a cash settlement amount on the settlement date. Open futures contracts can also be closed out prior to settlement by entering into an offsetting transaction in a matching futures contract. If the Fund is not able to enter into an offsetting transaction, the Fund will continue to be required to maintain margin deposits on the futures contract. When the contract is closed or expires, the Fund records a realized gain or loss equal to the difference between the value of the contract at the time it was opened and the value at the time it was closed or expired. This gain or loss is included in “Net realized gain (loss) on futures contracts” on the Statements of Operations.
Upon entering into a futures contract, the Fund must deposit funds, called margin, with its custodian in the name of the clearing broker equal to a specified percentage of the current value of the contract. Open futures contracts are marked to market daily with the change in value recognized as a component of “Net change in unrealized appreciation (depreciation) on futures contracts” on the Statements of Operations. Pursuant to the contract, the Fund agrees to receive from or pay to the broker an amount of cash equal to the daily fluctuation in value of the contract. Such receipts or payments are known as variation margin and are included in “Variation margin” payable or receivable on the Statements of Assets and Liabilities.
If market conditions change unexpectedly, the Fund may not achieve the anticipated benefits of the futures contract and may realize a loss. The use of futures contracts involves the risk of imperfect correlation in movements in the price of the futures contracts, interest rates and the underlying instruments.
Restricted cash segregated as collateral for futures contracts in the amount of $53,130 is shown as “Cash segregated as collateral for open futures contracts” on the Statements of Assets and Liabilities.
D. Dividends and Distributions to Shareholders
Dividends from net investment income, if any, are declared and paid monthly by each Fund, or as the Board of Trustees may determine from time to time. Distributions of net realized capital gains earned by each Fund, if any, are distributed at least annually.
Distributions from net investment income and realized capital gains are determined in accordance with federal income tax regulations, which may differ from U.S. GAAP. Certain capital accounts in the financial statements are periodically adjusted for permanent differences in order to reflect their tax character. These permanent differences are primarily due to the varying treatment of income and gain/loss on portfolio securities held by the Funds and have no impact on net assets or NAV per share. Temporary differences, which arise from recognizing certain items of income, expense and gain/loss in different periods for financial statement and tax purposes, will reverse at some time in the future.
The tax character of distributions paid by each Fund during the fiscal year ended July 31, 2021, was as follows:
| | Distributions
paid from
Tax-Exempt
Income | | Distributions
paid from
Ordinary
Income | | Distributions
paid from
Capital
Gains | | Distributions
paid from
Return of
Capital |
First Trust Short Duration Managed Municipal ETF
| $ 1,095,234 | | $ 6,520 | | $ — | | $ 105,072 |
First Trust Ultra Short Duration Municipal ETF
| 671,972 | | 25,678 | | — | | — |
Notes to Financial Statements (Continued)
First Trust Exchange-Traded Fund III
July 31, 2021
The tax character of distributions paid by each Fund during the fiscal year ended July 31, 2020, was as follows:
| | Distributions
paid from
Tax-Exempt
Income | | Distributions
paid from
Ordinary
Income | | Distributions
paid from
Capital
Gains | | Distributions
paid from
Return of
Capital |
First Trust Short Duration Managed Municipal ETF
| $ 636,236 | | $ 859 | | $ — | | $ 18,716 |
First Trust Ultra Short Duration Municipal ETF
| 526,947 | | 8,438 | | 617 | | 2,449 |
As of July 31, 2021, the components of distributable earnings on a tax basis for each Fund were as follows:
| | Undistributed
Ordinary
Income | | Accumulated
Capital and
Other
Gain (Loss) | | Net
Unrealized
Appreciation
(Depreciation) |
First Trust Short Duration Managed Municipal ETF
| $ — | | $ (237,751) | | $ 2,725,275 |
First Trust Ultra Short Duration Municipal ETF
| 40,935 | | (22,670) | | 519,268 |
E. Income Taxes
Each Fund intends to continue to qualify as a regulated investment company by complying with the requirements under Subchapter M of the Internal Revenue Code of 1986, as amended (the “Code”), which includes distributing substantially all of its net investment income and net realized gains to shareholders. Accordingly, no provision has been made for federal and state income taxes. However, due to the timing and amount of distributions, each Fund may be subject to an excise tax of 4% of the amount by which approximately 98% of each Fund’s taxable income exceeds the distributions from such taxable income for the calendar year.
In addition, each Fund intends to invest in municipal securities to allow it to pay shareholders “exempt dividends” as defined in the Code.
The Funds are subject to accounting standards that establish a minimum threshold for recognizing, and a system for measuring, the benefits of a tax position taken or expected to be taken in a tax return. Taxable years ended 2019, 2020, and 2021 remain open to federal and state audit. As of July 31, 2021, management has evaluated the application of these standards to the Funds and has determined that no provision for income tax is required in the Funds’ financial statements for uncertain tax positions.
The Funds intend to utilize provisions of the federal income tax laws, which allow them to carry a realized capital loss forward indefinitely following the year of the loss and offset such loss against any future realized capital gains. The Funds are subject to certain limitations under U.S. tax rules on the use of capital loss carryforwards and net unrealized built-in losses. These limitations apply when there has been a 50% change in ownership. At July 31, 2021, for federal income tax purposes, each Fund had a capital loss carryforward available that is shown in the table below, to the extent provided by regulations, to offset future capital gains.
| | Non-Expiring
Capital Loss
Carryforward |
First Trust Short Duration Managed Municipal ETF
| $ 237,751 |
First Trust Ultra Short Duration Municipal ETF
| 22,670 |
Certain losses realized during the current fiscal year may be deferred and treated as occurring on the first day of the following fiscal year for federal income tax purposes. For the fiscal year ended July 31, 2021, the Funds did not incur any net ordinary losses.
In order to present paid-in capital and accumulated distributable earnings (loss) (which consists of accumulated net investment income (loss), accumulated net realized gain (loss) on investments and net unrealized appreciation (depreciation) on investments) on the Statements of Assets and Liabilities that more closely represent their tax character, certain adjustments have been made to paid-in capital, accumulated net investment income (loss) and accumulated net realized gain (loss) on investments. These adjustments are primarily due to the difference between book and tax treatments of income and gains on various investment securities held by the
Notes to Financial Statements (Continued)
First Trust Exchange-Traded Fund III
July 31, 2021
Funds. The results of operations and net assets were not affected by these adjustments. For the fiscal year ended July 31, 2021, the adjustments for each Fund were as follows:
| | Accumulated
Net
Investment
Income (Loss) | | Accumulated
Net Realized
Gain (Loss)
on Investments | | Paid-in
Capital |
First Trust Short Duration Managed Municipal ETF
| $ (286) | | $ (13,496) | | $ 13,782 |
First Trust Ultra Short Duration Municipal ETF
| — | | — | | — |
F. Expenses
Expenses, other than the investment advisory fee and other excluded expenses, are paid by the Advisor (See Note 3).
3. Investment Advisory Fee, Affiliated Transactions and Other Fee Arrangements
First Trust, the investment advisor to the Funds, is a limited partnership with one limited partner, Grace Partners of DuPage L.P., and one general partner, The Charger Corporation. The Charger Corporation is an Illinois corporation controlled by James A. Bowen, Chief Executive Officer of First Trust. First Trust is responsible for the selection and ongoing monitoring of the securities in each Fund’s portfolio, managing the Funds’ business affairs and providing certain administrative services necessary for the management of the Funds.
FSMB and FUMB have agreed to pay First Trust an annual unitary management fee of 0.55% and 0.45% of FSMB’s and FUMB’s average daily net assets, respectively. Pursuant to the Investment Management Agreement between First Trust and the Trust, First Trust manages the investment of the Funds’ assets and is responsible for the expenses of each Fund, including the cost of transfer agency, custody, fund administration, legal, audit and other services, but excluding fee payments under the Investment Management Agreement, interest, taxes, brokerage commissions and other expenses connected with the execution of portfolio transactions, distribution and service fees payable pursuant to a Rule 12b-1 plan, if any, and extraordinary expenses, which are paid by each respective Fund. First Trust also provides fund reporting services to each Fund for a flat annual fee in the amount of $9,250, which is covered under the annual unitary management fee.
The Trust’s Board of Trustees and the Advisor have entered into a Fee Waiver Agreement for the Funds pursuant to which the Advisor contractually agreed to waive management fees of 0.10% of each Fund’s average daily net assets until November 30, 2021. The Board also approved an additional fee waiver for FSMB of 0.10% of average daily net assets which will continue through November 30, 2022 and for FUMB of 0.10% of average daily net assets which will continue through November 30, 2021. The waiver agreement may be terminated by action of the Trust’s Board of Trustees at any time upon 60 days’ written notice by the Trust on behalf of the Funds or by the Funds’ investment advisor only after the agreement’s termination date. First Trust does not have the right to recover the fees waived. During the fiscal year ended July 31, 2021, the Advisor waived fees of $103,613 and $223,410 for FSMB and FUMB, respectively.
The Trust has multiple service agreements with Brown Brothers Harriman & Co. (“BBH”). Under the service agreements, BBH performs custodial, fund accounting, certain administrative services, and transfer agency services for the Funds. As custodian, BBH is responsible for custody of each Fund’s assets. As fund accountant and administrator, BBH is responsible for maintaining the books and records of each Fund’s securities and cash. As transfer agent, BBH is responsible for maintaining shareholder records for each Fund.
Each Trustee who is not an officer or employee of First Trust, any sub-advisor or any of their affiliates (“Independent Trustees”) is paid a fixed annual retainer that is allocated equally among each fund in the First Trust Fund Complex. Each Independent Trustee is also paid an annual per fund fee that varies based on whether the fund is a closed-end or other actively managed fund, a defined-outcome fund or an index fund.
Additionally, the Lead Independent Trustee and the Chairmen of the Audit Committee, Nominating and Governance Committee and Valuation Committee are paid annual fees to serve in such capacities, with such compensation allocated pro rata among each fund in the First Trust Fund Complex based on net assets. Independent Trustees are reimbursed for travel and out-of-pocket expenses in connection with all meetings. The Lead Independent Trustee and Committee Chairmen rotate every three years. The officers and “Interested” Trustee receive no compensation from the Trust for acting in such capacities.
Notes to Financial Statements (Continued)
First Trust Exchange-Traded Fund III
July 31, 2021
4. Purchases and Sales of Securities
For the fiscal year ended July 31, 2021, the cost of purchases and proceeds from sales of investment securities for each Fund, excluding short-term investments and in-kind transactions, were as follows:
| | Purchases | | Sales |
| First Trust Short Duration Managed Municipal ETF | $ 84,598,017 | | $ 13,251,186 |
| First Trust Ultra Short Duration Municipal ETF | 115,753,002 | | 39,395,365 |
| | | | |
For the fiscal year ended July 31, 2021, the Funds had no in-kind transactions.
5. Derivative Transactions
The following table presents the type of derivatives held by FSMB at July 31, 2021, the primary underlying risk exposure and the location of these instruments as presented on the Statements of Assets and Liabilities.
| | | | | Asset Derivatives | | Liability Derivatives |
Derivative
Instrument | | Risk
Exposure | | Statements of Assets and
Liabilities Location | | Value | | Statements of Assets and
Liabilities Location | | Value |
| Futures contracts | | Interest Rate Risk | | Unrealized appreciation
on futures contracts* | | $ — | | Unrealized depreciation
on futures contracts* | | $ 107,844 |
*Includes cumulative appreciation/depreciation on futures contracts as reported in the Portfolio of Investments. Only the current day’s variation margin is presented on the Statements of Assets and Liabilities.
The following table presents the amount of net realized gain (loss) and change in net unrealized appreciation (depreciation) recognized for the fiscal year ended July 31, 2021, on derivative instruments, as well as the primary underlying risk exposure associated with each instrument.
| Statements of Operations Location | |
| Interest Rate Risk Exposure | |
| Net realized gain (loss) on futures contracts | $52,569 |
| Net change in unrealized appreciation (depreciation) on futures contracts | (107,844) |
During the fiscal year ended July 31, 2021, the notional value of futures contracts opened and closed were $7,957,008 and $5,302,477, respectively.
The Funds do not have the right to offset financial assets and liabilities related to futures contracts on the Statements of Assets and Liabilities.
6. Creations, Redemptions and Transaction Fees
Each Fund generally issues and redeems its shares in primary market transactions through a creation and redemption mechanism and does not sell or redeem individual shares. Instead, financial entities known as “Authorized Participants” have contractual arrangements with a Fund or one of the Fund’s service providers to purchase and redeem Fund shares directly with the Fund in large blocks of shares known as “Creation Units.” Prior to the start of trading on every business day, a Fund publishes through the National Securities Clearing Corporation (“NSCC”) the “basket” of securities, cash or other assets that it will accept in exchange for a Creation Unit of the Fund’s shares. An Authorized Participant that wishes to effectuate a creation of a Fund’s shares deposits with the Fund the “basket” of securities, cash or other assets identified by the Fund that day, and then receives the Creation Unit of the Fund’s shares in return for those assets. After purchasing a Creation Unit, the Authorized Participant may continue to hold the Fund’s shares or sell them in the secondary market. The redemption process is the reverse of the purchase process: the Authorized Participant redeems a Creation Unit of a Fund’s shares for a basket of securities, cash or other assets. The combination of the creation and redemption process with secondary market trading in a Fund’s shares and underlying securities provides arbitrage opportunities that are designed to help keep the market price of a Fund’s shares at or close to the NAV per share of the Fund.
Each Fund imposes fees in connection with the purchase of Creation Units. These fees may vary based upon various fact-based circumstances, including, but not limited to, the composition of the securities included in the Creation Unit or the countries in which
Notes to Financial Statements (Continued)
First Trust Exchange-Traded Fund III
July 31, 2021
the transactions are settled. The price for each Creation Unit will equal the daily NAV per share of a Fund times the number of shares in a Creation Unit, plus the fees described above and, if applicable, any operational processing and brokerage costs, transfer fees, stamp taxes and part or all of the spread between the expected bid and offer side of the market related to the securities comprising the creation basket.
Each Fund also imposes fees in connection with the redemption of Creation Units. These fees may vary based upon various fact-based circumstances, including, but not limited to, the composition of the securities included in the Creation Unit or the countries in which the transactions are settled. The price received for each Creation Unit will equal the daily NAV per share of a Fund times the number of shares in a Creation Unit, minus the fees described above and, if applicable, any operational processing and brokerage costs, transfer fees, stamp taxes and part or all of the spread between the expected bid and offer side of the market related to the securities comprising the redemption basket. Investors who use the services of a broker or other such intermediary in addition to an Authorized Participant to effect a redemption of a Creation Unit may also be assessed an amount to cover the cost of such services. The redemption fee charged by a Fund will comply with Rule 22c-2 of the 1940 Act which limits redemption fees to no more than 2% of the value of the shares redeemed.
7. Distribution Plan
The Board of Trustees adopted a Distribution and Service Plan pursuant to Rule 12b-1 under the 1940 Act. In accordance with the Rule 12b-1 plan, each Fund is authorized to pay an amount up to 0.25% of its average daily net assets each year to reimburse First Trust Portfolios L.P. (“FTP”), the distributor of the Funds, for amounts expended to finance activities primarily intended to result in the sale of Creation Units or to provide investor services. FTP may also use this amount to compensate securities dealers or other persons that are Authorized Participants for providing distribution assistance, including broker-dealer and shareholder support and educational and promotional services.
No 12b-1 fees are currently paid by the Funds, and pursuant to a contractual arrangement, no 12b-1 fees will be paid any time before November 30, 2022.
8. Indemnification
The Trust, on behalf of the Funds, has a variety of indemnification obligations under contracts with its service providers. The Trust’s maximum exposure under these arrangements is unknown. However, the Trust has not had prior claims or losses pursuant to these contracts and expects the risk of loss to be remote.
9. Subsequent Events
Management has evaluated the impact of all subsequent events to the Funds through the date the financial statements were issued, and has determined that there was the following subsequent event:
On September 13, 2021, the Board of Trustees approved the continuation of the fee waiver for the Funds of 0.10% of average daily net assets through November 30, 2022. The Board also approved an additional fee waiver for FUMB of 0.10% of average daily net assets which will continue through November 30, 2022.
Report of Independent Registered Public Accounting Firm
To the Shareholders and the Board of Trustees of First Trust Exchange-Traded Fund III:
Opinion on the Financial Statements and Financial Highlights
We have audited the accompanying statements of assets and liabilities of First Trust Short Duration Managed Municipal ETF and First Trust Ultra Short Duration Municipal ETF (the “Funds”), each a series of the First Trust Exchange-Traded Fund III, including the portfolios of investments, as of July 31, 2021, the related statements of operations for the year then ended, the statements of changes in net assets for each of the two years in the period then ended, the financial highlights for the years ended July 31, 2021, 2020, and the period from November 1, 2018 (commencement of operations) through July 31, 2019, and the related notes. In our opinion, the financial statements and financial highlights present fairly, in all material respects, the financial position of each of the Funds as of July 31, 2021, and the results of their operations for the year then ended, the changes in their net assets for each of the two years in the period then ended, and the financial highlights for the years ended July 31, 2021, 2020, and the period from November 1, 2018 (commencement of operations) through July 31, 2019 in conformity with accounting principles generally accepted in the United States of America.
Basis for Opinion
These financial statements and financial highlights are the responsibility of the Funds’ management. Our responsibility is to express an opinion on the Funds’ financial statements and financial highlights based on our audits. We are a public accounting firm registered with the Public Company Accounting Oversight Board (United States) (PCAOB) and are required to be independent with respect to the Funds in accordance with the U.S. federal securities laws and the applicable rules and regulations of the Securities and Exchange Commission and the PCAOB.
We conducted our audits in accordance with the standards of the PCAOB. Those standards require that we plan and perform the audit to obtain reasonable assurance about whether the financial statements and financial highlights are free of material misstatement, whether due to error or fraud. The Funds are not required to have, nor were we engaged to perform, an audit of its internal control over financial reporting. As part of our audits we are required to obtain an understanding of internal control over financial reporting but not for the purpose of expressing an opinion on the effectiveness of the Funds’ internal control over financial reporting. Accordingly, we express no such opinion.
Our audits included performing procedures to assess the risks of material misstatement of the financial statements and financial highlights, whether due to error or fraud, and performing procedures that respond to those risks. Such procedures included examining, on a test basis, evidence regarding the amounts and disclosures in the financial statements and financial highlights. Our audits also included evaluating the accounting principles used and significant estimates made by management, as well as evaluating the overall presentation of the financial statements and financial highlights. Our procedures included confirmation of securities owned as of July 31, 2021, by correspondence with the custodian and brokers; when replies were not received from brokers, we performed other auditing procedures. We believe that our audits provide a reasonable basis for our opinion.
Chicago, Illinois
September 22, 2021
We have served as the auditor of one or more First Trust investment companies since 2001.
Additional Information
First Trust Exchange-Traded Fund III
July 31, 2021 (Unaudited)
Proxy Voting Policies and Procedures
A description of the policies and procedures that the Trust uses to determine how to vote proxies and information on how each Fund voted proxies relating to portfolio securities during the most recent 12-month period ended June 30 is available (1) without charge, upon request, by calling (800) 988-5891; (2) on each Fund’s website at www.ftportfolios.com; and (3) on the Securities and Exchange Commission’s (“SEC”) website at www.sec.gov.
Portfolio Holdings
Each Fund files portfolio holdings information for each month in a fiscal quarter within 60 days after the end of the relevant fiscal quarter on Form N-PORT. Portfolio holdings information for the third month of each fiscal quarter will be publicly available on the SEC’s website at www.sec.gov. Each Fund’s complete schedule of portfolio holdings for the second and fourth quarters of each fiscal year is included in the semi-annual and annual reports to shareholders, respectively, and is filed with the SEC on Form N-CSR. The semi-annual and annual report for each Fund is available to investors within 60 days after the period to which it relates. Each Fund’s Forms N-PORT and Forms N-CSR are available on the SEC’s website listed above.
Federal Tax Information
For the taxable year ended July 31, 2021, the following distribution information is being provided as required by the Internal Revenue Code of 1986, as amended, or to meet a specific state’s requirement. The Funds designate the following percentages or, if subsequently determined to be different, the maximum amount allowable for its fiscal year ended July 31, 2021:
| | Tax-Exempt
Interest Dividends | | Alternative Minimum
Tax (AMT) |
First Trust Short Duration Managed Municipal ETF
| 99.41% | | 12.19% |
First Trust Ultra Short Duration Municipal ETF
| 96.32% | | 13.05% |
Risk Considerations
Risks are inherent in all investing. Certain general risks that may be applicable to a Fund are identified below, but not all of the material risks relevant to each Fund are included in this report and not all of the risks below apply to each Fund. The material risks of investing in each Fund are spelled out in its prospectus, statement of additional information and other regulatory filings. Before investing, you should consider each Fund’s investment objective, risks, charges and expenses, and read each Fund’s prospectus and statement of additional information carefully. You can download each Fund’s prospectus at www.ftportfolios.com or contact First Trust Portfolios L.P. at (800) 621-1675 to request a prospectus, which contains this and other information about each Fund.
Concentration Risk. To the extent that a fund is able to invest a significant percentage of its assets in a single asset class or the securities of issuers within the same country, state, region, industry or sector, an adverse economic, business or political development may affect the value of the fund’s investments more than if the fund were more broadly diversified. A fund that tracks an index will be concentrated to the extent the fund’s corresponding index is concentrated. A concentration makes a fund more susceptible to any single occurrence and may subject the fund to greater market risk than a fund that is more broadly diversified.
Credit Risk. Credit risk is the risk that an issuer of a security will be unable or unwilling to make dividend, interest and/or principal payments when due and the related risk that the value of a security may decline because of concerns about the issuer’s ability to make such payments.
Cyber Security Risk. The funds are susceptible to potential operational risks through breaches in cyber security. A breach in cyber security refers to both intentional and unintentional events that may cause a fund to lose proprietary information, suffer data corruption or lose operational capacity. Such events could cause a fund to incur regulatory penalties, reputational damage, additional compliance costs associated with corrective measures and/or financial loss. In addition, cyber security breaches of a fund’s third-party service providers, such as its administrator, transfer agent, custodian, or sub-advisor, as applicable, or issuers in which the fund invests, can also subject a fund to many of the same risks associated with direct cyber security breaches.
Defined Outcome Funds Risk. To the extent a fund’s investment strategy is designed to deliver returns tied to the price performance of an underlying ETF, an investor may not realize the returns the fund seeks to achieve if that investor does not hold shares for the entire target outcome period. In the event an investor purchases shares after the first day of the target outcome period or sells shares prior to the end of the target outcome period, the buffer that the fund seeks to provide against a decline in the value of the underlying ETF may not be available, the enhanced returns that the fund seeks to provide (if any) may not be available and the investor may not participate in a gain in the value of the underlying ETF up to the cap for the investor’s investment period. Additionally, the fund will
Additional Information (Continued)
First Trust Exchange-Traded Fund III
July 31, 2021 (Unaudited)
not participate in gains of the underlying ETF above the cap and a shareholder may lose their entire investment. If the fund seeks enhanced returns, there are certain time periods when the value of the fund may fall faster than the value of the underlying ETF, and it is very unlikely that, on any given day during which the underlying ETF share price increases in value, the fund’s share price will increase at the same rate as the enhanced returns sought by the fund, which is designed for an entire target outcome period. Trading flexible exchange options involves risks different from, or possibly greater than, the risks associated with investing directly in securities, such as less liquidity and correlation and valuation risks. A fund may experience substantial downside from specific flexible exchange option positions and certain positions may expire worthless.
Derivatives Risk. To the extent a fund uses derivative instruments such as futures contracts, options contracts and swaps, the fund may experience losses because of adverse movements in the price or value of the underlying asset, index or rate, which may be magnified by certain features of the derivative. These risks are heightened when a fund’s portfolio managers use derivatives to enhance the fund’s return or as a substitute for a position or security, rather than solely to hedge (or offset) the risk of a position or security held by the fund.
Equity Securities Risk. To the extent a fund invests in equity securities, the value of the fund’s shares will fluctuate with changes in the value of the equity securities. Equity securities prices fluctuate for several reasons, including changes in investors’ perceptions of the financial condition of an issuer or the general condition of the relevant stock market, such as market volatility, or when political or economic events affecting the issuers occur. In addition, common stock prices may be particularly sensitive to rising interest rates, as the cost of capital rises and borrowing costs increase. Equity securities may decline significantly in price over short or extended periods of time, and such declines may occur in the equity market as a whole, or they may occur in only a particular country, company, industry or sector of the market.
ETF Risk. The shares of an ETF trade like common stock and represent an interest in a portfolio of securities. The risks of owning an ETF generally reflect the risks of owning the underlying securities, although lack of liquidity in an ETF could result in it being more volatile and ETFs have management fees that increase their costs. Shares of an ETF trade on an exchange at market prices rather than net asset value, which may cause the shares to trade at a price greater than net asset value (premium) or less than net asset value (discount). In times of market stress, decisions by market makers to reduce or step away from their role of providing a market for an ETF’s shares, or decisions by an ETF’s authorized participants that they are unable or unwilling to proceed with creation and/or redemption orders of an ETF’s shares, could result in shares of the ETF trading at a discount to net asset value and in greater than normal intraday bid-ask spreads.
Fixed Income Securities Risk. To the extent a fund invests in fixed income securities, the fund will be subject to credit risk, income risk, interest rate risk, liquidity risk and prepayment risk. Income risk is the risk that income from a fund’s fixed income investments could decline during periods of falling interest rates. Interest rate risk is the risk that the value of a fund’s fixed income securities will decline because of rising interest rates. Liquidity risk is the risk that a security cannot be purchased or sold at the time desired, or cannot be purchased or sold without adversely affecting the price. Prepayment risk is the risk that the securities will be redeemed or prepaid by the issuer, resulting in lower interest payments received by the fund. In addition to these risks, high yield securities, or “junk” bonds, are subject to greater market fluctuations and risk of loss than securities with higher ratings, and the market for high yield securities is generally smaller and less liquid than that for investment grade securities.
Index or Model Constituent Risk. Certain funds may be a constituent of one or more indices or ETF models. As a result, such a fund may be included in one or more index-tracking exchange-traded funds or mutual funds. Being a component security of such a vehicle could greatly affect the trading activity involving a fund, the size of the fund and the market volatility of the fund. Inclusion in an index could increase demand for the fund and removal from an index could result in outsized selling activity in a relatively short period of time. As a result, a fund’s net asset value could be negatively impacted and the fund’s market price may be significantly below its net asset value during certain periods. In addition, index rebalances may potentially result in increased trading activity in a fund’s shares.
Index Provider Risk. To the extent a fund seeks to track an index, it is subject to Index Provider Risk. There is no assurance that the Index Provider will compile the Index accurately, or that the Index will be determined, maintained, constructed, reconstituted, rebalanced, composed, calculated or disseminated accurately. To correct any such error, the Index Provider may carry out an unscheduled rebalance or other modification of the Index constituents or weightings, which may increase the fund’s costs. The Index Provider does not provide any representation or warranty in relation to the quality, accuracy or completeness of data in the Index, and it does not guarantee that the Index will be calculated in accordance with its stated methodology. Losses or costs associated with any Index Provider errors generally will be borne by the fund and its shareholders.
Investment Companies Risk. To the extent a fund invests in the securities of other investment vehicles, the fund will incur additional fees and expenses that would not be present in a direct investment in those investment vehicles. Furthermore, the fund’s investment performance and risks are directly related to the investment performance and risks of the investment vehicles in which the fund invests.
Additional Information (Continued)
First Trust Exchange-Traded Fund III
July 31, 2021 (Unaudited)
LIBOR Risk. To the extent a fund invests in floating or variable rate obligations that use the London Interbank Offered Rate (“LIBOR”) as a reference interest rate, it is subject to LIBOR Risk. The United Kingdom’s Financial Conduct Authority, which regulates LIBOR, will cease making LIBOR available as a reference rate over a phase-out period that will begin immediately after December 31, 2021. The unavailability or replacement of LIBOR may affect the value, liquidity or return on certain fund investments and may result in costs incurred in connection with closing out positions and entering into new trades. Any potential effects of the transition away from LIBOR on the fund or on certain instruments in which the fund invests can be difficult to ascertain, and they may vary depending on a variety of factors, and they could result in losses to the fund.
Management Risk. To the extent that a fund is actively managed, it is subject to management risk. In managing an actively-managed fund’s investment portfolio, the fund’s portfolio managers will apply investment techniques and risk analyses that may not have the desired result. There can be no guarantee that a fund will meet its investment objective.
Market Risk. Securities held by a fund, as well as shares of a fund itself, are subject to market fluctuations caused by factors such as general economic conditions, political events, regulatory or market developments, changes in interest rates and perceived trends in securities prices. Shares of a fund could decline in value or underperform other investments as a result of the risk of loss associated with these market fluctuations. In addition, local, regional or global events such as war, acts of terrorism, spread of infectious diseases or other public health issues, recessions, or other events could have a significant negative impact on a fund and its investments. Such events may affect certain geographic regions, countries, sectors and industries more significantly than others. The outbreak of the respiratory disease designated as COVID-19 in December 2019 has caused significant volatility and declines in global financial markets, which have caused losses for investors. While the development of vaccines has slowed the spread of the virus and allowed for the resumption of “reasonably” normal business activity in the United States, many countries continue to impose lockdown measures in an attempt to slow the spread. Additionally, there is no guarantee that vaccines will be effective against emerging variants of the disease.
Non-U.S. Securities Risk. To the extent a fund invests in non-U.S. securities, it is subject to additional risks not associated with securities of domestic issuers. Non-U.S. securities are subject to higher volatility than securities of domestic issuers due to: possible adverse political, social or economic developments; restrictions on foreign investment or exchange of securities; capital controls; lack of liquidity; currency exchange rates; excessive taxation; government seizure of assets; the imposition of sanctions by foreign governments; different legal or accounting standards; and less government supervision and regulation of exchanges in foreign countries. Investments in non-U.S. securities may involve higher costs than investments in U.S. securities, including higher transaction and custody costs, as well as additional taxes imposed by non-U.S. governments. These risks may be heightened for securities of companies located, or with significant operations, in emerging market countries.
Operational Risk. Each fund is subject to risks arising from various operational factors, including, but not limited to, human error, processing and communication errors, errors of a fund’s service providers, counterparties or other third-parties, failed or inadequate processes and technology or systems failures. Each fund relies on third-parties for a range of services, including custody. Any delay or failure relating to engaging or maintaining such service providers may affect a fund’s ability to meet its investment objective. Although the funds and the funds’ investment advisor seek to reduce these operational risks through controls and procedures, there is no way to completely protect against such risks.
Passive Investment Risk. To the extent a fund seeks to track an index, the fund will invest in the securities included in, or representative of, the index regardless of their investment merit. A fund generally will not attempt to take defensive positions in declining markets.
| NOT FDIC INSURED | NOT BANK GUARANTEED | MAY LOSE VALUE |
Advisory Agreement
Board Considerations Regarding Approval of Continuation of Investment Management Agreements
The Board of Trustees of First Trust Exchange-Traded Fund III (the “Trust”), including the Independent Trustees, unanimously approved the continuation of the Investment Management Agreement (the “Agreement”) with First Trust Advisors L.P. (the “Advisor”) on behalf of the following two series of the Trust (each a “Fund” and collectively, the “Funds”):
First Trust Short Duration Managed Municipal ETF (FSMB)
First Trust Ultra Short Duration Municipal ETF (FUMB)
The Board approved the continuation of the Agreement for each Fund for a one-year period ending June 30, 2022 at a meeting held on June 6–7, 2021. The Board determined for each Fund that the continuation of the Agreement is in the best interests of the Fund in light
Additional Information (Continued)
First Trust Exchange-Traded Fund III
July 31, 2021 (Unaudited)
of the nature, extent and quality of the services provided and such other matters as the Board considered to be relevant in the exercise of its business judgment.
To reach this determination for each Fund, the Board considered its duties under the Investment Company Act of 1940, as amended (the “1940 Act”), as well as under the general principles of state law, in reviewing and approving advisory contracts; the requirements of the 1940 Act in such matters; the fiduciary duty of investment advisors with respect to advisory agreements and compensation; the standards used by courts in determining whether investment company boards have fulfilled their duties; and the factors to be considered by the Board in voting on such agreements. At meetings held on April 26, 2021 and June 6–7, 2021, the Board, including the Independent Trustees, reviewed materials provided by the Advisor responding to requests for information from counsel to the Independent Trustees, submitted on behalf of the Independent Trustees, that, among other things, outlined: the services provided by the Advisor to each Fund (including the relevant personnel responsible for these services and their experience); the unitary fee rate payable by each Fund as compared to fees charged to a peer group of funds (the “Expense Group”) and a broad peer universe of funds (the “Expense Universe”), each assembled by Broadridge Financial Solutions, Inc. (“Broadridge”), an independent source, and as compared to fees charged to other clients of the Advisor, including other exchange-traded funds (“ETFs”) managed by the Advisor; the expense ratio of each Fund as compared to expense ratios of the funds in the Fund’s Expense Group and Expense Universe; performance information for each Fund, including comparisons of each Fund’s performance to that of one or more relevant benchmark indexes and to that of a performance group of funds and a broad performance universe of funds (the “Performance Universe”), each assembled by Broadridge; the nature of expenses incurred in providing services to each Fund and the potential for the Advisor to realize economies of scale, if any; profitability and other financial data for the Advisor; any fall-out benefits to the Advisor and its affiliate, First Trust Portfolios L.P. (“FTP”); and information on the Advisor’s compliance program. The Board reviewed initial materials with the Advisor at the meeting held on April 26, 2021, prior to which the Independent Trustees and their counsel met separately to discuss the information provided by the Advisor. Following the April meeting, counsel to the Independent Trustees, on behalf of the Independent Trustees, requested certain clarifications and supplements to the materials provided, and the information provided in response to those requests was considered at an executive session of the Independent Trustees and their counsel held prior to the June 6–7, 2021 meeting, as well as at the June meeting. The Board applied its business judgment to determine whether the arrangement between the Trust and the Advisor continues to be a reasonable business arrangement from each Fund’s perspective. The Board determined that, given the totality of the information provided with respect to the Agreement, the Board had received sufficient information to renew the Agreement. The Board considered that shareholders chose to invest or remain invested in a Fund knowing that the Advisor manages the Fund and knowing the Fund’s unitary fee.
In reviewing the Agreement for each Fund, the Board considered the nature, extent and quality of the services provided by the Advisor under the Agreement. The Board considered that the Advisor is responsible for the overall management and administration of the Trust and each Fund and reviewed all of the services provided by the Advisor to the Funds, as well as the background and experience of the persons responsible for such services. The Board noted that the Fund is an actively-managed ETF and noted that the Advisor’s Municipal Securities Team is responsible for the day-to-day management of the Fund’s investments. The Board considered the background and experience of the members of the Municipal Securities Team and noted the Board’s prior meetings with members of the Team. The Board considered the Advisor’s statement that it applies the same oversight model internally with its Municipal Securities Team as it uses for overseeing external sub-advisors, including portfolio risk monitoring and performance review. In reviewing the services provided, the Board noted the compliance program that had been developed by the Advisor and considered that it includes a robust program for monitoring the Advisor’s and each Fund’s compliance with the 1940 Act, as well as each Fund’s compliance with its investment objective, policies and restrictions. The Board also considered a report from the Advisor with respect to its risk management functions related to the operation of the Funds. Finally, as part of the Board’s consideration of the Advisor’s services, the Advisor, in its written materials and at the April 26, 2021 meeting, described to the Board the scope of its ongoing investment in additional personnel and infrastructure to maintain and improve the quality of services provided to the Funds and the other funds in the First Trust Fund Complex. In light of the information presented and the considerations made, the Board concluded that the nature, extent and quality of the services provided to the Trust and each Fund by the Advisor under the Agreement have been and are expected to remain satisfactory and that the Advisor has managed each Fund consistent with its investment objective, policies and restrictions.
The Board considered the unitary fee rate payable by each Fund under the Agreement for the services provided. The Board considered that as part of the unitary fee the Advisor is responsible for each Fund’s expenses, including the cost of transfer agency, custody, fund administration, legal, audit and other services and license fees, if any, but excluding the fee payment under the Agreement and interest, taxes, brokerage commissions and other expenses connected with the execution of portfolio transactions, distribution and service fees pursuant to a Rule 12b-1 plan, if any, and extraordinary expenses, if any. The Board noted that the Advisor had previously agreed to waive a portion of its unitary fee for FSMB in an amount equal to 0.10% of the Fund’s average daily net assets and for FUMB in an amount equal to 0.20% of the Fund’s average daily net assets until at least November 30, 2021 and that the Advisor had agreed to waive an additional portion of its unitary fee for FSMB in an amount equal to 0.10% of the Fund’s average daily net assets until at least November 30, 2022. The Board received and reviewed information showing the advisory or unitary fee rates and expense ratios
Additional Information (Continued)
First Trust Exchange-Traded Fund III
July 31, 2021 (Unaudited)
of the peer funds in the Expense Groups, as well as advisory and unitary fee rates charged by the Advisor to other fund (including ETFs) and non-fund clients, as applicable. Because each Fund pays a unitary fee, the Board determined that expense ratios were the most relevant comparative data point. Based on the information provided, the Board noted that the unitary fee rate for FSMB, after taking into account the contractual fee waivers, was above the median total (net) expense ratio of the peer funds in its Expense Group and that the unitary fee rate for FUMB, after taking into account the contractual fee waiver, was below the median total (net) expense ratio of the peer funds in its Expense Group. With respect to the Expense Groups, the Board, at the April 26, 2021 meeting, discussed with the Advisor limitations in creating peer groups for actively-managed ETFs, including that the Expense Group for each Fund contained both actively-managed ETFs and open-end mutual funds, and different business models that may affect the pricing of services among ETF sponsors. The Board took these limitations and differences into account in considering the peer data. With respect to fees charged to other non-ETF clients, the Board considered differences between the Funds and other non-ETF clients that limited their comparability. In considering the unitary fee rates overall, the Board also considered the Advisor’s statement that it seeks to meet investor needs through innovative and value-added investment solutions and the Advisor’s demonstrated long-term commitment to each Fund and the other funds in the First Trust Fund Complex.
The Board considered performance information for each Fund. The Board noted the process it has established for monitoring each Fund’s performance and portfolio risk on an ongoing basis, which includes quarterly performance reporting from the Advisor for the Funds. The Board determined that this process continues to be effective for reviewing each Fund’s performance. The Board received and reviewed information comparing each Fund’s performance for the one-year period ended December 31, 2020 to the performance of the funds in its Performance Universe and a benchmark index. Based on the information provided, the Board noted that FSMB outperformed its Performance Universe median and benchmark index for the one-year period ended December 31, 2020 and that FUMB underperformed its Performance Universe median for the one-year period ended December 31, 2020 and outperformed its benchmark index for the one-year period ended December 31, 2020.
On the basis of all the information provided on the unitary fee and performance of each Fund and the ongoing oversight by the Board, the Board concluded that the unitary fee for each Fund continues to be reasonable and appropriate in light of the nature, extent and quality of the services provided by the Advisor to each Fund under the Agreement.
The Board considered information and discussed with the Advisor whether there were any economies of scale in connection with providing advisory services to the Funds and noted the Advisor’s statement that it believes its expenses will likely increase during the next twelve months as the Advisor continues to hire personnel and build infrastructure, including technology, to improve the services to the Funds. The Board noted that any reduction in fixed costs associated with the management of the Funds would benefit the Advisor, but that the unitary fee structure provides a level of certainty in expenses for the Funds. The Board considered the revenues and allocated costs (including the allocation methodology) of the Advisor in serving as investment advisor to each Fund for the twelve months ended December 31, 2020 and the estimated profitability level for each Fund calculated by the Advisor based on such data, as well as complex-wide and product-line profitability data, for the same period. The Board noted the inherent limitations in the profitability analysis and concluded that, based on the information provided, the Advisor’s profitability level for each Fund was not unreasonable. In addition, the Board considered fall-out benefits described by the Advisor that may be realized from its relationship with the Funds. The Board considered that the Advisor had identified as a fall-out benefit to the Advisor and FTP their exposure to investors and brokers who, absent their exposure to the Funds, may have had no dealings with the Advisor or FTP, and noted that the Advisor does not utilize soft dollars in connection with the Funds. The Board also considered the Advisor’s compensation for fund reporting services provided to each Fund pursuant to a separate Fund Reporting Services Agreement, which is paid from the unitary fee. The Board concluded that the character and amount of potential fall-out benefits to the Advisor were not unreasonable.
Based on all of the information considered and the conclusions reached, the Board, including the Independent Trustees, unanimously determined that the terms of the Agreement continue to be fair and reasonable and that the continuation of the Agreement is in the best interests of each Fund. No single factor was determinative in the Board’s analysis.
Liquidity Risk Management Program
In accordance with Rule 22e-4 under the Investment Company Act of 1940, as amended (the “1940 Act”), the Funds and each other fund in the First Trust Fund Complex, other than the closed-end funds, have adopted and implemented a liquidity risk management program (the “Program”) reasonably designed to assess and manage the funds’ liquidity risk, i.e., the risk that a fund could not meet requests to redeem shares issued by the fund without significant dilution of remaining investors’ interests in the fund. The Board of Trustees of the First Trust Funds has appointed First Trust Advisors, L.P. (the “Advisor”) as the person designated to administer the Program, and in this capacity the Advisor performs its duties primarily through the activities and efforts of the First Trust Liquidity Committee (the “Liquidity Committee”).
Pursuant to the Program, the Liquidity Committee classifies the liquidity of each fund’s portfolio investments into one of the four liquidity categories specified by Rule 22e-4: highly liquid investments, moderately liquid investments, less liquid investments and
Additional Information (Continued)
First Trust Exchange-Traded Fund III
July 31, 2021 (Unaudited)
illiquid investments. The Liquidity Committee determines certain of the inputs for this classification process, including reasonably anticipated trade sizes and significant investor dilution thresholds. The Liquidity Committee also determines and periodically reviews a highly liquid investment minimum for certain funds, monitors the funds’ holdings of assets classified as illiquid investments to seek to ensure they do not exceed 15% of a fund’s net assets and establishes policies and procedures regarding redemptions in kind.
At the April 26, 2021 meeting of the Board of Trustees, as required by Rule 22e-4 and the Program, the Advisor provided the Board with a written report prepared by the Advisor that addressed the operation of the Program during the period from March 20, 2020 through the Liquidity Committee’s annual meeting held on March 16, 2021 and assessed the Program’s adequacy and effectiveness of implementation during this period, including the operation of the highly liquid investment minimum for each fund that is required under the Program to have one, and any material changes to the Program. Note that because the Funds primarily hold assets that are highly liquid investments, the Funds have not adopted any highly liquid investment minimums.
As stated in the written report, during the review period, no fund breached the 15% limitation on illiquid investments, no fund with a highly liquid investment minimum breached that minimum and no fund filed a Form N-LIQUID. The Advisor concluded that each fund’s investment strategy is appropriate for an open-end fund; that the Program operated effectively in all material respects during the review period; and that the Program is reasonably designed to assess and manage the liquidity risk of each fund and to maintain compliance with Rule 22e-4.
Board of Trustees and Officers
First Trust Exchange-Traded Fund III
July 31, 2021 (Unaudited)
The following tables identify the Trustees and Officers of the Trust. Unless otherwise indicated, the address of all persons is 120 East Liberty Drive, Suite 400, Wheaton, IL 60187.
The Trust’s statement of additional information includes additional information about the Trustees and is available, without charge, upon request, by calling (800) 988-5891.
| Name, Year of Birth and Position with the Trust | Term of Office and Year First Elected or Appointed | Principal Occupations
During Past 5 Years | Number of Portfolios in the First Trust Fund Complex Overseen by Trustee | Other Trusteeships or Directorships Held by Trustee During Past 5 Years |
| INDEPENDENT TRUSTEES |
Richard E. Erickson, Trustee
(1951) | • Indefinite Term
• Since Inception | Physician; Officer, Wheaton Orthopedics; Limited Partner, Gundersen Real Estate Limited Partnership (June 1992 to December 2016) | 211 | None |
Thomas R. Kadlec, Trustee
(1957) | • Indefinite Term
• Since Inception | President, ADM Investor Services, Inc. (Futures Commission Merchant) | 211 | Director of ADM Investor Services, Inc., ADM Investor Services International, Futures Industry Association, and National Futures Association |
Robert F. Keith, Trustee
(1956) | • Indefinite Term
• Since Inception | President, Hibs Enterprises (Financial and Management Consulting) | 211 | Director of Trust Company of Illinois |
Niel B. Nielson, Trustee
(1954) | • Indefinite Term
• Since Inception | Senior Advisor (August 2018 to Present), Managing Director and Chief Operating Officer (January 2015 to August 2018), Pelita Harapan Educational Foundation (Educational Products and Services) | 211 | None |
| INTERESTED TRUSTEE |
James A. Bowen(1), Trustee and
Chairman of the Board
(1955) | • Indefinite Term
• Since Inception | Chief Executive Officer, First Trust Advisors L.P. and First Trust Portfolios L.P.; Chairman of the Board of Directors, BondWave LLC (Software Development Company) and Stonebridge Advisors LLC (Investment Advisor) | 211 | None |
| (1) | Mr. Bowen is deemed an “interested person” of the Trust due to his position as CEO of First Trust Advisors L.P., investment advisor of the Trust. |
Board of Trustees and Officers (Continued)
First Trust Exchange-Traded Fund III
July 31, 2021 (Unaudited)
| Name and Year of Birth | Position and Offices with Trust | Term of Office and Length of Service | Principal Occupations
During Past 5 Years |
| OFFICERS(2) |
James M. Dykas
(1966) | President and Chief Executive Officer | • Indefinite Term
• Since January 2016 | Managing Director and Chief Financial Officer (January 2016 to Present), Controller (January 2011 to January 2016), Senior Vice President (April 2007 to January 2016), First Trust Advisors L.P. and First Trust Portfolios L.P.; Chief Financial Officer (January 2016 to Present), BondWave LLC (Software Development Company) and Stonebridge Advisors LLC (Investment Advisor) |
Donald P. Swade
(1972) | Treasurer, Chief Financial Officer and Chief Accounting Officer | • Indefinite Term
• Since January 2016 | Senior Vice President (July 2016 to Present), Vice President (April 2012 to July 2016), First Trust Advisors L.P. and First Trust Portfolios L.P. |
W. Scott Jardine
(1960) | Secretary and Chief Legal Officer | • Indefinite Term
• Since Inception | General Counsel, First Trust Advisors L.P. and First Trust Portfolios L.P.; Secretary and General Counsel, BondWave LLC; Secretary, Stonebridge Advisors LLC |
Daniel J. Lindquist
(1970) | Vice President | • Indefinite Term
• Since Inception | Managing Director, First Trust Advisors L.P. and First Trust Portfolios L.P. |
Kristi A. Maher
(1966) | Chief Compliance Officer and Assistant Secretary | • Indefinite Term
• Since Inception | Deputy General Counsel, First Trust Advisors L.P. and First Trust Portfolios L.P. |
Roger F. Testin
(1966) | Vice President | • Indefinite Term
• Since Inception | Senior Vice President, First Trust Advisors L.P. and First Trust Portfolios L.P. |
Stan Ueland
(1970) | Vice President | • Indefinite Term
• Since Inception | Senior Vice President, First Trust Advisors L.P. and First Trust Portfolios L.P |
| (2) | The term “officer” means the president, vice president, secretary, treasurer, controller or any other officer who performs a policy making function. |
Privacy Policy
First Trust Exchange-Traded Fund III
July 31, 2021 (Unaudited)
Privacy Policy
First Trust values our relationship with you and considers your privacy an important priority in maintaining that relationship. We are committed to protecting the security and confidentiality of your personal information.
Sources of Information
We collect nonpublic personal information about you from the following sources:
| • | Information we receive from you and your broker-dealer, investment professional or financial representative through interviews, applications, agreements or other forms; |
| • | Information about your transactions with us, our affiliates or others; |
| • | Information we receive from your inquiries by mail, e-mail or telephone; and |
| • | Information we collect on our website through the use of “cookies”. For example, we may identify the pages on our website that your browser requests or visits. |
Information Collected
The type of data we collect may include your name, address, social security number, age, financial status, assets, income, tax information, retirement and estate plan information, transaction history, account balance, payment history, investment objectives, marital status, family relationships and other personal information.
Disclosure of Information
We do not disclose any nonpublic personal information about our customers or former customers to anyone, except as permitted by law. In addition to using this information to verify your identity (as required under law), the permitted uses may also include the disclosure of such information to unaffiliated companies for the following reasons:
| • | In order to provide you with products and services and to effect transactions that you request or authorize, we may disclose your personal information as described above to unaffiliated financial service providers and other companies that perform administrative or other services on our behalf, such as transfer agents, custodians and trustees, or that assist us in the distribution of investor materials such as trustees, banks, financial representatives, proxy services, solicitors and printers. |
| • | We may release information we have about you if you direct us to do so, if we are compelled by law to do so, or in other legally limited circumstances (for example to protect your account from fraud). |
In addition, in order to alert you to our other financial products and services, we may share your personal information within First Trust.
Use of Website Analytics
We currently use third party analytics tools, Google Analytics and AddThis, to gather information for purposes of improving First Trust’s website and marketing our products and services to you. These tools employ cookies, which are small pieces of text stored in a file by your web browser and sent to websites that you visit, to collect information, track website usage and viewing trends such as the number of hits, pages visited, videos and PDFs viewed and the length of user sessions in order to evaluate website performance and enhance navigation of the website. We may also collect other anonymous information, which is generally limited to technical and web navigation information such as the IP address of your device, internet browser type and operating system for purposes of analyzing the data to make First Trust’s website better and more useful to our users. The information collected does not include any personal identifiable information such as your name, address, phone number or email address unless you provide that information through the website for us to contact you in order to answer your questions or respond to your requests. To find out how to opt-out of these services click on: Google Analytics and AddThis.
Confidentiality and Security
With regard to our internal security procedures, First Trust restricts access to your nonpublic personal information to those First Trust employees who need to know that information to provide products or services to you. We maintain physical, electronic and procedural safeguards to protect your nonpublic personal information.
Policy Updates and Inquiries
As required by federal law, we will notify you of our privacy policy annually. We reserve the right to modify this policy at any time, however, if we do change it, we will tell you promptly. For questions about our policy, or for additional copies of this notice, please go to www.ftportfolios.com, or contact us at 1-800-621-1675 (First Trust Portfolios) or 1-800-222-6822 (First Trust Advisors).
March 2021
This page intentionally left blank
This page intentionally left blank
This page intentionally left blank
First Trust Exchange-Traded Fund III
INVESTMENT ADVISOR
First Trust Advisors L.P.
120 East Liberty Drive, Suite 400
Wheaton, IL 60187
ADMINISTRATOR, CUSTODIAN,
FUND ACCOUNTANT &
TRANSFER AGENT
Brown Brothers Harriman & Co.
50 Post Office Square
Boston, MA 02110
INDEPENDENT REGISTERED
PUBLIC ACCOUNTING FIRM
Deloitte & Touche LLP
111 S. Wacker Drive
Chicago, IL 60606
LEGAL COUNSEL
Chapman and Cutler LLP
111 W. Monroe Street
Chicago, IL 60603
First Trust Exchange-Traded Fund III
First Trust Merger Arbitrage ETF (MARB)
Annual Report
For the Year Ended
July 31, 2021
First Trust Merger Arbitrage ETF (MARB)
Annual Report
July 31, 2021
Caution Regarding Forward-Looking Statements
This report contains certain forward-looking statements within the meaning of the Securities Act of 1933, as amended, and the Securities Exchange Act of 1934, as amended. Forward-looking statements include statements regarding the goals, beliefs, plans or current expectations of First Trust Advisors L.P. (“First Trust” or the “Advisor”) and/or Vivaldi Asset Management, LLC (“Vivaldi” or the “Sub-Advisor”) and their respective representatives, taking into account the information currently available to them. Forward-looking statements include all statements that do not relate solely to current or historical fact. For example, forward-looking statements include the use of words such as “anticipate,” “estimate,” “intend,” “expect,” “believe,” “plan,” “may,” “should,” “would” or other words that convey uncertainty of future events or outcomes.
Forward-looking statements involve known and unknown risks, uncertainties and other factors that may cause the actual results, performance or achievements of the series of First Trust Exchange-Traded Fund III (the “Trust”) described in this report (First Trust Merger Arbitrage ETF; hereinafter referred to as the “Fund”) to be materially different from any future results, performance or achievements expressed or implied by the forward-looking statements. When evaluating the information included in this report, you are cautioned not to place undue reliance on these forward-looking statements, which reflect the judgment of the Advisor and/or Sub-Advisor and their respective representatives only as of the date hereof. We undertake no obligation to publicly revise or update these forward-looking statements to reflect events and circumstances that arise after the date hereof.
Performance and Risk Disclosure
There is no assurance that the Fund will achieve its investment objective. The Fund is subject to market risk, which is the possibility that the market values of securities owned by the Fund will decline and that the value of the Fund’s shares may therefore be less than what you paid for them. Accordingly, you can lose money by investing in the Fund. See “Risk Considerations” in the Additional Information section of this report for a discussion of certain other risks of investing in the Fund.
Performance data quoted represents past performance, which is no guarantee of future results, and current performance may be lower or higher than the figures shown. For the most recent month-end performance figures, please visit www.ftportfolios.com or speak with your financial advisor. Investment returns, net asset value and share price will fluctuate and Fund shares, when sold, may be worth more or less than their original cost.
The Advisor may also periodically provide additional information on Fund performance on the Fund’s web page at www.ftportfolios.com.
How to Read This Report
This report contains information that may help you evaluate your investment in the Fund. It includes details about the Fund and presents data and analysis that provide insight into the Fund’s performance and investment approach.
By reading the portfolio commentary by the portfolio management team of the Fund, you may obtain an understanding of how the market environment affected the Fund’s performance. The statistical information that follows may help you understand the Fund’s performance compared to that of relevant market benchmarks.
It is important to keep in mind that the opinions expressed by personnel of the Advisor and/or Sub-Advisor are just that: informed opinions. They should not be considered to be promises or advice. The opinions, like the statistics, cover the period through the date on the cover of this report. The material risks of investing in the Fund are spelled out in the prospectus, the statement of additional information, and other Fund regulatory filings.
First Trust Merger Arbitrage ETF (MARB)
Annual Letter from the Chairman and CEO
July 31, 2021
Dear Shareholders,
First Trust is pleased to provide you with the annual report for the First Trust Merger Arbitrage ETF (the “Fund”), which contains detailed information about the Fund for the 12-month period ended July 31, 2021.
I often mention at the end of my shareholder letters that investors should stay the course. I do so because First Trust believes in the buy and hold investment philosophy, and the math supports our view. The S&P 500® Index (the “Index”) has never failed to fully recover the losses sustained in any correction or bear market. As of July 31, 2021, the Index stood just 0.61% below its all-time closing high set on July 26, 2021. Whether you believe that history repeats itself or simply rhymes, it provides us with valuable insight either way. When it comes to setting realistic expectations about equity returns over time, we know that the Index delivered an average annual total return of 10.28% from 1926-2020 (95 years), according to data from Morningstar/Ibbotson Associates. That is our long-term performance benchmark for stocks in the U.S. Why is that relevant in today’s climate? It is important to note that this very Index has posted a total return of 17.99% year-to-date and 36.45% for the 12-month period ended July 31, 2021, according to Bloomberg. Using industry jargon, these are sometimes referred to as “outsized” returns, or well-above the norm.
As previously noted, the stock market experiences selloffs of various degrees on an ongoing basis. The more severe declines are referred to as corrections and bear markets. Corrections are defined as a 10.00% to 19.99% decline in the price of an index or security from its most recent closing high. Bear markets entail price declines of 20% or more. Since 1950, the Index has endured 38 selloffs totaling 10% or more, with nine of them being bear markets, according to The Motley Fool, a private financial and investing advice company. Over that 71-year period, on average, the stock market experienced a correction every 1.84 years, compared to every 7.78 years for bear markets. The last major selloff occurred in the first quarter of 2020 (17 months ago), when the Index plunged 33.79%, due to the initial shock from the onset of the coronavirus (“COVID-19”) pandemic. While that qualified as a bear market, some investors may be thinking we are due for a correction in the coming months. Remember, these statistics represent averages. A June 2021 survey by the CFA Institute found that 45% of the chartered financial analysts it polled believe we will have a correction within 1-3 years. I offer this forecast to show investors how challenging it is to make such market calls, even for highly credentialled professionals. A 1-3 year projection isn’t exactly actionable information, in my opinion.
The bottom line is that those individuals who have remained invested in the stock and bond markets throughout the COVID-19 pandemic have likely prospered beyond what they might have imagined. Suffice it to say that the markets have exceeded expectations over the past 12 months. I think your average investor would have been content with just being in positive territory. Looking ahead, I see more tailwinds for the markets than headwinds, particularly with respect to the stock market. There is plenty of liquidity in the economy thanks to the accommodative monetary policy of the Federal Reserve (the “Fed”) and fiscal stimulus from Congress. We have the potential for another $4 to $5 trillion in fiscal stimulus from President Joe Biden’s bipartisan infrastructure bill and the Democrat-driven budget package, including funds earmarked for climate change projects (green energy), health care, education, and more. Perhaps the biggest headwind moving forward is rising inflation. We should know in the next few months if it is transitory, as Fed Chairman Jerome Powell believes, or if it will be with us for a sustained period. Stay tuned and stay the course!
Thank you for giving First Trust the opportunity to play a role in your financial future. We value our relationship with you and will report on the Fund again in six months.
Sincerely,
James A. Bowen
Chairman of the Board of Trustees
Chief Executive Officer of First Trust Advisors L.P.
Fund Performance Overview (Unaudited)
First Trust Merger Arbitrage ETF (MARB)
The First Trust Merger Arbitrage ETF’s (the “Fund”) investment objective is to seek to provide investors with capital appreciation. Under normal market conditions, the Fund seeks to achieve its investment objective by establishing long and short positions in the equity securities of companies that are involved in a publicly-announced significant corporate event, such as a merger or acquisition. The Fund’s portfolio may include equity securities issued by U.S. and non-U.S. companies, including American Depositary Receipts, and derivatives, including total return swaps. The Fund may invest in securities issued by small, mid and large capitalization issuers. The Fund lists and principally trades its shares on NYSE Arca, Inc. under the ticker symbol “MARB.”
| Performance | | | |
| | | Average Annual
Total Returns | Cumulative
Total Returns |
| | 1 Year Ended
7/31/21 | Inception (2/4/20)
to 7/31/21 | Inception (2/4/20)
to 7/31/21 |
| Fund Performance | | | |
| NAV | 0.46% | -1.55% | -2.30% |
| Market Price | 0.41% | -1.59% | -2.35% |
| Index Performance | | | |
| Hedge Fund Research Merger Arbitrage Index | 8.00% | 4.43% | 6.65% |
| S&P 500® Index | 36.45% | 23.43% | 36.70% |
Total returns for the period since inception are calculated from the inception date of the Fund. “Average Annual Total Returns” represent the average annual change in value of an investment over the period indicated. “Cumulative Total Returns” represent the total change in value of an investment over the period indicated.
The Fund’s per share net asset value (“NAV”) is the value of one share of the Fund and is computed by dividing the value of all assets of the Fund (including accrued interest and dividends), less all liabilities (including accrued expenses and dividends declared but unpaid), by the total number of outstanding shares. The price used to calculate market return (“Market Price”) is determined by using the midpoint of the national best bid and offer price (“NBBO”) as of the time that the Fund’s NAV is calculated. Under SEC rules, the NBBO consists of the highest displayed buy and lowest sell prices among the various exchanges trading the Fund at the time the Fund’s NAV is calculated. Since shares of the Fund did not trade in the secondary market until after its inception, for the period from inception to the first day of secondary market trading in shares of the Fund, the NAV of the Fund is used as a proxy for the secondary market trading price to calculate market returns. NAV and market returns assume that all distributions have been reinvested in the Fund at NAV and Market Price, respectively.
An index is a statistical composite that tracks a specified financial market or sector. Unlike the Fund, the indices do not actually hold a portfolio of securities and therefore do not incur the expenses incurred by the Fund. These expenses negatively impact the performance of the Fund. Also, market returns do not include brokerage commissions that may be payable on secondary market transactions. If brokerage commissions were included, market returns would be lower. The total returns presented reflect the reinvestment of dividends on securities in the indices. The returns presented do not reflect the deduction of taxes that a shareholder would pay on Fund distributions or the redemption or sale of Fund shares. The investment return and principal value of shares of the Fund will vary with changes in market conditions. Shares of the Fund may be worth more or less than their original cost when they are redeemed or sold in the market. The Fund’s past performance is no guarantee of future performance.
Fund Performance Overview (Unaudited) (Continued)
First Trust Merger Arbitrage ETF (MARB)
| Portfolio Sector Allocation | % of Total
Long-Term
Investments |
| Information Technology | 41.0% |
| Health Care | 15.4 |
| Financials | 13.0 |
| Industrials | 11.7 |
| Utilities | 6.4 |
| Communication Services | 4.9 |
| Materials | 4.2 |
| Consumer Discretionary | 3.4 |
| Total | 100.0% |
| Portfolio Sector Allocation | % of
Investments
Sold Short |
| Financials | 50.3% |
| Information Technology | 49.6 |
| Industrials | 0.1 |
| Health Care | 0.0* |
| Total | 100.0% |
| * | Amount is less than 0.1%. |
| Top Ten Long-Term Investments | % of
Net Assets |
| Nuance Communications, Inc. | 6.3% |
| Maxim Integrated Products, Inc. | 5.3 |
| Athene Holding Ltd., Class A | 4.9 |
| Xilinx, Inc. | 4.4 |
| IHS Markit Ltd. | 3.8 |
| Magellan Health, Inc. | 3.7 |
| Proofpoint, Inc. | 3.5 |
| PNM Resources, Inc. | 3.4 |
| ORBCOMM, Inc. | 2.7 |
| Cloudera, Inc. | 2.5 |
| Total | 40.5% |
| Top Investments Sold Short | % of
Net Assets |
| Analog Devices, Inc. | -5.6% |
| Advanced Micro Devices, Inc. | -5.4 |
| Apollo Global Management, Inc. | -5.1 |
| S&P Global, Inc. | -4.0 |
| Independent Bank Corp. | -2.1 |
| Herman Miller, Inc. | -0.0* |
| ICON PLC | -0.0* |
| Total | -22.2% |
| * | Amount is less than 0.1%. |
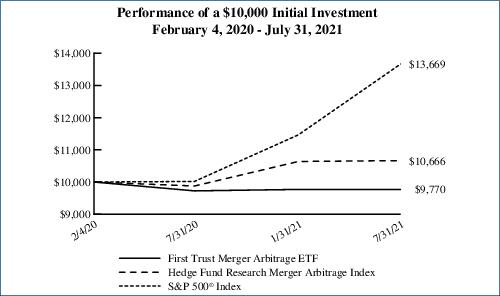
Performance figures assume reinvestment of all distributions and do not reflect the deduction of taxes that a shareholder would pay on Fund distributions or the redemption or sale of Fund shares. An index is a statistical composite that tracks a specified financial market or sector. Unlike the Fund, the indices do not actually hold a portfolio of securities and therefore do not incur the expenses incurred by the Fund. These expenses negatively impact the performance of the Fund. The Fund’s past performance does not predict future performance.
Frequency Distribution of Discounts and Premiums
Information showing the number of days the market price of the Fund’s shares was greater (at a premium) and less (at a discount) than the Fund’s net asset value for the most recently completed year, and the most recently completed calendar quarters since that year (or life of the Fund, if shorter), is available at https://www.ftportfolios.com/Retail/etf/home.aspx.
Portfolio Commentary
First Trust Merger Arbitrage ETF (MARB)
Annual Report
July 31, 2021 (Unaudited)
Advisor
First Trust Advisors L.P. (“First Trust”) serves as the investment advisor to the First Trust Merger Arbitrage ETF (the “Fund” or “MARB”). First Trust is responsible for the ongoing monitoring of the Fund’s investment portfolio, managing the Fund’s business affairs and providing certain administrative services necessary for the management of the Fund.
Sub-Advisor
Vivaldi Asset Management, LLC
Vivaldi Asset Management, LLC (“Vivaldi” or the “Sub-Advisor”) serves as the Fund’s investment sub-advisor. Vivaldi is an SEC registered investment advisor, founded in 2013 and headquartered in Chicago, Illinois, that specializes in structuring and managing alternative investment, multi-manager, and multi-strategy mutual funds. Vivaldi prides itself on its ability to combine rigorous research and risk management processes with disciplined portfolio construction and management.
Portfolio Management Team
Michael Peck – CFA, President and Co-Chief Investment Officer, Vivaldi
Scott Hergott – Co-Chief Investment Officer, Vivaldi
Brian Murphy – Portfolio Manager, Vivaldi
Jeff O’Brien – Portfolio Manager, Vivaldi
Daniel Lancz – Portfolio Manager, Vivaldi
Michael Grayson – Portfolio Manager, Vivaldi
The portfolio managers are primarily and jointly responsible for the day to day management of the Fund. Each portfolio manager has served in such capacity for the Fund since 2020.
Commentary
Market Recap
The broader mergers and acquisitions (“M&A”) market has been quite eventful against the backdrop of a global health crisis. As has been the case since the onset of the coronavirus (“COVID-19”) pandemic, we continue to hope for a rapid end to the pandemic. We look forward with the hope that everyone’s life can begin to approximate something more “normal” in the quarters to come.
On the investment front, global M&A activity set a record during the first quarter of 2021 as deal makers started to anticipate a post-COVID-19 world. A booming stock market and low interest rates have emboldened strategic buyers, private equity firms, as well as blank check acquisition companies to aggressively pursue deals. Colin Ryan, co-head of Americas M&A at Goldman Sachs, commented that “This is as robust and broad-based an M&A market as I have ever witnessed in the last 20 years. We are in an environment where assets are scarcer than the available capital right now.” In our opinion, acquirors are positioning for how people live, work, and transact business in a post-pandemic environment as well as positioning for new growth in technology and areas like cloud computing and artificial intelligence. We expect this to continue as the U.S. vaccination program seems to be leading the industrialized world forward. We have also seen a number of deals receive unsolicited bids from would-be third party acquirors. Assets are trading, and, in our view, the expectation of a post-pandemic recovery had some trying to buy assets on the cheap, and had other acquirors saying, “not so fast.” The average deal size in the first quarter of 2021 was $6.8 billion, up from $4.6 billion in the fourth quarter of 2020. We do expect this number to drop as merger activity broadens out to include more small and mid-cap companies as the year progresses. This will be very welcome and provide more potential shots on goal for our arbitrage portfolio as the arbitrage universe broadens out. We finished March 2021 with fourteen merger arbitrage investments and would not be surprised to see this number expand to the mid-twenties or higher later this year. Arbitrage spreads have been attractive with the highest quality transactions trading in the range of 4-5% (gross) annualized. This is a critical metric in our evaluation of the opportunity set given merger arbitrage is an investment strategy that capitalizes on the arbitrage spread that exists between a company’s current share price and the consideration paid for its acquisition in the context of an announced merger transaction. The merger yield is the estimated annualized return provided by the merger spread. To calculate this figure, we take the current net spread as represented by the percent discount the target stock is trading at compared to the consideration offered and annualize it. The net spread is calculated as the gross spread adjusted for various items such as dividends, commissions and short borrow costs. The arbitrage spread is one of the main determinants when evaluating whether to allocate capital to a merger arbitrage investment. Finally, no transaction experienced a price cut or deal break during the first quarter of 2021. We believe this speaks well of the quality of mergers that have been announced in the last six months as well as to the improving fundamentals of the U.S. economy.
The merger arbitrage deal flow train began to pick up momentum in the second quarter of 2021 and throughout July and August month-to-date. There were 38 deal announcements for a total equity value of $167 billion in the second quarter of 2021. For historical context, the second quarter of 2021 deal activity was 12% above the average quarterly deal count and 10% above the average quarterly
Portfolio Commentary (Continued)
First Trust Merger Arbitrage ETF (MARB)
Annual Report
July 31, 2021 (Unaudited)
deal value since the first quarter of 1998. The top ten definitive deals accounted for 70% of all definitive deals announced in the second quarter of 2021. With that said, the average deal value decreased in the second quarter of 2021 to $4.4 billion from $6.8 billion in the first quarter of 2021, remaining approximately aligned with the $4.5 billion quarterly average since the first quarter of 1998. The most notable difference in recent deal activity was that sector balance in the first half of 2021 improved relative to 2020 as much as the sector distribution was relatively unbalanced by historical norms. In the first half of 2021, industrial (by deal value) and financial (by deal count) were the most active sectors. All told, announced value in the first half of 2021 totaled $369 billion (82 deals), 211% greater than the $118 billion level (30 deals) in the first half of 2020.
We added sixteen new transactions into the portfolio during the month of May as well as seven new deals in June, and we are currently researching a handful of others for possible future investment. As we enter the latter summer months, historically a slower time of the year for announced merger transactions, the current environment feels like we may buck the “summer sleepy trend.” It has been exciting to see the continued rebound and overall health of the M&A market year-to-date and it seems we may be seeing more of it. Acquisition-hungry buyers have announced $2.5 trillion of deals so far in 2021, an unprecedented number that puts this year on track to be the best ever.
Performance Review
The Fund has returned 0.46% over the 12-month period ended July 31, 2021. That compares to the following indices over the same time frame: the S&P 500® Index (36.45%); the Russell 2000® Index (51.57%); and the Bloomberg Barclays US Aggregate Bond Index (-0.70%).
Recent months have been a relatively challenging period for our merger arbitrage focused strategy, which we suspect was experienced industry wide. We witnessed multiple effective deal breaks across the universe of mergers, an infrequent occurrence in the historical context of our M&A experience. We held one of those aforementioned deal breaks in our portfolio: Aon’s (“AON”) acquisition of Willis Towers Watson PLC (“WLTW”). WLTW/AON was responsible for a -0.49% (realized) loss over its holding period. It is worth mentioning, however, that we did proactively exit our position prior to the parties’ agreement to terminate the merger and end antitrust litigation with the Department of Justice. It is our willingness to take small losses in broken deals that we believe will enable us to mitigate large drawdowns, preserve capital during volatile M&A markets, and subsequently recover to new equity highs.
A bit more on deals that broke and/or widened which we did not own. Spire Healthcare and S Immo AG broke this year, and Kansas City Southern widened materially during the trailing one-year period ended July 31, 2021. We avoided those deals for our portfolio. We are encouraged by the fact that, notwithstanding so many negative events at once, the overall Fund gained a modest 0.46% due to our stringent deal selection and the high conviction nature of our portfolio construction. On the positive side of the ledger, the portfolio experienced several contributors during the period, to name a few: FBL Financial Group, Inc./Farm Bureau Property & Casualty Insurance Company attributed 0.49%; Slack Technologies, Inc./salesforce.com, Inc. attributed 0.19%; and RealPage, Inc./Thoma Bravo attributed 0.15%. Other attribution for the trailing one-year period ended July 31, 2021 was fairly well balanced as we had moderate spread tightening across the portfolio with no outsized position gains or losses.
Market Outlook
With the current combination of historic low interest rates, equity valuations near all-time highs and animal spirits in the boardrooms for strategic M&A, we believe the backdrop is in place for a continuation of new deal activity, which should lead us to a much busier than normal summer and continued momentum for the rest of the year.
At a recent conference on M&A, Goldman Sachs President and COO John Waldron commented that “We are seeing rising CEO confidence… By many measures, CEO confidence is at the highest level it has been since the early 2000s. So, you are seeing a real increased conviction in CEO offices and in boardrooms to be more offensive thinking about providing M&A as a key part of their overall strategy. Strategic thinking coming out of this pandemic is at very high levels right now.” As merger arbitrageurs that is about as good a peek under the tent as it gets from the bankers who see the activity behind the scenes.
Also commenting on the level of activity is Eric Swedenburg, partner and co-head of the M&A practice at the law firm Simpson Thacher & Bartlett. Swedenburg said, “It’s as busy as I can ever remember it. The market is humming on the M&A front across nearly every sector. I think the rest of this year will continue to be as busy, if not busier.”
As you can tell, we are excited about the increased activity in our merger arbitrage universe. We pride ourselves on opportunistically investing in the best risk-adjusted returns within our investable universe and are elated at how many opportunities we are currently finding.
First Trust Merger Arbitrage ETF (MARB)
Understanding Your Fund Expenses
July 31, 2021 (Unaudited)
As a shareholder of the First Trust Merger Arbitrage ETF (the “Fund”), you incur two types of costs: (1) transaction costs; and (2) ongoing costs, including management fees, distribution and/or service (12b-1) fees, if any, and other Fund expenses. This Example is intended to help you understand your ongoing costs of investing in the Fund and to compare these costs with the ongoing costs of investing in other funds.
The Example is based on an investment of $1,000 invested at the beginning of the period and held through the six-month period ended July 31, 2021.
Actual Expenses
The first line in the following table provides information about actual account values and actual expenses. You may use the information in this line, together with the amount you invested, to estimate the expenses that you paid over the period. Simply divide your account value by $1,000 (for example, an $8,600 account value divided by $1,000 = 8.6), then multiply the result by the number in the first line under the heading entitled “Expenses Paid During the Six-Month Period” to estimate the expenses you paid on your account during this six-month period.
Hypothetical Example for Comparison Purposes
The second line in the following table provides information about hypothetical account values and hypothetical expenses based on the Fund’s actual expense ratio and an assumed rate of return of 5% per year before expenses, which is not the Fund’s actual return. The hypothetical account values and expenses may not be used to estimate the actual ending account balance or expenses you paid for the period. You may use this information to compare the ongoing costs of investing in the Fund and other funds. To do so, compare this 5% hypothetical example with the 5% hypothetical examples that appear in the shareholder reports of the other funds.
Please note that the expenses shown in the table are meant to highlight your ongoing costs only and do not reflect any transactional costs such as brokerage commissions. Therefore, the second line in the table is useful in comparing ongoing costs only, and will not help you determine the relative total costs of owning different funds. In addition, if these transactional costs were included, your costs would have been higher.
| | Beginning
Account Value
February 1, 2021 | Ending
Account Value
July 31, 2021 | Annualized
Expense Ratio
Based on the
Six-Month
Period | Expenses Paid
During the
Six-Month
Period (a) |
| First Trust Merger Arbitrage ETF (MARB) |
| Actual | $1,000.00 | $1,000.00 | 2.28% | $11.31 |
| Hypothetical (5% return before expenses) | $1,000.00 | $1,013.49 | 2.28% | $11.38 |
| (a) | Expenses are equal to the annualized expense ratios as indicated in the table multiplied by the average account value over the period (February 1, 2021 through July 31, 2021), multiplied by 181/365 (to reflect the six-month period). |
First Trust Merger Arbitrage ETF (MARB)
Portfolio of Investments
July 31, 2021
| Shares | | Description | | Value |
| COMMON STOCKS – 53.8% |
| | | Aerospace & Defense – 2.5% | | |
| 5,776 | | Aerojet Rocketdyne Holdings, Inc. (a) | | $272,512 |
| | | Chemicals – 2.3% | | |
| 3,476 | | W.R. Grace & Co. | | 241,930 |
| | | Diversified Telecommunication
Services – 2.7% | | |
| 25,190 | | ORBCOMM, Inc. (b) | | 284,395 |
| | | Electric Utilities – 3.4% | | |
| 7,651 | | PNM Resources, Inc. (a) | | 369,773 |
| | | Health Care Providers &
Services – 3.7% | | |
| 4,174 | | Magellan Health, Inc. (b) | | 393,692 |
| | | Health Care Technology – 2.1% | | |
| 10,300 | | Change Healthcare, Inc. (b) | | 223,613 |
| | | Insurance – 4.9% | | |
| 8,225 | | Athene Holding Ltd., Class A (a) (b) | | 531,499 |
| | | Life Sciences Tools &
Services – 2.5% | | |
| 5,891 | | PPD, Inc. (a) (b) | | 271,693 |
| | | Professional Services – 3.8% | | |
| 3,491 | | IHS Markit Ltd. | | 407,888 |
| | | Semiconductors &
Semiconductor Equipment – 9.7% | | |
| 5,667 | | Maxim Integrated Products, Inc. | | 566,190 |
| 3,197 | | Xilinx, Inc. (a) | | 479,038 |
| | | | | 1,045,228 |
| | | Software – 12.3% | | |
| 17,237 | | Cloudera, Inc. (b) | | 273,551 |
| 12,358 | | Nuance Communications, Inc. (a) (b) | | 678,455 |
| 2,129 | | Proofpoint, Inc. (b) | | 371,851 |
| 12 | | salesforce.com, Inc. (b) | | 2,903 |
| | | | | 1,326,760 |
| | | Specialty Retail – 1.8% | | |
| 11,066 | | Sportsman’s Warehouse Holdings, Inc. (b) | | 195,536 |
| | | Thrifts & Mortgage Finance – 2.1% | | |
| 11,575 | | Meridian Bancorp, Inc. | | 221,198 |
| | | Total Investments – 53.8% | | 5,785,717 |
| | | (Cost $5,791,713) (c) | | |
| Shares | | Description | | Value |
| COMMON STOCKS SOLD SHORT – (22.2)% |
| | | Banks – (2.1)% | | |
| (3,175) | | Independent Bank Corp. | | $(224,409) |
| | | Capital Markets – (9.1)% | | |
| (9,388) | | Apollo Global Management, Inc. | | (552,577) |
| (990) | | S&P Global, Inc. | | (424,433) |
| | | | | (977,010) |
| | | Commercial Services &
Supplies – (0.0)% | | |
| (48) | | Herman Miller, Inc. | | (2,071) |
| | | Life Sciences Tools &
Services – (0.0)% | | |
| (6) | | ICON PLC (b) | | (1,460) |
| | | Semiconductors &
Semiconductor Equipment – (11.0)% | | |
| (5,520) | | Advanced Micro Devices, Inc. (b) | | (586,169) |
| (3,577) | | Analog Devices, Inc. | | (598,861) |
| | | | | (1,185,030) |
| | | Total Investments Sold Short – (22.2)% | | (2,389,980) |
| | | (Proceeds $2,195,264) | | |
| | | Net Other Assets and Liabilities – 68.4% | | 7,356,694 |
| | | Net Assets – 100.0% | | $10,752,431 |
|
| (a) | This security or a portion of this security is segregated as collateral for investments sold short. |
| (b) | Non-income producing security. |
| (c) | Aggregate cost for federal income tax purposes was $3,598,146. As of July 31, 2021, the aggregate gross unrealized appreciation for all investments in which there was an excess of value over tax cost was $61,277 and the aggregate gross unrealized depreciation for all investments in which there was an excess of tax cost over value was $263,686. The net unrealized depreciation was $202,409. |
See Notes to Financial Statements
Page 7
First Trust Merger Arbitrage ETF (MARB)
Portfolio of Investments (Continued)
July 31, 2021
Valuation Inputs
A summary of the inputs used to value the Fund’s investments as of July 31, 2021 is as follows (see Note 2A - Portfolio Valuation in the Notes to Financial Statements):
| ASSETS TABLE |
| | Total
Value at
7/31/2021 | Level 1
Quoted
Prices | Level 2
Significant
Observable
Inputs | Level 3
Significant
Unobservable
Inputs |
| Common Stocks* | $ 5,785,717 | $ 5,785,717 | $ — | $ — |
| LIABILITIES TABLE |
| | Total
Value at
7/31/2021 | Level 1
Quoted
Prices | Level 2
Significant
Observable
Inputs | Level 3
Significant
Unobservable
Inputs |
| Common Stocks Sold Short* | $ (2,389,980) | $ (2,389,980) | $ — | $ — |
| * | See Portfolio of Investments for industry breakout. |
Page 8
See Notes to Financial Statements
First Trust Merger Arbitrage ETF (MARB)
Statement of Assets and Liabilities
July 31, 2021
| ASSETS: | |
Investments, at value
(Cost $5,791,713)
| $ 5,785,717 |
Cash
| 3,210,044 |
Restricted Cash
| 3,545,596 |
| Receivables: | |
Investment securities sold
| 612,546 |
Dividends
| 698 |
Total Assets
| 13,154,601 |
| LIABILITIES: | |
Investments sold short, at value (proceeds $2,195,264)
| 2,389,980 |
| Payables: | |
Investment advisory fees
| 11,458 |
Margin interest expense
| 732 |
Total Liabilities
| 2,402,170 |
NET ASSETS
| $10,752,431 |
| NET ASSETS consist of: | |
Paid-in capital
| $ 11,299,154 |
Par value
| 5,500 |
Accumulated distributable earnings (loss)
| (552,223) |
NET ASSETS
| $10,752,431 |
NET ASSET VALUE, per share
| $19.55 |
Number of shares outstanding (unlimited number of shares authorized, par value $0.01 per share)
| 550,002 |
See Notes to Financial Statements
Page 9
First Trust Merger Arbitrage ETF (MARB)
Statement of Operations
For the Year Ended July 31, 2021
| INVESTMENT INCOME: | |
Dividends
| $ 133,777 |
Interest
| 148 |
Other
| 1,136 |
Total investment income
| 135,061 |
| EXPENSES: | |
Investment advisory fees
| 156,595 |
Dividend expense on investments sold short
| 110,928 |
Margin interest expense
| 11,513 |
Total expenses
| 279,036 |
NET INVESTMENT INCOME (LOSS)
| (143,975) |
| NET REALIZED AND UNREALIZED GAIN (LOSS): | |
| Net realized gain (loss) on: | |
Investments
| 139,627 |
In-kind redemptions
| 697,865 |
Investments sold short
| (423,010) |
Net realized gain (loss)
| 414,482 |
| Net change in unrealized appreciation (depreciation) on: | |
Investments
| (11,843) |
Investments sold short
| (162,599) |
Net change in unrealized appreciation (depreciation)
| (174,442) |
NET REALIZED AND UNREALIZED GAIN (LOSS)
| 240,040 |
NET INCREASE (DECREASE) IN NET ASSETS RESULTING FROM OPERATIONS
| $ 96,065 |
Page 10
See Notes to Financial Statements
First Trust Merger Arbitrage ETF (MARB)
Statements of Changes in Net Assets
| | Year
Ended
7/31/2021 | | Period
Ended
7/31/2020 (a) |
| OPERATIONS: | | | |
Net investment income (loss)
| $ (143,975) | | $ (46,812) |
Net realized gain (loss)
| 414,482 | | 49,574 |
Net change in unrealized appreciation (depreciation)
| (174,442) | | (26,270) |
Net increase (decrease) in net assets resulting from operations
| 96,065 | | (23,508) |
| SHAREHOLDER TRANSACTIONS: | | | |
Proceeds from shares sold
| 21,654,151 | | 14,621,923 |
Cost of shares redeemed
| (23,646,537) | | (1,949,663) |
Net increase (decrease) in net assets resulting from shareholder transactions
| (1,992,386) | | 12,672,260 |
Total increase (decrease) in net assets
| (1,896,321) | | 12,648,752 |
| NET ASSETS: | | | |
Beginning of period
| 12,648,752 | | — |
End of period
| $10,752,431 | | $12,648,752 |
| CHANGES IN SHARES OUTSTANDING: | | | |
Shares outstanding, beginning of period
| 650,002 | | — |
Shares sold
| 1,100,000 | | 750,002 |
Shares redeemed
| (1,200,000) | | (100,000) |
Shares outstanding, end of period
| 550,002 | | 650,002 |
| (a) | Inception date is February 4, 2020, which is consistent with the commencement of investment operations and is the date the initial creation units were established. |
See Notes to Financial Statements
Page 11
First Trust Merger Arbitrage ETF (MARB)
Financial Highlights
For a share outstanding throughout each period
| | Year Ended
7/31/2021 | | Period
Ended
7/31/2020 (a) |
Net asset value, beginning of period
| $ 19.46 | | $ 20.01 |
| Income from investment operations: | | | |
Net investment income (loss)
| (0.26) | | (0.07) |
Net realized and unrealized gain (loss)
| 0.35 | | (0.48) |
Total from investment operations
| 0.09 | | (0.55) |
Net asset value, end of period
| $19.55 | | $19.46 |
Total return (b)
| 0.46% | | (2.75)% |
| Ratios to average net assets/supplemental data: | | | |
Net assets, end of period (in 000’s)
| $ 10,752 | | $ 12,649 |
Ratio of total expenses to average net assets
| 2.23% | | 2.30% (c) |
Ratio of total expenses to average net assets excluding dividend expense and margin interest expense
| 1.25% | | 1.25% (c) |
Ratio of net investment income (loss) to average net assets
| (1.15)% | | (1.71)% (c) |
Portfolio turnover rate (d)
| 280% | | 137% |
| (a) | Inception date is February 4, 2020, which is consistent with the commencement of investment operations and is the date the initial creation units were established. |
| (b) | Total return is calculated assuming an initial investment made at the net asset value at the beginning of the period, reinvestment of all distributions at net asset value during the period, and redemption at net asset value on the last day of the period. The returns presented do not reflect the deduction of taxes that a shareholder would pay on Fund distributions or the redemption or sale of Fund shares. Total return is calculated for the time period presented and is not annualized for periods of less than a year. |
| (c) | Annualized. |
| (d) | Portfolio turnover is calculated for the time period presented and is not annualized for periods of less than a year and does not include securities received or delivered from processing creations or redemptions and in-kind transactions. |
Notes to Financial Statements
First Trust Merger Arbitrage ETF (MARB)
July 31, 2021
1. Organization
First Trust Exchange-Traded Fund III (the “Trust”) is an open-end management investment company organized as a Massachusetts business trust on January 9, 2008, and is registered with the Securities and Exchange Commission under the Investment Company Act of 1940, as amended (the “1940 Act”).
The Trust currently consists of eighteen funds that are offering shares. This report covers the First Trust Merger Arbitrage ETF (the “Fund”), a non-diversified series of the Trust, which trades under the ticker “MARB” on NYSE Arca, Inc. The Fund represents a separate series of beneficial interest in the Trust. Unlike conventional mutual funds, the Fund issues and redeems shares on a continuous basis, at net asset value (“NAV”), only in large blocks of shares known as “Creation Units.”
The Fund is an actively managed exchange-traded fund. The investment objective of the Fund is to seek to provide investors with capital appreciation. Under normal market conditions, the Fund seeks to achieve its investment objective by establishing long and short positions in the equity securities of companies that are involved in a publicly-announced significant corporate event, such as a merger or acquisition. The Fund’s portfolio may include equity securities issued by U.S. and non-U.S. companies, including American Depositary Receipts, and derivatives, including total return swaps. The Fund may invest in securities issued by small, mid and large capitalization issuers.
2. Significant Accounting Policies
The Fund is considered an investment company and follows accounting and reporting guidance under Financial Accounting Standards Board Accounting Standards Codification Topic 946, “Financial Services-Investment Companies.” The following is a summary of significant accounting policies consistently followed by the Fund in the preparation of the financial statements. The preparation of the financial statements in accordance with accounting principles generally accepted in the United States of America (“U.S. GAAP”) requires management to make estimates and assumptions that affect the reported amounts and disclosures in the financial statements. Actual results could differ from those estimates.
A. Portfolio Valuation
The Fund’s NAV is determined daily as of the close of regular trading on the New York Stock Exchange (“NYSE”), normally 4:00 p.m. Eastern time, on each day the NYSE is open for trading. If the NYSE closes early on a valuation day, the NAV is determined as of that time. Foreign securities are priced using data reflecting the earlier closing of the principal markets for those securities. The Fund’s NAV is calculated by dividing the value of all assets of the Fund (including accrued interest and dividends), less all liabilities (including accrued expenses and dividends declared but unpaid), by the total number of shares outstanding.
The Fund’s investments are valued daily at market value or, in the absence of market value with respect to any portfolio securities, at fair value. Market value prices represent last sale or official closing prices from a national or foreign exchange (i.e., a regulated market) and are primarily obtained from third-party pricing services. Fair value prices represent any prices not considered market value prices and are either obtained from a third-party pricing service or are determined by the Pricing Committee of the Fund’s investment advisor, First Trust Advisors L.P. (“First Trust” or the “Advisor”), in accordance with valuation procedures adopted by the Trust’s Board of Trustees, and in accordance with provisions of the 1940 Act. Investments valued by the Advisor’s Pricing Committee, if any, are footnoted as such in the footnotes to the Portfolio of Investments. The Fund’s investments are valued as follows:
Common stocks and other equity securities listed on any national or foreign exchange (excluding Nasdaq and the London Stock Exchange Alternative Investment Market (“AIM”)) are valued at the last sale price on the exchange on which they are principally traded or, for Nasdaq and AIM securities, the official closing price. Securities traded on more than one securities exchange are valued at the last sale price or official closing price, as applicable, at the close of the securities exchange representing the principal market for such securities.
Securities traded in an over-the-counter market are fair valued at the mean of their most recent bid and asked price, if available, and otherwise at their closing bid price.
Certain securities may not be able to be priced by pre-established pricing methods. Such securities may be valued by the Trust’s Board of Trustees or its delegate, the Advisor’s Pricing Committee, at fair value. These securities generally include, but are not limited to, restricted securities (securities which may not be publicly sold without registration under the Securities Act of 1933, as amended) for which a third-party pricing service is unable to provide a market price; securities whose trading has been formally suspended; a security whose market or fair value price is not available from a pre-established pricing source; a security with respect to which an event has occurred that is likely to materially affect the value of the security after the market has closed but before the calculation of the Fund’s NAV or make it difficult or impossible to obtain a reliable market quotation; and a security whose price, as provided by the third-party pricing service, does not reflect the security’s fair value. As a general principle, the current fair value of a security would appear to be the amount which the owner might reasonably expect to receive for the security upon its current sale. When fair value
Notes to Financial Statements (Continued)
First Trust Merger Arbitrage ETF (MARB)
July 31, 2021
prices are used, generally they will differ from market quotations or official closing prices on the applicable exchanges. A variety of factors may be considered in determining the fair value of such securities, including, but not limited to, the following:
| 1) | the type of security; |
| 2) | the size of the holding; |
| 3) | the initial cost of the security; |
| 4) | transactions in comparable securities; |
| 5) | price quotes from dealers and/or third-party pricing services; |
| 6) | relationships among various securities; |
| 7) | information obtained by contacting the issuer, analysts, or the appropriate stock exchange; |
| 8) | an analysis of the issuer’s financial statements; and |
| 9) | the existence of merger proposals or tender offers that might affect the value of the security. |
The Fund is subject to fair value accounting standards that define fair value, establish the framework for measuring fair value and provide a three-level hierarchy for fair valuation based upon the inputs to the valuation as of the measurement date. The three levels of the fair value hierarchy are as follows:
| • | Level 1 – Level 1 inputs are quoted prices in active markets for identical investments. An active market is a market in which transactions for the investment occur with sufficient frequency and volume to provide pricing information on an ongoing basis. |
| • | Level 2 – Level 2 inputs are observable inputs, either directly or indirectly, and include the following: |
| o | Quoted prices for similar investments in active markets. |
| o | Quoted prices for identical or similar investments in markets that are non-active. A non-active market is a market where there are few transactions for the investment, the prices are not current, or price quotations vary substantially either over time or among market makers, or in which little information is released publicly. |
| o | Inputs other than quoted prices that are observable for the investment (for example, interest rates and yield curves observable at commonly quoted intervals, volatilities, prepayment speeds, loss severities, credit risks, and default rates). |
| o | Inputs that are derived principally from or corroborated by observable market data by correlation or other means. |
| • | Level 3 – Level 3 inputs are unobservable inputs. Unobservable inputs may reflect the reporting entity’s own assumptions about the assumptions that market participants would use in pricing the investment. |
The inputs or methodologies used for valuing investments are not necessarily an indication of the risk associated with investing in those investments. A summary of the inputs used to value the Fund’s investments as of July 31, 2021, is included with the Fund’s Portfolio of Investments.
B. Securities Transactions and Investment Income
Securities transactions are recorded as of the trade date. Realized gains and losses from securities transactions are recorded on the identified cost basis. Dividend income is recorded on the ex-dividend date. Interest income, if any, is recorded daily on the accrual basis.
Distributions received from the Fund’s investments in real estate investment trusts (“REITs”) may be comprised of return of capital, capital gains, and income. The actual character of the amounts received during the year are not known until after the REITs’ fiscal year end. The Fund records the character of distributions received from the REITs during the year based on estimates available. The characterization of distributions received by the Fund may be subsequently revised based on information received from the REITs after their tax reporting periods conclude.
C. Short Sales
Short sales are utilized for investment and risk management purposes and are transactions in which securities or other instruments (such as options, forwards, futures or other derivative contracts) are sold by the Fund, but are not currently owned in the Fund’s portfolio. When the Fund engages in a short sale, the Fund must borrow the security sold short and deliver the security to the counterparty. Short selling allows the Fund to profit from a decline in a market price to the extent such decline exceeds the transaction costs and the costs of borrowing the securities. The Fund will pay a fee or premium to borrow the securities sold short and is obligated to repay the lenders of the securities. Any dividends or interest that accrues on the securities during the period of the loan are due to the lenders. A gain, limited to the price at which the security was sold short, or a loss, unlimited in size, will be recognized upon the termination of the short sale; which is affected by the Fund purchasing the security sold short and delivering the security to the lender.
Notes to Financial Statements (Continued)
First Trust Merger Arbitrage ETF (MARB)
July 31, 2021
Any such gain or loss may be offset, completely or in part, by the change in the value of the long portion of the Fund’s portfolio. The Fund is subject to the risk that it may be unable to reacquire a security to terminate a short position except at a price substantially in excess of the last quoted price. Also, there is the risk that the counterparty to a short sale may fail to honor its contractual terms, causing a loss to the Fund.
The Fund has established an account with BNP Paribas Prime Brokerage International, Ltd. for the purpose of borrowing securities that the Fund intends to sell short. The Fund is charged interest on debit margin balances at a rate equal to 1-Month LIBOR plus 75 basis points. With regard to securities held short, the Fund is credited a rebate equal to the market value of its short positions at a rate equal to the Overnight Bank Funding Rate less 35 basis points. This rebate rate applies to easy to borrow securities. Securities that are hard to borrow may earn a rebate that is less than the foregoing or may be subject to a premium charge on a security by security basis. The different rebate rate is determined at the time of a short sale request. For the fiscal year ended July 31, 2021, the Fund had margin interest expense of $11,513, as shown on the Statement of Operations. Restricted cash in the amount of $3,545,596, as shown on the Statement of Assets and Liabilities, is associated with collateral at the broker as of July 31, 2021.
D. Dividends and Distributions to Shareholders
Dividends from net investment income, if any, are declared and paid quarterly by the Fund, or as the Board of Trustees may determine from time to time. Distributions of net realized capital gains earned by the Fund, if any, are distributed at least annually.
Distributions from net investment income and realized capital gains are determined in accordance with federal income tax regulations, which may differ from U.S. GAAP. Certain capital accounts in the financial statements are periodically adjusted for permanent differences in order to reflect their tax character. These permanent differences are primarily due to the varying treatment of income and gain/loss on portfolio securities held by the Fund and have no impact on net assets or NAV per share. Temporary differences, which arise from recognizing certain items of income, expense and gain/loss in different periods for financial statement and tax purposes, will reverse at some time in the future.
During the fiscal periods ended July 31, 2021 and 2020, no distributions were paid by the Fund.
As of July 31, 2021, the components of distributable earnings on a tax basis were as follows:
Undistributed ordinary income
| $— |
Accumulated capital and other gain (loss)
| (349,814) |
Net unrealized appreciation (depreciation)
| (202,409) |
E. Income Taxes
The Fund intends to continue to qualify as a regulated investment company by complying with the requirements under Subchapter M of the Internal Revenue Code of 1986, as amended, which includes distributing substantially all of its net investment income and net realized gains to shareholders. Accordingly, no provision has been made for federal and state income taxes. However, due to the timing and amount of distributions, the Fund may be subject to an excise tax of 4% of the amount by which approximately 98% of the Fund’s taxable income exceeds the distributions from such taxable income for the calendar year.
The Fund is subject to accounting standards that establish a minimum threshold for recognizing, and a system for measuring, the benefits of a tax position taken or expected to be taken in a tax return. The taxable periods ended 2020 and 2021 remain open to federal and state audit. As of July 31, 2021, management has evaluated the application of these standards to the Fund and has determined that no provision for income tax is required in the Fund’s financial statements for uncertain tax positions.
The Fund intends to utilize provisions of the federal income tax laws, which allow it to carry a realized capital loss forward indefinitely following the year of the loss and offset such loss against any future realized capital gains. The Fund is subject to certain limitations under U.S. tax rules on the use of capital loss carryforwards and net unrealized built-in losses. These limitations apply when there has been a 50% change in ownership. At July 31, 2021, for federal income tax purposes, the Fund had $302,118 of capital loss carryforward available, to the extent provided by regulations, to offset future capital gains.
Certain losses realized during the current fiscal year may be deferred and treated as occurring on the first day of the following fiscal year for federal income tax purposes. For the fiscal year ended July 31, 2021, the Fund incurred and elected to defer net ordinary losses of $47,696.
In order to present paid-in capital and accumulated distributable earnings (loss) (which consists of accumulated net investment income (loss), accumulated net realized gain (loss) on investments and net unrealized appreciation (depreciation) on investments) on the Statement of Assets and Liabilities that more closely represent their tax character, certain adjustments have been made to paid-in capital, accumulated net investment income (loss) and accumulated net realized gain (loss) on investments. These adjustments are
Notes to Financial Statements (Continued)
First Trust Merger Arbitrage ETF (MARB)
July 31, 2021
primarily due to the difference between book and tax treatments of income and gains on various investment securities held by the Fund and in-kind transactions. The results of operations and net assets were not affected by these adjustments. For the fiscal year ended July 31, 2021, the adjustments for the Fund were as follows:
Accumulated
Net Investment
Income (Loss) | | Accumulated
Net Realized
Gain (Loss)
on Investments | | Paid-in
Capital |
| $96,279 | | $(686,980) | | $590,701 |
F. Expenses
Expenses, other than the investment advisory fee, dividend and interest expenses on investments sold short and other excluded expenses, are paid by the Advisor (See Note 3).
3. Investment Advisory Fee, Affiliated Transactions and Other Fee Arrangements
First Trust, the investment advisor to the Fund, is a limited partnership with one limited partner, Grace Partners of DuPage L.P., and one general partner, The Charger Corporation. The Charger Corporation is an Illinois corporation controlled by James A. Bowen, Chief Executive Officer of First Trust. First Trust is responsible for supervising the selection and ongoing monitoring of the securities in the Fund’s portfolio, managing the Fund’s business affairs and providing certain administrative services necessary for the management of the Fund.
Pursuant to an investment management agreement between First Trust and the Trust, on behalf of the Fund (the “Investment Management Agreement”), First Trust oversees Vivaldi Asset Management, LLC’s (“Vivaldi” or the “Sub-Advisor”) management of the Fund’s assets. First Trust is paid an annual unitary management fee by the Fund equal to 1.25% of the Fund’s average daily net assets and is responsible for the expenses of the Fund including the cost of transfer agency, custody, fund administration, legal, audit and other services, but excluding fee payments under the Investment Management Agreement, interest, taxes, acquired fund fees and expenses, if any, brokerage commissions and other expenses connected with the execution of portfolio transactions, expenses associated with short sales transactions, distribution and service fees pursuant to a Rule 12b-1 plan, if any, and extraordinary expenses. First Trust also provides fund reporting services to the Fund for a flat annual fee in the amount of $9,250, which is covered under the annual unitary management fee.
Vivaldi receives sub-advisory fees equal to the annual rate of 0.625% of the average daily net assets of the Fund less the amount of Fund expenses owed by the Sub-Advisor. The Sub-Advisor’s fees are paid by the Advisor out of the Advisor’s management fee.
The Trust has multiple service agreements with Brown Brothers Harriman & Co. (“BBH”). Under the service agreements, BBH performs custodial, fund accounting, certain administrative services, and transfer agency services for the Fund. As custodian, BBH is responsible for custody of the Fund’s assets. As fund accountant and administrator, BBH is responsible for maintaining the books and records of the Fund’s securities and cash. As transfer agent, BBH is responsible for maintaining shareholder records for the Fund.
Each Trustee who is not an officer or employee of First Trust, any sub-advisor or any of their affiliates (“Independent Trustees”) is paid a fixed annual retainer that is allocated equally among each fund in the First Trust Fund Complex. Each Independent Trustee is also paid an annual per fund fee that varies based on whether the fund is a closed-end or other actively managed fund, a defined-outcome fund or an index fund.
Additionally, the Lead Independent Trustee and the Chairmen of the Audit Committee, Nominating and Governance Committee and Valuation Committee are paid annual fees to serve in such capacities, with such compensation allocated pro rata among each fund in the First Trust Fund Complex based on net assets. Independent Trustees are reimbursed for travel and out-of-pocket expenses in connection with all meetings. The Lead Independent Trustee and Committee Chairmen rotate every three years. The officers and “Interested” Trustee receive no compensation from the Trust for acting in such capacities.
4. Purchases and Sales of Securities
For the fiscal year ended July 31, 2021, the cost of purchases and proceeds from sales of investments, excluding short term investments, investments sold short and in-kind transactions were $30,051,009 and $25,208,227, respectively. The cost of purchases to cover short sales and the proceeds of short sales were $11,835,389 and $11,119,456, respectively.
For the fiscal year ended July 31, 2021, the cost of in-kind purchases and proceeds from in-kind sales were $9,360,693 and $16,580,348, respectively.
Notes to Financial Statements (Continued)
First Trust Merger Arbitrage ETF (MARB)
July 31, 2021
5. Creations, Redemptions and Transaction Fees
The Fund generally issues and redeems its shares in primary market transactions through a creation and redemption mechanism and does not sell or redeem individual shares. Instead, financial entities known as “Authorized Participants” have contractual arrangements with the Fund or one of the Fund’s service providers to purchase and redeem Fund shares directly with the Fund in large blocks of shares known as “Creation Units.” Prior to the start of trading on every business day, the Fund publishes through the National Securities Clearing Corporation (“NSCC”) the “basket” of securities, cash or other assets that it will accept in exchange for a Creation Unit of the Fund’s shares. An Authorized Participant that wishes to effectuate a creation of the Fund’s shares deposits with the Fund the “basket” of securities, cash or other assets identified by the Fund that day, and then receives the Creation Unit of the Fund’s shares in return for those assets. After purchasing a Creation Unit, the Authorized Participant may continue to hold the Fund’s shares or sell them in the secondary market. The redemption process is the reverse of the purchase process: the Authorized Participant redeems a Creation Unit of the Fund’s shares for a basket of securities, cash or other assets. The combination of the creation and redemption process with secondary market trading in the Fund’s shares and underlying securities provides arbitrage opportunities that are designed to help keep the market price of the Fund’s shares at or close to the NAV per share of the Fund.
The Fund imposes fees in connection with the purchase of Creation Units. These fees may vary based upon various fact-based circumstances, including, but not limited to, the composition of the securities included in the Creation Unit or the countries in which the transactions are settled. The price for each Creation Unit will equal the daily NAV per share of the Fund times the number of shares in a Creation Unit, plus the fees described above and, if applicable, any operational processing and brokerage costs, transfer fees, stamp taxes and part or all of the spread between the expected bid and offer side of the market related to the securities comprising the creation basket.
The Fund also imposes fees in connection with the redemption of Creation Units. These fees may vary based upon various fact-based circumstances, including, but not limited to, the composition of the securities included in the Creation Unit or the countries in which the transactions are settled. The price received for each Creation Unit will equal the daily NAV per share of the Fund times the number of shares in a Creation Unit, minus the fees described above and, if applicable, any operational processing and brokerage costs, transfer fees, stamp taxes and part or all of the spread between the expected bid and offer side of the market related to the securities comprising the redemption basket. Investors who use the services of a broker or other such intermediary in addition to an Authorized Participant to effect a redemption of a Creation Unit may also be assessed an amount to cover the cost of such services. The redemption fee charged by the Fund will comply with Rule 22c-2 of the 1940 Act which limits redemption fees to no more than 2% of the value of the shares redeemed.
6. Distribution Plan
The Board of Trustees adopted a Distribution and Service Plan pursuant to Rule 12b-1 under the 1940 Act. In accordance with the Rule 12b-1 plan, the Fund is authorized to pay an amount up to 0.25% of its average daily net assets each year to reimburse First Trust Portfolios L.P. (“FTP”), the distributor of the Fund, for amounts expended to finance activities primarily intended to result in the sale of Creation Units or to provide investor services. FTP may also use this amount to compensate securities dealers or other persons that are Authorized Participants for providing distribution assistance, including broker-dealer and shareholder support and educational and promotional services.
No 12b-1 fees are currently paid by the Fund, and pursuant to a contractual arrangement, no 12b-1 fees will be paid any time before November 30, 2022.
7. Indemnification
The Trust, on behalf of the Fund, has a variety of indemnification obligations under contracts with its service providers. The Trust’s maximum exposure under these arrangements is unknown. However, the Trust has not had prior claims or losses pursuant to these contracts and expects the risk of loss to be remote.
8. Subsequent Events
Management has evaluated the impact of all subsequent events to the Fund through the date the financial statements were issued, and has determined that there were no subsequent events requiring recognition or disclosure in the financial statements that have not already been disclosed.
Report of Independent Registered Public Accounting Firm
To the Shareholders and the Board of Trustees of First Trust Exchange-Traded Fund III:
Opinion on the Financial Statements and Financial Highlights
We have audited the accompanying statement of assets and liabilities of First Trust Merger Arbitrage ETF (the “Fund”), a series of the First Trust Exchange-Traded Fund III, including the portfolio of investments, as of July 31, 2021, the related statement of operations for the year then ended, the statement of changes in net assets for the year ended July 31, 2021 and the period from February 4, 2020 (commencement of operations) through July 31, 2020, and the financial highlights for the year ended July 31, 2021 and the period from February 4, 2020 (commencement of operations) through July 31, 2020, and the related notes. In our opinion, the financial statements and financial highlights present fairly, in all material respects, the financial position of the Fund as of July 31, 2021 and the results of its operations for the year then ended, the changes in its net assets for the year ended July 31, 2021 and the period from February 4, 2020 (commencement of operations) through July 31, 2020, and the financial highlights for the year ended July 31, 2021 and the period from February 4, 2020 (commencement of operations) through July 31, 2020 in conformity with accounting principles generally accepted in the United States of America.
Basis for Opinion
These financial statements and financial highlights are the responsibility of the Fund’s management. Our responsibility is to express an opinion on the Fund’s financial statements and financial highlights based on our audits. We are a public accounting firm registered with the Public Company Accounting Oversight Board (United States) (PCAOB) and are required to be independent with respect to the Fund in accordance with the U.S. federal securities laws and the applicable rules and regulations of the Securities and Exchange Commission and the PCAOB.
We conducted our audits in accordance with the standards of the PCAOB. Those standards require that we plan and perform the audit to obtain reasonable assurance about whether the financial statements and financial highlights are free of material misstatement, whether due to error or fraud. The Fund is not required to have, nor were we engaged to perform, an audit of its internal control over financial reporting. As part of our audits we are required to obtain an understanding of internal control over financial reporting but not for the purpose of expressing an opinion on the effectiveness of the Fund’s internal control over financial reporting. Accordingly, we express no such opinion.
Our audits included performing procedures to assess the risks of material misstatement of the financial statements and financial highlights, whether due to error or fraud, and performing procedures that respond to those risks. Such procedures included examining, on a test basis, evidence regarding the amounts and disclosures in the financial statements and financial highlights. Our audits also included evaluating the accounting principles used and significant estimates made by management, as well as evaluating the overall presentation of the financial statements and financial highlights. Our procedures included confirmation of securities owned as of July 31, 2021, by correspondence with the custodian and brokers. We believe that our audits provide a reasonable basis for our opinion.
Chicago, Illinois
September 22, 2021
We have served as the auditor of one or more First Trust investment companies since 2001.
Additional Information
First Trust Merger Arbitrage ETF (MARB)
July 31, 2021 (Unaudited)
Proxy Voting Policies and Procedures
A description of the policies and procedures that the Trust uses to determine how to vote proxies and information on how the Fund voted proxies relating to portfolio securities during the most recent 12-month period ended June 30 is available (1) without charge, upon request, by calling (800) 988-5891; (2) on the Fund’s website at www.ftportfolios.com; and (3) on the Securities and Exchange Commission’s (“SEC”) website at www.sec.gov.
Portfolio Holdings
The Fund files portfolio holdings information for each month in a fiscal quarter within 60 days after the end of the relevant fiscal quarter on Form N-PORT. Portfolio holdings information for the third month of each fiscal quarter will be publicly available on the SEC’s website at www.sec.gov. The Fund’s complete schedule of portfolio holdings for the second and fourth quarters of each fiscal year is included in the semi-annual and annual reports to shareholders, respectively, and is filed with the SEC on Form N-CSR. The semi-annual and annual report for the Fund is available to investors within 60 days after the period to which it relates. The Fund’s Forms N-PORT and Forms N-CSR are available on the SEC’s website listed above.
Risk Considerations
Risks are inherent in all investing. Certain general risks that may be applicable to a Fund are identified below, but not all of the material risks relevant to each Fund are included in this report and not all of the risks below apply to each Fund. The material risks of investing in each Fund are spelled out in its prospectus, statement of additional information and other regulatory filings. Before investing, you should consider each Fund’s investment objective, risks, charges and expenses, and read each Fund’s prospectus and statement of additional information carefully. You can download each Fund’s prospectus at www.ftportfolios.com or contact First Trust Portfolios L.P. at (800) 621-1675 to request a prospectus, which contains this and other information about each Fund.
Concentration Risk. To the extent that a fund is able to invest a significant percentage of its assets in a single asset class or the securities of issuers within the same country, state, region, industry or sector, an adverse economic, business or political development may affect the value of the fund’s investments more than if the fund were more broadly diversified. A fund that tracks an index will be concentrated to the extent the fund’s corresponding index is concentrated. A concentration makes a fund more susceptible to any single occurrence and may subject the fund to greater market risk than a fund that is more broadly diversified.
Credit Risk. Credit risk is the risk that an issuer of a security will be unable or unwilling to make dividend, interest and/or principal payments when due and the related risk that the value of a security may decline because of concerns about the issuer’s ability to make such payments.
Cyber Security Risk. The funds are susceptible to potential operational risks through breaches in cyber security. A breach in cyber security refers to both intentional and unintentional events that may cause a fund to lose proprietary information, suffer data corruption or lose operational capacity. Such events could cause a fund to incur regulatory penalties, reputational damage, additional compliance costs associated with corrective measures and/or financial loss. In addition, cyber security breaches of a fund’s third-party service providers, such as its administrator, transfer agent, custodian, or sub-advisor, as applicable, or issuers in which the fund invests, can also subject a fund to many of the same risks associated with direct cyber security breaches.
Defined Outcome Funds Risk. To the extent a fund’s investment strategy is designed to deliver returns tied to the price performance of an underlying ETF, an investor may not realize the returns the fund seeks to achieve if that investor does not hold shares for the entire target outcome period. In the event an investor purchases shares after the first day of the target outcome period or sells shares prior to the end of the target outcome period, the buffer that the fund seeks to provide against a decline in the value of the underlying ETF may not be available, the enhanced returns that the fund seeks to provide (if any) may not be available and the investor may not participate in a gain in the value of the underlying ETF up to the cap for the investor’s investment period. Additionally, the fund will not participate in gains of the underlying ETF above the cap and a shareholder may lose their entire investment. If the fund seeks enhanced returns, there are certain time periods when the value of the fund may fall faster than the value of the underlying ETF, and it is very unlikely that, on any given day during which the underlying ETF share price increases in value, the fund’s share price will increase at the same rate as the enhanced returns sought by the fund, which is designed for an entire target outcome period. Trading flexible exchange options involves risks different from, or possibly greater than, the risks associated with investing directly in securities, such as less liquidity and correlation and valuation risks. A fund may experience substantial downside from specific flexible exchange option positions and certain positions may expire worthless.
Derivatives Risk. To the extent a fund uses derivative instruments such as futures contracts, options contracts and swaps, the fund may experience losses because of adverse movements in the price or value of the underlying asset, index or rate, which may be magnified
Additional Information (Continued)
First Trust Merger Arbitrage ETF (MARB)
July 31, 2021 (Unaudited)
by certain features of the derivative. These risks are heightened when a fund’s portfolio managers use derivatives to enhance the fund’s return or as a substitute for a position or security, rather than solely to hedge (or offset) the risk of a position or security held by the fund.
Equity Securities Risk. To the extent a fund invests in equity securities, the value of the fund’s shares will fluctuate with changes in the value of the equity securities. Equity securities prices fluctuate for several reasons, including changes in investors’ perceptions of the financial condition of an issuer or the general condition of the relevant stock market, such as market volatility, or when political or economic events affecting the issuers occur. In addition, common stock prices may be particularly sensitive to rising interest rates, as the cost of capital rises and borrowing costs increase. Equity securities may decline significantly in price over short or extended periods of time, and such declines may occur in the equity market as a whole, or they may occur in only a particular country, company, industry or sector of the market.
ETF Risk. The shares of an ETF trade like common stock and represent an interest in a portfolio of securities. The risks of owning an ETF generally reflect the risks of owning the underlying securities, although lack of liquidity in an ETF could result in it being more volatile and ETFs have management fees that increase their costs. Shares of an ETF trade on an exchange at market prices rather than net asset value, which may cause the shares to trade at a price greater than net asset value (premium) or less than net asset value (discount). In times of market stress, decisions by market makers to reduce or step away from their role of providing a market for an ETF’s shares, or decisions by an ETF’s authorized participants that they are unable or unwilling to proceed with creation and/or redemption orders of an ETF’s shares, could result in shares of the ETF trading at a discount to net asset value and in greater than normal intraday bid-ask spreads.
Fixed Income Securities Risk. To the extent a fund invests in fixed income securities, the fund will be subject to credit risk, income risk, interest rate risk, liquidity risk and prepayment risk. Income risk is the risk that income from a fund’s fixed income investments could decline during periods of falling interest rates. Interest rate risk is the risk that the value of a fund’s fixed income securities will decline because of rising interest rates. Liquidity risk is the risk that a security cannot be purchased or sold at the time desired, or cannot be purchased or sold without adversely affecting the price. Prepayment risk is the risk that the securities will be redeemed or prepaid by the issuer, resulting in lower interest payments received by the fund. In addition to these risks, high yield securities, or “junk” bonds, are subject to greater market fluctuations and risk of loss than securities with higher ratings, and the market for high yield securities is generally smaller and less liquid than that for investment grade securities.
Index or Model Constituent Risk. Certain funds may be a constituent of one or more indices or ETF models. As a result, such a fund may be included in one or more index-tracking exchange-traded funds or mutual funds. Being a component security of such a vehicle could greatly affect the trading activity involving a fund, the size of the fund and the market volatility of the fund. Inclusion in an index could increase demand for the fund and removal from an index could result in outsized selling activity in a relatively short period of time. As a result, a fund’s net asset value could be negatively impacted and the fund’s market price may be significantly below its net asset value during certain periods. In addition, index rebalances may potentially result in increased trading activity in a fund’s shares.
Index Provider Risk. To the extent a fund seeks to track an index, it is subject to Index Provider Risk. There is no assurance that the Index Provider will compile the Index accurately, or that the Index will be determined, maintained, constructed, reconstituted, rebalanced, composed, calculated or disseminated accurately. To correct any such error, the Index Provider may carry out an unscheduled rebalance or other modification of the Index constituents or weightings, which may increase the fund’s costs. The Index Provider does not provide any representation or warranty in relation to the quality, accuracy or completeness of data in the Index, and it does not guarantee that the Index will be calculated in accordance with its stated methodology. Losses or costs associated with any Index Provider errors generally will be borne by the fund and its shareholders.
Investment Companies Risk. To the extent a fund invests in the securities of other investment vehicles, the fund will incur additional fees and expenses that would not be present in a direct investment in those investment vehicles. Furthermore, the fund’s investment performance and risks are directly related to the investment performance and risks of the investment vehicles in which the fund invests.
LIBOR Risk. To the extent a fund invests in floating or variable rate obligations that use the London Interbank Offered Rate (“LIBOR”) as a reference interest rate, it is subject to LIBOR Risk. The United Kingdom’s Financial Conduct Authority, which regulates LIBOR, will cease making LIBOR available as a reference rate over a phase-out period that will begin immediately after December 31, 2021. The unavailability or replacement of LIBOR may affect the value, liquidity or return on certain fund investments and may result in costs incurred in connection with closing out positions and entering into new trades. Any potential effects of the transition away from LIBOR on the fund or on certain instruments in which the fund invests can be difficult to ascertain, and they may vary depending on a variety of factors, and they could result in losses to the fund.
Additional Information (Continued)
First Trust Merger Arbitrage ETF (MARB)
July 31, 2021 (Unaudited)
Management Risk. To the extent that a fund is actively managed, it is subject to management risk. In managing an actively-managed fund’s investment portfolio, the fund’s portfolio managers will apply investment techniques and risk analyses that may not have the desired result. There can be no guarantee that a fund will meet its investment objective.
Market Risk. Securities held by a fund, as well as shares of a fund itself, are subject to market fluctuations caused by factors such as general economic conditions, political events, regulatory or market developments, changes in interest rates and perceived trends in securities prices. Shares of a fund could decline in value or underperform other investments as a result of the risk of loss associated with these market fluctuations. In addition, local, regional or global events such as war, acts of terrorism, spread of infectious diseases or other public health issues, recessions, or other events could have a significant negative impact on a fund and its investments. Such events may affect certain geographic regions, countries, sectors and industries more significantly than others. The outbreak of the respiratory disease designated as COVID-19 in December 2019 has caused significant volatility and declines in global financial markets, which have caused losses for investors. While the development of vaccines has slowed the spread of the virus and allowed for the resumption of “reasonably” normal business activity in the United States, many countries continue to impose lockdown measures in an attempt to slow the spread. Additionally, there is no guarantee that vaccines will be effective against emerging variants of the disease.
Non-U.S. Securities Risk. To the extent a fund invests in non-U.S. securities, it is subject to additional risks not associated with securities of domestic issuers. Non-U.S. securities are subject to higher volatility than securities of domestic issuers due to: possible adverse political, social or economic developments; restrictions on foreign investment or exchange of securities; capital controls; lack of liquidity; currency exchange rates; excessive taxation; government seizure of assets; the imposition of sanctions by foreign governments; different legal or accounting standards; and less government supervision and regulation of exchanges in foreign countries. Investments in non-U.S. securities may involve higher costs than investments in U.S. securities, including higher transaction and custody costs, as well as additional taxes imposed by non-U.S. governments. These risks may be heightened for securities of companies located, or with significant operations, in emerging market countries.
Operational Risk. Each fund is subject to risks arising from various operational factors, including, but not limited to, human error, processing and communication errors, errors of a fund’s service providers, counterparties or other third-parties, failed or inadequate processes and technology or systems failures. Each fund relies on third-parties for a range of services, including custody. Any delay or failure relating to engaging or maintaining such service providers may affect a fund’s ability to meet its investment objective. Although the funds and the funds’ investment advisor seek to reduce these operational risks through controls and procedures, there is no way to completely protect against such risks.
Passive Investment Risk. To the extent a fund seeks to track an index, the fund will invest in the securities included in, or representative of, the index regardless of their investment merit. A fund generally will not attempt to take defensive positions in declining markets.
| NOT FDIC INSURED | NOT BANK GUARANTEED | MAY LOSE VALUE |
Advisory and Sub-Advisory Agreements
Board Considerations Regarding Approval of Continuation of Investment Management and Investment Sub-Advisory Agreements
The Board of Trustees of First Trust Exchange-Traded Fund III (the “Trust”), including the Independent Trustees, unanimously approved the continuation of the Investment Management Agreement (the “Advisory Agreement”) with First Trust Advisors L.P. (the “Advisor”), on behalf of the First Trust Merger Arbitrage ETF (the “Fund”), and the Investment Sub-Advisory Agreement (the “Sub-Advisory Agreement” and together with the Advisory Agreement, the “Agreements”) among the Trust, on behalf of the Fund, the Advisor and Vivaldi Asset Management, LLC (the “Sub-Advisor”). The Board approved the continuation of the Agreements for a one-year period ending June 30, 2022 at a meeting held on June 6–7, 2021. The Board determined that the continuation of the Agreements is in the best interests of the Fund in light of the nature, extent and quality of the services provided and such other matters as the Board considered to be relevant in the exercise of its business judgment.
To reach this determination, the Board considered its duties under the Investment Company Act of 1940, as amended (the “1940 Act”), as well as under the general principles of state law, in reviewing and approving advisory contracts; the requirements of the 1940 Act in such matters; the fiduciary duty of investment advisors with respect to advisory agreements and compensation; the standards used by courts in determining whether investment company boards have fulfilled their duties; and the factors to be considered by the Board in voting on such agreements. At meetings held on April 26, 2021 and June 6–7, 2021, the Board, including the Independent Trustees, reviewed materials provided by the Advisor and the Sub-Advisor responding to requests for information from counsel to the Independent Trustees, submitted on behalf of the Independent Trustees, that, among other things, outlined: the services provided by the Advisor and the Sub-Advisor to the Fund (including the relevant personnel responsible for these services and their experience); the
Additional Information (Continued)
First Trust Merger Arbitrage ETF (MARB)
July 31, 2021 (Unaudited)
unitary fee rate payable by the Fund as compared to fees charged to a peer group of funds (the “Expense Group”) and a broad peer universe of funds (the “Expense Universe”), each assembled by Broadridge Financial Solutions, Inc. (“Broadridge”), an independent source, and as compared to fees charged to other clients of the Advisor, including other exchange-traded funds (“ETFs”) managed by the Advisor; the sub-advisory fee rate as compared to fees charged to other clients of the Sub-Advisor; the expense ratio of the Fund as compared to expense ratios of the funds in the Fund’s Expense Group and Expense Universe; performance information for the Fund; the nature of expenses incurred in providing services to the Fund and the potential for the Advisor and the Sub-Advisor to realize economies of scale, if any; profitability and other financial data for the Advisor; financial data for the Sub-Advisor; any fall-out benefits to the Advisor and its affiliate, First Trust Portfolios L.P. (“FTP”), and the Sub-Advisor; and information on the Advisor’s and the Sub-Advisor’s compliance programs. The Board reviewed initial materials with the Advisor at the meeting held on April 26, 2021, prior to which the Independent Trustees and their counsel met separately to discuss the information provided by the Advisor and the Sub-Advisor. Following the April meeting, counsel to the Independent Trustees, on behalf of the Independent Trustees, requested certain clarifications and supplements to the materials provided, and the information provided in response to those requests was considered at an executive session of the Independent Trustees and their counsel held prior to the June 6–7, 2021 meeting, as well as at the June meeting. The Board applied its business judgment to determine whether the arrangements between the Trust and the Advisor and among the Trust, the Advisor and the Sub-Advisor continue to be reasonable business arrangements from the Fund’s perspective. The Board determined that, given the totality of the information provided with respect to the Agreements, the Board had received sufficient information to renew the Agreements. The Board considered that shareholders chose to invest or remain invested in the Fund knowing that the Advisor and the Sub-Advisor manage the Fund and knowing the Fund’s unitary fee.
In reviewing the Agreements, the Board considered the nature, extent and quality of the services provided by the Advisor and the Sub-Advisor under the Agreements. With respect to the Advisory Agreement, the Board considered that the Advisor is responsible for the overall management and administration of the Trust and the Fund and reviewed all of the services provided by the Advisor to the Fund, including the oversight of the Sub-Advisor, as well as the background and experience of the persons responsible for such services. The Board noted that the Advisor oversees the Sub-Advisor’s day-to-day management of the Fund’s investments, including portfolio risk monitoring and performance review. In reviewing the services provided, the Board noted the compliance program that had been developed by the Advisor and considered that it includes a robust program for monitoring the Advisor’s, the Sub-Advisor’s and the Fund’s compliance with the 1940 Act, as well as the Fund’s compliance with its investment objective, policies and restrictions. The Board also considered a report from the Advisor with respect to its risk management functions related to the operation of the Fund. Finally, as part of the Board’s consideration of the Advisor’s services, the Advisor, in its written materials and at the April 26, 2021 meeting, described to the Board the scope of its ongoing investment in additional personnel and infrastructure to maintain and improve the quality of services provided to the Fund and the other funds in the First Trust Fund Complex. With respect to the Sub-Advisory Agreement, the Board noted that the Fund is an actively-managed ETF and the Sub-Advisor actively manages the Fund’s investments. The Board reviewed the materials provided by the Sub-Advisor and considered the services that the Sub-Advisor provides to the Fund, including the Sub-Advisor’s day-to-day management of the Fund’s investments. In considering the Sub-Advisor’s management of the Fund, the Board noted the background and experience of the Sub-Advisor’s portfolio management team, including the Board’s prior meetings with members of the portfolio management team. In light of the information presented and the considerations made, the Board concluded that the nature, extent and quality of the services provided to the Trust and the Fund by the Advisor and the Sub-Advisor under the Agreements have been and are expected to remain satisfactory and that the Sub-Advisor, under the oversight of the Advisor, has managed the Fund consistent with its investment objective, policies and restrictions.
The Board considered the unitary fee rate payable by the Fund under the Advisory Agreement for the services provided. The Board noted that the sub-advisory fee for the Fund is paid by the Advisor from the Fund’s unitary fee. The Board considered that as part of the unitary fee the Advisor is responsible for the Fund’s expenses, including the cost of sub-advisory, transfer agency, custody, fund administration, legal, audit and other services and license fees, if any, but excluding the fee payment under the Advisory Agreement and interest, taxes, brokerage commissions and other expenses connected with the execution of portfolio transactions (such as dividend and distribution expenses from securities sold short and/or other investment related costs), distribution and service fees pursuant to a Rule 12b-1 plan, if any, and extraordinary expenses, if any. The Board noted that because the Fund may establish short positions in the equity securities of companies, the Fund will incur margin interest expense and dividend expense on investments sold short, which are not payable out of the unitary fee. The Board received and reviewed information showing the advisory fee rates and expense ratios of the peer funds in the Expense Group, as well as advisory and unitary fee rates charged by the Advisor and the Sub-Advisor to other fund (including ETFs) and non-fund clients, as applicable. Based on the information provided, the Board noted that the unitary fee rate for the Fund was equal to the median advisory fee rate of the peer funds in its Expense Group. With respect to the Expense Group, the Board, at the April 26, 2021 meeting, discussed with the Advisor limitations in creating peer groups for actively-managed ETFs, including that all peer funds in the Expense Group were open-end mutual funds, and different business models that may affect the pricing of services among ETF sponsors. The Board also noted that not all peer funds employ an advisor/sub-advisor management structure. The Board took these limitations and differences into account in considering the peer data. With respect to fees charged to other clients, the Board considered differences between the Fund and other clients that limited their comparability. In considering the
Additional Information (Continued)
First Trust Merger Arbitrage ETF (MARB)
July 31, 2021 (Unaudited)
unitary fee rate overall, the Board also considered the Advisor’s statement that it seeks to meet investor needs through innovative and value-added investment solutions and the Advisor’s demonstrated long-term commitment to the Fund and the other funds in the First Trust Fund Complex.
The Board considered performance information for the Fund. The Board noted the process it has established for monitoring each Fund’s performance and portfolio risk on an ongoing basis, which includes quarterly performance reporting from the Advisor and the Sub-Advisor for the Fund. The Board determined that this process continues to be effective for reviewing the Fund’s performance. Because the Fund commenced operations on February 4, 2020 and therefore has a limited performance history, comparative performance information for the Fund was not considered.
On the basis of all the information provided on the unitary fee for the Fund and the ongoing oversight by the Board, the Board concluded that the unitary fee for the Fund (out of which the Sub-Advisor is compensated) continues to be reasonable and appropriate in light of the nature, extent and quality of the services provided by the Advisor and the Sub-Advisor to the Fund under the Agreements.
The Board considered information and discussed with the Advisor whether there were any economies of scale in connection with providing advisory services to the Fund and noted the Advisor’s statement that it believes its expenses will likely increase during the next twelve months as the Advisor continues to hire personnel and build infrastructure, including technology, to improve the services to the Funds. The Board noted that any reduction in fixed costs associated with the management of the Funds would benefit the Advisor, but that the unitary fee structure provides a level of certainty in expenses for the Funds. The Board considered the revenues and allocated costs (including the allocation methodology) of the Advisor in serving as investment advisor to the Fund for the period from inception through December 31, 2020 and the estimated profitability level for the Fund calculated by the Advisor based on such data, as well as complex-wide and product-line profitability data, for the twelve months ended December 31, 2020. The Board noted the inherent limitations in the profitability analysis and concluded that, based on the information provided, the Advisor’s profitability level for the Fund was not unreasonable. In addition, the Board considered fall-out benefits described by the Advisor that may be realized from its relationship with the Fund. The Board considered that the Advisor had identified as a fall-out benefit to the Advisor and FTP their exposure to investors and brokers who, absent their exposure to the Fund, may have had no dealings with the Advisor or FTP. The Board also considered the Advisor’s compensation for fund reporting services provided to the Fund pursuant to a separate Fund Reporting Services Agreement, which is paid from the unitary fee. The Board concluded that the character and amount of potential fall-out benefits to the Advisor were not unreasonable.
The Board considered the Sub-Advisor’s statement that it believes that the sub-advisory fee is appropriate based on expected economies of scale. The Board noted the Sub-Advisor’s statements that the majority of its expenses are fixed and are shared and allocated across various funds advised or sub-advised by the Sub-Advisor and that it has added additional personnel over the past year. The Board did not review the profitability of the Sub-Advisor with respect to the Fund. The Board noted that the Advisor pays the Sub-Advisor for the Fund from its unitary fee and its understanding that the Fund’s sub-advisory fee rate was the product of an arm’s length negotiation. The Board concluded that the profitability analysis for the Advisor was more relevant. The Board considered the potential fall-out benefits to the Sub-Advisor from being associated with the Advisor and the Fund, and noted the Sub-Advisor’s statement that, although it benefits from the name recognition associated with its role as sub-advisor to the Fund, it has not received and does not anticipate receiving any reduction in fees incurred for research or other services as a result of its management of the Fund. The Board also noted the Sub-Advisor’s statement that the Sub-Advisor does not intend to use soft dollars in connection with the Fund. The Board concluded that the character and amount of potential fall-out benefits to the Sub-Advisor were not unreasonable.
Based on all of the information considered and the conclusions reached, the Board, including the Independent Trustees, unanimously determined that the terms of the Agreements continue to be fair and reasonable and that the continuation of the Agreements is in the best interests of the Fund. No single factor was determinative in the Board’s analysis.
Liquidity Risk Management Program
In accordance with Rule 22e-4 under the Investment Company Act of 1940, as amended (the “1940 Act”), the Fund and each other fund in the First Trust Fund Complex, other than the closed-end funds, have adopted and implemented a liquidity risk management program (the “Program”) reasonably designed to assess and manage the funds’ liquidity risk, i.e., the risk that a fund could not meet requests to redeem shares issued by the fund without significant dilution of remaining investors’ interests in the fund. The Board of Trustees of the First Trust Funds has appointed First Trust Advisors, L.P. (the “Advisor”) as the person designated to administer the Program, and in this capacity the Advisor performs its duties primarily through the activities and efforts of the First Trust Liquidity Committee (the “Liquidity Committee”).
Pursuant to the Program, the Liquidity Committee classifies the liquidity of each fund’s portfolio investments into one of the four liquidity categories specified by Rule 22e-4: highly liquid investments, moderately liquid investments, less liquid investments and
Additional Information (Continued)
First Trust Merger Arbitrage ETF (MARB)
July 31, 2021 (Unaudited)
illiquid investments. The Liquidity Committee determines certain of the inputs for this classification process, including reasonably anticipated trade sizes and significant investor dilution thresholds. The Liquidity Committee also determines and periodically reviews a highly liquid investment minimum for certain funds, monitors the funds’ holdings of assets classified as illiquid investments to seek to ensure they do not exceed 15% of a fund’s net assets and establishes policies and procedures regarding redemptions in kind.
At the April 26, 2021 meeting of the Board of Trustees, as required by Rule 22e-4 and the Program, the Advisor provided the Board with a written report prepared by the Advisor that addressed the operation of the Program during the period from March 20, 2020 through the Liquidity Committee’s annual meeting held on March 16, 2021 and assessed the Program’s adequacy and effectiveness of implementation during this period, including the operation of the highly liquid investment minimum for each fund that is required under the Program to have one, and any material changes to the Program. Note that because the Fund primarily holds assets that are highly liquid investments, the Fund has not adopted any highly liquid investment minimum.
As stated in the written report, during the review period, no fund breached the 15% limitation on illiquid investments, no fund with a highly liquid investment minimum breached that minimum and no fund filed a Form N-LIQUID. The Advisor concluded that each fund’s investment strategy is appropriate for an open-end fund; that the Program operated effectively in all material respects during the review period; and that the Program is reasonably designed to assess and manage the liquidity risk of each fund and to maintain compliance with Rule 22e-4.
Board of Trustees and Officers
First Trust Merger Arbitrage ETF (MARB)
July 31, 2021 (Unaudited)
The following tables identify the Trustees and Officers of the Trust. Unless otherwise indicated, the address of all persons is 120 East Liberty Drive, Suite 400, Wheaton, IL 60187.
The Trust’s statement of additional information includes additional information about the Trustees and is available, without charge, upon request, by calling (800) 988-5891.
| Name, Year of Birth and Position with the Trust | Term of Office and Year First Elected or Appointed | Principal Occupations
During Past 5 Years | Number of Portfolios in the First Trust Fund Complex Overseen by Trustee | Other Trusteeships or Directorships Held by Trustee During Past 5 Years |
| INDEPENDENT TRUSTEES |
Richard E. Erickson, Trustee
(1951) | • Indefinite Term
• Since Inception | Physician; Officer, Wheaton Orthopedics; Limited Partner, Gundersen Real Estate Limited Partnership (June 1992 to December 2016) | 211 | None |
Thomas R. Kadlec, Trustee
(1957) | • Indefinite Term
• Since Inception | President, ADM Investor Services, Inc. (Futures Commission Merchant) | 211 | Director of ADM Investor Services, Inc., ADM Investor Services International, Futures Industry Association, and National Futures Association |
Robert F. Keith, Trustee
(1956) | • Indefinite Term
• Since Inception | President, Hibs Enterprises (Financial and Management Consulting) | 211 | Director of Trust Company of Illinois |
Niel B. Nielson, Trustee
(1954) | • Indefinite Term
• Since Inception | Senior Advisor (August 2018 to Present), Managing Director and Chief Operating Officer (January 2015 to August 2018), Pelita Harapan Educational Foundation (Educational Products and Services) | 211 | None |
| INTERESTED TRUSTEE |
James A. Bowen(1), Trustee and
Chairman of the Board
(1955) | • Indefinite Term
• Since Inception | Chief Executive Officer, First Trust Advisors L.P. and First Trust Portfolios L.P.; Chairman of the Board of Directors, BondWave LLC (Software Development Company) and Stonebridge Advisors LLC (Investment Advisor) | 211 | None |
| (1) | Mr. Bowen is deemed an “interested person” of the Trust due to his position as CEO of First Trust Advisors L.P., investment advisor of the Trust. |
Board of Trustees and Officers (Continued)
First Trust Merger Arbitrage ETF (MARB)
July 31, 2021 (Unaudited)
| Name and Year of Birth | Position and Offices with Trust | Term of Office and Length of Service | Principal Occupations
During Past 5 Years |
| OFFICERS(2) |
James M. Dykas
(1966) | President and Chief Executive Officer | • Indefinite Term
• Since Inception | Managing Director and Chief Financial Officer (January 2016 to Present), Controller (January 2011 to January 2016), Senior Vice President (April 2007 to January 2016), First Trust Advisors L.P. and First Trust Portfolios L.P.; Chief Financial Officer (January 2016 to Present), BondWave LLC (Software Development Company) and Stonebridge Advisors LLC (Investment Advisor) |
Donald P. Swade
(1972) | Treasurer, Chief Financial Officer and Chief Accounting Officer | • Indefinite Term
• Since Inception | Senior Vice President (July 2016 to Present), Vice President (April 2012 to July 2016), First Trust Advisors L.P. and First Trust Portfolios L.P. |
W. Scott Jardine
(1960) | Secretary and Chief Legal Officer | • Indefinite Term
• Since Inception | General Counsel, First Trust Advisors L.P. and First Trust Portfolios L.P.; Secretary and General Counsel, BondWave LLC; Secretary, Stonebridge Advisors LLC |
Daniel J. Lindquist
(1970) | Vice President | • Indefinite Term
• Since Inception | Managing Director, First Trust Advisors L.P. and First Trust Portfolios L.P. |
Kristi A. Maher
(1966) | Chief Compliance Officer and Assistant Secretary | • Indefinite Term
• Since Inception | Deputy General Counsel, First Trust Advisors L.P. and First Trust Portfolios L.P. |
Roger F. Testin
(1966) | Vice President | • Indefinite Term
• Since Inception | Senior Vice President, First Trust Advisors L.P. and First Trust Portfolios L.P. |
Stan Ueland
(1970) | Vice President | • Indefinite Term
• Since Inception | Senior Vice President, First Trust Advisors L.P. and First Trust Portfolios L.P |
| (2) | The term “officer” means the president, vice president, secretary, treasurer, controller or any other officer who performs a policy making function. |
Privacy Policy
First Trust Merger Arbitrage ETF (MARB)
July 31, 2021 (Unaudited)
Privacy Policy
First Trust values our relationship with you and considers your privacy an important priority in maintaining that relationship. We are committed to protecting the security and confidentiality of your personal information.
Sources of Information
We collect nonpublic personal information about you from the following sources:
| • | Information we receive from you and your broker-dealer, investment professional or financial representative through interviews, applications, agreements or other forms; |
| • | Information about your transactions with us, our affiliates or others; |
| • | Information we receive from your inquiries by mail, e-mail or telephone; and |
| • | Information we collect on our website through the use of “cookies”. For example, we may identify the pages on our website that your browser requests or visits. |
Information Collected
The type of data we collect may include your name, address, social security number, age, financial status, assets, income, tax information, retirement and estate plan information, transaction history, account balance, payment history, investment objectives, marital status, family relationships and other personal information.
Disclosure of Information
We do not disclose any nonpublic personal information about our customers or former customers to anyone, except as permitted by law. In addition to using this information to verify your identity (as required under law), the permitted uses may also include the disclosure of such information to unaffiliated companies for the following reasons:
| • | In order to provide you with products and services and to effect transactions that you request or authorize, we may disclose your personal information as described above to unaffiliated financial service providers and other companies that perform administrative or other services on our behalf, such as transfer agents, custodians and trustees, or that assist us in the distribution of investor materials such as trustees, banks, financial representatives, proxy services, solicitors and printers. |
| • | We may release information we have about you if you direct us to do so, if we are compelled by law to do so, or in other legally limited circumstances (for example to protect your account from fraud). |
In addition, in order to alert you to our other financial products and services, we may share your personal information within First Trust.
Use of Website Analytics
We currently use third party analytics tools, Google Analytics and AddThis, to gather information for purposes of improving First Trust’s website and marketing our products and services to you. These tools employ cookies, which are small pieces of text stored in a file by your web browser and sent to websites that you visit, to collect information, track website usage and viewing trends such as the number of hits, pages visited, videos and PDFs viewed and the length of user sessions in order to evaluate website performance and enhance navigation of the website. We may also collect other anonymous information, which is generally limited to technical and web navigation information such as the IP address of your device, internet browser type and operating system for purposes of analyzing the data to make First Trust’s website better and more useful to our users. The information collected does not include any personal identifiable information such as your name, address, phone number or email address unless you provide that information through the website for us to contact you in order to answer your questions or respond to your requests. To find out how to opt-out of these services click on: Google Analytics and AddThis.
Confidentiality and Security
With regard to our internal security procedures, First Trust restricts access to your nonpublic personal information to those First Trust employees who need to know that information to provide products or services to you. We maintain physical, electronic and procedural safeguards to protect your nonpublic personal information.
Policy Updates and Inquiries
As required by federal law, we will notify you of our privacy policy annually. We reserve the right to modify this policy at any time, however, if we do change it, we will tell you promptly. For questions about our policy, or for additional copies of this notice, please go to www.ftportfolios.com, or contact us at 1-800-621-1675 (First Trust Portfolios) or 1-800-222-6822 (First Trust Advisors).
March 2021
This page intentionally left blank
First Trust Exchange-Traded Fund III
INVESTMENT ADVISOR
First Trust Advisors L.P.
120 East Liberty Drive, Suite 400
Wheaton, IL 60187
INVESTMENT SUB-ADVISOR
Vivaldi Asset Management, LLC
225 West Wacker Drive, Suite 2100
Chicago, IL 60606
ADMINISTRATOR, CUSTODIAN,
FUND ACCOUNTANT &
TRANSFER AGENT
Brown Brothers Harriman & Co.
50 Post Office Square
Boston, MA 02110
INDEPENDENT REGISTERED
PUBLIC ACCOUNTING FIRM
Deloitte & Touche LLP
111 S. Wacker Drive
Chicago, IL 60606
LEGAL COUNSEL
Chapman and Cutler LLP
111 W. Monroe Street
Chicago, IL 60603
Item 2. Code of Ethics.
| (a) | | The registrant, as of the end of the period covered by this report, has adopted a code of ethics that applies to the registrant’s principal executive officer, principal financial officer, principal accounting officer or controller, or persons performing similar functions, regardless of whether these individuals are employed by the registrant or a third party. |
| (c) | | There have been no amendments, during the period covered by this report, to a provision of the code of ethics that applies to the registrant’s principal executive officer, principal financial officer, principal accounting officer or controller, or persons performing similar functions, regardless of whether these individuals are employed by the registrant or a third party, and that relates to any element of the code of ethics description. |
| (d) | | The registrant, during the period covered by this report, has not granted any waivers, including an implicit waiver, from a provision of the code of ethics that applies to the registrant’s principal executive officer, principal financial officer, principal accounting officer or controller, or persons performing similar functions, regardless of whether these individuals are employed by the registrant or a third party, that relates to one or more of the items set forth in paragraph (b) of this item’s instructions. |
| (f) | | A copy of the code of ethics that applies to the registrant’s principal executive officer, principal financial officer, principal accounting officer or controller is filed as an exhibit pursuant to Item 13(a)(1). |
Item 3. Audit Committee Financial Expert.
As of the end of the period covered by the report, the registrant’s board of trustees has determined that Thomas R. Kadlec and Robert F. Keith are qualified to serve as audit committee financial experts serving on its audit committee and that each of them is “independent,” as defined by Item 3 of Form N-CSR.
Item 4. Principal Accountant Fees and Services.
(a) Audit Fees (Registrant) -- The aggregate fees billed for professional services rendered by the principal accountant for the audit of the registrant’s annual financial statements or services that are normally provided by the accountant in connection with statutory and regulatory filings or engagements were $222,375 for the fiscal year ended July 31, 2020 and $267,688 for the fiscal year ended July 31, 2021.
(b) Audit-Related Fees (Registrant) -- The aggregate fees billed for assurance and related services by the principal accountant that are reasonably related to the performance of the audit of the registrant’s financial statements and are not reported under paragraph (a) of this Item were $0 for the fiscal year ended July 31, 2020 and $0 for the fiscal year ended July 31, 2021.
Audit-Related Fees (Investment Advisor and Distributor) -- The aggregate fees billed for assurance and related services by the principal accountant that are reasonably related to the performance of the audit of the registrant’s financial statements and are not reported under paragraph (a) of this Item were $0 for the fiscal year ended July 31, 2020 and $0 for the fiscal year ended July 31, 2021.
(c) Tax Fees (Registrant) -- The aggregate fees billed for professional services rendered by the principal accountant for tax compliance, tax advice, and tax planning to the registrant were $73,662 for the fiscal year ended July 31, 2020 and $40,221 for the fiscal year ended July 31, 2021. These fees were for tax consultation and/or tax return preparation and professional services rendered for PFIC (Passive Foreign Investment Company) Identification Services. .
Tax Fees (Investment Advisor and Distributor) -- The aggregate fees billed for professional services rendered by the principal accountant for tax compliance, tax advice, and tax planning to the registrant’s advisor and distributor were $0 for the fiscal year ended July 31, 2020 and $0 for the fiscal year ended July 31, 2021.
(d) All Other Fees (Registrant) -- The aggregate fees billed for products and services provided by the principal accountant to the registrant, other than the services reported in paragraphs (a) through (c) of this Item were $0 for the fiscal year ended July 31, 2020 and $0 for the fiscal year ended July 31, 2021.
All Other Fees (Investment Advisor and Distributor) -- The aggregate fees billed for products and services provided by the principal accountant to the registrant’s investment advisor and distributor, other than the services reported in paragraphs (a) through (c) of this Item were $0 for the fiscal year ended July 31, 2020 and $0 for the fiscal year ended July 31, 2021.
(e)(1) Disclose the audit committee’s pre-approval policies and procedures described in paragraph (c) (7) of Rule 2-01 of Regulation S-X.
Pursuant to its charter and its Audit and Non-Audit Services Pre-Approval Policy, the Audit Committee (the “Committee”) is responsible for the pre-approval of all audit services and permitted non-audit services (including the fees and terms thereof) to be performed for the registrant by its independent auditors. The Chairman of the Committee is authorized to give such pre-approvals on behalf of the Committee up to $25,000 and report any such pre-approval to the full Committee.
The Committee is also responsible for the pre-approval of the independent auditor’s engagements for non-audit services with the registrant’s advisor (not including a sub-advisor whose role is primarily portfolio management and is sub-contracted or overseen by another investment advisor) and any entity controlling, controlled by or under common control with the investment advisor that provides ongoing services to the registrant, if the engagement relates directly to the operations and financial reporting of the registrant, subject to the de minimis exceptions for non-audit services described in Rule 2-01 of Regulation S-X. If the independent auditor has provided non-audit services to the registrant’s advisor (other than any sub-advisor whose role is primarily portfolio management and is sub-contracted with or overseen by another investment advisor) and any entity controlling, controlled by or under common control with the investment advisor that provides ongoing services to the registrant that were not pre-approved pursuant to its policies, the Committee will consider whether the provision of such non-audit services is compatible with the auditor’s independence.
(e)(2) The percentage of services described in each of paragraphs (b) through (d) for the registrant and the registrant’s investment advisor and distributor of this Item that were approved by the audit committee pursuant to the pre-approval exceptions included in paragraph (c)(7)(i)(C) or paragraph(C)(7)(ii) of Rule 2-01 of Regulation S-X are as follows:
Registrant: Advisor and Distributor:
(b) 0% (b) 0%
(c) 0% (c) 0%
(d) 0% (d) 0%
(f) The percentage of hours expended on the principal accountant’s engagement to audit the registrant’s financial statements for the most recent fiscal year that were attributed to work performed by persons other than the principal accountant’s full-time, permanent employees was less than fifty
percent.
(g) The aggregate non-audit fees billed by the registrant’s accountant for services rendered to the registrant, and rendered to the registrant’s investment advisor (not including any sub-advisor whose role is primarily portfolio management and is subcontracted with or overseen by another investment advisor), and any entity controlling, controlled by, or under common control with the advisor that provides ongoing services to the registrant for the fiscal year ended July 31, 2020 were $73,662 for the registrant, $47,170 for the registrant’s investment advisor and $70,330 for the registrant’s distributor and for the fiscal year ended July 31, 2021 were $40,221 for the registrant, $23,200 for the registrant’s investment advisor and $29,500 for the registrant’s distributor.
(h) The registrant’s audit committee of its Board of Trustees has determined that the provision of non-audit services that were rendered to the registrant’s investment advisor (not including any sub-advisor whose role is primarily portfolio management and is subcontracted with or overseen by another investment advisor), and any entity controlling, controlled by, or under common control with the investment advisor that provides ongoing services to the registrant that were not pre-approved pursuant to paragraph (c)(7)(ii) of Rule 2-01 of Regulation S-X is compatible with maintaining the principal accountant’s independence.
(i) Not applicable.
(j) Not applicable.
Items 5. Audit Committee of Listed Registrants.
The registrant has a separately designated standing audit committee established in accordance with Section 3(a)(58)(A) of the Securities Exchange Act of 1934. The audit committee of the registrant is comprised of Richard E. Erickson, Thomas R. Kadlec, Robert F. Keith and Niel B. Nielson.
Item 6. Investments.
| (a) | | Schedule of Investments in securities of unaffiliated issuers as of the close of the reporting period is included as part of the report to shareholders filed under Item 1 of this form. |
Item 7. Disclosure of Proxy Voting Policies and Procedures for Closed-End Management Investment Companies.
Not applicable.
Item 8. Portfolio Managers of Closed-End Management Investment Companies.
Not applicable.
Item 9. Purchases of Equity Securities by Closed-End Management Investment Company and Affiliated Purchasers.
Not applicable.
Item 10. Submission of Matters to a Vote of Security Holders.
There have been no material changes to the procedures by which the shareholders may recommend nominees to the registrant’s board of directors, where those changes were implemented after the registrant last provided disclosure in response to the requirements of Item 407 (c) (2) (iv) of Regulation S-K (17 CFR 229.407) (as required by Item 22 (b) (15) of Schedule 14A (17 CFR 240.14a-101)), or this Item.
Item 11. Controls and Procedures.
| (a) | | The registrant’s principal executive and principal financial officers, or persons performing similar functions, have concluded that the registrant’s disclosure controls and procedures (as defined in Rule 30a-3(c) under the Investment Company Act of 1940, as amended (the “1940 Act”) (17 CFR 270.30a-3 (c))) are effective, as of a date within 90 days of the filing date of the report that includes the disclosure required by this paragraph, based on their evaluation of these controls and procedures required by Rule 30a-3(b) under the 1940 Act (17 CFR 270.30a-3(b)) and Rules 13a-15(b) or 15d-15(b) under the Securities Exchange Act of 1934, as amended (17 CFR 240.13a-15(b) or 240.15d-15 (b)). |
| (b) | | There were no changes in the registrant’s internal control over financial reporting (as defined in Rule 30a-3(d) under the 1940 Act (17 CFR 270.30a-3(d)) that occurred during the period covered by this report that have materially affected, or are reasonably likely to materially affect, the registrant’s internal control over financial reporting. |
Item 12. Disclosure of Securities Lending Activities for Closed-End Management Investment Companies.
Not applicable.
Item 13. Exhibits.
SIGNATURES
Pursuant to the requirements of the Securities Exchange Act of 1934 and the Investment Company Act of 1940, the registrant has duly caused this report to be signed on its behalf by the undersigned, thereunto duly authorized.
| (registrant) | | First Trust Exchange-Traded Fund III |
| By (Signature and Title)* | | /s/ James M. Dykas |
| | | James M. Dykas, President and Chief Executive Officer
(principal executive officer) |
Pursuant to the requirements of the Securities Exchange Act of 1934 and the Investment Company Act of 1940, this report has been signed below by the following persons on behalf of the registrant and in the capacities and on the dates indicated.
| By (Signature and Title)* | | /s/ James M. Dykas |
| | | James M. Dykas, President and Chief Executive Officer
(principal executive officer) |
| By (Signature and Title)* | | /s/ Donald P. Swade |
| | | Donald P. Swade, Treasurer, Chief Financial Officer
and Chief Accounting Officer
(principal financial officer) |