UNITED STATES
SECURITIES AND EXCHANGE COMMISSION
Washington, D.C. 20549
FORM N-CSR
CERTIFIED SHAREHOLDER REPORT OF REGISTERED MANAGEMENT
INVESTMENT COMPANIES
Investment Company Act file number 811-22209
Global X Funds
(Exact name of registrant as specified in charter)
605 Third Avenue, 43rd floor
New York, NY 10158
(Address of principal executive offices) (Zip code)
Thomas Park
Global X Management Company LLC
605 Third Avenue, 43rd floor
New York, NY 10158
(Name and address of agent for service)
With a copy to:
Global X Management Company LLC
605 Third Avenue, 43rd floor
New York, NY 10158 | Eric S. Purple, Esq.
Stradley Ronon Stevens & Young, LLP
2000 K Street, N.W., Suite 700
Washington, DC 20006-1871 |
Registrant’s telephone number, including area code: (212) 644-6440
Date of fiscal year end: October 31, 2023
Date of reporting period: October 31, 2023
Item 1. Reports to Stockholders.
(a) A copy of the report transmitted to stockholders pursuant to Rule 30e-1 under the Investment Company Act of 1940, as amended (the “Act”) (17 CFR § 270.30e-1), is attached hereto.

Global X Lithium & Battery Tech ETF (ticker: LIT)
Global X SuperDividend® ETF (ticker: SDIV)
Global X Social Media ETF (ticker: SOCL)
Global X Guru® Index ETF (ticker: GURU)
Global X SuperIncome™ Preferred ETF (ticker: SPFF)
Global X SuperDividend® U.S. ETF (ticker: DIV)
Global X S&P 500® Covered Call ETF (ticker: XYLD)
Global X NASDAQ 100® Covered Call ETF (ticker: QYLD)
Global X MSCI SuperDividend® Emerging Markets ETF (ticker: SDEM)
Global X SuperDividend® REIT ETF (ticker: SRET)
Global X Renewable Energy Producers ETF (ticker: RNRG)
Global X S&P 500® Catholic Values ETF (ticker: CATH)
Global X MSCI SuperDividend® EAFE ETF (ticker: EFAS)
Global X E-commerce ETF (ticker: EBIZ)
Global X Russell 2000 Covered Call ETF (ticker: RYLD)
Global X S&P Catholic Values Developed ex-U.S. ETF (ticker: CEFA)
Global X Nasdaq 100® Covered Call & Growth ETF (ticker: QYLG)
Global X S&P 500® Covered Call & Growth ETF (ticker: XYLG)
Global X Emerging Markets Internet & E-commerce ETF (ticker: EWEB)
Global X NASDAQ 100® Tail Risk ETF (ticker: QTR)
Global X NASDAQ 100® Risk Managed Income ETF (ticker: QRMI)
Global X NASDAQ 100® Collar 95-110 ETF (ticker: QCLR)
Global X S&P 500® Tail Risk ETF (ticker: XTR)
Global X S&P 500® Risk Managed Income ETF (ticker: XRMI)
Global X S&P 500® Collar 95-110 ETF (ticker: XCLR)
Global X Disruptive Materials ETF (ticker: DMAT)
Global X Dow 30® Covered Call ETF (ticker: DJIA)
Global X Russell 2000 Covered Call & Growth ETF (ticker: RYLG)
Global X Financials Covered Call & Growth ETF (ticker: FYLG)
Global X Health Care Covered Call & Growth ETF (ticker: HYLG)
Global X Information Technology Covered Call & Growth ETF (ticker: TYLG)
Global X Nasdaq 100® ESG Covered Call ETF (ticker: QYLE)
Global X S&P 500® ESG Covered Call ETF (ticker: XYLE)
Global X Dow 30® Covered Call & Growth ETF (ticker: DYLG)
Annual Report
October 31, 2023
As permitted by regulations adopted by the Securities and Exchange Commission, paper copies of the Funds’ (defined below) shareholder reports will no longer be sent by mail, unless you specifically request paper copies of the reports from your financial intermediary (such as a broker-dealer or bank). Instead, shareholder reports will be available on the Funds’ website (www.globalxetfs.com/explore), and you will be notified by mail each time a report is posted and provided with a website link to access the report.
If you already elected to receive shareholder reports electronically, you will not be affected by this change and you need not take any action. You may elect to receive shareholder reports and other communications from the Funds electronically anytime by contacting your financial intermediary.
You may elect to receive all future Fund shareholder reports in paper free of charge. Please contact your financial intermediary to inform them that you wish to continue receiving paper copies of Fund shareholder reports and for details about whether your election to receive reports in paper will apply to all funds held with your financial intermediary.

Table of Contents
Shares are bought and sold at market price (not NAV) and are not individually redeemed from a Fund. Shares may only be redeemed directly from a Fund by Authorized Participants, in very large creation/redemption units. Brokerage commissions will reduce returns.
The Funds file their complete schedules of Fund holdings with the Securities and Exchange Commission (the “SEC” or “Commission”) for the first and third quarters of each fiscal year as an exhibit to its reports on Form N-PORT. The Funds’ Form N-PORT is available on the Commission’s website at https://www.sec.gov, and may be reviewed and copied at the Commission’s Public Reference Room in Washington, DC. Information on the operation of the Public Reference Room may be obtained by calling 1-800-SEC-0330.
A description of the policies and procedures that Global X Funds uses to determine how to vote proxies relating to Fund securities, as well as information relating to how the Funds voted proxies relating to Fund securities during the most recent 12-month period ended June 30, is available (i) without charge, upon request, by calling 1-888-493-8631; and (ii) on the Commission’s website at https://www.sec.gov.
Management Discussion of Fund Performance (unaudited)
Global X Lithium & Battery Tech ETF
Global X Lithium & Battery Tech ETF
The Global X Lithium & Battery Tech ETF (the “Fund”) seeks to provide investment results that correspond generally to the price and yield performance, before fees and expenses, of the Solactive Global Lithium Index (the “Underlying Index”). The Fund is passively managed, which means the investment adviser does not attempt to take defensive positions in declining markets. The Fund generally seeks to fully replicate the Underlying Index.
The Underlying Index is designed to measure broad-based equity market performance of global companies involved in the lithium industry, as defined by Solactive AG, the provider of the Underlying Index.
For the 12-month period ended October 31, 2023 (the “reporting period”), the Fund decreased 28.63%, while the Underlying Index decreased 28.42%. The Fund had a net asset value of $67.13 per share on October 31, 2022 and ended the reporting period with a net asset value of $47.33 on October 31, 2023.
During the reporting period, the highest returns came from Simplo Technology Co Ltd and BYD Co Ltd-H, which returned 41.43% and 36.22%, respectively. The worst performers were Freyr Battery SA and Core Lithium Ltd, which returned -75.88% and -74.26, respectively.
The Fund recorded negative performance over the reporting period, as lithium producers were impacted by declining prices, and both lithium producers and battery manufacturers were impacted by weakened demand. In particular, lithium prices were weighed down by performance in the Chinese spot market, the largest spot market in the world by a wide margin, amid weakened demand and bearish sentiment. Notably, electric vehicle (EV) sales in China were weaker at the start of 2023 and remained volatile for several months due to policy changes, including the end of subsidies on EV purchases, as well as a decline in consumer sentiment amid the broader economic slowdown. To counter slower demand and continued uncertainty over the short-term, battery makers largely worked through built up inventories instead of taking on new lithium contracts. During the reporting period, the Fund had an average approximate stock exposure of 35.44% in China and 24.62% in the United States. By sector, the Fund had its highest average exposure to Materials at 38.16%, Consumer Discretionary at 23.17% and Industrials at 23.03%.
| | AVERAGE ANNUAL TOTAL RETURN FOR THE YEAR ENDED
OCTOBER 31, 2023 |
| | One Year
Return | Three Year
Return | Five Year
Return | Ten Year
Return |
| | Net
Asset
Value | Market
Price | Net
Asset
Value | Market
Price | Net
Asset
Value | Market
Price | Net
Asset
Value | Market
Price |
| Global X Lithium & Battery Tech | -28.63% | -27.69% | 3.93% | 4.01% | 10.75% | 11.00% | 7.66% | 7.71% |
| Solactive Global Lithium Index (USD) | -28.42% | -28.42% | 4.45% | 4.45% | 11.02% | 11.02% | 8.18% | 8.18% |
| MSCI ACWI (Net) (USD) | 10.50% | -10.50% | 6.68% | 6.68% | 7.47% | 7.47% | 6.81% | 6.81% |
1
Management Discussion of Fund Performance (unaudited)
Global X Lithium & Battery Tech ETF
Growth of a $10,000 Investment
(At Net Asset Value)

*Fund commenced operations on July 22, 2010.
The MSCI ACWI (All Country World Index) Index is a free float-adjusted market capitalization weighted index that is designed to measure the equity market performance of developed and emerging markets.
The performance data quoted herein represents past performance and the return and value of an investment in the Fund will fluctuate so that, when redeemed, it may be worth less than its original cost. Past performance is no guarantee of future performance and should not be considered as a representation of the future results of the Fund. The Fund’s performance assumes the reinvestment of all dividends and all capital gains. Index returns assume reinvestment of dividends and, unlike the Fund’s returns, do not reflect any fees or expenses. If such fees and expenses were included in the index returns, the performance would have been lower. Please note that one cannot invest directly in an unmanaged index. Performance figures for the periods shown may reflect contractual fee waivers and/or expense reimbursements. In the absence of fee waiver sand/or expense reimbursements (if applicable), returns would have been lower.
There are no assurances that the Fund will meet its stated objectives.
The Fund’s holdings and allocations are subject to change and should not be considered recommendations to buy individual securities.
The graph and table do not reflect the deduction of taxes that a shareholder would pay on Fund distributions or the redemption or sale of Fund shares.
See definition of comparative indices on the previous page.
2
Management Discussion of Fund Performance (unaudited)
Global X SuperDividend® ETF
Global X SuperDividend® ETF
The Global X SuperDividend® ETF (the “Fund”) seeks investment results that correspond generally to the price and yield performance, before fees and expenses, of the Solactive Global SuperDividend® Index (the “Underlying Index”). The Fund is passively managed, which means the investment adviser does not attempt to take defensive positions in declining markets. The Fund generally seeks to fully replicate the Underlying Index.
The Underlying Index tracks the performance of 100 equally weighted companies that rank among the highest dividend yielding equity securities in the world, including emerging market countries, as defined by Solactive AG, the provider of the Underlying Index (“Index Provider”). The Index Provider applies certain dividend stability filters.
For the 12-month period ended October 31, 2023 (the “reporting period”), the Fund decreased 0.31%, while the Underlying Index increased 0.49%. The Fund had a net asset value of $23.05 per share on October 31, 2022 and ended the reporting period with a net asset value of $20.36 on October 31, 2023, following a 1:3 reverse share split on December 19, 2022.
During the reporting period, the highest returns came from China SCE Group Holdings Ltd and Powerlong Real Estate Holdings, which returned 199.23% and 196.66%, respectively. The worst performers were Manulife US REIT and Grange Resources Limited, which returned -85.27% and -60.84%, respectively.
The Fund generated negative returns during the reporting period, as uncertainty on the direction of interest rates continued to impact global equity markets. Real estate experienced a continued decline, as high interest rates increased financing costs, which negatively impacted Mortgage REITs, the largest industry holding in the Fund. The Materials sector also detracted from performance in 2023, as recession worries around the world depressed returns. However, elevated energy prices and structural supply issues lent strength to energy and energy-linked industrial holdings within the Fund’s portfolio. During the reporting period, the Fund had an average approximate exposure of 30.33% to stocks in United States and 13.45% in Brazil. By sector, it had the highest exposure to Financials at 31.29%, Materials at 15.72% and Energy at 13.99%.
| | AVERAGE ANNUAL TOTAL RETURN FOR THE YEAR ENDED
OCTOBER 31, 2023 |
| | One Year
Return | Three Year
Return | Five Year
Return | Ten Year
Return |
| | Net
Asset
Value | Market
Price | Net
Asset
Value | Market
Price | Net
Asset
Value | Market
Price | Net
Asset
Value | Market
Price |
| Global X SuperDividend® ETF | -0.31% | -0.86% | -4.45% | -4.45% | -10.31% | -10.32% | -4.17% | -4.17% |
| Solactive Global SuperDividend Index (USD) | 0.49% | 0.49% | -5.07% | -5.07% | -10.66% | -10.66% | -4.41% | -4.41% |
| MSCI ACWI (Net) (USD) | 10.50% | 10.50% | 6.68% | 6.68% | 7.47% | 7.47% | 6.81% | 6.81% |
3
Management Discussion of Fund Performance (unaudited)
Global X SuperDividend® ETF
Growth of a $10,000 Investment
(At Net Asset Value)

* The Fund commenced operations on June 8, 2011.
The MSCI ACWI (Net) (All Country World Index) Index is a free float-adjusted market capitalization weighted index that is designed to measure the equity market performance of developed and emerging markets.
The performance data quoted herein represents past performance and the return and value of an investment in the Fund will fluctuate so that, when redeemed, it may be worth less than its original cost. Past performance is no guarantee of future performance and should not be considered as a representation of the future results of the Fund. The Fund’s performance assumes the reinvestment of all dividends and all capital gains. Index returns assume reinvestment of dividends and, unlike the Fund’s returns, do not reflect any fees or expenses. If such fees and expenses were included in the index returns, the performance would have been lower. Please note that one cannot invest directly in an unmanaged index. Performance figures for the periods shown may reflect contractual fee waivers and/or expense reimbursements. In the absence of fee waiver sand/or expense reimbursements (if applicable), returns would have been lower.
There are no assurances that the Fund will meet its stated objectives.
The Fund’s holdings and allocations are subject to change and should not be considered recommendations to buy individual securities.
The graph and table do not reflect the deduction of taxes that a shareholder would pay on Fund distributions or the redemption or sale of Fund shares.
See definition of comparative indices on the previous page.
4
Management Discussion of Fund Performance (unaudited)
Global X Social Media ETF
Global X Social Media ETF
The Global X Social Media ETF (“Fund”) seeks to provide investment results that correspond generally to the price and yield performance, before fees and expenses, of the Solactive Social Media Total Return Index (the “Underlying Index”). The Fund is passively managed, which means the investment adviser does not attempt to take defensive positions in declining markets. The Fund generally seeks to fully replicate the Underlying Index.
The Underlying Index is designed to reflect the performance of companies involved in the social media industry, including companies that provide social networking, file sharing, and other web-based media applications, as defined by Solactive AG, the provider of the Underlying Index.
For the 12-month period ended October 31, 2023 (the “reporting period”), the Fund increased 40.40%, while the Underlying Index increased 41.27%. The Fund had a net asset value of $24.88 per share on October 31, 2022, and ended the reporting period with a net asset value of $34.75 on October 31, 2023.
During the reporting period, the highest returns came from Meitu Inc and Meta Platforms Inc-Class A which returned 366.35% and 223.39%, respectively. The worst performers were Bumble Inc A and Giftee Inc, which returned -47.09% and -45.04%, respectively.
During the reporting period, the Fund achieved positive performance, driven by escalating user engagement and increased time spent on global social media platforms. Bundled product offerings encompassing entertainment, news, and diverse content verticals generated additional revenue streams, reflecting the social media industry’s adaptability and resilience. Industry-wide price adjustments reinforced social media platforms’ potential, signifying confidence in their future growth. The incorporation of generative artificial intelligence (AI) technology proved pivotal, personalizing user experiences. Furthermore, strategic workforce reductions within social media firms resonated positively with investors and improved profit margins. Lower valuations of these companies also attracted the attention of prospective investors during the reporting period. During the reporting period, the Fund had an average approximate stock exposure of 38.19% in the United States, 34.80% in China and 13.40% in South Korea.
| | AVERAGE ANNUAL TOTAL RETURN FOR THE YEAR ENDED
OCTOBER 31, 2023 |
| | One Year
Return | Three Year
Return | Five Year
Return | Ten Year
Return |
| | Net
Asset
Value | Market
Price | Net
Asset
Value | Market
Price | Net
Asset
Value | Market
Price | Net
Asset
Value | Market
Price |
| Global X Social Media ETF | 40.40% | 40.27% | -12.29% | -12.43 | 3.79% | 3.77% | 6.29% | 6.24% |
| Solactive Social Media Total Return Index (USD) | 41.27% | 41.27% | -11.88% | -11.88% | 4.34% | 4.34% | 6.80% | 6.80% |
| MSCI ACWI (Net) (USD) | 10.50% | 10.50% | 6.68% | 6.68% | 7.47% | 7.47% | 6.81% | 6.81% |
5
Management Discussion of Fund Performance (unaudited)
Global X Social Media ETF
Growth of a $10,000 Investment
(At Net Asset Value)

* The Fund commenced operations on November 14, 2011.
The MSCI ACWI (Net) (All Country World Index) Index is a free float-adjusted market capitalization weighted index that is designed to measure the equity market performance of developed and emerging market
The performance data quoted herein represents past performance and the return and value of an investment in the Fund will fluctuate so that, when redeemed, it may be worth less than its original cost. Past performance is no guarantee of future performance and should not be considered as a representation of the future results of the Fund. The Fund’s performance assumes the reinvestment of all dividends and all capital gains. Index returns assume reinvestment of dividends and, unlike the Fund’s returns, do not reflect any fees or expenses. If such fees and expenses were included in the index returns, the performance would have been lower. Please note that one cannot invest directly in an unmanaged index. Performance figures for the periods shown may reflect contractual fee waivers and/or expense reimbursements. In the absence of fee waiver sand/or expense reimbursements (if applicable), returns would have been lower.
There are no assurances that the Fund will meet its stated objectives.
The Fund’s holdings and allocations are subject to change and should not be considered recommendations to buy individual securities.
The graph and table do not reflect the deduction of taxes that a shareholder would pay on Fund distributions or the redemption or sale of Fund shares.
See definition of comparative indices on the previous page.
6
Management Discussion of Fund Performance (unaudited)
Global X Guru® Index ETF
Global X Guru® Index ETF
The Global X Guru Index ETF (the “Fund”) seeks to provide investment results that correspond generally to the price and yield performance, before fees and expenses, of the Solactive Guru Index (the “Underlying Index”). The Fund is passively managed, which means the investment adviser does not attempt to take defensive positions in declining markets. The Fund generally seeks to fully replicate the Underlying Index.
The Underlying Index is comprised of the top U.S. listed equity positions reported on Form 13F by a select group of entities that Solactive AG characterizes as hedge funds. Hedge funds are selected from a pool of thousands of privately offered pooled investment vehicles based on the size of their reported equity holdings and the efficacy of replicating their publicly disclosed positions. Additional filters are applied to eliminate hedge funds that have high turnover rates for equity holdings. Only hedge funds with concentrated top holdings are included in the selection process. Once the hedge fund pool has been determined, the Index Provider utilizes 13F filings to compile the top stock holding from each of these hedge funds. The stocks are screened for liquidity and equal weighted.
For the 12-month period ended October 31, 2023 (the “reporting period”), the Fund increased 2.58%, while the Underlying Index increased 1.96%. The Fund had a net asset value of $33.48 per share on October 31, 2022 and ended the reporting period with a net asset value of $34.23 on October 31, 2023.
During the reporting period, the highest returns came from BiliBili Inc-Sponsored ADR and GDS Holdings Ltd-ADR, which returned 129.48% and 119.24%, respectively. The worst performers were Fate Therapeutics Inc and Icahn Enterprises LP, which returned -72.32% and -63.75%, respectively.
During the reporting period, an increased focus on technological advancements within artificial intelligence technology, led to positive investor sentiment towards technology sector holdings within the Fund. Pharmaceutical holdings that made weight loss drug advancements positively impacted the Fund during the reporting period. Furthermore, as inflation within the U.S. declined, the Federal Reserve’s slower pace of interest rate hikes during the reporting period positively impacted holdings within the Fund. Amid geopolitical concerns, oil refiners and explorers within the Fund provided a level of negative performance as volatility in the oil markets remained apparent during the reporting period. During the reporting period, the Fund had the highest sector exposure to Health Care at 18.38%, Consumer Discretionary at 14.59%, Information Technology at 12.46% and Financials at 12.37%.
| | AVERAGE ANNUAL TOTAL RETURN FOR THE YEAR ENDED
OCTOBER 31, 2023 |
| | One Year
Return | Three Year
Return | Five Year
Return | Ten Year
Return |
| | Net
Asset
Value | Market
Price | Net
Asset
Value | Market
Price | Net
Asset
Value | Market
Price | Net
Asset
Value | Market
Price |
| Global X Guru® Index ETF | 2.58% | 2.49% | -2.02% | -1.95% | 3.49% | 3.47% | 4.31% | 4.29% |
| Solactive Guru Index | 1.96% | 1.96% | -2.12% | -2.12% | 3.48% | 3.48% | 4.48% | 4.48% |
| S&P 500® Index | 10.14% | 10.14% | 10.36% | 10.36% | 11.01% | 11.01% | 11.18% | 11.18% |
7
Management Discussion of Fund Performance (unaudited)
Global X Guru® Index ETF
Growth of a $10,000 Investment
(At Net Asset Value)

* The Fund commenced operations on June 4, 2012.
The S&P 500® Index is a market capitalization weighted composite index of 500 large capitalization U.S. companies.
The performance data quoted herein represents past performance and the return and value of an investment in the Fund will fluctuate so that, when redeemed, it may be worth less than its original cost. Past performance is no guarantee of future performance and should not be considered as a representation of the future results of the Fund. The Fund’s performance assumes the reinvestment of all dividends and all capital gains. Index returns assume reinvestment of dividends and, unlike the Fund’s returns, do not reflect any fees or expenses. If such fees and expenses were included in the index returns, the performance would have been lower. Please note that one cannot invest directly in an unmanaged index. Performance figures for the periods shown may reflect contractual fee waivers and/or expense reimbursements. In the absence of fee waiver sand/or expense reimbursements (if applicable), returns would have been lower.
There are no assurances that the Fund will meet its stated objectives.
The Fund’s holdings and allocations are subject to change and should not be considered recommendations to buy individual securities.
The graph and table do not reflect the deduction of taxes that a shareholder would pay on Fund distributions or the redemption or sale of Fund shares.
See definition of comparative indices on the previous page.
8
Management Discussion of Fund Performance (unaudited)
Global X SuperIncome™ Preferred ETF
Global X SuperIncome™ Preferred ETF
The Global X SuperIncome™ Preferred ETF (“Fund”) seeks investment results that correspond generally to the price and yield performance, before fees and expenses, of the Global X U.S. High Yield Preferred Index (the “Underlying Index”). The Fund is passively managed, which means the investment adviser does not attempt to take defensive positions in declining markets. The Fund generally seeks to fully replicate the Underlying Index.
The Underlying Index tracks the performance of the highest-yielding preferred securities listed in the United States, as determined by Solactive AG, the administrator of the Underlying Index (“Index Administrator”). The Underlying Index is comprised of preferred stocks that meet certain criteria relating to size, liquidity, issuer concentration and rating, maturity and other requirements, as determined by the Index Administrator. The Underlying Index does not seek to directly reflect the performance of the companies issuing the preferred stock. The Underlying Index is owned and was developed by Global X Management Company LLC, an affiliate of the Fund and the Fund’s investment adviser.
For the 12-month period ended October 31, 2023 (the “reporting period”), the Fund decreased 9.26% and the Underlying Index decreased 9.01%. The Fund had a net asset value of $9.67 per share on October 31, 2022 and ended the reporting period with a net asset value of $8.21 on October 31, 2023.
During the reporting period, the highest returns came from Rithm Capital Corp and Annaly Capital Management Inc., which returned 24.42% and 22.29%, respectively. The worst performers were First Republic Bank and Signature Bank, which returned -99.75% and -99.62%, respectively.
The Fund generated negative returns over the reporting period as challenging geopolitical concerns and monetary policy tightening by central banks weighed negatively on preferred stock and fixed income markets. The U.S. Federal Reserve slowed down its pace of interest rate hikes during the reporting period, however, borrowers continued to feel the negative impact of rising interest costs. Furthermore, the banking sector, one of the primary issuers of preferred securities, continued to face pressure due to regulatory concerns about potential contagion following the collapse of certain regional banks during the middle of the reporting period. This led to fears of widening credit spreads for preferred securities, which dampened valuations during the reporting period. During the reporting period, the Fund had an approximate average sector exposure of 72.04% to Financials, 7.11% to Communication Services, and 5.25% to Utilities.
| | AVERAGE ANNUAL TOTAL RETURN FOR THE YEAR ENDED
OCTOBER 31, 2023 |
| | One Year
Return | Three Year
Return | Five Year
Return | Ten Year
Return |
| | Net
Asset
Value | Market
Price | Net
Asset
Value | Market
Price | Net
Asset
Value | Market
Price | Net
Asset
Value | Market
Price |
| Global X SuperIncome™ Preferred ETF | -9.26% | -9.08% | -3.84% | -3.69% | -0.49% | -0.47% | 0.71% | 0.62% |
| S&P Enhanced Yield North American Preferred Stock Index | -9.01% | -9.01% | -3.37% | -3.37% | 0.00% | 0.00% | 1.28% | 1.28% |
| S&P 500® Index | 10.14% | 10.14% | 10.36% | 10.36% | 11.01% | 11.01% | 11.18% | 11.18% |
9
Management Discussion of Fund Performance (unaudited)
Global X SuperIncome™ Preferred ETF
Growth of a $10,000 Investment
(At Net Asset Value)

* Fund commenced operations on July 16, 2012.
The S&P 500® Index is a market capitalization weighted composite index of 500 large capitalization U.S. companies.
The performance data quoted herein represents past performance and the return and value of an investment in the Fund will fluctuate so that, when redeemed, it may be worth less than its original cost. Past performance is no guarantee of future performance and should not be considered as a representation of the future results of the Fund. The Fund’s performance assumes the reinvestment of all dividends and all capital gains. Index returns assume reinvestment of dividends and, unlike the Fund’s returns, do not reflect any fees or expenses. If such fees and expenses were included in the index returns, the performance would have been lower. Please note that one cannot invest directly in an unmanaged index. Performance figures for the periods shown may reflect contractual fee waivers and/or expense reimbursements. In the absence of fee waiver sand/or expense reimbursements (if applicable), returns would have been lower.
There are no assurances that the Fund will meet its stated objectives.
The Fund’s holdings and allocations are subject to change and should not be considered recommendations to buy individual securities.
The graph and table do not reflect the deduction of taxes that a shareholder would pay on Fund distributions or the redemption or sale of Fund shares.
See definition of comparative indices on the previous page.
10
Management Discussion of Fund Performance (unaudited)
Global X SuperDividend® U.S. ETF
Global X SuperDividend® U.S. ETF
The Global X SuperDividend® U.S. ETF (the “Fund”) seeks to provide investment results that correspond generally to the price and yield performance, before fees and expenses, of the Indxx SuperDividend® U.S. Low Volatility Index (the “Underlying Index”). The Fund is passively managed, which means the investment adviser does not attempt to take defensive positions in declining markets. The Fund generally seeks to fully replicate the Underlying Index.
The Underlying Index is maintained by Indxx, LCC (the “Index Provider”). The Underlying Index tracks the performance of 50 equally weighted common stocks, MLPs and REITs that rank among the highest dividend yielding equity securities in the United States, as defined by the Index Provider. The components of the Underlying Index will have also paid dividends consistently over the last two years. The Underlying Index is comprised of securities that the Index Provider determines to have lower relative volatility than the market.
For the 12-month period ended October 31, 2023 (the “reporting period”), the Fund decreased 12.60% and the Underlying Index decreased 12.09%. The Fund had a net asset value of $19.18 per share on October 31, 2022 and ended the reporting period with a net asset value of $15.62 on October 31, 2023.
During the reporting period, the highest returns came from US Compression Partners LP and Magellan Midsteam Partners, which returned 52.91% and 38.82%, respectively. The worst performers were PetMed Express, Inc. and Lumen Technologies, Inc., which returned -65.20% and -56.11%, respectively.
The Fund generated negative returns during the reporting period as elevated interest rates resulted in higher borrowing costs, reduced profit margins, and increased pressures on underlying constituents. This negatively impacted interest rate sensitive sectors within the Fund such as real estate investment trusts (REITs) and utilities. A strong U.S. dollar, coupled with slower-than-expected economic activity globally weighed negatively on energy prices, creating mixed impacts on the Fund’s energy holdings. Lastly, the rise in financing costs translated into reduced cash flows for REITs, due to increased carrying costs for acquisitions and development projects. During the reporting period, the Fund had an average sector exposure of 23.89% to Energy, 15.24% to Consumer Staples and 14.41% to Financials.
| | AVERAGE ANNUAL TOTAL RETURN FOR THE YEAR ENDED
OCTOBER 31, 2023 |
| | One Year
Return | Three Year
Return | Five Year
Return | Ten Year
Return |
| | Net
Asset
Value | Market
Price | Net
Asset
Value | Market
Price | Net
Asset
Value | Market
Price | Net
Asset
Value | Market
Price |
| Global X SuperDividend® U.S. ETF | -12.60% | 12.59% | 8.01% | 8.03% | -2.01% | -2.00% | 1.65% | 1.65% |
| Indxx SuperDividend U.S. Low Volatility Index | -12.09% | -12.09% | 8.52% | 8.52% | -1.66% | -1.66% | 2.21% | 2.21% |
| S&P 500 Index (Gross) | 10.14% | 10.14% | 10.36% | 10.36% | 11.01% | 11.01% | 11.18% | 11.18% |
11
Management Discussion of Fund Performance (unaudited)
Global X SuperDividend® U.S. ETF
Growth of a $10,000 Investment
(At Net Asset Value)
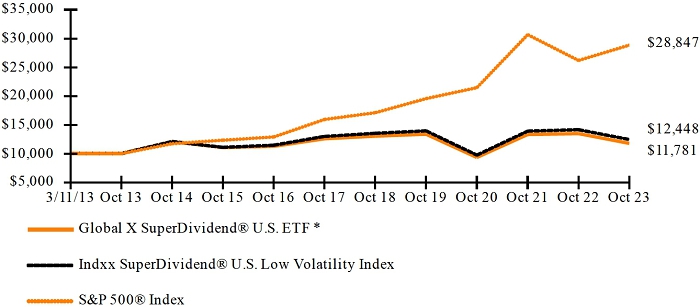
* The Fund commenced operations on March 11, 2013.
The S&P 500® Index is a market capitalization weighted composite index of 500 large capitalization U.S. companies.
The performance data quoted herein represents past performance and the return and value of an investment in the Fund will fluctuate so that, when redeemed, it may be worth less than its original cost. Past performance is no guarantee of future performance and should not be considered as a representation of the future results of the Fund. The Fund’s performance assumes the reinvestment of all dividends and all capital gains. Index returns assume reinvestment of dividends and, unlike the Fund’s returns, do not reflect any fees or expenses. If such fees and expenses were included in the index returns, the performance would have been lower. Please note that one cannot invest directly in an unmanaged index. Performance figures for the periods shown may reflect contractual fee waivers and/or expense reimbursements. In the absence of fee waiver sand/or expense reimbursements (if applicable), returns would have been lower.
There are no assurances that the Fund will meet its stated objectives.
The Fund’s holdings and allocations are subject to change and should not be considered recommendations to buy individual securities.
The graph and table do not reflect the deduction of taxes that a shareholder would pay on Fund distributions or the redemption or sale of Fund shares.
See definition of comparative indices on the previous page.
12
Management Discussion of Fund Performance (unaudited)
Global X S&P 500® Covered Call ETF
Global X S&P 500® Covered Call ETF
The Global X S&P 500 Covered Call ETF (“Fund”) seeks to provide investment results that correspond generally to the price and yield performance, before fees and expenses, of the Cboe S&P 500 BuyWrite Index (the “Underlying Index”). The Fund is passively managed, which means the investment adviser does not attempt to take defensive positions in declining markets. The Fund generally seeks to fully replicate the Underlying Index.
The Underlying Index is comprised of two parts: (1) all the equity securities in the S&P 500® Index (the “Reference Index”) in substantially similar weight as the Reference Index; and (2) short (written) call options on up to 100% of the S&P 500® Index.
For the 12-month period ending October 31, 2023 (the “reporting period”), the Fund increased 6.45%, while the Underlying Index increased 7.27%. The Fund had a net asset value of $40.00 per share on October 31, 2022 and ended the reporting period with a net asset value of $38.18 on October 31, 2023.
During the reporting period, the highest returns came from Meta Platforms Inc. Class-A and Nvidia Corp., which returned 223.39% and 202.32%, respectively. The worst performers were Signature Bank and SVB Financial Group, which returned -99.92% and -99.83%, respectively.
The Fund recorded positive returns during the reporting period as a slower pace of interest rate hikes by the Federal Reserve positively impacted the valuations of the growth-style names held within the Underlying Index. Concurrently, corporate earnings largely met market expectations and quelled concerns over an impending recession and drove investor confidence in U.S. markets, including holdings within the Fund. Market volatility was subdued, on a relative basis, and the Fund’s buy-write strategy contributed to a level of underperformance relative to the Reference Index. Despite the Fund’s inability to participate in the Reference Index’s upward price appreciation, the Fund still managed to generate positive returns during the reporting period due to the premiums produced by its buy-write option strategy.
| | AVERAGE ANNUAL TOTAL RETURN FOR THE YEAR ENDED
OCTOBER 31, 2023 |
| | One Year Return | Three Year Return | Five Year Return | Ten Year
Return |
| | Net
Asset
Value | Market
Price | Net
Asset
Value | Market
Price | Net
Asset
Value | Market
Price | Net
Asset
Value | Market
Price |
| Global X S&P 500® Covered Call ETF | 6.45% | 6.50% | 7.49% | 7.13% | 4.50% | 4.47% | 6.01% | 6.52% |
| Hybrid S&P 500® Stock Covered Call Index/CBOE S&P 500 2% OTM BuyWrite Index/CBOE S&P 500 BuyWrite Index** | 7.27% | 7.27% | 8.30% | 8.30% | 5.45% | 5.45% | 6.40% | 6.40% |
| S&P 500® Index | 10.14% | 10.14% | 10.36% | 10.36% | 11.01% | 11.01% | 11.18% | 11.18% |
13
Management Discussion of Fund Performance (unaudited)
Global X S&P 500® Covered Call ETF
Growth of a $10,000 Investment
(At Net Asset Value)

* The Fund commenced operations on June 21, 2013.
** Hybrid Index performance reflects the performance of the S&P 500® Stock Covered Call Index through September 14, 2017, the CBOE S&P 500 2% OTM BuyWrite Index through August 20, 2020 and the CBOE S&P 500 BuyWrite Index thereafter.
The Fund operated as the Horizons S&P 500® Covered Call ETF (the “Predecessor Fund”), a series of Horizons ETF Trust I, prior to the Fund’s acquisition of the assets and assumption of the liabilities of the Predecessor Fund on December 24, 2018 (See Note 1 in Notes to Financial Statements).
The S&P 500® Index is a market capitalization weighted composite index of 500 large capitalization U.S. companies.
The performance data quoted herein represents past performance and the return and value of an investment in the Fund will fluctuate so that, when redeemed, it may be worth less than its original cost. Past performance is no guarantee of future performance and should not be considered as a representation of the future results of the Fund. The Fund’s performance assumes the reinvestment of all dividends and all capital gains. Index returns assume reinvestment of dividends and, unlike the Fund’s returns, do not reflect any fees or expenses. If such fees and expenses were included in the index returns, the performance would have been lower. Please note that one cannot invest directly in an unmanaged index. Performance figures for the periods shown may reflect contractual fee waivers and/or expense reimbursements. In the absence of fee waiver sand/or expense reimbursements (if applicable), returns would have been lower.
There are no assurances that the Fund will meet its stated objectives.
The Fund’s holdings and allocations are subject to change and should not be considered recommendations to buy individual securities.
14
Management Discussion of Fund Performance (unaudited)
Global X S&P 500® Covered Call ETF
The graph and table do not reflect the deduction of taxes that a shareholder would pay on Fund distributions or the redemption or sale of Fund shares.
See definition of comparative indices on the previous page.
15
Management Discussion of Fund Performance (unaudited)
Global X NASDAQ 100® Covered Call ETF
Global X NASDAQ 100® Covered Call ETF
The Global X Nasdaq 100® Covered Call ETF (the “Fund”) seeks to provide investment results that correspond generally to the price and yield performance, before fees and expenses, of the CBOE Nasdaq-100® BuyWrite V2 Index (the “Underlying Index”). The Fund is passively managed and the investment adviser does not attempt to take defensive positions in declining markets. The Fund generally seeks to fully replicate the Underlying Index.
The CBOE Nasdaq-100® BuyWrite Index (“BXN Index”) is a benchmark index that measures the performance of a theoretical portfolio that holds a portfolio of the stocks included in the Nasdaq-100® Index (“Reference Index”), and “writes” (or sells) a succession of one-month at-the-money (“ATM”) covered call options on the Reference Index. The Underlying Index replicates the methodology used to calculate the BXN Index, with one exception: the written Reference Index covered call options are held until one day prior to the expiration date (i.e., generally the Thursday preceding the Third Friday of the month) and are liquidated at a volume weighted average price determined at the close.
For the 12-month period ending October 31, 2023 (the “reporting period”), the Fund increased 15.91%, while the Underlying Index increased 16.68%. The Fund had a net asset value of $16.15 per share on October 31, 2022 and ended the reporting period with a net asset value of $16.60 on October 31, 2023.
During the reporting period, the highest returns came from Meta Platforms Inc- Class A and Nvidia Corp, which returned 223.39% and 202.32%, respectively. The worst performers were Enphase Energy Inc and Lucid Group Inc, which returned -74.49% and -71.17%, respectively.
During the reporting period, the Fund experienced positive performance as the adoption of new machine learning platforms and advancements in artificial intelligence technology resulted in valuation expansions for technology sector constituents within the Fund. The Fund underperformed its Reference Index during the reporting period since its covered call strategy mitigates the upside potential for options premiums. During the reporting period, the Fund had average stock exposure of 48.60% to the Information Technology sector, 16.14% to the Communication Services sector and 14.43% to the Consumer Discretionary sector.
| | AVERAGE ANNUAL TOTAL RETURN FOR THE YEAR ENDED
OCTOBER 31, 2023 |
| | One Year Return | Three Year Return | Five Year Return | Annualized
Inception to Date* |
| | Net
Asset
Value | Market
Price | Net
Asset
Value | Market
Price | Net
Asset
Value | Market
Price | Net
Asset
Value | Market
Price |
| Global X NASDAQ 100® Covered Call ETF | 15.91% | 16.05% | 5.09% | 5.04% | 4.93% | 4.88% | 6.67% | 6.66% |
| Hybrid CBOE NASDAQ-100® BuyWrite Index/CBOE NASDAQ-100® BuyWrite V2 Index** | 16.68% | 16.68% | 5.61% | 5.61% | 5.94% | 5.94% | 7.53% | 7.53% |
| NASDAQ 100® Total Return Index | 27.45% | 27.45 | 10.12% | 10.12% | 16.68% | 16.68% | 16.68% | 16.68% |
16
Management Discussion of Fund Performance (unaudited)
Global X NASDAQ 100® Covered Call ETF
Growth of a $10,000 Investment
(At Net Asset Value)

* The Fund commenced operations on December 11, 2013.
** Hybrid Index performance reflects the performance of the CBOE NASDAQ-100® BuyWrite Index through October 14, 2015 and CBOE NASDAQ-100® BuyWrite V2 Index thereafter.
The Fund operated as the Horizons NASDAQ 100® Covered Call ETF (the “Predecessor Fund”), a series of Horizons ETF Trust I, prior to the Fund’s acquisition of the assets and assumption of the liabilities of the Predecessor Fund on December 24, 2018 (See Note 1 in Notes to Financial Statements).
On October 14, 2015, Global X Management Company LLC (The “Advisor”) changed the Fund’s primary benchmark from the BXN Index to BXNT Index in connection with a change in the Fund’s principal strategies. The Advisor believes the BXNT Index is a better measure of the Fund’s performance. Returns reflect a blended benchmark.
The Nasdaq-100® Index includes 100 of the largest domestic and international non-financial companies listed on The Nasdaq Stock Market based on market capitalization.
The performance data quoted herein represents past performance and the return and value of an investment in the Fund will fluctuate so that, when redeemed, it may be worth less than its original cost. Past performance is no guarantee of future performance and should not be considered as a representation of the future results of the Fund. The Fund’s performance assumes the reinvestment of all dividends and all capital gains. Index returns assume reinvestment of dividends and, unlike the Fund’s returns, do not reflect any fees or expenses. If such fees and expenses were included in the index returns, the performance would have been lower. Please note that one cannot invest directly in an unmanaged index. Performance figures for the periods shown may reflect contractual fee waivers and/or expense reimbursements. In the absence of fee waiver sand/or expense reimbursements (if applicable), returns would have been lower.
There are no assurances that the Fund will meet its stated objectives.
17
Management Discussion of Fund Performance (unaudited)
Global X NASDAQ 100® Covered Call ETF
The Fund’s holdings and allocations are subject to change and should not be considered recommendations to buy individual securities.
The graph and table do not reflect the deduction of taxes that a shareholder would pay on Fund distributions or the redemption or sale of Fund shares.
See definition of comparative indices on the previous page.
18
Management Discussion of Fund Performance (unaudited)
Global X MSCI SuperDividend® Emerging Markets ETF
Global X MSCI SuperDividend® Emerging Markets ETF
The Global X MSCI SuperDividend® Emerging Markets ETF (the “Fund”) seeks to provide investment results that correspond generally to the price and yield performance, before fees and expenses, of the MSCI Emerging Markets Top 50 Dividend Index (the “Underlying Index”). The Fund is passively managed and the investment adviser does not attempt to take defensive positions in declining markets. The Fund generally seeks to fully replicate the Underlying Index.
The Underlying Index is based on the MSCI Emerging Markets Index, its parent index (the “Parent Index”), which includes large and mid-cap stocks across 23 emerging markets countries. The Underlying Index aims to reflect the performance of 50 securities from the Parent Index, selected by dividend yield that have increased or maintained their dividend per share compared to the previous year or have increased or maintained their payout ratio (defined as dividend per share/earnings per share) if the dividend per share has dropped by up to 10%.
For the 12-month period ended October 31, 2023 (the “reporting period”), the Fund increased 13.77%, while the Underlying Index increased 14.97%. The Fund had a net asset value of $21.36 per share on October 31, 2022 and ended the reporting period with a net asset value of $22.48 on October 31, 2023, following a 1:3 reverse share split on December 19, 2022.
During the reporting period, the highest returns came from Lite-On Technology Corp. and Eastern Co, which returned 128.95% and 122.87%, respectively. The worst performers were Shanghai Lujiazui Fin & Trad-B and Braskem SA-Pref A, which returned -45.22% and -40.01%, respectively.
The Fund experienced a positive return during the reporting period as the reorganization of strategic supply chains supported opportunities for companies in emerging markets. China’s reopening, following the relaxation of COVID-19 restrictions, led to a resurgence in private consumption. Technology holdings in Taiwan experienced positive sentiment, as manufacturers of chips and electronics benefited from a tech-driven rally in the first half of 2023. During the reporting period, exporters from emerging market nations generally benefited from a strengthening dollar and higher oil prices. This positively impacted holdings within the energy sector, particularly global petroleum and oil refiners, which saw increased demand for refining capacity. During the reporting period, the Fund had an average stock exposure of 26.27% in China, 15.10% in Taiwan and 12.55% in Brazil. By sector, it had the highest average exposure to Materials at 30.28%, Financials at 20.86% and Energy at 17.88%.
| | AVERAGE ANNUAL TOTAL RETURN FOR THE YEAR ENDED
OCTOBER 31, 2023 |
| | One Year
Return | Three Year
Return | Five Year
Return | Annualized
Inception to Date* |
| | Net
Asset
Value | Market
Price | Net
Asset
Value | Market
Price | Net
Asset
Value | Market
Price | Net
Asset
Value | Market
Price |
| Global X MSCI SuperDividend® Emerging Markets ETF | 13.77% | 13.34% | -0.31% | -0.55% | -3.46% | -3.43% | -1.39% | -1.42% |
| Hybrid INDXX SuperDividend Emerging Markets Index/MSCI Emerging Markets Top 50 Dividend Index | 14.97% | 14.97% | 0.39% | 0.39% | -2.64% | -2.64% | -0.34% | -0.34% |
| MSCI Emerging Markets Index (Net) | 10.80% | 10.80% | -3.67% | -3.67% | 1.59% | 1.59% | 2.15% | 2.15% |
19
Management Discussion of Fund Performance (unaudited)
Global X MSCI SuperDividend® Emerging Markets ETF
Growth of a $10,000 Investment
(At Net Asset Value)

* The Fund commenced operations on March 16, 2015.
** Hybrid Index performance reflects the performance of the INDXX SuperDividend® Emerging Markets Index through November 15, 2016 and the MSCI Emerging Markets Top 50 Dividend Index thereafter.
The MSCI Emerging Markets Index (Net) is a free float-adjusted market capitalization index that is designed to measure equity market performance of emerging markets.
The performance data quoted herein represents past performance and the return and value of an investment in the Fund will fluctuate so that, when redeemed, it may be worth less than its original cost. Past performance is no guarantee of future performance and should not be considered as a representation of the future results of the Fund. The Fund’s performance assumes the reinvestment of all dividends and all capital gains. Index returns assume reinvestment of dividends and, unlike the Fund’s returns, do not reflect any fees or expenses. If such fees and expenses were included in the index returns, the performance would have been lower. Please note that one cannot invest directly in an unmanaged index.
Performance figures for the periods shown may reflect contractual fee waivers and/or expense reimbursements. In the absence of fee waiver sand/or expense reimbursements (if applicable), returns would have been lower.
There are no assurances that the Fund will meet its stated objectives.
The Fund’s holdings and allocations are subject to change and should not be considered recommendations to buy individual securities.
The graph and table do not reflect the deduction of taxes that a shareholder would pay on Fund distributions or the redemption or sale of Fund shares.
See definition of comparative indices on the previous page.
20
Management Discussion of Fund Performance (unaudited)
Global X SuperDividend® REIT ETF
Global X SuperDividend® REIT ETF
The Global X SuperDividend® REIT ETF (the “Fund”) seeks to provide investment results that correspond generally to the price and yield performance, before fees and expenses, of the Solactive Global SuperDividend® REIT Index (the “Underlying Index”). The Fund is passively managed, which means the investment adviser does not attempt to take defensive positions in declining markets. The Fund generally seeks to fully replicate the Underlying Index.
The Underlying Index tracks the performance of Real Estate Investment Trusts (“REITs”) that rank among the highest yielding REITs globally, as determined by Solactive AG, the provider of the Underlying Index.
For the 12-month period ended October 31, 2023 (the “reporting period”), the Fund decreased 6.97% and the Underlying Index decreased 6.32%. The Fund had a net asset value of $21.65 per share on October 31, 2022 and ended the reporting period with a net asset value of $18.67 on October 31, 2023, following a 1:3 reverse share split on December 19, 2022.
During the reporting period, the highest returns came from AGNC Investment Corp. and Annaly Capital Management, Inc., which returned 47.80% and 30.94%, respectively. The worst performers were Northwest Healthcare Properties and Global Net Lease Inc, which returned -63.31% and -40.61%, respectively.
The Fund generated negative returns over the reporting period as tightening credit conditions, declining demand for commercial office space, and rising interest rates weighed down REIT performance. Increasing financing costs made it difficult for REITs to fund acquisitions and development projects. This led to reduced prospects for growth and negatively impacted the Fund’s constituents. REITs concentrated in long-term care and data center facilities performed well during the reporting period, while holdings concentrated in office space and mortgage investments exhibited negative performance. Furthermore, upward wage pressure and reduced leasing activities adversely impacted the profitability of underlying portfolio companies. During the reporting period, the Fund had an average approximate exposure of 58.68% to the United States and 18.28% to Singapore.
| | AVERAGE ANNUAL TOTAL RETURN FOR THE YEAR ENDED
OCTOBER 31, 2023 |
| | One Year
Return | Three Year
Return | Five Year
Return | Annualized
Inception to Date* |
| | Net
Asset
Value | Market
Price | Net
Asset
Value | Market
Price | Net
Asset
Value | Market
Price | Net
Asset
Value | Market
Price |
| Global X SuperDividend® REIT ETF | -6.97% | -6.46% | 0.59% | 0.54% | -8.96% | -8.98% | -2.37% | -2.37% |
| Solactive Global SuperDividend® REIT Index | -6.32% | -6.32% | 1.08% | 1.08% | -8.59% | -8.59% | -1.85% | -1.85% |
| S&P 500® Index | 10.14% | 10.14% | 10.36% | 10.36% | 11.01% | 11.01% | 10.48% | 10.48% |
21
Management Discussion of Fund Performance (unaudited)
Global X SuperDividend® REIT ETF
Growth of a $10,000 Investment
(At Net Asset Value)

* The Fund commenced operations on March 16, 2015.
The S&P 500® Index is a market capitalization weighted composite index of 500 large capitalization U.S. companies.
The performance data quoted herein represents past performance and the return and value of an investment in the Fund will fluctuate so that, when redeemed, it may be worth less than its original cost. Past performance is no guarantee of future performance and should not be considered as a representation of the future results of the Fund. The Fund’s performance assumes the reinvestment of all dividends and all capital gains. Index returns assume reinvestment of dividends and, unlike the Fund’s returns, do not reflect any fees or expenses. If such fees and expenses were included in the index returns, the performance would have been lower. Please note that one cannot invest directly in an unmanaged index. Performance figures for the periods shown may reflect contractual fee waivers and/or expense reimbursements. In the absence of fee waiver sand/or expense reimbursements (if applicable), returns would have been lower.
There are no assurances that the Fund will meet its stated objectives.
The Fund’s holdings and allocations are subject to change and should not be considered recommendations to buy individual securities.
The graph and table do not reflect the deduction of taxes that a shareholder would pay on Fund distributions or the redemption or sale of Fund shares.
See definition of comparative indices on the previous page.
22
Management Discussion of Fund Performance (unaudited)
Global X Renewable Energy Producers ETF
Global X Renewable Energy Producers ETF
The Global X Renewable Energy Producers ETF (the “Fund”) seeks to provide investment results that correspond generally to the price and yield performance, before fees and expenses, of the Indxx Renewable Energy Producers Index (the “Underlying Index”). The Fund is passively managed, which means the investment adviser does not attempt to take defensive positions in declining markets. The Fund generally seeks to fully replicate the Underlying Index.
The Underlying Index is designed to provide exposure to publicly traded companies that produce energy from renewable sources including wind, solar, hydroelectric, geothermal, and biofuels (including publicly traded companies that are formed to own operating assets that produce defined cash flows, as defined by Indxx LLC, the provider of the Underlying Index.
For the 12-month period ended October 31, 2023 (the “reporting period”), the Fund decreased 27.93%, while the Underlying Index decreased 27.72%. The Fund had a net asset value of $13.05 per share on October 31, 2022 and ended the reporting period with a net asset value of $9.30 on October 31, 2023.
During the reporting period, the highest returns came from Concord New Energy Goup Ltd and Verbund AG which returned 26.85% and 15.91%, respectively. The worst performers were Enviva Inc and Renova Inc, which returned -93.73% and -67.62%, respectively.
The Fund recorded negative performance over the reporting period, as renewable energy producers saw their performances impacted by higher interest rates, long permitting timelines, and project delays, as well as elevated materials costs throughout the wind and solar power value chains. Within the solar industry developers faced dampened residential and commercial demand in key markets, such as the U.S. and China. Notably, high polysilicon costs translated into higher costs across the entire solar power value chain, impacting demand and leading to project delays. In the U.S., policy uncertainty over tariffs at the federal level and shifting policies for residential solar in California also created headwinds. Wind power project developers faced continued challenges within the supply chain, along with pressures due to elevated project costs and higher interest rates. During the reporting period, the Fund had an average approximate stock exposure of 12.54% in Canada, 11.88% in the United States, 11.60% in Brazil and 10.72% in New Zealand.
| | AVERAGE ANNUAL TOTAL RETURN FOR THE YEAR ENDED
OCTOBER 31, 2023 |
| | One Year
Return | Three Year
Return | Five Year
Return | Annualized
Inception to Date* |
| | Net
Asset
Value | Market
Price | Net
Asset
Value | Market
Price | Net
Asset
Value | Market
Price | Net
Asset
Value | Market
Price |
| Global X Renewable Energy Producers ETF | -27.93% | -28.37% | -13.28% | -13.44% | -2.02% | -1.98% | -2.51% | -2.58% |
| Hybrid Indxx Renewable Energy Producers Index** | -27.72% | -27.72% | -12.95% | -12.95% | 1.59% | 1.59% | -2.15% | -2.15% |
| MSCI ACWI (Net) | 10.50% | 10.50% | 6.68% | 6.68% | 7.47% | 7.47% | 6.46% | 6.46% |
23
Management Discussion of Fund Performance (unaudited)
Global X Renewable Energy Producers ETF
Growth of a $10,000 Investment
(At Net Asset Value)

* Fund commenced operations on May 27, 2015.
**Hybrid index performance reflects the performance of the Indxx Global YieldCo Index through November 18, 2018 and the Indxx YieldCo & Renewable Energy Income Index thereafter. Effective February 1, 2021, the name of the Underlying Index changed from Indxx YieldCo & Renewable Energy Income Index to the Indxx Renewable Energy Producers Index.
The MSCI ACWI (Net) (All Country World Index) Index is a free float-adjusted market capitalization weighted index that is designed to measure the equity market performance of developed and emerging markets.
The performance data quoted herein represents past performance and the return and value of an investment in the Fund will fluctuate so that, when redeemed, it may be worth less than its original cost. Past performance is no guarantee of future performance and should not be considered as a representation of the future results of the Fund. The Fund’s performance assumes the reinvestment of all dividends and all capital gains. Index returns assume reinvestment of dividends and, unlike the Fund’s returns, do not reflect any fees or expenses. If such fees and expenses were included in the index returns, the performance would have been lower. Please note that one cannot invest directly in an unmanaged index. Performance figures for the periods shown may reflect contractual fee waivers and/or expense reimbursements. In the absence of fee waiver sand/or expense reimbursements (if applicable), returns would have been lower.
There are no assurances that the Fund will meet its stated objectives.
The Fund’s holdings and allocations are subject to change and should not be considered recommendations to buy individual securities.
The graph and table do not reflect the deduction of taxes that a shareholder would pay on Fund distributions or the redemption or sale of Fund shares.
24
Management Discussion of Fund Performance (unaudited)
Global X Renewable Energy Producers ETF
High short term performance of the fund is unusual and investors should not expect such performance to be repeated.
See definition of comparative indices on the previous page
25
Management Discussion of Fund Performance (unaudited)
Global X S&P 500® Catholic Values ETF
Global X S&P 500® Catholic Values ETF
The Global X S&P 500® Catholic Values ETF (the “Fund”) seeks investment results that correspond generally to the price and yield performance, before fees and expenses, of the S&P 500® Catholic Values Index (the “Underlying Index”). The Fund is passively managed, which means the investment adviser does not attempt to take defensive positions in declining markets. The Fund generally seeks to fully replicate the Underlying Index.
The S&P 500® Catholic Values Index is designed to provide exposure to U.S. equity securities included in the S&P 500® Index while maintaining alignment with the moral and social teachings of the Catholic Church. The Underlying Index is based on the S&P 500® Index, and generally comprises approximately 500 or less U.S. listed common stocks. All index constituents are members of the S&P 500® Index and follow the eligibility criteria for that index. From this starting universe, constituents are screened to exclude companies involved in activities which are perceived to be inconsistent with Catholic values as outlined in the Socially Responsible Investment Guidelines of the United States Conference of Catholic Bishops. The Underlying Index then reweights the remaining constituents so that the Underlying Index’s sector exposures matches the sector exposures of the S&P 500® Index.
For the 12-month period ended October 31, 2023 (the “reporting period”), the Fund increased 9.22%, while the Underlying Index increased 9.56%. The Fund had a net asset value of $47.19 per share on October 31, 2022 and ended the reporting period with a net asset value of $50.89 on October 31, 2023.
During the reporting period, the highest returns came from Meta Platforms Inc Class-A and Nvidia Corp, which returned 223.39% and 202.32%, respectively. The worst performers were Signature Bank and SVB Financial Group, which returned -99.92% and -99.83%, respectively.
The Fund recorded positive performance over the reporting period as the Federal Reserve’s pace of interest rate hikes slowed due to positive inflation data. Improved market estimates of economic growth resulted in increased stock valuations for companies held by the Fund. Artificial Intelligence and robotics technology enabled additional growth avenues for information technology companies, the largest sector exposure of the Fund. Furthermore, positive inflation adjusted wage growth in the labor market helped the U.S. economy remain resilient. During the reporting period, the Fund had an average approximate sector exposure to Information Technology at 25.76%, Health Care at 14.15% and Financials at 13.38%.
| | AVERAGE TOTAL RETURN FOR THE YEAR ENDED
OCTOBER 31, 2023 |
| | One Year
Return | Three Year
Return | Five Year
Return | Annualized
Inception to Date* |
| | Net
Asset
Value | Market
Price | Net
Asset
Value | Market
Price | Net
Asset
Value | Market
Price | Net
Asset
Value | Market
Price |
| Global X S&P 500® Catholic Values ETF | 9.22% | 9.20% | 9.38% | 9.63% | 10.36% | 10.36% | 11.20% | 11.20% |
| S&P 500® Catholic Values Index | 9.56% | 9.56% | 9.68% | 9.68% | 10.70% | 10.70% | 11.16% | 11.16% |
| S&P 500® Index | 10.14% | 10.14% | 10.36% | 10.36% | 11.01% | 11.01% | 11.66% | 11.66% |
26
Management Discussion of Fund Performance (unaudited)
Global X S&P 500® Catholic Values ETF
Growth of a $10,000 Investment
(At Net Asset Value)

* Fund commenced operations on April 18, 2016.
The S&P 500® Index is a market capitalization weighted composite index of 500 large capitalization U.S. companies.
The performance data quoted herein represents past performance and the return and value of an investment in the Fund will fluctuate so that, when redeemed, it may be worth less than its original cost. Past performance is no guarantee of future performance and should not be considered as a representation of the future results of the Fund. The Fund’s performance assumes the reinvestment of all dividends and all capital gains. Index returns assume reinvestment of dividends and, unlike the Fund’s returns, do not reflect any fees or expenses. If such fees and expenses were included in the index returns, the performance would have been lower. Please note that one cannot invest directly in an unmanaged index. Performance figures for the periods shown may reflect contractual fee waivers and/or expense reimbursements. In the absence of fee waiver sand/or expense reimbursements (if applicable), returns would have been lower.
There are no assurances that the Fund will meet its stated objectives.
The Fund’s holdings and allocations are subject to change and should not be considered recommendations to buy individual securities.
The graph and table do not reflect the deduction of taxes that a shareholder would pay on Fund distributions or the redemption or sale of Fund shares.
See definition of comparative indices on the previous page.
27
Management Discussion of Fund Performance (unaudited)
Global X MSCI SuperDividend® EAFE ETF
Global X MSCI SuperDividend® EAFE ETF
The Global X MSCI SuperDividend® EAFE ETF (the “Fund”) seeks to provide investment results that correspond generally to the price and yield performance, before fees and expenses, of the MSCI EAFE Top 50 Dividend Index (the “Underlying Index”). The Fund is passively managed, which means the investment adviser does not attempt to take defensive positions in declining markets. The Fund generally seeks to fully replicate the Underlying Index.
The Underlying Index tracks the performance of 50 equally-weighted companies that rank among the highest dividend yielding equity securities in Europe, Australasia and the Far East, as defined by MSCI, the provider of the Underlying Index.
For the 12-month period ended October 31, 2023 (the “reporting period”), the Fund increased 14.08%, while the Underlying Index increased 14.21%. The Fund had a net asset value of $11.98 per share on October 31, 2022 and ended the reporting period with a net asset value of $12.76 on October 31, 2023.
During the reporting period, the highest returns came from Swiss RE AG and Kawasaki Kisen Kaisha Ltd, which returned 55.89% and 54.17%, respectively. The worst performers were Aroundtown SA and Xinyi Glass Holdings Ltd, which returned -55.79% and -22.82%, respectively.
The Fund performed positively during the reporting period as developed market central banks signaled potential pauses to interest rate hikes, particularly in the European Union, as weaker growth and cooling labor markets eased inflation tensions. Purchases of long-term Gilts by the Bank of England helped stabilize the United Kingdom’s local currency in response to market dislocations from its budget proposal during the reporting period. Multinational insurance companies domiciled in Europe were positively impacted, spurred by higher investment earnings from elevated interest rates. Japanese holdings within the Fund outperformed regional peers, driven by strong economic data which increased foreign investment inflows. Japanese transport companies within the Fund such as oil tankers, container ships and liquefied natural gas (LNG) carriers, benefited from increased exports related to automobiles and a continued pickup in LNG spot charter rates. During the reporting period, the Fund had the highest average exposure to United Kingdom at 16.18% and Japan at 12.72%. By sector, the Fund had the highest average exposure to Financials at 30.90% and Communication Services at 14.92%.
| | AVERAGE TOTAL RETURN FOR THE YEAR ENDED
OCTOBER 31, 2023 |
| | One Year
Return | Three Year
Return | Five Year
Return | Annualized
Inception to Date* |
| | Net
Asset
Value | Market
Price | Net
Asset
Value | Market
Price | Net
Asset
Value | Market
Price | Net
Asset
Value | Market
Price |
| Global X MSCI SuperDividend® EAFE ETF | 14.08% | 14.94% | 10.14% | 10.29% | 1.49% | 1.52% | 3.64% | 3.51% |
| MSCI EAFE Top 50 Dividend Index | 14.21% | 14.21% | 10.64% | 10.64% | 1.98% | 1.98% | 4.11% | 4.11% |
| MSCI EAFE Index (Net) | 14.40% | 14.40% | 5.73% | 5.73% | 4.10% | 4.10% | 5.34% | 5.34% |
28
Management Discussion of Fund Performance (unaudited)
Global X MSCI SuperDividend® EAFE ETF
Growth of a $10,000 Investment
(At Net Asset Value)

* The Fund commenced operations on November 14, 2016.
The MSCI EAFE Index (Net) (Europe, Australasia, Far East) is a free float-adjusted market capitalization index that is designed to measure the equity market performance of developed markets, excluding the US & Canada.
The performance data quoted herein represents past performance and the return and value of an investment in the Fund will fluctuate so that, when redeemed, it may be worth less than its original cost. Past performance is no guarantee of future performance and should not be considered as a representation of the future results of the Fund. The Fund’s performance assumes the reinvestment of all dividends and all capital gains. Index returns assume reinvestment of dividends and, unlike the Fund’s returns, do not reflect any fees or expenses. If such fees and expenses were included in the index returns, the performance would have been lower. Please note that one cannot invest directly in an unmanaged index. Performance figures for the periods shown may reflect contractual fee waivers and/or expense reimbursements. In the absence of fee waiver sand/or expense reimbursements (if applicable), returns would have been lower.
There are no assurances that the Fund will meet its stated objectives.
The Fund’s holdings and allocations are subject to change and should not be considered recommendations to buy individual securities.
The graph and table do not reflect the deduction of taxes that a shareholder would pay on Fund distributions or the redemption or sale of Fund shares.
See definition of comparative indices on the previous page.
29
Management Discussion of Fund Performance (unaudited)
Global X E-commerce ETF
Global X E-commerce ETF
The Global X E-commerce ETF (the “Fund”) seeks to provide investment results that correspond generally to the price and yield performance, before fees and expenses, of the Solactive E-commerce Index (the “Underlying Index”). The Fund is passively managed, which means the investment adviser does not attempt to take defensive positions in declining markets. The Fund generally seeks to fully replicate the Underlying Index.
The Underlying Index is designed to provide exposure to exchange-listed companies that are positioned to benefit from the increased adoption of e-commerce as a distribution model, including but not limited to companies whose principal business is in operating e-commerce platforms, providing e-commerce software and services, and/or selling goods and services online (collectively, “E-commerce Companies”), as defined by Solactive AG, the provider of the Underlying Index.
For the 12-month period ended October 31, 2023 (the “reporting period”), the Fund increased 12.13%, while the Underlying Index increased 12.60%. The Fund had a net asset value of $15.14 per share on October 31, 2022 and ended the reporting period with a net asset value of $16.96 on October 31, 2023.
During the reporting period, the highest returns came from Ehealth Inc and Ocado Group Plc, which returned 220.15% and 121.99%, respectively. The worst performers were Qurate Retail Inc Series-A and Liveperson Inc, which returned -81.17% and -75.02%, respectively.
The Fund achieved positive returns during the reporting period, benefitting from the e-commerce landscape’s shift towards an omnichannel business model. This evolution to an omnichannel business model emphasized the necessity of an online presence, even for traditional brick-and-mortar stores. Industry leaders prioritized technological advancements during the reporting period, notably generative artificial intelligence. Given these changes during the reporting period, E-Commerce Companies delivered personalized product recommendations to consumers, simplified listing options for merchants, enhanced cybersecurity on e-commerce platforms, and introduced efficient chatbots for customer interactions. Additionally, advertising became a prominent revenue source for digital marketplace players within the e-commerce domain. Furthermore, e-commerce’s share of total retail sales continued its upward trajectory during the reporting period. During the reporting period, the Fund had an average approximate stock exposure of 49.95% in the United States and 20.01% in China. By sector, it had the highest average sector exposure to Consumer Discretionary at 65.97% and Communication Services at 14.22%.
| | AVERAGE TOTAL RETURN FOR THE YEAR ENDED
OCTOBER 31, 2023 |
| | One Year
Return | Three Year
Return | Annualized
Inception to Date* |
| | Net Asset
Value | Market
Price | Net Asset
Value | Market
Price | Net Asset
Value | Market
Price |
| Global X E-Commerce ETF | 12.13% | 12.27% | -13.71% | -13.75% | 2.87% | 2.88% |
| Solactive E-Commerce Index | 12.60% | 12.60% | -13.37% | -13.37% | 3.32% | 3.32% |
| MSCI ACWI (Net) | 10.50% | 10.50% | 6.68% | 6.68% | 7.71% | 7.71% |
30
Management Discussion of Fund Performance (unaudited)
Global X E-commerce ETF
Growth of a $10,000 Investment
(At Net Asset Value)
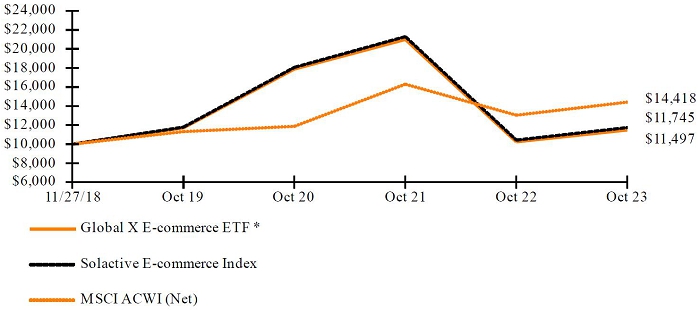
* The Fund commenced operations on November 27, 2018.
The MSCI ACWI (Net) (All Country World Index) Index is a free float-adjusted market capitalization weighted index that is designed to measure the equity market performance of developed and emerging markets.
The performance data quoted herein represents past performance and the return and value of an investment in the Fund will fluctuate so that, when redeemed, it may be worth less than its original cost. Past performance is no guarantee of future performance and should not be considered as a representation of the future results of the Fund. The Fund’s performance assumes the reinvestment of all dividends and all capital gains. Index returns assume reinvestment of dividends and, unlike the Fund’s returns, do not reflect any fees or expenses. If such fees and expenses were included in the index returns, the performance would have been lower. Please note that one cannot invest directly in an unmanaged index. Performance figures for the periods shown may reflect contractual fee waivers and/or expense reimbursements. In the absence of fee waiver sand/or expense reimbursements (if applicable), returns would have been lower.
There are no assurances that the Fund will meet its stated objectives.
The Fund’s holdings and allocations are subject to change and should not be considered recommendations to buy individual securities.
The graph and table do not reflect the deduction of taxes that a shareholder would pay on Fund distributions or the redemption or sale of Fund shares.
See definition of comparative indices above.
31
Management Discussion of Fund Performance (unaudited)
Global X Russell 2000 Covered Call ETF
Global X Russell 2000 Covered Call ETF
The Global X Russell 2000 Covered Call ETF (the “Fund”) seeks to provide investment results that correspond generally to the price and yield performance, before fees and expenses, of the CBOE Russell 2000 BuyWrite Index (“Underlying Index”). The Fund is passively managed and the investment adviser does not attempt to take defensive positions in declining markets. The Fund generally seeks to fully replicate the Underlying Index.
The Underlying Index measures the performance of a theoretical portfolio that holds a portfolio of stocks included in the Russell 2000 Index (the “Reference Index”), and “writes” (or sells) a succession of one-month at-the-money covered call options on the Reference Index. The written covered call options on the Reference Index are held until expiration. The Reference Index is an equity benchmark which measures the performance of the small-capitalization sector of the U.S. equity market, as defined by FTSE Russell, the provider of the Reference Index.
For the 12-month period ending October 31, 2023 (the “reporting period”), the Fund decreased 7.18%, while the Underlying Index decreased 6.92%. The Fund had a net asset value of $19.55 per share on October 31, 2022 and ended the reporting period with a net asset value of $16.10 on October 31, 2023.
During the reporting period, the highest returns came from Reata Pharmaceuticals, Inc. Class A and Prometheus Biosciences Inc, which returned 435.28% and 280.65%, respectively. The worst performers were Babylon Holdings Ltd Class A and Avaya Holdings Corp., which returned -100.00% and -99.97%, respectively.
During the reporting period, the Fund underperformed due to the U.S. regional banking crisis, which hampered the credit and financial position of small businesses. Additionally, high interest rate levels increased borrowing costs and weakened the balance sheets of smaller companies. Investor sentiment decreased as a lack of liquidity raised the chances of borrower default. During the reporting period, the Fund’s options-writing strategy led it to outperform its Reference Index as a result of the premiums received. By sector, the Fund had the highest average exposure to Financials at 11.63% and Industrials at 11.48%.
| | AVERAGE ANNUAL TOTAL RETURN FOR THE YEAR
ENDED
OCTOBER 31, 2023 |
| | One Year
Return | Three Year
Return | Annualized
Inception to Date* |
| | Net Asset
Value | Market
Price | Net Asset
Value | Market
Price | Net Asset
Value | Market
Price |
| Global X Russell 2000 Covered Call ETF | -7.18% | -7.39% | 4.21% | 4.14% | 1.90% | 1.86% |
| CBOE Russell 2000 BuyWrite Index | -6.92% | -6.92% | 4.72% | 4.72% | 2.65% | 2.65% |
| Russell 2000 Index | -8.56% | -8.56% | 3.95% | 3.95% | 2.65% | 2.65% |
32
Management Discussion of Fund Performance (unaudited)
Global X Russell 2000 Covered Call ETF
Growth of a $10,000 Investment
(At Net Asset Value)

* The Fund commenced operations on April 17, 2019.
The Russell 2000 Index is an index measuring the performance of approximately 2,000 smallest-cap American companies in the Russell 3000 Index, which is made up of 3,000 of the largest U.S. stocks. It is a market-cap weighted index.
The performance data quoted herein represents past performance and the return and value of an investment in the Fund will fluctuate so that, when redeemed, it may be worth less than its original cost. Past performance is no guarantee of future performance and should not be considered as a representation of the future results of the Fund. The Fund’s performance assumes the reinvestment of all dividends and all capital gains. Index returns assume reinvestment of dividends and, unlike the Fund’s returns, do not reflect any fees or expenses. If such fees and expenses were included in the index returns, the performance would have been lower. Please note that one cannot invest directly in an unmanaged index. Performance figures for the periods shown may reflect contractual fee waivers and/or expense reimbursements. In the absence of fee waiver sand/or expense reimbursements (if applicable), returns would have been lower.
There are no assurances that the Fund will meet its stated objectives.
The Fund’s holdings and allocations are subject to change and should not be considered recommendations to buy individual securities.
The graph and table do not reflect the deduction of taxes that a shareholder would pay on Fund distributions or the redemption or sale of Fund shares. See definition of comparative indices above.
33
Management Discussion of Fund Performance (unaudited)
Global X S&P Catholic Values Developed ex-US ETF
Global X S&P Catholic Values Developed ex-US ETF
The Global X S&P Catholic Values Developed ex-U.S. ETF (the “Fund”) seeks to provide investment results that correspond generally to the price and yield performance, before fees and expenses, of the S&P Developed Ex-U.S. Catholic Values Index (the “Underlying Index”). The Fund is passively managed, which means the investment adviser does not attempt to take defensive positions in declining markets. The Fund generally seeks to fully replicate the Underlying Index.
The Underlying Index is designed to provide exposure to developed market equity securities outside of the U.S. while maintaining alignment with the moral and social teachings of the Catholic Church. The Underlying Index is based on the S&P EPAC ex-Korea Large Cap Index, a benchmark index that provides exposure to the large capitalization segment of developed markets within the Europe and Asia Pacific regions, excluding Korea. The S&P EPAC ex-Korea Large Cap Index does not target any specific sector exposure. All index constituents are members of the S&P EPAC ex-Korea Large Cap Index and follow the eligibility criteria for that index. From this starting universe, constituents are screened to exclude companies involved in activities which are perceived to be inconsistent with Catholic values as outlined in the Socially Responsible Investment Guidelines of the United States Conference of Catholic Bishops. The Underlying Index then reweights the remaining constituents so that the Underlying Index’s sector exposures match the current sector exposures of the S&P EPAC ex-Korea Large Cap Index.
For the 12-month period ended October 31, 2023 (the “reporting period”), the Fund increased 13.45%, while the Underlying Index increased 13.69%. The Fund had a net asset value of $23.30 per share on October 31, 2022 and ended the reporting period with a net asset value of $25.87 on October 31, 2023.
During the reporting period, the highest returns came from Disco Corp and UniCredit SPA, which returned 119.41% and 111.89%, respectively. The worst performers were Embracer Group AB Class-B and China Evergrande New Energy Vehicle Group Ltd., which returned -66.79% and -66.48%, respectively.
The Fund performed positively during the reporting period as higher exports and lower energy prices drove the performance of developed market equities. Japanese equities within the Fund experienced positive investor sentiment driven by share buybacks and improved economic data within the country. Furthermore, Japanese exports increased from a weakened yen. Fund holdings in the Consumer Discretionary sector were positively impacted by rising consumer confidence as a result of easing inflation, strong wage growth, and low unemployment. Securities of European banks held by the Fund benefited from elevated interest rates in the European Union and United Kingdom resulting in higher net interest income during the reporting period. During the reporting period, the Fund had an average approximate stock exposure of 26.65% in Japan, 12.03% in France and 10.85% in Australia. By sector, it had the highest exposure to Financials at 18.57%, Industrials at 14.35% and Health Care at 14.22%.
34
Management Discussion of Fund Performance (unaudited)
Global X S&P Catholic Values Developed ex-US ETF
| | AVERAGE ANNUAL TOTAL RETURN FOR THE YEAR
ENDED
OCTOBER 31, 2023 |
| | One Year
Return | Three Year
Return | Annualized
Inception to Date* |
| | Net Asset
Value | Market
Price | Net Asset
Value | Market
Price | Net Asset
Value | Market
Price |
| Global X S&P Catholic Values Developed ex-U.S. ETF | 13.45% | 14.46% | 3.90% | 4.34% | 3.39% | 3.74% |
| S&P Developed ex-U.S. Catholic Values Index | 13.69% | 13.69% | 4.20% | 4.20% | 3.68% | 3.68% |
| MSCI EAFE Index (Net) | 14.40% | 14.40% | 5.73% | 5.73% | 4.95% | 4.95% |
Growth of a $10,000 Investment
(At Net Asset Value)

* Fund commenced operations on June 22, 2020.
The MSCI EAFE Index (Net) (Europe, Australasia, Far East) is a free float-adjusted market capitalization index that is designed to measure the equity market performance of developed markets, excluding the US & Canada.
The performance data quoted herein represents past performance and the return and value of an investment in the Fund will fluctuate so that, when redeemed, it may be worth less than its original cost. Past performance is no guarantee of future performance and should not be considered as a representation of the future results of the Fund. The Fund’s performance assumes the reinvestment of all dividends and all capital gains. Index returns assume reinvestment of dividends and, unlike the Fund’s returns, do not reflect any fees or expenses. If such fees and expenses were included in the index returns, the performance would have been lower. Please note that one cannot invest directly in an unmanaged index. Performance figures for the periods shown may reflect contractual fee waivers and/or expense reimbursements. In the absence of fee waiver sand/or expense reimbursements (if applicable), returns would have been lower.
There are no assurances that the Fund will meet its stated objectives.
35
Management Discussion of Fund Performance (unaudited)
Global X S&P Catholic Values Developed ex-US ETF
The Fund’s holdings and allocations are subject to change and should not be considered recommendations to buy individual securities.
The graph and table do not reflect the deduction of taxes that a shareholder would pay on Fund distributions or the redemption or sale of Fund shares.
See definition of comparative indices on the previous page.
36
Management Discussion of Fund Performance (unaudited)
Global X Nasdaq 100® Covered Call & Growth ETF
Global X Nasdaq 100® Covered Call & Growth ETF
The Global X NASDAQ 100® Covered Call & Growth ETF (the “Fund”) seeks to provide investment results that correspond generally to the price and yield performance, before fees and expenses, of the Cboe NASDAQ-100® Half BuyWrite V2 Index (the “Underlying Index”). The Fund is passively managed and the investment adviser does not attempt to take defensive positions in declining markets. The Fund generally seeks to fully replicate the Underlying Index.
The Underlying Index is a benchmark index that measures the performance of a theoretical portfolio that owns the portfolio of stocks included in the NASDAQ-100® Index (the “Reference Index”), and “writes” (or sells) corresponding call options on approximately 50% of the value of the portfolio of stocks in the Reference Index.
For the 12-month period ending October 31, 2023 (the “reporting period”), the Fund increased 21.43% and the Underlying Index increased 22.23%. The Fund had a net asset value of $22.80 per share on October 31, 2022 and ended the reporting period with a net asset value of $26.07 on October 31, 2023.
During the reporting period, the highest returns came from Meta Platforms Inc Class-A and Nvidia Corp, which returned 223.39% and 202.32%, respectively. The worst performers were Enphase Energy Inc and Lucid Group Inc, which returned -74.49% and -71.17%, respectively.
The Fund produced a positive total return over the course of the reporting period. Inflationary data that underscored softer pricing represented a market catalyst and positive earnings performances, increasing investor sentiment for holdings within the Fund. Advancements made within generative artificial intelligence (AI), positively impacted valuations of Fund holdings. Furthermore, semiconductor-related companies whose businesses provided the necessary hardware for the continued increase in spending for AI computing power were positively impacted from an increase in demand. During the reporting period, the Fund had an average approximate stock exposure of 48.69% in the Information Technology sector, 16.18% in Communication Services sector and 14.45% in Consumer Discretionary sector.
| | AVERAGE ANNUAL TOTAL RETURN FOR THE YEAR
ENDED
OCTOBER 31, 2023 |
| | One Year
Return | Three Year
Return | Annualized
Inception to Date* |
| | Net Asset
Value | Market
Price | Net Asset
Value | Market
Price | Net Asset
Value | Market
Price |
| Global X Nasdaq 100® Covered Call & Growth ETF | 21.43% | 21.07% | 7.38% | 7.46% | 7.23% | 7.19% |
| CBOE NASDAQ-100 Half BuyWrite V2 Index | 22.23% | 22.23% | 8.06% | 8.06% | 7.87% | 7.87% |
| NASDAQ-100® Index | 27.45% | 27.45% | 10.12% | 10.12% | 10.11% | 10.11% |
37
Management Discussion of Fund Performance (unaudited)
Global X Nasdaq 100® Covered Call & Growth ETF
Growth of a $10,000 Investment
(At Net Asset Value)

* The Fund commenced operations on September 18, 2020.
The Nasdaq-100® Index includes 100 of the largest domestic and international non-financial companies listed on The Nasdaq Stock Market based on market capitalization.
The performance data quoted herein represents past performance and the return and value of an investment in the Fund will fluctuate so that, when redeemed, it may be worth less than its original cost. Past performance is no guarantee of future performance and should not be considered as a representation of the future results of the Fund. The Fund’s performance assumes the reinvestment of all dividends and all capital gains. Index returns assume reinvestment of dividends and, unlike the Fund’s returns, do not reflect any fees or expenses. If such fees and expenses were included in the index returns, the performance would have been lower. Please note that one cannot invest directly in an unmanaged index. Performance figures for the periods shown may reflect contractual fee waivers and/or expense reimbursements. In the absence of fee waiver sand/or expense reimbursements (if applicable), returns would have been lower.
There are no assurances that the Fund will meet its stated objectives.
The Fund’s holdings and allocations are subject to change and should not be considered recommendations to buy individual securities.
The graph and table do not reflect the deduction of taxes that a shareholder would pay on Fund distributions or the redemption or sale of Fund shares.
See definition of comparative indices on the previous page.
38
Management Discussion of Fund Performance (unaudited)
Global X S&P 500® Covered Call & Growth ETF
Global X S&P 500® Covered Call & Growth ETF
The Global X S&P 500® Covered Call & Growth ETF (the “Fund”) seeks to provide investment results that correspond generally to the price and yield performance, before fees and expenses, of the CBOE S&P 500® Half BuyWrite Index (the “Underlying Index”). The Fund is passively managed and the investment adviser does not attempt to take defensive positions in declining markets. The Fund generally seeks to fully replicate the Underlying Index.
The Underlying Index is a benchmark index that measures the performance of a theoretical portfolio that owns the portfolio of stocks included in the S&P 500® Index (the “Reference Index”), and “writes” (or sells) corresponding call options on approximately 50% of the value of the portfolio of stocks in the Reference Index.
For the 12-month period ending October 31, 2023 (the “reporting period”), the Fund increased 8.01%, while the Underlying Index increased 8.80%. The Fund had a net asset value of $25.47 per share on October 31, 2022 and ended the reporting period with a net asset value of $26.07 on October 31, 2023.
During the reporting period, the highest returns came from Meta Platforms Inc-Class A and Nvidia Corp, which returned 223.39% and 202.32%, respectively. The worst performers were Signature Bank and SVB Financial Group, which returned -99.92% and -99.83%, respectively.
During the reporting period, the Fund generated positive returns as corporate earnings met market expectations and softening levels of inflation contributed to improving investor sentiment towards holdings within the Fund. A slowing of interest rate hikes by the U.S. Federal Reserve further ushered in a positive outlook for many of the Fund’s top constituents. The Fund’s 50% covered call writing strategy allowed the Fund to participate in some of the Reference Index’s upside, while also generating supplemental option premiums. In environments such as this, the Fund’s options-writing strategy has the potential to cede a measure of upside participation relative to its Reference Index. However, it does so in exchange for these premiums, which may help support the Fund’s performance during stagnant or declining markets. During the reporting period, the Fund had an approximate average sector exposure of 25.74% to Information Technology, 14.19% to Health Care, and 13.29% to Financials.
| | AVERAGE ANNUAL TOTAL RETURN FOR THE YEAR
ENDED
OCTOBER 31, 2023 |
| | One Year
Return | Three Year
Return | Annualized
Inception to Date* |
| | Net Asset
Value | Market
Price | Net Asset
Value | Market
Price | Net Asset
Value | Market
Price |
| Global X S&P 500® Covered Call & Growth ETF | 8.01% | 7.84% | 8.44% | 8.52% | 7.55% | 7.50% |
| CBOE S&P 500 Half BuyWrite Index | 8.80% | 8.80% | 9.45% | 9.45% | 8.39% | 8.39% |
| S&P 500® Index | 10.14% | 10.14% | 10.36% | 10.36% | 9.47% | 9.47% |
39
Management Discussion of Fund Performance (unaudited)
Global X S&P 500® Covered Call & Growth ETF
Growth of a $10,000 Investment
(At Net Asset Value)
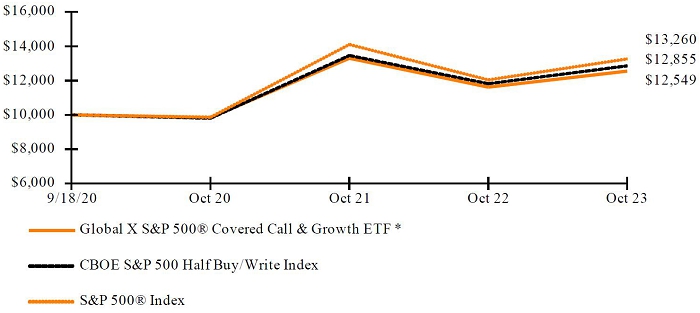
* The Fund commenced operations on September 18, 2020.
The S&P 500® Index is a market capitalization weighted composite index of 500 large capitalization U.S. companies.
The performance data quoted herein represents past performance and the return and value of an investment in the Fund will fluctuate so that, when redeemed, it may be worth less than its original cost. Past performance is no guarantee of future performance and should not be considered as a representation of the future results of the Fund. The Fund’s performance assumes the reinvestment of all dividends and all capital gains. Index returns assume reinvestment of dividends and, unlike the Fund’s returns, do not reflect any fees or expenses. If such fees and expenses were included in the index returns, the performance would have been lower. Please note that one cannot invest directly in an unmanaged index. Performance figures for the periods shown may reflect contractual fee waivers and/or expense reimbursements. In the absence of fee waiver sand/or expense reimbursements (if applicable), returns would have been lower.
There are no assurances that the Fund will meet its stated objectives.
The Fund’s holdings and allocations are subject to change and should not be considered recommendations to buy individual securities.
The graph and table do not reflect the deduction of taxes that a shareholder would pay on Fund distributions or the redemption or sale of Fund shares.
See definition of comparative indices above.
40
Management Discussion of Fund Performance (unaudited)
Global X Emerging Markets Internet & E-commerce ETF
Global X Emerging Markets Internet & E-commerce ETF
The Global X Emerging Markets Internet & E-commerce ETF (the “Fund”) seeks to provide investment results that correspond generally to the price and yield performance, before fees and expenses, of the Nasdaq CTA Emerging Markets Internet & E-commerce Net Total Return Index (the “Underlying Index”). The Fund is passively managed, which means the investment adviser does not attempt to take defensive positions in declining markets. The Fund generally seeks to fully replicate the Underlying Index.
The Underlying Index is designed to provide exposure to exchange-listed companies that are expected to benefit from further adoption of internet and e-commerce technologies in emerging markets countries (collectively, “Emerging Markets Internet & E-commerce Companies”), as defined by Nasdaq, Inc., the provider of the Underlying Index (the “Index Provider”) and the Consumer Technology Association (“CTA”). The Index Provider and the CTA have jointly developed the eligibility and selection criteria for the Underlying Index. In order to be eligible for inclusion in the Underlying Index, a company is considered by the CTA to be an Emerging Markets Internet & E-commerce Company if it derives at least 50% of its revenue, operating income, or assets from: (i) internet-related services (including social media and online entertainment), (ii) internet retail commerce, (iii) internet search engine services, and/or (iv) software delivered via the internet.
For the 12-month period ended October 31, 2023 (the “reporting period”), the Fund increased 22.28%, while the Underlying Index increased 23.19%. The Fund had a net asset value of $16.38 per share on October 31, 2022 and ended the reporting period with a net asset value of $19.97 on October 31, 2023, following a 1:3 reverse share split on December 19, 2022.
During the reporting period, the highest returns came from iQIYI Inc-ADR and Vipshop Holdings Ltd-ADR, which returned 130.69% and 104.59%, respectively. The worst performers were Magazine Luiza SA and PT GoTo Gojek Tokopedia Tbk, which returned -69.04% and -50.03%, respectively.
The Fund recorded positive returns during the reporting period as better-than-expected economic performance, a gradual decline in headline inflation in emerging markets, and China’s reopening post-COVID-19 lockdowns supported market sentiment. Supportive government policies towards innovation and the expansion of digital services in local markets weighed positively, as well. Furthermore, the Chinese e-Commerce market continued to grow, supported by the rise in consumer preference for online shopping, improved payment infrastructure, and proliferation of payment tools. Lastly, the increased popularity of social commerce and livestream shopping attracted investor attention. During the reporting period, the Fund had an average approximate stock exposure of 62.9% in China. By sector, it had the highest average exposure to Consumer Discretionary at 54.04% and Communication Services at 34.46%.
41
Management Discussion of Fund Performance (unaudited)
Global X Emerging Markets Internet & E-commerce ETF
| | AVERAGE TOTAL RETURN FOR THE YEAR ENDED
OCTOBER 31, 2023 |
| | One Year Return | Annualized Inception to Date* |
| | Net Asset Value | Market Price | Net Asset Value | Market Price |
| Global X Emerging Markets Internet & E-commerce ETF | 22.28% | 22.65% | -23.36% | -23.15% |
| NASDAQ CTA Emerging Markets Internet & E-commerce Net Total Return Index | 23.19% | 23.19% | -22.90% | -22.90% |
| MSCI Emerging Markets Index (Net) | 10.80% | 10.80% | -6.18% | -6.18% |
Growth of a $10,000 Investment
(At Net Asset Value)

* The Fund commenced operations on November 9, 2020.
The MSCI Emerging Markets Index (Net) is a free float-adjusted market capitalization index that is designed to measure equity market performance of emerging markets. The MSCI Emerging Markets Index consists of the following 21 emerging market country indices: Brazil, Chile, China, Colombia, Czech Republic, Egypt, Hungary, India, Indonesia, Korea, Malaysia, Mexico, Morocco, Peru, Philippines, Poland, Russia, South Africa, Taiwan, Thailand, and Turkey.
The performance data quoted herein represents past performance and the return and value of an investment in the Fund will fluctuate so that, when redeemed, it may be worth less than its original cost. Past performance is no guarantee of future performance and should not be considered as a representation of the future results of the Fund. The Fund’s performance assumes the reinvestment of all dividends and all capital gains. Index returns assume reinvestment of dividends and, unlike the Fund’s returns, do not reflect any fees or expenses. If such fees and expenses were included in the index returns, the performance would
42
Management Discussion of Fund Performance (unaudited)
Global X Emerging Markets Internet & E-commerce ETF
have been lower. Please note that one cannot invest directly in an unmanaged index. Performance figures for the periods shown may reflect contractual fee waivers and/or expense reimbursements. In the absence of fee waiver sand/or expense reimbursements (if applicable), returns would have been lower.
There are no assurances that the Fund will meet its stated objectives.
The Fund’s holdings and allocations are subject to change and should not be considered recommendations to buy individual securities.
The graph and table do not reflect the deduction of taxes that a shareholder would pay on Fund distributions or the redemption or sale of Fund shares.
See definition of comparative indices above.
43
Management Discussion of Fund Performance (unaudited)
Global X NASDAQ 100® Tail Risk ETF
Global X NASDAQ 100® Tail Risk ETF
The Global X Nasdaq 100® Tail Risk ETF (the “Fund”) seeks to provide investment results that correspond generally to the price and yield performance, before fees and expenses, of the Nasdaq-100 Quarterly Protective Put 90 Index (the “Underlying Index”). The Fund is passively managed and the investment adviser does not attempt to take defensive positions in declining markets. The Fund generally seeks to fully replicate the Underlying Index.
The Underlying Index measures the performance of a risk management strategy that holds the underlying stocks of the NASDAQ 100® Index (the “Reference Index”) and applies a protective put strategy with long (purchased) put options on the Reference Index. The Underlying Index specifically reflects the performance of the component securities of the Reference Index, combined with a long position in 10% out-of-the-money (“OTM”) put options that correspond to the value of the portfolio of stocks in the Reference Index.
For the 12-month period ending October 31, 2023 (the “reporting period”), the Fund increased 19.42%, while the Underlying Index increased 19.41%. The Fund had a net asset value of $19.08 per share on October 31, 2022 and ended the reporting period with a net asset value of $22.71 on October 31, 2023.
During the reporting period, the highest returns came from Meta Platforms Inc Class-A and Nvidia Corp, which returned 223.39% and 202.32%, respectively. The worst performers were Enphase Energy Inc and Lucid Group Inc, which returned -74.49% and -71.17%, respectively.
The Fund performed positively during the reporting period on account of higher valuations, increased consumer spending, and positive real wage growth. Furthermore, investors’ focus on companies showcasing real-world applications of artificial intelligence drove growth prospects for software equities in the Fund. During the reporting period, the Fund had an average approximate stock exposure of 48.46% in the Information Technology sector, 16.10% in the Communication Services sector and 14.35% in Consumer Discretionary sector.
| | AVERAGE ANNUAL TOTAL RETURN FOR THE YEAR ENDED
OCTOBER 31, 2023 |
| | One Year Return | Annualized Inception to Date* |
| | Net Asset Value | Market Price | Net Asset Value | Market Price |
| Global X NASDAQ 100® Tail Risk ETF | 19.42% | 19.11% | -3.49% | -3.49% |
| NASDAQ 100 Quarterly Protective Put 90 Index | 19.41% | 19.41% | -3.02% | -3.02% |
| NASDAQ-100® Index | 27.45% | 27.45% | -2.12% | -2.12% |
44
Management Discussion of Fund Performance (unaudited)
Global X NASDAQ 100® Tail Risk ETF
Growth of a $10,000 Investment
(At Net Asset Value)
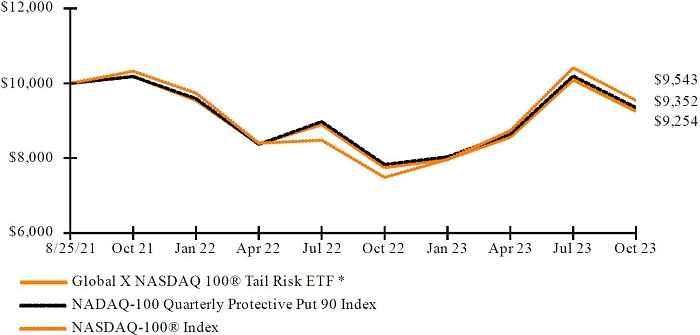
* The Fund commenced operations on August 25, 2021.
The Nasdaq-100® Index includes 100 of the largest domestic and international non-financial companies listed on The Nasdaq Stock Market based on market capitalization.
The performance data quoted herein represents past performance and the return and value of an investment in the Fund will fluctuate so that, when redeemed, it may be worth less than its original cost. Past performance is no guarantee of future performance and should not be considered as a representation of the future results of the Fund. The Fund’s performance assumes the reinvestment of all dividends and all capital gains. Index returns assume reinvestment of dividends and, unlike the Fund’s returns, do not reflect any fees or expenses. If such fees and expenses were included in the index returns, the performance would have been lower. Please note that one cannot invest directly in an unmanaged index. Performance figures for the periods shown may reflect contractual fee waivers and/or expense reimbursements. In the absence of fee waiver sand/or expense reimbursements (if applicable), returns would have been lower.
There are no assurances that the Fund will meet its stated objectives.
The Fund’s holdings and allocations are subject to change and should not be considered recommendations to buy individual securities.
The graph and table do not reflect the deduction of taxes that a shareholder would pay on Fund distributions or the redemption or sale of Fund shares.
See definition of comparative indices above.
45
Management Discussion of Fund Performance (unaudited)
Global X NASDAQ 100® Risk Managed Income ETF
Global X NASDAQ 100® Risk Managed Income ETF
The Global X Nasdaq 100® Risk Managed Income ETF (the “Fund”) seeks to provide investment results that correspond generally to the price and yield performance, before fees and expenses, of the Nasdaq-100® Monthly Net Credit Collar 95-100 Index (the “Underlying Index”). The Fund is passively managed and the investment adviser does not attempt to take defensive positions in declining markets. The Fund generally seeks to fully replicate the Underlying Index.
The Underlying Index measures the performance of a risk managed income strategy that holds the underlying stocks of the NASDAQ 100® Index (the “Reference Index”) and applies an options collar strategy consisting of a mix of short (sold) call options and long (purchased) put options on the Reference Index. The Underlying Index specifically reflects the performance of the component securities of the Reference Index, combined with a long position in the 5% out-of-the-money (“OTM”) put options and a short position in at-the-money (“ATM”) call options, each corresponding to the value of the portfolio of stocks in the Reference Index. The options collar seeks to generate a net-credit, meaning that the premium received from the sale of the call options will be greater than the premium paid when buying the put options.
For the 12-month period ending October 31, 2023 (the “reporting period”), the Fund increased 3.42%, while the Underlying Index increased 3.60%. The Fund had a net asset value of $18.17 per share on October 31, 2022 and ended the reporting period with a net asset value of $16.64 on October 31, 2023.
During the reporting period, the highest returns came from Meta Platforms Inc Class-A and Nvidia Corp., which returned 223.39% and 202.32%, respectively. The worst performers were Enphase Energy Inc. and Lucid Group Inc., which returned -74.49% and -71.17%, respectively.
During the reporting period, new investment opportunities within the artificial intelligence space positively supported the Fund’s performance. Workforce reductions, paired with increasing cash flows amongst the Fund’s largest technology sector holdings, led to a decrease in costs and an improvement in margins during the reporting period. By sector, the Fund had the highest average exposure to Information Technology at 48.59%, Communication Services at 16.14% and Consumer Discretionary at 14.43%.
| | AVERAGE ANNUAL TOTAL RETURN FOR THE YEAR ENDED
OCTOBER 31, 2023 |
| | One Year Return | Annualized Inception to Date* |
| | Net Asset Value | Market Price | Net Asset Value | Market Price |
| Global X NASDAQ 100® Risk Managed Income ETF | 3.42% | 3.11% | -7.17% | -7.25% |
| NASDAQ 100 Monthly Net Credit Collar 95-100 Index | 3.60% | 3.60% | -7.22% | -7.22% |
| NASDAQ-100® Index | 27.45% | 27.45% | -2.12% | -2.12% |
46
Management Discussion of Fund Performance (unaudited)
Global X NASDAQ 100® Risk Managed Income ETF
Growth of a $10,000 Investment
(At Net Asset Value)

* The Fund commenced operations on August 25, 2021.
The Nasdaq-100® Index includes 100 of the largest domestic and international non-financial companies listed on The Nasdaq Stock Market based on market capitalization.
The performance data quoted herein represents past performance and the return and value of an investment in the Fund will fluctuate so that, when redeemed, it may be worth less than its original cost. Past performance is no guarantee of future performance and should not be considered as a representation of the future results of the Fund. The Fund’s performance assumes the reinvestment of all dividends and all capital gains. Index returns assume reinvestment of dividends and, unlike the Fund’s returns, do not reflect any fees or expenses. If such fees and expenses were included in the index returns, the performance would have been lower. Please note that one cannot invest directly in an unmanaged index. Performance figures for the periods shown may reflect contractual fee waivers and/or expense reimbursements. In the absence of fee waiver sand/or expense reimbursements (if applicable), returns would have been lower.
There are no assurances that the Fund will meet its stated objectives.
The Fund’s holdings and allocations are subject to change and should not be considered recommendations to buy individual securities.
The graph and table do not reflect the deduction of taxes that a shareholder would pay on Fund distributions or the redemption or sale of Fund shares.
See definition of comparative indices on the previous page.
47
Management Discussion of Fund Performance (unaudited)
Global X NASDAQ 100® Collar 95-110 ETF
Global X NASDAQ 100® Collar 95-110 ETF
The Global X Nasdaq 100® Collar 95-110 ETF (the “Fund”) seeks to provide investment results that correspond generally to the price and yield performance, before fees and expenses, of the Nasdaq-100® Quarterly Collar 95-110 Index (the “Underlying Index”). The Fund is passively managed and the investment adviser does not attempt to take defensive positions in declining markets. The Fund generally seeks to fully replicate the Underlying Index.
The Underlying Index measures the performance of a risk management strategy that holds the underlying stocks of the NASDAQ 100® Index (the “Underlying Index”) and applies an options collar strategy with a mix of short (sold) call options and long (purchased) put options on the Reference Index. The Underlying Index specifically reflects the performance of the component securities of the Reference Index, combined with a long position in 5% out-of-the-money (“OTM”) put options and a short position in 10% OTM call options, each corresponding to the value of the portfolio of stocks in the Reference Index.
For the 12-month period ending October 31, 2023 (the “reporting period”), the Fund increased 7.01% and the Underlying Index increased 6.86%. The Fund had a net asset value of $22.00 per share on October 31, 2022 and ended the reporting period with a net asset value of $23.47 on October 31, 2023.
During the reporting period, the highest returns came from Meta Platforms Inc Class-A and Nvidia Corp, which returned 223.39% and 202.32%, respectively. The worst performers were Enphase Energy Inc. and Lucid Group Inc., which returned -74.49% and -71.17%, respectively.
During the reporting period, evolving artificial intelligence capabilities bolstered investor sentiment in the technology sector and resulted in positive performance for the Fund and its holdings. Furthermore, the Federal Reserve’s pace of interest rate hikes slowed during the reporting period relative to that of the previous reporting period, which increased investor sentiment towards information technology and communication services sector holdings within the Fund. During the reporting period, by sector, the Fund retained its highest average exposures to Information Technology at 48.3%, Communication Services at 16.04% and Consumer Discretionary at 14.33%.
| | AVERAGE ANNUAL TOTAL RETURN FOR THE YEAR ENDED
OCTOBER 31, 2023 |
| | One Year Return | Annualized Inception to Date* |
| | Net Asset Value | Market Price | Net Asset Value | Market Price |
| Global X NASDAQ 100® Collar 95-110 ETF | 7.01% | 7.11% | -2.43% | -2.47% |
| NASDAQ -100 Quarterly Collar 95-110 Index | 6.86% | 6.86% | -1.97% | -1.97% |
| NASDAQ-100® Index | 27.45% | 27.45% | -2.12% | -2.12% |
48
Management Discussion of Fund Performance (unaudited)
Global X NASDAQ 100® Collar 95-110 ETF
Growth of a $10,000 Investment
(At Net Asset Value)

* The Fund commenced operations on August 25, 2021.
The Nasdaq-100® Index includes 100 of the largest domestic and international non-financial companies listed on The Nasdaq Stock Market based on market capitalization.
The performance data quoted herein represents past performance and the return and value of an investment in the Fund will fluctuate so that, when redeemed, it may be worth less than its original cost. Past performance is no guarantee of future performance and should not be considered as a representation of the future results of the Fund. The Fund’s performance assumes the reinvestment of all dividends and all capital gains. Index returns assume reinvestment of dividends and, unlike the Fund’s returns, do not reflect any fees or expenses. If such fees and expenses were included in the index returns, the performance would have been lower. Please note that one cannot invest directly in an unmanaged index. Performance figures for the periods shown may reflect contractual fee waivers and/or expense reimbursements. In the absence of fee waiver sand/or expense reimbursements (if applicable), returns would have been lower.
There are no assurances that the Fund will meet its stated objectives.
The Fund’s holdings and allocations are subject to change and should not be considered recommendations to buy individual securities.
The graph and table do not reflect the deduction of taxes that a shareholder would pay on Fund distributions or the redemption or sale of Fund shares.
See definition of comparative indices above.
49
Management Discussion of Fund Performance (unaudited)
Global X S&P 500® Tail Risk ETF
Global X S&P 500® Tail Risk ETF
The Global X S&P 500® Tail Risk ETF (the “Fund”) seeks to provide investment results that correspond generally to the price and yield performance, before fees and expenses, of the Cboe S&P 500® Tail Risk Index (the “Underlying Index”). The Fund is passively managed and the investment adviser does not attempt to take defensive positions in declining markets. The Fund generally seeks to fully replicate the Underlying Index.
The Underlying Index measures the performance of a risk management strategy that holds the underlying stocks of the S&P 500® Index (the “Reference Index”) and applies a protective put strategy (i.e. long (purchased) put options) on the Reference Index. The Underlying Index specifically reflects the performance of the component securities of the Reference Index, combined with a long position in 10% out-of-the-money (“OTM”) put options that correspond to the value of the portfolio of stocks in the Reference Index.
For the 12-month period ending October 31, 2023 (the “reporting period”), the Fund increased 5.51%, while the Underlying Index increased 6.06%. The Fund had a net asset value of $23.21 per share on October 31, 2022 and ended the reporting period with a net asset value of $24.23 on October 31, 2023.
During the reporting period, the highest returns came from Meta Platforms Inc. Class-A and Nvidia Corp, which returned 223.39% and 202.32%, respectively. The worst performers were Signature Bank and SVB Financial Group, which returned -99.92% and -99.83%, respectively.
During the reporting period, the Fund recorded a positive return as revised market estimates of economic growth boosted investor confidence. Softening inflation data and the Federal Reserve’s slower pace of interest rate hikes positively impacted the performance of growth style companies held within the Fund. Artificial Intelligence and robotics technology supported additional growth avenues for technology sector constituents leading to optimistic sentiment amongst investors. Furthermore, positive inflation-adjusted wage growth in the labor market helped the U.S. economy remain resilient, and positively impacted U.S. consumer confidence, thus benefitting the Fund. During the reporting period, the Fund retained its highest average sector exposures to Information Technology at 25.68%, Health Care at 14.21% and Financials at 13.26%.
| | AVERAGE ANNUAL TOTAL RETURN FOR THE YEAR ENDED
OCTOBER 31, 2023 |
| | One Year Return | Annualized Inception to Date* |
| | Net Asset Value | Market Price | Net Asset Value | Market Price |
| Global X S&P 500® Tail Risk ETF | 5.51% | 5.37% | -3.72% | -3.74% |
| Cboe S&P 500® Tail Risk Index | 6.06% | 6.06% | -3.11% | -3.11% |
| S&P 500® Index | 10.14% | 10.14% | -1.60% | -1.60% |
50
Management Discussion of Fund Performance (unaudited)
Global X S&P 500® Tail Risk ETF
Growth of a $10,000 Investment
(At Net Asset Value)
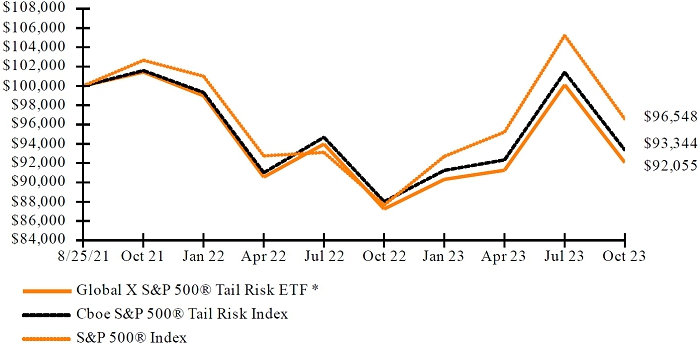
* The Fund commenced operations on August 25, 2021.
The S&P 500® Index is a market capitalization weighted composite index of 500 large capitalization U.S. companies.
The performance data quoted herein represents past performance and the return and value of an investment in the Fund will fluctuate so that, when redeemed, it may be worth less than its original cost. Past performance is no guarantee of future performance and should not be considered as a representation of the future results of the Fund. The Fund’s performance assumes the reinvestment of all dividends and all capital gains. Index returns assume reinvestment of dividends and, unlike the Fund’s returns, do not reflect any fees or expenses. If such fees and expenses were included in the index returns, the performance would have been lower. Please note that one cannot invest directly in an unmanaged index. Performance figures for the periods shown may reflect contractual fee waivers and/or expense reimbursements. In the absence of fee waiver sand/or expense reimbursements (if applicable), returns would have been lower.
There are no assurances that the Fund will meet its stated objectives.
The Fund’s holdings and allocations are subject to change and should not be considered recommendations to buy individual securities.
The graph and table do not reflect the deduction of taxes that a shareholder would pay on Fund distributions or the redemption or sale of Fund shares.
See definition of comparative indices above.
51
Management Discussion of Fund Performance (unaudited)
Global X S&P 500® Risk Managed Income ETF
Global X S&P 500® Risk Managed Income ETF
The Global X S&P 500 Risk Managed Income ETF (the “Fund”) seeks to provide investment results that correspond generally to the price and yield performance, before fees and expenses, of the Cboe S&P 500 Risk Managed Income Index (the “Underlying Index”). The Fund is passively managed, which means the investment adviser does not attempt to take defensive positions in declining markets. The Fund generally seeks to fully replicate the Underlying Index.
The Underlying Index measures the performance of a risk managed income strategy that holds the underlying stocks of the S&P 500® Index (the “Reference Index”) and applies an options collar strategy which is a mix of short (sold) call options and long (purchased) put options on the Reference Index. The Underlying Index specifically reflects the performance of the component securities of the Reference Index, combined with a long position in the 5% out-of-the-money (“OTM”) put options and a short position in at-the-money (“ATM”) call options, each corresponding to the value of the portfolio of stocks in the Reference Index. The options collar seeks to generate a net-credit, meaning that the premium received from the sale of the call options will be greater than the premium paid when buying the put options.
For the 12-month period ended October 31, 2023 (the “reporting period”), the Fund decreased 0.61%, while the Underlying Index increased 0.16%. The Fund had a net asset value of $21.05 per share on October 31, 2022 and ended the reporting period with a net asset value of $18.56 on October 31, 2023.
During the reporting period, the highest returns came from Meta Platforms Inc Class-A and Nvidia Corp, which returned 223.39% and 202.32%, respectively. The worst performers were Signature Bank and SVB Financial Group, which returned -99.92% and -99.83%, respectively.
During the reporting period, subdued market volatility had an impact on the performance of the Fund. The Fund experienced a modestly negative return during the reporting period, underperforming its Reference Index. The Fund’s methodical net credit collar implementation lowered the Fund’s ability to retain upside participation during most of the reporting period. A steep downturn in the Fund’s holdings towards the end of the reporting period was only partially thwarted by the Fund’s put option protection. During the reporting period, the Fund had an average approximate sector exposure to Information Technology of 25.65%, Health Care at 14.15%, and Financials at 13.26%.
| | AVERAGE ANNUAL TOTAL RETURN FOR THE YEAR ENDED
OCTOBER 31, 2023 |
| | One Year Return | Annualized Inception to Date* |
| | Net Asset Value | Market Price | Net Asset Value | Market Price |
| Global X S&P 500® Risk Managed Income ETF | -0.61% | -0.31% | -5.46% | -5.37% |
| Cboe S&P 500® Risk Managed Income Index | 0.16% | 0.16% | -4.93% | -4.93% |
| S&P 500® Index | 10.14% | 10.14% | -1.60% | -1.60% |
52
Management Discussion of Fund Performance (unaudited)
Global X S&P 500® Risk Managed Income ETF
Growth of a $10,000 Investment
(At Net Asset Value)

* The Fund commenced operations on August 25, 2021.
The S&P 500® Index is a market capitalization weighted composite index of 500 large capitalization U.S. companies.
The performance data quoted herein represents past performance and the return and value of an investment in the Fund will fluctuate so that, when redeemed, it may be worth less than its original cost. Past performance is no guarantee of future performance and should not be considered as a representation of the future results of the Fund. The Fund’s performance assumes the reinvestment of all dividends and all capital gains. Index returns assume reinvestment of dividends and, unlike the Fund’s returns, do not reflect any fees or expenses. If such fees and expenses were included in the index returns, the performance would have been lower. Please note that one cannot invest directly in an unmanaged index. Performance figures for the periods shown may reflect contractual fee waivers and/or expense reimbursements. In the absence of fee waiver sand/or expense reimbursements (if applicable), returns would have been lower.
There are no assurances that the Fund will meet its stated objectives.
The Fund’s holdings and allocations are subject to change and should not be considered recommendations to buy individual securities.
The graph and table do not reflect the deduction of taxes that a shareholder would pay on Fund distributions or the redemption or sale of Fund shares.
See definition of comparative indices on the previous page.
53
Management Discussion of Fund Performance (unaudited)
Global X S&P 500® Collar 95-110 ETF
Global X S&P 500® Collar 95-110 ETF
The Global X S&P 500® Collar 95-110 ETF (the “Fund”) seeks to provide investment results that correspond generally to the price and yield performance, before fees and expenses, of the Cboe S&P 500® 3-Month Collar 95-110 Index (the “Underlying Index”). The Fund is passively managed, which means the investment adviser does not attempt to take defensive positions in declining markets. The Fund generally seeks to fully replicate the Underlying Index.
The Underlying Index measures the performance of a risk management strategy that holds the underlying stocks of the S&P 500® Index (the “Reference Index”) and applies an options collar strategy with a mix of short (sold) call options and long (purchased) put options on Reference Index. The Underlying Index specifically reflects the performance of the component securities of the Reference Index, combined with a long position in 5% out-of-the-money (“OTM”) put options and a short position in 10% OTM call options, each corresponding to the value of the portfolio of stocks in the Reference Index.
For the 12-month period ending October 31, 2023 (the “reporting period”), the Fund increased 2.20%, while the Underlying Index increased 2.79%. The Fund had a net asset value of $24.47 per share on October 31, 2022 and ended the reporting period with a net asset value of $24.68 on October 31, 2023.
During the reporting period, the highest returns came from Meta Platforms Inc Class-A and Nvidia Corp, which returned 223.39% and 202.32%, respectively. The worst performers were Signature Bank and SVB Financial Group, which returned -99.92% and -99.83%, respectively.
During the reporting period, better-than-expected corporate earnings in the U.S., spurred by softening inflation and resilient jobs data, weighed positively on holdings within the Fund. Concurrently, domestic equity markets derived optimism from the slowing pace of interest rate hikes being taken by the U.S. Federal Reserve. This environment promoted positive returns for the Fund, which had its largest average sector exposures within Information Technology at 25.59%, Health Care at 14.10% and Financials at 13.20%, during the reporting period.
| | AVERAGE ANNUAL TOTAL RETURN FOR THE YEAR ENDED
OCTOBER 31, 2023 |
| | One Year Return | Annualized Inception to Date* |
| | Net Asset Value | Market Price | Net Asset Value | Market Price |
| Global X S&P 500® Collar 95-110 ETF | 2.20% | 2.07% | -2.99% | -3.03% |
| Cboe S&P 500® 3-Month Collar 95-110 Index | 2.79% | 2.79% | -2.54% | -2.54% |
| S&P 500® Index | 10.14% | 10.14% | -1.60% | -1.60% |
54
Management Discussion of Fund Performance (unaudited)
Global X S&P 500® Collar 95-110 ETF
Growth of a $10,000 Investment
(At Net Asset Value)

* The Fund commenced operations on August 25, 2021.
The S&P 500® Index is a market capitalization weighted composite index of 500 large capitalization U.S. companies.
The performance data quoted herein represents past performance and the return and value of an investment in the Fund will fluctuate so that, when redeemed, it may be worth less than its original cost. Past performance is no guarantee of future performance and should not be considered as a representation of the future results of the Fund. The Fund’s performance assumes the reinvestment of all dividends and all capital gains. Index returns assume reinvestment of dividends and, unlike the Fund’s returns, do not reflect any fees or expenses. If such fees and expenses were included in the index returns, the performance would have been lower. Please note that one cannot invest directly in an unmanaged index. Performance figures for the periods shown may reflect contractual fee waivers and/or expense reimbursements. In the absence of fee waiver sand/or expense reimbursements (if applicable), returns would have been lower.
There are no assurances that the Fund will meet its stated objectives.
The Fund’s holdings and allocations are subject to change and should not be considered recommendations to buy individual securities.
The graph and table do not reflect the deduction of taxes that a shareholder would pay on Fund distributions or the redemption or sale of Fund shares.
See definition of comparative indices above.
55
Management Discussion of Fund Performance (unaudited)
Global X Disruptive Materials ETF
Global X Disruptive Materials ETF
The Global X Disruptive Materials ETF (the “Fund”) seeks to provide investment results that correspond generally to the price and yield performance, before fees and expenses, of the Solactive Disruptive Materials Index (the “Underlying Index”). The Fund is passively managed, which means the investment adviser does not attempt to take defensive positions in declining markets. The Fund generally seeks to fully replicate the Underlying Index.
The Underlying Index is designed to provide exposure to companies that produce metals and other raw or composite materials that have been identified as being essential to disruptive technologies such as lithium batteries, solar panels, wind turbines, fuel cells, robotics, and 3D printers. Each material has been determined by Solactive AG, the provider of the Underlying Index (the “Index Provider”) to be instrumental to the development and materialization of one or more disruptive technologies. Disruptive technologies refer to those technologies that are essential to the development and materialization of long-term, structural changes to existing products, services, industries, or sectors. Specifically, the Underlying Index will include securities issued by “Disruptive Materials Companies” as defined by the Index Provider.
For the 12-month period ended October 31, 2023 (the “reporting period”), the Fund decreased 19.96%, while the Underlying Index decreased 19.66%. The Fund had a net asset value of $18.07 per share on October 31, 2022 and ended the reporting period with a net asset value of $14.23 on October 31, 2023.
During the reporting period, the highest returns came from China Nonferrous Mining Corp. Ltd. and Southern Copper Corporation, which returned 77.19% and 58.23%, respectively. The worst performers were Jervois Global Ltd and Syrah Resources Ltd, which returned -93.20% and -72.45%, respectively.
The Fund generated negative returns during the reporting period as the performances of many disruptive materials producers were negatively impacted by dampened demand and higher supply levels amid global macroeconomic headwinds. In particular, prices for key battery materials such as lithium, graphite, cobalt, and nickel saw declines over the reporting period. These prices were primarily impacted by weakened demand and bearish sentiment due to the Chinese economy and the potential for resulting weakened demand for electric vehicles (EVs) and EV batteries. Furthermore, platinum miners continued to face short-term headwinds with a challenging operating environment due to South Africa’s energy crisis, as well as elevated production costs and lower platinum prices. During the reporting period, the Fund had an average approximate stock exposure of 27.62% in China and 19.14% in the United States.
| | AVERAGE ANNUAL TOTAL RETURN FOR THE YEAR ENDED
OCTOBER 31, 2023 |
| | One Year Return | Annualized Inception to Date* |
| | Net Asset Value | Market Price | Net Asset Value | Market Price |
| Global X Disruptive Materials ETF | -19.96% | -19.47% | -23.95% | -23.92% |
| Solactive Disruptive Materials Index | -19.66% | -19.66% | -23.64% | -23.64% |
| MSCI ACWI (Net) | 10.50% | 10.50% | -4.04% | -4.04% |
56
Management Discussion of Fund Performance (unaudited)
Global X Disruptive Materials ETF
Growth of a $10,000 Investment
(At Net Asset Value)

* The Fund commenced operations on January 24, 2022.
The MSCI ACWI (Net) (All Country World Index) Index is a free float-adjusted market capitalization weighted index that is designed to measure the equity market performance of developed and emerging markets.
The performance data quoted herein represents past performance and the return and value of an investment in the Fund will fluctuate so that, when redeemed, it may be worth less than its original cost. Past performance is no guarantee of future performance and should not be considered as a representation of the future results of the Fund. The Fund’s performance assumes the reinvestment of all dividends and all capital gains. Index returns assume reinvestment of dividends and, unlike the Fund’s returns, do not reflect any fees or expenses. If such fees and expenses were included in the index returns, the performance would have been lower. Please note that one cannot invest directly in an unmanaged index. Performance figures for the periods shown may reflect contractual fee waivers and/or expense reimbursements. In the absence of fee waiver sand/or expense reimbursements (if applicable), returns would have been lower.
There are no assurances that the Fund will meet its stated objectives.
The Fund’s holdings and allocations are subject to change and should not be considered recommendations to buy individual securities.
The graph and table do not reflect the deduction of taxes that a shareholder would pay on Fund distributions or the redemption or sale of Fund shares.
See definition of comparative indices above.
57
Management Discussion of Fund Performance (unaudited)
Global X Dow 30® Covered Call ETF
Global X Dow 30® Covered Call ETF
The Global X Dow 30® Covered Call ETF (the “Fund”) seeks to provide investment results that correspond generally to the price and yield performance, before fees and expenses, of the DJIA Cboe BuyWrite v2 Index (the “Underlying Index”). The Fund is passively managed, which means the investment adviser does not attempt to take defensive positions in declining markets. The Fund generally seeks to fully replicate the Underlying Index.
The Underlying Index measures the performance of a covered call strategy that holds a theoretical portfolio of the underlying stocks of the Dow Jones Industrial Average® (the “Reference Index”) and “writes” (or sells) a succession of one-month at-the-money (“ATM”) covered call options on the Reference Index. The Underlying Index specifically reflects the performance of the component securities of the Reference Index, combined with written (sold) ATM call options corresponding to the value of the portfolio of stocks in the Reference Index.
For the 12-month period ending October 31, 2023 (the “reporting period”), the Fund increased 3.30%, while the Underlying Index increased 4.27%. The Fund had a net asset value of $21.89 per share on October 31, 2022 and it ended the reporting period with a net asset value of $20.89 on October 31, 2023.
During the reporting period, the highest returns came from Microsoft Corp and Intel Corp, which returned 47.06% and 32.70%, respectively. The worst performers were Walgreens Boots Alliance Inc and 3M Co, which returned -38.80% and -23.63%, respectively.
During the reporting period, the Fund recorded positive returns as a product of supportive data regarding the U.S. economy. Positive corporate earnings results, softening levels of inflation, and high consumer confidence positively impacted holdings within the Fund. Despite the Reference Index experiencing mostly muted levels of volatility, the Fund was still able to deliver modest outperformance relative to the Reference Index over the course of the reporting period. This outperformance was driven by the premiums received from the Fund’s covered call writing strategy. During the reporting period, the Fund had the highest average sector exposure to Financials at 20.33%, Health Care at 19.96% and Information Technology at 16.81%.
| | AVERAGE TOTAL RETURN FOR THE YEAR ENDED
OCTOBER 31, 2023 |
| | One Year Return | Annualized Inception to Date* |
| | Net Asset Value | Market Price | Net Asset Value | Market Price |
| Global X Dow 30® Covered Call ETF | 3.30% | 4.53% | 0.26% | 1.12% |
| DJIA Cboe BuyWrite v2 Index | 4.27% | 4.27% | 1.30% | 1.30% |
| DJIA Index | 3.17% | 3.17% | 1.97% | 1.97% |
58
Management Discussion of Fund Performance (unaudited)
Global X Dow 30® Covered Call ETF
Growth of a $10,000 Investment
(At Net Asset Value)
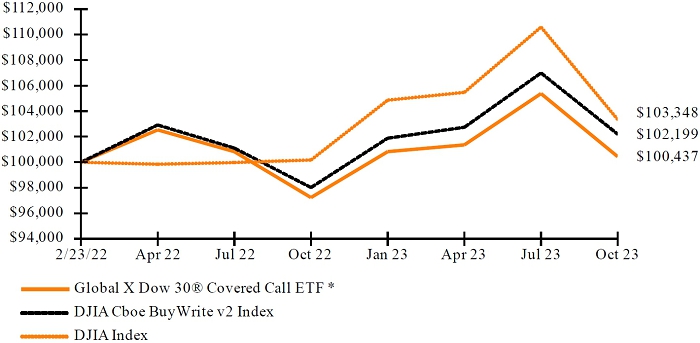
* The Fund commenced operations on February 23, 2022.
The Dow Jones Industrial Average®, Dow Jones, or simply the Dow, is a stock market index of 30 prominent companies listed on stock exchanges in the United States. The DJIA is one of the oldest and most commonly followed equity indexes.
The performance data quoted herein represents past performance and the return and value of an investment in the Fund will fluctuate so that, when redeemed, it may be worth less than its original cost. Past performance is no guarantee of future performance and should not be considered as a representation of the future results of the Fund. The Fund’s performance assumes the reinvestment of all dividends and all capital gains. Index returns assume reinvestment of dividends and, unlike the Fund’s returns, do not reflect any fees or expenses. If such fees and expenses were included in the index returns, the performance would have been lower. Please note that one cannot invest directly in an unmanaged index. Performance figures for the periods shown may reflect contractual fee waivers and/or expense reimbursements. In the absence of fee waiver sand/or expense reimbursements (if applicable), returns would have been lower.
There are no assurances that the Fund will meet its stated objectives.
The Fund’s holdings and allocations are subject to change and should not be considered recommendations to buy individual securities.
The graph and table do not reflect the deduction of taxes that a shareholder would pay on Fund distributions or the redemption or sale of Fund shares.
See definition of comparative indices above.
59
Management Discussion of Fund Performance (unaudited)
Russell 2000 Covered Call & Growth ETF
Global X Russell 2000 Covered Call & Growth ETF
The Global X Russell 2000 Covered Call & Growth ETF (the “Fund”) seeks to provide investment results that correspond generally to the price and yield performance, before fees and expenses, of the Cboe Russell 2000 Half BuyWrite Index (the “Underlying Index”). The Fund is passively managed and the investment adviser does not attempt to take defensive positions in declining markets. The Fund generally seeks to fully replicate the Underlying Index.
The Underlying Index measures the performance of a covered call strategy that holds a theoretical portfolio of the underlying stocks of the Russell 2000 Index (the “Reference Index”) and “writes” (or sells) a succession of one-month at-the-money covered call options on the Reference Index. The written covered call options on the Reference Index correspond to approximately 50% of the value of the portfolio of stocks in the Reference Index.
For the 12-month period ended October 31, 2022 (the “reporting period”), the Fund decreased 8.16%, while the Underlying Index decreased 7.66%. The Fund had a net asset value of $26.58 per share on October 31, 2022 and ended the reporting period with a net asset value of $22.38 on October 31, 2023.
During the reporting period, the Vanguard Russell 2000 ETF, the only equity holding of the Fund, returned -8.60%.
During the reporting period, holdings within the Fund experienced a sell-off as a product of rising interest rates and the fallout of the regional banking crisis. Thus, the Reference Index’s decline negatively impacted the performance of the Fund. Furthermore, performance was also deterred by biotechnology companies within the Fund as merger and acquisition activities remained stifled during the reporting period. When the market was volatile, the Fund collected elevated levels of option premiums, offsetting a portion of its negative equity performance. This led to the Fund’s outperformance of its Reference Index during the reporting period.
| | AVERAGE TOTAL RETURN FOR THE YEAR ENDED
OCTOBER 31, 2023 |
| | One Year Return | Annualized Inception to Date* |
| | Net Asset Value | Market Price | Net Asset Value | Market Price |
| Global X Russell 2000 Covered Call & Growth ETF | -8.16% | -8.07% | -4.92% | -4.77% |
| Cboe Russell 2000 Half BuyWrite Index | -7.66% | -7.66% | -4.58% | -4.58% |
| Russell 2000 Index | -8.56% | -8.56% | -4.53% | -4.53% |
60
Management Discussion of Fund Performance (unaudited)
Russell 2000 Covered Call & Growth ETF
Growth of a $10,000 Investment
(At Net Asset Value)
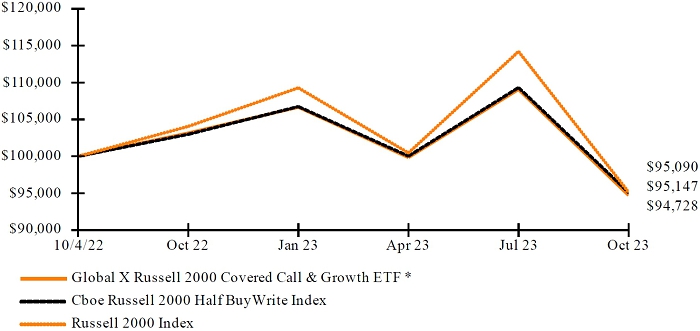
* The Fund commenced operations on October 4, 2022.
The Russell 2000 Index is a U.S. small-cap stock market index of the bottom 2,000 stocks in the Russell 3000 Index. The index is maintained by FTSE Russell, a subsidiary of the London Stock Exchange Group.
The performance data quoted herein represents past performance and the return and value of an investment in the Fund will fluctuate so that, when redeemed, it may be worth less than its original cost. Past performance is no guarantee of future performance and should not be considered as a representation of the future results of the Fund. The Fund’s performance assumes the reinvestment of all dividends and all capital gains. Index returns assume reinvestment of dividends and, unlike the Fund’s returns, do not reflect any fees or expenses. If such fees and expenses were included in the index returns, the performance would have been lower. Please note that one cannot invest directly in an unmanaged index. Performance figures for the periods shown may reflect contractual fee waivers and/or expense reimbursements. In the absence of fee waiver sand/or expense reimbursements (if applicable), returns would have been lower.
There are no assurances that the Fund will meet its stated objectives.
The Fund’s holdings and allocations are subject to change and should not be considered recommendations to buy individual securities.
The graph and table do not reflect the deduction of taxes that a shareholder would pay on Fund distributions or the redemption or sale of Fund shares.
See definition of comparative indices above.
61
Management Discussion of Fund Performance (unaudited)
Global X Financials Covered Call & Growth ETF
Global X Financials Covered Call & Growth ETF
The Global X Financials Covered Call & Growth ETF (the “Fund”) seeks to provide investment results that correspond generally to the price and yield performance, before fees and expenses, of the Cboe S&P Financial Select Sector Half BuyWrite Index (the “Underlying Index”). The Fund is passively managed, which means the investment adviser does not attempt to take defensive positions in declining markets. The Fund generally seeks to fully replicate the Underlying Index.
The Underlying Index measures the performance of a partially covered call strategy that holds a theoretical portfolio of the underlying securities of the Financial Select Sector Index (the “Reference Index”). The Index “writes” (or sells) a succession of one-month at-the-money covered call options on the Financial Select Sector SPDR Fund (the “Reference Fund”), or such other fund that seeks to track the performance of the Reference Index, as determined by Cboe. The call options correspond to approximately 50% of the value of the securities in the Reference Index, thereby representing a partially covered call strategy.
From the inception of the Fund to the period ending October 31, 2023 (the “reporting period”), the Fund decreased 5.40% and the Underlying Index decreased 4.31%. The Fund had a net asset value of $24.88 per share on November 21, 2022 and ended the reporting period with a net asset value of $22.30 on October 31, 2023.
During the reporting period, the highest returns came from Arch Capital Group Ltd. and Cboe Global markets Inc., which returned 51.64% and 34.19%, respectively. The worst performers were Signature Bank and First Republic Bank, which returned -99.82% and -99.73%, respectively.
Since its inception, the Fund has recorded negative returns as a product of banking sector volatility stemming from elevated interest rates. The U.S. regional banking crisis and its aftermath had a negative impact on investor confidence within the financial sector. These negative catalysts came in conjunction with higher loan charge-offs, which resulted in decreased equity valuations within the banking sector over the course of the reporting period. Financial company performance was also impaired by higher deposit funding costs due to higher short-term interest rates. A level of the downside performance associated with the Fund’s underlying equity positions was partially offset by premiums received from its covered call strategy.
| | AVERAGE TOTAL RETURN FOR THE PERIOD ENDED
OCTOBER 31, 2023 |
| | Cumulative Inception to Date* |
| | Net Asset Value | Market Price |
| Global X Financials Covered Call & Growth ETF | -5.40% | -5.49% |
| Cboe S&P Financials Select Sector Half BuyWrite Index | -4.31% | -4.31% |
| Financial Select Sector Index | -6.91% | -6.91% |
62
Management Discussion of Fund Performance (unaudited)
Global X Financials Covered Call & Growth ETF
Growth of a $10,000 Investment
(At Net Asset Value)

* The Fund commenced operations on November 21, 2022.
The Financial Select Sector Index is a modified market capitalization weighted index containing the securities of the S&P 500® Index that are classified within the financials sector under the Global Industry Classification System (“GICS”), including securities of companies from the following industries: diversified financial services; insurance; banks; capital markets; mortgage real estate investment trusts (“REITs”); consumer finance; and thrifts and mortgage finance.
The performance data quoted herein represents past performance and the return and value of an investment in the Fund will fluctuate so that, when redeemed, it may be worth less than its original cost. Past performance is no guarantee of future performance and should not be considered as a representation of the future results of the Fund. The Fund’s performance assumes the reinvestment of all dividends and all capital gains. Index returns assume reinvestment of dividends and, unlike the Fund’s returns, do not reflect any fees or expenses. If such fees and expenses were included in the index returns, the performance would have been lower. Please note that one cannot invest directly in an unmanaged index. Performance figures for the periods shown may reflect contractual fee waivers and/or expense reimbursements. In the absence of fee waiver sand/or expense reimbursements (if applicable), returns would have been lower.
There are no assurances that the Fund will meet its stated objectives.
The Fund’s holdings and allocations are subject to change and should not be considered recommendations to buy individual securities.
The graph and table do not reflect the deduction of taxes that a shareholder would pay on Fund distributions or the redemption or sale of Fund shares.
See definition of comparative indices above.
63
Management Discussion of Fund Performance (unaudited)
Global X Health Care Covered Call & Growth ETF
Global X Health Care Covered Call & Growth ETF
The Global X Health Care Covered Call & Growth ETF (the “Fund”) seeks to provide investment results that correspond generally to the price and yield performance, before fees and expenses, of the Cboe S&P Health Care Select Sector Half BuyWrite Index (the “Underlying Index”). The Fund is passively managed, which means the investment adviser does not attempt to take defensive positions in declining markets. The Fund generally seeks to fully replicate the Underlying Index.
The Underlying Index measures the performance of a partially covered call strategy that holds a theoretical portfolio of the underlying securities of the Health Care Select Sector Index (the “Reference Index”). The Index “writes” (or sells) a succession of one-month at-the-money covered call options on the Health Care Select Sector SPDR Fund (the “Reference Fund”), or such other fund that seeks to track the performance of the Reference Index, as determined by Cboe. The call options correspond to approximately 50% of the value of the securities in the Reference Index, thereby representing a partially covered call strategy.
From the Fund’s inception through the period ending October 31, 2023 (the “reporting period”), the Fund decreased 2.05%, while the Underlying Index decreased 2.26%. The Fund had a net asset value of $25.06 per share on November 21, 2022 and ended the reporting period with a net asset value of $23.42 on October 31, 2023.
During the reporting period, the highest returns came from Eli Lilly and Co and West Pharmaceutical Services, which returned 54.59% and 41.56%, respectively. The worst performers were Insulet Corp and Moderna Inc, which returned -57.61% and -57.02%, respectively.
Since its inception, the Fund recorded a negative return as a result of economic instability across the broader health care sector. Contracting operating margins, declining patient volumes, and pressured payer relationships impacted performance and, consequently, the Fund’s underlying holdings. Inflationary pressures increased the cost of drugs, equipment, and supplies, dampening investor sentiment over the course of the reporting period, including towards the U.S. health care sector. A level of the downside performance associated with the Fund’s underlying equity positions was partially offset by premiums received from its covered call strategy.
| | AVERAGE TOTAL RETURN FOR THE PERIOD ENDED
OCTOBER 31, 2023 |
| | Cumulative Inception to Date* |
| | Net Asset Value | Market Price |
| Global X Health Care Covered Call & Growth ETF | -2.05% | -1.97% |
| Cboe S&P Health Care Select Sector Half BuyWrite Index | -2.26% | -2.26% |
| Health Care Select Sector Index | -5.91% | -5.91% |
64
Management Discussion of Fund Performance (unaudited)
Global X Health Care Covered Call & Growth ETF
Growth of a $10,000 Investment
(At Net Asset Value)
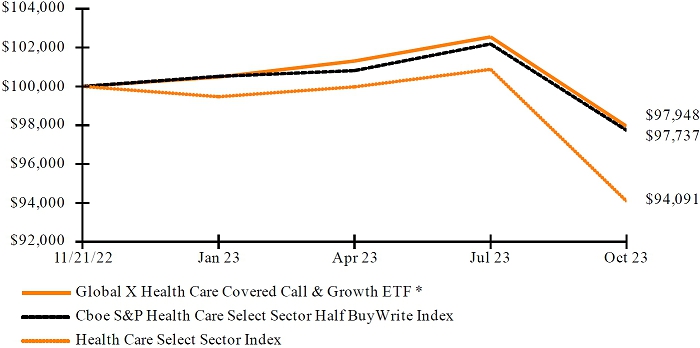
* The Fund commenced operations on November 21, 2022.
The Health Care Select Sector Index is a modified market capitalization weighted index containing the securities of the S&P 500® Index that are classified within the health care sector under the Global Industry Classification System (“GICS”), including securities of companies from the following industries: pharmaceuticals; health care equipment and supplies; health care providers and services; biotechnology; life sciences tools and services; and health care technology.
The performance data quoted herein represents past performance and the return and value of an investment in the Fund will fluctuate so that, when redeemed, it may be worth less than its original cost. Past performance is no guarantee of future performance and should not be considered as a representation of the future results of the Fund. The Fund’s performance assumes the reinvestment of all dividends and all capital gains. Index returns assume reinvestment of dividends and, unlike the Fund’s returns, do not reflect any fees or expenses. If such fees and expenses were included in the index returns, the performance would have been lower. Please note that one cannot invest directly in an unmanaged index. Performance figures for the periods shown may reflect contractual fee waivers and/or expense reimbursements. In the absence of fee waiver sand/or expense reimbursements (if applicable), returns would have been lower.
There are no assurances that the Fund will meet its stated objectives.
The Fund’s holdings and allocations are subject to change and should not be considered recommendations to buy individual securities.
The graph and table do not reflect the deduction of taxes that a shareholder would pay on Fund distributions or the redemption or sale of Fund shares.
See definition of comparative indices above.
65
Management Discussion of Fund Performance (unaudited)
Global X Information Technology Covered Call & Growth ETF
Global X Information Technology Covered Call & Growth ETF
The Global X Information Technology Covered Call & Growth ETF (the “Fund”) seeks to provide investment results that correspond generally to the price and yield performance, before fees and expenses, of the Cboe S&P Technology Select Sector Half BuyWrite Index. (the “Underlying Index”). The Fund is passively managed, and the investment adviser does not attempt to take defensive positions in declining markets. The Fund generally seeks to fully replicate the Underlying Index.
The Underlying Index measures the performance of a partially covered call strategy that holds a theoretical portfolio of the underlying securities of the Information Technology Select Sector Index (the “Reference Index”). The Underlying Index “writes” (or sells) a succession of one-month at-the-money covered call options on the Information Technology Select Sector SPDR® Fund, or such other fund that seeks to track the performance of the Reference Index, as determined by Cboe. The call options correspond to approximately 50% of the value of the securities in the Reference Index, creating a partially covered call strategy.
From inception of the Fund to the period ending October 31, 2023 (the “reporting period”), the Fund increased 23.27% and the Underlying Index increased 23.97%. The Fund had a net asset value of $24.74 per share on November 21, 2022 and ended the reporting period with a net asset value of $28.86 on October 31, 2023.
During the reporting period, the highest returns came from Nvidia Corp. and Broadcom Inc., which returned 166.40% and 66.96%, respectively. The worst performers were SolarEdge Technologies Inc and Enphase Energy Inc, which returned -74.80 % and -74.17%, respectively.
Since its inception, the Fund has recorded positive returns supported by evolving artificial intelligence (AI) capabilities, increased internal investment activity, and a heightened need for data security. Generative AI technology enabled companies to create personalized user experiences and made it easier for advertisers to produce targeted messaging. Thus, technology companies who offered generative AI solutions and/or technology largely benefited during the reporting period. These developments led to increased investor sentiment towards many of the holdings within the Fund.
| | AVERAGE TOTAL RETURN FOR THE PERIOD ENDED
OCTOBER 31, 2023 |
| | Cumulative Inception to Date* |
| | Net Asset Value | Market Price |
| Global X Information Technology Covered Call & Growth ETF | 23.27% | 23.27% |
| Cboe S&P Technology Select Sector Half BuyWrite Index | 23.97% | 23.97% |
| Information Technology Select Sector Index | 26.84% | 26.84% |
66
Management Discussion of Fund Performance (unaudited)
Global X Information Technology Covered Call & Growth ETF
Growth of a $10,000 Investment
(At Net Asset Value)

* The Fund commenced operations on November 21, 2021.
The Information Technology Select Sector Index is a modified market capitalization weighted index containing the securities of the S&P 500 Index® that are classified within the information technology sector under the Global Industry Classification System (“GICS”), including securities of companies from the following industries: technology hardware, storage, and peripherals; software; communications equipment; semiconductors and semiconductor equipment; IT services; and electronic equipment, instruments and components.
The performance data quoted herein represents past performance and the return and value of an investment in the Fund will fluctuate so that, when redeemed, it may be worth less than its original cost. Past performance is no guarantee of future performance and should not be considered as a representation of the future results of the Fund. The Fund’s performance assumes the reinvestment of all dividends and all capital gains. Index returns assume reinvestment of dividends and, unlike the Fund’s returns, do not reflect any fees or expenses. If such fees and expenses were included in the index returns, the performance would have been lower. Please note that one cannot invest directly in an unmanaged index. Performance figures for the periods shown may reflect contractual fee waivers and/or expense reimbursements. In the absence of fee waiver sand/or expense reimbursements (if applicable), returns would have been lower.
There are no assurances that the Fund will meet its stated objectives.
The Fund’s holdings and allocations are subject to change and should not be considered recommendations to buy individual securities.
The graph and table do not reflect the deduction of taxes that a shareholder would pay on Fund distributions or the redemption or sale of Fund shares.
See definition of comparative indices above.
67
Management Discussion of Fund Performance (unaudited)
Global X Nasdaq 100® ESG Covered Call ETF
Global X NASDAQ 100® ESG Covered Call ETF
The Global X NASDAQ 100® ESG Covered Call ETF (“Fund”) seeks to provide investment results that correspond generally to the price and yield performance, before fees and expenses, of the Nasdaq-100 ESG BuyWrite Index (the “Underlying Index”). The Fund is passively managed, which means the investment adviser does not attempt to take defensive positions in declining markets. The Fund generally seeks to fully replicate the Underlying Index.
The Underlying Index seeks to provide long exposure to an equity portfolio that applies a set of specific Environmental, Social and Governance (“ESG”) criteria as part of its security selection process, while also selling call options generally associated with such exposure. Specifically, the Underlying Index measures the performance of a covered call strategy, also known as a “buy-write” strategy, that seeks to provide long exposure by “buying” the underlying components of the Nasdaq-100 ESG Index (the “Reference Index”) and to generate options premium income by “writing” (selling) a succession of one-month, at-the-money (“ATM”) covered call options on the Nasdaq-100 Index. In seeking to track the Underlying Index, the Fund invests in the securities reflected in the Underlying Index by purchasing the underlying holdings of the Reference Index in proportion to their weight in the Reference Index, and systematically writing (selling) a succession of one-month, ATM covered call options on the Nasdaq-100 Index.
From inception of the Fund on February 21, 2023 through the period ending October 31, 2023 (the “reporting period”), the Fund increased 9.67%, while the Underlying Index increased 9.53%. The Fund had a net asset value of $24.46 per share on February 21, 2023 and ended the reporting period with a net asset value of $24.77 on October 31, 2023.
During the reporting period, the highest returns came from Nvidia Corp and Meta Platforms Inc., which returned 97.51% and 75.08%, respectively. The worst performers were SolarEdge Technologies Inc and Enphase Energy Inc, which returned -74.21% and -60.54%, respectively.
Since its inception, the Fund experienced positive returns as inflationary pressures lessened and supported the Federal Reserve’s decision to slow the pace of its interest rate hikes. This positively impacted growth-oriented names within the fund over the course of the reporting period. During the reporting period, the Fund had an average approximate sector exposure to Information Technology at 58.61% and Communication Services at 12.65%.
| | AVERAGE TOTAL RETURN FOR THE PERIOD ENDED
OCTOBER 31, 2023 |
| | Cumulative Inception to Date* |
| | Net Asset Value | Market Price |
| Global X NASDAQ 100® ESG Covered Call ETF | 9.67% | 9.23% |
| NASDAQ-100 ESG BuyWrite Index | 9.53% | 9.53% |
| NASDAQ-100® Index | 20.13% | 20.13% |
68
Management Discussion of Fund Performance (unaudited)
Global X Nasdaq 100® ESG Covered Call ETF
Growth of a $10,000 Investment
(At Net Asset Value)

* The Fund commenced operations on February 21, 2023.
The NASDAQ-100® Index includes 100 of the largest domestic and international non-financial companies listed on The NASDAQ Stock Market based on market capitalization.
The performance data quoted herein represents past performance and the return and value of an investment in the Fund will fluctuate so that, when redeemed, it may be worth less than its original cost. Past performance is no guarantee of future performance and should not be considered as a representation of the future results of the Fund. The Fund’s performance assumes the reinvestment of all dividends and all capital gains. Index returns assume reinvestment of dividends and, unlike the Fund’s returns, do not reflect any fees or expenses. If such fees and expenses were included in the index returns, the performance would have been lower. Please note that one cannot invest directly in an unmanaged index. Performance figures for the periods shown may reflect contractual fee waivers and/or expense reimbursements. In the absence of fee waiver sand/or expense reimbursements (if applicable), returns would have been lower.
There are no assurances that the Fund will meet its stated objectives.
The Fund’s holdings and allocations are subject to change and should not be considered recommendations to buy individual securities.
The graph and table do not reflect the deduction of taxes that a shareholder would pay on Fund distributions or the redemption or sale of Fund shares.
See definition of comparative indices above.
69
Management Discussion of Fund Performance (unaudited)
Global X S&P 500® ESG Covered Call ETF
Global X S&P 500® ESG Covered Call ETF
The Global X S&P 500® ESG Covered Call ETF (“Fund”) seeks to provide investment results that correspond generally to the price and yield performance, before fees and expenses, of the Cboe S&P 500® ESG BuyWrite Index (the “Underlying Index”). The Fund is passively managed, which means the investment adviser does not attempt to take defensive positions in declining markets. The Fund generally seeks to fully replicate the Underlying Index.
The Underlying Index seeks to provide long exposure to an equity portfolio that applies a set of specific Environmental, Social and Governance criteria as part of its security selection process, while also “selling” call options generally associated with such exposure. Specifically, the Underlying Index measures the performance of a covered call strategy, also known as a “buy-write” strategy, that seeks to provide long exposure by “buying” the underlying components of the S&P 500 ESG Index (the “Reference Index”) and “writing” (selling) a succession of one-month, at-the-money (“ATM”) covered call options on the Reference Index to generate premium income.
From the inception of the Fund through the period ending October 31, 2023 (the “reporting period”), the Fund increased 1.79%, while the Underlying Index increased 2.42%. The Fund had a net asset value of $24.65 per share on February 21, 2023 and ended the reporting period with a net asset value of $23.79 on October 31, 2023.
During the reporting period, the highest returns came from Nvidia Corp and Eli Lilly & Co, which returned 97.51% and 69.93%, respectively. The worst performers were SolarEdge Technologies Inc and FMC Corp, which returned -73.41% and -57.01%, respectively.
Softening inflation and a deceleration of interest rate hikes by central banks around the world supported investor sentiment resulting in modestly positive performance for the Fund since its inception. Due to the Fund’s ATM call option writing strategy, the Fund has a propensity to underperform its Reference Index during times when the underlying asset is trending on a strong upward trajectory. Thus, the Reference Index’s increase during the reporting period led to the Fund trailing the Reference Index during the reporting period. The Fund produced its returns harnessing its largest sector exposures to Information Technology at 30.07%, Health Care at 13.95% and Financials at 12.56%.
| | AVERAGE TOTAL RETURN FOR THE PERIOD ENDED
OCTOBER 31, 2023 |
| | Cumulative Inception to Date* |
| | Net Asset Value | Market Price |
| Global X S&P 500® ESG Covered Call ETF | 1.79% | 1.23% |
| Cboe S&P 500® ESG BuyWrite Index | 2.42% | 2.42% |
| S&P 500® Index | 6.06% | 6.06% |
70
Management Discussion of Fund Performance (unaudited)
Global X S&P 500® ESG Covered Call ETF
Growth of a $10,000 Investment
(At Net Asset Value)

* The Fund commenced operations on February 21, 2023.
The S&P 500® Index is a market capitalization weighted composite index of 500 large capitalization U.S. companies.
The performance data quoted herein represents past performance and the return and value of an investment in the Fund will fluctuate so that, when redeemed, it may be worth less than its original cost. Past performance is no guarantee of future performance and should not be considered as a representation of the future results of the Fund. The Fund’s performance assumes the reinvestment of all dividends and all capital gains. Index returns assume reinvestment of dividends and, unlike the Fund’s returns, do not reflect any fees or expenses. If such fees and expenses were included in the index returns, the performance would have been lower. Please note that one cannot invest directly in an unmanaged index. Performance figures for the periods shown may reflect contractual fee waivers and/or expense reimbursements. In the absence of fee waiver sand/or expense reimbursements (if applicable), returns would have been lower.
There are no assurances that the Fund will meet its stated objectives.
The Fund’s holdings and allocations are subject to change and should not be considered recommendations to buy individual securities.
The graph and table do not reflect the deduction of taxes that a shareholder would pay on Fund distributions or the redemption or sale of Fund shares.
See definition of comparative indices above.
71
Management Discussion of Fund Performance (unaudited)
Global X Dow 30® Covered Call & Growth ETF
Global X Dow 30® Covered Call & Growth ETF
The Global X Dow 30® Covered Call & Growth ETF (the “Fund”) seeks to provide investment results that correspond generally to the price and yield performance, before fees and expenses, of the Cboe DJIA Half BuyWrite Index (the “Underlying Index”). The Fund is passively managed, which means the investment adviser does not attempt to take defensive positions in declining markets. The Fund generally seeks to fully replicate the Underlying Index.
The Underlying Index measures the performance of a partially covered call strategy that holds a theoretical portfolio of the underlying stocks of the Dow Jones Industrial Average® (the “Reference Index”) and “writes” (or sells) a succession of one-month at-the-money covered call options on the same. The call options correspond to approximately 50% of the value of the securities in the Reference Index, thereby creating a partially covered call strategy.
From the inception of the Fund through the period ending October 31, 2023 (the “reporting period”), the Fund decreased 5.35% and the Underlying Index decreased 5.31%. The Fund had a net asset value of $25.81 per share on July 25, 2023 and ended the reporting period with a net asset value of $24.20 on October 31, 2023.
During the reporting period, the highest returns came from Microsoft Corporation and Intel Corporation, which returned 47.06% and 32.70%, respectively. The worst performers were Walgreens Boots Alliance, Inc. and 3M Company, which returned -38.80% and -23.63%, respectively.
Since its inception, the Fund has recorded negative returns as a product of elevated interest rates and concerns over inflation, which in turn negatively impacted U.S. equities held by the Fund during the reporting period. Rising unemployment since the Fund’s inception and weaker consumer confidence, coupled with adverse geopolitical proceedings detracted from the Fund’s performance. Option premiums collected by the Fund helped dampen a level of the impact of its negative performance. During the reporting period, the Fund’s average sector exposure was most heavily weighted towards Health Care at 19.88%, followed by Financials 19.84%, and Information Technology 18.23%.
| | AVERAGE TOTAL RETURN FOR THE PERIOD ENDED
OCTOBER 31, 2023 |
| | Cumulative Inception to Date* |
| | Net Asset Value | Market Price |
| Global X Dow 30® Covered Call & Growth ETF | -5.35% | -4.88% |
| Cboe DJIA Half BuyWrite Index | -5.31% | -5.31% |
| DJIA Index | -6.23% | -6.23% |
72
Management Discussion of Fund Performance (unaudited)
Global X Dow 30® Covered Call & Growth ETF
Growth of a $10,000 Investment
(At Net Asset Value)

* The Fund commenced operations on July 25, 2023.
The Dow Jones Industrial Average®, Dow Jones, or simply the Dow, is a stock market index of 30 prominent companies listed on stock exchanges in the United States. The DJIA is one of the oldest and most commonly followed equity indexes.
The performance data quoted herein represents past performance and the return and value of an investment in the Fund will fluctuate so that, when redeemed, it may be worth less than its original cost. Past performance is no guarantee of future performance and should not be considered as a representation of the future results of the Fund. The Fund’s performance assumes the reinvestment of all dividends and all capital gains. Index returns assume reinvestment of dividends and, unlike the Fund’s returns, do not reflect any fees or expenses. If such fees and expenses were included in the index returns, the performance would have been lower. Please note that one cannot invest directly in an unmanaged index. Performance figures for the periods shown may reflect contractual fee waivers and/or expense reimbursements. In the absence of fee waiver sand/or expense reimbursements (if applicable), returns would have been lower.
There are no assurances that the Fund will meet its stated objectives.
The Fund’s holdings and allocations are subject to change and should not be considered recommendations to buy individual securities.
The graph and table do not reflect the deduction of taxes that a shareholder would pay on Fund distributions or the redemption or sale of Fund shares.
See definition of comparative indices above.
73
| Schedule of Investments | October 31, 2023 |
| Global X Lithium & Battery Tech ETF |
Sector Weightings (Unaudited)†:
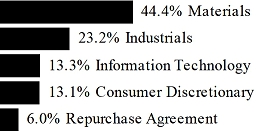
† Sector weightings percentages are based on the total market value of investments. Total investments do not include derivatives such as options, futures contracts, forward contracts, and swap contracts, if applicable.
| | | Shares | | | Value | |
| COMMON STOCK — 99.0% | | | | | | | | |
| AUSTRALIA — 14.9% | | | | | | | | |
| Materials — 14.9% | | | | | | | | |
| Allkem * | | | 7,796,762 | | | $ | 47,094,536 | |
| Core Lithium * (A) | | | 25,594,350 | | | | 5,833,839 | |
| IGO | | | 9,961,628 | | | | 59,981,691 | |
| Latin Resources * | | | 29,199,660 | | | | 4,529,516 | |
| Liontown Resources * (A) | | | 16,716,362 | | | | 17,040,232 | |
| Mineral Resources | | | 2,262,475 | | | | 82,740,633 | |
| Pilbara Minerals (A) | | | 38,700,546 | | | | 89,927,190 | |
| Sayona Mining * (A) | | | 108,471,888 | | | | 5,150,938 | |
| | | | | | | | | |
| TOTAL AUSTRALIA | | | | | | | 312,298,575 | |
| BRAZIL — 0.8% | | | | | | | | |
| Materials — 0.8% | | | | | | | | |
| Sigma Lithium * (A) | | | 728,522 | | | | 17,812,363 | |
| | | | | | | | | |
| CANADA — 1.8% | | | | | | | | |
| Materials — 1.8% | | | | | | | | |
| Lithium Americas * (A) | | | 2,083,047 | | | | 13,969,507 | |
| Lithium Americas Argentina * (A) | | | 1,598,678 | | | | 8,832,602 | |
| Patriot Battery Metals * | | | 1,333,768 | | | | 9,338,538 | |
| Standard Lithium * | | | 1,694,261 | | | | 4,686,448 | |
| | | | | | | | | |
| TOTAL CANADA | | | | | | | 36,827,095 | |
The accompanying notes are an integral part of the financial statements.
74
| Schedule of Investments | October 31, 2023 |
| Global X Lithium & Battery Tech ETF |
| | | Shares | | | Value | |
| COMMON STOCK — continued | | | | | | | | |
| CHILE — 4.4% | | | | | | | | |
| Industrials — 4.4% | | | | | | | | |
| Sociedad Quimica y Minera de Chile ADR (A) | | | 1,893,841 | | | $ | 91,661,904 | |
| | | | | | | | | |
| CHINA — 40.4% | | | | | | | | |
| Consumer Discretionary — 4.4% | | | | | | | | |
| BYD, Cl H | | | 3,054,274 | | | | 92,667,312 | |
| | | | | | | | | |
| Industrials — 14.2% | | | | | | | | |
| Contemporary Amperex Technology, Cl A | | | 3,712,909 | | | | 93,858,787 | |
| Eve Energy, Cl A | | | 15,434,988 | | | | 97,587,478 | |
| Jiangxi Special Electric Motor, Cl A * | | | 12,860,477 | | | | 20,949,368 | |
| Sunwoda Electronic, Cl A | | | 17,318,891 | | | | 37,977,696 | |
| Wuxi Lead Intelligent Equipment, Cl A | | | 12,563,036 | | | | 47,893,896 | |
| | | | | | | | 298,267,225 | |
| Information Technology — 4.7% | | | | | | | | |
| NAURA Technology Group, Cl A | | | 2,791,441 | | | | 97,330,977 | |
| | | | | | | | | |
| Materials — 17.1% | | | | | | | | |
| Ganfeng Lithium Group, Cl A | | | 13,978,540 | | | | 84,304,758 | |
| Guangzhou Tinci Materials Technology, Cl A | | | 14,742,778 | | | | 55,842,259 | |
| Shanghai Putailai New Energy Technology, Cl A | | | 10,760,211 | | | | 36,638,988 | |
| Sinomine Resource Group, Cl A | | | 6,616,800 | | | | 33,678,579 | |
| Tianqi Lithium, Cl A | | | 12,313,841 | | | | 92,244,163 | |
| Yunnan Energy New Material, Cl A | | | 6,062,459 | | | | 55,323,071 | |
| | | | | | | | 358,031,818 | |
| TOTAL CHINA | | | | | | | 846,297,332 | |
| FRANCE — 0.3% | | | | | | | | |
| Materials — 0.3% | | | | | | | | |
| Eramet | | | 102,840 | | | | 7,092,826 | |
| | | | | | | | | |
| JAPAN — 7.9% | | | | | | | | |
| Consumer Discretionary — 3.7% | | | | | | | | |
| Panasonic Holdings | | | 8,878,727 | | | | 76,742,406 | |
The accompanying notes are an integral part of the financial statements.
75
| Schedule of Investments | October 31, 2023 |
| Global X Lithium & Battery Tech ETF |
| | | Shares | | | Value | |
| COMMON STOCK — continued | | | | | | | | |
| Information Technology — 4.2% | | | | | | | | |
| TDK | | | 2,430,410 | | | $ | 89,195,541 | |
| | | | | | | | | |
| TOTAL JAPAN | | | | | | | 165,937,947 | |
| NETHERLANDS — 0.5% | | | | | | | | |
| Materials — 0.5% | | | | | | | | |
| AMG Critical Materials | | | 398,733 | | | | 10,359,548 | |
| | | | | | | | | |
| SOUTH KOREA — 8.8% | | | | | | | | |
| Industrials — 3.7% | | | | | | | | |
| LG Energy Solution * | | | 267,833 | | | | 76,450,055 | |
| | | | | | | | | |
| Information Technology — 5.1% | | | | | | | | |
| L&F (A) | | | 324,685 | | | | 31,349,394 | |
| Samsung SDI | | | 242,806 | | | | 76,497,688 | |
| | | | | | | | 107,847,082 | |
| TOTAL SOUTH KOREA | | | | | | | 184,297,137 | |
| UNITED STATES — 19.2% | | | | | | | | |
| Consumer Discretionary — 5.6% | | | | | | | | |
| Lucid Group * (A) | | | 10,858,875 | | | | 44,738,565 | |
| Tesla * | | | 368,733 | | | | 74,056,336 | |
| | | | | | | | 118,794,901 | |
| Industrials — 2.2% | | | | | | | | |
| EnerSys | | | 536,968 | | | | 45,953,721 | |
| | | | | | | | 45,953,721 | |
| Materials — 11.4% | | | | | | | | |
| Albemarle | | | 1,560,625 | | | | 197,856,037 | |
| Livent * | | | 2,368,637 | | | | 34,558,414 | |
| Piedmont Lithium * | | | 231,972 | | | | 6,372,271 | |
| | | | | | | | 238,786,722 | |
| TOTAL UNITED STATES | | | | | | | 403,535,344 | |
TOTAL COMMON STOCK
(Cost $2,429,692,845) | | | | | | | 2,076,120,071 | |
The accompanying notes are an integral part of the financial statements.
76
| Schedule of Investments | October 31, 2023 |
| Global X Lithium & Battery Tech ETF |
| | | Face Amount | | | Value | |
| REPURCHASE AGREEMENT(B) — 6.3% | | | | | | | | |
BNP Paribas
5.210%, dated 10/31/2023, to be repurchased on 11/01/2023, repurchase price $131,510,882 (collateralized by U.S. Treasury Obligations, ranging in par value $17,335,318 - $2,796,013, 4.000% - 2.000%, 02/15/26 - 02/15/25, with a total market value of $133,924,739)
(Cost $131,491,852) | | $ | 131,491,852 | | | $ | 131,491,852 | |
TOTAL INVESTMENTS — 105.3%
(Cost $2,561,184,697) | | | | | | $ | 2,207,611,923 | |
Percentages are based on Net Assets of $2,095,790,645.
| * | Non-income producing security. |
| (A) | This security or a partial position of this security is on loan at October 31, 2023. The total market value of securities on loan at October 31, 2023 was $121,159,472. |
| (B) | These securities were purchased with cash collateral held from securities on loan. The total value of such securities as of October 31, 2023 was $131,491,852. The total value of non-cash collateral held from securities on loan as of October 31, 2023 was $–. |
The following is a summary of the level of inputs used as of October 31, 2023, in valuing the Fund’s investments carried at value:
| Investments in Securities | | Level 1 | | | Level 2 | | | Level 3 | | | Total | |
| Common Stock | | $ | 2,076,120,071 | | | $ | — | | | $ | — | | | $ | 2,076,120,071 | |
| Repurchase Agreement | | | — | | | | 131,491,852 | | | | — | | | | 131,491,852 | |
| Total Investments in Securities | | $ | 2,076,120,071 | | | $ | 131,491,852 | | | $ | — | | | $ | 2,207,611,923 | |
Amounts designated as “—” are $0 or have been rounded to $0.
See “Glossary” for abbreviations.
The accompanying notes are an integral part of the financial statements.
77
| Schedule of Investments | | October 31, 2023 |
| | Global X SuperDividend® ETF | |
Sector Weightings (Unaudited)†:
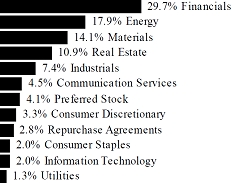
† Sector weightings percentages are based on the total market value of investments. Total investments do not include derivatives such as options, futures contracts, forward contracts, and swap contracts, if applicable.
| | | Shares | | | Value | |
| COMMON STOCK — 94.8% | | | | | | | | |
| ARGENTINA — 1.1% | | | | | | | | |
| Materials — 1.1% | | | | | | | | |
| Loma Negra Cia Industrial Argentina ADR | | | 1,302,681 | | | $ | 7,425,282 | |
| | | | | | | | | |
| AUSTRALIA — 10.6% | | | | | | | | |
| Consumer Discretionary — 0.8% | | | | | | | | |
| Harvey Norman Holdings (A) | | | 2,540,206 | | | | 5,902,593 | |
| | | | | | | | | |
| Energy — 3.3% | | | | | | | | |
| New Hope (A) | | | 1,918,391 | | | | 7,008,431 | |
| Woodside Energy Group | | | 364,506 | | | | 7,906,785 | |
| Yancoal Australia (A) | | | 2,731,852 | | | | 8,354,340 | |
| | | | | | | | 23,269,556 | |
| Financials — 1.8% | | | | | | | | |
| Magellan Financial Group (A) | | | 1,456,702 | | | | 5,985,815 | |
| Platinum Asset Management | | | 8,888,971 | | | | 6,331,577 | |
| | | | | | | | 12,317,392 | |
The accompanying notes are an integral part of the financial statements.
78
| Schedule of Investments | | October 31, 2023 |
| | Global X SuperDividend® ETF | |
| | | Shares | | | Value | |
| COMMON STOCK — continued | | | | | | | | |
| Industrials — 1.1% | | | | | | | | |
| McMillan Shakespeare | | | 729,782 | | | $ | 7,744,173 | |
| | | | | | | | | |
| Materials — 3.6% | | | | | | | | |
| BHP Group | | | 245,762 | | | | 6,924,407 | |
| Fortescue Metals Group | | | 490,671 | | | | 6,927,924 | |
| Grange Resources | | | 16,686,207 | | | | 4,384,435 | |
| Incitec Pivot | | | 3,962,683 | | | | 6,874,605 | |
| | | | | | | | 25,111,371 | |
| TOTAL AUSTRALIA | | | | | | | 74,345,085 | |
| BELGIUM — 1.0% | | | | | | | | |
| Communication Services — 1.0% | | | | | | | | |
| Proximus | | | 856,455 | | | | 7,081,073 | |
| | | | | | | | | |
| BRAZIL — 5.1% | | | | | | | | |
| Consumer Discretionary — 0.8% | | | | | | | | |
| Mahle-Metal Leve | | | 740,900 | | | | 5,353,638 | |
| | | | | | | | | |
| Consumer Staples — 0.9% | | | | | | | | |
| BrasilAgro - Brasileira de Propriedades Agricolas | | | 1,342,220 | | | | 6,584,676 | |
| | | | | | | | | |
| Materials — 2.1% | | | | | | | | |
| Cia Siderurgica Nacional | | | 2,640,100 | | | | 6,156,569 | |
| CSN Mineracao | | | 8,618,500 | | | | 8,852,633 | |
| | | | | | | | 15,009,202 | |
| Utilities — 1.3% | | | | | | | | |
| CPFL Energia | | | 1,352,411 | | | | 8,967,802 | |
| | | | | | | | | |
| TOTAL BRAZIL | | | | | | | 35,915,318 | |
| | | | | | | | | |
| CHILE — 0.9% | | | | | | | | |
| Communication Services — 0.9% | | | | | | | | |
| ENTEL Chile | | | 1,970,449 | | | | 6,617,320 | |
The accompanying notes are an integral part of the financial statements.
79
| Schedule of Investments | | October 31, 2023 |
| | Global X SuperDividend® ETF | |
| | | Shares | | | Value | |
| COMMON STOCK — continued | | | | | | | | |
| CHINA — 10.1% | | | | | | | | |
| Consumer Discretionary — 0.9% | | | | | | | | |
| China Yongda Automobiles Services Holdings | | | 16,175,061 | | | $ | 6,201,618 | |
| | | | | | | | | |
| Energy — 2.2% | | | | | | | | |
| China Petroleum & Chemical, Cl H | | | 15,083,500 | | | | 7,710,810 | |
| China Shenhua Energy, Cl H | | | 2,511,400 | | | | 7,703,090 | |
| | | | | | | | 15,413,900 | |
| Financials — 2.6% | | | | | | | | |
| China Everbright Bank, Cl H | | | 28,892,000 | | | | 8,234,179 | |
| Chongqing Rural Commercial Bank, Cl H | | | 26,250,700 | | | | 9,930,485 | |
| | | | | | | | 18,164,664 | |
| Industrials — 1.3% | | | | | | | | |
| Shanghai Industrial Holdings | | | 7,233,700 | | | | 8,847,291 | |
| | | | | | | | | |
| Materials — 2.4% | | | | | | | | |
| Fufeng Group (A) | | | 12,935,300 | | | | 6,711,821 | |
| Shougang Fushan Resources Group | | | 30,678,200 | | | | 10,076,295 | |
| | | | | | | | 16,788,116 | |
| Real Estate — 0.7% | | | | | | | | |
| Midea Real Estate Holding | | | 7,258,974 | | | | 4,963,258 | |
| | | | | | | | | |
| TOTAL CHINA | | | | | | | 70,378,847 | |
| DENMARK — 0.9% | | | | | | | | |
| Industrials — 0.9% | | | | | | | | |
| AP Moller - Maersk, Cl B | | | 3,635 | | | | 6,035,726 | |
| | | | | | | | | |
| FRANCE — 1.6% | | | | | | | | |
| Communication Services — 0.8% | | | | | | | | |
| Eutelsat Communications (A) | | | 1,196,386 | | | | 5,096,278 | |
| | | | | | | | | |
| Financials — 0.8% | | | | | | | | |
| Coface | | | 479,161 | | | | 5,763,688 | |
| | | | | | | | | |
| TOTAL FRANCE | | | | | | | 10,859,966 | |
The accompanying notes are an integral part of the financial statements.
80
| Schedule of Investments | | October 31, 2023 |
| | Global X SuperDividend® ETF | |
| | | Shares | | | Value | |
| COMMON STOCK — continued | | | | | | | | |
| GERMANY — 0.8% | | | | | | | | |
| Financials — 0.8% | | | | | | | | |
| Deutsche Pfandbriefbank (A) | | | 842,944 | | | $ | 5,613,271 | |
| | | | | | | | | |
| HONG KONG — 5.6% | | | | | | | | |
| Communication Services — 2.0% | | | | | | | | |
| HKBN | | | 13,413,710 | | | | 4,645,752 | |
| PCCW | | | 18,625,100 | | | | 9,116,649 | |
| | | | | | | | 13,762,401 | |
| Industrials — 1.7% | | | | | | | | |
| Orient Overseas International | | | 930,100 | | | | 11,726,397 | |
| | | | | | | | | |
| Information Technology — 1.1% | | | | | | | | |
| VTech Holdings | | | 1,352,500 | | | | 7,873,422 | |
| | | | | | | | | |
| Real Estate — 0.8% | | | | | | | | |
| New World Development | | | 3,264,000 | | | | 5,981,873 | |
| | | | | | | | | |
| TOTAL HONG KONG | | | | | | | 39,344,093 | |
| INDONESIA — 2.5% | | | | | | | | |
| Energy — 2.5% | | | | | | | | |
| Adaro Energy | | | 43,887,700 | | | | 7,072,868 | |
| Bukit Asam | | | 28,994,900 | | | | 4,526,746 | |
| Indo Tambangraya Megah | | | 3,719,600 | | | | 6,211,041 | |
| | | | | | | | | |
| TOTAL INDONESIA | | | | | | | 17,810,655 | |
| ITALY — 1.0% | | | | | | | | |
| Financials — 1.0% | | | | | | | | |
| BFF Bank | | | 764,950 | | | | 7,337,640 | |
| | | | | | | | | |
| JAPAN — 1.0% | | | | | | | | |
| Industrials — 1.0% | | | | | | | | |
| Mitsui OSK Lines | | | 281,269 | | | | 7,211,645 | |
The accompanying notes are an integral part of the financial statements.
81
| Schedule of Investments | | October 31, 2023 |
| | Global X SuperDividend® ETF | |
| | | Shares | | | Value | |
| COMMON STOCK — continued | | | | | | | | |
| KUWAIT — 1.0% | | | | | | | | |
| Consumer Discretionary — 1.0% | | | | | | | | |
| Humansoft Holding KSC | | | 679,680 | | | $ | 6,674,938 | |
| | | | | | | | | |
| MEXICO — 1.0% | | | | | | | | |
| Financials — 1.0% | | | | | | | | |
| Banco del Bajio | | | 2,223,400 | | | | 6,795,946 | |
| | | | | | | | | |
| NORWAY — 2.3% | | | | | | | | |
| Energy — 2.3% | | | | | | | | |
| FLEX LNG | | | 250,268 | | | | 7,643,185 | |
| SFL | | | 791,412 | | | | 8,594,734 | |
| | | | | | | | | |
| TOTAL NORWAY | | | | | | | 16,237,919 | |
| POLAND — 1.1% | | | | | | | | |
| Materials — 1.1% | | | | | | | | |
| Grupa Kety (A) | | | 44,661 | | | | 7,524,753 | |
| | | | | | | | | |
| PORTUGAL — 1.2% | | | | | | | | |
| Materials — 1.2% | | | | | | | | |
| Portucel | | | 2,102,029 | | | | 8,354,169 | |
| | | | | | | | |
| RUSSIA — 0.0% | | | | | | | | |
| Materials — 0.0% | | | | | | | | |
| Magnitogorsk Iron & Steel Works PJSC *(B) | | | 6,332,020 | | | | — | |
| PhosAgro PJSC GDR *(B) | | | 119 | | | | — | |
| Severstal PJSC *(B) | | | 312,897 | | | | — | |
| | | | | | | | — | |
| Utilities — 0.0% | | | | | | | | |
| Unipro PJSC *(B) | | | 209,143,887 | | | | — | |
| | | | | | | | | |
| TOTAL RUSSIA | | | | | | | — | |
| SINGAPORE — 1.8% | | | | | | | | |
| Energy — 1.5% | | | | | | | | |
| BW LPG | | | 756,133 | | | | 10,693,898 | |
The accompanying notes are an integral part of the financial statements.
82
| Schedule of Investments | | October 31, 2023 |
| | Global X SuperDividend® ETF | |
| | | Shares | | | Value | |
| COMMON STOCK — continued | | | | | | | | |
| Real Estate — 0.3% | | | | | | | | |
| Manulife US Real Estate Investment Trust ‡ | | | 35,440,805 | | | $ | 1,772,040 | |
| | | | | | | | | |
| TOTAL SINGAPORE | | | | | | | 12,465,938 | |
| SOUTH AFRICA — 3.8% | | | | | | | | |
| Energy — 0.9% | | | | | | | | |
| Exxaro Resources | | | 658,409 | | | | 6,566,213 | |
| | | | | | | | | |
| Materials — 0.8% | | | | | | | | |
| African Rainbow Minerals (A) | | | 686,933 | | | | 5,627,553 | |
| | | | | | | | | |
| Real Estate — 2.1% | | | | | | | | |
| Equites Property Fund ‡ | | | 11,703,190 | | | | 7,147,930 | |
| Redefine Properties ‡ | | | 39,808,030 | | | | 7,432,061 | |
| | | | | | | | 14,579,991 | |
| TOTAL SOUTH AFRICA | | | | | | | 26,773,757 | |
| TAIWAN — 1.8% | | | | | | | | |
| Industrials — 0.9% | | | | | | | | |
| Wisdom Marine Lines | | | 4,563,000 | | | | 5,866,413 | |
| | | | | | | | | |
| Information Technology — 0.9% | | | | | | | | |
| Raydium Semiconductor | | | 592,000 | | | | 6,543,302 | |
| | | | | | | | | |
| TOTAL TAIWAN | | | | | | | 12,409,715 | |
| THAILAND — 0.7% | | | | | | | | |
| Industrials — 0.7% | | | | | | | | |
| Regional Container Lines NVDR | | | 9,116,276 | | | | 4,971,246 | |
| | | | | | | | | |
| UNITED ARAB EMIRATES — 2.4% | | | | | | | | |
| Energy — 1.3% | | | | | | | | |
| Dana Gas PJSC | | | 41,109,409 | | | | 9,065,783 | |
| | | | | | | | | |
| Materials — 1.1% | | | | | | | | |
| Fertiglobe | | | 8,649,081 | | | | 7,558,821 | |
| | | | | | | | | |
| TOTAL UNITED ARAB EMIRATES | | | | | | | 16,624,604 | |
The accompanying notes are an integral part of the financial statements.
83
| Schedule of Investments | | October 31, 2023 |
| | Global X SuperDividend® ETF | |
| | | Shares | | | Value | |
| COMMON STOCK — continued | | | | | | | | |
| UNITED KINGDOM — 1.0% | | | | | | | | |
| Financials — 1.0% | | | | | | | | |
| M&G | | | 2,987,545 | | | $ | 7,185,189 | |
| | | | | | | | | |
| UNITED STATES — 34.5% | | | | | | | | |
| Consumer Staples — 1.1% | | | | | | | | |
| JBS | | | 2,014,417 | | | | 8,000,946 | |
| | | | | | | | | |
| Energy — 4.0% | | | | | | | | |
| Civitas Resources | | | 101,461 | | | | 7,653,203 | |
| Diversified Energy | | | 7,453,753 | | | | 6,046,395 | |
| Equitrans Midstream | | | 815,450 | | | | 7,233,042 | |
| Kimbell Royalty Partners | | | 426,928 | | | | 6,882,079 | |
| | | | | | | | 27,814,719 | |
| Financials — 21.3% | | | | | | | | |
| AGNC Investment ‡ | | | 704,089 | | | | 5,196,177 | |
| Annaly Capital Management ‡ | | | 376,835 | | | | 5,882,394 | |
| Apollo Commercial Real Estate Finance ‡ | | | 679,909 | | | | 6,771,894 | |
| Arbor Realty Trust ‡ | | | 599,935 | | | | 7,565,180 | |
| Ares Commercial Real Estate ‡ | | | 699,558 | | | | 6,414,947 | |
| B Riley Financial | | | 202,751 | | | | 7,341,614 | |
| Blackstone Mortgage Trust, Cl A ‡ | | | 352,634 | | | | 7,035,048 | |
| BrightSpire Capital, Cl A ‡ | | | 1,061,004 | | | | 6,005,283 | |
| Chimera Investment ‡ | | | 1,252,917 | | | | 6,014,002 | |
| Claros Mortgage Trust ‡ | | | 603,644 | | | | 6,296,007 | |
| Dynex Capital ‡ | | | 563,468 | | | | 5,657,219 | |
| Ellington Financial ‡ | | | 640,673 | | | | 7,707,296 | |
| Franklin BSP Realty Trust ‡ | | | 495,534 | | | | 6,248,684 | |
| KKR Real Estate Finance Trust ‡ | | | 534,808 | | | | 5,583,395 | |
| MFA Financial ‡ | | | 746,931 | | | | 6,640,217 | |
| New York Mortgage Trust ‡ | | | 826,874 | | | | 6,441,348 | |
| PennyMac Mortgage Investment Trust ‡ | | | 594,117 | | | | 7,515,580 | |
| Ready Capital ‡ | | | 1,478,525 | | | | 13,942,491 | |
| Rithm Capital ‡ | | | 834,824 | | | | 7,788,908 | |
| Starwood Property Trust ‡ | | | 367,344 | | | | 6,520,356 | |
| TPG RE Finance Trust ‡ | | | 870,398 | | | | 4,795,893 | |
| Two Harbors Investment ‡ | | | 456,896 | | | | 5,304,562 | |
| | | | | | | | 148,668,495 | |
The accompanying notes are an integral part of the financial statements.
84
| Schedule of Investments | | October 31, 2023 |
| | Global X SuperDividend® ETF | |
| | | Shares | | | Value | |
| COMMON STOCK — continued | | | | | | | | |
| Materials — 1.0% | | | | | | | | |
| Arch Resources | | | 45,967 | | | $ | 6,933,203 | |
| | | | | | | | | |
| Real Estate — 7.1% | | | | | | | | |
| Brandywine Realty Trust ‡ | | | 1,354,021 | | | | 5,064,039 | |
| Global Net Lease ‡ | | | 1,080,441 | | | | 8,578,705 | |
| Medical Properties Trust ‡ | | | 937,366 | | | | 4,480,609 | |
| Omega Healthcare Investors ‡ | | | 255,506 | | | | 8,457,249 | |
| Sabra Health Care ‡ | | | 613,696 | | | | 8,370,813 | |
| SL Green Realty ‡ | | | 223,735 | | | | 6,553,198 | |
| Uniti Group ‡ | | | 1,764,499 | | | | 8,116,695 | |
| | | | | | | | 49,621,308 | |
| TOTAL UNITED STATES | | | | | | | 241,038,671 | |
TOTAL COMMON STOCK
(Cost $794,115,166) | | | | | | | 663,032,766 | |
| | | | | | | | | |
| PREFERRED STOCK — 4.2% | | | | | | | | |
| BRAZIL—4.2% | | | | | | | | |
| Materials — 2.8% | | | | | | | | |
| Gerdau (C) | | | 1,506,508 | | | | 6,503,407 | |
| Metalurgica Gerdau, Cl A (C) | | | 3,012,200 | | | | 6,170,142 | |
| Unipar Carbocloro (C) | | | 464,969 | | | | 6,557,326 | |
| | | | | | | | 19,230,875 | |
| Utilities — 1.4% | | | | | | | | |
| Cia Paranaense de Energia (C) | | | 5,918,385 | | | | 9,846,371 | |
| TOTAL BRAZIL | | | | | | | 29,077,246 | |
TOTAL PREFERRED STOCK
(Cost $31,374,608) | | | | | | | 29,077,246 | |
| | | | | | | | | |
| | | Face Amount | | | | | |
| REPURCHASE AGREEMENTS(D) — 2.8% | | | | | | | | |
Bank of America
5.310%, dated 10/31/2023, to be repurchased on 11/01/2023, repurchase price $4,635,176 (collateralized by various U.S. Government Obligations and U.S. Treasury Obligations, ranging in par value $77,123 - $2,013,749, 2.000% - 6.500%, 04/01/48 - 10/01/53, with a total market value of $4,727,182) | | $ | 4,634,492 | | | | 4,634,492 | |
The accompanying notes are an integral part of the financial statements.
85
| Schedule of Investments | | October 31, 2023 |
| | Global X SuperDividend® ETF | |
| | | Face Amount | | | Value | |
| REPURCHASE AGREEMENTS — continued | | | | | | | | |
Citigroup Global Markets
5.310%, dated 10/31/2023, to be repurchased on 11/01/2023, repurchase price $4,635,176 (collateralized by various U.S. Government Obligations and U.S. Treasury Obligations, ranging in par value $646 - $848,846, 2.000% - 7.715%, 12/01/27 - 06/20/73, with a total market value of $4,727,182) | | $ | 4,634,492 | | | $ | 4,634,492 | |
Daiwa Capital Markets
5.320%, dated 10/31/2023, to be repurchased on 11/01/2023, repurchase price $4,635,177 (collateralized by various U.S. Government Obligations and U.S. Treasury Obligations, ranging in par value $288 - $366,107, 0.125% - 7.000%, 01/15/24 - 11/01/53, with a total market value of $4,727,182) | | | 4,634,492 | | | | 4,634,492 | |
Deutsche Bank Securities
5.310%, dated 10/31/2023, to be repurchased on 11/01/2023, repurchase price $1,183,453 (collateralized by various U.S. Government Obligations and U.S. Treasury Obligations, ranging in par value $125 - $233,918, 1.000% - 7.000%, 09/01/28 - 01/01/61, with a total market value of $1,206,944) | | | 1,183,278 | | | | 1,183,278 | |
RBC Dominion Securities
5.310%, dated 10/31/2023, to be repurchased on 11/01/2023, repurchase price $4,635,176 (collateralized by various U.S. Government Obligations and U.S. Treasury Obligations, ranging in par value $156 - $1,214,752, 0.000% - 6.500%, 11/07/23 - 08/20/53, with a total market value of $4,727,182) | | | 4,634,492 | | | | 4,634,492 | |
TOTAL REPURCHASE AGREEMENTS
(Cost $19,721,246) | | | | | | | 19,721,246 | |
TOTAL INVESTMENTS — 101.8%
(Cost $845,211,020) | | | | | | $ | 711,831,258 | |
Percentages are based on Net Assets of $699,110,630.
The accompanying notes are an integral part of the financial statements.
86
| Schedule of Investments | | October 31, 2023 |
| | Global X SuperDividend® ETF | |
| * | Non-income producing security. |
| ‡ | Real Estate Investment Trust |
| (A) | This security or a partial position of this security is on loan at October 31, 2023. The total market value of securities on loan at October 31, 2023 was $24,017,012. |
| (B) | Level 3 security in accordance with fair value hierarchy. |
| (C) | There is currently no stated interest rate. |
| (D) | These securities were purchased with cash collateral held from securities on loan. The total value of such securities as of October 31, 2023 was $19,721,246. The total value of non-cash collateral held from securities on loan as of October 31, 2023 was $5,597,097. |
The following is a summary of the level of inputs used as of October 31, 2023, in valuing the Fund’s investments carried at value:
| Investments in Securities | | Level 1 | | | Level 2 | | | Level 3(1) | | | Total | |
| Common Stock | | $ | 663,032,766 | | | $ | — | | | $ | — | ^ | | $ | 663,032,766 | |
| Preferred Stock | | | 29,077,246 | | | | — | | | | — | | | | 29,077,246 | |
| Repurchase Agreements | | | — | | | | 19,721,246 | | | | — | | | | 19,721,246 | |
| Total Investments in Securities | | $ | 692,110,012 | | | $ | 19,721,246 | | | $ | — | | | $ | 711,831,258 | |
| ^ | Includes Securities in which the fair value is $0 or has been rounded to $0. |
| (1) | A reconciliation of Level 3 investments and disclosures of significant unobservable inputs are presented when the Fund has a significant amount of Level 3 investments at the end of the period in relation to Net Assets. Management has concluded that Level 3 investments are not material in relation to Net Assets. |
Amounts designated as “—” are $0 or have been rounded to $0.
See “Glossary” for abbreviations.
The accompanying notes are an integral part of the financial statements.
87
| Schedule of Investments | October 31, 2023 |
Global X Social Media ETF
Sector Weightings (Unaudited)†:

† Sector weightings percentages are based on the total market value of investments. Total investments do not include derivatives such as options, futures contracts, forward contracts, and swap contracts, if applicable.
| | | Shares | | | Value | |
| COMMON STOCK — 100.1% | | | | | | | | |
| CHINA — 34.0% | | | | | | | | |
| Communication Services — 34.0% | | | | | | | | |
| Baidu ADR * | | | 58,262 | | | $ | 6,117,510 | |
| Bilibili ADR * (A) | | | 176,296 | | | | 2,367,655 | |
| Hello Group ADR | | | 100,679 | | | | 712,807 | |
| HUYA ADR * | | | 30,236 | | | | 94,639 | |
| JOYY ADR | | | 21,997 | | | | 856,123 | |
| Kuaishou Technology, Cl B * | | | 1,809,788 | | | | 11,645,685 | |
| Meitu (A) | | | 1,973,700 | | | | 789,521 | |
| NetEase ADR | | | 67,247 | | | | 7,190,049 | |
| Tencent Holdings | | | 380,427 | | | | 14,060,717 | |
| Tencent Music Entertainment Group ADR * | | | 451,370 | | | | 3,276,946 | |
| Weibo ADR | | | 51,198 | | | | 605,673 | |
| | | | | | | | | |
| TOTAL CHINA | | | | | | | 47,717,325 | |
| GERMANY — 0.8% | | | | | | | | |
| Communication Services — 0.8% | | | | | | | | |
| United Internet | | | 56,455 | | | | 1,172,578 | |
| | | | | | | | | |
| JAPAN — 5.3% | | | | | | | | |
| Communication Services — 5.3% | | | | | | | | |
| DeNA | | | 51,086 | | | | 495,023 | |
| giftee * | | | 12,892 | | | | 108,451 | |
| Gree | | | 36,158 | | | | 134,179 | |
| Kakaku.com | | | 90,610 | | | | 866,941 | |
| MIXI | | | 26,040 | | | | 391,688 | |
The accompanying notes are an integral part of the financial statements.
88
| Schedule of Investments | October 31, 2023 |
Global X Social Media ETF
| | | Shares | | | Value | |
| COMMON STOCK — continued | | | | | | | | |
| Communication Services — continued | | | | | | | | |
| Nexon | | | 298,616 | | | $ | 5,413,518 | |
| | | | | | | | | |
| TOTAL JAPAN | | | | | | | 7,409,800 | |
| SOUTH KOREA — 14.5% | | | | | | | | |
| Communication Services — 14.5% | | | | | | | | |
| AfreecaTV | | | 5,808 | | | | 287,702 | |
| Com2uSCorp | | | 5,134 | | | | 159,469 | |
| Kakao | | | 210,208 | | | | 5,883,427 | |
| NAVER | | | 101,409 | | | | 14,071,339 | |
| | | | | | | | | |
| TOTAL SOUTH KOREA | | | | | | | 20,401,937 | |
| TAIWAN — 0.1% | | | | | | | | |
| Consumer Discretionary — 0.1% | | | | | | | | |
| PChome Online * | | | 83,426 | | | | 114,458 | |
| | | | | | | | | |
| UNITED ARAB EMIRATES — 0.3% | | | | | | | | |
| Communication Services — 0.3% | | | | | | | | |
| Yalla Group ADR * | | | 69,398 | | | | 372,667 | |
| | | | | | | | | |
| UNITED KINGDOM — 0.2% | | | | | | | | |
| Communication Services — 0.2% | | | | | | | | |
| Trustpilot Group * | | | 241,757 | | | | 293,359 | |
| | | | | | | | | |
| UNITED STATES — 44.9% | | | | | | | | |
| Communication Services — 42.4% | | | | | | | | |
| Alphabet, Cl A * | | | 49,938 | | | | 6,196,307 | |
| Angi, Cl A * | | | 52,054 | | | | 83,807 | |
| Bumble, Cl A * | | | 70,225 | | | | 943,824 | |
| IAC * | | | 53,273 | | | | 2,266,766 | |
| Match Group * | | | 198,590 | | | | 6,871,214 | |
| Meta Platforms, Cl A * | | | 45,357 | | | | 13,664,704 | |
| Nextdoor Holdings * | | | 94,137 | | | | 171,329 | |
| Pinterest, Cl A * | | | 411,993 | | | | 12,310,351 | |
| Rumble * (A) | | | 56,025 | | | | 251,552 | |
| Snap, Cl A * | | | 722,367 | | | | 7,230,894 | |
| Spotify Technology * | | | 44,354 | | | | 7,307,765 | |
| Vimeo * | | | 101,839 | | | | 313,664 | |
The accompanying notes are an integral part of the financial statements.
89
| Schedule of Investments | October 31, 2023 |
Global X Social Media ETF
| | | Shares | | | Value | |
| COMMON STOCK — continued | | | | | | | | |
| Communication Services — continued | | | | | | | | |
| Yelp, Cl A * | | | 45,796 | | | $ | 1,932,133 | |
| | | | | | | | 59,544,310 | |
| Consumer Discretionary — 0.1% | | | | | | | | |
| Groupon, Cl A * (A) | | | 11,034 | | | | 141,125 | |
| | | | | | | | | |
| Industrials — 0.4% | | | | | | | | |
| Fiverr International * | | | 23,633 | | | | 500,310 | |
| | | | | | | | | |
| Information Technology — 2.0% | | | | | | | | |
| Life360 * | | | 73,717 | | | | 361,724 | |
| Sprinklr, Cl A * | | | 75,195 | | | | 1,021,900 | |
| Sprout Social, Cl A * | | | 33,625 | | | | 1,455,290 | |
| | | | | | | | 2,838,914 | |
| TOTAL UNITED STATES | | | | | | | 63,024,659 | |
TOTAL COMMON STOCK
(Cost $222,875,833) | | | | | | | 140,506,783 | |
| | | | | | | | | |
| | | Face Amount | | | | | |
| REPURCHASE AGREEMENTS(B) — 1.8% | | | | | | | | |
Bank of America
5.310%, dated 10/31/2023, to be repurchased on 11/01/2023, repurchase price $603,858 (collateralized by various U.S. Government Obligations and U.S. Treasury Obligations, ranging in par value $10,047 - $262,346, 2.000% - 6.500%, 04/01/48 - 10/01/53, with a total market value of $615,844) | | $ | 603,769 | | | | 603,769 | |
Citigroup Global Markets
5.310%, dated 10/31/2023, to be repurchased on 11/01/2023, repurchase price $603,858 (collateralized by various U.S. Government Obligations and U.S. Treasury Obligations, ranging in par value $84 - $110,585, 2.000% - 7.715%, 12/01/27 - 06/20/73, with a total market value of $615,844) | | | 603,769 | | | | 603,769 | |
The accompanying notes are an integral part of the financial statements.
90
| Schedule of Investments | October 31, 2023 |
Global X Social Media ETF
| | | Face Amount | | | Value | |
| REPURCHASE AGREEMENTS — continued | | | | | | | | |
Daiwa Capital Markets
5.320%, dated 10/31/2023, to be repurchased on 11/01/2023, repurchase price $603,858 (collateralized by various U.S. Government Obligations and U.S. Treasury Obligations, ranging in par value $38 - $47,695, 0.125% - 7.000%, 01/15/24 - 11/01/53, with a total market value of $615,844) | | $ | 603,769 | | | $ | 603,769 | |
HSBC Securities
5.310%, dated 10/31/2023, to be repurchased on 11/01/2023, repurchase price $591,780 (collateralized by various U.S. Government Obligations and U.S. Treasury Obligations, ranging in par value $5,917 - $590,109, 2.500% - 7.000%, 06/20/33 - 10/20/53, with a total market value of $603,527) | | | 591,693 | | | | 591,693 | |
RBC Dominion Securities
5.310%, dated 10/31/2023, to be repurchased on 11/01/2023, repurchase price $166,256 (collateralized by various U.S. Government Obligations and U.S. Treasury Obligations, ranging in par value $6 - $43,571, 0.000% - 6.500%, 11/07/23 - 08/20/53, with a total market value of $169,556) | | | 166,231 | | | | 166,231 | |
TOTAL REPURCHASE AGREEMENTS
(Cost $2,569,231) | | | | | | | 2,569,231 | |
TOTAL INVESTMENTS — 101.9%
(Cost $225,445,064) | | | | | | $ | 143,076,014 | |
Percentages are based on Net Assets of $140,396,996.
| * | Non-income producing security. |
| (A) | This security or a partial position of this security is on loan at October 31, 2023. The total market value of securities on loan at October 31, 2023 was $2,413,260. |
| (B) | These securities were purchased with cash collateral held from securities on loan. The total value of such securities as of October 31, 2023 was $2,569,231. The total value of non-cash collateral held from securities on loan as of October 31, 2023 was $–. |
The accompanying notes are an integral part of the financial statements.
91
| Schedule of Investments | October 31, 2023 |
Global X Social Media ETF
The following is a summary of the level of inputs used as of October 31, 2023, in valuing the Fund’s investments carried at value:
| Investments in Securities | | Level 1 | | | Level 2 | | | Level 3 | | | Total | |
| Common Stock | | $ | 140,506,783 | | | $ | — | | | $ | — | | | $ | 140,506,783 | |
| Repurchase Agreements | | | — | | | | 2,569,231 | | | | — | | | | 2,569,231 | |
| Total Investments in Securities | | $ | 140,506,783 | | | $ | 2,569,231 | | | $ | — | | | $ | 143,076,014 | |
Amounts designated as “—” are $0 or have been rounded to $0.
See “Glossary” for abbreviations.
The accompanying notes are an integral part of the financial statements.
92
| Schedule of Investments | October 31, 2023 |
Global X Guru® Index ETF
Sector Weightings (Unaudited)†:

† Sector weightings percentages are based on the total market value of investments. Total investments do not include derivatives such as options, futures contracts, forward contracts, and swap contracts, if applicable.
| | | Shares | | | Value | |
| COMMON STOCK — 98.7% | | | | | | | | |
| CAMEROON — 1.7% | | | | | | | | |
| Energy — 1.7% | | | | | | | | |
| Golar LNG | | | 32,330 | | | $ | 725,162 | |
| | | | | | | | | |
| CANADA — 3.2% | | | | | | | | |
| Industrials — 3.2% | | | | | | | | |
| Canadian National Railway | | | 6,353 | | | | 672,020 | |
| Canadian Pacific Kansas City | | | 9,166 | | | | 650,511 | |
| | | | | | | | | |
| TOTAL CANADA | | | | | | | 1,322,531 | |
| CHINA — 1.5% | | | | | | | | |
| Consumer Discretionary — 1.5% | | | | | | | | |
| Alibaba Group Holding ADR * | | | 7,902 | | | | 652,231 | |
| | | | | | | | | |
| DENMARK — 1.7% | | | | | | | | |
| Health Care — 1.7% | | | | | | | | |
| Ascendis Pharma ADR * | | | 7,825 | | | | 698,851 | |
The accompanying notes are an integral part of the financial statements.
93
| Schedule of Investments | October 31, 2023 |
Global X Guru® Index ETF
| | | Shares | | | Value | |
| COMMON STOCK — continued | | | | | | | | |
| UNITED KINGDOM — 2.8% | | | | | | | | |
| Communication Services — 1.5% | | | | | | | | |
| Liberty Global, Cl C * | | | 37,135 | | | $ | 629,810 | |
| | | | | | | | | |
| Health Care — 1.3% | | | | | | | | |
| Immunocore Holdings ADR * | | | 12,011 | | | | 533,288 | |
| | | | | | | | | |
| TOTAL UNITED KINGDOM | | | | | | | 1,163,098 | |
| UNITED STATES — 87.8% | | | | | | | | |
| Communication Services — 3.3% | | | | | | | | |
| Liberty Broadband, Cl C * | | | 7,844 | | | | 653,484 | |
| Meta Platforms, Cl A * | | | 2,397 | | | | 722,144 | |
| | | | | | | | 1,375,628 | |
| Consumer Discretionary — 11.8% | | | | | | | | |
| Asbury Automotive Group * | | | 3,243 | | | | 620,613 | |
| Dutch Bros, Cl A * (A) | | | 22,265 | | | | 541,930 | |
| Expedia Group * | | | 6,737 | | | | 641,969 | |
| Hilton Worldwide Holdings | | | 4,710 | | | | 713,706 | |
| Home Depot | | | 2,179 | | | | 620,339 | |
| Lithia Motors, Cl A | | | 2,332 | | | | 564,834 | |
| Lowe’s | | | 3,233 | | | | 616,113 | |
| SeaWorld Entertainment * | | | 14,594 | | | | 628,710 | |
| | | | | | | | 4,948,214 | |
| Consumer Staples — 4.9% | | | | | | | | |
| Albertsons, Cl A | | | 33,128 | | | | 718,877 | |
| Mondelez International, Cl A | | | 10,013 | | | | 662,961 | |
| Post Holdings * | | | 8,045 | | | | 645,853 | |
| | | | | | | | 2,027,691 | |
| Energy — 5.4% | | | | | | | | |
| Chesapeake Energy | | | 8,735 | | | | 751,909 | |
| Marathon Petroleum | | | 5,075 | | | | 767,594 | |
| Texas Pacific Land | | | 392 | | | | 723,612 | |
| | | | | | | | 2,243,115 | |
| Financials — 14.7% | | | | | | | | |
| Arch Capital Group * | | | 9,357 | | | | 811,065 | |
| Discover Financial Services | | | 7,786 | | | | 639,075 | |
The accompanying notes are an integral part of the financial statements.
94
| Schedule of Investments | October 31, 2023 |
Global X Guru® Index ETF
| | | Shares | | | Value | |
| COMMON STOCK — continued | | | | | | | | |
| Financials — continued | | | | | | | | |
| First American Financial | | | 11,464 | | | $ | 589,708 | |
| Fiserv * | | | 5,876 | | | | 668,395 | |
| KKR | | | 11,974 | | | | 663,359 | |
| LPL Financial Holdings | | | 3,258 | | | | 731,486 | |
| S&P Global | | | 1,870 | | | | 653,210 | |
| Visa, Cl A | | | 3,018 | | | | 709,532 | |
| Wells Fargo | | | 16,939 | | | | 673,664 | |
| | | | | | | | 6,139,494 | |
| | | | | | | | | |
| Health Care — 17.1% | | | | | | | | |
| Amicus Therapeutics * | | | 55,709 | | | | 611,128 | |
| Eli Lilly | | | 1,324 | | | | 733,403 | |
| IQVIA Holdings * | | | 3,325 | | | | 601,260 | |
| Jazz Pharmaceuticals * | | | 5,171 | | | | 656,820 | |
| MoonLake Immunotherapeutics, Cl A * (A) | | | 12,862 | | | | 666,380 | |
| Revvity | | | 6,180 | | | | 512,013 | |
| Royalty Pharma, Cl A | | | 24,288 | | | | 652,619 | |
| Seagen * | | | 3,727 | | | | 793,143 | |
| Tenet Healthcare * | | | 9,923 | | | | 532,865 | |
| United Therapeutics * | | | 3,071 | | | | 684,403 | |
| Universal Health Services, Cl B | | | 5,535 | | | | 696,801 | |
| | | | | | | | 7,140,835 | |
| | | | | | | | | |
| Industrials — 6.5% | | | | | | | | |
| Avis Budget Group * | | | 3,229 | | | | 525,681 | |
| Delta Air Lines | | | 16,821 | | | | 525,656 | |
| Ferguson | | | 4,517 | | | | 678,454 | |
| Hertz Global Holdings * | | | 41,340 | | | | 348,496 | |
| Howmet Aerospace | | | 14,840 | | | | 654,444 | |
| | | | | | | | 2,732,731 | |
| | | | | | | | | |
| Information Technology — 11.9% | | | | | | | | |
| Apple | | | 4,079 | | | | 696,571 | |
| GoDaddy, Cl A * | | | 10,333 | | | | 756,685 | |
| Microsoft | | | 2,249 | | | | 760,409 | |
| NVIDIA | | | 1,647 | | | | 671,647 | |
| Salesforce * | | | 3,467 | | | | 696,278 | |
| Snowflake, Cl A * | | | 4,791 | | | | 695,318 | |
The accompanying notes are an integral part of the financial statements.
95
| Schedule of Investments | October 31, 2023 |
Global X Guru® Index ETF
| | | Shares | | | Value | |
| COMMON STOCK — continued | | | | | | | | |
| Information Technology — continued | | | | | | | | |
| VMware, Cl A * (A) | | | 4,640 | | | $ | 675,816 | |
| | | | | | | | 4,952,724 | |
| Materials — 4.9% | | | | | | | | |
| Ashland Global Holdings | | | 8,324 | | | | 637,868 | |
| International Flavors & Fragrances | | | 11,208 | | | | 766,067 | |
| Sherwin-Williams | | | 2,629 | | | | 626,254 | |
| | | | | | | | 2,030,189 | |
| Real Estate — 4.2% | | | | | | | | |
| American Tower ‡ | | | 3,899 | | | | 694,763 | |
| ProLogis ‡ | | | 5,899 | | | | 594,324 | |
| Zillow Group, Cl C * | | | 13,213 | | | | 478,971 | |
| | | | | | | | 1,768,058 | |
| Utilities — 3.1% | | | | | | | | |
| AES | | | 40,200 | | | | 598,980 | |
| PG&E * | | | 42,727 | | | | 696,450 | |
| | | | | | | | 1,295,430 | |
| TOTAL UNITED STATES | | | | | | | 36,654,109 | |
TOTAL COMMON STOCK
(Cost $43,364,944) | | | | | | | 41,215,982 | |
| | | | | | | | | |
| MASTER LIMITED PARTNERSHIP — 1.2% | | | | | | | | |
| UNITED STATES— 1.2% | | | | | | | | |
| Industrials — 1.2% | | | | | | | | |
| Icahn Enterprises | | | 30,480 | | | | 502,920 | |
TOTAL MASTER LIMITED PARTNERSHIP
(Cost $906,119) | | | | | | | 502,920 | |
| TOTAL MASTER LIMITED PARTNERSHIP | | | | | | | | |
The accompanying notes are an integral part of the financial statements.
96
| Schedule of Investments | | October 31, 2023 |
Global X Guru® Index ETF
| | | Face Amount | | | Value | |
| REPURCHASE AGREEMENT(B) — 3.6% | | | | | | | | |
BNP Paribas
5.210%, dated 10/31/2023, to be repurchased on 11/01/2023, to be repurchased on 11/01/23, repurchase price $1,484,722 (collateralized by U.S. Treasury Obligations, ranging in par value $195,711 - $31,566, 4.000% - 2.000%, 02/15/26 - 02/15/25, with a total market value of $1,511,975) (Cost $1,484,508) | | $ | 1,484,508 | | | $ | 1,484,508 | |
TOTAL INVESTMENTS — 103.5%
(Cost $45,755,571) | | | | | | $ | 43,203,410 | |
Percentages are based on Net Assets of $41,757,248.
| * | Non-income producing security. |
| ‡ | Real Estate Investment Trust |
| (A) | This security or a partial position of this security is on loan at October 31, 2023. The total market value of securities on loan at October 31, 2023 was $1,409,565. |
| (B) | These securities were purchased with cash collateral held from securities on loan. The total value of such securities as of October 31, 2023 was $1,484,508. The total value of non-cash collateral held from securities on loan as of October 31, 2023 was $–. |
The following is a summary of the level of inputs used as of October 31, 2023, in valuing the Fund’s investments carried at value:
| Investments in Securities | | Level 1 | | | Level 2 | | | Level 3 | | | Total | |
| Common Stock | | $ | 41,215,982 | | | $ | — | | | $ | — | | | $ | 41,215,982 | |
| Master Limited Partnership | | | 502,920 | | | | — | | | | — | | | | 502,920 | |
| Repurchase Agreement | | | — | | | | 1,484,508 | | | | — | | | | 1,484,508 | |
| Total Investments in Securities | | $ | 41,718,902 | | | $ | 1,484,508 | | | $ | — | | | $ | 43,203,410 | |
Amounts designated as “—” are $0 or have been rounded to $0.
See “Glossary” for abbreviations.
The accompanying notes are an integral part of the financial statements.
97
| Schedule of Investments | October 31, 2023 |
| Global X SuperIncome™ Preferred ETF |
Sector Weightings (Unaudited)†:
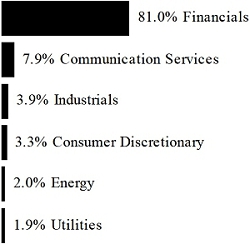
† Sector weightings percentages are based on the total market value of investments. Total investments do not include derivatives such as options, futures contracts, forward contracts, and swap contracts, if applicable.
| | | Shares | | | Value | |
| PREFERRED STOCK — 99.5% | | | | | | | | |
| UNITED STATES— 99.5% | | | | | | | | |
| Communication Services — 7.9% | | | | | | | | |
| AT&T, 5.000% | | | 213,721 | | | $ | 3,977,348 | |
| AT&T, 4.750% | | | 311,733 | | | | 5,392,981 | |
| Telephone and Data Systems, 6.000% | | | 122,558 | | | | 1,574,870 | |
| United States Cellular, 6.250% | | | 88,835 | | | | 1,465,778 | |
| | | | | | | | 12,410,977 | |
| Consumer Discretionary — 3.3% | | | | | | | | |
| Ford Motor, 6.500% | | | 106,696 | | | | 2,232,080 | |
| Ford Motor, 6.000% | | | 142,410 | | | | 2,990,610 | |
| | | | | | | | 5,222,690 | |
| Energy — 2.0% | | | | | | | | |
| Crestwood Equity Partners, 9.250% | | | 317,077 | | | | 3,056,622 | |
| Financials — 80.5% | | | | | | | | |
| AGNC Investment CME Term SOFR, 6.125%, TSFR3M + 4.697% ‡,(A) | | | 102,426 | | | | 2,047,496 | |
| Allstate, 7.375% | | | 106,731 | | | | 2,750,458 | |
| Allstate, 5.100% | | | 204,746 | | | | 3,890,174 | |
| Apollo Global Management, 7.625%, H15T5Y + 3.226% (A) | | | 106,731 | | | | 2,792,083 | |
| Apollo Global Management, 6.750% | | | 128,060 | | | | 6,160,967 | |
| Athene Holding, 7.750%, H15T5Y + 3.962% (A) | | | 88,937 | | | | 2,214,531 | |
The accompanying notes are an integral part of the financial statements.
98
| Schedule of Investments | October 31, 2023 |
| Global X SuperIncome™ Preferred ETF |
| | | Shares | | | Value | |
| PREFERRED STOCK — continued | | | | | | | | |
| Financials — continued | | | | | | | | |
| Athene Holding, 6.375%, H15T5Y + 5.970% (A) | | | 106,703 | | | $ | 2,589,682 | |
| Athene Holding, 6.350%, US0003M + 4.253% (A) | | | 153,526 | | | | 3,244,004 | |
| Bank of America, 7.250% * | | | 10,218 | | | | 10,761,598 | |
| Bank of America, 5.000% | | | 171,758 | | | | 3,332,105 | |
| Bank of America, 4.750% | | | 90,494 | | | | 1,617,128 | |
| Brighthouse Financial, 5.375% | | | 102,196 | | | | 1,588,126 | |
| Capital One Financial, 5.000% | | | 267,196 | | | | 4,352,623 | |
| Capital One Financial, 4.800% | | | 222,575 | | | | 3,501,105 | |
| Capital One Financial, 4.375% | | | 119,936 | | | | 1,733,075 | |
| Enstar Group, 7.000%, US0003M + 4.015% (A) | | | 71,063 | | | | 1,690,589 | |
| Huntington Bancshares, 6.875%, H15T5Y + 2.704% (A) | | | 57,699 | | | | 1,278,033 | |
| Jackson Financial, 8.000%, H15T5Y + 3.728% (A) | | | 97,822 | | | | 2,395,661 | |
| JPMorgan Chase, 4.750% | | | 160,152 | | | | 3,047,693 | |
| JPMorgan Chase, 4.625% | | | 329,609 | | | | 6,186,761 | |
| JPMorgan Chase, 4.550% | | | 267,205 | | | | 4,908,556 | |
| KeyCorp, 6.200%, H15T5Y + 3.132% (A) | | | 106,634 | | | | 1,781,854 | |
| KeyCorp, 6.125%, TSFR3M + 4.154% (A) | | | 88,898 | | | | 1,586,829 | |
| Lincoln National, 9.000% | | | 88,961 | | | | 2,357,466 | |
| MetLife, 4.750% | | | 178,003 | | | | 3,333,996 | |
| Morgan Stanley, 6.500% | | | 178,073 | | | | 4,391,280 | |
| Morgan Stanley, 6.375%, (A) | | | 178,066 | | | | 4,188,112 | |
| Morgan Stanley, 5.850%, (A) | | | 178,050 | | | | 3,892,173 | |
| New York Community Bancorp, 6.375%, US0003M + 3.821% (A) | | | 91,534 | | | | 1,933,198 | |
| PacWest Bancorp, 7.750%, H15T5Y + 4.820% (A) | | | 91,173 | | | | 1,856,282 | |
| Regions Financial, Ser B, 6.375%, TSFE3M + 3.798% (A) | | | 88,917 | | | | 1,864,589 | |
| Reinsurance Group of America, 7.125%, H15T5Y + 3.456% (A) | | | 124,581 | | | | 3,176,816 | |
| State Street, 5.350%, TSFR3M + 3.971% (A) | | | 88,916 | | | | 1,944,593 | |
| Synchrony Financial, 5.625% | | | 133,312 | | | | 1,969,018 | |
| Truist Financial, 4.750% | | | 164,599 | | | | 2,934,800 | |
| US Bancorp, 4.000% | | | 133,307 | | | | 1,976,943 | |
| Wells Fargo, 7.500% * | | | 10,838 | | | | 11,448,179 | |
The accompanying notes are an integral part of the financial statements.
99
| Schedule of Investments | October 31, 2023 |
| Global X SuperIncome™ Preferred ETF |
| | | Shares | | | Value | |
| PREFERRED STOCK — continued | | | | | | | | |
| Financials — continued | | | | | | | | |
| Wells Fargo, 4.700% | | | 127,942 | | | $ | 2,260,735 | |
| Wells Fargo, 4.375% | | | 114,750 | | | | 1,857,803 | |
| | | | | | | | 126,837,114 | |
| Industrials — 3.9% | | | | | | | | |
| Chart Industries, 6.750% * | | | 35,760 | | | | 1,757,961 | |
| Clarivate, 5.250% | | | 63,890 | | | | 1,784,448 | |
| WESCO International, 10.625%, H15T5Y + 10.325% (A) | | | 95,776 | | | | 2,553,388 | |
| | | | | | | | 6,095,797 | |
| Utilities — 1.9% | | | | | | | | |
| Sempra, 5.750% | | | 134,840 | | | | 3,033,900 | |
| TOTAL UNITED STATES | | | | | | | 156,657,100 | |
TOTAL PREFERRED STOCK
(Cost $176,926,434) | | | | | | | 156,657,100 | |
TOTAL INVESTMENTS — 99.5%
(Cost $176,926,434) | | | | | | $ | 156,657,100 | |
Percentages are based on Net Assets of $157,490,099.
| * | Non-income producing security. |
| ‡ | Real Estate Investment Trust |
| (A) | Variable or floating rate security. The rate shown is the effective interest rate as of period end. The rates on certain securities are not based on published reference rates and spreads and are either determined by the issuer or agent based on current market conditions; by using a formula based on the rates of underlying loans; or by adjusting periodically based on prevailing interest rates. |
As of October 31, 2023, all of the Fund’s investments were considered Level 1, in accordance with authoritative guidance on fair value measurements and disclosure under U.S. GAAP.
See “Glossary” for abbreviations.
The accompanying notes are an integral part of the financial statements.
100
| Schedule of Investments | October 31, 2023 |
| Global X SuperDividend® U.S. ETF |
Sector Weightings (Unaudited)†:
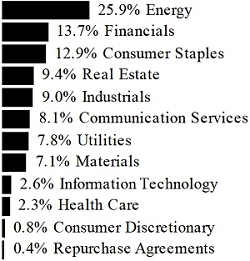
† Sector weightings percentages are based on the total market value of investments. Total investments do not include derivatives such as options, futures contracts, forward contracts, and swap contracts, if applicable.
| | | Shares | | | Value | |
| COMMON STOCK — 78.7% | | | | | | | | |
| UNITED STATES — 78.7% | | | | | | | | |
| Communication Services — 8.1% | | | | | | | | |
| AT&T | | | 720,225 | | | $ | 11,091,465 | |
| Cogent Communications Holdings | | | 211,698 | | | | 13,756,136 | |
| Telephone and Data Systems | | | 569,664 | | | | 10,362,188 | |
| Verizon Communications | | | 359,242 | | | | 12,620,172 | |
| | | | | | | | 47,829,961 | |
| Consumer Discretionary — 0.8% | | | | | | | | |
| PetMed Express | | | 725,526 | | | | 4,998,874 | |
| | | | | | | | | |
| Consumer Staples — 12.9% | | | | | | | | |
| Altria Group | | | 300,562 | | | | 12,073,575 | |
| B&G Foods (A) | | | 1,161,319 | | | | 9,371,844 | |
| Kraft Heinz | | | 359,565 | | | | 11,311,915 | |
| Philip Morris International | | | 141,917 | | | | 12,653,320 | |
| Universal | | | 271,081 | | | | 12,198,645 | |
| Vector Group | | | 1,006,233 | | | | 10,344,075 | |
| Walgreens Boots Alliance | | | 393,746 | | | | 8,300,166 | |
| | | | | | | | 76,253,540 | |
The accompanying notes are an integral part of the financial statements.
101
| Schedule of Investments | October 31, 2023 |
| Global X SuperDividend® U.S. ETF |
| | | Shares | | | Value | |
| COMMON STOCK — continued | | | | | | | | |
| Energy — 9.4% | | | | | | | | |
| Chesapeake Energy | | | 179,967 | | | $ | 15,491,559 | |
| Coterra Energy | | | 483,320 | | | | 13,291,300 | |
| Kinder Morgan | | | 812,448 | | | | 13,161,658 | |
| Pioneer Natural Resources | | | 56,353 | | | | 13,468,367 | |
| | | | | | | | 55,412,884 | |
| Financials — 13.7% | | | | | | | | |
| AGNC Investment ‡ | | | 1,262,236 | | | | 9,315,302 | |
| Ellington Financial ‡ | | | 894,361 | | | | 10,759,163 | |
| KKR Real Estate Finance Trust ‡ | | | 946,293 | | | | 9,879,299 | |
| New York Community Bancorp | | | 1,534,867 | | | | 14,550,539 | |
| TFS Financial | | | 995,777 | | | | 11,809,915 | |
| Virtu Financial, Cl A | | | 710,472 | | | | 13,136,627 | |
| Western Union | | | 1,041,392 | | | | 11,757,316 | |
| | | | | | | | 81,208,161 | |
| Health Care — 2.3% | | | | | | | | |
| AbbVie | | | 95,502 | | | | 13,482,972 | |
| | | | | | | | | |
| Industrials — 9.0% | | | | | | | | |
| 3M | | | 127,861 | | | | 11,628,958 | |
| Ennis | | | 664,681 | | | | 14,197,586 | |
| National Presto Industries | | | 187,870 | | | | 14,043,282 | |
| PACCAR | | | 163,911 | | | | 13,527,575 | |
| | | | | | | | 53,397,401 | |
| Information Technology — 2.6% | | | | | | | | |
| International Business Machines | | | 107,039 | | | | 15,482,121 | |
| | | | | | | | | |
| Materials — 4.9% | | | | | | | | |
| International Paper | | | 300,947 | | | | 10,150,942 | |
| Kronos Worldwide | | | 1,300,899 | | | | 8,976,203 | |
| LyondellBasell Industries, Cl A | | | 105,410 | | | | 9,512,199 | |
| | | | | | | | 28,639,344 | |
| Real Estate — 9.4% | | | | | | | | |
| Alexander’s ‡ | | | 64,095 | | | | 12,049,219 | |
| Easterly Government Properties, Cl A ‡ | | | 914,746 | | | | 9,842,667 | |
| Global Net Lease ‡ | | | 2,177,971 | | | | 17,293,086 | |
The accompanying notes are an integral part of the financial statements.
102
| Schedule of Investments | October 31, 2023 |
| Global X SuperDividend® U.S. ETF |
| | | Shares | | | Value | |
| COMMON STOCK — continued | | | | | | |
| Real Estate — continued | | | | | | |
| Iron Mountain ‡ | | | 274,056 | | | $ | 16,188,488 | |
| | | | | | | | 55,373,460 | |
| Utilities — 5.6% | | | | | | | | |
| Avangrid | | | 350,220 | | | | 10,461,071 | |
| Clearway Energy, Cl C | | | 441,876 | | | | 9,593,128 | |
| Duke Energy | | | 145,232 | | | | 12,909,673 | |
| | | | | | | | 32,963,872 | |
| TOTAL UNITED STATES | | | | | | | 465,042,590 | |
TOTAL COMMON STOCK
(Cost $556,819,002) | | | | | | | 465,042,590 | |
| | | | | | | | | |
| MASTER LIMITED PARTNERSHIPS — 20.9% | | | | | | | | |
| UNITED STATES— 20.9% | | | | | | | | |
| Energy — 16.5% | | | | | | | | |
| Crestwood Equity Partners | | | 366,104 | | | | 9,987,317 | |
| CrossAmerica Partners | | | 664,983 | | | | 15,135,013 | |
| Global Partners | | | 399,170 | | | | 12,685,623 | |
| Holly Energy Partners | | | 777,388 | | | | 16,519,495 | |
| MPLX | | | 412,765 | | | | 14,876,051 | |
| NuStar Energy | | | 623,458 | | | | 10,661,132 | |
| USA Compression Partners | | | 702,197 | | | | 17,625,145 | |
| | | | | | | | 97,489,776 | |
| Materials — 2.2% | | | | | | | | |
| Westlake Chemical Partners | | | 610,723 | | | | 13,093,901 | |
| Utilities — 2.2% | | | | | | | | |
| Suburban Propane Partners | | | 738,216 | | | | 12,985,219 | |
| TOTAL UNITED STATES | | | | | | | 123,568,896 | |
TOTAL MASTER LIMITED PARTNERSHIPS
(Cost $87,116,240) | | | | | | | 123,568,896 | |
The accompanying notes are an integral part of the financial statements.
103
| Schedule of Investments | October 31, 2023 |
| Global X SuperDividend® U.S. ETF |
| | | Face Amount | | | Value | |
| REPURCHASE AGREEMENTS(B) — 0.4% | | | | | | | | |
Bank of America
5.310%, dated 10/31/2023, to be repurchased on 11/01/2023, repurchase price $486,499 (collateralized by various U.S. Government Obligations and U.S. Treasury Obligations, ranging in par value $8,095 - $211,359, 2.000% - 6.500%, 04/01/48 - 10/01/53, with a total market value of $496,156) | | $ | 486,427 | | | $ | 486,427 | |
Citigroup Global Markets
5.310%, dated 10/31/2023, to be repurchased on 11/01/2023, repurchase price $486,499 (collateralized by various U.S. Government Obligations and U.S. Treasury Obligations, ranging in par value $68 - $89,093, 2.000% - 7.715%, 12/01/27 - 06/20/73, with a total market value of $496,156) | | | 486,427 | | | | 486,427 | |
Daiwa Capital Markets
5.320%, dated 10/31/2023, to be repurchased on 11/01/2023, repurchase price $486,499 (collateralized by various U.S. Government Obligations and U.S. Treasury Obligations, ranging in par value $30 - $38,426, 0.125% - 7.000%, 01/15/24 - 11/01/53, with a total market value of $496,156) | | | 486,427 | | | | 486,427 | |
HSBC Securities
5.310%, dated 10/31/2023, to be repurchased on 11/01/2023, repurchase price $476,768 (collateralized by various U.S. Government Obligations and U.S. Treasury Obligations, ranging in par value $4,767 - $475,422, 2.500% - 7.000%, 06/20/33 - 10/20/53, with a total market value of $486,232) | | | 476,698 | | | | 476,698 | |
The accompanying notes are an integral part of the financial statements.
104
| Schedule of Investments | October 31, 2023 |
| Global X SuperDividend® U.S. ETF |
| | | Face Amount | | | Value | |
| REPURCHASE AGREEMENTS — continued | | | | | | | | |
RBC Dominion Securities
5.310%, dated 10/31/2023, to be repurchased on 11/01/2023, repurchase price $133,943 (collateralized by various U.S. Government Obligations and U.S. Treasury Obligations, ranging in par value $5 - $35,103, 0.000% - 6.500%, 11/07/23 - 08/20/53, with a total market value of $136,601) | | $ | 133,923 | | | $ | 133,923 | |
TOTAL REPURCHASE AGREEMENTS
(Cost $2,069,902) | | | | | | | 2,069,902 | |
TOTAL INVESTMENTS — 100.0%
(Cost $646,005,144) | | | | | | $ | 590,681,388 | |
Percentages are based on Net Assets of $590,899,500.
| ‡ | Real Estate Investment Trust |
| (A) | This security or a partial position of this security is on loan at October 31, 2023. The total market value of securities on loan at October 31, 2023 was $1,971,501. |
| (B) | These securities were purchased with cash collateral held from securities on loan. The total value of such securities as of October 31, 2023 was $2,069,902. The total value of non-cash collateral held from securities on loan as of October 31, 2023 was $–. |
The following is a summary of the level of inputs used as of October 31, 2023, in valuing the Fund’s investments carried at value:
| Investments in Securities | | Level 1 | | | Level 2 | | | Level 3 | | | Total | |
| Common Stock | | $ | 465,042,590 | | | $ | — | | | $ | — | | | $ | 465,042,590 | |
| Master Limited Partnerships | | | 123,568,896 | | | | — | | | | — | | | | 123,568,896 | |
| Repurchase Agreements | | | — | | | | 2,069,902 | | | | — | | | | 2,069,902 | |
| Total Investments in Securities | | $ | 588,611,486 | | | $ | 2,069,902 | | | $ | — | | | $ | 590,681,388 | |
Amounts designated as “—” are $0 or have been rounded to $0.
See “Glossary” for abbreviations.
The accompanying notes are an integral part of the financial statements.
105
| Schedule of Investments | October 31, 2023 |
Global X S&P 500® Covered Call ETF |
Sector Weightings (Unaudited)†:
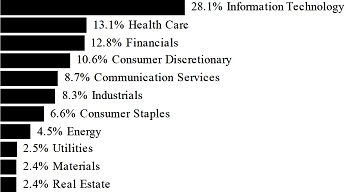
† Sector weightings percentages are based on the total market value of investments. Total investments do not include derivatives such as options, futures contracts, forward contracts, and swap contracts, if applicable.
| | | Shares | | | Value | |
| COMMON STOCK(A) — 100.8% | | | | | | | | |
| CHINA — 0.1% | | | | | | | | |
| Information Technology — 0.1% | | | | | | | | |
| NXP Semiconductors | | | 20,923 | | | $ | 3,607,753 | |
| | | | | | | | | |
| UNITED STATES — 100.7% | | | | | | | | |
| Communication Services — 8.8% | | | | | | | | |
| Alphabet, Cl A * | | | 478,132 | | | | 59,326,619 | |
| Alphabet, Cl C * | | | 406,720 | | | | 50,962,016 | |
| AT&T | | | 576,128 | | | | 8,872,371 | |
| Charter Communications, Cl A * | | | 8,332 | | | | 3,356,130 | |
| Comcast, Cl A | | | 331,678 | | | | 13,694,985 | |
| Electronic Arts | | | 18,678 | | | | 2,312,150 | |
| Fox, Cl A | | | 20,785 | | | | 631,656 | |
| Fox, Cl B | | | 14,839 | | | | 414,156 | |
| Interpublic Group | | | 30,465 | | | | 865,206 | |
| Live Nation Entertainment * | | | 11,534 | | | | 922,951 | |
| Match Group * | | | 21,780 | | | | 753,588 | |
| Meta Platforms, Cl A * | | | 179,115 | | | | 53,961,976 | |
| Netflix * | | | 35,713 | | | | 14,702,685 | |
| News, Cl A | | | 36,612 | | | | 757,136 | |
| News, Cl B | | | 12,197 | | | | 261,504 | |
The accompanying notes are an integral part of the financial statements.
106
| Schedule of Investments | October 31, 2023 |
Global X S&P 500® Covered Call ETF |
| | | Shares | | | Value | |
| COMMON STOCK — continued | | | | | | | | |
| Communication Services — continued | | | | | | | | |
| Omnicom Group | | | 15,820 | | | $ | 1,185,076 | |
| Paramount Global, Cl B | | | 43,538 | | | | 473,693 | |
| Take-Two Interactive Software * | | | 12,584 | | | | 1,683,110 | |
| T-Mobile US | | | 40,404 | | | | 5,812,519 | |
| Verizon Communications | | | 338,798 | | | | 11,901,974 | |
| Walt Disney * | | | 147,459 | | | | 12,031,180 | |
| Warner Bros Discovery * | | | 184,325 | | | | 1,832,190 | |
| | | | | | | | 246,714,871 | |
| Consumer Discretionary — 10.6% | | | | | | | | |
| Airbnb, Cl A * | | | 33,149 | | | | 3,921,195 | |
| Amazon.com * | | | 731,714 | | | | 97,383,816 | |
| Aptiv * | | | 21,787 | | | | 1,899,826 | |
| AutoZone * | | | 1,419 | | | | 3,515,048 | |
| Bath & Body Works | | | 17,811 | | | | 528,096 | |
| Best Buy | | | 16,855 | | | | 1,126,251 | |
| Booking Holdings * | | | 2,850 | | | | 7,950,246 | |
| BorgWarner | | | 21,875 | | | | 807,188 | |
| Caesars Entertainment * | | | 16,576 | | | | 661,217 | |
| CarMax * | | | 12,297 | | | | 751,224 | |
| Carnival * | | | 79,640 | | | | 912,674 | |
| Chipotle Mexican Grill, Cl A * | | | 2,170 | | | | 4,214,574 | |
| Darden Restaurants | | | 9,470 | | | | 1,378,169 | |
| Domino’s Pizza | | | 2,892 | | | | 980,359 | |
| DR Horton | | | 24,238 | | | | 2,530,447 | |
| eBay | | | 42,988 | | | | 1,686,419 | |
| Etsy * | | | 11,364 | | | | 707,977 | |
| Expedia Group * | | | 11,903 | | | | 1,134,237 | |
| Ford Motor | | | 315,911 | | | | 3,080,132 | |
| Garmin | | | 12,009 | | | | 1,231,283 | |
| General Motors | | | 111,639 | | | | 3,148,220 | |
| Genuine Parts | | | 11,492 | | | | 1,480,859 | |
| Hasbro | | | 9,729 | | | | 439,264 | |
| Hilton Worldwide Holdings | | | 21,462 | | | | 3,252,137 | |
| Home Depot | | | 81,022 | | | | 23,066,153 | |
| Las Vegas Sands | | | 28,839 | | | | 1,368,699 | |
| Lennar, Cl A | | | 20,577 | | | | 2,195,154 | |
| LKQ | | | 22,464 | | | | 986,619 | |
| Lowe’s | | | 47,223 | | | | 8,999,287 | |
The accompanying notes are an integral part of the financial statements.
107
| Schedule of Investments | October 31, 2023 |
Global X S&P 500® Covered Call ETF |
| | | Shares | | | Value | |
| COMMON STOCK — continued | | | | | | | | |
| Consumer Discretionary — continued | | | | | | | | |
| Lululemon Athletica * | | | 9,181 | | | $ | 3,612,540 | |
| Marriott International, Cl A | | | 19,383 | | | | 3,654,859 | |
| McDonald’s | | | 58,730 | | | | 15,397,244 | |
| MGM Resorts International | | | 23,590 | | | | 823,763 | |
| Mohawk Industries * | | | 5,347 | | | | 429,792 | |
| NIKE, Cl B | | | 98,727 | | | | 10,146,174 | |
| Norwegian Cruise Line Holdings * | | | 38,136 | | | | 518,650 | |
| NVR * | | | 269 | | | | 1,455,995 | |
| O’Reilly Automotive * | | | 4,707 | | | | 4,379,581 | |
| Pool | | | 2,952 | | | | 932,153 | |
| PulteGroup | | | 19,319 | | | | 1,421,685 | |
| Ralph Lauren, Cl A | | | 3,634 | | | | 408,934 | |
| Ross Stores | | | 27,799 | | | | 3,223,850 | |
| Royal Caribbean Cruises * | | | 19,030 | | | | 1,612,412 | |
| Starbucks | | | 92,306 | | | | 8,514,306 | |
| Tapestry | | | 21,724 | | | | 598,714 | |
| Tesla * | | | 222,535 | | | | 44,693,929 | |
| TJX | | | 92,616 | | | | 8,156,691 | |
| Tractor Supply | | | 8,098 | | | | 1,559,351 | |
| Ulta Beauty * | | | 4,040 | | | | 1,540,492 | |
| VF | | | 29,586 | | | | 435,802 | |
| Whirlpool | | | 5,293 | | | | 553,436 | |
| Wynn Resorts | | | 6,499 | | | | 570,482 | |
| Yum! Brands | | | 22,641 | | | | 2,736,391 | |
| | | | | | | | 298,713,996 | |
| Consumer Staples — 6.7% | | | | | | | | |
| Altria Group | | | 143,013 | | | | 5,744,832 | |
| Archer-Daniels-Midland | | | 43,749 | | | | 3,131,116 | |
| Brown-Forman, Cl B | | | 14,134 | | | | 793,765 | |
| Bunge | | | 10,974 | | | | 1,163,025 | |
| Campbell Soup | | | 17,025 | | | | 687,980 | |
| Church & Dwight | | | 19,393 | | | | 1,763,599 | |
| Clorox | | | 10,651 | | | | 1,253,623 | |
| Coca-Cola | | | 313,644 | | | | 17,717,750 | |
| Colgate-Palmolive | | | 67,503 | | | | 5,070,825 | |
| Conagra Brands | | | 37,751 | | | | 1,032,867 | |
| Constellation Brands, Cl A | | | 12,924 | | | | 3,026,155 | |
| Costco Wholesale | | | 35,713 | | | | 19,729,290 | |
The accompanying notes are an integral part of the financial statements.
108
| Schedule of Investments | October 31, 2023 |
Global X S&P 500® Covered Call ETF |
| | | Shares | | | Value | |
| COMMON STOCK — continued | | | | | | | | |
| Consumer Staples — continued | | | | | | | | |
| Dollar General | | | 17,517 | | | $ | 2,085,224 | |
| Dollar Tree * | | | 16,606 | | | | 1,844,761 | |
| Estee Lauder, Cl A | | | 19,052 | | | | 2,455,231 | |
| General Mills | | | 47,131 | | | | 3,074,826 | |
| Hershey | | | 11,854 | | | | 2,220,847 | |
| Hormel Foods | | | 25,687 | | | | 836,112 | |
| J M Smucker | | | 7,196 | | | | 819,193 | |
| Kellanova | | | 22,780 | | | | 1,149,707 | |
| Kenvue | | | 139,260 | | | | 2,590,236 | |
| Keurig Dr Pepper | | | 81,920 | | | | 2,484,634 | |
| Kimberly-Clark | | | 27,132 | | | | 3,246,072 | |
| Kraft Heinz | | | 66,426 | | | | 2,089,762 | |
| Kroger | | | 52,577 | | | | 2,385,418 | |
| Lamb Weston Holdings | | | 10,559 | | | | 948,198 | |
| McCormick | | | 19,866 | | | | 1,269,437 | |
| Molson Coors Beverage, Cl B | | | 16,962 | | | | 979,895 | |
| Mondelez International, Cl A | | | 109,634 | | | | 7,258,867 | |
| Monster Beverage * | | | 61,285 | | | | 3,131,664 | |
| PepsiCo | | | 110,937 | | | | 18,113,793 | |
| Philip Morris International | | | 125,101 | | | | 11,154,005 | |
| Procter & Gamble | | | 189,972 | | | | 28,501,499 | |
| Sysco | | | 40,056 | | | | 2,663,323 | |
| Target | | | 37,540 | | | | 4,159,057 | |
| Tyson Foods, Cl A | | | 20,579 | | | | 953,837 | |
| Walgreens Boots Alliance | | | 57,492 | | | | 1,211,931 | |
| Walmart | | | 113,975 | | | | 18,624,655 | |
| | | | | | | | 187,367,011 | |
| Energy — 4.5% | | | | | | | | |
| APA | | | 21,657 | | | | 860,216 | |
| Baker Hughes, Cl A | | | 81,625 | | | | 2,809,533 | |
| Chevron | | | 142,985 | | | | 20,837,204 | |
| ConocoPhillips | | | 96,504 | | | | 11,464,675 | |
| Coterra Energy | | | 60,280 | | | | 1,657,700 | |
| Devon Energy | | | 50,637 | | | | 2,358,165 | |
| Diamondback Energy | | | 14,530 | | | | 2,329,450 | |
| EOG Resources | | | 46,924 | | | | 5,924,155 | |
| EQT | | | 28,587 | | | | 1,211,517 | |
| Exxon Mobil | | | 322,612 | | | | 34,148,480 | |
The accompanying notes are an integral part of the financial statements.
109
| Schedule of Investments | October 31, 2023 |
Global X S&P 500® Covered Call ETF |
| | | Shares | | | Value | |
| COMMON STOCK — continued | | | | | | | | |
| Energy — continued | | | | | | | | |
| Halliburton | | | 72,776 | | | $ | 2,863,008 | |
| Hess | | | 21,727 | | | | 3,137,379 | |
| Kinder Morgan | | | 159,448 | | | | 2,583,058 | |
| Marathon Oil | | | 48,923 | | | | 1,336,087 | |
| Marathon Petroleum | | | 31,040 | | | | 4,694,800 | |
| Occidental Petroleum | | | 51,029 | | | | 3,154,102 | |
| ONEOK | | | 46,206 | | | | 3,012,631 | |
| Phillips 66 | | | 34,486 | | | | 3,933,818 | |
| Pioneer Natural Resources | | | 18,093 | | | | 4,324,227 | |
| Schlumberger | | | 114,531 | | | | 6,374,795 | |
| Targa Resources | | | 18,116 | | | | 1,514,679 | |
| Valero Energy | | | 27,305 | | | | 3,467,735 | |
| Williams | | | 98,818 | | | | 3,399,339 | |
| | | | | | | | 127,396,753 | |
| Financials — 12.9% | | | | | | | | |
| Aflac | | | 44,059 | | | | 3,441,448 | |
| Allstate | | | 21,239 | | | | 2,721,353 | |
| American Express | | | 46,887 | | | | 6,846,909 | |
| American International Group | | | 58,685 | | | | 3,597,977 | |
| Ameriprise Financial | | | 8,346 | | | | 2,625,401 | |
| Aon, Cl A | | | 16,518 | | | | 5,110,669 | |
| Arch Capital Group * | | | 29,642 | | | | 2,569,369 | |
| Arthur J Gallagher | | | 17,702 | | | | 4,168,644 | |
| Assurant | | | 3,405 | | | | 507,005 | |
| Bank of America | | | 557,137 | | | | 14,674,989 | |
| Bank of New York Mellon | | | 63,227 | | | | 2,687,148 | |
| Berkshire Hathaway, Cl B * | | | 146,968 | | | | 50,164,587 | |
| BlackRock, Cl A | | | 11,038 | | | | 6,758,347 | |
| Blackstone | | | 55,488 | | | | 5,124,317 | |
| Brown & Brown | | | 18,524 | | | | 1,285,936 | |
| Capital One Financial | | | 29,801 | | | | 3,018,543 | |
| Cboe Global Markets | | | 9,212 | | | | 1,509,755 | |
| Charles Schwab | | | 116,325 | | | | 6,053,553 | |
| Chubb | | | 33,101 | | | | 7,104,137 | |
| Cincinnati Financial | | | 12,605 | | | | 1,256,340 | |
| Citigroup | | | 150,545 | | | | 5,945,022 | |
| Citizens Financial Group | | | 33,384 | | | | 782,187 | |
| CME Group, Cl A | | | 29,325 | | | | 6,259,715 | |
The accompanying notes are an integral part of the financial statements.
110
| Schedule of Investments | October 31, 2023 |
Global X S&P 500® Covered Call ETF |
| | | Shares | | | Value | |
| COMMON STOCK — continued | | | | | | | | |
| Financials — continued | | | | | | | | |
| Comerica | | | 11,837 | | | $ | 466,378 | |
| Discover Financial Services | | | 20,576 | | | | 1,688,878 | |
| Everest Group | | | 3,165 | | | | 1,252,137 | |
| FactSet Research Systems | | | 2,776 | | | | 1,198,927 | |
| Fidelity National Information Services | | | 48,013 | | | | 2,357,918 | |
| Fifth Third Bancorp | | | 54,400 | | | | 1,289,824 | |
| Fiserv * | | | 47,585 | | | | 5,412,794 | |
| FleetCor Technologies * | | | 5,471 | | | | 1,231,905 | |
| Franklin Resources | | | 26,552 | | | | 605,120 | |
| Global Payments | | | 21,129 | | | | 2,244,322 | |
| Globe Life | | | 7,416 | | | | 862,926 | |
| Goldman Sachs Group | | | 26,568 | | | | 8,066,310 | |
| Hartford Financial Services Group | | | 24,650 | | | | 1,810,543 | |
| Huntington Bancshares | | | 126,973 | | | | 1,225,289 | |
| Intercontinental Exchange | | | 45,508 | | | | 4,889,380 | |
| Invesco | | | 36,518 | | | | 473,638 | |
| Jack Henry & Associates | | | 6,657 | | | | 938,570 | |
| JPMorgan Chase | | | 234,197 | | | | 32,567,435 | |
| KeyCorp | | | 86,188 | | | | 880,841 | |
| Loews | | | 14,732 | | | | 942,995 | |
| M&T Bank | | | 13,348 | | | | 1,504,987 | |
| MarketAxess Holdings | | | 2,745 | | | | 586,744 | |
| Marsh & McLennan | | | 39,807 | | | | 7,549,398 | |
| Mastercard, Cl A | | | 67,051 | | | | 25,234,644 | |
| MetLife | | | 51,308 | | | | 3,078,993 | |
| Moody’s | | | 12,834 | | | | 3,952,872 | |
| Morgan Stanley | | | 102,820 | | | | 7,281,712 | |
| MSCI, Cl A | | | 6,543 | | | | 3,085,352 | |
| Nasdaq | | | 27,079 | | | | 1,343,118 | |
| Northern Trust | | | 14,860 | | | | 979,423 | |
| PayPal Holdings * | | | 85,572 | | | | 4,432,630 | |
| PNC Financial Services Group | | | 32,237 | | | | 3,690,169 | |
| Principal Financial Group | | | 16,515 | | | | 1,117,735 | |
| Progressive | | | 47,171 | | | | 7,457,263 | |
| Prudential Financial | | | 29,457 | | | | 2,693,548 | |
| Raymond James Financial | | | 15,168 | | | | 1,447,634 | |
| Regions Financial | | | 82,313 | | | | 1,196,008 | |
| S&P Global | | | 26,224 | | | | 9,160,305 | |
| State Street | | | 26,938 | | | | 1,741,003 | |
The accompanying notes are an integral part of the financial statements.
111
| Schedule of Investments | October 31, 2023 |
Global X S&P 500® Covered Call ETF |
| | | Shares | | | Value | |
| COMMON STOCK — continued | | | | | | | | |
| Financials — continued | | | | | | | | |
| Synchrony Financial | | | 33,982 | | | $ | 953,195 | |
| T Rowe Price Group | | | 18,145 | | | | 1,642,123 | |
| Travelers | | | 18,501 | | | | 3,097,807 | |
| Truist Financial | | | 106,694 | | | | 3,025,842 | |
| US Bancorp | | | 125,631 | | | | 4,005,116 | |
| Visa, Cl A | | | 129,489 | | | | 30,442,864 | |
| W R Berkley | | | 17,733 | | | | 1,195,559 | |
| Wells Fargo | | | 294,856 | | | | 11,726,423 | |
| Willis Towers Watson | | | 8,463 | | | | 1,996,337 | |
| Zions Bancorp | | | 15,033 | | | | 463,768 | |
| | | | | | | | 360,702,053 | |
| Health Care — 13.2% | | | | | | | | |
| Abbott Laboratories | | | 139,850 | | | | 13,222,817 | |
| AbbVie | | | 142,243 | | | | 20,081,867 | |
| Agilent Technologies | | | 22,495 | | | | 2,325,308 | |
| Align Technology * | | | 5,818 | | | | 1,073,945 | |
| Amgen | | | 43,107 | | | | 11,022,460 | |
| Baxter International | | | 40,701 | | | | 1,319,933 | |
| Becton Dickinson | | | 23,094 | | | | 5,837,701 | |
| Biogen * | | | 11,661 | | | | 2,769,954 | |
| Bio-Rad Laboratories, Cl A * | | | 1,574 | | | | 433,291 | |
| Bio-Techne | | | 14,220 | | | | 776,839 | |
| Boston Scientific * | | | 117,361 | | | | 6,007,710 | |
| Bristol-Myers Squibb | | | 168,358 | | | | 8,675,488 | |
| Cardinal Health | | | 20,520 | | | | 1,867,320 | |
| Catalent * | | | 16,589 | | | | 570,496 | |
| Cencora | | | 13,550 | | | | 2,508,783 | |
| Centene * | | | 41,380 | | | | 2,854,392 | |
| Charles River Laboratories International * | | | 3,981 | | | | 670,241 | |
| Cigna Group | | | 24,009 | | | | 7,423,583 | |
| Cooper | | | 3,864 | | | | 1,204,602 | |
| CVS Health | | | 103,508 | | | | 7,143,087 | |
| Danaher | | | 52,957 | | | | 10,168,803 | |
| DaVita * | | | 5,441 | | | | 420,208 | |
| DENTSPLY SIRONA | | | 16,139 | | | | 490,787 | |
| Dexcom * | | | 31,051 | | | | 2,758,260 | |
| Edwards Lifesciences * | | | 49,477 | | | | 3,152,674 | |
| Elevance Health | | | 18,991 | | | | 8,547,659 | |
The accompanying notes are an integral part of the financial statements.
112
| Schedule of Investments | October 31, 2023 |
Global X S&P 500® Covered Call ETF |
| | | Shares | | | Value | |
| COMMON STOCK — continued | | | | | | | | |
| Health Care — continued | | | | | | | | |
| Eli Lilly | | | 64,262 | | | $ | 35,596,650 | |
| GE HealthCare Technologies | | | 30,211 | | | | 2,011,146 | |
| Gilead Sciences | | | 100,415 | | | | 7,886,594 | |
| HCA Healthcare | | | 15,550 | | | | 3,516,477 | |
| Henry Schein * | | | 11,573 | | | | 752,014 | |
| Hologic * | | | 19,812 | | | | 1,310,960 | |
| Humana | | | 9,985 | | | | 5,229,045 | |
| IDEXX Laboratories * | | | 6,670 | | | | 2,664,465 | |
| Illumina * | | | 12,900 | | | | 1,411,518 | |
| Incyte * | | | 15,619 | | | | 842,333 | |
| Insulet * | | | 5,684 | | | | 753,528 | |
| Intuitive Surgical * | | | 28,315 | | | | 7,424,759 | |
| IQVIA Holdings * | | | 14,538 | | | | 2,628,907 | |
| Johnson & Johnson | | | 194,059 | | | | 28,786,712 | |
| Laboratory Corp of America Holdings | | | 7,099 | | | | 1,417,883 | |
| McKesson | | | 10,872 | | | | 4,950,674 | |
| Medtronic | | | 107,276 | | | | 7,569,395 | |
| Merck | | | 204,495 | | | | 21,001,637 | |
| Mettler-Toledo International * | | | 1,741 | | | | 1,715,233 | |
| Moderna * | | | 26,444 | | | | 2,008,686 | |
| Molina Healthcare * | | | 4,806 | | | | 1,600,158 | |
| Pfizer | | | 455,000 | | | | 13,904,800 | |
| Quest Diagnostics | | | 9,864 | | | | 1,283,306 | |
| Regeneron Pharmaceuticals * | | | 8,602 | | | | 6,708,614 | |
| ResMed | | | 11,665 | | | | 1,647,331 | |
| Revvity | | | 8,831 | | | | 731,648 | |
| STERIS PLC | | | 7,899 | | | | 1,658,632 | |
| Stryker | | | 27,239 | | | | 7,360,523 | |
| Teleflex | | | 3,327 | | | | 614,663 | |
| Thermo Fisher Scientific | | | 31,103 | | | | 13,833,681 | |
| UnitedHealth Group | | | 74,650 | | | | 39,979,554 | |
| Universal Health Services, Cl B | | | 4,169 | | | | 524,835 | |
| Vertex Pharmaceuticals * | | | 20,800 | | | | 7,531,888 | |
| Viatris | | | 83,539 | | | | 743,497 | |
| Waters * | | | 4,859 | | | | 1,159,017 | |
| West Pharmaceutical Services | | | 6,068 | | | | 1,931,384 | |
| Zimmer Biomet Holdings | | | 16,670 | | | | 1,740,515 | |
| Zoetis, Cl A | | | 37,108 | | | | 5,825,956 | |
| | | | | | | | 371,586,826 | |
The accompanying notes are an integral part of the financial statements.
113
| Schedule of Investments | October 31, 2023 |
Global X S&P 500® Covered Call ETF |
| | | Shares | | | Value | |
| COMMON STOCK — continued | | | | | | | | |
| Industrials — 8.4% | | | | | | | | |
| 3M | | | 44,850 | | | $ | 4,079,107 | |
| A O Smith | | | 11,453 | | | | 798,961 | |
| Alaska Air Group * | | | 10,360 | | | | 327,687 | |
| Allegion | | | 7,410 | | | | 728,848 | |
| American Airlines Group * | | | 44,421 | | | | 495,294 | |
| AMETEK | | | 18,148 | | | | 2,554,694 | |
| Automatic Data Processing | | | 33,201 | | | | 7,245,122 | |
| Axon Enterprise * | | | 6,020 | | | | 1,231,030 | |
| Boeing * | | | 45,695 | | | | 8,536,740 | |
| Broadridge Financial Solutions | | | 10,148 | | | | 1,731,655 | |
| Carrier Global | | | 65,284 | | | | 3,111,435 | |
| Caterpillar | | | 41,112 | | | | 9,293,368 | |
| Ceridian HCM Holding * | | | 14,042 | | | | 898,828 | |
| CH Robinson Worldwide | | | 9,934 | | | | 812,899 | |
| Cintas | | | 6,944 | | | | 3,521,441 | |
| Copart * | | | 67,720 | | | | 2,947,174 | |
| CSX | | | 155,911 | | | | 4,653,943 | |
| Cummins | | | 11,178 | | | | 2,417,801 | |
| Deere | | | 22,058 | | | | 8,059,111 | |
| Delta Air Lines | | | 51,711 | | | | 1,615,969 | |
| Dover | | | 11,415 | | | | 1,483,379 | |
| Eaton | | | 32,316 | | | | 6,718,820 | |
| Emerson Electric | | | 45,977 | | | | 4,090,574 | |
| Equifax | | | 9,664 | | | | 1,638,724 | |
| Expeditors International of Washington | | | 12,334 | | | | 1,347,490 | |
| Fastenal | | | 45,976 | | | | 2,682,240 | |
| FedEx | | | 17,992 | | | | 4,319,879 | |
| Fortive | | | 28,142 | | | | 1,837,110 | |
| Generac Holdings * | | | 5,630 | | | | 473,314 | |
| General Dynamics | | | 18,360 | | | | 4,430,452 | |
| General Electric | | | 87,711 | | | | 9,528,046 | |
| Honeywell International | | | 53,508 | | | | 9,805,876 | |
| Howmet Aerospace | | | 32,482 | | | | 1,432,456 | |
| Hubbell, Cl B | | | 4,252 | | | | 1,148,465 | |
| Huntington Ingalls Industries | | | 3,329 | | | | 731,781 | |
| IDEX | | | 6,185 | | | | 1,183,871 | |
| Illinois Tool Works | | | 22,514 | | | | 5,045,838 | |
| Ingersoll Rand | | | 32,106 | | | | 1,948,192 | |
| Jacobs Solutions | | | 9,835 | | | | 1,311,006 | |
The accompanying notes are an integral part of the financial statements.
114
| Schedule of Investments | October 31, 2023 |
Global X S&P 500® Covered Call ETF |
| | | Shares | | | Value | |
| COMMON STOCK — continued | | | | | | | | |
| Industrials — continued | | | | | | | | |
| JB Hunt Transport Services | | | 5,906 | | | $ | 1,015,064 | |
| Johnson Controls International | | | 55,026 | | | | 2,697,375 | |
| L3Harris Technologies | | | 15,290 | | | | 2,743,179 | |
| Leidos Holdings | | | 9,652 | | | | 956,706 | |
| Lockheed Martin | | | 18,062 | | | | 8,211,708 | |
| Masco | | | 17,348 | | | | 903,657 | |
| Nordson | | | 4,436 | | | | 943,049 | |
| Norfolk Southern | | | 18,662 | | | | 3,560,523 | |
| Northrop Grumman | | | 11,084 | | | | 5,225,330 | |
| Old Dominion Freight Line | | | 7,254 | | | | 2,732,292 | |
| Otis Worldwide | | | 33,594 | | | | 2,593,793 | |
| PACCAR | | | 41,168 | | | | 3,397,595 | |
| Parker-Hannifin | | | 10,211 | | | | 3,766,940 | |
| Paychex | | | 26,124 | | | | 2,901,070 | |
| Paycom Software | | | 4,086 | | | | 1,000,947 | |
| Pentair | | | 14,979 | | | | 870,579 | |
| Quanta Services | | | 11,887 | | | | 1,986,555 | |
| Republic Services, Cl A | | | 16,447 | | | | 2,442,215 | |
| Robert Half | | | 10,142 | | | | 758,317 | |
| Rockwell Automation | | | 9,139 | | | | 2,401,821 | |
| Rollins | | | 23,869 | | | | 897,713 | |
| RTX | | | 117,298 | | | | 9,546,884 | |
| Snap-On | | | 4,394 | | | | 1,133,388 | |
| Southwest Airlines | | | 51,781 | | | | 1,151,092 | |
| Stanley Black & Decker | | | 11,950 | | | | 1,016,348 | |
| Textron | | | 15,781 | | | | 1,199,356 | |
| Trane Technologies | | | 18,345 | | | | 3,491,237 | |
| TransDigm Group * | | | 4,446 | | | | 3,681,688 | |
| Union Pacific | | | 49,115 | | | | 10,196,765 | |
| United Airlines Holdings * | | | 24,037 | | | | 841,535 | |
| United Parcel Service, Cl B | | | 58,288 | | | | 8,233,180 | |
| United Rentals | | | 5,343 | | | | 2,170,701 | |
| Veralto * | | | 17,288 | | | | 1,192,849 | |
| Verisk Analytics, Cl A | | | 11,639 | | | | 2,646,243 | |
| Waste Management | | | 30,102 | | | | 4,946,662 | |
| Westinghouse Air Brake Technologies | | | 14,192 | | | | 1,504,636 | |
| WW Grainger | | | 3,360 | | | | 2,452,229 | |
| Xylem | | | 19,442 | | | | 1,818,605 | |
| | | | | | | | 235,448,446 | |
The accompanying notes are an integral part of the financial statements.
115
| Schedule of Investments | October 31, 2023 |
Global X S&P 500® Covered Call ETF |
| | | Shares | | | Value | |
| COMMON STOCK — continued | | | | | | | | |
| Information Technology — 28.2% | | | | | | | | |
| Accenture, Cl A | | | 50,835 | | | $ | 15,102,570 | |
| Adobe * | | | 36,732 | | | | 19,543,628 | |
| Advanced Micro Devices * | | | 130,205 | | | | 12,825,193 | |
| Akamai Technologies * | | | 12,176 | | | | 1,258,146 | |
| Amphenol, Cl A | | | 47,897 | | | | 3,858,103 | |
| Analog Devices | | | 40,409 | | | | 6,357,548 | |
| ANSYS * | | | 7,008 | | | | 1,950,046 | |
| Apple | | | 1,184,345 | | | | 202,250,596 | |
| Applied Materials | | | 67,674 | | | | 8,956,654 | |
| Arista Networks * | | | 19,343 | | | | 3,875,757 | |
| Autodesk * | | | 17,203 | | | | 3,399,829 | |
| Broadcom | | | 33,258 | | | | 27,982,283 | |
| Cadence Design Systems * | | | 22,210 | | | | 5,327,069 | |
| CDW | | | 10,903 | | | | 2,184,961 | |
| Cisco Systems | | | 328,403 | | | | 17,119,648 | |
| Cognizant Technology Solutions, Cl A | | | 41,132 | | | | 2,651,780 | |
| Corning | | | 63,102 | | | | 1,688,610 | |
| Enphase Energy * | | | 11,644 | | | | 926,630 | |
| EPAM Systems * | | | 4,736 | | | | 1,030,412 | |
| F5 * | | | 4,005 | | | | 607,118 | |
| Fair Isaac * | | | 1,902 | | | | 1,608,845 | |
| First Solar * | | | 7,878 | | | | 1,122,221 | |
| Fortinet * | | | 52,835 | | | | 3,020,577 | |
| Gartner * | | | 6,599 | | | | 2,191,132 | |
| Gen Digital | | | 43,760 | | | | 729,042 | |
| Hewlett Packard Enterprise | | | 102,504 | | | | 1,576,512 | |
| HP | | | 68,969 | | | | 1,815,954 | |
| Intel | | | 337,505 | | | | 12,318,933 | |
| International Business Machines | | | 73,417 | | | | 10,619,035 | |
| Intuit | | | 22,570 | | | | 11,171,022 | |
| Juniper Networks | | | 30,427 | | | | 819,095 | |
| Keysight Technologies * | | | 13,607 | | | | 1,660,734 | |
| KLA | | | 11,018 | | | | 5,175,155 | |
| Lam Research | | | 10,788 | | | | 6,345,717 | |
| Microchip Technology | | | 43,470 | | | | 3,098,976 | |
| Micron Technology | | | 89,216 | | | | 5,965,874 | |
| Microsoft | | | 598,755 | | | | 202,445,053 | |
| Monolithic Power Systems | | | 3,556 | | | | 1,570,827 | |
| Motorola Solutions | | | 13,504 | | | | 3,760,324 | |
The accompanying notes are an integral part of the financial statements.
116
| Schedule of Investments | October 31, 2023 |
Global X S&P 500® Covered Call ETF |
| | | Shares | | | Value | |
| COMMON STOCK — continued | | | | | | | | |
| Information Technology — continued | | | | | | | | |
| NetApp | | | 17,004 | | | $ | 1,237,551 | |
| NVIDIA | | | 199,054 | | | | 81,174,221 | |
| ON Semiconductor * | | | 34,002 | | | | 2,129,885 | |
| Oracle | | | 126,868 | | | | 13,118,151 | |
| Palo Alto Networks * | | | 24,508 | | | | 5,955,934 | |
| PTC * | | | 9,303 | | | | 1,306,327 | |
| Qorvo * | | | 8,395 | | | | 733,891 | |
| QUALCOMM | | | 89,937 | | | | 9,802,234 | |
| Roper Technologies | | | 8,571 | | | | 4,187,533 | |
| Salesforce * | | | 78,493 | | | | 15,763,749 | |
| Seagate Technology Holdings | | | 16,155 | | | | 1,102,579 | |
| ServiceNow * | | | 16,440 | | | | 9,565,614 | |
| Skyworks Solutions | | | 12,788 | | | | 1,109,231 | |
| SolarEdge Technologies * | | | 4,657 | | | | 353,699 | |
| Synopsys * | | | 11,878 | | | | 5,576,008 | |
| TE Connectivity | | | 25,145 | | | | 2,963,338 | |
| Teledyne Technologies * | | | 3,719 | | | | 1,393,100 | |
| Teradyne | | | 12,479 | | | | 1,039,126 | |
| Texas Instruments | | | 73,172 | | | | 10,391,156 | |
| Trimble * | | | 22,172 | | | | 1,044,966 | |
| Tyler Technologies * | | | 3,509 | | | | 1,308,506 | |
| VeriSign * | | | 7,241 | | | | 1,445,738 | |
| Western Digital * | | | 22,741 | | | | 913,051 | |
| Zebra Technologies, Cl A * | | | 4,284 | | | | 897,198 | |
| | | | | | | | 790,424,395 | |
| Materials — 2.5% | | | | | | | | |
| Air Products & Chemicals | | | 17,870 | | | | 5,047,203 | |
| Albemarle | | | 9,908 | | | | 1,256,136 | |
| Amcor | | | 130,932 | | | | 1,163,985 | |
| Avery Dennison | | | 6,302 | | | | 1,096,989 | |
| Ball | | | 25,098 | | | | 1,208,469 | |
| Celanese, Cl A | | | 8,992 | | | | 1,029,674 | |
| CF Industries Holdings | | | 16,566 | | | | 1,321,635 | |
| Corteva | | | 57,694 | | | | 2,777,389 | |
| Dow | | | 55,401 | | | | 2,678,084 | |
| DuPont de Nemours | | | 38,111 | | | | 2,777,530 | |
| Eastman Chemical | | | 10,141 | | | | 757,837 | |
| Ecolab | | | 19,938 | | | | 3,344,400 | |
The accompanying notes are an integral part of the financial statements.
117
| Schedule of Investments | October 31, 2023 |
Global X S&P 500® Covered Call ETF |
| | | Shares | | | Value | |
| COMMON STOCK — continued | | | | | | | | |
| Materials — continued | | | | | | | | |
| FMC | | | 11,343 | | | $ | 603,447 | |
| Freeport-McMoRan | | | 116,729 | | | | 3,943,106 | |
| International Flavors & Fragrances | | | 20,491 | | | | 1,400,560 | |
| International Paper | | | 30,762 | | | | 1,037,602 | |
| Linde | | | 39,323 | | | | 15,027,678 | |
| LyondellBasell Industries, Cl A | | | 20,170 | | | | 1,820,141 | |
| Martin Marietta Materials | | | 4,885 | | | | 1,997,672 | |
| Mosaic | | | 29,902 | | | | 971,217 | |
| Newmont | | | 64,385 | | | | 2,412,506 | |
| Nucor | | | 20,458 | | | | 3,023,488 | |
| Packaging Corp of America | | | 7,052 | | | | 1,079,309 | |
| PPG Industries | | | 17,906 | | | | 2,198,320 | |
| Sealed Air | | | 14,830 | | | | 456,616 | |
| Sherwin-Williams | | | 19,307 | | | | 4,599,120 | |
| Steel Dynamics | | | 12,869 | | | | 1,370,677 | |
| Vulcan Materials | | | 10,520 | | | | 2,067,075 | |
| Westrock | | | 17,243 | | | | 619,541 | |
| | | | | | | | 69,087,406 | |
| Real Estate — 2.4% | | | | | | | | |
| Alexandria Real Estate Equities ‡ | | | 12,419 | | | | 1,156,581 | |
| American Tower ‡ | | | 36,450 | | | | 6,495,026 | |
| AvalonBay Communities ‡ | | | 11,650 | | | | 1,930,871 | |
| Boston Properties ‡ | | | 11,118 | | | | 595,591 | |
| Camden Property Trust ‡ | | | 9,219 | | | | 782,509 | |
| CBRE Group, Cl A * | | | 24,746 | | | | 1,715,888 | |
| CoStar Group * | | | 33,192 | | | | 2,436,625 | |
| Crown Castle ‡ | | | 34,854 | | | | 3,240,725 | |
| Digital Realty Trust ‡ | | | 23,403 | | | | 2,910,397 | |
| Equinix ‡ | | | 7,611 | | | | 5,553,290 | |
| Equity Residential ‡ | | | 29,580 | | | | 1,636,661 | |
| Essex Property Trust ‡ | | | 5,230 | | | | 1,118,802 | |
| Extra Space Storage ‡ | | | 16,743 | | | | 1,734,407 | |
| Federal Realty Investment Trust ‡ | | | 7,010 | | | | 639,242 | |
| Healthpeak Properties ‡ | | | 50,546 | | | | 785,990 | |
| Host Hotels & Resorts ‡ | | | 55,876 | | | | 864,961 | |
| Invitation Homes ‡ | | | 46,576 | | | | 1,382,841 | |
| Iron Mountain ‡ | | | 23,043 | | | | 1,361,150 | |
| Kimco Realty ‡ | | | 56,616 | | | | 1,015,691 | |
The accompanying notes are an integral part of the financial statements.
118
| Schedule of Investments | October 31, 2023 |
Global X S&P 500® Covered Call ETF |
| | | Shares | | | Value | |
| COMMON STOCK — continued | | | | | | | | |
| Real Estate — continued | | | | | | | | |
| Mid-America Apartment Communities ‡ | | | 9,956 | | | $ | 1,176,301 | |
| ProLogis ‡ | | | 74,453 | | | | 7,501,140 | |
| Public Storage ‡ | | | 12,745 | | | | 3,042,359 | |
| Realty Income ‡ | | | 57,489 | | | | 2,723,829 | |
| Regency Centers ‡ | | | 14,012 | | | | 844,363 | |
| SBA Communications, Cl A ‡ | | | 8,081 | | | | 1,685,939 | |
| Simon Property Group ‡ | | | 26,257 | | | | 2,885,382 | |
| UDR ‡ | | | 27,714 | | | | 881,582 | |
| Ventas ‡ | | | 34,999 | | | | 1,486,058 | |
| VICI Properties, Cl A ‡ | | | 81,080 | | | | 2,262,132 | |
| Welltower ‡ | | | 39,944 | | | | 3,339,718 | |
| Weyerhaeuser ‡ | | | 58,676 | | | | 1,683,414 | |
| | | | | | | | 66,869,465 | |
| Utilities — 2.5% | | | | | | | | |
| AES | | | 58,030 | | | | 864,647 | |
| Alliant Energy | | | 22,139 | | | | 1,080,162 | |
| Ameren | | | 21,094 | | | | 1,597,027 | |
| American Electric Power | | | 41,342 | | | | 3,122,975 | |
| American Water Works | | | 15,616 | | | | 1,837,222 | |
| Atmos Energy | | | 11,693 | | | | 1,258,868 | |
| CenterPoint Energy | | | 50,332 | | | | 1,352,924 | |
| CMS Energy | | | 23,323 | | | | 1,267,372 | |
| Consolidated Edison | | | 28,080 | | | | 2,465,143 | |
| Constellation Energy | | | 26,312 | | | | 2,971,151 | |
| Dominion Energy | | | 67,004 | | | | 2,701,601 | |
| DTE Energy | | | 17,160 | | | | 1,653,881 | |
| Duke Energy | | | 60,093 | | | | 5,341,667 | |
| Edison International | | | 30,714 | | | | 1,936,825 | |
| Entergy | | | 15,625 | | | | 1,493,594 | |
| Evergy | | | 18,278 | | | | 898,181 | |
| Eversource Energy | | | 28,113 | | | | 1,512,198 | |
| Exelon | | | 79,749 | | | | 3,105,426 | |
| FirstEnergy | | | 40,326 | | | | 1,435,606 | |
| NextEra Energy | | | 163,088 | | | | 9,508,030 | |
| NiSource | | | 37,330 | | | | 939,223 | |
| NRG Energy | | | 15,219 | | | | 644,981 | |
| PG&E * | | | 159,732 | | | | 2,603,632 | |
| Pinnacle West Capital | | | 10,392 | | | | 770,878 | |
The accompanying notes are an integral part of the financial statements.
119
| Schedule of Investments | October 31, 2023 |
Global X S&P 500® Covered Call ETF |
| | | Shares | | | Value | |
| COMMON STOCK — continued | | | | | | | | |
| Utilities — continued | | | | | | | | |
| PPL | | | 54,124 | | | $ | 1,329,827 | |
| Public Service Enterprise Group | | | 41,887 | | | | 2,582,333 | |
| Sempra | | | 50,510 | | | | 3,537,215 | |
| Southern | | | 85,171 | | | | 5,732,008 | |
| WEC Energy Group | | | 25,512 | | | | 2,076,422 | |
| Xcel Energy | | | 44,480 | | | | 2,636,330 | |
| | | | | | | | 70,257,349 | |
| TOTAL UNITED STATES | | | | | | | 2,824,568,571 | |
TOTAL COMMON STOCK
(Cost $2,701,136,440) | | | | | | | 2,828,176,324 | |
TOTAL INVESTMENTS — 100.8%
(Cost $2,701,136,440) | | | | | | $ | 2,828,176,324 | |
| | | | | | | | | |
WRITTEN OPTIONS— (1.0)%
(Premiums Received $(63,027,174)) | | | | | | $ | (27,077,160 | ) |
Percentages are based on Net Assets of $2,805,205,828.
A list of the exchange traded option contracts held by the Fund at October 31, 2023, is as follows:
| Description | | Number of
Contracts | | Notional
Amount | | | Exercise
Price | | | Expiration
Date | | Value | |
| WRITTEN OPTIONS — (1.0)% | | | | | | | | | | | | | | | | |
| Call Options | | | | | | | | | | | | | | | | |
| S&P 500 Index | | (6,744) | | $ | (2,828,298,720 | ) | | $ | 4,240 | | | 11/17/23 | | $ | (27,077,160 | ) |
| * | Non-income producing security. |
| ‡ | Real Estate Investment Trust |
| (A) | All or a portion of these securities has been segregated as collateral for options contracts. The Fair Value of the securities pledged as collateral is $2,828,176,278. |
As of October 31, 2023, all of the Fund’s investments and other financial instruments were considered Level 1, in accordance with authoritative guidance on fair value measurements and disclosure under U.S. GAAP.
See “Glossary” for abbreviations.
The accompanying notes are an integral part of the financial statements.
120
| Schedule of Investments | October 31, 2023 |
| Global X NASDAQ 100® Covered Call ETF |
Sector Weightings (Unaudited)†:

† Sector weightings percentages are based on the total market value of investments. Total investments do not include derivatives such as options, futures contracts, forward contracts, and swap contracts, if applicable.
| | | Shares | | | Value | |
| COMMON STOCK(A) — 101.2% | | | | | | |
| BRAZIL — 0.6% | | | | | | |
| Consumer Discretionary — 0.6% | | | | | | |
| MercadoLibre * | | | 33,706 | | | $ | 41,820,382 | |
| | | | | | | | | |
| CHINA — 1.1% | | | | | | | | |
| Consumer Discretionary — 0.7% | | | | | | | | |
| JD.com ADR | | | 290,780 | | | | 7,391,628 | |
| PDD Holdings ADR * | | | 438,807 | | | | 44,503,806 | |
| | | | | | | | 51,895,434 | |
| | | | | | | | | |
| Information Technology — 0.4% | | | | | | | | |
| NXP Semiconductors | | | 173,570 | | | | 29,928,675 | |
| | | | | | | | | |
| TOTAL CHINA | | | | | | | 81,824,109 | |
| NETHERLANDS — 0.5% | | | | | | | | |
| Information Technology — 0.5% | | | | | | | | |
| ASML Holding | | | 58,428 | | | | 34,987,271 | |
The accompanying notes are an integral part of the financial statements.
121
| Schedule of Investments | October 31, 2023 |
| Global X NASDAQ 100® Covered Call ETF |
| �� | | Shares | | | Value | |
| COMMON STOCK — continued | | | | | | |
| UNITED KINGDOM — 0.3% | | | | | | |
| Health Care — 0.3% | | | | | | |
| AstraZeneca ADR | | | 392,090 | | | $ | 24,791,851 | |
| | | | | | | | | |
| UNITED STATES — 98.7% | | | | | | | | |
| Communication Services — 16.2% | | | | | | | | |
| Alphabet, Cl A * | | | 1,864,740 | | | | 231,376,939 | |
| Alphabet, Cl C * | | | 1,823,259 | | | | 228,454,353 | |
| Charter Communications, Cl A * | | | 100,839 | | | | 40,617,949 | |
| Comcast, Cl A | | | 2,773,716 | | | | 114,526,734 | |
| Electronic Arts | | | 182,338 | | | | 22,571,621 | |
| Meta Platforms, Cl A * | | | 979,142 | | | | 294,986,110 | |
| Netflix * | | | 298,601 | | | | 122,931,046 | |
| Sirius XM Holdings | | | 2,581,833 | | | | 11,050,245 | |
| T-Mobile US * | | | 792,767 | | | | 114,047,461 | |
| Trade Desk, Cl A * | | | 300,219 | | | | 21,303,540 | |
| Warner Bros Discovery * | | | 1,639,519 | | | | 16,296,819 | |
| | | | | | | | 1,218,162,817 | |
| Consumer Discretionary — 12.7% | | | | | | | | |
| Airbnb, Cl A * | | | 287,145 | | | | 33,966,382 | |
| Amazon.com * | | | 3,242,966 | | | | 431,606,345 | |
| Booking Holdings * | | | 23,991 | | | | 66,924,334 | |
| eBay | | | 357,806 | | | | 14,036,729 | |
| Lucid Group * | | | 1,455,806 | | | | 5,997,921 | |
| Lululemon Athletica * | | | 81,738 | | | | 32,162,268 | |
| Marriott International, Cl A | | | 200,907 | | | | 37,883,024 | |
| O’Reilly Automotive * | | | 40,568 | | | | 37,746,090 | |
| Ross Stores | | | 229,330 | | | | 26,595,400 | |
| Starbucks | | | 771,767 | | | | 71,187,788 | |
| Tesla * | | | 997,547 | | | | 200,347,340 | |
| | | | | | | | 958,453,621 | |
| Consumer Staples — 6.6% | | | | | | | | |
| Costco Wholesale | | | 298,855 | | | | 165,099,456 | |
| Dollar Tree * | | | 148,004 | | | | 16,441,764 | |
| Keurig Dr Pepper | | | 940,599 | | | | 28,528,368 | |
| Kraft Heinz | | | 826,861 | | | | 26,013,047 | |
| Mondelez International, Cl A | | | 916,556 | | | | 60,685,173 | |
| Monster Beverage * | | | 705,367 | | | | 36,044,254 | |
The accompanying notes are an integral part of the financial statements.
122
| Schedule of Investments | October 31, 2023 |
| Global X NASDAQ 100® Covered Call ETF |
| | | Shares | | | Value | |
| COMMON STOCK — continued | | | | | | | | |
| Consumer Staples — continued | | | | | | | | |
| PepsiCo | | | 927,837 | | | $ | 151,497,225 | |
| Walgreens Boots Alliance | | | 580,144 | | | | 12,229,436 | |
| | | | | | | | 496,538,723 | |
| Energy — 0.5% | | | | | | | | |
| Baker Hughes, Cl A | | | 679,562 | | | | 23,390,524 | |
| Diamondback Energy | | | 120,279 | | | | 19,283,129 | |
| | | | | | | | 42,673,653 | |
| Financials — 0.5% | | | | | | | | |
| PayPal Holdings * | | | 739,567 | | | | 38,309,571 | |
| | | | | | | | | |
| Health Care — 6.6% | | | | | | | | |
| Align Technology * | | | 50,459 | | | | 9,314,227 | |
| Amgen | | | 360,460 | | | | 92,169,622 | |
| Biogen * | | | 97,503 | | | | 23,160,863 | |
| Dexcom * | | | 261,013 | | | | 23,185,785 | |
| GE HealthCare Technologies | | | 306,001 | | | | 20,370,486 | |
| Gilead Sciences | | | 839,451 | | | | 65,930,481 | |
| IDEXX Laboratories * | | | 55,901 | | | | 22,330,772 | |
| Illumina * | | | 106,439 | | | | 11,646,555 | |
| Intuitive Surgical * | | �� | 236,750 | | | | 62,080,585 | |
| Moderna * | | | 256,057 | | | | 19,450,090 | |
| Regeneron Pharmaceuticals * | | | 71,862 | | | | 56,044,455 | |
| Seagen * | | | 126,333 | | | | 26,884,926 | |
| Vertex Pharmaceuticals * | | | 173,869 | | | | 62,959,704 | |
| | | | | | | | 495,528,551 | |
| Industrials — 5.0% | | | | | | | | |
| Automatic Data Processing | | | 277,597 | | | | 60,577,217 | |
| Cintas | | | 68,453 | | | | 34,713,885 | |
| Copart * | | | 642,876 | | | | 27,977,964 | |
| CSX | | | 1,351,297 | | | | 40,336,215 | |
| Fastenal | | | 384,438 | | | | 22,428,113 | |
| Honeywell International | | | 447,382 | | | | 81,987,225 | |
| Old Dominion Freight Line | | | 73,519 | | | | 27,691,667 | |
| PACCAR | | | 351,951 | | | | 29,046,516 | |
| Paychex | | | 242,776 | | | | 26,960,275 | |
The accompanying notes are an integral part of the financial statements.
123
| Schedule of Investments | October 31, 2023 |
| Global X NASDAQ 100® Covered Call ETF |
| | | Shares | | | Value | |
| COMMON STOCK — continued | | | | | | |
| Industrials — continued | | | | | | |
| Verisk Analytics, Cl A | | | 97,625 | | | $ | 22,196,020 | |
| | | | | | | | 373,915,097 | |
| Information Technology — 49.0% | | | | | | | | |
| Adobe * | | | 307,179 | | | | 163,437,659 | |
| Advanced Micro Devices * | | | 1,088,828 | | | | 107,249,558 | |
| Analog Devices | | | 335,758 | | | | 52,824,806 | |
| ANSYS * | | | 57,370 | | | | 15,963,776 | |
| Apple | | | 4,914,359 | | | | 839,225,086 | |
| Applied Materials | | | 563,716 | | | | 74,607,813 | |
| Atlassian, Cl A * | | | 103,171 | | | | 18,636,809 | |
| Autodesk * | | | 143,941 | | | | 28,447,060 | |
| Broadcom | | | 278,183 | | | | 234,054,831 | |
| Cadence Design Systems * | | | 183,072 | | | | 43,909,819 | |
| Cisco Systems | | | 2,746,420 | | | | 143,170,875 | |
| Cognizant Technology Solutions, Cl A | | | 339,833 | | | | 21,909,033 | |
| Crowdstrike Holdings, Cl A * | | | 152,226 | | | | 26,908,990 | |
| Datadog, Cl A * | | | 197,224 | | | | 16,067,839 | |
| Enphase Energy * | | | 88,098 | | | | 7,010,839 | |
| Fortinet * | | | 528,715 | | | | 30,226,636 | |
| GLOBALFOUNDRIES * | | | 368,581 | | | | 18,288,989 | |
| Intel | | | 2,822,271 | | | | 103,012,891 | |
| Intuit | | | 188,746 | | | | 93,419,833 | |
| KLA | | | 92,091 | | | | 43,255,143 | |
| Lam Research | | | 89,265 | | | | 52,507,458 | |
| Marvell Technology | | | 580,863 | | | | 27,428,351 | |
| Microchip Technology | | | 366,468 | | | | 26,125,504 | |
| Micron Technology | | | 737,863 | | | | 49,340,899 | |
| Microsoft | | | 2,335,328 | | | | 789,597,750 | |
| NVIDIA | | | 776,353 | | | | 316,596,753 | |
| ON Semiconductor * | | | 290,515 | | | | 18,197,860 | |
| Palo Alto Networks * | | | 205,979 | | | | 50,057,017 | |
| QUALCOMM | | | 751,949 | | | | 81,954,921 | |
| Synopsys * | | | 102,477 | | | | 48,106,803 | |
| Texas Instruments | | | 611,785 | | | | 86,879,588 | |
| Workday, Cl A * | | | 139,377 | | | | 29,507,505 | |
| Zoom Video Communications, Cl A * | | | 166,519 | | | | 9,987,810 | |
| Zscaler * | | | 96,012 | | | | 15,236,144 | |
| | | | | | | | 3,683,152,648 | |
The accompanying notes are an integral part of the financial statements.
124
| Schedule of Investments | October 31, 2023 |
| Global X NASDAQ 100® Covered Call ETF |
| | | Shares | | | Value | |
| COMMON STOCK — continued | | | | | | |
| Real Estate — 0.3% | | | | | | |
| CoStar Group * | | | 274,769 | | | $ | 20,170,792 | |
| | | | | | | | | |
| Utilities — 1.3% | | | | | | | | |
| American Electric Power | | | 346,744 | | | | 26,193,042 | |
| Constellation Energy | | | 216,432 | | | | 24,439,502 | |
| Exelon | | | 669,927 | | | | 26,086,957 | |
| Xcel Energy | | | 371,182 | | | | 21,999,957 | |
| | | | | | | | 98,719,458 | |
| TOTAL UNITED STATES | | | | | | | 7,425,624,931 | |
TOTAL COMMON STOCK
(Cost $6,367,480,382) | | | | | | | 7,609,048,544 | |
TOTAL INVESTMENTS — 101.2%
(Cost $6,367,480,382) | | | | | | $ | 7,609,048,544 | |
| | | | | | | | | |
| WRITTEN OPTIONS— (1.3)% | | | | | | | | |
| (Premiums Received $(216,504,359)) | | | | | | $ | (98,419,200 | ) |
Percentages are based on Net Assets of $7,521,213,399.
A list of the exchange traded option contracts held by the Fund at October 31, 2023, is as follows:
| Description | | Number of
Contracts | | | Notional
Amount | | | Exercise
Price | | | Expiration
Date | | Value | |
| WRITTEN OPTIONS — (1.3)% | | | | | | | | | | | | | | |
| Call Options | | | | | | | | | | | | | | |
| Nasdaq-100 | | | (5,280 | ) | | $ | (7,608,363,840 | ) | | $ | 14,600 | | | 11/17/23 | | $ | (98,419,200 | ) |
| * | Non-income producing security. |
| (A) | All or a portion of these securities has been segregated as collateral for options contracts. The Fair Value of the securities pledged as collateral is $7,609,048,544. |
As of October 31, 2023, all of the Fund’s investments and other financial instruments were considered Level 1, in accordance with authoritative guidance on fair value measurements and disclosure under U.S. GAAP.
See “Glossary” for abbreviations.
The accompanying notes are an integral part of the financial statements.
125
| Schedule of Investments | October 31, 2023 |
| Global X MSCI SuperDividend® Emerging Markets ETF |
Sector Weightings (Unaudited)†:

† Sector weightings percentages are based on the total market value of investments. Total investments do not include derivatives such as options, futures contracts, forward contracts, and swap contracts, if applicable.
| | | Shares | | | Value | |
| COMMON STOCK — 91.7% | | | | | | |
| BRAZIL — 6.1% | | | | | | |
| Financials — 2.3% | | | | | | |
| Banco do Brasil | | | 98,600 | | | $ | 945,332 | |
| | | | | | | | | |
| Materials — 3.8% | | | | | | | | |
| Cia Siderurgica Nacional | | | 321,851 | | | | 750,539 | |
| Vale | | | 62,335 | | | | 852,888 | |
| | | | | | | | 1,603,427 | |
| | | | | | | | | |
| TOTAL BRAZIL | | | | | | | 2,548,759 | |
| CHILE — 6.9% | | | | | | | | |
| Financials — 2.0% | | | | | | | | |
| Banco de Chile | | | 8,047,006 | | | | 824,059 | |
| | | | | | | | | |
| Industrials — 1.2% | | | | | | | | |
| Cia Sud Americana de Vapores | | | 8,836,141 | | | | 489,093 | |
| | | | | | | | | |
| Materials — 2.0% | | | | | | | | |
| Empresas CMPC | | | 478,834 | | | | 853,251 | |
The accompanying notes are an integral part of the financial statements.
126
| Schedule of Investments | October 31, 2023 |
| Global X MSCI SuperDividend® Emerging Markets ETF |
| | | Shares | | | Value | |
| COMMON STOCK — continued | | | | | | |
| Utilities — 1.7% | | | | | | |
| Enel Chile | | | 11,756,306 | | | $ | 693,935 | |
| | | | | | | | | |
| TOTAL CHILE | | | | | | | 2,860,338 | |
| CHINA — 34.8% | | | | | | | | |
| Consumer Staples — 1.8% | | | | | | | | |
| Tingyi Cayman Islands Holding | | | 552,000 | | | | 732,275 | |
| | | | | | | | | |
| Energy — 15.4% | | | | | | | | |
| China Shenhua Energy, Cl H | | | 244,764 | | | | 750,752 | |
| Guanghui Energy, Cl A | | | 867,500 | | | | 886,163 | |
| Inner Mongolia Yitai Coal, Cl B * | | | 563,000 | | | | 772,436 | |
| Jizhong Energy Resources, Cl A | | | 774,400 | | | | 676,092 | |
| Shaanxi Coal Industry, Cl A | | | 354,500 | | | | 870,069 | |
| Shanxi Coking Coal Energy Group, Cl A | | | 698,500 | | | | 821,983 | |
| Shanxi Lu’an Environmental Energy Development, Cl A | | | 369,800 | | | | 956,981 | |
| Yankuang Energy Group, Cl H (A) | | | 381,350 | | | | 662,827 | |
| | | | | | | | 6,397,303 | |
| Financials — 8.6% | | | | | | | | |
| Bank of China, Cl H | | | 2,055,500 | | | | 719,790 | |
| Bank of Communications, Cl H | | | 1,283,380 | | | | 759,406 | |
| China CITIC Bank, Cl H | | | 1,514,900 | | | | 675,690 | |
| China Construction Bank, Cl H | | | 1,505,000 | | | | 853,999 | |
| Lufax Holding ADR | | | 587,741 | | | | 561,175 | |
| | | | | | | | 3,570,060 | |
| Industrials — 3.8% | | | | | | | | |
| COSCO SHIPPING Holdings, Cl A | | | 546,700 | | | | 727,489 | |
| Shanxi Coal International Energy Group, Cl A | | | 374,000 | | | | 829,294 | |
| | | | | | | | 1,556,783 | |
| Materials — 3.7% | | | | | | | | |
| Western Mining, Cl A | | | 478,700 | | | | 818,909 | |
| Zangge Mining, Cl A | | | 241,200 | | | | 735,553 | |
| | | | | | | | 1,554,462 | |
The accompanying notes are an integral part of the financial statements.
127
| Schedule of Investments | October 31, 2023 |
| Global X MSCI SuperDividend® Emerging Markets ETF |
| | | Shares | | | Value | |
| COMMON STOCK — continued | | | | | | |
| Utilities — 1.5% | | | | | | |
| Guangdong Investment | | | 933,200 | | | $ | 636,875 | |
| | | | | | | | | |
| TOTAL CHINA | | | | | | | 14,447,758 | |
| CZECH REPUBLIC — 4.1% | | | | | | | | |
| Financials — 2.3% | | | | | | | | |
| Moneta Money Bank | | | 242,604 | | | | 935,821 | |
| | | | | | | | | |
| Utilities — 1.8% | | | | | | | | |
| CEZ | | | 17,949 | | | | 766,850 | |
| | | | | | | | | |
| TOTAL CZECH REPUBLIC | | | | | | | 1,702,671 | |
| EGYPT — 3.3% | | | | | | | | |
| Consumer Staples — 3.3% | | | | | | | | |
| Eastern SAE | | | 1,633,750 | | | | 1,389,414 | |
| | | | | | | | | |
| INDIA — 4.3% | | | | | | | | |
| Energy — 2.7% | | | | | | | | |
| Coal India | | | 298,366 | | | | 1,126,146 | |
| | | | | | | | | |
| Materials — 1.6% | | | | | | | | |
| Vedanta | | | 248,606 | | | | 646,756 | |
| | | | | | | | | |
| TOTAL INDIA | | | | | | | 1,772,902 | |
| INDONESIA — 2.1% | | | | | | | | |
| Energy — 2.1% | | | | | | | | |
| Adaro Energy | | | 5,351,100 | | | | 862,374 | |
| | | | | | | | | |
| MEXICO — 3.8% | | | | | | | | |
| Financials — 1.9% | | | | | | | | |
| Banco del Bajio | | | 261,740 | | | | 800,023 | |
| | | | | | | | | |
| Real Estate — 1.9% | | | | | | | | |
| Fibra Uno Administracion ‡ | | | 528,300 | | | | 800,951 | |
| | | | | | | | | |
| TOTAL MEXICO | | | | | | | 1,600,974 | |
The accompanying notes are an integral part of the financial statements.
128
| Schedule of Investments | October 31, 2023 |
| Global X MSCI SuperDividend® Emerging Markets ETF |
| | | Shares | | | Value | |
| COMMON STOCK — continued | | | | | | | | |
| RUSSIA — 0.0% | | | | | | | | |
| Materials — 0.0% | | | | | | | | |
| Alrosa PJSC (B) | | | 1,194,381 | | | $ | — | |
| PhosAgro PJSC GDR *(B) | | | 42 | | | | — | |
| Severstal PJSC *(B) | | | 71,665 | | | | — | |
| | | | | | | | | |
| TOTAL RUSSIA | | | | | | | — | |
| SOUTH AFRICA — 3.2% | | | | | | | | |
| Materials — 1.4% | | | | | | | | |
| African Rainbow Minerals | | | 73,272 | | | | 600,265 | |
| | | | | | | | | |
| Real Estate — 1.8% | | | | | | | | |
| Growthpoint Properties ‡ | | | 1,415,936 | | | | 731,877 | |
| | | | | | | | | |
| TOTAL SOUTH AFRICA | | | | | | | 1,332,142 | |
| SOUTH KOREA — 6.2% | | | | | | | | |
| Financials — 6.2% | | | | | | | | |
| Hana Financial Group | | | 27,750 | | | | 805,449 | |
| Industrial Bank of Korea | | | 112,269 | | | | 928,544 | |
| Woori Financial Group | | | 95,198 | | | | 838,811 | |
| | | | | | | | | |
| TOTAL SOUTH KOREA | | | | | | | 2,572,804 | |
| TAIWAN — 3.8% | | | | | | | | |
| Industrials — 1.4% | | | | | | | | |
| Evergreen Marine Taiwan | | | 178,120 | | | | 590,347 | |
| | | | | | | | | |
| Information Technology — 2.4% | | | | | | | | |
| MediaTek | | | 38,400 | | | | 996,849 | |
| | | | | | | | | |
| TOTAL TAIWAN | | | | | | | 1,587,196 | |
| THAILAND — 1.9% | | | | | | | | |
| Energy — 1.9% | | | | | | | | |
| Banpu NVDR | | | 3,717,400 | | | | 786,040 | |
| | | | | | | | | |
| TURKEY — 8.8% | | | | | | | | |
| Energy — 3.2% | | | | | | | | |
| Turkiye Petrol Rafinerileri | | | 261,223 | | | | 1,310,143 | |
The accompanying notes are an integral part of the financial statements.
129
| Schedule of Investments | October 31, 2023 |
| Global X MSCI SuperDividend® Emerging Markets ETF |
| | | Shares | | | Value | |
| COMMON STOCK — continued | | | | | | | | |
| Financials — 5.6% | | | | | | | | |
| Akbank | | | 1,143,035 | | | $ | 1,190,192 | |
| Yapi ve Kredi Bankasi | | | 1,881,435 | | | | 1,146,440 | |
| | | | | | | | 2,336,632 | |
| TOTAL TURKEY | | | | | | | 3,646,775 | |
| UNITED STATES — 2.4% | | | | | | | | |
| Consumer Staples — 2.4% | | | | | | | | |
| JBS | | | 253,748 | | | | 1,007,847 | |
| | | | | | | | | |
TOTAL COMMON STOCK
(Cost $41,920,624) | | | | | | | 38,117,994 | |
| | | | | | | | | |
| PREFERRED STOCK — 7.4% | | | | | | | | |
| BRAZIL—3.8% | | | | | | | | |
| Materials — 1.8% | | | | | | | | |
| Gerdau (C) | | | 179,110 | | | | 773,196 | |
| | | | | | | | | |
| Utilities — 2.0% | | | | | | | | |
| Cia Energetica de Minas Gerais (C) | | | 352,550 | | | | 820,729 | |
| | | | | | | | | |
| TOTAL BRAZIL | | | | | | | 1,593,925 | |
| CHILE—1.4% | | | | | | | | |
| Materials — 1.4% | | | | | | | | |
| Sociedad Quimica y Minera de Chile, Cl B (C) | | | 12,087 | | | | 582,879 | |
| | | | | | | | | |
| TOTAL CHILE | | | | | | | 582,879 | |
| COLOMBIA—2.2% | | �� | | | | | | |
| Financials — 2.2% | | | | | | | | |
| Bancolombia (C) | | | 145,675 | | | | 929,638 | |
| | | | | | | | | |
| TOTAL COLOMBIA | | | | | | | 929,638 | |
| RUSSIA—0.0% | | | | | | | | |
| Energy — 0.0% | | | | | | | | |
| Surgutneftegas PJSC (B)(C) | | | 3,166,303 | | | | — | |
| | | | | | | | | |
| TOTAL RUSSIA | | | | | | | — | |
TOTAL PREFERRED STOCK
(Cost $4,818,551) | | | | | | | 3,106,442 | |
The accompanying notes are an integral part of the financial statements.
130
| Schedule of Investments | October 31, 2023 |
| Global X MSCI SuperDividend® Emerging Markets ETF |
| | | Face Amount | | | Value | |
| REPURCHASE AGREEMENTS(D) — 1.0% | | | | | | | | |
Bank of America
5.310%, dated 10/31/2023, to be repurchased on 11/01/2023, repurchase price $154,021 (collateralized by various U.S. Government Obligations and U.S. Treasury Obligations, ranging in par value $2,563 - $66,914, 2.000% - 6.500%, 04/01/48 - 10/01/53, with a total market value of $157,078) | | $ | 153,998 | | | $ | 153,998 | |
Daiwa Capital Markets
5.320%, dated 10/31/2023, to be repurchased on 11/01/2023, repurchase price $249,037 (collateralized by various U.S. Government Obligations and U.S. Treasury Obligations, ranging in par value $15 - $19,670, 0.125% - 7.000%, 01/15/24 - 11/01/53, with a total market value of $253,980) | | | 249,000 | | | | 249,000 | |
| | | | | | | | | |
TOTAL REPURCHASE AGREEMENTS
(Cost $402,998) | | | | | | | 402,998 | |
TOTAL INVESTMENTS — 100.1%
(Cost $47,142,173) | | | | | | $ | 41,627,434 | |
Percentages are based on Net Assets of $41,573,901.
| * | Non-income producing security. |
| ‡ | Real Estate Investment Trust |
| (A) | This security or a partial position of this security is on loan at October 31, 2023. The total market value of securities on loan at October 31, 2023 was $347,622. |
| (B) | Level 3 security in accordance with fair value hierarchy. |
| (C) | There is currently no stated interest rate. |
| (D) | These securities were purchased with cash collateral held from securities on loan. The total value of such securities as of October 31, 2023 was $402,998. The total value of non-cash collateral held from securities on loan as of October 31, 2023 was $–. |
The accompanying notes are an integral part of the financial statements.
131
| Schedule of Investments | October 31, 2023 |
| Global X MSCI SuperDividend® Emerging Markets ETF |
The following is a summary of the level of inputs used as of October 31, 2023, in valuing the Fund’s investments and other financial instruments carried at value:
| Investments in Securities | | Level 1 | | | Level 2 | | | Level 3(1) | | | Total | |
| Common Stock | | $ | 38,117,994 | | | $ | — | | | $ | — | ^ | | $ | 38,117,994 | |
| Preferred Stock | | | 3,106,442 | | | | — | | | | — | ^ | | | 3,106,442 | |
| Repurchase Agreements | | | — | | | | 402,998 | | | | — | | | | 402,998 | |
| Total Investments in Securities | | $ | 41,224,436 | | | $ | 402,998 | | | $ | — | ^ | | $ | 41,627,434 | |
| ^ | Includes Securities in which the fair value is $0 or has been rounded to $0. |
| (1) | A reconciliation of Level 3 investments and disclosures of significant unobservable inputs are presented when the Fund has a significant amount of Level 3 investments at the end of the period in relation to Net Assets. Management has concluded that Level 3 investments are not material in relation to Net Assets. |
Amounts designated as “—” are $0 or have been rounded to $0.
See “Glossary” for abbreviations.
The accompanying notes are an integral part of the financial statements.
132
| Schedule of Investments | | October 31, 2023 |
| | | |
| | Global X SuperDividend® REIT ETF | |
Sector Weightings (Unaudited)†:

† Sector weightings percentages are based on the total market value of investments. Total investments do not include derivatives such as options, futures contracts, forward contracts, and swap contracts, if applicable.
| | | Shares | | | Value | |
| COMMON STOCK — 99.9% | | | | | | | | |
| AUSTRALIA — 6.7% | | | | | | | | |
| Real Estate — 6.7% | | | | | | | | |
| Dexus ‡ | | | 1,693,329 | | | $ | 6,947,431 | |
| Stockland ‡ | | | 3,437,299 | | | | 7,704,216 | |
| | | | | | | | | |
| TOTAL AUSTRALIA | | | | | | | 14,651,647 | |
| BELGIUM — 2.9% | | | | | | | | |
| Real Estate — 2.9% | | | | | | | | |
| Cofinimmo ‡ | | | 99,836 | | | | 6,194,439 | |
| | | | | | | | | |
| CANADA — 1.4% | | | | | | | | |
| Real Estate — 1.4% | | | | | | | | |
| NorthWest Healthcare Properties Real Estate Investment Trust ‡ | | | 1,028,980 | | | | 2,972,238 | |
| | | | | | | | | |
| FRANCE — 3.9% | | | | | | | | |
| Real Estate — 3.9% | | | | | | | | |
| Klepierre ‡ | | | 352,713 | | | | 8,537,558 | |
| | | | | | | | | |
| SINGAPORE — 17.0% | | | | | | | | |
| Real Estate — 17.0% | | | | | | | | |
| Frasers Logistics & Commercial Trust ‡ | | | 9,570,046 | | | | 7,264,587 | |
| Keppel ‡ | | | 13,094,210 | | | | 7,598,188 | |
| Mapletree Industrial Trust ‡ | | | 5,233,094 | | | | 8,212,220 | |
| Mapletree Pan Asia Commercial Trust ‡ | | | 7,019,633 | | | | 6,814,431 | |
| Suntec Real Estate Investment Trust ‡ | | | 8,891,878 | | | | 7,139,204 | |
| | | | | | | | | |
| TOTAL SINGAPORE | | | | | | | 37,028,630 | |
The accompanying notes are an integral part of the financial statements.
133
| Schedule of Investments | | October 31, 2023 |
| | | |
| | Global X SuperDividend® REIT ETF | |
| | | Shares | | | Value | |
| COMMON STOCK — continued | | | | | | | | |
| SOUTH AFRICA — 2.7% | | | | | | | | |
| Real Estate — 2.7% | | | | | | | | |
| Growthpoint Properties ‡ | | | 11,506,315 | | | $ | 5,947,447 | |
| | | | | | | | | |
| UNITED KINGDOM — 3.5% | | | | | | | | |
| Real Estate — 3.5% | | | | | | | | |
| Land Securities Group ‡ | | | 1,090,503 | | | | 7,529,380 | |
| | | | | | | | | |
| UNITED STATES — 61.8% | | | | | | | | |
| Financials — 19.6% | | | | | | | | |
| Arbor Realty Trust ‡ | | | 602,496 | | | | 7,597,475 | |
| ARMOUR Residential ‡ | | | 405,887 | | | | 5,913,776 | |
| Blackstone Mortgage Trust, Cl A ‡ | | | 372,246 | | | | 7,426,308 | |
| KKR Real Estate Finance Trust ‡ | | | 578,675 | | | | 6,041,367 | |
| Ladder Capital, Cl A ‡ | | | 808,700 | | | | 8,175,957 | |
| Starwood Property Trust ‡ | | | 421,424 | | | | 7,480,276 | |
| | | | | | | | 42,635,159 | |
| | | | | | | | | |
| Real Estate — 42.2% | | | | | | | | |
| Broadstone Net Lease, Cl A ‡ | | | 524,390 | | | | 7,420,119 | |
| CareTrust ‡ | | | 462,393 | | | | 9,950,697 | |
| Easterly Government Properties, Cl A ‡ | | | 571,923 | | | | 6,153,892 | |
| EPR Properties ‡ | | | 216,141 | | | | 9,229,221 | |
| Global Net Lease ‡ | | | 651,023 | | | | 5,169,123 | |
| Highwoods Properties ‡ | | | 311,533 | | | | 5,573,325 | |
| LTC Properties ‡ | | | 252,965 | | | | 7,996,224 | |
| National Health Investors ‡ | | | 162,162 | | | | 8,114,586 | |
| National Storage Affiliates Trust ‡ | | | 223,573 | | | | 6,376,302 | |
| Office Properties Income Trust ‡ | | | 182,541 | | | | 819,609 | |
| Omega Healthcare Investors ‡ | | | 334,912 | | | | 11,085,587 | |
| Physicians Realty Trust ‡ | | | 615,005 | | | | 6,678,954 | |
The accompanying notes are an integral part of the financial statements.
134
| Schedule of Investments | | October 31, 2023 |
| | | |
| | Global X SuperDividend® REIT ETF | |
| | | Shares | | | Value | |
| COMMON STOCK — continued | | | | | | | | |
| Real Estate — continued | | | | | | | | |
| Spirit Realty Capital ‡ | | | 204,304 | | | $ | 7,352,901 | |
| | | | | | | | 91,920,540 | |
| TOTAL UNITED STATES | | | | | | | 134,555,699 | |
TOTAL COMMON STOCK
(Cost $290,244,144) | | | | | | | 217,417,038 | |
TOTAL INVESTMENTS — 99.9%
(Cost $290,244,144) | | | | | | $ | 217,417,038 | |
Percentages are based on Net Assets of $217,653,112.
| ‡ | Real Estate Investment Trust |
As of October 31, 2023, all of the Fund’s investments were considered Level 1, in accordance with authoritative guidance on fair value measurements and disclosure under U.S. GAAP.
See “Glossary” for abbreviations.
The accompanying notes are an integral part of the financial statements.
135
| Schedule of Investments | | October 31, 2023 |
| | | |
| | Global X Renewable Energy Producers ETF | |
Sector Weightings (Unaudited)†:

† Sector weightings percentages are based on the total market value of investments. Total investments do not include derivatives such as options, futures contracts, forward contracts, and swap contracts, if applicable.
| | | Shares | | | Value | |
| COMMON STOCK — 94.6% | | | | | | | | |
| AUSTRIA — 8.4% | | | | | | | | |
| Utilities — 8.4% | | | | | | | | |
| Verbund | | | 42,398 | | | $ | 3,674,819 | |
| | | | | | | | | |
| BRAZIL — 14.2% | | | | | | | | |
| Utilities — 14.2% | | | | | | | | |
| AES Brasil Energia * | | | 228,796 | | | | 456,866 | |
| Centrais Eletricas Brasileiras | | | 436,955 | | | | 3,018,741 | |
| Engie Brasil Energia | | | 304,884 | | | | 2,375,955 | |
| Omega Energia * | | | 229,062 | | | | 345,206 | |
| | | | | | | | | |
| TOTAL BRAZIL | | | | | | | 6,196,768 | |
| CANADA — 5.7% | | | | | | | | |
| Utilities — 5.7% | | | | | | | | |
| Boralex, Cl A | | | 38,424 | | | | 714,370 | |
| Innergex Renewable Energy | | | 76,042 | | | | 467,782 | |
| Northland Power | | | 94,659 | | | | 1,328,942 | |
| | | | | | | | | |
| TOTAL CANADA | | | | | | | 2,511,094 | |
| CHINA — 4.1% | | | | | | | | |
| Utilities — 4.1% | | | | | | | | |
| China Datang Renewable Power, Cl H | | | 941,000 | | | | 212,863 | |
| China Longyuan Power Group, Cl H | | | 1,257,100 | | | | 1,065,176 | |
| Xinyi Energy Holdings (A) | | | 3,046,300 | | | | 533,373 | |
| | | | | | | | | |
| TOTAL CHINA | | | | | | | 1,811,412 | |
The accompanying notes are an integral part of the financial statements.
136
| Schedule of Investments | | October 31, 2023 |
| | | |
| | Global X Renewable Energy Producers ETF | |
| | | Shares | | | Value | |
| COMMON STOCK — continued | | | | | | | | |
| DENMARK — 4.3% | | | | | | | | |
| Utilities — 4.3% | | | | | | | | |
| Orsted | | | 39,368 | | | $ | 1,894,432 | |
| | | | | | | | | |
| FRANCE — 3.5% | | | | | | | | |
| Utilities — 3.5% | | | | | | | | |
| Neoen | | | 57,306 | | | | 1,507,048 | |
| | | | | | | | | |
| GERMANY — 3.6% | | | | | | | | |
| Energy — 1.8% | | | | | | | | |
| VERBIO Vereinigte BioEnergie (A) | | | 23,927 | | | | 806,023 | |
| | | | | | | | | |
| Utilities — 1.8% | | | | | | | | |
| Encavis * | | | 60,157 | | | | 782,428 | |
| | | | | | | | | |
| TOTAL GERMANY | | | | | | | 1,588,451 | |
| GREECE — 1.5% | | | | | | | | |
| Utilities — 1.5% | | | | | | | | |
| Terna Energy | | | 44,059 | | | | 660,836 | |
| | | | | | | | | |
| INDIA — 1.3% | | | | | | | | |
| Utilities — 1.3% | | | | | | | | |
| ReNew Energy Global, Cl A * (A) | | | 106,317 | | | | 574,112 | |
| | | | | | | | | |
| ISRAEL — 2.5% | | | | | | | | |
| Utilities — 2.5% | | | | | | | | |
| Energix-Renewable Energies | | | 205,206 | | | | 498,261 | |
| Enlight Renewable Energy * (A) | | | 44,501 | | | | 598,513 | |
| | | | | | | | | |
| TOTAL ISRAEL | | | | | | | 1,096,774 | |
| ITALY — 3.2% | | | | | | | | |
| Utilities — 3.2% | | | | | | | | |
| ERG | | | 56,627 | | | | 1,388,635 | |
| | | | | | | | | |
| JAPAN — 1.4% | | | | | | | | |
| Utilities — 1.4% | | | | | | | | |
| RENOVA * | | | 29,844 | | | | 212,630 | |
The accompanying notes are an integral part of the financial statements.
137
| Schedule of Investments | | October 31, 2023 |
| | | |
| | Global X Renewable Energy Producers ETF | |
| | | Shares | | | Value | |
| COMMON STOCK — continued | | | | | | | | |
| Utilities — continued | | | | | | | | |
| West Holdings | | | 17,061 | | | $ | 372,887 | |
| | | | | | | | | |
| TOTAL JAPAN | | | | | | | 585,517 | |
| NEW ZEALAND — 13.4% | | | | | | | | |
| Utilities — 13.4% | | | | | | | | |
| Contact Energy | | | 294,605 | | | | 1,334,869 | |
| Mercury NZ | | | 521,124 | | | | 1,788,356 | |
| Meridian Energy (A) | | | 971,927 | | | | 2,730,497 | |
| | | | | | | | | |
| TOTAL NEW ZEALAND | | | | | | | 5,853,722 | |
| PORTUGAL — 0.8% | | | | | | | | |
| Utilities — 0.8% | | | | | | | | |
| Greenvolt-Energias Renovaveis * (A) | | | 52,426 | | | | 349,666 | |
| | | | | | | | | |
| RUSSIA — 0.0% | | | | | | | | |
| Utilities — 0.0% | | | | | | | | |
| RusHydro PJSC (B) | | | 271,804,543 | | | | — | |
| | | | | | | | | |
| SOUTH AFRICA — 0.7% | | | | | | | | |
| Utilities — 0.7% | | | | | | | | |
| Scatec * | | | 60,072 | | | | 302,734 | |
| | | | | | | | | |
| SPAIN — 10.1% | | | | | | | | |
| Utilities — 10.1% | | | | | | | | |
| Atlantica Sustainable Infrastructure | | | 43,681 | | | | 791,063 | |
| EDP Renovaveis | | | 182,100 | | | | 2,923,778 | |
| Solaria Energia y Medio Ambiente * | | | 47,070 | | | | 704,008 | |
| | | | | | | | | |
| TOTAL SPAIN | | | | | | | 4,418,849 | |
| THAILAND — 4.2% | | | | | | | | |
| Utilities — 4.2% | | | | | | | | |
| Energy Absolute NVDR | | | 1,402,265 | | | | 1,638,593 | |
| Gunkul Engineering NVDR | | | 3,269,540 | | | | 207,402 | |
| | | | | | | | | |
| TOTAL THAILAND | | | | | | | 1,845,995 | |
The accompanying notes are an integral part of the financial statements.
138
| Schedule of Investments | | October 31, 2023 |
| | | |
| | Global X Renewable Energy Producers ETF | |
| | | Shares | | | Value | |
| COMMON STOCK — continued | | | | | | | | |
| TURKEY — 0.4% | | | | | | | | |
| Utilities — 0.4% | | | | | | | | |
| Aydem Yenilenebilir Enerji * | | | 268,923 | | | $ | 187,724 | |
| Galata Wind Enerji | | | 1 | | | | 1 | |
| | | | | | | | | |
| TOTAL TURKEY | | | | | | | 187,725 | |
| UNITED KINGDOM — 1.7% | | | | | | | | |
| Utilities — 1.7% | | | | | | | | |
| Drax Group | | | 146,381 | | | | 750,644 | |
| | | | | | | | | |
| UNITED STATES — 9.6% | | | | | | | | |
| Energy — 0.2% | | | | | | | | |
| Enviva | | | 24,178 | | | | 87,524 | |
| | | | | | | | | |
| Industrials — 1.8% | | | | | | | | |
| Sunrun * | | | 80,589 | | | | 777,684 | |
| | | | | | | | | |
| Utilities — 7.6% | | | | | | | | |
| Clearway Energy, Cl C | | | 31,009 | | | | 673,205 | |
| NextEra Energy Partners | | | 33,461 | | | | 905,789 | |
| Ormat Technologies | | | 22,370 | | | | 1,376,650 | |
| Sunnova Energy International * (A) | | | 43,119 | | | | 393,677 | |
| | | | | | | | 3,349,321 | |
| TOTAL UNITED STATES | | | | | | | 4,214,529 | |
TOTAL COMMON STOCK
(Cost $80,366,891) | | | | | | | 41,413,762 | |
| | | | | | | | | |
| MASTER LIMITED PARTNERSHIP — 5.2% | | | | | | | | |
| CANADA— 5.2% | | | | | | | | |
| Utilities — 5.2% | | | | | | | | |
| Brookfield Renewable Partners, Cl A | | | 108,861 | | | | 2,267,006 | |
TOTAL MASTER LIMITED PARTNERSHIP
(Cost $2,586,104) | | | | | | | 2,267,006 | |
| TOTAL MASTER LIMITED PARTNERSHIP | | | | | | | | |
The accompanying notes are an integral part of the financial statements.
139
| Schedule of Investments | | October 31, 2023 |
| | | |
| | Global X Renewable Energy Producers ETF | |
| | | Face Amount | | | Value | |
| REPURCHASE AGREEMENTS(C) — 2.9% | | | | | | | | |
Bank of America
5.310%, dated 10/31/2023, to be repurchased on 11/01/2023, repurchase price $301,753 (collateralized by various U.S. Government Obligations and U.S. Treasury Obligations, ranging in par value $5,021 - $131,096, 2.000% - 6.500%, 04/01/48 - 10/01/53, with a total market value of $307,742) | | $ | 301,708 | | | $ | 301,708 | |
Citigroup Global Markets
5.310%, dated 10/31/2023, to be repurchased on 11/01/2023, repurchase price $301,753 (collateralized by various U.S. Government Obligations and U.S. Treasury Obligations, ranging in par value $42 - $55,260, 2.000% - 7.715%, 12/01/27 - 06/20/73, with a total market value of $307,742) | | | 301,708 | | | | 301,708 | |
Daiwa Capital Markets
5.320%, dated 10/31/2023, to be repurchased on 11/01/2023, repurchase price $301,753 (collateralized by various U.S. Government Obligations and U.S. Treasury Obligations, ranging in par value $19 - $23,834, 0.125% - 7.000%, 01/15/24 - 11/01/53, with a total market value of $307,742) | | | 301,708 | | | | 301,708 | |
HSBC Securities
5.310%, dated 10/31/2023, to be repurchased on 11/01/2023, repurchase price $295,718 (collateralized by various U.S. Government Obligations and U.S. Treasury Obligations, ranging in par value $2,957 - $294,883, 2.500% - 7.000%, 06/20/33 - 10/20/53, with a total market value of $301,587) | | | 295,674 | | | | 295,674 | |
The accompanying notes are an integral part of the financial statements.
140
| Schedule of Investments | | October 31, 2023 |
| | | |
| | Global X Renewable Energy Producers ETF | |
| | | Face Amount | | | Value | |
| REPURCHASE AGREEMENTS — continued | | | | | | | | |
RBC Dominion Securities
5.310%, dated 10/31/2023, to be repurchased on 11/01/2023, repurchase price $83,081 (collateralized by various U.S. Government Obligations and U.S. Treasury Obligations, ranging in par value $3 - $21,773, 0.000% - 6.500%, 11/07/23 - 08/20/53, with a total market value of $84,730) | | $ | 83,069 | | | $ | 83,069 | |
TOTAL REPURCHASE AGREEMENTS
(Cost $1,283,867) | | | | | | | 1,283,867 | |
TOTAL INVESTMENTS — 102.7%
(Cost $84,236,862) | | | | | | $ | 44,964,635 | |
Percentages are based on Net Assets of $43,796,687.
| * | Non-income producing security. |
| (A) | This security or a partial position of this security is on loan at October 31, 2023. The total market value of securities on loan at October 31, 2023 was $2,047,817. |
| (B) | Level 3 security in accordance with fair value hierarchy. |
| (C) | These securities were purchased with cash collateral held from securities on loan. The total value of such securities as of October 31, 2023 was $1,283,867. The total value of non-cash collateral held from securities on loan as of October 31, 2023 was $825,049. |
The accompanying notes are an integral part of the financial statements.
141
| Schedule of Investments | | October 31, 2023 |
| | | |
| | Global X Renewable Energy Producers ETF | |
The following is a summary of the level of inputs used as of October 31, 2023, in valuing the Fund’s investments carried at value:
| Investments in Securities | | Level 1 | | | Level 2 | | | Level 3(1) | | | Total | |
| Common Stock | | $ | 41,413,762 | | | $ | — | | | $ | — | ^ | | $ | 41,413,762 | |
| Master Limited Partnership | | | 2,267,006 | | | | — | | | | — | | | | 2,267,006 | |
| Repurchase Agreements | | | — | | | | 1,283,867 | | | | — | | | | 1,283,867 | |
| Total Investments in Securities | | $ | 43,680,768 | | | $ | 1,283,867 | | | $ | — | | | $ | 44,964,635 | |
| | |
| ^ | Includes Securities in which the fair value is $0 or has been rounded to $0. |
| (1) | A reconciliation of Level 3 investments and disclosures of significant unobservable inputs are presented when the Fund has a significant amount of Level 3 investments at the end of the period in relation to Net Assets. Management has concluded that Level 3 investments are not material in relation to Net Assets. |
Amounts designated as “—” are $0 or have been rounded to $0.
See “Glossary” for abbreviations.
The accompanying notes are an integral part of the financial statements.
142
| Schedule of Investments | | October 31, 2023 |
| | | |
| | Global X S&P 500® Catholic Values ETF | |
Sector Weightings (Unaudited)†:

† Sector weightings percentages are based on the total market value of investments. Total investments do not include derivatives such as options, futures contracts, forward contracts, and swap contracts, if applicable.
| | | Shares | | | Value | |
| COMMON STOCK — 99.9% | | | | | | | | |
| CHINA — 0.2% | | | | | | | | |
| Information Technology — 0.2% | | | | | | | | |
| NXP Semiconductors | | | 5,187 | | | $ | 894,395 | |
| | | | | | | | | |
| UNITED STATES — 99.7% | | | | | | | | |
| Communication Services — 8.8% | | | | | | | | |
| Alphabet, Cl A * | | | 114,967 | | | | 14,265,105 | |
| Alphabet, Cl C * | | | 97,586 | | | | 12,227,526 | |
| AT&T | | | 137,226 | | | | 2,113,280 | |
| Charter Communications, Cl A * | | | 2,055 | | | | 827,754 | |
| Comcast, Cl A | | | 80,883 | | | | 3,339,659 | |
| Electronic Arts | | | 5,445 | | | | 674,036 | |
| Fox, Cl A | | | 4,958 | | | | 150,674 | |
| Fox, Cl B | | | 3,164 | | | | 88,307 | |
| Interpublic Group | | | 8,218 | | | | 233,391 | |
| Match Group * | | | 5,131 | | | | 177,533 | |
| Meta Platforms, Cl A * | | | 43,086 | | | | 12,980,519 | |
| Netflix * | | | 8,570 | | | | 3,528,183 | |
| News, Cl A | | | 8,115 | | | | 167,818 | |
| News, Cl B | | | 2,559 | | | | 54,865 | |
| Omnicom Group | | | 4,020 | | | | 301,138 | |
The accompanying notes are an integral part of the financial statements.
143
| Schedule of Investments | | October 31, 2023 |
| | | |
| | Global X S&P 500® Catholic Values ETF | |
| | | Shares | | | Value | |
| COMMON STOCK — continued | | | | | | | | |
| Communication Services — continued | | | | | | | | |
| Paramount Global, Cl B | | | 11,285 | | | $ | 122,781 | |
| Take-Two Interactive Software * | | | 3,225 | | | | 431,344 | |
| T-Mobile US * | | | 9,688 | | | | 1,393,716 | |
| Verizon Communications | | | 80,974 | | | | 2,844,617 | |
| Walt Disney * | | | 35,249 | | | | 2,875,966 | |
| Warner Bros Discovery * | | | 42,790 | | | | 425,333 | |
| | | | | | | | 59,223,545 | |
| Consumer Discretionary — 9.9% | | | | | | | | |
| Aptiv * | | | 7,631 | | | | 665,423 | |
| AutoZone * | | | 526 | | | | 1,302,970 | |
| Bath & Body Works | | | 5,107 | | | | 151,423 | |
| Best Buy | | | 5,437 | | | | 363,300 | |
| Booking Holdings * | | | 1,026 | | | | 2,862,089 | |
| BorgWarner | | | 6,615 | | | | 244,093 | |
| CarMax * | | | 4,389 | | | | 268,124 | |
| Carnival * | | | 28,142 | | | | 322,507 | |
| Chipotle Mexican Grill, Cl A * | | | 814 | | | | 1,580,951 | |
| Darden Restaurants | | | 3,432 | | | | 499,459 | |
| Domino’s Pizza | | | 1,013 | | | | 343,397 | |
| DR Horton | | | 8,778 | | | | 916,423 | |
| eBay | | | 15,034 | | | | 589,784 | |
| Etsy * | | | 2,671 | | | | 166,403 | |
| Expedia Group * | | | 3,990 | | | | 380,207 | |
| Ford Motor | | | 110,950 | | | | 1,081,763 | |
| Garmin | | | 4,266 | | | | 437,393 | |
| General Motors | | | 39,254 | | | | 1,106,963 | |
| Genuine Parts | | | 3,949 | | | | 508,868 | |
| Hasbro | | | 3,691 | | | | 166,649 | |
| Hilton Worldwide Holdings | | | 7,488 | | | | 1,134,657 | |
| Home Depot | | | 28,680 | | | | 8,164,909 | |
| Lennar, Cl A | | | 7,109 | | | | 758,388 | |
| LKQ | | | 7,101 | | | | 311,876 | |
| Lowe’s | | | 16,881 | | | | 3,217,012 | |
| Marriott International, Cl A | | | 7,259 | | | | 1,368,757 | |
| McDonald’s | | | 20,684 | | | | 5,422,724 | |
| Mohawk Industries * | | | 1,109 | | | | 89,141 | |
| NIKE, Cl B | | | 34,840 | | | | 3,580,507 | |
| Norwegian Cruise Line Holdings * | | | 11,968 | | | | 162,765 | |
The accompanying notes are an integral part of the financial statements.
144
| Schedule of Investments | | October 31, 2023 |
| | | |
| | Global X S&P 500® Catholic Values ETF | |
| | | Shares | | | Value | |
| COMMON STOCK — continued | | | | | | | | |
| Consumer Discretionary — continued | | | | | | | | |
| NVR * | | | 94 | | | $ | 508,786 | |
| O’Reilly Automotive * | | | 1,692 | | | | 1,574,304 | |
| Pool | | | 944 | | | | 298,087 | |
| PulteGroup | | | 5,689 | | | | 418,654 | |
| Ralph Lauren, Cl A | | | 1,214 | | | | 136,611 | |
| Ross Stores | | | 9,613 | | | | 1,114,820 | |
| Starbucks | | | 32,396 | | | | 2,988,207 | |
| Tapestry | | | 5,925 | | | | 163,293 | |
| Tesla * | | | 79,388 | | | | 15,944,286 | |
| TJX | | | 32,571 | | | | 2,868,528 | |
| Tractor Supply | | | 3,051 | | | | 587,501 | |
| Ulta Beauty * | | | 1,402 | | | | 534,597 | |
| VF | | | 9,321 | | | | 137,298 | |
| Whirlpool | | | 1,334 | | | | 139,483 | |
| Yum! Brands | | | 7,896 | | | | 954,311 | |
| | | | | | | | 66,537,691 | |
| Consumer Staples — 6.5% | | | | | | | | |
| Archer-Daniels-Midland | | | 15,972 | | | | 1,143,116 | |
| Brown-Forman, Cl B | | | 4,726 | | | | 265,412 | |
| Bunge | | | 4,379 | | | | 464,086 | |
| Campbell Soup | | | 5,145 | | | | 207,909 | |
| Clorox | | | 3,381 | | | | 397,944 | |
| Coca-Cola | | | 121,068 | | | | 6,839,131 | |
| Colgate-Palmolive | | | 25,257 | | | | 1,897,306 | |
| Conagra Brands | | | 13,652 | | | | 373,519 | |
| Constellation Brands, Cl A | | | 4,875 | | | | 1,141,481 | |
| Costco Wholesale | | | 13,812 | | | | 7,630,301 | |
| Dollar General | | | 6,418 | | | | 763,999 | |
| Dollar Tree * | | | 6,106 | | | | 678,316 | |
| Estee Lauder, Cl A | | | 6,978 | | | | 899,255 | |
| General Mills | | | 17,608 | | | | 1,148,746 | |
| Hormel Foods | | | 9,040 | | | | 294,252 | |
| J M Smucker | | | 2,971 | | | | 338,219 | |
| Kellanova | | | 7,284 | | | | 367,623 | |
| Keurig Dr Pepper | | | 30,092 | | | | 912,690 | |
| Kimberly-Clark | | | 10,212 | | | | 1,221,764 | |
| Kraft Heinz | | | 25,074 | | | | 788,828 | |
| Kroger | | | 19,659 | | | | 891,929 | |
The accompanying notes are an integral part of the financial statements.
145
| Schedule of Investments | | October 31, 2023 |
| | | |
| | Global X S&P 500® Catholic Values ETF | |
| | | Shares | | | Value | |
| COMMON STOCK — continued | | | | | | | | |
| Consumer Staples — continued | | | | | | | | |
| Lamb Weston Holdings | | | 4,637 | | | $ | 416,403 | |
| McCormick | | | 6,903 | | | | 441,102 | |
| Molson Coors Beverage, Cl B | | | 6,006 | | | | 346,967 | |
| Monster Beverage * | | | 21,900 | | | | 1,119,090 | |
| Procter & Gamble | | | 74,035 | | | | 11,107,471 | |
| Sysco | | | 15,152 | | | | 1,007,456 | |
| Tyson Foods, Cl A | | | 7,721 | | | | 357,868 | |
| Walgreens Boots Alliance | | | 19,602 | | | | 413,210 | |
| | | | | | | | 43,875,393 | |
| Energy — 4.6% | | | | | | | | |
| APA | | | 6,185 | | | | 245,668 | |
| Baker Hughes, Cl A | | | 19,468 | | | | 670,089 | |
| Chevron | | | 34,433 | | | | 5,017,921 | |
| ConocoPhillips | | | 23,424 | | | | 2,782,771 | |
| Coterra Energy | | | 16,465 | | | | 452,787 | |
| Devon Energy | | | 12,033 | | | | 560,377 | |
| Diamondback Energy | | | 3,330 | | | | 533,866 | |
| EOG Resources | | | 11,420 | | | | 1,441,775 | |
| EQT | | | 6,002 | | | | 254,365 | |
| Exxon Mobil | | | 76,693 | | | | 8,117,954 | |
| Halliburton | | | 18,213 | | | | 716,499 | |
| Hess | | | 5,472 | | | | 790,157 | |
| Kinder Morgan | | | 37,763 | | | | 611,761 | |
| Marathon Oil | | | 11,545 | | | | 315,294 | |
| Marathon Petroleum | | | 8,173 | | | | 1,236,166 | |
| Occidental Petroleum | | | 13,746 | | | | 849,640 | |
| ONEOK | | | 11,204 | | | | 730,501 | |
| Phillips 66 | | | 9,207 | | | | 1,050,242 | |
| Pioneer Natural Resources | | | 4,398 | | | | 1,051,122 | |
| Schlumberger | | | 27,850 | | | | 1,550,131 | |
| Targa Resources | | | 3,851 | | | | 321,982 | |
| Valero Energy | | | 7,372 | | | | 936,244 | |
| Williams | | | 23,550 | | | | 810,120 | |
| | | | | | | | 31,047,432 | |
| Financials — 12.8% | | | | | | | | |
| Aflac | | | 10,855 | | | | 847,884 | |
| Allstate | | | 5,116 | | | | 655,513 | |
The accompanying notes are an integral part of the financial statements.
146
| Schedule of Investments | | October 31, 2023 |
| | | |
| | Global X S&P 500® Catholic Values ETF | |
| | | Shares | | | Value | |
| COMMON STOCK — continued | | | | | | | | |
| Financials — continued | | | | | | | | |
| American Express | | | 11,293 | | | $ | 1,649,117 | |
| American International Group | | | 13,901 | | | | 852,270 | |
| Ameriprise Financial | | | 2,054 | | | | 646,127 | |
| Aon, Cl A | | | 3,905 | | | | 1,208,207 | |
| Arch Capital Group * | | | 6,677 | | | | 578,762 | |
| Arthur J Gallagher | | | 3,975 | | | | 936,073 | |
| Assurant | | | 1,254 | | | | 186,721 | |
| Bank of America | | | 134,253 | | | | 3,536,224 | |
| Bank of New York Mellon | | | 15,059 | | | | 640,008 | |
| Berkshire Hathaway, Cl B * | | | 35,253 | | | | 12,032,907 | |
| BlackRock, Cl A | | | 2,836 | | | | 1,736,426 | |
| Brown & Brown | | | 3,975 | | | | 275,945 | |
| Capital One Financial | | | 7,136 | | | | 722,805 | |
| Cboe Global Markets | | | 2,441 | | | | 400,056 | |
| Charles Schwab | | | 29,260 | | | | 1,522,690 | |
| Chubb | | | 7,866 | | | | 1,688,201 | |
| Cincinnati Financial | | | 3,036 | | | | 302,598 | |
| Citigroup | | | 37,607 | | | | 1,485,100 | |
| Citizens Financial Group | | | 8,463 | | | | 198,288 | |
| CME Group, Cl A | | | 6,902 | | | | 1,473,301 | |
| Comerica | | | 2,503 | | | | 98,618 | |
| Discover Financial Services | | | 4,912 | | | | 403,177 | |
| Everest Group | | | 802 | | | | 317,287 | |
| FactSet Research Systems | | | 702 | | | | 303,187 | |
| Fidelity National Information Services | | | 12,018 | | | | 590,204 | |
| Fifth Third Bancorp | | | 12,221 | | | | 289,760 | |
| Fiserv * | | | 12,029 | | | | 1,368,299 | |
| FleetCor Technologies * | | | 1,298 | | | | 292,271 | |
| Franklin Resources | | | 6,031 | | | | 137,447 | |
| Global Payments | | | 4,767 | | | | 506,351 | |
| Globe Life | | | 1,963 | | | | 228,415 | |
| Goldman Sachs Group | | | 6,341 | | | | 1,925,191 | |
| Hartford Financial Services Group | | | 6,601 | | | | 484,843 | |
| Huntington Bancshares | | | 28,153 | | | | 271,676 | |
| Intercontinental Exchange | | | 10,870 | | | | 1,167,873 | |
| Invesco | | | 6,661 | | | | 86,393 | |
| Jack Henry & Associates | | | 1,373 | | | | 193,579 | |
| JPMorgan Chase | | | 56,602 | | | | 7,871,074 | |
| KeyCorp | | | 18,249 | | | | 186,505 | |
The accompanying notes are an integral part of the financial statements.
147
| Schedule of Investments | | October 31, 2023 |
| | | |
| | Global X S&P 500® Catholic Values ETF | |
| | | Shares | | | Value | |
| COMMON STOCK — continued | | | | | | | | |
| Financials — continued | | | | | | | | |
| Loews | | | 3,807 | | | $ | 243,686 | |
| M&T Bank | | | 3,371 | | | | 380,080 | |
| MarketAxess Holdings | | | 733 | | | | 156,679 | |
| Marsh & McLennan | | | 9,731 | | | | 1,845,484 | |
| Mastercard, Cl A | | | 16,064 | | | | 6,045,686 | |
| MetLife | | | 12,284 | | | | 737,163 | |
| Moody’s | | | 3,034 | | | | 934,472 | |
| Morgan Stanley | | | 24,900 | | | | 1,763,418 | |
| MSCI, Cl A | | | 1,537 | | | | 724,772 | |
| Nasdaq | | | 7,327 | | | | 363,419 | |
| Northern Trust | | | 3,976 | | | | 262,058 | |
| PayPal Holdings * | | | 21,070 | | | | 1,091,426 | |
| PNC Financial Services Group | | | 7,771 | | | | 889,546 | |
| Principal Financial Group | | | 4,647 | | | | 314,509 | |
| Progressive | | | 11,422 | | | | 1,805,704 | |
| Prudential Financial | | | 7,380 | | | | 674,827 | |
| Raymond James Financial | | | 3,967 | | | | 378,610 | |
| Regions Financial | | | 20,143 | | | | 292,678 | |
| S&P Global | | | 6,277 | | | | 2,192,619 | |
| State Street | | | 6,524 | | | | 421,646 | |
| Synchrony Financial | | | 8,647 | | | | 242,548 | |
| T Rowe Price Group | | | 4,300 | | | | 389,150 | |
| Travelers | | | 4,254 | | | | 712,290 | |
| Truist Financial | | | 25,875 | | | | 733,815 | |
| US Bancorp | | | 28,668 | | | | 913,936 | |
| Visa, Cl A | | | 31,058 | | | | 7,301,736 | |
| W R Berkley | | | 3,894 | | | | 262,533 | |
| Wells Fargo | | | 72,913 | | | | 2,899,750 | |
| Willis Towers Watson | | | 1,985 | | | | 468,242 | |
| Zions Bancorp | | | 2,893 | | | | 89,249 | |
| | | | | | | | 85,829,104 | |
| Health Care — 13.2% | | | | | | | | |
| Align Technology * | | | 4,401 | | | | 812,381 | |
| Baxter International | | | 31,258 | | | | 1,013,697 | |
| Boston Scientific * | | | 90,665 | | | | 4,641,141 | |
| Cardinal Health | | | 16,107 | | | | 1,465,737 | |
| Cencora | | | 10,455 | | | | 1,935,743 | |
| Cigna Group | | | 18,564 | | | | 5,739,989 | |
The accompanying notes are an integral part of the financial statements.
148
| Schedule of Investments | | October 31, 2023 |
| | | |
| | Global X S&P 500® Catholic Values ETF | |
| | | Shares | | | Value | |
| COMMON STOCK — continued | | | | | | | | |
| Health Care — continued | | | | | | | | |
| CVS Health | | | 80,340 | | | $ | 5,544,263 | |
| DaVita * | | | 3,732 | | | | 288,222 | |
| DENTSPLY SIRONA | | | 14,216 | | | | 432,309 | |
| Dexcom * | | | 23,827 | | | | 2,116,552 | |
| Edwards Lifesciences * | | | 37,288 | | | | 2,375,991 | |
| Elevance Health | | | 14,781 | | | | 6,652,780 | |
| GE HealthCare Technologies | | | 24,027 | | | | 1,599,477 | |
| Gilead Sciences | | | 78,151 | | | | 6,137,980 | |
| Henry Schein * | | | 7,997 | | | | 519,645 | |
| Hologic * | | | 15,412 | | | | 1,019,812 | |
| Humana | | | 7,770 | | | | 4,069,071 | |
| IDEXX Laboratories * | | | 5,194 | | | | 2,074,847 | |
| Incyte * | | | 11,203 | | | | 604,178 | |
| Insulet * | | | 4,254 | | | | 563,953 | |
| Intuitive Surgical * | | | 21,829 | | | | 5,724,000 | |
| IQVIA Holdings * | | | 11,434 | | | | 2,067,610 | |
| Laboratory Corp of America Holdings | | | 5,582 | | | | 1,114,893 | |
| McKesson | | | 8,465 | | | | 3,854,622 | |
| Medtronic | | | 82,683 | | | | 5,834,112 | |
| Mettler-Toledo International * | | | 1,383 | | | | 1,362,532 | |
| Molina Healthcare * | | | 3,496 | | | | 1,163,993 | |
| Quest Diagnostics | | | 6,845 | | | | 890,535 | |
| ResMed | | | 9,066 | | | | 1,280,301 | |
| STERIS PLC | | | 6,210 | | | | 1,303,976 | |
| Stryker | | | 21,200 | | | | 5,728,664 | |
| Teleflex | | | 2,770 | | | | 511,758 | |
| Waters * | | | 3,752 | | | | 894,965 | |
| West Pharmaceutical Services | | | 4,557 | | | | 1,450,448 | |
| Zimmer Biomet Holdings | | | 12,872 | | | | 1,343,966 | |
| Zoetis, Cl A | | | 28,870 | | | | 4,532,590 | |
| | | | | | | | 88,666,733 | |
| Industrials — 8.3% | | | | | | | | |
| 3M | | | 14,290 | | | | 1,299,675 | |
| A O Smith | | | 3,387 | | | | 236,277 | |
| Alaska Air Group * | | | 3,725 | | | | 117,822 | |
| Allegion | | | 2,362 | | | | 232,326 | |
| American Airlines Group * | | | 16,622 | | | | 185,335 | |
| AMETEK | | | 6,144 | | | | 864,891 | |
The accompanying notes are an integral part of the financial statements.
149
| Schedule of Investments | | October 31, 2023 |
| | | |
| | Global X S&P 500® Catholic Values ETF | |
| | | Shares | | | Value | |
| COMMON STOCK — continued | | | | | | | | |
| Industrials — continued | | | | | | | | |
| Automatic Data Processing | | | 10,934 | | | $ | 2,386,017 | |
| Axon Enterprise * | | | 1,808 | | | | 369,718 | |
| Broadridge Financial Solutions | | | 3,076 | | | | 524,889 | |
| Carrier Global | | | 22,844 | | | | 1,088,745 | |
| Caterpillar | | | 13,485 | | | | 3,048,284 | |
| Ceridian HCM Holding * | | | 4,044 | | | | 258,856 | |
| CH Robinson Worldwide | | | 3,368 | | | | 275,603 | |
| Cintas | | | 2,249 | | | | 1,140,513 | |
| Copart * | | | 22,662 | | | | 986,250 | |
| CSX | | | 53,847 | | | | 1,607,333 | |
| Cummins | | | 3,788 | | | | 819,344 | |
| Deere | | | 7,120 | | | | 2,601,363 | |
| Delta Air Lines | | | 16,714 | | | | 522,313 | |
| Dover | | | 3,778 | | | | 490,951 | |
| Eaton | | | 10,537 | | | | 2,190,748 | |
| Emerson Electric | | | 15,610 | | | | 1,388,822 | |
| Equifax | | | 3,163 | | | | 536,350 | |
| Expeditors International of Washington | | | 4,261 | | | | 465,514 | |
| Fastenal | | | 14,925 | | | | 870,725 | |
| FedEx | | | 6,158 | | | | 1,478,536 | |
| Fortive | | | 9,280 | | | | 605,798 | |
| Generac Holdings * | | | 1,565 | | | | 131,570 | |
| Howmet Aerospace | | | 9,916 | | | | 437,296 | |
| IDEX | | | 1,966 | | | | 376,312 | |
| Illinois Tool Works | | | 7,202 | | | | 1,614,112 | |
| Ingersoll Rand | | | 10,488 | | | | 636,412 | |
| JB Hunt Transport Services | | | 2,261 | | | | 388,598 | |
| Johnson Controls International | | | 18,537 | | | | 908,684 | |
| Masco | | | 5,439 | | | | 283,318 | |
| Nordson | | | 1,280 | | | | 272,115 | |
| Norfolk Southern | | | 6,033 | | | | 1,151,036 | |
| Old Dominion Freight Line | | | 2,481 | | | | 934,493 | |
| Otis Worldwide | | | 10,572 | | | | 816,264 | |
| PACCAR | | | 13,566 | | | | 1,119,602 | |
| Parker-Hannifin | | | 3,500 | | | | 1,291,185 | |
| Paychex | | | 8,449 | | | | 938,261 | |
| Paycom Software | | | 1,290 | | | | 316,011 | |
| Pentair | | | 4,158 | | | | 241,663 | |
| Quanta Services | | | 3,664 | | | | 612,328 | |
The accompanying notes are an integral part of the financial statements.
150
| Schedule of Investments | | October 31, 2023 |
| | | |
| | Global X S&P 500® Catholic Values ETF | |
| | | Shares | | | Value | |
| COMMON STOCK — continued | | | | | | | | |
| Industrials — continued | | | | | | | | |
| Republic Services, Cl A | | | 5,408 | | | $ | 803,034 | |
| Robert Half | | | 2,790 | | | | 208,608 | |
| Rockwell Automation | | | 2,947 | | | | 774,501 | |
| Rollins | | | 6,498 | | | | 244,390 | |
| Snap-On | | | 1,357 | | | | 350,025 | |
| Southwest Airlines | | | 15,846 | | | | 352,257 | |
| Stanley Black & Decker | | | 4,172 | | | | 354,829 | |
| Trane Technologies | | | 6,261 | | | | 1,191,531 | |
| TransDigm Group * | | | 1,377 | | | | 1,140,280 | |
| Union Pacific | | | 16,162 | | | | 3,355,393 | |
| United Airlines Holdings * | | | 8,318 | | | | 291,213 | |
| United Parcel Service, Cl B | | | 19,242 | | | | 2,717,933 | |
| United Rentals | | | 1,760 | | | | 715,035 | |
| Verisk Analytics, Cl A | | | 3,836 | | | | 872,153 | |
| Waste Management | | | 9,582 | | | | 1,574,610 | |
| Westinghouse Air Brake Technologies | | | 4,948 | | | | 524,587 | |
| WW Grainger | | | 1,169 | | | | 853,171 | |
| Xylem | | | 6,450 | | | | 603,333 | |
| | | | | | | | 55,989,141 | |
| Information Technology — 28.3% | | | | | | | | |
| Accenture, Cl A | | | 12,104 | | | | 3,595,977 | |
| Adobe * | | | 8,990 | | | | 4,783,219 | |
| Advanced Micro Devices * | | | 31,495 | | | | 3,102,257 | |
| Akamai Technologies * | | | 3,293 | | | | 340,266 | |
| Amphenol, Cl A | | | 11,672 | | | | 940,180 | |
| Analog Devices | | | 9,704 | | | | 1,526,730 | |
| ANSYS * | | | 1,639 | | | | 456,068 | |
| Apple | | | 284,536 | | | | 48,590,213 | |
| Applied Materials | | | 16,338 | | | | 2,162,334 | |
| Arista Networks * | | | 4,704 | | | | 942,540 | |
| Autodesk * | | | 4,213 | | | | 832,615 | |
| Broadcom | | | 7,991 | | | | 6,723,388 | |
| Cadence Design Systems * | | | 5,352 | | | | 1,283,677 | |
| CDW | | | 2,642 | | | | 529,457 | |
| Cisco Systems | | | 79,182 | | | | 4,127,758 | |
| Cognizant Technology Solutions, Cl A | | | 10,144 | | | | 653,984 | |
| Enphase Energy * | | | 2,586 | | | | 205,794 | |
| EPAM Systems * | | | 1,010 | | | | 219,746 | |
The accompanying notes are an integral part of the financial statements.
151
| Schedule of Investments | | October 31, 2023 |
| | | |
| | Global X S&P 500® Catholic Values ETF | |
| | | Shares | | | Value | |
| COMMON STOCK — continued | | | | | | | | |
| Information Technology — continued | | | | | | | | |
| F5 * | | | 1,340 | | | $ | 203,131 | |
| Fair Isaac * | | | 449 | | | | 379,796 | |
| First Solar * | | | 1,927 | | | | 274,501 | |
| Fortinet * | | | 13,104 | | | | 749,156 | |
| Gartner * | | | 1,541 | | | | 511,674 | |
| Gen Digital | | | 11,038 | | | | 183,893 | |
| Hewlett Packard Enterprise | | | 27,370 | | | | 420,951 | |
| HP | | | 18,158 | | | | 478,100 | |
| Intel | | | 79,262 | | | | 2,893,063 | |
| International Business Machines | | | 17,461 | | | | 2,525,559 | |
| Intuit | | | 5,372 | | | | 2,658,871 | |
| Juniper Networks | | | 7,317 | | | | 196,974 | |
| Keysight Technologies * | | | 3,649 | | | | 445,360 | |
| KLA | | | 2,725 | | | | 1,279,932 | |
| Lam Research | | | 2,608 | | | | 1,534,078 | |
| Microchip Technology | | | 10,618 | | | | 756,957 | |
| Micron Technology | | | 21,866 | | | | 1,462,179 | |
| Microsoft | | | 143,851 | | | | 48,637,462 | |
| Monolithic Power Systems | | | 938 | | | | 414,352 | |
| Motorola Solutions | | | 3,135 | | | | 872,972 | |
| NetApp | | | 4,203 | | | | 305,894 | |
| NVIDIA | | | 47,825 | | | | 19,503,035 | |
| ON Semiconductor * | | | 7,931 | | | | 496,798 | |
| Oracle | | | 30,481 | | | | 3,151,735 | |
| Palo Alto Networks * | | | 5,691 | | | | 1,383,027 | |
| PTC * | | | 2,131 | | | | 299,235 | |
| Qorvo * | | | 2,125 | | | | 185,768 | |
| QUALCOMM | | | 21,404 | | | | 2,332,822 | |
| Roper Technologies | | | 2,017 | | | | 985,446 | |
| Salesforce * | | | 18,783 | | | | 3,772,190 | |
| Seagate Technology Holdings | | | 3,971 | | | | 271,021 | |
| ServiceNow * | | | 3,898 | | | | 2,268,051 | |
| Skyworks Solutions | | | 3,057 | | | | 265,164 | |
| SolarEdge Technologies * | | | 980 | | | | 74,431 | |
| Synopsys * | | | 2,891 | | | | 1,357,151 | |
| TE Connectivity | | | 6,422 | | | | 756,833 | |
| Teledyne Technologies * | | | 987 | | | | 369,720 | |
| Teradyne | | | 3,146 | | | | 261,967 | |
| Texas Instruments | | | 17,385 | | | | 2,468,844 | |
The accompanying notes are an integral part of the financial statements.
152
| Schedule of Investments | | October 31, 2023 |
| | | |
| | Global X S&P 500® Catholic Values ETF | |
| | | Shares | | | Value | |
| COMMON STOCK — continued | | | | | | | | |
| Information Technology — continued | | | | | | | | |
| Trimble * | | | 4,923 | | | $ | 232,021 | |
| Tyler Technologies * | | | 901 | | | | 335,983 | |
| VeriSign * | | | 1,737 | | | | 346,809 | |
| Western Digital * | | | 6,410 | | | | 257,362 | |
| Zebra Technologies, Cl A * | | | 1,096 | | | | 229,535 | |
| | | | | | | | 189,806,006 | |
| Materials — 2.5% | | | | | | | | |
| Air Products & Chemicals | | | 4,220 | | | | 1,191,897 | |
| Albemarle | | | 2,428 | | | | 307,822 | |
| Amcor | | | 31,487 | | | | 279,919 | |
| Avery Dennison | | | 1,643 | | | | 285,997 | |
| Ball | | | 6,350 | | | | 305,752 | |
| CF Industries Holdings | | | 3,445 | | | | 274,842 | |
| Corteva | | | 14,048 | | | | 676,271 | |
| Dow | | | 14,300 | | | | 691,262 | |
| DuPont de Nemours | | | 8,864 | | | | 646,008 | |
| Ecolab | | | 4,932 | | | | 827,294 | |
| FMC | | | 2,802 | | | | 149,066 | |
| Freeport-McMoRan | | | 28,359 | | | | 957,967 | |
| International Flavors & Fragrances | | | 5,175 | | | | 353,711 | |
| International Paper | | | 7,364 | | | | 248,388 | |
| Linde | | | 9,485 | | | | 3,624,788 | |
| LyondellBasell Industries, Cl A | | | 5,236 | | | | 472,497 | |
| Martin Marietta Materials | | | 1,219 | | | | 498,498 | |
| Mosaic | | | 7,260 | | | | 235,805 | |
| Newmont | | | 15,534 | | | | 582,059 | |
| Nucor | | | 4,964 | | | | 733,629 | |
| Packaging Corp of America | | | 1,806 | | | | 276,408 | |
| PPG Industries | | | 4,692 | | | | 576,037 | |
| Sealed Air | | | 3,024 | | | | 93,109 | |
| Sherwin-Williams | | | 4,679 | | | | 1,114,585 | |
| Steel Dynamics | | | 3,196 | | | | 340,406 | |
| Vulcan Materials | | | 2,751 | | | | 540,544 | |
| Westrock | | | 5,400 | | | | 194,022 | |
| | | | | | | | 16,478,583 | |
| Real Estate — 2.3% | | | | | | | | |
| Alexandria Real Estate Equities ‡ | | | 2,955 | | | | 275,199 | |
The accompanying notes are an integral part of the financial statements.
153
| Schedule of Investments | | October 31, 2023 |
| | | |
| | Global X S&P 500® Catholic Values ETF | |
| | | Shares | | | Value | |
| COMMON STOCK — continued | | | | | | | | |
| Real Estate — continued | | | | | | | | |
| American Tower ‡ | | | 9,530 | | | $ | 1,698,151 | |
| AvalonBay Communities ‡ | | | 2,867 | | | | 475,177 | |
| Boston Properties ‡ | | | 3,067 | | | | 164,299 | |
| Camden Property Trust ‡ | | | 1,994 | | | | 169,251 | |
| CBRE Group, Cl A * | | | 6,705 | | | | 464,925 | |
| CoStar Group * | | | 7,794 | | | | 572,158 | |
| Crown Castle ‡ | | | 8,878 | | | | 825,476 | |
| Digital Realty Trust ‡ | | | 5,731 | | | | 712,707 | |
| Equinix ‡ | | | 1,852 | | | | 1,351,293 | |
| Equity Residential ‡ | | | 6,765 | | | | 374,307 | |
| Essex Property Trust ‡ | | | 1,408 | | | | 301,199 | |
| Extra Space Storage ‡ | | | 4,339 | | | | 449,477 | |
| Federal Realty Investment Trust ‡ | | | 1,430 | | | | 130,402 | |
| Host Hotels & Resorts ‡ | | | 15,327 | | | | 237,262 | |
| Invitation Homes ‡ | | | 11,073 | | | | 328,757 | |
| Iron Mountain ‡ | | | 5,739 | | | | 339,003 | |
| Kimco Realty ‡ | | | 12,137 | | | | 217,738 | |
| Mid-America Apartment Communities ‡ | | | 2,383 | | | | 281,551 | |
| ProLogis ‡ | | | 19,014 | | | | 1,915,660 | |
| Public Storage ‡ | | | 3,134 | | | | 748,117 | |
| Realty Income ‡ | | | 14,031 | | | | 664,789 | |
| Regency Centers ‡ | | | 3,215 | | | | 193,736 | |
| SBA Communications, Cl A ‡ | | | 2,304 | | | | 480,684 | |
| Simon Property Group ‡ | | | 6,619 | | | | 727,362 | |
| UDR ‡ | | | 5,964 | | | | 189,715 | |
| Welltower ‡ | | | 10,351 | | | | 865,447 | |
| Weyerhaeuser ‡ | | | 15,798 | | | | 453,245 | |
| | | | | | | | 15,607,087 | |
| Utilities — 2.5% | | | | | | | | |
| AES | | | 13,822 | | | | 205,948 | |
| Alliant Energy | | | 5,081 | | | | 247,902 | |
| Ameren | | | 5,206 | | | | 394,146 | |
| American Electric Power | | | 9,685 | | | | 731,605 | |
| American Water Works | | | 3,600 | | | | 423,540 | |
| Atmos Energy | | | 2,476 | | | | 266,566 | |
| CenterPoint Energy | | | 11,301 | | | | 303,771 | |
| CMS Energy | | | 5,827 | | | | 316,639 | |
| Consolidated Edison | | | 6,728 | | | | 590,651 | |
The accompanying notes are an integral part of the financial statements.
154
| Schedule of Investments | | October 31, 2023 |
| | | |
| | Global X S&P 500® Catholic Values ETF | |
| | | Shares | | | Value | |
| COMMON STOCK — continued | | | | | | | | |
| Utilities — continued | | | | | | | | |
| Constellation Energy | | | 6,341 | | | $ | 716,026 | |
| Dominion Energy | | | 15,733 | | | | 634,355 | |
| DTE Energy | | | 3,916 | | | | 377,424 | |
| Duke Energy | | | 15,061 | | | | 1,338,772 | |
| Edison International | | | 7,392 | | | | 466,140 | |
| Entergy | | | 3,983 | | | | 380,735 | |
| Evergy | | | 4,796 | | | | 235,675 | |
| Eversource Energy | | | 6,744 | | | | 362,760 | |
| Exelon | | | 18,904 | | | | 736,122 | |
| FirstEnergy | | | 10,762 | | | | 383,127 | |
| NextEra Energy | | | 38,411 | | | | 2,239,361 | |
| NiSource | | | 7,351 | | | | 184,951 | |
| NRG Energy | | | 5,319 | | | | 225,419 | |
| PG&E * | | | 37,531 | | | | 611,755 | |
| Pinnacle West Capital | | | 2,428 | | | | 180,109 | |
| PPL | | | 15,029 | | | | 369,263 | |
| Public Service Enterprise Group | | | 9,613 | | | | 592,641 | |
| Sempra | | | 12,480 | | | | 873,974 | |
| Southern | | | 20,670 | | | | 1,391,091 | |
| WEC Energy Group | | | 6,179 | | | | 502,909 | |
| Xcel Energy | | | 10,876 | | | | 644,621 | |
| | | | | | | | 16,927,998 | |
| TOTAL UNITED STATES | | | | | | | 669,988,713 | |
TOTAL COMMON STOCK
(Cost $599,700,496) | | | | | | | 670,883,108 | |
TOTAL INVESTMENTS — 99.9%
(Cost $599,700,496) | | | | | | $ | 670,883,108 | |
Percentages are based on Net Assets of $671,797,193.
| * | Non-income producing security. |
| ‡ | Real Estate Investment Trust |
As of October 31, 2023, all of the Fund’s investments were considered Level 1, in accordance with authoritative guidance on fair value measurements and disclosure under U.S. GAAP.
See “Glossary” for abbreviations.
The accompanying notes are an integral part of the financial statements.
155
| Schedule of Investments | October 31, 2023 |
| Global X MSCI SuperDividend® EAFE ETF |
Sector Weightings (Unaudited)†:

† Sector weightings percentages are based on the total market value of investments. Total investments do not include derivatives such as options, futures contracts, forward contracts, and swap contracts, if applicable.
| | | Shares | | | Value | |
| COMMON STOCK — 97.7% | | | | | | | | |
| AUSTRALIA — 7.5% | | | | | | | | |
| Energy — 2.1% | | | | | | | | |
| Woodside Energy Group | | | 9,455 | | | $ | 205,096 | |
| | | | | | | | | |
| Materials — 3.7% | | | | | | | | |
| BHP Group | | | 7,331 | | | | 206,553 | |
| South32 | | | 79,652 | | | | 167,433 | |
| | | | | | | | 373,986 | |
| Real Estate — 1.7% | | | | | | | | |
| Vicinity ‡ | | | 160,125 | | | | 172,352 | |
| | | | | | | | | |
| TOTAL AUSTRALIA | | | | | | | 751,434 | |
| AUSTRIA — 2.0% | | | | | | | | |
| Energy — 2.0% | | | | | | | | |
| OMV | | | 4,686 | | | | 204,861 | |
| | | | | | | | | |
| BELGIUM — 1.8% | | | | | | | | |
| Financials — 1.8% | | | | | | | | |
| Ageas | | | 4,842 | | | | 185,579 | |
The accompanying notes are an integral part of the financial statements.
156
| Schedule of Investments | October 31, 2023 |
| Global X MSCI SuperDividend® EAFE ETF |
| | | Shares | | | Value | |
| COMMON STOCK — continued | | | | | | | | |
| BRAZIL — 1.8% | | | | | | | | |
| Materials — 1.8% | | | | | | | | |
| Yara International | | | 5,541 | | | $ | 181,035 | |
| | | | | | | | | |
| FINLAND — 4.0% | | | | | | | | |
| Financials — 2.2% | | | | | | | | |
| Nordea Bank Abp | | | 20,783 | | | | 218,197 | |
| | | | | | | | | |
| Utilities — 1.8% | | | | | | | | |
| Fortum | | | 15,185 | | | | 179,767 | |
| | | | | | | | | |
| TOTAL FINLAND | | | | | | | 397,964 | |
| FRANCE — 8.3% | | | | | | | | |
| Communication Services — 2.0% | | | | | | | | |
| Orange | | | 17,645 | | | | 207,211 | |
| | | | | | | | | |
| Financials — 4.1% | | | | | | | | |
| AXA | | | 7,196 | | | | 212,631 | |
| Credit Agricole | | | 16,828 | | | | 202,384 | |
| | | | | | | | 415,015 | |
| Utilities — 2.2% | | | | | | | | |
| Engie | | | 13,783 | | | | 218,588 | |
| | | | | | | | | |
| TOTAL FRANCE | | | | | | | 840,814 | |
| GERMANY — 3.1% | | | | | | | | |
| Communication Services — 1.2% | | | | | | | | |
| Telefonica Deutschland Holding | | | 72,234 | | | | 122,430 | |
| | | | | | | | | |
| Materials — 1.9% | | | | | | | | |
| BASF | | | 4,194 | | | | 192,994 | |
| | | | | | | | | |
| TOTAL GERMANY | | | | | | | 315,424 | |
| HONG KONG — 8.3% | | | | | | | | |
| Communication Services — 1.7% | | | | | | | | |
| HKT Trust & HKT | | | 165,220 | | | | 171,035 | |
The accompanying notes are an integral part of the financial statements.
157
| Schedule of Investments | October 31, 2023 |
| Global X MSCI SuperDividend® EAFE ETF |
| | | Shares | | | Value | |
| COMMON STOCK — continued | | | | | | | | |
| Real Estate — 3.2% | | | | | | | | |
| Henderson Land Development | | | 62,300 | | | $ | 162,426 | |
| New World Development | | | 86,800 | | | | 159,077 | |
| | | | | | | | 321,503 | |
| Utilities — 3.4% | | | | | | | | |
| CK Infrastructure Holdings | | | 36,700 | | | | 170,025 | |
| Power Assets Holdings | | | 36,506 | | | | 174,491 | |
| | | | | | | | 344,516 | |
| TOTAL HONG KONG | | | | | | | 837,054 | |
| ISRAEL — 1.2% | | | | | | | | |
| Materials — 1.2% | | | | | | | | |
| ICL Group | | | 25,643 | | | | 124,236 | |
| | | | | | | | | |
| ITALY — 8.2% | | | | | | | | |
| Financials — 6.4% | | | | | | | | |
| Assicurazioni Generali | | | 10,512 | | | | 208,280 | |
| Mediobanca Banca di Credito Finanziario | | | 19,923 | | | | 237,331 | |
| Poste Italiane | | | 20,420 | | | | 201,595 | |
| | | | | | | | 647,206 | |
| Utilities — 1.8% | | | | | | | | |
| Snam | | | 39,255 | | | | 179,664 | |
| | | | | | | | | |
| TOTAL ITALY | | | | | | | 826,870 | |
| JAPAN — 14.5% | | | | | | | | |
| Communication Services — 2.2% | | | | | | | | |
| SoftBank | | | 19,675 | | | | 221,505 | |
| | | | | | | | | |
| Financials — 2.5% | | | | | | | | |
| Japan Post Holdings | | | 28,789 | | | | 253,587 | |
| | | | | | | | | |
| Industrials — 7.9% | | | | | | | | |
| Kawasaki Kisen Kaisha | | | 9,188 | | | | 312,020 | |
| Mitsui OSK Lines | | | 9,484 | | | | 243,167 | |
| Nippon Yusen | | | 9,907 | | | | 240,536 | |
| | | | | | | | 795,723 | |
The accompanying notes are an integral part of the financial statements.
158
| Schedule of Investments | October 31, 2023 |
| Global X MSCI SuperDividend® EAFE ETF |
| | | Shares | | | Value | |
| COMMON STOCK — continued | | | | | | | | |
| Real Estate — 1.9% | | | | | | | | |
| Japan Metropolitan Fund Invest ‡ | | | 300 | | | $ | 193,140 | |
| | | | | | | | | |
| TOTAL JAPAN | | | | | | | 1,463,955 | |
| NETHERLANDS — 1.8% | | | | | | | | |
| Financials — 1.8% | | | | | | | | |
| NN Group | | | 5,654 | | | | 180,843 | |
| | | | | | | | | |
| NEW ZEALAND — 1.9% | | | | | | | | |
| Communication Services — 1.9% | | | | | | | | |
| Spark New Zealand | | | 65,420 | | | | 189,116 | |
| | | | | | | | | |
| NORWAY — 4.7% | | | | | | | | |
| Communication Services — 2.0% | | | | | | | | |
| Telenor | | | 19,795 | | | | 202,261 | |
| | | | | | | | | |
| Energy — 2.7% | | | | | | | | |
| Aker BP | | | 9,437 | | | | 271,241 | |
| | | | | | | | | |
| TOTAL NORWAY | | | | | | | 473,502 | |
| PORTUGAL — 1.7% | | | | | | | | |
| Utilities — 1.7% | | | | | | | | |
| EDP - Energias de Portugal | | | 41,800 | | | | 175,406 | |
| | | | | | | | | |
| SPAIN — 4.3% | | | | | | | | |
| Industrials — 2.4% | | | | | | | | |
| ACS Actividades de Construccion y Servicios | | | 6,709 | | | | 242,314 | |
| | | | | | | | | |
| Utilities — 1.9% | | | | | | | | |
| Enagas | | | 11,192 | | | | 186,855 | |
| | | | | | | | | |
| TOTAL SPAIN | | | | | | | 429,169 | |
| SWITZERLAND — 4.6% | | | | | | | | |
| Financials — 2.1% | | | | | | | | |
| Zurich Insurance Group | | | 452 | | | | 213,869 | |
The accompanying notes are an integral part of the financial statements.
159
| Schedule of Investments | October 31, 2023 |
| Global X MSCI SuperDividend® EAFE ETF |
| | | Shares | | | Value | |
| COMMON STOCK — continued | | | | | | | | |
| Industrials — 2.5% | | | | | | | | |
| Adecco Group | | | 6,753 | | | $ | 254,077 | |
| | | | | | | | | |
| TOTAL SWITZERLAND | | | | | | | 467,946 | |
| UNITED KINGDOM — 13.3% | | | | | | | | |
| Communication Services — 1.9% | | | | | | | | |
| Vodafone Group | | | 208,450 | | | | 191,477 | |
| | | | | | | | | |
| Consumer Staples — 1.9% | | | | | | | | |
| British American Tobacco | | | 6,495 | | | | 193,408 | |
| | | | | | | | | |
| Financials — 7.6% | | | | | | | | |
| Aviva | | | 41,899 | | | | 202,148 | |
| Legal & General Group | | | 73,636 | | | | 188,893 | |
| M&G | | | 86,194 | | | | 207,301 | |
| Phoenix Group Holdings | | | 30,055 | | | | 165,501 | |
| | | | | | | | 763,843 | |
| Utilities — 1.9% | | | | | | | | |
| National Grid | | | 15,698 | | | | 186,410 | |
| | | | | | | | | |
| TOTAL UNITED KINGDOM | | | | | | | 1,335,138 | |
| UNITED STATES — 4.7% | | | | | | | | |
| Consumer Discretionary — 2.4% | | | | | | | | |
| Stellantis | | | 12,957 | | | | 241,043 | |
| | | | | | | | | |
| Financials — 2.3% | | | | | | | | |
| Swiss Re | | | 2,121 | | | | 231,013 | |
| | | | | | | | | |
| TOTAL UNITED STATES | | | | | | | 472,056 | |
TOTAL COMMON STOCK
(Cost $10,906,168) | | | | | | | 9,852,402 | |
The accompanying notes are an integral part of the financial statements.
160
| Schedule of Investments | October 31, 2023 |
| Global X MSCI SuperDividend® EAFE ETF |
| | | Shares | | | Value | |
| PREFERRED STOCK — 1.7% | | | | | | | | |
| GERMANY—1.7% | | | | | | | | |
| Consumer Discretionary — 1.7% | | | | | | | | |
| Bayerische Motoren Werke (A) | | | 2,040 | | | $ | 172,826 | |
TOTAL PREFERRED STOCK
(Cost $209,088) | | | | | | | 172,826 | |
TOTAL INVESTMENTS — 99.4%
(Cost $11,115,256) | | | | | | $ | 10,025,228 | |
Percentages are based on Net Assets of $10,081,976.
| ‡ | Real Estate Investment Trust |
| (A) | There is currently no stated interest rate. |
As of October 31, 2023, all of the Fund’s investments were considered Level 1, in accordance with authoritative guidance on fair value measurements and disclosure under U.S. GAAP.
See “Glossary” for abbreviations.
The accompanying notes are an integral part of the financial statements.
161
| Schedule of Investments | October 31, 2023 |
| Global X E-commerce ETF |
Sector Weightings (Unaudited)†:
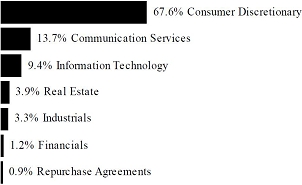
† Sector weightings percentages are based on the total market value of investments. Total investments do not include derivatives such as options, futures contracts, forward contracts, and swap contracts, if applicable.
| | | Shares | | | Value | |
| COMMON STOCK — 99.9% | | | | | | | | |
| AUSTRALIA — 0.6% | | | | | | | | |
| Consumer Discretionary — 0.6% | | | | | | | | |
| Temple & Webster Group * (A) | | | 96,959 | | | $ | 343,169 | |
| | | | | | | | | |
| BRAZIL — 5.7% | | | | | | | | |
| Communication Services — 0.5% | | | | | | | | |
| VTEX, Cl A * | | | 60,730 | | | | 328,549 | |
| | | | | | | | | |
| Consumer Discretionary — 5.2% | | | | | | | | |
| MercadoLibre * | | | 2,568 | | | | 3,186,221 | |
| | | | | | | | | |
| TOTAL BRAZIL | | | | | | | 3,514,770 | |
| CANADA — 3.2% | | | | | | | | |
| Information Technology — 3.2% | | | | | | | | |
| Shopify, Cl A * | | | 41,919 | | | | 1,978,157 | |
| | | | | | | | | |
| CHINA — 26.9% | | | | | | | | |
| Communication Services — 4.8% | | | | | | | | |
| NetEase ADR | | | 28,100 | | | | 3,004,452 | |
The accompanying notes are an integral part of the financial statements.
162
| Schedule of Investments | October 31, 2023 |
| Global X E-commerce ETF |
| | | Shares | | | Value | |
| COMMON STOCK — continued | | | | | | | | |
| Consumer Discretionary — 21.6% | | | | | | | | |
| Alibaba Group Holding ADR * | | | 30,554 | | | $ | 2,521,927 | |
| Baozun ADR * | | | 66,396 | | | | 200,516 | |
| JD.com ADR | | | 74,903 | | | | 1,904,034 | |
| PDD Holdings ADR * | | | 36,454 | | | | 3,697,165 | |
| Trip.com Group ADR * | | | 77,621 | | | | 2,639,114 | |
| Vipshop Holdings ADR * | | | 169,693 | | | | 2,419,822 | |
| | | | | | | | 13,382,578 | |
| Financials — 0.5% | | | | | | | | |
| LexinFintech Holdings ADR | | | 169,026 | | | | 308,473 | |
| | | | | | | | | |
| TOTAL CHINA | | | | | | | 16,695,503 | |
| GERMANY — 0.5% | | | | | | | | |
| Consumer Discretionary — 0.5% | | | | | | | | |
| Jumia Technologies ADR * (A) | | | 122,548 | | | | 301,468 | |
| | | | | | | | | |
| ISRAEL — 3.7% | | | | | | | | |
| Consumer Discretionary — 3.7% | | | | | | | | |
| Global-e Online, Cl E * | | | 65,670 | | | | 2,305,674 | |
| | | | | | | | | |
| JAPAN — 4.7% | | | | | | | | |
| Consumer Discretionary — 4.4% | | | | | | | | |
| Rakuten Group | | | 748,312 | | | | 2,751,230 | |
| | | | | | | | | |
| Information Technology — 0.3% | | | | | | | | |
| BASE * | | | 117,211 | | | | 190,392 | |
| | | | | | | | | |
| TOTAL JAPAN | | | | | | | 2,941,622 | |
| SINGAPORE — 3.1% | | | | | | | | |
| Communication Services — 3.1% | | | | | | | | |
| Sea ADR * | | | 46,756 | | | | 1,949,725 | |
| | | | | | | | | |
| UNITED KINGDOM — 0.7% | | | | | | | | |
| Consumer Discretionary — 0.7% | | | | | | | | |
| ASOS * (A) | | | 94,871 | | | | 455,187 | |
The accompanying notes are an integral part of the financial statements.
163
| Schedule of Investments | October 31, 2023 |
| Global X E-commerce ETF |
| | | Shares | | | Value | |
| COMMON STOCK — continued | | | | | | | | |
| UNITED STATES — 50.8% | | | | | | | | |
| Communication Services — 5.3% | | | | | | | | |
| Angi, Cl A * | | | 95,998 | | | $ | 154,557 | |
| Shutterstock | | | 30,035 | | | | 1,221,824 | |
| TripAdvisor * | | | 132,054 | | | | 1,949,117 | |
| | | | | | | | 3,325,498 | |
| Consumer Discretionary — 31.6% | | | | | | | | |
| Amazon.com * | | | 21,945 | | | | 2,920,660 | |
| Beyond * | | | 54,727 | | | | 853,741 | |
| Booking Holdings * | | | 1,042 | | | | 2,906,722 | |
| eBay | | | 63,913 | | | | 2,507,307 | |
| Etsy * | | | 31,680 | | | | 1,973,664 | |
| Expedia Group * | | | 24,682 | | | | 2,351,948 | |
| Groupon, Cl A * (A) | | | 31,860 | | | | 407,489 | |
| Lands’ End * | | | 25,057 | | | | 157,358 | |
| PetMed Express | | | 24,963 | | | | 171,995 | |
| Qurate Retail, Cl A * | | | 421,247 | | | | 185,644 | |
| Wayfair, Cl A * | | | 40,862 | | | | 1,741,130 | |
| Williams-Sonoma | | | 22,701 | | | | 3,410,598 | |
| | | | | | | | 19,588,256 | |
| Financials — 0.7% | | | | | | | | |
| eHealth * | | | 27,514 | | | | 236,070 | |
| LendingTree * | | | 13,197 | | | | 174,596 | |
| | | | | | | | 410,666 | |
| Industrials — 3.3% | | | | | | | | |
| ACV Auctions, Cl A * | | | 155,877 | | | | 2,077,840 | |
| | | | | | | | | |
| Information Technology — 6.0% | | | | | | | | |
| BigCommerce Holdings * | | | 75,123 | | | | 667,843 | |
| GoDaddy, Cl A * | | | 38,186 | | | | 2,796,361 | |
| LivePerson * | | | 89,676 | | | | 236,745 | |
| | | | | | | | 3,700,949 | |
The accompanying notes are an integral part of the financial statements.
164
| Schedule of Investments | October 31, 2023 |
| Global X E-commerce ETF |
| | | Shares | | | Value | |
| COMMON STOCK — continued | | | | | | | | |
| Real Estate — 3.9% | | | | | | | | |
| CoStar Group * | | | 33,241 | | | $ | 2,440,222 | |
| | | | | | | | | |
| TOTAL UNITED STATES | | | | | | | 31,543,431 | |
TOTAL COMMON STOCK
(Cost $104,618,527) | | | | | | | 62,028,706 | |
| | | Face Amount | | | | | |
| REPURCHASE AGREEMENTS(B) — 0.9% | | | | | | | | |
Bank of America
5.310%, dated 10/31/2023, to be repurchased on 11/01/2023, repurchase price $50,148 (collateralized by various U.S. Government Obligations, ranging in par value $834 - $21,787, 2.00% - 6.500%, 04/01/2048 – 10/01/2053; with total market value $51,144) | | $ | 50,141 | | | | 50,141 | |
Citigroup Global Markets
5.310%, dated 10/31/2023, to be repurchased on 11/01/2023, repurchase price $249,037 (collateralized by various U.S. Government Obligations, ranging in par value $35 - $45,606, 2.00% - 7.715%, 12/01/2027 – 6/20/2073; with total market value $253,980) | | | 249,000 | | | | 249,000 | |
Daiwa Capital Markets
5.320%, dated 10/31/2023, to be repurchased on 11/01/2023, repurchase price $249,037 (collateralized by various U.S. Government Obligations and U.S. Treasury Obligations, ranging in par value $15 - $19,670, 0.125% - 7.000%, 01/15/2024 – 11/01/2053; with total market value $253,980) | | | 249,000 | | | | 249,000 | |
| | | | | | | | | |
TOTAL REPURCHASE AGREEMENTS
(Cost $548,141) | | | | | | | 548,141 | |
TOTAL INVESTMENTS — 100.8%
(Cost $105,166,668) | | | | | | $ | 62,576,847 | |
Percentages are based on Net Assets of $62,068,545.
The accompanying notes are an integral part of the financial statements.
165
| Schedule of Investments | October 31, 2023 |
| Global X E-commerce ETF |
| * | Non-income producing security. |
| (A) | This security or a partial position of this security is on loan at October 31, 2023. The total market value of securities on loan at October 31, 2023 was $802,249. |
| (B) | These securities were purchased with cash collateral held from securities on loan. The total value of such securities as of October 31, 2023 was $548,141. The total value of non-cash collateral held from securities on loan as of October 31, 2023 was $272,385. |
The following is a summary of the level of inputs used as of October 31, 2023, in valuing the Fund’s investments carried at value:
| Investments in Securities | | Level 1 | | | Level 2 | | | Level 3 | | | Total | |
| Common Stock | | $ | 62,028,706 | | | $ | — | | | $ | — | | | $ | 62,028,706 | |
| Repurchase Agreements | | | — | | | | 548,141 | | | | — | | | | 548,141 | |
| Total Investments in Securities | | $ | 62,028,706 | | | $ | 548,141 | | | $ | — | | | $ | 62,576,847 | |
Amounts designated as “—” are $0 or have been rounded to $0.
See “Glossary” for abbreviations.
The accompanying notes are an integral part of the financial statements.
166
| Schedule of Investments | October 31, 2023 |
| Global X Russell 2000 Covered Call ETF |
Sector Weightings (Unaudited)†:
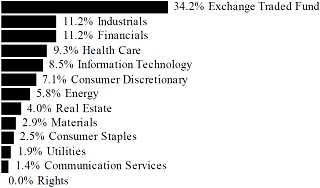
† Sector weightings percentages are based on the total market value of investments. Total investments do not include derivatives such as options, futures contracts, forward contracts, and swap contracts, if applicable.
| | | Shares | | | Value |
| COMMON STOCK(A) — 66.5% | | | | | | | | |
| BAHAMAS — 0.0% | | | | | | | | |
| Consumer Discretionary — 0.0% | | | | | | | | |
| OneSpaWorld Holdings * | | | 32,104 | | | $ | 336,450 | |
| | | | | | | | | |
| BERMUDA — 0.1% | | | | | | | | |
| Energy — 0.0% | | | | | | | | |
| Teekay * | | | 49,003 | | | | 344,491 | |
| | | | | | | | | |
| Financials — 0.1% | | | | | | | | |
| Bank of NT Butterfield & Son | | | 21,713 | | | | 548,470 | |
| Fidelis Insurance Holdings * | | | 6,651 | | | | 94,045 | |
| SiriusPoint * | | | 52,035 | | | | 512,545 | |
| | | | | | | | 1,155,060 | |
| Industrials — 0.0% | | | | | | | | |
| Himalaya Shipping * | | | 15,759 | | | | 71,546 | |
| | | | | | | | | |
| TOTAL BERMUDA | | | | | | | 1,571,097 | |
| BRAZIL — 0.1% | | | | | | | | |
| Financials — 0.1% | | | | | | | | |
| Pagseguro Digital, Cl A * | | | 89,399 | | | | 631,157 | |
The accompanying notes are an integral part of the financial statements.
167
| Schedule of Investments | October 31, 2023 |
| Global X Russell 2000 Covered Call ETF |
| | | Shares | | | Value |
| COMMON STOCK — continued | | | | | | | | |
| Financials — continued | | | | | | | | |
| StoneCo, Cl A * | | | 129,422 | | | $ | 1,283,219 | |
| | | | | | | | | |
| TOTAL BRAZIL | | | | | | | 1,914,376 | |
| CAMEROON — 0.1% | | | | | | | | |
| Energy — 0.1% | | | | | | | | |
| Golar LNG | | | 44,227 | | | | 992,012 | |
| | | | | | | | | |
| CANADA — 0.2% | | | | | | | | |
| Consumer Staples — 0.0% | | | | | | | | |
| SunOpta * | | | 40,348 | | | | 154,936 | |
| | | | | | | | | |
| Energy — 0.0% | | | | | | | | |
| Encore Energy * | | | 1 | | | | 3 | |
| Teekay Tankers, Cl A | | | 10,308 | | | | 512,308 | |
| | | | | | | | 512,311 | |
| Financials — 0.0% | | | | | | | | |
| Kingsway Financial Services * | | | 7,322 | | | | 56,526 | |
| | | | | | | | | |
| Health Care — 0.1% | | | | | | | | |
| Aurinia Pharmaceuticals * | | | 60,419 | | | | 443,476 | |
| Fennec Pharmaceuticals * | | | 10,398 | | | | 71,538 | |
| | | | | | | | 515,014 | |
| Industrials — 0.0% | | | | | | | | |
| Brookfield Business, Cl A | | | 11,675 | | | | 166,019 | |
| Li-Cycle Holdings * | | | 1 | | | | 1 | |
| | | | | | | | 166,020 | |
| Materials — 0.0% | | | | | | | | |
| i-80 Gold * | | | 1 | | | | 1 | |
| NioCorp Developments * | | | 5,380 | | | | 24,102 | |
| Novagold Resources * | | | 98,097 | | | | 345,302 | |
| PolyMet Mining * | | | 1 | | | | 2 | |
| | | | | | | | 369,407 | |
The accompanying notes are an integral part of the financial statements.
168
| Schedule of Investments | October 31, 2023 |
| Global X Russell 2000 Covered Call ETF |
| | | Shares | | | Value |
| COMMON STOCK — continued | | | | | | | | |
| Utilities — 0.1% | | | | | | | | |
| Brookfield Infrastructure, Cl A | | | 54,907 | | | $ | 1,414,413 | |
| | | | | | | | | |
| TOTAL CANADA | | | | | | | 3,188,627 | |
| CAYMAN ISLANDS — 0.1% | | | | | | | | |
| Consumer Discretionary — 0.0% | | | | | | | | |
| Livewire Group * | | | 6,872 | | | | 73,668 | |
| | | | | | | | | |
| Financials — 0.1% | | | | | | | | |
| Patria Investments, Cl A | | | 25,362 | | | | 326,916 | |
| | | | | | | | | |
| Utilities — 0.0% | | | | | | | | |
| Consolidated Water | | | 7,585 | | | | 223,909 | |
| | | | | | | | | |
| TOTAL CAYMAN ISLANDS | | | | | | | 624,493 | |
| CHINA — 0.1% | | | | | | | | |
| Industrials — 0.1% | | | | | | | | |
| Textainer Group Holdings | | | 20,012 | | | | 982,989 | |
| | | | | | | | | |
| Information Technology — 0.0% | | | | | | | | |
| Bit Digital * | | | 1 | | | | 2 | |
| indie Semiconductor, Cl A * | | | 62,955 | | | | 307,850 | |
| | | | | | | | 307,852 | |
| TOTAL CHINA | | | | | | | 1,290,841 | |
| GERMANY — 0.1% | | | | | | | | |
| Materials — 0.1% | | | | | | | | |
| Orion | | | 26,461 | | | | 537,158 | |
| | | | | | | | | |
| GHANA — 0.1% | | | | | | | | |
| Energy — 0.1% | | | | | | | | |
| Kosmos Energy * | | | 201,470 | | | | 1,458,643 | |
| | | | | | | | | |
| GIBRALTAR — 0.0% | | | | | | | | |
| Consumer Staples — 0.0% | | | | | | | | |
| Forafric Global * | | | 4,326 | | | | 47,759 | |
The accompanying notes are an integral part of the financial statements.
169
| Schedule of Investments | October 31, 2023 |
| Global X Russell 2000 Covered Call ETF |
| | | Shares | | | Value |
| COMMON STOCK — continued | | | | | | | | |
| GREECE — 0.0% | | | | | | | | |
| Industrials — 0.0% | | | | | | | | |
| Safe Bulkers | | | 1 | | | $ | 3 | |
| | | | | | | | | |
| GUERNSEY — 0.0% | | | | | | | | |
| Consumer Discretionary — 0.0% | | | | | | | | |
| Super Group SGHC * | | | 65,642 | | | | 251,409 | |
| | | | | | | | | |
| IRELAND — 0.1% | | | | | | | | |
| Energy — 0.0% | | | | | | | | |
| Ardmore Shipping | | | 18,427 | | | | 244,895 | |
| | | | | | | | | |
| Health Care — 0.1% | | | | | | | | |
| Prothena * | | | 19,349 | | | | 705,465 | |
| | | | | | | | | |
| Industrials — 0.0% | | | | | | | | |
| Cimpress * | | | 8,069 | | | | 481,477 | |
| | | | | | | | | |
| TOTAL IRELAND | | | | | | | 1,431,837 | |
| ISRAEL — 0.0% | | | | | | | | |
| Health Care — 0.0% | | | | | | | | |
| Nano-X Imaging, Cl X * | | | 22,381 | | | | 113,024 | |
| | | | | | | | | |
| Information Technology — 0.0% | | | | | | | | |
| Sapiens International | | | 14,240 | | | | 363,120 | |
| | | | | | | | | |
| TOTAL ISRAEL | | | | | | | 476,144 | |
| MALTA — 0.0% | | | | | | | | |
| Communication Services — 0.0% | | | | | | | | |
| Gambling.com Group * | | | 3,671 | | | | 47,576 | |
| | | | | | | | | |
| MEXICO — 0.1% | | | | | | | | |
| Energy — 0.1% | | | | | | | | |
| Borr Drilling * | | | 112,613 | | | | 690,318 | |
The accompanying notes are an integral part of the financial statements.
170
| Schedule of Investments | October 31, 2023 |
| Global X Russell 2000 Covered Call ETF |
| | | Shares | | | Value |
| COMMON STOCK — continued | | | | | | | | |
| MONACO — 0.1% | | | | | | | | |
| Energy — 0.1% | | | | | | | | |
| Scorpio Tankers | | | 23,640 | | | $ | 1,327,386 | |
| | | | | | | | | |
| Industrials — 0.0% | | | | | | | | |
| Costamare | | | 21,890 | | | | 197,667 | |
| | | | | | | | | |
| TOTAL MONACO | | | | | | | 1,525,053 | |
| NORWAY — 0.2% | | | | | | | | |
| Energy — 0.2% | | | | | | | | |
| FLEX LNG | | | 12,741 | | | | 389,110 | |
| Seadrill * | | | 22,782 | | | | 900,345 | |
| SFL | | | 49,682 | | | | 539,546 | |
| | | | | | | | 1,829,001 | |
| Industrials — 0.0% | | | | | | | | |
| Golden Ocean Group | | | 50,760 | | | | 368,010 | |
| | | | | | | | | |
| TOTAL NORWAY | | | | | | | 2,197,011 | |
| PANAMA — 0.0% | | | | | | | | |
| Financials — 0.0% | | | | | | | | |
| Banco Latinoamericano de Comercio Exterior, Cl E | | | 12,522 | | | | 282,747 | |
| | | | | | | | | |
| PUERTO RICO — 0.2% | | | | | | | | |
| Communication Services — 0.0% | | | | | | | | |
| Liberty Latin America, Cl A * | | | 16,493 | | | | 112,647 | |
| Liberty Latin America, Cl C * | | | 63,564 | | | | 435,414 | |
| | | | | | | | 548,061 | |
| Financials — 0.2% | | | | | | | | |
| EVERTEC | | | 30,023 | | | | 954,131 | |
| First BanCorp | | | 83,523 | | | | 1,115,032 | |
| OFG Bancorp | | | 20,787 | | | | 615,711 | |
| | | | | | | | 2,684,874 | |
| TOTAL PUERTO RICO | | | | | | | 3,232,935 | |
The accompanying notes are an integral part of the financial statements.
171
| Schedule of Investments | October 31, 2023 |
| Global X Russell 2000 Covered Call ETF |
| | | Shares | | | Value |
| COMMON STOCK — continued | | | | | | | | |
| SINGAPORE — 0.1% | | | | | | | | |
| Communication Services — 0.0% | | | | | | | | |
| Grindr * | | | 21,848 | | | $ | 129,996 | |
| | | | | | | | | |
| Information Technology — 0.1% | | | | | | | | |
| Kulicke & Soffa Industries | | | 25,569 | | | | 1,063,926 | |
| | | | | | | | | |
| TOTAL SINGAPORE | | | | | | | 1,193,922 | |
| SOUTH AFRICA — 0.0% | | | | | | | | |
| Materials — 0.0% | | | | | | | | |
| Caledonia Mining | | | 8,946 | | | | 99,032 | |
| | | | | | | | | |
| THAILAND — 0.2% | | | | | | | | |
| Information Technology — 0.2% | | | | | | | | |
| Fabrinet * | | | 16,735 | | | | 2,593,925 | |
| | | | | | | | | |
| UNITED KINGDOM — 0.0% | | | | | | | | |
| Health Care — 0.0% | | | | | | | | |
| Zura Bio, Cl A * | | | 5,170 | | | | 24,299 | |
| | | | | | | | | |
| Industrials — 0.0% | | | | | | | | |
| Luxfer Holdings | | | 12,150 | | | | 100,480 | |
| | | | | | | | | |
| TOTAL UNITED KINGDOM | | | | | | | 124,779 | |
| UNITED STATES — 64.6% | | | | | | | | |
| Communication Services — 1.4% | | | | | | | | |
| Advantage Solutions * | | | 1 | | | | 2 | |
| AMC Networks, Cl A * | | | 13,913 | | | | 164,173 | |
| Anterix * | | | 8,236 | | | | 251,116 | |
| AST SpaceMobile, Cl A * | | | 29,850 | | | | 98,803 | |
| Atlanta Braves Holdings, Cl A * | | | 4,604 | | | | 174,538 | |
| Atlanta Braves Holdings, Cl C * | | | 21,402 | | | | 744,362 | |
| ATN International | | | 4,949 | | | | 153,172 | |
| Bandwidth, Cl A * | | | 10,561 | | | | 112,052 | |
| Boston Omaha, Cl A * | | | 10,381 | | | | 147,722 | |
| Bumble, Cl A * | | | 45,130 | | | | 606,547 | |
| Cardlytics * | | | 18,771 | | | | 232,573 | |
| Cargurus, Cl A * | | | 49,170 | | | | 847,199 | |
The accompanying notes are an integral part of the financial statements.
172
| Schedule of Investments | October 31, 2023 |
| Global X Russell 2000 Covered Call ETF |
| | | Shares | | | Value |
| COMMON STOCK — continued | | | | | | | | |
| Communication Services — continued | | | | | | | | |
| Cars.com * | | | 29,699 | | | $ | 452,316 | |
| Charge Enterprises * | | | 1 | | | | — | |
| Cinemark Holdings * | | | 47,697 | | | | 786,524 | |
| Clear Channel Outdoor Holdings, Cl A * | | | 1 | | | | 1 | |
| Cogent Communications Holdings | | | 19,972 | | | | 1,297,781 | |
| Consolidated Communications Holdings * | | | 1 | | | | 4 | |
| Daily Journal * | | | 1,117 | | | | 324,924 | |
| DHI Group * | | | 1 | | | | 3 | |
| EchoStar, Cl A * | | | 15,893 | | | | 220,277 | |
| Emerald Holding * | | | 12,101 | | | | 60,263 | |
| Entravision Communications, Cl A | | | 24,808 | | | | 88,813 | |
| Eventbrite, Cl A * | | | 31,494 | | | | 260,770 | |
| EverQuote, Cl A * | | | 8,145 | | | | 69,966 | |
| EW Scripps, Cl A * | | | 24,766 | | | | 135,470 | |
| fuboTV * | | | 1 | | | | 2 | |
| Gannett * | | | 1 | | | | 2 | |
| Globalstar * | | | 1 | | | | 1 | |
| Gogo * | | | 30,432 | | | | 319,536 | |
| Gray Television | | | 36,295 | | | | 236,643 | |
| IDT, Cl B * | | | 6,963 | | | | 195,312 | |
| iHeartMedia, Cl A * | | | 1 | | | | 2 | |
| IMAX * | | | 21,399 | | | | 389,676 | |
| Integral Ad Science Holding * | | | 30,568 | | | | 350,921 | |
| John Wiley & Sons, Cl A | | | 18,747 | | | | 567,472 | |
| Lions Gate Entertainment, Cl A * | | | 23,892 | | | | 187,791 | |
| Lions Gate Entertainment, Cl B * | | | 48,530 | | | | 362,034 | |
| Loop Media * | | | 1 | | | | — | |
| Lumen Technologies * | | | 1 | | | | 1 | |
| Madison Square Garden Entertainment, Cl A * | | | 19,661 | | | | 599,267 | |
| Magnite * | | | 58,167 | | | | 386,229 | |
| Marcus | | | 10,412 | | | | 161,802 | |
| MediaAlpha, Cl A * | | | 10,547 | | | | 108,423 | |
| Nextdoor Holdings * | | | 1 | | | | 2 | |
| Ooma * | | | 10,025 | | | | 109,373 | |
| Outbrain * | | | 11,814 | | | | 50,446 | |
| Playstudios * | | | 1 | | | | 3 | |
| PubMatic, Cl A * | | | 20,006 | | | | 225,468 | |
| QuinStreet * | | | 22,452 | | | | 253,932 | |
| Reservoir Media * | | | 8,401 | | | | 47,298 | |
The accompanying notes are an integral part of the financial statements.
173
| Schedule of Investments | October 31, 2023 |
| Global X Russell 2000 Covered Call ETF |
| | | Shares | | | Value |
| COMMON STOCK — continued | | | | | | | | |
| Communication Services — continued | | | | | | | | |
| Scholastic | | | 13,744 | | | $ | 507,154 | |
| Shenandoah Telecommunications | | | 20,650 | | | | 488,579 | |
| Shutterstock | | | 10,764 | | | | 437,879 | |
| Sinclair | | | 19,040 | | | | 206,965 | |
| Sphere Entertainment * | | | 11,403 | | | | 375,273 | |
| Spok Holdings | | | 9,495 | | | | 141,570 | |
| Stagwell, Cl A * | | | 47,748 | | | | 196,722 | |
| System1 * | | | 1 | | | | 1 | |
| TechTarget * | | | 11,786 | | | | 296,771 | |
| TEGNA | | | 100,910 | | | | 1,464,204 | |
| Telephone and Data Systems | | | 44,217 | | | | 804,307 | |
| Thryv Holdings * | | | 16,815 | | | | 293,085 | |
| Tingo Group * | | | 1 | | | | 1 | |
| Townsquare Media, Cl A | | | 7,102 | | | | 61,077 | |
| TrueCar * | | | 1 | | | | 2 | |
| Urban One * | | | 4,963 | | | | 26,354 | |
| Urban One, Cl A * | | | 3,388 | | | | 18,397 | |
| Vimeo * | | | 59,315 | | | | 182,690 | |
| Vivid Seats, Cl A * | | | 10,306 | | | | 60,599 | |
| WideOpenWest * | | | 22,515 | | | | 158,506 | |
| Yelp, Cl A * | | | 30,071 | | | | 1,268,695 | |
| Ziff Davis * | | | 20,781 | | | | 1,256,419 | |
| ZipRecruiter, Cl A * | | | 35,718 | | | | 380,397 | |
| | | | | | | | 20,406,654 | |
| Consumer Discretionary — 7.1% | | | | | | | | |
| 1-800-Flowers.com, Cl A * | | | 10,860 | | | | 81,559 | |
| 2U * | | | 1 | | | | 2 | |
| Aaron’s | | | 14,220 | | | | 105,370 | |
| Abercrombie & Fitch, Cl A * | | | 22,970 | | | | 1,397,035 | |
| Academy Sports & Outdoors | | | 35,457 | | | | 1,589,892 | |
| Accel Entertainment, Cl A * | | | 24,148 | | | | 237,858 | |
| Acushnet Holdings | | | 14,665 | | | | 747,328 | |
| Adient * | | | 42,555 | | | | 1,433,678 | |
| Adtalem Global Education * | | | 20,529 | | | | 1,063,402 | |
| Allbirds, Cl A * | | | 1 | | | | 1 | |
| American Axle & Manufacturing Holdings * | | | 51,046 | | | | 344,560 | |
| American Eagle Outfitters | | | 82,169 | | | | 1,435,492 | |
| America’s Car-Mart * | | | 2,545 | | | | 170,464 | |
The accompanying notes are an integral part of the financial statements.
174
| Schedule of Investments | October 31, 2023 |
| Global X Russell 2000 Covered Call ETF |
| | | Shares | | | Value |
| COMMON STOCK — continued | | | | | | | | |
| Consumer Discretionary — continued | | | | | | | | |
| AMMO * | | | 1 | | | $ | 3 | |
| Arko | | | 36,905 | | | | 278,633 | |
| Asbury Automotive Group * | | | 10,218 | | | | 1,955,419 | |
| Atmus Filtration Technologies * | | | 7,237 | | | | 135,766 | |
| Bally’s * | | | 16,695 | | | | 152,258 | |
| BARK * | | | 1 | | | | 1 | |
| Beazer Homes USA * | | | 13,176 | | | | 318,727 | |
| Beyond * | | | 24,953 | | | | 389,267 | |
| Big 5 Sporting Goods | | | 9,816 | | | | 69,301 | |
| Big Lots | | | 12,716 | | | | 57,985 | |
| Biglari Holdings, Cl B * | | | 340 | | | | 50,242 | |
| BJ’s Restaurants * | | | 10,189 | | | | 262,061 | |
| Bloomin’ Brands | | | 39,057 | | | | 911,590 | |
| Bluegreen Vacations Holding, Cl A | | | 6,233 | | | | 208,868 | |
| Boot Barn Holdings * | | | 13,256 | | | | 921,292 | |
| Bowlero * | | | 17,514 | | | | 176,716 | |
| Brinker International * | | | 18,873 | | | | 640,172 | |
| Buckle | | | 13,641 | | | | 460,657 | |
| Build-A-Bear Workshop, Cl A | | | 5,927 | | | | 146,990 | |
| Caleres | | | 15,728 | | | | 402,322 | |
| Camping World Holdings, Cl A | | | 17,469 | | | | 292,606 | |
| CarParts.com * | | | 20,261 | | | | 57,339 | |
| Carriage Services, Cl A | | | 6,416 | | | | 138,586 | |
| Carrols Restaurant Group * | | | 21,103 | | | | 121,342 | |
| Carvana, Cl A * | | | 44,061 | | | | 1,189,647 | |
| Cato, Cl A | | | 7,975 | | | | 56,862 | |
| Cavco Industries * | | | 4,430 | | | | 1,105,329 | |
| Century Casinos * | | | 11,233 | | | | 49,201 | |
| Century Communities | | | 12,687 | | | | 780,251 | |
| Cheesecake Factory | | | 21,642 | | | | 672,417 | |
| Chegg * | | | 53,289 | | | | 401,266 | |
| Chico’s FAS * | | | 49,956 | | | | 373,671 | |
| Children’s Place * | | | 5,914 | | | | 161,866 | |
| Chuy’s Holdings * | | | 8,607 | | | | 289,712 | |
| Clarus | | | 11,872 | | | | 68,739 | |
| ContextLogic, Cl A * | | | 8,000 | | | | 31,360 | |
| Cooper-Standard Holdings * | | | 23,623 | | | | 293,398 | |
| Coursera * | | | 57,451 | | | | 996,200 | |
| Cracker Barrel Old Country Store | | | 9,919 | | | | 658,225 | |
The accompanying notes are an integral part of the financial statements.
175
| Schedule of Investments | October 31, 2023 |
| Global X Russell 2000 Covered Call ETF |
| | | Shares | | | Value |
| COMMON STOCK — continued | | | | | | | | |
| Consumer Discretionary — continued | | | | | | | | |
| Cricut, Cl A | | | 35,325 | | | $ | 301,322 | |
| Dana | | | 59,278 | | | | 680,511 | |
| Dave & Buster’s Entertainment * | | | 19,298 | | | | 674,272 | |
| Denny’s * | | | 25,181 | | | | 217,060 | |
| Designer Brands, Cl A | | | 25,968 | | | | 262,536 | |
| Destination XL Group * | | | 24,746 | | | | 102,943 | |
| Dillard’s, Cl A | | | 2,131 | | | | 661,569 | |
| Dine Brands Global | | | 6,933 | | | | 341,728 | |
| Dorman Products * | | | 11,480 | | | | 713,826 | |
| Dream Finders Homes, Cl A * | | | 18,714 | | | | 368,479 | |
| Duluth Holdings, Cl B * | | | 5,057 | | | | 25,437 | |
| Duolingo, Cl A * | | | 12,757 | | | | 1,863,160 | |
| El Pollo Loco Holdings * | | | 8,129 | | | | 67,877 | |
| Envela * | | | 6,280 | | | | 24,618 | |
| Escalade | | | 5,929 | | | | 101,030 | |
| Ethan Allen Interiors | | | 9,866 | | | | 259,081 | |
| European Wax Center, Cl A * | | | 17,368 | | | | 256,525 | |
| Everi Holdings * | | | 37,720 | | | | 406,999 | |
| EVgo, Cl A * | | | 1 | | | | 2 | |
| Figs, Cl A * | | | 52,803 | | | | 290,945 | |
| First Watch Restaurant Group * | | | 14,277 | | | | 238,569 | |
| Fisker * | | | 76,949 | | | | 346,271 | |
| Foot Locker | | | 38,182 | | | | 801,440 | |
| Fossil Group * | | | 1 | | | | 2 | |
| Fox Factory Holding * | | | 19,510 | | | | 1,589,480 | |
| Frontdoor * | | | 36,069 | | | | 1,043,476 | |
| Full House Resorts * | | | 13,575 | | | | 50,906 | |
| Funko, Cl A * | | | 13,343 | | | | 102,875 | |
| Genesco * | | | 6,040 | | | | 165,556 | |
| Gentherm * | | | 14,447 | | | | 581,058 | |
| G-III Apparel Group * | | | 18,895 | | | | 482,767 | |
| Global Business Travel Group I * | | | 17,011 | | | | 83,864 | |
| Golden Entertainment | | | 8,886 | | | | 278,665 | |
| Goodyear Tire & Rubber * | | | 122,600 | | | | 1,458,940 | |
| GoPro, Cl A * | | | 1 | | | | 3 | |
| Graham Holdings, Cl B | | | 1,844 | | | | 1,067,160 | |
| Green Brick Partners * | | | 12,936 | | | | 500,623 | |
| Group 1 Automotive | | | 6,960 | | | | 1,756,217 | |
| GrowGeneration * | | | 1 | | | | 2 | |
The accompanying notes are an integral part of the financial statements.
176
| Schedule of Investments | October 31, 2023 |
| Global X Russell 2000 Covered Call ETF |
| | | Shares | | | Value |
| COMMON STOCK — continued | | | | | | | | |
| Consumer Discretionary — continued | | | | | | | | |
| Guess? | | | 16,627 | | | $ | 357,481 | |
| Hanesbrands | | | 159,701 | | | | 669,147 | |
| Haverty Furniture | | | 6,949 | | | | 181,021 | |
| Helen of Troy * | | | 11,671 | | | | 1,147,493 | |
| Hibbett | | | 5,909 | | | | 272,228 | |
| Hilton Grand Vacations * | | | 40,711 | | | | 1,463,560 | |
| Holley * | | | 17,001 | | | | 72,254 | |
| Hooker Furnishings | | | 6,083 | | | | 101,708 | |
| Hovnanian Enterprises, Cl A * | | | 2,388 | | | | 165,918 | |
| Inspired Entertainment * | | | 9,225 | | | | 92,066 | |
| Installed Building Products | | | 11,034 | | | | 1,232,167 | |
| International Game Technology | | | 48,420 | | | | 1,230,836 | |
| iRobot * | | | 11,831 | | | | 389,595 | |
| J Jill * | | | 3,083 | | | | 88,328 | |
| Jack in the Box | | | 9,256 | | | | 584,794 | |
| JAKKS Pacific * | | | 4,271 | | | | 71,625 | |
| Johnson Outdoors, Cl A | | | 2,348 | | | | 111,647 | |
| KB Home | | | 33,714 | | | | 1,490,159 | |
| Kontoor Brands | | | 26,015 | | | | 1,208,397 | |
| Krispy Kreme | | | 38,633 | | | | 499,525 | |
| Kura Sushi USA, Cl A * | | | 5,090 | | | | 290,843 | |
| Lands’ End * | | | 5,973 | | | | 37,510 | |
| Landsea Homes * | | | 4,344 | | | | 32,319 | |
| Latham Group * | | | 1 | | | | 2 | |
| Laureate Education, Cl A * | | | 60,053 | | | | 849,149 | |
| La-Z-Boy, Cl Z | | | 18,671 | | | | 545,940 | |
| Lazydays Holdings * | | | 7,630 | | | | 48,145 | |
| LCI Industries | | | 11,394 | | | | 1,236,135 | |
| Legacy Housing * | | | 4,026 | | | | 74,521 | |
| Leslie’s * | | | 80,319 | | | | 396,776 | |
| LGI Homes * | | | 9,127 | | | | 862,593 | |
| Life Time Group Holdings * | | | 18,174 | | | | 214,817 | |
| Light & Wonder * | | | 42,406 | | | | 3,100,303 | |
| Lincoln Educational Services * | | | 13,861 | | | | 118,512 | |
| Lindblad Expeditions Holdings * | | | 12,659 | | | | 78,739 | |
| Lovesac * | | | 6,290 | | | | 103,533 | |
| Luminar Technologies, Cl A * | | | 116,339 | | | | 368,795 | |
| M/I Homes * | | | 12,118 | | | | 994,524 | |
| Malibu Boats, Cl A * | | | 8,938 | | | | 389,876 | |
The accompanying notes are an integral part of the financial statements.
177
| Schedule of Investments | October 31, 2023 |
| Global X Russell 2000 Covered Call ETF |
| | | Shares | | | Value |
| COMMON STOCK — continued | | | | | | | | |
| Consumer Discretionary — continued | | | | | | | | |
| Marine Products | | | 3,258 | | | $ | 31,733 | |
| MarineMax * | | | 9,105 | | | | 249,295 | |
| MasterCraft Boat Holdings * | | | 8,121 | | | | 165,993 | |
| MDC Holdings | | | 25,535 | | | | 969,053 | |
| Meritage Homes | | | 16,646 | | | | 1,897,977 | |
| Modine Manufacturing * | | | 26,440 | | | | 1,044,380 | |
| Monarch Casino & Resort | | | 5,884 | | | | 354,158 | |
| Mondee Holdings, Cl A * | | | 22,510 | | | | 83,062 | |
| Monro | | | 14,176 | | | | 351,848 | |
| Movado Group | | | 6,868 | | | | 191,342 | |
| Nathan’s Famous | | | 1,523 | | | | 99,696 | |
| National Vision Holdings * | | | 34,948 | | | | 543,092 | |
| Nerdy * | | | 1 | | | | 3 | |
| Noodles, Cl A * | | | 1 | | | | 2 | |
| ODP * | | | 19,146 | | | | 860,038 | |
| ONE Group Hospitality * | | | 8,858 | | | | 39,064 | |
| OneWater Marine, Cl A * | | | 4,828 | | | | 109,258 | |
| Oxford Industries | | | 6,844 | | | | 577,634 | |
| Papa John’s International | | | 15,639 | | | | 1,016,848 | |
| Patrick Industries | | | 9,683 | | | | 727,677 | |
| Perdoceo Education | | | 28,812 | | | | 521,209 | |
| PetMed Express | | | 8,924 | | | | 61,486 | |
| PlayAGS * | | | 20,388 | | | | 145,570 | |
| Portillo’s, Cl A * | | | 19,761 | | | | 295,427 | |
| Potbelly * | | | 14,278 | | | | 125,646 | |
| Purple Innovation, Cl A | | | 1 | | | | 1 | |
| Qurate Retail, Cl B * | | | 3,460 | | | | 27,818 | |
| RCI Hospitality Holdings | | | 3,926 | | | | 214,006 | |
| Red Robin Gourmet Burgers * | | | 8,665 | | | | 70,100 | |
| Red Rock Resorts, Cl A | | | 22,732 | | | | 899,051 | |
| Rent the Runway, Cl A * | | | 1 | | | | 1 | |
| Revolve Group, Cl A * | | | 18,401 | | | | 253,014 | |
| Rocky Brands | | | 3,095 | | | | 38,007 | |
| Rover Group, Cl A * | | | 38,428 | | | | 247,861 | |
| Rush Street Interactive * | | | 1 | | | | 4 | |
| Sabre * | | | 134,946 | | | | 472,311 | |
| Sally Beauty Holdings * | | | 46,061 | | | | 391,518 | |
| Savers Value Village * | | | 11,446 | | | | 171,347 | |
| SeaWorld Entertainment * | | | 20,666 | | | | 890,291 | |
The accompanying notes are an integral part of the financial statements.
178
| Schedule of Investments | October 31, 2023 |
| Global X Russell 2000 Covered Call ETF |
| | | Shares | | | Value |
| COMMON STOCK — continued | | | | | | | | |
| Consumer Discretionary — continued | | | | | | | | |
| Shake Shack, Cl A * | | | 17,606 | | | $ | 986,640 | |
| Shoe Carnival | | | 7,699 | | | | 176,153 | |
| Signet Jewelers | | | 21,575 | | | | 1,506,582 | |
| Six Flags Entertainment * | | | 32,555 | | | | 647,844 | |
| Skyline Champion * | | | 24,606 | | | | 1,442,650 | |
| Sleep Number * | | | 9,394 | | | | 152,840 | |
| Smith & Wesson Brands | | | 20,208 | | | | 297,664 | |
| Snap One Holdings * | | | 7,602 | | | | 56,939 | |
| Solid Power * | | | 1 | | | | 1 | |
| Solo Brands, Cl A * | | | 6,993 | | | | 26,923 | |
| Sonic Automotive, Cl A | | | 9,075 | | | | 434,239 | |
| Sonos * | | | 55,585 | | | | 599,206 | |
| Sportsman’s Warehouse Holdings * | | | 17,919 | | | | 91,208 | |
| Standard Motor Products | | | 8,885 | | | | 310,353 | |
| Steven Madden | | | 33,883 | | | | 1,111,024 | |
| Stitch Fix, Cl A * | | | 1 | | | | 3 | |
| Stoneridge * | | | 11,478 | | | | 186,747 | |
| Strategic Education | | | 10,155 | | | | 835,858 | |
| Stride * | | | 18,445 | | | | 1,014,106 | |
| Sturm Ruger | | | 8,839 | | | | 489,239 | |
| Sweetgreen, Cl A * | | | 48,505 | | | | 501,057 | |
| Target Hospitality * | | | 15,056 | | | | 206,719 | |
| Taylor Morrison Home, Cl A * | | | 50,113 | | | | 1,920,330 | |
| ThredUp, Cl A * | | | 1 | | | | 3 | |
| Tile Shop Holdings * | | | 7,981 | | | | 43,816 | |
| Tilly’s, Cl A * | | | 9,231 | | | | 74,771 | |
| Topgolf Callaway Brands * | | | 66,266 | | | | 809,771 | |
| Torrid Holdings * | | | 1 | | | | 2 | |
| Traeger * | | | 1 | | | | 3 | |
| Tri Pointe Homes * | | | 45,804 | | | | 1,147,848 | |
| Udemy * | | | 45,570 | | | | 406,940 | |
| United Homes Group * | | | 4,691 | | | | 31,430 | |
| Universal Technical Institute * | | | 13,347 | | | | 116,519 | |
| Upbound Group, Cl A | | | 26,432 | | | | 688,818 | |
| Urban Outfitters * | | | 28,997 | | | | 1,003,876 | |
| Vera Bradley * | | | 15,044 | | | | 110,122 | |
| Vista Outdoor * | | | 27,374 | | | | 687,635 | |
| Visteon * | | | 12,880 | | | | 1,482,874 | |
| Vizio Holding, Cl A * | | | 28,081 | | | | 142,932 | |
The accompanying notes are an integral part of the financial statements.
179
| Schedule of Investments | October 31, 2023 |
| Global X Russell 2000 Covered Call ETF |
| | | Shares | | | Value |
| COMMON STOCK — continued | | | | | | | | |
| Consumer Discretionary — continued | | | | | | | | |
| VOXX International, Cl A * | | | 8,087 | | | $ | 74,158 | |
| Warby Parker, Cl A * | | | 37,732 | | | | 489,761 | |
| Weyco Group | | | 2,368 | | | | 68,483 | |
| Winmark | | | 1,459 | | | | 588,444 | |
| Winnebago Industries | | | 13,733 | | | | 795,827 | |
| Wolverine World Wide | | | 34,427 | | | | 277,137 | |
| Workhorse Group * | | | 1 | | | | — | |
| WW International * | | | 21,890 | | | | 171,180 | |
| XPEL * | | | 10,703 | | | | 495,549 | |
| Xponential Fitness, Cl A * | | | 9,106 | | | | 129,943 | |
| Zumiez * | | | 8,005 | | | | 131,522 | |
| | | | | | | | 100,324,213 | |
| Consumer Staples — 2.5% | | | | | | | | |
| Alico | | | 3,353 | | | | 81,947 | |
| Andersons | | | 14,357 | | | | 719,716 | |
| B&G Foods | | | 32,279 | | | | 260,492 | |
| Beauty Health * | | | 45,023 | | | | 182,343 | |
| BellRing Brands * | | | 62,486 | | | | 2,732,513 | |
| Benson Hill * | | | 1 | | | | — | |
| Beyond Meat * | | | 26,529 | | | | 158,378 | |
| BRC, Cl A * | | | 1 | | | | 3 | |
| Calavo Growers | | | 7,487 | | | | 189,721 | |
| Cal-Maine Foods | | | 17,056 | | | | 772,807 | |
| Central Garden & Pet * | | | 4,269 | | | | 186,257 | |
| Central Garden & Pet, Cl A * | | | 17,619 | | | | 699,298 | |
| Chefs’ Warehouse * | | | 15,470 | | | | 294,394 | |
| Coca-Cola Consolidated | | | 2,372 | | | | 1,509,565 | |
| Dole | | | 33,071 | | | | 377,671 | |
| Duckhorn Portfolio * | | | 18,445 | | | | 192,381 | |
| Edgewell Personal Care | | | 22,938 | | | | 800,536 | |
| elf Beauty * | | | 23,854 | | | | 2,209,596 | |
| Energizer Holdings | | | 31,356 | | | | 990,223 | |
| Fresh Del Monte Produce | | | 16,691 | | | | 417,275 | |
| Hain Celestial Group * | | | 38,883 | | | | 429,657 | |
| Herbalife * | | | 46,417 | | | | 661,442 | |
| HF Foods Group * | | | 15,391 | | | | 62,180 | |
| Hostess Brands, Cl A * | | | 60,628 | | | | 2,024,975 | |
| Ingles Markets, Cl A | | | 6,259 | | | | 502,097 | |
The accompanying notes are an integral part of the financial statements.
180
| Schedule of Investments | October 31, 2023 |
| Global X Russell 2000 Covered Call ETF |
| | | Shares | | | Value |
| COMMON STOCK — continued | | | | | | | | |
| Consumer Staples — continued | | | | | | | | |
| Inter Parfums | | | 9,038 | | | $ | 1,148,820 | |
| Ispire Technology * | | | 4,245 | | | | 33,663 | |
| J & J Snack Foods | | | 6,605 | | | | 1,034,409 | |
| John B Sanfilippo & Son | | | 3,901 | | | | 398,916 | |
| Lancaster Colony | | | 8,648 | | | | 1,462,982 | |
| Limoneira | | | 9,111 | | | | 130,196 | |
| Medifast | | | 4,948 | | | | 342,204 | |
| MGP Ingredients | | | 7,187 | | | | 680,321 | |
| Mission Produce * | | | 19,777 | | | | 186,102 | |
| National Beverage * | | | 10,398 | | | | 482,259 | |
| Natural Grocers by Vitamin Cottage | | | 4,396 | | | | 55,258 | |
| Nature’s Sunshine Products * | | | 5,057 | | | | 90,520 | |
| Nu Skin Enterprises, Cl A | | | 21,942 | | | | 416,679 | |
| Oil-Dri Corp of America | | | 2,562 | | | | 146,751 | |
| PriceSmart | | | 11,268 | | | | 704,137 | |
| Primo Water | | | 68,643 | | | | 896,478 | |
| Seneca Foods, Cl A * | | | 2,565 | | | | 140,177 | |
| Simply Good Foods * | | | 41,800 | | | | 1,558,722 | |
| Sovos Brands * | | | 23,340 | | | | 506,711 | |
| SpartanNash | | | 15,328 | | | | 344,727 | |
| Sprouts Farmers Market * | | | 47,480 | | | | 1,995,110 | |
| TreeHouse Foods * | | | 23,992 | | | | 1,000,227 | |
| Turning Point Brands | | | 6,435 | | | | 129,022 | |
| United Natural Foods * | | | 26,223 | | | | 382,331 | |
| Universal | | | 10,604 | | | | 477,180 | |
| USANA Health Sciences * | | | 4,988 | | | | 227,203 | |
| Utz Brands | | | 31,774 | | | | 387,325 | |
| Vector Group | | | 63,787 | | | | 655,730 | |
| Village Super Market, Cl A | | | 3,880 | | | | 94,944 | |
| Vita Coco * | | | 12,488 | | | | 338,425 | |
| Vital Farms * | | | 13,185 | | | | 145,826 | |
| Waldencast, Cl A * | | | 11,234 | | | | 86,277 | |
| WD-40 | | | 6,952 | | | | 1,469,653 | |
| Weis Markets | | | 7,209 | | | | 469,306 | |
| Westrock Coffee * | | | 14,488 | | | | 119,381 | |
| Zevia PBC, Cl A * | | | 1 | | | | 2 | |
| | | | | | | | 35,193,441 | |
The accompanying notes are an integral part of the financial statements.
181
| Schedule of Investments | October 31, 2023 |
| Global X Russell 2000 Covered Call ETF |
| | | Shares | | | Value |
| COMMON STOCK — continued | | | | | | | | |
| Energy — 5.3% | | | | | | | | |
| Amplify Energy * | | | 16,438 | | | $ | 114,244 | |
| Archrock | | | 62,002 | | | | 785,565 | |
| Atlas Energy Solutions | | | 8,514 | | | | 155,040 | |
| Berry | | | 34,161 | | | | 285,244 | |
| Bristow Group * | | | 10,265 | | | | 268,327 | |
| Cactus, Cl A | | | 28,526 | | | | 1,339,010 | |
| California Resources | | | 33,972 | | | | 1,786,587 | |
| Callon Petroleum * | | | 27,600 | | | | 1,030,860 | |
| Centrus Energy, Cl A * | | | 6,752 | | | | 358,329 | |
| ChampionX | | | 88,429 | | | | 2,723,613 | |
| Chord Energy | | | 18,650 | | | | 3,083,218 | |
| Civitas Resources | | | 32,145 | | | | 2,424,697 | |
| Clean Energy Fuels * | | | 77,361 | | | | 269,990 | |
| CNX Resources * | | | 72,950 | | | | 1,584,474 | |
| Comstock Resources | | | 39,071 | | | | 492,295 | |
| CONSOL Energy | | | 14,983 | | | | 1,376,788 | |
| Core Laboratories | | | 21,570 | | | | 462,029 | |
| Crescent Energy, Cl A | | | 17,378 | | | | 211,664 | |
| CVR Energy | | | 12,664 | | | | 414,746 | |
| Delek US Holdings | | | 31,089 | | | | 819,195 | |
| Denbury * | | | 23,536 | | | | 2,092,115 | |
| DHT Holdings | | | 60,707 | | | | 675,062 | |
| Diamond Offshore Drilling * | | | 56,929 | | | | 706,489 | |
| DMC Global * | | | 8,765 | | | | 166,097 | |
| Dorian LPG | | | 13,544 | | | | 433,002 | |
| Dril-Quip * | | | 14,976 | | | | 324,380 | |
| Earthstone Energy, Cl A * | | | 27,309 | | | | 578,132 | |
| Empire Petroleum * | | | 6,701 | | | | 56,020 | |
| Energy Fuels * | | | 63,904 | | | | 511,871 | |
| Enviva | | | 15,864 | | | | 57,428 | |
| Equitrans Midstream | | | 194,254 | | | | 1,723,033 | |
| Evolution Petroleum | | | 16,712 | | | | 107,458 | |
| Excelerate Energy, Cl A | | | 7,687 | | | | 109,309 | |
| Expro Group Holdings * | | | 40,114 | | | | 631,796 | |
| Forum Energy Technologies * | | | 5,898 | | | | 128,399 | |
| FutureFuel | | | 10,690 | | | | 70,020 | |
| Gevo * | | | 1 | | | | 1 | |
| Granite Ridge Resources | | | 14,778 | | | | 91,032 | |
| Green Plains * | | | 25,664 | | | | 754,008 | |
The accompanying notes are an integral part of the financial statements.
182
| Schedule of Investments | October 31, 2023 |
| Global X Russell 2000 Covered Call ETF |
| | | Shares | | | Value |
| COMMON STOCK — continued | | | | | | | | |
| Energy — continued | | | | | | | | |
| Gulfport Energy * | | | 5,082 | | | $ | 628,186 | |
| Hallador Energy * | | | 12,566 | | | | 175,673 | |
| Helix Energy Solutions Group * | | | 68,016 | | | | 666,557 | |
| Helmerich & Payne | | | 45,500 | | | | 1,800,435 | |
| HighPeak Energy | | | 3,306 | | | | 58,549 | |
| International Seaways | | | 19,016 | | | | 914,479 | |
| Kinetik Holdings, Cl A | | | 8,446 | | | | 299,326 | |
| KLX Energy Services Holdings * | | | 8,063 | | | | 82,888 | |
| Kodiak Gas Services | | | 6,756 | | | | 116,136 | |
| Liberty Energy, Cl A | | | 76,845 | | | | 1,513,847 | |
| Magnolia Oil & Gas, Cl A | | | 81,653 | | | | 1,833,110 | |
| Mammoth Energy Services * | | | 15,016 | | | | 60,815 | |
| Matador Resources | | | 52,282 | | | | 3,225,277 | |
| Murphy Oil | | | 68,073 | | | | 3,054,436 | |
| Nabors Industries * | | | 3,895 | | | | 380,308 | |
| NACCO Industries, Cl A | | | 1,669 | | | | 57,664 | |
| Newpark Resources * | | | 26,001 | | | | 179,927 | |
| NextDecade * | | | 12,755 | | | | 55,994 | |
| Noble | | | 50,924 | | | | 2,377,642 | |
| Nordic American Tankers | | | 89,408 | | | | 410,383 | |
| Northern Oil and Gas | | | 36,778 | | | | 1,410,069 | |
| Oceaneering International * | | | 47,853 | | | | 1,052,287 | |
| Oil States International * | | | 24,978 | | | | 181,340 | |
| Overseas Shipholding Group, Cl A * | | | 30,943 | | | | 151,311 | |
| Par Pacific Holdings * | | | 24,387 | | | | 800,381 | |
| Patterson-UTI Energy | | | 164,710 | | | | 2,091,813 | |
| PBF Energy, Cl A | | | 51,599 | | | | 2,452,500 | |
| Peabody Energy | | | 55,525 | | | | 1,309,835 | |
| Permian Resources, Cl A | | | 133,817 | | | | 1,949,714 | |
| PrimeEnergy Resources * | | | 559 | | | | 59,768 | |
| ProFrac Holding, Cl A * | | | 10,918 | | | | 102,848 | |
| ProPetro Holding * | | | 43,512 | | | | 456,006 | |
| Ranger Energy Services, Cl A | | | 9,074 | | | | 105,349 | |
| REX American Resources * | | | 6,930 | | | | 263,409 | |
| Riley Exploration Permian | | | 4,819 | | | | 152,521 | |
| Ring Energy * | | | 1 | | | | 2 | |
| RPC | | | 32,717 | | | | 272,205 | |
| SandRidge Energy | | | 13,766 | | | | 218,191 | |
| SEACOR Marine Holdings * | | | 12,683 | | | | 175,786 | |
The accompanying notes are an integral part of the financial statements.
183
| Schedule of Investments | October 31, 2023 |
| Global X Russell 2000 Covered Call ETF |
| | | Shares | | | Value |
| COMMON STOCK — continued | | | | | | | | |
| Energy — continued | | | | | | | | |
| Select Water Solutions, Cl A | | | 31,426 | | | $ | 233,809 | |
| SilverBow Resources * | | | 12,886 | | | | 439,413 | |
| Sitio Royalties, Cl A | | | 40,855 | | | | 1,009,936 | |
| SM Energy | | | 54,677 | | | | 2,204,577 | |
| Solaris Oilfield Infrastructure, Cl A | | | 13,032 | | | | 120,416 | |
| Talos Energy * | | | 50,727 | | | | 786,268 | |
| Tellurian * | | | 1 | | | | 1 | |
| TETRA Technologies * | | | 1 | | | | 5 | |
| Tidewater * | | | 21,711 | | | | 1,483,947 | |
| Uranium Energy * | | | 163,146 | | | | 970,719 | |
| US Silica Holdings * | | | 31,528 | | | | 380,543 | |
| VAALCO Energy | | | 24,202 | | | | 108,183 | |
| Valaris * | | | 28,022 | | | | 1,850,573 | |
| Verde Clean Fuels * | | | 4,217 | | | | 17,711 | |
| Vertex Energy * | | | 22,440 | | | | 96,716 | |
| Vital Energy * | | | 7,136 | | | | 357,085 | |
| Vitesse Energy | | | 12,058 | | | | 285,654 | |
| W&T Offshore * | | | 38,553 | | | | 159,995 | |
| Weatherford International * | | | 32,644 | | | | 3,038,830 | |
| World Kinect | | | 26,591 | | | | 491,934 | |
| | | | | | | | 74,334,849 | |
| Financials — 10.8% | | | | | | | | |
| 1st Source | | | 7,125 | | | | 325,042 | |
| Acacia Research * | | | 22,079 | | | | 79,264 | |
| ACNB | | | 3,764 | | | | 129,519 | |
| AFC Gamma ‡ | | | 7,440 | | | | 78,715 | |
| Alerus Financial | | | 6,611 | | | | 114,436 | |
| AlTi Global * | | | 14,545 | | | | 91,197 | |
| Amalgamated Financial | | | 7,884 | | | | 143,804 | |
| A-Mark Precious Metals | | | 8,522 | | | | 230,776 | |
| Ambac Financial Group * | | | 19,837 | | | | 240,623 | |
| Amerant Bancorp, Cl A | | | 12,075 | | | | 220,127 | |
| American Coastal Insurance * | | | 13,657 | | | | 102,291 | |
| American Equity Investment Life Holding * | | | 34,625 | | | | 1,833,740 | |
| American National Bankshares | | | 4,657 | | | | 177,711 | |
| Ameris Bancorp | | | 29,493 | | | | 1,100,089 | |
| AMERISAFE | | | 8,682 | | | | 442,522 | |
| Ames National | | | 5,021 | | | | 84,955 | |
The accompanying notes are an integral part of the financial statements.
184
| Schedule of Investments | October 31, 2023 |
| Global X Russell 2000 Covered Call ETF |
| | | Shares | | | Value |
| COMMON STOCK — continued | | | | | | | | |
| Financials — continued | | | | | | | | |
| Angel Oak Mortgage REIT ‡ | | | 4,577 | | | $ | 38,309 | |
| Apollo Commercial Real Estate Finance ‡ | | | 63,341 | | | | 630,876 | |
| Arbor Realty Trust ‡ | | | 80,452 | | | | 1,014,500 | |
| Ares Commercial Real Estate ‡ | | | 24,708 | | | | 226,572 | |
| Argo Group International Holdings | | | 14,292 | | | | 426,473 | |
| ARMOUR Residential ‡ | | | 22,580 | | | | 328,985 | |
| Arrow Financial | | | 6,673 | | | | 142,210 | |
| Artisan Partners Asset Management, Cl A | | | 27,383 | | | | 903,639 | |
| AssetMark Financial Holdings * | | | 9,846 | | | | 235,418 | |
| Associated Banc-Corp | | | 74,227 | | | | 1,203,220 | |
| Atlantic Union Bankshares | | | 33,482 | | | | 964,616 | |
| Atlanticus Holdings * | | | 2,185 | | | | 63,933 | |
| Avantax * | | | 20,685 | | | | 533,880 | |
| AvidXchange Holdings * | | | 76,750 | | | | 663,120 | |
| Axos Financial * | | | 25,340 | | | | 913,000 | |
| B Riley Financial | | | 9,172 | | | | 332,118 | |
| Bakkt Holdings * | | | 1 | | | | 1 | |
| Banc of California | | | 24,435 | | | | 273,916 | |
| BancFirst | | | 9,926 | | | | 805,098 | |
| Bancorp * | | | 23,756 | | | | 846,901 | |
| Bank First | | | 4,177 | | | | 329,858 | |
| Bank of Hawaii | | | 17,753 | | | | 876,821 | |
| Bank of Marin Bancorp | | | 7,106 | | | | 119,381 | |
| Bank7 | | | 2,579 | | | | 54,004 | |
| BankUnited | | | 35,625 | | | | 776,981 | |
| Bankwell Financial Group | | | 2,541 | | | | 62,178 | |
| Banner | | | 15,276 | | | | 644,800 | |
| Bar Harbor Bankshares | | | 6,723 | | | | 168,209 | |
| BayCom | | | 5,376 | | | | 106,445 | |
| BCB Bancorp | | | 6,883 | | | | 70,757 | |
| Berkshire Hills Bancorp | | | 20,596 | | | | 403,888 | |
| BGC Group, Cl A | | | 152,639 | | | | 895,991 | |
| Blackstone Mortgage Trust, Cl A ‡ | | | 76,746 | | | | 1,531,083 | |
| Blue Foundry Bancorp * | | | 11,233 | | | | 84,809 | |
| Blue Ridge Bankshares | | | 7,859 | | | | 24,756 | |
| Bread Financial Holdings | | | 22,506 | | | | 608,337 | |
| Bridgewater Bancshares * | | | 9,415 | | | | 90,666 | |
| Brightsphere Investment Group | | | 14,582 | | | | 228,354 | |
| BrightSpire Capital, Cl A ‡ | | | 60,047 | | | | 339,866 | |
The accompanying notes are an integral part of the financial statements.
185
| Schedule of Investments | October 31, 2023 |
| Global X Russell 2000 Covered Call ETF |
| | | Shares | | | Value |
| COMMON STOCK — continued | | | | | | | | |
| Financials — continued | | | | | | | | |
| Brookline Bancorp | | | 39,886 | | | $ | 324,672 | |
| BRP Group, Cl A * | | | 26,646 | | | | 557,701 | |
| Burke & Herbert Financial Services | | | 3,111 | | | | 139,155 | |
| Business First Bancshares | | | 10,771 | | | | 210,465 | |
| Byline Bancorp | | | 11,108 | | | | 210,719 | |
| C&F Financial | | | 1,855 | | | | 97,684 | |
| Cadence Bank | | | 82,664 | | | | 1,750,824 | |
| Cambridge Bancorp | | | 2,951 | | | | 158,498 | |
| Camden National | | | 6,413 | | | | 187,003 | |
| Cannae Holdings * | | | 34,932 | | | | 571,138 | |
| Cantaloupe * | | | 43,132 | | | | 283,809 | |
| Capital Bancorp | | | 3,894 | | | | 79,593 | |
| Capital City Bank Group | | | 5,960 | | | | 170,277 | |
| Capitol Federal Financial | | | 53,587 | | | | 278,652 | |
| Capstar Financial Holdings | | | 8,958 | | | | 135,982 | |
| Carter Bankshares * | | | 10,520 | | | | 118,455 | |
| Cass Information Systems | | | 6,139 | | | | 232,116 | |
| Cathay General Bancorp | | | 31,319 | | | | 1,062,027 | |
| Central Pacific Financial | | | 11,758 | | | | 185,541 | |
| Central Valley Community Bancorp | | | 5,919 | | | | 93,343 | |
| Chemung Financial | | | 2,120 | | | | 87,514 | |
| Chicago Atlantic Real Estate Finance ‡ | | | 12,715 | | | | 179,154 | |
| Chimera Investment ‡ | | | 99,791 | | | | 478,997 | |
| ChoiceOne Financial Services | | | 4,017 | | | | 75,801 | |
| Citizens & Northern | | | 6,685 | | | | 120,998 | |
| Citizens Financial Services | | | 2,179 | | | | 107,752 | |
| City Holding | | | 6,633 | | | | 602,144 | |
| Civista Bancshares | | | 6,568 | | | | 95,761 | |
| Claros Mortgage Trust ‡ | | | 39,535 | | | | 412,350 | |
| CNB Financial | | | 8,955 | | | | 162,802 | |
| CNO Financial Group | | | 50,217 | | | | 1,164,030 | |
| Coastal Financial * | | | 4,561 | | | | 169,532 | |
| Codorus Valley Bancorp | | | 5,356 | | | | 105,085 | |
| Cohen & Steers | | | 12,303 | | | | 642,709 | |
| Colony Bankcorp | | | 6,722 | | | | 66,884 | |
| Columbia Financial * | | | 16,328 | | | | 262,881 | |
| Community Bank System | | | 23,217 | | | | 927,519 | |
| Community Trust Bancorp | | | 6,796 | | | | 255,258 | |
| Compass Diversified Holdings | | | 26,649 | | | | 457,830 | |
The accompanying notes are an integral part of the financial statements.
186
| Schedule of Investments | October 31, 2023 |
| Global X Russell 2000 Covered Call ETF |
| | | Shares | | | Value |
| COMMON STOCK — continued | | | | | | | | |
| Financials — continued | | | | | | | | |
| ConnectOne Bancorp | | | 15,994 | | | $ | 260,542 | |
| Consumer Portfolio Services * | | | 5,964 | | | | 55,167 | |
| Crawford, Cl A | | | 6,686 | | | | 61,177 | |
| CrossFirst Bankshares * | | | 19,747 | | | | 208,923 | |
| Customers Bancorp * | | | 13,062 | | | | 525,223 | |
| CVB Financial | | | 57,783 | | | | 902,570 | |
| Diamond Hill Investment Group | | | 1,276 | | | | 200,460 | |
| Dime Community Bancshares | | | 14,395 | | | | 264,724 | |
| Donegal Group, Cl A | | | 6,720 | | | | 94,886 | |
| Donnelley Financial Solutions * | | | 12,474 | | | | 678,960 | |
| Dynex Capital ‡ | | | 24,142 | | | | 242,386 | |
| Eagle Bancorp | | | 13,887 | | | | 270,519 | |
| Eastern Bankshares | | | 71,290 | | | | 784,903 | |
| eHealth * | | | 10,147 | | | | 87,061 | |
| Ellington Financial ‡ | | | 28,792 | | | | 346,368 | |
| Employers Holdings | | | 11,959 | | | | 454,442 | |
| Enact Holdings | | | 13,417 | | | | 369,773 | |
| Encore Capital Group * | | | 10,437 | | | | 393,266 | |
| Enova International * | | | 14,981 | | | | 597,442 | |
| Enstar Group * | | | 6,200 | | | | 1,469,214 | |
| Enterprise Bancorp | | | 4,159 | | | | 109,423 | |
| Enterprise Financial Services | | | 15,485 | | | | 538,413 | |
| Equity Bancshares, Cl A | | | 6,590 | | | | 159,478 | |
| Esquire Financial Holdings | | | 3,161 | | | | 144,774 | |
| ESSA Bancorp | | | 5,226 | | | | 87,013 | |
| Essent Group | | | 48,198 | | | | 2,276,874 | |
| Evans Bancorp | | | 3,214 | | | | 79,450 | |
| F&G Annuities & Life | | | 9,291 | | | | 285,141 | |
| Farmers & Merchants Bancorp | | | 5,753 | | | | 100,217 | |
| Farmers National Banc | | | 26,060 | | | | 294,217 | |
| FB Financial | | | 15,381 | | | | 451,740 | |
| Federal Agricultural Mortgage, Cl C | | | 4,072 | | | | 604,936 | |
| Fidelity D&D Bancorp | | | 2,505 | | | | 112,224 | |
| Finance of America, Cl A * | | | 1 | | | | 1 | |
| Financial Institutions | | | 6,762 | | | | 107,110 | |
| First Bancorp | | | 4,511 | | | | 105,693 | |
| First Bancorp | | | 17,038 | | | | 494,443 | |
| First Bancshares | | | 13,388 | | | | 324,257 | |
| First Bank | | | 6,516 | | | | 72,067 | |
The accompanying notes are an integral part of the financial statements.
187
| Schedule of Investments | October 31, 2023 |
| Global X Russell 2000 Covered Call ETF |
| | | Shares | | | Value |
| COMMON STOCK — continued | | | | | | | | |
| Financials — continued | | | | | | | | |
| First Busey | | | 23,199 | | | $ | 460,732 | |
| First Business Financial Services | | | 3,314 | | | | 101,740 | |
| First Commonwealth Financial | | | 45,252 | | | | 551,169 | |
| First Community | | | 4,513 | | | | 79,880 | |
| First Community Bankshares | | | 7,213 | | | | 235,504 | |
| First Financial | | | 5,012 | | | | 172,463 | |
| First Financial Bancorp | | | 40,619 | | | | 751,451 | |
| First Financial Bankshares | | | 59,915 | | | | 1,440,956 | |
| First Foundation | | | 22,630 | | | | 102,740 | |
| First Interstate BancSystem, Cl A | | | 42,437 | | | | 979,022 | |
| First Merchants | | | 27,826 | | | | 759,928 | |
| First Mid Bancshares | | | 8,308 | | | | 226,975 | |
| First of Long Island | | | 9,890 | | | | 106,219 | |
| First Western Financial * | | | 3,278 | | | | 43,827 | |
| FirstCash Holdings | | | 16,665 | | | | 1,815,152 | |
| Five Star Bancorp | | | 5,503 | | | | 107,143 | |
| Flushing Financial | | | 12,626 | | | | 155,805 | |
| Flywire * | | | 42,889 | | | | 1,153,285 | |
| Forge Global Holdings * | | | 1 | | | | 3 | |
| Franklin BSP Realty Trust ‡ | | | 36,251 | | | | 457,125 | |
| FS Bancorp | | | 3,659 | | | | 105,635 | |
| Fulton Financial | | | 71,035 | | | | 922,745 | |
| FVCBankcorp * | | | 6,185 | | | | 67,540 | |
| GCM Grosvenor | | | 18,122 | | | | 145,882 | |
| Genworth Financial, Cl A * | | | 230,453 | | | | 1,380,413 | |
| German American Bancorp | | | 11,924 | | | | 325,883 | |
| Glacier Bancorp | | | 51,200 | | | | 1,545,728 | |
| GoHealth, Cl A * | | | 2,899 | | | | 40,702 | |
| Goosehead Insurance, Cl A * | | | 9,509 | | | | 616,849 | |
| Granite Point Mortgage Trust ‡ | | | 22,093 | | | | 92,791 | |
| Great Southern Bancorp | | | 4,301 | | | | 213,846 | |
| Green Dot, Cl A * | | | 22,238 | | | | 248,621 | |
| Greene County Bancorp | | | 2,958 | | | | 70,105 | |
| Greenlight Capital Re, Cl A * | | | 10,860 | | | | 121,089 | |
| Guaranty Bancshares | | | 3,591 | | | | 102,451 | |
| Hamilton Lane, Cl A | | | 18,641 | | | | 1,568,081 | |
| Hancock Whitney | | | 38,192 | | | | 1,314,951 | |
| Hanmi Financial | | | 13,221 | | | | 194,084 | |
The accompanying notes are an integral part of the financial statements.
188
| Schedule of Investments | October 31, 2023 |
| Global X Russell 2000 Covered Call ETF |
| | | Shares | | | Value |
| COMMON STOCK — continued | | | | | | | | |
| Financials — continued | | | | | | | | |
| Hannon Armstrong Sustainable Infrastructure Capital ‡ | | | 48,854 | | | $ | 837,358 | |
| HarborOne Bancorp | | | 19,208 | | | | 189,007 | |
| HBT Financial | | | 4,838 | | | | 87,084 | |
| HCI Group | | | 2,957 | | | | 174,374 | |
| Heartland Financial USA | | | 18,034 | | | | 494,132 | |
| Heritage Commerce | | | 25,369 | | | | 207,518 | |
| Heritage Financial | | | 14,909 | | | | 242,569 | |
| Hilltop Holdings | | | 26,220 | | | | 724,196 | |
| Hingham Institution For Savings | | | 821 | | | | 121,984 | |
| Hippo Holdings * | | | 7,508 | | | | 54,058 | |
| Home Bancorp | | | 3,282 | | | | 112,474 | |
| Home BancShares | | | 85,272 | | | | 1,743,812 | |
| HomeStreet | | | 8,313 | | | | 40,152 | |
| HomeTrust Bancshares | | | 6,564 | | | | 135,284 | |
| Hope Bancorp | | | 49,806 | | | | 436,301 | |
| Horace Mann Educators | | | 18,558 | | | | 588,845 | |
| Horizon Bancorp | | | 18,124 | | | | 171,997 | |
| I3 Verticals, Cl A * | | | 10,335 | | | | 193,781 | |
| Independent Bank | | | 8,963 | | | | 178,812 | |
| Independent Bank | | | 21,216 | | | | 1,035,341 | |
| Independent Bank Group | | | 15,784 | | | | 557,964 | |
| International Bancshares | | | 24,938 | | | | 1,093,033 | |
| International Money Express * | | | 13,983 | | | | 223,169 | |
| Invesco Mortgage Capital ‡ | | | 24,251 | | | | 165,634 | |
| Investors Title | | | 596 | | | | 85,711 | |
| Jackson Financial, Cl A | | | 38,970 | | | | 1,430,589 | |
| James River Group Holdings | | | 15,808 | | | | 217,360 | |
| John Marshall Bancorp | | | 4,789 | | | | 88,022 | |
| Kearny Financial | | | 26,640 | | | | 184,882 | |
| KKR Real Estate Finance Trust ‡ | | | 26,071 | | | | 272,181 | |
| Ladder Capital, Cl A ‡ | | | 50,987 | | | | 515,479 | |
| Lakeland Bancorp | | | 28,522 | | | | 321,728 | |
| Lakeland Financial | | | 10,774 | | | | 530,620 | |
| LCNB | | | 6,130 | | | | 85,759 | |
| Lemonade * | | | 19,863 | | | | 217,301 | |
| LendingClub * | | | 42,768 | | | | 221,966 | |
| LendingTree * | | | 4,894 | | | | 64,748 | |
| Live Oak Bancshares | | | 14,383 | | | | 414,950 | |
The accompanying notes are an integral part of the financial statements.
189
| Schedule of Investments | October 31, 2023 |
| Global X Russell 2000 Covered Call ETF |
| | | Shares | | | Value |
| COMMON STOCK — continued | | | | | | | | |
| Financials — continued | | | | | | | | |
| Luther Burbank | | | 6,346 | | | $ | 51,656 | |
| Macatawa Bank | | | 10,860 | | | | 99,152 | |
| Maiden Holdings * | | | 1 | | | | 2 | |
| MainStreet Bancshares | | | 4,093 | | | | 78,913 | |
| MarketWise | | | 1 | | | | 2 | |
| Marqeta, Cl A * | | | 208,127 | | | | 1,076,017 | |
| MBIA * | | | 22,614 | | | | 155,584 | |
| Mercantile Bank | | | 6,846 | | | | 225,507 | |
| Merchants Bancorp | | | 6,715 | | | | 200,711 | |
| Mercury General | | | 11,468 | | | | 354,132 | |
| Metrocity Bankshares | | | 8,352 | | | | 167,374 | |
| Metropolitan Bank Holding * | | | 4,418 | | | | 143,187 | |
| MFA Financial ‡ | | | 44,422 | | | | 394,912 | |
| Mid Penn Bancorp | | | 6,345 | | | | 120,936 | |
| Middlefield Banc | | | 4,281 | | | | 109,166 | |
| Midland States Bancorp | | | 9,259 | | | | 202,031 | |
| MidWestOne Financial Group | | | 6,321 | | | | 125,914 | |
| Moelis, Cl A | | | 29,484 | | | | 1,227,714 | |
| Mr Cooper Group * | | | 30,724 | | | | 1,736,828 | |
| MVB Financial | | | 4,562 | | | | 89,643 | |
| National Bank Holdings, Cl A | | | 16,923 | | | | 527,659 | |
| National Bankshares | | | 3,252 | | | | 76,422 | |
| National Western Life Group, Cl A | | | 1,332 | | | | 637,895 | |
| Navient | | | 46,486 | | | | 739,592 | |
| NBT Bancorp | | | 25,274 | | | | 845,921 | |
| Nelnet, Cl A | | | 6,939 | | | | 588,497 | |
| NerdWallet, Cl A * | | | 11,611 | | | | 125,167 | |
| New York Mortgage Trust ‡ | | | 40,000 | | | | 311,600 | |
| NewtekOne | | | 11,641 | | | | 161,461 | |
| Nexpoint Real Estate Finance ‡ | | | 3,263 | | | | 48,390 | |
| NI Holdings * | | | 4,022 | | | | 51,039 | |
| Nicolet Bankshares | | | 5,419 | | | | 394,612 | |
| NMI Holdings, Cl A * | | | 35,934 | | | | 982,795 | |
| Northeast Bank | | | 2,772 | | | | 132,335 | |
| Northeast Community Bancorp | | | 7,448 | | | | 113,508 | |
| Northfield Bancorp | | | 18,276 | | | | 157,174 | |
| Northrim BanCorp | | | 2,985 | | | | 124,504 | |
| Northwest Bancshares | | | 54,150 | | | | 564,243 | |
| Norwood Financial | | | 3,961 | | | | 101,441 | |
The accompanying notes are an integral part of the financial statements.
190
| Schedule of Investments | October 31, 2023 |
| Global X Russell 2000 Covered Call ETF |
| | | Shares | | | Value |
| COMMON STOCK — continued | | | | | | | | |
| Financials — continued | | | | | | | | |
| Oak Valley Bancorp | | | 3,855 | | | $ | 96,182 | |
| OceanFirst Financial | | | 24,963 | | | | 316,032 | |
| Ocwen Financial * | | | 3,603 | | | | 86,616 | |
| Old National Bancorp | | | 137,799 | | | | 1,887,846 | |
| Old Second Bancorp | | | 18,785 | | | | 254,725 | |
| Open Lending, Cl A * | | | 61,177 | | | | 366,450 | |
| OppFi * | | | 1 | | | | 2 | |
| Orange County Bancorp | | | 2,905 | | | | 128,110 | |
| Orchid Island Capital, Cl A ‡ | | | 24,079 | | | | 151,216 | |
| Origin Bancorp | | | 13,566 | | | | 401,418 | |
| Orrstown Financial Services | | | 4,899 | | | | 103,418 | |
| Oscar Health, Cl A * | | | 71,519 | | | | 366,177 | |
| P10, Cl A | | | 20,931 | | | | 197,170 | |
| Pacific Premier Bancorp | | | 44,249 | | | | 840,731 | |
| PacWest Bancorp | | | 55,842 | | | | 395,361 | |
| Palomar Holdings * | | | 10,683 | | | | 535,005 | |
| Park National | | | 6,293 | | | | 638,047 | |
| Parke Bancorp | | | 4,251 | | | | 71,587 | |
| Pathward Financial | | | 12,570 | | | | 569,295 | |
| Payoneer Global * | | | 109,642 | | | | 634,827 | |
| Paysafe * | | | 12,055 | | | | 117,175 | |
| Paysign * | | | 1 | | | | 2 | |
| PCB Bancorp | | | 4,859 | | | | 74,731 | |
| Peapack-Gladstone Financial | | | 7,668 | | | | 179,201 | |
| Penns Woods Bancorp | | | 3,858 | | | | 81,327 | |
| PennyMac Financial Services | | | 12,726 | | | | 855,187 | |
| PennyMac Mortgage Investment Trust ‡ | | | 40,947 | | | | 517,980 | |
| Peoples Bancorp | | | 16,943 | | | | 467,288 | |
| Peoples Financial Services | | | 3,065 | | | | 120,179 | |
| Perella Weinberg Partners, Cl A | | | 19,276 | | | | 189,098 | |
| Pioneer Bancorp * | | | 4,887 | | | | 40,073 | |
| Piper Sandler | | | 8,032 | | | | 1,123,275 | |
| PJT Partners | | | 10,309 | | | | 807,813 | |
| Plumas Bancorp | | | 3,022 | | | | 103,201 | |
| Ponce Financial Group * | | | 11,579 | | | | 90,085 | |
| PRA Group * | | | 17,980 | | | | 221,334 | |
| Preferred Bank | | | 5,793 | | | | 345,089 | |
| Premier Financial | | | 15,476 | | | | 268,509 | |
| Primis Financial | | | 9,604 | | | | 89,893 | |
The accompanying notes are an integral part of the financial statements.
191
| Schedule of Investments | October 31, 2023 |
| Global X Russell 2000 Covered Call ETF |
| | | Shares | | | Value |
| COMMON STOCK — continued | | | | | | | | |
| Financials — continued | | | | | | | | |
| Princeton Bancorp | | | 3,059 | | | $ | 91,770 | |
| Priority Technology Holdings * | | | 5,567 | | | | 20,876 | |
| ProAssurance | | | 23,090 | | | | 392,530 | |
| PROG Holdings * | | | 23,836 | | | | 652,868 | |
| Provident Financial Services | | | 31,866 | | | | 447,717 | |
| QCR Holdings | | | 7,044 | | | | 334,238 | |
| Radian Group | | | 75,251 | | | | 1,906,860 | |
| RBB Bancorp | | | 6,395 | | | | 73,990 | |
| Ready Capital ‡ | | | 72,418 | | | | 682,898 | |
| Red River Bancshares | | | 1,971 | | | | 91,612 | |
| Redwood Trust ‡ | | | 47,751 | | | | 299,876 | |
| Regional Management | | | 3,423 | | | | 85,096 | |
| Remitly Global * | | | 58,007 | | | | 1,562,129 | |
| Renasant | | | 23,887 | | | | 582,604 | |
| Repay Holdings, Cl A * | | | 35,838 | | | | 214,670 | |
| Republic Bancorp, Cl A | | | 4,109 | | | | 181,577 | |
| S&T Bancorp | | | 17,099 | | | | 440,470 | |
| Safety Insurance Group | | | 6,202 | | | | 466,204 | |
| Sandy Spring Bancorp | | | 18,777 | | | | 383,990 | |
| Sculptor Capital Management, Cl A | | | 9,741 | | | | 123,224 | |
| Seacoast Banking Corp of Florida | | | 38,031 | | | | 768,606 | |
| Security National Financial, Cl A * | | | 8,209 | | | | 56,723 | |
| Selective Insurance Group | | | 27,126 | | | | 2,824,088 | |
| Selectquote * | | | 1 | | | | 1 | |
| ServisFirst Bancshares | | | 23,809 | | | | 1,122,832 | |
| Shore Bancshares | | | 14,407 | | | | 147,818 | |
| Sierra Bancorp | | | 6,202 | | | | 109,155 | |
| Silvercrest Asset Management Group, Cl A | | | 4,027 | | | | 71,479 | |
| Simmons First National, Cl A | | | 55,729 | | | | 791,909 | |
| Skyward Specialty Insurance Group * | | | 11,171 | | | | 314,464 | |
| SmartFinancial | | | 6,435 | | | | 134,170 | |
| South Plains Financial | | | 4,784 | | | | 128,307 | |
| Southern First Bancshares * | | | 3,392 | | | | 91,584 | |
| Southern Missouri Bancorp | | | 3,441 | | | | 139,188 | |
| Southern States Bancshares | | | 4,349 | | | | 100,984 | |
| Southside Bancshares | | | 13,245 | | | | 353,641 | |
| SouthState | | | 34,658 | | | | 2,290,894 | |
| Stellar Bancorp | | | 23,471 | | | | 510,260 | |
| StepStone Group, Cl A | | | 23,922 | | | | 676,993 | |
The accompanying notes are an integral part of the financial statements.
192
| Schedule of Investments | October 31, 2023 |
| Global X Russell 2000 Covered Call ETF |
| | | Shares | | | Value |
| COMMON STOCK — continued | | | | | | | | |
| Financials — continued | | | | | | | | |
| Sterling Bancorp * | | | 7,108 | | | $ | 39,378 | |
| Stewart Information Services | | | 11,785 | | | | 514,651 | |
| Stock Yards Bancorp | | | 12,573 | | | | 491,730 | |
| StoneX Group * | | | 7,718 | | | | 735,680 | |
| Summit Financial Group | | | 4,937 | | | | 106,145 | |
| SWK Holdings * | | | 1,528 | | | | 24,662 | |
| Texas Capital Bancshares * | | | 21,744 | | | | 1,197,225 | |
| Third Coast Bancshares * | | | 5,446 | | | | 84,467 | |
| Timberland Bancorp | | | 4,218 | | | | 118,905 | |
| Tiptree | | | 10,880 | | | | 164,397 | |
| Tompkins Financial | | | 6,121 | | | | 306,540 | |
| Towne Bank | | | 30,284 | | | | 724,999 | |
| TPG RE Finance Trust ‡ | | | 29,673 | | | | 163,498 | |
| TriCo Bancshares | | | 13,643 | | | | 441,351 | |
| Triumph Financial * | | | 10,156 | | | | 632,211 | |
| Trupanion * | | | 17,172 | | | | 353,743 | |
| TrustCo Bank NY | | | 8,177 | | | | 208,759 | |
| Trustmark | | | 26,755 | | | | 538,043 | |
| Two Harbors Investment ‡ | | | 52,146 | | | | 605,415 | |
| UMB Financial | | | 19,566 | | | | 1,227,180 | |
| United Bankshares | | | 57,659 | | | | 1,639,822 | |
| United Community Banks | | | 51,683 | | | | 1,141,677 | |
| United Fire Group | | | 9,153 | | | | 184,341 | |
| Unity Bancorp | | | 2,864 | | | | 68,908 | |
| Universal Insurance Holdings | | | 11,233 | | | | 175,909 | |
| Univest Financial | | | 12,532 | | | | 208,783 | |
| Upstart Holdings * | | | 32,393 | | | | 778,404 | |
| USCB Financial Holdings * | | | 4,444 | | | | 47,729 | |
| Valley National Bancorp | | | 186,436 | | | | 1,450,472 | |
| Value Line | | | 400 | | | | 16,380 | |
| Velocity Financial * | | | 3,631 | | | | 41,938 | |
| Veritex Holdings | | | 22,561 | | | | 388,500 | |
| Victory Capital Holdings, Cl A | | | 12,899 | | | | 380,005 | |
| Virginia National Bankshares | | | 2,801 | | | | 86,075 | |
| Virtus Investment Partners | | | 3,088 | | | | 568,902 | |
| WaFd | | | 28,246 | | | | 697,111 | |
| Walker & Dunlop | | | 14,040 | | | | 909,792 | |
| Washington Trust Bancorp | | | 7,398 | | | | 171,560 | |
| Waterstone Financial | | | 9,316 | | | | 100,613 | |
The accompanying notes are an integral part of the financial statements.
193
| Schedule of Investments | October 31, 2023 |
| Global X Russell 2000 Covered Call ETF |
| | | Shares | | | Value |
| COMMON STOCK — continued | | | | | | | | |
| Financials — continued | | | | | | | | |
| WesBanco | | | 25,436 | | | $ | 620,384 | |
| West BanCorp | | | 7,091 | | | | 116,505 | |
| Westamerica BanCorp | | | 11,867 | | | | 560,597 | |
| WisdomTree | | | 55,743 | | | | 345,607 | |
| World Acceptance * | | | 1,811 | | | | 178,601 | |
| WSFS Financial | | | 27,342 | | | | 967,907 | |
| | | | | | | | 151,604,689 | |
| Health Care — 9.2% | | | | | | | | |
| 23andMe Holding, Cl A * | | | 1 | | | | 1 | |
| 2seventy bio * | | | 30,096 | | | | 73,434 | |
| 4D Molecular Therapeutics * | | | 13,920 | | | | 149,501 | |
| 89bio * | | | 28,309 | | | | 209,487 | |
| Aadi Bioscience * | | | 7,532 | | | | 32,990 | |
| ACADIA Pharmaceuticals * | | | 57,936 | | | | 1,307,616 | |
| Accolade * | | | 30,766 | | | | 199,979 | |
| Accuray * | | | 1 | | | | 3 | |
| ACELYRIN * | | | 14,608 | | | | 148,782 | |
| Aclaris Therapeutics * | | | 31,144 | | | | 155,097 | |
| Acrivon Therapeutics * | | | 3,889 | | | | 20,378 | |
| Actinium Pharmaceuticals * | | | 14,285 | | | | 79,710 | |
| AdaptHealth, Cl A * | | | 32,903 | | | | 241,179 | |
| Adaptive Biotechnologies * | | | 50,796 | | | | 225,534 | |
| Addus HomeCare * | | | 7,244 | | | | 571,552 | |
| Adicet Bio * | | | 1 | | | | 1 | |
| ADMA Biologics * | | | 91,204 | | | | 308,270 | |
| Aerovate Therapeutics * | | | 4,920 | | | | 52,201 | |
| Agenus * | | | 1 | | | | 1 | |
| Agiliti * | | | 13,210 | | | | 74,372 | |
| Agios Pharmaceuticals * | | | 24,765 | | | | 520,313 | |
| AirSculpt Technologies * | | | 5,495 | | | | 32,970 | |
| Akero Therapeutics * | | | 23,109 | | | | 275,459 | |
| Akoya Biosciences * | | | 7,038 | | | | 24,633 | |
| Aldeyra Therapeutics * | | | 1 | | | | 2 | |
| Alector * | | | 26,855 | | | | 139,646 | |
| Alignment Healthcare * | | | 40,576 | | | | 279,163 | |
| Alkermes * | | | 73,827 | | | | 1,785,875 | |
| Allakos * | | | 1 | | | | 2 | |
| Allogene Therapeutics * | | | 38,828 | | | | 109,495 | |
The accompanying notes are an integral part of the financial statements.
194
| Schedule of Investments | October 31, 2023 |
| Global X Russell 2000 Covered Call ETF |
| | | Shares | | | Value |
| COMMON STOCK — continued | | | | | | | | |
| Health Care — continued | | | | | | | | |
| Allovir * | | | 1 | | | $ | 2 | |
| Alphatec Holdings * | | | 34,380 | | | | 315,608 | |
| Alpine Immune Sciences * | | | 15,997 | | | | 163,809 | |
| Altimmune * | | | 1 | | | | 2 | |
| ALX Oncology Holdings * | | | 9,458 | | | | 68,098 | |
| American Well, Cl A * | | | 1 | | | | 1 | |
| Amicus Therapeutics * | | | 126,348 | | | | 1,386,038 | |
| AMN Healthcare Services * | | | 19,671 | | | | 1,492,242 | |
| Amneal Pharmaceuticals * | | | 1 | | | | 4 | |
| Amphastar Pharmaceuticals * | | | 17,233 | | | | 780,138 | |
| Amylyx Pharmaceuticals * | | | 22,671 | | | | 369,764 | |
| AnaptysBio * | | | 8,602 | | | | 140,299 | |
| Anavex Life Sciences * | | | 32,172 | | | | 179,520 | |
| AngioDynamics * | | | 17,028 | | | | 105,574 | |
| ANI Pharmaceuticals * | | | 7,134 | | | | 440,453 | |
| Anika Therapeutics * | | | 6,621 | | | | 129,110 | |
| Annexon * | | | 1 | | | | 2 | |
| Apogee Therapeutics * | | | 8,596 | | | | 147,679 | |
| Apollo Medical Holdings * | | | 19,100 | | | | 596,111 | |
| Arbutus Biopharma * | | | 1 | | | | 2 | |
| Arcellx * | | | 17,339 | | | | 611,200 | |
| Arcturus Therapeutics Holdings * | | | 13,049 | | | | 249,236 | |
| Arcus Biosciences * | | | 22,094 | | | | 347,097 | |
| Arcutis Biotherapeutics * | | | 23,092 | | | | 51,957 | |
| Ardelyx * | | | 99,757 | | | | 394,040 | |
| Arrowhead Pharmaceuticals * | | | 45,645 | | | | 1,122,411 | |
| ARS Pharmaceuticals * | | | 14,137 | | | | 50,469 | |
| Artivion * | | | 17,628 | | | | 224,581 | |
| Arvinas * | | | 21,898 | | | | 352,996 | |
| Assertio Holdings * | | | 1 | | | | 2 | |
| Astria Therapeutics * | | | 13,495 | | | | 67,340 | |
| Atara Biotherapeutics * | | | 1 | | | | 1 | |
| Atea Pharmaceuticals * | | | 27,967 | | | | 90,893 | |
| AtriCure * | | | 20,753 | | | | 718,884 | |
| Atrion | | | 891 | | | | 304,704 | |
| Aura Biosciences * | | | 12,405 | | | | 101,225 | |
| Avanos Medical * | | | 20,668 | | | | 379,464 | |
| Aveanna Healthcare Holdings * | | | 1 | | | | 1 | |
| Avid Bioservices * | | | 27,782 | | | | 170,859 | |
The accompanying notes are an integral part of the financial statements.
195
| Schedule of Investments | October 31, 2023 |
| Global X Russell 2000 Covered Call ETF |
| | | Shares | | | Value |
| COMMON STOCK — continued | | | | | | | | |
| Health Care — continued | | | | | | | | |
| Avidity Biosciences * | | | 29,024 | | | $ | 149,474 | |
| Avista Public Acquisition II, Cl W * | | | 35,001 | | | | 159,255 | |
| Avita Medical * | | | 12,416 | | | | 115,593 | |
| Axogen * | | | 18,401 | | | | 69,188 | |
| Axonics * | | | 21,846 | | | | 1,118,734 | |
| Axsome Therapeutics * | | | 16,781 | | | | 1,045,121 | |
| Beam Therapeutics * | | | 30,465 | | | | 644,030 | |
| Beyond Air * | | | 1 | | | | 2 | |
| BioAtla * | | | 1 | | | | 1 | |
| BioCryst Pharmaceuticals * | | | 84,528 | | | | 464,059 | |
| Biohaven * | | | 27,047 | | | | 717,016 | |
| BioLife Solutions * | | | 15,622 | | | | 157,782 | |
| Biomea Fusion * | | | 9,448 | | | | 96,559 | |
| Biote, Cl A * | | | 9,681 | | | | 51,600 | |
| BioVie, Cl A * | | | 5,290 | | | | 23,064 | |
| Bioxcel Therapeutics * | | | 1 | | | | 4 | |
| Bluebird Bio * | | | 1 | | | | 3 | |
| Blueprint Medicines * | | | 27,073 | | | | 1,593,517 | |
| Bridgebio Pharma * | | | 50,975 | | | | 1,327,389 | |
| Bright Green * | | | 1 | | | | — | |
| Brookdale Senior Living * | | | 80,973 | | | | 316,604 | |
| Butterfly Network * | | | 1 | | | | 1 | |
| Cabaletta Bio * | | | 13,000 | | | | 185,380 | |
| Cano Health * | | | 1 | | | | — | |
| Cara Therapeutics * | | | 1 | | | | 1 | |
| CareDx * | | | 21,596 | | | | 116,834 | |
| CareMax * | | | 1 | | | | 2 | |
| Caribou Biosciences * | | | 21,517 | | | | 78,107 | |
| Carisma Therapeutics | | | 14,244 | | | | 42,732 | |
| Cassava Sciences * | | | 16,475 | | | | 331,971 | |
| Castle Biosciences * | | | 10,917 | | | | 170,524 | |
| Catalyst Pharmaceuticals * | | | 42,460 | | | | 526,929 | |
| Celcuity * | | | 9,505 | | | | 101,228 | |
| Celldex Therapeutics * | | | 19,996 | | | | 470,306 | |
| Century Therapeutics * | | | 1 | | | | 2 | |
| Cerevel Therapeutics Holdings * | | | 27,845 | | | | 658,534 | |
| Cerus * | | | 1 | | | | 1 | |
| Citius Pharmaceuticals * | | | 1 | | | | 1 | |
| ClearPoint Neuro * | | | 13,378 | | | | 73,579 | |
The accompanying notes are an integral part of the financial statements.
196
| Schedule of Investments | October 31, 2023 |
| Global X Russell 2000 Covered Call ETF |
| | | Shares | | | Value |
| COMMON STOCK — continued | | | | | | | | |
| Health Care — continued | | | | | | | | |
| Codexis * | | | 1 | | | $ | 2 | |
| Cogent Biosciences * | | | 27,999 | | | | 228,472 | |
| Coherus Biosciences * | | | 41,842 | | | | 140,171 | |
| Collegium Pharmaceutical * | | | 15,029 | | | | 327,031 | |
| Community Health Systems * | | | 1 | | | | 2 | |
| Compass Therapeutics * | | | 1 | | | | 2 | |
| Computer Programs and Systems * | | | 6,264 | | | | 88,260 | |
| CONMED | | | 13,625 | | | | 1,327,893 | |
| Corcept Therapeutics * | | | 37,726 | | | | 1,059,346 | |
| CorMedix * | | | 23,751 | | | | 82,653 | |
| CorVel * | | | 4,001 | | | | 775,954 | |
| Crinetics Pharmaceuticals * | | | 29,232 | | | | 856,205 | |
| Cross Country Healthcare * | | | 15,769 | | | | 365,210 | |
| CryoPort * | | | 19,468 | | | | 188,840 | |
| Cue Biopharma * | | | 1 | | | | 2 | |
| Cullinan Oncology * | | | 13,067 | | | | 121,915 | |
| Cutera * | | | 7,348 | | | | 22,852 | |
| CVRx * | | | 6,447 | | | | 86,261 | |
| Cymabay Therapeutics * | | | 45,838 | | | | 750,826 | |
| Cytek Biosciences * | | | 49,053 | | | | 206,513 | |
| Cytokinetics * | | | 41,490 | | | | 1,446,341 | |
| Day One Biopharmaceuticals * | | | 33,901 | | | | 401,049 | |
| Deciphera Pharmaceuticals * | | | 23,379 | | | | 280,314 | |
| Definitive Healthcare, Cl A * | | | 22,108 | | | | 127,342 | |
| Denali Therapeutics * | | | 52,595 | | | | 990,364 | |
| Design Therapeutics * | | | 1 | | | | 2 | |
| Disc Medicine, Cl A * | | | 3,810 | | | | 174,536 | |
| DocGo * | | | 37,175 | | | | 220,820 | |
| Dynavax Technologies * | | | 65,491 | | | | 930,627 | |
| Dyne Therapeutics * | | | 15,804 | | | | 111,418 | |
| Eagle Pharmaceuticals * | | | 4,884 | | | | 67,057 | |
| Edgewise Therapeutics * | | | 14,557 | | | | 93,165 | |
| Editas Medicine, Cl A * | | | 32,105 | | | | 214,461 | |
| Embecta | | | 25,000 | | | | 378,000 | |
| Emergent BioSolutions * | | | 1 | | | | 2 | |
| Enanta Pharmaceuticals * | | | 9,220 | | | | 83,164 | |
| Enhabit * | | | 23,979 | | | | 176,725 | |
| Enliven Therapeutics * | | | 11,276 | | | | 139,710 | |
| Ensign Group | | | 24,814 | | | | 2,397,032 | |
The accompanying notes are an integral part of the financial statements.
197
| Schedule of Investments | October 31, 2023 |
| Global X Russell 2000 Covered Call ETF |
| | | Shares | | | Value |
| COMMON STOCK — continued | | | | | | | | |
| Health Care — continued | | | | | | | | |
| Entrada Therapeutics * | | | 10,874 | | | $ | 174,093 | |
| EQRx * | | | 1 | | | | 2 | |
| Erasca * | | | 1 | | | | 2 | |
| Evolent Health, Cl A * | | | 49,134 | | | | 1,200,344 | |
| Evolus * | | | 13,915 | | | | 105,754 | |
| Eyenovia * | | | 1 | | | | 1 | |
| EyePoint Pharmaceuticals * | | | 14,702 | | | | 88,506 | |
| Fate Therapeutics * | | | 1 | | | | 2 | |
| FibroGen * | | | 1 | | | | 1 | |
| Foghorn Therapeutics * | | | 8,145 | | | | 27,286 | |
| Fulgent Genetics * | | | 9,317 | | | | 223,049 | |
| Genelux * | | | 8,772 | | | | 127,282 | |
| Generation Bio * | | | 18,259 | | | | 17,132 | |
| Geron * | | | 1 | | | | 2 | |
| Glaukos * | | | 20,676 | | | | 1,410,103 | |
| Graphite Bio * | | | 1 | | | | 3 | |
| Gritstone bio * | | | 1 | | | | 2 | |
| Guardant Health * | | | 51,927 | | | | 1,343,871 | |
| Haemonetics * | | | 22,874 | | | | 1,949,551 | |
| Halozyme Therapeutics * | | | 60,171 | | | | 2,037,992 | |
| Harmony Biosciences Holdings * | | | 15,100 | | | | 355,454 | |
| Harrow * | | | 12,628 | | | | 181,022 | |
| Harvard Bioscience * | | | 20,973 | | | | 92,071 | |
| Health Catalyst * | | | 25,818 | | | | 193,377 | |
| HealthEquity * | | | 38,149 | | | | 2,734,520 | |
| HealthStream | | | 10,872 | | | | 276,149 | |
| Heron Therapeutics * | | | 1 | | | | 1 | |
| HilleVax * | | | 8,001 | | | | 88,011 | |
| Hims & Hers Health * | | | 50,188 | | | | 300,124 | |
| Humacyte * | | | 1 | | | | 2 | |
| Icosavax * | | | 10,198 | | | | 62,718 | |
| Ideaya Biosciences * | | | 24,753 | | | | 672,539 | |
| IGM Biosciences * | | | 4,241 | | | | 16,710 | |
| Ikena Oncology * | | | 12,687 | | | | 51,129 | |
| Immuneering, Cl A * | | | 11,118 | | | | 78,160 | |
| ImmunityBio * | | | 1 | | | | 3 | |
| ImmunoGen * | | | 110,056 | | | | 1,635,432 | |
| Immunovant * | | | 24,787 | | | | 819,210 | |
| Inari Medical * | | | 24,958 | | | | 1,515,200 | |
The accompanying notes are an integral part of the financial statements.
198
| Schedule of Investments | October 31, 2023 |
| Global X Russell 2000 Covered Call ETF |
| | | Shares | | | Value |
| COMMON STOCK — continued | | | | | | | | |
| Health Care — continued | | | | | | | | |
| InfuSystem Holdings * | | | 10,267 | | | $ | 98,358 | |
| Inhibrx * | | | 14,411 | | | | 222,938 | |
| Inmode * | | | 34,621 | | | | 661,261 | |
| Innovage Holding * | | | 13,867 | | | | 75,298 | |
| Innoviva * | | | 27,317 | | | | 339,004 | |
| Inogen * | | | 9,588 | | | | 42,858 | |
| Inozyme Pharma * | | | 55,403 | | | | 164,547 | |
| Insmed * | | | 58,348 | | | | 1,462,201 | |
| Integer Holdings * | | | 15,363 | | | | 1,247,015 | |
| Intellia Therapeutics * | | | 39,258 | | | | 983,413 | |
| Intercept Pharmaceuticals * | | | 25,861 | | | | 489,549 | |
| Intra-Cellular Therapies * | | | 43,226 | | | | 2,150,926 | |
| Invitae * | | | 1 | | | | 1 | |
| Iovance Biotherapeutics * | | | 94,078 | | | | 359,378 | |
| iRadimed | | | 2,967 | | | | 120,876 | |
| iRhythm Technologies * | | | 14,183 | | | | 1,113,649 | |
| Ironwood Pharmaceuticals, Cl A * | | | 59,286 | | | | 531,795 | |
| iTeos Therapeutics * | | | 10,236 | | | | 102,974 | |
| Janux Therapeutics * | | | 7,432 | | | | 47,713 | |
| Joint * | | | 6,430 | | | | 50,218 | |
| KalVista Pharmaceuticals * | | | 9,401 | | | | 79,814 | |
| Karyopharm Therapeutics * | | | 1 | | | | 1 | |
| Keros Therapeutics * | | | 9,927 | | | | 283,317 | |
| Kezar Life Sciences * | | | 1 | | | | 1 | |
| Kiniksa Pharmaceuticals, Cl A * | | | 15,634 | | | | 238,419 | |
| Kodiak Sciences * | | | 1 | | | | 1 | |
| KORU Medical Systems * | | | 1 | | | | 2 | |
| Krystal Biotech * | | | 9,549 | | | | 1,115,992 | |
| Kura Oncology * | | | 29,306 | | | | 247,636 | |
| Kymera Therapeutics * | | | 16,286 | | | | 190,058 | |
| Lantheus Holdings * | | | 30,079 | | | | 1,943,103 | |
| Larimar Therapeutics * | | | 1 | | | | 3 | |
| LeMaitre Vascular | | | 8,580 | | | | 416,816 | |
| Lexicon Pharmaceuticals * | | | 1 | | | | 1 | |
| LifeStance Health Group * | | | 49,051 | | | | 285,967 | |
| Ligand Pharmaceuticals * | | | 7,989 | | | | 417,745 | |
| Lineage Cell Therapeutics * | | | 1 | | | | 1 | |
| Liquidia * | | | 19,771 | | | | 128,709 | |
| LivaNova * | | | 25,058 | | | | 1,229,095 | |
The accompanying notes are an integral part of the financial statements.
199
| Schedule of Investments | October 31, 2023 |
| Global X Russell 2000 Covered Call ETF |
| | | Shares | | | Value |
| COMMON STOCK — continued | | | | | | | | |
| Health Care — continued | | | | | | | | |
| Longboard Pharmaceuticals * | | | 9,578 | | | $ | 51,865 | |
| Lyell Immunopharma * | | | 1 | | | | 2 | |
| MacroGenics * | | | 44,563 | | | | 232,619 | |
| Madrigal Pharmaceuticals * | | | 6,196 | | | | 814,030 | |
| MannKind * | | | 102,986 | | | | 441,810 | |
| Marinus Pharmaceuticals * | | | 24,081 | | | | 167,122 | |
| MaxCyte * | | | 1 | | | | 3 | |
| MeiraGTx Holdings * | | | 12,489 | | | | 56,450 | |
| Merit Medical Systems * | | | 26,502 | | | | 1,821,747 | |
| Merrimack Pharmaceuticals * | | | 6,417 | | | | 78,480 | |
| Mersana Therapeutics * | | | 1 | | | | 1 | |
| Mesa Laboratories | | | 2,260 | | | | 212,056 | |
| MiMedx Group * | | | 49,107 | | | | 322,142 | |
| Mineralys Therapeutics * | | | 5,236 | | | | 40,474 | |
| Mirum Pharmaceuticals * | | | 11,793 | | | | 323,482 | |
| ModivCare * | | | 5,796 | | | | 244,823 | |
| Monte Rosa Therapeutics * | | | 11,946 | | | | 40,616 | |
| Morphic Holding * | | | 15,613 | | | | 311,479 | |
| Multiplan * | | | 1 | | | | 2 | |
| Myriad Genetics * | | | 34,791 | | | | 542,044 | |
| NanoString Technologies * | | | 1 | | | | 1 | |
| National HealthCare | | | 5,589 | | | | 376,475 | |
| National Research | | | 6,216 | | | | 262,688 | |
| Nautilus Biotechnology, Cl A * | | | 1 | | | | 3 | |
| Neogen * | | | 98,392 | | | | 1,465,057 | |
| NeoGenomics * | | | 63,547 | | | | 890,929 | |
| Nevro * | | | 15,004 | | | | 216,508 | |
| NextGen Healthcare * | | | 24,910 | | | | 595,847 | |
| NGM Biopharmaceuticals * | | | 1 | | | | 1 | |
| Nkarta * | | | 1 | | | | 2 | |
| Novavax * | | | 41,465 | | | | 276,157 | |
| Nurix Therapeutics * | | | 23,065 | | | | 128,933 | |
| Nuvalent, Cl A * | | | 10,577 | | | | 550,956 | |
| Nuvation Bio * | | | 1 | | | | 1 | |
| Nuvectis Pharma * | | | 4,274 | | | | 38,252 | |
| Ocean Biomedical * | | | 1 | | | | 2 | |
| Ocular Therapeutix * | | | 1 | | | | 3 | |
| Olema Pharmaceuticals * | | | 14,584 | | | | 193,821 | |
| Omega Therapeutics * | | | 1 | | | | 1 | |
The accompanying notes are an integral part of the financial statements.
200
| Schedule of Investments | October 31, 2023 |
| Global X Russell 2000 Covered Call ETF |
| | | Shares | | | Value |
| COMMON STOCK — continued | | | | | | | | |
| Health Care — continued | | | | | | | | |
| Omeros * | | | 1 | | | $ | 1 | |
| Omnicell * | | | 20,997 | | | | 746,233 | |
| OPKO Health * | | | 1 | | | | 1 | |
| OptimizeRx * | | | 7,556 | | | | 60,901 | |
| Optinose * | | | 1 | | | | 1 | |
| Option Care Health * | | | 77,132 | | | | 2,138,870 | |
| OraSure Technologies * | | | 39,618 | | | | 204,429 | |
| Orchestra BioMed Holdings * | | | 4,591 | | | | 21,532 | |
| Organogenesis Holdings, Cl A * | | | 1 | | | | 2 | |
| ORIC Pharmaceuticals * | | | 20,681 | | | | 138,563 | |
| Orthofix Medical * | | | 15,206 | | | | 167,874 | |
| OrthoPediatrics * | | | 7,024 | | | | 171,807 | |
| Outlook Therapeutics * | | | 1 | | | | 1 | |
| Outset Medical * | | | 21,296 | | | | 75,388 | |
| Ovid therapeutics * | | | 32,231 | | | | 114,420 | |
| Owens & Minor * | | | 31,731 | | | | 454,705 | |
| P3 Health Partners * | | | 1 | | | | 1 | |
| Pacific Biosciences of California * | | | 111,603 | | | | 689,707 | |
| Pacira BioSciences * | | | 19,697 | | | | 556,637 | |
| Paragon 28 * | | | 21,994 | | | | 189,808 | |
| Patterson | | | 38,373 | | | | 1,168,842 | |
| PDS Biotechnology * | | | 51,576 | | | | 215,072 | |
| Pediatrix Medical Group * | | | 35,983 | | | | 412,365 | |
| Pennant Group * | | | 11,372 | | | | 123,614 | |
| PepGen * | | | 6,927 | | | | 35,466 | |
| PetIQ, Cl A * | | | 12,030 | | | | 225,803 | |
| Phathom Pharmaceuticals * | | | 12,207 | | | | 113,525 | |
| Phibro Animal Health, Cl A | | | 8,983 | | | | 98,094 | |
| Phreesia * | | | 21,801 | | | | 297,802 | |
| Pliant Therapeutics * | | | 25,868 | | | | 379,484 | |
| PMV Pharmaceuticals * | | | 1 | | | | 2 | |
| Point Biopharma Global, Cl A * | | | 57,504 | | | | 728,001 | |
| Poseida Therapeutics, Cl A * | | | 1 | | | | 2 | |
| Precigen * | | | 1 | | | | 1 | |
| Prelude Therapeutics * | | | 1 | | | | 2 | |
| Prestige Consumer Healthcare * | | | 22,932 | | | | 1,361,244 | |
| Prime Medicine * | | | 18,871 | | | | 122,473 | |
| Privia Health Group * | | | 49,859 | | | | 1,048,036 | |
| PROCEPT BioRobotics * | | | 16,508 | | | | 442,249 | |
The accompanying notes are an integral part of the financial statements.
201
| Schedule of Investments | October 31, 2023 |
| Global X Russell 2000 Covered Call ETF |
| | | Shares | | | Value |
| COMMON STOCK — continued | | | | | | | | |
| Health Care — continued | | | | | �� | | | |
| Progyny * | | | 34,468 | | | $ | 1,063,682 | |
| ProKidney, Cl A * | | | 1 | | | | 2 | |
| Protagonist Therapeutics * | | | 24,606 | | | | 357,771 | |
| Protalix BioTherapeutics * | | | 1 | | | | 2 | |
| PTC Therapeutics * | | | 31,028 | | | | 581,775 | |
| Pulmonx * | | | 14,391 | | | | 126,497 | |
| Pulse Biosciences * | | | 10,571 | | | | 47,781 | |
| Quanterix * | | | 16,471 | | | | 357,750 | |
| Quantum-Si * | | | 1 | | | | 1 | |
| Quipt Home Medical * | | | 21,844 | | | | 103,322 | |
| RadNet * | | | 26,995 | | | | 727,785 | |
| Rain Oncology * | | | 1 | | | | 1 | |
| Rallybio * | | | 7,262 | | | | 30,500 | |
| RAPT Therapeutics * | | | 16,631 | | | | 218,698 | |
| Recursion Pharmaceuticals, Cl A * | | | 66,042 | | | | 348,702 | |
| REGENXBIO * | | | 17,074 | | | | 220,084 | |
| Relay Therapeutics * | | | 37,002 | | | | 244,213 | |
| Reneo Pharmaceuticals * | | | 7,340 | | | | 59,381 | |
| Replimune Group * | | | 22,969 | | | | 334,658 | |
| Revance Therapeutics * | | | 35,831 | | | | 282,707 | |
| REVOLUTION Medicines * | | | 45,383 | | | | 898,583 | |
| Rhythm Pharmaceuticals * | | | 23,827 | | | | 550,642 | |
| Rigel Pharmaceuticals * | | | 1 | | | | 1 | |
| Rocket Pharmaceuticals * | | | 27,945 | | | | 505,805 | |
| RxSight * | | | 13,580 | | | | 300,661 | |
| Sage Therapeutics * | | | 24,928 | | | | 466,901 | |
| Sagimet Biosciences, Cl A * | | | 2,284 | | | | 8,359 | |
| Sana Biotechnology * | | | 36,008 | | | | 106,584 | |
| Sanara Medtech * | | | 2,228 | | | | 61,248 | |
| Sangamo Therapeutics * | | | 1 | | | | 1 | |
| Savara * | | | 1 | | | | 4 | |
| Scholar Rock Holding * | | | 15,000 | | | | 176,400 | |
| Schrodinger * | | | 23,241 | | | | 504,330 | |
| scPharmaceuticals * | | | 14,884 | | | | 79,629 | |
| Seer, Cl A * | | | 1 | | | | 2 | |
| Select Medical Holdings | | | 46,452 | | | | 1,055,854 | |
| Selecta Biosciences * | | | 1 | | | | 1 | |
| Semler Scientific * | | | 3,071 | | | | 89,581 | |
| Seres Therapeutics * | | | 1 | | | | 2 | |
The accompanying notes are an integral part of the financial statements.
202
| Schedule of Investments | October 31, 2023 |
| Global X Russell 2000 Covered Call ETF |
| | | Shares | | | Value |
| COMMON STOCK — continued | | | | | | | | |
| Health Care — continued | | | | | | | | |
| Sharecare * | | | 1 | | | $ | 1 | |
| SI-BONE * | | | 14,825 | | | | 252,173 | |
| SIGA Technologies | | | 19,751 | | | | 100,730 | |
| Sight Sciences * | | | 9,061 | | | | 14,362 | |
| Silk Road Medical * | | | 16,826 | | | | 126,363 | |
| Simulations Plus | | | 6,704 | | | | 236,450 | |
| SomaLogic * | | | 1 | | | | 2 | |
| SpringWorks Therapeutics * | | | 26,443 | | | | 605,545 | |
| STAAR Surgical * | | | 22,679 | | | | 948,436 | |
| Stoke Therapeutics * | | | 9,461 | | | | 36,046 | |
| Summit Therapeutics * | | | 1 | | | | 2 | |
| Supernus Pharmaceuticals * | | | 21,654 | | | | 516,448 | |
| Surgery Partners * | | | 30,187 | | | | 698,225 | |
| Surmodics * | | | 5,882 | | | | 173,284 | |
| Sutro Biopharma * | | | 44,019 | | | | 121,052 | |
| Syndax Pharmaceuticals * | | | 31,423 | | | | 442,436 | |
| Tactile Systems Technology * | | | 16,846 | | | | 183,958 | |
| Tango Therapeutics * | | | 19,290 | | | | 162,036 | |
| Taro Pharmaceutical Industries * | | | 4,170 | | | | 141,613 | |
| Tarsus Pharmaceuticals * | | | 10,399 | | | | 148,082 | |
| Tela Bio * | | | 9,097 | | | | 53,126 | |
| Tenaya Therapeutics * | | | 1 | | | | 2 | |
| Terns Pharmaceuticals * | | | 39,136 | | | | 205,855 | |
| TG Therapeutics * | | | 58,026 | | | | 448,541 | |
| Theravance Biopharma * | | | 29,858 | | | | 281,860 | |
| Theseus Pharmaceuticals * | | | 1 | | | | 2 | |
| Third Harmonic Bio * | | | 8,591 | | | | 54,982 | |
| TransMedics Group * | | | 14,940 | | | | 559,951 | |
| Travere Therapeutics * | | | 29,936 | | | | 193,985 | |
| Treace Medical Concepts * | | | 20,725 | | | | 207,872 | |
| Trevi Therapeutics * | | | 1 | | | | 2 | |
| Turnstone Biologics * | | | 1 | | | | 4 | |
| Twist Bioscience * | | | 24,734 | | | | 389,808 | |
| Tyra Biosciences * | | | 6,382 | | | | 74,031 | |
| UFP Technologies * | | | 3,412 | | | | 531,999 | |
| UroGen Pharma * | | | 10,577 | | | | 118,568 | |
| US Physical Therapy | | | 6,375 | | | | 536,201 | |
| Utah Medical Products | | | 1,629 | | | | 129,538 | |
| Vanda Pharmaceuticals * | | | 26,160 | | | | 114,581 | |
The accompanying notes are an integral part of the financial statements.
203
| Schedule of Investments | October 31, 2023 |
| Global X Russell 2000 Covered Call ETF |
| | | Shares | | | Value |
| COMMON STOCK — continued | | | | | | | | |
| Health Care — continued | | | | | | | | |
| Varex Imaging * | | | 16,527 | | | $ | 298,312 | |
| Vaxcyte * | | | 43,366 | | | | 2,085,905 | |
| Vaxxinity, Cl A * | | | 1 | | | | 1 | |
| Ventyx Biosciences * | | | 21,234 | | | | 306,194 | |
| Vera Therapeutics, Cl A * | | | 16,192 | | | | 168,721 | |
| Veracyte * | | | 31,457 | | | | 651,789 | |
| Veradigm * | | | 50,685 | | | | 668,535 | |
| Vericel * | | | 21,320 | | | | 750,038 | |
| Verrica Pharmaceuticals * | | | 47,963 | | | | 176,504 | |
| Verve Therapeutics * | | | 20,629 | | | | 248,373 | |
| Vicarious Surgical, Cl A * | | | 1 | | | | — | |
| Viemed Healthcare * | | | 17,377 | | | | 109,649 | |
| Vigil Neuroscience * | | | 9,319 | | | | 65,233 | |
| Viking Therapeutics * | | | 43,286 | | | | 424,636 | |
| Vir Biotechnology * | | | 37,659 | | | | 298,636 | |
| Viridian Therapeutics * | | | 20,792 | | | | 259,900 | |
| Vor BioPharma * | | | 1 | | | | 2 | |
| Voyager Therapeutics * | | | 15,812 | | | | 103,885 | |
| WaVe Life Sciences * | | | 33,050 | | | | 177,809 | |
| Xencor * | | | 25,198 | | | | 437,185 | |
| Xeris Biopharma Holdings * | | | 1 | | | | 2 | |
| XOMA * | | | 4,438 | | | | 83,656 | |
| Y-mAbs Therapeutics * | | | 25,001 | | | | 133,505 | |
| Zentalis Pharmaceuticals * | | | 26,545 | | | | 434,276 | |
| Zevra Therapeutics * | | | 19,072 | | | | 85,443 | |
| Zimvie * | | | 8,673 | | | | 61,231 | |
| Zymeworks * | | | 26,210 | | | | 183,994 | |
| Zynex * | | | 9,231 | | | | 81,971 | |
| | | | | | | | 129,065,870 | |
| Industrials — 11.2% | | | | | | | | |
| 374Water * | | | 1 | | | | 2 | |
| 3D Systems * | | | 56,355 | | | | 210,204 | |
| AAON | | | 30,169 | | | | 1,643,607 | |
| AAR * | | | 15,376 | | | | 912,719 | |
| ABM Industries | | | 29,509 | | | | 1,160,884 | |
| ACCO Brands | | | 38,553 | | | | 195,078 | |
| ACV Auctions, Cl A * | | | 56,637 | | | | 754,971 | |
| AeroVironment * | | | 12,299 | | | | 1,410,203 | |
The accompanying notes are an integral part of the financial statements.
204
| Schedule of Investments | October 31, 2023 |
| Global X Russell 2000 Covered Call ETF |
| | | Shares | | | Value |
| COMMON STOCK — continued | | | | | | | | |
| Industrials — continued | | | | | | | | |
| AerSale * | | | 11,619 | | | $ | 177,655 | |
| Air Transport Services Group * | | | 25,156 | | | | 492,303 | |
| Alamo Group | | | 4,499 | | | | 721,190 | |
| Albany International, Cl A | | | 13,940 | | | | 1,137,643 | |
| Alight, Cl A * | | | 177,348 | | | | 1,177,591 | |
| Allegiant Travel | | | 7,053 | | | | 469,871 | |
| Allient | | | 6,218 | | | | 171,617 | |
| Alta Equipment Group | | | 9,163 | | | | 84,208 | |
| Ameresco, Cl A * | | | 14,350 | | | | 375,252 | |
| American Woodmark * | | | 7,584 | | | | 509,872 | |
| Amprius Technologies * | | | 5,086 | | | | 14,800 | |
| API Group * | | | 93,129 | | | | 2,409,247 | |
| Apogee Enterprises | | | 10,237 | | | | 439,372 | |
| Applied Industrial Technologies | | | 17,200 | | | | 2,640,372 | |
| ArcBest | | | 10,752 | | | | 1,170,678 | |
| Archer Aviation, Cl A * | | | 68,121 | | | | 323,575 | |
| Arcosa | | | 21,607 | | | | 1,492,395 | |
| Argan | | | 6,449 | | | | 294,977 | |
| Aris Water Solutions, Cl A | | | 16,967 | | | | 141,674 | |
| Array Technologies * | | | 68,835 | | | | 1,192,911 | |
| ASGN * | | | 21,471 | | | | 1,791,970 | |
| Astec Industries | | | 10,147 | | | | 406,286 | |
| Astronics * | | | 11,672 | | | | 178,932 | |
| Asure Software * | | | 10,178 | | | | 86,106 | |
| Atkore * | | | 18,653 | | | | 2,318,195 | |
| AZZ | | | 11,079 | | | | 523,704 | |
| Babcock & Wilcox Enterprises * | | | 1 | | | | 3 | |
| Barnes Group | | | 21,839 | | | | 454,033 | |
| Barrett Business Services | | | 3,154 | | | | 288,465 | |
| Beacon Roofing Supply * | | | 24,025 | | | | 1,709,859 | |
| BlackSky Technology * | | | 1 | | | | 1 | |
| Blade Air Mobility * | | | 1 | | | | 2 | |
| Blink Charging * | | | 15,870 | | | | 37,771 | |
| Bloom Energy, Cl A * | | | 86,026 | | | | 894,670 | |
| Blue Bird * | | | 7,935 | | | | 144,496 | |
| BlueLinx Holdings * | | | 3,990 | | | | 283,729 | |
| Boise Cascade | | | 19,696 | | | | 1,846,500 | |
| Bowman Consulting Group, Cl A * | | | 5,142 | | | | 136,623 | |
| BrightView Holdings * | | | 19,038 | | | | 128,316 | |
The accompanying notes are an integral part of the financial statements.
205
| Schedule of Investments | October 31, 2023 |
| Global X Russell 2000 Covered Call ETF |
| | | Shares | | | Value |
| COMMON STOCK — continued | | | | | | | | |
| Industrials — continued | | | | | | | | |
| Brink’s | | | 20,556 | | | $ | 1,374,374 | |
| Cadre Holdings | | | 9,385 | | | | 263,249 | |
| Casella Waste Systems, Cl A * | | | 25,772 | | | | 1,944,497 | |
| CBIZ * | | | 22,158 | | | | 1,151,330 | |
| CECO Environmental * | | | 14,745 | | | | 238,574 | |
| Chart Industries * | | | 19,201 | | | | 2,231,732 | |
| Columbus McKinnon | | | 12,775 | | | | 390,532 | |
| Comfort Systems USA | | | 16,090 | | | | 2,925,966 | |
| Commercial Vehicle Group * | | | 16,390 | | | | 114,238 | |
| CompX International | | | 1,017 | | | | 19,140 | |
| Concrete Pumping Holdings * | | | 11,797 | | | | 82,933 | |
| Conduent * | | | 1 | | | | 3 | |
| Construction Partners, Cl A * | | | 18,933 | | | | 727,974 | |
| CoreCivic * | | | 49,413 | | | | 627,545 | |
| Covenant Logistics Group, Cl A | | | 5,292 | | | | 208,955 | |
| CRA International | | | 3,063 | | | | 297,448 | |
| CSG Systems International | | | 15,134 | | | | 709,179 | |
| CSW Industrials | | | 6,802 | | | | 1,205,723 | |
| Custom Truck One Source * | | | 24,435 | | | | 140,990 | |
| Daseke * | | | 16,833 | | | | 74,739 | |
| Deluxe | | | 18,431 | | | | 314,249 | |
| Desktop Metal, Cl A * | | | 1 | | | | 1 | |
| Distribution Solutions Group * | | | 4,674 | | | | 140,921 | |
| Douglas Dynamics | | | 9,782 | | | | 237,507 | |
| Dragonfly Energy Holdings * | | | 1 | | | | 1 | |
| Ducommun * | | | 6,658 | | | | 318,519 | |
| DXP Enterprises * | | | 7,228 | | | | 235,633 | |
| Dycom Industries * | | | 12,621 | | | | 1,075,057 | |
| Eagle Bulk Shipping | | | 5,804 | | | | 236,803 | |
| Encore Wire | | | 8,230 | | | | 1,471,771 | |
| Energy Recovery * | | | 24,149 | | | | 367,065 | |
| Energy Vault Holdings * | | | 1 | | | | 2 | |
| Enerpac Tool Group, Cl A | | | 25,913 | | | | 733,338 | |
| EnerSys | | | 18,878 | | | | 1,615,579 | |
| Eneti | | | 9,437 | | | | 95,786 | |
| Ennis | | | 11,172 | | | | 238,634 | |
| Enovix * | | | 61,758 | | | | 550,264 | |
| EnPro Industries | | | 9,686 | | | | 1,075,727 | |
| Enviri * | | | 32,410 | | | | 186,033 | |
The accompanying notes are an integral part of the financial statements.
206
| Schedule of Investments | October 31, 2023 |
| Global X Russell 2000 Covered Call ETF |
| | | Shares | | | Value |
| COMMON STOCK — continued | | | | | | | | |
| Industrials — continued | | | | | | | | |
| Eos Energy Enterprises * | | | 1 | | | $ | 2 | |
| ESCO Technologies | | | 11,227 | | | | 1,091,489 | |
| ESS Tech * | | | 1 | | | | 1 | |
| Eve Holding * | | | 10,020 | | | | 75,150 | |
| EVI Industries | | | 3,107 | | | | 79,943 | |
| ExlService Holdings * | | | 73,706 | | | | 1,924,464 | |
| Exponent | | | 23,110 | | | | 1,693,732 | |
| Federal Signal | | | 27,462 | | | | 1,593,894 | |
| First Advantage | | | 25,204 | | | | 327,904 | |
| FiscalNote Holdings * | | | 1 | | | | 1 | |
| Fluence Energy, Cl A * | | | 16,937 | | | | 293,349 | |
| Fluor * | | | 64,494 | | | | 2,147,005 | |
| Forrester Research * | | | 5,000 | | | | 116,000 | |
| Forward Air | | | 11,700 | | | | 753,597 | |
| Franklin Covey * | | | 5,441 | | | | 214,430 | |
| Franklin Electric | | | 21,121 | | | | 1,831,613 | |
| Frontier Group Holdings * | | | 16,222 | | | | 54,993 | |
| FTAI Aviation | | | 44,487 | | | | 1,673,156 | |
| FTAI Infrastructure | | | 1 | | | | 3 | |
| FTC Solar * | | | 1 | | | | 1 | |
| FuelCell Energy * | | | 1 | | | | 1 | |
| GATX | | | 15,975 | | | | 1,670,665 | |
| Genco Shipping & Trading | | | 16,258 | | | | 214,118 | |
| Gencor Industries * | | | 6,096 | | | | 86,563 | |
| GEO Group * | | | 52,803 | | | | 461,498 | |
| Gibraltar Industries * | | | 14,069 | | | | 856,239 | |
| Global Industrial | | | 5,678 | | | | 181,412 | |
| GMS * | | | 18,563 | | | | 1,085,564 | |
| Gorman-Rupp | | | 9,825 | | | | 290,329 | |
| GrafTech International | | | 82,229 | | | | 283,690 | |
| Granite Construction | | | 19,436 | | | | 786,769 | |
| Great Lakes Dredge & Dock * | | | 28,107 | | | | 213,613 | |
| Greenbrier | | | 13,618 | | | | 471,047 | |
| Griffon | | | 21,335 | | | | 852,120 | |
| H&E Equipment Services | | | 14,456 | | | | 588,648 | |
| Hawaiian Holdings * | | | 21,780 | | | | 91,694 | |
| Healthcare Services Group | | | 31,957 | | | | 303,591 | |
| Heartland Express | | | 20,219 | | | | 235,754 | |
| Heidrick & Struggles International | | | 8,472 | | | | 206,208 | |
The accompanying notes are an integral part of the financial statements.
207
| Schedule of Investments | October 31, 2023 |
| Global X Russell 2000 Covered Call ETF |
| | | Shares | | | Value |
| COMMON STOCK — continued | | | | | | | | |
| Industrials — continued | | | | | | | | |
| Helios Technologies | | | 14,249 | | | $ | 736,958 | |
| Herc Holdings | | | 12,591 | | | | 1,344,593 | |
| Hillenbrand | | | 30,914 | | | | 1,175,659 | |
| Hillman Solutions * | | | 78,313 | | | | 513,733 | |
| HireQuest | | | 10,871 | | | | 165,674 | |
| HireRight Holdings * | | | 9,061 | | | | 83,452 | |
| HNI | | | 20,313 | | | | 704,672 | |
| Hub Group, Cl A * | | | 14,408 | | | | 990,550 | |
| Hudson Technologies * | | | 20,735 | | | | 267,067 | |
| Huron Consulting Group * | | | 9,216 | | | | 915,702 | |
| Hyliion Holdings * | | | 1 | | | | 1 | |
| Hyster-Yale Materials Handling | | | 4,864 | | | | 194,609 | |
| IBEX Holdings * | | | 4,114 | | | | 67,140 | |
| ICF International | | | 8,668 | | | | 1,098,496 | |
| IES Holdings * | | | 4,002 | | | | 249,044 | |
| Innodata * | | | 13,030 | | | | 97,725 | |
| INNOVATE * | | | 1 | | | | 1 | |
| Insperity | | | 17,368 | | | | 1,838,229 | |
| Insteel Industries | | | 8,043 | | | | 224,480 | |
| Interface, Cl A | | | 27,420 | | | | 243,764 | |
| Janus International Group * | | | 37,320 | | | | 349,315 | |
| JELD-WEN Holding * | | | 38,292 | | | | 433,848 | |
| JetBlue Airways * | | | 148,031 | | | | 556,597 | |
| Joby Aviation * | | | 125,888 | | | | 663,430 | |
| John Bean Technologies | | | 14,695 | | | | 1,528,574 | |
| Kadant | | | 5,755 | | | | 1,266,100 | |
| Kaman | | | 11,908 | | | | 221,608 | |
| Karat Packaging | | | 2,468 | | | | 50,915 | |
| Kelly Services, Cl A | | | 15,165 | | | | 270,695 | |
| Kennametal | | | 35,331 | | | | 816,499 | |
| Kforce | | | 8,608 | | | | 525,432 | |
| Korn Ferry | | | 23,748 | | | | 1,081,009 | |
| Kratos Defense & Security Solutions * | | | 54,050 | | | | 921,553 | |
| LanzaTech Global * | | | 12,547 | | | | 44,165 | |
| Legalzoom.com * | | | 45,944 | | | | 458,062 | |
| Leonardo DRS * | | | 23,520 | | | | 448,526 | |
| Limbach Holdings * | | | 5,032 | | | | 149,954 | |
| Lindsay | | | 4,831 | | | | 603,489 | |
| Liquidity Services * | | | 10,657 | | | | 205,360 | |
The accompanying notes are an integral part of the financial statements.
208
| Schedule of Investments | October 31, 2023 |
| Global X Russell 2000 Covered Call ETF |
| | | Shares | | | Value |
| COMMON STOCK — continued | | | | | | | | |
| Industrials — continued | | | | | | | | |
| LSI Industries | | | 13,278 | | | $ | 197,577 | |
| Manitowoc * | | | 15,417 | | | | 197,338 | |
| Marten Transport | | | 25,386 | | | | 446,286 | |
| Masonite International * | | | 9,960 | | | | 788,234 | |
| Masterbrand * | | | 58,972 | | | | 655,179 | |
| Matson | | | 17,367 | | | | 1,511,797 | |
| Matthews International, Cl A | | | 13,233 | | | | 468,978 | |
| Maximus | | | 27,730 | | | | 2,071,986 | |
| Mayville Engineering * | | | 6,468 | | | | 78,198 | |
| McGrath RentCorp | | | 12,126 | | | | 1,219,876 | |
| Microvast Holdings * | | | 1 | | | | 1 | |
| Miller Industries | | | 4,955 | | | | 180,213 | |
| MillerKnoll | | | 35,492 | | | | 834,062 | |
| Mistras Group * | | | 12,261 | | | | 67,068 | |
| Montrose Environmental Group * | | | 11,833 | | | | 273,579 | |
| Moog, Cl A | | | 12,512 | | | | 1,452,018 | |
| MRC Global * | | | 35,535 | | | | 373,473 | |
| Mueller Industries | | | 51,230 | | | | 1,931,883 | |
| Mueller Water Products, Cl A | | | 67,989 | | | | 841,024 | |
| MYR Group * | | | 7,647 | | | | 885,752 | |
| National Presto Industries | | | 2,302 | | | | 172,075 | |
| NEXTracker, Cl A * | | | 23,346 | | | | 811,507 | |
| Nikola * | | | 1 | | | | 1 | |
| NL Industries | | | 3,258 | | | | 16,225 | |
| Northwest Pipe * | | | 4,289 | | | | 116,918 | |
| NOW * | | | 47,435 | | | | 522,734 | |
| NuScale Power * | | | 23,636 | | | | 79,890 | |
| NV5 Global * | | | 5,921 | | | | 558,646 | |
| Omega Flex | | | 1,477 | | | | 107,924 | |
| OPENLANE * | | | 51,286 | | | | 688,771 | |
| PAM Transportation Services * | | | 3,245 | | | | 56,041 | |
| Pangaea Logistics Solutions | | | 19,278 | | | | 111,620 | |
| Park Aerospace | | | 8,145 | | | | 119,569 | |
| Park-Ohio Holdings | | | 4,962 | | | | 112,538 | |
| Parsons * | | | 18,592 | | | | 1,051,378 | |
| Performant Financial * | | | 1 | | | | 2 | |
| PGT Innovations * | | | 24,789 | | | | 742,183 | |
| Pitney Bowes | | | 1 | | | | 3 | |
| Planet Labs PBC * | | | 1 | | | | 2 | |
The accompanying notes are an integral part of the financial statements.
209
| Schedule of Investments | October 31, 2023 |
| Global X Russell 2000 Covered Call ETF |
| | | Shares | | | Value |
| COMMON STOCK — continued | | | | | | | | |
| Industrials — continued | | | | | | | | |
| Powell Industries | | | 4,181 | | | $ | 320,474 | |
| Preformed Line Products | | | 1,339 | | | | 181,234 | |
| Primoris Services | | | 22,811 | | | | 685,699 | |
| Proto Labs * | | | 11,886 | | | | 280,628 | |
| Quad * | | | 13,714 | | | | 67,061 | |
| Quanex Building Products | | | 14,485 | | | | 388,922 | |
| Radiant Logistics * | | | 15,950 | | | | 93,467 | |
| Redwire * | | | 1 | | | | 3 | |
| Resideo Technologies * | | | 62,962 | | | | 911,690 | |
| Resources Connection | | | 13,731 | | | | 184,957 | |
| REV Group | | | 14,491 | | | | 206,352 | |
| Rocket Lab USA * | | | 126,379 | | | | 534,583 | |
| Rush Enterprises, Cl A | | | 27,330 | | | | 972,401 | |
| Rush Enterprises, Cl B | | | 4,382 | | | | 177,188 | |
| RXO * | | | 52,084 | | | | 911,991 | |
| SES AI * | | | 1 | | | | 2 | |
| Shoals Technologies Group, Cl A * | | | 76,228 | | | | 1,170,862 | |
| Shyft Group | | | 14,946 | | | | 164,107 | |
| Simpson Manufacturing | | | 19,688 | | | | 2,622,048 | |
| Skillsoft * | | | 4,196 | | | | 78,885 | |
| SkyWest * | | | 21,369 | | | | 901,131 | |
| SKYX Platforms * | | | 1 | | | | 2 | |
| Southland Holdings * | | | 4,176 | | | | 26,309 | |
| SP Plus * | | | 9,931 | | | | 501,813 | |
| Spirit Airlines | | | 46,763 | | | | 536,839 | |
| SPX Technologies * | | | 20,664 | | | | 1,655,600 | |
| Standex International | | | 5,121 | | | | 735,222 | |
| Steelcase, Cl A | | | 35,295 | | | | 385,068 | |
| Stem * | | | 67,907 | | | | 229,526 | |
| Sterling Check * | | | 19,579 | | | | 218,893 | |
| Sterling Infrastructure * | | | 13,794 | | | | 1,004,893 | |
| Sun Country Airlines Holdings * | | | 20,133 | | | | 262,132 | |
| SunPower, Cl A * | | | 35,155 | | | | 150,112 | |
| Tennant | | | 8,162 | | | | 605,784 | |
| Terex | | | 30,791 | | | | 1,410,228 | |
| Terran Orbital * | | | 1 | | | | 1 | |
| Thermon Group Holdings * | | | 14,348 | | | | 382,948 | |
| Titan International * | | | 21,947 | | �� | | 249,318 | |
| Titan Machinery * | | | 8,921 | | | | 221,598 | |
The accompanying notes are an integral part of the financial statements.
210
| Schedule of Investments | October 31, 2023 |
| Global X Russell 2000 Covered Call ETF |
| | | Shares | | | Value |
| COMMON STOCK — continued | | | | | | | | |
| Industrials — continued | | | | | | | | |
| TPI Composites * | | | 1 | | | $ | 2 | |
| Transcat * | | | 3,071 | | | | 276,451 | |
| TriNet Group * | | | 16,734 | | | | 1,719,418 | |
| Trinity Industries | | | 35,809 | | | | 745,901 | |
| Triumph Group * | | | 27,685 | | | | 206,530 | |
| TrueBlue * | | | 14,853 | | | | 164,423 | |
| TTEC Holdings | | | 8,333 | | | | 171,493 | |
| TuSimple Holdings, Cl A * | | | 1 | | | | 1 | |
| Tutor Perini * | | | 17,003 | | | | 122,592 | |
| UFP Industries | | | 27,575 | | | | 2,624,313 | |
| UniFirst | | | 6,714 | | | | 1,103,983 | |
| Universal Logistics Holdings | | | 3,432 | | | | 76,808 | |
| Upwork * | | | 57,503 | | | | 600,906 | |
| V2X * | | | 5,145 | | | | 262,755 | |
| Velo3D * | | | 1 | | | | 1 | |
| Veritiv | | | 6,132 | | | | 1,038,822 | |
| Verra Mobility, Cl A * | | | 63,779 | | | | 1,260,911 | |
| Viad * | | | 8,779 | | | | 212,715 | |
| Vicor * | | | 9,482 | | | | 367,333 | |
| Virgin Galactic Holdings * | | | 1 | | | | 1 | |
| VSE | | | 7,034 | | | | 378,429 | |
| Wabash National | | | 21,091 | | | | 436,373 | |
| Watts Water Technologies, Cl A | | | 12,461 | | | | 2,155,878 | |
| Werner Enterprises | | | 29,301 | | | | 1,064,212 | |
| Willdan Group * | | | 5,110 | | | | 90,140 | |
| Willis Lease Finance * | | | 1,765 | | | | 78,860 | |
| Xometry, Cl A * | | | 15,010 | | | | 218,395 | |
| Zurn Elkay Water Solutions | | | 65,852 | | | | 1,742,444 | |
| | | | | | | | 157,126,083 | |
| Information Technology — 8.3% | | | | | | | | |
| 8x8 * | | | 1 | | | | 2 | |
| 908 Devices * | | | 11,175 | | | | 66,268 | |
| A10 Networks | | | 34,100 | | | | 370,667 | |
| ACI Worldwide * | | | 49,474 | | | | 1,007,785 | |
| ACM Research, Cl A * | | | 22,050 | | | | 299,880 | |
| Adeia | | | 47,789 | | | | 402,861 | |
| ADTRAN Holdings | | | 34,934 | | | | 229,516 | |
| Advanced Energy Industries | | | 16,751 | | | | 1,461,692 | |
The accompanying notes are an integral part of the financial statements.
211
| Schedule of Investments | October 31, 2023 |
| Global X Russell 2000 Covered Call ETF |
| | | Shares | | | Value |
| COMMON STOCK — continued | | | | | | | | |
| Information Technology — continued | | | | | | | | |
| Aehr Test Systems * | | | 11,914 | | | $ | 280,694 | |
| Aeva Technologies * | | | 1 | | | | — | |
| Agilysys * | | | 8,973 | | | | 769,794 | |
| Akoustis Technologies * | | | 1 | | | | 1 | |
| Alarm.com Holdings * | | | 21,345 | | | | 1,091,370 | |
| Alkami Technology * | | | 17,685 | | | | 317,446 | |
| Alpha & Omega Semiconductor * | | | 10,376 | | | | 246,119 | |
| Altair Engineering, Cl A * | | | 24,472 | | | | 1,520,201 | |
| Ambarella * | | | 17,668 | | | | 794,883 | |
| American Software, Cl A | | | 17,436 | | | | 191,273 | |
| Amkor Technology | | | 45,648 | | | | 952,217 | |
| Amplitude, Cl A * | | | 33,514 | | | | 333,799 | |
| Appfolio, Cl A * | | | 8,579 | | | | 1,609,163 | |
| Appian, Cl A * | | | 18,290 | | | | 721,723 | |
| Applied Digital * | | | 31,997 | | | | 156,145 | |
| Arlo Technologies * | | | 38,625 | | | | 327,926 | |
| Asana, Cl A * | | | 35,435 | | | | 654,484 | |
| Atomera * | | | 9,743 | | | | 62,355 | |
| Aurora Innovation, Cl A * | | | 1 | | | | 2 | |
| AvePoint * | | | 71,041 | | | | 532,097 | |
| Aviat Networks * | | | 4,982 | | | | 133,019 | |
| Avid Technology * | | | 15,484 | | | | 418,378 | |
| Axcelis Technologies * | | | 14,509 | | | | 1,849,897 | |
| Badger Meter | | | 13,099 | | | | 1,814,866 | |
| Bel Fuse, Cl B | | | 4,995 | | | | 270,629 | |
| Belden | | | 18,932 | | | | 1,342,279 | |
| Benchmark Electronics | | | 15,810 | | | | 382,760 | |
| BigBear.ai Holdings * | | | 1 | | | | 1 | |
| BigCommerce Holdings * | | | 30,074 | | | | 267,358 | |
| Blackbaud * | | | 21,352 | | | | 1,396,421 | |
| BlackLine * | | | 25,107 | | | | 1,232,754 | |
| Box, Cl A * | | | 63,875 | | | | 1,587,932 | |
| Braze, Cl A * | | | 23,243 | | | | 989,687 | |
| Brightcove * | | | 16,833 | | | | 51,846 | |
| C3.ai, Cl A * | | | 31,482 | | | | 768,161 | |
| Calix * | | | 27,111 | | | | 897,916 | |
| Cambium Networks * | | | 5,073 | | | | 25,264 | |
| Cerence * | | | 18,060 | | | | 276,499 | |
| CEVA * | | | 9,734 | | | | 167,133 | |
The accompanying notes are an integral part of the financial statements.
212
| Schedule of Investments | October 31, 2023 |
| Global X Russell 2000 Covered Call ETF |
| | | Shares | | | Value |
| COMMON STOCK — continued | | | | | | | | |
| Information Technology — continued | | | | | | | | |
| Cipher Mining * | | | 1 | | | $ | 3 | |
| Cleanspark * | | | 28,001 | | | | 114,804 | |
| Clear Secure, Cl A | | | 37,585 | | | | 632,180 | |
| Clearfield * | | | 5,859 | | | | 140,733 | |
| Climb Global Solutions | | | 2,289 | | | | 101,815 | |
| Cohu * | | | 20,449 | | | | 616,333 | |
| CommScope Holding * | | | 1 | | | | 1 | |
| CommVault Systems * | | | 19,384 | | | | 1,266,744 | |
| CompoSecure * | | | 3,243 | | | | 19,555 | |
| Comtech Telecommunications | | | 11,670 | | | | 142,374 | |
| Consensus Cloud Solutions * | | | 8,198 | | | | 176,995 | |
| CoreCard * | | | 4,063 | | | | 86,826 | |
| Corsair Gaming * | | | 21,337 | | | | 272,900 | |
| Couchbase * | | | 15,239 | | | | 237,119 | |
| CPI Card Group * | | | 2,815 | | | | 46,588 | |
| Credo Technology Group Holding * | | | 42,942 | | | | 610,635 | |
| CS Disco * | | | 9,381 | | | | 52,627 | |
| CTS | | | 14,312 | | | | 535,412 | |
| CXApp * | | | 1 | | | | 1 | |
| Daktronics * | | | 20,802 | | | | 200,115 | |
| Digi International * | | | 14,962 | | | | 376,743 | |
| Digimarc * | | | 5,918 | | | | 153,513 | |
| Digital Turbine * | | | 42,333 | | | | 200,658 | |
| DigitalOcean Holdings * | | | 32,291 | | | | 660,674 | |
| Diodes * | | | 20,707 | | | | 1,347,612 | |
| Domo, Cl B * | | | 13,879 | | | | 113,253 | |
| DZS * | | | 1 | | | | 1 | |
| E2open Parent Holdings * | | | 1 | | | | 3 | |
| Eastman Kodak * | | | 19,992 | | | | 74,370 | |
| Ebix | | | 11,454 | | | | 69,755 | |
| eGain * | | | 8,688 | | | | 52,302 | |
| Enfusion, Cl A * | | | 13,916 | | | | 115,503 | |
| EngageSmart * | | | 22,590 | | | | 511,663 | |
| Envestnet * | | | 24,320 | | | | 899,840 | |
| ePlus * | | | 11,669 | | | | 729,313 | |
| Everbridge * | | | 17,541 | | | | 361,520 | |
| EverCommerce * | | | 11,639 | | | | 111,502 | |
| Evolv Technologies Holdings * | | | 53,199 | | | | 226,096 | |
| Expensify, Cl A * | | �� | 1 | | | | 3 | |
The accompanying notes are an integral part of the financial statements.
213
| Schedule of Investments | October 31, 2023 |
| Global X Russell 2000 Covered Call ETF |
| | | Shares | | | Value |
| COMMON STOCK — continued | | | | | | | | |
| Information Technology — continued | | | | | | | | |
| Extreme Networks * | | | 62,219 | | | $ | 1,282,956 | |
| FARO Technologies * | | | 7,967 | | | | 102,535 | |
| Fastly, Cl A * | | | 62,068 | | | | 910,538 | |
| FormFactor * | | | 35,640 | | | | 1,207,483 | |
| Freshworks, Cl A * | | | 72,520 | | | | 1,301,009 | |
| Grid Dynamics Holdings * | | | 22,933 | | | | 232,541 | |
| Hackett Group | | | 11,682 | | | | 260,392 | |
| Harmonic * | | | 49,665 | | | | 535,885 | |
| Ichor Holdings * | | | 12,094 | | | | 293,400 | |
| Immersion | | | 16,991 | | | | 108,572 | |
| Impinj * | | | 10,370 | | | | 670,006 | |
| Infinera * | | | 103,987 | | | | 304,682 | |
| Information Services Group | | | 14,756 | | | | 59,909 | |
| Insight Enterprises * | | | 14,260 | | | | 2,043,458 | |
| Instructure Holdings * | | | 10,142 | | | | 249,797 | |
| Intapp * | | | 10,257 | | | | 350,789 | |
| InterDigital | | | 13,103 | | | | 986,001 | |
| inTEST * | | | 5,620 | | | | 72,667 | |
| Intevac * | | | 17,403 | | | | 55,864 | |
| IonQ * | | | 72,938 | | | | 703,122 | |
| Iteris * | | | 24,043 | | | | 106,270 | |
| Itron * | | | 21,046 | | | | 1,205,515 | |
| Jamf Holding * | | | 31,902 | | | | 512,346 | |
| Kaltura * | | | 1 | | | | 2 | |
| Kimball Electronics * | | | 10,579 | | | | 277,170 | |
| Knowles * | | | 38,547 | | | | 500,726 | |
| KVH Industries * | | | 10,540 | | | | 49,327 | |
| Lightwave Logic * | | | 46,256 | | | | 209,540 | |
| LivePerson * | | | 1 | | | | 3 | |
| LiveRamp Holdings * | | | 28,895 | | | | 799,236 | |
| LiveVox Holdings * | | | 1 | | | | 4 | |
| Luna Innovations * | | | 16,509 | | | | 93,771 | |
| MACOM Technology Solutions Holdings * | | | 24,972 | | | | 1,761,525 | |
| Marathon Digital Holdings * | | | 75,675 | | | | 666,697 | |
| Matterport * | | | 1 | | | | 2 | |
| Maxeon Solar Technologies * | | | 11,941 | | | | 74,512 | |
| MaxLinear, Cl A * | | | 35,132 | | | | 534,006 | |
| MeridianLink * | | | 10,014 | | | | 164,430 | |
| Methode Electronics | | | 15,615 | | | | 357,115 | |
The accompanying notes are an integral part of the financial statements.
214
| Schedule of Investments | October 31, 2023 |
| Global X Russell 2000 Covered Call ETF |
| | | Shares | | | Value |
| COMMON STOCK — continued | | | | | | | | |
| Information Technology — continued | | | | | | | | |
| MicroStrategy, Cl A * | | | 5,361 | | | $ | 2,269,794 | |
| MicroVision * | | | 1 | | | | 2 | |
| Mirion Technologies, Cl A * | | | 90,717 | | | | 628,669 | |
| Mitek Systems * | | | 17,749 | | | | 189,559 | |
| Model N * | | | 16,087 | | | | 387,697 | |
| N-able * | | | 31,448 | | | | 407,566 | |
| Napco Security Technologies | | | 13,870 | | | | 254,792 | |
| Navitas Semiconductor, Cl A * | | | 47,419 | | | | 248,476 | |
| NETGEAR * | | | 12,489 | | | | 157,861 | |
| NetScout Systems * | | | 29,782 | | | | 650,141 | |
| NextNav * | | | 1 | | | | 5 | |
| nLight * | | | 21,409 | | | | 178,337 | |
| Novanta * | | | 16,291 | | | | 2,151,389 | |
| NVE | | | 2,336 | | | | 158,848 | |
| Olo, Cl A * | | | 45,630 | | | | 233,169 | |
| ON24 | | | 17,331 | | | | 106,586 | |
| OneSpan * | | | 19,473 | | | | 153,837 | |
| Onto Innovation * | | | 22,633 | | | | 2,543,270 | |
| OSI Systems * | | | 7,017 | | | | 731,663 | |
| PagerDuty * | | | 41,521 | | | | 837,479 | |
| PAR Technology * | | | 12,379 | | | | 361,343 | |
| PC Connection | | | 4,792 | | | | 256,755 | |
| PDF Solutions * | | | 13,056 | | | | 346,376 | |
| Perficient * | | | 16,015 | | | | 931,913 | |
| Photronics * | | | 26,355 | | | | 483,878 | |
| Plexus * | | | 12,740 | | | | 1,252,597 | |
| Power Integrations | | | 25,937 | | | | 1,798,212 | |
| PowerSchool Holdings, Cl A * | | | 25,754 | | | | 513,020 | |
| Presto Automation * | | | 1 | | | | 1 | |
| Progress Software | | | 21,279 | | | | 1,093,315 | |
| PROS Holdings * | | | 19,724 | | | | 614,403 | |
| Q2 Holdings * | | | 26,645 | | | | 800,149 | |
| Qualys * | | | 16,811 | | | | 2,571,242 | |
| Rackspace Technology * | | | 1 | | | | 1 | |
| Rambus * | | | 50,119 | | | | 2,722,965 | |
| Rapid7 * | | | 27,454 | | | | 1,276,336 | |
| Red Violet * | | | 3,900 | | | | 77,181 | |
| Ribbon Communications * | | | 1 | | | | 2 | |
| Richardson Electronics | | | 6,540 | | | | 75,014 | |
The accompanying notes are an integral part of the financial statements.
215
| Schedule of Investments | October 31, 2023 |
| Global X Russell 2000 Covered Call ETF |
| | | Shares | | | Value |
| COMMON STOCK — continued | | | | | | | | |
| Information Technology — continued | | | | | | | | |
| Rimini Street * | | | 1 | | | $ | 2 | |
| Riot Platforms * | | | 92,389 | | | | 903,564 | |
| Rogers * | | | 8,314 | | | | 1,021,707 | |
| Sanmina * | | | 26,208 | | | | 1,333,201 | |
| ScanSource * | | | 10,823 | | | | 329,019 | |
| SEMrush Holdings, Cl A * | | | 16,387 | | | | 132,407 | |
| Semtech * | | | 27,729 | | | | 387,097 | |
| Silicon Laboratories * | | | 14,325 | | | | 1,320,478 | |
| SiTime * | | | 7,580 | | | | 756,484 | |
| SkyWater Technology * | | | 8,716 | | | | 42,970 | |
| SMART Global Holdings * | | | 20,931 | | | | 286,755 | |
| SmartRent, Cl A * | | | 1 | | | | 2 | |
| SolarWinds * | | | 19,934 | | | | 183,592 | |
| SoundHound AI, Cl A * | | | 1 | | | | 2 | |
| SoundThinking * | | | 3,947 | | | | 59,560 | |
| Sprinklr, Cl A * | | | 46,864 | | | | 636,882 | |
| Sprout Social, Cl A * | | | 22,319 | | | | 965,966 | |
| SPS Commerce * | | | 16,523 | | | | 2,649,298 | |
| Squarespace, Cl A * | | | 20,391 | | | | 579,308 | |
| Super Micro Computer * | | | 21,022 | | | | 5,034,138 | |
| Synaptics * | | | 17,955 | | | | 1,502,115 | |
| Tenable Holdings * | | | 51,568 | | | | 2,171,528 | |
| Terawulf * | | | 1 | | | | 1 | |
| Thoughtworks Holding * | | | 43,664 | | | | 148,021 | |
| Transphorm * | | | 1 | | | | 3 | |
| TTM Technologies * | | | 43,575 | | | | 500,677 | |
| Tucows, Cl A * | | | 4,255 | | | | 71,867 | |
| Turtle Beach * | | | 6,960 | | | | 57,420 | |
| Ultra Clean Holdings * | | | 19,413 | | | | 463,194 | |
| Unisys * | | | 27,150 | | | | 75,477 | |
| Varonis Systems, Cl B * | | | 49,846 | | | | 1,676,819 | |
| Veeco Instruments * | | | 22,298 | | | | 533,814 | |
| Verint Systems * | | | 28,348 | | | | 533,226 | |
| Veritone * | | | 1 | | | | 3 | |
| Viant Technology, Cl A * | | | 5,227 | | | | 28,174 | |
| Viavi Solutions * | | | 99,736 | | | | 775,946 | |
| Vishay Intertechnology | | | 59,336 | | | | 1,319,633 | |
| Vishay Precision Group * | | | 5,452 | | | | 163,124 | |
| Vuzix * | | | 24,435 | | | | 79,414 | |
The accompanying notes are an integral part of the financial statements.
216
| Schedule of Investments | October 31, 2023 |
| Global X Russell 2000 Covered Call ETF |
| | | Shares | | | Value |
| COMMON STOCK — continued | | | | | | | | |
| Information Technology — continued | | | | | | | | |
| Weave Communications * | | | 18,813 | | | $ | 134,701 | |
| Workiva, Cl A * | | | 21,809 | | | | 1,899,346 | |
| X4 Pharmaceuticals * | | | 1 | | | | 1 | |
| Xerox Holdings | | | 51,039 | | | | 655,341 | |
| Xperi * | | | 17,793 | | | | 151,063 | |
| Yext * | | | 47,751 | | | | 287,939 | |
| Zeta Global Holdings, Cl A * | | | 61,566 | | | | 480,215 | |
| Zuora, Cl A * | | | 55,764 | | | | 413,211 | |
| | | | | | | | 116,783,598 | |
| Materials — 2.9% | | | | | | | | |
| 5E Advanced Materials * | | | 1 | | | | 2 | |
| AdvanSix | | | 11,842 | | | | 326,247 | |
| Alpha Metallurgical Resources | | | 5,754 | | | | 1,265,650 | |
| American Vanguard | | | 12,698 | | | | 118,853 | |
| Arch Resources | | | 8,232 | | | | 1,241,633 | |
| Aspen Aerogels * | | | 23,052 | | | | 177,961 | |
| ATI * | | | 57,418 | | | | 2,168,678 | |
| Avient | | | 40,261 | | | | 1,273,053 | |
| Balchem | | | 14,244 | | | | 1,655,723 | |
| Cabot | | | 24,567 | | | | 1,633,214 | |
| Carpenter Technology | | | 22,146 | | | | 1,388,997 | |
| Century Aluminum * | | | 23,105 | | | | 152,724 | |
| Chase | | | 3,301 | | | | 419,425 | |
| Clearwater Paper * | | | 7,291 | | | | 246,509 | |
| Coeur Mining * | | | 1 | | | | 3 | |
| Commercial Metals | | | 52,333 | | | | 2,213,163 | |
| Compass Minerals International | | | 15,031 | | | | 370,364 | |
| Constellium, Cl A * | | | 54,345 | | | | 858,651 | |
| Contango ORE * | | | 2,407 | | | | 41,039 | |
| Core Molding Technologies * | | | 4,496 | | | | 115,008 | |
| Dakota Gold * | | | 1 | | | | 3 | |
| Danimer Scientific * | | | 1 | | | | 1 | |
| Ecovyst * | | | 42,014 | | | | 386,529 | |
| Glatfelter * | | | 1 | | | | 2 | |
| Greif, Cl A | | | 11,092 | | | | 704,342 | |
| Greif, Cl B | | | 2,562 | | | | 164,122 | |
| Hawkins | | | 8,416 | | | | 483,331 | |
| Haynes International | | | 5,345 | | | | 229,969 | |
The accompanying notes are an integral part of the financial statements.
217
| Schedule of Investments | October 31, 2023 |
| Global X Russell 2000 Covered Call ETF |
| | | Shares | | | Value |
| COMMON STOCK — continued | | | | | | | | |
| Materials — continued | | | | | | | | |
| HB Fuller | | | 24,763 | | | $ | 1,638,072 | |
| Hecla Mining | | | 261,889 | | | | 1,065,888 | |
| Ingevity * | | | 16,683 | | | | 671,991 | |
| Innospec | | | 11,551 | | | | 1,131,998 | |
| Intrepid Potash * | | | 4,844 | | | | 96,347 | |
| Ivanhoe Electric * | | | 27,524 | | | | 281,846 | |
| Kaiser Aluminum | | | 6,979 | | | | 396,407 | |
| Knife River * | | | 25,455 | | | | 1,280,896 | |
| Koppers Holdings | | | 8,967 | | | | 327,923 | |
| Kronos Worldwide | | | 9,880 | | | | 68,172 | |
| Livent * | | | 80,131 | | | | 1,169,111 | |
| LSB Industries * | | | 31,613 | | | | 287,994 | |
| Materion | | | 8,936 | | | | 866,613 | |
| Mativ Holdings | | | 23,562 | | | | 308,662 | |
| Minerals Technologies | | | 14,092 | | | | 761,814 | |
| Myers Industries | | | 15,525 | | | | 260,354 | |
| O-I Glass, Cl I * | | | 67,657 | | | | 1,045,301 | |
| Olympic Steel | | | 4,186 | | | | 212,523 | |
| Origin Materials * | | | 1 | | | | 1 | |
| Pactiv Evergreen | | | 17,919 | | | | 154,462 | |
| Perimeter Solutions * | | | 72,652 | | | | 232,486 | |
| Perpetua Resources * | | | 22,514 | | | | 81,276 | |
| Piedmont Lithium * | | | 8,891 | | | | 244,236 | |
| PureCycle Technologies * | | | 58,498 | | | | 260,316 | |
| Quaker Chemical | | | 6,097 | | | | 876,261 | |
| Ramaco Resources, Cl A | | | 9,303 | | | | 109,589 | |
| Ramaco Resources, Cl B | | | 1,861 | | | | 23,276 | |
| Ranpak Holdings, Cl A * | | | 16,427 | | | | 51,909 | |
| Rayonier Advanced Materials * | | | 1 | | | | 3 | |
| Ryerson Holding | | | 12,110 | | | | 351,795 | |
| Schnitzer Steel Industries, Cl A | | | 11,153 | | | | 253,285 | |
| Sensient Technologies | | | 19,546 | | | | 1,102,785 | |
| Stepan | | | 9,311 | | | | 696,463 | |
| Summit Materials, Cl A * | | | 54,111 | | | | 1,780,252 | |
| SunCoke Energy | | | 34,209 | | | | 325,328 | |
| Sylvamo | | | 17,159 | | | | 760,144 | |
| TimkenSteel * | | | 19,789 | | | | 402,310 | |
| Tredegar | | | 14,086 | | | | 63,105 | |
| TriMas | | | 18,403 | | | | 445,537 | |
The accompanying notes are an integral part of the financial statements.
218
| Schedule of Investments | October 31, 2023 |
| Global X Russell 2000 Covered Call ETF |
| | | Shares | | | Value |
| COMMON STOCK — continued | | | | | | | | |
| Materials — continued | | | | | | | | |
| Trinseo | | | 16,171 | | | $ | 100,098 | |
| Tronox Holdings, Cl A | | | 50,293 | | | | 537,632 | |
| United States Lime & Minerals | | | 1,086 | | | | 215,017 | |
| Valhi | | | 1,238 | | | | 13,816 | |
| Warrior Met Coal | | | 23,940 | | | | 1,166,596 | |
| Worthington Industries | | | 13,943 | | | | 859,168 | |
| | | | | | | | 40,614,254 | |
| Real Estate — 4.0% | | | | | | | | |
| Acadia Realty Trust ‡ | | | 41,706 | | | | 597,230 | |
| Alexander & Baldwin ‡ | | | 32,372 | | | | 511,478 | |
| Alexander’s ‡ | | | 1,086 | | | | 204,157 | |
| Alpine Income Property Trust ‡ | | | 7,199 | | | | 110,865 | |
| American Assets Trust ‡ | | | 21,805 | | | | 387,039 | |
| American Realty Investors * | | | 597 | | | | 7,492 | |
| Anywhere Real Estate * | | | 47,614 | | | | 222,357 | |
| Apartment Investment and Management, Cl A ‡ * | | | 66,238 | | | | 388,155 | |
| Apple Hospitality REIT ‡ | | | 96,057 | | | | 1,506,174 | |
| Armada Hoffler Properties ‡ | | | 30,142 | | | | 300,214 | |
| Braemar Hotels & Resorts ‡ | | | 1 | | | | 3 | |
| Brandywine Realty Trust ‡ | | | 69,877 | | | | 261,340 | |
| Broadstone Net Lease, Cl A ‡ | | | 83,754 | | | | 1,185,119 | |
| BRT Apartments ‡ | | | 5,411 | | | | 87,821 | |
| CareTrust ‡ | | | 43,745 | | | | 941,392 | |
| CBL & Associates Properties ‡ | | | 11,506 | | | | 238,519 | |
| Centerspace ‡ | | | 6,501 | | | | 315,819 | |
| Chatham Lodging Trust ‡ | | | 20,787 | | | | 192,280 | |
| City Office REIT ‡ | | | 17,733 | | | | 67,563 | |
| Clipper Realty ‡ | | | 4,887 | | | | 23,213 | |
| Community Healthcare Trust ‡ | | | 12,727 | | | | 364,883 | |
| Compass, Cl A * | | | 1 | | | | 2 | |
| COPT Defense Properties ‡ | | | 52,034 | | | | 1,186,375 | |
| CTO Realty Growth ‡ | | | 10,455 | | | | 169,266 | |
| Cushman & Wakefield * | | | 70,065 | | | | 516,379 | |
| DiamondRock Hospitality ‡ | | | 88,446 | | | | 683,688 | |
| DigitalBridge Group | | | 71,187 | | | | 1,128,314 | |
| Diversified Healthcare Trust ‡ | | | 1 | | | | 2 | |
| Douglas Elliman | | | 1 | | | | 2 | |
The accompanying notes are an integral part of the financial statements.
219
| Schedule of Investments | October 31, 2023 |
| Global X Russell 2000 Covered Call ETF |
| | | Shares | | | Value |
| COMMON STOCK — continued | | | | | | | | |
| Real Estate — continued | | | | | | | | |
| Douglas Emmett ‡ | | | 76,594 | | | $ | 858,619 | |
| Easterly Government Properties, Cl A ‡ | | | 39,196 | | | | 421,749 | |
| Elme Communities ‡ | | | 38,221 | | | | 487,700 | |
| Empire State Realty Trust, Cl A ‡ | | | 58,337 | | | | 471,946 | |
| Equity Commonwealth ‡ | | | 45,930 | | | | 869,914 | |
| Essential Properties Realty Trust ‡ | | | 73,081 | | | | 1,604,128 | |
| eXp World Holdings | | | 30,921 | | | | 410,322 | |
| Farmland Partners ‡ | | | 23,223 | | | | 241,984 | |
| Forestar Group * | | | 7,939 | | | | 188,551 | |
| Four Corners Property Trust ‡ | | | 40,058 | | | | 853,235 | |
| FRP Holdings * | | | 2,952 | | | | 158,788 | |
| Getty Realty ‡ | | | 18,993 | | | | 505,594 | |
| Gladstone Commercial ‡ | | | 16,943 | | | | 202,469 | |
| Gladstone Land ‡ | | | 13,603 | | | | 185,817 | |
| Global Medical REIT ‡ | | | 28,630 | | | | 247,936 | |
| Global Net Lease ‡ | | | 80,059 | | | | 635,666 | |
| Hersha Hospitality Trust, Cl A ‡ | | | 13,405 | | | | 132,978 | |
| Hudson Pacific Properties ‡ | | | 66,013 | | | | 294,418 | |
| Independence Realty Trust ‡ | | | 107,442 | | | | 1,331,206 | |
| Innovative Industrial Properties, Cl A ‡ | | | 12,176 | | | | 874,602 | |
| InvenTrust Properties ‡ | | | 29,630 | | | | 743,713 | |
| JBG SMITH Properties ‡ | | | 50,735 | | | | 652,959 | |
| Kennedy-Wilson Holdings | | | 51,531 | | | | 663,204 | |
| Kite Realty Group Trust ‡ | | | 98,460 | | | | 2,099,167 | |
| LTC Properties ‡ | | | 17,920 | | | | 566,451 | |
| LXP Industrial Trust ‡ | | | 129,633 | | | | 1,025,397 | |
| Macerich ‡ | | | 93,786 | | | | 911,600 | |
| Marcus & Millichap | | | 11,849 | | | | 340,066 | |
| Maui Land & Pineapple * | | | 4,821 | | | | 70,579 | |
| National Health Investors ‡ | | | 18,564 | | | | 928,943 | |
| NETSTREIT ‡ | | | 34,802 | | | | 495,928 | |
| Newmark Group, Cl A | | | 66,614 | | | | 377,701 | |
| NexPoint Diversified Real Estate Trust ‡ | | | 15,715 | | | | 123,834 | |
| NexPoint Residential Trust ‡ | | | 10,323 | | | | 278,618 | |
| Office Properties Income Trust ‡ | | | 20,542 | | | | 92,234 | |
| One Liberty Properties ‡ | | | 7,069 | | | | 130,070 | |
| Opendoor Technologies * | | | 1 | | | | 2 | |
| Orion Office REIT ‡ | | | 23,633 | | | | 112,966 | |
| Outfront Media ‡ | | | 63,758 | | | | 622,278 | |
The accompanying notes are an integral part of the financial statements.
220
| Schedule of Investments | October 31, 2023 |
| Global X Russell 2000 Covered Call ETF |
| | | Shares | | | Value |
| COMMON STOCK — continued | | | | | | | | |
| Real Estate — continued | | | | | | | | |
| Paramount Group ‡ | | | 76,766 | | | $ | 328,558 | |
| Peakstone Realty Trust ‡ | | | 20,467 | | | | 264,434 | |
| Pebblebrook Hotel Trust ‡ | | | 57,218 | | | | 682,611 | |
| Phillips Edison ‡ | | | 53,933 | | | | 1,904,374 | |
| Physicians Realty Trust ‡ | | | 108,559 | | | | 1,178,951 | |
| Piedmont Office Realty Trust, Cl A ‡ | | | 50,702 | | | | 264,157 | |
| Plymouth Industrial REIT ‡ | | | 21,009 | | | | 418,919 | |
| Postal Realty Trust, Cl A ‡ | | | 7,799 | | | | 103,259 | |
| PotlatchDeltic ‡ | | | 35,185 | | | | 1,507,677 | |
| RE/MAX Holdings, Cl A | | | 8,170 | | | | 87,909 | |
| Redfin * | | | 42,897 | | | | 199,900 | |
| Retail Opportunity Investments ‡ | | | 51,789 | | | | 608,003 | |
| RLJ Lodging Trust ‡ | | | 69,770 | | | | 655,838 | |
| RMR Group, Cl A | | | 6,799 | | | | 153,113 | |
| RPT Realty ‡ | | | 38,494 | | | | 415,350 | |
| Ryman Hospitality Properties ‡ | | | 25,618 | | | | 2,192,901 | |
| Sabra Health Care REIT ‡ | | | 101,067 | | | | 1,378,554 | |
| Safehold ‡ | | | 21,188 | | | | 344,729 | |
| Saul Centers ‡ | | | 5,238 | | | | 182,125 | |
| Service Properties Trust ‡ | | | 67,705 | | | | 490,861 | |
| SITE Centers ‡ | | | 86,001 | | | | 1,002,772 | |
| SL Green Realty ‡ | | | 29,848 | | | | 874,248 | |
| St. Joe | | | 15,510 | | | | 723,386 | |
| Star Holdings * | | | 8,885 | | | | 101,733 | |
| Stratus Properties * | | | 2,367 | | | | 60,761 | |
| Summit Hotel Properties ‡ | | | 42,897 | | | | 241,939 | |
| Sunstone Hotel Investors ‡ | | | 91,604 | | | | 851,917 | |
| Tanger Factory Outlet Centers ‡ | | | 47,363 | | | | 1,068,036 | |
| Tejon Ranch * | | | 9,310 | | | | 144,491 | |
| Terreno Realty ‡ | | | 37,301 | | | | 1,987,397 | |
| Transcontinental Realty Investors * | | | 700 | | | | 21,266 | |
| UMH Properties ‡ | | | 22,462 | | | | 310,200 | |
| Uniti Group ‡ | | | 100,452 | | | | 462,079 | |
| Universal Health Realty Income Trust ‡ | | | 5,622 | | | | 216,110 | |
| Urban Edge Properties ‡ | | | 48,989 | | | | 776,966 | |
| Veris Residential ‡ | | | 37,541 | | | | 502,674 | |
| Whitestone REIT, Cl B ‡ | | | 19,005 | | | | 189,100 | |
| Xenia Hotels & Resorts ‡ | | | 50,014 | | | | 581,663 | |
| | | | | | | | 56,289,434 | |
The accompanying notes are an integral part of the financial statements.
221
| Schedule of Investments | October 31, 2023 |
| Global X Russell 2000 Covered Call ETF |
| | | Shares | | | Value |
| COMMON STOCK — continued | | | | | | | | |
| Utilities — 1.9% | | | | | | | | |
| ALLETE | | | 25,749 | | | $ | 1,378,601 | |
| Altus Power, Cl A * | | | 42,422 | | | | 225,261 | |
| American States Water | | | 16,509 | | | | 1,288,527 | |
| Artesian Resources, Cl A | | | 3,780 | | | | 148,554 | |
| Avista | | | 37,156 | | | | 1,177,474 | |
| Black Hills | | | 29,684 | | | | 1,435,221 | |
| Cadiz * | | | 1 | | | | 3 | |
| California Water Service Group | | | 27,393 | | | | 1,333,491 | |
| Chesapeake Utilities | | | 7,621 | | | | 675,297 | |
| Genie Energy, Cl B | | | 10,363 | | | | 205,602 | |
| Global Water Resources | | | 5,430 | | | | 57,178 | |
| MGE Energy | | | 16,863 | | | | 1,207,897 | |
| Middlesex Water | | | 7,610 | | | | 483,463 | |
| Montauk Renewables * | | | 27,801 | | | | 279,678 | |
| New Jersey Resources | | | 44,427 | | | | 1,802,848 | |
| Northwest Natural Holding | | | 15,526 | | | | 569,959 | |
| Northwestern Energy Group | | | 26,564 | | | | 1,275,338 | |
| ONE Gas | | | 25,033 | | | | 1,511,993 | |
| Ormat Technologies | | | 23,604 | | | | 1,452,590 | |
| Otter Tail | | | 18,993 | | | | 1,461,321 | |
| PNM Resources | | | 39,256 | | | | 1,658,959 | |
| Portland General Electric | | | 43,136 | | | | 1,726,303 | |
| Pure Cycle * | | | 8,145 | | | | 77,866 | |
| RGC Resources | | | 4,567 | | | | 71,428 | |
| SJW Group | | | 13,931 | | | | 870,409 | |
| Southwest Gas Holdings | | | 29,224 | | | | 1,712,819 | |
| Spire | | | 24,324 | | | | 1,353,144 | |
| Sunnova Energy International * | | | 42,615 | | | | 389,075 | |
| Unitil | | | 7,036 | | | | 321,334 | |
| York Water | | | 6,145 | | | | 221,650 | |
| | | | | | | | 26,373,283 | |
| TOTAL UNITED STATES | | | | | | | 908,116,368 | |
TOTAL COMMON STOCK
(Cost $1,033,417,296) | | | | | | | 934,224,515 | |
The accompanying notes are an integral part of the financial statements.
222
| Schedule of Investments | October 31, 2023 |
| Global X Russell 2000 Covered Call ETF |
| | | Shares | | | Value |
| EXCHANGE TRADED FUND(A)(B) — 34.5% | | | | | | | | |
| Vanguard Russell 2000 ETF (C) | | | 7,291,848 | | | $ | 485,418,321 | |
TOTAL EXCHANGE TRADED FUND
(Cost $526,119,573) | | | | | | | 485,418,321 | |
| | | Number of
Rights | | | | | |
| RIGHTS — 0.0% | | | | | | | | |
| United States — 0.0% | | | | | | | | |
| CinCor Pharma# *(A)(D) | | | 15,984 | | | | 48,911 | |
| Jounce Therapeutics# *(A)(D) | | | 1 | | | | — | |
Lazydays Holdings*(A)(D)
Expires 11/14/2023 | | | 7,630 | | | | — | |
| Novartis CVR# *(D) | | | 26,043 | | | | 10,157 | |
| OmniAb CVR# *(A)(D) | | | 2,421 | | | | 49 | |
| OmniAb CVR# *(A)(D) | | | 2,421 | | | | 48 | |
TOTAL RIGHTS
(Cost $–) | | | | | | | 59,165 | |
TOTAL INVESTMENTS — 101.0%
(Cost $1,559,536,869) | | | | | | $ | 1,419,702,001 | |
| | | | | | | | | |
WRITTEN OPTIONS— (1.2)%
(Premiums Received $(40,868,285)) | | | | | | $ | (16,253,460 | ) |
Percentages are based on Net Assets of $1,406,037,745.
A list of the exchange traded option contracts held by the Fund at October 31, 2023, is as follows:
| Description | | Number of
Contracts | | | Notional
Amount | | | Exercise
Price | | | Expiration
Date | | Value | |
| WRITTEN OPTIONS — (1.2)% | | | | | | | | | | | | | | | | | | |
| Call Options | | | | | | | | | | | | | | | | | | |
| Russell 2000 Index | | | (8,532 | ) | | $ | (1,418,259,002) | | | $ | 1,690 | | | 11/17/23 | | $ | (16,253,460) | |
| * | Non-income producing security. |
| ‡ | Real Estate Investment Trust |
| # | Expiration date not available. |
| (A) | All or a portion of these securities has been segregated as collateral for options contracts. The Fair Value of the securities pledged as collateral is $1,419,702,001. |
The accompanying notes are an integral part of the financial statements.
223
| Schedule of Investments | October 31, 2023 |
| Global X Russell 2000 Covered Call ETF |
| | |
| (B) | For financial information on the Vanguard Russell 2000 ETF, please go to the Securities Exchange Commission’s website at http://www.sec.gov. |
| (C) | Affiliated investment. |
| (D) | Level 3 security in accordance with fair value hierarchy. |
The following is a summary of the level of inputs used as of October 31, 2023, in valuing the Fund’s investments and other financial instruments carried at value:
| Investments in Securities | | Level 1 | | Level 2 | | | Level 3(1) | | | Total |
| Common Stock | | $ | 934,176,125 | | | $ | 48,390 | | | $ | — | | | $ | 934,224,515 | |
| Exchange Traded Fund | | | 485,418,321 | | | | — | | | | — | | | | 485,418,321 | |
| Rights | | | — | | | | — | | | | 59,165 | | | | 59,165 | |
| Total Investments in Securities | | $ | 1,419,594,446 | | | $ | 48,390 | | | $ | 59,165 | | | $ | 1,419,702,001 | |
| | | | | | | | | | | | | | | | | |
| Other Financial Instruments | | Level 1 | | | Level 2 | | | Level 3 | | | Total |
| Written Options | | $ | (16,253,460 | ) | | $ | — | | | $ | — | | | $ | (16,253,460 | ) |
| Total Other Financial Instruments | | $ | (16,253,460 | ) | | $ | — | | | $ | — | | | $ | (16,253,460 | ) |
| (1) | A reconciliation of Level 3 investments and disclosures of significant unobservable inputs are presented when the Fund has a significant amount of Level 3 investments at the end of the period in relation to Net Assets. Management has concluded that Level 3 investments are not material in relation to Net Assets. |
The following is a summary of the transactions with affiliates for the year ended October 31, 2023:
Value at
10/31/22 | | | Purchases at
Cost | | | Proceeds from
Sales | | | Changes in
Unrealized
Appreciation
(Depreciation) | | | Realized Gain
(Loss) | | | Value at
10/31/23 | | | Income | | | Capital
Gains | |
| Vanguard Russell 2000 ETF | | | | | | | | | | | | | | | | | | |
| | $444,049,022 | | | | $636,462,168 | | | | ($551,283,787) | | | | ($44,524,279) | | | | $715,197 | | | | $485,418,321 | | | | $7,451,586 | | | $ | — | |
Amounts designated as “—” are $0 or have been rounded to $0.
See “Glossary” for abbreviations.
The accompanying notes are an integral part of the financial statements.
224
| Schedule of Investments | October 31, 2023 |
| Global X S&P Catholic Values Developed ex-US ETF |
Sector Weightings (Unaudited)†:

† Sector weightings percentages are based on the total market value of investments. Total investments do not include derivatives such as options, futures contracts, forward contracts, and swap contracts, if applicable.
| | | Shares | | | Value | |
| COMMON STOCK — 99.1% | | | | | | | | |
| AUSTRALIA — 8.7% | | | | | | | | |
| Communication Services — 0.1% | | | | | | | | |
| REA Group | | | 56 | | | $ | 5,095 | |
| Telstra Group | | | 4,848 | | | | 11,695 | |
| | | | | | | | 16,790 | |
| Consumer Discretionary — 0.3% | | | | | | | | |
| Wesfarmers | | | 1,541 | | | | 49,292 | |
| | | | | | | | | |
| Consumer Staples — 0.7% | | | | | | | | |
| Coles Group | | | 3,011 | | | | 29,111 | |
| Endeavour Group | | | 2,690 | | | | 8,414 | |
| Woolworths Group | | | 2,775 | | | | 61,881 | |
| | | | | | | | 99,406 | |
| Energy — 0.5% | | | | | | | | |
| Santos | | | 3,804 | | | | 18,473 | |
| Woodside Energy Group | | | 2,231 | | | | 48,395 | |
| | | | | | | | 66,868 | |
| Financials — 2.6% | | | | | | | | |
| ANZ Group Holdings | | | 3,559 | | | | 55,681 | |
| ASX | | | 226 | | | | 8,032 | |
The accompanying notes are an integral part of the financial statements.
225
| Schedule of Investments | October 31, 2023 |
| Global X S&P Catholic Values Developed ex-US ETF |
| | | Shares | | | Value | |
| COMMON STOCK — continued | | | | | | | | |
| Financials — continued | | | | | | | | |
| Commonwealth Bank of Australia | | | 1,974 | | | $ | 120,685 | |
| Macquarie Group | | | 425 | | | | 43,318 | |
| National Australia Bank | | | 3,687 | | | | 65,481 | |
| QBE Insurance Group | | | 1,761 | | | | 17,394 | |
| Suncorp Group | | | 1,491 | | | | 12,631 | |
| Westpac Banking | | | 4,104 | | | | 53,528 | |
| | | | | | | | 376,750 | |
| Health Care — 0.8% | | | | | | | | |
| Cochlear | | | 359 | | | | 54,743 | |
| EBOS Group | | | 796 | | | | 16,200 | |
| Sonic Healthcare | | | 2,588 | | | | 47,110 | |
| | | | | | | | 118,053 | |
| Industrials — 0.5% | | | | | | | | |
| Brambles | | | 2,176 | | | | 18,062 | |
| Computershare | | | 802 | | | | 12,588 | |
| Transurban Group | | | 4,923 | | | | 36,843 | |
| | | | | | | | 67,493 | |
| Information Technology — 0.1% | | | | | | | | |
| WiseTech Global | | | 210 | | | | 7,733 | |
| | | | | | | | | |
| Materials — 2.8% | | | | | | | | |
| BHP Group | | | 6,196 | | | | 174,574 | |
| Fortescue Metals Group | | | 2,060 | | | | 29,086 | |
| Glencore | | | 13,832 | | | | 73,037 | |
| Rio Tinto | | | 464 | | | | 34,543 | |
| Rio Tinto PLC | | | 1,373 | | | | 87,551 | |
| South32 | | | 5,674 | | | | 11,927 | |
| | | | | | | | 410,718 | |
| Real Estate — 0.2% | | | | | | | | |
| Goodman Group ‡ | | | 1,995 | | | | 26,198 | |
| Scentre Group ‡ | | | 6,119 | | | | 9,414 | |
| | | | | | | | 35,612 | |
The accompanying notes are an integral part of the financial statements.
226
| Schedule of Investments | October 31, 2023 |
| Global X S&P Catholic Values Developed ex-US ETF |
| | | Shares | | | Value | |
| COMMON STOCK — continued | | | | | | | | |
| Utilities — 0.1% | | | | | | | | |
| APA Group | | | 1,365 | | | $ | 7,121 | |
| | | | | | | | | |
| TOTAL AUSTRALIA | | | | | | | 1,255,836 | |
| AUSTRIA — 0.3% | | | | | | | | |
| Communication Services — 0.0% | | | | | | | | |
| Eurotelesites * | | | 43 | | | | 144 | |
| Telekom Austria, Cl A | | | 170 | | | | 1,186 | |
| | | | | | | | 1,330 | |
| Energy — 0.0% | | | | | | | | |
| OMV | | | 170 | | | | 7,432 | |
| |
| Financials — 0.2% | | | | | | | | |
| BAWAG Group | | | 100 | | | | 4,433 | |
| Erste Group Bank | | | 426 | | | | 15,197 | |
| Raiffeisen Bank International * | | | 168 | | | | 2,428 | |
| | | | | | | | 22,058 | |
| Industrials — 0.0% | | | | | | | | |
| ANDRITZ | | | 110 | | | | 5,046 | |
| Strabag | | | 21 | | | | 829 | |
| | | | | | | | 5,875 | |
| Utilities — 0.1% | | | | | | | | |
| EVN | | | 15 | | | | 407 | |
| Verbund | | | 112 | | | | 9,707 | |
| | | | | | | | 10,114 | |
| TOTAL AUSTRIA | | | | | | | 46,809 | |
| BELGIUM — 1.6% | | | | | | | | |
| Consumer Discretionary — 0.0% | | | | | | | | |
| D’ieteren Group | | | 26 | | | | 3,850 | |
| | | | | | | | | |
| Consumer Staples — 0.9% | | | | | | | | |
| Anheuser-Busch InBev | | | 2,357 | | | | 133,612 | |
| | | | | | | | | |
| Financials — 0.2% | | | | | | | | |
| Groupe Bruxelles Lambert | | | 120 | | | | 8,752 | |
The accompanying notes are an integral part of the financial statements.
227
| Schedule of Investments | October 31, 2023 |
| Global X S&P Catholic Values Developed ex-US ETF |
| | | Shares | | | Value | |
| COMMON STOCK — continued | | | | | | | | |
| Financials — continued | | | | | | | | |
| KBC Group | | | 393 | | | $ | 21,559 | |
| | | | | | | | 30,311 | |
| Health Care — 0.3% | | | | | | | | |
| UCB | | | 641 | | | | 46,791 | |
| | | | | | | | | |
| Materials — 0.1% | | | | | | | | |
| Solvay | | | 87 | | | | 9,172 | |
| | | | | | | | | |
| Utilities — 0.1% | | | | | | | | |
| Elia Group | | | 43 | | | | 4,075 | |
| | | | | | | | | |
| TOTAL BELGIUM | | | | | | | 227,811 | |
| BRAZIL — 0.0% | | | | | | | | |
| Materials — 0.0% | | | | | | | | |
| Yara International | | | 199 | | | | 6,502 | |
| |
| CHINA — 0.7% | | | | | | | | |
| Consumer Discretionary — 0.4% | | | | | | | | |
| Chow Tai Fook Jewellery Group | | | 3,000 | | | | 4,233 | |
| Prosus | | | 2,052 | | | | 57,332 | |
| | | | | | | | 61,565 | |
| Consumer Staples — 0.2% | | | | | | | | |
| Budweiser Brewing APAC | | | 3,700 | | | | 7,037 | |
| Wilmar International | | | 6,512 | | | | 16,921 | |
| | | | | | | | 23,958 | |
| Financials — 0.1% | | | | | | | | |
| BOC Hong Kong Holdings | | | 4,400 | | | | 11,640 | |
| |
| Utilities — 0.0% | | | | | | | | |
| ENN Energy Holdings | | | 800 | | | | 6,109 | |
| |
| TOTAL CHINA | | | | | | | 103,272 | |
The accompanying notes are an integral part of the financial statements.
228
| Schedule of Investments | October 31, 2023 |
| Global X S&P Catholic Values Developed ex-US ETF |
| | | Shares | | | Value | |
| COMMON STOCK — continued | | | | | | | | |
| DENMARK — 1.2% | | | | | | | | |
| Health Care — 0.4% | | | | | | | | |
| Coloplast, Cl B | | | 637 | | | $ | 66,304 | |
| | | | | | | | | |
| Industrials — 0.7% | | | | | | | | |
| AP Moller - Maersk, Cl A | | | 4 | | | | 6,515 | |
| AP Moller - Maersk, Cl B | | | 7 | | | | 11,623 | |
| DSV | | | 286 | | | | 42,608 | |
| Vestas Wind Systems * | | | 1,618 | | | | 34,888 | |
| | | | | | | | 95,634 | |
| Utilities — 0.1% | | | | | | | | |
| Orsted | | | 226 | | | | 10,875 | |
| | | | | | | | | |
| TOTAL DENMARK | | | | | | | 172,813 | |
| FINLAND — 0.9% | | | | | | | | |
| Energy — 0.1% | | | | | | | | |
| Neste | | | 504 | | | | 16,893 | |
| | | | | | | | | |
| Financials — 0.5% | | | | | | | | |
| Mandatum * | | | 563 | | | | 2,173 | |
| Nordea Bank Abp | | | 4,344 | | | | 45,607 | |
| Sampo, Cl A | | | 563 | | | | 22,084 | |
| | | | | | | | 69,864 | |
| Industrials — 0.2% | | | | | | | | |
| Kone, Cl B | | | 651 | | | | 28,137 | |
| |
| Information Technology — 0.1% | | | | | | | | |
| Nokia | | | 6,457 | | | | 21,431 | |
| | | | | | | | | |
| TOTAL FINLAND | | | | | | | 136,325 | |
| FRANCE — 11.5% | | | | | | | | |
| Communication Services — 0.0% | | | | | | | | |
| Adevinta, Cl B * | | | 340 | | | | 2,984 | |
| |
| Consumer Discretionary — 2.6% | | | | | | | | |
| Christian Dior | | | 4 | | | | 2,757 | |
| Hermes International SCA | | | 46 | | | | 85,556 | |
The accompanying notes are an integral part of the financial statements.
229
| Schedule of Investments | October 31, 2023 |
| Global X S&P Catholic Values Developed ex-US ETF |
| | | Shares | | | Value | |
| COMMON STOCK — continued | | | | | | | | |
| Consumer Discretionary — continued | | | | | | | | |
| Kering | | | 91 | | | $ | 36,859 | |
| LVMH Moet Hennessy Louis Vuitton | | | 349 | | | | 248,819 | |
| | | | | | | | 373,991 | |
| Consumer Staples — 2.6% | | | | | | | | |
| Danone | | | 1,431 | | | | 84,931 | |
| L’Oreal | | | 519 | | | | 217,322 | |
| Pernod Ricard | | | 453 | | | | 80,203 | |
| | | | | | | | 382,456 | |
| Energy — 1.3% | | | | | | | | |
| TotalEnergies | | | 2,719 | | | | 181,636 | |
| |
| Financials — 1.1% | | | | | | | | |
| AXA | | | 2,096 | | | | 61,934 | |
| BNP Paribas | | | 1,326 | | | | 76,092 | |
| Credit Agricole | | | 1,335 | | | | 16,056 | |
| | | | | | | | 154,082 | |
| Health Care — 1.9% | | | | | | | | |
| EssilorLuxottica | | | 1,542 | | | | 278,126 | |
| |
| Industrials — 0.6% | | | | | | | | |
| Vinci | | | 802 | | | | 88,570 | |
| |
| Information Technology — 0.5% | | | | | | | | |
| Capgemini | | | 189 | | | | 33,262 | |
| Dassault Systemes | | | 833 | | | | 34,176 | |
| | | | | | | | 67,438 | |
| Materials — 0.7% | | | | | | | | |
| Air Liquide | | | 637 | | | | 108,861 | |
| |
| Utilities — 0.2% | | | | | | | | |
| Engie | | | 2,215 | | | | 35,128 | |
| |
| TOTAL FRANCE | | | | | | | 1,673,272 | |
The accompanying notes are an integral part of the financial statements.
230
| Schedule of Investments | October 31, 2023 |
| Global X S&P Catholic Values Developed ex-US ETF |
| | | Shares | | | Value | |
| COMMON STOCK — continued | | | | | | | | |
| GERMANY — 6.3% | | | | | | | | |
| Communication Services — 0.6% | | | | | | | | |
| Deutsche Telekom | | | 4,085 | | | $ | 88,408 | |
| |
| Consumer Discretionary — 1.0% | | | | | | | | |
| adidas | | | 224 | | | | 39,588 | |
| Bayerische Motoren Werke | | | 407 | | | | 37,699 | |
| Mercedes-Benz Group | | | 1,084 | | | | 63,511 | |
| Volkswagen | | | 37 | | | | 4,255 | |
| | | | | | | | 145,053 | |
| Consumer Staples — 0.3% | | | | | | | | |
| Beiersdorf | | | 221 | | | | 28,978 | |
| Henkel & KGaA | | | 206 | | | | 12,990 | |
| | | | | | | | 41,968 | |
| Financials — 1.5% | | | | | | | | |
| Allianz | | | 482 | | | | 112,543 | |
| Deutsche Boerse | | | 224 | | | | 36,747 | |
| Muenchener Rueckversicherungs-Gesellschaft in Muenchen | | | 160 | | | | 64,012 | |
| | | | | | | | 213,302 | |
| Industrials — 0.6% | | | | | | | | |
| Daimler Truck Holding | | | 837 | | | | 26,205 | |
| Deutsche Post | | | 1,492 | | | | 57,972 | |
| Hapag-Lloyd | | | 10 | | | | 1,439 | |
| | | | | | | | 85,616 | |
| Information Technology — 1.5% | | | | | | | | |
| Infineon Technologies | | | 1,574 | | | | 45,711 | |
| SAP | | | 1,249 | | | | 167,322 | |
| | | | | | | | 213,033 | |
| Materials — 0.3% | | | | | | | | |
| BASF | | | 1,109 | | | | 51,033 | |
| |
| Real Estate — 0.1% | | | | | | | | |
| Vonovia ‡ | | | 902 | | | | 20,689 | |
The accompanying notes are an integral part of the financial statements.
231
| Schedule of Investments | October 31, 2023 |
| Global X S&P Catholic Values Developed ex-US ETF |
| | | Shares | | | Value | |
| COMMON STOCK — continued | | | | | | | | |
| Utilities — 0.4% | | | | | | | | |
| E.ON | | | 2,694 | | | $ | 31,950 | |
| RWE | | | 798 | | | | 30,475 | |
| | | | | | | | 62,425 | |
| TOTAL GERMANY | | | | | | | 921,527 | |
| HONG KONG — 2.1% | | | | | | | | |
| Financials — 1.4% | | | | | | | | |
| AIA Group | | | 13,565 | | | | 117,627 | |
| Hang Seng Bank | | | 780 | | | | 8,937 | |
| Hong Kong Exchanges & Clearing | | | 1,394 | | | | 48,993 | |
| Prudential | | | 3,260 | | | | 33,933 | |
| | | | | | | | 209,490 | |
| Industrials — 0.2% | | | | | | | | |
| MTR | | | 2,400 | | | | 8,971 | |
| Techtronic Industries | | | 1,932 | | | | 17,605 | |
| | | | | | | | 26,576 | |
| Real Estate — 0.3% | | | | | | | | |
| CK Asset Holdings ‡ | | | 2,000 | | | | 9,994 | |
| Henderson Land Development | | | 1,700 | | | | 4,432 | |
| Link REIT ‡ | | | 3,000 | | | | 13,764 | |
| Sun Hung Kai Properties ‡ | | | 1,590 | | | | 16,328 | |
| | | | | | | | 44,518 | |
| Utilities — 0.2% | | | | | | | | |
| CK Infrastructure Holdings | | | 800 | | | | 3,706 | |
| CLP Holdings | | | 1,800 | | | | 13,170 | |
| Hong Kong & China Gas | | | 12,510 | | | | 8,714 | |
| | | | | | | | 25,590 | |
| TOTAL HONG KONG | | | | | | | 306,174 | |
| ISRAEL — 0.7% | | | | | | | | |
| Communication Services — 0.0% | | | | | | | | |
| Bezeq The Israeli Telecommunication | | | 2,319 | | | | 2,851 | |
| |
| Consumer Discretionary — 0.0% | | | | | | | | |
| Global-e Online * | | | 102 | | | | 3,581 | |
The accompanying notes are an integral part of the financial statements.
232
| Schedule of Investments | October 31, 2023 |
| Global X S&P Catholic Values Developed ex-US ETF |
| | | Shares | | | Value | |
| COMMON STOCK — continued | | | | | | | | |
| Consumer Staples — 0.0% | | | | | | | | |
| Strauss Group * | | | 111 | | | $ | 2,054 | |
| |
| Energy — 0.0% | | | | | | | | |
| Delek Group | | | 8 | | | | 872 | |
| |
| Financials — 0.3% | | | | | | | | |
| Bank Hapoalim | | | 1,436 | | | | 10,248 | |
| Bank Leumi Le-Israel | | | 1,783 | | | | 11,455 | |
| First International Bank of Israel | | | 59 | | | | 2,005 | |
| Israel Discount Bank, Cl A | | | 1,437 | | | | 6,305 | |
| Mizrahi Tefahot Bank | | | 168 | | | | 5,191 | |
| Phoenix Holdings | | | 137 | | | | 1,162 | |
| | | | | | | | 36,366 | |
| Industrials — 0.0% | | | | | | | | |
| Ashtrom Group | | | 82 | | | | 882 | |
| Shapir Engineering and Industry | | | 205 | | | | 1,098 | |
| ZIM Integrated Shipping Services | | | 104 | | | | 805 | |
| | | | | | | | 2,785 | |
| Information Technology — 0.3% | | | | | | | | |
| Check Point Software Technologies * | | | 118 | | | | 15,842 | |
| Nice * | | | 74 | | | | 11,425 | |
| Nova * | | | 35 | | | | 3,330 | |
| Tower Semiconductor * | | | 133 | | | | 3,077 | |
| Wix.com * | | | 68 | | | | 5,433 | |
| | | | | | | | 39,107 | |
| Materials — 0.0% | | | | | | | | |
| Israel * | | | 5 | | | | 1,077 | |
| |
| Real Estate — 0.1% | | | | | | | | |
| Airport City * | | | 94 | | | | 1,234 | |
| Alony Hetz Properties & Investments | | | 221 | | | | 1,075 | |
| Amot Investments | | | 255 | | | | 1,067 | |
| Azrieli Group | | | 31 | | | | 1,331 | |
| Big Shopping Centers * | | | 14 | | | | 979 | |
| Melisron | | | 29 | | | | 1,569 | |
The accompanying notes are an integral part of the financial statements.
233
| Schedule of Investments | October 31, 2023 |
| Global X S&P Catholic Values Developed ex-US ETF |
| | | Shares | | | Value | |
| COMMON STOCK — continued | | | | | | | | |
| Real Estate — continued | | | | | | | | |
| Mivne Real Estate KD | | | 579 | | | $ | 1,248 | |
| | | | | | | | 8,503 | |
| TOTAL ISRAEL | | | | | | | 97,196 | |
| ITALY — 2.3% | | | | | | | | |
| Consumer Discretionary — 0.4% | | | | | | | | |
| Ferrari | | | 168 | | | | 50,698 | |
| PRADA | | | 600 | | �� | | 3,604 | |
| | | | | | | | 54,302 | |
| Consumer Staples — 0.1% | | | | | | | | |
| Davide Campari-Milano | | | 1,114 | | | | 12,281 | |
| |
| Energy — 0.3% | | | | | | | | |
| Eni | | | 2,939 | | | | 47,928 | |
| |
| Financials — 0.9% | | | | | | | | |
| Assicurazioni Generali | | | 1,408 | | | | 27,898 | |
| Intesa Sanpaolo | | | 19,220 | | | | 49,905 | |
| UniCredit | | | 2,153 | | | | 53,764 | |
| | | | | | | | 131,567 | |
| Utilities — 0.6% | | | | | | | | |
| Enel | | | 9,253 | | | | 58,565 | |
| Snam | | | 2,442 | | | | 11,177 | |
| Terna - Rete Elettrica Nazionale | | | 1,661 | | | | 12,687 | |
| | | | | | | | 82,429 | |
| TOTAL ITALY | | | | | | | 328,507 | |
| JAPAN — 27.9% | | | | | | | | |
| Communication Services — 1.9% | | | | | | | | |
| Dentsu Group | | | 290 | | | | 8,330 | |
| KDDI | | | 1,817 | | | | 53,834 | |
| Konami Group | | | 114 | | | | 5,837 | |
| LY | | | 3,075 | | | | 7,762 | |
| Nexon | | | 538 | | | | 9,753 | |
| Nintendo | | | 1,424 | | | | 58,494 | |
| Nippon Telegraph & Telephone | | | 34,285 | | | | 40,025 | |
| SoftBank | | | 3,222 | | | | 36,274 | |
The accompanying notes are an integral part of the financial statements.
234
| Schedule of Investments | October 31, 2023 |
| Global X S&P Catholic Values Developed ex-US ETF |
| | | Shares | | | Value | |
| COMMON STOCK — continued | | | | | | | | |
| Communication Services — continued | | | | | | | | |
| SoftBank Group | | | 1,185 | | | $ | 47,918 | |
| Toho | | | 170 | | | | 5,760 | |
| | | | | | | | 273,987 | |
| Consumer Discretionary — 4.9% | | | | | | | | |
| Aisin | | | 224 | | | | 7,694 | |
| Bandai Namco Holdings | | | 842 | | | | 17,252 | |
| Bridgestone | | | 782 | | | | 29,262 | |
| Denso | | | 2,548 | | | | 37,006 | |
| Fast Retailing | | | 239 | | | | 52,110 | |
| Honda Motor | | | 6,522 | | | | 64,878 | |
| Isuzu Motors | | | 815 | | | | 8,936 | |
| Nissan Motor | | | 2,997 | | | | 11,229 | |
| Nitori Holdings | | | 110 | | | | 11,919 | |
| Oriental Land | | | 1,536 | | | | 49,261 | |
| Pan Pacific International Holdings | | | 693 | | | | 13,300 | |
| Panasonic Holdings | | | 3,367 | | | | 29,102 | |
| Rakuten Group | | | 1,996 | | | | 7,338 | |
| Sekisui House | | | 951 | | | | 18,455 | |
| Shimano | | | 112 | | | | 15,941 | |
| Subaru | | | 792 | | | | 13,385 | |
| Sumitomo Electric Industries | | | 1,004 | | | | 10,402 | |
| Suzuki Motor | | | 634 | | | | 24,214 | |
| Toyota Motor | | | 16,626 | | | | 284,336 | |
| Yamaha | | | 222 | | | | 5,833 | |
| ZOZO | | | 180 | | | | 3,395 | |
| | | | | | | | 715,248 | |
| Consumer Staples — 2.2% | | | | | | | | |
| Aeon | | | 1,997 | | | | 41,761 | |
| Asahi Group Holdings | | | 1,153 | | | | 41,386 | |
| Kao | | | 1,010 | | | | 36,640 | |
| Kirin Holdings | | | 1,792 | | | | 25,079 | |
| Kobe Bussan | | | 314 | | | | 7,761 | |
| Nissin Foods Holdings | | | 174 | | | | 15,109 | |
| Seven & i Holdings | | | 1,759 | | | | 63,800 | |
| Shiseido | | | 931 | | | | 29,274 | |
| Suntory Beverage & Food | | | 284 | | | | 8,397 | |
| Unicharm | | | 961 | | | | 32,496 | |
The accompanying notes are an integral part of the financial statements.
235
| Schedule of Investments | October 31, 2023 |
| Global X S&P Catholic Values Developed ex-US ETF |
| | | Shares | | | Value | |
| COMMON STOCK — continued | | | | | | | | |
| Consumer Staples — continued | | | | | | | | |
| Yakult Honsha | | | 670 | | | $ | 15,736 | |
| | | | | | | | 317,439 | |
| Energy — 0.3% | | | | | | | | |
| ENEOS Holdings | | | 3,717 | | | | 13,688 | |
| Idemitsu Kosan | | | 260 | | | | 5,870 | |
| Inpex | | | 1,217 | | | | 17,538 | |
| | | | | | | | 37,096 | |
| Financials — 3.2% | | | | | | | | |
| Dai-ichi Life Holdings | | | 1,162 | | | | 24,369 | |
| Japan Exchange Group | | | 629 | | | | 12,313 | |
| Japan Post Bank | | | 1,689 | | | | 15,608 | |
| Mitsubishi UFJ Financial Group | | | 15,178 | | | | 125,978 | |
| Mizuho Financial Group | | | 3,068 | | | | 51,567 | |
| MS&AD Insurance Group Holdings | | | 563 | | | | 20,420 | |
| Nomura Holdings | | | 3,515 | | | | 13,459 | |
| ORIX | | | 1,363 | | | | 24,435 | |
| Resona Holdings | | | 2,820 | | | | 14,962 | |
| Sompo Holdings | | | 409 | | | | 17,573 | |
| Sumitomo Mitsui Financial Group | | | 1,590 | | | | 75,802 | |
| Sumitomo Mitsui Trust Holdings | | | 450 | | | | 16,669 | |
| Tokio Marine Holdings | | | 2,430 | | | | 53,640 | |
| | | | | | | | 466,795 | |
| Health Care — 4.5% | | | | | | | | |
| Eisai | | | 1,661 | | | | 87,314 | |
| Hoya | | | 1,907 | | | | 180,507 | |
| Kyowa Kirin | | | 1,323 | | | | 20,599 | |
| M3 | | | 2,352 | | | | 35,937 | |
| Otsuka Holdings | | | 3,048 | | | | 101,637 | |
| Shionogi | | | 1,564 | | | | 72,156 | |
| Sysmex | | | 834 | | | | 39,391 | |
| Terumo | | | 4,084 | | | | 110,348 | |
| | | | | | | | 647,889 | |
| Industrials — 5.8% | | | | | | | | |
| ANA Holdings * | | | 212 | | | | 4,132 | |
| Central Japan Railway | | | 1,613 | | | | 36,170 | |
The accompanying notes are an integral part of the financial statements.
236
| Schedule of Investments | October 31, 2023 |
| Global X S&P Catholic Values Developed ex-US ETF |
| | | Shares | | | Value | |
| COMMON STOCK — continued | | | | | | | | |
| Industrials — continued | | | | | | | | |
| Daifuku | | | 608 | | | $ | 9,902 | |
| Daikin Industries | | | 460 | | | | 65,699 | |
| East Japan Railway | | | 607 | | | | 31,551 | |
| FANUC | | | 1,477 | | | | 35,627 | |
| Hankyu Hanshin Holdings | | | 443 | | | | 13,827 | |
| ITOCHU | | | 2,277 | | | | 80,784 | |
| Japan Airlines | | | 201 | | | | 3,669 | |
| Komatsu | | | 1,531 | | | | 35,009 | |
| Kubota | | | 1,697 | | | | 22,568 | |
| Marubeni | | | 2,686 | | | | 38,629 | |
| MINEBEA MITSUMI | | | 671 | | | | 10,321 | |
| MISUMI Group | | | 396 | | | | 5,908 | |
| Mitsubishi Electric | | | 3,419 | | | | 37,871 | |
| Mitsui | | | 2,412 | | | | 86,274 | |
| Mitsui OSK Lines | | | 590 | | | | 15,127 | |
| MonotaRO | | | 342 | | | | 2,711 | |
| NIDEC CORP | | | 837 | | | | 29,961 | |
| Nippon Yusen | | | 806 | | | | 19,569 | |
| Recruit Holdings | | | 2,668 | | | | 76,334 | |
| Secom | | | 389 | | | | 26,842 | |
| SG Holdings | | | 710 | | | | 9,995 | |
| SMC | | | 90 | | | | 40,815 | |
| Sumitomo | | | 1,928 | | | | 37,409 | |
| Tokyu | | | 884 | | | | 9,923 | |
| Toshiba * | | | 180 | | | | 5,466 | |
| Toyota Industries | | | 276 | | | | 20,147 | |
| West Japan Railway | | | 422 | | | | 16,011 | |
| Yaskawa Electric | | | 377 | | | | 12,141 | |
| | | | | | | | 840,392 | |
| Information Technology — 3.2% | | | | | | | | |
| Advantest | | | 922 | | | | 23,226 | |
| Canon | | | 1,278 | | | | 29,966 | |
| Disco | | | 115 | | | | 19,861 | |
| Fujitsu | | | 225 | | | | 28,845 | |
| Keyence | | | 239 | | | | 91,768 | |
| Kyocera | | | 409 | | | | 19,915 | |
| Lasertec | | | 94 | | | | 15,644 | |
| Murata Manufacturing | | | 2,359 | | | | 38,591 | |
The accompanying notes are an integral part of the financial statements.
237
| Schedule of Investments | October 31, 2023 |
| Global X S&P Catholic Values Developed ex-US ETF |
| | | Shares | | | Value | |
| COMMON STOCK — continued | | | | | | | | |
| Information Technology — continued | | | | | | | | |
| NEC | | | 336 | | | $ | 15,985 | |
| Nomura Research Institute | | | 534 | | | | 13,907 | |
| NTT Data Group | | | 798 | | | | 9,714 | |
| Obic | | | 76 | | | | 11,163 | |
| Omron | | | 237 | | | | 8,368 | |
| Oracle Japan | | | 54 | | | | 3,804 | |
| Renesas Electronics * | | | 1,684 | | | | 21,744 | |
| Rohm | | | 456 | | | | 7,184 | |
| TDK | | | 454 | | | | 16,662 | |
| TIS | | | 260 | | | | 5,502 | |
| Tokyo Electron | | | 563 | | | | 73,440 | |
| Trend Micro | | | 166 | | | | 6,184 | |
| | | | | | | | 461,473 | |
| Materials — 1.1% | | | | | | | | |
| Asahi Kasei | | | 1,693 | | | | 10,323 | |
| Mitsubishi Chemical Group | | | 1,622 | | | | 9,083 | |
| Nippon Paint Holdings | | | 1,245 | | | | 8,278 | |
| Nippon Sanso Holdings | | | 277 | | | | 6,897 | |
| Nippon Steel | | | 1,134 | | | | 24,201 | |
| Nitto Denko | | | 178 | | | | 11,381 | |
| Shin-Etsu Chemical | | | 2,438 | | | | 71,927 | |
| Sumitomo Metal Mining | | | 338 | | | | 9,409 | |
| Toray Industries | | | 2,025 | | | | 9,692 | |
| | | | | | | | 161,191 | |
| Real Estate — 0.6% | | | | | | | | |
| Daiwa House Industry | | | 792 | | | | 21,583 | |
| Mitsubishi Estate ‡ | | | 1,465 | | | | 18,515 | |
| Mitsui Fudosan ‡ | | | 1,124 | | | | 24,099 | |
| Nippon Building Fund ‡ | | | 2 | | | | 8,016 | |
| Sumitomo Realty & Development | | | 570 | | | | 14,129 | |
| | | | | | | | 86,342 | |
| Utilities — 0.2% | | | | | | | | |
| Chubu Electric Power | | | 907 | | | | 10,915 | |
| Osaka Gas | | | 505 | | | | 9,477 | |
The accompanying notes are an integral part of the financial statements.
238
| Schedule of Investments | October 31, 2023 |
| Global X S&P Catholic Values Developed ex-US ETF |
| | | Shares | | | Value | |
| COMMON STOCK — continued | | | | | | | | |
| Utilities — continued | | | | | | | | |
| Tokyo Gas | | | 465 | | | $ | 10,375 | |
| | | | | | | | 30,767 | |
| TOTAL JAPAN | | | | | | | 4,038,619 | |
| LUXEMBOURG — 0.1% | | | | | | | | |
| Materials — 0.1% | | | | | | | | |
| ArcelorMittal | | | 561 | | | | 12,381 | |
| |
| NETHERLANDS — 6.7% | | | | | | | | |
| Communication Services ��� 0.1% | | | | | | | | |
| Universal Music Group | | | 867 | | | | 21,169 | |
| |
| Consumer Staples — 0.8% | | | | | | | | |
| Heineken | | | 579 | | | | 51,861 | |
| Koninklijke Ahold Delhaize | | | 2,220 | | | | 65,704 | |
| | | | | | | | 117,565 | |
| Energy — 1.8% | | | | | | | | |
| Shell | | | 7,912 | | | | 254,084 | |
| |
| Financials — 0.6% | | | | | | | | |
| Adyen * | | | 37 | | | | 24,791 | |
| EXOR | | | 136 | | | | 11,636 | |
| ING Groep | | | 4,232 | | | | 53,804 | |
| | | | | | | | 90,231 | |
| Health Care — 1.0% | | | | | | | | |
| Argenx * | | | 318 | | | | 149,274 | |
| |
| Industrials — 0.4% | | | | | | | | |
| Wolters Kluwer | | | 410 | | | | 52,481 | |
| |
| Information Technology — 2.0% | | | | | | | | |
| ASML Holding | | | 493 | | | | 294,580 | |
| |
| TOTAL NETHERLANDS | | | | | | | 979,384 | |
The accompanying notes are an integral part of the financial statements.
239
| Schedule of Investments | October 31, 2023 |
| Global X S&P Catholic Values Developed ex-US ETF |
| | | Shares | | | Value | |
| COMMON STOCK — continued | | | | | | | | |
| NEW ZEALAND — 0.6% | | | | | | | | |
| Communication Services — 0.0% | | | | | | | | |
| Spark New Zealand | | | 2,231 | | | $ | 6,449 | |
| |
| Health Care — 0.3% | | | | | | | | |
| Fisher & Paykel Healthcare | | | 3,207 | | | | 38,818 | |
| |
| Industrials — 0.1% | | | | | | | | |
| Auckland International Airport | | | 2,053 | | | | 8,765 | |
| Infratil | | | 1,302 | | | | 7,437 | |
| Mainfreight | | | 127 | | | | 4,228 | |
| | | | | | | | 20,430 | |
| Information Technology — 0.1% | | | | | | | | |
| Xero * | | | 164 | | | | 11,078 | |
| |
| Utilities — 0.1% | | | | | | | | |
| Mercury NZ | | | 746 | | | | 2,560 | |
| Meridian Energy | | | 1,446 | | | | 4,063 | |
| | | | | | | | 6,623 | |
| TOTAL NEW ZEALAND | | | | | | | 83,398 | |
| NORWAY — 0.9% | | | | | | | | |
| Communication Services — 0.0% | | | | | | | | |
| Telenor | | | 757 | | | | 7,735 | |
| |
| Consumer Staples — 0.2% | | | | | | | | |
| Mowi | | | 982 | | | | 15,936 | |
| Orkla | | | 1,632 | | | | 11,240 | |
| Salmar | | | 143 | | | | 6,769 | |
| | | | | | | | 33,945 | |
| Energy — 0.4% | | | | | | | | |
| Aker BP | | | 344 | | | | 9,887 | |
| Equinor | | | 1,204 | | | | 40,355 | |
| Var Energi | | | 369 | | | | 1,243 | |
| | | | | | | | 51,485 | |
| Financials — 0.2% | | | | | | | | |
| DNB Bank | | | 1,078 | | | | 19,424 | |
The accompanying notes are an integral part of the financial statements.
240
| Schedule of Investments | October 31, 2023 |
| Global X S&P Catholic Values Developed ex-US ETF |
| | | Shares | | | Value | |
| COMMON STOCK — continued | | | | | | | | |
| Financials — continued | | | | | | | | |
| Gjensidige Forsikring | | | 226 | | | $ | 3,385 | |
| | | | | | | | 22,809 | |
| Materials — 0.1% | | | | | | | | |
| Norsk Hydro | | | 1,658 | | | | 9,451 | |
| |
| TOTAL NORWAY | | | | | | | 125,425 | |
| PORTUGAL — 0.1% | | | | | | | | |
| Utilities — 0.1% | | | | | | | | |
| EDP - Energias de Portugal | | | 3,674 | | | | 15,417 | |
| |
| SINGAPORE — 1.7% | | | | | | | | |
| Communication Services — 0.2% | | | | | | | | |
| Sea ADR * | | | 424 | | | | 17,681 | |
| Singapore Telecommunications | | | 8,090 | | | | 14,053 | |
| | | | | | | | 31,734 | |
| Financials — 0.9% | | | | | | | | |
| DBS Group Holdings | | | 2,135 | | | | 51,192 | |
| Oversea-Chinese Banking | | | 4,794 | | | | 44,369 | |
| United Overseas Bank | | | 1,779 | | | | 35,085 | |
| | | | | | | | 130,646 | |
| Industrials — 0.2% | | | | | | | | |
| Grab Holdings, Cl A * | | | 2,825 | | | | 8,673 | |
| Jardine Cycle & Carriage | | | 100 | | | | 2,058 | |
| Keppel | | | 1,900 | | | | 8,612 | |
| Singapore Airlines | | | 1,763 | | | | 7,863 | |
| Singapore Technologies Engineering | | | 2,128 | | | | 5,840 | |
| | | | | | | | 33,046 | |
| Information Technology — 0.2% | | | | | | | | |
| STMicroelectronics | | | 791 | | | | 30,074 | |
| |
| Real Estate — 0.2% | | | | | | | | |
| CapitaLand Ascendas REIT ‡ | | | 3,913 | | | | 7,426 | |
| CapitaLand Integrated Commercial Trust ‡ | | | 5,434 | | | | 6,981 | |
| CapitaLand Investment ‡ | | | 2,729 | | | | 5,856 | |
The accompanying notes are an integral part of the financial statements.
241
| Schedule of Investments | October 31, 2023 |
| Global X S&P Catholic Values Developed ex-US ETF |
| | | Shares | | | Value | |
| COMMON STOCK — continued | | | | | | | | |
| Real Estate — continued | | | | | | | | |
| Keppel ‡ | | | 380 | | | $ | 220 | |
| | | | | | | | 20,483 | |
| TOTAL SINGAPORE | | | | | | | 245,983 | |
| SOUTH AFRICA — 0.3% | | | | | | | | |
| Materials — 0.3% | | | | | | | | |
| Anglo American | | | 1,618 | | | | 41,162 | |
| |
| SPAIN — 2.6% | | | | | | | | |
| Communication Services — 0.3% | | | | | | | | |
| Cellnex Telecom ‡ | | | 697 | | | | 20,422 | |
| Telefonica | | | 6,795 | | | | 26,187 | |
| | | | | | | | 46,609 | |
| Consumer Discretionary — 0.6% | | | | | | | | |
| Amadeus IT Group | | | 615 | | | | 34,986 | |
| Industria de Diseno Textil | | | 1,522 | | | | 52,365 | |
| | | | | | | | 87,351 | |
| Financials — 1.0% | | | | | | | | |
| Banco Bilbao Vizcaya Argentaria | | | 7,155 | | | | 56,132 | |
| Banco Santander | | | 19,618 | | | | 71,872 | |
| CaixaBank | | | 4,722 | | | | 19,141 | |
| | | | | | | | 147,145 | |
| Utilities — 0.7% | | | | | | | | |
| EDP Renovaveis | | | 348 | | | | 5,587 | |
| Iberdrola | | | 7,141 | | | | 79,255 | |
| Naturgy Energy Group | | | 206 | | | | 5,814 | |
| | | | | | | | 90,656 | |
| TOTAL SPAIN | | | | | | | 371,761 | |
| SWEDEN — 3.3% | | | | | | | | |
| Communication Services — 0.1% | | | | | | | | |
| Embracer Group, Cl B * | | | 1,069 | | | | 1,732 | |
| Telia | | | 2,952 | | | | 6,238 | |
| | | | | | | | 7,970 | |
The accompanying notes are an integral part of the financial statements.
242
| Schedule of Investments | October 31, 2023 |
| Global X S&P Catholic Values Developed ex-US ETF |
| | | Shares | | | Value | |
| COMMON STOCK — continued | | | | | | | | |
| Consumer Discretionary — 0.1% | | | | | | | | |
| H & M Hennes & Mauritz, Cl B | | | 898 | | | $ | 12,000 | |
| Volvo Car, Cl B * | | | 624 | | | | 2,140 | |
| | | | | | | | 14,140 | |
| Consumer Staples — 0.2% | | | | | | | | |
| Essity, Cl B | | | 1,355 | | | | 30,841 | |
| |
| Financials — 0.8% | | | | | | | | |
| EQT | | | 359 | | | | 6,519 | |
| Industrivarden, Cl A | | | 224 | | | | 5,778 | |
| Industrivarden, Cl C | | | 218 | | | | 5,604 | |
| Investor, Cl B | | | 2,160 | | | | 39,516 | |
| L E Lundbergforetagen, Cl B | | | 62 | | | | 2,523 | |
| Skandinaviska Enskilda Banken, Cl A | | | 1,962 | | | | 21,828 | |
| Skandinaviska Enskilda Banken, Cl C | | | 4 | | | | 46 | |
| Svenska Handelsbanken, Cl A | | | 1,821 | | | | 15,484 | |
| Svenska Handelsbanken, Cl B | | | 54 | | | | 556 | |
| Swedbank, Cl A | | | 1,092 | | | | 17,862 | |
| | | | | | | | 115,716 | |
| Industrials — 1.8% | | | | | | | | |
| Alfa Laval | | | 453 | | | | 14,621 | |
| Assa Abloy, Cl B | | | 1,594 | | | | 33,884 | |
| Atlas Copco, Cl A | | | 4,109 | | | | 53,033 | |
| Atlas Copco, Cl B | | | 2,519 | | | | 28,194 | |
| Epiroc, Cl A | | | 1,027 | | | | 16,867 | |
| Epiroc, Cl B | | | 551 | | | | 7,629 | |
| Investment Latour, Cl B | | | 174 | | | | 3,002 | |
| Nibe Industrier, Cl B | | | 2,163 | | | | 12,425 | |
| Sandvik | | | 1,736 | | | | 29,460 | |
| Volvo, Cl A | | | 252 | | | | 5,039 | |
| Volvo, Cl B | | | 2,530 | | | | 50,022 | |
| | | | | | | | 254,176 | |
| Information Technology — 0.2% | | | | | | | | |
| Hexagon, Cl B | | | 2,533 | | | | 20,563 | |
| Telefonaktiebolaget LM Ericsson, Cl B | | | 3,593 | | | | 16,083 | |
| | | | | | | | 36,646 | |
The accompanying notes are an integral part of the financial statements.
243
| Schedule of Investments | October 31, 2023 |
| Global X S&P Catholic Values Developed ex-US ETF |
| | | Shares | | | Value | |
| COMMON STOCK — continued | | | | | | | | |
| Materials — 0.1% | | | | | | | | |
| Boliden | | | 346 | | | $ | 8,849 | |
| Svenska Cellulosa, Cl B | | | 739 | | | | 10,117 | |
| | | | | | | | 18,966 | |
| TOTAL SWEDEN | | | | | | | 478,455 | |
| SWITZERLAND — 4.5% | | | | | | | | |
| Consumer Discretionary — 0.6% | | | | | | | | |
| Cie Financiere Richemont, Cl A | | | 703 | | | | 82,579 | |
| |
| Financials — 1.2% | | | | | | | | |
| UBS Group | | | 3,662 | | | | 85,388 | |
| Zurich Insurance Group | | | 176 | | | | 83,276 | |
| | | | | | | | 168,664 | |
| Health Care — 1.3% | | | | | | | | |
| Alcon | | | 2,706 | | | | 192,740 | |
| |
| Industrials — 0.7% | | | | | | | | |
| ABB | | | 2,555 | | | | 85,461 | |
| Kuehne + Nagel International | | | 88 | | | | 23,643 | |
| | | | | | | | 109,104 | |
| Materials — 0.7% | | | | | | | | |
| DSM-Firmenich | | | 248 | | | | 22,436 | |
| Givaudan | | | 9 | | | | 29,867 | |
| Sika | | | 186 | | | | 44,331 | |
| | | | | | | | 96,634 | |
| TOTAL SWITZERLAND | | | | | | | 649,721 | |
| UNITED KINGDOM — 7.6% | | | | | | | | |
| Communication Services — 0.2% | | | | | | | | |
| BT Group, Cl A | | | 7,762 | | | | 10,620 | |
| Vodafone Group | | | 27,702 | | | | 25,446 | |
| | | | | | | | 36,066 | |
| Consumer Discretionary — 0.4% | | | | | | | | |
| Compass Group | | | 2,419 | | | | 60,849 | |
The accompanying notes are an integral part of the financial statements.
244
| Schedule of Investments | October 31, 2023 |
| Global X S&P Catholic Values Developed ex-US ETF |
| | | Shares | | | Value | |
| COMMON STOCK — continued | | | | | | | | |
| Consumer Staples — 2.0% | | | | | | | | |
| Associated British Foods | | | 718 | | | $ | 17,652 | |
| Coca-Cola Europacific Partners | | | 477 | | | | 27,909 | |
| Diageo | | | 5,051 | | | | 190,432 | |
| Tesco | | | 16,046 | | | | 52,513 | |
| | | | | | | | 288,506 | |
| Energy — 0.9% | | | | | | | | |
| BP | | | 20,494 | | | | 124,988 | |
| |
| Financials — 2.4% | | | | | | | | |
| Barclays | | | 17,249 | | | | 27,545 | |
| HSBC Holdings | | | 23,756 | | | | 170,740 | |
| Legal & General Group | | | 7,061 | | | | 18,113 | |
| Lloyds Banking Group | | | 79,612 | | | | 38,584 | |
| London Stock Exchange Group | | | 501 | | | | 50,337 | |
| NatWest Group | | | 6,654 | | | | 14,388 | |
| Standard Chartered | | | 2,908 | | | | 22,231 | |
| | | | | | | | 341,938 | |
| Industrials — 1.2% | | | | | | | | |
| Ashtead Group | | | 721 | | | | 41,155 | |
| CK Hutchison Holdings | | | 4,320 | | | | 21,836 | |
| RELX | | | 3,055 | | | | 106,319 | |
| | | | | | | | 169,310 | |
| Utilities — 0.5% | | | | | | | | |
| National Grid | | | 4,633 | | | | 55,016 | |
| SSE | | | 1,246 | | | | 24,690 | |
| | | | | | | | 79,706 | |
| TOTAL UNITED KINGDOM | | | | | | | 1,101,363 | |
| UNITED STATES — 6.5% | | | | | | | | |
| Communication Services — 0.2% | | | | | | | | |
| Spotify Technology * | | | 163 | | | | 26,856 | |
| |
| Consumer Discretionary — 0.4% | | | | | | | | |
| Stellantis | | | 3,002 | | | | 55,847 | |
The accompanying notes are an integral part of the financial statements.
245
| Schedule of Investments | October 31, 2023 |
| Global X S&P Catholic Values Developed ex-US ETF |
| | | Shares | | | Value | |
| COMMON STOCK — continued | | | | | | | | |
| Consumer Staples — 0.3% | | | | | | | | |
| Haleon | | | 10,527 | | | $ | 42,090 | |
| |
| Energy — 0.1% | | | | | | | | |
| Tenaris | | | 557 | | | | 8,799 | |
| |
| Health Care — 3.4% | | | | | | | | |
| CSL | | | 2,608 | | | | 383,670 | |
| ICON * | | | 447 | | | | 109,050 | |
| Inmode * | | | 335 | | | | 6,399 | |
| | | | | | | | 499,119 | |
| Industrials — 1.2% | | | | | | | | |
| Experian | | | 1,469 | | | | 44,403 | |
| Schneider Electric | | | 847 | | | | 129,798 | |
| | | | | | | | 174,201 | |
| Information Technology — 0.1% | | | | | | | | |
| CyberArk Software * | | | 50 | | | | 8,182 | |
| Monday.com * | | | 32 | | | | 4,160 | |
| | | | | | | | 12,342 | |
| Materials — 0.8% | | | | | | | | |
| CRH | | | 894 | | | | 47,960 | |
| Holcim | | | 650 | | | | 40,055 | |
| James Hardie Industries * | | | 557 | | | | 13,786 | |
| Newmont * | | | 406 | | | | 15,544 | |
| | | | | | | | 117,345 | |
| TOTAL UNITED STATES | | | | | | | 936,599 | |
TOTAL COMMON STOCK
(Cost $15,077,298) | | | | | | | 14,355,712 | |
| |
| PREFERRED STOCK — 0.5% | | | | | | | | |
| GERMANY— 0.5% | | | | | | | | |
| Consumer Discretionary — 0.3% | | | | | | | | |
| Bayerische Motoren Werke (A) | | | 75 | | | | 6,354 | |
| Dr Ing hc F Porsche (A) | | | 130 | | | | 11,342 | |
| Volkswagen (A) | | | 245 | | | | 25,852 | |
| | | | | | | | 43,548 | |
The accompanying notes are an integral part of the financial statements.
246
| Schedule of Investments | October 31, 2023 |
| Global X S&P Catholic Values Developed ex-US ETF |
| | | Shares | | | Value | |
| PREFERRED STOCK — continued | | | | | | | | |
| Consumer Staples — 0.2% | | | | | | | | |
| Henkel & KGaA (A) | | | 372 | | | $ | 26,770 | |
| TOTAL GERMANY | | | | | | | 70,318 | |
TOTAL PREFERRED STOCK
(Cost $91,426) | | | | | | | 70,318 | |
TOTAL INVESTMENTS — 99.6%
(Cost $15,168,724) | | | | | | $ | 14,426,030 | |
Percentages are based on Net Assets of $14,484,615.
| * | Non-income producing security. |
| ‡ | Real Estate Investment Trust |
| (A) | There is currently no stated interest rate. |
As of October 31, 2023, all of the Fund’s investments were considered Level 1, in accordance with authoritative guidance on fair value measurements and disclosure under U.S. GAAP.
See “Glossary” for abbreviations.
The accompanying notes are an integral part of the financial statements.
247
| Schedule of Investments | | October 31, 2023 |
| | Global X Nasdaq 100® Covered Call & Growth ETF | |
Sector Weightings (Unaudited)†:
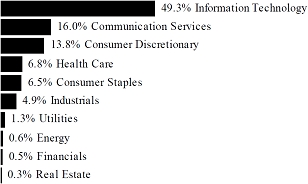
† Sector weightings percentages are based on the total market value of investments. Total investments do not include derivatives such as options, futures contracts, forward contracts, and swap contracts, if applicable.
| | | Shares | | | Value | |
| COMMON STOCK(A) — 100.5% | | | | | | | | |
| BRAZIL — 0.5% | | | | | | | | |
| Consumer Discretionary — 0.5% | | | | | | | | |
| MercadoLibre * | | | 456 | | | $ | 565,778 | |
| | | | | | | | | |
| CHINA — 1.1% | | | | | | | | |
| Consumer Discretionary — 0.7% | | | | | | | | |
| JD.com ADR | | | 4,125 | | | | 104,858 | |
| PDD Holdings ADR * | | | 5,951 | | | | 603,550 | |
| | | | | | | | 708,408 | |
| Information Technology — 0.4% | | | | | | | | |
| NXP Semiconductors | | | 2,346 | | | | 404,521 | |
| | | | | | | | | |
| TOTAL CHINA | | | | | | | 1,112,929 | |
| NETHERLANDS — 0.5% | | | | | | | | |
| Information Technology — 0.5% | | | | | | | | |
| ASML Holding | | | 783 | | | | 468,868 | |
The accompanying notes are an integral part of the financial statements.
248
| Schedule of Investments | | October 31, 2023 |
| | | |
| | Global X Nasdaq 100® Covered Call & Growth ETF | |
| | | | | | | |
| | | Shares | | | Value | |
| COMMON STOCK — continued | | | | | | | | |
| UNITED KINGDOM — 0.3% | | | | | | | | |
| Health Care — 0.3% | | | | | | | | |
| AstraZeneca ADR | | | 5,265 | | | $ | 332,906 | |
| | | | | | | | | |
| UNITED STATES — 98.1% | | | | | | | | |
| Communication Services — 16.1% | | | | | | | | |
| Alphabet, Cl A * | | | 25,174 | | | | 3,123,590 | |
| Alphabet, Cl C * | | | 24,614 | | | | 3,084,134 | |
| Charter Communications, Cl A * | | | 1,362 | | | | 548,614 | |
| Comcast, Cl A | | | 37,452 | | | | 1,546,393 | |
| Electronic Arts | | | 2,465 | | | | 305,142 | |
| Meta Platforms, Cl A * | | | 13,219 | | | | 3,982,488 | |
| Netflix * | | | 4,033 | | | | 1,660,346 | |
| Sirius XM Holdings | | | 35,086 | | | | 150,168 | |
| T-Mobile US * | | | 10,705 | | | | 1,540,021 | |
| Trade Desk, Cl A * | | | 4,060 | | | | 288,098 | |
| Warner Bros Discovery * | | | 22,180 | | | | 220,469 | |
| | | | | | | | 16,449,463 | |
| Consumer Discretionary — 12.7% | | | | | | | | |
| Airbnb, Cl A * | | | 3,897 | | | | 460,976 | |
| Amazon.com * | | | 43,779 | | | | 5,826,547 | |
| Booking Holdings * | | | 324 | | | | 903,818 | |
| eBay | | | 4,741 | | | | 185,989 | |
| Lucid Group * | | | 20,504 | | | | 84,477 | |
| Lululemon Athletica * | | | 1,093 | | | | 430,074 | |
| Marriott International, Cl A | | | 2,720 | | | | 512,883 | |
| O’Reilly Automotive * | | | 551 | | | | 512,672 | |
| Ross Stores | | | 3,100 | | | | 359,507 | |
| Starbucks | | | 10,423 | | | | 961,418 | |
| Tesla * | | | 13,467 | | | | 2,704,712 | |
| | | | | | | | 12,943,073 | |
| Consumer Staples — 6.6% | | | | | | | | |
| Costco Wholesale | | | 4,036 | | | | 2,229,648 | |
| Dollar Tree * | | | 2,017 | | | | 224,068 | |
| Keurig Dr Pepper | | | 12,715 | | | | 385,646 | |
| Kraft Heinz | | | 11,177 | | | | 351,628 | |
| Mondelez International, Cl A | | | 12,379 | | | | 819,614 | |
| Monster Beverage * | | | 9,579 | | | | 489,487 | |
The accompanying notes are an integral part of the financial statements.
249
| Schedule of Investments | | October 31, 2023 |
| | | |
| | Global X Nasdaq 100® Covered Call & Growth ETF | |
| | | | | | | |
| | | Shares | | | Value | |
| COMMON STOCK — continued | | | | | | | | |
| Consumer Staples — continued | | | | | | | | |
| PepsiCo | | | 12,527 | | | $ | 2,045,408 | |
| Walgreens Boots Alliance | | | 7,920 | | | | 166,954 | |
| | | | | | | | 6,712,453 | |
| Energy — 0.6% | | | | | | | | |
| Baker Hughes, Cl A | | | 9,188 | | | | 316,251 | |
| Diamondback Energy | | | 1,651 | | | | 264,688 | |
| | | | | | | | 580,939 | |
| Financials — 0.5% | | | | | | | | |
| PayPal Holdings * | | | 9,953 | | | | 515,565 | |
| | | | | | | | | |
| Health Care — 6.5% | | | | | | | | |
| Align Technology * | | | 684 | | | | 126,260 | |
| Amgen | | | 4,852 | | | | 1,240,656 | |
| Biogen * | | | 1,309 | | | | 310,940 | |
| Dexcom * | | | 3,530 | | | | 313,570 | |
| GE HealthCare Technologies | | | 4,139 | | | | 275,533 | |
| Gilead Sciences | | | 11,338 | | | | 890,487 | |
| IDEXX Laboratories * | | | 755 | | | | 301,600 | |
| Illumina * | | | 1,409 | | | | 154,173 | |
| Intuitive Surgical * | | | 3,194 | | | | 837,531 | |
| Moderna * | | | 3,401 | | | | 258,340 | |
| Regeneron Pharmaceuticals * | | | 971 | | | | 757,273 | |
| Seagen * | | | 1,708 | | | | 363,479 | |
| Vertex Pharmaceuticals * | | | 2,349 | | | | 850,596 | |
| | | | | | | | 6,680,438 | |
| Industrials — 4.9% | | | | | | | | |
| Automatic Data Processing | | | 3,749 | | | | 818,107 | |
| Cintas | | | 926 | | | | 469,593 | |
| Copart * | | | 8,689 | | | | 378,145 | |
| CSX | | | 18,135 | | | | 541,330 | |
| Fastenal | | | 5,199 | | | | 303,310 | |
| Honeywell International | | | 6,042 | | | | 1,107,257 | |
| Old Dominion Freight Line | | | 986 | | | | 371,387 | |
| PACCAR | | | 4,757 | | | | 392,595 | |
| Paychex | | | 3,281 | | | | 364,355 | |
The accompanying notes are an integral part of the financial statements.
250
| Schedule of Investments | | October 31, 2023 |
| | | |
| | Global X Nasdaq 100® Covered Call & Growth ETF | |
| | | | | | | |
| | | Shares | | | Value | |
| COMMON STOCK — continued | | | | | | | | |
| Industrials — continued | | | | | | | | |
| Verisk Analytics, Cl A | | | 1,310 | | | $ | 297,841 | |
| | | | | | | | 5,043,920 | |
| Information Technology — 48.7% | | | | | | | | |
| Adobe * | | | 4,148 | | | | 2,206,985 | |
| Advanced Micro Devices * | | | 14,702 | | | | 1,448,147 | |
| Analog Devices | | | 4,535 | | | | 713,492 | |
| ANSYS * | | | 790 | | | | 219,825 | |
| Apple | | | 66,337 | | | | 11,328,369 | |
| Applied Materials | | | 7,612 | | | | 1,007,448 | |
| Atlassian, Cl A * | | | 1,395 | | | | 251,993 | |
| Autodesk * | | | 1,945 | | | | 384,390 | |
| Broadcom | | | 3,755 | | | | 3,159,344 | |
| Cadence Design Systems * | | | 2,473 | | | | 593,149 | |
| Cisco Systems | | | 37,082 | | | | 1,933,085 | |
| Cognizant Technology Solutions, Cl A | | | 4,523 | | | | 291,598 | |
| Crowdstrike Holdings, Cl A * | | | 2,057 | | | | 363,616 | |
| Datadog, Cl A * | | | 2,721 | | | | 221,680 | |
| Enphase Energy * | | | 1,248 | | | | 99,316 | |
| Fortinet * | | | 7,146 | | | | 408,537 | |
| GLOBALFOUNDRIES * | | | 4,984 | | | | 247,306 | |
| Intel | | | 37,964 | | | | 1,385,686 | |
| Intuit | | | 2,539 | | | | 1,256,678 | |
| KLA | | | 1,244 | | | | 584,307 | |
| Lam Research | | | 1,200 | | | | 705,864 | |
| Marvell Technology | | | 7,917 | | | | 373,841 | |
| Microchip Technology | | | 4,953 | | | | 353,099 | |
| Micron Technology | | | 9,967 | | | | 666,493 | |
| Microsoft | | | 31,525 | | | | 10,658,918 | |
| NVIDIA | | | 10,480 | | | | 4,273,744 | |
| ON Semiconductor * | | | 3,927 | | | | 245,987 | |
| Palo Alto Networks * | | | 2,789 | | | | 677,783 | |
| QUALCOMM | | | 10,130 | | | | 1,104,069 | |
| Synopsys * | | | 1,388 | | | | 651,583 | |
| Texas Instruments | | | 8,234 | | | | 1,169,310 | |
| Workday, Cl A * | | | 1,884 | | | | 398,862 | |
| Zoom Video Communications, Cl A * | | | 2,281 | | | | 136,814 | |
| Zscaler * | | | 1,312 | | | | 208,201 | |
| | | | | | | | 49,729,519 | |
The accompanying notes are an integral part of the financial statements.
251
| Schedule of Investments | | October 31, 2023 |
| | | |
| | Global X Nasdaq 100® Covered Call & Growth ETF | |
| | | | | | | |
| | | Shares | | | Value | |
| COMMON STOCK — continued | | | | | | | | |
| Real Estate — 0.2% | | | | | | | | |
| CoStar Group * | | | 3,716 | | | $ | 272,792 | |
| | | | | | | | | |
| Utilities — 1.3% | | | | | | | | |
| American Electric Power | | | 4,688 | | | | 354,132 | |
| Constellation Energy | | | 2,882 | | | | 325,435 | |
| Exelon | | | 9,056 | | | | 352,641 | |
| Xcel Energy | | | 5,019 | | | | 297,476 | |
| | | | | | | | 1,329,684 | |
| TOTAL UNITED STATES | | | | | | | 100,257,846 | |
TOTAL COMMON STOCK
(Cost $98,833,475) | | | | | | | 102,738,327 | |
TOTAL INVESTMENTS — 100.5%
(Cost $98,833,475) | | | | | | $ | 102,738,327 | |
| | | | | | | | | |
WRITTEN OPTIONS— (0.6)%
(Premiums Received $(1,430,104)) | | | | | | $ | (652,400 | ) |
Percentages are based on Net Assets of $102,178,687.
A list of the exchange traded option contracts held by the Fund at October 31, 2023, is as follows:
| Description | | Number of Contracts | | | Notional Amount | | | Exercise Price | | | Expiration Date | | Value | |
| WRITTEN OPTIONS — (0.6)% | | | | | | | | | | | | | | | | | | |
| Call Options | | | | | | | | | | | | | | | | | | |
| Nasdaq-100 | | | (35 | ) | | $ | (50,434,230 | ) | | $ | 14,600 | | | 11/17/23 | | $ | (652,400 | ) |
| * | Non-income producing security. |
| (A) | All or a portion of these securities has been segregated as collateral for options contracts. The Fair Value of the securities pledged as collateral is $74,989,598. |
The accompanying notes are an integral part of the financial statements.
252
| Schedule of Investments | | October 31, 2023 |
| | | |
| | Global X Nasdaq 100® Covered Call & Growth ETF | |
The following is a summary of the level of inputs used as of October 31, 2023, in valuing the Fund’s investments and other financial instruments carried at value:
| Investments in Securities | | Level 1 | | | Level 2 | | Level 3 | | Total | |
| Common Stock | | $ | 102,738,327 | | | $ | — | | $ | — | | $ | 102,738,327 | |
| Total Investments in Securities | | $ | 102,738,327 | | | $ | — | | $ | — | | $ | 102,738,327 | |
| | | | | | | | | | | | | | | |
| Other Financial Instruments | | | Level 1 | | | | Level 2 | | | Level 3 | | | Total | |
| Written Options | | $ | (652,400 | ) | | $ | — | | $ | — | | $ | (652,400 | ) |
| Total Other Financial Instruments | | $ | (652,400 | ) | | $ | — | | $ | — | | $ | (652,400 | ) |
Amounts designated as “—” are $0 or have been rounded to $0.
See “Glossary” for abbreviations.
The accompanying notes are an integral part of the financial statements.
253
| Schedule of Investments | | October 31, 2023 |
| | | |
| | Global X S&P 500® Covered Call & Growth ETF | |
Sector Weightings (Unaudited)†:

† Sector weightings percentages are based on the total market value of investments. Total investments do not include derivatives such as options, futures contracts, forward contracts, and swap contracts, if applicable.
| | | Shares | | | Value | |
| COMMON STOCK(A) — 100. 4% | | | | | | | | |
| CHINA — 0.1% | | | | | | | | |
| Information Technology — 0.1% | | | | | | | | |
| NXP Semiconductors | | | 451 | | | $ | 77,766 | |
| | | | | | | | | |
| UNITED STATES — 100.3% | | | | | | | | |
| Communication Services — 8.7% | | | | | | | | |
| Alphabet, Cl A * | | | 10,348 | | | | 1,283,980 | |
| Alphabet, Cl C * | | | 8,802 | | | | 1,102,891 | |
| AT&T | | | 12,485 | | | | 192,269 | |
| Charter Communications, Cl A * | | | 183 | | | | 73,712 | |
| Comcast, Cl A | | | 7,178 | | | | 296,380 | |
| Electronic Arts | | | 405 | | | | 50,135 | |
| Fox, Cl A | | | 493 | | | | 14,982 | |
| Fox, Cl B | | | 238 | | | | 6,643 | |
| Interpublic Group | | | 708 | | | | 20,107 | |
| Live Nation Entertainment * | | | 235 | | | | 18,805 | |
| Match Group * | | | 490 | | | | 16,954 | |
| Meta Platforms, Cl A * | | | 3,876 | | | | 1,167,723 | |
| Netflix * | | | 764 | | | | 314,531 | |
| News, Cl A | | | 708 | | | | 14,641 | |
| News, Cl B | | | 236 | | | | 5,060 | |
| Omnicom Group | | | 328 | | | | 24,570 | |
The accompanying notes are an integral part of the financial statements.
254
| Schedule of Investments | | October 31, 2023 |
| | | |
| | Global X S&P 500® Covered Call & Growth ETF | |
| | | | | | | |
| | | Shares | | | Value | |
| COMMON STOCK — continued | | | | | | | | |
| Communication Services — continued | | | | | | | | |
| Paramount Global, Cl B | | | 893 | | | $ | 9,716 | |
| Take-Two Interactive Software * | | | 290 | | | | 38,787 | |
| T-Mobile US * | | | 879 | | | | 126,453 | |
| Verizon Communications | | | 7,195 | | | | 252,760 | |
| Walt Disney * | | | 3,208 | | | | 261,741 | |
| Warner Bros Discovery * | | | 4,051 | | | | 40,267 | |
| | | | | | | | 5,333,107 | |
| Consumer Discretionary — 10.6% | | | | | | | | |
| Airbnb, Cl A * | | | 716 | | | | 84,696 | |
| Amazon.com * | | | 15,836 | | | | 2,107,613 | |
| Aptiv * | | | 473 | | | | 41,246 | |
| AutoZone * | | | 32 | | | | 79,268 | |
| Bath & Body Works | | | 470 | | | | 13,935 | |
| Best Buy | | | 350 | | | | 23,387 | |
| Booking Holdings * | | | 62 | | | | 172,953 | |
| BorgWarner | | | 467 | | | | 17,232 | |
| Caesars Entertainment * | | | 402 | | | | 16,036 | |
| CarMax * | | | 300 | | | | 18,327 | |
| Carnival * | | | 1,688 | | | | 19,344 | |
| Chipotle Mexican Grill, Cl A * | | | 48 | | | | 93,226 | |
| Darden Restaurants | | | 206 | | | | 29,979 | |
| Domino’s Pizza | | | 57 | | | | 19,322 | |
| DR Horton | | | 529 | | | | 55,228 | |
| eBay | | | 970 | | | | 38,053 | |
| Etsy * | | | 233 | | | | 14,516 | |
| Expedia Group * | | | 211 | | | | 20,106 | |
| Ford Motor | | | 6,832 | | | | 66,612 | |
| Garmin | | | 274 | | | | 28,093 | |
| General Motors | | | 2,445 | | | | 68,949 | |
| Genuine Parts | | | 257 | | | | 33,117 | |
| Hasbro | | | 237 | | | | 10,701 | |
| Hilton Worldwide Holdings | | | 466 | | | | 70,613 | |
| Home Depot | | | 1,753 | | | | 499,062 | |
| Las Vegas Sands | | | 600 | | | | 28,476 | |
| Lennar, Cl A | | | 414 | | | | 44,166 | |
| LKQ | | | 474 | | | | 20,818 | |
| Lowe’s | | | 1,022 | | | | 194,763 | |
| Lululemon Athletica * | | | 216 | | | | 84,992 | |
The accompanying notes are an integral part of the financial statements.
255
| Schedule of Investments | | October 31, 2023 |
| | | |
| | Global X S&P 500® Covered Call & Growth ETF | |
| | | | | | | |
| | | Shares | | | Value | |
| COMMON STOCK — continued | | | | | | | | |
| Consumer Discretionary — continued | | | | | | | | |
| Marriott International, Cl A | | | 422 | | | $ | 79,572 | |
| McDonald’s | | | 1,265 | | | | 331,645 | |
| MGM Resorts International | | | 415 | | | | 14,492 | |
| Mohawk Industries * | | | 69 | | | | 5,546 | |
| NIKE, Cl B | | | 2,137 | | | | 219,619 | |
| Norwegian Cruise Line Holdings * | | | 698 | | | | 9,493 | |
| NVR * | | | 6 | | | | 32,476 | |
| O’Reilly Automotive * | | | 105 | | | | 97,696 | |
| Pool | | | 63 | | | | 19,894 | |
| PulteGroup | | | 377 | | | | 27,743 | |
| Ralph Lauren, Cl A | | | 48 | | | | 5,401 | |
| Ross Stores | | | 597 | | | | 69,234 | |
| Royal Caribbean Cruises * | | | 410 | | | | 34,739 | |
| Starbucks | | | 1,998 | | | | 184,296 | |
| Tapestry | | | 474 | | | | 13,063 | |
| Tesla * | | | 4,816 | | | | 967,245 | |
| TJX | | | 2,019 | | | | 177,813 | |
| Tractor Supply | | | 194 | | | | 37,357 | |
| Ulta Beauty * | | | 87 | | | | 33,174 | |
| VF | | | 578 | | | | 8,514 | |
| Whirlpool | | | 73 | | | | 7,633 | |
| Wynn Resorts | | | 195 | | | | 17,117 | |
| Yum! Brands | | | 503 | | | | 60,793 | |
| | | | | | | | 6,469,384 | |
| Consumer Staples — 6.7% | | | | | | | | |
| Altria Group | | | 3,105 | | | | 124,728 | |
| Archer-Daniels-Midland | | | 944 | | | | 67,562 | |
| Brown-Forman, Cl B | | | 302 | | | | 16,960 | |
| Bunge | | | 268 | | | | 28,403 | |
| Campbell Soup | | | 388 | | | | 15,679 | |
| Church & Dwight | | | 418 | | | | 38,013 | |
| Clorox | | | 233 | | | | 27,424 | |
| Coca-Cola | | | 6,788 | | | | 383,454 | |
| Colgate-Palmolive | | | 1,430 | | | | 107,422 | |
| Conagra Brands | | | 806 | | | | 22,052 | |
| Constellation Brands, Cl A | | | 282 | | | | 66,030 | |
| Costco Wholesale | | | 773 | | | | 427,036 | |
| Dollar General | | | 399 | | | | 47,497 | |
The accompanying notes are an integral part of the financial statements.
256
| Schedule of Investments | | October 31, 2023 |
| | | |
| | Global X S&P 500® Covered Call & Growth ETF | |
| | | | | | | |
| | | Shares | | | Value | |
| COMMON STOCK — continued | | | | | | | | |
| Consumer Staples — continued | | | | | | | | |
| Dollar Tree * | | | 369 | | | $ | 40,992 | |
| Estee Lauder, Cl A | | | 406 | | | | 52,321 | |
| General Mills | | | 998 | | | | 65,110 | |
| Hershey | | | 262 | | | | 49,086 | |
| Hormel Foods | | | 474 | | | | 15,429 | |
| J M Smucker | | | 200 | | | | 22,768 | |
| Kellanova | | | 472 | | | | 23,822 | |
| Kenvue | | | 3,019 | | | | 56,153 | |
| Keurig Dr Pepper | | | 1,650 | | | | 50,044 | |
| Kimberly-Clark | | | 592 | | | | 70,827 | |
| Kraft Heinz | | | 1,424 | | | | 44,799 | |
| Kroger | | | 1,121 | | | | 50,860 | |
| Lamb Weston Holdings | | | 238 | | | | 21,372 | |
| McCormick | | | 469 | | | | 29,969 | |
| Molson Coors Beverage, Cl B | | | 325 | | | | 18,775 | |
| Mondelez International, Cl A | | | 2,376 | | | | 157,315 | |
| Monster Beverage * | | | 1,326 | | | | 67,759 | |
| PepsiCo | | | 2,394 | | | | 390,892 | |
| Philip Morris International | | | 2,717 | | | | 242,248 | |
| Procter & Gamble | | | 4,111 | | | | 616,773 | |
| Sysco | | | 884 | | | | 58,777 | |
| Target | | | 811 | | | | 89,851 | |
| Tyson Foods, Cl A | | | 527 | | | | 24,426 | |
| Walgreens Boots Alliance | | | 1,307 | | | | 27,552 | |
| Walmart | | | 2,470 | | | | 403,623 | |
| | | | | | | | 4,063,803 | |
| Energy — 4.5% | | | | | | | | |
| APA | | | 524 | | | | 20,813 | |
| Baker Hughes, Cl A | | | 1,807 | | | | 62,197 | |
| Chevron | | | 3,094 | | | | 450,889 | |
| ConocoPhillips | | | 2,053 | | | | 243,896 | |
| Coterra Energy | | | 1,415 | | | | 38,912 | |
| Devon Energy | | | 1,105 | | | | 51,460 | |
| Diamondback Energy | | | 324 | | | | 51,944 | |
| EOG Resources | | | 1,011 | | | | 127,639 | |
| EQT | | | 698 | | | | 29,581 | |
| Exxon Mobil | | | 6,982 | | | | 739,045 | |
| Halliburton | | | 1,493 | | | | 58,735 | |
The accompanying notes are an integral part of the financial statements.
257
| Schedule of Investments | | October 31, 2023 |
| | | |
| | Global X S&P 500® Covered Call & Growth ETF | |
| | | | | | | |
| | | Shares | | | Value | |
| COMMON STOCK — continued | | | | | | | | |
| Energy — continued | | | | | | | | |
| Hess | | | 475 | | | $ | 68,590 | |
| Kinder Morgan | | | 3,407 | | | | 55,193 | |
| Marathon Oil | | | 934 | | | | 25,508 | |
| Marathon Petroleum | | | 674 | | | | 101,943 | |
| Occidental Petroleum | | | 1,107 | | | | 68,424 | |
| ONEOK | | | 1,003 | | | | 65,396 | |
| Phillips 66 | | | 743 | | | | 84,754 | |
| Pioneer Natural Resources | | | 409 | | | | 97,751 | |
| Schlumberger | | | 2,496 | | | | 138,927 | |
| Targa Resources | | | 358 | | | | 29,932 | |
| Valero Energy | | | 629 | | | | 79,883 | |
| Williams | | | 2,111 | | | | 72,618 | |
| | | | | | | | 2,764,030 | |
| Financials — 12.8% | | | | | | | | |
| Aflac | | | 946 | | | | 73,892 | |
| Allstate | | | 480 | | | | 61,502 | |
| American Express | | | 986 | | | | 143,986 | |
| American International Group | | | 1,242 | | | | 76,147 | |
| Ameriprise Financial | | | 187 | | | | 58,825 | |
| Aon, Cl A | | | 363 | | | | 112,312 | |
| Arch Capital Group * | | | 649 | | | | 56,255 | |
| Arthur J Gallagher | | | 383 | | | | 90,193 | |
| Assurant | | | 65 | | | | 9,679 | |
| Bank of America | | | 12,058 | | | | 317,608 | |
| Bank of New York Mellon | | | 1,358 | | | | 57,715 | |
| Berkshire Hathaway, Cl B * | | | 3,181 | | | | 1,085,771 | |
| BlackRock, Cl A | | | 238 | | | | 145,723 | |
| Blackstone | | | 1,200 | | | | 110,820 | |
| Brown & Brown | | | 452 | | | | 31,378 | |
| Capital One Financial | | | 666 | | | | 67,459 | |
| Cboe Global Markets | | | 196 | | | | 32,122 | |
| Charles Schwab | | | 2,589 | | | | 134,732 | |
| Chubb | | | 717 | | | | 153,883 | |
| Cincinnati Financial | | | 268 | | | | 26,712 | |
| Citigroup | | | 3,392 | | | | 133,950 | |
| Citizens Financial Group | | | 907 | | | | 21,251 | |
| CME Group, Cl A | | | 631 | | | | 134,693 | |
| Comerica | | | 236 | | | | 9,298 | |
The accompanying notes are an integral part of the financial statements.
258
| Schedule of Investments | | October 31, 2023 |
| | | |
| | Global X S&P 500® Covered Call & Growth ETF | |
| | | | | | | |
| | | Shares | | | Value | |
| COMMON STOCK — continued | | | | | | | | |
| Financials — continued | | | | | | | | |
| Discover Financial Services | | | 437 | | | $ | 35,869 | |
| Everest Group | | | 76 | | | | 30,067 | |
| FactSet Research Systems | | | 67 | | | | 28,937 | |
| Fidelity National Information Services | | | 1,010 | | | | 49,601 | |
| Fifth Third Bancorp | | | 1,211 | | | | 28,713 | |
| Fiserv * | | | 1,082 | | | | 123,078 | |
| FleetCor Technologies * | | | 139 | | | | 31,299 | |
| Franklin Resources | | | 472 | | | | 10,757 | |
| Global Payments | | | 454 | | | | 48,224 | |
| Globe Life | | | 148 | | | | 17,221 | |
| Goldman Sachs Group | | | 562 | | | | 170,629 | |
| Hartford Financial Services Group | | | 521 | | | | 38,267 | |
| Huntington Bancshares | | | 2,682 | | | | 25,881 | |
| Intercontinental Exchange | | | 970 | | | | 104,217 | |
| Invesco | | | 766 | | | | 9,935 | |
| Jack Henry & Associates | | | 125 | | | | 17,624 | |
| JPMorgan Chase | | | 5,069 | | | | 704,895 | |
| KeyCorp | | | 1,786 | | | | 18,253 | |
| Loews | | | 307 | | | | 19,651 | |
| M&T Bank | | | 297 | | | | 33,487 | |
| MarketAxess Holdings | | | 61 | | | | 13,039 | |
| Marsh & McLennan | | | 868 | | | | 164,616 | |
| Mastercard, Cl A | | | 1,451 | | | | 546,084 | |
| MetLife | | | 1,110 | | | | 66,611 | |
| Moody’s | | | 278 | | | | 85,624 | |
| Morgan Stanley | | | 2,171 | | | | 153,750 | |
| MSCI, Cl A | | | 137 | | | | 64,602 | |
| Nasdaq | | | 635 | | | | 31,496 | |
| Northern Trust | | | 400 | | | | 26,364 | |
| PayPal Holdings * | | | 1,938 | | | | 100,388 | |
| PNC Financial Services Group | | | 692 | | | | 79,213 | |
| Principal Financial Group | | | 353 | | | | 23,891 | |
| Progressive | | | 1,013 | | | | 160,145 | |
| Prudential Financial | | | 639 | | | | 58,430 | |
| Raymond James Financial | | | 314 | | | | 29,968 | |
| Regions Financial | | | 1,659 | | | | 24,105 | |
| S&P Global | | | 561 | | | | 195,963 | |
| State Street | | | 507 | | | | 32,767 | |
| Synchrony Financial | | | 708 | | | | 19,859 | |
The accompanying notes are an integral part of the financial statements.
259
| Schedule of Investments | | October 31, 2023 |
| | | |
| | Global X S&P 500® Covered Call & Growth ETF | |
| | | | | | | |
| | | Shares | | | Value | |
| COMMON STOCK — continued | | | | | | | | |
| Financials — continued | | | | | | | | |
| T Rowe Price Group | | | 396 | | | $ | 35,838 | |
| Travelers | | | 410 | | | | 68,650 | |
| Truist Financial | | | 2,388 | | | | 67,724 | |
| US Bancorp | | | 2,716 | | | | 86,586 | |
| Visa, Cl A | | | 2,802 | | | | 658,750 | |
| W R Berkley | | | 357 | | | | 24,069 | |
| Wells Fargo | | | 6,381 | | | | 253,772 | |
| Willis Towers Watson | | | 185 | | | | 43,640 | |
| Zions Bancorp | | | 241 | | | | 7,435 | |
| | | | | | | | 7,815,890 | |
| Health Care — 13.2% | | | | | | | | |
| Abbott Laboratories | | | 3,027 | | | | 286,203 | |
| AbbVie | | | 3,073 | | | | 433,846 | |
| Agilent Technologies | | | 507 | | | | 52,409 | |
| Align Technology * | | | 121 | | | | 22,335 | |
| Amgen | | | 935 | | | | 239,079 | |
| Baxter International | | | 935 | | | | 30,322 | |
| Becton Dickinson | | | 493 | | | | 124,621 | |
| Biogen * | | | 253 | | | | 60,098 | |
| Bio-Rad Laboratories, Cl A * | | | 34 | | | | 9,360 | |
| Bio-Techne | | | 250 | | | | 13,657 | |
| Boston Scientific * | | | 2,513 | | | | 128,640 | |
| Bristol-Myers Squibb | | | 3,644 | | | | 187,775 | |
| Cardinal Health | | | 468 | | | | 42,588 | |
| Catalent * | | | 301 | | | | 10,351 | |
| Cencora | | | 275 | | | | 50,916 | |
| Centene * | | | 943 | | | | 65,048 | |
| Charles River Laboratories International * | | | 81 | | | | 13,637 | |
| Cigna Group | | | 512 | | | | 158,310 | |
| Cooper | | | 76 | | | | 23,693 | |
| CVS Health | | | 2,195 | | | | 151,477 | |
| Danaher | | | 1,129 | | | | 216,791 | |
| DaVita * | | | 68 | | | | 5,252 | |
| DENTSPLY SIRONA | | | 345 | | | | 10,491 | |
| Dexcom * | | | 682 | | | | 60,582 | |
| Edwards Lifesciences * | | | 1,058 | | | | 67,416 | |
| Elevance Health | | | 418 | | | | 188,138 | |
| Eli Lilly | | | 1,384 | | | | 766,639 | |
The accompanying notes are an integral part of the financial statements.
260
| Schedule of Investments | | October 31, 2023 |
| | | |
| | Global X S&P 500® Covered Call & Growth ETF | |
| | | | | | | |
| | | Shares | | | Value | |
| COMMON STOCK — continued | | | | | | | | |
| Health Care — continued | | | | | | | | |
| GE HealthCare Technologies | | | 676 | | | $ | 45,001 | |
| Gilead Sciences | | | 2,173 | | | | 170,667 | |
| HCA Healthcare | | | 352 | | | | 79,601 | |
| Henry Schein * | | | 238 | | | | 15,465 | |
| Hologic * | | | 425 | | | | 28,122 | |
| Humana | | | 222 | | | | 116,259 | |
| IDEXX Laboratories * | | | 155 | | | | 61,918 | |
| Illumina * | | | 277 | | | | 30,309 | |
| Incyte * | | | 325 | | | | 17,527 | |
| Insulet * | | | 139 | | | | 18,427 | |
| Intuitive Surgical * | | | 604 | | | | 158,381 | |
| IQVIA Holdings * | | | 318 | | | | 57,504 | |
| Johnson & Johnson | | | 4,200 | | | | 623,028 | |
| Laboratory Corp of America Holdings | | | 156 | | | | 31,158 | |
| McKesson | | | 227 | | | | 103,367 | |
| Medtronic | | | 2,328 | | | | 164,264 | |
| Merck | | | 4,426 | | | | 454,550 | |
| Mettler-Toledo International * | | | 38 | | | | 37,438 | |
| Moderna * | | | 554 | | | | 42,082 | |
| Molina Healthcare * | | | 94 | | | | 31,297 | |
| Pfizer | | | 9,847 | | | | 300,924 | |
| Quest Diagnostics | | | 215 | | | | 27,972 | |
| Regeneron Pharmaceuticals * | | | 184 | | | | 143,500 | |
| ResMed | | | 263 | | | | 37,141 | |
| Revvity | | | 234 | | | | 19,387 | |
| STERIS PLC | | | 172 | | | | 36,117 | |
| Stryker | | | 598 | | | | 161,592 | |
| Teleflex | | | 75 | | | | 13,856 | |
| Thermo Fisher Scientific | | | 665 | | | | 295,772 | |
| UnitedHealth Group | | | 1,616 | | | | 865,465 | |
| Universal Health Services, Cl B | | | 91 | | | | 11,456 | |
| Vertex Pharmaceuticals * | | | 451 | | | | 163,312 | |
| Viatris | | | 2,318 | | | | 20,630 | |
| Waters * | | | 96 | | | | 22,899 | |
| West Pharmaceutical Services | | | 127 | | | | 40,423 | |
| Zimmer Biomet Holdings | | | 365 | | | | 38,110 | |
| Zoetis, Cl A | | | 789 | | | | 123,873 | |
| | | | | | | | 8,028,468 | |
The accompanying notes are an integral part of the financial statements.
261
| Schedule of Investments | | October 31, 2023 |
| | | |
| | Global X S&P 500® Covered Call & Growth ETF | |
| | | | | | | |
| | | Shares | | | Value | |
| COMMON STOCK — continued | | | | | | | | |
| Industrials — 8.4% | | | | | | | | |
| 3M | | | 956 | | | $ | 86,948 | |
| A O Smith | | | 236 | | | | 16,463 | |
| Alaska Air Group * | | | 236 | | | | 7,465 | |
| Allegion | | | 143 | | | | 14,065 | |
| American Airlines Group * | | | 1,169 | | | | 13,034 | |
| AMETEK | | | 401 | | | | 56,449 | |
| Automatic Data Processing | | | 718 | | | | 156,682 | |
| Axon Enterprise * | | | 130 | | | | 26,584 | |
| Boeing * | | | 978 | | | | 182,710 | |
| Broadridge Financial Solutions | | | 206 | | | | 35,152 | |
| Carrier Global | | | 1,435 | | | | 68,392 | |
| Caterpillar | | | 876 | | | | 198,020 | |
| Ceridian HCM Holding * | | | 271 | | | | 17,347 | |
| CH Robinson Worldwide | | | 236 | | | | 19,312 | |
| Cintas | | | 155 | | | | 78,604 | |
| Copart * | | | 1,552 | | | | 67,543 | |
| CSX | | | 3,534 | | | | 105,490 | |
| Cummins | | | 245 | | | | 52,993 | |
| Deere | | | 471 | | | | 172,085 | |
| Delta Air Lines | | | 1,170 | | | | 36,562 | |
| Dover | | | 259 | | | | 33,657 | |
| Eaton | | | 696 | | | | 144,705 | |
| Emerson Electric | | | 1,001 | | | | 89,059 | |
| Equifax | | | 211 | | | | 35,779 | |
| Expeditors International of Washington | | | 274 | | | | 29,934 | |
| Fastenal | | | 976 | | | | 56,940 | |
| FedEx | | | 414 | | | | 99,401 | |
| Fortive | | | 610 | | | | 39,821 | |
| Generac Holdings * | | | 84 | | | | 7,062 | |
| General Dynamics | | | 402 | | | | 97,007 | |
| General Electric | | | 1,899 | | | | 206,288 | |
| Honeywell International | | | 1,165 | | | | 213,498 | |
| Howmet Aerospace | | | 708 | | | | 31,223 | |
| Hubbell, Cl B | | | 100 | | | | 27,010 | |
| Huntington Ingalls Industries | | | 63 | | | | 13,849 | |
| IDEX | | | 134 | | | | 25,649 | |
| Illinois Tool Works | | | 480 | | | | 107,578 | |
| Ingersoll Rand | | | 706 | | | | 42,840 | |
| Jacobs Solutions | | | 236 | | | | 31,459 | |
The accompanying notes are an integral part of the financial statements.
262
| Schedule of Investments | | October 31, 2023 |
| | | |
| | Global X S&P 500® Covered Call & Growth ETF | |
| | | | | | | |
| | | Shares | | | Value | |
| COMMON STOCK — continued | | | | | | | | |
| Industrials — continued | | | | | | | | |
| JB Hunt Transport Services | | | 156 | | | $ | 26,812 | |
| Johnson Controls International | | | 1,187 | | | | 58,187 | |
| L3Harris Technologies | | | 314 | | | | 56,335 | |
| Leidos Holdings | | | 236 | | | | 23,392 | |
| Lockheed Martin | | | 399 | | | | 181,401 | |
| Masco | | | 416 | | | | 21,669 | |
| Nordson | | | 86 | | | | 18,283 | |
| Norfolk Southern | | | 406 | | | | 77,461 | |
| Northrop Grumman | | | 247 | | | | 116,443 | |
| Old Dominion Freight Line | | | 153 | | | | 57,629 | |
| Otis Worldwide | | | 736 | | | | 56,827 | |
| PACCAR | | | 910 | | | | 75,102 | |
| Parker-Hannifin | | | 224 | | | | 82,636 | |
| Paychex | | | 545 | | | | 60,522 | |
| Paycom Software | | | 78 | | | | 19,108 | |
| Pentair | | | 286 | | | | 16,622 | |
| Quanta Services | | | 259 | | | | 43,284 | |
| Republic Services, Cl A | | | 379 | | | | 56,278 | |
| Robert Half | | | 184 | | | | 13,758 | |
| Rockwell Automation | | | 200 | | | | 52,562 | |
| Rollins | | | 469 | | | | 17,639 | |
| RTX | | | 2,560 | | | | 208,358 | |
| Snap-On | | | 85 | | | | 21,925 | |
| Southwest Airlines | | | 1,077 | | | | 23,942 | |
| Stanley Black & Decker | | | 262 | | | | 22,283 | |
| Textron | | | 298 | | | | 22,648 | |
| Trane Technologies | | | 399 | | | | 75,934 | |
| TransDigm Group * | | | 91 | | | | 75,356 | |
| Union Pacific | | | 1,074 | | | | 222,973 | |
| United Airlines Holdings * | | | 543 | | | | 19,010 | |
| United Parcel Service, Cl B | | | 1,261 | | | | 178,116 | |
| United Rentals | | | 119 | | | | 48,346 | |
| Veralto * | | | 375 | | | | 25,875 | |
| Verisk Analytics, Cl A | | | 247 | | | | 56,158 | |
| Waste Management | | | 647 | | | | 106,322 | |
| Westinghouse Air Brake Technologies | | | 310 | | | | 32,866 | |
| WW Grainger | | | 78 | | | | 56,927 | |
| Xylem | | | 412 | | | | 38,538 | |
| | | | | | | | 5,112,186 | |
The accompanying notes are an integral part of the financial statements.
263
| Schedule of Investments | | October 31, 2023 |
| | | |
| | Global X S&P 500® Covered Call & Growth ETF | |
| | | | | | | |
| | | Shares | | | Value | |
| COMMON STOCK — continued | | | | | | | | |
| Information Technology — 28.1% | | | | | | | | |
| Accenture, Cl A | | | 1,088 | | | $ | 323,234 | |
| Adobe * | | | 795 | | | | 422,988 | |
| Advanced Micro Devices * | | | 2,824 | | | | 278,164 | |
| Akamai Technologies * | | | 281 | | | | 29,036 | |
| Amphenol, Cl A | | | 1,023 | | | | 82,403 | |
| Analog Devices | | | 889 | | | | 139,866 | |
| ANSYS * | | | 157 | | | | 43,687 | |
| Apple | | | 25,632 | | | | 4,377,177 | |
| Applied Materials | | | 1,463 | | | | 193,628 | |
| Arista Networks * | | | 433 | | | | 86,760 | |
| Autodesk * | | | 385 | | | | 76,088 | |
| Broadcom | | | 720 | | | | 605,786 | |
| Cadence Design Systems * | | | 474 | | | | 113,689 | |
| CDW | | | 236 | | | | 47,294 | |
| Cisco Systems | | | 7,107 | | | | 370,488 | |
| Cognizant Technology Solutions, Cl A | | | 838 | | | | 54,026 | |
| Corning | | | 1,408 | | | | 37,678 | |
| Enphase Energy * | | | 249 | | | | 19,816 | |
| EPAM Systems * | | | 93 | | | | 20,234 | |
| F5 * | | | 96 | | | | 14,553 | |
| Fair Isaac * | | | 43 | | | | 36,372 | |
| First Solar * | | | 181 | | | | 25,784 | |
| Fortinet * | | | 1,176 | | | | 67,232 | |
| Gartner * | | | 134 | | | | 44,493 | |
| Gen Digital | | | 820 | | | | 13,661 | |
| Hewlett Packard Enterprise | | | 2,206 | | | | 33,928 | |
| HP | | | 1,489 | | | | 39,205 | |
| Intel | | | 7,287 | | | | 265,976 | |
| International Business Machines | | | 1,593 | | | | 230,412 | |
| Intuit | | | 489 | | | | 242,031 | |
| Juniper Networks | | | 579 | | | | 15,587 | |
| Keysight Technologies * | | | 308 | | | | 37,591 | |
| KLA | | | 236 | | | | 110,849 | |
| Lam Research | | | 233 | | | | 137,055 | |
| Microchip Technology | | | 979 | | | | 69,793 | |
| Micron Technology | | | 1,880 | | | | 125,716 | |
| Microsoft | | | 12,958 | | | | 4,381,229 | |
| Monolithic Power Systems | | | 83 | | | | 36,664 | |
| Motorola Solutions | | | 283 | | | | 78,804 | |
The accompanying notes are an integral part of the financial statements.
264
| Schedule of Investments | | October 31, 2023 |
| | | |
| Global X S&P 500® Covered Call & Growth ETF |
| | | | | | | |
| | | Shares | | | Value | |
| COMMON STOCK — continued | | | | | | | | |
| Information Technology — continued | | | | | | | | |
| NetApp | | | 360 | | | $ | 26,201 | |
| NVIDIA | | | 4,308 | | | | 1,756,802 | |
| ON Semiconductor * | | | 722 | | | | 45,226 | |
| Oracle | | | 2,746 | | | | 283,936 | |
| Palo Alto Networks * | | | 523 | | | | 127,100 | |
| PTC * | | | 200 | | | | 28,084 | |
| Qorvo * | | | 196 | | | | 17,134 | |
| QUALCOMM | | | 1,953 | | | | 212,858 | |
| Roper Technologies | | | 190 | | | | 92,828 | |
| Salesforce * | | | 1,699 | | | | 341,210 | |
| Seagate Technology Holdings | | | 373 | | | | 25,457 | |
| ServiceNow * | | | 355 | | | | 206,557 | |
| Skyworks Solutions | | | 283 | | | | 24,547 | |
| SolarEdge Technologies * | | | 94 | | | | 7,139 | |
| Synopsys * | | | 260 | | | | 122,054 | |
| TE Connectivity | | | 547 | | | | 64,464 | |
| Teledyne Technologies * | | | 76 | | | | 28,469 | |
| Teradyne | | | 281 | | | | 23,399 | |
| Texas Instruments | | | 1,594 | | | | 226,364 | |
| Trimble * | | | 470 | | | | 22,151 | |
| Tyler Technologies * | | | 67 | | | | 24,984 | |
| VeriSign * | | | 161 | | | | 32,145 | |
| Western Digital * | | | 618 | | | | 24,813 | |
| Zebra Technologies, Cl A * | | | 83 | | | | 17,383 | |
| | | | | | | | 17,110,282 | |
| Materials — 2.4% | | | | | | | | |
| Air Products & Chemicals | | | 392 | | | | 110,717 | |
| Albemarle | | | 216 | | | | 27,384 | |
| Amcor | | | 2,452 | | | | 21,798 | |
| Avery Dennison | | | 141 | | | | 24,544 | |
| Ball | | | 565 | | | | 27,205 | |
| Celanese, Cl A | | | 163 | | | | 18,665 | |
| CF Industries Holdings | | | 322 | | | | 25,689 | |
| Corteva | | | 1,221 | | | | 58,779 | |
| Dow | | | 1,214 | | | | 58,685 | |
| DuPont de Nemours | | | 788 | | | | 57,429 | |
| Eastman Chemical | | | 236 | | | | 17,636 | |
| Ecolab | | | 434 | | | | 72,799 | |
The accompanying notes are an integral part of the financial statements.
265
| Schedule of Investments | | October 31, 2023 |
| | | |
| Global X S&P 500® Covered Call & Growth ETF |
| | | | | | | |
| | | Shares | | | Value | |
| COMMON STOCK — continued | | | | | | | | |
| Materials — continued | | | | | | | | |
| FMC | | | 236 | | | $ | 12,555 | |
| Freeport-McMoRan | | | 2,417 | | | | 81,646 | |
| International Flavors & Fragrances | | | 470 | | | | 32,125 | |
| International Paper | | | 521 | | | | 17,573 | |
| Linde | | | 843 | | | | 322,161 | |
| LyondellBasell Industries, Cl A | | | 472 | | | | 42,593 | |
| Martin Marietta Materials | | | 108 | | | | 44,166 | |
| Mosaic | | | 640 | | | | 20,787 | |
| Newmont | | | 1,368 | | | | 51,259 | |
| Nucor | | | 435 | | | | 64,289 | |
| Packaging Corp of America | | | 157 | | | | 24,029 | |
| PPG Industries | | | 414 | | | | 50,827 | |
| Sealed Air | | | 238 | | | | 7,328 | |
| Sherwin-Williams | | | 416 | | | | 99,095 | |
| Steel Dynamics | | | 285 | | | | 30,355 | |
| Vulcan Materials | | | 236 | | | | 46,372 | |
| Westrock | | | 473 | | | | 16,995 | |
| | | | | | | | 1,485,485 | |
| Real Estate — 2.4% | | | | | | | | |
| Alexandria Real Estate Equities ‡ | | | 263 | | | | 24,493 | |
| American Tower ‡ | | | 795 | | | | 141,661 | |
| AvalonBay Communities ‡ | | | 257 | | | | 42,595 | |
| Boston Properties ‡ | | | 237 | | | | 12,696 | |
| Camden Property Trust ‡ | | | 179 | | | | 15,194 | |
| CBRE Group, Cl A * | | | 539 | | | | 37,374 | |
| CoStar Group * | | | 709 | | | | 52,048 | |
| Crown Castle ‡ | | | 747 | | | | 69,456 | |
| Digital Realty Trust ‡ | | | 522 | | | | 64,916 | |
| Equinix ‡ | | | 163 | | | | 118,931 | |
| Equity Residential ‡ | | | 586 | | | | 32,423 | |
| Essex Property Trust ‡ | | | 103 | | | | 22,034 | |
| Extra Space Storage ‡ | | | 376 | | | | 38,950 | |
| Federal Realty Investment Trust ‡ | | | 122 | | | | 11,125 | |
| Healthpeak Properties ‡ | | | 957 | | | | 14,881 | |
| Host Hotels & Resorts ‡ | | | 1,393 | | | | 21,564 | |
| Invitation Homes ‡ | | | 1,055 | | | | 31,323 | |
| Iron Mountain ‡ | | | 520 | | | | 30,716 | |
| Kimco Realty ‡ | | | 1,116 | | | | 20,021 | |
The accompanying notes are an integral part of the financial statements.
266
| Schedule of Investments | | October 31, 2023 |
| | | |
| Global X S&P 500® Covered Call & Growth ETF |
| | | | | | | |
| | | Shares | | | Value | |
| COMMON STOCK — continued | | | | | | | | |
| Real Estate — continued | | | | | | | | |
| Mid-America Apartment Communities ‡ | | | 214 | | | $ | 25,284 | |
| ProLogis ‡ | | | 1,616 | | | | 162,812 | |
| Public Storage ‡ | | | 269 | | | | 64,213 | |
| Realty Income ‡ | | | 1,159 | | | | 54,914 | |
| Regency Centers ‡ | | | 238 | | | | 14,342 | |
| SBA Communications, Cl A ‡ | | | 198 | | | | 41,309 | |
| Simon Property Group ‡ | | | 556 | | | | 61,099 | |
| UDR ‡ | | | 547 | | | | 17,400 | |
| Ventas ‡ | | | 706 | | | | 29,977 | |
| VICI Properties, Cl A ‡ | | | 1,670 | | | | 46,593 | |
| Welltower ‡ | | | 871 | | | | 72,824 | |
| Weyerhaeuser ‡ | | | 1,252 | | | | 35,920 | |
| | | | | | | | 1,429,088 | |
| Utilities — 2.5% | | | | | | | | |
| AES | | | 1,273 | | | | 18,968 | |
| Alliant Energy | | | 471 | | | | 22,980 | |
| Ameren | | | 470 | | | | 35,584 | |
| American Electric Power | | | 897 | | | | 67,759 | |
| American Water Works | | | 322 | | | | 37,883 | |
| Atmos Energy | | | 257 | | | | 27,669 | |
| CenterPoint Energy | | | 1,170 | | | | 31,450 | |
| CMS Energy | | | 523 | | | | 28,420 | |
| Consolidated Edison | | | 602 | | | | 52,850 | |
| Constellation Energy | | | 549 | | | | 61,993 | |
| Dominion Energy | | | 1,441 | | | | 58,101 | |
| DTE Energy | | | 358 | | | | 34,504 | |
| Duke Energy | | | 1,346 | | | | 119,646 | |
| Edison International | | | 699 | | | | 44,079 | |
| Entergy | | | 395 | | | | 37,758 | |
| Evergy | | | 383 | | | | 18,821 | |
| Eversource Energy | | | 639 | | | | 34,372 | |
| Exelon | | | 1,736 | | | | 67,600 | |
| FirstEnergy | | | 959 | | | | 34,140 | |
| NextEra Energy | | | 3,464 | | | | 201,951 | |
| NiSource | | | 709 | | | | 17,838 | |
| NRG Energy | | | 470 | | | | 19,919 | |
| PG&E * | | | 3,448 | | | | 56,202 | |
| Pinnacle West Capital | | | 234 | | | | 17,358 | |
The accompanying notes are an integral part of the financial statements.
267
| Schedule of Investments | | October 31, 2023 |
| | | |
| Global X S&P 500® Covered Call & Growth ETF |
| | | | | | | |
| | | Shares | | | Value | |
| COMMON STOCK — continued | | | | | | | | |
| Utilities — continued | | | | | | | | |
| PPL | | | 1,267 | | | $ | 31,130 | |
| Public Service Enterprise Group | | | 860 | | | | 53,019 | |
| Sempra | | | 1,055 | | | | 73,882 | |
| Southern | | | 1,898 | | | | 127,735 | |
| WEC Energy Group | | | 565 | | | | 45,985 | |
| Xcel Energy | | | 996 | | | | 59,033 | |
| | | | | | | | 1,538,629 | |
| TOTAL UNITED STATES | | | | | | | 61,150,352 | |
TOTAL COMMON STOCK
(Cost $64,851,213) | | | | | | | 61,228,118 | |
TOTAL INVESTMENTS — 100.4%
(Cost $64,851,213) | | | | | | $ | 61,228,118 | |
| | | | | | | | | |
WRITTEN OPTIONS— (0.5)%
(Premiums Received $(682,499)) | | | | | | $ | (293,095 | ) |
Percentages are based on Net Assets of $61,006,334.
A list of the exchange traded option contracts held by the Fund at October 31, 2023, is as follows:
| Description | | Number of
Contracts | | | Notional
Amount | | | Exercise
Price | | | Expiration
Date | | Value | |
| WRITTEN OPTIONS — (0.5)% | | | | | | | | | | | | | | | | | | |
| Call Options | | | | | | | | | | | | | | | | | | |
| S&P 500 Index | | | (73 | ) | | $ | (30,614,740 | ) | | $ | 4,240 | | | 11/17/23 | | $ | (293,095 | ) |
| * | Non-income producing security. |
| ‡ | Real Estate Investment Trust |
| (A) | All or a portion of these securities has been segregated as collateral for options contracts. The Fair Value of the securities pledged as collateral is $37,152,615. |
The accompanying notes are an integral part of the financial statements.
268
| Schedule of Investments | | October 31, 2023 |
| | | |
| Global X S&P 500® Covered Call & Growth ETF |
The following is a summary of the level of inputs used as of October 31, 2023, in valuing the Fund’s investments and other financial instruments carried at value:
| Investments in Securities | | Level 1 | | | Level 2 | | Level 3 | | Total | |
| Common Stock | | $ | 61,228,118 | | | $ | — | | $ | — | | $ | 61,228,118 | |
| Total Investments in Securities | | $ | 61,228,118 | | | $ | — | | $ | — | | $ | 61,228,118 | |
| | | | | | | | | | | | | | | |
| Other Financial Instruments | | | Level 1 | | | | Level 2 | | | Level 3 | | | Total | |
| Written Options | | $ | (293,095 | ) | | $ | — | | $ | — | | $ | (293,095 | ) |
| Total Other Financial Instruments | | $ | (293,095 | ) | | $ | — | | $ | — | | $ | (293,095 | ) |
Amounts designated as “—” are $0 or have been rounded to $0.
See “Glossary” for abbreviations.
The accompanying notes are an integral part of the financial statements.
269
| Schedule of Investments | October 31, 2023 |
| Global X Emerging Markets Internet & E-commerce ETF |
Sector Weightings (Unaudited)†:

† Sector weightings percentages are based on the total market value of investments. Total investments do not include derivatives such as options, futures contracts, forward contracts, and swap contracts, if applicable.
| | | Shares | | | Value | |
| COMMON STOCK — 99.9% | | | | | | | | |
| BRAZIL — 14.9% | | | | | | | | |
| Consumer Discretionary — 4.3% | | | | | | | | |
| Magazine Luiza * | | | 26,949 | | | $ | 7,107 | |
| MercadoLibre * | | | 78 | | | | 96,778 | |
| | | | | | | | 103,885 | |
| Financials — 9.8% | | | | | | | | |
| NU Holdings, Cl A * | | | 15,651 | | | | 128,338 | |
| Pagseguro Digital, Cl A * | | | 1,866 | | | | 13,174 | |
| StoneCo, Cl A * | | | 2,109 | | | | 20,911 | |
| XP, Cl A | | | 3,577 | | | | 71,540 | |
| | | | | | | | 233,963 | |
| Information Technology — 0.8% | | | | | | | | |
| TOTVS | | | 3,797 | | | | 19,057 | |
| | | | | | | | | |
| TOTAL BRAZIL | | | | | | | 356,905 | |
| CHILE — 1.0% | | | | | | | | |
| Consumer Discretionary — 1.0% | | | | | | | | |
| Falabella * | | | 12,108 | | | | 24,576 | |
| | | | | | | | | |
| CHINA — 63.2% | | | | | | | | |
| Communication Services — 32.3% | | | | | | | | |
| Autohome ADR | | | 1,033 | | | | 27,633 | |
| Baidu ADR * | | | 751 | | | | 78,855 | |
| Bilibili ADR * | | | 3,329 | | | | 44,708 | |
| China Literature * | | | 3,540 | | | | 11,921 | |
The accompanying notes are an integral part of the financial statements.
270
| Schedule of Investments | October 31, 2023 |
| Global X Emerging Markets Internet & E-commerce ETF |
| | | Shares | | | Value | |
| COMMON STOCK — continued | | | | | | | | |
| Communication Services — continued | | | | | | | | |
| Hello Group ADR | | | 1,350 | | | $ | 9,558 | |
| iQIYI ADR * | | | 7,204 | | | | 33,571 | |
| Kingsoft | | | 8,050 | | | | 28,086 | |
| NetEase ADR | | | 2,073 | | | | 221,645 | |
| Tencent Holdings | | | 5,183 | | | | 191,566 | |
| Tencent Music Entertainment Group ADR * | | | 14,280 | | | | 103,673 | |
| Weibo ADR | | | 1,769 | | | | 20,927 | |
| | | | | | | | 772,143 | |
| Consumer Discretionary — 28.0% | | | | | | | | |
| Alibaba Group Holding ADR * | | | 2,309 | | | | 190,585 | |
| JD.com ADR | | | 3,227 | | | | 82,030 | |
| Meituan, Cl B * | | | 13,086 | | | | 184,970 | |
| Tongcheng Travel Holdings * | | | 9,850 | | | | 18,807 | |
| TravelSky Technology, Cl H | | | 23,850 | | | | 37,613 | |
| Trip.com Group ADR * | | | 2,727 | | | | 92,718 | |
| Vipshop Holdings ADR * | | | 4,431 | | | | 63,186 | |
| | | | | | | | 669,909 | |
| Consumer Staples — 1.4% | | | | | | | | |
| Alibaba Health Information Technology * | | | 40,800 | | | | 24,038 | |
| Ping An Healthcare and Technology * | | | 4,630 | | | | 10,829 | |
| | | | | | | | 34,867 | |
| Information Technology — 1.5% | | | | | | | | |
| Kingdee International Software Group * | | | 21,050 | | | | 27,925 | |
| Weimob * | | | 18,000 | | | | 7,223 | |
| | | | | | | | 35,148 | |
| TOTAL CHINA | | | | | | | 1,512,067 | |
| INDIA — 0.8% | | | | | | | | |
| Consumer Discretionary — 0.8% | | | | | | | | |
| MakeMyTrip * | | | 491 | | | | 19,016 | |
| | | | | | | | | |
| INDONESIA — 1.1% | | | | | | | | |
| Consumer Discretionary — 1.1% | | | | | | | | |
| GoTo Gojek Tokopedia, Cl A * | | | 6,885,200 | | | | 26,006 | |
The accompanying notes are an integral part of the financial statements.
271
| Schedule of Investments | October 31, 2023 |
| Global X Emerging Markets Internet & E-commerce ETF |
| | | Shares | | | Value | |
| COMMON STOCK — continued | | | | | | |
| POLAND — 1.2% | | | | | | |
| Consumer Discretionary — 1.2% | | | | | | |
| Allegro.eu * | | | 3,878 | | | $ | 27,746 | |
| | | | | | | | | |
| SOUTH AFRICA — 8.2% | | | | | | | | |
| Consumer Discretionary — 8.2% | | | | | | | | |
| Naspers, Cl N | | | 1,263 | | | | 196,005 | |
| | | | | | | | | |
| SOUTH KOREA — 8.7% | | | | | | | | |
| Communication Services — 8.7% | | | | | | | | |
| Kakao | | | 2,326 | | | | 65,101 | |
| Krafton * | | | 257 | | | | 31,170 | |
| NAVER | | | 660 | | | | 91,580 | |
| NCSoft | | | 115 | | | | 19,798 | |
| | | | | | | | | |
| TOTAL SOUTH KOREA | | | | | | | 207,649 | |
| URUGUAY — 0.8% | | | | | | | | |
| Financials — 0.8% | | | | | | | | |
| Dlocal, Cl A * | | | 1,202 | | | | 20,254 | |
| | | | | | | | | |
TOTAL COMMON STOCK
(Cost $4,041,201) | | | | | | | 2,390,224 | |
TOTAL INVESTMENTS — 99.9%
(Cost $4,041,201) | | | | | | $ | 2,390,224 | |
Percentages are based on Net Assets of $2,393,420.
| * | Non-income producing security. |
As of October 31, 2023, all of the Fund’s investments were considered Level 1, in accordance with authoritative guidance on fair value measurements and disclosure under U.S. GAAP.
See “Glossary” for abbreviations.
The accompanying notes are an integral part of the financial statements.
272
| Schedule of Investments | October 31, 2023 |
| Global X NASDAQ 100® Tail Risk ETF |
Sector Weightings (Unaudited)†:
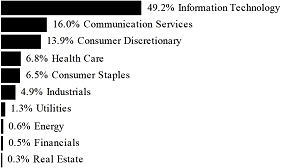
† Sector weightings percentages are based on the total market value of investments. Total investments do not include derivatives such as options, futures contracts, forward contracts, and swap contracts, if applicable.
| | | Shares | | | Value | |
| COMMON STOCK — 98.8% | | | | | | |
| BRAZIL — 0.6% | | | | | | |
| Consumer Discretionary — 0.6% | | | | | | |
| MercadoLibre * | | | 6 | | | $ | 7,444 | |
| | | | | | | | | |
| CHINA — 1.1% | | | | | | | | |
| Consumer Discretionary — 0.7% | | | | | | | | |
| JD.com ADR | | | 55 | | | | 1,398 | |
| PDD Holdings ADR * | | | 77 | | | | 7,810 | |
| | | | | | | | 9,208 | |
| Information Technology — 0.4% | | | | | | | | |
| NXP Semiconductors | | | 31 | | | | 5,345 | |
| | | | | | | | | |
| TOTAL CHINA | | | | | | | 14,553 | |
| NETHERLANDS — 0.4% | | | | | | | | |
| Information Technology — 0.4% | | | | | | | | |
| ASML Holding | | | 10 | | | | 5,988 | |
The accompanying notes are an integral part of the financial statements.
273
| Schedule of Investments | October 31, 2023 |
| Global X NASDAQ 100® Tail Risk ETF |
| | | Shares | | | Value | |
| COMMON STOCK — continued | | | | | | |
| UNITED KINGDOM — 0.3% | | | | | | |
| Health Care — 0.3% | | | | | | |
| AstraZeneca ADR | | | 69 | | | $ | 4,363 | |
| | | | | | | | | |
| UNITED STATES — 96.4% | | | | | | | | |
| Communication Services — 15.8% | | | | | | | | |
| Alphabet, Cl A * | | | 330 | | | | 40,946 | |
| Alphabet, Cl C * | | | 322 | | | | 40,347 | |
| Charter Communications, Cl A * | | | 18 | | | | 7,250 | |
| Comcast, Cl A | | | 490 | | | | 20,232 | |
| Electronic Arts | | | 32 | | | | 3,961 | |
| Meta Platforms, Cl A * | | | 173 | | | | 52,120 | |
| Netflix * | | | 53 | | | | 21,820 | |
| Sirius XM Holdings | | | 465 | | | | 1,990 | |
| T-Mobile US * | | | 140 | | | | 20,140 | |
| Trade Desk, Cl A * | | | 53 | | | | 3,761 | |
| Warner Bros Discovery * | | | 293 | | | | 2,913 | |
| | | | | | | | 215,480 | |
| Consumer Discretionary — 12.4% | | | | | | | | |
| Airbnb, Cl A * | | | 51 | | | | 6,033 | |
| Amazon.com * | | | 574 | | | | 76,394 | |
| Booking Holdings * | | | 4 | | | | 11,158 | |
| eBay | | | 64 | | | | 2,511 | |
| Lucid Group * | | | 273 | | | | 1,125 | |
| Lululemon Athletica * | | | 15 | | | | 5,902 | |
| Marriott International, Cl A | | | 35 | | | | 6,599 | |
| O’Reilly Automotive * | | | 7 | | | | 6,513 | |
| Ross Stores | | | 41 | | | | 4,755 | |
| Starbucks | | | 136 | | | | 12,544 | |
| Tesla * | | | 177 | | | | 35,549 | |
| | | | | | | | 169,083 | |
| Consumer Staples — 6.5% | | | | | | | | |
| Costco Wholesale | | | 53 | | | | 29,279 | |
| Dollar Tree * | | | 26 | | | | 2,888 | |
| Keurig Dr Pepper | | | 166 | | | | 5,035 | |
| Kraft Heinz | | | 147 | | | | 4,625 | |
| Mondelez International, Cl A | | | 162 | | | | 10,726 | |
| Monster Beverage * | | | 126 | | | | 6,439 | |
The accompanying notes are an integral part of the financial statements.
274
| Schedule of Investments | October 31, 2023 |
| Global X NASDAQ 100® Tail Risk ETF |
| | | Shares | | | Value | |
| COMMON STOCK — continued | | | | | | | | |
| Consumer Staples — continued | | | | | | | | |
| PepsiCo | | | 164 | | | $ | 26,778 | |
| Walgreens Boots Alliance | | | 104 | | | | 2,192 | |
| | | | | | | | 87,962 | |
| Energy — 0.5% | | | | | | | | |
| Baker Hughes, Cl A | | | 122 | | | | 4,199 | |
| Diamondback Energy | | | 21 | | | | 3,367 | |
| | | | | | | | 7,566 | |
| Financials — 0.5% | | | | | | | | |
| PayPal Holdings * | | | 131 | | | | 6,786 | |
| | | | | | | | | |
| Health Care — 6.5% | | | | | | | | |
| Align Technology * | | | 9 | | | | 1,661 | |
| Amgen | | | 64 | | | | 16,365 | |
| Biogen * | | | 17 | | | | 4,038 | |
| Dexcom * | | | 46 | | | | 4,086 | |
| GE HealthCare Technologies | | | 55 | | | | 3,661 | |
| Gilead Sciences | | | 148 | | | | 11,624 | |
| IDEXX Laboratories * | | | 10 | | | | 3,995 | |
| Illumina * | | | 19 | | | | 2,079 | |
| Intuitive Surgical * | | | 42 | | | | 11,013 | |
| Moderna * | | | 46 | | | | 3,494 | |
| Regeneron Pharmaceuticals * | | | 13 | | | | 10,139 | |
| Seagen * | | | 23 | | | | 4,895 | |
| Vertex Pharmaceuticals * | | | 31 | | | | 11,225 | |
| | | | | | | | 88,275 | |
| Industrials — 4.8% | | | | | | | | |
| Automatic Data Processing | | | 49 | | | | 10,693 | |
| Cintas | | | 12 | | | | 6,085 | |
| Copart * | | | 114 | | | | 4,961 | |
| CSX | | | 239 | | | | 7,134 | |
| Fastenal | | | 69 | | | | 4,026 | |
| Honeywell International | | | 79 | | | | 14,478 | |
| Old Dominion Freight Line | | | 13 | | | | 4,897 | |
| PACCAR | | | 63 | | | | 5,199 | |
| Paychex | | | 43 | | | | 4,775 | |
The accompanying notes are an integral part of the financial statements.
275
| Schedule of Investments | October 31, 2023 |
| Global X NASDAQ 100® Tail Risk ETF |
| | | Shares | | | Value | |
| COMMON STOCK — continued | | | | | | |
| Industrials — continued | | | | | | |
| Verisk Analytics, Cl A | | | 17 | | | $ | 3,865 | |
| | | | | | | | 66,113 | |
| Information Technology — 47.8% | | | | | | | | |
| Adobe * | | | 54 | | | | 28,731 | |
| Advanced Micro Devices * | | | 193 | | | | 19,010 | |
| Analog Devices | | | 59 | | | | 9,282 | |
| ANSYS * | | | 10 | | | | 2,783 | |
| Apple . | | | 869 | | | | 148,399 | |
| Applied Materials | | | 100 | | | | 13,235 | |
| Atlassian, Cl A * | | | 18 | | | | 3,252 | |
| Autodesk * | | | 25 | | | | 4,941 | |
| Broadcom | | | 49 | | | | 41,227 | |
| Cadence Design Systems * | | | 33 | | | | 7,915 | |
| Cisco Systems | | | 486 | | | | 25,335 | |
| Cognizant Technology Solutions, Cl A | | | 61 | | | | 3,933 | |
| Crowdstrike Holdings, Cl A * | | | 27 | | | | 4,773 | |
| Datadog, Cl A * | | | 36 | | | | 2,933 | |
| Enphase Energy * | | | 16 | | | | 1,273 | |
| Fortinet * | | | 94 | | | | 5,374 | |
| GLOBALFOUNDRIES * | | | 66 | | | | 3,275 | |
| Intel | | | 501 | | | | 18,286 | |
| Intuit | | | 33 | | | | 16,333 | |
| KLA | | | 16 | | | | 7,515 | |
| Lam Research | | | 16 | | | | 9,412 | |
| Marvell Technology | | | 103 | | | | 4,864 | |
| Microchip Technology | | | 65 | | | | 4,634 | |
| Micron Technology | | | 131 | | | | 8,760 | |
| Microsoft | | | 413 | | | | 139,639 | |
| NVIDIA | | | 137 | | | | 55,869 | |
| ON Semiconductor * | | | 52 | | | | 3,257 | |
| Palo Alto Networks * | | | 37 | | | | 8,992 | |
| QUALCOMM | | | 133 | | | | 14,496 | |
| Synopsys * | | | 18 | | | | 8,450 | |
| Texas Instruments | | | 108 | | | | 15,337 | |
| Workday, Cl A * | | | 25 | | | | 5,293 | |
| Zoom Video Communications, Cl A * | | | 30 | | | | 1,799 | |
| Zscaler * | | | 17 | | | | 2,698 | |
| | | | | | | | 651,305 | |
The accompanying notes are an integral part of the financial statements.
276
| Schedule of Investments | October 31, 2023 |
| Global X NASDAQ 100® Tail Risk ETF |
| | | Shares | | | Value | |
| COMMON STOCK — continued | | | | | | |
| Real Estate — 0.3% | | | | | | |
| CoStar Group * | | | 49 | | | $ | 3,597 | |
| | | | | | | | | |
| Utilities — 1.3% | | | | | | | | |
| American Electric Power | | | 62 | | | | 4,683 | |
| Constellation Energy | | | 38 | | | | 4,291 | |
| Exelon | | | 119 | | | | 4,634 | |
| Xcel Energy | | | 66 | | | | 3,912 | |
| | | | | | | | 17,520 | |
| TOTAL UNITED STATES | | | | | | | 1,313,687 | |
TOTAL COMMON STOCK
(Cost $1,486,402) | | | | | | | 1,346,035 | |
| | | | | | | | | |
PURCHASED OPTIONS — 1.1%
(Cost $11,822) | | | | | | | 14,940 | |
| | | | | | | | | |
TOTAL INVESTMENTS — 99.9%
(Cost $1,498,224) | | | | | | $ | 1,360,975 | |
Percentages are based on Net Assets of $1,362,369.
A list of the exchange traded option contracts held by the Fund at October 31, 2023, is as follows:
| Description | | Number of
Contracts | | Notional
Amount | | Exercise
Price | | Expiration
Date | | Value | |
| PURCHASED OPTIONS — 1.1% | | | | | | | | | | | |
| Put Options | | | | | | | | | | | |
| Nasdaq-100® Reduced-Value Index | | 4 | | $ | 1,152,784 | | $ | 2,740 | | 12/15/23 | | $ | 14,940 | |
| * | Non-income producing security. |
As of October 31, 2023, all of the Fund’s investments were considered Level 1, in accordance with authoritative guidance on fair value measurements and disclosure under U.S. GAAP.
See “Glossary” for abbreviations.
The accompanying notes are an integral part of the financial statements.
277
| Schedule of Investments | October 31, 2023 |
| Global X NASDAQ 100® Risk Managed Income ETF |
Sector Weightings (Unaudited)†:
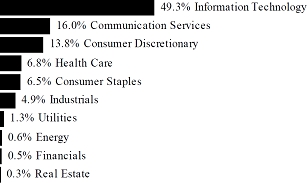
† Sector weightings percentages are based on the total market value of investments. Total investments do not include derivatives such as options, futures contracts, forward contracts, and swap contracts, if applicable.
| | | Shares | | | Value | |
| COMMON STOCK(A) — 100.6% | | | | | | |
| BRAZIL — 0.6% | | | | | | |
| Consumer Discretionary — 0.6% | | | | | | |
| MercadoLibre * | | | 53 | | | $ | 65,759 | |
| | | | | | | | | |
| CHINA — 1.1% | | | | | | | | |
| Consumer Discretionary — 0.7% | | | | | | | | |
| JD.com ADR | | | 484 | | | | 12,304 | |
| PDD Holdings ADR * | | | 686 | | | | 69,574 | |
| | | | | | | | 81,878 | |
| Information Technology — 0.4% | | | | | | | | |
| NXP Semiconductors | | | 266 | | | | 45,866 | |
| | | | | | | | | |
| TOTAL CHINA | | | | | | | 127,744 | |
| NETHERLANDS — 0.5% | | | | | | | | |
| Information Technology — 0.5% | | | | | | | | |
| ASML Holding | | | 91 | | | | 54,492 | |
The accompanying notes are an integral part of the financial statements.
278
| Schedule of Investments | October 31, 2023 |
| Global X NASDAQ 100® Risk Managed Income ETF |
| | | Shares | | | Value | |
| COMMON STOCK — continued | | | | | | |
| UNITED KINGDOM — 0.3% | | | | | | |
| Health Care — 0.3% | | | | | | |
| AstraZeneca ADR | | | 608 | | | $ | 38,444 | |
| | | | | | | | | |
| UNITED STATES — 98.1% | | | | | | | | |
| Communication Services — 16.1% | | | | | | | | |
| Alphabet, Cl A * | | | 2,910 | | | | 361,073 | |
| Alphabet, Cl C * | | | 2,845 | | | | 356,478 | |
| Charter Communications, Cl A * | | | 157 | | | | 63,240 | |
| Comcast, Cl A | | | 4,340 | | | | 179,199 | |
| Electronic Arts | | | 283 | | | | 35,033 | |
| Meta Platforms, Cl A * | | | 1,528 | | | | 460,341 | |
| Netflix * | | | 467 | | | | 192,259 | |
| Sirius XM Holdings | | | 4,107 | | | | 17,578 | |
| T-Mobile US * | | | 1,240 | | | | 178,386 | |
| Trade Desk, Cl A * | | | 466 | | | | 33,067 | |
| Warner Bros Discovery * | | | 2,596 | | | | 25,804 | |
| | | | | | | | 1,902,458 | |
| Consumer Discretionary — 12.6% | | | | | | | | |
| Airbnb, Cl A * | | | 449 | | | | 53,112 | |
| Amazon.com * | | | 5,061 | | | | 673,568 | |
| Booking Holdings * | | | 37 | | | | 103,214 | |
| eBay | | | 569 | | | | 22,322 | |
| Lucid Group * | | | 2,403 | | | | 9,900 | |
| Lululemon Athletica * | | | 126 | | | | 49,578 | |
| Marriott International, Cl A | | | 314 | | | | 59,208 | |
| O’Reilly Automotive * | | | 63 | | | | 58,618 | |
| Ross Stores | | | 348 | | | | 40,358 | |
| Starbucks | | | 1,207 | | | | 111,334 | |
| Tesla * | | | 1,556 | | | | 312,507 | |
| | | | | | | | 1,493,719 | |
| Consumer Staples — 6.5% | | | | | | | | |
| Costco Wholesale | | | 466 | | | | 257,437 | |
| Dollar Tree * | | | 229 | | | | 25,440 | |
| Keurig Dr Pepper | | | 1,436 | | | | 43,554 | |
| Kraft Heinz | | | 1,311 | | | | 41,244 | |
| Mondelez International, Cl A | | | 1,433 | | | | 94,879 | |
| Monster Beverage * | | | 1,075 | | | | 54,932 | |
The accompanying notes are an integral part of the financial statements.
279
| Schedule of Investments | October 31, 2023 |
| Global X NASDAQ 100® Risk Managed Income ETF |
| | | Shares | | | Value | |
| COMMON STOCK — continued | | | | | | | | |
| Consumer Staples — continued | | | | | | | | |
| PepsiCo | | | 1,452 | | | $ | 237,082 | |
| Walgreens Boots Alliance | | | 920 | | | | 19,394 | |
| | | | | | | | 773,962 | |
| Energy — 0.6% | | | | | | | | |
| Baker Hughes, Cl A | | | 1,077 | | | | 37,070 | |
| Diamondback Energy | | | 186 | | | | 29,820 | |
| | | | | | | | 66,890 | |
| Financials — 0.5% | | | | | | | | |
| PayPal Holdings * | | | 1,131 | | | | 58,586 | |
| Health Care — 6.6% | | | | | | | | |
| Align Technology * | | | 80 | | | | 14,767 | |
| Amgen | | | 564 | | | | 144,215 | |
| Biogen * | | | 147 | | | | 34,918 | |
| Dexcom * | | | 405 | | | | 35,976 | |
| GE HealthCare Technologies | | | 487 | | | | 32,420 | |
| Gilead Sciences | | | 1,313 | | | | 103,123 | |
| IDEXX Laboratories * | | | 87 | | | | 34,754 | |
| Illumina * | | | 170 | | | | 18,601 | |
| Intuitive Surgical * | | | 370 | | | | 97,021 | |
| Moderna * | | | 397 | | | | 30,156 | |
| Regeneron Pharmaceuticals * | | | 113 | | | | 88,128 | |
| Seagen * | | | 196 | | | | 41,711 | |
| Vertex Pharmaceuticals * | | | 272 | | | | 98,494 | |
| | | | | | | | 774,284 | |
| Industrials — 4.9% | | | | | | | | |
| Automatic Data Processing | | | 434 | | | | 94,708 | |
| Cintas | | | 107 | | | | 54,262 | |
| Copart * | | | 1,016 | | | | 44,216 | |
| CSX | | | 2,111 | | | | 63,013 | |
| Fastenal | | | 608 | | | | 35,471 | |
| Honeywell International | | | 700 | | | | 128,282 | |
| Old Dominion Freight Line | | | 115 | | | | 43,316 | |
| PACCAR | | | 547 | | | | 45,144 | |
| Paychex | | | 367 | | | | 40,755 | |
The accompanying notes are an integral part of the financial statements.
280
| Schedule of Investments | October 31, 2023 |
| Global X NASDAQ 100® Risk Managed Income ETF |
| | | Shares | | | Value | |
| COMMON STOCK — continued | | | | | | |
| Industrials — continued | | | | | | |
| Verisk Analytics, Cl A | | | 151 | | | $ | 34,331 | |
| | | | | | | | 583,498 | |
| Information Technology — 48.7% | | | | | | | | |
| Adobe * | | | 479 | | | | 254,857 | |
| Advanced Micro Devices * | | | 1,704 | | | | 167,844 | |
| Analog Devices | | | 525 | | | | 82,598 | |
| ANSYS * | | | 93 | | | | 25,878 | |
| Apple . | | | 7,671 | | | | 1,309,977 | |
| Applied Materials | | | 882 | | | | 116,733 | |
| Atlassian, Cl A * | | | 164 | | | | 29,625 | |
| Autodesk * | | | 218 | | | | 43,083 | |
| Broadcom | | | 435 | | | | 365,996 | |
| Cadence Design Systems * | | | 286 | | | | 68,597 | |
| Cisco Systems | | | 4,298 | | | | 224,055 | |
| Cognizant Technology Solutions, Cl A | | | 539 | | | | 34,749 | |
| Crowdstrike Holdings, Cl A * | | | 236 | | | | 41,718 | |
| Datadog, Cl A * | | | 321 | | | | 26,152 | |
| Enphase Energy * | | | 145 | | | | 11,539 | |
| Fortinet * | | | 821 | | | | 46,937 | |
| GLOBALFOUNDRIES * | | | 581 | | | | 28,829 | |
| Intel | | | 4,415 | | | | 161,147 | |
| Intuit | | | 295 | | | | 146,010 | |
| KLA | | | 141 | | | | 66,228 | |
| Lam Research | | | 140 | | | | 82,351 | |
| Marvell Technology | | | 920 | | | | 43,442 | |
| Microchip Technology | | | 557 | | | | 39,709 | |
| Micron Technology | | | 1,153 | | | | 77,101 | |
| Microsoft | | | 3,646 | | | | 1,232,749 | |
| NVIDIA | | | 1,212 | | | | 494,254 | |
| ON Semiconductor * | | | 461 | | | | 28,877 | |
| Palo Alto Networks * | | | 322 | | | | 78,252 | |
| QUALCOMM | | | 1,176 | | | | 128,172 | |
| Synopsys * | | | 160 | | | | 75,110 | |
| Texas Instruments | | | 957 | | | | 135,904 | |
| Workday, Cl A * | | | 212 | | | | 44,882 | |
| Zoom Video Communications, Cl A * | | | 270 | | | | 16,195 | |
| Zscaler * | | | 152 | | | | 24,121 | |
| | | | | | | | 5,753,671 | |
The accompanying notes are an integral part of the financial statements.
281
| Schedule of Investments | October 31, 2023 |
| Global X NASDAQ 100® Risk Managed Income ETF |
| | | Shares | | | Value | |
| COMMON STOCK — continued | | | | | | |
| Real Estate — 0.3% | | | | | | |
| CoStar Group * | | | 434 | | | $ | 31,860 | |
| | | | | | | | | |
| Utilities — 1.3% | | | | | | | | |
| American Electric Power | | | 538 | | | | 40,640 | |
| Constellation Energy | | | 336 | | | | 37,941 | |
| Exelon | | | 1,063 | | | | 41,393 | |
| Xcel Energy | | | 584 | | | | 34,614 | |
| | | | | | | | 154,588 | |
| TOTAL UNITED STATES | | | | | | | 11,593,516 | |
TOTAL COMMON STOCK
(Cost $11,858,755) | | | | | | | 11,879,955 | |
| | | | | | | | | |
PURCHASED OPTIONS — 0.6%
(Cost $107,984) | | | | | | | 73,920 | |
| | | | | | | | | |
TOTAL INVESTMENTS — 101.2%
(Cost $11,966,739) | | | | | | $ | 11,953,875 | |
| | | | | | | | | |
WRITTEN OPTIONS— (1.3)%
(Premiums Received $(337,034)) | | | | | | $ | (158,680 | ) |
Percentages are based on Net Assets of $11,812,572.
The accompanying notes are an integral part of the financial statements.
282
| Schedule of Investments | October 31, 2023 |
| Global X NASDAQ 100® Risk Managed Income ETF |
A list of the exchange traded option contracts held by the Fund at October 31, 2023, is as follows:
| Description | | Number of
Contracts | | Notional
Amount | | | Exercise
Price | | | Expiration
Date | | Value | |
| PURCHASED OPTIONS — 0.6% | | | | | | | | | | | | | |
| Put Options | | | | | | | | | | | | | |
| Nasdaq-100 | | 8 | | $ | 11,527,824 | | | $ | 13,850 | | | 11/17/23 | | $ | 73,920 | |
| | | | | | | | | | | | | | | | | |
| WRITTEN OPTIONS — (1.3)% | | | | | | | | | | | | | | | | |
| Call Options | | | | | | | | | | | | | | | | |
| Nasdaq-100 | | (8) | | $ | (11,527,824 | ) | | $ | 14,575 | | | 11/17/23 | | $ | (158,680 | ) |
| * | Non-income producing security. |
| (A) | All or a portion of these securities has been segregated as collateral for options contracts. The Fair Value of the securities pledged as collateral is $11,879,586. |
The following is a summary of the level of inputs used as of October 31, 2023, in valuing the Fund’s investments and other financial instruments carried at value:
| Investments in Securities | | Level 1 | | | Level 2 | | Level 3 | | Total | |
| Common Stock | | $ | 11,879,955 | | | $ | — | | $ | — | | $ | 11,879,955 | |
| Purchased Options | | | 73,920 | | | | — | | | — | | | 73,920 | |
| Total Investments in Securities | | $ | 11,953,875 | | | $ | — | | $ | — | | $ | 11,953,875 | |
| | | | | | | | | | | | | | | |
| Other Financial Instruments | | | Level 1 | | | | Level 2 | | | Level 3 | | | Total | |
| Written Options | | $ | (158,680 | ) | | $ | — | | $ | — | | $ | (158,680 | ) |
| Total Other Financial Instruments | | $ | (158,680 | ) | | $ | — | | $ | — | | $ | (158,680 | ) |
Amounts designated as “—” are $0 or have been rounded to $0.
See “Glossary” for abbreviations.
The accompanying notes are an integral part of the financial statements.
283
| Schedule of Investments | October 31, 2023 |
| Global X NASDAQ 100® Collar 95-110 ETF |
Sector Weightings (Unaudited)†:

† Sector weightings percentages are based on the total market value of investments. Total investments do not include derivatives such as options, futures contracts, forward contracts, and swap contracts, if applicable.
| | | Shares | | | Value | |
| COMMON STOCK(A) — 97.2% | | | | | | |
| BRAZIL — 0.5% | | | | | | |
| Consumer Discretionary — 0.5% | | | | | | |
| MercadoLibre * | | | 9 | | | $ | 11,167 | |
| | | | | | | | | |
| CHINA — 1.1% | | | | | | | | |
| Consumer Discretionary — 0.7% | | | | | | | | |
| JD.com ADR | | | 83 | | | | 2,110 | |
| PDD Holdings ADR * | | | 118 | | | | 11,968 | |
| | | | | | | | 14,078 | |
| Information Technology — 0.4% | | | | | | | | |
| NXP Semiconductors | | | 47 | | | | 8,104 | |
| | | | | | | | | |
| TOTAL CHINA | | | | | | | 22,182 | |
| NETHERLANDS — 0.4% | | | | | | | | |
| Information Technology — 0.4% | | | | | | | | |
| ASML Holding | | | 15 | | | | 8,982 | |
The accompanying notes are an integral part of the financial statements.
284
| Schedule of Investments | October 31, 2023 |
| Global X NASDAQ 100® Collar 95-110 ETF |
| | | Shares | | | Value | |
| COMMON STOCK — continued | | | | | | |
| UNITED KINGDOM — 0.3% | | | | | | |
| Health Care — 0.3% | | | | | | |
| AstraZeneca ADR | | | 105 | | | $ | 6,639 | |
| | | | | | | | | |
| UNITED STATES — 94.9% | | | | | | | | |
| Communication Services — 15.6% | | | | | | | | |
| Alphabet, Cl A * | | | 504 | | | | 62,536 | |
| Alphabet, Cl C * | | | 492 | | | | 61,648 | |
| Charter Communications, Cl A * | | | 27 | | | | 10,876 | |
| Comcast, Cl A | | | 749 | | | | 30,926 | |
| Electronic Arts | | | 50 | | | | 6,189 | |
| Meta Platforms, Cl A * | | | 263 | | | | 79,234 | |
| Netflix * | | | 81 | | | | 33,347 | |
| Sirius XM Holdings | | | 707 | | | | 3,026 | |
| T-Mobile US * | | | 214 | | | | 30,786 | |
| Trade Desk, Cl A * | | | 81 | | | | 5,748 | |
| Warner Bros Discovery * | | | 445 | | | | 4,423 | |
| | | | | | | | 328,739 | |
| Consumer Discretionary — 12.2% | | | | | | | | |
| Airbnb, Cl A * | | | 75 | | | | 8,872 | |
| Amazon.com * | | | 876 | | | | 116,587 | |
| Booking Holdings * | | | 6 | | | | 16,737 | |
| eBay | | | 97 | | | | 3,805 | |
| Lucid Group * | | | 412 | | | | 1,697 | |
| Lululemon Athletica * | | | 22 | | | | 8,657 | |
| Marriott International, Cl A | | | 54 | | | | 10,182 | |
| O’Reilly Automotive * | | | 11 | | | | 10,235 | |
| Ross Stores | | | 62 | | | | 7,190 | |
| Starbucks | | | 208 | | | | 19,186 | |
| Tesla * | | | 269 | | | | 54,026 | |
| | | | | | | | 257,174 | |
| Consumer Staples — 6.3% | | | | | | | | |
| Costco Wholesale | | | 80 | | | | 44,195 | |
| Dollar Tree * | | | 41 | | | | 4,555 | |
| Keurig Dr Pepper | | | 257 | | | | 7,795 | |
| Kraft Heinz | | | 224 | | | | 7,047 | |
| Mondelez International, Cl A | | | 247 | | | | 16,354 | |
| Monster Beverage * | | | 192 | | | | 9,811 | |
The accompanying notes are an integral part of the financial statements.
285
| Schedule of Investments | October 31, 2023 |
| Global X NASDAQ 100® Collar 95-110 ETF |
| | | Shares | | | Value | |
| COMMON STOCK — continued | | | | | | | | |
| Consumer Staples — continued | | | | | | | | |
| PepsiCo | | | 250 | | | $ | 40,820 | |
| Walgreens Boots Alliance | | | 158 | | | | 3,330 | |
| | | | | | | | 133,907 | |
| Energy — 0.5% | | | | | | | | |
| Baker Hughes, Cl A | | | 186 | | | | 6,402 | |
| Diamondback Energy | | | 32 | | | | 5,130 | |
| | | | | | | | 11,532 | |
| Financials — 0.5% | | | | | | | | |
| PayPal Holdings * | | | 200 | | | | 10,360 | |
| | | | | | | | | |
| Health Care — 6.3% | | | | | | | | |
| Align Technology * | | | 13 | | | | 2,400 | |
| Amgen . | | | 97 | | | | 24,803 | |
| Biogen * | | | 26 | | | | 6,176 | |
| Dexcom * | | | 71 | | | | 6,307 | |
| GE HealthCare Technologies . | | | 83 | | | | 5,525 | |
| Gilead Sciences | | | 227 | | | | 17,829 | |
| IDEXX Laboratories * | | | 15 | | | | 5,992 | |
| Illumina * | | | 29 | | | | 3,173 | |
| Intuitive Surgical * | | | 64 | | | | 16,782 | |
| Moderna * | | | 69 | | | | 5,241 | |
| Regeneron Pharmaceuticals * | | | 19 | | | | 14,818 | |
| Seagen * | | | 34 | | | | 7,236 | |
| Vertex Pharmaceuticals * | | | 47 | | | | 17,019 | |
| | | | | | | | 133,301 | |
| Industrials — 4.8% | | | | | | | | |
| Automatic Data Processing | | | 75 | | | | 16,367 | |
| Cintas | | | 18 | | | | 9,128 | |
| Copart * | | | 175 | | | | 7,616 | |
| CSX | | | 364 | | | | 10,866 | |
| Fastenal | | | 104 | | | | 6,067 | |
| Honeywell International . | | | 121 | | | | 22,175 | |
| Old Dominion Freight Line | | | 20 | | | | 7,533 | |
| PACCAR | | | 95 | | | | 7,840 | |
| Paychex | | | 66 | | | | 7,329 | |
The accompanying notes are an integral part of the financial statements.
286
| Schedule of Investments | October 31, 2023 |
| Global X NASDAQ 100® Collar 95-110 ETF |
| | | Shares | | | Value | |
| COMMON STOCK — continued | | | | | | |
| Industrials — continued | | | | | | |
| Verisk Analytics, Cl A | | | 26 | | | $ | 5,911 | |
| | | | | | | | 100,832 | |
| Information Technology — 47.1% | | | | | | | | |
| Adobe * | | | 83 | | | | 44,161 | |
| Advanced Micro Devices * | | | 295 | | | | 29,057 | |
| Analog Devices | | | 91 | | | | 14,317 | |
| ANSYS * | | | 15 | | | | 4,174 | |
| Apple | | | 1,324 | | | | 226,099 | |
| Applied Materials | | | 152 | | | | 20,117 | |
| Atlassian, Cl A * | | | 28 | | | | 5,058 | |
| Autodesk * | | | 39 | | | | 7,708 | |
| Broadcom | | | 75 | | | | 63,103 | |
| Cadence Design Systems * | | | 49 | | | | 11,753 | |
| Cisco Systems | | | 742 | | | | 38,680 | |
| Cognizant Technology Solutions, Cl A | | | 93 | | | | 5,996 | |
| Crowdstrike Holdings, Cl A * | | | 40 | | | | 7,071 | |
| Datadog, Cl A * | | | 54 | | | | 4,399 | |
| Enphase Energy * | | | 25 | | | | 1,990 | |
| Fortinet * | | | 144 | | | | 8,232 | |
| GLOBALFOUNDRIES * | | | 100 | | | | 4,962 | |
| Intel | | | 765 | | | | 27,923 | |
| Intuit | | | 51 | | | | 25,242 | |
| KLA | | | 25 | | | | 11,743 | |
| Lam Research | | | 24 | | | | 14,117 | |
| Marvell Technology | | | 158 | | | | 7,461 | |
| Microchip Technology | | | 100 | | | | 7,129 | |
| Micron Technology | | | 201 | | | | 13,441 | |
| Microsoft | | | 629 | | | | 212,671 | |
| NVIDIA | | | 210 | | | | 85,638 | |
| ON Semiconductor * | | | 79 | | | | 4,949 | |
| Palo Alto Networks * | | | 56 | | | | 13,609 | |
| QUALCOMM | | | 203 | | | | 22,125 | |
| Synopsys * | | | 28 | | | | 13,144 | |
| Texas Instruments | | | 166 | | | | 23,574 | |
| Workday, Cl A * | | | 38 | | | | 8,045 | |
| Zoom Video Communications, Cl A * | | | 46 | | | | 2,759 | |
| Zscaler * | | | 26 | | | | 4,126 | |
| | | | | | | | 994,573 | |
The accompanying notes are an integral part of the financial statements.
287
| Schedule of Investments | October 31, 2023 |
| Global X NASDAQ 100® Collar 95-110 ETF |
| | | Shares | | | Value | |
| COMMON STOCK — continued | | | | | | |
| Real Estate — 0.3% | | | | | | |
| CoStar Group * | | | 75 | | | $ | 5,506 | |
| | | | | | | | | |
| Utilities — 1.3% | | | | | | | | |
| American Electric Power | | | 95 | | | | 7,177 | |
| Constellation Energy | | | 59 | | | | 6,662 | |
| Exelon | | | 182 | | | | 7,087 | |
| Xcel Energy | | | 101 | | | | 5,986 | |
| | | | | | | | 26,912 | |
| TOTAL UNITED STATES | | | | | | | 2,002,836 | |
TOTAL COMMON STOCK
(Cost $2,247,843) | | | | | | | 2,051,806 | |
| | | | | | | | | |
PURCHASED OPTIONS — 2.7%
(Cost $35,679) | | | | | | | 57,935 | |
| | | | | | | | | |
TOTAL INVESTMENTS — 99.9%
(Cost $2,283,522) | | | | | | $ | 2,109,741 | |
| | | | | | | | | |
WRITTEN OPTIONS— (0.0)%
(Premiums Received $(12,721)) | | | | | | $ | (291 | ) |
Percentages are based on Net Assets of $2,112,034.
The accompanying notes are an integral part of the financial statements.
288
| Schedule of Investments | October 31, 2023 |
| Global X NASDAQ 100® Collar 95-110 ETF |
A list of the exchange traded option contracts held by the Fund at October 31, 2023, is as follows:
| Description | | Number of
Contracts | | Notional
Amount | | | Exercise
Price | | | Expiration
Date | | Value | |
| PURCHASED OPTIONS — 2.7% | | | | | | | | | | | | | | | | |
| Put Options | | | | | | | | | | | | | | | | |
| Nasdaq-100 | | 1 | | $ | 1,440,978 | | | $ | 14,475 | | | 12/15/23 | | $ | 41,565 | |
Nasdaq-100®
Reduced-Value Index | | 2 | | | 576,392 | | | | 2,890 | | | 12/15/23 | | | 16,370 | |
| Total Purchased Options | | | | $ | 2,017,370 | | | | | | | | | $ | 57,935 | |
| | | | | | | | | | | | | | | | | |
| WRITTEN OPTIONS — 0.0% | | | | | | | | | | | | | | | | |
| Call Options | | | | | | | | | | | | | | | | |
| Nasdaq-100 | | (1) | | $ | (1,440,978 | ) | | $ | 16,750 | | | 12/15/23 | | $ | (265 | ) |
Nasdaq-100®
Reduced-Value Index | | (2) | | | (576,392 | ) | | | 3,350 | | | 12/15/23 | | | (26 | ) |
| Total Written Options | | | | $ | (2,017,370 | ) | | | | | | | | $ | (291 | ) |
| * | Non-income producing security. |
| (A) | All or a portion of these securities has been segregated as collateral for options contracts. The Fair Value of the securities pledged as collateral is $2,051,806. |
The following is a summary of the level of inputs used as of October 31, 2023, in valuing the Fund’s investments and other financial instruments carried at value:
| Investments in Securities | | Level 1 | | | Level 2 | | Level 3 | | Total | |
| Common Stock | | $ | 2,051,806 | | | $ | — | | $ | — | | $ | 2,051,806 | |
| Purchased Options | | | 57,935 | | | | — | | | — | | | 57,935 | |
| Total Investments in Securities | | $ | 2,109,741 | | | $ | — | | $ | — | | $ | 2,109,741 | |
| | | | | | | | | | | | | | | |
| Other Financial Instruments | | | Level 1 | | | | Level 2 | | | Level 3 | | | Total | |
| Written Options | | $ | (291 | ) | | $ | — | | $ | — | | $ | (291 | ) |
| Total Other Financial Instruments | | $ | (291 | ) | | $ | — | | $ | — | | $ | (291 | ) |
Amounts designated as “—” are $0 or have been rounded to $0.
See “Glossary” for abbreviations.
The accompanying notes are an integral part of the financial statements.
289
| Schedule of Investments | October 31, 2023 |
| Global X S&P 500® Tail Risk ETF |
Sector Weightings (Unaudited)†:
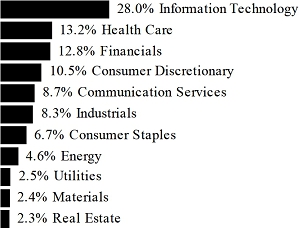
† Sector weightings percentages are based on the total market value of investments. Total investments do not include derivatives such as options, futures contracts, forward contracts, and swap contracts, if applicable.
| | | Shares | | | Value | |
| COMMON STOCK — 98.9% | | | | | | | | |
| CHINA — 0.1% | | | | | | | | |
| Information Technology — 0.1% | | | | | | | | |
| NXP Semiconductors | | | 17 | | | $ | 2,931 | |
| | | | | | | | | |
| UNITED STATES — 98.8% | | | | | | | | |
| Communication Services — 8.6% | | | | | | | | |
| Alphabet, Cl A * | | | 404 | | | | 50,128 | |
| Alphabet, Cl C * | | | 344 | | | | 43,103 | |
| AT&T | | | 499 | | | | 7,685 | |
| Charter Communications, Cl A * | | | 7 | | | | 2,820 | |
| Comcast, Cl A | | | 279 | | | | 11,520 | |
| Electronic Arts | | | 17 | | | | 2,105 | |
| Fox, Cl A | | | 19 | | | | 578 | |
| Fox, Cl B | | | 7 | | | | 195 | |
| Interpublic Group | | | 24 | | | | 682 | |
| Live Nation Entertainment * | | | 9 | | | | 720 | |
| Match Group * | | | 18 | | | | 623 | |
| Meta Platforms, Cl A * | | | 151 | | | | 45,492 | |
| Netflix * | | | 31 | | | | 12,762 | |
| News, Cl A | | | 21 | | | | 434 | |
| News, Cl B | | | 3 | | | | 64 | |
The accompanying notes are an integral part of the financial statements.
290
| Schedule of Investments | October 31, 2023 |
| Global X S&P 500® Tail Risk ETF |
| | | Shares | | | Value | |
| COMMON STOCK — continued | | | | | | | | |
| Communication Services — continued | | | | | | | | |
| Omnicom Group | | | 13 | | | $ | 974 | |
| Paramount Global, Cl B | | | 32 | | | | 348 | |
| Take-Two Interactive Software * | | | 11 | | | | 1,471 | |
| T-Mobile US | | | 35 | | | | 5,035 | |
| Verizon Communications | | | 294 | | | | 10,328 | |
| Walt Disney | | | 127 | | | | 10,362 | |
| Warner Bros Discovery * | | | 149 | | | | 1,481 | |
| | | | | | | | 208,910 | |
| Consumer Discretionary — 10.4% | | | | | | | | |
| Airbnb, Cl A * | | | 29 | | | | 3,430 | |
| Amazon.com * | | | 619 | | | | 82,383 | |
| Aptiv * | | | 18 | | | | 1,570 | |
| AutoZone * | | | 1 | | | | 2,477 | |
| Bath & Body Works | | | 20 | | | | 593 | |
| Best Buy | | | 14 | | | | 936 | |
| Booking Holdings * | | | 2 | | | | 5,579 | |
| BorgWarner | | | 20 | | | | 738 | |
| Caesars Entertainment * | | | 15 | | | | 598 | |
| CarMax * | | | 10 | | | | 611 | |
| Carnival * | | | 70 | | | | 802 | |
| Chipotle Mexican Grill, Cl A * | | | 2 | | | | 3,884 | |
| Darden Restaurants | | | 8 | | | | 1,164 | |
| Domino’s Pizza | | | 3 | | | | 1,017 | |
| DR Horton | | | 20 | | | | 2,088 | |
| eBay | | | 39 | | | | 1,530 | |
| Etsy * | | | 10 | | | | 623 | |
| Expedia Group * | | | 10 | | | | 953 | |
| Ford Motor | | | 263 | | | | 2,564 | |
| Garmin | | | 10 | | | | 1,025 | |
| General Motors | | | 97 | | | | 2,735 | |
| Genuine Parts | | | 9 | | | | 1,160 | |
| Hasbro | | | 7 | | | | 316 | |
| Hilton Worldwide Holdings | | | 18 | | | | 2,728 | |
| Home Depot | | | 68 | | | | 19,359 | |
| Las Vegas Sands | | | 20 | | | | 949 | |
| Lennar, Cl A | | | 16 | | | | 1,707 | |
| LKQ | | | 20 | | | | 878 | |
| Lowe’s | | | 40 | | | | 7,623 | |
The accompanying notes are an integral part of the financial statements.
291
| Schedule of Investments | October 31, 2023 |
| Global X S&P 500® Tail Risk ETF |
| | | Shares | | | Value | |
| COMMON STOCK — continued | | | | | | | | |
| Consumer Discretionary — continued | | | | | | | | |
| Lululemon Athletica * | | | 9 | | | $ | 3,541 | |
| Marriott International, Cl A | | | 18 | | | | 3,394 | |
| McDonald’s | | | 51 | | | | 13,371 | |
| MGM Resorts International | | | 21 | | | | 733 | |
| Mohawk Industries * | | | 4 | | | | 322 | |
| NIKE, Cl B | | | 86 | | | | 8,838 | |
| Norwegian Cruise Line Holdings * | | | 24 | | | | 326 | |
| O’Reilly Automotive * | | | 4 | | | | 3,722 | |
| Pool | | | 3 | | | | 947 | |
| PulteGroup | | | 13 | | | | 957 | |
| Ralph Lauren, Cl A | | | 3 | | | | 338 | |
| Ross Stores | | | 24 | | | | 2,783 | |
| Royal Caribbean Cruises * | | | 13 | | | | 1,102 | |
| Starbucks | | | 80 | | | | 7,379 | |
| Tapestry | | | 14 | | | | 386 | |
| Tesla * | | | 188 | | | | 37,758 | |
| TJX | | | 81 | | | | 7,134 | |
| Tractor Supply | | | 8 | | | | 1,541 | |
| Ulta Beauty * | | | 3 | | | | 1,144 | |
| VF | | | 21 | | | | 309 | |
| Whirlpool | | | 4 | | | | 418 | |
| Wynn Resorts | | | 6 | | | | 527 | |
| Yum! Brands | | | 19 | | | | 2,296 | |
| | | | | | | | 251,286 | |
| Consumer Staples — 6.6% | | | | | | | | |
| Altria Group | | | 126 | | | | 5,061 | |
| Archer-Daniels-Midland | | | 36 | | | | 2,577 | |
| Brown-Forman, Cl B | | | 14 | | | | 786 | |
| Bunge | | | 11 | | | | 1,166 | |
| Campbell Soup | | | 14 | | | | 566 | |
| Church & Dwight | | | 15 | | | | 1,364 | |
| Clorox | | | 8 | | | | 942 | |
| Coca-Cola | | | 268 | | | | 15,139 | |
| Colgate-Palmolive | | | 57 | | | | 4,282 | |
| Conagra Brands | | | 30 | | | | 821 | |
| Constellation Brands, Cl A | | | 11 | | | | 2,576 | |
| Costco Wholesale | | | 30 | | | | 16,573 | |
| Dollar General | | | 14 | | | | 1,667 | |
The accompanying notes are an integral part of the financial statements.
292
| Schedule of Investments | October 31, 2023 |
| Global X S&P 500® Tail Risk ETF |
| | | Shares | | | Value | |
| COMMON STOCK — continued | | | | | | | | |
| Consumer Staples — continued | | | | | | | | |
| Dollar Tree * | | | 16 | | | $ | 1,777 | |
| Estee Lauder, Cl A | | | 15 | | | | 1,933 | |
| General Mills | | | 40 | | | | 2,610 | |
| Hershey | | | 10 | | | | 1,873 | |
| Hormel Foods | | | 19 | | | | 618 | |
| J M Smucker | | | 6 | | | | 683 | |
| Kellanova | | | 20 | | | | 1,009 | |
| Kenvue | | | 118 | | | | 2,195 | |
| Keurig Dr Pepper | | | 66 | | | | 2,002 | |
| Kimberly-Clark | | | 24 | | | | 2,871 | |
| Kraft Heinz | | | 56 | | | | 1,762 | |
| Kroger | | | 46 | | | | 2,087 | |
| Lamb Weston Holdings | | | 9 | | | | 808 | |
| McCormick | | | 16 | | | | 1,022 | |
| Molson Coors Beverage, Cl B | | | 13 | | | | 751 | |
| Mondelez International, Cl A | | | 96 | | | | 6,356 | |
| Monster Beverage * | | | 53 | | | | 2,708 | |
| PepsiCo | | | 96 | | | | 15,675 | |
| Philip Morris International | | | 108 | �� | | | 9,629 | |
| Procter & Gamble | | | 163 | | | | 24,455 | |
| Sysco | | | 36 | | | | 2,394 | |
| Target | | | 32 | | | | 3,545 | |
| Tyson Foods, Cl A | | | 19 | | | | 881 | |
| Walgreens Boots Alliance | | | 48 | | | | 1,012 | |
| Walmart | | | 97 | | | | 15,851 | |
| | | | | | | | 160,027 | |
| Energy — 4.5% | | | | | | | | |
| APA | | | 21 | | | | 834 | |
| Baker Hughes, Cl A | | | 68 | | | | 2,341 | |
| Chevron | | | 121 | | | | 17,633 | |
| ConocoPhillips | | | 81 | | | | 9,623 | |
| Coterra Energy | | | 48 | | | | 1,320 | |
| Devon Energy | | | 46 | | | | 2,142 | |
| Diamondback Energy | | | 12 | | | | 1,924 | |
| EOG Resources | | | 40 | | | | 5,050 | |
| EQT | | | 25 | | | | 1,059 | |
| Exxon Mobil | | | 273 | | | | 28,897 | |
| Halliburton | | | 60 | | | | 2,360 | |
The accompanying notes are an integral part of the financial statements.
293
| Schedule of Investments | October 31, 2023 |
| Global X S&P 500® Tail Risk ETF |
| | | Shares | | | Value | |
| COMMON STOCK — continued | | | | | | | | |
| Energy — continued | | | | | | | | |
| Hess | | | 19 | | | $ | 2,744 | |
| Kinder Morgan | | | 130 | | | | 2,106 | |
| Marathon Oil | | | 43 | | | | 1,174 | |
| Marathon Petroleum | | | 27 | | | | 4,084 | |
| Occidental Petroleum | | | 50 | | | | 3,091 | |
| ONEOK | | | 40 | | | | 2,608 | |
| Phillips 66 | | | 33 | | | | 3,764 | |
| Pioneer Natural Resources | | | 15 | | | | 3,585 | |
| Schlumberger | | | 98 | | | | 5,455 | |
| Targa Resources | | | 13 | | | | 1,087 | |
| Valero Energy | | | 26 | | | | 3,302 | |
| Williams | | | 85 | | | | 2,924 | |
| | | | | | | | 109,107 | |
| Financials — 12.6% | | | | | | | | |
| Aflac | | | 38 | | | | 2,968 | |
| Allstate | | | 17 | | | | 2,178 | |
| American Express | | | 39 | | | | 5,695 | |
| American International Group | | | 47 | | | | 2,882 | |
| Ameriprise Financial | | | 7 | | | | 2,202 | |
| Aon, Cl A | | | 14 | | | | 4,332 | |
| Arch Capital Group * | | | 26 | | | | 2,254 | |
| Arthur J Gallagher | | | 14 | | | | 3,297 | |
| Assurant | | | 4 | | | | 596 | |
| Bank of America | | | 475 | | | | 12,511 | |
| Bank of New York Mellon | | | 50 | | | | 2,125 | |
| Berkshire Hathaway, Cl B * | | | 124 | | | | 42,325 | |
| BlackRock, Cl A | | | 10 | | | | 6,123 | |
| Blackstone | | | 48 | | | | 4,433 | |
| Brown & Brown | | | 14 | | | | 972 | |
| Capital One Financial | | | 25 | | | | 2,532 | |
| Cboe Global Markets | | | 6 | | | | 983 | |
| Charles Schwab | | | 102 | | | | 5,308 | |
| Chubb | | | 28 | | | | 6,009 | |
| Cincinnati Financial | | | 11 | | | | 1,096 | |
| Citigroup | | | 129 | | | | 5,094 | |
| Citizens Financial Group | | | 30 | | | | 703 | |
| CME Group, Cl A | | | 24 | | | | 5,123 | |
| Comerica | | | 8 | | | | 315 | |
The accompanying notes are an integral part of the financial statements.
294
| Schedule of Investments | October 31, 2023 |
| Global X S&P 500® Tail Risk ETF |
| | | Shares | | | Value | |
| COMMON STOCK — continued | | | | | | | | |
| Financials — continued | | | | | | | | |
| Discover Financial Services | | | 18 | | | $ | 1,477 | |
| Everest Group | | | 3 | | | | 1,187 | |
| FactSet Research Systems | | | 3 | | | | 1,296 | |
| Fidelity National Information Services | | | 41 | | | | 2,014 | |
| Fifth Third Bancorp | | | 45 | | | | 1,067 | |
| Fiserv * | | | 41 | | | | 4,664 | |
| FleetCor Technologies * | | | 5 | | | | 1,126 | |
| Franklin Resources | | | 17 | | | | 387 | |
| Global Payments | | | 18 | | | | 1,912 | |
| Globe Life | | | 5 | | | | 582 | |
| Goldman Sachs Group | | | 22 | | | | 6,679 | |
| Hartford Financial Services Group | | | 20 | | | | 1,469 | |
| Huntington Bancshares | | | 96 | | | | 926 | |
| Intercontinental Exchange | | | 37 | | | | 3,975 | |
| Invesco | | | 32 | | | | 415 | |
| Jack Henry & Associates | | | 5 | | | | 705 | |
| JPMorgan Chase | | | 198 | | | | 27,534 | |
| KeyCorp | | | 62 | | | | 634 | |
| Loews | | | 13 | | | | 832 | |
| M&T Bank | | | 14 | | | | 1,578 | |
| MarketAxess Holdings | | | 3 | | | | 641 | |
| Marsh & McLennan | | | 34 | | | | 6,448 | |
| Mastercard, Cl A | | | 57 | | | | 21,452 | |
| MetLife | | | 46 | | | | 2,760 | |
| Moody’s | | | 11 | | | | 3,388 | |
| Morgan Stanley | | | 90 | | | | 6,374 | |
| MSCI, Cl A | | | 6 | | | | 2,829 | |
| Nasdaq | | | 21 | | | | 1,042 | |
| Northern Trust | | | 15 | | | | 989 | |
| PayPal Holdings * | | | 79 | | | | 4,092 | |
| PNC Financial Services Group | | | 27 | | | | 3,091 | |
| Principal Financial Group | | | 14 | | | | 948 | |
| Progressive | | | 40 | | | | 6,324 | |
| Prudential Financial | | | 24 | | | | 2,195 | |
| Raymond James Financial | | | 14 | | | | 1,336 | |
| Regions Financial | | | 63 | | | | 915 | |
| S&P Global | | | 23 | | | | 8,034 | |
| State Street | | | 26 | | | | 1,680 | |
| Synchrony Financial | | | 30 | | | | 842 | |
The accompanying notes are an integral part of the financial statements.
295
| Schedule of Investments | October 31, 2023 |
| Global X S&P 500® Tail Risk ETF |
| | | Shares | | | Value | |
| COMMON STOCK — continued | | | | | | | | |
| Financials — continued | | | | | | | | |
| T Rowe Price Group | | | 16 | | | $ | 1,448 | |
| Travelers | | | 15 | | | | 2,512 | |
| Truist Financial | | | 91 | | | | 2,581 | |
| US Bancorp | | | 96 | | | | 3,060 | |
| Visa, Cl A | | | 111 | | | | 26,096 | |
| W R Berkley | | | 15 | | | | 1,011 | |
| Wells Fargo | | | 257 | | | | 10,221 | |
| Willis Towers Watson | | | 6 | | | | 1,415 | |
| Zions Bancorp | | | 9 | | | | 278 | |
| | | | | | | | 306,517 | |
| Health Care — 13.1% | | | | | | | | |
| Abbott Laboratories | | | 120 | | | | 11,346 | |
| AbbVie | | | 122 | | | | 17,224 | |
| Agilent Technologies | | | 20 | | | | 2,067 | |
| Align Technology * | | | 5 | | | | 923 | |
| Amgen | | | 36 | | | | 9,205 | |
| Baxter International | | | 35 | | | | 1,135 | |
| Becton Dickinson | | | 20 | | | | 5,056 | |
| Biogen * | | | 10 | | | | 2,375 | |
| Bio-Rad Laboratories, Cl A * | | | 1 | | | | 275 | |
| Bio-Techne | | | 10 | | | | 546 | |
| Boston Scientific * | | | 99 | | | | 5,068 | |
| Bristol-Myers Squibb | | | 145 | | | | 7,472 | |
| Cardinal Health | | | 17 | | | | 1,547 | |
| Catalent * | | | 12 | | | | 413 | |
| Cencora | | | 11 | | | | 2,037 | |
| Centene * | | | 39 | | | | 2,690 | |
| Charles River Laboratories International * | | | 4 | | | | 673 | |
| Cigna Group | | | 20 | | | | 6,184 | |
| Cooper | | | 3 | | | | 935 | |
| CVS Health | | | 87 | | | | 6,004 | |
| Danaher | | | 45 | | | | 8,641 | |
| DaVita * | | | 4 | | | | 309 | |
| DENTSPLY SIRONA | | | 14 | | | | 426 | |
| Dexcom * | | | 26 | | | | 2,310 | |
| Edwards Lifesciences * | | | 43 | | | | 2,740 | |
| Elevance Health | | | 16 | | | | 7,201 | |
| Eli Lilly | | | 54 | | | | 29,912 | |
The accompanying notes are an integral part of the financial statements.
296
| Schedule of Investments | October 31, 2023 |
| Global X S&P 500® Tail Risk ETF |
| | | Shares | | | Value | |
| COMMON STOCK — continued | | | | | | | | |
| Health Care — continued | | | | | | | | |
| GE HealthCare Technologies | | | 27 | | | $ | 1,797 | |
| Gilead Sciences | | | 87 | | | | 6,833 | |
| HCA Healthcare | | | 14 | | | | 3,166 | |
| Henry Schein * | | | 8 | | | | 520 | |
| Hologic * | | | 16 | | | | 1,059 | |
| Humana | | | 8 | | | | 4,190 | |
| IDEXX Laboratories * | | | 6 | | | | 2,397 | |
| Illumina * | | | 10 | | | | 1,094 | |
| Incyte * | | | 13 | | | | 701 | |
| Insulet * | | | 6 | | | | 795 | |
| Intuitive Surgical * | | | 25 | | | | 6,556 | |
| IQVIA Holdings * | | | 14 | | | | 2,532 | |
| Johnson & Johnson | | | 165 | | | | 24,476 | |
| Laboratory Corp of America Holdings | | | 5 | | | | 999 | |
| McKesson | | | 9 | | | | 4,098 | |
| Medtronic | | | 93 | | | | 6,562 | |
| Merck | | | 176 | | | | 18,075 | |
| Mettler-Toledo International * | | | 1 | | | | 985 | |
| Moderna * | | | 25 | | | | 1,899 | |
| Molina Healthcare * | | | 5 | | | | 1,665 | |
| Pfizer | | | 386 | | | | 11,796 | |
| Quest Diagnostics | | | 7 | | | | 911 | |
| Regeneron Pharmaceuticals * | | | 7 | | | | 5,459 | |
| ResMed | | | 10 | | | | 1,412 | |
| Revvity | | | 8 | | | | 663 | |
| STERIS PLC | | | 7 | | | | 1,470 | |
| Stryker | | | 24 | | | | 6,485 | |
| Teleflex | | | 4 | | | | 739 | |
| Thermo Fisher Scientific | | | 26 | | | | 11,564 | |
| UnitedHealth Group | | | 64 | | | | 34,276 | |
| Universal Health Services, Cl B | | | 6 | | | | 755 | |
| Vertex Pharmaceuticals * | | | 17 | | | | 6,156 | |
| Viatris | | | 79 | | | | 703 | |
| Waters * | | | 5 | | | | 1,193 | |
| West Pharmaceutical Services | | | 5 | | | | 1,591 | |
| Zimmer Biomet Holdings | | | 16 | | | | 1,671 | |
| Zoetis, Cl A | | | 33 | | | | 5,181 | |
| | | | | | | | 317,138 | |
The accompanying notes are an integral part of the financial statements.
297
| Schedule of Investments | October 31, 2023 |
| Global X S&P 500® Tail Risk ETF |
| | | Shares | | | Value | |
| COMMON STOCK — continued | | | | | | | | |
| Industrials — 8.2% | | | | | | | | |
| 3M | | | 40 | | | $ | 3,638 | |
| A O Smith | | | 7 | | | | 488 | |
| Alaska Air Group * | | | 7 | | | | 221 | |
| Allegion | | | 4 | | | | 393 | |
| American Airlines Group * | | | 41 | | | | 457 | |
| AMETEK | | | 14 | | | | 1,971 | |
| Automatic Data Processing | | | 28 | | | | 6,110 | |
| Axon Enterprise * | | | 4 | | | | 818 | |
| Boeing * | | | 39 | | | | 7,286 | |
| Broadridge Financial Solutions | | | 7 | | | | 1,195 | |
| Carrier Global | | | 56 | | | | 2,669 | |
| Caterpillar | | | 35 | | | | 7,912 | |
| Ceridian HCM Holding * | | | 10 | | | | 640 | |
| CH Robinson Worldwide | | | 7 | | | | 573 | |
| Cintas | | | 6 | | | | 3,043 | |
| Copart * | | | 58 | | | | 2,524 | |
| CSX | | | 139 | | | | 4,149 | |
| Cummins | | | 10 | | | | 2,163 | |
| Deere | | | 18 | | | | 6,577 | |
| Delta Air Lines | | | 44 | | | | 1,375 | |
| Dover | | | 9 | | | | 1,170 | |
| Eaton | | | 27 | | | | 5,614 | |
| Emerson Electric | | | 40 | | | | 3,559 | |
| Equifax | | | 7 | | | | 1,187 | |
| Expeditors International of Washington | | | 10 | | | | 1,093 | |
| Fastenal | | | 39 | | | | 2,275 | |
| FedEx | | | 15 | | | | 3,602 | |
| Fortive | | | 23 | | | | 1,501 | |
| Generac Holdings * | | | 5 | | | | 420 | |
| General Dynamics | | | 14 | | | | 3,378 | |
| General Electric | | | 74 | | | | 8,039 | |
| Honeywell International | | | 44 | | | | 8,063 | |
| Howmet Aerospace | | | 24 | | | | 1,058 | |
| Hubbell, Cl B | | | 5 | | | | 1,351 | |
| Huntington Ingalls Industries | | | 3 | | | | 660 | |
| IDEX | | | 5 | | | | 957 | |
| Illinois Tool Works | | | 19 | | | | 4,258 | |
| Ingersoll Rand | | | 26 | | | | 1,578 | |
| Jacobs Solutions | | | 10 | | | | 1,333 | |
The accompanying notes are an integral part of the financial statements.
298
| Schedule of Investments | October 31, 2023 |
| Global X S&P 500® Tail Risk ETF |
| | | Shares | | | Value | |
| COMMON STOCK — continued | | | | | | | | |
| Industrials — continued | | | | | | | | |
| JB Hunt Transport Services | | | 4 | | | $ | 688 | |
| Johnson Controls International | | | 47 | | | | 2,304 | |
| L3Harris Technologies | | | 14 | | | | 2,512 | |
| Leidos Holdings | | | 9 | | | | 892 | |
| Lockheed Martin | | | 16 | | | | 7,274 | |
| Masco | | | 14 | | | | 729 | |
| Nordson | | | 5 | | | | 1,063 | |
| Norfolk Southern | | | 15 | | | | 2,862 | |
| Northrop Grumman | | | 10 | | | | 4,714 | |
| Old Dominion Freight Line | | | 6 | | | | 2,260 | |
| Otis Worldwide | | | 28 | | | | 2,162 | |
| PACCAR | | | 34 | | | | 2,806 | |
| Parker-Hannifin | | | 9 | | | | 3,320 | |
| Paychex | | | 22 | | | | 2,443 | |
| Paycom Software | | | 4 | | | | 980 | |
| Pentair | | | 10 | | | | 581 | |
| Quanta Services | | | 9 | | | | 1,504 | |
| Republic Services, Cl A | | | 15 | | | | 2,227 | |
| Robert Half | | | 6 | | | | 449 | |
| Rockwell Automation | | | 7 | | | | 1,840 | |
| Rollins | | | 16 | | | | 602 | |
| RTX | | | 101 | | | | 8,220 | |
| Snap-On | | | 4 | | | | 1,032 | |
| Southwest Airlines | | | 40 | | | | 889 | |
| Stanley Black & Decker | | | 9 | | | | 765 | |
| Textron | | | 13 | | | | 988 | |
| Trane Technologies | | | 14 | | | | 2,664 | |
| TransDigm Group * | | | 4 | | | | 3,312 | |
| Union Pacific | | | 43 | | | | 8,927 | |
| United Airlines Holdings * | | | 20 | | | | 700 | |
| United Parcel Service, Cl B | | | 51 | | | | 7,204 | |
| United Rentals | | | 5 | | | | 2,031 | |
| Veralto * | | | 15 | | | | 1,035 | |
| Verisk Analytics, Cl A | | | 10 | | | | 2,274 | |
| Waste Management | | | 25 | | | | 4,108 | |
| Westinghouse Air Brake Technologies | | | 13 | | | | 1,378 | |
| WW Grainger | | | 3 | | | | 2,190 | |
| Xylem | | | 15 | | | | 1,403 | |
| | | | | | | | 198,630 | |
The accompanying notes are an integral part of the financial statements.
299
| Schedule of Investments | October 31, 2023 |
| Global X S&P 500® Tail Risk ETF |
| | | Shares | | | Value | |
| COMMON STOCK — continued | | | | | | | | |
| Information Technology — 27.6% | | | | | | | | |
| Accenture, Cl A | | | 43 | | | $ | 12,775 | |
| Adobe * | | | 31 | | | | 16,494 | |
| Advanced Micro Devices * | | | 109 | | | | 10,736 | |
| Akamai Technologies * | | | 10 | | | | 1,033 | |
| Amphenol, Cl A | | | 40 | | | | 3,222 | |
| Analog Devices | | | 36 | | | | 5,664 | |
| ANSYS * | | | 5 | | | | 1,391 | |
| Apple | | | 1,003 | | | | 171,282 | |
| Applied Materials | | | 57 | | | | 7,544 | |
| Arista Networks * | | | 18 | | | | 3,607 | |
| Autodesk * | | | 14 | | | | 2,767 | |
| Broadcom | | | 28 | | | | 23,558 | |
| Cadence Design Systems * | | | 18 | | | | 4,317 | |
| CDW | | | 9 | | | | 1,804 | |
| Cisco Systems | | | 277 | | | | 14,440 | |
| Cognizant Technology Solutions, Cl A | | | 36 | | | | 2,321 | |
| Corning | | | 52 | | | | 1,392 | |
| Enphase Energy * | | | 10 | | | | 796 | |
| EPAM Systems * | | | 5 | | | | 1,088 | |
| F5 * | | | 4 | | | | 606 | |
| Fair Isaac * | | | 2 | | | | 1,692 | |
| First Solar * | | | 6 | | | | 855 | |
| Fortinet * | | | 46 | | | | 2,630 | |
| Gartner * | | | 5 | | | | 1,660 | |
| Gen Digital | | | 37 | | | | 616 | |
| Hewlett Packard Enterprise | | | 85 | | | | 1,307 | |
| HP | | | 58 | | | | 1,527 | |
| Intel | | | 287 | | | | 10,475 | |
| International Business Machines | | | 64 | | | | 9,257 | |
| Intuit | | | 19 | | | | 9,404 | |
| Juniper Networks | | | 21 | | | | 565 | |
| Keysight Technologies * | | | 13 | | | | 1,587 | |
| KLA | | | 9 | | | | 4,227 | |
| Lam Research | | | 9 | | | | 5,294 | |
| Microchip Technology | | | 37 | | | | 2,638 | |
| Micron Technology | | | 74 | | | | 4,948 | |
| Microsoft | | | 507 | | | | 171,422 | |
| Monolithic Power Systems | | | 3 | | | | 1,325 | |
| Motorola Solutions | | | 12 | | | | 3,342 | |
The accompanying notes are an integral part of the financial statements.
300
| Schedule of Investments | October 31, 2023 |
| Global X S&P 500® Tail Risk ETF |
| | | Shares | | | Value | |
| COMMON STOCK — continued | | | | | | | | |
| Information Technology — continued | | | | | | | | |
| NetApp | | | 15 | | | $ | 1,092 | |
| NVIDIA | | | 168 | | | | 68,510 | |
| ON Semiconductor * | | | 29 | | | | 1,817 | |
| Oracle | | | 106 | | | | 10,960 | |
| Palo Alto Networks * | | | 21 | | | | 5,103 | |
| PTC * | | | 6 | | | | 843 | |
| Qorvo * | | | 5 | | | | 437 | |
| QUALCOMM | | | 75 | | | | 8,174 | |
| Roper Technologies | | | 7 | | | | 3,420 | |
| Salesforce * | | | 66 | | | | 13,255 | |
| Seagate Technology Holdings | | | 13 | | | | 887 | |
| ServiceNow * | | | 14 | | | | 8,146 | |
| Skyworks Solutions | | | 10 | | | | 867 | |
| SolarEdge Technologies * | | | 4 | | | | 304 | |
| Synopsys * | | | 11 | | | | 5,164 | |
| TE Connectivity | | | 22 | | | | 2,593 | |
| Teledyne Technologies * | | | 4 | | | | 1,498 | |
| Teradyne | | | 10 | | | | 833 | |
| Texas Instruments | | | 63 | | | | 8,947 | |
| Trimble * | | | 20 | | | | 943 | |
| Tyler Technologies * | | | 3 | | | | 1,119 | |
| VeriSign * | | | 5 | | | | 998 | |
| Western Digital * | | | 20 | | | | 803 | |
| Zebra Technologies, Cl A * | | | 4 | | | | 838 | |
| | | | | | | | 669,159 | |
| Materials — 2.4% | | | | | | | | |
| Air Products & Chemicals | | | 15 | | | | 4,237 | |
| Albemarle | | | 7 | | | | 888 | |
| Amcor | | | 99 | | | | 880 | |
| Avery Dennison | | | 4 | | | | 696 | |
| Ball | | | 21 | | | | 1,011 | |
| Celanese, Cl A | | | 5 | | | | 573 | |
| CF Industries Holdings | | | 13 | | | | 1,037 | |
| Corteva | | | 49 | | | | 2,359 | |
| Dow | | | 48 | | | | 2,320 | |
| DuPont de Nemours | | | 30 | | | | 2,186 | |
| Eastman Chemical | | | 10 | | | | 747 | |
| Ecolab | | | 16 | | | | 2,684 | |
The accompanying notes are an integral part of the financial statements.
301
| Schedule of Investments | October 31, 2023 |
| Global X S&P 500® Tail Risk ETF |
| | | Shares | | | Value | |
| COMMON STOCK — continued | | | | | | | | |
| Materials — continued | | | | | | | | |
| FMC | | | 10 | | | $ | 532 | |
| Freeport-McMoRan | | | 98 | | | | 3,310 | |
| International Flavors & Fragrances | | | 16 | | | | 1,094 | |
| International Paper | | | 33 | | | | 1,113 | |
| Linde | | | 34 | | | | 12,993 | |
| LyondellBasell Industries, Cl A | | | 17 | | | | 1,534 | |
| Martin Marietta Materials | | | 4 | | | | 1,636 | |
| Mosaic | | | 23 | | | | 747 | |
| Newmont | | | 55 | | | | 2,061 | |
| Nucor | | | 16 | | | | 2,365 | |
| Packaging Corp of America | | | 7 | | | | 1,071 | |
| PPG Industries | | | 15 | | | | 1,842 | |
| Sealed Air | | | 9 | | | | 277 | |
| Sherwin-Williams | | | 15 | | | | 3,573 | |
| Steel Dynamics | | | 12 | | | | 1,278 | |
| Vulcan Materials | | | 10 | | | | 1,965 | |
| Westrock | | | 15 | | | | 539 | |
| | | | | | | | 57,548 | |
| Real Estate — 2.3% | | | | | | | | |
| Alexandria Real Estate Equities ‡ | | | 10 | | | | 931 | |
| American Tower ‡ | | | 31 | | | | 5,524 | |
| AvalonBay Communities ‡ | | | 9 | | | | 1,492 | |
| Boston Properties ‡ | | | 9 | | | | 482 | |
| Camden Property Trust ‡ | | | 6 | | | | 509 | |
| CBRE Group, Cl A * | | | 20 | | | | 1,387 | |
| CoStar Group * | | | 27 | | | | 1,982 | |
| Crown Castle ‡ | | | 30 | | | | 2,789 | |
| Digital Realty Trust ‡ | | | 19 | | | | 2,363 | |
| Equinix ‡ | | | 6 | | | | 4,378 | |
| Equity Residential ‡ | | | 24 | | | | 1,328 | |
| Essex Property Trust ‡ | | | 5 | | | | 1,070 | |
| Extra Space Storage ‡ | | | 15 | | | | 1,554 | |
| Federal Realty Investment Trust ‡ | | | 5 | | | | 456 | |
| Healthpeak Properties ‡ | | | 34 | | | | 529 | |
| Host Hotels & Resorts ‡ | | | 45 | | | | 697 | |
| Invitation Homes ‡ | | | 38 | | | | 1,128 | |
| Iron Mountain ‡ | | | 19 | | | | 1,122 | |
| Kimco Realty ‡ | | | 41 | | | | 736 | |
The accompanying notes are an integral part of the financial statements.
302
| Schedule of Investments | October 31, 2023 |
| Global X S&P 500® Tail Risk ETF |
| | | Shares | | | Value | |
| COMMON STOCK — continued | | | | | | | | |
| Real Estate — continued | | | | | | | | |
| Mid-America Apartment Communities ‡ | | | 6 | | | $ | 709 | |
| ProLogis ‡ | | | 65 | | | | 6,549 | |
| Public Storage ‡ | | | 12 | | | | 2,865 | |
| Realty Income ‡ | | | 46 | | | | 2,179 | |
| Regency Centers ‡ | | | 10 | | | | 603 | |
| SBA Communications, Cl A ‡ | | | 6 | | | | 1,252 | |
| Simon Property Group ‡ | | | 23 | | | | 2,527 | |
| UDR ‡ | | | 20 | | | | 636 | |
| Ventas ‡ | | | 26 | | | | 1,104 | |
| VICI Properties, Cl A ‡ | | | 68 | | | | 1,897 | |
| Welltower ‡ | | | 35 | | | | 2,926 | |
| Weyerhaeuser ‡ | | | 50 | | | | 1,434 | |
| | | | | | | | 55,138 | |
| Utilities — 2.5% | | | | | | | | |
| AES | | | 40 | | | | 596 | |
| Alliant Energy | | | 20 | | | | 976 | |
| Ameren | | | 20 | | | | 1,514 | |
| American Electric Power | | | 34 | | | | 2,568 | |
| American Water Works | | | 13 | | | | 1,529 | |
| Atmos Energy | | | 9 | | | | 969 | |
| CenterPoint Energy | | | 40 | | | | 1,075 | |
| CMS Energy | | | 19 | | | | 1,033 | |
| Consolidated Edison | | | 26 | | | | 2,283 | |
| Constellation Energy | | | 23 | | | | 2,597 | |
| Dominion Energy | | | 57 | | | | 2,298 | |
| DTE Energy | | | 14 | | | | 1,349 | |
| Duke Energy | | | 55 | | | | 4,889 | |
| Edison International | | | 25 | | | | 1,577 | |
| Entergy | | | 14 | | | | 1,338 | |
| Evergy | | | 14 | | | | 688 | |
| Eversource Energy | | | 25 | | | | 1,345 | |
| Exelon | | | 68 | | | | 2,648 | |
| FirstEnergy | | | 36 | | | | 1,282 | |
| NextEra Energy | | | 138 | | | | 8,045 | |
| NiSource | | | 25 | | | | 629 | |
| NRG Energy | | | 20 | | | | 848 | |
| PG&E | | | 138 | | | | 2,249 | |
| Pinnacle West Capital | | | 10 | | | | 742 | |
The accompanying notes are an integral part of the financial statements.
303
| Schedule of Investments | October 31, 2023 |
| Global X S&P 500® Tail Risk ETF |
| | | Shares | | | Value | |
| COMMON STOCK — continued | | | | | | | | |
| Utilities — continued | | | | | | | | |
| PPL | | | 49 | | | $ | 1,204 | |
| Public Service Enterprise Group | | | 33 | | | | 2,034 | |
| Sempra | | | 44 | | | | 3,081 | |
| Southern | | | 76 | | | | 5,115 | |
| WEC Energy Group | | | 20 | | | | 1,628 | |
| Xcel Energy | | | 37 | | | | 2,193 | |
| | | | | | | | 60,322 | |
| TOTAL UNITED STATES | | | | | | | 2,393,782 | |
TOTAL COMMON STOCK
(Cost $2,557,704) | | | | | | | 2,396,713 | |
| | | | | | | | | |
| PURCHASED OPTIONS — 0.9% | | | | | | | | |
| (Cost $13,075) | | | | | | | 22,219 | |
| | | | | | | | | |
| TOTAL INVESTMENTS — 99.8% | | | | | | | | |
| (Cost $2,570,779) | | | | | | $ | 2,418,932 | |
Percentages are based on Net Assets of $2,423,348.
A list of the exchange traded option contracts held by the Fund at October 31, 2023, is as follows:
| Description | | Number of
Contracts | | Notional
Amount | | Exercise
Price | | Expiration
Date | | Value | |
| PURCHASED OPTIONS — 0.9% | | | | | | | | | | | | | | |
| Put Options | | | | | | | | | | | | | | |
| Mini-SPX Index | | 7 | | $ | 293,566 | | $ | 402 | | 12/15/23 | | $ | 2,769 | |
| S&P 500 Index | | 5 | | | 2,096,900 | | | 4,020 | | 12/15/23 | | | 19,450 | |
| Total Purchased Options | | | | $ | 2,390,466 | | | | | | | $ | 22,219 | |
| * | Non-income producing security. |
| ‡ | Real Estate Investment Trust |
As of October 31, 2023, all of the Fund’s investments were considered Level 1, in accordance with authoritative guidance on fair value measurements and disclosure under U.S. GAAP.
See “Glossary” for abbreviations.
The accompanying notes are an integral part of the financial statements.
304
| Schedule of Investments | October 31, 2023 |
| Global X S&P 500® Risk Managed Income ETF |
Sector Weightings (Unaudited)†:

† Sector weightings percentages are based on the total market value of investments. Total investments do not include derivatives such as options, futures contracts, forward contracts, and swap contracts, if applicable.
| | | Shares | | | Value |
| COMMON STOCK(A) — 100.5% | | | | | | | | |
| CHINA — 0.1% | | | | | | | | |
| Information Technology — 0.1% | | | | �� | | | | |
| NXP Semiconductors | | | 204 | | | $ | 35,176 | |
| | | | | | | | | |
| UNITED STATES — 100.4% | | | | | | | | |
| Communication Services — 8.8% | | | | | | | | |
| Alphabet, Cl A * | | | 4,610 | | | | 572,009 | |
| Alphabet, Cl C * | | | 3,922 | | | | 491,427 | |
| AT&T | | | 5,571 | | | | 85,793 | |
| Charter Communications, Cl A * | | | 78 | | | | 31,418 | |
| Comcast, Cl A | | | 3,183 | | | | 131,426 | |
| Electronic Arts | | | 183 | | | | 22,654 | |
| Fox, Cl A | | | 202 | | | | 6,139 | |
| Fox, Cl B | | | 146 | | | | 4,075 | |
| Interpublic Group | | | 332 | | | | 9,429 | |
| Live Nation Entertainment * | | | 102 | | | | 8,162 | |
| Match Group * | | | 196 | | | | 6,782 | |
| Meta Platforms, Cl A * | | | 1,727 | | | | 520,293 | |
| Netflix * | | | 346 | | | | 142,445 | |
| News, Cl A | | | 289 | | | | 5,976 | |
| News, Cl B | | | 146 | | | | 3,130 | |
The accompanying notes are an integral part of the financial statements.
305
| Schedule of Investments | October 31, 2023 |
| Global X S&P 500® Risk Managed Income ETF |
| | | Shares | | | Value |
| COMMON STOCK — continued | | | | | | | | |
| Communication Services — continued | | | | | | | | |
| Omnicom Group | | | 157 | | | $ | 11,761 | |
| Paramount Global, Cl B | | | 460 | | | | 5,005 | |
| Take-Two Interactive Software * | | | 127 | | | | 16,986 | |
| T-Mobile US | | | 394 | | | | 56,681 | |
| Verizon Communications | | | 3,248 | | | | 114,102 | |
| Walt Disney | | | 1,414 | | | | 115,368 | |
| Warner Bros Discovery * | | | 1,762 | | | | 17,514 | |
| | | | | | | | 2,378,575 | |
| | | | | | | | | |
| Consumer Discretionary — 10.6% | | | | | | | | |
| Airbnb, Cl A * | | | 323 | | | | 38,208 | |
| Amazon.com * | | | 7,050 | | | | 938,285 | |
| Aptiv * | | | 211 | | | | 18,399 | |
| AutoZone * | | | 14 | | | | 34,680 | |
| Bath & Body Works | | | 177 | | | | 5,248 | |
| Best Buy | | | 139 | | | | 9,288 | |
| Booking Holdings * | | | 27 | | | | 75,318 | |
| BorgWarner | | | 204 | | | | 7,528 | |
| Caesars Entertainment * | | | 165 | | | | 6,582 | |
| CarMax * | | | 113 | | | | 6,903 | |
| Carnival * | | | 798 | | | | 9,145 | |
| Chipotle Mexican Grill, Cl A * | | | 21 | | | | 40,786 | |
| Darden Restaurants | | | 92 | | | | 13,389 | |
| Domino’s Pizza | | | 24 | | | | 8,136 | |
| DR Horton | | | 228 | | | | 23,803 | |
| eBay | | | 425 | | | | 16,673 | |
| Etsy * | | | 99 | | | | 6,168 | |
| Expedia Group * | | | 99 | | | | 9,434 | |
| Ford Motor | | | 2,969 | | | | 28,948 | |
| Garmin | | | 115 | | | | 11,791 | |
| General Motors | | | 1,037 | | | | 29,243 | |
| Genuine Parts | | | 112 | | | | 14,432 | |
| Hasbro | | | 115 | | | | 5,192 | |
| Hilton Worldwide Holdings | | | 207 | | | | 31,367 | |
| Home Depot | | | 783 | | | | 222,912 | |
| Las Vegas Sands | | | 242 | | | | 11,485 | |
| Lennar, Cl A | | | 192 | | | | 20,483 | |
| LKQ | | | 219 | | | | 9,619 | |
| Lowe’s | | | 448 | | | | 85,375 | |
The accompanying notes are an integral part of the financial statements.
306
| Schedule of Investments | October 31, 2023 |
| Global X S&P 500® Risk Managed Income ETF |
| | | Shares | | | Value |
| COMMON STOCK — continued | | | | | | | | |
| Consumer Discretionary — continued | | | | | | | | |
| Lululemon Athletica * | | | 90 | | | $ | 35,413 | |
| Marriott International, Cl A | | | 189 | | | | 35,638 | |
| McDonald’s | | | 570 | | | | 149,437 | |
| MGM Resorts International | | | 218 | | | | 7,613 | |
| Mohawk Industries * | | | 41 | | | | 3,296 | |
| NIKE, Cl B | | | 947 | | | | 97,323 | |
| Norwegian Cruise Line Holdings * | | | 281 | | | | 3,822 | |
| NVR * | | | 3 | | | | 16,238 | |
| O’Reilly Automotive * | | | 48 | | | | 44,661 | |
| Pool | | | 27 | | | | 8,526 | |
| PulteGroup | | | 161 | | | | 11,848 | |
| Ralph Lauren, Cl A | | | 31 | | | | 3,488 | |
| Ross Stores | | | 274 | | | | 31,776 | |
| Royal Caribbean Cruises * | | | 178 | | | | 15,082 | |
| Starbucks | | | 893 | | | | 82,370 | |
| Tapestry | | | 206 | | | | 5,677 | |
| Tesla * | | | 2,140 | | | | 429,798 | |
| TJX | | | 877 | | | | 77,237 | |
| Tractor Supply | | | 81 | | | | 15,597 | |
| Ulta Beauty * | | | 40 | | | | 15,252 | |
| VF | | | 292 | | | | 4,301 | |
| Whirlpool | | | 34 | | | | 3,555 | |
| Wynn Resorts | | | 76 | | | | 6,671 | |
| Yum! Brands | | | 226 | | | | 27,314 | |
| | | | | | | | 2,870,753 | |
| | | | | | | | | |
| Consumer Staples — 6.7% | | | | | | | | |
| Altria Group | | | 1,349 | | | | 54,189 | |
| Archer-Daniels-Midland | | | 404 | | | | 28,914 | |
| Brown-Forman, Cl B | | | 147 | | | | 8,256 | |
| Bunge | | | 110 | | | | 11,658 | |
| Campbell Soup | | | 180 | | | | 7,274 | |
| Church & Dwight | | | 196 | | | | 17,824 | |
| Clorox | | | 101 | | | | 11,888 | |
| Coca-Cola | | | 3,039 | | | | 171,673 | |
| Colgate-Palmolive | | | 626 | | | | 47,025 | |
| Conagra Brands | | | 379 | | | | 10,369 | |
| Constellation Brands, Cl A | | | 122 | | | | 28,566 | |
| Costco Wholesale | | | 345 | | | | 190,592 | |
The accompanying notes are an integral part of the financial statements.
307
| Schedule of Investments | October 31, 2023 |
| Global X S&P 500® Risk Managed Income ETF |
| | | Shares | | | Value |
| COMMON STOCK — continued | | | | | | | | |
| Consumer Staples — continued | | | | | | | | |
| Dollar General | | | 173 | | | $ | 20,594 | |
| Dollar Tree * | | | 164 | | | | 18,219 | |
| Estee Lauder, Cl A | | | 182 | | | | 23,454 | |
| General Mills | | | 468 | | | | 30,532 | |
| Hershey | | | 121 | | | | 22,669 | |
| Hormel Foods | | | 240 | | | | 7,812 | |
| J M Smucker | | | 88 | | | | 10,018 | |
| Kellanova | | | 219 | | | | 11,053 | |
| Kenvue | | | 1,363 | | | | 25,352 | |
| Keurig Dr Pepper | | | 818 | | | | 24,810 | |
| Kimberly-Clark | | | 272 | | | | 32,542 | |
| Kraft Heinz | | | 631 | | | | 19,851 | |
| Kroger | | | 496 | | | | 22,504 | |
| Lamb Weston Holdings | | | 105 | | | | 9,429 | |
| McCormick | | | 200 | | | | 12,780 | |
| Molson Coors Beverage, Cl B | | | 146 | | | | 8,434 | |
| Mondelez International, Cl A | | | 1,057 | | | | 69,984 | |
| Monster Beverage * | | | 559 | | | | 28,565 | |
| PepsiCo | | | 1,065 | | | | 173,893 | |
| Philip Morris International | | | 1,199 | | | | 106,903 | |
| Procter & Gamble | | | 1,826 | | | | 273,955 | |
| Sysco | | | 408 | | | | 27,128 | |
| Target | | | 349 | | | | 38,666 | |
| Tyson Foods, Cl A | | | 209 | | | | 9,687 | |
| Walgreens Boots Alliance | | | 598 | | | | 12,606 | |
| Walmart | | | 1,104 | | | | 180,405 | |
| | | | | | | | 1,810,073 | |
| | | | | | | | | |
| Energy — 4.6% | | | | | | | | |
| APA | | | 219 | | | | 8,699 | |
| Baker Hughes, Cl A | | | 803 | | | | 27,639 | |
| Chevron | | | 1,382 | | | | 201,399 | |
| ConocoPhillips | | | 925 | | | | 109,890 | |
| Coterra Energy | | | 596 | | | | 16,390 | |
| Devon Energy | | | 514 | | | | 23,937 | |
| Diamondback Energy | | | 144 | | | | 23,086 | |
| EOG Resources | | | 443 | | | | 55,929 | |
| EQT | | | 283 | | | | 11,993 | |
| Exxon Mobil | | | 3,101 | | | | 328,241 | |
The accompanying notes are an integral part of the financial statements.
308
| Schedule of Investments | October 31, 2023 |
| Global X S&P 500® Risk Managed Income ETF |
| | | Shares | | | Value |
| COMMON STOCK — continued | | | | | | | | |
| Energy — continued | | | | | | | | |
| Halliburton | | | 719 | | | $ | 28,285 | |
| Hess | | | 218 | | | | 31,479 | |
| Kinder Morgan | | | 1,573 | | | | 25,483 | |
| Marathon Oil | | | 480 | | | | 13,109 | |
| Marathon Petroleum | | | 303 | | | | 45,829 | |
| Occidental Petroleum | | | 501 | | | | 30,967 | |
| ONEOK | | | 448 | | | | 29,210 | |
| Phillips 66 | | | 336 | | | | 38,327 | |
| Pioneer Natural Resources | | | 184 | | | | 43,976 | |
| Schlumberger | | | 1,084 | | | | 60,335 | |
| Targa Resources | | | 181 | | | | 15,133 | |
| Valero Energy | | | 267 | | | | 33,909 | |
| Williams | | | 932 | | | | 32,061 | |
| | | | | | | | 1,235,306 | |
| | | | | | | | | |
| Financials — 12.8% | | | | | | | | |
| Aflac | | | 407 | | | | 31,791 | |
| Allstate | | | 205 | | | | 26,267 | |
| American Express | | | 444 | | | | 64,837 | |
| American International Group | | | 536 | | | | 32,862 | |
| Ameriprise Financial | | | 78 | | | | 24,536 | |
| Aon, Cl A | | | 154 | | | | 47,648 | |
| Arch Capital Group * | | | 296 | | | | 25,657 | |
| Arthur J Gallagher | | | 163 | | | | 38,385 | |
| Assurant | | | 48 | | | | 7,147 | |
| Bank of America | | | 5,346 | | | | 140,814 | |
| Bank of New York Mellon | | | 573 | | | | 24,353 | |
| Berkshire Hathaway, Cl B * | | | 1,418 | | | | 484,006 | |
| BlackRock, Cl A | | | 108 | | | | 66,126 | |
| Blackstone | | | 541 | | | | 49,961 | |
| Brown & Brown | | | 185 | | | | 12,843 | |
| Capital One Financial | | | 304 | | | | 30,792 | |
| Cboe Global Markets | | | 87 | | | | 14,258 | |
| Charles Schwab | | | 1,133 | | | | 58,961 | |
| Chubb | | | 313 | | | | 67,176 | |
| Cincinnati Financial | | | 125 | | | | 12,459 | |
| Citigroup | | | 1,466 | | | | 57,892 | |
| Citizens Financial Group | | | 350 | | | | 8,201 | |
| CME Group, Cl A | | | 274 | | | | 58,488 | |
The accompanying notes are an integral part of the financial statements.
309
| Schedule of Investments | October 31, 2023 |
| Global X S&P 500® Risk Managed Income ETF |
| | | Shares | | | Value |
| COMMON STOCK — continued | | | | | | | | |
| Financials — continued | | | | | | | | |
| Comerica | | | 118 | | | $ | 4,649 | |
| Discover Financial Services | | | 198 | | | | 16,252 | |
| Everest Group | | | 35 | | | | 13,847 | |
| FactSet Research Systems | | | 30 | | | | 12,957 | |
| Fidelity National Information Services | | | 448 | | | | 22,001 | |
| Fifth Third Bancorp | | | 539 | | | | 12,780 | |
| Fiserv * | | | 463 | | | | 52,666 | |
| FleetCor Technologies * | | | 61 | | | | 13,735 | |
| Franklin Resources | | | 222 | | | | 5,059 | |
| Global Payments | | | 193 | | | | 20,500 | |
| Globe Life | | | 78 | | | | 9,076 | |
| Goldman Sachs Group | | | 252 | | | | 76,510 | |
| Hartford Financial Services Group | | | 249 | | | | 18,289 | |
| Huntington Bancshares | | | 1,052 | | | | 10,152 | |
| Intercontinental Exchange | | | 449 | | | | 48,241 | |
| Invesco | | | 409 | | | | 5,305 | |
| Jack Henry & Associates | | | 52 | | | | 7,331 | |
| JPMorgan Chase | | | 2,261 | | | | 314,415 | |
| KeyCorp | | | 646 | | | | 6,602 | |
| Loews | | | 146 | | | | 9,345 | |
| M&T Bank | | | 132 | | | | 14,883 | |
| MarketAxess Holdings | | | 29 | | | | 6,199 | |
| Marsh & McLennan | | | 388 | | | | 73,584 | |
| Mastercard, Cl A | | | 648 | | | | 243,875 | |
| MetLife | | | 474 | | | | 28,445 | |
| Moody’s | | | 120 | | | | 36,960 | |
| Morgan Stanley | | | 975 | | | | 69,050 | |
| MSCI, Cl A | | | 62 | | | | 29,236 | |
| Nasdaq | | | 248 | | | | 12,301 | |
| Northern Trust | | | 162 | | | | 10,677 | |
| PayPal Holdings * | | | 835 | | | | 43,253 | |
| PNC Financial Services Group | | | 301 | | | | 34,455 | |
| Principal Financial Group | | | 161 | | | | 10,896 | |
| Progressive | | | 451 | | | | 71,299 | |
| Prudential Financial | | | 289 | | | | 26,426 | |
| Raymond James Financial | | | 150 | | | | 14,316 | |
| Regions Financial | | | 767 | | | | 11,145 | |
| S&P Global | | | 249 | | | | 86,978 | |
| State Street | | | 235 | | | | 15,188 | |
The accompanying notes are an integral part of the financial statements.
310
| Schedule of Investments | October 31, 2023 |
| Global X S&P 500® Risk Managed Income ETF |
| | | Shares | | | Value |
| COMMON STOCK — continued | | | | | | | | |
| Financials — continued | | | | | | | | |
| Synchrony Financial | | | 332 | | | $ | 9,313 | |
| T Rowe Price Group | | | 176 | | | | 15,928 | |
| Travelers | | | 174 | | | | 29,135 | |
| Truist Financial | | | 1,062 | | | | 30,118 | |
| US Bancorp | | | 1,193 | | | | 38,033 | |
| Visa, Cl A | | | 1,245 | | | | 292,700 | |
| W R Berkley | | | 155 | | | | 10,450 | |
| Wells Fargo | | | 2,827 | | | | 112,430 | |
| Willis Towers Watson | | | 78 | | | | 18,399 | |
| Zions Bancorp | | | 146 | | | | 4,504 | |
| | | | | | | | 3,465,348 | |
| | | | | | | | | |
| Health Care — 13.2% | | | | | | | | |
| Abbott Laboratories | | | 1,357 | | | | 128,304 | |
| AbbVie | | | 1,376 | | | | 194,264 | |
| Agilent Technologies | | | 240 | | | | 24,809 | |
| Align Technology * | | | 53 | | | | 9,783 | |
| Amgen | | | 418 | | | | 106,883 | |
| Baxter International | | | 403 | | | | 13,069 | |
| Becton Dickinson | | | 222 | | | | 56,117 | |
| Biogen * | | | 109 | | | | 25,892 | |
| Bio-Rad Laboratories, Cl A * | | | 16 | | | | 4,405 | |
| Bio-Techne | | | 114 | | | | 6,228 | |
| Boston Scientific * | | | 1,114 | | | | 57,026 | |
| Bristol-Myers Squibb | | | 1,597 | | | | 82,293 | |
| Cardinal Health | | | 196 | | | | 17,836 | |
| Catalent * | | | 120 | | | | 4,127 | |
| Cencora | | | 130 | | | | 24,070 | |
| Centene * | | | 418 | | | | 28,834 | |
| Charles River Laboratories International * | | | 34 | | | | 5,724 | |
| Cigna Group | | | 233 | | | | 72,044 | |
| Cooper | | | 39 | | | | 12,158 | |
| CVS Health | | | 979 | | | | 67,561 | |
| Danaher | | | 503 | | | | 96,586 | |
| DaVita * | | | 43 | | | | 3,321 | |
| DENTSPLY SIRONA | | | 170 | | | | 5,170 | |
| Dexcom * | | | 309 | | | | 27,448 | |
| Edwards Lifesciences * | | | 483 | | | | 30,777 | |
| Elevance Health | | | 185 | | | | 83,267 | |
The accompanying notes are an integral part of the financial statements.
311
| Schedule of Investments | October 31, 2023 |
| Global X S&P 500® Risk Managed Income ETF |
| | | Shares | | | Value |
| COMMON STOCK — continued | | | | | | | | |
| Health Care — continued | | | | | | | | |
| Eli Lilly | | | 620 | | | $ | 343,437 | |
| GE HealthCare Technologies | | | 284 | | | | 18,906 | |
| Gilead Sciences | | | 974 | | | | 76,498 | |
| HCA Healthcare | | | 152 | | | | 34,373 | |
| Henry Schein * | | | 91 | | | | 5,913 | |
| Hologic * | | | 178 | | | | 11,778 | |
| Humana | | | 95 | | | | 49,751 | |
| IDEXX Laboratories * | | | 61 | | | | 24,368 | |
| Illumina * | | | 120 | | | | 13,130 | |
| Incyte * | | | 158 | | | | 8,521 | |
| Insulet * | | | 54 | | | | 7,159 | |
| Intuitive Surgical * | | | 274 | | | | 71,848 | |
| IQVIA Holdings * | | | 142 | | | | 25,678 | |
| Johnson & Johnson | | | 1,875 | | | | 278,138 | |
| Laboratory Corp of America Holdings | | | 65 | | | | 12,982 | |
| McKesson | | | 103 | | | | 46,902 | |
| Medtronic | | | 1,036 | | | | 73,100 | |
| Merck | | | 1,978 | | | | 203,141 | |
| Mettler-Toledo International * | | | 17 | | | | 16,748 | |
| Moderna * | | | 264 | | | | 20,053 | |
| Molina Healthcare * | | | 46 | | | | 15,316 | |
| Pfizer | | | 4,365 | | | | 133,394 | |
| Quest Diagnostics | | | 81 | | | | 10,538 | |
| Regeneron Pharmaceuticals * | | | 82 | | | | 63,951 | |
| ResMed | | | 111 | | | | 15,675 | |
| Revvity | | | 101 | | | | 8,368 | |
| STERIS PLC | | | 83 | | | | 17,428 | |
| Stryker | | | 265 | | | | 71,608 | |
| Teleflex | | | 32 | | | | 5,912 | |
| Thermo Fisher Scientific | | | 298 | | | | 132,541 | |
| UnitedHealth Group | | | 718 | | | | 384,532 | |
| Universal Health Services, Cl B | | | 46 | | | | 5,791 | |
| Vertex Pharmaceuticals * | | | 199 | | | | 72,060 | |
| Viatris | | | 930 | | | | 8,277 | |
| Waters * | | | 46 | | | | 10,972 | |
| West Pharmaceutical Services | | | 58 | | | | 18,461 | |
| Zimmer Biomet Holdings | | | 154 | | | | 16,079 | |
| Zoetis, Cl A | | | 350 | | | | 54,950 | |
| | | | | | | | 3,576,273 | |
The accompanying notes are an integral part of the financial statements.
312
| Schedule of Investments | October 31, 2023 |
| Global X S&P 500® Risk Managed Income ETF |
| | | Shares | | | Value |
| COMMON STOCK — continued | | | | | | | | |
| Industrials — 8.3% | | | | | | | | |
| 3M | | | 418 | | | $ | 38,017 | |
| A O Smith | | | 114 | | | | 7,953 | |
| Alaska Air Group * | | | 112 | | | | 3,543 | |
| Allegion | | | 57 | | | | 5,607 | |
| American Airlines Group * | | | 457 | | | | 5,096 | |
| AMETEK | | | 181 | | | | 25,479 | |
| Automatic Data Processing | | | 314 | | | | 68,521 | |
| Axon Enterprise * | | | 51 | | | | 10,429 | |
| Boeing * | | | 441 | | | | 82,388 | |
| Broadridge Financial Solutions | | | 97 | | | | 16,552 | |
| Carrier Global | | | 668 | | | | 31,837 | |
| Caterpillar | | | 391 | | | | 88,386 | |
| Ceridian HCM Holding * | | | 108 | | | | 6,913 | |
| CH Robinson Worldwide | | | 84 | | | | 6,874 | |
| Cintas | | | 64 | | | | 32,456 | |
| Copart * | | | 675 | | | | 29,376 | |
| CSX | | | 1,522 | | | | 45,432 | |
| Cummins | | | 115 | | | | 24,875 | |
| Deere | | | 214 | | | | 78,187 | |
| Delta Air Lines | | | 481 | | | | 15,031 | |
| Dover | | | 113 | | | | 14,684 | |
| Eaton | | | 304 | | | | 63,205 | |
| Emerson Electric | | | 433 | | | | 38,524 | |
| Equifax | | | 100 | | | | 16,957 | |
| Expeditors International of Washington | | | 122 | | | | 13,329 | |
| Fastenal | | | 432 | | | | 25,203 | |
| FedEx | | | 183 | | | | 43,938 | |
| Fortive | | | 281 | | | | 18,344 | |
| Generac Holdings * | | | 43 | | | | 3,615 | |
| General Dynamics | | | 178 | | | | 42,953 | |
| General Electric | | | 851 | | | | 92,444 | |
| Honeywell International | | | 509 | | | | 93,279 | |
| Howmet Aerospace | | | 294 | | | | 12,965 | |
| Hubbell, Cl B | | | 40 | | | | 10,804 | |
| Huntington Ingalls Industries | | | 27 | | | | 5,935 | |
| IDEX | | | 59 | | | | 11,293 | |
| Illinois Tool Works | | | 208 | | | | 46,617 | |
| Ingersoll Rand | | | 319 | | | | 19,357 | |
| Jacobs Solutions | | | 94 | | | | 12,530 | |
The accompanying notes are an integral part of the financial statements.
313
| Schedule of Investments | October 31, 2023 |
| Global X S&P 500® Risk Managed Income ETF |
| | | Shares | | | Value |
| COMMON STOCK — continued | | | | | | | | |
| Industrials — continued | | | | | | | | |
| JB Hunt Transport Services | | | 66 | | | $ | 11,343 | |
| Johnson Controls International | | | 511 | | | | 25,049 | |
| L3Harris Technologies | | | 151 | | | | 27,091 | |
| Leidos Holdings | | | 98 | | | | 9,714 | |
| Lockheed Martin | | | 171 | | | | 77,743 | |
| Masco | | | 193 | | | | 10,053 | |
| Nordson | | | 36 | | | | 7,653 | |
| Norfolk Southern | | | 180 | | | | 34,342 | |
| Northrop Grumman | | | 108 | | | | 50,914 | |
| Old Dominion Freight Line | | | 67 | | | | 25,236 | |
| Otis Worldwide | | | 312 | | | | 24,090 | |
| PACCAR | | | 419 | | | | 34,580 | |
| Parker-Hannifin | | | 98 | | | | 36,153 | |
| Paychex | | | 259 | | | | 28,762 | |
| Paycom Software | | | 38 | | | | 9,309 | |
| Pentair | | | 146 | | | | 8,486 | |
| Quanta Services | | | 117 | | | | 19,553 | |
| Republic Services, Cl A | | | 153 | | | | 22,719 | |
| Robert Half | | | 101 | | | | 7,552 | |
| Rockwell Automation | | | 87 | | | | 22,864 | |
| Rollins | | | 177 | | | | 6,657 | |
| RTX | | | 1,112 | | | | 90,506 | |
| Snap-On | | | 36 | | | | 9,286 | |
| Southwest Airlines | | | 439 | | | | 9,759 | |
| Stanley Black & Decker | | | 106 | | | | 9,015 | |
| Textron | | | 157 | | | | 11,932 | |
| Trane Technologies | | | 172 | | | | 32,733 | |
| TransDigm Group * | | | 41 | | | | 33,952 | |
| Union Pacific | | | 466 | | | | 96,746 | |
| United Airlines Holdings * | | | 242 | | | | 8,472 | |
| United Parcel Service, Cl B | | | 553 | | | | 78,111 | |
| United Rentals | | | 51 | | | | 20,720 | |
| Veralto * | | | 169 | | | | 11,638 | |
| Verisk Analytics, Cl A | | | 117 | | | | 26,601 | |
| Waste Management | | | 279 | | | | 45,848 | |
| Westinghouse Air Brake Technologies | | | 135 | | | | 14,313 | |
| WW Grainger | | | 33 | | | | 24,084 | |
| Xylem | | | 196 | | | | 18,334 | |
| | | | | | | | 2,250,841 | |
The accompanying notes are an integral part of the financial statements.
314
| Schedule of Investments | October 31, 2023 |
| Global X S&P 500® Risk Managed Income ETF |
| | | Shares | | | Value |
| COMMON STOCK — continued | | | | | | | | |
| Information Technology — 28.1% | | | | | | | | |
| Accenture, Cl A | | | 493 | | | $ | 146,465 | |
| Adobe * | | | 355 | | | | 188,881 | |
| Advanced Micro Devices * | | | 1,249 | | | | 123,026 | |
| Akamai Technologies * | | | 121 | | | | 12,503 | |
| Amphenol, Cl A | | | 474 | | | | 38,181 | |
| Analog Devices | | | 383 | | | | 60,257 | |
| ANSYS * | | | 64 | | | | 17,809 | |
| Apple | | | 11,404 | | | | 1,947,461 | |
| Applied Materials | | | 641 | | | | 84,836 | |
| Arista Networks * | | | 188 | | | | 37,670 | |
| Autodesk * | | | 170 | | | | 33,597 | |
| Broadcom | | | 321 | | | | 270,080 | |
| Cadence Design Systems * | | | 205 | | | | 49,169 | |
| CDW | | | 110 | | | | 22,044 | |
| Cisco Systems | | | 3,181 | | | | 165,826 | |
| Cognizant Technology Solutions, Cl A | | | 387 | | | | 24,950 | |
| Corning | | | 634 | | | | 16,966 | |
| Enphase Energy * | | | 111 | | | | 8,833 | |
| EPAM Systems * | | | 45 | | | | 9,791 | |
| F5 * | | | 41 | | | | 6,215 | |
| Fair Isaac * | | | 20 | | | | 16,917 | |
| First Solar * | | | 77 | | | | 10,969 | |
| Fortinet * | | | 524 | | | | 29,957 | |
| Gartner * | | | 62 | | | | 20,586 | |
| Gen Digital | | | 449 | | | | 7,480 | |
| Hewlett Packard Enterprise | | | 961 | | | | 14,780 | |
| HP | | | 641 | | | | 16,878 | |
| Intel | | | 3,263 | | | | 119,099 | |
| International Business Machines | | | 710 | | | | 102,694 | |
| Intuit | | | 219 | | | | 108,394 | |
| Juniper Networks | | | 292 | | | | 7,861 | |
| Keysight Technologies * | | | 142 | | | | 17,331 | |
| KLA | | | 104 | | | | 48,849 | |
| Lam Research | | | 102 | | | | 59,998 | |
| Microchip Technology | | | 438 | | | | 31,225 | |
| Micron Technology | | | 834 | | | | 55,770 | |
| Microsoft | | | 5,765 | | | | 1,949,204 | |
| Monolithic Power Systems | | | 34 | | | | 15,019 | |
| Motorola Solutions | | | 126 | | | | 35,086 | |
The accompanying notes are an integral part of the financial statements.
315
| Schedule of Investments | October 31, 2023 |
| Global X S&P 500® Risk Managed Income ETF |
| | | Shares | | | Value |
| COMMON STOCK — continued | | | | | | | | |
| Information Technology — continued | | | | | | | | |
| NetApp | | | 154 | | | $ | 11,208 | |
| NVIDIA | | | 1,918 | | | | 782,160 | |
| ON Semiconductor * | | | 344 | | | | 21,548 | |
| Oracle | | | 1,217 | | | | 125,838 | |
| Palo Alto Networks * | | | 233 | | | | 56,624 | |
| PTC * | | | 88 | | | | 12,357 | |
| Qorvo * | | | 73 | | | | 6,382 | |
| QUALCOMM | | | 871 | | | | 94,930 | |
| Roper Technologies | | | 82 | | | | 40,063 | |
| Salesforce * | | | 761 | | | | 152,832 | |
| Seagate Technology Holdings | | | 163 | | | | 11,125 | |
| ServiceNow * | | | 156 | | | | 90,769 | |
| Skyworks Solutions | | | 127 | | | | 11,016 | |
| SolarEdge Technologies * | | | 44 | | | | 3,342 | |
| Synopsys * | | | 116 | | | | 54,455 | |
| TE Connectivity | | | 236 | | | | 27,813 | |
| Teledyne Technologies * | | | 37 | | | | 13,860 | |
| Teradyne | | | 124 | | | | 10,325 | |
| Texas Instruments | | | 696 | | | | 98,839 | |
| Trimble * | | | 207 | | | | 9,756 | |
| Tyler Technologies * | | | 33 | | | | 12,306 | |
| VeriSign * | | | 69 | | | | 13,777 | |
| Western Digital * | | | 227 | | | | 9,114 | |
| Zebra Technologies, Cl A * | | | 36 | | | | 7,539 | |
| | | | | | | | 7,610,635 | |
| | | | | | | | | |
| Materials — 2.4% | | | | | | | | |
| Air Products & Chemicals | | | 168 | | | | 47,450 | |
| Albemarle | | | 96 | | | | 12,171 | |
| Amcor | | | 1,051 | | | | 9,343 | |
| Avery Dennison | | | 64 | | | | 11,141 | |
| Ball | | | 250 | | | | 12,038 | |
| Celanese, Cl A | | | 82 | | | | 9,390 | |
| CF Industries Holdings | | | 158 | | | | 12,605 | |
| Corteva | | | 569 | | | | 27,392 | |
| Dow | | | 563 | | | | 27,215 | |
| DuPont de Nemours | | | 344 | | | | 25,071 | |
| Eastman Chemical | | | 110 | | | | 8,220 | |
| Ecolab | | | 194 | | | | 32,542 | |
The accompanying notes are an integral part of the financial statements.
316
| Schedule of Investments | October 31, 2023 |
| Global X S&P 500® Risk Managed Income ETF |
| | | Shares | | | Value |
| COMMON STOCK — continued | | | | | | | | |
| Materials — continued | | | | | | | | |
| FMC | | | 86 | | | $ | 4,575 | |
| Freeport-McMoRan | | | 1,087 | | | | 36,719 | |
| International Flavors & Fragrances | | | 187 | | | | 12,782 | |
| International Paper | | | 288 | | | | 9,714 | |
| Linde | | | 378 | | | | 144,457 | |
| LyondellBasell Industries, Cl A | | | 197 | | | | 17,777 | |
| Martin Marietta Materials | | | 48 | | | | 19,629 | |
| Mosaic | | | 260 | | | | 8,445 | |
| Newmont | | | 630 | | | | 23,606 | |
| Nucor | | | 189 | | | | 27,932 | |
| Packaging Corp of America | | | 65 | | | | 9,948 | |
| PPG Industries | | | 185 | | | | 22,712 | |
| Sealed Air | | | 134 | | | | 4,126 | |
| Sherwin-Williams | | | 185 | | | | 44,069 | |
| Steel Dynamics | | | 127 | | | | 13,527 | |
| Vulcan Materials | | | 109 | | | | 21,417 | |
| Westrock | | | 211 | | | | 7,581 | |
| | | | | | | | 663,594 | |
| | | | | | | | | |
| Real Estate — 2.4% | | | | | | | | |
| Alexandria Real Estate Equities ‡ | | | 113 | | | | 10,524 | |
| American Tower ‡ | | | 354 | | | | 63,079 | |
| AvalonBay Communities ‡ | | | 106 | | | | 17,569 | |
| Boston Properties ‡ | | | 111 | | | | 5,946 | |
| Camden Property Trust ‡ | | | 79 | | | | 6,706 | |
| CBRE Group, Cl A * | | | 248 | | | | 17,196 | |
| CoStar Group * | | | 324 | | | | 23,785 | |
| Crown Castle ‡ | | | 344 | | | | 31,985 | |
| Digital Realty Trust ‡ | | | 225 | | | | 27,981 | |
| Equinix ‡ | | | 74 | | | | 53,993 | |
| Equity Residential ‡ | | | 272 | | | | 15,050 | |
| Essex Property Trust ‡ | | | 50 | | | | 10,696 | |
| Extra Space Storage ‡ | | | 158 | | | | 16,367 | |
| Federal Realty Investment Trust ‡ | | | 50 | | | | 4,560 | |
| Healthpeak Properties ‡ | | | 462 | | | | 7,184 | |
| Host Hotels & Resorts ‡ | | | 575 | | | | 8,901 | |
| Invitation Homes ‡ | | | 428 | | | | 12,707 | |
| Iron Mountain ‡ | | | 217 | | | | 12,818 | |
| Kimco Realty ‡ | | | 479 | | | | 8,593 | |
The accompanying notes are an integral part of the financial statements.
317
| Schedule of Investments | October 31, 2023 |
| Global X S&P 500® Risk Managed Income ETF |
| | | Shares | | | Value |
| COMMON STOCK — continued | | | | | | | | |
| Real Estate — continued | | | | | | | | |
| Mid-America Apartment Communities ‡ | | | 96 | | | $ | 11,342 | |
| ProLogis ‡ | | | 720 | | | | 72,540 | |
| Public Storage ‡ | | | 119 | | | | 28,407 | |
| Realty Income ‡ | | | 572 | | | | 27,101 | |
| Regency Centers ‡ | | | 107 | | | | 6,448 | |
| SBA Communications, Cl A ‡ | | | 90 | | | | 18,777 | |
| Simon Property Group ‡ | | | 263 | | | | 28,901 | |
| UDR ‡ | | | 245 | | | | 7,794 | |
| Ventas ‡ | | | 314 | | | | 13,332 | |
| VICI Properties, Cl A ‡ | | | 790 | | | | 22,041 | |
| Welltower ‡ | | | 397 | | | | 33,193 | |
| Weyerhaeuser ‡ | | | 580 | | | | 16,640 | |
| | | | | | | | 642,156 | |
| | | | | | | | | |
| Utilities — 2.5% | | | | | | | | |
| AES | | | 585 | | | | 8,716 | |
| Alliant Energy | | | 211 | | | | 10,295 | |
| Ameren | | | 216 | | | | 16,353 | |
| American Electric Power | | | 414 | | | | 31,274 | |
| American Water Works | | | 149 | | | | 17,530 | |
| Atmos Energy | | | 126 | | | | 13,565 | |
| CenterPoint Energy | | | 493 | | | | 13,252 | |
| CMS Energy | | | 217 | | | | 11,792 | |
| Consolidated Edison | | | 277 | | | | 24,318 | |
| Constellation Energy | | | 261 | | | | 29,472 | |
| Dominion Energy | | | 671 | | | | 27,055 | |
| DTE Energy | | | 159 | | | | 15,324 | |
| Duke Energy | | | 586 | | | | 52,089 | |
| Edison International | | | 277 | | | | 17,468 | |
| Entergy | | | 166 | | | | 15,868 | |
| Evergy | | | 177 | | | | 8,698 | |
| Eversource Energy | | | 278 | | | | 14,954 | |
| Exelon | | | 795 | | | | 30,957 | |
| FirstEnergy | | | 403 | | | | 14,347 | |
| NextEra Energy | | | 1,549 | | | | 90,307 | |
| NiSource | | | 344 | | | | 8,655 | |
| NRG Energy | | | 184 | | | | 7,798 | |
| PG&E * | | | 1,567 | | | | 25,542 | |
| Pinnacle West Capital | | | 97 | | | | 7,195 | |
The accompanying notes are an integral part of the financial statements.
318
| Schedule of Investments | October 31, 2023 |
| Global X S&P 500® Risk Managed Income ETF |
| | | Shares | | | Value |
| COMMON STOCK — continued | | | | | | | | |
| Utilities — continued | | | | | | | | |
| PPL | | | 544 | | | $ | 13,366 | |
| Public Service Enterprise Group | | | 400 | | | | 24,660 | |
| Sempra | | | 474 | | | | 33,194 | |
| Southern | | | 830 | | | | 55,859 | |
| WEC Energy Group | | | 254 | | | | 20,673 | |
| Xcel Energy | | | 439 | | | | 26,019 | |
| | | | | | | | 686,595 | |
| TOTAL UNITED STATES | | | | | | | 27,190,149 | |
TOTAL COMMON STOCK
(Cost $27,283,512) | | | | | | | 27,225,325 | |
| | | | | | | | | |
PURCHASED OPTIONS — 0.3%
(Cost $176,446) | | | | | | | 99,292 | |
| | | | | | | | | |
TOTAL INVESTMENTS — 100.8%
(Cost $27,459,958) | | | | | | $ | 27,324,617 | |
| | | | | | | | | |
WRITTEN OPTIONS— (1.0)%
(Premiums Received $(603,028)) | | | | | | $ | (260,677 | ) |
Percentages are based on Net Assets of $27,097,811.
The accompanying notes are an integral part of the financial statements.
319
| Schedule of Investments | October 31, 2023 |
| Global X S&P 500® Risk Managed Income ETF |
A list of the exchange traded option contracts held by the Fund at October 31, 2023, is as follows:
| Description | | Number of
Contracts | | Notional
Amount | | Exercise
Price | | | Expiration
Date | | Value |
| PURCHASED OPTIONS — 0.3% | | | | | | | | | | | | | | | | | | |
| Put Options | | | | | | | | | | | | | | | | | | |
| Mini-SPX Index | | | 9 | | | $ | 377,442 | | | $ | 402 | | | 11/17/23 | | $ | 1,372 | |
| S&P 500 Index | | | 64 | | | | 26,840,320 | | | | 4,025 | | | 11/17/23 | | | 97,920 | |
| | | | | | | | | | | | | | | | | | | |
| Total Purchased Options | | | | | | $ | 27,217,762 | | | | | | | | | $ | 99,292 | |
| | | | | | | | | | | | | | | | | | | |
| WRITTEN OPTIONS — (1.0)% | | | | | | | | | | | | | | | | | | |
| Call Options | | | | | | | | | | | | | | | | | | |
| Mini-SPX Index | | | (9 | ) | | $ | (377,442 | ) | | $ | 424 | | | 11/17/23 | | $ | (3,717 | ) |
| S&P 500 Index | | | (64 | ) | | | (26,840,320 | ) | | | 4,240 | | | 11/17/23 | | | (256,960 | ) |
| | | | | | | | | | | | | | | | | | | |
| Total Written Options | | | | | | $ | (27,217,762 | ) | | | | | | | | $ | (260,677 | ) |
| * | Non-income producing security. |
| ‡ | Real Estate Investment Trust |
| (A) | All or a portion of these securities has been segregated as collateral for options contracts. The Fair Value of the securities pledged as collateral is $27,224,647. |
The following is a summary of the level of inputs used as of October 31, 2023, in valuing the Fund’s investments and other financial instruments carried at value:
| Investments in Securities | | Level 1 | | Level 2 | | | Level 3 | | | Total |
| Common Stock | | $ | 27,225,325 | | | $ | — | | | $ | — | | | $ | 27,225,325 | |
| Purchased Options | | | 99,292 | | | | — | | | | — | | | | 99,292 | |
| Total Investments in Securities | | $ | 27,324,617 | | | $ | — | | | $ | — | | | $ | 27,324,617 | |
| | | | | | | | | | | |
| Other Financial Instruments | | Level 1 | | Level 2 | | | Level 3 | | | Total |
| Written Options | | $ | (260,677 | ) | | $ | — | | | $ | — | | | $ | (260,677 | ) |
| Total Other Financial Instruments | | $ | (260,677 | ) | | $ | — | | | $ | — | | | $ | (260,677 | ) |
Amounts designated as “—” are $0 or have been rounded to $0.
See “Glossary” for abbreviations.
The accompanying notes are an integral part of the financial statements.
320
| Schedule of Investments | October 31, 2023 |
| Global X S&P 500® Collar 95-110 ETF |
Sector Weightings (Unaudited)†:

† Sector weightings percentages are based on the total market value of investments. Total investments do not include derivatives such as options, futures contracts, forward contracts, and swap contracts, if applicable.
| | | Shares | | | Value |
| COMMON STOCK(A) — 97.4% | | | | | | | | |
| CHINA — 0.1% | | | | | | | | |
| Information Technology — 0.1% | | | | | | | | |
| NXP Semiconductors | | | 16 | | | $ | 2,759 | |
| | | | | | | | | |
| UNITED STATES — 97.3% | | | | | | | | |
| Communication Services — 8.5% | | | | | | | | |
| Alphabet, Cl A * | | | 365 | | | | 45,289 | |
| Alphabet, Cl C * | | | 311 | | | | 38,968 | |
| AT&T | | | 450 | | | | 6,930 | |
| Charter Communications, Cl A * | | | 6 | | | | 2,417 | |
| Comcast, Cl A | | | 255 | | | | 10,529 | |
| Electronic Arts | | | 15 | | | | 1,857 | |
| Fox, Cl A | | | 18 | | | | 547 | |
| Fox, Cl B | | | 9 | | | | 251 | |
| Interpublic Group | | | 27 | | | | 767 | |
| Live Nation Entertainment * | | | 9 | | | | 720 | |
| Match Group * | | | 17 | | | | 588 | |
| Meta Platforms, Cl A * | | | 137 | | | | 41,274 | |
| Netflix * | | | 27 | | | | 11,116 | |
| News, Cl A | | | 27 | | | | 558 | |
| News, Cl B | | | 9 | | | | 193 | |
The accompanying notes are an integral part of the financial statements.
321
| Schedule of Investments | October 31, 2023 |
| Global X S&P 500® Collar 95-110 ETF |
| | | Shares | | | Value |
| COMMON STOCK — continued | | | | | | | | |
| Communication Services — continued | | | | | | | | |
| Omnicom Group | | | 13 | | | $ | 974 | |
| Paramount Global, Cl B | | | 36 | | | | 392 | |
| Take-Two Interactive Software * | | | 10 | | | | 1,338 | |
| T-Mobile US | | | 34 | | | | 4,891 | |
| Verizon Communications | | | 262 | | | | 9,204 | |
| Walt Disney * | | | 111 | | | | 9,057 | |
| Warner Bros Discovery * | | | 142 | | | | 1,411 | |
| | | | | | | | 189,271 | |
| Consumer Discretionary — 10.2% | | | | | | | | |
| Airbnb, Cl A * | | | 26 | | | | 3,076 | |
| Amazon.com * | | | 559 | | | | 74,397 | |
| Aptiv * | | | 17 | | | | 1,482 | |
| AutoZone * | | | 1 | | | | 2,477 | |
| Bath & Body Works | | | 7 | | | | 208 | |
| Best Buy | | | 11 | | | | 735 | |
| Booking Holdings * | | | 2 | | | | 5,579 | |
| BorgWarner | | | 9 | | | | 332 | |
| Caesars Entertainment * | | | 11 | | | | 439 | |
| CarMax * | | | 9 | | | | 550 | |
| Carnival * | | | 67 | | | | 768 | |
| Chipotle Mexican Grill, Cl A * | | | 2 | | | | 3,884 | |
| Darden Restaurants | | | 7 | | | | 1,019 | |
| Domino’s Pizza | | | 2 | | | | 678 | |
| DR Horton | | | 20 | | | | 2,088 | |
| eBay | | | 33 | | | | 1,295 | |
| Etsy * | | | 9 | | | | 561 | |
| Expedia Group * | | | 9 | | | | 858 | |
| Ford Motor | | | 253 | | | | 2,467 | |
| Garmin | | | 9 | | | | 923 | |
| General Motors | | | 83 | | | | 2,341 | |
| Genuine Parts | | | 9 | | | | 1,160 | |
| Hasbro | | | 9 | | | | 406 | |
| Hilton Worldwide Holdings | | | 16 | | | | 2,424 | |
| Home Depot | | | 62 | | | | 17,651 | |
| Las Vegas Sands | | | 22 | | | | 1,044 | |
| Lennar, Cl A | | | 15 | | | | 1,600 | |
| LKQ | | | 18 | | | | 791 | |
| Lowe’s | | | 37 | | | | 7,051 | |
The accompanying notes are an integral part of the financial statements.
322
| Schedule of Investments | October 31, 2023 |
| Global X S&P 500® Collar 95-110 ETF |
| | | Shares | | | Value |
| COMMON STOCK — continued | | | | | | | | |
| Consumer Discretionary — continued | | | | | | | | |
| Lululemon Athletica * | | | 7 | | | $ | 2,754 | |
| Marriott International, Cl A | | | 15 | | | | 2,828 | |
| McDonald’s | | | 45 | | | | 11,798 | |
| MGM Resorts International | | | 20 | | | | 698 | |
| Mohawk Industries * | | | 4 | | | | 321 | |
| NIKE, Cl B | | | 77 | | | | 7,913 | |
| Norwegian Cruise Line Holdings * | | | 17 | | | | 231 | |
| O’Reilly Automotive * | | | 4 | | | | 3,722 | |
| Pool | | | 2 | | | | 632 | |
| PulteGroup | | | 11 | | | | 809 | |
| Ralph Lauren, Cl A | | | 3 | | | | 338 | |
| Ross Stores | | | 22 | | | | 2,551 | |
| Royal Caribbean Cruises * | | | 13 | | | | 1,101 | |
| Starbucks | | | 69 | | | | 6,365 | |
| Tapestry | | | 18 | | | | 496 | |
| Tesla * | | | 170 | | | | 34,143 | |
| TJX | | | 69 | | | | 6,077 | |
| Tractor Supply | | | 7 | | | | 1,348 | |
| Ulta Beauty * | | | 3 | | | | 1,144 | |
| VF | | | 18 | | | | 265 | |
| Whirlpool | | | 5 | | | | 523 | |
| Wynn Resorts | | | 4 | | | | 351 | |
| Yum! Brands | | | 18 | | | | 2,175 | |
| | | | | | | | 226,867 | |
| Consumer Staples — 6.4% | | | | | | | | |
| Altria Group | | | 112 | | | | 4,499 | |
| Archer-Daniels-Midland | | | 30 | | | | 2,147 | |
| Brown-Forman, Cl B | | | 9 | | | | 505 | |
| Bunge | | | 10 | | | | 1,060 | |
| Campbell Soup | | | 11 | | | | 445 | |
| Church & Dwight | | | 12 | | | | 1,091 | |
| Clorox | | | 6 | | | | 706 | |
| Coca-Cola | | | 240 | | | | 13,558 | |
| Colgate-Palmolive | | | 48 | | | | 3,606 | |
| Conagra Brands | | | 25 | | | | 684 | |
| Constellation Brands, Cl A | | | 11 | | | | 2,576 | |
| Costco Wholesale | | | 27 | | | | 14,916 | |
| Dollar General | | | 12 | | | | 1,428 | |
The accompanying notes are an integral part of the financial statements.
323
| Schedule of Investments | October 31, 2023 |
| Global X S&P 500® Collar 95-110 ETF |
| | | Shares | | | Value |
| COMMON STOCK — continued | | | | | | | | |
| Consumer Staples — continued | | | | | | | | |
| Dollar Tree * | | | 14 | | | $ | 1,555 | |
| Estee Lauder, Cl A | | | 13 | | | | 1,675 | |
| General Mills | | | 36 | | | | 2,349 | |
| Hershey | | | 9 | | | | 1,686 | |
| Hormel Foods | | | 18 | | | | 586 | |
| J M Smucker | | | 6 | | | | 683 | |
| Kellanova | | | 18 | | | | 908 | |
| Kenvue | | | 107 | | | | 1,990 | |
| Keurig Dr Pepper | | | 52 | | | | 1,577 | |
| Kimberly-Clark | | | 21 | | | | 2,512 | |
| Kraft Heinz | | | 49 | | | | 1,542 | |
| Kroger | | | 45 | | | | 2,042 | |
| Lamb Weston Holdings | | | 9 | | | | 808 | |
| McCormick | | | 13 | | | | 831 | |
| Molson Coors Beverage, Cl B | | | 13 | | | | 751 | |
| Mondelez International, Cl A | | | 84 | | | | 5,562 | |
| Monster Beverage * | | | 50 | | | | 2,555 | |
| PepsiCo | | | 86 | | | | 14,042 | |
| Philip Morris International | | | 97 | | | | 8,649 | |
| Procter & Gamble | | | 145 | | | | 21,754 | |
| Sysco | | | 31 | | | | 2,061 | |
| Target | | | 29 | | | | 3,213 | |
| Tyson Foods, Cl A | | | 18 | | | | 834 | |
| Walgreens Boots Alliance | | | 45 | | | | 949 | |
| Walmart | | | 87 | | | | 14,217 | |
| | | | | | | | 142,552 | |
| Energy — 4.4% | | | | | | | | |
| APA | | | 13 | | | | 516 | |
| Baker Hughes, Cl A | | | 65 | | | | 2,237 | |
| Chevron | | | 109 | | | | 15,885 | |
| ConocoPhillips | | | 75 | | | | 8,910 | |
| Coterra Energy | | | 54 | | | | 1,485 | |
| Devon Energy | | | 40 | | | | 1,863 | |
| Diamondback Energy | | | 12 | | | | 1,924 | |
| EOG Resources | | | 37 | | | | 4,671 | |
| EQT | | | 27 | | | | 1,144 | |
| Exxon Mobil | | | 246 | | | | 26,039 | |
| Halliburton | | | 54 | | | | 2,124 | |
The accompanying notes are an integral part of the financial statements.
324
| Schedule of Investments | October 31, 2023 |
| Global X S&P 500® Collar 95-110 ETF |
| | | Shares | | | Value |
| COMMON STOCK — continued | | | | | | | | |
| Energy — continued | | | | | | | | |
| Hess | | | 18 | | | $ | 2,599 | |
| Kinder Morgan | | | 122 | | | | 1,977 | |
| Marathon Oil | | | 36 | | | | 983 | |
| Marathon Petroleum | | | 24 | | | | 3,630 | |
| Occidental Petroleum | | | 40 | | | | 2,472 | |
| ONEOK | | | 36 | | | | 2,347 | |
| Phillips 66 | | | 29 | | | | 3,308 | |
| Pioneer Natural Resources | | | 14 | | | | 3,346 | |
| Schlumberger | | | 87 | | | | 4,843 | |
| Targa Resources | | | 13 | | | | 1,087 | |
| Valero Energy | | | 21 | | | | 2,667 | |
| Williams | | | 79 | | | | 2,718 | |
| | | | | | | | 98,775 | |
| Financials — 12.4% | | | | | | | | |
| Aflac | | | 30 | | | | 2,343 | |
| Allstate | | | 14 | | | | 1,794 | |
| American Express | | | 36 | | | | 5,257 | |
| American International Group | | | 42 | | | | 2,575 | |
| Ameriprise Financial | | | 6 | | | | 1,887 | |
| Aon, Cl A | | | 12 | | | | 3,713 | |
| Arch Capital Group * | | | 19 | | | | 1,647 | |
| Arthur J Gallagher | | | 14 | | | | 3,297 | |
| Assurant | | | 3 | | | | 447 | |
| Bank of America | | | 427 | | | | 11,247 | |
| Bank of New York Mellon | | | 47 | | | | 1,998 | |
| Berkshire Hathaway, Cl B * | | | 112 | | | | 38,229 | |
| BlackRock, Cl A | | | 9 | | | | 5,511 | |
| Blackstone | | | 43 | | | | 3,971 | |
| Brown & Brown | | | 17 | | | | 1,180 | |
| Capital One Financial | | | 24 | | | | 2,431 | |
| Cboe Global Markets | | | 7 | | | | 1,147 | |
| Charles Schwab | | | 90 | | | | 4,684 | |
| Chubb | | | 26 | | | | 5,580 | |
| Cincinnati Financial | | | 8 | | | | 797 | |
| Citigroup | | | 115 | | | | 4,541 | |
| Citizens Financial Group | | | 23 | | | | 539 | |
| CME Group, Cl A | | | 23 | | | | 4,910 | |
| Comerica | | | 3 | | | | 118 | |
The accompanying notes are an integral part of the financial statements.
325
| Schedule of Investments | October 31, 2023 |
| Global X S&P 500® Collar 95-110 ETF |
| | | Shares | | | Value |
| COMMON STOCK — continued | | | | | | | | |
| Financials — continued | | | | | | | | |
| Discover Financial Services | | | 18 | | | $ | 1,477 | |
| Everest Group | | | 3 | | | | 1,187 | |
| FactSet Research Systems | | | 2 | | | | 864 | |
| Fidelity National Information Services | | | 40 | | | | 1,964 | |
| Fifth Third Bancorp | | | 45 | | | | 1,067 | |
| Fiserv * | | | 39 | | | | 4,436 | |
| FleetCor Technologies * | | | 5 | | | | 1,126 | |
| Franklin Resources | | | 20 | | | | 456 | |
| Global Payments | | | 18 | | | | 1,912 | |
| Globe Life | | | 6 | | | | 698 | |
| Goldman Sachs Group | | | 20 | | | | 6,072 | |
| Hartford Financial Services Group | | | 18 | | | | 1,322 | |
| Huntington Bancshares | | | 90 | | | | 869 | |
| Intercontinental Exchange | | | 37 | | | | 3,975 | |
| Invesco | | | 33 | | | | 428 | |
| Jack Henry & Associates | | | 3 | | | | 423 | |
| JPMorgan Chase | | | 179 | | | | 24,892 | |
| KeyCorp | | | 49 | | | | 501 | |
| Loews | | | 13 | | | | 832 | |
| M&T Bank | | | 12 | | | | 1,353 | |
| MarketAxess Holdings | | | 3 | | | | 641 | |
| Marsh & McLennan | | | 31 | | | | 5,879 | |
| Mastercard, Cl A | | | 51 | | | | 19,194 | |
| MetLife | | | 41 | | | | 2,460 | |
| Moody’s | | | 10 | | | | 3,080 | |
| Morgan Stanley | | | 78 | | | | 5,524 | |
| MSCI, Cl A | | | 5 | | | | 2,358 | |
| Nasdaq | | | 22 | | | | 1,091 | |
| Northern Trust | | | 13 | | | | 857 | |
| PayPal Holdings * | | | 69 | | | | 3,574 | |
| PNC Financial Services Group | | | 26 | | | | 2,976 | |
| Principal Financial Group | | | 11 | | | | 745 | |
| Progressive | | | 37 | | | | 5,849 | |
| Prudential Financial | | | 22 | | | | 2,012 | |
| Raymond James Financial | | | 11 | | | | 1,050 | |
| Regions Financial | | | 49 | | | | 712 | |
| S&P Global | | | 20 | | | | 6,986 | |
| State Street | | | 22 | | | | 1,422 | |
| Synchrony Financial | | | 28 | | | | 785 | |
The accompanying notes are an integral part of the financial statements.
326
| Schedule of Investments | October 31, 2023 |
| Global X S&P 500® Collar 95-110 ETF |
| | | Shares | | | Value |
| COMMON STOCK — continued | | | | | | | | |
| Financials — continued | | | | | | | | |
| T Rowe Price Group | | | 11 | | | $ | 996 | |
| Travelers | | | 13 | | | | 2,177 | |
| Truist Financial | | | 87 | | | | 2,467 | |
| US Bancorp | | | 88 | | | | 2,805 | |
| Visa, Cl A | | | 99 | | | | 23,275 | |
| W R Berkley | | | 12 | | | | 809 | |
| Wells Fargo | | | 230 | | | | 9,147 | |
| Willis Towers Watson | | | 6 | | | | 1,415 | |
| Zions Bancorp | | | 9 | | | | 278 | |
| | | | | | | | 276,261 | |
| Health Care — 12.8% | | | | | | | | |
| Abbott Laboratories | | | 107 | | | | 10,117 | |
| AbbVie | | | 108 | | | | 15,248 | |
| Agilent Technologies | | | 17 | | | | 1,757 | |
| Align Technology * | | | 4 | | | | 738 | |
| Amgen | | | 33 | | | | 8,438 | |
| Baxter International | | | 33 | | | | 1,070 | |
| Becton Dickinson | | | 17 | | | | 4,297 | |
| Biogen * | | | 8 | | | | 1,900 | |
| Bio-Rad Laboratories, Cl A * | | | 1 | | | | 275 | |
| Bio-Techne | | | 13 | | | | 710 | |
| Boston Scientific * | | | 86 | | | | 4,402 | |
| Bristol-Myers Squibb | | | 127 | | | | 6,544 | |
| Cardinal Health | | | 13 | | | | 1,183 | |
| Catalent * | | | 10 | | | | 344 | |
| Cencora | | | 9 | | | | 1,666 | |
| Centene * | | | 30 | | | | 2,070 | |
| Charles River Laboratories International * | | | 3 | | | | 505 | |
| Cigna Group | | | 18 | | | | 5,566 | |
| Cooper | | | 3 | | | | 935 | |
| CVS Health | | | 80 | | | | 5,521 | |
| Danaher | | | 40 | | | | 7,681 | |
| DaVita * | | | 5 | | | | 386 | |
| DENTSPLY SIRONA | | | 19 | | | | 578 | |
| Dexcom * | | | 23 | | | | 2,043 | |
| Edwards Lifesciences * | | | 38 | | | | 2,421 | |
| Elevance Health | | | 15 | | | | 6,751 | |
| Eli Lilly | | | 49 | | | | 27,143 | |
The accompanying notes are an integral part of the financial statements.
327
| Schedule of Investments | October 31, 2023 |
| Global X S&P 500® Collar 95-110 ETF |
| | | Shares | | | Value |
| COMMON STOCK — continued | | | | | | | | |
| Health Care — continued | | | | | | | | |
| GE HealthCare Technologies | | | 21 | | | $ | 1,398 | |
| Gilead Sciences | | | 78 | | | | 6,126 | |
| HCA Healthcare | | | 13 | | | | 2,940 | |
| Henry Schein * | | | 9 | | | | 585 | |
| Hologic * | | | 13 | | | | 860 | |
| Humana | | | 8 | | | | 4,190 | |
| IDEXX Laboratories * | | | 5 | | | | 1,997 | |
| Illumina * | | | 11 | | | | 1,204 | |
| Incyte * | | | 13 | | | | 701 | |
| Insulet * | | | 5 | | | | 663 | |
| Intuitive Surgical * | | | 22 | | | | 5,769 | |
| IQVIA Holdings * | | | 12 | | | | 2,170 | |
| Johnson & Johnson | | | 148 | | | | 21,954 | |
| Laboratory Corp of America Holdings | | | 6 | | | | 1,198 | |
| McKesson | | | 8 | | | | 3,643 | |
| Medtronic | | | 82 | | | | 5,786 | |
| Merck | | | 158 | | | | 16,227 | |
| Mettler-Toledo International * | | | 1 | | | | 985 | |
| Moderna * | | | 21 | | | | 1,595 | |
| Molina Healthcare * | | | 3 | | | | 999 | |
| Pfizer | | | 352 | | | | 10,757 | |
| Quest Diagnostics | | | 6 | | | | 781 | |
| Regeneron Pharmaceuticals * | | | 7 | | | | 5,459 | |
| ResMed | | | 9 | | | | 1,271 | |
| Revvity | | | 7 | | | | 580 | |
| STERIS PLC | | | 6 | | | | 1,260 | |
| Stryker | | | 21 | | | | 5,675 | |
| Teleflex | | | 4 | | | | 739 | |
| Thermo Fisher Scientific | | | 24 | | | | 10,675 | |
| UnitedHealth Group | | | 57 | | | | 30,527 | |
| Universal Health Services, Cl B | | | 4 | | | | 504 | |
| Vertex Pharmaceuticals * | | | 16 | | | | 5,794 | |
| Viatris | | | 69 | | | | 614 | |
| Waters * | | | 4 | | | | 954 | |
| West Pharmaceutical Services | | | 4 | | | | 1,273 | |
| Zimmer Biomet Holdings | | | 13 | | | | 1,357 | |
| Zoetis, Cl A | | | 28 | | | | 4,396 | |
| | | | | | | | 283,895 | |
The accompanying notes are an integral part of the financial statements.
328
| Schedule of Investments | October 31, 2023 |
| Global X S&P 500® Collar 95-110 ETF |
| | | Shares | | | Value |
| COMMON STOCK — continued | | | | | | | | |
| Industrials — 8.2% | | | | | | | | |
| 3M | | | 34 | | | $ | 3,092 | |
| A O Smith | | | 4 | | | | 279 | |
| Alaska Air Group * | | | 3 | | | | 95 | |
| Allegion | | | 6 | | | | 590 | |
| American Airlines Group * | | | 46 | | | | 513 | |
| AMETEK | | | 15 | | | | 2,112 | |
| Automatic Data Processing | | | 26 | | | | 5,674 | |
| Axon Enterprise * | | | 5 | | | | 1,022 | |
| Boeing * | | | 34 | | | | 6,352 | |
| Broadridge Financial Solutions | | | 8 | | | | 1,365 | |
| Carrier Global | | | 47 | | | | 2,240 | |
| Caterpillar | | | 32 | | | | 7,234 | |
| Ceridian HCM Holding * | | | 7 | | | | 448 | |
| CH Robinson Worldwide | | | 4 | | | | 327 | |
| Cintas | | | 5 | | | | 2,536 | |
| Copart * | | | 54 | | | | 2,350 | |
| CSX | | | 121 | | | | 3,612 | |
| Cummins | | | 8 | | | | 1,730 | |
| Deere | | | 17 | | | | 6,211 | |
| Delta Air Lines | | | 40 | | | | 1,250 | |
| Dover | | | 9 | | | | 1,170 | |
| Eaton | | | 25 | | | | 5,198 | |
| Emerson Electric | | | 36 | | | | 3,203 | |
| Equifax | | | 8 | | | | 1,357 | |
| Expeditors International of Washington | | | 9 | | | | 983 | |
| Fastenal | | | 36 | | | | 2,100 | |
| FedEx | | | 15 | | | | 3,602 | |
| Fortive | | | 24 | | | | 1,567 | |
| Generac Holdings * | | | 4 | | | | 336 | |
| General Dynamics | | | 14 | | | | 3,378 | |
| General Electric | | | 68 | | | | 7,387 | |
| Honeywell International | | | 42 | | | | 7,697 | |
| Howmet Aerospace | | | 27 | | | | 1,191 | |
| Hubbell, Cl B | | | 3 | | | | 810 | |
| Huntington Ingalls Industries | | | 2 | | | | 440 | |
| IDEX | | | 5 | | | | 957 | |
| Illinois Tool Works | | | 18 | | | | 4,034 | |
| Ingersoll Rand | | | 27 | | | | 1,638 | |
| Jacobs Solutions | | | 9 | | | | 1,200 | |
The accompanying notes are an integral part of the financial statements.
329
| Schedule of Investments | October 31, 2023 |
| Global X S&P 500® Collar 95-110 ETF |
| | | Shares | | | Value |
| COMMON STOCK — continued | | | | | | | | |
| Industrials — continued | | | | | | | | |
| JB Hunt Transport Services | | | 4 | | | $ | 687 | |
| Johnson Controls International | | | 45 | | | | 2,206 | |
| L3Harris Technologies | | | 12 | | | | 2,153 | |
| Leidos Holdings | | | 9 | | | | 892 | |
| Lockheed Martin | | | 14 | | | | 6,365 | |
| Masco | | | 10 | | | | 521 | |
| Nordson | | | 4 | | | | 850 | |
| Norfolk Southern | | | 13 | | | | 2,480 | |
| Northrop Grumman | | | 9 | | | | 4,243 | |
| Old Dominion Freight Line | | | 6 | | | | 2,260 | |
| Otis Worldwide | | | 27 | | | | 2,085 | |
| PACCAR | | | 29 | | | | 2,393 | |
| Parker-Hannifin | | | 8 | | | | 2,951 | |
| Paychex | | | 19 | | | | 2,110 | |
| Paycom Software | | | 3 | | | | 735 | |
| Pentair | | | 9 | | | | 523 | |
| Quanta Services | | | 9 | | | | 1,504 | |
| Republic Services, Cl A | | | 13 | | | | 1,930 | |
| Robert Half | | | 9 | | | | 673 | |
| Rockwell Automation | | | 7 | | | | 1,840 | |
| Rollins | | | 16 | | | | 602 | |
| RTX | | | 91 | | | | 7,407 | |
| Snap-On | | | 4 | | | | 1,032 | |
| Southwest Airlines | | | 36 | | | | 800 | |
| Stanley Black & Decker | | | 9 | | | | 765 | |
| Textron | | | 13 | | | | 988 | |
| Trane Technologies | | | 14 | | | | 2,664 | |
| TransDigm Group * | | | 3 | | | | 2,484 | |
| Union Pacific | | | 38 | | | | 7,889 | |
| United Airlines Holdings * | | | 18 | | | | 630 | |
| United Parcel Service, Cl B | | | 44 | | | | 6,215 | |
| United Rentals | | | 4 | | | | 1,625 | |
| Veralto * | | | 13 | | | | 920 | |
| Verisk Analytics, Cl A | | | 8 | | | | 1,819 | |
| Waste Management | | | 22 | | | | 3,615 | |
| Westinghouse Air Brake Technologies | | | 13 | | | | 1,378 | |
| WW Grainger | | | 3 | | | | 2,190 | |
| Xylem | | | 15 | | | | 1,403 | |
| | | | | | | | 181,107 | |
The accompanying notes are an integral part of the financial statements.
330
| Schedule of Investments | October 31, 2023 |
| Global X S&P 500® Collar 95-110 ETF |
| | | Shares | | | Value |
| COMMON STOCK — continued | | | | | | | | |
| Information Technology — 27.3% | | | | | | | | |
| Accenture, Cl A | | | 39 | | | $ | 11,586 | |
| Adobe * | | | 28 | | | | 14,898 | |
| Advanced Micro Devices * | | | 100 | | | | 9,850 | |
| Akamai Technologies * | | | 7 | | | | 723 | |
| Amphenol, Cl A | | | 35 | | | | 2,819 | |
| Analog Devices | | | 32 | | | | 5,035 | |
| ANSYS * | | | 5 | | | | 1,391 | |
| Apple | | | 905 | | | | 154,547 | |
| Applied Materials | | | 51 | | | | 6,750 | |
| Arista Networks * | | | 16 | | | | 3,206 | |
| Autodesk * | | | 14 | | | | 2,767 | |
| Broadcom | | | 25 | | | | 21,034 | |
| Cadence Design Systems * | | | 16 | | | | 3,838 | |
| CDW | | | 7 | | | | 1,403 | |
| Cisco Systems | | | 254 | | | | 13,241 | |
| Cognizant Technology Solutions, Cl A | | | 33 | | | | 2,127 | |
| Corning | | | 45 | | | | 1,204 | |
| Enphase Energy * | | | 9 | | | | 716 | |
| EPAM Systems * | | | 4 | | | | 870 | |
| F5 * | | | 4 | | | | 606 | |
| Fair Isaac * | | | 2 | | | | 1,692 | |
| First Solar * | | | 7 | | | | 997 | |
| Fortinet * | | | 40 | | | | 2,287 | |
| Gartner * | | | 5 | | | | 1,660 | |
| Gen Digital | | | 36 | | | | 600 | |
| Hewlett Packard Enterprise | | | 81 | | | | 1,246 | |
| HP | | | 61 | | | | 1,606 | |
| Intel | | | 260 | | | | 9,490 | |
| International Business Machines | | | 57 | | | | 8,244 | |
| Intuit | | | 17 | | | | 8,414 | |
| Juniper Networks | | | 18 | | | | 485 | |
| Keysight Technologies * | | | 11 | | | | 1,343 | |
| KLA | | | 8 | | | | 3,758 | |
| Lam Research | | | 8 | | | | 4,706 | |
| Microchip Technology | | | 36 | | | | 2,566 | |
| Micron Technology | | | 69 | | | | 4,614 | |
| Microsoft | | | 458 | | | | 154,854 | |
| Monolithic Power Systems | | | 3 | | | | 1,325 | |
| Motorola Solutions | | | 11 | | | | 3,063 | |
The accompanying notes are an integral part of the financial statements.
331
| Schedule of Investments | October 31, 2023 |
| Global X S&P 500® Collar 95-110 ETF |
| | | Shares | | | Value |
| COMMON STOCK — continued | | | | | | | | |
| Information Technology — continued | | | | | | | | |
| NetApp | | | 12 | | | $ | 873 | |
| NVIDIA | | | 152 | | | | 61,986 | |
| ON Semiconductor * | | | 28 | | | | 1,754 | |
| Oracle | | | 96 | | | | 9,926 | |
| Palo Alto Networks * | | | 18 | | | | 4,374 | |
| PTC * | | | 7 | | | | 983 | |
| Qorvo * | | | 4 | | | | 350 | |
| QUALCOMM | | | 70 | | | | 7,629 | |
| Roper Technologies | | | 7 | | | | 3,420 | |
| Salesforce * | | | 61 | | | | 12,251 | |
| Seagate Technology Holdings | | | 15 | | | | 1,024 | |
| ServiceNow * | | | 13 | | | | 7,564 | |
| Skyworks Solutions | | | 9 | | | | 781 | |
| SolarEdge Technologies * | | | 4 | | | | 304 | |
| Synopsys * | | | 9 | | | | 4,225 | |
| TE Connectivity | | | 20 | | | | 2,357 | |
| Teledyne Technologies * | | | 3 | | | | 1,124 | |
| Teradyne | | | 9 | | | | 749 | |
| Texas Instruments | | | 57 | | | | 8,095 | |
| Trimble * | | | 18 | | | | 848 | |
| Tyler Technologies * | | | 2 | | | | 746 | |
| VeriSign * | | | 6 | | | | 1,198 | |
| Western Digital * | | | 18 | | | | 723 | |
| Zebra Technologies, Cl A * | | | 3 | | | | 628 | |
| | | | | | | | 605,473 | |
| Materials — 2.4% | | | | | | | | |
| Air Products & Chemicals | | | 14 | | | | 3,954 | |
| Albemarle | | | 6 | | | | 761 | |
| Amcor | | | 71 | | | | 631 | |
| Avery Dennison | | | 5 | | | | 870 | |
| Ball | | | 16 | | | | 770 | |
| Celanese, Cl A | | | 7 | | | | 802 | |
| CF Industries Holdings | | | 10 | | | | 798 | |
| Corteva | | | 45 | | | | 2,166 | |
| Dow | | | 45 | | | | 2,175 | |
| DuPont de Nemours | | | 31 | | | | 2,259 | |
| Eastman Chemical | | | 9 | | | | 673 | |
| Ecolab | | | 15 | | | | 2,516 | |
The accompanying notes are an integral part of the financial statements.
332
| Schedule of Investments | October 31, 2023 |
| Global X S&P 500® Collar 95-110 ETF |
| | | Shares | | | Value |
| COMMON STOCK — continued | | | | | | | | |
| Materials — continued | | | | | | | | |
| FMC | | | 9 | | | $ | 479 | |
| Freeport-McMoRan | | | 87 | | | | 2,939 | |
| International Flavors & Fragrances | | | 18 | | | | 1,230 | |
| International Paper | | | 21 | | | | 708 | |
| Linde | | | 30 | | | | 11,465 | |
| LyondellBasell Industries, Cl A | | | 15 | | | | 1,354 | |
| Martin Marietta Materials | | | 4 | | | | 1,636 | |
| Mosaic | | | 22 | | | | 715 | |
| Newmont | | | 48 | | | | 1,799 | |
| Nucor | | | 15 | | | | 2,217 | |
| Packaging Corp of America | | | 6 | | | | 918 | |
| PPG Industries | | | 13 | | | | 1,596 | |
| Sealed Air | | | 9 | | | | 277 | |
| Sherwin-Williams | | | 15 | | | | 3,573 | |
| Steel Dynamics | | | 10 | | | | 1,065 | |
| Vulcan Materials | | | 9 | | | | 1,768 | |
| Westrock | | | 18 | | | | 647 | |
| | | | | | | | 52,761 | |
| Real Estate — 2.2% | | | | | | | | |
| Alexandria Real Estate Equities ‡ | | | 8 | | | | 745 | |
| American Tower ‡ | | | 29 | | | | 5,167 | |
| AvalonBay Communities ‡ | | | 8 | | | | 1,326 | |
| Boston Properties ‡ | | | 5 | | | | 268 | |
| Camden Property Trust ‡ | | | 4 | | | | 339 | |
| CBRE Group, Cl A * | | | 17 | | | | 1,179 | |
| CoStar Group * | | | 24 | | | | 1,762 | |
| Crown Castle ‡ | | | 25 | | | | 2,324 | |
| Digital Realty Trust ‡ | | | 18 | | | | 2,238 | |
| Equinix ‡ | | | 6 | | | | 4,378 | |
| Equity Residential ‡ | | | 22 | | | | 1,217 | |
| Essex Property Trust ‡ | | | 4 | | | | 856 | |
| Extra Space Storage ‡ | | | 14 | | | | 1,450 | |
| Federal Realty Investment Trust ‡ | | | 3 | | | | 274 | |
| Healthpeak Properties ‡ | | | 36 | | | | 560 | |
| Host Hotels & Resorts ‡ | | | 45 | | | | 697 | |
| Invitation Homes ‡ | | | 37 | | | | 1,099 | |
| Iron Mountain ‡ | | | 18 | | | | 1,063 | |
| Kimco Realty ‡ | | | 36 | | | | 646 | |
The accompanying notes are an integral part of the financial statements.
333
| Schedule of Investments | October 31, 2023 |
| Global X S&P 500® Collar 95-110 ETF |
| | | Shares | | | Value |
| COMMON STOCK — continued | | | | | | | | |
| Real Estate — continued | | | | | | | | |
| Mid-America Apartment Communities ‡ | | | 5 | | | $ | 591 | |
| ProLogis ‡ | | | 58 | | | | 5,843 | |
| Public Storage ‡ | | | 10 | | | | 2,387 | |
| Realty Income ‡ | | | 40 | | | | 1,895 | |
| Regency Centers ‡ | | | 9 | | | | 542 | |
| SBA Communications, Cl A ‡ | | | 7 | | | | 1,460 | |
| Simon Property Group ‡ | | | 20 | | | | 2,198 | |
| UDR ‡ | | | 18 | | | | 573 | |
| Ventas ‡ | | | 24 | | | | 1,019 | |
| VICI Properties, Cl A ‡ | | | 64 | | | | 1,786 | |
| Welltower ‡ | | | 32 | | | | 2,676 | |
| Weyerhaeuser ‡ | | | 45 | | | | 1,291 | |
| | | | | | | | 49,849 | |
| Utilities — 2.5% | | | | | | | | |
| AES | | | 46 | | | | 685 | |
| Alliant Energy | | | 18 | | | | 878 | |
| Ameren | | | 13 | | | | 984 | |
| American Electric Power | | | 33 | | | | 2,493 | |
| American Water Works | | | 12 | | | | 1,412 | |
| Atmos Energy | | | 7 | | | | 754 | |
| CenterPoint Energy | | | 33 | | | | 887 | |
| CMS Energy | | | 15 | | | | 815 | |
| Consolidated Edison | | | 22 | | | | 1,931 | |
| Constellation Energy | | | 19 | | | | 2,145 | |
| Dominion Energy | | | 53 | | | | 2,137 | |
| DTE Energy | | | 13 | | | | 1,253 | |
| Duke Energy | | | 47 | | | | 4,178 | |
| Edison International | | | 22 | | | | 1,387 | |
| Entergy | | | 14 | | | | 1,338 | |
| Evergy | | | 11 | | | | 540 | |
| Eversource Energy | | | 20 | | | | 1,076 | |
| Exelon | | | 61 | | | | 2,375 | |
| FirstEnergy | | | 36 | | | | 1,282 | |
| NextEra Energy | | | 124 | | | | 7,229 | |
| NiSource | | | 27 | | | | 679 | |
| NRG Energy | | | 18 | | | | 763 | |
| PG&E * | | | 126 | | | | 2,054 | |
| Pinnacle West Capital | | | 9 | | | | 668 | |
The accompanying notes are an integral part of the financial statements.
334
| Schedule of Investments | October 31, 2023 |
| Global X S&P 500® Collar 95-110 ETF |
| | | Shares | | | Value |
| COMMON STOCK — continued | | | | | | | | |
| Utilities — continued | | | | | | | | |
| PPL | | | 45 | | | $ | 1,106 | |
| Public Service Enterprise Group | | | 32 | | | | 1,973 | |
| Sempra | | | 40 | | | | 2,801 | |
| Southern | | | 69 | | | | 4,644 | |
| WEC Energy Group | | | 22 | | | | 1,791 | |
| Xcel Energy | | | 36 | | | | 2,134 | |
| | | | | | | | 54,392 | |
| TOTAL UNITED STATES | | | | | | | 2,161,203 | |
TOTAL COMMON STOCK
(Cost $2,338,047) | | | | | | | 2,163,962 | |
| | | | | | | | | |
PURCHASED OPTIONS — 2.4%
(Cost $22,204) | | | | | | | 53,635 | |
| | | | | | | | | |
TOTAL INVESTMENTS — 99.8%
(Cost $2,360,251) | | | | | | $ | 2,217,597 | |
| | | | | | | | | |
WRITTEN OPTIONS— (0.0)%
(Premiums Received $(2,498)) | | | | | | $ | (103 | ) |
Percentages are based on Net Assets of $2,221,163.
The accompanying notes are an integral part of the financial statements.
335
| Schedule of Investments | October 31, 2023 |
| Global X S&P 500® Collar 95-110 ETF |
A list of the exchange traded option contracts held by the Fund at October 31, 2023, is as follows:
| Description | | Number of
Contracts | | | Notional
Amount | | Exercise
Price | | | Expiration
Date | | Value |
| PURCHASED OPTIONS — 2.4% | | | | | | | | | | | | | | | | | | |
| Put Options | | | | | | | | | | | | | | | | | | |
| Mini-SPX Index | | | 1 | | | $ | 41,938 | | | $ | 424 | | | 12/15/23 | | $ | 1,060 | |
| S&P 500 Index | | | 5 | | | | 2,096,900 | | | | 4,240 | | | 12/15/23 | | | 52,575 | |
| | | | | | | | | | | | | | | | | | | |
| Total Purchased Options | | | | | | $ | 2,138,838 | | | | | | | | | $ | 53,635 | |
| | | | | | | | | | | | | | | | | | | |
| WRITTEN OPTIONS — 0.0% | | | | | | | | | | | | | | | | | | |
| Call Options | | | | | | | | | | | | | | | | | | |
| Mini-SPX Index | | | (1 | ) | | $ | (41,938 | ) | | $ | 491 | | | 12/15/23 | | $ | (3 | ) |
| S&P 500 Index | | | (5 | ) | | | (2,096,900 | ) | | | 4,910 | | | 12/15/23 | | | (100 | ) |
| | | | | | | | | | | | | | | | | | | |
| Total Written Options | | | | | | $ | (2,138,838 | ) | | | | | | | | $ | (103 | ) |
| * | Non-income producing security. |
| ‡ | Real Estate Investment Trust |
| (A) | All or a portion of these securities has been segregated as collateral for options contracts. The Fair Value of the securities pledged as collateral is $2,159,037. |
The following is a summary of the level of inputs used as of October 31, 2023, in valuing the Fund’s investments and other financial instruments carried at value:
| Investments in Securities | | Level 1 | | Level 2 | | | Level 3 | | | Total |
| Common Stock | | $ | 2,163,962 | | | $ | — | | | $ | — | | | $ | 2,163,962 | |
| Purchased Options | | | 53,635 | | | | — | | | | — | | | | 53,635 | |
| Total Investments in Securities | | $ | 2,217,597 | | | $ | — | | | $ | — | | | $ | 2,217,597 | |
| | | | | | | | | | | |
| Other Financial Instruments | | Level 1 | | Level 2 | | | Level 3 | | | Total |
| Written Options | | $ | (103 | ) | | $ | — | | | $ | — | | | $ | (103 | ) |
| Total Other Financial Instruments | | $ | (103 | ) | | $ | — | | | $ | — | | | $ | (103 | ) |
Amounts designated as “—” are $0 or have been rounded to $0.
See “Glossary” for abbreviations.
The accompanying notes are an integral part of the financial statements.
336
| Schedule of Investments | | October 31, 2023 |
| | | |
| | Global X Disruptive Materials ETF | |
Sector Weightings (Unaudited)†:

† Sector weightings percentages are based on the total market value of investments. Total investments do not include derivatives such as options, futures contracts, forward contracts, and swap contracts, if applicable.
| | | Shares | | | Value | |
| COMMON STOCK — 99.9% | | | | | | | | |
| AUSTRALIA — 13.3% | | | | | | | | |
| Materials — 13.3% | | | | | | | | |
| Allkem * | | | 35,331 | | | $ | 213,409 | |
| IGO | | | 35,624 | | | | 214,502 | |
| Lynas Rare Earths * | | | 56,221 | | | | 250,955 | |
| Pilbara Minerals | | | 131,602 | | | | 305,799 | |
| Syrah Resources * | | | 85,252 | | | | 35,895 | |
| | | | | | | | | |
| TOTAL AUSTRALIA | | | | | | | 1,020,560 | |
| CANADA — 2.3% | | | | | | | | |
| Materials — 2.3% | | | | | | | | |
| HudBay Minerals | | | 20,529 | | | | 89,466 | |
| Lithium Americas * | | | 7,433 | | | | 49,848 | |
| Lithium Americas Argentina * | | | 7,424 | | | | 41,017 | |
| | | | | | | | | |
| TOTAL CANADA | | | | | | | 180,331 | |
| CHILE — 7.4% | | | | | | | | |
| Materials — 7.4% | | | | | | | | |
| Antofagasta | | | 19,622 | | | | 320,247 | |
| Lundin Mining | | | 39,461 | | | | 246,161 | |
| | | | | | | | | |
| TOTAL CHILE | | | | | | | 566,408 | |
| CHINA — 33.4% | | | | | | | | |
| Industrials — 6.3% | | | | | | | | |
| Eve Energy, Cl A | | | 57,300 | | | | 362,279 | |
| Fangda Carbon New Material, Cl A * | | | 144,600 | | | | 116,199 | |
| | | | | | | | 478,478 | |
| Materials — 27.1% | | | | | | | | |
| China Nonferrous Mining | | | 71,100 | | | | 43,162 | |
The accompanying notes are an integral part of the financial statements.
337
| Schedule of Investments | | October 31, 2023 |
| | | |
| | Global X Disruptive Materials ETF | |
| | | Shares | | | Value | |
| COMMON STOCK — continued | | | | | | | | |
| Materials — continued | | | | | | | | |
| China Northern Rare Earth Group High-Tech, Cl A | | | 118,200 | | | $ | 336,470 | |
| China Rare Earth Resources And Technology, Cl A | | | 34,900 | | | | 142,461 | |
| GEM, Cl A | | | 270,600 | | | | 215,977 | |
| KBC, Cl A | | | 6,439 | | | | 68,819 | |
| MMG * | | | 165,100 | | | | 48,741 | |
| Nanjing Hanrui Cobalt, Cl A | | | 13,600 | | | | 56,515 | |
| Shenghe Resources Holding, Cl A | | | 66,100 | | | | 96,241 | |
| Sinofibers Technology, Cl A | | | 18,900 | | | | 80,367 | |
| South Manganese Investment *(A) | | | 142,300 | | | | 5,401 | |
| Tongling Nonferrous Metals Group, Cl A | | | 452,500 | | | | 191,673 | |
| Weihai Guangwei Composites, Cl A | | | 47,160 | | | | 164,693 | |
| Western Mining, Cl A | | | 87,700 | | | | 150,028 | |
| Xiangtan Electrochemical Scientific, Cl A | | | 23,500 | | | | 34,248 | |
| Yunnan Chihong Zinc&Germanium, Cl A | | | 169,900 | | | | 119,637 | |
| Zhejiang Huayou Cobalt, Cl A | | | 65,830 | | | | 329,865 | |
| | | | | | | | 2,084,298 | |
| TOTAL CHINA | | | | | | | 2,562,776 | |
| FRANCE — 0.4% | | | | | | | | |
| Materials — 0.4% | | | | | | | | |
| Eramet | | | 487 | | | | 33,588 | |
| | | | | | | | | |
| GERMANY — 0.3% | | | | | | | | |
| Industrials — 0.3% | | | | | | | | |
| SGL Carbon * | | | 3,606 | | | | 22,088 | |
| | | | | | | | | |
| INDONESIA — 1.3% | | | | | | | | |
| Materials — 1.3% | | | | | | | | |
| Nickel Industries | | | 124,125 | | | | 58,549 | |
| Vale Indonesia | | | 126,842 | | | | 39,526 | |
| | | | | | | | | |
| TOTAL INDONESIA | | | | | | | 98,075 | |
| JAPAN — 5.8% | | | | | | | | |
| Industrials — 0.3% | | | | | | | | |
| Nippon Carbon | | | 823 | | | | 23,993 | |
The accompanying notes are an integral part of the financial statements.
338
| Schedule of Investments | | October 31, 2023 |
| | | |
| | Global X Disruptive Materials ETF | |
| | | Shares | | | Value | |
| COMMON STOCK — continued | | | | | | | | |
| Materials — 5.5% | | | | | | | | |
| Nippon Denko | | | 12,944 | | | $ | 24,701 | |
| Sumitomo Metal Mining | | | 11,226 | | | | 312,515 | |
| Tokai Carbon | | | 10,911 | | | | 82,636 | |
| | | | | | | | 419,852 | |
| TOTAL JAPAN | | | | | | | 443,845 | |
| MEXICO — 4.2% | | | | | | | | |
| Materials — 4.2% | | | | | | | | |
| Southern Copper | | | 4,545 | | | | 322,241 | |
| | | | | | | | | |
| NETHERLANDS — 0.6% | | | | | | | | |
| Materials — 0.6% | | | | | | | | |
| AMG Critical Materials | | | 1,752 | | | | 45,519 | |
| | | | | | | | | |
| SOUTH AFRICA — 12.7% | | | | | | | | |
| Materials — 12.7% | | | | | | | | |
| African Rainbow Minerals | | | 5,560 | | | | 45,549 | |
| Anglo American | | | 12,435 | | | | 316,345 | |
| Anglo American Platinum | | | 3,166 | | | | 105,382 | |
| Impala Platinum Holdings | | | 49,375 | | | | 204,591 | |
| Northam Platinum Holdings | | | 17,258 | | | | 103,556 | |
| Sibanye Stillwater | | | 160,123 | | | | 204,137 | |
| | | | | | | | | |
| TOTAL SOUTH AFRICA | | | | | | | 979,560 | |
| SWEDEN — 4.2% | | | | | | | | |
| Materials — 4.2% | | | | | | | | |
| Boliden | | | 12,481 | | | | 319,212 | |
| | | | | | | | | |
| UNITED STATES — 11.9% | | | | | | | | |
| Industrials — 0.5% | | | | | | | | |
| GrafTech International | | | 11,758 | | | | 40,565 | |
| | | | | | | | | |
| Materials — 11.4% | | | | | | | | |
| Albemarle | | | 2,029 | | | | 257,237 | |
| Freeport-McMoRan | | | 9,150 | | | | 309,087 | |
| Livent * | | | 11,417 | | | | 166,574 | |
The accompanying notes are an integral part of the financial statements.
339
| Schedule of Investments | | October 31, 2023 |
| | | |
| | Global X Disruptive Materials ETF | |
| | | Shares | | | Value | |
| COMMON STOCK — continued | | | | | | | | |
| Materials — continued | | | | | | | | |
| MP Materials * | | | 8,754 | | | $ | 143,565 | |
| | | | | | | | 876,463 | |
| TOTAL UNITED STATES | | | | | | | 917,028 | |
| ZAMBIA — 2.1% | | | | | | | | |
| Materials — 2.1% | | | | | | | | |
| First Quantum Minerals | | | 14,087 | | | | 163,067 | |
| | | | | | | | | |
TOTAL COMMON STOCK
(Cost $10,169,834) | | | | | | | 7,674,298 | |
TOTAL INVESTMENTS — 99.9%
(Cost $10,169,834) | | | | | | $ | 7,674,298 | |
Percentages are based on Net Assets of $7,683,847.
| * | Non-income producing security. |
| (A) | Level 3 security in accordance with fair value hierarchy. |
The following is a summary of the level of inputs used as of October 31, 2023, in valuing the Fund’s investments carried at value:
| Investments in Securities | | Level 1 | | | Level 2 | | | Level 3(1) | | | Total | |
| Common Stock | | $ | 7,668,897 | | | $ | — | | | $ | 5,401 | | | $ | 7,674,298 | |
| Total Investments in Securities | | $ | 7,668,897 | | | $ | — | | | $ | 5,401 | | | $ | 7,674,298 | |
| (1) | A reconciliation of Level 3 investments and disclosures of significant unobservable inputs are presented when the Fund has a significant amount of Level 3 investments at the end of the period in relation to Net Assets. Management has concluded that Level 3 investments are not material in relation to Net Assets. |
Amounts designated as “—” are $0 or have been rounded to $0.
See “Glossary” for abbreviations.
The accompanying notes are an integral part of the financial statements.
340
| Schedule of Investments | | October 31, 2023 |
| | | |
| | Global X Dow 30® Covered Call ETF | |
Sector Weightings (Unaudited)†:

† Sector weightings percentages are based on the total market value of investments. Total investments do not include derivatives such as options, futures contracts, forward contracts, and swap contracts, if applicable.
| | | Shares | | | Value |
| COMMON STOCK(A) — 101.4% | | | | | | | | |
| UNITED STATES — 101.4% | | | | | | | | |
| Communication Services — 2.4% | | | | | | | | |
| Verizon Communications | | | 15,967 | | | $ | 560,921 | |
| Walt Disney * | | | 15,967 | | | | 1,302,747 | |
| | | | | | | | 1,863,668 | |
| Consumer Discretionary — 13.1% | | | | | | | | |
| Home Depot | | | 15,967 | | | | 4,545,645 | |
| McDonald’s | | | 15,967 | | | | 4,186,068 | |
| NIKE, Cl B | | | 15,967 | | | | 1,640,929 | |
| | | | | | | | 10,372,642 | |
| Consumer Staples — 7.9% | | | | | | | | |
| Coca-Cola | | | 15,967 | | | | 901,976 | |
| Procter & Gamble | | | 15,967 | | | | 2,395,529 | |
| Walgreens Boots Alliance | | | 15,967 | | | | 336,584 | |
| Walmart | | | 15,967 | | | | 2,609,168 | |
| | | | | | | | 6,243,257 | |
| Energy — 2.9% | | | | | | | | |
| Chevron | | | 15,967 | | | | 2,326,871 | |
The accompanying notes are an integral part of the financial statements.
341
| Schedule of Investments | | October 31, 2023 |
| | | |
| | Global X Dow 30® Covered Call ETF | |
| | | Shares | | | Value |
| COMMON STOCK — continued | | | | | | | | |
| Financials — 20.0% | | | | | | | | |
| American Express | | | 15,967 | | | $ | 2,331,661 | |
| Goldman Sachs Group | | | 15,967 | | | | 4,847,741 | |
| JPMorgan Chase | | | 15,967 | | | | 2,220,371 | |
| Travelers | | | 15,967 | | | | 2,673,514 | |
| Visa, Cl A | | | 15,967 | | | | 3,753,842 | |
| | | | | | | | 15,827,129 | |
| Health Care — 21.1% | | | | | | | | |
| Amgen | | | 15,967 | | | | 4,082,762 | |
| Johnson & Johnson | | | 15,967 | | | | 2,368,545 | |
| Merck | | | 15,967 | | | | 1,639,811 | |
| UnitedHealth Group | | | 15,967 | | | | 8,551,286 | |
| | | | | | | | 16,642,404 | |
| Industrials — 13.9% | | | | | | | | |
| 3M | | | 15,967 | | | | 1,452,199 | |
| Boeing * | | | 15,967 | | | | 2,982,955 | |
| Caterpillar | | | 15,967 | | | | 3,609,340 | |
| Honeywell International | | | 15,967 | | | | 2,926,112 | |
| | | | | | | | 10,970,606 | |
| Information Technology — 19.1% | | | | | | | | |
| Apple | | | 15,967 | | | | 2,726,685 | |
| Cisco Systems | | | 15,967 | | | | 832,360 | |
| Intel | | | 15,967 | | | | 582,795 | |
| International Business Machines | | | 15,967 | | | | 2,309,467 | |
| Microsoft | | | 15,967 | | | | 5,398,602 | |
| Salesforce * | | | 15,967 | | | | 3,206,653 | |
| | | | | | | | 15,056,562 | |
| Materials — 1.0% | | | | | | | | |
| Dow | | | 15,967 | | | | 771,845 | |
| | | | | | | | | |
| TOTAL UNITED STATES | | | | | | | 80,074,984 | |
TOTAL COMMON STOCK
(Cost $78,716,691) | | | | | | | 80,074,984 | |
TOTAL INVESTMENTS — 101.4%
(Cost $78,716,691) | | | | | | $ | 80,074,984 | |
The accompanying notes are an integral part of the financial statements.
342
| Schedule of Investments | | October 31, 2023 |
| | | |
| | Global X Dow 30® Covered Call ETF | |
| | | Value |
| WRITTEN OPTIONS— (1.5)% | | | | |
| (Premiums Received $(1,082,757)) | | $ | (1,217,055 | ) |
Percentages are based on Net Assets of $78,947,151.
A list of the exchange traded option contracts held by the Fund at October 31, 2023, is as follows:
| Description | | Number of
Contracts | | Notional
Amount | | Exercise
Price | | | Expiration
Date | | Value |
| WRITTEN OPTIONS — (1.5)% | | | | | | | | | | | | | | | | | | |
| Call Options | | | | | | | | | | | | | | | | | | |
| Dow Jones Industrial Average | | | (2,422 | ) | | $ | (80,054,366 | ) | | $ | 335 | | | 11/17/23 | | $ | (1,217,055 | ) |
| * | Non-income producing security. |
| (A) | All or a portion of these securities has been segregated as collateral for options contracts. The Fair Value of the securities pledged as collateral is $80,074,984. |
The following is a summary of the level of inputs used as of October 31, 2023, in valuing the Fund’s investments and other financial instruments carried at value:
| Investments in Securities | | Level 1 | | Level 2 | | | Level 3 | | | Total |
| Common Stock | | $ | 80,074,984 | | | $ | — | | | $ | — | | | $ | 80,074,984 | |
| Total Investments in Securities | | $ | 80,074,984 | | | $ | — | | | $ | — | | | $ | 80,074,984 | |
| | | | | | | | | | | |
| Other Financial Instruments | | Level 1 | | Level 2 | | | Level 3 | | | Total |
| Written Options | | $ | (1,217,055 | ) | | $ | — | | | $ | — | | | $ | (1,217,055 | ) |
| Total Other Financial Instruments | | $ | (1,217,055 | ) | | $ | — | | | $ | — | | | $ | (1,217,055 | ) |
Amounts designated as “—” are $0 or have been rounded to $0.
See “Glossary” for abbreviations.
The accompanying notes are an integral part of the financial statements.
343
| Schedule of Investments | | October 31, 2023 |
| | | |
| Global X Russell 2000 Covered Call & Growth ETF |
Sector Weightings (Unaudited)†:

† Sector weightings percentages are based on the total market value of investments. Total investments do not include derivatives such as options, futures contracts, forward contracts, and swap contracts, if applicable.
| | | Shares | | | Value | |
| EXCHANGE TRADED FUND(A) — 100.5% | | | | | | | | |
| Vanguard Russell 2000 ETF (B) | | | 124,940 | | | $ | 8,317,256 | |
TOTAL EXCHANGE TRADED FUND
(Cost $8,612,686) | | | | | | | 8,317,256 | |
TOTAL INVESTMENTS — 100.5%
(Cost $8,612,686) | | | | | | $ | 8,317,256 | |
| | | | | | | | | |
| WRITTEN OPTIONS— (0.6)% | | | | | | | | |
| (Premiums Received $(87,797)) | | | | | | $ | (47,300 | ) |
Percentages are based on Net Assets of $8,279,411.
A list of the exchange traded option contracts held by the Fund at October 31, 2023, is as follows:
| Description | | Number of
Contracts | | Notional
Amount | | Exercise
Price | | | Expiration
Date | | Value |
| WRITTEN OPTIONS — (0.6)% | | | | | | | | | | | | | | | | | | |
| Call Options | | | | | | | | | | | | | | | | | | |
| Cboe Mini-Russell 2000 Index | | | (10 | ) | | $ | (166,228 | ) | | $ | 170 | | | 11/17/23 | | $ | (1,580 | ) |
| Russell 2000 Index | | | (24 | ) | | | (3,989,477 | ) | | | 1,690 | | | 11/17/23 | | | (45,720 | ) |
| | | | | | | | | | | | | | | | | | | |
| Total Written Options | | | | | | $ | (4,155,705 | ) | | | | | | | | $ | (47,300 | ) |
| (A) | All or a portion of these securities has been segregated as collateral for options contracts. The Fair Value of the securities pledged as collateral is $3,673,199. |
| (B) | Affiliated investment. |
The accompanying notes are an integral part of the financial statements.
344
| Schedule of Investments | | October 31, 2023 |
| | | |
| Global X Russell 2000 Covered Call & Growth ETF |
The following is a summary of the level of inputs used as of October 31, 2023, in valuing the Fund’s investments and other financial instruments carried at value:
| Investments in Securities | | Level 1 | | Level 2 | | | Level 3 | | | Total |
| Exchange Traded Fund | | $ | 8,317,256 | | | $ | — | | | $ | — | | | $ | 8,317,256 | |
| Total Investments in Securities | | $ | 8,317,256 | | | $ | — | | | $ | — | | | $ | 8,317,256 | |
| | | | | | | | | | | |
| Other Financial Instruments | | Level 1 | | Level 2 | | | Level 3 | | | Total |
| Written Options | | $ | (47,300 | ) | | $ | — | | | $ | — | | | $ | (47,300 | ) |
| Total Other Financial Instruments | | $ | (47,300 | ) | | $ | — | | | $ | — | | | $ | (47,300 | ) |
The following is a summary of the transactions with affiliates for the period ended October 31, 2023:
Value at
10/31/22 | | Purchases at
Cost | | Proceeds from
Sales | | Changes in
Unrealized
Appreciation
(Depreciation) | | Realized Gain
(Loss) | | Value at
10/31/23 | | Income | | | Capital
Gains | |
| Vanguard Russell 2000 ETF | | | | | | | | | | | | | | |
| $2,769,770 | | $7,165,398 | | ($1,244,941) | | ($407,948) | | $34,977 | | $8,317,256 | | | $50,588 | | | $ | — | |
Amounts designated as “—” are $0 or have been rounded to $0.
See “Glossary” for abbreviations.
The accompanying notes are an integral part of the financial statements.
345
| Schedule of Investments | October 31, 2023 |
| Global X Financials Covered Call & Growth ETF |
Sector Weightings (Unaudited)†:

† Sector weightings percentages are based on the total market value of investments. Total investments do not include derivatives such as options, futures contracts, forward contracts, and swap contracts, if applicable.
| | | Shares | | | Value |
| EXCHANGE TRADED FUND(A)— 54.4% | | | | | | | | |
| Financial Select Sector SPDR Fund | | | 37,454 | | | $ | 1,212,012 | |
TOTAL EXCHANGE TRADED FUND
(Cost $1,318,492) | | | | | | | 1,212,012 | |
| | | | | | | | | |
| COMMON STOCK — 45.9% | | | | | | | | |
| UNITED STATES — 45.9% | | | | | | | | |
| Financials — 45.9% | | | | | | | | |
| Aflac | | | 124 | | | | 9,686 | |
| Allstate | | | 60 | | | | 7,688 | |
| American Express | | | 133 | | | | 19,422 | |
| American International Group | | | 163 | | | | 9,994 | |
| Ameriprise Financial | | | 23 | | | | 7,235 | |
| Aon, Cl A | | | 46 | | | | 14,232 | |
| Arch Capital Group * | | | 85 | | | | 7,368 | |
| Arthur J Gallagher | | | 49 | | | | 11,539 | |
| Assurant | | | 12 | | | | 1,787 | |
| Bank of America | | | 1,581 | | | | 41,644 | |
| Bank of New York Mellon | | | 178 | | | | 7,565 | |
| Berkshire Hathaway, Cl B * | | | 417 | | | | 142,335 | |
| BlackRock, Cl A | | | 32 | | | | 19,593 | |
| Blackstone | | | 161 | | | | 14,868 | |
| Brown & Brown | | | 53 | | | | 3,679 | |
| Capital One Financial | | | 88 | | | | 8,914 | |
| Cboe Global Markets | | | 24 | | | | 3,933 | |
| Charles Schwab | | | 341 | | | | 17,746 | |
| Chubb | | | 94 | | | | 20,174 | |
| Cincinnati Financial | | | 36 | | | | 3,588 | |
| Citigroup | | | 440 | | | | 17,376 | |
| Citizens Financial Group | | | 111 | | | | 2,601 | |
The accompanying notes are an integral part of the financial statements.
346
| Schedule of Investments | October 31, 2023 |
| Global X Financials Covered Call & Growth ETF |
| | | Shares | | | Value |
| COMMON STOCK — continued | | | | | | | | |
| Financials — continued | | | | | | | | |
| CME Group, Cl A | | | 82 | | | $ | 17,504 | |
| Comerica | | | 29 | | | | 1,143 | |
| Discover Financial Services | | | 57 | | | | 4,679 | |
| Everest Group | | | 10 | | | | 3,956 | |
| FactSet Research Systems | | | 9 | | | | 3,887 | |
| Fidelity National Information Services | | | 136 | | | | 6,679 | |
| Fifth Third Bancorp | | | 155 | | | | 3,675 | |
| Fiserv * | | | 139 | | | | 15,811 | |
| FleetCor Technologies * | | | 17 | | | | 3,828 | |
| Franklin Resources | | | 64 | | | | 1,459 | |
| Global Payments | | | 60 | | | | 6,373 | |
| Globe Life | | | 20 | | | | 2,327 | |
| Goldman Sachs Group | | | 75 | | | | 22,771 | |
| Hartford Financial Services Group | | | 72 | | | | 5,288 | |
| Huntington Bancshares | | | 325 | | | | 3,136 | |
| Intercontinental Exchange | | | 129 | | | | 13,860 | |
| Invesco | | | 102 | | | | 1,323 | |
| Jack Henry & Associates | | | 16 | | | | 2,256 | |
| JPMorgan Chase | | | 665 | | | | 92,475 | |
| KeyCorp | | | 207 | | | | 2,116 | |
| Loews | | | 43 | | | | 2,752 | |
| M&T Bank | | | 39 | | | | 4,397 | |
| MarketAxess Holdings | | | 9 | | | | 1,924 | |
| Marsh & McLennan | | | 113 | | | | 21,430 | |
| Mastercard, Cl A | | | 190 | | | | 71,506 | |
| MetLife | | | 144 | | | | 8,641 | |
| Moody’s | | | 36 | | | | 11,088 | |
| Morgan Stanley | | | 292 | | | | 20,679 | |
| MSCI, Cl A | | | 18 | | | | 8,488 | |
| Nasdaq | | | 77 | | | | 3,819 | |
| Northern Trust | | | 47 | | | | 3,098 | |
| PayPal Holdings * | | | 251 | | | | 13,002 | |
| PNC Financial Services Group | | | 91 | | | | 10,417 | |
| Principal Financial Group | | | 51 | | | | 3,452 | |
| Progressive | | | 134 | | | | 21,184 | |
| Prudential Financial | | | 84 | | | | 7,681 | |
| Raymond James Financial | | | 44 | | | | 4,199 | |
| Regions Financial | | | 211 | | | | 3,066 | |
| S&P Global | | | 74 | | | | 25,849 | |
The accompanying notes are an integral part of the financial statements.
347
| Schedule of Investments | October 31, 2023 |
| Global X Financials Covered Call & Growth ETF |
| | | Shares | | | Value |
| COMMON STOCK — continued | | | | | | | | |
| Financials — continued | | | | | | | | |
| State Street | | | 73 | | | $ | 4,718 | |
| Synchrony Financial | | | 98 | | | | 2,749 | |
| T Rowe Price Group | | | 51 | | | | 4,615 | |
| Travelers | | | 53 | | | | 8,874 | |
| Truist Financial | | | 306 | | | | 8,678 | |
| US Bancorp | | | 356 | | | | 11,349 | |
| Visa, Cl A | | | 367 | | | | 86,282 | |
| W R Berkley | | | 46 | | | | 3,101 | |
| Wells Fargo | | | 837 | | | | 33,287 | |
| Willis Towers Watson | | | 24 | | | | 5,661 | |
| Zions Bancorp | | | 34 | | | | 1,049 | |
| | | | | | | | | |
| TOTAL UNITED STATES | | | | | | | 1,024,548 | |
TOTAL COMMON STOCK
(Cost $1,080,907) | | | | | | | 1,024,548 | |
TOTAL INVESTMENTS — 100.3%
(Cost $2,399,399) | | | | | | $ | 2,236,560 | |
| | | | | | | | | |
WRITTEN OPTIONS— (0.4)%
(Premiums Received $(26,765)) | | | | | | $ | (8,281 | ) |
Percentages are based on Net Assets of $2,229,779.
A list of the exchange traded option contracts held by the Fund at October 31, 2023, is as follows:
| Description | | | Number of
Contracts | | | | Notional
Amount | | | | Exercise
Price | | | Expiration
Date | | | Value | |
| WRITTEN OPTIONS — (0.4)% | | | | | | | | | | | |
| Call Options | | | | | | | | | | | | | | | | | | |
| The Financial Select Sector SPDR® Fund | | | (345) | | | $ | (1,116,420) | | | $ | 33 | | | 11/17/23 | | $ | (8,281) | |
| * | Non-income producing security. |
| (A) | All or a portion of these securities has been segregated as collateral for options contracts. The Fair Value of the securities pledged as collateral is $1,116,420. |
The accompanying notes are an integral part of the financial statements.
348
| Schedule of Investments | October 31, 2023 |
| Global X Financials Covered Call & Growth ETF |
The following is a summary of the level of inputs used as of October 31, 2023, in valuing the Fund’s investments and other financial instruments carried at value:
| Investments in Securities | | Level 1 | | | Level 2 | | Level 3 | | | Total |
| Exchange Traded Fund | | $ | 1,212,012 | | | $ | — | | | $ | — | | | $ | 1,212,012 | |
| Common Stock | | | 1,024,548 | | | | — | | | | — | | | | 1,024,548 | |
| Total Investments in Securities | | $ | 2,236,560 | | | $ | — | | | $ | — | | | $ | 2,236,560 | |
| | | | | | | | | | | |
| Other Financial Instruments | | Level 1 | | | Level 2 | | Level 3 | | | Total |
| Written Options | | $ | — | | | $ | (8,281 | ) | | $ | — | | | $ | (8,281 | ) |
| Total Other Financial Instruments | | $ | — | | | $ | (8,281 | ) | | $ | — | | | $ | (8,281 | ) |
Amounts designated as “—” are $0 or have been rounded to $0.
See “Glossary” for abbreviations.
The accompanying notes are an integral part of the financial statements.
349
| Schedule of Investments | October 31, 2023 |
| Global X Health Care Covered Call & Growth ETF |
Sector Weightings (Unaudited)†:

† Sector weightings percentages are based on the total market value of investments. Total investments do not include derivatives such as options, futures contracts, forward contracts, and swap contracts, if applicable.
| | | Shares | | | Value |
| EXCHANGE TRADED FUND(A) — 55.0% | | | | | | | | |
| Health Care Select Sector SPDR Fund | | | 11,387 | | | $ | 1,418,137 | |
TOTAL EXCHANGE TRADED FUND
(Cost $1,530,663) | | | | | | | 1,418,137 | |
| | | | | | | | | |
| COMMON STOCK — 45.0% | | | | | | | | |
| UNITED STATES — 45.0% | | | | | | | | |
| Health Care — 45.0% | | | | | | | | |
| Abbott Laboratories | | | 435 | | | | 41,129 | |
| AbbVie | | | 442 | | | | 62,402 | |
| Agilent Technologies | | | 74 | | | | 7,649 | |
| Align Technology * | | | 18 | | | | 3,323 | |
| Amgen | | | 134 | | | | 34,264 | |
| Baxter International | | | 122 | | | | 3,957 | |
| Becton Dickinson | | | 73 | | | | 18,453 | |
| Biogen * | | | 36 | | | | 8,552 | |
| Bio-Rad Laboratories, Cl A * | | | 5 | | | | 1,377 | |
| Bio-Techne | | | 40 | | | | 2,185 | |
| Boston Scientific * | | | 365 | | | | 18,684 | |
| Bristol-Myers Squibb | | | 526 | | | | 27,105 | |
| Cardinal Health | | | 66 | | | | 6,006 | |
| Catalent * | | | 44 | | | | 1,513 | |
| Cencora | | | 42 | | | | 7,776 | |
| Centene * | | | 135 | | | | 9,312 | |
| Charles River Laboratories International * | | | 13 | | | | 2,189 | |
| Cigna Group | | | 75 | | | | 23,190 | |
| Cooper | | | 12 | | | | 3,741 | |
| CVS Health | | | 318 | | | | 21,945 | |
| Danaher | | | 165 | | | | 31,683 | |
| DaVita * | | | 11 | | | | 850 | |
The accompanying notes are an integral part of the financial statements.
350
| Schedule of Investments | October 31, 2023 |
| Global X Health Care Covered Call & Growth ETF |
| | | Shares | | | Value |
| COMMON STOCK — continued | | | | | | | | |
| Health Care — continued | | | | | | | | |
| DENTSPLY SIRONA | | | 55 | | | $ | 1,673 | |
| Dexcom * | | | 99 | | | | 8,794 | |
| Edwards Lifesciences * | | | 154 | | | | 9,813 | |
| Elevance Health | | | 59 | | | | 26,555 | |
| Eli Lilly | | | 201 | | | | 111,340 | |
| GE HealthCare Technologies | | | 97 | | | | 6,457 | |
| Gilead Sciences | | | 315 | | | | 24,740 | |
| HCA Healthcare | | | 51 | | | | 11,533 | |
| Henry Schein * | | | 33 | | | | 2,144 | |
| Hologic * | | | 61 | | | | 4,036 | |
| Humana | | | 31 | | | | 16,234 | |
| IDEXX Laboratories * | | | 21 | | | | 8,389 | |
| Illumina * | | | 40 | | | | 4,377 | |
| Incyte * | | | 44 | | | | 2,373 | |
| Insulet * | | | 18 | | | | 2,386 | |
| Intuitive Surgical * | | | 88 | | | | 23,075 | |
| IQVIA Holdings * | | | 47 | | | | 8,499 | |
| Johnson & Johnson | | | 607 | | | | 90,042 | |
| Laboratory Corp of America Holdings | | | 22 | | | | 4,394 | |
| McKesson | | | 34 | | | | 15,482 | |
| Medtronic | | | 330 | | | | 23,285 | |
| Merck | | | 637 | | | | 65,420 | |
| Mettler-Toledo International * | | | 5 | | | | 4,926 | |
| Moderna * | | | 84 | | | | 6,381 | |
| Molina Healthcare * | | | 15 | | | | 4,994 | |
| Pfizer | | | 1,414 | | | | 43,212 | |
| Quest Diagnostics | | | 29 | | | | 3,773 | |
| Regeneron Pharmaceuticals * | | | 27 | | | | 21,057 | |
| ResMed | | | 36 | | | | 5,084 | |
| Revvity | | | 33 | | | | 2,734 | |
| STERIS PLC | | | 25 | | | | 5,250 | |
| Stryker | | | 84 | | | | 22,699 | |
| Teleflex | | | 11 | | | | 2,032 | |
| Thermo Fisher Scientific | | | 97 | | | | 43,143 | |
| UnitedHealth Group | | | 233 | | | | 124,786 | |
| Universal Health Services, Cl B | | | 16 | | | | 2,014 | |
| Vertex Pharmaceuticals * | | | 65 | | | | 23,537 | |
| Viatris | | | 298 | | | | 2,652 | |
| Waters * | | | 15 | | | | 3,578 | |
The accompanying notes are an integral part of the financial statements.
351
| Schedule of Investments | October 31, 2023 |
| Global X Health Care Covered Call & Growth ETF |
| | | Shares | | | Value |
| COMMON STOCK — continued | | | | | | | | |
| Health Care — continued | | | | | | | | |
| West Pharmaceutical Services | | | 18 | | | $ | 5,729 | |
| Zimmer Biomet Holdings | | | 52 | | | | 5,429 | |
| Zoetis, Cl A | | | 116 | | | | 18,212 | |
| | | | | | | | | |
| TOTAL UNITED STATES | | | | | | | 1,159,548 | |
TOTAL COMMON STOCK
(Cost $1,260,380) | | | | | | | 1,159,548 | |
TOTAL INVESTMENTS — 100.0%
(Cost $2,791,043) | | | | | | $ | 2,577,685 | |
| | | | | | | | | |
WRITTEN OPTIONS— (0.1)%
(Premiums Received $(20,289)) | | | | | | $ | (2,061 | ) |
Percentages are based on Net Assets of $2,576,641.
A list of the exchange traded option contracts held by the Fund at October 31, 2023, is as follows:
| Description | | | Number of
Contracts | | | | Notional
Amount | | | | Exercise
Price | | | Expiration
Date | | | Value | |
| WRITTEN OPTIONS — (0.1)% | | | | | | | | | | | |
| Call Options | | | | | | | | | | | | | | | | | | |
| The Health Care Select Sector SPDR® Fund | | | (103) | | | $ | (1,282,762) | | | $ | 130 | | | 11/17/23 | | $ | (2,061) | |
| * | Non-income producing security. |
| (A) | All or a portion of these securities has been segregated as collateral for options contracts. The Fair Value of the securities pledged as collateral is $1,282,762. |
The accompanying notes are an integral part of the financial statements.
352
| Schedule of Investments | October 31, 2023 |
| Global X Health Care Covered Call & Growth ETF |
The following is a summary of the level of inputs used as of October 31, 2023, in valuing the Fund’s investments and other financial instruments carried at value:
| Investments in Securities | | Level 1 | | | Level 2 | | Level 3 | | | Total |
| Exchange Traded Fund | | $ | 1,418,137 | | | $ | — | | | $ | — | | | $ | 1,418,137 | |
| Common Stock | | | 1,159,548 | | | | — | | | | — | | | | 1,159,548 | |
| Total Investments in Securities | | $ | 2,577,685 | | | $ | — | | | $ | — | | | $ | 2,577,685 | |
| | | | | | | | | | | | | | | | | |
| Other Financial Instruments | | Level 1 | | | Level 2 | | Level 3 | | | Total |
| Written Options | | $ | — | | | $ | (2,061 | ) | | $ | — | | | $ | (2,061 | ) |
| Total Other Financial Instruments | | $ | — | | | $ | (2,061 | ) | | $ | — | | | $ | (2,061 | ) |
Amounts designated as “—” are $0 or have been rounded to $0.
See “Glossary” for abbreviations.
The accompanying notes are an integral part of the financial statements.
353
| Schedule of Investments | October 31, 2023 |
| Global X Information Technology Covered Call & Growth ETF |
Sector Weightings (Unaudited)†:

† Sector weightings percentages are based on the total market value of investments. Total investments do not include derivatives such as options, futures contracts, forward contracts, and swap contracts, if applicable.
| | | Shares | | | Value |
| EXCHANGE TRADED FUND(A) — 54.5% | | | | | | | | |
| Technology Select Sector SPDR Fund | | | 11,506 | | | $ | 1,887,099 | |
TOTAL EXCHANGE TRADED FUND
(Cost $1,587,034) | | | | | | | 1,887,099 | |
| | | | | | | | | |
| COMMON STOCK — 45.8% | | | | | | | | |
| CHINA — 0.2% | | | | | | | | |
| Information Technology — 0.2% | | | | | | | | |
| NXP Semiconductors | | | 51 | | | | 8,794 | |
| | | | | | | | | |
| UNITED STATES — 45.6% | | | | | | | | |
| Information Technology — 45.6% | | | | | | | | |
| Accenture, Cl A | | | 126 | | | | 37,433 | |
| Adobe * | | | 91 | | | | 48,417 | |
| Advanced Micro Devices * | | | 323 | | | | 31,816 | |
| Akamai Technologies * | | | 30 | | | | 3,100 | |
| Amphenol, Cl A | | | 119 | | | | 9,585 | |
| Analog Devices | | | 100 | | | | 15,733 | |
| ANSYS * | | | 17 | | | | 4,730 | |
| Apple | | | 2,157 | | | | 368,351 | |
| Applied Materials | | | 168 | | | | 22,235 | |
| Arista Networks * | | | 51 | | | | 10,219 | |
| Autodesk * | | | 43 | | | | 8,498 | |
| Broadcom | | | 82 | | | | 68,992 | |
| Cadence Design Systems * | | | 54 | | | | 12,952 | |
| CDW | | | 27 | | | | 5,411 | |
| Cisco Systems | | | 811 | | | | 42,277 | |
| Cognizant Technology Solutions, Cl A | | | 100 | | | | 6,447 | |
| Corning | | | 153 | | | | 4,094 | |
| Enphase Energy * | | | 28 | | | | 2,228 | |
| EPAM Systems * | | | 12 | | | | 2,611 | |
The accompanying notes are an integral part of the financial statements.
354
| Schedule of Investments | October 31, 2023 |
| Global X Information Technology Covered Call & Growth ETF |
| | | Shares | | | Value |
| COMMON STOCK — continued | | | | | | | | |
| Information Technology — continued | | | | | | | | |
| F5 * | | | 12 | | | $ | 1,819 | |
| Fair Isaac * | | | 5 | | | | 4,229 | |
| First Solar * | | | 21 | | | | 2,991 | |
| Fortinet * | | | 130 | | | | 7,432 | |
| Gartner * | | | 16 | | | | 5,313 | |
| Gen Digital | | | 118 | | | | 1,966 | |
| Hewlett Packard Enterprise | | | 257 | | | | 3,953 | |
| HP | | | 173 | | | | 4,555 | |
| Intel | | | 837 | | | | 30,551 | |
| International Business Machines | | | 182 | | | | 26,325 | |
| Intuit | | | 56 | | | | 27,717 | |
| Juniper Networks | | | 68 | | | | 1,831 | |
| Keysight Technologies * | | | 35 | | | | 4,272 | |
| KLA | | | 27 | | | | 12,682 | |
| Lam Research | | | 26 | | | | 15,294 | |
| Microchip Technology | | | 108 | | | | 7,699 | |
| Micron Technology | | | 219 | | | | 14,645 | |
| Microsoft | | | 1,150 | | | | 388,827 | |
| Monolithic Power Systems | | | 9 | | | | 3,976 | |
| Motorola Solutions | | | 33 | | | | 9,189 | |
| NetApp | | | 42 | | | | 3,057 | |
| NVIDIA | | | 165 | | | | 67,287 | |
| ON Semiconductor * | | | 88 | | | | 5,512 | |
| Oracle | | | 313 | | | | 32,364 | |
| Palo Alto Networks * | | | 61 | | | | 14,824 | |
| PTC * | | | 23 | | | | 3,230 | |
| Qorvo * | | | 19 | | | | 1,661 | |
| QUALCOMM | | | 223 | | | | 24,305 | |
| Roper Technologies | | | 21 | | | | 10,260 | |
| Salesforce * | | | 194 | | | | 38,961 | |
| Seagate Technology Holdings | | | 36 | | | | 2,457 | |
| ServiceNow * | | | 40 | | | | 23,274 | |
| Skyworks Solutions | | | 34 | | | | 2,949 | |
| SolarEdge Technologies * | | | 12 | | | | 911 | |
| Synopsys * | | | 30 | | | | 14,083 | |
| TE Connectivity | | | 62 | | | | 7,307 | |
| Teledyne Technologies * | | | 9 | | | | 3,371 | |
| Teradyne | | | 33 | | | | 2,748 | |
| Texas Instruments | | | 181 | | | | 25,704 | |
The accompanying notes are an integral part of the financial statements.
355
| Schedule of Investments | October 31, 2023 |
| Global X Information Technology Covered Call & Growth ETF |
| | | Shares | | | Value |
| COMMON STOCK — continued | | | | | | | | |
| Information Technology — continued | | | | | | | | |
| Trimble * | | | 51 | | | $ | 2,404 | |
| Tyler Technologies * | | | 8 | | | | 2,983 | |
| VeriSign * | | | 18 | | | | 3,594 | |
| Western Digital * | | | 67 | | | | 2,690 | |
| Zebra Technologies, Cl A * | | | 10 | | | | 2,094 | |
| | | | | | | | | |
| TOTAL UNITED STATES | | | | | | | 1,578,425 | |
TOTAL COMMON STOCK
(Cost $1,343,374) | | | | | | | 1,587,219 | |
TOTAL INVESTMENTS — 100.3%
(Cost $2,930,408) | | | | | | $ | 3,474,318 | |
| | | | | | | | | |
WRITTEN OPTIONS— (0.4)%
(Premiums Received $(42,292)) | | | | | | $ | (12,245 | ) |
Percentages are based on Net Assets of $3,463,401.
A list of the exchange traded option contracts held by the Fund at October 31, 2023, is as follows:
| Description | | Number of
Contracts | | | Notional
Amount | | | Exercise
Price | | | Expiration
Date | | Value | |
| WRITTEN OPTIONS — (0.4)% | | | | | | | | | | | | | | | | | | |
| Call Options | | | | | | | | | | | | | | | | | | |
| The Technology Select Sector SPDR® Fund | | | (106) | | | $ | (1,738,506) | | | $ | 169 | | | 11/17/23 | | $ | (12,245) | |
| * | Non-income producing security. |
| (A) | All or a portion of these securities has been segregated as collateral for options contracts. The Fair Value of the securities pledged as collateral is $1,738,506. |
The accompanying notes are an integral part of the financial statements.
356
| Schedule of Investments | October 31, 2023 |
| Global X Information Technology Covered Call & Growth ETF |
The following is a summary of the level of inputs used as of October 31, 2023, in valuing the Fund’s investments and other financial instruments carried at value:
| Investments in Securities | | Level 1 | | | Level 2 | | | Level 3 | | | Total | |
| Exchange Traded Fund | | $ | 1,887,099 | | | $ | — | | | $ | — | | | $ | 1,887,099 | |
| Common Stock | | | 1,587,219 | | | | — | | | | — | | | | 1,587,219 | |
| Total Investments in Securities | | $ | 3,474,318 | | | $ | — | | | $ | — | | | $ | 3,474,318 | |
| | | | | | | | | | | | | | | | | |
| Other Financial Instruments | | Level 1 | | | Level 2 | | | Level 3 | | | Total | |
| Written Options | | $ | — | | | $ | (12,245 | ) | | $ | — | | | $ | (12,245 | ) |
| Total Other Financial Instruments | | $ | — | | | $ | (12,245 | ) | | $ | — | | | $ | (12,245 | ) |
Amounts designated as “—” are $0 or have been rounded to $0.
See “Glossary” for abbreviations.
The accompanying notes are an integral part of the financial statements.
357
| Schedule of Investments | October 31, 2023 |
| Global X Nasdaq 100® ESG Covered Call ETF |
Sector Weightings (Unaudited)†:

† Sector weightings percentages are based on the total market value of investments. Total investments do not include derivatives such as options, futures contracts, forward contracts, and swap contracts, if applicable.
| | | Shares | | | Value |
| COMMON STOCK — 101.1% | | | | | | | | |
| BRAZIL — 0.5% | | | | | | | | |
| Consumer Discretionary — 0.5% | | | | | | | | |
| MercadoLibre *(A) | | | 10 | | | $ | 12,408 | |
| | | | | | | | | |
| CHINA — 0.8% | | | | | | | | |
| Consumer Discretionary — 0.4% | | | | | | | | |
| JD.com ADR (A) | | | 70 | | | | 1,780 | |
| PDD Holdings ADR *(A) | | | 79 | | | | 8,012 | |
| | | | | | | | 9,792 | |
| Information Technology — 0.4% | | | | | | | | |
| NXP Semiconductors (A) | | | 59 | | | | 10,173 | |
| | | | | | | | | |
| TOTAL CHINA | | | | | | | 19,965 | |
| NETHERLANDS — 0.7% | | | | | | | | |
| Information Technology — 0.7% | | | | | | | | |
| ASML Holding (A) | | | 30 | | | | 17,964 | |
The accompanying notes are an integral part of the financial statements.
358
| Schedule of Investments | October 31, 2023 |
| Global X Nasdaq 100® ESG Covered Call ETF |
| | | Shares | | | Value |
| COMMON STOCK — continued | | | | | | | | |
| UNITED KINGDOM — 0.3% | | | | | | | | |
| Health Care — 0.3% | | | | | | | | |
| AstraZeneca ADR (A) | | | 116 | | | $ | 7,335 | |
| | | | | | | | | |
| UNITED STATES — 98.8% | | | | | | | | |
| Communication Services — 12.3% | | | | | | | | |
| Alphabet, Cl A *(A) | | | 503 | | | | 62,412 | |
| Alphabet, Cl C *(A) | | | 492 | | | | 61,648 | |
| Charter Communications, Cl A *(A) | | | 26 | | | | 10,473 | |
| Comcast, Cl A (A) | | | 803 | | | | 33,156 | |
| Electronic Arts (A) | | | 82 | | | | 10,151 | |
| Meta Platforms, Cl A *(A) | | | 99 | | | | 29,826 | |
| Netflix *(A) | | | 121 | | | | 49,814 | |
| Sirius XM Holdings (A) | | | 1,050 | | | | 4,494 | |
| T-Mobile US *(A) | | | 206 | | | | 29,635 | |
| Trade Desk, Cl A * | | | 89 | | | | 6,315 | |
| Warner Bros Discovery * | | | 551 | | | | 5,477 | |
| | | | | | | | 303,401 | |
| Consumer Discretionary — 9.4% | | | | | | | | |
| Airbnb, Cl A *(A) | | | 83 | | | | 9,818 | |
| Amazon.com *(A) | | | 525 | | | | 69,872 | |
| Booking Holdings *(A) | | | 9 | | | | 25,106 | |
| eBay (A) | | | 135 | | | | 5,296 | |
| Lucid Group *(A) | | | 493 | | | | 2,031 | |
| Lululemon Athletica *(A) | | | 32 | | | | 12,591 | |
| Marriott International, Cl A (A) | | | 64 | | | | 12,068 | |
| O’Reilly Automotive *(A) | | | 19 | | | | 17,678 | |
| Ross Stores (A) | | | 83 | | | | 9,626 | |
| Starbucks (A) | | | 199 | | | | 18,356 | |
| Tesla *(A) | | | 252 | | | | 50,612 | |
| | | | | | | | 233,054 | |
| Consumer Staples — 6.3% | | | | | | | | |
| Costco Wholesale (A) | | | 84 | | | | 46,405 | |
| Dollar Tree *(A) | | | 61 | | | | 6,776 | |
| Keurig Dr Pepper (A) | | | 263 | | | | 7,977 | |
| Kraft Heinz (A) | | | 85 | | | | 2,674 | |
| Mondelez International, Cl A (A) | | | 277 | | | | 18,340 | |
| Monster Beverage *(A) | | | 128 | | | | 6,541 | |
The accompanying notes are an integral part of the financial statements.
359
| Schedule of Investments | October 31, 2023 |
| Global X Nasdaq 100® ESG Covered Call ETF |
| | | Shares | | | Value |
| COMMON STOCK — continued | | | | | | | | |
| Consumer Staples — continued | | | | | | | | |
| PepsiCo (A) | | | 388 | | | $ | 63,353 | |
| Walgreens Boots Alliance (A) | | | 225 | | | | 4,743 | |
| | | | | | | | 156,809 | |
| Financials — 0.6% | | | | | | | | |
| PayPal Holdings *(A) | | | 276 | | | | 14,297 | |
| | | | | | | | | |
| Health Care — 6.0% | | | | | | | | |
| Align Technology *(A) | | | 18 | | | | 3,323 | |
| Amgen (A) | | | 111 | | | | 28,383 | |
| Biogen *(A) | | | 29 | | | | 6,889 | |
| Dexcom *(A) | | | 69 | | | | 6,129 | |
| Gilead Sciences (A) | | | 247 | | | | 19,399 | |
| IDEXX Laboratories *(A) | | | 20 | | | | 7,989 | |
| Illumina *(A) | | | 51 | | | | 5,580 | |
| Intuitive Surgical *(A) | | | 75 | | | | 19,667 | |
| Moderna *(A) | | | 71 | | | | 5,393 | |
| Regeneron Pharmaceuticals *(A) | | | 27 | | | | 21,057 | |
| Seagen *(A) | | | 29 | | | | 6,171 | |
| Vertex Pharmaceuticals *(A) | | | 52 | | | | 18,830 | |
| | | | | | | | 148,810 | |
| Industrials — 4.2% | | | | | | | | |
| Automatic Data Processing (A) | | | 125 | | | | 27,277 | |
| Cintas (A) | | | 25 | | | | 12,678 | |
| Copart *(A) | | | 259 | | | | 11,272 | |
| CSX (A) | | | 414 | | | | 12,358 | |
| Fastenal (A) | | | 99 | | | | 5,775 | |
| Old Dominion Freight Line (A) | | | 29 | | | | 10,923 | |
| PACCAR (A) | | | 73 | | | | 6,025 | |
| Paychex (A) | | | 94 | | | | 10,439 | |
| Verisk Analytics, Cl A (A) | | | 34 | | | | 7,730 | |
| | | | | | | | 104,477 | |
| Information Technology — 59.4% | | | | | | | | |
| Adobe *(A) | | | 141 | | | | 75,020 | |
| Advanced Micro Devices *(A) | | | 459 | | | | 45,212 | |
| ANSYS *(A) | | | 24 | | | | 6,678 | |
| Apple (A) | | | 1,909 | | | | 326,000 | |
The accompanying notes are an integral part of the financial statements.
360
| Schedule of Investments | October 31, 2023 |
| Global X Nasdaq 100® ESG Covered Call ETF |
| | | Shares | | | Value |
| COMMON STOCK — continued | | | | | | | | |
| Information Technology — continued | | | | | | | | |
| Applied Materials (A) | | | 263 | | | $ | 34,808 | |
| Atlassian, Cl A *(A) | | | 33 | | | | 5,961 | |
| Autodesk *(A) | | | 57 | | | | 11,265 | |
| Broadcom (A) | | | 95 | | | | 79,930 | |
| Cadence Design Systems *(A) | | | 88 | | | | 21,107 | |
| Cisco Systems (A) | | | 1,299 | | | | 67,717 | |
| Cognizant Technology Solutions, Cl A (A) | | | 143 | | | | 9,219 | |
| Crowdstrike Holdings, Cl A *(A) | | | 42 | | | | 7,424 | |
| Datadog, Cl A *(A) | | | 79 | | | | 6,436 | |
| Enphase Energy *(A) | | | 29 | | | | 2,308 | |
| Fortinet *(A) | | | 185 | | | | 10,576 | |
| GLOBALFOUNDRIES *(A) | | | 149 | | | | 7,393 | |
| Intel (A) | | | 1,021 | | | | 37,267 | |
| Intuit (A) | | | 76 | | | | 37,616 | |
| KLA (A) | | | 36 | | | | 16,909 | |
| Lam Research (A) | | | 40 | | | | 23,529 | |
| Marvell Technology (A) | | | 218 | | | | 10,294 | |
| Microchip Technology (A) | | | 50 | | | | 3,565 | |
| Micron Technology (A) | | | 270 | | | | 18,055 | |
| Microsoft (A) | | | 983 | | | | 332,362 | |
| NVIDIA (A) | | | 349 | | | | 142,322 | |
| ON Semiconductor *(A) | | | 84 | | | | 5,262 | |
| Palo Alto Networks *(A) | | | 92 | | | | 22,358 | |
| QUALCOMM (A) | | | 320 | | | | 34,877 | |
| Synopsys *(A) | | | 46 | | | | 21,594 | |
| Texas Instruments (A) | | | 204 | | | | 28,970 | |
| Workday, Cl A *(A) | | | 53 | | | | 11,221 | |
| Zoom Video Communications, Cl A *(A) | | | 60 | | | | 3,599 | |
| Zscaler *(A) | | | 30 | | | | 4,761 | |
| | | | | | | | 1,471,615 | |
| Real Estate — 0.3% | | | | | | | | |
| CoStar Group *(A) | | | 82 | | | | 6,020 | |
The accompanying notes are an integral part of the financial statements.
361
| Schedule of Investments | October 31, 2023 |
| Global X Nasdaq 100® ESG Covered Call ETF |
| | | Shares | | | Value |
| COMMON STOCK — continued | | | | | | | | |
| Utilities — 0.3% | | | | | | | | |
| Exelon (A) | | | 193 | | | $ | 7,515 | |
| | | | | | | | | |
| TOTAL UNITED STATES | | | | | | | 2,445,998 | |
TOTAL COMMON STOCK
(Cost $2,384,383) | | | | | | | 2,503,670 | |
TOTAL INVESTMENTS — 101.1%
(Cost $2,384,383) | | | | | | $ | 2,503,670 | |
| | | | | | | | | |
WRITTEN OPTIONS— (1.2)%
(Premiums Received $(62,878)) | | | | | | $ | (30,175 | ) |
Percentages are based on Net Assets of $2,477,498.
A list of the exchange traded option contracts held by the Fund at October 31, 2023, is as follows:
| Description | | Number of
Contracts | | Notional
Amount | | Exercise
Price | | Expiration
Date | Value |
| WRITTEN OPTIONS — (1.2)% | | | | | | | | | | | | | | | | | | |
| Call Options | | | | | | | | | | | | | | | | | | |
| Nasdaq-100 | | | (1 | ) | | $ | (1,440,978 | ) | | $ | 14,600 | | | 11/17/23 | | $ | (18,640 | ) |
| Nasdaq-100® Reduced-Value Index | | | (3 | ) | | | (864,588 | ) | | | 2,920 | | | 11/17/23 | | | (11,535 | ) |
| | | | | | | | | | | | | | | | | | | |
| Total Written Options | | | | | | $ | (2,305,566 | ) | | | | | | | | $ | (30,175 | ) |
| * | Non-income producing security. |
| (A) | All or a portion of these securities has been segregated as collateral for options contracts. The Fair Value of the securities pledged as collateral is $2,344,615. |
The accompanying notes are an integral part of the financial statements.
362
| Schedule of Investments | October 31, 2023 |
| Global X Nasdaq 100® ESG Covered Call ETF |
The following is a summary of the level of inputs used as of October 31, 2023, in valuing the Fund’s investments and other financial instruments carried at value:
| Investments in Securities | | Level 1 | | Level 2 | | | Level 3 | | | Total |
| Common Stock | | $ | 2,503,670 | | | $ | — | | | $ | — | | | $ | 2,503,670 | |
| Total Investments in Securities | | $ | 2,503,670 | | | $ | — | | | $ | — | | | $ | 2,503,670 | |
| | | | | | | | | |
| Other Financial Instruments | | Level 1 | | Level 2 | | | Level 3 | | | Total |
| Written Options | | $ | (30,175 | ) | | $ | — | | | $ | — | | | $ | (30,175 | ) |
| Total Other Financial Instruments | | $ | (30,175 | ) | | $ | — | | | $ | — | | | $ | (30,175 | ) |
Amounts designated as “—” are $0 or have been rounded to $0.
See “Glossary” for abbreviations.
The accompanying notes are an integral part of the financial statements.
363
| Schedule of Investments | October 31, 2023 |
| Global X S&P 500® ESG Covered Call ETF |
Sector Weightings (Unaudited)†:

† Sector weightings percentages are based on the total market value of investments. Total investments do not include derivatives such as options, futures contracts, forward contracts, and swap contracts, if applicable.
| | | Shares | | | Value |
| COMMON STOCK(A) — 100.4% | | | | | | | | |
| CHINA — 0.2% | | | | | | | | |
| Information Technology — 0.2% | | | | | | | | |
| NXP Semiconductors | | | 24 | | | $ | 4,138 | |
| | | | | | | | | |
| UNITED STATES — 100.2% | | | | | | | | |
| Communication Services — 8.7% | | | | | | | | |
| Alphabet, Cl A * | | | 537 | | | | 66,631 | |
| Alphabet, Cl C * | | | 457 | | | | 57,262 | |
| AT&T | | | 636 | | | | 9,794 | |
| Charter Communications, Cl A * | | | 9 | | | | 3,625 | |
| Comcast, Cl A | | | 368 | | | | 15,195 | |
| Electronic Arts | | | 22 | | | | 2,723 | |
| Fox, Cl A | | | 26 | | | | 790 | |
| Fox, Cl B | | | 10 | | | | 279 | |
| Interpublic Group | | | 40 | | | | 1,136 | |
| Match Group * | | | 25 | | | | 865 | |
| Netflix * | | | 40 | | | | 16,468 | |
| News, Cl A | | | 32 | | | | 662 | |
| News, Cl B | | | 6 | | | | 129 | |
| Omnicom Group | | | 20 | | | | 1,498 | |
| Paramount Global, Cl B | | | 45 | | | | 490 | |
The accompanying notes are an integral part of the financial statements.
364
| Schedule of Investments | October 31, 2023 |
| Global X S&P 500® ESG Covered Call ETF |
| | | Shares | | | Value |
| COMMON STOCK — continued | | | | | | | | |
| Communication Services — continued | | | | | | | | |
| Verizon Communications | | | 377 | | | $ | 13,244 | |
| Walt Disney | | | 164 | | | | 13,381 | |
| Warner Bros Discovery * | | | 208 | | | | 2,067 | |
| | | | | | | | 206,239 | |
| Consumer Discretionary — 11.8% | | | | | | | | |
| Amazon.com * | | | 822 | | | | 109,400 | |
| Aptiv * | | | 25 | | | | 2,180 | |
| Best Buy | | | 16 | | | | 1,069 | |
| BorgWarner | | | 20 | | | | 738 | |
| Caesars Entertainment * | | | 20 | | | | 798 | |
| Darden Restaurants | | | 10 | | | | 1,455 | |
| eBay | | | 48 | | | | 1,883 | |
| Etsy * | | | 13 | | | | 810 | |
| Ford Motor | | | 347 | | | | 3,383 | |
| General Motors | | | 127 | | | | 3,581 | |
| Hasbro | | | 10 | | | | 452 | |
| Hilton Worldwide Holdings | | | 24 | | | | 3,637 | |
| Home Depot | | | 91 | | | | 25,907 | |
| Las Vegas Sands | | | 30 | | | | 1,424 | |
| Lowe’s | | | 53 | | | | 10,100 | |
| Marriott International, Cl A | | | 22 | | | | 4,148 | |
| McDonald’s | | | 66 | | | | 17,303 | |
| MGM Resorts International | | | 23 | | | | 803 | |
| Mohawk Industries * | | | 6 | | | | 482 | |
| NIKE, Cl B | | | 110 | | | | 11,305 | |
| Norwegian Cruise Line Holdings * | | | 34 | | | | 462 | |
| PulteGroup | | | 20 | | | | 1,472 | |
| Ralph Lauren, Cl A | | | 5 | | | | 563 | |
| Royal Caribbean Cruises * | | | 20 | | | | 1,695 | |
| Starbucks | | | 102 | | | | 9,408 | |
| Tapestry | | | 20 | | | | 551 | |
| Tesla * | | | 250 | | | | 50,210 | |
| TJX | | | 102 | | | | 8,983 | |
| Tractor Supply | | | 10 | | | | 1,926 | |
| VF | | | 30 | | | | 442 | |
| Whirlpool | | | 6 | | | | 627 | |
| Yum! Brands | | | 24 | | | | 2,901 | |
| | | | | | | | 280,098 | |
The accompanying notes are an integral part of the financial statements.
365
| Schedule of Investments | October 31, 2023 |
| Global X S&P 500® ESG Covered Call ETF |
| | | Shares | | | Value |
| COMMON STOCK — continued | | | | | | | | |
| Consumer Staples — 6.5% | | | | | | | | |
| Archer-Daniels-Midland | | | 49 | | | $ | 3,507 | |
| Brown-Forman, Cl B | | | 15 | | | | 842 | |
| Campbell Soup | | | 20 | | | | 808 | |
| Coca-Cola | | | 352 | | | | 19,885 | |
| Colgate-Palmolive | | | 75 | | | | 5,634 | |
| Conagra Brands | | | 40 | | | | 1,094 | |
| Constellation Brands, Cl A | | | 15 | | | | 3,512 | |
| Dollar General | | | 21 | | | | 2,500 | |
| Dollar Tree * | | | 20 | | | | 2,222 | |
| Estee Lauder, Cl A | | | 20 | | | | 2,577 | |
| General Mills | | | 56 | | | | 3,654 | |
| Hershey | | | 14 | | | | 2,623 | |
| Hormel Foods | | | 30 | | | | 977 | |
| J M Smucker | | | 10 | | | | 1,138 | |
| Kellanova | | | 26 | | | | 1,312 | |
| Keurig Dr Pepper | | | 91 | | | | 2,760 | |
| Kraft Heinz | | | 69 | | | | 2,171 | |
| Kroger | | | 60 | | | | 2,722 | |
| McCormick | | | 25 | | | | 1,598 | |
| Molson Coors Beverage, Cl B | | | 20 | | | | 1,155 | |
| Mondelez International, Cl A | | | 121 | | | | 8,012 | |
| PepsiCo | | | 125 | | | | 20,410 | |
| Procter & Gamble | | | 213 | | | | 31,956 | |
| Sysco | | | 46 | | | | 3,059 | |
| Target | | | 41 | | | | 4,542 | |
| Tyson Foods, Cl A | | | 24 | | | | 1,112 | |
| Walgreens Boots Alliance | | | 70 | | | | 1,476 | |
| Walmart | | | 129 | | | | 21,080 | |
| | | | | | | | 154,338 | |
| Energy — 4.0% | | | | | | | | |
| APA | | | 30 | | | | 1,192 | |
| Baker Hughes, Cl A | | | 91 | | | | 3,132 | |
| Chevron | | | 160 | | | | 23,317 | |
| ConocoPhillips | | | 108 | | | | 12,830 | |
| Devon Energy | | | 58 | | | | 2,701 | |
| EOG Resources | | | 53 | | | | 6,691 | |
| EQT | | | 33 | | | | 1,399 | |
| Halliburton | | | 79 | | | | 3,108 | |
The accompanying notes are an integral part of the financial statements.
366
| Schedule of Investments | October 31, 2023 |
| Global X S&P 500® ESG Covered Call ETF |
| | | Shares | | | Value |
| COMMON STOCK — continued | | | | | | | | |
| Energy — continued | | | | | | | | |
| Hess | | | 25 | | | $ | 3,610 | |
| Kinder Morgan | | | 165 | | | | 2,673 | |
| Marathon Oil | | | 58 | | | | 1,584 | |
| Marathon Petroleum | | | 37 | | | | 5,596 | |
| ONEOK | | | 52 | | | | 3,390 | |
| Phillips 66 | | | 39 | | | | 4,449 | |
| Pioneer Natural Resources | | | 22 | | | | 5,258 | |
| Schlumberger | | | 128 | | | | 7,125 | |
| Valero Energy | | | 33 | | | | 4,191 | |
| Williams | | | 110 | | | | 3,784 | |
| | | | | | | | 96,030 | |
| Financials — 12.2% | | | | | | | | |
| Aflac | | | 50 | | | | 3,905 | |
| Allstate | | | 24 | | | | 3,075 | |
| American Express | | | 53 | | | | 7,740 | |
| American International Group | | | 67 | | | | 4,108 | |
| Ameriprise Financial | | | 9 | | | | 2,831 | |
| Arch Capital Group * | | | 35 | | | | 3,034 | |
| Arthur J Gallagher | | | 19 | | | | 4,474 | |
| Assurant | | | 6 | | | | 893 | |
| Bank of America | | | 626 | | | | 16,489 | |
| Bank of New York Mellon | | | 68 | | | | 2,890 | |
| BlackRock, Cl A | | | 13 | | | | 7,960 | |
| Capital One Financial | | | 35 | | | | 3,545 | |
| Cboe Global Markets | | | 10 | | | | 1,639 | |
| Charles Schwab | | | 136 | | | | 7,077 | |
| Chubb | | | 37 | | | | 7,941 | |
| Citigroup | | | 171 | | | | 6,753 | |
| CME Group, Cl A | | | 32 | | | | 6,831 | |
| Discover Financial Services | | | 23 | | | | 1,888 | |
| Everest Group | | | 4 | | | | 1,582 | |
| FactSet Research Systems | | | 3 | | | | 1,296 | |
| Fidelity National Information Services | | | 56 | | | | 2,750 | |
| Fifth Third Bancorp | | | 58 | | | | 1,375 | |
| Franklin Resources | | | 30 | | | | 684 | |
| Globe Life | | | 8 | | | | 931 | |
| Goldman Sachs Group | | | 30 | | | | 9,108 | |
| Hartford Financial Services Group | | | 26 | | | | 1,910 | |
The accompanying notes are an integral part of the financial statements.
367
| Schedule of Investments | October 31, 2023 |
| Global X S&P 500® ESG Covered Call ETF |
| | | Shares | | | Value |
| COMMON STOCK — continued | | | | | | | | |
| Financials — continued | | | | | | | | |
| Intercontinental Exchange | | | 51 | | | $ | 5,479 | |
| Invesco | | | 50 | | | | 648 | |
| JPMorgan Chase | | | 263 | | | | 36,573 | |
| M&T Bank | | | 16 | | | | 1,804 | |
| MarketAxess Holdings | | | 3 | | | | 641 | |
| Mastercard, Cl A | | | 75 | | | | 28,226 | |
| MetLife | | | 59 | | | | 3,541 | |
| Moody’s | | | 14 | | | | 4,312 | |
| Morgan Stanley | | | 116 | | | | 8,215 | |
| MSCI, Cl A | | | 7 | | | | 3,301 | |
| Nasdaq | | | 28 | | | | 1,389 | |
| Northern Trust | | | 20 | | | | 1,318 | |
| PayPal Holdings * | | | 97 | | | | 5,025 | |
| PNC Financial Services Group | | | 36 | | | | 4,121 | |
| Principal Financial Group | | | 19 | | | | 1,286 | |
| Progressive | | | 52 | | | | 8,221 | |
| Prudential Financial | | | 31 | | | | 2,835 | |
| Raymond James Financial | | | 15 | | | | 1,432 | |
| Regions Financial | | | 76 | | | | 1,104 | |
| S&P Global | | | 29 | | | | 10,130 | |
| State Street | | | 27 | | | | 1,745 | |
| Synchrony Financial | | | 39 | | | | 1,094 | |
| T Rowe Price Group | | | 21 | | | | 1,900 | |
| Travelers | | | 20 | | | | 3,349 | |
| Truist Financial | | | 119 | | | | 3,375 | |
| Visa, Cl A | | | 145 | | | | 34,089 | |
| W R Berkley | | | 20 | | | | 1,348 | |
| Willis Towers Watson | | | 10 | | | | 2,359 | |
| | | | | | | | 291,569 | |
| Health Care — 13.6% | | | | | | | | |
| Abbott Laboratories | | | 157 | | | | 14,844 | |
| AbbVie | | | 160 | | | | 22,589 | |
| Agilent Technologies | | | 27 | | | | 2,791 | |
| Amgen | | | 48 | | | | 12,274 | |
| Baxter International | | | 50 | | | | 1,621 | |
| Becton Dickinson | | | 26 | | | | 6,572 | |
| Biogen * | | | 13 | | | | 3,088 | |
| Bio-Rad Laboratories, Cl A * | | | 2 | | | | 551 | |
The accompanying notes are an integral part of the financial statements.
368
| Schedule of Investments | October 31, 2023 |
| Global X S&P 500® ESG Covered Call ETF |
| | | Shares | | | Value |
| COMMON STOCK — continued | | | | | | | | |
| Health Care — continued | | | | | | | | |
| Boston Scientific * | | | 130 | | | $ | 6,655 | |
| Bristol-Myers Squibb | | | 188 | | | | 9,688 | |
| Cardinal Health | | | 23 | | | | 2,093 | |
| Cencora | | | 15 | | | | 2,777 | |
| Centene * | | | 49 | | | | 3,380 | |
| Cigna Group | | | 27 | | | | 8,348 | |
| CVS Health | | | 116 | | | | 8,005 | |
| DaVita * | | | 5 | | | | 386 | |
| Edwards Lifesciences * | | | 57 | | | | 3,632 | |
| Elevance Health | | | 21 | | | | 9,452 | |
| Eli Lilly | | | 72 | | | | 39,883 | |
| Gilead Sciences | | | 114 | | | | 8,954 | |
| Henry Schein * | | | 11 | | | | 715 | |
| Hologic * | | | 21 | | | | 1,390 | |
| Humana | | | 11 | | | | 5,761 | |
| IDEXX Laboratories * | | | 7 | | | | 2,796 | |
| Illumina * | | | 13 | | | | 1,422 | |
| Laboratory Corp of America Holdings | | | 8 | | | | 1,598 | |
| Medtronic | | | 118 | | | | 8,326 | |
| Merck | | | 230 | | | | 23,621 | |
| Mettler-Toledo International * | | | 2 | | | | 1,970 | |
| Moderna * | | | 28 | | | | 2,127 | |
| Pfizer | | | 511 | | | | 15,616 | |
| Quest Diagnostics | | | 10 | | | | 1,301 | |
| Regeneron Pharmaceuticals * | | | 10 | | | | 7,799 | |
| Teleflex | | | 4 | | | | 739 | |
| Thermo Fisher Scientific | | | 35 | | | | 15,567 | |
| UnitedHealth Group | | | 84 | | | | 44,987 | |
| Vertex Pharmaceuticals * | | | 23 | | | | 8,329 | |
| Viatris | | | 120 | | | | 1,068 | |
| Waters * | | | 6 | | | | 1,431 | |
| Zimmer Biomet Holdings | | | 20 | | | | 2,088 | |
| Zoetis, Cl A | | | 42 | | | | 6,594 | |
| | | | | | | | 322,828 | |
| Industrials — 6.6% | | | | | | | | |
| Alaska Air Group * | | | 10 | | | | 316 | |
| American Airlines Group * | | | 70 | | | | 780 | |
| Automatic Data Processing | | | 37 | | | | 8,074 | |
The accompanying notes are an integral part of the financial statements.
369
| Schedule of Investments | October 31, 2023 |
| Global X S&P 500® ESG Covered Call ETF |
| | | Shares | | | Value |
| COMMON STOCK — continued | | | | | | | | |
| Industrials — continued | | | | | | | | |
| Broadridge Financial Solutions | | | 11 | | | $ | 1,877 | |
| Carrier Global | | | 76 | | | | 3,622 | |
| Caterpillar | | | 46 | | | | 10,398 | |
| CH Robinson Worldwide | | | 11 | | | | 900 | |
| Cintas | | | 8 | | | | 4,057 | |
| CSX | | | 178 | | | | 5,313 | |
| Cummins | | | 13 | | | | 2,812 | |
| Deere | | | 25 | | | | 9,134 | |
| Dover | | | 13 | | | | 1,689 | |
| Eaton | | | 35 | | | | 7,277 | |
| Emerson Electric | | | 50 | | | | 4,449 | |
| Expeditors International of Washington | | | 13 | | | | 1,420 | |
| Fortive | | | 31 | | | | 2,024 | |
| Generac Holdings * | | | 6 | | | | 504 | |
| General Electric | | | 97 | | | | 10,537 | |
| IDEX | | | 6 | | | | 1,148 | |
| Illinois Tool Works | | | 25 | | | | 5,603 | |
| Ingersoll Rand | | | 35 | | | | 2,124 | |
| JB Hunt Transport Services | | | 8 | | | | 1,375 | |
| Johnson Controls International | | | 62 | | | | 3,039 | |
| Nordson | | | 5 | | | | 1,063 | |
| Norfolk Southern | | | 20 | | | | 3,816 | |
| Otis Worldwide | | | 39 | | | | 3,011 | |
| PACCAR | | | 47 | | | | 3,879 | |
| Parker-Hannifin | | | 12 | | | | 4,427 | |
| Paychex | | | 30 | | | | 3,332 | |
| Pentair | | | 16 | | | | 930 | |
| Quanta Services | | | 13 | | | | 2,173 | |
| Republic Services, Cl A | | | 18 | | | | 2,673 | |
| Robert Half | | | 10 | | | | 748 | |
| Rockwell Automation | | | 11 | | | | 2,891 | |
| Stanley Black & Decker | | | 15 | | | | 1,276 | |
| Trane Technologies | | | 20 | | | | 3,806 | |
| Union Pacific | | | 55 | | | | 11,419 | |
| United Parcel Service, Cl B | | | 65 | | | | 9,181 | |
| United Rentals | | | 6 | | | | 2,438 | |
| Verisk Analytics, Cl A | | | 14 | | | | 3,183 | |
| Waste Management | | | 34 | | | | 5,587 | |
| Westinghouse Air Brake Technologies | | | 15 | | | | 1,590 | |
The accompanying notes are an integral part of the financial statements.
370
| Schedule of Investments | October 31, 2023 |
| Global X S&P 500® ESG Covered Call ETF |
| | | Shares | | | Value |
| COMMON STOCK — continued | | | | | | | | |
| Industrials — continued | | | | | | | | |
| Xylem | | | 20 | | | $ | 1,871 | |
| | | | | | | | 157,766 | |
| Information Technology — 30.8% | | | | | | | | |
| Adobe * | | | 41 | | | | 21,814 | |
| Advanced Micro Devices * | | | 145 | | | | 14,282 | |
| Apple | | | 1,330 | | | | 227,124 | |
| Applied Materials | | | 75 | | | | 9,926 | |
| Arista Networks * | | | 24 | | | | 4,809 | |
| Autodesk * | | | 19 | | | | 3,755 | |
| Cisco Systems | | | 369 | | | | 19,236 | |
| Corning | | | 71 | | | | 1,900 | |
| F5 * | | | 5 | | | | 758 | |
| Fortinet * | | | 62 | | | | 3,544 | |
| Gen Digital | | | 60 | | | | 1,000 | |
| Hewlett Packard Enterprise | | | 111 | | | | 1,707 | |
| HP | | | 75 | | | | 1,975 | |
| Intel | | | 374 | | | | 13,651 | |
| Intuit | | | 25 | | | | 12,374 | |
| Juniper Networks | | | 30 | | | | 808 | |
| Keysight Technologies * | | | 15 | | | | 1,831 | |
| KLA | | | 12 | | | | 5,636 | |
| Lam Research | | | 12 | | | | 7,059 | |
| Micron Technology | | | 100 | | | | 6,687 | |
| Microsoft | | | 672 | | | | 227,210 | |
| Motorola Solutions | | | 15 | | | | 4,177 | |
| NVIDIA | | | 223 | | | | 90,939 | |
| ON Semiconductor * | | | 41 | | | | 2,568 | |
| QUALCOMM | | | 100 | | | | 10,899 | |
| Salesforce * | | | 88 | | | | 17,673 | |
| Seagate Technology Holdings | | | 20 | | | | 1,365 | |
| SolarEdge Technologies * | | | 5 | | | | 380 | |
| TE Connectivity | | | 28 | | | | 3,300 | |
| Texas Instruments | | | 82 | | | | 11,645 | |
| Tyler Technologies * | | | 4 | | | | 1,492 | |
| Zebra Technologies, Cl A * | | | 5 | | | | 1,047 | |
| | | | | | | | 732,571 | |
The accompanying notes are an integral part of the financial statements.
371
| Schedule of Investments | October 31, 2023 |
| Global X S&P 500® ESG Covered Call ETF |
| | | Shares | | | Value |
| COMMON STOCK — continued | | | | | | | | |
| Materials — 2.3% | | | | | | | | |
| Air Products & Chemicals | | | 20 | | | $ | 5,649 | |
| Albemarle | | | 10 | | | | 1,268 | |
| Amcor | | | 150 | | | | 1,333 | |
| Ball | | | 30 | | | | 1,444 | |
| CF Industries Holdings | | | 16 | | | | 1,276 | |
| Corteva | | | 64 | | | | 3,081 | |
| Dow | | | 62 | | | | 2,997 | |
| Ecolab | | | 24 | | | | 4,026 | |
| FMC | | | 13 | | | | 692 | |
| Freeport-McMoRan | | | 131 | | | | 4,425 | |
| International Flavors & Fragrances | | | 22 | | | | 1,504 | |
| International Paper | | | 27 | | | | 911 | |
| Linde | | | 44 | | | | 16,815 | |
| LyondellBasell Industries, Cl A | | | 22 | | | | 1,985 | |
| Mosaic | | | 30 | | | | 974 | |
| Newmont | | | 72 | | | | 2,698 | |
| PPG Industries | | | 22 | | | | 2,701 | |
| Westrock | | | 21 | | | | 755 | |
| | | | | | | | 54,534 | |
| Real Estate — 2.3% | | | | | | | | |
| Alexandria Real Estate Equities ‡ | | | 13 | | | | 1,211 | |
| American Tower ‡ | | | 41 | | | | 7,306 | |
| AvalonBay Communities ‡ | | | 13 | | | | 2,155 | |
| Boston Properties ‡ | | | 10 | | | | 536 | |
| CBRE Group, Cl A * | | | 30 | | | | 2,080 | |
| Digital Realty Trust ‡ | | | 27 | | | | 3,358 | |
| Equinix ‡ | | | 8 | | | | 5,837 | |
| Equity Residential ‡ | | | 29 | | | | 1,605 | |
| Essex Property Trust ‡ | | | 6 | | | | 1,283 | |
| Extra Space Storage ‡ | | | 19 | | | | 1,968 | |
| Federal Realty Investment Trust ‡ | | | 7 | | | | 638 | |
| Healthpeak Properties ‡ | | | 45 | | | | 700 | |
| Host Hotels & Resorts ‡ | | | 70 | | | | 1,084 | |
| Iron Mountain ‡ | | | 25 | | | | 1,477 | |
| Kimco Realty ‡ | | | 60 | | | | 1,076 | |
| ProLogis ‡ | | | 84 | | | | 8,463 | |
| Regency Centers ‡ | | | 15 | | | | 904 | |
| SBA Communications, Cl A ‡ | | | 10 | | | | 2,086 | |
The accompanying notes are an integral part of the financial statements.
372
| Schedule of Investments | October 31, 2023 |
| Global X S&P 500® ESG Covered Call ETF |
| | | Shares | | | Value |
| COMMON STOCK — continued | | | | | | | | |
| Real Estate — continued | | | | | | | | |
| Simon Property Group ‡ | | | 30 | | | $ | 3,297 | |
| UDR ‡ | | | 30 | | | | 954 | |
| Ventas ‡ | | | 40 | | | | 1,698 | |
| Welltower ‡ | | | 45 | | | | 3,762 | |
| Weyerhaeuser ‡ | | | 63 | | | | 1,807 | |
| | | | | | | | 55,285 | |
| Utilities — 1.4% | | | | | | | | |
| American Water Works | | | 17 | | | | 2,000 | |
| CenterPoint Energy | | | 58 | | | | 1,559 | |
| Constellation Energy | | | 28 | | | | 3,162 | |
| Edison International | | | 36 | | | | 2,270 | |
| Entergy | | | 20 | | | | 1,912 | |
| Eversource Energy | | | 30 | | | | 1,614 | |
| Exelon | | | 89 | | | | 3,466 | |
| NextEra Energy | | | 182 | | | | 10,610 | |
| Public Service Enterprise Group | | | 45 | | | | 2,774 | |
| Sempra | | | 55 | | | | 3,852 | |
| | | | | | | | 33,219 | |
| TOTAL UNITED STATES | | | | | | | 2,384,477 | |
TOTAL COMMON STOCK
(Cost $2,359,418) | | | | | | | 2,388,615 | |
TOTAL INVESTMENTS — 100.4%
(Cost $2,359,418) | | | | | | $ | 2,388,615 | |
| | | | | | | | | |
WRITTEN OPTIONS— (0.6)%
(Premiums Received $(37,137)) | | | | | | $ | (14,080 | ) |
| | | | | | | | | |
| Percentages are based on Net Assets of $2,378,685. | | | | | | | | |
The accompanying notes are an integral part of the financial statements.
373
| Schedule of Investments | October 31, 2023 |
| Global X S&P 500® ESG Covered Call ETF |
A list of the exchange traded option contracts held by the Fund at October 31, 2023, is as follows:
| Description | | Number of
Contracts | | Notional
Amount | | Exercise
Price | | Expiration
Date | Value |
| WRITTEN OPTIONS — (0.6)% | | | | | | | | | | | | | | | | | | |
| Call Options | | | | | | | | | | | | | | | | | | |
| S&P 500 ESG Index | | | (64 | ) | | $ | (2,385,152 | ) | | $ | 380 | | | 11/17/23 | | $ | (14,080 | ) |
| * | Non-income producing security. |
| ‡ | Real Estate Investment Trust |
| (A) | All or a portion of these securities has been segregated as collateral for options contracts. The Fair Value of the securities pledged as collateral is $2,387,762. |
The following is a summary of the level of inputs used as of October 31, 2023, in valuing the Fund’s investments and other financial instruments carried at value:
| Investments in Securities | | Level 1 | | Level 2 | | | Level 3 | | | Total |
| Common Stock | | $ | 2,388,615 | | | $ | — | | | $ | — | | | $ | 2,388,615 | |
| Total Investments in Securities | | $ | 2,388,615 | | | $ | — | | | $ | — | | | $ | 2,388,615 | |
| | | | | | | | | | | | | | | | | |
| Other Financial Instruments | | Level 1 | | Level 2 | | | Level 3 | | | Total |
| Written Options | | $ | (14,080 | ) | | $ | — | | | $ | — | | | $ | (14,080 | ) |
| Total Other Financial Instruments | | $ | (14,080 | ) | | $ | — | | | $ | — | | | $ | (14,080 | ) |
Amounts designated as “—” are $0 or have been rounded to $0.
See “Glossary” for abbreviations.
The accompanying notes are an integral part of the financial statements.
374
| Schedule of Investments | October 31, 2023 |
Global X Dow 30® Covered Call & Growth ETF
Sector Weightings (Unaudited)†:

† Sector weightings percentages are based on the total market value of investments. Total investments do not include derivatives such as options, futures contracts, forward contracts, and swap contracts, if applicable.
| | | Shares | | | Value |
| COMMON STOCK(A) — 100.5% | | | | | | | | |
| UNITED STATES — 100.5% | | | | | | | | |
| Communication Services — 2.3% | | | | | | | | |
| Verizon Communications | | | 485 | | | $ | 17,038 | |
| Walt Disney * | | | 485 | | | | 39,571 | |
| | | | | | | | 56,609 | |
| Consumer Discretionary — 13.0% | | | | | | | | |
| Home Depot | | | 485 | | | | 138,075 | |
| McDonald’s | | | 485 | | | | 127,153 | |
| NIKE, Cl B | | | 485 | | | | 49,843 | |
| | | | | | | | 315,071 | |
| Consumer Staples — 7.8% | | | | | | | | |
| Coca-Cola | | | 485 | | | | 27,398 | |
| Procter & Gamble | | | 485 | | | | 72,764 | |
| Walgreens Boots Alliance | | | 485 | | | | 10,224 | |
| Walmart | | | 485 | | | | 79,254 | |
| | | | | | | | 189,640 | |
| Energy — 2.9% | | | | | | | | |
| Chevron | | | 485 | | | | 70,679 | |
The accompanying notes are an integral part of the financial statements.
375
| Schedule of Investments | October 31, 2023 |
Global X Dow 30® Covered Call & Growth ETF
| | | Shares | | Value |
| COMMON STOCK — continued | | | | | | | | |
| Financials — 19.9% | | | | | | | | |
| American Express | | | 485 | | | $ | 70,825 | |
| Goldman Sachs Group | | | 485 | | | | 147,251 | |
| JPMorgan Chase | | | 485 | | | | 67,444 | |
| Travelers | | | 485 | | | | 81,208 | |
| Visa, Cl A | | | 485 | | | | 114,023 | |
| | | | | | | | 480,751 | |
| Health Care — 20.9% | | | | | | | | |
| Amgen | | | 485 | | | | 124,014 | |
| Johnson & Johnson | | | 485 | | | | 71,945 | |
| Merck | | | 485 | | | | 49,810 | |
| UnitedHealth Group | | | 485 | | | | 259,747 | |
| | | | | | | | 505,516 | |
| Industrials — 13.8% | | | | | | | | |
| 3M | | | 485 | | | | 44,111 | |
| Boeing * | | | 485 | | | | 90,608 | |
| Caterpillar | | | 485 | | | | 109,634 | |
| Honeywell International | | | 485 | | | | 88,881 | |
| | | | | | | | 333,234 | |
| Information Technology — 18.9% | | | | | | | | |
| Apple | | | 485 | | | | 82,823 | |
| Cisco Systems | | | 485 | | | | 25,283 | |
| Intel | | | 485 | | | | 17,703 | |
| International Business Machines | | | 485 | | | | 70,150 | |
| Microsoft | | | 485 | | | | 163,983 | |
| Salesforce * | | | 485 | | | | 97,403 | |
| | | | | | | | 457,345 | |
| Materials — 1.0% | | | | | | | | |
| Dow | | | 485 | | | | 23,445 | |
| | | | | | | | | |
| TOTAL UNITED STATES | | | | | | | 2,432,290 | |
TOTAL COMMON STOCK
(Cost $2,606,967) | | | | | | | 2,432,290 | |
TOTAL INVESTMENTS — 100.5%
(Cost $2,606,967) | | | | | | $ | 2,432,290 | |
The accompanying notes are an integral part of the financial statements.
376
| Schedule of Investments | October 31, 2023 |
Global X Dow 30® Covered Call & Growth ETF
| | | Value |
| WRITTEN OPTIONS— (0.7)% | | | | |
| (Premiums Received $(16,246)) | | $ | (18,090 | ) |
Percentages are based on Net Assets of $2,420,486.
A list of the exchange traded option contracts held by the Fund at October 31, 2023, is as follows:
| Description | | Number of
Contracts | | Notional
Amount | | Exercise
Price | | Expiration
Date | | Value |
| WRITTEN OPTIONS — (0.7)% | | | | | | | | | | | | | | |
| Call Options | | | | | | | | | | | | | | | | | | |
| Dow Jones Industrial Average | | | (36 | ) | | $ | (1,189,908 | ) | | $ | 335 | | | 11/17/23 | | $ | (18,090 | ) |
| * | Non-income producing security. |
| (A) | All or a portion of these securities has been segregated as collateral for options contracts. The Fair Value of the securities pledged as collateral is $2,407,171. |
The following is a summary of the level of inputs used as of October 31, 2023, in valuing the Fund’s investments and other financial instruments carried at value:
| Investments in Securities | | Level 1 | | Level 2 | | | Level 3 | | | Total |
| Common Stock | | $ | 2,432,290 | | | $ | — | | | $ | — | | | $ | 2,432,290 | |
| Total Investments in Securities | | $ | 2,432,290 | | | $ | — | | | $ | — | | | $ | 2,432,290 | |
| | | | | | | | | |
| Other Financial Instruments | | Level 1 | | Level 2 | | | Level 3 | | | Total |
| Written Options | | $ | (18,090 | ) | | $ | — | | | $ | — | | | $ | (18,090 | ) |
| Total Other Financial Instruments | | $ | (18,090 | ) | | $ | — | | | $ | — | | | $ | (18,090 | ) |
Amounts designated as “—” are $0 or have been rounded to $0.
See “Glossary” for abbreviations.
The accompanying notes are an integral part of the financial statements.
377
| Schedule of Investments | October 31, 2023 |
Glossary (abbreviations used in preceding Schedule of Investments):
Fund Abbreviations
ADR — American Depositary Receipt
Cl — Class
ETF — Exchange-Traded Fund
GDR — Global Depositary Receipt
H15T7Y — Harmonized Index of Consumer Prices
ICE— Intercontinental Exchange
NVDR — Non-Voting Depositary Receipt
PJSC — Public Joint-Stock Company
REIT — Real Estate Investment Trust
S&P— Standard & Poor’s
Ser — Series
SPDR — Standard & Poor’s Depository Receipt
TSFR3M — Term Secured Overnight Financing Rate 3 Month
USD — U.S. Dollar
378
Statements of Assets and Liabilities
October 31, 2023
| | | Global X Lithium
& Battery Tech
ETF | | | Global X
SuperDividend®
ETF | | | Global X Social
Media ETF | | | Global X Guru®
Index ETF | |
| Assets: | | | | | | | | | | | | | | | | |
| Cost of Investments | | $ | 2,429,692,845 | | | $ | 825,489,774 | | | $ | 222,875,833 | | | $ | 44,271,063 | |
| Cost of Repurchase Agreement | | | 131,491,852 | | | | 19,721,246 | | | | 2,569,231 | | | | 1,484,508 | |
| Cost/(Proceeds) of Foreign Currency | | | — | | | | 58 | | | | — | | | | — | |
| Investments, at Value | | $ | 2,076,120,071 | * | | $ | 692,110,012 | * | | $ | 140,506,783 | * | | $ | 41,718,902 | * |
| Repurchase Agreement, at Value | | | 131,491,852 | | | | 19,721,246 | | | | 2,569,231 | | | | 1,484,508 | |
| Cash | | | 71,405,913 | | | | 2,378,934 | | | | 165,384 | | | | 45,671 | |
| Foreign Currency, at Value | | | — | | | | 1,071 | | | | — | | | | — | |
| Receivable for Investment Securities Sold | | | 354,563,668 | | | | 155,093 | | | | 12,168,392 | | | | — | |
| Dividend, Interest, and Securities Lending Income Receivable | | | 3,321,159 | | | | 4,358,295 | | | | 60,292 | | | | 20,393 | |
| Receivable for Capital Shares Sold | | | 350,653 | | | | — | | | | — | | | | — | |
| Reclaim Receivable | | | 38,809 | | | | 677,683 | | | | 5,427 | | | | 129 | |
| Due from Broker | | | 22,141 | | | | 170,747 | | | | — | | | | — | |
| Total Assets | | | 2,637,314,266 | | | | 719,573,081 | | | | 155,475,509 | | | | 43,269,603 | |
| Liabilities: | | | | | | | | | | | | | | | | |
| Obligation to Return Securities Lending Collateral | | | 131,491,852 | | | | 19,721,246 | | | | 2,569,231 | | | | 1,484,508 | |
| Payable for Investment Securities Purchased | | | 382,101,995 | | | | 395 | | | | 12,430,268 | | | | — | |
| Payable for Capital Shares Redeemed | | | 25,930,258 | | | | 32,076 | | | | — | | | | — | |
| Payable due to Investment Adviser | | | 1,511,323 | | | | 324,457 | | | | 78,638 | | | | 27,638 | |
| Unrealized Depreciation on Spot Contracts | | | 113,481 | | | | — | | | | 290 | | | | — | |
| Custodian Fees Payable | | | 23,591 | | | | 52,787 | | | | 86 | | | | 209 | |
| Due to Broker | | | 351,121 | | | | 331,490 | | | | — | | | | — | |
| Total Liabilities | | | 541,523,621 | | | | 20,462,451 | | | | 15,078,513 | | | | 1,512,355 | |
| Net Assets | | $ | 2,095,790,645 | | | $ | 699,110,630 | | | $ | 140,396,996 | | | $ | 41,757,248 | |
| Net Assets Consist of: | | | | | | | | | | | | | | | | |
| Paid-in Capital | | $ | 3,235,030,315 | | | $ | 1,723,306,451 | | | $ | 331,576,682 | | | $ | 65,292,277 | |
| Total Accumulated Losses | | | (1,139,239,670 | ) | | | (1,024,195,821 | ) | | | (191,179,686 | ) | | | (23,535,029 | ) |
| Net Assets | | $ | 2,095,790,645 | | | $ | 699,110,630 | | | $ | 140,396,996 | | | $ | 41,757,248 | |
| Outstanding Shares of Beneficial Interest (unlimited authorization — no par value) | | | 44,284,628 | | | | 34,339,412 | | | | 4,040,000 | | | | 1,220,000 | |
| Net Asset Value, Offering and Redemption Price Per Share | | | $47.33 | | | | $20.36 | | | | $34.75 | | | | $34.23 | |
| *Includes Market Value of Securities on Loan | | $ | 121,159,472 | | | $ | 24,017,012 | | | $ | 2,413,260 | | | $ | 1,409,565 | |
The accompanying notes are an integral part of the financial statements.
379
Statements of Assets and Liabilities
October 31, 2023
| | | Global X
SuperIncome™
Preferred ETF | | | Global X
SuperDividend®
U.S. ETF | | | Global X S&P
500® Covered
Call ETF | | | Global X
NASDAQ 100®
Covered Call
ETF | |
| Assets: | | | | | | | | | | | | | | | | |
| Cost of Investments | | $ | 176,926,434 | | | $ | 643,935,242 | | | $ | 2,701,136,440 | | | $ | 6,367,480,382 | |
| Cost of Repurchase Agreement | | | — | | | | 2,069,902 | | | | — | | | | — | |
| Investments, at Value | | $ | 156,657,100 | | | $ | 588,611,486 | * | | $ | 2,828,176,324 | | | $ | 7,609,048,544 | |
| Repurchase Agreement, at Value | | | — | | | | 2,069,902 | | | | — | | | | — | |
| Cash | | | 307,810 | | | | 432,773 | | | | 4,000,227 | | | | 13,180,626 | |
| Dividend, Interest, and Securities Lending Income Receivable | | | 572,450 | | | | 2,074,062 | | | | 2,051,967 | | | | 940,834 | |
| Receivable for Capital Shares Sold | | | — | | | | 2,031,119 | | | | — | | | | — | |
| Receivable for Investment Securities Sold | | | — | | | | — | | | | — | | | | 13,897,181 | |
| Reclaim Receivable | | | — | | | | 8,116 | | | | 15,506 | | | | — | |
| Due from Broker | | | 63,218 | | | | 407 | | | | 52,550 | | | | 321,512 | |
| Total Assets | | | 157,600,578 | | | | 595,227,865 | | | | 2,834,296,574 | | | | 7,637,388,697 | |
| Liabilities: | | | | | | | | | | | | | | | | |
| Obligation to Return Securities Lending Collateral | | | — | | | | 2,069,902 | | | | — | | | | — | |
| Payable due to Investment Adviser | | | 67,822 | | | | 222,240 | | | | 1,448,340 | | | | 3,909,402 | |
| Payable for Investment Securities Purchased | | | — | | | | 2,027,308 | | | | — | | | | — | |
| Payable for Capital Shares Redeemed | | | — | | | | — | | | | — | | | | 13,552,630 | |
| Options Written at Value (Premiums received $–, $–, $63,027,174 and $216,504,359, respectively) | | | — | | | | — | | | | 27,077,160 | | | | 98,419,200 | |
| Custodian Fees Payable | | | 2,608 | | | | 6,059 | | | | 8,613 | | | | 242,850 | |
| Due to Broker | | | 40,049 | | | | 2,856 | | | | 556,633 | | | | 51,216 | |
| Total Liabilities | | | 110,479 | | | | 4,328,365 | | | | 29,090,746 | | | | 116,175,298 | |
| Net Assets | | $ | 157,490,099 | | | $ | 590,899,500 | | | $ | 2,805,205,828 | | | $ | 7,521,213,399 | |
| Net Assets Consist of: | | | | | | | | | | | | | | | | |
| Paid-in Capital | | $ | 284,334,931 | | | $ | 844,322,305 | | | $ | 2,915,763,059 | | | $ | 7,975,843,042 | |
| Total Accumulated Losses | | | (126,844,832 | ) | | | (253,422,805 | ) | | | (110,557,231 | ) | | | (454,629,643 | ) |
| Net Assets | | $ | 157,490,099 | | | $ | 590,899,500 | | | $ | 2,805,205,828 | | | $ | 7,521,213,399 | |
| Outstanding Shares of Beneficial Interest (unlimited authorization — no par value) | | | 19,190,000 | | | | 37,820,000 | | | | 73,480,000 | | | | 453,010,000 | |
| Net Asset Value, Offering and Redemption Price Per Share | | | $8.21 | | | | $15.62 | | | | $38.18 | | | | $16.60 | |
| *Includes Market Value of Securities on Loan | | $ | — | | | $ | 1,971,501 | | | $ | — | | | $ | — | |
The accompanying notes are an integral part of the financial statements.
380
Statements of Assets and Liabilities
October 31, 2023
| | | Global X MSCI
SuperDividend®
Emerging
Markets ETF | | | Global X
SuperDividend®
REIT ETF | | | Global X
Renewable
Energy Producers
ETF | | | Global X S&P
500® Catholic
Values ETF | |
| Assets: | | | | | | | | | | | | | | | | |
| Cost of Investments | | $ | 46,739,175 | | | $ | 290,244,144 | | | $ | 82,952,995 | | | $ | 599,700,496 | |
| Cost of Repurchase Agreement | | | 402,998 | | | | — | | | | 1,283,867 | | | | — | |
| Cost/(Proceeds) of Foreign Currency | | | 31,089 | | | | — | | | | — | | | | — | |
| Investments, at Value | | $ | 41,224,436 | * | | $ | 217,417,038 | | | $ | 43,680,768 | * | | $ | 670,883,108 | |
| Repurchase Agreement, at Value | | | 402,998 | | | | — | | | | 1,283,867 | | | | — | |
| Cash | | | 32,501 | | | | 226,618 | | | | 100,635 | | | | 583,408 | |
| Foreign Currency, at Value | | | 31,488 | | | | 42 | | | | — | | | | — | |
| Dividend, Interest, and Securities Lending Income Receivable | | | 351,936 | | | | 583,074 | | | | 71,825 | | | | 493,266 | |
| Receivable for Capital Shares Sold | | | 19,242 | | | | — | | | | — | | | | — | |
| Reclaim Receivable | | | 14,690 | | | | 186,217 | | | | 103,368 | | | | 3,808 | |
| Receivable for Investment Securities Sold | | | — | | | | 1,759,640 | | | | — | | | | — | |
| Due from Broker | | | 5,466 | | | | 5,750 | | | | 17,761 | | | | 6,695 | |
| Total Assets | | | 42,082,757 | | | | 220,178,379 | | | | 45,258,224 | | | | 671,970,285 | |
| Liabilities: | | | | | | | | | | | | | | | | |
| Obligation to Return Securities Lending Collateral | | | 402,998 | | | | — | | | | 1,283,867 | | | | — | |
| Accrued Foreign Capital Gains Tax on Appreciated Securities | | | 30,865 | | | | — | | | | — | | | | — | |
| Payable due to Investment Adviser | | | 23,281 | | | | 108,863 | | | | 25,367 | | | | 168,912 | |
| Payable for Investment Securities Purchased | | | — | | | | 2,311,615 | | | | 82,081 | | | | — | |
| Unrealized Depreciation on Spot Contracts | | | — | | | | 1,339 | | | | 395 | | | | — | |
| Custodian Fees Payable | | | 1,435 | | | | 1,426 | | | | 1,497 | | | | 1 | |
| Due to Broker | | | 50,277 | | | | 102,024 | | | | 68,330 | | | | 4,179 | |
| Total Liabilities | | | 508,856 | | | | 2,525,267 | | | | 1,461,537 | | | | 173,092 | |
| Net Assets | | $ | 41,573,901 | | | $ | 217,653,112 | | | $ | 43,796,687 | | | $ | 671,797,193 | |
| Net Assets Consist of: | | | | | | | | | | | | | | | | |
| Paid-in Capital | | $ | 77,113,779 | | | $ | 548,800,109 | | | $ | 95,928,270 | | | $ | 609,678,097 | |
| Total Distributable Earnings (Accumulated Losses) | | | (35,539,878 | ) | | | (331,146,997 | ) | | | (52,131,583 | ) | | | 62,119,096 | |
| Net Assets | | $ | 41,573,901 | | | $ | 217,653,112 | | | $ | 43,796,687 | | | $ | 671,797,193 | |
| Outstanding Shares of Beneficial Interest (unlimited authorization — no par value) | | | 1,849,181 | | | | 11,659,193 | | | | 4,710,000 | | | | 13,200,000 | |
| Net Asset Value, Offering and Redemption Price Per Share | | | $22.48 | | | | $18.67 | | | | $9.30 | | | | $50.89 | |
| *Includes Market Value of Securities on Loan | | $ | 347,622 | | | $ | — | | | $ | 2,047,817 | | | $ | — | |
The accompanying notes are an integral part of the financial statements.
381
Statements of Assets and Liabilities
October 31, 2023
| | | Global X MSCI
SuperDividend®
EAFE ETF | | | Global X
E-commerce ETF | | | Global X Russell
2000 Covered
Call ETF | | | Global X S&P
Catholic Values
Developed ex-
U.S. ETF | |
| Assets: | | | | | | | | | | | | | | | | |
| Cost of Investments | | $ | 11,115,256 | | | $ | 104,618,527 | | | $ | 1,033,417,296 | | | $ | 15,168,724 | |
| Cost of Repurchase Agreement | | | — | | | | 548,141 | | | | — | | | | — | |
| Cost of Affiliated Investments | | | — | | | | — | | | | 526,119,573 | | | | — | |
| Cost/(Proceeds) of Foreign Currency | | | 5,805 | | | | — | | | | — | | | | 303 | |
| Investments, at Value | | $ | 10,025,228 | | | $ | 62,028,706 | * | | $ | 934,283,680 | | | $ | 14,426,030 | |
| Repurchase Agreement, at Value | | | — | | | | 548,141 | | | | — | | | | — | |
| Affiliated Investments, at Value | | | — | | | | — | | | | 485,418,321 | | | | — | |
| Cash | | | — | | | | 60,495 | | | | 2,833,832 | | | | 10,403 | |
| Foreign Currency, at Value | | | 5,805 | | | | — | | | | — | | | | 303 | |
| Reclaim Receivable | | | 80,550 | | | | — | | | | 5,411 | | | | 10,592 | |
| Dividend, Interest, and Securities Lending Income Receivable | | | 38,027 | | | | 22,632 | | | | 275,930 | | | | 32,701 | |
| Unrealized Appreciation on Spot Contracts | | | 12 | | | | — | | | | — | | | | — | |
| Receivable for Capital Shares Sold | | | — | | | | 3,372,669 | | | | — | | | | 517,876 | |
| Receivable for Investment Securities Sold | | | — | | | | — | | | | 8,018,841 | | | | — | |
| Due from Broker | | | — | | | | — | | | | 510,561 | | | | — | |
| Total Assets | | | 10,149,622 | | | | 66,032,643 | | | | 1,431,346,576 | | | | 14,997,905 | |
| Liabilities: | | | | | | | | | | | | | | | | |
| Obligation to Return Securities Lending Collateral | | | — | | | | 548,141 | | | | — | | | | — | |
| Payable due to Investment Adviser | | | 4,769 | | | | 25,647 | | | | 696,515 | | | | 4,226 | |
| Payable for Investment Securities Purchased | | | — | | | | 3,390,299 | | | | 57,091 | | | | 504,747 | |
| Payable for Capital Shares Redeemed | | | — | | | | — | | | | 7,870,479 | | | | — | |
| Options Written at Value (Premiums received $–, $–, $40,868,285 and $–, respectively) | | | — | | | | — | | | | 16,253,460 | | | | — | |
| Unrealized Depreciation on Spot Contracts | | | — | | | | — | | | | — | | | | 4,114 | |
| Cash Overdraft | | | 62,679 | | | | — | | | | — | | | | — | |
| Custodian Fees Payable | | | 198 | | | | 11 | | | | 48,384 | | | | 203 | |
| Due to Broker | | | — | | | | — | | | | 382,902 | | | | — | |
| Total Liabilities | | | 67,646 | | | | 3,964,098 | | | | 25,308,831 | | | | 513,290 | |
| Net Assets | | $ | 10,081,976 | | | $ | 62,068,545 | | | $ | 1,406,037,745 | | | $ | 14,484,615 | |
| Net Assets Consist of: | | | | | | | | | | | | | | | | |
| Paid-in Capital | | $ | 13,564,748 | | | $ | 130,973,949 | | | $ | 1,695,453,884 | | | $ | 15,526,363 | |
| Total Accumulated Losses | | | (3,482,772 | ) | | | (68,905,404 | ) | | | (289,416,139 | ) | | | (1,041,748 | ) |
| Net Assets | | $ | 10,081,976 | | | $ | 62,068,545 | | | $ | 1,406,037,745 | | | $ | 14,484,615 | |
| Outstanding Shares of Beneficial Interest (unlimited authorization — no par value) | | | 790,000 | | | | 3,660,002 | | | | 87,330,000 | | | | 560,000 | |
The accompanying notes are an integral part of the financial statements.
382
Statements of Assets and Liabilities
October 31, 2023
| | | Global X MSCI
SuperDividend®
EAFE ETF | | | Global X
E-commerce ETF | | | Global X Russell
2000 Covered
Call ETF | | | Global X S&P
Catholic Values
Developed ex-
U.S. ETF | |
| Net Asset Value, Offering and Redemption Price Per Share | | | $12.76 | | | | $16.96 | | | | $16.10 | | | | $25.87 | |
| *Includes Market Value of Securities on Loan | | $ | — | | | $ | 802,249 | | | $ | — | | | $ | — | |
The accompanying notes are an integral part of the financial statements.
383
Statements of Assets and Liabilities
October 31, 2023
| | | Global X Nasdaq
100® Covered
Call & Growth
ETF | | | Global X S&P
500® Covered
Call & Growth
ETF | | | Global X
Emerging
Markets Internet
& E-commerce
ETF | | | Global X
NASDAQ 100®
Tail Risk ETF | |
| Assets: | | | | | | | | | | | | | | | | |
| Cost of Investments | | $ | 98,833,475 | | | $ | 64,851,213 | | | $ | 4,041,201 | | | $ | 1,498,224 | |
| Investments, at Value | | $ | 102,738,327 | | | $ | 61,228,118 | | | $ | 2,390,224 | | | $ | 1,360,975 | |
| Cash | | | 161,741 | | | | 45,371 | | | | 4,188 | | | | 1,534 | |
| Dividend, Interest, and Securities Lending Income Receivable | | | 12,645 | | | | 43,724 | | | | 350 | | | | 166 | |
| Reclaim Receivable | | | — | | | | 326 | | | | — | | | | — | |
| Due from Broker | | | — | | | | 13,775 | | | | — | | | | — | |
| Total Assets | | | 102,912,713 | | | | 61,331,314 | | | | 2,394,762 | | | | 1,362,675 | |
| Liabilities: | | | | | | | | | | | | | | | | |
| Options Written at Value (Premiums received $1,430,104, $682,499, $– and $–, respectively) | | | 652,400 | | | | 293,095 | | | | — | | | | — | |
| Payable due to Investment Adviser | | | 53,439 | | | | 30,881 | | | | 1,342 | | | | 296 | |
| Custodian Fees Payable | | | 423 | | | | 183 | | | | — | | | | 10 | |
| Due to Broker | | | 27,764 | | | | 821 | | | | — | | | | — | |
| Total Liabilities | | | 734,026 | | | | 324,980 | | | | 1,342 | | | | 306 | |
| Net Assets | | $ | 102,178,687 | | | $ | 61,006,334 | | | $ | 2,393,420 | | | $ | 1,362,369 | |
| Net Assets Consist of: | | | | | | | | | | | | | | | | |
| Paid-in Capital | | $ | 105,976,408 | | | $ | 63,273,856 | | | $ | 5,957,335 | | | $ | 1,892,681 | |
| Total Accumulated Losses | | | (3,797,721 | ) | | | (2,267,522 | ) | | | (3,563,915 | ) | | | (530,312 | ) |
| Net Assets | | $ | 102,178,687 | | | $ | 61,006,334 | | | $ | 2,393,420 | | | $ | 1,362,369 | |
| Outstanding Shares of Beneficial Interest (unlimited authorization — no par value) | | | 3,920,000 | | | | 2,340,000 | | | | 119,871 | | | | 60,000 | |
| Net Asset Value, Offering and Redemption Price Per Share | | | $26.07 | | | | $26.07 | | | | $19.97 | | | | $22.71 | |
The accompanying notes are an integral part of the financial statements.
384
Statements of Assets and Liabilities
October 31, 2023
| | | Global X
NASDAQ 100®
Risk Managed
Income ETF | | | Global X
NASDAQ 100®
Collar 95-110
ETF | | | Global X S&P
500® Tail Risk
ETF | | | Global X S&P
500® Risk
Managed Income
ETF | |
| Assets: | | | | | | | | | | | | | | | | |
| Cost of Investments | | $ | 11,966,739 | | | $ | 2,283,522 | | | $ | 2,570,779 | | | $ | 27,459,958 | |
| Investments, at Value | | $ | 11,953,875 | | | $ | 2,109,741 | | | $ | 2,418,932 | | | $ | 27,324,617 | |
| Cash | | | 22,714 | | | | 2,996 | | | | 3,169 | | | | 28,805 | |
| Dividend, Interest, and Securities Lending Income Receivable | | | 1,471 | | | | 255 | | | | 1,770 | | | | 19,659 | |
| Reclaim Receivable | | | — | | | | — | | | | 13 | | | | 148 | |
| Total Assets | | | 11,978,060 | | | | 2,112,992 | | | | 2,423,884 | | | | 27,373,229 | |
| Liabilities: | | | | | | | | | | | | | | | | |
| Options Written at Value (Premiums received $337,034, $12,721, $– and $603,028, respectively) | | | 158,680 | | | | 291 | | | | — | | | | 260,677 | |
| Payable due to Investment Adviser | | | 5,915 | | | | 488 | | | | 524 | | | | 13,917 | |
| Custodian Fees Payable | | | 745 | | | | 179 | | | | 12 | | | | 824 | |
| Due to Broker | | | 148 | | | | — | | | | — | | | | — | |
| Total Liabilities | | | 165,488 | | | | 958 | | | | 536 | | | | 275,418 | |
| Net Assets | | $ | 11,812,572 | | | $ | 2,112,034 | | | $ | 2,423,348 | | | $ | 27,097,811 | |
| Net Assets Consist of: | | | | | | | | | | | | | | | | |
| Paid-in Capital | | $ | 14,098,045 | | | $ | 2,478,905 | | | $ | 2,759,594 | | | $ | 30,749,112 | |
| Total Accumulated Losses | | | (2,285,473 | ) | | | (366,871 | ) | | | (336,246 | ) | | | (3,651,301 | ) |
| Net Assets | | $ | 11,812,572 | | | $ | 2,112,034 | | | $ | 2,423,348 | | | $ | 27,097,811 | |
| Outstanding Shares of Beneficial Interest (unlimited authorization — no par value) | | | 710,000 | | | | 90,000 | | | | 100,000 | | | | 1,460,000 | |
| Net Asset Value, Offering and Redemption Price Per Share | | | $16.64 | | | | $23.47 | | | | $24.23 | | | | $18.56 | |
The accompanying notes are an integral part of the financial statements.
385
Statements of Assets and Liabilities
October 31, 2023
| | | Global X S&P
500® Collar 95-
110 ETF | | | Global X
Disruptive
Materials ETF | | | Global X Dow
30® Covered Call
ETF | | | Global X Russell
2000 Covered
Call & Growth
ETF | |
| Assets: | | | | | | | | | | | | | | | | |
| Cost of Investments | | $ | 2,360,251 | | | $ | 10,169,834 | | | $ | 78,716,691 | | | $ | 8,612,686 | |
| Investments, at Value | | $ | 2,217,597 | | | $ | 7,674,298 | | | $ | 80,074,984 | | | $ | 8,317,256 | |
| Cash | | | 2,620 | | | | 8,693 | | | | 75,274 | | | | 10,815 | |
| Dividend, Interest, and Securities Lending Income Receivable | | | 1,597 | | | | 3,657 | | | | 56,003 | | | | — | |
| Reclaim Receivable | | | 12 | | | | 1,343 | | | | — | | | | — | |
| Receivable for Capital Shares Sold | | | — | | | | — | | | | — | | | | 1,118,851 | |
| Receivable for Investment Securities Sold | | | — | | | | — | | | | — | | | | 7,578 | |
| Total Assets | | | 2,221,826 | | | | 7,687,991 | | | | 80,206,261 | | | | 9,454,500 | |
| Liabilities: | | | | | | | | | | | | | | | | |
| Payable due to Investment Adviser | | | 478 | | | | 4,090 | | | | 40,962 | | | | 1,638 | |
| Options Written at Value (Premiums received $2,498, $–, $1,082,757 and $87,797, respectively) | | | 103 | | | | — | | | | 1,217,055 | | | | 47,300 | |
| Payable for Investment Securities Purchased | | | — | | | | — | | | | — | | | | 1,125,361 | |
| Custodian Fees Payable | | | 82 | | | | 54 | | | | 217 | | | | — | |
| Due to Broker | | | — | | | | — | | | | 876 | | | | 790 | |
| Total Liabilities | | | 663 | | | | 4,144 | | | | 1,259,110 | | | | 1,175,089 | |
| Net Assets | | $ | 2,221,163 | | | $ | 7,683,847 | | | $ | 78,947,151 | | | $ | 8,279,411 | |
| Net Assets Consist of: | | | | | | | | | | | | | | | | |
| Paid-in Capital | | $ | 2,526,617 | | | $ | 11,282,867 | | | $ | 79,241,435 | | | $ | 8,609,242 | |
| Total Accumulated Losses | | | (305,454 | ) | | | (3,599,020 | ) | | | (294,284 | ) | | | (329,831 | ) |
| Net Assets | | $ | 2,221,163 | | | $ | 7,683,847 | | | $ | 78,947,151 | | | $ | 8,279,411 | |
| Outstanding Shares of Beneficial Interest (unlimited authorization — no par value) | | | 90,000 | | | | 540,000 | | | | 3,780,000 | | | | 370,000 | |
| Net Asset Value, Offering and Redemption Price Per Share | | | $24.68 | | | | $14.23 | | | | $20.89 | | | | $22.38 | |
The accompanying notes are an integral part of the financial statements.
386
Statements of Assets and Liabilities
October 31, 2023
| | | Global X
Financials
Covered Call &
Growth ETF | | | Global X Health
Care Covered
Call & Growth
ETF | | | Global X
Information
Technology
Covered Call &
Growth ETF | | | Global X
NASDAQ 100®
ESG Covered
Call ETF | |
| Assets: | | | | | | | | | | | | | | | | |
| Cost of Investments | | $ | 2,399,399 | | | $ | 2,791,043 | | | $ | 2,930,408 | | | $ | 2,384,383 | |
| Investments, at Value | | $ | 2,236,560 | | | $ | 2,577,685 | | | $ | 3,474,318 | | | $ | 2,503,670 | |
| Cash | | | 1,704 | | | | 1,536 | | | | 2,550 | | | | 4,987 | |
| Dividend, Interest, and Securities Lending Income Receivable | | | 966 | | | | 1,614 | | | | 365 | | | | 300 | |
| Reclaim Receivable | | | 5 | | | | — | | | | 33 | | | | — | |
| Total Assets | | | 2,239,235 | | | | 2,580,835 | | | | 3,477,266 | | | | 2,508,957 | |
| Liabilities: | | | | | | | | | | | | | | | | |
| Options Written at Value (Premiums received $26,765, $20,289, $42,292 and $62,878, respectively) | | | 8,281 | | | | 2,061 | | | | 12,245 | | | | 30,175 | |
| Payable due to Investment Adviser | | | 1,043 | | | | 1,225 | | | | 1,620 | | | | 1,284 | |
| Due to Broker | | | 132 | | | | 908 | | | | — | | | | — | |
| Total Liabilities | | | 9,456 | | | | 4,194 | | | | 13,865 | | | | 31,459 | |
| Net Assets | | $ | 2,229,779 | | | $ | 2,576,641 | | | $ | 3,463,401 | | | $ | 2,477,498 | |
| Net Assets Consist of: | | | | | | | | | | | | | | | | |
| Paid-in Capital | | $ | 2,445,667 | | | $ | 2,767,218 | | | $ | 3,079,828 | | | $ | 2,446,000 | |
| Total Distributable Earnings (Accumulated Losses) | | | (215,888 | ) | | | (190,577 | ) | | | 383,573 | | | | 31,498 | |
| Net Assets | | $ | 2,229,779 | | | $ | 2,576,641 | | | $ | 3,463,401 | | | $ | 2,477,498 | |
| Outstanding Shares of Beneficial Interest (unlimited authorization — no par value) | | | 100,000 | | | | 110,000 | | | | 120,000 | | | | 100,000 | |
| Net Asset Value, Offering and Redemption Price Per Share | | | $22.30 | | | | $23.42 | | | | $28.86 | | | | $24.77 | |
The accompanying notes are an integral part of the financial statements.
387
Statements of Assets and Liabilities
October 31, 2023
| | | Global X S&P
500® ESG
Covered Call
ETF | | | Global X Dow
30® Covered Call
& Growth ETF | |
| Assets: | | | | | | | | |
| Cost of Investments | | $ | 2,359,418 | | | $ | 2,606,967 | |
| Investments, at Value | | $ | 2,388,615 | | | $ | 2,432,290 | |
| Cash | | | 3,403 | | | | 5,837 | |
| Dividend, Interest, and Securities Lending Income Receivable | | | 1,976 | | | | 1,697 | |
| Reclaim Receivable | | | 1 | | | | — | |
| Total Assets | | | 2,393,995 | | | | 2,439,824 | |
| Liabilities: | | | | | | | | |
| Options Written at Value (Premiums received $37,137 and $16,246, respectively) | | | 14,080 | | | | 18,090 | |
| Payable due to Investment Adviser | | | 1,230 | | | | 1,248 | |
| Total Liabilities | | | 15,310 | | | | 19,338 | |
| Net Assets | | $ | 2,378,685 | | | $ | 2,420,486 | |
| Net Assets Consist of: | | | | | | | | |
| Paid-in Capital | | $ | 2,378,687 | | | $ | 2,567,169 | |
| Total Accumulated Losses | | | (2 | ) | | | (146,683 | ) |
| Net Assets | | $ | 2,378,685 | | | $ | 2,420,486 | |
| Outstanding Shares of Beneficial Interest (unlimited authorization — no par value) | | | 100,000 | | | | 100,000 | |
| Net Asset Value, Offering and Redemption Price Per Share | | | $23.79 | | | | $24.20 | |
The accompanying notes are an integral part of the financial statements.
388
Statements of Operations
For the year ended October 31, 2023
| | | Global X
Lithium &
Battery Tech
ETF | | Global X
SuperDividend®
ETF | | Global X Social
Media ETF | | Global X Guru®
Index ETF |
| Investment Income: | | | | | | | | | | | | | | | | |
| Dividend Income | | $ | 49,186,672 | | | $ | 75,338,317 | | | $ | 1,591,545 | | | $ | 485,134 | |
| Interest Income | | | 268,854 | | | | (136,447 | ) | | | 8,958 | | | | 2,306 | |
| Security Lending Income | | | 6,972,879 | | | | 903,532 | | | | 57,300 | | | | 33,242 | |
| Less: Foreign Taxes Withheld | | | (1,839,085 | ) | | | (2,896,228 | ) | | | (42,192 | ) | | | (4,733 | ) |
| Total Investment Income | | | 54,589,320 | | | | 73,209,174 | | | | 1,615,611 | | | | 515,949 | |
| Expenses: | | | | | | | | | | | | | | | | |
| Supervision and Administration Fees(1) | | | 24,454,335 | | | | 4,350,528 | | | | 888,954 | | | | 352,098 | |
| Custodian Fees(2) | | | 23,750 | | | | 113,541 | | | | 121 | | | | 274 | |
| Total Expenses | | | 24,478,085 | | | | 4,464,069 | | | | 889,075 | | | | 352,372 | |
| Waiver of Supervision and Administration Fees | | | – | | | | (78,019 | ) | | | – | | | | – | |
| Net Expenses | | | 24,478,085 | | | | 4,386,050 | | | | 889,075 | | | | 352,372 | |
| Net Investment Income | | | 30,111,235 | | | | 68,823,124 | | | | 726,536 | | | | 163,577 | |
| Net Realized Gain (Loss) on: | | | | | | | | | | | | | | | | |
| Investments(3) | | | (290,277,677 | ) | | | (173,559,042 | ) | | | (23,499,453 | ) | | | (2,729,202 | ) |
| Foreign Currency Transactions | | | (612,790 | ) | | | (4,459,488 | ) | | | (4,846 | ) | | | – | |
| Net Realized Gain (Loss) | | | (290,890,467 | ) | | | (178,018,530 | ) | | | (23,504,299 | ) | | | (2,729,202 | ) |
| Net Change in Unrealized Appreciation (Depreciation) on: | | | | | | | | | | | | | | | | |
| Investments | | | (678,200,172 | ) | | | 101,221,370 | | | | 64,248,486 | | | | 3,924,121 | |
| Foreign Currency Translations | | | (97,496 | ) | | | 338,455 | | | | (774 | ) | | | – | |
| Net Change in Unrealized Appreciation (Depreciation) | | | (678,297,668 | ) | | | 101,559,825 | | | | 64,247,712 | | | | 3,924,121 | |
| Net Realized and Unrealized Gain (Loss) | | | (969,188,135 | ) | | | (76,458,705 | ) | | | 40,743,413 | | | | 1,194,919 | |
| Net Increase (Decrease) in Net Assets Resulting from Operations | | $ | (939,076,900 | ) | | $ | (7,635,581 | ) | | $ | 41,469,949 | | | $ | 1,358,496 | |
| | |
| (1) | The Supervision and Administration fees includes fees paid by the Funds for the investment advisory services provided by the Adviser. (See Note 3 in Notes to Financial Statements.) |
| (2) | See Note 2 in the Notes to Financial Statements. |
| (3) | Includes realized gains (losses) as a result of in-kind redemptions. (See Note 4 in Notes to Financial Statements.) |
The accompanying notes are an integral part of the financial statements.
389
Statements of Operations
For the year ended October 31, 2023
| | | Global X
SuperIncome™
Preferred ETF | | Global X
SuperDividend®
U.S. ETF | | Global X S&P
500® Covered
Call ETF | | Global X
NASDAQ 100®
Covered Call
ETF |
| Investment Income: | | | | | | | | | | | | | | | | |
| Dividend Income | | $ | 13,406,088 | | | $ | 27,602,355 | | | $ | 42,442,402 | | | $ | 65,567,203 | |
| Interest Income | | | 17,549 | | | | 58,520 | | | | 325,859 | | | | 1,102,275 | |
| Security Lending Income | | | 76,683 | | | | 77,336 | | | | — | | | | — | |
| Less: Foreign Taxes Withheld | | | — | | | | — | | | | 6,549 | | | | (144,025 | ) |
| Total Investment Income | | | 13,500,320 | | | | 27,738,211 | | | | 42,774,810 | | | | 66,525,453 | |
| Expenses: | | | | | | | | | | | | | | | | |
| Supervision and Administration Fees(1) | | | 1,011,603 | | | | 2,858,686 | | | | 15,335,780 | | | | 43,691,990 | |
| Custodian Fees(2) | | | 6,557 | | | | 28,693 | | | | 46,161 | | | | 436,725 | |
| Total Expenses | | | 1,018,160 | | | | 2,887,379 | | | | 15,381,941 | | | | 44,128,715 | |
| Net Investment Income | | | 12,482,160 | | | | 24,850,832 | | | | 27,392,869 | | | | 22,396,738 | |
| Net Realized Gain (Loss) on: | | | | | | | | | | | | | | | | |
| Investments(3) | | | (35,344,694 | ) | | | (40,314,161 | ) | | | (57,958,335 | ) | | | (57,160,584 | ) |
| Purchased Options | | | — | | | | — | | | | — | | | | (934,152,667 | ) |
| Written Options | | | — | | | | — | | | | (175,722,132 | ) | | | — | |
| Net Realized Gain (Loss) | | | (35,344,694 | ) | | | (40,314,161 | ) | | | (233,680,467 | ) | | | (991,313,251 | ) |
| Net Change in Unrealized Appreciation (Depreciation) on: | | | | | | | | | | | | | | | | |
| Investments | | | 4,801,453 | | | | (69,852,699 | ) | | | 259,046,874 | | | | 1,823,568,738 | |
| Written Options | | | — | | | | — | | | | 81,655,711 | | | | 150,126,300 | |
| Net Change in Unrealized Appreciation (Depreciation) | | | 4,801,453 | | | | (69,852,699 | ) | | | 340,702,585 | | | | 1,973,695,038 | |
| Net Realized and Unrealized Gain (Loss) | | | (30,543,241 | ) | | | (110,166,860 | ) | | | 107,022,118 | | | | 982,381,787 | |
| Net Increase (Decrease) in Net Assets Resulting from Operations | | $ | (18,061,081 | ) | | $ | (85,316,028 | ) | | $ | 134,414,987 | | | $ | 1,004,778,525 | |
| | |
| (1) | The Supervision and Administration fees includes fees paid by the Funds for the investment advisory services provided by the Adviser. (See Note 3 in Notes to Financial Statements.) |
| (2) | See Note 2 in the Notes to Financial Statements. |
| (3) | Includes realized gains (losses) as a result of in-kind redemptions. (See Note 4 in Notes to Financial Statements.) |
The accompanying notes are an integral part of the financial statements.
390
Statements of Operations
For the year ended October 31, 2023
| | | Global X MSCI
SuperDividend®
Emerging
Markets ETF | | Global X
SuperDividend®
REIT ETF | | Global X
Renewable
Energy
Producers ETF | | Global X S&P
500® Catholic
Values ETF |
| Investment Income: | | | | | | | | | | | | | | | | |
| Dividend Income | | $ | 4,400,096 | | | $ | 18,523,942 | | | $ | 1,290,417 | | | $ | 9,954,937 | |
| Interest Income | | | 4,577 | | | | 15,051 | | | | 170,895 | | | | 27,202 | |
| Security Lending Income | | | 1,291 | | | | 24,967 | | | | 36,419 | | | | — | |
| Less: Foreign Taxes Withheld | | | (575,581 | ) | | | (1,176,180 | ) | | | (185,316 | ) | | | (2,850 | ) |
| Total Investment Income | | | 3,830,383 | | | | 17,387,780 | | | | 1,312,415 | | | | 9,979,289 | |
| | | | | | | | | | | | | | | | | |
| Expenses: | | | | | | | | | | | | | | | | |
| Supervision and Administration Fees(1) | | | 279,717 | | | | 1,554,093 | | | | 464,410 | | | | 1,840,714 | |
| Custodian Fees(2) | | | 12,333 | | | | 17,575 | | | | 2,541 | | | | 464 | |
| Total Expenses | | | 292,050 | | | | 1,571,668 | | | | 466,951 | | | | 1,841,178 | |
| Net Investment Income | | | 3,538,333 | | | | 15,816,112 | | | | 845,464 | | | | 8,138,111 | |
| Net Realized Gain (Loss) on: | | | | | | | | | | | | | | | | |
| Investments(3) | | | (7,338,740 | ) | | | (30,499,082 | ) | | | (9,830,336 | ) | | | 11,684,291 | |
| Foreign Currency Transactions | | | (66,954 | ) | | | (92,701 | ) | | | (31,875 | ) | | | — | |
| Foreign Capital Gains Tax | | | 8,991 | | | | — | | | | — | | | | — | |
| Net Realized Gain (Loss) | | | (7,396,703 | ) | | | (30,591,783 | ) | | | (9,862,211 | ) | | | 11,684,291 | |
| Net Change in Unrealized Appreciation (Depreciation) on: | | | | | | | | | | | | | | | | |
| Investments | | | 9,200,590 | | | | 771,275 | | | | (10,204,271 | ) | | | 30,978,489 | |
| Foreign Capital Gains Tax on Appreciated Securities | | | 8,463 | | | | — | | | | — | | | | — | |
| Foreign Currency Translations | | | (5,842 | ) | | | (1,679 | ) | | | 5,416 | | | | — | |
| Net Change in Unrealized Appreciation (Depreciation) | | | 9,203,211 | | | | 769,596 | | | | (10,198,855 | ) | | | 30,978,489 | |
| Net Realized and Unrealized Gain (Loss) | | | 1,806,508 | | | | (29,822,187 | ) | | | (20,061,066 | ) | | | 42,662,780 | |
| Net Increase (Decrease) in Net Assets Resulting from Operations | | $ | 5,344,841 | | | $ | (14,006,075 | ) | | $ | (19,215,602 | ) | | $ | 50,800,891 | |
| | |
| (1) | The Supervision and Administration fees includes fees paid by the Funds for the investment advisory services provided by the Adviser. (See Note 3 in Notes to Financial Statements.) |
| (2) | See Note 2 in the Notes to Financial Statements. |
| (3) | Includes realized gains (losses) as a result of in-kind redemptions. (See Note 4 in Notes to Financial Statements.) |
The accompanying notes are an integral part of the financial statements.
391
Statements of Operations
For the year ended October 31, 2023
| | | Global X MSCI
SuperDividend®
EAFE ETF | | Global X
E-commerce
ETF | | Global X Russell
2000 Covered
Call ETF | | Global X S&P
Catholic Values
Developed ex-
U.S. ETF |
| Investment Income: | | | | | | | | | | | | | | | | |
| Dividend Income | | $ | 779,100 | | | $ | 231,921 | | | $ | 15,737,084 | | | $ | 429,323 | |
| Dividend Income, from Affiliated Investments | | | — | | | | — | | | | 7,451,586 | | | | — | |
| Interest Income | | | 397 | | | | 773 | | | | 171,768 | | | | 752 | |
| Security Lending Income | | | — | | | | 13,600 | | | | — | | | | — | |
| Less: Foreign Taxes Withheld | | | (78,764 | ) | | | (2,054 | ) | | | (18,707 | ) | | | (43,600 | ) |
| Total Investment Income | | | 700,733 | | | | 244,240 | | | | 23,341,731 | | | | 386,475 | |
| | | | | | | | | | | | | | | | | |
| Expenses: | | | | | | | | | | | | | | | | |
| Supervision and Administration Fees(1) | | | 60,962 | | | | 255,544 | | | | 8,700,301 | | | | 42,850 | |
| Custodian Fees(2) | | | 1,363 | | | | 111 | | | | 17,862 | | | | 362 | |
| Total Expenses | | | 62,325 | | | | 255,655 | | | | 8,718,163 | | | | 43,212 | |
| Waiver of Supervision and Administration Fees | | | — | | | | — | | | | (467,311 | ) | | | — | |
| Net Expenses | | | 62,325 | | | | 255,655 | | | | 8,250,852 | | | | 43,212 | |
| Net Investment Income (Loss) | | | 638,408 | | | | (11,415 | ) | | | 15,090,879 | | | | 343,263 | |
| Net Realized Gain (Loss) on: | | | | | | | | | | | | | | | | |
| Investments(3) | | | (832,677 | ) | | | (17,233,339 | ) | | | 6,051,309 | | | | (307,218 | ) |
| Affiliated Investments | | | — | | | | — | | | | 715,197 | | | | — | |
| Written Options | | | — | | | | — | | | | (76,518,146 | ) | | | — | |
| Foreign Currency Transactions | | | (1,590 | ) | | | (7,470 | ) | | | — | | | | (2,066 | ) |
| Net Realized Gain (Loss) | | | (834,267 | ) | | | (17,240,809 | ) | | | (69,751,640 | ) | | | (309,284 | ) |
| Net Change in Unrealized Appreciation (Depreciation) on: | | | | | | | | | | | | | | | | |
| Investments | | | 1,353,397 | | | | 20,074,893 | | | | (99,044,198 | ) | | | 257,671 | |
| Affiliated Investments | | | — | | | | — | | | | (44,524,279 | ) | | | — | |
| Written Options | | | — | | | | — | | | | 86,994,451 | | | | — | |
| Foreign Currency Translations | | | 3,863 | | | | — | | | | — | | | | (263 | ) |
| Net Change in Unrealized Appreciation (Depreciation) | | | 1,357,260 | | | | 20,074,893 | | | | (56,574,026 | ) | | | 257,408 | |
| Net Realized and Unrealized Gain (Loss) | | | 522,993 | | | | 2,834,084 | | | | (126,325,666 | ) | | | (51,876 | ) |
| Net Increase (Decrease) in Net Assets Resulting from Operations | | $ | 1,161,401 | | | $ | 2,822,669 | | | $ | (111,234,787 | ) | | $ | 291,387 | |
| | |
| (1) | The Supervision and Administration fees includes fees paid by the Funds for the investment advisory services provided by the Adviser. (See Note 3 in Notes to Financial Statements.) |
| (2) | See Note 2 in the Notes to Financial Statements. |
| (3) | Includes realized gains (losses) as a result of in-kind redemptions. (See Note 4 in Notes to Financial Statements.) |
The accompanying notes are an integral part of the financial statements.
392
Statements of Operations
For the year ended October 31, 2023
| | | Global X Nasdaq
100® Covered
Call & Growth
ETF | | Global X S&P
500® Covered
Call & Growth
ETF | | Global X
Emerging
Markets Internet
& E-commerce
ETF | | Global X
NASDAQ 100®
Tail Risk ETF |
| Investment Income: | | | | | | | | | | | | | | | | |
| Dividend Income | | $ | 688,067 | | | $ | 879,847 | | | $ | 23,075 | | | $ | 13,369 | |
| Interest Income | | | 6,287 | | | | 2,871 | | | | 110 | | | | 35 | |
| Less: Foreign Taxes Withheld | | | (1,512 | ) | | | (232 | ) | | | (369 | ) | | | (29 | ) |
| Total Investment Income | | | 692,842 | | | | 882,486 | | | | 22,816 | | | | 13,375 | |
| Expenses: | | | | | | | | | | | | | | | | |
| Supervision and Administration Fees(1) | | | 474,198 | | | | 319,872 | | | | 16,915 | | | | 8,067 | |
| Custodian Fees(2) | | | 1,785 | | | | — | | | | 101 | | | | 10 | |
| Total Expenses | | | 475,983 | | | | 319,872 | | | | 17,016 | | | | 8,077 | |
| Net Investment Income | | | 216,859 | | | | 562,614 | | | | 5,800 | | | | 5,298 | |
| Net Realized Gain (Loss) on: | | | | | | | | | | | | | | | | |
| Investments(3) | | | (2,691,803 | ) | | | 1,941,533 | | | | (305,927 | ) | | | (157,471 | ) |
| Purchased Options | | | — | | | | (1,833,364 | ) | | | — | | | | (108,252 | ) |
| Written Options | | | (4,759,944 | ) | | | — | | | | — | | | | — | |
| Foreign Currency Transactions | | | — | | | | — | | | | (368 | ) | | | — | |
| Net Realized Gain (Loss) | | | (7,451,747 | ) | | | 108,169 | | | | (306,295 | ) | | | (265,723 | ) |
| Net Change in Unrealized Appreciation (Depreciation) on: | | | | | | | | | | | | | | | | |
| Investments | | | 19,273,168 | | | | 2,061,163 | | | | 738,242 | | | | 494,524 | |
| Purchased Options | | | — | | | | 871,640 | | | | — | | | | 22,980 | |
| Written Options | | | 937,738 | | | | — | | | | — | | | | — | |
| Foreign Currency Translations | | | — | | | | — | | | | (2 | ) | | | — | |
| Net Change in Unrealized Appreciation (Depreciation) | | | 20,210,906 | | | | 2,932,803 | | | | 738,240 | | | | 517,504 | |
| Net Realized and Unrealized Gain (Loss) | | | 12,759,159 | | | | 3,040,972 | | | | 431,945 | | | | 251,781 | |
| Net Increase��in Net Assets Resulting from Operations | | $ | 12,976,018 | | | $ | 3,603,586 | | | $ | 437,745 | | | $ | 257,079 | |
| | |
| (1) | The Supervision and Administration fees includes fees paid by the Funds for the investment advisory services provided by the Adviser. (See Note 3 in Notes to Financial Statements.) |
| (2) | See Note 2 in the Notes to Financial Statements. |
| (3) | Includes realized gains (losses) as a result of in-kind redemptions. (See Note 4 in Notes to Financial Statements.) |
The accompanying notes are an integral part of the financial statements.
393
Statements of Operations
For the year ended October 31, 2023
| | | Global X
NASDAQ 100®
Risk Managed
Income ETF | | Global X
NASDAQ 100®
Collar 95-110
ETF | | Global X S&P
500® Tail Risk
ETF | | Global X S&P
500® Risk
Managed
Income ETF |
| Investment Income: | | | | | | | | | | | | | | | | |
| Dividend Income | | $ | 90,127 | | | $ | 25,028 | | | $ | 48,027 | | | $ | 435,795 | |
| Interest Income | | | 848 | | | | 71 | | | | 47 | | | | 2,366 | |
| Less: Foreign Taxes Withheld | | | (199 | ) | | | (54 | ) | | | (14 | ) | | | (117 | ) |
| Total Investment Income | | | 90,776 | | | | 25,045 | | | | 48,060 | | | | 438,044 | |
| Expenses: | | | | | | | | | | | | | | | | |
| Supervision and Administration Fees(1) | | | 59,521 | | | | 14,950 | | | | 15,762 | | | | 156,122 | |
| Custodian Fees(2) | | | 1,258 | | | | 279 | | | | 15 | | | | 761 | |
| Total Expenses | | | 60,779 | | | | 15,229 | | | | 15,777 | | | | 156,883 | |
| Net Investment Income | | | 29,997 | | | | 9,816 | | | | 32,283 | | | | 281,161 | |
| Net Realized Gain (Loss) on: | | | | | | | | | | | | | | | | |
| Investments(3) | | | (1,055,959 | ) | | | (148,588 | ) | | | 37,754 | | | | (1,170,122 | ) |
| Purchased Options | | | (1,039,839 | ) | | | (194,742 | ) | | | (156,985 | ) | | | (1,875,705 | ) |
| Written Options | | | (1,317,175 | ) | | | (336,034 | ) | | | — | | | | (1,914,332 | ) |
| Net Realized Gain (Loss) | | | (3,412,973 | ) | | | (679,364 | ) | | | (119,231 | ) | | | (4,960,159 | ) |
| Net Change in Unrealized Appreciation (Depreciation) on: | | | | | | | | | | | | | | | | |
| Investments | | | 3,233,480 | | | | 868,090 | | | | 249,186 | | | | 3,289,189 | |
| Purchased Options | | | 82,077 | | | | 52,485 | | | | 42,973 | | | | 150,599 | |
| Written Options | | | 238,445 | | | | (38,825 | ) | | | — | | | | 928,959 | |
| Net Change in Unrealized Appreciation (Depreciation) | | | 3,554,002 | | | | 881,750 | | | | 292,159 | | | | 4,368,747 | |
| Net Realized and Unrealized Gain (Loss) | | | 141,029 | | | | 202,386 | | | | 172,928 | | | | (591,412 | ) |
| Net Increase (Decrease) in Net Assets Resulting from Operations | | $ | 171,026 | | | $ | 212,202 | | | $ | 205,211 | | | $ | (310,251 | ) |
| | |
| (1) | The Supervision and Administration fees includes fees paid by the Funds for the investment advisory services provided by the Adviser. (See Note 3 in Notes to Financial Statements.) |
| (2) | See Note 2 in the Notes to Financial Statements. |
| (3) | Includes realized gains (losses) as a result of in-kind redemptions. (See Note 4 in Notes to Financial Statements.) |
The accompanying notes are an integral part of the financial statements.
394
Statements of Operations
For the year ended October 31, 2023
| | | Global X S&P
500® Collar 95-
110 ETF | | Global X
Disruptive
Materials ETF | | Global X Dow
30® Covered Call
ETF | | Global X Russell
2000 Covered
Call & Growth
ETF |
| Investment Income: | | | | | | | | | | | | | | | | |
| Dividend Income | | $ | 54,361 | | | $ | 146,706 | | | $ | 1,533,170 | | | $ | 50,589 | |
| Interest Income | | | 100 | | | | 474 | | | | 4 | | | | 496 | |
| Less: Foreign Taxes Withheld | | | (15 | ) | | | (12,695 | ) | | | — | | | | — | |
| Total Investment Income | | | 54,446 | | | | 134,485 | | | | 1,533,174 | | | | 51,085 | |
| Expenses: | | | | | | | | | | | | | | | | |
| Supervision and Administration Fees(1) | | | 18,014 | | | | 32,635 | | | | 426,787 | | | | 19,007 | |
| Custodian Fees(2) | | | (40 | ) | | | 233 | | | | 717 | | | | 4 | |
| Total Expenses | | | 17,974 | | | | 32,868 | | | | 427,504 | | | | 19,011 | |
| Waiver of Supervision and Administration Fees | | | — | | | | — | | | | — | | | | (3,203 | ) |
| Net Expenses | | | 17,974 | | | | 32,868 | | | | 427,504 | | | | 15,808 | |
| Net Investment Income | | | 36,472 | | | | 101,617 | | | | 1,105,670 | | | | 35,277 | |
| Net Realized Gain (Loss) on: | | | | | | | | | | | | | | | | |
| Investments(3) | | | 46,069 | | | | (859,911 | ) | | | 904,467 | | | | 34,977 | |
| Purchased Options | | | (324,007 | ) | | | — | | | | — | | | | 58,285 | |
| Written Options | | | (9,885 | ) | | | — | | | | (1,826,622 | ) | | | (113,636 | ) |
| Foreign Currency Transactions | | | — | | | | (1,397 | ) | | | — | | | | — | |
| Net Realized Gain (Loss) | | | (287,823 | ) | | | (861,308 | ) | | | (922,155 | ) | | | (20,374 | ) |
| Net Change in Unrealized Appreciation (Depreciation) on: | | | | | | | | | | | | | | | | |
| Investments | | | 302,236 | | | | (1,250,525 | ) | | | (555,992 | ) | | | (407,948 | ) |
| Purchased Options | | | 87,783 | | | | — | | | | — | | | | — | |
| Written Options | | | (19,919 | ) | | | — | | | | 2,152,614 | | | | 98,488 | |
| Foreign Currency Translations | | | — | | | | 47 | | | | — | | | | 2 | |
| Net Change in Unrealized Appreciation (Depreciation) | | | 370,100 | | | | (1,250,478 | ) | | | 1,596,622 | | | | (309,458 | ) |
| Net Realized and Unrealized Gain (Loss) | | | 82,277 | | | | (2,111,786 | ) | | | 674,467 | | | | (329,832 | ) |
| Net Increase (Decrease) in Net Assets Resulting from Operations | | $ | 118,749 | | | $ | (2,010,169 | ) | | $ | 1,780,137 | | | $ | (294,555 | ) |
| | |
| (1) | The Supervision and Administration fees includes fees paid by the Funds for the investment advisory services provided by the Adviser. (See Note 3 in Notes to Financial Statements.) |
| (2) | See Note 2 in the Notes to Financial Statements. |
| (3) | Includes realized gains (losses) as a result of in-kind redemptions. (See Note 4 in Notes to Financial Statements.) |
The accompanying notes are an integral part of the financial statements.
395
Statements of Operations
For the year ended October 31, 2023
| | | Global X
Financials
Covered Call &
Growth ETF(1) | | Global X Health
Care Covered
Call & Growth
ETF(1) | | Global X
Information
Technology
Covered Call &
Growth ETF(1) | | Global X
NASDAQ 100®
ESG Covered
Call ETF(2) |
| Investment Income: | | | | | | | | | | | | | | | | |
| Dividend Income | | $ | 46,668 | | | $ | 41,507 | | | $ | 26,988 | | | $ | 14,296 | |
| Interest Income | | | 175 | | | | 207 | | | | 247 | | | | 267 | |
| Less: Foreign Taxes Withheld | | | — | | | | — | | | | (25 | ) | | | (41 | ) |
| Total Investment Income | | | 46,843 | | | | 41,714 | | | | 27,210 | | | | 14,522 | |
| Expenses: | | | | | | | | | | | | | | | | |
| Supervision and Administration Fees(3) | | | 13,353 | | | | 14,682 | | | | 16,835 | | | | 10,681 | |
| Custodian Fees(4) | | | 34 | | | | 68 | | | | 40 | | | | 117 | |
| Total Expenses | | | 13,387 | | | | 14,750 | | | | 16,875 | | | | 10,798 | |
| Waiver of Supervision and Administration Fees | | | (1,234 | ) | | | (1,345 | ) | | | (1,541 | ) | | | — | |
| Net Expenses | | | 12,153 | | | | 13,405 | | | | 15,334 | | | | 10,798 | |
| Net Investment Income | | | 34,690 | | | | 28,309 | | | | 11,876 | | | | 3,724 | |
| Net Realized Gain (Loss) on: | | | | | | | | | | | | | | | | |
| Investments(5) | | | (45,141 | ) | | | 8,472 | | | | 76,179 | | | | 387,311 | |
| Purchased Options | | | (5,881 | ) | | | 3,570 | | | | (71,239 | ) | | | 47,797 | |
| Written Options | | | 29,786 | | | | 98,708 | | | | (40,979 | ) | | | (353,184 | ) |
| Net Realized Gain (Loss) | | | (21,236 | ) | | | 110,750 | | | | (36,039 | ) | | | 81,924 | |
| Net Change in Unrealized Appreciation (Depreciation) on: | | | | | | | | | | | | | | | | |
| Investments | | | (162,839 | ) | | | (213,358 | ) | | | 543,910 | | | | 119,287 | |
| Written Options | | | 18,484 | | | | 18,228 | | | | 30,047 | | | | 32,703 | |
| Net Change in Unrealized Appreciation (Depreciation) | | | (144,355 | ) | | | (195,130 | ) | | | 573,957 | | | | 151,990 | |
| Net Realized and Unrealized Gain (Loss) | | | (165,591 | ) | | | (84,380 | ) | | | 537,918 | | | | 233,914 | |
| Net Increase (Decrease) in Net Assets Resulting from Operations | | $ | (130,901 | ) | | $ | (56,071 | ) | | $ | 549,794 | | | $ | 237,638 | |
| | |
| (1) | The Fund commenced operations on November 21, 2022. |
| (2) | The Fund commenced operations on February 21, 2023. |
| (3) | The Supervision and Administration fees includes fees paid by the Funds for the investment advisory services provided by the Adviser. (See Note 3 in Notes to Financial Statements.) |
| (4) | See Note 2 in the Notes to Financial Statements. |
| (5) | Includes realized gains (losses) as a result of in-kind redemptions. (See Note 4 in Notes to Financial Statements.) |
The accompanying notes are an integral part of the financial statements.
396
Statements of Operations
For the year ended October 31, 2023
| | | Global X S&P
500® ESG
Covered Call
ETF(1) | | Global X Dow
30® Covered
Call & Growth
ETF(2) |
| Investment Income: | | | | | | | | |
| Dividend Income | | $ | 27,410 | | | $ | 13,535 | |
| Interest Income | | | 193 | | | | 41 | |
| Less: Foreign Taxes Withheld | | | (7 | ) | | | — | |
| Total Investment Income | | | 27,596 | | | | 13,576 | |
| Expenses: | | | | | | | | |
| Supervision and Administration Fees(3) | | | 10,311 | | | | 4,004 | |
| Custodian Fees(4) | | | 14 | | | | 6 | |
| Total Expenses | | | 10,325 | | | | 4,010 | |
| Net Investment Income | | | 17,271 | | | | 9,566 | |
| Net Realized Gain (Loss) on: | | | | | | | | |
| Investments(5) | | | 151,452 | | | | (225 | ) |
| Purchased Options | | | 82,789 | | | | 26,362 | |
| Written Options | | | (258,808 | ) | | | 3,701 | |
| Net Realized Gain (Loss) | | | (24,567 | ) | | | 29,838 | |
| Net Change in Unrealized Appreciation (Depreciation) on: | | | | | | | | |
| Investments | | | 29,197 | | | | (174,677 | ) |
| Written Options | | | 23,057 | | | | (1,844 | ) |
| Net Change in Unrealized Appreciation (Depreciation) | | | 52,254 | | | | (176,521 | ) |
| Net Realized and Unrealized Gain (Loss) | | | 27,687 | | | | (146,683 | ) |
| Net Increase (Decrease) in Net Assets Resulting from Operations | | $ | 44,958 | | | $ | (137,117 | ) |
| | |
| (1) | The Fund commenced operations on February 21, 2023. |
| (2) | The Fund commenced operations on July 25, 2023. |
| (3) | The Supervision and Administration fees includes fees paid by the Funds for the investment advisory services provided by the Adviser. (See Note 3 in Notes to Financial Statements.) |
| (4) | See Note 2 in the Notes to Financial Statements. |
| (5) | Includes realized gains (losses) as a result of in-kind redemptions. (See Note 4 in Notes to Financial Statements.) |
The accompanying notes are an integral part of the financial statements.
397
Statements of Changes in Net Assets
| | | Global X Lithium & Battery Tech
ETF | | Global X SuperDividend® ETF‡ |
| | | Year Ended
October 31, 2023 | | Year Ended
October 31, 2022 | | Year Ended
October 31, 2023 | | Year Ended
October 31, 2022 |
| Operations: | | | | | | | | | | | | | | | | |
| Net Investment Income | | $ | 30,111,235 | | | $ | 16,046,131 | | | $ | 68,823,124 | | | $ | 60,797,461 | |
| Net Realized Gain (Loss) | | | (290,890,467 | ) | | | (90,735,668 | ) | | | (178,018,530 | ) | | | (161,604,111 | ) |
| Net Change in Unrealized Appreciation (Depreciation) | | | (678,297,668 | ) | | | (1,486,392,494 | ) | | | 101,559,825 | | | | (229,713,972 | ) |
| Net Decrease in Net Assets Resulting from Operations | | | (939,076,900 | ) | | | (1,561,082,031 | ) | | | (7,635,581 | ) | | | (330,520,622 | ) |
| Distributions: | | | (38,976,032 | ) | | | (13,550,903 | ) | | | (71,554,165 | ) | | | (68,726,670 | ) |
| Return of Capital: | | | — | | | | — | | | | (17,865,200 | ) | | | (25,091,152 | ) |
| Capital Share Transactions: | | | | | | | | | | | | | | | | |
| Issued | | | 18,655,425 | | | | 987,083,874 | | | | 134,701,260 | | | | 193,866,024 | |
| Redeemed | | | (844,321,195 | ) | | | (888,340,328 | ) | | | (14,814,220 | ) | | | (23,680,516 | ) |
| Increase (Decrease) in Net Assets from Capital Share Transactions | | | (825,665,770 | ) | | | 98,743,546 | | | | 119,887,040 | | | | 170,185,508 | |
| Total Increase (Decrease) in Net Assets | | | (1,803,718,702 | ) | | | (1,475,889,388 | ) | | | 22,832,094 | | | | (254,152,936 | ) |
| Net Assets: | | | | | | | | | | | | | | | | |
| Beginning of Year | | | 3,899,509,347 | | | | 5,375,398,735 | | | | 676,278,536 | | | | 930,431,472 | |
| End of Year | | $ | 2,095,790,645 | | | $ | 3,899,509,347 | | | $ | 699,110,630 | | | $ | 676,278,536 | |
| Share Transactions: | | | | | | | | | | | | | | | | |
| Issued | | | 270,000 | | | | 11,480,000 | | | | 5,620,000 | | | | 6,286,667 | |
| Redeemed | | | (14,070,000 | ) | | | (12,420,000 | ) | | | (613,921 | ) | | | (796,667 | ) |
| Net Increase (Decrease) in Shares Outstanding from Share Transactions | | | (13,800,000 | ) | | | (940,000 | ) | | | 5,006,079 | | | | 5,490,000 | |
| ‡ | Share transactions have been adjusted to reflect the effect of a 1 for 3 reverse share split on December 19, 2022 (See Note 9 in the Notes to Financial Statements). |
The accompanying notes are an integral part of the financial statements.
398
Statements of Changes in Net Assets
| | | Global X Social Media ETF | | Global X Guru® Index ETF |
| | | Year Ended
October 31, 2023 | | Year Ended
October 31, 2022 | | Year Ended
October 31, 2023 | | Year Ended
October 31, 2022 |
| Operations: | | | | | | | | | | | | | | | | |
| Net Investment Income | | $ | 726,536 | | | $ | 147,637 | | | $ | 163,577 | | | $ | 9,277 | |
| Net Realized Gain (Loss) | | | (23,504,299 | ) | | | (59,049,029 | ) | | | (2,729,202 | ) | | | (10,085,129 | ) |
| Net Change in Unrealized Appreciation (Depreciation) | | | 64,247,712 | | | | (148,544,746 | ) | | | 3,924,121 | | | | (14,494,976 | ) |
| Net Increase (Decrease) in Net Assets Resulting from Operations | | | 41,469,949 | | | | (207,446,138 | ) | | | 1,358,496 | | | | (24,570,828 | ) |
| Distributions: | | | (696,865 | ) | | | — | | | | (140,340 | ) | | | (14,584 | ) |
| Return of Capital: | | | — | | | | (663,636 | ) | | | (13,339 | ) | | | (63,227 | ) |
| Capital Share Transactions: | | | | | | | | | | | | | | | | |
| Issued | | | 50,133,051 | | | | 4,148,772 | | | | — | | | | 2,097,530 | |
| Redeemed | | | (53,754,585 | ) | | | (94,686,332 | ) | | | (5,982,656 | ) | | | (6,769,839 | ) |
| Decrease in Net Assets from Capital Share Transactions | | | (3,621,534 | ) | | | (90,537,560 | ) | | | (5,982,656 | ) | | | (4,672,309 | ) |
| Total Increase (Decrease) in Net Assets | | | 37,151,550 | | | | (298,647,334 | ) | | | (4,777,839 | ) | | | (29,320,948 | ) |
| Net Assets: | | | | | | | | | | | | | | | | |
| Beginning of Year | | | 103,245,446 | | | | 401,892,780 | | | | 46,535,087 | | | | 75,856,035 | |
| End of Year | | $ | 140,396,996 | | | $ | 103,245,446 | | | $ | 41,757,248 | | | $ | 46,535,087 | |
| Share Transactions: | | | | | | | | | | | | | | | | |
| Issued | | | 1,400,000 | | | | 130,000 | | | | — | | | | 50,000 | |
| Redeemed | | | (1,510,000 | ) | | | (2,540,000 | ) | | | (170,000 | ) | | | (170,000 | ) |
| Net Decrease in Shares Outstanding from Share Transactions | | | (110,000 | ) | | | (2,410,000 | ) | | | (170,000 | ) | | | (120,000 | ) |
The accompanying notes are an integral part of the financial statements.
399
Statements of Changes in Net Assets
| | | Global X SuperIncome™ Preferred
ETF | | Global X SuperDividend® U.S. ETF |
| | | Year Ended
October 31, 2023 | | Year Ended
October 31, 2022 | | Year Ended
October 31, 2023 | | Year Ended
October 31, 2022 |
| Operations: | | | | | | | | |
| Net Investment Income | | $ | 12,482,160 | | | $ | 10,604,029 | | | $ | 24,850,832 | | | $ | 23,270,439 | |
| Net Realized Gain (Loss) | | | (35,344,694 | ) | | | (9,393,788 | ) | | | (40,314,161 | ) | | | 64,409,036 | |
| Net Change in Unrealized Appreciation (Depreciation) | | | 4,801,453 | | | | (32,526,988 | ) | | | (69,852,699 | ) | | | (82,329,930 | ) |
| Net Increase (Decrease) in Net Assets Resulting from Operations | | | (18,061,081 | ) | | | (31,316,747 | ) | | | (85,316,028 | ) | | | 5,349,545 | |
| Distributions: | | | (12,843,440 | ) | | | (12,532,497 | ) | | | (32,670,182 | ) | | | (27,892,254 | ) |
| Return of Capital: | | | — | | | | (653,473 | ) | | | (12,029,058 | ) | | | (13,969,909 | ) |
| Capital Share Transactions: | | | | | | | | | | | | | | | | |
| Issued | | | 28,847,405 | | | | 24,951,801 | | | | 151,410,242 | | | | 157,123,738 | |
| Redeemed | | | (35,612,035 | ) | | | (20,242,558 | ) | | | (114,359,782 | ) | | | (106,481,128 | ) |
| Increase (Decrease) in Net Assets from Capital Share Transactions | | | (6,764,630 | ) | | | 4,709,243 | | | | 37,050,460 | | | | 50,642,610 | |
| Total Increase (Decrease) in Net Assets | | | (37,669,151 | ) | | | (39,793,474 | ) | | | (92,964,808 | ) | | | 14,129,992 | |
| Net Assets: | | | | | | | | | | | | | | | | |
| Beginning of Year | | | 195,159,250 | | | | 234,952,724 | | | | 683,864,308 | | | | 669,734,316 | |
| End of Year | | $ | 157,490,099 | | | $ | 195,159,250 | | | $ | 590,899,500 | | | $ | 683,864,308 | |
| Share Transactions: | | | | | | | | | | | | | | | | |
| Issued | | | 2,990,000 | | | | 2,370,000 | | | | 8,650,000 | | | | 7,750,000 | |
| Redeemed | | | (3,980,000 | ) | | | (1,870,000 | ) | | | (6,490,000 | ) | | | (5,360,000 | ) |
| Net Increase (Decrease) in Shares Outstanding from Share Transactions | | | (990,000 | ) | | | 500,000 | | | | 2,160,000 | | | | 2,390,000 | |
The accompanying notes are an integral part of the financial statements.
400
Statements of Changes in Net Assets
| | | Global X S&P 500® Covered Call
ETF | | Global X NASDAQ 100® Covered
Call ETF |
| | | Year Ended
October 31, 2023 | | Year Ended
October 31, 2022 | | Year Ended
October 31, 2023 | | Year Ended
October 31, 2022 |
| Operations: | | | | | | | | |
| Net Investment Income | | $ | 27,392,869 | | | $ | 14,116,473 | | | $ | 22,396,738 | | | $ | 16,191,726 | |
| Net Realized Gain (Loss) | | | (233,680,467 | ) | | | 36,092,173 | | | | (991,313,251 | ) | | | 375,062,659 | |
| Net Change in Unrealized Appreciation (Depreciation) | | | 340,702,585 | | | | (253,367,614 | ) | | | 1,973,695,038 | | | | (1,812,074,096 | ) |
| Net Increase (Decrease) in Net Assets Resulting from Operations | | | 134,414,987 | | | | (203,158,968 | ) | | | 1,004,778,525 | | | | (1,420,819,711 | ) |
| Distributions: | | | (8,585,958 | ) | | | (35,714,783 | ) | | | — | | | | (211,906,795 | ) |
| Return of Capital: | | | (269,122,735 | ) | | | (133,893,882 | ) | | | (875,982,507 | ) | | | (642,111,562 | ) |
| Capital Share Transactions: | | | | | | | | | | | | | | | | |
| Issued | | | 1,162,324,728 | | | | 1,708,732,044 | | | | 1,525,390,555 | | | | 4,057,801,963 | |
| Redeemed | | | (148,370,274 | ) | | | (71,274,199 | ) | | | (530,621,484 | ) | | | (421,530,332 | ) |
| Increase in Net Assets from Capital Share Transactions | | | 1,013,954,454 | | | | 1,637,457,845 | | | | 994,769,071 | | | | 3,636,271,631 | |
| Total Increase in Net Assets | | | 870,660,748 | | | | 1,264,690,212 | | | | 1,123,565,089 | | | | 1,361,433,563 | |
| Net Assets: | | | | | | | | | | | | | | | | |
| Beginning of Year | | | 1,934,545,080 | | | | 669,854,868 | | | | 6,397,648,310 | | | | 5,036,214,747 | |
| End of Year | | $ | 2,805,205,828 | | | $ | 1,934,545,080 | | | $ | 7,521,213,399 | | | $ | 6,397,648,310 | |
| Share Transactions: | | | | | | | | | | | | | | | | |
| Issued | | | 28,790,000 | | | | 36,750,000 | | | | 88,410,000 | | | | 200,110,000 | |
| Redeemed | | | (3,670,000 | ) | | | (1,690,000 | ) | | | (31,540,000 | ) | | | (24,700,000 | ) |
| Net Increase in Shares Outstanding from Share Transactions | | | 25,120,000 | | | | 35,060,000 | | | | 56,870,000 | | | | 175,410,000 | |
The accompanying notes are an integral part of the financial statements.
401
Statements of Changes in Net Assets
| | | Global X MSCI SuperDividend®
Emerging Markets ETF‡ | | Global X SuperDividend® REIT
ETF‡ |
| | | Year Ended
October 31, 2023 | | Year Ended
October 31, 2022 | | Year Ended
October 31, 2023 | | Year Ended
October 31, 2022 |
| Operations: | | | | | | | | | | | | | | | | |
| Net Investment Income | | $ | 3,538,333 | | | $ | 3,889,079 | | | $ | 15,816,112 | | | $ | 16,107,768 | |
| Net Realized Gain (Loss) | | | (7,396,703 | ) | | | (15,697,196 | ) | | | (30,591,783 | ) | | | 13,963,202 | |
| Net Change in Unrealized Appreciation (Depreciation) | | | 9,203,211 | | | | (11,715,946 | ) | | | 769,596 | | | | (114,883,784 | ) |
| Net Increase (Decrease) in Net Assets Resulting from Operations | | | 5,344,841 | | | | (23,524,063 | ) | | | (14,006,075 | ) | | | (84,812,814 | ) |
| Distributions: | | | (3,319,170 | ) | | | (5,018,224 | ) | | | (13,547,728 | ) | | | (15,789,114 | ) |
| Return of Capital: | | | — | | | | (1,057,591 | ) | | | (6,960,250 | ) | | | (9,960,386 | ) |
| Capital Share Transactions: | | | | | | | | | | | | | | | | |
| Issued | | | 2,345,719 | | | | 23,410,044 | | | | 15,653,093 | | | | 2,797,978 | |
| Redeemed | | | (1,965,623 | ) | | | (17,338,196 | ) | | | (50,140,564 | ) | | | (73,515,296 | ) |
| Increase (Decrease) in Net Assets from Capital Share Transactions | | | 380,096 | | | | 6,071,848 | | | | (34,487,471 | ) | | | (70,717,318 | ) |
| Total Increase (Decrease) in Net Assets | | | 2,405,767 | | | | (23,528,030 | ) | | | (69,001,524 | ) | | | (181,279,632 | ) |
| Net Assets: | | | | | | | | | | | | | | | | |
| Beginning of Year | | | 39,168,134 | | | | 62,696,164 | | | | 286,654,636 | | | | 467,934,268 | |
| End of Year | | $ | 41,573,901 | | | $ | 39,168,134 | | | $ | 217,653,112 | | | $ | 286,654,636 | |
| Share Transactions: | | | | | | | | | | | | | | | | |
| Issued | | | 96,667 | | | | 720,000 | | | | 740,000 | | | | 113,333 | |
| Redeemed | | | (80,819 | ) | | | (743,333 | ) | �� | | (2,324,140 | ) | | | (2,750,000 | ) |
| Net Increase (Decrease) in Shares Outstanding from Share Transactions | | | 15,848 | | | | (23,333 | ) | | | (1,584,140 | ) | | | (2,636,667 | ) |
| | |
| ‡ | Share transactions have been adjusted to reflect the effect of a 1 for 3 reverse share split on December 19, 2022 (See Note 9 in the Notes to Financial Statements). |
The accompanying notes are an integral part of the financial statements.
402
Statements of Changes in Net Assets
| | | Global X Renewable Energy
Producers ETF | | Global X S&P 500® Catholic Values
ETF |
| | | Year Ended
October 31, 2023 | | Year Ended
October 31, 2022 | | Year Ended
October 31, 2023 | | Year Ended
October 31, 2022 |
| Operations: | | | | | | | | |
| Net Investment Income | | $ | 845,464 | | | $ | 1,183,661 | | | $ | 8,138,111 | | | $ | 6,853,787 | |
| Net Realized Gain (Loss) | | | (9,862,211 | ) | | | 939,711 | | | | 11,684,291 | | | | 21,294,231 | |
| Net Change in Unrealized Appreciation (Depreciation) | | | (10,198,855 | ) | | | (31,396,085 | ) | | | 30,978,489 | | | | (137,525,098 | ) |
| Net Increase (Decrease) in Net Assets Resulting from Operations | | | (19,215,602 | ) | | | (29,272,713 | ) | | | 50,800,891 | | | | (109,377,080 | ) |
| Distributions: | | | (839,231 | ) | | | (1,233,925 | ) | | | (7,699,184 | ) | | | (7,163,403 | ) |
| Capital Share Transactions: | | | | | | | | | | | | | | | | |
| Issued | | | 2,633,738 | | | | 31,092,956 | | | | 119,238,821 | | | | 145,015,222 | |
| Redeemed | | | (29,751,744 | ) | | | (56,593,086 | ) | | | (39,830,981 | ) | | | (73,172,445 | ) |
| Increase (Decrease) in Net Assets from Capital Share Transactions | | | (27,118,006 | ) | | | (25,500,130 | ) | | | 79,407,840 | | | | 71,842,777 | |
| Total Increase (Decrease) in Net Assets | | | (47,172,839 | ) | | | (56,006,768 | ) | | | 122,509,547 | | | | (44,697,706 | ) |
| Net Assets: | | | | | | | | | | | | | | | | |
| Beginning of Year | | | 90,969,526 | | | | 146,976,294 | | | | 549,287,646 | | | | 593,985,352 | |
| End of Year | | $ | 43,796,687 | | | $ | 90,969,526 | | | $ | 671,797,193 | | | $ | 549,287,646 | |
| Share Transactions: | | | | | | | | | | | | | | | | |
| Issued | | | 200,000 | | | | 2,050,000 | | | | 2,350,000 | | | | 2,730,000 | |
| Redeemed | | | (2,460,000 | ) | | | (3,820,000 | ) | | | (790,000 | ) | | | (1,470,000 | ) |
| Net Increase (Decrease) in Shares Outstanding from Share Transactions | | | (2,260,000 | ) | | | (1,770,000 | ) | | | 1,560,000 | | | | 1,260,000 | |
The accompanying notes are an integral part of the financial statements.
403
Statements of Changes in Net Assets
| | | Global X MSCI SuperDividend®
EAFE ETF | | Global X E-commerce ETF |
| | | Year Ended
October 31, 2023 | | Year Ended
October 31, 2022 | | Year Ended
October 31, 2023 | | Year Ended
October 31, 2022 |
| Operations: | | | | | | | | | | | | | | | | |
| Net Investment Income (Loss) | | $ | 638,408 | | | $ | 769,620 | | | $ | (11,415 | ) | | $ | 362,843 | |
| Net Realized Gain (Loss) | | | (834,267 | ) | | | 160,842 | | | | (17,240,809 | ) | | | (31,325,250 | ) |
| Net Change in Unrealized Appreciation (Depreciation) | | | 1,357,260 | | | | (2,899,393 | ) | | | 20,074,893 | | | | (50,085,062 | ) |
| Net Increase (Decrease) in Net Assets Resulting from Operations | | | 1,161,401 | | | | (1,968,931 | ) | | | 2,822,669 | | | | (81,047,469 | ) |
| Distributions: | | | (736,065 | ) | | | (742,260 | ) | | | — | | | | (897,920 | ) |
| Return of Capital: | | | — | | | | — | | | | (42,666 | ) | | | (66,565 | ) |
| Capital Share Transactions: | | | | | | | | | | | | | | | | |
| Issued | | | 3,052,141 | | | | 135,570 | | | | 33,960,916 | | | | 21,458,714 | |
| Redeemed | | | (1,779,069 | ) | | | (3,098,512 | ) | | | (16,912,892 | ) | | | (94,957,434 | ) |
| Increase (Decrease) in Net Assets from Capital Share Transactions | | | 1,273,072 | | | | (2,962,942 | ) | | | 17,048,024 | | | | (73,498,720 | ) |
| Total Increase (Decrease) in Net Assets | | | 1,698,408 | | | | (5,674,133 | ) | | | 19,828,027 | | | | (155,510,674 | ) |
| Net Assets: | | | | | | | | | | | | | | | | |
| Beginning of Year | | | 8,383,568 | | | | 14,057,701 | | | | 42,240,518 | | | | 197,751,192 | |
| End of Year | | $ | 10,081,976 | | | $ | 8,383,568 | | | $ | 62,068,545 | | | $ | 42,240,518 | |
| Share Transactions: | | | | | | | | | | | | | | | | |
| Issued | | | 220,000 | | | | 10,000 | | | | 1,830,000 | | | | 1,000,000 | |
| Redeemed | | | (130,000 | ) | | | (210,000 | ) | | | (960,000 | ) | | | (4,550,000 | ) |
| Net Increase (Decrease) in Shares Outstanding from Share Transactions | | | 90,000 | | | | (200,000 | ) | | | 870,000 | | | | (3,550,000 | ) |
The accompanying notes are an integral part of the financial statements.
404
Statements of Changes in Net Assets
| | | Global X Russell 2000 Covered
Call ETF | | Global X S&P Catholic Values
Developed ex-U.S. ETF |
| | | Year Ended
October 31, 2023 | | Year Ended
October 31, 2022 | | Year Ended
October 31, 2023 | | Year Ended
October 31, 2022 |
| Operations: | | | | | | | | | | | | | | | | |
| Net Investment Income | | $ | 15,090,879 | | | $ | 9,603,123 | | | $ | 343,263 | | | $ | 150,316 | |
| Net Realized Gain (Loss) | | | (69,751,640 | ) | | | (76,256,194 | ) | | | (309,284 | ) | | | (113,203 | ) |
| Net Change in Unrealized Appreciation (Depreciation) | | | (56,574,026 | ) | | | (86,371,791 | ) | | | 257,408 | | | | (1,701,489 | ) |
| Net Increase (Decrease) in Net Assets Resulting from Operations | | | (111,234,787 | ) | | | (153,024,862 | ) | | | 291,387 | | | | (1,664,376 | ) |
| Distributions: | | | (2,455,329 | ) | | | (32,998,311 | ) | | | (253,178 | ) | | | (203,751 | ) |
| Return of Capital: | | | (170,194,451 | ) | | | (105,055,357 | ) | | | — | | | | — | |
| Capital Share Transactions: | | | | | | | | | | | | | | | | |
| Issued | | | 488,673,691 | | | | 1,143,457,691 | | | | 8,854,084 | | | | 3,196,433 | |
| Redeemed | | | (140,992,543 | ) | | | (64,583,797 | ) | | | — | | | | — | |
| Increase in Net Assets from Capital Share Transactions | | | 347,681,148 | | | | 1,078,873,894 | | | | 8,854,084 | | | | 3,196,433 | |
| Total Increase in Net Assets | | | 63,796,581 | | | | 787,795,364 | | | | 8,892,293 | | | | 1,328,306 | |
| Net Assets: | | | | | | | | | | | | | | | | |
| Beginning of Year | | | 1,342,241,164 | | | | 554,445,800 | | | | 5,592,322 | | | | 4,264,016 | |
| End of Year | | $ | 1,406,037,745 | | | $ | 1,342,241,164 | | | $ | 14,484,615 | | | $ | 5,592,322 | |
| Share Transactions: | | | | | | | | | | | | | | | | |
| Issued | | | 26,620,000 | | | | 49,770,000 | | | | 320,000 | | | | 110,000 | |
| Redeemed | | | (7,940,000 | ) | | | (3,140,000 | ) | | | — | | | | — | |
| Net Increase in Shares Outstanding from Share Transactions | | | 18,680,000 | | | | 46,630,000 | | | | 320,000 | | | | 110,000 | |
The accompanying notes are an integral part of the financial statements.
405
Statements of Changes in Net Assets
| | | Global X Nasdaq 100® Covered
Call & Growth ETF | | Global X S&P 500® Covered Call &
Growth ETF |
| | | Year Ended
October 31, 2023 | | Year Ended
October 31, 2022 | | Year Ended
October 31, 2023 | | Year Ended
October 31, 2022 |
| Operations: | | | | | | | | | | | | | | | | |
| Net Investment Income | | $ | 216,859 | | | $ | 131,719 | | | $ | 562,614 | | | $ | 357,976 | |
| Net Realized Gain (Loss) | | | (7,451,747 | ) | | | 3,303,859 | | | | 108,169 | | | | 2,410,750 | |
| Net Change in Unrealized Appreciation (Depreciation) | | | 20,210,906 | | | | (19,860,737 | ) | | | 2,932,803 | | | | (7,710,275 | ) |
| Net Increase (Decrease) in Net Assets Resulting from Operations | | | 12,976,018 | | | | (16,425,159 | ) | | | 3,603,586 | | | | (4,941,549 | ) |
| Distributions: | | | — | | | | (3,262,405 | ) | | | (376,487 | ) | | | (1,865,684 | ) |
| Return of Capital: | | | (4,776,529 | ) | | | (2,741,520 | ) | | | (2,498,448 | ) | | | (1,465,030 | ) |
| Capital Share Transactions: | | | | | | | | | | | | | | | | |
| Issued | | | 38,046,832 | | | | 55,565,131 | | | | 37,732,859 | | | | 28,875,885 | |
| Redeemed | | | (5,172,322 | ) | | | (16,702,729 | ) | | | (18,965,715 | ) | | | (14,111,207 | ) |
| Increase in Net Assets from Capital Share Transactions | | | 32,874,510 | | | | 38,862,402 | | | | 18,767,144 | | | | 14,764,678 | |
| Total Increase in Net Assets | | | 41,073,999 | | | | 16,433,318 | | | | 19,495,795 | | | | 6,492,415 | |
| Net Assets: | | | | | | | | | | | | | | | | |
| Beginning of Year | | | 61,104,688 | | | | 44,671,370 | | | | 41,510,539 | | | | 35,018,124 | |
| End of Year | | $ | 102,178,687 | | | $ | 61,104,688 | | | $ | 61,006,334 | | | $ | 41,510,539 | |
| Share Transactions: | | | | | | | | | | | | | | | | |
| Issued | | | 1,430,000 | | | | 1,900,000 | | | | 1,400,000 | | | | 1,020,000 | |
| Redeemed | | | (190,000 | ) | | | (570,000 | ) | | | (690,000 | ) | | | (490,000 | ) |
| Net Increase in Shares Outstanding from Share Transactions | | | 1,240,000 | | | | 1,330,000 | | | | 710,000 | | | | 530,000 | |
The accompanying notes are an integral part of the financial statements.
406
Statements of Changes in Net Assets
| | | Global X Emerging Markets
Internet & E-commerce ETF‡ | | Global X NASDAQ 100® Tail Risk
ETF |
| | | Year Ended
October 31, 2023 | | Year Ended
October 31, 2022 | | Year Ended
October 31, 2023 | | Year Ended
October 31, 2022 |
| Operations: | | | | | | | | | | | | | | | | |
| Net Investment Income | | $ | 5,800 | | | $ | 4,302 | | | $ | 5,298 | | | $ | 5,325 | |
| Net Realized Gain (Loss) | | | (306,295 | ) | | | (1,482,571 | ) | | | (265,723 | ) | | | (64,066 | ) |
| Net Change in Unrealized Appreciation (Depreciation) | | | 738,240 | | | | (927,019 | ) | | | 517,504 | | | | (720,494 | ) |
| Net Increase (Decrease) in Net Assets Resulting from Operations | | | 437,745 | | | | (2,405,288 | ) | | | 257,079 | | | | (779,235 | ) |
| Distributions: | | | (5,946 | ) | | | — | | | | (4,771 | ) | | | (66,715 | ) |
| Return of Capital: | | | (1,727 | ) | | | (9,979 | ) | | | — | | | | — | |
| Capital Share Transactions: | | | | | | | | | | | | | | | | |
| Issued | | | — | | | | — | | | | — | | | | 1,394,296 | |
| Redeemed | | | (2,821 | ) | | | (173,768 | ) | | | (797,923 | ) | | | (1,966,628 | ) |
| Decrease in Net Assets from Capital Share Transactions | | | (2,821 | ) | | | (173,768 | ) | | | (797,923 | ) | | | (572,332 | ) |
| Total Increase (Decrease) in Net Assets | | | 427,251 | | | | (2,589,035 | ) | | | (545,615 | ) | | | (1,418,282 | ) |
| Net Assets: | | | | | | | | | | | | | | | | |
| Beginning of Year | | | 1,966,169 | | | | 4,555,204 | | | | 1,907,984 | | | | 3,326,266 | |
| End of Year | | $ | 2,393,420 | | | $ | 1,966,169 | | | $ | 1,362,369 | | | $ | 1,907,984 | |
| Share Transactions: | | | | | | | | | | | | | | | | |
| Issued | | | — | | | | — | | | | — | | | | 60,000 | |
| Redeemed | | | (129 | ) | | | (6,667 | ) | | | (40,000 | ) | | | (90,000 | ) |
| Net Decrease in Shares Outstanding from Share Transactions | | | (129 | ) | | | (6,667 | ) | | | (40,000 | ) | | | (30,000 | ) |
| | |
| ‡ | Share transactions have been adjusted to reflect the effect of a 1 for 3 reverse share split on December 19, 2022. (See Note 9 in the Notes to Financial Statements.) |
The accompanying notes are an integral part of the financial statements.
407
Statements of Changes in Net Assets
| | | Global X NASDAQ 100® Risk
Managed Income ETF | | Global X NASDAQ 100® Collar
95-110 ETF |
| | | Year Ended
October 31, 2023 | | Year Ended
October 31, 2022 | | Year Ended
October 31, 2023 | | Year Ended
October 31, 2022 |
| Operations: | | | | | | | | | | | | | | | | |
| Net Investment Income | | $ | 29,997 | | | $ | 20,521 | | | $ | 9,816 | | | $ | 6,905 | |
| Net Realized Gain (Loss) | | | (3,412,973 | ) | | | 961,113 | | | | (679,364 | ) | | | 509,677 | |
| Net Change in Unrealized Appreciation (Depreciation) | | | 3,554,002 | | | | (3,382,166 | ) | | | 881,750 | | | | (1,083,002 | ) |
| Net Increase (Decrease) in Net Assets Resulting from Operations | | | 171,026 | | | | (2,400,532 | ) | | | 212,202 | | | | (566,420 | ) |
| Distributions: | | | — | | | | (128,024 | ) | | | (8,877 | ) | | | (57,957 | ) |
| Return of Capital: | | | (1,196,718 | ) | | | (869,114 | ) | | | — | | | | — | |
| Capital Share Transactions: | | | | | | | | | | | | | | | | |
| Issued | | | 4,456,197 | | | | 15,545,690 | | | | — | | | | 1,741,889 | |
| Redeemed | | | (2,337,483 | ) | | | (5,769,910 | ) | | | (1,171,831 | ) | | | (873,233 | ) |
| Increase (Decrease) in Net Assets from Capital Share Transactions | | | 2,118,714 | | | | 9,775,780 | | | | (1,171,831 | ) | | | 868,656 | |
| Total Increase (Decrease) in Net Assets | | | 1,093,022 | | | | 6,378,110 | | | | (968,506 | ) | | | 244,279 | |
| Net Assets: | | | | | | | | | | | | | | | | |
| Beginning of Year | | | 10,719,550 | | | | 4,341,440 | | | | 3,080,540 | | | | 2,836,261 | |
| End of Year | | $ | 11,812,572 | | | $ | 10,719,550 | | | $ | 2,112,034 | | | $ | 3,080,540 | |
| Share Transactions: | | | | | | | | | | | | | | | | |
| Issued | | | 250,000 | | | | 690,000 | | | | — | | | | 70,000 | |
| Redeemed | | | (130,000 | ) | | | (280,000 | ) | | | (50,000 | ) | | | (40,000 | ) |
| Net Increase (Decrease) in Shares Outstanding from Share Transactions | | | 120,000 | | | | 410,000 | | | | (50,000 | ) | | | 30,000 | |
The accompanying notes are an integral part of the financial statements.
408
Statements of Changes in Net Assets
| | | Global X S&P 500® Tail Risk ETF | | Global X S&P 500® Risk Managed
Income ETF |
| | | Year Ended
October 31, 2023 | | Year Ended
October 31, 2022 | | Year Ended
October 31, 2023 | | Year Ended
October 31, 2022 |
| Operations: | | | | | | | | | | | | | | | | |
| Net Investment Income | | $ | 32,283 | | | $ | 29,933 | | | $ | 281,161 | | | $ | 186,483 | |
| Net Realized Gain (Loss) | | | (119,231 | ) | | | 1,502 | | | | (4,960,159 | ) | | | 1,155,778 | |
| Net Change in Unrealized Appreciation (Depreciation) | | | 292,159 | | | | (521,816 | ) | | | 4,368,747 | | | | (4,212,097 | ) |
| Net Increase (Decrease) in Net Assets Resulting from Operations | | | 205,211 | | | | (490,381 | ) | | | (310,251 | ) | | | (2,869,836 | ) |
| Distributions: | | | (32,745 | ) | | | (96,334 | ) | | | (41,006 | ) | | | (472,058 | ) |
| Return of Capital: | | | — | | | | — | | | | (3,063,982 | ) | | | (1,738,194 | ) |
| Capital Share Transactions: | | | | | | | | | | | | | | | | |
| Issued | | | — | | | | — | | | | 8,369,780 | | | | 30,428,544 | |
| Redeemed | | | (766,526 | ) | | | — | | | | (2,490,395 | ) | | | (6,616,383 | ) |
| Increase (Decrease) in Net Assets from Capital Share Transactions | | | (766,526 | ) | | | — | | | | 5,879,385 | | | | 23,812,161 | |
| Total Increase (Decrease) in Net Assets | | | (594,060 | ) | | | (586,715 | ) | | | 2,464,146 | | | | 18,732,073 | |
| Net Assets: | | | | | | | | | | | | | | | | |
| Beginning of Year | | | 3,017,408 | | | | 3,604,123 | | | | 24,633,665 | | | | 5,901,592 | |
| End of Year | | $ | 2,423,348 | | | $ | 3,017,408 | | | $ | 27,097,811 | | | $ | 24,633,665 | |
| Share Transactions: | | | | | | | | | | | | | | | | |
| Issued | | | — | | | | — | | | | 410,000 | | | | 1,240,000 | |
| Redeemed | | | (30,000 | ) | | | — | | | | (120,000 | ) | | | (290,000 | ) |
| Net Increase (Decrease) in Shares Outstanding from Share Transactions | | | (30,000 | ) | | | — | | | | 290,000 | | | | 950,000 | |
The accompanying notes are an integral part of the financial statements.
409
Statements of Changes in Net Assets
| | | Global X S&P 500® Collar 95-110
ETF | | Global X Disruptive Materials ETF |
| | | Year Ended
October 31, 2023 | | Year Ended
October 31, 2022 | | Year Ended
October 31, 2023 | | Period Ended
October 31,
2022(1) |
| Operations: | | | | | | | | | | | | | | | | |
| Net Investment Income | | $ | 36,472 | | | $ | 33,909 | | | $ | 101,617 | | | $ | 81,482 | |
| Net Realized Gain (Loss) | | | (287,823 | ) | | | 160,285 | | | | (861,308 | ) | | | (203,576 | ) |
| Net Change in Unrealized Appreciation (Depreciation) | | | 370,100 | | | | (558,753 | ) | | | (1,250,478 | ) | | | (1,245,093 | ) |
| Net Increase (Decrease) in Net Assets Resulting from Operations | | | 118,749 | | | | (364,559 | ) | | | (2,010,169 | ) | | | (1,367,187 | ) |
| Distributions: | | | (40,011 | ) | | | (70,908 | ) | | | (77,885 | ) | | | (47,516 | ) |
| Capital Share Transactions: | | | | | | | | | | | | | | | | |
| Issued | | | — | | | | 1,041,732 | | | | 6,774,401 | | | | 6,008,659 | |
| Redeemed | | | (1,772,256 | ) | | | — | | | | (435,664 | ) | | | (1,160,792 | ) |
| Increase (Decrease) in Net Assets from Capital Share Transactions | | | (1,772,256 | ) | | | 1,041,732 | | | | 6,338,737 | | | | 4,847,867 | |
| Total Increase (Decrease) in Net Assets | | | (1,693,518 | ) | | | 606,265 | | | | 4,250,683 | | | | 3,433,164 | |
| Net Assets: | | | | | | | | | | | | | | | | |
| Beginning of Year | | | 3,914,681 | | | | 3,308,416 | | | | 3,433,164 | | | | — | |
| End of Year | | $ | 2,221,163 | | | $ | 3,914,681 | | | $ | 7,683,847 | | | $ | 3,433,164 | |
| Share Transactions: | | | | | | | | | | | | | | | | |
| Issued | | | — | | | | 40,000 | | | | 370,000 | | | | 240,000 | |
| Redeemed | | | (70,000 | ) | | | — | | | | (20,000 | ) | | | (50,000 | ) |
| Net Increase (Decrease) in Shares Outstanding from Share Transactions | | | (70,000 | ) | | | 40,000 | | | | 350,000 | | | | 190,000 | |
| | |
| (1) | The Fund commenced operations on January 24, 2022. |
The accompanying notes are an integral part of the financial statements.
410
Statements of Changes in Net Assets
| | | Global X Dow 30® Covered Call
ETF | | Global X Russell 2000 Covered Call
& Growth ETF |
| | | Year Ended
October 31, 2023 | | Period Ended
October 31,
2022(1) | | Year Ended
October 31, 2023 | | Period Ended
October 31,
2022(2) |
| Operations: | | | | | | | | | | | | | | | | |
| Net Investment Income (Loss) | | $ | 1,105,670 | | | $ | 238,679 | | | $ | 35,277 | | | $ | (908 | ) |
| Net Realized Gain (Loss) | | | (922,155 | ) | | | (596,124 | ) | | | (20,374 | ) | | | 27,432 | |
| Net Change in Unrealized Appreciation (Depreciation) | | | 1,596,622 | | | | (372,627 | ) | | | (309,458 | ) | | | 54,527 | |
| Net Increase (Decrease) in Net Assets Resulting from Operations | | | 1,780,137 | | | | (730,072 | ) | | | (294,555 | ) | | | 81,051 | |
| Distributions: | | | (609,561 | ) | | | (734,788 | ) | | | (103,467 | ) | | | (12,860 | ) |
| Return of Capital: | | | (4,969,158 | ) | | | (1,115,840 | ) | | | (152,549 | ) | | | — | |
| Capital Share Transactions: | | | | | | | | | | | | | | | | |
| Issued | | | 40,828,893 | | | | 55,565,290 | | | | 6,907,493 | | | | 2,590,000 | |
| Redeemed | | | (11,067,750 | ) | | | — | | | | (735,702 | ) | | | — | |
| Increase in Net Assets from Capital Share Transactions | | | 29,761,143 | | | | 55,565,290 | | | | 6,171,791 | | | | 2,590,000 | |
| Total Increase in Net Assets | | | 25,962,561 | | | | 52,984,590 | | | | 5,621,220 | | | | 2,658,191 | |
| Net Assets: | | | | | | | | | | | | | | | | |
| Beginning of Year | | | 52,984,590 | | | | — | | | | 2,658,191 | | | | — | |
| End of Year | | $ | 78,947,151 | | | $ | 52,984,590 | | | $ | 8,279,411 | | | $ | 2,658,191 | |
| Share Transactions: | | | | | | | | | | | | | | | | |
| Issued | | | 1,870,000 | | | | 2,420,000 | | | | 300,000 | | | | 100,000 | |
| Redeemed | | | (510,000 | ) | | | — | | | | (30,000 | ) | | | — | |
| Net Increase in Shares Outstanding from Share Transactions | | | 1,360,000 | | | | 2,420,000 | | | | 270,000 | | | | 100,000 | |
| | |
| (1) | The Fund commenced operations on February 23, 2022. |
| (2) | The Fund commenced operations on October 4, 2022. |
The accompanying notes are an integral part of the financial statements.
411
Statements of Changes in Net Assets
| | | Global X
Financials
Covered Call &
Growth ETF | | Global X Health
Care Covered
Call & Growth
ETF |
| | | Period Ended
October 31,
2023(1) | | Period Ended
October 31,
2023(1) |
| Operations: | | | | | | | | |
| Net Investment Income | | $ | 34,690 | | | $ | 28,309 | |
| Net Realized Gain (Loss) | | | (21,236 | ) | | | 110,750 | |
| Net Change in Unrealized Appreciation (Depreciation) | | | (144,355 | ) | | | (195,130 | ) |
| Net Decrease in Net Assets Resulting from Operations | | | (130,901 | ) | | | (56,071 | ) |
| Distributions: | | | (84,987 | ) | | | (122,360 | ) |
| Return of Capital: | | | (42,333 | ) | | | — | |
| Capital Share Transactions: | | | | | | | | |
| Issued | | | 2,488,000 | | | | 3,251,236 | |
| Redeemed | | | — | | | | (496,164 | ) |
| Increase in Net Assets from Capital Share Transactions | | | 2,488,000 | | | | 2,755,072 | |
| Total Increase in Net Assets | | | 2,229,779 | | | | 2,576,641 | |
| Net Assets: | | | | | | | | |
| Beginning of Period | | | — | | | | — | |
| End of Period | | $ | 2,229,779 | | | $ | 2,576,641 | |
| Share Transactions: | | | | | | | | |
| Issued | | | 100,000 | | | | 130,000 | |
| Redeemed | | | — | | | | (20,000 | ) |
| | | | | | | | | |
| Net Increase in Shares Outstanding from Share Transactions | | | 100,000 | | | | 110,000 | |
| | |
| (1) | The Fund commenced operations on November 21, 2022. |
The accompanying notes are an integral part of the financial statements.
412
Statements of Changes in Net Assets
| | | Global X
Information
Technology
Covered Call &
Growth ETF | | Global X
NASDAQ 100®
ESG Covered
Call ETF |
| | | Period Ended
October 31,
2023(1) | | Period Ended
October 31,
2023(2) |
| Operations: | | | | | | | | |
| Net Investment Income | | $ | 11,876 | | | $ | 3,724 | |
| Net Realized Gain (Loss) | | | (36,039 | ) | | | 81,924 | |
| Net Change in Unrealized Appreciation (Depreciation) | | | 573,957 | | | | 151,990 | |
| Net Increase in Net Assets Resulting from Operations | | | 549,794 | | | | 237,638 | |
| Distributions: | | | (166,221 | ) | | | (206,140 | ) |
| Capital Share Transactions: | | | | | | | | |
| Issued | | | 3,079,828 | | | | 3,683,183 | |
| Redeemed | | | — | | | | (1,237,183 | ) |
| Increase in Net Assets from Capital Share Transactions | | | 3,079,828 | | | | 2,446,000 | |
| Total Increase in Net Assets | | | 3,463,401 | | | | 2,477,498 | |
| Net Assets: | | | | | | | | |
| Beginning of Period | | | — | | | | — | |
| End of Period | | $ | 3,463,401 | | | $ | 2,477,498 | |
| Share Transactions: | | | | | | | | |
| Issued | | | 120,000 | | | | 150,000 | |
| Redeemed | | | — | | | | (50,000 | ) |
| | | | | | | | | |
| Net Increase in Shares Outstanding from Share Transactions | | | 120,000 | | | | 100,000 | |
| | |
| (1) | The Fund commenced operations on November 21, 2022. |
| (2) | The Fund commenced operations on February 21, 2023. |
The accompanying notes are an integral part of the financial statements.
413
Statements of Changes in Net Assets
| | | Global X S&P
500® ESG
Covered Call
ETF | | Global X Dow
30® Covered Call
& Growth ETF |
| | | Period Ended
October 31,
2023(1) | | Period Ended
October 31,
2023(2) |
| Operations: | | | | | | | | |
| Net Investment Income | | $ | 17,271 | | | $ | 9,566 | |
| Net Realized Gain (Loss) | | | (24,567 | ) | | | 29,838 | |
| Net Change in Unrealized Appreciation (Depreciation) | | | 52,254 | | | | (176,521 | ) |
| Net Increase (Decrease) in Net Assets Resulting from Operations | | | 44,958 | | | | (137,117 | ) |
| Distributions: | | | (44,960 | ) | | | (9,566 | ) |
| Return of Capital: | | | (86,314 | ) | | | (13,830 | ) |
| Capital Share Transactions: | | | | | | | | |
| Issued | | | 3,427,824 | | | | 2,580,999 | |
| Redeemed | | | (962,823 | ) | | | — | |
| Increase in Net Assets from Capital Share Transactions | | | 2,465,001 | | | | 2,580,999 | |
| Total Increase in Net Assets | | | 2,378,685 | | | | 2,420,486 | |
| Net Assets: | | | | | | | | |
| Beginning of Period | | | — | | | | — | |
| End of Period | | $ | 2,378,685 | | | $ | 2,420,486 | |
| Share Transactions: | | | | | | | | |
| Issued | | | 140,000 | | | | 100,000 | |
| Redeemed | | | (40,000 | ) | | | — | |
| | | | | | | | | |
| Net Increase in Shares Outstanding from Share Transactions | | | 100,000 | | | | 100,000 | |
| | |
| (1) | The Fund commenced operations on February 21, 2023. |
| (2) | The Fund commenced operations on July 25, 2023. |
The accompanying notes are an integral part of the financial statements.
414
Page intentionally left blank.
415
Financial Highlights
| Selected Per Share Data & Ratios |
| For a Share Outstanding Throughout the Period |
| | | Net
Asset Value,
Beginning
of Period
($) | | Net Investment
Income (Loss)
($)* | | Net Realized
and Unrealized
Gain (Loss) on
Investments
($) | | Total from
Operations
($) | | Distribution
from Net
Investment
Income ($) | | Distribution
from Capital
Gains ($) | | Return of
Capital ($) |
| Global X Lithium & Battery Tech ETF | | | | | | | | | | | | | | | | | | | | | | | | | | | | |
| 2023 | | | 67.13 | | | | 0.58 | | | | (19.66 | ) | | | (19.08 | ) | | | (0.72 | ) | | | — | | | | — | |
| 2022 | | | 91.07 | | | | 0.26 | | | | (23.99 | ) | | | (23.73 | ) | | | (0.21 | ) | | | — | | | | — | |
| 2021 | | | 42.86 | | | | 0.12 | | | | 48.21 | | | | 48.33 | | | | (0.12 | ) | | | — | | | | — | |
| 2020 | | | 25.04 | | | | 0.40 | | | | 17.86 | | | | 18.26 | | | | (0.44 | ) | | | — | | | | — | |
| 2019 | | | 30.32 | | | | 0.48 | | | | (4.86 | ) | | | (4.38 | ) | | | (0.90 | ) | | | — | | | | — | |
| Global X SuperDividend® ETF | | | | | | | | | | | | | | | | | | | | | | | | | | | | |
| 2023(1) | | | 23.05 | | | | 2.11 | | | | (2.02 | ) | | | 0.09 | | | | (2.22 | ) | | | — | | | | (0.56 | ) |
| 2022(1) | | | 39.03 | | | | 2.31 | | | | (14.68 | ) | | | (12.37 | ) | | | (2.65 | ) | | | — | | | | (0.96 | ) |
| 2021(1) | | | 31.83 | | | | 2.82 | | | | 7.38 | | | | 10.20 | | | | (3.00 | ) | | | — | | | | — | |
| 2020(1) | | | 51.75 | | | | 2.58 | | | | (19.02 | ) | | | (16.44 | ) | | | (3.12 | ) | | | — | | | | (0.36 | ) |
| 2019(1) | | | 57.18 | | | | 3.72 | | | | (4.41 | ) | | | (0.69 | ) | | | (4.14 | ) | | | — | | | | (0.60 | ) |
| Global X Social Media ETF | | | | | | | | | | | | | | | | | | | | | | | | | | | | |
| 2023 | | | 24.88 | | | | 0.19 | | | | 9.87 | | | | 10.06 | | | | (0.19 | ) | | | — | | | | — | |
| 2022 | | | 61.26 | | | | 0.03 | | | | (36.29 | ) | | | (36.26 | ) | | | — | | | | — | | | | (0.12 | ) |
| 2021 | | | 51.95 | | | | (0.31 | ) | | | 9.62 | | | | 9.31 | | | | — | | | | — | | | | — | |
| 2020 | | | 31.92 | | | | (0.11 | ) | | | 20.14 | | | | 20.03 | | | | — | | | | — | | | | — | |
| 2019 | | | 29.10 | | | | (0.10 | ) | | | 2.92 | | | | 2.82 | | | | — | | | | — | | | | — | |
| * | Per share data calculated using average shares method. |
| ** | Total Return is for the period indicated and has not been annualized. The return shown does not reflect the deduction of taxes that a shareholder would pay on Fund distributions or the redemption of Fund shares. |
| †† | Portfolio turnover rate is for the period indicated and periods of less than one year have not been annualized. Excludes effect of in-kind transfers. |
| (1) | Per share amounts have been adjusted for a 1 for 3 reverse share split on December 19, 2022. (See Note 9 in the Notes to Financial Statements.) |
Amounts designated as “—” are either $0 or have been rounded to $0.
The accompanying notes are an integral part of the financial statements.
416
Financial Highlights
Total from
Distributions ($) | | Net
Asset Value,
End of
Period ($) | | Total
Return
(%)** | | Net Assets, End of
Period ($)(000) | | Ratio of Expenses
to Average Net
Assets (%) | | Ratio of Net
Investment Income
(Loss) to Average
Net Assets (%) | | Portfolio
Turnover (%)†† |
| | | | | | | | | | | | | | | | | | | | | | | | | | | |
| | (0.72 | ) | | | 47.33 | | | | (28.63 | ) | | | 2,095,791 | | | | 0.75 | | | | 0.92 | | | | 19.76 | |
| | (0.21 | ) | | | 67.13 | | | | (26.10 | ) | | | 3,899,509 | | | | 0.75 | | | | 0.33 | | | | 38.73 | |
| | (0.12 | ) | | | 91.07 | | | | 112.89 | | | | 5,375,399 | | | | 0.75 | | | | 0.17 | | | | 39.09 | |
| | (0.44 | ) | | | 42.86 | | | | 73.82 | | | | 868,894 | | | | 0.75 | | | | 1.30 | | | | 65.14 | |
| | (0.90 | ) | | | 25.04 | | | | (14.61 | ) | | | 455,124 | | | �� | 0.75 | | | | 1.75 | | | | 35.28 | |
| | | | | | | | | | | | | | | | | | | | | | | | | | | |
| | (2.78 | ) | | | 20.36 | | | | (0.31 | ) | | | 699,111 | | | | 0.58 | | | | 9.18 | | | | 91.59 | |
| | (3.61 | ) | | | 23.05 | | | | (33.80 | ) | | | 676,279 | | | | 0.61 | | | | 7.39 | | | | 91.10 | |
| | (3.00 | ) | | | 39.03 | | | | 32.21 | | | | 930,431 | | | | 0.58 | | | | 6.98 | | | | 82.37 | |
| | (3.48 | ) | | | 31.83 | | | | (32.80 | ) | | | 626,871 | | | | 0.59 | | | | 6.62 | | | | 124.55 | |
| | (4.74 | ) | | | 51.75 | | | | (1.02 | ) | | | 932,111 | | | | 0.59 | | | | 7.03 | | | | 56.85 | |
| | | | | | | | | | | | | | | | | | | | | | | | | | | |
| | (0.19 | ) | | | 34.75 | | | | 40.40 | | | | 140,397 | | | | 0.65 | | | | 0.53 | | | | 29.09 | |
| | (0.12 | ) | | | 24.88 | | | | (59.24 | ) | | | 103,245 | | | | 0.65 | | | | 0.06 | | | | 21.59 | |
| | — | | | | 61.26 | | | | 17.94 | | | | 401,893 | | | | 0.65 | | | | (0.48 | ) | | | 30.89 | |
| | — | | | | 51.95 | | | | 62.75 | | | | 225,999 | | | | 0.65 | | | | (0.28 | ) | | | 19.23 | |
| | — | | | | 31.92 | | | | 9.69 | | | | 121,289 | | | | 0.65 | | | | (0.33 | ) | | | 16.92 | |
The accompanying notes are an integral part of the financial statements.
417
Financial Highlights
| Selected Per Share Data & Ratios |
| For a Share Outstanding Throughout the Period |
| | | Net
Asset Value,
Beginning
of Period
($) | | Net Investment
Income
($)* | | Net Realized
and Unrealized
Gain (Loss) on
Investments
($) | | Total from
Operations
($) | | Distribution
from Net
Investment
Income ($) | | Distribution
from Capital
Gains ($) | | Return of
Capital ($) |
| Global X Guru® Index ETF | | | | | | | | | | | | | | | | | | | | | | | | | | | | |
| 2023 | | | 33.48 | | | | 0.12 | | | | 0.75 | | | | 0.87 | | | | (0.11 | ) | | | — | | | | (0.01 | ) |
| 2022 | | | 50.24 | | | | 0.01 | | | | (16.72 | ) | | | (16.71 | ) | | | (0.01 | ) | | | — | | | | (0.04 | ) |
| 2021 | | | 37.31 | | | | 0.69 | | | | 13.14 | | | | 13.83 | | | | (0.90 | ) | | | — | | | | — | |
| 2020 | | | 34.02 | | | | 0.33 | | | | 3.32 | | | | 3.65 | | | | (0.34 | ) | | | — | | | | (0.02 | ) |
| 2019 | | | 30.09 | | | | 0.12 | | | | 4.02 | | | | 4.14 | | | | (0.17 | ) | | | — | | | | (0.04 | ) |
| Global X SuperIncome™ Preferred ETF | | | | | | | | | | | | | | | | | | | | | | | | | | | | |
| 2023 | | | 9.67 | | | | 0.60 | | | | (1.44 | ) | | | (0.84 | ) | | | (0.62 | ) | | | — | | | | — | |
| 2022 | | | 11.94 | | | | 0.54 | | | | (2.13 | ) | | | (1.59 | ) | | | (0.65 | ) | | | — | | | | (0.03 | ) |
| 2021 | | | 11.12 | | | | 0.61 | | | | 0.89 | | | | 1.50 | | | | (0.68 | ) | | | — | | | | — | |
| 2020 | | | 11.73 | | | | 0.60 | | | | (0.53 | ) | | | 0.07 | | | | (0.65 | ) | | | — | | | | (0.03 | ) |
| 2019 | | | 11.49 | | | | 0.66 | | | | 0.32 | | | | 0.98 | | | | (0.73 | ) | | | — | | | | (0.01 | ) |
| Global X SuperDividend® U.S. ETF | | | | | | | | | | | | | | | | | | | | | | | | | | | | |
| 2023 | | | 19.18 | | | | 0.69 | | | | (3.02 | ) | | | (2.33 | ) | | | (0.90 | ) | | | — | | | | (0.33 | ) |
| 2022 | | | 20.13 | | | | 0.67 | | | | (0.41 | ) | | | 0.26 | | | | (0.81 | ) | | | — | | | | (0.40 | ) |
| 2021 | | | 14.99 | | | | 0.65 | | | | 5.59 | | | | 6.24 | | | | (0.99 | ) | | | — | | | | (0.11 | ) |
| 2020 | | | 23.34 | | | | 0.62 | | | | (7.45 | ) | | | (6.83 | ) | | | (1.14 | ) | | | — | | | | (0.38 | ) |
| 2019 | | | 24.53 | | | | 1.12 | | | | (0.56 | ) | | | 0.56 | | | | (1.49 | ) | | | — | | | | (0.26 | ) |
| * | Per share data calculated using average shares method. |
| ** | Total Return is for the period indicated and has not been annualized. The return shown does not reflect the deduction of taxes that a shareholder would pay on Fund distributions or the redemption of Fund shares. |
| †† | Portfolio turnover rate is for the period indicated and periods of less than one year have not been annualized. Excludes effect of in-kind transfers. |
Amounts designated as “—” are either $0 or have been rounded to $0.
The accompanying notes are an integral part of the financial statements.
418
Financial Highlights
Total from
Distributions ($) | | Net
Asset Value,
End of
Period ($) | | Total
Return
(%)** | | Net Assets, End of
Period ($)(000) | | Ratio of Expenses
to Average Net
Assets (%) | | Ratio of Net
Investment Income
to Average Net
Assets (%) | | Portfolio
Turnover (%)†† |
| | | | | | | | | | | | | | | | | | | | | | | | | | | |
| | (0.12 | ) | | | 34.23 | | | | 2.58 | | | | 41,757 | | | | 0.75 | | | | 0.35 | | | | 100.70 | |
| | (0.05 | ) | | | 33.48 | | | | (33.28 | ) | | | 46,535 | | | | 0.75 | | | | 0.02 | | | | 111.39 | |
| | (0.90 | ) | | | 50.24 | | | | 37.43 | | | | 75,856 | | | | 0.75 | | | | 1.47 | | | | 121.91 | |
| | (0.36 | ) | | | 37.31 | | | | 10.84 | | | | 55,961 | | | | 0.75 | | | | 0.96 | | | | 124.90 | |
| | (0.21 | ) | | | 34.02 | | | | 13.90 | | | | 56,134 | | | | 0.75 | | | | 0.38 | | | | 126.44 | |
| | | | | | | | | | | | | | | | | | | | | | | | | | | |
| | (0.62 | ) | | | 8.21 | | | | (9.26 | ) | | | 157,490 | | | | 0.53 | | | | 6.47 | | | | 109.60 | |
| | (0.68 | ) | | | 9.67 | | | | (13.81 | ) | | | 195,159 | | | | 0.58 | | | | 5.04 | | | | 39.39 | |
| | (0.68 | ) | | | 11.94 | | | | 13.71 | | | | 234,953 | | | | 0.58 | | | | 5.13 | | | | 98.47 | |
| | (0.68 | ) | | | 11.12 | | | | 0.81 | | | | 184,015 | | | | 0.58 | | | | 5.47 | | | | 67.65 | |
| | (0.74 | ) | | | 11.73 | | | | 8.87 | | | | 201,092 | | | | 0.58 | | | | 5.72 | | | | 55.98 | |
| | | | | | | | | | | | | | | | | | | | | | | | | | | |
| | (1.23 | ) | | | 15.62 | | | | (12.60 | ) | | | 590,900 | | | | 0.45 | | | | 3.91 | | | | 63.24 | |
| | (1.21 | ) | | | 19.18 | | | | 1.16 | | | | 683,864 | | | | 0.45 | | | | 3.34 | | | | 38.51 | |
| | (1.10 | ) | | | 20.13 | | | | 42.53 | | | | 669,734 | | | | 0.45 | | | | 3.41 | | | | 60.53 | |
| | (1.52 | ) | | | 14.99 | | | | (30.12 | ) | | | 412,110 | | | | 0.45 | | | | 3.50 | | | | 93.44 | |
| | (1.75 | ) | | | 23.34 | | | | 2.61 | | | | 544,884 | | | | 0.46 | | | | 4.83 | | | | 60.00 | |
The accompanying notes are an integral part of the financial statements.
419
Financial Highlights
| Selected Per Share Data & Ratios |
| For a Share Outstanding Throughout the Period |
| | | Net
Asset Value,
Beginning
of Period
($) | | Net Investment
Income
($)* | | Net Realized
and Unrealized
Gain (Loss) on
Investments
($) | | Total from
Operations
($) | | Distribution
from Net
Investment
Income ($) | | Distribution
from Capital
Gains ($) | | Return of
Capital ($) |
| Global X S&P 500® Covered Call ETF(1) | | | | | | | | | | | | | | | | | | | | | | | | | | | | |
| 2023 | | | 40.00 | | | | 0.43 | | | | 2.13 | | | | 2.56 | | | | (0.14 | ) | | | — | | | | (4.24 | ) |
| 2022 | | | 50.37 | | | | 0.45 | | | | (5.50 | ) | | | (5.05 | ) | | | (1.05 | ) | | | (0.11 | ) | | | (4.16 | ) |
| 2021 | | | 42.45 | | | | 0.39 | | | | 12.14 | | | | 12.53 | | | | (4.61 | ) | | | — | | | | — | |
| 2020 | | | 49.39 | | | | 0.56 | | | | (4.17 | ) | | | (3.61 | ) | | | (0.58 | ) | | | — | | | | (2.75 | ) |
| 2019 | | | 48.56 | | | | 0.56 | | | | 3.30 | | | | 3.86 | | | | (2.27 | ) | | | (0.39 | ) | | | (0.37 | ) |
| Global X NASDAQ 100® Covered Call ETF(1) | | | | | | | | | | | | | | | | | | | | | | | | | | | | |
| 2023 | | | 16.15 | | | | 0.05 | | | | 2.44 | | | | 2.49 | | | | — | | | | — | | | | (2.04 | ) |
| 2022 | | | 22.82 | | | | 0.05 | | | | (4.13 | ) | | | (4.08 | ) | | | (0.24 | ) | | | (0.50 | ) | | | (1.85 | ) |
| 2021 | | | 20.65 | | | | 0.02 | | | | 4.73 | | | | 4.75 | | | | (2.58 | ) | | | — | | | | — | |
| 2020 | | | 23.10 | | | | 0.06 | | | | (0.06 | ) | | | — | | | | (0.06 | ) | | | — | | | | (2.39 | ) |
| 2019 | | | 23.45 | | | | 0.06 | | | | 1.95 | | | | 2.01 | | | | (1.83 | ) | | | — | | | | (0.53 | ) |
| Global X MSCI SuperDividend® Emerging Markets ETF | | | | | | | | | | | | | | | | | | | | | | | | | | | | |
| 2023(4) | | | 21.36 | | | | 1.95 | | | | 1.00 | | | | 2.95 | | | | (1.83 | ) | | | — | | | | — | |
| 2022(4) | | | 33.78 | | | | 1.67 | | | | (11.44 | ) | | | (9.77 | ) | | | (2.19 | ) | | | — | | | | (0.46 | ) |
| 2021(4) | | | 28.59 | | | | 3.06 | | | | 4.35 | | | | 7.41 | | | | (2.22 | ) | | | — | | | | — | |
| 2020(4) | | | 38.85 | | | | 1.65 | | | | (9.51 | ) | | | (7.86 | ) | | | (1.98 | ) | | | — | | | | (0.42 | ) |
| 2019(4) | | | 38.73 | | | | 2.61 | | | | 0.15 | | | | 2.76 | | | | (2.64 | ) | | | — | | | | — | |
| * | Per share data calculated using average shares method. |
| ** | Total Return is for the period indicated and has not been annualized. The return shown does not reflect the deduction of taxes that a shareholder would pay on Fund distributions or the redemption of Fund shares. |
| †† | Portfolio turnover rate is for the period indicated and periods of less than one year have not been annualized. Excludes effect of in-kind transfers. |
| (1) | The financial statements include the financial information of the Predecessor Funds through December 21, 2018 (See Note 1 in Notes to Financial Statements). As a result of the Reorganization, the Fund assumed the performance and accounting history of the Predecessor Fund. Accordingly, performance figures for the Fund for periods prior to the date of the Reorganization represent the performance of the Predecessor Fund. |
| (2) | Excluding broker fees on written options, the ratio of expenses to average net assets would have been 0.64% and 0.65% for the year ended October 31, 2020 and year ended October 31, 2019, respectively. The ratio of Expenses to Average Net Assets includes the effect of a waiver. If these offsets were excluded, the ratio would have been 0.64% and 0.65% for the year ended October 31, 2020 and year ended October 31, 2019. |
| (3) | Excluding broker fees on written options, the ratio of expenses to average net assets would have been 0.60% and 0.60% for the year ended October 31, 2020 and October 31, 2019, respectively. The ratio of Expenses to Average Net Assets includes the effect of a waiver. If these offsets were excluded, the ratio would have been 0.60% and 0.60% for the year ended October 31, 2020 and year ended October 31, 2019. |
| (4) | Per share amounts have been adjusted for a 1 for 3 reverse share split on December 19, 2022. (See Note 9 in the Notes to Financial Statements.) |
Amounts designated as “—” are either $0 or have been rounded to $0.
The accompanying notes are an integral part of the financial statements.
420
Financial Highlights
Total from
Distributions ($) | | Net
Asset Value,
End of
Period ($) | | Total
Return
(%)** | | Net Assets, End of
Period ($)(000) | | Ratio of Expenses
to Average Net
Assets (%) | | Ratio of Net
Investment Income
to Average Net
Assets (%) | | Portfolio
Turnover (%)†† |
| | | | | | | | | | | | | | | | | | | | | | | | | | | |
| | (4.38 | ) | | | 38.18 | | | | 6.45 | | | | 2,805,206 | | | | 0.60 | | | | 1.07 | | | | 7.90 | |
| | (5.32 | ) | | | 40.00 | | | | (10.72 | ) | | | 1,934,545 | | | | 0.60 | | | | 1.00 | | | | 15.60 | |
| | (4.61 | ) | | | 50.37 | | | | 30.67 | | | | 669,855 | | | | 0.60 | | | | 0.80 | | | | 4.84 | |
| | (3.33 | ) | | | 42.45 | | | | (7.42 | ) | | | 103,992 | | | | 0.71 | (2) | | | 1.22 | | | | 7.29 | |
| | (3.03 | ) | | | 49.39 | | | | 8.40 | | | | 133,353 | | | | 0.87 | (2) | | | 1.16 | | | | 3.92 | |
| | | | | | | | | | | | | | | | | | | | | | | | | | | |
| | (2.04 | ) | | | 16.60 | | | | 15.91 | | | | 7,521,213 | | | | 0.61 | | | | 0.31 | | | | 38.93 | |
| | (2.59 | ) | | | 16.15 | | | | (19.18 | ) | | | 6,397,648 | | | | 0.60 | | | | 0.25 | | | | 31.11 | |
| | (2.58 | ) | | | 22.82 | | | | 23.89 | | | | 5,036,215 | | | | 0.60 | | | | 0.11 | | | | 19.99 | |
| | (2.45 | ) | | | 20.65 | | | | 0.21 | | | | 1,325,642 | | | | 0.67 | (3) | | | 0.27 | | | | 27.87 | |
| | (2.36 | ) | | | 23.10 | | | | 9.39 | | | | 768,036 | | | | 0.85 | (3) | | | 0.26 | | | | 11.82 | |
| | | | | | | | | | | | | | | | | | | | | | | | | | | |
| | (1.83 | ) | | | 22.48 | | | | 13.77 | | | | 41,574 | | | | 0.68 | | | | 8.22 | | | | 87.06 | |
| | (2.65 | ) | | | 21.36 | | | | (30.80 | ) | | | 39,168 | | | | 0.67 | | | | 5.88 | | | | 101.78 | |
| | (2.22 | ) | | | 33.78 | | | | 25.83 | | | | 62,696 | | | | 0.72 | | | | 8.59 | | | | 102.27 | |
| | (2.40 | ) | | | 28.59 | | | | (21.01 | ) | | | 20,007 | | | | 0.67 | | | | 5.04 | | | | 93.04 | |
| | (2.64 | ) | | | 38.85 | | | | 7.14 | | | | 17,489 | | | | 0.66 | | | | 6.51 | | | | 66.65 | |
The accompanying notes are an integral part of the financial statements.
421
Financial Highlights
| Selected Per Share Data & Ratios |
| For a Share Outstanding Throughout the Period |
| | | Net
Asset Value,
Beginning
of Period
($) | | Net Investment
Income
($)* | | Net Realized
and Unrealized
Gain (Loss) on
Investments
($) | | Total from
Operations
($) | | Distribution
from Net
Investment
Income ($) | | Distribution
from Capital
Gains ($) | | Return of
Capital ($) |
| Global X SuperDividend® REIT ETF | | | | | | | | | | | | | | | | | | | | | | | | | | | | |
| 2023(1) | | | 21.65 | | | | 1.28 | | | | (2.60 | ) | | | (1.32 | ) | | | (1.10 | ) | | | — | | | | (0.56 | ) |
| 2022(1) | | | 29.46 | | | | 1.13 | | | | (7.14 | ) | | | (6.01 | ) | | | (1.10 | ) | | | — | | | | (0.70 | ) |
| 2021(1) | | | 22.68 | | | | 1.14 | | | | 7.50 | | | | 8.64 | | | | (1.23 | ) | | | — | | | | (0.63 | ) |
| 2020(1) | | | 45.99 | | | | 1.68 | | | | (22.23 | ) | | | (20.55 | ) | | | (2.58 | ) | | | — | | | | (0.18 | ) |
| 2019(1) | | | 43.86 | | | | 2.97 | | | | 2.73 | | | | 5.70 | | | | (3.57 | ) | | | — | | | | — | |
| Global X Renewable Energy Producers ETF | | | | | | | | | | | | | | | | | | | | | | | | | | | | |
| 2023 | | | 13.05 | | | | 0.15 | | | | (3.76 | ) | | | (3.61 | ) | | | (0.14 | ) | | | — | | | | — | |
| 2022 | | | 16.82 | | | | 0.15 | | | | (3.76 | ) | | | (3.61 | ) | | | (0.16 | ) | | | — | | | | — | |
| 2021 | | | 14.87 | | | | 0.23 | | | | 2.05 | | | | 2.28 | | | | (0.30 | ) | | | (0.03 | ) | | | — | |
| 2020 | | | 13.79 | | | | 0.41 | | | | 1.13 | | | | 1.54 | | | | (0.46 | ) | | | — | | | | — | |
| 2019 | | | 11.52 | | | | 0.13 | | | | 2.61 | | | | 2.74 | | | | (0.47 | ) | | | — | | | | — | |
| Global X S&P 500® Catholic Values ETF | | | | | | | | | | | | | | | | | | | | | | | | | | | | |
| 2023 | | | 47.19 | | | | 0.65 | | | | 3.68 | | | | 4.33 | | | | (0.63 | ) | | | — | | | | — | |
| 2022 | | | 57.22 | | | | 0.61 | | | | (9.99 | ) | | | (9.38 | ) | | | (0.57 | ) | | | (0.08 | ) | | | — | |
| 2021 | | | 40.32 | | | | 0.56 | | | | 16.89 | | | | 17.45 | | | | (0.55 | ) | | | — | | | | — | |
| 2020 | | | 37.23 | | | | 0.58 | | | | 3.08 | | | | 3.66 | | | | (0.55 | ) | | | (0.02 | ) | | | — | |
| 2019 | | | 33.59 | | | | 0.58 | | | | 3.92 | | | | 4.50 | | | | (0.81 | ) | | | (0.05 | ) | | | — | |
| * | Per share data calculated using average shares method. |
| ** | Total Return is for the period indicated and has not been annualized. The return shown does not reflect the deduction of taxes that a shareholder would pay on Fund distributions or the redemption of Fund shares. |
| †† | Portfolio turnover rate is for the period indicated and periods of less than one year have not been annualized. Excludes effect of in-kind transfers. |
| (1) | Per share amounts have been adjusted for a 1 for 3 reverse share split on December 19, 2022. (See Note 9 in the Notes to Financial Statements.) |
Amounts designated as “—” are either $0 or have been rounded to $0.
The accompanying notes are an integral part of the financial statements.
422
Financial Highlights
Total from
Distributions ($) | | Net
Asset Value,
End of
Period ($) | | Total
Return
(%)** | | Net Assets, End of
Period ($)(000) | | Ratio of Expenses
to Average Net
Assets (%) | | Ratio of Net
Investment Income
to Average Net
Assets (%) | | Portfolio
Turnover (%)†† |
| | | | | | | | | | | | | | | | | | | | | | | | | | | |
| | (1.66 | ) | | | 18.67 | | | | (6.97 | ) | | | 217,653 | | | | 0.59 | | | | 5.90 | | | | 92.84 | |
| | (1.80 | ) | | | 21.65 | | | | (21.21 | ) | | | 286,655 | | | | 0.59 | | | | 4.36 | | | | 82.67 | |
| | (1.86 | ) | | | 29.46 | | | | 38.84 | | | | 467,934 | | | | 0.58 | | | | 3.99 | | | | 59.44 | |
| | (2.76 | ) | | | 22.68 | | | | (45.94 | ) | | | 311,625 | | | | 0.58 | | | | 5.74 | | | | 106.23 | |
| | (3.57 | ) | | | 45.99 | | | | 13.68 | | | | 364,790 | | | | 0.59 | | | | 6.71 | | | | 34.16 | |
| | | | | | | | | | | | | | | | | | | | | | | | | | | |
| | (0.14 | ) | | | 9.30 | | | | (27.93 | ) | | | 43,797 | | | | 0.65 | | | | 1.18 | | | | 12.68 | |
| | (0.16 | ) | | | 13.05 | | | | (21.57 | ) | | | 90,970 | | | | 0.66 | | | | 1.01 | | | | 18.33 | |
| | (0.33 | ) | | | 16.82 | | | | 15.37 | | | | 146,976 | | | | 0.65 | | | | 1.39 | | | | 55.97 | |
| | (0.46 | ) | | | 14.87 | | | | 11.39 | | | | 66,192 | | | | 0.65 | | | | 2.89 | | | | 29.27 | |
| | (0.47 | ) | | | 13.79 | | | | 24.34 | | | | 26,205 | | | | 0.65 | | | | 1.01 | | | | 87.06 | |
| | | | | | | | | | | | | | | | | | | | | | | | | | | |
| | (0.63 | ) | | | 50.89 | | | | 9.22 | | | | 671,797 | | | | 0.29 | | | | 1.28 | | | | 6.70 | |
| | (0.65 | ) | | | 47.19 | | | | (16.53 | ) | | | 549,288 | | | | 0.29 | | | | 1.17 | | | | 6.79 | |
| | (0.55 | ) | | | 57.22 | | | | 43.54 | | | | 593,985 | | | | 0.29 | | | | 1.09 | | | | 8.29 | |
| | (0.57 | ) | | | 40.32 | | | | 9.89 | | | | 379,053 | | | | 0.29 | | | | 1.51 | | | | 5.55 | |
| | (0.86 | ) | | | 37.23 | | | | 13.86 | | | | 275,511 | | | | 0.29 | | | | 1.66 | | | | 8.54 | |
The accompanying notes are an integral part of the financial statements.
423
Financial Highlights
| Selected Per Share Data & Ratios |
| For a Share Outstanding Throughout the Period |
| | | Net
Asset Value,
Beginning
of Period
($) | | Net Investment
Income (Loss)
($)* | | Net Realized
and Unrealized
Gain (Loss) on
Investments
($) | | Total from
Operations
($) | | Distribution
from Net
Investment
Income ($) | | Distribution
from Capital
Gains ($) | | Return of
Capital ($) |
| Global X MSCI SuperDividend® EAFE ETF | | | | | | | | | | | | | | | | | | | | | | | |
| 2023 | | | 11.98 | | | | 0.78 | | | | 0.92 | | | | 1.70 | | | | (0.92 | ) | | | — | | | | — | |
| 2022 | | | 15.62 | | | | 1.00 | | | | (3.70 | ) | | | (2.70 | ) | | | (0.94 | ) | | | — | | | | — | |
| 2021 | | | 11.44 | | | | 0.79 | | | | 4.10 | | | | 4.89 | | | | (0.71 | ) | | | — | | | | — | |
| 2020 | | | 16.11 | | | | 0.56 | | | | (4.53 | ) | | | (3.97 | ) | | | (0.55 | ) | | | — | | | | (0.15 | ) |
| 2019 | | | 15.96 | | | | 0.82 | | | | 0.36 | | | | 1.18 | | | | (1.03 | ) | | | — | | | | — | |
| Global X E-commerce ETF | | | | | | | | | | | | | | | | | | | | | | | |
| 2023 | | | 15.14 | | | | — | | | | 1.84 | | | | 1.84 | | | | — | | | | — | | | | (0.02 | ) |
| 2022 | | | 31.19 | | | | 0.08 | | | | (15.97 | ) | | | (15.89 | ) | | | (0.05 | ) | | | (0.10 | ) | | | (0.01 | ) |
| 2021 | | | 26.79 | | | | (0.04 | ) | | | 4.70 | | | | 4.66 | | | | (0.13 | ) | | | (0.13 | ) | | | — | |
| 2020 | | | 17.58 | | | | 0.19 | | | | 9.05 | | | | 9.24 | | | | (0.03 | ) | | | — | | | | — | |
| 2019(1) | | | 15.00 | | | | (0.05 | ) | | | 2.63 | | | | 2.58 | | | | — | | | | — | | | | — | |
| Global X Russell 2000 Covered Call ETF | | | | | | | | | | | | | | | | | | | | | | | |
| 2023 | | | 19.55 | | | | 0.19 | | | | (1.47 | ) | | | (1.28 | ) | | | (0.03 | ) | | | — | | | | (2.14 | ) |
| 2022 | | | 25.18 | | | | 0.19 | | | | (3.10 | ) | | | (2.91 | ) | | | (0.44 | ) | | | (0.31 | ) | | | (1.97 | ) |
| 2021 | | | 20.45 | | | | 0.13 | | | | 7.50 | | | | 7.63 | | | | (2.90 | ) | | | — | | | | — | |
| 2020 | | | 25.24 | | | | 0.12 | | | | (2.51 | ) | | | (2.39 | ) | | | (0.11 | ) | | | (0.17 | ) | | | (2.12 | ) |
| 2019(4) | | | 25.00 | | | | 0.09 | | | | 1.37 | | | | 1.46 | | | | (1.22 | ) | | | — | | | | — | |
| * | Per share data calculated using average shares method. |
| ** | Total Return is for the period indicated and has not been annualized. The return shown does not reflect the deduction of taxes that a shareholder would pay on Fund distributions or the redemption of Fund shares. |
| † | Annualized. |
| †† | Portfolio turnover rate is for the period indicated and periods of less than one year have not been annualized. Excludes effect of in-kind transfers. |
| (1) | The Fund commenced operations on November 27, 2018. |
| (2) | The ratio of Expenses to Average Net Assets includes the effect of a waiver due to acquired fund fees and expenses. The ratio to Average Net Assets does not include acquired fund fees and expenses of the underlying investments, if applicable. If these offsets were excluded, the ratio would have been 0.60%, 0.60%, 0.60%, 0.68% and 0.97% for the year ended October 31, 2023 to the year ended October 31, 2019, respectively. |
| (3) | Includes fees charged by the Fund custodian that were reimbursed by the custodian to the Fund subsequent to the reporting period. Excluding these fees, the ratio to average net assets would have been 0.54%. |
| (4) | The Fund commenced operations on April 17, 2019. |
Amounts designated as “—” are either $0 or have been rounded to $0.
The accompanying notes are an integral part of the financial statements.
424
Financial Highlights
Total from
Distributions ($) | | Net
Asset Value,
End of
Period ($) | | Total
Return
(%)** | | Net Assets, End of
Period ($)(000) | | Ratio of Expenses
to Average Net
Assets (%) | | Ratio of Net
Investment Income
(Loss) to Average
Net Assets (%) | | Portfolio
Turnover (%)†† |
| | | | | | | | | | | | | | | | | | | | | | | | | | | |
| | (0.92 | ) | | | 12.76 | | | | 14.08 | | | | 10,082 | | | | 0.56 | | | | 5.76 | | | | 37.00 | |
| | (0.94 | ) | | | 11.98 | | | | (18.12 | ) | | | 8,384 | | | | 0.57 | | | | 6.89 | | | | 34.00 | |
| | (0.71 | ) | | | 15.62 | | | | 43.05 | | | | 14,058 | | | | 0.55 | | | | 5.12 | | | | 88.53 | |
| | (0.70 | ) | | | 11.44 | | | | (25.24 | ) | | | 7,436 | | | | 0.56 | | | | 4.07 | | | | 59.28 | |
| | (1.03 | ) | | | 16.11 | | | | 7.81 | | | | 18,527 | | | | 0.56 | | | | 5.23 | | | | 29.81 | |
| | | | | | | | | | | | | | | | | | | | | | | | | | | |
| | (0.02 | ) | | | 16.96 | | | | 12.13 | | | | 62,069 | | | | 0.50 | | | | (0.02 | ) | | | 26.67 | |
| | (0.16 | ) | | | 15.14 | | | | (51.19 | ) | | | 42,241 | | | | 0.50 | | | | 0.34 | | | | 25.82 | |
| | (0.26 | ) | | | 31.19 | | | | 17.39 | | | | 197,751 | | | | 0.50 | | | | (0.11 | ) | | | 14.64 | |
| | (0.03 | ) | | | 26.79 | | | | 52.67 | | | | 91,083 | | | | 0.50 | | | | 0.75 | | | | 42.01 | |
| | — | | | | 17.58 | | | | 17.20 | | | | 3,517 | | | �� | 0.68 | † | | | (0.32 | )† | | | 23.50 | |
| | | | | | | | | | | | | | | | | | | | | | | | | | | |
| | (2.17 | ) | | | 16.10 | | | | (7.18 | ) | | | 1,406,038 | | | | 0.57 | (2) | | | 1.04 | | | | 19.24 | |
| | (2.72 | ) | | | 19.55 | | | | (12.18 | ) | | | 1,342,241 | | | | 0.55 | (2)(3) | | | 0.86 | | | | 186.48 | |
| | (2.90 | ) | | | 25.18 | | | | 38.82 | | | | 554,446 | | | | 0.50 | (2) | | | 0.53 | | | | 8.94 | |
| | (2.40 | ) | | | 20.45 | | | | (9.18 | ) | | | 21,475 | | | | 0.56 | (2) | | | 0.68 | | | | 11.16 | |
| | (1.22 | ) | | | 25.24 | | | | 5.99 | | | | 8,833 | | | | 0.82 | †(2) | | | 0.68 | † | | | 5.82 | |
The accompanying notes are an integral part of the financial statements.
425
Financial Highlights
| | Selected Per Share Data & Ratios |
| | For a Share Outstanding Throughout the Period |
| | | Net
Asset Value,
Beginning
of Period
($) | | Net Investment
Income
($)* | | Net Realized
and Unrealized
Gain (Loss) on
Investments
($) | | Total from
Operations
($) | | Distribution
from Net
Investment
Income ($) | | Distribution
from Capital
Gains ($) | | Return of
Capital ($) |
| Global X S&P Catholic Values Developed ex-U.S. ETF |
| 2023 | | | 23.30 | | | | 0.77 | | | | 2.39 | | | | 3.16 | | | | (0.59 | ) | | | — | | | | — | |
| 2022 | | | 32.80 | | | | 0.77 | | | | (9.11 | ) | | | (8.34 | ) | | | (0.79 | ) | | | (0.37 | ) | | | — | |
| 2021 | | | 24.98 | | | | 0.70 | | | | 7.71 | | | | 8.41 | | | | (0.59 | ) | | | — | | | | — | |
| 2020(1) | | | 25.05 | | | | 0.19 | | | | (0.26 | ) | | | (0.07 | ) | | | — | | | | — | | | | — | |
| Global X Nasdaq 100® Covered Call & Growth ETF |
| 2023 | | | 22.80 | | | | 0.07 | | | | 4.73 | | | | 4.80 | | | | — | | | | — | | | | (1.53 | ) |
| 2022 | | | 33.09 | | | | 0.06 | | | | (7.29 | ) | | | (7.23 | ) | | | (0.20 | ) | | | (1.60 | ) | | | (1.26 | ) |
| 2021 | | | 26.27 | | | | 0.02 | | | | 8.56 | | | | 8.58 | | | | (1.76 | ) | | | — | | | | — | |
| 2020(3) | | | 26.30 | | | | — | | | | 0.11 | | | | 0.11 | | | | — | | | | — | | | | (0.14 | ) |
| Global X S&P 500® Covered Call & Growth ETF |
| 2023 | | | 25.47 | | | | 0.28 | | | | 1.75 | | | | 2.03 | | | | (0.19 | ) | | | — | | | | (1.24 | ) |
| 2022 | | | 31.83 | | | | 0.27 | | | | (4.03 | ) | | | (3.76 | ) | | | (0.42 | ) | | | (1.10 | ) | | | (1.08 | ) |
| 2021 | | | 24.69 | | | | 0.22 | | | | 8.29 | | | | 8.51 | | | | (1.37 | ) | | | — | | | | — | |
| 2020(3) | | | 25.22 | | | | 0.02 | | | | (0.41 | ) | | | (0.39 | ) | | | (0.02 | ) | | | — | | | | (0.12 | ) |
| * | Per share data calculated using average shares method. |
| ** | Total Return is for the period indicated and has not been annualized. The return shown does not reflect the deduction of taxes that a shareholder would pay on Fund distributions or the redemption of Fund shares. |
| † | Annualized. |
| †† | Portfolio turnover rate is for the period indicated and periods of less than one year have not been annualized. Excludes effect of in-kind transfers. |
| (1) | The Fund commenced operations on June 22, 2020. |
| (2) | Includes fees charged by the Fund custodian that were reimbursed by the custodian to the Fund subsequent to the reporting period. Excluding these fees, the ratio to average net assets would have been 0.60%. |
| (3) | The Fund commenced operations on September 18, 2020. |
Amounts designated as “—” are either $0 or have been rounded to $0.
The accompanying notes are an integral part of the financial statements.
426
Financial Highlights
Total from
Distributions ($) | | Net
Asset Value,
End of
Period ($) | | Total
Return
(%)** | | Net Assets, End of
Period ($)(000) | | Ratio of Expenses
to Average Net
Assets (%) | | Ratio of Net
Investment Income
(Loss) to Average
Net Assets (%) | | Portfolio
Turnover (%)†† |
| | | | | | | | | | | | | | | | | | | | | | | | | | | |
| | (0.59 | ) | | | 25.87 | | | | 13.45 | | | | 14,485 | | | | 0.35 | | | | 2.80 | | | | 13.64 | |
| | (1.16 | ) | | | 23.30 | | | | (26.11 | ) | | | 5,592 | | | | 0.35 | | | | 2.83 | | | | 12.83 | |
| | (0.59 | ) | | | 32.80 | | | | 33.79 | | | | 4,264 | | | | 0.35 | | | | 2.22 | | | | 17.17 | |
| | — | | | | 24.98 | | | | (0.28 | ) | | | 2,498 | | | | 0.35 | † | | | 2.02 | † | | | 4.04 | |
| | | | | | | | | | | | | | | | | | | | | | | | | | | |
| | (1.53 | ) | | | 26.07 | | | | 21.43 | | | | 102,179 | | | | 0.60 | | | | 0.27 | | | | 28.03 | |
| | (3.06 | ) | | | 22.80 | | | | (23.57 | ) | | | 61,105 | | | | 0.61 | (2) | | | 0.23 | | | | 18.12 | |
| | (1.76 | ) | | | 33.09 | | | | 33.42 | | | | 44,671 | | | | 0.60 | | | | 0.06 | | | | 11.21 | |
| | (0.14 | ) | | | 26.27 | | | | 0.40 | | | | 6,568 | | | | 0.60 | † | | | (0.10 | )† | | | 1.65 | |
| | | | | | | | | | | | | | | | | | | | | | | | | | | |
| | (1.43 | ) | | | 26.07 | | | | 8.01 | | | | 61,006 | | | | 0.60 | | | | 1.05 | | | | 5.25 | |
| | (2.60 | ) | | | 25.47 | | | | (12.63 | ) | | | 41,511 | | | | 0.61 | (2) | | | 0.94 | | | | 9.36 | |
| | (1.37 | ) | | | 31.83 | | | | 35.18 | | | | 35,018 | | | | 0.60 | | | | 0.74 | | | | 12.17 | |
| | (0.14 | ) | | | 24.69 | | | | (1.60 | ) | | | 3,704 | | | | 0.60 | † | | | 0.75 | † | | | 0.75 | |
The accompanying notes are an integral part of the financial statements.
427
Financial Highlights
| | Selected Per Share Data & Ratios |
| | For a Share Outstanding Throughout the Period |
| | | Net
Asset Value,
Beginning
of Period
($) | | Net Investment
Income (Loss)
($)* | | Net Realized
and Unrealized
Gain (Loss) on
Investments
($) | | Total from
Operations
($) | | Distribution
from Net
Investment
Income ($) | | Distribution
from Capital
Gains ($) | | Return of
Capital ($) |
| Global X Emerging Markets Internet & E-commerce ETF | | | | | | | | | | | | | | | | | | | | | |
| 2023(1) | | | 16.38 | | | | 0.05 | | | | 3.60 | | | | 3.65 | | | | (0.05 | ) | | | — | | | | (0.01 | ) |
| 2022(1) | | | 35.97 | | | | 0.04 | | | | (19.55 | ) | | | (19.51 | ) | | | — | | | | — | | | | (0.08 | ) |
| 2021(2)(1) | | | 44.37 | | | | (0.21 | ) | | | (8.19 | ) | | | (8.40 | ) | | | — | | | | — | | | | — | |
| Global X NASDAQ 100® Tail Risk ETF | | | | | | | | | | | | | | | | | | | | | |
| 2023 | | | 19.08 | | | | 0.07 | | | | 3.63 | | | | 3.70 | | | | (0.07 | ) | | | — | | | | — | |
| 2022 | | | 25.59 | | | | 0.04 | | | | (6.03 | ) | | | (5.99 | ) | | | (0.03 | ) | | | (0.49 | ) | | | — | |
| 2021(3) | | | 25.13 | | | | (0.01 | ) | | | 0.47 | | | | 0.46 | | | | — | | | | — | | | | — | |
| Global X NASDAQ 100® Risk Managed Income ETF | | | | | | | | | | | | | | | | | | | | | |
| 2023 | | | 18.17 | | | | 0.05 | | | | 0.58 | | | | 0.63 | | | | — | | | | — | | | | (2.16 | ) |
| 2022 | | | 24.12 | | | | 0.04 | | | | (4.04 | ) | | | (4.00 | ) | | | (0.25 | ) | | | — | | | | (1.70 | ) |
| 2021(3) | | | 24.60 | | | | (0.01 | ) | | | (0.16 | ) | | | (0.17 | ) | | | — | | | | — | | | | (0.31 | ) |
| * | Per share data calculated using average shares method. |
| ** | Total Return is for the period indicated and has not been annualized. The return shown does not reflect the deduction of taxes that a shareholder would pay on Fund distributions or the redemption of Fund shares. |
| † | Annualized. |
| †† | Portfolio turnover rate is for the period indicated and periods of less than one year have not been annualized. Excludes effect of in-kind transfers. |
| (1) | Per share amounts have been adjusted for a 1 for 3 reverse share split on December 19, 2022. (See Note 9 in the Notes to Financial Statements.) |
| (2) | The Fund commenced operations on November 9, 2020. |
| (3) | The Fund commenced operations on August 25, 2021. |
| (4) | Includes fees charged by the Fund custodian that were reimbursed by the custodian to the Fund subsequent to the reporting period. Excluding these fees, the ratio to average net assets would have been 0.60% and 0.61% for the year ended October 31, 2023 and October 31, 2022, respectively. |
Amounts designated as “—” are either $0 or have been rounded to $0.
The accompanying notes are an integral part of the financial statements.
428
Financial Highlights
Total from
Distributions ($) | | Net
Asset Value,
End of
Period ($) | | Total
Return
(%)** | | Net Assets, End of
Period ($)(000) | | Ratio of Expenses
to Average Net
Assets (%) | | Ratio of Net
Investment Income
(Loss) to Average
Net Assets (%) | | Portfolio
Turnover (%)†† |
| | | | | | | | | | | | | | | | | | | | | | | | | | | |
| | (0.06 | ) | | | 19.97 | | | | 22.28 | | | | 2,393 | | | | 0.65 | | | | 0.22 | | | | 27.72 | |
| | (0.08 | ) | | | 16.38 | | | | (54.30 | ) | | | 1,966 | | | | 0.65 | | | | 0.14 | | | | 26.27 | |
| | — | | | | 35.97 | | | | (18.93 | ) | | | 4,555 | | | | 0.65 | † | | | (0.49 | )† | | | 23.61 | |
| | | | | | | | | | | | | | | | | | | | | | | | | | | |
| | (0.07 | ) | | | 22.71 | | | | 19.42 | | | | 1,362 | | | | 0.53 | | | | 0.35 | | | | 19.43 | |
| | (0.52 | ) | | | 19.08 | | | | (23.90 | ) | | | 1,908 | | | | 0.61 | | | | 0.19 | | | | 13.88 | |
| | — | | | | 25.59 | | | | 1.83 | | | | 3,326 | | | | 0.60 | † | | | (0.12 | )† | | | 1.71 | |
| | | | | | | | | | | | | | | | | | | | | | | | | | | |
| | (2.16 | ) | | | 16.64 | | | | 3.42 | | | | 11,813 | | | | 0.61 | (4) | | | 0.30 | | | | 22.73 | |
| | (1.95 | ) | | | 18.17 | | | | (17.24 | ) | | | 10,720 | | | | 0.62 | (4) | | | 0.19 | | | | 27.40 | |
| | (0.31 | ) | | | 24.12 | | | | (0.69 | ) | | | 4,341 | | | | 0.60 | † | | | (0.15 | )† | | | 2.16 | |
The accompanying notes are an integral part of the financial statements.
429
Financial Highlights
| Selected Per Share Data & Ratios |
| For a Share Outstanding Throughout the Period |
| | | Net
Asset Value,
Beginning
of Period
($) | | Net Investment
Income (Loss)
($)* | | Net Realized
and Unrealized
Gain (Loss) on
Investments
($) | | Total from
Operations
($) | | Distribution
from Net
Investment
Income ($) | | Distribution
from Capital
Gains ($) | | Return of
Capital ($) |
| Global X NASDAQ 100® Collar 95-110 ETF | | | | | | | | | | | | | | | | | | | | | | | |
| 2023 | | | 22.00 | | | | 0.08 | | | | 1.46 | | | | 1.54 | | | | (0.07 | ) | | | — | | | | — | |
| 2022 | | | 25.78 | | | | 0.04 | | | | (3.38 | ) | | | (3.34 | ) | | | (0.02 | ) | | | (0.42 | ) | | | — | |
| 2021(2) | | | 25.27 | | | | (0.01 | ) | | | 0.52 | | | | 0.51 | | | | — | | | | — | | | | — | |
| Global X S&P 500® Tail Risk ETF | | | | | | | | | | | | | | | | | | | | | | | |
| 2023 | | | 23.21 | | | | 0.27 | | | | 1.00 | | | | 1.27 | | | | (0.25 | ) | | | — | | | | — | |
| 2022 | | | 27.72 | | | | 0.23 | | | | (4.00 | ) | | | (3.77 | ) | | | (0.16 | ) | | | (0.58 | ) | | | — | |
| 2021(2) | | | 27.33 | | | | 0.03 | | | | 0.36 | | | | 0.39 | | | | — | | | | — | | | | — | |
| Global X S&P 500® Risk Managed Income ETF | | | | | | | | | | | | | | | | | | | | | | |
| 2023 | | | 21.05 | | | | 0.22 | | | | (0.29 | ) | | | (0.07 | ) | | | (0.03 | ) | | | — | | | | (2.39 | ) |
| 2022 | | | 26.83 | | | | 0.23 | | | | (3.38 | ) | | | (3.15 | ) | | | (0.52 | ) | | | (0.07 | ) | | | (2.04 | ) |
| 2021(2) | | | 26.77 | | | | 0.03 | | | | 0.39 | | | | 0.42 | | | | (0.36 | ) | | | — | | | | — | |
| * | Per share data calculated using average shares method. |
| ** | Total Return is for the period indicated and has not been annualized. The return shown does not reflect the deduction of taxes that a shareholder would pay on Fund distributions or the redemption of Fund shares. |
| † | Annualized. |
| †† | Portfolio turnover rate is for the period indicated and periods of less than one year have not been annualized. Excludes effect of in-kind transfers. |
| (1) | Includes fees charged by the Fund custodian that were reimbursed by the custodian to the Fund subsequent to the reporting period. Excluding these fees, the ratio to average net assets would have been 0.61%. |
| (2) | The Fund commenced operations on August 25, 2021. |
Amounts designated as “—” are either $0 or have been rounded to $0.
The accompanying notes are an integral part of the financial statements.
430
Financial Highlights
Total from
Distributions ($) | | Net
Asset Value,
End of
Period ($) | | Total
Return
(%)** | | Net Assets, End of
Period ($)(000) | | Ratio of Expenses
to Average Net
Assets (%) | | Ratio of Net
Investment Income
(Loss) to Average
Net Assets (%) | | Portfolio
Turnover (%)†† |
| | | | | | | | | | | | | | | | | | | | | | | | | | | |
| | (0.07 | ) | | | 23.47 | | | | 7.01 | | | | 2,112 | | | | 0.55 | | | | 0.35 | | | | 18.56 | |
| | (0.44 | ) | | | 22.00 | | | | (13.19 | ) | | | 3,081 | | | | 0.62 | (1) | | | 0.18 | | | | 9.89 | |
| | — | | | | 25.78 | | | | 2.06 | | | | 2,836 | | | | 0.60 | † | | | (0.11 | )† | | | 2.11 | |
| | | | | | | | | | | | | | | | | | | | | | | | | | | |
| | (0.25 | ) | | | 24.23 | | | | 5.51 | | | | 2,423 | | | | 0.54 | | | | 1.10 | | | | 2.71 | |
| | (0.74 | ) | | | 23.21 | | | | (13.98 | ) | | | 3,017 | | | | 0.61 | | | | 0.92 | | | | 7.40 | |
| | — | | | | 27.72 | | | | 1.43 | | | | 3,604 | | | | 0.60 | † | | | 0.58 | † | | | 6.21 | |
| | | | | | | | | | | | | | | | | | | | | | | | | | | |
| | (2.42 | ) | | | 18.56 | | | | (0.61 | ) | | | 27,098 | | | | 0.60 | | | | 1.08 | | | | 4.85 | |
| | (2.63 | ) | | | 21.05 | | | | (12.39 | ) | | | 24,634 | | | | 0.63 | (1) | | | 0.97 | | | | 21.62 | |
| | (0.36 | ) | | | 26.83 | | | | 1.60 | | | | 5,902 | | | | 0.60 | † | | | 0.57 | † | | | 7.08 | |
The accompanying notes are an integral part of the financial statements.
431
Financial Highlights
Selected Per Share Data & Ratios
For a Share Outstanding Throughout the Period |
| | | Net
Asset Value,
Beginning
of Period
($) | | Net Investment
Income
($)* | | Net Realized
and Unrealized
Gain (Loss) on
Investments
($) | | Total from
Operations
($) | | Distribution
from Net
Investment
Income ($) | | Distribution
from Capital
Gains ($) | | Return of
Capital ($) |
| Global X S&P 500® Collar 95-110 ETF | | | | | | | | | | | | | | | | | | | | |
| 2023 | | | 24.47 | | | | 0.28 | | | | 0.26 | | | | 0.54 | | | | (0.33 | ) | | | — | | | | — | |
| 2022 | | | 27.57 | | | | 0.23 | | | | (2.77 | ) | | | (2.54 | ) | | | (0.16 | ) | | | (0.40 | ) | | | — | |
| 2021(2) | | | 27.28 | | | | 0.03 | | | | 0.26 | | | | 0.29 | | | | — | | | | — | | | | — | |
| Global X Disruptive Materials ETF | | | | | | | | | | | | | | | | | | | | |
| 2023 | | | 18.07 | | | | 0.34 | | | | (3.88 | ) | | | (3.54 | ) | | | (0.30 | ) | | | — | | | | — | |
| 2022(3) | | | 23.75 | | | | 0.45 | | | | (5.88 | ) | | | (5.43 | ) | | | (0.25 | ) | | | — | | | | — | |
| Global X Dow 30® Covered Call ETF | | | | | | | | | | | | | | | | | | | | |
| 2023 | | | 21.89 | | | | 0.34 | | | | 0.38 | | | | 0.72 | | | | (0.18 | ) | | | — | | | | (1.54 | ) |
| 2022(4) | | | 24.13 | | | | 0.22 | | | | (0.86 | ) | | | (0.64 | ) | | | (0.64 | ) | | | — | | | | (0.96 | ) |
| * | Per share data calculated using average shares method. |
| ** | Total Return is for the period indicated and has not been annualized. The return shown does not reflect the deduction of taxes that a shareholder would pay on Fund distributions or the redemption of Fund shares. |
| † | Annualized. |
| †† | Portfolio turnover rate is for the period indicated and periods of less than one year have not been annualized. Excludes effect of in-kind transfers. |
| (1) | Includes fees charged by the Fund custodian that were reimbursed by the custodian to the Fund subsequent to the reporting period. Excluding these fees, the ratio to average net assets would have been 0.61%. |
| (2) | The Fund commenced operations on August 25, 2021. |
| (3) | The Fund commenced operations on January 24, 2022. |
| (4) | The Fund commenced operations on February 23, 2022. |
| (5) | Includes fees charged by the Fund custodian that were reimbursed by the custodian to the Fund subsequent to the reporting period. Excluding these fees, the ratio to average net assets would have been 0.60%. |
Amounts designated as “—” are either $0 or have been rounded to $0.
The accompanying notes are an integral part of the financial statements.
432
Financial Highlights
Total from
Distributions ($) | | Net
Asset Value,
End of
Period ($) | | Total
Return
(%)** | | Net Assets, End of
Period ($)(000) | | Ratio of Expenses
to Average Net
Assets (%) | | Ratio of Net
Investment Income
to Average Net
Assets (%) | | Portfolio
Turnover (%)†† |
| | | | | | | | | | | | | | | | | | | | | | | | | | | |
| | (0.33 | ) | | | 24.68 | | | | 2.20 | | | | 2,221 | | | | 0.55 | | | | 1.11 | | | | 3.09 | |
| | (0.56 | ) | | | 24.47 | | | | (9.40 | ) | | | 3,915 | | | | 0.64 | (1) | | | 0.90 | | | | 8.96 | |
| | — | | | | 27.57 | | | | 1.06 | | | | 3,308 | | | | 0.60 | † | | | 0.58 | † | | | 6.44 | |
| | | | | | | | | | | | | | | | | | | | | | | | | | | |
| | (0.30 | ) | | | 14.23 | | | | (19.96 | ) | | | 7,684 | | | | 0.59 | | | | 1.84 | | | | 36.55 | |
| | (0.25 | ) | | | 18.07 | | | | (22.98 | ) | | | 3,433 | | | | 0.60 | † | | | 2.72 | † | | | 25.34 | |
| | | | | | | | | | | | | | | | | | | | | | | | | | | |
| | (1.72 | ) | | | 20.89 | | | | 3.30 | | | | 78,947 | | | | 0.60 | | | | 1.55 | | | | 6.67 | |
| | (1.60 | ) | | | 21.89 | | | | (2.77 | ) | | | 52,985 | | | | 0.61 | †(5) | | | 1.42 | † | | | 8.82 | |
The accompanying notes are an integral part of the financial statements.
433
Financial Highlights
Selected Per Share Data & Ratios
For a Share Outstanding Throughout the Period |
| | | Net
Asset Value,
Beginning
of Period
($) | | Net Investment
Income (Loss)
($)* | | Net Realized
and Unrealized
Gain (Loss) on
Investments
($) | | Total from
Operations
($) | | Distribution
from Net
Investment
Income ($) | | Distribution
from Capital
Gains ($) | | Return of
Capital ($) |
| Global X Russell 2000 Covered Call & Growth ETF | | | | | | | | | | | | | | | | | | | | |
| 2023 | | | 26.58 | | | | 0.28 | | | | (2.31 | ) | | | (2.03 | ) | | | (0.17 | ) | | | (0.82 | ) | | | (1.18 | ) |
| 2022(2) | | | 25.90 | | | | (0.01 | ) | | | 0.82 | | | | 0.81 | | | | (0.13 | ) | | | — | | | | — | |
| Global X Financials Covered Call & Growth ETF | | | | | | | | | | | | | | | | | | | | |
| 2023(3) | | | 24.88 | | | | 0.35 | | | | (1.66 | ) | | | (1.31 | ) | | | (0.85 | ) | | | — | | | | (0.42 | ) |
| Global X Health Care Covered Call & Growth ETF | | | | | | | | | | | | | | | | | | | | |
| 2023(3) | | | 25.06 | | | | 0.27 | | | | (0.75 | ) | | | (0.48 | ) | | | (1.16 | ) | | | — | | | | — | |
| * | Per share data calculated using average shares method. |
| ** | Total Return is for the period indicated and has not been annualized. The return shown does not reflect the deduction of taxes that a shareholder would pay on Fund distributions or the redemption of Fund shares. |
| † | Annualized. |
| †† | Portfolio turnover rate is for the period indicated and periods of less than one year have not been annualized. Excludes effect of in-kind transfers. |
| (1) | The ratio of Expenses to Average Net Assets includes the effect of a waiver due to acquired fund fees and expenses. The ratio to Average Net Assets does not include acquired fund fees and expenses of the underlying investments, if applicable. If these offsets were excluded, the ratio would have been 0.60% and 0.60% for the year ended October 31, 2023 and the year ended October 31, 2022, respectively. |
| (2) | The Fund commenced operations on October 4, 2022. |
| (3) | The Fund commenced operations on November 21, 2022. |
| (4) | The ratio of Expenses to Average Net Assets includes the effect of a waiver due to acquired fund fees and expenses. The ratio to Average Net Assets does not include acquired fund fees and expenses of the underlying investments, if applicable. If these offsets were excluded, the ratio would have been 0.60% for the year ended October 31, 2023. |
Amounts designated as “—” are either $0 or have been rounded to $0.
The accompanying notes are an integral part of the financial statements.
434
Financial Highlights
Total from
Distributions ($) | | Net
Asset Value,
End of
Period ($) | | Total
Return
(%)** | | Net Assets, End of
Period ($)(000) | | Ratio of Expenses
to Average Net
Assets (%) | | Ratio of Net
Investment Income
(Loss) to Average
Net Assets (%) | | Portfolio
Turnover (%)†† |
| | | | | | | | | | | | | |
| | (2.17 | ) | | | 22.38 | | | | (8.16 | ) | | | 8,279 | | | | 0.50 | (1) | | | 1.11 | | | | 5.48 | |
| | (0.13 | ) | | | 26.58 | | | | 3.14 | | | | 2,658 | | | | 0.50 | †(1) | | | (0.50 | )† | | | 0.00 | |
| | | | | | | | | | | | | | | | | | | | | | | | | | | |
| | (1.27 | ) | | | 22.30 | | | | (5.40 | ) | | | 2,230 | | | | 0.54 | †(4) | | | 1.55 | † | | | 16.45 | |
| | | | | | | | | | | | | | | | | | | | | | | | | | | |
| | (1.16 | ) | | | 23.42 | | | | (2.05 | ) | | | 2,577 | | | | 0.55 | †(4) | | | 1.16 | † | | | 6.85 | |
The accompanying notes are an integral part of the financial statements.
435
Financial Highlights
Selected Per Share Data & Ratios
For a Share Outstanding Throughout the Period |
| | | Net
Asset Value,
Beginning
of Period
($) | | Net Investment
Income
($)* | | Net Realized
and Unrealized
Gain on
Investments
($) | | Total from
Operations
($) | | Distribution
from Net
Investment
Income ($) | | Distribution
from Capital
Gains ($) | | Return of
Capital ($) |
| Global X Information Technology Covered Call & Growth ETF | | | | | | | | | | | | | | | | | | | | |
| 2023(1) | | | 24.74 | | | | 0.11 | | | | 5.55 | | | | 5.66 | | | | (1.54 | ) | | | — | | | | — | |
| Global X NASDAQ 100® ESG Covered Call ETF | | | | | | | | | | | | | | | | | | | | |
| 2023(3) | | | 24.46 | | | | 0.04 | | | | 2.33 | | | | 2.37 | | | | (2.06 | ) | | | — | | | | — | |
| Global X S&P 500® ESG Covered Call ETF | | | | | | | | | | | | | | | | | | | | |
| 2023(3) | | | 24.65 | | | | 0.17 | | | | 0.28 | | | | 0.45 | | | | (0.45 | ) | | | — | | | | (0.86 | ) |
| * | Per share data calculated using average shares method. |
| ** | Total Return is for the period indicated and has not been annualized. The return shown does not reflect the deduction of taxes that a shareholder would pay on Fund distributions or the redemption of Fund shares. |
| † | Annualized. |
| †† | Portfolio turnover rate is for the period indicated and periods of less than one year have not been annualized. Excludes effect of in-kind transfers. |
| (1) | The Fund commenced operations on November 21, 2022. |
| (2) | The ratio of Expenses to Average Net Assets includes the effect of a waiver due to acquired fund fees and expenses. The ratio to Average Net Assets does not include acquired fund fees and expenses of the underlying investments, if applicable. If these offsets were excluded, the ratio would have been 0.60% for the year ended October 31, 2023. |
| (3) | The Fund commenced operations on February 21, 2023. |
| | |
| Amounts designated as “—” are either $0 or have been rounded to $0. |
The accompanying notes are an integral part of the financial statements.
436
Financial Highlights
Total from
Distributions ($) | | Net
Asset Value,
End of
Period ($) | | Total
Return
(%)** | | Net Assets, End of
Period ($)(000) | | Ratio of Expenses
to Average Net
Assets (%) | | Ratio of Net
Investment Income
to Average Net
Assets (%) | | Portfolio
Turnover (%)†† |
| | | | | | | | | | | | | | | | | | | | | | | | | | | |
| | (1.54 | ) | | | 28.86 | | | | 23.27 | | | | 3,463 | | | | 0.55 | †(2) | | | 0.42 | † | | | 13.93 | |
| | | | | | | | | | | | | | | | | | | | | | | | | | | |
| | (2.06 | ) | | | 24.77 | | | | 9.67 | | | | 2,478 | | | | 0.61 | † | | | 0.21 | † | | | 11.82 | |
| | | | | | | | | | | | | | | | | | | | | | | | | | | |
| | (1.31 | ) | | | 23.79 | | | | 1.79 | | | | 2,379 | | | | 0.60 | † | | | 1.00 | † | | | 13.87 | |
The accompanying notes are an integral part of the financial statements.
437
Financial Highlights
Selected Per Share Data & Ratios
For a Share Outstanding Throughout the Period |
| | | Net
Asset Value,
Beginning
of Period
($) | | Net Investment
Income
($)* | | Net Realized
and Unrealized
Loss on
Investments
($) | | Total from
Operations
($) | | Distribution
from Net
Investment
Income ($) | | Distribution
from Capital
Gains ($) | | Return of
Capital ($) |
| Global X Dow 30® Covered Call & Growth ETF | | | | | | | | | | | | | | | | | | | | |
| 2023(1) | | | 25.81 | | | | 0.10 | | | | (1.48 | ) | | | (1.38 | ) | | | (0.09 | ) | | | — | | | | (0.14 | ) |
| * | Per share data calculated using average shares method. |
| ** | Total Return is for the period indicated and has not been annualized. The return shown does not reflect the deduction of taxes that a shareholder would pay on Fund distributions or the redemption of Fund shares. |
| † | Annualized. |
| †† | Portfolio turnover rate is for the period indicated and periods of less than one year have not been annualized. Excludes effect of in-kind transfers. |
| (1) | The Fund commenced operations on July 25, 2023. |
Amounts designated as “—” are either $0 or have been rounded to $0.
The accompanying notes are an integral part of the financial statements.
438
Financial Highlights
Total from
Distributions ($) | | Net
Asset Value,
End of
Period ($) | | Total
Return
(%)** | | Net Assets, End of
Period ($)(000) | | Ratio of Expenses
to Average Net
Assets (%) | | Ratio of Net
Investment Income
to Average Net
Assets (%) | | Portfolio
Turnover (%)†† |
| | | | | | | | | | | | | | | | | | | | | | | | | | | |
| | (0.23 | ) | | | 24.20 | | | | (5.35 | ) | | | 2,421 | | | | 0.60 | † | | | 1.43 | † | | | 0.21 | |
The accompanying notes are an integral part of the financial statements.
439
Notes to Financial Statements
October 31, 2023
1. ORGANIZATION
The Global X Funds (the “Trust”) is a Delaware statutory trust formed on March 6, 2008. The Trust is registered under the Investment Company Act of 1940 (the “1940 Act”), as amended, as an open-end management investment company. As of October 31, 2023, the Trust had one hundred and thirteen portfolios, one hundred and eight of which were operational. The financial statements herein and the related notes pertain to the Global X Lithium and Battery Tech ETF, Global X SuperDividend® ETF, Global X Social Media ETF, Global X Guru® Index ETF, Global X SuperIncome™ Preferred ETF, Global X SuperDividend® U.S. ETF, Global X S&P 500® Covered Call ETF, Global X NASDAQ 100® Covered Call ETF, Global X MSCI SuperDividend® Emerging Markets ETF, Global X SuperDividend® REIT ETF, Global X Renewable Energy Producers ETF, Global X S&P 500® Catholic Values ETF, Global X MSCI SuperDividend® EAFE ETF, Global X E-commerce ETF, Global X Russell 2000 Covered Call ETF, Global X S&P Catholic Values Developed ex-U.S. ETF, Global X Nasdaq 100® Covered Call & Growth ETF, Global X S&P 500® Covered Call & Growth ETF, Global X Emerging Markets Internet & E-commerce ETF, Global X NASDAQ 100® Tail Risk ETF, Global X NASDAQ 100® Risk Managed Income ETF, Global X NASDAQ 100® Collar 95-110 ETF, Global X S&P 500® Tail Risk ETF, Global X S&P 500® Risk Managed Income ETF, Global X S&P 500® Collar 95-110 ETF, Global X Disruptive Materials ETF, Global X Dow 30® Covered Call ETF, Global X Russell 2000 Covered Call & Growth ETF, Global X Financials Covered Call & Growth ETF, Global X Health Care Covered Call & Growth ETF, Global X Information Technology Covered Call & Growth ETF, Global X Nasdaq 100® ESG Covered Call ETF, Global X S&P 500® ESG Covered Call ETF and Global X Dow 30® Covered Call & Growth ETF (each a “Fund”, collectively, the “Funds”).
Each Fund (except the Global X SuperDividend® ETF, Global X SuperDividend® U.S. ETF, Global X MSCI SuperDividend® Emerging Markets ETF, Global X MSCI SuperDividend® EAFE ETF, Global X SuperDividend® REIT ETF, Global X SuperIncomeTM Preferred ETF, Global X Guru® Index ETF, Global X S&P 500® Catholic Values ETF, Global X Russell 2000 Covered Call ETF, Global X Dow 30® Covered Call ETF, Global X S&P 500® Covered Call ETF, Global X S&P 500® Covered Call & Growth ETF, Global X S&P 500® Tail Risk ETF, Global X S&P 500® Risk Managed Income ETF, and Global X S&P 500® Collar 95-110 ETF) has elected non-diversified status under the 1940 Act.
Global X Financials Covered Call & Growth ETF commenced operations on November 21, 2022.
Global X Health Care Covered Call & Growth ETF commenced operations on November 21, 2022.
Global X Information Technology Covered Call & Growth ETF commenced operations on November 21, 2022.
Notes to Financial Statements (Continued)
October 31, 2023
1. ORGANIZATION (continued)
Global X Nasdaq 100® ESG Covered Call ETF commenced operations on February 21, 2023.
Global X S&P 500® ESG Covered Call ETF commenced operations on February 21, 2023.
Global X Dow 30® Covered Call & Growth ETF commenced operations on July 25, 2023.
On December 24, 2018, the shareholders of the Horizons NASDAQ 100® Covered Call ETF and Horizons S&P 500® Covered Call ETF (each, a “Predecessor Fund” and together, the “Predecessor Funds”) approved a proposed agreement and plan of reorganization (the “Reorganization”) that provided for (a) the transfer of all the assets and assumption of certain of the liabilities of each Predecessor Fund to the Global X Nasdaq 100® Covered Call ETF and the Global X S&P 500® Covered Call ETF (together, the “Successor Funds”), respectively; (b) the issuance of shares of the Successor Fund to the shareholders of the corresponding Predecessor Fund; and (c) the liquidation and termination of the Predecessor Funds. The effective date of the Reorganization of each Predecessor Fund was December 24, 2018. The Successor Funds had no operations prior to the Reorganization. The Predecessor Funds had substantially similar investment objectives, investment strategies, policies and restrictions as those of the Successor Funds. The financial highlights include the financial information of the Predecessor Funds through December 21, 2018.
2. SIGNIFICANT ACCOUNTING POLICIES
The following is a summary of the significant accounting policies followed by the Funds:
USE OF ESTIMATES – The Funds are investment companies that apply the accounting and reporting guidance issued in Topic 946 by the U.S. Financial Accounting Standards Board. The preparation of financial statements in conformity with U.S. generally accepted accounting principles (“U.S. GAAP”) requires management to make estimates and assumptions that affect the reported amounts of assets and liabilities and disclosure of contingent assets and liabilities at the date of the financial statements and the reported amounts of increases and decreases in net assets from operations during the reporting period. Actual results could materially differ from those estimates.
RETURN OF CAPITAL ESTIMATES – Distributions received by the Funds from underlying master limited partnership (“MLP”) and real estate investment trust (“REIT”) investments generally are comprised of income and return of capital. The Funds record investment income and return of capital based on estimates made at the time such distributions are received. Such estimates are based on historical information available from the MLPs, REITs and other industry sources. These estimates may subsequently be revised based on information received from the MLPs and REITs after their tax reporting periods are concluded.
Notes to Financial Statements (Continued)
October 31, 2023
2. SIGNIFICANT ACCOUNTING POLICIES (continued)
MLPs – Certain Funds may invest in MLPs. MLPs are publicly traded partnerships engaged in the transportation, storage and processing of minerals and natural resources. By confining their operations to these specific activities, their interests, or units, are able to trade on public securities exchanges exactly like the shares of a corporation, without entity level taxation. To qualify as an MLP and to not be taxed as a corporation, a partnership must receive at least 90% of its income from qualifying sources as set forth in Section 7704(d) of the Internal Revenue Code of 1986, as amended (the “Code”). These qualifying sources include natural resource-based activities such as the processing, transportation and storage of mineral or natural resources. MLPs generally have two classes of owners: the general partner and limited partners. The general partner of an MLP is typically owned by a major energy company, an investment fund, the direct management of the MLP, or is an entity owned by one or more of such parties. The general partner may be structured as a private or publicly traded corporation or other entity.
The general partner typically controls the operations and management of the MLP through an up to 2% equity interest in the MLP plus, in many cases, ownership of common units and subordinated units.
Limited partners typically own the remainder of the partnership through ownership of common units, and have a limited role in the partnership’s operations and management. MLPs are typically structured such that common units and general partner interests have first priority to receive quarterly cash distributions up to an established minimum amount (“minimum quarterly distributions” or “MQD”). Common and general partner interests also accrue arrearages in distributions to the extent the MQD is not paid. Once common and general partner interests have been paid, subordinated units receive distributions of up to the MQD; however, subordinated units do not accrue arrearages. Distributable cash in excess of the MQD is paid to both common and subordinated units and is distributed to both common and subordinated units generally on a pro rata basis. The general partner is also eligible to receive incentive distributions if the general partner operates the business in a manner which results in distributions paid per common unit surpassing specified target levels. As the general partner increases cash distributions to the limited partners, the general partner receives an increasingly higher percentage of the incremental cash distributions.
SECURITY VALUATION - Securities listed on a securities exchange, market or automated quotation system for which quotations are readily available (except for securities traded on the NASDAQ Stock Market (“NASDAQ”)), including securities traded over the counter, are valued at the last quoted sale price on the primary exchange or market (foreign or domestic) on which they are traded (or at approximately 4:00 pm Eastern Time if a security’s primary exchange is normally open at that time), or, if there is no such reported sale, at the most recent mean between the quoted bid and asked prices, which approximates fair value (absent both bid and asked prices on such exchange, the bid price may be used).
Notes to Financial Statements (Continued)
October 31, 2023
2. SIGNIFICANT ACCOUNTING POLICIES (continued)
For securities traded on NASDAQ, the NASDAQ Official Closing Price will be used. The prices for foreign securities are reported in local currency and converted to U.S. dollars using currency exchange rates as of the reporting date. The exchange rates used by the Trust for valuation are captured as of the New York or London close each day.
Options traded on an exchange will be valued at the mean of the bid and ask quotations for the current day at the close of the market. If either the bid or the ask is not available, the last closing price will be used.
Securities for which market prices are not “readily available” are valued in accordance with fair value procedures (the “Fair Value Procedures”) established by Global X Management Company LLC, the Funds’ investment adviser (the “Adviser”), and approved by the Funds’ Board of Trustees (the “Board”). Pursuant to Rule 2a-5 under the 1940 Act, the Board has designated the Adviser as the “valuation designee” to determine the fair value of securities and other instruments for which no readily available market quotations are available. The Fair Value Procedures are implemented through a fair value committee (the “Committee”) of the Adviser. Some of the more common reasons that may necessitate that a security be valued using the Fair Value Procedures include: the security’s trading has been halted or suspended; the security has been de-listed from its primary trading exchange; the security’s primary trading market is temporarily closed at a time when, under normal conditions, it would be open; the security has not been traded for an extended period of time; the security’s primary pricing source is not able or willing to provide a price; or trading of the security is subject to local government-imposed restrictions. In addition, the Funds may fair value a security if an event that may materially affect the value of the Funds’ security that is traded outside the United States (a “Significant Event”) has occurred between the time of the security’s last close and the time that each Fund calculates its net asset value (“NAV”). A Significant Event may relate to a single issuer or to an entire market sector. Events that may be Significant Events include: government actions, natural disasters, armed conflict, acts of terrorism and significant market fluctuations. If the Adviser becomes aware of a Significant Event that has occurred with respect to a security or group of securities after the closing of the exchange or market on which the security or securities principally trade, but before the time at which the Funds calculate their NAV, it may request that a Committee meeting be called. When a security is valued in accordance with the Fair Value Procedures, the Committee will determine the value after taking into consideration all relevant information reasonably available to the Committee.
If available, debt securities are priced based upon valuations provided by independent, third-party pricing agents. Such values generally reflect the last reported sales price if the security is actively traded. The third-party pricing agents may also value debt securities at an evaluated bid price by employing methodologies that utilize actual market transactions, broker-supplied valuations, or other methodologies designed to identify the market value for such securities. Debt obligations with remaining maturities of sixty days or less will
Notes to Financial Statements (Continued)
October 31, 2023
2. SIGNIFICANT ACCOUNTING POLICIES (continued)
be valued at their market value. Prices for most securities held by the Funds are provided daily by recognized independent pricing agents. If a security price cannot be obtained from an independent, third-party pricing agent, the Funds seek to obtain a bid price from at least one independent broker.
In accordance with the authoritative guidance on fair value measurements and disclosure under U.S. GAAP, the Funds disclose the fair value of their investments in a hierarchy that prioritizes the inputs to valuation techniques used to measure the fair value. The objective of a fair value measurement is to determine the price that would be received upon the sale of an asset or paid to transfer a liability in an orderly transaction between market participants at the measurement date (an exit price). Accordingly, the fair value hierarchy gives the highest priority to quoted prices (unadjusted) in active markets for identical assets or liabilities (Level 1) and the lowest priority to unobservable inputs (Level 3). The three levels of the fair value hierarchy are described below:
Level 1 – Unadjusted quoted prices in active markets for identical, unrestricted assets or liabilities that the Funds have the ability to access at the measurement date
Level 2 – Other significant observable inputs (including quoted prices in non-active markets, quoted prices for similar investments, fair value of investments for which the Funds have the ability to fully redeem tranches at NAV as of the measurement date or within the near term, and short-term investments valued at amortized cost)
Level 3 – Significant unobservable inputs (including the Funds’ own assumptions in determining the fair value of investments, and fair value of investments for which the Funds do not have the ability to fully redeem tranches at NAV as of the measurement date or within the near term)
Investments are classified within the level of the lowest significant input considered in determining fair value. Investments classified within Level 3 whose fair value measurement considers several inputs may include Level 1 or Level 2 inputs as components of the overall fair value measurement. For details of the investment classification, reference the Schedule of Investments.
The unobservable inputs used to determine fair value of Level 3 assets may have similar or diverging impacts on valuation. Significant increases and decreases in these inputs in isolation and interrelationships between those inputs could result in significantly higher or lower fair value measurement.
DUE TO/FROM BROKERS – Due to/from brokers includes cash and collateral balances with the Funds’ clearing brokers or counterparties as of October 31, 2023. The Funds continuously monitor the credit standing of each broker or counterparty with whom they
Notes to Financial Statements (Continued)
October 31, 2023
2. SIGNIFICANT ACCOUNTING POLICIES (continued)
conduct business. In the event a broker or counterparty is unable to fulfill its obligations, the Funds would be subject to counterparty credit risk.
REPURCHASE AGREEMENTS - Securities pledged as collateral for repurchase agreements by BNP Paribas are held by Brown Brothers Harriman & Co. (“BBH”) or the Bank of New York Mellon (“BNY Mellon”), as appropriate, in their roles as Custodian to respective Funds (each, a “Custodian” and together, the “Custodians”), and are designated as being held on each Fund’s behalf by the Custodian under a book-entry system. Each Fund monitors the adequacy of the collateral on a daily basis and can require the seller to provide additional collateral in the event the market value of the securities pledged falls below the carrying value of the repurchase agreement, including accrued interest.
It is the Funds’ policy to only enter into repurchase agreements with banks and other financial institutions which are deemed by the Adviser to be creditworthy. The Funds bear the risk of loss in the event that the counterparty to a repurchase agreement defaults on its obligations and the Funds are prevented from exercising their rights to dispose of the underlying securities received as collateral. For financial statement purposes, the Funds record the securities lending collateral (included in repurchase agreements, at value or restricted cash) as an asset and the obligation to return securities lending collateral as a liability on the Statements of Assets and Liabilities.
Repurchase agreements are entered into by the Funds under Master Repurchase Agreements (“MRA”) which permit the Funds, under certain circumstances, including an event of default (such as bankruptcy or insolvency), to offset payables and/or receivables under the MRA with collateral held and/or posted to the counterparty and create one single net payment due to or from the Funds.
FEDERAL INCOME TAXES – It is each Fund’s intention to qualify, or continue to qualify, as a regulated investment company for Federal income tax purposes by complying with the appropriate provisions of Subchapter M of the Code. Accordingly, no provisions for Federal income taxes have been made in the financial statements except as described below.
The Funds evaluate tax positions taken or expected to be taken in the course of preparing the Funds’ tax returns to determine whether it is “more-likely-than-not” (i.e., greater than 50 percent) that each tax position will be sustained upon examination by a taxing authority based on the technical merits of the position. Tax positions not deemed to meet the more-likely-than-not threshold are recorded as a tax benefit or expense in the current year. The Funds did not record any tax positions in the current period; however, management’s conclusions regarding tax positions may be subject to review and adjustment at a later date based on factors including, but not limited to, examination by tax authorities (i.e., the last three tax year ends, as applicable), and on-going analysis of and changes to tax laws and regulations, and interpretations thereof.
Notes to Financial Statements (Continued)
October 31, 2023
2. SIGNIFICANT ACCOUNTING POLICIES (continued)
If a Fund has foreign tax filings that have not been made, the tax years that remain subject to examination may date back to the inception of the Fund.
As of and during the reporting period ended October 31, 2023, the Funds did not have a liability for any unrecognized tax benefits. The Funds recognize interest and penalties, if any, related to unrecognized tax benefits as an income tax expense on the Statements of Operations. During the reporting period, the Funds did not incur any interest or penalties.
SECURITY TRANSACTIONS AND INVESTMENT INCOME – Security transactions are accounted for on the trade date for financial reporting purposes. Costs used in determining realized gains and losses on the sale of investment securities are based on specific identification. Dividend income is recorded on the ex-dividend date. Interest income is recognized on the accrual basis from the settlement date. Amortization of premiums and accretion of discounts is included in interest income.
FOREIGN CURRENCY TRANSACTIONS AND TRANSLATION – The books and records of the Funds are maintained in U.S. dollars. Investment securities and other assets and liabilities denominated in a foreign currency are translated into U.S. dollars on the date of valuation. Purchases and sales of investment securities, income and expenses are translated into U.S. dollars at the relevant rates of exchange prevailing on the respective dates of such transactions. The Funds do not isolate that portion of realized or unrealized gains and losses resulting from changes in the foreign exchange rate from fluctuations arising from changes in the market prices of the securities. These gains and losses are included in net realized and unrealized gains and losses on investments on the Statements of Operations. Net realized and unrealized gains and losses on foreign currency transactions and translations represent net foreign exchange gains or losses from foreign currency spot contracts, disposition of foreign currencies, currency gains or losses realized between trade and settlement dates on securities transactions and the difference between the amount of the investment income and foreign withholding taxes recorded on the Funds’ books and the U.S. dollar equivalent amounts actually received or paid.
DIVIDENDS AND DISTRIBUTIONS TO SHAREHOLDERS – The Funds distribute their net investment income on a pro rata basis. Any net investment income and net realized capital gains are distributed at least annually. All distributions are recorded on the ex-dividend date.
INVESTMENTS IN REITs – With respect to the Funds, dividend income is recorded based on the income included in distributions received from REIT investments using published REIT reclassifications, including some management estimates when actual amounts are not available. Distributions received in excess of these estimated amounts are recorded as a reduction of the cost of investments or reclassified to capital gains. The actual amounts of income, return of capital, and capital gains are only determined by each REIT after its fiscal year end, and may differ from the estimated amounts.
Notes to Financial Statements (Continued)
October 31, 2023
2. SIGNIFICANT ACCOUNTING POLICIES (continued)
CREATION UNITS – The Funds issue and redeem their shares (“Shares”) on a continuous basis at net asset value (“NAV”) and only in large blocks of 10,000 Shares, referred to as “Creation Units”. Purchasers of Creation Units (“Authorized Participants”) at NAV must pay a standard creation transaction fee per transaction. The fee is a single charge and will be the same regardless of the number of Creation Units purchased by an Authorized Participant on the same day.
An Authorized Participant who holds Creation Units and wishes to redeem at NAV would also pay a standard redemption fee per transaction to the Fund’s Custodian, on the date of such redemption, regardless of the number of Creation Units redeemed that day.
If a Creation Unit is purchased or redeemed for cash, an additional variable fee may be charged. The following table discloses Creation Unit breakdown:
| | | Creation
Unit
Shares | | Creation
Fee | | Value at
October 31,
2023 | | Redemption
Fee |
| Global X Lithium & Battery Tech ETF | | | 10,000 | | | $ | 1,000 | | | $ | 473,300 | | | $ | 1,000 | |
| Global X SuperDividend® ETF | | | 10,000 | | | | 2,000 | | | | 203,600 | | | | 2,000 | |
| Global X Social Media ETF | | | 10,000 | | | | 300 | | | | 347,500 | | | | 300 | |
| Global X Guru® Index ETF | | | 10,000 | | | | 250 | | | | 342,300 | | | | 250 | |
| Global X SuperIncome™ Preferred ETF | | | 10,000 | | | | 300 | | | | 82,100 | | | | 300 | |
| Global X SuperDividend® U.S. ETF | | | 10,000 | | | | 150 | | | | 156,200 | | | | 150 | |
| Global X S&P 500® Covered Call ETF | | | 10,000 | | | | 2,000 | | | | 381,800 | | | | 2,000 | |
| Global X NASDAQ 100® Covered Call ETF | | | 10,000 | | | | 500 | | | | 166,000 | | | | 500 | |
| Global X MSCI SuperDividend® Emerging Markets ETF | | | 10,000 | | | | 1,600 | | | | 224,800 | | | | 1,600 | |
| Global X SuperDividend® REIT ETF | | | 10,000 | | | | 400 | | | | 186,700 | | | | 400 | |
| Global X Renewable Energy Producers ETF | | | 10,000 | | | | 1,100 | | | | 93,000 | | | | 1,100 | |
| Global X S&P 500® Catholic Values ETF | | | 10,000 | | | | 1,300 | | | | 508,900 | | | | 1,300 | |
| Global X MSCI SuperDividend® EAFE ETF | | | 10,000 | | | | 1,000 | | | | 127,600 | | | | 1,000 | |
| Global X E-commerce ETF | | | 10,000 | | | | 250 | | | | 169,600 | | | | 250 | |
| Global X Russell 2000 Covered Call ETF | | | 10,000 | | | | 250 | | | | 161,000 | | | | 250 | |
| Global X S&P Catholic Values Developed ex-U.S. ETF | | | 10,000 | | | | 8,000 | | | | 258,700 | | | | 8,000 | |
| Global X Nasdaq 100® Covered Call & Growth ETF | | | 10,000 | | | | 500 | | | | 260,700 | | | | 500 | |
| Global X S&P 500® Covered Call & Growth ETF | | | 10,000 | | | | 1,500 | | | | 260,700 | | | | 1,500 | |
| Global X Emerging Markets Internet & E-commerce ETF | | | 10,000 | | | | 800 | | | | 199,700 | | | | 800 | |
| Global X NASDAQ 100® Tail Risk ETF | | | 10,000 | | | | 500 | | | | 227,100 | | | | 500 | |
| Global X NASDAQ 100® Risk Managed Income ETF | | | 10,000 | | | | 500 | | | | 166,400 | | | | 500 | |
| Global X NASDAQ 100® Collar 95-110 ETF | | | 10,000 | | | | 500 | | | | 234,700 | | | | 500 | |
Notes to Financial Statements (Continued)
October 31, 2023
2. SIGNIFICANT ACCOUNTING POLICIES (continued)
| | | Creation
Unit
Shares | | Creation
Fee | | Value at
October 31,
2023 | | Redemption
Fee |
| Global X S&P 500® Tail Risk ETF | | | 10,000 | | | $ | 2,000 | | | $ | 242,300 | | | $ | 2,000 | |
| Global X S&P 500® Risk Managed Income ETF | | | 10,000 | | | | 2,000 | | | | 185,600 | | | | 2,000 | |
| Global X S&P 500® Collar 95-110 ETF | | | 10,000 | | | | 2,000 | | | | 246,800 | | | | 2,000 | |
| Global X Disruptive Materials ETF | | | 10,000 | | | | 800 | | | | 142,300 | | | | 800 | |
| Global X Dow 30® Covered Call ETF | | | 10,000 | | | | 250 | | | | 208,900 | | | | 250 | |
| Global X Russell 2000 Covered Call & Growth ETF | | | 10,000 | | | | 250 | | | | 223,800 | | | | 250 | |
| Global X Financials Covered Call & Growth ETF | | | 10,000 | | | | 250 | | | | 223,000 | | | | 250 | |
| Global X Health Care Covered Call & Growth ETF | | | 10,000 | | | | 250 | | | | 234,200 | | | | 250 | |
| Global X Information Technology Covered Call & Growth ETF | | | 10,000 | | | | 250 | | | | 288,600 | | | | 250 | |
| Global X Nasdaq 100® ESG Covered Call ETF | | | 10,000 | | | | 500 | | | | 247,700 | | | | 500 | |
| Global X S&P 500® ESG Covered Call ETF | | | 10,000 | | | | 2,000 | | | | 237,900 | | | | 2,000 | |
| Global X Dow 30 Covered Call & Growth ETF | | | 10,000 | | | | 250 | | | | 242,000 | | | | 250 | |
CASH OVERDRAFT CHARGES – Per the terms of an agreement with BBH, if a Fund for which BBH is Custodian has a cash overdraft on a given day, it will be assessed an overdraft charge equal to the applicable BBH Base Rate plus 2.00%. Per the terms of an agreement with BNY Mellon, if a Fund for which BNY Mellon is Custodian has a cash overdraft, it will be charged interest at a rate then charged by BNY Mellon to its institutional custody clients in the relevant currency. Cash overdraft charges are included in custodian fees on the Statements of Operations.
OPTIONS/SWAPTIONS WRITING/PURCHASING – To the extent consistent with their investment policies, certain Funds may either purchase or write options.
When a Fund purchases an option, the premium paid by it is recorded as an asset of the Fund. When a Fund writes an option, an amount equal to the net premium (the premium less the commission) received by the Fund is included in the liability section of the Fund’s Statement of Assets and Liabilities as a deferred credit. The amount of this asset or deferred credit will be subsequently marked-to-market to reflect the current value of the option purchased or written. The current value of the traded option is the last sale price or, in the absence of a sale, the current bid price. If an option purchased by a Fund expires unexercised, the Fund realizes a loss equal to the premium paid. If a Fund enters into a closing sale transaction on an option purchased by it, the Fund will realize a gain if the premium received by the Fund on the closing transaction is more than the premium paid to purchase the option, or a loss if it is less. If an option written by a Fund expires on the stipulated expiration date or if a Fund enters into a closing purchase transaction, it will realize a gain (or loss if the cost of a closing purchase transaction exceeds the net premium
Notes to Financial Statements (Continued)
October 31, 2023
2. SIGNIFICANT ACCOUNTING POLICIES (continued)
received when the option is sold) and the deferred credit related to such option will be eliminated. If an option written by a Fund is exercised, the proceeds of the sale will be increased by the net premium originally received and the Fund will realize a gain or loss.
Risks may arise from an imperfect correlation between the change in market value of the securities held and the prices of options relating to the securities purchased or sold and from possible lack of a liquid secondary market for an option. The maximum exposure to loss for any purchased option is limited to the premium initially paid for the option. Written uncovered call options subject a Fund to unlimited risk of loss. Written covered call options limit the upside potential of a security above the strike price. Written put options expose a Fund to risk of loss if the value of the security declines below the strike price.
The Global X S&P 500® Covered Call ETF , Global X NASDAQ 100® Covered Call ETF, Global X Russell 2000 Covered Call ETF, Global X Nasdaq 100® Covered Call & Growth ETF, Global X S&P 500® Covered Call & Growth ETF, Global X NASDAQ 100® Tail Risk ETF, Global X NASDAQ 100® Risk Managed Income ETF, Global X NASDAQ 100® Collar 95-110 ETF, Global X S&P 500® Tail Risk ETF, Global X S&P 500® Risk Managed Income ETF, Global X S&P 500® Collar 95-110 ETF, Global X Dow 30® Covered Call ETF, Global X Russell 2000 Covered Call & Growth ETF, Global X Financials Covered Call & Growth ETF, Global X Health Care Covered Call & Growth ETF, Global X Information Technology Covered Call & Growth ETF, Global X Nasdaq 100® ESG Covered Call ETF, Global X S&P 500® ESG Covered Call ETF and Global X Dow 30® Covered Call & Growth ETF may write covered call and/or put options that correspond to their respective reference index. By writing a covered call option, a Fund, in exchange for the premium, foregoes the opportunity for capital appreciation above the strike price should the market price of the underlying security increase. Conversely, by writing a put option, the Fund, in exchange for the premium, accepts the risk of having to purchase a security at a fixed strike price even should the price of the underlying security decrease, exposing the Fund to downside risk in the underlying security.
When the written option expires, is terminated or is sold, a Fund will record a gain or loss. The net realized gain or loss on options contracts is reflected in the Statements of Operations and the net unrealized gains/(losses) are included as a component of the net change in unrealized appreciation/(depreciation) on options contracts in the Statements of Operations.
3. RELATED PARTIES AND SERVICE PROVIDER TRANSACTIONS
On July 2, 2018, the Adviser consummated a transaction pursuant to which it became an indirect, wholly-owned subsidiary of Mirae Asset Global Investments Co., Ltd. (“Mirae”). In this manner, the Adviser is ultimately controlled by Mirae.
Notes to Financial Statements (Continued)
October 31, 2023
3. RELATED PARTIES AND SERVICE PROVIDER TRANSACTIONS (continued)
The Adviser serves as the investment adviser and the administrator for the Funds. Subject to the supervision of the Board, the Adviser is responsible for managing the investment activities of the Funds and the Funds’ business affairs and other administrative matters and provides, or causes to be furnished, all supervisory, administrative and other services reasonably necessary for the operation of the Funds, including certain distribution services (provided pursuant to a separate distribution agreement), certain shareholder and distribution-related services (provided pursuant to a separate Rule 12b-1 Plan and related agreements) and investment advisory services (provided pursuant to a separate Investment Advisory Agreement), under what is essentially an “all-in” fee structure.
For the Adviser’s service to the respective Funds, under a supervision and administration agreement (the “Supervision and Administration Agreement”), each Fund pays a monthly fee to the Adviser at the annual rate below (stated as a percentage of the average daily net assets of the Fund) (“Supervision and Administration Fee”). In addition, the Funds bear other expenses, directly and indirectly, that are not covered by the Supervision and Administration Agreement, which may vary and affect the total expense ratios of the Funds, such as taxes, brokerage fees, commissions, certain custodian fees, acquired fund fees, and other transaction expenses, interest expenses and extraordinary expenses (such as litigation and indemnification expenses).
Notes to Financial Statements (Continued)
October 31, 2023
3. RELATED PARTIES AND SERVICE PROVIDER TRANSACTIONS (continued)
The following table discloses supervision and administration fees payable pursuant to the Supervision and Administration Agreement:
| | | Supervision and
Administration Fee |
| Global X Lithium & Battery Tech ETF | | 0.75% |
| Global X SuperDividend® ETF(1) | | 0.58% |
| Global X Social Media ETF | | 0.65% |
| Global X Guru® Index ETF | | 0.75% |
| Global X SuperIncomeTM Preferred ETF(2) | | 0.48% |
| Global X SuperDividend® U.S. ETF | | 0.45% |
| Global X S&P 500® Covered Call ETF | | 0.60% |
| Global X NASDAQ 100® Covered Call ETF | | 0.60% |
| Global X MSCI SuperDividend® Emerging Markets ETF | | 0.65% |
| Global X SuperDividend® REIT ETF | | 0.58% |
| Global X Renewable Energy Producers ETF | | 0.65% |
| Global X S&P 500® Catholic Values ETF | | 0.29% |
| Global X MSCI SuperDividend® EAFE ETF | | 0.55% |
| Global X E-commerce ETF | | 0.50% |
| Global X Russell 2000 Covered Call ETF(3) | | 0.60% |
| Global X S&P 500® Catholic Values Developed ex-U.S. ETF | | 0.35% |
| Global X NASDAQ 100® Covered Call & Growth ETF | | 0.60% |
| Global X S&P 500® Covered Call & Growth ETF | | 0.60% |
| Global X Emerging Markets Internet & E-commerce ETF | | 0.65% |
| Global X NASDAQ 100® Tail Risk ETF(8) | | 0.25% |
| Global X NASDAQ 100® Risk Managed Income ETF | | 0.60% |
| Global X NASDAQ 100® Collar 95-110 ETF(9) | | 0.25% |
Notes to Financial Statements (Continued)
October 31, 2023
3. RELATED PARTIES AND SERVICE PROVIDER TRANSACTIONS (continued)
| | | Supervision and
Administration Fee |
| Global X S&P 500® Tail Risk ETF(10) | | 0.25% |
| Global X S&P 500® Risk Managed Income ETF | | 0.60% |
| Global X S&P 500® Collar 95-110 ETF(11) | | 0.25% |
| Global X Disruptive Materials ETF | | 0.59% |
| Global X Dow 30® Covered Call ETF | | 0.60% |
| Global X Russell 2000 Covered Call & Growth ETF(4) | | 0.60% |
| Global X Financials Covered Call & Growth ETF(5) | | 0.60% |
| Global X Health Care Covered Call & Growth ETF(6) | | 0.60% |
| Global X Information Technology Covered Call & Growth ETF(7) | | 0.60% |
| Global X Nasdaq 100® ESG Covered Call ETF | | 0.60% |
| Global X S&P 500® ESG Covered Call ETF | | 0.60% |
| Global X Dow 30® Covered Call & Growth ETF | | 0.60% |
(1) Pursuant to an Expense Limitation Agreement, the Adviser has contractually agreed to reimburse or waive fees and/or limit expenses for the Global X SuperDividend® ETF to the extent necessary to assure that the operating expenses of the Global X SuperDividend® ETF (exclusive of taxes, brokerage fees, commissions, and other transaction expenses and extraordinary expenses (such as litigation and indemnification expenses)) will not exceed 0.58% of the average daily net assets of the Global X SuperDividend® ETF per year until at least March 1, 2025.
(2) Effective April 3, 2023, the Supervision and Administration Fee for the Global X SuperIncome™ Preferred ETF was reduced to 0.48%. Prior to that, the Fund was subject to a Supervision and Administration Fee of 0.58%.
(3) Pursuant to an Expense Limitation Agreement, the Adviser has contractually agreed to reimburse or waive fees and/or limit expenses for the Global X Russell 2000 Covered Call ETF to the extent necessary to assure that the operating expenses of the Global X Russell 2000 Covered Call ETF (exclusive of taxes, brokerage fees, commissions, and other transaction expenses, interest, and extraordinary expenses (such as litigation and indemnification expenses)) will not exceed 0.60% of the average daily net assets of the Global X Russell 2000 Covered Call ETF per year until at least March 1, 2025.
(4) Pursuant to an Expense Limitation Agreement, the Adviser has contractually agreed to reimburse or waive fees and/or limit expenses for the Global X Russell 2000 Covered Call & Growth ETF to the extent necessary to assure that the operating expenses of the Global X Russell 2000 Covered Call & Growth ETF (exclusive of taxes, brokerage fees, commissions, and other transaction expenses, interest, and extraordinary expenses (such as litigation and indemnification expenses)) will not exceed
Notes to Financial Statements (Continued)
October 31, 2023
3. RELATED PARTIES AND SERVICE PROVIDER TRANSACTIONS (continued)
0.60% of the average daily net assets of the Global X Russell 2000 Covered Call & Growth ETF per year until at least March 1, 2025.
(5) Pursuant to an Expense Limitation Agreement, the Adviser has contractually agreed to reimburse or waive fees and/or limit expenses for the Global X Financials Covered Call & Growth ETF to the extent necessary to assure that the operating expenses of the Global X Financials Covered Call & Growth ETF (exclusive of taxes, brokerage fees, commissions, and other transaction expenses, interest and extraordinary expenses (such as litigation and indemnification expenses)) will not exceed 0.60% of the average daily net assets of the Global X Financials Covered Call & Growth ETF per year until at least March 1, 2025.
(6) Pursuant to an Expense Limitation Agreement, the Adviser has contractually agreed to reimburse or waive fees and/or limit expenses for the Global X Health Care Covered Call & Growth ETF to the extent necessary to assure that the operating expenses of the Global X Health Care Covered Call & Growth ETF (exclusive of taxes, brokerage fees, commissions, and other transaction expenses, interest and extraordinary expenses (such as litigation and indemnification expenses)) will not exceed 0.60% of the average daily net assets of the Global X Health Care Covered Call & Growth ETF per year until at least March 1, 2025.
(7) Pursuant to an Expense Limitation Agreement, the Adviser has contractually agreed to reimburse or waive fees and/or limit expenses for the Global X Information Technology Covered Call & Growth ETF to the extent necessary to assure that the operating expenses of the Global X Information Technology Covered Call & Growth ETF (exclusive of taxes, brokerage fees, commissions, and other transaction expenses, interest and extraordinary expenses (such as litigation and indemnification expenses)) will not exceed 0.60% of the average daily net assets of the Global X Information Technology Covered Call & Growth ETF per year until at least March 1, 2025.
(8) Effective August 18, 2023, the Supervision and Administration Fee for the Global X NASDAQ 100® Tail Risk ETF was reduced to 0.25%. Prior to that, the Fund was subject to a Supervision and Administration Fee of 0.60%.
(9) Effective August 18, 2023, the Supervision and Administration Fee for the Global X NASDAQ 100® Collar 95-110 ETF was reduced to 0.25%. Prior to that, the Fund was subject to a Supervision and Administration Fee of 0.60%.
(10) Effective August 18, 2023, the Supervision and Administration Fee for the Global X S&P 500® Tail Risk ETF was reduced to 0.25%. Prior to that, the Fund was subject to a Supervision and Administration Fee of 0.60%.
(11) Effective August 18, 2023, the Supervision and Administration Fee for the Global X S&P 500® Collar 95-110 ETF was reduced to 0.25%. Prior to that, the Fund was subject to a Supervision and Administration Fee of 0.60%.
SEI Investments Global Funds Services (“SEIGFS”) serves as sub-administrator to the Funds. As sub-administrator, SEIGFS provides the Funds with all required general administrative services, including, without limitation: office space, equipment, and personnel; clerical and general back office services; bookkeeping, internal accounting and
Notes to Financial Statements (Continued)
October 31, 2023
3. RELATED PARTIES AND SERVICE PROVIDER TRANSACTIONS (continued)
secretarial services; the calculation of NAV; and assistance with the preparation and filing of reports, registration statements, proxy statements, and other materials required to be filed or furnished by the Funds under federal and state securities laws. As compensation for these services, SEIGFS receives certain out-of-pocket costs, transaction fees, and asset-based fees which are accrued daily and paid monthly by the Adviser.
SEI Investments Distribution Co. (“SIDCO”) serves as the Funds’ underwriter and distributor of Creation Units pursuant to a distribution agreement (the “Distribution Agreement”). SIDCO has no obligation to sell any specific quantity of Shares of the Funds.
SIDCO bears the following costs and expenses relating to the distribution of Shares: (i) the costs of processing and maintaining records of creations of Creation Units; (ii) all costs of maintaining the records required of a registered broker/dealer; (iii) the expenses of maintaining its registration or qualification as a dealer or broker under federal or state laws; (iv) filing fees; and (v) all other expenses incurred in connection with the distribution services as contemplated in the Distribution Agreement. SIDCO receives no fee from the Funds for its distribution services under the Distribution Agreement, rather, the Adviser compensates SIDCO for certain expenses, out-of-pocket costs, and transaction fees.
BBH serves as custodian and transfer agent of the Global X Lithium & Battery Tech ETF, Global X Guru® Index ETF, Global X SuperIncome™ Preferred ETF, Global X S&P 500® Covered Call ETF, Global X NASDAQ 100® Covered Call ETF, Global X S&P 500® Catholic Values ETF and Global X Russell 2000 Covered Call ETF. For the Funds for which it serves as custodian, BBH has agreed to (i) make receipts and disbursements of money on behalf of the Funds; (ii) collect and receive all income and other payments and distributions on account of the Funds’ portfolio investments; (iii) respond to correspondence from shareholders, security brokers and others relating to its duties; and (iv) make periodic reports to the Funds concerning the Funds’ operations. BBH does not exercise any supervisory function over the purchase and sale of securities. As compensation for these services, BBH receives certain out-of-pocket costs, transaction fees and asset-based fees which are accrued daily and paid monthly by the Adviser from its fees. For the funds which it serves as transfer agent, BBH has agreed to (i) issue and redeem Shares of each Fund; (ii) make dividend and other distributions to shareholders of each Fund; (iii) respond to correspondence by shareholders and others relating to its duties; (iv) maintain shareholder accounts; and (v) make periodic reports to the Funds. As compensation for these services, BBH receives certain out-of-pocket costs, transaction fees and asset-based fees which are accrued daily and paid monthly by the Adviser from its fees.
For all Funds other than the Global X Lithium & Battery Tech ETF, Global X Guru® Index ETF, Global X SuperIncome™ Preferred ETF, Global X S&P 500® Covered Call ETF, Global X NASDAQ 100® Covered Call ETF, Global X S&P 500® Catholic Values ETF and Global X Russell 2000 Covered Call ETF, BNY Mellon serves as custodian and transfer
Notes to Financial Statements (Continued)
October 31, 2023
3. RELATED PARTIES AND SERVICE PROVIDER TRANSACTIONS (continued)
agent to the Trust on behalf of the Funds. As custodian, BNY Mellon may appoint domestic and foreign sub-custodians and use depositories from time to time to hold securities and other instruments purchased by the Trust in foreign countries and to hold cash and currencies for the Trust on behalf of the Funds. Under its transfer agency agreement with the Trust, BNY Mellon has undertaken with the Trust to provide the following services with respect to the Funds for which it serves as transfer agent: (i) perform and facilitate the performance of purchases and redemptions of Creation Units, (ii) prepare and transmit by means of Depository Trust Company’s book-entry system payments for dividends and distributions on or with respect to the Shares declared by the Trust on behalf of the Fund, as applicable, (iii) prepare and deliver reports, information and documents as specified in the transfer agency agreement, (iv) perform the customary services of a transfer agent and dividend disbursing agent, and (v) render certain other miscellaneous services as specified in the transfer agency agreement or as otherwise agreed upon.
The custodian, transfer agent and securities lending agent for the Global X SuperDividend® U.S. ETF and Global X SuperDividend® REIT ETF transitioned from BBH to BNY Mellon on or about May 15, 2023. The custodian, transfer agent and securities lending agent for the Global X S&P Catholic Values Developed ex-U.S. ETF and Global X Disruptive Materials ETF transitioned from BBH to BNY Mellon on or about June 12, 2023. The custodian, transfer agent and securities lending agent for the Global X MSCI SuperDividend® EAFE ETF and Global X E-commerce ETF transitioned from BBH to BNY Mellon on or about June 26, 2023. The custodian, transfer agent and securities lending agent for the Global X Social Media ETF transitioned from BBH to BNY Mellon on or about July 10, 2023. The custodian, transfer agent and securities lending agent for the Global X MSCI SuperDividend® Emerging Markets ETF, Global X SuperDividend® ETF, Global X Renewable Energy Producers ETF, Global X Emerging Markets Internet & E-commerce ETF and Global X S&P 500® Tail Risk ETF transitioned from BBH to BNY Mellon on or about July 24, 2023. The custodian, transfer agent and securities lending agent for the Global X NASDAQ 100® Risk Managed Income ETF and Global X S&P 500® Risk Managed Income ETF transitioned from BBH to BNY Mellon on or about October 23, 2023. The custodian, transfer agent and securities lending agent for the Global X Nasdaq 100® Covered Call & Growth ETF, Global X S&P 500® Covered Call & Growth ETF and Global X NASDAQ 100® Tail Risk ETF transitioned from BBH to BNY Mellon on or about November 8, 2023.
Notes to Financial Statements (Continued)
October 31, 2023
4. INVESTMENT TRANSACTIONS
For the year ended October 31, 2023, the purchases and sales of investments in securities, excluding in-kind transactions, long-term U.S. Government and short-term securities were:
| | | Purchases | | Sales and
Maturities |
| Global X Lithium & Battery Tech ETF | | $ | 638,506,964 | | | $ | 994,295,973 | |
| Global X SuperDividend® ETF | | | 732,884,262 | | | | 672,655,365 | |
| Global X Social Media ETF | | | 47,720,135 | | | | 39,250,743 | |
| Global X Guru® Index ETF | | | 47,685,618 | | | | 47,198,745 | |
| Global X SuperIncome™ Preferred ETF | | | 211,322,266 | | | | 210,190,586 | |
| Global X SuperDividend® U.S. ETF | | | 403,097,391 | | | | 433,243,287 | |
| Global X S&P 500® Covered Call ETF | | | 205,726,462 | | | | 648,161,392 | |
| Global X NASDAQ 100® Covered Call ETF | | | 2,919,532,879 | | | | 4,806,336,226 | |
| Global X MSCI SuperDividend® Emerging Markets ETF | | | 37,713,057 | | | | 36,915,522 | |
| Global X SuperDividend® REIT ETF | | | 247,260,208 | | | | 250,853,675 | |
| Global X Renewable Energy Producers ETF | | | 8,999,389 | | | | 13,184,128 | |
| Global X S&P 500® Catholic Values ETF | | | 43,411,726 | | | | 42,531,478 | |
| Global X MSCI SuperDividend® EAFE ETF | | | 4,342,603 | | | | 4,007,921 | |
| Global X E-commerce ETF | | | 13,597,248 | | | | 13,716,977 | |
| Global X Russell 2000 Covered Call ETF | | | 285,921,403 | | | | 547,621,646 | |
| Global X S&P Catholic Values Developed ex-U.S. ETF | | | 2,440,797 | | | | 1,642,589 | |
| Global X Nasdaq 100® Covered Call & Growth ETF | | | 22,617,053 | | | | 32,306,868 | |
| Global X S&P 500® Covered Call & Growth ETF | | | 2,823,164 | | | | 7,173,199 | |
| Global X Emerging Markets Internet & E-commerce ETF | | | 709,732 | | | | 716,825 | |
| Global X NASDAQ 100® Tail Risk ETF | | | 295,652 | | | | 374,809 | |
| Global X NASDAQ 100® Risk Managed Income ETF | | | 2,336,458 | | | | 5,972,112 | |
| Global X NASDAQ 100® Collar 95-110 ETF | | | 517,368 | | | | 1,009,408 | |
| Global X S&P 500® Tail Risk ETF | | | 79,012 | | | | 204,120 | |
| Global X S&P 500® Risk Managed Income ETF | | | 1,293,148 | | | | 8,138,569 | |
| Global X S&P 500® Collar 95-110 ETF | | | 100,352 | | | | 417,795 | |
| Global X Disruptive Materials ETF | | | 3,797,690 | | | | 1,972,620 | |
| Global X Dow 30® Covered Call ETF | | | 4,777,649 | | | | 12,547,319 | |
| Global X Russell 2000 Covered Call & Growth ETF | | | 193,501 | | | | 508,751 | |
| Global X Financials Covered Call & Growth ETF | | | 394,501 | | | | 452,937 | |
| Global X Health Care Covered Call & Growth ETF | | | 190,195 | | | | 178,936 | |
| Global X Information Technology Covered Call & Growth ETF | | | 427,806 | | | | 679,933 | |
| Global X Nasdaq 100® ESG Covered Call ETF | | | 313,639 | | | | 761,883 | |
| Global X S&P 500® ESG Covered Call ETF | | | 350,825 | | | | 607,640 | |
| Global X Dow 30® Covered Call & Growth ETF | | | 31,517 | | | | 5,252 | |
During the year ended October 31, 2023, there were no purchases or sales of long-term U.S. Government securities for the Funds.
Notes to Financial Statements (Continued)
October 31, 2023
4. INVESTMENT TRANSACTIONS (continued)
For the year ended October 31, 2023, in-kind transactions associated with creations and redemptions were:
| 2023 | | Purchases | | Sales | | Realized
Gain/(Loss) |
| Global X Lithium & Battery Tech ETF | | $ | 9,594,733 | | | $ | 503,175,844 | | | $ | 80,816,875 | |
| Global X SuperDividend® ETF | | | 44,161,315 | | | | 11,784,983 | | | | 2,114,716 | |
| Global X Social Media ETF | | | 34,506,212 | | | | 46,372,642 | | | | 5,680,099 | |
| Global X Guru® Index ETF | | | – | | | | 5,988,755 | | | | 610,976 | |
| Global X SuperIncome™ Preferred ETF | | | 27,295,864 | | | | 35,397,333 | | | | (653,376 | ) |
| Global X SuperDividend® U.S. ETF | | | 149,468,252 | | | | 102,018,502 | | | | 14,258,851 | |
| Global X S&P 500® Covered Call ETF | | | 1,173,450,581 | | | | 153,353,443 | | | | 39,980,669 | |
| Global X NASDAQ 100® Covered Call ETF | | | 1,563,611,337 | | | | 544,852,875 | | | | 253,904,621 | |
| Global X MSCI SuperDividend® Emerging Markets ETF | | | 157,207 | | | | 756,231 | | | | 80,875 | |
| Global X SuperDividend® REIT ETF | | | 15,624,410 | | | | 50,018,319 | | | | (4,477,839 | ) |
| Global X Renewable Energy Producers ETF | | | 1,968,283 | | | | 24,725,203 | | | | (4,722,473 | ) |
| Global X S&P 500® Catholic Values ETF | | | 118,578,622 | | | | 39,880,690 | | | | 15,973,267 | |
| Global X MSCI SuperDividend® EAFE ETF | | | 2,609,937 | | | | 1,792,007 | | | | 165,438 | |
| Global X E-commerce ETF | | | 33,987,547 | | | | 16,879,480 | | | | (3,575,254 | ) |
| Global X Russell 2000 Covered Call ETF | | | 499,863,194 | | | | 143,285,594 | | | | 6,480,735 | |
| Global X S&P Catholic Values Developed ex-U.S. ETF | | | 8,090,518 | | | | – | | | | – | |
| Global X Nasdaq 100® Covered Call & Growth ETF | | | 38,575,463 | | | | 5,213,397 | | | | 1,629,423 | |
| Global X S&P 500® Covered Call & Growth ETF | | | 37,752,410 | | | | 18,852,922 | | | | 3,335,997 | |
| Global X Emerging Markets Internet & E-commerce ETF | | | – | | | | – | | | | – | |
| Global X NASDAQ 100® Tail Risk ETF | | | – | | | | 787,029 | | | | (96,215 | ) |
| Global X NASDAQ 100® Risk Managed Income ETF | | | 4,549,807 | | | | 2,396,162 | | | | 147,899 | |
| Global X NASDAQ 100® Collar 95-110 ETF | | | – | | | | 1,171,618 | | | | 18,523 | |
| Global X S&P 500® Tail Risk ETF | | | – | | | | 756,720 | | | | 65,157 | |
| Global X S&P 500® Risk Managed Income ETF | | | 8,408,917 | | | | 2,488,321 | | | | 245,819 | |
| Global X S&P 500® Collar 95-110 ETF | | | – | | | | 1,742,140 | | | | 105,856 | |
| Global X Disruptive Materials ETF | | | 4,851,469 | | | | 319,287 | | | | 52,663 | |
| Global X Dow 30® Covered Call ETF | | | 41,655,798 | | | | 11,150,093 | | | | 1,712,527 | |
| Global X Russell 2000 Covered Call & Growth ETF | | | 6,971,898 | | | | 736,190 | | | | 29,432 | |
| Global X Financials Covered Call & Growth ETF | | | 2,502,976 | | | | – | | | | – | |
| Global X Health Care Covered Call & Growth ETF | | | 3,280,041 | | | | 508,729 | | | | 12,146 | |
| Global X Information Technology Covered Call & Growth ETF | | | 3,106,356 | | | | – | | | | – | |
| Global X NASDAQ 100® ESG Covered Call ETF | | | 3,695,643 | | | | 1,250,328 | | | | 212,143 | |
| Global X S&P 500® ESG Covered Call ETF | | | 3,418,700 | | | | 953,791 | | | | 118,594 | |
| Global X Dow 30® Covered Call & Growth ETF | | | 2,580,926 | | | | – | | | | – | |
Notes to Financial Statements (Continued)
October 31, 2023
5. DERIVATIVE TRANSACTIONS
The following tables show the derivatives categorized by underlying risk exposure.
The fair value of derivative instruments as of October 31, 2023 was as follows:
| Asset Derivatives | | | | Liability Derivatives | | |
Statements of Assets
and Liability Location | | Fair Value | | Statements of Assets
and Liability Location | | Fair Value |
Derivatives not accounted for as hedging instruments:
Global X S&P 500® Covered Call ETF
| Equity contracts | | Investments purchased, at value | | $ | – | | | Equity contracts | | Options written, at value | | $ | 27,077,160 | |
| Total Derivatives not accounted for as hedging instruments | | $ | – | | | | | | | $ | 27,077,160 | |
| Asset Derivatives | | | | Liability Derivatives | | |
Statements of Assets
and Liability Location | | Fair Value | | Statements of Assets
and Liability Location | | Fair Value |
Derivatives not accounted for as hedging instruments:
Global X NASDAQ 100® Covered Call ETF
| Equity contracts | | Investments purchased, at value | | $ | – | | | Equity contracts | | Options written, at value | | $ | 98,419,200 | |
| Total Derivatives not accounted for as hedging instruments | | $ | – | | | | | | | $ | 98,419,200 | |
| Asset Derivatives | | | | Liability Derivatives | | |
Statements of Assets
and Liability Location | | Fair Value | | Statements of Assets
and Liability Location | | Fair Value |
Derivatives not accounted for as hedging instruments:
Global X Russell 2000 Covered Call ETF
| Equity contracts | | Investments purchased, at value | | $ | – | | | Equity contracts | | Options written, at value | | $ | 16,253,460 | |
| Total Derivatives not accounted for as hedging instruments | | $ | – | | | | | | | $ | 16,253,460 | |
| Asset Derivatives | | | | Liability Derivatives | | |
Statements of Assets
and Liability Location | | Fair Value | | Statements of Assets
and Liability Location | | Fair Value |
Derivatives not accounted for as hedging instruments:
Global X Nasdaq 100® Covered Call & Growth ETF
| Equity contracts | | Investments purchased, at value | | $ | – | | | Equity contracts | | Options written, at value | | $ | 652,400 | |
| Total Derivatives not accounted for as hedging instruments | | $ | – | | | | | | | $ | 652,400 | |
458
Notes to Financial Statements (Continued)
October 31, 2023
5. DERIVATIVE TRANSACTIONS (continued)
| Asset Derivatives | | | | Liability Derivatives | | |
Statements of Assets
and Liability Location | | Fair Value | | Statements of Assets
and Liability Location | | Fair Value |
Derivatives not accounted for as hedging instruments:
Global X S&P 500® Covered Call & Growth ETF
| Equity contracts | | Investments purchased, at value | | $ | – | | | Equity contracts | | Options written, at value | | $ | 293,095 | |
| Total Derivatives not accounted for as hedging instruments | | $ | – | | | | | | | $ | 293,095 | |
| Asset Derivatives | | | | Liability Derivatives | | |
Statements of Assets
and Liability Location | | Fair Value | | Statements of Assets
and Liability Location | | Fair Value |
Derivatives not accounted for as hedging instruments:
Global X NASDAQ 100® Tail Risk ETF
| Equity contracts | | Investments purchased, at value | | $ | 14,940 | | | Equity contracts | | Options written, at value | | $ | – | |
| Total Derivatives not accounted for as hedging instruments | | $ | 14,940 | | | | | | | $ | – | |
| Asset Derivatives | | | | Liability Derivatives | | |
Statements of Assets
and Liability Location | | Fair Value | | Statements of Assets
and Liability Location | | Fair Value |
Derivatives not accounted for as hedging instruments:
Global X NASDAQ 100® Risk Managed Income ETF
| Equity contracts | | Investments purchased, at value | | $ | 73,920 | | | Equity contracts | | Options written, at value | | $ | 158,680 | |
| Total Derivatives not accounted for as hedging instruments | | $ | 73,920 | | | | | | | $ | 158,680 | |
| Asset Derivatives | | | | Liability Derivatives | | |
Statements of Assets
and Liability Location | | Fair Value | | Statements of Assets
and Liability Location | | Fair Value |
Derivatives not accounted for as hedging instruments:
Global X NASDAQ 100® Collar 95-110 ETF
| Equity contracts | | Investments purchased, at value | | $ | 57,935 | | | Equity contracts | | Options written, at value | | $ | 291 | |
| Total Derivatives not accounted for as hedging instruments | | $ | 57,935 | | | | | | | $ | 291 | |
459
Notes to Financial Statements (Continued)
October 31, 2023
5. DERIVATIVE TRANSACTIONS (continued)
| Asset Derivatives | | | | Liability Derivatives | | |
Statements of Assets
and Liability Location | | Fair Value | | Statements of Assets
and Liability Location | | Fair Value |
Derivatives not accounted for as hedging instruments:
Global X S&P 500® Tail Risk ETF
| Equity contracts | | Investments purchased, at value | | $ | 22,219 | | | Equity contracts | | Options written, at value | | $ | – | |
| Total Derivatives not accounted for as hedging instruments | | $ | 22,219 | | | | | | | $ | – | |
| Asset Derivatives | | | | Liability Derivatives | | |
Statements of Assets
and Liability Location | | Fair Value | | Statements of Assets
and Liability Location | | Fair Value |
Derivatives not accounted for as hedging instruments:
Global X S&P 500® Risk Managed Income ETF
| Equity contracts | | Investments purchased, at value | | $ | 99,292 | | | Equity contracts | | Options written, at value | | $ | 260,677 | |
| Total Derivatives not accounted for as hedging instruments | | $ | 99,292 | | | | | | | $ | 260,677 | |
| Asset Derivatives | | | | Liability Derivatives | | |
Statements of Assets
and Liability Location | | Fair Value | | Statements of Assets
and Liability Location | | Fair Value |
Derivatives not accounted for as hedging instruments:
Global X S&P 500® Collar 95-110 ETF
| Equity contracts | | Investments purchased, at value | | $ | 53,635 | | | Equity contracts | | Options written, at value | | $ | 103 | |
| Total Derivatives not accounted for as hedging instruments | | $ | 53,635 | | | | | | | $ | 103 | |
| Asset Derivatives | | | | Liability Derivatives | | |
Statements of Assets
and Liability Location | | Fair Value | | Statements of Assets
and Liability Location | | Fair Value |
Derivatives not accounted for as hedging instruments:
Global X Dow 30® Covered Call ETF
| Equity contracts | | Investments purchased, at value | | $ | – | | | Equity contracts | | Options written, at value | | $ | 1,217,055 | |
| Total Derivatives not accounted for as hedging instruments | | $ | – | | | | | | | $ | 1,217,055 | |
460
Notes to Financial Statements (Continued)
October 31, 2023
5. DERIVATIVE TRANSACTIONS (continued)
| Asset Derivatives | | | | Liability Derivatives | | |
Statements of Assets
and Liability Location | | Fair Value | | Statements of Assets
and Liability Location | | Fair Value |
Derivatives not accounted for as hedging instruments:
Global X Russell 2000 Covered Call & Growth ETF
| Equity contracts | | Investments purchased, at value | | $ | – | | | Equity contracts | | Options written, at value | | $ | 47,300 | |
| Total Derivatives not accounted for as hedging instruments | | $ | – | | | | | | | $ | 47,300 | |
| Asset Derivatives | | | | Liability Derivatives | | |
Statements of Assets
and Liability Location | | Fair Value | | Statements of Assets
and Liability Location | | Fair Value |
Derivatives not accounted for as hedging instruments:
Global X Financials Covered Call & Growth ETF
| Equity contracts | | Investments purchased, at value | | $ | – | | | Equity contracts | | Options written, at value | | $ | 8,281 | |
| Total Derivatives not accounted for as hedging instruments | | $ | – | | | | | | | $ | 8,281 | |
| Asset Derivatives | | | | Liability Derivatives | | |
Statements of Assets
and Liability Location | | Fair Value | | Statements of Assets
and Liability Location | | Fair Value |
Derivatives not accounted for as hedging instruments:
Global X Health Care Covered Call & Growth ETF
| Equity contracts | | Investments purchased, at value | | $ | – | | | Equity contracts | | Options written, at value | | $ | 2,061 | |
| Total Derivatives not accounted for as hedging instruments | | $ | – | | | | | | | $ | 2,061 | |
| Asset Derivatives | | | | Liability Derivatives | | |
Statements of Assets
and Liability Location | | Fair Value | | Statements of Assets
and Liability Location | | Fair Value |
Derivatives not accounted for as hedging instruments:
Global X Information Technology Covered Call & Growth ETF
| Equity contracts | | Investments purchased, at value | | $ | – | | | Equity contracts | | Options written, at value | | $ | 12,245 | |
| Total Derivatives not accounted for as hedging instruments | | $ | – | | | | | | | $ | 12,245 | |
461
Notes to Financial Statements (Continued)
October 31, 2023
5. DERIVATIVE TRANSACTIONS (continued)
| Asset Derivatives | | | | Liability Derivatives | | |
Statements of Assets
and Liability Location | | Fair Value | | Statements of Assets
and Liability Location | | Fair Value |
Derivatives not accounted for as hedging instruments:
Global X Nasdaq 100® ESG Covered Call ETF
| Equity contracts | | Investments purchased, at value | | $ | – | | | Equity contracts | | Options written, at value | | $ | 30,175 | |
| Total Derivatives not accounted for as hedging instruments | | $ | – | | | | | | | $ | 30,175 | |
| Asset Derivatives | | | | Liability Derivatives | | |
Statements of Assets
and Liability Location | | Fair Value | | Statements of Assets
and Liability Location | | Fair Value |
Derivatives not accounted for as hedging instruments:
Global X S&P 500® ESG Covered Call ETF
| Equity contracts | | Investments purchased, at value | | $ | – | | | Equity contracts | | Options written, at value | | $ | 14,080 | |
| Total Derivatives not accounted for as hedging instruments | | $ | – | | | | | | | $ | 14,080 | |
| Asset Derivatives | | | | Liability Derivatives | | |
Statements of Assets
and Liability Location | | Fair Value | | Statements of Assets
and Liability Location | | Fair Value |
Derivatives not accounted for as hedging instruments:
Global X Dow 30® Covered Call & Growth ETF
| Equity contracts | | Investments purchased, at value | | $ | – | | | Equity contracts | | Options written, at value | | $ | 18,090 | |
| Total Derivatives not accounted for as hedging instruments | | $ | – | | | | | | | $ | 18,090 | |
The effect of derivative instruments on the Statements of Operations for the year ended October 31, 2023:
Amount of realized gain or (loss) on derivatives recognized in income:
| | | Purchased
Options | | | Written
Options | |
| Global X S&P 500® Covered Call ETF | | | | | | |
| Equity contracts | | $ | — | | | $ | (175,722,132 | ) |
| | | | | | | | | |
| Global X NASDAQ 100® Covered Call ETF | | | | | | | | |
| Equity contracts | | $ | (934,152,667 | ) | | $ | — | |
462
Notes to Financial Statements (Continued)
October 31, 2023
5. DERIVATIVE TRANSACTIONS (continued)
| | | Purchased
Options | | | Written
Options | |
| Global X Russell 2000 Covered Call ETF | | | | | | |
| Equity contracts | | $ | — | | | $ | (76,518,146 | ) |
| | | | | | | | | |
| Global X Nasdaq 100® Covered Call & Growth ETF | | | | | | | | |
| Equity contracts | | $ | — | | | $ | (4,759,944 | ) |
| | | | | | | | | |
| Global X S&P 500® Covered Call & Growth ETF | | | | | | | | |
| Equity contracts | | $ | (1,833,364 | ) | | $ | — | |
| | | | | | | | | |
| Global X NASDAQ 100® Tail Risk ETF | | | | | | | | |
| Equity contracts | | $ | (108,252 | ) | | $ | — | |
| | | | | | | | | |
| Global X NASDAQ 100® Risk Managed Income ETF | | | | | | | | |
| Equity contracts | | $ | (1,039,839 | ) | | $ | (1,317,175 | ) |
| | | | | | | | | |
| Global X NASDAQ 100® Collar 95-110 ETF | | | | | | | | |
| Equity contracts | | $ | (194,742 | ) | | $ | (336,034 | ) |
| | | | | | | | | |
| Global X S&P 500® Tail Risk ETF | | | | | | | | |
| Equity contracts | | $ | (156,985 | ) | | $ | — | |
| | | | | | | | | |
| Global X S&P 500® Risk Managed Income ETF | | | | | | | | |
| Equity contracts | | $ | (1,875,705 | ) | | $ | (1,914,332 | ) |
| | | | | | | | | |
| Global X S&P 500® Collar 95-110 ETF | | | | | | | | |
| Equity contracts | | $ | (324,007 | ) | | $ | (9,885 | ) |
| | | | | | | | | |
| Global X Dow 30® Covered Call ETF | | | | | | | | |
| Equity contracts | | $ | — | | | $ | (1,826,622 | ) |
| | | | | | | | | |
| Global X Russell 2000 Covered Call & Growth ETF | | | | | | | | |
| Equity contracts | | $ | 58,285 | | | $ | (113,636 | ) |
| | | | | | | | | |
| Global X Financials Covered Call & Growth ETF | | | | | | | | |
| Equity contracts | | $ | (5,881 | ) | | $ | 29,786 | |
| | | | | | | | | |
| Global X Health Care Covered Call & Growth ETF | | | | | | | | |
| Equity contracts | | $ | 3,570 | | | $ | 98,708 | |
| | | | | | | | | |
| Global X Information Technology Covered Call & Growth ETF | | | | | | | | |
| Equity contracts | | $ | (71,239 | ) | | $ | (40,979 | ) |
| | | | | | | | | |
| Global X Nasdaq 100® ESG Covered Call ETF | | | | | | | | |
| Equity contracts | | $ | 47,797 | | | $ | (353,184 | ) |
| | | | | | | | | |
| Global X S&P 500® ESG Covered Call ETF | | | | | | | | |
| Equity contracts | | $ | 82,789 | | | $ | (258,808 | ) |
463
Notes to Financial Statements (Continued)
October 31, 2023
5. DERIVATIVE TRANSACTIONS (continued)
| | | Purchased
Options | | | Written
Options | |
| Global X Dow 30® Covered Call & Growth ETF | | | | | | | | |
| Equity contracts | | $ | 26,362 | | | $ | 3,701 | |
Change in unrealized appreciation or (depreciation) on derivatives recognized in income:
| | | Purchased
Options | | | Written
Options | |
| Global X S&P 500® Covered Call ETF | | | | | | |
| Equity contracts | | $ | — | | | $ | 81,655,711 | |
| | | | | | | | | |
| Global X NASDAQ 100® Covered Call ETF | | | | | | | | |
| Equity contracts | | $ | — | | | $ | 150,126,300 | |
| | | | | | | | | |
| Global X Russell 2000 Covered Call ETF | | | | | | | | |
| Equity contracts | | $ | — | | | $ | 86,994,451 | |
| | | | | | | | | |
| Global X Nasdaq 100® Covered Call & Growth ETF | | | | | | | | |
| Equity contracts | | $ | — | | | $ | 937,738 | |
| | | | | | | | | |
| Global X S&P 500® Covered Call & Growth ETF | | | | | | | | |
| Equity contracts | | $ | 871,640 | | | $ | — | |
| | | | | | | | | |
| Global X NASDAQ 100® Tail Risk ETF | | | | | | | | |
| Equity contracts | | $ | 22,980 | | | $ | — | |
| | | | | | | | | |
| Global X NASDAQ 100® Risk Managed Income ETF | | | | | | | | |
| Equity contracts | | $ | 82,077 | | | $ | 238,445 | |
| | | | | | | | | |
| Global X NASDAQ 100® Collar 95-110 ETF | | | | | | | | |
| Equity contracts | | $ | 52,485 | | | $ | (38,825 | ) |
| | | | | | | | | |
| Global X S&P 500® Tail Risk ETF | | | | | | | | |
| Equity contracts | | $ | 42,973 | | | $ | — | |
| | | | | | | | | |
| Global X S&P 500® Risk Managed Income ETF | | | | | | | | |
| Equity contracts | | $ | 150,599 | | | $ | 928,959 | |
| | | | | | | | | |
| Global X S&P 500® Collar 95-110 ETF | | | | | | | | |
| Equity contracts | | $ | 87,783 | | | $ | (19,919 | ) |
| | | | | | | | | |
| Global X Dow 30® Covered Call ETF | | | | | | | | |
| Equity contracts | | $ | — | | | $ | 2,152,614 | |
| | | | | | | | | |
| Global X Russell 2000 Covered Call & Growth ETF | | | | | | | | |
| Equity contracts | | $ | — | | | $ | 98,488 | |
464
Notes to Financial Statements (Continued)
October 31, 2023
5. DERIVATIVE TRANSACTIONS (continued)
| | | Purchased
Options | | | Written
Options | |
| Global X Financials Covered Call & Growth ETF | | | | | | |
| Equity contracts | | $ | — | | | $ | 18,484 | |
| | | | | | | | | |
| Global X Health Care Covered Call & Growth ETF | | | | | | | | |
| Equity contracts | | $ | — | | | $ | 18,228 | |
| | | | | | | | | |
| Global X Information Technology Covered Call & Growth ETF | | | | | | | | |
| Equity contracts | | $ | — | | | $ | 30,047 | |
| | | | | | | | | |
| Global X Nasdaq 100® ESG Covered Call ETF | | | | | | | | |
| Equity contracts | | $ | 32,703 | | | $ | — | |
| | | | | | | | | |
| Global X S&P 500® ESG Covered Call ETF | | | | | | | | |
| Equity contracts | | $ | — | | | $ | 23,057 | |
| | | | | | | | | |
| Global X Dow 30® Covered Call & Growth ETF | | | | | | | | |
| Equity contracts | | $ | — | | | $ | (1,844 | ) |
The following table discloses the average monthly balances of the Funds’ options activity during the year ended October 31, 2023:
| | | Short Avg | | Long Avg | |
| Global X S&P 500® Covered Call ETF | | $(51,793,150) | | $ | - | |
| Global X NASDAQ 100® Covered Call ETF | | (194,078,277) | | | - | |
| Global X Russell 2000 Covered Call ETF | | (36,354,792) | | | - | |
| Global X Nasdaq 100® Covered Call & Growth ETF | | (1,049,022) | | | - | |
| Global X S&P 500® Covered Call & Growth ETF | | (539,858) | | | - | |
| Global X NASDAQ 100® Tail Risk ETF | | - | | | 22,516 | |
| Global X NASDAQ 100® Risk Managed Income ETF | | (265,268) | | | 88,312 | |
| Global X NASDAQ 100® Collar 95-110 ETF | | (33,428) | | | 69,638 | |
| Global X S&P 500® Tail Risk ETF | | - | | | 32,278 | |
| Global X S&P 500® Risk Managed Income ETF | | (526,882) | | | 147,974 | |
| Global X S&P 500® Collar 95-110 ETF | | (17,802) | | | 65,011 | |
| Global X Dow 30® Covered Call ETF | | (959,849) | | | - | |
| Global X Russell 2000 Covered Call & Growth ETF | | (41,419) | | | - | |
| Global X Financials Covered Call & Growth ETF | | (29,953) | | | - | |
| Global X Health Care Covered Call & Growth ETF | | (23,572) | | | - | |
| Global X Information Technology Covered Call & Growth ETF | | (40,268) | | | - | |
| Global X Nasdaq 100® ESG Covered Call ETF | | (57,530) | | | - | |
| Global X S&P 500® ESG Covered Call ETF | | (33,949) | | | - | |
| Global X Dow 30® Covered Call & Growth ETF | | (15,316) | | | - | |
6. TAX INFORMATION
The Global X SuperDividend® REIT ETF has a tax year that ends on December 31. The following tax disclosures are representative as of October 31, 2023. Accordingly, the
465
Notes to Financial Statements (Continued)
October 31, 2023
6. TAX INFORMATION (continued)
disclosures are for informational use by shareholders and are subject to change attributable to activity through the end of the tax year ending December 31, 2022.
The amount and character of income and capital gain distributions to be paid, if any, are determined in accordance with Federal income tax regulations, which may differ from U.S. GAAP. As a result, net investment income (loss) and net realized gain (loss) on investment transactions for a reporting period may differ significantly from distributions during such period. These book/tax differences may be temporary or permanent. To the extent these differences are permanent in nature, they are charged or credited to undistributed net investment income (loss), accumulated net realized gain (loss) or paid-in capital, as appropriate, in the period that the differences arise.
The following differences, primarily attributable to preferred stock interest, foreign currency, redemptions in-kind, REIT adjustments, MLP adjustments, net operating loss, return of capital distribution, sales of passive foreign investment companies and non-deductible excise taxes have been reclassified to/from the following accounts during the fiscal year ended October 31, 2023:
466
Notes to Financial Statements (Continued)
October 31, 2023
6. TAX INFORMATION (continued)
| Global X Funds | | Paid-in
Capital | | Total
Distributable
Earnings
(Accumulated
Losses) |
| Global X Lithium & Battery Tech ETF | | $73,936,040 | | $(73,936,040) |
| Global X SuperDividend® ETF | | (792,521) | | 792,521 |
| Global X Social Media ETF | | 5,395,868 | | (5,395,868) |
| Global X Guru® Index ETF | | 593,515 | | (593,515) |
| Global X SuperIncome™ Preferred ETF | | (738,631) | | 738,631 |
| Global X SuperDividend® U.S. ETF | | 7,811,806 | | (7,811,806) |
| Global X S&P 500® Covered Call ETF | | (25,027,198) | | 25,027,198 |
| Global X NASDAQ 100® Covered Call ETF | | (245,051,235) | | 245,051,235 |
| Global X MSCI SuperDividend® Emerging Markets ETF | | 73,118 | | (73,118) |
| Global X SuperDividend® REIT ETF | | 1,174,987 | | (1,174,987) |
| Global X Renewable Energy Producers ETF | | (4,941,519) | | 4,941,519 |
| Global X S&P 500® Catholic Values ETF | | 15,838,903 | | (15,838,903) |
| Global X MSCI SuperDividend® EAFE ETF | | 142,030 | | (142,030) |
| Global X E-commerce ETF | | (3,790,966) | | 3,790,966 |
| Global X Russell 2000 Covered Call ETF | | (2,876,756) | | 2,876,756 |
| Global X Nasdaq 100® Covered Call & Growth ETF | | (3,317,985) | | 3,317,985 |
| Global X S&P 500® Covered Call & Growth ETF | | (1,909,768) | | 1,909,768 |
| Global X NASDAQ 100® Tail Risk ETF | | 38,325 | | (38,325) |
| Global X NASDAQ 100® Risk Managed Income ETF | | 52,568 | | (52,568) |
| Global X NASDAQ 100® Collar 95-110 ETF | | 38,369 | | (38,369) |
| Global X S&P 500® Risk Managed Income ETF | | (644,261) | | 644,261 |
| Global X Disruptive Materials ETF | | 52,090 | | (52,090) |
| Global X Health Care Covered Call & Growth ETF | | 12,146 | | (12,146) |
The tax character of dividends and distributions declared during the periods ended October 31, 2023 and October 31, 2022 were as follows:
| Global X Funds | | Ordinary Income | | Long-Term
Capital Gain | | | Return of Capital | | | Totals |
| Global X Lithium & Battery Tech ETF |
| 2023 | | $ | 38,976,032 | | | $ | – | | | $ | – | | | $ | 38,976,032 | |
| 2022 | | | 13,550,903 | | | | – | | | | – | | | | 13,550,903 | |
| Global X SuperDividend® ETF |
| 2023 | | $ | 71,554,165 | | | $ | – | | | $ | 17,865,200 | | | $ | 89,419,365 | |
| 2022 | | | 68,726,670 | | | | – | | | | 25,091,152 | | | | 93,817,822 | |
| Global X Social Media ETF |
| 2023 | | $ | 696,865 | | | $ | – | | | $ | – | | | $ | 696,865 | |
| 2022 | | | – | | | | – | | | | 663,636 | | | | 663,636 | |
| Global X Guru® Index ETF |
| 2023 | | $ | 140,340 | | | $ | – | | | $ | 13,339 | | | $ | 153,679 | |
| 2022 | | | 14,584 | | | | – | | | | 63,227 | | | | 77,811 | |
467
Notes to Financial Statements (Continued)
October 31, 2023
6. TAX INFORMATION (continued)
| Global X Funds | | Ordinary Income | | Long-Term
Capital Gain | | | Return of Capital | | | Totals |
| Global X SuperIncome™ Preferred ETF |
| 2023 | | $ | 12,843,440 | | | $ | – | | | $ | – | | | $ | 12,843,440 | |
| 2022 | | | 12,532,497 | | | | – | | | | 653,473 | | | | 13,185,970 | |
| Global X SuperDividend® U.S. ETF |
| 2023 | | $ | 32,670,182 | | | $ | – | | | $ | 12,029,058 | | | $ | 44,699,240 | |
| 2022 | | | 27,892,254 | | | | – | | | | 13,969,909 | | | | 41,862,163 | |
| Global X S&P 500® Covered Call ETF |
| 2023 | | $ | 8,585,958 | | | $ | – | | | $ | 269,122,735 | | | $ | 277,708,693 | |
| 2022 | | | 35,714,783 | | | | – | | | | 133,893,882 | | | | 169,608,665 | |
| Global X NASDAQ 100® Covered Call ETF |
| 2023 | | $ | – | | | $ | – | | | $ | 875,982,507 | | | $ | 875,982,507 | |
| 2022 | | | 211,906,795 | | | | – | | | | 642,111,562 | | | | 854,018,357 | |
| Global X MSCI SuperDividend® Emerging Markets ETF |
| 2023 | | $ | 3,319,170 | | | $ | – | | | $ | – | | | $ | 3,319,170 | |
| 2022 | | | 5,018,224 | | | | – | | | | 1,057,591 | | | | 6,075,815 | |
| Global X SuperDividend® REIT ETF |
| 2023 | | $ | 17,667,250 | | | $ | – | | | $ | 6,960,250 | | | $ | 24,627,500 | |
| 2022 | | | 19,134,864 | | | | – | | | | 9,960,386 | | | | 29,095,250 | |
| Global X Renewable Energy Producers ETF |
| 2023 | | $ | 839,231 | | | $ | – | | | $ | – | | | $ | 839,231 | |
| 2022 | | | 1,233,925 | | | | – | | | | – | | | | 1,233,925 | |
| Global X S&P 500® Catholic Values ETF |
| 2023 | | $ | 7,699,184 | | | $ | – | | | $ | – | | | $ | 7,699,184 | |
| 2022 | | | 6,232,670 | | | | 930,733 | | | | – | | | | 7,163,403 | |
| Global X MSCI SuperDividend® EAFE ETF |
| 2023 | | $ | 736,065 | | | $ | – | | | $ | – | | | $ | 736,065 | |
| 2022 | | | 742,260 | | | | – | | | | – | | | | 742,260 | |
| Global X E-commerce ETF |
| 2023 | | $ | – | | | $ | – | | | $ | 42,666 | | | $ | 42,666 | |
| 2022 | | | 283,940 | | | | 613,980 | | | | 66,565 | | | | 964,485 | |
| Global X Russell 2000 Covered Call ETF |
| 2023 | | $ | 2,455,329 | | | $ | – | | | $ | 170,194,451 | | | $ | 172,649,780 | |
| 2022 | | | 32,998,311 | | | | – | | | | 105,055,357 | | | | 138,053,668 | |
| Global X S&P Catholic Values Developed ex-U.S. ETF |
| 2023 | | $ | 253,178 | | | $ | – | | | $ | – | | | $ | 253,178 | |
| 2022 | | | 188,641 | | | | 15,110 | | | | – | | | | 203,751 | |
| Global X Nasdaq 100® Covered Call & Growth ETF |
| 2023 | | $ | – | | | $ | – | | | $ | 4,776,529 | | | $ | 4,776,529 | |
| 2022 | | | 3,262,405 | | | | – | | | | 2,741,520 | | | | 6,003,925 | |
| Global X S&P 500® Covered Call & Growth ETF |
| 2023 | | $ | 376,487 | | | $ | – | | | $ | 2,498,448 | | | $ | 2,874,935 | |
| 2022 | | | 1,862,038 | | | | 3,646 | | | | 1,465,030 | | | | 3,330,714 | |
| Global X Emerging Markets Internet & E-commerce ETF |
| 2023 | | $ | 5,946 | | | $ | – | | | $ | 1,727 | | | $ | 7,673 | |
468
Notes to Financial Statements (Continued)
October 31, 2023
6. TAX INFORMATION (continued)
| Global X Funds | | Ordinary Income | | Long-Term
Capital Gain | | | Return of Capital | | | Totals |
| 2022 | | | – | | | | – | | | | 9,979 | | | | 9,979 | |
| Global X NASDAQ 100® Tail Risk ETF |
| 2023 | | $ | 4,771 | | | $ | – | | | $ | – | | | $ | 4,771 | |
| 2022 | | | 66,715 | | | | – | | | | – | | | | 66,715 | |
| Global X NASDAQ 100® Risk Managed Income ETF |
| 2023 | | $ | – | | | $ | – | | | $ | 1,196,718 | | | $ | 1,196,718 | |
| 2022 | | | 128,024 | | | | – | | | | 869,114 | | | | 997,138 | |
| Global X NASDAQ 100® Collar 95-110 ETF |
| 2023 | | $ | 8,877 | | | $ | – | | | $ | – | | | $ | 8,877 | |
| 2022 | | | 55,614 | | | | 2,343 | | | | – | | | | 57,957 | |
| Global X S&P 500® Tail Risk ETF |
| 2023 | | $ | 32,745 | | | $ | – | | | $ | – | | | $ | 32,745 | |
| 2022 | | | 91,737 | | | | 4,597 | | | | – | | | | 96,334 | |
| Global X S&P 500® Risk Managed Income ETF |
| 2023 | | $ | 41,006 | | | $ | – | | | $ | 3,063,982 | | | $ | 3,104,988 | |
| 2022 | | | 472,058 | | | | – | | | | 1,738,194 | | | | 2,210,252 | |
| Global X S&P 500® Collar 95-110 ETF |
| 2023 | | $ | 40,011 | | | $ | – | | | $ | – | | | $ | 40,011 | |
| 2022 | | | 70,495 | | | | 413 | | | | – | | | | 70,908 | |
| Global X Disruptive Materials ETF |
| 2023 | | $ | 77,885 | | | $ | – | | | $ | – | | | $ | 77,885 | |
| 2022 | | | 47,516 | | | | – | | | | – | | | | 47,516 | |
| Global X Dow 30® Covered Call ETF |
| 2023 | | $ | 609,561 | | | $ | – | | | $ | 4,969,158 | | | $ | 5,578,719 | |
| 2022 | | | 734,788 | | | | – | | | | 1,115,840 | | | | 1,850,628 | |
| Global X Russell 2000 Covered Call & Growth ETF |
| 2023 | | $ | 101,250 | | | $ | 2,217 | | | $ | 152,549 | | | $ | 256,016 | |
| 2022 | | | 12,860 | | | | – | | | | – | | | | 12,860 | |
| Global X Financials Covered Call & Growth ETF |
| 2023 | | $ | 84,987 | | | $ | – | | | $ | 42,333 | | | $ | 127,320 | |
| Global X Health Care Covered Call & Growth ETF |
| 2023 | | $ | 122,360 | | | $ | – | | | $ | – | | | $ | 122,360 | |
| Global X Information Technology Covered Call & Growth ETF |
| 2023 | | $ | 166,221 | | | $ | – | | | $ | – | | | $ | 166,221 | |
| Global X NASDAQ 100® ESG Covered Call ETF |
| 2023 | | $ | 206,140 | | | $ | – | | | $ | – | | | $ | 206,140 | |
| Global X S&P 500® ESG Covered Call ETF |
| 2023 | | $ | 44,960 | | | $ | – | | | $ | 86,314 | | | $ | 131,274 | |
| Global X Dow 30® Covered Call & Growth ETF |
| 2023 | | $ | 9,566 | | | $ | – | | | $ | 13,830 | | | $ | 23,396 | |
As of October 31, 2023, the components of tax basis distributable earnings (accumulated losses) were as follows:
469
Notes to Financial Statements (Continued)
October 31, 2023
6. TAX INFORMATION (continued)
| | | Global X Funds |
| | | Global X
Lithium &
Battery Tech
ETF | | Global X
SuperDividend®
ETF | | Global X Social
Media ETF |
| Undistributed Ordinary Income | | $ | 13,418,223 | | | $ | – | | | $ | 221,843 | |
| Capital Loss Carryforwards | | | (709,741,048 | ) | | | (875,799,892 | ) | | | (102,258,532 | ) |
| Unrealized Depreciation on Investments and Foreign Currency | | | (442,916,833 | ) | | | (148,395,913 | ) | | | (89,142,998 | ) |
| Other Temporary Differences | | | (12 | ) | | | (16 | ) | | | 1 | |
| Total Accumulated Losses | | $ | (1,139,239,670 | ) | | $ | (1,024,195,821 | ) | | $ | (191,179,686 | ) |
| | | | |
| | | Global X Funds |
| | | Global X Guru®
Index ETF | | Global X
SuperIncome™
Preferred ETF | | Global X
SuperDividend®
U.S. ETF |
| Undistributed Ordinary Income | | $ | – | | | $ | 690,570 | | | $ | – | |
| Capital Loss Carryforwards | | | (20,896,196 | ) | | | (107,036,095 | ) | | | (183,409,023 | ) |
| Unrealized Depreciation on Investments and Foreign Currency | | | (2,638,826 | ) | | | (20,499,314 | ) | | | (70,013,786 | ) |
| Other Temporary Differences | | | (7 | ) | | | 7 | | | | 4 | |
| Total Accumulated Losses | | $ | (23,535,029 | ) | | $ | (126,844,832 | ) | | $ | (253,422,805 | ) |
| | | | |
| | | Global X Funds |
| | | Global X S&P
500® Covered
Call ETF | | Global X
NASDAQ 100®
Covered Call
ETF | | Global X MSCI
SuperDividend®
Emerging
Markets ETF |
| Undistributed Ordinary Income | | $ | – | | | $ | – | | | $ | 190,241 | |
| Capital Loss Carryforwards | | | (110,562,611 | ) | | | (454,629,649 | ) | | | (30,084,393 | ) |
| Unrealized Depreciation on Investments and Foreign Currency | | | (1 | ) | | | – | | | | (5,645,724 | ) |
| Other Temporary Differences | | | 5,381 | | | | 6 | | | | (2 | ) |
| Total Accumulated Losses | | $ | (110,557,231 | ) | | $ | (454,629,643 | ) | | $ | (35,539,878 | ) |
| | | | |
| | | Global X Funds |
| | | Global X
SuperDividend®
REIT ETF(1) | | Global X
Renewable
Energy
Producers ETF | | Global X S&P
500® Catholic
Values ETF |
| Undistributed Ordinary Income | | $ | – | | | $ | 276,433 | | | $ | 3,291,295 | |
| Capital Loss Carryforwards | | | (223,665,882 | ) | | | (11,285,599 | ) | | | (5,249,389 | ) |
| Unrealized Appreciation (Depreciation) on Investments and Foreign Currency | | | (68,727,995 | ) | | | (41,122,415 | ) | | | 64,077,187 | |
| Other Temporary Differences | | | (1,911,500 | ) | | | (2 | ) | | | 3 | |
| Total Distributable Earnings (Accumulated Losses) | | $ | (294,305,377 | ) | | $ | (52,131,583 | ) | | $ | 62,119,096 | |
470
Notes to Financial Statements (Continued)
October 31, 2023
6. TAX INFORMATION (continued)
| | | Global X Funds |
| | | Global X MSCI
SuperDividend®
EAFE ETF | | Global X
E-commerce
ETF | | Global X Russell
2000 Covered
Call ETF |
| Undistributed Ordinary Income | | $ | 123,431 | | | $ | – | | | $ | – | |
| Capital Loss Carryforwards | | | (2,308,676 | ) | | | (21,904,088 | ) | | | (289,416,145 | ) |
| Unrealized Depreciation on Investments and Foreign Currency | | | (1,297,522 | ) | | | (46,987,499 | ) | | | – | |
| Late Year Loss Deferral | | | – | | | | (13,818 | ) | | | – | |
| Other Temporary Differences | | | (5 | ) | | | 1 | | | | 6 | |
| Total Accumulated Losses | | $ | (3,482,772 | ) | | $ | (68,905,404 | ) | | $ | (289,416,139 | ) |
| | | |
| | | Global X Funds |
| | | Global X S&P
Catholic Values
Developed ex-
U.S. ETF | | Global X
Nasdaq 100®
Covered Call &
Growth ETF | | Global X S&P
500® Covered
Call & Growth
ETF |
| Undistributed Ordinary Income | | $ | 152,209 | | | $ | – | | | $ | – | |
| Capital Loss Carryforwards | | | (305,713 | ) | | | (3,797,720 | ) | | | (2,267,522 | ) |
| Unrealized Depreciation on Investments and Foreign Currency | | | (888,246 | ) | | | – | | | | – | |
| Other Temporary Differences | | | 2 | | | | (1 | ) | | | – | |
| Total Accumulated Losses | | $ | (1,041,748 | ) | | $ | (3,797,721 | ) | | $ | (2,267,522 | ) |
| | | |
| | | Global X Funds |
| | | Global X
Emerging
Markets
Internet &
E-commerce
ETF | | Global X
NASDAQ 100®
Tail Risk ETF | | Global X
NASDAQ 100®
Risk Managed
Income ETF |
| Undistributed Ordinary Income | | $ | – | | | $ | 2,466 | | | $ | – | |
| Capital Loss Carryforwards | | | (1,886,802 | ) | | | (532,778 | ) | | | (2,285,474 | ) |
| Unrealized Depreciation on Investments and Foreign Currency | | | (1,677,113 | ) | | | – | | | | – | |
| Other Temporary Differences | | | – | | | | – | | | | 1 | |
| Total Accumulated Losses | | $ | (3,563,915 | ) | | $ | (530,312 | ) | | $ | (2,285,473 | ) |
| | | |
| | | Global X Funds |
| | | Global X
NASDAQ 100®
Collar 95-110
ETF | | Global X S&P
500® Tail Risk
ETF | | Global X S&P
500® Risk
Managed
Income ETF |
| Undistributed Ordinary Income | | $ | 4,067 | | | $ | 11,623 | | | $ | – | |
| Capital Loss Carryforwards | | | (370,940 | ) | | | (347,869 | ) | | | (3,651,301 | ) |
| Other Temporary Differences | | | 2 | | | | – | | | | – | |
| Total Accumulated Losses | | $ | (366,871 | ) | | $ | (336,246 | ) | | $ | (3,651,301 | ) |
471
Notes to Financial Statements (Continued)
October 31, 2023
6. TAX INFORMATION (continued)
| | | Global X Funds |
| | | Global X S&P
500® Collar 95-
110 ETF | | Global X
Disruptive
Materials ETF | | Global X Dow
30® Covered
Call ETF |
| Undistributed Ordinary Income | | $ | 11,286 | | | $ | 54,723 | | | $ | – | |
| Capital Loss Carryforwards | | | (316,741 | ) | | | (1,020,325 | ) | | | (294,284 | ) |
| Unrealized Depreciation on Investments and Foreign Currency | | | – | | | | (2,633,416 | ) | | | – | |
| Other Temporary Differences | | | 1 | | | | (2 | ) | | | – | |
| Total Accumulated Losses | | $ | (305,454 | ) | | $ | (3,599,020 | ) | | $ | (294,284 | ) |
| | | | |
| | | Global X Funds | |
| | | Global X Russell
2000 Covered
Call & Growth
ETF | | Global X
Financials
Covered Call &
Growth ETF | | Global X Health
Care Covered
Call & Growth
ETF |
| Undistributed Ordinary Income | | $ | – | | | $ | – | | | $ | 64,863 | |
| Capital Loss Carryforwards | | | (329,834 | ) | | | – | | | | – | |
| Unrealized Depreciation on Investments and Foreign Currency | | | – | | | | (215,889 | ) | | | (255,440 | ) |
| Other Temporary Differences | | | 3 | | | | 1 | | | | – | |
| Total Accumulated Losses | | $ | (329,831 | ) | | $ | (215,888 | ) | | $ | (190,577 | ) |
| | | | |
| | | Global X Funds |
| | | Global X
Information
Technology
Covered Call &
Growth ETF | | Global X
NASDAQ 100®
ESG Covered
Call ETF | | Global X S&P
500® ESG
Covered Call
ETF |
| Undistributed Ordinary Income | | $ | 123,784 | | | $ | 31,264 | | | $ | – | |
| Undistributed Long-Term Capital Gain | | | – | | | | 235 | | | | – | |
| Unrealized Appreciation on Investments and Foreign Currency | | | 259,788 | | | | – | | | | – | |
| Other Temporary Differences | | | 1 | | | | (1 | ) | | | (2 | ) |
| Total Distributable Earnings (Accumulated Losses) | | $ | 383,573 | | | $ | 31,498 | | | $ | (2 | ) |
| | | |
| | | Global X Funds |
| | | Global X Dow
30® Covered
Call & Growth
ETF |
| Capital Loss Carryforwards | | $ | (146,683 | ) |
| Total Accumulated Losses | | $ | (146,683 | ) |
(1) The Global X SuperDividend® REIT ETF has a tax year that ends on December 31.
For taxable years beginning after December 22, 2010, a Registered Investment Company within the meaning of the 1940 Act is permitted to carry forward net capital losses to offset
472
Notes to Financial Statements (Continued)
October 31, 2023
6. TAX INFORMATION (continued)
capital gains realized in later years, and the losses carried forward retain their original character as either long-term or short-term losses. Losses carried forward under these provisions are as follows:
| | | Short-Term
Loss | | | Long-Term
Loss | | | Total | |
| Global X Lithium & Battery Tech ETF | | $ | 355,912,902 | | | $ | 353,828,146 | | | $ | 709,741,048 | |
| Global X SuperDividend® ETF | | | 367,126,978 | | | | 508,672,914 | | | | 875,799,892 | |
| Global X Social Media ETF | | | 17,019,328 | | | | 85,239,204 | | | | 102,258,532 | |
| Global X Guru® Index ETF | | | 16,553,371 | | | | 4,342,825 | | | | 20,896,196 | |
| Global X SuperIncome™ Preferred ETF | | | 30,612,061 | | | | 76,424,034 | | | | 107,036,095 | |
| Global X SuperDividend® U.S. ETF | | | 159,480,584 | | | | 23,928,440 | | | | 183,409,024 | |
| Global X S&P 500® Covered Call ETF(1) | | | – | | | | 110,562,611 | | | | 110,562,611 | |
| Global X NASDAQ 100® Covered Call ETF(2) | | | – | | | | 454,629,649 | | | | 454,629,649 | |
| Global X MSCI SuperDividend® Emerging Markets ETF | | | 22,559,808 | | | | 7,524,585 | | | | 30,084,393 | |
| Global X SuperDividend® REIT ETF | | | 168,985,755 | | | | 54,680,127 | | | | 223,665,882 | |
| Global X Renewable Energy Producers ETF | | | 3,312,422 | | | | 7,973,177 | | | | 11,285,599 | |
| Global X S&P 500® Catholic Values ETF | | | 2,311,247 | | | | 2,938,142 | | | | 5,249,389 | |
| Global X MSCI SuperDividend® EAFE ETF | | | 474,711 | | | | 1,833,965 | | | | 2,308,676 | |
| Global X E-commerce ETF | | | 2,820,527 | | | | 19,083,561 | | | | 21,904,088 | |
| Global X Russell 2000 Covered Call ETF(3) | | | 115,766,458 | | | | 173,649,687 | | | | 289,416,145 | |
| Global X S&P Catholic Values Developed ex-U.S. ETF | | | 148,206 | | | | 157,507 | | | | 305,713 | |
| Global X Nasdaq 100® Covered Call & Growth ETF(4) | | | – | | | | 3,797,720 | | | | 3,797,720 | |
| Global X S&P 500® Covered Call & Growth ETF(5) | | | – | | | | 2,267,522 | | | | 2,267,522 | |
| Global X Emerging Markets Internet & E-commerce ETF | | | 418,302 | | | | 1,468,500 | | | | 1,886,802 | |
| Global X NASDAQ 100® Tail Risk ETF(6) | | | 66,442 | | | | 466,336 | | | | 532,778 | |
| Global X NASDAQ 100® Risk Managed Income ETF(7) | | | 748,175 | | | | 1,537,299 | | | | 2,285,474 | |
| Global X NASDAQ 100® Collar 95-110 ETF(8) | | | 17,262 | | | | 353,678 | | | | 370,940 | |
| Global X S&P 500® Tail Risk ETF | | | 21,340 | | | | 326,529 | | | | 347,869 | |
| Global X S&P 500® Risk Managed Income ETF(9) | | | 1,460,937 | | | | 2,190,364 | | | | 3,651,301 | |
| Global X S&P 500® Collar 95-110 ETF | | | 66,167 | | | | 250,574 | | | | 316,741 | |
| Global X Disruptive Materials ETF | | | 536,299 | | | | 484,026 | | | | 1,020,325 | |
| Global X Dow 30® Covered Call ETF | | | 50,267 | | | | 244,017 | | | | 294,284 | |
| Global X Russell 2000 Covered Call & Growth ETF | | | 131,934 | | | | 197,900 | | | | 329,834 | |
| Global X Dow 30® Covered Call & Growth ETF | | | 58,673 | | | | 88,010 | | | | 146,683 | |
(1) The prior year ending balances of $96,805,692 (ST) and $145,227,280 (LT) (not presented herein), have been revised to correct for an error in the accounting for the mixed straddle election. The “as revised” balances (also not presented herein) are $86,965,261 (ST) and $130,466,633 (LT). Additionally, the same error resulted in Accumulated Losses and Paid in Capital, as presented on the Statement of Assets and Liabilities as of October 31, 2022, being understated and overstated,
473
Notes to Financial Statements (Continued)
October 31, 2023
6. TAX INFORMATION (continued)
respectively, by an equal and offsetting amount totaling $24,601,078. Management has determined that the impact of these errors are not material to the prior year financial statements.
(2) The prior year ending balances of $656,016,216 (ST) and $984,024,325 (LT) (not presented herein), have been revised to correct for an error in the accounting for the mixed straddle election. The “as revised” balances (also not presented herein) are $574,804,574 (ST) and $862,206,861 (LT). Additionally, the same error resulted in Accumulated Losses and Paid in Capital, as presented on the Statement of Assets and Liabilities as of October 31, 2022, being understated and overstated, respectively, by an equal and offsetting amount totaling $203,029,105. Management has determined that the impact of these errors are not material to the prior year financial statements.
(3) The prior year ending balances of $66,140,478 (ST) and $99,210,716 (LT) (not presented herein), have been revised to correct for an error in the accounting for the mixed straddle election. The “as revised” balances (also not presented herein) are $65,115,657 (ST) and $97,673,485 (LT).Additionally, the same error resulted in Accumulated Losses and Paid in Capital, as presented on the Statement of Assets and Liabilities as of October 31, 2022, being understated and overstated, respectively, by an equal and offsetting amount totaling $2,562,052. Management has determined that the impact of these errors are not material to the prior year financial statements.
(4) The prior year ending balances of $7,919,707 (ST) and $11,879,561 (LT) (not presented herein), have been revised to correct for an error in the accounting for the mixed straddle election. The “as revised” balances (also not presented herein) are $6,622,752 (ST) and $9,934,128 (LT). Additionally, the same error resulted in Accumulated Losses and Paid in Capital, as presented on the Statement of Assets and Liabilities as of October 31, 2022, being understated and overstated, respectively, by an equal and offsetting amount totaling $3,242,388. Management has determined that the impact of these errors are not material to the prior year financial statements.
(5) The prior year ending balances of $2,881,662 (ST) and $4,323,051 (LT) (not presented herein), have been revised to correct for an error in the accounting for the mixed straddle election. The “as revised” balances (also not presented herein) are $2,121,596 (ST) and $3,182,952 (LT). Additionally, the same error resulted in Accumulated Losses and Paid in Capital, as presented on the Statement of Assets and Liabilities as of October 31, 2022, being understated and overstated, respectively, by an equal and offsetting amount totaling $1,900,165. Management has determined that the impact of these errors are not material to the prior year financial statements.
(6) The prior year ending balances of $298,494 (ST) and $447,741 (LT) (not presented herein), have been revised to correct for an error in the accounting for the mixed straddle election. The “as revised” balances (also not presented herein) are $313,824 (ST) and $470,735 (LT). Additionally, the same error resulted in Accumulated Losses and Paid in Capital, as presented on the Statement of Assets and Liabilities as of October 31, 2022, being understated and overstated, respectively, by an equal and offsetting amount totaling $38,325. Management has determined that the impact of these errors are not material to the prior year financial statements.
(7) The prior year ending balances of $918,195 (ST) and $1,377,293 (LT) (not presented herein), have been revised to correct for an error in the accounting for the mixed straddle election. The “as revised” balances (also not presented herein) are $970,602 (ST) and $1,455,902 (LT). Additionally, the same error resulted in Accumulated Losses and Paid in Capital, as presented on the Statement of Assets and Liabilities as of October 31, 2022, being understated and overstated, respectively, by an equal and
474
Notes to Financial Statements (Continued)
October 31, 2023
6. TAX INFORMATION (continued)
offsetting amount totaling $131,015. Management has determined that the impact of these errors are not material to the prior year financial statements.
(8) The prior year ending balances of $213,983 (ST) and $320,974 (LT) (not presented herein), have been revised to correct for an error in the accounting for the mixed straddle election. The “as revised” balances (also not presented herein) are $229,330 (ST) and $343,996 (LT). Additionally, the same error resulted in Accumulated Losses and Paid in Capital, as presented on the Statement of Assets and Liabilities as of October 31, 2022, being understated and overstated, respectively, by an equal and offsetting amount totaling $38,369. Management has determined that the impact of these errors are not material to the prior year financial statements.
(9) The prior year ending balances of $1,478,770 (ST) and $2,218,198 (LT) (not presented herein), have been revised to correct for an error in the accounting for the mixed straddle election. The “as revised” balances (also not presented herein) are $1,223,164 (ST) and $1,834,789 (LT). Additionally, the same error resulted in Accumulated Losses and Paid in Capital, as presented on the Statement of Assets and Liabilities as of October 31, 2022, being understated and overstated, respectively, by an equal and offsetting amount totaling $639,015. Management has determined that the impact of these errors are not material to the prior year financial statements.
During the year ended October 31, 2023, the following Funds utilized capital loss carryforwards to offset capital gains amounting to:
| | | Short-Term
Loss | | | Long-Term
Loss | | | Total | |
| Global X S&P 500® Covered Call ETF | | $ | 86,934,159 | | | $ | 19,721,271 | | | $ | 106,655,430 | |
| Global X NASDAQ 100® Covered Call ETF | | | 574,804,574 | | | | 407,577,212 | | | | 982,381,786 | |
| Global X SuperDividend® REIT ETF | | | – | | | | 14,376,608 | | | | 14,376,608 | |
| Global X S&P 500® Catholic Values ETF | | | 142,058 | | | | – | | | | 142,058 | |
| Global X E-commerce ETF | | | 214,740 | | | | – | | | | 214,740 | |
| Global X Nasdaq 100® Covered Call & Growth ETF | | | 6,622,752 | | | | 6,136,408 | | | | 12,759,160 | |
| Global X S&P 500® Covered Call & Growth ETF | | | 2,120,851 | | | | 910,975 | | | | 3,031,826 | |
| Global X Emerging Markets Internet & E-commerce ETF | | | 13,665 | | | | – | | | | 13,665 | |
| Global X NASDAQ 100® Tail Risk ETF | | | 247,382 | | | | 4,398 | | | | 251,780 | |
| Global X NASDAQ 100® Risk Managed Income ETF | | | 222,427 | | | | – | | | | 222,427 | |
| Global X NASDAQ 100® Collar 95-110 ETF | | | 212,068 | | | | – | | | | 212,068 | |
| Global X S&P 500® Tail Risk ETF | | | 186,833 | | | | – | | | | 186,833 | |
| Global X S&P 500® Collar 95-110 ETF | | | 93,274 | | | | – | | | | 93,274 | |
| Global X Dow 30® Covered Call ETF | | | 337,233 | | | | 337,233 | | | | 674,466 | |
475
Notes to Financial Statements (Continued)
October 31, 2023
6. TAX INFORMATION (continued)
The Federal tax cost basis of investments and aggregate gross unrealized appreciation and depreciation on investments held by the Funds at October 31, 2023 were as follows:
| Global X Funds | | Federal Tax
Cost | | Aggregated
Gross
Unrealized
Appreciation | | Aggregated
Gross
Unrealized
Depreciation | | Net Unrealized
Appreciation
(Depreciation) |
| Global X Lithium & Battery Tech ETF | | $ | 2,650,374,459 | | | $ | 133,760,153 | | | $ | (576,676,986 | ) | | $ | (442,916,833 | ) |
| Global X SuperDividend® ETF | | | 860,169,208 | | | | 26,911,183 | | | | (175,307,095 | ) | | | (148,395,912 | ) |
| Global X Social Media ETF | | | 232,217,576 | | | | 6,299,858 | | | | (95,442,856 | ) | | | (89,142,998 | ) |
| Global X Guru® Index ETF | | | 45,842,238 | | | | 2,979,323 | | | | (5,618,149 | ) | | | (2,638,826 | ) |
| Global X SuperIncome™ Preferred ETF | | | 177,156,413 | | | | 521,386 | | | | (21,020,700 | ) | | | (20,499,314 | ) |
| Global X SuperDividend® U.S. ETF | | | 660,695,175 | | | | 59,211,279 | | | | (129,225,065 | ) | | | (70,013,786 | ) |
| Global X S&P 500® Covered Call ETF | | | 2,801,099,164 | | | | 306,135,760 | | | | (306,135,761 | ) | | | (1 | ) |
| Global X NASDAQ 100® Covered Call ETF | | | 7,510,629,343 | | | | 1,467,600,749 | | | | (1,467,600,749 | ) | | | – | |
| Global X MSCI SuperDividend® Emerging Markets ETF | | | 47,275,385 | | | | 3,419,403 | | | | (9,065,127 | ) | | | (5,645,724 | ) |
| Global X SuperDividend® REIT ETF | | | 292,459,244 | | | | 1,918,797 | | | | (76,965,454 | ) | | | (75,046,657 | ) |
| Global X Renewable Energy Producers ETF | | | 86,081,674 | | | | 718,902 | | | | (41,841,317 | ) | | | (41,122,415 | ) |
| Global X S&P 500® Catholic Values ETF | | | 606,805,922 | | | | 118,751,354 | | | | (54,674,167 | ) | | | 64,077,187 | |
| Global X MSCI SuperDividend® EAFE ETF | | | 11,319,748 | | | | 535,914 | | | | (1,833,436 | ) | | | (1,297,522 | ) |
| Global X E-commerce ETF | | | 109,564,347 | | | | 1,054,412 | | | | (48,041,911 | ) | | | (46,987,499 | ) |
| Global X Russell 2000 Covered Call ETF | | | 1,403,448,540 | | | | 107,030,370 | | | | (107,030,370 | ) | | | – | |
| Global X S&P Catholic Values Developed ex-U.S. ETF | | | 15,313,436 | | | | 631,053 | | | | (1,519,299 | ) | | | (888,246 | ) |
| Global X Nasdaq 100® Covered Call & Growth ETF | | | 102,085,927 | | | | 9,160,849 | | | | (9,160,849 | ) | | | – | |
| Global X S&P 500® Covered Call & Growth ETF | | | 60,935,023 | | | | 2,941,814 | | | | (2,941,814 | ) | | | – | |
| Global X Emerging Markets Internet & E-commerce ETF | | | 4,067,337 | | | | 86,571 | | | | (1,763,684 | ) | | | (1,677,113 | ) |
| Global X NASDAQ 100® Tail Risk ETF | | | 1,360,975 | | | | 95,605 | | | | (95,605 | ) | | | – | |
| Global X NASDAQ 100® Risk Managed Income ETF | | | 11,795,194 | | | | 835,101 | | | | (835,101 | ) | | | – | |
| Global X NASDAQ 100® Collar 95-110 ETF | | | 2,109,450 | | | | 173,675 | | | | (173,675 | ) | | | – | |
| Global X S&P 500® Tail Risk ETF | | | 2,418,932 | | | | 246,135 | | | | (246,135 | ) | | | – | |
476
Notes to Financial Statements (Continued)
October 31, 2023
6. TAX INFORMATION (continued)
| Global X Funds | | Federal Tax
Cost | | Aggregated
Gross
Unrealized
Appreciation | | Aggregated
Gross
Unrealized
Depreciation | | Net Unrealized
Appreciation
(Depreciation) |
| Global X S&P 500® Risk Managed Income ETF | | $ | 27,063,940 | | | $ | 2,288,146 | | | $ | (2,288,146 | ) | | $ | – | |
| Global X S&P 500® Collar 95-110 ETF | | | 2,217,495 | | | | 220,101 | | | | (220,101 | ) | | | – | |
| Global X Disruptive Materials ETF | | | 10,307,679 | | | | 5,496 | | | | (2,638,912 | ) | | | (2,633,416 | ) |
| Global X Dow 30® Covered Call ETF | | | 78,857,929 | | | | 4,089,794 | | | | (4,089,794 | ) | | | – | |
| Global X Russell 2000 Covered Call & Growth ETF | | | 8,269,956 | | | | – | | | | – | | | | – | |
| Global X Financials Covered Call & Growth ETF | | | 2,444,167 | | | | 48,956 | | | | (264,845 | ) | | | (215,889 | ) |
| Global X Health Care Covered Call & Growth ETF | | | 2,831,064 | | | | 56,673 | | | | (312,113 | ) | | | (255,440 | ) |
| Global X Information Technology Covered Call & Growth ETF | | | 3,202,285 | | | | 571,442 | | | | (311,654 | ) | | | 259,788 | |
| Global X NASDAQ 100® ESG Covered Call ETF | | | 2,473,495 | | | | 204,513 | | | | (204,513 | ) | | | – | |
| Global X S&P 500® ESG Covered Call ETF | | | 2,374,535 | | | | 181,432 | | | | (181,432 | ) | | | – | |
| Global X Dow 30® Covered Call & Growth ETF | | | 2,414,200 | | | | 27,519 | | | | (27,519 | ) | | | – | |
The preceding differences between book and tax cost are primarily due to mark-to-market treatment of passive foreign investment companies, mixed straddles, MLP adjustments, wash sales, late year loss deferrals and differences due to preferred debt securities.
7. CONCENTRATION OF RISKS
The Funds invest in securities of foreign issuers in various countries. These investments may involve certain considerations and risks not typically associated with investments in the United States as a result of, among other factors, the possibility of future political and economic developments, the level of governmental supervision and regulation of securities markets in the respective countries.
The securities markets of emerging market countries are less liquid, subject to greater price volatility, and have a smaller market capitalization than the U.S. securities markets. In certain countries, there may be fewer publicly traded securities and the market may be dominated by a few issuers or sectors. Issuers and securities markets in such countries are not subject to as extensive and frequent accounting, financial and other reporting requirements or as comprehensive government regulations as are issuers and securities markets in the United States. In particular, the assets and profits appearing on the financial statements of emerging market country issuers may not reflect their financial position or results of operations in the same manner as financial statements for U.S. issuers.
477
Notes to Financial Statements (Continued)
October 31, 2023
7. CONCENTRATION OF RISKS (continued)
Substantially less information may be publicly available about emerging market country issuers than is available about issuers in the United States.
The Funds may be subject to taxes imposed by countries in which they invest. Such taxes are generally based on either income, gains earned or repatriated. The Funds accrue and apply such taxes to net investment income, net realized gains and net unrealized gains as income and/or capital gains are earned.
Except for the Global X Russell 2000® Covered Call ETF, Global X Russell 2000 Covered Call & Growth ETF, Global X Financials Covered Call & Growth ETF, Global X Health Care Covered Call & Growth ETF and the Global X Information Technology Covered Call & Growth ETF which use a representative sampling strategy, the Funds use a replication strategy. A replication strategy is an indexing strategy that involves investing in the securities of an underlying index in approximately the same proportions as in the underlying index. A representative sampling strategy is an indexing strategy that involves investing in a representative sample of securities (including indirect investments through underlying ETFs) that collectively has an investment profile similar to an underlying index in terms of key risk factors, performance attributes and other characteristics. Each Fund may utilize a representative sampling strategy with respect to its underlying index when a replication strategy might be detrimental to its shareholders, such as when there are practical difficulties or substantial costs involved in compiling a portfolio of equity securities to follow their underlying index, or, in certain instances, when securities in the underlying index become temporarily illiquid, unavailable or less liquid, or due to legal restrictions (such as diversification requirements that apply to a Fund but not the underlying index).
Certain Funds may invest in commodity related securities, which are susceptible to fluctuations in certain commodity markets. Any negative changes in commodity markets could have a great impact on those securities.
Certain Funds may have investments in financial instruments that utilize the London Interbank Offered Rate (“LIBOR”) as the reference or benchmark rate for variable interest rate calculations. LIBOR was intended to measure the rate generally at which banks can lend and borrow from one another in the relevant currency on an unsecured basis. The UK Financial Conduct Authority (“FCA”), the regulator that oversees LIBOR, announced that the majority of LIBOR rates would cease to be published or would no longer be representative on January 1, 2022. The publication of most LIBOR rates ceased at the end of 2021, and the remaining USD LIBOR rates ceased to be published after June 2023. There remains uncertainty and risks relating to the continuing LIBOR transition and its effects on the Funds and the instruments in which the Funds invest. There can be no assurance that the composition or characteristics of any alternative reference rates (“ARRs”) or financial instruments in which the Funds invest that utilize ARRs will be similar to or produce the same value or economic equivalence as LIBOR or that these instruments will have
478
Notes to Financial Statements (Continued)
October 31, 2023
7. CONCENTRATION OF RISKS (continued)
the same volume or liquidity. Additionally, there remains uncertainty and risks relating to certain “legacy” USD LIBOR instruments that were issued or entered into before December 31, 2021 and the process by which a replacement interest rate will be identified and implemented into these instruments when USD LIBOR is ultimately discontinued. On December 16, 2022, the Federal Reserve Board adopted regulations implementing the Adjustable Interest Rate Act. The regulations provide a statutory fallback mechanism to replace LIBOR, by identifying benchmark rates based on the Secured Overnight Financing Rate (“SOFR”) that replaced LIBOR in certain financial contracts after June 30, 2023. These regulations apply only to contracts governed by U.S. law, among other limitations. The Funds may have instruments linked to other interbank offered rates that may also cease to be published in the future. The effects of such uncertainty and risks in “legacy” USD LIBOR instruments held by the Funds could result in losses to the Funds.
Please refer to each Fund’s prospectus and statement of additional information (“SAI”) for a more complete description of risks.
8. LOANS OF PORTFOLIO SECURITIES
Each Fund may lend portfolio securities having a market value up to one-third of its total assets. Security loans made pursuant to securities lending agreements with BBH and BNY Mellon are initially required to be secured by collateral equal to at least 102% of the value of domestic equity securities and American Depositary Receipts (“ADRs”) and 105% of the value of foreign equity securities (other than ADRs). Such collateral received in connection with these loans will be cash and can be invested in repurchase agreements, short-term investments or U.S. Treasury obligations, and is recognized in the Schedules of Investments and Statements of Assets and Liabilities. The obligation to return securities lending collateral is also recognized as a liability in the Statements of Assets and Liabilities. It is the Funds’ policy to obtain additional collateral from or return excess collateral to the borrower by the end of the next business day, following the valuation date of the securities loaned. Therefore, the value of the collateral held may be temporarily less than the value of the securities on loan.
Securities pledged as collateral for repurchase agreements held in the Global X Lithium & Battery Tech ETF, Global X SuperDividend® ETF, Global X Social Media ETF, Global X Guru® Index ETF, Global X SuperDividend® U.S. ETF, Global X MSCI SuperDividend® Emerging Markets ETF, Global X Renewable Energy Producers ETF, and Global X E-commerce ETF, are held by BNY Mellon and are designated as being held on the Fund’s behalf under a book-entry system. The Funds monitor the adequacy of the collateral on a daily basis and can require the seller to provide additional collateral in the event the market value of the securities pledged falls below the carrying value of the repurchase agreement, including accrued interest. It is the Funds’ policy to only enter into repurchase agreements with banks and other financial institutions which are deemed by the Adviser to be creditworthy. The Funds bear the risk of loss in the event the other party to a repurchase
479
Notes to Financial Statements (Continued)
October 31, 2023
8. LOANS OF PORTFOLIO SECURITIES (continued)
agreement defaults on its obligations and the Fund is prevented from exercising its rights to dispose of the underlying securities received as collateral and the risk of a possible decline in the value of the underlying securities during the period. For financial statement purposes, the Funds record the securities lending collateral (including in repurchase agreements, at value or restricted cash) as an asset and the obligation to return securities lending collateral as a liability on the Statement of Assets and Liabilities.
Cash collateral received in connection with securities lending is invested in repurchase agreements and short-term investments by the lending agent. The Funds do not have effective control of the non-cash collateral and therefore it is not disclosed in the Fund’s Schedule of Investments.
Securities lending transactions are entered into by the Funds under the Securities Lending Agreement, which permits a Fund, under certain circumstances such as an event of default, to offset amounts payable by the Fund to the same counterparty against amounts receivable from the counterparty to create a net payment due to or from the Fund.
The following is a summary of securities lending agreements held by the Funds, with cash collateral of overnight maturities and non-cash collateral, which would be subject to offset as of October 31, 2023.
| | | Gross Amount
of Recognized
Assets (Value
of Securities on
Loan) | | | Value of
Cash
Collateral
Received(1) | | | Value of
Non-Cash
Collateral
Received(1) | | | Net Amount | |
| Global X Lithium & Battery Tech ETF | | $ | 121,159,472 | | | $ | 121,159,472 | | | $ | — | | | $ | — | |
| Global X SuperDividend® ETF | | | 24,017,012 | | | | 18,419,915 | | | | 5,597,097 | | | | — | |
| Global X Social Media ETF | | | 2,413,260 | | | | 2,413,260 | | | | — | | | | — | |
| Global X Guru® Index ETF | | | 1,409,565 | | | | 1,409,565 | | | | — | | | | — | |
| Global X SuperDividend® U.S. ETF | | | 1,971,501 | | | | 1,971,501 | | | | — | | | | — | |
| Global X MSCI SuperDividend® | | | | | | | | | | | | | | | | |
| Emerging Markets ETF | | | 347,622 | | | | 347,622 | | | | — | | | | — | |
| Global X Renewable Energy | | | | | | | | | | | | | | | | |
| Producers ETF | | | 2,047,817 | | | | 1,222,768 | | | | 825,049 | | | | — | |
| Global X E-commerce ETF | | | 802,249 | | | | 529,864 | | | | 272,385 | | | | — | |
| (1) | Collateral and non-cash collateral received in excess of market value of securities on loan is not presented in this table. The total cash collateral received by the Fund is disclosed in the Statements of Assets and Liabilities. |
480
Notes to Financial Statements (Continued)
October 31, 2023
8. LOANS OF PORTFOLIO SECURITIES (continued)
The value of loaned securities and related collateral outstanding at October 31, 2023 are shown in the Schedules of Investments. The value of the collateral held may be temporarily less than that required under the lending contract. As of October 31, 2023, the cash collateral was invested in repurchase agreements and the non-cash collateral consisted of U.S. Treasury Bills, Notes, Bonds and U.S. Treasury Inflation Indexed Bonds with the following maturities:
| | | Overnight and
Continuous | | <30 Days | | | Between
30 & 90
Days | | | >90 Days | | | Total |
| Global X Lithium & Battery Tech ETF | | | | | | | | | | | | | | | | | | | | |
| Repurchase Agreements | | $ | 131,491,852 | | | $ | — | | | $ | — | | | $— | | | $131,491,852 |
| Total | | $ | 131,491,852 | | | $ | — | | | $ | — | | | $— | | | $131,491,852 |
| Global X SuperDividend® ETF | | | | | | | | | | | | | | | | | | | |
| Repurchase Agreements | | $ | 19,721,246 | | | $ | — | | | $ | — | | | $— | | | $19,721,246 |
| U.S. Government Securities | | | — | | | | — | | | | — | | | 5,597,097 | | | 5,597,097 |
| Total | | $ | 19,721,246 | | | $ | — | | | $ | — | | | $5,597,097 | | | $25,318,343 |
| Global X Social Media ETF | | | | | | | | | | | | | | | | | | | |
| Repurchase Agreements | | $ | 2,569,231 | | | $ | — | | | $ | — | | | $— | | | $2,569,231 |
| Total | | $ | 2,569,231 | | | $ | — | | | $ | — | | | $— | | | $2,569,231 |
| Global X Guru® Index ETF | | | | | | | | | | | | | | | | | | | |
| Repurchase Agreements | | $ | 1,484,508 | | | $ | — | | | $ | — | | | $— | | | $1,484,508 |
| Total | | $ | 1,484,508 | | | $ | — | | | $ | — | | | $— | | | $1,484,508 |
| Global X SuperDividend® U.S. ETF | | | | | | | | | | | | | | | | | | | |
| Repurchase Agreements | | $ | 2,069,902 | | | $ | — | | | $ | — | | | $— | | | $2,069,902 |
| Total | | $ | 2,069,902 | | | $ | — | | | $ | — | | | $— | | | $2,069,902 |
| Global X MSCI SuperDividend® Emerging Markets ETF | | | | | | | | | | | | | | | | | | | |
| Repurchase Agreements | | $ | 402,998 | | | $ | — | | | $ | — | | | $— | | | $402,998 |
| Total | | $ | 402,998 | | | $ | — | | | $ | — | | | $— | | | $402,998 |
| Global X Renewable Energy Producers ETF | | | | | | | | | | | | | | | | | | | |
| Repurchase Agreements | | $ | 1,283,867 | | | $ | — | | | $ | — | | | $— | | | $1,283,867 |
| U.S. Government Securities | | | — | | | | — | | | | — | | | 825,049 | | | 825,049 |
| Total | | $ | 1,283,867 | | | $ | — | | | $ | — | | | $825,049 | | | $2,108,916 |
| Global X E-commerce ETF | | | | | | | | | | | | | | | | | | | |
| Repurchase Agreements | | $ | 548,141 | | | $ | — | | | $ | — | | | $— | | | $548,141 |
| U.S. Government Securities | | | — | | | | — | | | | — | | | 272,385 | | | 272,385 |
| Total | | $ | 548,141 | | | $ | — | | | $ | — | | | $272,385 | | | $820,526 |
481
Notes to Financial Statements (Concluded)
October 31, 2023
9. REVERSE STOCK SPLIT
The Board of the Trust approved a reverse share split of one to three (1:3) of the issued and outstanding shares of the Global X SuperDividend® ETF, Global X MSCI SuperDividend® Emerging Markets ETF and Global X SuperDividend® REIT ETF, and Global X Emerging Markets Internet & E-commerce ETF, (the “Reverse Share Split”). The Reverse Share Split was completed after the close of business on December 19, 2022. The effect of this transaction for each Fund was to divide the number of outstanding Shares of the Fund by three, resulting in a corresponding increase in the NAV per Share. The capital share activity presented on the Statement of Changes in Net Assets for each of the years in the period then ended, and the per share data in the financial highlights for each of the years in the period then ended, have been given retroactive effect to reflect these reverse share splits. There were no changes in net assets, results of operations or total return as a result of these transactions.
10. CONTRACTUAL OBLIGATION
The Funds enter into contracts in the normal course of business that contain a variety of indemnifications. The Funds’ maximum exposure under these contracts is unknown; however, the Funds have not had prior gains or losses pursuant to these contracts. Management has reviewed the Funds’ existing contracts and expects the risk of loss to be remote.
Pursuant to the Trust’s organizational documents, the Trustees of the Trust and the Trust’s officers are indemnified against certain liabilities that may arise out of the performance of their duties.
11. SUBSEQUENT EVENTS
The Funds have been evaluated by management regarding the need for additional disclosures and/or adjustments resulting from subsequent events.
In preparing these financial statements, management has evaluated the need for additional disclosures and/or adjustments resulting from subsequent events through the date the financial statements were issued. On October 12, 2023 the Board approved the liquidation of the Global X Emerging Markets Internet & E-commerce ETF. The Fund was liquidated on November 17, 2023.
Based on this evaluation, no additional adjustments were required to the financial statements.
482
Report of Independent Registered Public Accounting Firm
To the Board of Trustees of Global X Funds and Shareholders of each of the Funds listed in the table below
Opinions on the Financial Statements
We have audited the accompanying statements of assets and liabilities, including the schedules of investments, of each of the funds listed in the table below (thirty-four of the funds constituting Global X Funds, hereafter collectively referred to as the “Funds”) as of October 31, 2023, the related statements of operations and of changes in net assets for each of the periods indicated in the table below, including the related notes, and the financial highlights for each of the periods indicated in the table below (collectively referred to as the “financial statements”). In our opinion, the financial statements present fairly, in all material respects, the financial position of each of the Funds as of October 31, 2023, the results of each of their operations, the changes in each of their net assets, and each of the financial highlights for each of the periods indicated in the table below, in conformity with accounting principles generally accepted in the United States of America.
| Global X Lithium & Battery Tech ETF (1) | Global X S&P 500® Covered Call & Growth ETF (5) |
| Global X SuperDividend® ETF (1) | Global X Emerging Markets Internet & E-commerce ETF (6) |
| Global X Social Media ETF (1) | Global X Nasdaq 100® Tail Risk ETF (7) |
| Global X Guru® Index ETF (1) | Global X Nasdaq 100® Risk Managed Income ETF (7) |
| Global X SuperIncome™ Preferred ETF (1) | Global X Nasdaq 100® Collar 95-110 ETF (7) |
| Global X SuperDividend® U.S. ETF (1) | Global X S&P 500® Tail Risk ETF (7) |
| Global X S&P 500® Covered Call ETF (1) | Global X S&P 500® Risk Managed Income ETF (7) |
| Global X NASDAQ 100® Covered Call ETF (1) | Global X S&P 500® Collar 95-110 ETF (7) |
| Global X MSCI SuperDividend® Emerging Markets ETF (1) | Global X Disruptive Materials ETF (8) |
| Global X SuperDividend® REIT ETF (1) | Global X Dow 30® Covered Call ETF (9) |
| Global X Renewable Energy Producers ETF (1) | Global X Russell 2000 Covered Call & Growth ETF (10) |
| Global X S&P 500® Catholic Values ETF (1) | Global X Financials Covered Call & Growth ETF (11) |
| Global X MSCI SuperDividend® EAFE ETF (1) | Global X Health Care Covered Call & Growth ETF (11) |
| Global X E-commerce ETF (2) | Global X Information Technology Covered Call & Growth ETF (11) |
| Global X Russell 2000 Covered Call ETF (3) | Global X Nasdaq 100® ESG Covered Call ETF (12) |
483
Report of Independent Registered Public Accounting Firm (Continued)
| Global X S&P Catholic Values Developed ex-U.S. ETF (4) | Global X S&P 500® ESG Covered Call ETF (12) |
| Global X Nasdaq 100® Covered Call & Growth ETF (5) | Global X Dow 30® Covered Call & Growth ETF (13) |
| 1. | Statements of operations for the year ended October 31, 2023, statements of changes in net assets for each of the two years in the period ended October 31, 2023 and the financial highlights for each of the five years in the period ended October 31, 2023. |
| 2. | Statement of operations for the year ended October 31, 2023, statements of changes in net assets for each of the two years in the period ended October 31, 2023 and the financial highlights for each of the four years in the period ended October 31, 2023 and for the period November 27, 2018 (commencement of operations) through October 31, 2019. |
| 3. | Statement of operations for the year ended October 31, 2023, statements of changes in net assets for each of the two years in the period ended October 31, 2023 and the financial highlights for each of the four years in the period ended October 31, 2023 and for the period April 17, 2019 (commencement of operations) through October 31, 2019. |
| 4. | Statement of operations for the year ended October 31, 2023, statements of changes in net assets for each of the two years in the period ended October 31, 2023 and the financial highlights for each of the three years in the period ended October 31, 2023 and for the period June 22, 2020 (commencement of operations) through October 31, 2020. |
| 5. | Statements of operations for the year ended October 31, 2023, statements of changes in net assets for each of the two years in the period ended October 31, 2023 and the financial highlights for each of the three years in the period ended October 31, 2023 and for the period September 18, 2020 (commencement of operations) through October 31, 2020. |
| 6. | Statement of operations for the year ended October 31, 2023, statements of changes in net assets for each of the two years in the period ended October 31, 2023 and the financial highlights for each of the two years in the period ended October 31, 2023 and for the period November 9, 2020 (commencement of operations) through October 31, 2021. |
| 7. | Statements of operations for the year ended October 31, 2023, statements of changes in net assets for each of the two years in the period ended October 31, 2023 and the financial highlights for each of the two years in the period ended October 31, 2023 and for the period August 25, 2021 (commencement of operations) through October 31, 2021. |
| 8. | Statement of operations for the year ended October 31, 2023, statement of changes in net assets and the financial highlights for the year ended October 31, 2023 and for the period January 24, 2022 (commencement of operations) through October 31, 2022. |
| 9. | Statement of operations for the year ended October 31, 2023, statement of changes in net assets and the financial highlights for the year ended October 31, 2023 and for the period February 23, 2022 (commencement of operations) through October 31, 2022. |
| 10. | Statement of operations for the year ended October 31, 2023, statement of changes in net assets and the financial highlights for the year ended October 31, 2023 and for the period October 4, 2022 (commencement of operations) through October 31, 2022. |
| 11. | Statements of operations and changes in net assets and the financial highlights for the period November 21, 2022 (commencement of operations) through October 31, 2023. |
| 12. | Statements of operations and changes in net assets and the financial highlights for the period February 21, 2023 (commencement of operations) through October 31, 2023. |
| 13. | Statements of operations and changes in net assets and the financial highlights for the period July 25, 2023 (commencement of operations) through October 31, 2023. |
Basis for Opinions
These financial statements are the responsibility of the Funds’ management. Our responsibility is to express an opinion on the Funds’ financial statements based on our
484
Report of Independent Registered Public Accounting Firm (Concluded)
audits. We are a public accounting firm registered with the Public Company Accounting Oversight Board (United States) (PCAOB) and are required to be independent with respect to the Funds in accordance with the U.S. federal securities laws and the applicable rules and regulations of the Securities and Exchange Commission and the PCAOB.
We conducted our audits of these financial statements in accordance with the standards of the PCAOB. Those standards require that we plan and perform the audit to obtain reasonable assurance about whether the financial statements are free of material misstatement, whether due to error or fraud.
Our audits included performing procedures to assess the risks of material misstatement of the financial statements, whether due to error or fraud, and performing procedures that respond to those risks. Such procedures included examining, on a test basis, evidence regarding the amounts and disclosures in the financial statements. Our audits also included evaluating the accounting principles used and significant estimates made by management, as well as evaluating the overall presentation of the financial statements. Our procedures included confirmation of securities owned as of October 31, 2023, by correspondence with the custodians and brokers; when replies were not received from brokers, we performed other auditing procedures. We believe that our audits provide a reasonable basis for our opinions.
/s/PricewaterhouseCoopers LLP
Philadelphia, Pennsylvania
January 4, 2024
We have served as the auditor of one or more investment companies in Global X Funds since 2016.
485
Disclosure of Fund Expenses (Unaudited)
ETFs (such as the Funds) have operating expenses. As a shareholder of an ETF, your investment is affected by these ongoing costs, which include (among others) costs for ETF management, administrative services, brokerage fees, and shareholder reports like this one. It is important for you to understand the impact of these costs on your investment returns. In addition, a shareholder is responsible for brokerage fees as a result of the shareholder’s investment in a Fund.
Operating expenses such as these are deducted from a Fund’s gross income and directly reduce your final investment returns. These expenses are expressed as a percentage of the Fund’s average net assets; this percentage is known as the Fund’s expense ratio.
The following examples use the expense ratio and are intended to help you understand the ongoing costs (in dollars) of investing in a Fund and to compare these costs with those of other funds. The examples are based on an investment of $1,000 made at the beginning of the period shown and held for the entire period from (May 1, 2023 through October 31, 2023).
The table on the next page illustrates the Funds’ costs in two ways:
Actual Fund Return. This section helps you to estimate the actual expenses that your Fund incurred over the period. The “Expenses Paid During Period” column shows the actual dollar expense cost incurred by a $1,000 investment in the Fund, and the “Ending Account Value” number is derived from deducting that expense cost from the Fund’s gross investment return.
You can use this information, together with the actual amount you invested in a Fund, to estimate the expenses you paid over that period. Simply divide your actual account value by $1,000 to arrive at a ratio (for example, an $8,600 account value divided by $1,000 = 8.6), then multiply that ratio by the number shown for your Fund under “Expenses Paid During Period.”
Hypothetical 5% Return. This section helps you compare your Fund’s costs with those of other funds. It assumes that the Fund had an annual 5% return before expenses during the year, but that the expense ratio (Column 3) for the period is unchanged. This example is useful in making comparisons because the Securities and Exchange Commission requires all funds to make this 5% calculation. You can assess your Fund’s comparative cost by comparing the hypothetical result for your Fund in the “Expenses Paid During Period” column with those that appear in the same charts in the shareholder reports for other funds.
NOTE: Because the return is set at 5% for comparison purposes — NOT your Fund’s actual return — the account values shown may not apply to your specific investment.
486
Disclosure of Fund Expenses (Unaudited) (Continued)
| | | Beginning
Account Value
5/1/2023 | | Ending
Account
Value
10/31/2023 | | Annualized
Expense
Ratios | | Expenses
Paid During
Period(1) | |
| Global X Lithium & Battery Tech ETF | | | | | | | | | | | | |
| Actual Fund Return | | $ | 1,000.00 | | | | $789.20 | | | | 0.75 | % | | $ | 3.38 | |
| Hypothetical 5% Return | | | 1,000.00 | | | | 1,021.43 | | | | 0.75 | | | | 3.82 | |
| | | | | | | | | | | | | | | | | |
| Global X SuperDividend® ETF | | | | | | | | | | | | | | | | |
| Actual Fund Return | | $ | 1,000.00 | | | | $953.70 | | | | 0.58 | % | | $ | 2.86 | |
| Hypothetical 5% Return | | | 1,000.00 | | | | 1,022.28 | | | | 0.58 | | | | 2.96 | |
| | | | | | | | | | | | | | | | | |
| Global X Social Media ETF | | | | | | | | | | | | | | | | |
| Actual Fund Return | | $ | 1,000.00 | | | | $1,004.00 | | | | 0.65 | % | | $ | 3.28 | |
| Hypothetical 5% Return | | | 1,000.00 | | | | 1,021.93 | | | | 0.65 | | | | 3.31 | |
| | | | | | | | | | | | | | | | | |
| Global X Guru® Index ETF | | | | | | | | | | | | | | | | |
| Actual Fund Return | | $ | 1,000.00 | | | | $976.60 | | | | 0.75 | % | | $ | 3.74 | |
| Hypothetical 5% Return | | | 1,000.00 | | | | 1,021.43 | | | | 0.75 | | | | 3.82 | |
| | | | | �� | | | | | | | | | | | | |
| Global X SuperIncome™ Preferred ETF | | | | | | | | | | | | | | | | |
| Actual Fund Return | | $ | 1,000.00 | | | | $916.90 | | | | 0.48 | % | | $ | 2.32 | |
| Hypothetical 5% Return | | | 1,000.00 | | | | 1,022.79 | | | | 0.48 | | | | 2.45 | |
| | | | | | | | | | | | | | | | | |
| Global X SuperDividend® U.S. ETF | | | | | | | | | | | | | | | | |
| Actual Fund Return | | $ | 1,000.00 | | | | $935.80 | | | | 0.46 | % | | $ | 2.24 | |
| Hypothetical 5% Return | | | 1,000.00 | | | | 1,022.89 | | | | 0.46 | | | | 2.35 | |
| | | | | | | | | | | | | | | | | |
| Global X S&P 500® Covered Call ETF | | | | | | | | | | | | | | | | |
| Actual Fund Return | | $ | 1,000.00 | | | | $990.40 | | | | 0.60 | % | | $ | 3.01 | |
| Hypothetical 5% Return | | | 1,000.00 | | | | 1,022.18 | | | | 0.60 | | | | 3.06 | |
| | | | | | | | | | | | | | | | | |
| Global X NASDAQ 100® Covered Call ETF | | | | | | | | | | | | | | | | |
| Actual Fund Return | | $ | 1,000.00 | | | | $1,017.90 | | | | 0.60 | % | | $ | 3.05 | |
| Hypothetical 5% Return | | | 1,000.00 | | | | 1,022.18 | | | | 0.60 | | | | 3.06 | |
| | | | | | | | | | | | | | | | | |
| Global X MSCI SuperDividend® Emerging Markets ETF | | | | | | | | | | | | | | | |
| Actual Fund Return | | $ | 1,000.00 | | | | $986.20 | | | | 0.69 | % | | $ | 3.45 | |
| Hypothetical 5% Return | | | 1,000.00 | | | | 1,021.73 | | | | 0.69 | | | | 3.52 | |
| | | | | | | | | | | | | | | | | |
| Global X SuperDividend® REIT ETF | | | | | | | | | | | | | | | | |
| Actual Fund Return | | $ | 1,000.00 | | | | $896.60 | | | | 0.58 | % | | $ | 2.77 | |
| Hypothetical 5% Return | | | 1,000.00 | | | | 1,022.28 | | | | 0.58 | | | | 2.96 | |
487
Disclosure of Fund Expenses (Unaudited) (Continued)
| | | Beginning
Account Value
5/1/2023 | | Ending
Account
Value
10/31/2023 | | Annualized
Expense
Ratios | | Expenses
Paid During
Period(1) | |
| Global X Renewable Energy Producers ETF | | | | | | | | | | | | |
| Actual Fund Return | | $ | 1,000.00 | | | | $763.00 | | | | 0.66 | % | | $ | 2.93 | |
| Hypothetical 5% Return | | | 1,000.00 | | | | 1,021.88 | | | | 0.66 | | | | 3.36 | |
| | | | | | | | | | | | | | | | | |
| Global X S&P 500® Catholic Values ETF | | | | | | | | | | | | | | | | |
| Actual Fund Return | | $ | 1,000.00 | | | | $1,002.80 | | | | 0.29 | % | | $ | 1.46 | |
| Hypothetical 5% Return | | | 1,000.00 | | | | 1,023.74 | | | | 0.29 | | | | 1.48 | |
| | | | | | | | | | | | | | | | | |
| Global X MSCI SuperDividend® EAFE ETF | | | | | | | | | | | | | | | | |
| Actual Fund Return | | $ | 1,000.00 | | | | $926.90 | | | | 0.56 | % | | $ | 2.72 | |
| Hypothetical 5% Return | | | 1,000.00 | | | | 1,022.38 | | | | 0.56 | | | | 2.85 | |
| | | | | �� | | | | | | | | | | | | |
| Global X E-commerce ETF | | | | | | | | | | | | | | | | |
| Actual Fund Return | | $ | 1,000.00 | | | | $977.00 | | | | 0.50 | % | | $ | 2.49 | |
| Hypothetical 5% Return | | | 1,000.00 | | | | 1,022.69 | | | | 0.50 | | | | 2.55 | |
| | | | | | | | | | | | | | | | | |
| Global X Russell 2000 Covered Call ETF | | | | | | | | | | | | | | | | |
| Actual Fund Return | | $ | 1,000.00 | | | | $950.40 | | | | 0.56 | % | | $ | 2.75 | |
| Hypothetical 5% Return | | | 1,000.00 | | | | 1,022.38 | | | | 0.56 | | | | 2.85 | |
| | | | | | | | | | | | | | | | | |
| Global X S&P Catholic Values Developed ex-U.S. ETF | | | | | | | | | | | | | | | | |
| Actual Fund Return | | $ | 1,000.00 | | | | $921.50 | | | | 0.35 | % | | $ | 1.70 | |
| Hypothetical 5% Return | | | 1,000.00 | | | | 1,023.44 | | | | 0.35 | | | | 1.79 | |
| | | | | | | | | | | | | | | | | |
| Global X Nasdaq 100® Covered Call & Growth ETF | | | | | | | | | | | | | | | | |
| Actual Fund Return | | $ | 1,000.00 | | | | $1,054.70 | | | | 0.60 | % | | $ | 3.11 | |
| Hypothetical 5% Return | | | 1,000.00 | | | | 1,022.18 | | | | 0.60 | | | | 3.06 | |
| | | | | | | | | | | | | | | | | |
| Global X S&P 500® Covered Call & Growth ETF | | | | | | | | | | | | | | | | |
| Actual Fund Return | | $ | 1,000.00 | | | | $1,001.00 | | | | 0.60 | % | | $ | 3.03 | |
| Hypothetical 5% Return | | | 1,000.00 | | | | 1,022.18 | | | | 0.60 | | | | 3.06 | |
| | | | | | | | | | | | | | | | | |
| Global X Emerging Markets Internet & E-commerce ETF | | | | | | | | | | | | | | | |
| Actual Fund Return | | $ | 1,000.00 | | | | $943.50 | | | | 0.65 | % | | $ | 3.18 | |
| Hypothetical 5% Return | | | 1,000.00 | | | | 1,021.93 | | | | 0.65 | | | | 3.31 | |
| | | | | | | | | | | | | | | | | |
| Global X NASDAQ 100® Tail Risk ETF | | | | | | | | | | | | | | | | |
| Actual Fund Return | | $ | 1,000.00 | | | | $1,080.80 | | | | 0.46 | % | | $ | 2.41 | |
| Hypothetical 5% Return | | | 1,000.00 | | | | 1,022.89 | | | | 0.46 | | | | 2.35 | |
488
Disclosure of Fund Expenses (Unaudited) (Continued)
| | | Beginning
Account Value
5/1/2023 | | Ending
Account
Value
10/31/2023 | | Annualized
Expense
Ratios | | Expenses
Paid During
Period(1) | |
| Global X NASDAQ 100® Risk Managed Income ETF | | | | | | | | | | | | |
| Actual Fund Return | | $ | 1,000.00 | | | | $975.90 | | | | 0.61 | % | | $ | 3.04 | |
| Hypothetical 5% Return | | | 1,000.00 | | | | 1,022.13 | | | | 0.61 | | | | 3.11 | |
| | | | | | | | | | | | | | | | | |
| Global X NASDAQ 100® Collar 95-110 ETF | | | | | | | | | | | | | | | | |
| Actual Fund Return | | $ | 1,000.00 | | | | $1,001.30 | | | | 0.48 | % | | $ | 2.42 | |
| Hypothetical 5% Return | | | 1,000.00 | | | | 1,022.79 | | | | 0.48 | | | | 2.45 | |
| | | | | | | | | | | | | | | | | |
| Global X S&P 500® Tail Risk ETF | | | | | | | | | | | | | | | | |
| Actual Fund Return | | $ | 1,000.00 | | | | $1,008.70 | | | | 0.47 | % | | $ | 2.38 | |
| Hypothetical 5% Return | | | 1,000.00 | | | | 1,022.84 | | | | 0.47 | | | | 2.40 | |
| | | | | | | | | | | | | | | | | |
| Global X S&P 500® Risk Managed Income ETF | | | | | | | | | | | | | | | | |
| Actual Fund Return | | $ | 1,000.00 | | | | $969.20 | | | | 0.60 | % | | $ | 2.98 | |
| Hypothetical 5% Return | | | 1,000.00 | | | | 1,022.18 | | | | 0.60 | | | | 3.06 | |
| | | | | | | | | | | | | | | | | |
| Global X S&P 500® Collar 95-110 ETF | | | | | | | | | | | | | | | | |
| Actual Fund Return | | $ | 1,000.00 | | | | $990.10 | | | | 0.46 | % | | $ | 2.31 | |
| Hypothetical 5% Return | | | 1,000.00 | | | | 1,022.89 | | | | 0.46 | | | | 2.35 | |
| | | | | | | | | | | | | | | | | |
| Global X Disruptive Materials ETF | | | | | | | | | | | | | | | | |
| Actual Fund Return | | $ | 1,000.00 | | | | $753.20 | | | | 0.59 | % | | $ | 2.61 | |
| Hypothetical 5% Return | | | 1,000.00 | | | | 1,022.23 | | | | 0.59 | | | | 3.01 | |
| | | | | | | | | | | | | | | | | |
| Global X Dow 30® Covered Call ETF | | | | | | | | | | | | | | | | |
| Actual Fund Return | | $ | 1,000.00 | | | | $990.90 | | | | 0.60 | % | | $ | 3.01 | |
| Hypothetical 5% Return | | | 1,000.00 | | | | 1,022.18 | | | | 0.60 | | | | 3.06 | |
| | | | | | | | | | | | | | | | | |
| Global X Russell 2000 Covered Call & Growth ETF | | | | | | | | | | | | | | | | |
| Actual Fund Return | | $ | 1,000.00 | | | | $948.70 | | | | 0.50 | % | | $ | 2.46 | |
| Hypothetical 5% Return | | | 1,000.00 | | | | 1,022.69 | | | | 0.50 | | | | 2.55 | |
| | | | | | | | | | | | | | | | | |
| Global X Financials Covered Call & Growth ETF | | | | | | | | | | | | | | | | |
| Actual Fund Return | | $ | 1,000.00 | | | | $989.90 | | | | 0.55 | % | | $ | 2.76 | |
| Hypothetical 5% Return | | | 1,000.00 | | | | 1,022.43 | | | | 0.55 | | | | 2.80 | |
| | | | | | | | | | | | | | | | | |
| Global X Health Care Covered Call & Growth ETF | | | | | | | | | | | | | | | | |
| Actual Fund Return | | $ | 1,000.00 | | | | $966.90 | | | | 0.55 | % | | $ | 2.73 | |
| Hypothetical 5% Return | | | 1,000.00 | | | | 1,022.43 | | | | 0.55 | | | | 2.80 | |
489
Disclosure of Fund Expenses (Unaudited) (Concluded)
| | | Beginning
Account Value
5/1/2023 | | Ending
Account
Value
10/31/2023 | | Annualized
Expense
Ratios | | Expenses
Paid During
Period(1) | |
| Global X Information Technology Covered Call & Growth ETF | | | | | | | | | | |
| Actual Fund Return | | $ | 1,000.00 | | | | $1,061.70 | | | | 0.55 | % | | $ | 2.86 | |
| Hypothetical 5% Return | | | 1,000.00 | | | | 1,022.43 | | | | 0.55 | | | | 2.80 | |
| | | | | | | | | | | | | | | | | |
| Global X NASDAQ 100® ESG Covered Call ETF | | | | | | | | | | | | | | | | |
| Actual Fund Return | | $ | 1,000.00 | | | | $1,011.20 | | | | 0.61 | % | | $ | 3.09 | |
| Hypothetical 5% Return | | | 1,000.00 | | | | 1,022.13 | | | | 0.61 | | | | 3.11 | |
| | | | | | | | | | | | | | | | | |
| Global X S&P 500® ESG Covered Call ETF | | | | | | | | | | | | | | | | |
| Actual Fund Return | | $ | 1,000.00 | | | | $983.50 | | | | 0.60 | % | | $ | 3.00 | |
| Hypothetical 5% Return | | | 1,000.00 | | | | 1,022.18 | | | | 0.60 | | | | 3.06 | |
| | | | | | | | | | | | | | | | | |
| Global X Dow 30® Covered Call & Growth ETF(3) | | | | | | | | | | | | | | | | |
| Actual Fund Return | | $ | 1,000.00 | | | | $946.50 | | | | 0.60 | % | | $ | 1.57(2) | |
| Hypothetical 5% Return | | | 1,000.00 | | | | 1,011.81 | | | | 0.60 | | | | 1.62 | |
| (1) | Expenses are equal to the Fund’s annualized expense ratio multiplied by the average account value over the period, multiplied by 184/365 (to reflect the one-half year period). |
| (2) | Expenses are equal to the Fund’s annualized expense ratio multiplied by the average account value over the period, multiplied by 98/365 (to reflect the one-half year period). |
| (3) | Commenced operations on July 25, 2023. |
490
Liquidity Risk Management Program (unaudited)
Pursuant to Rule 22e-4 under the 1940 Act, the Funds’ investment adviser has adopted, and the Board has approved, a liquidity risk management program (the “Program”) to govern the Funds’ approach to managing liquidity risk. The Program is overseen by the Funds’ Liquidity Risk Management Committee (the “Committee”), and the Program’s principal objectives include assessing, managing and periodically reviewing each Fund’s liquidity risk, based on factors specific to the circumstances of the Funds.
At a meeting of the Board held on May 19, 2023, the Trustees received a report from the Committee addressing the operations of the Program and assessing its adequacy and effectiveness of implementation for the period from January 1, 2022 through December 31, 2022. The Committee’s report noted that the Committee had determined that the Program is reasonably designed to assess and manage each Fund’s Liquidity Risk and operated adequately and effectively to manage each Fund’s Liquidity Risk for the period covered by the report. The Committee’s report noted that during the period covered by the report, there were no liquidity events that impacted the Funds or their ability to timely meet redemptions without dilution to existing shareholders. The Committee’s report noted that one Fund, the Global X Nigeria Fund, was classified as an In-Kind Fund for purposes of Liquidity Reporting. The Committee’s report noted that no other material changes have been made to the Program since its implementation.
There can be no assurance that the Program will achieve its objectives in the future. Please refer to the prospectus for more information regarding a Fund’s exposure to liquidity risk and other principal risks to which an investment in the Funds may be subject.
491
Approval of Investment Advisory Agreement (Unaudited)
Section 15(c) of the Investment Company Act of 1940, as amended (“1940 Act”), requires that the board of trustees of an exchange-traded fund (“ETF”), including a majority of those trustees who are not “interested persons” of the ETF, as defined in the 1940 Act (“Independent Trustees”), consider on an initial basis and periodically thereafter (as required by the 1940 Act), at an in person meeting called for such purpose, the terms of each ETF’s investment advisory agreement and whether to approve entering into, or renewing, each agreement.
At a Board meeting of the Global X Funds (the “Trust”) held at the office of Global X Management Company LLC, the Trust’s investment adviser (“Global X Management”), on May 19, 2023 (the “New Fund Board Meeting”), the Board of Trustees (the “Board”) (including the Trust’s Independent Trustees, voting separately) considered and unanimously approved (i) the initial Investment Advisory Agreement (“New Investment Advisory Agreement”) for the Global X Dow 30® Covered Call & Growth ETF (“New Fund”) and (ii) the initial Supervision and Administration Agreement between the Trust (“New Supervision and Administration Agreement”), on behalf of the New Fund, and Global X Management. The New Investment Advisory Agreement and New Supervision and Administration Agreement are referred to collectively as the “New Fund Agreements.”
In advance of the Board meeting, the Board (including the Trust’s Independent Trustees) and the Independent Trustees’ independent legal counsel requested (in writing) detailed information from Global X Management in connection with the Board’s consideration of the New Fund Agreements and received and reviewed written responses from Global X Management and supporting materials relating to those requests for information. In the course of their consideration of the New Fund Agreements, the Trust’s Independent Trustees were advised by their independent legal counsel and, in addition to meetings with management of Global X Management, the Independent Trustees met separately in executive sessions with their counsel.
In determining to approve the New Fund Agreements for the New Fund, the Board considered a variety of factors, including the factors discussed in greater detail below.
Nature, Extent and Quality of Services
With respect to this factor, the Board considered:
| • | the terms of the New Fund Agreements and the range of services proposed to be provided to the New Funds in accordance with the New Fund Agreements; |
| | |
| • | Global X Management’s key personnel and the portfolio managers who would provide investment advisory, supervision and administrative services to the New Fund; |
| | |
| • | Global X Management’s responsibilities under the New Fund Agreements to, among other things, (i) manage the investment operations of the New Fund and the composition of the New Fund’s assets, including the purchase, retention and disposition of its holdings, (ii) provide quarterly reports to the Trust’s officers and the Board and |
492
Approval of Investment Advisory Agreement (Unaudited) (Continued)
other reports as the Board deems necessary or appropriate, (iii) vote proxies, exercise consents, and exercise all other rights appertaining to securities and assets held by the New Fund, (iv) select broker-dealers to execute portfolio transactions for the New Fund when necessary, (v) assist in the preparation and filing of reports and proxy statements (if any) to the shareholders of the New Fund, and the periodic updating of the registration statements, prospectuses, statements of additional information, and other reports and documents for the New Fund that are required to be filed by the Trust with the U.S. Securities and Exchange Commission (“SEC”) and other regulatory or governmental bodies, and (vi) monitor anticipated purchases and redemptions of the shares (including Creation Units) of the New Fund by shareholders and new investors;
| • | the nature, extent and quality of all of the services (including advisory, administrative and compliance services) that are proposed to be provided by Global X Management or made available to the New Fund; and |
| | |
| • | the quality of Global X Management’s resources and personnel that would be made available to the New Fund, including Global X Management’s experience and the professional qualifications of Global X Management’s key personnel. |
Based on these considerations, the Board concluded, at the New Fund Board Meeting, that it was satisfied with the nature, extent and quality of the services proposed to be provided to the New Fund by Global X Management.
Performance
The Board determined that, because the New Fund had not yet begun investment operations as of the date of the New Fund Board Meeting, meaningful data relating to the investment performance of the New Fund was not available and, therefore, could not be a factor in approving the New Fund Agreements.
Cost of Services and Profitability
With respect to this factor, the Board considered:
| • | Global X Management’s expected costs to provide investment management, supervision and administrative and related services to the New Fund; |
| | |
| • | the management fee (including the proposed investment advisory fee) (“Management Fee”) that was proposed to be borne by the New Fund under the New Fund Agreements for the various investment advisory, supervisory and administrative services that the New Fund requires under a unitary fee structure (including the types of fees and |
493
Approval of Investment Advisory Agreement (Unaudited) (Continued)
expenses that are not included within the unitary fee and would be borne by the New Fund); and
| • | the expected profitability to Global X Management, if any, from all of the services proposed to be provided to the New Fund by Global X Management and all aspects of the relationship between Global X Management and the New Fund. |
Based on these considerations, the Board concluded that the proposed Management Fee to be paid by the New Fund to Global X Management, in light of the nature, extent and quality of the services to be provided, was reasonable and in the best interests of the New Fund’s shareholders.
Comparison of Fees and Services
With respect to this factor, the Board considered:
| • | comparative information with respect to the proposed Management Fee to be paid to Global X Management by the New Fund. In connection with this consideration, Global X Management provided the Board with comparative expense data for the New Fund, including fees and expenses paid by unaffiliated similar specialized and/ or focused ETFs, and/or other similar registered funds; |
| | |
| • | the structure of the proposed unitary Management Fee (which includes as one component the proposed investment advisory fee for the New Fund) and the expected total expense ratio for the New Fund. In this regard, the Board took into consideration that the purpose of adopting a unitary Management Fee structure for the New Fund was to create a simple, all-inclusive fee that would provide a level of predictability with respect to the overall expense ratio (i.e., the total fees) of the New Fund and that the proposed Management Fee for the New Fund was set at a competitive level to make the New Fund viable in the marketplace; and |
| | |
| • | that, under the proposed unified Management Fee structure, Global X Management would be responsible for most ordinary expenses of the New Fund, including the costs of various third-party services required by the New Fund, including investment advisory, administrative, audit, certain custody, portfolio accounting, legal, transfer agency and printing costs, but that the New Fund would bear other expenses not covered under the proposed all-inclusive Management Fee, such as taxes, brokerage fees, commissions, and other transaction expenses, interest expenses, and extraordinary expenses. |
Based on these considerations, the Board concluded, at the New Fund Board Meeting, that the services to be received and the fees to be charged under the New Fund Agreements were reasonable on a comparative basis.
494
Approval of Investment Advisory Agreement (Unaudited) (Concluded)
Economies of Scale
With respect to this factor, the Board considered:
| • | the extent to which economies of scale would be realized as the New Fund grows and whether the proposed unitary Management Fee for the New Fund reflected these economies of scale; |
| | |
| • | the significant investment of time, personnel and other resources that Global X Management intends to make in the New Fund in order to seek to assure that the New Fund is attractive to investors; and |
| | |
| • | that the proposed unitary Management Fee would provide a high level of certainty as to the total level of expenses for the New Fund and its shareholders. |
Based on these considerations, the Board concluded, at the New Fund Board Meeting, that the proposed unitary Management Fee for the New Fund appropriately addressed economies of scale.
Other Benefits
In considering the New Fund Agreements, in addition to the factors discussed above, the Board considered other benefits that may be realized by Global X Management as a result of its relationships with the New Fund. As a result, the Board concluded that, in the case of the New Fund, in the exercise of the Board’s business judgement, all information the Board considered supported approval of the New Fund Agreements.
Conclusion
After full consideration of the factors above, as well as other factors that were instructive in their consideration, the Board, including all of the Trust’s Independent Trustees voting separately, concluded, in the exercise of its business judgement, that the New Fund Agreements were fair and reasonable and in the best interest of the New Fund.
In reaching this decision, the Board did not assign relative weights to the factors above nor did the Board deem any one factor or group of them to be controlling in and of themselves. Each member of the Board may have assigned different weights to the various factors.
495
Supplemental Information (unaudited)
NAV is the price per Share at which the Funds issue and redeem Shares. It is calculated in accordance with the standard formula for valuing mutual fund shares. The “Market Price” of a Fund generally is determined using the midpoint between the highest bid and the lowest offer on the stock exchange on which the Shares of the Fund are listed for trading, as of the time that the Fund’s NAV is calculated. A Fund’s Market Price may be at, above or below its NAV. The NAV of a Fund will fluctuate with changes in the market value of the Fund’s holdings. The Market Price of a Fund will fluctuate in accordance with changes in its NAV, as well as market supply and demand.
Premiums or discounts are the differences (expressed as a percentage) between the NAV and Market Price of a Fund on a given day, generally at the time NAV is calculated. A premium is the amount that a Fund is trading above the reported NAV, expressed as a percentage of the NAV. A discount is the amount that a Fund is trading below the reported NAV, expressed as a percentage of the NAV.
Further information regarding premiums and discounts is available on the Funds’ website at www.globalxetfs.com.
496
Trustees and Officers of the Trustees (unaudited)
The Trustees and officers are identified in the table below, which provides information as to their principal business occupations held during the last five years and certain other information. Each Trustee serves until his or her death, resignation or removal and replacement. The Trust’s Statement of Additional Information (“SAI”) includes additional information about the Trustees and officers. The SAI may be obtained without charge by calling 1-888-493-8631. The address for all Trustees and officers is c/o Global X Funds®, 605 3rd Avenue, 43rd Floor, New York, New York 10158. The following chart lists Trustees and Officers as of December 15, 2023.
Name
(Year of Birth) | Position(s)
Held
with Trust | Principal Occupation(s) During the Past
5 Years | Number of
Funds in Trust
Overseen by
Trustee4 | Other Directorships
Held by Trustees |
| Independent Trustees1, 2 |
Charles A. Baker
(1953) | Trustee (since 07/2018) | Chief Executive Officer of Investment Innovations LLC (investment consulting) (since 2013); Managing Director of NYSE Euronext (2003 to 2012). | 113 funds (108 of which were operational) | Trustee of OSI ETF Trust (2016-2022). |
Susan M. Ciccarone
(1973) | Trustee (since 09/2019) | Partner, Further Global Capital Management (private equity) (since 2017); formerly Chief Operating Officer (2014-2016) and Chief Financial Officer (2012-2016), Emerging Global Advisors, LLC (ETF issuer). | 113 funds (108 of which were operational) | Director of E78 Partners (since 2022); Director of ProSight Global, Inc. (since 2021); Director of Casa Holdco LP, parent of Celink (since 2018); Chairman, Payment Alliance International, Inc. (2019-2021). |
Clifford J. Weber
(1963) | Trustee (since 07/2018) | Owner, Financial Products Consulting Group LLC (consulting services to financial institutions) (since 2015); Formerly, Executive Vice President of Global Index and Exchange-Traded Products, NYSE Market, Inc., a subsidiary of Intercontinental Exchange (ETF/ETP listing exchange) (2013- 2015). | 113 funds (108 of which were operational) | Chairman and Trustee of Clayton Street Trust (since 2016); Chairman and Trustee of Janus Detroit Street Trust (since 2016); Trustee of Clough Global Equity Fund (since 2017); Trustee of Clough Global Dividend and Income Fund (since 2017); Trustee of Clough Global Opportunities Fund (since 2017); Chairman (2017-2023) and Trustee (2015- 2023) of Clough Funds Trust; and Chairman and Trustee of Elevation ETF Trust (2016-2018). |
497
Trustees and Officers of the Trustees (unaudited)
Name
(Year of Birth) | Position(s)
Held
with Trust | Principal Occupation(s) During the Past
5 Years | Number of Funds in
Trust Overseen by
Trustee | Other Directorships
Held by Trustees |
| Interested Trustee/Officers1, 2 |
Thomas Park
(1978) | President (since 11/2023) | Chief Executive Officer, GXMC (since 11/2023); Co-Chief Executive Officer Mirae Asset Global Investments (USA) (since 12/2022); President of Mirae Asset Global Investments (USA) (1/2020- 12/2022); and Executive Managing Director of Mirae Asset Global Investments (USA) (2011- 2022). | N/A | N/A |
Alex Ashby
(1986) | Chief Operating Officer (since 11/2023) | Head of Product Development, GXMC (since 2019); Vice President, Director of Product Development (2015 - 2018). | N/A | N/A |
Susan Lively
(1981) | Secretary (since 09/2020) | General Counsel, GXMC (since 9/2020); Senior Corporate Counsel at Franklin Templeton (previously, Managing Director and Associate General Counsel at Legg Mason & Co., LLC) (2014-2020). | N/A | N/A |
Eric Griffith3
(1969) | Assistant Secretary (since 02/2020) | Counsel, SEI Investments (since 10/2019); Vice President and Assistant General Counsel, JPMorgan Chase & Co. (2012-2018). | N/A | N/A |
Joe Costello
(1974) | Chief Compliance Officer (since 09/2016) | Chief Compliance Officer, GXMC (since 09/2016). | N/A | N/A |
Ronnie Riven
(1984) | Chief Financial Officer (since 11/2023); Treasurer and Principal Accounting Officer (since 12/2020) | Head of Finance & Business Management, GXMC (since 01/2022); Treasurer, GXMC (since 02/2022); Director of Finance, GXMC (08/2018- 12/2021); Director of Accounting and Finance at Barclays Center (2016-2018). | N/A | N/A |
Eric Olsen3
(1970) | Assistant Treasurer (since 05/2021) | Director of Accounting, SEI Investment Manager Services (March 2021 to present); Deputy Head of Fund Operations, Traditional Assets, Aberdeen Standard Investments (2013-2021). | N/A | N/A |
| 1 | Each Trustee serves until his or her successor is duly elected or appointed and qualified. |
| 2 | Luis Berruga served as an Interested Trustee of the Trust until December 15, 2023, and as President of the Trust until November 21, 2023. John Belanger served as Chief Operating Officer of the Trust and as Chief Financial Officer of the Trust until November 28, 2023. |
| 3 | These officers of the Trust also serve as officers of one or more funds for which SEI Investments Company or an affiliate acts as investment manager, administrator or distributor. |
| 4 | As of October 31, 2023. |
498
Notice to Shareholders (unaudited)
For shareholders that do not have an October 31, 2023 tax year end, this notice is for informational purposes only. For shareholders with an October 31, 2023 tax year end, please consult your tax advisor as to the pertinence of this notice.
| | | Return of Capital | | Long-Term
Capital Gain
Distributions | | Ordinary Income
Distributions | | Total
Distributions | | Qualifying
for Corporate
Dividends
Received
Deduction(1) | | Qualifying
Dividend
Income(2) |
| Global X Lithium and Battery Tech ETF | | | | | | | | | | | | |
| | | 0.00 | | 0.00% | | 100.00% | | 100.00% | | 28.94% | | 84.22% |
| Global X SuperDividend® ETF | | | | | | | | | | | | |
| | | 24.12% | | 0.00% | | 75.88% | | 100.00% | | 0.00% | | 33.89% |
| Global X Social Media ETF | | | | | | | | | | | | |
| | | 0.00% | | 0.00% | | 100.00% | | 100.00% | | 0.00% | | 29.34% |
| Global X Guru® Index ETF | | | | | | | | | | | | |
| | | 9.50% | | 0.00% | | 90.50% | | 100.00% | | 100.00% | | 100.00% |
| Global X SuperIncome™ Preferred ETF | | | | | | | | | | | | |
| | | 0.00% | | 0.00% | | 100.00% | | 100.00% | | 72.44% | | 72.44% |
| Global X SuperDividend® U.S. ETF | | | | | | | | | | | | |
| | | 36.82% | | 0.00% | | 63.18% | | 100.00% | | 66.33% | | 66.16% |
| Global X S&P 500® Covered Call ETF | | | | | | | | | | | | |
| | | 90.58% | | 0.00% | | 9.42% | | 100.00% | | 0.00% | | 0.00% |
| Global X NASDAQ 100® Covered Call ETF | | | | | | | | | | | | |
| | | 97.51% | | 0.00% | | 2.49% | | 100.00% | | 0.00% | | 0.00% |
| Global X MSCI SuperDividend® Emerging Markets ETF | | | | | | | | | | | | |
| | | 0.00% | | 0.00% | | 100.00% | | 100.00% | | 0.00% | | 54.45% |
| Global X SuperDividend® REIT ETF | | | | | | | | | | | | |
| | | 38.66% | | 0.00% | | 61.34% | | 100.00% | | 0.00% | | 9.33% |
| Global X Renewable Energy Producers ETF | | | | | | | | | | | | |
| | | 0.00% | | 0.00% | | 100.00% | | 100.00% | | 15.69% | | 100.00% |
| Global X S&P 500® Catholic Values ETF | | | | | | | | | | | | |
| | | 0.00% | | 0.00% | | 100.00% | | 100.00% | | 85.44% | | 87.84% |
| Global X MSCI SuperDividend® EAFE ETF | | | | | | | | | | | | |
| | | 0.00% | | 0.00% | | 100.00% | | 100.00% | | 0.00% | | 76.96% |
| Global X E-commerce ETF | | | | | | | | | | | | |
| | | 100.00% | | 0.00% | | 0.00% | | 100.00% | | 0.00% | | 0.00% |
| Global X Russell 2000 Covered Call ETF | | | | | | | | | | | | |
| | | 91.55% | | 0.00% | | 8.45% | | 100.00% | | 0.00% | | 0.00% |
| Global X S&P Catholic Values Developed ex-U.S. ETF | | | | | | | | | | | | |
| | | 0.00% | | 0.00% | | 100.00% | | 100.00% | | 0.00% | | 94.17% |
| Global X Nasdaq 100® Covered Call & Growth ETF | | | | | | | | | | | | |
| | | 95.66% | | 0.00% | | 4.34% | | 100.00% | | 0.00% | | 0.00% |
| Global X S&P 500® Covered Call & Growth ETF | | | | | | | | | | | | |
| | | 81.26% | | 0.00% | | 18.74% | | 100.00% | | 0.00% | | 0.00% |
| Global X Emerging Markets Internet & E-commerce ETF | | | | | | | | | | | | |
| | | 29.04% | | 0.00% | | 70.96% | | 100.00% | | 0.01% | | 58.99% |
| Global X NASDAQ 100® Tail Risk ETF | | | | | | | | | | | | |
| | | 0.00% | | 0.00% | | 100.00% | | 100.00% | | 0.00% | | 0.00% |
| Global X NASDAQ 100® Risk Managed Income ETF | | | | | | | | | | | | |
| | | 97.55% | | 0.00% | | 2.45% | | 100.00% | | 0.00% | | 0.00% |
| Global X NASDAQ 100® Collar 95-110 ETF | | | | | | | | | | | | |
| | | 0.00% | | 0.00% | | 100.00% | | 100.00% | | 0.00% | | 0.00% |
| Global X S&P 500® Tail Risk ETF | | | | | | | | | | | | |
| | | 0.00% | | 0.00% | | 100.00% | | 100.00% | | 0.00% | | 0.00% |
| Global X S&P 500® Risk Managed Income ETF | | | | | | | | | | | | |
| | | 91.40% | | 0.00% | | 8.60% | | 100.00% | | 0.00% | | 0.00% |
| Global X S&P 500® Collar 95-110 ETF | | | | | | | | | | | | |
| | | 0.00% | | 0.00% | | 100.00% | | 100.00% | | 0.00% | | 0.00% |
| Global X Disruptive Materials ETF | | | | | | | | | | | | |
| | | 0.00% | | 0.00% | | 100.00% | | 100.00% | | 9.33% | | 63.52% |
| Global X Dow 30® Covered Call ETF | | | | | | | | | | | | |
| | | 81.80% | | 0.00% | | 18.20% | | 100.00% | | 0.00% | | 0.00% |
| Global X Russell 2000 Covered Call & Growth ETF | | | | | | | | | | | | |
| | | 56.74% | | 1.90% | | 41.36% | | 100.00% | | 0.00% | | 0.00% |
| Global X Financials Covered Call & Growth ETF | | | | | | | | | | | | |
| | | 33.25% | | 0.00% | | 66.75% | | 100.00% | | 0.00% | | 0.00% |
| Global X Health Care Covered Call & Growth ETF | | | | | | | | | | | | |
| | | 0.00% | | 0.00% | | 100.00% | | 100.00% | | 0.00% | | 0.00% |
| Global X Information Technology Covered Call & Growth ETF | | | | | | | | | | | | |
| | | 0.00% | | 0.00% | | 100.00% | | 100.00% | | 0.00% | | 0.00% |
| Global X Nasdaq 100® ESG Covered Call ETF | | | | | | | | | | | | |
| | | 0.00% | | 0.00% | | 100.00% | | 100.00% | | 0.00% | | 0.00% |
| Global X S&P 500® ESG Covered Call ETF | | | | | | | | | | | | |
| | | 65.75% | | 0.00% | | 34.25% | | 100.00% | | 0.00% | | 0.00% |
| Global X Dow 30® Covered Call & Growth ETF | | | | | | | | | | | | |
| | | 59.11% | | 0.00% | | 40.89% | | 100.00% | | 0.00% | | 0.00% |
499
Notice to Shareholders (unaudited)
For the fiscal year ended October 31, 2023, the Funds have designated the following items with regard to distributions paid during the year.
| | | U.S. Government
Interest(3) | | Interest Related
Dividends(4) | | Short Term
Capital Gain
Dividends(5) | | Qualifying
Business
Income(6) | | Foreign Tax
Credit |
| Global X Lithium and Battery Tech ETF | | | | | | | | | | |
| | | 0.00% | | 0.21% | | 0.00% | | 0.00% | | 3.13% |
| Global X SuperDividend® ETF | | | | | | | | | | |
| | | 0.00% | | 0.06% | | 0.00% | | 0.00% | | 2.74% |
| Global X Social Media ETF | | | | | | | | | | |
| | | 0.00% | | 0.41% | | 0.00% | | 0.00% | | 0.00% |
| Global X Guru® Index ETF | | | | | | | | | | |
| | | 0.00% | | 1.14% | | 0.00% | | 0.00% | | 0.00% |
| Global X SuperIncome™ Preferred ETF | | | | | | | | | | |
| | | 0.00% | | 1.17% | | 0.00% | | 0.00% | | 0.00% |
| Global X SuperDividend® U.S. ETF | | | | | | | | | | |
| | | 0.00% | | 0.42% | | 0.00% | | 0.00% | | 0.00% |
| Global X S&P 500® Covered Call ETF | | | | | | | | | | |
| | | 0.00% | | 0.75% | | 0.00% | | 0.00% | | 0.00% |
| Global X NASDAQ 100® Covered Call ETF | | | | | | | | | | |
| | | 0.00% | | 1.65% | | 0.00% | | 0.07% | | 0.00% |
| Global X MSCI SuperDividend® Emerging Markets ETF | | | | | | | | |
| | | 0.00% | | 0.10% | | 0.00% | | 0.00% | | 14.58% |
| Global X SuperDividend® REIT ETF | | | | | | | | | | |
| | | 0.00% | | 0.01% | | 0.00% | | 59.53% | | 0.00% |
| Global X Renewable Energy Producers ETF | | | | | | | | | | |
| | | 0.00% | | 0.12% | | 0.00% | | 0.00% | | 17.75% |
| Global X S&P 500® Catholic Values ETF | | | | | | | | | | |
| | | 0.00% | | 0.19% | | 0.00% | | 0.00% | | 0.00% |
| Global X MSCI SuperDividend® EAFE ETF | | | | | | | | | | |
| | | 0.00% | | 0.03% | | 0.00% | | 0.00% | | 8.32% |
| Global X E-commerce ETF | | | | | | | | | | |
| | | 0.00% | | 0.00% | | 0.00% | | 0.00% | | 0.00% |
| Global X Russell 2000 Covered Call ETF | | | | | | | | | | |
| | | 0.00% | | 0.72% | | 0.00% | | 0.00% | | 0.00% |
| Global X S&P Catholic Values Developed ex-U.S. ETF | | | | | | | | |
| | | 0.00% | | 0.04% | | 0.00% | | 0.00% | | 10.95% |
| Global X Nasdaq 100® Covered Call & Growth ETF | | | | | | | | | | |
| | | 0.00% | | 0.91% | | 0.00% | | 6.29% | | 0.00% |
| Global X S&P 500® Covered Call & Growth ETF | | | | | | | | | | |
| | | 0.00% | | 0.32% | | 0.00% | | 0.00% | | 0.00% |
| Global X Emerging Markets Internet & E-commerce ETF | | | | | | | | |
| | | 0.15% | | 0.44% | | 0.00% | | 0.00% | | 0.00% |
| Global X NASDAQ 100® Tail Risk ETF | | | | | | | | | | |
| | | 0.00% | | 0.16% | | 0.00% | | 0.00% | | 0.00% |
| Global X NASDAQ 100® Risk Managed Income ETF | | | | | | | | | | |
| | | 0.00% | | 0.93% | | 0.00% | | 0.00% | | 0.00% |
| Global X NASDAQ 100® Collar 95-110 ETF | | | | | | | | | | |
| | | 0.00% | | 0.19% | | 0.00% | | 100.00% | | 0.00% |
| Global X S&P 500® Tail Risk ETF | | | | | | | | | | |
| | | 0.00% | | 0.06% | | 0.00% | | 0.00% | | 0.00% |
| Global X S&P 500® Risk Managed Income ETF | | | | | | | | | | |
| | | 0.00% | | 0.53% | | 0.00% | | 0.00% | | 0.00% |
| Global X S&P 500® Collar 95-110 ETF | | | | | | | | | | |
| | | 0.00% | | 0.12% | | 0.00% | | 0.00% | | 0.00% |
| Global X Disruptive Materials ETF | | | | | | | | | | |
| | | 0.00% | | 0.07% | | 0.00% | | 0.00% | | 12.32% |
| Global X Dow 30® Covered Call ETF | | | | | | | | | | |
| | | 0.00% | | 0.00% | | 0.00% | | 0.00% | | 0.00% |
| Global X Russell 2000 Covered Call & Growth ETF | | | | | | | | | | |
| | | 0.00% | | 0.30% | | 100.00% | | 0.00% | | 0.00% |
| Global X Financials Covered Call & Growth ETF | | | | | | | | | | |
| | | 0.00% | | 0.01% | | 100.00% | | 0.00% | | 0.00% |
| Global X Health Care Covered Call & Growth ETF | | | | | | | | | | |
| | | 0.00% | | 0.01% | | 100.00% | | 0.00% | | 0.00% |
| Global X Information Technology Covered Call & Growth ETF | | | | | | | | |
| | | 0.00% | | 0.00% | | 100.00% | | 0.00% | | 0.00% |
| Global X Nasdaq 100® ESG Covered Call ETF | | | | | | | | | | |
| | | 0.00% | | 0.11% | | 100.00% | | 0.00% | | 0.00% |
| Global X S&P 500® ESG Covered Call ETF | | | | | | | | |
| | | 0.00% | | 0.35% | | 100.00% | | 0.00% | | 0.00% |
| Global X Dow 30® Covered Call & Growth ETF | | | | | | | | | | |
| | | 0.00% | | 0.30% | | 0.00% | | 0.00% | | 0.00% |
500
Notice to Shareholders (unaudited)
(1) Qualifying dividends represent dividends which qualify for the corporate dividends received deduction and is reflected as a percentage of ordinary income distributions (the total of short term capital gain and net investment income distributions).
(2) The percentage in this column represents the amount of “Qualifying Dividend Income” as created by the Jobs and Growth Relief Reconciliation Act of 2003 and its reflected as a percentage of ordinary income distributions (the total of short term capital gain and net investment income distributions). It is the intention of each of the aforementioned Funds to designate the maximum amount permitted by law.
(3) “U.S. Government Interest” represents the amount of interest that was derived from U.S. Government obligations and distributed during the fiscal year. Generally, interest from direct U.S. Government obligations is exempt from state income tax. However, for shareholders who are residents of California, Connecticut and New York, the statutory threshold requirements were not satisfied to permit exemption of these amounts from state income.
(4) The percentage in this column represents the amount of “Interest Related Dividends” as created by the American Jobs Creation Act of 2004 and is a percentage of net investment income that is exempt from U.S. withholding tax when paid for foreign investors.
(5) The percentage of this column represents the amount of “Short Term Capital Gain Dividend” and is reflected as a percentage of short term capital gain distribution that is exempted from U.S. withholding tax when paid to foreign investors.
(6) The percentage of this column represents that amount of ordinary dividend income that qualified for 20% Business Income Deduction.
Certain Funds intend to pass through a foreign tax credit to shareholders. For the fiscal year ended October 31, 2023 the total amount of foreign source income and foreign tax credit are as follows:
| Fund Name | | Foreign Source
Income | | | Foreign Tax Credit
Pass Through | |
| Global X Lithium and Battery Tech ETF | | $ | 24,051,507 | | | $ | 1,259,703 | |
| Global X Superdividend® ETF | | | 36,187,303 | | | | 2,516,242 | |
| Global X MSCI SuperDividend® Emerging Markets ETF | | | 3,371,621 | | | | 566,496 | |
| Global X Renewable Energy Producers ETF | | | 1,203,815 | | | | 181,136 | |
| Global X MSCI SuperDividend® EAFE ETF | | | 715,237 | | | | 66,767 | |
| Global X S&P Catholic Values Developed ex-U.S. ETF | | | 377,438 | | | | 31,144 | |
| Global X Disruptive Materials ETF | | | 99,377 | | | | 10,944 | |
The information reported herein may differ from the information and distributions taxable to the shareholders for the calendar year ending December 31, 2023. Complete information will be computed and reported in conjunction with your 2023 Form 1099-DIV.
501
Notes
502
605 3rd Avenue, 43rd Floor
New York, NY 10158
1-888-493-8631
www.globalxetfs.com
Investment Adviser and Administrator:
Global X Management Company LLC
605 3rd Avenue, 43rd Floor
New York, NY 10158
Distributor:
SEI Investments Distribution Co.
One Freedom Valley Drive
Oaks, PA 19456
Sub-Administrator:
SEI Investments Global Funds Services
One Freedom Valley Drive
Oaks, PA 19456
Counsel for Global X Funds and the Independent Trustees:
Stradley Ronon Stevens & Young, LLP
2000 K Street, N.W.
Suite 700
Washington, DC 20006
Custodians and Transfer Agents:
Brown Brothers Harriman & Co.
40 Water Street
Boston, MA 02109
The Bank of New York Mellon
240 Greenwich Street
New York, NY 10286
Independent Registered Public Accounting Firm:
PricewaterhouseCoopers LLP
Two Commerce Square
Suite 1800
2001 Market Street
Philadelphia, PA 19103
This information must be preceded or accompanied by a current prospectus for the Funds described.
GLX-AR-003-1300
(b) Not applicable.
Item 2. Code of Ethics.
The registrant has adopted a code of ethics that applies to the registrant’s principal executive officer, principal financial officer, controller or principal accounting officer, and any person who performs a similar function.
Item 3. Audit Committee Financial Expert.
(a)(1) The registrant’s board of trustees has determined that the registrant has at least one audit committee financial expert serving on the audit committee.
(a)(2) The audit committee financial experts are Charles A. Baker and Susan M. Ciccarone and each is independent as defined in Form N-CSR Item 3(a)(2).
Item 4. Principal Accountant Fees and Services.
Fees billed by Pricewaterhouse Coopers LLP (“PwC”) relate to the registrant.
PWC billed the registrant aggregate fees for services rendered to the registrant for the last two fiscal years as follows:
| | 2023 | 2022 |
| | | All fees and
services to
the Trust
that were
pre-
approved | All fees and
services to
service
affiliates
that were
pre-
approved | All other
fees and
services to
service
affiliates
that did not
require pre-
approval | All fees and
services to
the Trust
that were
pre-
approved | All fees and
services to
service
affiliates
that were
pre-
approved | All other
fees and
services to
service
affiliates
that did not
require pre-
approval |
| (a) | Audit Fees | $1,235,693 | $0 | $0 | $1,148,958 | $0 | $0 |
| (b) | Audit-Related Fees | $0 | $0 | $0 | $0 | $0 | $0 |
| (c) | Tax Fees(1) | $392,972 | $0 | $0 | $406,447 | $0 | $0 |
| (d) | All Other Fees | $0 | $0 | $0 | $0 | $0 | $0 |
Notes:
| (1) | Tax Compliance and excise distribution services. |
(e)(2) Percentage of fees billed applicable to non-audit services pursuant to waiver of pre-approval requirement were as follows (PwC):
| | 2023 | 2022 |
| Audit-Related Fees | 0% | 0% |
| Tax Fees | 0% | 0% |
| All Other Fees | 0% | 0% |
(f) Not applicable.
(g) The aggregate non-audit fees and services billed by PwC for the last two fiscal years were $392,972 and $406,447, respectively.
(h) During the past fiscal year, all non-audit services provided by registrant’s principal accountant to either registrant’s investment adviser or to any entity controlling, controlled by, or under common control with registrant’s investment adviser that provides ongoing services to registrant were pre-approved by the audit committee of registrant’s Board of Trustees. Included in the audit committee’s pre-approval was the review and consideration as to whether the provision of these non-audit services is compatible with maintaining the principal accountant’s independence.
(i) Not applicable.
(j) Not applicable.
Item 5. Audit Committee of Listed Registrants.
The registrant has a separately-designated standing Audit Committee, which is composed of the registrant’s Independent Trustees, Charles A. Baker, Susan M. Ciccarone and Clifford J. Weber.
Item 6. Investments.
Schedule of Investments is included as part of the report to shareholders filed under Item 1 of this form.
Item 7. Disclosure of Proxy Voting Policies and Procedures for Closed-End Management Investment Companies.
Not applicable to open-end management investment companies.
Item 8. Portfolio Managers of Closed-End Management Investment Companies.
Not applicable to open-end management investment companies.
Item 9. Purchases of Equity Securities by Closed-End Management Investment Company and Affiliated Purchasers.
Not applicable to open-end management investment companies.
Item 10. Submission of Matters to a Vote of Security Holders.
There have been no material changes to the procedures by which shareholders may recommend nominees to the registrant’s board of directors.
Item 11. Controls and Procedures.
(a) The certifying officers, whose certifications are included herewith, have evaluated the registrant’s disclosure controls and procedures within 90 days of the filing date of this report. In their opinion, based on their evaluation, the registrant’s disclosure controls and procedures are adequately designed, and are operating effectively to ensure, that information required to be disclosed by the registrant in the reports it files or submits under the Securities Exchange Act of 1934 is recorded, processed, summarized and reported within the time periods specified in the Securities and Exchange Commission’s rules and forms.
(b) There were no significant changes in the registrant’s internal control over financial reporting that occurred during the period covered by this report that has materially affected, or is reasonably likely to materially affect, the registrant’s internal control over financial reporting.
Item 12. Disclosure of Securities Lending Activities for Closed-End Management Investment Companies.
Not applicable to open-end management investment companies.
Item 13. Exhibits.
(a)(1) Code of Ethics attached hereto.
(a)(2) A separate certification for the principal executive officer and the principal financial officer of the registrant as required by Rule 30a-2(a) under the Investment Company Act of 1940, as amended (17 CFR 270.30a-2(a)), are filed herewith.
(b) Officer certifications as required by Rule 30a-2(b) under the Investment Company Act of 1940, as amended (17 CFR 270.30a-2(b)) also accompany this filing as an Exhibit.
SIGNATURES
Pursuant to the requirements of the Securities Exchange Act of 1934 and the Investment Company Act of 1940, the registrant has duly caused this report to be signed on its behalf by the undersigned, thereunto duly authorized.
| (Registrant) | Global X Funds |
| | |
| By (Signature and Title) | /s/ Thomas Park |
| | Thomas Park
President |
Date: January 9, 2024
Pursuant to the requirements of the Securities Exchange Act of 1934 and the Investment Company Act of 1940, this report has been signed below by the following persons on behalf of the registrant and in the capacities and on the dates indicated.
| By (Signature and Title) | /s/ Thomas Park |
| | Thomas Park
President |
| | |
Date: January 9, 2024
| By (Signature and Title) | /s/ Ronnie Riven |
| | Ronnie Riven
Chief Financial Officer |
Date: January 9, 2024