UNITED STATES
SECURITIES AND EXCHANGE COMMISSION
Washington, D.C. 20549
FORM N-CSR
CERTIFIED SHAREHOLDER REPORT OF REGISTERED MANAGEMENT
INVESTMENT COMPANIES
Investment Company Act file number 811-22209
Global X Funds
(Exact name of registrant as specified in charter)
605 Third Avenue, 43rd floor
New York, NY 10158
(Address of principal executive offices) (Zip code)
Thomas Park
Global X Management Company LLC
605 Third Avenue, 43rd floor
New York, NY 10158
(Name and address of agent for service)
With a copy to:
Global X Management Company LLC
605 Third Avenue, 43rd floor
New York, NY 10158 | Eric S. Purple, Esq.
Stradley Ronon Stevens & Young, LLP
2000 K Street, N.W., Suite 700
Washington, DC 20006-1871 |
Registrant’s telephone number, including area code: (212) 644-6440
Date of fiscal year end: October 31, 2023
Date of reporting period: October 31, 2023
Item 1. Reports to Stockholders.
(a) A copy of the report transmitted to stockholders pursuant to Rule 30e-1 under the Investment Company Act of 1940, as amended (the “Act”) (17 CFR § 270.30e-1), is attached hereto.

Global X Silver Miners ETF (ticker: SIL)
Global X Copper Miners ETF (ticker: COPX)
Global X Gold Explorers ETF (ticker: GOEX)
Global X Uranium ETF (ticker: URA)
Annual Report
October 31, 2023
As permitted by regulations adopted by the Securities and Exchange Commission, paper copies of the Funds’ (defined below) shareholder reports will no longer be sent by mail, unless you specifically request paper copies of the reports from your financial intermediary (such as a broker-dealer or bank). Instead, shareholder reports will be available on the Funds’ website (www. globalxetfs.com/explore), and you will be notified by mail each time a report is posted and provided with a website link to access the report.
If you already elected to receive shareholder reports electronically, you will not be affected by this change and you need not take any action. You may elect to receive shareholder reports and other communications from the Funds electronically anytime by contacting your financial intermediary.
You may elect to receive all future Fund shareholder reports in paper free of charge. Please contact your financial intermediary to inform them that you wish to continue receiving paper copies of Fund shareholder reports and for details about whether your election to receive reports in paper will apply to all funds held with your financial intermediary.

Table of Contents
Shares are bought and sold at market price (not net asset value (“NAV”)) and are not individually redeemed from a Fund. Shares may only be redeemed directly from a Fund by Authorized Participants, in very large creation/ redemption units. Brokerage commissions will reduce returns.
The Funds file their complete schedules of Fund holdings with the Securities and Exchange Commission (the “SEC” or “Commission”) for the first and third quarters of each fiscal year as an exhibit to their reports on Form N-PORT. The Funds’ Form N-PORT is available on the Commission’s website at https://www.sec.gov, and may be reviewed and copied at the Commission’s Public Reference Room in Washington, DC. Information on the operation of the Public Reference Room may be obtained by calling 1-800-SEC-0330.
A description of the policies and procedures that Global X Funds uses to determine how to vote proxies relating to Fund securities, as well as information relating to how the Funds voted proxies relating to Fund securities during the most recent 12-month period ended June 30, is available (i) without charge, upon request, by calling 1-888-493-8631; and (ii) on the Commission’s website at https://www.sec.gov.
Management Discussion of Fund Performance (unaudited)
Global X Silver Miners ETF
Global X Silver Miners ETF
The Global X Silver Miners ETF (the “Fund”) seeks to provide investment results that correspond generally to the price and yield performance, before fees and expenses, of the Solactive Global Silver Miners Total Return Index (the “Underlying Index”). The Fund is passively managed, which means the investment adviser does not attempt to take defensive positions in declining markets. The Fund generally seeks to fully replicate the Underlying Index.
The Underlying Index is designed to reflect the performance of the silver mining industry. It is comprised of selected companies globally that are actively engaged in some aspect of the silver mining industry, such as silver mining, refining, or exploration, as defined by Solactive AG, the provider of the Underlying Index.
For the 12-month period ended October 31, 2023 (the “reporting period”), the Fund decreased 3.12%, while the Underlying Index decreased 2.61%. The Fund had a net asset value of $24.93 per share on October 31, 2022 and ended the reporting period with a net asset value of $24.07 per share on October 31, 2023.
During the reporting period, the highest returns came from MCewen Mining Inc. and Hochschild Mining Plc, which returned 89.86% and 84.81%, respectively. The worst performers were Golden Minerals Co. and Gold Resource Co., which returned -84.93% and -74.72%, respectively.
The Fund recorded negative returns during the reporting period as various economic and contractionary U.S. monetary policy weighed on silver prices. The Mexican mining industry, a bellwether in the silver production industry, faced challenges due to sweeping new regulations, making it difficult for companies to obtain mineral concessions and putting downward pressure on the industry. A sluggish industrial outlook further impacted silver demand and dampened investor sentiment. Furthermore, silver prices declined as the U.S. dollar rose towards the end of the reporting period and negatively impacted holdings within the Fund. However, the uptake of solar panel technology, increased investments in renewable energies, and 5G cellular service upgrades worldwide were positives for silver miners. During the reporting period, the Fund had an average approximate stock exposure of 59.43% in Canada and 14.79% in United States.
| | | | | | | | | |
Global X Silver Miners ETF
Solactive Global Silver Miners Total
Return Index
MSCI ACWI Index (Net) | AVERAGE ANNUAL TOTAL RETURN FOR THE YEAR ENDED
OCTOBER 31, 2023 |
| One Year Return | Three Year Return | Five Year Return | Ten Year Return |
Net
Asset
Value | Market
Price | Net
Asset
Value | Market
Price | Net
Asset
Value | Market
Price | Net
Asset
Value | Market
Price |
| -3.12% | -3.63% | -16.09% | -16.14% | 2.14% | 2.21% | -3.53% | -3.56% |
| -2.61% | -2.61% | -16.23% | -16.23% | 2.19% | 2.19% | -3.22% | -3.22% |
| 10.50% | 10.50% | 6.68% | 6.68% | 7.47% | 7.47% | 6.81% | 6.81% |
1
Management Discussion of Fund Performance (unaudited)
Global X Silver Miners ETF
Growth of a $10,000 Investment
(at Net Asset Value)

*Fund commenced operations on April 19, 2010.
The MSCI ACWI (Net) (All Country World Index) Index is a free float-adjusted market capitalization weighted index that is designed to measure the equity market performance of developed and emerging markets.
The performance data quoted herein represents past performance and the return and value of an investment in the Fund will fluctuate so that, when redeemed, it may be worth less than its original cost. High short-term performance of the fund is unusual and investors should not expect such performance to be repeated. Past performance is no guarantee of future performance and should not be considered as a representation of the future results of the Fund. The Fund’s performance assumes the reinvestment of all dividends and all capital gains. Index returns assume reinvestment of dividends and, unlike the Fund’s returns, do not reflect any fees or expenses. If such fees and expenses were included in the index returns, the performance would have been lower. Please note that one cannot invest directly in an unmanaged index. Performance figures for the periods shown may reflect contractual fee waivers and/or expense reimbursements. In the absence of fee waivers and/or expense reimbursements (if applicable), returns would have been lower.
There are no assurances that the Fund will meet its stated objectives.
The Fund’s holdings and allocations are subject to change and should not be considered recommendations to buy individual securities.
The graph and table do not reflect the deduction of taxes that a shareholder would pay on Fund distributions or the redemption or sale of Fund shares.
See definition of comparative indices above.
2
Management Discussion of Fund Performance (unaudited)
Global X Copper Miners ETF
Global X Copper Miners ETF
The Global X Copper Miners ETF (the “Fund”) seeks to provide investment results that correspond generally to the price and yield performance, before fees and expenses, of the Solactive Global Copper Miners Total Return Index (the “Underlying Index”). The Fund is passively managed, which means the investment adviser does not attempt to take defensive positions in declining markets. The Fund generally seeks to fully replicate the Underlying Index.
The Underlying Index is designed to reflect the performance of the copper mining industry. It is comprised of selected companies globally that are actively engaged in some aspect of the copper mining industry, such as copper mining, refining, or exploration , as defined by Solactive AG, the provider of the Underlying Index.
For the 12-month period ended October 31, 2023 (the “reporting period”), the Fund increased 17.07%, while the Underlying Index increased 17.67%. The Fund had a net asset value of $28.74 per share on October 31, 2022 and ended the reporting period with a net asset value of $32.83 per share on October 31, 2023.
During the reporting period, the highest returns came from China Gold International Resources Corp. Ltd. and China Nonferrous Mining Corp, which returned 96.13% and 77.19%, respectively. The worst performers were 29Metals Ltd and SolGold Plc, which returned -65.97% and -37.09%, respectively.
The Fund performed positively during the reporting period amidst a rebound in the Chinese economy, which drove copper equity valuations upward. The reopening of economic activity in China during the reporting period fueled copper demand, putting further pressure on supply and inventories. Moreover, the weakening of the U.S. dollar improved the purchasing power of copper for emerging markets and drove demand further. Lastly, clean energy transition policies enabled by U.S. and European policymakers increased copper demand as copper is a highly efficient conductor of electricity in renewable energy systems. During the reporting period, the Fund had an average approximate stock exposure of 31.99% in Canada and 11.10% in Australia.
| | | | | | | | | |
| | AVERAGE ANNUAL TOTAL RETURN FOR THE YEAR ENDED
OCTOBER 31, 2023 |
| | One Year Return | Three Year Return | Five Year Return | Ten Year Return |
| | Net
Asset
Value | Market
Price | Net
Asset
Value | Market
Price | Net
Asset
Value | Market
Price | Net
Asset
Value | Market
Price |
Global X Copper Miners ETF
Solactive Global Copper Miners Total
Return Index
MSCI EAFE Index (Net) | 17.07% | 17.42% | 18.12% | 18.00% | 13.72% | 13.88% | 2.94% | 3.01% |
| 17.67% | 17.67% | 18.69% | 18.69% | 14.29% | 14.29% | 3.52% | 3.52% |
| 14.40% | 14.40% | 5.73% | 5.73% | 4.10% | 4.10% | 3.05% | 3.05% |
3
Management Discussion of Fund Performance (unaudited)
Global X Copper Miners ETF
Growth of a $10,000 Investment
(at Net Asset Value)

*Fund commenced operations on April 19, 2010.
The MSCI EAFE Index (Net) (Europe, Australasia, Far East) is a free float-adjusted market capitalization index that is designed to measure the equity market performance of developed markets, excluding the US & Canada.
The performance data quoted herein represents past performance and the return and value of an investment in the Fund will fluctuate so that, when redeemed, it may be worth less than its original cost. Past performance is no guarantee of future performance and should not be considered as a representation of the future results of the Fund. The Fund’s performance assumes the reinvestment of all dividends and all capital gains. Index returns assume reinvestment of dividends and, unlike the Fund’s returns, do not reflect any fees or expenses. If such fees and expenses were included in the index returns, the performance would have been lower. Please note that one cannot invest directly in an unmanaged index. Performance figures for the periods shown may reflect contractual fee waivers and/or expense reimbursements. In the absence of fee waivers and/or expense reimbursements (if applicable), returns would have been lower.
There are no assurances that the Fund will meet its stated objectives.
The Fund’s holdings and allocations are subject to change and should not be considered recommendations to buy individual securities.
The graph and table do not reflect the deduction of taxes that a shareholder would pay on Fund distributions or the redemption or sale of Fund shares.
See definition of comparative indices above.
4
Management Discussion of Fund Performance (unaudited)
Global X Gold Explorers ETF
Global X Gold Explorers ETF
The Global X Gold Explorers ETF (the “Fund”) seeks to provide investment results that correspond generally to the price and yield performance, before fees and expenses, of the Solactive Global Gold Explorers & Developers Total Return Index (the “Underlying Index”). The Fund is passively managed, which means the investment adviser does not attempt to take defensive positions in declining markets. The Fund generally seeks to fully replicate the Underlying Index.
The Underlying Index tracks the price movements in the shares of companies which are active in the gold mining industry as an explorer, as defined by Solactive AG, the provider of the Underlying Index. This implies that a decision about production from the respective gold mining projects in which the companies are involved in has not been made yet.
For the 12-month period ended October 31, 2023 (the “reporting period”), the Fund increased 11.24%, while the Underlying Index increased 11.95%. The Fund had a net asset value of $20.36 per share on October 31, 2022 and ended the reporting period with a net asset value of $22.45 per share on October 31, 2023.
During the reporting period, the highest returns came from Westgold Resources Ltd. and Ramelius Resources Ltd., which returned 183.48% and 126.38%, respectively. The worst performers were PT Merdeka Copper Gold TBK and SolGold Plc, which returned -41.92% and -37.09%, respectively.
The Fund recorded positive returns during the reporting period as a weakened U.S. dollar and continued central bank demand supported gold prices. Investor appetite for explorers and producers of gold increased on account of improved operating leverage and earnings upside due to rising gold prices. Volatility in the regional banking industry within the U.S. coupled with rising geopolitical uncertainties improved sentiment towards holdings within the Fund, as investors shifted towards companies exposed to gold bullion. Furthermore, demand from central banks to buy and hold gold for strengthening national reserves, created a supportive environment for gold prices. Lastly, renewed jewelry demand from China, the second largest consumer of gold, contributed to sustaining the performance. During the reporting period, the Fund had an average approximate stock exposure of 40.89% in Canada, 27.25% in Australia and 12.94% in the United States.
| | | | | | | | | |
| | AVERAGE ANNUAL TOTAL RETURN FOR THE YEAR ENDED
OCTOBER 31, 2023 |
| | One Year Return | Three Year Return | Five Year Return | Ten Year Return |
| | Net
Asset
Value | Market
Price | Net
Asset
Value | Market
Price | Net
Asset
Value | Market
Price | Net
Asset
Value | Market
Price |
Global X Gold Explorers ETF
Hybrid Solactive Global Gold Explorers
Total Return Index/Solactive Global
Gold Explorers & Developers Total
Return Transition Index/Solactive
Global Gold Explorers & Developers
Total Return Index**
MSCI ACWI Index (Net) | 11.24% | 10.59% | -10.71% | -10.81% | 5.57% | 5.53% | 3.52% | 3.29% |
| 11.95% | 11.95% | -10.25% | -10.25% | 6.12% | 6.12% | 4.12% | 4.12% |
| 10.50% | 10.50% | 6.68% | 6.68% | 7.47% | 7.47% | 6.81% | 6.81% |
5
Management Discussion of Fund Performance (unaudited)
Global X Gold Explorers ETF
Growth of a $10,000 Investment
(at Net Asset Value)

*Fund commenced operations on November 3, 2010.
**Hybrid index performance reflects the performance of the Solactive Global Gold Explorers Total Return Index through November 30, 2016, the Solactive Global Gold Explorers & Developers Total Return Transition Index through April 30, 2017, and the Solactive Global Gold Explorers & Developers Total Return Index thereafter. This change was due to planned migration to the new Underlying Index, in an effort to provide broader exposure to the local market.
The MSCI ACWI (Net) (All Country World Index) Index is a free float-adjusted market capitalization weighted index that is designed to measure the equity market performance of developed and emerging markets.
The performance data quoted herein represents past performance and the return and value of an investment in the Fund will fluctuate so that, when redeemed, it may be worth less than its original cost. High short-term performance of the fund is unusual and investors should not expect such performance to be repeated. Past performance is no guarantee of future performance and should not be considered as a representation of the future results of the Fund. The Fund’s performance assumes the reinvestment of all dividends and all capital gains. Index returns assume reinvestment of dividends and, unlike the Fund’s returns, do not reflect any fees or expenses. If such fees and expenses were included in the index returns, the performance would have been lower. Please note that one cannot invest directly in an unmanaged index. Performance figures for the periods shown may reflect contractual fee waivers and/or expense reimbursements. In the absence of fee waivers and/or expense reimbursements (if applicable), returns would have been lower.
There are no assurances that the Fund will meet its stated objectives.
The Fund’s holdings and allocations are subject to change and should not be considered recommendations to buy individual securities.
6
Management Discussion of Fund Performance (unaudited)
Global X Gold Explorers ETF
The graph and table do not reflect the deduction of taxes that a shareholder would pay on Fund distributions or the redemption or sale of Fund shares.
See definition of comparative indices on previous page.
7
Management Discussion of Fund Performance (unaudited)
Global X Uranium ETF
Global X Uranium ETF
The Global X Uranium ETF (the “Fund”) seeks to provide investment results that correspond generally to the price and yield performance, before fees and expenses, of the Solactive Global Uranium & Nuclear Components Total Return Index (the “Underlying Index”). The Fund is passively managed, which means the investment adviser does not attempt to take defensive positions in declining markets. The Fund generally seeks to fully replicate the Underlying Index.
The Underlying Index tracks the price movements in shares of companies which are (or are expected to be in the near future) active in the uranium industry, as defined by Solactive AG, the provider of the Underlying Index. This particularly includes uranium mining, exploration, uranium investments and technologies related to the uranium industry.
For the 12-month period ended October 31, 2023 (the “reporting period”), the Fund increased 30.86%, while the Underlying Index increased 31.49%. The Fund had a net asset value of $20.30 per share on October 31, 2022 and ended the reporting period with a net asset value of $26.50 per share on October 31, 2023.
During the reporting period, the highest returns came from CGN Mining Co Ltd and Cameco Corp, which returned 75.91% and 73.17%, respectively. The worst performers were Nuscale Power Corp and American Lithium Corp, which returned -68.29% and -66.76%, respectively.
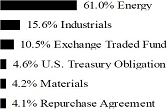
The Fund generated positive returns over the reporting period as increased demand for nuclear energy and geopolitical tensions drove uranium prices upwards. Concerns that existing capacity during the reporting period was not enough to meet bullish long-term demand was a supporting factor for uranium prices. Geopolitics was another source of recent support, as the United States prohibited the purchase of uranium from Russia, a scenario that burdened the resources of the few converters and enrichers operating in the West. Moreover, Cameco’s guidance update and the coup in Niger provided catalysts of supply dependability issues. Cameco, a significant uranium miner and constituent within the Fund over the course of the reporting period, announced a reduction in its production guidance for 2023 at its Cigar Lake and McArthur River mines. The coup in Niger threatened Europe’s capacity since a significant portion of European Union’s electricity comes from nuclear power. These developments put upward pressure on uranium prices, positively impacting the Fund’s performance during the reporting period. During the review period, the Fund has its highest sector exposure to Energy at 61.44% and Industrials at 21.29%.
| | | | | | | | |
| | AVERAGE ANNUAL TOTAL RETURN FOR THE YEAR ENDED
OCTOBER 31, 2023 |
| | One Year Return | Three Year Return | Five Year Return | Ten Year Return |
| | Net
Asset
Value | Market
Price | Net
Asset
Value | Market
Price | Net
Asset
Value | Market
Price | Net
Asset
Value | Market
Price |
Global X Uranium ETF
Hybrid Solactive Global Uranium
Total Return Index/ Solactive Global
Uranium & Nuclear Components
Transition TR Index/Solactive Global
Uranium & Nuclear Components Total
Return Index**
MSCI EAFE Index (Net) | 30.86% | 33.20% | 37.88% | 38.72% | 19.55% | 20.01% | 1.81% | 1.80% |
| 31.49% | 31.49% | 38.92% | 38.92% | 20.19% | 20.19% | 2.97% | 2.97% |
| 14.40% | 14.40% | 5.73% | 5.73% | 4.10% | 4.10% | 3.05% | 3.05% |
8
Management Discussion of Fund Performance (unaudited)
Global X Uranium ETF
Growth of a $10,000 Investment
(at Net Asset Value)
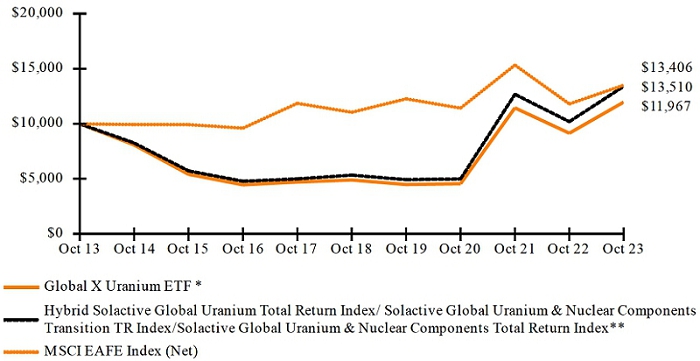
*Fund commenced operations on November 4, 2010.
**Hybrid index performance reflects the performance of the Solactive Global Uranium Total Return Index through April 30, 2018, the Solactive Global Uranium & Nuclear Components Transition TR Index through July 31, 2018, and the Solactive Global Uranium & Nuclear Components Total Return Index thereafter. This change was due to planned migration to the new Underlying Index, in an effort to provide broader exposure to the local market.
The MSCI EAFE Index (Net) (Europe, Australasia, Far East) is a free float-adjusted market capitalization index that is designed to measure the equity market performance of developed markets, excluding the United States & Canada.
The performance data quoted herein represents past performance and the return and value of an investment in the Fund will fluctuate so that, when redeemed, it may be worth less than its original cost. Past performance is no guarantee of future performance and should not be considered as a representation of the future results of the Fund. The Fund’s performance assumes the reinvestment of all dividends and all capital gains. Index returns assume reinvestment of dividends and, unlike the Fund’s returns, do not reflect any fees or expenses. If such fees and expenses were included in the index returns, the performance would have been lower. Please note that one cannot invest directly in an unmanaged index. Performance figures for the periods shown may reflect contractual fee waivers and/or expense reimbursements. In the absence of fee waivers and/or expense reimbursements (if applicable), returns would have been lower.
There are no assurances that the Fund will meet its stated objectives.
The Fund’s holdings and allocations are subject to change and should not be considered recommendations to buy individual securities.
9
Management Discussion of Fund Performance (unaudited)
Global X Uranium ETF
The graph and table do not reflect the deduction of taxes that a shareholder would pay on Fund distributions or the redemption or sale of Fund shares.
See definition of comparative indices on previous page.
10
| | |
| Schedule of Investments | October 31, 2023 |
| | |
| Global X Silver Miners ETF |
Sector Weightings (Unaudited)†:

† Sector weightings percentages are based on the total market value of investments. Total investments do not include derivatives such as options, futures contracts, forward contracts, and swap contracts, if applicable.
| | | Shares | | | Value | |
| COMMON STOCK — 99.7% | | | | | | | | |
| AUSTRALIA — 1.0% | | | | | | | | |
| Materials — 1.0% | | | | | | | | |
| Kingsgate Consolidated * | | | 6,024,701 | | | $ | 4,405,806 | |
| Silver Mines * | | | 34,392,099 | | | | 3,810,698 | |
| | | | | | | | | |
| TOTAL AUSTRALIA | | | | | | | 8,216,504 | |
| BOSNIA AND HERZEGOVINA — 2.1% | | | | | | | | |
| Materials — 2.1% | | | | | | | | |
| Adriatic Metals, Cl CDI * | | | 7,942,550 | | | | 17,098,056 | |
| | | | | | | | | |
| BRAZIL — 22.9% | | | | | | | | |
| Materials — 22.9% | | | | | | | | |
| Wheaton Precious Metals (A) | | | 4,473,602 | | | | 189,009,685 | |
| | | | | | | | | |
| CANADA — 43.2% | | | | | | | | |
| Materials — 43.2% | | | | | | | | |
| AbraSilver Resource * | | | 11,361,291 | | | | 2,414,249 | |
| Aya Gold & Silver * (A) | | | 2,796,881 | | | | 15,130,255 | |
| Discovery Silver * | | | 7,510,193 | | | | 3,408,191 | |
| Dolly Varden Silver * | | | 3,768,472 | | | | 2,063,057 | |
| Endeavour Silver * | | | 5,131,299 | | | | 10,980,980 | |
| First Majestic Silver | | | 7,167,943 | | | | 36,865,920 | |
| Fortuna Silver Mines * | | | 7,772,567 | | | | 21,779,424 | |
| GoGold Resources * | | | 8,154,936 | | | | 7,519,048 | |
| Guanajuato Silver * | | | 7,026,786 | | | | 1,518,484 | |
| MAG Silver * | | | 2,520,897 | | | | 25,186,271 | |
| McEwen Mining * | | | 1,058,887 | | | | 7,338,087 | |
| New Pacific Metals * (A) | | | 2,140,205 | | | | 3,268,312 | |
| Pan American Silver | | | 8,199,132 | | | | 119,789,318 | |
| Prime Mining * | | | 2,536,602 | | | | 2,320,536 | |
| Santacruz Silver Mining * | | | 2,221,287 | | | | 336,013 | |
The accompanying notes are an integral part of the financial statements.
11
| | |
| Schedule of Investments | October 31, 2023 |
| | |
| Global X Silver Miners ETF |
| | | Shares | | | Value | |
| COMMON STOCK — continued | | | | | | | | |
| Materials — continued | | | | | | | | |
| Silvercorp Metals | | | 4,577,747 | | | $ | 10,156,284 | |
| SilverCrest Metals * | | | 3,828,539 | | | | 18,946,201 | |
| SSR Mining | | | 2,928,104 | | | | 40,642,084 | |
| Triple Flag Precious Metals | | | 1,694,467 | | | | 21,518,785 | |
| Vizsla Silver * | | | 4,991,606 | | | | 5,141,723 | |
| | | | | | | | | |
| TOTAL CANADA | | | | | | | 356,323,222 | |
| MEXICO — 8.7% | | | | | | | | |
| Materials — 8.7% | | | | | | | | |
| Fresnillo | | | 4,832,846 | | | | 32,477,007 | |
| Industrias Penoles * | | | 3,491,042 | | | | 38,921,067 | |
| | | | | | | | | |
| TOTAL MEXICO | | | | | | | 71,398,074 | |
| PERU — 5.9% | | | | | | | | |
| Materials — 5.9% | | | | | | | | |
| Cia de Minas Buenaventura SAA ADR | | | 4,848,573 | | | | 39,273,441 | |
| Hochschild Mining * | | | 8,226,098 | | | | 9,338,084 | |
| | | | | | | | | |
| TOTAL PERU | | | | | | | 48,611,525 | |
| SOUTH KOREA — 7.6% | | | | | | | | |
| Materials — 7.6% | | | | | | | | |
| Korea Zinc | | | 179,548 | | | | 62,350,903 | |
| | | | | | | | | |
| UNITED STATES — 8.3% | | | | | | | | |
| Materials — 8.3% | | | | | | | | |
| Coeur Mining * | | | 9,435,536 | | | | 23,683,195 | |
| Gatos Silver * | | | 1,240,920 | | | | 6,043,280 | |
| Gold Resource | | | 2,186,434 | | | | 878,947 | |
| Golden Minerals * (A) | | | — | | | | — | |
| Hecla Mining (A) | | | 9,341,122 | | | | 38,018,367 | |
| | | | | | | | | |
| TOTAL UNITED STATES | | | | | | | 68,623,789 | |
TOTAL COMMON STOCK
(Cost $1,095,071,710) | | | | | | | 821,631,758 | |
The accompanying notes are an integral part of the financial statements.
12
| Schedule of Investments | October 31, 2023 |
| Global X Silver Miners ETF |
| | | Face Amount | | | Value | |
| REPURCHASE AGREEMENTS(B) — 0.6% | | | | | | | | |
Bank of America Securities
5.310%, dated 10/31/2023, to be repurchased on 11/01/2023, repurchase price $1,076,571 (collateralized by various U.S. Government Obligations ranging in par value $17,913 - $467,715, 2.000% - 6.500%, 04/01/2048 - 10/01/2053, with a total market value of $1,097,940) | | $ | 1,076,412 | | | $ | 1,076,412 | |
Citigroup Global Markets Inc.
5.310%, dated 10/31/2023, to be repurchased on 11/01/2023, repurchase price $1,076,571 (collateralized by various U.S. Government Obligations ranging in par value $150 - $197,154, 2.000% - 7.715%, 12/01/2027 - 06/20/2073, with a total market value of $1,097,940) | | | 1,076,412 | | | | 1,076,412 | |
Daiwa Capital Markets America
5.320%, dated 10/31/2023, to be repurchased on 11/01/2023, repurchase price $1,076,571 (collateralized by various U.S. Government Obligations and U.S. Treasury Obligations, ranging in par value $67 - $85,032, 0.125% - 7.000%, 01/15/2024 - 11/01/2053, with a total market value of $1,097,940) | | | 1,076,412 | | | | 1,076,412 | |
Deutsche Bank Securities Inc.,
5.310%, dated 10/31/2023, to be repurchased on 11/01/2023, repurchase price $274,873 (collateralized by various U.S. Government Obligations ranging in par value $29 - $54,330, 1.000% - 7.000%, 09/01/2028 - 01/01/2061, with a total market value of $280,329) | | | 274,832 | | | | 274,832 | |
The accompanying notes are an integral part of the financial statements.
13
| Schedule of Investments | October 31, 2023 |
| Global X Silver Miners ETF |
| | | Face Amount | | | Value | |
| REPURCHASE AGREEMENTS — continued | | | | | | | | |
RBC Dominion Securities
5.310%, dated 10/31/2023, to be repurchased on 11/01/2023, repurchase price $1,076,571 (collateralized by various U.S. Government Obligations and U.S. Treasury Obligations, ranging in par value $36 - $282,140, 0.000% - 6.500%, 11/07/2023 - 08/20/2053, with a total market value of $1,097,940) | | $ | 1,076,412 | | | $ | 1,076,412 | |
| | | | | | | | | |
TOTAL REPURCHASE AGREEMENTS
(Cost $4,580,480) | | | | | | | 4,580,480 | |
TOTAL INVESTMENTS — 100.3%
(Cost $1,099,652,190) | | | | | | $ | 826,212,238 | |
Percentages are based on Net Assets of $823,747,415.
| * | Non-income producing security. |
| (A) | This security or a partial position of this security is on loan at October 31, 2023. The total market value of securities on loan at October 31, 2023 was $4,066,372. |
| (B) | These securities were purchased with cash collateral held from securities on loan. The total value of such securities as of October 31, 2023 was $4,580,480. The total value of non-cash collateral held from securities on loan as of October 31, 2023 was $27,300. |
The following is a summary of the level of inputs used as of October 31, 2023, in valuing the Fund’s investments carried at value:
| Investments in Securities | | Level 1 | | | Level 2 | | | Level 3 | | | Total | |
| Common Stock | | $ | 821,631,758 | | | $ | — | | | $ | — | | | $ | 821,631,758 | |
| Repurchase Agreements | | | — | | | | 4,580,480 | | | | — | | | | 4,580,480 | |
| Total Investments in Securities | | $ | 821,631,758 | | | $ | 4,580,480 | | | $ | — | | | $ | 826,212,238 | |
Amounts designated as “—” are $0 or have been rounded to $0.
See “Glossary” for abbreviations.
The accompanying notes are an integral part of the financial statements.
14
| Schedule of Investments | October 31, 2023 |
| Global X Copper Miners ETF |
Sector Weightings (Unaudited)†:

† Sector weightings percentages are based on the total market value of investments. Total investments do not include derivatives such as options, futures contracts, forward contracts, and swap contracts, if applicable.
| | | Shares | | | Value | |
| COMMON STOCK — 100.5% | | | | | | | | |
| AUSTRALIA — 14.3% | | | | | | | | |
| Materials — 14.3% | | | | | | | | |
| 29Metals * (A) | | | 9,842,739 | | | $ | 3,863,808 | |
| BHP Group | | | 2,318,445 | | | | 65,322,782 | |
| Develop Global * | | | 3,325,134 | | | | 7,073,857 | |
| Glencore | | | 11,926,407 | | | | 62,975,076 | |
| Sandfire Resources * | | | 11,728,364 | | | | 44,332,236 | |
| SolGold * (A) | | | 40,341,989 | | | | 4,674,991 | |
| | | | | | | | | |
| TOTAL AUSTRALIA | | | | | | | 188,242,750 | |
| BRAZIL — 2.5% | | | | | | | | |
| Materials — 2.5% | | | | | | | | |
| ERO Copper * | | | 2,145,489 | | | | 29,085,614 | |
| Nexa Resources | | | 658,669 | | | | 3,945,427 | |
| | | | | | | | | |
| TOTAL BRAZIL | | | | | | | 33,031,041 | |
| CANADA — 21.3% | | | | | | | | |
| Materials — 21.3% | | | | | | | | |
| Altius Minerals | | | 1,009,614 | | | | 14,770,582 | |
| Capstone Copper * | | | 10,400,310 | | | | 35,360,679 | |
| Filo * | | | 2,262,970 | | | | 29,439,394 | |
| Foran Mining * | | | 5,280,286 | | | | 16,469,395 | |
| HudBay Minerals | | | 8,912,138 | | | | 38,839,138 | |
| Ivanhoe Mines, Cl A * | | | 8,210,741 | | | | 60,445,722 | |
| NGEx Minerals * | | | 2,949,816 | | | | 12,536,585 | |
| Solaris Resources * | | | 1,907,234 | | | | 7,528,646 | |
| Taseko Mines * | | | 7,156,078 | | | | 7,728,564 | |
| Teck Resources, Cl B | | | 1,640,569 | | | | 57,905,911 | |
| | | | | | | | | |
| TOTAL CANADA | | | | | | | 281,024,616 | |
The accompanying notes are an integral part of the financial statements.
15
| Schedule of Investments | October 31, 2023 |
| Global X Copper Miners ETF |
| | | Shares | | | Value | |
| COMMON STOCK — continued | | | | | | | | |
| CHILE — 9.6% | | | | | | | | |
| Materials — 9.6% | | | | | | | | |
| Antofagasta | | | 3,958,575 | | | $ | 64,607,249 | |
| Lundin Mining | | | 9,840,260 | | | | 61,384,226 | |
| | | | | | | | | |
| TOTAL CHILE | | | | | | | 125,991,475 | |
| CHINA — 13.9% | | | | | | | | |
| Materials — 13.9% | | | | | | | | |
| China Gold International Resources | | | 6,247,500 | | | | 26,668,009 | |
| China Nonferrous Mining | | | 29,909,400 | | | | 18,156,794 | |
| Jiangxi Copper, Cl H | | | 28,380,301 | | | | 40,187,835 | |
| Jinchuan Group International Resources (A) | | | 128,388,400 | | | | 7,793,943 | |
| MMG * | | | 73,697,400 | | | | 21,757,150 | |
| Zijin Mining Group, Cl H | | | 44,507,360 | | | | 69,167,689 | |
| | | | | | | | | |
| TOTAL CHINA | | | | | | | 183,731,420 | |
| CYPRUS — 0.7% | | | | | | | | |
| Materials — 0.7% | | | | | | | | |
| Atalaya Mining | | | 2,551,924 | | | | 9,289,858 | |
| | | | | | | | | |
| GERMANY — 4.9% | | | | | | | | |
| Materials — 4.9% | | | | | | | | |
| Aurubis | | | 782,722 | | | | 64,251,261 | |
| | | | | | | | | |
| JAPAN — 9.4% | | | | | | | | |
| Materials — 9.4% | | | | | | | | |
| Mitsubishi Materials | | | 3,201,787 | | | | 50,887,790 | |
| Nittetsu Mining | | | 243,905 | | | | 7,593,595 | |
| Sumitomo Metal Mining | | | 2,361,993 | | | | 65,754,317 | |
| | | | | | | | | |
| TOTAL JAPAN | | | | | | | 124,235,702 | |
| MEXICO — 4.9% | | | | | | | | |
| Materials — 4.9% | | | | | | | | |
| Southern Copper | | | 910,755 | | | | 64,572,529 | |
The accompanying notes are an integral part of the financial statements.
16
| Schedule of Investments | October 31, 2023 |
| Global X Copper Miners ETF |
| | | Shares | | | Value | |
| COMMON STOCK — continued | | | | | | | | |
| POLAND — 5.1% | | | | | | | | |
| Materials — 5.1% | | | | | | | | |
| KGHM Polska Miedz | | | 2,515,825 | | | $ | 67,015,035 | |
| | | | | | | | | |
| SAUDI ARABIA — 1.0% | | | | | | | | |
| Materials — 1.0% | | | | | | | | |
| Al Masane Al Kobra Mining | | | 888,015 | | | | 12,474,248 | |
| | | | | | | | | |
| SWEDEN — 4.7% | | | | | | | | |
| Materials — 4.7% | | | | | | | | |
| Boliden | | | 2,422,143 | | | | 61,948,362 | |
| | | | | | | | | |
| TURKEY — 0.3% | | | | | | | | |
| Industrials — 0.3% | | | | | | | | |
| Sarkuysan Elektrolitik Bakir Sanayi ve Ticaret | | | 3,018,987 | | | | 3,367,620 | |
| | | | | | | | | |
| UNITED KINGDOM — 0.7% | | | | | | | | |
| Materials — 0.7% | | | | | | | | |
| Central Asia Metals | | | 4,623,470 | | | | 9,189,715 | |
| | | | | | | | | |
| UNITED STATES — 4.7% | | | | | | | | |
| Materials — 4.7% | | | | | | | | |
| Freeport-McMoRan | | | 1,843,148 | | | | 62,261,539 | |
| | | | | | | | | |
| ZAMBIA — 2.5% | | | | | | | | |
| Materials — 2.5% | | | | | | | | |
| First Quantum Minerals | | | 2,863,462 | | | | 33,146,648 | |
| | | | | | | | | |
TOTAL COMMON STOCK
(Cost $1,584,675,186) | | | | | | | 1,323,773,819 | |
The accompanying notes are an integral part of the financial statements.
17
| Schedule of Investments | October 31, 2023 |
| Global X Copper Miners ETF |
| | | Face Amount | | | Value | |
| REPURCHASE AGREEMENTS(B) — 0.3% | | | | | | | | |
Bank of America Securities
5.310%, dated 10/31/2023, to be repurchased on 11/01/2023, repurchase price $961,454 (collateralized by various U.S. Government Obligations ranging in par value $15,997 - $417,703, 2.000% - 6.500%, 04/01/2048 - 10/01/2053, with a total market value of $980,538) | | $ | 961,312 | | | $ | 961,312 | |
Citigroup Global Markets Inc.
5.310%, dated 10/31/2023, to be repurchased on 11/01/2023, repurchase price $961,454 (collateralized by various U.S. Government Obligations ranging in par value $134 - $176,072, 2.000% - 7.715%, 12/01/2027 - 06/20/2073, with a total market value of $980,538) | | | 961,312 | | | | 961,312 | |
Daiwa Capital Markets America
5.320%, dated 10/31/2023, to be repurchased on 11/01/2023, repurchase price $961,454 (collateralized by various U.S. Government Obligations and U.S. Treasury Obligations, ranging in par value $60 - $75,940, 0.125% - 7.000%, 01/15/2024 - 11/01/2053, with a total market value of $980,538) | | | 961,312 | | | | 961,312 | |
HSBC Securities USA Inc.,
5.310%, dated 10/31/2023, to be repurchased on 11/01/2023, repurchase price $942,225 (collateralized by various U.S. Government Obligations ranging in par value $9,421 - $939,565, 2.500% - 7.000%, 06/20/2033 - 10/20/2053, with a total market value of $960,928) | | | 942,086 | | | | 942,086 | |
The accompanying notes are an integral part of the financial statements.
18
| Schedule of Investments | October 31, 2023 |
| Global X Copper Miners ETF |
| | | Face Amount | | | Value | |
| REPURCHASE AGREEMENTS — continued | | | | | | | | |
RBC Dominion Securities
5.310%, dated 10/31/2023, to be repurchased on 11/01/2023, repurchase price $264,709 (collateralized by various U.S. Government Obligations and U.S. Treasury Obligations, ranging in par value $9 - $69,373, 0.000% - 6.500%, 11/07/2023 - 08/20/2053, with a total market value of $269,963) | | $ | 264,670 | | | $ | 264,670 | |
| | | | | | | | | |
TOTAL REPURCHASE AGREEMENTS
(Cost $4,090,692) | | | | | | | 4,090,692 | |
TOTAL INVESTMENTS — 100.8%
(Cost $1,588,765,878) | | | | | | $ | 1,327,864,511 | |
Percentages are based on Net Assets of $1,317,932,097.
| * | Non-income producing security. |
| (A) | This security or a partial position of this security is on loan at October 31, 2023. The total market value of the securities on loan at October 31, 2023 was $3,405,922. |
| (B) | These securities were purchased with cash collateral held from securities on loan. The total value of such securities as of October 31, 2023 was $4,090,692. The total value of non-cash collateral held from securities on loan as of October 31, 2023 was $-. |
The following is a summary of the level of inputs used as of October 31, 2023, in valuing the Fund’s investments carried at value:
| Investments in Securities | | Level 1 | | | Level 2 | | | Level 3 | | | Total | |
| Common Stock | | $ | 1,323,773,819 | | | $ | — | | | $ | — | | | $ | 1,323,773,819 | |
| Repurchase Agreements | | | — | | | | 4,090,692 | | | | — | | | | 4,090,692 | |
| Total Investments in Securities | | $ | 1,323,773,819 | | | $ | 4,090,692 | | | $ | — | | | $ | 1,327,864,511 | |
Amounts designated as “—” are $0 or have been rounded to $0.
See “Glossary” for abbreviations.
The accompanying notes are an integral part of the financial statements.
19
|
| | | |
| Schedule of Investments | | October 31, 2023 |
| | | |
| Global X Gold Explorers ETF |
Sector Weightings (Unaudited)†:

† Sector weightings percentages are based on the total market value of investments. Total investments do not include derivatives such as options, futures contracts, forward contracts, and swap contracts, if applicable.
| | | Shares | | | Value | |
| COMMON STOCK — 100.0% | | | | | | | | |
| AUSTRALIA — 32.6% | | | | | | | | |
| Materials — 32.6% | | | | | | | | |
| Bellevue Gold * | | | 827,856 | | | $ | 757,409 | |
| Capricorn Metals * | | | 245,189 | | | | 734,294 | |
| De Grey Mining * | | | 1,055,604 | | | | 798,687 | |
| Emerald Resources NL * | | | 383,129 | | | | 628,279 | |
| Firefinch *(A) | | | 825,148 | | | | 36,728 | |
| Genesis Minerals * | | | 731,347 | | | | 676,058 | |
| Gold Road Resources | | | 787,712 | | | | 945,115 | |
| OceanaGold | | | 530,801 | | | | 887,058 | |
| Perseus Mining | | | 983,517 | | | | 1,061,730 | |
| Ramelius Resources | | | 785,895 | | | | 823,513 | |
| Red 5 * | | | 2,285,055 | | | | 462,972 | |
| Regis Resources * | | | 560,797 | | | | 614,270 | |
| Resolute Mining * | | | 1,599,176 | | | | 364,508 | |
| Silver Lake Resources * (B) | | | 692,063 | | | | 460,090 | |
| SolGold * | | | 1,176,208 | | | | 136,304 | |
| Tietto Minerals * (B) | | | 705,244 | | | | 250,055 | |
| West African Resources * | | | 695,465 | | | | 325,848 | |
| Westgold Resources * | | | 337,395 | | | | 446,470 | |
| | | | | | | | | |
| TOTAL AUSTRALIA | | | | | | | 10,409,388 | |
| CANADA — 39.4% | | | | | | | | |
| Materials — 39.4% | | | | | | | | |
| Alamos Gold, Cl A | | | 104,256 | | | | 1,289,448 | |
| Artemis Gold * | | | 99,303 | | | | 364,093 | |
| Calibre Mining * | | | 245,349 | | | | 254,495 | |
| Centerra Gold | | | 162,169 | | | | 823,549 | |
| Dundee Precious Metals | | | 144,599 | | | | 946,807 | |
| Endeavour Silver * | | | 149,113 | | | | 320,084 | |
| Equinox Gold * | | | 210,350 | | | | 919,737 | |
The accompanying notes are an integral part of the financial statements.
20
|
| | | |
| Schedule of Investments | | October 31, 2023 |
| | | |
| Global X Gold Explorers ETF |
| | | Shares | | | Value | |
| COMMON STOCK — continued | | | | | | | | |
| Materials — continued | | | | | | | | |
| K92 Mining * | | | 169,130 | | | $ | 609,148 | |
| Karora Resources * | | | 129,397 | | | | 384,952 | |
| Lundin Gold | | | 72,356 | | | | 871,451 | |
| McEwen Mining * | | | 29,324 | | | | 203,215 | |
| New Gold * | | | 473,673 | | | | 576,631 | |
| Novagold Resources * | | | 183,246 | | | | 645,026 | |
| Orla Mining * | | | 157,461 | | | | 482,052 | |
| Osisko Mining * | | | 238,229 | | | | 461,614 | |
| Seabridge Gold * | | | 52,321 | | | | 573,438 | |
| Skeena Resources * | | | 61,925 | | | | 223,033 | |
| SSR Mining | | | 94,251 | | | | 1,302,847 | |
| Torex Gold Resources * | | | 64,408 | | | | 620,302 | |
| Victoria Gold * | | | 28,653 | | | | 119,504 | |
| Wesdome Gold Mines * | | | 110,551 | | | | 590,879 | |
| | | | | | | | | |
| TOTAL CANADA | | | | | | | 12,582,305 | |
| EGYPT — 2.6% | | | | | | | | |
| Materials — 2.6% | | | | | | | | |
| Centamin | | | 834,899 | | | | 835,304 | |
| | | | | | | | | |
| INDONESIA — 8.2% | | | | | | | | |
| Materials — 8.2% | | | | | | | | |
| Aneka Tambang | | | 6,317,534 | | | | 678,086 | |
| Bumi Resources Minerals * | | | 50,738,600 | | | | 619,660 | |
| Merdeka Copper Gold * | | | 9,332,853 | | | | 1,310,183 | |
| | | | | | | | | |
| TOTAL INDONESIA | | | | | | | 2,607,929 | |
| PERU — 0.9% | | | | | | | | |
| Materials — 0.9% | | | | | | | | |
| Hochschild Mining * | | | 237,347 | | | | 269,431 | |
| | | | | | | | | |
| TURKEY — 6.2% | | | | | | | | |
| Materials — 6.2% | | | | | | | | |
| Eldorado Gold * | | | 131,541 | | | | 1,421,297 | |
| Koza Altin Isletmeleri | | | 722,523 | | | | 560,801 | |
| | | | | | | | | |
| TOTAL TURKEY | | | | | | | 1,982,098 | |
The accompanying notes are an integral part of the financial statements.
21
|
| | | |
| Schedule of Investments | | October 31, 2023 |
| | | |
| Global X Gold Explorers ETF |
| | | Shares | | | Value | |
| COMMON STOCK — continued | | | | | | | | |
| UNITED KINGDOM — 2.2% | | | | | | | | |
| Materials — 2.2% | | | | | | | | |
| Greatland Gold * | | | 3,707,649 | | | $ | 422,009 | |
| Pan African Resources | | | 1,428,053 | | | | 280,724 | |
| | | | | | | | | |
| TOTAL UNITED KINGDOM | | | | | | | 702,733 | |
| UNITED STATES — 7.9% | | | | | | | | |
| Materials — 7.9% | | | | | | | | |
| Argonaut Gold * | | | 477,154 | | | | 171,854 | |
| Coeur Mining * | | | 241,385 | | | | 605,876 | |
| Hecla Mining | | | 431,565 | | | | 1,756,470 | |
| | | | | | | | | |
| TOTAL UNITED STATES | | | | | | | 2,534,200 | |
TOTAL COMMON STOCK
(Cost $41,185,706) | | | | | | | 31,923,388 | |
| | | Number of
Rights | | | | | |
| RIGHTS — 0.0% | | | | | | | | |
| Canada — 0.0% | | | | | | | | |
Great Bear Resources#*(A)
Expires (Cost $ –) | | | 46,614 | | | | — | |
| | | | | | | | | |
| | | Face Amount | | | | | |
| REPURCHASE AGREEMENTS(C) — 1.6% | | | | | | | | |
Bank of America Securities
5.310%, dated 10/31/2023, to be repurchased on 11/01/2023, repurchase price $23,920 (collateralized by various U.S. Government Obligations ranging in par value $398 - $10,392, 2.000% - 6.500%, 04/01/2048 - 10/01/2053, with a total market value of $24,394) | | $ | 23,916 | | | | 23,916 | |
The accompanying notes are an integral part of the financial statements.
22
|
| | | |
| Schedule of Investments | | October 31, 2023 |
| | | |
| Global X Gold Explorers ETF |
| | | Face Amount | | | Value | |
| REPURCHASE AGREEMENTS — continued | | | | | | | | |
Citigroup Global Markets Inc.
5.310%, dated 10/31/2023, to be repurchased on 11/01/2023, repurchase price $249,037 (collateralized by various U.S. Government Obligations ranging in par value $35 - $45,606, 2.000% - 7.715%, 12/01/2027 - 06/20/2073, with a total market value of $253,980) | | $ | 249,000 | | | $ | 249,000 | |
Daiwa Capital Markets America
5.320%, dated 10/31/2023, to be repurchased on 11/01/2023, repurchase price $249,037 (collateralized by various U.S. Government Obligations and U.S. Treasury Obligations, ranging in par value $15 - $19,670, 0.125% - 7.000%, 01/15/2024 - 11/01/2053, with a total market value of $253,980) | | | 249,000 | | | | 249,000 | |
| | | | | | | | | |
TOTAL REPURCHASE AGREEMENTS
(Cost $521,916) | | | | | | | 521,916 | |
TOTAL INVESTMENTS — 101.6%
(Cost $41,707,622) | | | | | | $ | 32,445,304 | |
| | | | | | | | | |
| Percentages are based on Net Assets of $31,930,834. | | | | | | | | |
| * | Non-income producing security. |
| # | Expiration date not available. |
| (A) | Level 3 security in accordance with fair value hierarchy. |
| (B) | This security or a partial position of this security is on loan at October 31, 2023. The total market value of securities on loan at October 31, 2023 was $489,763. |
| (C) | These securities were purchased with cash collateral held from securities on loan. The total value of such securities as of October 31, 2023 was $521,916. The total value of non-cash collateral held from securities on loan as of October 31, 2023 was $9,563. |
The accompanying notes are an integral part of the financial statements.
23
|
| | | |
| Schedule of Investments | | October 31, 2023 |
| | | |
| Global X Gold Explorers ETF |
The following is a summary of the level of inputs used as of October 31, 2023, in valuing the Fund’s investments carried at value:
| Investments in Securities | | Level 1 | | | Level 2 | | | Level 3(1) | | | Total | |
| Common Stock | | $ | 31,886,660 | | | $ | — | | | $ | 36,728 | | | $ | 31,923,388 | |
| Rights | | | — | | | | — | | | | — | ^ | | | — | |
| Repurchase Agreements | | | — | | | | 521,916 | | | | — | | | | 521,916 | |
| Total Investments in Securities | | $ | 31,886,660 | | | $ | 521,916 | | | $ | 36,728 | | | $ | 32,445,304 | |
| (1) | A reconciliation of Level 3 investments and disclosures of significant unobservable inputs are presented when the Fund has a significant amount of Level 3 investments at the end of the period in relation to Net Assets. Management has concluded that Level 3 investments are not material in relation to Net Assets. |
| ^ | Includes Securities in which the fair value is $0 or has been rounded to $0. |
Amounts designated as “—” are $0 or have been rounded to $0.
See “Glossary” for abbreviations.
The accompanying notes are an integral part of the financial statements.
24
| Schedule of Investments | | October 31, 2023 |
| | | |
| | Global X Uranium ETF | |
Sector Weightings (Unaudited)†:
† Sector weightings percentages are based on the total market value of investments. Total investments do not include derivatives such as options, futures contracts, forward contracts, and swap contracts, if applicable.
| | | Shares | | | Value | |
| COMMON STOCK — 88.5% | | | | | | | | |
| AUSTRALIA — 12.4% | | | | | | | | |
| Energy — 9.3% | | | | | | | | |
| Alligator Energy * (A) | | | 164,641,278 | | | $ | 5,212,146 | |
| Aura Energy * (A) | | | 23,430,067 | | | | 4,376,263 | |
| Bannerman Energy * (A)(B) | | | 7,989,002 | | | | 12,949,123 | |
| Berkeley Energia * (A) | | | 21,940,764 | | | | 4,696,275 | |
| Boss Energy *(B) | | | 17,957,532 | | | | 49,117,727 | |
| Deep Yellow * (A) | | | 35,838,768 | | | | 28,477,684 | |
| Elevate Uranium * (A) | | | 11,896,777 | | | | 2,899,999 | |
| Paladin Energy *(B) | | | 150,549,277 | | | | 90,077,920 | |
| Peninsula Energy * (B) | | | 68,172,215 | | | | 5,179,604 | |
| | | | | | | | 202,986,741 | |
| Industrials — 0.9% | | | | | | | | |
| Silex Systems * | | | 9,544,031 | | | | 19,397,454 | |
| | | | | | | | | |
| Materials — 2.2% | | | | | | | | |
| Anson Resources * (A) | | | 54,296,348 | | | | 5,672,343 | |
| BHP Group | | | 1,165,145 | | | | 32,828,259 | |
| Lotus Resources * (A) | | | 55,192,656 | | | | 8,037,426 | |
| | | | | | | | 46,538,028 | |
| TOTAL AUSTRALIA | | | | | | | 268,922,223 | |
| CANADA — 40.5% | | | | | | | | |
| Energy — 38.1% | | | | | | | | |
| Cameco | | | 12,800,726 | | | | 523,093,957 | |
| Denison Mines * (A) | | | 45,108,444 | | | | 72,134,519 | |
The accompanying notes are an integral part of the financial statements.
25
| Schedule of Investments | | October 31, 2023 |
| | | |
| | Global X Uranium ETF | |
| | | Shares | | | Value | |
| COMMON STOCK — continued | | | | | | | | |
| Energy — continued | | | | | | | | |
| Encore Energy * (A) | | | 7,625,771 | | | $ | 25,323,108 | |
| F3 Uranium * (A) | | | 18,583,212 | | | | 5,019,776 | |
| Fission Uranium * (A) | | | 34,345,524 | | | | 23,008,347 | |
| GoviEx Uranium, Cl A * (A) | | | 35,031,118 | | | | 4,037,442 | |
| IsoEnergy * (A) | | | 2,925,488 | | | | 7,923,526 | |
| Laramide Resources * (A) | | | 10,979,559 | | | | 4,903,531 | |
| Mega Uranium * | | | 17,461,713 | | | | 4,339,486 | |
| NexGen Energy * | | | 23,471,088 | | | | 141,511,260 | |
| Skyharbour Resources * | | | 8,109,352 | | | | 3,271,195 | |
| Uranium Royalty * (A) | | | 4,529,537 | | | | 12,953,187 | |
| | | | | | | | 827,519,334 | |
| Industrials — 1.1% | | | | | | | | |
| Aecon Group (A) | | | 3,340,066 | | | | 24,540,733 | |
| | | | | | | | | |
| Materials — 1.3% | | | | | | | | |
| American Lithium * (A) | | | 11,522,158 | | | | 13,943,616 | |
| Global Atomic * (A) | | | 9,971,154 | | | | 14,939,673 | |
| | | | | | | | 28,883,289 | |
| TOTAL CANADA | | | | | | | 880,943,356 | |
| CHINA — 1.2% | | | | | | | | |
| Energy — 1.2% | | | | | | | | |
| CGN Mining * (A) | | | 159,850,900 | | | | 26,149,471 | |
| | | | | | | | | |
| JAPAN — 3.3% | | | | | | | | |
| Industrials — 3.3% | | | | | | | | |
| ITOCHU | | | 915,723 | | | | 32,488,228 | |
| Mitsubishi Heavy Industries | | | 790,684 | | | | 40,159,407 | |
| | | | | | | | | |
| TOTAL JAPAN | | | | | | | 72,647,635 | |
| KAZAKHSTAN — 6.7% | | | | | | | | |
| Energy — 6.7% | | | | | | | | |
| NAC Kazatomprom JSC GDR | | | 3,589,924 | | | | 145,391,922 | |
The accompanying notes are an integral part of the financial statements.
26
| Schedule of Investments | | October 31, 2023 |
| | | |
| | Global X Uranium ETF | |
| | | Shares | | | Value | |
| COMMON STOCK — continued | | | | | | | | |
| SOUTH AFRICA — 1.2% | | | | | | | | |
| Materials — 1.2% | | | | | | | | |
| Sibanye Stillwater | | | 20,095,277 | | | $ | 25,619,015 | |
| | | | | | | | | |
| SOUTH KOREA — 7.9% | | | | | | | | |
| Industrials — 7.9% | | | | | | | | |
| Daewoo Engineering & Construction * | | | 9,699,670 | | | | 28,225,318 | |
| Doosan Enerbility * | | | 2,587,851 | | | | 25,714,680 | |
| GS Engineering & Construction | | | 3,056,169 | | | | 29,779,856 | |
| Hyundai Engineering & Construction | | | 1,168,131 | | | | 28,888,657 | |
| KEPCO Engineering & Construction | | | 625,247 | | | | 24,212,667 | |
| Samsung C&T | | | 435,970 | | | | 34,443,744 | |
| | | | | | | | | |
| TOTAL SOUTH KOREA | | | | | | | 171,264,922 | |
| UNITED KINGDOM — 3.4% | | | | | | | | |
| Industrials — 3.4% | | | | | | | | |
| Yellow Cake *(B) | | | 10,909,077 | | | | 73,071,357 | |
| | | | | | | | | |
| UNITED STATES — 11.9% | | | | | | | | |
| Energy — 11.5% | | | | | | | | |
| Centrus Energy, Cl A * | | | 680,111 | | | | 36,093,491 | |
| Energy Fuels * (A)(B) | | | 8,560,490 | | | | 68,385,258 | |
| Uranium Energy *(B) | | | 20,538,171 | | | | 122,202,117 | |
| Ur-Energy * (A)(B) | | | 14,080,774 | | | | 22,951,661 | |
| | | | | | | | 249,632,527 | |
| Industrials — 0.4% | | | | | | | | |
| NuScale Power * (A) | | | 3,066,799 | | | | 10,365,781 | |
| | | | | | | | | |
| TOTAL UNITED STATES | | | | | | | 259,998,308 | |
TOTAL COMMON STOCK
(Cost $1,711,765,926) | | | | | | | 1,924,008,209 | |
| | | | | | | | | |
| EXCHANGE TRADED FUND — 11.4% | | | | | | | | |
Sprott Physical Uranium Trust * (A)
(Cost $176,277,619) | | | 13,759,221 | | | | 248,870,188 | |
The accompanying notes are an integral part of the financial statements.
27
| Schedule of Investments | | October 31, 2023 |
| | | |
| | Global X Uranium ETF | |
| | | Face Amount | | | Value | |
| U.S. TREASURY OBLIGATION — 5.0% | | | | | | | | |
U.S. Treasury Bill
5.400%, 02/01/24(C) (Cost $108,519,354) | | $ | 110,000,000 | | | $ | 108,505,098 | |
| | | | | | | | | |
| REPURCHASE AGREEMENT(D) — 4.5% | | | | | | | | |
BNP Paribas
5.210%, dated 10/31/2023, to be repurchased on 11/01/2023, repurchase price $97,624,523 (collateralized by various U.S. Treasury Obligations, ranging in par value $2,075,566 - $12,868,533, 2.000% - 4.000%, 02/15/2025 - 02/15/2026, with a total market value of $99,416,403)
(Cost $97,610,396) | | | 97,610,396 | | | | 97,610,396 | |
TOTAL INVESTMENTS — 109.4%
(Cost $2,094,173,295) | | | | | | $ | 2,378,993,891 | |
Percentages are based on Net Assets of $2,175,005,586.
| * | Non-income producing security. |
| (A) | This security or a partial position of this security is on loan at October 31, 2023. The total market value of the securities on loan at October 31, 2023 was $89,600,381. |
| (B) | Affiliated investment. |
| (C) | Interest rate represents the security’s effective yield at the time of purchase. |
| (D) | These securities were purchased with cash collateral held from securities on loan. The total value of such securities as of October 31, 2023 was $97,610,396. The total value of non-cash collateral held from securities on loan as of October 31, 2023 was $-. |
The following is a summary of the level of inputs used as of October 31, 2023, in valuing the Fund’s investments carried at value:
| Investments in Securities | | Level 1 | | | Level 2 | | | Level 3 | | | Total | |
| Common Stock | | $ | 1,924,008,209 | | | $ | — | | | $ | — | | | $ | 1,924,008,209 | |
| Exchange Traded Fund | | | 248,870,188 | | | | — | | | | — | | | | 248,870,188 | |
| U.S Treasury Obligation | | | — | | | | 108,505,098 | | | | — | | | | 108,505,098 | |
| Repurchase Agreement | | | — | | | | 97,610,396 | | | | — | | | | 97,610,396 | |
| Total Investments in Securities | | $ | 2,172,878,397 | | | $ | 206,115,494 | | | $ | — | | | $ | 2,378,993,891 | |
The accompanying notes are an integral part of the financial statements.
28
| Schedule of Investments | | October 31, 2023 |
| | | |
| | Global X Uranium ETF | |
The following is a summary of the transactions with affiliates for the year ended October 31, 2023:
Value at
10/31/22 | | Purchases at
Cost | | Proceeds from
Sales | | Changes in
Unrealized
Appreciation
(Depreciation) | | Realized Gain
(Loss) | | Value at
10/31/23 | | Income | | | Capital
Gains | |
| Bannerman Energy | | | | | | | | | | | | | | | | | | |
| $10,098,092 | | $3,143,049 | | $(2,280,826) | | $2,180,880 | | $(192,072) | | $12,949,123 | | $ | — | | | $ | — | |
| Boss Energy | | | | | | | | | | | | | | | | | | |
| $28,757,838 | | $12,292,484 | | $(8,156,606) | | $13,815,291 | | $2,408,720 | | $49,117,727 | | $ | — | | | $ | — | |
| Energy Fuels | | | | | | | | | | | | | | | | | | |
| $60,320,467 | | $18,269,372 | | $(15,903,996) | | $5,911,310 | | $(211,895) | | $68,385,258 | | $ | — | | | $ | — | |
| Paladin Energy | | | | | | | | | | | | | | | | | | |
| $76,964,381 | | $25,111,671 | | $(19,133,558) | | $3,923,962 | | $3,211,464 | | $90,077,920 | | $ | — | | | $ | — | |
| Peninsula Energy | | | | | | | | | | | | | | | | | | |
| $5,558,922 | | $2,959,321 | | $(1,336,757) | | $(1,920,746) | | $(81,136) | | $5,179,604 | | $ | — | | | $ | — | |
| Uranium Energy | | | | | | | | | | | | | | | | | | |
| $73,972,508 | | $29,749,201 | | $(15,816,223) | | $30,969,034 | | $3,327,597 | | $122,202,117 | | $ | — | | | $ | — | |
| Ur-Energy | | | | | | | | | | | | | | | | | | |
| $14,759,804 | | $6,655,532 | | $(3,299,092) | | $5,078,570 | | $(243,153) | | $22,951,661 | | $ | — | | | $ | — | |
| Yellow Cake | | | | | | | | | | | | | | | | | | |
| $45,428,047 | | $21,677,624 | | $(10,749,567) | | $14,623,005 | | $2,092,248 | | $73,071,357 | | $ | — | | | $ | — | |
| Totals: | | | | | | | | | | | | | | | | | | |
| $315,860,059 | | $119,858,254 | | $(76,676,625) | | $74,581,306 | | $10,311,773 | | $443,934,767 | | $ | — | | | $ | — | |
Amounts designated as “—” are $0 or have been rounded to $0.
See “Glossary” for abbreviations.
The accompanying notes are an integral part of the financial statements.
29
October 31, 2023
Glossary: (abbreviations which may be used in the preceding Schedules of Investments)
Fund Abbreviations
ADR — American Depositary Receipt
Cl — Class
GDR — Global Depositary Receipt
JSC — Joint-Stock Company
30
Statements of Assets and Liabilities
October 31, 2023
| | | Global X Silver
Miners ETF | | Global X Copper
Miners ETF | | Global X Gold
Explorers ETF |
| Assets: | | | | | | | | | | | | |
| Cost of Investments | | $ | 1,095,071,710 | | | $ | 1,584,675,186 | | | $ | 41,185,706 | |
| Cost of Repurchase Agreement | | | 4,580,480 | | | | 4,090,692 | | | | 521,916 | |
| Cost/(Proceeds) of Foreign Currency | | | (890 | ) | | | (22,416 | ) | | | — | |
| Investments, at Value | | $ | 821,631,758 | * | | $ | 1,323,773,819 | * | | $ | 31,923,388 | * |
| Repurchase Agreement, at Value | | | 4,580,480 | | | | 4,090,692 | | | | 521,916 | |
| Cash | | | 1,295,337 | | | | 312,085 | | | | 68,774 | |
| Foreign Currency, at Value | | | 8 | | | | — | | | | — | |
| Receivable for Investment Securities Sold | | | 48,145,808 | | | | 152,061,956 | | | | 2,146,784 | |
| Reclaim Receivable | | | 261,610 | | | | 580,029 | | | | 2,177 | |
| Dividend, Interest, and Securities Lending Income Receivable | | | 9,442 | | | | 1,419,362 | | | | 558 | |
| Receivable for Capital Shares Sold | | | — | | | | 3,939,729 | | | | — | |
| Due from Broker | | | — | | | | 106,111 | | | | — | |
| Due from Custodian | | | — | | | | 600 | | | | — | |
| Total Assets | | | 875,924,443 | | | | 1,486,284,383 | | | | 34,663,597 | |
| Liabilities: | | | | | | | | | | | | |
| Obligation to Return Securities Lending Collateral | | | 4,580,480 | | | | 4,090,692 | | | | 521,916 | |
| Payable for Investment Securities Purchased | | | 47,039,750 | | | | 149,419,547 | | | | 1,743,866 | |
| Payable due to Investment Adviser | | | 456,188 | | | | 778,773 | | | | 17,713 | |
| Unrealized Depreciation on Spot Contracts | | | 9,805 | | | | 19,975 | | | | 166 | |
| Payable for Capital Shares Redeemed | | | — | | | | 14,016,009 | | | | 449,102 | |
| Custodian Fees Payable | | | 18,952 | | | | 23,103 | | | | — | |
| Due to Broker | | | 71,853 | | | | 4,187 | | | | — | |
| Total Liabilities | | | 52,177,028 | | | | 168,352,286 | | | | 2,732,763 | |
| Net Assets | | $ | 823,747,415 | | | $ | 1,317,932,097 | | | $ | 31,930,834 | |
| Net Assets Consist of: | | | | | | | | | | | | |
| Paid-in Capital | | $ | 1,714,117,025 | | | $ | 1,691,415,936 | | | $ | 111,095,742 | |
| Total Accumulated Losses | | | (890,369,610 | ) | | | (373,483,839 | ) | | | (79,164,908 | ) |
| Net Assets | | $ | 823,747,415 | | | $ | 1,317,932,097 | | | $ | 31,930,834 | |
| Outstanding Shares of Beneficial Interest (unlimited authorization — no par value) | | | 34,227,318 | | | | 40,149,374 | | | | 1,422,054 | |
| Net Asset Value, Offering and Redemption Price Per Share | | | $24.07 | | | | $32.83 | | | | $22.45 | |
| *Includes Market Value of Securities on Loan | | $ | 4,066,372 | | | $ | 3,405,922 | | | $ | 489,763 | |
The accompanying notes are an integral part of the financial statements.
31
Statements of Assets and Liabilities
October 31, 2023
| | | Global X
Uranium ETF |
| Assets: | | | | |
| Cost of Investments | | $ | 1,641,533,399 | |
| Cost of Repurchase Agreement | | | 97,610,396 | |
| Cost of Affiliated Investments | | | 355,029,500 | |
| Cost/(Proceeds) of Foreign Currency | | | 54 | |
| Investments, at Value | | $ | 1,837,448,728 | * |
| Repurchase Agreement, at Value | | | 97,610,396 | |
| Affiliated Investments, at Value | | | 443,934,767 | |
| Cash | | | 2,073,121 | |
| Dividend, Interest, and Securities Lending Income Receivable | | | 1,268,796 | |
| Due from Broker | | | 797,496 | |
| Total Assets | | | 2,383,133,304 | |
| Liabilities: | | | | |
| Obligation to Return Securities Lending Collateral | | | 97,610,396 | |
| Payable for Investment Securities Purchased | | | 108,519,354 | |
| Payable for Fund Shares Redeemed | | | 797,496 | |
| Payable due to Investment Adviser | | | 1,194,963 | |
| Custodian Fees Payable | | | 5,509 | |
| Total Liabilities | | | 208,127,718 | |
| Net Assets | | $ | 2,175,005,586 | |
| Net Assets Consist of: | | | | |
| Paid-in Capital | | $ | 2,527,345,369 | |
| Total Accumulated Losses | | | (352,339,783 | ) |
| Net Assets | | $ | 2,175,005,586 | |
| Outstanding Shares of Beneficial Interest (unlimited authorization — no par value) | | | 82,081,666 | |
| Net Asset Value, Offering and Redemption Price Per Share | | | $26.50 | |
| *Includes Market Value of Securities on Loan | | $ | 89,600,381 | |
The accompanying notes are an integral part of the financial statements.
32
Statements of Operations
For the year ended October 31, 2023
| | | Global X Silver
Miners ETF | | Global X Copper
Miners ETF | | Global X Gold
Explorers ETF |
| Investment Income: | | | | | | | | | | | | |
| Dividend Income | | $ | 12,033,043 | | | $ | 47,015,917 | | | $ | 348,170 | |
| Interest Income | | | 33,610 | | | | 67,453 | | | | 1,582 | |
| Security Lending Income | | | 774,338 | | | | 498,097 | | | | 13,267 | |
| Less: Foreign Taxes Withheld | | | (1,969,303 | ) | | | (3,303,123 | ) | | | (33,558 | ) |
| Total Investment Income | | | 10,871,688 | | | | 44,278,344 | | | | 329,461 | |
| Expenses: | | | | | | | | | | | | |
| Supervision and Administration Fees(1) | | | 6,022,025 | | | | 10,865,689 | | | | 239,503 | |
| Custodian Fees(2) | | | 21,432 | | | | 33,149 | | | | 86 | |
| Total Expenses | | | 6,043,457 | | | | 10,898,838 | | | | 239,589 | |
| Net Investment Income | | | 4,828,231 | | | | 33,379,506 | | | | 89,872 | |
| Net Realized Gain (Loss) on: | | | | | | | | | | | | |
| Investments(3) | | | (45,313,219 | ) | | | 111,756,396 | | | | (1,038,061 | ) |
| Foreign Currency Transactions | | | (150,171 | ) | | | (149,288 | ) | | | 2,856 | |
| Net Realized Gain (Loss) | | | (45,463,390 | ) | | | 111,607,108 | | | | (1,035,205 | ) |
| Net Change in Unrealized Appreciation (Depreciation) on: | | | | | | | | | | | | |
| Investments | | | 11,256,741 | | | | 135,932,121 | | | | 3,982,422 | |
| Foreign Currency Translations | | | 17,296 | | | | 180,327 | | | | (1,248 | ) |
| Net Change in Unrealized Appreciation (Depreciation) | | | 11,274,037 | | | | 136,112,448 | | | | 3,981,174 | |
| Net Realized and Unrealized Gain (Loss) | | | (34,189,353 | ) | | | 247,719,556 | | | | 2,945,969 | |
| Net Increase (Decrease) in Net Assets Resulting from Operations | | $ | (29,361,122 | ) | | $ | 281,099,062 | | | $ | 3,035,841 | |
| (1) | The Supervision and Administration fees include fees paid by the Funds for the investment advisory services provided by the Adviser. (See Note 3 in Notes to Financial Statements.) |
| (2) | See Note 2 in the Notes to Financial Statements. |
| (3) | Includes realized gains (losses) as a result of in-kind redemptions. (See Note 4 in Notes to Financial Statements.) |
The accompanying notes are an integral part of the financial statements.
33
Statements of Operations
For the year ended October 31, 2023
| | | Global X
Uranium ETF |
| Investment Income: | | | | |
| Dividend Income | | $ | 16,353,836 | |
| Interest Income | | | 102,368 | |
| Security Lending Income | | | 2,889,388 | |
| Less: Foreign Taxes Withheld | | | (1,319,108 | ) |
| Total Investment Income | | | 18,026,484 | |
| Expenses: | | | | |
| Supervision and Administration Fees(1) | | | 11,095,324 | |
| Custodian Fees(2) | | | 11,605 | |
| Total Expenses | | | 11,106,929 | |
| Net Investment Income | | | 6,919,555 | |
| Net Realized Gain (Loss) on: | | | | |
| Investments(3) | | | 23,911,627 | |
| Affiliated Investments | | | 10,311,773 | |
| Foreign Currency Transactions | | | (315,610 | ) |
| Net Realized Gain (Loss) | | | 33,907,790 | |
| Net Change in Unrealized Appreciation (Depreciation) on: | | | | |
| Investments | | | 340,258,858 | |
| Affiliated Investments | | | 74,581,306 | |
| Foreign Currency Translations | | | 24,000 | |
| Net Change in Unrealized Appreciation (Depreciation) | | | 414,864,164 | |
| Net Realized and Unrealized Gain (Loss) | | | 448,771,954 | |
| Net Increase in Net Assets Resulting from Operations | | $ | 455,691,509 | |
| (1) | The Supervision and Administration fees include fees paid by the Funds for the investment advisory services provided by the Adviser. (See Note 3 in Notes to Financial Statements.) |
| (2) | See Note 2 in the Notes to Financial Statements. |
| (3) | Includes realized gains (losses) as a result of in-kind redemptions. (See Note 4 in Notes to Financial Statements.) |
The accompanying notes are an integral part of the financial statements.
34
Statements of Changes in Net Assets
| | | Global X Silver Miners ETF | | Global X Copper Miners ETF |
| | | Year Ended
October 31, 2023 | | Year Ended
October 31, 2022 | | Year Ended
October 31, 2023 | | Year Ended
October 31, 2022 |
| Operations: | | | | | | | | | | | | | | | | |
| Net Investment Income | | $ | 4,828,231 | | | $ | 6,091,528 | | | $ | 33,379,506 | | | $ | 50,898,257 | |
| Net Realized Gain (Loss) | | | (45,463,390 | ) | | | (162,152,951 | ) | | | 111,607,108 | | | | (5,605,150 | ) |
| Net Change in Unrealized Appreciation (Depreciation) | | | 11,274,037 | | | | (256,020,595 | ) | | | 136,112,448 | | | | (361,943,382 | ) |
| Net Increase (Decrease) in Net Assets Resulting from Operations | | | (29,361,122 | ) | | | (412,082,018 | ) | | | 281,099,062 | | | | (316,650,275 | ) |
| Distributions: | | | (3,186,496 | ) | | | (10,656,479 | ) | | | (38,138,689 | ) | | | (48,850,684 | ) |
| Return of Capital | | | — | | | | (3,107,323 | ) | | | — | | | | — | |
| Capital Share Transactions: | | | | | | | | | | | | | | | | |
| Issued | | | 115,347,129 | | | | 240,640,155 | | | | 562,418,276 | | | | 1,192,691,215 | |
| Redeemed | | | (100,960,271 | ) | | | (73,077,499 | ) | | | (802,934,467 | ) | | | (505,711,107 | ) |
| Increase (Decrease) in Net Assets from Capital Share Transactions | | | 14,386,858 | | | | 167,562,656 | | | | (240,516,191 | ) | | | 686,980,108 | |
| Total Increase (Decrease) in Net Assets | | | (18,160,760 | ) | | | (258,283,164 | ) | | | 2,444,182 | | | | 321,479,149 | |
| Net Assets: | | | | | | | | | | | | | | | | |
| Beginning of Year | | | 841,908,175 | | | | 1,100,191,339 | | | | 1,315,487,915 | | | | 994,008,766 | |
| End of Year | | $ | 823,747,415 | | | $ | 841,908,175 | | | $ | 1,317,932,097 | | | $ | 1,315,487,915 | |
| Share Transactions: | | | | | | | | | | | | | | | | |
| Issued | | | 4,130,000 | | | | 7,690,000 | | | | 14,940,000 | | | | 33,190,000 | |
| Redeemed | | | (3,670,000 | ) | | | (2,290,000 | ) | | | (20,570,000 | ) | | | (14,050,000 | ) |
| Net Increase (Decrease) in Shares Outstanding from Share Transactions | | | 460,000 | | | | 5,400,000 | | | | (5,630,000 | ) | | | 19,140,000 | |
The accompanying notes are an integral part of the financial statements.
35
Statements of Changes in Net Assets
| | | Global X Gold Explorers ETF | | Global X Uranium ETF |
| | | Year Ended
October 31, 2023 | | Year Ended
October 31, 2022 | | Year Ended
October 31, 2023 | | Year Ended
October 31, 2022 |
| Operations: | | | | | | | | | | | | | | | | |
| Net Investment Income | | $ | 89,872 | | | $ | 261,995 | | | $ | 6,919,555 | | | $ | 19,072,965 | |
| Net Realized Gain (Loss) | | | (1,035,205 | ) | | | 1,143,660 | | | | 33,907,790 | | | | (46,867,233 | ) |
| Net Change in Unrealized Appreciation (Depreciation) | | | 3,981,174 | | | | (14,150,744 | ) | | | 414,864,164 | | | | (402,350,552 | ) |
| Net Increase (Decrease) in Net Assets Resulting from Operations | | | 3,035,841 | | | | (12,745,089 | ) | | | 455,691,509 | | | | (430,144,820 | ) |
| Distributions: | | | (292,264 | ) | | | (967,622 | ) | | | (3,660,937 | ) | | | (74,869,077 | ) |
| Return of Capital | | | (18,046 | ) | | | — | | | | — | | | | — | |
| Capital Share Transactions: | | | | | | | | | | | | | | | | |
| Issued | | | 2,710,559 | | | | — | | | | 510,536,160 | | | | 1,082,750,695 | |
| Redeemed | | | (2,250,041 | ) | | | (7,264,855 | ) | | | (376,090,584 | ) | | | (304,816,155 | ) |
| Increase (Decrease) in Net Assets from Capital Share Transactions | | | 460,518 | | | | (7,264,855 | ) | | | 134,445,576 | | | | 777,934,540 | |
| Total Increase (Decrease) in Net Assets | | | 3,186,049 | | | | (20,977,566 | ) | | | 586,476,148 | | | | 272,920,643 | |
| Net Assets: | | | | | | | | | | | | | | | | |
| Beginning of Year | | | 28,744,785 | | | | 49,722,351 | | | | 1,588,529,438 | | | | 1,315,608,795 | |
| End of Year | | $ | 31,930,834 | | | $ | 28,744,785 | | | $ | 2,175,005,586 | | | $ | 1,588,529,438 | |
| Share Transactions: | | | | | | | | | | | | | | | | |
| Issued | | | 110,000 | | | | — | | | | 21,870,000 | | | | 44,260,000 | |
| Redeemed | | | (100,000 | ) | | | (240,000 | ) | | | (18,040,000 | ) | | | (14,670,000 | ) |
| Net Increase (Decrease) in Shares Outstanding from Share Transactions | | | 10,000 | | | | (240,000 | ) | | | 3,830,000 | | | | 29,590,000 | |
The accompanying notes are an integral part of the financial statements.
36
Financial Highlights
Selected Per Share Data & Ratios
For a Share Outstanding Throughout the Period |
| | | Net
Asset Value,
Beginning
of Period
($) | | Net Investment
Income
($)* | | Net Realized
and Unrealized
Gain (Loss) on
Investments
($) | | Total from
Operations
($) | | Distribution
from Net
Investment
Income ($) | | Distribution
from Capital
Gains ($) | | Return of
Capital ($) |
| Global X Silver Miners ETF | | | | | | | | | | | | | | | | | | | | |
| 2023 | | | 24.93 | | | | 0.14 | | | | (0.91 | ) | | | (0.77 | ) | | | (0.09 | ) | | | — | | | | — | |
| 2022 | | | 38.78 | | | | 0.20 | | | | (13.57 | ) | | | (13.37 | ) | | | (0.37 | ) | | | — | | | | (0.11 | ) |
| 2021 | | | 42.28 | | | | 0.41 | | | | (3.00 | ) | | | (2.59 | ) | | | (0.91 | ) | | | — | | | | — | |
| 2020 | | | 30.39 | | | | 0.33 | | | | 12.11 | | | | 12.44 | | | | (0.55 | ) | | | — | | | | — | |
| 2019 | | | 23.20 | | | | 0.21 | | | | 7.38 | | | | 7.59 | | | | (0.40 | ) | | | — | | | | — | |
| Global X Copper Miners ETF | | | | | | | | | | | | | | | | | | | | | |
| 2023 | | | 28.74 | | | | 0.75 | | | | 4.24 | | | | 4.99 | | | | (0.90 | ) | | | — | | | | — | |
| 2022 | | | 37.31 | | | | 1.19 | | | | (8.66 | ) | | | (7.47 | ) | | | (1.10 | ) | | | — | | | | — | |
| 2021 | | | 21.42 | | | | 0.63 | | | | 15.74 | | | | 16.37 | | | | (0.48 | ) | | | — | | | | — | |
| 2020 | | | 17.47 | | | | 0.23 | | | | 3.85 | | | | 4.08 | | | | (0.13 | ) | | | — | | | | — | |
| 2019 | | | 19.38 | | | | 0.37 | | | | (1.58 | ) | | | (1.21 | ) | | | (0.70 | ) | | | — | | | | — | |
| * | Per share data calculated using average shares method. |
| ** | Total Return is for the period indicated and has not been annualized. The return shown does not reflect the deduction of taxes that a shareholder would pay on Fund distributions or the redemption of Fund shares. |
| †† | Portfolio turnover rate is for the period indicated and periods of less than one year have not been annualized. Excludes effect of in-kind transfers. |
Amounts designated as “—” are either $0 or have been rounded to $0.
The accompanying notes are an integral part of the financial statements.
Financial Highlights
Total from
Distributions ($) | | Net
Asset Value,
End of
Period ($) | | Total
Return
(%)** | | Net Assets, End of
Period ($)(000) | | Ratio of Expenses
to Average Net
Assets (%) | | Ratio of Net
Investment Income
to Average Net
Assets (%) | | Portfolio
Turnover (%)†† |
| | | | | | | | | | | | | | | | | | | | |
| | (0.09 | ) | | | 24.07 | | | | (3.12 | ) | | | 823,747 | | | | 0.65 | | | | 0.52 | | | | 19.72 | |
| | (0.48 | ) | | | 24.93 | | | | (34.83 | ) | | | 841,908 | | | | 0.65 | | | | 0.64 | | | | 17.72 | |
| | (0.91 | ) | | | 38.78 | | | | (6.43 | ) | | | 1,100,191 | | | | 0.65 | | | | 0.96 | | | | 15.61 | |
| | (0.55 | ) | | | 42.28 | | | | 41.40 | | | | 984,993 | | | | 0.65 | | | | 0.90 | | | | 19.95 | |
| | (0.40 | ) | | | 30.39 | | | | 33.08 | | | | 525,591 | | | | 0.66 | | | | 0.80 | | | | 42.16 | |
| | | | | | | | | | | | | | | | | | | | | | | | | | | |
| | (0.90 | ) | | | 32.83 | | | | 17.07 | | | | 1,317,932 | | | | 0.65 | | | | 2.00 | | | | 23.73 | |
| | (1.10 | ) | | | 28.74 | | | | (20.38 | ) | | | 1,315,488 | | | | 0.65 | | | | 3.31 | | | | 30.46 | |
| | (0.48 | ) | | | 37.31 | | | | 76.80 | | | | 994,009 | | | | 0.65 | | | | 1.71 | | | | 20.13 | |
| | (0.13 | ) | | | 21.42 | | | | 23.45 | | | | 103,888 | | | | 0.65 | | | | 1.26 | | | | 16.85 | |
| | (0.70 | ) | | | 17.47 | | | | (6.51 | ) | | | 48,021 | | | | 0.65 | | | | 1.89 | | | | 18.77 | |
The accompanying notes are an integral part of the financial statements.
Financial Highlights
Selected Per Share Data & Ratios
For a Share Outstanding Throughout the Period |
| | | Net
Asset Value,
Beginning
of Period
($) | | Net Investment
Income
($)* | | Net Realized
and Unrealized
Gain (Loss) on
Investments
($) | | Total from
Operations
($) | | Distribution
from Net
Investment
Income ($) | | Distribution
from Capital
Gains ($) | | Return of
Capital ($) |
| Global X Gold Explorers ETF | | | | | | | | | | | | | | | | | | | | |
| 2023 | | | 20.36 | | | | 0.06 | | | | 2.25 | | | | 2.31 | | | | (0.21 | ) | | | — | | | | (0.01 | ) |
| 2022 | | | 30.10 | | | | 0.17 | | | | (9.32 | ) | | | (9.15 | ) | | | (0.59 | ) | | | — | | | | — | |
| 2021 | | | 33.48 | | | | 0.20 | | | | (2.54 | ) | | | (2.34 | ) | | | (1.04 | ) | | | — | | | | — | |
| 2020 | | | 25.39 | | | | 0.06 | | | | 8.47 | | | | 8.53 | | | | (0.44 | ) | | | — | | | | — | |
| 2019 | | | 18.49 | | | | 0.04 | | | | 6.87 | | | | 6.91 | | | | (0.01 | ) | | | — | | | | — | |
| Global X Uranium ETF | | | | | | | | | | | | | | | | | | | | |
| 2023 | | | 20.30 | | | | 0.09 | | | | 6.16 | | | | 6.25 | | | | (0.05 | ) | | | — | | | | — | |
| 2022 | | | 27.04 | | | | 0.28 | | | | (5.61 | ) | | | (5.33 | ) | | | (1.41 | ) | | | — | | | | — | |
| 2021 | | | 10.87 | | | | 0.39 | | | | 15.91 | | | | 16.30 | | | | (0.13 | ) | | | — | | | | — | |
| 2020 | | | 10.92 | | | | 0.22 | | | | (0.03 | ) | | | 0.19 | | | | (0.24 | ) | | | — | | | | — | |
| 2019 | | | 12.08 | | | | 0.17 | | | | (1.17 | ) | | | (1.00 | ) | | | (0.16 | ) | | | — | | | | — | |
| * | Per share data calculated using average shares method. |
| ** | Total Return is for the period indicated and has not been annualized. The return shown does not reflect the deduction of taxes that a shareholder would pay on Fund distributions or the redemption of Fund shares. |
| †† | Portfolio turnover rate is for the period indicated and periods of less than one year have not been annualized. Excludes effect of in-kind transfers. |
Amounts designated as “—” are either $0 or have been rounded to $0.
The accompanying notes are an integral part of the financial statements.
Financial Highlights
Total from
Distributions ($) | | Net
Asset Value,
End of
Period ($) | | Total
Return
(%)** | | Net Assets, End of
Period ($)(000) | | Ratio of Expenses
to Average Net
Assets (%) | | Ratio of Net
Investment Income
to Average Net
Assets (%) | | Portfolio
Turnover (%)†† |
| | | | | | | | | | | | | |
| | (0.22 | ) | | | 22.45 | | | | 11.24 | | | | 31,931 | | | | 0.65 | | | | 0.24 | | | | 19.87 | |
| | (0.59 | ) | | | 20.36 | | | | (30.94 | ) | | | 28,745 | | | | 0.65 | | | | 0.63 | | | | 30.04 | |
| | (1.04 | ) | | | 30.10 | | | | (7.36 | ) | | | 49,722 | | | | 0.65 | | | | 0.61 | | | | 18.30 | |
| | (0.44 | ) | | | 33.48 | | | | 34.03 | | | | 60,670 | | | | 0.65 | | | | 0.20 | | | | 18.81 | |
| | (0.01 | ) | | | 25.39 | | | | 37.40 | | | | 43,470 | | | | 0.65 | | | | 0.19 | | | | 16.35 | |
| | | | | | | | | | | | | | | | | | | | | | | | | | | |
| | (0.05 | ) | | | 26.50 | | | | 30.86 | | | | 2,175,006 | | | | 0.69 | | | | 0.43 | | | | 20.03 | |
| | (1.41 | ) | | | 20.30 | | | | (20.11 | ) | | | 1,588,529 | | | | 0.69 | | | | 1.25 | | | | 26.47 | |
| | (0.13 | ) | | | 27.04 | | | | 150.73 | | | | 1,315,609 | | | | 0.69 | | | | 1.91 | | | | 30.01 | |
| | (0.24 | ) | | | 10.87 | | | | 1.72 | | | | 141,609 | | | | 0.69 | | | | 2.03 | | | | 59.21 | |
| | (0.16 | ) | | | 10.92 | | | | (8.42 | ) | | | 187,616 | | | | 0.71 | | | | 1.46 | | | | 23.93 | |
The accompanying notes are an integral part of the financial statements.
Notes to Financial Statements
October 31, 2023
1. ORGANIZATION
The Global X Funds (the “Trust”) is a Delaware statutory trust formed on March 6, 2008. The Trust is registered under the Investment Company Act of 1940 (the “1940 Act”), as amended, as an open-end management investment company. As of October 31, 2023, the Trust had one hundred and thirteen portfolios, one hundred and eight of which were operational. The financial statements herein and the related notes pertain to the Global X Silver Miners ETF, Global X Copper Miners ETF, Global X Gold Explorers ETF and Global X Uranium ETF (the “Funds”). Each Fund has elected non-diversified status under the 1940 Act.
2. SIGNIFICANT ACCOUNTING POLICIES
The following is a summary of the significant accounting policies followed by the Funds:
USE OF ESTIMATES — The Funds are investment companies that apply the accounting and reporting guidance issued in Topic 946 by the U.S. Financial Accounting Standards Board. The preparation of financial statements in conformity with U.S. generally accepted accounting principles (“U.S. GAAP”) requires management to make estimates and assumptions that affect the reported amounts of assets and liabilities and disclosure of contingent assets and liabilities at the date of the financial statements and the reported amounts of increases and decreases in net assets from operations during the reporting period. Actual results could materially differ from those estimates.
RETURN OF CAPITAL ESTIMATES — Distributions received by the Funds from underlying master limited partnership (“MLP”) and real estate investment trust (“REIT”) investments generally are comprised of income and return of capital. The Funds record investment income and return of capital based on estimates made at the time such distributions are received. Such estimates are based on historical information available from the MLPs, REITs and other industry sources. These estimates may subsequently be revised based on information received from the MLPs and REITs after their tax reporting periods are concluded.
SECURITY VALUATION — Securities listed on a securities exchange, market or automated quotation system for which quotations are readily available (except for securities traded on the NASDAQ Stock Market (“NASDAQ”)), including securities traded over the counter, are valued at the last quoted sale price on the primary exchange or market (foreign or domestic) on which they are traded (or at approximately 4:00 pm Eastern time if a security’s primary exchange is normally open at that time), or, if there is no such reported sale, at the most recent mean between the quoted bid and asked prices, which approximates fair value (absent both bid and asked prices on such exchange, the bid price may be used). For securities traded on NASDAQ, the NASDAQ Official Closing Price will be used. The prices for foreign securities are reported in local currency and converted to U.S. dollars using currency exchange rates as of the reporting date. The exchange rates used by the Trust for valuation are captured as of the New York or London close each day.
Notes to Financial Statements (Continued)
October 31, 2023
2. SIGNIFICANT ACCOUNTING POLICIES (continued)
Securities for which market prices are not “readily available” are valued in accordance with fair value procedures (the “Fair Value Procedures”) established by Global X Management Company LLC, the Funds’ investment adviser (the “Adviser”), and approved by the Funds’ Board of Trustees (the “Board”). Pursuant to Rule 2a-5 under the 1940 Act, the Board has designated the Adviser as the “valuation designee” to determine the fair value of securities and other instruments for which no readily available market quotations are available. The Fair Value Procedures are implemented through a fair value committee (the “Committee”) of the Adviser. Some of the more common reasons that may necessitate that a security be valued using the Fair Value Procedures include: the security’s trading has been halted or suspended; the security has been de-listed from its primary trading exchange; the security’s primary trading market is temporarily closed at a time when, under normal conditions, it would be open; the security has not been traded for an extended period of time; the security’s primary pricing source is not able or willing to provide a price; or trading of the security is subject to local government-imposed restrictions. In addition, the Funds may fair value a security if an event that may materially affect the value of the Funds’ security that traded outside of the United States (a “Significant Event”) has occurred between the time of the security’s last close and the time that each Fund calculates its net asset value (“NAV”). A Significant Event may relate to a single issuer or to an entire market sector. Events that may be Significant Events include: government actions, natural disasters, armed conflict, acts of terrorism and significant market fluctuations. If the Adviser becomes aware of a Significant Event that has occurred with respect to a security or group of securities after the closing of the exchange or market on which the security or securities principally trade, but before the time at which the Funds calculate their NAV, it may request that a Committee meeting be called. When a security is valued in accordance with the Fair Value Procedures, the Committee will determine the value after taking into consideration all relevant information reasonably available to the Committee.
If available, debt securities are priced based upon valuations provided by independent, third-party pricing agents. Such values generally reflect the last reported sales price if the security is actively traded. The third-party pricing agents may also value debt securities at an evaluated bid price by employing methodologies that utilize actual market transactions, broker-supplied valuations, or other methodologies designed to identify the market value for such securities. Debt obligations with remaining maturities of sixty days or less will be valued at their market value. Prices for most securities held by the Funds are provided daily by recognized independent pricing agents. If a security price cannot be obtained from an independent, third-party pricing agent, the Funds seek to obtain a bid price from at least one independent broker.
In accordance with the authoritative guidance on fair value measurements and disclosure under U.S. GAAP, the Funds disclose the fair value of their investments in a hierarchy that prioritizes the inputs to valuation techniques used to measure the fair value. The objective of a fair value measurement is to determine the price that would be received to sell an asset
Notes to Financial Statements (Continued)
October 31, 2023
2. SIGNIFICANT ACCOUNTING POLICIES (continued)
or paid to transfer a liability in an orderly transaction between market participants at the measurement date (an exit price). Accordingly, the fair value hierarchy gives the highest priority to quoted prices (unadjusted) in active markets for identical assets or liabilities (Level 1) and the lowest priority to unobservable inputs (Level 3). The three levels of the fair value hierarchy are described below:
Level 1 – Unadjusted quoted prices in active markets for identical, unrestricted assets or liabilities that the Funds have the ability to access at the measurement date
Level 2 – Other significant observable inputs (including quoted prices in non-active markets, quoted prices for similar investments, fair value of investments for which the Funds have the ability to fully redeem tranches at NAV as of the measurement date or within the near term, and short-term investments valued at amortized cost)
Level 3 – Significant unobservable inputs (including the Funds’ own assumptions in determining the fair value of investments and fair value of investments for which the Funds do not have the ability to fully redeem tranches at NAV as of the measurement date or within the near term)
Investments are classified within the level of the lowest significant input considered in determining fair value. Investments classified within Level 3 whose fair value measurement considers several inputs may include Level 1 or Level 2 inputs as components of the overall fair value measurement. For details of the investment classification, reference the Schedules of Investments.
The unobservable inputs used to determine fair value of Level 3 assets may have similar or diverging impacts on valuation. Significant increases and decreases in these inputs in isolation and interrelationships between those inputs could result in significantly higher or lower fair value measurement.
DUE TO/FROM BROKERS — Due to/from brokers includes cash and collateral balances with the Funds’ clearing brokers or counterparties as of October 31, 2023. The Funds continuously monitor the credit standing of each broker or counterparty with whom they conduct business. In the event a broker or counterparty is unable to fulfill its obligations, the Funds would be subject to counterparty credit risk.
REPURCHASE AGREEMENTS — Securities pledged as collateral for repurchase agreements by BNP Paribas are held by Brown Brothers Harriman & Co. (“BBH”), or the Bank of New York Mellon (“BNY Mellon”), as appropriate, in their roles as Custodian to respective Funds (each, a “Custodian” and together, the “Custodians”), and are designated as being held on each Fund’s behalf by the Custodian under a book-entry system. Each Fund monitors the adequacy of the collateral on a daily basis and can require the seller to
Notes to Financial Statements (Continued)
October 31, 2023
2. SIGNIFICANT ACCOUNTING POLICIES (continued)
provide additional collateral in the event the market value of the securities pledged falls below the carrying value of the repurchase agreement, including accrued interest.
It is the Funds’ policy to only enter into repurchase agreements with banks and other financial institutions which are deemed by the Adviser to be creditworthy. The Funds bear the risk of loss in the event that the counterparty to a repurchase agreement defaults on its obligations, and the Funds are prevented from exercising their rights to dispose of the underlying securities received as collateral. For financial statement purposes, the Funds record the securities lending collateral (included in repurchase agreements, at value or restricted cash) as an asset and the obligation to return securities lending collateral as a liability on the Statements of Assets and Liabilities.
Repurchase agreements are entered into by the Funds under Master Repurchase Agreements (“MRA”) which permit the Funds, under certain circumstances, including an event of default (such as bankruptcy or insolvency), to offset payables and/or receivables under an MRA with collateral held and/or posted to the counterparty and create one single net payment due to or from the Funds.
FEDERAL INCOME TAXES — It is each Fund’s intention to qualify, or continue to qualify, as a regulated investment company for Federal income tax purposes by complying with the appropriate provisions of Subchapter M of the Internal Revenue Code of 1986, as amended. Accordingly, no provisions for Federal income taxes have been made in the financial statements.
The Funds evaluate tax positions taken or expected to be taken in the course of preparing the Funds’ tax returns to determine whether it is “more-likely-than-not” (i.e., greater than 50 percent) that each tax position will be sustained upon examination by a taxing authority based on the technical merits of the position. Tax positions not deemed to meet the more-likely-than-not threshold are recorded as a tax benefit or expense in the current year. The Funds did not record any tax positions in the current period. Management’s conclusions regarding tax positions may be subject to review and adjustment at a later date based on factors including, but not limited to, examination by tax authorities (i.e., the last three tax year ends, as applicable) and on-going analysis of and changes to tax laws and regulations, and interpretations thereof.
If a Fund has foreign tax filings that have not been made, the tax years that remain subject to examination may date back to the inception of the Fund.
As of and during the year ended October 31, 2023, the Funds did not have a liability for any unrecognized tax benefits. The Funds recognize interest and penalties, if any, related to unrecognized tax benefits as income tax expense on the Statements of Operations. During the reporting period, the Funds did not incur any interest or penalties.
Notes to Financial Statements (Continued)
October 31, 2023
2. SIGNIFICANT ACCOUNTING POLICIES (continued)
SECURITY TRANSACTIONS AND INVESTMENT INCOME — Security transactions are accounted for on the trade date for financial reporting purposes. Costs used in determining realized gains and losses on the sale of investment securities are based on specific identification. Dividend income is recorded on the ex-dividend date. Interest income is recognized on the accrual basis from the settlement date. Amortization of premiums and accretion of discounts is included in interest income.
FOREIGN CURRENCY TRANSACTIONS AND TRANSLATION — The books and records of the Funds are maintained in U.S. dollars. Investment securities and other assets and liabilities denominated in a foreign currency are translated into U.S. dollars on the date of valuation. Purchases and sales of investment securities, income and expenses are translated into U.S. dollars at the relevant rates of exchange prevailing on the respective dates of such transactions. The Funds do not isolate that portion of realized or unrealized gains and losses resulting from changes in the foreign exchange rate from fluctuations arising from changes in the market prices of the securities. These gains and losses are included in net realized and unrealized gains and losses on investments on the Statements of Operations. Net realized and unrealized gains and losses on foreign currency transactions and translations represent net foreign exchange gains or losses from foreign currency spot contracts, disposition of foreign currencies, currency gains or losses realized between trade and settlement dates on securities transactions and the difference between the amount of the investment income and foreign withholding taxes recorded on the Funds’ books and the U.S. dollar equivalent amounts actually received or paid.
DIVIDENDS AND DISTRIBUTIONS TO SHAREHOLDERS — The Funds distribute their net investment income on a pro rata basis. Any net investment income and net realized capital gains are distributed at least annually. All distributions are recorded on the ex-dividend date.
CREATION UNITS — The Funds issue and redeem their shares (“Shares”) on a continuous basis at NAV and only in large blocks of 10,000 Shares, referred to as “Creation Units”. Purchasers of Creation Units (“Authorized Participants”) at NAV must pay a standard creation transaction fee per transaction. The fee is a single charge and will be the same regardless of the number of Creation Units purchased by an Authorized Participant on the same day. An Authorized Participant who holds Creation Units and wishes to redeem at NAV would also pay a standard redemption fee per transaction to BBH or BNY Mellon, as applicable, on the date of such redemption, regardless of the number of Creation Units
Notes to Financial Statements (Continued)
October 31, 2023
2. SIGNIFICANT ACCOUNTING POLICIES (continued)
redeemed that day. If a Creation Unit is purchased or redeemed for cash, an additional variable fee may be charged. The following table discloses Creation Unit breakdown:
| | | Creation
Unit
Shares | | Creation
Fee | | Value at
October 31,
2023 | | Redemption
Fee |
| Global X Silver Miners ETF | | 10,000 | | $ | 500 | | | $ | 240,700 | | | $ | 500 | |
| Global X Copper Miners ETF | | 10,000 | | | 600 | | | | 328,300 | | | | 600 | |
| Global X Gold Explorers ETF | | 10,000 | | | 1,000 | | | | 224,500 | | | | 1,000 | |
| Global X Uranium ETF | | 10,000 | | | 500 | | | | 265,000 | | | | 500 | |
CASH OVERDRAFT CHARGES — Per the terms of an agreement with BBH, if a Fund has a cash overdraft on a given day, it will be assessed an overdraft charge equal to the applicable BBH Base Rate plus 2.00%. Per the terms of an agreement with BNY Mellon, if a Fund has a cash overdraft, it will be charged interest at a rate then charged by BNY Mellon to its institutional custody clients in the relevant currency. Cash overdraft charges are included in custodian fees on the Statements of Operations.
3. RELATED PARTIES AND SERVICE PROVIDER TRANSACTIONS
On July 2, 2018, the Adviser consummated a transaction pursuant to which it became an indirect, wholly-owned subsidiary of Mirae Asset Global Investments Co., Ltd. (“Mirae”). In this manner, the Adviser is ultimately controlled by Mirae.
The Adviser serves as the investment adviser and the administrator for the Funds. Subject to the supervision of the Board, the Adviser is responsible for managing the investment activities of the Funds and the Funds’ business affairs and other administrative matters and provides, or causes to be furnished, all supervisory, administrative and other services reasonably necessary for the operation of the Funds, including certain distribution services (provided pursuant to a separate distribution agreement), certain shareholder and distribution-related services (provided pursuant to a separate Rule 12b-1 Plan and related agreements) and investment advisory services (provided pursuant to a separate Investment Advisory Agreement), under what is essentially an “all-in” fee structure. For the Adviser’s service to the respective Funds, under a supervision and administration agreement (the “Supervision and Administration Agreement”), each Fund pays a monthly fee to the Adviser at the annual rate below (stated as a percentage of the average daily net assets of the Fund) (“Supervision and Administrative Fee”). In addition, the Funds bear other expenses, directly and indirectly, that are not covered by the Supervision and Administration Agreement, which may vary and affect the total expense ratios of the Funds, such as taxes, brokerage fees, commissions, certain custodian fees, acquired fund fees and other transaction expenses, interest expenses and extraordinary expenses (such as litigation and indemnification expenses).
Notes to Financial Statements (Continued)
October 31, 2023
3. RELATED PARTIES AND SERVICE PROVIDER TRANSACTIONS (continued)
The following table discloses supervision and administration fees payable pursuant to the Supervision and Administration Agreement:
| | | Supervision and
Administration Fee |
| Global X Silver Miners ETF | | 0.65% |
| Global X Copper Miners ETF | | 0.65% |
| Global X Gold Explorers ETF | | 0.65% |
| Global X Uranium ETF | | 0.69% |
SEI Investments Global Funds Services (“SEIGFS”) serves as sub-administrator to the Funds. As sub-administrator, SEIGFS provides the Funds with all the required general administrative services, including, without limitation: office space, equipment, and personnel; clerical and general back office services; bookkeeping, internal accounting and secretarial services; the calculation of NAV; and assistance with the preparation and filing of reports, registration statements, proxy statements and other materials required to be filed or furnished by the Funds under federal and state securities laws. As compensation for these services, SEIGFS receives certain out-of-pocket costs, transaction fees and asset-based fees which are accrued daily and paid monthly by the Adviser.
SEI Investments Distribution Co. (“SIDCO”) serves as the Funds’ underwriter and distributor of Creation Units pursuant to a distribution agreement (the “Distribution Agreement”). SIDCO has no obligation to sell any specific quantity of Shares of the Funds. SIDCO bears the following costs and expenses relating to the distribution of Shares: (1) the costs of processing and maintaining records of creations of Creation Units; (2) all costs of maintaining the records required of a registered broker/dealer; (3) the expenses of maintaining its registration or qualification as a dealer or broker under federal or state laws; (4) filing fees; and (5) all other expenses incurred in connection with the distribution services as contemplated in the Distribution Agreement. SIDCO receives no fee from the Funds for its distribution services under the Distribution Agreement; rather, the Adviser compensates SIDCO for certain expenses, out-of-pocket costs, and transaction fees.
BBH serves as transfer agent and Custodian of the Global X Uranium ETF’s assets. As Custodian, BBH has agreed to (1) make receipts and disbursements of money on behalf of the Fund; (2) collect and receive all income and other payments and distributions on account of the portfolio investments; (3) respond to correspondence from shareholders, security brokers and others relating to its duties; and (4) make periodic reports to the Fund concerning the Fund’s operations. BBH does not exercise any supervisory function over the purchase and sale of securities. As compensation for these services, BBH receives certain out-of-pocket costs, transaction fees and asset-based fees which are accrued daily and paid monthly by the Adviser from its fees. As transfer agent, BBH has agreed to (1) issue and redeem Shares of the Fund; (2) make dividend and other distributions
Notes to Financial Statements (Continued)
October 31, 2023
3. RELATED PARTIES AND SERVICE PROVIDER TRANSACTIONS (continued)
to shareholders of the Fund; (3) respond to correspondence by shareholders and others relating to its duties; (4) maintain shareholder accounts; and (5) make periodic reports to the Fund. As compensation for these services, BBH receives certain out-of-pocket costs, transaction fees and asset-based fees which are accrued daily and paid monthly by the Adviser from its fees.
BNY Mellon serves as Custodian and transfer agent to the Global X Silver Miners ETF, Global X Copper Miners ETF and Global X Gold Explorers ETF. BNY Mellon may appoint domestic and foreign sub-custodians and use depositories from time to time to hold securities and other instruments purchased by the Trust in foreign countries and to hold cash and currencies for the Trust. Under its transfer agency agreement with the Trust, BNY Mellon has undertaken with the Trust to provide the following services with respect to the Funds: (i) perform and facilitate the performance of purchases and redemptions of Creation Units, (ii) prepare and transmit by means of Depository Trust Company’s book-entry system payments for dividends and distributions on or with respect to the Shares declared by the Trust on behalf of the Fund, as applicable, (iii) prepare and deliver reports, information and documents as specified in the transfer agency agreement, (iv) perform the customary upon. services of a transfer agent and dividend disbursing agent, and (v) render certain other miscellaneous services as specified in the transfer agency agreement or as otherwise agreed upon. The custodian, transfer agent and securities lending agent for the Global X Copper Miners ETF and Global X Gold Explorers ETF transitioned from BBH to BNY Mellon on or about June 12, 2023. The custodian, transfer agent and securities lending agent for the Global X Silver Miners ETF transitioned from BBH to BNY Mellon on or about July 10, 2023.
4. INVESTMENT TRANSACTIONS
For the year ended October 31, 2023, the purchases and sales of investments in securities, excluding in-kind transactions, long-term U.S. Government and short-term securities were:
| | | Purchases | | Sales and
Maturities |
| Global X Silver Miners ETF | | $ | 181,133,955 | | | $ | 180,219,444 | |
| Global X Copper Miners ETF | | | 441,102,707 | | | | 386,476,847 | |
| Global X Gold Explorers ETF | | | 7,235,867 | | | | 7,175,012 | |
| Global X Uranium ETF | | | 348,416,810 | | | | 329,470,731 | |
Notes to Financial Statements (Continued)
October 31, 2023
4. INVESTMENT TRANSACTIONS (continued)
For the year ended October 31, 2023, in-kind transactions associated with creations and redemptions were:
| | | Purchases | | | Sales | | | Realized
Gain/(Loss) |
| Global X Silver Miners ETF | | $ | 106,115,443 | | | $ | 92,856,949 | | | $ | 17,681,463 | |
| Global X Copper Miners ETF | | | 511,587,135 | | | | 802,383,588 | | | | 138,697,800 | |
| Global X Gold Explorers ETF | | | 2,455,527 | | | | 2,245,651 | | | | 619,289 | |
| Global X Uranium ETF | | | 449,927,608 | | | | 331,902,126 | | | | 63,151,110 | |
During the year ended October 31, 2023, there were no purchases or sales of long-term U.S. Government securities for the Funds.
5. TAX INFORMATION
The amount and character of income and capital gain distributions to be paid, if any, are determined in accordance with Federal income tax regulations, which may differ from U.S. GAAP. As a result, net investment income (loss) and net realized gain (loss) on investment transactions for a reporting period may differ significantly from distributions during such period. These book/tax differences may be temporary or permanent. To the extent these differences are permanent in nature, they are charged or credited to undistributed net investment income (loss), accumulated net realized gain (loss) or paid-in capital, as appropriate, in the period that the differences arise.
The following differences, primarily attributable to redemptions in-kind, sales of passive foreign investment companies, net operating loss, and return of capital distributions, have been reclassified to/from the following accounts during the fiscal year ended October 31, 2023:
| Global X Funds | | Paid-in
Capital | | Distributable
Earnings (Loss) |
| Global X Silver Miners ETF | | | $11,645,702 | | | | $ (11,645,702) | |
| Global X Copper Miners ETF | | | 125,689,004 | | | | (125,689,004) | |
| Global X Gold Explorers ETF | | | 494,713 | | | | (494,713) | |
| Global X Uranium ETF | | | 47,480,297 | | | | (47,480,297) | |
Notes to Financial Statements (Continued)
October 31, 2023
5. TAX INFORMATION (continued)
The tax character of dividends and distributions declared during the years ended October 31, 2023 and 2022 were as follows:
| Global X Funds | | Ordinary Income | | | Long-Term
Capital Gain | | | Return of Capital | | | Totals | |
| Global X Silver Miners ETF | | | | | | | | | | | | | | | | |
| 2023 | | $ | 3,186,496 | | | $ | — | | | $ | — | | | $ | 3,186,496 | |
| 2022 | | | 10,656,479 | | | | — | | | | 3,107,323 | | | | 13,763,802 | |
| Global X Copper Miners ETF | | | | | | | | | | | | | | | | |
| 2023 | | $ | 38,138,689 | | | $ | — | | | $ | — | | | $ | 38,138,689 | |
| 2022 | | | 48,850,684 | | | | — | | | | — | | | | 48,850,684 | |
| Global X Gold Explorers ETF | | | | | | | | | | | | | | | | |
| 2023 | | $ | 292,264 | | | $ | — | | | $ | 18,046 | | | $ | 310,310 | |
| 2022 | | | 967,622 | | | | — | | | | — | | | | 967,622 | |
| Global X Uranium ETF | | | | | | | | | | | | | | | | |
| 2023 | | $ | 3,660,937 | | | $ | — | | | $ | — | | | $ | 3,660,937 | |
| 2022 | | | 74,869,077 | | | | — | | | | — | | | | 74,869,077 | |
As of October 31, 2023, the components of tax basis accumulated losses were as follows:
| | | Global X Funds |
| | | Global X Silver
Miners ETF | | Global X
Copper Miners
ETF | | Global X Gold
Explorers ETF |
| Undistributed Ordinary Income | | $ | 4,498,628 | | | $ | 15,418,184 | | | $ | — | |
| Capital Loss Carryforwards | | | (567,822,644 | ) | | | (97,148,826 | ) | | | (68,980,498 | ) |
| Unrealized Depreciation on Investments and Foreign Currency | | | (327,045,582 | ) | | | (291,754,778 | ) | | | (10,184,404 | ) |
| Other Temporary Differences | | | (12 | ) | | | 1,581 | | | | (6 | ) |
| Total Accumulated Losses | | $ | (890,369,610 | ) | | $ | (373,483,839 | ) | | $ | (79,164,908 | ) |
| | | Global X Funds |
| | | Global X
Uranium ETF |
| Undistributed Ordinary Income | | $ | 141,416,179 | |
| Capital Loss Carryforwards | | | (533,820,062 | ) |
| Unrealized Appreciation on Investments and Foreign Currency | | | 40,064,098 | |
| Other Temporary Differences | | | 2 | |
| Total Accumulated Losses | | $ | (352,339,783 | ) |
For taxable years beginning after December 22, 2010, a Registered Investment Company within the meaning of the 1940 Act is permitted to carry forward net capital losses to offset capital gains realized in later years, and the losses carried forward retain their original
Notes to Financial Statements (Continued)
October 31, 2023
5. TAX INFORMATION (continued)
character as either long-term or short-term losses. Losses carried forward under these provisions are as follows:
| | | Short-Term
Loss | | | Long-Term
Loss | | | Total | |
| Global X Silver Miners ETF | | $ | 135,128,785 | | | $ | 432,693,859 | | | $ | 567,822,644 | |
| Global X Copper Miners ETF | | | 67,986,007 | | | | 29,162,819 | | | | 97,148,826 | |
| Global X Gold Explorers ETF | | | 15,695,120 | | | | 53,285,378 | | | | 68,980,498 | |
| Global X Uranium ETF | | | 146,284,604 | | | | 387,535,458 | | | | 533,820,062 | |
The Federal tax cost and aggregate gross unrealized appreciation and depreciation on investments held by the Funds at October 31, 2023 were as follows:
| Global X Funds | | Federal Tax
Cost | | | Aggregated
Gross
Unrealized
Appreciation | | | Aggregated
Gross
Unrealized
Depreciation | | | Net
Unrealized
Appreciation
(Depreciation) | |
| Global X Silver Miners ETF | | | $1,153,248,915 | | | | $14,092,718 | | | | $(341,138,300 | ) | | | $(327,045,582 | ) |
| Global X Copper Miners ETF | | | 1,619,600,084 | | | | 20,162,436 | | | | (311,917,214 | ) | | | (291,754,778 | ) |
| Global X Gold Explorers ETF | | | 42,629,422 | | | | 2,138,679 | | | | (12,323,083 | ) | | | (10,184,404 | ) |
| Global X Uranium ETF | | | 2,338,919,786 | | | | 482,358,610 | | | | (442,294,512 | ) | | | 40,064,098 | |
The preceding differences between book and tax cost are primarily due to mark-to-market treatment of passive foreign investment companies and wash sales.
6. CONCENTRATION OF RISKS
The Funds invest in securities of foreign issuers in various countries. These investments may involve certain considerations and risks not typically associated with investments in the United States as a result of, among other factors, the possibility of future political and economic developments and the level of governmental supervision and regulation of securities markets in the respective countries.
The securities markets of emerging market countries are less liquid, subject to greater price volatility, and have a smaller market capitalization than the U.S. securities markets. In certain countries, there may be fewer publicly traded securities and the market may be dominated by a few issuers or sectors. Issuers and securities markets in such countries are not subject to as extensive and frequent accounting, financial and other reporting requirements or as comprehensive government regulations as are issuers and securities markets in the United States. In particular, the assets and profits appearing on the financial statements of emerging market country issuers may not reflect their financial position or results of operations in the same manner as financial statements for U.S. issuers. Substantially less information may be publicly available about emerging market country issuers than is available about issuers in the United States.
Notes to Financial Statements (Continued)
October 31, 2023
6. CONCENTRATION OF RISKS (continued)
The Funds may be subject to taxes imposed by countries in which they invest. Such taxes are generally based on either income or gains earned or repatriated. The Funds accrue and apply such taxes to net investment income, net realized gains and net unrealized gains as income and/or capital gains are earned.
The Funds use a replication strategy. A replication strategy is an indexing strategy that involves investing in the securities of an underlying index in approximately the same proportions as in the underlying index. Each Fund may utilize a representative sampling strategy with respect to its underlying index when a replication strategy might be detrimental to its shareholders, such as when there are practical difficulties or substantial costs involved in compiling a portfolio of equity securities to follow its underlying index, or, in certain instances, when securities in the underlying index become temporarily illiquid, unavailable or less liquid, or due to legal restrictions (such as diversification requirements that apply to the Funds but not the underlying indexes). Commodity related securities are susceptible to fluctuations in certain commodity markets. Any negative changes in commodity markets could have a material impact on the Funds.
Certain Funds may invest in commodity related securities, which are susceptible to fluctuations in certain commodity markets. Any negative changes in commodity markets could have a great impact on those securities.
Certain Funds may have investments in financial instruments that utilize the London Interbank Offered Rate (“LIBOR”) as the reference or benchmark rate for variable interest rate calculations. LIBOR was intended to measure the rate generally at which banks can lend and borrow from one another in the relevant currency on an unsecured basis. The UK Financial Conduct Authority (“FCA”), the regulator that oversees LIBOR, announced that the majority of LIBOR rates would cease to be published or would no longer be representative on January 1, 2022. The publication of most LIBOR rates ceased at the end of 2021, and the remaining USD LIBOR rates ceased to be published after June 2023.There remains uncertainty and risks relating to the continuing LIBOR transition and its effects on the Funds and the instruments in which the Funds invest. There can be no assurance that the composition or characteristics of any alternative reference rates (“ARRs”) or financial instruments in which the Funds invest that utilize ARRs will be similar to or produce the same value or economic equivalence as LIBOR or that these instruments will have the same volume or liquidity. Additionally, there remains uncertainty and risks relating to certain “legacy” USD LIBOR instruments that were issued or entered into before December 31, 2021 and the process by which a replacement interest rate will be identified and implemented into these instruments when USD LIBOR is ultimately discontinued. On December 16, 2022, the Federal Reserve Board adopted regulations implementing the Adjustable Interest Rate Act. The regulations provide a statutory fallback mechanism to replace LIBOR, by identifying benchmark rates based on the Secured Overnight Financing Rate (“SOFR”) that replaced LIBOR in certain financial contracts after June 30, 2023.
Notes to Financial Statements (Continued)
October 31, 2023
6. CONCENTRATION OF RISKS (continued)
These regulations apply only to contracts governed by U.S. law, among other limitations. The Funds may have instruments linked to other interbank offered rates that may also cease to be published in the future. The effects of such uncertainty and risks in “legacy” USD LIBOR instruments held by the Funds could result in losses to the Funds.
Please refer to each Fund’s prospectus and statement of additional information (“SAI”) for a more complete description of risks.
7. LOANS OF PORTFOLIO SECURITIES
Each Fund may lend portfolio securities having a market value up to one-third of its total assets. Security loans made pursuant to securities lending agreements with BBH and BNY Mellon are initially required to be secured by collateral equal to at least 102% of the value of domestic equity securities and American Depositary Receipts (“ADRs”) and 105% of the value of foreign equity securities (other than ADRs). Such collateral received in connection with these loans will be cash and can be invested in repurchase agreements, short-term investments or U.S. Treasury obligations and is recognized in the Schedules of Investments and Statements of Assets and Liabilities. The obligation to return securities lending collateral is also recognized as a liability in the Statements of Assets and Liabilities. It is the Funds’ policy to obtain additional collateral from or return excess collateral to the borrower by the end of the next business day, following the valuation date of the securities loaned. Therefore, the value of the collateral held may be temporarily less than the value of the securities on loan.
Securities pledged as collateral for repurchase agreements held in Global X Silver Miners ETF, Global X Copper Minters ETF and Global X Gold Explorers ETF are held by BNY Mellon and are designated as being held on the Fund’s behalf under a book-entry system. The Funds monitor the adequacy of the collateral on a daily basis and can require the seller to provide additional collateral in the event the market value of the securities pledged falls below the carrying value of the repurchase agreement, including accrued interest. It is the Funds’ policy to only enter into repurchase agreements with banks and other financial institutions which are deemed by the Adviser to be creditworthy. The Funds bear the risk of loss in the event the other party to a repurchase agreement defaults on its obligations and the Fund is prevented from exercising its rights to dispose of the underlying securities received as collateral and the risk of a possible decline in the value of the underlying securities during the period. For financial statement purposes, the Funds record the securities lending collateral (including in repurchase agreements, at value or restricted cash) as an asset and the obligation to return securities lending collateral as a liability- on the Statement of Assets and Liabilities.
Cash collateral received in connection with securities lending is invested in repurchase agreements and short-term investments by the lending agent. The Funds do not have
Notes to Financial Statements (Continued)
October 31, 2023
7. LOANS OF PORTFOLIO SECURITIES (continued)
effective control of the non-cash collateral and therefore it is not disclosed in the Fund’s Schedule of Investments.
Securities lending transactions are entered into by the Funds under the Securities Lending Agreement, which permits a Fund, under certain circumstances such as an event of default, to offset amounts payable by the Fund to the same counterparty against amounts receivable from the counterparty to create a net payment due to or from the Fund.
The following is a summary of securities lending agreements held by the Funds, with cash collateral of overnight maturities and non-cash collateral, which would be subject to offset as of October 31, 2023.
| | | Gross Amount
of Recognized
Assets (Value
of Securities on
Loan) | | Value of
Cash
Collateral
Received(1) | | Value of
Non-Cash
Collateral
Received(1) | | Net Amount |
| Global X Silver Miners ETF | | $ | 4,066,372 | | | $ | 4,039,072 | | | $ | 27,300 | | | $ | — | |
| Global X Copper Miners ETF | | | 3,405,922 | | | | 3,405,922 | | | | — | | | | — | |
| Global X Gold Explorers ETF | | | 489,763 | | | | 480,200 | | | | 9,563 | | | | — | |
| Global X Uranium ETF | | | 89,600,381 | | | | 89,600,381 | | | | — | | | | — | |
| (1) | Collateral and non-cash collateral received in excess of market value of securities on loan is not presented in this table. The total cash collateral received by the Fund is disclosed in the Statements of Assets and Liabilities. |
The value of loaned securities and related collateral outstanding at October 31, 2023 are shown in the Schedules of Investments. The value of the collateral held may be temporarily less than that required under the lending contract. As of October 31, 2023, the cash collateral was invested in repurchase agreements and the non-cash collateral consisted of U.S. Treasury Bills, Notes, Bonds and U.S. Treasury Inflation Indexed Bonds with the following maturities:
Notes to Financial Statements (Concluded)
October 31, 2023
7. LOANS OF PORTFOLIO SECURITIES (continued)
| | | Overnight and
Continuous | | | <30 Days | | | Between
30 & 90
Days | | | >90 Days | | | Total | |
| Global X Silver Miners ETF | | | | | | | | | | | | | | | | | | | | |
| Repurchase Agreements | | $ | 4,580,480 | | | $ | — | | | $ | — | | | $ | — | | | $ | 4,580,480 | |
| U.S. Government Securities | | | — | | | | — | | | | — | | | | 27,300 | | | | 27,300 | |
| Total | | $ | 4,580,480 | | | $ | — | | | $ | — | | | $ | 27,300 | | | $ | 4,607,780 | |
| Global X Copper Miners ETF | | | | | | | | | | | | | | | | | | | | |
| Repurchase Agreements | | $ | 4,090,692 | | | $ | — | | | $ | — | | | $ | — | | | $ | 4,090,692 | |
| Total | | $ | 4,090,692 | | | $ | — | | | $ | — | | | $ | — | | | $ | 4,090,692 | |
| Global X Gold Explorers ETF | | | | | | | | | | | | | | | | | | | | |
| Repurchase Agreements | | $ | 521,916 | | | $ | — | | | $ | — | | | $ | — | | | $ | 521,916 | |
| U.S. Government Securities | | | — | | | | — | | | | — | | | | 9,563 | | | | 9,563 | |
| Total | | $ | 521,916 | | | $ | — | | | $ | — | | | $ | 9,563 | | | $ | 531,479 | |
| Global X Uranium ETF | | | | | | | | | | | | | | | | | | | | |
| Repurchase Agreements | | $ | 97,610,396 | | | $ | — | | | $ | — | | | $ | — | | | $ | 97,610,396 | |
| Total | | $ | 97,610,396 | | | $ | — | | | $ | — | | | $ | — | | | $ | 97,610,396 | |
8. CONTRACTUAL OBLIGATION
The Funds enter into contracts in the normal course of business that contain a variety of indemnifications. The Funds’ maximum exposure under these contracts is unknown, however, the Funds have not had prior gains or losses pursuant to these contracts. Management has reviewed the Funds’ existing contracts and expects the risk of loss to be remote.
Pursuant to the Trust’s organizational documents, the Trustees of the Trust and the Trust’s officers are indemnified against certain liabilities that may arise out of the performance of their duties.
9. SUBSEQUENT EVENTS
The Funds have been evaluated by management regarding the need for additional disclosures and/or adjustments resulting from subsequent events. Based on this evaluation, no additional adjustments were required to the financial statements.
Report of Independent Registered Public Accounting Firm
To the Board of Trustees of Global X Funds and Shareholders of Global X Silver Miners ETF, Global X Copper Miners ETF, Global X Gold Explorers ETF and Global X Uranium ETF
Opinions on the Financial Statements
We have audited the accompanying statements of assets and liabilities, including the schedules of investments, of Global X Silver Miners ETF, Global X Copper Miners ETF, Global X Gold Explorers ETF and Global X Uranium ETF (four of the funds constituting Global X Funds, hereafter collectively referred to as the “Funds”) as of October 31, 2023, the related statements of operations for the year ended October 31, 2023, the statements of changes in net assets for each of the two years in the period ended October 31, 2023, including the related notes, and the financial highlights for each of the five years in the period ended October 31, 2023 (collectively referred to as the “financial statements”). In our opinion, the financial statements present fairly, in all material respects, the financial position of each of the Funds as of October 31, 2023, the results of each of their operations for the year then ended, the changes in each of their net assets for each of the two years in the period ended October 31, 2023 and each of the financial highlights for each of the five years in the period ended October 31, 2023 in conformity with accounting principles generally accepted in the United States of America.
Basis for Opinions
These financial statements are the responsibility of the Funds’ management. Our responsibility is to express an opinion on the Funds’ financial statements based on our audits. We are a public accounting firm registered with the Public Company Accounting Oversight Board (United States) (PCAOB) and are required to be independent with respect to the Funds in accordance with the U.S. federal securities laws and the applicable rules and regulations of the Securities and Exchange Commission and the PCAOB.
We conducted our audits of these financial statements in accordance with the standards of the PCAOB. Those standards require that we plan and perform the audit to obtain reasonable assurance about whether the financial statements are free of material misstatement, whether due to error or fraud.
Our audits included performing procedures to assess the risks of material misstatement of the financial statements, whether due to error or fraud, and performing procedures that respond to those risks. Such procedures included examining, on a test basis, evidence regarding the amounts and disclosures in the financial statements. Our audits also included evaluating the accounting principles used and significant estimates made by management, as well as evaluating the overall presentation of the financial statements. Our procedures included confirmation of securities owned as of October 31, 2023 by correspondence with the custodians and brokers; when replies were not received from brokers, we performed
Report of Independent Registered Public Accounting Firm
other auditing procedures. We believe that our audits provide a reasonable basis for our opinions.
/s/PricewaterhouseCoopers LLP
Philadelphia, Pennsylvania
January 2, 2024
We have served as the auditor of one or more investment companies in Global X Funds since 2016.
Disclosure of Fund Expenses (Unaudited)
ETFs (such as the Funds) have operating expenses. As a shareholder of an ETF, your investment is affected by these ongoing costs, which include (among others) costs for ETF management, administrative services, brokerage fees, and shareholder reports like this one. It is important for you to understand the impact of these costs on your investment returns. In addition, a shareholder is responsible for brokerage fees as a result of the shareholder’s investment in a Fund.
Operating expenses such as these are deducted from a Fund’s gross income and directly reduce your final investment return. These expenses are expressed as a percentage of the Fund’s average net assets; this percentage is known as the Fund’s expense ratio.
The following examples use the expense ratio and are intended to help you understand the ongoing costs (in dollars) of investing in a Fund and to compare these costs with those of other funds. The examples are based on an investment of $1,000 made at the beginning of the period shown and held for the entire period from May 1, 2023 through October 31, 2023.
The table on the next page illustrates the Funds’ costs in two ways:
Actual Fund Return. This section helps you to estimate the actual expenses that your Fund incurred over the period. The “Expenses Paid During Period” column shows the actual dollar expense cost incurred by a $1,000 investment in the Fund, and the “Ending Account Value” number is derived from deducting that expense cost from the Fund’s gross investment return.
You can use this information, together with the actual amount you invested in a Fund, to estimate the expenses you paid over that period. Simply divide your actual account value by $1,000 to arrive at a ratio (for example, an $8,600 account value divided by $1,000 = 8.6), then multiply that ratio by the number shown for your Fund under “Expenses Paid During Period.”
Hypothetical 5% Return. This section helps you compare your Fund’s costs with those of other funds. It assumes that the Fund had an annual 5% return before expenses during the year, but that the expense ratio (Column 3) for the period is unchanged. This example is useful in making comparisons because the Securities and Exchange Commission requires all funds to make this 5% calculation. You can assess your Fund’s comparative cost by comparing the hypothetical result for your Fund in the “Expenses Paid During Period” column with those that appear in the same charts in the shareholder reports for other funds.
NOTE: Because the return is set at 5% for comparison purposes — NOT your Fund’s actual return — the account values shown may not apply to your specific investment.
Disclosure of Fund Expenses (Unaudited) (Concluded)
| | | Beginning
Account Value
5/1/2023 | | Ending
Account
Value
10/31/2023 | | Annualized
Expense
Ratios | | Expenses
Paid During
Period(1) |
| Global X Silver Miners ETF | | | | | | | | | | | | | | | | |
| Actual Fund Return | | $ | 1,000.00 | | | $ | 808.40 | | | | 0.65 | % | | $ | 2.96 | |
| Hypothetical 5% Return | | | 1,000.00 | | | | 1,021.93 | | | | 0.65 | | | | 3.31 | |
| | | | | | | | | | | | | | | | | |
| Global X Copper Miners ETF | | | | | | | | | | | | | | | | |
| Actual Fund Return | | $ | 1,000.00 | | | $ | 844.90 | | | | 0.65 | % | | $ | 3.02 | |
| Hypothetical 5% Return | | | 1,000.00 | | | | 1,021.93 | | | | 0.65 | | | | 3.31 | |
| | | | | | | | | | | | | | | | | |
| Global X Gold Explorers ETF | | | | | | | | | | | | | | | | |
| Actual Fund Return | | $ | 1,000.00 | | | $ | 812.40 | | | | 0.65 | % | | $ | 2.97 | |
| Hypothetical 5% Return | | | 1,000.00 | | | | 1,021.93 | | | | 0.65 | | | | 3.31 | |
| | | | | | | | | | | | | | | | | |
| Global X Uranium ETF | | | | | | | | | | | | | | | | |
| Actual Fund Return | | $ | 1,000.00 | | | $ | 1,324.30 | | | | 0.69 | % | | $ | 4.04 | |
| Hypothetical 5% Return | | | 1,000.00 | | | | 1,021.73 | | | | 0.69 | | | | 3.52 | |
| (1) | Expenses are equal to the Fund's annualized expense ratio multiplied by the average account value over the period, multiplied by 184/365 (to reflect the one-half year period). |
Liquidity Risk Management Program (UNAUDITED)
Pursuant to Rule 22e-4 under the 1940 Act, the Funds’ investment adviser has adopted, and the Board has approved, a liquidity risk management program (the “Program”) to govern the Funds’ approach to managing liquidity risk. The Program is overseen by the Funds’ Liquidity Risk Management Committee (the “Committee”), and the Program’s principal objectives include assessing, managing and periodically reviewing each Fund’s liquidity risk, based on factors specific to the circumstances of the Funds.
At a meeting of the Board held on May 19, 2023, the Trustees received a report from the Committee addressing the operations of the Program and assessing its adequacy and effectiveness of implementation for the period from January 1, 2022 through December 31, 2022. The Committee’s report noted that the Committee had determined that the Program is reasonably designed to assess and manage each Fund’s Liquidity Risk and operated adequately and effectively to manage each Fund’s Liquidity Risk for the period covered by the report. The Committee’s report noted that during the period covered by the report, there were no liquidity events that impacted the Funds or their ability to timely meet redemptions without dilution to existing shareholders. The Committee’s report noted that one Fund, the Global X Nigeria Fund, was classified as an In-Kind Fund for purposes of Liquidity Reporting. The Committee’s report noted that no other material changes have been made to the Program since its implementation.
There can be no assurance that the Program will achieve its objectives in the future. Please refer to the prospectus for more information regarding a Fund’s exposure to liquidity risk and other principal risks to which an investment in the Funds may be subject.
Supplemental Information (UNAUDITED)
NAV is the price per Share at which the Funds issue and redeem Shares. It is calculated in accordance with the standard formula for valuing mutual fund shares. The “Market Price” of a Fund generally is determined using the midpoint between the highest bid and the lowest offer on the stock exchange on which the Shares of the Funds are listed for trading, as of the time that the Fund’s NAV is calculated. A Fund’s Market Price may be at, above or below its NAV. The NAV of a Fund will fluctuate with changes in the market value of the Fund’s holdings. The Market Price of a Fund will fluctuate in accordance with changes in its NAV, as well as market supply and demand.
Premiums or discounts are the differences (expressed as a percentage) between the NAV and Market Price of a Fund on a given day, generally at the time NAV is calculated. A premium is the amount that a Fund is trading above the reported NAV, expressed as a percentage of the NAV. A discount is the amount that a Fund is trading below the reported NAV, expressed as a percentage of the NAV.
Further information regarding premiums and discounts is available on the Funds’ website at www.globalxetfs.com.
Notes
Notes
Trustees and Officers of the Trust (UNAUDITED)
The Trustees and officers are identified in the table below, which provides information as to their principal business occupations held during the last five years and certain other information. Each Trustee serves until his or her death, resignation or removal and replacement. The Trust’s Statement of Additional Information (“SAI”) includes additional information about the Trustees and officers. The SAI may be obtained without charge by calling 1-888-493-8631. The address for all Trustees and officers is c/o Global X Funds®, 605 3rd Avenue, 43rd Floor, New York, New York 10158. The following chart lists Trustees and Officers as of December 15, 2023.
Name
(Year of Birth) | Position(s)
Held
with Trust | Principal Occupation(s) During the Past
5 Years | Number of Funds in
Trust Overseen by
Trustee4 | Other Directorships
Held by Trustees |
| Independent Trustees1,2 | | | | |
Charles A. Baker
(1953) | Trustee (since 07/2018) | Chief Executive Officer of Investment Innovations LLC (investment consulting) (since 2013); Managing Director of NYSE Euronext (2003 to 2012). | 113 funds (108 of which were operational) | Trustee of OSI ETF Trust (2016-2022). |
Susan M. Ciccarone
(1973) | Trustee (since 09/2019) | Partner, Further Global Capital Management (private equity) (since 2017); formerly Chief Operating Officer (2014-2016) and Chief Financial Officer (2012-2016), Emerging Global Advisors, LLC (ETF issuer). | 113 funds (108 of which were operational) | Director of E78 Partners (since 2022); Director of ProSight Global, Inc. (since 2021); Director of Casa Holdco LP, parent of Celink (since 2018); Chairman, Payment Alliance International, Inc. (2019-2021). |
Clifford J. Weber
(1963) | Trustee (since 07/2018) | Owner, Financial Products Consulting Group LLC (consulting services to financial institutions) (since 2015); Formerly, Executive Vice President of Global Index and Exchange-Traded Products, NYSE Market, Inc., a subsidiary of Intercontinental Exchange (ETF/ETP listing exchange) (2013- 2015). | 113 funds (108 of which were operational) | Chairman and Trustee of Clayton Street Trust (since 2016); Chairman and Trustee of Janus Detroit Street Trust (since 2016); Trustee of Clough Global Equity Fund (since 2017); Trustee of Clough Global Dividend and Income Fund (since 2017); Trustee of Clough Global Opportunities Fund (since 2017); Chairman (2017-2023) and Trustee (2015- 2023) of Clough Funds Trust; and Chairman and Trustee of Elevation ETF Trust (2016-2018). |
Trustees and Officers of the Trust (UNAUDITED)
Name
(Year of Birth) | Position(s)
Held
with Trust | Principal Occupation(s) During the Past
5 Years | Number of Funds in
Trust Overseen by
Trustee | Other Directorships
Held by Trustees |
| Interested Trustee/Officers1,2 | | | | |
Thomas Park
(1978) | President (since 11/2023) | Chief Executive Officer, GXMC (since 11/2023); Co-Chief Executive Officer Mirae Asset Global Investments (USA) (since 12/2022); President of Mirae Asset Global Investments (USA) (1/2020- 12/2022); and Executive Managing Director of Mirae Asset Global Investments (USA) (2011-2022). | N/A | N/A |
Alex Ashby
(1986) | Chief Operating Officer (since 11/2023) | Head of Product Development, GXMC (since 2019); Vice President, Director of Product Development (2015 - 2018). | N/A | N/A |
Susan Lively
(1981) | Secretary (since 09/2020) | General Counsel, GXMC (since 9/2020); Senior Corporate Counsel at Franklin Templeton (previously, Managing Director and Associate General Counsel at Legg Mason & Co., LLC) (2014-2020). | N/A | N/A |
Eric Griffith3
(1969) | Assistant Secretary (since 02/2020) | Counsel, SEI Investments (since 10/2019); Vice President and Assistant General Counsel, JPMorgan Chase & Co. (2012-2018). | N/A | N/A |
Joe Costello
(1974) | Chief Compliance Officer (since 09/2016) | Chief Compliance Officer, GXMC (since 09/2016). | N/A | N/A |
Ronnie Riven
(1984) | Chief Financial Officer (since 11/2023); Treasurer and Principal Accounting Officer (since 12/2020) | Head of Finance & Business Management, GXMC (since 01/2022); Treasurer, GXMC (since 02/2022); Director of Finance, GXMC (08/2018- 12/2021); Director of Accounting and Finance at Barclays Center (2016-2018). | N/A | N/A |
Eric Olsen3
(1970) | Assistant Treasurer (since 05/2021) | Director of Accounting, SEI Investment Manager Services (March 2021 to present); Deputy Head of Fund Operations, Traditional Assets, Aberdeen Standard Investments (2013-2021). | N/A | N/A |
| 1 | Each Trustee serves until his or her successor is duly elected or appointed and qualified. |
| 2 | Luis Berruga served as an Interested Trustee of the Trust until December 15, 2023, and as President of the Trust until November 21, 2023. John Belanger served as Chief Operating Officer of the Trust and as Chief Financial Officer of the Trust until November 28, 2023. |
| 3 | These officers of the Trust also serve as officers of one or more funds for which SEI Investments Company or an affiliate acts as investment manager, administrator or distributor. |
| 4 | As of October 31, 2023. |
Notice to Shareholders (UNAUDITED)
For shareholders that do not have an October 31, 2023 tax year end, this notice is for informational purposes only. For shareholders with an October 31, 2023 tax year end, please consult your tax advisor as to the pertinence of this notice. For the fiscal year ended October 31, 2023, the Funds have designated the following items with regard to distributions paid during the year.
| Return of Capital | | Long-Term
Capital Gain
Distributions | | Ordinary Income
Distributions | | Total
Distributions | | Qualifying
for Corporate
Dividends
Received
Deduction(1) | | Qualifying
Dividend
Income(2) |
| Global X Silver Miners ETF | | | | | | | | | | |
| 0.00% | | 0.00% | | 100.00% | | 100.00% | | 0.00% | | 100.00% |
| Global X Copper Miners ETF | | | | | | | | | | |
| 0.00% | | 0.00% | | 100.00% | | 100.00% | | 6.07% | | 84.22% |
| Global X Gold Explorers ETF | | | | | | | | | | |
| 6.17% | | 0.00% | | 93.83% | | 100.00% | | 0.00% | | 67.42% |
| Global X Uranium ETF | | | | | | | | | | |
| 0.00% | | 0.00% | | 100.00% | | 100.00% | | 0.00% | | 10.23% |
(1) Qualifying dividends represent dividends which qualify for the corporate dividends received deduction and is reflected as a percentage of ordinary income distributions (the total of short term capital gain and net investment income distributions).
(2) The percentage in this column represents the amount of “Qualifying Dividend Income” as created by the Jobs and Growth Relief Reconciliation Act of 2003 and its reflected as a percentage of ordinary income distributions (the total of short term capital gain and net investment income distributions). It is the intention of each of the aforementioned Funds to designate the maximum amount permitted by law.
| | | U.S. Government
Interest(3) | | Interest Related
Dividends(4) | | Short Term
Capital Gain
Dividends (5) | | Foreign Tax
Credit |
| Global X Silver Miners ETF | | | | | | | | |
| | | 0.00% | | 0.21% | | 0.00% | | 0.00% |
| Global X Copper Miners ETF | | | | | | | | |
| | | 0.00% | | 0.08% | | 0.00% | | 5.85% |
| Global X Gold Explorers ETF | | | | | | | | |
| | | 0.00% | | 0.03% | | 0.00% | | 0.00% |
| Global X Uranium ETF | | | | | | | | |
| | | 0.00% | | 0.06% | | 0.00% | | 24.69% |
(3) “U.S. Government Interest” represents the amount of interest that was derived from U.S. Government Obligations and distributed during the fiscal year. Generally, interest from direct U.S. Government obligations is exempt from state income tax. However, for shareholders who are residents of California, Connecticut and New York, the statutory threshold requirements were not satisfied to permit exemption of these amounts from state income.
(4) The percentage in this column represents the amount of “Interest Related Dividends” as created by the American Jobs Creation Act of 2004 and is a percentage of net investment income that is exempt from U.S. withholding tax when paid for foreign investors.
(5) The percentage of this column represents the amount of “Short Term Capital Gain Dividend” and is reflected as a percentage of short term capital gain distribution that is exempted from U.S. withholding tax when paid to foreign investors.
Notice to Shareholders (UNAUDITED)
The Funds intend to pass through a foreign tax credit to shareholders. For the fiscal year ended October 31, 2023, the total amount of foreign source income and foreign tax credit are as follows:
| Fund Name | | Foreign Source
Income | | | Foreign Tax Credit
Pass Through | |
| Global X Copper Miners ETF | | $ | 31,668,332 | | | $ | 2,369,107 | |
| Global X Uranium ETF | | | 15,188,033 | | | | 1,200,098 | |
The information reported herein may differ from the information and distributions taxable to the shareholders for the calendar year ending December 31, 2023. Complete information will be computed and reported in conjunction with your 2023 Form 1099-DIV.
Notes
605 Third Avenue, 43rd floor
New York, NY 10158
1-888-493-8631
www.globalxetfs.com
Investment Adviser and Administrator:
Global X Management Company LLC
605 Third Avenue, 43rd floor
New York, NY 10158
Distributor:
SEI Investments Distribution Co.
One Freedom Valley Drive
Oaks, PA 19456
Sub-Administrator:
SEI Investments Global Funds Services
One Freedom Valley Drive
Oaks, PA 19456
Counsel for Global X Funds and the Independent Trustees:
Stradley Ronon Stevens & Young, LLP
2000 K Street, N.W.
Suite 700
Washington, DC 20006
Custodians and Transfer Agents:
Brown Brothers Harriman & Co.
40 Water Street
Boston, MA 02109
The Bank of New York Mellon
240 Greenwich Street
New York, NY 10286
Independent Registered Public Accounting Firm:
PricewaterhouseCoopers LLP
Two Commerce Square
Suite 1800
2001 Market Street
Philadelphia, PA 19103
This information must be preceded or accompanied by a current prospectus for the Funds described.
GLX-AR-001-1500
(b) Not applicable.
Item 2. Code of Ethics.
The registrant has adopted a code of ethics that applies to the registrant’s principal executive officer, principal financial officer, controller or principal accounting officer, and any person who performs a similar function.
Item 3. Audit Committee Financial Expert.
(a)(1) The registrant’s board of trustees has determined that the registrant has at least one audit committee financial expert serving on the audit committee.
(a)(2) The audit committee financial experts are Charles A. Baker and Susan M. Ciccarone and each is independent as defined in Form N-CSR Item 3(a)(2).
Item 4. Principal Accountant Fees and Services.
Fees billed by Pricewaterhouse Coopers LLP (“PwC”) relate to the registrant.
PWC billed the registrant aggregate fees for services rendered to the registrant for the last two fiscal years as follows:
| | 2023 | 2022 |
| | | All fees and
services to
the Trust
that were
pre-
approved | All fees and
services to
service
affiliates
that were
pre-
approved | All other
fees and
services to
service
affiliates
that did not
require pre-
approval | All fees and
services to
the Trust
that were
pre-
approved | All fees and
services to
service
affiliates
that were
pre-
approved | All other
fees and
services to
service
affiliates
that did not
require pre-
approval |
| (a) | Audit Fees | $1,235,693 | $0 | $0 | $1,148,958 | $0 | $0 |
| (b) | Audit-Related Fees | $0 | $0 | $0 | $0 | $0 | $0 |
| (c) | Tax Fees(1) | $392,972 | $0 | $0 | $406,447 | $0 | $0 |
| (d) | All Other Fees | $0 | $0 | $0 | $0 | $0 | $0 |
Notes:
| (1) | Tax Compliance and excise distribution services. |
(e)(2) Percentage of fees billed applicable to non-audit services pursuant to waiver of pre-approval requirement were as follows (PwC):
| | 2023 | 2022 |
| Audit-Related Fees | 0% | 0% |
| Tax Fees | 0% | 0% |
| All Other Fees | 0% | 0% |
(f) Not applicable.
(g) The aggregate non-audit fees and services billed by PwC for the last two fiscal years were $392,972 and $406,447, respectively.
(h) During the past fiscal year, all non-audit services provided by registrant’s principal accountant to either registrant’s investment adviser or to any entity controlling, controlled by, or under common control with registrant’s investment adviser that provides ongoing services to registrant were pre-approved by the audit committee of registrant’s Board of Trustees. Included in the audit committee’s pre-approval was the review and consideration as to whether the provision of these non-audit services is compatible with maintaining the principal accountant’s independence.
(i) Not applicable.
(j) Not applicable.
Item 5. Audit Committee of Listed Registrants.
The registrant has a separately-designated standing Audit Committee, which is composed of the registrant’s Independent Trustees, Charles A. Baker, Susan M. Ciccarone and Clifford J. Weber.
Item 6. Investments.
Schedule of Investments is included as part of the report to shareholders filed under Item 1 of this form.
Item 7. Disclosure of Proxy Voting Policies and Procedures for Closed-End Management Investment Companies.
Not applicable to open-end management investment companies.
Item 8. Portfolio Managers of Closed-End Management Investment Companies.
Not applicable to open-end management investment companies.
Item 9. Purchases of Equity Securities by Closed-End Management Investment Company and Affiliated Purchasers.
Not applicable to open-end management investment companies.
Item 10. Submission of Matters to a Vote of Security Holders.
There have been no material changes to the procedures by which shareholders may recommend nominees to the registrant’s board of directors.
Item 11. Controls and Procedures.
(a) The certifying officers, whose certifications are included herewith, have evaluated the registrant’s disclosure controls and procedures within 90 days of the filing date of this report. In their opinion, based on their evaluation, the registrant’s disclosure controls and procedures are adequately designed, and are operating effectively to ensure, that information required to be disclosed by the registrant in the reports it files or submits under the Securities Exchange Act of 1934 is recorded, processed, summarized and reported within the time periods specified in the Securities and Exchange Commission’s rules and forms.
(b) There were no significant changes in the registrant’s internal control over financial reporting that occurred during the period covered by this report that has materially affected, or is reasonably likely to materially affect, the registrant’s internal control over financial reporting.
Item 12. Disclosure of Securities Lending Activities for Closed-End Management Investment Companies.
Not applicable to open-end management investment companies.
Item 13. Exhibits.
(a)(1) Code of Ethics attached hereto.
(a)(2) A separate certification for the principal executive officer and the principal financial officer of the registrant as required by Rule 30a-2(a) under the Investment Company Act of 1940, as amended (17 CFR 270.30a-2(a)), are filed herewith.
(b) Officer certifications as required by Rule 30a-2(b) under the Investment Company Act of 1940, as amended (17 CFR 270.30a-2(b)) also accompany this filing as an Exhibit.
SIGNATURES
Pursuant to the requirements of the Securities Exchange Act of 1934 and the Investment Company Act of 1940, the registrant has duly caused this report to be signed on its behalf by the undersigned, thereunto duly authorized.
| (Registrant) | Global X Funds |
| | |
| By (Signature and Title) | /s/ Thomas Park |
| | Thomas Park
President |
Date: January 9, 2024
Pursuant to the requirements of the Securities Exchange Act of 1934 and the Investment Company Act of 1940, this report has been signed below by the following persons on behalf of the registrant and in the capacities and on the dates indicated.
| By (Signature and Title) | /s/ Thomas Park |
| | Thomas Park
President |
| | |
Date: January 9, 2024
| By (Signature and Title) | /s/ Ronnie Riven |
| | Ronnie Riven
Chief Financial Officer |
Date: January 9, 2024