| Global X Social Media ETF (ticker: SOCL) |
| Global X Lithium & Battery Tech ETF (ticker: LIT) |
| Global X E-commerce ETF (ticker: EBIZ) |
| Global X Emerging Markets Internet & E-commerce ETF (ticker: EWEB) |
Global X SuperDividend® ETF (ticker: SDIV) |
Global X SuperDividend® U.S. ETF (ticker: DIV) |
Global X MSCI SuperDividend® EAFE ETF (ticker: EFAS) |
Global X MSCI SuperDividend® Emerging Markets ETF (ticker: SDEM) |
Global X SuperDividend® REIT ETF (ticker: SRET) |
Global X NASDAQ 100® Covered Call ETF (ticker: QYLD) |
Global X S&P 500® Covered Call ETF (ticker: XYLD) |
| Global X Russell 2000 Covered Call ETF (ticker: RYLD) |
Global X Nasdaq 100® Covered Call & Growth ETF (ticker: QYLG) |
Global X S&P 500® Covered Call & Growth ETF (ticker: XYLG) |
| Global X SuperIncome™ Preferred ETF (ticker: SPFF) |
| Global X Renewable Energy Producers ETF (ticker: RNRG) |
Global X S&P 500® Catholic Values ETF (ticker: CATH) |
| Global X S&P Catholic Values Developed ex-U.S. ETF (ticker: CEFA) |
Global X Guru® Index ETF (ticker: GURU) |
Global X S&P 500® Tail Risk ETF (ticker: XTR) |
Global X S&P 500® Risk Managed Income ETF (ticker: XRMI) |
Global X S&P 500® Collar 95-110 ETF (ticker: XCLR) |
Global X NASDAQ 100® Tail Risk ETF (ticker: QTR) |
Global X NASDAQ 100® Risk Managed Income ETF (ticker: QRMI) |
Global X NASDAQ 100® Collar 95-110 ETF (ticker: QCLR) |
Annual Report
October 31, 2021
As permitted by regulations adopted by the Securities and Exchange Commission, paper copies of the Funds’ (defined below) shareholder reports will no longer be sent by mail, unless you specifically request paper copies of the reports from your financial intermediary (such as a broker-dealer or bank). Instead, shareholder reports will be available on the Funds’ website (www. globalxetfs.com/explore), and you will be notified by mail each time a report is posted and provided with a website link to access the report.
If you already elected to receive shareholder reports electronically, you will not be affected by this change and you need not take any action. You may elect to receive shareholder reports and other communications from the Funds electronically anytime by contacting your financial intermediary.
You may elect to receive all future Fund shareholder reports in paper free of charge. Please contact your financial intermediary to inform them that you wish to continue receiving paper copies of Fund shareholder reports and for details about whether your election to receive reports in paper will apply to all funds held with your financial intermediary.
| Management Discussion of Fund Performance | 1 |
| Schedules of Investments | |
| Global X Social Media ETF | 68 |
| Global X Lithium & Battery Tech ETF | 72 |
| Global X E-commerce ETF | 77 |
| Global X Emerging Markets Internet & E-commerce ETF | 82 |
Global X SuperDividend® ETF | 86 |
Global X SuperDividend® U.S. ETF | 95 |
Global X MSCI SuperDividend® EAFE ETF | 100 |
Global X MSCI SuperDividend® Emerging Markets ETF | 105 |
Global X SuperDividend® REIT ETF | 110 |
Global X NASDAQ 100® Covered Call ETF | 114 |
Global X S&P 500® Covered Call ETF | 120 |
| Global X Russell 2000 Covered Call ETF | 138 |
Global X Nasdaq 100® Covered Call & Growth ETF | 140 |
Global X Global X S&P 500® Covered Call & Growth ETF | 146 |
| Global X SuperIncome™ Preferred ETF | 164 |
| Global X Renewable Energy Producers ETF | 169 |
Global X S&P 500® Catholic Values ETF | 175 |
| Global X S&P Catholic Values Developed ex-US ETF | 191 |
Global X Guru® Index ETF | 217 |
Global X S&P 500® Tail Risk ETF | 223 |
Global X S&P 500® Risk Managed Income ETF | 241 |
Global X S&P 500® Collar 95-110 ETF | 260 |
Global X NASDAQ 100® Tail Risk ETF | 279 |
Global X NASDAQ 100® Risk Managed Income ETF | 285 |
Global X NASDAQ 100® Collar 95-110 ETF | 292 |
| Statements of Assets and Liabilities | 299 |
| Statements of Operations | 306 |
| Statements of Changes in Net Assets | 313 |
| Financial Highlights | 326 |
| Notes To Financial Statements | 342 |
| Report of Independent Registered Public Accounting Firm | 370 |
| Disclosure of Fund Expenses | 373 |
| Liquidity Risk Management Program | 377 |
| Approval of Investment Advisory Agreement | 378 |
| Supplemental Information | 383 |
| Trustees and Officers of the Trust | 384 |
| Notice to Shareholders | 387 |
Shares are bought and sold at market price (not NAV) and are not individually redeemed from a Fund. Shares may only be redeemed directly from a Fund by Authorized Participants, in very large creation/redemption units. Brokerage commissions will reduce returns.
The Funds file their complete schedules of Fund holdings with the Securities and Exchange Commission (the “SEC” or “Commission”) for the first and third quarters of each fiscal year as an exhibit to its reports on Form N-PORT. The Funds’ Forms N-PORT are available on the Commission’s website at https://www.sec.gov/, and may be reviewed and copied at the Commission’s Public Reference Room in Washington, DC. Information on the operation of the Public Reference Room may be obtained by calling 1-800-SEC-0330.
A description of the policies and procedures that the Global X Funds use to determine how to vote proxies relating to Fund securities, as well as information relating to how the Funds voted proxies relating to Fund securities during the most recent 12-month period ended June 30, is available (i) without charge, upon request, by calling 1-888-493-8631; and (ii) on the Commission’s website at https://www.sec.gov/.
| | Management Discussion of Fund Performance (unaudited) | |
| | Global X Social Media ETF | |
Global X Social Media ETF
The Global X Social Media ETF (“Fund”) seeks to provide investment results that correspond generally to the price and yield performance, before fees and expenses, of the Solactive Social Media Total Return Index (“Underlying Index”). The Fund is passively managed, which means the investment adviser does not attempt to take defensive positions in declining markets. The Fund generally seeks to fully replicate the Underlying Index.
The Underlying Index is designed to track the price movements in shares of companies which are active in the social media industry, including companies that provide social networking, file sharing, and other web-based media applications, as defined by Solactive AG, the provider of the Underlying Index. A maximum of 50 components are included in the Underlying Index which are weighted according to freefloat market capitalization.
For the 12-month period ended October 31, 2021 (the “reporting period”), the Fund increased 17.94%, while the Underlying Index increased 18.58%. The Fund had a net asset value of $51.95 per share on October 31, 2020 and ended the reporting period with a net asset value of $61.26 per share on October 31, 2021.
During the reporting period, the highest returns came from AfreecaTV Co., Ltd. and Life360, Inc. Shs Chess Depository Interests Repr 3 Sh, which returned 216.79% and 198.34%, respectively. The worst performers were Kuaishou Technology Class B and Hello Pal International, Inc., which returned -75.15% and -72.42%, respectively.
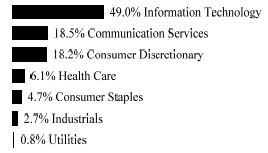
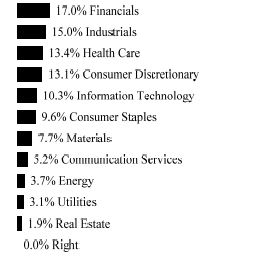
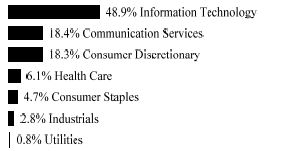
The social media segment has seen robust growth since the beginning of the COVID-19 pandemic as consumers increase their engagement with these platforms to maintain social interactions with family, friends, and acquaintances. With over half of the world’s population now on social media platforms, businesses continue to rely on social media as a key advertising channel, resulting in strong revenue growth during the reporting period despite an uncertain economic backdrop. In addition, new forms of monetization such as social commerce, or the intersection between social media and e-commerce, are accelerating monetization opportunities for companies in the social media space. Sector weightings of the Fund were highest in Communication Services, at 92.8% during the reporting period. Geographically, the Fund maintained an average allocation of 44.1% to United States stocks, followed by China (29%) and South Korea (10.2%) during the reporting period.
| | Management Discussion of Fund Performance (unaudited) | |
| | Global X Social Media ETF | |
| | AVERAGE TOTAL RETURN FOR THE YEAR ENDED OCTOBER 31, 2021 |
| | One Year Return | Three Year Return | Five Year Return | Annualized Inception to Date* |
| | Net Asset Value | Market Price | Net Asset Value | Market Price | Net Asset Value | Market Price | Net Asset Value | Market Price |
| Global X Social Media ETF | 17.94% | 17.16% | 28.17% | 28.05% | 21.49% | 21.42% | 15.52% | 15.48% |
| Solactive Social Media Total Return Index | 18.58% | 18.58% | 28.92% | 28.92% | 22.18% | 22.18% | 16.14% | 16.14% |
| MSCI ACWI (Net) | 37.28% | 37.28% | 17.47% | 17.47% | 14.72% | 14.72% | 11.56% | 11.56% |

* The Fund commenced operations on November 14, 2011.
The MSCI ACWI (Net) (All Country World Index) Index is a free float-adjusted market capitalization weighted index that is designed to measure the equity market performance of developed and emerging market
The performance data quoted herein represents past performance and the return and value of an investment in the Fund will fluctuate so that, when redeemed, it may be worth less than its original cost. Past performance is no guarantee of future performance and should not be considered as a representation of the future results of the Fund. The Fund’s performance assumes the reinvestment of all dividends and all capital gains. Index returns assume reinvestment of dividends and, unlike the Fund’s returns, do not reflect any fees or expenses. If such fees and expenses were included in the index returns, the performance would have been lower. Please note that one cannot invest directly in an unmanaged index. Performance figures for the periods shown may reflect contractual fee waivers and/or expense reimbursements. In the absence of fee waiver sand/or expense reimbursements (if applicable), returns would have been lower.
| | Management Discussion of Fund Performance (unaudited) | |
| | Global X Social Media ETF | |
There are no assurances that the Fund will meet its stated objectives.
The Fund’s holdings and allocations are subject to change and should not be considered recommendations to buy individual securities.
The graph and table do not reflect the deduction of taxes that a shareholder would pay on Fund distributions or the redemption or sale of Fund shares.
See definition of comparative indices on the previous page.
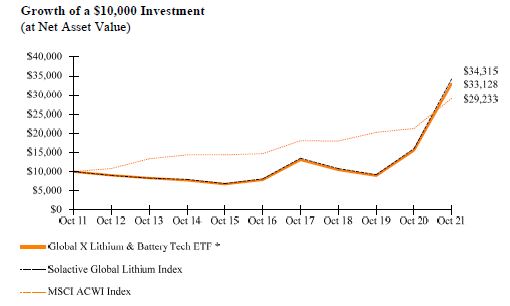
| | Management Discussion of Fund Performance (unaudited) | |
| | Global X Lithium & Battery Tech ETF | |
Global X Lithium & Battery Tech ETF
The Global X Lithium & Battery Tech ETF (“Fund”) seeks to provide investment results that correspond generally to the price and yield performance, before fees and expenses, of the Solactive Global Lithium Index (“Underlying Index”). The Fund is passively managed, which means the investment adviser does not attempt to take defensive positions in declining markets. The Fund generally seeks to fully replicate the Underlying Index.
The Underlying Index is designed to track the performance of the largest and most liquid listed companies active in exploration and/or mining of lithium or the production of lithium batteries, as defined by Solactive AG, the provider of the Underlying Index. The Underlying Index is calculated as a total return index and adjusted semi-annually.
For the 12-month period ended October 31, 2021 (the “reporting period”), the Fund increased 112.89%, while the Underlying Index increased 114.17%. The Fund had a net asset value of $42.86 per share on October 31, 2020 and ended the reporting period with a net asset value of $91.07 per share on October 31, 2021.
During the reporting period, the highest returns came from Pilbara Minerals Limited and L & F Co Ltd., which returned 501.41% and 377.22%, respectively. The worst performers were Tianneng Power International Limited and Galaxy Resources Ltd., which returned -27.6% and -26.81%, respectively.
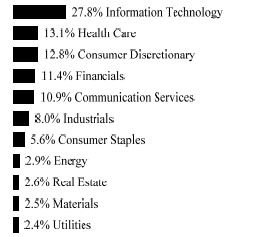
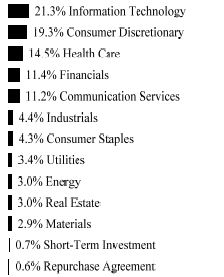
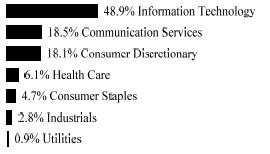
Despite the unprecedented global disruptions caused by the COVID-19 pandemic, the electric vehicle (EV) theme is reaching an inflection point as consumers, original equipment manufacturers, and governments accelerate the shift away from internal combustion engines and towards battery-powered vehicles. During the reporting period, EV sales reached record highs, more than doubling the sales numbers from the previous year in countries such as China, the United States and Germany. As a result of the strong current and future expected demand, lithium prices have risen rapidly in 2021, creating positive tailwinds for lithium miners. On the battery front, the ability to efficiently, reliably, and inexpensively mass-produce lithium-ion cells was essential for growing the EV market. Battery prices continued to fall, albeit at a slower pace as raw material prices weighed on the cost of production. During the reporting period, the Fund had an average approximate stock exposure of 46% in China, 22% in the United States, 11% in South Korea, and 6% in Australia. By sector, it had the highest exposure to Materials, at 48%, followed by Industrials (21%), Information Technology (17%), and Consumer Discretionary (15%).
| | Management Discussion of Fund Performance (unaudited) | |
| | Global X Lithium & Battery Tech ETF | |
| | AVERAGE ANNUAL TOTAL RETURN FOR THE YEAR ENDED OCTOBER 31, 2021 |
| | One Year Return | Three Year Return | Five Year Return | Ten Year Return |
| | Net Asset Value | Market Price | Net Asset Value | Market Price | Net Asset Value | Market Price | Net Asset Value | Market Price |
| Global X Lithium & Battery Tech ETF | 112.89% | 113.51% | 46.74% | 47.33% | 33.32% | 33.45% | 12.74% | 12.94% |
| Solactive Global Lithium Index | 114.17% | 114.17% | 46.89% | 46.89% | 33.36% | 33.36% | 13.12% | 13.12% |
| MSCI ACWI Index | 37.28% | 37.28% | 17.47% | 17.47% | 14.72% | 14.72% | 11.32% | 11.32% |
*Fund commenced operations on July 22, 2010.
The MSCI ACWI (All Country World Index) Index is a free float-adjusted market capitalization weighted index that is designed to measure the equity market performance of developed and emerging markets.
The performance data quoted herein represents past performance and the return and value of an investment in the Fund will fluctuate so that, when redeemed, it may be worth less than its original cost. Past performance is no guarantee of future performance and should not be considered as a representation of the future results of the Fund. The Fund’s performance assumes the reinvestment of all dividends and all capital gains. Index returns assume reinvestment of dividends and, unlike the Fund’s returns, do not reflect any fees or expenses. If such fees and expenses were included in the index returns, the performance would have been lower. Please note that one cannot invest directly in an unmanaged index. Performance figures for the periods shown may reflect contractual fee waivers and/or expense reimbursements. In the absence of fee waiver sand/or expense reimbursements (if applicable), returns would have been lower.
| | Management Discussion of Fund Performance (unaudited) | |
| | Global X Lithium & Battery Tech ETF | |
There are no assurances that the Fund will meet its stated objectives.
The Fund’s holdings and allocations are subject to change and should not be considered recommendations to buy individual securities.
The graph and table do not reflect the deduction of taxes that a shareholder would pay on Fund distributions or the redemption or sale of Fund shares.
See definition of comparative indices on the previous page.
| | Management Discussion of Fund Performance (unaudited) | |
| | Global X E-commerce ETF | |
Global X E-commerce ETF
The Global X E-commerce ETF (“Fund”) seeks to provide investment results that correspond generally to the price and yield performance, before fees and expenses, of the Solactive E-commerce Index (“Underlying Index”). The Fund is passively managed, which means the investment adviser does not attempt to take defensive positions in declining markets. The Fund generally seeks to fully replicate the Underlying Index.
The Underlying Index is designed to track the price movements in shares of companies which are active in the field of e-commerce, as defined by Solactive AG, the provider of the Underlying Index. This may include companies that operate e-commerce platforms, provide e-commerce software, analytics or services, and/or primarily sell goods and services online and generate the majority of their overall revenue from online retail.
For the 12-month period ended October 31, 2021 (the “reporting period”), the Fund increased 17.39%, while the Underlying Index increased 17.87%. The Fund had a net asset value of $26.79 per share on October 31, 2020 and ended the reporting period with a net asset value of $31.19 per share on October 31, 2021.
During the reporting period, the highest returns derived from Uxin Ltd. Sponsored ADR and Williams-Sonoma, Inc., which returned 150.00% and 106.76% respectively. The worst performers included Baozun, Inc. Sponsored ADR Class A and LendingTree, Inc., which returned -52.72% and -50.13% respectively.
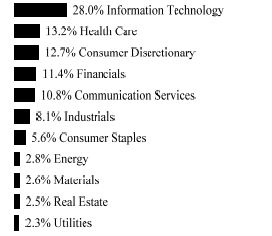
The global e-commerce market continued to benefit from the COVID-19 pandemic over the reporting period, as consumers chose to purchase goods from afar. Even as countries loosened social distancing stipulations, consumers continued to turn to digital marketplaces for convenience and safety reasons. Although e-commerce sales as a percent of total retail sales in the United States fell somewhat with easing lockdowns, its market share is still well above comparable periods prior to the COVID-19 pandemic. Additionally, e-commerce vendors have proven more resilient than their brick-and-mortar counterparts to supply chain disruption caused by the COVID-19 pandemic. E-commerce companies tend to swap product offerings and source alternative suppliers quicker than conventional retailers, a valuable trait for adapting to the now rampant bottlenecks. During the reporting period, sector weightings were highest in Consumer Discretionary at 74%, followed by Communication Services (22.1%). Geographically, the Fund maintained an average allocation of 56.3% to United States stocks, followed by China (23.5%) and the United Kingdom (5.7%) during the reporting period.
| | Management Discussion of Fund Performance (unaudited) | |
| | Global X E-commerce ETF | |
| | AVERAGE TOTAL RETURN FOR THE YEAR ENDED OCTOBER 31, 2021 |
| | One Year Return | Annualized Inception to Date* |
| | Net Asset Value | Market Price | Net Asset Value | Market Price |
| Global X E-commerce ETF | 17.39% | 17.06% | 28.88% | 28.84% |
| Solactive E-commerce Index | 17.87% | 17.87% | 29.45% | 29.45% |
| MSCI ACWI (Net) | 37.28% | 37.28% | 18.16% | 18.16% |
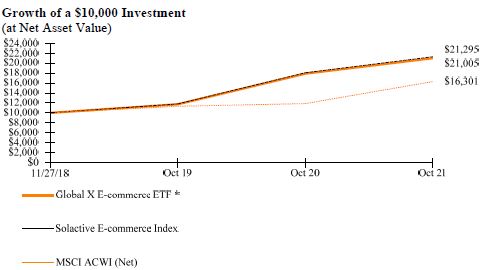
* The Fund commenced operations on November 27, 2018.
The MSCI ACWI (Net) (All Country World Index) Index is a free float-adjusted market capitalization weighted index that is designed to measure the equity market performance of developed and emerging markets.
The performance data quoted herein represents past performance and the return and value of an investment in the Fund will fluctuate so that, when redeemed, it may be worth less than its original cost. Past performance is no guarantee of future performance and should not be considered as a representation of the future results of the Fund. The Fund’s performance assumes the reinvestment of all dividends and all capital gains. Index returns assume reinvestment of dividends and, unlike the Fund’s returns, do not reflect any fees or expenses. If such fees and expenses were included in the index returns, the performance would have been lower. Please note that one cannot invest directly in an unmanaged index. Performance figures for the periods shown may reflect contractual fee waivers and/or expense reimbursements. In the absence of fee waiver sand/or expense reimbursements (if applicable), returns would have been lower.
There are no assurances that the Fund will meet its stated objectives.
The Fund’s holdings and allocations are subject to change and should not be considered recommendations to buy individual securities.
The graph and table do not reflect the deduction of taxes that a shareholder would pay on Fund distributions or the redemption or sale of Fund shares.
See definition of comparative indices above.
| | Management Discussion of Fund Performance (unaudited) | |
| | Global X Emerging Markets Internet & E-commerce ETF | |
Global X Emerging Markets Internet & E-commerce ETF
The Global X Emerging Markets Internet & E-commerce ETF (“Fund”) seeks to provide investment results that correspond generally to the price and yield performance, before fees and expenses, of the NASDAQ CTA Emerging Markets Internet & E-commerce Net Total Return Index (“Underlying Index”). The Fund is passively managed, which means the investment adviser does not attempt to take defensive positions in declining markets. The Fund generally seeks to fully replicate the Underlying Index.
The Underlying Index is designed to provide exposure to exchange-listed companies that are expected to benefit from further adoption of internet and e-commerce technologies in emerging markets, as defined by Nasdaq, Inc., the provider of the Underlying Index (the “Index Provider”) and the Consumer Technology Association (“CTA”). The Index Provider and the CTA jointly developed the eligibility and selection criteria for the Underlying Index. In order to be eligible for inclusion in the Underlying Index, a company must derive at least 50% of its revenue, operating income, or assets from: (i) internet-related services (including social media and online entertainment); (ii) internet retail commerce; (iii) internet search engine services; and/or (iv) software delivered via the internet.
From the inception of the Fund to the period ended October 31, 2021 (the “reporting period”), the Fund decreased 18.93%, while the Underlying Index decreased 18.41%. The Fund had a net asset value of $14.79 per share on November 9, 2020 and ended the reporting period with a net asset value of $11.99 per share on October 31, 2021.
During the reporting period, the highest returns derived from Kakao Corp. and Bilibili, Inc. Sponsored ADR Class Z, which returned 84.72% and 64.09%, respectively. The worst performers included New Oriental Education & Technology Group, Inc. Sponsored ADR and Koolearn Technology Holding Limited, which returned -87.22% and -82.29%, respectively.
Emerging markets, which tend to be most susceptible to downturns in the global economy, faced several challenges during the reporting period as COVID-19 variants lingered and spread, energy crises arose, and supply chain constraints heightened. The COVID-19 pandemic’s impact initially caused a setback in the progress emerging market economies made in previous decades due to a widening income gap and the lack of access to work-from-home capabilities that developed countries have. Despite the COVID-19 pandemic resurging sporadically in some regions and reducing expendable income for vulnerable workers, the primary sectors leading growth in developing economies amid the COVID-19 pandemic include Internet and E-Commerce. China, a primary emerging market, is the acting world leader in e-commerce, with an industry size nearly three times larger than that of the United States. Additionally, the country has nearly one billion internet users, representing more than
| | Management Discussion of Fund Performance (unaudited) | |
| | Global X Emerging Markets Internet & E-commerce ETF | |
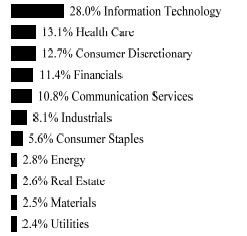
one-fifth of the global user base. Yet increasing regulatory scrutiny in China towards the end of the reporting period severely hurt the performance of many leading Chinese internet and e-commerce companies. During the reporting period, sector weightings of the Fund were highest in Communication Services at 56.7%, ahead of Consumer Discretionary at 35.4%. Geographically, the Fund maintained an average allocation of 70.1% to Chinese stocks, followed by South Korean (8.7%) and Brazilian (5.6%) during the reporting period.
| | AVERAGE TOTAL RETURN FOR THE PERIOD ENDED OCTOBER 31, 2021 |
| | Cumulative Inception to Date* |
| | Net Asset Value | Market Price |
| Global X Emerging Markets Internet & E-commerce ETF | -18.93% | -19.61% |
| NASDAQ CTA Emerging Markets Internet & E-commerce Net Total Return Index | -18.41% | -18.41% |
| MSCI Emerging Markets Index (Net) | 8.22% | 8.22% |

* The Fund commenced operations on November 9, 2020.
| | Management Discussion of Fund Performance (unaudited) | |
| | Global X Emerging Markets Internet & E-commerce ETF | |
The MSCI Emerging Markets Index (Net) is a free float-adjusted market capitalization index that is designed to measure equity market performance of emerging markets. The MSCI Emerging Markets Index consists of the following 21 emerging market country indices: Brazil, Chile, China, Colombia, Czech Republic, Egypt, Hungary, India, Indonesia, Korea, Malaysia, Mexico, Morocco, Peru, Philippines, Poland, Russia, South Africa, Taiwan, Thailand, and Turkey.
The performance data quoted herein represents past performance and the return and value of an investment in the Fund will fluctuate so that, when redeemed, it may be worth less than its original cost. Past performance is no guarantee of future performance and should not be considered as a representation of the future results of the Fund. The Fund’s performance assumes the reinvestment of all dividends and all capital gains. Index returns assume reinvestment of dividends and, unlike the Fund’s returns, do not reflect any fees or expenses. If such fees and expenses were included in the index returns, the performance would have been lower. Please note that one cannot invest directly in an unmanaged index. Performance figures for the periods shown may reflect contractual fee waivers and/or expense reimbursements. In the absence of fee waiver sand/or expense reimbursements (if applicable), returns would have been lower.
There are no assurances that the Fund will meet its stated objectives.
The Fund’s holdings and allocations are subject to change and should not be considered recommendations to buy individual securities.
The graph and table do not reflect the deduction of taxes that a shareholder would pay on Fund distributions or the redemption or sale of Fund shares.
See definition of comparative indices above.
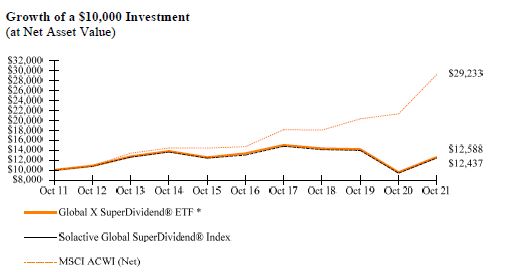
| | Management Discussion of Fund Performance (unaudited) | |
| | Global X SuperDividend® ETF | |
Global X SuperDividend® ETF
The Global X SuperDividend® ETF (“Fund”) seeks to provide investment results that correspond generally to the price and yield performance, before fees and expenses, of the Solactive Global SuperDividend® Index (“Underlying Index”). The Fund is passively managed, which means the investment adviser does not attempt to take defensive positions in declining markets. The Fund generally seeks to fully replicate the Underlying Index.
The Underlying Index tracks the price movements in shares of the 100 international companies with the highest dividend yield subject to several qualitative dividend outlook checks applied by Solactive AG, the provider of the Underlying Index. The components of the Underlying Index are weighted equally, and adjustments are conducted annually with additional quarterly dividend sustainability checks. The Underlying Index is a total return index.
For the 12-month period ended October 31, 2021 (the “reporting period”), the Fund increased 32.21%, while the Underlying Index increased 32.62%. The Fund had a net asset value of $10.61 per share on October 31, 2020 and ended the reporting period with a net asset value of $13.01 per share on October 31, 2021.
During the reporting period, the highest returns derived from China Power International Development Ltd. and PhosAgro, which returned 185.4% and 127.65%, respectively. The worst performers included Hoegh LNG Partners LP and Yuzhou Group Holdings Co Ltd, which returned -69.9% and -67.43%, respectively.
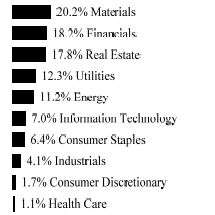
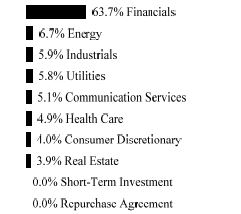
The stocks held by the Fund have some of the highest dividend yields in the world. As the COVID-19 pandemic eased, high-dividend-yield sectors, such as Real Estate and Energy, strongly rallied during the reporting period, contributing to the Fund’s robust performance. The Fund’s strategy performed well during the fiscal year, given the low-interest-rate environment, outperforming the broader MSCI ACWI Index. During the reporting period, the Fund had an approximate average exposure of 27% to U.S. stocks, 16% to Chinese stocks, 8% to Hong Kong stocks, and 6% to U.K. stocks. By sector, it averaged an approximate exposure of 27% to Real Estate Investment Trusts, 25% to Financial Services, 14% to Energy, and 9% to Mortgage Materials.
| | Management Discussion of Fund Performance (unaudited) | |
| | Global X SuperDividend® ETF | |
| | AVERAGE TOTAL RETURN FOR THE YEAR ENDED OCTOBER 31, 2021 |
| | One Year Return | Three Year Return | Five Year Return | Ten Year Return |
| | Net Asset Value | Market Price | Net Asset Value | Market Price | Net Asset Value | Market Price | Net Asset Value | Market Price |
Global X SuperDividend® ETF | 32.21% | 32.24% | -4.19% | -4.18% | -1.13% | -1.11% | 2.23% | 2.39% |
Solactive Global SuperDividend® Index | 32.62% | 32.62% | -4.09% | -4.09% | -0.90% | -0.90% | 2.21% | 2.21% |
| MSCI ACWI (Net) | 37.28% | 37.28% | 17.47% | 17.47% | 14.72% | 14.72% | 11.32% | 11.32% |
* The Fund commenced operations on June 8, 2011.
The MSCI ACWI (Net) (All Country World Index) Index is a free float-adjusted market capitalization weighted index that is designed to measure the equity market performance of developed and emerging markets.
The performance data quoted herein represents past performance and the return and value of an investment in the Fund will fluctuate so that, when redeemed, it may be worth less than its original cost. Past performance is no guarantee of future performance and should not be considered as a representation of the future results of the Fund. The Fund’s performance assumes the reinvestment of all dividends and all capital gains. Index returns assume reinvestment of dividends and, unlike the Fund’s returns, do not reflect any fees or expenses. If such fees and expenses were included in the index returns, the performance would have been lower. Please note that one cannot invest directly in an unmanaged index. Performance figures for the periods shown may reflect contractual fee waivers and/or expense reimbursements. In the absence of fee waiver sand/or expense reimbursements (if applicable), returns would have been lower.
There are no assurances that the Fund will meet its stated objectives.
| | Management Discussion of Fund Performance (unaudited) | |
| | Global X SuperDividend® ETF | |
The Fund’s holdings and allocations are subject to change and should not be considered recommendations to buy individual securities.
The graph and table do not reflect the deduction of taxes that a shareholder would pay on Fund distributions or the redemption or sale of Fund shares.
See definition of comparative indices on the previous page.
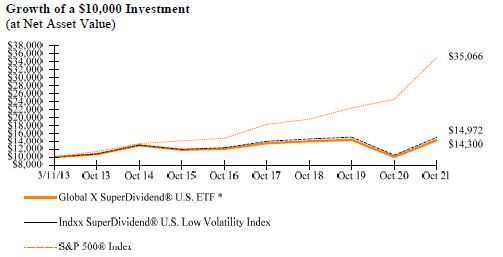
| | Management Discussion of Fund Performance (unaudited) | |
| | Global X SuperDividend® U.S. ETF | |
Global X SuperDividend® U.S. ETF
The Global X SuperDividend® U.S. ETF (“Fund”) seeks to provide investment results that correspond generally to the price and yield performance, before fees and expenses, of the Indxx SuperDividend® U.S. Low Volatility Index (“Underlying Index”). The Fund is passively managed, which means the investment adviser does not attempt to take defensive positions in declining markets. The Fund generally seeks to fully replicate the Underlying Index.
The Underlying Index is maintained by Indxx, LLC, (the “Index Provider”). The Underlying Index tracks the performance of a maximum of 50 equally weighted common stocks, Master Limited Partnerships, and Real Estate Investment Trusts that rank among the highest dividend yielding equity securities in the United States, as defined by the Index Provider. The components of the Underlying Index will have also paid dividends consistently over the last two years. The Underlying Index is comprised of securities that the Index Provider determines to have lower relative volatility than the market.
For the 12-month period ended October 31, 2021 (the “reporting period”), the Fund increased 42.53%, while the Underlying Index increased 42.80%. The Fund had a net asset value of $14.99 per share on October 31, 2020 and ended the reporting period with a net asset value of $20.13 per share on October 31, 2021.
During the reporting period, the highest returns derived from MPLX LP and Compass Diversified Holdings, which returned 96.26% and 88.46%, respectively. The worst performers included National Presto Industries, Inc. and PetMed Express, Inc., which returned -18.62% and -17.24%, respectively.
The Fund invests in many of the highest-yielding stocks in the United States. High-dividend investing is a value-oriented strategy, which seeks to produce low-volatility returns. The strategy performed well during the fiscal year, given the low-interest-rate environment and recovery from the COVID-19 pandemic, outperforming the broader S&P 500® Index. The Fund’s exposure to sectors aided by the reopening from the COVID-19 pandemic, such as Real Estate and Energy, added to the strong performance during the reporting period relative to the benchmark. During the fiscal year, by sector, the Fund averaged an exposure of 23% to Consumer Staples, 19% to Energy, 13% to Real Estate, and 12% to Utilities. Given the income-oriented nature of these sectors, they could be affected by changes in interest rates, particularly in the short term.
| | Management Discussion of Fund Performance (unaudited) | |
| | Global X SuperDividend® U.S. ETF | |
| | AVERAGE TOTAL RETURN FOR THE YEAR ENDED OCTOBER 31, 2021 |
| | One Year Return | Three Year Return | Five Year Return | Annualized Inception to Date* |
| | Net Asset Value | Market Price | Net Asset Value | Market Price | Net Asset Value | Market Price | Net Asset Value | Market Price |
Global X SuperDividend® U.S. ETF | 42.53% | 42.57% | 0.73% | 0.74% | 3.41% | 3.43% | 4.23% | 4.31% |
Indxx SuperDividend® U.S. Low Volatility Index | 42.80% | 42.80% | 0.91% | 0.91% | 3.94% | 3.94% | 4.78% | 4.78% |
S&P 500® Index | 42.91% | 42.91% | 21.48% | 21.48% | 18.93% | 18.93% | 15.62% | 15.62% |
* The Fund commenced operations on March 11, 2013.
The S&P 500® Index is a market capitalization weighted composite index of 500 large capitalization U.S. companies.
The performance data quoted herein represents past performance and the return and value of an investment in the Fund will fluctuate so that, when redeemed, it may be worth less than its original cost. Past performance is no guarantee of future performance and should not be considered as a representation of the future results of the Fund. The Fund’s performance assumes the reinvestment of all dividends and all capital gains. Index returns assume reinvestment of dividends and, unlike the Fund’s returns, do not reflect any fees or expenses. If such fees and expenses were included in the index returns, the performance would have been lower. Please note that one cannot invest directly in an unmanaged index. Performance figures for the periods shown may reflect contractual fee waivers and/or expense reimbursements. In the absence of fee waiver sand/or expense reimbursements (if applicable), returns would have been lower.
There are no assurances that the Fund will meet its stated objectives.
The Fund’s holdings and allocations are subject to change and should not be considered recommendations to buy individual securities.
| | Management Discussion of Fund Performance (unaudited) | |
| | Global X SuperDividend® U.S. ETF | |
The graph and table do not reflect the deduction of taxes that a shareholder would pay on Fund distributions or the redemption or sale of Fund shares.
See definition of comparative indices on the previous page.
| | Management Discussion of Fund Performance (unaudited) | |
| | Global X MSCI SuperDividend® EAFE ETF | |
Global X MSCI SuperDividend® EAFE ETF
The Global X MSCI SuperDividend® EAFE ETF (“Fund”) seeks to provide investment results that correspond generally to the price and yield performance, before fees and expenses, of the MSCI EAFE Top 50 Dividend Index (“Underlying Index”). The Fund is passively managed, which means the investment adviser does not attempt to take defensive positions in declining markets. The Fund generally seeks to fully replicate the Underlying Index.
The Underlying Index tracks the performance of 50 equally-weighted companies that rank among the highest dividend yielding equity securities from international developed markets across Europe, Australasia, and the Far East as defined by MSCI, the provider of the Underlying Index.
For the 12-month period ended October 31, 2021 (the “reporting period”), the Fund increased 43.05%, while the Underlying Index increased 44.08%. The Fund had a net asset value of $11.44 per share on October 31, 2020 and ended the reporting period with a net asset value of $15.62 per share on October 31, 2021.
During the reporting period, the highest returns derived from Banco Bilbao Vizcaya Argentaria, S.A. and Klepierre S.A., which returned 121.69% and 101.38%, respectively. The worst performers included Rio Tinto Limited and Aurizon Holdings Ltd., which returned -22.39% and -12.96%, respectively.
The Fund tracks performance of 50 equally weighted companies that rank among the highest dividend yielding securities in Europe, Australasia, and the Far East. Developed international markets began recovering from the effects of the COVID-19 pandemic and value stocks, in particular, benefited from an improved global economy. A lifting of travel and lockdown restrictions boosted cyclical businesses and, by extension, the financial systems in developed markets. The recovery in Western European economies drove much of the Fund’s returns during the reporting period. During the reporting period, sector weighting reported highest in Financials (31.5%), followed by Communication Services (13.4%). The Fund has the highest average exposure to U.K. stocks at 22%, ahead of Japan (10.7%), France (9.4%), and Hong Kong (8.2%).
| | Management Discussion of Fund Performance (unaudited) | |
| | Global X MSCI SuperDividend® EAFE ETF | |
| | AVERAGE TOTAL RETURN FOR THE YEAR ENDED OCTOBER 31, 2021 * |
| | One Year Return | Three Year Return | Annualized Inception to Date* |
| | Net Asset Value | Market Price | Net Asset Value | Market Price | Net Asset Value | Market Price |
Global X MSCI SuperDividend® EAFE ETF | 43.05% | 44.55% | 4.86% | 5.13% | 6.61% | 6.55% |
| MSCI EAFE Top 50 Dividend Index | 44.08% | 44.08% | 5.48% | 5.48% | 7.14% | 7.14% |
| MSCI EAFE Index (Net) | 34.18% | 34.18% | 11.54% | 11.54% | 10.36% | 10.36% |
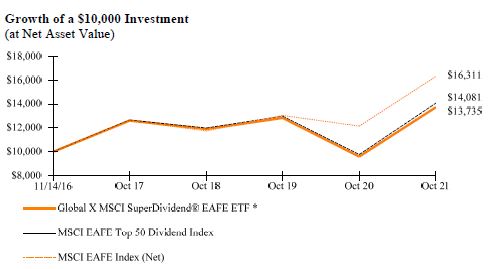
* The Fund commenced operations on November 14, 2016.
The MSCI EAFE Index (Net) (Europe, Australasia, Far East) is a free float-adjusted market capitalization index that is designed to measure the equity market performance of developed markets, excluding the US & Canada.
The performance data quoted herein represents past performance and the return and value of an investment in the Fund will fluctuate so that, when redeemed, it may be worth less than its original cost. Past performance is no guarantee of future performance and should not be considered as a representation of the future results of the Fund. The Fund’s performance assumes the reinvestment of all dividends and all capital gains. Index returns assume reinvestment of dividends and, unlike the Fund’s returns, do not reflect any fees or expenses. If such fees and expenses were included in the index returns, the performance would have been lower. Please note that one cannot invest directly in an unmanaged index. Performance figures for the periods shown may reflect contractual fee waivers and/or expense reimbursements. In the absence of fee waiver sand/or expense reimbursements (if applicable), returns would have been lower.
There are no assurances that the Fund will meet its stated objectives.
| | Management Discussion of Fund Performance (unaudited) | |
| | Global X MSCI SuperDividend® EAFE ETF | |
The Fund’s holdings and allocations are subject to change and should not be considered recommendations to buy individual securities.
The graph and table do not reflect the deduction of taxes that a shareholder would pay on Fund distributions or the redemption or sale of Fund shares.
See definition of comparative indices on the previous page.
| | Management Discussion of Fund Performance (unaudited) | |
| | Global X MSCI SuperDividend® Emerging Markets ETF | |
Global X MSCI SuperDividend® Emerging Markets ETF
The Global X MSCI SuperDividend® Emerging Markets ETF (“Fund”) seeks to provide investment results that correspond generally to the price and yield performance, before fees and expenses, of the MSCI Emerging Markets Top 50 Dividend Index (“Underlying Index”). The Fund is passively managed, which means the investment adviser does not attempt to take defensive positions in declining markets. The Fund generally seeks to fully replicate the Underlying Index.
The Underlying Index tracks the performance of 50 equally-weighted companies that rank among the highest dividend yielding equity securities in emerging markets, as defined by MSCI, the provider of the Underlying Index. The Underlying Index may include components from the following countries: Brazil, Chile, China, Colombia, Czech Republic, Egypt, India, Indonesia, Malaysia, Mexico, Pakistan, Romania, Russia, South Africa, South Korea, Taiwan, Thailand and United Arab Emirates. The Underlying Index begins with the MSCI Emerging Markets Index, which is a capitalization weighted index, as its starting universe, and then follows a rules-based methodology that is designed to select among the highest dividend yielding equity securities of the MSCI Emerging Markets Index.
For the 12-month period ended October 31, 2021 (the “reporting period”), the Fund increased 25.83%, while the Underlying Index increased 27.69%. The Fund had a net asset value of $9.53 per share on October 31, 2020 and ended the reporting period with a net asset value of $11.26 per share on October 31, 2021.
During the reporting period, the highest returns came from China Power International Development Ltd. and PhosAgro, which returned 185.4% and 127.65%, respectively. The worst performers included China Fortune Land Development Co Ltd. and China Aoyuan Group Limited, which returned -74.51% and -57.6%, respectively.
Stocks held in the Fund are among those with the highest dividend yields in the emerging markets. During the reporting period, the low-interest-rate environment globally, combined with effective COVID-19 vaccine distribution, accelerated the reopening of emerging economies, setting up economic recovery in many emerging nations. Emerging markets also benefited from escalating commodity prices on supply constraints, combined with elevated demand over the fiscal year. During the reporting period, the Fund averaged an approximate stock exposure of 27% in China, 10% in Russia, 8% in Brazil, and 8% in South Africa. By sector, it had the highest exposure to Financials (27%), followed by Real Estate (18%), Materials (14%), and Energy (12%) during the reporting period.
| | Management Discussion of Fund Performance (unaudited) | |
| | Global X MSCI SuperDividend® Emerging Markets ETF | |
| | AVERAGE TOTAL RETURN FOR THE YEAR ENDED OCTOBER 31, 2021 |
| | One Year Return | Three Year Return | Five Year Return | Annualized Inception to Date* |
| | Net Asset Value | Market Price | Net Asset Value | Market Price | Net Asset Value | Market Price | Net Asset Value | Market Price |
Global X MSCI SuperDividend® Emerging Markets ETF | 25.83% | 25.59% | 2.12% | 2.35% | 0.48% | 0.50% | 1.80% | 1.84% |
Hybrid INDXX SuperDividend® Emerging Markets Index/MSCI Emerging Markets Top 50 Dividend Index** | 27.69% | 27.69% | 3.36% | 3.36% | 1.86% | 1.86% | 3.12% | 3.12% |
| MSCI Emerging Markets Index (Net) | 16.96% | 16.96% | 12.30% | 12.30% | 9.39% | 9.39% | 7.06% | 7.06% |

* The Fund commenced operations on March 16, 2015.
** Hybrid Index performance reflects the performance of the INDXX SuperDividend® Emerging Markets Index through November 15, 2016 and the MSCI Emerging Markets Top 50 Dividend Index thereafter.
The MSCI Emerging Markets Index (Net) is a free float-adjusted market capitalization index that is designed to measure equity market performance of emerging markets.
| | Management Discussion of Fund Performance (unaudited) | |
| | Global X MSCI SuperDividend® Emerging Markets ETF | |
The performance data quoted herein represents past performance and the return and value of an investment in the Fund will fluctuate so that, when redeemed, it may be worth less than its original cost. Past performance is no guarantee of future performance and should not be considered as a representation of the future results of the Fund. The Fund’s performance assumes the reinvestment of all dividends and all capital gains. Index returns assume reinvestment of dividends and, unlike the Fund’s returns, do not reflect any fees or expenses. If such fees and expenses were included in the index returns, the performance would have been lower. Please note that one cannot invest directly in an unmanaged index.
Performance figures for the periods shown may reflect contractual fee waivers and/or expense reimbursements. In the absence of fee waiver sand/or expense reimbursements (if applicable), returns would have been lower.
There are no assurances that the Fund will meet its stated objectives.
The Fund’s holdings and allocations are subject to change and should not be considered recommendations to buy individual securities.
The graph and table do not reflect the deduction of taxes that a shareholder would pay on Fund distributions or the redemption or sale of Fund shares.
See definition of comparative indices on the previous page.
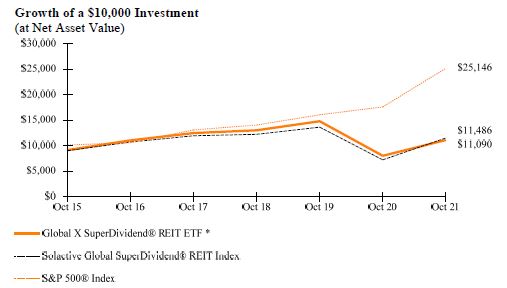
| | Management Discussion of Fund Performance (unaudited) | |
| | Global X SuperDividend® REIT ETF | |
Global X SuperDividend® REIT ETF
The Global X SuperDividend® REIT ETF (“Fund”) seeks to provide investment results that correspond generally to the price and yield performance, before fees and expenses, of the Solactive Global SuperDividend® REIT Index (“Underlying Index”). The Fund is passively managed, which means the investment adviser does not attempt to take defensive positions in declining markets. The Fund generally seeks to fully replicate the Underlying Index.
The Underlying Index tracks the performance of Real Estate Investment Trusts (“REITs”) that rank among the highest yielding REITs globally, as determined by Solactive AG, the provider of the Underlying Index. Solactive AG screens the highest yielding REITs to exclude REITs that have historically exhibited the highest volatility, as determined by the index provider.
For the 12-month period ended October 31, 2021 (the “reporting period”), the Fund increased 38.84%, while the Underlying Index increased 39.33%. The Fund had a net asset value of $7.56 per share on October 31, 2020 and ended the reporting period with a net asset value of $9.82 per share on October 31, 2021.
During the reporting period, the highest returns derived from Chimera Investment Corporation and Iron Mountain, Inc., which returned 105.78% and 86.79%, respectively. The worst performers included Fibra Uno and CapitaLand China Trust, which returned -8.26% and -7.91%, respectively.
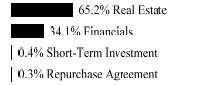
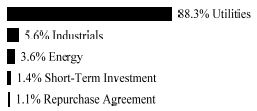
The Fund invests in REITs, which have some of the highest dividend yields worldwide. During the reporting period, REITs registered solid performance, exploiting the robust recovery of the global economy from the COVID-19 pandemic. Given their higher yielding nature, REITs continued to catch investors’ attention in a low-interest-rate environment at the start of the fiscal year. As the reopening accelerated in the second quarter of 2021 and global mobility resumed, demand for real estate increased. Concerns about inflation also led investors to turn to REITs, since higher costs can often be passed along to tenants. During the reporting period, the Fund averaged an approximate exposure of 65% to Mortgage REITs and 35% to Financials. Geographically, the United States led average approximate exposure at 74%, followed by Canada (9%) and Australia (8%).
| | Management Discussion of Fund Performance (unaudited) | |
| | Global X SuperDividend® REIT ETF | |
| | AVERAGE ANNUAL TOTAL RETURN FOR THE YEAR ENDED OCTOBER 31, 2021 |
| | One Year Return | Three Year Return | Five Year Return | Annualized Inception to Date* |
| | Net Asset Value | Market Price | Net Asset Value | Market Price | Net Asset Value | Market Price | Net Asset Value | Market Price |
Global X SuperDividend® REIT ETF | 38.84% | 38.46% | -5.15% | -5.23% | 0.11% | 0.06% | 1.57% | 1.56% |
Solactive Global SuperDividend® REIT Index | 39.33% | 39.33% | -4.87% | -4.87% | 0.60% | 0.60% | 2.11% | 2.11% |
S&P 500® Index | 42.91% | 42.91% | 21.48% | 21.48% | 18.93% | 18.93% | 14.92% | 14.92% |
* The Fund commenced operations on March 16, 2015.
The S&P 500® Index is a market capitalization weighted composite index of 500 large capitalization U.S. companies.
The performance data quoted herein represents past performance and the return and value of an investment in the Fund will fluctuate so that, when redeemed, it may be worth less than its original cost. Past performance is no guarantee of future performance and should not be considered as a representation of the future results of the Fund. The Fund’s performance assumes the reinvestment of all dividends and all capital gains. Index returns assume reinvestment of dividends and, unlike the Fund’s returns, do not reflect any fees or expenses. If such fees and expenses were included in the index returns, the performance would have been lower. Please note that one cannot invest directly in an unmanaged index. Performance figures for the periods shown may reflect contractual fee waivers and/or expense reimbursements. In the absence of fee waiver sand/or expense reimbursements (if applicable), returns would have been lower.
| | Management Discussion of Fund Performance (unaudited) | |
| | Global X SuperDividend® REIT ETF | |
There are no assurances that the Fund will meet its stated objectives.
The Fund’s holdings and allocations are subject to change and should not be considered recommendations to buy individual securities.
The graph and table do not reflect the deduction of taxes that a shareholder would pay on Fund distributions or the redemption or sale of Fund shares.
See definition of comparative indices on the previous page.
| | Management Discussion of Fund Performance (unaudited) | |
| | Global X NASDAQ 100® Covered Call ETF | |
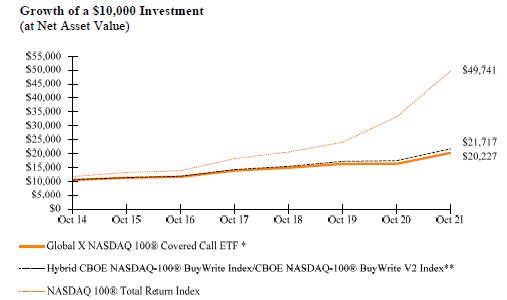
Global X NASDAQ 100® Covered Call ETF
The Global X NASDAQ® 100 Covered Call ETF (“Fund”) seeks to provide investment results that correspond generally to the price and yield performance, before fees and expenses, of the CBOE NASDAQ-100-100® BuyWrite V2 Index (“Underlying Index”). The Fund is passively managed, which means the investment adviser does not attempt to take defensive positions in declining markets. The Fund generally seeks to fully replicate the Underlying Index.
The CBOE NASDAQ-100® BuyWrite Index (“BXN Index”) is a benchmark index that measures the performance of a theoretical portfolio that holds a variety of the stocks included in the NASDAQ-100® Index (“Reference Index”) and “writes” (or sells) a succession of one-month at-the-money (“ATM”) Reference Index covered call options. The Underlying Index replicates the methodology used to calculate the BXN Index, with one exception: the written Reference Index covered call options are held until one day prior to the expiration date (i.e., generally the Thursday preceding the third Friday of the month) and are liquidated at a volume weighted average price determined at the close.
For the 12-month period ended October 31, 2021 (the “reporting period”), the Fund increased 23.89%, while the Underlying Index increased 24.46%. The Fund had a net asset value of $20.65 per share on October 31, 2020 and ended the reporting period with a net asset value of $22.82 per share on October 31, 2021.
During the reporting period, the highest returns derived from Moderna, Inc., and Tesla Inc., which returned 411.65% and 187.08%, respectively. The worst performers included Zoom Video Communications Inc., and Peloton Interactive Inc., which returned -40.41% and -34.61%, respectively.
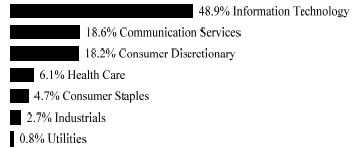
The Fund invests in stocks on the NASDAQ-100® and “writes” or “sells” corresponding call options on the Reference Index. The strategy tends to produce higher yields in volatile and uncertain times, when it can collect higher option premiums. The Fund underperformed the benchmark, the NASDAQ-100®, during the reporting period, as volatility subsided over the fiscal year, reducing the amount of premiums received on written options. The Fund’s performance was affected as stocks rallied over the period, with progress in COVID-19 vaccinations leading to a shift from a stay-at-home economy to a reopening economy. The Fund collected high option premiums when the market was volatile, but the NASDAQ-100® market rally later in the period limited the upside at the Fund level due to the ATM options writing. The Fund benefited from the constituents of NASDAQ-100®, which performed positively during the reporting period. Given the Fund’s options-writing strategy, it loses profit potential if the Reference Index rises above the strike price of the index call option.
| | Management Discussion of Fund Performance (unaudited) | |
| | Global X NASDAQ 100® Covered Call ETF | |
| | AVERAGE TOTAL RETURN FOR THE YEAR ENDED OCTOBER 31, 2021 |
| | One Year Return | Three Year Return | Five Year Return | Annualized Inception to Date* |
| | Net Asset Value | Market Price | Net Asset Value | Market Price | Net Asset Value | Market Price | Net Asset Value | Market Price |
Global X NASDAQ 100® Covered Call ETF | 23.89% | 23.64% | 10.74% | 10.63% | 11.67% | 11.54% | 9.34% | 9.32% |
Hybrid CBOE NASDAQ-100® BuyWrite Index/CBOE NASDAQ-100® BuyWrite V2 Index** | 24.46% | 24.46% | 12.13% | 12.13% | 12.88% | 12.88% | 10.32% | 10.32% |
NASDAQ 100® Total Return Index | 44.43% | 44.43% | 32.74% | 32.74% | 28.25% | 28.25% | 22.54% | 22.54% |
* The Fund commenced operations on December 11, 2013.
** Hybrid Index performance reflects the performance of the CBOE NASDAQ-100® BuyWrite Index through October 14, 2015 and CBOE NASDAQ-100® BuyWrite V2 Index thereafter.
The Fund operated as the Horizons NASDAQ 100® Covered Call ETF (the “Predecessor Fund”), a series of Horizons ETF Trust I, prior to the Fund’s acquisition of the assets and assumption of the liabilities of the Predecessor Fund on December 24, 2018 (See Note 1 in Notes to Financial Statements).
On October 14, 2015, Global X Management Company LLC (The “Advisor”) changed the Fund’s primary benchmark from the BXN Index to BXNT Index in connection with a change in the Fund’s principal strategies. The Advisor believes the BXNT Index is a better measure of the Fund’s performance. Returns reflect a blended benchmark.
| | Management Discussion of Fund Performance (unaudited) | |
| | Global X NASDAQ 100® Covered Call ETF | |
The Nasdaq-100® Index includes 100 of the largest domestic and international non-financial companies listed on The Nasdaq Stock Market based on market capitalization.
The performance data quoted herein represents past performance and the return and value of an investment in the Fund will fluctuate so that, when redeemed, it may be worth less than its original cost. Past performance is no guarantee of future performance and should not be considered as a representation of the future results of the Fund. The Fund’s performance assumes the reinvestment of all dividends and all capital gains. Index returns assume reinvestment of dividends and, unlike the Fund’s returns, do not reflect any fees or expenses. If such fees and expenses were included in the index returns, the performance would have been lower. Please note that one cannot invest directly in an unmanaged index. Performance figures for the periods shown may reflect contractual fee waivers and/or expense reimbursements. In the absence of fee waiver sand/or expense reimbursements (if applicable), returns would have been lower.
There are no assurances that the Fund will meet its stated objectives.
The Fund’s holdings and allocations are subject to change and should not be considered recommendations to buy individual securities.
The graph and table do not reflect the deduction of taxes that a shareholder would pay on Fund distributions or the redemption or sale of Fund shares.
See definition of comparative indices on the previous page.
| | Management Discussion of Fund Performance (unaudited) | |
| | Global X S&P 500® Covered Call ETF | |
Global X S&P 500® Covered Call ETF
The Global X S&P 500® Covered Call ETF (“Fund”) seeks to provide investment results that correspond generally to the price and yield performance, before fees and expenses, of the CBOE S&P 500 BuyWrite Index (“Underlying Index”). The Fund is passively managed, which means the investment adviser does not attempt to take defensive positions in declining markets. The Fund generally seeks to fully replicate the Underlying Index.
The Underlying Index measures the total rate of return of a S&P 500® Index covered call strategy. This strategy consists of holding a portfolio indexed to the S&P 500® Index and selling a succession of one-month at-the-money S&P 500® Index call options. A covered call strategy is generally considered to be an investment strategy in which an investor buys a security, and sells (or “writes”) a call option on that security in an attempt to generate more income. Each time the Fund writes a covered call option, the Fund receives a payment of money from the investor who buys the option from the Fund, which is called the premium. If the value of the Fund’s call option that it has written declines because of a decline in the value of the S&P 500® Index, the premium that the Fund received for writing the covered call option offsets this loss to some extent.
For the 12-month period ended October 31, 2021 (the “reporting period”), the Fund increased 30.67%, while the Underlying Index increased 31.54%. The Fund had a net asset value of $42.45 per share on October 31, 2020 and ended the reporting period with a net asset value of $50.37 per share on October 31, 2021.
During the reporting period, the highest returns derived from Devon Energy Corporation and Diamondback Energy Inc., which returned 370.78% and 324.25%, respectively. The worst performers included Penn National Gaming Inc., and MarketAxess Holdings Inc., which returned -39.00% and -23.77%, respectively.
The Fund invests in stocks listed on the S&P 500® Index and “writes” or “sells” corresponding call options on the same index. The S&P 500® Index generated strong returns in the reporting period, reaching record levels, which contributed to the Fund’s performance. However, the Fund’s gains were constrained by call-option writing, leading to underperformance versus the broad S&P 500® Index. The Fund collected high option premiums when the market was volatile, but the stock rally later in the period affected its performance. The S&P 500® Index improved in the period with accommodative Federal Reserve policies, the reopening economy, and strong earnings. Given the Fund’s options-writing strategy, it cedes potential profit when the Underlying Index advances above the strike price of the index call option.
| | Management Discussion of Fund Performance (unaudited) | |
| | Global X S&P 500® Covered Call ETF | |
| | AVERAGE TOTAL RETURN FOR THE YEAR ENDED OCTOBER 31, 2021 |
| | One Year Return | Three Year Return | Five Year Return | Annualized Inception to Date* |
| | Net Asset Value | Market Price | Net Asset Value | Market Price | Net Asset Value | Market Price | Net Asset Value | Market Price |
Global X S&P 500® Covered Call ETF | 30.67% | 29.46% | 9.46% | 9.43% | 9.99% | 9.99% | 8.93% | 9.02% |
Hybrid S&P 500® Stock Covered Call Index/CBOE S&P 500 2% OTM BuyWrite Index/CBOE S&P 500 BuyWrite Index** | 31.54% | 31.54% | 10.53% | 10.53% | 10.62% | 10.62% | 9.18% | 9.18% |
S&P 500® Index | 42.91% | 42.91% | 21.48% | 21.48% | 18.93% | 18.93% | 15.79% | 15.79% |
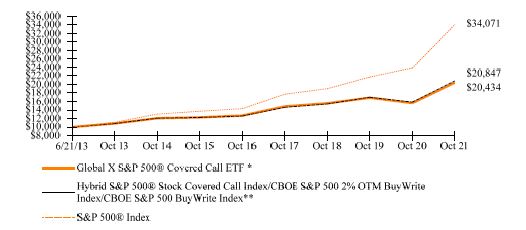
* The Fund commenced operations on June 21, 2013.
** Hybrid Index performance reflects the performance of the S&P 500® Stock Covered Call Index through September 14, 2017, the CBOE S&P 500 2% OTM BuyWrite Index through August 20, 2020 and the CBOE S&P 500 BuyWrite Index thereafter.
The Fund operated as the Horizons S&P 500® Covered Call ETF (the “Predecessor Fund”), a series of Horizons ETF Trust I, prior to the Fund’s acquisition of the assets and assumption of the liabilities of the Predecessor Fund on December 24, 2018 (See Note 1 in Notes to Financial Statements).
The S&P 500® Index is a market capitalization weighted composite index of 500 large capitalization U.S. companies.
| | Management Discussion of Fund Performance (unaudited) | |
| | Global X S&P 500® Covered Call ETF | |
The performance data quoted herein represents past performance and the return and value of an investment in the Fund will fluctuate so that, when redeemed, it may be worth less than its original cost. Past performance is no guarantee of future performance and should not be considered as a representation of the future results of the Fund. The Fund’s performance assumes the reinvestment of all dividends and all capital gains. Index returns assume reinvestment of dividends and, unlike the Fund’s returns, do not reflect any fees or expenses. If such fees and expenses were included in the index returns, the performance would have been lower. Please note that one cannot invest directly in an unmanaged index. Performance figures for the periods shown may reflect contractual fee waivers and/or expense reimbursements. In the absence of fee waiver sand/or expense reimbursements (if applicable), returns would have been lower.
There are no assurances that the Fund will meet its stated objectives.
The Fund’s holdings and allocations are subject to change and should not be considered recommendations to buy individual securities.
The graph and table do not reflect the deduction of taxes that a shareholder would pay on Fund distributions or the redemption or sale of Fund shares.
See definition of comparative indices on the previous page.
| | Management Discussion of Fund Performance (unaudited) | |
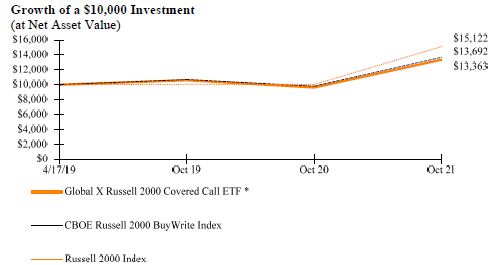
| | Global X Russell 2000 Covered Call ETF | |
Global X Russell 2000 Covered Call ETF
The Global X Russell 2000 Covered Call ETF (“Fund”) seeks to provide investment results that correspond generally to the price and yield performance, before fees and expenses, of the CBOE Russell 2000 BuyWrite Index (“Underlying Index”). The Fund is passively managed, which means the investment adviser does not attempt to take defensive positions in declining markets. The Fund generally seeks to fully replicate the Underlying Index.
The Underlying Index measures the performance of a theoretical portfolio that holds a portfolio of the stocks included in the Russell 2000 Index (the “Reference Index”), and “writes” (or sells) a succession of one-month at-the-money covered call options on the Reference Index. The written covered call options on the Reference Index are held until expiration. The Reference Index is an equity benchmark which measures the performance of the small-capitalization sector of the U.S. equity market, as defined by FTSE Russell, the provider of the Underlying Index. In seeking to track the Underlying Index, the Fund follows a “buywrite” (also called a covered call) investment strategy on the Reference Index in which the Fund purchases the component securities of the Reference Index or purchases other investments (including other underlying ETFs) that have economic characteristics that are substantially identical to the economic characteristics of such component securities, and also writes (or sells) call options that correspond to the Reference Index.
For the 12-month period ended October 31, 2021 (the “reporting period”), the Fund increased 38.82%, while the Underlying Index increased 39.62%. The Fund had a net asset value of $20.45 per share on October 31, 2020 and ended the reporting period with a net asset value of $25.18 per share on October 31, 2021.
During the reporting period, the Vanguard Russell 2000 ETF, the only holding of the Fund, returned 50.63%.
The Fund invests in the Vanguard Russell 2000 ETF, which invests in the underlying holdings of the Russell 2000 Index and “writes” or “sells” corresponding call options on the same index. During the reporting period, U.S. small cap stocks strongly rallied at the end of 2020 and in the early stages of 2021. However, small cap stocks did not perform as well for the rest of the reporting period, with waves of COVID-19 outbreaks, news about the Federal Reserve’s tapering plans, and inflation worries. The U.S. Dollar was generally on an upward trajectory, which helped domestic-oriented small cap stocks. High volatility in the small-cap space and broader market saw the Fund collect higher option premiums during the reporting period. Given the Fund’s options-writing strategy, it cedes potential profit when the Russell 2000 Index advances above the strike price of the index call option.
| | Management Discussion of Fund Performance (unaudited) | |
| | Global X Russell 2000 Covered Call ETF | |
| | AVERAGE TOTAL RETURN FOR THE YEAR ENDED OCTOBER 31, 2021 |
| | One Year Return | Annualized Inception to Date* |
| | Net Asset Value | Market Price | Net Asset Value | Market Price |
| Global X Russell 2000 Covered Call ETF | 38.82% | 38.88% | 12.11% | 12.14% |
| CBOE Russell 2000 BuyWrite Index | 39.62% | 39.62% | 13.16% | 13.16% |
| Russell 2000 Index | 50.80% | 50.80% | 17.68% | 17.68% |
* The Fund commenced operations on April 17, 2019.
The Russell 2000 Index is an index measuring the performance of approximately 2,000 smallest-cap American companies in the Russell 3000 Index, which is made up of 3,000 of the largest U.S. stocks. It is a market-cap weighted index.
The performance data quoted herein represents past performance and the return and value of an investment in the Fund will fluctuate so that, when redeemed, it may be worth less than its original cost. Past performance is no guarantee of future performance and should not be considered as a representation of the future results of the Fund. The Fund’s performance assumes the reinvestment of all dividends and all capital gains. Index returns assume reinvestment of dividends and, unlike the Fund’s returns, do not reflect any fees or expenses. If such fees and expenses were included in the index returns, the performance would have been lower. Please note that one cannot invest directly in an unmanaged index. Performance figures for the periods shown may reflect contractual fee waivers and/or expense reimbursements. In the absence of fee waiver sand/or expense reimbursements (if applicable), returns would have been lower.
There are no assurances that the Fund will meet its stated objectives.
The Fund’s holdings and allocations are subject to change and should not be considered recommendations to buy individual securities.
The graph and table do not reflect the deduction of taxes that a shareholder would pay on Fund distributions or the redemption or sale of Fund shares. See definition of comparative indices above.
| | Management Discussion of Fund Performance (unaudited) | |
| | Global X Nasdaq 100® Covered Call & Growth ETF | |
Global X Nasdaq 100® Covered Call & Growth ETF
The Global X Nasdaq 100® Covered Call & Growth ETF (“Fund”) seeks to provide investment results that correspond generally to the price and yield performance, before fees and expenses, of the CBOE Nasdaq-100® Half BuyWrite V2 Index (“Underlying Index”). The Fund is passively managed, which means the investment adviser does not attempt to take defensive positions in declining markets. The Fund generally seeks to fully replicate the Underlying Index.
The Underlying Index measures the performance of a theoretical portfolio that holds a portfolio of the stocks included in the Nasdaq 100® Index (the “Reference Index”), and “writes” (or sells) a succession of one-month at-the-money covered call options on the Reference Index. The written covered call options on the Reference Index correspond to approximately 50% of the value of the portfolio of stocks in the Reference Index. The written covered call options on the Reference Index are held until one day prior to expiration. By only writing call options on approximately 50% of the value of the portfolio of stocks in the Reference Index, the strategy can provide income generation from call options while allowing for some potential upside exposure to the growth of the underlying constituents of the Reference Index, relative to a 100% covered call strategy.
For the 12-month period ended October 31, 2021 (the “reporting period”), the Fund increased 33.42%, while the Underlying Index increased 34.37%. The Fund had a net asset value of $26.27 per share on October 31, 2020 and ended the reporting period with a net asset value of $33.09 per share on October 31, 2021.
During the reporting period, the highest returns came from Moderna Inc and Tesla Inc, which returned 411.65% and 187.08%, respectively. The worst performers included Zoom Video Communications Inc. and Peloton Interactive Inc, which returned -40.41% and -34.61%, respectively.
The Fund follows a “covered call” or “buy-write” strategy, buying stocks on the Nasdaq-100® and “writing” or “selling” corresponding call options on approximately 50% of the value of the portfolio of stocks on the same index. Over the reporting period, the Fund collected high option premiums when the market was volatile, and participated in some of the market rally in the Nasdaq-100®. Technology stocks performed well over the reporting period, with the higher adoption of technologies and the low interest rate environment. The Fund underperformed the Nasdaq-100® due to the call options written to generate income.
| | Management Discussion of Fund Performance (unaudited) | |
| | Global X Nasdaq 100® Covered Call & Growth ETF | |
| | AVERAGE TOTAL RETURN FOR THE YEAR ENDED OCTOBER 31, 2021 |
| | One Year Return | Annualized Inception to Date* |
| | Net Asset Value | Market Price | Net Asset Value | Market Price |
Global X Nasdaq 100® Covered Call & Growth ETF | 33.42% | 34.00% | 29.92% | 30.02% |
| CBOE NASDAQ-100 Half BuyWrite V2 Index** | 34.37% | 34.37% | 30.67% | 30.67% |
NASDAQ-100® Index | 44.43% | 44.43% | 40.33% | 40.33% |

* The Fund commenced operations on September 18, 2020.
** The CBOE NASDAQ-100 Half BuyWrite V2 Index measures the total rate of return of a hypothetical “covered call” strategy applied to the NASDAQ 100® Index that only writes half a unit of an at-the-money monthly Call option for every notional unit of the long position.
The Nasdaq-100® Index includes 100 of the largest domestic and international non-financial companies listed on The Nasdaq Stock Market based on market capitalization.
The performance data quoted herein represents past performance and the return and value of an investment in the Fund will fluctuate so that, when redeemed, it may be worth less than its original cost. Past performance is no guarantee of future performance and should not be considered as a representation of the future results of the Fund. The Fund’s performance assumes the reinvestment of all dividends and all capital gains. Index returns assume reinvestment of dividends and, unlike the Fund’s returns, do not reflect any fees or expenses. If such fees and expenses were included in the index returns, the performance would have been lower. Please note that one cannot invest directly in an unmanaged index. Performance figures for the periods shown may reflect contractual fee waivers and/or expense reimbursements. In the absence of fee waiver sand/or expense reimbursements (if applicable), returns would have been lower.
There are no assurances that the Fund will meet its stated objectives.
| | Management Discussion of Fund Performance (unaudited) | |
| | Global X Nasdaq 100® Covered Call & Growth ETF | |
The Fund’s holdings and allocations are subject to change and should not be considered recommendations to buy individual securities.
The graph and table do not reflect the deduction of taxes that a shareholder would pay on Fund distributions or the redemption or sale of Fund shares.
See definition of comparative indices on the previous page.
| | Management Discussion of Fund Performance (unaudited) | |
| | Global X S&P 500® Covered Call & Growth ETF | |
Global X S&P 500® Covered Call & Growth ETF
The Global X S&P 500® Covered Call & Growth ETF (“Fund”) seeks to provide investment results that correspond generally to the price and yield performance, before fees and expenses, of the CBOE S&P 500 Half BuyWrite Index (“Underlying Index”). The Fund is passively managed, which means the investment adviser does not attempt to take defensive positions in declining markets. The Fund generally seeks to fully replicate the Underlying Index.
The Underlying Index measures the performance of a theoretical portfolio that holds a portfolio of the stocks included in the S&P 500® Index (the “Reference Index”), and “writes” (or sells) a succession of one-month at-the-money covered call options on the Reference Index. The written covered call options on the Reference Index correspond to approximately 50% of the value of the portfolio of stocks in the Reference Index. The written covered call options on the Reference Index are held until expiration. The Reference Index is a float-adjusted market capitalization weighted index which measures the performance of the equity securities of 500 industrial, information technology, utility and financial companies, amongst other sectors, and is regarded as generally representative of the U.S. stock market.
During the reporting period ended October 31, 2021 (the “reporting period”), the Fund increased 35.18%, while the Underlying Index increased 37.26%. The Fund had a net asset value of $24.69 per share on October 31, 2020 and ended the reporting period with a net asset value of $31.83 per share on October 31, 2021.
During the reporting period, the highest returns derived from Devon Energy Corporation and Diamondback Energy Inc., which returned 370.78% and 324.25%, respectively. The worst performers included Penn National Gaming Inc. and MarketAxess Holdings Inc., which returned -39.00% and -23.77%, respectively.
The Fund follows a “covered-call” or “buy-write” strategy, purchasing stocks on the Reference Index, and “writing” or “selling” corresponding call options on approximately 50% of the value of the portfolio of stocks on the Reference Index. Over the reporting period, it collected high option premiums when the market was volatile, but the stock rally later during the reporting period affected its returns to some extent, leading to underperformance in comparison to the Reference Index, which reached an all-time high.
| | AVERAGE TOTAL RETURN FOR THE YEAR ENDED OCTOBER 31, 2021 |
| | One Year Return | Annualized Inception to Date* |
| | Net Asset Value | Market Price | Net Asset Value | Market Price |
Global X S&P 500® Covered Call & Growth ETF | 35.18% | 35.38% | 29.11% | 28.86% |
| CBOE S&P 500 Half BuyWrite Index** | 37.26% | 37.26% | 30.43% | 30.43% |
S&P 500® Index | 42.91% | 42.91% | 35.98% | 35.98% |
| | Management Discussion of Fund Performance (unaudited) | |
| | Global X S&P 500® Covered Call & Growth ETF | |
* The Fund commenced operations on September 18, 2020.
** The CBOE S&P 500 Half BuyWrite Index (the “BXMH Index”) measures the total rate of return of a hypothetical “covered call” strategy applied to the S&P 500 Composite Price Index (the “S&P 500® Index”) that only writes half a unit of an at-the-money monthly Call option for every notional unit of the long position.
The S&P 500® Index is a market capitalization weighted composite index of 500 large capitalization U.S. companies.
The performance data quoted herein represents past performance and the return and value of an investment in the Fund will fluctuate so that, when redeemed, it may be worth less than its original cost. Past performance is no guarantee of future performance and should not be considered as a representation of the future results of the Fund. The Fund’s performance assumes the reinvestment of all dividends and all capital gains. Index returns assume reinvestment of dividends and, unlike the Fund’s returns, do not reflect any fees or expenses. If such fees and expenses were included in the index returns, the performance would have been lower. Please note that one cannot invest directly in an unmanaged index. Performance figures for the periods shown may reflect contractual fee waivers and/or expense reimbursements. In the absence of fee waiver sand/or expense reimbursements (if applicable), returns would have been lower.
There are no assurances that the Fund will meet its stated objectives.
The Fund’s holdings and allocations are subject to change and should not be considered recommendations to buy individual securities.
The graph and table do not reflect the deduction of taxes that a shareholder would pay on Fund distributions or the redemption or sale of Fund shares.
See definition of comparative indices above.
| | Management Discussion of Fund Performance (unaudited) | |
| | Global X SuperIncome™ Preferred ETF | |
Global X SuperIncome™ Preferred ETF
The Global X SuperIncomeTM Preferred ETF (“Fund”) seeks to provide investment results that correspond generally to the price and yield performance, before fees and expenses, of the S&P Enhanced Yield North American Preferred Stock Index (“Underlying Index”). The Fund is passively managed, which means the investment adviser does not attempt to take defensive positions in declining markets. The Fund generally seeks to fully replicate the Underlying Index.
The Underlying Index tracks the performance of the highest-yielding preferred securities in the United States and Canada, as determined by Standard & Poor’s Financial Services, LLC, a subsidiary of the McGraw-Hill Companies (“S&P”), the provider of the Underlying Index. The Underlying Index is comprised of preferred stocks that meet certain criteria relating to size, liquidity, issuer concentration and rating, maturity and other requirements, as determined by S&P. The Underlying Index does not seek to directly reflect the performance of the companies issuing the preferred stock.
For the 12-month period ended October 31, 2021 (the “reporting period”), the Fund increased 13.71%, while the Underlying Index increased 14.56%. The Fund had a net asset value of $11.12 per share on October 31, 2020 and ended the reporting period with a net asset value of $11.94 per share on October 31, 2021.
During the reporting period, the highest returns derived from Sabre Corporation and Crestwood Equity Partners LP, which returned 103.17% and 84.75%, respectively. The worst performers included ViacomCBS Inc., and Becton Dickinson, which returned
-6.51% and -4.80%, respectively.
The Fund invests in preferred shares, with some of the highest dividend yields in the United States and Canada. Globally, effective COVID-19 vaccination programs drove economic growth during the reporting period. During the reporting period, accomodative Federal Reserve policies kept rates low and credit spreads tight, driving interest in higher yielding assets, such as preferred stock. Investors also refocused their attention on preferred stocks due to their considerable sector exposure to Financials, which benefits from a stronger economy. During the reporting period, the Fund had an approximate average sector exposure of 58% to Financials, 8% to Information Technology, and 6% to Energy.
| | Management Discussion of Fund Performance (unaudited) | |
| | Global X SuperIncome™ Preferred ETF | |
| | AVERAGE TOTAL RETURN FOR THE YEAR ENDED OCTOBER 31, 2021 |
| | One Year Return | Three Year Return | Five Year Return | AnnualizedInception to Date* |
| | Net Asset Value | Market Price | Net Asset Value | Market Price | Net Asset Value | Market Price | Net Asset Value | Market Price |
| Global X SuperIncome™ Preferred ETF | 13.71% | 14.41% | 7.66% | 7.75% | 4.62% | 4.59% | 4.32% | 4.51% |
| S&P Enhanced Yield North American Preferred Stock Index | 14.56% | 14.56% | 8.28% | 8.28% | 5.19% | 5.19% | 4.95% | 4.95% |
S&P 500® Index | 42.91% | 42.91% | 21.48% | 21.48% | 18.93% | 18.93% | 16.37% | 16.37% |
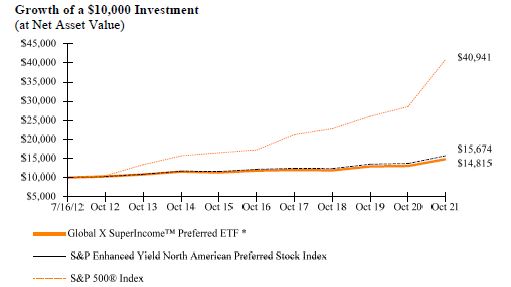
* Fund commenced operations on July 16, 2012.
The S&P 500® Index is a market capitalization weighted composite index of 500 large capitalization U.S. companies.
The performance data quoted herein represents past performance and the return and value of an investment in the Fund will fluctuate so that, when redeemed, it may be worth less than its original cost. Past performance is no guarantee of future performance and should not be considered as a representation of the future results of the Fund. The Fund’s performance assumes the reinvestment of all dividends and all capital gains. Index returns assume reinvestment of dividends and, unlike the Fund’s returns, do not reflect any fees or expenses. If such fees and expenses were included in the index returns, the performance would have been lower. Please note that one cannot invest directly in an unmanaged index. Performance figures for the periods shown may reflect contractual fee waivers and/or expense reimbursements. In the absence of fee waiver sand/or expense reimbursements (if applicable), returns would have been lower.
There are no assurances that the Fund will meet its stated objectives.
| | Management Discussion of Fund Performance (unaudited) | |
| | Global X SuperIncome™ Preferred ETF | |
The Fund’s holdings and allocations are subject to change and should not be considered recommendations to buy individual securities.
The graph and table do not reflect the deduction of taxes that a shareholder would pay on Fund distributions or the redemption or sale of Fund shares.
See definition of comparative indices on the previous page.
| | Management Discussion of Fund Performance (unaudited) | |
| | Global X Renewable Energy Producers ETF | |
Global X Renewable Energy Producers ETF
The Global X Renewable Energy Producers ETF (“Fund”) seeks to provide investment results that correspond generally to the price and yield performance, before fees and expenses, of the Indxx Renewable Energy Producers Index. (“Underlying Index”). The Fund is passively managed, which means the investment adviser does not attempt to take defensive positions in declining markets. The Fund generally seeks to fully replicate the Underlying Index.
The Underlying Index is a net total return index designed to track the performance of companies that are involved in the generation, distribution, transmission, or providing infrastructure to the renewable energy space, as defined by Indxx, the provider of the Underlying Index.
For the 12-month period ended October 31, 2021 (the “reporting period”), the Fund increased 15.37%, while the Underlying Index increased 15.96%. The Fund had a net asset value of $14.87 per share on October 31, 2020 and ended the reporting period with a net asset value of $16.82 per share on October 31, 2021.
During the reporting period, the highest returns came from China Longyuan Power Group Corp. Ltd. Class H and Gunkul Engineering Public Co. Ltd. NVDR, which returned 246.40% and 163.12%, respectively. The worst performers were Scatec ASA and Azure Power Global Ltd., which returned -48.25% and -37.25%, respectively.
Durable tailwinds resulted in solid performance for renewable energy producers despite significant obstacles over the reporting period. The COVID-19 pandemic continued to disrupt supply chains across several sectors, driving up prices and making it more difficult for renewable energy producers to acquire equipment or components. However, costs associated with renewable energy remained competitive against traditional energy sources in most markets, especially as oil and gas prices rallied higher. Increasing demand for power globally and mounting urgency to address climate change also drove the segment forward during the reporting period. Notably, the United States reported record renewable energy consumption in the first half of 2021, while key markets such as China, the European Union, and Canada continued to add capacity. Increasingly forthcoming international commitments coupled with new technologies such as green hydrogen could continue to expand the reach of clean energy. Sector weightings of the Fund were reported to be the highest in Utilities, at 88.3%. Geographically, the Fund maintained an average allocation of 14.6% to United States stocks, followed by New Zealand (9.6%) and Canada (8.5%).
| | Management Discussion of Fund Performance (unaudited) | |
| | Global X Renewable Energy Producers ETF | |
| | AVERAGE TOTAL RETURN FOR THE YEAR ENDED OCTOBER 31, 2021 |
| | One Year Return | Three Year Return | Five Year Return | Annualized Inception to Date* |
| | Net Asset Value | Market Price | Net Asset Value | Market Price | Net Asset Value | Market Price | Net Asset Value | Market Price |
| Global X Renewable Energy Producers ETF | 15.37% | 15.43% | 16.91% | 16.89% | 12.58% | 12.39% | 5.70% | 5.69% |
| Hybrid Indxx Renewable Energy Producers Index** | 15.96% | 15.96% | 17.50% | 17.50% | 13.09% | 13.09% | 6.10% | 6.10% |
| MSCI ACWI (Net) | 37.28% | 37.28% | 17.47% | 17.47% | 14.72% | 14.72% | 10.65% | 10.65% |
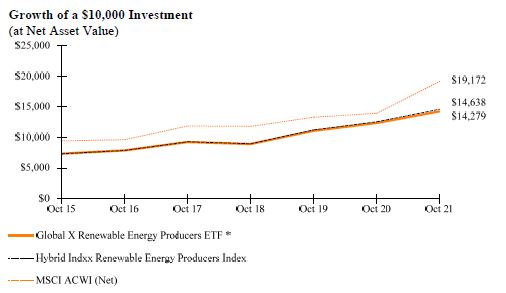
* Fund commenced operations on May 27, 2015.
**Hybrid index performance reflects the performance of the Indxx Global YieldCo Index through November 18, 2018 and the Indxx YieldCo & Renewable Energy Income Index thereafter. Effective February 1, 2021, the name of the Underlying Index changed from Indxx YieldCo & Renewable Energy Income Index to the Indxx Renewable Energy Producers Index.
The MSCI ACWI (Net) (All Country World Index) Index is a free float-adjusted market capitalization weighted index that is designed to measure the equity market performance of developed and emerging markets.
| | Management Discussion of Fund Performance (unaudited) | |
| | Global X Renewable Energy Producers ETF | |
The performance data quoted herein represents past performance and the return and value of an investment in the Fund will fluctuate so that, when redeemed, it may be worth less than its original cost. Past performance is no guarantee of future performance and should not be considered as a representation of the future results of the Fund. The Fund’s performance assumes the reinvestment of all dividends and all capital gains. Index returns assume reinvestment of dividends and, unlike the Fund’s returns, do not reflect any fees or expenses. If such fees and expenses were included in the index returns, the performance would have been lower. Please note that one cannot invest directly in an unmanaged index. Performance figures for the periods shown may reflect contractual fee waivers and/or expense reimbursements. In the absence of fee waiver sand/or expense reimbursements (if applicable), returns would have been lower.
There are no assurances that the Fund will meet its stated objectives.
The Fund’s holdings and allocations are subject to change and should not be considered recommendations to buy individual securities.
The graph and table do not reflect the deduction of taxes that a shareholder would pay on Fund distributions or the redemption or sale of Fund shares.
High short term performance of the fund is unusual and investors should not expect such performance to be repeated.
See definition of comparative indices on the previous page.
| | Management Discussion of Fund Performance (unaudited) | |
| | Global X S&P 500® Catholic Values ETF | |
Global X S&P 500® Catholic Values ETF
The Global X S&P 500® Catholic Values ETF (“Fund”) seeks to provide investment results that correspond generally to the price and yield performance, before fees and expenses, of the S&P 500® Catholic Values Index (“Underlying Index”). The Fund is passively managed, which means the investment adviser does not attempt to take defensive positions in declining markets. The Fund generally seeks to fully replicate the Underlying Index.
The Underlying Index is designed to provide exposure to U.S. equity securities included in the S&P 500® Index while maintaining alignment with the moral and social teachings of the Catholic Church. The Underlying Index applies exclusion criteria to the constituents of the S&P 500® Index in order to create a benchmark aligned with the moral and social teachings of the Catholic Church. These values are consistent with the Socially Responsible Investment Guidelines outlined by the United States Conference of Catholic Bishops (USCCB). The Underlying Index is designed for investors who do not want to breach religious norms in their passive investment strategies. The Underlying Index is reweighted quarterly so that its sector exposures match the sector exposures of the S&P 500® Index..
For the 12-month period ended October 31, 2021 (the “reporting period”), the Fund increased 43.54%, while the Underlying Index increased 43.94%. The Fund had a net asset value of $40.32 per share on October 31, 2020 and ended the reporting period with a net asset value of $57.22 per share on October 31, 2021.
During the reporting period, the highest returns came from Devon Energy Corporation and Diamondback Energy Inc., which returned 370.78% and 324.25%, respectively. The worst performers were MarketAxess Holdings Inc., and Incyte Corporation which returned -23.77% and -22.69%, respectively.
The Fund provides exposure to companies within the S&P 500® Index whose business practices align with the investment guidelines set by the USCCB. As of October 31, 2021, the Fund had 474 equity holdings compared with the 505 holdings of the S&P 500® Index. To mitigate the potential performance differences between the S&P 500® Index and the Fund, the Fund’s sector exposures are reweighted to align with those of the S&P 500® Index on a quarterly basis. Because of supportive fiscal and monetary policies in the U.S., during the reporting period the economy experienced a strong recovery and corporate profitability increased, all helping to propel equity markets. Over the reporting period, Information Technology had the highest average sector weighting of 28% in the Fund, followed by Health Care at 13% and Financials at 12%.
| | Management Discussion of Fund Performance (unaudited) | |
| | Global X S&P 500® Catholic Values ETF | |
| | AVERAGE TOTAL RETURN FOR THE YEAR ENDED OCTOBER 31, 2021 |
| | One Year Return | Three Year Return | Five Year Return | AnnualizedInception to Date* |
| | Net Asset Value | Market Price | Net Asset Value | Market Price | Net Asset Value | Market Price | Net Asset Value | Market Price |
Global X S&P 500® Catholic Values ETF | 43.54% | 44.68% | 21.56% | 21.58% | 18.99% | 18.94% | 17.51% | 17.54% |
S&P 500® Catholic Values Index | 43.94% | 43.94% | 21.95% | 21.95% | 19.36% | 19.36% | 17.85% | 17.85% |
S&P 500® Index | 42.91% | 42.91% | 21.48% | 21.48% | 18.93% | 18.93% | 17.50% | 17.50% |
* Fund commenced operations on April 18, 2016.
The S&P 500® Index is a market capitalization weighted composite index of 500 large capitalization U.S. companies.
The performance data quoted herein represents past performance and the return and value of an investment in the Fund will fluctuate so that, when redeemed, it may be worth less than its original cost. Past performance is no guarantee of future performance and should not be considered as a representation of the future results of the Fund. The Fund’s performance assumes the reinvestment of all dividends and all capital gains. Index returns assume reinvestment of dividends and, unlike the Fund’s returns, do not reflect any fees or expenses. If such fees and expenses were included in the index returns, the performance would have been lower. Please note that one cannot invest directly in an unmanaged index. Performance figures for the periods shown may reflect contractual fee waivers and/or expense reimbursements. In the absence of fee waiver sand/or expense reimbursements (if applicable), returns would have been lower.
There are no assurances that the Fund will meet its stated objectives.
| | Management Discussion of Fund Performance (unaudited) | |
| | Global X S&P 500® Catholic Values ETF | |
The Fund’s holdings and allocations are subject to change and should not be considered recommendations to buy individual securities.
The graph and table do not reflect the deduction of taxes that a shareholder would pay on Fund distributions or the redemption or sale of Fund shares.
See definition of comparative indices on the previous page.
| | Management Discussion of Fund Performance (unaudited) | |
| | Global X S&P Catholic Values Developed ex-US ETF | |
Global X S&P Catholic Values Developed ex-US ETF
The Global X S&P Catholic Values Developed ex-U.S. ETF (“Fund”) seeks investment results that correspond generally to the price and yield performance, before fees and expenses, of the S&P Developed ex-U.S. Catholic Values Index (“Underlying Index”). The Fund is passively managed, which means the investment adviser does not attempt to take defensive positions in declining markets. The Fund generally seeks to fully replicate the Underlying Index.
The Underlying Index is designed to provide exposure to developed market equity securities outside the U.S. while maintaining alignment with the moral and social teachings of the Catholic Church. The Underlying Index applies exclusion criteria to the constituents of the S&P EPAC ex-Korea Large Cap Index in order to create a benchmark aligned with Catholic values. These values are consistent with the Social Responsible Investment Guidelines outlined by the United States Conference of Catholic Bishops (USCCB). The Underlying Index is designed for investors who do not want to breach religious norms in their passive investment strategies. The Underlying Index is reweighted quarterly so that the Underlying Index’s sector exposures match the sector exposures of the S&P EPAC ex-Korea Large Cap Index.
For the 12-month period ended October 31, 2021 (the “reporting period”), the Fund increased 33.79%, while the Underlying Index increased 34.43%. The Fund had a net asset value of $24.98 per share on October 31, 2020 and ended the reporting period with a net asset value of $32.8 per share on October 31, 2021.
During the reporting period, the highest returns came from Ascendas REIT and Norsk Hydro ASA which returned 518.75% and 177.76%, respectively. The worst performers were China Evergrande New Energy Vehicle Group Ltd. and Alibaba Health Information Technology Ltd. which returned -86.88% and -63.38%, respectively.
The Fund provides exposure to companies in developed markets outside of the U.S., whose business practices align with the investment guidelines set by the USCCB. To mitigate the potential performance differences between the Fund and traditional International equity benchmarks, the Fund’s sector exposures are reweighted to align with those of the S&P EPAC ex-Korea Large Cap Index on a quarterly basis. During the reporting period, Financials had the highest average weighting of 17% in the Fund, followed by Industrials at 15% and Health Care at 13%. Geographically, the Fund had an approximate average exposure of 32% to Japan, 10% to Australia, 9% to the United Kingdom.
| | Management Discussion of Fund Performance (unaudited) | |
| | Global X S&P Catholic Values Developed ex-US ETF | |
| | AVERAGE TOTAL RETURN FOR THE YEAR ENDED OCTOBER 31, 2021 |
| | One Year Return | AnnualizedInception to Date* |
| | Net Asset Value | Market Price | Net Asset Value | Market Price |
| Global X S&P Catholic Values Developed ex-US ETF | 33.79% | 34.40% | 23.70% | 24.16% |
| S&P Developed ex-U.S. Catholic Values Index | 34.43% | 34.43% | 24.16% | 24.16% |
| MSCI EAFE Index (Net) | 34.18% | 34.18% | 23.73% | 23.73% |

* Fund commenced operations on June 22, 2020.
The MSCI EAFE Index (Net) (Europe, Australasia, Far East) is a free float-adjusted market capitalization index that is designed to measure the equity market performance of developed markets, excluding the US & Canada.
The performance data quoted herein represents past performance and the return and value of an investment in the Fund will fluctuate so that, when redeemed, it may be worth less than its original cost. Past performance is no guarantee of future performance and should not be considered as a representation of the future results of the Fund. The Fund’s performance assumes the reinvestment of all dividends and all capital gains. Index returns assume reinvestment of dividends and, unlike the Fund’s returns, do not reflect any fees or expenses. If such fees and expenses were included in the index returns, the performance would have been lower. Please note that one cannot invest directly in an unmanaged index. Performance figures for the periods shown may reflect contractual fee waivers and/or expense reimbursements. In the absence of fee waiver sand/or expense reimbursements (if applicable), returns would have been lower.
| | Management Discussion of Fund Performance (unaudited) | |
| | Global X S&P Catholic Values Developed ex-US ETF | |
There are no assurances that the Fund will meet its stated objectives.
The Fund’s holdings and allocations are subject to change and should not be considered recommendations to buy individual securities.
The graph and table do not reflect the deduction of taxes that a shareholder would pay on Fund distributions or the redemption or sale of Fund shares.
See definition of comparative indices on the previous page.
| | Management Discussion of Fund Performance (unaudited) | |
| | Global X Guru® Index ETF | |
Global X Guru® Index ETF
The Global X Global X Guru® Index ETF (“Fund”) seeks to provide investment results that correspond generally to the price and yield performance, before fees and expenses, of the Solactive Guru Index (“Underlying Index”). The Fund is passively managed, which means the investment adviser does not attempt to take defensive positions in declining markets. The Fund generally seeks to fully replicate the Underlying Index.
The Underlying Index is comprised of the top U.S. listed equity positions reported on Form 13F by a select group of entities that Solactive AG (the “Index Provider”) characterizes as hedge funds. Hedge funds are selected from a pool of thousands of privately offered pooled investment vehicles based on the size of their reported equity holdings and the efficacy of replicating their publicly disclosed positions. Additional filters are applied to eliminate hedge funds that have high turnover rates for equity holdings. Only hedge funds with concentrated top holdings are included in the selection process. Once the hedge fund pool has been determined, the Index Provider utilizes 13F filings to compile the top stock holding from each of these hedge funds. The stocks are screened for liquidity and equal weighted.
For the 12-month period ended October 31, 2021 (the “reporting period”), the Fund increased 37.43%, while the Underlying Index increased 37.36%. The Fund had a net asset value of $37.31 per share on October 31, 2020 and ended the reporting period with a net asset value of $50.24 per share on October 31, 2021.
During the reporting period, the highest returns came from Tenet Healthcare Corporation and Cheniere Energy Inc., which returned 192.01% and 116%, respectively. The worst performers were Turning Point Therapeutics, Inc. and Amicus Therapeutics Inc., which returned -64.43% and -49.52%, respectively.
The Fund’s investments are among the highest-conviction U.S.-listed equity positions reported on Form 13F by major hedge funds. Over the reporting period, the Fund delivered positive performance but trailed the S&P 500® Index. Quarterly rebalancing results in dynamic exposures, which can change significantly through the year. The Fund benefited from its exposure to the Information Technology, Consumer Discretionary, and Communication Services sectors, which delivered strong performance compared to other sectors. The Fund’s underperformance relative to the S&P 500® Index was primarily the result of more limited exposure in the Information Technology sector, as well as underperformance in stock selection in that sector. Poor stock selection in the Health Care sector also negatively contributed to performance relative to the S&P 500® Index.
| | Management Discussion of Fund Performance (unaudited) | |
| | Global X Guru® Index ETF | |
| | AVERAGE TOTAL RETURN FOR THE YEAR ENDED OCTOBER 31, 2021 |
| | One Year Return | Three Year Return | Five Year Return | Annualized Inception to Date* |
| | Net Asset Value | Market Price | Net Asset Value | Market Price | Net Asset Value | Market Price | Net Asset Value | Market Price |
Global X Guru® Index ETF | 37.43% | 37.93% | 20.16% | 20.18% | 17.85% | 17.87% | 15.18% | 15.19% |
| Solactive Guru Index | 37.36% | 37.36% | 20.23% | 20.23% | 18.05% | 18.05% | 15.53% | 15.53% |
S&P 500® Index | 42.91% | 42.91% | 21.48% | 21.48% | 18.93% | 18.93% | 16.89% | 16.89% |
* The Fund commenced operations on June 4, 2012.
The S&P 500® Index is a market capitalization weighted composite index of 500 large capitalization U.S. companies.
The performance data quoted herein represents past performance and the return and value of an investment in the Fund will fluctuate so that, when redeemed, it may be worth less than its original cost. Past performance is no guarantee of future performance and should not be considered as a representation of the future results of the Fund. The Fund’s performance assumes the reinvestment of all dividends and all capital gains. Index returns assume reinvestment of dividends and, unlike the Fund’s returns, do not reflect any fees or expenses. If such fees and expenses were included in the index returns, the performance would have been lower. Please note that one cannot invest directly in an unmanaged index. Performance figures for the periods shown may reflect contractual fee waivers and/or expense reimbursements. In the absence of fee waiver sand/or expense reimbursements (if applicable), returns would have been lower.
| | Management Discussion of Fund Performance (unaudited) | |
| | Global X Guru® Index ETF | |
There are no assurances that the Fund will meet its stated objectives.
The Fund’s holdings and allocations are subject to change and should not be considered recommendations to buy individual securities.
The graph and table do not reflect the deduction of taxes that a shareholder would pay on Fund distributions or the redemption or sale of Fund shares.
See definition of comparative indices on the previous page.
| | Management Discussion of Fund Performance (unaudited) | |
| | Global X S&P 500® Tail Risk ETF | |
Global X S&P 500® Tail Risk ETF
The Global X S&P 500® Tail Risk ETF (“Fund”) seeks to provide investment results that correspond generally to the price and yield performance, before fees and expenses, of the Cboe S&P 500 Tail Risk Index (“Underlying Index”). The Fund is passively managed, which means the investment adviser does not attempt to take defensive positions in declining markets. The Fund generally seeks to fully replicate the Underlying Index.
The Underlying Index measures the performance of a risk management strategy that holds the underlying stocks of the S&P 500® Index and applies a protective put strategy (i.e. long put options) on the S&P 500® Index. The Underlying Index specifically reflects the performance of the component securities of the S&P 500® Index, combined with a long position in 10% out-of-the-money (“OTM”) put options that correspond to the value of the portfolio of stocks in the S&P 500® Index.
From the inception of the Fund to the period ended October 31, 2021 (the “reporting period”), the Fund increased 1.43%, while the Underlying Index increased 1.59%. The Fund had a net asset value of $27.33 per share on August 25, 2021 and ended the reporting period with a net asset value of $27.72 per share on October 31, 2021.
During the reporting period, the highest returns came from Tesla Inc., and Coterra Energy Inc., which returned 56.64% and 45.53%, respectively. The worst performers were Biogen Inc., and DaVita Inc., which returned -22.19% and -21.05%, respectively.
The Fund invests in the stocks in the S&P 500® Index, while buying OTM put options on the S&P 500® Index. While the strategy provides uncapped growth potential, it offers a measure of downside risk, mitigating significant selloffs of greater than approximately -10% between the purchase of the put option and its expiration in three months. Since its launch, the Fund has benefited from the S&P 500’s equity market rally. Accommodative monetary policies and earnings growth drove some of the Underlying Index’s gains during the reporting period. Nonetheless, the gains were pared by costs associated with protection-buying puts, causing a measure of underperformance versus the S&P 500® Index.
| | AVERAGE TOTAL RETURN FOR THE PERIOD ENDED OCTOBER 31, 2021 |
| | Cumulative Inception to Date* |
| | Net Asset Value | Market Price |
Global X S&P 500® Tail Risk ETF | 1.43% | 1.54% |
| Cboe S&P 500 Tail Risk Index | 1.59% | 1.59% |
S&P 500® Index | 2.66% | 2.66% |
| | Management Discussion of Fund Performance (unaudited) | |
| | Global X S&P 500® Tail Risk ETF | |

* The Fund commenced operations on August 25, 2021.
The S&P 500® Index is a market capitalization weighted composite index of 500 large capitalization U.S. companies.
The performance data quoted herein represents past performance and the return and value of an investment in the Fund will fluctuate so that, when redeemed, it may be worth less than its original cost. Past performance is no guarantee of future performance and should not be considered as a representation of the future results of the Fund. The Fund’s performance assumes the reinvestment of all dividends and all capital gains. Index returns assume reinvestment of dividends and, unlike the Fund’s returns, do not reflect any fees or expenses. If such fees and expenses were included in the index returns, the performance would have been lower. Please note that one cannot invest directly in an unmanaged index. Performance figures for the periods shown may reflect contractual fee waivers and/or expense reimbursements. In the absence of fee waiver sand/or expense reimbursements (if applicable), returns would have been lower.
There are no assurances that the Fund will meet its stated objectives.
The Fund’s holdings and allocations are subject to change and should not be considered recommendations to buy individual securities.
The graph and table do not reflect the deduction of taxes that a shareholder would pay on Fund distributions or the redemption or sale of Fund shares.
See definition of comparative indices above.
| | Management Discussion of Fund Performance (unaudited) | |
| | Global X S&P 500® Risk Managed Income ETF | |
Global X S&P 500® Risk Managed Income ETF
The Global X S&P 500® Risk Managed Income ETF (“Fund”) seeks to provide investment results that correspond generally to the price and yield performance, before fees and expenses, of the Cboe S&P 500 Risk Managed Income Index (“Underlying Index”). The Fund is passively managed, which means the investment adviser does not attempt to take defensive positions in declining markets. The Fund generally seeks to fully replicate the Underlying Index.
The Underlying Index measures the performance of a risk managed income strategy that holds the underlying stocks of the S&P 500® Index and applies an options collar strategy (i.e., a mix of short (sold) call options and long (purchased) put options) on the S&P 500® Index. The Underlying Index specifically reflects the performance of the component securities of the S&P 500® Index, combined with a long position in the 5% out-of-the-money (“OTM”) put options and a short position in at-the-money (“ATM”) call options, each corresponding to the value of the portfolio of stocks in the S&P 500® Index. The options collar seeks to generate a net-credit, meaning that the premium received from the sale of the call options is greater than the premium paid when buying the put options.
From the inception of the Fund to the period ended October 31, 2021 (the “reporting period”), the Fund increased 1.60%, while the Underlying Index increased 1.82%. The Fund had a net asset value of $26.77 per share on August 25, 2021 and ended the reporting period with a net asset value of $26.83 per share on October 31, 2021.
During the reporting period, the highest returns derived from Tesla Inc. and Coterra Energy Inc., which returned 56.64% and 45.53%, respectively. The worst performers included Biogen Inc. and DaVita Inc., which returned -22.19% and -21.05%, respectively.
The Fund’s options collar strategy tends to produce higher yields in volatile and uncertain times, allowing the Fund to collect higher option premiums and mitigate risks arising from a major market selloff through the purchase of protective puts. Since its launch, the Fund has been earning income from the volatility inherent to equities; as volatility increases, option premiums become more expensive, resulting in a greater net credit when selling the ATM call option and buying the OTM put option. The S&P 500® also finished modestly higher in the period, benefiting the Fund.
| | AVERAGE TOTAL RETURN FOR THE PERIOD ENDED OCTOBER 31, 2021 |
| | Cumulative Inception to Date* |
| | Net Asset Value | Market Price |
Global X S&P 500® Risk Managed Income ETF | 1.60% | 1.64% |
| CBOE S&P 500 Risk Managed Income Index | 1.82% | 1.82% |
S&P 500® Index | 2.66% | 2.66% |
| | Management Discussion of Fund Performance (unaudited) | |
| | Global X S&P 500® Risk Managed Income ETF | |

* The Fund commenced operations on August 25, 2021.
The S&P 500® Index is a market capitalization weighted composite index of 500 large capitalization U.S. companies.
The performance data quoted herein represents past performance and the return and value of an investment in the Fund will fluctuate so that, when redeemed, it may be worth less than its original cost. Past performance is no guarantee of future performance and should not be considered as a representation of the future results of the Fund. The Fund’s performance assumes the reinvestment of all dividends and all capital gains. Index returns assume reinvestment of dividends and, unlike the Fund’s returns, do not reflect any fees or expenses. If such fees and expenses were included in the index returns, the performance would have been lower. Please note that one cannot invest directly in an unmanaged index. Performance figures for the periods shown may reflect contractual fee waivers and/or expense reimbursements. In the absence of fee waiver sand/or expense reimbursements (if applicable), returns would have been lower.
There are no assurances that the Fund will meet its stated objectives.
The Fund’s holdings and allocations are subject to change and should not be considered recommendations to buy individual securities.
The graph and table do not reflect the deduction of taxes that a shareholder would pay on Fund distributions or the redemption or sale of Fund shares.
See definition of comparative indices on the previous page.
| | Management Discussion of Fund Performance (unaudited) | |
| | Global X S&P 500® Collar 95-110 ETF | |
Global X S&P 500® Collar 95-110 ETF
The Global X S&P 500® Collar 95-110 ETF (“Fund”) seeks to provide investment results that correspond generally to the price and yield performance, before fees and expenses, of the Cboe S&P 500 3-Month Collar 95-110 Index (“Underlying Index”). The Fund is passively managed, which means the investment adviser does not attempt to take defensive positions in declining markets. The Fund generally seeks to fully replicate the Underlying Index.
The Underlying Index measures the performance of a risk management strategy that holds the underlying stocks of the S&P 500® Index and applies an options collar strategy (i.e., a mix of short call options and long put options) on the S&P 500® Index. The Underlying Index specifically reflects the performance of the component securities of the S&P 500® Index, combined with a long position in 5% out-of-the-money (“OTM”) put options and a short position in 10% OTM call options, each corresponding to the value of the portfolio of stocks in the S&P 500® Index.
From the inception of the Fund to the period ended October 31, 2021 (the “reporting period”), the Fund increased 1.06%, while the Underlying Index increased 1.12%. The Fund had a net asset value of $27.28 per share on August 25, 2021 and ended the reporting period with a net asset value of $27.57 per share on October 31, 2021.
During the reporting period, the highest returns came from Tesla Inc. and Coterra Energy Inc., which returned 56.64% and 45.53%, respectively. The worst performers were Biogen Inc. and DaVita Inc., which returned -22.19% and -21.05%, respectively.
The Fund invests in the stocks in the S&P 500® Index, while applying a net-debit options collar strategy, meaning the cost of the purchased put option is expected to surpass the premiums received from selling the call option. The strategy is designed for investing in a broad basket of U.S. equities, while capping the upside at 10% over the three-month option period and limiting the downside to 5%. The intention is to balance between limiting the downside and retaining upside potential, while ensuring the strategy is not too costly to implement. Returns during the reporting period finished modestly higher as market expectations were tapered with hawkish monetary policies and concerns about potential further waves of COVID-19 outbreaks. Since its launch, the Fund’s returns were range-bound within the collar strategy the Fund is designed to implement.
| | AVERAGE TOTAL RETURN FOR THE PERIOD ENDED OCTOBER 31, 2021 |
| | Cumulative Inception to Date* |
| | Net Asset Value | Market Price |
Global X S&P 500® Collar 95-110 ETF | 1.06% | 1.17% |
| Cboe S&P 500 3-Month Collar 95-110 Index | 1.12% | 1.12% |
S&P 500® Index | 2.66% | 2.66% |
| | Management Discussion of Fund Performance (unaudited) | |
| | Global X S&P 500® Collar 95-110 ETF | |

* The Fund commenced operations on August 25, 2021.
The S&P 500® Index is a market capitalization weighted composite index of 500 large capitalization U.S. companies.
The performance data quoted herein represents past performance and the return and value of an investment in the Fund will fluctuate so that, when redeemed, it may be worth less than its original cost. Past performance is no guarantee of future performance and should not be considered as a representation of the future results of the Fund. The Fund’s performance assumes the reinvestment of all dividends and all capital gains. Index returns assume reinvestment of dividends and, unlike the Fund’s returns, do not reflect any fees or expenses. If such fees and expenses were included in the index returns, the performance would have been lower. Please note that one cannot invest directly in an unmanaged index. Performance figures for the periods shown may reflect contractual fee waivers and/or expense reimbursements. In the absence of fee waiver sand/or expense reimbursements (if applicable), returns would have been lower.
There are no assurances that the Fund will meet its stated objectives.
The Fund’s holdings and allocations are subject to change and should not be considered recommendations to buy individual securities.
The graph and table do not reflect the deduction of taxes that a shareholder would pay on Fund distributions or the redemption or sale of Fund shares.
See definition of comparative indices above.
| | Management Discussion of Fund Performance (unaudited) | |
| | Global X NASDAQ 100® Tail Risk ETF | |
Global X NASDAQ 100® Tail Risk ETF
The Global X NASDAQ® 100 Tail Risk ETF (“Fund”) seeks to provide investment results that correspond generally to the price and yield performance, before fees and expenses, of the NASDAQ -100 Quarterly Protective Put 90 Index (“Underlying Index”). The Fund is passively managed, which means the investment adviser does not attempt to take defensive positions in declining markets. The Fund generally seeks to fully replicate the Underlying Index.
The Underlying Index measures the performance of a risk management strategy that holds the underlying stocks of the NASDAQ-100® Index and applies a protective put strategy by purchasing long put options on the NASDAQ-100® Index. The Underlying Index specifically reflects the performance of the component securities of the NASDAQ-100® Index, combined with a long position in 10% out-of-the-money (“OTM”) put options that correspond to the value of the portfolio of stocks in the NASDAQ-100® Index.
From the inception of the Fund to period ended October 31, 2021 (the “reporting period”), the Fund increased 1.83%, while the Underlying Index increased 1.8%. The Fund had a net asset value of $25.13 per share on August 25, 2021 and ended the reporting period with a net asset value of $25.59 per share on October 31, 2021.
During the reporting period, the highest returns came from Tesla Inc. and Atlassian Corp PLC which returned 56.64% and 29.63%, respectively. The worst performers were Biogen Inc. and Peloton Interactive Inc., which returned -22.19% and -21.34%, respectively.
The Fund invests in the stocks in the NASDAQ-100® Index, while buying OTM put options on the same index. While the strategy provides uncapped growth potential, it offers a measure of downside risk, mitigating significant selloffs of greater than approximately -10% between the purchase of the put and the options’ expiration in three months. Tail risk strategies can crimp potential downside risks while helping investors participate in rising markets. Since its launch, the Fund has benefited from the equity rally in the underlying stocks of the NASDAQ-100® Index. Nonetheless, the gains have been pared by costs associated with protection-buying puts, causing a measure of underperformance versus the NASDAQ-100® Index.
| | AVERAGE TOTAL RETURN FOR THE PERIOD ENDED OCTOBER 31, 2021 |
| | Cumulative Inception to Date* |
| | Net Asset Value | Market Price |
Global X NASDAQ 100® Tail Risk ETF | 1.83% | 1.91% |
| NASDAQ 100 Quarterly Protective Put 90 Index | 1.80% | 1.80% |
NASDAQ-100® Index | 3.23% | 3.23% |
| | Management Discussion of Fund Performance (unaudited) | |
| | Global X NASDAQ 100® Tail Risk ETF | |
* The Fund commenced operations on August 25, 2021.
The Nasdaq-100® Index includes 100 of the largest domestic and international non-financial companies listed on The Nasdaq Stock Market based on market capitalization.
The performance data quoted herein represents past performance and the return and value of an investment in the Fund will fluctuate so that, when redeemed, it may be worth less than its original cost. Past performance is no guarantee of future performance and should not be considered as a representation of the future results of the Fund. The Fund’s performance assumes the reinvestment of all dividends and all capital gains. Index returns assume reinvestment of dividends and, unlike the Fund’s returns, do not reflect any fees or expenses. If such fees and expenses were included in the index returns, the performance would have been lower. Please note that one cannot invest directly in an unmanaged index. Performance figures for the periods shown may reflect contractual fee waivers and/or expense reimbursements. In the absence of fee waiver sand/or expense reimbursements (if applicable), returns would have been lower.
There are no assurances that the Fund will meet its stated objectives.
The Fund’s holdings and allocations are subject to change and should not be considered recommendations to buy individual securities.
The graph and table do not reflect the deduction of taxes that a shareholder would pay on Fund distributions or the redemption or sale of Fund shares.
See definition of comparative indices above.
| | Management Discussion of Fund Performance (unaudited) | |
| | Global X NASDAQ 100® Risk Managed Income ETF | |
Global X NASDAQ 100® Risk Managed Income ETF
The Global X NASDAQ 100® Risk Managed Income ETF (“Fund”) seeks to provide investment results that correspond generally to the price and yield performance, before fees and expenses, of the NASDAQ-100 Monthly Net Credit Collar 95-100 Index (“Underlying Index”). The Fund is passively managed, which means the investment adviser does not attempt to take defensive positions in declining markets. The Fund generally seeks to fully replicate the Underlying Index.
The Underlying Index measures the performance of a risk managed income strategy that holds the underlying stocks of the NASDAQ-100® Index and applies an options collar strategy (i.e., a mix of short (sold) call options and long (purchased) put options) on the NASDAQ-100® Index. The Underlying Index specifically reflects the performance of the component securities of the NASDAQ-100® Index, combined with a long position in the 5% out-of-the-money (“OTM”) put options and a short position in at-the-money (“ATM”) call options, each corresponding to the value of the portfolio of stocks in the NASDAQ-100® Index. The options collar strategy seeks to generate a net-credit, meaning that the premium received from the sale of the call options is greater than the premium paid when buying the put options.
From the inception of the Fund to period ended October 31, 2021 (the “reporting period”), the Fund decreased 0.69%, while the Underlying Index decreased 1.11%. The Fund had a net asset value of $24.60 per share on August 25, 2021 and ended the reporting period with a net asset value of $24.12 per share on October 31, 2021.
During the reporting period, the highest returns derived from Tesla Inc. and Atlassian Corp PLC, which returned 56.64% and 29.63%, respectively. The worst performers included Biogen Inc. and Peloton Interactive Inc., which returned -22.19% and -21.34%, respectively.
The Fund’s options collar strategy seeks to produce higher yields in volatile and uncertain times, allowing the Fund to collect higher option premiums and mitigate risks arising from a major market selloff through the purchase of protective puts.
Since its launch, the Fund has been earning income from the volatility inherent to equities. As volatility increases, option premiums become more expensive, resulting in a greater net credit when selling ATM call options and buying OTM put options. The Fund finished slightly down for the reporting period, as rising bond yields negatively affected technology and growth stocks to which the NASDAQ-100® Index is heavily exposed. The net positive premiums generated by the Fund helped offset some of the losses.
| | Management Discussion of Fund Performance (unaudited) | |
| | Global X NASDAQ 100® Risk Managed Income ETF | |
| | AVERAGE TOTAL RETURN FOR THE PERIOD ENDED OCTOBER 31, 2021 |
| | Cumulative Inception to Date* |
| | Net Asset Value | Market Price |
Global X NASDAQ 100® Risk Managed Income ETF | -0.69% | -0.69% |
| NASDAQ 100 Monthly Net Credit Collar 95-100 Index | -1.11% | -1.11% |
NASDAQ-100® Index | 3.23% | 3.23% |
* The Fund commenced operations on August 25, 2021.
The Nasdaq-100® Index includes 100 of the largest domestic and international non-financial companies listed on The Nasdaq Stock Market based on market capitalization.
The performance data quoted herein represents past performance and the return and value of an investment in the Fund will fluctuate so that, when redeemed, it may be worth less than its original cost. Past performance is no guarantee of future performance and should not be considered as a representation of the future results of the Fund. The Fund’s performance assumes the reinvestment of all dividends and all capital gains. Index returns assume reinvestment of dividends and, unlike the Fund’s returns, do not reflect any fees or expenses. If such fees and expenses were included in the index returns, the performance would have been lower. Please note that one cannot invest directly in an unmanaged index. Performance figures for the periods shown may reflect contractual fee waivers and/or expense reimbursements. In the absence of fee waiver sand/or expense reimbursements (if applicable), returns would have been lower.
There are no assurances that the Fund will meet its stated objectives.
The Fund’s holdings and allocations are subject to change and should not be considered recommendations to buy individual securities.
| | Management Discussion of Fund Performance (unaudited) | |
| | Global X NASDAQ 100® Risk Managed Income ETF | |
The graph and table do not reflect the deduction of taxes that a shareholder would pay on Fund distributions or the redemption or sale of Fund shares.
See definition of comparative indices on the previous page.
| | Management Discussion of Fund Performance (unaudited) | |
| | Global X NASDAQ 100® Collar 95-110 ETF | |
Global X NASDAQ 100® Collar 95-110 ETF
The Global X NASDAQ 100® Collar 95-110 ETF (“Fund”) seeks to provide investment results that correspond generally to the price and yield performance, before fees and expenses, of the NASDAQ-100 Quarterly Collar 95-110 Index. (“Underlying Index”). The Fund is passively managed, which means the investment adviser does not attempt to take defensive positions in declining markets. The Fund generally seeks to fully replicate the Underlying Index.
The Underlying Index measures the performance of a risk management strategy that holds the underlying stocks of the NASDAQ-100® Index and applies an options collar strategy (i.e., a mix of short call options and long put options) on the NASDAQ-100® Index. The Underlying Index specifically reflects the performance of the component securities of the NASDAQ-100® Index, combined with a long position in 5% out-of-the-money (“OTM”) put options and a short position in 10% OTM call options, each corresponding to the value of the portfolio of stocks in the NASDAQ-100® Index.
From the inception of the Fund to the period ended October 31, 2021 (the “reporting period”), the Fund increased 2.06%, while the Underlying Index increased 1.87%. The Fund had a net asset value of $25.27 per share on August 25, 2021 and ended the reporting period with a net asset value of $25.78 per share on October 31, 2021.
During the reporting period, the highest returns came from Tesla Inc. and Atlassian Corp. PLC, which returned 56.64% and 29.63%, respectively. The worst performers were Biogen Inc. and Peloton Interactive Inc., which returned -22.19% and -21.34%, respectively.
The Fund invests in the stocks in the NASDAQ-100® Index, while applying a net-debit options collar strategy, meaning the cost of the purchased put option is expected to surpass the premiums received from selling the call option. Furthermore, the strategy is designed for investing in a tech-heavy basket of U.S. equities, capping the upside at 10% over the three-month option horizon and limiting downside to 5%. The intention is to balance between limiting downside and retaining upside potential while ensuring the strategy is not too costly to implement. During the reporting period, major central banks began to implement or consider implementing tighter monetary policies as inflation accelerated amid strong economic growth and disrupted supply chains, resulting in modestly positive markets. Since its launch, the Fund’s returns were range-bound within the collar strategy the Fund is designed to implement.
| | AVERAGE TOTAL RETURN FOR THE PERIOD ENDED OCTOBER 31, 2021 |
| | Cumulative Inception to Date* |
| | Net Asset Value | Market Price |
Global X NASDAQ 100® Collar 95-110 ETF | 2.06% | 2.14% |
| NASDAQ -100 Quarterly Collar 95-110 Index | 1.87% | 1.87% |
NASDAQ-100® Index | 3.23% | 3.23% |
| | Management Discussion of Fund Performance (unaudited) | |
| | Global X NASDAQ 100® Collar 95-110 ETF | |
* The Fund commenced operations on August 25, 2021.
The Nasdaq-100® Index includes 100 of the largest domestic and international non-financial companies listed on The Nasdaq Stock Market based on market capitalization.
The performance data quoted herein represents past performance and the return and value of an investment in the Fund will fluctuate so that, when redeemed, it may be worth less than its original cost. Past performance is no guarantee of future performance and should not be considered as a representation of the future results of the Fund. The Fund’s performance assumes the reinvestment of all dividends and all capital gains. Index returns assume reinvestment of dividends and, unlike the Fund’s returns, do not reflect any fees or expenses. If such fees and expenses were included in the index returns, the performance would have been lower. Please note that one cannot invest directly in an unmanaged index. Performance figures for the periods shown may reflect contractual fee waivers and/or expense reimbursements. In the absence of fee waiver sand/or expense reimbursements (if applicable), returns would have been lower.
There are no assurances that the Fund will meet its stated objectives.
The Fund’s holdings and allocations are subject to change and should not be considered recommendations to buy individual securities.
The graph and table do not reflect the deduction of taxes that a shareholder would pay on Fund distributions or the redemption or sale of Fund shares.
See definition of comparative indices above.
| Schedule of Investments | | October 31, 2021 |
| | Global X Social Media ETF | |
Sector Weightings (Unaudited)†:
† Sector weightings percentages are based on the total market value of investments. Repurchase agreements purchased from cash collateral received for securities lending activity are included in total investments. Please see Note 2 and 7 in Notes to Financial Statements for more detailed information.
| | | | | | | |
| COMMON STOCK — 99.8% | | | | | | |
| CANADA — 0.0% | | | | | | |
| Energy — 0.0% | | | | | | |
Hello Pal International * | | | 47,410 | | | $ | 16,829 | |
| | | | | | | | | |
| | | | | | | | | |
| CHINA — 28.9% | | | | | | | | |
| Communication Services — 28.9% | | | | | | | | |
Baidu ADR * | | | 119,704 | | | | 19,420,777 | |
Bilibili ADR * | | | 231,421 | | | | 16,963,159 | |
BlueCity Holdings ADR * | | | 17,068 | | | | 47,108 | |
Hello Group ADR | | | 138,688 | | | | 1,726,666 | |
HUYA ADR * (A) | | | 23,625 | | | | 194,198 | |
JOYY ADR | | | 33,944 | | | | 1,710,438 | |
Kuaishou Technology, Cl B * | | | 761,488 | | | | 10,131,572 | |
Meitu * | | | 2,094,600 | | | | 457,745 | |
NetEase ADR | | | 204,883 | | | | 19,994,532 | |
Tencent Holdings | | | 647,427 | | | | 40,032,187 | |
Tencent Music Entertainment Group ADR * | | | 527,187 | | | | 4,143,690 | |
Weibo ADR * | | | 28,447 | | | | 1,279,546 | |
| | | | | | | | | |
TOTAL CHINA | | | | | | | 116,101,618 | |
| GERMANY — 0.9% | | | | | | | | |
| Communication Services — 0.9% | | | | | | | | |
United Internet | | | 93,821 | | | | 3,461,340 | |
| Schedule of Investments | | October 31, 2021 |
| | Global X Social Media ETF | |
| | | | | | | |
| COMMON STOCK — continued | | | | | | |
| JAPAN — 3.8% | | | | | | |
| Communication Services — 3.8% | | | | | | |
DeNA | | | 78,712 | | | $ | 1,453,092 | |
giftee * | | | 16,100 | | | | 541,491 | |
Gree | | | 80,988 | | | | 680,434 | |
Kakaku.com | | | 125,832 | | | | 4,154,856 | |
Mixi | | | 34,955 | | | | 798,577 | |
Nexon | | | 458,621 | | | | 7,766,693 | |
| | | | | | | | | |
| | | | | | | | | |
TOTAL JAPAN | | | | | | | 15,395,143 | |
| RUSSIA — 6.0% | | | | | | | | |
| Communication Services — 6.0% | | | | | | | | |
Mail.Ru Group GDR * | | | 144,854 | | | | 2,963,713 | |
Yandex, Cl A * | | | 257,092 | | | | 21,297,501 | |
| | | | | | | | | |
| | | | | | | | | |
TOTAL RUSSIA | | | | | | | 24,261,214 | |
| SOUTH KOREA — 10.2% | | | | | | | | |
| Communication Services — 10.2% | | | | | | | | |
AfreecaTV | | | 7,326 | | | | 1,209,977 | |
Com2uSCorp | | | 7,550 | | | | 830,238 | |
Kakao | | | 189,835 | | | | 20,387,910 | |
NAVER | | | 53,330 | | | | 18,574,567 | |
| | | | | | | | | |
| | | | | | | | | |
TOTAL SOUTH KOREA | | | | | | | 41,002,692 | |
| TAIWAN — 0.1% | | | | | | | | |
| Consumer Discretionary — 0.1% | | | | | | | | |
PChome Online | | | 88,344 | | | | 460,646 | |
| | | | | | | | | |
| | | | | | | | | |
| UNITED ARAB EMIRATES — 0.2% | | | | | | | | |
| Communication Services — 0.2% | | | | | | | | |
Yalla Group ADR * (A) | | | 113,281 | | | | 727,264 | |
| | | | | | | | | |
| | | | | | | | | |
| UNITED STATES — 49.7% | | | | | | | | |
| Communication Services — 48.3% | | | | | | | | |
Alphabet, Cl A * | | | 6,928 | | | | 20,513,254 | |
Angi, Cl A * | | | 68,518 | | | | 858,531 | |
| Schedule of Investments | | October 31, 2021 |
| | Global X Social Media ETF | |
| | | | | | | |
| COMMON STOCK — continued | | | | | | |
| Communication Services — continued | | | | | | |
Bumble, Cl A | | | 84,357 | | | $ | 4,430,430 | |
IAC * | | | 76,766 | | | | 11,696,835 | |
Match Group * | | | 114,107 | | | | 17,205,053 | |
Meta Platforms, Cl A * | | | 127,018 | | | | 41,099,214 | |
Pinterest, Cl A * | | | 327,664 | | | | 14,626,921 | |
Snap, Cl A * | | | 533,291 | | | | 28,040,441 | |
Spotify Technology * | | | 79,178 | | | | 22,914,113 | |
Twitter * | | | 333,767 | | | | 17,869,885 | |
Vimeo * | | | 136,088 | | | | 4,590,248 | |
Yelp, Cl A * | | | 67,909 | | | | 2,623,325 | |
Zynga, Cl A * | | | 1,042,909 | | | | 7,696,668 | |
| | | | | | | | 194,164,918 | |
| | | | | | | | | |
| | | | | | | | | |
| Consumer Discretionary — 0.1% | | | | | | | | |
Groupon, Cl A * | | | 23,944 | | | | 508,092 | |
| | | | | | | | | |
| | | | | | | | | |
| Information Technology — 1.3% | | | | | | | | |
Life360, Cl CDI | | | 76,044 | | | | 627,712 | |
Sprout Social, Cl A * | | | 34,011 | | | | 4,342,525 | |
| | | | | | | | 4,970,237 | |
| | | | | | | | | |
| | | | | | | | | |
TOTAL UNITED STATES | | | | | | | 199,643,247 | |
| TOTAL COMMON STOCK | | | | | | | | |
(Cost $399,141,940) | | | | | | | 401,069,993 | |
| | | | | | | | | |
SHORT-TERM INVESTMENT — 0.1%(B)(C) | | | | | | | | |
| Fidelity Investments Money Market Government Portfolio, Cl Institutional, 0.010% | | | | | | | | |
(Cost $415,544) | | | 415,544 | | | | 415,544 | |
| Schedule of Investments | | October 31, 2021 |
| | Global X Social Media ETF | |
| | | | | | | |
REPURCHASE AGREEMENT — 0.1%(B) | | | | | | |
| BNP Paribas | | | | | | |
| 0.030%, dated 10/29/21, to be repurchased on 11/01/21, repurchase price $334,500 (collateralized by U.S. Treasury Obligations, ranging in par value $13,453 - $44,862, 0.750% - 1.250%, 01/31/28 - 03/31/28, with a total market value of $341,831) | | | | | | |
(Cost $334,499) | | $ | 334,499 | | | $ | 334,499 | |
| TOTAL INVESTMENTS — 100.0% | | | | | | | | |
(Cost $399,891,983) | | | | | | $ | 401,820,036 | |
Percentages are based on Net Assets of $401,892,780.
| * | Non-income producing security. |
| (A) | This security or a partial position of this security is on loan at October 31, 2021. The total value of securities on loan at October 31, 2021 was $706,718. |
| (B) | Security was purchased with cash collateral held from securities on loan. The total value of such securities as of October 31, 2021 was $750,043. |
| (C) | The rate reported on the Schedule of Investments is the 7-day effective yield as of October 31, 2021. |
ADR — American Depositary Receipt
Cl — Class
GDR — Global Depositary Receipt
The following is a summary of the level of inputs used as of October 31, 2021, in valuing the Fund’s investments carried at value:
| Investments in Securities | | | | | | | | | | | | |
| Common Stock | | $ | 401,069,993 | | | $ | — | | | $ | — | | | $ | 401,069,993 | |
| Short-Term Investment | | | 415,544 | | | | — | | | | — | | | | 415,544 | |
| Repurchase Agreement | | | — | | | | 334,499 | | | | — | | | | 334,499 | |
| Total Investments in Securities | | $ | 401,485,537 | | | $ | 334,499 | | | $ | — | | | $ | 401,820,036 | |
For the year ended October 31, 2021, there have been no transfers in or out of Level 3.
Amounts designated as “—“ are $0 or have been rounded to $0.
| Schedule of Investments | | October 31, 2021 |
| | Global X Lithium & Battery Tech ETF | |
Sector Weightings (Unaudited)†:
† Sector weightings percentages are based on the total market value of investments. Repurchase agreements purchased from cash collateral received for securities lending activity are included in total investments. Please see Note 2 and 7 in Notes to Financial Statements for more detailed information.
| | | | | | | |
| COMMON STOCK — 100.3% | | | | | | |
| AUSTRALIA — 5.1% | | | | | | |
| Materials — 5.1% | | | | | | |
ioneer * | | | 32,281,961 | | | $ | 16,609,190 | |
Mineral Resources | | | 3,214,958 | | | | 93,185,439 | |
Orocobre * | | | 11,441,367 | | | | 76,483,173 | |
Pilbara Minerals * | | | 43,424,893 | | | | 71,756,196 | |
Vulcan Energy Resources * | | | 1,849,173 | | | | 17,375,320 | |
| | | | | | | | | |
TOTAL AUSTRALIA | | | | | | | 275,409,318 | |
| CANADA — 1.4% | | | | | | | | |
| Materials — 1.4% | | | | | | | | |
Lithium Americas * (A) | | | 1,637,799 | | | | 47,434,137 | |
Standard Lithium * | | | 2,674,032 | | | | 30,309,507 | |
| | | | | | | | | |
TOTAL CANADA | | | | | | | 77,743,644 | |
| CHILE — 2.9% | | | | | | | | |
| Materials — 2.9% | | | | | | | | |
| Sociedad Quimica y Minera de Chile ADR | | | 2,797,777 | | | | 153,569,979 | |
| | | | | | | | | |
| CHINA — 45.8% | | | | | | | | |
| Consumer Discretionary — 5.1% | | | | | | | | |
BYD, Cl H | | | 6,754,976 | | | | 257,554,056 | |
| Schedule of Investments | | October 31, 2021 |
| | Global X Lithium & Battery Tech ETF | |
| | | | | | | |
| COMMON STOCK — continued | | | | | | |
| Consumer Discretionary — continued | | | | | | |
Tianneng Power International (A) | | | 12,781,600 | | | $ | 14,606,980 | |
| | | | | | | | 272,161,036 | |
| | | | | | | | | |
| Industrials — 13.1% | | | | | | | | |
| Contemporary Amperex Technology, Cl A | | | 2,678,105 | | | | 267,371,309 | |
Eve Energy, Cl A | | | 14,090,097 | | | | 249,663,658 | |
| Shenzhen Yinghe Technology, Cl A | | | 6,162,953 | | | | 30,079,854 | |
Sunwoda Electronic, Cl A | | | 20,305,683 | | | | 156,319,539 | |
| | | | | | | | 703,434,360 | |
| | | | | | | | | |
| Information Technology — 8.8% | | | | | | | | |
| NAURA Technology Group, Cl A | | | 4,211,051 | | | | 244,170,848 | |
| Wuxi Lead Intelligent Equipment, Cl A | | | 18,014,526 | | | | 228,575,459 | |
| | | | | | | | 472,746,307 | |
| | | | | | | | | |
| Materials — 18.8% | | | | | | | | |
| Beijing Easpring Material Technology, Cl A | | | 6,450,091 | | | | 89,396,829 | |
Ganfeng Lithium, Cl A | | | 9,348,334 | | | | 244,414,249 | |
| Guangzhou Tinci Materials Technology, Cl A | | | 8,749,011 | | | | 225,369,670 | |
| Shanghai Putailai New Energy Technology, Cl A | | | 3,707,926 | | | | 102,961,588 | |
| Shenzhen Capchem Technology, Cl A | | | 4,527,906 | | | | 101,382,324 | |
| Yunnan Energy New Material, Cl A | | | 5,471,626 | | | | 249,315,471 | |
| | | | | | | | 1,012,840,131 | |
| | | | | | | | | |
TOTAL CHINA | | | | | | | 2,461,181,834 | |
| GERMANY — 1.0% | | | | | | | | |
| Industrials — 1.0% | | | | | | | | |
Varta (A) | | | 356,591 | | | | 54,884,279 | |
| | | | | | | | | |
| HONG KONG — 0.1% | | | | | | | | |
| Industrials — 0.1% | | | | | | | | |
Honbridge Holdings * (A) | | | 70,943,900 | | | | 4,012,741 | |
| | | | | | | | | |
| JAPAN — 9.8% | | | | | | | | |
| Consumer Discretionary — 4.4% | | | | | | | | |
Panasonic | | | 19,244,649 | | | | 235,020,160 | |
| Schedule of Investments | | October 31, 2021 |
| | Global X Lithium & Battery Tech ETF | |
| | | | | | | |
| COMMON STOCK — continued | | | | | | |
| Industrials — 0.6% | | | | | | |
GS Yuasa | | | 1,465,638 | | | $ | 31,799,942 | |
| | | | | | | | | |
| Information Technology — 4.8% | | | | | | | | |
TDK | | | 7,160,464 | | | | 259,352,916 | |
| | | | | | | | | |
TOTAL JAPAN | | | | | | | 526,173,018 | |
| NETHERLANDS — 0.3% | | | | | | | | |
| Materials — 0.3% | | | | | | | | |
| AMG Advanced Metallurgical Group | | | 555,408 | | | | 16,415,683 | |
| | | | | | | | | |
| NORWAY — 0.4% | | | | | | | | |
| Industrials — 0.4% | | | | | | | | |
FREYR Battery * | | | 2,079,414 | | | | 21,064,464 | |
| | | | | | | | | |
| SOUTH KOREA — 10.9% | | | | | | | | |
| Information Technology — 6.4% | | | | | | | | |
Iljin Materials | | | 366,266 | | | | 31,500,349 | |
L&F | | | 421,260 | | | | 66,367,692 | |
Power Logics * (A) | | | 31,837 | | | | 215,235 | |
Samsung SDI | | | 393,516 | | | | 247,178,763 | |
| | | | | | | | 345,262,039 | |
| | | | | | | | | |
| Materials — 4.5% | | | | | | | | |
LG Chemical | | | 335,134 | | | | 239,760,407 | |
| | | | | | | | | |
TOTAL SOUTH KOREA | | | | | | | 585,022,446 | |
| TAIWAN — 0.6% | | | | | | | | |
| Information Technology — 0.6% | | | | | | | | |
Simplo Technology | | | 3,118,280 | | | | 33,528,084 | |
| | | | | | | | | |
| UNITED STATES — 22.0% | | | | | | | | |
| Consumer Discretionary — 7.6% | | | | | | | | |
QuantumScape, Cl A * | | | 3,373,393 | | | | 97,625,993 | |
Tesla * | | | 281,148 | | | | 313,198,872 | |
| | | | | | | | 410,824,865 | |
| Industrials — 1.7% | | | | | | | | |
EnerSys | | | 815,591 | | | | 65,279,904 | |
| Schedule of Investments | | October 31, 2021 |
| | Global X Lithium & Battery Tech ETF | |
| | | | | | | |
| COMMON STOCK — continued | | | | | | |
| Industrials — continued | | | | | | |
Microvast Holdings * | | | 2,884,362 | | | $ | 24,401,702 | |
| | | | | | | | 89,681,606 | |
| | | | | | | | | |
| Materials — 12.7% | | | | | | | | |
Albemarle | | | 2,292,413 | | | | 574,180,684 | |
Livent * | | | 3,145,085 | | | | 88,754,299 | |
Piedmont Lithium | | | 28,543,689 | | | | 18,437,691 | |
| | | | | | | | 681,372,674 | |
| | | | | | | | | |
TOTAL UNITED STATES | | | | | | | 1,181,879,145 | |
| TOTAL COMMON STOCK | | | | | | | | |
(Cost $3,579,426,404) | | | | | | | 5,390,884,635 | |
| | | | | | | | | |
SHORT-TERM INVESTMENT — 1.1%(B)(C) | | | | | | | | |
| Fidelity Investments Money Market Government Portfolio, Cl Institutional, 0.010% | | | | | | | | |
(Cost $61,359,577) | | | 61,359,577 | | | | 61,359,577 | |
| | | | | | | | | |
REPURCHASE AGREEMENT — 0.9%(B) | | | | | | | | |
| BNP Paribas | | | | | | | | |
| 0.030%, dated 10/29/21, to be repurchased on 11/01/21, repurchase price $49,400,471 (collateralized by various U.S. Treasury Obligations, ranging in par value $1,986,743 - $6,625,405, 0.750% - 1.250%, 01/31/28 -03/31/28, with a total market value of $50,482,953) | | | | | | | | |
(Cost $49,400,348) | | $ | 49,400,348 | | | | 49,400,348 | |
| TOTAL INVESTMENTS — 102.3% | | | | | | | | |
(Cost $3,690,186,329) | | | | | | $ | 5,501,644,560 | |
Percentages are based on Net Assets of $5,375,398,735.
| Schedule of Investments | | October 31, 2021 |
| | Global X Lithium & Battery Tech ETF | |
| * | Non-income producing security. |
| (A) | This security or a partial position of this security is on loan at October 31, 2021. The total value of securities on loan at October 31, 2021 was $105,092,823. |
| (B) | Security was purchased with cash collateral held from securities on loan. The total value of such securities as of October 31, 2021 was $110,759,925. |
| (C) | The rate reported on the Schedule of Investments is the 7-day effective yield as of October 31, 2021. |
ADR — American Depositary Receipt
Cl — Class
The following is a summary of the level of inputs used as of October 31, 2021, in valuing the Fund’s investments carried at value:
| Investments in Securities | | | | | | | | | | | | |
| Common Stock | | $ | 5,390,884,635 | | | $ | — | | | $ | — | | | $ | 5,390,884,635 | |
| Short-Term Investment | | | 61,359,577 | | | | — | | | | — | | | | 61,359,577 | |
| Repurchase Agreement | | | — | | | | 49,400,348 | | | | — | | | | 49,400,348 | |
| Total Investments in Securities | | $ | 5,452,244,212 | | | $ | 49,400,348 | | | $ | — | | | $ | 5,501,644,560 | |
For the year ended October 31, 2021, there have been no transfers in or out of Level 3.
Amounts designated as “—“ are $0 or have been rounded to $0.
| Schedule of Investments | | October 31, 2021 |
| | Global X E-commerce ETF | |
Sector Weightings (Unaudited)†:
† Sector weightings percentages are based on the total market value of investments. Repurchase agreements purchased from cash collateral received for securities lending activity are included in total investments. Please see Note 2 and 7 in Notes to Financial Statements for more detailed information.
| | | | | | | |
| COMMON STOCK — 99.8% | | | | | | |
| ARGENTINA — 4.4% | | | | | | |
| Consumer Discretionary — 4.4% | | | | | | |
MercadoLibre * | | | 5,818 | | | $ | 8,616,574 | |
| | | | | | | | | |
| AUSTRALIA — 0.4% | | | | | | | | |
| Consumer Discretionary — 0.4% | | | | | | | | |
Temple & Webster Group * | | | 85,823 | | | | 816,730 | |
| | | | | | | | | |
| CANADA — 4.4% | | | | | | | | |
| Information Technology — 4.4% | | | | | | | | |
Shopify, Cl A * | | | 5,996 | | | | 8,794,513 | |
| | | | | | | | | |
| CHINA — 23.5% | | | | | | | | |
| Communication Services — 3.9% | | | | | | | | |
NetEase ADR | | | 77,625 | | | | 7,575,424 | |
| | | | | | | | | |
| Consumer Discretionary — 19.2% | | | | | | | | |
Alibaba Group Holding ADR * | | | 41,418 | | | | 6,831,485 | |
Baozun ADR * | | | 71,365 | | | | 1,234,614 | |
JD.com ADR * | | | 116,128 | | | | 9,090,500 | |
Pinduoduo ADR * | | | 80,412 | | | | 7,150,235 | |
Trip.com Group ADR * | | | 273,980 | | | | 7,824,869 | |
| Schedule of Investments | | October 31, 2021 |
| | Global X E-commerce ETF | |
| | | | | | | |
| COMMON STOCK — continued | | | | | | |
| Consumer Discretionary — continued | | | | | | |
Uxin ADR (A) | | | 349,520 | | | $ | 838,848 | |
Vipshop Holdings ADR * | | | 451,336 | | | | 5,036,910 | |
| | | | | | | | 38,007,461 | |
| | | | | | | | | |
| Financials — 0.4% | | | | | | | | |
LexinFintech Holdings ADR * | | | 155,334 | | | | 829,483 | |
| | | | | | | | | |
TOTAL CHINA | | | | | | | 46,412,368 | |
| GERMANY — 0.9% | | | | | | | | |
| Consumer Discretionary — 0.9% | | | | | | | | |
Jumia Technologies ADR * (A) | | | 107,866 | | | | 1,884,419 | |
| | | | | | | | | |
| JAPAN — 4.0% | | | | | | | | |
| Consumer Discretionary — 4.0% | | | | | | | | |
Rakuten Group | | | 722,377 | | | | 7,919,064 | |
| | | | | | | | | |
| SOUTH KOREA — 0.3% | | | | | | | | |
| Information Technology — 0.3% | | | | | | | | |
Cafe24 * | | | 23,849 | | | | 587,781 | |
| | | | | | | | | |
| UNITED KINGDOM — 5.7% | | | | | | | | |
| Consumer Discretionary — 1.4% | | | | | | | | |
ASOS * | | | 81,229 | | | | 2,763,566 | |
| | | | | | | | | |
| Consumer Staples — 4.3% | | | | | | | | |
Ocado Group * | | | 341,892 | | | | 8,449,704 | |
| | | | | | | | | |
TOTAL UNITED KINGDOM | | | | | | | 11,213,270 | |
| UNITED STATES — 56.2% | | | | | | | | |
| Communication Services — 2.4% | | | | | | | | |
Angi, Cl A * | | | 85,883 | | | | 1,076,114 | |
TripAdvisor * | | | 111,706 | | | | 3,682,947 | |
| | | | | | | | 4,759,061 | |
| | | | | | | | | |
| Consumer Discretionary — 41.0% | | | | | | | | |
1847 Goedeker * (A) | | | 208,342 | | | | 652,110 | |
Amazon.com * | | | 2,375 | | | | 8,009,521 | |
Booking Holdings * | | | 4,032 | | | | 9,760,585 | |
| Schedule of Investments | | October 31, 2021 |
| | Global X E-commerce ETF | |
| | | | | | | |
| COMMON STOCK — continued | | | | | | |
| Consumer Discretionary — continued | | | | | | |
eBay | | | 128,803 | | | $ | 9,881,766 | |
Etsy * | | | 47,914 | | | | 12,011,561 | |
Expedia Group * | | | 54,426 | | | | 8,948,179 | |
Groupon, Cl A * | | | 27,328 | | | | 579,900 | |
Lands’ End * | | | 16,517 | | | | 434,067 | |
Overstock.com * | | | 49,774 | | | | 4,739,978 | |
Overstock.com, Ser A1 | | | 366 | | | | 30,286 | |
PetMed Express (A) | | | 22,832 | | | | 649,114 | |
Qurate Retail, Cl A | | | 405,174 | | | | 4,230,017 | |
Shutterstock | | | 27,124 | | | | 3,286,073 | |
Wayfair, Cl A * | | | 31,241 | | | | 7,782,133 | |
Williams-Sonoma | | | 54,489 | | | | 10,120,242 | |
| | | | | | | | 81,115,532 | |
| | | | | | | | | |
| Financials — 1.8% | | | | | | | | |
eHealth * | | | 28,800 | | | | 1,277,280 | |
LendingTree * | | | 13,410 | | | | 2,164,240 | |
| | | | | | | | 3,441,520 | |
| | | | | | | | | |
| Industrials — 4.4% | | | | | | | | |
CoStar Group * | | | 102,039 | | | | 8,780,456 | |
| | | | | | | | | |
| Information Technology — 6.6% | | | | | | | | |
BigCommerce Holdings * | | | 45,097 | | | | 2,083,932 | |
GoDaddy, Cl A * | | | 103,409 | | | | 7,152,801 | |
LivePerson * | | | 75,046 | | | | 3,865,619 | |
| | | | | | | | 13,102,352 | |
| | | | | | | | | |
TOTAL UNITED STATES | | | | | | | 111,198,921 | |
| TOTAL COMMON STOCK | | | | | | | | |
(Cost $210,023,292) | | | | | | | 197,443,640 | |
| Schedule of Investments | | October 31, 2021 |
| | Global X E-commerce ETF | |
| | | | | | | |
SHORT-TERM INVESTMENT — 0.9%(B)(C) | | | | | | |
| Fidelity Investments Money Market Government Portfolio, Cl Institutional, 0.010% | | | | | | |
(Cost $1,720,547) | | | 1,720,547 | | | $ | 1,720,547 | |
| | | | | | | | | |
REPURCHASE AGREEMENT — 0.7%(B) | | | | | | | | |
| BNP Paribas | | | | | | | | |
| 0.030%, dated 10/29/21, to be repurchased on 11/01/21, repurchase price $1,384,985 (collateralized by various U.S. Treasury Obligations, ranging in par value $55,700 - $185,749, 0.750% - 1.250%, 01/31/28 -03/31/28, with a total market value of $1,415,333) | | | | | | | | |
(Cost $1,384,981) | | $ | 1,384,981 | | | | 1,384,981 | |
| TOTAL INVESTMENTS — 101.4% | | | | | | | | |
(Cost $213,128,820) | | | | | | $ | 200,549,168 | |
Percentages are based on Net Assets of $197,751,192.
| * | Non-income producing security. |
| (A) | This security or a partial position of this security is on loan at October 31, 2021. The total value of securities on loan at October 31, 2021 was $2,959,284. |
| (B) | Security was purchased with cash collateral held from securities on loan. The total value of such securities as of October 31, 2021 was $3,105,528. |
| (C) | The rate reported on the Schedule of Investments is the 7-day effective yield as of October 31, 2021. |
ADR — American Depositary Receipt
Cl — Class
Ser — Series
| Schedule of Investments | | October 31, 2021 |
| | Global X E-commerce ETF | |
The following is a summary of the level of inputs used as of October 31, 2021, in valuing the Fund’s investments carried at value:
| Investments in Securities | | | | | | | | | | | | |
| Common Stock | | $ | 197,443,640 | | | $ | — | | | $ | — | | | $ | 197,443,640 | |
| Short-Term Investment | | | 1,720,547 | | | | — | | | | — | | | | 1,720,547 | |
| Repurchase Agreement | | | — | | | | 1,384,981 | | | | — | | | | 1,384,981 | |
| Total Investments in Securities | | $ | 199,164,187 | | | $ | 1,384,981 | | | $ | — | | | $ | 200,549,168 | |
For the year ended October 31, 2021, there have been no transfers in or out of Level 3.
Amounts designated as “—“ are $0 or have been rounded to $0.
| Schedule of Investments | | October 31, 2021 |
| | Global X Emerging Markets Internet & E-commerce ETF | |
Sector Weightings (Unaudited)†:
† Sector weightings percentages are based on the total market value of investments.
| | | | | | | |
| COMMON STOCK — 100.0% | | | | | | |
| ARGENTINA — 3.5% | | | | | | |
| Consumer Discretionary — 3.5% | | | | | | |
MercadoLibre * | | | 106 | | | $ | 156,988 | |
| | | | | | | | | |
| | | | | | | | | |
| BRAZIL — 5.6% | | | | | | | | |
| Consumer Discretionary — 1.9% | | | | | | | | |
Afya, Cl A * | | | 525 | | | | 9,161 | |
Americanas | | | 3,983 | | | | 20,986 | |
Magazine Luiza | | | 23,491 | | | | 45,048 | |
Via S * | | | 9,475 | | | | 10,337 | |
| | | | | | | | 85,532 | |
| | | | | | | | | |
| | | | | | | | | |
| Financials — 1.0% | | | | | | | | |
XP, Cl A * | | | 1,395 | | | | 45,770 | |
| | | | | | | | | |
| | | | | | | | | |
| Information Technology — 2.7% | | | | | | | | |
Pagseguro Digital, Cl A * | | | 1,645 | | | | 59,549 | |
StoneCo, Cl A * | | | 1,405 | | | | 47,574 | |
TOTVS | | | 3,163 | | | | 18,382 | |
| | | | | | | | 125,505 | |
| | | | | | | | | |
| | | | | | | | | |
TOTAL BRAZIL | | | | | | | 256,807 | |
| CHILE — 0.5% | | | | | | | | |
| Consumer Discretionary — 0.5% | | | | | | | | |
Falabella | | | 8,440 | | | | 23,402 | |
| | | | | | | | | |
| Schedule of Investments | | October 31, 2021 |
| | Global X Emerging Markets Internet & E-commerce ETF | |
| | | | | | | |
| COMMON STOCK — continued | | | | | | |
| CHINA — 71.0% | | | | | | |
| Communication Services — 27.9% | | | | | | |
Autohome ADR | | | 807 | | | $ | 31,756 | |
Baidu ADR * | | | 1,255 | | | | 203,611 | |
Bilibili ADR * | | | 2,311 | | | | 169,396 | |
China Literature * | | | 3,140 | | | | 21,858 | |
Hello Group ADR | | | 1,462 | | | | 18,202 | |
HUYA ADR * | | | 1,373 | | | | 11,286 | |
iQIYI ADR * | | | 5,149 | | | | 42,634 | |
Kingsoft | | | 7,250 | | | | 31,175 | |
NetEase ADR | | | 2,022 | | | | 197,327 | |
Tencent Holdings | | | 6,410 | | | | 396,348 | |
Tencent Music Entertainment Group ADR * | | | 10,949 | | | | 86,059 | |
Weibo ADR * | | | 1,378 | | | | 61,982 | |
| | | | | | | | 1,271,634 | |
| | | | | | | | | |
| | | | | | | | | |
| Consumer Discretionary — 39.3% | | | | | | | | |
Alibaba Group Holding ADR * | | | 2,361 | | | | 389,424 | |
Baozun ADR * | | | 501 | | | | 8,667 | |
JD.com ADR * | | | 5,019 | | | | 392,887 | |
Meituan, Cl B * | | | 12,270 | | | | 425,244 | |
New Oriental Education & Technology Group ADR * | | | 11,986 | | | | 24,571 | |
Pinduoduo ADR * | | | 3,942 | | | | 350,523 | |
Tongcheng-Elong Holdings * | | | 8,650 | | | | 19,371 | |
Trip.com Group ADR * | | | 4,247 | | | | 121,294 | |
Vipshop Holdings ADR * | | | 4,963 | | | | 55,387 | |
| | | | | | | | 1,787,368 | |
| | | | | | | | | |
| | | | | | | | | |
| Health Care — 1.2% | | | | | | | | |
Alibaba Health Information Technology * | | | 30,400 | | | | 38,415 | |
Ping An Healthcare and Technology * | | | 3,630 | | | | 17,662 | |
| | | | | | | | 56,077 | |
| | | | | | | | | |
| | | | | | | | | |
| Information Technology — 2.6% | | | | | | | | |
| Kingdee International Software Group | | | 16,050 | | | | 53,025 | |
| Schedule of Investments | | October 31, 2021 |
| | Global X Emerging Markets Internet & E-commerce ETF | |
| | | | | | | |
| COMMON STOCK — continued | | | | | | |
| Information Technology — continued | | | | | | |
Travelsky Technology, Cl H | | | 21,450 | | | $ | 40,148 | |
Weimob * | | | 15,150 | | | | 23,487 | |
| | | | | | | | 116,660 | |
| | | | | | | | | |
| | | | | | | | | |
TOTAL CHINA | | | | | | | 3,231,739 | |
| RUSSIA — 6.1% | | | | | | | | |
| Communication Services — 4.6% | | | | | | | | |
Yandex, Cl A * | | | 2,548 | | | | 211,076 | |
| | | | | | | | | |
| | | | | | | | | |
| Consumer Discretionary — 1.5% | | | | | | | | |
Ozon Holdings ADR * | | | 1,496 | | | | 67,320 | |
| | | | | | | | | |
| | | | | | | | | |
TOTAL RUSSIA | | | | | | | 278,396 | |
| SOUTH AFRICA — 4.6% | | | | | | | | |
| Communication Services — 0.3% | | | | | | | | |
MultiChoice Group | | | 1,860 | | | | 14,864 | |
| | | | | | | | | |
| | | | | | | | | |
| Consumer Discretionary — 4.3% | | | | | | | | |
Naspers, Cl N | | | 1,149 | | | | 195,794 | |
| | | | | | | | | |
| | | | | | | | | |
TOTAL SOUTH AFRICA | | | | | | | 210,658 | |
| SOUTH KOREA — 8.7% | | | | | | | | |
| Communication Services — 8.7% | | | | | | | | |
Kakao | | | 1,473 | | | | 158,197 | |
NAVER | | | 520 | | | | 181,114 | |
NCSoft | | | 110 | | | | 59,022 | |
| | | | | | | | | |
| | | | | | | | | |
TOTAL SOUTH KOREA | | | | | | | 398,333 | |
| TOTAL COMMON STOCK | | | | | | | | |
(Cost $6,018,517) | | | | | | | 4,556,323 | |
| TOTAL INVESTMENTS — 100.0% | | | | | | | | |
(Cost $6,018,517) | | | | | | $ | 4,556,323 | |
Percentages are based on Net Assets of $4,555,204.
| Schedule of Investments | | October 31, 2021 |
| | Global X Emerging Markets Internet & E-commerce ETF | |
| * | Non-income producing security. |
ADR — American Depositary Receipt
Cl — Class
As of October 31, 2021, all of the Fund’s investments were considered Level 1, in accordance with authoritative guidance on fair value measurements and disclosure under U.S. GAAP.
For the year ended October 31, 2021, there have been no transfers in or out of Level 3.
Amounts designated as “—“ are $0 or have been rounded to $0.
| Schedule of Investments | | October 31, 2021 |
| | Global X SuperDividend® ETF | |
Sector Weightings (Unaudited)†:
† Sector weightings percentages are based on the total market value of investments. Repurchase agreements purchased from cash collateral received for securities lending activity are included in total investments. Please see Note 2 and 7 in Notes to Financial Statements for more detailed information.
| | | | | | | |
| COMMON STOCK — 97.7% | | | | | | |
| AUSTRALIA — 3.6% | | | | | | |
| Financials — 1.8% | | | | | | |
IOOF Holdings | | | 3,324,660 | | | $ | 10,188,385 | |
Platinum Asset Management | | | 3,064,019 | | | | 6,996,213 | |
| | | | | | | | 17,184,598 | |
| | | | | | | | | |
| Industrials — 1.0% | | | | | | | | |
Aurizon Holdings | | | 3,586,912 | | | | 9,079,221 | |
| | | | | | | | | |
| Materials — 0.8% | | | | | | | | |
Fortescue Metals Group | | | 704,030 | | | | 7,366,145 | |
| Schedule of Investments | | October 31, 2021 |
| | Global X SuperDividend® ETF | |
| | | | | | | |
| COMMON STOCK — continued | | | | | | |
TOTAL AUSTRALIA | | | | | $ | 33,629,964 | |
| BRAZIL — 1.8% | | | | | | | |
| Consumer Discretionary — 0.5% | | | | | | | |
| Cyrela Brazil Realty Empreendimentos e Participacoes | | | 1,914,612 | | | | 4,785,681 | |
| | | | | | | | | |
| Utilities — 1.3% | | | | | | | | |
| Transmissora Alianca de Energia Eletrica | | | 1,922,736 | | | | 12,504,435 | |
| | | | | | | | | |
TOTAL BRAZIL | | | | | | | 17,290,116 | |
| CHINA — 24.3% | | | | | | | | |
| Communication Services — 1.2% | | | | | | | | |
| CITIC Telecom International Holdings | | | 31,074,800 | | | | 11,025,311 | |
| | | | | | | | | |
| Consumer Discretionary — 0.9% | | | | | | | | |
China Dongxiang Group | | | 81,391,700 | | | | 8,579,607 | |
| | | | | | | | | |
| Energy — 2.1% | | | | | | | | |
China Shenhua Energy, Cl H | | | 4,937,300 | | | | 10,637,436 | |
Yanzhou Coal Mining, Cl H (A) | | | 5,819,900 | | | | 8,633,657 | |
| | | | | | | | 19,271,093 | |
| | | | | | | | | |
| Financials — 0.6% | | | | | | | | |
China Everbright Bank, Cl H | | | 16,682,000 | | | | 5,875,869 | |
| | | | | | | | | |
| Industrials — 2.2% | | | | | | | | |
Lonking Holdings | | | 33,806,800 | | | | 9,908,601 | |
| Sinopec Engineering Group, Cl H | | | 20,956,700 | | | | 11,045,368 | |
| | | | | | | | 20,953,969 | |
| | | | | | | | | |
| Materials — 2.5% | | | | | | | | |
Asia Cement China Holdings | | | 10,118,500 | | | | 7,713,372 | |
| China Sanjiang Fine Chemicals | | | 26,032,900 | | | | 7,830,903 | |
| Shougang Fushan Resources Group | | | 28,145,000 | | | | 7,417,005 | |
| | | | | | | | 22,961,280 | |
| | | | | | | | | |
| Real Estate — 13.1% | | | | | | | | |
Agile Group Holdings | | | 9,260,100 | | | | 7,285,184 | |
| Schedule of Investments | | October 31, 2021 |
| | Global X SuperDividend® ETF | |
| | | | | | | |
| COMMON STOCK — continued | | | | | | |
| Real Estate — continued | | | | | | |
Central China Real Estate (A) | | | 26,689,000 | | | $ | 4,014,132 | |
China Aoyuan Group (A) | | | 14,156,700 | | | | 5,586,938 | |
China Jinmao Holdings Group | | | 26,431,000 | | | | 7,746,792 | |
China SCE Group Holdings | | | 23,837,000 | | | | 7,446,142 | |
| Gemdale Properties & Investment | | | 77,445,200 | | | | 7,566,265 | |
Guangzhou R&F Properties, Cl H (A) | | | 9,076,700 | | | | 5,694,049 | |
KWG Group Holdings | | | 8,253,500 | | | | 7,214,737 | |
Logan Group | | | 7,313,800 | | | | 7,342,899 | |
Midea Real Estate Holding (A) | | | 4,669,100 | | | | 8,054,881 | |
| Powerlong Real Estate Holdings | | | 13,293,600 | | | | 9,159,691 | |
Ronshine China Holdings (A) | | | 17,955,300 | | | | 7,270,707 | |
Shenzhen Investment (A) | | | 29,245,700 | | | | 7,180,734 | |
Shimao Group Holdings | | | 2,976,000 | | | | 4,682,608 | |
Times China Holdings | | | 9,152,880 | | | | 6,247,780 | |
Yuexiu Property | | | 9,123,660 | | | | 8,045,752 | |
Yuzhou Group Holdings (A) | | | 29,959,520 | | | | 3,273,612 | |
Zhongliang Holdings Group (A) | | | 16,591,100 | | | | 7,656,725 | |
| | | | | | | | 121,469,628 | |
| | | | | | | | | |
| Utilities — 1.7% | | | | | | | | |
China Power International Development (A) | | | 31,570,900 | | | | 15,868,547 | |
| | | | | | | | | |
TOTAL CHINA | | | | | | | 226,005,304 | |
| EGYPT — 0.9% | | | | | | | | |
| Consumer Staples — 0.9% | | | | | | | | |
Eastern SAE | | | 10,874,533 | | | | 8,029,572 | |
| | | | | | | | | |
| HONG KONG — 2.5% | | | | | | | | |
| Communication Services — 1.7% | | | | | | | | |
HKBN | | | 5,090,700 | | | | 6,112,204 | |
PCCW | | | 19,634,200 | | | | 10,121,177 | |
| | | | | | | | 16,233,381 | |
| | | | | | | | | |
| Consumer Discretionary — 0.8% | | | | | | | | |
Pacific Textiles Holdings | | | 14,152,600 | | | | 7,058,971 | |
| Schedule of Investments | | October 31, 2021 |
| | Global X SuperDividend® ETF | |
| | | | | | | |
| COMMON STOCK — continued | | | | | | |
TOTAL HONG KONG | | | | | $ | 23,292,352 | |
| INDONESIA — 1.0% | | | | | | | |
| Real Estate — 1.0% | | | | | | | |
Puradelta Lestari | | | 590,517,437 | | | | 9,336,574 | |
| | | | | | | | | |
| ISRAEL — 1.4% | | | | | | | | |
| Consumer Discretionary — 1.4% | | | | | | | | |
| Electra Consumer Products 1970 | | | 271,901 | | | | 12,764,537 | |
| | | | | | | | | |
| KAZAKHSTAN — 1.4% | | | | | | | | |
| Financials — 1.4% | | | | | | | | |
| Halyk Savings Bank of Kazakhstan JSC GDR | | | 714,841 | | | | 12,867,138 | |
| | | | | | | | | |
| NETHERLANDS — 0.9% | | | | | | | | |
| Financials — 0.9% | | | | | | | | |
Flow Traders | | | 260,210 | | | | 8,841,093 | |
| | | | | | | | | |
| NIGERIA — 1.2% | | | | | | | | |
| Financials — 1.2% | | | | | | | | |
Zenith Bank | | | 176,982,843 | | | | 10,800,766 | |
| | | | | | | | | |
| NORWAY — 2.2% | | | | | | | | |
| Energy — 2.2% | | | | | | | | |
Ocean Yield | | | 2,313,246 | | | | 11,211,695 | |
SFL | | | 1,176,864 | | | | 9,308,994 | |
| | | | | | | | | |
TOTAL NORWAY | | | | | | | 20,520,689 | |
| PORTUGAL — 1.5% | | | | | | | | |
| Communication Services — 1.5% | | | | | | | | |
NOS SGPS | | | 3,519,940 | | | | 13,743,783 | |
| | | | | | | | | |
| RUSSIA — 9.9% | | | | | | | | |
| Communication Services — 1.1% | | | | | | | | |
| Mobile TeleSystems PJSC ADR | | | 1,117,098 | | | | 10,266,131 | |
| | | | | | | | | |
| Consumer Staples — 2.7% | | | | | | | | |
Magnit PJSC GDR | | | 738,055 | | | | 13,668,779 | |
X5 Retail Group GDR | | | 343,291 | | | | 11,680,686 | |
| Schedule of Investments | | October 31, 2021 |
| | Global X SuperDividend® ETF | |
| | | | | | | |
| COMMON STOCK — continued | | | | | | |
| Consumer Staples — continued | | | | | | |
| | | | | | $ | 25,349,465 | |
| | | | | | | | |
| Industrials — 1.3% | | | | | | | |
Globaltrans Investment GDR | | | 1,351,994 | | | | 11,911,067 | |
| | | | | | | | | |
| Information Technology — 1.0% | | | | | | | | |
QIWI ADR (A) | | | 1,067,709 | | | | 9,342,454 | |
| | | | | | | | | |
| Materials — 3.8% | | | | | | | | |
Evraz | | | 1,406,456 | | | | 11,983,785 | |
| Magnitogorsk Iron & Steel Works PJSC | | | 5,788,858 | | | | 5,398,406 | |
PhosAgro PJSC GDR | | | 475,812 | | | | 11,381,423 | |
Severstal PJSC | | | 276,886 | | | | 6,286,013 | |
| | | | | | | | 35,049,627 | |
| | | | | | | | | |
TOTAL RUSSIA | | | | | | | 91,918,744 | |
| SINGAPORE — 2.3% | | | | | | | | |
| Energy — 1.2% | | | | | | | | |
BW LPG | | | 2,084,725 | | | | 11,089,880 | |
| | | | | | | | | |
| Real Estate — 1.1% | | | | | | | | |
Sasseur Real Estate Investment Trust ‡ | | | 16,457,160 | | | | 10,373,442 | |
| | | | | | | | | |
TOTAL SINGAPORE | | | | | | | 21,463,322 | |
| SOUTH AFRICA — 3.4% | | | | | | | | |
| Financials — 1.2% | | | | | | | | |
Coronation Fund Managers | | | 3,271,767 | | | | 10,893,693 | |
| | | | | | | | | |
| Real Estate — 2.2% | | | | | | | | |
Equites Property Fund ‡ (A) | | | 7,562,918 | | | | 10,145,256 | |
Resilient ‡ (A) | | | 2,923,676 | | | | 10,771,438 | |
| | | | | | | | 20,916,694 | |
| | | | | | | | | |
TOTAL SOUTH AFRICA | | | | | | | 31,810,387 | |
| SPAIN — 1.1% | | | | | | | | |
| Energy — 1.1% | | | | | | | | |
Repsol | | | 790,249 | | | | 10,110,856 | |
| Schedule of Investments | | October 31, 2021 |
| | Global X SuperDividend® ETF | |
| | | | | | | |
| COMMON STOCK — continued | | | | | | |
| TAIWAN — 1.2% | | | | | | |
| Real Estate — 1.2% | | | | | | |
Farglory Land Development | | | 4,495,000 | | | $ | 10,862,290 | |
| | | | | | | | | |
| THAILAND — 3.1% | | | | | | | | |
| Communication Services — 1.1% | | | | | | | | |
| Total Access Communication NVDR | | | 9,123,534 | | | | 10,516,844 | |
| | | | | | | | | |
| Financials — 1.0% | | | | | | | | |
Tisco Financial Group NVDR | | | 3,195,101 | | | | 8,882,636 | |
| | | | | | | | | |
| Real Estate — 1.0% | | | | | | | | |
Land & Houses NVDR | | | 36,900,087 | | | | 9,396,692 | |
| | | | | | | | | |
TOTAL THAILAND | | | | | | | 28,796,172 | |
| UNITED KINGDOM — 4.4% | | | | | | | | |
| Consumer Staples — 2.3% | | | | | | | | |
British American Tobacco | | | 296,658 | | | | 10,355,155 | |
Imperial Brands | | | 538,685 | | | | 11,386,129 | |
| | | | | | | | 21,741,284 | |
| | | | | | | | | |
| Financials — 2.1% | | | | | | | | |
Abrdn | | | 2,556,038 | | | | 8,899,341 | |
M&G | | | 3,793,160 | | | | 10,388,516 | |
| | | | | | | | 19,287,857 | |
| | | | | | | | | |
TOTAL UNITED KINGDOM | | | | | | | 41,029,141 | |
| UNITED STATES — 29.6% | | | | | | | | |
| Communication Services — 0.9% | | | | | | | | |
Lumen Technologies | | | 685,522 | | | | 8,130,291 | |
| | | | | | | | | |
| Consumer Staples — 1.0% | | | | | | | | |
Altria Group | | | 212,852 | | | | 9,388,902 | |
| | | | | | | | | |
| Energy — 4.6% | | | | | | | | |
Antero Midstream | | | 1,006,124 | | | | 10,705,159 | |
Diversified Energy | | | 6,412,958 | | | | 10,144,276 | |
Plains GP Holdings, Cl A | | | 919,133 | | | | 10,018,550 | |
| Schedule of Investments | | October 31, 2021 |
| | Global X SuperDividend® ETF | |
| | | | | | | |
| COMMON STOCK — continued | | | | | | |
| Energy — continued | | | | | | |
Williams | | | 415,859 | | | $ | 11,681,479 | |
| | | | | | | | 42,549,464 | |
| | | | | | | | | |
| Financials — 17.8% | | | | | | | | |
AGNC Investment ‡ | | | 633,663 | | | | 10,087,915 | |
Annaly Capital Management ‡ | | | 1,202,455 | | | | 10,172,769 | |
Apollo Commercial Real Estate Finance ‡ | | | 715,219 | | | | 10,828,416 | |
Arbor Realty Trust ‡ | | | 590,327 | | | | 11,871,476 | |
ARMOUR Residential ‡ | | | 832,241 | | | | 8,755,175 | |
Blackstone Mortgage Trust, Cl A ‡ | | | 337,413 | | | | 11,100,888 | |
Chimera Investment ‡ | | | 764,069 | | | | 11,927,117 | |
Ellington Financial ‡ | | | 542,536 | | | | 9,863,304 | |
Invesco Mortgage Capital ‡ (A) | | | 2,356,354 | | | | 7,398,952 | |
KKR Real Estate Finance Trust ‡ | | | 509,343 | | | | 11,057,836 | |
Ladder Capital, Cl A ‡ | | | 862,329 | | | | 10,347,948 | |
PennyMac Mortgage Investment Trust ‡ | | | 486,372 | | | | 9,800,396 | |
Ready Capital ‡ | | | 715,709 | | | | 11,072,018 | |
Starwood Property Trust ‡ | | | 439,144 | | | | 11,184,998 | |
TPG RE Finance Trust ‡ | | | 889,811 | | | | 11,629,830 | |
Two Harbors Investment ‡ | | | 1,366,850 | | | | 8,775,177 | |
| | | | | | | | 165,874,215 | |
| | | | | | | | | |
| Real Estate — 5.3% | | | | | | | | |
American Finance Trust ‡ | | | 1,081,335 | | | | 8,953,454 | |
Gladstone Commercial ‡ | | | 510,507 | | | | 11,159,683 | |
Global Net Lease ‡ | | | 572,077 | | | | 9,164,673 | |
Iron Mountain ‡ | | | 258,839 | | | | 11,813,412 | |
Office Properties Income Trust ‡ | | | 334,947 | | | | 8,581,342 | |
| | | | | | | | 49,672,564 | |
| | | | | | | | | |
TOTAL UNITED STATES | | | | | | | 275,615,436 | |
| TOTAL COMMON STOCK | | | | | | | | |
(Cost $913,869,498) | | | | | | | 908,728,236 | |
| Schedule of Investments | | October 31, 2021 |
| | Global X SuperDividend® ETF | |
| | | | | | | |
| PREFERRED STOCK — 2.0% | | | | | | |
| BRAZIL— 2.0% | | | | | | |
| Utilities — 2.0% | | | | | | |
Cia de Transmissao de Energia Eletrica Paulista (B) | | | 2,248,326 | | | $ | 9,700,069 | |
Cia Energetica de Sao Paulo (B) | | | 1,992,428 | | | | 9,013,112 | |
TOTAL BRAZIL | | | | | | | 18,713,181 | |
| TOTAL PREFERRED STOCK | | | | | | | | |
(Cost $18,835,721) | | | | | | | 18,713,181 | |
| | | | | | | | | |
SHORT-TERM INVESTMENT — 2.2%(C)(D) | | | | | | | | |
| Fidelity Investments Money Market Government Portfolio, Cl Institutional, 0.010% | | | | | | | | |
(Cost $20,552,237) | | | 20,552,237 | | | | 20,552,237 | |
| | | | | | | | | |
REPURCHASE AGREEMENT — 1.8%(C) | | | | | | | | |
| BNP Paribas | | | | | | | | |
| 0.030%, dated 10/29/21, to be repurchased on 11/01/21, repurchase price $16,543,886 (collateralized by U.S. Treasury Obligations, ranging in par value $665,347 - $2,218,804, 0.750% - 1.250%, 01/31/28 - 03/31/28, with a total market value of $16,906,404) | | | | | | | | |
(Cost $16,543,844) | | $ | 16,543,844 | | | | 16,543,844 | |
| TOTAL INVESTMENTS — 103.7% | | | | | | | | |
(Cost $969,801,300) | | | | | | $ | 964,537,498 | |
Percentages are based on Net Assets of $930,431,472.
| Schedule of Investments | | October 31, 2021 |
| | Global X SuperDividend® ETF | |
| ‡ | Real Estate Investment Trust |
| (A) | This security or a partial position of this security is on loan at October 31, 2021. The total value of securities on loan at October 31, 2021 was $32,747,398. |
| (B) | There is currently no stated interest rate. |
| (C) | Security was purchased with cash collateral held from securities on loan. The total value of such securities as of October 31, 2021 was $37,096,081. |
| (D) | The rate reported on the Schedule of Investments is the 7-day effective yield as of October 31, 2021. |
ADR — American Depositary Receipt
Cl — Class
GDR — Global Depositary Receipt
NVDR — Non-Voting Depositary Receipt
PJSC — Public Joint Stock Company
The following is a summary of the level of inputs used as of October 31, 2021, in valuing the Fund’s investments carried at value:
| Investments in Securities | | Level 1 | | | Level 2 | | | Level 3 | | | Total | |
| Common Stock | | $ | 887,934,127 | | | $ | 20,794,109 | | | $ | — | | | $ | 908,728,236 | |
| Preferred Stock | | | 18,713,181 | | | | — | | | | — | | | | 18,713,181 | |
| Short-Term Investment | | | 20,552,237 | | | | — | | | | — | | | | 20,552,237 | |
| Repurchase Agreement | | | — | | | | 16,543,844 | | | | — | | | | 16,543,844 | |
| Total Investments in Securities | | $ | 927,199,545 | | | $ | 37,337,953 | | | $ | — | | | $ | 964,537,498 | |
For the year ended October 31, 2021, there have been no transfers in or out of Level 3.
Amounts designated as “—“ are $0 or have been rounded to $0.
| Schedule of Investments | | October 31, 2021 |
| | Global X SuperDividend® U.S. ETF | |
Sector Weightings (Unaudited)†:
† Sector weightings percentages are based on the total market value of investments. Repurchase agreements purchased from cash collateral received for securities lending activity are included in total investments. Please see Note 2 and 7 in Notes to Financial Statements for more detailed information.
| | | | | | | |
| COMMON STOCK — 83.1% | | | | | | |
| UNITED STATES — 83.1% | | | | | | |
| Communication Services — 5.5% | | | | | | |
AT&T | | | 413,531 | | | $ | 10,445,793 | |
| Cogent Communications Holdings | | | 201,543 | | | | 15,436,178 | |
Verizon Communications | | | 212,106 | | | | 11,239,497 | |
| | | | | | | | 37,121,468 | |
| | | | | | | | | |
| Consumer Discretionary — 1.4% | | | | | | | | |
PetMed Express (A) | | | 337,246 | | | | 9,587,904 | |
| | | | | | | | | |
| Consumer Staples — 22.6% | | | | | | | | |
Altria Group | | | 277,070 | | | | 12,221,558 | |
B&G Foods | | | 391,253 | | | | 11,518,488 | |
Bunge | | | 161,693 | | | | 14,979,239 | |
Flowers Foods | | | 547,142 | | | | 13,541,764 | |
General Mills | | | 208,295 | | | | 12,872,631 | |
| Schedule of Investments | | October 31, 2021 |
| | Global X SuperDividend® U.S. ETF | |
| | | | | | | |
| COMMON STOCK — continued | | | | | | |
| Consumer Staples — continued | | | | | | |
Kellogg | | | 203,052 | | | $ | 12,447,088 | |
Kraft Heinz | | | 310,256 | | | | 11,135,088 | |
Philip Morris International | | | 140,027 | | | | 13,238,153 | |
SpartanNash | | | 662,706 | | | | 15,335,017 | |
Universal | | | 234,454 | | | | 11,019,338 | |
Vector Group | | | 872,754 | | | | 11,572,718 | |
Walgreens Boots Alliance | | | 247,096 | | | | 11,618,454 | |
| | | | | | | | 151,499,536 | |
| | | | | | | | | |
| | | | | | | | | |
| Energy — 2.7% | | | | | | | | |
Equitrans Midstream | | | 1,719,477 | | | | 17,727,808 | |
| | | | | | | | | |
| | | | | | | | | |
| Financials — 11.7% | | | | | | | | |
AGNC Investment ‡ | | | 750,721 | | | | 11,951,478 | |
Compass Diversified Holdings | | | 519,475 | | | | 15,506,329 | |
KKR Real Estate Finance Trust ‡ | | | 658,011 | | | | 14,285,419 | |
| New York Community Bancorp | | | 1,082,177 | | | | 13,451,460 | |
TFS Financial | | | 636,821 | | | | 12,392,537 | |
Virtu Financial, Cl A | | | 430,232 | | | | 10,704,172 | |
| | | | | | | | 78,291,395 | |
| | | | | | | | | |
| | | | | | | | | |
| Health Care — 6.0% | | | | | | | | |
AbbVie | | | 113,990 | | | | 13,071,233 | |
Gilead Sciences | | | 185,280 | | | | 12,020,967 | |
Pfizer | | | 349,800 | | | | 15,300,252 | |
| | | | | | | | 40,392,452 | |
| | | | | | | | | |
| | | | | | | | | |
| Industrials — 7.0% | | | | | | | | |
| 3M | | | 71,298 | | | | 12,739,526 | |
Ennis | | | 621,439 | | | | 11,770,055 | |
MSC Industrial Direct, Cl A | | | 141,958 | | | | 11,934,409 | |
National Presto Industries | | | 128,667 | | | | 10,698,661 | |
| | | | | | | | 47,142,651 | |
| | | | | | | | | |
| | | | | | | | | |
| Real Estate — 13.7% | | | | | | | | |
Alexander’s ‡ | | | 45,865 | | | | 12,786,245 | |
CoreSite Realty ‡ | | | 99,980 | | | | 14,243,151 | |
| Schedule of Investments | | October 31, 2021 |
| | Global X SuperDividend® U.S. ETF | |
| | | | | | | |
| COMMON STOCK — continued | | | | | | |
| Real Estate — continued | | | | | | |
CubeSmart ‡ | | | 335,990 | | | $ | 18,482,810 | |
Easterly Government Properties, Cl A ‡ | | | 559,354 | | | | 11,763,215 | |
Iron Mountain ‡ | | | 372,540 | | | | 17,002,725 | |
Public Storage ‡ | | | 51,479 | | | | 17,100,294 | |
| | | | | | | | 91,378,440 | |
| | | | | | | | | |
| | | | | | | | | |
| Utilities — 12.5% | | | | | | | | |
Avangrid | | | 266,560 | | | | 14,047,712 | |
Clearway Energy, Cl C | | | 386,296 | | | | 13,705,782 | |
Consolidated Edison | | | 172,621 | | | | 13,015,623 | |
Duke Energy | | | 134,983 | | | | 13,769,616 | |
Hawaiian Electric Industries | | | 346,383 | | | | 14,049,295 | |
National Fuel Gas | | | 267,405 | | | | 15,357,069 | |
| | | | | | | | 83,945,097 | |
| | | | | | | | | |
| | | | | | | | | |
TOTAL UNITED STATES | | | | | | | 557,086,751 | |
| TOTAL COMMON STOCK | | | | | | | | |
(Cost $487,800,330) | | | | | | | 557,086,751 | |
| | | | | | | | | |
| MASTER LIMITED PARTNERSHIPS — 16.5% | | | | | | | | |
| UNITED KINGDOM— 2.0% | | | | | | | | |
| Energy — 2.0% | | | | | | | | |
KNOT Offshore Partners (B) | | | 729,513 | | | | 13,313,612 | |
| UNITED STATES— 14.5% | | | | | | | | |
| Energy — 10.9% | | | | | | | | |
BP Midstream Partners (B) | | | 1,003,938 | | | | 13,352,375 | |
CrossAmerica Partners (B) | | | 662,686 | | | | 14,817,659 | |
Enviva Partners (B) | | | 234,011 | | | | 15,669,377 | |
Holly Energy Partners (B) | | | 786,938 | | | | 14,495,398 | |
MPLX (B) | | | 494,976 | | | | 14,908,677 | |
| | | | | | | | 73,243,486 | |
| Industrials — 1.6% | | | | | | | | |
Icahn Enterprises (B) | | | 184,973 | | | | 10,654,445 | |
| Schedule of Investments | | October 31, 2021 |
| | Global X SuperDividend® U.S. ETF | |
| | | | | | | |
| MASTER LIMITED PARTNERSHIPS — continued | | | | | | |
| Materials — 2.0% | | | | | | |
Westlake Chemical Partners (B) | | | 517,202 | | | $ | 13,302,435 | |
TOTAL UNITED STATES | | | | | | | 97,200,366 | |
| TOTAL MASTER LIMITED PARTNERSHIPS | | | | | | | | |
(Cost $82,941,526) | | | | | | | 110,513,978 | |
| | | | | | | | | |
SHORT-TERM INVESTMENT — 0.6%(C)(D) | | | | | | | | |
| Fidelity Investments Money Market Government Portfolio, Cl Institutional, 0.010% | | | | | | | | |
(Cost $3,889,811) | | | 3,889,811 | | | | 3,889,811 | |
| | | | | | | | | |
REPURCHASE AGREEMENT — 0.5%(C) | | | | | | | | |
| BNP Paribas | | | | | | | | |
| 0.030%, dated 10/29/21, to be repurchased on 11/01/21, repurchase price $3,131,172 (collateralized by various U.S. Treasury Obligations, ranging in par value $125,927 - $419,941, 0.750% - 1.250%, 01/31/28 -03/31/28, with a total market value of $3,199,784) | | | | | | | | |
(Cost $3,131,165) | | $ | 3,131,165 | | | | 3,131,165 | |
| TOTAL INVESTMENTS — 100.7% | | | | | | | | |
(Cost $577,762,832) | | | | | | $ | 674,621,705 | |
Percentages are based on Net Assets of $669,734,316.
| ‡ | Real Estate Investment Trust |
| (A) | This security or a partial position of this security is on loan at October 31, 2021. The total value of securities on loan at October 31, 2021 was $6,887,281. |
| (B) | Security considered Master Limited Partnership. At October 31, 2021, these securities amounted to $110,513,978 or 16.5% of Net Assets. |
| (C) | Security was purchased with cash collateral held from securities on loan. The total value of such securities as of October 31, 2021 was $7,020,976. |
| (D) | The rate reported on the Schedule of Investments is the 7-day effective yield as of October 31, 2021. |
| Schedule of Investments | | October 31, 2021 |
| | Global X SuperDividend® U.S. ETF | |
Cl — Class
The following is a summary of the level of inputs used as of October 31, 2021, in valuing the Fund’s investments carried at value:
| Investments in Securities | | | | | | | | | | | | |
| Common Stock | | $ | 557,086,751 | | | $ | — | | | $ | — | | | $ | 557,086,751 | |
| Master Limited Partnerships | | | 110,513,978 | | | | — | | | | — | | | | 110,513,978 | |
| Short-Term Investment | | | 3,889,811 | | | | — | | | | — | | | | 3,889,811 | |
| Repurchase Agreement | | | — | | | | 3,131,165 | | | | — | | | | 3,131,165 | |
| Total Investments in Securities | | $ | 671,490,540 | | | $ | 3,131,165 | | | $ | — | | | $ | 674,621,705 | |
For the year ended October 31, 2021, there have been no transfers in or out of Level 3.
Amounts designated as “—“ are $0 or have been rounded to $0.
| Schedule of Investments | | October 31, 2021 |
| | Global X MSCI SuperDividend® EAFE ETF | |
Sector Weightings (Unaudited)†:
† Sector weightings percentages are based on the total market value of investments.
| | | | | | | |
| COMMON STOCK — 99.8% | | | | | | |
| AUSTRALIA — 8.5% | | | | | | |
| Industrials — 2.0% | | | | | | |
Aurizon Holdings | | | 109,685 | | | $ | 277,636 | |
| | | | | | | | | |
| Materials — 4.3% | | | | | | | | |
Fortescue Metals Group | | | 17,175 | | | | 179,699 | |
Rio Tinto Ltd. | | | 3,149 | | | | 213,555 | |
Rio Tinto PLC | | | 3,479 | | | | 217,482 | |
| | | | | | | | 610,736 | |
| | | | | | | | | |
| Real Estate — 2.2% | | | | | | | | |
Vicinity Centres ‡ | | | 241,137 | | | | 312,429 | |
| | | | | | | | | |
TOTAL AUSTRALIA | | | | | | | 1,200,801 | |
| AUSTRIA — 2.3% | | | | | | | | |
| Energy — 2.3% | | | | | | | | |
OMV | | | 5,319 | | | | 322,543 | |
| | | | | | | | | |
| BELGIUM — 1.7% | | | | | | | | |
| Consumer Discretionary — 1.7% | | | | | | | | |
Ageas | | | 4,825 | | | | 235,074 | |
| Schedule of Investments | | October 31, 2021 |
| | Global X MSCI SuperDividend® EAFE ETF | |
| | | | | | | |
| COMMON STOCK — continued | | | | | | |
| FINLAND — 2.4% | | | | | | |
| Utilities — 2.4% | | | | | | |
Fortum | | | 11,163 | | | $ | 332,001 | |
| | | | | | | | | |
| FRANCE — 11.2% | | | | | | | | |
| Communication Services — 1.9% | | | | | | | | |
Orange | | | 23,929 | | | | 261,272 | |
| | | | | | | | | |
| Financials — 7.2% | | | | | | | | |
AXA | | | 9,691 | | | | 282,166 | |
CNP Assurances | | | 16,776 | | | | 420,506 | |
SCOR | | | 9,053 | | | | 304,868 | |
| | | | | | | | 1,007,540 | |
| | | | | | | | | |
| Industrials — 2.1% | | | | | | | | |
Credit Agricole | | | 19,769 | | | | 298,324 | |
| | | | | | | | | |
TOTAL FRANCE | | | | | | | 1,567,136 | |
| GERMANY — 3.7% | | | | | | | | |
| Communication Services — 1.8% | | | | | | | | |
| Telefonica Deutschland Holding | | | 96,921 | | | | 252,700 | |
| | | | | | | | | |
| Materials — 1.9% | | | | | | | | |
BASF | | | 3,671 | | | | 264,581 | |
| | | | | | | | | |
TOTAL GERMANY | | | | | | | 517,281 | |
| HONG KONG — 8.7% | | | | | | | | |
| Communication Services — 2.2% | | | | | | | | |
HKT Trust & HKT | | | 229,020 | | | | 310,893 | |
| | | | | | | | | |
| Real Estate — 2.1% | | | | | | | | |
Henderson Land Development | | | 68,900 | | | | 288,742 | |
| | | | | | | | | |
| Utilities — 4.4% | | | | | | | | |
CK Infrastructure Holdings | | | 50,900 | | | | 306,877 | |
Power Assets Holdings | | | 51,206 | | | | 312,342 | |
| | | | | | | | 619,219 | |
| Schedule of Investments | | October 31, 2021 |
| | Global X MSCI SuperDividend® EAFE ETF | |
| | | | | | | |
| COMMON STOCK — continued | | | | | | |
TOTAL HONG KONG | | | | | $ | 1,218,854 | |
| ITALY — 8.1% | | | | | | | |
| Communication Services — 1.5% | | | | | | | |
Telecom Italia | | | 534,206 | | | | 203,081 | |
| | | | | | | | | |
| Financials — 4.5% | | | | | | | | |
Assicurazioni Generali | | | 14,390 | | | | 313,905 | |
Poste Italiane | | | 22,491 | | | | 321,181 | |
| | | | | | | | | |
| | | | | | | | 635,086 | |
| | | | | | | | | |
| Utilities — 2.1% | | | | | | | | |
Snam | | | 52,718 | | | | 298,755 | |
| | | | | | | | | |
| | | | | | | | | |
TOTAL ITALY | | | | | | | 1,136,922 | |
| JAPAN — 10.4% | | | | | | | | |
| Communication Services — 2.3% | | | | | | | | |
SoftBank | | | 23,553 | | | | 321,097 | |
| | | | | | | | | |
| Consumer Staples — 2.2% | | | | | | | | |
Japan Tobacco | | | 15,460 | | | | 303,099 | |
| | | | | | | | | |
| Financials — 3.9% | | | | | | | | |
Japan Post Holdings | | | 36,325 | | | | 278,749 | |
Nomura Holdings | | | 57,098 | | | | 275,412 | |
| | | | | | | | 554,161 | |
| | | | | | | | | |
| Real Estate — 2.0% | | | | | | | | |
Japan Metropolitan Fund Invest ‡ | | | 311 | | | | 285,021 | |
| | | | | | | | | |
TOTAL JAPAN | | | | | | | 1,463,378 | |
| NETHERLANDS — 2.2% | | | | | | | | |
| Financials — 2.2% | | | | | | | | |
NN Group | | | 5,842 | | | | 313,153 | |
| | | | | | | | | |
| NEW ZEALAND — 2.2% | | | | | | | | |
| Communication Services — 2.2% | | | | | | | | |
Spark New Zealand | | | 95,715 | | | | 312,696 | |
| Schedule of Investments | | October 31, 2021 |
| | Global X MSCI SuperDividend® EAFE ETF | |
| | | | | | | |
| COMMON STOCK — continued | | | | | | |
| NORWAY — 1.9% | | | | | | |
| Communication Services — 1.9% | | | | | | |
Telenor | | | 17,235 | | | $ | 271,688 | |
| | | | | | | | | |
| PORTUGAL — 2.2% | | | | | | | | |
| Utilities — 2.2% | | | | | | | | |
Energias de Portugal | | | 55,793 | | | | 315,342 | |
| | | | | | | | | |
| SPAIN — 7.8% | | | | | | | | |
| Communication Services — 1.7% | | | | | | | | |
Telefonica | | | 54,595 | | | | 237,841 | |
| | | | | | | | | |
| Utilities — 6.1% | | | | | | | | |
Enagas | | | 13,338 | | | | 299,523 | |
Endesa | | | 10,968 | | | | 253,156 | |
Naturgy Energy Group | | | 11,641 | | | | 306,207 | |
| | | | | | | | 858,886 | |
| | | | | | | | | |
TOTAL SPAIN | | | | | | | 1,096,727 | |
| SWEDEN — 4.4% | | | | | | | | |
| Communication Services — 1.8% | | | | | | | | |
Tele2, Cl B | | | 18,308 | | | | 258,254 | |
| | | | | | | | | |
| Energy — 2.6% | | | | | | | | |
Lundin Energy | | | 9,106 | | | | 359,638 | |
| | | | | | | | | |
TOTAL SWEDEN | | | | | | | 617,892 | |
| SWITZERLAND — 2.3% | | | | | | | | |
| Financials — 2.3% | | | | | | | | |
Zurich Insurance Group | | | 730 | | | | 324,276 | |
| | | | | | | | | |
| UNITED KINGDOM — 17.6% | | | | | | | | |
| Communication Services — 1.6% | | | | | | | | |
Vodafone Group | | | 154,060 | | | | 228,156 | |
| | | | | | | | | |
| Consumer Discretionary — 1.9% | | | | | | | | |
Persimmon | | | 6,968 | | | | 259,892 | |
| Schedule of Investments | | October 31, 2021 |
| | Global X MSCI SuperDividend® EAFE ETF | |
| | | | | | | |
| COMMON STOCK — continued | | | | | | |
| Consumer Staples — 1.9% | | | | | | |
British American Tobacco | | | 7,753 | | | $ | 270,626 | |
| | | | | | | | | |
| Financials — 10.1% | | | | | | | | |
Aviva | | | 53,696 | | | | 290,513 | |
Direct Line Insurance Group | | | 74,557 | | | | 298,829 | |
Legal & General Group | | | 77,941 | | | | 308,653 | |
M&G | | | 92,316 | | | | 252,830 | |
Phoenix Group Holdings | | | 29,928 | | | | 269,362 | |
| | | | | | | | 1,420,187 | |
| Utilities — 2.1% | | | | | | | | |
National Grid | | | 23,454 | | | | 300,726 | |
| | | | | | | | | |
TOTAL UNITED KINGDOM | | | | | | | 2,479,587 | |
| UNITED STATES — 2.2% | | | | | | | | |
| Financials — 2.2% | | | | | | | | |
Swiss Re | | | 3,162 | | | | 306,736 | |
| | | | | | | | | |
| TOTAL COMMON STOCK | | | | | | | | |
(Cost $13,582,420) | | | | | | | 14,032,087 | |
| TOTAL INVESTMENTS — 99.8% | | | | | | | | |
(Cost $13,582,420) | | | | | | $ | 14,032,087 | |
Percentages are based on Net Assets of $14,057,701.
| ‡ | Real Estate Investment Trust |
Cl — Class
As of October 31, 2021, all of the Fund’s investments were considered Level 1, in accordance with authoritative guidance on fair value measurements and disclosure under U.S. GAAP.
For the year ended October 31, 2021, there have been no transfers in or out of Level 3.
| Schedule of Investments | | October 31, 2021 |
| | Global X MSCI SuperDividend® Emerging Markets ETF | |
Sector Weightings (Unaudited)†:
† Sector weightings percentages are based on the total market value of investments.
| | | | | | | |
| COMMON STOCK — 92.1% | | | | | | |
| BRAZIL— 3.0% | | | | | | |
| Consumer Discretionary — 1.7% | | | | | | |
Vibra Energia | | | 291,165 | | | $ | 1,083,669 | |
| Materials — 1.3% | | | | | | | | |
Vale | | | 63,643 | | | | 808,493 | |
TOTAL BRAZIL | | | | | | | 1,892,162 | |
| CHILE— 0.8% | | | | | | | | |
| Utilities — 0.8% | | | | | | | | |
Colbun | | | 7,522,683 | | | | 520,171 | |
| CHINA— 34.3% | | | | | | | | |
| Energy — 4.6% | | | | | | | | |
China Shenhua Energy, Cl H | | | 615,864 | | | | 1,326,882 | |
Yanzhou Coal Mining, Cl H | | | 1,049,700 | | | | 1,557,200 | |
Total Energy | | | | | | | 2,884,082 | |
| Financials — 9.5% | | | | | | | | |
Bank of China, Cl H | | | 3,420,000 | | | | 1,209,017 | |
| Bank of Communications, Cl H | | | 2,116,780 | | | | 1,259,882 | |
| China Cinda Asset Management, Cl H | | | 6,601,500 | | | | 1,103,213 | |
| Schedule of Investments | | October 31, 2021 |
| | Global X MSCI SuperDividend® Emerging Markets ETF | |
| | | | | | | |
| COMMON STOCK — continued | | | | | | |
| Financials — continued | | | | | | |
China Everbright Bank, Cl H | | | 3,280,400 | | | $ | 1,155,449 | |
Haitong Securities, Cl H | | | 1,383,300 | | | | 1,232,319 | |
Total Financials | | | | | | | 5,959,880 | |
| Real Estate — 15.4% | | | | | | | | |
Agile Group Holdings | | | 961,700 | | | | 756,597 | |
China Aoyuan Group | | | 1,295,700 | | | | 511,348 | |
| China Fortune Land Development, Cl A | | | 1,710,300 | | | | 983,008 | |
| China Jinmao Holdings Group | | | 4,161,800 | | | | 1,219,802 | |
| Jiangsu Zhongnan Construction Group, Cl A | | | 1,582,900 | | | | 946,867 | |
Jinke Properties Group, Cl A | | | 1,623,228 | | | | 1,125,640 | |
KWG Group Holdings | | | 942,900 | | | | 824,229 | |
Logan Group | | | 902,200 | | | | 905,790 | |
| Shanghai Lujiazui Finance & Trade Zone Development, Cl B | | | 1,527,600 | | | | 1,358,036 | |
Shenzhen Investment | | | 3,965,500 | | | | 973,654 | |
Total Real Estate | | | | | | | 9,604,971 | |
| Utilities — 4.8% | | | | | | | | |
| China Power International Development | | | 5,991,364 | | | | 3,011,452 | |
TOTAL CHINA | | | | | | | 21,460,385 | |
| CZECH REPUBLIC— 2.5% | | | | | | | | |
| Utilities — 2.5% | | | | | | | | |
CEZ | | | 47,323 | | | | 1,563,755 | |
| EGYPT— 2.1% | | | | | | | | |
| Consumer Staples — 2.1% | | | | | | | | |
Eastern SAE | | | 1,806,906 | | | | 1,334,189 | |
| INDIA— 7.4% | | | | | | | | |
| Energy — 2.4% | | | | | | | | |
Indian Oil | | | 863,142 | | | | 1,474,855 | |
| Financials — 2.3% | | | | | | | | |
REC | | | 715,718 | | | | 1,420,803 | |
| | | | | | | | | |
| Schedule of Investments | | October 31, 2021 |
| | Global X MSCI SuperDividend® Emerging Markets ETF | |
| | | | | | | |
| COMMON STOCK — continued | | | | | | |
| Materials — 2.7% | | | | | | |
Ambuja Cements | | | 324,069 | | | $ | 1,751,882 | |
TOTAL INDIA | | | | | | | 4,647,540 | |
| MALAYSIA— 5.5% | | | | | | | | |
| Financials — 2.1% | | | | | | | | |
Malayan Banking | | | 688,928 | | | | 1,339,259 | |
| Health Care — 1.1% | | | | | | | | |
Top Glove | | | 1,064,252 | | | | 699,050 | |
| Industrials — 2.3% | | | | | | | | |
Sime Darby | | | 2,622,145 | | | | 1,437,399 | |
TOTAL MALAYSIA | | | | | | | 3,475,708 | |
| PAKISTAN— 1.9% | | | | | | | | |
| Financials — 1.9% | | | | | | | | |
MCB Bank | | | 1,250,904 | | | | 1,197,654 | |
| RUSSIA— 11.7% | | | | | | | | |
| Consumer Staples — 2.4% | | | | | | | | |
Magnit PJSC GDR | | | 81,805 | | | | 1,515,029 | |
| Materials — 9.3% | | | | | | | | |
Alrosa PJSC | | | 902,551 | | | | 1,588,847 | |
Novolipetsk Steel PJSC | | | 376,532 | | | | 1,186,777 | |
PhosAgro PJSC GDR | | | 74,234 | | | | 1,775,677 | |
Severstal PJSC | | | 53,930 | | | | 1,224,348 | |
Total Materials | | | | | | | 5,775,649 | |
TOTAL RUSSIA | | | | | | | 7,290,678 | |
| SOUTH AFRICA— 3.5% | | | | | | | | |
| Energy — 2.1% | | | | | | | | |
Exxaro Resources | | | 119,641 | | | | 1,316,444 | |
| Materials — 1.4% | | | | | | | | |
Kumba Iron Ore | | | 28,158 | | | | 859,931 | |
TOTAL SOUTH AFRICA | | | | | | | 2,176,375 | |
| | | | | | | | | |
| Schedule of Investments | | October 31, 2021 |
| | Global X MSCI SuperDividend® Emerging Markets ETF | |
| | | | | | | |
| COMMON STOCK — continued | | | | | | |
| SOUTH KOREA— 4.2% | | | | | | |
| Financials — 2.4% | | | | | | |
Meritz Securities | | | 370,575 | | | $ | 1,477,797 | |
| Industrials — 1.8% | | | | | | | | |
| Hyundai Heavy Industries Holdings | | | 21,079 | | | | 1,140,039 | |
TOTAL SOUTH KOREA | | | | | | | 2,617,836 | |
| TAIWAN— 9.0% | | | | | | | | |
| Information Technology — 7.0% | | | | | | | | |
Compal Electronics | | | 1,771,200 | | | | 1,557,289 | |
Lite-On Technology | | | 630,310 | | | | 1,389,431 | |
Wistron | | | 1,380,500 | | | | 1,449,578 | |
Total Information Technology | | | | | | | 4,396,298 | |
| Materials — 2.0% | | | | | | | | |
Asia Cement | | | 800,600 | | | | 1,275,386 | |
TOTAL TAIWAN | | | | | | | 5,671,684 | |
| TURKEY— 3.7% | | | | | | | | |
| Consumer Staples — 1.8% | | | | | | | | |
BIM Birlesik Magazalar | | | 174,452 | | | | 1,127,615 | |
| Materials — 1.9% | | | | | | | | |
| Eregli Demir ve Celik Fabrikalari | | | 589,094 | | | | 1,206,353 | |
TOTAL TURKEY | | | | | | | 2,333,968 | |
| UNITED ARAB EMIRATES— 2.5% | | | | | | | | |
| Real Estate — 2.5% | | | | | | | | |
Aldar Properties PJSC | | | 1,420,817 | | | | 1,562,719 | |
| TOTAL COMMON STOCK | | | | | | | | |
(Cost $59,953,345) | | | | | | | 57,744,824 | |
| | | | | | | | | |
| PREFERRED STOCK — 7.8% | | | | | | | | |
| BRAZIL— 5.7% | | | | | | | | |
| Materials — 1.5% | | | | | | | | |
Bradespar, (A) | | | 112,417 | | | | 970,413 | |
| Schedule of Investments | | October 31, 2021 |
| | Global X MSCI SuperDividend® Emerging Markets ETF | |
| | | | | | | |
| PREFERRED STOCK — continued | | | | | | |
| Utilities — 4.2% | | | | | | |
Cia Energetica de Minas Gerais, (A) | | | 586,525 | | | $ | 1,340,153 | |
Cia Paranaense de Energia, (A) | | | 1,215,002 | | | | 1,276,000 | |
| | | | | | | | 2,616,153 | |
TOTAL BRAZIL | | | | | | | 3,586,566 | |
| RUSSIA— 2.1% | | | | | | | | |
| Energy — 2.1% | | | | | | | | |
Surgutneftegas PJSC, (A) | | | 2,412,589 | | | | 1,313,199 | |
| TOTAL PREFERRED STOCK | | | | | | | | |
(Cost $5,580,389) | | | | | | | 4,899,765 | |
| TOTAL INVESTMENTS — 99.9% | | | | | | | | |
(Cost $65,533,734) | | | | | | $ | 62,644,589 | |
Percentages are based on Net Assets of $62,696,164.
| (A) | There is currently no stated interest rate. |
Cl — Class
GDR — Global Depositary Receipt
PJSC — Public Joint Stock Company
The following is a summary of the level of inputs used as of October 31, 2021, in valuing the Fund’s investments carried at value:
| Investments in Securities | | | | | | | | | | | | |
| Common Stock | | $ | 52,513,948 | | | $ | 5,230,876 | | | $ | — | | | $ | 57,744,824 | |
| Preferred Stock | | | 4,899,765 | | | | — | | | | — | | | | 4,899,765 | |
| Total Investments in Securities | | $ | 57,413,713 | | | $ | 5,230,876 | | | $ | — | | | $ | 62,644,589 | |
For the year ended October 31, 2021, there have been no transfers in or out of Level 3.
Amounts designated as “—“ are $0 or have been rounded to $0.
| Schedule of Investments | | October 31, 2021 |
| | Global X SuperDividend® REIT ETF | |
Sector Weightings (Unaudited)†:
† Sector weightings percentages are based on the total market value of investments. Repurchase agreements purchased from cash collateral received for securities lending activity are included in total investments. Please see Note 2 and 7 in Notes to Financial Statements for more detailed information.
| | | | | | | |
| COMMON STOCK — 99.5% | | | | | | |
| AUSTRALIA — 9.4% | | | | | | |
| Real Estate — 9.4% | | | | | | |
Charter Hall Long Wale ‡ | | | 4,014,595 | | | $ | 14,654,668 | |
Dexus ‡ | | | 2,105,794 | | | | 17,192,673 | |
Waypoint ‡ | | | 6,001,224 | | | | 12,305,533 | |
| | | | | | | | | |
| | | | | | | | | |
TOTAL AUSTRALIA | | | | | | | 44,152,874 | |
| CANADA — 11.4% | | | | | | | | |
| Real Estate — 11.4% | | | | | | | | |
H&R Real Estate Investment Trust ‡ | | | 1,375,656 | | | | 18,877,745 | |
NorthWest Healthcare Properties Real Estate Investment Trust ‡ (A) | | | 1,405,392 | | | | 15,056,759 | |
SmartCentres Real Estate Investment Trust ‡ | | | 776,064 | | | | 19,527,600 | |
| | | | | | | | | |
| | | | | | | | | |
TOTAL CANADA | | | | | | | 53,462,104 | |
| MEXICO — 2.6% | | | | | | | | |
| Real Estate — 2.6% | | | | | | | | |
Fibra Uno Administracion ‡ | | | 12,082,566 | | | | 12,033,749 | |
| | | | | | | | | |
| | | | | | | | | |
| SINGAPORE — 5.8% | | | | | | | | |
| Real Estate — 5.8% | | | | | | | | |
Ascendas Real Estate Investment Trust ‡ | | | 6,236,911 | | | | 14,291,476 | |
CapitaLand China Trust ‡ | | | 14,382,929 | | | | 13,012,364 | |
| | | | | | | | | |
| Schedule of Investments | | October 31, 2021 |
| | Global X SuperDividend® REIT ETF | |
| | | | | | | |
| COMMON STOCK — continued | | | | | | |
TOTAL SINGAPORE | | | | | $ | 27,303,840 | |
| UNITED STATES — 70.3% | | | | | | | |
| Financials — 34.2% | | | | | | | |
AGNC Investment ‡ | | | 892,018 | | | | 14,200,927 | |
Annaly Capital Management ‡ | | | 1,703,270 | | | | 14,409,664 | |
Apollo Commercial Real Estate Finance ‡ | | | 232,617 | | | | 3,521,822 | |
Arbor Realty Trust ‡ | | | 954,019 | | | | 19,185,322 | |
ARMOUR Residential ‡ | | | 1,242,700 | | | | 13,073,204 | |
Broadmark Realty Capital ‡ | | | 1,347,941 | | | | 13,910,751 | |
Chimera Investment ‡ | | | 1,341,566 | | | | 20,941,845 | |
Dynex Capital ‡ | | | 793,958 | | | | 13,894,265 | |
Invesco Mortgage Capital ‡ | | | 1,116,708 | | | | 3,506,463 | |
Orchid Island Capital, Cl A ‡ | | | 2,683,078 | | | | 13,308,067 | |
PennyMac Mortgage Investment Trust ‡ | | | 783,746 | | | | 15,792,482 | |
Two Harbors Investment ‡ | | | 2,255,934 | | | | 14,483,096 | |
| | | | | | | | 160,227,908 | |
| | | | | | | | | |
| | | | | | | | | |
| Real Estate — 36.1% | | | | | | | | |
Gaming and Leisure Properties ‡ | | | 330,168 | | | | 16,009,846 | |
Global Net Lease ‡ | | | 830,944 | | | | 13,311,723 | |
Industrial Logistics Properties Trust ‡ | | | 640,530 | | | | 17,992,488 | |
Iron Mountain ‡ | | | 446,172 | | | | 20,363,290 | |
LTC Properties ‡ | | | 355,141 | | | | 11,314,792 | |
Medical Properties Trust ‡ | | | 659,167 | | | | 14,060,032 | |
MGM Growth Properties, Cl A ‡ | | | 438,302 | | | | 17,260,333 | |
National Health Investors ‡ | | | 211,061 | | | | 11,350,861 | |
Physicians Realty Trust ‡ | | | 791,016 | | | | 15,037,214 | |
VEREIT ‡ | | | 309,030 | | | | 15,544,209 | |
WP Carey ‡ | | | 212,784 | | | | 16,407,774 | |
| | | | | | | | 168,652,562 | |
| | | | | | | | | |
| | | | | | | | | |
| Schedule of Investments | | October 31, 2021 |
| | Global X SuperDividend® REIT ETF | |
| | | | | | | |
| COMMON STOCK — continued | | | | | | |
TOTAL UNITED STATES | | | | | $ | 328,880,470 | |
| TOTAL COMMON STOCK | | | | | | | |
(Cost $424,564,334) | | | | | | 465,833,037 | |
| | | | | | | | |
SHORT-TERM INVESTMENT — 0.4%(B)(C) | | | | | | | |
| Fidelity Investments Money Market Government Portfolio, Cl Institutional, 0.010% | | | | | | | |
(Cost $1,669,693) | | | 1,669,693 | | | | 1,669,693 | |
| | | | | | | | | |
REPURCHASE AGREEMENT — 0.3%(B) | | | | | | | | |
| BNP Paribas | | | | | | | | |
| 0.030%, dated 10/29/21, to be repurchased on 11/01/21, repurchase price $1,344,049 (collateralized by U.S. Treasury Obligations, ranging in par value $54,054 - $180,259, 0.750% - 1.250%, 01/31/28 - 03/31/28, with a total market value of $1,373,502) | | | | | | | | |
(Cost $1,344,045) | | $ | 1,344,045 | | | | 1,344,045 | |
| TOTAL INVESTMENTS — 100.2% | | | | | | | | |
(Cost $427,578,072) | | | | | | $ | 468,846,775 | |
Percentages are based on Net Assets of $467,934,268.
| ‡ | Real Estate Investment Trust |
| (A) | This security or a partial position of this security is on loan at October 31, 2021. The total value of securities on loan at October 31, 2021 was $2,827,310. |
| (B) | Security was purchased with cash collateral held from securities on loan. The total value of such securities as of October 31, 2021 was $3,013,738. |
| (C) | The rate reported on the Schedule of Investments is the 7-day effective yield as of October 31, 2021. |
Cl — Class
| Schedule of Investments | | October 31, 2021 |
| | Global X SuperDividend® REIT ETF | |
The following is a summary of the level of inputs used as of October 31, 2021, in valuing the Fund’s investments carried at value:
| Investments in Securities | | | | | | | | | | | | |
| Common Stock | | $ | 465,833,037 | | | $ | — | | | $ | — | | | $ | 465,833,037 | |
| Short-Term Investment | | | 1,669,693 | | | | — | | | | — | | | | 1,669,693 | |
| Repurchase Agreement | | | — | | | | 1,344,045 | | | | — | | | | 1,344,045 | |
| Total Investments in Securities | | $ | 467,502,730 | | | $ | 1,344,045 | | | $ | — | | | $ | 468,846,775 | |
For the year ended October 31, 2021, there have been no transfers in or out of Level 3.
Amounts designated as “—“ are $0 or have been rounded to $0.
| Schedule of Investments | | October 31, 2021 |
| | Global X NASDAQ 100® Covered Call ETF | |
Sector Weightings (Unaudited)†:
† Sector weightings percentages are based on the total market value of investments.
| | | | | | | |
| COMMON STOCK — 105.0%(A) | | | | | | |
| ARGENTINA — 0.5% | | | | | | |
| Consumer Discretionary — 0.5% | | | | | | |
MercadoLibre * | | | 17,858 | | | $ | 26,448,055 | |
| | | | | | | | | |
| | | | | | | | | |
| CHINA — 1.6% | | | | | | | | |
| Communication Services — 0.5% | | | | | | | | |
Baidu ADR * | | | 89,060 | | | | 14,449,094 | |
NetEase ADR | | | 104,052 | | | | 10,154,435 | |
| | | | | | | | 24,603,529 | |
| | | | | | | | | |
| | | | | | | | | |
| Consumer Discretionary — 0.7% | | | | | | | | |
JD.com ADR * | | | 276,930 | | | | 21,678,080 | |
Pinduoduo ADR * | | | 130,394 | | | | 11,594,635 | |
Trip.com Group ADR * | | | 178,332 | | | | 5,093,162 | |
| | | | | | | | 38,365,877 | |
| | | | | | | | | |
| | | | | | | | | |
| Information Technology — 0.4% | | | | | | | | |
NXP Semiconductors | | | 94,271 | | | | 18,935,273 | |
| | | | | | | | | |
| | | | | | | | | |
TOTAL CHINA | | | | | | | 81,904,679 | |
| ISRAEL — 0.1% | | | | | | | | |
| Information Technology — 0.1% | | | | | | | | |
Check Point Software Technologies * | | | 45,682 | | | | 5,463,567 | |
| | | | | | | | | |
| Schedule of Investments | | October 31, 2021 |
| | Global X NASDAQ 100® Covered Call ETF | |
| | | | | | | |
| COMMON STOCK — continued | | | | | | |
| NETHERLANDS — 0.5% | | | | | | |
| Information Technology — 0.5% | | | | | | |
ASML Holding, Cl G | | | 28,205 | | | $ | 22,927,281 | |
| | | | | | | | | |
| | | | | | | | | |
| UNITED STATES — 102.3% | | | | | | | | |
| Communication Services — 19.0% | | | | | | | | |
Activision Blizzard | | | 267,800 | | | | 20,939,282 | |
Alphabet, Cl A * | | | 69,770 | | | | 206,583,388 | |
Alphabet, Cl C * | | | 74,092 | | | | 219,713,158 | |
Charter Communications, Cl A * | | | 64,899 | | | | 43,799,686 | |
Comcast, Cl A | | | 1,624,253 | | | | 83,535,332 | |
Electronic Arts | | | 97,625 | | | | 13,691,906 | |
Fox, Cl A | | | 109,201 | | | | 4,339,648 | |
Fox, Cl B | | | 84,811 | | | | 3,134,615 | |
Match Group * | | | 101,734 | | | | 15,339,452 | |
Meta Platforms, Cl A * | | | 553,151 | | | | 178,983,069 | |
Netflix * | | | 156,778 | | | | 108,225,421 | |
Sirius XM Holdings | | | 1,397,866 | | | | 8,513,004 | |
T-Mobile US * | | | 433,126 | | | | 49,822,484 | |
| | | | | | | | 956,620,445 | |
| | | | | | | | | |
| | | | | | | | | |
| Consumer Discretionary — 17.8% | | | | | | | | |
Amazon.com * | | | 117,118 | | | | 394,972,257 | |
Booking Holdings * | | | 15,204 | | | | 36,805,539 | |
Dollar Tree * | | | 80,301 | | | | 8,653,236 | |
eBay | | | 233,069 | | | | 17,881,054 | |
Lululemon Athletica * | | | 43,276 | | | | 20,167,049 | |
Marriott International, Cl A * | | | 111,959 | | | | 17,915,679 | |
O’Reilly Automotive * | | | 23,766 | | | | 14,790,057 | |
Peloton Interactive, Cl A * | | | 91,625 | | | | 8,378,190 | |
Ross Stores | | | 123,950 | | | | 14,031,140 | |
Starbucks | | | 409,436 | | | | 43,428,876 | |
Tesla * | | | 287,378 | | | | 320,139,092 | |
| | | | | | | | 897,162,169 | |
| | | | | | | | | |
| Schedule of Investments | | October 31, 2021 |
| | Global X NASDAQ 100® Covered Call ETF | |
| | | | | | | |
| COMMON STOCK — continued | | | | | | |
| Consumer Staples — 4.9% | | | | | | |
Costco Wholesale | | | 157,056 | | | $ | 77,199,306 | |
Keurig Dr Pepper | | | 488,661 | | | | 17,635,776 | |
Kraft Heinz | | | 421,016 | | | | 15,110,264 | |
Mondelez International, Cl A | | | 485,656 | | | | 29,498,745 | |
Monster Beverage * | | | 181,521 | | | | 15,429,285 | |
PepsiCo | | | 490,643 | | | | 79,287,909 | |
Walgreens Boots Alliance | | | 299,045 | | | | 14,061,096 | |
| | | | | | | | 248,222,381 | |
| | | | | | | | | |
| | | | | | | | | |
| Health Care — 6.4% | | | | | | | | |
Align Technology * | | | 26,635 | | | | 16,630,095 | |
Amgen | | | 198,863 | | | | 41,158,675 | |
Biogen * | | | 50,870 | | | | 13,566,012 | |
Cerner | | | 103,868 | | | | 7,716,354 | |
Dexcom * | | | 34,730 | | | | 21,644,083 | |
Gilead Sciences | | | 434,659 | | | | 28,200,676 | |
IDEXX Laboratories * | | | 30,908 | | | | 20,589,055 | |
Illumina * | | | 54,397 | | | | 22,578,019 | |
Incyte * | | | 74,078 | | | | 4,961,744 | |
Intuitive Surgical * | | | 124,176 | | | | 44,843,679 | |
Moderna * | | | 144,014 | | | | 49,715,073 | |
Regeneron Pharmaceuticals * | | | 37,175 | | | | 23,789,770 | |
Seagen * | | | 62,698 | | | | 11,055,538 | |
Vertex Pharmaceuticals * | | | 89,086 | | | | 16,474,674 | |
| | | | | | | | 322,923,447 | |
| | | | | | | | | |
| | | | | | | | | |
| Industrials — 2.9% | | | | | | | | |
Cintas | | | 37,177 | | | | 16,101,359 | |
Copart * | | | 82,202 | | | | 12,765,148 | |
CSX | | | 785,750 | | | | 28,420,577 | |
Fastenal | | | 196,765 | | | | 11,231,346 | |
Honeywell International | | | 240,848 | | | | 52,654,190 | |
PACCAR | | | 118,393 | | | | 10,610,381 | |
| Schedule of Investments | | October 31, 2021 |
| | Global X NASDAQ 100® Covered Call ETF | |
| | | | | | | |
| COMMON STOCK — continued | | | | | | |
| Industrials — continued | | | | | | |
Verisk Analytics, Cl A | | | 57,004 | | | $ | 11,986,231 | |
| | | | | | | | 143,769,232 | |
| | | | | | | | | |
| | | | | | | | | |
| Information Technology — 50.4% | | | | | | | | |
Adobe * | | | 166,806 | | | | 108,483,950 | |
Advanced Micro Devices * | | | 420,518 | | | | 50,558,879 | |
Analog Devices | | | 189,159 | | | | 32,817,195 | |
ANSYS * | | | 32,538 | | | | 12,350,774 | |
Apple | | | 3,825,072 | | | | 572,995,786 | |
Applied Materials | | | 315,536 | | | | 43,117,994 | |
Atlassian, Cl A * | | | 49,993 | | | | 22,903,293 | |
Autodesk * | | | 75,207 | | | | 23,886,495 | |
Automatic Data Processing | | | 148,047 | | | | 33,235,071 | |
Broadcom | | | 143,164 | | | | 76,116,004 | |
Cadence Design Systems * | | | 94,895 | | | | 16,427,274 | |
CDW | | | 47,538 | | | | 8,872,968 | |
Cisco Systems | | | 1,495,084 | | | | 83,679,852 | |
| Cognizant Technology Solutions, Cl A | | | 180,889 | | | | 14,125,622 | |
Crowdstrike Holdings, Cl A * | | | 68,353 | | | | 19,261,875 | |
DocuSign, Cl A * | | | 66,980 | | | | 18,639,864 | |
Fiserv * | | | 229,589 | | | | 22,612,221 | |
Intel | | | 1,422,697 | | | | 69,712,153 | |
Intuit | | | 97,261 | | | | 60,884,413 | |
KLA | | | 51,764 | | | | 19,295,549 | |
Lam Research | | | 48,651 | | | | 27,418,244 | |
Marvell Technology | | | 283,023 | | | | 19,387,076 | |
Microchip Technology | | | 187,334 | | | | 13,879,576 | |
Micron Technology | | | 388,883 | | | | 26,871,815 | |
Microsoft | | | 1,739,203 | | | | 576,754,499 | |
NVIDIA | | | 882,569 | | | | 225,646,416 | |
Okta, Cl A * | | | 51,090 | | | | 12,628,426 | |
Paychex | | | 125,046 | | | | 15,415,671 | |
PayPal Holdings * | | | 416,053 | | | | 96,769,767 | |
QUALCOMM | | | 391,551 | | | | 52,091,945 | |
| Schedule of Investments | | October 31, 2021 |
| | Global X NASDAQ 100® Covered Call ETF | |
| | | Shares/Number of Contracts | | | | |
| COMMON STOCK — continued | | | | | | |
| Information Technology — continued | | | | | | |
Skyworks Solutions | | | 57,840 | | | $ | 9,666,799 | |
Splunk * | | | 57,377 | | | | 9,456,877 | |
Synopsys * | | | 51,520 | | | | 17,165,434 | |
Texas Instruments | | | 321,069 | | | | 60,194,016 | |
VeriSign * | | | 39,258 | | | | 8,741,579 | |
Workday, Cl A * | | | 65,289 | | | | 18,932,504 | |
Xilinx | | | 85,027 | | | | 15,304,860 | |
Zoom Video Communications, Cl A * | | | 82,435 | | | | 22,640,773 | |
| | | | | | | | 2,538,943,509 | |
| | | | | | | | | |
| | | | | | | | | |
| Utilities — 0.9% | | | | | | | | |
American Electric Power | | | 172,631 | | | | 14,623,572 | |
Exelon | | | 336,529 | | | | 17,899,977 | |
Xcel Energy | | | 186,352 | | | | 12,036,476 | |
| | | | | | | | 44,560,025 | |
| | | | | | | | | |
| | | | | | | | | |
TOTAL UNITED STATES | | | | | | | 5,152,201,208 | |
| TOTAL COMMON STOCK | | | | | | | | |
(Cost $3,921,536,273) | | | | | | | 5,288,944,790 | |
| TOTAL INVESTMENTS — 105.0% | | | | | | | | |
(Cost $3,921,536,273) | | | | | | $ | 5,288,944,790 | |
| | | | | | | | | |
| | | | | | | | | |
WRITTEN OPTION— (5.1)%(1) | | | | | | | | |
| UNITED STATES— (5.1)% | | | | | | | | |
| (Premiums Received ($89,664,262)) | | | (3,336 | ) | | $ | (259,040,400 | ) |
Percentages are based on Net Assets of $5,036,214,747.
| Schedule of Investments | | October 31, 2021 |
| | Global X NASDAQ 100® Covered Call ETF | |
A list of the exchange traded option contracts held by the Fund at October 31, 2021, is as follows:
| Description | | Number of Contracts | | | Cost+ | | | Exercise Price | | Expiration Date | | Value | |
| WRITTEN OPTION — (5.1)% | | | | | | | | | | | | | |
| Call Options | | | | | | | | | | | | | |
| NDX* | | | (3,336 | ) | | $ | (89,664,262 | ) | | $ | 15,125.00 | | 11/19/21 | | $ | (259,040,400 | ) |
| * | Non-income producing security. |
| + | Notional amount for all options totals $(5,287,717,326). |
| (1) | Refer to table below for details on Options Contracts. |
| (A) | All or a portion of these securities has been segregated as collateral for writtenoptions contracts. The aggregate market value of collateral at October 31, 2021 was$5,288,944,790.
|
ADR — American Depositary Receipt
Cl — Class
NDX — Nasdaq 100 Index
The following is a summary of the level of inputs used as of October 31, 2021, in valuing the Fund’s investments carried at value:
| Investments in Securities | | | | | | | | | | | | |
| Common Stock | | $ | 5,288,944,790 | | | $ | — | | | $ | — | | | $ | 5,288,944,790 | |
| Total Investments in Securities | | $ | 5,288,944,790 | | | $ | — | | | $ | — | | | $ | 5,288,944,790 | |
| Other Financial Instruments | | | | | | | | | | | | |
| Written Option | | $ | (259,040,400 | ) | | $ | — | | | $ | — | | | $ | (259,040,400 | ) |
| Total Liabilities | | $ | (259,040,400 | ) | | $ | — | | | $ | — | | | $ | (259,040,400 | ) |
For the year ended October 31, 2021, there have been no transfers in or out of Level 3.
Amounts designated as “—“ are $0 or have been rounded to $0.
| Schedule of Investments | | October 31, 2021 |
| | Global X S&P 500® Covered Call ETF | |
Sector Weightings (Unaudited)†:
† Sector weightings percentages are based on the total market value of investments.
| | | | | | | |
| COMMON STOCK — 103.3%(A) | | | | | | |
| CHINA — 0.2% | | | | | | |
| Information Technology — 0.2% | | | | | | |
NXP Semiconductors | | | 4,642 | | | $ | 932,392 | |
| | | | | | | | | |
| UNITED KINGDOM — 0.4% | | | | | | | | |
| Materials — 0.4% | | | | | | | | |
Linde | | | 9,100 | | | | 2,904,720 | |
| | | | | | | | | |
| UNITED STATES — 102.7% | | | | | | | | |
| Communication Services — 11.2% | | | | | | | | |
Activision Blizzard | | | 13,620 | | | | 1,064,948 | |
Alphabet, Cl A * | | | 5,317 | | | | 15,743,212 | |
Alphabet, Cl C * | | | 5,028 | | | | 14,910,082 | |
AT&T | | | 124,928 | | | | 3,155,681 | |
Charter Communications, Cl A * | | | 2,272 | | | | 1,533,350 | |
Comcast, Cl A | | | 80,482 | | | | 4,139,189 | |
Discovery, Cl A * | | | 3,028 | | | | 70,976 | |
Discovery, Cl C * | | | 5,232 | | | | 118,034 | |
DISH Network, Cl A * | | | 4,623 | | | | 189,867 | |
| Schedule of Investments | | October 31, 2021 |
| | Global X S&P 500® Covered Call ETF | |
| | | | | | | |
| COMMON STOCK — continued | | | | | | |
| Communication Services — continued | | | | | | |
Electronic Arts | | | 5,107 | | | $ | 716,257 | |
Fox, Cl A | | | 6,019 | | | | 239,195 | |
Fox, Cl B | | | 3,013 | | | | 111,361 | |
Interpublic Group | | | 6,327 | | | | 231,378 | |
Live Nation Entertainment * | | | 2,702 | | | | 273,307 | |
Lumen Technologies | | | 18,001 | | | | 213,492 | |
Match Group * | | | 4,760 | | | | 717,713 | |
Meta Platforms, Cl A * | | | 42,122 | | | | 13,629,416 | |
Netflix * | | | 7,830 | | | | 5,405,127 | |
News, Cl A | | | 7,539 | | | | 172,643 | |
News, Cl B | | | 2,781 | | | | 62,739 | |
Omnicom Group | | | 4,030 | | | | 274,362 | |
Take-Two Interactive Software * | | | 2,126 | | | | 384,806 | |
T-Mobile US * | | | 10,170 | | | | 1,169,855 | |
Twitter * | | | 14,222 | | | | 761,446 | |
Verizon Communications | | | 72,523 | | | | 3,842,994 | |
ViacomCBS, Cl B | | | 10,985 | | | | 397,877 | |
Walt Disney | | | 31,863 | | | | 5,387,077 | |
| | | | | | | | 74,916,384 | |
| | | | | | | | | |
| | | | | | | | | |
| Consumer Discretionary — 13.3% | | | | | | | | |
Advance Auto Parts | | | 1,321 | | | | 297,912 | |
Amazon.com * | | | 7,739 | | | | 26,099,236 | |
Aptiv * | | | 5,141 | | | | 888,828 | |
AutoZone * | | | 353 | | | | 630,049 | |
Bath & Body Works | | | 4,574 | | | | 316,018 | |
Best Buy | | | 4,087 | | | | 499,595 | |
Booking Holdings * | | | 818 | | | | 1,980,198 | |
BorgWarner | | | 4,007 | | | | 180,596 | |
Caesars Entertainment * | | | 3,883 | | | | 425,033 | |
CarMax * | | | 2,823 | | | | 386,525 | |
Carnival * | | | 14,538 | | | | 322,162 | |
Chipotle Mexican Grill, Cl A * | | | 464 | | | | 825,470 | |
Darden Restaurants | | | 2,591 | | | | 373,467 | |
| Schedule of Investments | | October 31, 2021 |
| | Global X S&P 500® Covered Call ETF | |
| | | | | | | |
| COMMON STOCK — continued | | | | | | |
| Consumer Discretionary — continued | | | | | | |
Dollar General | | | 4,219 | | | $ | 934,593 | |
Dollar Tree * | | | 3,863 | | | | 416,277 | |
Domino’s Pizza | | | 585 | | | | 286,047 | |
DR Horton | | | 5,737 | | | | 512,142 | |
eBay | | | 11,500 | | | | 882,280 | |
Etsy * | | | 2,168 | | | | 543,496 | |
Expedia Group * | | | 2,630 | | | | 432,398 | |
Ford Motor | | | 70,629 | | | | 1,206,343 | |
Gap | | | 4,378 | | | | 99,337 | |
Garmin | | | 2,792 | | | | 400,931 | |
General Motors * | | | 24,955 | | | | 1,358,301 | |
Genuine Parts | | | 2,756 | | | | 361,339 | |
Hanesbrands | | | 7,304 | | | | 124,460 | |
Hasbro | | | 2,712 | | | | 259,701 | |
Hilton Worldwide Holdings * | | | 5,032 | | | | 724,356 | |
Home Depot | | | 18,629 | | | | 6,925,144 | |
Las Vegas Sands * | | | 6,366 | | | | 247,064 | |
Leggett & Platt | | | 2,850 | | | | 133,523 | |
Lennar, Cl A | | | 4,995 | | | | 499,150 | |
LKQ | | | 5,345 | | | | 294,403 | |
Lowe’s | | | 12,423 | | | | 2,904,746 | |
Marriott International, Cl A * | | | 4,988 | | | | 798,180 | |
McDonald’s | | | 13,141 | | | | 3,226,773 | |
MGM Resorts International | | | 7,602 | | | | 358,510 | |
Mohawk Industries * | | | 1,228 | | | | 217,614 | |
Newell Brands | | | 7,491 | | | | 171,469 | |
NIKE, Cl B | | | 22,327 | | | | 3,735,084 | |
Norwegian Cruise Line Holdings * | | | 6,233 | | | | 160,313 | |
NVR * | | | 43 | | | | 210,476 | |
O’Reilly Automotive * | | | 1,264 | | | | 786,612 | |
Penn National Gaming * | | | 2,635 | | | | 188,666 | |
Pool | | | 900 | | | | 463,644 | |
PulteGroup | | | 4,901 | | | | 235,640 | |
| Schedule of Investments | | October 31, 2021 |
| | Global X S&P 500® Covered Call ETF | |
| | | | | | | |
| COMMON STOCK — continued | | | | | | |
| Consumer Discretionary — continued | | | | | | |
PVH | | | 1,240 | | | $ | 135,569 | |
Ralph Lauren, Cl A | | | 982 | | | | 124,881 | |
Ross Stores | | | 6,393 | | | | 723,688 | |
Royal Caribbean Cruises * | | | 3,958 | | | | 334,174 | |
Starbucks | | | 21,103 | | | | 2,238,395 | |
Tapestry | | | 5,138 | | | | 200,279 | |
Target | | | 8,911 | | | | 2,313,474 | |
Tesla * | | | 14,350 | | | | 15,985,900 | |
TJX | | | 21,307 | | | | 1,395,395 | |
Tractor Supply | | | 2,036 | | | | 442,158 | |
Ulta Beauty * | | | 970 | | | | 356,339 | |
Under Armour, Cl A * | | | 4,184 | | | | 91,881 | |
Under Armour, Cl C * | | | 4,221 | | | | 79,692 | |
VF | | | 5,477 | | | | 399,164 | |
Whirlpool | | | 1,158 | | | | 244,141 | |
Wynn Resorts * | | | 1,573 | | | | 141,255 | |
Yum! Brands | | | 5,372 | | | | 671,178 | |
| | | | | | | | 89,201,664 | |
| | | | | | | | | |
| Consumer Staples — 5.8% | | | | | | | | |
Altria Group | | | 33,150 | | | | 1,462,246 | |
Archer-Daniels-Midland | | | 10,238 | | | | 657,689 | |
Brown-Forman, Cl B | | | 3,172 | | | | 215,347 | |
Campbell Soup | | | 3,905 | | | | 156,005 | |
Church & Dwight | | | 4,210 | | | | 367,786 | |
Clorox | | | 2,327 | | | | 379,324 | |
Coca-Cola | | | 68,170 | | | | 3,842,743 | |
Colgate-Palmolive | | | 14,901 | | | | 1,135,307 | |
Conagra Brands | | | 8,597 | | | | 276,823 | |
Constellation Brands, Cl A | | | 2,794 | | | | 605,767 | |
Costco Wholesale | | | 7,788 | | | | 3,828,114 | |
Estee Lauder, Cl A | | | 4,086 | | | | 1,325,212 | |
General Mills | | | 10,857 | | | | 670,963 | |
Hershey | | | 2,751 | | | | 482,388 | |
| Schedule of Investments | | October 31, 2021 |
| | Global X S&P 500® Covered Call ETF | |
| | | | | | | |
| COMMON STOCK — continued | | | | | | |
| Consumer Staples — continued | | | | | | |
Hormel Foods | | | 5,477 | | | $ | 231,787 | |
J M Smucker | | | 1,903 | | | | 233,803 | |
Kellogg | | | 4,627 | | | | 283,635 | |
Kimberly-Clark | | | 5,769 | | | | 747,028 | |
Kraft Heinz | | | 12,392 | | | | 444,749 | |
Kroger | | | 11,222 | | | | 449,104 | |
Lamb Weston Holdings | | | 2,746 | | | | 155,012 | |
McCormick | | | 4,413 | | | | 354,055 | |
Molson Coors Beverage, Cl B | | | 4,179 | | | | 184,252 | |
Mondelez International, Cl A | | | 25,079 | | | | 1,523,298 | |
Monster Beverage * | | | 6,826 | | | | 580,210 | |
PepsiCo | | | 23,975 | | | | 3,874,360 | |
Philip Morris International | | | 27,290 | | | | 2,579,997 | |
Procter & Gamble | | | 43,059 | | | | 6,157,006 | |
Sysco | | | 9,331 | | | | 717,554 | |
Tyson Foods, Cl A | | | 5,005 | | | | 400,250 | |
Walgreens Boots Alliance | | | 12,732 | | | | 598,659 | |
Walmart | | | 25,039 | | | | 3,741,327 | |
| | | | | | | | 38,661,800 | |
| | | | | | | | | |
| Energy — 2.9% | | | | | | | | |
APA | | | 6,419 | | | | 168,242 | |
Baker Hughes, Cl A | | | 13,858 | | | | 347,559 | |
Chevron | | | 33,943 | | | | 3,886,134 | |
ConocoPhillips | | | 23,045 | | | | 1,716,622 | |
Coterra Energy | | | 13,485 | | | | 287,500 | |
Devon Energy | | | 10,141 | | | | 406,451 | |
Diamondback Energy | | | 3,153 | | | | 337,970 | |
EOG Resources | | | 10,695 | | | | 988,860 | |
Exxon Mobil | | | 74,231 | | | | 4,785,673 | |
Halliburton | | | 16,955 | | | | 423,705 | |
Hess | | | 4,971 | | | | 410,455 | |
Kinder Morgan | | | 35,390 | | | | 592,783 | |
Marathon Oil | | | 16,041 | | | | 261,789 | |
| Schedule of Investments | | October 31, 2021 |
| | Global X S&P 500® Covered Call ETF | |
| | | | | | | |
| COMMON STOCK — continued | | | | | | |
| Energy — continued | | | | | | |
Marathon Petroleum | | | 11,123 | | | $ | 733,339 | |
Occidental Petroleum | | | 15,286 | | | | 512,540 | |
ONEOK | | | 8,347 | | | | 531,036 | |
Phillips 66 | | | 7,945 | | | | 594,127 | |
Pioneer Natural Resources | | | 3,837 | | | | 717,442 | |
Schlumberger | | | 26,187 | | | | 844,793 | |
Valero Energy | | | 7,076 | | | | 547,187 | |
Williams | | | 21,763 | | | | 611,323 | |
| | | | | | | | 19,705,530 | |
| | | | | | | | | |
| | | | | | | | | |
| Financials — 11.8% | | | | | | | | |
Aflac | | | 11,328 | | | | 607,974 | |
Allstate | | | 5,447 | | | | 673,630 | |
American Express | | | 11,279 | | | | 1,960,065 | |
American International Group | | | 15,346 | | | | 906,795 | |
Ameriprise Financial | | | 2,107 | | | | 636,588 | |
Aon, Cl A | | | 4,089 | | | | 1,308,153 | |
Arthur J Gallagher | | | 3,723 | | | | 624,235 | |
Assurant | | | 1,219 | | | | 196,637 | |
Bank of America | | | 130,056 | | | | 6,214,076 | |
Bank of New York Mellon | | | 14,082 | | | | 833,654 | |
Berkshire Hathaway, Cl B * | | | 32,733 | | | | 9,394,698 | |
BlackRock, Cl A | | | 2,552 | | | | 2,407,710 | |
Brown & Brown | | | 3,529 | | | | 222,715 | |
Capital One Financial | | | 7,911 | | | | 1,194,798 | |
Cboe Global Markets | | | 1,656 | | | | 218,493 | |
Charles Schwab | | | 26,617 | | | | 2,183,393 | |
Chubb | | | 7,888 | | | | 1,541,157 | |
Cincinnati Financial | | | 2,810 | | | | 341,246 | |
Citigroup | | | 36,357 | | | | 2,514,450 | |
Citizens Financial Group | | | 7,917 | | | | 375,107 | |
CME Group, Cl A | | | 6,252 | | | | 1,378,879 | |
Comerica | | | 2,550 | | | | 216,980 | |
Discover Financial Services | | | 5,538 | | | | 627,566 | |
| Schedule of Investments | | October 31, 2021 |
| | Global X S&P 500® Covered Call ETF | |
| | | | | | | |
| COMMON STOCK — continued | | | | | | |
| Financials — continued | | | | | | |
Everest Re Group | | | 765 | | | $ | 200,048 | |
Fifth Third Bancorp | | | 12,942 | | | | 563,365 | |
First Republic Bank | | | 2,691 | | | | 582,144 | |
Franklin Resources | | | 5,756 | | | | 181,256 | |
Globe Life | | | 1,460 | | | | 129,969 | |
Goldman Sachs Group | | | 5,895 | | | | 2,436,698 | |
| Hartford Financial Services Group | | | 6,569 | | | | 479,077 | |
Huntington Bancshares | | | 26,156 | | | | 411,695 | |
Intercontinental Exchange | | | 9,818 | | | | 1,359,400 | |
Invesco | | | 5,888 | | | | 149,614 | |
JPMorgan Chase | | | 52,681 | | | | 8,949,975 | |
KeyCorp | | | 18,501 | | | | 430,518 | |
Lincoln National | | | 2,831 | | | | 204,257 | |
Loews | | | 3,050 | | | | 171,014 | |
M&T Bank | | | 2,599 | | | | 382,365 | |
MarketAxess Holdings | | | 841 | | | | 343,691 | |
Marsh & McLennan | | | 9,259 | | | | 1,544,401 | |
MetLife | | | 13,009 | | | | 816,965 | |
Moody’s | | | 2,877 | | | | 1,162,740 | |
Morgan Stanley | | | 25,388 | | | | 2,609,379 | |
MSCI, Cl A | | | 1,419 | | | | 943,465 | |
Nasdaq | | | 2,015 | | | | 422,888 | |
Northern Trust | | | 4,033 | | | | 496,220 | |
People’s United Financial | | | 8,374 | | | | 143,530 | |
PNC Financial Services Group | | | 7,455 | | | | 1,573,229 | |
Principal Financial Group | | | 4,243 | | | | 284,663 | |
Progressive | | | 10,618 | | | | 1,007,436 | |
Prudential Financial | | | 6,850 | | | | 753,843 | |
Raymond James Financial | | | 3,763 | | | | 370,994 | |
Regions Financial | | | 18,067 | | | | 427,827 | |
S&P Global | | | 4,168 | | | | 1,976,299 | |
State Street | | | 6,283 | | | | 619,190 | |
SVB Financial Group * | | | 1,048 | | | | 751,835 | |
| Schedule of Investments | | October 31, 2021 |
| | Global X S&P 500® Covered Call ETF | |
| | | | | | | |
| COMMON STOCK — continued | | | | | | |
| Financials — continued | | | | | | |
Synchrony Financial | | | 10,074 | | | $ | 467,937 | |
T Rowe Price Group | | | 4,162 | | | | 902,655 | |
Travelers | | | 4,318 | | | | 694,680 | |
Truist Financial | | | 23,069 | | | | 1,464,189 | |
US Bancorp | | | 23,136 | | | | 1,396,720 | |
W R Berkley | | | 2,568 | | | | 204,413 | |
Wells Fargo | | | 73,110 | | | | 3,740,308 | |
Willis Towers Watson | | | 2,508 | | | | 607,638 | |
Zions Bancorp | | | 3,121 | | | | 196,592 | |
| | | | | | | | 79,134,121 | |
| | | | | | | | | |
| | | | | | | | | |
| Health Care — 13.4% | | | | | | | | |
Abbott Laboratories | | | 31,301 | | | | 4,034,386 | |
AbbVie | | | 30,865 | | | | 3,539,290 | |
ABIOMED * | | | 865 | | | | 287,215 | |
Agilent Technologies | | | 5,409 | | | | 851,863 | |
Align Technology * | | | 1,331 | | | | 831,036 | |
AmerisourceBergen, Cl A | | | 2,742 | | | | 334,579 | |
Amgen | | | 10,299 | | | | 2,131,584 | |
Anthem | | | 4,194 | | | | 1,824,935 | |
Baxter International | | | 8,970 | | | | 708,271 | |
Becton Dickinson | | | 5,209 | | | | 1,248,024 | |
Biogen * | | | 2,709 | | | | 722,436 | |
Bio-Rad Laboratories, Cl A * | | | 272 | | | | 216,153 | |
Bio-Techne | | | 751 | | | | 393,261 | |
Boston Scientific * | | | 24,524 | | | | 1,057,720 | |
Bristol-Myers Squibb | | | 38,854 | | | | 2,269,074 | |
Cardinal Health | | | 5,569 | | | | 266,254 | |
Catalent * | | | 2,787 | | | | 384,216 | |
Centene * | | | 10,953 | | | | 780,292 | |
Cerner | | | 5,558 | | | | 412,904 | |
Charles River Laboratories International * | | | 1,015 | | | | 455,410 | |
Cigna | | | 6,235 | | | | 1,331,858 | |
Cooper | | | 941 | | | | 392,322 | |
| Schedule of Investments | | October 31, 2021 |
| | Global X S&P 500® Covered Call ETF | |
| | | | | | | |
| COMMON STOCK — continued | | | | | | |
| Health Care — continued | | | | | | |
CVS Health | | | 23,569 | | | $ | 2,104,240 | |
Danaher | | | 11,175 | | | | 3,484,030 | |
DaVita * | | | 1,452 | | | | 149,904 | |
DENTSPLY SIRONA | | | 4,128 | | | | 236,163 | |
Dexcom * | | | 1,586 | | | | 988,411 | |
Edwards Lifesciences * | | | 11,151 | | | | 1,336,113 | |
Eli Lilly | | | 14,137 | | | | 3,601,542 | |
Gilead Sciences | | | 22,301 | | | | 1,446,889 | |
HCA Healthcare | | | 4,168 | | | | 1,043,917 | |
Henry Schein * | | | 2,869 | | | | 219,048 | |
Hologic * | | | 4,784 | | | | 350,715 | |
Humana | | | 2,340 | | | | 1,083,794 | |
IDEXX Laboratories * | | | 1,429 | | | | 951,914 | |
Illumina * | | | 2,665 | | | | 1,106,135 | |
Incyte * | | | 3,463 | | | | 231,952 | |
Intuitive Surgical * | | | 6,441 | | | | 2,326,038 | |
IQVIA Holdings * | | | 3,365 | | | | 879,678 | |
Johnson & Johnson | | | 46,415 | | | | 7,560,075 | |
Laboratory Corp of America Holdings * | | | 1,540 | | | | 442,011 | |
McKesson | | | 2,759 | | | | 573,541 | |
Medtronic | | | 23,526 | | | | 2,819,826 | |
Merck | | | 44,456 | | | | 3,914,351 | |
Mettler-Toledo International * | | | 377 | | | | 558,292 | |
Moderna * | | | 6,208 | | | | 2,143,064 | |
Organon | | | 4,340 | | | | 159,495 | |
PerkinElmer | | | 1,938 | | | | 342,813 | |
Pfizer | | | 98,248 | | | | 4,297,368 | |
Quest Diagnostics | | | 2,405 | | | | 353,006 | |
Regeneron Pharmaceuticals * | | | 1,715 | | | | 1,097,497 | |
ResMed | | | 2,590 | | | | 680,937 | |
STERIS | | | 1,421 | | | | 332,145 | |
Stryker | | | 5,706 | | | | 1,518,195 | |
Teleflex | | | 910 | | | | 324,815 | |
| Schedule of Investments | | October 31, 2021 |
| | Global X S&P 500® Covered Call ETF | |
| | | | | | | |
| COMMON STOCK — continued | | | | | | |
| Health Care — continued | | | | | | |
Thermo Fisher Scientific | | | 6,883 | | | $ | 4,357,421 | |
UnitedHealth Group | | | 16,699 | | | | 7,689,389 | |
| Universal Health Services, Cl B | | | 1,485 | | | | 184,289 | |
Vertex Pharmaceuticals * | | | 4,087 | | | | 755,809 | |
Viatris, Cl W * | | | 23,142 | | | | 308,946 | |
Waters * | | | 1,057 | | | | 388,500 | |
West Pharmaceutical Services | | | 1,367 | | | | 587,646 | |
Zimmer Biomet Holdings | | | 3,768 | | | | 539,276 | |
Zoetis, Cl A | | | 8,281 | | | | 1,790,352 | |
| | | | | | | | 89,732,625 | |
| | | | | | | | | |
| | | | | | | | | |
| Industrials — 8.2% | | | | | | | | |
3M | | | 10,474 | | | | 1,871,494 | |
Alaska Air Group * | | | 2,447 | | | | 129,202 | |
Allegion | | | 1,454 | | | | 186,548 | |
American Airlines Group * | | | 11,725 | | | | 225,120 | |
AMETEK | | | 4,174 | | | | 552,638 | |
AO Smith | | | 2,587 | | | | 189,032 | |
Boeing * | | | 9,754 | | | | 2,019,371 | |
Carrier Global | | | 15,402 | | | | 804,446 | |
Caterpillar | | | 9,311 | | | | 1,899,537 | |
CH Robinson Worldwide | | | 2,703 | | | | 262,164 | |
Cintas | | | 1,445 | | | | 625,829 | |
Copart * | | | 3,949 | | | | 613,240 | |
CSX | | | 38,553 | | | | 1,394,462 | |
Cummins | | | 2,416 | | | | 579,453 | |
Deere | | | 4,977 | | | | 1,703,677 | |
Delta Air Lines *�� | | | 11,297 | | | | 442,052 | |
Dover | | | 2,700 | | | | 456,516 | |
Eaton | | | 6,941 | | | | 1,143,599 | |
Emerson Electric | | | 10,447 | | | | 1,013,463 | |
Equifax | | | 2,171 | | | | 602,301 | |
| Expeditors International of Washington | | | 2,828 | | | | 348,579 | |
Fastenal | | | 10,538 | | | | 601,509 | |
| Schedule of Investments | | October 31, 2021 |
| | Global X S&P 500® Covered Call ETF | |
| | | | | | | |
| COMMON STOCK — continued | | | | | | |
| Industrials — continued | | | | | | |
FedEx | | | 4,208 | | | $ | 991,110 | |
Fortive | | | 6,431 | | | | 486,891 | |
| Fortune Brands Home & Security | | | 2,637 | | | | 267,392 | |
Generac Holdings * | | | 1,079 | | | | 537,946 | |
General Dynamics | | | 3,924 | | | | 795,591 | |
General Electric | | | 19,616 | | | | 2,057,130 | |
Honeywell International | | | 11,967 | | | | 2,616,226 | |
Howmet Aerospace | | | 7,159 | | | | 212,551 | |
Huntington Ingalls Industries | | | 720 | | | | 145,966 | |
IDEX | | | 1,368 | | | | 304,476 | |
IHS Markit | | | 6,755 | | | | 883,014 | |
Illinois Tool Works | | | 4,975 | | | | 1,133,653 | |
Ingersoll Rand | | | 7,103 | | | | 381,857 | |
Jacobs Engineering Group | | | 2,608 | | | | 366,215 | |
JB Hunt Transport Services | | | 1,405 | | | | 277,052 | |
Johnson Controls International | | | 12,825 | | | | 940,970 | |
Kansas City Southern | | | 1,484 | | | | 460,411 | |
L3Harris Technologies | | | 3,562 | | | | 821,183 | |
Leidos Holdings | | | 2,647 | | | | 264,647 | |
Lockheed Martin | | | 4,188 | | | | 1,391,756 | |
Masco | | | 4,694 | | | | 307,692 | |
Nielsen Holdings | | | 7,236 | | | | 146,529 | |
Norfolk Southern | | | 4,270 | | | | 1,251,323 | |
Northrop Grumman | | | 2,679 | | | | 956,992 | |
Old Dominion Freight Line | | | 1,490 | | | | 508,612 | |
Otis Worldwide | | | 7,241 | | | | 581,525 | |
PACCAR | | | 6,591 | | | | 590,685 | |
Parker-Hannifin | | | 2,278 | | | | 675,632 | |
Pentair | | | 3,067 | | | | 226,866 | |
Quanta Services | | | 2,589 | | | | 313,994 | |
Raytheon Technologies F | | | 26,935 | | | | 2,393,444 | |
Republic Services, Cl A | | | 3,792 | | | | 510,403 | |
Robert Half International | | | 2,083 | | | | 235,525 | |
| Schedule of Investments | | October 31, 2021 |
| | Global X S&P 500® Covered Call ETF | |
| | | | | | | |
| COMMON STOCK — continued | | | | | | |
| Industrials — continued | | | | | | |
Rockwell Automation | | | 2,142 | | | $ | 684,155 | |
Rollins | | | 4,340 | | | | 152,898 | |
Roper Technologies | | | 1,701 | | | | 829,867 | |
Snap-On | | | 1,060 | | | | 215,424 | |
Southwest Airlines * | | | 10,257 | | | | 484,951 | |
Stanley Black & Decker | | | 2,803 | | | | 503,783 | |
Textron | | | 4,032 | | | | 297,763 | |
Trane Technologies | | | 4,225 | | | | 764,429 | |
TransDigm Group * | | | 943 | | | | 588,262 | |
Union Pacific | | | 11,443 | | | | 2,762,340 | |
United Airlines Holdings * | | | 5,355 | | | | 247,080 | |
United Parcel Service, Cl B | | | 12,806 | | | | 2,733,697 | |
United Rentals * | | | 1,341 | | | | 508,387 | |
Verisk Analytics, Cl A | | | 2,818 | | | | 592,541 | |
Waste Management | | | 6,598 | | | | 1,057,198 | |
| Westinghouse Air Brake Technologies | | | 3,356 | | | | 304,490 | |
WW Grainger | | | 935 | | | | 433,008 | |
Xylem | | | 3,139 | | | | 409,922 | |
| | | | | | | | 55,269,686 | |
| | | | | | | | | |
| | | | | | | | | |
| Information Technology — 28.7% | | | | | | | | |
Accenture, Cl A | | | 11,162 | | | | 4,004,814 | |
Adobe * | | | 8,294 | | | | 5,394,086 | |
Advanced Micro Devices * | | | 21,542 | | | | 2,589,995 | |
Akamai Technologies * | | | 2,827 | | | | 298,135 | |
Amphenol, Cl A | | | 10,346 | | | | 794,262 | |
Analog Devices | | | 9,449 | | | | 1,639,307 | |
ANSYS * | | | 1,445 | | | | 548,493 | |
Apple | | | 278,353 | | | | 41,697,279 | |
Applied Materials | | | 16,335 | | | | 2,232,178 | |
Arista Networks * | | | 985 | | | | 403,545 | |
Autodesk * | | | 3,917 | | | | 1,244,078 | |
Automatic Data Processing | | | 7,402 | | | | 1,661,675 | |
Broadcom | | | 7,082 | | | | 3,765,287 | |
| Schedule of Investments | | October 31, 2021 |
| | Global X S&P 500® Covered Call ETF | |
| | | | | | | |
| COMMON STOCK — continued | | | | | | |
| Information Technology — continued | | | | | | |
Broadridge Financial Solutions | | | 2,225 | | | $ | 396,962 | |
Cadence Design Systems * | | | 4,768 | | | | 825,388 | |
CDW | | | 2,300 | | | | 429,295 | |
Ceridian HCM Holding * | | | 2,130 | | | | 266,782 | |
Cisco Systems | | | 73,800 | | | | 4,130,586 | |
Citrix Systems | | | 1,987 | | | | 188,229 | |
| Cognizant Technology Solutions, Cl A | | | 9,620 | | | | 751,226 | |
Corning | | | 14,123 | | | | 502,355 | |
DXC Technology * | | | 4,911 | | | | 159,951 | |
Enphase Energy * | | | 2,605 | | | | 603,396 | |
F5 Networks * | | | 1,129 | | | | 238,388 | |
| Fidelity National Information Services | | | 10,516 | | | | 1,164,542 | |
Fiserv * | | | 10,655 | | | | 1,049,411 | |
FleetCor Technologies * | | | 1,366 | | | | 337,962 | |
Fortinet * | | | 2,520 | | | | 847,577 | |
Gartner * | | | 1,476 | | | | 489,899 | |
Global Payments | | | 5,446 | | | | 778,724 | |
Hewlett Packard Enterprise | | | 23,726 | | | | 347,586 | |
HP | | | 22,205 | | | | 673,478 | |
Intel | | | 70,891 | | | | 3,473,659 | |
| International Business Machines | | | 15,551 | | | | 1,945,430 | |
Intuit | | | 4,953 | | | | 3,100,528 | |
IPG Photonics * | | | 235 | | | | 37,367 | |
Jack Henry & Associates | | | 1,379 | | | | 229,576 | |
Juniper Networks | | | 6,392 | | | | 188,692 | |
Keysight Technologies * | | | 3,150 | | | | 567,063 | |
KLA | | | 2,683 | | | | 1,000,115 | |
Lam Research | | | 2,600 | | | | 1,465,282 | |
Mastercard, Cl A | | | 15,598 | | | | 5,233,441 | |
Microchip Technology | | | 9,879 | | | | 731,935 | |
Micron Technology | | | 19,908 | | | | 1,375,643 | |
Microsoft | | | 133,204 | | | | 44,173,110 | |
Monolithic Power Systems | | | 869 | | | | 456,625 | |
| Schedule of Investments | | October 31, 2021 |
| | Global X S&P 500® Covered Call ETF | |
| | | | | | | |
| COMMON STOCK — continued | | | | | | |
| Information Technology — continued | | | | | | |
Motorola Solutions | | | 2,773 | | | $ | 689,340 | |
NetApp | | | 4,205 | | | | 375,507 | |
NortonLifeLock | | | 11,210 | | | | 285,295 | |
NVIDIA | | | 43,842 | | | | 11,209,084 | |
Oracle | | | 28,768 | | | | 2,760,002 | |
Paychex | | | 5,370 | | | | 662,014 | |
Paycom Software * | | | 929 | | | | 508,953 | |
PayPal Holdings * | | | 20,886 | | | | 4,857,875 | |
PTC * | | | 1,342 | | | | 170,904 | |
Qorvo * | | | 1,939 | | | | 326,198 | |
QUALCOMM | | | 19,648 | | | | 2,613,970 | |
salesforce.com * | | | 17,141 | | | | 5,136,986 | |
Seagate Technology Holdings | | | 3,566 | | | | 317,624 | |
ServiceNow * | | | 3,623 | | | | 2,527,984 | |
Skyworks Solutions | | | 2,705 | | | | 452,087 | |
Synopsys * | | | 2,704 | | | | 900,919 | |
TE Connectivity | | | 5,683 | | | | 829,718 | |
Teledyne Technologies * | | | 922 | | | | 414,181 | |
Teradyne | | | 2,797 | | | | 386,657 | |
Texas Instruments | | | 16,409 | | | | 3,076,359 | |
Trimble * | | | 4,304 | | | | 376,040 | |
Tyler Technologies * | | | 873 | | | | 474,231 | |
VeriSign * | | | 1,574 | | | | 350,483 | |
Visa, Cl A | | | 29,892 | | | | 6,330,229 | |
Western Digital * | | | 5,620 | | | | 293,870 | |
Western Union | | | 7,691 | | | | 140,130 | |
Xilinx | | | 4,271 | | | | 768,780 | |
Zebra Technologies, Cl A * | | | 1,057 | | | | 564,385 | |
| | | | | | | | 192,233,142 | |
| | | | | | | | | |
| | | | | | | | | |
| Materials — 2.2% | | | | | | | | |
Air Products & Chemicals | | | 4,067 | | | | 1,219,327 | |
Albemarle | | | 2,234 | | | | 559,550 | |
Amcor | | | 28,827 | | | | 347,942 | |
| Schedule of Investments | | October 31, 2021 |
| | Global X S&P 500® Covered Call ETF | |
| | | | | | | |
| COMMON STOCK — continued | | | | | | |
| Materials — continued | | | | | | |
Avery Dennison | | | 1,442 | | | $ | 313,952 | |
Ball | | | 5,811 | | | | 531,590 | |
Celanese, Cl A | | | 1,789 | | | | 288,941 | |
CF Industries Holdings | | | 3,932 | | | | 223,338 | |
Corteva | | | 13,572 | | | | 585,632 | |
Dow | | | 13,733 | | | | 768,636 | |
DuPont de Nemours | | | 9,720 | | | | 676,512 | |
Eastman Chemical | | | 2,634 | | | | 274,015 | |
Ecolab | | | 4,261 | | | | 946,879 | |
FMC | | | 2,642 | | | | 240,448 | |
Freeport-McMoRan | | | 25,776 | | | | 972,271 | |
| International Flavors & Fragrances | | | 4,299 | | | | 633,888 | |
International Paper | | | 7,148 | | | | 355,041 | |
| LyondellBasell Industries, Cl A | | | 4,790 | | | | 444,608 | |
Martin Marietta Materials | | | 1,056 | | | | 414,839 | |
Mosaic | | | 5,936 | | | | 246,760 | |
Newmont | | | 14,529 | | | | 784,566 | |
Nucor | | | 5,483 | | | | 612,177 | |
Packaging Corp of America | | | 1,462 | | | | 200,835 | |
PPG Industries | | | 4,224 | | | | 678,248 | |
Sealed Air | | | 2,918 | | | | 173,096 | |
Sherwin-Williams | | | 4,159 | | | | 1,316,781 | |
Vulcan Materials | | | 2,432 | | | | 462,372 | |
Westrock | | | 5,134 | | | | 246,945 | |
| | | | | | | | 14,519,189 | |
| | | | | | | | | |
| | | | | | | | | |
| Real Estate — 2.7% | | | | | | | | |
Alexandria Real Estate Equities ‡ | | | 2,544 | | | | 519,332 | |
American Tower, Cl A ‡ | | | 8,117 | | | | 2,288,751 | |
AvalonBay Communities ‡ | | | 2,520 | | | | 596,434 | |
Boston Properties ‡ | | | 2,647 | | | | 300,805 | |
CBRE Group, Cl A * | | | 6,067 | | | | 631,453 | |
Crown Castle International ‡ | | | 7,738 | | | | 1,395,161 | |
Digital Realty Trust ‡ | | | 5,075 | | | | 800,886 | |
| Schedule of Investments | | October 31, 2021 |
| | Global X S&P 500® Covered Call ETF | |
| | | | | | | |
| COMMON STOCK — continued | | | | | | |
| Real Estate — continued | | | | | | |
Duke Realty ‡ | | | 6,968 | | | $ | 391,880 | |
Equinix ‡ | | | 1,504 | | | | 1,258,953 | |
Equity Residential ‡ | | | 6,158 | | | | 532,051 | |
Essex Property Trust ‡ | | | 1,134 | | | | 385,481 | |
Extra Space Storage ‡ | | | 2,445 | | | | 482,570 | |
Federal Realty Investment Trust ‡ | | | 1,456 | | | | 175,230 | |
Healthpeak Properties ‡ | | | 9,403 | | | | 333,901 | |
Host Hotels & Resorts ‡ * | | | 13,103 | | | | 220,524 | |
Iron Mountain ‡ | | | 5,789 | | | | 264,210 | |
Kimco Realty ‡ | | | 9,517 | | | | 215,084 | |
Mid-America Apartment Communities ‡ | | | 2,022 | | | | 412,913 | |
ProLogis ‡ | | | 13,118 | | | | 1,901,585 | |
Public Storage ‡ | | | 2,695 | | | | 895,225 | |
Realty Income ‡ | | | 6,891 | | | | 492,224 | |
Regency Centers ‡ | | | 3,013 | | | | 212,145 | |
SBA Communications, Cl A ‡ | | | 1,738 | | | | 600,184 | |
Simon Property Group ‡ | | | 5,869 | | | | 860,278 | |
UDR ‡ | | | 4,393 | | | | 243,943 | |
Ventas ‡ | | | 6,839 | | | | 364,997 | |
Vornado Realty Trust ‡ | | | 2,852 | | | | 121,581 | |
Welltower ‡ | | | 7,511 | | | | 603,884 | |
Weyerhaeuser ‡ | | | 13,782 | | | | 492,293 | |
| | | | | | | | 17,993,958 | |
| | | | | | | | | |
| Utilities — 2.5% | | | | | | | | |
AES | | | 12,164 | | | | 305,681 | |
Alliant Energy | | | 4,271 | | | | 241,611 | |
Ameren | | | 4,300 | | | | 362,447 | |
American Electric Power | | | 8,927 | | | | 756,206 | |
American Water Works | | | 3,140 | | | | 546,925 | |
Atmos Energy | | | 2,579 | | | | 237,578 | |
CenterPoint Energy | | | 10,523 | | | | 274,019 | |
CMS Energy | | | 5,528 | | | | 333,615 | |
Consolidated Edison | | | 6,564 | | | | 494,926 | |
| Schedule of Investments | | October 31, 2021 |
| | Global X S&P 500® Covered Call ETF | |
| | | Shares/Number of Contracts | | | | |
| COMMON STOCK — continued | | | | | | |
| Utilities — continued | | | | | | |
Dominion Energy | | | 14,358 | | | $ | 1,090,203 | |
DTE Energy | | | 3,654 | | | | 414,181 | |
Duke Energy | | | 13,027 | | | | 1,328,884 | |
Edison International | | | 7,028 | | | | 442,272 | |
Entergy | | | 3,667 | | | | 377,774 | |
Evergy | | | 4,217 | | | | 268,834 | |
Eversource Energy | | | 6,227 | | | | 528,672 | |
Exelon | | | 17,261 | | | | 918,113 | |
FirstEnergy | | | 10,265 | | | | 395,510 | |
NextEra Energy | | | 34,938 | | | | 2,981,260 | |
NiSource | | | 7,314 | | | | 180,436 | |
NRG Energy | | | 4,191 | | | | 167,179 | |
Pinnacle West Capital | | | 2,162 | | | | 139,427 | |
PPL | | | 14,292 | | | | 411,610 | |
| Public Service Enterprise Group | | | 9,334 | | | | 595,509 | |
Sempra Energy | | | 5,324 | | | | 679,502 | |
Southern | | | 19,009 | | | | 1,184,641 | |
WEC Energy Group | | | 5,473 | | | | 492,898 | |
Xcel Energy | | | 9,660 | | | | 623,939 | |
| | | | | | | | 16,773,852 | |
| | | | | | | | | |
TOTAL UNITED STATES | | | | | | | 688,141,951 | |
| TOTAL COMMON STOCK | | | | | | | | |
(Cost $602,844,830) | | | | | | | 691,979,063 | |
| TOTAL INVESTMENTS — 103.3% | | | | | | | | |
(Cost $602,844,830) | | | | | | $ | 691,979,063 | |
| | | | | | | | | |
| | | | | | | | | |
WRITTEN OPTION— (3.5)%(1) | | | | | | | | |
| UNITED STATES— (3.5)% | | | | | | | | |
| (Premiums Received ($9,674,024)) | | | (1,502 | ) | | | (23,153,330 | ) |
Percentages are based on Net Assets of $669,854,868.
| Schedule of Investments | | October 31, 2021 |
| | Global X S&P 500® Covered Call ETF | |
A list of the exchange traded option contracts held by the Fund at October 31, 2021, is as follows:
| Description | | Number of Contracts | | | Cost+ | | | Exercise Price | | Expiration Date | | Value | |
| WRITTEN OPTION — (3.5)% | | | | | | | | | | | | | |
| Call Options | | | | | | | | | | | | | |
| S&P 500 Index* | | | (1,502 | ) | | $ | (9,674,024 | ) | | $ | 4,470.00 | | 11/19/21 | | $ | (23,153,330 | ) |
| * | Non-income producing security. |
| ‡ | Real Estate Investment Trust |
| + | Notional amount for all options totals $(691,728,076). |
| (1) | Refer to table below for details on Options Contracts. |
| (A) | All or a portion of these securities has been segregated as collateral for writtenoptions contracts. The aggregate market value of collateral at October 31, 2021 was$691,979,063. |
Cl — Class
S&P — Standard & Poor’s
The following is a summary of the level of inputs used as of October 31, 2021, in valuing the Fund’s investments carried at value:
| Investments in Securities | | | | | | | | | | | | |
| Common Stock | | $ | 691,979,063 | | | $ | — | | | $ | — | | | $ | 691,979,063 | |
| Total Investments in Securities | | $ | 691,979,063 | | | $ | — | | | $ | — | | | $ | 691,979,063 | |
| Other Financial Instruments | | | | | | | | | | | | |
| Written Option | | $ | (23,153,330 | ) | | $ | — | | | $ | — | | | $ | (23,153,330 | ) |
| Total Liabilities | | $ | (23,153,330 | ) | | $ | — | | | $ | — | | | $ | (23,153,330 | ) |
For the year ended October 31, 2021, there have been no transfers in or out of Level 3.
Amounts designated as “—“ are $0 or have been rounded to $0.
| Schedule of Investments | | October 31, 2021 |
| | Global X Russell 2000 Covered Call ETF | |
Sector Weightings (Unaudited)†:
† Sector weightings percentages are based on the total market value of investments.
| | | Shares/Number of Contracts | | | | |
| EXCHANGE TRADED FUND — 101.6%‡(A) | | | | | | |
Vanguard Russell 2000 ETF | | | 6,111,954 | | | $ | 563,461,039 | |
| TOTAL INVESTMENTS — 101.6% | | | | | | | | |
(Cost $536,883,182) | | | | | | $ | 563,461,039 | |
| | | | | | | | | |
WRITTEN OPTION— (1.7)%(1) | | | | | | | | |
| UNITED STATES— (1.7)% | | | | | | | | |
| (Premiums Received ($10,800,917)) | | | (2,450 | ) | | | (9,653,000 | ) |
Percentages are based on Net Assets of $554,445,800.
A list of the exchange traded option contracts held by the Fund at October 31, 2021, is as follows:
| Description | | Number of Contracts | | | Cost+ | | | Exercise Price | | Expiration Date | | Value | |
| WRITTEN OPTION — (1.7)% | | | | | | | | | | | | | |
| Call Options | | | | | | | | | | | | | |
| Russell 2000 Index* | | | (2,450 | ) | | $ | (10,800,917 | ) | | $ | 2,300.00 | | 11/19/21 | | $ | (9,653,000 | ) |
| + | Notional amount for all options totals $(562,811,775). |
| ‡ | For financial information on the Vanguard Russell 2000 ETF, please go to the Securities Exchange Commission’s website at http://www.sec.gov. |
| (1) | Refer to table below for details on Options Contracts. |
| (A) | All or a portion of these securities has been segregated as collateral for writtenoptions contracts. The aggregate market value of collateral at October 31, 2021 was$563,461,039. |
ETF — Exchange Traded Fund
| Schedule of Investments | | October 31, 2021 |
| | Global X Russell 2000 Covered Call ETF | |
The following is a summary of the level of inputs used as of October 31, 2021, in valuing the Fund’s investments carried at value:
| Investments in Securities | | | | | | | | | | | | |
| Exchange Traded Fund | | $ | 563,461,039 | | | $ | — | | | $ | — | | | $ | 563,461,039 | |
| Total Investments in Securities | | $ | 563,461,039 | | | $ | — | | | $ | — | | | $ | 563,461,039 | |
| Other Financial Instruments | | | | | | | | | | | | |
| Written Option | | $ | (9,653,000 | ) | | $ | — | | | $ | — | | | $ | (9,653,000 | ) |
| Total Liabilities | | $ | (9,653,000 | ) | | $ | — | | | $ | — | | | $ | (9,653,000 | ) |
For the year ended October 31, 2021, there have been no transfers in or out of Level 3.
Amounts designated as “—“ are $0 or have been rounded to $0.
| Schedule of Investments | | October 31, 2021 |
| | Global X Nasdaq 100® Covered Call & Growth ETF | |
Sector Weightings (Unaudited)†:
† Sector weightings percentages are based on the total market value of investments.
| | | | | | | |
COMMON STOCK — 102.3%(A) | | | | | | |
| ARGENTINA — 0.5% | | | | | | |
| Consumer Discretionary — 0.5% | | | | | | |
MercadoLibre * | | | 147 | | | $ | 217,710 | |
| | | | | | | | | |
| | | | | | | | | |
| CHINA — 1.6% | | | | | | | | |
| Communication Services — 0.5% | | | | | | | | |
Baidu ADR * | | | 784 | | | | 127,196 | |
NetEase ADR | | | 910 | | | | 88,807 | |
| | | | | | | | 216,003 | |
| | | | | | | | | |
| | | | | | | | | |
| Consumer Discretionary — 0.7% | | | | | | | | |
JD.com ADR * | | | 2,425 | | | | 189,829 | |
Pinduoduo ADR * | | | 1,125 | | | | 100,035 | |
Trip.com Group ADR * | | | 1,574 | | | | 44,953 | |
| | | | | | | | 334,817 | |
| | | | | | | | | |
| | | | | | | | | |
| Information Technology — 0.4% | | | | | | | | |
NXP Semiconductors | | | 825 | | | | 165,710 | |
| | | | | | | | | |
| | | | | | | | | |
TOTAL CHINA | | | | | | | 716,530 | |
| ISRAEL — 0.1% | | | | | | | | |
| Information Technology — 0.1% | | | | | | | | |
Check Point Software Technologies * | | | 402 | | | | 48,079 | |
| | | | | | | | | |
| Schedule of Investments | | October 31, 2021 |
| | Global X Nasdaq 100® Covered Call & Growth ETF | |
| | | | | | | |
| COMMON STOCK — continued | | | | | | |
| NETHERLANDS — 0.4% | | | | | | |
| Information Technology — 0.4% | | | | | | |
ASML Holding, Cl G | | | 246 | | | $ | 199,968 | |
| | | | | | | | | |
| | | | | | | | | |
| UNITED STATES — 99.7% | | | | | | | | |
| Communication Services — 18.4% | | | | | | | | |
Activision Blizzard | | | 2,329 | | | | 182,104 | |
Alphabet, Cl A * | | | 601 | | | | 1,779,513 | |
Alphabet, Cl C * | | | 646 | | | | 1,915,655 | |
Charter Communications, Cl A * | | | 558 | | | | 376,589 | |
Comcast, Cl A | | | 13,853 | | | | 712,460 | |
Electronic Arts | | | 842 | | | | 118,090 | |
Fox, Cl A | | | 961 | | | | 38,190 | |
Fox, Cl B | | | 755 | | | | 27,905 | |
Match Group * | | | 811 | | | | 122,283 | |
Meta Platforms, Cl A * | | | 4,750 | | | | 1,536,957 | |
Netflix * | | | 1,341 | | | | 925,706 | |
Sirius XM Holdings | | | 12,370 | | | | 75,333 | |
T-Mobile US * | | | 3,765 | | | | 433,088 | |
| | | | | | | | 8,243,873 | |
| | | | | | | | | |
| | | | | | | | | |
| Consumer Discretionary — 17.3% | | | | | | | | |
Amazon.com * | | | 1,011 | | | | 3,409,527 | |
Booking Holdings * | | | 126 | | | | 305,018 | |
Dollar Tree * | | | 679 | | | | 73,169 | |
eBay | | | 2,043 | | | | 156,739 | |
Lululemon Athletica * | | | 380 | | | | 177,084 | |
Marriott International, Cl A * | | | 968 | | | | 154,899 | |
O’Reilly Automotive * | | | 222 | | | | 138,155 | |
Peloton Interactive, Cl A * | | | 805 | | | | 73,609 | |
Ross Stores | | | 1,072 | | | | 121,351 | |
Starbucks | | | 3,544 | | | | 375,912 | |
Tesla * | | | 2,482 | | | | 2,764,948 | |
| | | | | | | | 7,750,411 | |
| | | | | | | | | |
| Schedule of Investments | | October 31, 2021 |
| | Global X Nasdaq 100® Covered Call & Growth ETF | |
| | | | | | | |
| COMMON STOCK — continued | | | | | | |
| Consumer Staples — 4.8% | | | | | | |
Costco Wholesale | | | 1,339 | | | $ | 658,172 | |
Keurig Dr Pepper | | | 4,272 | | | | 154,176 | |
Kraft Heinz | | | 3,667 | | | | 131,609 | |
Mondelez International, Cl A | | | 4,221 | | | | 256,383 | |
Monster Beverage * | | | 1,595 | | | | 135,575 | |
PepsiCo | | | 4,173 | | | | 674,357 | |
Walgreens Boots Alliance | | | 2,589 | | | | 121,735 | |
| | | | | | | | 2,132,007 | |
| | | | | | | | | |
| | | | | | | | | |
| Health Care — 6.3% | | | | | | | | |
Align Technology * | | | 245 | | | | 152,971 | |
Amgen | | | 1,737 | | | | 359,507 | |
Biogen * | | | 442 | | | | 117,873 | |
Cerner | | | 882 | | | | 65,524 | |
Dexcom * | | | 283 | | | | 176,368 | |
Gilead Sciences | | | 3,778 | | | | 245,117 | |
IDEXX Laboratories * | | | 259 | | | | 172,530 | |
Illumina * | | | 495 | | | | 205,455 | |
Incyte * | | | 658 | | | | 44,073 | |
Intuitive Surgical * | | | 1,101 | | | | 397,604 | |
Moderna * | | | 1,212 | | | | 418,394 | |
Regeneron Pharmaceuticals * | | | 325 | | | | 207,980 | |
Seagen * | | | 542 | | | | 95,571 | |
Vertex Pharmaceuticals * | | | 784 | | | | 144,985 | |
| | | | | | | | 2,803,952 | |
| | | | | | | | | |
| | | | | | | | | |
| Industrials — 2.8% | | | | | | | | |
Cintas | | | 306 | | | | 132,529 | |
Copart * | | | 702 | | | | 109,014 | |
CSX | | | 6,847 | | | | 247,656 | |
Fastenal | | | 1,746 | | | | 99,662 | |
Honeywell International | | | 2,081 | | | | 454,948 | |
PACCAR | | | 1,047 | | | | 93,832 | |
| Schedule of Investments | | October 31, 2021 |
| | Global X Nasdaq 100® Covered Call & Growth ETF | |
| | | | | | | |
| COMMON STOCK — continued | | | | | | |
| Industrials — continued | | | | | | |
Verisk Analytics, Cl A | | | 497 | | | $ | 104,504 | |
| | | | | | | | 1,242,145 | |
| | | | | | | | | |
| | | | | | | | | |
| Information Technology — 49.2% | | | | | | | | |
Adobe * | | | 1,452 | | | | 944,323 | |
Advanced Micro Devices * | | | 3,660 | | | | 440,042 | |
Analog Devices | | | 1,647 | | | | 285,738 | |
ANSYS * | | | 263 | | | | 99,829 | |
Apple | | | 33,074 | | | | 4,954,485 | |
Applied Materials | | | 2,744 | | | | 374,968 | |
Atlassian, Cl A * | | | 406 | | | | 186,001 | |
Autodesk * | | | 665 | | | | 211,211 | |
Automatic Data Processing | | | 1,268 | | | | 284,653 | |
Broadcom | | | 1,255 | | | | 667,246 | |
Cadence Design Systems * | | | 828 | | | | 143,335 | |
CDW | | | 420 | | | | 78,393 | |
Cisco Systems | | | 12,741 | | | | 713,114 | |
| Cognizant Technology Solutions, Cl A | | | 1,566 | | | | 122,289 | |
Crowdstrike Holdings, Cl A * | | | 586 | | | | 165,135 | |
DocuSign, Cl A * | | | 576 | | | | 160,295 | |
Fiserv * | | | 2,011 | | | | 198,063 | |
Intel | | | 12,417 | | | | 608,433 | |
Intuit | | | 821 | | | | 513,938 | |
KLA | | | 475 | | | | 177,061 | |
Lam Research | | | 423 | | | | 238,390 | |
Marvell Technology | | | 2,432 | | | | 166,592 | |
Microchip Technology | | | 1,638 | | | | 121,359 | |
Micron Technology | | | 3,377 | | | | 233,351 | |
Microsoft | | | 15,037 | | | | 4,986,570 | |
NVIDIA | | | 7,587 | | | | 1,939,768 | |
Okta, Cl A * | | | 443 | | | | 109,501 | |
Paychex | | | 1,088 | | | | 134,129 | |
PayPal Holdings * | | | 3,588 | | | | 834,533 | |
QUALCOMM | | | 3,397 | | | | 451,937 | |
| Schedule of Investments | | October 31, 2021 |
| | Global X Nasdaq 100® Covered Call & Growth ETF | |
| | | Shares/ Number of Contracs | | | | |
| COMMON STOCK — continued | | | | | | |
| Information Technology — continued | | | | | | |
Skyworks Solutions | | | 504 | | | $ | 84,233 | |
Splunk * | | | 486 | | | | 80,102 | |
Synopsys * | | | 447 | | | | 148,931 | |
Texas Instruments | | | 2,797 | | | | 524,382 | |
VeriSign * | | | 345 | | | | 76,821 | |
Workday, Cl A * | | | 562 | | | | 162,969 | |
Xilinx | | | 752 | | | | 135,360 | |
Zoom Video Communications, Cl A * | | | 746 | | | | 204,889 | |
| | | | | | | | 21,962,369 | |
| | | | | | | | | |
| | | | | | | | | |
| Utilities — 0.9% | | | | | | | | |
American Electric Power | | | 1,503 | | | | 127,319 | |
Exelon | | | 2,943 | | | | 156,538 | |
Xcel Energy | | | 1,627 | | | | 105,088 | |
| | | | | | | | 388,945 | |
| | | | | | | | | |
| | | | | | | | | |
TOTAL UNITED STATES | | | | | | | 44,523,702 | |
| TOTAL COMMON STOCK | | | | | | | | |
(Cost $40,641,115) | | | | | | | 45,705,989 | |
| TOTAL INVESTMENTS — 102.3% | | | | | | | | |
(Cost $40,641,115) | | | | | | $ | 45,705,989 | |
| | | | | | | | | |
| | | | | | | | | |
WRITTEN OPTION— (2.5)%(1) | | | | | | | | |
| UNITED STATES— (2.5)% | | | | | | | | |
| (Premiums Received ($400,793)) | | | (72 | ) | | $ | (1,133,280 | ) |
Percentages are based on Net Assets of $44,671,370.
| Schedule of Investments | | October 31, 2021 |
| | Global X Nasdaq 100® Covered Call & Growth ETF | |
A list of the exchange traded option contracts held by the Fund at October 31, 2021, is as follows:
| Description | | Number of Contracts | | | Cost+ | | | Exercise Price | | Expiration Date | | Value | |
| WRITTEN OPTION — (2.5)% | | | | | | | | | | | | | |
| Call Options | | | | | | | | | | | | | |
| NQX* | | | (72 | ) | | $ | (400,793 | ) | | $ | 3,025.00 | | 11/19/21 | | $ | (1,133,280 | ) |
| * | Non-income producing security. |
| + | Notional amount for all options totals $(22,824,679). |
| (1) | Refer to table below for details on Options Contracts. |
| (A) | All or a portion of these securities has been segregated as collateral for written options contracts. The aggregate market value of collateral at October 31, 2021 was $45,705,989. |
ADR — American Depositary Receipt
Cl — Class
NQX — Nasdaq-100 Reduced Value Index
The following is a summary of the level of inputs used as of October 31, 2021, in valuing the Fund’s investments carried at value:
| Investments in Securities | | | | | | | | | | | | |
| Common Stock | | $ | 45,705,989 | | | $ | — | | | $ | — | | | $ | 45,705,989 | |
| Total Investments in Securities | | $ | 45,705,989 | | | $ | — | | | $ | — | | | $ | 45,705,989 | |
| Other Financial Instruments | | | | | | | | | | | | |
| Written Option | | $ | (1,133,280 | ) | | $ | — | | | $ | — | | | $ | (1,133,280 | ) |
| Total Liabilities | | $ | (1,133,280 | ) | | $ | — | | | $ | — | | | $ | (1,133,280 | ) |
For the year ended October 31, 2021, there have been no transfers in or out of Level 3.
Amounts designated as “—” are $0 or have been rounded to $0.
| Schedule of Investments | | October 31, 2021 |
| | Global X S&P 500® Covered Call & Growth ETF | |
Sector Weightings (Unaudited)†:
† Sector weightings percentages are based on the total market value of investments.
| | | | | | | |
| COMMON STOCK — 101.5%(A) | | | | | | |
| CHINA — 0.1% | | | | | | |
| Information Technology — 0.1% | | | | | | |
NXP Semiconductors | | | 226 | | | $ | 45,394 | |
| | | | | | | | | |
| | | | | | | | | |
| UNITED KINGDOM — 0.4% | | | | | | | | |
| Materials — 0.4% | | | | | | | | |
Linde | | | 462 | | | | 147,471 | |
| | | | | | | | | |
| | | | | | | | | |
| UNITED STATES — 101.0% | | | | | | | | |
| Communication Services — 11.0% | | | | | | | | |
Activision Blizzard | | | 668 | | | | 52,231 | |
Alphabet, Cl A * | | | 276 | | | | 817,214 | |
Alphabet, Cl C * | | | 259 | | | | 768,041 | |
AT&T | | | 6,497 | | | | 164,114 | |
Charter Communications, Cl A * | | | 113 | | | | 76,263 | |
Comcast, Cl A | | | 4,184 | | | | 215,183 | |
Discovery, Cl A * | | | 114 | | | | 2,672 | |
Discovery, Cl C * | | | 256 | | | | 5,775 | |
DISH Network, Cl A * | | | 222 | | | | 9,117 | |
| Schedule of Investments | | October 31, 2021 |
| | Global X S&P 500® Covered Call & Growth ETF | |
| | | | | | | |
| COMMON STOCK — continued | | | | | | |
| Communication Services — continued | | | | | | |
Electronic Arts | | | 223 | | | $ | 31,276 | |
Fox, Cl A | | | 332 | | | | 13,194 | |
Fox, Cl B | | | 114 | | | | 4,213 | |
Interpublic Group | | | 336 | | | | 12,287 | |
Live Nation Entertainment * | | | 111 | | | | 11,228 | |
Lumen Technologies | | | 891 | | | | 10,567 | |
Match Group * | | | 242 | | | | 36,489 | |
Meta Platforms, Cl A * | | | 2,173 | | | | 703,118 | |
Netflix * | | | 409 | | | | 282,337 | |
News, Cl A | | | 336 | | | | 7,694 | |
News, Cl B | | | 112 | | | | 2,527 | |
Omnicom Group | | | 220 | | | | 14,978 | |
Take-Two Interactive Software * | | | 110 | | | | 19,910 | |
T-Mobile US * | | | 544 | | | | 62,576 | |
Twitter * | | | 766 | | | | 41,012 | |
Verizon Communications | | | 3,740 | | | | 198,183 | |
ViacomCBS, Cl B | | | 553 | | | | 20,030 | |
Walt Disney | | | 1,649 | | | | 278,796 | |
| | | | | | | | 3,861,025 | |
| | | | | | | | | |
| | | | | | | | | |
| Consumer Discretionary — 13.0% | | | | | | | | |
Advance Auto Parts | | | 67 | | | | 15,110 | |
Amazon.com * | | | 398 | | | | 1,342,227 | |
Aptiv * | | | 225 | | | | 38,900 | |
AutoZone * | | | 21 | | | | 37,482 | |
Bath & Body Works | | | 222 | | | | 15,338 | |
Best Buy | | | 219 | | | | 26,771 | |
Booking Holdings * | | | 40 | | | | 96,831 | |
BorgWarner | | | 219 | | | | 9,870 | |
Caesars Entertainment * | | | 214 | | | | 23,424 | |
CarMax * | | | 115 | | | | 15,746 | |
Carnival * | | | 749 | | | | 16,598 | |
Chipotle Mexican Grill, Cl A * | | | 29 | | | | 51,592 | |
Darden Restaurants | | | 112 | | | | 16,144 | |
| Schedule of Investments | | October 31, 2021 |
| | Global X S&P 500® Covered Call & Growth ETF | |
| | | | | | | |
| COMMON STOCK — continued | | | | | | |
| Consumer Discretionary — continued | | | | | | |
Dollar General | | | 221 | | | $ | 48,956 | |
Dollar Tree * | | | 220 | | | | 23,707 | |
Domino’s Pizza | | | 26 | | | | 12,713 | |
DR Horton | | | 324 | | | | 28,924 | |
eBay | | | 550 | | | | 42,196 | |
Etsy * | | | 109 | | | | 27,325 | |
Expedia Group * | | | 112 | | | | 18,414 | |
Ford Motor | | | 3,579 | | | | 61,129 | |
Gap | | | 219 | | | | 4,969 | |
Garmin | | | 115 | | | | 16,514 | |
General Motors * | | | 1,310 | | | | 71,303 | |
Genuine Parts | | | 114 | | | | 14,947 | |
Hanesbrands | | | 332 | | | | 5,657 | |
Hasbro | | | 113 | | | | 10,821 | |
Hilton Worldwide Holdings * | | | 223 | | | | 32,101 | |
Home Depot | | | 970 | | | | 360,588 | |
Las Vegas Sands * | | | 330 | | | | 12,807 | |
Leggett & Platt | | | 112 | | | | 5,247 | |
Lennar, Cl A | | | 221 | | | | 22,085 | |
LKQ | | | 226 | | | | 12,448 | |
Lowe’s | | | 655 | | | | 153,152 | |
Marriott International, Cl A * | | | 222 | | | | 35,524 | |
McDonald’s | | | 664 | | | | 163,045 | |
MGM Resorts International | | | 339 | | | | 15,987 | |
Mohawk Industries * | | | 38 | | | | 6,734 | |
Newell Brands | | | 335 | | | | 7,668 | |
NIKE, Cl B | | | 1,169 | | | | 195,562 | |
Norwegian Cruise Line Holdings * | | | 326 | | | | 8,385 | |
NVR * | | | 3 | | | | 14,684 | |
O’Reilly Automotive * | | | 71 | | | | 44,185 | |
Penn National Gaming * | | | 116 | | | | 8,306 | |
Pool | | | 28 | | | | 14,425 | |
PulteGroup | | | 224 | | | | 10,770 | |
| Schedule of Investments | | October 31, 2021 |
| | Global X S&P 500® Covered Call & Growth ETF | |
| | | | | | | |
| COMMON STOCK — continued | | | | | | |
| Consumer Discretionary — continued | | | | | | |
PVH | | | 106 | | | $ | 11,589 | |
Ralph Lauren, Cl A | | | 4 | | | | 509 | |
Ross Stores | | | 329 | | | | 37,243 | |
Royal Caribbean Cruises * | | | 216 | | | | 18,237 | |
Starbucks | | | 1,096 | | | | 116,253 | |
Tapestry | | | 226 | | | | 8,809 | |
Target | | | 444 | | | | 115,271 | |
Tesla * | | | 744 | | | | 828,816 | |
TJX | | | 1,105 | | | | 72,366 | |
Tractor Supply | | | 110 | | | | 23,889 | |
Ulta Beauty * | | | 38 | | | | 13,960 | |
Under Armour, Cl A * | | | 218 | | | | 4,787 | |
Under Armour, Cl C * | | | 219 | | | | 4,135 | |
VF | | | 330 | | | | 24,050 | |
Whirlpool | | | 65 | | | | 13,704 | |
Wynn Resorts * | | | 108 | | | | 9,698 | |
Yum! Brands | | | 255 | | | | 31,860 | |
| | | | | | | | 4,552,487 | |
| | | | | | | | | |
| | | | | | | | | |
| Consumer Staples — 5.7% | | | | | | | | |
Altria Group | | | 1,659 | | | | 73,179 | |
Archer-Daniels-Midland | | | 541 | | | | 34,754 | |
Brown-Forman, Cl B | | | 216 | | | | 14,664 | |
Campbell Soup | | | 218 | | | | 8,709 | |
Church & Dwight | | | 222 | | | | 19,394 | |
Clorox | | | 109 | | | | 17,768 | |
Coca-Cola | | | 3,529 | | | | 198,930 | |
Colgate-Palmolive | | | 767 | | | | 58,438 | |
Conagra Brands | | | 445 | | | | 14,329 | |
Constellation Brands, Cl A | | | 142 | | | | 30,787 | |
Costco Wholesale | | | 409 | | | | 201,040 | |
Estee Lauder, Cl A | | | 219 | | | | 71,028 | |
General Mills | | | 550 | | | | 33,990 | |
Hershey | | | 112 | | | | 19,639 | |
| Schedule of Investments | | October 31, 2021 |
| | Global X S&P 500® Covered Call & Growth ETF | |
| | | | | | | |
| COMMON STOCK — continued | | | | | | |
| Consumer Staples — continued | | | | | | |
Hormel Foods | | | 226 | | | $ | 9,564 | |
J M Smucker | | | 110 | | | | 13,515 | |
Kellogg | | | 224 | | | | 13,731 | |
Kimberly-Clark | | | 329 | | | | 42,602 | |
Kraft Heinz | | | 583 | | | | 20,924 | |
Kroger | | | 667 | | | | 26,693 | |
Lamb Weston Holdings | | | 114 | | | | 6,435 | |
McCormick | | | 221 | | | | 17,731 | |
Molson Coors Beverage, Cl B | | | 218 | | | | 9,612 | |
Mondelez International, Cl A | | | 1,305 | | | | 79,266 | |
Monster Beverage * | | | 330 | | | | 28,050 | |
PepsiCo | | | 1,244 | | | | 201,031 | |
Philip Morris International | | | 1,432 | | | | 135,381 | |
Procter & Gamble | | | 2,204 | | | | 315,150 | |
Sysco | | | 441 | | | | 33,913 | |
Tyson Foods, Cl A | | | 228 | | | | 18,233 | |
Walgreens Boots Alliance | | | 667 | | | | 31,362 | |
Walmart | | | 1,300 | | | | 194,246 | |
| | | | | | | | 1,994,088 | |
| | | | | | | | | |
| | | | | | | | | |
| Energy — 2.9% | | | | | | | | |
APA | | | 335 | | | | 8,780 | |
Baker Hughes, Cl A | | | 682 | | | | 17,105 | |
Chevron | | | 1,756 | | | | 201,044 | |
ConocoPhillips | | | 1,208 | | | | 89,984 | |
Coterra Energy | | | 1,045 | | | | 22,279 | |
Devon Energy | | | 537 | | | | 21,523 | |
Diamondback Energy | | | 158 | | | | 16,936 | |
EOG Resources | | | 547 | | | | 50,576 | |
Exxon Mobil | | | 3,859 | | | | 248,790 | |
Halliburton | | | 789 | | | | 19,717 | |
Hess | | | 222 | | | | 18,331 | |
Kinder Morgan | | | 1,781 | | | | 29,832 | |
Marathon Oil | | | 774 | | | | 12,632 | |
| Schedule of Investments | | October 31, 2021 |
| | Global X S&P 500® Covered Call & Growth ETF | |
| | | | | | | |
| COMMON STOCK — continued | | | | | | |
| Energy — continued | | | | | | |
Marathon Petroleum | | | 560 | | | $ | 36,921 | |
Occidental Petroleum | | | 778 | | | | 26,086 | |
ONEOK | | | 441 | | | | 28,056 | |
Phillips 66 | | | 435 | | | | 32,529 | |
Pioneer Natural Resources | | | 220 | | | | 41,136 | |
Schlumberger | | | 1,313 | | | | 42,357 | |
Valero Energy | | | 339 | | | | 26,215 | |
Williams | | | 1,114 | | | | 31,292 | |
| | | | | | | | 1,022,121 | |
| | | | | | | | | |
| | | | | | | | | |
| Financials — 11.6% | | | | | | | | |
Aflac | | | 557 | | | | 29,894 | |
Allstate | | | 232 | | | | 28,691 | |
American Express | | | 598 | | | | 103,920 | |
American International Group | | | 774 | | | | 45,736 | |
Ameriprise Financial | | | 109 | | | | 32,932 | |
Aon, Cl A | | | 220 | | | | 70,382 | |
Arthur J Gallagher | | | 218 | | | | 36,552 | |
Assurant | | | 39 | | | | 6,291 | |
Bank of America | | | 6,831 | | | | 326,385 | |
Bank of New York Mellon | | | 766 | | | | 45,347 | |
Berkshire Hathaway, Cl B * | | | 1,677 | | | | 481,316 | |
BlackRock, Cl A | | | 126 | | | | 118,876 | |
Brown & Brown | | | 204 | | | | 12,874 | |
Capital One Financial | | | 409 | | | | 61,771 | |
Cboe Global Markets | | | 110 | | | | 14,513 | |
Charles Schwab | | | 1,322 | | | | 108,444 | |
Chubb | | | 404 | | | | 78,934 | |
Cincinnati Financial | | | 110 | | | | 13,358 | |
Citigroup | | | 1,874 | | | | 129,606 | |
Citizens Financial Group | | | 433 | | | | 20,516 | |
CME Group, Cl A | | | 329 | | | | 72,561 | |
Comerica | | | 112 | | | | 9,530 | |
Discover Financial Services | | | 258 | | | | 29,237 | |
| Schedule of Investments | | October 31, 2021 |
| | Global X S&P 500® Covered Call & Growth ETF | |
| | | | | | | |
| COMMON STOCK — continued | | | | | | |
| Financials — continued | | | | | | |
Everest Re Group | | | 27 | | | $ | 7,060 | |
Fifth Third Bancorp | | | 656 | | | | 28,556 | |
First Republic Bank | | | 148 | | | | 32,017 | |
Franklin Resources | | | 224 | | | | 7,054 | |
Globe Life | | | 109 | | | | 9,703 | |
Goldman Sachs Group | | | 310 | | | | 128,138 | |
| Hartford Financial Services Group | | | 334 | | | | 24,359 | |
Huntington Bancshares | | | 1,284 | | | | 20,210 | |
Intercontinental Exchange | | | 539 | | | | 74,630 | |
Invesco | | | 335 | | | | 8,512 | |
JPMorgan Chase | | | 2,750 | | | | 467,197 | |
KeyCorp | | | 891 | | | | 20,734 | |
Lincoln National | | | 126 | | | | 9,091 | |
Loews | | | 222 | | | | 12,448 | |
M&T Bank | | | 109 | | | | 16,036 | |
MarketAxess Holdings | | | 26 | | | | 10,625 | |
Marsh & McLennan | | | 444 | | | | 74,059 | |
MetLife | | | 666 | | | | 41,825 | |
Moody’s | | | 138 | | | | 55,773 | |
Morgan Stanley | | | 1,331 | | | | 136,800 | |
MSCI, Cl A | | | 81 | | | | 53,855 | |
Nasdaq | | | 110 | | | | 23,086 | |
Northern Trust | | | 217 | | | | 26,700 | |
People’s United Financial | | | 440 | | | | 7,542 | |
PNC Financial Services Group | | | 394 | | | | 83,146 | |
Principal Financial Group | | | 224 | | | | 15,028 | |
Progressive | | | 552 | | | | 52,374 | |
Prudential Financial | | | 336 | | | | 36,977 | |
Raymond James Financial | | | 156 | | | | 15,380 | |
Regions Financial | | | 889 | | | | 21,052 | |
S&P Global | | | 221 | | | | 104,789 | |
State Street | | | 332 | | | | 32,719 | |
SVB Financial Group * | | | 56 | | | | 40,174 | |
| Schedule of Investments | | October 31, 2021 |
| | Global X S&P 500® Covered Call & Growth ETF | |
| | | | | | | |
| COMMON STOCK — continued | | | | | | |
| Financials — continued | | | | | | |
Synchrony Financial | | | 483 | | | $ | 22,435 | |
T Rowe Price Group | | | 218 | | | | 47,280 | |
Travelers | | | 222 | | | | 35,715 | |
Truist Financial | | | 1,219 | | | | 77,370 | |
US Bancorp | | | 1,221 | | | | 73,712 | |
W R Berkley | | | 113 | | | | 8,995 | |
Wells Fargo | | | 3,749 | | | | 191,799 | |
Willis Towers Watson | | | 112 | | | | 27,135 | |
Zions Bancorp | | | 117 | | | | 7,370 | |
| | | | | | | | 4,067,126 | |
| | | | | | | | | |
| | | | | | | | | |
| Health Care — 13.3% | | | | | | | | |
Abbott Laboratories | | | 1,646 | | | | 212,153 | |
AbbVie | | | 1,645 | | | | 188,632 | |
ABIOMED * | | | 32 | | | | 10,625 | |
Agilent Technologies | | | 284 | | | | 44,727 | |
Align Technology * | | | 75 | | | | 46,828 | |
AmerisourceBergen, Cl A | | | 110 | | | | 13,422 | |
Amgen | | | 521 | | | | 107,831 | |
Anthem | | | 221 | | | | 96,164 | |
Baxter International | | | 439 | | | | 34,663 | |
Becton Dickinson | | | 251 | | | | 60,137 | |
Biogen * | | | 129 | | | | 34,402 | |
Bio-Rad Laboratories, Cl A * | | | 15 | | | | 11,920 | |
Bio-Techne | | | 27 | | | | 14,139 | |
Boston Scientific * | | | 1,311 | | | | 56,543 | |
Bristol-Myers Squibb | | | 2,027 | | | | 118,377 | |
Cardinal Health | | | 220 | | | | 10,518 | |
Catalent * | | | 142 | | | | 19,576 | |
Centene * | | | 549 | | | | 39,111 | |
Cerner | | | 265 | | | | 19,687 | |
Charles River Laboratories International * | | | 35 | | | | 15,704 | |
Cigna | | | 328 | | | | 70,064 | |
Cooper | | | 35 | | | | 14,592 | |
| Schedule of Investments | | October 31, 2021 |
| | Global X S&P 500® Covered Call & Growth ETF | |
| | | | | | | |
| COMMON STOCK — continued | | | | | | |
| Health Care — continued | | | | | | |
CVS Health | | | 1,206 | | | $ | 107,672 | |
Danaher | | | 571 | | | | 178,021 | |
DaVita * | | | 66 | | | | 6,814 | |
DENTSPLY SIRONA | | | 213 | | | | 12,186 | |
Dexcom * | | | 91 | | | | 56,712 | |
Edwards Lifesciences * | | | 554 | | | | 66,380 | |
Eli Lilly | | | 729 | | | | 185,720 | |
Gilead Sciences | | | 1,101 | | | | 71,433 | |
HCA Healthcare | | | 222 | | | | 55,602 | |
Henry Schein * | | | 114 | | | | 8,704 | |
Hologic * | | | 224 | | | | 16,421 | |
Humana | | | 111 | | | | 51,411 | |
IDEXX Laboratories * | | | 83 | | | | 55,290 | |
Illumina * | | | 128 | | | | 53,128 | |
Incyte * | | | 215 | | | | 14,401 | |
Intuitive Surgical * | | | 330 | | | | 119,173 | |
IQVIA Holdings * | | | 181 | | | | 47,317 | |
Johnson & Johnson | | | 2,415 | | | | 393,355 | |
Laboratory Corp of America Holdings * | | | 104 | | | | 29,850 | |
McKesson | | | 132 | | | | 27,440 | |
Medtronic | | | 1,216 | | | | 145,750 | |
Merck | | | 2,317 | | | | 204,012 | |
Mettler-Toledo International * | | | 23 | | | | 34,060 | |
Moderna * | | | 320 | | | | 110,467 | |
Organon | | | 221 | | | | 8,122 | |
PerkinElmer | | | 110 | | | | 19,458 | |
Pfizer | | | 5,085 | | | | 222,418 | |
Quest Diagnostics | | | 112 | | | | 16,439 | |
Regeneron Pharmaceuticals * | | | 98 | | | | 62,714 | |
ResMed | | | 126 | | | | 33,127 | |
STERIS | | | 108 | | | | 25,244 | |
Stryker | | | 322 | | | | 85,674 | |
Teleflex | | | 33 | | | | 11,779 | |
| Schedule of Investments | | October 31, 2021 |
| | Global X S&P 500® Covered Call & Growth ETF | |
| | | | | | | |
| COMMON STOCK — continued | | | | | | |
| Health Care — continued | | | | | | |
Thermo Fisher Scientific | | | 351 | | | $ | 222,208 | |
UnitedHealth Group | | | 861 | | | | 396,465 | |
| Universal Health Services, Cl B | | | 99 | | | | 12,286 | |
Vertex Pharmaceuticals * | | | 222 | | | | 41,054 | |
Viatris, Cl W * | | | 1,089 | | | | 14,538 | |
Waters * | | | 65 | | | | 23,891 | |
West Pharmaceutical Services | | | 75 | | | | 32,241 | |
Zimmer Biomet Holdings | | | 211 | | | | 30,198 | |
Zoetis, Cl A | | | 441 | | | | 95,344 | |
| | | | | | | | 4,644,334 | |
| | | | | | | | | |
| | | | | | | | | |
| Industrials — 8.2% | | | | | | | | |
3M | | | 544 | | | | 97,202 | |
Alaska Air Group * | | | 112 | | | | 5,914 | |
Allegion | | | 108 | | | | 13,856 | |
American Airlines Group * | | | 549 | | | | 10,541 | |
AMETEK | | | 219 | | | | 28,996 | |
AO Smith | | | 112 | | | | 8,184 | |
Boeing * | | | 508 | | | | 105,171 | |
Carrier Global | | | 765 | | | | 39,956 | |
Caterpillar | | | 506 | | | | 103,229 | |
CH Robinson Worldwide | | | 112 | | | | 10,863 | |
Cintas | | | 84 | | | | 36,380 | |
Copart * | | | 215 | | | | 33,387 | |
CSX | | | 2,073 | | | | 74,980 | |
Cummins | | | 113 | | | | 27,102 | |
Deere | | | 249 | | | | 85,235 | |
Delta Air Lines * | | | 550 | | | | 21,521 | |
Dover | | | 112 | | | | 18,937 | |
Eaton | | | 334 | | | | 55,030 | |
Emerson Electric | | | 551 | | | | 53,453 | |
Equifax | | | 110 | | | | 30,517 | |
| Expeditors International of Washington | | | 116 | | | | 14,298 | |
Fastenal | | | 542 | | | | 30,937 | |
| Schedule of Investments | | October 31, 2021 |
| | Global X S&P 500® Covered Call & Growth ETF | |
| | | | | | | |
| COMMON STOCK — continued | | | | | | |
| Industrials — continued | | | | | | |
FedEx | | | 219 | | | $ | 51,581 | |
Fortive | | | 324 | | | | 24,530 | |
| Fortune Brands Home & Security | | | 112 | | | | 11,357 | |
Generac Holdings * | | | 67 | | | | 33,404 | |
General Dynamics | | | 220 | | | | 44,605 | |
General Electric | | | 986 | | | | 103,402 | |
Honeywell International | | | 653 | | | | 142,759 | |
Howmet Aerospace | | | 336 | | | | 9,976 | |
Huntington Ingalls Industries | | | 26 | | | | 5,271 | |
IDEX | | | 75 | | | | 16,693 | |
IHS Markit | | | 334 | | | | 43,660 | |
Illinois Tool Works | | | 250 | | | | 56,967 | |
Ingersoll Rand | | | 334 | | | | 17,956 | |
Jacobs Engineering Group | | | 112 | | | | 15,727 | |
JB Hunt Transport Services | | | 101 | | | | 19,916 | |
Johnson Controls International | | | 659 | | | | 48,351 | |
Kansas City Southern | | | 86 | | | | 26,681 | |
L3Harris Technologies | | | 188 | | | | 43,342 | |
Leidos Holdings | | | 112 | | | | 11,198 | |
Lockheed Martin | | | 221 | | | | 73,443 | |
Masco | | | 224 | | | | 14,683 | |
Nielsen Holdings | | | 334 | | | | 6,763 | |
Norfolk Southern | | | 222 | | | | 65,057 | |
Northrop Grumman | | | 130 | | | | 46,439 | |
Old Dominion Freight Line | | | 88 | | | | 30,039 | |
Otis Worldwide | | | 355 | | | | 28,510 | |
PACCAR | | | 328 | | | | 29,395 | |
Parker-Hannifin | | | 110 | | | | 32,625 | |
Pentair | | | 116 | | | | 8,581 | |
Quanta Services | | | 112 | | | | 13,583 | |
Raytheon Technologies | | | 1,406 | | | | 124,937 | |
Republic Services, Cl A | | | 220 | | | | 29,612 | |
Robert Half International | | | 110 | | | | 12,438 | |
| Schedule of Investments | | October 31, 2021 |
| | Global X S&P 500® Covered Call & Growth ETF | |
| | | | | | | |
| COMMON STOCK — continued | | | | | | |
| Industrials — continued | | | | | | |
Rockwell Automation | | | 110 | | | $ | 35,134 | |
Rollins | | | 221 | | | | 7,786 | |
Roper Technologies | | | 106 | | | | 51,714 | |
Snap-On | | | 37 | | | | 7,520 | |
Southwest Airlines * | | | 555 | | | | 26,240 | |
Stanley Black & Decker | | | 138 | | | | 24,803 | |
Textron | | | 221 | | | | 16,321 | |
Trane Technologies | | | 218 | | | | 39,443 | |
TransDigm Group * | | | 51 | | | | 31,815 | |
Union Pacific | | | 596 | | | | 143,874 | |
United Airlines Holdings * | | | 326 | | | | 15,042 | |
United Parcel Service, Cl B | | | 662 | | | | 141,317 | |
United Rentals * | | | 73 | | | | 27,675 | |
Verisk Analytics, Cl A | | | 137 | | | | 28,807 | |
Waste Management | | | 336 | | | | 53,837 | |
| Westinghouse Air Brake Technologies | | | 145 | | | | 13,156 | |
WW Grainger | | | 30 | | | | 13,893 | |
Xylem | | | 149 | | | | 19,458 | |
| | | | | | | | 2,847,005 | |
| | | | | | | | | |
| | | | | | | | | |
| Information Technology — 28.1% | | | | | | | | |
Accenture, Cl A | | | 570 | | | | 204,510 | |
Adobe * | | | 440 | | | | 286,158 | |
Advanced Micro Devices * | | | 1,102 | | | | 132,493 | |
Akamai Technologies * | | | 115 | | | | 12,128 | |
Amphenol, Cl A | | | 552 | | | | 42,377 | |
Analog Devices | | | 502 | | | | 87,092 | |
ANSYS * | | | 84 | | | | 31,885 | |
Apple | | | 14,308 | | | | 2,143,338 | |
Applied Materials | | | 837 | | | | 114,376 | |
Arista Networks * | | | 39 | | | | 15,978 | |
Autodesk * | | | 217 | | | | 68,921 | |
Automatic Data Processing | | | 371 | | | | 83,286 | |
Broadcom | | | 364 | | | | 193,528 | |
| Schedule of Investments | | October 31, 2021 |
| | Global X S&P 500® Covered Call & Growth ETF | |
| | | | | | | |
| COMMON STOCK — continued | | | | | | |
| Information Technology — continued | | | | | | |
Broadridge Financial Solutions | | | 110 | | | $ | 19,625 | |
Cadence Design Systems * | | | 224 | | | | 38,777 | |
CDW | | | 112 | | | | 20,905 | |
Ceridian HCM Holding * | | | 115 | | | | 14,404 | |
Cisco Systems | | | 3,854 | | | | 215,708 | |
Citrix Systems | | | 110 | | | | 10,420 | |
| Cognizant Technology Solutions, Cl A | | | 441 | | | | 34,438 | |
Corning | | | 664 | | | | 23,619 | |
DXC Technology * | | | 224 | | | | 7,296 | |
Enphase Energy * | | | 109 | | | | 25,248 | |
F5 Networks * | | | 41 | | | | 8,657 | |
| Fidelity National Information Services | | | 550 | | | | 60,907 | |
Fiserv * | | | 548 | | | | 53,973 | |
FleetCor Technologies * | | | 80 | | | | 19,793 | |
Fortinet * | | | 112 | | | | 37,670 | |
Gartner * | | | 81 | | | | 26,885 | |
Global Payments | | | 254 | | | | 36,319 | |
Hewlett Packard Enterprise | | | 1,219 | | | | 17,858 | |
HP | | | 1,121 | | | | 34,000 | |
Intel | | | 3,702 | | | | 181,398 | |
| International Business Machines | | | 802 | | | | 100,330 | |
Intuit | | | 242 | | | | 151,490 | |
IPG Photonics * | | | 3 | | | | 477 | |
Jack Henry & Associates | | | 73 | | | | 12,153 | |
Juniper Networks | | | 330 | | | | 9,742 | |
Keysight Technologies * | | | 175 | | | | 31,504 | |
KLA | | | 132 | | | | 49,204 | |
Lam Research | | | 125 | | | | 70,446 | |
Mastercard, Cl A | | | 786 | | | | 263,719 | |
Microchip Technology | | | 444 | | | | 32,896 | |
Micron Technology | | | 999 | | | | 69,031 | |
Microsoft | | | 6,839 | | | | 2,267,949 | |
Monolithic Power Systems | | | 30 | | | | 15,764 | |
| Schedule of Investments | | October 31, 2021 |
| | Global X S&P 500® Covered Call & Growth ETF | |
| | | | | | | |
| COMMON STOCK — continued | | | | | | |
| Information Technology — continued | | | | | | |
Motorola Solutions | | | 143 | | | $ | 35,548 | |
NetApp | | | 220 | | | | 19,646 | |
NortonLifeLock | | | 554 | | | | 14,099 | |
NVIDIA | | | 2,273 | | | | 581,138 | |
Oracle | | | 1,501 | | | | 144,006 | |
Paychex | | | 325 | | | | 40,066 | |
Paycom Software * | | | 34 | | | | 18,627 | |
PayPal Holdings * | | | 1,073 | | | | 249,569 | |
PTC * | | | 106 | | | | 13,499 | |
Qorvo * | | | 110 | | | | 18,505 | |
QUALCOMM | | | 994 | | | | 132,242 | |
salesforce.com * | | | 875 | | | | 262,229 | |
Seagate Technology Holdings | | | 220 | | | | 19,595 | |
ServiceNow * | | | 187 | | | | 130,481 | |
Skyworks Solutions | | | 139 | | | | 23,231 | |
Synopsys * | | | 131 | | | | 43,647 | |
TE Connectivity | | | 321 | | | | 46,866 | |
Teledyne Technologies * | | | 33 | | | | 14,824 | |
Teradyne | | | 116 | | | | 16,036 | |
Texas Instruments | | | 845 | | | | 158,421 | |
Trimble * | | | 222 | | | | 19,396 | |
Tyler Technologies * | | | 29 | | | | 15,753 | |
VeriSign * | | | 108 | | | | 24,048 | |
Visa, Cl A | | | 1,539 | | | | 325,914 | |
Western Digital * | | | 328 | | | | 17,151 | |
Western Union | | | 339 | | | | 6,177 | |
Xilinx | | | 222 | | | | 39,960 | |
Zebra Technologies, Cl A * | | | 53 | | | | 28,299 | |
| | | | | | | | 9,837,648 | |
| | | | | | | | | |
| | | | | | | | | |
| Materials — 2.1% | | | | | | | | |
Air Products & Chemicals | | | 217 | | | | 65,059 | |
Albemarle | | | 110 | | | | 27,552 | |
Amcor | | | 1,446 | | | | 17,453 | |
| Schedule of Investments | | October 31, 2021 |
| | Global X S&P 500® Covered Call & Growth ETF | |
| | | | | | | |
| COMMON STOCK — continued | | | | | | |
| Materials — continued | | | | | | |
Avery Dennison | | | 80 | | | $ | 17,418 | |
Ball | | | 324 | | | | 29,640 | |
Celanese, Cl A | | | 110 | | | | 17,766 | |
CF Industries Holdings | | | 220 | | | | 12,496 | |
Corteva | | | 660 | | | | 28,479 | |
Dow | | | 664 | | | | 37,164 | |
DuPont de Nemours | | | 444 | | | | 30,902 | |
Eastman Chemical | | | 112 | | | | 11,651 | |
Ecolab | | | 219 | | | | 48,666 | |
FMC | | | 112 | | | | 10,193 | |
Freeport-McMoRan | | | 1,326 | | | | 50,017 | |
| International Flavors & Fragrances | | | 222 | | | | 32,734 | |
International Paper | | | 336 | | | | 16,689 | |
| LyondellBasell Industries, Cl A | | | 224 | | | | 20,792 | |
Martin Marietta Materials | | | 66 | | | | 25,927 | |
Mosaic | | | 332 | | | | 13,801 | |
Newmont | | | 769 | | | | 41,526 | |
Nucor | | | 224 | | | | 25,010 | |
Packaging Corp of America | | | 108 | | | | 14,836 | |
PPG Industries | | | 219 | | | | 35,165 | |
Sealed Air | | | 114 | | | | 6,762 | |
Sherwin-Williams | | | 220 | | | | 69,654 | |
Vulcan Materials | | | 112 | | | | 21,293 | |
Westrock | | | 225 | | | | 10,823 | |
| | | | | | | | 739,468 | |
| | | | | | | | | |
| | | | | | | | | |
| Real Estate — 2.6% | | | | | | | | |
Alexandria Real Estate Equities ‡ | | | 110 | | | | 22,455 | |
American Tower, Cl A ‡ | | | 417 | | | | 117,582 | |
AvalonBay Communities ‡ | | | 110 | | | | 26,035 | |
Boston Properties ‡ | | | 113 | | | | 12,841 | |
CBRE Group, Cl A * | | | 324 | | | | 33,722 | |
Crown Castle International �� | | | 400 | | | | 72,120 | |
Digital Realty Trust ‡ | | | 224 | | | | 35,350 | |
| Schedule of Investments | | October 31, 2021 |
| | Global X S&P 500® Covered Call & Growth ETF | |
| | | | | | | |
| COMMON STOCK — continued | | | | | | |
| Real Estate — continued | | | | | | |
Duke Realty ‡ | | | 334 | | | $ | 18,784 | |
Equinix ‡ | | | 87 | | | | 72,825 | |
Equity Residential ‡ | | | 324 | | | | 27,994 | |
Essex Property Trust ‡ | | | 68 | | | | 23,115 | |
Extra Space Storage ‡ | | | 112 | | | | 22,105 | |
Federal Realty Investment Trust ‡ | | | 106 | | | | 12,757 | |
Healthpeak Properties ‡ | | | 461 | | | | 16,370 | |
Host Hotels & Resorts ‡ * | | | 666 | | | | 11,209 | |
Iron Mountain ‡ | | | 227 | | | | 10,360 | |
Kimco Realty ‡ | | | 496 | | | | 11,210 | |
Mid-America Apartment Communities ‡ | | | 110 | | | | 22,463 | |
ProLogis ‡ | | | 664 | | | | 96,253 | |
Public Storage ‡ | | | 131 | | | | 43,516 | |
Realty Income ‡ | | | 332 | | | | 23,715 | |
Regency Centers ‡ | | | 114 | | | | 8,027 | |
SBA Communications, Cl A ‡ | | | 110 | | | | 37,986 | |
Simon Property Group ‡ | | | 328 | | | | 48,078 | |
UDR ‡ | | | 236 | | | | 13,105 | |
Ventas ‡ | | | 334 | | | | 17,826 | |
Vornado Realty Trust ‡ | | | 114 | | | | 4,860 | |
Welltower ‡ | | | 333 | | | | 26,773 | |
Weyerhaeuser ‡ | | | 670 | | | | 23,932 | |
| | | | | | | | 913,368 | |
| | | | | | | | | |
| | | | | | | | | |
| Utilities — 2.5% | | | | | | | | |
AES | | | 644 | | | | 16,184 | |
Alliant Energy | | | 223 | | | | 12,615 | |
Ameren | | | 222 | | | | 18,712 | |
American Electric Power | | | 443 | | | | 37,526 | |
American Water Works | | | 173 | | | | 30,133 | |
Atmos Energy | | | 108 | | | | 9,949 | |
CenterPoint Energy | | | 550 | | | | 14,322 | |
CMS Energy | | | 227 | | | | 13,699 | |
Consolidated Edison | | | 330 | | | | 24,882 | |
| Schedule of Investments | | October 31, 2021 |
| | Global X S&P 500® Covered Call & Growth ETF | |
| | | Shares/Number of Contracts | | | | |
| COMMON STOCK — continued | | | | | | |
| Utilities — continued | | | | | | |
Dominion Energy | | | 763 | | | $ | 57,935 | |
DTE Energy | | | 214 | | | | 24,257 | |
Duke Energy | | | 671 | | | | 68,449 | |
Edison International | | | 327 | | | | 20,578 | |
Entergy | | | 218 | | | | 22,458 | |
Evergy | | | 221 | | | | 14,089 | |
Eversource Energy | | | 329 | | | | 27,932 | |
Exelon | | | 884 | | | | 47,020 | |
FirstEnergy | | | 536 | | | | 20,652 | |
NextEra Energy | | | 1,773 | | | | 151,290 | |
NiSource | | | 337 | | | | 8,314 | |
NRG Energy | | | 222 | | | | 8,856 | |
Pinnacle West Capital | | | 110 | | | | 7,094 | |
PPL | | | 679 | | | | 19,555 | |
| Public Service Enterprise Group | | | 446 | | | | 28,455 | |
Sempra Energy | | | 324 | | | | 41,352 | |
Southern | | | 991 | | | | 61,759 | |
WEC Energy Group | | | 329 | | | | 29,630 | |
Xcel Energy | | | 458 | | | | 29,582 | |
| | | | | | | | 867,279 | |
| | | | | | | | | |
| | | | | | | | | |
TOTAL UNITED STATES | | | | | | | 35,345,949 | |
| TOTAL COMMON STOCK | | | | | | | | |
(Cost $33,633,036) | | | | | | | 35,538,814 | |
| TOTAL INVESTMENTS — 101.5% | | | | | | | | |
(Cost $33,633,036) | | | | | | $ | 35,538,814 | |
| | | | | | | | | |
| | | | | | | | | |
WRITTEN OPTION— (1.7)%(1) | | | | | | | | |
| UNITED STATES— (1.7)% | | | | | | | | |
| (Premiums Received ($239,180)) | | | (385 | ) | | $ | (601,178 | ) |
Percentages are based on Net Assets of $35,018,124.
| Schedule of Investments | | October 31, 2021 |
| | Global X S&P 500® Covered Call & Growth ETF | |
A list of the exchange traded option contracts held by the Fund at October 31, 2021, is as follows:
| Description | | Number of Contracts | | | Cost+ | | | Exercise Price | | Expiration Date | | Value | |
| WRITTEN OPTION — (1.7)% | | | | | | | | | | | | | |
| Call Options | | | | | | | | | | | | | |
| XSP* | | | (385 | ) | | $ | (239,180 | ) | | $ | 447.00 | | 11/19/21 | | $ | (601,178 | ) |
| * | Non-income producing security. |
| + | Notional amount for all options totals $(17,730,790). |
| ‡ | Real Estate Investment Trust |
| (1) | Refer to table below for details on Options Contracts. |
| (A) | All or a portion of these securities has been segregated as collateral for writtenoptions contracts. The aggregate market value of collateral at October 31, 2021 was $35,538,814.
|
Cl — Class
S&P — Standard & Poor’s
XSP — iShares Core S&P 500 Index ETF
The following is a summary of the level of inputs used as of October 31, 2021, in valuing the Fund’s investments carried at value:
| Investments in Securities | | | | | | | | | | | | |
| Common Stock | | $ | 35,538,814 | | | $ | — | | | $ | — | | | $ | 35,538,814 | |
| Total Investments in Securities | | $ | 35,538,814 | | | $ | — | | | $ | — | | | $ | 35,538,814 | |
| Other Financial Instruments | | | | | | | | | | | | |
| Written Option | | $ | (601,178 | ) | | $ | — | | | $ | — | | | $ | (601,178 | ) |
| Total Liabilities | | $ | (601,178 | ) | | $ | — | | | $ | — | | | $ | (601,178 | ) |
For the year ended October 31, 2021, there have been no transfers in or out of Level 3.
Amounts designated as “—” are $0 or have been rounded to $0.
| Schedule of Investments | | October 31, 2021 |
| | Global X SuperIncome™ Preferred ETF | |
Sector Weightings (Unaudited)†:
† Sector weightings percentages are based on the total market value of investments. Repurchase agreements purchased from cash collateral received for securities lending activity are included in total investments. Please see Note 2 and 7 in Notes to Financial Statements for more detailed information.
| | | | | | | |
| PREFERRED STOCK — 99.8% | | | | | | |
| UNITED STATES— 99.8% | | | | | | |
| Communication Services — 5.1% | | | | | | |
| Telephone and Data Systems, 6.625% | | | 107,968 | | | $ | 2,961,562 | |
| Telephone and Data Systems, 6.000% | | | 187,462 | | | | 4,915,254 | |
ViacomCBS, 5.750% | | | 67,390 | | | | 4,085,856 | |
| | | | | | | | 11,962,672 | |
| Consumer Discretionary — 3.9% | | | | | | | | |
Qurate Retail, 8.000% | | | 84,799 | | | | 9,258,355 | |
| Energy — 6.7% | | | | | | | | |
| Crestwood Equity Partners, 9.250% | | | 472,362 | | | | 4,832,263 | |
| Energy Transfer, 7.600%, VAR ICE LIBOR USD 3 Month + 5.161% | | | 215,046 | | | | 5,487,974 | |
| Energy Transfer, 7.375%, VAR ICE LIBOR USD 3 Month + 4.530% | | | 120,425 | | | | 3,039,527 | |
| NuStar Energy, 7.625%, VAR ICE LIBOR USD 3 Month + 5.643% | | | 105,459 | | | | 2,388,646 | |
| | | | | | | | 15,748,410 | |
| Schedule of Investments | | October 31, 2021 |
| | Global X SuperIncome™ Preferred ETF | |
| | | | | | | |
| PREFERRED STOCK — continued | | | | | | |
| Financials — 63.7% | | | | | | |
AGNC Investment, 6.500%, VAR ICE LIBOR USD 3 Month + 4.993% ‡ | | | 110,539 | | | $ | 2,866,276 | |
AGNC Investment, 6.125%, VAR ICE LIBOR USD 3 Month + 4.697% ‡ | | | 156,857 | | | | 3,973,188 | |
Allstate, 5.625% | | | 156,597 | | | | 4,267,268 | |
| American International Group, 5.850% | | | 134,852 | | | | 3,673,369 | |
Annaly Capital Management, 6.950%, VAR ICE LIBOR USD 3 Month + 4.993% ‡ | | | 192,208 | | | | 4,872,473 | |
Annaly Capital Management, 6.750%, VAR ICE LIBOR USD 3 Month + 4.989% ‡ | | | 118,378 | | | | 3,112,158 | |
| Athene Holding, 6.350%, VAR ICE LIBOR USD 3 Month + 4.253% | | | 233,258 | | | | 6,972,082 | |
Bank of America, 6.000% | | | 264,244 | | | | 7,034,175 | |
Bank of America, 5.875% | | | 169,801 | | | | 4,586,325 | |
Charles Schwab, 5.950% | | | 202,425 | | | | 5,200,298 | |
| Citigroup, Ser J, 7.125%, VAR ICE LIBOR USD 3 Month + 4.040% | | | 84,793 | | | | 2,381,835 | |
| Citigroup, 6.875%, VAR ICE LIBOR USD 3 Month + 4.130% | | | 132,581 | | | | 3,759,997 | |
| Citigroup Capital XIII, 6.499%, VAR ICE LIBOR USD 3 Month + 6.370% | | | 200,959 | | | | 5,516,325 | |
| Fifth Third Bancorp, 6.625%, VAR ICE LIBOR USD 3 Month + 3.710% | | | 124,381 | | | | 3,575,954 | |
| Goldman Sachs Group, 6.375%, VAR ICE LIBOR USD 3 Month + 3.550% | | | 190,341 | | | | 5,398,071 | |
| Hartford Financial Services Group, 7.875%, VAR ICE LIBOR USD 3 Month + 5.596% | | | 165,073 | | | | 4,301,802 | |
JPMorgan Chase, 6.000% | | | 221,798 | | | | 6,152,677 | |
JPMorgan Chase, 5.750% F | | | 202,762 | | | | 5,525,265 | |
| Morgan Stanley, Ser E, 7.125%, VAR ICE LIBOR USD 3 Month + 4.320% | | | 130,967 | | | | 3,719,463 | |
| Morgan Stanley, Ser F, 6.875%, VAR ICE LIBOR USD 3 Month + 3.940% | | | 128,557 | | | | 3,631,735 | |
| Morgan Stanley, 6.375%, VAR ICE LIBOR USD 3 Month + 3.708% | | | 151,920 | | | | 4,347,950 | |
| Schedule of Investments | | October 31, 2021 |
| | Global X SuperIncome™ Preferred ETF | |
| | | | | | | |
| PREFERRED STOCK — continued | | | | | | |
| Financials — continued | | | | | | |
New Residential Investment, 7.000%, VAR US Treas Yield Curve Rate T Note Const Mat 5 Yr + 6.223% ‡ | | | 113,538 | | | $ | 2,866,835 | |
New Residential Investment, 6.375%, VAR ICE LIBOR USD 3 Month + 4.969% ‡ | | | 107,976 | | | | 2,536,356 | |
PennyMac Mortgage Investment Trust, 6.750% ‡ | | | 66,726 | | | | 1,694,840 | |
| PNC Financial Services Group, 6.125%, VAR ICE LIBOR USD 3 Month + 4.067% | | | 405,279 | | | | 10,423,776 | |
| Regions Financial, Ser B, 6.375%, VAR ICE LIBOR USD 3 Month + 3.536% | | | 133,291 | | | | 3,785,464 | |
| Reinsurance Group of America, 6.200%, VAR ICE LIBOR USD 3 Month + 4.370% | | | 106,810 | | | | 2,799,490 | |
| State Street, 5.900%, VAR ICE LIBOR USD 3 Month + 3.108% | | | 203,018 | | | | 5,783,983 | |
Synchrony Financial, 5.625% | | | 201,532 | | | | 5,374,859 | |
| US Bancorp, 6.500%, VAR ICE LIBOR USD 3 Month + 4.468% | | | 301,711 | | | | 7,657,425 | |
| Wells Fargo, 6.625%, VAR ICE LIBOR USD 3 Month + 3.690% | | | 110,026 | | | | 3,097,232 | |
| Wells Fargo, 5.850%, VAR ICE LIBOR USD 3 Month + 3.090% | | | 227,194 | | | | 6,122,878 | |
Wells Fargo, 5.625% | | | 90,345 | | | | 2,342,646 | |
| | | | | | | | 149,354,470 | |
| Health Care — 4.9% | | | | | | | | |
Becton Dickinson, 6.000% | | | 218,779 | | | | 11,507,776 | |
| Industrials — 5.9% | | | | | | | | |
Clarivate, 5.250% | | | 102,492 | | | | 9,424,139 | |
| WESCO International, 10.625%, VAR US Treas Yield Curve Rate T Note Const Mat 5 Yr + 10.325% | | | 142,805 | | | | 4,484,077 | |
| | | | | | | | 13,908,216 | |
| Real Estate — 3.9% | | | | | | | | |
| Brookfield Property Preferred, 6.250% | | | 144,370 | | | | 3,584,707 | |
| Schedule of Investments | | October 31, 2021 |
| | Global X SuperIncome™ Preferred ETF | |
| | | | | | | |
| PREFERRED STOCK — continued | | | | | | |
| Real Estate — continued | | | | | | |
Monmouth Real Estate Investment, 6.125% ‡ | | | 147,922 | | | $ | 3,773,490 | |
Pebblebrook Hotel Trust, 5.700% ‡ (A) | | | 67,734 | | | | 1,763,116 | |
| | | | | | | | 9,121,313 | |
| Utilities — 5.7% | | | | | | | | |
Duke Energy, 5.750% | | | 268,173 | | | | 7,455,209 | |
| NiSource, 6.500%, VAR US Treas Yield Curve Rate T Note Const Mat 5 Yr + 3.632% | | | 134,828 | | | | 3,791,363 | |
| SCE Trust IV, 5.375%, VAR ICE LIBOR USD 3 Month + 3.132% | | | 88,051 | | | | 2,206,558 | |
| | | | | | | | 13,453,130 | |
TOTAL UNITED STATES | | | | | | | 234,314,342 | |
| TOTAL PREFERRED STOCK | | | | | | | | |
(Cost $226,858,141) | | | | | | | 234,314,342 | |
| | | | | | | | | |
SHORT-TERM INVESTMENT — 0.0%(B)(C) | | | | | | | | |
| Fidelity Investments Money Market Government Portfolio, Cl Institutional, 0.010% | | | | | | | | |
(Cost $41,109) | | | 41,109 | | | | 41,109 | |
| | | | | | | | | |
REPURCHASE AGREEMENT — 0.0%(B) | | | | | | | | |
| BNP Paribas | | | | | | | | |
| 0.030%, dated 10/29/21, to be repurchased on 11/01/21, repurchase price $33,091 (collateralized by U.S. Treasury Obligations, ranging in par value $1,331 - $4,438, 0.750% - 1.250%, 01/31/28 - 03/31/28, with a total market value of $33,816) | | | | | | | | |
(Cost $33,091) | | $ | 33,091 | | | | 33,091 | |
| TOTAL INVESTMENTS — 99.8% | | | | | | | | |
(Cost $226,932,341) | | | | | | $ | 234,388,542 | |
Percentages are based on Net Assets of $234,952,724.
| Schedule of Investments | | October 31, 2021 |
| | Global X SuperIncome™ Preferred ETF | |
| ‡ | Real Estate Investment Trust |
| (A) | This security or a partial position of this security is on loan at October 31, 2021. The total value of securities on loan at October 31, 2021 was $72,884. |
| (B) | Security was purchased with cash collateral held from securities on loan. The total value of such securities as of October 31, 2021 was $74,200. |
| (C) | The rate reported on the Schedule of Investments is the 7-day effective yield as of October 31, 2021. |
Cl — Class
ICE — Intercontinental Exchange
LIBOR — London Interbank Offered Rate
Ser — Series
USD — U.S. Dollar
VAR – Variable Rate
The following is a summary of the level of inputs used as of October 31, 2021, in valuing the Fund’s investments carried at value:
| Investments in Securities | | | | | | | | | | | | |
| Preferred Stock | | $ | 234,314,342 | | | $ | — | | | $ | — | | | $ | 234,314,342 | |
| Short-Term Investment | | | 41,109 | | | | — | | | | — | | | | 41,109 | |
| Repurchase Agreement | | | — | | | | 33,091 | | | | — | | | | 33,091 | |
| Total Investments in Securities | | $ | 234,355,451 | | | $ | 33,091 | | | $ | — | | | $ | 234,388,542 | |
For the year ended October 31, 2021, there have been no transfers in or out of Level 3.
Amounts designated as “—“ are $0 or have been rounded to $0.
| Schedule of Investments | | October 31, 2021 |
| | Global X Renewable Energy Producers ETF | |
Sector Weightings (Unaudited)†:
† Sector weightings percentages are based on the total market value of investments. Repurchase agreements purchased from cash collateral received for securities lending activity are included in total investments. Please see Note 2 and 7 in Notes to Financial Statements for more detailed information.
| | | | | | | |
| COMMON STOCK — 93.0% | | | | | | |
| AUSTRIA — 6.2% | | | | | | |
| Utilities — 6.2% | | | | | | |
Verbund | | | 87,634 | | | $ | 9,137,415 | |
| | | | | | | | | |
| BRAZIL — 7.1% | | | | | | | | |
| Utilities — 7.1% | | | | | | | | |
Centrais Eletricas Brasileiras | | | 927,175 | | | | 5,564,366 | |
Engie Brasil Energia | | | 586,318 | | | | 4,047,123 | |
Omega Geracao * | | | 139,814 | | | | 811,799 | |
| | | | | | | | | |
TOTAL BRAZIL | | | | | | | 10,423,288 | |
| CANADA — 8.4% | | | | | | | | |
| Utilities — 8.4% | | | | | | | | |
Boralex, Cl A | | | 73,665 | | | | 2,276,124 | |
Innergex Renewable Energy | | | 125,462 | | | | 2,085,045 | |
Northland Power | | | 162,088 | | | | 5,203,083 | |
TransAlta Renewables (A) | | | 191,709 | | | | 2,833,374 | |
| | | | | | | | | |
TOTAL CANADA | | | | | | | 12,397,626 | |
| CHINA — 5.9% | | | | | | | | |
| Utilities — 5.9% | | | | | | | | |
| China Longyuan Power Group, Cl H | | | 2,403,300 | | | | 5,616,623 | |
Xinyi Energy Holdings | | | 5,106,900 | | | | 3,006,743 | |
| Schedule of Investments | | October 31, 2021 |
| | Global X Renewable Energy Producers ETF | |
| | | | | | | |
| COMMON STOCK — continued | | | | | | |
TOTAL CHINA | | | | | $ | 8,623,366 | |
| DENMARK — 5.4% | | | | | | | |
| Utilities — 5.4% | | | | | | | |
Orsted | | | 56,502 | | | | 7,980,869 | |
| | | | | | | | | |
| FRANCE — 4.2% | | | | | | | | |
| Utilities — 4.2% | | | | | | | | |
Albioma | | | 22,671 | | | | 892,022 | |
Neoen * | | | 76,861 | | | | 3,540,096 | |
Voltalia * | | | 68,397 | | | | 1,780,925 | |
| | | | | | | | | |
TOTAL FRANCE | | | | | | | 6,213,043 | |
| GERMANY — 1.4% | | | | | | | | |
| Utilities — 1.4% | | | | | | | | |
Encavis (A) | | | 99,921 | | | | 2,092,962 | |
| | | | | | | | | |
| GREECE — 0.8% | | | | | | | | |
| Utilities — 0.8% | | | | | | | | |
Terna Energy | | | 82,584 | | | | 1,118,170 | |
| | | | | | | | | |
| INDIA — 0.6% | | | | | | | | |
| Utilities — 0.6% | | | | | | | | |
Azure Power Global * (A) | | | 34,261 | | | | 815,069 | |
| | | | | | | | | |
| ISRAEL — 2.2% | | | | | | | | |
| Utilities — 2.2% | | | | | | | | |
Energix-Renewable Energies | | | 349,373 | | | | 1,643,470 | |
Enlight Renewable Energy * | | | 655,095 | | | | 1,618,620 | |
| | | | | | | | | |
TOTAL ISRAEL | | | | | | | 3,262,090 | |
| ITALY — 4.1% | | | | | | | | |
| Utilities — 4.1% | | | | | | | | |
ERG | | | 107,992 | | | | 3,901,669 | |
Falck Renewables | | | 209,079 | | | | 2,108,646 | |
| Schedule of Investments | | October 31, 2021 |
| | Global X Renewable Energy Producers ETF | |
| | | | | | | |
| COMMON STOCK — continued | | | | | | |
TOTAL ITALY | | | | | $ | 6,010,315 | |
| JAPAN — 2.9% | | | | | | | |
| Utilities — 2.9% | | | | | | | |
RENOVA * | | | 56,001 | | | | 2,455,646 | |
West Holdings | | | 32,812 | | | | 1,824,407 | |
| | | | | | | | | |
TOTAL JAPAN | | | | | | | 4,280,053 | |
| NEW ZEALAND — 9.6% | | | | | | | | |
| Utilities — 9.6% | | | | | | | | |
Contact Energy | | | 557,554 | | | | 3,263,933 | |
Mercury NZ | | | 980,494 | | | | 4,304,875 | |
Meridian Energy | | | 1,840,798 | | | | 6,573,667 | |
| | | | | | | | | |
TOTAL NEW ZEALAND | | | | | | | 14,142,475 | |
| | | | | | | | | |
| RUSSIA — 2.5% | | | | | | | | |
| Utilities — 2.5% | | | | | | | | |
RusHydro PJSC | | | 316,057,042 | | | | 3,621,497 | |
| | | | | | | | | |
| SOUTH AFRICA — 1.5% | | | | | | | | |
| Utilities — 1.5% | | | | | | | | |
Scatec | | | 114,031 | | | | 2,239,021 | |
| SPAIN — 9.9% | | | | | | | | |
| Utilities — 9.9% | | | | | | | | |
| Atlantica Sustainable Infrastructure | | | 79,808 | | | | 3,140,445 | |
EDP Renovaveis | | | 346,514 | | | | 9,664,152 | |
Solaria Energia y Medio Ambiente * | | | 89,222 | | | | 1,783,160 | |
| | | | | | | | | |
TOTAL SPAIN | | | | | | | 14,587,757 | |
| THAILAND — 5.8% | | | | | | | | |
| Utilities — 5.8% | | | | | | | | |
Absolute Clean Energy NVDR (A) | | | 7,242,189 | | | | 785,712 | |
BCPG NVDR | | | 1,880,131 | | | | 742,250 | |
Energy Absolute NVDR | | | 2,683,902 | | | | 5,297,840 | |
Gunkul Engineering NVDR | | | 6,324,105 | | | | 1,029,162 | |
| Schedule of Investments | | October 31, 2021 |
| | Global X Renewable Energy Producers ETF | |
| | | | | | | |
| COMMON STOCK — continued | | | | | | |
| Utilities — continued | | | | | | |
Super Energy NVDR (A) | | | 20,279,842 | | | $ | 592,826 | |
| | | | | | | | | |
TOTAL THAILAND | | | | | | | 8,447,790 | |
| UNITED KINGDOM — 1.4% | | | | | | | | |
| Utilities — 1.4% | | | | | | | | |
Drax Group | | | 286,044 | | | | 2,080,056 | |
| | | | | | | | | |
| UNITED STATES — 13.1% | | | | | | | | |
| Energy — 2.2% | | | | | | | | |
Gevo * (A) | | | 141,017 | | | | 1,019,553 | |
Renewable Energy Group * | | | 34,201 | | | | 2,188,864 | |
| | | | | | | | 3,208,417 | |
| | | | | | | | | |
| Industrials — 5.7% | | | | | | | | |
Sunrun * | | | 146,689 | | | | 8,461,022 | |
| | | | | | | | | |
| Utilities — 5.2% | | | | | | | | |
NextEra Energy Partners | | | 54,626 | | | | 4,714,224 | |
Ormat Technologies | | | 40,210 | | | | 2,908,389 | |
| | | | | | | | 7,622,613 | |
| | | | | | | | | |
TOTAL UNITED STATES | | | | | | | 19,292,052 | |
| TOTAL COMMON STOCK | | | | | | | | |
(Cost $136,858,067) | | | | | | | 136,764,914 | |
| | | | | | | | | |
| MASTER LIMITED PARTNERSHIPS — 6.9% | | | | | | | | |
| CANADA— 5.4% | | | | | | | | |
| Utilities — 5.4% | | | | | | | | |
Brookfield Renewable Partners (B) | | | 197,691 | | | | 7,912,106 | |
| UNITED STATES— 1.5% | | | | | | | | |
| Energy — 1.5% | | | | | | | | |
Enviva Partners (B) | | | 32,258 | | | | 2,159,996 | |
| TOTAL MASTER LIMITED PARTNERSHIPS | | | | | | | | |
(Cost $7,655,203) | | | | | | | 10,072,102 | |
| Schedule of Investments | | October 31, 2021 |
| | Global X Renewable Energy Producers ETF | |
| | | | | | | |
SHORT-TERM INVESTMENT — 1.4%(C)(D) | | | | | | |
| Fidelity Investments Money Market Government Portfolio, Cl Institutional, 0.010% | | | | | | |
(Cost $2,100,993) | | | 2,100,993 | | | $ | 2,100,993 | |
| | | | | | | | | |
REPURCHASE AGREEMENT — 1.2%(C) | | | | | | | | |
| BNP Paribas | | | | | | | | |
| 0.030%, dated 10/29/21, to be repurchased on 11/01/21, repurchase price $1,691,232 (collateralized by U.S. Treasury Obligations, ranging in par value $68,016 - $226,822, 0.750% - 1.250%, 01/31/28 - 03/31/28, with a total market value of $1,728,293) | | | | | | | | |
(Cost $1,691,227) | | $ | 1,691,227 | | | | 1,691,227 | |
| TOTAL INVESTMENTS — 102.5% | | | | | | | | |
(Cost $148,305,490) | | | | | | $ | 150,629,236 | |
Percentages are based on Net Assets of $146,976,294.
| * | Non-income producing security. |
| (A) | This security or a partial position of this security is on loan at October 31, 2021. The total value of securities on loan at October 31, 2021 was $3,623,682. |
| (B) | Security considered Master Limited Partnership. At October 31, 2021, these securities amounted to $10,072,102 or 6.9% of Net Assets. |
| (C) | Security was purchased with cash collateral held from securities on loan. The total value of such securities as of October 31, 2021 was $3,792,220. |
| (D) | The rate reported on the Schedule of Investments is the 7-day effective yield as of October 31, 2021. |
Cl — Class
NVDR — Non-Voting Depositary Receipt
PJSC — Public Joint Stock Company
| Schedule of Investments | | October 31, 2021 |
| | Global X Renewable Energy Producers ETF | |
The following is a summary of the level of inputs used as of October 31, 2021, in valuing the Fund’s investments carried at value:
| Investments in Securities | | | | | | | | | | | | |
| Common Stock | | $ | 133,502,824 | | | $ | 3,262,090 | | | $ | — | | | $ | 136,764,914 | |
| Master Limited Partnerships | | | 10,072,102 | | | | — | | | | — | | | | 10,072,102 | |
| Short-Term Investment | | | 2,100,993 | | | | — | | | | — | | | | 2,100,993 | |
| Repurchase Agreement | | | — | | | | 1,691,227 | | | | — | | | | 1,691,227 | |
| Total Investments in Securities | | $ | 145,675,919 | | | $ | 4,953,317 | | | $ | — | | | $ | 150,629,236 | |
For the year ended October 31, 2021, there have been no transfers in or out of Level 3.
Amounts designated as “—“ are $0 or have been rounded to $0.
| Schedule of Investments | | October 31, 2021 |
| | Global X S&P 500® Catholic Values ETF | |
Sector Weightings (Unaudited)†:
† Sector weightings percentages are based on the total market value of investments.
| | | | | | | |
| COMMON STOCK — 99.7% | | | | | | |
| CHINA — 0.1% | | | | | | |
| Information Technology — 0.1% | | | | | | |
NXP Semiconductors | | | 4,003 | | | $ | 804,043 | |
| | | | | | | | | |
| UNITED KINGDOM — 0.4% | | | | | | | | |
| Materials — 0.4% | | | | | | | | |
Linde | | | 7,834 | | | | 2,500,613 | |
| | | | | | | | | |
| UNITED STATES — 99.2% | | | | | | | | |
| Communication Services — 10.7% | | | | | | | | |
Activision Blizzard | | | 11,716 | | | | 916,074 | |
Alphabet, Cl A * | | | 4,578 | | | | 13,555,092 | |
Alphabet, Cl C * | | | 4,285 | | | | 12,706,782 | |
AT&T | | | 108,353 | | | | 2,736,997 | |
Charter Communications, Cl A * | | | 1,919 | | | | 1,295,114 | |
Comcast, Cl A | | | 70,140 | | | | 3,607,300 | |
Discovery, Cl A * | | | 2,214 | | | | 51,896 | |
Discovery, Cl C * | | | 5,455 | | | | 123,065 | |
DISH Network, Cl A * | | | 4,071 | | | | 167,196 | |
Electronic Arts | | | 4,261 | | | | 597,605 | |
| Schedule of Investments | | October 31, 2021 |
| | Global X S&P 500® Catholic Values ETF | |
| | | | | | | |
| COMMON STOCK — continued | | | | | | |
| Communication Services — continued | | | | | | |
Fox, Cl A | | | 5,656 | | | $ | 224,769 | |
Fox, Cl B | | | 2,572 | | | | 95,061 | |
Interpublic Group | | | 6,442 | | | | 235,584 | |
Live Nation Entertainment * | | | 1,895 | | | | 191,679 | |
Lumen Technologies | | | 15,998 | | | | 189,736 | |
Meta Platforms, Cl A * | | | 36,266 | | | | 11,734,590 | |
Netflix * | | | 6,766 | | | | 4,670,637 | |
News, Cl A | | | 6,339 | | | | 145,163 | |
News, Cl B | | | 1,967 | | | | 44,375 | |
Omnicom Group | | | 3,132 | | | | 213,227 | |
Take-Two Interactive Software * | | | 1,862 | | | | 337,022 | |
T-Mobile US * | | | 8,857 | | | | 1,018,821 | |
Twitter * | | | 12,314 | | | | 659,292 | |
Verizon Communications | | | 63,241 | | | | 3,351,141 | |
ViacomCBS, Cl B | | | 8,985 | | | | 325,437 | |
Walt Disney | | | 27,614 | | | | 4,668,699 | |
| | | | | | | | 63,862,354 | |
| | | | | | | | | |
| Consumer Discretionary — 12.8% | | | | | | | | |
Advance Auto Parts | | | 1,133 | | | | 255,514 | |
Amazon.com * | | | 6,723 | | | | 22,672,847 | |
Aptiv * | | | 4,366 | | | | 754,838 | |
AutoZone * | | | 338 | | | | 603,276 | |
Bath & Body Works | | | 3,945 | | | | 272,560 | |
Best Buy | | | 3,719 | | | | 454,611 | |
Booking Holdings * | | | 633 | | | | 1,532,354 | |
BorgWarner | | | 3,484 | | | | 157,024 | |
CarMax * | | | 2,445 | | | | 334,769 | |
Carnival * | | | 11,919 | | | | 264,125 | |
Chipotle Mexican Grill, Cl A * | | | 426 | | | | 757,867 | |
Darden Restaurants | | | 2,061 | | | | 297,073 | |
Dollar General | | | 3,608 | | | | 799,244 | |
Dollar Tree * | | | 3,473 | | | | 374,250 | |
Domino’s Pizza | | | 626 | | | | 306,095 | |
| Schedule of Investments | | October 31, 2021 |
| | Global X S&P 500® Catholic Values ETF | |
| | | | | | | |
| COMMON STOCK — continued | | | | | | |
| Consumer Discretionary — continued | | | | | | |
DR Horton | | | 4,929 | | | $ | 440,012 | |
eBay | | | 9,915 | | | | 760,679 | |
Etsy * | | | 1,993 | | | | 499,625 | |
Expedia Group * | | | 2,179 | | | | 358,249 | |
Ford Motor | | | 59,896 | | | | 1,023,024 | |
Gap | | | 3,551 | | | | 80,572 | |
Garmin | | | 2,288 | | | | 328,557 | |
General Motors * | | | 22,242 | | | | 1,210,632 | |
Genuine Parts | | | 2,421 | | | | 317,417 | |
Hanesbrands | | | 6,017 | | | | 102,530 | |
Hasbro | | | 2,002 | | | | 191,711 | |
Hilton Worldwide Holdings * | | | 4,231 | | | | 609,052 | |
Home Depot | | | 16,398 | | | | 6,095,793 | |
Las Vegas Sands * | | | 5,511 | | | | 213,882 | |
Leggett & Platt | | | 2,198 | | | | 102,976 | |
Lennar, Cl A | | | 4,147 | | | | 414,410 | |
LKQ | | | 3,992 | | | | 219,879 | |
Lowe’s | | | 10,877 | | | | 2,543,260 | |
Marriott International, Cl A * | | | 4,159 | | | | 665,523 | |
McDonald’s | | | 11,496 | | | | 2,822,843 | |
Mohawk Industries * | | | 813 | | | | 144,072 | |
NIKE, Cl B | | | 19,683 | | | | 3,292,769 | |
Norwegian Cruise Line Holdings * | | | 5,334 | | | | 137,190 | |
NVR * | | | 50 | | | | 244,740 | |
O’Reilly Automotive * | | | 1,049 | | | | 652,814 | |
Penn National Gaming * | | | 2,293 | | | | 164,179 | |
Pool | | | 648 | | | | 333,824 | |
PulteGroup | | | 4,530 | | | | 217,802 | |
PVH | | | 1,316 | | | | 143,878 | |
Ralph Lauren, Cl A | | | 918 | | | | 116,742 | |
Ross Stores | | | 5,430 | | | | 614,676 | |
Starbucks | | | 18,134 | | | | 1,923,473 | |
Tapestry | | | 4,655 | | | | 181,452 | |
| Schedule of Investments | | October 31, 2021 |
| | Global X S&P 500® Catholic Values ETF | |
| | | | | | | |
| COMMON STOCK — continued | | | | | | |
| Consumer Discretionary — continued | | | | | | |
Target | | | 7,601 | | | $ | 1,973,372 | |
Tesla * | | | 12,522 | | | | 13,949,508 | |
TJX | | | 18,502 | | | | 1,211,696 | |
Tractor Supply | | | 1,722 | | | | 373,967 | |
Ulta Beauty * | | | 920 | | | | 337,971 | |
Under Armour, Cl A * | | | 3,104 | | | | 68,164 | |
Under Armour, Cl C * | | | 2,706 | | | | 51,089 | |
VF | | | 5,387 | | | | 392,605 | |
Whirlpool | | | 1,038 | | | | 218,842 | |
Wynn Resorts * | | | 1,683 | | | | 151,133 | |
Yum! Brands | | | 4,489 | | | | 560,856 | |
| | | | | | | | 76,293,887 | |
| | | | | | | | | |
| Consumer Staples — 5.5% | | | | | | | | |
Altria Group | | | 47,776 | | | | 2,107,399 | |
Archer-Daniels-Midland | | | 14,399 | | | | 924,992 | |
Brown-Forman, Cl B | | | 4,805 | | | | 326,212 | |
Campbell Soup | | | 5,856 | | | | 233,947 | |
Clorox | | | 3,137 | | | | 511,362 | |
Coca-Cola | | | 100,893 | | | | 5,687,338 | |
Colgate-Palmolive | | | 21,818 | | | | 1,662,313 | |
Conagra Brands | | | 12,208 | | | | 393,098 | |
Constellation Brands, Cl A | | | 4,331 | | | | 939,004 | |
Estee Lauder, Cl A | | | 6,004 | | | | 1,947,277 | |
General Mills | | | 15,607 | | | | 964,513 | |
Hormel Foods | | | 7,103 | | | | 300,599 | |
J M Smucker | | | 2,742 | | | | 336,882 | |
Kellogg | | | 6,497 | | | | 398,266 | |
Kimberly-Clark | | | 8,688 | | | | 1,125,009 | |
Kraft Heinz | | | 17,242 | | | | 618,815 | |
Kroger | | | 17,759 | | | | 710,715 | |
Lamb Weston Holdings | | | 3,622 | | | | 204,462 | |
McCormick | | | 6,370 | | | | 511,065 | |
Molson Coors Beverage, Cl B | | | 4,695 | | | | 207,003 | |
| Schedule of Investments | | October 31, 2021 |
| | Global X S&P 500® Catholic Values ETF | |
| | | | | | | |
| COMMON STOCK — continued | | | | | | |
| Consumer Staples — continued | | | | | | |
Monster Beverage * | | | 9,666 | | | $ | 821,610 | |
Procter & Gamble | | | 63,085 | | | | 9,020,524 | |
Sysco | | | 13,185 | | | | 1,013,927 | |
Tyson Foods, Cl A | | | 7,540 | | | | 602,974 | |
Walgreens Boots Alliance | | | 18,485 | | | | 869,165 | |
| | | | | | | | 32,438,471 | |
| | | | | | | | | |
| Energy — 2.9% | | | | | | | | |
APA | | | 6,265 | | | | 164,206 | |
Baker Hughes, Cl A | | | 12,287 | | | | 308,158 | |
Chevron | | | 29,511 | | | | 3,378,714 | |
ConocoPhillips | | | 20,340 | | | | 1,515,127 | |
Coterra Energy | | | 7,175 | | | | 152,971 | |
Devon Energy | | | 9,319 | | | | 373,505 | |
Diamondback Energy | | | 2,488 | | | | 266,689 | |
EOG Resources | | | 8,811 | | | | 814,665 | |
Exxon Mobil | | | 64,639 | | | | 4,167,276 | |
Halliburton | | | 14,365 | | | | 358,981 | |
Hess | | | 4,288 | | | | 354,060 | |
Kinder Morgan | | | 29,247 | | | | 489,887 | |
Marathon Oil | | | 13,594 | | | | 221,854 | |
Marathon Petroleum | | | 9,605 | | | | 633,258 | |
Occidental Petroleum | | | 14,361 | | | | 481,524 | |
ONEOK | | | 6,652 | | | | 423,200 | |
Phillips 66 | | | 6,556 | | | | 490,258 | |
Pioneer Natural Resources | | | 3,410 | | | | 637,602 | |
Schlumberger | | | 22,360 | | | | 721,334 | |
Valero Energy | | | 6,664 | | | | 515,327 | |
Williams | | | 18,222 | | | | 511,856 | |
| | | | | | | | 16,980,452 | |
| | | | | | | | | |
| Financials — 11.3% | | | | | | | | |
Aflac | | | 9,229 | | | | 495,320 | |
Allstate | | | 4,432 | | | | 548,105 | |
| Schedule of Investments | | October 31, 2021 |
| | Global X S&P 500® Catholic Values ETF | |
| | | | | | | |
| COMMON STOCK — continued | | | | | | |
| Financials — continued | | | | | | |
American Express | | | 9,747 | | | $ | 1,693,834 | |
American International Group | | | 12,862 | | | | 760,016 | |
Ameriprise Financial | | | 1,700 | | | | 513,621 | |
Aon, Cl A | | | 3,406 | | | | 1,089,648 | |
Arthur J Gallagher | | | 3,087 | | | | 517,597 | |
Assurant | | | 958 | | | | 154,535 | |
Bank of America | | | 112,644 | | | | 5,382,130 | |
Bank of New York Mellon | | | 11,920 | | | | 705,664 | |
Berkshire Hathaway, Cl B * | | | 28,220 | | | | 8,099,422 | |
BlackRock, Cl A | | | 2,203 | | | | 2,078,442 | |
Capital One Financial | | | 6,743 | | | | 1,018,395 | |
Cboe Global Markets | | | 1,849 | | | | 243,957 | |
Charles Schwab | | | 22,748 | | | | 1,866,018 | |
Chubb | | | 6,632 | | | | 1,295,760 | |
Cincinnati Financial | | | 2,444 | | | | 296,799 | |
Citigroup | | | 30,759 | | | | 2,127,292 | |
Citizens Financial Group | | | 6,273 | | | | 297,215 | |
CME Group, Cl A | | | 5,422 | | | | 1,195,822 | |
Comerica | | | 1,911 | | | | 162,607 | |
Discover Financial Services | | | 4,485 | | | | 508,240 | |
Everest Re Group | | | 694 | | | | 181,481 | |
Fifth Third Bancorp | | | 11,230 | | | | 488,842 | |
First Republic Bank | | | 2,714 | | | | 587,120 | |
Franklin Resources | | | 4,847 | | | | 152,632 | |
Globe Life | | | 1,667 | | | | 148,396 | |
Goldman Sachs Group | | | 5,115 | | | | 2,114,285 | |
| Hartford Financial Services Group | | | 5,155 | | | | 375,954 | |
Huntington Bancshares | | | 21,869 | | | | 344,218 | |
Intercontinental Exchange | | | 8,502 | | | | 1,177,187 | |
Invesco | | | 4,817 | | | | 122,400 | |
JPMorgan Chase | | | 45,490 | | | | 7,728,296 | |
KeyCorp | | | 14,117 | | | | 328,503 | |
Lincoln National | | | 2,550 | | | | 183,983 | |
| Schedule of Investments | | October 31, 2021 |
| | Global X S&P 500® Catholic Values ETF | |
| | | | | | | |
| COMMON STOCK — continued | | | | | | |
| Financials — continued | | | | | | |
Loews | | | 2,919 | | | $ | 163,668 | |
M&T Bank | | | 1,892 | | | | 278,351 | |
MarketAxess Holdings | | | 618 | | | | 252,558 | |
Marsh & McLennan | | | 7,659 | | | | 1,277,521 | |
MetLife | | | 10,950 | | | | 687,660 | |
Moody’s | | | 2,442 | | | | 986,934 | |
Morgan Stanley | | | 22,154 | | | | 2,276,988 | |
MSCI, Cl A | | | 1,241 | | | | 825,116 | |
Nasdaq | | | 1,911 | | | | 401,062 | |
Northern Trust | | | 3,088 | | | | 379,948 | |
People’s United Financial | | | 5,922 | | | | 101,503 | |
PNC Financial Services Group | | | 6,426 | | | | 1,356,079 | |
Principal Financial Group | | | 3,660 | | | | 245,549 | |
Progressive | | | 8,819 | | | | 836,747 | |
Prudential Financial | | | 5,805 | | | | 638,840 | |
Raymond James Financial | | | 3,079 | | | | 303,559 | |
Regions Financial | | | 15,999 | | | | 378,856 | |
S&P Global | | | 3,655 | | | | 1,733,055 | |
State Street | | | 5,125 | | | | 505,069 | |
SVB Financial Group * | | | 879 | | | | 630,595 | |
Synchrony Financial | | | 8,484 | | | | 394,082 | |
T Rowe Price Group | | | 3,412 | | | | 739,995 | |
Travelers | | | 3,744 | | | | 602,335 | |
Truist Financial | | | 20,176 | | | | 1,280,571 | |
US Bancorp | | | 20,399 | | | | 1,231,488 | |
W R Berkley | | | 2,004 | | | | 159,518 | |
Wells Fargo | | | 62,386 | | | | 3,191,668 | |
Willis Towers Watson | | | 1,926 | | | | 466,631 | |
Zions Bancorp | | | 2,301 | | | | 144,940 | |
| | | | | | | | 67,454,622 | |
| | | | | | | | | |
| Health Care — 13.0% | | | | | | | | |
ABIOMED * | | | 1,951 | | | | 647,810 | |
Align Technology * | | | 3,187 | | | | 1,989,867 | |
| Schedule of Investments | | October 31, 2021 |
| | Global X S&P 500® Catholic Values ETF | |
| | | | | | | |
| COMMON STOCK — continued | | | | | | |
| Health Care — continued | | | | | | |
AmerisourceBergen, Cl A | | | 6,438 | | | $ | 785,565 | |
Anthem | | | 10,595 | | | | 4,610,202 | |
Baxter International | | | 21,662 | | | | 1,710,431 | |
Boston Scientific * | | | 62,333 | | | | 2,688,422 | |
Cardinal Health | | | 12,456 | | | | 595,521 | |
Cerner | | | 12,744 | | | | 946,752 | |
Cigna | | | 14,768 | | | | 3,154,592 | |
CVS Health | | | 57,371 | | | | 5,122,083 | |
DaVita * | | | 2,844 | | | | 293,615 | |
DENTSPLY SIRONA | | | 9,365 | | | | 535,772 | |
Dexcom * | | | 4,260 | | | | 2,654,875 | |
Edwards Lifesciences * | | | 27,074 | | | | 3,244,007 | |
Gilead Sciences | | | 54,488 | | | | 3,535,181 | |
Henry Schein * | | | 5,963 | | | | 455,275 | |
Hologic * | | | 10,920 | | | | 800,545 | |
IDEXX Laboratories * | | | 3,694 | | | | 2,460,721 | |
Incyte * | | | 8,050 | | | | 539,189 | |
Intuitive Surgical * | | | 15,510 | | | | 5,601,126 | |
IQVIA Holdings * | | | 8,310 | | | | 2,172,400 | |
Laboratory Corp of America Holdings * | | | 4,180 | | | | 1,199,744 | |
McKesson | | | 6,737 | | | | 1,400,488 | |
Medtronic | | | 58,470 | | | | 7,008,214 | |
Mettler-Toledo International * | | | 1,001 | | | | 1,482,361 | |
Moderna * | | | 15,278 | | | | 5,274,118 | |
Quest Diagnostics | | | 5,260 | | | | 772,063 | |
ResMed | | | 6,305 | | | | 1,657,648 | |
STERIS | | | 4,300 | | | | 1,005,082 | |
Stryker | | | 14,585 | | | | 3,880,631 | |
Teleflex | | | 2,014 | | | | 718,877 | |
Waters * | | | 2,652 | | | | 974,743 | |
West Pharmaceutical Services | | | 3,201 | | | | 1,376,046 | |
Zimmer Biomet Holdings | | | 9,033 | | | | 1,292,803 | |
| Schedule of Investments | | October 31, 2021 |
| | Global X S&P 500® Catholic Values ETF | |
| | | | | | | |
| COMMON STOCK — continued | | | | | | |
| Health Care — continued | | | | | | |
Zoetis, Cl A | | | 20,600 | | | $ | 4,453,720 | |
| | | | | | | | 77,040,489 | |
| | | | | | | | | |
| Industrials — 8.1% | | | | | | | | |
3M | | | 11,793 | | | | 2,107,173 | |
Alaska Air Group * | | | 2,998 | | | | 158,294 | |
Allegion | | | 1,770 | | | | 227,091 | |
American Airlines Group * | | | 12,774 | | | | 245,261 | |
AMETEK | | | 4,664 | | | | 617,514 | |
AO Smith | | | 2,585 | | | | 188,886 | |
Carrier Global | | | 17,874 | | | | 933,559 | |
Caterpillar | | | 11,164 | | | | 2,277,568 | |
CH Robinson Worldwide | | | 2,593 | | | | 251,495 | |
Cintas | | | 1,847 | | | | 799,936 | |
Copart * | | | 4,441 | | | | 689,643 | |
CSX | | | 45,849 | | | | 1,658,358 | |
Cummins | | | 2,900 | | | | 695,536 | |
Deere | | | 5,788 | | | | 1,981,290 | |
Delta Air Lines * | | | 12,866 | | | | 503,447 | |
Dover | | | 2,890 | | | | 488,641 | |
Eaton | | | 8,102 | | | | 1,334,886 | |
Emerson Electric | | | 12,144 | | | | 1,178,089 | |
Equifax | | | 2,572 | | | | 713,550 | |
| Expeditors International of Washington | | | 3,401 | | | | 419,207 | |
Fastenal | | | 11,586 | | | | 661,329 | |
FedEx | | | 5,000 | | | | 1,177,650 | |
Fortive | | | 7,208 | | | | 545,718 | |
| Fortune Brands Home & Security | | | 2,724 | | | | 276,214 | |
Generac Holdings * | | | 1,269 | | | | 632,673 | |
Howmet Aerospace | | | 7,600 | | | | 225,644 | |
IDEX | | | 1,509 | | | | 335,858 | |
IHS Markit | | | 8,085 | | | | 1,056,871 | |
Illinois Tool Works | | | 5,827 | | | | 1,327,799 | |
Ingersoll Rand | | | 8,120 | | | | 436,531 | |
| Schedule of Investments | | October 31, 2021 |
| | Global X S&P 500® Catholic Values ETF | |
| | | | | | | |
| COMMON STOCK — continued | | | | | | |
| Industrials — continued | | | | | | |
JB Hunt Transport Services | | | 1,669 | | | $ | 329,110 | |
Johnson Controls International | | | 14,455 | | | | 1,060,563 | |
Kansas City Southern | | | 1,829 | | | | 567,447 | |
Leidos Holdings | | | 2,795 | | | | 279,444 | |
Masco | | | 5,415 | | | | 354,953 | |
Nielsen Holdings | | | 8,501 | | | | 172,145 | |
Norfolk Southern | | | 5,019 | | | | 1,470,818 | |
Old Dominion Freight Line | | | 1,889 | | | | 644,810 | |
Otis Worldwide | | | 9,049 | | | | 726,725 | |
PACCAR | | | 6,993 | | | | 626,713 | |
Parker-Hannifin | | | 2,612 | | | | 774,693 | |
Pentair | | | 3,270 | | | | 241,882 | |
Quanta Services | | | 2,768 | | | | 335,703 | |
Republic Services, Cl A | | | 4,224 | | | | 568,550 | |
Robert Half International | | | 2,198 | | | | 248,528 | |
Rockwell Automation | | | 2,344 | | | | 748,674 | |
Rollins | | | 5,154 | | | | 181,575 | |
Roper Technologies | | | 2,138 | | | | 1,043,066 | |
Snap-On | | | 1,061 | | | | 215,627 | |
Southwest Airlines * | | | 12,294 | | | | 581,260 | |
Stanley Black & Decker | | | 3,284 | | | | 590,233 | |
Trane Technologies | | | 4,815 | | | | 871,178 | |
TransDigm Group * | | | 1,114 | | | | 694,936 | |
Union Pacific | | | 13,306 | | | | 3,212,068 | |
United Airlines Holdings * | | | 6,407 | | | | 295,619 | |
United Parcel Service, Cl B | | | 14,860 | | | | 3,172,164 | |
United Rentals * F | | | 1,452 | | | | 550,468 | |
Verisk Analytics, Cl A | | | 3,255 | | | | 684,429 | |
Waste Management | | | 7,872 | | | | 1,261,331 | |
| Westinghouse Air Brake Technologies | | | 3,764 | | | | 341,508 | |
WW Grainger | | | 873 | | | | 404,295 | |
Xylem | | | 3,619 | | | | 472,605 | |
| | | | | | | | 47,868,831 | |
| Schedule of Investments | | October 31, 2021 |
| | Global X S&P 500® Catholic Values ETF | |
| | | | | | | |
| COMMON STOCK — continued | | | | | | |
| Information Technology — 27.8% | | | | | | |
Accenture, Cl A | | | 9,725 | | | $ | 3,489,233 | |
Adobe * | | | 7,259 | | | | 4,720,963 | |
Advanced Micro Devices * | | | 18,430 | | | | 2,215,839 | |
Akamai Technologies * | | | 2,701 | | | | 284,847 | |
Amphenol, Cl A | | | 9,008 | | | | 691,544 | |
Analog Devices | | | 8,158 | | | | 1,415,331 | |
ANSYS * | | | 1,343 | | | | 509,776 | |
Apple | | | 239,703 | | | | 35,907,509 | |
Applied Materials | | | 13,885 | | | | 1,897,385 | |
Arista Networks * | | | 898 | | | | 367,902 | |
Autodesk * | | | 3,325 | | | | 1,056,053 | |
Automatic Data Processing | | | 6,410 | | | | 1,438,981 | |
Broadcom | | | 6,290 | | | | 3,344,204 | |
Broadridge Financial Solutions | | | 1,718 | | | | 306,508 | |
Cadence Design Systems * | | | 4,168 | | | | 721,522 | |
CDW | | | 2,050 | | | | 382,633 | |
Cisco Systems | | | 64,585 | | | | 3,614,822 | |
Citrix Systems | | | 2,063 | | | | 195,428 | |
| Cognizant Technology Solutions, Cl A | | | 7,901 | | | | 616,989 | |
DXC Technology * | | | 4,265 | | | | 138,911 | |
Enphase Energy * | | | 1,994 | | | | 461,870 | |
F5 Networks * | | | 1,044 | | | | 220,441 | |
| Fidelity National Information Services | | | 9,354 | | | | 1,035,862 | |
Fiserv * | | | 9,124 | | | | 898,623 | |
FleetCor Technologies * | | | 1,362 | | | | 336,972 | |
Fortinet * | | | 2,038 | | | | 685,461 | |
Gartner * | | | 1,245 | | | | 413,228 | |
Global Payments | | | 4,424 | | | | 632,588 | |
Hewlett Packard Enterprise | | | 21,746 | | | | 318,579 | |
HP | | | 17,999 | | | | 545,910 | |
Intel | | | 61,770 | | | | 3,026,730 | |
| International Business Machines | | | 13,613 | | | | 1,702,986 | |
Intuit | | | 4,155 | | | | 2,600,988 | |
| Schedule of Investments | | October 31, 2021 |
| | Global X S&P 500® Catholic Values ETF | |
| | | | | | | |
| COMMON STOCK — continued | | | | | | |
| Information Technology — continued | | | | | | |
IPG Photonics * | | | 675 | | | $ | 107,332 | |
Jack Henry & Associates | | | 1,077 | | | | 179,299 | |
Juniper Networks | | | 5,837 | | | | 172,308 | |
Keysight Technologies * | | | 2,761 | | | | 497,035 | |
KLA | | | 2,305 | | | | 859,212 | |
Lam Research | | | 2,160 | | | | 1,217,311 | |
Mastercard, Cl A | | | 13,274 | | | | 4,453,692 | |
Microchip Technology | | | 8,250 | | | | 611,243 | |
Micron Technology | | | 17,062 | | | | 1,178,984 | |
Microsoft | | | 114,711 | | | | 38,040,462 | |
Monolithic Power Systems | | | 642 | | | | 337,345 | |
Motorola Solutions | | | 2,543 | | | | 632,164 | |
NetApp | | | 3,315 | | | | 296,030 | |
NortonLifeLock | | | 8,506 | | | | 216,478 | |
NVIDIA | | | 38,007 | | | | 9,717,250 | |
Oracle | | | 25,039 | | | | 2,402,242 | |
Paychex | | | 4,803 | | | | 592,114 | |
Paycom Software * | | | 764 | | | | 418,557 | |
PayPal Holdings * | | | 17,905 | | | | 4,164,524 | |
PTC * | | | 1,539 | | | | 195,992 | |
Qorvo * | | | 1,646 | | | | 276,907 | |
QUALCOMM | | | 17,155 | | | | 2,282,301 | |
salesforce.com * | | | 14,795 | | | | 4,433,914 | |
Seagate Technology Holdings | | | 3,083 | | | | 274,603 | |
ServiceNow * | | | 3,010 | | | | 2,100,258 | |
Skyworks Solutions | | | 2,465 | | | | 411,975 | |
Synopsys * | | | 2,299 | | | | 765,981 | |
TE Connectivity | | | 4,942 | | | | 721,532 | |
Teledyne Technologies * | | | 691 | | | | 310,411 | |
Teradyne | | | 2,554 | | | | 353,065 | |
Texas Instruments | | | 14,049 | | | | 2,633,907 | |
Trimble * | | | 3,739 | | | | 326,676 | |
Tyler Technologies * | | | 605 | | | | 328,648 | |
| Schedule of Investments | | October 31, 2021 |
| | Global X S&P 500® Catholic Values ETF | |
| | | | | | | |
| COMMON STOCK — continued | | | | | | |
| Information Technology — continued | | | | | | |
VeriSign * | | | 1,441 | | | $ | 320,867 | |
Visa, Cl A | | | 25,726 | | | | 5,447,995 | |
Western Digital * | | | 4,930 | | | | 257,790 | |
Western Union | | | 7,430 | | | | 135,375 | |
Xilinx | | | 3,719 | | | | 669,420 | |
Zebra Technologies, Cl A * | | | 800 | | | | 427,160 | |
| | | | | | | | 164,964,977 | |
| | | | | | | | | |
| Materials — 2.1% | | | | | | | | |
Air Products & Chemicals | | | 3,332 | | | | 998,967 | |
Albemarle | | | 1,836 | | | | 459,863 | |
Amcor | | | 24,929 | | | | 300,893 | |
Avery Dennison | | | 1,347 | | | | 293,269 | |
Ball | | | 4,870 | | | | 445,508 | |
Celanese, Cl A | | | 1,631 | | | | 263,423 | |
CF Industries Holdings | | | 3,706 | | | | 210,501 | |
Corteva | | | 10,952 | | | | 472,579 | |
Dow | | | 11,192 | | | | 626,416 | |
DuPont de Nemours | | | 7,829 | | | | 544,898 | |
Eastman Chemical | | | 2,271 | | | | 236,252 | |
Ecolab | | | 3,748 | | | | 832,880 | |
FMC | | | 2,210 | | | | 201,132 | |
Freeport-McMoRan | | | 22,072 | | | | 832,556 | |
| International Flavors & Fragrances | | | 3,991 | | | | 588,473 | |
International Paper | | | 5,785 | | | | 287,341 | |
| LyondellBasell Industries, Cl A | | | 4,052 | | | | 376,107 | |
Martin Marietta Materials | | | 923 | | | | 362,591 | |
Mosaic | | | 5,780 | | | | 240,275 | |
Newmont | | | 11,994 | | | | 647,676 | |
Nucor | | | 4,382 | | | | 489,250 | |
Packaging Corp of America | | | 1,510 | | | | 207,429 | |
PPG Industries | | | 3,770 | | | | 605,349 | |
Sealed Air | | | 2,432 | | | | 144,266 | |
Sherwin-Williams | | | 3,658 | | | | 1,158,159 | |
| Schedule of Investments | | October 31, 2021 |
| | Global X S&P 500® Catholic Values ETF | |
| | | | | | | |
| COMMON STOCK — continued | | | | | | |
| Materials — continued | | | | | | |
Sylvamo * | | | 0 | | | $ | — | |
Vulcan Materials | | | 2,159 | | | | 410,469 | |
Westrock | | | 4,216 | | | | 202,790 | |
| | | | | | | | 12,439,312 | |
| | | | | | | | | |
| Real Estate — 2.6% | | | | | | | | |
Alexandria Real Estate Equities ‡ | | | 2,150 | | | | 438,901 | |
American Tower, Cl A ‡ | | | 7,186 | | | | 2,026,236 | |
AvalonBay Communities ‡ | | | 2,275 | | | | 538,447 | |
Boston Properties ‡ | | | 2,475 | | | | 281,259 | |
CBRE Group, Cl A * | | | 5,225 | | | | 543,818 | |
Crown Castle International ‡ | | | 6,806 | | | | 1,227,122 | |
Digital Realty Trust ‡ | | | 4,418 | | | | 697,204 | |
Duke Realty ‡ | | | 5,811 | | | | 326,811 | |
Equinix ‡ | | | 1,410 | | | | 1,180,269 | |
Equity Residential ‡ | | | 5,285 | | | | 456,624 | |
Essex Property Trust ‡ | | | 1,112 | | | | 378,002 | |
Extra Space Storage ‡ | | | 2,069 | | | | 408,358 | |
Federal Realty Investment Trust ‡ | | | 1,134 | | | | 136,477 | |
Host Hotels & Resorts ‡ * | | | 12,071 | | | | 203,155 | |
Iron Mountain ‡ | | | 4,373 | | | | 199,584 | |
Kimco Realty ‡ | | | 9,291 | | | | 209,977 | |
Mid-America Apartment Communities ‡ | | | 1,791 | | | | 365,740 | |
ProLogis ‡ | | | 11,650 | | | | 1,688,784 | |
Public Storage ‡ | | | 2,457 | | | | 816,166 | |
Realty Income ‡ | | | 6,035 | | | | 431,080 | |
Regency Centers ‡ | | | 2,559 | | | | 180,179 | |
SBA Communications, Cl A ‡ | | | 1,712 | | | | 591,205 | |
Simon Property Group ‡ | | | 5,139 | | | | 753,275 | |
UDR ‡ | | | 4,611 | | | | 256,049 | |
Vornado Realty Trust ‡ | | | 2,759 | | | | 117,616 | |
Welltower ‡ | | | 6,875 | | | | 552,750 | |
Weyerhaeuser ‡ | | | 12,394 | | | | 442,714 | |
| | | | | | | | 15,447,802 | |
| Schedule of Investments | | October 31, 2021 |
| | Global X S&P 500® Catholic Values ETF | |
| | | | | | | |
| COMMON STOCK — continued | | | | | | |
| Utilities — 2.4% | | | | | | |
AES | | | 10,862 | | | $ | 272,962 | |
Alliant Energy | | | 3,897 | | | | 220,453 | |
Ameren | | | 4,022 | | | | 339,014 | |
American Electric Power | | | 7,502 | | | | 635,494 | |
American Water Works | | | 2,712 | | | | 472,376 | |
Atmos Energy | | | 1,884 | | | | 173,554 | |
CenterPoint Energy | | | 8,637 | | | | 224,908 | |
CMS Energy | | | 4,643 | | | | 280,205 | |
Consolidated Edison | | | 5,248 | | | | 395,699 | |
Dominion Energy | | | 12,181 | | | | 924,903 | |
DTE Energy | | | 3,028 | | | | 343,224 | |
Duke Energy | | | 11,805 | | | | 1,204,228 | |
Edison International | | | 5,616 | | | | 353,415 | |
Entergy | | | 3,095 | | | | 318,847 | |
Evergy | | | 3,908 | | | | 249,135 | |
Eversource Energy | | | 5,264 | | | | 446,914 | |
Exelon | | | 14,693 | | | | 781,521 | |
FirstEnergy | | | 8,394 | | | | 323,421 | |
NextEra Energy | | | 29,753 | | | | 2,538,824 | |
NiSource | | | 5,575 | | | | 137,535 | |
NRG Energy | | | 4,332 | | | | 172,803 | |
Pinnacle West Capital | | | 1,836 | | | | 118,404 | |
PPL | | | 11,773 | | | | 339,062 | |
| Public Service Enterprise Group | | | 7,541 | | | | 481,116 | |
Sempra Energy | | | 4,792 | | | | 611,603 | |
Southern | | | 15,975 | | | | 995,562 | |
WEC Energy Group | | | 4,699 | | | | 423,192 | |
Xcel Energy | | | 8,508 | | | | 549,532 | |
| | | | | | | | 14,327,906 | |
| Schedule of Investments | | October 31, 2021 |
| | Global X S&P 500® Catholic Values ETF | |
| | | | |
| COMMON STOCK — continued | | | |
TOTAL UNITED STATES | | $ | 589,119,103 | |
| TOTAL COMMON STOCK | | | | |
(Cost $414,694,538) | | | 592,423,759 | |
| TOTAL INVESTMENTS — 99.7% | | | | |
(Cost $414,694,538) | | $ | 592,423,759 | |
Percentages are based on Net Assets of $593,985,352.
| * | Non-income producing security. |
| ‡ | Real Estate Investment Trust |
Cl — Class
S&P — Standard & Poor’s
As of October 31, 2021, all of the Fund’s investments were considered Level 1, in accordance with authoritative guidance on fair value measurements and disclosure under U.S. GAAP.
For the year ended October 31, 2021, there have been no transfers in or out of Level 3.
| Schedule of Investments | | October 31, 2021 |
| | Global X S&P Catholic Values Developed ex-US ETF | |
Sector Weightings (Unaudited)†:
† Sector weightings percentages are based on the total market value of investments.
| | | | | | | |
| COMMON STOCK — 99.2% | | | | | | |
| AUSTRALIA — 11.1% | | | | | | |
| Communication Services — 0.1% | | | | | | |
REA Group | | | 13 | | | $ | 1,564 | |
Telstra | | | 1,227 | | | | 3,520 | |
TPG Telecom | | | 22 | | | | 112 | |
| | | | | | | | 5,196 | |
| | | | | | | | | |
| Consumer Discretionary — 0.5% | | | | | | | | |
Aristocrat Leisure | | | 186 | | | | 6,522 | |
Wesfarmers | | | 355 | | | | 15,265 | |
| | | | | | | | 21,787 | |
| | | | | | | | | |
| Consumer Staples — 0.7% | | | | | | | | |
Coles Group | | | 688 | | | | 8,857 | |
Woolworths Group | | | 649 | | | | 18,563 | |
| | | | | | | | 27,420 | |
| | | | | | | | | |
| Energy — 0.2% | | | | | | | | |
Santos | | | 517 | | | | 2,710 | |
| Schedule of Investments | | October 31, 2021 |
| | Global X S&P Catholic Values Developed ex-US ETF | |
| | | | | | | |
| COMMON STOCK — continued | | | | | | |
| Energy — continued | | | | | | |
Woodside Petroleum | | | 276 | | | $ | 4,822 | |
| | | | | | | | 7,532 | |
| | | | | | | | | |
| Financials — 2.9% | | | | | | | | |
ASX | | | 54 | | | | 3,367 | |
| Australia & New Zealand Banking Group | | | 818 | | | | 17,289 | |
| Commonwealth Bank of Australia | | | 509 | | | | 40,020 | |
Insurance Australia Group | | | 677 | | | | 2,441 | |
Macquarie Group (A) | | | 99 | | | | 14,710 | |
National Australia Bank | | | 948 | | | | 20,443 | |
QBE Insurance Group | | | 423 | | | | 3,759 | |
Suncorp Group | | | 362 | | | | 3,187 | |
Westpac Banking | | | 1,051 | | | | 20,264 | |
| | | | | | | | 125,480 | |
| | | | | | | | | |
| Health Care — 3.4% | | | | | | | | |
Cochlear | | | 76 | | | | 12,584 | |
CSL | | | 516 | | | | 116,460 | |
Sonic Healthcare | | | 548 | | | | 16,476 | |
| | | | | | | | 145,520 | |
| | | | | | | | | |
| Industrials — 0.4% | | | | | | | | |
Brambles | | | 478 | | | | 3,604 | |
Sydney Airport | | | 503 | | | | 3,094 | |
Transurban Group | | | 1,084 | | | | 10,943 | |
| | | | | | | | 17,641 | |
| | | | | | | | | |
| Information Technology — 0.2% | | | | | | | | |
Afterpay * | | | 69 | | | | 6,390 | |
| | | | | | | | | |
| Materials — 2.4% | | | | | | | | |
BHP Group | | | 648 | | | | 17,188 | |
BHP Group | | | 903 | | | | 24,810 | |
Fortescue Metals Group | | | 500 | | | | 5,231 | |
Glencore | | | 3,358 | | | | 16,812 | |
Newcrest Mining | | | 239 | | | | 4,468 | |
Rio Tinto | | | 110 | | | | 7,460 | |
| Schedule of Investments | | October 31, 2021 |
| | Global X S&P Catholic Values Developed ex-US ETF | |
| | | | | | | |
| COMMON STOCK — continued | | | | | | |
| Materials — continued | | | | | | |
Rio Tinto | | | 327 | | | $ | 20,442 | |
South32 | | | 1,421 | | | | 3,810 | |
| | | | | | | | 100,221 | |
| | | | | | | | | |
| Real Estate — 0.3% | | | | | | | | |
Dexus ‡ | | | 314 | | | | 2,564 | |
Goodman Group ‡ | | | 481 | | | | 7,912 | |
Scentre Group ‡ | | | 1,492 | | | | 3,384 | |
| | | | | | | | 13,860 | |
| | | | | | | | | |
| Utilities — 0.0% | | | | | | | | |
APA Group | | | 293 | | | | 1,805 | |
| | | | | | | | | |
TOTAL AUSTRALIA | | | | | | | 472,852 | |
| AUSTRIA — 0.4% | | | | | | | | |
| Communication Services — 0.0% | | | | | | | | |
Telekom Austria, Cl A | | | 41 | | | | 355 | |
| | | | | | | | | |
| Energy — 0.1% | | | | | | | | |
OMV | | | 41 | | | | 2,486 | |
| | | | | | | | | |
| Financials — 0.2% | | | | | | | | |
BAWAG Group | | | 22 | | | | 1,386 | |
Erste Group Bank | | | 87 | | | | 3,735 | |
Raiffeisen Bank International | | | 39 | | | | 1,142 | |
| | | | | | | | 6,263 | |
| | | | | | | | | |
| Industrials — 0.0% | | | | | | | | |
ANDRITZ | | | 24 | | | | 1,360 | |
| | | | | | | | | |
| Information Technology — 0.0% | | | | | | | | |
AMS | | | 80 | | | | 1,584 | |
| | | | | | | | | |
| Materials — 0.0% | | | | | | | | |
voestalpine | | | 35 | | | | 1,330 | |
| | | | | | | | | |
| Utilities — 0.1% | | | | | | | | |
Verbund | | | 21 | | | | 2,190 | |
| Schedule of Investments | | October 31, 2021 |
| | Global X S&P Catholic Values Developed ex-US ETF | |
| | | | | | | |
| COMMON STOCK — continued | | | | | | |
TOTAL AUSTRIA | | | | | $ | 15,568 | |
| BELGIUM — 1.5% | | | | | | | |
| Consumer Staples — 0.6% | | | | | | | |
Anheuser-Busch InBev | | | 433 | | | | 26,442 | |
| | | | | | | | | |
| Financials — 0.4% | | | | | | | | |
Groupe Bruxelles Lambert | | | 34 | | | | 3,945 | |
KBC Group | | | 97 | | | | 9,043 | |
Sofina | | | 4 | | | | 1,770 | |
| | | | | | | | 14,758 | |
| | | | | | | | | |
| Health Care — 0.4% | | | | | | | | |
UCB | | | 145 | | | | 17,300 | |
| | | | | | | | | |
| Materials — 0.1% | | | | | | | | |
Solvay | | | 22 | | | | 2,618 | |
Umicore | | | 59 | | | | 3,385 | |
| | | | | | | | 6,003 | |
| | | | | | | | | |
TOTAL BELGIUM | | | | | | | 64,503 | |
| BRAZIL — 0.1% | | | | | | | | |
| Materials — 0.1% | | | | | | | | |
Yara International | | | 52 | | | | 2,710 | |
| | | | | | | | | |
| CHINA — 1.0% | | | | | | | | |
| Consumer Discretionary — 0.6% | | | | | | | | |
Prosus | | | 272 | | | | 23,989 | |
| | | | | | | | | |
| Consumer Staples — 0.2% | | | | | | | | |
Budweiser Brewing APAC | | | 1,000 | | | | 2,757 | |
Wilmar International | | | 1,673 | | | | 5,360 | |
| | | | | | | | 8,117 | |
| | | | | | | | | |
| Financials — 0.1% | | | | | | | | |
BOC Hong Kong Holdings | | | 1,100 | | | | 3,493 | |
| | | | | | | | | |
| Health Care — 0.1% | | | | | | | | |
Alibaba Health Information Technology * | | | 4,290 | | | | 5,421 | |
| Schedule of Investments | | October 31, 2021 |
| | Global X S&P Catholic Values Developed ex-US ETF | |
| | | | | | | |
| COMMON STOCK — continued | | | | | | |
| Health Care — continued | | | | | | |
China Evergrande New Energy Vehicle Group* | | | 2,100 | | | $ | 1,009 | |
| | | | | | | | 6,430 | |
| | | | | | | | | |
TOTAL CHINA | | | | | | | 42,029 | |
| DENMARK — 1.8% | | | | | | | | |
| Consumer Staples — 0.2% | | | | | | | | |
Carlsberg, Cl B | | | 49 | | | | 8,091 | |
| | | | | | | | | |
| Health Care — 0.5% | | | | | | | | |
Coloplast, Cl B | | | 135 | | | | 22,030 | |
| | | | | | | | | |
| Industrials — 0.9% | | | | | | | | |
AP Moller - Maersk, Cl A | | | 1 | | | | 2,741 | |
AP Moller - Maersk, Cl B | | | 2 | | | | 5,785 | |
DSV | | | 76 | | | | 17,681 | |
Vestas Wind Systems | | | 345 | | | | 14,936 | |
| | | | | | | | 41,143 | |
| | | | | | | | | |
| Utilities — 0.2% | | | | | | | | |
Orsted | | | 54 | | | | 7,627 | |
| | | | | | | | | |
TOTAL DENMARK | | | | | | | 78,891 | |
| FINLAND — 1.2% | | | | | | | | |
| Energy — 0.1% | | | | | | | | |
Neste | | | 125 | | | | 6,971 | |
| | | | | | | | | |
| Financials — 0.5% | | | | | | | | |
Nordea Bank Abp | | | 1,044 | | | | 12,771 | |
Sampo, Cl A | | | 143 | | | | 7,612 | |
| | | | | | | | 20,383 | |
| | | | | | | | | |
| Industrials — 0.2% | | | | | | | | |
Kone, Cl B | | | 139 | | | | 9,484 | |
| | | | | | | | | |
| Information Technology — 0.2% | | | | | | | | |
Nokia | | | 1,649 | | | | 9,484 | |
| Schedule of Investments | | October 31, 2021 |
| | Global X S&P Catholic Values Developed ex-US ETF | |
| | | | | | | |
| COMMON STOCK — continued | | | | | | |
| Materials — 0.1% | | | | | | |
Stora Enso, Cl R | | | 180 | | | $ | 2,996 | |
| | | | | | | | | |
| Utilities — 0.1% | | | | | | | | |
Fortum | | | 126 | | | | 3,747 | |
| | | | | | | | | |
TOTAL FINLAND | | | | | | | 53,065 | |
| FRANCE — 8.8% | | | | | | | | |
| Communication Services — 0.1% | | | | | | | | |
Adevinta, Cl B * | | | 69 | | | | 1,134 | |
Vivendi | | | 239 | | | | 3,080 | |
| | | | | | | | 4,214 | |
| | | | | | | | | |
| Consumer Discretionary — 2.8% | | | | | | | | |
Christian Dior | | | 1 | | | | 784 | |
EssilorLuxottica | | | 93 | | | | 19,254 | |
Hermes International | | | 11 | | | | 17,446 | |
Kering | | | 24 | | | | 18,003 | |
| LVMH Moet Hennessy Louis Vuitton | | | 82 | | | | 64,262 | |
| | | | | | | | 119,749 | |
| | | | | | | | | |
| Consumer Staples — 1.1% | | | | | | | | |
Danone | | | 352 | | | | 22,954 | |
Pernod Ricard | | | 103 | | | | 23,685 | |
| | | | | | | | 46,639 | |
| | | | | | | | | |
| Energy — 0.8% | | | | | | | | |
TotalEnergies | | | 717 | | | | 35,986 | |
| | | | | | | | | |
| Financials — 1.1% | | | | | | | | |
AXA | | | 598 | | | | 17,412 | |
BNP Paribas | | | 330 | | | | 22,111 | |
Credit Agricole | | | 411 | | | | 6,202 | |
| | | | | | | | 45,725 | |
| | | | | | | | | |
| Industrials — 0.5% | | | | | | | | |
Vinci | | | 185 | | | | 19,776 | |
| Schedule of Investments | | October 31, 2021 |
| | Global X S&P Catholic Values Developed ex-US ETF | |
| | | | | | | |
| COMMON STOCK — continued | | | | | | |
| Information Technology — 0.3% | | | | | | |
Dassault Systemes | | | 207 | | | $ | 12,069 | |
| | | | | | | | | |
| | | | | | | | | |
| Materials — 1.9% | | | | | | | | |
Air Liquide | | | 145 | | | | 24,203 | |
L’Oreal | | | 126 | | | | 57,589 | |
| | | | | | | | 81,792 | |
| | | | | | | | | |
| | | | | | | | | |
| Utilities — 0.2% | | | | | | | | |
Electricite de France | | | 133 | | | | 1,959 | |
Engie | | | 528 | | | | 7,513 | |
| | | | | | | | 9,472 | |
| | | | | | | | | |
| | | | | | | | | |
TOTAL FRANCE | | | | | | | 375,422 | |
| GERMANY — 6.9% | | | | | | | | |
| Communication Services — 0.4% | | | | | | | | |
Deutsche Telekom | | | 972 | | | | 18,085 | |
| | | | | | | | | |
| | | | | | | | | |
| Consumer Discretionary — 2.0% | | | | | | | | |
adidas | | | 57 | | | | 18,687 | |
Allianz | | | 119 | | | | 27,701 | |
Bayerische Motoren Werke | | | 95 | | | | 9,591 | |
Daimler | | | 260 | | | | 25,798 | |
Volkswagen | | | 9 | | | | 2,925 | |
| | | | | | | | 84,702 | |
| | | | | | | | | |
| | | | | | | | | |
| Consumer Staples — 0.2% | | | | | | | | |
Beiersdorf | | | 49 | | | | 5,211 | |
Henkel & KGaA | | | 48 | | | | 4,005 | |
| | | | | | | | 9,216 | |
| | | | | | | | | |
| | | | | | | | | |
| Financials — 0.5% | | | | | | | | |
Deutsche Boerse | | | 54 | | | | 8,974 | |
| Muenchener Rueckversicherungs-Gesellschaft in Muenchen | | | 40 | | | | 11,859 | |
| | | | | | | | 20,833 | |
| | | | | | | | | |
| | | | | | | | | |
| Health Care — 0.9% | | | | | | | | |
| Fresenius Medical Care & KGaA | | | 228 | | | | 15,161 | |
| Schedule of Investments | | October 31, 2021 |
| | Global X S&P Catholic Values Developed ex-US ETF | |
| | | | | | | |
| COMMON STOCK — continued | | | | | | |
| Health Care — continued | | | | | | |
Siemens Healthineers | | | 322 | | | $ | 21,412 | |
| | | | | | | | 36,573 | |
| | | | | | | | | |
| | | | | | | | | |
| Industrials — 0.5% | | | | | | | | |
Deutsche Post | | | 352 | | | | 21,801 | |
| | | | | | | | | |
| | | | | | | | | |
| Information Technology — 1.5% | | | | | | | | |
Infineon Technologies | | | 376 | | | | 17,577 | |
SAP | | | 321 | | | | 46,553 | |
| | | | | | | | 64,130 | |
| | | | | | | | | |
| | | | | | | | | |
| Materials — 0.5% | | | | | | | | |
BASF | | | 281 | | | | 20,253 | |
| | | | | | | | | |
| | | | | | | | | |
| Real Estate — 0.2% | | | | | | | | |
Vonovia | | | 163 | | | | 9,896 | |
| | | | | | | | | |
| | | | | | | | | |
| Utilities — 0.2% | | | | | | | | |
E.ON | | | 633 | | | | 8,033 | |
| | | | | | | | | |
| | | | | | | | | |
TOTAL GERMANY | | | | | | | 293,522 | |
| HONG KONG — 2.5% | | | | | | | | |
| Financials — 1.5% | | | | | | | | |
AIA Group | | | 3,765 | | | | 42,519 | |
Hang Seng Bank | | | 180 | | | | 3,425 | |
| Hong Kong Exchanges & Clearing | | | 294 | | | | 17,793 | |
| | | | | | | | 63,737 | |
| | | | | | | | | |
| | | | | | | | | |
| Industrials — 0.4% | | | | | | | | |
Jardine Matheson Holdings | | | 92 | | | | 5,330 | |
MTR | | | 400 | | | | 2,180 | |
Techtronic Industries | | | 523 | | | | 10,764 | |
| | | | | | | | 18,274 | |
| | | | | | | | | |
| | | | | | | | | |
| Real Estate — 0.4% | | | | | | | | |
CK Asset Holdings | | | 600 | | | | 3,706 | |
Henderson Land Development | | | 400 | | | | 1,676 | |
Link ‡ | | | 600 | | | | 5,322 | |
| Schedule of Investments | | October 31, 2021 |
| | Global X S&P Catholic Values Developed ex-US ETF | |
| | | | | | | |
| COMMON STOCK — continued | | | | | | |
| Real Estate — common stock | | | | | | |
Sun Hung Kai Properties | | | 390 | | | $ | 5,189 | |
| | | | | | | | 15,893 | |
| | | | | | | | | |
| | | | | | | | | |
| Utilities — 0.2% | | | | | | | | |
CLP Holdings | | | 400 | | | | 3,916 | |
Hong Kong & China Gas | | | 2,910 | | | | 4,526 | |
| | | | | | | | 8,442 | |
| | | | | | | | | |
| | | | | | | | | |
TOTAL HONG KONG | | | | | | | 106,346 | |
| IRELAND — 1.0% | | | | | | | | |
| Consumer Discretionary — 0.2% | | | | | | | | |
Flutter Entertainment * | | | 49 | | | | 9,277 | |
| | | | | | | | | |
| | | | | | | | | |
| Consumer Staples — 0.3% | | | | | | | | |
Kerry Group, Cl A | | | 79 | | | | 10,614 | |
| | | | | | | | | |
| | | | | | | | | |
| Industrials — 0.2% | | | | | | | | |
Kingspan Group | | | 56 | | | | 6,457 | |
Ryanair Holdings * | | | 206 | | | | 4,042 | |
| | | | | | | | 10,499 | |
| | | | | | | | | |
| | | | | | | | | |
| Materials — 0.3% | | | | | | | | |
CRH | | | 232 | | | | 11,137 | |
| | | | | | | | | |
| | | | | | | | | |
TOTAL IRELAND | | | | | | | 41,527 | |
| ISRAEL — 0.7% | | | | | | | | |
| Communication Services — 0.0% | | | | | | | | |
Bezeq The Israeli Telecommunication * | | | 496 | | | | 622 | |
| | | | | | | | | |
| Financials — 0.3% | | | | | | | | |
Bank Hapoalim | | | 325 | | | | 3,202 | |
Bank Leumi Le-Israel | | | 421 | | | | 4,023 | |
| First International Bank of Israel | | | 18 | | | | 722 | |
Israel Discount Bank, Cl A * | | | 336 | | | | 2,031 | |
Mizrahi Tefahot Bank | | | 39 | | | | 1,419 | |
Plus500 | | | 36 | | | | 650 | |
| | | | | | | | 12,047 | |
| Schedule of Investments | | October 31, 2021 |
| | Global X S&P Catholic Values Developed ex-US ETF | |
| | | | | | | |
| COMMON STOCK — continued | | | | | | |
| Industrials — 0.1% | | | | | | |
Kornit Digital * | | | 17 | | | $ | 2,844 | |
| Shapir Engineering and Industry | | | 1 | | | | 8 | |
| | | | | | | | 2,852 | |
| | | | | | | | | |
| Information Technology — 0.3% | | | | | | | | |
Check Point Software Technologies * | | | 32 | | | | 3,827 | |
JFrog * | | | 1 | | | | 33 | |
Nice * | | | 17 | | | | 4,794 | |
Wix.com * | | | 15 | | | | 2,789 | |
| | | | | | | | 11,443 | |
| | | | | | | | | |
| Materials — 0.0% | | | | | | | | |
ICL Group | | | 204 | | | | 1,748 | |
| | | | | | | | | |
| Real Estate — 0.0% | | | | | | | | |
Azrieli Group | | | 11 | | | | 1,029 | |
Strauss Group | | | 29 | | | | 854 | |
| | | | | | | | 1,883 | |
| | | | | | | | | |
| Utilities — 0.0% | | | | | | | | |
Energix-Renewable Energies | | | 1 | | | | 5 | |
| | | | | | | | | |
TOTAL ISRAEL | | | | | | | 30,600 | |
| ITALY — 2.0% | | | | | | | | |
| Consumer Discretionary — 0.2% | | | | | | | | |
Ferrari | | | 40 | | | | 9,489 | |
| | | | | | | | | |
| Consumer Staples — 0.1% | | | | | | | | |
Davide Campari-Milano | | | 287 | | | | 4,079 | |
| | | | | | | | | |
| Energy — 0.2% | | | | | | | | |
Eni | | | 729 | | | | 10,465 | |
| | | | | | | | | |
| Financials — 0.8% | | | | | | | | |
Assicurazioni Generali | | | 353 | | | | 7,700 | |
Intesa Sanpaolo | | | 5,090 | | | | 14,476 | |
Poste Italiane | | | 132 | | | | 1,885 | |
| Schedule of Investments | | October 31, 2021 |
| | Global X S&P Catholic Values Developed ex-US ETF | |
| | | | | | | |
| COMMON STOCK — continued | | | | | | |
UniCredit | | | 615 | | | | 8,130 | |
| | | | | | | | 32,191 | |
| | | | | | | | | |
| Industrials — 0.1% | | | | | | | | |
Atlantia | | | 185 | | | | 3,576 | |
| | | | | | | | | |
| Utilities — 0.6% | | | | | | | | |
Enel | | | 2,195 | | | | 18,381 | |
Snam | | | 619 | | | | 3,508 | |
| Terna - Rete Elettrica Nazionale | | | 403 | | | | 3,004 | |
| | | | | | | | 24,893 | |
| | | | | | | | | |
TOTAL ITALY | | | | | | | 84,693 | |
| JAPAN — 28.2% | | | | | | | | |
| Communication Services — 2.0% | | | | | | | | |
Dentsu Group | | | 73 | | | | 2,669 | |
KDDI | | | 508 | | | | 15,718 | |
Nexon | | | 136 | | | | 2,303 | |
Nintendo | | | 36 | | | | 15,849 | |
| Nippon Telegraph & Telephone | | | 389 | | | | 10,876 | |
SoftBank | | | 839 | | | | 11,438 | |
SoftBank Group | | | 378 | | | | 20,434 | |
Toho | | | 41 | | | | 1,924 | |
Z Holdings | | | 777 | | | | 4,811 | |
| | | | | | | | 86,022 | |
| | | | | | | | | |
| Consumer Discretionary — 4.6% | | | | | | | | |
Aisin | | | 52 | | | | 1,899 | |
Bandai Namco Holdings | | | 65 | | | | 4,952 | |
Bridgestone | | | 180 | | | | 7,923 | |
Denso | | | 152 | | | | 10,962 | |
Fast Retailing | | | 21 | | | | 13,907 | |
Hikari Tsushin | | | 4 | | | | 616 | |
Honda Motor | | | 520 | | | | 15,273 | |
Isuzu Motors | | | 209 | | | | 2,802 | |
Koito Manufacturing | | | 37 | | | | 2,090 | |
| Schedule of Investments | | October 31, 2021 |
| | Global X S&P Catholic Values Developed ex-US ETF | |
| | | | | | | |
| COMMON STOCK — continued | | | | | | |
| Consumer Discretionary — continued | | | | | | |
Nissan Motor | | | 767 | | | $ | 3,884 | |
Nitori Holdings | | | 24 | | | | 4,390 | |
Oriental Land | | | 71 | | | | 11,171 | |
| Pan Pacific International Holdings | | | 173 | | | | 3,620 | |
Panasonic | | | 722 | | | | 8,817 | |
Rakuten Group | | | 264 | | | | 2,894 | |
Sekisui Chemical | | | 133 | | | | 2,175 | |
Sekisui House | | | 204 | | | | 4,225 | |
Sharp | | | 61 | | | | 717 | |
Shimano | | | 26 | | | | 7,201 | |
Subaru | | | 186 | | | | 3,634 | |
Sumitomo Electric Industries | | | 226 | | | | 2,986 | |
Suzuki Motor | | | 157 | | | | 6,988 | |
Toyota Motor | | | 3,976 | | | | 69,966 | |
Yamaha | | | 50 | | | | 3,148 | |
ZOZO | | | 52 | | | | 1,662 | |
| | | | | | | | 197,902 | |
| | | | | | | | | |
| Consumer Staples — 2.3% | | | | | | | | |
Aeon | | | 441 | | | | 10,125 | |
Asahi Group Holdings | | | 262 | | | | 11,850 | |
Kao | | | 235 | | | | 13,254 | |
Kirin Holdings | | | 417 | | | | 7,245 | |
Kobe Bussan | | | 70 | | | | 2,403 | |
Kose | | | 17 | | | | 1,967 | |
Nissin Foods Holdings | | | 45 | | | | 3,437 | |
Seven & i Holdings | | | 408 | | | | 17,111 | |
Shiseido | | | 206 | | | | 13,685 | |
Suntory Beverage & Food | | | 69 | | | | 2,672 | |
Unicharm | | | 231 | | | | 9,303 | |
Welcia Holdings | | | 42 | | | | 1,567 | |
Yakult Honsha | | | 77 | | | | 3,876 | |
| | | | | | | | 98,495 | |
| Schedule of Investments | | October 31, 2021 |
| | Global X S&P Catholic Values Developed ex-US ETF | |
| | | | | | | |
| COMMON STOCK — continued | | | | | | |
| Energy — 0.1% | | | | | | |
ENEOS Holdings | | | 901 | | | $ | 3,632 | |
Inpex | | | 272 | | | | 2,271 | |
| | | | | | | | 5,903 | |
| | | | | | | | | |
| Financials — 2.3% | | | | | | | | |
Dai-ichi Life Holdings | | | 332 | | | | 6,992 | |
Daiwa Securities Group | | | 419 | | | | 2,347 | |
Japan Exchange Group | | | 154 | | | | 3,638 | |
Japan Post Bank | | | 117 | | | | 912 | |
Japan Post Insurance | | | 68 | | | | 1,103 | |
| Mitsubishi UFJ Financial Group | | | 3,658 | | | | 19,970 | |
Mizuho Financial Group | | | 728 | | | | 9,609 | |
| MS&AD Insurance Group Holdings | | | 139 | | | | 4,493 | |
Nomura Holdings | | | 802 | | | | 3,869 | |
ORIX | | | 383 | | | | 7,574 | |
Resona Holdings | | | 661 | | | | 2,481 | |
Sompo Holdings | | | 106 | | | | 4,600 | |
| Sumitomo Mitsui Financial Group | | | 394 | | | | 12,858 | |
| Sumitomo Mitsui Trust Holdings | | | 106 | | | | 3,490 | |
T&D Holdings | | | 139 | | | | 1,782 | |
Tokio Marine Holdings | | | 201 | | | | 10,573 | |
| | | | | | | | 96,291 | |
| | | | | | | | | |
| Health Care — 4.9% | | | | | | | | |
Hoya | | | 419 | | | | 61,458 | |
Kyowa Kirin | | | 293 | | | | 9,610 | |
M3 | | | 486 | | | | 28,591 | |
Otsuka Holdings | | | 635 | | | | 25,027 | |
Shionogi | | | 324 | | | | 21,047 | |
Sysmex | | | 194 | | | | 23,939 | |
Terumo | | | 863 | | | | 37,979 | |
| | | | | | | | 207,651 | |
| | | | | | | | | |
| Industrials — 6.5% | | | | | | | | |
ANA Holdings | | | 40 | | | | 931 | |
| Schedule of Investments | | October 31, 2021 |
| | Global X S&P Catholic Values Developed ex-US ETF | |
| | | | | | | |
| COMMON STOCK — continued | | | | | | |
| Industrials — continued | | | | | | |
Central Japan Railway | | | 75 | | | $ | 11,116 | |
Daifuku | | | 39 | | | | 3,574 | |
Daikin Industries | | | 104 | | | | 22,702 | |
East Japan Railway | | | 136 | | | | 8,454 | |
FANUC | | | 68 | | | | 13,305 | |
Hankyu Hanshin Holdings | | | 81 | | | | 2,504 | |
ITOCHU | | | 530 | | | | 15,069 | |
Japan Airlines | | | 38 | | | | 817 | |
Keio | | | 39 | | | | 1,963 | |
Komatsu | | | 350 | | | | 9,106 | |
Kubota | | | 392 | | | | 8,328 | |
Makita | | | 103 | | | | 4,754 | |
Marubeni | | | 637 | | | | 5,370 | |
Minebea Mitsumi | | | 135 | | | | 3,404 | |
MISUMI Group | | | 91 | | | | 3,799 | |
Mitsubishi | | | 528 | | | | 16,725 | |
Mitsubishi Electric | | | 734 | | | | 9,817 | |
Mitsui | | | 586 | | | | 13,321 | |
Monotaro | | | 80 | | | | 1,810 | |
Nidec | | | 195 | | | | 21,496 | |
Nihon M&A Center | | | 112 | | | | 3,423 | |
Odakyu Electric Railway | | | 107 | | | | 2,311 | |
Recruit Holdings | | | 599 | | | | 39,777 | |
Secom | | | 70 | | | | 4,751 | |
SG Holdings | | | 186 | | | | 4,649 | |
SMC | | | 22 | | | | 13,108 | |
Taisei | | | 72 | | | | 2,254 | |
Tokyu | | | 215 | | | | 3,021 | |
Toshiba | | | 165 | | | | 7,105 | |
TOTO | | | 50 | | | | 2,412 | |
Toyota Industries | | | 61 | | | | 5,168 | |
West Japan Railway | | | 62 | | | | 2,916 | |
Yamato Holdings | | | 125 | | | | 3,066 | |
| Schedule of Investments | | October 31, 2021 |
| | Global X S&P Catholic Values Developed ex-US ETF | |
| | | | | | | |
| COMMON STOCK — continued | | | | | | |
| Industrials — continued | | | | | | |
Yaskawa Electric | | | 85 | | | $ | 3,668 | |
| | | | | | | | 275,994 | |
| | | | | | | | | |
| Information Technology — 3.5% | | | | | | | | |
Advantest | | | 58 | | | | 4,746 | |
Canon | | | 330 | | | | 7,403 | |
Disco | | | 10 | | | | 2,684 | |
Fujitsu | | | 53 | | | | 9,122 | |
GMO Payment Gateway | | | 13 | | | | 1,646 | |
Itochu Techno-Solutions | | | 14 | | | | 441 | |
Keyence | | | 56 | | | | 33,647 | |
Kyocera | | | 104 | | | | 6,070 | |
Lasertec | | | 24 | | | | 5,268 | |
Murata Manufacturing | | | 188 | | | | 14,267 | |
NEC | | | 78 | | | | 3,981 | |
Nomura Research Institute | | | 116 | | | | 4,619 | |
NTT Data | | | 199 | | | | 3,984 | |
Obic | | | 19 | | | | 3,497 | |
Omron | | | 61 | | | | 5,815 | |
Oracle Japan | | | 11 | | | | 1,037 | |
Otsuka | | | 28 | | | | 1,375 | |
Renesas Electronics * | | | 393 | | | | 4,832 | |
Rohm | | | 28 | | | | 2,549 | |
Shimadzu | | | 80 | | | | 3,238 | |
TDK | | | 108 | | | | 3,912 | |
Tokyo Electron | | | 48 | | | | 22,248 | |
Trend Micro | | | 37 | | | | 2,086 | |
| | | | | | | | 148,467 | |
| | | | | | | | | |
| Materials — 1.1% | | | | | | | | |
Asahi Kasei | | | 398 | | | | 4,176 | |
Nippon Paint Holdings | | | 471 | | | | 5,035 | |
Nippon Sanso Holdings | | | 63 | | | | 1,484 | |
Nippon Steel | | | 266 | | | | 4,663 | |
| Schedule of Investments | | October 31, 2021 |
| | Global X S&P Catholic Values Developed ex-US ETF | |
| | | | | | | |
| COMMON STOCK — continued | | | | | | |
| Materials — continued | | | | | | |
Nitto Denko | | | 47 | | | $ | 3,660 | |
Shin-Etsu Chemical | | | 121 | | | | 21,494 | |
Sumitomo Metal Mining | | | 80 | | | | 3,103 | |
Toray Industries | | | 513 | | | | 3,190 | |
| | | | | | | | 46,805 | |
| | | | | | | | | |
| Real Estate — 0.7% | | | | | | | | |
Daiwa House Industry | | | 188 | | | | 6,185 | |
Hulic | | | 133 | | | | 1,275 | |
Mitsubishi Estate | | | 381 | | | | 5,774 | |
Mitsui Fudosan | | | 263 | | | | 5,993 | |
Nippon Prologis ‡ | | | 1 | | | | 3,337 | |
Nomura Real Estate Master Fund ‡ | | | 1 | | | | 1,497 | |
| Sumitomo Realty & Development | | | 138 | | | | 4,974 | |
| | | | | | | | 29,035 | |
| | | | | | | | | |
| Utilities — 0.2% | | | | | | | | |
Chubu Electric Power | | | 228 | | | | 2,357 | |
Kansai Electric Power | | | 254 | | | | 2,335 | |
Osaka Gas | | | 119 | | | | 1,916 | |
Tokyo Gas | | | 112 | | | | 1,944 | |
| | | | | | | | 8,552 | |
| | | | | | | | | |
TOTAL JAPAN | | | | | | | 1,201,117 | |
| LUXEMBOURG — 0.2% | | | | | | | | |
| Materials — 0.2% | | | | | | | | |
ArcelorMittal | | | 210 | | | | 7,127 | |
| | | | | | | | | |
| MACAO — 0.1% | | | | | | | | |
| Consumer Discretionary — 0.1% | | | | | | | | |
Galaxy Entertainment Group | | | 420 | | | | 2,273 | |
Sands China | | | 900 | | | | 2,057 | |
| Schedule of Investments | | October 31, 2021 |
| | Global X S&P Catholic Values Developed ex-US ETF | |
| | | | | | | |
| COMMON STOCK — continued | | | | | | |
TOTAL MACAO | | | | | $ | 4,330 | |
| NETHERLANDS — 6.7% | | | | | | | |
| Communication Services — 0.2% | | | | | | | |
Universal Music Group | | | 245 | | | | 7,121 | |
| | | | | | | | | |
| Consumer Staples — 0.7% | | | | | | | | |
Heineken | | | 121 | | | | 13,417 | |
Koninklijke Ahold Delhaize | | | 534 | | | | 17,384 | |
| | | | | | | | 30,801 | |
| | | | | | | | | |
| Energy — 1.2% | | | | | | | | |
Royal Dutch Shell, Cl A | | | 1,197 | | | | 27,582 | |
Royal Dutch Shell, Cl B | | | 1,082 | | | | 24,991 | |
| | | | | | | | 52,573 | |
| | | | | | | | | |
| Financials — 0.5% | | | | | | | | |
EXOR | | | 31 | | | | 2,924 | |
ING Groep | | | 1,116 | | | | 16,944 | |
| | | | | | | | 19,868 | |
| | | | | | | | | |
| Health Care — 1.1% | | | | | | | | |
Koninklijke Philips | | | 1,042 | | | | 49,108 | |
| | | | | | | | | |
| Information Technology — 3.0% | | | | | | | | |
Adyen * | | | 9 | | | | 27,189 | |
ASML Holding | | | 122 | | | | 98,899 | |
| | | | | | | | 126,088 | |
| | | | | | | | | |
TOTAL NETHERLANDS | | | | | | | 285,559 | |
| NEW ZEALAND — 0.7% | | | | | | | | |
| Communication Services — 0.0% | | | | | | | | |
Spark New Zealand | | | 545 | | | | 1,781 | |
| | | | | | | | | |
| Health Care — 0.5% | | | | | | | | |
Fisher & Paykel Healthcare | | | 661 | | | | 14,764 | |
Ryman Healthcare | | | 496 | | | | 5,129 | |
| | | | | | | | 19,893 | |
| Schedule of Investments | | October 31, 2021 |
| | Global X S&P Catholic Values Developed ex-US ETF | |
| | | | | | | |
| COMMON STOCK — continued | | | | | | |
| Industrials — 0.0% | | | | | | |
Auckland International Airport * | | | 381 | | | $ | 2,179 | |
| | | | | | | | | |
| Information Technology — 0.1% | | | | | | | | |
Xero * | | | 35 | | | | 3,930 | |
| | | | | | | | | |
| Utilities — 0.1% | | | | | | | | |
Contact Energy | | | 209 | | | | 1,223 | |
Mercury NZ | | | 180 | | | | 790 | |
Meridian Energy | | | 360 | | | | 1,286 | |
| | | | | | | | 3,299 | |
| | | | | | | | | |
TOTAL NEW ZEALAND | | | | | | | 31,082 | |
| NORWAY — 0.9% | | | | | | | | |
| Communication Services — 0.1% | | | | | | | | |
Schibsted, Cl A | | | 24 | | | | 1,236 | |
Schibsted, Cl B | | | 30 | | | | 1,352 | |
Telenor | | | 192 | | | | 3,027 | |
| | | | | | | | 5,615 | |
| | | | | | | | | |
| Consumer Staples — 0.3% | | | | | | | | |
Mowi | | | 219 | | | | 6,333 | |
Orkla | | | 386 | | | | 3,749 | |
Salmar | | | 28 | | | | 2,128 | |
| | | | | | | | 12,210 | |
| | | | | | | | | |
| Energy — 0.2% | | | | | | | | |
Equinor | | | 316 | | | | 7,985 | |
| | | | | | | | | |
| Financials — 0.2% | | | | | | | | |
Aker BP | | | 30 | | | | 1,149 | |
DNB Bank | | | 260 | | | | 6,171 | |
Gjensidige Forsikring | | | 54 | | | | 1,341 | |
| | | | | | | | 8,661 | |
| | | | | | | | | |
| Industrials — 0.0% | | | | | | | | |
TOMRA Systems | | | 38 | | | | 2,449 | |
| Schedule of Investments | | October 31, 2021 |
| | Global X S&P Catholic Values Developed ex-US ETF | |
| | | | | | | |
| COMMON STOCK — continued | | | | | | |
| Materials — 0.1% | | | | | | |
Norsk Hydro | | | 403 | | | $ | 2,948 | |
| | | | | | | | | |
TOTAL NORWAY | | | | | | | 39,868 | |
| POLAND — 0.0% | | | | | | | | |
| Consumer Discretionary — 0.0% | | | | | | | | |
Allegro.eu * | | | 134 | | | | 1,517 | |
| | | | | | | | | |
| PORTUGAL — 0.1% | | | | | | | | |
| Utilities — 0.1% | | | | | | | | |
Energias de Portugal | | | 877 | | | | 4,957 | |
| | | | | | | | | |
| SINGAPORE — 1.0% | | | | | | | | |
| Communication Services — 0.1% | | | | | | | | |
| Singapore Telecommunications | | | 1,941 | | | | 3,598 | |
| | | | | | | | | |
| Financials — 0.7% | | | | | | | | |
DBS Group Holdings | | | 520 | | | | 12,158 | |
Oversea-Chinese Banking | | | 1,167 | | | | 10,212 | |
United Overseas Bank | | | 423 | | | | 8,391 | |
| | | | | | | | 30,761 | |
| | | | | | | | | |
| Industrials — 0.1% | | | | | | | | |
Singapore Airlines | | | 506 | | | | 1,951 | |
| Singapore Technologies Engineering | | | 521 | | | | 1,480 | |
| | | | | | | | 3,431 | |
| | | | | | | | | |
| Real Estate — 0.1% | | | | | | | | |
Ascendas Real Estate Investment Trust ‡ | | | 842 | | | | 1,930 | |
CapitaLand Integrated Commercial Trust ‡ | | | 93 | | | | 148 | |
Capitaland Investment * | | | 655 | | | | 1,671 | |
| | | | | | | | 3,749 | |
| | | | | | | | | |
TOTAL SINGAPORE | | | | | | | 41,539 | |
| SOUTH AFRICA — 0.3% | | | | | | | | |
| Materials — 0.3% | | | | | | | | |
Anglo American | | | 403 | | | | 15,371 | |
| Schedule of Investments | | October 31, 2021 |
| | Global X S&P Catholic Values Developed ex-US ETF | |
| | | | | | | |
| COMMON STOCK — continued | | | | | | |
| SPAIN — 2.4% | | | | | | |
| Communication Services — 0.4% | | | | | | |
Cellnex Telecom | | | 173 | | | $ | 10,647 | |
Telefonica | | | 1,636 | | | | 7,127 | |
| | | | | | | | 17,774 | |
| | | | | | | | | |
| Consumer Discretionary — 0.3% | | | | | | | | |
Industria de Diseno Textil | | | 353 | | | | 12,762 | |
| | | | | | | | | |
| Financials — 0.8% | | | | | | | | |
| Banco Bilbao Vizcaya Argentaria | | | 1,918 | | | | 13,455 | |
Banco Santander | | | 4,970 | | | | 18,845 | |
| | | | | | | | 32,300 | |
| | | | | | | | | |
| Industrials — 0.1% | | | | | | | | |
Aena SME * | | | 24 | | | | 3,934 | |
| | | | | | | | | |
| Information Technology — 0.2% | | | | | | | | |
Amadeus IT Group, Cl A | | | 132 | | | | 8,835 | |
| | | | | | | | | |
| Utilities — 0.6% | | | | | | | | |
EDP Renovaveis | | | 73 | | | | 2,036 | |
Endesa | | | 91 | | | | 2,101 | |
Iberdrola | | | 1,660 | | | | 19,623 | |
Naturgy Energy Group | | | 95 | | | | 2,499 | |
| | | | | | | | 26,259 | |
| | | | | | | | | |
TOTAL SPAIN | | | | | | | 101,864 | |
| SWEDEN — 4.1% | | | | | | | | |
| Communication Services — 0.1% | | | | | | | | |
Telia | | | 744 | | | | 2,927 | |
| | | | | | | | | |
| Consumer Discretionary — 0.2% | | | | | | | | |
Evolution | | | 56 | | | | 9,058 | |
| | | | | | | | | |
| Consumer Staples — 0.4% | | | | | | | | |
Essity, Cl B | | | 300 | | | | 9,704 | |
Swedish Match | | | 795 | | | | 6,996 | |
| | | | | | | | 16,700 | |
| Schedule of Investments | | October 31, 2021 |
| | Global X S&P Catholic Values Developed ex-US ETF | |
| | | | | | | |
| COMMON STOCK — continued | | | | | | |
| Financials — 1.0% | | | | | | |
Industrivarden, Cl A | | | 54 | | | $ | 1,781 | |
Industrivarden, Cl C | | | 48 | | | | 1,559 | |
Investor, Cl A | | | 150 | | | | 3,467 | |
Investor, Cl B | | | 524 | | | | 12,074 | |
Kinnevik, Cl B * | | | 69 | | | | 2,705 | |
L E Lundbergforetagen, Cl B | | | 17 | | | | 979 | |
| Skandinaviska Enskilda Banken, Cl A | | | 464 | | | | 7,253 | |
| Skandinaviska Enskilda Banken, Cl C | | | 4 | | | | 64 | |
Svenska Handelsbanken, Cl A | | | 438 | | | | 5,015 | |
Svenska Handelsbanken, Cl B | | | 11 | | | | 139 | |
Swedbank, Cl A | | | 269 | | | | 5,833 | |
| | | | | | | | 40,869 | |
| | | | | | | | | |
| Industrials — 1.7% | | | | | | | | |
Alfa Laval | | | 96 | | | | 4,110 | |
Assa Abloy, Cl B | | | 346 | | | | 10,132 | |
Atlas Copco, Cl A | | | 220 | | | | 14,135 | |
Atlas Copco, Cl B | | | 142 | | | | 7,680 | |
Epiroc, Cl A | | | 200 | | | | 4,976 | |
Epiroc, Cl B | | | 126 | | | | 2,677 | |
Investment Latour, Cl B | | | 41 | | | | 1,486 | |
Nibe Industrier, Cl B | | | 513 | | | | 7,637 | |
Skanska, Cl B | | | 146 | | | | 3,706 | |
SKF, Cl B | | | 120 | | | | 2,780 | |
Volvo, Cl B | | | 568 | | | | 13,222 | |
| | | | | | | | 72,541 | |
| | | | | | | | | |
| Information Technology — 0.4% | | | | | | | | |
Hexagon, Cl B | | | 580 | | | | 9,319 | |
| Telefonaktiebolaget LM Ericsson, Cl B | | | 862 | | | | 9,435 | |
| | | | | | | | 18,754 | |
| | | | | | | | | |
| | | | | | | | | |
| Materials — 0.3% | | | | | | | | |
Sandvik | | | 378 | | | | 9,573 | |
| Schedule of Investments | | October 31, 2021 |
| | Global X S&P Catholic Values Developed ex-US ETF | |
| | | | | | | |
| COMMON STOCK — continued | | | | | | |
| Materials — continued | | | | | | |
Svenska Cellulosa, Cl B | | | 178 | | | $ | 2,775 | |
| | | | | | | | 12,348 | |
| | | | | | | | | |
TOTAL SWEDEN | | | | | | | 173,197 | |
| SWITZERLAND — 3.4% | | | | | | | | |
| Consumer Discretionary — 0.5% | | | | | | | | |
| Cie Financiere Richemont, Cl A | | | 162 | | | | 20,052 | |
| | | | | | | | | |
| Financials — 0.9% | | | | | | | | |
UBS Group | | | 1,098 | | | | 20,001 | |
Zurich Insurance Group | | | 42 | | | | 18,657 | |
| | | | | | | | 38,658 | |
| | | | | | | | | |
| Health Care — 1.1% | | | | | | | | |
Alcon | | | 566 | | | | 46,866 | |
| | | | | | | | | |
| Industrials — 0.5% | | | | | | | | |
ABB | | | 640 | | | | 21,215 | |
| | | | | | | | | |
| Information Technology — 0.2% | | | | | | | | |
STMicroelectronics | | | 193 | | | | 9,134 | |
| | | | | | | | | |
| Materials — 0.2% | | | | | | | | |
Givaudan | | | 2 | | | | 9,431 | |
| | | | | | | | | |
TOTAL SWITZERLAND | | | | | | | 145,356 | |
| TAIWAN — 0.8% | | | | | | | | |
| Communication Services — 0.8% | | | | | | | | |
Sea ADR * | | | 96 | | | | 32,983 | |
| | | | | | | | | |
| UNITED KINGDOM — 9.0% | | | | | | | | |
| Communication Services — 0.5% | | | | | | | | |
BT Group, Cl A * | | | 2,445 | | | | 4,655 | |
Vodafone Group | | | 8,055 | | | | 11,929 | |
WPP | | | 396 | | | | 5,732 | |
| | | | | | | | 22,316 | |
| Schedule of Investments | | October 31, 2021 |
| | Global X S&P Catholic Values Developed ex-US ETF | |
| | | | | | | |
| COMMON STOCK — continued | | | | | | |
| Consumer Discretionary — 0.3% | | | | | | |
Compass Group | | | 560 | | | $ | 11,898 | |
| | | | | | | | | |
| Consumer Staples — 2.4% | | | | | | | | |
Associated British Foods | | | 176 | | | | 4,313 | |
| Coca-Cola Europacific Partners | | | 105 | | | | 5,528 | |
Diageo | | | 1,185 | | | | 58,996 | |
Imperial Brands | | | 488 | | | | 10,315 | |
Ocado Group * | | | 336 | | | | 8,304 | |
Tesco | | | 3,960 | | | | 14,651 | |
| | | | | | | | 102,107 | |
| | | | | | | | | |
| Energy — 0.7% | | | | | | | | |
BP | | | 5,944 | | | | 28,533 | |
| | | | | | | | | |
| Financials — 2.6% | | | | | | | | |
Aviva | | | 1,131 | | | | 6,119 | |
Barclays | | | 4,664 | | | | 12,930 | |
HSBC Holdings | | | 5,960 | | | | 36,069 | |
Legal & General Group | | | 1,702 | | | | 6,740 | |
Lloyds Banking Group | | | 20,392 | | | | 14,038 | |
| London Stock Exchange Group | | | 91 | | | | 8,856 | |
Natwest Group | | | 1,491 | | | | 4,519 | |
Prudential | | | 799 | | | | 16,368 | |
Standard Chartered | | | 758 | | | | 5,142 | |
| | | | | | | | 110,781 | |
| | | | | | | | | |
| Health Care — 0.4% | | | | | | | | |
Smith & Nephew | | | 1,012 | | | | 17,409 | |
| | | | | | | | | |
| Industrials — 1.5% | | | | | | | | |
Ashtead Group | | | 155 | | | | 13,012 | |
CK Hutchison Holdings | | | 1,020 | | | | 6,864 | |
CNH Industrial | | | 364 | | | | 6,289 | |
Experian | | | 345 | | | | 15,828 | |
RELX | | | 705 | | | | 21,879 | |
| | | | | | | | 63,872 | |
| Schedule of Investments | | October 31, 2021 |
| | Global X S&P Catholic Values Developed ex-US ETF | |
| | | | | | | |
| COMMON STOCK — continued | | | | | | |
| Real Estate — 0.1% | | | | | | |
Segro ‡ | | | 337 | | | $ | 5,971 | |
| | | | | | | | | |
| Utilities — 0.5% | | | | | | | | |
National Grid | | | 1,086 | | | | 13,925 | |
SSE | | | 301 | | | | 6,781 | |
| | | | | | | | 20,706 | |
| | | | | | | | | |
TOTAL UNITED KINGDOM | | | | | | | 383,593 | |
| UNITED STATES — 2.3% | | | | | | | | |
| Communication Services — 0.3% | | | | | | | | |
Spotify Technology * | | | 41 | | | | 11,865 | |
| | | | | | | | | |
| Consumer Discretionary — 0.4% | | | | | | | | |
Fiverr International * | | | 11 | | | | 1,874 | |
Stellantis | | | 697 | | | | 13,914 | |
| | | | | | | | 15,788 | |
| | | | | | | | | |
| Industrials — 1.1% | | | | | | | | |
Ferguson | | | 80 | | | | 12,057 | |
Schneider Electric | | | 200 | | | | 34,463 | |
| | | | | | | | 46,520 | |
| | | | | | | | | |
| Information Technology — 0.4% | | | | | | | | |
Atlassian, Cl A * | | | 39 | | | | 17,867 | |
CyberArk Software * | | | 11 | | | | 1,981 | |
| | | | | | | | 19,848 | |
| | | | | | | | | |
| Materials — 0.1% | | | | | | | | |
James Hardie Industries | | | 128 | | | | 4,966 | |
| | | | | | | | | |
TOTAL UNITED STATES | | | | | | | 98,987 | |
| TOTAL COMMON STOCK | | | | | | | | |
(Cost $3,528,348) | | | | | | | 4,230,175 | |
| Schedule of Investments | | October 31, 2021 |
| | Global X S&P Catholic Values Developed ex-US ETF | |
| | | | | | | |
PREFERRED STOCK — 0.5% | | | | | | |
| GERMANY— 0.5% | | | | | | |
| Consumer Discretionary — 0.3% | | | | | | |
Bayerische Motoren Werke (B) | | | 15 | | | $ | 1,277 | |
Volkswagen (B) | | | 57 | | | | 12,785 | |
| | | | | | | | 14,062 | |
| Consumer Staples — 0.2% | | | | | | | | |
Henkel & KGaA (B) | | | 89 | | | | 7,970 | |
TOTAL GERMANY | | | | | | | 22,032 | |
| TOTAL PREFERRED STOCK | | | | | | | | |
(Cost $23,211) | | | | | | | 22,032 | |
| | | | | | | | | |
RIGHT — 0.0% | | | | | | | | |
| Australia — 0.0% | | | | | | | | |
Aristocrat Leisure # (Cost $–) | | | 9 | | | | 32 | |
| | | | | | | | | |
| TOTAL INVESTMENTS — 99.7% | | | | | | | | |
(Cost $3,551,559) | | | | | | $ | 4,252,239 | |
Percentages are based on Net Assets of $4,264,016.
| * | Non-income producing security. |
| ‡ | Real Estate Investment Trust |
| # | Expiration Date Not Available. |
| (A) | Security is fair valued using methods determined in good faith by the Fair Value Committee of the Fund. The total value of such securities as of October 31, 2021, was $14,710 and represents 0.3% of Net Assets. |
| (B) | There is currently no stated interest rate. |
| Schedule of Investments | | October 31, 2021 |
| | Global X S&P Catholic Values Developed ex-US ETF | |
The following is a summary of the level of inputs used as of October 31, 2021, in valuing the Fund’s investments carried at value:
| Investments in Securities | | | | | | | | | | | | |
| Common Stock | | $ | 4,195,008 | | | $ | 35,167 | | | $ | — | | | $ | 4,230,175 | |
| Preferred Stock | | | 22,032 | | | | — | | | | — | | | | 22,032 | |
| Right | | | 32 | | | | — | | | | — | | | | 32 | |
| Total Investments in Securities | | $ | 4,217,072 | | | $ | 35,167 | | | $ | — | | | $ | 4,252,239 | |
For the year ended October 31, 2021, there have been no transfers in or out of Level 3.
Amounts designated as “—“ are $0 or have been rounded to $0.
| Schedule of Investments | | October 31, 2021 |
| | Global X Guru® Index ETF | |
Sector Weightings (Unaudited)†:
† Sector weightings percentages are based on the total market value of investments. Repurchase agreements purchased from cash collateral received for securities lending activity are included in total investments. Please see Note 2 and 7 in Notes to Financial Statements for more detailed information.
| | | | | | | |
| COMMON STOCK — 98.3% | | | | | | |
| CANADA — 1.4% | | | | | | |
| Information Technology — 1.4% | | | | | | |
Shopify, Cl A * | | | 721 | | | $ | 1,057,512 | |
| | | | | | | | | |
| CHINA — 3.0% | | | | | | | | |
| Consumer Discretionary — 1.5% | | | | | | | | |
JD.com ADR * | | | 14,437 | | | | 1,130,128 | |
| | | | | | | | | |
| Information Technology — 1.5% | | | | | | | | |
GDS Holdings ADR * | | | 19,786 | | | | 1,175,289 | |
| | | | | | | | | |
TOTAL CHINA | | | | | | | 2,305,417 | |
| DENMARK — 1.4% | | | | | | | | |
| Health Care — 1.4% | | | | | | | | |
Ascendis Pharma ADR * | | | 7,176 | | | | 1,087,953 | |
| Schedule of Investments | | October 31, 2021 |
| | Global X Guru® Index ETF | |
| | | | | | | |
| COMMON STOCK — continued | | | | | | |
| SOUTH KOREA — 1.5% | | | | | | |
| Consumer Discretionary — 1.5% | | | | | | |
Coupang, Cl A * | | | 36,796 | | | $ | 1,095,049 | |
| | | | | | | | | |
| TAIWAN — 2.9% | | | | | | | | |
| Communication Services — 1.5% | | | | | | | | |
Sea ADR * | | | 3,336 | | | | 1,146,150 | |
| | | | | | | | | |
| Information Technology — 1.4% | | | | | | | | |
| Taiwan Semiconductor Manufacturing ADR | | | 9,303 | | | | 1,057,751 | |
| | | | | | | | | |
TOTAL TAIWAN | | | | | | | 2,203,901 | |
| UNITED KINGDOM — 1.5% | | | | | | | | |
| Communication Services — 1.5% | | | | | | | | |
Liberty Global, Cl C * | | | 39,103 | | | | 1,127,731 | |
| | | | | | | | | |
| UNITED STATES — 86.6% | | | | | | | | |
| Communication Services — 8.4% | | | | | | | | |
Alphabet, Cl C * | | | 380 | | | | 1,126,856 | |
Charter Communications, Cl A * | | | 1,359 | | | | 917,175 | |
DISH Network, Cl A * | | | 25,564 | | | | 1,049,913 | |
Liberty Broadband, Cl C * | | | 5,879 | | | | 955,044 | |
Meta Platforms, Cl A * | | | 2,936 | | | | 950,002 | |
Netflix * | | | 1,955 | | | | 1,349,556 | |
| | | | | | | | 6,348,546 | |
| | | | | | | | | |
| Consumer Discretionary — 16.6% | | | | | | | | |
Amazon.com * | | | 324 | | | | 1,092,667 | |
Booking Holdings * | | | 486 | | | | 1,176,499 | |
DoorDash, Cl A * | | | 5,800 | | | | 1,129,840 | |
eBay | | | 14,410 | | | | 1,105,535 | |
Expedia Group * | | | 7,751 | | | | 1,274,342 | |
Home Depot | | | 3,416 | | | | 1,269,864 | |
Las Vegas Sands * | | | 25,726 | | | | 998,426 | |
Lithia Motors, Cl A | | | 3,412 | | | | 1,089,179 | |
Lowe’s | | | 5,452 | | | | 1,274,787 | |
| Schedule of Investments | | October 31, 2021 |
| | Global X Guru® Index ETF | |
| | | | | | | |
| COMMON STOCK — continued | | | | | | |
| Consumer Discretionary — continued | | | | | | |
ThredUp, Cl A * (A) | | | 57,604 | | | $ | 1,246,550 | |
Wayfair, Cl A * | | | 3,829 | | | | 953,804 | |
| | | | | | | | 12,611,493 | |
| | | | | | | | | |
| Consumer Staples — 4.3% | | | | | | | | |
Albertsons, Cl A | | | 37,985 | | | | 1,175,636 | |
Mondelez International, Cl A | | | 17,979 | | | | 1,092,045 | |
Post Holdings * | | | 9,984 | | | | 1,013,176 | |
| | | | | | | | 3,280,857 | |
| | | | | | | | | |
| Energy — 3.0% | | | | | | | | |
Cheniere Energy | | | 12,564 | | | | 1,299,118 | |
Texas Pacific Land | | | 790 | | | | 1,006,199 | |
| | | | | | | | 2,305,317 | |
| | | | | | | | | |
| Financials — 11.5% | | | | | | | | |
Arch Capital Group * | | | 27,090 | | | | 1,132,904 | |
Citigroup | | | 15,593 | | | | 1,078,412 | |
LPL Financial Holdings | | | 7,531 | | | | 1,235,235 | |
S&P Global | | | 2,516 | | | | 1,192,987 | |
Upstart Holdings * | | | 5,139 | | | | 1,654,963 | |
Wells Fargo | | | 23,082 | | | | 1,180,875 | |
Willis Towers Watson | | | 5,132 | | | | 1,243,381 | |
| | | | | | | | 8,718,757 | |
| | | | | | | | | |
| Health Care — 13.3% | | | | | | | | |
Bausch Health * | | | 38,378 | | | | 1,077,654 | |
Fate Therapeutics * | | | 15,427 | | | | 829,973 | |
Invitae * | | | 38,049 | | | | 1,008,299 | |
Mirati Therapeutics * | | | 6,616 | | | | 1,250,556 | |
Rocket Pharmaceuticals * | | | 32,894 | | | | 977,281 | |
Seagen * | | | 6,627 | | | | 1,168,539 | |
Tenet Healthcare * | | | 14,810 | | | | 1,061,285 | |
Turning Point Therapeutics * | | | 14,336 | | | | 596,091 | |
Viatris, Cl W * | | | 77,558 | | | | 1,035,399 | |
| Schedule of Investments | | October 31, 2021 |
| | Global X Guru® Index ETF | |
| | | | | | | |
| COMMON STOCK — continued | | | | | | |
| Health Care — continued | | | | | | |
Zimmer Biomet Holdings | | | 7,462 | | | $ | 1,067,961 | |
| | | | | | | | 10,073,038 | |
| | | | | | | | | |
| Industrials — 2.9% | | | | | | | | |
Otis Worldwide | | | 12,099 | | | | 971,670 | |
Uber Technologies * | | | 27,957 | | | | 1,225,076 | |
| | | | | | | | 2,196,746 | |
| | | | | | | | | |
| Information Technology — 17.2% | | | | | | | | |
Adobe * | | | 1,678 | | | | 1,091,304 | |
Appian, Cl A * | | | 10,258 | | | | 1,019,748 | |
Dell Technologies, Cl C * | | | 11,386 | | | | 1,252,346 | |
Elastic * | | | 6,961 | | | | 1,207,803 | |
Fiserv * | | | 9,555 | | | | 941,072 | |
Micron Technology | | | 15,276 | | | | 1,055,572 | |
Microsoft | | | 3,681 | | | | 1,220,693 | |
NortonLifeLock | | | 41,716 | | | | 1,061,672 | |
Pegasystems | | | 8,075 | | | | 958,664 | |
Twilio, Cl A * | | | 3,048 | | | | 888,065 | |
Unity Software * | | | 8,763 | | | | 1,325,930 | |
Visa, Cl A | | | 4,833 | | | | 1,023,484 | |
| | | | | | | | 13,046,353 | |
| | | | | | | | | |
| Materials — 3.0% | | | | | | | | |
| International Flavors & Fragrances | | | 7,391 | | | | 1,089,803 | |
Sherwin-Williams | | | 3,661 | | | | 1,159,109 | |
| | | | | | | | 2,248,912 | |
| | | | | | | | | |
| Real Estate — 3.0% | | | | | | | | |
American Tower, Cl A ‡ | | | 3,795 | | | | 1,070,076 | |
Zillow Group, Cl C * | | | 11,629 | | | | 1,205,113 | |
| | | | | | | | 2,275,189 | |
| | | | | | | | | |
| Utilities — 3.4% | | | | | | | | |
PG&E * | | | 122,852 | | | | 1,425,083 | |
Vistra | | | 59,288 | | | | 1,161,452 | |
| | | | | | | | 2,586,535 | |
| Schedule of Investments | | October 31, 2021 |
| | Global X Guru® Index ETF | |
| | | | | | | |
| COMMON STOCK — continued | | | | | | |
TOTAL UNITED STATES | | | | | $ | 65,691,743 | |
| TOTAL COMMON STOCK | | | | | | | |
(Cost $66,614,394) | | | | | | 74,569,306 | |
| | | | | | | | |
| MASTER LIMITED PARTNERSHIP — 1.5% | | | | | | | |
| UNITED STATES— 1.5% | | | | | | | |
| Industrials — 1.5% | | | | | | | |
Icahn Enterprises (B) (Cost $1,095,418) | | | 20,125 | | | | 1,159,200 | |
| | | | | | | | | |
SHORT-TERM INVESTMENT — 0.7%(C)(D) | | | | | | | | |
| Fidelity Investments Money Market Government Portfolio, Cl Institutional, 0.010% | | | | | | | | |
(Cost $539,892) | | | 539,892 | | | | 539,892 | |
| | | | | | | | | |
REPURCHASE AGREEMENT — 0.6%(C) | | | | | | | | |
| BNP Paribas | | | | | | | | |
| 0.030%, dated 10/29/21, to be repurchased on 11/01/21, repurchase price $434,595 (collateralized by various U.S. Treasury Obligations, ranging in par value $17,478 - $58,286, 0.750% - 1.250%, 01/31/28 -03/31/28, with a total market value of $444,116) | | | | | | | | |
(Cost $434,594) | | $ | 434,594 | | | | 434,594 | |
| TOTAL INVESTMENTS — 101.1% | | | | | | | | |
(Cost $68,684,298) | | | | | | $ | 76,702,992 | |
Percentages are based on Net Assets of $75,856,035.
Cl — Class
S&P — Standard & Poor’s
| Schedule of Investments | | October 31, 2021 |
| | Global X Guru® Index ETF | |
| * | Non-income producing security. |
| ‡ | Real Estate Investment Trust |
| (A) | This security or a partial position of this security is on loan at October 31, 2021. The total value of securities on loan at October 31, 2021 was $979,084. |
| (B) | Security considered Master Limited Partnership. At October 31, 2021, these securities amounted to $1,159,200 or 1.5% of Net Assets. |
| (C) | Security was purchased with cash collateral held from securities on loan. The total value of such securities as of October 31, 2021 was $974,486. |
| (D) | The rate reported on the Schedule of Investments is the 7-day effective yield as of October 31, 2021. |
The following is a summary of the level of inputs used as of October 31, 2021, in valuing the Fund’s investments carried at value:
| Investments in Securities | | | | | | | | | | | | |
| Common Stock | | $ | 74,569,306 | | | $ | — | | | $ | — | | | $ | 74,569,306 | |
| Master Limited Partnership | | | 1,159,200 | | | | — | | | | — | | | | 1,159,200 | |
| Short-Term Investment | | | 539,892 | | | | — | | | | — | | | | 539,892 | |
| Repurchase Agreement | | | — | | | | 434,594 | | | | — | | | | 434,594 | |
| Total Investments in Securities | | $ | 76,268,398 | | | $ | 434,594 | | | $ | — | | | $ | 76,702,992 | |
For the year ended October 31, 2021, there have been no transfers in or out of Level 3.
Amounts designated as “—“ are $0 or have been rounded to $0.
| Schedule of Investments | | October 31, 2021 |
| | Global X S&P 500® Tail Risk ETF | |
Sector Weightings (Unaudited)†:
† Sector weightings percentages are based on the total market value of investments.
| | | | | | | |
| COMMON STOCK — 99.3% | | | | | | |
| CHINA — 0.1% | | | | | | |
| Information Technology — 0.1% | | | | | | |
NXP Semiconductors | | | 26 | | | $ | 5,222 | |
| | | | | | | | | |
| UNITED KINGDOM — 0.4% | | | | | | | | |
| Materials — 0.4% | | | | | | | | |
Linde | | | 48 | | | | 15,322 | |
| | | | | | | | | |
| UNITED STATES — 98.8% | | | | | | | | |
| Communication Services — 10.7% | | | | | | | | |
Activision Blizzard | | | 65 | | | | 5,082 | |
Alphabet, Cl A * | | | 27 | | | | 79,945 | |
Alphabet, Cl C * | | | 26 | | | | 77,101 | |
AT&T | | | 654 | | | | 16,520 | |
Charter Communications, Cl A * | | | 12 | | | | 8,099 | |
Comcast, Cl A | | | 420 | | | | 21,601 | |
Discovery, Cl A * | | | 13 | | | | 305 | |
Discovery, Cl C * | | | 26 | | | | 587 | |
DISH Network, Cl A * | | | 26 | | | | 1,068 | |
| Schedule of Investments | | October 31, 2021 |
| | Global X S&P 500® Tail Risk ETF | |
| | | | | | | |
| COMMON STOCK — continued | | | | | | |
| Communication Services — continued | | | | | | |
Electronic Arts | | | 26 | | | $ | 3,647 | |
Fox, Cl A | | | 26 | | | | 1,033 | |
Fox, Cl B | | | 13 | | | | 480 | |
Interpublic Group | | | 39 | | | | 1,426 | |
Live Nation Entertainment * | | | 13 | | | | 1,315 | |
Lumen Technologies | | | 91 | | | | 1,079 | |
Match Group * | | | 25 | | | | 3,770 | |
Meta Platforms, Cl A * | | | 220 | | | | 71,185 | |
Netflix * | | | 40 | | | | 27,612 | |
News, Cl A | | | 39 | | | | 893 | |
News, Cl B | | | 13 | | | | 293 | |
Omnicom Group | | | 16 | | | | 1,089 | |
Take-Two Interactive Software * | | | 13 | | | | 2,353 | |
T-Mobile US * | | | 52 | | | | 5,982 | |
Twitter * | | | 68 | | | | 3,641 | |
Verizon Communications | | | 379 | | | | 20,083 | |
ViacomCBS, Cl B | | | 52 | | | | 1,883 | |
Walt Disney | | | 167 | | | | 28,235 | |
| | | | | | | | 386,307 | |
| | | | | | | | | |
| Consumer Discretionary — 12.6% | | | | | | | | |
Advance Auto Parts | | | 5 | | | | 1,128 | |
Amazon.com * | | | 40 | | | | 134,897 | |
Aptiv * | | | 26 | | | | 4,495 | |
AutoZone * | | | 2 | | | | 3,570 | |
Bath & Body Works | | | 26 | | | | 1,796 | |
Best Buy | | | 22 | | | | 2,689 | |
Booking Holdings * | | | 3 | | | | 7,262 | |
BorgWarner | | | 26 | | | | 1,172 | |
Caesars Entertainment * | | | 21 | | | | 2,299 | |
CarMax * | | | 13 | | | | 1,780 | |
Carnival * | | | 68 | | | | 1,507 | |
Chipotle Mexican Grill, Cl A * | | | 2 | | | | 3,558 | |
Darden Restaurants | | | 13 | | | | 1,874 | |
| Schedule of Investments | | October 31, 2021 |
| | Global X S&P 500® Tail Risk ETF | |
| | | | | | | |
| COMMON STOCK — continued | | | | | | |
| Consumer Discretionary — continued | | | | | | |
Dollar General | | | 23 | | | $ | 5,095 | |
Dollar Tree * | | | 26 | | | | 2,802 | |
Domino’s Pizza | | | 3 | | | | 1,467 | |
DR Horton | | | 26 | | | | 2,321 | |
eBay | | | 55 | | | | 4,220 | |
Etsy * | | | 13 | | | | 3,259 | |
Expedia Group * | | | 13 | | | | 2,137 | |
Ford Motor | | | 344 | | | | 5,876 | |
Gap | | | 16 | | | | 363 | |
Garmin | | | 13 | | | | 1,867 | |
General Motors * | | | 132 | | | | 7,185 | |
Genuine Parts | | | 13 | | | | 1,704 | |
Hanesbrands | | | 26 | | | | 443 | |
Hasbro | | | 13 | | | | 1,245 | |
Hilton Worldwide Holdings * | | | 26 | | | | 3,743 | |
Home Depot | | | 99 | | | | 36,802 | |
Las Vegas Sands * | | | 26 | | | | 1,009 | |
Leggett & Platt | | | 13 | | | | 609 | |
Lennar, Cl A | | | 26 | | | | 2,598 | |
LKQ | | | 26 | | | | 1,432 | |
Lowe’s | | | 65 | | | | 15,198 | |
Marriott International, Cl A * | | | 26 | | | | 4,161 | |
McDonald’s | | | 68 | | | | 16,697 | |
MGM Resorts International | | | 39 | | | | 1,839 | |
Mohawk Industries * | | | 4 | | | | 709 | |
Newell Brands | | | 29 | | | | 664 | |
NIKE, Cl B | | | 117 | | | | 19,573 | |
Norwegian Cruise Line Holdings * | | | 29 | | | | 746 | |
O’Reilly Automotive * | | | 5 | | | | 3,112 | |
Penn National Gaming * | | | 13 | | | | 931 | |
Pool | | | 3 | | | | 1,546 | |
PulteGroup | | | 26 | | | | 1,250 | |
PVH | | | 8 | | | | 875 | |
| Schedule of Investments | | October 31, 2021 |
| | Global X S&P 500® Tail Risk ETF | |
| | | | | | | |
| COMMON STOCK — continued | | | | | | |
| Consumer Discretionary — continued | | | | | | |
Ralph Lauren, Cl A | | | 3 | | | $ | 382 | |
Ross Stores | | | 34 | | | | 3,849 | |
Royal Caribbean Cruises * | | | 22 | | | | 1,857 | |
Starbucks | | | 104 | | | | 11,031 | |
Tapestry | | | 26 | | | | 1,014 | |
Target | | | 45 | | | | 11,683 | |
Tesla * | | | 75 | | | | 83,550 | |
TJX | | | 107 | | | | 7,007 | |
Tractor Supply | | | 13 | | | | 2,823 | |
Ulta Beauty * | | | 4 | | | | 1,469 | |
Under Armour, Cl A * | | | 13 | | | | 285 | |
Under Armour, Cl C * | | | 13 | | | | 245 | |
VF | | | 26 | | | | 1,895 | |
Whirlpool | | | 5 | | | | 1,054 | |
Wynn Resorts * | | | 13 | | | | 1,167 | |
Yum! Brands | | | 26 | | | | 3,248 | |
| | | | | | | | 454,064 | |
| | | | | | | | | |
| Consumer Staples — 5.6% | | | | | | | | |
Altria Group | | | 169 | | | | 7,455 | |
Archer-Daniels-Midland | | | 52 | | | | 3,341 | |
Brown-Forman, Cl B | | | 13 | | | | 883 | |
Campbell Soup | | | 13 | | | | 519 | |
Church & Dwight | | | 26 | | | | 2,271 | |
Clorox | | | 13 | | | | 2,119 | |
Coca-Cola | | | 363 | | | | 20,462 | |
Colgate-Palmolive | | | 78 | | | | 5,943 | |
Conagra Brands | | | 39 | | | | 1,256 | |
Constellation Brands, Cl A | | | 15 | | | | 3,252 | |
Costco Wholesale | | | 40 | | | | 19,662 | |
Estee Lauder, Cl A | | | 22 | | | | 7,135 | |
General Mills | | | 52 | | | | 3,214 | |
Hershey | | | 13 | | | | 2,280 | |
Hormel Foods | | | 26 | | | | 1,100 | |
| Schedule of Investments | | October 31, 2021 |
| | Global X S&P 500® Tail Risk ETF | |
| | | | | | | |
| COMMON STOCK — continued | | | | | | |
| Consumer Staples — continued | | | | | | |
J M Smucker | | | 13 | | | $ | 1,597 | |
Kellogg | | | 26 | | | | 1,594 | |
Kimberly-Clark | | | 30 | | | | 3,885 | |
Kraft Heinz | | | 55 | | | | 1,974 | |
Kroger | | | 65 | | | | 2,601 | |
Lamb Weston Holdings | | | 13 | | | | 734 | |
McCormick | | | 26 | | | | 2,086 | |
Molson Coors Beverage, Cl B | | | 13 | | | | 573 | |
Mondelez International, Cl A | | | 129 | | | | 7,835 | |
Monster Beverage * | | | 35 | | | | 2,975 | |
PepsiCo | | | 130 | | | | 21,008 | |
Philip Morris International | | | 147 | | | | 13,897 | |
Procter & Gamble | | | 223 | | | | 31,887 | |
Sysco | | | 48 | | | | 3,691 | |
Tyson Foods, Cl A | | | 26 | | | | 2,079 | |
Walgreens Boots Alliance | | | 65 | | | | 3,056 | |
Walmart | | | 130 | | | | 19,425 | |
| | | | | | | | 201,789 | |
| | | | | | | | | |
| Energy — 2.8% | | | | | | | | |
APA | | | 29 | | | | 760 | |
Baker Hughes, Cl A | | | 68 | | | | 1,705 | |
Chevron | | | 179 | | | | 20,494 | |
ConocoPhillips | | | 117 | | | | 8,715 | |
Coterra Energy | | | 39 | | | | 832 | |
Devon Energy | | | 52 | | | | 2,084 | |
Diamondback Energy | | | 13 | | | | 1,394 | |
EOG Resources | | | 52 | | | | 4,808 | |
Exxon Mobil | | | 389 | | | | 25,079 | |
Halliburton | | | 78 | | | | 1,949 | |
Hess | | | 26 | | | | 2,147 | |
Kinder Morgan | | | 172 | | | | 2,881 | |
Marathon Oil | | | 68 | | | | 1,110 | |
Marathon Petroleum | | | 55 | | | | 3,626 | |
| Schedule of Investments | | October 31, 2021 |
| | Global X S&P 500® Tail Risk ETF | |
| | | | | | | |
| COMMON STOCK — continued | | | | | | |
| Energy — continued | | | | | | |
Occidental Petroleum | | | 78 | | | $ | 2,615 | |
ONEOK | | | 39 | | | | 2,481 | |
Phillips 66 | | | 39 | | | | 2,916 | |
Pioneer Natural Resources | | | 22 | | | | 4,114 | |
Schlumberger | | | 120 | | | | 3,871 | |
Valero Energy | | | 39 | | | | 3,016 | |
Williams | | | 107 | | | | 3,006 | |
| | | | | | | | 99,603 | |
| | | | | | | | | |
| Financials — 11.3% | | | | | | | | |
Aflac | | | 52 | | | | 2,791 | |
Allstate | | | 26 | | | | 3,215 | |
American Express | | | 60 | | | | 10,427 | |
American International Group | | | 78 | | | | 4,609 | |
Ameriprise Financial | | | 11 | | | | 3,323 | |
Aon, Cl A | | | 23 | | | | 7,358 | |
Arthur J Gallagher | | | 17 | | | | 2,850 | |
Assurant | | | 4 | | | | 645 | |
Bank of America | | | 679 | | | | 32,443 | |
Bank of New York Mellon | | | 68 | | | | 4,026 | |
Berkshire Hathaway, Cl B * | | | 170 | | | | 48,792 | |
BlackRock, Cl A | | | 13 | | | | 12,265 | |
Brown & Brown | | | 22 | | | | 1,388 | |
Capital One Financial | | | 39 | | | | 5,890 | |
Cboe Global Markets | | | 13 | | | | 1,715 | |
Charles Schwab | | | 139 | | | | 11,402 | |
Chubb | | | 39 | | | | 7,620 | |
Cincinnati Financial | | | 13 | | | | 1,579 | |
Citigroup | | | 182 | | | | 12,587 | |
Citizens Financial Group | | | 39 | | | | 1,848 | |
CME Group, Cl A | | | 36 | | | | 7,940 | |
Comerica | | | 13 | | | | 1,106 | |
Discover Financial Services | | | 26 | | | | 2,946 | |
Everest Re Group | | | 4 | | | | 1,046 | |
| Schedule of Investments | | October 31, 2021 |
| | Global X S&P 500® Tail Risk ETF | |
| | | | | | | |
| COMMON STOCK — continued | | | | | | |
| Financials — continued | | | | | | |
Fifth Third Bancorp | | | 65 | | | $ | 2,829 | |
First Republic Bank | | | 13 | | | | 2,812 | |
Franklin Resources | | | 26 | | | | 819 | |
Globe Life | | | 13 | | | | 1,157 | |
Goldman Sachs Group | | | 31 | | | | 12,814 | |
| Hartford Financial Services Group | | | 26 | | | | 1,896 | |
Huntington Bancshares | | | 130 | | | | 2,046 | |
Intercontinental Exchange | | | 52 | | | | 7,200 | |
Invesco | | | 26 | | | | 661 | |
JPMorgan Chase | | | 274 | | | | 46,550 | |
KeyCorp | | | 81 | | | | 1,885 | |
Lincoln National | | | 13 | | | | 938 | |
Loews | | | 13 | | | | 729 | |
M&T Bank | | | 13 | | | | 1,913 | |
MarketAxess Holdings | | | 3 | | | | 1,226 | |
Marsh & McLennan | | | 50 | | | | 8,340 | |
MetLife | | | 65 | | | | 4,082 | |
Moody’s | | | 13 | | | | 5,254 | |
Morgan Stanley | | | 130 | | | | 13,361 | |
MSCI, Cl A | | | 9 | | | | 5,984 | |
Nasdaq | | | 13 | | | | 2,728 | |
Northern Trust | | | 18 | | | | 2,215 | |
People’s United Financial | | | 39 | | | | 669 | |
PNC Financial Services Group | | | 39 | | | | 8,230 | |
Principal Financial Group | | | 26 | | | | 1,744 | |
Progressive | | | 52 | | | | 4,934 | |
Prudential Financial | | | 39 | | | | 4,292 | |
Raymond James Financial | | | 18 | | | | 1,775 | |
Regions Financial | | | 81 | | | | 1,918 | |
S&P Global | | | 23 | | | | 10,906 | |
State Street | | | 26 | | | | 2,562 | |
SVB Financial Group * | | | 4 | | | | 2,870 | |
Synchrony Financial | | | 52 | | | | 2,415 | |
| Schedule of Investments | | October 31, 2021 |
| | Global X S&P 500® Tail Risk ETF | |
| | | | | | | |
| COMMON STOCK — continued | | | | | | |
| Financials — continued | | | | | | |
T Rowe Price Group | | | 23 | | | $ | 4,988 | |
Travelers | | | 26 | | | | 4,183 | |
Truist Financial | | | 117 | | | | 7,426 | |
US Bancorp | | | 120 | | | | 7,244 | |
W R Berkley | | | 13 | | | | 1,035 | |
Wells Fargo | | | 377 | | | | 19,287 | |
Willis Towers Watson | | | 13 | | | | 3,150 | |
Zions Bancorp | | | 13 | | | | 819 | |
| | | | | | | | 407,697 | |
| | | | | | | | | |
| Health Care — 13.1% | | | | | | | | |
Abbott Laboratories | | | 164 | | | | 21,138 | |
AbbVie | | | 161 | | | | 18,462 | |
ABIOMED * | | | 4 | | | | 1,328 | |
Agilent Technologies | | | 26 | | | | 4,095 | |
Align Technology * | | | 8 | | | | 4,995 | |
AmerisourceBergen, Cl A | | | 13 | | | | 1,586 | |
Amgen | | | 52 | | | | 10,762 | |
Anthem | | | 23 | | | | 10,008 | |
Baxter International | | | 47 | | | | 3,711 | |
Becton Dickinson | | | 26 | | | | 6,229 | |
Biogen * | | | 13 | | | | 3,467 | |
Bio-Rad Laboratories, Cl A * | | | 2 | | | | 1,589 | |
Bio-Techne | | | 3 | | | | 1,571 | |
Boston Scientific * | | | 130 | | | | 5,607 | |
Bristol-Myers Squibb | | | 205 | | | | 11,972 | |
Cardinal Health | | | 26 | | | | 1,243 | |
Catalent * | | | 13 | | | | 1,792 | |
Centene * | | | 52 | | | | 3,704 | |
Cerner | | | 26 | | | | 1,932 | |
Charles River Laboratories International * | | | 4 | | | | 1,795 | |
Cigna | | | 30 | | | | 6,408 | |
Cooper | | | 4 | | | | 1,668 | |
CVS Health | | | 117 | | | | 10,446 | |
| Schedule of Investments | | October 31, 2021 |
| | Global X S&P 500® Tail Risk ETF | |
| | | | | | | |
| COMMON STOCK — continued | | | | | | |
| Health Care — continued | | | | | | |
Danaher | | | 58 | | | $ | 18,083 | |
DaVita * | | | 5 | | | | 516 | |
DENTSPLY SIRONA | | | 16 | | | | 915 | |
Dexcom * | | | 10 | | | | 6,232 | |
Edwards Lifesciences * | | | 56 | | | | 6,710 | |
Eli Lilly | | | 74 | | | | 18,852 | |
Gilead Sciences | | | 115 | | | | 7,461 | |
HCA Healthcare | | | 23 | | | | 5,761 | |
Henry Schein * | | | 13 | | | | 993 | |
Hologic * | | | 26 | | | | 1,906 | |
Humana | | | 13 | | | | 6,021 | |
IDEXX Laboratories * | | | 9 | | | | 5,995 | |
Illumina * | | | 13 | | | | 5,396 | |
Incyte * | | | 13 | | | | 871 | |
Intuitive Surgical * | | | 33 | | | | 11,917 | |
IQVIA Holdings * | | | 18 | | | | 4,706 | |
Johnson & Johnson | | | 243 | | | | 39,580 | |
Laboratory Corp of America Holdings * | | | 10 | | | | 2,870 | |
McKesson | | | 13 | | | | 2,702 | |
Medtronic | | | 125 | | | | 14,983 | |
Merck | | | 233 | | | | 20,516 | |
Mettler-Toledo International * | | | 2 | | | | 2,962 | |
Moderna * | | | 31 | | | | 10,702 | |
Organon | | | 26 | | | | 955 | |
PerkinElmer | | | 13 | | | | 2,300 | |
Pfizer | | | 516 | | | | 22,570 | |
Quest Diagnostics | | | 13 | | | | 1,908 | |
Regeneron Pharmaceuticals * | | | 11 | | | | 7,039 | |
ResMed | | | 13 | | | | 3,418 | |
STERIS | | | 10 | | | | 2,337 | |
Stryker | | | 30 | | | | 7,982 | |
Teleflex | | | 4 | | | | 1,428 | |
Thermo Fisher Scientific | | | 37 | | | | 23,424 | |
| Schedule of Investments | | October 31, 2021 |
| | Global X S&P 500® Tail Risk ETF | |
| | | | | | | |
| COMMON STOCK — continued | | | | | | |
| Health Care — continued | | | | | | |
UnitedHealth Group | | | 88 | | | $ | 40,521 | |
| Universal Health Services, Cl B | | | 8 | | | | 993 | |
Vertex Pharmaceuticals * | | | 26 | | | | 4,808 | |
Viatris, Cl W * | | | 107 | | | | 1,428 | |
Waters * | | | 5 | | | | 1,838 | |
West Pharmaceutical Services | | | 9 | | | | 3,869 | |
Zimmer Biomet Holdings | | | 18 | | | | 2,576 | |
Zoetis, Cl A | | | 42 | | | | 9,080 | |
| | | | | | | | 470,632 | |
| | | | | | | | | |
| Industrials — 8.1% | | | | | | | | |
3M | | | 52 | | | | 9,291 | |
Alaska Air Group * | | | 13 | | | | 686 | |
Allegion | | | 9 | | | | 1,155 | |
American Airlines Group * | | | 55 | | | | 1,056 | |
AMETEK | | | 22 | | | | 2,913 | |
AO Smith | | | 13 | | | | 950 | |
Boeing * | | | 52 | | | | 10,766 | |
Carrier Global | | | 79 | | | | 4,126 | |
Caterpillar | | | 52 | | | | 10,608 | |
CH Robinson Worldwide | | | 13 | | | | 1,261 | |
Cintas | | | 10 | | | | 4,331 | |
Copart * | | | 21 | | | | 3,261 | |
CSX | | | 198 | | | | 7,162 | |
Cummins | | | 13 | | | | 3,118 | |
Deere | | | 26 | | | | 8,900 | |
Delta Air Lines * | | | 55 | | | | 2,152 | |
Dover | | | 13 | | | | 2,198 | |
Eaton | | | 39 | | | | 6,426 | |
Emerson Electric | | | 52 | | | | 5,045 | |
Equifax | | | 13 | | | | 3,607 | |
| Expeditors International of Washington | | | 13 | | | | 1,602 | |
Fastenal | | | 52 | | | | 2,968 | |
FedEx | | | 23 | | | | 5,417 | |
| Schedule of Investments | | October 31, 2021 |
| | Global X S&P 500® Tail Risk ETF | |
| | | | | | | |
| COMMON STOCK — continued | | | | | | |
| Industrials — continued | | | | | | |
Fortive | | | 29 | | | $ | 2,196 | |
| Fortune Brands Home & Security | | | 13 | | | | 1,318 | |
Generac Holdings * | | | 5 | | | | 2,493 | |
General Dynamics | | | 22 | | | | 4,460 | |
General Electric | | | 101 | | | | 10,592 | |
Honeywell International | | | 65 | | | | 14,210 | |
Howmet Aerospace | | | 39 | | | | 1,158 | |
Huntington Ingalls Industries | | | 4 | | | | 811 | |
IDEX | | | 9 | | | | 2,003 | |
IHS Markit | | | 37 | | | | 4,837 | |
Illinois Tool Works | | | 26 | | | | 5,925 | |
Ingersoll Rand | | | 39 | | | | 2,097 | |
Jacobs Engineering Group | | | 13 | | | | 1,825 | |
JB Hunt Transport Services | | | 9 | | | | 1,775 | |
Johnson Controls International | | | 65 | | | | 4,769 | |
Kansas City Southern | | | 9 | | | | 2,792 | |
L3Harris Technologies | | | 19 | | | | 4,380 | |
Leidos Holdings | | | 13 | | | | 1,300 | |
Lockheed Martin | | | 23 | | | | 7,643 | |
Masco | | | 26 | | | | 1,704 | |
Nielsen Holdings | | | 29 | | | | 587 | |
Norfolk Southern | | | 23 | | | | 6,740 | |
Northrop Grumman | | | 13 | | | | 4,644 | |
Old Dominion Freight Line | | | 10 | | | | 3,413 | |
Otis Worldwide | | | 39 | | | | 3,132 | |
PACCAR | | | 26 | | | | 2,330 | |
Parker-Hannifin | | | 13 | | | | 3,856 | |
Pentair | | | 13 | | | | 962 | |
Quanta Services | | | 13 | | | | 1,577 | |
Raytheon Technologies | | | 139 | | | | 12,352 | |
Republic Services, Cl A | | | 18 | | | | 2,423 | |
Robert Half International | | | 13 | | | | 1,470 | |
Rockwell Automation | | | 11 | | | | 3,513 | |
| Schedule of Investments | | October 31, 2021 |
| | Global X S&P 500® Tail Risk ETF | |
| | | | | | | |
| COMMON STOCK — continued | | | | | | |
| Industrials — continued | | | | | | |
Rollins | | | 16 | | | $ | 564 | |
Roper Technologies | | | 10 | | | | 4,879 | |
Snap-On | | | 5 | | | | 1,016 | |
Southwest Airlines * | | | 52 | | | | 2,459 | |
Stanley Black & Decker | | | 13 | | | | 2,336 | |
Textron | | | 16 | | | | 1,182 | |
Trane Technologies | | | 23 | | | | 4,161 | |
TransDigm Group * | | | 4 | | | | 2,495 | |
Union Pacific | | | 61 | | | | 14,725 | |
United Airlines Holdings * | | | 26 | | | | 1,200 | |
United Parcel Service, Cl B | | | 65 | | | | 13,876 | |
United Rentals * | | | 9 | | | | 3,412 | |
Verisk Analytics, Cl A | | | 13 | | | | 2,733 | |
Waste Management | | | 39 | | | | 6,249 | |
| Westinghouse Air Brake Technologies | | | 13 | | | | 1,179 | |
WW Grainger | | | 4 | | | | 1,852 | |
Xylem | | | 13 | | | | 1,698 | |
| | | | | | | | 290,302 | |
| | | | | | | | | |
| Information Technology — 27.7% | | | | | | | | |
Accenture, Cl A | | | 58 | | | | 20,810 | |
Adobe * | | | 43 | | | | 27,966 | |
Advanced Micro Devices * | | | 113 | | | | 13,586 | |
Akamai Technologies * | | | 13 | | | | 1,371 | |
Amphenol, Cl A | | | 52 | | | | 3,992 | |
Analog Devices | | | 51 | | | | 8,848 | |
ANSYS * | | | 10 | | | | 3,796 | |
Apple | | | 1,443 | | | | 216,161 | |
Applied Materials | | | 82 | | | | 11,205 | |
Arista Networks * | | | 5 | | | | 2,048 | |
Autodesk * | | | 22 | | | | 6,987 | |
Automatic Data Processing | | | 39 | | | | 8,755 | |
Broadcom | | | 38 | | | | 20,203 | |
Broadridge Financial Solutions | | | 13 | | | | 2,319 | |
| Schedule of Investments | | October 31, 2021 |
| | Global X S&P 500® Tail Risk ETF | |
| | | | | | | |
| COMMON STOCK — continued | | | | | | |
| Information Technology — continued | | | | | | |
Cadence Design Systems * | | | 26 | | | $ | 4,501 | |
CDW | | | 13 | | | | 2,426 | |
Ceridian HCM Holding * | | | 12 | | | | 1,503 | |
Cisco Systems | | | 388 | | | | 21,716 | |
Citrix Systems | | | 13 | | | | 1,232 | |
| Cognizant Technology Solutions, Cl A | | | 49 | | | | 3,826 | |
Corning | | | 65 | | | | 2,312 | |
DXC Technology * | | | 26 | | | | 847 | |
Enphase Energy * | | | 13 | | | | 3,011 | |
F5 Networks * | | | 4 | | | | 845 | |
| Fidelity National Information Services | | | 52 | | | | 5,759 | |
Fiserv * | | | 52 | | | | 5,121 | |
FleetCor Technologies * | | | 9 | | | | 2,227 | |
Fortinet * | | | 13 | | | | 4,372 | |
Gartner * | | | 9 | | | | 2,987 | |
Global Payments | | | 26 | | | | 3,718 | |
Hewlett Packard Enterprise | | | 117 | | | | 1,714 | |
HP | | | 104 | | | | 3,154 | |
Intel | | | 381 | | | | 18,669 | |
| International Business Machines | | | 78 | | | | 9,758 | |
Intuit | | | 26 | | | | 16,276 | |
IPG Photonics * | | | 4 | | | | 636 | |
Jack Henry & Associates | | | 8 | | | | 1,332 | |
Juniper Networks | | | 26 | | | | 768 | |
Keysight Technologies * | | | 16 | | | | 2,880 | |
KLA | | | 13 | | | | 4,846 | |
Lam Research | | | 13 | | | | 7,326 | |
Mastercard, Cl A | | | 81 | | | | 27,177 | |
Microchip Technology | | | 52 | | | | 3,853 | |
Micron Technology | | | 103 | | | | 7,117 | |
Microsoft | | | 690 | | | | 228,818 | |
Monolithic Power Systems | | | 3 | | | | 1,576 | |
Motorola Solutions | | | 15 | | | | 3,729 | |
| Schedule of Investments | | October 31, 2021 |
| | Global X S&P 500® Tail Risk ETF | |
| | | | | | | |
| COMMON STOCK — continued | | | | | | |
| Information Technology — continued | | | | | | |
NetApp | | | 22 | | | $ | 1,965 | |
NortonLifeLock | | | 52 | | | | 1,323 | |
NVIDIA | | | 230 | | | | 58,804 | |
Oracle | | | 156 | | | | 14,967 | |
Paychex | | | 26 | | | | 3,205 | |
Paycom Software * | | | 4 | | | | 2,191 | |
PayPal Holdings * | | | 107 | | | | 24,887 | |
PTC * | | | 13 | | | | 1,656 | |
Qorvo * | | | 13 | | | | 2,187 | |
QUALCOMM | | | 106 | | | | 14,102 | |
salesforce.com * | | | 91 | | | | 27,272 | |
Seagate Technology Holdings | | | 13 | | | | 1,158 | |
ServiceNow * | | | 17 | | | | 11,862 | |
Skyworks Solutions | | | 13 | | | | 2,173 | |
Synopsys * | | | 13 | | | | 4,331 | |
TE Connectivity | | | 29 | | | | 4,234 | |
Teledyne Technologies * | | | 4 | | | | 1,797 | |
Teradyne | | | 13 | | | | 1,797 | |
Texas Instruments | | | 88 | | | | 16,498 | |
Trimble * | | | 26 | | | | 2,272 | |
Tyler Technologies * | | | 3 | | | | 1,630 | |
VeriSign * | | | 10 | | | | 2,227 | |
Visa, Cl A | | | 155 | | | | 32,824 | |
Western Digital * | | | 26 | | | | 1,360 | |
Western Union | | | 39 | | | | 711 | |
Xilinx | | | 26 | | | | 4,680 | |
Zebra Technologies, Cl A * | | | 4 | | | | 2,136 | |
| | | | | | | | 998,328 | |
| | | | | | | | | |
| Materials — 2.1% | | | | | | | | |
Air Products & Chemicals | | | 23 | | | | 6,896 | |
Albemarle | | | 13 | | | | 3,256 | |
Amcor | | | 133 | | | | 1,605 | |
Avery Dennison | | | 9 | | | | 1,959 | |
| Schedule of Investments | | October 31, 2021 |
| | Global X S&P 500® Tail Risk ETF | |
| | | | | | | |
| COMMON STOCK — continued | | | | | | |
| Materials — continued | | | | | | |
Ball | | | 26 | | | $ | 2,378 | |
Celanese, Cl A | | | 13 | | | | 2,100 | |
CF Industries Holdings | | | 16 | | | | 909 | |
Corteva | | | 65 | | | | 2,805 | |
Dow | | | 65 | | | | 3,638 | |
DuPont de Nemours | | | 52 | | | | 3,619 | |
Eastman Chemical | | | 13 | | | | 1,352 | |
Ecolab | | | 24 | | | | 5,333 | |
FMC | | | 13 | | | | 1,183 | |
Freeport-McMoRan | | | 130 | | | | 4,904 | |
| International Flavors & Fragrances | | | 26 | | | | 3,834 | |
International Paper | | | 39 | | | | 1,937 | |
| LyondellBasell Industries, Cl A | | | 26 | | | | 2,413 | |
Martin Marietta Materials | | | 5 | | | | 1,964 | |
Mosaic | | | 26 | | | | 1,081 | |
Newmont | | | 68 | | | | 3,672 | |
Nucor | | | 26 | | | | 2,903 | |
Packaging Corp of America | | | 10 | | | | 1,374 | |
PPG Industries | | | 23 | | | | 3,693 | |
Sealed Air | | | 13 | | | | 771 | |
Sherwin-Williams | | | 23 | | | | 7,282 | |
Sylvamo * | | | 0 | | | | — | |
Vulcan Materials | | | 13 | | | | 2,472 | |
Westrock | | | 26 | | | | 1,251 | |
| | | | | | | | 76,584 | |
| | | | | | | | | |
| Real Estate — 2.5% | | | | | | | | |
Alexandria Real Estate Equities ‡ | | | 13 | | | | 2,654 | |
American Tower, Cl A ‡ | | | 41 | | | | 11,561 | |
AvalonBay Communities ‡ | | | 13 | | | | 3,077 | |
Boston Properties ‡ | | | 13 | | | | 1,477 | |
CBRE Group, Cl A * | | | 26 | | | | 2,706 | |
Crown Castle International ‡ | | | 39 | | | | 7,032 | |
Digital Realty Trust ‡ | | | 26 | | | | 4,103 | |
| Schedule of Investments | | October 31, 2021 |
| | Global X S&P 500® Tail Risk ETF | |
| | | | | | | |
| COMMON STOCK — continued | | | | | | |
| Real Estate — continued | | | | | | |
Duke Realty ‡ | | | 29 | | | $ | 1,631 | |
Equinix ‡ | | | 9 | | | | 7,534 | |
Equity Residential ‡ | | | 26 | | | | 2,246 | |
Essex Property Trust ‡ | | | 5 | | | | 1,700 | |
Extra Space Storage ‡ | | | 13 | | | | 2,566 | |
Federal Realty Investment Trust ‡ | | | 5 | | | | 602 | |
Healthpeak Properties ‡ | | | 52 | | | | 1,846 | |
Host Hotels & Resorts ‡ * | | | 65 | | | | 1,094 | |
Iron Mountain ‡ | | | 26 | | | | 1,187 | |
Kimco Realty ‡ | | | 52 | | | | 1,175 | |
Mid-America Apartment Communities ‡ | | | 13 | | | | 2,655 | |
ProLogis ‡ | | | 65 | | | | 9,422 | |
Public Storage ‡ | | | 13 | | | | 4,318 | |
Realty Income ‡ | | | 36 | | | | 2,571 | |
Regency Centers ‡ | | | 13 | | | | 915 | |
SBA Communications, Cl A ‡ | | | 11 | | | | 3,799 | |
Simon Property Group ‡ | | | 26 | | | | 3,811 | |
UDR ‡ | | | 26 | | | | 1,444 | |
Ventas ‡ | | | 29 | | | | 1,548 | |
Vornado Realty Trust ‡ | | | 13 | | | | 554 | |
Welltower ‡ | | | 39 | | | | 3,135 | |
Weyerhaeuser ‡ | | | 65 | | | | 2,322 | |
| | | | | | | | 90,685 | |
| | | | | | | | | |
| Utilities — 2.3% | | | | | | | | |
AES | | | 55 | | | | 1,382 | |
Alliant Energy | | | 26 | | | | 1,471 | |
Ameren | | | 26 | | | | 2,192 | |
American Electric Power | | | 47 | | | | 3,981 | |
American Water Works | | | 16 | | | | 2,787 | |
Atmos Energy | | | 13 | | | | 1,198 | |
CenterPoint Energy | | | 52 | | | | 1,354 | |
CMS Energy | | | 26 | | | | 1,569 | |
Consolidated Edison | | | 26 | | | | 1,960 | |
| Schedule of Investments | | October 31, 2021 |
| | Global X S&P 500® Tail Risk ETF | |
| | | Shares/Number of Contracts | | | | |
| COMMON STOCK — continued | | | | | | |
| Utilities — continued | | | | | | |
Dominion Energy | | | 75 | | | $ | 5,695 | |
DTE Energy | | | 13 | | | | 1,474 | |
Duke Energy | | | 65 | | | | 6,631 | |
Edison International | | | 29 | | | | 1,825 | |
Entergy | | | 17 | | | | 1,751 | |
Evergy | | | 26 | | | | 1,657 | |
Eversource Energy | | | 26 | | | | 2,207 | |
Exelon | | | 90 | | | | 4,787 | |
FirstEnergy | | | 52 | | | | 2,004 | |
NextEra Energy | | | 180 | | | | 15,359 | |
NiSource | | | 39 | | | | 962 | |
NRG Energy | | | 26 | | | | 1,037 | |
Pinnacle West Capital | | | 13 | | | | 838 | |
PPL | | | 65 | | | | 1,872 | |
| Public Service Enterprise Group | | | 42 | | | | 2,680 | |
Sempra Energy | | | 26 | | | | 3,318 | |
Southern | | | 91 | | | | 5,671 | |
WEC Energy Group | | | 26 | | | | 2,342 | |
Xcel Energy | | | 52 | | | | 3,359 | |
| | | | | | | | 83,363 | |
| | | | | | | | | |
TOTAL UNITED STATES | | | | | | | 3,559,354 | |
| TOTAL COMMON STOCK | | | | | | | | |
(Cost $3,469,379) | | | | | | | 3,579,898 | |
| TOTAL INVESTMENTS — 99.3% | | | | | | | | |
(Cost $3,469,379) | | | | | | $ | 3,579,898 | |
| | | | | | | | | |
PURCHASED OPTION— 0.3%(1) | | | | | | | | |
| UNITED STATES— 0.3% | | | | | | | | |
(Cost $43,527) | | | 77 | | | $ | 10,819 | |
Percentages are based on Net Assets of $3,604,123.
| Schedule of Investments | | October 31, 2021 |
| | Global X S&P 500® Tail Risk ETF | |
A list of the exchange traded option contracts held by the Fund at October 31, 2021, is as follows:
| Description | | Number of Contracts | | | Cost+ | | | Exercise Price | | Expiration Date | | Value | |
| PURCHASED OPTION — 0.3% | | | | | | | | | | | | | |
| Put Options | | | | | | | | | | | | | |
| XSP* | | | 77 | | | $ | 43,527 | | | $ | 400.00 | | 12/17/21 | | $ | 10,819 | |
Cl — Class
S&P — Standard & Poor’s
XSP — iShares Core S&P 500 Index ETF
| + | Notional amount for all options totals $3,546,158. |
| * | Non-income producing security. |
| ‡ | Real Estate Investment Trust |
| (1) | Refer to table below for details on Options Contracts. |
The following is a summary of the level of inputs used as of October 31, 2021, in valuing the Fund’s investments carried at value:
| Investments in Securities | | | | | | | | | | | | |
| Common Stock | | $ | 3,579,898 | | | $ | — | | | $ | — | | | $ | 3,579,898 | |
| Total Investments in Securities | | $ | 3,579,898 | | | $ | — | | | $ | — | | | $ | 3,579,898 | |
| Other Financial Instruments | | | | | | | | | | | | |
| Purchased Option | | $ | 10,819 | | | $ | — | | | $ | — | | | $ | 10,819 | |
| Total Other Financial Instruments | | $ | 10,819 | | | $ | — | | | $ | — | | | $ | 10,819 | |
For the year ended October 31, 2021, there have been no transfers in or out of Level 3.
Amounts designated as “—“ are $0 or have been rounded to $0.
| Schedule of Investments | | October 31, 2021 |
| | Global X S&P 500® Risk Managed Income ETF | |
Sector Weightings (Unaudited)†:
† Sector weightings percentages are based on the total market value of investments.
| | | | | | | |
| COMMON STOCK — 103.1% (A) | | | | | | |
| CHINA — 0.2% | | | | | | |
| Information Technology — 0.2% | | | | | | |
NXP Semiconductors | | | 44 | | | $ | 8,838 | |
| | | | | | | | | |
| UNITED KINGDOM — 0.4% | | | | | | | | |
| Materials — 0.4% | | | | | | | | |
Linde | | | 81 | | | | 25,855 | |
| | | | | | | | | |
| UNITED STATES — 102.5% | | | | | | | | |
| Communication Services — 11.2% | | | | | | | | |
Activision Blizzard | | | 122 | | | | 9,539 | |
Alphabet, Cl A * | | | 47 | | | | 139,163 | |
Alphabet, Cl C * | | | 44 | | | | 130,478 | |
AT&T | | | 1,132 | | | | 28,594 | |
Charter Communications, Cl A * | | | 21 | | | | 14,173 | |
Comcast, Cl A | | | 726 | | | | 37,338 | |
Discovery, Cl A * | | | 22 | | | | 516 | |
| Schedule of Investments | | October 31, 2021 |
| | Global X S&P 500® Risk Managed Income ETF | |
| | | | | | | |
| COMMON STOCK — continued | | | | | | |
| Communication Services — continued | | | | | | |
Discovery, Cl C * | | | 44 | | | $ | 993 | |
DISH Network, Cl A * | | | 44 | | | | 1,807 | |
Electronic Arts | | | 44 | | | | 6,171 | |
Fox, Cl A | | | 44 | | | | 1,749 | |
Fox, Cl B | | | 22 | | | | 813 | |
Interpublic Group | | | 66 | | | | 2,414 | |
Live Nation Entertainment * | | | 22 | | | | 2,225 | |
Lumen Technologies | | | 154 | | | | 1,827 | |
Match Group * | | | 44 | | | | 6,634 | |
Meta Platforms, Cl A * | | | 372 | | | | 120,368 | |
Netflix * | | | 68 | | | | 46,941 | |
News, Cl A | | | 66 | | | | 1,511 | |
News, Cl B | | | 22 | | | | 496 | |
Omnicom Group | | | 34 | | | | 2,315 | |
Take-Two Interactive Software * | | | 22 | | | | 3,982 | |
T-Mobile US * | | | 88 | | | | 10,123 | |
Twitter * | | | 122 | | | | 6,532 | |
Verizon Communications | | | 649 | | | | 34,391 | |
ViacomCBS, Cl B | | | 88 | | | | 3,187 | |
Walt Disney | | | 287 | | | | 48,523 | |
| | | | | | | | 662,803 | |
| | | | | | | | | |
| Consumer Discretionary — 13.2% | | | | | | | | |
Advance Auto Parts | | | 9 | | | | 2,030 | |
Amazon.com * | | | 68 | | | | 229,325 | |
Aptiv * | | | 44 | | | | 7,607 | |
AutoZone * | | | 3 | | | | 5,355 | |
Bath & Body Works | | | 44 | | | | 3,040 | |
Best Buy | | | 40 | | | | 4,890 | |
Booking Holdings * | | | 6 | | | | 14,525 | |
BorgWarner | | | 44 | | | | 1,983 | |
Caesars Entertainment * | | | 39 | | | | 4,269 | |
CarMax * | | | 22 | | | | 3,012 | |
Carnival * | | | 122 | | | | 2,704 | |
| Schedule of Investments | | October 31, 2021 |
| | Global X S&P 500® Risk Managed Income ETF | |
| | | | | | | |
| COMMON STOCK — continued | | | | | | |
| Consumer Discretionary — continued | | | | | | |
Chipotle Mexican Grill, Cl A * | | | 4 | | | $ | 7,116 | |
Darden Restaurants | | | 22 | | | | 3,171 | |
Dollar General | | | 41 | | | | 9,082 | |
Dollar Tree * | | | 44 | | | | 4,741 | |
Domino’s Pizza | | | 5 | | | | 2,445 | |
DR Horton | | | 44 | | | | 3,928 | |
eBay | | | 100 | | | | 7,672 | |
Etsy * | | | 22 | | | | 5,515 | |
Expedia Group * | | | 22 | | | | 3,617 | |
Ford Motor | | | 596 | | | | 10,180 | |
Gap | | | 34 | | | | 771 | |
Garmin | | | 22 | | | | 3,159 | |
General Motors * | | | 224 | | | | 12,192 | |
Genuine Parts | | | 22 | | | | 2,884 | |
Hanesbrands | | | 44 | | | | 750 | |
Hasbro | | | 22 | | | | 2,107 | |
Hilton Worldwide Holdings * | | | 44 | | | | 6,334 | |
Home Depot | | | 166 | | | | 61,709 | |
Las Vegas Sands * | | | 44 | | | | 1,708 | |
Leggett & Platt | | | 22 | | | | 1,031 | |
Lennar, Cl A | | | 44 | | | | 4,397 | |
LKQ | | | 44 | | | | 2,424 | |
Lowe’s | | | 110 | | | | 25,720 | |
Marriott International, Cl A * | | | 44 | | | | 7,041 | |
McDonald’s | | | 113 | | | | 27,747 | |
MGM Resorts International | | | 66 | | | | 3,113 | |
Mohawk Industries * | | | 4 | | | | 709 | |
Newell Brands | | | 56 | | | | 1,282 | |
NIKE, Cl B | | | 201 | | | | 33,625 | |
Norwegian Cruise Line Holdings * | | | 56 | | | | 1,440 | |
O’Reilly Automotive * | | | 10 | | | | 6,223 | |
Penn National Gaming * | | | 22 | | | | 1,575 | |
Pool | | | 6 | | | | 3,091 | |
| Schedule of Investments | | October 31, 2021 |
| | Global X S&P 500® Risk Managed Income ETF | |
| | | | | | | |
| COMMON STOCK — continued | | | | | | |
| Consumer Discretionary — continued | | | | | | |
PulteGroup | | | 44 | | | $ | 2,116 | |
PVH | | | 17 | | | | 1,859 | |
Ralph Lauren, Cl A | | | 3 | | | | 381 | |
Ross Stores | | | 62 | | | | 7,018 | |
Royal Caribbean Cruises * | | | 40 | | | | 3,377 | |
Starbucks | | | 176 | | | | 18,668 | |
Tapestry | | | 44 | | | | 1,715 | |
Target | | | 78 | | | | 20,250 | |
Tesla * | | | 127 | | | | 141,478 | |
TJX | | | 188 | | | | 12,312 | |
Tractor Supply | | | 22 | | | | 4,778 | |
Ulta Beauty * | | | 8 | | | | 2,939 | |
Under Armour, Cl A * | | | 22 | | | | 483 | |
Under Armour, Cl C * | | | 22 | | | | 415 | |
VF | | | 44 | | | | 3,207 | |
Whirlpool | | | 6 | | | | 1,265 | |
Wynn Resorts * | | | 22 | | | | 1,976 | |
Yum! Brands | | | 44 | | | | 5,497 | |
| | | | | | | | 776,973 | |
| | | | | | | | | |
| Consumer Staples — 5.8% | | | | | | | | |
Altria Group | | | 288 | | | | 12,704 | |
Archer-Daniels-Midland | | | 88 | | | | 5,653 | |
Brown-Forman, Cl B | | | 22 | | | | 1,494 | |
Campbell Soup | | | 22 | | | | 879 | |
Church & Dwight | | | 44 | | | | 3,844 | |
Clorox | | | 22 | | | | 3,586 | |
Coca-Cola | | | 616 | | | | 34,724 | |
Colgate-Palmolive | | | 132 | | | | 10,057 | |
Conagra Brands | | | 66 | | | | 2,125 | |
Constellation Brands, Cl A | | | 26 | | | | 5,637 | |
Costco Wholesale | | | 68 | | | | 33,425 | |
Estee Lauder, Cl A | | | 37 | | | | 12,000 | |
General Mills | | | 88 | | | | 5,438 | |
| Schedule of Investments | | October 31, 2021 |
| | Global X S&P 500® Risk Managed Income ETF | |
| | | | | | | |
| COMMON STOCK — continued | | | | | | |
| Consumer Staples — continued | | | | | | |
Hershey | | | 22 | | | $ | 3,858 | |
Hormel Foods | | | 44 | | | | 1,862 | |
J M Smucker | | | 22 | | | | 2,703 | |
Kellogg | | | 44 | | | | 2,697 | |
Kimberly-Clark | | | 48 | | | | 6,216 | |
Kraft Heinz | | | 100 | | | | 3,589 | |
Kroger | | | 110 | | | | 4,402 | |
Lamb Weston Holdings | | | 22 | | | | 1,242 | |
McCormick | | | 44 | | | | 3,530 | |
Molson Coors Beverage, Cl B | | | 22 | | | | 970 | |
Mondelez International, Cl A | | | 220 | | | | 13,363 | |
Monster Beverage * | | | 63 | | | | 5,355 | |
PepsiCo | | | 220 | | | | 35,552 | |
Philip Morris International | | | 246 | | | | 23,257 | |
Procter & Gamble | | | 378 | | | | 54,050 | |
Sysco | | | 78 | | | | 5,998 | |
Tyson Foods, Cl A | | | 44 | | | | 3,519 | |
Walgreens Boots Alliance | | | 110 | | | | 5,172 | |
Walmart | | | 220 | | | | 32,872 | |
| | | | | | | | 341,773 | |
| | | | | | | | | |
| Energy — 2.9% | | | | | | | | |
APA | | | 56 | | | | 1,468 | |
Baker Hughes, Cl A | | | 122 | | | | 3,060 | |
Chevron | | | 306 | | | | 35,034 | |
ConocoPhillips | | | 208 | | | | 15,494 | |
Coterra Energy | | | 126 | | | | 2,686 | |
Devon Energy | | | 88 | | | | 3,527 | |
Diamondback Energy | | | 22 | | | | 2,358 | |
EOG Resources | | | 88 | | | | 8,136 | |
Exxon Mobil | | | 667 | | | | 43,001 | |
Halliburton | | | 132 | | | | 3,299 | |
Hess | | | 44 | | | | 3,633 | |
Kinder Morgan | | | 298 | | | | 4,992 | |
| Schedule of Investments | | October 31, 2021 |
| | Global X S&P 500® Risk Managed Income ETF | |
| | | | | | | |
| COMMON STOCK — continued | | | | | | |
| Energy — continued | | | | | | |
Marathon Oil | | | 122 | | | $ | 1,991 | |
Marathon Petroleum | | | 100 | | | | 6,593 | |
Occidental Petroleum | | | 132 | | | | 4,426 | |
ONEOK | | | 66 | | | | 4,199 | |
Phillips 66 | | | 66 | | | | 4,935 | |
Pioneer Natural Resources | | | 40 | | | | 7,479 | |
Schlumberger | | | 210 | | | | 6,775 | |
Valero Energy | | | 66 | | | | 5,104 | |
Williams | | | 188 | | | | 5,281 | |
| | | | | | | | 173,471 | |
| | | | | | | | | |
| Financials — 11.7% | | | | | | | | |
Aflac | | | 88 | | | | 4,723 | |
Allstate | | | 44 | | | | 5,441 | |
American Express | | | 101 | | | | 17,552 | |
American International Group | | | 132 | | | | 7,800 | |
Ameriprise Financial | | | 20 | | | | 6,043 | |
Aon, Cl A | | | 36 | | | | 11,517 | |
Arthur J Gallagher | | | 27 | | | | 4,527 | |
Assurant | | | 4 | | | | 645 | |
Bank of America | | | 1,164 | | | | 55,616 | |
Bank of New York Mellon | | | 122 | | | | 7,222 | |
Berkshire Hathaway, Cl B * | | | 289 | | | | 82,946 | |
BlackRock, Cl A | | | 22 | | | | 20,756 | |
Brown & Brown | | | 41 | | | | 2,588 | |
Capital One Financial | | | 66 | | | | 9,968 | |
Cboe Global Markets | | | 22 | | | | 2,903 | |
Charles Schwab | | | 239 | | | | 19,605 | |
Chubb | | | 66 | | | | 12,895 | |
Cincinnati Financial | | | 22 | | | | 2,672 | |
Citigroup | | | 308 | | | | 21,301 | |
Citizens Financial Group | | | 66 | | | | 3,127 | |
CME Group, Cl A | | | 57 | | | | 12,571 | |
Comerica | | | 22 | | | | 1,872 | |
| Schedule of Investments | | October 31, 2021 |
| | Global X S&P 500® Risk Managed Income ETF | |
| | | | | | | |
| COMMON STOCK — continued | | | | | | |
| Financials — continued | | | | | | |
Discover Financial Services | | | 44 | | | $ | 4,986 | |
Everest Re Group | | | 4 | | | | 1,046 | |
Fifth Third Bancorp | | | 110 | | | | 4,788 | |
First Republic Bank | | | 25 | | | | 5,408 | |
Franklin Resources | | | 44 | | | | 1,386 | |
Globe Life | | | 22 | | | | 1,958 | |
Goldman Sachs Group | | | 52 | | | | 21,494 | |
| Hartford Financial Services Group | | | 44 | | | | 3,209 | |
Huntington Bancshares | | | 220 | | | | 3,463 | |
Intercontinental Exchange | | | 88 | | | | 12,185 | |
Invesco | | | 44 | | | | 1,118 | |
JPMorgan Chase | | | 466 | | | | 79,169 | |
KeyCorp | | | 144 | | | | 3,351 | |
Lincoln National | | | 22 | | | | 1,587 | |
Loews | | | 22 | | | | 1,234 | |
M&T Bank | | | 22 | | | | 3,237 | |
MarketAxess Holdings | | | 5 | | | | 2,043 | |
Marsh & McLennan | | | 80 | | | | 13,344 | |
MetLife | | | 110 | | | | 6,908 | |
Moody’s | | | 24 | | | | 9,700 | |
Morgan Stanley | | | 220 | | | | 22,612 | |
MSCI, Cl A | | | 14 | | | | 9,308 | |
Nasdaq | | | 22 | | | | 4,617 | |
Northern Trust | | | 27 | | | | 3,322 | |
People’s United Financial | | | 66 | | | | 1,131 | |
PNC Financial Services Group | | | 66 | | | | 13,928 | |
Principal Financial Group | | | 44 | | | | 2,952 | |
Progressive | | | 88 | | | | 8,349 | |
Prudential Financial | | | 66 | | | | 7,263 | |
Raymond James Financial | | | 27 | | | | 2,662 | |
Regions Financial | | | 144 | | | | 3,410 | |
S&P Global | | | 38 | | | | 18,018 | |
State Street | | | 58 | | | | 5,716 | |
| Schedule of Investments | | October 31, 2021 |
| | Global X S&P 500® Risk Managed Income ETF | |
| | | | | | | |
| COMMON STOCK — continued | | | | | | |
| Financials — continued | | | | | | |
SVB Financial Group * | | | 8 | | | $ | 5,739 | |
Synchrony Financial | | | 88 | | | | 4,088 | |
T Rowe Price Group | | | 36 | | | | 7,808 | |
Travelers | | | 44 | | | | 7,079 | |
Truist Financial | | | 198 | | | | 12,567 | |
US Bancorp | | | 210 | | | | 12,678 | |
W R Berkley | | | 22 | | | | 1,751 | |
Wells Fargo | | | 633 | | | | 32,384 | |
Willis Towers Watson | | | 22 | | | | 5,330 | |
Zions Bancorp | | | 22 | | | | 1,386 | |
| | | | | | | | 690,002 | |
| | | | | | | | | |
| Health Care — 13.4% | | | | | | | | |
Abbott Laboratories | | | 283 | | | | 36,476 | |
AbbVie | | | 282 | | | | 32,337 | |
ABIOMED * | | | 6 | | | | 1,992 | |
Agilent Technologies | | | 44 | | | | 6,930 | |
Align Technology * | | | 12 | | | | 7,492 | |
AmerisourceBergen, Cl A | | | 22 | | | | 2,684 | |
Amgen | | | 88 | | | | 18,213 | |
Anthem | | | 38 | | | | 16,535 | |
Baxter International | | | 84 | | | | 6,633 | |
Becton Dickinson | | | 44 | | | | 10,542 | |
Biogen * | | | 22 | | | | 5,867 | |
Bio-Rad Laboratories, Cl A * | | | 2 | | | | 1,589 | |
Bio-Techne | | | 5 | | | | 2,618 | |
Boston Scientific * | | | 222 | | | | 9,575 | |
Bristol-Myers Squibb | | | 351 | | | | 20,498 | |
Cardinal Health | | | 44 | | | | 2,104 | |
Catalent * | | | 22 | | | | 3,033 | |
Centene * | | | 88 | | | | 6,269 | |
Cerner | | | 44 | | | | 3,269 | |
Charles River Laboratories International * | | | 7 | | | | 3,141 | |
Cigna | | | 50 | | | | 10,681 | |
| Schedule of Investments | | October 31, 2021 |
| | Global X S&P 500® Risk Managed Income ETF | |
| | | | | | | |
| COMMON STOCK — continued | | | | | | |
| Health Care — continued | | | | | | |
Cooper | | | 7 | | | $ | 2,918 | |
CVS Health | | | 198 | | | | 17,677 | |
Danaher | | | 98 | | | | 30,554 | |
DaVita * | | | 5 | | | | 516 | |
DENTSPLY SIRONA | | | 34 | | | | 1,945 | |
Dexcom * | | | 16 | | | | 9,971 | |
Edwards Lifesciences * | | | 93 | | | | 11,143 | |
Eli Lilly | | | 124 | | | | 31,590 | |
Gilead Sciences | | | 198 | | | | 12,846 | |
HCA Healthcare | | | 42 | | | | 10,519 | |
Henry Schein * | | | 22 | | | | 1,680 | |
Hologic * | | | 44 | | | | 3,226 | |
Humana | | | 22 | | | | 10,190 | |
IDEXX Laboratories * | | | 14 | | | | 9,326 | |
Illumina * | | | 22 | | | | 9,131 | |
Incyte * | | | 22 | | | | 1,474 | |
Intuitive Surgical * | | | 56 | | | | 20,223 | |
IQVIA Holdings * | | | 27 | | | | 7,058 | |
Johnson & Johnson | | | 413 | | | | 67,269 | |
Laboratory Corp of America Holdings * | | | 16 | | | | 4,592 | |
McKesson | | | 22 | | | | 4,573 | |
Medtronic | | | 216 | | | | 25,890 | |
Merck | | | 397 | | | | 34,956 | |
Mettler-Toledo International * | | | 3 | | | | 4,443 | |
Moderna * | | | 54 | | | | 18,641 | |
Organon | | | 44 | | | | 1,617 | |
PerkinElmer | | | 22 | | | | 3,892 | |
Pfizer | | | 886 | | | | 38,754 | |
Quest Diagnostics | | �� | 22 | | | | 3,229 | |
Regeneron Pharmaceuticals * | | | 17 | | | | 10,879 | |
ResMed | | | 22 | | | | 5,784 | |
STERIS | | | 19 | | | | 4,441 | |
Stryker | | | 51 | | | | 13,570 | |
| Schedule of Investments | | October 31, 2021 |
| | Global X S&P 500® Risk Managed Income ETF | |
| | | | | | | |
| COMMON STOCK — continued | | | | | | |
| Health Care — continued | | | | | | |
Teleflex | | | 7 | | | $ | 2,499 | |
Thermo Fisher Scientific | | | 62 | | | | 39,250 | |
UnitedHealth Group | | | 147 | | | | 67,689 | |
| Universal Health Services, Cl B | | | 17 | | | | 2,110 | |
Vertex Pharmaceuticals * | | | 44 | | | | 8,137 | |
Viatris, Cl W * | | | 188 | | | | 2,510 | |
Waters * | | | 9 | | | | 3,308 | |
West Pharmaceutical Services | | | 12 | | | | 5,159 | |
Zimmer Biomet Holdings | | | 27 | | | | 3,864 | |
Zoetis, Cl A | | | 70 | | | | 15,134 | |
| | | | | | | | 792,655 | |
| | | | | | | | | |
| Industrials — 8.3% | | | | | | | | |
3M | | | 88 | | | | 15,724 | |
Alaska Air Group * | | | 22 | | | | 1,162 | |
Allegion | | | 18 | | | | 2,309 | |
American Airlines Group * | | | 100 | | | | 1,920 | |
AMETEK | | | 41 | | | | 5,428 | |
AO Smith | | | 22 | | | | 1,608 | |
Boeing * | | | 88 | | | | 18,219 | |
Carrier Global | | | 134 | | | | 6,999 | |
Caterpillar | | | 88 | | | | 17,953 | |
CH Robinson Worldwide | | | 22 | | | | 2,134 | |
Cintas | | | 14 | | | | 6,063 | |
Copart * | | | 39 | | | | 6,056 | |
CSX | | | 342 | | | | 12,370 | |
Cummins | | | 22 | | | | 5,276 | |
Deere | | | 44 | | | | 15,062 | |
Delta Air Lines * | | | 100 | | | | 3,913 | |
Dover | | | 22 | | | | 3,720 | |
Eaton | | | 66 | | | | 10,874 | |
Emerson Electric | | | 88 | | | | 8,537 | |
Equifax | | | 22 | | | | 6,103 | |
| Expeditors International of Washington | | | 22 | | | | 2,712 | |
| Schedule of Investments | | October 31, 2021 |
| | Global X S&P 500® Risk Managed Income ETF | |
| | | | | | | |
| COMMON STOCK — continued | | | | | | |
| Industrials — continued | | | | | | |
Fastenal | | | 88 | | | $ | 5,023 | |
FedEx | | | 42 | | | | 9,892 | |
Fortive | | | 56 | | | | 4,240 | |
| Fortune Brands Home & Security | | | 22 | | | | 2,231 | |
Generac Holdings * | | | 9 | | | | 4,487 | |
General Dynamics | | | 37 | | | | 7,502 | |
General Electric | | | 175 | | | | 18,352 | |
Honeywell International | | | 110 | | | | 24,048 | |
Howmet Aerospace | | | 66 | | | | 1,960 | |
Huntington Ingalls Industries | | | 4 | | | | 811 | |
IDEX | | | 13 | | | | 2,893 | |
IHS Markit | | | 65 | | | | 8,497 | |
Illinois Tool Works | | | 44 | | | | 10,026 | |
Ingersoll Rand | | | 66 | | | | 3,548 | |
Jacobs Engineering Group | | | 22 | | | | 3,089 | |
JB Hunt Transport Services | | | 18 | | | | 3,549 | |
Johnson Controls International | | | 110 | | | | 8,071 | |
Kansas City Southern | | | 15 | | | | 4,654 | |
L3Harris Technologies | | | 28 | | | | 6,455 | |
Leidos Holdings | | | 22 | | | | 2,200 | |
Lockheed Martin | | | 39 | | | | 12,961 | |
Masco | | | 44 | | | | 2,884 | |
Nielsen Holdings | | | 56 | | | | 1,134 | |
Norfolk Southern | | | 39 | | | | 11,429 | |
Northrop Grumman | | | 22 | | | | 7,859 | |
Old Dominion Freight Line | | | 15 | | | | 5,120 | |
Otis Worldwide | | | 66 | | | | 5,300 | |
PACCAR | | | 44 | | | | 3,943 | |
Parker-Hannifin | | | 22 | | | | 6,525 | |
Pentair | | | 22 | | | | 1,627 | |
Quanta Services | | | 22 | | | | 2,668 | |
Raytheon Technologies | | | 240 | | | | 21,326 | |
Republic Services, Cl A | | | 27 | | | | 3,634 | |
| Schedule of Investments | | October 31, 2021 |
| | Global X S&P 500® Risk Managed Income ETF | |
| | | | | | | |
| COMMON STOCK — continued | | | | | | |
| Industrials — continued | | | | | | |
Robert Half International | | | 22 | | | $ | 2,488 | |
Rockwell Automation | | | 20 | | | | 6,388 | |
Rollins | | | 34 | | | | 1,198 | |
Roper Technologies | | | 17 | | | | 8,294 | |
Snap-On | | | 5 | | | | 1,016 | |
Southwest Airlines * | | | 88 | | | | 4,161 | |
Stanley Black & Decker | | | 22 | | | | 3,954 | |
Textron | | | 34 | | | | 2,511 | |
Trane Technologies | | | 41 | | | | 7,418 | |
TransDigm Group * | | | 7 | | | | 4,367 | |
Union Pacific | | | 102 | | | | 24,623 | |
United Airlines Holdings * | | | 44 | | | | 2,030 | |
United Parcel Service, Cl B | | | 110 | | | | 23,482 | |
United Rentals * | | | 12 | | | | 4,549 | |
Verisk Analytics, Cl A | | | 22 | | | | 4,626 | |
Waste Management | | | 61 | | | | 9,774 | |
| Westinghouse Air Brake Technologies | | | 22 | | | | 1,996 | |
WW Grainger | | | 6 | | | | 2,779 | |
Xylem | | | 22 | | | | 2,873 | |
| | | | | | | | 490,607 | |
| | | | | | | | | |
| Information Technology — 28.7% | | | | | | | | |
Accenture, Cl A | | | 98 | | | | 35,161 | |
Adobe * | | | 73 | | | | 47,476 | |
Advanced Micro Devices * | | | 195 | | | | 23,445 | |
Akamai Technologies * | | | 22 | | | | 2,320 | |
Amphenol, Cl A | | | 88 | | | | 6,756 | |
Analog Devices | | | 87 | | | | 15,094 | |
ANSYS * | | | 14 | | | | 5,314 | |
Apple | | | 2,445 | | | | 366,261 | |
Applied Materials | | | 137 | | | | 18,721 | |
Arista Networks * | | | 8 | | | | 3,277 | |
Autodesk * | | | 35 | | | | 11,116 | |
Automatic Data Processing | | | 66 | | | | 14,816 | |
| Schedule of Investments | | October 31, 2021 |
| | Global X S&P 500® Risk Managed Income ETF | |
| | | | | | | |
| COMMON STOCK — continued | | | | | | |
| Information Technology — continued | | | | | | |
Broadcom | | | 64 | | | $ | 34,027 | |
Broadridge Financial Solutions | | | 22 | | | | 3,925 | |
Cadence Design Systems * | | | 44 | | | | 7,617 | |
CDW | | | 22 | | | | 4,106 | |
Ceridian HCM Holding * | | | 22 | | | | 2,755 | |
Cisco Systems | | | 666 | | | | 37,276 | |
Citrix Systems | | | 22 | | | | 2,084 | |
| Cognizant Technology Solutions, Cl A | | | 86 | | | | 6,716 | |
Corning | | | 110 | | | | 3,913 | |
DXC Technology * | | | 44 | | | | 1,433 | |
Enphase Energy * | | | 22 | | | | 5,096 | |
F5 Networks * | | | 8 | | | | 1,689 | |
| Fidelity National Information Services | | | 92 | | | | 10,188 | |
Fiserv * | | | 88 | | | | 8,667 | |
FleetCor Technologies * | | | 14 | | | | 3,464 | |
Fortinet * | | | 22 | | | | 7,399 | |
Gartner * | | | 14 | | | | 4,647 | |
Global Payments | | | 44 | | | | 6,292 | |
Hewlett Packard Enterprise | | | 198 | | | | 2,901 | |
HP | | | 188 | | | | 5,702 | |
Intel | | | 641 | | | | 31,409 | |
| International Business Machines | | | 136 | | | | 17,014 | |
Intuit | | | 44 | | | | 27,544 | |
IPG Photonics * | | | 4 | | | | 636 | |
Jack Henry & Associates | | | 17 | | | | 2,830 | |
Juniper Networks | | | 44 | | | | 1,299 | |
Keysight Technologies * | | | 25 | | | | 4,500 | |
KLA | | | 22 | | | | 8,201 | |
Lam Research | | | 22 | | | | 12,398 | |
Mastercard, Cl A | | | 134 | | | | 44,960 | |
Microchip Technology | | | 88 | | | | 6,520 | |
Micron Technology | | | 177 | | | | 12,231 | |
Microsoft | | | 1,168 | | | | 387,332 | |
| Schedule of Investments | | October 31, 2021 |
| | Global X S&P 500® Risk Managed Income ETF | |
| | | | | | | |
| COMMON STOCK — continued | | | | | | |
| Information Technology — continued | | | | | | |
Monolithic Power Systems | | | 6 | | | $ | 3,153 | |
Motorola Solutions | | | 26 | | | | 6,463 | |
NetApp | | | 40 | | | | 3,572 | |
NortonLifeLock | | | 88 | | | | 2,240 | |
NVIDIA | | | 391 | | | | 99,967 | |
Oracle | | | 264 | | | | 25,328 | |
Paychex | | | 44 | | | | 5,424 | |
Paycom Software * | | | 7 | | | | 3,835 | |
PayPal Holdings * | | | 182 | | | | 42,331 | |
PTC * | | | 22 | | | | 2,802 | |
Qorvo * | | | 22 | | | | 3,701 | |
QUALCOMM | | | 178 | | | | 23,681 | |
salesforce.com * | | | 154 | | | | 46,152 | |
Seagate Technology Holdings | | | 22 | | | | 1,960 | |
ServiceNow * | | | 30 | | | | 20,933 | |
Skyworks Solutions | | | 22 | | | | 3,677 | |
Synopsys * | | | 22 | | | | 7,330 | |
TE Connectivity | | | 50 | | | | 7,300 | |
Teledyne Technologies * | | | 7 | | | | 3,145 | |
Teradyne | | | 22 | | | | 3,041 | |
Texas Instruments | | | 145 | | | | 27,185 | |
Trimble * | | | 44 | | | | 3,844 | |
Tyler Technologies * | | | 6 | | | | 3,259 | |
VeriSign * | | | 19 | | | | 4,231 | |
Visa, Cl A | | | 262 | | | | 55,484 | |
Western Digital * | | | 44 | | | | 2,301 | |
Western Union | | | 66 | | | | 1,202 | |
Xilinx | | | 39 | | | | 7,020 | |
Zebra Technologies, Cl A * | | | 8 | | | | 4,272 | |
| | | | | | | | 1,691,361 | |
| | | | | | | | | |
| Materials — 2.2% | | | | | | | | |
Air Products & Chemicals | | | 35 | | | | 10,493 | |
Albemarle | | | 22 | | | | 5,510 | |
| Schedule of Investments | | October 31, 2021 |
| | Global X S&P 500® Risk Managed Income ETF | |
| | | | | | | |
| COMMON STOCK — continued | | | | | | |
| Materials — continued | | | | | | |
Amcor | | | 232 | | | $ | 2,800 | |
Avery Dennison | | | 14 | | | | 3,048 | |
Ball | | | 44 | | | | 4,025 | |
Celanese, Cl A | | | 22 | | | | 3,553 | |
CF Industries Holdings | | | 34 | | | | 1,931 | |
Corteva | | | 110 | | | | 4,747 | |
Dow | | | 110 | | | | 6,157 | |
DuPont de Nemours | | | 85 | | | | 5,916 | |
Eastman Chemical | | | 22 | | | | 2,289 | |
Ecolab | | | 42 | | | | 9,333 | |
FMC | | | 22 | | | | 2,002 | |
Freeport-McMoRan | | | 220 | | | | 8,299 | |
| International Flavors & Fragrances | | | 44 | | | | 6,488 | |
International Paper | | | 66 | | | | 3,278 | |
| LyondellBasell Industries, Cl A | | | 44 | | | | 4,084 | |
Martin Marietta Materials | | | 9 | | | | 3,536 | |
Mosaic | | | 44 | | | | 1,829 | |
Newmont | | | 122 | | | | 6,588 | |
Nucor | | | 44 | | | | 4,913 | |
Packaging Corp of America | | | 19 | | | | 2,610 | |
PPG Industries | | | 41 | | | | 6,583 | |
Sealed Air | | | 22 | | | | 1,305 | |
Sherwin-Williams | | | 38 | | | | 12,031 | |
Sylvamo * | | | 0 | | | | — | |
Vulcan Materials | | | 22 | | | | 4,183 | |
Westrock | | | 44 | | | | 2,116 | |
| | | | | | | | 129,647 | |
| | | | | | | | | |
| Real Estate — 2.6% | | | | | | | | |
Alexandria Real Estate Equities ‡ | | | 22 | | | | 4,491 | |
American Tower, Cl A ‡ | | | 69 | | | | 19,456 | |
AvalonBay Communities ‡ | | | 22 | | | | 5,207 | |
Boston Properties ‡ | | | 22 | | | | 2,500 | |
CBRE Group, Cl A * | | | 44 | | | | 4,579 | |
| Schedule of Investments | | October 31, 2021 |
| | Global X S&P 500® Risk Managed Income ETF | |
| | | | | | | |
| COMMON STOCK — continued | | | | | | |
| Real Estate — continued | | | | | | |
Crown Castle International ‡ | | | 66 | | | $ | 11,900 | |
Digital Realty Trust ‡ | | | 44 | | | | 6,944 | |
Duke Realty ‡ | | | 56 | | | | 3,149 | |
Equinix ‡ | | | 15 | | | | 12,556 | |
Equity Residential ‡ | | | 44 | | | | 3,802 | |
Essex Property Trust ‡ | | | 9 | | | | 3,059 | |
Extra Space Storage ‡ | | | 22 | | | | 4,342 | |
Federal Realty Investment Trust ‡ | | | 5 | | | | 602 | |
Healthpeak Properties ‡ | | | 88 | | | | 3,125 | |
Host Hotels & Resorts ‡ * | | | 110 | | | | 1,851 | |
Iron Mountain ‡ | | | 44 | | | | 2,008 | |
Kimco Realty ‡ | | | 88 | | | | 1,989 | |
Mid-America Apartment Communities ‡ | | | 22 | | | | 4,493 | |
ProLogis ‡ | | | 110 | | | | 15,946 | |
Public Storage ‡ | | | 22 | | | | 7,308 | |
Realty Income ‡ | | | 64 | | | | 4,571 | |
Regency Centers ‡ | | | 22 | | | | 1,549 | |
SBA Communications, Cl A ‡ | | | 17 | | | | 5,871 | |
Simon Property Group ‡ | | | 50 | | | | 7,329 | |
UDR ‡ | | | 44 | | | | 2,443 | |
Ventas ‡ | | | 56 | | | | 2,989 | |
Vornado Realty Trust ‡ | | | 22 | | | | 938 | |
Welltower ‡ | | | 66 | | | | 5,306 | |
Weyerhaeuser ‡ | | | 110 | | | | 3,929 | |
| | | | | | | | 154,232 | |
| | | | | | | | | |
| Utilities — 2.5% | | | | | | | | |
AES | | | 100 | | | | 2,513 | |
Alliant Energy | | | 44 | | | | 2,489 | |
Ameren | | | 44 | | | | 3,709 | |
American Electric Power | | | 84 | | | | 7,116 | |
American Water Works | | | 25 | | | | 4,354 | |
Atmos Energy | | | 22 | | | | 2,027 | |
CenterPoint Energy | | | 88 | | | | 2,291 | |
| Schedule of Investments | | October 31, 2021 |
| | Global X S&P 500® Risk Managed Income ETF | |
| | | | | | | |
| COMMON STOCK — continued | | | | | | |
| Utilities — continued | | | | | | |
CMS Energy | | | 44 | | | $ | 2,655 | |
Consolidated Edison | | | 56 | | | | 4,222 | |
Dominion Energy | | | 130 | | | | 9,871 | |
DTE Energy | | | 26 | | | | 2,947 | |
Duke Energy | | | 115 | | | | 11,731 | |
Edison International | | | 56 | | | | 3,524 | |
Entergy | | | 30 | | | | 3,091 | |
Evergy | | | 44 | | | | 2,805 | |
Eversource Energy | | | 44 | | | | 3,736 | |
Exelon | | | 154 | | | | 8,191 | |
FirstEnergy | | | 88 | | | | 3,391 | |
NextEra Energy | | | 308 | | | | 26,282 | |
NiSource | | | 66 | | | | 1,628 | |
NRG Energy | | | 44 | | | | 1,755 | |
Pinnacle West Capital | | | 22 | | | | 1,419 | |
PPL | | | 110 | | | | 3,168 | |
| Public Service Enterprise Group | | | 78 | | | | 4,976 | |
Sempra Energy | | | 44 | | | | 5,616 | |
Southern | | | 164 | | | | 10,220 | |
WEC Energy Group | | | 44 | | | | 3,963 | |
Xcel Energy | | | 88 | | | | 5,684 | |
| | | | | | | | 145,374 | |
| | | | | | | | | |
TOTAL UNITED STATES | | | | | | | 6,048,898 | |
| TOTAL COMMON STOCK | | | | | | | | |
(Cost $5,893,983) | | | | | | | 6,083,591 | |
| TOTAL INVESTMENTS — 103.1% | | | | | | | | |
(Cost $5,893,983) | | | | | | $ | 6,083,591 | |
| Schedule of Investments | | October 31, 2021 |
| | Global X S&P 500® Risk Managed Income ETF | |
| | | | | | | |
PURCHASED OPTION— 0.2%(1) | | | | | | |
| UNITED STATES— 0.2% | | | | | | |
(Cost $35,039) | | | 132 | | | $ | 11,286 | |
WRITTEN OPTION— (3.5)%(1) | | | | | | | | |
| UNITED STATES— (3.5)% | | | | | | | | |
| (Premiums Received ($90,624)) | | | (132 | ) | | $ | (206,118 | ) |
Percentages are based on Net Assets of $5,901,592.
A list of the exchange traded option contracts held by the Fund at October 31, 2021, is as follows:
| Description | | Number of Contracts | | | Cost+ | | | Exercise Price | | Expiration Date | | Value | |
| PURCHASED OPTION — 0.2% | | | | | | | | | | | | | |
| Put Options | | | | | | | | | | | | | |
| XSP* | | | 132 | | | $ | 35,039 | | | $ | 425.00 | | 11/19/21 | | $ | 11,286 | |
| | | | | | | | | | | | | | | | | | |
| WRITTEN OPTION — (3.5)% | | | | | | | | | | | | | | | | | |
| Call Options | | | | | | | | | | | | | | | | | |
| XSP* | | | (132 | ) | | $ | (90,624 | ) | | | 447.00 | | 11/19/21 | | $ | (206,118 | ) |
| + | Notional amount for purchased options totals $6,079,128. |
| + | Notional amount for written options totals $(6,079,128). |
| * | Non-income producing security. |
| ‡ | Real Estate Investment Trust |
| (1) | Refer to table below for details on Options Contracts. |
| (A) | All or a portion of these securities has been segregated as collateral for writtenoptions contracts. The aggregate market value of collateral at October 31, 2021 was$6,083,591. |
Cl — Class
S&P — Standard & Poor’s
XSP — iShares Core S&P 500 Index ETF
| Schedule of Investments | | October 31, 2021 |
| | Global X S&P 500® Risk Managed Income ETF | |
The following is a summary of the level of inputs used as of October 31, 2021, in valuing the Fund’s investments carried at value:
| Investments in Securities | | | | | | | | | | | | |
| Common Stock | | $ | 6,083,591 | | | $ | — | | | $ | — | | | $ | 6,083,591 | |
| Total Investments in Securities | | $ | 6,083,591 | | | $ | — | | | $ | — | | | $ | 6,083,591 | |
| Other Financial Instruments | | | | | | | | | | | | |
| Purchased Option | | $ | 11,286 | | | $ | — | | | $ | — | | | $ | 11,286 | |
| Written Option | | | (206,118 | ) | | | — | | | | — | | | | (206,118 | ) |
| Total Other Financial Instruments | | $ | (194,832 | ) | | $ | — | | | $ | — | | | $ | (194,832 | ) |
For the year ended October 31, 2021, there have been no transfers in or out of Level 3.
Amounts designated as “—“ are $0 or have been rounded to $0.
| Schedule of Investments | | October 31, 2021 |
| | Global X S&P 500® Collar 95-110 ETF | |
Sector Weightings (Unaudited)†:
† Sector weightings percentages are based on the total market value of investments.
| | | | | | | |
| COMMON STOCK — 99.2% (A) | | | | | | |
| CHINA — 0.2% | | | | | | |
| Information Technology — 0.2% | | | | | | |
NXP Semiconductors | | | 24 | | | $ | 4,821 | |
| | | | | | | | | |
| UNITED KINGDOM — 0.4% | | | | | | | | |
| Materials — 0.4% | | | | | | | | |
Linde | | | 44 | | | | 14,045 | |
| | | | | | | | | |
| UNITED STATES — 98.6% | | | | | | | | |
| Communication Services — 10.8% | | | | | | | | |
Activision Blizzard | | | 60 | | | | 4,691 | |
Alphabet, Cl A * | | | 25 | | | | 74,023 | |
Alphabet, Cl C * | | | 24 | | | | 71,170 | |
AT&T | | | 600 | | | | 15,156 | |
Charter Communications, Cl A * | | | 11 | | | | 7,424 | |
Comcast, Cl A | | | 385 | | | | 19,801 | |
Discovery, Cl A * | | | 12 | | | | 281 | |
| Schedule of Investments | | October 31, 2021 |
| | Global X S&P 500® Collar 95-110 ETF | |
| | | | | | | |
| COMMON STOCK — continued | | | | | | |
| Communication Services — continued | | | | | | |
Discovery, Cl C * | | | 24 | | | $ | 541 | |
DISH Network, Cl A * | | | 24 | | | | 986 | |
Electronic Arts | | | 24 | | | | 3,366 | |
Fox, Cl A | | | 24 | | | | 954 | |
Fox, Cl B | | | 12 | | | | 443 | |
Interpublic Group | | | 36 | | | | 1,317 | |
Live Nation Entertainment * | | | 12 | | | | 1,214 | |
Lumen Technologies | | | 84 | | | | 996 | |
Match Group * | | | 23 | | | | 3,468 | |
Meta Platforms, Cl A * | | | 201 | | | | 65,038 | |
Netflix * | | | 37 | | | | 25,541 | |
News, Cl A | | | 36 | | | | 824 | |
News, Cl B | | | 12 | | | | 271 | |
Omnicom Group | | | 14 | | | | 953 | |
Take-Two Interactive Software * | | | 12 | | | | 2,172 | |
T-Mobile US * | | | 48 | | | | 5,521 | |
Twitter * | | | 62 | | | | 3,319 | |
Verizon Communications | | | 348 | | | | 18,441 | |
ViacomCBS, Cl B | | | 48 | | | | 1,739 | |
Walt Disney | | | 153 | | | | 25,868 | |
| | | | | | | | 355,518 | |
| | | | | | | | | |
| Consumer Discretionary — 12.6% | | | | | | | | |
Advance Auto Parts | | | 4 | | | | 902 | |
Amazon.com * | | | 37 | | | | 124,780 | |
Aptiv * | | | 24 | | | | 4,149 | |
AutoZone * | | | 1 | | | | 1,785 | |
Bath & Body Works | | | 24 | | | | 1,658 | |
Best Buy | | | 20 | | | | 2,445 | |
Booking Holdings * | | | 3 | | | | 7,262 | |
BorgWarner | | | 24 | | | | 1,082 | |
Caesars Entertainment * | | | 17 | | | | 1,861 | |
CarMax * | | | 12 | | | | 1,643 | |
Carnival * | | | 62 | | | | 1,374 | |
| Schedule of Investments | | October 31, 2021 |
| | Global X S&P 500® Collar 95-110 ETF | |
| | | | | | | |
| COMMON STOCK — continued | | | | | | |
| Consumer Discretionary — continued | | | | | | |
Chipotle Mexican Grill, Cl A * | | | 2 | | | $ | 3,558 | |
Darden Restaurants | | | 12 | | | | 1,730 | |
Dollar General | | | 20 | | | | 4,430 | |
Dollar Tree * | | | 24 | | | | 2,586 | |
Domino’s Pizza | | | 3 | | | | 1,467 | |
DR Horton | | | 24 | | | | 2,142 | |
eBay | | | 55 | | | | 4,220 | |
Etsy * | | | 12 | | | | 3,008 | |
Expedia Group * | | | 12 | | | | 1,973 | |
Ford Motor | | | 316 | | | | 5,397 | |
Gap | | | 14 | | | | 318 | |
Garmin | | | 12 | | | | 1,723 | |
General Motors * | | | 121 | | | | 6,586 | |
Genuine Parts | | | 12 | | | | 1,573 | |
Hanesbrands | | | 24 | | | | 409 | |
Hasbro | | | 12 | | | | 1,149 | |
Hilton Worldwide Holdings * | | | 24 | | | | 3,455 | |
Home Depot | | | 89 | | | | 33,085 | |
Las Vegas Sands * | | | 24 | | | | 931 | |
Leggett & Platt | | | 12 | | | | 562 | |
Lennar, Cl A | | | 24 | | | | 2,398 | |
LKQ | | | 24 | | | | 1,322 | |
Lowe’s | | | 60 | | | | 14,029 | |
Marriott International, Cl A * | | | 24 | | | | 3,840 | |
McDonald’s | | | 62 | | | | 15,224 | |
MGM Resorts International | | | 36 | | | | 1,698 | |
Mohawk Industries * | | | 4 | | | | 709 | |
Newell Brands | | | 26 | | | | 595 | |
NIKE, Cl B | | | 108 | | | | 18,067 | |
Norwegian Cruise Line Holdings * | | | 26 | | | | 669 | |
O’Reilly Automotive * | | | 5 | | | | 3,112 | |
Penn National Gaming * | | | 12 | | | | 859 | |
Pool | | | 3 | | | | 1,545 | |
| Schedule of Investments | | October 31, 2021 |
| | Global X S&P 500® Collar 95-110 ETF | |
| | | | | | | |
| COMMON STOCK — continued | | | | | | |
| Consumer Discretionary — continued | | | | | | |
PulteGroup | | | 24 | | | $ | 1,154 | |
PVH | | | 7 | | | | 765 | |
Ralph Lauren, Cl A | | | 3 | | | | 382 | |
Ross Stores | | | 31 | | | | 3,509 | |
Royal Caribbean Cruises * | | | 19 | | | | 1,604 | |
Starbucks | | | 96 | | | | 10,183 | |
Tapestry | | | 24 | | | | 936 | |
Target | | | 42 | | | | 10,904 | |
Tesla * | | | 69 | | | | 76,866 | |
TJX | | | 96 | | | | 6,287 | |
Tractor Supply | | | 10 | | | | 2,172 | |
Ulta Beauty * | | | 4 | | | | 1,469 | |
Under Armour, Cl A * | | | 12 | | | | 264 | |
Under Armour, Cl C * | | | 12 | | | | 227 | |
VF | | | 24 | | | | 1,749 | |
Whirlpool | | | 5 | | | | 1,054 | |
Wynn Resorts * | | | 12 | | | | 1,078 | |
Yum! Brands | | | 24 | | | | 2,999 | |
| | | | | | | | 416,912 | |
| | | | | | | | | |
| Consumer Staples — 5.6% | | | | | | | | |
Altria Group | | | 155 | | | | 6,837 | |
Archer-Daniels-Midland | | | 48 | | | | 3,084 | |
Brown-Forman, Cl B | | | 12 | | | | 815 | |
Campbell Soup | | | 12 | | | | 479 | |
Church & Dwight | | | 24 | | | | 2,097 | |
Clorox | | | 12 | | | | 1,956 | |
Coca-Cola | | | 326 | | | | 18,377 | |
Colgate-Palmolive | | | 72 | | | | 5,486 | |
Conagra Brands | | | 36 | | | | 1,159 | |
Constellation Brands, Cl A | | | 12 | | | | 2,602 | |
Costco Wholesale | | | 37 | | | | 18,187 | |
Estee Lauder, Cl A | | | 20 | | | | 6,487 | |
General Mills | | | 48 | | | | 2,966 | |
| Schedule of Investments | | October 31, 2021 |
| | Global X S&P 500® Collar 95-110 ETF | |
| | | | | | | |
| COMMON STOCK — continued | | | | | | |
| Consumer Staples — continued | | | | | | |
Hershey | | | 12 | | | $ | 2,104 | |
Hormel Foods | | | 24 | | | | 1,016 | |
J M Smucker | | | 12 | | | | 1,474 | |
Kellogg | | | 24 | | | | 1,471 | |
Kimberly-Clark | | | 27 | | | | 3,496 | |
Kraft Heinz | | | 50 | | | | 1,795 | |
Kroger | | | 60 | | | | 2,401 | |
Lamb Weston Holdings | | | 12 | | | | 677 | |
McCormick | | | 24 | | | | 1,926 | |
Molson Coors Beverage, Cl B | | | 12 | | | | 529 | |
Mondelez International, Cl A | | | 118 | | | | 7,167 | |
Monster Beverage * | | | 32 | | | | 2,720 | |
PepsiCo | | | 117 | | | | 18,907 | |
Philip Morris International | | | 131 | | | | 12,385 | |
Procter & Gamble | | | 204 | | | | 29,170 | |
Sysco | | | 44 | | | | 3,384 | |
Tyson Foods, Cl A | | | 24 | | | | 1,919 | |
Walgreens Boots Alliance | | | 60 | | | | 2,821 | |
Walmart | | | 120 | | | | 17,930 | |
| | | | | | | | 183,824 | |
| | | | | | | | | |
| Energy — 2.8% | | | | | | | | |
APA | | | 26 | | | | 681 | |
Baker Hughes, Cl A | | | 62 | | | | 1,555 | |
Chevron | | | 163 | | | | 18,662 | |
ConocoPhillips | | | 108 | | | | 8,045 | |
Coterra Energy | | | 36 | | | | 767 | |
Devon Energy | | | 48 | | | | 1,924 | |
Diamondback Energy | | | 12 | | | | 1,286 | |
EOG Resources | | | 48 | | | | 4,438 | |
Exxon Mobil | | | 357 | | | | 23,016 | |
Halliburton | | | 72 | | | | 1,799 | |
Hess | | | 24 | | | | 1,982 | |
Kinder Morgan | | | 158 | | | | 2,646 | |
| Schedule of Investments | | October 31, 2021 |
| | Global X S&P 500® Collar 95-110 ETF | |
| | | | | | | |
| COMMON STOCK — continued | | | | | | |
| Energy — continued | | | | | | |
Marathon Oil | | | 62 | | | $ | 1,012 | |
Marathon Petroleum | | | 48 | | | | 3,165 | |
Occidental Petroleum | | | 72 | | | | 2,414 | |
ONEOK | | | 36 | | | | 2,290 | |
Phillips 66 | | | 36 | | | | 2,692 | |
Pioneer Natural Resources | | | 20 | | | | 3,740 | |
Schlumberger | | | 110 | | | | 3,549 | |
Valero Energy | | | 36 | | | | 2,784 | |
Williams | | | 98 | | | | 2,753 | |
| | | | | | | | 91,200 | |
| | | | | | | | | |
| Financials — 11.3% | | | | | | | | |
Aflac | | | 48 | | | | 2,576 | |
Allstate | | | 24 | | | | 2,968 | |
American Express | | | 55 | | | | 9,558 | |
American International Group | | | 72 | | | | 4,255 | |
Ameriprise Financial | | | 10 | | | | 3,021 | |
Aon, Cl A | | | 21 | | | | 6,718 | |
Arthur J Gallagher | | | 16 | | | | 2,683 | |
Assurant | | | 4 | | | | 645 | |
Bank of America | | | 623 | | | | 29,767 | |
Bank of New York Mellon | | | 62 | | | | 3,670 | |
Berkshire Hathaway, Cl B * | | | 156 | | | | 44,774 | |
BlackRock, Cl A | | | 12 | | | | 11,322 | |
Brown & Brown | | | 20 | | | | 1,262 | |
Capital One Financial | | | 36 | | | | 5,437 | |
Cboe Global Markets | | | 12 | | | | 1,583 | |
Charles Schwab | | | 122 | | | | 10,008 | |
Chubb | | | 36 | | | | 7,034 | |
Cincinnati Financial | | | 12 | | | | 1,457 | |
Citigroup | | | 168 | | | | 11,619 | |
Citizens Financial Group | | | 36 | | | | 1,706 | |
CME Group, Cl A | | | 33 | | | | 7,278 | |
Comerica | | | 12 | | | | 1,021 | |
| Schedule of Investments | | October 31, 2021 |
| | Global X S&P 500® Collar 95-110 ETF | |
| | | | | | | |
| COMMON STOCK — continued | | | | | | |
| Financials — continued | | | | | | |
Discover Financial Services | | | 24 | | | $ | 2,720 | |
Everest Re Group | | | 4 | | | | 1,046 | |
Fifth Third Bancorp | | | 60 | | | | 2,612 | |
First Republic Bank | | | 14 | | | | 3,029 | |
Franklin Resources | | | 24 | | | | 756 | |
Globe Life | | | 12 | | | | 1,068 | |
Goldman Sachs Group | | | 28 | | | | 11,574 | |
| Hartford Financial Services Group | | | 24 | | | | 1,750 | |
Huntington Bancshares | | | 120 | | | | 1,889 | |
Intercontinental Exchange | | | 48 | | | | 6,646 | |
Invesco | | | 24 | | | | 610 | |
JPMorgan Chase | | | 252 | | | | 42,812 | |
KeyCorp | | | 74 | | | | 1,722 | |
Lincoln National | | | 12 | | | | 866 | |
Loews | | | 12 | | | | 673 | |
M&T Bank | | | 12 | | | | 1,765 | |
MarketAxess Holdings | | | 3 | | | | 1,226 | |
Marsh & McLennan | | | 46 | | | | 7,673 | |
MetLife | | | 60 | | | | 3,768 | |
Moody’s | | | 13 | | | | 5,254 | |
Morgan Stanley | | | 120 | | | | 12,334 | |
MSCI, Cl A | | | 8 | | | | 5,319 | |
Nasdaq | | | 12 | | | | 2,518 | |
Northern Trust | | | 16 | | | | 1,969 | |
People’s United Financial | | | 36 | | | | 617 | |
PNC Financial Services Group | | | 36 | | | | 7,597 | |
Principal Financial Group | | | 24 | | | | 1,610 | |
Progressive | | | 48 | | | | 4,554 | |
Prudential Financial | | | 36 | | | | 3,962 | |
Raymond James Financial | | | 17 | | | | 1,676 | |
Regions Financial | | | 74 | | | | 1,752 | |
S&P Global | | | 21 | | | | 9,957 | |
State Street | | | 24 | | | | 2,365 | |
| Schedule of Investments | | October 31, 2021 |
| | Global X S&P 500® Collar 95-110 ETF | |
| | | | | | | |
| COMMON STOCK — continued | | | | | | |
| Financials — continued | | | | | | |
SVB Financial Group * | | | 4 | | | $ | 2,870 | |
Synchrony Financial | | | 48 | | | | 2,230 | |
T Rowe Price Group | | | 21 | | | | 4,554 | |
Travelers | | | 24 | | | | 3,861 | |
Truist Financial | | | 108 | | | | 6,855 | |
US Bancorp | | | 108 | | | | 6,520 | |
W R Berkley | | | 12 | | | | 955 | |
Wells Fargo | | | 346 | | | | 17,701 | |
Willis Towers Watson | | | 12 | | | | 2,907 | |
Zions Bancorp | | | 12 | | | | 756 | |
| | | | | | | | 375,260 | |
| | | | | | | | | |
| Health Care — 13.0% | | | | | | | | |
Abbott Laboratories | | | 148 | | | | 19,076 | |
AbbVie | | | 148 | | | | 16,971 | |
ABIOMED * | | | 4 | | | | 1,328 | |
Agilent Technologies | | | 24 | | | | 3,780 | |
Align Technology * F | | | 7 | | | | 4,371 | |
AmerisourceBergen, Cl A | | | 12 | | | | 1,464 | |
Amgen | | | 48 | | | | 9,935 | |
Anthem | | | 21 | | | | 9,138 | |
Baxter International | | | 43 | | | | 3,395 | |
Becton Dickinson | | | 24 | | | | 5,750 | |
Biogen * | | | 12 | | | | 3,200 | |
Bio-Rad Laboratories, Cl A * | | | 2 | | | | 1,589 | |
Bio-Techne | | | 3 | | | | 1,571 | |
Boston Scientific * | | | 119 | | | | 5,132 | |
Bristol-Myers Squibb | | | 182 | | | | 10,629 | |
Cardinal Health | | | 24 | | | | 1,147 | |
Catalent * | | | 12 | | | | 1,654 | |
Centene * | | | 48 | | | | 3,419 | |
Cerner | | | 24 | | | | 1,783 | |
Charles River Laboratories International * | | | 4 | | | | 1,795 | |
Cigna | | | 28 | | | | 5,981 | |
| Schedule of Investments | | October 31, 2021 |
| | Global X S&P 500® Collar 95-110 ETF | |
| | | | | | | |
| COMMON STOCK — continued | | | | | | |
| Health Care — continued | | | | | | |
Cooper | | | 4 | | | $ | 1,668 | |
CVS Health | | | 108 | | | | 9,642 | |
Danaher | | | 53 | | | | 16,524 | |
DaVita * | | | 5 | | | | 516 | |
DENTSPLY SIRONA | | | 14 | | | | 801 | |
Dexcom * | | | 9 | | | | 5,609 | |
Edwards Lifesciences * | | | 52 | | | | 6,231 | |
Eli Lilly | | | 68 | | | | 17,324 | |
Gilead Sciences | | | 106 | | | | 6,877 | |
HCA Healthcare | | | 21 | | | | 5,260 | |
Henry Schein * | | | 12 | | | | 916 | |
Hologic * | | | 24 | | | | 1,759 | |
Humana | | | 11 | | | | 5,095 | |
IDEXX Laboratories * F | | | 8 | | | | 5,329 | |
Illumina * | | | 12 | | | | 4,981 | |
Incyte * | | | 12 | | | | 804 | |
Intuitive Surgical * | | | 30 | | | | 10,834 | |
IQVIA Holdings * | | | 15 | | | | 3,921 | |
Johnson & Johnson | | | 221 | | | | 35,996 | |
Laboratory Corp of America Holdings * | | | 9 | | | | 2,583 | |
McKesson | | | 12 | | | | 2,495 | |
Medtronic | | | 112 | | | | 13,424 | |
Merck | | | 213 | | | | 18,755 | |
Mettler-Toledo International * | | | 2 | | | | 2,962 | |
Moderna * | | | 29 | | | | 10,011 | |
Organon | | | 24 | | | | 882 | |
PerkinElmer | | | 10 | | | | 1,769 | |
Pfizer | | | 471 | | | | 20,601 | |
Quest Diagnostics | | | 12 | | | | 1,761 | |
Regeneron Pharmaceuticals * | | | 9 | | | | 5,759 | |
ResMed | | | 12 | | | | 3,155 | |
STERIS | | | 9 | | | | 2,104 | |
Stryker | | | 27 | | | | 7,184 | |
| Schedule of Investments | | October 31, 2021 |
| | Global X S&P 500® Collar 95-110 ETF | |
| | | | | | | |
| COMMON STOCK — continued | | | | | | |
| Health Care — continued | | | | | | |
Teleflex | | | 4 | | | $ | 1,428 | |
Thermo Fisher Scientific | | | 34 | | | | 21,524 | |
UnitedHealth Group | | | 80 | | | | 36,838 | |
| Universal Health Services, Cl B | | | 7 | | | | 869 | |
Vertex Pharmaceuticals * | | | 24 | | | | 4,438 | |
Viatris, Cl W * | | | 96 | | | | 1,282 | |
Waters * | | | 5 | | | | 1,838 | |
West Pharmaceutical Services | | | 8 | | | | 3,439 | |
Zimmer Biomet Holdings | | | 17 | | | | 2,433 | |
Zoetis, Cl A | | | 39 | | | | 8,432 | |
| | | | | | | | 429,161 | |
| | | | | | | | | |
| Industrials — 8.0% | | | | | | | | |
3M | | | 48 | | | | 8,577 | |
Alaska Air Group * | | | 12 | | | | 634 | |
Allegion | | | 8 | | | | 1,026 | |
American Airlines Group * | | | 50 | | | | 960 | |
AMETEK | | | 20 | | | | 2,648 | |
AO Smith | | | 12 | | | | 877 | |
Boeing * | | | 48 | | | | 9,937 | |
Carrier Global | | | 73 | | | | 3,813 | |
Caterpillar | | | 48 | | | | 9,793 | |
CH Robinson Worldwide | | | 12 | | | | 1,164 | |
Cintas | | | 9 | | | | 3,898 | |
Copart * | | | 17 | | | | 2,640 | |
CSX | | | 182 | | | | 6,583 | |
Cummins | | | 12 | | | | 2,878 | |
Deere | | | 24 | | | | 8,215 | |
Delta Air Lines * | | | 48 | | | | 1,878 | |
Dover | | | 12 | | | | 2,029 | |
Eaton | | | 36 | | | | 5,931 | |
Emerson Electric | | | 48 | | | | 4,657 | |
Equifax | | | 12 | | | | 3,329 | |
| Expeditors International of Washington | | | 12 | | | | 1,479 | |
| Schedule of Investments | | October 31, 2021 |
| | Global X S&P 500® Collar 95-110 ETF | |
| | | | | | | |
| COMMON STOCK — continued | | | | | | |
| Industrials — continued | | | | | | |
Fastenal | | | 48 | | | $ | 2,740 | |
FedEx | | | 21 | | | | 4,946 | |
Fortive | | | 26 | | | | 1,968 | |
| Fortune Brands Home & Security | | | 12 | | | | 1,217 | |
Generac Holdings * | | | 5 | | | | 2,493 | |
General Dynamics | | | 20 | | | | 4,055 | |
General Electric | | | 93 | | | | 9,753 | |
Honeywell International | | | 60 | | | | 13,117 | |
Howmet Aerospace | | | 36 | | | | 1,069 | |
Huntington Ingalls Industries | | | 4 | | | | 811 | |
IDEX | | | 7 | | | | 1,558 | |
IHS Markit | | | 34 | | | | 4,444 | |
Illinois Tool Works | | | 24 | | | | 5,469 | |
Ingersoll Rand | | | 36 | | | | 1,935 | |
Jacobs Engineering Group | | | 12 | | | | 1,685 | |
JB Hunt Transport Services | | | 8 | | | | 1,578 | |
Johnson Controls International | | | 60 | | | | 4,402 | |
Kansas City Southern | | | 8 | | | | 2,482 | |
L3Harris Technologies | | | 16 | | | | 3,689 | |
Leidos Holdings | | | 12 | | | | 1,200 | |
Lockheed Martin | | | 21 | | | | 6,979 | |
Masco | | | 24 | | | | 1,573 | |
Nielsen Holdings | | | 26 | | | | 527 | |
Norfolk Southern | | | 21 | | | | 6,154 | |
Northrop Grumman | | | 12 | | | | 4,287 | |
Old Dominion Freight Line | | | 9 | | | | 3,072 | |
Otis Worldwide | | | 36 | | | | 2,891 | |
PACCAR | | | 24 | | | | 2,151 | |
Parker-Hannifin | | | 12 | | | | 3,559 | |
Pentair | | | 12 | | | | 888 | |
Quanta Services | | | 12 | | | | 1,455 | |
Raytheon Technologies | | | 128 | | | | 11,374 | |
Republic Services, Cl A | | | 17 | | | | 2,288 | |
| Schedule of Investments | | October 31, 2021 |
| | Global X S&P 500® Collar 95-110 ETF | |
| | | | | | | |
| COMMON STOCK — continued | | | | | | |
| Industrials — continued | | | | | | |
Robert Half International | | | 12 | | | $ | 1,357 | |
Rockwell Automation | | | 10 | | | | 3,194 | |
Rollins | | | 14 | | | | 493 | |
Roper Technologies | | | 9 | | | | 4,391 | |
Snap-On | | | 5 | | | | 1,016 | |
Southwest Airlines * | | | 48 | | | | 2,269 | |
Stanley Black & Decker | | | 12 | | | | 2,157 | |
Textron | | | 14 | | | | 1,034 | |
Trane Technologies | | | 21 | | | | 3,800 | |
TransDigm Group * | | | 4 | | | | 2,495 | |
Union Pacific | | | 56 | | | | 13,518 | |
United Airlines Holdings * | | | 24 | | | | 1,107 | |
United Parcel Service, Cl B | | | 60 | | | | 12,808 | |
United Rentals * | | | 8 | | | | 3,033 | |
Verisk Analytics, Cl A | | | 12 | | | | 2,523 | |
Waste Management | | | 33 | | | | 5,288 | |
| Westinghouse Air Brake Technologies | | | 12 | | | | 1,089 | |
WW Grainger | | | 4 | | | | 1,852 | |
Xylem | | | 12 | | | | 1,567 | |
| | | | | | | | 265,746 | |
| | | | | | | | | |
| Information Technology — 27.6% | | | | | | | | |
Accenture, Cl A | | | 52 | | | | 18,657 | |
Adobe * | | | 39 | | | | 25,364 | |
Advanced Micro Devices * | | | 103 | | | | 12,384 | |
Akamai Technologies * | | | 12 | | | | 1,265 | |
Amphenol, Cl A | | | 48 | | | | 3,685 | |
Analog Devices | | | 47 | | | | 8,154 | |
ANSYS * | | | 9 | | | | 3,416 | |
Apple | | | 1,322 | | | | 198,036 | |
Applied Materials | | | 76 | | | | 10,385 | |
Arista Networks * | | | 5 | | | | 2,048 | |
Autodesk * | | | 20 | | | | 6,352 | |
Automatic Data Processing | | | 36 | | | | 8,082 | |
| Schedule of Investments | | October 31, 2021 |
| | Global X S&P 500® Collar 95-110 ETF | |
| | | | | | | |
| COMMON STOCK — continued | | | | | | |
| Information Technology — continued | | | | | | |
Broadcom | | | 35 | | | $ | 18,608 | |
Broadridge Financial Solutions | | | 12 | | | | 2,141 | |
Cadence Design Systems * | | | 24 | | | | 4,155 | |
CDW | | | 12 | | | | 2,240 | |
Ceridian HCM Holding * | | | 11 | | | | 1,378 | |
Cisco Systems | | | 355 | | | | 19,869 | |
Citrix Systems | | | 12 | | | | 1,137 | |
| Cognizant Technology Solutions, Cl A | | | 45 | | | | 3,514 | |
Corning | | | 60 | | | | 2,134 | |
DXC Technology * | | | 24 | | | | 782 | |
Enphase Energy * | | | 12 | | | | 2,780 | |
F5 Networks * | | | 4 | | | | 845 | |
| Fidelity National Information Services | | | 51 | | | | 5,648 | |
Fiserv * | | | 48 | | | | 4,728 | |
FleetCor Technologies * | | | 8 | | | | 1,979 | |
Fortinet * | | | 12 | | | | 4,036 | |
Gartner * | | | 8 | | | | 2,655 | |
Global Payments | | | 24 | | | | 3,432 | |
Hewlett Packard Enterprise | | | 108 | | | | 1,582 | |
HP | | | 96 | | �� | | 2,912 | |
Intel | | | 340 | | | | 16,660 | |
| International Business Machines | | | 72 | | | | 9,007 | |
Intuit | | | 23 | | | | 14,398 | |
IPG Photonics * | | | 4 | | | | 636 | |
Jack Henry & Associates | | | 7 | | | | 1,165 | |
Juniper Networks | | | 24 | | | | 708 | |
Keysight Technologies * | | | 15 | | | | 2,700 | |
KLA | | | 12 | | | | 4,473 | |
Lam Research | | | 12 | | | | 6,763 | |
Mastercard, Cl A | | | 73 | | | | 24,493 | |
Microchip Technology | | | 48 | | | | 3,556 | |
Micron Technology | | | 95 | | | | 6,564 | |
Microsoft | | | 633 | | | | 209,915 | |
| Schedule of Investments | | October 31, 2021 |
| | Global X S&P 500® Collar 95-110 ETF | |
| | | | | | | |
| COMMON STOCK — continued | | | | | | |
| Information Technology — continued | | | | | | |
Monolithic Power Systems | | | 3 | | | $ | 1,576 | |
Motorola Solutions | | | 14 | | | | 3,480 | |
NetApp | | | 19 | | | | 1,697 | |
NortonLifeLock | | | 48 | | | | 1,222 | |
NVIDIA | | | 209 | | | | 53,435 | |
Oracle | | | 144 | | | | 13,815 | |
Paychex | | | 24 | | | | 2,959 | |
Paycom Software * | | | 4 | | | | 2,191 | |
PayPal Holdings * | | | 98 | | | | 22,794 | |
PTC * | | | 12 | | | | 1,528 | |
Qorvo * | | | 12 | | | | 2,019 | |
QUALCOMM | | | 98 | | | | 13,038 | |
salesforce.com * | | | 82 | | | | 24,575 | |
Seagate Technology Holdings | | | 12 | | | | 1,069 | |
ServiceNow * | | | 16 | | | | 11,164 | |
Skyworks Solutions | | | 12 | | | | 2,006 | |
Synopsys * | | | 12 | | | | 3,998 | |
TE Connectivity | | | 27 | | | | 3,942 | |
Teledyne Technologies * | | | 4 | | | | 1,797 | |
Teradyne | | | 12 | | | | 1,659 | |
Texas Instruments | | | 77 | | | | 14,436 | |
Trimble * | | | 24 | | | | 2,097 | |
Tyler Technologies * | | | 3 | | | | 1,630 | |
VeriSign * | | | 9 | | | | 2,004 | |
Visa, Cl A | | | 142 | | | | 30,071 | |
Western Digital * | | | 24 | | | | 1,255 | |
Western Union | | | 36 | | | | 656 | |
Xilinx | | | 21 | | | | 3,780 | |
Zebra Technologies, Cl A * | | | 4 | | | | 2,136 | |
| | | | | | | | 913,450 | |
| | | | | | | | | |
| Materials — 2.1% | | | | | | | | |
Air Products & Chemicals | | | 21 | | | | 6,296 | |
Albemarle | | | 10 | | | | 2,505 | |
| Schedule of Investments | | October 31, 2021 |
| | Global X S&P 500® Collar 95-110 ETF | |
| | | | | | | |
| COMMON STOCK — continued | | | | | | |
| Materials — continued | | | | | | |
Amcor | | | 122 | | | $ | 1,473 | |
Avery Dennison | | | 8 | | | | 1,742 | |
Ball | | | 24 | | | | 2,196 | |
Celanese, Cl A | | | 12 | | | | 1,938 | |
CF Industries Holdings | | | 14 | | | | 795 | |
Corteva | | | 60 | | | | 2,589 | |
Dow | | | 60 | | | | 3,358 | |
DuPont de Nemours | | | 44 | | | | 3,062 | |
Eastman Chemical | | | 12 | | | | 1,248 | |
Ecolab | | | 21 | | | | 4,667 | |
FMC | | | 12 | | | | 1,092 | |
Freeport-McMoRan | | | 120 | | | | 4,526 | |
| International Flavors & Fragrances | | | 24 | | | | 3,539 | |
International Paper | | | 36 | | | | 1,788 | |
| LyondellBasell Industries, Cl A | | | 24 | | | | 2,228 | |
Martin Marietta Materials | | | 5 | | | | 1,964 | |
Mosaic | | | 24 | | | | 998 | |
Newmont | | | 62 | | | | 3,348 | |
Nucor | | | 24 | | | | 2,680 | |
Packaging Corp of America | | | 9 | | | | 1,236 | |
PPG Industries | | | 21 | | | | 3,372 | |
Sealed Air | | | 12 | | | | 712 | |
Sherwin-Williams | | | 21 | | | | 6,649 | |
Sylvamo * | | | 0 | | | | — | |
Vulcan Materials | | | 12 | | | | 2,281 | |
Westrock | | | 24 | | | | 1,154 | |
| | | | | | | | 69,436 | |
| | | | | | | | | |
| Real Estate — 2.5% | | | | | | | | |
Alexandria Real Estate Equities ‡ | | | 12 | | | | 2,450 | |
American Tower, Cl A ‡ | | | 38 | | | | 10,715 | |
AvalonBay Communities ‡ | | | 12 | | | | 2,840 | |
Boston Properties ‡ | | | 12 | | | | 1,364 | |
CBRE Group, Cl A * | | | 24 | | | | 2,498 | |
| Schedule of Investments | | October 31, 2021 |
| | Global X S&P 500® Collar 95-110 ETF | |
| | | | | | | |
| COMMON STOCK — continued | | | | | | |
| Real Estate — continued | | | | | | |
Crown Castle International ‡ | | | 36 | | | $ | 6,491 | |
Digital Realty Trust ‡ | | | 24 | | | | 3,787 | |
Duke Realty ‡ | | | 26 | | | | 1,462 | |
Equinix ‡ | | | 8 | | | | 6,696 | |
Equity Residential ‡ | | | 24 | | | | 2,074 | |
Essex Property Trust ‡ | | | 5 | | | | 1,700 | |
Extra Space Storage ‡ | | | 12 | | | | 2,368 | |
Federal Realty Investment Trust ‡ | | | 5 | | | | 602 | |
Healthpeak Properties ‡ | | | 48 | | | | 1,704 | |
Host Hotels & Resorts ‡ * | | | 60 | | | | 1,010 | |
Iron Mountain ‡ | | | 24 | | | | 1,095 | |
Kimco Realty ‡ | | | 48 | | | | 1,085 | |
Mid-America Apartment Communities ‡ | | | 12 | | | | 2,450 | |
ProLogis ‡ | | | 60 | | | | 8,698 | |
Public Storage ‡ | | | 12 | | | | 3,986 | |
Realty Income ‡ | | | 33 | | | | 2,357 | |
Regency Centers ‡ | | | 12 | | | | 845 | |
SBA Communications, Cl A ‡ | | | 10 | | | | 3,453 | |
Simon Property Group ‡ | | | 27 | | | | 3,958 | |
UDR ‡ | | | 24 | | | | 1,333 | |
Ventas ‡ | | | 26 | | | | 1,388 | |
Vornado Realty Trust ‡ | | | 12 | | | | 512 | |
Welltower ‡ | | | 36 | | | | 2,894 | |
Weyerhaeuser ‡ | | | 60 | | | | 2,143 | |
| | | | | | | | 83,958 | |
| | | | | | | | | |
| Utilities — 2.3% | | | | | | | | |
AES | | | 50 | | | | 1,257 | |
Alliant Energy | | | 24 | | | | 1,358 | |
Ameren | | | 24 | | | | 2,023 | |
American Electric Power | | | 43 | | | | 3,643 | |
American Water Works | | | 15 | | | | 2,613 | |
Atmos Energy | | | 12 | | | | 1,105 | |
CenterPoint Energy | | | 48 | | | | 1,250 | |
| Schedule of Investments | | October 31, 2021 |
| | Global X S&P 500® Collar 95-110 ETF | |
| | | | | | | |
| COMMON STOCK — continued | | | | | | |
| Utilities — continued | | | | | | |
CMS Energy | | | 24 | | | $ | 1,448 | |
Consolidated Edison | | | 24 | | | | 1,810 | |
Dominion Energy | | | 68 | | | | 5,163 | |
DTE Energy | | | 15 | | | | 1,700 | |
Duke Energy | | | 64 | | | | 6,529 | |
Edison International | | | 26 | | | | 1,636 | |
Entergy | | | 16 | | | | 1,648 | |
Evergy | | | 24 | | | | 1,530 | |
Eversource Energy | | | 24 | | | | 2,038 | |
Exelon | | | 82 | | | | 4,362 | |
FirstEnergy | | | 48 | | | | 1,849 | |
NextEra Energy | | | 165 | | | | 14,080 | |
NiSource | | | 36 | | | | 888 | |
NRG Energy | | | 24 | | | | 957 | |
Pinnacle West Capital | | | 12 | | | | 774 | |
PPL | | | 60 | | | | 1,728 | |
| Public Service Enterprise Group | | | 38 | | | | 2,424 | |
Sempra Energy | | | 24 | | | | 3,063 | |
Southern | | | 84 | | | | 5,235 | |
WEC Energy Group | | | 24 | | | | 2,161 | |
Xcel Energy | | | 48 | | | | 3,100 | |
| | | | | | | | 77,372 | |
| | | | | | | | | |
TOTAL UNITED STATES | | | | | | | 3,261,837 | |
| TOTAL COMMON STOCK | | | | | | | | |
(Cost $3,185,472) | | | | | | | 3,280,703 | |
| TOTAL INVESTMENTS — 99.2% | | | | | | | | |
(Cost $3,185,472) | | | | | | $ | 3,280,703 | |
| Schedule of Investments | | October 31, 2021 |
| | Global X S&P 500® Collar 95-110 ETF | |
| | | | | | | |
PURCHASED OPTION— 0.6%(1) | | | | | | |
| UNITED STATES— 0.6% | | | | | | |
(Cost $66,297) | | | 71 | | | $ | 19,206 | |
WRITTEN OPTION— (0.1)%(1) | | | | | | | | |
| UNITED STATES— (0.1)% | | | | | | | | |
(Premiums Received ($2,774)) | | | (71 | ) | | $ | (2,521 | ) |
Percentages are based on Net Assets of $3,308,416.
A list of the exchange traded option contracts held by the Fund at October 31, 2021, is as follows:
| Description | | Number of Contracts | | | Cost+ | | | Exercise Price | | Expiration Date | | Value | |
| PURCHASED OPTION — 0.6% | | | | | | | | | | | | | |
| Put Options | | | | | | | | | | | | | |
| XSP* | | | 71 | | | $ | 66,297 | | | $ | 422.00 | | 12/17/21 | | $ | 19,206 | |
| | | | | | | | | | | | | | | | | | |
| WRITTEN OPTION — (0.1)% | | | | | | | | | | | | | | | | | |
| Call Options | | | | | | | | | | | | | | | | | |
| XSP* | | | (71 | ) | | $ | (2,774 | ) | | | 489.00 | | 12/17/21 $ | | | (2,521 | ) |
Cl — Class
S&P — Standard & Poor’s
XSP — iShares Core S&P 500 Index ETF
| * | Non-income producing security. |
| + | Notional amount for all purchased options totals $3,269,834. |
| + | Notional amount for all written options totals $(3,269,834). |
| ‡ | Real Estate Investment Trust |
| (1) | Refer to table below for details on Options Contracts. |
| (A) | All or a portion of these securities has been segregated as collateral for writtenoptions contracts. The aggregate market value of collateral at October 31, 2021 was$3,280,703. |
| Schedule of Investments | | October 31, 2021 |
| | Global X S&P 500® Collar 95-110 ETF | |
The following is a summary of the level of inputs used as of October 31, 2021, in valuing the Fund’s investments carried at value:
| Investments in Securities | | | | | | | | | | | | |
| Common Stock | | $ | 3,280,703 | | | $ | — | | �� | $ | — | | | $ | 3,280,703 | |
| Total Investments in Securities | | $ | 3,280,703 | | | $ | — | | | $ | — | | | $ | 3,280,703 | |
| Other Financial Instruments | | | | | | | | | | | | |
| Purchased Option | | $ | 19,206 | | | $ | — | | | $ | — | | | $ | 19,206 | |
| Written Option | | | (2,521 | ) | | | — | | | | — | | | | (2,521 | ) |
| Total Other Financial Instruments | | $ | 16,685 | | | $ | — | | | $ | — | | | $ | 16,685 | |
For the year ended October 31, 2021, there have been no transfers in or out of Level 3.
Amounts designated as “—“ are $0 or have been rounded to $0.
| Schedule of Investments | | October 31, 2021 |
| | Global X NASDAQ 100® Tail Risk ETF | |
Sector Weightings (Unaudited)†:
† Sector weightings percentages are based on the total market value of investments.
| | | | | | | |
| COMMON STOCK — 99.6% | | | | | | |
| ARGENTINA — 0.5% | | | | | | |
| Consumer Discretionary — 0.5% | | | | | | |
MercadoLibre * | | | 11 | | | $ | 16,291 | |
| | | | | | | | | |
| CHINA — 1.5% | | | | | | | | |
| Communication Services — 0.5% | | | | | | | | |
Baidu ADR * | | | 52 | | | | 8,437 | |
NetEase ADR | | | 65 | | | | 6,343 | |
| | | | | | | | 14,780 | |
| | | | | | | | | |
| Consumer Discretionary — 0.7% | | | | | | | | |
JD.com ADR * | | | 171 | | | | 13,386 | |
Pinduoduo ADR * | | | 78 | | | | 6,936 | |
Trip.com Group ADR * | | | 117 | | | | 3,341 | |
| | | | | | | | 23,663 | |
| | | | | | | | | |
| Information Technology — 0.3% | | | | | | | | |
NXP Semiconductors | | | 56 | | | | 11,248 | |
| | | | | | | | | |
TOTAL CHINA | | | | | | | 49,691 | |
| ISRAEL — 0.1% | | | | | | | | |
| Information Technology — 0.1% | | | | | | | | |
Check Point Software Technologies * | | | 26 | | | | 3,110 | |
| | | | | | | | | |
| Schedule of Investments | | October 31, 2021 |
| | Global X NASDAQ 100® Tail Risk ETF | |
| | | | | | | |
| COMMON STOCK — continued | | | | | | |
| NETHERLANDS — 0.4% | | | | | | |
| Information Technology — 0.4% | | | | | | |
ASML Holding, Cl G | | | 17 | | | $ | 13,819 | |
| | | | | | | | | |
| UNITED STATES — 97.1% | | | | | | | | |
| Communication Services — 17.9% | | | | | | | | |
Activision Blizzard | | | 169 | | | | 13,214 | |
Alphabet, Cl A * | | | 42 | | | | 124,359 | |
Alphabet, Cl C * | | | 48 | | | | 142,340 | |
Charter Communications, Cl A * | | | 40 | | | | 26,996 | |
Comcast, Cl A | | | 1,003 | | | | 51,584 | |
Electronic Arts | | | 65 | | | | 9,116 | |
Fox, Cl A | | | 75 | | | | 2,980 | |
Fox, Cl B | | | 52 | | | | 1,922 | |
Match Group * | | | 61 | | | | 9,198 | |
Meta Platforms, Cl A * | | | 343 | | | | 110,985 | |
Netflix * | | | 96 | | | | 66,270 | |
Sirius XM Holdings | | | 904 | | | | 5,505 | |
T-Mobile US * | | | 273 | | | | 31,403 | |
| | | | | | | | 595,872 | |
| | | | | | | | | |
| Consumer Discretionary — 17.0% | | | | | | | | |
Amazon.com * | | | 74 | | | | 249,560 | |
Booking Holdings * | | | 10 | | | | 24,208 | |
Dollar Tree * | | | 52 | | | | 5,603 | |
eBay | | | 141 | | | | 10,818 | |
Lululemon Athletica * | | | 26 | | | | 12,116 | |
Marriott International, Cl A * | | | 72 | | | | 11,521 | |
O’Reilly Automotive * | | | 15 | | | | 9,335 | |
Peloton Interactive, Cl A * | | | 60 | | | | 5,486 | |
Ross Stores | | | 78 | | | | 8,830 | |
Starbucks | | | 260 | | | | 27,578 | |
Tesla * | | | 180 | | | | 200,520 | |
| | | | | | | | 565,575 | |
| Schedule of Investments | | October 31, 2021 |
| | Global X NASDAQ 100® Tail Risk ETF | |
| | | | | | | |
| COMMON STOCK — continued | | | | | | |
| Consumer Staples — 4.6% | | | | | | |
Costco Wholesale | | | 95 | | | $ | 46,696 | |
Keurig Dr Pepper | | | 312 | | | | 11,260 | |
Kraft Heinz | | | 273 | | | | 9,798 | |
Mondelez International, Cl A | | | 312 | | | | 18,951 | |
Monster Beverage * | | | 117 | | | | 9,945 | |
PepsiCo | | | 302 | | | | 48,803 | |
Walgreens Boots Alliance | | | 195 | | | | 9,169 | |
| | | | | | | | 154,622 | |
| | | | | | | | | |
| Health Care — 6.1% | | | | | | | | |
Align Technology * | | | 16 | | | | 9,990 | |
Amgen | | | 125 | | | | 25,871 | |
Biogen * | | | 35 | | | | 9,334 | |
Cerner | | | 65 | | | | 4,829 | |
Dexcom * | | | 23 | | | | 14,334 | |
Gilead Sciences | | | 273 | | | | 17,712 | |
IDEXX Laboratories * | | | 17 | | | | 11,324 | |
Illumina * | | | 35 | | | | 14,527 | |
Incyte * | | | 52 | | | | 3,483 | |
Intuitive Surgical * | | | 78 | | | | 28,168 | |
Moderna * | | | 89 | | | | 30,724 | |
Regeneron Pharmaceuticals * | | | 24 | | | | 15,359 | |
Seagen * | | | 39 | | | | 6,877 | |
Vertex Pharmaceuticals * | | | 55 | | | | 10,171 | |
| | | | | | | | 202,703 | |
| | | | | | | | | |
| Industrials — 2.8% | | | | | | | | |
Cintas | | | 23 | | | | 9,961 | |
Copart * | | | 52 | | | | 8,075 | |
CSX | | | 504 | | | | 18,230 | |
Fastenal | | | 130 | | | | 7,421 | |
Honeywell International | | | 152 | | | | 33,230 | |
PACCAR | | | 78 | | | | 6,990 | |
| Schedule of Investments | | October 31, 2021 |
| | Global X NASDAQ 100® Tail Risk ETF | |
| | | | | | | |
| COMMON STOCK — continued | | | | | | |
| Industrials — continued | | | | | | |
Verisk Analytics, Cl A | | | 36 | | | $ | 7,570 | |
| | | | | | | | 91,477 | |
| | | | | | | | | |
| Information Technology — 47.8% | | | | | | | | |
Adobe * | | | 104 | | | | 67,638 | |
Advanced Micro Devices * | | | 267 | | | | 32,101 | |
Analog Devices | | | 117 | | | | 20,298 | |
ANSYS * | | | 18 | | | | 6,833 | |
Apple | | | 2,388 | | | | 357,722 | |
Applied Materials | | | 197 | | | | 26,920 | |
Atlassian, Cl A * | | | 30 | | | | 13,744 | |
Autodesk * | | | 49 | | | | 15,563 | |
Automatic Data Processing | | | 91 | | | | 20,429 | |
Broadcom | | | 91 | | | | 48,382 | |
Cadence Design Systems * | | | 61 | | | | 10,560 | |
CDW | | | 29 | | | | 5,413 | |
Cisco Systems | | | 924 | | | | 51,716 | |
| Cognizant Technology Solutions, Cl A | | | 117 | | | | 9,137 | |
Crowdstrike Holdings, Cl A * | | | 44 | | | | 12,399 | |
DocuSign, Cl A * | | | 42 | | | | 11,688 | |
Fiserv * | | | 143 | | | | 14,084 | |
Intel | | | 897 | | | | 43,953 | |
Intuit | | | 61 | | | | 38,185 | |
KLA | | | 35 | | | | 13,047 | |
Lam Research | | | 30 | | | | 16,907 | |
Marvell Technology | | | 182 | | | | 12,467 | |
Microchip Technology | | | 122 | | | | 9,039 | |
Micron Technology | | | 247 | | | | 17,068 | |
Microsoft | | | 1,087 | | | | 360,471 | |
NVIDIA | | | 548 | | | | 140,107 | |
Okta, Cl A * | | | 30 | | | | 7,415 | |
Paychex | | | 78 | | | | 9,616 | |
PayPal Holdings * | | | 260 | | | | 60,473 | |
QUALCOMM | | | 247 | | | | 32,861 | |
| Schedule of Investments | | October 31, 2021 |
| | Global X NASDAQ 100® Tail Risk ETF | |
| | | Shares/Number of Contracts | | | | |
| COMMON STOCK — continued | | | | | | |
| Information Technology — continued | | | | | | |
Skyworks Solutions | | | 39 | | | $ | 6,518 | |
Splunk * | | | 39 | | | | 6,428 | |
Synopsys * | | | 34 | | | | 11,328 | |
Texas Instruments | | | 204 | | | | 38,246 | |
VeriSign * | | | 26 | | | | 5,789 | |
Workday, Cl A * | | | 41 | | | | 11,889 | |
Xilinx | | | 52 | | | | 9,360 | |
Zoom Video Communications, Cl A * | | | 52 | | | | 14,282 | |
| | | | | | | | 1,590,076 | |
| | | | | | | | | |
| Utilities — 0.9% | | | | | | | | |
American Electric Power | | | 107 | | | | 9,064 | |
Exelon | | | 221 | | | | 11,755 | |
Xcel Energy | | | 117 | | | | 7,557 | |
| | | | | | | | 28,376 | |
| | | | | | | | | |
TOTAL UNITED STATES | | | | | | | 3,228,701 | |
| TOTAL COMMON STOCK | | | | | | | | |
(Cost $3,208,011) | | | | | | | 3,311,612 | |
| TOTAL INVESTMENTS — 99.6% | | | | | | | | |
(Cost $3,208,011) | | | | | | $ | 3,311,612 | |
| | | | | | | | | |
PURCHASED OPTION— 0.4%(1) | | | | | | | | |
| UNITED STATES— 0.4% | | | | | | | | |
(Cost $52,310) | | | 10 | | | $ | 14,450 | |
Percentages are based on Net Assets of $3,326,266.
| Schedule of Investments | | October 31, 2021 |
| | Global X NASDAQ 100® Tail Risk ETF | |
A list of the exchange traded option contracts held by the Fund at October 31, 2021, is as follows:
| Description | | Number of Contracts | | | Cost+ | | | Exercise Price | | Expiration Date | | Value | |
| PURCHASED OPTION — 0.4% | | | | | | | | | | | | | |
| Put Options | | | | | | | | | | | | | |
| NQX* | | | 10 | | | $ | 52,310 | | | $ | 2,795.00 | | 12/17/21 | | $ | 14,450 | |
ADR — American Depositary Receipt
Cl — Class
NQX — Nasdaq-100 Reduced Value Index
| + | Notional amount for all options totals $3,170,094. |
| * | Non-income producing security. |
| (1) | Refer to table below for details on Options Contracts. |
The following is a summary of the level of inputs used as of October 31, 2021, in valuing the Fund’s investments carried at value:
| Investments in Securities | | | | | | | | | | | | |
| Common Stock | | $ | 3,311,612 | | | $ | — | | | $ | — | | | $ | 3,311,612 | |
| Total Investments in Securities | | $ | 3,311,612 | | | $ | — | | | $ | — | | | $ | 3,311,612 | |
| Other Financial Instruments | | | | | | | | | | | | |
| Purchased Option | | $ | 14,450 | | | $ | — | | | $ | — | | | $ | 14,450 | |
| Total Other Financial Instruments | | $ | 14,450 | | | $ | — | | | $ | — | | | $ | 14,450 | |
For the year ended October 31, 2021, there have been no transfers in or out of Level 3.
Amounts designated as “—“ are $0 or have been rounded to $0.
| Schedule of Investments | | October 31, 2021 |
| | Global X NASDAQ 100® Risk Managed Income ETF | |
Sector Weightings (Unaudited)†:
† Sector weightings percentages are based on the total market value of investments.
| | | | | | | |
| COMMON STOCK — 105.2% (A) | | | | | | |
| ARGENTINA — 0.5% | | | | | | |
| Consumer Discretionary — 0.5% | | | | | | |
MercadoLibre * | | | 15 | | | $ | 22,215 | |
| | | | | | | | | |
| CHINA — 1.6% | | | | | | | | |
| Communication Services — 0.5% | | | | | | | | |
Baidu ADR * | | | 74 | | | | 12,006 | |
NetEase ADR | | | 90 | | | | 8,783 | |
| | | | | | | | 20,789 | |
| | | | | | | | | |
| Consumer Discretionary — 0.7% | | | | | | | | |
JD.com ADR * | | | 235 | | | | 18,396 | |
Pinduoduo ADR * | | | 111 | | | | 9,870 | |
Trip.com Group ADR * | | | 162 | | | | 4,626 | |
| | | | | | | | 32,892 | |
| | | | | | | | | |
| Information Technology — 0.4% | | | | | | | | |
NXP Semiconductors | | | 80 | | | | 16,069 | |
| Schedule of Investments | | October 31, 2021 |
| | Global X NASDAQ 100® Risk Managed Income ETF | |
| | | | | | | |
| COMMON STOCK — continued | | | | | | |
TOTAL CHINA | | | | | $ | 69,750 | |
| ISRAEL — 0.1% | | | | | | | |
| Information Technology — 0.1% | | | | | | | |
Check Point Software Technologies * | | | 36 | | | | 4,306 | |
| | | | | | | | | |
| NETHERLANDS — 0.5% | | | | | | | | |
| Information Technology — 0.5% | | | | | | | | |
ASML Holding, Cl G | | | 25 | | | | 20,322 | |
| | | | | | | | | |
| UNITED STATES — 102.5% | | | | | | | | |
| Communication Services — 19.0% | | | | | | | | |
Activision Blizzard | | | 234 | | | | 18,296 | |
Alphabet, Cl A * | | | 58 | | | | 171,733 | |
Alphabet, Cl C * | | | 66 | | | | 195,717 | |
Charter Communications, Cl A * | | | 55 | | | | 37,119 | |
Comcast, Cl A | | | 1,383 | | | | 71,128 | |
Electronic Arts | | | 90 | | | | 12,623 | |
Fox, Cl A | | | 103 | | | | 4,093 | |
Fox, Cl B | | | 72 | | | | 2,661 | |
Match Group * | | | 84 | | | | 12,666 | |
Meta Platforms, Cl A * | | | 476 | | | | 154,019 | |
Netflix * | | | 134 | | | | 92,502 | |
Sirius XM Holdings | | | 1,250 | | | | 7,613 | |
T-Mobile US * | | | 378 | | | | 43,481 | |
| | | | | | | | 823,651 | |
| | | | | | | | | |
| Consumer Discretionary — 17.8% | | | | | | | | |
Amazon.com * | | | 101 | | | | 340,616 | |
Booking Holdings * | | | 12 | | | | 29,049 | |
Dollar Tree * | | | 72 | | | | 7,759 | |
eBay | | | 194 | | | | 14,884 | |
Lululemon Athletica * | | | 37 | | | | 17,242 | |
Marriott International, Cl A * | | | 95 | | | | 15,202 | |
O’Reilly Automotive * | | | 20 | | | | 12,446 | |
Peloton Interactive, Cl A * | | | 82 | | | | 7,498 | |
| Schedule of Investments | | October 31, 2021 |
| | Global X NASDAQ 100® Risk Managed Income ETF | |
| | | | | | | |
| COMMON STOCK — continued | | | | | | |
| Consumer Discretionary — continued | | | | | | |
Ross Stores | | | 108 | | | $ | 12,226 | |
Starbucks | | | 360 | | | | 38,185 | |
Tesla * | | | 248 | | | | 276,272 | |
| | | | | | | | 771,379 | |
| | | | | | | | | |
| Consumer Staples — 4.9% | | | | | | | | |
Costco Wholesale | | | 134 | | | | 65,866 | |
Keurig Dr Pepper | | | 432 | | | | 15,591 | |
Kraft Heinz | | | 378 | | | | 13,566 | |
Mondelez International, Cl A | | | 432 | | | | 26,240 | |
Monster Beverage * | | | 162 | | | | 13,770 | |
PepsiCo | | | 416 | | | | 67,226 | |
Walgreens Boots Alliance | | | 270 | | | | 12,695 | |
| | | | | | | | 214,954 | |
| | | | | | | | | |
| Health Care — 6.5% | | | | | | | | |
Align Technology * | | | 24 | | | | 14,985 | |
Amgen | | | 173 | | | | 35,806 | |
Biogen * | | | 47 | | | | 12,534 | |
Cerner | | | 90 | | | | 6,686 | |
Dexcom * | | | 29 | | | | 18,073 | |
Gilead Sciences | | | 376 | | | | 24,395 | |
IDEXX Laboratories * | | | 26 | | | | 17,319 | |
Illumina * | | | 47 | | | | 19,508 | |
Incyte * | | | 72 | | | | 4,822 | |
Intuitive Surgical * | | | 108 | | | | 39,002 | |
Moderna * | | | 123 | | | | 42,461 | |
Regeneron Pharmaceuticals * | | | 33 | | | | 21,118 | |
Seagen * | | | 54 | | | | 9,522 | |
Vertex Pharmaceuticals * | | | 76 | | | | 14,055 | |
| | | | | | | | 280,286 | |
| | | | | | | | | |
| Industrials — 2.9% | | | | | | | | |
Cintas | | | 32 | | | | 13,859 | |
Copart * | | | 72 | | | | 11,181 | |
| Schedule of Investments | | October 31, 2021 |
| | Global X NASDAQ 100® Risk Managed Income ETF | |
| | | | | | | |
| COMMON STOCK — continued | | | | | | |
| Industrials — continued | | | | | | |
CSX | | | 697 | | | $ | 25,211 | |
Fastenal | | | 180 | | | | 10,275 | |
Honeywell International | | | 210 | | | | 45,910 | |
PACCAR | | | 108 | | | | 9,679 | |
Verisk Analytics, Cl A | | | 49 | | | | 10,303 | |
| | | | | | | | 126,418 | |
| | | | | | | | | |
| Information Technology — 50.5% | | | | | | | | |
Adobe * | | | 144 | | | | 93,652 | |
Advanced Micro Devices * | | | 363 | | | | 43,643 | |
Analog Devices | | | 161 | | | | 27,932 | |
ANSYS * | | | 26 | | | | 9,869 | |
Apple | | | 3,300 | | | | 494,340 | |
Applied Materials | | | 271 | | | | 37,032 | |
Atlassian, Cl A * | | | 41 | | | | 18,783 | |
Autodesk * | | | 67 | | | | 21,280 | |
Automatic Data Processing | | | 126 | | | | 28,286 | |
Broadcom | | | 124 | | | | 65,927 | |
Cadence Design Systems * | | | 84 | | | | 14,541 | |
CDW | | | 39 | | | | 7,279 | |
Cisco Systems | | | 1,273 | | | | 71,250 | |
| Cognizant Technology Solutions, Cl A | | | 162 | | | | 12,651 | |
Crowdstrike Holdings, Cl A * | | | 60 | | | | 16,908 | |
DocuSign, Cl A * | | | 59 | | | | 16,419 | |
Fiserv * | | | 198 | | | | 19,501 | |
Intel F | | | 1,237 | | | | 60,613 | |
Intuit | | | 84 | | | | 52,583 | |
KLA | | | 48 | | | | 17,892 | |
Lam Research | | | 43 | | | | 24,234 | |
Marvell Technology | | | 252 | | | | 17,262 | |
Microchip Technology | | | 168 | | | | 12,447 | |
Micron Technology | | | 342 | | | | 23,632 | |
Microsoft | | | 1,500 | | | | 497,430 | |
NVIDIA | | | 759 | | | | 194,054 | |
| Schedule of Investments | | October 31, 2021 |
| | Global X NASDAQ 100® Risk Managed Income ETF | |
| | | | | | | |
| COMMON STOCK — continued | | | | | | |
| Information Technology — continued | | | | | | |
Okta, Cl A * | | | 43 | | | $ | 10,629 | |
Paychex | | | 108 | | | | 13,314 | |
PayPal Holdings * | | | 356 | | | | 82,802 | |
QUALCOMM | | | 342 | | | | 45,500 | |
Skyworks Solutions | | | 50 | | | | 8,356 | |
Splunk * | | | 49 | | | | 8,076 | |
Synopsys * | | | 48 | | | | 15,993 | |
Texas Instruments | | | 281 | | | | 52,682 | |
VeriSign * | | | 36 | | | | 8,016 | |
Workday, Cl A * | | | 56 | | | | 16,239 | |
Xilinx | | | 72 | | | | 12,960 | |
Zoom Video Communications, Cl A * | | | 72 | | | | 19,775 | |
| | | | | | | | 2,193,782 | |
| | | | | | | | | |
| Utilities — 0.9% | | | | | | | | |
American Electric Power | | | 147 | | | | 12,452 | |
Exelon | | | 301 | | | | 16,010 | |
Xcel Energy | | | 162 | | | | 10,464 | |
| | | | | | | | 38,926 | |
| | | | | | | | | |
TOTAL UNITED STATES | | | | | | | 4,449,396 | |
| TOTAL COMMON STOCK | | | | | | | | |
(Cost $4,396,734) | | | | | | | 4,565,989 | |
| TOTAL INVESTMENTS — 105.2% | | | | | | | | |
(Cost $4,396,734) | | | | | | $ | 4,565,989 | |
| Schedule of Investments | | October 31, 2021 |
| | Global X NASDAQ 100® Risk Managed Income ETF | |
| | | | | | | |
PURCHASED OPTION— 0.1%(1) | | | | | | |
| UNITED STATES— 0.1% | | | | | | |
(Cost $31,242) | | | 14 | | | $ | 6,160 | |
WRITTEN OPTION— (5.5)%(1) | | | | | | | | |
| UNITED STATES— (5.5)% | | | | | | | | |
| (Premiums Received ($88,602)) | | | (14 | ) | | $ | (239,120 | ) |
Percentages are based on Net Assets of $4,341,440.
A list of the exchange traded option contracts held by the Fund at October 31, 2021, is as follows:
| Description | | Number of Contracts | | | Cost+ | | | Exercise Price | | Expiration Date | | Value | |
| PURCHASED OPTION — 0.1% | | | | | | | | | | | | | |
| Put Options | | | | | | | | | | | | | |
| NQX* | | | 14 | | | $ | 31,242 | | | $ | 2,860.00 | | 11/19/21 | | $ | 6,160 | |
| | | | | | | | | | | | | | | | | | |
| WRITTEN OPTION — (5.5)% | | | | | | | | | | | | | | | | | |
| Call Options | | | | | | | | | | | | | | | | | |
| NQX* | | | (14 | ) | | $ | (88,602 | ) | | | 3,010.00 | | 11/19/21 | | $ | (239,120 | ) |
ADR — American Depositary Receipt
Cl — Class
NQX — Nasdaq-100 Reduced Value Index
| * | Non-income producing security. |
| + | Notional amount for all purchased options totals $4,438,132. |
| + | Notional amount for all written options totals $(4,438,132). |
| (1) | Refer to table below for details on Options Contracts. |
| (A) | All or a portion of these securities has been segregated as collateral for writtenoptions contracts. The aggregate market value of collateral at October 31, 2021 was$4,565,989. |
| Schedule of Investments | | October 31, 2021 |
| | Global X NASDAQ 100® Risk Managed Income ETF | |
The following is a summary of the level of inputs used as of October 31, 2021, in valuing the Fund’s investments carried at value:
| Investments in Securities | | | | | | | | | | | | |
| Common Stock | | $ | 4,565,989 | | | $ | — | | | $ | — | | | $ | 4,565,989 | |
| Total Investments in Securities | | $ | 4,565,989 | | | $ | — | | | $ | — | | | $ | 4,565,989 | |
| Other Financial Instruments | | | | | | | | | | | | |
| Purchased Option | | $ | 6,160 | | | $ | — | | | $ | — | | | $ | 6,160 | |
| Written Option | | | (239,120 | ) | | | — | | | | — | | | | (239,120 | ) |
| Total Other Financial Instruments | | $ | (232,960 | ) | | $ | — | | | $ | — | | | $ | (232,960 | ) |
For the year ended October 31, 2021, there have been no transfers in or out of Level 3.
Amounts designated as “—“ are $0 or have been rounded to $0.
| Schedule of Investments | | October 31, 2021 |
| | Global X NASDAQ 100® Collar 95-110 ETF | |
Sector Weightings (Unaudited)†:
† Sector weightings percentages are based on the total market value of investments.
| | | | | | | |
| COMMON STOCK — 99.2% (A) | | | | | | |
| ARGENTINA — 0.5% | | | | | | |
| Consumer Discretionary — 0.5% | | | | | | |
MercadoLibre * | | | 9 | | | $ | 13,329 | |
| | | | | | | | | |
| CHINA — 1.5% | | | | | | | | |
| Communication Services — 0.5% | | | | | | | | |
Baidu ADR * | | | 47 | | | | 7,625 | |
NetEase ADR | | | 55 | | | | 5,368 | |
| | | | | | | | 12,993 | |
| | | | | | | | | |
| Consumer Discretionary — 0.7% | | | | | | | | |
JD.com ADR * | | | 147 | | | | 11,507 | |
Pinduoduo ADR * | | | 71 | | | | 6,313 | |
Trip.com Group ADR * | | | 99 | | | | 2,828 | |
| | | | | | | | 20,648 | |
| | | | | | | | | |
| Information Technology — 0.3% | | | | | | | | |
NXP Semiconductors | | | 49 | | | | 9,842 | |
| Schedule of Investments | | October 31, 2021 |
| | Global X NASDAQ 100® Collar 95-110 ETF | |
| | | | | | | |
| COMMON STOCK — continued | | | | | | |
TOTAL CHINA | | | | | $ | 43,483 | |
| ISRAEL — 0.1% | | | | | | | |
| Information Technology — 0.1% | | | | | | | |
Check Point Software Technologies * | | | 22 | | | | 2,632 | |
| | | | | | | | | |
| NETHERLANDS — 0.4% | | | | | | | | |
| Information Technology — 0.4% | | | | | | | | |
ASML Holding, Cl G | | | 15 | | | | 12,193 | |
| | | | | | | | | |
| UNITED STATES — 96.7% | | | | | | | | |
| Communication Services — 17.8% | | | | | | | | |
Activision Blizzard | | | 143 | | | | 11,181 | |
Alphabet, Cl A * | | | 37 | | | | 109,554 | |
Alphabet, Cl C * | | | 39 | | | | 115,651 | |
Charter Communications, Cl A * | | | 34 | | | | 22,946 | |
Comcast, Cl A | | | 857 | | | | 44,075 | |
Electronic Arts | | | 55 | | | | 7,714 | |
Fox, Cl A | | | 66 | | | | 2,623 | |
Fox, Cl B | | | 44 | | | | 1,626 | |
Match Group * | | | 52 | | | | 7,841 | |
Meta Platforms, Cl A * | | | 293 | | | | 94,806 | |
Netflix * | | | 83 | | | | 57,296 | |
Sirius XM Holdings | | | 770 | | | | 4,689 | |
T-Mobile US * | | | 231 | | | | 26,572 | |
| | | | | | | | 506,574 | |
| | | | | | | | | |
| Consumer Discretionary — 16.8% | | | | | | | | |
Amazon.com * | | | 62 | | | | 209,091 | |
Booking Holdings * | | | 8 | | | | 19,366 | |
Dollar Tree * | | | 44 | | | | 4,742 | |
eBay | | | 121 | | | | 9,283 | |
Lululemon Athletica * | | | 23 | | | | 10,718 | |
Marriott International, Cl A * | | | 61 | | | | 9,761 | |
O’Reilly Automotive * | | | 13 | | | | 8,090 | |
Peloton Interactive, Cl A * | | | 50 | | | | 4,572 | |
| Schedule of Investments | | October 31, 2021 |
| | Global X NASDAQ 100® Collar 95-110 ETF | |
| | | | | | | |
| COMMON STOCK — continued | | | | | | |
| Consumer Discretionary — continued | | | | | | |
Ross Stores | | | 66 | | | $ | 7,471 | |
Starbucks | | | 220 | | | | 23,336 | |
Tesla * | | | 152 | | | | 169,328 | |
| | | | | | | | 475,758 | |
| | | | | | | | | |
| Consumer Staples — 4.7% | | | | | | | | |
Costco Wholesale | | | 83 | | | | 40,798 | |
Keurig Dr Pepper | | | 264 | | | | 9,528 | |
Kraft Heinz | | | 231 | | | | 8,291 | |
Mondelez International, Cl A | | | 264 | | | | 16,035 | |
Monster Beverage * | | | 99 | | | | 8,415 | |
PepsiCo | | | 259 | | | | 41,854 | |
Walgreens Boots Alliance | | | 165 | | | | 7,758 | |
| | | | | | | | 132,679 | |
| | | | | | | | | |
| Health Care — 6.1% | | | | | | | | |
Align Technology * | | | 15 | | | | 9,365 | |
Amgen | | | 106 | | | | 21,939 | |
Biogen * | | | 28 | | | | 7,467 | |
Cerner | | | 55 | | | | 4,086 | |
Dexcom * | | | 18 | | | | 11,218 | |
Gilead Sciences | | | 234 | | | | 15,182 | |
IDEXX Laboratories * | | | 16 | | | | 10,658 | |
Illumina * | | | 29 | | | | 12,037 | |
Incyte * | | | 44 | | | | 2,947 | |
Intuitive Surgical * | | | 66 | | | | 23,834 | |
Moderna * | | | 75 | | | | 25,891 | |
Regeneron Pharmaceuticals * | | | 20 | | | | 12,799 | |
Seagen * | | | 33 | | | | 5,819 | |
Vertex Pharmaceuticals * | | | 48 | | | | 8,877 | |
| | | | | | | | 172,119 | |
| | | | | | | | | |
| Industrials — 2.7% | | | | | | | | |
Cintas | | | 19 | | | | 8,229 | |
Copart * | | | 44 | | | | 6,832 | |
| Schedule of Investments | | October 31, 2021 |
| | Global X NASDAQ 100® Collar 95-110 ETF | |
| | | | | | | |
| COMMON STOCK — continued | | | | | | |
| Industrials — continued | | | | | | |
CSX | | | 429 | | | $ | 15,517 | |
Fastenal | | | 110 | | | | 6,279 | |
Honeywell International | | | 129 | | | | 28,202 | |
PACCAR | | | 66 | | | | 5,915 | |
Verisk Analytics, Cl A | | | 30 | | | | 6,308 | |
| | | | | | | | 77,282 | |
| | | | | | | | | |
| Information Technology — 47.8% | | | | | | | | |
Adobe * | | | 89 | | | | 57,882 | |
Advanced Micro Devices * | | | 231 | | | | 27,773 | |
Analog Devices | | | 100 | | | | 17,349 | |
ANSYS * | | | 17 | | | | 6,453 | |
Apple | | | 2,034 | | | | 304,693 | |
Applied Materials | | | 169 | | | | 23,094 | |
Atlassian, Cl A * | | | 26 | | | | 11,911 | |
Autodesk * | | | 41 | | | | 13,022 | |
Automatic Data Processing | | | 79 | | | | 17,735 | |
Broadcom | | | 77 | | | | 40,939 | |
Cadence Design Systems * | | | 52 | | | | 9,002 | |
CDW | | | 26 | | | | 4,853 | |
Cisco Systems | | | 792 | | | | 44,328 | |
| Cognizant Technology Solutions, Cl A | | | 99 | | | | 7,731 | |
Crowdstrike Holdings, Cl A * | | | 37 | | | | 10,427 | |
DocuSign, Cl A * | | | 36 | | | | 10,018 | |
Fiserv * | | | 121 | | | | 11,917 | |
Intel | | | 759 | | | | 37,191 | |
Intuit | | | 51 | | | | 31,926 | |
KLA | | | 28 | | | | 10,437 | |
Lam Research | | | 27 | | | | 15,216 | |
Marvell Technology | | | 154 | | | | 10,549 | |
Microchip Technology | | | 102 | | | | 7,557 | |
Micron Technology | | | 209 | | | | 14,442 | |
Microsoft | | | 925 | | | | 306,749 | |
NVIDIA | | | 468 | | | | 119,654 | |
| Schedule of Investments | | October 31, 2021 |
| | Global X NASDAQ 100® Collar 95-110 ETF | |
| | | | | | | |
| COMMON STOCK — continued | | | | | | |
| Information Technology — continued | | | | | | |
Okta, Cl A * | | | 27 | | | $ | 6,674 | |
Paychex | | | 66 | | | | 8,136 | |
PayPal Holdings * | | | 220 | | | | 51,170 | |
QUALCOMM | | | 209 | | | | 27,805 | |
Skyworks Solutions | | | 33 | | | | 5,515 | |
Splunk * | | | 33 | | | | 5,439 | |
Synopsys * | | | 28 | | | | 9,329 | |
Texas Instruments | | | 173 | | | | 32,434 | |
VeriSign * | | | 22 | | | | 4,899 | |
Workday, Cl A * | | | 36 | | | | 10,439 | |
Xilinx | | | 44 | | | | 7,920 | |
Zoom Video Communications, Cl A * | | | 44 | | | | 12,085 | |
| | | | | | | | 1,354,693 | |
| | | | | | | | | |
| Utilities — 0.8% | | | | | | | | |
American Electric Power | | | 93 | | | | 7,878 | |
Exelon | | | 187 | | | | 9,947 | |
Xcel Energy | | | 99 | | | | 6,394 | |
| | | | | | | | 24,219 | |
| | | | | | | | | |
TOTAL UNITED STATES | | | | | | | 2,743,324 | |
| TOTAL COMMON STOCK | | | | | | | | |
(Cost $2,731,287) | | | | | | | 2,814,961 | |
| TOTAL INVESTMENTS — 99.2% | | | | | | | | |
(Cost $2,731,287) | | | | | | $ | 2,814,961 | |
| Schedule of Investments | | October 31, 2021 |
| | Global X NASDAQ 100® Collar 95-110 ETF | |
| | | | | | | |
PURCHASED OPTION— 0.8%(1) | | | | | | |
| UNITED STATES— 0.8% | | | | | | |
(Cost $67,630) | | | 8 | | | $ | 22,560 | |
WRITTEN OPTION— (0.2)%(1) | | | | | | | | |
| UNITED STATES— (0.2)% | | | | | | | | |
(Premiums Received ($6,457)) | | | (8 | ) | | $ | (5,160 | ) |
Percentages are based on Net Assets of $2,836,261.
A list of the exchange traded option contracts held by the Fund at October 31, 2021, is as follows:
| Description | | Number of Contracts | | | Cost+ | | | Exercise Price | | Expiration Date | | Value | |
| PURCHASED OPTION — 0.8% | | | | | | | | | | | | | |
| Put Options | | | | | | | | | | | | | |
| NQX* | | | 8 | | | $ | 67,630 | | | $ | 2,950.00 | | 12/17/21 | | $ | 22,560 | |
| | | | | | | | | | | | | | | | | | |
| WRITTEN OPTION — (0.2)% | | | | | | | | | | | | | | | | | |
| Call Options | | | | | | | | | | | | | | | | | |
| NQX* | | | (8 | ) | | $ | (6,457 | ) | | | 3,410.00 | | 12/17/21 | | $ | (5,160 | ) |
ADR — American Depositary Receipt
Cl — Class
NQX — Nasdaq-100 Reduced Value Index
| * | Non-income producing security. |
| + | Notional amount for all purchased options totals $2,536,075. |
| + | Notional amount for all written options totals $(2,536,075). |
| (1) | Refer to table below for details on Options Contracts. |
| (A) | All or a portion of these securities has been segregated as collateral for writtenoptions contracts. The aggregate market value of collateral at October 31, 2021 was$2,814,961. |
| Schedule of Investments | | October 31, 2021 |
| | Global X NASDAQ 100® Collar 95-110 ETF | |
The following is a summary of the level of inputs used as of October 31, 2021, in valuing the Fund’s investments carried at value:
| Investments in Securities | | | | | | | | | | | | |
| Common Stock | | $ | 2,814,961 | | | $ | — | | | $ | — | | | $ | 2,814,961 | |
| Total Investments in Securities | | $ | 2,814,961 | | | $ | — | | | $ | — | | | $ | 2,814,961 | |
| Other Financial Instruments | | | | | | | | | | | | |
| Purchased Option | | $ | 22,560 | | | $ | — | | | $ | — | | | $ | 22,560 | |
| Written Option | | | (5,160 | ) | | | — | | | | — | | | | (5,160 | ) |
| Total Other Financial Instruments | | $ | 17,400 | | | $ | — | | | $ | — | | | $ | 17,400 | |
For the year ended October 31, 2021, there have been no transfers in or out of Level 3.
Amounts designated as “—“ are $0 or have been rounded to $0.
| | Statements of Assets and Liabilities | |
| | October 31, 2021 | |
| | | Global X Social Media ETF | | | Global X Lithium & Battery Tech ETF | | | Global X E-commerce ETF | | | Global X Emerging Markets Internet & E-commerce ETF | |
| Assets: | | | | | | | | | | | | |
| Cost of Investments | | $ | 399,557,484 | | | $ | 3,640,785,981 | | | $ | 211,743,839 | | | $ | 6,018,517 | |
| Cost of Repurchase Agreement | | | 334,499 | | | | 49,400,348 | | | | 1,384,981 | | | | — | |
| Cost of Foreign Currency | | | — | | | | 531,922,323 | | | | — | | | | 2 | |
| Investments, at Value | | $ | 401,485,537 | * | | $ | 5,452,244,212 | * | | $ | 199,164,187 | * | | $ | 4,556,323 | |
| Repurchase Agreement, at Value | | | 334,499 | | | | 49,400,348 | | | | 1,384,981 | | | | — | |
| Cash | | | 314,072 | | | | 75,488,796 | | | | 351,769 | | | | 1,377 | |
| Foreign Currency, at Value | | | — | | | | 531,922,322 | | | | — | | | | 2 | |
| Receivable for Investment Securities Sold | | | 35,270,438 | | | | 547,257,163 | | | | — | | | | — | |
| Receivable for Capital Shares Sold | | | 73,920 | | | | 3,647,049 | | | | — | | | | — | |
| Dividend and Interest Receivable | | | 36,900 | | | | 1,919,559 | | | | 41,067 | | | | 60 | |
| Reclaim Receivable | | | 5,942 | | | | — | | | | — | | | | — | |
| Due from Authorized Participants | | | — | | | | — | | | | — | | | | — | |
| Due from Broker | | | — | | | | 50,974,785 | | | | — | | | | — | |
| Total Assets | | | 437,521,308 | | | | 6,712,854,234 | | | | 200,942,004 | | | | 4,557,762 | |
| Liabilities: | | | | | | | | | | | | | | | | |
| Obligation to Return Securities Lending Collateral | | | 750,043 | | | | 110,759,925 | | | | 3,105,528 | | | | — | |
| Payable for Investment Securities Purchased | | | 34,573,798 | | | | 916,854,113 | | | | — | | | | — | |
| Payable due to Investment Adviser | | | 230,210 | | | | 3,170,801 | | | | 85,284 | | | | 2,558 | |
| Unrealized Depreciation on Spot Contracts | | | 557 | | | | 402,411 | | | | — | | | | — | |
| Payable for Capital Shares Redeemed | | | — | | | | 306,268,249 | | | | — | | | | — | |
| Due to Broker | | | 73,920 | | | | — | | | | — | | | | — | |
| Total Liabilities | | | 35,628,528 | | | | 1,337,455,499 | | | | 3,190,812 | | | | 2,558 | |
| Net Assets | | $ | 401,892,780 | | | $ | 5,375,398,735 | | | $ | 197,751,192 | | | $ | 4,555,204 | |
| Net Assets Consist of: | | | | | | | | | | | | | | | | |
| Paid-in Capital | | $ | 433,140,627 | | | $ | 3,692,545,667 | | | $ | 211,413,855 | | | $ | 6,243,910 | |
| Total Distributable Earnings/(Loss) | | | (31,247,847 | ) | | | 1,682,853,068 | | | | (13,662,663 | ) | | | (1,688,706 | ) |
| Net Assets | | $ | 401,892,780 | | | $ | 5,375,398,735 | | | $ | 197,751,192 | | | $ | 4,555,204 | |
| Outstanding Shares of Beneficial Interest | | | | | | | | | | | | | | | | |
| (unlimited authorization — no par value) | | | 6,560,000 | | | | 59,024,628 | | | | 6,340,002 | | | | 380,000 | |
| Net Asset Value, Offering and Redemption Price Per Share | | $ | 61.26 | | | $ | 91.07 | | | $ | 31.19 | | | $ | 11.99 | |
| *Includes Market Value of Securities on Loan | | $ | 706,718 | | | $ | 105,092,823 | | | $ | 2,959,284 | | | $ | — | |
| | Statements of Assets and Liabilities | |
| | October 31, 2021 | |
| | | Global X SuperDividend® ETF | | | Global X SuperDividend® U.S. ETF | | | Global X MSCI SuperDividend® EAFE ETF | | | Global X MSCI SuperDividend® Emerging Markets ETF | |
| Assets: | | | | | | | | | | | | |
| Cost of Investments | | $ | 953,257,456 | | | $ | 574,631,667 | | | $ | 13,582,420 | | | $ | 65,533,734 | |
| Cost of Repurchase Agreement | | | 16,543,844 | | | | 3,131,165 | | | | — | | | | — | |
| Cost of Foreign Currency | | | 2,940,650 | | | | — | | | | — | | | | 85,681 | |
| Investments, at Value | | $ | 947,993,654 | * | | $ | 671,490,540 | * | | $ | 14,032,087 | | | $ | 62,644,589 | |
| Repurchase Agreement, at Value | | | 16,543,844 | | | | 3,131,165 | | | | — | | | | — | |
| Cash | | | — | | | | 154,940 | | | | — | | | | — | |
| Foreign Currency, at Value | | | 2,907,014 | | | | — | | | | — | | | | 88,983 | |
| Dividend and Interest Receivable | | | 3,196,332 | | | | 2,227,724 | | | | 20,297 | | | | 329,922 | |
| Reclaim Receivable | | | 382,771 | | | | 8,115 | | | | 35,995 | | | | 20,998 | |
| Unrealized Appreciation on Spot Contracts | | | 432 | | | | — | | | | — | | | | — | |
| Receivable for Investment Securities Sold | | | — | | | | — | | | | 453,849 | | | | — | |
| Due from Authorized Participants | | | — | | | | 1,200 | | | | — | | | | — | |
| Due from Broker | | | 24,750 | | | | — | | | | — | | | | 73,859 | |
| Total Assets | | | 971,048,797 | | | | 677,013,684 | | | | 14,542,228 | | | | 63,158,351 | |
| Liabilities: | | | | | | | | | | | | | | | | |
| Obligation to Return Securities Lending Collateral | | | 37,096,081 | | | | 7,020,976 | | | | — | | | | — | |
| Payable due to Investment Adviser | | | 475,198 | | | | 255,536 | | | | 6,554 | | | | 35,878 | |
| Payable for Investment Securities Purchased | | | — | | | | — | | | | 65,611 | | | | 38,160 | |
| Payable for Capital Shares Redeemed | | | — | | | | — | | | | — | | | | 55,804 | |
| Accrued Foreign Capital Gains Tax on Appreciated Securities | | | — | | | | — | | | | — | | | | 140,148 | |
| Unrealized Depreciation on Spot Contracts | | | — | | | | — | | | | — | | | | 5 | |
| Cash Overdraft | | | 3,030,375 | | | | — | | | | 412,362 | | | | 192,192 | |
| Due to Broker | | | 15,671 | | | | 2,856 | | | | — | | | | — | |
| Total Liabilities | | | 40,617,325 | | | | 7,279,368 | | | | 484,527 | | | | 462,187 | |
| Net Assets | | $ | 930,431,472 | | | $ | 669,734,316 | | | $ | 14,057,701 | | | $ | 62,696,164 | |
| Net Assets Consist of: | | | | | | | | | | | | | | | | |
| Paid-in Capital | | $ | 1,474,914,574 | | | $ | 764,230,698 | | | $ | 14,971,395 | | | $ | 71,089,604 | |
| Total Distributable Loss | | | (544,483,102 | ) | | | (94,496,382 | ) | | | (913,694 | ) | | | (8,393,440 | ) |
| Net Assets | | $ | 930,431,472 | | | $ | 669,734,316 | | | $ | 14,057,701 | | | $ | 62,696,164 | |
| Outstanding Shares of Beneficial Interest | | | | | | | | | | | | | | | | |
| (unlimited authorization — no par value) | | | 71,530,000 | | | | 33,270,000 | | | | 900,000 | | | | 5,570,000 | |
| Net Asset Value, Offering and Redemption Price Per Share | | $ | 13.01 | | | $ | 20.13 | | | $ | 15.62 | | | $ | 11.26 | |
| *Includes Market Value of Securities on Loan | | $ | 32,747,398 | | | $ | 6,887,281 | | | $ | — | | | $ | — | |
| | Statements of Assets and Liabilities | |
| | October 31, 2021 | |
| | | Global X SuperDividend® REIT ETF | | | Global X NASDAQ 100® Covered Call ETF | | | Global X S&P 500® Covered Call ETF | | | Global X Russell 2000 Covered Call ETF | |
| Assets: | | | | | | | | | | | | |
| Cost of Investments | | $ | 426,234,027 | | | $ | 3,921,536,273 | | | $ | 602,844,830 | | | $ | 536,883,182 | |
| Cost of Repurchase Agreement | | | 1,344,045 | | | | — | | | | — | | | | — | |
| Cost of Foreign Currency | | | 5,165 | | | | — | | | | — | | | | — | |
| Investments, at Value | | $ | 467,502,730 | * | | $ | 5,288,944,790 | | | $ | 691,979,063 | | | $ | 563,461,039 | |
| Repurchase Agreement, at Value | | | 1,344,045 | | | | — | | | | — | | | | — | |
| Cash | | | 730,052 | | | | 8,344,388 | | | | 856,848 | | | | 1,217,912 | |
| Foreign Currency, at Value | | | 5,176 | | | | — | | | | — | | | | — | |
| Receivable for Investment Securities Sold | | | 6,837,763 | | | | — | | | | — | | | | — | |
| Dividend and Interest Receivable | | | 1,780,002 | | | | 629,459 | | | | 486,511 | | | | — | |
| Reclaim Receivable | | | 3,723 | | | | — | | | | 2,490 | | | | — | |
| Unrealized Appreciation on Spot Contracts | | | 2,503 | | | | — | | | | — | | | | — | |
| Receivable for Capital Shares Sold | | | — | | | | 4,563,384 | | | | — | | | | — | |
| Due from Authorized Participants | | | — | | | | — | | | | — | | | | — | |
| Due from Broker | | | 5,750 | | | | — | | | | — | | | | — | |
| Total Assets | | | 478,211,744 | | | | 5,302,482,021 | | | | 693,324,912 | | | | 564,678,951 | |
| Liabilities: | | | | | | | | | | | | | | | | |
| Obligation to Return Securities Lending Collateral | | | 3,013,738 | | | | — | | | | — | | | | — | |
| Payable for Investment Securities Purchased | | | 7,031,969 | | | | 4,768,728 | | | | — | | | | 367,064 | |
| Payable due to Investment Adviser | | | 231,769 | | | | 2,458,146 | | | | 316,714 | | | | 213,087 | |
| Options written at value (Premiums received ($–), ($89,664,262), ($9,674,024) and ($10,800,917) respectively) | | | — | | | | 259,040,400 | | | | 23,153,330 | | | | 9,653,000 | |
| Total Liabilities | | | 10,277,476 | | | | 266,267,274 | | | | 23,470,044 | | | | 10,233,151 | |
| Net Assets | | $ | 467,934,268 | | | $ | 5,036,214,747 | | | $ | 669,854,868 | | | $ | 554,445,800 | |
| Net Assets Consist of: | | | | | | | | | | | | | | | | |
| Paid-in Capital | | $ | 656,814,496 | | | $ | 4,904,918,760 | | | $ | 667,844,682 | | | $ | 544,463,377 | |
| Total Distributable Earnings/(Loss) | | | (188,880,228 | ) | | | 131,295,987 | | | | 2,010,186 | | | | 9,982,423 | |
| Net Assets | | $ | 467,934,268 | | | $ | 5,036,214,747 | | | $ | 669,854,868 | | | $ | 554,445,800 | |
| Outstanding Shares of Beneficial Interest | | | | | | | | | | | | | | | | |
| (unlimited authorization — no par value) | | | 47,640,000 | | | | 220,730,000 | | | | 13,300,000 | | | | 22,020,000 | |
| Net Asset Value, Offering and Redemption Price Per Share | | $ | 9.82 | | | $ | 22.82 | | | $ | 50.37 | | | $ | 25.18 | |
| *Includes Market Value of Securities on Loan | | $ | 2,827,310 | | | $ | — | | | $ | — | | | $ | — | |
| | Statements of Assets and Liabilities | |
| | October 31, 2021 | |
| | | Global X Nasdaq 100® Covered Call & Growth ETF | | | Global X S&P 500® Covered Call & Growth ETF | | | Global X SuperIncome™ Preferred ETF | | | Global X Renewable Energy Producers ETF | |
| Assets: | | | | | | | | | | | | |
| Cost of Investments | | $ | 40,641,115 | | | $ | 33,633,036 | | | $ | 226,899,250 | | | $ | 146,614,263 | |
| Cost of Repurchase Agreement | | | — | | | | — | | | | 33,091 | | | | 1,691,227 | |
| Cost of Foreign Currency | | | — | | | | — | | | | — | | | | 8,535 | |
| Investments, at Value | | $ | 45,705,989 | | | $ | 35,538,814 | | | $ | 234,355,451 | * | | $ | 148,938,009 | * |
| Repurchase Agreement, at Value | | | — | | | | — | | | | 33,091 | | | | 1,691,227 | |
| Cash | | | 118,749 | | | | 71,322 | | | | — | | | | 29,905 | |
| Foreign Currency, at Value | | | — | | | | — | | | | — | | | | 8,694 | |
| Receivable for Capital Shares Sold | | | 330,910 | | | | — | | | | — | | | | — | |
| Dividend and Interest Receivable | | | 5,437 | | | | 26,290 | | | | 787,824 | | | | 118,006 | |
| Unrealized Appreciation on Spot Contracts | | | — | | | | — | | | | — | | | | 25 | |
| Reclaim Receivable | | | — | | | | 138 | | | | — | | | | 64,210 | |
| Due from Authorized Participants | | | — | | | | — | | | | 66,468 | | | | — | |
| Due from Broker | | | — | | | | — | | | | — | | | | 36,249 | |
| Total Assets | | | 46,161,085 | | | | 35,636,564 | | | | 235,242,834 | | | | 150,886,325 | |
| Liabilities: | | | | | | | | | | | | | | | | |
| Obligation to Return Securities Lending Collateral | | | — | | | | — | | | | 74,200 | | | | 3,792,220 | |
| Options written at value (Premiums received ($400,793), ($239,180), ($–) and ($–), respectively) | | | 1,133,280 | | | | 601,178 | | | | — | | | | — | |
| Payable for Investment Securities Purchased | | | 335,272 | | | | — | | | | — | | | | — | |
| Payable due to Investment Adviser | | | 21,163 | | | | 17,262 | | | | 114,829 | | | | 77,888 | |
| Payable for Capital Shares Redeemed | | | — | | | | — | | | | — | | | | 36,249 | |
| Cash Overdraft | | | — | | | | — | | | | 61,032 | | | | — | |
| Due to Broker | | | — | | | | — | | | | 40,049 | | | | 3,674 | |
| Total Liabilities | | | 1,489,715 | | | | 618,440 | | | | 290,110 | | | | 3,910,031 | |
| Net Assets | | $ | 44,671,370 | | | $ | 35,018,124 | | | $ | 234,952,724 | | | $ | 146,976,294 | |
| Net Assets Consist of: | | | | | | | | | | | | | | | | |
| Paid-in Capital | | $ | 41,833,144 | | | $ | 33,715,720 | | | $ | 287,721,893 | | | $ | 149,104,183 | |
| Total Distributable Earnings/(Loss) | | | 2,838,226 | | | | 1,302,404 | | | | (52,769,169 | ) | | | (2,127,889 | ) |
| Net Assets | | $ | 44,671,370 | | | $ | 35,018,124 | | | $ | 234,952,724 | | | $ | 146,976,294 | |
| Outstanding Shares of Beneficial Interest | | | | | | | | | | | | | | | | |
| (unlimited authorization — no par value) | | | 1,350,000 | | | | 1,100,000 | | | | 19,680,000 | | | | 8,740,000 | |
| Net Asset Value, Offering and Redemption Price Per Share | | $ | 33.09 | | | $ | 31.83 | | | $ | 11.94 | | | $ | 16.82 | |
| *Includes Market Value of Securities on Loan | | $ | — | | | $ | — | | | $ | 72,884 | | | $ | 3,623,682 | |
| | Statements of Assets and Liabilities | |
| | October 31, 2021 | |
| | | Global X S&P 500® Catholic Values ETF | | | Global X S&P Catholic Values Developed ex-U.S. ETF | | | Global X Guru® Index ETF | |
| Assets: | | | | | | | | | |
| Cost of Investments | | $ | 414,694,538 | | | $ | 3,551,559 | | | $ | 68,249,704 | |
| Cost of Repurchase Agreement | | | — | | | | — | | | | 434,594 | |
| Investments, at Value | | $ | 592,423,759 | | | $ | 4,252,239 | | | $ | 76,268,398 | * |
| Repurchase Agreement, at Value | | | — | | | | — | | | | 434,594 | |
| Cash | | | 1,260,572 | | | | 5,666 | | | | 158,050 | |
| Dividend and Interest Receivable | | | 439,861 | | | | 7,606 | | | | 17,355 | |
| Reclaim Receivable | | | 2,354 | | | | 1,019 | | | | — | |
| Due from Authorized Participants | | | 3,900 | | | | — | | | | — | |
| Due from Broker | | | — | | | | 6,697 | | | | — | |
| Total Assets | | | 594,130,446 | | | | 4,273,227 | | | | 76,878,397 | |
| Liabilities: | | | | | | | | | | | | |
| Obligation to Return Securities Lending Collateral | | | — | | | | — | | | | 974,486 | |
| Payable due to Investment Adviser | | | 140,915 | | | | 1,198 | | | | 47,876 | |
| Payable for Capital Shares Redeemed | | | — | | | | 6,697 | | | | — | |
| Cash Overdraft | | | — | | | | 1,316 | | | | — | |
| Due to Broker | | | 4,179 | | | | — | | | | — | |
| Total Liabilities | | | 145,094 | | | | 9,211 | | | | 1,022,362 | |
| Net Assets | | $ | 593,985,352 | | | $ | 4,264,016 | | | $ | 75,856,035 | |
| Net Assets Consist of: | | | | | | | | | | | | |
| Paid-in Capital | | $ | 415,924,565 | | | $ | 3,475,846 | | | $ | 74,735,618 | |
| Total Distributable Earnings | | | 178,060,787 | | | | 788,170 | | | | 1,120,417 | |
| Net Assets | | $ | 593,985,352 | | | $ | 4,264,016 | | | $ | 75,856,035 | |
| Outstanding Shares of Beneficial Interest | | | | | | | | | | | | |
| (unlimited authorization — no par value) | | | 10,380,000 | | | | 130,000 | | | | 1,510,000 | |
| Net Asset Value, Offering and Redemption Price Per Share | | $ | 57.22 | | | $ | 32.80 | | | $ | 50.24 | |
| *Includes Market Value of Securities on Loan | | $ | — | | | $ | — | | | $ | 979,084 | |
| | Statements of Assets and Liabilities | |
| | October 31, 2021 | |
| | | Global X S&P 500® Tail Risk ETF | | | Global X S&P 500® Risk Managed Income ETF | | | Global X S&P 500® Collar 95-110 ETF | |
| Assets: | | | | | | | | | |
| Cost of Investments | | $ | 3,469,379 | | | $ | 5,893,983 | | | $ | 3,185,472 | |
| Investments, at Value | | $ | 3,579,898 | | | $ | 6,083,591 | | | $ | 3,280,703 | |
| Cash | | | 12,839 | | | | 11,969 | | | | 10,508 | |
| Options Purchased at Value (Cost $43,527, $35,039 and $66,297 respectively) | | | 10,819 | | | | 11,286 | | | | 19,206 | |
| Dividend and Interest Receivable | | | 2,159 | | | | 2,909 | | | | 2,032 | |
| Reclaim Receivable | | | 12 | | | | 15 | | | | 11 | |
| Due from Broker | | | — | | | | 360 | | | | — | |
| Total Assets | | | 3,605,727 | | | | 6,110,130 | | | | 3,312,460 | |
| Liabilities: | | | | | | | | | | | | |
| Payable for Capital Shares Redeemed | | | — | | | | 360 | | | | — | |
| Payable due to Investment Adviser | | | 1,604 | | | | 2,060 | | | | 1,523 | |
| Options written at value (Premiums received ($–), ($90,624) and ($2,774) respectively) | | | — | | | | 206,118 | | | | 2,521 | |
| Total Liabilities | | | 1,604 | | | | 208,538 | | | | 4,044 | |
| Net Assets | | $ | 3,604,123 | | | $ | 5,901,592 | | | $ | 3,308,416 | |
| Net Assets Consist of: | | | | | | | | | | | | |
| Paid-in Capital | | $ | 3,526,120 | | | $ | 5,865,129 | | | $ | 3,257,141 | |
| Total Distributable Earnings | | | 78,003 | | | | 36,463 | | | | 51,275 | |
| Net Assets | | $ | 3,604,123 | | | $ | 5,901,592 | | | $ | 3,308,416 | |
| Outstanding Shares of Beneficial Interest | | | | | | | | | | | | |
| (unlimited authorization — no par value) | | | 130,000 | | | | 220,000 | | | | 120,000 | |
| Net Asset Value, Offering and Redemption Price Per Share | | $ | 27.72 | | | $ | 26.83 | | | $ | 27.57 | |
| | Statements of Assets and Liabilities | |
| | October 31, 2021 | |
| | | Global X NASDAQ 100® Tail Risk ETF | | | Global X NASDAQ 100® Risk Managed Income ETF | | | Global X NASDAQ 100® Collar 95-110 ETF | |
| Assets: | | | | | | | | | |
| Cost of Investments | | $ | 3,208,011 | | | $ | 4,396,734 | | | $ | 2,731,287 | |
| Investments, at Value | | $ | 3,311,612 | | | $ | 4,565,989 | | | $ | 2,814,961 | |
| Cash | | | 1,440 | | | | 9,908 | | | | 4,963 | |
| Options Purchased at Value (Cost $52,310, $31,242 and $67,630) | | | 14,450 | | | | 6,160 | | | | 22,560 | |
| Dividend and Interest Receivable | | | 398 | | | | 551 | | | | 339 | |
| Total Assets | | | 3,327,900 | | | | 4,582,608 | | | | 2,842,823 | |
| Liabilities: | | | | | | | | | | | | |
| Payable due to Investment Adviser | | | 1,634 | | | | 2,048 | | | | 1,402 | |
| Options written at value (Premiums received ($–), ($88,602) and ($6,457) respectively) | | | — | | | | 239,120 | | | | 5,160 | |
| Total Liabilities | | | 1,634 | | | | 241,168 | | | | 6,562 | |
| Net Assets | | $ | 3,326,266 | | | $ | 4,341,440 | | | $ | 2,836,261 | |
| Net Assets Consist of: | | | | | | | | | | | | |
| Paid-in Capital | | $ | 3,262,936 | | | $ | 4,347,830 | | | $ | 2,782,080 | |
| Total Distributable Earnings/(Loss) | | | 63,330 | | | | (6,390 | ) | | | 54,181 | |
| Net Assets | | $ | 3,326,266 | | | $ | 4,341,440 | | | $ | 2,836,261 | |
| Outstanding Shares of Beneficial Interest | | | | | | | | | | | | |
| (unlimited authorization — no par value) | | | 130,000 | | | | 180,000 | | | | 110,000 | |
| Net Asset Value, Offering and Redemption Price Per Share | | $ | 25.59 | | | $ | 24.12 | | | $ | 25.78 | |
| | Statements of Operations | |
| | For the year ended October 31, 2021 | |
| | | Global X Social Media ETF | | | Global X Lithium & Battery Tech ETF | | | | | | Global X Emerging Markets Internet & E-commerce ETF(1) | |
| Investment Income: | | | | | | | | | | | | |
| Dividend Income | | $ | 625,805 | | | $ | 26,605,596 | | | $ | 746,049 | | | $ | 9,912 | |
| Interest Income | | | 141 | | | | 335 | | | | — | | | | — | |
| Security Lending Income | | | 118,295 | | | | 5,768,984 | | | | 16,283 | | | | — | |
| Less: Foreign Taxes Withheld | | | (31,850 | ) | | | (2,644,159 | ) | | | (2,154 | ) | | | (668 | ) |
| Total Investment Income | | | 712,391 | | | | 29,730,756 | | | | 760,178 | | | | 9,244 | |
Supervision and Administration Fees(2) | | | 2,615,063 | | | | 24,325,097 | | | | 980,423 | | | | 36,760 | |
Custodian Fees(3) | | | 8,934 | | | | 14,840 | | | | 392 | | | | 95 | |
| Total Expenses | | | 2,623,997 | | | | 24,339,937 | | | | 980,815 | | | | 36,855 | |
| Net Investment Income (Loss) | | | (1,911,606 | ) | | | 5,390,819 | | | | (220,637 | ) | | | (27,611 | ) |
| Net Realized Gain (Loss) on: | | | | | | | | | | | | | | | | |
Investments(4) | | | 103,854,926 | | | | 275,354,197 | | | | 20,992,031 | | | | (321,846 | ) |
| Foreign Currency Transactions | | | 98,016 | | | | (864,636 | ) | | | 2,548 | | | | (1,639 | ) |
| Net Realized Gain (Loss) on Investments and Foreign Currency Transactions | | | 103,952,942 | | | | 274,489,561 | | | | 20,994,579 | | | | (323,485 | ) |
| Net Change in Unrealized Appreciation (Depreciation) on: | | | | | | | | | | | | | | | | |
| Investments | | | (71,436,724 | ) | | | 1,628,865,310 | | | | (15,365,762 | ) | | | (1,462,194 | ) |
| Foreign Currency Translations | | | (1,937 | ) | | | (488,207 | ) | | | — | | | | (3 | ) |
| Net Change in Unrealized Appreciation (Depreciation) on Investments and Foreign Currency Translations | | | (71,438,661 | ) | | | 1,628,377,103 | | | | (15,365,762 | ) | | | (1,462,197 | ) |
| Net Realized and Unrealized Gain (Loss) on Investments and Foreign Currency Transactions and Translations | | | 32,514,281 | | | | 1,902,866,664 | | | | 5,628,817 | | | | (1,785,682 | ) |
| Net Increase (Decrease) in Net Assets Resulting from Operations | | $ | 30,602,675 | | | $ | 1,908,257,483 | | | $ | 5,408,180 | | | $ | (1,813,293 | ) |
| (1) | The Fund commenced operations on November 9, 2020. |
| (2) | The Supervision and Administration fees reflect the supervisory and administrative fee, which includes fees paid by the Funds for the investment advisory services provided by the Adviser. (See Note 3 in Notes to Financial Statements.) |
| (3) | See Note 2 in the Notes to Financial Statements. |
| (4) | Includes realized gains (losses) as a result of in-kind redemptions. (See Note 4 in Notes to Financial Statements.) |
| | Statements of Operations | |
| | For the year ended October 31, 2021 | |
| | | Global X SuperDividend® ETF | | | Global X SuperDividend® U.S. ETF | | | Global X MSCI SuperDividend® EAFE ETF | | | Global X MSCI SuperDividend® Emerging Markets ETF | |
| Investment Income: | | | | | | | | | | | | |
| Dividend Income | | $ | 68,213,279 | | | $ | 22,330,972 | | | $ | 726,778 | | | $ | 4,782,586 | |
| Interest Income | | | — | | | | 41 | | | | — | | | | 98 | |
| Security Lending Income | | | 1,175,244 | | | | 1,444,245 | | | | — | | | | — | |
| Less: Foreign Taxes Withheld | | | (2,612,588 | ) | | | — | | | | (60,711 | ) | | | (566,271 | ) |
| Total Investment Income | | | 66,775,935 | | | | 23,775,258 | | | | 666,067 | | | | 4,216,413 | |
Supervision and Administration Fees(1) | | | 5,113,691 | | | | 2,767,013 | | | | 64,424 | | | | 294,228 | |
Custodian Fees(2) | | | 126,704 | | | | 6,586 | | | | 1,480 | | | | 31,555 | |
| Total Expenses | | | 5,240,395 | | | | 2,773,599 | | | | 65,904 | | | | 325,783 | |
| Net Investment Income | | | 61,535,540 | | | | 21,001,659 | | | | 600,163 | | | | 3,890,630 | |
| Net Realized Gain (Loss) on: | | | | | | | | | | | | | | | | |
Investments(3) | | | 74,245,885 | | | | 53,431,904 | | | | 1,275,617 | | | | 1,584,879 | |
| Foreign Currency Transactions | | | (264,007 | ) | | | — | | | | (11,246 | ) | | | (37,853 | ) |
| Net Realized Gain on Investments and Foreign Currency Transactions | | | 73,981,878 | | | | 53,431,904 | | | | 1,264,371 | | | | 1,547,026 | |
| Net Change in Unrealized Appreciation (Depreciation) on: | | | | | | | | | | | | | | | | |
| Investments | | | 61,546,296 | | | | 114,820,912 | | | | 1,339,288 | | | | (1,607,647 | ) |
| Foreign Capital Gains Tax on Appreciated Securities | | | — | | | | — | | | | — | | | | (131,033 | ) |
| Foreign Currency Translations | | | (22,863 | ) | | | — | | | | (1,166 | ) | | | 1,740 | |
| Net Change in Unrealized Appreciation (Depreciation) on Investments and Foreign Currency Translations | | | 61,523,433 | | | | 114,820,912 | | | | 1,338,122 | | | | (1,736,940 | ) |
| Net Realized and Unrealized Gain (Loss) on Investments and Foreign Currency Transactions and Translations | | | 135,505,311 | | | | 168,252,816 | | | | 2,602,493 | | | | (189,914 | ) |
| Net Increase in Net Assets Resulting from Operations | | $ | 197,040,851 | | | $ | 189,254,475 | | | $ | 3,202,656 | | | $ | 3,700,716 | |
| (1) | The Supervision and Administration fees reflect the supervisory and administrative fee, which includes fees paid by the Funds for the investment advisory services provided by the Adviser. (See Note 3 in Notes to Financial Statements.) |
| (2) | See Note 2 in the Notes to Financial Statements. |
| (3) | Includes realized gains (losses) as a result of in-kind redemptions. (See Note 4 in Notes to Financial Statements.) |
| | Statements of Operations | |
| | For the year ended October 31, 2021 | |
| | | Global X SuperDividend® REIT ETF | | | Global X NASDAQ 100® Covered Call ETF | | | Global X S&P 500® Covered Call ETF | | | Global X Russell 2000 Covered Call ETF | |
| Investment Income: | | | | | | | | | | | | |
| Dividend Income | | $ | 20,019,962 | | | $ | 19,987,493 | | | $ | 3,966,866 | | | $ | 1,813,099 | |
| Interest Income | | | 6 | | | | — | | | | 30 | | | | — | |
| Security Lending Income | | | 1,350,834 | | | | — | | | | — | | | | — | |
| Less: Foreign Taxes Withheld | | | (733,031 | ) | | | (25,123 | ) | | | (2,633 | ) | | | — | |
| Total Investment Income | | | 20,637,771 | | | | 19,962,370 | | | | 3,964,263 | | | | 1,813,099 | |
Supervision and Administration Fees(1) | | | 2,618,112 | | | | 16,896,510 | | | | 1,701,201 | | | | 1,053,988 | |
Custodian Fees(2) | | | 20,111 | | | | 52,589 | | | | 4,310 | | | | 3,114 | |
| Broker Fees | | | — | | | | 72 | | | | 16 | | | | — | |
| Total Expenses | | | 2,638,223 | | | | 16,949,171 | | | | 1,705,527 | | | | 1,057,102 | |
| Waiver of Supervision and Administration Fees | | | – | | | | (40 | ) | | | (16 | ) | | | (175,662 | ) |
| Net Expenses | | | 2,638,223 | | | | 16,949,131 | | | | 1,705,511 | | | | 881,440 | |
| Net Investment Income | | | 17,999,548 | | | | 3,013,239 | | | | 2,258,752 | | | | 931,659 | |
| Net Realized Gain (Loss) on: | | | | | | | | | | | | | | | | |
Investments(3) | | | (7,113,244 | ) | | | 11,144,344 | | | | 540,532 | | | | (667,467 | ) |
| Written Options | | | — | | | | (241,508,818 | ) | | | (3,868,953 | ) | | | 6,583,260 | |
| Foreign Currency Transactions | | | (124,234 | ) | | | — | | | | — | | | | — | |
| Net Realized Gain (Loss) on Investments, Written Options and Foreign Currency Transactions | | | (7,237,478 | ) | | | (230,364,474 | ) | | | (3,328,421 | ) | | | 5,915,793 | |
| Net Change in Unrealized Appreciation (Depreciation) on: | | | | | | | | | | | | | | | | |
| Investments | | | 115,847,219 | | | | 948,294,199 | | | | 80,366,528 | | | | 25,917,681 | |
| Written Options | | | — | | | | (212,770,075 | ) | | | (15,077,314 | ) | | | 607,832 | |
| Foreign Currency Translations | | | 8,328 | | | | — | | | | — | | | | — | |
| Net Change in Unrealized Appreciation on Investments, Written Options and Foreign Currency Translations | | | 115,855,547 | | | | 735,524,124 | | | | 65,289,214 | | | | 26,525,513 | |
| Net Realized and Unrealized Gain on Investments, Written Options and Foreign Currency Transactions and Translations | | | 108,618,069 | | | | 505,159,650 | | | | 61,960,793 | | | | 32,441,306 | |
| Net Increase in Net Assets Resulting from Operations | | $ | 126,617,617 | | | $ | 508,172,889 | | | $ | 64,219,545 | | | $ | 33,372,965 | |
| (1) | The Supervision and Administration fees reflect the supervisory and administrative fee, which includes fees paid by the Funds for the investment advisory services provided by the Adviser. (See Note 3 in Notes to Financial Statements.) |
| (2) | See Note 2 in the Notes to Financial Statements. |
| (3) | Includes realized gains (losses) as a result of in-kind redemptions. (See Note 4 in Notes to Financial Statements.) |
| | Statements of Operations | |
| | For the year ended October 31, 2021 | |
| | | Global X Nasdaq 100® Covered Call & Growth ETF | | | Global X S&P 500® Covered Call & Growth ETF | | | Global X SuperIncome™ Preferred ETF | | | Global X Renewable Energy Producers ETF | |
| Investment Income: | | | | | | | | | | | | |
| Dividend Income | | $ | 106,686 | | | $ | 112,955 | | | $ | 12,057,840 | | | $ | 2,625,497 | |
| Interest Income | | | — | | | | — | | | | 60 | | | | 131 | |
| Security Lending Income | | | — | | | | — | | | | 21,720 | | | | 37,051 | |
| Less: Foreign Taxes Withheld | | | (138 | ) | | | (20 | ) | | | — | | | | (288,462 | ) |
| Total Investment Income | | | 106,548 | | | | 112,935 | | | | 12,079,620 | | | | 2,374,217 | |
Supervision and Administration Fees(1) | | | 97,164 | | | | 50,636 | | | | 1,226,468 | | | | 754,490 | |
Custodian Fees(2) | | | 185 | | | | 201 | | | | 1,413 | | | | 2,247 | |
| Broker Fees | | | — | | | | 31 | | | | — | | | | — | |
| Total Expenses | | | 97,349 | | | | 50,868 | | | | 1,227,881 | | | | 756,737 | |
| Net Investment Income | | | 9,199 | | | | 62,067 | | | | 10,851,739 | | | | 1,617,480 | |
| Net Realized Gain (Loss) on: | | | | | | | | | | | | | | | | |
Investments(3) | | | 209,900 | | | | 416,983 | | | | 7,442,457 | | | | 7,155,092 | |
| Written Options | | | (464,366 | ) | | | 136,373 | | | | — | | | | — | |
| Foreign Currency Transactions | | | — | | | | — | | | | — | | | | 2,259 | |
| Net Realized Gain (Loss) on Investments, Written Options and Foreign Currency Transactions | | | (254,466 | ) | | | 553,356 | | | | 7,442,457 | | | | 7,157,351 | |
| Net Change in Unrealized Appreciation (Depreciation) on: | | | | | | | | | | | | | | | | |
| Investments | | | 5,176,460 | | | | 1,966,805 | | | | 7,403,025 | | | | (671,849 | ) |
| Written Options | | | (813,126 | ) | | | (405,123 | ) | | | — | | | | — | |
| Foreign Currency Translations | | | — | | | | — | | | | — | | | | (5,502 | ) |
| Net Change in Unrealized Appreciation (Depreciation) on Investments, Written Options and Foreign Currency Translations | | | 4,363,334 | | | | 1,561,682 | | | | 7,403,025 | | | | (677,351 | ) |
| Net Realized and Unrealized Gain on Investments, Written Options and Foreign Currency Transactions and Translations | | | 4,108,868 | | | | 2,115,038 | | | | 14,845,482 | | | | 6,480,000 | |
| Net Increase in Net Assets Resulting from Operations | | $ | 4,118,067 | | | $ | 2,177,105 | | | $ | 25,697,221 | | | $ | 8,097,480 | |
| (1) | The Supervision and Administration fees reflect the supervisory and administrative fee, which includes fees paid by the Funds for the investment advisory services provided by the Adviser. (See Note 3 in Notes to Financial Statements.) |
| (2) | See Note 2 in the Notes to Financial Statements. |
| (3) | Includes realized gains (losses) as a result of in-kind redemptions. (See Note 4 in Notes to Financial Statements.) |
| | Statements of Operations | |
| | For the year ended October 31, 2021 | |
| | | Global X S&P 500® Catholic Values ETF | | | Global X S&P Catholic Values Developed ex-U.S. ETF | | | | |
| Investment Income: | | | | | | | | | |
| Dividend Income | | $ | 7,139,358 | | | $ | 95,213 | | | $ | 1,548,124 | |
| Interest Income | | | 52 | | | | 4 | | | | 5 | |
| Security Lending Income | | | — | | | | — | | | | 38,430 | |
| Less: Foreign Taxes Withheld | | | (317 | ) | | | (12,029 | ) | | | (2,542 | ) |
| Total Investment Income | | | 7,139,093 | | | | 83,188 | | | | 1,584,017 | |
Supervision and Administration Fees(1) | | | 1,495,289 | | | | 11,318 | | | | 535,587 | |
Custodian Fees(2) | | | 216 | | | | 16 | | | | 642 | |
| Total Expenses | | | 1,495,505 | | | | 11,334 | | | | 536,229 | |
| Net Investment Income | | | 5,643,588 | | | | 71,854 | | | | 1,047,788 | |
| Net Realized Gain (Loss) on: | | | | | | | | | | | | |
Investments(3) | | | 39,989,880 | | | | 59,366 | | | | 16,693,239 | |
| Foreign Currency Transactions | | | — | | | | (107 | ) | | | — | |
| Net Realized Gain on Investments and Foreign Currency Transactions | | | 39,989,880 | | | | 59,259 | | | | 16,693,239 | |
| Net Change in Unrealized Appreciation (Depreciation) on: | | | | | | | | | | | | |
| Investments | | | 128,170,186 | | | | 724,001 | | | | 3,201,689 | |
| Foreign Currency Translations | | | — | | | | (203 | ) | | | — | |
| Net Change in Unrealized Appreciation on Investments and Foreign Currency Translations | | | 128,170,186 | | | | 723,798 | | | | 3,201,689 | |
| Net Realized and Unrealized Gain on Investments and Foreign Currency Transactions and Translations | | | 168,160,066 | | | | 783,057 | | | | 19,894,928 | |
| Net Increase in Net Assets Resulting from Operations | | $ | 173,803,654 | | | $ | 854,911 | | | $ | 20,942,716 | |
| (1) | The Supervision and Administration fees reflect the supervisory and administrative fee, which includes fees paid by the Funds for the investment advisory services provided by the Adviser. (See Note 3 in Notes to Financial Statements.) |
| (2) | See Note 2 in the Notes to Financial Statements. |
| (3) | Includes realized gains (losses) as a result of in-kind redemptions. (See Note 4 in Notes to Financial Statements.) |
| | Statements of Operations | |
| | For the year ended October 31, 2021 | |
| | | Global X S&P 500® Tail Risk ETF(1) | | | Global X S&P 500® Risk Managed Income ETF(1) | | | Global X S&P 500® Collar 95-110 ETF(1) | |
| Investment Income: | | | | | | | | | |
| Dividend Income | | $ | 6,248 | | | $ | 7,021 | | | $ | 6,105 | |
| Less: Foreign Taxes Withheld | | | (1 | ) | | | (2 | ) | | | (2 | ) |
| Total Investment Income | | | 6,247 | | | | 7,019 | | | | 6,103 | |
Supervision and Administration Fees(2) | | | 3,166 | | | | 3,585 | | | | 3,085 | |
Custodian Fees(3) | | | 1 | | | | 27 | | | | 22 | |
| Total Expenses | | | 3,167 | | | | 3,612 | | | | 3,107 | |
| Net Investment Income | | | 3,080 | | | | 3,407 | | | | 2,996 | |
| Net Realized Gain (Loss) on: | | | | | | | | | | | | |
Investments(4) | | | (1,146 | ) | | | (2,952 | ) | | | (1,366 | ) |
| Purchased Options | | | (1,741 | ) | | | 175,045 | | | | 8,491 | |
| Written Options | | | — | | | | (137,757 | ) | | | (7,240 | ) |
| Net Realized Gain (Loss) on Investments, Purchased Options and Written Options | | | (2,887 | ) | | | 34,336 | | | | (115 | ) |
| Net Change in Unrealized Appreciation (Depreciation) on: | | | | | | | | | | | | |
| Investments | | | 110,519 | | | | 189,608 | | | | 95,231 | |
| Purchased Options | | | (32,709 | ) | | | (23,753 | ) | | | (47,091 | ) |
| Written Options | | | — | | | | (115,495 | ) | | | 254 | |
| Net Change in Unrealized Appreciation on Investments, Purchased Options and Written Options | | | 77,810 | | | | 50,360 | | | | 48,394 | |
| Net Realized and Unrealized Gain on Investments, Purchased Options and Written Options | | | 74,923 | | | | 84,696 | | | | 48,279 | |
| Net Increase in Net Assets Resulting from Operations | | $ | 78,003 | | | $ | 88,103 | | | $ | 51,275 | |
| (1) | The Fund commenced operations on August 25, 2021. |
| (2) | The Supervision and Administration fees reflect the supervisory and administrative fee, which includes fees paid by the Funds for the investment advisory services provided by the Adviser. (See Note 3 in Notes to Financial Statements.) |
| (3) | See Note 2 in the Notes to Financial Statements. |
| (4) | Includes realized gains (losses) as a result of in-kind redemptions. (See Note 4 in Notes to Financial Statements.) |
| | Statements of Operations | |
| | For the year ended October 31, 2021 | |
| | | Global X NASDAQ 100® Tail Risk ETF(1) | | | Global X NASDAQ 100® Risk Managed Income ETF(1) | | | Global X NASDAQ 100® Collar 95-110 ETF(1) | |
| Investment Income: | | | | | | | | | |
| Dividend Income | | $ | 2,533 | | | $ | 2,871 | | | $ | 2,428 | |
| Less: Foreign Taxes Withheld | | | (3 | ) | | | (6 | ) | | | (4 | ) |
| Total Investment Income | | | 2,530 | | | | 2,865 | | | | 2,424 | |
Supervision and Administration Fees(2) | | | 3,155 | | | | 3,781 | | | | 2,974 | |
Custodian Fees(3) | | | — | | | | 25 | | | | 10 | |
| Total Expenses | | | 3,155 | | | | 3,806 | | | | 2,984 | |
| Net Investment Loss | | | (625 | ) | | | (941 | ) | | | (560 | ) |
| Net Realized Gain (Loss) on: | | | | | | | | | | | | |
Investments(4) | | | 207 | | | | (2,885 | ) | | | (1,019 | ) |
| Purchased Options | | | (1,993 | ) | | | 144,367 | | | | 42,396 | |
| Written Options | | | — | | | | (140,585 | ) | | | (26,537 | ) |
| Net Realized Gain (Loss) on Investments, Purchased Options and Written Options | | | (1,786 | ) | | | 897 | | | | 14,840 | |
| Net Change in Unrealized Appreciation (Depreciation) on: | | | | | | | | | | | | |
| Investments | | | 103,601 | | | | 169,255 | | | | 83,674 | |
| Purchased Options | | | (37,860 | ) | | | (25,082 | ) | | | (45,070 | ) |
| Written Options | | | — | | | | (150,519 | ) | | | 1,297 | |
| Net Change in Unrealized Appreciation (Depreciation) on Investments, Purchased Options and Written Options | | | 65,741 | | | | (6,346 | ) | | | 39,901 | |
| Net Realized and Unrealized Gain (Loss) on Investments, Purchased Options and Written Options | | | 63,955 | | | | (5,449 | ) | | | 54,741 | |
| Net Increase (Decrease) in Net Assets Resulting from Operations | | $ | 63,330 | | | $ | (6,390 | ) | | $ | 54,181 | |
| (1) | The Fund commenced operations on August 25, 2021. |
| (2) | The Supervision and Administration fees reflect the supervisory and administrative fee, which includes fees paid by the Funds for the investment advisory services provided by the Adviser. (See Note 3 in Notes to Financial Statements.) |
| (3) | See Note 2 in the Notes to Financial Statements. |
| (4) | Includes realized gains (losses) as a result of in-kind redemptions. (See Note 4 in Notes to Financial Statements.) |
| | Statements of Changes in Net Assets | |
| | | |
| | | Global X Social Media ETF | | | Global X Lithium & Battery Tech ETF | |
| | | Year Ended October 31, 2021 | | | Year Ended October 31, 2020 | | | Year Ended October 31, 2021 | | | Year Ended October 31, 2020 | |
| Operations: | | | | | | | | | | | | |
| Net Investment Income (Loss) | | $ | (1,911,606 | ) | | $ | (419,184 | ) | | $ | 5,390,819 | | | $ | 7,436,786 | |
Net Realized Gain (Loss) on Investments and Foreign Currency Transactions(1) | | | 103,952,942 | | | | 2,388,309 | | | | 274,489,561 | | | | (70,959,626 | ) |
| Net Change in Unrealized Appreciation (Depreciation) on Investments and Foreign Currency Translations | | | (71,438,661 | ) | | | 72,141,710 | | | | 1,628,377,103 | | | | 380,703,549 | |
| Net Increase in Net Assets Resulting from Operations | | | 30,602,675 | | | | 74,110,835 | | | | 1,908,257,483 | | | | 317,180,709 | |
| Distributions | | | — | | | | — | | | | (4,617,167 | ) | | | (7,964,116 | ) |
| Capital Share Transactions: | | | | | | | | | | | | | | | | |
| Issued | | | 312,935,286 | | | | 42,396,781 | | | | 3,085,540,584 | | | | 192,232,822 | |
| Redeemed | | | (167,644,538 | ) | | | (11,797,388 | ) | | | (482,676,020 | ) | | | (87,679,225 | ) |
| Increase in Net Assets from Capital Share Transactions | | | 145,290,748 | | | | 30,599,393 | | | | 2,602,864,564 | | | | 104,553,597 | |
| Total Increase in Net Assets | | | 175,893,423 | | | | 104,710,228 | | | | 4,506,504,880 | | | | 413,770,190 | |
| Net Assets: | | | | | | | | | | | | | | | | |
| Beginning of Year | | | 225,999,357 | | | | 121,289,129 | | | | 868,893,855 | | | | 455,123,665 | |
| End of Year | | $ | 401,892,780 | | | $ | 225,999,357 | | | $ | 5,375,398,735 | | | $ | 868,893,855 | |
| Share Transactions: | | | | | | | | | | | | | | | | |
| Issued | | | 4,480,000 | | | | 900,000 | | | | 45,050,000 | | | | 5,500,000 | |
| Redeemed | | | (2,270,000 | ) | | | (350,000 | ) | | | (6,300,000 | ) | | | (3,400,000 | ) |
| Net Increase in Shares Outstanding from Share Transactions | | | 2,210,000 | | | | 550,000 | | | | 38,750,000 | | | | 2,100,000 | |
| (1) | Includes realized gains (losses) as a result of in-kind redemptions. (See Note 4 in Notes to Financial Statements.) |
| | Statements of Changes in Net Assets | |
| | | |
| | | | | | Global X Emerging Markets Internet & E-commerce ETF | |
| | | Year Ended October 31, 2021 | | | Year Ended October 31, 2020 | | | Period Ended October 31, 2021(1) | |
| Operations: | | | | | | | | | |
| Net Investment Income (Loss) | | $ | (220,637 | ) | | $ | 236,091 | | | $ | (27,611 | ) |
Net Realized Gain (Loss) on Investments and Foreign Currency Transactions(2) | | | 20,994,579 | | | | 5,004,215 | | | | (323,485 | ) |
| Net Change in Unrealized Appreciation (Depreciation) on Investments and Foreign Currency Translations | | | (15,365,762 | ) | | | 2,848,383 | | | | (1,462,197 | ) |
| Net Increase (Decrease) in Net Assets Resulting from Operations | | | 5,408,180 | | | | 8,088,689 | | | | (1,813,293 | ) |
| Distributions | | | (1,105,636 | ) | | | (11,908 | ) | | | — | |
| Capital Share Transactions: | | | | | | | | | | | | |
| Issued | | | 157,633,184 | | | | 92,365,190 | | | | 7,267,793 | |
| Redeemed | | | (55,267,404 | ) | | | (12,875,911 | ) | | | (899,296 | ) |
| Increase in Net Assets from Capital Share Transactions | | | 102,365,780 | | | | 79,489,279 | | | | 6,368,497 | |
| Total Increase in Net Assets | | | 106,668,324 | | | | 87,566,060 | | | | 4,555,204 | |
| Net Assets: | | | | | | | | | | | | |
| Beginning of Year/ Period | | | 91,082,868 | | | | 3,516,808 | | | | — | |
| End of Year/ Period | | $ | 197,751,192 | | | $ | 91,082,868 | | | $ | 4,555,204 | |
| Share Transactions: | | | | | | | | | | | | |
| Issued | | | 4,640,000 | | | | 3,700,000 | | | | 450,000 | |
| Redeemed | | | (1,700,000 | ) | | | (500,000 | ) | | | (70,000 | ) |
| Net Increase in Shares Outstanding from Share Transactions | | | 2,940,000 | | | | 3,200,000 | | | | 380,000 | |
| (1) | The Fund commenced operations on November 9, 2020. |
| (2) | Includes realized gains (losses) as a result of in-kind redemptions. (See Note 4 in Notes to Financial Statements.) |
| | Statements of Changes in Net Assets | |
| | | |
| | | Global X SuperDividend® ETF | | | Global X SuperDividend® U.S. ETF | |
| | | Year Ended October 31, 2021 | | | Year Ended October 31, 2020 | | | Year Ended October 31, 2021 | | | Year Ended October 31, 2020 | |
| Operations: | | | | | | | | | | | | |
| Net Investment Income | | $ | 61,535,540 | | | $ | 47,853,557 | | | $ | 21,001,659 | | | $ | 16,034,317 | |
Net Realized Gain (Loss) on Investments and Foreign Currency Transactions(1) | | | 73,981,878 | | | | (332,000,940 | ) | | | 53,431,904 | | | | (164,403,700 | ) |
| Net Change in Unrealized Appreciation (Depreciation) on Investments and Foreign Currency Translations | | | 61,523,433 | | | | (31,232,599 | ) | | | 114,820,912 | | | | (30,409,532 | ) |
| Net Increase (Decrease) in Net Assets Resulting from Operations | | | 197,040,851 | | | | (315,379,982 | ) | | | 189,254,475 | | | | (178,778,915 | ) |
| Distributions | | | (65,648,210 | ) | | | (57,676,007 | ) | | | (31,364,614 | ) | | | (28,896,892 | ) |
| Return of Capital | | | — | | | | (6,836,903 | ) | | | (3,660,741 | ) | | | (9,790,983 | ) |
| Capital Share Transactions: | | | | | | | | | | | | | | | | |
| Issued | | | 177,439,475 | | | | 103,937,093 | | | | 143,549,897 | | | | 126,598,315 | |
| Redeemed | | | (5,271,538 | ) | | | (29,283,816 | ) | | | (40,154,269 | ) | | | (41,906,406 | ) |
| Increase in Net Assets from Capital Share Transactions | | | 172,167,937 | | | | 74,653,277 | | | | 103,395,628 | | | | 84,691,909 | |
| Total Increase (Decrease) in Net Assets | | | 303,560,578 | | | | (305,239,615 | ) | | | 257,624,748 | | | | (132,774,881 | ) |
| Net Assets: | | | | | | | | | | | | | | | | |
| Beginning of Year | | | 626,870,894 | | | | 932,110,509 | | | | 412,109,568 | | | | 544,884,449 | |
| End of Year | | $ | 930,431,472 | | | $ | 626,870,894 | | | $ | 669,734,316 | | | $ | 412,109,568 | |
| Share Transactions: | | | | | | | | | | | | | | | | |
| Issued | | | 12,830,000 | | | | 7,900,000 | | | | 7,860,000 | | | | 6,850,000 | |
| Redeemed | | | (400,000 | ) | | | (2,850,000 | ) | | | (2,090,000 | ) | | | (2,700,000 | ) |
| Net Increase in Shares Outstanding from Share Transactions | | | 12,430,000 | | | | 5,050,000 | | | | 5,770,000 | | | | 4,150,000 | |
| (1) | Includes realized gains (losses) as a result of in-kind redemptions. (See Note 4 in Notes to Financial Statements.) |
| | Statements of Changes in Net Assets | |
| | | |
| | | Global X MSCI SuperDividend® EAFE ETF | | | Global X MSCI SuperDividend® Emerging Markets ETF | |
| | | Year Ended October 31, 2021 | | | Year Ended October 31, 2020 | | | Year Ended October 31, 2021 | | | Year Ended October 31, 2020 | |
| Operations: | | | | | | | | | | | | |
| Net Investment Income | | $ | 600,163 | | | $ | 420,436 | | | $ | 3,890,630 | | | $ | 937,936 | |
Net Realized Gain (Loss) on Investments and Foreign Currency Transactions(1) | | | 1,264,371 | | | | (2,850,672 | ) | | | 1,547,026 | | | | (4,240,074 | ) |
| Net Change in Unrealized Appreciation (Depreciation) on Investments and Foreign Currency Translations | | | 1,338,122 | | | | (1,397,681 | ) | | | (1,736,940 | ) | | | (1,273,762 | ) |
| Net Increase (Decrease) in Net Assets Resulting from Operations | | | 3,202,656 | | | | (3,827,917 | ) | | | 3,700,716 | | | | (4,575,900 | ) |
| Distributions | | | (542,165 | ) | | | (454,057 | ) | | | (2,831,439 | ) | | | (1,074,084 | ) |
| Return of Capital | | | — | | | | (119,148 | ) | | | — | | | | (222,316 | ) |
| Capital Share Transactions: | | | | | | | | | | | | | | | | |
| Issued | | | 4,890,027 | | | | 1,244,166 | | | | 41,819,662 | | | | 8,390,747 | |
| Redeemed | | | (928,933 | ) | | | (7,934,045 | ) | | | — | | | | — | |
| Increase (Decrease) in Net Assets from Capital Share Transactions | | | 3,961,094 | | | | (6,689,879 | ) | | | 41,819,662 | | | | 8,390,747 | |
| Total Increase (Decrease) in Net Assets | | | 6,621,585 | | | | (11,091,001 | ) | | | 42,688,939 | | | | 2,518,447 | |
| Net Assets: | | | | | | | | | | | | | | | | |
| Beginning of Year | | | 7,436,116 | | | | 18,527,117 | | | | 20,007,225 | | | | 17,488,778 | |
| End of Year | | $ | 14,057,701 | | | $ | 7,436,116 | | | $ | 62,696,164 | | | $ | 20,007,225 | |
| Share Transactions: | | | | | | | | | | | | | | | | |
| Issued | | | 310,000 | | | | 100,000 | | | | 3,470,000 | | | | 750,000 | |
| Redeemed | | | (60,000 | ) | | | (600,000 | ) | | | — | | | | — | |
| Net Increase (Decrease) in Shares Outstanding from Share Transactions | | | 250,000 | | | | (500,000 | ) | | | 3,470,000 | | | | 750,000 | |
| (1) | Includes realized gains (losses) as a result of in-kind redemptions. (See Note 4 in Notes to Financial Statements.) |
| | Statements of Changes in Net Assets | |
| | | |
| | | Global X SuperDividend® REIT ETF | | | Global X NASDAQ 100® Covered Call ETF | |
| | | Year Ended October 31, 2021 | | | Year Ended October 31, 2020 | | | Year Ended October 31, 2021 | | | Year Ended October 31, 2020 | |
| Operations: | | | | | | | | | | | | |
| Net Investment Income | | $ | 17,999,548 | | | $ | 20,875,910 | | | $ | 3,013,239 | | | $ | 2,834,579 | |
Net Realized Loss on Investments, Written Options and Foreign Currency Transactions(1) | | | (7,237,478 | ) | | | (189,607,476 | ) | | | (230,364,474 | ) | | | (362,054,221 | ) |
| Net Change in Unrealized Appreciation (Depreciation) on Investments, Written Options and Foreign Currency Translations | | | 115,855,547 | | | | (86,948,832 | ) | | | 735,524,124 | | | | 350,742,699 | |
| Net Increase (Decrease) in Net Assets Resulting from Operations | | | 126,617,617 | | | | (255,680,398 | ) | | | 508,172,889 | | | | (8,476,943 | ) |
| Distributions | | | (19,492,525 | ) | | | (30,276,922 | ) | | | (320,053,733 | ) | | | (2,834,579 | ) |
| Return of Capital | | | (9,729,725 | ) | | | (2,127,168 | ) | | | — | | | | (117,268,361 | ) |
| Capital Share Transactions: | | | | | | | | | | | | | | | | |
| Issued | | | 112,985,429 | | | | 353,909,646 | | | | 3,548,421,512 | | | | 751,004,959 | |
| Redeemed | | | (54,071,703 | ) | | | (118,989,550 | ) | | | (25,968,248 | ) | | | (64,819,105 | ) |
| Increase in Net Assets from Capital Share Transactions | | | 58,913,726 | | | | 234,920,096 | | | | 3,522,453,264 | | | | 686,185,854 | |
| Total Increase (Decrease) in Net Assets | | | 156,309,093 | | | | (53,164,392 | ) | | | 3,710,572,420 | | | | 557,605,971 | |
| Net Assets: | | | | | | | | | | | | | | | | |
| Beginning of Year | | | 311,625,175 | | | | 364,789,567 | | | | 1,325,642,327 | | | | 768,036,356 | |
| End of Year | | $ | 467,934,268 | | | $ | 311,625,175 | | | $ | 5,036,214,747 | | | $ | 1,325,642,327 | |
| Share Transactions: | | | | | | | | | | | | | | | | |
| Issued | | | 11,980,000 | | | | 27,700,000 | | | | 157,690,000 | | | | 34,200,000 | |
| Redeemed | | | (5,540,000 | ) | | | (10,300,000 | ) | | | (1,160,000 | ) | | | (3,250,000 | ) |
| Net Increase in Shares Outstanding from Share Transactions | | | 6,440,000 | | | | 17,400,000 | | | | 156,530,000 | | | | 30,950,000 | |
| (1) | Includes realized gains (losses) as a result of in-kind redemptions. (See Note 4 in Notes to Financial Statements.) |
| | Statements of Changes in Net Assets | |
| | | |
| | | Global X S&P 500® Covered Call ETF | | | Global X Russell 2000 Covered Call ETF | |
| | | Year Ended October 31, 2021 | | | Year Ended October 31, 2020 | | | Year Ended October 31, 2021 | | | Year Ended October 31, 2020 | |
| Operations: | | | | | | | | | | | | |
| Net Investment Income | | $ | 2,258,752 | | | $ | 1,494,418 | | | $ | 931,659 | | | $ | 82,683 | |
Net Realized Gain (Loss) on Investments and Written Options(1) | | | (3,328,421 | ) | | | (8,346,049 | ) | | | 5,915,793 | | | | (2,140,737 | ) |
| Net Change in Unrealized Appreciation (Depreciation) on Investments and Written Options | | | 65,289,214 | | | | (7,125,377 | ) | | | 26,525,513 | | | | 1,139,858 | |
| Net Increase (Decrease) in Net Assets Resulting from Operations | | | 64,219,545 | | | | (13,977,008 | ) | | | 33,372,965 | | | | (918,196 | ) |
| Distributions | | | (26,627,258 | ) | | | (1,539,799 | ) | | | (21,788,088 | ) | | | (157,338 | ) |
| Return of Capital | | | — | | | | (7,321,411 | ) | | | — | | | | (1,449,526 | ) |
| Capital Share Transactions: | | | | | | | | | | | | | | | | |
| Issued | | | 535,288,406 | | | | 59,320,432 | | | | 521,879,514 | | | | 16,222,704 | |
| Redeemed | | | (7,017,545 | ) | | | (65,843,588 | ) | | | (493,345 | ) | | | (1,056,273 | ) |
| Increase (Decrease) in Net Assets from Capital Share Transactions | | | 528,270,861 | | | | (6,523,156 | ) | | | 521,386,169 | | | | 15,166,431 | |
| Total Increase (Decrease) in Net Assets | | | 565,863,148 | | | | (29,361,374 | ) | | | 532,971,046 | | | | 12,641,371 | |
| Net Assets: | | | | | | | | | | | | | | | | |
| Beginning of Year | | | 103,991,720 | | | | 133,353,094 | | | | 21,474,754 | | | | 8,833,383 | |
| End of Year | | $ | 669,854,868 | | | $ | 103,991,720 | | | $ | 554,445,800 | | | $ | 21,474,754 | |
| Share Transactions: | | | | | | | | | | | | | | | | |
| Issued | | | 11,000,000 | | | | 1,250,000 | | | | 20,990,000 | | | | 750,000 | |
| Redeemed | | | (150,000 | ) | | | (1,500,000 | ) | | | (20,000 | ) | | | (50,000 | ) |
| Net Increase (Decrease) in Shares Outstanding from Share Transactions | | | 10,850,000 | | | | (250,000 | ) | | | 20,970,000 | | | | 700,000 | |
| (1) | Includes realized gains (losses) as a result of in-kind redemptions. (See Note 4 in Notes to Financial Statements.) |
| | Statements of Changes in Net Assets | |
| | | |
| | | Global X Nasdaq 100® Covered Call & Growth ETF | | | Global X S&P 500® Covered Call & Growth ETF | |
| | | Year Ended October 31, 2021 | | | Period Ended October 31, 2020(1) | | | Year Ended October 31, 2021 | | | Period Ended October 31, 2020(1) | |
| Operations: | | | | | | | | | | | | |
| Net Investment Income (Loss) | | $ | 9,199 | | | $ | (468 | ) | | $ | 62,067 | | | $ | 2,911 | |
Net Realized Gain (Loss) on Investments and Written Options(2) | | | (254,466 | ) | | | (83,188 | ) | | | 553,356 | | | | (52,329 | ) |
| Net Change in Unrealized Appreciation (Depreciation) on Investments and Written Options | | | 4,363,334 | | | | (30,947 | ) | | | 1,561,682 | | | | (17,901 | ) |
| Net Increase (Decrease) in Net Assets Resulting from Operations | | | 4,118,067 | | | | (114,603 | ) | | | 2,177,105 | | | | (67,319 | ) |
| Distributions | | | (919,727 | ) | | | — | | | | (376,497 | ) | | | (2,931 | ) |
| Return of Capital | | | — | | | | (20,955 | ) | | | — | | | | (16,682 | ) |
| Capital Share Transactions: | | | | | | | | | | | | | | | | |
| Issued | | | 37,707,138 | | | | 6,703,114 | | | | 33,611,221 | | | | 3,790,823 | |
| Redeemed | | | (2,801,664 | ) | | | — | | | | (4,097,596 | ) | | | — | |
| Increase in Net Assets from Capital Share Transactions | | | 34,905,474 | | | | 6,703,114 | | | | 29,513,625 | | | | 3,790,823 | |
| Total Increase in Net Assets | | | 38,103,814 | | | | 6,567,556 | | | | 31,314,233 | | | | 3,703,891 | |
| Net Assets: | | | | | | | | | | | | | | | | |
| Beginning of Year/Period | | | 6,567,556 | | | | — | | | | 3,703,891 | | | | — | |
| End of Year/Period | | $ | 44,671,370 | | | $ | 6,567,556 | | | $ | 35,018,124 | | | $ | 3,703,891 | |
| Share Transactions: | | | | | | | | | | | | | | | | |
| Issued | | | 1,200,000 | | | | 249,999 | | | | 1,100,000 | | | | 149,999 | |
| Redeemed | | | (100,000 | ) | | | — | | | | (150,000 | ) | | | — | |
| Net Increase in Shares Outstanding from Share Transactions | | | 1,100,000 | | | | 249,999 | | | | 950,000 | | | | 149,999 | |
| (1) | The Fund commenced operations on September 18, 2020. |
| (2) | Includes realized gains (losses) as a result of in-kind redemptions. (See Note 4 in Notes to Financial Statements.) |
| | Statements of Changes in Net Assets | |
| | | |
| | | Global X SuperIncome™ Preferred ETF | | | Global X Renewable Energy Producers ETF | |
| | | Year Ended October 31, 2021 | | | Year Ended October 31, 2020 | | | Year Ended October 31, 2021 | | | Year Ended October 31, 2020 | |
| Operations: | | | | | | | | | | | | |
| Net Investment Income | | $ | 10,851,739 | | | $ | 10,122,981 | | | $ | 1,617,480 | | | $ | 1,290,726 | |
Net Realized Gain (Loss) on Investments and Foreign Currency Transactions(1) | | | 7,442,457 | | | | (9,284,388 | ) | | | 7,157,351 | | | | 1,497,337 | |
| Net Change in Unrealized Appreciation (Depreciation) on Investments and Foreign Currency Translations | | | 7,403,025 | | | | (2,761,284 | ) | | | (677,351 | ) | | | (96,682 | ) |
| Net Increase (Decrease) in Net Assets Resulting from Operations | | | 25,697,221 | | | | (1,922,691 | ) | | | 8,097,480 | | | | 2,691,381 | |
| Distributions | | | (12,037,890 | ) | | | (10,818,268 | ) | | | (1,854,987 | ) | | | (1,352,385 | ) |
| Return of Capital | | | — | | | | (549,532 | ) | | | — | | | | — | |
| Capital Share Transactions: | | | | | | | | | | | | | | | | |
| Issued | | | 44,774,820 | | | | 24,650,476 | | | | 127,915,612 | | | | 43,544,055 | |
| Redeemed | | | (7,496,771 | ) | | | (28,436,633 | ) | | | (53,373,821 | ) | | | (4,895,974 | ) |
| Increase (Decrease) in Net Assets from Capital Share Transactions | | | 37,278,049 | | | | (3,786,157 | ) | | | 74,541,791 | | | | 38,648,081 | |
| Total Increase (Decrease) in Net Assets | | | 50,937,380 | | | | (17,076,648 | ) | | | 80,784,284 | | | | 39,987,077 | |
| Net Assets: | | | | | | | | | | | | | | | | |
| Beginning of Year | | | 184,015,344 | | | | 201,091,992 | | | | 66,192,010 | | | | 26,204,933 | |
| End of Year | | $ | 234,952,724 | | | $ | 184,015,344 | | | $ | 146,976,294 | | | $ | 66,192,010 | |
| Share Transactions: | | | | | | | | | | | | | | | | |
| Issued | | | 3,760,000 | | | | 2,200,000 | | | | 7,360,000 | | | | 2,900,000 | |
| Redeemed | | | (630,000 | ) | | | (2,800,000 | ) | | | (3,070,000 | ) | | | (350,000 | ) |
| Net Increase (Decrease) in Shares Outstanding from Share Transactions | | | 3,130,000 | | | | (600,000 | ) | | | 4,290,000 | | | | 2,550,000 | |
| (1) | Includes realized gains (losses) as a result of in-kind redemptions. (See Note 4 in Notes to Financial Statements.) |
| | Statements of Changes in Net Assets | |
| | | |
| | | Global X S&P 500® Catholic Values ETF | | | Global X S&P Catholic Values Developed ex-U.S. ETF | |
| | | Year Ended October 31, 2021 | | | Year Ended October 31, 2020 | | | Year Ended October 31, 2021 | | | Period Ended October 31, 2020(1) | |
| Operations: | | | | | | | | | | | | |
| Net Investment Income | | $ | 5,643,588 | | | $ | 4,980,263 | | | $ | 71,854 | | | $ | 18,647 | |
Net Realized Gain (Loss) on Investments and Foreign Currency Transactions(2) | | | 39,989,880 | | | | 16,852,821 | | | | 59,259 | | | | (2,816 | ) |
| Net Change in Unrealized Appreciation (Depreciation) on Investments and Foreign Currency Translations | | | 128,170,186 | | | | 13,850,451 | | | | 723,798 | | | | (23,250 | ) |
| Net Increase (Decrease) in Net Assets Resulting from Operations | | | 173,803,654 | | | | 35,683,535 | | | | 854,911 | | | | (7,419 | ) |
| Distributions | | | (5,511,704 | ) | | | (4,642,650 | ) | | | (59,322 | ) | | | — | |
| Capital Share Transactions: | | | | | | | | | | | | | | | | |
| Issued | | | 127,314,441 | | | | 118,264,481 | | | | 970,818 | | | | 2,505,028 | |
| Redeemed | | | (80,673,768 | ) | | | (45,763,409 | ) | | | — | | | | — | |
| Increase in Net Assets from Capital Share Transactions | | | 46,640,673 | | | | 72,501,072 | | | | 970,818 | | | | 2,505,028 | |
| Total Increase in Net Assets | | | 214,932,623 | | | | 103,541,957 | | | | 1,766,407 | | | | 2,497,609 | |
| Net Assets: | | | | | | | | | | | | | | | | |
| Beginning of Year/Period | | | 379,052,729 | | | | 275,510,772 | | | | 2,497,609 | | | | — | |
| End of Year/Period | | $ | 593,985,352 | | | $ | 379,052,729 | | | $ | 4,264,016 | | | $ | 2,497,609 | |
| Share Transactions: | | | | | | | | | | | | | | | | |
| Issued | | | 2,520,000 | | | | 3,150,000 | | | | 30,000 | | | | 99,999 | |
| Redeemed | | | (1,540,000 | ) | | | (1,150,000 | ) | | | — | | | | — | |
| Net Increase in Shares Outstanding from Share Transactions | | | 980,000 | | | | 2,000,000 | | | | 30,000 | | | | 99,999 | |
| (1) | The Fund commenced operations on June 22, 2020. |
| (2) | Includes realized gains (losses) as a result of in-kind redemptions. (See Note 4 in Notes to Financial Statements.) |
| | Statements of Changes in Net Assets | |
| | | |
| | | | | | Global X S&P 500® Tail Risk ETF | |
| | | Year Ended October 31, 2021 | | | Year Ended October 31, 2020 | | | Period Ended October 31, 2021(1) | |
| Operations: | | | | | | | | | |
| Net Investment Income | | $ | 1,047,788 | | | $ | 532,416 | | | $ | 3,080 | |
Net Realized Gain (Loss) on Investments, Purchased Options and Written Options(2) | | | 16,693,239 | | | | 5,774,378 | | | | (2,887 | ) |
| Net Change in Unrealized Appreciation (Depreciation) on Investments, Purchased Options and Written Options | | | 3,201,689 | | | | (1,127,648 | ) | | | 77,810 | |
| Net Increase in Net Assets Resulting from Operations | | | 20,942,716 | | | | 5,179,146 | | | | 78,003 | |
| Distributions | | | (1,352,859 | ) | | | (538,248 | ) | | | — | |
| Return of Capital | | | — | | | | (28,732 | ) | | | — | |
| Capital Share Transactions: | | | | | | | | | | | | |
| Issued | | | 22,506,630 | | | | — | | | | 3,526,120 | |
| Redeemed | | | (22,201,951 | ) | | | (4,784,665 | ) | | | — | |
| Increase (Decrease) in Net Assets from Capital Share Transactions | | | 304,679 | | | | (4,784,665 | ) | | | 3,526,120 | |
| Total Increase (Decrease) in Net Assets | | | 19,894,536 | | | | (172,499 | ) | | | 3,604,123 | |
| Net Assets: | | | | | | | | | | | | |
| Beginning of Year/Period | | | 55,961,499 | | | | 56,133,998 | | | | — | |
| End of Year/Period | | $ | 75,856,035 | | | $ | 55,961,499 | | | $ | 3,604,123 | |
| Share Transactions: | | | | | | | | | | | | |
| Issued | | | 480,000 | | | | — | | | | 130,000 | |
| Redeemed | | | (470,000 | ) | | | (150,000 | ) | | | — | |
| Net Increase (Decrease) in Shares Outstanding from Share Transactions | | | 10,000 | | | | (150,000 | ) | | | 130,000 | |
| (1) | The Fund commenced operations on August 25, 2021. |
| (2) | Includes realized gains (losses) as a result of in-kind redemptions. (See Note 4 in Notes to Financial Statements.) |
| | Statements of Changes in Net Assets | |
| | | |
| | | Global X S&P 500® Risk Managed Income ETF | | | Global X S&P 500® Collar 95-110 ETF | |
| | | Period Ended October 31, 2021(1) | | | Period Ended October 31, 2021(1) | |
| Operations: | | | | | | |
| Net Investment Income | | $ | 3,407 | | | $ | 2,996 | |
Net Realized Gain (Loss) on Investments, Purchased Options and Written Options(2) | | | 34,336 | | | | (115 | ) |
| Net Change in Unrealized Appreciation (Depreciation) on Investments, Purchased Options and Written Options | | | 50,360 | | | | 48,394 | |
| Net Increase in Net Assets Resulting from Operations | | | 88,103 | | | | 51,275 | |
| Distributions | | | (51,640 | ) | | | — | |
| Capital Share Transactions: | | | | | | | | |
| Issued | | | 5,865,129 | | | | 3,257,141 | |
| Increase in Net Assets from Capital Share Transactions | | | 5,865,129 | | | | 3,257,141 | |
| Total Increase in Net Assets | | | 5,901,592 | | | | 3,308,416 | |
| Net Assets: | | | | | | | | |
| Beginning of Period | | | — | | | | — | |
| End of Period | | $ | 5,901,592 | | | $ | 3,308,416 | |
| Share Transactions: | | | | | | | | |
| Issued | | | 220,000 | | | | 120,000 | |
| Net Increase in Shares Outstanding from Share Transactions | | | 220,000 | | | | 120,000 | |
| (1) | The Fund commenced operations on August 25, 2021. |
| (2) | Includes realized gains (losses) as a result of in-kind redemptions. (See Note 4 in Notes to Financial Statements.) |
| | Statements of Changes in Net Assets | |
| | | |
| | | Global X NASDAQ 100® Tail Risk ETF | | | Global X NASDAQ 100® Risk Managed Income ETF | |
| | | Period Ended October 31, 2021(1) | | | Period Ended October 31, 2021(1) | |
| Operations: | | | | | | |
| Net Investment Loss | | $ | (625 | ) | | $ | (941 | ) |
Net Realized Gain (Loss) on Investments, Purchased Options and Written Options(2) | | | (1,786 | ) | | | 897 | |
| Net Change in Unrealized Appreciation (Depreciation) on Investments, Purchased Options and Written Options | | | 65,741 | | | | (6,346 | ) |
| Net Increase (Decrease) in Net Assets Resulting from Operations | | | 63,330 | | | | (6,390 | ) |
| Return of Capital | | | — | | | | (52,273 | ) |
| Capital Share Transactions: | | | | | | | | |
| Issued | | | 3,262,936 | | | | 4,400,103 | |
| Increase in Net Assets from Capital Share Transactions | | | 3,262,936 | | | | 4,400,103 | |
| Total Increase in Net Assets | | | 3,326,266 | | | | 4,341,440 | |
| Net Assets: | | | | | | | | |
| Beginning of Period | | | — | | | | — | |
| End of Period | | $ | 3,326,266 | | | $ | 4,341,440 | |
| Share Transactions: | | | | | | | | |
| Issued | | | 130,000 | | | | 180,000 | |
| Net Increase in Shares Outstanding from Share Transactions | | | 130,000 | | | | 180,000 | |
| (1) | The Fund commenced operations on August 25, 2021. |
| (2) | Includes realized gains (losses) as a result of in-kind redemptions. (See Note 4 in Notes to Financial Statements.) |
| | Statements of Changes in Net Assets | |
| | | |
| | | Global X NASDAQ 100® Collar 95-110 ETF | |
| | | Period Ended October 31, 2021(1) | |
| Operations: | | | |
| Net Investment Loss | | $ | (560 | ) |
Net Realized Gain on Investments and Purchased Options(2) | | | 14,840 | |
| Net Change in Unrealized Appreciation (Depreciation) on Investments and Purchased Options | | | 39,901 | |
| Net Increase in Net Assets Resulting from Operations | | | 54,181 | |
| Capital Share Transactions: | | | | |
| Issued | | | 2,782,080 | |
| Increase in Net Assets from Capital Share Transactions | | | 2,782,080 | |
| Total Increase in Net Assets | | | 2,836,261 | |
| Net Assets: | | | | |
| Beginning of Period | | | — | |
| End of Period | | $ | 2,836,261 | |
| Share Transactions: | | | | |
| Issued | | | 110,000 | |
| Net Increase in Shares Outstanding from Share Transactions | | | 110,000 | |
| (1) | The Fund commenced operations on August 25, 2021. |
| (2) | Includes realized gains (losses) as a result of in-kind redemptions. (See Note 4 in Notes to Financial Statements.) |
Selected Per Share Data & Ratios
For a Share Outstanding Throughout the Period
| | | Net
Asset Value, Beginning
of Period
($) | | | Net Investment Income (Loss)
($)* | | | Net Realized and Unrealized Gain (Loss) on Investments
($) | | | Total from Operations
($) | | | Distribution from Net Investment Income ($) | | | Distribution from Capital Gains ($) | | | Return of Capital ($) | |
| Global X Social Media ETF | | | | | | | | | | | | | | | | | | | | | |
| 2021 | | | 51.95 | | | | (0.31 | ) | | | 9.62 | | | | 9.31 | | | | — | | | | — | | | | — | |
| 2020 | | | 31.92 | | | | (0.11 | ) | | | 20.14 | | | | 20.03 | | | | — | | | | — | | | | — | |
| 2019 | | | 29.10 | | | | (0.10 | ) | | | 2.92 | | | | 2.82 | | | | — | | | | — | | | | — | |
| 2018 | | | 32.67 | | | | (0.06 | ) | | | (3.02 | ) | | | (3.08 | ) | | | (0.49 | ) | | | — | | | | — | |
| 2017 | | | 23.53 | | | | 0.10 | | | | 9.08 | | | | 9.18 | | | | (0.04 | ) | | | — | | | | — | |
| Global X Lithium & Battery Tech ETF | | | | | | | | | | | | | | | | | | | | | | | | | | | | |
| 2021 | | | 42.86 | | | | 0.12 | | | | 48.21 | | | | 48.33 | | | | (0.12 | ) | | | — | | | | — | |
| 2020 | | | 25.04 | | | | 0.40 | | | | 17.86 | | | | 18.26 | | | | (0.44 | ) | | | — | | | | — | |
| 2019 | | | 30.32 | | | | 0.48 | | | | (4.86 | ) | | | (4.38 | ) | | | (0.90 | ) | | | — | | | | — | |
| 2018 | | | 39.14 | | | | 0.33 | | | | (7.89 | ) | | | (7.56 | ) | | | (1.26 | ) | | | — | | | | — | |
| 2017 | | | 24.02 | | | | 0.33 | | | | 15.31 | | | | 15.64 | | | | (0.52 | ) | | | — | | | | — | |
| Global X E-commerce ETF | | | | | | | | | | | | | | | | | | | | | | | | | | | | |
| 2021 | | | 26.79 | | | | (0.04 | ) | | | 4.70 | | | | 4.66 | | | | (0.13 | ) | | | (0.13 | ) | | | — | |
| 2020 | | | 17.58 | | | | 0.19 | | | | 9.05 | | | | 9.24 | | | | (0.03 | ) | | | — | | | | — | |
2019(1) | | | 15.00 | | | | (0.05 | ) | | | 2.63 | | | | 2.58 | | | | — | | | | — | | | | — | |
| Global X Emerging Markets Internet & E-commerce ETF | | | | | | | | | | | | | | | | | | | | | | | | | | | | |
2021(2) | | | 14.79 | | | | (0.07 | ) | | | (2.73 | ) | | | (2.80 | ) | | | — | | | | — | | | | — | |
| Total from Distributions ($) | | | Net
Asset Value,
End of
Period ($) | | | Total Return (%)** | | | Net Assets End of Period ($)(000) | | | Ratio of Expenses to Average Net Assets (%) | | | Ratio of Net Investment Income (Loss) to Average Net Assets (%) | | | Portfolio Turnover (%)†† | |
| | | | | | | | | | | | | | | | | | | | |
| | — | | | | 61.26 | | | | 17.94 | | | | 401,893 | | | | 0.65 | | | | (0.48 | ) | | | 30.89 | |
| | — | | | | 51.95 | | | | 62.75 | | | | 225,999 | | | | 0.65 | | | | (0.28 | ) | | | 19.23 | |
| | — | | | | 31.92 | | | | 9.69 | | | | 121,289 | | | | 0.65 | | | | (0.33 | ) | | | 16.92 | |
| | (0.49 | ) | | | 29.10 | | | | (9.61 | ) | | | 129,496 | | | | 0.65 | | | | (0.16 | ) | | | 21.36 | |
| | (0.04 | ) | | | 32.67 | | | | 39.09 | | | | 164,998 | | | | 0.65 | | | | 0.35 | | | | 41.40 | |
| | | | | | | | | | | | | | | | | | | | | | | | | | | |
| | (0.12 | ) | | | 91.07 | | | | 112.89 | | | | 5,375,399 | | | | 0.75 | | | | 0.17 | | | | 39.09 | |
| | (0.44 | ) | | | 42.86 | | | | 73.82 | | | | 868,894 | | | | 0.75 | | | | 1.30 | | | | 65.14 | |
| | (0.90 | ) | | | 25.04 | | | | (14.61 | ) | | | 455,124 | | | | 0.75 | | | | 1.75 | | | | 35.28 | |
| | (1.26 | ) | | | 30.32 | | | | (20.01 | ) | | | 739,153 | | | | 0.75 | | | | 0.96 | | | | 16.48 | |
| | (0.52 | ) | | | 39.14 | | | | 66.46 | | | | 950,071 | | | | 0.75 | | | | 1.02 | | | | 68.13 | |
| | | | | | | | | | | | | | | | | | | | | | | | | | | |
| | (0.26 | ) | | | 31.19 | | | | 17.39 | | | | 197,751 | | | | 0.50 | | | | (0.11 | ) | | | 14.64 | |
| | (0.03 | ) | | | 26.79 | | | | 52.67 | | | | 91,083 | | | | 0.50 | | | | 0.75 | | | | 42.01 | |
| | — | | | | 17.58 | | | | 17.20 | | | | 3,517 | | | | 0.68 | † | | | (0.32 | )† | | | 23.50 | |
| | | | | | | | | | | | | | | | | | | | | | | | | | | |
| | — | | | | 11.99 | | | | (18.93 | ) | | | 4,555 | | | | 0.65 | † | | | (0.49 | )† | | | 23.61 | |
| * | Per share data calculated using average shares method. |
| ** | Total Return is for the period indicated and has not been annualized. The return shown does not reflect the deduction of taxes that a shareholder would pay on Fund distributions or the redemption of Fund shares. |
| † | Annualized. |
| †† | Portfolio turnover rate is for the period indicated and periods of less than one year have not been annualized. Excludes effect of in-kind transfers. |
| (1) | The Fund commenced operations on November 27, 2018. |
| (2) | The Fund commenced operations on November 9, 2020. |
Amounts designated as “—” are $0 or have been rounded to $0.
Selected Per Share Data & Ratios
For a Share Outstanding Throughout the Period
| | | Net
Asset Value, Beginning
of Period
($) | | | Net Investment Income
($)* | | | Net Realized and Unrealized Gain (Loss) on Investments
($) | | | Total from Operations
($) | | | Distribution from Net Investment Income ($) | | | Distribution from Capital Gains ($) | | | Return of Capital ($) | |
Global X SuperDividend® ETF | | | | | | | | | | | | | | | | | | | | | |
| 2021 | | | 10.61 | | | | 0.94 | | | | 2.46 | | | | 3.40 | | | | (1.00 | ) | | | — | | | | — | |
| 2020 | | | 17.25 | | | | 0.86 | | | | (6.34 | ) | | | (5.48 | ) | | | (1.04 | ) | | | — | | | | (0.12 | ) |
| 2019 | | | 19.06 | | | | 1.24 | | | | (1.47 | ) | | | (0.23 | ) | | | (1.38 | ) | | | — | | | | (0.20 | ) |
| 2018 | | | 21.51 | | | | 1.35 | | | | (2.26 | ) | | | (0.91 | ) | | | (1.43 | ) | | | — | | | | (0.11 | ) |
| 2017 | | | 20.43 | | | | 1.08 | | | | 1.45 | | | | 2.53 | | | | (1.22 | ) | | | — | | | | (0.23 | ) |
Global X SuperDividend® U.S. ETF | | | | | | | | | | | | | | | | | | | | | | | | | | | | |
| 2021 | | | 14.99 | | | | 0.65 | | | | 5.59 | | | | 6.24 | | | | (0.99 | ) | | | — | | | | (0.11 | ) |
| 2020 | | | 23.34 | | | | 0.62 | | | | (7.45 | ) | | | (6.83 | ) | | | (1.14 | ) | | | — | | | | (0.38 | ) |
| 2019 | | | 24.53 | | | | 1.12 | | | | (0.56 | ) | | | 0.56 | | | | (1.49 | ) | | | — | | | | (0.26 | ) |
| 2018 | | | 25.18 | | | | 1.07 | | | | (0.17 | ) | | | 0.90 | | | | (1.35 | ) | | | — | | | | (0.20 | ) |
| 2017 | | | 24.00 | | | | 0.79 | | | | 1.94 | | | | 2.73 | | | | (0.96 | ) | | | — | | | | (0.59 | ) |
Global X MSCI SuperDividend® EAFE ETF | | | | | | | | | | | | | | | | | | | | | | | | | | | | |
| 2021 | | | 11.44 | | | | 0.79 | | | | 4.10 | | | | 4.89 | | | | (0.71 | ) | | | — | | | | — | |
| 2020 | | | 16.11 | | | | 0.56 | | | | (4.53 | ) | | | (3.97 | ) | | | (0.55 | ) | | | — | | | | (0.15 | ) |
| 2019 | | | 15.96 | | | | 0.82 | | | | 0.36 | | | | 1.18 | | | | (1.03 | ) | | | — | | | | — | |
| 2018 | | | 18.13 | | | | 1.12 | | | | (2.04 | ) | | | (0.92 | ) | | | (1.10 | ) | | | (0.15 | ) | | | — | |
2017(1) | | | 14.87 | | | | 0.81 | | | | 3.04 | | | | 3.85 | | | | (0.59 | ) | | | — | | | | — | |
| Total from Distributions ($) | | | Net
Asset Value,
End of
Period ($) | | | Total Return (%)** | | | Net Assets End of Period ($)(000) | | | Ratio of Expenses to Average Net Assets (%) | | | Ratio of Net Investment Income to Average Net Assets (%) | | | Portfolio Turnover (%)†† | |
| | | | | | | | | | | | | | | | | | | | |
| | (1.00 | ) | | | 13.01 | | | | 32.21 | | | | 930,431 | | | | 0.58 | | | | 6.98 | | | | 82.37 | |
| | (1.16 | ) | | | 10.61 | | | | (32.80 | ) | | | 626,871 | | | | 0.59 | | | | 6.62 | | | | 124.55 | |
| | (1.58 | ) | | | 17.25 | | | | (1.02 | ) | | | 932,111 | | | | 0.59 | | | | 7.03 | | | | 56.85 | |
| | (1.54 | ) | | | 19.06 | | | | (4.65 | ) | | | 912,968 | | | | 0.59 | | | | 6.48 | | | | 59.48 | |
| | (1.45 | ) | | | 21.51 | | | | 12.69 | | | | 992,893 | | | | 0.58 | | | | 5.07 | | | | 67.38 | |
| | | | | | | | | | | | | | | | | | | | | | | | | | | |
| | (1.10 | ) | | | 20.13 | | | | 42.53 | | | | 669,734 | | | | 0.45 | | | | 3.41 | | | | 60.53 | |
| | (1.52 | ) | | | 14.99 | | | | (30.12 | ) | | | 412,110 | | | | 0.45 | | | | 3.50 | | | | 93.44 | |
| | (1.75 | ) | | | 23.34 | | | | 2.61 | | | | 544,884 | | | | 0.46 | | | | 4.83 | | | | 60.00 | |
| | (1.55 | ) | | | 24.53 | | | | 3.66 | | | | 413,311 | | | | 0.46 | | | | 4.31 | | | | 33.25 | |
| | (1.55 | ) | | | 25.18 | | | | 11.64 | | | | 425,579 | | | | 0.45 | | | | 3.15 | | | | 53.01 | |
| | | | | | | | | | | | | | | | | | | | | | | | | | | |
| | (0.71 | ) | | | 15.62 | | | | 43.05 | | | | 14,058 | | | | 0.55 | | | | 5.12 | | | | 88.53 | |
| | (0.70 | ) | | | 11.44 | | | | (25.24 | ) | | | 7,436 | | | | 0.56 | | | | 4.07 | | | | 59.28 | |
| | (1.03 | ) | | | 16.11 | | | | 7.81 | | | | 18,527 | | | | 0.56 | | | | 5.23 | | | | 29.81 | |
| | (1.25 | ) | | | 15.96 | | | | (5.59 | ) | | | 4,788 | | | | 0.56 | | | | 6.36 | | | | 52.96 | |
| | (0.59 | ) | | | 18.13 | | | | 26.19 | | | | 1,813 | | | | 0.56 | † | | | 4.97 | † | | | 45.40 | |
| * | Per share data calculated using average shares method. |
| ** | Total Return is for the period indicated and has not been annualized. The return shown does not reflect the deduction of taxes that a shareholder would pay on Fund distributions or the redemption of Fund shares. |
| † | Annualized. |
| †† | Portfolio turnover rate is for the period indicated and periods of less than one year have not been annualized. Excludes effect of in-kind transfers. |
| (1) | The Fund commenced operations on November 14, 2016. |
Selected Per Share Data & Ratios
For a Share Outstanding Throughout the Period
| | | Net
Asset Value, Beginning
of Period
($) | | | Net Investment Income
($)* | | | Net Realized and Unrealized Gain (Loss) on Investments
($) | | | Total from Operations
($) | | | Distribution from Net Investment Income ($) | | | Distribution from Capital Gains ($) | | | Return of Capital ($) | |
Global X MSCI SuperDividend® Emerging Markets ETF | | | | | | | | | | | | | | | | | | | | | |
| 2021 | | | 9.53 | | | | 1.02 | | | | 1.45 | | | | 2.47 | | | | (0.74 | ) | | | — | | | | — | |
| 2020 | | | 12.95 | | | | 0.55 | | | | (3.17 | ) | | | (2.62 | ) | | | (0.66 | ) | | | — | | | | (0.14 | ) |
| 2019 | | | 12.91 | | | | 0.87 | | | | 0.05 | | | | 0.92 | | | | (0.88 | ) | | | — | | | | — | |
| 2018 | | | 15.94 | | | | 0.90 | | | | (3.02 | ) | | | (2.12 | ) | | | (0.91 | ) | | | — | | | | — | |
| 2017 | | | 14.96 | | | | 0.83 | | | | 0.91 | | | | 1.74 | | | | (0.76 | ) | | | — | | | | — | |
Global X SuperDividend® REIT ETF | | | | | | | | | | | | | | | | | | | | | | | | | | | | |
| 2021 | | | 7.56 | | | | 0.38 | | | | 2.50 | | | | 2.88 | | | | (0.41 | ) | | | — | | | | (0.21 | ) |
| 2020 | | | 15.33 | | | | 0.56 | | | | (7.41 | ) | | | (6.85 | ) | | | (0.86 | ) | | | — | | | | (0.06 | ) |
| 2019 | | | 14.62 | | | | 0.99 | | | | 0.91 | | | | 1.90 | | | | (1.19 | ) | | | — | | | | — | |
| 2018 | | | 15.29 | | | | 0.92 | | | | (0.28 | ) | | | 0.64 | | | | (1.31 | ) | | | — | | | | — | |
| 2017 | | | 14.60 | | | | 0.86 | | | | 0.96 | | | | 1.82 | | | | (1.13 | ) | | | — | | | | — | |
| Total from Distributions ($) | | | Net
Asset Value,
End of
Period ($) | | | Total Return (%)** | | | Net Assets End of Period ($)(000) | | | Ratio of Expenses to Average Net Assets (%) | | | Ratio of Net Investment Income to Average Net Assets (%) | | | Portfolio Turnover (%)†† | |
| | | | | | | | | | | | | | | | | | | | |
| | (0.74 | ) | | | 11.26 | | | | 25.83 | | | | 62,696 | | | | 0.72 | | | | 8.59 | | | | 102.27 | |
| | (0.80 | ) | | | 9.53 | | | | (21.01 | ) | | | 20,007 | | | | 0.67 | | | | 5.04 | | | | 93.04 | |
| | (0.88 | ) | | | 12.95 | | | | 7.14 | | | | 17,489 | | | | 0.66 | | | | 6.51 | | | | 66.65 | |
| | (0.91 | ) | | | 12.91 | | | | (14.10 | ) | | | 12,260 | | | | 0.67 | | | | 5.89 | | | | 79.52 | |
| | (0.76 | ) | | | 15.94 | | | | 11.95 | | | | 12,748 | | | | 0.66 | | | | 5.25 | | | | 122.32 | |
| | | | | | | | | | | | | | | | | | | | | | | | | | | |
| | (0.62 | ) | | | 9.82 | | | | 38.84 | | | | 467,934 | | | | 0.58 | | | | 3.99 | | | | 59.44 | |
| | (0.92 | ) | | | 7.56 | | | | (45.94 | ) | | | 311,625 | | | | 0.58 | | | | 5.74 | | | | 106.23 | |
| | (1.19 | ) | | | 15.33 | | | | 13.68 | | | | 364,790 | | | | 0.59 | | | | 6.71 | | | | 34.16 | |
| | (1.31 | ) | | | 14.62 | | | | 4.30 | | | | 118,408 | | | | 0.59 | | | | 6.15 | | | | 41.61 | |
| | (1.13 | ) | | | 15.29 | | | | 13.00 | | | | 51,986 | | | | 0.58 | | | | 5.74 | | | | 54.96 | |
| * | Per share data calculated using average shares method. |
| ** | Total Return is for the period indicated and has not been annualized. The return shown does not reflect the deduction of taxes that a shareholder would pay on Fund distributions or the redemption of Fund shares. |
| †† | Portfolio turnover rate is for the period indicated and periods of less than one year have not been annualized. Excludes effect of in-kind transfers. |
Selected Per Share Data & Ratios
For a Share Outstanding Throughout the Period
| | | Net
Asset Value, Beginning
of Period
($) | | | Net Investment Income
($)* | | | Net Realized and Unrealized Gain (Loss) on Investments
($) | | | Total from Operations
($) | | | Distribution from Net Investment Income ($) | | | Distribution from Capital Gains ($) | | | Return of Capital ($) | |
Global X NASDAQ 100® Covered Call ETF | | | | | | | | | | | | | | | | | | | | | |
| 2021 | | | 20.65 | | | | 0.02 | | | | 4.73 | | | | 4.75 | | | | (2.58 | ) | | | — | | | | — | |
| 2020 | | | 23.10 | | | | 0.06 | | | | (0.06 | ) | | | — | | | | (0.06 | ) | | | — | | | | (2.39 | ) |
| 2019 | | | 23.45 | | | | 0.06 | | | | 1.95 | | | | 2.01 | | | | (1.83 | ) | | | — | | | | (0.53 | ) |
| 2018 | | | 24.30 | | | | 0.07 | | | | 1.71 | | | | 1.78 | | | | (0.87 | ) | | | (0.11 | ) | | | (1.65 | ) |
| 2017 | | | 22.06 | | | | 0.12 | | | | 3.93 | | | | 4.05 | | | | (1.81 | ) | | | — | | | | — | |
Global X S&P 500® Covered Call ETF (6) | | | | | | | | | | | | | | | | | | | | | | | | | | | | |
| 2021 | | | 42.45 | | | | 0.39 | | | | 12.14 | | | | 12.53 | | | | (4.61 | ) | | | — | | | | — | |
| 2020 | | | 49.39 | | | | 0.56 | | | | (4.17 | ) | | | (3.61 | ) | | | (0.58 | ) | | | — | | | | (2.75 | ) |
| 2019 | | | 48.56 | | | | 0.56 | | | | 3.30 | | | | 3.86 | | | | (2.27 | ) | | | (0.39 | ) | | | (0.37 | ) |
| 2018 | | | 50.10 | | | | 0.62 | | | | 1.88 | | | | 2.50 | | | | (0.22 | ) | | | (1.22 | ) | | | (2.60 | ) |
2017(4) | | | 47.62 | | | | 0.34 | | | | 2.67 | | | | 3.01 | | | | (0.53 | ) | | | — | | | | — | |
2017(5) | | | 43.11 | | | | 0.66 | | | | 5.39 | | | | 6.05 | | | | (1.54 | ) | | | — | | | | — | |
| Total from Distributions ($) | | | Net
Asset Value,
End of
Period ($) | | | Total Return (%)** | | | Net Assets End of Period ($)(000) | | | Ratio of Expenses to Average Net Assets (%) | | | Ratio of Net Investment Income to Average Net Assets (%) | | | Portfolio Turnover (%)†† | |
| | | | | | | | | | | | | | | | | | | | |
| | (2.58 | ) | | | 22.82 | | | | 23.89 | | | | 5,036,215 | | | | 0.60 | | | | 0.11 | | | | 19.99 | |
| | (2.45 | ) | | | 20.65 | | | | 0.21 | | | | 1,325,642 | | | | 0.67 | (1) | | | 0.27 | | | | 27.87 | |
| | (2.36 | ) | | | 23.10 | | | | 9.39 | | | | 768,036 | | | | 0.85 | (1) | | | 0.26 | | | | 11.82 | |
| | (2.63 | ) | | | 23.45 | | | | 7.44 | | | | 395,202 | | | | 0.68 | (2) | | | 0.30 | | | | 15.00 | |
| | (1.81 | ) | | | 24.30 | | | | 19.04 | | | | 157,980 | | | | 0.60 | | | | 0.53 | | | | 4.00 | |
| | | | | | | | | | | | | | | | | | | | | | | | | | | |
| | (4.61 | ) | | | 50.37 | | | | 30.67 | | | | 669,855 | | | | 0.60 | | | | 0.80 | | | | 4.84 | |
| | (3.33 | ) | | | 42.45 | | | | (7.42 | ) | | | 103,992 | | | | 0.71 | (3) | | | 1.22 | | | | 7.29 | |
| | (3.03 | ) | | | 49.39 | | | | 8.40 | | | | 133,353 | | | | 0.87 | (3) | | | 1.16 | | | | 3.92 | |
| | (4.04 | ) | | | 48.56 | | | | 4.97 | | | | 77,701 | | | | 0.65 | | | | 1.22 | | | | 4.00 | |
| | (0.53 | ) | | | 50.10 | | | | 6.35 | | | | 62,628 | | | | 0.65 | † | | | 1.39 | † | | | 8.00 | |
| | (1.54 | ) | | | 47.62 | | | | 14.29 | | | | 64,413 | | | | 0.65 | | | | 1.46 | | | | 21.00 | |
| * | Per share data calculated using average shares method. |
| ** | Total Return is for the period indicated and has not been annualized. The return shown does not reflect the deduction of taxes that a shareholder would pay on Fund distributions or the redemption of Fund shares. |
| † | Annualized. |
| †† | Portfolio turnover rate is for the period indicated and periods of less than one year have not been annualized. Excludes effect of in-kind transfers. |
| (1) | Excluding broker fees on written options, the ratio of expenses to average net assets would have been 0.60% and 0.60% for the year ended October 31, 2020 and October 31, 2019, respectively. The ratio of Expenses to Average Net Assets includes the effect of a waiver. If these offsets were excluded, the ratio would have been 0.60% and 0.60% for the year ended October 31, 2020 and year ended October 31, 2019. |
| (2) | Includes excise tax. If this excise expense was not included, the ratio would have been 0.60%. |
| (3) | Excluding broker fees on written options, the ratio of expenses to average net assets would have been 0.64% and 0.65% for the year ended October 31, 2020 and year ended October 31, 2019, respectively. The ratio of Expenses to Average Net Assets includes the effect of a waiver. If these offsets were excluded, the ratio would have been 0.64% and 0.65% for the year ended October 31, 2020 and year ended October 31, 2019. |
| (4) | Effective October 31, 2017, the Predecessor Fund changed its fiscal year end from April 30 to October 31. The information presented is from May 1, 2017 through October 31, 2017. |
| (5) | For the year or period ended April 30. |
| (6) | The financial statements include the financial information of the Predecessor Funds through December 21, 2018 (See Note 1 in Notes to Financial Statements). As a result of the Reorganization, the Fund assumed the performance and accounting history of the Predecessor Fund. Accordingly, performance figures for the Fund for periods prior to the date of the Reorganization represent the performance of the Predecessor Fund. |
Amounts designated as “—” are $0 or have been rounded to $0.
Selected Per Share Data & Ratios
For a Share Outstanding Throughout the Period
| | | Net
Asset Value, Beginning
of Period
($) | | | Net Investment Income
($)* | | | Net Realized and Unrealized Gain (Loss) on Investments
($) | | | Total from Operations
($) | | | Distribution from Net Investment Income ($) | | | Distribution from Capital Gains ($) | | | Return of Capital ($) | |
| Global X Russell 2000 Covered Call ETF | | | | | | | | | | | | | | | | | | | | | |
| 2021 | | | 20.45 | | | | 0.13 | | | | 7.50 | | | | 7.63 | | | | (2.90 | ) | | | — | | | | — | |
| 2020 | | | 25.24 | | | | 0.12 | | | | (2.51 | ) | | | (2.39 | ) | | | (0.11 | ) | | | (0.17 | ) | | | (2.12 | ) |
2019(3) | | | 25.00 | | | | 0.09 | | | | 1.37 | | | | 1.46 | | | | (1.22 | ) | | | — | | | | — | |
Global X Nasdaq 100® Covered Call & Growth ETF | | | | | | | | | | | | | | | | | | | | | | | | | | | | |
| 2021 | | | 26.27 | | | | 0.02 | | | | 8.56 | | | | 8.58 | | | | (1.76 | ) | | | — | | | | — | |
2020(4) | | | 26.30 | | | | — | | | | 0.11 | | | | 0.11 | | | | — | | | | — | | | | (0.14 | ) |
Global X S&P 500® Covered Call & Growth ETF | | | | | | | | | | | | | | | | | | | | | | | | | | | | |
| 2021 | | | 24.69 | | | | 0.22 | | | | 8.29 | | | | 8.51 | | | | (1.37 | ) | | | — | | | | — | |
2020(4) | | | 25.22 | | | | 0.02 | | | | (0.41 | ) | | | (0.39 | ) | | | (0.02 | ) | | | — | | | | (0.12 | ) |
| Total from Distributions ($) | | | Net
Asset Value,
End of
Period ($) | | | Total Return (%)** | | | Net Assets End of Period ($)(000) | | | Ratio of Expenses to Average Net Assets (%) | | | Ratio of Net Investment Income (Loss) to Average Net Assets (%) | | | Portfolio Turnover (%)†† | |
| | | | | | | | | | | | | | | | | | | | |
| | (2.90 | ) | | | 25.18 | | | | 38.82 | | | | 554,446 | | | | 0.50 | (1)(2) | | | 0.53 | | | | 8.94 | |
| | (2.40 | ) | | | 20.45 | | | | (9.18 | ) | | | 21,475 | | | | 0.56 | (1)(2) | | | 0.68 | | | | 11.16 | |
| | (1.22 | ) | | | 25.24 | | | | 5.99 | | | | 8,833 | | | | 0.82 | †(1)(2) | | | 0.68 | † | | | 5.82 | |
| | | | | | | | | | | | | | | | | | | | | | | | | | | |
| | (1.76 | ) | | | 33.09 | | | | 33.42 | | | | 44,671 | | | | 0.60 | | | | 0.06 | | | | 11.21 | |
| | (0.14 | ) | | | 26.27 | | | | 0.40 | | | | 6,568 | | | | 0.60 | † | | | (0.10 | )† | | | 1.65 | |
| | | | | | | | | | | | | | | | | | | | | | | | | | | |
| | (1.37 | ) | | | 31.83 | | | | 35.18 | | | | 35,018 | | | | 0.60 | | | | 0.74 | | | | 12.17 | |
| | (0.14 | ) | | | 24.69 | | | | (1.60 | ) | | | 3,704 | | | | 0.60 | † | | | 0.75 | † | | | 0.75 | |
| * | Per share data calculated using average shares method. |
| ** | Total Return is for the period indicated and has not been annualized. The return shown does not reflect the deduction of taxes that a shareholder would pay on Fund distributions or the redemption of Fund shares. |
| † | Annualized. |
| †† | Portfolio turnover rate is for the period indicated and periods of less than one year have not been annualized. Excludes effect of in-kind transfers. |
| (1) | Excluding broker fees on written options, the ratio of expenses to average net assets would have been 0.60% 0.60%, and 0.60% for the year ended October 31, 2021, October 31, 2020 and period ended October 31, 2019, respectively. |
| (2) | The ratio of Expenses to Average Net Assets includes the effect of a waiver. If these offsets were excluded, the ratio would have been 0.60%, 0.68% and 0.97% for the year ended October 31, 2021, year ended October 31, 2020 and period ended October 31, 2019, respectively. |
| (3) | The Fund commenced operations on April 17, 2019. |
| (4) | The Fund commenced operations on September 18, 2020. |
Amounts designated as “—” are $0 or have been rounded to $0.
Selected Per Share Data & Ratios
For a Share Outstanding Throughout the Period
| | | Net
Asset Value, Beginning
of Period
($) | | | Net Investment Income
($)* | | | Net Realized and Unrealized Gain (Loss) on Investments
($) | | | Total from Operations
($) | | | Distribution from Net Investment Income ($) | | | Distribution from Capital Gains ($) | | | Return of Capital ($) | |
| Global X SuperIncome™ Preferred ETF | | | | | | | | | | | | | | | | | | | | | |
| 2021 | | | 11.12 | | | | 0.61 | | | | 0.89 | | | | 1.50 | | | | (0.68 | ) | | | — | | | | — | |
| 2020 | | | 11.73 | | | | 0.60 | | | | (0.53 | ) | | | 0.07 | | | | (0.65 | ) | | | — | | | | (0.03 | ) |
| 2019 | | | 11.49 | | | | 0.66 | | | | 0.32 | | | | 0.98 | | | | (0.73 | ) | | | — | | | | (0.01 | ) |
| 2018 | | | 12.44 | | | | 0.78 | | | | (0.88 | ) | | | (0.10 | ) | | | (0.85 | ) | | | — | | | | — | |
| 2017 | | | 13.16 | | | | 0.82 | | | | (0.65 | ) | | | 0.17 | | | | (0.85 | ) | | | — | | | | (0.04 | ) |
| Global X Renewable Energy Producers ETF | | | | | | | | | | | | | | | | | | | | | | | | | | | | |
| 2021 | | | 14.87 | | | | 0.23 | | | | 2.05 | | | | 2.28 | | | | (0.30 | ) | | | (0.03 | ) | | | — | |
| 2020 | | | 13.79 | | | | 0.41 | | | | 1.13 | | | | 1.54 | | | | (0.46 | ) | | | — | | | | — | |
| 2019 | | | 11.52 | | | | 0.13 | | | | 2.61 | | | | 2.74 | | | | (0.47 | ) | | | — | | | | — | |
| 2018 | | | 12.53 | | | | 0.37 | | | | (0.80 | ) | | | (0.43 | ) | | | (0.50 | ) | | | — | | | | (0.08 | ) |
| 2017 | | | 11.16 | | | | 0.28 | | | | 1.59 | | | | 1.87 | | | | (0.50 | ) | | | — | | | | — | |
| Total from Distributions ($) | | | Net
Asset Value,
End of
Period ($) | | | Total Return (%)** | | | Net Assets End of Period ($)(000) | | | Ratio of Expenses to Average Net Assets (%) | | | Ratio of Net Investment Income to Average Net Assets (%) | | | Portfolio Turnover (%)†† | |
| | | | | | | | | | | | | | | | | | | | |
| | (0.68 | ) | | | 11.94 | | | | 13.71 | | | | 234,953 | | | | 0.58 | | | | 5.13 | | | | 98.47 | |
| | (0.68 | ) | | | 11.12 | | | | 0.81 | | | | 184,015 | | | | 0.58 | | | | 5.47 | | | | 67.65 | |
| | (0.74 | ) | | | 11.73 | | | | 8.87 | | | | 201,092 | | | | 0.58 | | | | 5.72 | | | | 55.98 | |
| | (0.85 | ) | | | 11.49 | | | | (0.87 | ) | | | 186,154 | | | | 0.58 | | | | 6.48 | | | | 105.48 | |
| | (0.89 | ) | | | 12.44 | | | | 1.31 | | | | 236,331 | | | | 0.58 | | | | 6.39 | | | | 45.12 | |
| | | | | | | | | | | | | | | | | | | | | | | | | | | |
| | (0.33 | ) | | | 16.82 | | | | 15.37 | | | | 146,976 | | | | 0.65 | | | | 1.39 | | | | 55.97 | |
| | (0.46 | ) | | | 14.87 | | | | 11.39 | | | | 66,192 | | | | 0.65 | | | | 2.89 | | | | 29.27 | |
| | (0.47 | ) | | | 13.79 | | | | 24.34 | | | | 26,205 | | | | 0.65 | | | | 1.01 | | | | 87.06 | |
| | (0.58 | ) | | | 11.52 | | | | (3.50 | ) | | | 15,556 | | | | 0.65 | | | | 3.07 | | | | 33.50 | |
| | (0.50 | ) | | | 12.53 | | | | 17.30 | | | | 20,046 | | | | 0.65 | | | | 2.37 | | | | 25.99 | |
| * | Per share data calculated using average shares method. |
| ** | Total Return is for the period indicated and has not been annualized. The return shown does not reflect the deduction of taxes that a shareholder would pay on Fund distributions or the redemption of Fund shares. |
| †† | Portfolio turnover rate is for the period indicated and periods of less than one year have not been annualized. Excludes effect of in-kind transfers. |
Selected Per Share Data & Ratios
For a Share Outstanding Throughout the Period
| | | Net
Asset Value, Beginning
of Period
($) | | | Net Investment Income
($)* | | | Net Realized and Unrealized Gain (Loss) on Investments
($) | | | Total from Operations
($) | | | Distribution from Net Investment Income ($) | | | Distribution from Capital Gains ($) | | | Return of Capital ($) | |
Global X S&P 500® Catholic Values ETF | | | | | | | | | | | | | | | | | | | | | |
| 2021 | | | 40.32 | | | | 0.56 | | | | 16.89 | | | | 17.45 | | | | (0.55 | ) | | | — | | | | — | |
| 2020 | | | 37.23 | | | | 0.58 | | | | 3.08 | | | | 3.66 | | | | (0.55 | ) | | | (0.02 | ) | | | — | |
| 2019 | | | 33.59 | | | | 0.58 | | | | 3.92 | | | | 4.50 | | | | (0.81 | ) | | | (0.05 | ) | | | — | |
| 2018 | | | 31.83 | | | | 0.58 | | | | 1.60 | | | | 2.18 | | | | (0.41 | ) | | | (0.01 | ) | | | — | |
| 2017 | | | 25.74 | | | | 0.48 | | | | 5.74 | | | | 6.22 | | | | (0.13 | ) | | | | *** | | | — | |
| Global X S&P Catholic Values Developed ex-U.S. ETF | | | | | | | | | | | | | | | | | | | | | | | | | | | | |
| 2021 | | | 24.98 | | | | 0.70 | | | | 7.71 | | | | 8.41 | | | | (0.59 | ) | | | — | | | | — | |
2020(1) | | | 25.05 | | | | 0.19 | | | | (0.26 | ) | | | (0.07 | ) | | | — | | | | — | | | | — | |
Global X Guru® Index ETF | | | | | | | | | | | | | | | | | | | | | | | | | | | | |
| 2021 | | | 37.31 | | | | 0.69 | | | | 13.14 | | | | 13.83 | | | | (0.90 | ) | | �� | — | | | | — | |
| 2020 | | | 34.02 | | | | 0.33 | | | | 3.32 | | | | 3.65 | | | | (0.34 | ) | | | — | | | | (0.02 | ) |
| 2019 | | | 30.09 | | | | 0.12 | | | | 4.02 | | | | 4.14 | | | | (0.17 | ) | | | — | | | | (0.04 | ) |
| 2018 | | | 28.70 | | | | 0.11 | | | | 1.44 | | | | 1.55 | | | | (0.16 | ) | | | — | | | | — | |
| 2017 | | | 23.14 | | | | 0.14 | | | | 5.47 | | | | 5.61 | | | | (0.05 | ) | | | — | | | | — | |
| Total from Distributions ($) | | | Net
Asset Value,
End of
Period ($) | | | Total Return (%)** | | | Net Assets End of Period ($)(000) | | | Ratio of Expenses to Average Net Assets (%) | | | Ratio of Net Investment Income to Average Net Assets (%) | | | Portfolio Turnover (%)†† | |
| | | | | | | | | | | | | | | | | | | | |
| | (0.55 | ) | | | 57.22 | | | | 43.54 | | | | 593,985 | | | | 0.29 | | | | 1.09 | | | | 8.29 | |
| | (0.57 | ) | | | 40.32 | | | | 9.89 | | | | 379,053 | | | | 0.29 | | | | 1.51 | | | | 5.55 | |
| | (0.86 | ) | | | 37.23 | | | | 13.86 | | | | 275,511 | | | | 0.29 | | | | 1.66 | | | | 8.54 | |
| | (0.42 | ) | | | 33.59 | | | | 6.86 | | | | 147,789 | | | 0.29@ | | | | 1.72 | | | | 4.33 | |
| | (0.13 | ) | | | 31.83 | | | | 24.27 | | | | 114,581 | | | 0.29@ | | | | 1.64 | | | | 6.09 | |
| | | | | | | | | | | | | | | | | | | | | | | | | | | |
| | (0.59 | ) | | | 32.80 | | | | 33.79 | | | | 4,264 | | | | 0.35 | | | | 2.22 | | | | 17.17 | |
| | — | | | | 24.98 | | | | (0.28 | ) | | | 2,498 | | | | 0.35 | † | | | 2.02 | † | | | 4.04 | |
| | | | | | | | | | | | | | | | | | | | | | | | | | | |
| | (0.90 | ) | | | 50.24 | | | | 37.43 | | | | 75,856 | | | | 0.75 | | | | 1.47 | | | | 121.91 | |
| | (0.36 | ) | | | 37.31 | | | | 10.84 | | | | 55,961 | | | | 0.75 | | | | 0.96 | | | | 124.90 | |
| | (0.21 | ) | | | 34.02 | | | | 13.90 | | | | 56,134 | | | | 0.75 | | | | 0.38 | | | | 126.44 | |
| | (0.16 | ) | | | 30.09 | | | | 5.40 | | | | 57,180 | | | | 0.75 | | | | 0.36 | | | | 112.64 | |
| | (0.05 | ) | | | 28.70 | | | | 24.30 | | | | 55,956 | | | | 0.75 | | | | 0.54 | | | | 94.71 | |
| @ | The ratio of Expenses to Average Net Assets includes the effect of a waiver. If these offsets were excluded, the ratio would have been 0.39%, for the Global X S&P 500® Catholic Values ETF. |
| * | Per share data calculated using average shares method. |
| ** | Total Return is for the period indicated and has not been annualized. The return shown does not reflect the deduction of taxes that a shareholder would pay on Fund distributions or the redemption of Fund shares. |
| *** | Amount rounds to less than $0.005. |
| † | Annualized. |
| †† | Portfolio turnover rate is for the period indicated and periods of less than one year have not been annualized. Excludes effect of in-kind transfers. |
| (1) | The Fund commenced operations on June 22, 2020 |
Amounts designated as “—” are $0 or have been rounded to $0.
Selected Per Share Data & Ratios
For a Share Outstanding Throughout the Period
| | | Net
Asset Value, Beginning
of Period
($) | | | Net Investment Income (Loss)
($)* | | | Net Realized and Unrealized Gain (Loss) on Investments
($) | | | Total from Operations
($) | | | Distribution from Net Investment Income ($) | | | Distribution from Capital Gains ($) | | | Return of Capital ($) | |
Global X S&P 500® Tail Risk ETF | | | | | | | | | | | | | | | | | | | | | |
2021(1) | | | 27.33 | | | | 0.03 | | | | 0.36 | | | | 0.39 | | | | — | | | | — | | | | — | |
Global X S&P 500® Risk Managed Income ETF | | | | | | | | | | | | | | | | | | | | | | | | | | | | |
2021(1) | | | 26.77 | | | | 0.03 | | | | 0.39 | | | | 0.42 | | | | (0.36 | ) | | | — | | | | — | |
Global X S&P 500® Collar 95-110 ETF | | | | | | | | | | | | | | | | | | | | | | | | | | | | |
2021(1) | | | 27.28 | | | | 0.03 | | | | 0.26 | | | | 0.29 | | | | — | | | | — | | | | — | |
Global X NASDAQ 100® Tail Risk ETF | | | | | | | | | | | | | | | | | | | | | | | | | | | | |
2021(1) | | | 25.13 | | | | (0.01 | ) | | | 0.47 | | | | 0.46 | | | | — | | | | — | | | | — | |
Global X NASDAQ 100® Risk Managed Income ETF | | | | | | | | | | | | | | | | | | | | | | | | | | | | |
2021(1) | | | 24.60 | | | | (0.01 | ) | | | (0.16 | ) | | | (0.17 | ) | | | — | | | | — | | | | (0.31 | ) |
Global X NASDAQ 100® Collar 95-110 ETF | | | | | | | | | | | | | | | | | | | | | | | | | | | | |
2021(1) | | | 25.27 | | | | (0.01 | ) | | | 0.52 | | | | 0.51 | | | | — | | | | — | | | | — | |
| Total from Distributions ($) | | | Net
Asset Value,
End of
Period ($) | | | Total Return (%)** | | | Net Assets End of Period ($)(000) | | | Ratio of Expenses to Average Net Assets (%) | | | Ratio of Net Investment Income (Loss) to Average Net Assets (%) | | | Portfolio Turnover (%)†† | |
| | | | | | | | | | | | | | | | | | | | |
| | — | | | | 27.72 | | | | 1.43 | | | | 3,604 | | | | 0.60 | † | | | 0.58 | † | | | 6.21 | |
| | | | | | | | | | | | | | | | | | | | | | | | | | | |
| | (0.36 | ) | | | 26.83 | | | | 1.60 | | | | 5,902 | | | | 0.60 | † | | | 0.57 | † | | | 7.08 | |
| | | | | | | | | | | | | | | | | | | | | | | | | | | |
| | — | | | | 27.57 | | | | 1.06 | | | | 3,308 | | | | 0.60 | † | | | 0.58 | † | | | 6.44 | |
| | | | | | | | | | | | | | | | | | | | | | | | | | | |
| | — | | | | 25.59 | | | | 1.83 | | | | 3,326 | | | | 0.60 | † | | | (0.12 | )† | | | 1.71 | |
| | | | | | | | | | | | | | | | | | | | | | | | | | | |
| | (0.31 | ) | | | 24.12 | | | | (0.69 | ) | | | 4,341 | | | | 0.60 | † | | | (0.15 | )† | | | 2.16 | |
| | | | | | | | | | | | | | | | | | | | | | | | | | | |
| | — | | | | 25.78 | | | | 2.06 | | | | 2,836 | | | | 0.60 | † | | | (0.11 | )† | | | 2.11 | |
| * | Per share data calculated using average shares method. |
| ** | Total Return is for the period indicated and has not been annualized. The return shown does not reflect the deduction of taxes that a shareholder would pay on Fund distributions or the redemption of Fund shares. |
| † | Annualized. |
| †† | Portfolio turnover rate is for the period indicated and periods of less than one year have not been annualized. Excludes effect of in-kind transfers. |
| (1) | The Fund commenced operations on August 25, 2021. |
Amounts designated as “—” are $0 or have been rounded to $0.
| | Notes to Financial Statements | |
| | October 31, 2021 | |
1. ORGANIZATION
Global X Funds (the “Trust”) is a Delaware statutory trust formed on March 6, 2008. The Trust is registered under the Investment Company Act of 1940, as amended, as an open-end management investment company. As of October 31, 2021, the Trust had ninety-seven portfolios, eighty-eight of which were operational. The financial statements herein and the related notes pertain to the Global X Social Media ETF, Global X Lithium & Battery Tech ETF, Global X E-commerce ETF, Global X Emerging Markets Internet & E-commerce ETF, Global X SuperDividend® ETF, Global X SuperDividend® U.S. ETF, Global X MSCI SuperDividend® EAFE ETF, Global X MSCI SuperDividend® Emerging Markets ETF, Global X SuperDividend® REIT ETF, Global X NASDAQ 100® Covered Call ETF, Global X S&P 500® Covered Call ETF, Global X Russell 2000 Covered Call ETF, Global X Nasdaq 100® Covered Call & Growth ETF, Global X S&P 500® Covered Call & Growth ETF, Global X SuperIncome™ Preferred ETF, Global X Renewable Energy Producers ETF, Global X S&P 500® Catholic Values ETF, Global X S&P Catholic Values Developed ex-U.S. ETF, Global X Guru® Index ETF, Global X S&P 500® Tail Risk ETF, Global X S&P 500® Risk Managed Income ETF, Global X S&P 500® Collar 95-110 ETF, Global X NASDAQ 100® Tail Risk ETF, Global X NASDAQ 100® Risk Managed Income ETF and Global X NASDAQ 100® Collar 95-110 ETF (each a “Fund”, collectively, the “Funds”).
Each Fund (except the Global X SuperDividend® ETF, Global X SuperDividend® U.S. ETF, Global X MSCI SuperDividend® Emerging Markets ETF, Global X MSCI SuperDividend® EAFE ETF, Global X SuperDividend® REIT ETF, Global X SuperIncomeTM Preferred ETF, Global X Guru® Index ETF, Global X S&P 500® Catholic Values ETF, Global X Russell 2000 Covered Call ETF, Global X S&P 500® Covered Call ETF, Global X S&P 500® Covered Call & Growth ETF, Global X S&P 500® Tail Risk ETF, Global X S&P 500® Risk Managed Income ETF, and Global X S&P 500® Collar 95-110 ETF) has elected non-diversified status.
The Global X Emerging Markets Internet & E-commerce ETF commenced operations on November 9, 2020.
Effective February 2, 2021, the Global X YieldCo & Renewable Energy Income ETF was renamed the Global X Renewable Energy Producers ETF, and its underlying index was changed to the Indxx Renewable Energy Producers Index.
The Global X S&P 500® Tail Risk ETF, Global X S&P 500® Risk Managed Income ETF, Global X S&P 500® Collar 95-110 ETF, Global X NASDAQ 100® Tail Risk ETF, Global X NASDAQ 100® Risk Managed Income ETF, and Global X NASDAQ 100® Collar 95-110 ETF commenced operations on August 25, 2021.
| | Notes to Financial Statements (continued) | |
| | October 31, 2021 | |
1. ORGANIZATION (continued)
On December 24, 2018, the shareholders of the Horizons NASDAQ 100® Covered Call ETF and Horizons S&P 500® Covered Call ETF (each, a “Predecessor Fund” and together, the “Predecessor Funds”) approved a proposed agreement and plan of reorganization (the “Reorganization”) that provided for (a) the transfer of all the assets and assumption of certain of the liabilities of each Predecessor Fund to the Global X Nasdaq 100® Covered Call ETF and the Global X S&P 500® Covered Call ETF (together, the “Successor Funds”), respectively; (b) the issuance of shares of the Successor Fund to the shareholders of the corresponding Predecessor Fund; and (c) the liquidation and termination of the Predecessor Funds. The effective date of the Reorganization of each Predecessor Fund was December 24, 2018. The Successor Funds had no operations prior to the Reorganization. The Predecessor Funds had substantially similar investment objectives, investment strategies, policies and restrictions as those of the Successor Funds. The financial statements and financial highlights include the financial information of the Predecessor Funds through December 21, 2018.
2. SIGNIFICANT ACCOUNTING POLICIES
The following is a summary of the significant accounting policies followed by the Funds:
USE OF ESTIMATES – The Funds are investment companies that apply the accounting and reporting guidance issued in Topic 946 by the U.S. Financial Accounting Standards Board. The preparation of financial statements in conformity with U.S. generally accepted accounting principles (“U.S. GAAP”) requires management to make estimates and assumptions that affect the reported amounts of assets and liabilities and disclosure of contingent assets and liabilities at the date of the financial statements and the reported amounts of increases and decreases in net assets from operations during the reporting period. Actual results could materially differ from those estimates.
RETURN OF CAPITAL ESTIMATES – Distributions received by the Funds from underlying master limited partnership (“MLP”) and real estate investment trust (“REIT”) investments generally are comprised of income and return of capital. The Funds record investment income and return of capital based on estimates made at the time such distributions are received. Such estimates are based on historical information available from the MLPs, REITs and other industry sources. These estimates may subsequently be revised based on information received from the MLPs and REITs after their tax reporting periods are concluded.
MLPs – Certain Funds may invest in MLPs. MLPs are publicly traded partnerships engaged in the transportation, storage and processing of minerals and natural resources. By confining their operations to these specific activities, their interests, or units, are able to trade on public securities exchanges exactly like the shares of a corporation, without entity level taxation. To qualify as an MLP and to not be taxed as a corporation, a partnership must receive at least 90% of its income from qualifying sources as set forth in
| | Notes to Financial Statements (continued) | |
| | October 31, 2021 | |
2. SIGNIFICANT ACCOUNTING POLICIES (continued)
Section 7704(d) of the Internal Revenue Code of 1986, as amended (the ���Code”). These qualifying sources include natural resource-based activities such as the processing, transportation and storage of mineral or natural resources. MLPs generally have two classes of owners: the general partner and limited partners. The general partner of an MLP is typically owned by a major energy company, an investment fund, the direct management of the MLP, or is an entity owned by one or more of such parties. The general partner may be structured as a private or publicly traded corporation or other entity.
The general partner typically controls the operations and management of the MLP through an up to 2% equity interest in the MLP plus, in many cases, ownership of common units and subordinated units.
Limited partners typically own the remainder of the partnership through ownership of common units, and have a limited role in the partnership’s operations and management. MLPs are typically structured such that common units and general partner interests have first priority to receive quarterly cash distributions up to an established minimum amount (“minimum quarterly distributions” or “MQD”). Common and general partner interests also accrue arrearages in distributions to the extent the MQD is not paid. Once common and general partner interests have been paid, subordinated units receive distributions of up to the MQD; however, subordinated units do not accrue arrearages. Distributable cash in excess of the MQD is paid to both common and subordinated units and is distributed to both common and subordinated units generally on a pro rata basis. The general partner is also eligible to receive incentive distributions if the general partner operates the business in a manner which results in distributions paid per common unit surpassing specified target levels. As the general partner increases cash distributions to the limited partners, the general partner receives an increasingly higher percentage of the incremental cash distributions.
SECURITY VALUATION - Securities listed on a securities exchange, market or automated quotation system for which quotations are readily available (except for securities traded on NASDAQ), including securities traded over the counter, are valued at the last quoted sale price on the primary exchange or market (foreign or domestic) on which they are traded (or at approximately 4:00 pm EST if a security’s primary exchange is normally open at that time), or, if there is no such reported sale, at the most recent mean between the quoted bid and asked prices, which approximates fair value (absent both bid and asked prices on such exchange, the bid price may be used).
For securities traded on NASDAQ, the NASDAQ official closing price will be used. If available, debt securities are priced based upon valuations provided by independent, third-party pricing agents. Such values generally reflect the last reported sales price if the security is actively traded. The third-party pricing agents may also value debt securities at an evaluated bid price by employing methodologies that utilize actual market
| | Notes to Financial Statements (continued) | |
| | October 31, 2021 | |
2. SIGNIFICANT ACCOUNTING POLICIES (continued)
transactions, broker-supplied valuations, or other methodologies designed to identify the market value for such securities. Debt obligations with remaining maturities of sixty days or less may be valued at their amortized cost, which approximates market value. The prices for foreign securities are reported in local currency and converted to U.S. dollars using currency exchange rates as of the reporting date. The exchange rates used by the Trust for valuation are captured as of the New York or London close each day. Prices for most securities held in the Funds are provided daily by recognized independent pricing agents. If a security price cannot be obtained from an independent, third-party pricing agent, the Funds seek to obtain a bid price from at least one independent broker.
Securities for which market prices are not “readily available” are valued in accordance with fair value procedures (the “Fair Value Procedures”) established by the Board of Trustees (the “Board”) of the Trust. The Funds’ Fair Value Procedures are implemented through a fair value committee (the “Committee”) designated by the Board. Some of the more common reasons that may necessitate that a security be valued using the Fair Value Procedures include: the security’s trading has been halted or suspended; the security has been de-listed from its primary trading exchange; the security’s primary trading market is temporarily closed at a time when, under normal conditions, it would be open; the security has not been traded for an extended period of time; the security’s primary pricing source is not able or willing to provide a price; or trading of the security is subject to local government-imposed restrictions. In addition, the Funds may fair value a security if an event that may materially affect the value of the Funds’ security that is traded outside the United States (a “Significant Event”) has occurred between the time of the security’s last close and the time that the Funds calculate their net asset values. A Significant Event may relate to a single issuer or to an entire market sector. Events that may be Significant Events include: government actions, natural disasters, armed conflict, acts of terrorism and significant market fluctuations. If Global X Management Company LLC, the Funds’ investment advisor (the “Adviser”), becomes aware of a Significant Event that has occurred with respect to a security or group of securities after the closing of the exchange or market on which the security or securities principally trade, but before the time at which the Funds calculate their net asset values, it may request that a Committee meeting be called. When a security is valued in accordance with the Fair Value Procedures, the Committee will determine the value after taking into consideration all relevant information reasonably available to the Committee. As of October 31, 2021, Global X S&P Catholic Values Developed ex-U.S. ETF had fair valued securities valued at $14,710. There were no other securities priced using the Fair Value Procedures.
In accordance with the authoritative guidance on fair value measurements and disclosure under U.S. GAAP, the Funds disclose the fair value of their investments in a hierarchy that prioritizes the inputs to valuation techniques used to measure the fair value. The objective of a fair value measurement is to determine the price that would be received to sell an asset or paid to transfer a liability in an orderly transaction between market
| | Notes to Financial Statements (continued) | |
| | October 31, 2021 | |
2. SIGNIFICANT ACCOUNTING POLICIES (continued)
participants at the measurement date (an exit price). Accordingly, the fair value hierarchy gives the highest priority to quoted prices (unadjusted) in active markets for identical assets or liabilities (Level 1) and the lowest priority to unobservable inputs (Level 3). The three levels of the fair value hierarchy are described below:
Level 1 – Unadjusted quoted prices in active markets for identical, unrestricted assets or liabilities that the Funds have the ability to access at the measurement date
Level 2 – Other significant observable inputs (including quoted prices in non-active markets, quoted prices for similar investments, fair value of investments for which the Funds have the ability to fully redeem tranches at net asset value as of the measurement date or within the near term, and short-term investments valued at amortized cost)
Level 3 – Significant unobservable inputs (including the Funds’ own assumptions in determining the fair value of investments, and fair value of investments for which the Funds do not have the ability to fully redeem tranches at net asset value as of the measurement date or within the near term)
Investments are classified within the level of the lowest significant input considered in determining fair value. Investments classified within Level 3 whose fair value measurement considers several inputs may include Level 1 or Level 2 inputs as components of the overall fair value measurement.
For the year ended October 31, 2021, there have been no significant changes to the Funds’ fair valuation methodologies.
The unobservable inputs used to determine fair value of Level 3 assets may have similar or diverging impacts on valuation. Significant increases and decreases in these inputs in isolation and interrelationships between those inputs could result in significantly higher or lower fair value measurement.
DUE TO/FROM BROKERS – Due to/from brokers includes cash and collateral balances with the Funds’ clearing brokers or counterparties as of October 31, 2021. The Funds continuously monitor the credit standing of each broker or counterparty with whom they conduct business. In the event a broker or counterparty is unable to fulfill its obligations, the Funds would be subject to counterparty credit risk.
| | Notes to Financial Statements (continued) | |
| | October 31, 2021 | |
2. SIGNIFICANT ACCOUNTING POLICIES (continued)
REPURCHASE AGREEMENTS - Securities pledged as collateral for repurchase agreements by BNP Paribas are held by Brown Brothers Harriman & Co. (“BBH”), the Funds’ custodian (“Custodian”), and are designated as being held on each Fund’s behalf by the Custodian under a book-entry system. Each Fund monitors the adequacy of the collateral on a daily basis and can require the seller to provide additional collateral in the event the market value of the securities pledged falls below the carrying value of the repurchase agreement, including accrued interest.
It is the Funds’ policy to only enter into repurchase agreements with banks and other financial institutions which are deemed by the Adviser to be creditworthy. The Funds bear the risk of loss in the event that the counterparty to a repurchase agreement defaults on its obligations, and the Funds are prevented from exercising their rights to dispose of the underlying securities received as collateral and the risk of a possible decline in the value of the underlying securities during the period. For financial statement purposes, the Funds record the securities lending collateral (included in repurchase agreements, at value or restricted cash) as an asset and the obligation to return securities lending collateral as a liability on the Statements of Assets and Liabilities.
Repurchase agreements are entered into by the Funds under Master Repurchase Agreements (“MRA”) which permit the Funds, under certain circumstances, including an event of default (such as bankruptcy or insolvency), to offset payables and/or receivables under an MRA with collateral held and/or posted to the counterparty and create one single net payment due to or from the Funds.
As of October 31, 2021, the open repurchase agreements by counterparty which are subject to an MRA on a net payment basis are as follows:
| | | Repurchase Agreements* | | | Fair Value of Non-cash Collateral Received(1) | | | Cash Collateral Received | | | Net Amount(2) | |
| Global X Social Media ETF | | | | | | | | | | | | |
| BNP Paribas | | $ | 334,499 | | | $ | 334,499 | | | $ | − | | | $ | − | |
| Global X Lithium & Battery Tech ETF | | | | | | | | | | | | | | | | |
| BNP Paribas | | | 49,400,348 | | | | 49,400,348 | | | | − | | | | − | |
| Global X E-commerce ETF | | | | | | | | | | | | | | | | |
| BNP Paribas | | | 1,384,981 | | | | 1,384,981 | | | | − | | | | − | |
Global X SuperDividend® ETF | | | | | | | | | | | | | | | | |
| BNP Paribas | | | 16,543,844 | | | | 16,543,844 | | | | − | | | | − | |
| | Notes to Financial Statements (continued) | |
| | October 31, 2021 | |
2. SIGNIFICANT ACCOUNTING POLICIES (continued)
| | | Repurchase Agreements* | | | Fair Value of Non-cash Collateral Received(1) | | | Cash Collateral Received | | | Net Amount(2) | |
Global X SuperDividend® U.S. ETF | | | | | | | | | | | | |
| BNP Paribas | | $ | 3,131,165 | | | $ | 3,131,165 | | | $ | − | | | $ | − | |
Global X SuperDividend® REIT ETF | | | | | | | | | | | | | | | | |
| BNP Paribas | | | 1,344,045 | | | | 1,344,045 | | | | − | | | | − | |
| Global X SuperIncome™ Preferred ETF | | | | | | | | | | | | | | | | |
| BNP Paribas | | | 33,091 | | | | 33,091 | | | | − | | | | − | |
| Global X Renewable Energy Producers ETF | | | | | | | | | | | | | | | | |
| BNP Paribas | | | 1,691,227 | | | | 1,691,227 | | | | − | | | | − | |
Global X Guru® Index ETF | | | | | | | | | | | | | | | | |
| BNP Paribas | | | 434,594 | | | | 434,594 | | | | − | | | | − | |
| * | Repurchase agreements with an overstated and continous maturity. |
(1) | Excess collateral received is not presented in the table above. Please refer to the Schedules of Investments for the market value of the collateral received for each Fund. |
(2) | Net Amount represents the net amount receivable due from the counterparty in the event of default. |
FEDERAL INCOME TAXES – It is each Fund’s intention to qualify, or continue to qualify, as a regulated investment company for Federal income tax purposes by complying with the appropriate provisions of Subchapter M of the Code. Accordingly, no provisions for Federal income taxes have been made in the financial statements except as described below.
The Funds evaluate tax positions taken or expected to be taken in the course of preparing the Funds’ tax returns to determine whether it is “more-likely-than-not” (i.e., greater than 50 percent) that each tax position will be sustained upon examination by a taxing authority based on the technical merits of the position. Tax positions not deemed to meet the more-likely-than-not threshold are recorded as a tax benefit or expense in the current year. The Funds did not record any tax positions in the current period; however, management’s conclusions regarding tax positions may be subject to review and adjustment at a later date based on factors including, but not limited to, examination by tax authorities (i.e., the last three tax year ends, as applicable), and on-going analysis of and changes to tax laws and regulations, and interpretations thereof.
If a Fund has foreign tax filings that have not been made, the tax years that remain subject to examination may date back to the inception of the Fund.
As of and during the reporting period ended October 31, 2021, the Funds did not have a liability for any unrecognized tax benefits. The Funds recognize interest and penalties, if any, related to unrecognized tax benefits as income tax expense on the Statements of Operations. During the reporting period, the Funds did not incur any interest or penalties.
| | Notes to Financial Statements (continued) | |
| | October 31, 2021 | |
2. SIGNIFICANT ACCOUNTING POLICIES (continued)
SECURITY TRANSACTIONS AND INVESTMENT INCOME – Security transactions are accounted for on the trade date for financial reporting purposes. Costs used in determining realized gains and losses on the sale of investment securities are based on specific identification. Dividend income is recorded on the ex-dividend date. Interest income is recognized on the accrual basis from the settlement date.
FOREIGN CURRENCY TRANSACTIONS AND TRANSLATION – The books and records of the Funds are maintained in U.S. dollars. Investment securities and other assets and liabilities denominated in a foreign currency are translated into U.S. dollars on the date of valuation. Purchases and sales of investment securities, income and expenses are translated into U.S. dollars at the relevant rates of exchange prevailing on the respective dates of such transactions. The Funds do not isolate that portion of realized or unrealized gains and losses resulting from changes in the foreign exchange rate from fluctuations arising from changes in the market prices of the securities. These gains and losses are included in net realized and unrealized gains and losses on investments on the Statements of Operations. Net realized and unrealized gains and losses on foreign currency transactions and translations represent net foreign exchange gains or losses from foreign currency spot contracts, disposition of foreign currencies, currency gains or losses realized between trade and settlement dates on securities transactions and the difference between the amount of the investment income and foreign withholding taxes recorded on the Funds’ books and the U.S. dollar equivalent amounts actually received or paid.
DIVIDENDS AND DISTRIBUTIONS TO SHAREHOLDERS – The Funds distribute their net investment income on a pro rata basis. Any net investment income and net realized capital gains are distributed at least annually. All distributions are recorded on ex-dividend date.
INVESTMENTS IN REITs – With respect to the Funds, dividend income is recorded based on the income included in distributions received from REIT investments using published REIT reclassifications, including some management estimates when actual amounts are not available. Distributions received in excess of these estimated amounts are recorded as a reduction of the cost of investments or reclassified to capital gains. The actual amounts of income, return of capital, and capital gains are only determined by each REIT after its fiscal year end, and may differ from the estimated amounts.
CREATION UNITS – The Funds issue and redeem their shares (“Shares”) on a continuous basis at net asset value (“NAV”) and only in large blocks of 10,000 Shares, referred to as “Creation Units”. Purchasers of Creation Units (“Authorized Participants”) at NAV must pay a standard creation transaction fee per transaction. The fee is a single charge and will be the same regardless of the number of Creation Units purchased by an Authorized Participant on the same day.
| | Notes to Financial Statements (continued) | |
| | October 31, 2021 | |
2. SIGNIFICANT ACCOUNTING POLICIES (continued)
An Authorized Participant who holds Creation Units and wishes to redeem at NAV would also pay a standard redemption fee per transaction to BBH, on the date of such redemption, regardless of the number of Creation Units redeemed that day.
If a Creation Unit is purchased or redeemed for cash, an additional variable fee may be charged. The following table discloses Creation Unit breakdown:
| | | Creation Unit Shares | | | Creation Fee | | | Value at October 31, 2021 | | | Redemption Fee | |
| Global X Social Media ETF | | | 10,000 | | | $ | 300 | | | $ | 612,600 | | | $ | 300 | |
| Global X Lithium & Battery Tech ETF | | | 10,000 | | | | 1,000 | | | | 910,700 | | | | 1,000 | |
| Global X E-commerce ETF | | | 10,000 | | | | 500 | | | | 311,900 | | | | 500 | |
| Global X Emerging Markets Internet & E-commerce ETF | | | 10,000 | | | | 800 | | | | 119,900 | | | | 800 | |
Global X SuperDividend® ETF | | | 10,000 | | | | 2,000 | | | | 130,100 | | | | 2,000 | |
Global X SuperDividend® U.S. ETF | | | 10,000 | | | | 150 | | | | 201,300 | | | | 150 | |
Global X MSCI SuperDividend® EAFE ETF | | | 10,000 | | | | 1,000 | | | | 156,200 | | | | 1,000 | |
Global X MSCI SuperDividend® Emerging Markets ETF | | | 10,000 | | | | 3,000 | | | | 112,600 | | | | 3,000 | |
Global X SuperDividend® REIT ETF | | | 10,000 | | | | 250 | | | | 98,200 | | | | 250 | |
Global X NASDAQ 100® Covered Call ETF | | | 10,000 | | | | 500 | | | | 228,200 | | | | 500 | |
Global X S&P 500® Covered Call ETF | | | 10,000 | | | | 2,000 | | | | 503,700 | | | | 2,000 | |
| Global X Russell 2000 Covered Call ETF | | | 10,000 | | | | 250 | | | | 251,800 | | | | 250 | |
Global X Nasdaq 100® Covered Call & Growth ETF | | | 10,000 | | | | 500 | | | | 330,900 | | | | 500 | |
Global X S&P 500® Covered Call & Growth ETF | | | 10,000 | | | | 2,000 | | | | 318,300 | | | | 2,000 | |
| Global X SuperIncome™ Preferred ETF | | | 10,000 | | | | 300 | | | | 119,400 | | | | 300 | |
| Global X Renewable Energy Producers ETF | | | 10,000 | | | | 500 | | | | 168,200 | | | | 500 | |
Global X S&P 500® Catholic Values ETF | | | 10,000 | | | | 1,300 | | | | 572,200 | | | | 1,300 | |
| Global X S&P Catholic Values Developed ex-U.S. ETF | | | 10,000 | | | | 8,900 | | | | 328,000 | | | | 8,900 | |
Global X Guru® Index ETF | | | 10,000 | | | | 250 | | | | 502,400 | | | | 250 | |
Global X S&P 500® Tail Risk ETF | | | 10,000 | | | | 2,000 | | | | 277,200 | | | | 2,000 | |
Global X S&P 500® Risk Managed Income ETF | | | 10,000 | | | | 2,000 | | | | 268,300 | | | | 2,000 | |
Global X S&P 500® Collar 95-110 ETF | | | 10,000 | | | | 2,000 | | | | 275,700 | | | | 2,000 | |
Global X NASDAQ 100® Tail Risk ETF | | | 10,000 | | | | 500 | | | | 255,900 | | | | 500 | |
Global X NASDAQ 100® Risk Managed Income ETF | | | 10,000 | | | | 500 | | | | 241,200 | | | | 500 | |
Global X NASDAQ 100® Collar 95-110 ETF | | | 10,000 | | | | 500 | | | | 257,800 | | | | 500 | |
CASH OVERDRAFT CHARGES – Per the terms of an agreement with BBH, if a Fund has a cash overdraft on a given day, it will be assessed an overdraft charge of LIBOR plus 2.00%. Cash overdraft charges are included in custodian fees on the Statements of Operations.
| | Notes to Financial Statements (continued) | |
| | October 31, 2021 | |
3. RELATED PARTY TRANSACTIONS AND SERVICE PROVIDER TRANSACTIONS
On July 2, 2018, the Adviser consummated a transaction pursuant to which it became an indirect, wholly-owned subsidiary of Mirae Asset Global Investments Co., Ltd. (“Mirae”). In this manner, the Adviser is ultimately controlled by Mirae, which is a leading financial services company in Korea and is the headquarters for the Mirae Asset Global Investments Group.
The Adviser serves as the investment adviser and the administrator for the Funds. Subject to the supervision of the Board, the Adviser is responsible for managing the investment activities of the Funds and the Funds’ business affairs and other administrative matters and provides, or causes to be furnished, all supervisory, administrative and other services reasonably necessary for the operation of the Funds, including certain distribution services (provided pursuant to a separate distribution agreement), certain shareholder and distribution-related services (provided pursuant to a separate Rule 12b-1 Plan and related agreements) and investment advisory services (provided pursuant to a separate Investment Advisory Agreement), under what is essentially an “all-in” fee structure. For the Adviser’s service to the Funds, under a supervision and administration agreement (the “Supervision and Administration Agreement”), each Fund pays a monthly fee to the Adviser at the annual rate below (stated as a percentage of the average daily net assets of the Fund). In addition, the Funds bear other expenses, directly and indirectly, that are not covered by the Supervision and Administration Agreement, which may vary and affect the total expense ratios of the Funds, such as taxes, brokerage fees, commissions, custodian fees, acquired fund fees, and other transaction expenses, interest expenses and extraordinary expenses (such as litigation and indemnification expenses).
The following table discloses supervision and administration fees payable pursuant to the Supervision and Administration Agreement:
| | Supervision and Administration Fee |
| Global X Social Media ETF | 0.65% |
| Global X Lithium & Battery Tech ETF | 0.75% |
| Global X E-commerce ETF | 0.50% |
| Global X Emerging Markets Internet & E-commerce ETF | 0.65% |
Global X SuperDividend® ETF | 0.58% |
Global X SuperDividend® U.S. ETF | 0.45% |
Global X MSCI SuperDividend® EAFE ETF | 0.55% |
Global X MSCI SuperDividend® Emerging Markets ETF | 0.65% |
Global X SuperDividend® REIT ETF | 0.58% |
| | Notes to Financial Statements (continued) | |
| | October 31, 2021 | |
3. RELATED PARTY TRANSACTIONS AND SERVICE PROVIDER TRANSACTIONS (continued)
| | Supervision and Administration Fee |
Global X NASDAQ 100® Covered Call ETF | 0.60% |
Global X S&P 500® Covered Call ETF* | 0.60% |
| Global X Russell 2000 Covered Call ETF** | 0.60% |
Global X Nasdaq 100® Covered Call & Growth ETF | 0.60% |
Global X S&P 500® Covered Call & Growth ETF | 0.60% |
Global X SuperIncomeTM Preferred ETF | 0.58% |
| Global X Renewable Energy Producers ETF | 0.65% |
Global X S&P 500® Catholic Values ETF*** | 0.29% |
| Global X S&P Catholic Values Developed ex-U.S. ETF | 0.35% |
Global X Guru® Index ETF | 0.75% |
Global X S&P 500® Tail Risk ETF | 0.60% |
Global X S&P 500® Risk Managed Income ETF | 0.60% |
Global X S&P 500® Collar 95-110 ETF | 0.60% |
Global X NASDAQ 100® Tail Risk ETF | 0.60% |
Global X NASDAQ 100® Risk Managed Income ETF | 0.60% |
Global X NASDAQ 100® Collar 95-110 ETF | 0.60% |
*Pursuant to an expense limitation agreement in existence between the Global X S&P 500® Covered Call ETF (the “Fund”) and the Adviser, the Adviser agreed to reimburse or waive fees and/or limit Fund expenses to the extent necessary to assure that the operating expenses of the Fund, exclusive of taxes, commissions, and other transaction expenses, interest, and extraordinary expenses (such as litigation and indemnification expenses) will not exceed 0.60% of the Fund’s average daily net assets per year, effective August 21, 2020, until at least March 1, 2022.
**Pursuant to an expense limitation agreement in existence between the Global X Russell 2000 Covered Call ETF (the “Fund”) and the Adviser, the Adviser agreed to waive or reimburse fees and/or limit Fund expenses to the extent necessary to assure that the operating expenses of the Fund, exclusive of taxes, brokerage fees, commissions, and other transaction expenses, interest, and extraordinary expenses (such as litigation and indemnification expenses) will not exceed 0.60% of the Fund’s average daily net assets per year, effective March 1, 2021, until at least March 1, 2022.
| | Notes to Financial Statements (continued) | |
| | October 31, 2021 | |
3. RELATED PARTY TRANSACTIONS AND SERVICE PROVIDER TRANSACTIONS (continued)
***Pursuant to an expense limitation agreement in existence between the Global X S&P 500® Catholic Values ETF (the “Fund”) and the Adviser prior to March 1, 2018, the Adviser agreed to waive or reimburse fees and/or limit fund expenses to the extent necessary to assure that the operating expenses of the Fund (exclusive of taxes, brokerage fees, commissions, and other transaction expenses and extraordinary expenses (such as litigation and indemnification expenses) (“Total Annual Fund Operating Expenses”) would not exceed 0.29% of the Fund’s average daily net assets per year until at least March 1, 2018. Pursuant to the expense limitation agreement, the Fund (at a later date) could reimburse the Adviser for the fees and expenses it waived or reimbursed and/or limited during any of the prior three fiscal years, provided that, among other things, any reimbursement made to the Adviser would not cause Total Annual Fund Operating Expenses to exceed the maximum permitted rate during the period in which it is paid and the Board had approved such reimbursement to the Adviser. Although the Board voted on December 19, 2017, to permanently reduce the Fund’s fees to 0.29% and end the expense limitation agreement as of March 1, 2018, prior waived or reimbursed fees are still subject to recoupment. As of October 31, 2021, the amounts of waivers/reimbursements subject to recoupment for the Fund were $0 expiring in 2022, $43,032 expiring 2021 and $88,406 expiring 2020. As of October 31, 2021 there had been no recoupment of previously waived and reimbursed fees.
SEI Investments Global Funds Services (“SEIGFS”) serves as sub-administrator to the Funds. As sub-administrator, SEIGFS provides the Funds with required general administrative services, including, without limitation: office space, equipment, and personnel; clerical and general back office services; bookkeeping, internal accounting and secretarial services; the calculation of NAV; and assistance with the preparation and filing of reports, registration statements, proxy statements, and other materials required to be filed or furnished by the Funds under federal and state securities laws. As compensation for these services, SEIGFS receives certain out-of-pocket costs, transaction fees, and asset-based fees which are accrued daily and paid monthly by the Adviser.
SEI Investments Distribution Co. (“SIDCO”) serves as each Fund’s underwriter and distributor of Creation Units pursuant to a distribution agreement. SIDCO has no obligation to sell any specific quantity of Fund Shares.
SIDCO bears the following costs and expenses relating to the distribution of Shares: (1) the costs of processing and maintaining records of creations of Creation Units; (2) all costs of maintaining the records required of a registered broker/dealer; (3) the expenses of maintaining its registration or qualification as a dealer or broker under Federal or state laws; (4) filing fees; and (5) all other expenses incurred in connection with the distribution services as contemplated in the distribution agreement. SIDCO receives no fee from the Funds for its distribution services under the distribution agreement, rather, the Adviser compensates SIDCO for certain expenses, out-of-pocket costs, and transaction fees.
| | Notes to Financial Statements (continued) | |
| | October 31, 2021 | |
3. RELATED PARTY TRANSACTIONS AND SERVICE PROVIDER TRANSACTIONS (continued)
BBH serves as Custodian and transfer agent of the Funds’ assets. As Custodian, BBH has agreed to (1) make receipts and disbursements of money on behalf of the Funds; (2) collect and receive all income and other payments and distributions on account of the Funds’ portfolio investments; (3) respond to correspondence from shareholders, security brokers and others relating to its duties; and (4) make periodic reports to the Funds concerning the Funds’ operations. BBH does not exercise any supervisory function over the purchase and sale of securities. As transfer agent, BBH has agreed to (1) issue and redeem Shares of each Fund; (2) make dividend and other distributions to shareholders of each Fund; (3) respond to correspondence by shareholders and others relating to its duties; (4) maintain shareholder accounts; and (5) make periodic reports to the Funds. As compensation for these services, BBH receives certain out-of-pocket costs, transaction fees and asset-based fees which are accrued daily and paid monthly by the Adviser from its fees.
4. INVESTMENT TRANSACTIONS
For the year ended October 31, 2021, the purchases and sales of investments in securities, excluding in-kind transactions, long-term U.S. Government and short-term securities, were:
| | | Purchases | | | Sales and Maturities | |
| Global X Social Media ETF | | $ | 175,783,743 | | | $ | 121,973,730 | |
| Global X Lithium & Battery Tech ETF | | | 2,939,975,344 | | | | 1,259,517,064 | |
| Global X E-commerce ETF | | | 29,487,362 | | | | 27,784,454 | |
| Global X Emerging Markets Internet & E-commerce ETF | | | 2,942,566 | | | | 1,369,993 | |
Global X SuperDividend® ETF | | | 768,369,749 | | | | 710,925,893 | |
Global X SuperDividend® U.S. ETF | | | 364,952,263 | | | | 380,577,684 | |
Global X MSCI SuperDividend® EAFE ETF | | | 10,658,428 | | | | 10,216,566 | |
Global X MSCI SuperDividend® Emerging Markets ETF | | | 76,455,969 | | | | 45,869,773 | |
Global X SuperDividend® REIT ETF | | | 262,385,748 | | | | 265,740,470 | |
Global X NASDAQ 100® Covered Call ETF | | | 581,580,281 | | | | 1,173,008,400 | |
Global X S&P 500® Covered Call ETF | | | 14,235,728 | | | | 49,167,751 | |
| Global X Russell 2000 Covered Call ETF | | | 16,814,367 | | | | 33,707,588 | |
Global X Nasdaq 100® Covered Call & Growth ETF | | | 1,908,379 | | | | 3,511,435 | |
Global X S&P 500® Covered Call & Growth ETF | | | 1,227,237 | | | | 1,125,942 | |
| Global X SuperIncome™ Preferred ETF | | | 207,080,081 | | | | 207,690,565 | |
| Global X Renewable Energy Producers ETF | | | 83,688,527 | | | | 64,066,847 | |
Global X S&P 500® Catholic Values ETF | | | 44,014,147 | | | | 42,247,397 | |
| Global X S&P Catholic Values Developed ex-U.S. ETF | | | 598,157 | | | | 547,221 | |
Global X Guru® Index ETF | | | 85,972,386 | | | | 85,730,878 | |
Global X S&P 500® Tail Risk ETF | | | 184,271 | | | | 220,400 | |
Global X S&P 500® Risk Managed Income ETF | | | 269,282 | | | | 280,524 | |
Global X S&P 500® Collar 95-110 ETF | | | 184,112 | | | | 239,294 | |
Global X NASDAQ 100® Tail Risk ETF | | | 50,970 | | | | 95,612 | |
Global X NASDAQ 100® Risk Managed Income ETF | | | 73,308 | | | | 186,338 | |
Global X NASDAQ 100® Collar 95-110 ETF | | | 56,278 | | | | 120,057 | |
| | Notes to Financial Statements (continued) | |
| | October 31, 2021 | |
4. INVESTMENT TRANSACTIONS (continued)
For the year ended October 31, 2021, there were no purchases and sales of long-term U.S. Government securities.
For the year ended October 31, 2021, in-kind transactions associated with creations and redemptions were:
| 2021 | | Purchases | | | Sales and Maturities | | | Realized Gain/(Loss) | |
| Global X Social Media ETF | | $ | 249,814,697 | | | $ | 161,825,652 | | | $ | 104,250,876 | |
| Global X Lithium & Battery Tech ETF | | | 1,301,530,281 | | | | 366,384,618 | | | | 234,758,649 | |
| Global X E-commerce ETF | | | 154,359,054 | | | | 55,200,159 | | | | 21,442,562 | |
| Global X Emerging Markets Internet & E-commerce ETF | | | 5,524,406 | | | | 757,687 | | | | (121,392 | ) |
Global X SuperDividend® ETF | | | 116,148,336 | | | | 4,825,925 | | | | 1,306,373 | |
Global X SuperDividend® U.S. ETF | | | 141,063,730 | | | | 33,098,332 | | | | 5,304,331 | |
Global X MSCI SuperDividend® EAFE ETF | | | 4,473,039 | | | | 929,987 | | | | 89,950 | |
Global X MSCI SuperDividend® Emerging Markets ETF | | | 12,009,994 | | | | – | | | | – | |
Global X SuperDividend® REIT ETF | | | 109,800,947 | | | | 53,971,417 | | | | 11,010,490 | |
Global X NASDAQ 100® Covered Call ETF | | | 3,619,325,170 | | | | 26,690,549 | | | | 15,759,156 | |
Global X S&P 500® Covered Call ETF | | | 548,443,411 | | | | 7,302,890 | | | | 2,537,496 | |
| Global X Russell 2000 Covered Call ETF | | | 533,979,476 | | | | 501,604 | | | | 234,461 | |
Global X Nasdaq 100® Covered Call & Growth ETF | | | 38,168,292 | | | | 2,820,576 | | | | 245,511 | |
Global X S&P 500® Covered Call & Growth ETF | | | 33,475,572 | | | | 4,125,677 | | | | 427,939 | |
| Global X SuperIncome™ Preferred ETF | | | 44,678,336 | | | | 7,476,659 | | | | 831,987 | |
| Global X Renewable Energy Producers ETF | | | 103,945,368 | | | | 48,932,053 | | | | 11,012,881 | |
Global X S&P 500® Catholic Values ETF | | | 124,592,947 | | | | 80,395,996 | | | | 39,980,846 | |
| Global X S&P Catholic Values Developed ex-U.S. ETF | | | 930,692 | | | | – | | | | – | |
Global X Guru® Index ETF | | | 22,438,467 | | | | 22,168,067 | | | | 6,600,357 | |
Global X S&P 500® Tail Risk ETF | | | 3,506,784 | | | | – | | | | – | |
Global X S&P 500® Risk Managed Income ETF | | | 5,908,307 | | | | – | | | | – | |
Global X S&P 500® Collar 95-110 ETF | | | 3,242,149 | | | | – | | | | – | |
Global X NASDAQ 100® Tail Risk ETF | | | 3,252,445 | | | | – | | | | – | |
Global X NASDAQ 100® Risk Managed Income ETF | | | 4,512,650 | | | | – | | | | – | |
Global X NASDAQ 100® Collar 95-110 ETF | | | 2,796,085 | | | | – | | | | – | |
For the year or period ended October 31, 2020, in-kind transactions associated with creations and redemptions were:
| 2020 | | Purchases | | | Sales and Maturities | | | Realized Gain/(Loss) | |
| Global X Social Media ETF | | $ | 33,340,357 | | | $ | 10,559,714 | | | $ | 1,966,522 | |
| Global X Lithium & Battery Tech ETF | | | 104,208,945 | | | | 62,679,799 | | | | 3,955,066 | |
| Global X E-commerce ETF | | | 92,096,000 | | | | 12,844,433 | | | | 4,549,847 | |
| Global X Emerging Markets Internet & E-commerce ETF | | | – | | | | – | | | | – | |
Global X SuperDividend® ETF | | | 90,730,215 | | | | 27,787,216 | | | | (9,224,904 | ) |
Global X SuperDividend® U.S. ETF | | | 126,117,688 | | | | 34,059,155 | | | | 2,165,771 | |
Global X MSCI SuperDividend® EAFE ETF | | | 1,217,335 | | | | 7,923,306 | | | | (707,578 | ) |
Global X MSCI SuperDividend® Emerging Markets ETF | | | 3,714,194 | | | | – | | | | – | |
| | Notes to Financial Statements (continued) | |
| | October 31, 2021 | |
4. INVESTMENT TRANSACTIONS (continued)
| 2020 | | Purchases | | | Sales and Maturities | | | Realized Gain/(Loss) | |
Global X SuperDividend® REIT ETF | | | 353,613,219 | | | | 118,682,903 | | | | 19,269,208 | |
Global X NASDAQ 100® Covered Call ETF | | | 778,575,756 | | | | 66,199,151 | | | | 29,752,498 | |
Global X S&P 500® Covered Call ETF | | | 60,812,072 | | | | 66,922,435 | | | | 17,587,784 | |
| Global X Russell 2000 Covered Call ETF | | | 16,843,643 | | | | 1,088,385 | | | | 335,463 | |
Global X Nasdaq 100® Covered Call & Growth ETF | | | 6,753,905 | | | | – | | | | – | |
Global X S&P 500® Covered Call & Growth ETF | | | 3,799,913 | | | | – | | | | – | |
| Global X SuperIncome™ Preferred ETF | | | 24,579,689 | | | | 28,420,360 | | | | (2,327,435 | ) |
| Global X YieldCo & Renewable Energy Income ETF | | | 35,307,456 | | | | 5,003,213 | | | | 1,265,475 | |
Global X S&P 500® Catholic Values ETF | | | 117,889,845 | | | | 45,730,969 | | | | 17,772,932 | |
| Global X S&P Catholic Values Developed ex-U.S. ETF | | | 2,501,921 | | | | – | | | | – | |
Global X Guru® Index ETF | | | – | | | | 4,796,655 | | | | 428,411 | |
To the extent consistent with their investment policies, certain Funds may either purchase or write options.
When a Fund purchases an option, the premium paid by it is recorded as an asset of the Fund. When a Fund writes an option, an amount equal to the net premium (the premium less the commission) received by the Fund is included in the liability section of the Fund’s Statement of Assets and Liabilities as a deferred credit. The amount of this asset or deferred credit will be subsequently marked-to-market to reflect the current value of the option purchased or written. The current value of the traded option is the last sale price or, in the absence of a sale, the current bid price. If an option purchased by a Fund expires unexercised, the Fund realizes a loss equal to the premium paid. If a Fund enters into a closing sale transaction on an option purchased by it, the Fund will realize a gain if the premium received by the Fund on the closing transaction is more than the premium paid to purchase the option, or a loss if it is less. If an option written by a Fund expires on the stipulated expiration date or if a Fund enters into a closing purchase transaction, it will realize a gain (or loss if the cost of a closing purchase transaction exceeds the net premium received when the option is sold) and the deferred credit related to such option will be eliminated. If an option written by a Fund is exercised, the proceeds of the sale will be increased by the net premium originally received and the Fund will realize a gain or loss.
Risks may arise from an imperfect correlation between the change in market value of the securities held and the prices of options relating to the securities purchased or sold and from possible lack of a liquid secondary market for an option. The maximum exposure to loss for any purchased option is limited to the premium initially paid for the option. Written uncovered call options subject a Fund to unlimited risk of loss. Written covered call options limit the upside potential of a security above the strike price. Written put options expose a Fund to risk of loss if the value of the security declines below the strike price.
| | Notes to Financial Statements (continued) | |
| | October 31, 2021 | |
4. INVESTMENT TRANSACTIONS (continued)
The Global X NASDAQ 100® Covered Call ETF, Global X S&P 500® Covered Call ETF, Global X Russell 2000 Covered Call ETF, Global X Nasdaq 100® Covered Call & Growth ETF, Global X S&P 500® Covered Call & Growth ETF, Global X S&P 500® Tail Risk ETF, Global X S&P 500® Risk Managed Income ETF, Global X S&P 500® Collar 95-110 ETF, Global X Nasdaq 100® Tail Risk ETF, Global X Nasdaq 100® Risk Managed Income ETF, and Global X Nasdaq 100® Collar 95-110 ETF may write covered call and/or put options that correspond to their respective reference index. By writing a covered call option, a Fund, in exchange for the premium, foregoes the opportunity for capital appreciation above the strike price should the market price of the underlying security increase. Conversely, by writing a put option, the Fund, in exchange for the premium, accepts the risk of having to purchase a security at a fixed strike price even should the price of the underlying security decrease, exposing the Fund to downside risk in the underlying security.
For the year ended October 31, 2021, all options were considered Equity Risk.
When the written option expires, is terminated or is sold, a Fund will record a gain or loss. The net realized gain or loss on options contracts is reflected in the Statements of Operations and the net unrealized gains/(losses) are included as a component of the net change in unrealized appreciation/(depreciation) on options contracts in the Statements of Operations.
For the year ended October 31, 2021, the monthly average cost of the written and purchased options contracts held by the Funds were as follows:
| | | Short Avg | | | Short End | | | Long Avg | | | Long End | |
Global X NASDAQ 100® Covered Call ETF | | $ | (61,763,182 | ) | | $ | (89,664,262 | ) | | $ | – | | | $ | – | |
Global X S&P 500® Covered Call ETF | | | (4,780,016 | ) | | | (9,674,024 | ) | | | – | | | | – | |
| Global X Russell 2000 Covered Call ETF | | | (4,779,094 | ) | | | (10,800,917 | ) | | | – | | | | – | |
Global X Nasdaq 100® Covered Call & Growth ETF | | | (175,545 | ) | | | (400,793 | ) | | | – | | | | – | |
Global X S&P 500® Covered Call & Growth ETF | | | (75,654 | ) | | | (239,180 | ) | | | – | | | | – | |
Global X S&P 500® Tail Risk ETF | | | – | | | | – | | | | 26,964 | | | | 43,527 | |
Global X S&P 500® Risk Managed Income ETF | | | (62,186 | ) | | | (90,624 | ) | | | 20,140 | | | | 35,039 | |
Global X S&P 500® Collar 95-110 ETF | | | (3,238 | ) | | | (2,774 | ) | | | 41,897 | | | | 66,297 | |
Global X NASDAQ 100® Tail Risk ETF | | | – | | | | – | | | | 35,577 | | | | 52,310 | |
Global X NASDAQ 100® Risk Managed Income ETF | | | (71,245 | ) | | | (88,602 | ) | | | 22,413 | | | | 31,242 | |
Global X NASDAQ 100® Collar 95-110 ETF | | | (9,948 | ) | | | (6,457 | ) | | | 46,257 | | | | 67,630 | |
| | Notes to Financial Statements (continued) | |
| | October 31, 2021 | |
5. TAX INFORMATION
The Global X SuperDividend® REIT ETF has a tax year that ends on December 31. The following tax disclosures are representative as of October 31, 2021. Accordingly, the disclosures are for informational use by shareholders and are subject to change attributable to activity through the end of the tax year ending December 31, 2021.
The amount and character of income and capital gain distributions to be paid, if any, are determined in accordance with Federal income tax regulations, which may differ from U.S. GAAP. As a result, net investment income (loss) and net realized gain (loss) on investment transactions for a reporting period may differ significantly from distributions during such period. These book/tax differences may be temporary or permanent. To the extent these differences are permanent in nature, they are charged or credited to undistributed net investment income (loss), accumulated net realized gain (loss) or paid-in capital, as appropriate, in the period that the differences arise.
The following differences, primarily attributable to preferred stock interest, foreign currency, redemptions in-kind, REIT adjustments, MLP adjustments, net operating loss, return of capital distribution and sales of passive foreign investment companies have been reclassified to/from the following accounts during the fiscal year ended October 31, 2021:
| Global X Funds | | Paid-in Capital | | | Distributable Earnings (Loss) | |
| Global X Social Media ETF | | $ | 103,267,695 | | | $ | (103,267,695 | ) |
| Global X Lithium & Battery Tech ETF | | | 226,308,417 | | | | (226,308,417 | ) |
| Global X E-commerce ETF | | | 21,414,459 | | | | (21,414,459 | ) |
| Global X Emerging Markets Internet & E-commerce ETF | | | (124,587 | ) | | | 124,587 | |
Global X SuperDividend® ETF | | | (2,301,566 | ) | | | 2,301,566 | |
Global X SuperDividend® U.S. ETF | | | 44,856 | | | | (44,856 | ) |
Global X MSCI SuperDividend® EAFE ETF | | | 84,607 | | | | (84,607 | ) |
Global X SuperDividend® REIT ETF | | | 19,051,553 | | | | (19,051,553 | ) |
Global X NASDAQ 100® Covered Call ETF | | | 15,759,156 | | | | (15,759,156 | ) |
Global X S&P 500® Covered Call ETF | | | 2,493,316 | | | | (2,493,316 | ) |
| Global X Russell 2000 Covered Call ETF | | | 234,461 | | | | (234,461 | ) |
Global X Nasdaq 100® Covered Call & Growth ETF | | | 245,511 | | | | (245,511 | ) |
Global X S&P 500® Covered Call & Growth ETF | | | 427,954 | | | | (427,954 | ) |
| Global X SuperIncome™ Preferred ETF | | | 209,386 | | | | (209,386 | ) |
| Global X Renewable Energy Producers ETF | | | 10,238,793 | | | | (10,238,793 | ) |
Global X S&P 500® Catholic Values ETF | | | 39,718,259 | | | | (39,718,259 | ) |
Global X Guru® Index ETF | | | 6,333,266 | | | | (6,333,266 | ) |
| | Notes to Financial Statements (continued) | |
| | October 31, 2021 | |
The tax character of dividends and distributions declared during the years or periods ended October 31, 2021 and October 31, 2020 were as follows:
| Global X Funds | | Ordinary Income | | | Long-Term Capital Gain | | | Return of Capital | | | Totals | |
| Global X Social Media ETF | | | | | | | | | | | | |
| 2021 | | $ | – | | | $ | – | | | $ | – | | | $ | – | |
| 2020 | | | – | | | | – | | | | – | | | | – | |
| Global X Lithium & Battery Tech ETF | | | | | | | | | | | | | | | | |
| 2021 | | $ | 4,617,167 | | | $ | – | | | $ | – | | | $ | 4,617,167 | |
| 2020 | | | 7,964,116 | | | | – | | | | – | | | | 7,964,116 | |
| Global X E-commerce ETF | | | | | | | | | | | | | | | | |
| 2021 | | $ | 1,105,636 | | | $ | – | | | $ | – | | | $ | 1,105,636 | |
| 2020 | | | 11,908 | | | | – | | | | – | | | | 11,908 | |
| Global X Emerging Markets Internet & E-commerce ETF | | | | | | | | | | | | | | | | |
| 2021 | | $ | – | | | $ | – | | | $ | – | | | $ | – | |
Global X SuperDividend® ETF | | | | | | | | | | | | | | | | |
| 2021 | | $ | 65,648,210 | | | $ | – | | | $ | – | | | $ | 65,648,210 | |
| 2020 | | | 57,676,007 | | | | – | | | | 6,836,903 | | | | 64,512,910 | |
Global X SuperDividend® U.S. ETF | | | | | | | | | | | | | | | | |
| 2021 | | $ | 31,364,614 | | | $ | – | | | $ | 3,660,741 | | | $ | 35,025,355 | |
| 2020 | | | 28,896,892 | | | | – | | | | 9,790,983 | | | | 38,687,875 | |
Global X MSCI SuperDividend® EAFE ETF | | | | | | | | | | | | | | | | |
| 2021 | | $ | 542,165 | | | $ | – | | | $ | – | | | $ | 542,165 | |
| 2020 | | | 454,057 | | | | – | | | | 119,148 | | | | 573,205 | |
Global X MSCI SuperDividend® Emerging Markets ETF | | | | | | | | | | | | | | | | |
| 2021 | | $ | 2,831,439 | | | $ | – | | | $ | – | | | $ | 2,831,439 | |
| 2020 | | | 1,074,084 | | | | – | | | | 222,316 | | | | 1,296,400 | |
Global X SuperDividend® REIT ETF | | | | | | | | | | | | | | | | |
| 2021 | | $ | 21,690,155 | | | $ | – | | | $ | 9,729,725 | | | $ | 31,419,880 | |
| 2020 | | | 17,057,314 | | | | 482,944 | | | | 2,127,168 | | | | 19,667,426 | |
Global X NASDAQ 100® Covered Call ETF | | | | | | | | | | | | | | | | |
| 2021 | | $ | 320,053,733 | | | $ | – | | | $ | – | | | $ | 320,053,733 | |
| 2020 | | | 2,834,579 | | | | – | | | | 117,268,361 | | | | 120,102,940 | |
Global X S&P 500® Covered Call ETF | | | | | | | | | | | | | | | | |
| 2021 | | $ | 26,627,258 | | | $ | – | | | $ | – | | | $ | 26,627,258 | |
| 2020 | | | 1,539,799 | | | | – | | | | 7,321,411 | | | | 8,861,210 | |
| Global X Russell 2000 Covered Call ETF | | | | | | | | | | | | | | | | |
| 2021 | | $ | 21,788,088 | | | $ | – | | | $ | – | | | $ | 21,788,088 | |
| 2020 | | | 82,683 | | | | 74,655 | | | | 1,449,526 | | | | 1,606,864 | |
Global X Nasdaq 100® Covered Call & Growth ETF | | | | | | | | | | | | | | | | |
| 2021 | | $ | 919,727 | | | $ | – | | | $ | – | | | $ | 919,727 | |
| 2020 | | | – | | | | – | | | | 20,955 | | | | 20,955 | |
Global X S&P 500® Covered Call & Growth ETF | | | | | | | | | | | | | | | | |
| 2021 | | $ | 376,497 | | | $ | – | | | $ | – | | | $ | 376,497 | |
| 2020 | | | 2,931 | | | | – | | | | 16,682 | | | | 19,613 | |
| Global X SuperIncome™ Preferred ETF | | | | | | | | | | | | | | | | |
| 2021 | | $ | 12,037,890 | | | $ | – | | | $ | – | | | $ | 12,037,890 | |
| 2020 | | | 10,818,268 | | | | – | | | | 549,532 | | | | 11,367,800 | |
| | Notes to Financial Statements (continued) | |
| | October 31, 2021 | |
| Global X Funds | | Ordinary Income | | | Long-Term Capital Gain | | | Return of Capital | | | Totals | |
| Global X Renewable Energy Producers ETF | | | | | | | | | | | | |
| 2021 | | $ | 1,677,449 | | | $ | 177,538 | | | $ | – | | | $ | 1,854,987 | |
| 2020 | | | 1,352,385 | | | | – | | | | – | | | | 1,352,385 | |
Global X S&P 500® Catholic Values ETF | | | | | | | | | | | | | | | | |
| 2021 | | $ | 5,511,704 | | | $ | – | | | $ | – | | | $ | 5,511,704 | |
| 2020 | | | 4,513,893 | | | | 128,757 | | | | – | | | | 4,642,650 | |
| Global X S&P Catholic Values Developed ex-U.S. ETF | | | | | | | | | | | | | | | | |
| 2021 | | $ | 59,322 | | | $ | – | | | $ | – | | | $ | 59,322 | |
| 2020 | | | – | | | | – | | | | – | | | | – | |
Global X Guru® Index ETF | | | | | | | | | | | | | | | | |
| 2021 | | $ | 1,352,859 | | | $ | – | | | $ | – | | | $ | 1,352,859 | |
| 2020 | | | 538,248 | | | | – | | | | 28,732 | | | | 566,980 | |
Global X S&P 500® Tail Risk ETF | | | | | | | | | | | | | | | | |
| 2021 | | $ | – | | | $ | – | | | $ | – | | | $ | – | |
Global X S&P 500® Risk Managed Income ETF | | | | | | | | | | | | | | | | |
| 2021 | | $ | 51,640 | | | $ | – | | | $ | – | | | $ | 51,640 | |
Global X S&P 500® Collar 95-110 ETF | | | | | | | | | | | | | | | | |
| 2021 | | $ | – | | | $ | – | | | $ | – | | | $ | – | |
Global X NASDAQ 100® Tail Risk ETF | | | | | | | | | | | | | | | | |
| 2021 | | $ | – | | | $ | – | | | $ | – | | | $ | – | |
Global X NASDAQ 100® Risk Managed Income ETF | | | | | | | | | | | | | | | | |
| 2021 | | $ | – | | | $ | – | | | $ | 52,273 | | | $ | 52,273 | |
Global X NASDAQ 100® Collar 95-110 ETF | | | | | | | | | | | | | | | | |
| 2021 | | $ | – | | | $ | – | | | $ | – | | | $ | – | |
| | | Global X Funds | |
| | | Global X Social Media ETF | | | Global X Lithium & Battery Tech ETF | | | Global X E-commerce ETF | | | Global X Emerging Markets Internet & E-commerce ETF | |
| Undistributed Ordinary Income | | $ | – | | | $ | 9,202,844 | | | $ | – | | | $ | – | |
| Undistributed Long-Term Capital Gain | | | – | | | | – | | | | 613,980 | | | | – | |
| Capital Loss Carryforwards | | | (28,132,536 | ) | | | (63,831,937 | ) | | | – | | | | (198,274 | ) |
| Unrealized Appreciation (Depreciation) on Investments and Foreign Currency | | | (1,417,828 | ) | | | 1,737,482,168 | | | | (14,138,587 | ) | | | (1,464,448 | ) |
| Late Year Loss Deferral | | | (1,697,484 | ) | | | – | | | | (138,055 | ) | | | (25,979 | ) |
| Other Temporary Differences | | | 1 | | | | (7 | ) | | | (1 | ) | | | (5 | ) |
| Total Distributable Earnings (Accumulated Losses) | | $ | (31,247,847 | ) | | $ | 1,682,853,068 | | | $ | (13,662,663 | ) | | $ | (1,688,706 | ) |
| | Notes to Financial Statements (continued) | |
| | October 31, 2021 | |
| | | Global X Funds | |
| | | Global X SuperDividend® ETF | | | Global X SuperDividend® U.S. ETF | | | Global X MSCI SuperDividend® EAFE ETF | | | Global X MSCI SuperDividend® Emerging Markets ETF | |
| Undistributed Ordinary Income | | $ | 9,620,906 | | | $ | – | | | $ | 113,120 | | | $ | 1,051,269 | |
| Capital Loss Carryforwards | | | (539,182,806 | ) | | | (185,337,870 | ) | | | (1,391,460 | ) | | | (6,225,122 | ) |
| Unrealized Appreciation (Depreciation) on Investments and Foreign Currency | | | (14,921,184 | ) | | | 90,841,482 | | | | 364,649 | | | | (3,219,585 | ) |
| Other Temporary Differences | | | (18 | ) | | | 6 | | | | (3 | ) | | | (2 | ) |
| Total Accumulated Losses | | $ | (544,483,102 | ) | | $ | (94,496,382 | ) | | $ | (913,694 | ) | | $ | (8,393,440 | ) |
| | | Global X Funds | |
| | | Global X SuperDividend® REIT ETF(1) | | | Global X NASDAQ 100® Covered Call ETF | | | Global X S&P 500® Covered Call ETF | | | Global X Russell 2000 Covered Call ETF | |
| Undistributed Ordinary Income | | $ | – | | | $ | 131,295,980 | | | $ | 2,004,805 | | | $ | 9,982,417 | |
| Capital Loss Carryforwards | | | (200,308,013 | ) | | | – | | | | – | | | | – | |
| Unrealized Depreciation on Investments and Foreign Currency | | | (28,695,167 | ) | | | – | | | | – | | | | – | |
| Other Temporary Differences | | | (2,376,001 | ) | | | 7 | | | | 5,381 | | | | 6 | |
| Total Distributable Earnings (Accumulated Losses) | | $ | (231,379,181 | ) | | $ | 131,295,987 | | | $ | 2,010,186 | | | $ | 9,982,423 | |
(1) | The Global X SuperDividend® REIT ETF has a tax year that ends on December 31. |
| | | Global X Funds | |
| | | Global X Nasdaq 100® Covered Call & Growth ETF | | | Global X S&P 500® Covered Call & Growth ETF | | | Global X SuperIncome™ Preferred ETF | | | Global X Renewable Energy Producers ETF | |
| Undistributed Ordinary Income | | $ | 2,838,227 | | | $ | 1,299,834 | | | $ | 457,430 | | | $ | 465,503 | |
| Undistributed Long-Term Capital Gain | | | – | | | | 2,570 | | | | – | | | | – | |
| Capital Loss Carryforwards | | | – | | | | – | | | | (58,846,382 | ) | | | (2,081,509 | ) |
| Unrealized Appreciation (Depreciation) on Investments and Foreign Currency | | | – | | | | – | | | | 5,619,780 | | | | (511,888 | ) |
| Other Temporary Differences | | | (1 | ) | | | – | | | | 3 | | | | 5 | |
| Total Distributable Earnings (Accumulated Losses) | | $ | 2,838,226 | | | $ | 1,302,404 | | | $ | (52,769,169 | ) | | $ | (2,127,889 | ) |
| | Notes to Financial Statements (continued) | |
| | October 31, 2021 | |
| | | Global X Funds | |
| | | Global X S&P 500® Catholic Values ETF | | | Global X S&P Catholic Values Developed ex-U.S. ETF | | | Global X Guru® Index ETF | |
| Undistributed Ordinary Income | | $ | 2,153,515 | | | $ | 87,737 | | | $ | 4,425 | |
| Undistributed Long-Term Capital Gain | | | 863,038 | | | | 15,110 | | | | – | |
| Capital Loss Carryforwards | | | – | | | | – | | | | (5,779,354 | ) |
| Unrealized Appreciation on Investments and Foreign Currency | | | 175,044,230 | | | | 685,321 | | | | 6,895,905 | |
| Other Temporary Differences | | | 4 | | | | 2 | | | | (559 | ) |
| Total Distributable Earnings | | $ | 178,060,787 | | | $ | 788,170 | | | $ | 1,120,417 | |
| | | Global X Funds | |
| | | Global X S&P 500® Tail Risk ETF | | | Global X S&P 500® Risk Managed Income ETF | | | Global X S&P 500® Collar 95-110 ETF | |
| Undistributed Ordinary Income | | $ | 73,485 | | | $ | 36,462 | | | $ | 50,940 | |
| Undistributed Long-Term Capital Gain | | | 4,518 | | | | – | | | | 334 | |
| Other Temporary Differences | | | – | | | | 1 | | | | 1 | |
| Total Distributable Earnings | | $ | 78,003 | | | $ | 36,463 | | | $ | 51,275 | |
| | | Global X Funds | |
| | | Global X NASDAQ 100® Tail Risk ETF | | | Global X NASDAQ 100® Risk Managed Income ETF | | | Global X NASDAQ 100® Collar 95-110 ETF | |
| Undistributed Ordinary Income | | $ | 63,330 | | | $ | – | | | $ | 51,836 | |
| Undistributed Long-Term Capital Gain | | | – | | | | – | | | | 2,343 | |
| Capital Loss Carryforwards | | | – | | | | (5,450 | ) | | | – | |
| Late Year Loss Deferral | | | – | | | | (940 | ) | | | – | |
| Other Temporary Differences | | | – | | | | – | | | | 2
| |
| Total Distributable Earnings (Accumulated Losses) | | $ | 63,330 | | | $ | (6,390 | ) | | $ | 54,181 | |
| | Notes to Financial Statements (continued) | |
| | October 31, 2021 | |
For taxable years beginning after December 22, 2010, a Registered Investment Company within the meaning of the 1940 Act is permitted to carry forward net capital losses to offset capital gains realized in later years, and the losses carried forward retain their original character as either long-term or short-term losses. Losses carried forward under these provisions are as follows:
| | | Short-Term Loss | | | Long-Term Loss | | | Total * | |
| Global X Social Media ETF | | $ | 10,937,731 | | | $ | 17,194,805 | | | $ | 28,132,536 | |
| Global X Lithium & Battery Tech ETF | | | – | | | | 63,831,937 | | | | 63,831,937 | |
| Global X Emerging Markets Internet & E-commerce ETF | | | 198,274 | | | | – | | | | 198,274 | |
Global X SuperDividend® ETF | | | 196,838,358 | | | | 342,344,448 | | | | 539,182,806 | |
Global X SuperDividend® U.S. ETF | | | 135,731,524 | | | | 49,606,346 | | | | 185,337,870 | |
Global X MSCI SuperDividend® EAFE ETF | | | – | | | | 1,391,460 | | | | 1,391,460 | |
Global X MSCI SuperDividend® Emerging Markets ETF | | | 3,110,894 | | | | 3,114,228 | | | | 6,225,122 | |
Global X SuperDividend® REIT ETF | | | 157,576,754 | | | | 42,731,259 | | | | 200,308,013 | |
| Global X SuperIncome™ Preferred ETF | | | 14,218,863 | | | | 44,627,519 | | | | 58,846,382 | |
| Global X Renewable Energy Producers ETF | | | 405,177 | | | | 1,676,332 | | | | 2,081,509 | |
Global X Guru® Index ETF | | | 5,779,354 | | | | – | | | | 5,779,354 | |
Global X NASDAQ 100® Risk Managed Income ETF | | | 2,180 | | | | 3,270 | | | | 5,450 | |
During the year ended October 31, 2021, the following Funds utilized capital loss carryforwards to offset capital gains amounting to:
| | | Short-Term Loss | | | Long-Term Loss | | | Total | |
| Global X Social Media ETF | | $ | – | | | $ | 3,339,255 | | | $ | 3,339,255 | |
| Global X Lithium & Battery Tech ETF | | | 26,035,129 | | | | 64,776,767 | | | | 90,811,896 | |
Global X SuperDividend® ETF | | | 48,915,810 | | | | 14,853,324 | | | | 63,769,134 | |
Global X SuperDividend® U.S. ETF | | | 32,460,722 | | | | 2,349,841 | | | | 34,810,563 | |
Global X MSCI SuperDividend® EAFE ETF | | | 817,164 | | | | 352,232 | | | | 1,169,396 | |
Global X MSCI SuperDividend® Emerging Markets ETF | | | 1,160,861 | | | | 414,784 | | | | 1,575,645 | |
Global X NASDAQ 100® Covered Call ETF | | | 16,425,608 | | | | 24,638,412 | | | | 41,064,020 | |
Global X S&P 500® Covered Call ETF | | | 13,227,988 | | | | 19,848,520 | | | | 33,076,508 | |
| Global X Russell 2000 Covered Call ETF | | | 566,196 | | | | 801,805 | | | | 1,368,001 | |
Global X Nasdaq 100® Covered Call & Growth ETF | | | 45,654 | | | | 68,481 | | | | 114,135 | |
Global X S&P 500® Covered Call & Growth ETF | | | 28,095 | | | | 42,122 | | | | 70,217 | |
| Global X SuperIncome™ Preferred ETF | | | 4,008,352 | | | | 1,656,031 | | | | 5,664,383 | |
Global X S&P 500® Catholic Values ETF | | | – | | | | 205,691 | | | | 205,691 | |
| Global X S&P Catholic Values Developed ex-U.S. ETF | | | 3,244 | | | | – | | | | 3,244 | |
Global X Guru® Index ETF | | | 10,813,764 | | | | – | | | | 10,813,764 | |
| | Notes to Financial Statements (continued) | |
| | October 31, 2021 | |
The Federal tax cost and aggregate gross unrealized appreciation and depreciation on investments held by the Funds at October 31, 2021 were as follows:
| Global X Funds | | Federal Tax Cost | | | Aggregated Gross Unrealized Appreciation | | | Aggregated Gross Unrealized Depreciation | | | Net Unrealized Appreciation (Depreciation) | |
| Global X Social Media ETF | | $ | 403,236,358 | | | $ | 59,515,933 | | | $ | (60,933,761 | ) | | $ | (1,417,828 | ) |
| Global X Lithium & Battery Tech ETF | | | 3,763,667,252 | | | | 1,824,408,401 | | | | (86,926,233 | ) | | | 1,737,482,168 | |
| Global X E-commerce ETF | | | 214,687,755 | | | | 17,658,390 | | | | (31,796,977 | ) | | | (14,138,587 | ) |
| Global X Emerging Markets Internet & E-commerce ETF | | | 6,020,771 | | | | 153,980 | | | | (1,618,428 | ) | | | (1,464,448 | ) |
Global X SuperDividend® ETF | | | 979,438,907 | | | | 97,933,841 | | | | (112,855,025 | ) | | | (14,921,184 | ) |
Global X SuperDividend® U.S. ETF | | | 583,780,223 | | | | 113,244,676 | | | | (22,403,194 | ) | | | 90,841,482 | |
Global X MSCI SuperDividend® EAFE ETF | | | 13,666,873 | | | | 970,170 | | | | (605,521 | ) | | | 364,649 | |
Global X MSCI SuperDividend® Emerging Markets ETF | | | 65,722,677 | | | | 5,723,136 | | | | (8,942,721 | ) | | | (3,219,585 | ) |
Global X SuperDividend® REIT ETF | | | 440,254,438 | | | | 57,280,492 | | | | (28,674,228 | ) | | | 28,606,264 | |
Global X NASDAQ 100® Covered Call ETF | | | 5,029,904,390 | | | | 1,387,774,323 | | | | (1,387,774,323 | ) | | | – | |
Global X S&P 500® Covered Call ETF | | | 668,825,732 | | | | 95,544,866 | | | | (95,544,866 | ) | | | – | |
| Global X Russell 2000 Covered Call ETF | | | 553,808,039 | | | | 16,924,857 | | | | (16,924,857 | ) | | | – | |
Global X Nasdaq 100® Covered Call & Growth ETF | | | 44,572,709 | | | | 5,726,257 | | | | (5,726,257 | ) | | | – | |
Global X S&P 500® Covered Call & Growth ETF | | | 34,937,637 | | | | 2,464,415 | | | | (2,464,415 | ) | | | – | |
| Global X SuperIncome™ Preferred ETF | | | 228,768,765 | | | | 9,717,093 | | | | (4,097,313 | ) | | | 5,619,780 | |
| Global X Renewable Energy Producers ETF | | | 151,134,713 | | | | 15,388,015 | | | | (15,899,903 | ) | | | (511,888 | ) |
Global X S&P 500® Catholic Values ETF | | | 417,379,529 | | | | 185,753,345 | | | | (10,709,115 | ) | | | 175,044,230 | |
| Global X S&P Catholic Values Developed ex-U.S. ETF | | | 3,566,785 | | | | 758,022 | | | | (72,701 | ) | | | 685,321 | |
Global X Guru® Index ETF | | | 69,807,087 | | | | 11,362,145 | | | | (4,466,240 | ) | | | 6,895,905 | |
Global X S&P 500® Tail Risk ETF | | | 3,590,717 | | | | 180,742 | | | | (180,742 | ) | | | – | |
Global X S&P 500® Risk Managed Income ETF | | | 5,888,759 | | | | 269,104 | | | | (269,104 | ) | | | – | |
Global X S&P 500® Collar 95-110 ETF | | | 3,297,388 | | | | 165,200 | | | | (165,200 | ) | | | – | |
Global X NASDAQ 100® Tail Risk ETF | | | 3,326,062 | | | | 198,762 | | | | (198,762 | ) | | | – | |
Global X NASDAQ 100® Risk Managed Income ETF | | | 4,333,029 | | | | 279,822 | | | | (279,822 | ) | | | – | |
Global X NASDAQ 100® Collar 95-110 ETF | | | 2,832,361 | | | | 171,815 | | | | (171,815 | ) | | | – | |
The preceding differences between book and tax cost are primarily due to mark-to-market treatment of passive foreign investment companies, mixed straddles, MLP adjustments and wash sales.
6. CONCENTRATION OF RISKS
The Funds invest in securities of foreign issuers in various countries. These investments may involve certain considerations and risks not typically associated with investments in the United States as a result of, among other factors, the possibility of future political and economic developments, the level of governmental supervision and regulation of securities markets in the respective countries.
| | Notes to Financial Statements (continued) | |
| | October 31, 2021 | |
6. CONCENTRATION OF RISKS (continued)
The securities markets of emerging countries are less liquid, subject to greater price volatility, and have a smaller market capitalization than those of U.S. securities markets. In certain countries, there may be fewer publicly traded securities and the market may be dominated by a few issuers or sectors. Issuers and securities markets in such countries are not subject to as extensive and frequent accounting, financial and other reporting requirements or as comprehensive government regulations as are issuers and securities markets in the U.S. In particular, the assets and profits appearing on the financial statements of emerging country issuers may not reflect their financial position or results of operations in the same manner as financial statements for U.S. issuers. Substantially less information may be publicly available about emerging country issuers than is available about issuers in the United States.
The Funds may be subject to taxes imposed by countries in which they invest. Such taxes are generally based on either income or gains earned or repatriated. The Funds accrue and apply such taxes to net investment income, net realized gains and net unrealized gains as income and/or capital gains are earned.
Except for the Global X Russell 2000® Covered Call, which uses a representative sampling strategy, the Funds use a replication strategy. A replication strategy is an indexing strategy that involves investing in the securities of an underlying index in approximately the same proportions as in the underlying index. A representative sampling strategy is an indexing strategy that involves investing in a representative sample of securities (including indirect investments through underlying ETFs) that collectively has an investment profile similar to an underlying index in terms of key risk factors, performance attributes and other characteristics. Each Fund may utilize a representative sampling strategy with respect to its underlying indices when a replication strategy might be detrimental to its shareholders, such as when there are practical difficulties or substantial costs involved in compiling a portfolio of equity securities to follow their underlying indices, or, in certain instances, when securities in the underlying indices become temporarily illiquid, unavailable or less liquid, or due to legal restrictions (such as diversification requirements that apply to a Fund but not the underlying index).
The elimination of the London Inter-Bank Offered Rate (“LIBOR”) may adversely affect the interest rates on, and value of, certain Fund investments for which the value is tied to LIBOR. The U.K. Financial Conduct Authority has announced that it intends to stop compelling or inducing banks to submit LIBOR rates after 2021. On March 5, 2021, the administrator of LIBOR clarified that the publication of LIBOR on a representative basis will cease for the one-week and two-month U.S. dollar LIBOR settings immediately after December 31, 2021, and for the remaining U.S. dollar LIBOR settings immediately after June 30, 2023. Alternatives to LIBOR are established or in development in most major currencies, including the Secured Overnight Financing Rate (“SOFR”), which is intended to replace U.S. dollar LIBOR. Markets are slowly developing in response to these new rates. Questions around liquidity impacted by these rates, and how to appropriately adjust
| | Notes to Financial Statements (continued) | |
| | October 31, 2021 | |
6. CONCENTRATION OF RISKS (continued)
these rates at the time of transition, remain a concern for the Funds. Accordingly, it is difficult to predict the full impact of the transition away from LIBOR on the Funds until new reference rates and fallbacks for both legacy and new products, instruments and contracts are commercially accepted. Please refer to each Fund’s prospectus and statement of additional information (“SAI”) for a more complete description of risks.
7. LOANS OF PORTFOLIO SECURITIES
Each Fund may lend portfolio securities having a market value up to one-third of its total assets. Security loans made pursuant to a securities lending agreement with BBH are initially required to be secured by collateral equal to at least 102% of the value of domestic equity securities and American Depositary Receipts (“ADRs”) and 105% of the value of foreign equity securities (other than ADRs). Such collateral received in connection with these loans will be cash and can be invested in repurchase agreements, short term investments or U.S. Treasury obligations, and is recognized in the Schedules of Investments and Statements of Assets and Liabilities. The obligation to return securities lending collateral is also recognized as a liability in the Statements of Assets and Liabilities. It is the Funds’ policy to obtain additional collateral from or return excess collateral to the borrower by the end of the next business day, following the valuation date of the securities loaned. Therefore, the value of the collateral held may be temporarily less than the value of the securities on loan.
Lending securities entails a risk of loss to the Funds if and to the extent that the market value of the securities loans were to increase and the borrower did not increase the collateral accordingly, and the borrower failed to return the securities. In the event the borrower may not provide additional collateral when required or may not return the securities when due, the securities lending agency agreement requires the lending agent to indemnify the Funds by replacing either the security or the security’s current market value to the Funds. The Funds could suffer a loss if the value of an investment purchased with cash collateral falls below the market value of loaned securities or if the value of an investment purchased with cash collateral falls below the value of the original cash collateral received. The Funds could also experience delays and costs in gaining access to the collateral. The Funds bear the risk of any deficiency in the amount of the collateral available for return to the borrower due to any loss on the collateral invested.
As of October 31, 2021, the following Funds had securities on loan, by counterparty:
| | | Market Value | | | Cash Collateral | |
| Global X Social Media ETF | | | | | | |
| Morgan Stanley | | $ | 706,578 | | | $ | 749,890 | |
| SG Americas Securities LLC | | | 140 | | | | 153 | |
| Total | | $ | 706,718 | | | $ | 750,043 | |
| | Notes to Financial Statements (continued) | |
| | October 31, 2021 | |
7. LOANS OF PORTFOLIO SECURITIES (continued)
| | | Market Value | | | Cash Collateral | |
| Global X Lithium & Battery Tech ETF | | | | | | |
| Barclays Capital | | $ | 5,250,576 | | | $ | 5,626,931 | |
| BofA Securities, Inc. | | | 6,663,546 | | | | 7,068,231 | |
| Citigroup | | | 6,356,640 | | | | 6,813,261 | |
| Goldman Sachs & Co. | | | 27,489,029 | | | | 29,414,018 | |
| JPMorgan | | | 31,511,813 | | | | 32,174,649 | |
| Morgan Stanley | | | 19,014,575 | | | | 20,338,441 | |
| UBS Securities LLC | | | 8,806,644 | | | | 9,324,394 | |
| Total | | $ | 105,092,823 | | | $ | 110,759,925 | |
| Global X E-commerce ETF | | | | | | | | |
| Barclays Capital | | $ | 61,920 | | | $ | 64,500 | |
| BofA Securities, Inc. | | | 753,676 | | | | 773,532 | |
| Citigroup | | | 38,160 | | | | 38,160 | (1) |
| Credit Suisse | | | 862,703 | | | | 901,222 | |
| Goldman Sachs & Co. | | | 532,835 | | | | 556,014 | |
| UBS Securities LLC | | | 482,160 | | | | 535,536 | |
| Wells Fargo | | | 227,830 | | | | 236,564 | |
| Total | | $ | 2,959,284 | | | $ | 3,105,528 | |
Global X SuperDividend® ETF | | | | | | | | |
| BofA Securities, Inc. | | $ | 6,327,181 | | | $ | 6,701,652 | |
| Citigroup | | | 2,822,967 | | | | 2,970,000 | |
| Goldman Sachs & Co. | | | 14,234,108 | | | | 17,535,051 | |
| JPMorgan | | | 4,294,032 | | | | 4,546,478 | |
| Morgan Stanley | | | 4,077,485 | | | | 4,291,116 | |
| Scotia Capital | | | 140,030 | | | | 150,800 | |
| UBS Securities LLC | | | 851,595 | | | | 900,984 | |
| Total | | $ | 32,747,398 | | | $ | 37,096,081 | |
Global X SuperDividend® U.S. ETF | | | | | | | | |
| BNP Paribas Securities Corp | | $ | 213,225 | | | $ | 216,000 | (1) |
| BofA Securities, Inc. | | | 6,182,217 | | | | 6,306,166 | |
| Citigroup | | | 255,870 | | | | 259,200 | (1) |
| National Financial Services | | | 150,679 | | | | 152,640 | (1) |
| UBS Securities LLC | | | 85,290 | | | | 86,970 | |
| Total | | $ | 6,887,281 | | | $ | 7,020,976 | |
Global X SuperDividend® REIT ETF | | | | | | | | |
| Scotia Capital | | $ | 2,827,310 | | | $ | 3,013,738 | |
| Global X SuperIncome™ Preferred ETF | | | | | | | | |
| JPMorgan | | $ | 72,884 | | | $ | 74,200 | |
| | Notes to Financial Statements (continued) | |
| | October 31, 2021 | |
7. LOANS OF PORTFOLIO SECURITIES (continued)
| | | Market Value | | | Cash Collateral | |
| Global X Renewable Energy Producers ETF | | | | | | |
| Barclays Capital | | $ | 166,530 | | | $ | 168,000 | |
| BNP Paribas Securities Corp | | | 341,256 | | | | 328,040 | (1) |
| BofA Securities, Inc. | | | 2,696,428 | | | | 2,855,960 | |
| UBS Securities LLC | | | 419,468 | | | | 440,220 | |
| Total | | $ | 3,623,682 | | | $ | 3,792,220 | |
Global X Guru® Index ETF | | | | | | | | |
| BMO Capital Markets | | $ | 222,840 | | | $ | 221,040 | (1) |
| JPMorgan | | | 2,724 | | | | 2,706 | (1) |
| Morgan Stanley | | | 656,140 | | | | 650,840 | (1) |
| National Financial Services | | | 97,380 | | | | 99,900 | |
| Total | | $ | 979,084 | | | $ | 974,486 | |
| (1) | It is the Funds’ policy to obtain additional collateral from or return excess collateral to the borrower by the end of the next business day, following the valuation date of the securities loaned. Therefore, the value of the collateral held may be temporarily less than the value of the securities on loan. |
8. CONTRACTUAL OBLIGATIONS
The Funds enter into contracts in the normal course of business that contain a variety of indemnifications. The Funds’ maximum exposure under these contracts is unknown; however, the Funds have not had prior gains or losses pursuant to these contracts. Management has reviewed the Funds’ existing contracts and expects the risk of loss to be remote.
Pursuant to the Trust’s organizational documents, the Trustees of the Trust (the “Trustees”) and the Trust’s officers are indemnified against certain liabilities that may arise out of the performance of their duties.
9. REGULATORY MATTERS
In December 2020, the SEC adopted a new rule providing a framework for fund valuation practices (“Rule 2a-5”). Rule 2a-5 establishes requirements for determining fair value in good faith for purposes of the 1940 Act. Rule 2a-5 will permit fund boards to designate certain parties to perform fair value determinations, subject to board oversight and certain other conditions. Rule 2a-5 also defines when market quotations are “readily available” for purposes of the 1940 Act and the threshold for determining whether a fund must fair value a security. In connection with Rule 2a-5, the SEC also adopted related recordkeeping requirements and is rescinding previously issued guidance, including with respect to the role of a board in determining fair value and the accounting and auditing of fund investments. The Funds will be required to comply with the rules by September 8, 2022. Management is currently assessing the potential impact of the new rules on the Funds’ financial statements.
| | Notes to Financial Statements (concluded) | |
| | October 31, 2021 | |
10. SUBSEQUENT EVENTS
On September 7, 2021, the Custodian announced that it had entered into an agreement with State Street Bank and Trust Company (“State Street”) to sell BBH’s Investor Services business to State Street (the “Transaction”). The Transaction is subject to certain closing conditions, including regulatory and customary approvals, and it is expected to be consummated in the first quarter of 2022 (the “Closing Date”). Consequently, as a result of the Transaction, it is expected that State Street will replace BBH as the Funds’ custodian effective as of the Closing Date.
The Funds have been evaluated by management regarding the need for additional disclosures (other than what is disclosed in the preceding paragraph) and/or adjustments resulting from subsequent events. Based on this evaluation, no additional adjustments were required to the financial statements.
| | Report of Independent Registered Public Accounting Firm | |
| | | |
To the Board of Trustees of Global X Funds and Shareholders of each of the twenty-five funds listed in the table below
Opinions on the Financial Statements
We have audited the accompanying statements of assets and liabilities, including the schedules of investments, of each of the funds listed in the table below (twenty-five of the funds constituting Global X Funds, hereafter collectively referred to as the “Funds”) as of October 31, 2021, the related statements of operations and of changes in net assets for each of the periods indicated in the table below, including the related notes, and the financial highlights for each of the periods indicated in the table below (collectively referred to as the “financial statements”). In our opinion, the financial statements present fairly, in all material respects, the financial position of each of the Funds as of October 31, 2021, the results of each of their operations and the changes in each of their net assets for the periods indicated in the table below, and each of the financial highlights for each of the periods indicated in the table below, in conformity with accounting principles generally accepted in the United States of America.
Global X SuperDividend® ETF (1) | Global X S&P 500® Covered Call ETF (2) |
Global X SuperDividend® U.S. ETF (1) | Global X NASDAQ 100® Covered Call ETF (2) |
Global X Guru® Index ETF (1) | Global X S&P Catholic Values Developed ex-U.S. ETF (3) |
Global X MSCI SuperDividend® Emerging Markets ETF (1) | Global X S&P 500® Covered Call & Growth ETF (4) |
Global X SuperDividend® REIT ETF (1) | Global X Nasdaq 100® Covered Call & Growth ETF (4) |
| Global X SuperIncome™ Preferred ETF (1) | Global X Emerging Markets Internet & E-commerce ETF (5) |
| Global X Social Media ETF (1) | Global X Nasdaq 100® Tail Risk ETF (6) |
| Global X Renewable Energy Producers ETF (1) | Global X Nasdaq 100® Risk Managed Income ETF (6) |
| Global X Lithium & Battery Tech ETF (1) | Global X Nasdaq 100® Collar 95-110 ETF (6) |
Global X MSCI SuperDividend® EAFE ETF (1) | Global X S&P 500® Tail Risk ETF (6) |
Global X S&P 500® Catholic Values ETF (1) | Global X S&P 500® Collar 95-110 ETF (6) |
| Global X E-commerce ETF (1) | Global X S&P 500® Risk Managed Income ETF (6) |
| Global X Russell 2000 Covered Call ETF (1) | |
| | Report of Independent Registered Public Accounting Firm | |
| | | |
| (1) | Statement of operations for the year ended October 31, 2021, statements of changes in net assets for each of the two years in the period ended October 31, 2021 and financial highlights for each of the periods indicated therein |
| (2) | Statement of operations for the year ended October 31, 2021, statements of changes in net assets for each of the two years in the period ended October 31, 2021 and financial highlights for each of the three years in the period ended October 31, 2021 |
| (3) | Statement of operations for the year ended October 31, 2021 and statements of changes in net assets and financial highlights for the year ended October 31, 2021 and the period June 22, 2020 (commencement of operations) through October 31, 2020 |
| (4) | Statement of operations for the year ended October 31, 2021 and statements of changes in net assets and financial highlights for the year ended October 31, 2021 and the period September 18, 2020 (commencement of operations) through October 31, 2020 |
| (5) | Statement of operations, statement of changes in net assets and financial highlights for the period November 9, 2020 (commencement of operations) through October 31, 2021 |
| (6) | Statement of operations, statement of changes in net assets and financial highlights for the period August 25, 2021 (commencement of operations) through October 31, 2021 |
The financial statements of Global X S&P 500® Covered Call ETF and Global X NASDAQ 100® Covered Call ETF as of and for the year ended October 31, 2018 and the financial highlights for each of the periods ended on or prior to October 31, 2018 (not presented herein, other than the financial highlights) were audited by other auditors whose report dated December 28, 2018 expressed an unqualified opinion on those financial statements and financial highlights.
Basis for Opinions
These financial statements are the responsibility of the Funds’ management. Our responsibility is to express an opinion on the Funds’ financial statements based on our audits. We are a public accounting firm registered with the Public Company Accounting Oversight Board (United States) (PCAOB) and are required to be independent with respect to the Funds in accordance with the U.S. federal securities laws and the applicable rules and regulations of the Securities and Exchange Commission and the PCAOB.
We conducted our audits of these financial statements in accordance with the standards of the PCAOB. Those standards require that we plan and perform the audit to obtain reasonable assurance about whether the financial statements are free of material misstatement, whether due to error or fraud.
| | Report of Independent Registered Public Accounting Firm | |
| | | |
Our audits included performing procedures to assess the risks of material misstatement of the financial statements, whether due to error or fraud, and performing procedures that respond to those risks. Such procedures included examining, on a test basis, evidence regarding the amounts and disclosures in the financial statements. Our audits also included evaluating the accounting principles used and significant estimates made by management, as well as evaluating the overall presentation of the financial statements. Our procedures included confirmation of securities owned as of October 31, 2021, by correspondence with the custodian, transfer agent and brokers; when replies were not received from brokers, we performed other auditing procedures. We believe that our audits provide a reasonable basis for our opinions.
/s/PricewaterhouseCoopers LLP
Philadelphia, Pennsylvania
December 28, 2021
We have served as the auditor of one or more investment companies in the Global X Funds since 2016.
| | Disclosure of Fund Expenses (unaudited) | |
| | | |
All ETFs (such as the Funds) have operating expenses. As a shareholder of an ETF, your investment is affected by these ongoing costs, which include (among others) costs for ETF management, administrative services, commissions, and shareholder reports like this one. It is important for you to understand the impact of these costs on your investment returns. In addition, a shareholder is responsible for brokerage fees as a result of the shareholder’s investment in a Fund.
Operating expenses such as these are deducted from a Fund’s gross income and directly reduce their final investment returns. These expenses are expressed as a percentage of the Fund’s average net assets; this percentage is known as the Fund’s expense ratio.
The following examples use the expense ratio and are intended to help you understand the ongoing costs (in dollars) of investing in a Fund and to compare these costs with those of other funds. The examples are based on an investment of $1,000 made at the beginning of the period shown and held for the entire period (May 1, 2020 through October 31, 2021).
The table on the next page illustrates the Funds’ costs in two ways:
Actual Fund Return. This section helps you to estimate the actual expenses that your Fund incurred over the period. The “Expenses Paid During Period” column shows the actual dollar expense cost incurred by a $1,000 investment in the Fund, and the “Ending Account Value” number is derived from deducting that expense cost from the Fund’s gross investment return.
You can use this information, together with the actual amount you invested in the Fund, to estimate the expenses you paid over that period. Simply divide your actual account value by $1,000 to arrive at a ratio (for example, an $8,600 account value divided by $1,000 = 8.6), then multiply that ratio by the number shown for your Fund under “Expenses Paid During Period.”
Hypothetical 5% Return. This section helps you compare your Fund’s costs with those of other funds. It assumes that the Fund had an annual 5% return before expenses during the year, but that the expense ratio (Column 3) for the period is unchanged. This example is useful in making comparisons because the Securities and Exchange Commission requires all funds to make this 5% calculation. You can assess your Fund’s comparative cost by comparing the hypothetical result for your Fund in the “Expenses Paid During Period” column with those that appear in the same charts in the shareholder reports for other funds.
NOTE: Because the return is set at 5% for comparison purposes — NOT your Fund’s actual return — the account values shown may not apply to your specific investment.
| | Disclosure of Fund Expenses (unaudited) (continued) | |
| | | |
| | | Beginning Account Value 5/1/2021 | | | Ending Account Value 10/31/2021 | | | Annualized Expense Ratios | | | Expenses Paid During Period(1) | |
| Global X Social Media ETF | | | | | | | | | | | | |
| Actual Fund Return | | $ | 1,000.00 | | | $ | 885.90 | | | | 0.65 | % | | $ | 3.09 | |
| Hypothetical 5% Return | | | 1,000.00 | | | | 1,021.93 | | | | 0.65 | | | | 3.31 | |
| | | | | | | | | | | | | | | | | |
| Global X Lithium & Battery Tech ETF | | | | | | | | | | | | | | | | |
| Actual Fund Return | | $ | 1,000.00 | | | $ | 1,434.10 | | | | 0.75 | % | | $ | 4.60 | |
| Hypothetical 5% Return | | | 1,000.00 | | | | 1,021.43 | | | | 0.75 | | | | 3.82 | |
| | | | | | | | | | | | | | | | | |
| Global X E-commerce ETF | | | | | | | | | | | | | | | | |
| Actual Fund Return | | $ | 1,000.00 | | | $ | 900.10 | | | | 0.50 | % | | $ | 2.39 | |
| Hypothetical 5% Return | | | 1,000.00 | | | | 1,022.69 | | | | 0.50 | | | | 2.55 | |
| | | | | | | | | | | | | | | | | |
Global X SuperDividend® ETF | | | | | | | | | | | | | | | | |
| Actual Fund Return | | $ | 1,000.00 | | | $ | 957.20 | | | | 0.59 | % | | $ | 2.91 | |
| Hypothetical 5% Return | | | 1,000.00 | | | | 1,022.23 | | | | 0.59 | | | | 3.01 | |
| | | | | | | | | | | | | | | | | |
Global X SuperDividend® U.S. ETF | | | | | | | | | | | | | | | | |
| Actual Fund Return | | $ | 1,000.00 | | | $ | 1,048.20 | | | | 0.45 | % | | $ | 2.32 | |
| Hypothetical 5% Return | | | 1,000.00 | | | | 1,022.94 | | | | 0.45 | | | | 2.29 | |
| | | | | | | | | | | | | | | | | |
Global X MSCI SuperDividend® EAFE ETF | | | | | | | | | | | | | | | | |
| Actual Fund Return | | $ | 1,000.00 | | | $ | 1,008.00 | | | | 0.57 | % | | $ | 2.88 | |
| Hypothetical 5% Return | | | 1,000.00 | | | | 1,022.33 | | | | 0.57 | | | | 2.91 | |
| | | | | | | | | | | | | | | | | |
Global X MSCI SuperDividend® Emerging Markets ETF | | | | | | | | | | | | | | | | |
| Actual Fund Return | | $ | 1,000.00 | | | $ | 971.10 | | | | 0.75 | % | | $ | 3.73 | |
| Hypothetical 5% Return | | | 1,000.00 | | | | 1,021.43 | | | | 0.75 | | | | 3.82 | |
| | | | | | | | | | | | | | | | | |
Global X SuperDividend® REIT ETF | | | | | | | | | | | | | | | | |
| Actual Fund Return | | $ | 1,000.00 | | | $ | 1,010.40 | | | | 0.58 | % | | $ | 2.94 | |
| Hypothetical 5% Return | | | 1,000.00 | | | | 1,022.28 | | | | 0.58 | | | | 2.96 | |
| | | | | | | | | | | | | | | | | |
Global X NASDAQ 100® Covered Call ETF | | | | | | | | | | | | | | | | |
| Actual Fund Return | | $ | 1,000.00 | | | $ | 1,068.70 | | | | 0.60 | % | | $ | 3.13 | |
| Hypothetical 5% Return | | | 1,000.00 | | | | 1,022.18 | | | | 0.60 | | | | 3.06 | |
| | | | | | | | | | | | | | | | | |
Global X S&P 500® Covered Call ETF | | | | | | | | | | | | | | | | |
| Actual Fund Return | | $ | 1,000.00 | | | $ | 1,102.10 | | | | 0.60 | % | | $ | 3.18 | |
| Hypothetical 5% Return | | | 1,000.00 | | | | 1,022.18 | | | | 0.60 | | | | 3.06 | |
| | | | | | | | | | | | | | | | | |
| Global X Russell 2000 Covered Call ETF | | | | | | | | | | | | | | | | |
| Actual Fund Return | | $ | 1,000.00 | | | $ | 1,078.00 | | | | 0.50 | % | | $ | 2.62 | |
| Hypothetical 5% Return | | | 1,000.00 | | | | 1,022.69 | | | | 0.50 | | | | 2.55 | |
| | Disclosure of Fund Expenses (unaudited) (continued) | |
| | | |
| | | Beginning Account Value 5/1/2021 | | | Ending Account Value 10/31/2021 | | | Annualized Expense Ratios | | | Expenses Paid During Period(1) | |
Global X Nasdaq 100® Covered Call & Growth ETF | | | | | | | | | | | | |
| Actual Fund Return | | $ | 1,000.00 | | | $ | 1,106.00 | | | | 0.60 | % | | $ | 3.18 | |
| Hypothetical 5% Return | | | 1,000.00 | | | | 1,022.18 | | | | 0.60 | | | | 3.06 | |
| | | | | | | | | | | | | | | | | |
Global X S&P 500® Covered Call & Growth ETF | | | | | | | | | | | | | | | | |
| Actual Fund Return | | $ | 1,000.00 | | | $ | 1,099.60 | | | | 0.60 | % | | $ | 3.18 | |
| Hypothetical 5% Return | | | 1,000.00 | | | | 1,022.18 | | | | 0.60 | | | | 3.06 | |
| | | | | | | | | | | | | | | | | |
| Global X SuperIncome™ Preferred ETF | | | | | | | | | | | | | | | | |
| Actual Fund Return | | $ | 1,000.00 | | | $ | 1,033.00 | | | | 0.58 | % | | $ | 2.97 | |
| Hypothetical 5% Return | | | 1,000.00 | | | | 1,022.28 | | | | 0.58 | | | | 2.96 | |
| | | | | | | | | | | | | | | | | |
| Global X Renewable Energy Producers ETF | | | | | | | | | | | | | | | | |
| Actual Fund Return | | $ | 1,000.00 | | | $ | 1,073.20 | | | | 0.65 | % | | $ | 3.40 | |
| Hypothetical 5% Return | | | 1,000.00 | | | | 1,021.93 | | | | 0.65 | | | | 3.31 | |
| | | | | | | | | | | | | | | | | |
Global X S&P 500® Catholic Values ETF | | | | | | | | | | | | | | | | |
| Actual Fund Return | | $ | 1,000.00 | | | $ | 1,103.80 | | | | 0.29 | % | | $ | 1.54 | |
| Hypothetical 5% Return | | | 1,000.00 | | | | 1,023.74 | | | | 0.29 | | | | 1.48 | |
| | | | | | | | | | | | | | | | | |
| Global X S&P Catholic Values Developed ex-U.S. ETF | | | | | | | | | | | | | | | | |
| Actual Fund Return | | $ | 1,000.00 | | | $ | 1,039.20 | | | | 0.35 | % | | $ | 1.80 | |
| Hypothetical 5% Return | | | 1,000.00 | | | | 1,023.44 | | | | 0.35 | | | | 1.79 | |
| | | | | | | | | | | | | | | | | |
Global X Guru® Index ETF | | | | | | | | | | | | | | | | |
| Actual Fund Return | | $ | 1,000.00 | | | $ | 1,055.20 | | | | 0.75 | % | | $ | 3.89 | |
| Hypothetical 5% Return | | | 1,000.00 | | | | 1,021.43 | | | | 0.75 | | | | 3.82 | |
| | | | | | | | | | | | | | | | | |
| Global X Emerging Markets Internet & E-commerce ETF | | | | | | | | | | | | | | | | |
| Actual Fund Return | | $ | 1,000.00 | | | $ | 759.80 | | | | 0.65 | % | | $ | 2.88 | |
| Hypothetical 5% Return | | | 1,000.00 | | | | 1,021.93 | | | | 0.65 | | | | 3.31 | |
| | | | | | | | | | | | | | | | | |
Global X S&P 500® Tail Risk ETF(2) | | | | | | | | | | | | | | | | |
| Actual Fund Return | | $ | 1,000.00 | | | $ | 1,000.00 | | | | 0.64 | % | | $ | 1.17 | |
| Hypothetical 5% Return | | | 1,000.00 | | | | 1,008.00 | | | | 0.64 | | | | 1.18 | |
| | | | | | | | | | | | | | | | | |
Global X S&P 500® Risk Managed Income ETF(2) | | | | | | | | | | | | | | | | |
| Actual Fund Return | | $ | 1,000.00 | | | $ | 1,000.00 | | | | 0.65 | % | | $ | 1.19 | |
| Hypothetical 5% Return | | | 1,000.00 | | | | 1,007.99 | | | | 0.65 | | | | 1.20 | |
| | | | | | | | | | | | | | | | | |
Global X S&P 500® Collar 95-110 ETF(2) | | | | | | | | | | | | | | | | |
| Actual Fund Return | | $ | 1,000.00 | | | $ | 1,000.00 | | | | 0.65 | % | | $ | 1.19 | |
| Hypothetical 5% Return | | | 1,000.00 | | | | 1,007.99 | | | | 0.65 | | | | 1.20 | |
| | Disclosure of Fund Expenses (unaudited) (concluded) | |
| | | |
| | | Beginning Account Value 5/1/2021 | | | Ending Account Value 10/31/2021 | | | Annualized Expense Ratios | | | Expenses Paid During Period(1) | |
Global X NASDAQ 100® Tail Risk ETF(2) | | | | | | | | | | | | |
| Actual Fund Return | | $ | 1,000.00 | | | $ | 1,000.00 | | | | 0.64 | % | | $ | 1.17 | |
| Hypothetical 5% Return | | | 1,000.00 | | | | 1,008.00 | | | | 0.64 | | | | 1.18 | |
| | | | | | | | | | | | | | | | | |
Global X NASDAQ 100® Risk Managed Income ETF(2) | | | | | | | | | | | | | | | | |
| Actual Fund Return | | $ | 1,000.00 | | | $ | 1,000.00 | | | | 0.65 | % | | $ | 1.19 | |
| Hypothetical 5% Return | | | 1,000.00 | | | | 1,007.99 | | | | 0.65 | | | | 1.20 | |
| | | | | | | | | | | | | | | | | |
Global X NASDAQ 100® Collar 95-110 ETF(2) | | | | | | | | | | | | | | | | |
| Actual Fund Return | | $ | 1,000.00 | | | $ | 1,000.00 | | | | 0.65 | % | | $ | 1.19 | |
| Hypothetical 5% Return | | | 1,000.00 | | | | 1,007.99 | | | | 0.65 | | | | 1.20 | |
| (1) | Expenses are equal to the Fund’s annualized expense ratio multiplied by the average account value over the period, multiplied 183/365 (to reflect the one-half year period), unless otherwise noted. |
| (2) | Expenses are equal to the Fund’s annualized expense ratio multiplied by the average account value over the period, multiplied 67/365 (to reflect the one-half year period), unless otherwise note. |
| | Liquidity Risk Management Program (unaudited) | |
| | | |
Pursuant to Rule 22e-4 under the 1940 Act, the Funds’ investment adviser has adopted, and the Board has approved, a liquidity risk management program (the “Program”) to govern the Funds’ approach to managing liquidity risk. The Program is overseen by the Funds’ Liquidity Risk Management Committee (the “Committee”), and the Program’s principal objectives include assessing, managing and periodically reviewing each Fund’s liquidity risk, based on factors specific to the circumstances of the Funds.
At a meeting of the Board held on May 21, 2021, the Trustees received a report from the Committee addressing the operations of the Program and assessing its adequacy and effectiveness of implementation for the period from January 1, 2020 through December 31, 2020. The Committee’s report noted that the Committee had determined that the Program is reasonably designed to assess and manage each Fund’s liquidity risk and operated adequately and effectively to manage each Fund’s liquidity risk for the period covered by the report. The Committee’s report noted that during the period covered by the report, there were no liquidity events that impacted the Funds or their ability to timely meet redemptions without dilution to existing shareholders. The Committee’s report further noted that no material changes have been made to the Program during the period covered by the report. In August of 2021, the Committee determined to classify the Global X MSCI Nigeria ETF (NGE) as an In-kind ETF for purposes of the Program.
There can be no assurance that the Program will achieve its objectives in the future. Please refer to the prospectus for more information regarding a Fund’s exposure to liquidity risk and other principal risks to which an investment in the Funds may be subject.
| | Approval of Investment Advisory Agreement (unaudited) | |
| | | |
Section 15(c) of the Investment Company Act of 1940, as amended (“1940 Act”), requires that the board of trustees of an exchange-traded fund (“ETF”), including a majority of those trustees who are not “interested persons” of the ETF, as defined in the 1940 Act (“Independent Trustees”), consider on an initial basis and periodically thereafter (as required by the 1940 Act), at an in person meeting called for such purpose, the terms of each ETF’s investment advisory agreement and whether to approve entering into, or renewing, each agreement.
Approval of the Initial Investment Advisory and Supervision and Administration Agreements
At Board meeting of the Global X Funds (the “Trust”) held by videoconference on May 21, 20211 (the “New Fund Board Meeting”), the Board of Trustees (the “Board”) (including the Trust’s Independent Trustees, voting separately) also considered and unanimously approved (i) the initial Investment Advisory Agreement (“New Investment Advisory Agreement”) for the Global X Nasdaq 100 Tail Risk ETF, Global X Nasdaq 100 Risk Managed Income ETF, Global X Nasdaq 100 Collar 95-110 ETF, Global X S&P 500 Tail Risk ETF, Global X S&P 500 Risk Managed Income ETF and the Global X S&P 500 Collar ETF 95-110 ETF (“New Funds”) and (ii) the initial Supervision and Administration Agreement between the Trust (“New Supervision and Administration Agreement”), on behalf of the New Funds, and Global X Management. The New Investment Advisory Agreement and New Supervision and Administration Agreement are referred to collectively as the “New Fund Agreements.”
In advance of the Board meeting, the Board (including the Trust’s Independent Trustees) and the Independent Trustees’ independent legal counsel requested (in writing) detailed information from Global X Management in connection with the Board’s consideration of the New Fund Agreements and received and reviewed written responses from Global X Management and supporting materials relating to those requests for information. In the course of their consideration of the Renewal Agreements and New Fund Agreements, the Trust’s Independent Trustees were advised by their independent legal counsel and, in addition to meetings with management of Global X Management, the Independent Trustees met separately in executive sessions with their counsel.
In determining to approve the New Fund Agreements for the New Funds, the Board considered a variety of factors, including the factors discussed in greater detail below.
1 This meeting was held via videoconference in reliance on an exemptive order issued by the Securities and Exchange Commission on March 25, 2020. Reliance on the exemptive order is necessary and appropriate due to circumstances related to current or potential effects of COVID-19. All Trustees participating in the telephonic meeting were able to hear each other simultaneously during the meeting. Reliance on the exemptive order requires Trustees, including a majority of the Independent Trustees, to ratify actions taken pursuant to the exemptive order by vote cast at the next in-person meeting.
| | Approval of Investment Advisory Agreement (unaudited) | |
| | | |
Nature, Extent and Quality of Services
With respect to this factor, the Board considered:
• the terms of the New Fund Agreements and the range of services proposed to be provided to the New Funds in accordance with the New Fund Agreements;
• Global X Management’s key personnel and the portfolio managers who would provide investment advisory, supervision and administrative services to the New Funds;
• Global X X Management’s responsibilities under the New Fund Agreements to, among other things, (i) manage the investment operations of the New Funds and the composition of the New Funds’ assets, including the purchase, retention and disposition of its holdings, (ii) provide quarterly reports to the Trust’s officers and the Board and other reports as the Board deems necessary or appropriate, (iii) vote proxies, exercise consents, and exercise all other rights appertaining to securities and assets held by the New Funds, (iv) select broker-dealers to execute portfolio transactions for the New Funds when necessary, (v) assist in the preparation and filing of reports and proxy statements (if any) to the shareholders of the New Funds, and the periodic updating of the registration statements, prospectuses, statements of additional information, and other reports and documents for the New Funds that are required to be filed by the Trust with the U.S. Securities and Exchange Commission (“SEC”) and other regulatory or governmental bodies, and (vi) monitor anticipated purchases and redemptions of the shares (including Creation Units) of the New Funds by shareholders and new investors;
• the nature, extent and quality of all of the services (including advisory, administrative and compliance services) that are proposed to be provided by Global X Management or made available to the New Funds; and
• the quality of Global X Management’s resources and personnel that would be made available to the New Funds, including Global X Management’s experience and the professional qualifications of Global X Management’s key personnel.
Based on these considerations, the Board concluded, at the New Fund Board Meetings, that it was satisfied with the nature, extent and quality of the services proposed to be provided to the New Funds by Global X Management.
Performance
The Board determined that, because the New Funds had not yet begun investment operations as of the dates of the New Fund Board Meetings, meaningful data relating to
| | Approval of Investment Advisory Agreement (unaudited) | |
| | | |
the investment performance of the New Funds was not available and, therefore, could not be a factor in approving the New Fund Agreements.
Cost of Services and Profitability
With respect to this factor, the Board considered:
• Global X Management’s expected costs to provide investment management, supervision and administrative and related services to each New Fund;
• The management fee (including the proposed investment advisory fee) (“Management Fee”) that was proposed to be borne by each New Fund under the respective New Fund Agreement for the various investment advisory, supervisory and administrative services that the New Funds require under a unitary fee structure (including the types of fees and expenses that are not included within the unitary fee and would be borne by the New Funds); and
• the expected profitability to Global X Management, if any, from all of the services proposed to be provided to the New Funds by Global X Management and all aspects of the relationship between Global X Management and the New Funds.
Based on these considerations, the Board concluded that the proposed Management Fee to be paid by each New Fund to Global X Management, in light of the nature, extent and quality of the services to be provided, was reasonable and in the best interests of the New Fund’s shareholders.
Comparison of Fees and Services
With respect to this factor, the Board considered:
• comparative information with respect to the proposed Management Fee to be paid to Global X Management by each New Fund. In connection with this consideration, Global X Management provided the Board with comparative expense data for each New Fund, including fees and expenses paid by unaffiliated similar specialized and/or focused ETFs, and/or other similar registered funds. The Board considered Global X Management’s detailed explanation of the proposed fee structures of any New Fund that was above the average or median for the New Fund’s peer group;
• the structure of the proposed unitary Management Fee (which includes as one component the proposed investment advisory fee for the New Funds) and the expected total expense ratios for the New Funds. In this regard, the Board took into consideration that the purpose of adopting a unitary Management Fee structure for the New Funds was to create a simple, all-inclusive fee that would provide a level of predictability with
| | Approval of Investment Advisory Agreement (unaudited) | |
| | | |
respect to the overall expense ratios (i.e., the total fees) of the New Funds and that the proposed Management Fee for each New Fund was set at a competitive level to make the New Fund viable in the marketplace; and
• that, under the proposed unified Management Fee structure, Global X Management would be responsible for most ordinary expenses of the New Funds, including the costs of various third-party services required by the New Funds, including investment advisory, administrative, audit, certain custody, portfolio accounting, legal, transfer agency and printing costs, but that each New Fund would bear other expenses not covered under the proposed all-inclusive Management Fee, such as taxes, brokerage fees, commissions, and other transaction expenses, interest expenses, and extraordinary expenses.
Based on these considerations, the Board concluded, at the New Fund Board Meetings, that the services to be received and the fees to be charged under the applicable New Fund Agreements were reasonable on a comparative basis.
Economies of Scale
With respect to this factor, the Board considered:
• the extent to which economies of scale would be realized as the New Funds grow and whether the proposed unitary Management Fees for the New Funds reflected these economies of scale;
• the significant investment of time, personnel and other resources that Global X Management intends to make in the New Funds in order to seek to assure that the New Funds are attractive to investors; and
• that the proposed unitary Management Fee would provide a high level of certainty as to the total level of expenses for each New Fund and its shareholders.
Based on these considerations, the Board concluded, at the New Fund Board Meetings, that the proposed unitary Management Fees for the New Funds appropriately addressed economies of scale.
Other Benefits
In considering each New Fund Agreement, in addition to the factors discussed above, the Board considered other benefits that may be realized by Global X Management as a result of its relationships with the New Funds. As a result, the Board concluded that, in the case of each New Fund, in the exercise of the Board’s business judgement, all information the Board considered supported approval of the applicable New Fund Agreements.
| | Approval of Investment Advisory Agreement (unaudited) | |
| | | |
Conclusion
After full consideration of the factors above, as well as other factors that were instructive in their consideration, the Board, including all of the Trust’s Independent Trustees voting separately, concluded, in the exercise of its business judgement, that the New Fund Agreements were fair and reasonable and in the best interest of the New Funds.
In reaching this decision, the Board did not assign relative weights to the factors above nor did the Board deem any one factor or group of them to be controlling in and of themselves. Each member of the Board may have assigned different weights to the various factors.
| | Supplemental Information (unaudited) | |
| | | |
NAV is the price per Share at which a Fund issues and redeems Shares. It is calculated in accordance with the standard formula for valuing mutual fund shares. The “Market Price” of a Fund generally is determined using the midpoint between the highest bid and the lowest offer on the stock exchange on which the Shares of the Fund are listed for trading, as of the time that the Fund’s NAV is calculated. The Fund’s Market Price may be at, above or below its NAV. The NAV of a Fund will fluctuate with changes in the market value of the Fund’s holdings. The Market Price of a Fund will fluctuate in accordance with changes in its NAV, as well as market supply and demand.
Premiums or discounts are the differences (expressed as a percentage) between the NAV and Market Price of a Fund on a given day, generally at the time NAV is calculated. A premium is the amount that a Fund is trading above the reported NAV, expressed as a percentage of the NAV. A discount is the amount that a Fund is trading below the reported NAV, expressed as a percentage of the NAV.
Further information regarding premiums and discounts is available on the Funds’ website at www.globalxetfs.com
| | Trustees and Officers of the Trust (unaudited) | |
| | | |
Set forth below are the names, addresses, years of birth, position with the Trust, Term of Office and Length of Time Served, the principal occupations for the last five years, number of Funds in fund complex overseen by Trustee, and other directorships outside the fund complex of each of the persons currently serving as Trustees and Officers of the Trust.
| Name, Address (Year of Birth) | Position(s) Held with Trust | Principal Occupation(s) Duringthe Past 5 Years | Number of Funds in Trust Overseen by Trustee | Other Directorships Held by Trustees |
Independent Trustees1 | | | | |
Charles A. Baker 605 Third Avenue, 43rd Floor New York, NY 10158 (1953) | Trustee (since 07/2018) | Chief Executive Officer of Investment Innovations LLC (investment consulting) (since 2013); Managing Director of NYSE Euronext (2003 to 2012) | 97 (88 of which are operational) | Trustee of OSI ETF Trust (since 2016) |
Susan M. Ciccarone 605 Third Avenue, 43rd Floor New York, NY 10158 (1973) | Trustee (since 9/30/2019) | Partner, Further Global Capital Management (private equity) (since 2017); formerly Chief Operating Officer (2014-2016) and Chief Financial Officer (2012-2016), Emerging Global Advisors, LLC (ETF issuer) | 97 (88 of which are operational) | Chairman, Payment Alliance International, Inc. (since 2019); Director, Casa Holdco LP, parent of Celink (since 2018) |
Clifford J. Weber 605 Third Avenue, 43rd Floor New York, NY 10158 (1963) | Trustee (since 07/2018) | Owner, Financial Products Consulting Group LLC (consulting services to financial institutions) (since 2015); Formerly, Executive Vice President of Global Index and Exchange-Traded Products, NYSE Market, Inc., a subsidiary of Intercontinental Exchange (ETF/ETP listing exchange) (2013-2015) | 97 (88 of which are operational) | Chairman (since 2017) and Trustee (since 2015) of Clough Funds Trust; Chairman and Trustee of Clayton Street Trust (since 2016); Chairman and Trustee of Janus Detroit Street Trust (since 2016); Chairman and Trustee of Elevation ETF Trust (2016-2018); Trustee of Clough Global Equity Fund (since 2017); Trustee of Clough Global Dividend and Income Fund (since 2017); and Trustee of Clough Global Opportunities Fund (since 2017) |
| | Trustees and Officers of the Trust (unaudited) (continued) | |
| | | |
The Trust’s SAI includes additional information about the Trustees and Officers. The SAI may be obtained without charge by calling 1-888-493-8631. The following chart lists Trustees and Officers as of October 31, 2021.
| Name, Address (Year of Birth) | Position(s) Held with Funds | Principal Occupation(s) During the Past 5 Years | Number of Funds in Trust Overseen by Trustee | Other Directorships Held by Trustees |
Interested Trustee / Officers1 | | | | |
Luis Berruga 605 Third Avenue, 43rd Floor New York, NY 10158 (1977) | Trustee (since 07/2018); President (since 2018) | Chief Executive Officer, GXMC (since 07/2018), Chief Financial Officer (since 2/2014) and Chief Operating Officer (9/2015 - 7/2018); Investment Banker, Jefferies (2012-2014) | 97 (88 of which are operational) | None |
John Belanger 605 Third Avenue, 43rd Floor New York, NY 10158 (1982) | Chief Operating Officerand Chief FinancialOfficer (since 12/2020) | Chief Operating Officerand Head of PortfolioManagement & PortfolioAdministration, GXMC(since 12/2020);Portfolio Manager (since12/2020); Secretary ofthe Trust(3/2020-9/2020); Headof Product Management,GXMC (since 1/2020);Consultant to GXMC(9/2018-12/2019); ChiefOperating Officer, RexShares, LLC(2014-2018) | N/A | N/A |
Susan Lively 605 Third Avenue, 43rd Floor New York, NY 10158 (1981) | Secretary (since 9/2020) | General Counsel, GXMC (since 9/2020); Senior Corporate Counsel at Franklin Templeton (previously, Managing Director and Associate General Counsel at Legg Mason & Co., LLC) (2014-2020) | N/A | N/A |
Eric Griffith2 One Freedom Valley Drive Oaks, PA 19456 (1969) | Assistant Secretary (since 2/2020) | Counsel, SEI Investments (since 10/2019); Vice President and Assistant General Counsel, JPMorgan Chase & Co. (2012-2018) | N/A | N/A |
| | Trustees and Officers of the Trust (unaudited) (continued) | |
| | | |
| Name, Address (Year of Birth) | Position(s) Held with Funds | Principal Occupation(s) During the Past 5 Years | Number of Funds in Trust Overseen by Trustee | Other Directorships Held by Trustees |
Interested Trustee / Officers1 | | | | |
Joe Costello 605 Third Avenue, 43rd Floor New York, NY 10158 (1974) | Chief Compliance Officer (since 9/2016) | Chief Compliance Officer, FlexShares Funds (2011-2015); Vice President, Northern Trust Investments (2003 - 2015) | N/A | N/A |
Ronnie Riven 605 Third Avenue, 43rd Floor New York, NY 10158 (1984) | Treasurer and Principal Accounting Officer (since 12/2020) | Director of Finance, GXMC (since 2018); Director of Accounting and Finance at Barclays Center (2016-2018); Manager of External Reporting at National Grid (2013-2015) | N/A | N/A |
Eric Olsen2 One Freedom Valley Drive Oaks, PA 19456 (1970) | Assistant Treasurer (since 5/2021 ) | Director of Accounting, SEI Investment Manager Services (March 2021 to present); Deputy Head of Fund Operations, Traditional Assets, Aberdeen Standard Investments (2013-2021) | N/A | N/A |
| 1 | Each Trustee serves until his or her successor is duly elected or appointed and qualified. |
| 2 | These officers of the Trust also serve as officers of one or more funds for which SEI Investments Company or an affiliate acts as investment manager, administrator or distributor. |
| | Notice to Shareholders (unaudited) | |
| | | |
For shareholders that do not have an October 31, 2021 tax year end, this notice is for informational purposes only. For shareholders with an October 31, 2021 tax year end, please consult your tax advisor as to the pertinence of this notice. For the fiscal year ended October 31, 2021, the Funds are designating the following items with regard to distributions paid during the year.
| | | Return of Capital | | | Long-Term Capital Gain Distributions | | | Ordinary Income Distributions | | | Total Distributions | | | Qualifying for Corporate Dividends Received Deduction(1) | | | Qualifying Dividend Income(2) | |
| Global X Social Media ETF | | | 0.00 | % | | | 0.00 | % | | | 0.00 | % | | | 0.00 | % | | | 0.00 | % | | | 0.00 | % |
| Global Global X Lithium & Battery Tech ETF | | | 0.00 | % | | | 0.00 | % | | | 100.00 | % | | | 100.00 | % | | | 19.85 | % | | | 92.49 | % |
| Global X E-Commerce ETF | | | 0.00 | % | | | 0.00 | % | | | 100.00 | % | | | 100.00 | % | | | 62.77 | % | | | 63.71 | % |
| Global X Emerging Markets Internet & E-commerce ETF | | | 0.00 | % | | | 0.00 | % | | | 0.00 | % | | | 0.00 | % | | | 0.00 | % | | | 0.00 | % |
Global X SuperDividend® ETF | | | 0.00 | % | | | 0.00 | % | | | 100.00 | % | | | 100.00 | % | | | 1.76 | % | | | 37.10 | % |
Global X SuperDividend® U.S. ETF | | | 11.67 | % | | | 0.00 | % | | | 88.33 | % | | | 100.00 | % | | | 52.86 | % | | | 53.90 | % |
Global X MSCI SuperDividend® EAFE ETF | | | 0.00 | % | | | 0.00 | % | | | 100.00 | % | | | 100.00 | % | | | 0.00 | % | | | 85.60 | % |
Global X MSCI SuperDividend® Emerging Markets ETF | | | 0.00 | % | | | 0.00 | % | | | 100.00 | % | | | 100.00 | % | | | 0.00 | % | | | 56.80 | % |
Global X SuperDividend® REIT ETF | | | 0.00 | % | | | 0.00 | % | | | 0.00 | % | | | 0.00 | % | | | 0.00 | % | | | 0.00 | % |
Global X NASDAQ 100® Covered Call ETF | | | 0.00 | % | | | 0.00 | % | | | 100.00 | % | | | 100.00 | % | | | 0.00 | % | | | 0.00 | % |
Global X S&P 500® Covered Call ETF | | | 0.00 | % | | | 0.00 | % | | | 100.00 | % | | | 100.00 | % | | | 0.00 | % | | | 0.00 | % |
| Global X Russell 2000 Covered Call ETF | | | 0.00 | % | | | 0.00 | % | | | 100.00 | % | | | 100.00 | % | | | 0.00 | % | | | 0.00 | % |
Global X Nasdaq 100® Covered Call & Growth ETF | | | 0.00 | % | | | 0.00 | % | | | 100.00 | % | | | 100.00 | % | | | 0.00 | % | | | 0.00 | % |
Global X S&P 500® Covered Call & Growth ETF | | | 0.00 | % | | | 0.00 | % | | | 100.00 | % | | | 100.00 | % | | | 0.00 | % | | | 0.00 | % |
| Global X SuperIncome™ Preferred ETF | | | 0.00 | % | | | 0.00 | % | | | 100.00 | % | | | 100.00 | % | | | 72.35 | % | | | 73.42 | % |
| Global X Renewable Energy Producers ETF | | | 0.00 | % | | | 8.32 | % | | | 91.68 | % | | | 100.00 | % | | | 7.21 | % | | | 87.07 | % |
Global X S&P 500® Catholic Values ETF | | | 0.00 | % | | | 0.00 | % | | | 100.00 | % | | | 100.00 | % | | | 100.00 | % | | | 100.00 | % |
| Global X S&P Catholic Values Developed ex-U.S. ETF | | | 0.00 | % | | | 0.00 | % | | | 100.00 | % | | | 100.00 | % | | | 0.00 | % | | | 69.68 | % |
Global X Guru® Index ETF | | | 0.00 | % | | | 0.00 | % | | | 100.00 | % | | | 100.00 | % | | | 63.05 | % | | | 63.53 | % |
Global X S&P 500® Tail Risk ETF | | | 0.00 | % | | | 0.00 | % | | | 0.00 | % | | | 0.00 | % | | | 0.00 | % | | | 0.00 | % |
Global X S&P 500® Risk Managed Income ETF | | | 0.00 | % | | | 0.00 | % | | | 100.00 | % | | | 100.00 | % | | | 0.00 | % | | | 0.00 | % |
Global X S&P 500® Collar 95-110 ETF | | | 0.00 | % | | | 0.00 | % | | | 0.00 | % | | | 0.00 | % | | | 0.00 | % | | | 0.00 | % |
| | Notice to Shareholders (unaudited) | |
| | | |
| | | Return of Capital | | | Long-Term Capital Gain Distributions | | | Ordinary Income Distributions | | | Total Distributions | | | Qualifying for Corporate Dividends Received Deduction(1) | | | Qualifying Dividend Income(2) | |
Global X NASDAQ 100® Tail Risk ETF | | | 0.00 | % | | | 0.00 | % | | | 0.00 | % | | | 0.00 | % | | | 0.00 | % | | | 0.00 | % |
Global X NASDAQ 100® Risk Managed Income ETF | | | 0.00 | % | | | 0.00 | % | | | 0.00 | % | | | 0.00 | % | | | 0.00 | % | | | 0.00 | % |
Global X NASDAQ 100® Collar 95-110 ETF | | | 0.00 | % | | | 0.00 | % | | | 0.00 | % | | | 0.00 | % | | | 0.00 | % | | | 0.00 | % |
(1) | Qualifying dividends represent dividends which qualify for the corporate dividends received deduction and is reflected as a percentage of ordinary Income distributions (the total of short term capital gain and net investment income distributions). |
(2) | The percentage in this column represents the amount of “Qualifying Dividend Income” as created by the Jobs and Growth Relief Reconciliation Act of 2003 and is reflected as a percentage of ordinary income distributions (the total of short term capital gain and net investment income distributions). It is the intention of each of the aforementioned funds to designate the maximum amount permitted by law. |
| | Notice to Shareholders (unaudited) | |
| | | |
| | | U.S. Government Interest(3) | | | Interest Related Dividends(4) | | | Short Term Capital Gain Dividends(5) | | | Qualifying Business Income(6) | | | Foreign Tax Credit | |
| Global X Social Media ETF | | | 0.00 | % | | | 0.00 | % | | | 0.00 | % | | | 0.00 | % | | | 0.00 | % |
| Global X Lithium & Battery Tech ETF | | | 0.00 | % | | | 0.01 | % | | | 0.00 | % | | | 0.00 | % | | | 36.32 | % |
| Global X E-Commerce ETF | | | 0.00 | % | | | 0.00 | % | | | 100.00 | % | | | 0.00 | % | | | 0.00 | % |
| Global X Emerging Markets Internet & E-commerce ETF | | | 0.00 | % | | | 0.00 | % | | | 0.00 | % | | | 0.00 | % | | | 0.00 | % |
Global X SuperDividend® ETF | | | 0.00 | % | | | 0.00 | % | | | 0.00 | % | | | 8.30 | % | | | 3.28 | % |
Global X SuperDividend® U.S. ETF | | | 0.00 | % | | | 3.29 | % | | | 0.00 | % | | | 8.97 | % | | | 0.00 | % |
Global X MSCI SuperDividend® EAFE ETF | | | 0.00 | % | | | 0.00 | % | | | 0.00 | % | | | 0.00 | % | | | 9.02 | % |
Global X MSCI SuperDividend® Emerging Markets ETF | | | 0.00 | % | | | 0.00 | % | | | 0.00 | % | | | 0.00 | % | | | 16.66 | % |
Global X SuperDividend® REIT ETF | | | 0.00 | % | | | 0.00 | % | | | 0.00 | % | | | 0.00 | % | | | 0.00 | % |
Global X NASDAQ 100® Covered Call ETF | | | 0.00 | % | | | 0.00 | % | | | 100.00 | % | | | 0.00 | % | | | 0.00 | % |
Global X S&P 500® Covered Call ETF | | | 0.00 | % | | | 0.00 | % | | | 100.00 | % | | | 0.00 | % | | | 0.00 | % |
| Global X Russell 2000 Covered Call ETF | | | 0.00 | % | | | 0.00 | % | | | 100.00 | % | | | 0.00 | % | | | 0.00 | % |
Global X NASDAQ 100® Covered Call & Growth ETF | | | 0.00 | % | | | 0.00 | % | | | 100.00 | % | | | 0.00 | % | | | 0.00 | % |
Global X S&P 500® Covered Call & Growth ETF | | | 0.00 | % | | | 0.00 | % | | | 100.00 | % | | | 0.00 | % | | | 0.00 | % |
| Global X SuperIncome™ Preferred ETF | | | 0.00 | % | | | 0.33 | % | | | 0.00 | % | | | 0.00 | % | | | 0.00 | % |
| Global X Renewable Energy Producers ETF | | | 0.00 | % | | | 0.00 | % | | | 0.00 | % | | | 0.00 | % | | | 13.07 | % |
Global X S&P 500® Catholic Values ETF | | | 0.00 | % | | | 0.01 | % | | | 0.00 | % | | | 0.00 | % | | | 0.00 | % |
| Global X S&P Catholic Values Developed ex-U.S. ETF | | | 0.00 | % | | | 0.00 | % | | | 0.00 | % | | | 0.00 | % | | | 11.56 | % |
Global X Guru® Index ETF | | | 0.00 | % | | | 0.00 | % | | | 0.00 | % | | | 0.00 | % | | | 0.00 | % |
Global X S&P 500® Tail Risk ETF | | | 0.00 | % | | | 0.00 | % | | | 0.00 | % | | | 0.00 | % | | | 0.00 | % |
Global X S&P 500® Risk Managed Income ETF | | | 0.00 | % | | | 0.00 | % | | | 100.00 | % | | | 0.00 | % | | | 0.00 | % |
Global X S&P 500® Collar 95-110 ETF | | | 0.00 | % | | | 0.00 | % | | | 0.00 | % | | | 0.00 | % | | | 0.00 | % |
Global X NASDAQ 100® Tail Risk ETF | | | 0.00 | % | | | 0.00 | % | | | 0.00 | % | | | 0.00 | % | | | 0.00 | % |
Global X NASDAQ 100® Risk Managed Income ETF | | | 0.00 | % | | | 0.00 | % | | | 0.00 | % | | | 0.00 | % | | | 0.00 | % |
Global X NASDAQ 100® Collar 95-110 ETF | | | 0.00 | % | | | 0.00 | % | | | 0.00 | % | | | 0.00 | % | | | 0.00 | % |
| | Notice to Shareholders (unaudited) | |
| | | |
(3) | “U.S. Government Interest” represents the amount of interest that was derived from U.S. Government obligations and distributed during the fiscal year. Generally, interest from direct U.S. Government obligations is exempt from state income tax. However, for shareholders who are residents of California, Connecticut and New York, the statutory threshold requirements were not satisfied to permit exemption of these amounts from state income. |
(4) | The percentage in this column represents the amount of “Qualifying Interest Income” as created by the American Jobs Creation Act of 2004 and is a percentage of net investment income that is exempt from U.S. withholding tax when paid for foreign investors. |
(5) | The percentage of this column represents the amount of “Short Term Capital Gain Dividend” and is reflected as a percentage of short term capital gain distribution that is exempted from U.S. withholding tax when paid to foreign investors. |
(6) | The percentage of this column represents that amount of ordinary dividend income that qualified for 20% Business Income Deduction.Certain Funds intend to pass through a foreign tax credit to shareholders. For the fiscal year ended October 31, 2021 the total amount of foreign source income and foreign tax credit are as follows: |
Certain Funds intend to pass through a foreign tax credit to shareholders. For the fiscal year ended October 31, 2021 the total amount of foreign source income and foreign tax credit are as follows:
| | | Foreign Tax Paid | | | Foreign Source Income | |
| Global X Lithium & Battery Tech ETF | | $ | 2,633,829 | | | $ | 9,921,868 | |
Global X SuperDividend® ETF | | | 2,222,780 | | | | 40,353,556 | |
Global X MSCI SuperDividend® EAFE ETF | | | 53,751 | | | | 660,547 | |
Global X MSCI SuperDividend® Emerging Markets ETF | | | 565,962 | | | | 4,456,745 | |
| Global X Renewable Energy Producers ETF | | | 278,999 | | | | 2,125,735 | |
| Global X S&P Catholic Values Developed ex-U.S. ETF | | | 7,751 | | | | 85,327 | |
The information reported herein may differ from the information and distributions taxable to the shareholders for the calendar year ending December 31, 2021. Complete information will be computed and reported in conjunction with your 2021 Form 1099- DIV.
605 Third Avenue, 43rd Floor
New York, NY 10158
1-888-493-8631
www.globalxetfs.com
Investment Adviser and Administrator:
Global X Management Company LLC
605 Third Avenue, 43rd Floor
New York, NY 10158
Distributor:
SEI Investments Distribution Co.
One Freedom Valley Drive
Oaks, PA 19456
Sub-Administrator:
SEI Investments Global Funds Services
One Freedom Valley Drive
Oaks, PA 19456
Counsel for Global X Funds and the Independent Trustees:
Stradley Ronon Stevens & Young, LLP
2000 K Street, N.W.
Suite 700
Washington, DC 20006-1871
Custodian and Transfer Agent:
Brown Brothers Harriman & Co.
40 Water Street
Boston, MA 02109
Independent Registered Public Accounting Firm:
PricewaterhouseCoopers LLP
Two Commerce Square
Suite 1800
2001 Market Street
Philadelphia, PA 19103
This information must be preceded or accompanied by a current prospectus for the Funds described.
GLX-AR-003-1100
Item 2. Code of Ethics.
The registrant has adopted a code of ethics that applies to the registrant’s principal executive officer, principal financial officer, comptroller or principal accounting officer, and any person who performs a similar function.
Item 3. Audit Committee Financial Expert.
(a)(1) The registrant’s board of trustees has determined that the registrant has at least one audit committee financial expert serving on the audit committee.
(a)(2) The audit committee financial experts are Charles A. Baker and Susan M. Ciccarone and each is independent as defined in Form N-CSR Item 3(a)(2).
Item 4. Principal Accountant Fees and Services.
Fees billed by Pricewaterhouse Coopers LLP (“PwC”) relate to the registrant.
PWC billed the registrant aggregate fees for services rendered to the registrant for the last two fiscal years as follows:
| | 2021 | 2020 |
| | | All fees and services to the Trust that were pre-approved | All fees and services to service affiliates that were pre-approved | All other fees and services to service affiliates that did not require pre-approval | All fees and services to the Trust that were pre-approved | All fees and services to service affiliates that were pre-approved | All other fees and services to service affiliates that did not require pre-approval |
| (a) | Audit Fees | $929,467 | $0 | $0 | $1,056,304 | $0 | $0 |
| (b) | Audit-Related Fees | $0 | $0 | $0 | $0 | $0 | $0 |
| (c) | Tax Fees | $334,184 | $0 | $0 | $330,942 | $0 | $0 |
| (d) | All Other Fees | $0 | $0 | $0 | $0 | $0 | $0 |
(e)(1) Not applicable.
(e)(2) Percentage of fees billed applicable to non-audit services pursuant to waiver of pre-approval requirement were as follows (PwC):
| | 2021 | 2020 |
| Audit-Related Fees | 0% | 0% |
| Tax Fees | 0% | 0% |
| All Other Fees | 0% | 0% |
(f) Not applicable.
(g) The aggregate non-audit fees and services billed by PwC for the last two fiscal years were $334,184 and $330,942, respectively.
(h) During the past fiscal year, all non-audit services provided by registrant’s principal accountant to either registrant’s investment adviser or to any entity controlling, controlled by, or under common control with registrant’s investment adviser that provides ongoing services to registrant were pre-approved by the audit committee of registrant’s Board of Trustees. Included in the audit committee’s pre-approval was the review and consideration as to whether the provision of these non-audit services is compatible with maintaining the principal accountant’s independence.
Item 5. Audit Committee of Listed Registrants.
The registrant has a separately-designated standing Audit Committee, which is composed of the registrant's Independent Trustees, Charles A. Baker, Susan M. Ciccarone and Clifford J. Weber.
Item 6. Investments.
Not applicable.
Item 7. Disclosure of Proxy Voting Policies and Procedures for Closed-End Management Investment Companies.
Not applicable to open-end management investment companies.
Item 8. Portfolio Managers of Closed-End Management Investment Companies.
Not applicable to open-end management investment companies.
Item 9. Purchases of Equity Securities by Closed-End Management Investment Company and Affiliated Purchasers.
Not applicable to open-end management investment companies.
Item 10. Submission of Matters to a Vote of Security Holders.
There have been no material changes.
Item 11. Controls and Procedures.
(a) The certifying officers, whose certifications are included herewith, have evaluated the registrant’s disclosure controls and procedures within 90 days of the filing date of this report. In their opinion, based on their evaluation, the registrant’s disclosure controls and procedures are adequately designed, and are operating effectively to ensure, that information required to be disclosed by the registrant in the reports it files or submits under the Securities Exchange Act of 1934 is recorded, processed, summarized and reported within the time periods specified in the Securities and Exchange Commission’s rules and forms.
(b) There were no significant changes in the registrant’s internal control over financial reporting that occurred during the period covered by this report that has materially affected, or is reasonably likely to materially affect, the registrant’s internal control over financial reporting.
Item 12. Disclosure of Securities Lending Activities for Closed-End Management Investment Companies.
Not applicable to open-end management investment companies.
Item 13. Exhibits.
SIGNATURES
Pursuant to the requirements of the Securities Exchange Act of 1934 and the Investment Company Act of 1940, the registrant has duly caused this report to be signed on its behalf by the undersigned, thereunto duly authorized.
/s/ Luis Berruga
Luis Berruga
President
Date: January 6, 2022
Pursuant to the requirements of the Securities Exchange Act of 1934 and the Investment Company Act of 1940, this report has been signed below by the following persons on behalf of the registrant and in the capacities and on the dates indicated.
/s/ Luis Berruga
Luis Berruga
President
Date: January 6, 2022
/s/ John Belanger
John Belanger
Chief Financial Officer
Date: January 6, 2022