Global X Alternative Income ETF (ticker: ALTY)
(formerly, Global X SuperDividend® Alternatives ETF) |
Global X S&P 500® Quality Dividend ETF (ticker: QDIV) |
| Global X U.S. Preferred ETF (ticker: PFFD) |
| Global X Variable Rate Preferred ETF (ticker: PFFV) |
| Global X MLP ETF (ticker: MLPA) |
| Global X MLP & Energy Infrastructure ETF (ticker: MLPX) |
| Global X Conscious Companies ETF (ticker: KRMA) |
| Global X Adaptive U.S. Factor ETF (ticker: AUSF) |
| Global X Adaptive U.S. Risk Management ETF (ticker: ONOF) |
| Global X Founder-Run Companies ETF (ticker: BOSS) |
Annual Report
November 30, 2021
As permitted by regulations adopted by the Securities and Exchange Commission, paper copies of the Funds’ (defined below) shareholder reports will no longer be sent by mail, unless you specifically request paper copies of the reports from your financial intermediary (such as a broker-dealer or bank). Instead, shareholder reports will be available on the Funds’ website (www.globalxetfs.com/explore), and you will be notified by mail each time a report is posted and provided with a website link to access the report.
If you already elected to receive shareholder reports electronically, you will not be affected by this change and you need not take any action. You may elect to receive shareholder reports and other communications from the Funds electronically anytime by contacting your financial intermediary.
You may elect to receive all future Fund shareholder reports in paper free of charge. Please contact your financial intermediary to inform them that you wish to continue receiving paper copies of Fund shareholder reports and for details about whether your election to receive reports in paper will apply to all funds held with your financial intermediary.
| Management Discussion of Fund Performance | 1 |
| Schedules of Investments | |
| Global X Alternative Income ETF | 26 |
Global X S&P 500® Quality Dividend ETF | 30 |
| Global X U.S. Preferred ETF | 34 |
| Global X Variable Rate Preferred ETF | 48 |
| Global X MLP ETF | 55 |
| Global X MLP & Energy Infrastructure ETF | 57 |
| Global X Conscious Companies ETF | 59 |
| Global X Adaptive U.S. Factor ETF | 67 |
| Global X Adaptive U.S. Risk Management ETF | 75 |
| Global X Founder-Run Companies ETF | 93 |
| Statements of Assets and Liabilities | 98 |
| Statements of Operations | 101 |
| Statements of Changes in Net Assets | 104 |
| Financial Highlights | 109 |
| Notes to Financial Statements | 117 |
| Report of Independent Registered Public Accounting Firm | 140 |
| Disclosure of Fund Expenses | 142 |
| Approval of Investment Advisory Agreement | 144 |
| Supplemental Information | 148 |
| Trustees and Officers of the Trust | 149 |
| Notice to Shareholders | 152 |
Shares are bought and sold at market price (not NAV) and are not individually redeemed from the Fund. Shares may only be redeemed directly from the Fund by Authorized Participants, in very large creation/redemption units. Brokerage commissions will reduce returns.
The Funds file their complete schedules of Fund holdings with the Securities and Exchange Commission (the “SEC” or “Commission”) for the first and third quarters of each fiscal year as an exhibit to its report on Form N-PORT. The Funds’ Forms N-PORT are available on the Commission’s website at https://www.sec.gov, and may be reviewed and copied at the Commission’s Public Reference Room in Washington, DC. Information on the operation of the Public Reference Room may be obtained by calling 1-800-SEC-0330.
A description of the policies and procedures that Global X Funds uses to determine how to vote proxies relating to Fund securities, as well as information relating to how the Funds voted proxies relating to Fund securities during the most recent 12-month period ended June 30, is available (i) without charge, upon request, by calling 1-888-493-8631; and (ii) on the Commission’s website at https://www.sec.gov.
| | Management Discussion of Fund Performance (unaudited) | |
| | Global X Alternative Income ETF | |
Global X Alternative Income ETF
The Global X Alternative Income ETF (“Fund”) seeks to provide investment results that correspond generally to the price and yield performance, before fees and expenses, of the Indxx SuperDividend® Alternatives Index (“Underlying Index”). The Fund is passively managed, which means the investment adviser does not attempt to take defensive positions in declining markets. The Fund generally seeks to fully replicate the Underlying Index.
The Underlying Index is intended to provide exposure to five income-producing categories: Master Limited Partnerships (“MLPs”) and Infrastructure, Real Estate, Preferreds, Emerging Market Bonds, and Covered Calls. The MLPs and Infrastructure category primarily consists of units of MLPs and shares of infrastructure companies. The Real Estate category provides exposure to global real estate investment trusts (“REITs”) and receives this exposure through investing directly in the Global X SuperDividend® REIT ETF. The Preferreds category provides exposure to U.S. preferred securities and receives this exposure through investing directly in the Global X U.S. Preferred ETF. The Emerging Markets Bonds category provides exposure to emerging markets debt and receives this exposure through investing directly in the Global X Emerging Markets Bond ETF. The Covered Call category provides exposure to a covered call strategy and receives this exposure through investing directly in the Global X Nasdaq 100 Covered Call ETF.
For the 12-month period ended November 30, 2021 (the “reporting period”), the Fund increased 22.52%, while the Underlying Index increased 22.82%. The Fund had a net asset value of $11.51 per share on November 30, 2020 and ended the reporting period with a net asset value of $13.16 per share on November 30, 2021.
During the reporting period, the highest returns derived from Blackstone Inc. and Black Stone Minerals LP, which returned 101.06% and 82.05%, respectively. The worst performers were Holly Energy Partners, L.P. and Dominion Energy Inc, which returned -6.27% and -6.21%, respectively.
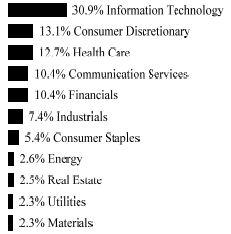
The Fund’s Underlying Index underwent a methodology update prior to the end of the reporting period, which modified the asset classes the Fund provides exposure to. Before that change, the Fund provided exposure to the highest yielding securities from various alternative income-generating asset classes, including REITs, MLPs, Business Development Companies (BDCs), and certain Closed End Fund strategies. Rising economic activity and inflation during the reporting period proved to be a tailwind for commodities and real assets, which tend to do well amid inflationary pressures. This primarily benefitted MLPs and Real Estate. BDCs also rallied as credit spreads tightened and business activity started to normalize. During the reporting period, the Fund maintained an average approximate sector exposure of 16% to Financials, 12% to Energy, 12% to Utilities, and 2% to Industrials.
| | Management Discussion of Fund Performance (unaudited) | |
| | Global X Alternative Income ETF | |
| | AVERAGE TOTAL RETURN FOR THE YEAR ENDED NOVEMBER 30, 2021 |
| | One Year Return | Three Year Return | Five Year Return | Annualized Inception to Date* |
| | Net Asset Value | Market Price | Net Asset Value | Market Price | Net Asset Value | Market Price | Net Asset Value | Market Price |
| Global X Alternative Income ETF | 22.52% | 23.09% | 5.36% | 5.43% | 6.18% | 6.00% | 6.20% | 6.24% |
Indxx SuperDividend® Alternatives Index | 22.82% | 22.82% | 5.38% | 5.38% | 6.53% | 6.53% | 6.67% | 6.67% |
S&P 500® Index | 27.92% | 27.92% | 20.38% | 20.38% | 17.90% | 17.90% | 15.13% | 15.13% |
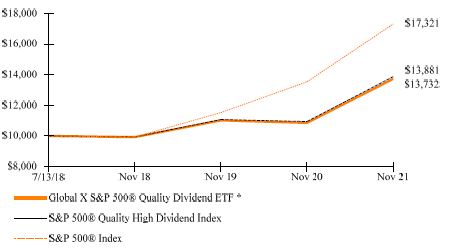
Growth of a $10,000 Investment
(at Net Asset Value)
* The Fund commenced investment operations on July 13, 2015.
The S&P 500® Index is a market capitalization weighted composite index of 500 large capitalization U.S. companies.
The Indxx SuperDividend® Alternatives Index is designed to track the performance of different Alternative asset classes, with an objective of providing a diversified portfolio of assets with a low volatility and high dividend yield.
The performance data quoted herein represents past performance and the return and value of an investment in the Fund will fluctuate so that, when sold, it may be worth less than its original cost. Past performance is no guarantee of future performance and should not be considered as a representation of the future results of the Fund. The Fund’s performance assumes the reinvestment of all dividends and all capital gains. Index returns assume reinvestment of dividends and, unlike the Fund’s returns, do not reflect any fees or expenses. If such fees and expenses were included in the index returns, the performance would have been lower. Please note that one cannot invest directly in an unmanaged index.
| | Management Discussion of Fund Performance (unaudited) | |
| | Global X Alternative Income ETF | |
Performance figures for the periods shown may reflect contractual fee waivers and/or expense reimbursements. In the absence of fee waivers and/or expense reimbursements (if applicable), returns would have been lower.
There are no assurances that the Fund will meet its stated objectives.
The Fund’s holdings and allocations are subject to change and should not be considered recommendations to buy individual securities.
Returns shown do not reflect the deduction of taxes that a shareholder would pay on Fund distributions or the redemption of Fund shares.
See definition of comparative indices on the previous page and above.
| | Management Discussion of Fund Performance (unaudited) | |
| | Global X S&P 500® Quality Dividend ETF | |
Global X S&P 500® Quality Dividend ETF
The Global X S&P 500® Quality Dividend ETF (“Fund”) seeks to provide investment results that correspond generally to the price and yield performance, before fees and expenses, of the S&P 500® Quality High Dividend Index (“Underlying Index”). The Fund is passively managed, which means the investment adviser does not attempt to take defensive positions in declining markets. The Fund generally seeks to fully replicate the Underlying Index.
The Underlying Index serves as a benchmark for income seeking equity investors. The Underyling Index is designed to measure the performance of 80 high yield companies within the S&P 500® Index (“Reference Index”) and is equally weighted to best represent the performance of this group, regardless of constituent size.
For the 12-month period ended November 30, 2021 (the “reporting period”), the Fund increased 26.45%, while the Underlying Index increased 26.82%. The Fund had a net asset value of $25.20 per share on November 30, 2020 and ended the reporting period with a net asset value of $31.02 per share on November 30, 2021.
During the reporting period, the highest returns derived from Nucor Corporation and Comerica Incorporated, which returned 75.43% and 74.83%, respectively. The worst performers included Sylvamo Corporation and Clorox Company, which returned -18.89% and -17.87%, respectively.
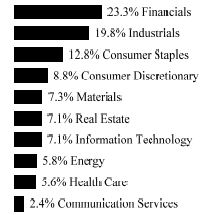
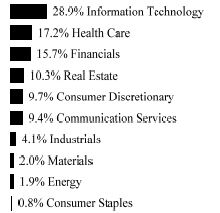
Low interest rates and successful vaccination programs buoyed the U.S. economy during the reporting period. Corporate balance sheets continued to improve and demand for higher quality companies that offered dividends also rose. Earnings growth for U.S. large-capitalization companies was strong, also boosting quality large-capitalization stocks. However, the Fund had a slight underperformance in comparison to the Reference Index (which also serves as the Fund’s benchmark index) during the reporting period related to its low exposure to the Information Technology sector. During the reporting period, the Fund maintained an approximate average sector exposure of 23% to Financials, 17% to Industrials, 14% to Consumer Staples, and 12% to Real Estate.
| | AVERAGE ANNUAL TOTAL RETURNFOR THE YEAR ENDED NOVEMBER 30, 2021 |
| | One Year Return | Three Year Return | Annualized Inception to Date* |
| | Net Asset Value | Market Price | Net Asset Value | Market Price | Net Asset Value | Market Price |
Global X S&P 500® Quality Dividend ETF | 26.45% | 26.49% | 11.42% | 11.46% | 9.83% | 9.84% |
S&P 500® Quality High Dividend Index | 26.82% | 26.82% | 11.77% | 11.77% | 10.17% | 10.17% |
S&P 500® Index | 27.92% | 27.92% | 20.38% | 20.38% | 17.63% | 17.63% |
| | Management Discussion of Fund Performance (unaudited) | |
| | Global X S&P 500® Quality Dividend ETF | |
Growth of a $10,000 Investment
(at Net Asset Value)
* The Fund commenced investment operations on July 13, 2018.
The S&P 500® Index is a market capitalization weighted composite index of 500 large capitalization U.S. companies.
The S&P 500® Quality High Dividend Index measures the performance of S&P 500® stocks that exhibit both high quality and high dividend yield characteristics.
The performance data quoted herein represents past performance and the return and value of an investment in the Fund will fluctuate so that, when sold, it may be worth less than its original cost. Past performance is no guarantee of future performance and should not be considered as a representation of the future results of the Fund. The Fund’s performance assumes the reinvestment of all dividends and all capital gains. Index returns assume reinvestment of dividends and, unlike the Fund’s returns, do not reflect any fees or expenses. If such fees and expenses were included in the index returns, the performance would have been lower. Please note that one cannot invest directly in an unmanaged index.
Performance figures for the periods shown may reflect contractual fee waivers and/or expense reimbursements. In the absence of fee waivers and/or expense reimbursements (if applicable), returns would have been lower.
There are no assurances that the Fund will meet its stated objectives.
The Fund’s holdings and allocations are subject to change and should not be considered recommendations to buy individual securities.
Returns shown do not reflect the deduction of taxes that a shareholder would pay on Fund distributions or the redemption of Fund shares.
See definition of comparative indices on the previous page and above.
| | Management Discussion of Fund Performance (unaudited) | |
| | Global X U.S. Preferred ETF | |
Global X U.S. Preferred ETF
The Global X U.S. Preferred ETF (“Fund”) seeks to provide investment results that correspond generally to the price and yield performance, before fees and expenses, of the ICE BofA Diversified Core U.S. Preferred Securities Index (“Underlying Index”). The Fund is passively managed, which means the investment adviser does not attempt to take defensive positions in declining markets. The Fund generally seeks to fully replicate the Underlying Index.
The Underlying Index is designed to track the broad-based performance of the U.S. preferred securities market. The Underlying Index includes different categories of preferred stock, such as floating variable and fixed-rate preferreds, cumulative and non-cumulative preferreds, and trust preferreds. Qualifying preferred securities must be listed on a U.S. exchange, denominated in U.S. dollars, and have a minimum amount outstanding of $100 million. Qualifying securities must meet minimum price, liquidity, maturity and other requirements as determined by ICE Data Indices, LLC, the provider of the Underlying Index.
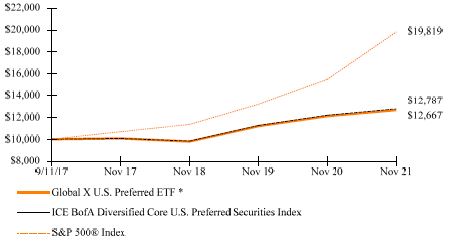
For the 12-month period ended November 30, 2021 (the “reporting period”), the Fund increased 4.61%, while the Underlying Index increased 4.84%. The Fund had a net asset value of $25.36 per share on November 30, 2020 and ended the reporting period with a net asset value of $25.21 per share on November 30, 2021.
During the reporting period, the highest returns came from Huntington Bancshares Inc. and KKR & Co. Inc, which returned 133.84% and 59.01%, respectively. The worst performers included Sabre Corp (6.5%) and ViacomCBS Inc (5.75%), which returned -30.12% and -28.62%, respectively.
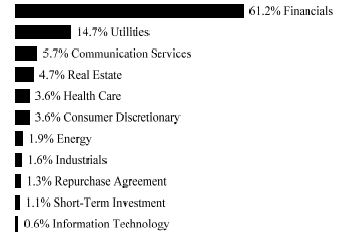
The Fund’s holdings consist of broad exposure to U.S. preferred stocks, providing benchmark-like exposure to the asset class. As the COVID-19 pandemic waned, economic recovery and removal of lockdown measures led to renewed confidence in securities with greater credit risk, leading to a tightening in credit spreads during the reporting period. The financial system also stabilized as borrowers recovered from the effects of the COVID-19 pandemic. The market also braced for rising interest rates and investors refocused their attention on preferred stocks. Preferred stocks offer considerable exposure to the Financials sector, which tends to benefit from higher rates. Preferred stocks performed positively during the reporting period, primarily due to tight credit spreads and a preference for higher yielding instruments among investors. During the reporting period, the Fund maintained an average approximate sector allocation of 54% to Financials, 14% to Utilities, and 6% to Real Estate.
| | AVERAGE ANNUAL TOTAL RETURNFOR THE YEAR ENDED NOVEMBER 30, 2021 |
| | One Year Return | Three Year Return | Annualized Inception to Date* |
| | Net Asset Value | Market Price | Net Asset Value | Market Price | Net Asset Value | Market Price |
| Global X U.S. Preferred ETF | 4.61% | 4.36% | 8.93% | 8.90% | 5.76% | 5.87% |
| ICE BofA Diversified Core U.S. Preferred Securities Index | 4.84% | 4.84% | 9.14% | 9.14% | 5.98% | 5.98% |
S&P 500® Index | 27.92% | 27.92% | 20.38% | 20.38% | 17.59% | 17.59% |
| | Management Discussion of Fund Performance (unaudited) | |
| | Global X U.S. Preferred ETF | |
Growth of a $10,000 Investment
(at Net Asset Value)
* The Fund commenced investment operations on September 11, 2017.
The S&P 500® Index is a market capitalization weighted composite index of 500 large capitalization U.S. companies.
The ICE BofA Diversified U.S. Preferred Securities Index was formerly known as BofA Merrill Lynch Diversified Core U.S. Preferred Securities Index.
The performance data quoted herein represents past performance and the return and value of an investment in the Fund will fluctuate so that, when sold, it may be worth less than its original cost. Past performance is no guarantee of future performance and should not be considered as a representation of the future results of the Fund. The Fund’s performance assumes the reinvestment of all dividends and all capital gains. Index returns assume reinvestment of dividends and, unlike the Fund’s returns, do not reflect any fees or expenses. If such fees and expenses were included in the index returns, the performance would have been lower. Please note that one cannot invest directly in an unmanaged index.
Performance figures for the periods shown may reflect contractual fee waivers and/or expense reimbursements. In the absence of fee waivers and/or expense reimbursements (if applicable), returns would have been lower.
There are no assurances that the Fund will meet its stated objectives.
The Fund’s holdings and allocations are subject to change and should not be considered recommendations to buy individual securities.
Returns shown do not reflect the deduction of taxes that a shareholder would pay on Fund distributions or the redemption of Fund shares.
See definition of comparative indices on the previous page and above.
| | Management Discussion of Fund Performance (unaudited) | |
| | Global X Variable Rate Preferred ETF | |
Global X Variable Rate Preferred ETF
The Global X Variable Rate Preferred ETF (“Fund”) seeks to provide investment results that correspond generally to the price and yield performance, before fees and expenses, of the ICE U.S. Variable Rate Preferred Securities Index (“Underlying Index”). The Fund is passively managed, which means the investment adviser does not attempt to take defensive positions in declining markets. The Fund generally seeks to fully replicate the Underlying Index.
The Underlying Index is designed to track the broad-based performance of the U.S.-listed variable rate preferred securities market. Qualifying preferred securities must be listed on a U.S. exchange, denominated in U.S. dollars, have floating or variable dividends or coupons, and have a minimum amount outstanding of $50 million. Qualifying preferred securities may, however, be issued by non-U.S. companies. Qualifying securities must be issued in $25, $50, $100, or $1000 par/liquidation preference increments, must have a traded market value of greater than $6 million in each of the previous three calendar months, and must have at least one year remaining to maturity, as determined by ICE Data Indices, LLC, the provider of the Underlying Index.
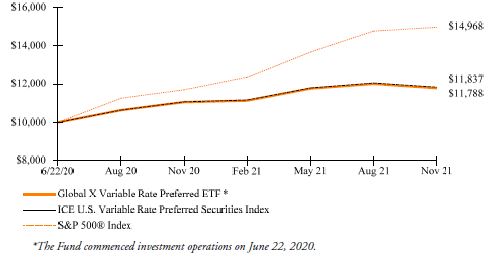
For the 12-month period ended November 30, 2021 (the “reporting period”), the Fund increased 6.60%, while the Underlying Index increased 6.88%. The Fund had a net asset value of $26.97 per share on November 30, 2020 and ended the reporting period with a net asset value of $27.28 per share on November 30, 2021.
During the reporting period, the highest returns derived from NGL Energy Partners L.P. and NuStar Energy L.P., which returned 44.19% and 29.90%, respectively. The worst performers included Altera Infrastructure L.P. and Fortress Transportation and Infrastructure Investors LLC, which returned -29.37% and -5.04%, respectively.
The Fund invests in a broad basket of U.S. variable-rate preferred stocks. Variable rate preferred stocks are a subset of the preferred asset class, which includes securities that reset their coupon at certain intervals based on the prevailing interest rate. Therefore, these securities tend to have lower duration compared to fixed rate preferred stocks. Higher inflation and increasing market expectations of rate hikes led to a rise in bond yields during the reporting period. This resulted in investor demand for lower duration instruments, such as variable rate preferred stocks. Tight credit spreads also benefited variable rate preferred stocks as an improving macroeconomic backdrop improved company balance sheets. During the reporting period, the Fund maintained an average approximate sector allocation of 84% to Financials, 7% to Energy, and 3% to Utilities.
| | AVERAGE ANNUAL TOTAL RETURN FOR THE YEAR ENDED NOVEMBER 30, 2021 |
| | One Year Return | Annualized Inception to Date* |
| | Net Asset Value | Market Price | Net Asset Value | Market Price |
| Global X Variable Rate Preferred ETF | 6.60% | 6.70% | 12.11% | 12.30% |
| ICE U.S. Variable Rate Preferred Securities Index | 6.88% | 6.88% | 12.42% | 12.42% |
S&P 500® Index | 27.92% | 27.92% | 32.30% | 32.30% |
| | Management Discussion of Fund Performance (unaudited) | |
| | Global X Variable Rate Preferred ETF | |
Growth of a $10,000 Investment
(at Net Asset Value)
* The Fund commenced investment operations on June 22, 2020.
The S&P 500® Index is a market capitalization weighted composite index of 500 large capitalization U.S. companies.
The ICE U.S. Variable Rate Preferred Securities Index is designed to track the broad-based performance of the U.S. variable rate preferred securities market.
The performance data quoted herein represents past performance and the return and value of an investment in the Fund will fluctuate so that, when sold, it may be worth less than its original cost. Past performance is no guarantee of future performance and should not be considered as a representation of the future results of the Fund. The Fund’s performance assumes the reinvestment of all dividends and all capital gains. Index returns assume reinvestment of dividends and, unlike the Fund’s returns, do not reflect any fees or expenses. If such fees and expenses were included in the index returns, the performance would have been lower. Please note that one cannot invest directly in an unmanaged index.
Performance figures for the periods shown may reflect contractual fee waivers and/or expense reimbursements. In the absence of fee waivers and/or expense reimbursements (if applicable), returns would have been lower.
There are no assurances that the Fund will meet its stated objectives.
The Fund’s holdings and allocations are subject to change and should not be considered recommendations to buy individual securities.
Returns shown do not reflect the deduction of taxes that a shareholder would pay on Fund distributions or the redemption of Fund shares.
See definition of comparative indices on the previous page and above.
| | Management Discussion of Fund Performance (unaudited) | |
| | Global X MLP ETF | |
Global X MLP ETF
The Global X MLP ETF (“Fund”) seeks to provide investment results that correspond generally to the price and yield performance, before fees and expenses, of the Solactive MLP Infrastructure Index (“Underlying Index”). The Fund is passively managed, which means the investment adviser does not attempt to take defensive positions in declining markets. The Fund generally seeks to fully replicate the Underlying Index.
The Underlying Index tracks the price movements in shares of companies that are structured as Master Limited Partnerships (“MLPs”) and that are engaged in or own and operate assets used in energy logistics, including, but not limited to, pipelines, storage facilities and other assets used in transporting, storing, gathering, and processing natural gas, natural gas liquids, crude oil or refined products, as defined by Solactive AG, the provider of the Underlying Index.
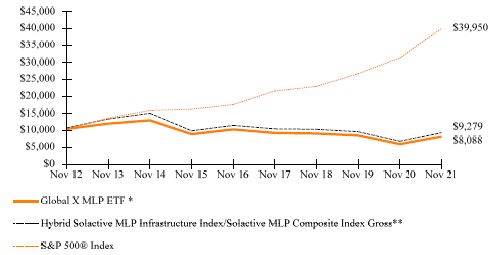
For the 12-month period ended November 30, 2021 (the “reporting period”), the Fund increased 37.49%, while the Underlying Index increased 38.19%. The Fund had a net asset value of $26.73 per share on November 30, 2020 and ended the reporting period with a net asset value of $33.59 per share on November 30, 2021.
During the reporting period, the highest returns derived from EnLink Midstream LLC and DCP Midstream LP, which returned 80.34% and 73.14%, respectively. The worst performer was TC PipeLines, L.P., which returned -0.13%.
The Fund seeks to provide exposure to midstream MLPs. Midstream MLPs operate toll-road-like business models, in which they are compensated based on the natural gas or crude oil volume they transport, store, or process. The energy market stabilized over the reporting period as the Organization of the Petroleum Exporting Countries and its allies, also known as OPEC+, implemented policies that acted as a check on production. This occurred while global demand was rising, helping to balance the energy markets. Demand for energy rose during the reporting period as economies around the world began the reopening process as the effects of the COVID-19 pandemic waned. U.S. energy production also began increasing as exploration and production companies expanded their operations in a stronger energy market. During the reporting period, merger and acquisition activity also picked up, driving equity prices higher. The Fund outperformed broad market indices as energy markets made a strong comeback.
| | AVERAGE TOTAL RETURN FOR THE YEAR ENDED NOVEMBER 30, 2021 |
| | One Year Return | Three Year Return | Five Year Return | Annualized Inception to Date* |
| | Net Asset Value | Market Price | Net Asset Value | Market Price | Net Asset Value | Market Price | Net Asset Value | Market Price |
| Global X MLP ETF | 37.49% | 37.47% | -3.71% | -3.73% | -4.58% | -4.60% | -2.18% | -2.20% |
| Hybrid Solactive MLP Infrastructure Index/Solactive MLP Composite Index Gross** | 38.19% | 38.19% | -3.28% | -3.28% | -4.03% | -4.03% | -0.77% | -0.77% |
S&P 500® Index | 27.92% | 27.92% | 20.38% | 20.38% | 17.90% | 17.90% | 15.48% | 15.48% |
| | Management Discussion of Fund Performance (unaudited) | |
| | Global X MLP ETF | |
Growth of a $10,000 Investment
(at Net Asset Value)
* The Fund commenced investment operations on April 18, 2012.
** Reflects performance of Solactive MLP Composite Index through March 31, 2015 and Solactive MLP Infrastructure Index thereafter.
The S&P 500® Index is a market capitalization weighted composite index of 500 large capitalization U.S. companies.
The Solactive MLP Composite Index tracks the price movements in shares of the largest entities that are structured as Master Limited Partnerships (MLP) and that are engaged in the transportation, storage, processing, refining, marketing, exploration, production, or mining of natural resources.
The Solactive MLP Infrastructure Index tracks the price movements in shares of companies that are structured as Master Limited Partnerships (MLP) and that are engaged in own and operate assets used in energy logistics, including, but not limited to, pipelines, storage facilities and other assets used in transporting, storing, gathering, and processing natural gas, natural gas liquids, crude oil or refined products.
The performance data quoted herein represents past performance and the return and value of an investment in the Fund will fluctuate so that, when sold, it may be worth less than its original cost. Past performance is no guarantee of future performance and should not be considered as a representation of the future results of the Fund. The Fund’s performance assumes the reinvestment of all dividends and all capital gains. Index returns assume reinvestment of dividends and, unlike the Fund’s returns, do not reflect any fees or expenses. If such fees and expenses were included in the index returns, the performance would have been lower. Please note that one cannot invest directly in an unmanaged index.
Performance figures for the periods shown may reflect contractual fee waivers and/or expense reimbursements. In the absence of fee waivers and/or expense reimbursements (if applicable), returns would have been lower.
There are no assurances that the Fund will meet its stated objectives.
| | Management Discussion of Fund Performance (unaudited) | |
| | Global X MLP ETF | |
The Fund’s holdings and allocations are subject to change and should not be considered recommendations to buy individual securities.
Returns shown do not reflect the deduction of taxes that a shareholder would pay on Fund distributions or the redemption of Fund shares.
See definition of comparative indices above.
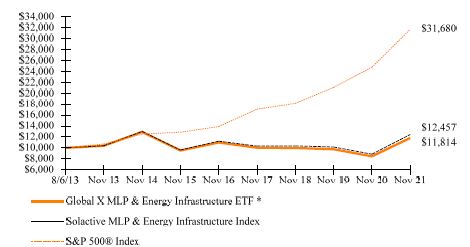
| | Management Discussion of Fund Performance (unaudited) | |
| | Global X MLP & Energy Infrastructure ETF | |
Global X MLP & Energy Infrastructure ETF
The Global X MLP & Energy Infrastructure ETF (“Fund”) seeks to provide investment results that correspond generally to the price and yield performance, before fees and expenses, of the Solactive MLP & Energy Infrastructure Index (“Underlying Index”). The Fund is passively managed, which means the investment adviser does not attempt to take defensive positions in declining markets. The Fund generally seeks to fully replicate the Underlying Index.
The Underlying Index is intended to give investors a means of tracking the performance of Master Limited Partnerships (“MLPs”) and energy infrastructure corporations. Midstream energy infrastructure MLPs and corporations principally own and operate assets used in energy logistics, including but not limited to pipelines, storage facilities and other assets used in transporting, storing, gathering, and processing natural gas, natural gas liquids, crude oil, or refined products. The Underlying Index limits its exposure to partnerships in order to comply with applicable tax diversification rules. Securities must be publicly traded in the United States. The Underlying Index is maintained by Solactive AG.
For the 12-month period ended November 30, 2021 (the “reporting period”), the Fund increased 39.64%, while the Underlying Index increased 40.58%. The Fund had a net asset value of $26.59 per share on November 30, 2020 and ended the reporting period with a net asset value of $34.89 per share on November 30, 2021.
During the reporting period, the highest returns derived from Targa Resources Corp. and EnLink Midstream LLC, which returned 122.05% and 88.91%, respectively. The worst performers included Holly Energy Partners, L.P. and TC PipeLines, LP, which returned -18.34% and -0.13%, respectively.
The Fund seeks to provide tax efficient exposure to midstream MLPs, the general partners of midstream MLPs, and energy infrastructure corporations. Midstream MLPs and energy infrastructure companies operate toll-road-like business models where they are generally compensated based on the volumes of natural gas or crude oil that they transport, store, or process. The energy market gained some stability over the reporting period as the Organization of the Petroleum Exporting Countries and its allies, also known as OPEC+, implemented policies that limited production growth, while demand for oil and natural gas also increased with further economic reopenings globally as the effects of the COVID-19 pandemic waned. The result was higher oil prices, providing greater profitability and incentives for U.S. oil and gas producers to increase production. The midstream space experienced consolidation during the reporting period, piquing the interest of investors as M&A deals increased the scale and geographic diversification of several midstream entities. The Fund outperformed broader markets with other sector exposures during the reporting period as the energy markets made a strong comeback, backed by attractive valuations in the midstream segment and solid yields in an inflationary environment.
| | Management Discussion of Fund Performance (unaudited) | |
| | Global X MLP & Energy Infrastructure ETF | |
| | AVERAGE ANNUAL TOTAL RETURN FOR THE YEAR ENDED NOVEMBER 30, 2021 |
| | One Year Return | Three Year Return | Five Year Return | Annualized Inception to Date* |
| | Net Asset Value | Market Price | Net Asset Value | Market Price | Net Asset Value | Market Price | Net Asset Value | Market Price |
| Global X MLP & Energy Infrastructure ETF | 39.64% | 39.44% | 5.73% | 5.71% | 1.44% | 1.41% | 2.02% | 2.07% |
| Solactive MLP & Energy Infrastructure Index | 40.58% | 40.58% | 6.34% | 6.34% | 2.08% | 2.08% | 2.67% | 2.67% |
S&P 500® Index | 27.92% | 27.92% | 20.38% | 20.38% | 17.90% | 17.90% | 14.86% | 14.86% |
Growth of a $10,000 Investment
(at Net Asset Value)
* The Fund commenced investment operations on August 6, 2013.
The S&P 500® Index is a market capitalization weighted composite index of 500 large capitalization U.S. companies.
The Solactive MLP & Energy Infrastructure Index tracks the performance of MLPs and energy infrastructure corporations.
The performance data quoted herein represents past performance and the return and value of an investment in the Fund will fluctuate so that, when sold, it may be worth less than its original cost. Past performance is no guarantee of future performance and should not be considered as a representation of the future results of the Fund. The Fund’s performance assumes the reinvestment of all dividends and all capital gains. Index returns assume reinvestment of dividends and, unlike the Fund’s returns, do not reflect any fees or expenses. If such fees and expenses were included in the index returns, the performance would have been lower. Please note that one cannot invest directly in an unmanaged index.
| | Management Discussion of Fund Performance (unaudited) | |
| | Global X MLP & Energy Infrastructure ETF | |
Performance figures for the periods shown may reflect contractual fee waivers and/or expense reimbursements. In the absence of fee waivers and/or expense reimbursements (if applicable), returns would have been lower.
There are no assurances that the Fund will meet its stated objectives.
The Fund’s holdings and allocations are subject to change and should not be considered recommendations to buy individual securities.
Returns shown do not reflect the deduction of taxes that a shareholder would pay on Fund distributions or the redemption of Fund shares.
See definition of comparative indices on the previous page and above.
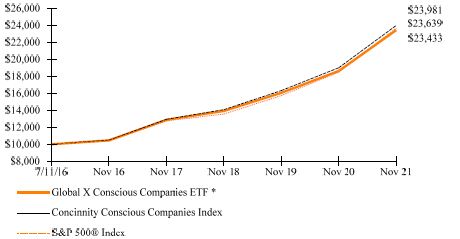
| | Management Discussion of Fund Performance (unaudited) | |
| | Global X Conscious Companies ETF | |
Global X Conscious Companies ETF
The Global X Conscious Companies ETF (“Fund”) seeks to provide investment results that correspond generally to the price and yield performance, before fees and expenses, of the Concinnity Conscious Companies Index (“Underlying Index”). The Fund is passively managed, which means the investment adviser does not attempt to take defensive positions in declining markets. The Fund generally seeks to fully replicate the Underlying Index.
The Underlying Index is designed to provide exposure to U.S.-listed companies that Concinnity Advisors LP, (the “Index Provider”) believes appear to achieve financial performance in a sustainable and responsible manner, as measured by their ability to achieve positive outcomes that are consistent with a multi-stakeholder operating system (“MsOS”), as defined by the Index Provider. The Index Provider conducts its analysis based on the following five key stakeholder groups: (1) Customers, (2) Employees, (3) Suppliers, (4) Stock and Debt Holders, and (5) Communities in which the companies operate.
For the 12-month period ended November 30, 2021 (the “reporting period”), the Fund increased 25.84%, while the Underlying Index increased 26.24%. The Fund had a net asset value of $26.46 per share on November 30, 2020 and ended the reporting period with a net asset value of $32.97 per share on November 30, 2021.
During the reporting period, the highest returns derived from Nvidia Corporation and ON Semiconductor Corporation, which returned 144.07% and 113.67%, respectively. The worst performers included Universal Display Corporation and PayPal Holdings, Inc., which returned -21.92% and -20.51%, respectively.
Socially conscious companies increasingly became a focus for businesses and investors over the reporting period. Many values-based strategies apply a negative screening approach that starts with a broad market index and removes companies scoring poorly in terms of environmental, social, and governance (ESG) factors. The Underlying Index expands upon this approach by looking to identify companies that seek beneficial outcomes for a variety of stakeholders, including employees, suppliers, customers, investors, and local communities. The Fund’s investment adviser believes this methodology more proactively tailors to investor needs. During the reporting period, a focus on climate action and the transition toward net zero emissions grew causing investor and regulatory demands to increase. U.S. equities, including those in the Fund, also performed well during the reporting period, as strong earnings growth propelled these companies. The Fund’s exposure to Information Technology companies positively contributed to performance. The Fund had the highest average approximate sector exposure to the Information Technology (26%), Health Care (14%), and Consumer Discretionary (12%) sectors during the reporting period.
| | Management Discussion of Fund Performance (unaudited) | |
| | Global X Conscious Companies ETF | |
| | AVERAGE ANNUAL TOTAL RETURNFOR THE YEAR ENDED NOVEMBER 30, 2021 |
| | One Year Return | Three Year Return | Five Year Return | Annualized Inception to Date* |
| | Net Asset Value | Market Price | Net Asset Value | Market Price | Net Asset Value | Market Price | Net Asset Value | Market Price |
| Global X Conscious Companies ETF | 25.84% | 25.73% | 18.97% | 19.02% | 17.50% | 17.46% | 17.12% | 17.13% |
| Concinnity Conscious Companies Index | 26.24% | 26.24% | 19.43% | 19.43% | 18.01% | 18.01% | 17.61% | 17.61% |
S&P 500® Index | 27.92% | 27.92% | 20.38% | 20.38% | 17.90% | 17.90% | 17.30% | 17.30% |
Growth of a $10,000 Investment
(at Net Asset Value)
* The Fund commenced investment operations on July 11, 2016.
The S&P 500® Index is a market capitalization weighted composite index of 500 large capitalization U.S. companies.
The Concinnity Conscious Companies Index is designed to provide exposure to companies listed in the U.S. that operate their businesses in a sustainable and responsible manner, as measured by their ability to achieve positive outcomes that are consistent with a multi-stakeholder operating system (“MsOS”), as defined by Concinnity Advisors LP (“Concinnity”), the provider of the Concinnity Conscious Companies Index.
The performance data quoted herein represents past performance and the return and value of an investment in the Fund will fluctuate so that, when sold, it may be worth less than its original cost. Past performance is no guarantee of future performance and should not be considered as a representation of the future results of the Fund. The Fund’s performance assumes the reinvestment of all dividends and all capital gains. Index returns assume reinvestment of dividends and, unlike the Fund’s returns, do not
| | Management Discussion of Fund Performance (unaudited) | |
| | Global X Conscious Companies ETF | |
reflect any fees or expenses. If such fees and expenses were included in the index returns, the performance would have been lower. Please note that one cannot invest directly in an unmanaged index.
Performance figures for the periods shown may reflect contractual fee waivers and/or expense reimbursements. In the absence of fee waivers and/or expense reimbursements (if applicable), returns would have been lower.
There are no assurances that the Fund will meet its stated objectives.
The Fund’s holdings and allocations are subject to change and should not be considered recommendations to buy individual securities.
Returns shown do not reflect the deduction of taxes that a shareholder would pay on Fund distributions or the redemption of Fund shares.
See definition of comparative indices on the previous page and above.
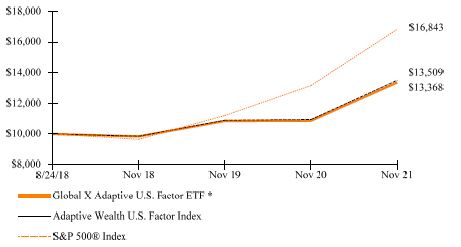
| | Management Discussion of Fund Performance (unaudited) | |
| | Global X Adaptive U.S. Factor ETF | |
Global X Adaptive U.S. Factor ETF
The Global X Adaptive U.S. Factor ETF (“Fund”) seeks to provide investment results that correspond generally to the price and yield performance, before fees and expenses, of the Adaptive Wealth Strategies U.S. Factor Index (“Underlying Index”). The Fund is passively managed, which means the investment adviser does not attempt to take defensive positions in declining markets. The Fund generally seeks to fully replicate the Underlying Index.
The Underlying Index is designed to dynamically allocate across three sub-indices that provide exposure to U.S. equities exhibiting characteristics of one of three primary factors: value, momentum, or low volatility. Each factor is represented by a sub-index that is derived from the Solactive U.S. Large & Mid Cap Index, which is designed to measure the 1,000 largest companies, by free float market capitalization, that are exchange-listed in the United States.
For the 12-month period ended November 30, 2021 (the “reporting period”), the Fund increased 23.01%, while the Underlying Index increased 23.42%. The Fund had a net asset value of $24.91 per share on November 30, 2020 and ended the reporting period with a net asset value of $29.86 per share on November 30, 2021.
During the reporting period, the highest returns derived from Nucor Corporation and HP Inc., which returned 104.95% and 94.77%, respectively. The worst performers included Kyndryl Holdings Incorporation and Loyalty Ventures, Inc., which returned -44.56% and -38.28%, respectively.
The Fund generated strong returns as its mean reversion strategy proved appropriate for shifting investor sentiments over the reporting period. The Underlying Index employs a dynamic multifactor investment strategy, allocating across three factors: low volatility, value, and momentum. At different points over the reporting period, momentum investing and volatility reduction swung in and out of favor, as investors grappled with concerns regarding the COVID-19 pandemic and rising inflation. During the reporting period, the mean reversion strategy provided exposure to popular factors while being able to rotate out of the best performing factors quarterly. The Fund underperformed S&P 500® Index, its benchmark index (“Benchmark Index”) due to lower exposure to the higher-volatility Information Technology sector compared to the Benchmark Index. During the reporting period, the Fund maintained an average approximate sector allocation of 22% to Financials, 14% to Information Technology, and 13% to Health care.
| | AVERAGE ANNUAL TOTAL RETURNFOR THE YEAR ENDED NOVEMBER 30, 2021 |
| | One Year Return | Three Year Return | Annualized Inception to Date* |
| | Net Asset Value | Market Price | Net Asset Value | Market Price | Net Asset Value | Market Price |
| Global X Adaptive U.S. Factor ETF | 23.01% | 23.11% | 10.74% | 10.71% | 9.29% | 9.28% |
| Adaptive Wealth U.S. Factor Index | 23.42% | 23.42% | 11.10% | 11.10% | 9.63% | 9.63% |
S&P 500® Index | 27.92% | 27.92% | 20.38% | 20.38% | 17.28% | 17.28% |
| | Management Discussion of Fund Performance (unaudited) | |
| | Global X Adaptive U.S. Factor ETF | |
Growth of a $10,000 Investment
(at Net Asset Value)
* The Fund commenced investment operations on August 24, 2018.
The S&P 500® Index is a market capitalization weighted composite index of 500 large capitalization U.S. companies.
The Adaptive Wealth Strategy U.S. Factor Index employs a reversion to the mean process to dictate which investment theme to own at any given time.
The performance data quoted herein represents past performance and the return and value of an investment in the Fund will fluctuate so that, when sold, it may be worth less than its original cost. Past performance is no guarantee of future performance and should not be considered as a representation of the future results of the Fund. The Fund’s performance assumes the reinvestment of all dividends and all capital gains. Index returns assume reinvestment of dividends and, unlike the Fund’s returns, do not reflect any fees or expenses. If such fees and expenses were included in the index returns, the performance would have been lower. Please note that one cannot invest directly in an unmanaged index.
Performance figures for the periods shown may reflect contractual fee waivers and/or expense reimbursements. In the absence of fee waivers and/or expense reimbursements (if applicable), returns would have been lower.
There are no assurances that the Fund will meet its stated objectives.
The Fund’s holdings and allocations are subject to change and should not be considered recommendations to buy individual securities.
Returns shown do not reflect the deduction of taxes that a shareholder would pay on Fund distributions or the redemption of Fund shares.
See definition of comparative indices on the previous page and above.
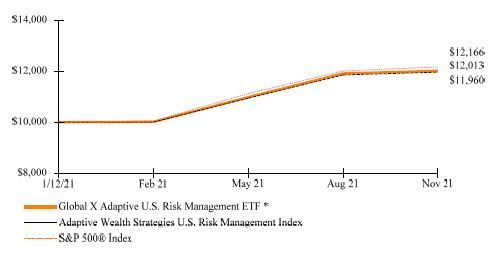
| | Management Discussion of Fund Performance (unaudited) | |
| | Global X Adaptive U.S. Risk Management ETF | |
Global X Adaptive U.S. Risk Management ETF
The Global X Adaptive U.S. Risk Management ETF (“Fund”) seeks to provide investment results that correspond generally to the price and yield performance, before fees and expenses, of the Adaptive Wealth Strategies U.S. Risk Management Index (“Underlying Index”). The Fund is passively managed, which means the investment adviser does not attempt to take defensive positions in declining markets. The Fund generally seeks to fully replicate the Underlying Index.
The Underlying Index is designed to dynamically allocate between either 100% exposure to the Solactive GBS United States 500 Index TR (“U.S. Equity Position”) or 100% exposure to a portfolio of U.S. Treasuries with 1-3 years remaining to maturity (“U.S. Treasury Position”). The Solactive GBS United States 500 Index TR is a float-adjusted market capitalization weighted index, which measures the performance of the equity securities of the 500 largest companies from the United States stock market across all sectors. A float-adjusted market capitalization weighted index weights each index component according to its market capitalization, using the number of shares that are readily available for purchase on the open market, rather than the total number of shares outstanding of an issuer. The Underlying Index seeks to provide exposure to the U.S. Equity Position during periods of normal equity market returns and seeks to provide exposure to the U.S. Treasury Position prior to and during periods of adverse market conditions, as determined by the quantitative model developed by the Index Provider. The Underlying Index seeks to anticipate periods of adverse market conditions using quantitative signals (explained in further detail below) that have been developed based on historical data.
From the inception of the Fund to the period ended November 30, 2021 (the “reporting period”), the Fund increased 20.13%, while the Underlying Index increased 19.60%. The Fund had a net asset value of $24.95 per share on January 12, 2021 and ended the reporting period with a net asset value of $29.88 per share on November 30, 2021.
During the reporting period, the highest returns derived from Moderna, Inc. and Nvidia Corporation, which returned 182.96% and 142.49%, respectively. The worst performers included Peloton Interactive, Inc. Class A and Zillow Group, Inc. Class A, which returned -71.80% and -64.45%, respectively.
The Fund generated strong returns over the reporting period, as investors sought downside risk protection for equities, and conditions were generally favorable for the Fund’s strategy. Equity markets encountered high volatility over the reporting period, stemming from fears over the COVID-19 pandemic, high commodity prices, and increasing inflation. In this environment, strategies that consider both short and long-term indicators to make investment decisions often appeal to investors. Such a strategy allows the portfolio to hedge against unfavorable market conditions for equities without taking an overly cautious position. Additionally, the Fund’s equity exposures during the risk-on stages are heavily concentrated in blue-chip tech companies, which generally appreciated strongly during the reporting period. During the reporting period, the Fund maintained an average approximate sector exposure of 29% to Information Technology, 13% to Health Care, and 12% to Consumer Discretionary.
| | Management Discussion of Fund Performance (unaudited) | |
| | Global X Adaptive U.S. Risk Management ETF | |
| | AVERAGE ANNUAL TOTAL RETURNFOR THE PERIOD ENDED NOVEMBER 30, 2021 |
| | Cumulative Inception to Date* |
| | Net Asset Value | Market Price |
| Global X Adaptive U.S. Risk Management ETF | 20.13% | 20.29% |
| Adaptive Wealth Strategies U.S. Risk Management Index | 19.60% | 19.60% |
S&P 500® Index | 21.66% | 21.66% |
Growth of a $10,000 Investment
(at Net Asset Value)
* The Fund commenced investment operations on January 12, 2021.
The Adaptive Wealth Strategies U.S. Risk Management Index is designed to dynamically allocate between either 100% exposure to the Solactive GBS United States 500 Index TR (“U.S. Equity Position”) or 100% exposure to a portfolio of U.S. Treasuries with 1-3 years remaining to maturity (“U.S. Treasury Position”). The Solactive GBS United States 500 Index TR is a float-adjusted market capitalization weighted index which measures the performance of the equity securities of the 500 largest companies from the United States stock market across all sectors. A float-adjusted market capitalization weighted index weights each index component according to its market capitalization, using the number of shares that are readily available for purchase on the open market, rather than the total number of shares outstanding of an issuer. The Underlying Index seeks to provide exposure to the U.S. Equity Position during periods of normal equity market returns, and seeks to provide exposure to the U.S. Treasury Position prior to and during periods of adverse market conditions, as determined by the quantitative model developed by the Index Provider. The Underlying Index seeks to anticipate periods
| | Management Discussion of Fund Performance (unaudited) | |
| | Global X Adaptive U.S. Risk Management ETF | |
of adverse market conditions using quantitative signals that have been developed based on historical data.
The performance data quoted herein represents past performance and the return and value of an investment in the Fund will fluctuate so that, when sold, it may be worth less than its original cost. Past performance is no guarantee of future performance and should not be considered as a representation of the future results of the Fund. The Fund’s performance assumes the reinvestment of all dividends and all capital gains. Index returns assume reinvestment of dividends and, unlike the Fund’s returns, do not reflect any fees or expenses. If such fees and expenses were included in the index returns, the performance would have been lower. Please note that one cannot invest directly in an unmanaged index.
Performance figures for the periods shown may reflect contractual fee waivers and/or expense reimbursements. In the absence of fee waivers and/or expense reimbursements (if applicable), returns would have been lower.
There are no assurances that the Fund will meet its stated objectives.
The Fund’s holdings and allocations are subject to change and should not be considered recommendations to buy individual securities.
Returns shown do not reflect the deduction of taxes that a shareholder would pay on Fund distributions or the redemption of Fund shares.
See definition of comparative indices on the previous page and above.
| | Management Discussion of Fund Performance (unaudited) | |
| | Global X Founder-Run Companies ETF | |
Global X Founder-Run Companies ETF
The Global X Founder-Run Companies ETF (“Fund”) seeks to provide investment results that correspond generally to the price and yield performance, before fees and expenses, of the Solactive U.S. Founder-Run Companies Index (“Underlying Index”). The Fund is passively managed, which means the investment adviser does not attempt to take defensive positions in declining markets. The Fund generally seeks to fully replicate the Underlying Index.
The Underlying Index is comprised of companies selected from the Solactive U.S. Broad Market Index that are currently led by a CEO who is also a founder of the company. The components of the Underlying Index must have average daily value traded on their primary stock exchange in the last six months of at least $5 million USD.
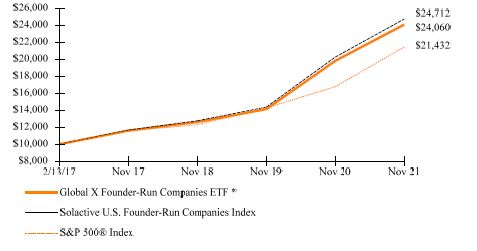
For the 12-month period ended November 30, 2021 (the “reporting period”), the Fund increased 21.51%, while the Underlying Index increased 22.05%. The Fund had a net asset value of $28.66 per share on November 30, 2020 and ended the reporting period with a net asset value of $34.44 per share on November 30, 2021.
During the reporting period, the highest returns derived from Signature Bank and Fortinet, Inc., which returned 172.13% and 169.50%, respectively. The worst performers included Chemocentryx, Inc. and Peloton Interactive, Inc. Class A, which returned -83.07% and -54.44%, respectively.
The Fund generated a healthy return over the reporting period based on strong fundamentals and a favorable allocation. Founder-run companies generally focus on long-term value creation and generally avoid taking on debt. Investors favored growth strategies for much of the reporting period and avoided highly levered companies, due to uncertainty and margin compression related to the COVID-19 pandemic. From this perspective, many founder-run companies compared favorably against peers, triggering investor interest in holdings of the Underlying Index. The Fund’s equal weight allocation and diversified sector exposure also insulated performance against negative outliers during the reporting period. Its exposure to the Information Technology sector also benefited fund performance. During the reporting period, the Fund saw an average approximate sector allocation of 32% to the Information Technology sector, 15% to the Financials sector, and 14% to the Health Care sector.
| | AVERAGE ANNUAL TOTAL RETURNFOR THE YEAR ENDED NOVEMBER 30, 2021 |
| | One Year Return | Three Year Return | Annualized Inception to Date* |
| | Net Asset Value | Market Price | Net Asset Value | Market Price | Net Asset Value | Market Price |
| Global X Founder-Run Companies ETF | 21.51% | 22.33% | 24.07% | 24.24% | 20.09% | 20.17% |
| Solactive U.S. Founder-Run Companies Index | 22.05% | 22.05% | 24.70% | 24.70% | 20.75% | 20.75% |
S&P 500® Index | 27.92% | 27.92% | 20.38% | 20.38% | 17.22% | 17.22% |
| | Management Discussion of Fund Performance (unaudited) | |
| | Global X Founder-Run Companies ETF | |
Growth of a $10,000 Investment
(at Net Asset Value)
* The Fund commenced investment operations on February 13, 2017.
The S&P 500® Index is a market capitalization weighted composite index of 500 large capitalization U.S. companies.
The Solactive U.S. Founder-Run Companies Index is designed to provide exposure to U.S. companies in which a founder or co-founder of the company is serving as the Chief Executive Officer of the company.
The performance data quoted herein represents past performance and the return and value of an investment in the Fund will fluctuate so that, when sold, it may be worth less than its original cost. Past performance is no guarantee of future performance and should not be considered as a representation of the future results of the Fund. The Fund’s performance assumes the reinvestment of all dividends and all capital gains. Index returns assume reinvestment of dividends and, unlike the Fund’s returns, do not reflect any fees or expenses. If such fees and expenses were included in the index returns, the performance would have been lower. Please note that one cannot invest directly in an unmanaged index.
Performance figures for the periods shown may reflect contractual fee waivers and/or expense reimbursements. In the absence of fee waivers and/or expense reimbursements (if applicable), returns would have been lower.
There are no assurances that the Fund will meet its stated objectives.
The Fund’s holdings and allocations are subject to change and should not be considered recommendations to buy individual securities.
Returns shown do not reflect the deduction of taxes that a shareholder would pay on Fund distributions or the redemption of Fund shares.
See definition of comparative indices on the previous page and above.
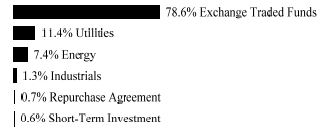
| Schedule of Investments | | November 30, 2021 |
| | Global X Alternative Income ETF | |
Sector Weightings (Unaudited)†:
† Sector weightings percentages are based on the total market value of investments. Repurchase agreements purchased from cash collateral received for securities lending activity are included in total investments. Please see Note 2 and 7 in Notes to Financial Statements for more detailed information.
| | | Shares | | | Value | |
| COMMON STOCK — 10.4% | | | | | | |
| Utilities — 10.4% | | | | | | |
Consolidated Edison | | | 6,185 | | | $ | 480,203 | |
Dominion Energy | | | 6,173 | | | | 439,517 | |
Duke Energy | | | 4,614 | | | | 447,604 | |
Edison International | | | 8,118 | | | | 529,943 | |
Entergy | | | 4,542 | | | | 455,744 | |
OGE Energy | | | 13,646 | | | | 468,332 | |
PPL | | | 16,129 | | | | 448,870 | |
Southern | | | 7,254 | | | | 443,219 | |
| | | | | | | | | |
| | | | | | | | | |
| TOTAL COMMON STOCK | | | | | | | | |
(Cost $3,535,994) | | | | | | | 3,713,432 | |
| | | | | | | | | |
| EXCHANGE TRADED FUNDS — 79.2% | | | | | | | | |
Global X Emerging Markets Bond ETF (A) (B) | | | 272,961 | | | | 7,042,394 | |
Global X Nasdaq 100 Covered Call ETF (A) (B) | | | 327,909 | | | | 7,381,232 | |
Global X SuperDividend® REIT ETF (A) | | | 760,638 | | | | 6,944,625 | |
Global X U.S. Preferred ETF (A) (B) | | | 280,814 | | | | 7,090,553 | |
| The accompanying notes are an integral part of the financial statements. |
| Schedule of Investments | | November 30, 2021 |
| | Global X Alternative Income ETF | |
| | | Shares | | | Value | |
| EXCHANGE TRADED FUNDS — continued | | | | | | |
| TOTAL EXCHANGE TRADED FUNDS | | | | | | |
(Cost $30,246,234) | | | | | $ | 28,458,804 | |
| | | | | | | | |
| MASTER LIMITED PARTNERSHIPS — 9.9% | | | | | | | |
| Energy — 7.4% | | | | | | | |
BP Midstream Partners | | | 34,070 | | | | 438,481 | |
Enterprise Products Partners | | | 20,724 | | | | 443,286 | |
Holly Energy Partners | | | 24,545 | | | | 411,374 | |
Magellan Midstream Partners | | | 9,863 | | | | 457,446 | |
MPLX | | | 15,777 | | | | 462,424 | |
Sunoco | | | 12,149 | | | | 466,400 | |
| | | | | | | | 2,679,411 | |
| Industrials — 1.3% | | | | | | | | |
Icahn Enterprises | | | 9,076 | | | | 458,792 | |
| Utilities — 1.2% | | | | | | | | |
Suburban Propane Partners | | | 29,395 | | | | 424,464 | |
| TOTAL MASTER LIMITED PARTNERSHIPS | | | | | | | | |
(Cost $2,643,279) | | | | | | | 3,562,667 | |
| | | | | | | | | |
SHORT-TERM INVESTMENT(C)(D) — 0.6% | | | | | | | | |
| Fidelity Investments Money Market Government Portfolio, Cl Institutional, 0.010% | | | | | | | | |
(Cost $211,476) | | | 211,476 | | | | 211,476 | |
| | | | | | | | | |
| Schedule of Investments | | November 30, 2021 |
| | Global X Alternative Income ETF | |
| | | Face Amount | | | Value | |
REPURCHASE AGREEMENT(C) — 0.7% | | | | | | |
| BNP Paribas | | | | | | |
| 0.030%, dated 11/30/2021, to be repurchased on 12/01/2021, repurchase price $248,556 (collateralized by various U.S. Treasury Obligations, ranging in par value $1,580 - $23,233, 0.750% - 1.130%, 02/28/2025 - 04/30/2026, with a total market value of $252,832) | | | | | | |
(Cost $248,556) | | $ | 248,556 | | | $ | 248,556 | |
| TOTAL INVESTMENTS — 100.8% | | | | | | | | |
(Cost $36,885,539) | | | | | | $ | 36,194,935 | |
Percentages are based on Net Assets of $35,920,746.
| (A) | Affiliated investment. |
| (B) | This security or a partial position of this security is on loan at November 30, 2021. The total value of securities on loan at November 30, 2021 was $447,213. |
| (C) | Security was purchased with cash collateral held from securities on loan. The total value of such securities as of November 30, 2021 was $460,032. |
| (D) | The rate reported on the Schedule of Investments is the 7-day effective yield as of November 30, 2021. |
Cl — Class
ETF — Exchange Traded Fund
REIT — Real Estate Investment Trust
| Schedule of Investments | | November 30, 2021 |
| | Global X Alternative Income ETF | |
The following is a summary of the level of inputs used as of November 30, 2021, in valuing the Fund’s investments carried at value:
| Investments in Securities | | | | | | | | | | | | |
| Common Stock | | $ | 3,713,432 | | | $ | — | | | $ | — | | | $ | 3,713,432 | |
| Exchange Traded Funds | | | 28,458,804 | | | | — | | | | — | | | | 28,458,804 | |
| Master Limited Partnerships | | | 3,562,667 | | | | — | | | | — | | | | 3,562,667 | |
| Short-Term Investment | | | 211,476 | | | | — | | | | — | | | | 211,476 | |
| Repurchase Agreement | | | — | | | | 248,556 | | | | — | | | | 248,556 | |
| Total Investments in Securities | | $ | 35,946,379 | | | $ | 248,556 | | | $ | — | | | $ | 36,194,935 | |
For the year ended November 30, 2021, there have been no transfers in or out of Level 3.
The following is a summary of the Fund’s transactions with affiliates for the year ended November 30, 2021:
| | | Value at 11/30/2020 | | | Purchases at Cost | | | Proceeds from Sales | | | Changes in Unrealized Appreciation/ (Depreciation) | | | Realized Gain/(Loss) | | | Value at 11/30/2021 | | | Shares | | | Income | |
| Global X Emerging Markets Bond ETF | | $ | 0 | | | $ | 7,338,636 | | | $ | (106,183 | ) | | $ | (189,399 | ) | | $ | (660 | ) | | $ | 7,042,394 | | | | 272,961 | | | $ | 43,395 | |
| Global X Nasdaq 100 Covered Call ETF | | $ | 0 | | | $ | 7,354,002 | | | $ | (66,374 | ) | | $ | 91,718 | | | $ | 1,886 | | | $ | 7,381,232 | | | | 327,909 | | | $ | 130,338 | |
Global X SuperDividend® REIT ETF | | $ | 3,618,456 | | | $ | 4,513,394 | | | $ | (1,300,594 | ) | | $ | 95,687 | | | $ | 17,682 | | | $ | 6,944,625 | | | | 760,638 | | | $ | 227,771 | |
| Global X U.S. Preferred ETF | | $ | 0 | | | $ | 7,325,413 | | | $ | (93,820 | ) | | $ | (140,237 | ) | | $ | (803 | ) | | $ | 7,090,553 | | | | 280,814 | | | $ | 55,243 | |
| Totals: | | $ | 3,618,456 | | | $ | 26,531,445 | | | $ | (1,566,971 | ) | | $ | (142,231 | ) | | $ | 18,105 | | | $ | 28,458,804 | | | | | | | $ | 456,747 | |
| Schedule of Investments | | November 30, 2021 |
| | Global X S&P 500® Quality Dividend ETF | |
Sector Weightings (Unaudited)†:
† Sector weightings percentages are based on the total market value of investments.
| | | Shares | | | Value | |
| COMMON STOCK — 99.7% | | | | | | |
| Communication Services — 2.4% | | | | | | |
Interpublic Group | | | 3,845 | | | $ | 127,615 | |
Omnicom Group | | | 1,567 | | | | 105,475 | |
| | | | | | | | 233,090 | |
| Consumer Discretionary — 8.8% | | | | | | | | |
Advance Auto Parts | | | 658 | | | | 145,234 | |
Best Buy | | | 1,148 | | | | 122,675 | |
Garmin | | | 907 | | | | 121,121 | |
Genuine Parts | | | 1,018 | | | | 130,039 | |
Leggett & Platt | | | 2,432 | | | | 98,228 | |
Newell Brands | | | 4,684 | | | | 100,565 | |
Whirlpool | | | 576 | | | | 125,419 | |
| | | | | | | | 843,281 | |
| Consumer Staples — 12.7% | | | | | | | | |
Campbell Soup | | | 2,849 | | | | 114,900 | |
Clorox | | | 738 | | | | 120,183 | |
Conagra Brands | | | 3,518 | | | | 107,475 | |
| Schedule of Investments | | November 30, 2021 |
| | Global X S&P 500® Quality Dividend ETF | |
| | | Shares | | | Value | |
| COMMON STOCK — continued | | | | | | |
| Consumer Staples — continued | | | | | | |
General Mills | | | 2,101 | | | $ | 129,779 | |
Hershey | | | 751 | | | | 133,295 | |
J M Smucker | | | 964 | | | | 121,917 | |
Kraft Heinz | | | 3,025 | | | | 101,670 | |
Mondelez International, Cl A | | | 2,059 | | | | 121,357 | |
Procter & Gamble | | | 964 | | | | 139,375 | |
Tyson Foods, Cl A | | | 1,698 | | | | 134,075 | |
| | | | | | | | 1,224,026 | |
| Energy — 5.8% | | | | | | | | |
Baker Hughes, Cl A | | | 5,069 | | | | 118,310 | |
ConocoPhillips | | | 2,191 | | | | 153,655 | |
Coterra Energy | | | 7,600 | | | | 152,608 | |
EOG Resources | | | 1,537 | | | | 133,719 | |
| | | | | | | | 558,292 | |
| Financials — 23.2% | | | | | | | | |
Ameriprise Financial | | �� | 502 | | | | 145,380 | |
BlackRock, Cl A | | | 149 | | | | 134,787 | |
Cincinnati Financial | | | 1,079 | | | | 122,898 | |
Citizens Financial Group | | | 2,745 | | | | 129,756 | |
Comerica | | | 1,761 | | | | 145,335 | |
Huntington Bancshares | | | 9,076 | | | | 134,688 | |
Invesco | | | 4,482 | | | | 100,083 | |
JPMorgan Chase | | | 819 | | | | 130,082 | |
M&T Bank | | | 837 | | | | 122,713 | |
Northern Trust | | | 1,117 | | | | 129,237 | |
PNC Financial Services Group | | | 694 | | | | 136,718 | |
Regions Financial | | | 6,105 | | | | 138,889 | |
Synchrony Financial | | | 2,661 | | | | 119,186 | |
T Rowe Price Group | | | 671 | | | | 134,166 | |
Truist Financial | | | 2,265 | | | | 134,337 | |
US Bancorp | | | 2,221 | | | | 122,910 | |
Zions Bancorp | | | 2,377 | | | | 149,941 | |
| | | | | | | | 2,231,106 | |
| Schedule of Investments | | November 30, 2021 |
| | Global X S&P 500® Quality Dividend ETF | |
| | | Shares | | | Value | |
| COMMON STOCK — continued | | | | | | |
| Health Care — 5.6% | | | | | | |
Amgen | | | 535 | | | $ | 106,401 | |
Cardinal Health | | | 2,214 | | | | 102,353 | |
Pfizer | | | 3,271 | | | | 175,751 | |
Quest Diagnostics | | | 1,032 | | | | 153,438 | |
| | | | | | | | 537,943 | |
| Industrials — 19.8% | | | | | | | | |
3M | | | 648 | | | | 110,186 | |
CH Robinson Worldwide | | | 1,313 | | | | 124,853 | |
Cummins | | | 520 | | | | 109,070 | |
Eaton | | | 896 | | | | 145,206 | |
Emerson Electric | | | 1,354 | | | | 118,935 | |
Fastenal | | | 2,503 | | | | 148,103 | |
General Dynamics | | | 686 | | | | 129,633 | |
Huntington Ingalls Industries | | | 594 | | | | 105,441 | |
Illinois Tool Works | | | 564 | | | | 130,932 | |
L3Harris Technologies | | | 588 | | | | 122,939 | |
Lockheed Martin | | | 339 | | | | 112,995 | |
Robert Half International | | | 1,449 | | | | 161,085 | |
Snap-On | | | 550 | | | | 113,251 | |
Union Pacific | | | 593 | | | | 139,735 | |
United Parcel Service, Cl B | | | 640 | | | | 126,957 | |
| | | | | | | | 1,899,321 | |
| Information Technology — 7.0% | | | | | | | | |
Automatic Data Processing | | | 651 | | | | 150,310 | |
Cisco Systems | | | 2,398 | | | | 131,506 | |
Intel | | | 2,271 | | | | 111,733 | |
Paychex | | | 1,251 | | | | 149,119 | |
Texas Instruments | | | 696 | | | | 133,890 | |
| | | | | | | | 676,558 | |
| Materials — 7.3% | | | | | | | | |
Amcor | | | 10,731 | | | | 121,474 | |
CF Industries Holdings | | | 2,442 | | | | 147,961 | |
| Schedule of Investments | | November 30, 2021 |
| | Global X S&P 500® Quality Dividend ETF | |
| | | Shares | | | Value | |
| COMMON STOCK — continued | | | | | | |
| Materials — continued | | | | | | |
Dow | | | 1,932 | | | $ | 106,125 | |
International Paper | | | 2,174 | | | | 98,960 | |
Newmont | | | 1,868 | | | | 102,591 | |
Packaging Corp of America | | | 913 | | | | 119,229 | |
| | | | | | | | 696,340 | |
| Real Estate — 7.1% | | | | | | | | |
Equity Residential ‡ | | | 1,609 | | | | 137,264 | |
Public Storage ‡ | | | 439 | | | | 143,719 | |
Regency Centers ‡ | | | 1,926 | | | | 133,549 | |
Welltower ‡ | | | 1,648 | | | | 131,214 | |
Weyerhaeuser ‡ | | | 3,719 | | | | 139,872 | |
| | | | | | | | 685,618 | |
| TOTAL COMMON STOCK | | | | | | | | |
(Cost $9,356,004) | | | | | | | 9,585,575 | |
| | | | | | | | | |
| TOTAL INVESTMENTS — 99.7% | | | | | | | | |
(Cost $9,356,004) | | | | | | $ | 9,585,575 | |
Percentages are based on Net Assets of $9,615,435.
| ‡ | Real Estate Investment Trust |
Cl — Class
As of November 30, 2021, all of the Fund’s investments were considered Level 1, in accordance with authoritative guidance on fair value measurements and disclosure under U.S. GAAP.
For the year ended November 30, 2021, there have been no transfers in or out of Level 3.
| Schedule of Investments | | November 30, 2021 |
| | Global X U.S. Preferred ETF | |
Sector Weightings (Unaudited)†:
† Sector weightings percentages are based on the total market value of investments. Repurchase agreements purchased from cash collateral received for securities lending activity are included in total investments. Please see Note 2 and 7 in Notes to Financial Statements for more detailed information.
| | | Shares | | | Value | |
| PREFERRED STOCK — 99.2% | | | | | | |
| BERMUDA— 1.1% | | | | | | |
| Financials — 0.9% | | | | | | |
| Aspen Insurance Holdings, 5.950%, VAR ICE LIBOR USD 3 Month + 4.060% | | | 158,683 | | | $ | 4,273,333 | |
| Aspen Insurance Holdings, 5.625% | | | 151,002 | | | | 3,924,542 | |
| Aspen Insurance Holdings, 5.625% | | | 144,239 | | | | 3,825,218 | |
PartnerRe, 4.875% (A) | | | 116,321 | | | | 2,998,755 | |
| RenaissanceRe Holdings, 5.750% | | | 151,020 | | | | 3,918,969 | |
| SiriusPoint, 8.000%, VAR US Treas Yield Curve Rate T Note Const Mat 5 Yr + 7.298% | | | 124,356 | | | | 3,391,188 | |
| | | | | | | | 22,332,005 | |
| Industrials — 0.2% | | | | | | | | |
Triton International, 8.000% | | | 83,322 | | | | 2,266,358 | |
| Schedule of Investments | | November 30, 2021 |
| | Global X U.S. Preferred ETF | |
| | | Shares | | | Value | |
| PREFERRED STOCK — continued | | | | | | |
| Industrials — continued | | | | | | |
Triton International, 6.875% | | | 80,217 | | | $ | 2,143,398 | |
| | | | | | | | 4,409,756 | |
TOTAL BERMUDA | | | | | | | 26,741,761 | |
| CANADA— 1.8% | | | | | | | | |
| Energy — 0.4% | | | | | | | | |
| Enbridge, 6.375%, VAR ICE LIBOR USD 3 Month + 3.593% | | | 363,532 | | | | 9,571,798 | |
| Financials — 0.4% | | | | | | | | |
Brookfield Finance, 4.625% | | | 244,307 | | | | 6,009,952 | |
Brookfield Finance I UK, 4.500% (A) | | | 130,585 | | | | 3,154,934 | |
| | | | | | | | 9,164,886 | |
| Utilities — 1.0% | | | | | | | | |
| Algonquin Power & Utilities, 6.875%, VAR ICE LIBOR USD 3 Month + 3.677% | | | 166,235 | | | | 4,571,463 | |
| Algonquin Power & Utilities, 6.200%, VAR ICE LIBOR USD 3 Month + 4.010% | | | 200,483 | | | | 5,545,360 | |
| Brookfield BRP Holdings Canada, 4.625% | | | 214,482 | | | | 5,218,347 | |
| Brookfield Infrastructure Finance ULC, 5.000% | | | 154,638 | | | | 3,879,867 | |
| Brookfield Infrastructure Partners, 5.125% | | | 119,622 | | | | 2,949,879 | |
Brookfield Infrastructure Partners, 5.000% (A) | | | 116,234 | | | | 2,910,499 | |
| | | | | | | | 25,075,415 | |
TOTAL CANADA | | | | | | | 43,812,099 | |
| NETHERLANDS— 0.6% | | | | | | | | |
| Financials — 0.6% | | | | | | | | |
Aegon, 5.100% | | | 557,442 | | | | 14,577,108 | |
TOTAL NETHERLANDS | | | | | | | 14,577,108 | |
| Schedule of Investments | | November 30, 2021 |
| | Global X U.S. Preferred ETF | |
| | | Shares | | | Value | |
| PREFERRED STOCK — continued | | | | | | |
| UNITED KINGDOM— 0.3% | | | | | | |
| Financials — 0.3% | | | | | | |
Prudential, 6.750% | | | 144,284 | | | $ | 3,657,599 | |
Prudential, 6.500% | | | 184,464 | | | | 4,687,230 | |
TOTAL UNITED KINGDOM | | | | | | | 8,344,829 | |
| UNITED STATES— 95.4% | | | | | | | | |
| Communication Services — 5.8% | | | | | | | | |
AT&T, 5.625% | | | 497,703 | | | | 13,204,060 | |
AT&T, 5.350% | | | 794,663 | | | | 20,645,345 | |
AT&T, 5.000% | | | 721,568 | | | | 18,544,298 | |
AT&T, 4.750% | | | 1,048,724 | | | | 26,469,794 | |
Qwest, 6.750% | | | 399,390 | | | | 10,288,286 | |
Qwest, 6.500% (A) | | | 588,852 | | | | 14,780,185 | |
| Telephone and Data Systems, 6.625% | | | 251,574 | | | | 6,686,837 | |
United States Cellular, 6.250% (A) | | | 299,535 | | | | 7,970,626 | |
United States Cellular, 5.500% | | | 299,530 | | | | 7,652,992 | |
United States Cellular, 5.500% (A) | | | 303,736 | | | | 7,739,193 | |
ViacomCBS, 5.750% | | | 151,263 | | | | 7,814,247 | |
| | | | | | | | 141,795,863 | |
| Consumer Discretionary — 3.6% | | | | | | | | |
Aptiv, 5.500% | | | 172,341 | | | | 30,768,039 | |
Brunswick, 6.375% (A) | | | 132,708 | | | | 3,494,202 | |
Ford Motor, 6.200% | | | 453,015 | | | | 12,023,018 | |
Ford Motor, 6.000% | | | 482,839 | | | | 12,867,659 | |
Qurate Retail, 8.000% | | | 187,777 | | | | 19,622,696 | |
QVC, 6.375% | | | 128,073 | | | | 3,212,071 | |
QVC, 6.250% | | | 299,675 | | | | 7,659,693 | |
| | | | | | | | 89,647,378 | |
| Energy — 1.5% | | | | | | | | |
| DCP Midstream, 7.950%, VAR ICE LIBOR USD 3 Month + 4.882% | | | 71,517 | | | | 1,767,900 | |
| DCP Midstream, 7.875%, VAR ICE LIBOR USD 3 Month + 4.919% | | | 94,569 | | | | 2,329,234 | |
| Schedule of Investments | | November 30, 2021 |
| | Global X U.S. Preferred ETF | |
| | | Shares | | | Value | |
| PREFERRED STOCK — continued | | | | | | |
| Energy — continued | | | | | | |
| Energy Transfer, 7.600%, VAR ICE LIBOR USD 3 Month + 5.161% | | | 483,154 | | | $ | 11,648,843 | |
Energy Transfer, 7.400% | | | 266,451 | | | | 6,461,437 | |
| Energy Transfer, 7.375%, VAR ICE LIBOR USD 3 Month + 4.530% | | | 269,568 | | | | 6,458,849 | |
| NuStar Energy, 9.000%, VAR ICE LIBOR USD 3 Month + 6.880% | | | 101,824 | | | | 2,557,819 | |
| NuStar Logistics, 6.922%, VAR ICE LIBOR USD 3 Month + 6.734% | | | 241,082 | | | | 6,000,531 | |
| | | | | | | | 37,224,613 | |
| Financials — 59.7% | | | | | | | | |
| Affiliated Managers Group, 5.875% | | | 172,261 | | | | 4,535,632 | |
| Affiliated Managers Group, 4.750% | | | 165,414 | | | | 4,168,433 | |
Allstate, 5.625% | | | 348,474 | | | | 9,203,198 | |
| Allstate, 5.100%, VAR ICE LIBOR USD 3 Month + 3.165% | | | 299,532 | | | | 7,808,799 | |
Allstate, 5.100% | | | 691,665 | | | | 18,336,039 | |
Allstate, 4.750% | | | 184,231 | | | | 4,845,275 | |
| American Equity Investment Life Holding, 6.625%, VAR US Treas Yield Curve Rate T Note Const Mat 5 Yr + 6.297% | | | 179,344 | | | | 4,930,167 | |
| American Equity Investment Life Holding, 5.950%, VAR US Treas Yield Curve Rate T Note Const Mat 5 Yr + 4.322% | | | 239,628 | | | | 6,422,030 | |
American International Group, 5.850% (A) | | | 303,636 | | | | 8,049,390 | |
| Apollo Global Management, 6.375% | | | 158,821 | | | | 3,994,348 | |
| Apollo Global Management, 6.375% | | | 184,309 | | | | 4,797,563 | |
Arch Capital Group, 5.450% (A) | | | 189,582 | | | | 4,836,237 | |
Arch Capital Group, 4.550% (A) | | | 303,865 | | | | 7,745,519 | |
| | | | | | | | | |
| | | | | | | | | |
| Schedule of Investments | | November 30, 2021 |
| | Global X U.S. Preferred ETF | |
| | | Shares | | | Value | |
| PREFERRED STOCK — continued | | | | | | |
| Financials — continued | | | | | | |
Argo Group International Holdings, 7.000%, VAR US Treas Yield Curve Rate T Note Const Mat 5 Yr + 6.712% (A) | | | 89,685 | | | $ | 2,379,343 | |
Assurant, 5.250% | | | 149,589 | | | | 3,940,174 | |
| Athene Holding, 6.375%, VAR US Treas Yield Curve Rate T Note Const Mat 5 Yr + 5.970% | | | 363,273 | | | | 10,095,357 | |
| Athene Holding, 6.350%, VAR ICE LIBOR USD 3 Month + 4.253% | | | 519,501 | | | | 14,800,584 | |
Athene Holding, 5.625% (A) | | | 198,140 | | | | 5,230,896 | |
Athene Holding, 4.875% | | | 348,617 | | | | 8,826,983 | |
Axis Capital Holdings, 5.500% | | | 333,841 | | | | 8,416,132 | |
Bank of America, 7.250% | | | 46,195 | | | | 65,504,510 | |
| Bank of America, 6.450%, VAR ICE LIBOR USD 3 Month + 1.327% | | | 632,146 | | | | 16,694,976 | |
Bank of America, 6.000% | | | 808,926 | | | | 21,250,486 | |
Bank of America, 5.875% | | | 515,046 | | | | 13,633,268 | |
Bank of America, 5.375% | | | 837,409 | | | | 21,898,245 | |
Bank of America, 5.000% | | | 787,378 | | | | 20,298,605 | |
Bank of America, 4.375% | | | 662,059 | | | | 16,399,201 | |
Bank of America, 4.125% | | | 551,670 | | | | 13,460,748 | |
Bank of America, 4.000%, VAR ICE LIBOR USD 3 Month + 0.350% (A) | | | 195,085 | | | | 4,849,813 | |
Bank of America, 3.000%, VAR ICE LIBOR USD 3 Month + 0.650% (A) | | | 178,937 | | | | 4,176,390 | |
| Bank of America, 0.938%, VAR ICE LIBOR USD 3 Month + 0.750% | | | 131,211 | | | | 3,221,230 | |
Bank of America, 0.688%, VAR ICE LIBOR USD 3 Month + 0.500% (A) | | | 252,553 | | | | 6,187,548 | |
Bank of Hawaii, 4.375% | | | 113,040 | | | | 2,827,130 | |
Brighthouse Financial, 6.750% (A) | | | 241,104 | | | | 6,574,906 | |
Brighthouse Financial, 6.600% | | | 254,517 | | | | 6,780,333 | |
Brighthouse Financial, 6.250% | | | 215,430 | | | | 5,639,957 | |
Brighthouse Financial, 5.375% | | | 336,544 | | | | 8,632,354 | |
| Schedule of Investments | | November 30, 2021 |
| | Global X U.S. Preferred ETF | |
| | | Shares | | | Value | |
| PREFERRED STOCK — continued | | | | | | |
| Financials — continued | | | | | | |
Capital One Financial, 6.000% | | | 299,521 | | | $ | 7,488,025 | |
Capital One Financial, 5.200% | | | 363,902 | | | | 9,097,550 | |
Capital One Financial, 5.000% | | | 898,855 | | | | 23,298,322 | |
Capital One Financial, 4.800% | | | 751,504 | | | | 19,246,017 | |
Capital One Financial, 4.625% | | | 65,881 | | | | 1,690,506 | |
Capital One Financial, 4.375% | | | 408,549 | | | | 9,993,109 | |
Carlyle Finance, 4.625% | | | 304,007 | | | | 7,584,975 | |
Charles Schwab, 5.950% | | | 453,289 | | | | 11,490,876 | |
Charles Schwab, 4.450% | | | 363,723 | | | | 9,307,672 | |
| Citigroup, Ser J, 7.125%, VAR ICE LIBOR USD 3 Month + 4.040% | | | 572,110 | | | | 15,584,276 | |
| Citigroup, 6.875%, VAR ICE LIBOR USD 3 Month + 4.130% | | | 895,852 | | | | 24,277,589 | |
| Citigroup Capital XIII, 6.499%, VAR ICE LIBOR USD 3 Month + 6.370% | | | 1,345,990 | | | | 36,314,810 | |
| Citizens Financial Group, 6.350%, VAR ICE LIBOR USD 3 Month + 3.642% | | | 172,178 | | | | 4,628,145 | |
| Citizens Financial Group, 5.000% | | | 257,198 | | | | 6,630,564 | |
Cullen, 4.450% | | | 90,020 | | | | 2,292,809 | |
| Enstar Group, 7.000%, VAR ICE LIBOR USD 3 Month + 4.015% | | | 239,639 | | | | 6,832,108 | |
Equitable Holdings, 5.250% | | | 482,776 | | | | 12,581,143 | |
Equitable Holdings, 4.300% | | | 172,674 | | | | 4,275,408 | |
| Fifth Third Bancorp, 6.625%, VAR ICE LIBOR USD 3 Month + 3.710% | | | 269,589 | | | | 7,367,867 | |
Fifth Third Bancorp, 4.950% | | | 150,933 | | | | 3,977,085 | |
First Citizens BancShares, 5.375% (A) | | | 198,136 | | | | 5,224,846 | |
First Horizon, 4.700% | | | 94,970 | | | | 2,389,445 | |
First Republic Bank, 4.700% | | | 236,505 | | | | 6,056,893 | |
First Republic Bank, 4.250% | | | 451,725 | | | | 10,827,848 | |
First Republic Bank, 4.125% (A) | | | 299,519 | | | | 7,107,586 | |
Fulton Financial, 5.125% | | | 114,301 | | | | 2,947,823 | |
Globe Life, 4.250% | | | 199,656 | | | | 5,011,366 | |
| | | | | | | | | |
| Schedule of Investments | | November 30, 2021 |
| | Global X U.S. Preferred ETF | |
| | | Shares | | | Value | |
| PREFERRED STOCK — continued | | | | | | |
| Financials — continued | | | | | | |
| Goldman Sachs Group, 6.375%, VAR ICE LIBOR USD 3 Month + 3.550% | | | 422,918 | | | $ | 11,714,829 | |
| Goldman Sachs Group, 5.500%, VAR ICE LIBOR USD 3 Month + 3.640% | | | 602,254 | | | | 15,875,415 | |
| Goldman Sachs Group, 4.000%, VAR ICE LIBOR USD 3 Month + 0.670% | | | 811,334 | | | | 19,991,270 | |
Goldman Sachs Group, 3.750%, VAR ICE LIBOR USD 3 Month + 0.750% (A) | | | 443,525 | | | | 10,946,197 | |
| Hartford Financial Services Group, 6.000% | | | 197,947 | | | | 5,249,555 | |
| Huntington Bancshares, 4.500% | | | 299,521 | | | | 7,505,996 | |
JPMorgan Chase, 6.000% | | | 1,108,645 | | | | 29,900,156 | |
JPMorgan Chase, 5.750% | | | 1,016,471 | | | | 27,038,129 | |
JPMorgan Chase, 4.750% | | | 542,656 | | | | 13,891,994 | |
JPMorgan Chase, 4.625% (A) | | | 1,108,634 | | | | 28,458,635 | |
JPMorgan Chase, 4.550% | | | 898,853 | | | | 22,956,706 | |
| KeyCorp, 6.125%, VAR ICE LIBOR USD 3 Month + 3.892% | | | 303,120 | | | | 8,951,134 | |
KeyCorp, 5.650% (A) | | | 254,515 | | | | 6,647,932 | |
KeyCorp, 5.625% (A) | | | 269,584 | | | | 7,063,101 | |
KKR, 6.000% (A) | | | 344,509 | | | | 31,760,285 | |
KKR Group Finance IX, 4.625% (A) | | | 303,920 | | | | 7,686,137 | |
MetLife, 5.625% | | | 485,832 | | | | 12,699,649 | |
MetLife, 4.750% | | | 602,314 | | | | 15,413,215 | |
| MetLife, 4.000%, VAR ICE LIBOR USD 3 Month + 1.000% | | | 363,911 | | | | 9,061,384 | |
| Morgan Stanley, Ser E, 7.125%, VAR ICE LIBOR USD 3 Month + 4.320% | | | 519,677 | | | | 14,275,527 | |
| Morgan Stanley, Ser F, 6.875%, VAR ICE LIBOR USD 3 Month + 3.940% | | | 512,395 | | | | 14,024,251 | |
| Morgan Stanley, 6.375%, VAR ICE LIBOR USD 3 Month + 3.708% | | | 601,998 | | | | 16,759,624 | |
| Morgan Stanley, 5.850%, VAR ICE LIBOR USD 3 Month + 3.491% | | | 601,808 | | | | 17,163,564 | |
| Schedule of Investments | | November 30, 2021 |
| | Global X U.S. Preferred ETF | |
| | | Shares | | | Value | |
| PREFERRED STOCK — continued | | | | | | |
| Financials — continued | | | | | | |
Morgan Stanley, 4.875% | | | 299,531 | | | $ | 7,742,876 | |
Morgan Stanley, 4.000%, VAR ICE LIBOR USD 3 Month + 0.700% (A) | | | 662,302 | | | | 16,411,843 | |
Navient, 6.000% | | | 172,840 | | | | 4,301,988 | |
| New York Community Bancorp, 6.375%, VAR ICE LIBOR USD 3 Month + 3.821% | | | 312,410 | | | | 8,709,990 | |
Northern Trust, 4.700% (A) | | | 239,627 | | | | 6,280,624 | |
| Oaktree Capital Group, 6.550% | | | 142,230 | | | | 3,760,561 | |
| People’s United Financial, 5.625%, VAR ICE LIBOR USD 3 Month + 4.020% | | | 144,098 | | | | 3,990,074 | |
Prudential Financial, 5.625% | | | 342,505 | | | | 9,069,532 | |
Prudential Financial, 4.125% (A) | | | 299,526 | | | | 7,730,766 | |
Ready Capital, 7.000% ‡ | | | 60,731 | | | | 1,618,785 | |
Regions Financial, Ser B, 6.375%, VAR ICE LIBOR USD 3 Month + 3.536% (A) | | | 303,459 | | | | 8,442,229 | |
| Regions Financial, 5.700%, VAR ICE LIBOR USD 3 Month + 3.148% | | | 303,476 | | | | 8,318,277 | |
Regions Financial, 4.450% (A) | | | 244,342 | | | | 6,035,247 | |
| Reinsurance Group of America, 5.750%, VAR ICE LIBOR USD 3 Month + 4.040% | | | 239,635 | | | | 6,786,463 | |
| Selective Insurance Group, 4.600% | | | 114,571 | | | | 2,860,838 | |
Signature Bank NY, 5.000% | | | 441,133 | | | | 11,257,714 | |
| State Street, 5.900%, VAR ICE LIBOR USD 3 Month + 3.108% | | | 452,732 | | | | 12,110,581 | |
| State Street, 5.350%, VAR ICE LIBOR USD 3 Month + 3.709% | | | 303,301 | | | | 8,386,273 | |
Stifel Financial, 6.125% | | | 139,521 | | | | 3,744,744 | |
SVB Financial Group, 5.250% | | | 207,960 | | | | 5,423,597 | |
Synchrony Financial, 5.625% | | | 453,051 | | | | 11,915,241 | |
| | | | | | | | | |
| | | | | | | | | |
| Schedule of Investments | | November 30, 2021 |
| | Global X U.S. Preferred ETF | |
| | | Shares | | | Value | |
| PREFERRED STOCK — continued | | | | | | |
| Financials — continued | | | | | | |
| Synovus Financial, 5.875%, VAR US Treas Yield Curve Rate T Note Const Mat 5 Yr + 4.127% | | | 207,862 | | | $ | 5,514,579 | |
| Texas Capital Bancshares, 5.750% | | | 172,275 | | | | 4,455,032 | |
Truist Financial, 5.250% (A) | | | 348,227 | | | | 9,443,916 | |
Truist Financial, 4.750% | | | 557,417 | | | | 14,437,100 | |
Unum Group, 6.250% | | | 172,624 | | | | 4,524,475 | |
US Bancorp, 5.500% | | | 348,408 | | | | 9,170,099 | |
US Bancorp, 4.000% (A) | | | 453,349 | | | | 10,948,378 | |
US Bancorp, 3.750% | | | 285,789 | | | | 6,607,442 | |
US Bancorp, 3.500%, VAR ICE LIBOR USD 3 Month + 0.600% (A) | | | 602,793 | | | | 14,527,311 | |
US Bancorp, 3.500%, VAR ICE LIBOR USD 3 Month + 1.020% (A) | | | 8,625 | | | | 7,980,281 | |
Voya Financial, 5.350%, VAR US Treas Yield Curve Rate T Note Const Mat 5 Yr + 3.210% (A) | | | 172,320 | | | | 4,862,870 | |
W R Berkley, 4.250% (A) | | | 154,420 | | | | 4,001,022 | |
Washington Federal, 4.875% | | | 172,415 | | | | 4,400,031 | |
Wells Fargo, 7.500% | | | 59,434 | | | | 87,131,433 | |
| Wells Fargo, 6.625%, VAR ICE LIBOR USD 3 Month + 3.690% | | | 506,470 | | | | 13,765,855 | |
| Wells Fargo, 5.850%, VAR ICE LIBOR USD 3 Month + 3.090% | | | 1,033,667 | | | | 27,061,402 | |
Wells Fargo, 5.625% | | | 417,273 | | | | 10,582,043 | |
Wells Fargo, 4.750% | | | 1,206,025 | | | | 30,657,156 | |
Wells Fargo, 4.700% | | | 703,733 | | | | 17,931,117 | |
Wells Fargo, 4.375% (A) | | | 632,431 | | | | 15,696,937 | |
| Wintrust Financial, 6.875%, VAR US Treas Yield Curve Rate T Note Const Mat 5 Yr + 6.507% | | | 171,825 | | | | 4,788,763 | |
W R Berkley, 5.100% | | | 172,616 | | | | 4,548,432 | |
| | | | | | | | 1,467,885,064 | |
| Schedule of Investments | | November 30, 2021 |
| | Global X U.S. Preferred ETF | |
| | | Shares | | | Value | |
| PREFERRED STOCK — continued | | | | | | |
| Health Care — 3.7% | | | | | | |
Becton Dickinson, 6.000% (A) | | | 449,391 | | | $ | 22,563,922 | |
Boston Scientific, 5.500% | | | 151,262 | | | | 15,882,510 | |
Danaher, 5.000% (A) | | | 25,831 | | | | 44,016,024 | |
Elanco Animal Health, 5.000% | | | 167,034 | | | | 7,509,849 | |
| | | | | | | | 89,972,305 | |
| Industrials — 1.5% | | | | | | | | |
| Air Lease, 6.150%, VAR ICE LIBOR USD 3 Month + 3.650% | | | 144,251 | | | | 3,762,066 | |
| Fortress Transportation and Infrastructure Investors, 8.250%, VAR ICE LIBOR USD 3 Month + 6.886% | | | 62,372 | | | | 1,562,419 | |
| Fortress Transportation and Infrastructure Investors, 8.250%, VAR US Treas Yield Curve Rate T Note Const Mat 5 Yr + 7.378% | | | 54,415 | | | | 1,397,377 | |
| Fortress Transportation and Infrastructure Investors, 8.000%, VAR ICE LIBOR USD 3 Month + 6.447% | | | 71,397 | | | | 1,790,637 | |
Pitney Bowes, 6.700% | | | 254,503 | | | | 6,276,044 | |
| Stanley Black & Decker, 5.250% | | | 113,247 | | | | 11,662,176 | |
| WESCO International, 10.625%, VAR US Treas Yield Curve Rate T Note Const Mat 5 Yr + 10.325% | | | 327,044 | | | | 9,912,704 | |
| | | | | | | | 36,363,423 | |
| Information Technology — 0.6% | | | | | | | | |
II-VI, 6.000% | | | 34,889 | | | | 9,203,021 | |
Sabre, 6.500% | | | 47,935 | | | | 4,914,296 | |
| | | | | | | | 14,117,317 | |
| Real Estate — 4.8% | | | | | | | | |
Braemar Hotels & Resorts, 5.500% ‡ | | | 56,090 | | | | 1,206,501 | |
| Brookfield Property Partners, 6.500% | | | 106,336 | | | | 2,682,857 | |
| Brookfield Property Partners, 6.375% | | | 155,276 | | | | 3,902,086 | |
| Brookfield Property Partners, 5.750% | | | 173,082 | | | | 4,098,582 | |
Digital Realty Trust, 5.850% ‡ (A) | | | 130,683 | | | | 3,570,260 | |
| Schedule of Investments | | November 30, 2021 |
| | Global X U.S. Preferred ETF | |
| | | Shares | | | Value | |
| PREFERRED STOCK — continued | | | | | | |
| Real Estate — continued | | | | | | |
Digital Realty Trust, 5.200% ‡ | | | 211,166 | | | $ | 5,627,574 | |
Diversified Healthcare Trust, 6.250% ‡ | | | 149,576 | | | | 3,494,095 | |
Diversified Healthcare Trust, 5.625% ‡ | | | 201,111 | | | | 4,583,320 | |
EPR Properties, 5.750% ‡ | | | 89,673 | | | | 2,243,618 | |
EPR Properties, 5.750% ‡ | | | 85,991 | | | | 2,150,635 | |
Kimco Realty, 5.250% ‡ | | | 159,194 | | | | 4,086,510 | |
Office Properties Income Trust, 6.375% ‡ | | | 96,923 | | | | 2,559,736 | |
PS Business Parks, 4.875% ‡ | | | 199,246 | | | | 5,232,200 | |
Public Storage, 5.600% ‡ | | | 175,285 | | | | 4,741,459 | |
Public Storage, 5.150% ‡ | | | 161,310 | | | | 4,100,500 | |
Public Storage, 5.050% ‡ (A) | | | 179,678 | | | | 4,583,586 | |
Public Storage, 4.900% ‡ (A) | | | 201,119 | | | | 5,076,244 | |
Public Storage, 4.875% ‡ | | | 188,490 | | | | 4,979,906 | |
Public Storage, 4.625% ‡ (A) | | | 342,466 | | | | 8,962,335 | |
Public Storage, 4.125% ‡ | | | 142,793 | | | | 3,582,676 | |
Public Storage, 4.000% ‡ | | | 365,989 | | | | 8,985,030 | |
Public Storage, 3.900% ‡ | | | 98,470 | | | | 2,440,087 | |
Public Storage, 3.875% ‡ (A) | | | 155,541 | | | | 3,832,530 | |
RLJ Lodging Trust, 1.950% ‡ | | | 192,844 | | | | 5,401,560 | |
SITE Centers, 6.375% ‡ | | | 104,737 | | | | 2,621,567 | |
Vornado Realty Trust, 5.400% ‡ | | | 179,818 | | | | 4,511,634 | |
Vornado Realty Trust, 5.250% ‡ | | | 172,603 | | | | 4,434,171 | |
Vornado Realty Trust, 5.250% ‡ | | | 190,795 | | | | 4,859,549 | |
| | | | | | | | 118,550,808 | |
| Utilities — 14.2% | | | | | | | | |
AES, 6.875% | | | 156,232 | | | | 14,660,811 | |
Alabama Power, 5.000% | | | 144,353 | | | | 3,724,307 | |
American Electric Power, 6.125% (A) | | | 256,516 | | | | 12,505,155 | |
CMS Energy, 5.875% | | | 381,294 | | | | 10,127,169 | |
CMS Energy, 5.875% | | | 167,835 | | | | 4,494,621 | |
CMS Energy, 4.200% | | | 142,950 | | | | 3,523,717 | |
| | | | | | | | | |
| Schedule of Investments | | November 30, 2021 |
| | Global X U.S. Preferred ETF | |
| | | Shares | | �� | Value | |
| PREFERRED STOCK — continued | | | | | | |
| Utilities — continued | | | | | | |
DTE Energy, 6.250% | | | 390,876 | | | $ | 18,883,220 | |
DTE Energy, 6.000% | | | 161,350 | | | | 4,028,910 | |
DTE Energy, 5.250% | | | 239,619 | | | | 6,182,170 | |
DTE Energy, 4.375% (A) | | | 130,314 | | | | 3,283,913 | |
Duke Energy, 5.750% | | | 602,146 | | | | 16,071,277 | |
Duke Energy, 5.625% | | | 299,536 | | | | 7,949,685 | |
Entergy Louisiana, 4.875% | | | 156,302 | | | | 3,960,693 | |
Entergy Mississippi, 4.900% | | | 150,271 | | | | 3,801,856 | |
Georgia Power, 5.000% | | | 162,588 | | | | 4,176,886 | |
| National Rural Utilities Cooperative Finance, 5.500% | | | 144,279 | | | | 3,840,707 | |
NextEra Energy, 6.219% | | | 598,784 | | | | 32,334,336 | |
NextEra Energy, 5.279% | | | 749,108 | | | | 40,519,252 | |
| NextEra Energy Capital Holdings, 5.650% | | | 415,396 | | | | 11,174,152 | |
| NextEra Energy Capital Holdings, 5.250% | | | 345,902 | | | | 8,675,222 | |
NiSource, 7.750% | | | 129,985 | | | | 13,402,753 | |
| NiSource, 6.500%, VAR US Treas Yield Curve Rate T Note Const Mat 5 Yr + 3.632% | | | 299,540 | | | | 8,063,617 | |
PG&E, 5.500% | | | 239,763 | | | | 27,150,762 | |
SCE Trust II, 5.100% | | | 128,653 | | | | 3,216,325 | |
| SCE Trust III, 5.750%, VAR ICE LIBOR USD 3 Month + 2.990% | | | 165,584 | | | | 4,091,581 | |
| SCE Trust IV, 5.375%, VAR ICE LIBOR USD 3 Month + 3.132% | | | 187,311 | | | | 4,649,059 | |
| SCE Trust V, 5.450%, VAR ICE LIBOR USD 3 Month + 3.790% | | | 172,832 | | | | 4,369,193 | |
SCE Trust VI, 5.000% | | | 271,084 | | | | 6,722,883 | |
Sempra Energy, 5.750% | | | 457,346 | | | | 12,229,432 | |
| South Jersey Industries, 8.750% | | | 96,631 | | | | 5,008,385 | |
Southern, 5.250% | | | 269,576 | | | | 7,017,063 | |
| Schedule of Investments | | November 30, 2021 |
| | Global X U.S. Preferred ETF | |
| | | Shares/Face Amount | | | Value | |
| PREFERRED STOCK — continued | | | | | | |
Southern, 4.950% | | | 602,348 | | | $ | 15,980,292 | |
Southern, 4.200% | | | 453,234 | | | | 11,498,547 | |
Spire, 5.900% | | | 144,174 | | | | 3,881,164 | |
| Tennessee Valley Authority, 2.134%, VAR US Treas Yield Curve Rate T Note Const Mat 30 Yr + 0.940% | | | 158,300 | | | | 3,987,577 | |
UGI, 7.250% | | | 34,100 | | | | 3,295,765 | |
| | | | | | | | 348,482,457 | |
TOTAL UNITED STATES | | | | | | | 2,344,039,228 | |
| TOTAL PREFERRED STOCK | | | | | | | | |
(Cost $2,466,703,648) | | | | | | | 2,437,515,025 | |
| | | | | | | | | |
SHORT-TERM INVESTMENT(B)(C) — 1.1% | | | | | | | | |
| Fidelity Investments Money Market Government Portfolio, Cl Institutional, 0.01% | | | | | | | | |
(Cost $26,984,834) | | | 26,984,834 | | | | 26,984,834 | |
| | | | | | | | | |
REPURCHASE AGREEMENT(B) — 1.3% | | | | | | | | |
| BNP Paribas | | | | | | | | |
| 0.030%, dated 11/30/2021, to be repurchased on 12/01/2021 , repurchase price $31,717,842 (collateralized by various U.S. Treasury Obligations, ranging in par value $201,628 - $2,964,688, 0.750% - 1.130%, 02/28/2025 - 04/30/2026, with a total market value of $32,263,103) | | | | | | | | |
(Cost $31,717,816) | | $ | 31,717,816 | | | | 31,717,816 | |
| | | | | | | | | |
| TOTAL INVESTMENTS — 101.6% | | | | | | | | |
(Cost $2,525,406,298) | | | | | | $ | 2,496,217,675 | |
Percentages are based on Net Assets of $2,458,022,192.
| Schedule of Investments | | November 30, 2021 |
| | Global X U.S. Preferred ETF | |
| ‡ | Real Estate Investment Trust |
| (A) | This security or a partial position of this security is on loan at November 30, 2021. The total value of securities on loan at November 30, 2021 was $56,280,886. |
| (B) | Security was purchased with cash collateral held from securities on loan. The total value of such securities as of November 30, 2021 was $58,702,650. |
| (C) | The rate reported on the Schedule of Investments is the 7-day effective yield as of November 30, 2021. |
Cl — Class
ICE — Intercontinental Exchange
LIBOR — London Interbank Offered Rate
Ser — Series
VAR – Variable Rate
The following is a summary of the level of inputs used as of November 30, 2021, in valuing the Fund’s investments carried at value:
| Investments in Securities | | | | | | | | | | | | |
| Preferred Stock | | $ | 2,437,515,025 | | | $ | — | | | $ | — | | | $ | 2,437,515,025 | |
| Short-Term Investment | | | 26,984,834 | | | | — | | | | — | | | | 26,984,834 | |
| Repurchase Agreement | | | — | | | | 31,717,816 | | | | — | | | | 31,717,816 | |
| Total Investments in Securities | | $ | 2,464,499,859 | | | $ | 31,717,816 | | | $ | — | | | $ | 2,496,217,675 | |
For the year ended November 30, 2021, there have been no transfers in or out of Level 3.
| Schedule of Investments | | November 30, 2021 |
| | Global X Variable Rate Preferred ETF | |
Sector Weightings (Unaudited)†:
† Sector weightings percentages are based on the total market value of investments.
| | | Shares | | | Value | |
| PREFERRED STOCK — 99.3% | | | | | | |
| BERMUDA— 1.3% | | | | | | |
| Financials — 1.3% | | | | | | |
| Aspen Insurance Holdings, 5.950%, VAR ICE LIBOR USD 3 Month + 4.060% | | | 24,856 | | | $ | 669,372 | |
| SiriusPoint, 8.000%, VAR US Treas Yield Curve Rate T Note Const Mat 5 Yr + 7.298% | | | 17,672 | | | | 481,915 | |
TOTAL BERMUDA | | | | | | | 1,151,287 | |
| CANADA— 3.0% | | | | | | | | |
| Energy — 1.6% | | | | | | | | |
| Enbridge, 6.375%, VAR ICE LIBOR USD 3 Month + 3.593% | | | 54,298 | | | | 1,429,666 | |
| Industrials — 0.4% | | | | | | | | |
| Atlas, 8.000%, VAR ICE LIBOR USD 3 Month + 5.008% | | | 13,317 | | | | 352,901 | |
| Utilities — 1.0% | | | | | | | | |
| Algonquin Power & Utilities, 6.200%, VAR ICE LIBOR USD 3 Month + 4.010% | | | 31,669 | | | | 875,964 | |
TOTAL CANADA | | | | | | | 2,658,531 | |
| CHINA— 0.4% | | | | | | | | |
| Industrials — 0.4% | | | | | | | | |
| Textainer Group Holdings, 7.000%, VAR US Treas Yield Curve Rate T Note Const Mat 5 Yr + 6.134% | | | 13,317 | | | | 357,561 | |
| Schedule of Investments | | November 30, 2021 |
| | Global X Variable Rate Preferred ETF | |
| | | Shares | | | Value | |
| PREFERRED STOCK — continued | | | | | | |
| UNITED KINGDOM— 0.0% | | | | | | |
| Energy — 0.0% | | | | | | |
| Altera Infrastructure, 8.875%, VAR ICE LIBOR USD 3 Month + 6.407% | | | 10,544 | | | $ | 42,176 | |
| UNITED STATES— 94.6% | | | | | | | | |
| Consumer Staples — 2.6% | | | | | | | | |
| CHS, Ser 2, 7.100%, VAR ICE LIBOR USD 3 Month + 4.298% | | | 37,990 | | | | 1,050,803 | |
| CHS, Ser 3, 6.750%, VAR ICE LIBOR USD 3 Month + 4.155% | | | 44,588 | | | | 1,231,075 | |
| | | | | | | | 2,281,878 | |
| Energy — 6.3% | | | | | | | | |
| DCP Midstream, 7.950%, VAR ICE LIBOR USD 3 Month + 4.882% | | | 9,759 | | | | 241,242 | |
| DCP Midstream, 7.875%, VAR ICE LIBOR USD 3 Month + 4.919% | | | 14,570 | | | | 358,859 | |
| Energy Transfer, 7.600%, VAR ICE LIBOR USD 3 Month + 5.161% | | | 72,425 | | | | 1,746,167 | |
Energy Transfer, 7.400% | | | 40,252 | | | | 976,111 | |
| Energy Transfer, 7.375%, VAR ICE LIBOR USD 3 Month + 4.530% | | | 40,730 | | | | 975,891 | |
| NuStar Energy, 9.000%, VAR ICE LIBOR USD 3 Month + 6.880% | | | 15,588 | | | | 391,571 | |
| NuStar Logistics, 6.922%, VAR ICE LIBOR USD 3 Month + 6.734% | | | 36,428 | | | | 906,693 | |
| | | | | | | | 5,596,534 | |
| Financials — 81.5% | | | | | | | | |
ACRES Commercial Realty, 8.625%, VAR ICE LIBOR USD 3 Month + 5.927%‡ | | | 10,400 | | | | 268,112 | |
AGNC Investment, 6.500%, VAR ICE LIBOR USD 3 Month + 4.993%‡ | | | 36,430 | | | | 922,043 | |
AGNC Investment, 6.125%, VAR ICE LIBOR USD 3 Month + 4.697%‡ | | | 52,029 | | | | 1,292,400 | |
| | | | | | | | | |
| | | | | | | | | |
| Schedule of Investments | | November 30, 2021 |
| | Global X Variable Rate Preferred ETF | |
| | | Shares | | | Value | |
| PREFERRED STOCK — continued | | | | | | |
| Financials — continued | | | | | | |
| Allstate, 5.100%, VAR ICE LIBOR USD 3 Month + 3.165% | | | 45,264 | | | $ | 1,180,032 | |
| American Equity Investment Life Holding, 6.625%, VAR US Treas Yield Curve Rate T Note Const Mat 5 Yr + 6.297% | | | 27,137 | | | | 745,996 | |
| American Equity Investment Life Holding, 5.950%, VAR US Treas Yield Curve Rate T Note Const Mat 5 Yr + 4.322% | | | 36,201 | | | | 970,187 | |
Annaly Capital Management, 6.750%, VAR ICE LIBOR USD 3 Month + 4.989%‡ | | | 40,053 | | | | 1,016,145 | |
Annaly Capital Management, 6.500%, VAR ICE LIBOR USD 3 Month + 4.172%‡ | | | 38,463 | | | | 958,498 | |
| Argo Group International Holdings, 7.000%, VAR US Treas Yield Curve Rate T Note Const Mat 5 Yr + 6.712% | | | 13,557 | | | | 359,667 | |
| Athene Holding, 6.375%, VAR US Treas Yield Curve Rate T Note Const Mat 5 Yr + 5.970% | | | 54,300 | | | | 1,508,997 | |
| Athene Holding, 6.350%, VAR ICE LIBOR USD 3 Month + 4.253% | | | 78,088 | | | | 2,224,727 | |
| Bank of America, 6.450%, VAR ICE LIBOR USD 3 Month + 1.327% | | | 95,069 | | | | 2,510,772 | |
| Bank of America, 4.000%, VAR ICE LIBOR USD 3 Month + 0.350% | | | 28,702 | | | | 713,532 | |
| Bank of America, 3.000%, VAR ICE LIBOR USD 3 Month + 0.650% | | | 27,045 | | | | 631,230 | |
| Bank of America, 0.688%, VAR ICE LIBOR USD 3 Month + 0.500% | | | 38,162 | | | | 934,969 | |
Chimera Investment, 8.000%, VAR ICE LIBOR USD 3 Month + 5.791%‡ | | | 29,399 | | | | 747,617 | |
Chimera Investment, 8.000%, VAR ICE LIBOR USD 3 Month + 5.379%‡ | | | 18,055 | | | | 460,402 | |
Chimera Investment, 7.750%, VAR ICE LIBOR USD 3 Month + 4.743%‡ | | | 23,511 | | | | 603,057 | |
| Citigroup, 6.875%, VAR ICE LIBOR USD 3 Month + 4.130% | | | 135,400 | | | | 3,669,340 | |
| Schedule of Investments | | November 30, 2021 |
| | Global X Variable Rate Preferred ETF | |
| | | Shares | | | Value | |
| PREFERRED STOCK — continued | | | | | | |
| Financials — continued | | | | | | |
| Citigroup, Ser J, 7.125%, VAR ICE LIBOR USD 3 Month + 4.040% | | | 86,008 | | | $ | 2,342,858 | |
| Citizens Financial Group, 6.350%, VAR ICE LIBOR USD 3 Month + 3.642% | | | 27,137 | | | | 729,443 | |
| Enstar Group, 7.000%, VAR ICE LIBOR USD 3 Month + 4.015% | | | 36,203 | | | | 1,032,148 | |
| Fifth Third Bancorp, 6.625%, VAR ICE LIBOR USD 3 Month + 3.710% | | | 40,735 | | | | 1,113,288 | |
| Goldman Sachs Group, 6.375%, VAR ICE LIBOR USD 3 Month + 3.550% | | | 63,364 | | | | 1,755,183 | |
| Goldman Sachs Group, 5.500%, VAR ICE LIBOR USD 3 Month + 3.640% | | | 90,539 | | | | 2,386,608 | |
| Goldman Sachs Group, 4.000%, VAR ICE LIBOR USD 3 Month + 0.670% | | | 122,229 | | | | 3,011,723 | |
| Goldman Sachs Group, 3.750%, VAR ICE LIBOR USD 3 Month + 0.750% | | | 67,890 | | | | 1,675,525 | |
Invesco Mortgage Capital, 7.750%, VAR ICE LIBOR USD 3 Month + 5.180%‡ | | | 14,000 | | | | 351,260 | |
Invesco Mortgage Capital, 7.500%, VAR ICE LIBOR USD 3 Month + 5.289%‡ | | | 26,009 | | | | 655,947 | |
| KeyCorp, 6.125%, VAR ICE LIBOR USD 3 Month + 3.892% | | | 45,269 | | | | 1,336,794 | |
| MetLife, 4.000%, VAR ICE LIBOR USD 3 Month + 1.000% | | | 54,295 | | | | 1,351,946 | |
MFA Financial, 6.500%, VAR ICE LIBOR USD 3 Month + 5.345%‡ | | | 24,850 | | | | 588,696 | |
| Morgan Stanley, 6.375%, VAR ICE LIBOR USD 3 Month + 3.708% | | | 69,731 | | | | 1,941,311 | |
| Morgan Stanley, 5.850%, VAR ICE LIBOR USD 3 Month + 3.491% | | | 69,732 | | | | 1,988,757 | |
| Morgan Stanley, 4.000%, VAR ICE LIBOR USD 3 Month + 0.700% | | | 76,681 | | | | 1,900,155 | |
| Morgan Stanley, Ser E, 7.125%, VAR ICE LIBOR USD 3 Month + 4.320% | | | 60,113 | | | | 1,651,304 | |
| Morgan Stanley, Ser F, 6.875%, VAR ICE LIBOR USD 3 Month + 3.940% | | | 59,266 | | | | 1,622,110 | |
| Schedule of Investments | | November 30, 2021 |
| | Global X Variable Rate Preferred ETF | |
| | | Shares | | | Value | |
| PREFERRED STOCK — continued | | | | | | |
| Financials — continued | | | | | | |
New Residential Investment, 7.125%, VAR ICE LIBOR USD 3 Month + 5.640%‡ | | | 25,530 | | | $ | 633,399 | |
New Residential Investment, 6.375%, VAR ICE LIBOR USD 3 Month + 4.969%‡ | | | 36,425 | | | | 826,848 | |
| New York Community Bancorp, 6.375%, VAR ICE LIBOR USD 3 Month + 3.821% | | | 46,624 | | | | 1,299,877 | |
New York Mortgage Trust, 8.000%, VAR ICE LIBOR USD 3 Month + 5.695%‡ | | | 13,805 | | | | 352,442 | |
New York Mortgage Trust, 7.875%, VAR ICE LIBOR USD 3 Month + 6.429%‡ | | | 16,723 | | | | 422,925 | |
New York Mortgage Trust, 6.875%, VAR United States Secured Overnight Financing Rate + 6.130%‡ | | | 11,080 | | | | 274,673 | |
| People’s United Financial, 5.625%, VAR ICE LIBOR USD 3 Month + 4.020% | | | 22,591 | | | | 625,545 | |
| Regions Financial, 5.700%, VAR ICE LIBOR USD 3 Month + 3.148% | | | 45,267 | | | | 1,240,768 | |
| Regions Financial, Ser B, 6.375%, VAR ICE LIBOR USD 3 Month + 3.536% | | | 45,267 | | | | 1,259,328 | |
| Reinsurance Group of America, 5.750%, VAR ICE LIBOR USD 3 Month + 4.040% | | | 36,202 | | | | 1,025,241 | |
| State Street, 5.900%, VAR ICE LIBOR USD 3 Month + 3.108% | | | 67,897 | | | | 1,816,245 | |
| State Street, 5.350%, VAR ICE LIBOR USD 3 Month + 3.709% | | | 45,268 | | | | 1,251,660 | |
| Synovus Financial, 5.875%, VAR US Treas Yield Curve Rate T Note Const Mat 5 Yr + 4.127% | | | 31,668 | | | | 840,152 | |
Two Harbors Investment, 7.250%, VAR ICE LIBOR USD 3 Month + 5.011%‡ | | | 26,686 | | | | 667,684 | |
| US Bancorp, 3.500%, VAR ICE LIBOR USD 3 Month + 1.020% | | | 1,301 | | | | 1,203,750 | |
| US Bancorp, 3.500%, VAR ICE LIBOR USD 3 Month + 0.600% | | | 90,535 | | | | 2,181,893 | |
| Schedule of Investments | | November 30, 2021 |
| | Global X Variable Rate Preferred ETF | |
| | | Shares | | | Value | |
| PREFERRED STOCK — continued | | | | | | |
| Financials — continued | | | | | | |
| Voya Financial, 5.350%, VAR US Treas Yield Curve Rate T Note Const Mat 5 Yr + 3.210% | | | 27,139 | | | $ | 765,863 | |
| Wells Fargo, 6.625%, VAR ICE LIBOR USD 3 Month + 3.690% | | | 76,051 | | | | 2,067,066 | |
| Wells Fargo, 5.850%, VAR ICE LIBOR USD 3 Month + 3.090% | | | 156,209 | | | | 4,089,552 | |
| Wintrust Financial, 6.875%, VAR US Treas Yield Curve Rate T Note Const Mat 5 Yr + 6.507% | | | 26,013 | | | | 724,982 | |
| | | | | | | | 72,722,672 | |
| Industrials — 2.8% | | | | | | | | |
| Air Lease, 6.150%, VAR ICE LIBOR USD 3 Month + 3.650% | | | 22,589 | | | | 589,121 | |
| Fortress Transportation and Infrastructure Investors, 8.250%, VAR US Treas Yield Curve Rate T Note Const Mat 5 Yr + 7.378% | | | 9,117 | | | | 234,125 | |
| Fortress Transportation and Infrastructure Investors, 8.250%, VAR ICE LIBOR USD 3 Month + 6.886% | | | 9,217 | | | | 230,886 | |
| WESCO International, 10.625%, VAR US Treas Yield Curve Rate T Note Const Mat 5 Yr + 10.325% | | | 48,917 | | | | 1,482,674 | |
| | | | | | | | 2,536,806 | |
| Utilities — 1.4% | | | | | | | | |
| NiSource, 6.500%, VAR US Treas Yield Curve Rate T Note Const Mat 5 Yr + 3.632% | | | 45,266 | | | | 1,218,561 | |
TOTAL UNITED STATES | | | | | | | 84,356,451 | |
| TOTAL PREFERRED STOCK | | | | | | | | |
(Cost $90,896,764) | | | | | | | 88,566,006 | |
| TOTAL INVESTMENTS — 99.3% | | | | | | | | |
(Cost $90,896,764) | | | | | | $ | 88,566,006 | |
Percentages are based on Net Assets of $89,217,369.
| Schedule of Investments | | November 30, 2021 |
| | Global X Variable Rate Preferred ETF | |
| ‡ | Real Estate Investment Trust |
ICE — Intercontinental Exchange
LIBOR — London Interbank Offered Rate
Ser — Series
VAR – Variable Rate
As of November 30, 2021, all of the Fund’s investments were considered Level 1, in accordance with authoritative guidance on fair value measurements and disclosure under U.S. GAAP.
For the year ended November 30, 2021, there have been no transfers in or out of Level 3.
| Schedule of Investments | | November 30, 2021 |
| | Global X MLP ETF | |
Sector Weightings (Unaudited)†:
† Sector weightings percentages are based on the total market value of investments.
| | | Shares | | | Value | |
| MASTER LIMITED PARTNERSHIPS — 96.0% | | | | | | |
| Energy — 96.0% | | | | | | |
BP Midstream Partners | | | 3,973,308 | | | $ | 51,136,474 | |
Cheniere Energy Partners | | | 1,224,639 | | | | 51,692,012 | |
Crestwood Equity Partners | | | 1,780,444 | | | | 45,508,149 | |
DCP Midstream | | | 1,704,690 | | | | 44,884,488 | |
Delek Logistics Partners | | | 695,236 | | | | 29,512,768 | |
Energy Transfer | | | 10,574,280 | | | | 89,035,438 | |
Enterprise Products Partners | | | 4,762,688 | | | | 101,873,896 | |
Genesis Energy | | | 4,283,966 | | | | 43,225,217 | |
Holly Energy Partners | | | 2,955,603 | | | | 49,535,906 | |
Magellan Midstream Partners | | | 1,768,539 | | | | 82,024,839 | |
MPLX | | | 2,470,578 | | | | 72,412,641 | |
NuStar Energy | | | 3,207,780 | | | | 44,908,920 | |
Oasis Midstream Partners | | | 1,226,427 | | | | 26,122,895 | |
PBF Logistics | | | 2,080,708 | | | | 23,574,422 | |
Phillips 66 Partners | | | 1,329,678 | | | | 45,794,110 | |
Plains All American Pipeline | | | 6,181,530 | | | | 57,488,229 | |
Shell Midstream Partners | | | 4,092,051 | | | | 46,649,381 | |
Western Midstream Partners | | | 2,468,894 | | | | 47,476,832 | |
Total Energy | | | | | | | 952,856,617 | |
| TOTAL MASTER LIMITED PARTNERSHIP | | | | | | | | |
(Cost $739,455,383) | | | | | | | 952,856,617 | |
| | | | | | | | | |
| COMMON STOCK — 4.1% | | | | | | | | |
| Energy — 4.1% | | | | | | | | |
EnLink Midstream | | | 3,057,707 | | | | 19,905,673 | |
| Schedule of Investments | | November 30, 2021 |
| | Global X MLP ETF | |
| | | Shares | | | Value | |
| COMMON STOCK — continued | | | | | | |
| Energy — continued | | | | | | |
Hess Midstream, Cl A | | | 864,249 | | | $ | 21,398,805 | |
Total Energy | | | | | | | 41,304,478 | |
| TOTAL COMMON STOCK | | | | | | | | |
(Cost $35,621,397) | | | | | | | 41,304,478 | |
| TOTAL INVESTMENTS — 100.1% | | | | | | | | |
(Cost $775,076,780) | | | | | | $ | 994,161,095 | |
Percentages are based on Net Assets of $992,935,482.
Cl — Class
As of November 30, 2021, all of the Fund’s investments were considered Level 1, in accordance with authoritative guidance on fair value measurements and disclosure under U.S. GAAP.
For the year ended November 30, 2021, there have been no transfers in or out of Level 3.
| Schedule of Investments | | November 30, 2021 |
| | Global X MLP & Energy Infrastructure ETF | |
Sector Weightings (Unaudited)†:
† Sector weightings percentages are based on the total market value of investments.
| | | Shares | | | Value | |
| COMMON STOCK — 76.2% | | | | | | |
| CANADA— 22.4% | | | | | | |
| Energy — 22.4% | | | | | | |
Enbridge | | | 1,768,586 | | | $ | 66,392,718 | |
Pembina Pipeline | | | 1,068,030 | | | | 31,667,090 | |
TC Energy | | | 1,442,796 | | | | 67,681,560 | |
Total Energy | | | | | | | 165,741,368 | |
TOTAL CANADA | | | | | | | 165,741,368 | |
| UNITED STATES— 53.8% | | | | | | | | |
| Energy — 53.8% | | | | | | | | |
Antero Midstream | | | 3,393,008 | | | | 32,946,108 | |
Archrock | | | 2,195,419 | | | | 16,224,147 | |
Cheniere Energy | | | 499,346 | | | | 52,336,454 | |
EnLink Midstream | | | 3,748,369 | | | | 24,401,882 | |
Equitrans Midstream | | | 3,428,861 | | | | 32,985,643 | |
Kinder Morgan | | | 3,769,509 | | | | 58,276,609 | |
ONEOK | | | 877,611 | | | | 52,516,242 | |
Plains GP Holdings, Cl A | | | 2,678,056 | | | | 26,780,560 | |
Targa Resources | | | 647,977 | | | | 33,455,053 | |
Williams | | | 2,499,322 | | | | 66,956,836 | |
Total Energy | | | | | | | 396,879,534 | |
TOTAL UNITED STATES | | | | | | | 396,879,534 | |
| TOTAL COMMON STOCK | | | | | | | | |
(Cost $505,932,531) | | | | | | | 562,620,902 | |
| Schedule of Investments | | November 30, 2021 |
| | Global X MLP & Energy Infrastructure ETF | |
| | | Shares | | | Value | |
MASTER LIMITED PARTNERSHIPS — 23.7% | | | | | | |
| UNITED STATES— 23.7% | | | | | | |
| Energy — 23.7% | | | | | | |
Cheniere Energy Partners | | | 123,075 | | | $ | 5,194,996 | |
DCP Midstream | | | 274,520 | | | | 7,228,112 | |
Enable Midstream Partners | | | 265,390 | | | | 1,894,885 | |
Energy Transfer | | | 3,845,733 | | | | 32,381,072 | |
Enterprise Products Partners | | | 1,558,807 | | | | 33,342,882 | |
Holly Energy Partners | | | 136,487 | | | | 2,287,522 | |
Magellan Midstream Partners | | | 649,278 | | | | 30,113,514 | |
MPLX | | | 922,526 | | | | 27,039,237 | |
Phillips 66 Partners | | | 177,169 | | | | 6,101,700 | |
Plains All American Pipeline | | | 1,391,177 | | | | 12,937,946 | |
Shell Midstream Partners | | | 374,178 | | | | 4,265,629 | |
Western Midstream Partners | | | 623,285 | | | | 11,985,770 | |
Total Energy | | | | | | | 174,773,265 | |
TOTAL UNITED STATES | | | | | | | 174,773,265 | |
| TOTAL MASTER LIMITED PARTNERSHIP | | | | | | | | |
(Cost $135,333,586) | | | | | | | 174,773,265 | |
| TOTAL INVESTMENTS — 99.9% | | | | | | | | |
(Cost $641,266,117) | | | | | | $ | 737,394,167 | |
Percentages are based on Net Assets of $738,092,211.
Cl — Class
As of November 30, 2021, all of the Fund’s investments were considered Level 1, in accordance with authoritative guidance on fair value measurements and disclosure under U.S. GAAP.
For the year ended November 30, 2021, there have been no transfers in or out of Level 3.
| Schedule of Investments | | November 30, 2021 |
| | Global X Conscious Companies ETF | |
Sector Weightings (Unaudited)†:
† Sector weightings percentages are based on the total market value of investments.
| | | Shares | | | Value | |
| COMMON STOCK — 99.8% | | | | | | |
| CANADA — 1.0% | | | | | | |
| Financials — 0.5% | | | | | | |
Toronto-Dominion Bank | | | 43,124 | | | $ | 3,107,515 | |
| | | | | | | | | |
| | | | | | | | | |
| Information Technology — 0.5% | | | | | | | | |
Shopify, Cl A * | | | 2,183 | | | | 3,322,068 | |
| | | | | | | | | |
| | | | | | | | | |
TOTAL CANADA | | | | | | | 6,429,583 | |
| UNITED STATES — 98.8% | | | | | | | | |
| Communication Services — 7.8% | | | | | | | | |
Alphabet, Cl A * | | | 7,579 | | | | 21,508,823 | |
AT&T | | | 122,178 | | | | 2,789,324 | |
Comcast, Cl A | | | 57,433 | | | | 2,870,501 | |
Meta Platforms, Cl A * | | | 20,397 | | | | 6,618,011 | |
Netflix * | | | 4,681 | | | | 3,004,734 | |
Omnicom Group | | | 43,884 | | | | 2,953,832 | |
Take-Two Interactive Software * | | | 17,232 | | | | 2,858,444 | |
T-Mobile US * | | | 26,643 | | | | 2,899,025 | |
| Schedule of Investments | | November 30, 2021 |
| | Global X Conscious Companies ETF | |
| | | Shares | | | Value | |
| COMMON STOCK — continued | | | | | | |
| Communication Services — continued | | | | | | |
Verizon Communications | | | 58,839 | | | $ | 2,957,837 | |
Walt Disney | | | 18,346 | | | | 2,658,335 | |
| | | | | | | | 51,118,866 | |
| | | | | | | | | |
| | | | | | | | | |
| Consumer Discretionary — 12.4% | | | | | | | | |
Amazon.com * | | | 5,461 | | | | 19,152,109 | |
AutoZone * | | | 1,700 | | | | 3,089,019 | |
Best Buy | | | 26,303 | | | | 2,810,739 | |
Booking Holdings * | | | 1,304 | | | | 2,740,812 | |
BorgWarner | | | 69,084 | | | | 2,989,956 | |
Choice Hotels International | | | 23,120 | | | | 3,318,876 | |
Darden Restaurants | | | 21,381 | | | | 2,949,509 | |
eBay | | | 38,631 | | | | 2,606,047 | |
Etsy * | | | 12,889 | | | | 3,539,062 | |
General Motors * | | | 53,802 | | | | 3,113,522 | |
Home Depot | | | 8,507 | | | | 3,407,989 | |
Lowe’s | | | 13,614 | | | | 3,329,848 | |
Lululemon Athletica * | | | 7,388 | | | | 3,357,181 | |
Marriott International, Cl A * | | | 20,088 | | | | 2,964,185 | |
NIKE, Cl B | | | 19,053 | | | | 3,224,530 | |
Shake Shack, Cl A * | | | 44,058 | | | | 3,215,793 | |
Starbucks | | | 27,189 | | | | 2,981,002 | |
Target | | | 12,145 | | | | 2,961,437 | |
Vail Resorts | | | 8,781 | | | | 2,912,746 | |
VF | | | 44,517 | | | | 3,193,204 | |
Whirlpool | | | 14,561 | | | | 3,170,512 | |
| | | | | | | | 81,028,078 | |
| | | | | | | | | |
| | | | | | | | | |
| Consumer Staples — 8.6% | | | | | | | | |
Campbell Soup | | | 76,518 | | | | 3,085,971 | |
Church & Dwight | | | 36,781 | | | | 3,287,486 | |
Clorox | | | 19,293 | | | | 3,141,865 | |
Coca-Cola | | | 57,198 | | | | 3,000,035 | |
Colgate-Palmolive | | | 41,251 | | | | 3,094,650 | |
| Schedule of Investments | | November 30, 2021 |
| | Global X Conscious Companies ETF | |
| | | Shares | | | Value | |
| COMMON STOCK — continued | | | | | | |
| Consumer Staples — continued | | | | | | |
Costco Wholesale | | | 6,544 | | | $ | 3,529,703 | |
Estee Lauder, Cl A | | | 9,758 | | | | 3,240,339 | |
General Mills | | | 49,683 | | | | 3,068,919 | |
Hershey | | | 17,105 | | | | 3,035,966 | |
Hormel Foods | | | 74,130 | | | | 3,068,982 | |
J M Smucker | | | 25,328 | | | | 3,203,232 | |
Kellogg | | | 50,129 | | | | 3,066,892 | |
Kimberly-Clark | | | 23,409 | | | | 3,050,427 | |
McCormick | | | 38,572 | | | | 3,310,249 | |
PepsiCo | | | 19,470 | | | | 3,110,917 | |
Procter & Gamble | | | 22,112 | | | | 3,196,953 | |
Sysco | | | 39,579 | | | | 2,772,113 | |
Walgreens Boots Alliance | | | 63,551 | | | | 2,847,085 | |
| | | | | | | | 56,111,784 | |
| | | | | | | | | |
| | | | | | | | | |
| Energy — 1.3% | | | | | | | | |
Chevron | | | 27,609 | | | | 3,116,228 | |
ConocoPhillips | | | 41,056 | | | | 2,879,257 | |
ONEOK | | | 47,964 | | | | 2,870,166 | |
| | | | | | | | 8,865,651 | |
| | | | | | | | | |
| | | | | | | | | |
| Financials — 8.9% | | | | | | | | |
Aflac | | | 55,080 | | | | 2,982,031 | |
Allstate | | | 24,327 | | | | 2,644,832 | |
American Express | | | 16,611 | | | | 2,529,855 | |
Bank of America | | | 65,466 | | | | 2,911,273 | |
BlackRock, Cl A | | | 3,400 | | | | 3,075,674 | |
Capital One Financial | | | 18,515 | | | | 2,601,913 | |
Citigroup | | | 43,634 | | | | 2,779,486 | |
CME Group, Cl A | | | 14,287 | | | | 3,150,569 | |
FactSet Research Systems | | | 7,230 | | | | 3,387,761 | |
| Hartford Financial Services Group | | | 41,949 | | | | 2,772,829 | |
JPMorgan Chase | | | 18,095 | | | | 2,874,029 | |
Moody’s | | | 8,381 | | | | 3,273,954 | |
| Schedule of Investments | | November 30, 2021 |
| | Global X Conscious Companies ETF | |
| | | Shares | | | Value | |
| COMMON STOCK — continued | | | | | | |
| Financials — continued | | | | | | |
Morgan Stanley | | | 30,533 | | | $ | 2,895,139 | |
Northern Trust | | | 24,809 | | | | 2,870,401 | |
PNC Financial Services Group | | | 14,384 | | | | 2,833,648 | |
Progressive | | | 32,565 | | | | 3,026,591 | |
Prudential Financial | | | 27,272 | | | | 2,788,835 | |
S&P Global | | | 6,909 | | | | 3,148,639 | |
T Rowe Price Group | | | 15,037 | | | | 3,006,648 | |
US Bancorp | | | 49,545 | | | | 2,741,820 | |
| | | | | | | | 58,295,927 | |
| | | | | | | | | |
| | | | | | | | | |
| Health Care — 13.5% | | | | | | | | |
Abbott Laboratories | | | 25,266 | | | | 3,177,705 | |
AbbVie | | | 28,531 | | | | 3,289,054 | |
Agilent Technologies | | | 19,678 | | | | 2,969,410 | |
Amgen | | | 14,924 | | | | 2,968,085 | |
Becton Dickinson | | | 12,600 | | | | 2,987,964 | |
Biogen * | | | 11,761 | | | | 2,772,538 | |
Boston Scientific * | | | 69,447 | | | | 2,643,847 | |
Bristol-Myers Squibb | | | 54,895 | | | | 2,944,019 | |
Cigna | | | 14,389 | | | | 2,761,249 | |
Edwards Lifesciences * | | | 26,658 | | | | 2,860,670 | |
Eli Lilly | | | 12,750 | | | | 3,162,510 | |
Gilead Sciences | | | 46,312 | | | | 3,192,286 | |
Humana | | | 6,818 | | | | 2,861,583 | |
IDEXX Laboratories * | | | 4,774 | | | | 2,902,926 | |
Illumina * | | | 7,613 | | | | 2,781,257 | |
Intuitive Surgical * | | | 9,123 | | | | 2,958,954 | |
IQVIA Holdings * | | | 12,100 | | | | 3,135,473 | |
Johnson & Johnson | | | 19,025 | | | | 2,966,568 | |
Merck | | | 38,377 | | | | 2,874,821 | |
Mettler-Toledo International * | | | 2,114 | | | | 3,200,871 | |
PerkinElmer | | | 17,657 | | | | 3,216,399 | |
Pfizer | | | 72,152 | | | | 3,876,727 | |
Quest Diagnostics | | | 21,261 | | | | 3,161,086 | |
| Schedule of Investments | | November 30, 2021 |
| | Global X Conscious Companies ETF | |
| | | Shares | | | Value | |
| COMMON STOCK — continued | | | | | | |
| Health Care — continued | | | | | | |
Regeneron Pharmaceuticals * | | | 5,444 | | | $ | 3,465,269 | |
Stryker | | | 11,297 | | | | 2,673,209 | |
Thermo Fisher Scientific | | | 5,093 | | | | 3,223,003 | |
Vertex Pharmaceuticals * | | | 16,973 | | | | 3,172,933 | |
Waters * | | | 8,526 | | | | 2,797,125 | |
Zoetis, Cl A | | | 14,913 | | | | 3,311,283 | |
| | | | | | | | 88,308,824 | |
| | | | | | | | | |
| | | | | | | | | |
| Industrials — 9.3% | | | | | | | | |
| 3M | | | 17,227 | | | | 2,929,279 | |
Caterpillar | | | 15,523 | | | | 3,001,372 | |
CH Robinson Worldwide | | | 31,237 | | | | 2,970,326 | |
Cummins | | | 12,919 | | | | 2,709,760 | |
Deere | | | 9,128 | | | | 3,154,089 | |
| Expeditors International of Washington | | | 25,315 | | | | 3,078,810 | |
FedEx | | | 13,370 | | | | 3,080,047 | |
Honeywell International | | | 14,323 | | | | 2,896,684 | |
Illinois Tool Works | | | 13,868 | | | | 3,219,456 | |
Owens Corning | | | 34,670 | | | | 2,941,403 | |
Republic Services, Cl A | | | 23,369 | | | | 3,090,784 | |
Rockwell Automation | | | 10,163 | | | | 3,416,801 | |
Southwest Airlines * | | | 65,383 | | | | 2,903,005 | |
Stanley Black & Decker | | | 16,553 | | | | 2,892,802 | |
Union Pacific | | | 13,111 | | | | 3,089,476 | |
United Parcel Service, Cl B | | | 15,284 | | | | 3,031,887 | |
Verisk Analytics, Cl A | | | 14,552 | | | | 3,272,308 | |
Waste Management | | | 18,943 | | | | 3,043,572 | |
WW Grainger | | | 7,129 | | | | 3,431,972 | |
Xylem | | | 24,142 | | | | 2,923,838 | |
| | | | | | | | 61,077,671 | |
| | | | | | | | | |
| | | | | | | | | |
| Information Technology — 30.1% | | | | | | | | |
Accenture, Cl A | | | 8,783 | | | | 3,139,044 | |
Adobe * | | | 4,835 | | | | 3,238,725 | |
| Schedule of Investments | | November 30, 2021 |
| | Global X Conscious Companies ETF | |
| | | Shares | | | Value | |
| COMMON STOCK — continued | | | | | | |
| Information Technology — continued | | | | | | |
Advanced Micro Devices * | | | 25,943 | | | $ | 4,108,593 | |
Akamai Technologies * | | | 28,857 | | | | 3,252,184 | |
Analog Devices | | | 17,455 | | | | 3,146,264 | |
Apple | | | 223,326 | | | | 36,915,788 | |
Applied Materials | | | 22,873 | | | | 3,366,677 | |
Arista Networks * | | | 31,844 | | | | 3,950,567 | |
Autodesk * | | | 10,092 | | | | 2,565,285 | |
Automatic Data Processing | | | 14,275 | | | | 3,295,955 | |
Block, Cl A * | | | 12,283 | | | | 2,558,917 | |
CDW | | | 16,262 | | | | 3,079,372 | |
Cisco Systems | | | 56,405 | | | | 3,093,250 | |
| Cognizant Technology Solutions, Cl A | | | 39,420 | | | | 3,073,972 | |
Dell Technologies, Cl C * | | | 27,190 | | | | 1,535,419 | |
F5 Networks * | | | 14,932 | | | | 3,398,225 | |
Fiserv * | | | 28,257 | | | | 2,727,366 | |
HubSpot * | | | 3,826 | | | | 3,087,238 | |
Intel | | | 62,963 | | | | 3,097,780 | |
Intuit | | | 5,265 | | | | 3,434,360 | |
Jack Henry & Associates | | | 17,871 | | | | 2,709,780 | |
Keysight Technologies * | | | 17,642 | | | | 3,431,016 | |
Lam Research | | | 5,585 | | | | 3,796,962 | |
Littelfuse | | | 10,556 | | | | 3,150,755 | |
Mastercard, Cl A | | | 8,678 | | | | 2,732,876 | |
Microsoft | | | 106,765 | | | | 35,295,441 | |
Motorola Solutions | | | 12,478 | | | | 3,159,180 | |
NVIDIA | | | 13,682 | | | | 4,470,730 | |
ON Semiconductor * | | | 67,624 | | | | 4,154,142 | |
Oracle | | | 31,639 | | | | 2,870,923 | |
Paychex | | | 25,164 | | | | 2,999,549 | |
Paycom Software * | | | 5,813 | | | | 2,543,071 | |
PayPal Holdings * | | | 12,958 | | | | 2,395,805 | |
salesforce.com * | | | 10,642 | | | | 3,032,544 | |
Synopsys * | | | 9,699 | | | | 3,307,359 | |
| Schedule of Investments | | November 30, 2021 |
| | Global X Conscious Companies ETF | |
| | | Shares | | | Value | |
| COMMON STOCK — continued | | | | | | |
| Information Technology — continued | | | | | | |
Texas Instruments | | | 15,763 | | | $ | 3,032,328 | |
Trimble * | | | 35,747 | | | | 3,069,595 | |
Tyler Technologies * | | | 5,901 | | | | 3,062,501 | |
Universal Display | | | 17,961 | | | | 2,569,321 | |
Visa, Cl A | | | 13,468 | | | | 2,609,694 | |
VMware, Cl A | | | 11,937 | | | | 1,393,525 | |
Workday, Cl A * | | | 11,075 | | | | 3,037,097 | |
Zendesk * | | | 23,027 | | | | 2,351,287 | |
| | | | | | | | 197,240,462 | |
| | | | | | | | | |
| | | | | | | | | |
| Materials — 2.3% | | | | | | | | |
Air Products & Chemicals | | | 10,690 | | | | 3,072,733 | |
Celanese, Cl A | | | 18,481 | | | | 2,797,284 | |
Ecolab | | | 14,062 | | | | 3,114,311 | |
| International Flavors & Fragrances | | | 21,433 | | | | 3,047,130 | |
Newmont | | | 54,050 | | | | 2,968,426 | |
| | | | | | | | 14,999,884 | |
| | | | | | | | | |
| | | | | | | | | |
| Real Estate — 2.3% | | | | | | | | |
American Tower, Cl A ‡ | | | 10,953 | | | | 2,874,943 | |
CBRE Group, Cl A * | | | 29,913 | | | | 2,858,785 | |
Equinix ‡ | | | 3,794 | | | | 3,081,487 | |
Jones Lang LaSalle * | | | 11,812 | | | | 2,774,757 | |
ProLogis ‡ | | | 21,628 | | | | 3,260,421 | |
| | | | | | | | 14,850,393 | |
| | | | | | | | | |
| | | | | | | | | |
| Utilities — 2.3% | | | | | | | | |
American Water Works | | | 17,714 | | | | 2,986,049 | |
Duke Energy | | | 30,006 | | | | 2,910,882 | |
Exelon | | | 60,701 | | | | 3,200,764 | |
NextEra Energy | | | 36,895 | | | | 3,201,748 | |
WEC Energy Group | | | 33,974 | | | | 2,953,360 | |
| | | | | | | | 15,252,803 | |
| | | | | | | | | |
| Schedule of Investments | | November 30, 2021 |
| | Global X Conscious Companies ETF | |
| | | Value | |
| COMMON STOCK — continued | | | |
TOTAL UNITED STATES | | $ | 647,150,343 | |
| TOTAL COMMON STOCK | | | | |
(Cost $568,031,028) | | | 653,579,926 | |
| TOTAL INVESTMENTS — 99.8% | | | | |
(Cost $568,031,028) | | $ | 653,579,926 | |
Percentages are based on Net Assets of $654,764,467.
| * | Non-income producing security. |
| ‡ | Real Estate Investment Trust |
Cl — Class
S&P — Standard & Poor’s
As of November 30, 2021, all of the Fund’s investments were considered Level 1, in accordance with authoritative guidance on fair value measurements and disclosure under U.S. GAAP.
For the year ended November 30, 2021, there have been no transfers in or out of Level 3.
| Schedule of Investments | | November 30, 2021 |
| | Global X Adaptive U.S. Factor ETF | |
Sector Weightings (Unaudited)†:
† Sector weightings percentages are based on the total market value of investments.
| | | Shares | | | Value | |
| COMMON STOCK — 99.8% | | | | | | |
| Communication Services — 8.6% | | | | | | |
AT&T | | | 97,212 | | | $ | 2,219,350 | |
Charter Communications, Cl A * | | | 2,874 | | | | 1,857,409 | |
Discovery, Cl A * | | | 11,481 | | | | 267,163 | |
DISH Network, Cl A * | | | 2,958 | | | | 92,437 | |
Electronic Arts | | | 8,313 | | | | 1,032,641 | |
Frontier Communications Parent * | | | 30,148 | | | | 1,007,245 | |
Liberty Broadband, Cl C * | | | 5,027 | | | | 778,431 | |
Loyalty Ventures * | | | 3,548 | | | | 101,828 | |
Lumen Technologies | | | 69,678 | | | | 859,827 | |
Nexstar Media Group, Cl A | | | 5,882 | | | | 879,359 | |
Omnicom Group | | | 1,756 | | | | 118,196 | |
TEGNA | | | 43,058 | | | | 850,395 | |
T-Mobile US * | | | 7,245 | | | | 788,328 | |
Verizon Communications | | | 50,074 | | | | 2,517,220 | |
ViacomCBS, Cl B | | | 22,730 | | | | 703,493 | |
Walt Disney | | | 5,181 | | | | 750,727 | |
Total Communication Services | | | | | | | 14,824,049 | |
| | | | | | | | | |
| Schedule of Investments | | November 30, 2021 |
| | Global X Adaptive U.S. Factor ETF | |
| | | Shares | | | Value | |
| COMMON STOCK — continued | | | | | | |
| Consumer Discretionary — 8.0% | | | | | | |
AutoZone * | | | 499 | | | $ | 906,718 | |
Dick’s Sporting Goods | | | 1,163 | | | | 136,722 | |
Dollar General | | | 4,106 | | | | 908,658 | |
Domino’s Pizza | | | 1,927 | | | | 1,010,018 | |
eBay | | | 2,183 | | | | 147,265 | |
Foot Locker | | | 18,560 | | | | 847,078 | |
Garmin | | | 21,986 | | | | 2,936,010 | |
H&R Block | | | 36,853 | | | | 872,679 | |
Kohl’s | | | 4,305 | | | | 220,545 | |
Lennar, Cl A | | | 1,632 | | | | 171,442 | |
McDonald’s | | | 11,192 | | | | 2,737,563 | |
Newell Brands | | | 7,600 | | | | 163,172 | |
O’Reilly Automotive * | | | 1,371 | | | | 874,917 | |
Starbucks | | | 7,759 | | | | 850,697 | |
Whirlpool | | | 756 | | | | 164,612 | |
Yum! Brands | | | 7,019 | | | | 862,214 | |
Total Consumer Discretionary | | | | | | | 13,810,310 | |
| Consumer Staples — 11.6% | | | | | | | | |
Archer-Daniels-Midland | | | 2,166 | | | | 134,747 | |
Bunge | | | 10,089 | | | | 873,405 | |
Church & Dwight | | | 10,571 | | | | 944,836 | |
Clorox | | | 5,486 | | | | 893,395 | |
Coca-Cola | | | 29,458 | | | | 1,545,072 | |
Costco Wholesale | | | 2,163 | | | | 1,166,679 | |
Flowers Foods | | | 94,961 | | | | 2,451,893 | |
Hershey | | | 4,903 | | | | 870,233 | |
Hormel Foods | | | 21,099 | | | | 873,499 | |
J M Smucker | | | 1,079 | | | | 136,461 | |
Kraft Heinz | | | 23,932 | | | | 804,355 | |
Kroger | | | 64,257 | | | | 2,668,593 | |
Mondelez International, Cl A | | | 14,655 | | | | 863,766 | |
PepsiCo | | | 7,783 | | | | 1,243,568 | |
| Schedule of Investments | | November 30, 2021 |
| | Global X Adaptive U.S. Factor ETF | |
| | | Shares | | | Value | |
| COMMON STOCK — continued | | | | | | |
| Consumer Staples — continued | | | | | | |
Procter & Gamble | | | 6,257 | | | $ | 904,637 | |
Tyson Foods, Cl A | | | 1,620 | | | | 127,915 | |
Walgreens Boots Alliance | | | 18,208 | | | | 815,718 | |
Walmart | | | 18,256 | | | | 2,567,341 | |
Total Consumer Staples | | | | | | | 19,886,113 | |
| Energy — 1.9% | | | | | | | | |
Baker Hughes, Cl A | | | 6,234 | | | | 145,502 | |
Chevron | | | 2,414 | | | | 272,468 | |
DT Midstream | | | 15,921 | | | | 730,296 | |
HollyFrontier | | | 23,628 | | | | 763,657 | |
Kinder Morgan | | | 47,605 | | | | 735,973 | |
Marathon Petroleum | | | 2,728 | | | | 165,999 | |
ONEOK | | | 2,975 | | | | 178,024 | |
Williams | | | 9,076 | | | | 243,146 | |
Total Energy | | | | | | | 3,235,065 | |
| Financials — 16.0% | | | | | | | | |
Aflac | | | 4,375 | | | | 236,862 | |
AGNC Investment ‡ | | | 161,813 | | | | 2,474,121 | |
Allstate | | | 6,884 | | | | 748,428 | |
American Financial Group | | | 6,490 | | | | 867,129 | |
Annaly Capital Management ‡ | | | 101,207 | | | | 819,777 | |
Aon, Cl A | | | 2,815 | | | | 832,593 | |
Arthur J Gallagher | | | 16,519 | | | | 2,690,945 | |
Berkshire Hathaway, Cl B * | | | 5,294 | | | | 1,464,797 | |
Blackstone Mortgage Trust, Cl A ‡ | | | 28,027 | | | | 840,810 | |
CIT Group | | | 16,807 | | | | 824,551 | |
Citigroup | | | 12,640 | | | | 805,168 | |
Citizens Financial Group | | | 5,713 | | | | 270,053 | |
Comerica | | | 1,514 | | | | 124,950 | |
Erie Indemnity, Cl A | | | 4,447 | | | | 826,297 | |
Everest Re Group | | | 566 | | | | 145,111 | |
Fidelity National Financial | | | 2,818 | | | | 137,828 | |
| Schedule of Investments | | November 30, 2021 |
| | Global X Adaptive U.S. Factor ETF | |
| | | Shares | | | Value | |
| COMMON STOCK — continued | | | | | | |
| Financials — continued | | | | | | |
First Horizon | | | 10,704 | | | $ | 172,656 | |
Intercontinental Exchange | | | 6,786 | | | | 887,066 | |
Invesco | | | 6,872 | | | | 153,452 | |
Jefferies Financial Group | | | 6,894 | | | | 259,077 | |
KeyCorp | | | 5,537 | | | | 124,250 | |
Lincoln National | | | 1,738 | | | | 115,282 | |
Marsh & McLennan | | | 16,172 | | | | 2,652,531 | |
Morningstar | | | 3,105 | | | | 963,575 | |
Nasdaq | | | 4,437 | | | | 901,732 | |
New Residential Investment ‡ | | | 77,305 | | | | 821,752 | |
| New York Community Bancorp | | | 62,652 | | | | 750,571 | |
Old Republic International | | | 35,305 | | | | 845,908 | |
People’s United Financial | | | 16,400 | | | | 279,456 | |
Principal Financial Group | | | 2,115 | | | | 145,047 | |
Progressive | | | 9,350 | | | | 868,989 | |
Prudential Financial | | | 7,750 | | | | 792,515 | |
Radian Group | | | 6,438 | | | | 131,142 | |
Regions Financial | | | 5,595 | | | | 127,286 | |
| Reinsurance Group of America, Cl A | | | 1,091 | | | | 103,547 | |
Starwood Property Trust ‡ | | | 5,367 | | | | 133,960 | |
Umpqua Holdings | | | 8,212 | | | | 156,521 | |
United Bankshares | | | 5,019 | | | | 179,329 | |
Unum Group | | | 30,793 | | | | 711,318 | |
Valley National Bancorp | | | 9,493 | | | | 127,586 | |
W R Berkley | | | 11,259 | | | | 862,890 | |
Zions Bancorp | | | 2,017 | | | | 127,232 | |
Total Financials | | | | | | | 27,504,090 | |
| Health Care — 16.3% | | | | | | | | |
Baxter International | | | 10,875 | | | | 810,949 | |
Bio-Rad Laboratories, Cl A * | | | 627 | | | | 472,256 | |
Bristol-Myers Squibb | | | 15,216 | | | | 816,034 | |
Cerner | | | 49,563 | | | | 3,491,713 | |
| Schedule of Investments | | November 30, 2021 |
| | Global X Adaptive U.S. Factor ETF | |
| | | Shares | | | Value | |
| COMMON STOCK — continued | | | | | | |
| Health Care — continued | | | | | | |
Change Healthcare * | | | 168,815 | | | $ | 3,423,568 | |
Cigna | | | 1,107 | | | | 212,433 | |
Cooper | | | 342 | | | | 128,753 | |
CVS Health | | | 3,469 | | | | 308,949 | |
Danaher | | | 2,806 | | | | 902,522 | |
Eli Lilly | | | 3,626 | | | | 899,393 | |
Gilead Sciences | | | 13,215 | | | | 910,910 | |
Johnson & Johnson | | | 15,423 | | | | 2,404,908 | |
Medtronic | | | 7,255 | | | | 774,109 | |
Merck | | | 17,916 | | | | 1,342,088 | |
Organon | | | 3,674 | | | | 107,391 | |
Pfizer | | | 62,645 | | | | 3,365,916 | |
PPD * | | | 18,812 | | | | 886,045 | |
Premier, Cl A | | | 67,008 | | | | 2,483,987 | |
QIAGEN * | | | 44,656 | | | | 2,461,885 | |
Quest Diagnostics | | | 6,016 | | | | 894,459 | |
| Universal Health Services, Cl B | | | 1,049 | | | | 124,548 | |
Waters * | | | 2,482 | | | | 814,270 | |
Total Health Care | | | | | | | 28,037,086 | |
| Industrials — 7.9% | | | | | | | | |
AMERCO | | | 1,213 | | | | 854,631 | |
CACI International, Cl A * | | | 3,130 | | | | 812,016 | |
FTI Consulting * | | | 6,128 | | | | 895,240 | |
General Dynamics | | | 631 | | | | 119,240 | |
Huntington Ingalls Industries | | | 788 | | | | 139,878 | |
L3Harris Technologies | | | 3,633 | | | | 759,588 | |
Landstar System | | | 780 | | | | 131,469 | |
Lockheed Martin | | | 7,088 | | | | 2,362,572 | |
ManpowerGroup | | | 2,457 | | | | 220,221 | |
Northrop Grumman | | | 2,203 | | | | 768,406 | |
nVent Electric | | | 4,009 | | | | 139,634 | |
PACCAR | | | 1,617 | | | | 134,890 | |
| Schedule of Investments | | November 30, 2021 |
| | Global X Adaptive U.S. Factor ETF | |
| | | Shares | | | Value | |
| COMMON STOCK — continued | | | | | | |
| Industrials — continued | | | | | | |
Raytheon Technologies | | | 1,434 | | | $ | 116,039 | |
Republic Services, Cl A | | | 25,642 | | | | 3,391,411 | |
Waste Management | | | 16,721 | | | | 2,686,563 | |
Total Industrials | | | | | | | 13,531,798 | |
| Information Technology — 13.3% | | | | | | | | |
Accenture, Cl A | | | 2,556 | | | | 913,514 | |
Akamai Technologies * | | | 8,175 | | | | 921,322 | |
Alliance Data Systems | | | 8,931 | | | | 608,737 | |
Amdocs | | | 44,123 | | | | 3,080,668 | |
Automatic Data Processing | | | 4,148 | | | | 957,732 | |
Black Knight * | | | 12,458 | | | | 890,373 | |
Cisco Systems | | | 47,750 | | | | 2,618,610 | |
Cognex | | | 3,278 | | | | 253,226 | |
Hewlett Packard Enterprise | | | 57,040 | | | | 818,524 | |
HP | | | 4,607 | | | | 162,535 | |
Intel | | | 5,739 | | | | 282,359 | |
| International Business Machines | | | 2,423 | | | | 283,733 | |
Jack Henry & Associates | | | 13,603 | | | | 2,062,623 | |
Juniper Networks | | | 6,429 | | | | 200,135 | |
Kyndryl Holdings * | | | 480 | | | | 7,584 | |
Motorola Solutions | | | 3,586 | | | | 907,903 | |
NortonLifeLock | | | 136,508 | | | | 3,392,224 | |
Oracle | | | 9,143 | | | | 829,636 | |
Paychex | | | 7,249 | | | | 864,081 | |
Seagate Technology Holdings | | | 1,636 | | | | 167,968 | |
Tyler Technologies * | | | 5,216 | | | | 2,707,000 | |
Total Information Technology | | | | | | | 22,930,487 | |
| Materials — 3.1% | | | | | | | | |
Air Products & Chemicals | | | 3,009 | | | | 864,907 | |
AptarGroup | | | 6,894 | | | | 824,453 | |
Corteva | | | 2,976 | | | | 133,920 | |
Dow | | | 4,972 | | | | 273,112 | |
| Schedule of Investments | | November 30, 2021 |
| | Global X Adaptive U.S. Factor ETF | |
| | | Shares | | | Value | |
| COMMON STOCK — continued | | | | | | |
| Materials — continued | | | | | | |
DuPont de Nemours | | | 12,062 | | | $ | 892,106 | |
Huntsman | | | 3,995 | | | | 126,602 | |
International Paper | | | 2,458 | | | | 111,888 | |
| LyondellBasell Industries, Cl A | | | 9,140 | | | | 796,368 | |
Mosaic | | | 3,089 | | | | 105,706 | |
Sonoco Products | | | 14,350 | | | | 834,165 | |
Steel Dynamics | | | 2,018 | | | | 120,676 | |
United States Steel | | | 10,582 | | | | 239,259 | |
Total Materials | | | | | | | 5,323,162 | |
| Real Estate — 7.4% | | | | | | | | |
Alexandria Real Estate Equities ‡ | | | 4,295 | | | | 859,301 | |
Camden Property Trust ‡ | | | 5,593 | | | | 924,020 | |
CoreSite Realty ‡ | | | 6,038 | | | | 1,032,800 | |
CubeSmart ‡ | | | 16,755 | | | | 903,430 | |
Digital Realty Trust ‡ | | | 5,769 | | | | 967,692 | |
Equity LifeStyle Properties ‡ | | | 10,269 | | | | 834,870 | |
Essex Property Trust ‡ | | | 2,651 | | | | 899,855 | |
Extra Space Storage ‡ | | | 4,777 | | | | 955,400 | |
Life Storage ‡ | | | 6,979 | | | | 922,205 | |
Mid-America Apartment Communities ‡ | | | 4,425 | | | | 912,656 | |
Public Storage ‡ | | | 6,206 | | | | 2,031,720 | |
SL Green Realty ‡ | | | 6,873 | | | | 477,192 | |
Sun Communities ‡ | | | 5,487 | | | | 1,034,738 | |
Total Real Estate | | | | | | | 12,755,879 | |
| Utilities — 5.7% | | | | | | | | |
Alliant Energy | | | 15,653 | | | | 857,628 | |
Ameren | | | 10,475 | | | | 854,655 | |
American Electric Power | | | 10,408 | | | | 843,569 | |
Consolidated Edison | | | 11,702 | | | | 908,543 | |
Duke Energy | | | 12,108 | | | | 1,174,597 | |
Hawaiian Electric Industries | | | 21,076 | | | | 800,677 | |
National Fuel Gas | | | 15,109 | | | | 873,451 | |
| Schedule of Investments | | November 30, 2021 |
| | Global X Adaptive U.S. Factor ETF | |
| | | Shares | | | Value | |
| COMMON STOCK — continued | | | | | | |
| Utilities — continued | | | | | | |
PNM Resources | | | 53,868 | | | $ | 2,652,461 | |
Southern | | | 13,869 | | | | 847,396 | |
Total Utilities | | | | | | | 9,812,977 | |
| TOTAL COMMON STOCK | | | | | | | | |
(Cost $162,752,575) | | | | | | | 171,651,016 | |
| TOTAL INVESTMENTS — 99.8% | | | | | | | | |
(Cost $162,752,575) | | | | | | $ | 171,651,016 | |
Percentages are based on Net Assets of $172,007,504.
| * | Non-income producing security. |
| ‡ | Real Estate Investment Trust |
Cl — Class
As of November 30, 2021, all of the Fund’s investments were considered Level 1, in accordance with authoritative guidance on fair value measurements and disclosure under U.S. GAAP.
For the year ended November 30, 2021, there have been no transfers in or out of Level 3.
| Schedule of Investments | | November 30, 2021 |
| | Global X Adaptive U.S. Risk Management ETF | |
Sector Weightings (Unaudited)†:
† Sector weightings percentages are based on the total market value of investments.
| | | Shares | | | Value | |
| COMMON STOCK — 99.8% | | | | | | |
| ARGENTINA— 0.1% | | | | | | |
| Consumer Discretionary — 0.1% | | | | | | |
MercadoLibre * | | | 115 | | | $ | 136,667 | |
| CHINA— 0.1% | | | | | | | | |
| Consumer Discretionary — 0.1% | | | | | | | | |
Yum China Holdings | | | 1,284 | | | | 64,328 | |
| KOREA— 0.0% | | | | | | | | |
| Consumer Discretionary — 0.0% | | | | | | | | |
Coupang, Cl A * | | | 1,594 | | | | 42,241 | |
| PERU— 0.0% | | | | | | | | |
| Materials — 0.0% | | | | | | | | |
Southern Copper | | | 278 | | | | 16,263 | |
| UNITED KINGDOM— 0.4% | | | | | | | | |
| Materials — 0.4% | | | | | | | | |
Linde | | | 1,319 | | | | 419,628 | |
| | | | | | | | | |
| | | | | | | | | |
| Schedule of Investments | | November 30, 2021 |
| | Global X Adaptive U.S. Risk Management ETF | |
| | | Shares | | | Value | |
| COMMON STOCK — continued | | | | | | |
| UNITED STATES— 99.2% | | | | | | |
| Communication Services — 10.4% | | | | | | |
Activision Blizzard | | | 1,885 | | | $ | 110,461 | |
Alphabet, Cl A * | | | 775 | | | | 2,199,412 | |
Alphabet, Cl C * | | | 723 | | | | 2,059,857 | |
AMC Entertainment Holdings, Cl A * | | | 1,512 | | | | 51,317 | |
AT&T | | | 18,344 | | | | 418,794 | |
Charter Communications, Cl A * | | | 301 | | | | 194,530 | |
Comcast, Cl A | | | 11,764 | | | | 587,964 | |
Discovery, Cl C * | | | 1,414 | | | | 32,112 | |
Discovery, Cl A * | | | 707 | | | | 16,452 | |
DISH Network, Cl A * | | | 742 | | | | 23,188 | |
Electronic Arts | | | 823 | | | | 102,233 | |
Fox, Cl B | | | 175 | | | | 5,880 | |
Fox, Cl A | | | 915 | | | | 32,675 | |
Liberty Broadband, Cl C * | | | 322 | | | | 49,862 | |
Liberty Broadband, Cl A * | | | 59 | | | | 8,943 | |
Live Nation Entertainment * | | | 392 | | | | 41,807 | |
Match Group * | | | 752 | | | | 97,752 | |
Meta Platforms, Cl A * | | | 6,198 | | | | 2,011,003 | |
Netflix * | | | 1,126 | | | | 722,779 | |
Omnicom Group | | | 656 | | | | 44,155 | |
Pinterest, Cl A * | | | 1,449 | | | | 58,047 | |
ROBLOX, Cl A * | | | 790 | | | | 99,619 | |
Roku, Cl A * | | | 333 | | | | 75,794 | |
Sirius XM Holdings | | | 3,716 | | | | 22,668 | |
Snap, Cl A * | | | 3,276 | | | | 155,970 | |
Spotify Technology * | | | 349 | | | | 83,237 | |
Take-Two Interactive Software * | | | 347 | | | | 57,560 | |
T-Mobile US * | | | 1,461 | | | | 158,971 | |
Twitter * | | | 2,292 | | | | 100,710 | |
Verizon Communications | | | 10,270 | | | | 516,272 | |
ViacomCBS, Cl A | | | 5 | | | | 167 | |
ViacomCBS, Cl B | | | 1,651 | | | | 51,098 | |
| Schedule of Investments | | November 30, 2021 |
| | Global X Adaptive U.S. Risk Management ETF | |
| | | Shares | | | Value | |
| COMMON STOCK — continued | | | | | | |
| Communication Services — continued | | | | | | |
Walt Disney | | | 4,713 | | | $ | 682,914 | |
Warner Music Group, Cl A | | | 84 | | | | 3,640 | |
ZoomInfo Technologies, Cl A * | | | 468 | | | | 28,876 | |
Total Communication Services | | | | | | | 10,906,719 | |
| Consumer Discretionary — 12.9% | | | | | | | | |
Airbnb, Cl A * | | | 731 | | | | 126,127 | |
Amazon.com * | | | 1,143 | | | | 4,008,580 | |
Aptiv * | | | 786 | | | | 126,035 | |
AutoZone * | | | 50 | | | | 90,854 | |
Bath & Body Works | | | 718 | | | | 53,943 | |
Best Buy | | | 636 | | | | 67,963 | |
Booking Holdings * | | | 101 | | | | 212,287 | |
Burlington Stores * | | | 155 | | | | 45,435 | |
Caesars Entertainment * | | | 609 | | | | 54,853 | |
CarMax * | | | 459 | | | | 64,834 | |
Carnival * | | | 2,455 | | | | 43,257 | |
Carvana, Cl A * | | | 266 | | | | 74,592 | |
Chewy, Cl A * | | | 268 | | | | 18,294 | |
Chipotle Mexican Grill, Cl A * | | | 65 | | | | 106,822 | |
Darden Restaurants | | | 371 | | | | 51,179 | |
Dollar General | | | 572 | | | | 126,584 | |
Dollar Tree * | | | 694 | | | | 92,878 | |
Domino’s Pizza | | | 90 | | | | 47,173 | |
DoorDash, Cl A * | | | 381 | | | | 68,111 | |
DR Horton | | | 907 | | | | 88,613 | |
DraftKings, Cl A * | | | 796 | | | | 27,502 | |
eBay | | | 1,805 | | | | 121,765 | |
Etsy * | | | 374 | | | | 102,693 | |
Expedia Group * | | | 470 | | | | 75,712 | |
Ford Motor | | | 9,777 | | | | 187,621 | |
Garmin | | | 359 | | | | 47,941 | |
| | | | | | | | | |
| Schedule of Investments | | November 30, 2021 |
| | Global X Adaptive U.S. Risk Management ETF | |
| | | Shares | | | Value | |
| COMMON STOCK — continued | | | | | | |
| Consumer Discretionary — continued | | | | | | |
General Motors * | | | 3,303 | | | $ | 191,145 | |
Genuine Parts | | | 418 | | | | 53,395 | |
Hilton Worldwide Holdings * | | | 798 | | | | 107,786 | |
Home Depot | | | 2,743 | | | | 1,098,872 | |
Las Vegas Sands * | | | 1,195 | | | | 42,566 | |
Lennar, Cl B | | | 38 | | | | 3,260 | |
Lennar, Cl A | | | 796 | | | | 83,620 | |
Lowe’s | | | 1,768 | | | | 432,434 | |
Lucid Group * | | | 1,135 | | | | 60,132 | |
Lululemon Athletica * | | | 294 | | | | 133,597 | |
Marriott International, Cl A * | | | 775 | | | | 114,359 | |
McDonald’s | | | 1,925 | | | | 470,855 | |
MGM Resorts International | | | 1,116 | | | | 44,171 | |
NIKE, Cl B | | | 3,252 | | | | 550,368 | |
NVR * | | | 8 | | | | 41,803 | |
O’Reilly Automotive * | | | 168 | | | | 107,211 | |
Peloton Interactive, Cl A * | | | 647 | | | | 28,468 | |
Ross Stores | | | 840 | | | | 91,636 | |
Royal Caribbean Cruises * | | | 663 | | | | 46,291 | |
Starbucks | | | 3,007 | | | | 329,687 | |
Target | | | 1,244 | | | | 303,337 | |
Tesla * | | | 2,127 | | | | 2,434,904 | |
TJX | | | 2,784 | | | | 193,210 | |
Tractor Supply | | | 347 | | | | 78,190 | |
Ulta Beauty * | | | 126 | | | | 48,378 | |
VF | | | 963 | | | | 69,076 | |
Wayfair, Cl A * | | | 252 | | | | 62,456 | |
Yum! Brands | | | 854 | | | | 104,905 | |
Total Consumer Discretionary | | | | | | | 13,457,760 | |
| Consumer Staples — 5.4% | | | | | | | | |
Altria Group | | | 4,629 | | | | 197,381 | |
Archer-Daniels-Midland | | | 1,624 | | | | 101,029 | |
| Schedule of Investments | | November 30, 2021 |
| | Global X Adaptive U.S. Risk Management ETF | |
| | | Shares | | | Value | |
| COMMON STOCK — continued | | | | | | |
| Consumer Staples — continued | | | | | | |
Brown-Forman, Cl B | | | 865 | | | $ | 60,861 | |
Brown-Forman, Cl A | | | 46 | | | | 3,021 | |
Church & Dwight | | | 730 | | | | 65,247 | |
Clorox | | | 369 | | | | 60,092 | |
Coca-Cola | | | 9,986 | | | | 523,766 | |
Colgate-Palmolive | | | 2,082 | | | | 156,192 | |
Conagra Brands | | | 1,415 | | | | 43,228 | |
Constellation Brands, Cl A | | | 445 | | | | 100,272 | |
Costco Wholesale | | | 1,135 | | | | 612,196 | |
Estee Lauder, Cl A | | | 545 | | | | 180,978 | |
General Mills | | | 1,811 | | | | 111,865 | |
Hershey | | | 383 | | | | 67,979 | |
Hormel Foods | | | 812 | | | | 33,617 | |
Kellogg | | | 850 | | | | 52,003 | |
Keurig Dr Pepper | | | 2,140 | | | | 72,739 | |
Kimberly-Clark | | | 815 | | | | 106,203 | |
Kraft Heinz | | | 1,484 | | | | 49,877 | |
Kroger | | | 1,795 | | | | 74,546 | |
McCormick | | | 735 | | | | 63,078 | |
Mondelez International, Cl A | | | 3,477 | | | | 204,934 | |
Monster Beverage * | | | 1,128 | | | | 94,504 | |
PepsiCo | | | 3,561 | | | | 568,976 | |
Philip Morris International | | | 3,985 | | | | 342,470 | |
Procter & Gamble | | | 6,252 | | | | 903,914 | |
Sysco | | | 1,439 | | | | 100,788 | |
Tyson Foods, Cl A | | | 807 | | | | 63,721 | |
Walgreens Boots Alliance | | | 2,167 | | | | 97,082 | |
Walmart | | | 3,760 | | | | 528,769 | |
Total Consumer Staples | | | | | | | 5,641,328 | |
| Energy — 2.6% | | | | | | | | |
Baker Hughes, Cl A | | | 2,085 | | | | 48,664 | |
Cheniere Energy | | | 760 | | | | 79,656 | |
| Schedule of Investments | | November 30, 2021 |
| | Global X Adaptive U.S. Risk Management ETF | |
| | | Shares | | | Value | |
| COMMON STOCK — continued | | | | | | |
| Energy — continued | | | | | | |
Chevron | | | 4,927 | | | $ | 556,110 | |
ConocoPhillips | | | 3,381 | | | | 237,110 | |
Devon Energy | | | 1,541 | | | | 64,814 | |
EOG Resources | | | 1,423 | | | | 123,801 | |
Exxon Mobil | | | 10,928 | | | | 653,931 | |
Halliburton | | | 2,403 | | | | 51,881 | |
Hess | | | 861 | | | | 64,162 | |
Kinder Morgan | | | 4,658 | | | | 72,013 | |
Marathon Petroleum | | | 1,518 | | | | 92,370 | |
Occidental Petroleum | | | 2,594 | | | | 76,912 | |
ONEOK | | | 1,227 | | | | 73,424 | |
Phillips 66 | | | 1,258 | | | | 87,016 | |
Pioneer Natural Resources | | | 528 | | | | 94,153 | |
Schlumberger | | | 4,109 | | | | 117,846 | |
Valero Energy | | | 1,189 | | | | 79,592 | |
Williams | | | 3,717 | | | | 99,578 | |
Total Energy | | | | | | | 2,673,033 | |
| Financials — 10.4% | | | | | | | | |
Aflac | | | 1,448 | | | | 78,395 | |
Allstate | | | 774 | | | | 84,149 | |
American Express | | | 1,499 | | | | 228,297 | |
| American International Group | | | 2,479 | | | | 130,395 | |
Ameriprise Financial | | | 269 | | | | 77,902 | |
Aon, Cl A | | | 538 | | | | 159,124 | |
| Apollo Global Management, Cl A | | | 724 | | | | 51,245 | |
Arch Capital Group * | | | 1,191 | | | | 48,093 | |
Ares Management, Cl A | | | 256 | | | | 20,777 | |
Arthur J Gallagher | | | 484 | | | | 78,844 | |
Bank of America | | | 19,187 | | | | 853,246 | |
Bank of New York Mellon | | | 2,154 | | | | 118,018 | |
Berkshire Hathaway, Cl B * | | | 3,322 | | | | 919,164 | |
BlackRock, Cl A | | | 359 | | | | 324,755 | |
| Schedule of Investments | | November 30, 2021 |
| | Global X Adaptive U.S. Risk Management ETF | |
| | | Shares | | | Value | |
| COMMON STOCK — continued | | | | | | |
| Financials — continued | | | | | | |
Blackstone, Cl A | | | 1,731 | | | $ | 244,850 | |
Brown & Brown | | | 718 | | | | 46,246 | |
Capital One Financial | | | 1,218 | | | | 171,166 | |
Charles Schwab | | | 3,836 | | | | 296,868 | |
Chubb | | | 923 | | | | 165,651 | |
Cincinnati Financial | | | 392 | | | | 44,649 | |
Citigroup | | | 5,168 | | | | 329,202 | |
Citizens Financial Group | | | 1,228 | | | | 58,048 | |
CME Group, Cl A | | | 885 | | | | 195,160 | |
Coinbase Global, Cl A * | | | 311 | | | | 97,965 | |
Discover Financial Services | | | 860 | | | | 92,751 | |
Fifth Third Bancorp | | | 1,950 | | | | 82,193 | |
First Republic Bank | | | 488 | | | | 102,314 | |
Franklin Resources | | | 780 | | | | 25,272 | |
Goldman Sachs Group | | | 862 | | | | 328,413 | |
| Hartford Financial Services Group | | | 1,077 | | | | 71,190 | |
Huntington Bancshares | | | 4,373 | | | | 64,895 | |
| Interactive Brokers Group, Cl A | | | 268 | | | | 19,784 | |
Intercontinental Exchange | | | 1,548 | | | | 202,355 | |
JPMorgan Chase | | | 7,710 | | | | 1,224,578 | |
KeyCorp | | | 2,811 | | | | 63,079 | |
KKR | | | 1,452 | | | | 108,101 | |
Loews | | | 814 | | | | 43,516 | |
M&T Bank | | | 378 | | | | 55,419 | |
Markel * | | | 31 | | | | 37,039 | |
MarketAxess Holdings | | | 84 | | | | 29,626 | |
Marsh & McLennan | | | 1,260 | | | | 206,665 | |
MetLife | | | 1,588 | | | | 93,152 | |
Moody’s | | | 457 | | | | 178,522 | |
Morgan Stanley | | | 3,672 | | | | 348,180 | |
MSCI, Cl A | | | 199 | | | | 125,261 | |
Nasdaq | | | 354 | | | | 71,943 | |
Northern Trust | | | 537 | | | | 62,131 | |
| Schedule of Investments | | November 30, 2021 |
| | Global X Adaptive U.S. Risk Management ETF | |
| | | Shares | | | Value | |
| COMMON STOCK — continued | | | | | | |
| Financials — continued | | | | | | |
| PNC Financial Services Group | | | 1,063 | | | $ | 209,411 | |
Principal Financial Group | | | 758 | | | | 51,984 | |
Progressive | | | 1,681 | | | | 156,232 | |
Prudential Financial | | | 1,137 | | | | 116,270 | |
Raymond James Financial | | | 501 | | | | 49,243 | |
Regions Financial | | | 2,116 | | | | 48,139 | |
Robinhood Markets, Cl A * | | | 2 | | | | 52 | |
Rocket, Cl A | | | 613 | | | | 9,502 | |
S&P Global | | | 613 | | | | 279,362 | |
State Street | | | 933 | | | | 83,009 | |
SVB Financial Group * | | | 131 | | | | 90,695 | |
Synchrony Financial | | | 1,671 | | | | 74,844 | |
T Rowe Price Group | | | 546 | | | | 109,173 | |
Tradeweb Markets, Cl A | | | 378 | | | | 36,288 | |
Travelers | | | 595 | | | | 87,435 | |
Truist Financial | | | 3,329 | | | | 197,443 | |
Upstart Holdings * | | | 100 | | | | 20,489 | |
US Bancorp | | | 3,332 | | | | 184,393 | |
Wells Fargo | | | 10,581 | | | | 505,560 | |
Willis Towers Watson | | | 378 | | | | 85,368 | |
Total Financials | | | | | | | 10,853,480 | |
| Health Care — 12.6% | | | | | | | | |
10X Genomics, Cl A * | | | 262 | | | | 40,036 | |
Abbott Laboratories | | | 4,542 | | | | 571,246 | |
AbbVie | | | 4,497 | | | | 518,415 | |
Agilent Technologies | | | 865 | | | | 130,529 | |
Align Technology * | | | 184 | | | | 112,522 | |
Alnylam Pharmaceuticals * | | | 352 | | | | 64,698 | |
AmerisourceBergen, Cl A | | | 365 | | | | 42,249 | |
Amgen | | | 1,442 | | | | 286,785 | |
Anthem | | | 618 | | | | 251,050 | |
Avantor * | | | 1,416 | | | | 55,904 | |
| Schedule of Investments | | November 30, 2021 |
| | Global X Adaptive U.S. Risk Management ETF | |
| | | Shares | | | Value | |
| COMMON STOCK — continued | | | | | | |
| Health Care — continued | | | | | | |
Baxter International | | | 1,196 | | | $ | 89,186 | |
Becton Dickinson | | | 712 | | | | 168,844 | |
Biogen * | | | 391 | | | | 92,174 | |
BioMarin Pharmaceutical * | | | 421 | | | | 36,328 | |
Bio-Rad Laboratories, Cl A * | | | 49 | | | | 36,907 | |
Boston Scientific * | | | 3,993 | | | | 152,014 | |
Bristol-Myers Squibb | | | 5,597 | | | | 300,167 | |
Catalent * | | | 475 | | | | 61,114 | |
Centene * | | | 1,648 | | | | 117,684 | |
Cerner | | | 862 | | | | 60,728 | |
Charles River Laboratories International * | | | 103 | | | | 37,685 | |
Cigna | | | 851 | | | | 163,307 | |
Cooper | | | 115 | | | | 43,294 | |
CVS Health | | | 3,356 | | | | 298,885 | |
Danaher | | | 1,634 | | | | 525,560 | |
Dexcom * | | | 240 | | | | 135,022 | |
Edwards Lifesciences * | | | 1,546 | | | | 165,901 | |
Elanco Animal Health * | | | 1,263 | | | | 36,299 | |
Eli Lilly | | | 2,183 | | | | 541,471 | |
Exact Sciences * | | | 422 | | | | 36,026 | |
Gilead Sciences | | | 3,147 | | | | 216,923 | |
Ginkgo Bioworks Holdings * | | | 2,567 | | | | 30,470 | |
HCA Healthcare | | | 617 | | | | 139,189 | |
Hologic * | | | 868 | | | | 64,866 | |
Horizon Therapeutics * | | | 718 | | | | 74,500 | |
Humana | | | 313 | | | | 131,369 | |
IDEXX Laboratories * | | | 210 | | | | 127,695 | |
Illumina * | | | 401 | | | | 146,497 | |
Incyte * | | | 513 | | | | 34,740 | |
Insulet * | | | 163 | | | | 47,016 | |
Intuitive Surgical * | | | 905 | | | | 293,527 | |
IQVIA Holdings * | | | 517 | | | | 133,970 | |
Johnson & Johnson | | | 6,847 | | | | 1,067,653 | |
| Schedule of Investments | | November 30, 2021 |
| | Global X Adaptive U.S. Risk Management ETF | |
| | | Shares | | | Value | |
| COMMON STOCK — continued | | | | | | |
| Health Care — continued | | | | | | |
Laboratory Corp of America Holdings * | | | 306 | | | $ | 87,311 | |
Masimo * | | | 118 | | | | 32,818 | |
McKesson | | | 441 | | | | 95,591 | |
Medtronic | | | 3,450 | | | | 368,114 | |
Merck | | | 6,509 | | | | 487,589 | |
Mettler-Toledo International * | | | 54 | | | | 81,763 | |
Moderna * | | | 882 | | | | 310,843 | |
PerkinElmer | | | 354 | | | | 64,485 | |
Pfizer | | | 14,497 | | | | 778,924 | |
Quest Diagnostics | | | 354 | | | | 52,633 | |
Regeneron Pharmaceuticals * | | | 256 | | | | 162,952 | |
ResMed | | | 416 | | | | 106,018 | |
Royalty Pharma, Cl A | | | 903 | | | | 35,912 | |
Seagen * | | | 389 | | | | 62,240 | |
STERIS | | | 311 | | | | 67,963 | |
Stryker | | | 828 | | | | 195,929 | |
Teladoc Health * | | | 385 | | | | 38,981 | |
Teleflex | | | 90 | | | | 26,768 | |
Thermo Fisher Scientific | | | 1,016 | | | | 642,954 | |
UnitedHealth Group | | | 2,440 | | | | 1,083,897 | |
Veeva Systems, Cl A * | | | 332 | | | | 93,817 | |
Vertex Pharmaceuticals * | | | 762 | | | | 142,448 | |
Viatris, Cl W * | | | 3,530 | | | | 43,454 | |
Waters * | | | 143 | | | | 46,914 | |
| West Pharmaceutical Services | | | 176 | | | | 77,908 | |
Zimmer Biomet Holdings | | | 645 | | | | 77,142 | |
Zoetis, Cl A | | | 1,202 | | | | 266,892 | |
Total Health Care | | | | | | | 13,212,705 | |
| Industrials — 7.4% | | | | | | | | |
3M | | | 1,462 | | | | 248,598 | |
AMETEK | | | 696 | | | | 95,004 | |
Boeing * | | | 1,489 | | | | 294,599 | |
| Schedule of Investments | | November 30, 2021 |
| | Global X Adaptive U.S. Risk Management ETF | |
| | | Shares | | | Value | |
| COMMON STOCK — continued | | | | | | |
| Industrials — continued | | | | | | |
Carrier Global | | | 2,504 | | | $ | 135,516 | |
Caterpillar | | | 1,388 | | | | 268,369 | |
Cintas | | | 212 | | | | 89,504 | |
Copart * | | | 499 | | | | 72,435 | |
CoStar Group * | | | 1,151 | | | | 89,502 | |
CSX | | | 5,643 | | | | 195,587 | |
Cummins | | | 420 | | | | 88,095 | |
Deere | | | 707 | | | | 244,297 | |
Delta Air Lines * | | | 1,885 | | | | 68,237 | |
Dover | | | 359 | | | | 58,822 | |
Eaton | | | 988 | | | | 160,114 | |
Emerson Electric | | | 1,708 | | | | 150,031 | |
Equifax | | | 354 | | | | 98,642 | |
| Expeditors International of Washington | | | 396 | | | | 48,162 | |
Fastenal | | | 1,560 | | | | 92,305 | |
FedEx | | | 607 | | | | 139,835 | |
Fortive | | | 936 | | | | 69,142 | |
Generac Holdings * | | | 145 | | | | 61,080 | |
General Dynamics | | | 708 | | | | 133,791 | |
General Electric | | | 2,752 | | | | 261,412 | |
HEICO, Cl A | | | 250 | | | | 31,050 | |
HEICO | | | 90 | | | | 12,467 | |
Honeywell International | | | 1,763 | | | | 356,550 | |
IDEX | | | 256 | | | | 57,495 | |
IHS Markit | | | 850 | | | | 108,647 | |
Illinois Tool Works | | | 692 | | | | 160,648 | |
Ingersoll Rand | | | 1,144 | | | | 66,741 | |
Jacobs Engineering Group | | | 395 | | | | 56,311 | |
JB Hunt Transport Services | | | 275 | | | | 52,569 | |
| Johnson Controls International | | | 2,067 | | | | 154,529 | |
Kansas City Southern | | | 211 | | | | 61,369 | |
L3Harris Technologies | | | 488 | | | | 102,031 | |
Lockheed Martin | | | 592 | | | | 197,325 | |
| Schedule of Investments | | November 30, 2021 |
| | Global X Adaptive U.S. Risk Management ETF | |
| | | Shares | | | Value | |
| COMMON STOCK — continued | | | | | | |
| Industrials — continued | | | | | | |
Lyft, Cl A * | | | 774 | | | $ | 31,432 | |
Norfolk Southern | | | 616 | | | | 163,406 | |
Northrop Grumman | | | 408 | | | | 142,310 | |
Old Dominion Freight Line | | | 248 | | | | 88,082 | |
Otis Worldwide | | | 1,003 | | | | 80,641 | |
PACCAR | | | 1,049 | | | | 87,508 | |
Parker-Hannifin | | | 379 | | | | 114,481 | |
Raytheon Technologies | | | 3,844 | | | | 311,057 | |
Republic Services, Cl A | | | 483 | | | | 63,882 | |
Rockwell Automation | | | 278 | | | | 93,464 | |
Rollins | | | 742 | | | | 24,694 | |
Roper Technologies | | | 258 | | | | 119,751 | |
Southwest Airlines * | | | 1,694 | | | | 75,214 | |
Stanley Black & Decker | | | 431 | | | | 75,322 | |
Trane Technologies | | | 570 | | | | 106,391 | |
TransDigm Group * | | | 125 | | | | 72,256 | |
TransUnion | | | 521 | | | | 57,930 | |
Uber Technologies * | | | 3,792 | | | | 144,096 | |
Union Pacific | | | 1,669 | | | | 393,284 | |
United Airlines Holdings * | | | 913 | | | | 38,583 | |
United Parcel Service, Cl B | | | 1,862 | | | | 369,364 | |
United Rentals * | | | 169 | | | | 57,247 | |
Verisk Analytics, Cl A | | | 454 | | | | 102,091 | |
Waste Management | | | 1,044 | | | | 167,739 | |
| Westinghouse Air Brake Technologies | | | 359 | | | | 31,868 | |
WW Grainger | | | 102 | | | | 49,104 | |
Xylem | | | 498 | | | | 60,313 | |
Total Industrials | | | | | | | 7,702,321 | |
| Information Technology — 30.8% | | | | | | | | |
Accenture, Cl A | | | 1,638 | | | | 585,421 | |
Adobe * | | | 1,235 | | | | 827,265 | |
Advanced Micro Devices * | | | 3,093 | | | | 489,838 | |
| Schedule of Investments | | November 30, 2021 |
| | Global X Adaptive U.S. Risk Management ETF | |
| | | Shares | | | Value | |
| COMMON STOCK — continued | | | | | | |
| Information Technology — continued | | | | | | |
Affirm Holdings, Cl A * | | | 361 | | | $ | 45,731 | |
Akamai Technologies * | | | 437 | | | | 49,250 | |
Amphenol, Cl A | | | 1,706 | | | | 137,469 | |
Analog Devices | | | 1,353 | | | | 243,878 | |
ANSYS * | | | 206 | | | | 80,645 | |
Apple | | | 43,463 | | | | 7,184,433 | |
Applied Materials | | | 2,293 | | | | 337,507 | |
AppLovin, Cl A * | | | 151 | | | | 13,758 | |
Arista Networks * | | | 524 | | | | 65,007 | |
Atlassian, Cl A * | | | 354 | | | | 133,217 | |
Autodesk * | | | 549 | | | | 139,550 | |
Automatic Data Processing | | | 1,065 | | | | 245,898 | |
Bentley Systems, Cl B | | | 513 | | | | 24,619 | |
Bill.com Holdings * | | | 215 | | | | 60,383 | |
Block, Cl A * | | | 1,006 | | | | 209,580 | |
Broadcom | | | 1,022 | | | | 565,861 | |
| Broadridge Financial Solutions | | | 375 | | | | 63,214 | |
Cadence Design Systems * | | | 800 | | | | 141,968 | |
CDW | | | 359 | | | | 67,980 | |
Cisco Systems | | | 10,035 | | | | 550,320 | |
Cloudflare, Cl A * | | | 566 | | | | 106,544 | |
| Cognizant Technology Solutions, Cl A | | | 1,546 | | | | 120,557 | |
Corning | | | 2,273 | | | | 84,306 | |
Coupa Software * | | | 252 | | | | 49,558 | |
Crowdstrike Holdings, Cl A * | | | 543 | | | | 117,907 | |
Datadog, Cl A * | | | 528 | | | | 94,137 | |
Dell Technologies, Cl C * | | | 788 | | | | 44,498 | |
DocuSign, Cl A * | | | 521 | | | | 128,354 | |
Enphase Energy * | | | 367 | | | | 91,750 | |
EPAM Systems * | | | 128 | | | | 77,894 | |
| Fidelity National Information Services | | | 1,510 | | | | 157,795 | |
Fiserv * | | | 1,462 | | | | 141,112 | |
FleetCor Technologies * | | | 269 | | | | 55,718 | |
| Schedule of Investments | | November 30, 2021 |
| | Global X Adaptive U.S. Risk Management ETF | |
| | | Shares | | | Value | |
| COMMON STOCK — continued | | | | | | |
| Information Technology — continued | | | | | | |
Fortinet * | | | 404 | | | $ | 134,172 | |
Gartner * | | | 188 | | | | 58,703 | |
Global Payments | | | 817 | | | | 97,256 | |
Hewlett Packard Enterprise | | | 4,108 | | | | 58,950 | |
HP | | | 2,725 | | | | 96,138 | |
HubSpot * | | | 103 | | | | 83,112 | |
Intel | | | 10,451 | | | | 514,189 | |
| International Business Machines | | | 2,278 | | | | 266,754 | |
Intuit | | | 681 | | | | 444,216 | |
Keysight Technologies * | | | 507 | | | | 98,601 | |
KLA | | | 372 | | | | 151,824 | |
Kyndryl Holdings * | | | 522 | | | | 8,248 | |
Lam Research | | | 352 | | | | 239,307 | |
Marvell Technology | | | 2,018 | | | | 143,621 | |
Mastercard, Cl A | | | 2,249 | | | | 708,255 | |
Microchip Technology | | | 1,570 | | | | 130,985 | |
Micron Technology | | | 2,815 | | | | 236,460 | |
Microsoft | | | 19,495 | | | | 6,444,852 | |
MongoDB, Cl A * | | | 141 | | | | 70,232 | |
Monolithic Power Systems | | | 93 | | | | 51,472 | |
Motorola Solutions | | | 474 | | | | 120,007 | |
NetApp | | | 678 | | | | 60,261 | |
NVIDIA | | | 6,331 | | | | 2,068,718 | |
Okta, Cl A * | | | 412 | | | | 88,675 | |
Oracle | | | 4,072 | | | | 369,493 | |
Palantir Technologies, Cl A * | | | 4,639 | | | | 95,795 | |
Palo Alto Networks * | | | 233 | | | | 127,437 | |
Paychex | | | 909 | | | | 108,353 | |
Paycom Software * | | | 118 | | | | 51,623 | |
PayPal Holdings * | | | 3,032 | | | | 560,586 | |
Qorvo * | | | 338 | | | | 49,426 | |
QUALCOMM | | | 2,885 | | | | 520,916 | |
Qualtrics International, Cl A * | | | 138 | | | | 4,466 | |
| Schedule of Investments | | November 30, 2021 |
| | Global X Adaptive U.S. Risk Management ETF | |
| | | Shares | | | Value | |
| COMMON STOCK — continued | | | | | | |
| Information Technology — continued | | | | | | |
RingCentral, Cl A * | | | 265 | | | $ | 57,235 | |
salesforce.com * | | | 2,451 | | | | 698,437 | |
Seagate Technology Holdings | | | 650 | | | | 66,736 | |
ServiceNow * | | | 500 | | | | 323,850 | |
Skyworks Solutions | | | 504 | | | | 76,437 | |
Snowflake, Cl A * | | | 669 | | | | 227,560 | |
Splunk * | | | 460 | | | | 55,660 | |
| | | | | | | | | |
| SS&C Technologies Holdings | | | 471 | | | | 35,951 | |
Synopsys * | | | 434 | | | | 147,994 | |
TE Connectivity | | | 929 | | | | 143,001 | |
Teledyne Technologies * | | | 107 | | | | 44,436 | |
Teradyne | | | 467 | | | | 71,390 | |
Texas Instruments | | | 2,370 | | | | 455,917 | |
Trade Desk, Cl A * | | | 1,236 | | | | 127,827 | |
Trimble * | | | 718 | | | | 61,655 | |
Twilio, Cl A * | | | 452 | | | | 129,340 | |
Tyler Technologies * | | | 94 | | | | 48,784 | |
Ubiquiti | | | 16 | | | | 4,789 | |
UiPath, Cl A * | | | 690 | | | | 33,293 | |
Unity Software * | | | 387 | | | | 66,715 | |
VeriSign * | | | 309 | | | | 74,132 | |
Visa, Cl A | | | 4,357 | | | | 844,256 | |
VMware, Cl A | | | 624 | | | | 72,846 | |
Western Digital * | | | 856 | | | | 49,511 | |
Workday, Cl A * | | | 515 | | | | 141,228 | |
Xilinx | | | 718 | | | | 164,027 | |
Zebra Technologies, Cl A * | | | 124 | | | | 73,009 | |
Zoom Video Communications, Cl A * | | | 506 | | | | 106,973 | |
Zscaler * | | | 186 | | | | 64,536 | |
Total Information Technology | | | | | | | 32,263,550 | |
| | | | | | | | | |
| Schedule of Investments | | November 30, 2021 |
| | Global X Adaptive U.S. Risk Management ETF | |
| | | Shares | | | Value | |
| COMMON STOCK — continued | | | | | | |
| Materials — 1.9% | | | | | | |
Air Products & Chemicals | | | 551 | | | $ | 158,379 | |
Albemarle | | | 351 | | | | 93,538 | |
Amcor | | | 4,479 | | | | 50,702 | |
Ball | | | 921 | | | | 86,068 | |
Celanese, Cl A | | | 340 | | | | 51,462 | |
Corteva | | | 2,179 | | | | 98,055 | |
Dow | | | 2,214 | | | | 121,615 | |
DuPont de Nemours | | | 1,557 | | | | 115,156 | |
Ecolab | | | 722 | | | | 159,901 | |
Freeport-McMoRan | | | 3,589 | | | | 133,080 | |
| International Flavors & Fragrances | | | 726 | | | | 103,215 | |
International Paper | | | 1,212 | | | | 55,170 | |
| LyondellBasell Industries, Cl A | | | 773 | | | | 67,351 | |
Martin Marietta Materials | | | 145 | | | | 58,509 | |
Newmont | | | 2,345 | | | | 128,787 | |
Nucor | | | 853 | | | | 90,640 | |
PPG Industries | | | 712 | | | | 109,769 | |
Sherwin-Williams | | | 602 | | | | 199,407 | |
Vulcan Materials | | | 415 | | | | 79,531 | |
Total Materials | | | | | | | 1,960,335 | |
| Real Estate — 2.5% | | | | | | | | |
Alexandria Real Estate Equities ‡ | | | 439 | | | | 87,831 | |
American Tower, Cl A ‡ | | | 1,153 | | | | 302,640 | |
AvalonBay Communities ‡ | | | 376 | | | | 89,815 | |
Boston Properties ‡ | | | 396 | | | | 42,705 | |
CBRE Group, Cl A * | | | 910 | | | | 86,969 | |
Crown Castle International ‡ | | | 1,188 | | | | 215,800 | |
Digital Realty Trust ‡ | | | 740 | | | | 124,128 | |
Duke Realty ‡ | | | 1,083 | | | | 63,171 | |
Equinix ‡ | | | 227 | | | | 184,369 | |
Equity Residential ‡ | | | 844 | | | | 72,002 | |
Essex Property Trust ‡ | | | 152 | | | | 51,595 | |
| Schedule of Investments | | November 30, 2021 |
| | Global X Adaptive U.S. Risk Management ETF | |
| | | Shares | | | Value | |
| COMMON STOCK — continued | | | | | | |
| Real Estate — continued | | | | | | |
Extra Space Storage ‡ | | | 359 | | | $ | 71,800 | |
Healthpeak Properties ‡ | | | 1,500 | | | | 49,290 | |
Invitation Homes ‡ | | | 1,436 | | | | 58,072 | |
Mid-America Apartment Communities ‡ | | | 363 | | | | 74,869 | |
Orion Office REIT ‡ * | | | 115 | | | | 2,044 | |
ProLogis ‡ | | | 1,875 | | | | 282,656 | |
Public Storage ‡ | | | 427 | | | | 139,791 | |
Realty Income ‡ | | | 1,173 | | | | 79,670 | |
SBA Communications, Cl A ‡ | | | 260 | | | | 89,388 | |
Simon Property Group ‡ | | | 922 | | | | 140,918 | |
Sun Communities ‡ | | | 354 | | | | 66,757 | |
Ventas ‡ | | | 1,224 | | | | 57,430 | |
Welltower ‡ | | | 1,137 | | | | 90,528 | |
Weyerhaeuser ‡ | | | 1,725 | | | | 64,877 | |
Zillow Group, Cl A * | | | 94 | | | | 5,086 | |
Zillow Group, Cl C * | | | 461 | | | | 25,018 | |
Total Real Estate | | | | | | | 2,619,219 | |
| Utilities — 2.3% | | | | | | | | |
AES | | | 1,935 | | | | 45,240 | |
Alliant Energy | | | 718 | | | | 39,339 | |
Ameren | | | 718 | | | | 58,582 | |
American Electric Power | | | 1,436 | | | | 116,388 | |
American Water Works | | | 502 | | | | 84,622 | |
Avangrid | | | 359 | | | | 18,173 | |
CMS Energy | | | 742 | | | | 43,667 | |
Consolidated Edison | | | 809 | | | | 62,811 | |
Dominion Energy | | | 2,256 | | | | 160,626 | |
DTE Energy | | | 529 | | | | 57,312 | |
Duke Energy | | | 1,927 | | | | 186,938 | |
Edison International | | | 1,124 | | | | 73,375 | |
Entergy | | | 441 | | | | 44,250 | |
Evergy | | | 718 | | | | 45,449 | |
| Schedule of Investments | | November 30, 2021 |
| | Global X Adaptive U.S. Risk Management ETF | |
| | | Shares | | | Value | |
| COMMON STOCK — continued | | | | | | |
| Utilities — continued | | | | | | |
Eversource Energy | | | 1,038 | | | $ | 85,396 | |
Exelon | | | 2,811 | | | | 148,224 | |
FirstEnergy | | | 1,508 | | | | 56,791 | |
NextEra Energy | | | 5,029 | | | | 436,417 | |
PG&E * | | | 4,420 | | | | 52,510 | |
PPL | | | 2,154 | | | | 59,946 | |
| Public Service Enterprise Group | | | 1,516 | | | | 94,735 | |
Sempra Energy | | | 818 | | | | 98,054 | |
Southern | | | 2,626 | | | | 160,449 | |
WEC Energy Group | | | 894 | | | | 77,715 | |
Xcel Energy | | | 1,600 | | | | 101,968 | |
Total Utilities | | | | | | | 2,408,977 | |
TOTAL UNITED STATES | | | | | | | 103,699,427 | |
| TOTAL COMMON STOCK | | | | | | | | |
(Cost $105,821,881) | | | | | | | 104,378,554 | |
| TOTAL INVESTMENTS — 99.8% | | | | | | | | |
(Cost $105,821,881) | | | | | | $ | 104,378,554 | |
Percentages are based on Net Assets of $104,574,490.
| * | Non-income producing security. |
| ‡ | Real Estate Investment Trust |
Cl — Class
S&P — Standard & Poor’s
As of November 30, 2021, all of the Fund’s investments were considered Level 1, in accordance with authoritative guidance on fair value measurements and disclosure under U.S. GAAP.
For the year ended November 30, 2021, there have been no transfers in or out of Level 3
| Schedule of Investments | | November 30, 2021 |
| | Global X Founder-Run Companies ETF | |
Sector Weightings (Unaudited)†:
† Sector weightings percentages are based on the total market value of investments.
| | | Shares | | | Value | |
| COMMON STOCK — 99.9% | | | | | | |
| UNITED STATES— 99.9% | | | | | | |
| Communication Services — 9.4% | | | | | | |
Meta Platforms, Cl A * | | | 537 | | | $ | 174,235 | |
Netflix * | | | 250 | | | | 160,475 | |
Nexstar Media Group, Cl A | | | 1,156 | | | | 172,822 | |
Pinterest, Cl A * | | | 3,884 | | | | 155,593 | |
ROBLOX, Cl A * | | | 2,086 | | | | 263,045 | |
Roku, Cl A * | | | 567 | | | | 129,055 | |
Snap, Cl A * | | | 3,297 | | | | 156,970 | |
TripAdvisor * | | | 5,255 | | | | 135,894 | |
Twitter * | | | 3,292 | | | | 144,651 | |
Total Communication Services | | | | | | | 1,492,740 | |
| Consumer Discretionary — 9.6% | | | | | | | | |
Airbnb, Cl A * | | | 1,015 | | | | 175,128 | |
Carvana, Cl A * | | | 570 | | | | 159,839 | |
ContextLogic, Cl A * | | | 33,987 | | | | 126,771 | |
DoorDash, Cl A * | | | 888 | | | | 158,748 | |
DraftKings, Cl A * | | | 3,719 | | | | 128,492 | |
Peloton Interactive, Cl A * | | | 1,892 | | | | 83,248 | |
| Schedule of Investments | | November 30, 2021 |
| | Global X Founder-Run Companies ETF | |
| | | Shares | | | Value | |
| COMMON STOCK — continued | | | | | | |
| Consumer Discretionary — continued | | | | | | |
QuantumScape, Cl A * | | | 5,990 | | | $ | 172,752 | |
Skechers USA, Cl A * | | | 3,810 | | | | 171,145 | |
Tesla * | | | 157 | | | | 179,727 | |
Wayfair, Cl A * | | | 695 | | | | 172,249 | |
Total Consumer Discretionary | | | | | | | 1,528,099 | |
| Consumer Staples — 0.8% | | | | | | | | |
Beyond Meat * | | | 1,750 | | | | 122,955 | |
| Energy — 2.0% | | | | | | | | |
New Fortress Energy, Cl A | | | 5,777 | | | | 143,790 | |
Pioneer Natural Resources | | | 926 | | | | 165,124 | |
Total Energy | | | | | | | 308,914 | |
| Financials — 15.7% | | | | | | | | |
| Apollo Global Management, Cl A | | | 2,252 | | | | 159,397 | |
Ares Management, Cl A | | | 2,046 | | | | 166,053 | |
Athene Holding, Cl A * | | | 1,990 | | | | 163,021 | |
BlackRock, Cl A | | | 184 | | | | 166,448 | |
Blackstone, Cl A | | | 1,251 | | | | 176,954 | |
Capital One Financial | | | 1,148 | | | | 161,328 | |
Essent Group | | | 3,612 | | | | 150,187 | |
First Republic Bank | | | 803 | | | | 168,357 | |
Intercontinental Exchange | | | 1,251 | | | | 163,531 | |
MarketAxess Holdings | | | 423 | | | | 149,188 | |
Pinnacle Financial Partners | | | 1,795 | | | | 171,261 | |
SEI Investments | | | 2,750 | | | | 163,982 | |
Signature Bank NY | | | 583 | | | | 176,241 | |
Starwood Property Trust ‡ | | | 6,804 | | | | 169,828 | |
Tradeweb Markets, Cl A | | | 1,944 | | | | 186,624 | |
Total Financials | | | | | | | 2,492,400 | |
| Health Care — 17.2% | | | | | | | | |
Bridgebio Pharma * | | | 3,508 | | | | 142,074 | |
Guardant Health * | | | 1,483 | | | | 155,893 | |
Invitae * | | | 6,537 | | | | 111,129 | |
| Schedule of Investments | | November 30, 2021 |
| | Global X Founder-Run Companies ETF | |
| | | Shares | | | Value | |
| COMMON STOCK — continued | | | | | | |
| Health Care — continued | | | | | | |
Ionis Pharmaceuticals * | | | 5,437 | | | $ | 144,080 | |
Jazz Pharmaceuticals * | | | 1,302 | | | | 156,071 | |
LHC Group * | | | 1,288 | | | | 147,759 | |
Masimo * | | | 610 | | | | 169,653 | |
Medpace Holdings * | | | 766 | | | | 158,876 | |
Neurocrine Biosciences * | | | 1,644 | | | | 136,863 | |
Oak Street Health * | | | 3,668 | | | | 113,525 | |
Penumbra * | | | 628 | | | | 154,268 | |
Regeneron Pharmaceuticals * | | | 271 | | | | 172,500 | |
Royalty Pharma, Cl A | | | 4,383 | | | | 174,312 | |
Seagen * | | | 982 | | | | 157,120 | |
Twist Bioscience * | | | 1,460 | | | | 139,430 | |
Ultragenyx Pharmaceutical * | | | 2,065 | | | | 155,350 | |
United Therapeutics * | | | 909 | | | | 172,256 | |
Veeva Systems, Cl A * | | | 550 | | | | 155,419 | |
Total Health Care | | | | | | | 2,716,578 | |
| Industrials — 4.1% | | | | | | | | |
Axon Enterprise * | | | 963 | | | | 162,545 | |
CoStar Group * | | | 2,014 | | | | 156,609 | |
FedEx | | | 736 | | | | 169,552 | |
Lyft, Cl A * | | | 3,778 | | | | 153,424 | |
Total Industrials | | | | | | | 642,130 | |
| Information Technology — 28.8% | | | | | | | | |
Affirm Holdings, Cl A * | | | 1,065 | | | | 134,914 | |
Akamai Technologies * | | | 1,668 | | | | 187,984 | |
Avalara * | | | 965 | | | | 134,791 | |
Block, Cl A * | | | 681 | | | | 141,873 | |
Dell Technologies, Cl C * | | | 1,572 | | | | 88,771 | |
Dropbox, Cl A * | | | 5,684 | | | | 139,883 | |
Elastic * | | | 999 | | | | 155,305 | |
EPAM Systems * | | | 259 | | | | 157,614 | |
Euronet Worldwide * | | | 1,546 | | | | 156,718 | |
| Schedule of Investments | | November 30, 2021 |
| | Global X Founder-Run Companies ETF | |
| | | Shares | | | Value | |
| COMMON STOCK — continued | | | | | | |
| Information Technology — continued | | | | | | |
Fortinet * | | | 523 | | | $ | 173,693 | |
Monolithic Power Systems | | | 334 | | | | 184,856 | |
NVIDIA | | | 678 | | | | 221,543 | |
Okta, Cl A * | | | 700 | | | | 150,661 | |
Palantir Technologies, Cl A * | | | 6,696 | | | | 138,272 | |
Paycom Software * | | | 317 | | | | 138,681 | |
Pegasystems | | | 1,460 | | | | 167,637 | |
RingCentral, Cl A * | | | 710 | | | | 153,346 | |
salesforce.com * | | | 580 | | | | 165,277 | |
| SS&C Technologies Holdings | | | 2,179 | | | | 166,323 | |
Synopsys * | | | 519 | | | | 176,979 | |
Trade Desk, Cl A * | | | 2,340 | | | | 242,003 | |
Twilio, Cl A * | | | 595 | | | | 170,259 | |
Ubiquiti | | | 575 | | | | 172,092 | |
VeriSign * | | | 779 | | | | 186,890 | |
Workday, Cl A * | | | 598 | | | | 163,990 | |
Zendesk * | | | 1,702 | | | | 173,791 | |
Zoom Video Communications, Cl A * | | | 632 | | | | 133,611 | |
Zscaler * | | | 544 | | | | 188,752 | |
Total Information Technology | | | | | | | 4,566,509 | |
| Materials — 2.0% | | | | | | | | |
Steel Dynamics | | | 2,621 | | | | 156,736 | |
Westlake Chemical | | | 1,781 | | | | 165,490 | |
Total Materials | | | | | | | 322,226 | |
| Real Estate — 10.3% | | | | | | | | |
American Campus Communities ‡ | | | 3,226 | | | | 166,913 | |
American Homes 4 Rent, Cl A ‡ | | | 4,269 | | | | 171,144 | |
Apartment Income REIT ‡ | | | 3,232 | | | | 164,056 | |
Camden Property Trust ‡ | | | 1,062 | | | | 175,453 | |
Invitation Homes ‡ | | | 4,200 | | | | 169,848 | |
Medical Properties Trust ‡ | | | 8,126 | | | | 173,003 | |
ProLogis ‡ | | | 1,196 | | | | 180,297 | |
| Schedule of Investments | | November 30, 2021 |
| | Global X Founder-Run Companies ETF | |
| | | Shares | | | Value | |
| COMMON STOCK — continued | | | | | | |
| Real Estate — continued | | | | | | |
STAG Industrial ‡ | | | 3,982 | | | $ | 173,536 | |
Vornado Realty Trust ‡ | | | 4,067 | | | | 163,249 | |
Zillow Group, Cl C * | | | 1,670 | | | | 90,631 | |
Total Real Estate | | | | | | | 1,628,130 | |
TOTAL UNITED STATES | | | | | | | 15,820,681 | |
| TOTAL COMMON STOCK | | | | | | | | |
(Cost $15,720,038) | | | | | | | 15,820,681 | |
| TOTAL INVESTMENTS — 99.9% | | | | | | | | |
(Cost $15,720,038) | | | | | | $ | 15,820,681 | |
Percentages are based on Net Assets of $15,841,817.
| * | Non-income producing security. |
| ‡ | Real Estate Investment Trust |
Cl — Class
As of November 30, 2021, all of the Fund’s investments were considered Level 1, in accordance with authoritative guidance on fair value measurements and disclosure under U.S. GAAP.
For the year ended November 30, 2021, there have been no transfers in or out of Level 3.
| | Statements of Assets and Liabilities | |
| | November 30, 2021 | |
| | | Global X Alternative Income ETF | | | Global X S&P 500® Quality Dividend ETF | | | Global X U.S. Preferred ETF | | | Global X Variable Rate Preferred ETF | |
| Assets: | | | | | | | | | | | | |
| Cost of Investments | | $ | 6,390,749 | | | $ | 9,356,004 | | | $ | 2,493,688,482 | | | $ | 90,896,764 | |
| Cost of Repurchase Agreement | | | 248,556 | | | | — | | | | 31,717,816 | | | | — | |
| Cost of Affiliated Investments | | | 30,246,234 | | | | — | | | | — | | | | — | |
| Investments, at Value | | $ | 7,487,575 | * | | $ | 9,585,575 | | | $ | 2,464,499,859 | * | | $ | 88,566,006 | |
| Repurchase Agreement, at Value | | | 248,556 | | | | — | | | | 31,717,816 | | | | — | |
| Affiliated Investments, at Value | | | 28,458,804 | | | | — | | | | — | | | | — | |
| Cash | | | 81,996 | | | | 6,570 | | | | 6,447,928 | | | | 328,512 | |
| Dividend, Interest, and Securities Lending Income Receivable | | | 115,855 | | | | 24,802 | | | | 14,512,552 | | | | 346,742 | |
| Receivable for Capital Shares Sold | | | — | | | | — | | | | 8,372,329 | | | | — | |
| Reclaim Receivable | | | — | | | | 136 | | | | — | | | | — | |
| Total Assets | | | 36,392,786 | | | | 9,617,083 | | | | 2,525,550,484 | | | | 89,241,260 | |
| Liabilities: | | | | | | | | | | | | | | | | |
| Obligation to Return Securities Lending Collateral | | | 460,032 | | | | — | | | | 58,702,650 | | | | — | |
| Payable due to Investment Adviser | | | 4,224 | | | | 1,648 | | | | 473,127 | | | | 17,766 | |
| Payable for Investment Securities Purchased | | | — | | | | — | | | | 8,352,515 | | | | — | |
| Payable for Income Distributions | | | — | | | | — | | | | — | | | | 6,125 | |
| Due to Broker | | | 7,784 | | | | — | | | | — | | | | — | |
| Total Liabilities | | | 472,040 | | | | 1,648 | | | | 67,528,292 | | | | 23,891 | |
| Net Assets | | $ | 35,920,746 | | | $ | 9,615,435 | | | $ | 2,458,022,192 | | | $ | 89,217,369 | |
| Net Assets Consist of: | | | | | | | | | | | | | | | | |
| Paid-in Capital | | $ | 38,962,216 | | | $ | 10,143,539 | | | $ | 2,490,474,600 | | | $ | 91,172,797 | |
| Total Distributable Loss | | | (3,041,470 | ) | | | (528,104 | ) | | | (32,452,408 | ) | | | (1,955,428 | ) |
| Net Assets | | $ | 35,920,746 | | | $ | 9,615,435 | | | $ | 2,458,022,192 | | | $ | 89,217,369 | |
| Outstanding Shares of Beneficial Interest | | | | | | | | | | | | | | | | |
| (unlimited authorization — no par value) | | | 2,730,000 | | | | 310,002 | | | | 97,510,000 | | | | 3,270,000 | |
| Net Asset Value, Offering and Redemption Price Per Share | | $ | 13.16 | | | $ | 31.02 | | | $ | 25.21 | | | $ | 27.28 | |
| *Includes Market Value of Securities on Loan | | $ | 447,213 | | | $ | — | | | $ | 56,280,886 | | | $ | — | |
Amounts designated as “—” are either $0 or have been rounded to $0.
| | Statements of Assets and Liabilities | |
| | November 30, 2021 | |
| | | Global X MLP ETF | | | Global X MLP & Energy Infrastructure ETF | | | Global X Conscious Companies ETF | |
| Assets: | | | | | | | | | |
| Cost of Investments | | $ | 775,076,780 | | | $ | 641,266,117 | | | $ | 568,031,028 | |
| Investments, at Value | | $ | 994,161,095 | | | $ | 737,394,167 | | | $ | 653,579,926 | |
| Cash | | | 2,105,883 | | | | 56,678 | | | | 587,815 | |
| Receivable for Investment Securities Sold | | | 32,643,715 | | | | 24,668,801 | | | | — | |
| Receivable for Capital Shares Sold | | | — | | | | 2,158,280 | | | | — | |
| Dividend, Interest, and Securities Lending Income Receivable | | | — | | | | 1,106,282 | | | | 835,015 | |
| Reclaim Receivable | | | — | | | | 579,714 | | | | — | |
| Prepaid Tax Asset | | | 2,907,007 | | | | — | | | | — | |
| Due from Broker | | | 3,250 | | | | 3,000 | | | | — | |
| Total Assets | | | 1,031,820,950 | | | | 765,966,922 | | | | 655,002,756 | |
| Liabilities: | | | | | | | | | | | | |
| Payable for Investment Securities Purchased | | | 35,471,838 | | | | 26,558,984 | | | | — | |
| Payable due to Investment Adviser | | | 393,755 | | | | 291,912 | | | | 238,289 | |
| Cash Overdraft | | | — | | | | 951,202 | | | | — | |
| Custodian Fees Payable | | | 919 | | | | — | | | | — | |
| Franchise Tax Payable | | | 18,999 | | | | — | | | | — | |
| Other Accrued Expenses | | | 8,596 | | | | 1,219 | | | | — | |
| Deferred Tax Liability | | | 2,907,007 | | | | — | | | | — | |
| Due to Broker | | | 84,354 | | | | 71,394 | | | | — | |
| Total Liabilities | | | 38,885,468 | | | | 27,874,711 | | | | 238,289 | |
| Net Assets | | $ | 992,935,482 | | | $ | 738,092,211 | | | $ | 654,764,467 | |
| Net Assets Consist of: | | | | | | | | | | | | |
| Paid-in Capital | | $ | 1,272,067,550 | | | $ | 877,393,939 | | | $ | 567,789,642 | |
| Total Distributable Earnings/(Loss) | | | (279,132,068 | ) | | | (139,301,728 | ) | | | 86,974,825 | |
| Net Assets | | $ | 992,935,482 | | | $ | 738,092,211 | | | $ | 654,764,467 | |
| Outstanding Shares of Beneficial Interest | | | | | | | | | | | | |
| (unlimited authorization — no par value) | | | 29,558,637 | | | | 21,157,506 | | | | 19,860,000 | |
| Net Asset Value, Offering and Redemption Price Per Share | | $ | 33.59 | | | $ | 34.89 | | | $ | 32.97 | |
Amounts designated as “—” are either $0 or have been rounded to $0.
| | Statements of Assets and Liabilities | |
| | November 30, 2021 | |
| | | Global X Adaptive U.S. Factor ETF | | | Global X Adaptive U.S. Risk Management ETF | | | Global X Founder-Run Companies ETF | |
| Assets: | | | | | | | | | |
| Cost of Investments | | $ | 162,752,575 | | | $ | 105,821,881 | | | $ | 15,720,038 | |
| Investments, at Value | | $ | 171,651,016 | | | $ | 104,378,554 | | | $ | 15,820,681 | |
| Cash | | | 61,250 | | | | 102,483 | | | | 49,181 | |
| Dividend, Interest, and Securities Lending Income Receivable | | | 334,990 | | | | 123,583 | | | | 5,605 | |
| Receivable for Capital Shares Sold | | | — | | | | 298,785 | | | | 706,201 | |
| Reclaim Receivable | | | — | | | | 265 | | | | — | |
| Total Assets | | | 172,047,256 | | | | 104,903,670 | | | | 16,581,668 | |
| Liabilities: | | | | | | | | | | | | |
| Payable due to Investment Adviser | | | 39,752 | | | | 33,964 | | | | 5,967 | |
| Payable for Investment Securities Purchased | | | — | | | | 295,216 | | | | 733,884 | |
| Total Liabilities | | | 39,752 | | | | 329,180 | | | | 739,851 | |
| Net Assets | | $ | 172,007,504 | | | $ | 104,574,490 | | | $ | 15,841,817 | |
| Net Assets Consist of: | | | | | | | | | | | | |
| Paid-in Capital | | $ | 171,741,925 | | | $ | 106,785,500 | | | $ | 16,030,826 | |
| Total Distributable Earnings/(Loss) | | | 265,579 | | | | (2,211,010 | ) | | | (189,009 | ) |
| Net Assets | | $ | 172,007,504 | | | $ | 104,574,490 | | | $ | 15,841,817 | |
| Outstanding Shares of Beneficial Interest | | | | | | | | | | | | |
| (unlimited authorization — no par value) | | | 5,760,002 | | | | 3,500,000 | | | | 460,000 | |
| Net Asset Value, Offering and Redemption Price Per Share | | $ | 29.86 | | | $ | 29.88 | | | $ | 34.44 | |
Amounts designated as “—” are either $0 or have been rounded to $0.
| | Statements of Operations | |
| | For the year ended November 30, 2021 | |
| | | Global X Alternative Income ETF | | | Global X S&P 500® Quality Dividend ETF | | | Global X U.S. Preferred ETF | | | Global X Variable Rate Preferred ETF | |
| Investment Income: | | | | | | | | | | | | |
| Dividend Income | | $ | 689,971 | | | $ | 240,248 | | | $ | 93,285,314 | | | $ | 1,779,299 | |
| Dividend Income, from Affiliated Investments | | | 456,747 | | | | — | | | | — | | | | — | |
| Interest Income | | | 5 | | | | — | | | | 1,120 | | | | — | |
| Security Lending Income | | | 123,374 | | | | — | | | | 626,910 | | | | — | |
| Total Investment Income | | | 1,270,097 | | | | 240,248 | | | | 93,913,344 | | | | 1,779,299 | |
Supervision and Administration Fees(1) | | | 201,440 | | | | 17,155 | | | | 4,137,495 | | | | 84,601 | |
Custodian Fees(2) | | | 355 | | | | 125 | | | | 16 | | | | 19 | |
| Total Expenses | | | 201,795 | | | | 17,280 | | | | 4,137,511 | | | | 84,620 | |
Reimbursement from Adviser (3) | | | (20,773 | ) | | | – | | | | – | | | | – | |
| Net Expenses | | | 181,022 | | | | 17,280 | | | | 4,137,511 | | | | 84,620 | |
| Net Investment Income | | | 1,089,075 | | | | 222,968 | | | | 89,775,833 | | | | 1,694,679 | |
| Net Realized Gain on: | | | | | | | | | | | | | | | | |
Investments(4) | | | 3,048,350 | | | | 1,519,036 | | | | 17,346,431 | | | | 463,555 | |
| Affiliated Investments | | | 18,105 | | | | — | | | | — | | | | — | |
| Net Realized Gain on Investments | | | 3,066,455 | | | | 1,519,036 | | | | 17,346,431 | | | | 463,555 | |
| Net Change in Unrealized Appreciation (Depreciation) on: | | | | | | | | | | | | | | | | |
| Investments | | | 675,103 | | | | (214,312 | ) | | | (54,576,713 | ) | | | (2,428,772 | ) |
| Affiliated Investments | | | (142,231 | ) | | | — | | | | — | | | | — | |
| Net Change in Unrealized Appreciation (Depreciation) on Investments | | | 532,872 | | | | (214,312 | ) | | | (54,576,713 | ) | | | (2,428,772 | ) |
| Net Realized and Unrealized Gain (Loss) on Investments | | | 3,599,327 | | | | 1,304,724 | | | | (37,230,282 | ) | | | (1,965,217 | ) |
| Net Increase (Decrease) in Net Assets Resulting from Operations | | $ | 4,688,402 | | | $ | 1,527,692 | | | $ | 52,545,551 | | | $ | (270,538 | ) |
| (1) | The Supervision and Administration fees reflect the supervisory and administrative fee, which includes fees paid by the Funds for the investment advisory services provided by the Adviser. (See Note 3 in Notes to Financial Statements.) |
| (2) | See Note 2 in the Notes to Financial Statements. |
| (3) | See Note 3 in the Notes to Financial Statements. |
| (4) | Includes realized gains (losses) as a result of in-kind redemptions. (See Note 4 in Notes to Financial Statements.) |
Amounts designated as “—” are either $0 or have been rounded to $0.
| | Statements of Operations | |
| | For the year ended November 30, 2021 | |
| | | Global X MLP ETF | | | Global X MLP & Energy Infrastructure ETF | | | Global X Conscious Companies ETF | |
| Investment Income: | | | | | | | | | |
| Distributions from Master Limited Partnerships | | $ | 74,400,953 | | | $ | — | | | $ | — | |
| Less: Return of Capital Distributions | | | (74,400,953 | ) | | | — | | | | — | |
| Dividend Income | | | 2,145,244 | | | | 13,669,311 | | | | 6,948,071 | |
| Interest Income | | | 179 | | | | 36 | | | | 33 | |
| Security Lending Income | | | — | | | | 23,926 | | | | — | |
| Less: Foreign Taxes Withheld | | | — | | | | (1,527,565 | ) | | | (16,765 | ) |
| Total Investment Income | | | 2,145,423 | | | | 12,165,708 | | | | 6,931,339 | |
Supervision and Administration Fees(1) | | | 4,040,677 | | | | 3,215,197 | | | | 2,088,608 | |
Custodian Fees(2) | | | 12,259 | | | | 9,629 | | | | 38 | |
| Net Expenses | | | 4,052,936 | | | | 3,224,826 | | | | 2,088,646 | |
| Net Investment Income (Loss), Before Taxes | | | (1,907,513 | ) | | | 8,940,882 | | | | 4,842,693 | |
| Tax Benefit/(Expense), net of valuation allowance | | | 166,972 | | | | – | | | | – | |
| Net Investment Income (Loss), Net of Taxes | | | (1,740,541 | ) | | | 8,940,882 | | | | 4,842,693 | |
| Net Realized Gain (Loss) on: | | | | | | | | | | | | |
Investments(3) | | | (24,709,425 | ) | | | 31,688,781 | | | | 81,365,114 | |
| Net Realized Gain (Loss) on Investments | | | (24,709,425 | ) | | | 31,688,781 | | | | 81,365,114 | |
| Net Change in Unrealized Appreciation on: | | | | | | | | | | | | |
| Investments | | | 262,177,887 | | | | 192,051,800 | | | | 18,829,589 | |
| Net Change in Unrealized Appreciation on Investments | | | 262,177,887 | | | | 192,051,800 | | | | 18,829,589 | |
| Net Realized and Unrealized Gain on Investments | | | 237,468,462 | | | | 223,740,581 | | | | 100,194,703 | |
| Net Increase in Net Assets Resulting from Operations | | $ | 235,727,921 | | | $ | 232,681,463 | | | $ | 105,037,396 | |
| (1) | The Supervision and Administration fees reflect the supervisory and administrative fee, which includes fees paid by the Funds for the investment advisory services provided by the Adviser. (See Note 3 in Notes to Financial Statements.) |
| (2) | See Note 2 in the Notes to Financial Statements. |
| (3) | Includes realized gains (losses) as a result of in-kind redemptions. (See Note 4 in Notes to Financial Statements.) |
Amounts designated as “—” are either $0 or have been rounded to $0.
| | Statements of Operations | |
| | For the year/period ended November 30, 2021 | |
| | | Global X Adaptive U.S. Factor ETF | | | Global X Adaptive U.S. Risk Management ETF* | | | Global X Founder-Run Companies ETF | |
| Investment Income: | | | | | | | | | |
| Dividend Income | | $ | 3,992,287 | | | $ | 935,340 | | | $ | 118,236 | |
| Interest Income | | | — | | | | 1 | | | | — | |
| Less: Foreign Taxes Withheld | | | (187 | ) | | | (199 | ) | | | — | |
| Total Investment Income | | | 3,992,100 | | | | 935,142 | | | | 118,236 | |
Supervision and Administration Fees(1) | | | 456,051 | | | | 260,736 | | | | 53,821 | |
Custodian Fees(2) | | | 422 | | | | — | | | | 15 | |
| Total Expenses | | | 456,473 | | | | 260,736 | | | | 53,836 | |
| Net Investment Income | | | 3,535,627 | | | | 674,406 | | | | 64,400 | |
| Net Realized Gain on: | | | | | | | | | | | | |
Investments(3) | | | 29,215,810 | | | | 12,780,557 | | | | 2,412,957 | |
| Net Realized Gain on Investments | | | 29,215,810 | | | | 12,780,557 | | | | 2,412,957 | |
| Net Change in Unrealized Appreciation (Depreciation) on: | | | | | | | | | | | | |
| Investments | | | 766,875 | | | | (1,443,327 | ) | | | (1,000,519 | ) |
| Net Change in Unrealized Appreciation (Depreciation) on Investments | | | 766,875 | | | | (1,443,327 | ) | | | (1,000,519 | ) |
| Net Realized and Unrealized Gain on Investments | | | 29,982,685 | | | | 11,337,230 | | | | 1,412,438 | |
| Net Increase in Net Assets Resulting from Operations | | $ | 33,518,312 | | | $ | 12,011,636 | | | $ | 1,476,838 | |
| * | The Fund commenced operations on January 12, 2021. |
| (1) | The Supervision and Administration fees reflect the supervisory and administrative fee, which includes fees paid by the Funds for the investment advisory services provided by the Adviser. (See Note 3 in Notes to Financial Statements.) |
| (2) | See Note 2 in the Notes to Financial Statements. |
| (3) | Includes realized gains (losses) as a result of in-kind redemptions. (See Note 4 in Notes to Financial Statements.) |
Amounts designated as “—” are either $0 or have been rounded to $0.
| | Statements of Changes in Net Assets | |
| | | |
| | | Global X Alternative Income ETF | | | Global X S&P 500® Quality Dividend ETF | |
| | | Year Ended November 30, 2021 | | | Year Ended November 30, 2020 | | | Year Ended November 30, 2021 | | | Year Ended November 30, 2020 | |
| Operations: | | | | | | | | | | | | |
| Net Investment Income | | $ | 1,089,075 | | | $ | 1,086,630 | | | $ | 222,968 | | | $ | 188,071 | |
Net Realized Gain (Loss) on Investments (1) | | | 3,066,455 | | | | (4,112,218 | ) | | | 1,519,036 | | | | 471,553 | |
| Net Change in Unrealized Appreciation (Depreciation) on Investments | | | 532,872 | | | | (823,634 | ) | | | (214,312 | ) | | | (252,255 | ) |
| Net Increase (Decrease) in Net Assets Resulting from Operations | | | 4,688,402 | | | | (3,849,222 | ) | | | 1,527,692 | | | | 407,369 | |
| Distributions | | | (1,353,663 | ) | | | (1,871,599 | ) | | | (224,212 | ) | | | (208,533 | ) |
| Return of Capital | | | (578,074 | ) | | | (218,100 | ) | | | — | | | | (950 | ) |
| Capital Share Transactions: | | | | | | | | | | | | | | | | |
| Issued | | | 21,228,614 | | | | 3,221,003 | | | | 7,407,813 | | | | 8,382,103 | |
| Redeemed | | | (7,637,384 | ) | | | (5,721,323 | ) | | | (5,396,072 | ) | | | (11,557,981 | ) |
| Increase (Decrease) in Net Assets from Capital Share Transactions | | | 13,591,230 | | | | (2,500,320 | ) | | | 2,011,741 | | | | (3,175,878 | ) |
| Total Increase (Decrease) in Net Assets | | | 16,347,895 | | | | (8,439,241 | ) | | | 3,315,221 | | | | (2,977,992 | ) |
| Net Assets: | | | | | | | | | | | | | | | | |
| Beginning of Year | | | 19,572,851 | | | | 28,012,092 | | | | 6,300,214 | | | | 9,278,206 | |
| End of Year | | $ | 35,920,746 | | | $ | 19,572,851 | | | $ | 9,615,435 | | | $ | 6,300,214 | |
| Share Transactions: | | | | | | | | | | | | | | | | |
| Issued | | | 1,600,000 | | | | 300,000 | | | | 240,000 | | | | 350,000 | |
| Redeemed | | | (570,000 | ) | | | (500,000 | ) | | | (180,000 | ) | | | (450,000 | ) |
| Net Increase (Decrease) in Shares Outstanding from Share Transactions | | | 1,030,000 | | | | (200,000 | ) | | | 60,000 | | | | (100,000 | ) |
| (1) | Includes realized gains (losses) as a result of in-kind redemptions. (See Note 4 in Notes to Financial Statements.) |
Amounts designated as “—” are either $0 or have been rounded to $0.
| | Statements of Changes in Net Assets | |
| | | |
| | | Global X U.S. Preferred ETF | | | Global X Variable Rate Preferred ETF | |
| | | Year Ended November 30, 2021 | | | Year Ended November 30, 2020 | | | Year Ended November 30, 2021 | | | Period Ended November 30, 2020(1) | |
| Operations: | | | | | | | | | | | | |
| Net Investment Income | | $ | 89,775,833 | | | $ | 37,998,789 | | | $ | 1,694,679 | | | $ | 57,108 | |
Net Realized Gain (Loss) on Investments (2) | | | 17,346,431 | | | | (6,299,727 | ) | | | 463,555 | | | | 84,037 | |
| Net Change in Unrealized Appreciation (Depreciation) on Investments | | | (54,576,713 | ) | | | 18,485,011 | | | | (2,428,772 | ) | | | 98,014 | |
| Net Increase (Decrease) in Net Assets Resulting from Operations | | | 52,545,551 | | | | 50,184,073 | | | | (270,538 | ) | | | 239,159 | |
| Distributions | | | (89,185,080 | ) | | | (37,989,950 | ) | | | (1,427,978 | ) | | | (49,000 | ) |
| Return of Capital | | | — | | | | — | | | | (167,337 | ) | | | — | |
| Capital Share Transactions: | | | | | | | | | | | | | | | | |
| Issued | | | 1,718,401,660 | | | | 520,184,945 | | | | 97,594,459 | | | | 2,485,001 | |
| Redeemed | | | (92,290,075 | ) | | | (248,979,070 | ) | | | (7,859,878 | ) | | | (1,326,519 | ) |
| Increase in Net Assets from Capital Share Transactions | | | 1,626,111,585 | | | | 271,205,875 | | | | 89,734,581 | | | | 1,158,482 | |
| Total Increase in Net Assets | | | 1,589,472,056 | | | | 283,399,998 | | | | 87,868,728 | | | | 1,348,641 | |
| Net Assets: | | | | | | | | | | | | | | | | |
| Beginning of Year/Period | | | 868,550,136 | | | | 585,150,138 | | | | 1,348,641 | | | | — | |
| End of Year/Period | | $ | 2,458,022,192 | | | $ | 868,550,136 | | | $ | 89,217,369 | | | $ | 1,348,641 | |
| Share Transactions: | | | | | | | | | | | | | | | | |
| Issued | | | 66,860,000 | | | | 21,150,000 | | | | 3,500,000 | | | | 100,000 | |
| Redeemed | | | (3,600,000 | ) | | | (10,500,000 | ) | | | (280,000 | ) | | | (50,000 | ) |
| Net Increase in Shares Outstanding from Share Transactions | | | 63,260,000 | | | | 10,650,000 | | | | 3,220,000 | | | | 50,000 | |
| (1) | The Fund commenced operations on June 22, 2020. |
| (2) | Includes realized gains (losses) as a result of in-kind redemptions. (See Note 4 in Notes to Financial Statements.) |
Amounts designated as “—” are either $0 or have been rounded to $0.
| | Statements of Changes in Net Assets | |
| | | |
| | | Global X MLP ETF | | | Global X MLP & Energy Infrastructure ETF | |
| | | Year Ended November 30, 2021 | | | Year Ended November 30, 2020 | | | Year Ended November 30, 2021 | | | Year Ended November 30, 2020 | |
| Operations: | | | | | | | | | | | | |
| Net Investment Income (Loss) | | $ | (1,740,541 | ) | | $ | (6,359,344 | ) | | $ | 8,940,882 | | | $ | 15,097,236 | |
Net Realized Gain (Loss) on Investments (1) | | | (24,709,425 | ) | | | (324,548,352 | ) | | | 31,688,781 | | | | (91,676,583 | ) |
| Net Change in Unrealized Appreciation (Depreciation) on Investments | | | 262,177,887 | | | | (4,748,459 | ) | | | 192,051,800 | | | | (34,621,560 | ) |
| Net Increase (Decrease) in Net Assets Resulting from Operations | | | 235,727,921 | | | | (335,656,155 | ) | | | 232,681,463 | | | | (111,200,907 | ) |
| Distributions | | | — | | | | — | | | | (22,548,205 | ) | | | (41,140,675 | ) |
| Return of Capital | | | (80,150,843 | ) | | | (95,194,445 | ) | | | (22,509,388 | ) | | | (6,129,052 | ) |
| Capital Share Transactions: | | | | | | | | | | | | | | | | |
| Issued | | | 237,875,194 | | | | 448,082,413 | | | | 226,639,862 | | | | 261,977,997 | |
| Redeemed | | | (88,093,480 | ) | | | (276,699,657 | ) | | | (214,515,108 | ) | | | (177,463,590 | ) |
| Increase in Net Assets from Capital Share Transactions | | | 149,781,714 | | | | 171,382,756 | | | | 12,124,754 | | | | 84,514,407 | |
| Total Increase (Decrease) in Net Assets | | | 305,358,792 | | | | (259,467,844 | ) | | | 199,748,624 | | | | (73,956,227 | ) |
| Net Assets: | | | | | | | | | | | | | | | | |
| Beginning of Year | | | 687,576,690 | | | | 947,044,534 | | | | 538,343,587 | | | | 612,299,814 | |
| End of Year | | $ | 992,935,482 | | | $ | 687,576,690 | | | $ | 738,092,211 | | | $ | 538,343,587 | |
| Share Transactions: | | | | | | | | | | | | | | | | |
| Issued | | | 6,810,000 | | | | 13,991,667 | | | | 6,860,000 | | | | 9,016,667 | |
| Redeemed | | | (2,970,000 | ) | | | (9,823,030 | ) | | | (5,950,000 | ) | | | (7,069,161 | ) |
| Net Increase in Shares Outstanding from Share Transactions | | | 3,840,000 | | | | 4,168,637 | | | | 910,000 | | | | 1,947,506 | |
| (1) | Includes realized gains (losses) as a result of in-kind redemptions. (See Note 4 in Notes to Financial Statements.) |
Amounts designated as “—” are either $0 or have been rounded to $0.
| | Statements of Changes in Net Assets | |
| | | |
| | | Global X Conscious Companies ETF | | | Global X Adaptive U.S. Factor ETF | |
| | | Year Ended November 30, 2021 | | | Year Ended November 30, 2020 | | | Year Ended November 30, 2021 | | | Year Ended November 30, 2020 | |
| Operations: | | | | | | | | | | | | |
| Net Investment Income | | $ | 4,842,693 | | | $ | 3,300,453 | | | $ | 3,535,627 | | | $ | 4,315,387 | |
Net Realized Gain (Loss) on Investments (1) | | | 81,365,114 | | | | 28,263,788 | | | | 29,215,810 | | | | (11,538,028 | ) |
| Net Change in Unrealized Appreciation (Depreciation) on Investments | | | 18,829,589 | | | | 53,212,614 | | | | 766,875 | | | | (1,379,090 | ) |
| Net Increase (Decrease) in Net Assets Resulting from Operations | | | 105,037,396 | | | | 84,776,855 | | | | 33,518,312 | | | | (8,601,731 | ) |
| Distributions | | | (4,254,673 | ) | | | (1,877,907 | ) | | | (4,080,634 | ) | | | (5,174,718 | ) |
| Return of Capital | | | — | | | | — | | | | (298,947 | ) | | | (635,325 | ) |
| Capital Share Transactions: | | | | | | | | | | | | | | | | |
| Issued | | | 333,414,724 | | | | 312,745,124 | | | | 37,224,536 | | | | 158,831,557 | |
| Redeemed | | | (182,932,213 | ) | | | (77,604,275 | ) | | | (38,840,101 | ) | | | (189,499,311 | ) |
| Increase (Decrease) in Net Assets from Capital Share Transactions | | | 150,482,511 | | | | 235,140,849 | | | | (1,615,565 | ) | | | (30,667,754 | ) |
| Total Increase (Decrease) in Net Assets | | | 251,265,234 | | | | 318,039,797 | | | | 27,523,166 | | | | (45,079,528 | ) |
| Net Assets: | | | | | | | | | | | | | | | | |
| Beginning of Year | | | 403,499,233 | | | | 85,459,436 | | | | 144,484,338 | | | | 189,563,866 | |
| End of Year | | $ | 654,764,467 | | | $ | 403,499,233 | | | $ | 172,007,504 | | | $ | 144,484,338 | |
| Share Transactions: | | | | | | | | | | | | | | | | |
| Issued | | | 10,500,000 | | | | 14,850,000 | | | | 1,400,000 | | | | 6,650,000 | |
| Redeemed | | | (5,890,000 | ) | | | (3,300,000 | ) | | | (1,440,000 | ) | | | (8,200,000 | ) |
| Net Increase (Decrease) in Shares Outstanding from Share Transactions | | | 4,610,000 | | | | 11,550,000 | | | | (40,000 | ) | | | (1,550,000 | ) |
| (1) | Includes realized gains (losses) as a result of in-kind redemptions. (See Note 4 in Notes to Financial Statements.) |
Amounts designated as “—” are either $0 or have been rounded to $0.
| | Statements of Changes in Net Assets | |
| | | |
| | | Global X Adaptive U.S. Risk Management ETF | | | Global X Founder-Run Companies ETF | |
| | | Period Ended November 30, 2021(1) | | | Year Ended November 30, 2021 | | | Year Ended November 30, 2020 | |
| Operations: | | | | | | | | | |
| Net Investment Income | | $ | 674,406 | | | $ | 64,400 | | | $ | 21,945 | |
Net Realized Gain (Loss) on Investments (2) | | | 12,780,557 | | | | 2,412,957 | | | | (1,120,416 | ) |
| Net Change in Unrealized Appreciation (Depreciation) on Investments | | | (1,443,327 | ) | | | (1,000,519 | ) | | | 942,221 | |
| Net Increase (Decrease) in Net Assets Resulting from Operations | | | 12,011,636 | | | | 1,476,838 | | | | (156,250 | ) |
| Distributions | | | (241,843 | ) | | | (67,743 | ) | | | (13,936 | ) |
| Capital Share Transactions: | | | | | | | | | | | | |
| Issued | | | 184,056,392 | | | | 14,648,680 | | | | 6,247,607 | |
| Redeemed | | | (91,251,695 | ) | | | (5,948,213 | ) | | | (4,444,963 | ) |
| Increase in Net Assets from Capital Share Transactions | | | 92,804,697 | | | | 8,700,467 | | | | 1,802,644 | |
| Total Increase in Net Assets | | | 104,574,490 | | | | 10,109,562 | | | | 1,632,458 | |
| Net Assets: | | | | | | | | | | | | |
| Beginning of Year/Period | | | — | | | | 5,732,255 | | | | 4,099,797 | |
| End of Year/Period | | $ | 104,574,490 | | | $ | 15,841,817 | | | $ | 5,732,255 | |
| Share Transactions: | | | | | | | | | | | | |
| Issued | | | 6,600,000 | | | | 430,000 | | | | 300,000 | |
| Redeemed | | | (3,100,000 | ) | | | (170,000 | ) | | | (300,000 | ) |
| Net Increase in Shares Outstanding from Share Transactions | | | 3,500,000 | | | | 260,000 | | | | — | |
| (1) | The Fund commenced operations on January 12, 2021. |
| (2) | Includes realized gains (losses) as a result of in-kind redemptions. (See Note 4 in Notes to Financial Statements.) |
Amounts designated as “—” are either $0 or have been rounded to $0.
Selected Per Share Data & Ratios
For a Share Outstanding Throughout the Period
| | | Net
Asset Value, Beginning
of Period
($) | | | Net Investment Income
($)* | | | Net Realized and Unrealized Gain (Loss) on Investments
($) | | | Total from Operations
($) | | | Distribution from Net Investment Income ($) | | | Distribution from Capital Gains ($) | | | Return of Capital ($) | |
| Global X Alternative Income ETF | | | | | | | | | | | | | | | | | | | | | |
| 2021 | | | 11.51 | | | | 0.49 | | | | 2.05 | | | | 2.54 | | | | (0.62 | ) | | | — | | | | (0.27 | ) |
| 2020 | | | 14.74 | | | | 0.66 | | | | (2.64 | ) | | | (1.98 | ) | | | (0.98 | ) | | | (0.15 | ) | | | (0.12 | ) |
| 2019 | | | 14.52 | | | | 0.94 | | | | 0.44 | | | | 1.38 | | | | (1.07 | ) | | | (0.09 | ) | | | — | |
| 2018 | | | 15.40 | | | | 0.92 | | | | (0.64 | ) | | | 0.28 | | | | (1.16 | ) | | | — | | | | — | |
| 2017 | | | 14.65 | | | | 1.04 | | | | 0.85 | | | | 1.89 | | | | (1.01 | ) | | | — | | | | (0.13 | ) |
Global X S&P 500® Quality Dividend ETF | | | | | | | | | | | | | | | | | | | | | | | | | | | | |
| 2021 | | | 25.20 | | | | 0.78 | | | | 5.84 | | | | 6.62 | | | | (0.80 | ) | | | — | | | | — | |
| 2020 | | | 26.51 | | | | 0.75 | | | | (1.24 | ) | | | (0.49 | ) | | | (0.82 | ) | | | — | | | | — | *** |
| 2019 | | | 24.60 | | | | 0.75 | | | | 1.89 | | | | 2.64 | | | | (0.73 | ) | | | — | | | | — | |
2018(1) | | | 25.00 | | | | 0.26 | | | | (0.44 | ) | | | (0.18 | ) | | | (0.22 | ) | | | — | | | | — | |
| Total from Distributions ($) | | | Net
Asset Value,
End of
Period ($) | | | Total Return (%)** | | | Net Assets End of Period ($)(000) | | | Ratio of Expenses to Average Net Assets (%) | | | Ratio of Net Investment Income to Average Net Assets (%) | | | Portfolio Turnover (%)†† | |
| | | | | | | | | | | | | | | | | | | | |
| | (0.89 | ) | | | 13.16 | | | | 22.52 | | | | 35,921 | | | 0.63 | ^‡‡
| | | 3.77 | | | | 86.85 | |
| | (1.25 | ) | | | 11.51 | | | | (13.13 | ) | | | 19,573 | | | | 0.75 | | | | 5.61 | | | | 52.78 | |
| | (1.16 | ) | | | 14.74 | | | | 9.89 | | | | 28,012 | | | | 0.75 | | | | 6.39 | | | | 18.16 | |
| | (1.16 | ) | | | 14.52 | | | | 1.89 | | | | 16,698 | | | | 0.75 | | | | 6.19 | | | | 18.32 | |
| | (1.14 | ) | | | 15.40 | | | | 13.24 | | | | 11,549 | | | | 0.75 | | | | 6.75 | | | | 34.84 | |
| | | | | | | | | | | | | | | | | | | | | | | | | | | |
| | (0.80 | ) | | | 31.02 | | | | 26.45 | | | | 9,615 | | | | 0.20 | | | | 2.60 | | | | 70.66 | |
| | (0.82 | ) | | | 25.20 | | | | (1.47 | ) | | | 6,300 | | | | 0.20 | | | | 3.27 | | | | 93.40 | |
| | (0.73 | ) | | | 26.51 | | | | 11.01 | | | | 9,278 | | | | 0.28 | ‡ | | | 2.99 | | | | 49.18 | |
| | (0.22 | ) | | | 24.60 | | | | (0.72 | ) | | | 2,460 | | | | 0.36 | † | | | 2.70 | † | | | 1.18 | |
| * | Per share data calculated using average shares method. |
| ** | Total Return is for the period indicated and has not been annualized. The return shown does not reflect the deduction of taxes that a shareholder would pay on Fund distributions or the redemption of Fund shares. |
| *** | Amount is less than $0.005. |
| ^ | Effective September 28, 2021, the fund’s fee were permanently lowered to 0.50%. |
| † | Annualized. |
| †† | Portfolio turnover rate is for the period indicated and periods of less than one year have not been annualized. Excludes effect of in-kind transfers. |
| ‡ | Effective April 1, 2019, the Fund’s fees were permanently lowered to 0.20%. Prior to April 1, 2019, the ratio of Expenses to Average Net Assets included the effect of a waiver. If these offsets were excluded, the ratio would have been 0.31% for the year ended November 30, 2019. |
| ‡‡ | The ratio of Expenses to Average Net Assets includes the effect of a reimbursement of acquired fund fees (See Note 3 in Notes to Financial Statements). If these offsets and acquired fund fees were excluded, the ratio would have been 0.70%. |
| (1) | The Fund commenced operations on July 13, 2018. |
Amounts designated as “—” are either $0 or have been rounded to $0.
Selected Per Share Data & Ratios
For a Share Outstanding Throughout the Period
| | | Net
Asset Value, Beginning
of Period
($) | | | Net Investment Income
($)* | | | Net Realized and Unrealized Gain (Loss) on Investments
($) | | | Total from Operations
($) | | | Distribution from Net Investment Income ($) | | | Distribution from Capital Gains ($) | | | Return of Capital ($) | |
| Global X U.S. Preferred ETF | | | | | | | | | | | | | | | | | | | | | |
| 2021 | | | 25.36 | | | | 1.28 | | | | (0.12 | ) | | | 1.16 | | | | (1.31 | ) | | | — | | | | — | |
| 2020 | | | 24.79 | | | | 1.33 | | | | 0.58 | | | | 1.91 | | | | (1.34 | ) | | | — | | | | — | |
| 2019 | | | 22.97 | | | | 1.36 | | | | 1.83 | | | | 3.19 | | | | (1.37 | ) | | | — | | | | — | |
| 2018 | | | 25.03 | | | | 1.44 | | | | (2.08 | ) | | | (0.64 | ) | | | (1.42 | ) | | | — | | | | — | |
2017(1) | | | 25.08 | | | | 0.44 | | | | (0.25 | ) | | | 0.19 | | | | (0.24 | ) | | | — | | | | — | |
| Global X Variable Rate Preferred ETF | | | | | | | | | | | | | | | | | | | | | | | | | | | | |
| 2021 | | | 26.97 | | | | 1.40 | | | | 0.37 | | | | 1.77 | | | | (1.29 | ) | | | (0.02 | ) | | | (0.15 | ) |
2020(2) | | | 24.85 | | | | 0.61 | | | | 2.00 | | | | 2.61 | | | | (0.49 | ) | | | — | | | | — | |
| Total from Distributions ($) | | | Net
Asset Value,
End of
Period ($) | | | Total Return (%)** | | | Net Assets End of Period ($)(000) | | | Ratio of Expenses to Average Net Assets (%) | | | Ratio of Net Investment Income to Average Net Assets (%) | | | Portfolio Turnover (%)†† | |
| | | | | | | | | | | | | | | | | | | | |
| | (1.31 | ) | | | 25.21 | | | | 4.61 | | | | 2,458,022 | | | 0.23 | ^^ | | | 4.99 | | | | 47.89 | |
| | (1.34 | ) | | | 25.36 | | | | 8.13 | | | | 868,550 | | | 0.23 | ^^ | | | 5.49 | | | | 39.14 | |
| | (1.37 | ) | | | 24.79 | | | | 14.25 | | | | 585,150 | | | | 0.24 | | | | 5.57 | | | | 32.93 | |
| | (1.42 | ) | | | 22.97 | | | | (2.72 | ) | | | 188,314 | | | | 0.23 | | | | 5.98 | | | | 42.90 | |
| | (0.24 | ) | | | 25.03 | | | | 0.75 | | | | 26,276 | | | | 0.23 | † | | | 8.01 | † | | | 3.82 | |
| | | | | | | | | | | | | | | | | | | | | | | | | | | |
| | (1.46 | ) | | | 27.28 | | | | 6.60 | | | | 89,217 | | | | 0.25 | | | | 5.01 | | | | 26.17 | |
| | (0.49 | ) | | | 26.97 | | | | 10.59 | | | | 1,349 | | | | 0.25 | † | | | 5.38 | † | | | 10.96 | |
| * | Per share data calculated using average shares method. |
| ** | Total Return is for the period indicated and has not been annualized. The return shown does not reflect the deduction of taxes that a shareholder would pay on Fund distributions or the redemption of Fund shares. |
| ^^ | Effective April 1, 2020, until April 1, 2021, the ratio of Expenses to Average Net Assets included the effect of a waiver. If these offsets were excluded, the ratio would have been 0.23%. |
| † | Annualized. |
| †† | Portfolio turnover rate is for the period indicated and periods of less than one year have not been annualized. Excludes effect of in-kind transfers. |
| (1) | The Fund commenced operations on September 11, 2017. |
| (2) | The Fund commenced operations on June 22, 2020. |
Amounts designated as “—” are either $0 or have been rounded to $0.
Selected Per Share Data & Ratios
For a Share Outstanding Throughout the Period
| | | Net
Asset Value, Beginning
of Period
($) | | | Net Investment Income (Loss)
($)* | | | Net Realized and Unrealized Gain (Loss) on Investments
($) | | | Total from Operations
($) | | | Distribution from Net Investment Income ($) | | | Distribution from Capital Gains ($) | | | Return of Capital ($) | |
| Global X MLP ETF | | | | | | | | | | | | | | | | | | | | | |
| 2021 | | | 26.73 | | | | (0.06 | ) | | | 9.97 | | | | 9.91 | | | | — | | | | — | | | | (3.05 | ) |
2020(1) | | | 43.92 | | | | (0.26 | ) | | | (13.13 | ) | | | (13.39 | ) | | | — | | | | — | | | | (3.80 | ) |
2019(1) | | | 51.24 | | | | (0.24 | ) | | | (2.76 | ) | | | (3.00 | ) | | | — | | | | — | | | | (4.32 | ) |
2018(1) | | | 56.52 | | | | (0.24 | ) | | | (0.42 | ) | | | (0.66 | ) | | | (0.12 | ) | | | — | | | | (4.50 | ) |
2017(1) | | | 67.44 | | | | (0.30 | ) | | | (5.88 | ) | | | (6.18 | ) | | | — | *** | | | — | | | | (4.74 | ) |
| Global X MLP & Energy Infrastructure ETF | | | | | | | | | | | | | | | | | | | | | | | | | | | | |
| 2021 | | | 26.59 | | | | 0.42 | | | | 9.97 | | | | 10.39 | | | | (1.05 | ) | | | — | | | | (1.04 | ) |
2020(2) | | | 33.45 | | | | 0.71 | | | | (5.33 | ) | | | (4.62 | ) | | | (1.95 | ) | | | — | | | | (0.29 | ) |
2019(2) | | | 36.39 | | | | 1.14 | | | | (1.89 | ) | | | (0.75 | ) | | | (2.01 | ) | | | — | | | | (0.18 | ) |
2018(2) | | | 38.40 | | | | 1.05 | | | | (1.11 | ) | | | (0.06 | ) | | | (1.56 | ) | | | — | | | | (0.39 | ) |
2017(2) | | | 44.46 | | | | 0.93 | | | | (4.62 | ) | | | (3.69 | ) | | | (2.16 | ) | | | — | | | | (0.21 | ) |
| Total from Distributions ($) | | | Net
Asset Value,
End of
Period ($) | | | Total Return (%)** | | | Net Assets End of Period ($)(000) | | | Ratio of Expenses to Average Net Assets (%) | | | Tax Expense/(Benefit) | | | Ratio of Net Investment Income (Loss) to Average Net Assets (%) | | | Portfolio Turnover (%)†† | |
| | | | | | | | | | | | | | | | | | | | | | | |
| | (3.05 | ) | | | 33.59 | | | | 37.49 | | | | 992,935 | | | | 0.43 | | | | (0.02 | )‡ | | | (0.19 | ) | | | 33.79 | |
| | (3.80 | ) | | | 26.73 | | | | (30.51 | ) | | | 687,577 | | | | 0.46 | | | | 0.46 | ‡ | | | (0.85 | ) | | | 33.78 | |
| | (4.32 | ) | | | 43.92 | | | | (6.54 | ) | | | 947,045 | | | | 0.46 | | | | — | ‡ | | | (0.46 | ) | | | 55.65 | |
| | (4.62 | ) | | | 51.24 | | | | (1.72 | ) | | | 828,622 | | | | 0.45 | | | | — | ‡ | | | (0.45 | ) | | | 30.35 | |
| | (4.74 | ) | | | 56.52 | | | | (9.85 | ) | | | 692,954 | | | | 0.35 | | | | (0.11 | )‡ | | | (0.46 | ) | | | 35.11 | |
| | | | | | | | | | | | | | | | | | | | | | | | | | | | | | | |
| | (2.09 | ) | | | 34.89 | | | | 39.64 | | | | 738,092 | | | | 0.45 | | | | — | | | | 1.25 | | | | 16.88 | |
| | (2.24 | ) | | | 26.59 | | | | (13.34 | ) | | | 538,344 | | | | 0.45 | | | | — | | | | 2.66 | | | | 35.86 | |
| | (2.19 | ) | | | 33.45 | | | | (2.34 | ) | | | 612,300 | | | | 0.45 | | | | — | | | | 3.03 | | | | 36.57 | |
| | (1.95 | ) | | | 36.39 | | | | (0.43 | ) | | | 540,381 | | | | 0.45 | | | | — | | | | 2.65 | | | | 25.68 | |
| | (2.37 | ) | | | 38.40 | | | | (8.71 | ) | | | 305,980 | | | | 0.45 | | | | — | | | | 2.20 | | | | 40.42 | |
| * | Per share data calculated using average shares method. |
| ** | Total Return is for the period indicated and has not been annualized. The return shown does not reflect the deduction of taxes that a shareholder would pay on Fund distributions or the redemption of Fund shares. |
| *** | Amount is less than $0.005. |
| †† | Portfolio turnover rate is for the period indicated and periods of less than one year have not been annualized. Excludes effect of in-kind transfers. |
| ‡ | The Before Net Deferred Tax Expense/(Benefit) ratios for the periods ending November 30, 2017, 2018, 2019, 2020, and 2021 was 0.46%, 0.45%, 0.46%, 0.45%, and 0.45%. |
| (1) | Per share amounts have been adjusted for a 1 for 6 reverse stock split on April 28, 2020 (see Note 9 in the Notes to Financial Statements). |
| (2) | Per share amounts have been adjusted for a 1 for 3 reverse share split on April 28, 2020 (See Note 9 in Notes to Financial Statements). |
Amounts designated as “—” are either $0 or have been rounded to $0.
Selected Per Share Data & Ratios
For a Share Outstanding Throughout the Period
| | | Net
Asset Value, Beginning
of Period
($) | | | Net Investment Income
($)* | | | Net Realized and Unrealized Gain (Loss) on Investments
($) | | | Total from Operations
($) | | | Distribution from Net Investment Income ($) | | | Distribution from Capital Gains ($) | | | Return of Capital ($) | |
| Global X Conscious Companies ETF | | | | | | | | | | | | | | | | | | | | | |
| 2021 | | | 26.46 | | | | 0.31 | | | | 6.49 | | | | 6.80 | | | | (0.29 | ) | | | — | | | | — | |
| 2020 | | | 23.10 | | | | 0.33 | | | | 3.32 | | | | 3.65 | | | | (0.27 | ) | | | (0.02 | ) | | | — | |
| 2019 | | | 20.55 | | | | 0.37 | | | | 2.68 | | | | 3.05 | | | | (0.50 | ) | | | — | | | | — | |
| 2018 | | | 19.23 | | | | 0.33 | | | | 1.22 | | | | 1.55 | | | | (0.23 | ) | | | — | | | | — | |
| 2017 | | | 15.79 | | | | 0.26 | | | | 3.33 | | | | 3.59 | | | | (0.15 | ) | | | — | | | | — | |
| Global X Adaptive U.S. Factor ETF | | | | | | | | | | | | | | | | | | | | | | | | | | | | |
| 2021 | | | 24.91 | | | | 0.61 | | | | 5.09 | | | | 5.70 | | | | (0.70 | ) | | | — | | | | (0.05 | ) |
| 2020 | | | 25.79 | | | | 0.63 | | | | (0.67 | ) | | | (0.04 | ) | | | (0.70 | ) | | | (0.05 | ) | | | (0.09 | ) |
| 2019 | | | 24.39 | | | | 0.89 | | | | 1.53 | | | | 2.42 | | | | (1.02 | ) | | | — | *** | | | — | |
2018(1) | | | 25.00 | | | | 0.22 | | | | (0.61 | ) | | | (0.39 | ) | | | (0.19 | ) | | | — | | | | (0.03 | ) |
| Global X Adaptive U.S. Risk Management ETF | | | | | | | | | | | | | | | | | | | | | | | | | | | | |
2021(2) | | | 24.95 | | | | 0.25 | | | | 4.77 | | | | 5.02 | | | | (0.09 | ) | | | — | | | | — | |
| Global X Founder-Run Companies ETF | | | | | | | | | | | | | | | | | | | | | | | | | | | | |
| 2021 | | | 28.66 | | | | 0.18 | | | | 5.94 | | | | 6.12 | | | | (0.34 | ) | | | — | | | | — | |
| 2020 | | | 20.50 | | | | 0.09 | | | | 8.14 | | | | 8.23 | | | | (0.07 | ) | | | — | | | | — | |
| 2019 | | | 18.63 | | | | 0.05 | | | | 2.12 | | | | 2.17 | | | | (0.07 | ) | | | (0.23 | ) | | | — | |
| 2018 | | | 17.41 | | | | 0.04 | | | | 1.45 | | | | 1.49 | | | | (0.04 | ) | | | (0.23 | ) | | | — | |
2017(3) | | | 15.02 | | | | 0.04 | | | | 2.35 | | | | 2.39 | | | | — | | | | — | | | | — | |
| Total from Distributions ($) | | | Net
Asset Value,
End of
Period ($) | | | Total Return (%)** | | | Net Assets End of Period ($)(000) | | | Ratio of Expenses to Average Net Assets (%) | | | Ratio of Net Investment Income to Average Net Assets (%) | | | Portfolio Turnover (%)†† | |
| | | | | | | | | | | | | | | | | | | | |
| | (0.29 | ) | | | 32.97 | | | | 25.84 | | | | 654,764 | | | | 0.43 | | | | 1.00 | | | | 22.92 | |
| | (0.29 | ) | | | 26.46 | | | | 16.01 | | | | 403,499 | | | | 0.43 | | | | 1.45 | | | | 48.73 | |
| | (0.50 | ) | | | 23.10 | | | | 15.35 | | | | 85,459 | | | | 0.43 | | | | 1.73 | | | | 34.97 | |
| | (0.23 | ) | | | 20.55 | | | | 8.16 | | | | 56,504 | | | | 0.43 | | | | 1.65 | | | | 36.35 | |
| | (0.15 | ) | | | 19.23 | | | | 22.95 | | | | 48,065 | | | | 0.43 | | | | 1.50 | | | | 41.77 | |
| | | | | | | | | | | | | | | | | | | | | | | | | | | |
| | (0.75 | ) | | | 29.86 | | | | 23.01 | | | | 172,008 | | | | 0.27 | | | | 2.09 | | | | 96.21 | |
| | (0.84 | ) | | | 24.91 | | | | 0.14 | | | | 144,484 | | | | 0.27 | | | | 2.78 | | | | 159.91 | |
| | (1.02 | ) | | | 25.79 | | | | 10.27 | | | | 189,564 | | | | 0.27 | | | | 3.63 | | | | 112.43 | |
| | (0.22 | ) | | | 24.39 | | | | (1.58 | ) | | | 102,438 | | | | 0.27 | † | | | 3.31 | † | | | 28.89 | |
| | | | | | | | | | | | | | | | | | | | | | | | | | | |
| | (0.09 | ) | | | 29.88 | | | | 20.13 | | | | 104,574 | | | | 0.39 | † | | | 1.01 | † | | | 30.10 | |
| | | | | | | | | | | | | | | | | | | | | | | | | | | |
| | (0.34 | ) | | | 34.44 | | | | 21.51 | | | | 15,842 | | | | 0.45 | | | | 0.54 | | | | 47.49 | |
| | (0.07 | ) | | | 28.66 | | | | 40.29 | | | | 5,732 | | | | 0.45 | | | | 0.39 | | | | 31.51 | |
| | (0.30 | ) | | | 20.50 | | | | 12.05 | | | | 4,100 | | | | 0.52 | | | | 0.29 | | | | 33.82 | |
| �� | (0.27 | ) | | | 18.63 | | | | 8.67 | | | | 4,657 | | | | 0.65 | | | | 0.13 | | | | 25.22 | |
| | — | | | | 17.41 | | | | 15.91 | | | | 3,483 | | | | 0.65 | † | | | 0.33 | † | | | 21.61 | |
| * | Per share data calculated using average shares method. |
| ** | Total Return is for the period indicated and has not been annualized. The return shown does not reflect the deduction of taxes that a shareholder would pay on Fund distributions or the redemption of Fund shares. |
| *** | Amount is less than $0.005. |
| † | Annualized. |
| †† | Portfolio turnover rate is for the period indicated and periods of less than one year have not been annualized. Excludes effect of in-kind transfers. |
| (1) | The Fund commenced operations on August 24, 2018. |
| (2) | The Fund commenced operations on January 12, 2021. |
| (3) | The Fund commenced operations on February 13, 2017. |
Amounts designated as “—” are either $0 or have been rounded to $0.
| | Notes to Financial Statements | |
| | November 30, 2021 | |
1. ORGANIZATION
The Global X Funds (the “Trust”) is a Delaware statutory trust formed on March 6, 2008. The Trust is registered under the Investment Company Act of 1940 (the “1940 Act”), as amended, as an open-end management investment company. As of November 30, 2021, the Trust had one hundred and two portfolios, eighty-nine of which were operational. The financial statements herein and the related notes pertain to the Global X Alternative Income ETF (formerly, Global X SuperDividend® Alternatives ETF), Global X S&P 500® Quality Dividend ETF, Global X U.S. Preferred ETF, Global X Variable Rate Preferred ETF, Global X MLP ETF, Global X MLP & Energy Infrastructure ETF, Global X Conscious Companies ETF, Global X Adaptive U.S. Factor ETF, Global X Adaptive U.S. Risk Management ETF, and Global X Founder-Run Companies ETF (each a “Fund” and collectively, the “Funds”). Each Fund, other than the Global X Alternative Income ETF, Global X U.S. Preferred ETF, Global X Founder-Run Companies ETF and Global X Conscious Companies ETF, has elected non-diversified status under the 1940 Act.
On October 15, 2021, the Global X TargetIncomeTM 5 ETF and TargetIncomeTM Plus 2 ETF were liquidated.
2. SIGNIFICANT ACCOUNTING POLICIES
The following is a summary of the significant accounting policies followed by the Funds:
USE OF ESTIMATES – The Funds are investment companies that apply the accounting and reporting guidance issued in Topic 946 by the U.S. Financial Accounting Standards Board. The preparation of financial statements in conformity with U.S. generally accepted accounting principles (“U.S. GAAP”) requires management to make estimates and assumptions that affect the reported amounts of assets and liabilities and disclosure of contingent assets and liabilities at the date of the financial statements and the reported amounts of increases and decreases in net assets from operations during the reporting period. Actual results could materially differ from those estimates.
RETURN OF CAPITAL ESTIMATES – Distributions received by the Funds from underlying master limited partnership (“MLP”) and real estate investment trust (“REIT”) investments generally are comprised of income and return of capital. The Funds record investment income and return of capital based on estimates made at the time such distributions are received. Such estimates are based on historical information available from the MLPs, REITs and other industry sources. These estimates may subsequently be revised based on information received from the MLPs and REITs after their tax reporting periods are concluded.
MLPs – Certain Funds may invest in MLPs in addition to other exchange-traded securities. MLPs are publicly-traded partnerships engaged in the transportation, storage and processing of minerals and natural resources. By confining their operations to these specific activities, their interests, or units, are able to trade on public securities exchanges exactly like the shares of a corporation, without entity-level taxation. To qualify as an
| | Notes to Financial Statements (continued) | |
| | November 30, 2021 | |
2. SIGNIFICANT ACCOUNTING POLICIES (continued)
MLP, and to not be taxed as a corporation, a partnership must receive at least 90% of its income from qualifying sources as set forth in Section 7704(d) of the Internal Revenue Code of 1986, as amended (the “Code”). These qualifying sources include natural resource-based activities, such as the processing, transportation and storage of mineral or natural resources. MLPs generally have two classes of owners, the general partner and limited partners. The general partner of an MLP is typically owned by a major energy company, an investment fund, the direct management of the MLP, or is an entity owned by one or more of such parties. The general partner may be structured as a private or publicly-traded corporation or other entity. The general partner typically controls the operations and management of the MLP through an up to 2% equity interest in the MLP plus, in many cases, ownership of common units and subordinated units.
Limited partners typically own the remainder of the partnership, through ownership of common units, and have a limited role in the partnership’s operations and management. MLPs are typically structured such that common units and general partner interests have first priority to receive quarterly cash distributions up to an established minimum amount (“minimum quarterly distributions” or “MQD”). Common and general partner interests also accrue arrearages in distributions to the extent the MQD is not paid. Once common and general partner interests have been paid, subordinated units receive distributions of up to the MQD; however, subordinated units do not accrue arrearages. Distributable cash in excess of the MQD is paid to both common and subordinated units and is distributed to both common and subordinated units generally on a pro rata basis. The general partner is also eligible to receive incentive distributions if the general partner operates the business in a manner which results in distributions paid per common unit surpassing specified target levels. As the general partner increases cash distributions to the limited partners, the general partner receives an increasingly higher percentage of the incremental cash distributions.
SECURITY VALUATION – Securities listed on a securities exchange, market or automated quotation system for which quotations are readily available (except for securities traded on the NASDAQ Stock Market (“NASDAQ”)), including securities traded over the counter, are valued at the last quoted sale price on the primary exchange or market (foreign or domestic) on which they are traded (or at approximately 4:00 pm Eastern Standard Time if a security’s primary exchange is normally open at that time), or, if there is no such reported sale, at the most recent mean between the quoted bid and asked prices (absent both bid and asked prices on such exchange, the bid price may be used).
For securities traded on NASDAQ, the NASDAQ Official Closing Price will be used. If available, debt securities are priced based upon valuations provided by independent, third-party pricing agents. Such values generally reflect the last reported sales price if the security is actively traded. The third-party pricing agents may also value debt securities at an evaluated bid price by employing methodologies that utilize actual market transactions, broker-supplied valuations, or other methodologies designed to identify the market value for such securities. Debt obligations with remaining maturities of sixty days
| | Notes to Financial Statements (continued) | |
| | November 30, 2021 | |
2. SIGNIFICANT ACCOUNTING POLICIES (continued)
or less may be valued at their amortized cost, which approximates market value. The prices for foreign securities are reported in local currency and converted to U.S. dollars using currency exchange rates as of the reporting date. The exchange rates used by the Trust for valuation are captured as of the New York or London close each day. Prices for most securities held in the Funds are provided daily by recognized independent pricing agents. If a security price cannot be obtained from an independent, third-party pricing agent, the Funds seek to obtain a bid price from at least one independent broker.
Securities for which market prices are not “readily available” are valued in accordance with fair value procedures (the “Fair Value Procedures”) established by the Board of Trustees (the “Board”) of the Trust. The Funds’ Fair Value Procedures are implemented through a fair value committee of the Trust (the “Committee”) designated by the Board. Some of the more common reasons that may necessitate that a security be valued using the Fair Value Procedures include: the security’s trading has been halted or suspended; the security has been de-listed from its primary trading exchange; the security’s primary trading market is temporarily closed at a time when, under normal conditions, it would be open; the security has not been traded for an extended period of time; the security’s primary pricing source is not able or willing to provide a price; or trading of the security is subject to local government-imposed restrictions. In addition, each Fund may fair value a security if an event that may materially affect the value of a Fund’s security that traded outside of the United States (a “Significant Event”) has occurred between the time of the security’s last close and the time that the Fund calculates its net asset value (“NAV”). A Significant Event may relate to a single issuer or to an entire market sector. Events that may be Significant Events include: government actions, natural disasters, armed conflict, acts of terrorism and significant market fluctuations. If Global X Management Company LLC, the Funds’ investment adviser (the “Adviser”), becomes aware of a Significant Event that has occurred with respect to a security or group of securities after the closing of the exchange or market on which the security or securities principally trade, but before the time at which the Funds calculate their NAV, it may request that a Committee meeting be called. When a security is valued in accordance with the Fair Value Procedures, the Committee will determine the value after taking into consideration all relevant information reasonably available to the Committee. As of November 30, 2021, there were no securities priced using the Fair Value Procedures.
In accordance with the authoritative guidance on fair value measurements and disclosure under U.S. GAAP, the Funds disclose the fair value of their investments in a hierarchy that prioritizes the inputs to valuation techniques used to measure the fair value. The objective of a fair value measurement is to determine the price that would be received to sell an asset or paid to transfer a liability in an orderly transaction between market participants at the measurement date (an exit price). Accordingly, the fair value hierarchy gives the highest priority to quoted prices (unadjusted) in active markets for identical assets or liabilities (Level 1) and the lowest priority to unobservable inputs (Level 3). The three levels of the fair value hierarchy are described below:
| | Notes to Financial Statements (continued) | |
| | November 30, 2021 | |
2. SIGNIFICANT ACCOUNTING POLICIES (continued)
Level 1 – Unadjusted quoted prices in active markets for identical, unrestricted assets or liabilities that the Funds have the ability to access at the measurement date;
Level 2 – Other significant observable inputs (including quoted prices in non-active markets, quoted prices for similar investments and fair value of investments for which the Funds have the ability to fully redeem tranches at NAV as of the measurement date or within the near term, and short-term investments valued at amortized cost); and
Level 3 – Significant unobservable inputs (including the Funds’ own assumptions in determining the fair value of investments, and fair value of investments for which the Funds do not have the ability to fully redeem tranches at NAV as of the measurement date or within the near term).
Investments are classified within the level of the lowest significant input considered in determining fair value. Investments classified within Level 3 whose fair value measurement considers several inputs may include Level 1 or Level 2 inputs as components of the overall fair value measurement.
The unobservable inputs used to determine fair value of Level 3 assets may have similar or diverging impacts on valuation. Significant increases and decreases in these inputs in isolation and interrelationships between those inputs could result in significantly higher or lower fair value measurement.
For the year ended November 30, 2021, there have been no significant changes to the Funds’ fair valuation methodologies.
DUE TO/FROM BROKERS — Due to/from brokers includes cash and collateral balances with the Funds’ clearing brokers or counterparties at November 30, 2021. The Funds continuously monitor the credit standing of each broker or counterparty with whom they conduct business. In the event a broker or counterparty is unable to fulfill its obligations, the Funds would be subject to counterparty credit risk.
REPURCHASE AGREEMENTS – Securities pledged as collateral for repurchase agreements by BNP Paribas are held by Brown Brothers Harriman & Co. (“BBH”), the Funds’ custodian (“Custodian”) and are designated as being held on each Fund’s behalf by the custodian under a book-entry system. Each Fund monitors the adequacy of the collateral on a daily basis and can require the seller to provide additional collateral in the event the market value of the securities pledged falls below the carrying value of the repurchase agreement, including accrued interest.
It is the Funds’ policy to only enter into repurchase agreements with banks and other financial institutions which are deemed by the Adviser to be creditworthy. The Funds bear the risk of loss in the event that the counterparty to a repurchase agreement defaults on its obligations, and the Funds are prevented from exercising their rights to dispose of the underlying securities received as collateral and the risk of a possible decline in the
| | Notes to Financial Statements (continued) | |
| | November 30, 2021 | |
2. SIGNIFICANT ACCOUNTING POLICIES (continued)
value of the underlying securities during the period. For financial statement purposes, the Funds record the securities lending collateral (included in repurchase agreements, at value or restricted cash) as an asset and the obligation to return securities lending collateral as a liability on the Statements of Assets and Liabilities.
Repurchase agreements are entered into by the Funds under Master Repurchase Agreements (“MRA”) which permit the Funds, under certain circumstances, including an event of default (such as bankruptcy or insolvency), to offset payables and/or receivables under an MRA with collateral held and/or posted to the counterparty, and create one single net payment due to or from the Funds.
As of November 30, 2021, the open repurchase agreements by counterparty which are subject to an MRA on a net payment basis are as follows:
| | | Repurchase Agreements* | | | Fair Value of Non-cash Collateral Received(1) | | | Cash Collateral Received | | | Net Amount(2) | |
| Global X Alternative Income ETF | | | | | | | | | | | | |
| BNP Paribas | | $ | 248,556 | | | $ | 248,556 | | | $ | – | | | $ | – | |
| Global X U.S. Preferred ETF | | | | | | | | | | | | | | | | |
| BNP Paribas | | | 31,717,816 | | | | 31,717,816 | | | | – | | | | – | |
| * | Repurchase agreements with an overnight and continuous maturity. |
(1) | Excess collateral received is not presented in the table above. Please refer to the Schedule of Investments for the market value of the collateral received for each Fund. |
(2) | Net Amount represents the net amount receivable due from the counterparty in the event of default. |
FEDERAL INCOME TAXES – It is each Fund’s intention, except for Global X MLP ETF, to qualify, or to continue to qualify, as a regulated investment company for Federal income tax purposes by complying with the appropriate provisions of Subchapter M of the Code. Accordingly, no provisions for federal income taxes have been made in the financial statements, except for Global X MLP ETF as described below.
The Funds evaluate tax positions taken or expected to be taken in the course of preparing the Funds’ tax returns to determine whether it is “more-likely-than-not” (i.e., greater than 50%) that each tax position will be sustained upon examination by a taxing authority based on the technical merits of the position. Tax positions not deemed to meet the more-likely-than-not threshold are recorded as a tax benefit or expense in the current year. The Funds did not record any tax positions in the current period. Management’s conclusions regarding tax positions may be subject to review and adjustment at a later date based on factors including, but not limited to, examination by tax authorities (i.e., the last three tax year ends, as applicable), and on-going analysis of and changes to tax laws and regulations, and interpretations thereof. If a Fund has foreign tax filings that have not been made, the tax years that remain subject to examination may date back to the inception of the Fund.
| | Notes to Financial Statements (continued) | |
| | November 30, 2021 | |
2. SIGNIFICANT ACCOUNTING POLICIES (continued)
As of and during the year ended November 30, 2021, the Funds did not have a liability for any unrecognized tax benefits. The Funds recognize interest and penalties, if any, related to unrecognized tax benefits as in income tax expense on the Statements of Operations. During the reporting period, the Funds did not incur any interest or penalties. The Funds are also not aware of any tax positions for which it is reasonably possible that the total amounts of unrecognized tax benefits will significantly change in the next 12 months.
Global X MLP ETF is taxed as a regular C‐corporation for federal income tax purposes and as such is obligated to pay federal and applicable state corporate income tax. Currently, the federal income tax rate for a corporation is 21%. This differs from most investment companies, which elect to be treated as “regulated investment companies” under Subchapter M of the Code in order to avoid paying entity level income taxes. Under current law, Global X MLP ETF is not eligible to elect treatment as regulated investment company due to its investments primarily in MLPs invested in energy assets. As a result, Global X MLP ETF will be obligated to pay applicable federal and state corporate income taxes on its taxable income as opposed to most other investment companies, which are not so obligated. Global X MLP ETF expects that a portion of the distributions that are received from MLPs may be treated as a tax‐deferred return of capital, thus reducing Global X MLP ETF’s current tax liability. However, the amount of taxes currently paid by Global X MLP ETF will vary depending on the amount of income and gains derived from investments and/or sales of MLP interests and such taxes have the potential to reduce an investor’s return from an investment in Global X MLP ETF.
SECURITY TRANSACTIONS AND INVESTMENT INCOME – Security transactions are accounted for on the trade date for financial reporting purposes. Costs used in determining realized gains and losses on the sale of investment securities are based on specific identification. Dividend income is recorded on the ex-dividend date. Interest income is recognized on the accrual basis from the settlement date.
FOREIGN CURRENCY TRANSACTIONS AND TRANSLATION – The books and records of the Funds are maintained in U.S. dollars. Investment securities and other assets and liabilities denominated in a foreign currency are translated into U.S. dollars on the date of valuation. Purchases and sales of investment securities, income and expenses are translated into U.S. dollars at the relevant rates of exchange prevailing on the respective dates of such transactions. The Funds do not isolate that portion of realized or unrealized gains and losses resulting from changes in the foreign exchange rate from fluctuations arising from changes in the market prices of the securities. These gains and losses are included in net realized and unrealized gains and losses on investments on the Statements of Operations. Net realized and unrealized gains and losses on foreign currency transactions and translations represent net foreign exchange gains or losses from foreign currency spot contracts, disposition of foreign currencies, currency gains or losses realized between trade and settlement dates on securities transactions and the difference between the amount of the investment income and foreign withholding taxes recorded on the Funds’ books and the U.S. dollar equivalent amounts actually received or paid.
| | Notes to Financial Statements (continued) | |
| | November 30, 2021 | |
2. SIGNIFICANT ACCOUNTING POLICIES (continued)
DIVIDENDS AND DISTRIBUTIONS TO SHAREHOLDERS – The Funds distribute their net investment income on a pro rata basis. Any net realized capital gains are distributed annually. All distributions are recorded on the ex-dividend date.
Cash distributions from MLPs to Global X MLP ETF that exceed the Global X MLP ETF’s allocable share of such MLP’s net taxable income are considered tax‐deferred return of capital that will reduce Global X MLP ETF’s adjusted tax basis in the equity securities of the MLP. These reductions in Global X MLP ETF’s adjusted tax basis in MLP equity securities will increase the amount of gain (or decrease the amount of loss) recognized by Global X MLP ETF on a subsequent sale of the securities. Global X MLP ETF will accrue deferred income taxes for any future tax liability associated with (i) that portion of MLP distributions considered to be a tax‐deferred return of capital as well as (ii) capital appreciation of its investments. Upon the sale of an MLP security, Global X MLP ETF may be liable for previously deferred taxes. Global X MLP ETF will rely to some extent on information provided by the MLPs, which may not necessarily be timely, to estimate deferred tax liability for purposes of financial statement reporting and determining Global X MLP ETF’s NAV. From time to time, the Adviser will modify the estimates or assumptions related to Global X MLP ETF’s deferred tax liabilities as new information becomes available. Global X MLP ETF will generally compute deferred income taxes based on the federal income tax rate applicable to corporations and an estimated rate attributable to state taxes.
INVESTMENTS IN REITs – With respect to the Funds, dividend income is recorded based on the income included in distributions received from REIT investments using published REIT reclassifications, including some management estimates when actual amounts are not available. Distributions received in excess of these estimated amounts are recorded as a reduction of the cost of investments or reclassified to capital gains. The actual amounts of income, return of capital, and capital gains are only determined by each REIT after its fiscal year end, and may differ from the estimated amounts.
CASH OVERDRAFT CHARGES – Per the terms of an agreement with the Custodian, if a Fund has a cash overdraft on a given day, it will be assessed an overdraft charge of LIBOR plus 2.00%. Cash overdraft charges are included in custodian fees on the Statements of Operations.
CREATION UNITS – The Funds issue and redeem their shares (“Shares”) on a continuous basis at NAV and only in large blocks of 10,000 Shares, referred to as “Creation Units”. Purchasers of Creation Units (“Authorized Participants”) at NAV must pay a standard creation transaction fee per transaction. The fee is a single charge and will be the same regardless of the number of Creation Units purchased by an Authorized Participant on the same day.
An Authorized Participant who holds Creation Units and wishes to redeem at NAV would also pay a standard redemption fee per transaction to BBH, on the date of such redemption, regardless of the number of Creation Units redeemed that day. If
| | Notes to Financial Statements (continued) | |
| | November 30, 2021 | |
2. SIGNIFICANT ACCOUNTING POLICIES (continued)
a Creation Unit is purchased or redeemed for cash, an additional variable fee may be charged. The following table discloses the Creation Unit breakdown:
| | | Creation Unit Shares | | | Creation Fee | | | Value at November 30, 2021 | | | Redemption Fee | |
| Global X Alternative Income ETF | | | 10,000 | | | $ | 300 | | | $ | 131,600 | | | $ | 300 | |
Global X S&P 500® Quality Dividend ETF | | | 10,000 | | | | 500 | | | | 310,200 | | | | 500 | |
| Global X U.S. Preferred ETF | | | 10,000 | | | | 650 | | | | 252,100 | | | | 650 | |
| Global X Variable Rate Preferred ETF | | | 10,000 | | | | 300 | | | | 272,800 | | | | 300 | |
| Global X MLP ETF | | | 10,000 | | | | 250 | | | | 335,900 | | | | 250 | |
| Global X MLP & Energy Infrastructure ETF | | | 10,000 | | | | 250 | | | | 348,900 | | | | 250 | |
| Global X Conscious Companies ETF | | | 10,000 | | | | 750 | | | | 329,700 | | | | 750 | |
| Global X Adaptive U.S. Factor ETF | | | 10,000 | | | | 700 | | | | 298,600 | | | | 700 | |
| Global X Adaptive U.S. Risk Management ETF | | | 10,000 | | | | 1,300 | | | | 298,800 | | | | 1,300 | |
| Global X Founder-Run Companies ETF | | | 10,000 | | | | 400 | | | | 344,400 | | | | 400 | |
3. RELATED PARTY AND SERVICE PROVIDER TRANSACTIONS
On July 2, 2018, the Adviser consummated a transaction pursuant to which it became an indirect, wholly-owned subsidiary of Mirae Asset Global Investments Co., Ltd. (“Mirae”). In this manner, the Adviser is ultimately controlled by Mirae, which is a leading financial services company in Korea and is the headquarters for the Mirae Asset Global Investments Group.
The Adviser serves as the investment adviser and the administrator for the Funds. Subject to the supervision of the Board, the Adviser is responsible for managing the investment activities of the Funds and the Funds’ business affairs and other administrative matters and provides or causes to be furnished all supervisory, administrative and other services reasonably necessary for the operation of the Funds, including certain distribution services (provided pursuant to a separate distribution agreement), certain shareholder and distribution-related services (provided pursuant to a separate Rule 12b-1 Plan and related agreements) and investment advisory services (provided pursuant to a separate investment advisory agreement), under what is essentially an “all-in” fee structure. For the Adviser’s services to the respective Funds, under a supervision and administration agreement (the “Supervision and Administration Agreement”), each fund pays a monthly fee to the Adviser at the annual rate below (stated as a percentage of the average daily net assets of the respective Fund) (the “Supervision and Administration Fee”). In addition, the Funds bear other expenses, directly and indirectly, that are not covered by the supervision and administration agreement, which may vary and affect the total expense ratios of the Funds, such as taxes, brokerage fees, commissions, acquired fund fees and expenses, and other transaction expenses, interest expenses and extraordinary expenses (such as litigation and indemnification expenses).
| | Notes to Financial Statements (continued) | |
| | November 30, 2021 | |
3. RELATED PARTY AND SERVICE PROVIDER TRANSACTIONS (continued)
The Supervision and Administration Agreement for the Global X Alternative Income ETF provides that the Adviser also bears the costs for acquired fund fees and expenses generated by investments by the Global X Alternative Income ETF in affiliated investment companies. For the year ended November 30, 2021, the Adviser paid the costs for the acquired fund fees of $20,773.
The following table discloses the rates of supervision and administration fees paid by the Funds pursuant to the Supervision and Administration Agreement:
| | | Supervision and Administration Fee | |
Global X Alternative Income ETF(1) | | 0.50% | |
Global X S&P 500® Quality Dividend ETF | | 0.20% | |
Global X U.S. Preferred ETF* | | 0.23% | |
| Global X Variable Rate Preferred ETF | | 0.25% | |
| Global X MLP ETF | | 0.45% | |
| Global X MLP & Energy Infrastructure ETF | | 0.45% | |
| Global X Conscious Companies ETF | | 0.43% | |
| Global X Adaptive U.S. Factor ETF | | 0.27% | |
| Global X Adaptive U.S. Risk Management ETF | | 0.39% | |
| Global X Founder-Run Companies ETF | | 0.45% | |
| (1) | Prior to September 28, 2021 the Supervision and Administration Fee was 0.75%. |
| * | Pursuant to an expense limitation agreement between the Global X U.S. Preferred ETF (the “Fund”) and the Adviser prior to April 1, 2021, the Adviser contractually agreed to waive or reimburse fees and/or limit annual fund expenses to the extent necessary to assure that the operating expenses of the Fund (exclusive of taxes, brokerage fees, commissions, and other transaction expenses, interest, and extraordinary expenses (such as litigation and indemnification expenses)) would not exceed 0.23% of the Fund’s average daily net assets until April 1, 2021. |
SEI Investments Global Funds Services (“SEIGFS”) serves as sub-administrator to the Funds. As sub-administrator, SEIGFS provides the Funds with required general administrative services, including, without limitation: office space, equipment, and personnel; clerical and general back office services; bookkeeping, internal accounting and secretarial services; the calculation of NAVs; and assistance with the preparation and filing of reports, registration statements, proxy statements and other materials required to be filed or furnished by the Funds under federal and state securities laws. As compensation for these services, SEIGFS receives certain out-of-pocket costs, transaction fees and asset-based fees which are accrued daily and paid monthly by the Adviser.
SEI Investments Distribution Co. (“SIDCO”) serves as the Funds’ underwriter and distributor of Creation Units pursuant to a distribution agreement. SIDCO has no obligation to sell any specific quantity of Fund Shares. SIDCO bears the following costs and expenses relating to the distribution of Shares: (1) the costs of processing and maintaining records of creations of Creation Units; (2) all costs of maintaining the
| | Notes to Financial Statements (continued) | |
| | November 30, 2021 | |
3. RELATED PARTY AND SERVICE PROVIDER TRANSACTIONS (continued)
records required of a registered broker/dealer; (3) the expenses of maintaining its registration or qualification as a dealer or broker under Federal or state laws; (4) filing fees; and (5) all other expenses incurred in connection with the distribution services as contemplated in the distribution agreement. SIDCO receives no fee from the Funds for its distribution services under the distribution agreement; rather, the Adviser compensates SIDCO for certain expenses, out-of-pocket costs, and transaction fees.
BBH serves as custodian and transfer agent of the Funds’ assets. As custodian, BBH has agreed to (1) make receipts and disbursements of money on behalf of the Funds; (2) collect and receive all income and other payments and distributions on account of the Funds’ portfolio investments; (3) respond to correspondence from shareholders, security brokers and others relating to its duties; and (4) make periodic reports to the Funds concerning the Funds’ operations. BBH does not exercise any supervisory function over the purchase and sale of securities. As transfer agent, BBH has agreed to (1) issue and redeem Shares of each Fund; (2) make dividend and other distributions to shareholders of each Fund; (3) respond to correspondence by shareholders and others relating to its duties; (4) maintain shareholder accounts; and (5) make periodic reports to the Funds. As compensation for these services, BBH receives certain out-of-pocket costs, transaction fees and asset-based fees which are accrued daily and paid monthly by the Adviser from its fees.
4. INVESTMENT TRANSACTIONS
For the year ended November 30, 2021, the purchases and sales of investments in securities, excluding in-kind transactions, long-term U.S. Government, and short-term securities were:
| | | | | | | |
| Global X Alternative Income ETF | | $ | 24,718,953 | | | $ | 25,671,250 | |
Global X S&P 500® Quality Dividend ETF | | | 13,315,004 | | | | 11,306,721 | |
| Global X U.S. Preferred ETF | | | 2,550,868,143 | | | | 939,643,445 | |
| Global X Variable Rate Preferred ETF | | | 106,587,960 | | | | 17,367,283 | |
| Global X MLP ETF | | | 529,895,130 | | | | 460,584,249 | |
| Global X MLP & Energy Infrastructure ETF | | | 341,973,363 | | | | 354,058,713 | |
| Global X Conscious Companies ETF | | | 113,226,712 | | | | 113,091,119 | |
| Global X Adaptive U.S. Factor ETF | | | 160,586,184 | | | | 159,872,490 | |
| Global X Adaptive U.S. Risk Management ETF | | | 25,206,592 | | | | 22,910,899 | |
| Global X Founder-Run Companies ETF | | | 5,668,267 | | | | 5,642,006 | |
| | Notes to Financial Statements (continued) | |
| | November 30, 2021 | |
4. INVESTMENT TRANSACTIONS (continued)
For the periods ended November 30, 2021 and November 30, 2020, in-kind transactions associated with creations and redemptions were, respectively:
2021
| | | Purchases | | | Sales and Maturities | | | Realized Gain/(Loss) | |
| Global X Alternative Income ETF | | $ | 21,175,789 | | | $ | 7,393,356 | | | $ | 1,667,754 | |
Global X S&P 500® Quality Dividend ETF | | | 7,401,975 | | | | 5,392,168 | | | | 1,425,312 | |
| Global X U.S. Preferred ETF | | | 1,707,913,454 | | | | 92,458,603 | | | | 7,162,067 | |
| Global X Variable Rate Preferred ETF | | | 97,475,320 | | | | 7,852,025 | | | | 409,395 | |
| Global X MLP ETF | | | 234,138,116 | | | | – | | | | – | |
| Global X MLP & Energy Infrastructure ETF | | | 224,593,293 | | | | 157,251,966 | | | | 48,544,868 | |
| Global X Conscious Companies ETF | | | 332,600,516 | | | | 182,457,442 | | | | 79,149,674 | |
| Global X Adaptive U.S. Factor ETF | | | 36,703,421 | | | | 39,042,509 | | | | 11,547,320 | |
| Global X Adaptive U.S. Risk Management ETF | | | 182,190,936 | | | | 91,441,692 | | | | 14,098,623 | |
| Global X Founder-Run Companies ETF | | | 14,657,602 | | | | 5,990,253 | | | | 2,619,762 | |
2020
| | | Purchases | | | Sales | | | Realized Gain/(Loss) | |
| Global X Alternative Income ETF | | $ | 3,217,688 | | | $ | 5,040,683 | | | $ | (384,435 | ) |
Global X S&P 500® Quality Dividend ETF | | | 8,364,729 | | | | 11,544,814 | | | | 1,162,033 | |
| Global X U.S. Preferred ETF | | | 517,546,492 | | | | 248,422,827 | | | | 7,241,591 | |
| Global X Variable Rate Preferred ETF | | | 2,484,728 | | | | 1,326,703 | | | | 81,942 | |
| Global X MLP ETF | | | 447,418,366 | | | | – | | | | – | |
| Global X MLP & Energy Infrastructure ETF | | | 261,376,336 | | | | 136,501,476 | | | | 15,168,807 | |
| Global X Conscious Companies ETF | | | 310,608,247 | | | | 77,589,333 | | | | 31,368,246 | |
| Global X Adaptive U.S. Factor ETF | | | 157,955,935 | | | | 188,910,310 | | | | 17,541,617 | |
| Global X Founder-Run Companies ETF | | | 6,242,948 | | | | 4,435,220 | | | | (1,104,663 | ) |
During the year ended November 30, 2021, there were no purchases or sales of long-term U.S. Government securities by the Funds.
5. TAX INFORMATION
Global X MLP ETF recognizes interest and penalties, if any, related to unrecognized tax benefits within the income tax expense line in the accompanying Statement of Operations. Accrued interest and penalties, if any, are included within the related tax liability line in the Statement of Assets and Liabilities. For the year ended November 30, 2021, Global X MLP ETF did not incur any interest or penalties.
Since Global X MLP ETF will be subject to taxation on its taxable income, the NAV of Global X MLP ETF shares will also be reduced by the accrual of any current and deferred tax liabilities.
| | Notes to Financial Statements (continued) | |
| | November 30, 2021 | |
5. TAX INFORMATION (continued)
Global X MLP ETF’s income tax expense/(benefit) consists of the following for the year ended November 30, 2021:
| | | Current MLP | | | Deferred MLP | | | Total MLP | |
| Federal | | $ | ( 2,906,395 | ) | | $ | 53,530,801 | | | $ | 50,624,406 | |
| State | | | (167,584 | ) | | | 6,031,561 | | | | 5,863,977 | |
| Valuation allowance | | | – | | | | (56,655,355 | ) | | | (56,655,355 | ) |
| Total tax expense (benefit) | | $ | (3,073,979 | ) | | $ | 2,907,007 | | | $ | (166,972 | ) |
Deferred income taxes reflect the net tax effect of temporary differences between the carrying amount of assets and liabilities for financial reporting and tax purposes.
Components of the Global X MLP ETF’s deferred tax assets and liabilities are as follows for the year ended November 30, 2021:
| | | MLP | |
| Deferred tax assets: | | | |
| Federal Net Operating Loss Carryforward | | $ | 16,715,431 | |
| State Net Operating Loss Carryforward | | | 2,275,089 | |
| Capital Loss Carryforward | | | 46,281,963 | |
| Other | | | 1,520,576 | |
| Less Valuation Allowance | | | (63,218,875 | ) |
| Net unrealized gain on investment securities | | | (6,481,191 | ) |
| Net Deferred Tax Asset/(Liability) | | $ | (2,907,007 | ) |
Global X MLP ETF reviews the recoverability of its deferred tax assets based upon the weight of available evidence. When assessing the recoverability of its deferred tax assets, significant weight was given to the effects of potential future realized and unrealized gains on investments and the period over which these deferred tax assets can be realized. Currently, any capital losses that may be generated by the Global X MLP ETF are eligible to be carried back up to three years and can be carried forward for five years to offset capital gains recognized by Global X MLP ETF in those years. The Tax Cuts and Jobs Act (TCJA) of 2017 eliminated the NOL carryback ability and replaced the 20 year carryforward period with an indefinite carryforward period for any NOLs arising in tax years beginning after December 31, 2017. The TCJA also established a limitation on the utilization of any NOLs generated in tax years beginning after December 31, 2017 to the lesser of the aggregate of available NOLs or 80% of taxable income before any NOL utilization. The 80% limitation established by the TCJA was effective for the NOLs generated in the fiscal period ending in November 30, 2019. The Coronavirus Aid,
| | Notes to Financial Statements (continued) | |
| | November 30, 2021 | |
5. TAX INFORMATION (continued)
Relief, and Economic Stability Act (CARES Act) was signed into law on March 27, 2020. The CARES Act delays the application of the 80% net operating loss limitation, established under the TCJA, to tax years ending November 30, 2022 and beyond. Currently, any net operating losses that may be generated by Global X MLP ETF are eligible to be carried forward indefinitely and are subject to the lesser of the aggregate of available net operating losses or 80% of taxable income before any net operating loss utilization.
Global X MLP ETF has estimated net operating loss carryforwards for federal tax income purposes as follows:
| | Year Ended | | Amount | | Expiration |
| Global X MLP ETF | | 11/30/2019 | | $ | 1,209,215 | | Indefinite |
| | 11/30/2021 | | | 78,388,073 | | Indefinite |
Global X MLP ETF has estimated capital loss carryforwards for federal income tax purposes as follows:
| | Year Ended | | Amount | | Expiration |
| Global X MLP ETF | | 11/30/2019 | | $ | 54,795,128 | | 11/30/2024 |
| | 11/30/2020 | | | 123,982,398 | | 11/30/2025 |
| | 11/30/2021 | | | 24,749,134 | | 11/30/2026 |
Global X MLP ETF had a capital loss carryforward expire unutilized in the current year in the amount of $9,483,687.
Based upon Global X MLP ETF’s assessment, it has been determined that it is not more likely than not that Global X MLP ETF’s deferred tax assets will be realized through future taxable income of the appropriate character. Accordingly, a valuation allowance has been established for Global X MLP ETF’s deferred tax assets. Global X MLP ETF will continue to assess the need for a valuation allowance in the future. Significant increases or declines in the fair value of its portfolio of investments may change Global X MLP ETF’s assessment of the recoverability of these assets and may result in the recording or removal of a valuation allowance against all or a portion of the Global X MLP ETF’s gross deferred tax assets.
Total income tax expense/(benefit) (current and deferred) during the year ended November 30, 2021, differs from the amount computed by applying the federal statutory income tax rate of 21% for Global X MLP ETF to net investment and realized and unrealized gain/(losses) on investment before taxes as follows:
| | Notes to Financial Statements (continued) | |
| | November 30, 2021 | |
5. TAX INFORMATION (continued)
For the year ended November 30, 2021:
| | | MLP | |
| Income tax (benefit) at statutory rate | | $ | 49,467,799 | | | | (21.00 | )% |
| State income taxes (net of federal benefit) | | | 4,098,761 | | | | (1.74 | )% |
| Permanent differences, net | | | (1,488,836 | ) | | | 0.63 | % |
| Effect of state tax rate change | | | 2,421,041 | | | | (1.03 | )% |
| Other adjustments | | | (166,972 | ) | | | (0.07 | )% |
| Capital Loss Carryforward Expiration | | | 2,156,590 | | | | (0.92 | )% |
| Change in valuation allowance | | | (56,655,355 | ) | | | 24.05 | % |
| Net income tax expense/(benefit) | | $ | (166,972 | ) | | | (0.08 | )% |
Global X MLP ETF recognizes the tax benefits of uncertain tax positions only where the position is “more likely than not” to be sustained assuming examination by tax authorities. Management has analyzed Global X MLP ETF’s tax positions, and has concluded that no liability for unrecognized tax benefits should be recorded related to uncertain tax positions taken on U.S. tax returns and state tax returns filed since inception of Global X MLP ETF. No U.S. federal or state income tax returns are currently under examination. The tax years ended November 30, 2020, 2019, and 2018, remain subject to examination by tax authorities in the United States. Due to the nature of Global X MLP ETF’s investments, Global X MLP ETF may be required to file income tax returns in several states. Global X MLP ETF is not aware of any tax positions for which it is reasonably possible that the total amounts of unrecognized tax benefits will change materially in the next 12 months.
State franchise taxes are separate and distinct from state income taxes. State franchise taxes are imposed on a corporation for the right to conduct business in the state and typically are based off the net worth or capital apportioned to a state. Due to the nature of Global X MLP ETF’s investments, Global X MLP ETF may be required to file franchise state tax returns in several states.
The amount and character of income and capital gain distributions to be paid, if any, are determined in accordance with Federal income tax regulations, which may differ from U.S. GAAP. As a result, net investment income (loss) and net realized gain (loss) on investment transactions for a reporting period may differ significantly from distributions during such period. These book/tax differences may be temporary or permanent. To the extent these differences are permanent in nature, they are charged or credited to undistributed net investment income (loss), accumulated net realized gain (loss) or paid-in capital, as appropriate, in the period that the differences arise.
| | Notes to Financial Statements (continued) | |
| | November 30, 2021 | |
5. TAX INFORMATION (continued)
The permanent differences primarily consist of REIT adjustments, reclassification of distributions, investments in publically traded partnerships, and preferred stock adjustments. The permanent differences that are credited or charged to Paid In Capital and distributable earnings are primarily related to redemptions in kind and return of capital distributions. These differences have been reclassified to/from the following accounts during the fiscal year ended November 30, 2021:
| Global X Funds | | Paid-in Capital | | | Distributable Earnings (Loss) | |
| Global X Alternative Income ETF | | $ | 729,191 | | | $ | (729,191 | ) |
Global X S&P 500® Quality Dividend ETF | | | 1,396,254 | | | | (1,396,254 | ) |
| Global X U.S. Preferred ETF | | | 7,627,321 | | | | (7,627,321 | ) |
| Global X Variable Rate Preferred ETF | | | 364,360 | | | | (364,360 | ) |
| Global X MLP & Energy Infrastructure ETF | | | 20,665,059 | | | | (20,665,059 | ) |
| Global X Conscious Companies ETF | | | 78,780,406 | | | | (78,780,406 | ) |
| Global X Adaptive U.S. Factor ETF | | | 7,658,763 | | | | (7,658,763 | ) |
| Global X Funds | | Paid-in Capital | | | Distributable Earnings (Loss) | |
| Global X Adaptive U.S. Risk Management ETF | | | 13,980,803 | | | | (13,980,803 | ) |
| Global X Founder-Run Companies ETF | | | 2,619,172 | | | | (2,619,172 | ) |
The tax character of dividends and distributions declared during the years or periods ended November 30, 2021 and November 30, 2020 were as follows:
| Global X Funds | | Ordinary Income | | | Long-Term Capital Gain | | | Return of Capital | | | Totals | |
| Global X Alternative Income ETF | | | | | | | | | | | | |
| 2021 | | $ | 1,353,663 | | | $ | – | | | $ | 578,074 | | | $ | 1,931,737 | |
| 2020 | | | 1,871,599 | | | | – | | | | 218,100 | | | | 2,089,699 | |
Global X S&P 500® Quality Dividend ETF | | | | | | | | | | | | | | | | |
| 2021 | | $ | 224,212 | | | $ | – | | | $ | – | | | $ | 224,212 | |
| 2020 | | | 208,533 | | | | – | | | | 950 | | | | 209,483 | |
| Global X U.S. Preferred ETF | | | | | | | | | | | | | | | | |
| 2021 | | $ | 89,185,080 | | | $ | – | | | $ | – | | | $ | 89,185,080 | |
| 2020 | | | 37,989,950 | | | | – | | | | – | | | | 37,989,950 | |
| Global X Variable Rate Preferred ETF | | | | | | | | | | | | | | | | |
| 2021 | | $ | 1,419,247 | | | $ | 8,731 | | | $ | 167,337 | | | $ | 1,595,315 | |
| 2020 | | | 49,000 | | | | – | | | | – | | | | 49,000 | |
| Global X MLP ETF | | | | | | | | | | | | | | | | |
| 2021 | | $ | – | | | $ | – | | | $ | 80,150,843 | | | $ | 80,150,843 | |
| 2020 | | | – | | | | – | | | | 95,194,445 | | | | 95,194,445 | |
| | Notes to Financial Statements (continued) | |
| | November 30, 2021 | |
5. TAX INFORMATION (continued)
| Global X Funds | | Ordinary Income | | | Long-Term Capital Gain | | | Return of Capital | | | Totals | |
| Global X MLP & Energy Infrastructure ETF | | | | | | | | | | | | |
| 2021 | | $ | 22,548,205 | | | $ | – | | | $ | 22,509,388 | | | $ | 45,057,593 | |
| 2020 | | | 41,140,675 | | | | – | | | | 6,129,052 | | | | 47,269,727 | |
| Global X Conscious Companies ETF | | | | | | | | | | | | | | | | |
| 2021 | | $ | 4,254,673 | | | $ | – | | | $ | – | | | $ | 4,254,673 | |
| 2020 | | | 1,788,344 | | | | 89,563 | | | | – | | | | 1,877,907 | |
| Global X Adaptive U.S. Factor ETF | | | | | | | | | | | | | | | | |
| 2021 | | $ | 4,080,634 | | | $ | – | | | $ | 298,947 | | | $ | 4,379,581 | |
| 2020 | | | 4,904,671 | | | | 270,047 | | | | 635,325 | | | | 5,810,043 | |
| Global X Adaptive U.S. Risk Management ETF | | | | | | | | | | | | | | | | |
| 2021 | | $ | 241,843 | | | $ | – | | | $ | – | | | $ | 241,843 | |
| Global X Founder-Run Companies ETF | | | | | | | | | | | | | | | | |
| 2021 | | $ | 67,743 | | | $ | – | | | $ | – | | | $ | 67,743 | |
| 2020 | | | 13,936 | | | | – | | | | – | | | | 13,936 | |
As of November 30, 2021, the components of tax basis distributable earnings (accumulated losses) were as follows:
| | | Global X Funds | |
| | | Global X Alternative Income ETF | | | Global X S&P 500® Quality Dividend ETF | | | Global X U.S. Preferred ETF | |
| Undistributed Ordinary Income | | $ | – | | | $ | 10,281 | | | $ | 3,624,949
| |
| Post October Losses | | | – | | | | – | | | | (128,026 | ) |
| Capital Loss Carryforwards | | | (1,558,399 | ) | | | (730,124 | ) | | | (3,804,050 | ) |
| Unrealized Appreciation (Depreciation) on Investments and Foreign Currency | | | (1,483,077 | ) | | | 191,741 | | | | (29,796,300 | ) |
| Other Temporary Differences | | | 6 | | | | (2 | ) | | | 2,349,001 | |
| Total Accumulated Losses | | $ | (3,041,470 | ) | | $ | (528,104 | ) | | $ | (32,452,408 | ) |
| | | Global X Funds | |
| | | Global X Variable Rate Preferred ETF | | | Global X MLP & Energy Infrastructure ETF | | | Global X Conscious Companies ETF | |
| Undistributed Ordinary Income | | $ | – | | | $ | – | | | $ | 2,654,223 | |
| Capital Loss Carryforwards | | | – |
| | | (150,385,884 | ) | | | (708,582 | ) |
| Unrealized Appreciation (Depreciation) on Investments and Foreign Currency | | | (2,346,296 | ) | | | 11,084,160 | | | | 85,029,185 | |
| Other Temporary Differences | | | 390,868 |
| | | (4 | ) | | | (1 | ) |
| Total Distributable Earnings (Accumulated Losses) | | $ | (1,955,428 | ) | | $ | (139,301,728 | ) | | $ | 86,974,825 | |
| | Notes to Financial Statements (continued) | |
| | November 30, 2021 | |
5. TAX INFORMATION (continued)
| | | Global X Funds | |
| | | Global X Adaptive U.S. Factor ETF | | | Global X Adaptive U.S. Risk Management ETF | | | Global X Founder-Run Companies ETF | |
| Undistributed Ordinary Income | | $ | – | | | $ | 436,746 | | | $ | 20,766 | |
| Capital Loss Carryforwards | | | (8,104,769 | ) | | | (4,152 | ) | | | (259,716 | ) |
| Unrealized Appreciation (Depreciation) on Investments and Foreign Currency | | | 8,370,349 | | | | (2,643,604 | ) | | | 49,942 | |
| Other Temporary Differences | | | (1 | ) | | | – | | | | (1 | ) |
| Total Distributable Earnings (Accumulated Losses) | | $ | 265,579 | | | $ | (2,211,010 | ) | | $ | (189,009 | ) |
For taxable years beginning after December 22, 2010, a Registered Investment Company within the meaning of the 1940 Act is permitted to carry forward net capital losses to offset capital gains realized in later years, and the losses carried forward retain their original character as either long-term or short-term losses. Losses carried forward under these provisions are as follows:
| Global X Funds | | Short-Term Loss | | | Long-Term Loss | | | Total | |
| Global X Alternative Income ETF | | $ | 148,924 | | | $ | 1,409,475 | | | $ | 1,558,399 | |
Global X S&P 500® Quality Dividend ETF | | | 586,335 | | | | 143,789 | | | | 730,124 | |
| Global X U.S. Preferred ETF | | | 3,804,050 | | | | – | | | | 3,804,050 | |
| Global X MLP & Energy Infrastructure ETF | | | 37,475,669 | | | | 112,910,215 | | | | 150,385,884 | |
| Global X Conscious Companies ETF | | | 47,728 | | | | 660,854 | | | | 708,582 | |
| Global X Adaptive U.S. Factor ETF | | | 6,644,209 | | | | 1,460,560 | | | | 8,104,769 | |
| Global X Adaptive U.S. Risk Management ETF | | | 4,152 | | | | – | | | | 4,152 | |
| Global X Founder-Run Companies ETF | | | 108,837 | | | | 150,879 | | | | 259,716 | |
During the year ended November 30, 2021 the following funds utilized capital loss carryforwards to offset capital gains amounting to:
| Global X Funds | | Short-Term Loss | | | Long-Term Loss | | | Total | |
| Global X Alternative Income ETF | | $ | 1,189,400 | | | $ | 303,233 | | | $ | 1,492,633 | |
Global X S&P 500® Quality Dividend ETF | | $ | 125,302 | | | $ | – | | | $ | 125,302 | |
| Global X U.S. Preferred ETF | | $ | 6.673,774 | | | $ | 3,210,236 | | | $ | 9,884,010 | |
| Global X Conscious Companies ETF | | $ | 1,759,802 | | | $ | 600,207 | | | $ | 2,360,009 | |
| Global X Adaptive U.S. Factor ETF | | $ | 11,111,880 | | | $ | 5,759,669 | | | $ | 16,871,549 | |
| | Notes to Financial Statements (continued) | |
| | November 30, 2021 | |
5. TAX INFORMATION (continued)
The adjusted cost basis of investments and aggregate gross unrealized appreciation and depreciation on investments held by the Funds at November 30, 2021 for federal income tax purposes, were as follows:
| Global X Funds | | Federal Tax Cost | | | Aggregated Gross Unrealized Appreciation | | | Aggregated Gross Unrealized Depreciation | | | Net Unrealized Appreciation (Depreciation) | |
| Global X Alternative Income ETF | | $ | 37,678,012 | | | $ | 1,259,406 | | | $ | (2,742,483 | ) | | $ | (1,483,077 | ) |
Global X S&P 500® Quality Dividend ETF | | | 9,393,834 | | | | 607,486 | | | | (415,745 | ) | | | 191,741 | |
| Global X U.S. Preferred ETF | | | 2,526,013,975 | | | | 32,267,646 | | | | (62,063,946 | ) | | | (29,796,300 | ) |
| Global X Variable Rate Preferred ETF | | | 90,912,302 | | | | 33,890 | | | | (2,380,186 | ) | | | (2,346,296 | ) |
| Global X MLP ETF | | | 965,658,405 | | | | 103,521,418 | | | | (75,018,728 | ) | | | 28,502,690 | |
| Global X MLP & Energy Infrastructure ETF | | | 726,310,008 | | | | 120,511,969 | | | | (109,427,809 | ) | | | 11,084,160 | |
| Global X Conscious Companies ETF | | | 568,550,740 | | | | 93,581,247 | | | | (8,552,062 | ) | | | 85,029,185 | |
| Global X Adaptive U.S. Factor ETF | | | 163,280,667 | | | | 13,908,559 | | | | (5,538,210 | ) | | | 8,370,349 | |
| Global X Adaptive U.S. Risk Management ETF | | | 107,022,158 | | | | 3,506,841 | | | | (6,150,445 | ) | | | (2,643,604 | ) |
| Global X Founder-Run Companies ETF | | | 15,770,739 | | | | 1,521,383 | | | | (1,471,441 | ) | | | 49,942 | |
The difference between book-basis and tax-basis unrealized appreciation (depreciation) is due to differences in the timing of recognition of gains and losses on investments for tax
and book purposes. The Funds’ net unrealized appreciation difference is attributable primarily to wash sales, mark-to-market treatment of passive foreign investment companies and adjustments in preferred stock and partnerships.
6. CONCENTRATION OF RISKS
The Funds may invest in securities in a particular asset class. Securities and other assets held in each Fund’s portfolio may underperform in comparison to the general securities markets, a particular securities market or other asset classes.
The Funds, except for Global X U.S. Preferred ETF and Global X Variable Rate Preferred ETF, use a replication strategy. A replication strategy is an indexing strategy that involves investing in the securities of an underlying index in approximately the same proportions as in the underlying its index. A representative sampling strategy is an indexing strategy that involves investing in a representative sample of securities (including indirect investments through underlying ETFs) that collectively has an investment profile similar to an underlying index in terms of key risk factors, performance attributes and other characteristics. Each Fund may utilize a representative sampling strategy with respect to its underlying index when a replication strategy might be detrimental to its shareholders, such as when there are practical difficulties or substantial costs involved in compiling a portfolio of equity securities to follow its underlying index, or, in certain instances, when securities in the underlying index become temporarily illiquid, unavailable or less liquid, or due to legal restrictions (such as diversification requirements that apply to a Fund but not its underlying index). The Global X U.S. Preferred ETF and Global X Variable Rate Preferred ETF, use a representative sampling strategy. Representative sampling is an indexing strategy that
| | Notes to Financial Statements (continued) | |
| | November 30, 2021 | |
6. CONCENTRATION OF RISKS (continued)
involves investing in a representative sample of securities that collectively has an investment profile similar to the Fund’s underlying index in terms of key risk factors, performance attributes and other characteristics. A more complete description of risks is included in each Fund’s prospectus and statement of additional information.
Each Fund may be subject to taxes imposed by countries in which they invest. Such taxes are generally based on either income or gains earned or repatriated. The Funds accrue and apply such taxes to net investment income, net realized gains and net unrealized gains as income and/or capital gains are earned.
The elimination of the London Inter-Bank Offered Rate (“LIBOR”) may adversely affect the interest rates on, and value of, certain Fund investments for which the value is tied to LIBOR. The U.K. Financial Conduct Authority has announced that it intends to stop compelling or inducing banks to submit LIBOR rates after 2021. On March 5, 2021, the administrator of LIBOR clarified that the publication of LIBOR on a representative basis will cease for the one-week and two-month U.S. dollar LIBOR settings immediately after
December 31, 2021, and for the remaining U.S. dollar LIBOR settings immediately after June 30, 2023. Alternatives to LIBOR are established or in development in most major currencies, including the Secured Overnight Financing Rate (“SOFR”), which is intended to replace U.S. dollar LIBOR. Markets are slowly developing in response to these new rates. Questions around liquidity impacted by these rates, and how to appropriately adjust these rates at the time of transition, remain a concern for the Funds. Accordingly, it is difficult to predict the full impact of the transition away from LIBOR on the Funds until new reference rates and fallbacks for both legacy and new products, instruments and contracts are commercially accepted.
Economic conditions, such as volatile currency exchange rates and interest rates, political events, military action and other conditions may, without prior warning, lead to foreign government intervention (including intervention by the U.S. government with respect to foreign governments, economic sectors, foreign companies and related securities and interests) and the imposition of capital controls (i.e., government measures designed to limit the flow of foreign capital in and out of the domestic economy) and/or sanctions, which may also include retaliatory actions of one government against another government, such as seizure of assets. Capital controls and/or sanctions include the prohibition of, or restrictions on, the ability to transfer currency, securities or other assets. Capital controls and/or sanctions may also impact the ability of a Fund to buy, sell or otherwise transfer securities or currency, negatively impact the value and/or liquidity of such instruments, adversely affect the trading market and price for Shares of a Fund, and cause a Fund to decline in value. Please refer to each Fund’s prospectus and statement of additional information (“SAI”) for a more complete description of risks.
| | Notes to Financial Statements (continued) | |
| | November 30, 2021 | |
7. LOANS OF PORTFOLIO SECURITIES
Each Fund may lend portfolio securities having a market value up to one-third of its total assets. Security loans made pursuant to a securities lending agreement with BBH are initially required to be secured by collateral equal to at least 102% of the value of domestic equity securities and American Depositary Receipts (“ADRs”) and 105% of the value of foreign equity securities (other than ADRs). Such collateral received in connection with these loans will be cash and can be invested in repurchase agreements, short-term investments or U.S. Treasury obligations and is recognized in the Schedules of Investments and Statements of Assets and Liabilities. The obligation to return securities lending collateral is also recognized as a liability in the Statements of Assets and Liabilities. It is the Funds’ policy to obtain additional collateral from or return excess collateral to the borrower by the end of the next business day, following the valuation date of the securities loaned. Therefore, the value of the collateral held may be temporarily less than the value of the securities on loan.
Lending securities entails a risk of loss to the Funds if and to the extent that the market values of the securities loaned were to increase and the borrower did not increase the collateral accordingly and the borrower failed to return the securities. In the event the borrower may not provide additional collateral when required or may not return the securities when due, the securities lending agency agreement requires the lending agent to indemnify the Funds by replacing either the security or the security’s current market value to the Funds. The Funds could also experience delays and costs gaining access to the collateral. The Funds bear the risk of any deficiency in the amount of the collateral available for return to the borrower due to any loss on the collateral invested.
| | Notes to Financial Statements (continued) | |
| | November 30, 2021 | |
7. LOANS OF PORTFOLIO SECURITIES (continued)
As of November 30, 2021, the following Funds had securities on loan, by counterparty:
| | | Market Value | | | Cash Collateral | |
| Global X Alternative Income ETF | | | | | | |
| BOFA Securities, Inc. | | $ | 50,500 | | | $ | 52,000 | |
| Citigroup | | | 1 8,060 | | | | 18,445 | |
| Scotia Capital | | | 5 6,760 | | | | 57,970 | |
| UBS AG London | | | 3 21,893 | | | | 331,617 | |
| Total | | $ | 447,213 | | | $ | 460,032 | |
| Global X U.S. Preferred ETF | | | | | | | | |
| Barclays Capital | | $ | 33,752,385 | | | $ | 35,527,900 | |
| BMO Capital Markets Corp. | | | 5,454 | | | | 5,590 | |
| BOFA Securities, Inc. | | | 1,814,450 | | | | 1,882,000 | |
| Citigroup | | | 7 3,920 | | | | 75,150 | |
| JPMorgan | | | 2,949,673 | | | | 3,048,225 | |
| Morgan Stanley | | | 108,910 | | | | 112,095 | |
| National Financial Services | | | 4,514,685 | | | | 4,623,635 | |
| TD Prime Services, LLC | | | 2,130,954 | | | | 2,186,630 | |
| Wells Fargo Securities, LLC | | | 10,930,455 | | | | 11,241,425 | |
| Total | | $ | 56,280,886 | | | $ | 58,702,650 | |
8. CONTRACTUAL OBLIGATIONS
The Funds enter into contracts in the normal course of business that contain a variety of indemnifications. The Funds’ maximum exposure under these arrangements is unknown; however, the Funds have not had prior gains or losses pursuant to these contracts. Management has reviewed the Funds’ existing contracts and expects the risk of loss to be remote.
Pursuant to the Trust’s organizational documents, the Trustees of the Trust and the Trust’s officers are indemnified against certain liabilities that may arise out of the performance of their duties.
9. REVERSE SHARE SPLIT
Effective April 28, 2020, the Global X MLP ETF executed a 1-for-6 reverse share split for shareholders of record after the close of markets on April 27, 2020. The effect of this transaction for the Fund was to divide the number of outstanding Shares of the Fund by six, resulting in a corresponding increase in the NAV per Share. The capital share activity presented in the statement of changes in net assets for each of the years in the period then ended, and per share data in the financial highlights for each of the years in the period then ended, have been given retroactive effect to reflect these reverse share splits. There were no changes in net assets, results of operations or total return as a result of these transactions.
| | Notes to Financial Statements (continued) | |
| | November 30, 2021 | |
9. REVERSE SHARE SPLIT (continued)
Effective April 28, 2020, the Global X MLP & Energy Infrastructure ETF executed a 1-for-3 reverse share split for shareholders of record after the close of markets on April 27, 2020. The effect of this transaction for the Fund was to divide the number of outstanding Shares of the Fund by three, resulting in a corresponding increase in the NAV per Share.
The capital share activity presented in the statement of changes in net assets for each of the years in the period then ended, and per share data in the financial highlights for each of the years in the period then ended, have been given retroactive effect to reflect these reverse share splits. There were no changes in net assets, results of operations or total return as a result of these transactions.
10. REGULATORY MATTERS
In December 2020, the SEC adopted a new rule providing a framework for fund valuation practices, Rule 2a-5 under the 1940 Act (“Rule 2a-5”). Rule 2a-5 establishes requirements for determining fair value in good faith for purposes of the 1940 Act. Rule 2a-5 will permit fund boards to designate certain parties to perform fair value determinations, subject to board oversight and certain other conditions. Rule 2a-5 also defines when market quotations are “readily available” for purposes of the 1940 Act and the threshold for determining whether a fund must fair value a security. In connection with the adoption of Rule 2a-5, the SEC also adopted related recordkeeping requirements and is rescinding previously issued guidance, including with respect to the role of a board in determining fair value and the accounting and auditing of fund investments. The Funds will be required to comply with Rule 2a-5 and the other requirements by September 8, 2022. Management is currently assessing the potential impact of the new rules on the Funds’ financial statements.
11. SUBSEQUENT EVENTS
On September 7, 2021, the Custodian announced that it entered into an agreement with State Street Bank and Trust Company (“State Street”) to sell BBH’s Investor Services business to State Street (the “Transaction”). The Transaction is subject to certain closing conditions, including regulatory and customary approvals, and it is expected to be consummated in the first quarter of 2022 (the “Closing Date”). Consequently, as a result of the Transaction, it is expected that State Street will replace BBH as the Funds’ custodian effective as of the Closing Date.
| | Notes to Financial Statements (concluded) | |
| | November 30, 2021 | |
11. SUBSEQUENT EVENTS (continued)
The Funds have been evaluated by management regarding the need for additional disclosures (other than what is disclosed in the preceding paragraph) and/or adjustments resulting from subsequent events. Based on this evaluation, no additional adjustments were required to the financial statements.
| | Report of Independent Registered Public Accounting Firm | |
| | | |
To the Board of Trustees and Shareholders of each of the ten funds indicated in the table below
Opinions on the Financial Statements
We have audited the accompanying statements of assets and liabilities, including the schedules of investments, of each of the funds listed in the table below (ten of the funds constituting Global X Funds, hereafter collectively referred to as the “Funds”) as of November 30, 2021, the related statements of operations and of changes in net assets for each of the periods indicated in the table below, including the related notes, and the financial highlights for each of the periods indicated therein (collectively referred to as the “financial statements”). In our opinion, the financial statements present fairly, in all material respects, the financial position of each of the Funds as of November 30, 2021, the results of each of their operations and the changes in each of their net assets for the periods indicated in the table below, and each of the financial highlights for each of the periods indicated therein, in conformity with accounting principles generally accepted in the United States of America.
| Global X MLP ETF (1) | Global X U.S. Preferred ETF (1) |
| Global X MLP & Energy Infrastructure ETF (1) | Global X S&P 500® Quality Dividend ETF (1) |
| Global X Alternative Income ETF (1) | Global X Adaptive U.S. Factor ETF (1) |
| Global X Conscious Companies ETF (1) | Global X Variable Rate Preferred ETF (2) |
| Global X Founder-Run Companies ETF (1) | Global X Adaptive U.S. Risk Management ETF (3) |
| 1. | Statement of operations for the year ended November 30, 2021, and statements of changes in net assets for each of the two years in the period ended November 30, 2021 |
| 2. | Statement of operations for the year ended November 30, 2021, and statements of changes in net assets for the year ended November 30, 2021 and the period June 22, 2020 (commencement of operations) through November 30, 2020 |
| 3. | Statement of operations and statement of changes in net assets for the period January 12, 2021 (commencement of operations) through November 30, 2021 |
| | Report of Independent Registered Public Accounting Firm | |
| | | |
Basis for Opinions
These financial statements are the responsibility of the Funds’ management. Our responsibility is to express an opinion on the Funds’ financial statements based on our audits. We are a public accounting firm registered with the Public Company Accounting Oversight Board (United States) (PCAOB) and are required to be independent with respect to the Funds in accordance with the U.S. federal securities laws and the applicable rules and regulations of the Securities and Exchange Commission and the PCAOB.
We conducted our audits of these financial statements in accordance with the standards of the PCAOB. Those standards require that we plan and perform the audit to obtain reasonable assurance about whether the financial statements are free of material misstatement, whether due to error or fraud.
Our audits included performing procedures to assess the risks of material misstatement of the financial statements, whether due to error or fraud, and performing procedures that respond to those risks. Such procedures included examining, on a test basis, evidence regarding the amounts and disclosures in the financial statements. Our audits also included evaluating the accounting principles used and significant estimates made by management, as well as evaluating the overall presentation of the financial statements. Our procedures included confirmation of securities owned as of November 30, 2021 by correspondence with the custodian, transfer agent and brokers; when replies were not received from brokers, we performed other auditing procedures. We believe that our audits provide a reasonable basis for our opinions.
/s/PricewaterhouseCoopers LLP
Philadelphia, Pennsylvania
January 27, 2022
We have served as the auditor of one or more investment companies in the Global X Funds since 2016.
| | Disclosure of Fund Expenses (unaudited) | |
| | | |
All exchange traded funds (“ETFs”) have operating expenses. As a shareholder of an ETF, your investment is affected by these ongoing costs, which include (among others) costs for ETF management, administrative services, commissions, and shareholder reports like this one. It is important for you to understand the impact of these costs on your investment returns. In addition, a shareholder is responsible for any brokerage fees as a result of his or her investment in the Fund. Shareholders may incur brokerage commissions on their purchases and sales of Fund shares, which are not reflected in the examples below.
Operating expenses such as these are deducted from an ETF’s gross income and directly reduce its final investment return. These expenses are expressed as a percentage of the ETF’s average net assets; this percentage is known as the ETF’s expense ratio.
The following examples use the expense ratio and are intended to help you understand the ongoing costs (in dollars) of investing in your Fund and to compare these costs with those of other funds. The examples are based on an investment of $1,000 made at the beginning of the six-month period shown and held for the entire period (June 1, 2021 to November 30, 2021).
The table below illustrates your Fund’s costs in two ways:
Actual Fund Return. This section helps you to estimate the actual expenses that your Fund incurred over the period. The “Expenses Paid During Period” column shows the actual dollar expense cost incurred by a $1,000 investment in the Fund, and the “Ending Account Value” number is derived from deducting that expense cost from the Fund’s gross investment return.
You can use this information, together with the actual amount you invested in the Fund, to estimate the expenses you paid over that period. Simply divide your actual account value by $1,000 to arrive at a ratio (for example, an $8,600 account value divided by $1,000 = 8.6), then multiply that ratio by the number shown for your Fund under “Expenses Paid During Period.”
Hypothetical 5% Return. This section helps you compare your Fund’s costs with those of other funds. It assumes that the Fund had an annual 5% return before expenses during the year, but that the expense ratio (Column 3) for the period is unchanged. This example is useful in making comparisons because the Securities and Exchange Commission requires all funds to make this 5% calculation. You can assess your Fund’s comparative cost by comparing the hypothetical result for your Fund in the “Expenses Paid During Period” column with those that appear in the same charts in the shareholder reports for other funds.
NOTE: Because the return is set at 5% for comparison purposes — NOT your Fund’s actual return — the account values shown may not apply to your specific investment.
| | Disclosure of Fund Expenses (unaudited) | |
| | | |
| | | Beginning Account Value 6/1/2021 | | | Ending Account Value 11/30/2021 | | | Annualized Expense Ratios | | | Expenses Paid During Period(1) | |
| Global X Alternative Income ETF | | | | | | | | | | | | |
| Actual Fund Return | | $ | 1,000.00 | | | $ | 1,008.60 | | | | 0.54 | % | | $ | 2.72 | |
| Hypothetical 5% Return | | | 1,000.00 | | | | 1,022.36 | | | | 0.54 | | | | 2.74 | |
| | | | | | | | | | | | | | | | | |
Global X S&P 500® Quality Dividend ETF | | | | | | | | | | | | | | | | |
| Actual Fund Return | | $ | 1,000.00 | | | $ | 996.80 | | | | 0.20 | % | | $ | 1.00 | |
| Hypothetical 5% Return | | | 1,000.00 | | | | 1,024.07 | | | | 0.20 | | | | 1.01 | |
| | | | | | | | | | | | | | | | | |
| Global X U.S. Preferred ETF | | | | | | | | | | | | | | | | |
| Actual Fund Return | | $ | 1,000.00 | | | $ | 1,004.20 | | | | 0.23 | % | | $ | 1.16 | |
| Hypothetical 5% Return | | | 1,000.00 | | | | 1,023.92 | | | | 0.23 | | | | 1.17 | |
| | | | | | | | | | | | | | | | | |
| Global X Variable Rate Preferred ETF | | | | | | | | | | | | | | | | |
| Actual Fund Return | | $ | 1,000.00 | | | $ | 1,001.80 | | | | 0.25 | % | | $ | 1.25 | |
| Hypothetical 5% Return | | | 1,000.00 | | | | 1,023.82 | | | | 0.25 | | | | 1.27 | |
| | | | | | | | | | | | | | | | | |
| Global X MLP ETF | | | | | | | | | | | | | | | | |
| Actual Fund Return | | $ | 1,000.00 | | | $ | 947.00 | | | | 0.42 | % | | $ | 2.05 | |
| Hypothetical 5% Return | | | 1,000.00 | | | | 1,022.96 | | | | 0.42 | | | | 2.13 | |
| | | | | | | | | | | | | | | | | |
| Global X MLP & Energy Infrastructure ETF | | | | | | | | | | | | | | | | |
| Actual Fund Return | | $ | 1,000.00 | | | $ | 1,028.40 | | | | 0.45 | % | | $ | 2.29 | |
| Hypothetical 5% Return | | | 1,000.00 | | | | 1,022.81 | | | | 0.45 | | | | 2.28 | |
| | | | | | | | | | | | | | | | | |
| Global X Conscious Companies ETF | | | | | | | | | | | | | | | | |
| Actual Fund Return | | $ | 1,000.00 | | | $ | 1,078.60 | | | | 0.43 | % | | $ | 2.24 | |
| Hypothetical 5% Return | | | 1,000.00 | | | | 1,022.91 | | | | 0.43 | | | | 2.18 | |
| | | | | | | | | | | | | | | | | |
| Global X Adaptive U.S. Factor ETF | | | | | | | | | | | | | | | | |
| Actual Fund Return | | $ | 1,000.00 | | | $ | 999.20 | | | | 0.27 | % | | $ | 1.35 | |
| Hypothetical 5% Return | | | 1,000.00 | | | | 1,023.72 | | | | 0.27 | | | | 1.37 | |
| | | | | | | | | | | | | | | | | |
| Global X Adaptive U.S. Risk Management ETF | | | | | | | | | | | | | | | | |
| Actual Fund Return | | $ | 1,000.00 | | | $ | 1,093.90 | | | | 0.39 | % | | $ | 2.05 | |
| Hypothetical 5% Return | | | 1,000.00 | | | | 1,023.11 | | | | 0.39 | | | | 1.98 | |
| | | | | | | | | | | | | | | | | |
| Global X Founder-Run Companies ETF | | | | | | | | | | | | | | | | |
| Actual Fund Return | | $ | 1,000.00 | | | $ | 1,040.20 | | | | 0.45 | % | | $ | 2.30 | |
| Hypothetical 5% Return | | | 1,000.00 | | | | 1,022.81 | | | | 0.45 | | | | 2.28 | |
(1) | Expenses are equal to the Fund’s annualized expense ratio multiplied by the average account value over the period, multiplied by 183/365 (to reflect the one-half year period.) |
| | Approval of Investment Advisory Agreement (unaudited) | |
| | | |
Section 15(c) of the Investment Company Act of 1940, as amended (“1940 Act”), requires that the board of trustees of an exchange-traded fund (“ETF”), including a majority of those trustees who are not “interested persons” of the ETF, as defined in the 1940 Act (“Independent Trustees”), consider on an initial basis and periodically thereafter (as required by the 1940 Act), at an in person meeting called for such purpose, the terms of each ETF’s investment advisory agreement and whether to approve entering into, or renewing, each agreement.
At a Board meeting of the Trust held via videoconference November 12, 20211, called for such purpose, the Board (including the Trust’s Independent Trustees, voting separately) considered and unanimously approved the continuation of (i) the Investment Advisory Agreement (“Renewal Investment Advisory Agreement”) for each Fund included in this Annual Report (each, a “Renewal Fund”); (ii) the Supervision and Administration Agreements between the Trust (“Renewal Supervision and Administration Agreements”), on behalf of each Renewal Fund, and Global X Management. The Renewal Investment Advisory Agreement and the Renewal Supervision and Administration Agreements are referred to herein as the “Renewal Agreements.”
In advance of the Board meetings, the Board (including the Trust’s Independent Trustees) and the Independent Trustees’ independent legal counsel requested (in writing) detailed information from Global X Management in connection with the Board’s consideration of the Renewal Agreements , and received and reviewed written responses from Global X Management as well as supporting materials relating to those requests for information. In the course of their consideration of the Renewal Agreements, the Trust’s Independent Trustees were advised by their independent legal counsel and, in addition to meetings with management of Global X Management, the Independent Trustees met separately in executive sessions with their counsel.
RENEWAL AGREEMENTS
In determining to approve the continuation of the Renewal Agreements for the Renewal Funds, the Board considered a variety of factors, including the factors discussed in greater detail below.
Nature, Extent and Quality of Services
With respect to this factor, the Board considered:
| ● | the terms of the Renewal Agreements and the range of services that would continue to be provided to each Renewal Fund in accordance with the Renewal Agreements; |
| ● | Global X Management’s key personnel and the portfolio managers who would continue to provide investment advisory, supervision and administrative services to each Renewal Fund; |
1 | This meeting was held via videoconference in reliance on an exemptive order issued by the Securities and Exchange Commission on March 25, 2020. Reliance on the exemptive order is necessary and appropriate due to circumstances related to current or potential effects of COVID-19. All Trustees participating in the telephonic meeting were able to hear each other simultaneously during the meeting. Reliance on the exemptive order requires Trustees, including a majority of the Independent Trustees, to ratify actions taken pursuant to the exemptive order by vote cast at the next in-person meeting. |
| | Approval of Investment Advisory Agreement (unaudited) (continued) | |
| | | |
| ● | Global X Management’s responsibilities under the Renewal Agreements, among other things, to: (i) manage the investment operations of the Renewal Funds and the composition of the Renewal Funds’ assets, including the purchase, retention and disposition of their holdings, (ii) provide quarterly reports to the Trust’s officers and the Board and other reports as the Board deems necessary or appropriate, (iii) vote proxies, exercise consents, and exercise all other rights relating to securities and assets held by the Renewal Funds, (iv) select broker-dealers to execute portfolio transactions for the Renewal Funds when necessary, (v) assist in the preparation and filing of reports and proxy statements (if any) to the shareholders of the Renewal Funds, and the periodic updating of the registration statement, prospectuses, statements of additional information, and other reports and documents for the Renewal Funds that are required to be filed by the Trust with the SEC and other regulatory and governmental bodies, and (vi) monitor anticipated purchases and redemptions of the shares (including Creation Units) of the Renewal Funds by shareholders and new investors; |
| ● | the nature, extent and quality of all of the services (including advisory, administrative and compliance services) that have been provided by Global X Management or made available to the Renewal Funds; and |
| ● | the quality of Global X Management’s resources and personnel that would continue to be made available to the Renewal Funds, including Global X Management’s experience and the professional qualifications of Global X Management’s key personnel. |
Based on these considerations, the Board concluded that it was satisfied with the nature, extent and quality of the services provided to the Renewal Funds by Global X Management.
Performance
The Board considered the performance of each Renewal Fund. They examined the performance of the Renewal Funds for the one-year, three-year, five-year and since-inception periods, as applicable. Also, the Board considered the total return and investments performance of the Renewal Funds relative to (i) the performance of unaffiliated comparable ETFs and/or other registered funds, which performance information is publicly available from such registered funds, as well as other third party sources; and (ii) the performance of pertinent indexes. The Board considered instances of under-performance and over-performance with respect to the competitor funds. The Board also considered the Renewal Funds’ tracking against their underlying indexes in absolute terms.
Based on these considerations and comparisons, the Board concluded that the investment performance of the Renewal Funds did not adversely affect the Board’s approval of the continuance of the Renewal Agreements.
Cost of Services and Profitability
The Board considered Global X Management’s cost to provide investment management, supervision and administrative and related services to the Renewal Funds. In this regard,
| | Approval of Investment Advisory Agreement (unaudited) (continued) | |
| | | |
the Board considered the management fee (“Management Fee”) that has been borne or is expected to be borne by the Renewal Funds under the Renewal Agreements for the various investment advisory, supervisory and administrative services that the Renewal Funds require under a unitary fee structure (including the types of fees and expenses that are not included within the unitary fee and would be borne by the Renewal Funds).
In addition, the Board considered expected profitability to Global X Management, as applicable, from all services provided or expected to be provided to the Renewal Funds and all aspects of Global X Management’s relationship with the Renewal Funds. In connection with these considerations, Global X Management provided the Board with financial information regarding its operations and the services provided to the Renewal Funds and discussed with the Board its current and expected, as applicable, profitability with respect to the Renewal Funds.
Based on these considerations, the Board concluded that the Management Fee rate paid by the Renewal Funds to Global X Management, in light of the nature, extent and quality of the services provided, was reasonable and in the best interests of the Renewal Funds’ shareholders.
Comparison of Fees and Services
With respect to this factor, the Board considered:
| ● | comparative information with respect to the Management Fee paid to Global X Management by the Renewal Funds. In connection with this consideration, Global X Management provided the Board with comparative expense data for the Renewal Funds, including fees and expenses paid by unaffiliated similar specialized and/or focused ETFs and/or other comparable registered funds. The Board considered the Global X Management’s detailed explanation of the fee structures of any Renewal Fund that was above the average or median for its peer group; |
| ● | the structure of the unitary Management Fee (which includes as one component the investment advisory fee for the Renewal Funds) and the current total expense ratios for the Renewal Funds. In this regard, the Board took into consideration that the purpose of adopting a unitary Management Fee structure for the Renewal Funds was to create a simple, all-inclusive fee that would provide a level of predictability with respect to the overall expense ratio (i.e., the total fees) of the Renewal Funds and that the proposed Management Fees for the Renewal Funds were set at a competitive levels to make the Renewal Funds viable in the marketplace; and |
| ● | that, under the unified Management Fee structure, Global X Management is responsible for most ordinary expenses of the Renewal Funds, including the costs of various third-party services required by the Renewal Funds, including investment advisory, administrative, audit, certain custody, portfolio accounting, legal, transfer agency and printing costs, but that the Renewal Funds would bear other expenses not covered under the proposed all-inclusive Management Fee, such as taxes, brokerage fees, commissions, and other transaction expenses, interest expenses, and extraordinary expenses. |
| | Approval of Investment Advisory Agreement (unaudited) (concluded) | |
| | | |
Based on these considerations, the Board concluded that the services received and the fees charged under the Renewal Agreements were reasonable on a comparative basis.
Economies of Scale
With respect to this factor, the Board considered:
| ● | the extent to which economies of scale would be realized as the Renewal Funds grow and whether the unitary Management Fee for the Renewal Funds reflected these economies of scale; |
| ● | the significant investment of time, personnel and other resources that Global X Management has made and intends to continue to make in the Renewal Funds in order to seek to assure that the Renewal Funds are attractive to investors; and |
| ● | that the unitary Management Fee would provide a high level of certainty as to the total level of expenses for the Renewal Funds and their shareholders. |
Based on these considerations, the Board concluded that the unitary Management Fee for the Renewal Funds appropriately addressed economies of scale.
Other Benefits
In considering the Renewal Agreements, in addition to the factors above, the Board considered any other benefits realized by Global X Management as a result of its relationships with the Renewal Funds and concluded that, in the exercise of the Board’s business judgement, all information the Board considered supported approval of the continuation of the Renewal Agreements.
Conclusion
After full consideration of the factors above, as well as other factors that were instructive in its consideration, the Board, including all of the Trust’s Independent Trustees voting separately, concluded, in the exercise of its business judgement, that the Renewal Agreements were fair and reasonable and in the best interest of each Renewal Fund.
In reaching this decision, the Board did not assign relative weights to the factors above nor did the Board deem any one factor or group of them to be controlling in and of themselves. Each member of the Board may have assigned different weights to the various factors.
| | Supplemental Information (unaudited) | |
| | | |
Net asset value, or “NAV”, is the price per Share at which a Fund issues and redeems Shares. It is calculated in accordance with the standard formula for valuing mutual fund shares. The “Market Price” of a Fund generally is determined using the midpoint between the highest bid and the lowest offer on the stock exchange on which the Shares of the Fund are listed for trading, as of the time that the Fund’s NAV is calculated. The Fund’s Market Price may be at, above or below its NAV. The NAV of a Fund will fluctuate with changes in the market value of the Fund’s holdings. The Market Price of a Fund will fluctuate in accordance with changes in their NAV, as well as market supply and demand.
Premiums or discounts are the differences (expressed as a percentage) between the NAV and Market Price of a Fund on a given day, generally at the time NAV is calculated. A premium is the amount that a Fund is trading above the reported NAV, expressed as a percentage of the NAV. A discount is the amount that a Fund is trading below the reported NAV, expressed as a percentage of the NAV.
Further information regarding premiums and discounts is available on the Funds’ website at www.globalxetfs.com.
| | Trustees and Officers of the Trust (unaudited) | |
| | | |
Set forth below are the names, addresses, years of birth, position with the Trust, term of office and length of time served, the principal occupations for the last five years, number of Funds in the Trust overseen by each Trustee, and other directorships outside the fund complex of each of the persons currently serving as Trustees and Officers of the Trust.
The Trust’s Statement of Additional Information includes additional information about the Trustees and Officers. The SAI may be obtained without charge by calling 1-888-493-8631.
| Name, Address (Year of Birth) | Position(s) Held with Trust | Principal Occupation(s) During the Past 5 Years | Number of Funds in Trust Overseen by Trustee | Other Directorships Held by Trustees |
Independent Trustees1 | | | | |
Charles A. Baker 605 Third Avenue, 43rd Floor New York, NY 10158 (1953) | Trustee (since 07/2018) | Chief Executive Officer of Investment Innovations LLC (investment consulting) (since 2013); Managing Director of NYSE Euronext (2003 to 2012). | 1022 | Trustee of OSI ETF Trust (since 2016). |
Susan M. Ciccarone 605 Third Avenue, 43rd Floor New York, NY 10158 (1973) | Trustee (since 9/30/2019) | Partner, Further Global Capital Management (private equity) (since 2017); formerly Chief Operating Officer (2014-2016) and Chief Financial Officer (2012-2016), Emerging Global Advisors, LLC (ETF issuer). | 1022 | Chairman, Payment Alliance International, Inc. (since 2019); Director, Casa Holdco LP, parent of Celink (since 2018). |
Clifford J. Weber 605 Third Avenue, 43rd Floor New York, NY 10158 (1963) | Trustee (since 07/2018) | Owner, Financial Products Consulting Group LLC (consulting services to financial institutions) (since 2015); formerly, Executive Vice President of Global Index and Exchange-Traded Products, NYSE Market, Inc., a subsidiary of Intercontinental Exchange (ETF/ETP listing exchange) (2013-2015). | 1022 | Chairman (since 2017) and Trustee (since 2015) of Clough Funds Trust; Chairman and Trustee of Clayton Street Trust (since 2016); Chairman and Trustee of Janus Detroit Street Trust (since 2016); Chairman and Trustee of Elevation ETF Trust (2016-2018); Trustee of Clough Global Equity Fund (since 2017); Trustee of Clough Global Dividend and Income Fund (since 2017); and Trustee of Clough Global Opportunities Fund (since 2017). |
| | Trustees and Officers of the Trust (unaudited) | |
| | | |
| Name, Address (Year of Birth) | Position(s) Held with Funds | Principal Occupation(s) During the Past 5 Years | Number of Funds in Trust Overseen by Trustee | Other Directorships Held by Trustees |
Interested Trustee / Officers1 | | | | |
Luis Berruga 605 Third Avenue, 43rd Floor New York, NY 10158 (1977) | Trustee (since 07/2018); President (since 2018) | Chief Executive Officer, GXMC (since 07/2018), Chief Financial Officer (since 2/2014) and Chief Operating Officer (9/2015 - 7/2018); Investment Banker, Jefferies (2012-2014). | 1022 | None. |
John Belanger 605 Third Avenue, 43rd Floor New York, NY 10158 (1982) | Chief Operating Officer and Chief Financial Officer (since 12/2020) | Chief Operating Officer and Head of Portfolio Management & Portfolio Administration, GXMC (since 12/2020); Portfolio Manager (since 12/2020); Secretary of the Trust (3/2020-9/2020); Head of Product Management, GXMC (since 1/2020); Consultant to GXMC (9/2018-12/2019); Chief Operating Officer, Rex Shares, LLC (2014-2018). | N/A | N/A |
Susan Lively 605 Third Avenue, 43rd Floor New York, NY 10158 (1981) | Secretary (since 9/2020) | General Counsel, GXMC (since 9/2020); Senior Corporate Counsel at Franklin Templeton (previously, Managing Director and Associate General Counsel at Legg Mason & Co., LLC) (2014-2020). | N/A | N/A. |
Eric Griffith3 One FreedomValley Drive Oaks, PA 19456 (1969) | Assistant Secretary (since 2/2020) | Counsel, SEI Investments (since 10/2019); Vice President and Assistant General Counsel, JPMorgan Chase & Co. (2012-2018). | N/A | N/A. |
Joe Costello 605 Third Avenue, 43rd Floor New York, NY 10158 (1974) | Chief Compliance Officer (since 9/2016) | Chief Compliance Officer, FlexShares Funds (2011-2015); Vice President, Northern Trust Investments (2003 - 2015). | N/A | N/A |
Ronnie Riven 605 Third Avenue, 43rd Floor New York, NY 10158 (1984) | Treasurer and Principal Accounting Officer (since 12/2020) | Director of Finance, GXMC (since 2018); Director of Accounting and Finance at Barclays Center (2016-2018); Manager of External Reporting at National Grid (2013-2015). | N/A | N/A |
| | Trustees and Officers of the Trust (unaudited) | |
| | | |
Name, Address (Year of Birth) | Position(s) Held with Funds | Principal Occupation(s) During the Past 5 Years | Number of Funds in Trust Overseen by Trustee | Other Directorships Held by Trustees |
Interested Trustee / Officers1 | | | | |
Eric Olsen3 One FreedomValley Drive Oaks, PA 19456 (1970) | Assistant Treasurer (since 5/2021) | Director of Accounting, SEI Investment Manager Services (March 2021 to present); formerly Deputy Head of Fund Operations, Traditional Assets, Aberdeen Standard Investments (2013-2021). | N/A | N/A |
1 | Each Trustee serves until his or her successor is duly elected or appointed and qualified. |
2 | As of November 30, 2021, the Trust had one hundred and two investment portfolios, eighty-nine of which were operational. |
3 | This officer of the Trust also serves as an officer of one or more funds for which SEI Investments Company or an affiliate acts as investment manager, administrator or distributor. |
| | Notice to Shareholders (unaudited) | |
| | | |
For shareholders that do not have a November 30, 2021 tax year end, this notice is for informational purposes only. For shareholders with a November 30, 2021 tax year end, please consult your tax advisor as to the pertinence of this notice. For the fiscal year ended November 30, 2021, the Funds have designated the following items with regard to distributions paid during the year.
| | | Long-Term Capital Gain Distributions | | | Ordinary Income Distributions | | | Return of Capital | | | Total Distributions | | | Qualifying for Corporate Dividends Received Deduction(1) | | | Qualifying Dividend Income(2) | |
| Global X Alternative Income ETF | | | 0.00 | % | | | 57.30 | % | | | 42.70 | % | | | 100.00 | % | | | 59.55 | % | | | 55.66 | % |
Global X S&P 500® Quality Dividend ETF | | | 0.00 | % | | | 100.00 | % | | | 0.00 | % | | | 100.00 | % | | | 86.52 | % | | | 93.43 | % |
| Global X U.S. Preferred ETF | | | 0.00 | % | | | 100.00 | % | | | 0.00 | % | | | 100.00 | % | | | 73.22 | % | | | 74.87 | % |
| Global X Variable Rate Preferred ETF | | | 0.61 | % | | | 87.67 | % | | | 11.72 | % | | | 100.00 | % | | | 91.50 | % | | | 94.76 | % |
| Global X MLP ETF | | | 0.00 | % | | | 0.00 | % | | | 100.00 | % | | | 100.00 | % | | | 0.00 | % | | | 0.00 | % |
| Global X MLP & Energy Infrastructure ETF | | | 0.00 | % | | | 50.04 | % | | | 49.96 | % | | | 100.00 | % | | | 9.34 | % | | | 54.08 | % |
| Global X Conscious Companies ETF | | | 0.00 | % | | | 100.00 | % | | | 0.00 | % | | | 100.00 | % | | | 100.00 | % | | | 100.00 | % |
| Global X Adaptive U.S. Factor ETF | | | 0.00 | % | | | 92.67 | % | | | 7.33 | % | | | 100.00 | % | | | 77.16 | % | | | 83.47 | % |
| Global X Adaptive U.S. Risk Management ETF | | | 0.00 | % | | | 100.00 | % | | | 0.00 | % | | | 100.00 | % | | | 100.00 | % | | | 100.00 | % |
| Global X Founder-Run Companies Preferred ETF | | | 0.00 | % | | | 100.00 | % | | | 0.00 | % | | | 100.00 | % | | | 58.66 | % | | | 58.34 | % |
(1) | Qualifying dividends represent dividends which qualify for the corporate dividends received deduction and is reflected as a percentage of ordinary income distributions (the total of short term capital gain and net investment income distributions). |
(2) | The percentage in this column represents the amount of “Qualifying Dividend Income” as created by the Jobs and Growth Relief Reconciliation Act of 2003 and is reflected as a percentage of ordinary income distributions (the total of short term capital gain and net investment income distributions). It is the intention of the Funds to designate the maximum amount permitted by law. |
| | Notice to Shareholders (unaudited) | |
| | | |
| | | U.S. Government Interest(3) | | | Interest Related Dividends(4) | | | Short Term Capital Gain Dividends(5) | | | Qualifying Business Income(6) | | | Foreign Tax Credit | |
| Global X Alternative Income ETF | | | 0.00 | % | | | 0.35 | % | | | 0.00 | % | | | 0.00 | % | | | 0.00 | % |
Global X S&P 500® Quality Dividend ETF | | | 0.00 | % | | | 0.00 | % | | | 0.00 | % | | | 2.29 | % | | | 0.00 | % |
| Global X U.S. Preferred ETF | | | 0.00 | % | | | 1.44 | % | | | 0.00 | % | | | 0.31 | % | | | 0.00 | % |
| Global X Variable Rate Preferred ETF | | | 0.00 | % | | | 1.11 | % | | | 100.00 | % | | | 0.00 | % | | | 0.00 | % |
| Global X MLP ETF | | | 0.00 | % | | | 0.00 | % | | | 0.00 | % | | | 0.00 | % | | | 0.00 | % |
| Global X MLP & Energy Infrastructure ETF | | | 0.00 | % | | | 0.23 | % | | | 0.00 | % | | | 49.52 | % | | | 0.00 | % |
| Global X Conscious Companies ETF | | | 0.00 | % | | | 0.00 | % | | | 0.00 | % | | | 0.00 | % | | | 0.00 | % |
| Global X Adaptive U.S. Factor ETF | | | 0.00 | % | | | 0.00 | % | | | 0.00 | % | | | 11.54 | % | | | 0.00 | % |
| Global X Adaptive U.S. Risk Management ETF | | | 0.00 | % | | | 0.00 | % | | | 0.00 | % | | | 0.00 | % | | | 0.00 | % |
| Global X Founder-Run Companies ETF | | | 0.00 | % | | | 0.00 | % | | | 0.00 | % | | | 0.00 | % | | | 0.00 | % |
(3) | “U.S. Government Interest” represents the amount of interest that was derived from U.S. Government obligations and distributed during the fiscal year. Generally, interest from direct U.S. Government obligations is exempt from state income tax. However, for shareholders who are residents of California, Connecticut and New York, the statutory threshold requirements were not satisfied to permit exemption of these amounts from state income. |
(4) | The percentage in this column represents the amount of “Qualifying Interest Income” as created by the American Jobs Creation Act of 2004 and is a percentage of net investment income that is exempt from U.S. withholding tax when paid for foreign investors. |
(5) | The percentage of this column represents the amount of “Short Term Capital Gain Dividend’’ and is reflected as a percentage of short term capital gain distribution that is exempted from U.S. withholding tax when paid to foreign investors. |
(6) | The percentage of this column represents that amount of ordinary dividend income that qualified for 20% Business Income Deduction. |
The information reported herein may differ from the information and distributions taxable to the shareholders for the calendar year ending December 31, 2021. Complete information will be computed and reported in conjunction with your 2021 Form 1099-DIV.
605 3rd Avenue, 43rd Floor
New York, NY 10158
1-888-493-8631
www.globalxetfs.com
Investment Adviser and Administrator:
Global X Management Company LLC
605 3rd Avenue, 43rd Floor
New York, NY 10158
Distributor:
SEI Investments Distribution Co.
One Freedom Valley Drive
Oaks, PA 19456
Sub-Administrator:
SEI Investments Global Funds Services
One Freedom Valley Drive
Oaks, PA 19456
Counsel for Global X Funds and the Independent Trustees:
Stradley Ronon Stevens & Young, LLP
2000 K Street, N.W.
Suite 700
Washington, DC 20006-1871
Custodian and Transfer Agent:
Brown Brothers Harriman & Co.
40 Water Street
Boston, MA 02109
Independent Registered Public Accounting Firm:
PricewaterhouseCoopers LLP
Two Commerce Square
Suite 1800
2001 Market Street
Philadelphia, PA 19103
This information must be preceded or accompanied by a current prospectus for the Funds described.
GLX-AR-006-0900
Item 2. Code of Ethics.
The registrant has adopted a code of ethics that applies to the registrant’s principal executive officer, principal financial officer, comptroller or principal accounting officer, and any person who performs a similar function.
Item 3. Audit Committee Financial Expert.
(a)(1) The registrant’s board of trustees has determined that the registrant has at least one audit committee financial expert serving on the audit committee.
(a)(2) The audit committee financial experts are Charles A. Baker and Susan M. Ciccarone and each is independent as defined in Form N-CSR Item 3(a)(2).
Item 4. Principal Accountant Fees and Services.
Fees billed by Pricewaterhouse Coopers LLP (“PwC”) relate to the registrant.
PWC billed the registrant aggregate fees for services rendered to the registrant for the last two fiscal years as follows:
| | 2021 | 2020 |
| | | All fees and services to the Trust that were pre-approved | All fees and services to service affiliates that were pre-approved | All other fees and services to service affiliates that did not require pre-approval | All fees and services to the Trust that were pre-approved | All fees and services to service affiliates that were pre-approved | All other fees and services to service affiliates that did not require pre-approval |
| (a) | Audit Fees | $929,467 | $0 | $0 | $1,056,304 | $0 | $0 |
| (b) | Audit-Related Fees | $0 | $0 | $0 | $0 | $0 | $0 |
| (c) | Tax Fees | $334,184 | $0 | $0 | $342,942 | $0 | $0 |
| (d) | All Other Fees | $0 | $0 | $0 | $0 | $0 | $0 |
(e)(1) Not applicable.
(e)(2) Percentage of fees billed applicable to non-audit services pursuant to waiver of pre-approval requirement were as follows (PwC):
| | 2021 | 2020 |
| Audit-Related Fees | 0% | 0% |
| Tax Fees | 0% | 0% |
| All Other Fees | 0% | 0% |
(f) Not applicable.
(g) The aggregate non-audit fees and services billed by PwC for the last two fiscal years were $334,184 and $342,942, respectively.
(h) During the past fiscal year, all non-audit services provided by registrant’s principal accountant to either registrant’s investment adviser or to any entity controlling, controlled by, or under common control with registrant’s investment adviser that provides ongoing services to registrant were pre-approved by the audit committee of registrant’s Board of Trustees. Included in the audit committee’s pre-approval was the review and consideration as to whether the provision of these non-audit services is compatible with maintaining the principal accountant’s independence.
Item 5. Audit Committee of Listed Registrants.
The registrant has a separately-designated standing Audit Committee, which is composed of the registrant's Independent Trustees, Charles A. Baker, Susan M. Ciccarone and Clifford J. Weber.
Item 6. Investments.
Not applicable.
Item 7. Disclosure of Proxy Voting Policies and Procedures for Closed-End Management Investment Companies.
Not applicable to open-end management investment companies.
Item 8. Portfolio Managers of Closed-End Management Investment Companies.
Not applicable to open-end management investment companies.
Item 9. Purchases of Equity Securities by Closed-End Management Investment Company and Affiliated Purchasers.
Not applicable to open-end management investment companies.
Item 10. Submission of Matters to a Vote of Security Holders.
There have been no material changes.
Item 11. Controls and Procedures.
(a) The certifying officers, whose certifications are included herewith, have evaluated the registrant’s disclosure controls and procedures within 90 days of the filing date of this report. In their opinion, based on their evaluation, the registrant’s disclosure controls and procedures are adequately designed, and are operating effectively to ensure, that information required to be disclosed by the registrant in the reports it files or submits under the Securities Exchange Act of 1934 is recorded, processed, summarized and reported within the time periods specified in the Securities and Exchange Commission’s rules and forms.
(b) There were no significant changes in the registrant’s internal control over financial reporting that occurred during the period covered by this report that has materially affected, or is reasonably likely to materially affect, the registrant’s internal control over financial reporting.
Item 12. Disclosure of Securities Lending Activities for Closed-End Management Investment Companies.
Not applicable to open-end management investment companies.
Item 13. Exhibits.
(a)(1) Code of Ethics attached hereto.
(a)(2) A separate certification for the principal executive officer and the principal financial officer of the registrant as required by Rule 30a-2(a) under the Investment Company Act of 1940, as amended (17 CFR 270.30a-2(a)), are filed herewith.
(b) Officer certifications as required by Rule 30a-2(b) under the Investment Company Act of 1940, as amended (17 CFR 270.30a-2(b)) also accompany this filing as an Exhibit.
SIGNATURES
Pursuant to the requirements of the Securities Exchange Act of 1934 and the Investment Company Act of 1940, the registrant has duly caused this report to be signed on its behalf by the undersigned, thereunto duly authorized.
/s/ Luis Berruga
Luis Berruga
President
Date: February 7, 2022
Pursuant to the requirements of the Securities Exchange Act of 1934 and the Investment Company Act of 1940, this report has been signed below by the following persons on behalf of the registrant and in the capacities and on the dates indicated.
/s/ Luis Berruga
Luis Berruga
President
/s/ John BelangerJohn Belanger
Chief Financial Officer
Date: February 7, 2022