UNITED STATES
SECURITIES AND EXCHANGE COMMISSION
Washington, D.C. 20549
________
FORM N-CSR
________
CERTIFIED SHAREHOLDER REPORT OF REGISTERED MANAGEMENT
INVESTMENT COMPANIES
Investment Company Act file number 811-22209
Global X Funds
(Exact name of registrant as specified in charter)
________
605 Third Avenue, 43rd floor
New York, NY 10158
(Address of principal executive offices) (Zip code)
Luis Berruga
Global X Management Company LLC
605 Third Avenue, 43rd floor
New York, NY 10158
(Name and address of agent for service)
With a copy to:
Global X Management Company LLC 605 Third Avenue, 43rd floor New York, NY 10158 | Eric S. Purple, Esq. Stradley Ronon Stevens & Young, LLP 2000 K Street, N.W., Suite 700 Washington, DC 20006-1871 |
Registrant’s telephone number, including area code: (212) 644-6440
Date of fiscal year end: October 31, 2022
Date of reporting period: October 31, 2022
Item 1. Reports to Stockholders.
A copy of the report transmitted to stockholders pursuant to Rule 30e-1 under the Investment Company Act of 1940, as amended (the “Act”) (17 CFR § 270.30e-1), is attached hereto.

| Global X MSCI China Energy ETF (ticker: CHIE) |
| Global X MSCI China Materials ETF (ticker: CHIM) |
| Global X MSCI China Industrials ETF (ticker: CHII) |
| Global X MSCI China Consumer Discretionary ETF (ticker: CHIQ) |
| Global X MSCI China Consumer Staples ETF (ticker: CHIS) |
| Global X MSCI China Health Care ETF (ticker: CHIH) |
| Global X MSCI China Financials ETF (ticker: CHIX) |
| Global X MSCI China Information Technology ETF (ticker: CHIK) |
| Global X MSCI China Communication Services ETF (ticker: CHIC) |
| Global X MSCI China Utilities ETF (ticker: CHIU) |
| Global X MSCI China Real Estate ETF (ticker: CHIR) |
| Global X MSCI Greece ETF (ticker: GREK) |
| Global X DAX Germany ETF (ticker: DAX) |
| Global X MSCI Portugal ETF (ticker: PGAL) |
| Global X MSCI Colombia ETF (ticker: GXG) |
| Global X MSCI Argentina ETF (ticker: ARGT) |
| Global X MSCI Pakistan ETF (ticker: PAK) |
| Global X MSCI Nigeria ETF (ticker: NGE) |
| Global X MSCI Vietnam ETF (ticker: VNAM) |
| Global X MSCI Next Emerging & Frontier ETF (ticker: EMFM) |
| Global X MSCI Norway ETF (ticker: NORW) |
| Global X FTSE Southeast Asia ETF (ticker: ASEA) |
Annual Report
October 31, 2022
As permitted by regulations adopted by the Securities and Exchange Commission, paper copies of the Funds’ (defined below) shareholder reports will no longer be sent by mail, unless you specifically request paper copies of the reports from your financial intermediary (such as a broker-dealer or bank). Instead, shareholder reports will be available on the Funds’ website (www. globalxetfs.com/explore), and you will be notified by mail each time a report is posted and provided with a website link to access the report.
If you already elected to receive shareholder reports electronically, you will not be affected by this change and you need not take any action. You may elect to receive shareholder reports and other communications from the Funds electronically anytime by contacting your financial intermediary.
You may elect to receive all future Fund shareholder reports in paper free of charge. Please contact your financial intermediary to inform them that you wish to continue receiving paper copies of Fund shareholder reports and for details about whether your election to receive reports in paper will apply to all funds held with your financial intermediary.
|
|
| Management Discussion of Fund Performance | 1 |
| Schedules of Investments | |
| Global X MSCI China Energy ETF | 52 |
| Global X MSCI China Materials ETF | 54 |
| Global X MSCI China Industrials ETF | 58 |
| Global X MSCI China Consumer Discretionary ETF | 62 |
| Global X MSCI China Consumer Staples ETF | 66 |
| Global X MSCI China Health Care ETF | 69 |
| Global X MSCI China Financials ETF | 73 |
| Global X MSCI China Information Technology ETF | 77 |
| Global X MSCI China Communication Services ETF | 81 |
| Global X MSCI China Utilities ETF | 84 |
| Global X MSCI China Real Estate ETF | 86 |
| Global X MSCI Greece ETF | 89 |
| Global X DAX Germany ETF | 92 |
| Global X MSCI Portugal ETF | 96 |
| Global X MSCI Colombia ETF | 99 |
| Global X MSCI Argentina ETF | 102 |
| Global X MSCI Pakistan ETF | 106 |
| Global X MSCI Nigeria ETF | 109 |
| Global X MSCI Vietnam ETF | 111 |
| Global X MSCI Next Emerging & Frontier ETF | 115 |
| Global X MSCI Norway ETF | 130 |
| Global X FTSE Southeast Asia ETF | 135 |
| Glossary | 140 |
| Statements of Assets and Liabilities | 141 |
| Statements of Operations | 147 |
| Statements of Changes in Net Assets | 153 |
| Financial Highlights | 165 |
| Notes to Financial Statements | 181 |
| Report of Independent Registered Public Accounting Firm | 210 |
| Disclosure of Fund Expenses | 213 |
| Liquidity Risk Management Program | 217 |
| Supplemental Information | 218 |
| Trustees and Officers of the Trust | 219 |
| Notice to Shareholders | 222 |
Shares are bought and sold at market price (not NAV) and are not individually redeemed from a Fund. Shares may only be redeemed directly from a Fund by Authorized Participants, in very large creation/redemption units. Brokerage commissions will reduce returns.
The Funds file their complete schedules of Fund holdings with the Securities and Exchange Commission (the “SEC” or “Commission”) for the first and third quarters of each fiscal year as an exhibit to its reports on Form N-PORT. The Funds’ Forms N-PORT are available on the Commission’s website at https://www.sec.gov, and may be reviewed and copied at the Commission's Public Reference Room in Washington, DC. Information on the operation of the Public Reference Room may be obtained by calling 1-800-SEC-0330.
A description of the policies and procedures that Global X Funds uses to determine how to vote proxies relating to Fund securities, as well as information relating to how the Funds voted proxies relating to Fund securities during the most recent
12-month period ended June 30, is available (i) without charge, upon request, by calling 1-888-493-8631; and (ii) on the Commission’s website at https://www.sec.gov.
|
| Management Discussion of Fund Performance (unaudited) |
Global X MSCI China Energy ETF
|
Global X MSCI China Energy ETF
The Global X MSCI China Energy ETF (“Fund”) seeks to provide investment results that correspond generally to the price and yield performance, before fees and expenses, of the MSCI China Energy IMI Plus 10/50 Index (“Underlying Index”). The Fund is passively managed, which means the investment adviser does not attempt to take defensive positions in declining markets. The Fund generally seeks to fully replicate the Underlying Index.
The Underlying Index tracks the performance of companies in the MSCI China Investable Market Index (the "Parent Index") that are classified in the Energy sector, as defined by MSCI, Inc. ("MSCI") the provider of the Underlying Index. The Parent Index is a free float-adjusted market capitalization-weighted index designed to measure the performance of securities that are classified as operating in China according to the MSCI Global Investable Markets Index Methodology, and that satisfy minimum market capitalization and liquidity thresholds. Additionally, the Underlying Index utilizes a 10/50 concentration constraint whereby the weight of each issuer in the Underlying Index is capped at 10% and the cumulative weight of all issuers with a weight in excess of 5% does not exceed 50% of the Underlying Index by weight.
For the 12-month period ended October 31, 2022 (the “reporting period”), the Fund increased 16.86%, while the Underlying Index increased 17.64%. The Fund had a net asset value of $11.93 per share on October 31, 2021 and ended the reporting period with a net asset value of $13.64 per share on October 31, 2022.
During the reporting period, the highest returns came from COSCO SHIPPING Energy Transportation Co., Ltd and Yankuang Energy Group Company Limited, which returned 150.02% and 109.90%, respectively. The worst performers were China Suntien Green Energy Corporation Limited and Yantai Jereh Oilfield Services Group Co., Ltd, which returned -43.34% and -37.36%, respectively.
The Fund generated positive returns during the reporting period, performing well due to continued elevated oil prices and increasing criticality of energy security. Coal stocks also delivered high returns during the reporting period, contributing to the Fund's positive performance. During the period, energy security was the primary concern for Chinese policymakers, resulting in an unusually high approval of coal-based power projects by the Chinese government. The demand for coal continued to edge higher as China has prioritized economic stability after the outbreak of the COVID-19 pandemic. The urgent need for energy security is the main reason for high returns throughout the reporting period.
| | AVERAGE ANNUAL TOTAL RETURN FOR THE YEAR ENDED OCTOBER 31, 2022 |
| | One Year Return | Three Year Return | Five Year Return | Ten Year Return |
| | Net Asset Value | Market Price | Net Asset Value | Market Price | Net Asset Value | Market Price | Net Asset Value | Market Price |
| Global X MSCI China Energy ETF | 16.86% | 16.96% | 12.88% | 13.17% | 6.97% | 7.19% | 2.91% | 3.03% |
| Hybrid Solactive China Energy Total Return Index/ MSCI China Energy IMI Plus 10/50 Index** | 17.64% | 17.64% | 14.08% | 14.08% | 8.05% | 8.05% | 3.84% | 3.84% |
MSCI Emerging Markets Index (Net)
| -31.03% | -31.03% | -4.42% | -4.42% | -3.09% | -3.09% | 0.79% | 0.79% |
|
| Management Discussion of Fund Performance (unaudited) |
Global X MSCI China Energy ETF
|
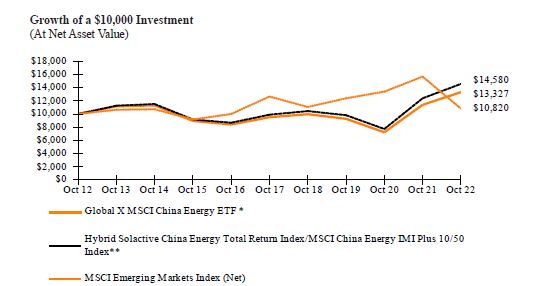
*Fund commenced operations on December 15, 2009.
** Reflects performance of Solactive China Energy Total Return Index through December 5, 2018 and MSCI China Energy IMI Plus 10/50 Index thereafter.
The MSCI Emerging Markets Index (Net) is a free float-adjusted market capitalization index that is designed to measure equity market performance of emerging markets.
The performance data quoted herein represents past performance and the return and value of an investment in the Fund will fluctuate so that, when redeemed, it may be worth less than its original cost. Past performance is no guarantee of future performance and should not be considered as a representation of the future results of the Fund. The Fund's performance assumes the reinvestment of all dividends and all capital gains. Index returns assume reinvestment of dividends and, unlike the Fund's returns, do not reflect any fees or expenses. If such fees and expenses were included in the index returns, the performance would have been lower. Please note that one cannot invest directly in an unmanaged index.
Performance figures for the periods shown may reflect contractual fee waivers and/or expense reimbursements. In the absence of fee waivers and/or expense reimbursements (if applicable), returns would have been lower.
There are no assurances that the Fund will meet its stated objectives.
The Fund’s holdings and allocations are subject to change and should not be considered recommendations to buy individual securities.
The graph and table do not reflect the deduction of taxes that a shareholder would pay on Fund distributions or the redemption or sale of Fund shares.
See definition of comparative indices above.
|
| Management Discussion of Fund Performance (unaudited) |
Global X MSCI China Materials ETF
|
Global X MSCI China Materials ETF
The Global X MSCI China Materials ETF (“Fund”) seeks to provide investment results that correspond generally to the price and yield performance, before fees and expenses, of the MSCI China Materials 10/50 Index (“Underlying Index”). The Fund is passively managed, which means the investment adviser does not attempt to take defensive positions in declining markets. The Fund generally seeks to fully replicate the Underlying Index.
The Underlying Index tracks the performance of companies in the MSCI China Index (the "Parent Index") that are classified in the materials sector, as defined by MSCI, Inc. ("MSCI") the provider of the Underlying Index. The Parent Index is a free float-adjusted market capitalization-weighted index designed to measure the performance of securities that are classified as operating in China according to the MSCI Global Investable Markets Index Methodology, and that satisfy minimum market capitalization and liquidity thresholds. Additionally, the Underlying Index utilizes a 10/50 concentration constraint whereby the weight of each group entity in the Underlying Index is capped at 10% and the cumulative weight of all group entities with a weight in excess of 5% does not exceed 50% of the Index by weight.
For the 12-month period ended October 31, 2022 (the “reporting period”), the Fund decreased 41.03%, while the Underlying Index decreased 40.63%. The Fund had a net asset value of $25.22 per share on October 31, 2021 and ended the reporting period with a net asset value of $14.60 per share on October 31, 2022.
During the reporting period, the highest returns came from Hangzhou Oxygen Plant Group Co., Ltd and Zhaojin Mining Industry Co., Ltd, which returned 45.76% and 38.28%, respectively. The worst performers were Huabao International Holdings Limited and Zhejiang Yongtai Technology Co., Ltd, which returned -71.38% and -69.53%, respectively.
The Fund generated negative returns during the reporting period, mostly attributable to COVID-19-influenced lockdowns in China and continued difficulties in the Property sector. The lockdown imposed in Shanghai between the beginning of April and the beginning of June hurt global supply chains as trucks faced obstacles in transporting materials and goods in and out of Shanghai. In addition to difficulties meeting international demand, China had trouble meeting its own growing domestic demand. A slowdown in China’s property market had a negative effect on the Fund’s holdings, many of which were engaged in the supply of construction materials. Notwithstanding opportunities for higher pay, China’s ongoing labor shortage was exacerbated as young people were reluctant to work in factories, further contributing to the Fund’s negative performance during the reporting period.
| | AVERAGE ANNUAL TOTAL RETURN FOR THE YEAR ENDED OCTOBER 31, 2022 |
| | One Year Return | Three Year Return | Five Year Return | Ten Year Return |
| | Net Asset Value | Market Price | Net Asset Value | Market Price | Net Asset Value | Market Price | Net Asset Value | Market Price |
| Global X MSCI China Materials ETF | -41.03% | -40.83% | 2.79% | 3.20% | -4.68% | -4.68% | 1.58% | 1.66% |
| Hybrid Solactive China Materials Total Return Index/ MSCI China Materials 10/50 Index** | -40.63% | -40.63% | 3.59% | 3.59% | -3.92% | -3.92% | 1.96% | 1.96% |
| MSCI Emerging Markets Index (Net) | -31.03% | -31.03% | -4.42% | -4.42% | -3.09% | -3.09% | 0.79% | 0.79% |
|
| Management Discussion of Fund Performance (unaudited) |
Global X MSCI China Materials ETF
|

*Fund commenced operations on January 12, 2010.
** Reflects performance of Solactive China Materials Total Return Index through December 5, 2018 and MSCI China Materials 10/50 Index thereafter.
The MSCI Emerging Markets Index (Net) is a free float-adjusted market capitalization index that is designed to measure equity market performance of emerging markets.
The performance data quoted herein represents past performance and the return and value of an investment in the Fund will fluctuate so that, when redeemed, it may be worth less than its original cost. Past performance is no guarantee of future performance and should not be considered as a representation of the future results of the Fund. The Fund's performance assumes the reinvestment of all dividends and all capital gains. Index returns assume reinvestment of dividends and, unlike the Fund's returns, do not reflect any fees or expenses. If such fees and expenses were included in the index returns, the performance would have been lower. Please note that one cannot invest directly in an unmanaged index.
Performance figures for the periods shown may reflect contractual fee waivers and/or expense reimbursements. In the absence of fee waivers and/or expense reimbursements (if applicable), returns would have been lower.
There are no assurances that the Fund will meet its stated objectives.
The Fund’s holdings and allocations are subject to change and should not be considered recommendations to buy individual securities.
The graph and table do not reflect the deduction of taxes that a shareholder would pay on Fund distributions or the redemption or sale of Fund shares.
See definition of comparative indices above.
|
| Management Discussion of Fund Performance (unaudited) |
Global X MSCI China Industrials ETF
|
Global X MSCI China Industrials ETF
The Global X MSCI China Industrials ETF (“Fund”) seeks to provide investment results that correspond generally to the price and yield performance, before fees and expenses, of the MSCI China Industrials 10/50 Index (“Underlying Index”). The Fund is passively managed, which means the investment adviser does not attempt to take defensive positions in declining markets. The Fund generally seeks to fully replicate the Underlying Index.
The Underlying Index tracks the performance of companies in the MSCI China Index (the "Parent Index") that are classified in the Industrials sector, as defined by MSCI, Inc. ("MSCI") the provider of the Underlying Index. The Parent Index is a free float-adjusted market capitalization-weighted index designed to measure the performance of securities that are classified as operating in China according to the MSCI Global Investable Markets Index Methodology, and that satisfy minimum market capitalization and liquidity thresholds. Additionally, the Underlying Index utilizes a 10/50 concentration constraint whereby the weight of each group entity in the Underlying Index is capped at 10% and the cumulative weight of all group entities with a weight in excess of 5% does not exceed 50% of the Underlying Index by weight.
For the 12-month period ended October 31, 2022 (the “reporting period”), the Fund decreased 33.68%, while the Underlying Index decreased 33.28%. The Fund had a net asset value of $16.62 per share on October 31, 2021 and ended the reporting period with a net asset value of $10.93 per share on October 31, 2022.
During the reporting period, the highest returns came from Jiangsu Zhongtian Technology Co., Ltd and Ningbo Deye Technology Co., Ltd, which returned 91.38% and 46.27%, respectively. The worst performers were DiDi Global Inc. and Zhejiang Chint Electrics Co., Ltd, which returned -75.84% and -62.65%, respectively.
The Fund generated negative returns over the reporting period, mainly attributable to rigid COVID-19 pandemic-related restrictions and a worsening Property sector downturn in China, which continued to have a serious effect on factory activity, as more industrial firms with high costs and declining profits faced operational difficulties. Rising investor concerns about the Chinese economy's pullback added further pressure to companies already struggling with low demand and high costs due to higher oil prices and a weaker Chinese yuan. Manufacturers who focus on exports also felt the effects of decreasing global demand during the reporting period. Additionally, unexpected factors such as a heatwave and power crunch also hampered the Industrials sector. However, economic growth picked up toward the end of the reporting period due to favorable government measures, such as tax deferrals, lending rate cuts, and funding largely focused on infrastructure spending, mitigating the Fund’s losses.
|
| Management Discussion of Fund Performance (unaudited) |
Global X MSCI China Industrials ETF
|
| | AVERAGE ANNUAL TOTAL RETURN FOR THE YEAR ENDED OCTOBER 31, 2022 |
| | One Year Return | Three Year Return | Five Year Return | Ten Year Return |
| | Net Asset Value | Market Price | Net Asset Value | Market Price | Net Asset Value | Market Price | Net Asset Value | Market Price |
| Global X MSCI China Industrials ETF | -33.68% | -33.54% | -4.07% | -3.17% | -5.56% | -5.31% | 1.36% | 1.42% |
| Hybrid Solactive China Industrials Total Return Index/ MSCI China Industrials 10/50 Index** | -33.28% | -33.28% | -3.33% | -3.33% | -5.59% | -5.59% | 1.88% | 1.88% |
| MSCI Emerging Markets Index (Net) | -31.03% | -31.03% | -4.42% | -4.42% | -3.09% | -3.09% | 0.79% | 0.79% |
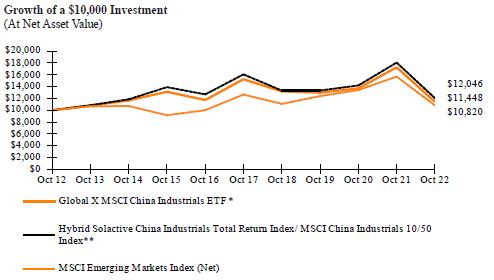
*Fund commenced operations on November 30, 2009.
** Reflects performance of Solactive China Industrials Total Return Index through December 5, 2018 and MSCI China Industrials 10/50 Index thereafter.
The MSCI Emerging Markets Index (Net) is a free float-adjusted market capitalization index that is designed to measure equity market performance of emerging markets.
The performance data quoted herein represents past performance and the return and value of an investment in the Fund will fluctuate so that, when redeemed, it may be worth less than its original cost. Past performance is no guarantee of future performance and should not be considered as a representation of the future results of the Fund. The Fund's performance assumes the reinvestment of all dividends and all capital gains. Index returns assume reinvestment of dividends and, unlike the Fund's returns, do not reflect any fees or expenses. If such fees and expenses were included in the index returns, the performance would have been lower. Please note that one cannot invest directly in an unmanaged index.
Performance figures for the periods shown may reflect contractual fee waivers and/or expense reimbursements. In the absence of fee waivers and/or expense reimbursements (if applicable), returns would have been lower.
|
| Management Discussion of Fund Performance (unaudited) |
Global X MSCI China Industrials ETF
|
There are no assurances that the Fund will meet its stated objectives.
The Fund’s holdings and allocations are subject to change and should not be considered recommendations to buy individual securities.
The graph and table do not reflect the deduction of taxes that a shareholder would pay on Fund distributions or the redemption or sale of Fund shares.
See definition of comparative indices on previous page.
|
| Management Discussion of Fund Performance (unaudited) |
Global X MSCI China Consumer Discretionary ETF
|
Global X MSCI China Consumer Discretionary ETF
The Global X MSCI China Consumer Discretionary ETF (“Fund”) seeks to provide investment results that correspond generally to the price and yield performance, before fees and expenses, of the MSCI China Consumer Discretionary 10/50 Index (“Underlying Index”). The Fund is passively managed, which means the investment adviser does not attempt to take defensive positions in declining markets. The Fund generally seeks to fully replicate the Underlying Index.
The Underlying Index tracks the performance of companies in the MSCI China Index (the "Parent Index") that are classified in the Consumer Discretionary sector, as defined by MSCI, Inc. ("MSCI") the provider of the Underlying Index. The Parent Index is a free float-adjusted market capitalization-weighted index designed to measure the performance of securities that are classified as operating in China according to the MSCI Global Investable Markets Index Methodology, and that satisfy minimum market capitalization and liquidity thresholds. Additionally, the Underlying Index utilizes a 10/50 concentration constraint whereby the weight of each group entity in the Underlying Index is capped at 10% and the cumulative weight of all group entities with a weight in excess of 5% does not exceed 50% of the Underlying Index by weight.
For the 12-month period ended October 31, 2022 (the “reporting period”), the Fund decreased 51.28%, while the Underlying Index decreased 51.03%. The Fund had a net asset value of $29.94 per share on October 31, 2021 and ended the reporting period with a net asset value of $14.55 per share on October 31, 2022.
During the reporting period, the highest returns came from New Oriental Education & Technology Group, Inc. and Navinfo Co., Ltd, which returned 71.22% and 35.33%, respectively. The worst performers were XPeng, Inc. and Great Wall Motor Co., Ltd, which returned -85.80% and -75.58%, respectively.
The Fund registered negative growth during the reporting period, as a stiff regulatory environment and strict COVID-19 pandemic-related restrictions in China both adversely affected the Consumer Discretionary sector. Lockdowns in major cities and travel restrictions, together with high joblessness among young people and uncertain economic outlook, made consumers drift away from discretionary products and focus more on necessities, which translated into weaker revenues for many of the holdings in the Fund. A COVID-19 pandemic-related lockdown in Shanghai in early 2022 had a particularly damaging effect on performance for Chinese consumer discretionary stocks. Consumer confidence remained low during the reporting period, and consumers had an inclination to save more due to economic uncertainties and strict measures to control the COVID-19 pandemic.
|
| Management Discussion of Fund Performance (unaudited) |
Global X MSCI China Consumer Discretionary ETF
|
| | AVERAGE ANNUAL TOTAL RETURN FOR THE YEAR ENDED OCTOBER 31, 2022 |
| | One Year Return | Three Year Return | Five Year Return | Ten Year Return |
| | Net Asset Value | Market Price | Net Asset Value | Market Price | Net Asset Value | Market Price | Net Asset Value | Market Price |
Global X MSCI China Consumer Discretionary ETF | -51.28% | -50.80% | -5.92% | -5.79% | -2.64% | -2.66% | 1.91% | 1.86% |
Hybrid Solactive China Consumer Total Return Index/MSCI China Consumer Discretionary 10/50 Index** | -51.03% | -51.03% | -5.53% | -5.53% | -2.12% | -2.12% | 2.52% | 2.52% |
| MSCI Emerging Markets Index (Net) | -31.03% | -31.03% | -4.42% | -4.42% | -3.09% | -3.09% | 0.79% | 0.79% |
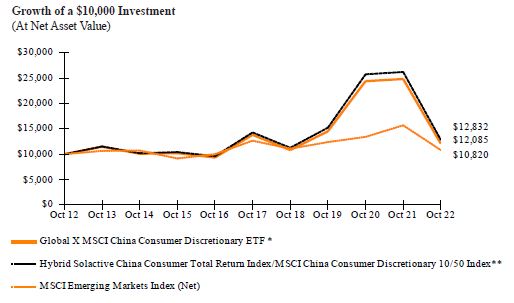
*Fund commenced operations on November 30, 2009.
** Reflects performance of Solactive China Total Return Index through December 5, 2018 and MSCI China Consumer Discretionary 10/50 Index thereafter.
The MSCI Emerging Markets Index (Net) is a free float-adjusted market capitalization index that is designed to measure equity market performance of emerging markets.
The performance data quoted herein represents past performance and the return and value of an investment in the Fund will fluctuate so that, when redeemed, it may be worth less than its original cost. High short term performance of the fund is unusual and investors should not expect such performance to be repeated. Past performance is no guarantee of future performance and should not be considered as a representation of the future results of the Fund. The Fund's performance assumes the reinvestment of all dividends and all capital gains. Index returns assume reinvestment of dividends and, unlike the Fund's returns, do not reflect any fees or expenses. If such fees and expenses were included in the index returns, the performance would have been lower. Please note that one cannot invest directly in an unmanaged index.
|
| Management Discussion of Fund Performance (unaudited) |
Global X MSCI China Consumer Discretionary ETF
|
Performance figures for the periods shown may reflect contractual fee waivers and/or expense reimbursements. In the absence of fee waivers and/or expense reimbursements (if applicable), returns would have been lower.
There are no assurances that the Fund will meet its stated objectives.
The Fund’s holdings and allocations are subject to change and should not be considered recommendations to buy individual securities.
The graph and table do not reflect the deduction of taxes that a shareholder would pay on Fund distributions or the redemption or sale of Fund shares.
See definition of comparative indices on previous page.
|
| Management Discussion of Fund Performance (unaudited) |
Global X MSCI China Consumer Staples ETF
|
Global X MSCI China Consumer Staples ETF
The Global X MSCI China Consumer Staples ETF (“Fund”) seeks to provide investment results that correspond generally to the price and yield performance, before fees and expenses, of the MSCI China Consumer Staples 10/50 Index (“Underlying Index”). The Fund is passively managed, which means the investment adviser does not attempt to take defensive positions in declining markets. The Fund generally seeks to fully replicate the Underlying Index.
The Underlying Index tracks the performance of companies in the MSCI China Index (the "Parent Index") that are classified in the Consumer Staples sector, as defined by MSCI, Inc. ("MSCI") the provider of the Underlying Index. The Parent Index is a free float-adjusted market capitalization-weighted index designed to measure the performance of securities that are classified as operating in China according to the MSCI Global Investable Markets Index Methodology, and that satisfy minimum market capitalization and liquidity thresholds. Additionally, the Underlying Index utilizes a 10/50 concentration constraint whereby the weight of each group entity in the Underlying Index is capped at 10% and the cumulative weight of all group entities with a weight in excess of 5% does not exceed 50% of the Underlying Index by weight.
For the 12-month period ended October 31, 2022 (the “reporting period”), the Fund decreased 38.53%, while the Underlying Index decreased 38.07%. The Fund had a net asset value of $29.38 per share on October 31, 2021 and ended the reporting period with a net asset value of $17.24 per share on October 31, 2022.
During the reporting period, the highest returns came from HeilongjiangAgriculture Company Limited and DaShenLin Pharmaceutical Group Co., Ltd, which returned 17.76% and 10.01%, respectively. The worst performers were Smoore International Holdings Limited and RLX Technology, Inc, which returned -77.44% and -74.28%, respectively.
The resurgence of the COVID-19 pandemic and China’s policy to curb the proliferation of the virus through strict lockdowns and travel restrictions in many cities were the main reasons for the Fund’s negative performance during the reporting period. The Chinese economy lost its recovery momentum and growth slowed during most of the reporting period. Unemployment levels shot up, particularly among young people, while sluggish growth in consumer income led to spending cuts and slowing consumption in China. Moreover, the fear of job losses and reduction in wages further undermined consumer confidence. The decline in property prices also discouraged spending as Chinese households who generally have significant investments in property suffered financially from the fall in property prices.
| | AVERAGE ANNUAL TOTAL RETURN FOR THE YEAR ENDED OCTOBER 31, 2022 |
| | One Year Return | Three Year Return | Annualized Inception to Date* |
| | Net Asset Value | Market Price | Net Asset Value | Market Price | Net Asset Value | Market Price |
| Global X MSCI China Consumer Staples ETF | -38.53% | -38.79% | -3.70% | -4.27% | 6.18% | 5.91% |
| MSCI China Consumer Staples 10/50 Index | -38.07% | -38.07% | -3.14% | -3.14% | 6.89% | 6.89% |
| MSCI Emerging Markets Index (Net) | -31.03% | -31.03% | -4.42% | -4.42% | -1.28% | -1.28% |
|
| Management Discussion of Fund Performance (unaudited) |
Global X MSCI China Consumer Staples ETF
|

*Fund commenced operations on December 7, 2018.
The MSCI Emerging Markets Index (Net) is a free float-adjusted market capitalization index that is designed to measure equity market performance of emerging markets.
The performance data quoted herein represents past performance and the return and value of an investment in the Fund will fluctuate so that, when redeemed, it may be worth less than its original cost. High short term performance of the fund is unusual and investors should not expect such performance to be repeated. Past performance is no guarantee of future performance and should not be considered as a representation of the future results of the Fund. The Fund's performance assumes the reinvestment of all dividends and all capital gains. Index returns assume reinvestment of dividends and, unlike the Fund's returns, do not reflect any fees or expenses. If such fees and expenses were included in the index returns, the performance would have been lower. Please note that one cannot invest directly in an unmanaged index.
Performance figures for the periods shown may reflect contractual fee waivers and/or expense reimbursements. In the absence of fee waivers and/or expense reimbursements (if applicable), returns would have been lower.
There are no assurances that the Fund will meet its stated objectives.
The Fund’s holdings and allocations are subject to change and should not be considered recommendations to buy individual securities.
The graph and table do not reflect the deduction of taxes that a shareholder would pay on Fund distributions or the redemption or sale of Fund shares.
See definition of comparative indices above.
|
| Management Discussion of Fund Performance (unaudited) |
Global X MSCI China Health Care ETF
|
Global X MSCI China Health Care ETF
The Global X MSCI China Health Care ETF (“Fund”) seeks to provide investment results that correspond generally to the price and yield performance, before fees and expenses, of the MSCI China Health Care 10/50 Index (“Underlying Index”). The Fund is passively managed, which means the investment adviser does not attempt to take defensive positions in declining markets. The Fund generally seeks to fully replicate the Underlying Index.
The Underlying Index tracks the performance of companies in the MSCI China Index (the "Parent Index") that are classified in the Health Care sector, as defined by MSCI, Inc. ("MSCI") the provider of the Underlying Index. The Parent Index is a free float-adjusted market capitalization-weighted index designed to measure the performance of securities that are classified as operating in China according to the MSCI Global Investable Markets Index Methodology, and that satisfy minimum market capitalization and liquidity thresholds. Additionally, the Underlying Index utilizes a 10/50 concentration constraint whereby the weight of each group entity in the Underlying Index is capped at 10% and the cumulative weight of all group entities with a weight in excess of 5% does not exceed 50% of the Underlying Index by weight.
For the 12-month period ended October 31, 2022 (the “reporting period”), the Fund decreased 45.67%, while the Underlying Index decreased 45.33%. The Fund had a net asset value of $24.81 per share on October 31, 2021 and ended the reporting period with a net asset value of $13.46 per share on October 31, 2022.
During the reporting period, the highest returns came from China Resources Sanjiu Medical & Pharmaceutical Co., Ltd and Shijiazhuang Yiling Pharmaceutical Co., Ltd, which returned 102.67% and 68.49%, respectively. The worst performers were I-MAB and Zai Lab Ltd, which returned -85.97% and -78.66%, respectively.
Policy uncertainties on drug research and development combined with a Chinese government policy to cut drug prices contributed to the Fund’s negative performance during the reporting period. The profit margin of Chinese drug makers shrank with the sharp fall in prices. The Health Care sector came under further strain as the U.S. Department of Commerce added Chinese pharmaceutical companies to its “unverified” list of exporters, as it was unable to verify the end use of the products these companies exported to the United States. Some holdings in the Fund suffered large losses after being added to the “unverified” list, contributing to the Fund’s negative returns during the reporting period.
| | AVERAGE ANNUAL TOTAL RETURN FOR THE YEAR ENDED OCTOBER 31, 2022 |
| | One Year Return | Three Year Return | Annualized Inception to Date* |
| | Net Asset Value | Market Price | Net Asset Value | Market Price | Net Asset Value | Market Price |
| Global X MSCI China Health Care ETF | -45.67% | -45.76% | -8.47% | -8.38% | -2.49% | -2.64% |
| MSCI China Health Care 10/50 Index | -45.33% | -45.33% | -7.82% | -7.82% | -1.80% | -1.80% |
| MSCI Emerging Markets Index (Net) | -31.03% | -31.03% | -4.42% | -4.42% | -1.28% | -1.28% |
|
| Management Discussion of Fund Performance (unaudited) |
Global X MSCI China Health Care ETF
|
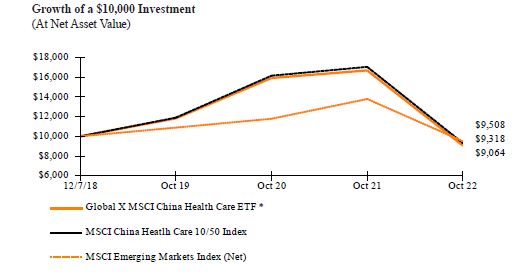
*Fund commenced operations on December 7, 2018.
The MSCI Emerging Markets Index (Net) is a free float-adjusted market capitalization index that is designed to measure equity market performance of emerging markets.
The performance data quoted herein represents past performance and the return and value of an investment in the Fund will fluctuate so that, when redeemed, it may be worth less than its original cost. High short term performance of the fund is unusual and investors should not expect such performance to be repeated. Past performance is no guarantee of future performance and should not be considered as a representation of the future results of the Fund. The Fund's performance assumes the reinvestment of all dividends and all capital gains. Index returns assume reinvestment of dividends and, unlike the Fund's returns, do not reflect any fees or expenses. If such fees and expenses were included in the index returns, the performance would have been lower. Please note that one cannot invest directly in an unmanaged index.
Performance figures for the periods shown may reflect contractual fee waivers and/or expense reimbursements. In the absence of fee waivers and/or expense reimbursements (if applicable), returns would have been lower.
There are no assurances that the Fund will meet its stated objectives.
The Fund’s holdings and allocations are subject to change and should not be considered recommendations to buy individual securities.
The graph and table do not reflect the deduction of taxes that a shareholder would pay on Fund distributions or the redemption or sale of Fund shares.
See definition of comparative indices above.
|
| Management Discussion of Fund Performance (unaudited) |
Global X MSCI China Financials ETF
|
Global X MSCI China Financials ETF
The Global X MSCI China Financials ETF (“Fund”) seeks to provide investment results that correspond generally to the price and yield performance, before fees and expenses, of the MSCI China Financials 10/50 Index (“Underlying Index”). The Fund is passively managed, which means the investment adviser does not attempt to take defensive positions in declining markets. The Fund generally seeks to fully replicate the Underlying Index.
The Underlying Index tracks the performance of companies in the MSCI China Index (the "Parent Index") that are classified in the financials sector, as defined by MSCI, Inc. ("MSCI") the provider of the Underlying Index. The Parent Index is a free float-adjusted market capitalization-weighted index designed to measure the performance of securities that are classified as operating in China according to the MSCI Global Investable Markets Index Methodology, and that satisfy minimum market capitalization and liquidity thresholds. Additionally, the Underlying Index utilizes a 10/50 concentration constraint whereby the weight of each group entity in the Underlying Index is capped at 10% and the cumulative weight of all group entities with a weight in excess of 5% does not exceed 50% of the Underlying Index by weight.
For the 12-month period ended October 31, 2022 (the “reporting period”), the Fund decreased 30.18%, while the Underlying Index decreased 29.66%. The Fund had a net asset value of $14.42 per share on October 31, 2021 and ended the reporting period with a net asset value of $9.78 per share on October 31, 2022.
During the reporting period, the highest returns came from Guolian Securities Co., Ltd. and Bank of Chengdu Co., Ltd, which returned 29.74% and 23.79%, respectively. The worst performers were Lufax Holding Limited and China Merchants Bank Co., Ltd, which returned -72.41% and -59.56%, respectively.
Investor fears of systemic risk prevailed in China’s Financials sector, resulting in the Fund’s negative performance during the reporting period. The freezing of depositor bank accounts by rural banks in the Henan province led to mass protests, while the ongoing property crisis in China led some investors to believe that the volatility could spill over to banks. Chinese banks have significant exposure to property loans, which positioned them to suffer losses from property developer defaults and mortgage boycotts. In addition, credit demand weakened during the reporting period as, private companies withheld investments due to the gloomy Chinese economic outlook. Holdings in the Fund also saw negative impacts to their bottom-line revenues as a result of a Chinese government initiative to reduce fees in financial transactions.
| | AVERAGE ANNUAL TOTAL RETURN FOR THE YEAR ENDED OCTOBER 31, 2022 |
| | One Year Return | Three Year Return | Five Year Return | Ten Year Return |
| | Net Asset Value | Market Price | Net Asset Value | Market Price | Net Asset Value | Market Price | Net Asset Value | Market Price |
| Global X MSCI China Financials ETF | -30.18% | -30.33% | -12.16% | -11.90% | -8.06% | -8.14% | 0.76% | 0.80% |
| Hybrid Solactive China Financials Total Return Index/MSCI China Financials 10/50 Index** | -29.66% | -29.66% | -11.50% | -11.50% | -7.46% | -7.46% | 1.46% | 1.46% |
| MSCI Emerging Markets Index (Net) | -31.03% | -31.03% | -4.42% | -4.42% | -3.09% | -3.09% | 0.79% | 0.79% |
|
| Management Discussion of Fund Performance (unaudited) |
Global X MSCI China Financials ETF
|
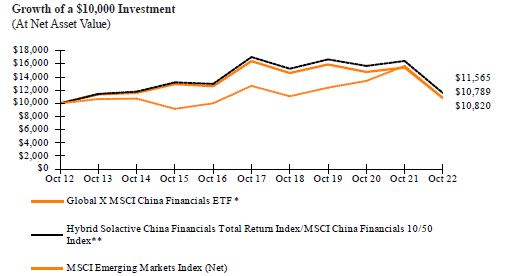
*Fund commenced operations on December 10, 2009.
** Reflects performance of Solactive China Financials Total Return Index through December 5, 2018 and MSCI China Financials 10/50 Index thereafter.
The MSCI Emerging Markets Index (Net) is a free float-adjusted market capitalization index that is designed to measure equity market performance of emerging markets.
The performance data quoted herein represents past performance and the return and value of an investment in the Fund will fluctuate so that, when redeemed, it may be worth less than its original cost. Past performance is no guarantee of future performance and should not be considered as a representation of the future results of the Fund. The Fund's performance assumes the reinvestment of all dividends and all capital gains. Index returns assume reinvestment of dividends and, unlike the Fund's returns, do not reflect any fees or expenses. If such fees and expenses were included in the index returns, the performance would have been lower. Please note that one cannot invest directly in an unmanaged index.
Performance figures for the periods shown may reflect contractual fee waivers and/or expense reimbursements. In the absence of fee waivers and/or expense reimbursements (if applicable), returns would have been lower.
There are no assurances that the Fund will meet its stated objectives.
The Fund’s holdings and allocations are subject to change and should not be considered recommendations to buy individual securities.
The graph and table do not reflect the deduction of taxes that a shareholder would pay on Fund distributions or the redemption or sale of Fund shares.
See definition of comparative indices above.
|
| Management Discussion of Fund Performance (unaudited) |
Global X MSCI China Information Technology ETF
|
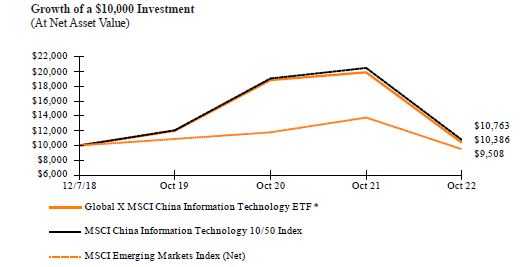
Global X MSCI China Information Technology ETF
The Global X MSCI China Information Technology ETF (“Fund”) seeks to provide investment results that correspond generally to the price and yield performance, before fees and expenses, of the MSCI China Information Technology 10/50 Index (“Underlying Index”). The Fund is passively managed, which means the investment adviser does not attempt to take defensive positions in declining markets. The Fund generally seeks to fully replicate the Underlying Index.
The Underlying Index tracks the performance of companies in the MSCI China Index (the "Parent Index") that are classified in the Information Technology sector, as defined by MSCI, Inc. ("MSCI") the provider of the Underlying Index. The Parent Index is a free float-adjusted market capitalization-weighted index designed to measure the performance of securities that are classified in as operating in China according to the MSCI Global Investable Markets Index Methodology, and that satisfy minimum market capitalization and liquidity thresholds. Additionally, the Underlying Index utilizes a 10/50 concentration constraint whereby the weight of each group entity in the Underlying Index is capped at 10% and the cumulative weight of all group entities with a weight in excess of 5% does not exceed 50% of the Underlying Index by weight.
For the 12-month period ended October 31, 2022 (the “reporting period”), the Fund decreased 47.82%, while the Underlying Index decreased 47.47%. The Fund had a net asset value of $29.07 per share on October 31, 2021 and ended the reporting period with a net asset value of $14.81 per share on October 31, 2022.
During the reporting period, the highest returns came from Ninestar Corp and Dawning Information Industry Co., Ltd, which returned 36.60% and 15.27%, respectively. The worst performers were Ming Yuan Cloud Group Holdings Limited and Kingsoft Cloud Holdings Limited, which returned -85.87% and -84.89%, respectively.
Chinese non-consumer internet companies and hardware companies such as semiconductors were largely affected by regulatory moves and came under pressure during the reporting period. This was a key contributor to the Fund’s negative performance. The resurgence of COVID-19 and subsequent lockdowns in many Chinese cities, together with weakening economic growth and slowing consumer and commercial demand in China, resulted in a significant slowdown in the smartphone and personal computer market, negatively impacting the performance of the Information Technology sector. Consumers worried about rising unemployment and a slowdown in income growth cut down on discretionary spending, lengthening smartphone upgrade cycles. Lockdowns also resulted in supply shortages of key inputs, such as integrated circuits, and disrupted production in many Chinese cities. The U.S. Department of Commerce’s regulation limiting the sale of semiconductors and chip-making equipment to Chinese firms also caused investors to sell off Information Technology stocks during the reporting period, negatively impacting the Fund.
|
| Management Discussion of Fund Performance (unaudited) |
Global X MSCI China Information Technology ETF
|
| | AVERAGE ANNUAL TOTAL RETURN FOR THE YEAR ENDED OCTOBER 31, 2022 |
| | One Year Return | Three Year Return | Annualized Inception to Date* |
| | Net Asset Value | Market Price | Net Asset Value | Market Price | Net Asset Value | Market Price |
Global X MSCI China Information Technology ETF | -47.82% | -47.34% | -4.72% | -4.50% | 0.98% | 0.91% |
| MSCI China Information Technology 10/50 Index | -47.47% | -47.47% | -3.73% | -3.73% | 1.90% | 1.90% |
| MSCI Emerging Markets Index (Net) | -31.03% | -31.03% | -4.42% | -4.42% | -1.28% | -1.28% |
*Fund commenced operations on December 7, 2018.
The MSCI Emerging Markets Index (Net) is a free float-adjusted market capitalization index that is designed to measure equity market performance of emerging markets.
The performance data quoted herein represents past performance and the return and value of an investment in the Fund will fluctuate so that, when redeemed, it may be worth less than its original cost. High short term performance of the fund is unusual and investors should not expect such performance to be repeated. Past performance is no guarantee of future performance and should not be considered as a representation of the future results of the Fund. The Fund's performance assumes the reinvestment of all dividends and all capital gains. Index returns assume reinvestment of dividends and, unlike the Fund's returns, do not reflect any fees or expenses. If such fees and expenses were included in the index returns, the performance would have been lower. Please note that one cannot invest directly in an unmanaged index.
Performance figures for the periods shown may reflect contractual fee waivers and/or expense reimbursements. In the absence of fee waivers and/or expense reimbursements (if applicable), returns would have been lower.
There are no assurances that the Fund will meet its stated objectives.
|
| Management Discussion of Fund Performance (unaudited) |
Global X MSCI China Information Technology ETF
|
The Fund’s holdings and allocations are subject to change and should not be considered recommendations to buy individual securities.
The graph and table do not reflect the deduction of taxes that a shareholder would pay on Fund distributions or the redemption or sale of Fund shares.
See definition of comparative indices on previous page.
|
| Management Discussion of Fund Performance (unaudited) |
Global X MSCI China Communication Services ETF
|
Global X MSCI China Communication Services ETF
The Global X MSCI China Communication Services ETF (“Fund”) seeks to provide investment results that correspond generally to the price and yield performance, before fees and expenses, of the MSCI China Communication Services 10/50 Index (“Underlying Index”). The Fund is passively managed, which means the investment adviser does not attempt to take defensive positions in declining markets. The Fund generally seeks to fully replicate the Underlying Index.
The Underlying Index tracks the performance of companies in the MSCI China Index (the "Parent Index") that are classified in the Communication Services sector, as defined by MSCI, Inc. ("MSCI") the provider of the Underlying Index. The Parent Index is a free float-adjusted market capitalization-weighted index designed to measure the performance of securities that are classified as operating in China according to the MSCI Global Investable Markets Index Methodology, and that satisfy minimum market capitalization and liquidity thresholds. Additionally, the Underlying Index utilizes a 10/50 concentration constraint whereby the weight of each group entity in the Underlying Index is capped at 10% and the cumulative weight of all group entities with a weight in excess of 5% does not exceed 50% of the Underlying Index by weight.
For the 12-month period ended October 31, 2022 (the “reporting period”), the Fund decreased 52.56%, while the Underlying Index decreased 52.22%. The Fund had a net asset value of $20.56 per share on October 31, 2021 and ended the reporting period with a net asset value of $9.65 per share on October 31, 2022.
During the reporting period, the highest returns came from China South Publishing & Media Group Co., Ltd and Netease Inc., which returned 12.57% and 10.35%, respectively. The worst performers were iQIYI, Inc. and Weibo Corp, which returned -75.60% and -74.83%, respectively.
Continued concerns over the delisting of Chinese ADRs in the United States and China’s regulatory plans for technology companies dragged down the Fund’s returns, which were negative during the reporting period. China’s position in the Ukraine crisis and U.S. regulators’ identification of Chinese companies that might be delisted for failing to meet auditing requirements also had a significant negative impact. Companies in the Communication Services sector benefitted from efforts to roll out 5G networks in China, which helped cushion the Fund from the impact of regulatory concerns.
| | AVERAGE ANNUAL TOTAL RETURN FOR THE YEAR ENDED OCTOBER 31, 2022 |
| | One Year Return | Three Year Return | Five Year Return | Ten Year Return |
| | Net Asset Value | Market Price | Net Asset Value | Market Price | Net Asset Value | Market Price | Net Asset Value | Market Price |
Global X MSCI China Communication Services ETF | -52.56% | -52.31% | -23.44% | -23.17% | -18.96% | -19.14% | -2.36% | -2.33% |
| Hybrid Solactive China Technology Index/NASDAX OMX China Technology Index/MSCI China Communication Services 10/50 Index ** | -52.22% | -52.22% | -23.09% | -23.09% | -18.55% | -18.55% | -1.53% | -1.53% |
| MSCI Emerging Markets Index (Net) | -31.03% | -31.03% | -4.42% | -4.42% | -3.09% | -3.09% | 0.79% | 0.79% |
|
| Management Discussion of Fund Performance (unaudited) |
Global X MSCI China Communication Services ETF
|
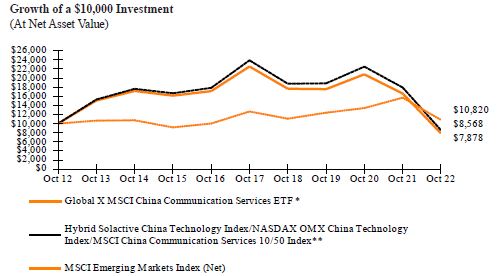
*Fund commenced operations on December 8, 2009.
** Reflects performance of Solactive China Technology Index through December 13, 2011, NASDAQ OMX China Technology Index through December 5, 2018 and the MSCI China Communication Services 10/50 Index thereafter.
The MSCI Emerging Markets Index (Net) is a free float-adjusted market capitalization index that is designed to measure equity market performance of emerging markets.
The performance data quoted herein represents past performance and the return and value of an investment in the Fund will fluctuate so that, when redeemed, it may be worth less than its original cost. Past performance is no guarantee of future performance and should not be considered as a representation of the future results of the Fund. The Fund's performance assumes the reinvestment of all dividends and all capital gains. Index returns assume reinvestment of dividends and, unlike the Fund's returns, do not reflect any fees or expenses. If such fees and expenses were included in the index returns, the performance would have been lower. Please note that one cannot invest directly in an unmanaged index.
Performance figures for the periods shown may reflect contractual fee waivers and/or expense reimbursements. In the absence of fee waivers and/or expense reimbursements (if applicable), returns would have been lower.
There are no assurances that the Fund will meet its stated objectives.
The Fund’s holdings and allocations are subject to change and should not be considered recommendations to buy individual securities.
The graph and table do not reflect the deduction of taxes that a shareholder would pay on Fund distributions or the redemption or sale of Fund shares.
See definition of comparative indices above.
|
| Management Discussion of Fund Performance (unaudited) |
Global X MSCI China Utilities ETF
|
Global X MSCI China Utilities ETF
The Global X MSCI China Utilities ETF (“Fund”) seeks to provide investment results that generally correspond to the price and yield performance, before fees and expenses, of the MSCI China Utilities 10/50 Index (“Underlying Index”). The Fund is passively managed, which means the investment adviser does not attempt to take defensive positions in declining markets. The Fund generally seeks to fully replicate the Underlying Index.
The Underlying Index tracks the performance of companies in the MSCI China Index (the "Parent Index") that are classified in the utilities sector, as defined by MSCI, Inc. ("MSCI") the provider of the Underlying Index. The Parent Index is a free float-adjusted market capitalization-weighted index designed to measure the performance of securities that are classified as operating in China according to the MSCI Global Investable Markets Index Methodology, and that satisfy minimum market capitalization and liquidity thresholds. Additionally, the Underlying Index utilizes a 10/50 concentration constraint whereby the weight of each group entity in the Underlying Index is capped at 10% and the cumulative weight of all group entities with a weight in excess of 5% does not exceed 50% of the Underlying Index by weight.
For the 12-month period ended October 31, 2022 (the “reporting period”), the Fund decreased 36.59%, while the Underlying Index decreased 36.11%. The Fund had a net asset value of $19.53 per share on October 31, 2021 and ended the reporting period with a net asset value of $11.84 per share on October 31, 2022.
During the reporting period, the highest returns came from GD Power Development Co., Ltd and Huadian Power International Corp. Ltd, which returned 50.18% and 14.25%, respectively. The worst performers were China Gas Holdings Limited and China Longyuan Power Group Corporation Ltd, which returned -62.85% and -50.56%, respectively.
China’s power shortage continued during the reporting period, but for different reasons than last year. The crisis during the reporting period was the outcome of unusually hot weather plus a lack of rain. In addition, domestic natural gas demand and consumption shrank, contributing to the Fund’s negative performance during the reporting period. However, China continued to boost coal mining and imports to generate electricity and continued transferring electricity between regions to smooth shortages. To counter the power exigency, authorities resorted to power-saving practices, like dimming decorative lights and paring the operational hours of malls. Even though the utilities sector is defensive, the aforementioned challenges contributed to the Fund’s negative performance during the reporting period.
| | AVERAGE ANNUAL TOTAL RETURN FOR THE YEAR ENDED OCTOBER 31, 2022 |
| | One Year Return | Three Year Return | Annualized Inception to Date* |
| | Net Asset Value | Market Price | Net Asset Value | Market Price | Net Asset Value | Market Price |
| Global X MSCI China Utilities ETF | -36.59% | -36.15% | -5.77% | -5.97% | -2.97% | -2.96% |
| MSCI China Utilities 10/50 Index | -36.11% | -36.11% | -4.95% | -4.95% | -2.15% | -2.15% |
| MSCI Emerging Markets Index (Net) | -31.03% | -31.03% | -4.42% | -4.42% | -1.28% | -1.28% |
|
| Management Discussion of Fund Performance (unaudited) |
Global X MSCI China Utilities ETF
|
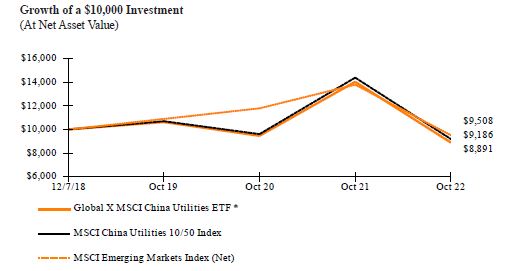
*Fund commenced operations on December 7, 2018.
The MSCI Emerging Markets Index (Net) is a free float-adjusted market capitalization index that is designed to measure equity market performance of emerging markets.
The performance data quoted herein represents past performance and the return and value of an investment in the Fund will fluctuate so that, when redeemed, it may be worth less than its original cost. Past performance is no guarantee of future performance and should not be considered as a representation of the future results of the Fund. The Fund's performance assumes the reinvestment of all dividends and all capital gains. Index returns assume reinvestment of dividends and, unlike the Fund's returns, do not reflect any fees or expenses. If such fees and expenses were included in the index returns, the performance would have been lower. Please note that one cannot invest directly in an unmanaged index.
Performance figures for the periods shown may reflect contractual fee waivers and/or expense reimbursements. In the absence of fee waivers and/or expense reimbursements (if applicable), returns would have been lower.
There are no assurances that the Fund will meet its stated objectives.
The Fund’s holdings and allocations are subject to change and should not be considered recommendations to buy individual securities.
The graph and table do not reflect the deduction of taxes that a shareholder would pay on Fund distributions or the redemption or sale of Fund shares.
See definition of comparative indices above.
|
| Management Discussion of Fund Performance (unaudited) |
Global X MSCI China Real Estate ETF
|
Global X MSCI China Real Estate ETF
The Global X MSCI China Real Estate ETF (“Fund”) seeks to provide investment results that correspond generally to the price and yield performance, before fees and expenses, of the MSCI China Real Estate 10/50 Index (“Underlying Index”). The Fund is passively managed, which means the investment adviser does not attempt to take defensive positions in declining markets. The Fund generally seeks to fully replicate the Underlying Index.
The Underlying Index tracks the performance of companies in the MSCI China Index (the "Parent Index") that are classified in the Real Estate sector, as defined by MSCI, Inc. ("MSCI") the provider of the Underlying Index. The Parent Index is a free float-adjusted market capitalization-weighted index designed to measure the performance of securities that are classified as operating in China according to the MSCI Global Investable Markets Index Methodology, and that satisfy minimum market capitalization and liquidity thresholds. Additionally, the Underlying Index utilizes a 10/50 concentration constraint whereby the weight of each group entity in the Underlying Index is capped at 10% and the cumulative weight of all group entities with a weight in excess of 5% does not exceed 50% of the Underlying Index by weight.
For the 12-month period ended October 31, 2022 (the “reporting period”), the Fund decreased 57.96%, while the Underlying Index decreased 59.32%. The Fund had a net asset value of $35.70 per share on October 31, 2021 and ended the reporting period with a net asset value of $14.55 on October 31, 2022 following a 1:3 reverse share split on December 19, 2022.
During the reporting period, the highest returns came from Poly Property Services Co., Ltd and Zhenro Properties Group Limited, which returned 21.02% and 18.66%, respectively. The worst performers were Logan Group Co., Ltd and Country Garden Services Holdings Co. Ltd, which returned -89.49% and -88.63%, respectively.
China’s Three Red Lines policy introduced in late 2020 to reduce the leverage of Chinese real estate developers, and the subsequent default of a few major Chinese real estate companies, led to a crisis in the Chinese housing market, which continued to negatively affect the returns of the Fund during the reporting period. Developers are in financial distress and prices of properties after their sales have fallen significantly. Buyers have gone back on their purchase decisions, fearing that developers could go insolvent, dampening demand and depressing returns for holdings in the Fund during the reporting period. Financially distressed developers failed to finish presold homes, which resulted in a mortgage boycott that further damaged investor sentiment during the reporting period. This was somewhat mitigated by support measures taken by the government towards the end of the reporting period, but these measures were not enough to bring about a sustained rally in the Real Estate sector.
| | AVERAGE ANNUAL TOTAL RETURN FOR THE YEAR ENDED OCTOBER 31, 2022 |
| | One Year Return | Three Year Return | Annualized Inception to Date* |
| | Net Asset Value | Market Price | Net Asset Value | Market Price | Net Asset Value | Market Price |
| Global X MSCI China Real Estate ETF | -57.96% | -58.61% | -31.86% | -31.81% | -22.56% | -22.64% |
| MSCI China Real Estate 10/50 Index | -59.32% | -59.32% | -32.34% | -32.34% | -22.84% | -22.84% |
| MSCI Emerging Markets Index (Net) | -31.03% | -31.03% | -4.42% | -4.42% | -1.28% | -1.28% |
|
| Management Discussion of Fund Performance (unaudited) |
Global X MSCI China Real Estate ETF
|

*Fund commenced operations on December 7, 2018.
The MSCI Emerging Markets Index (Net) is a free float-adjusted market capitalization index that is designed to measure equity market performance of emerging markets.
The performance data quoted herein represents past performance and the return and value of an investment in the Fund will fluctuate so that, when redeemed, it may be worth less than its original cost. High short term performance of the fund is unusual and investors should not expect such performance to be repeated. Past performance is no guarantee of future performance and should not be considered as a representation of the future results of the Fund. The Fund's performance assumes the reinvestment of all dividends and all capital gains. Index returns assume reinvestment of dividends and, unlike the Fund's returns, do not reflect any fees or expenses. If such fees and expenses were included in the index returns, the performance would have been lower. Please note that one cannot invest directly in an unmanaged index.
Performance figures for the periods shown may reflect contractual fee waivers and/or expense reimbursements. In the absence of fee waivers and/or expense reimbursements (if applicable), returns would have been lower.
There are no assurances that the Fund will meet its stated objectives.
The Fund’s holdings and allocations are subject to change and should not be considered recommendations to buy individual securities.
The graph and table do not reflect the deduction of taxes that a shareholder would pay on Fund distributions or the redemption or sale of Fund shares.
See definition of comparative indices above.
|
| Management Discussion of Fund Performance (unaudited) |
Global X MSCI Greece ETF
|
Global X MSCI Greece ETF
The Global X MSCI Greece ETF (“Fund”) seeks to provide investment results that correspond generally to the price and yield performance, before fees and expenses, of the MSCI All Greece Select 25/50 Index (“Underlying Index”). The Fund is passively managed, which means the investment adviser does not attempt to take defensive positions in declining markets. The Fund generally seeks to fully replicate the Underlying Index.
The Underlying Index is designed to represent the performance of the broad Greece equity universe, as defined by MSCI, Inc. ("MSCI"), the provider of the Underlying Index. The broad Greece equity universe includes securities that are classified in Greece according to the MSCI Global Investable Market Index Methodology, together with companies that are headquartered or listed in Greece and carry out the majority of their operations in Greece. The Underlying Index also applies minimum liquidity thresholds as criteria for company inclusion.
For the 12-month period ended October 31, 2022 (the “reporting period”), the Fund decreased 11.63%, while the Underlying Index decreased 11.15%. The Fund had a net asset value of $27.98 per share on October 31, 2021 and ended the reporting period with a net asset value of $24.14 per share on October 31, 2022.
During the reporting period, the highest returns came from Terna Energy SA and GasLog Partners LP, which returned 41.95% and 27.23%, respectively. The worst performers were Public Power Corporation SA and Admie Holdings SA, which returned -41.79% and -41.75%, respectively.
Global inflation, the COVID-19 pandemic, and geopolitical forces such as Greece-Turkey tensions, the Russia-Ukraine war and the European energy crisis, all weighed on Greece's economy during the reporting period. This resulted in negative Fund returns despite the tourism industry's strong performance. Despite macroeconomic headwinds and overall negative returns, the Fund’s negative performance was mitigated by stellar returns from the “Big Four” banks of Greece (Piraeus, Eurobank, National Bank of Greece, and Alpha Bank), all of which are significant holdings in the Fund. During the reporting period, the Big Four banks made significant progress in reducing their non-performing loan (NPL) ratio which boosted sentiment towards them and enabled high returns. Meanwhile, returns for the Greek Energy sector were mixed as Greece experimented with power subsidies and programs to boost energy independence.
| | AVERAGE ANNUAL TOTAL RETURN FOR THE YEAR ENDED OCTOBER 31, 2022 |
| | One Year Return | Three Year Return | Five Year Return | Ten Year Return |
| | Net Asset Value | Market Price | Net Asset Value | Market Price | Net Asset Value | Market Price | Net Asset Value | Market Price |
| Global X MSCI Greece ETF | -11.63% | -12.28% | -4.71% | -4.59% | -0.51% | -0.61% | -5.17% | -5.24% |
| Hybrid MSCI All Greece Select 25/50 Index/ FTSE/ATHEX Custom Capped Index** | -11.15% | -11.15% | -4.25% | -4.25% | -0.02% | -0.02% | -4.54% | -4.54% |
| MSCI Emerging Markets Index (Net) | -31.03% | -31.03% | -4.42% | -4.42% | -3.09% | -3.09% | 0.79% | 0.79% |
|
| Management Discussion of Fund Performance (unaudited) |
Global X MSCI Greece ETF
|
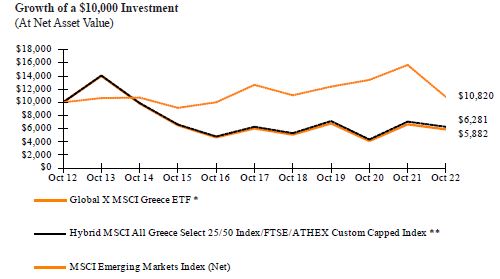
*Fund commenced operations on December 7, 2011.
** Reflects performance of the FTSE/ATHEX Custom Capped Index through February 29, 2016 and MSCI All Greece Select 25/50 Index, thereafter. The inception of the MSCI All Greece Select 25/50 Index (“New Index”) was on December 23, 2015. Effective on or around March 1, 2016, the Fund began to track the New Index. The change was due to the planned migration to the New Index, potentially allowing for broader exposure to the local market.
The MSCI Emerging Markets Index (Net) is a free float-adjusted market capitalization index that is designed to measure equity market performance of emerging markets.
The performance data quoted herein represents past performance and the return and value of an investment in the Fund will fluctuate so that, when redeemed, it may be worth less than its original cost. Past performance is no guarantee of future performance and should not be considered as a representation of the future results of the Fund. The Fund's performance assumes the reinvestment of all dividends and all capital gains. Index returns assume reinvestment of dividends and, unlike the Fund's returns, do not reflect any fees or expenses. If such fees and expenses were included in the index returns, the performance would have been lower. Please note that one cannot invest directly in an unmanaged index.
Performance figures for the periods shown may reflect contractual fee waivers and/or expense reimbursements. In the absence of fee waivers and/or expense reimbursements (if applicable), returns would have been lower.
There are no assurances that the Fund will meet its stated objectives.
The Fund’s holdings and allocations are subject to change and should not be considered recommendations to buy individual securities.
The graph and table do not reflect the deduction of taxes that a shareholder would pay on Fund distributions or the redemption or sale of Fund shares.
|
| Management Discussion of Fund Performance (unaudited) |
Global X MSCI Greece ETF
|
See definition of comparative indices on previous page.
|
| Management Discussion of Fund Performance (unaudited) |
Global X DAX Germany ETF
|
Global X DAX Germany ETF
The Global X DAX Germany ETF (“Fund”) seeks to provide investment results that correspond generally to the price and yield performance, before fees and expenses, of the DAX® Index (“Underlying Index”). The Fund is passively managed, which means the investment adviser does not attempt to take defensive positions in declining markets. The Fund generally seeks to fully replicate the Underlying Index.
The Underlying Index tracks the segment of the largest and most actively traded companies – known as blue chips – on the German equities market. It contains the shares of the 40 largest and most liquid companies admitted to the Frankfurt Stock Exchange in the Prime Standard segment. The Underlying Index represents about 80% of the free-float market capitalization authorized in Germany.
For the 12-month period ended October 31, 2022 (the “reporting period”), the Fund decreased 28.29%, while the Underlying Index decreased 27.85%. The Fund had a net asset value of $32.86 per share on October 31, 2021 and ended the reporting period with a net asset value of $22.74 per share on October 31, 2022.
During the reporting period, the highest returns came from Hannover Rueck SE and Deutsche Telekom AG, which returned 7.14% and 5.60%, respectively. The worst performers were Zalando SE and Delivery Hero SE, which returned -75.58% and -70.47%, respectively.
The German economy's recovery from the COVID-19 pandemic was affected by the war in Ukraine, an embargo on Russian oil, rising energy costs, inflation, supply chain bottlenecks, and continuing COVID-19 pandemic-related restrictions in Germany. This resulted in the Fund's negative performance during the reporting period. The Fund holds blue-chip German equities spread across several sectors. Some of these blue-chip companies suffered small shocks to their revenues after suddenly suspending or terminating operations in Russia, dampening performance. Despite headwinds from inflation, Germany avoided recession during the reporting period, which helped mitigate negative investor sentiment, and in turn, Fund losses. Nonetheless, the European Central Bank raised interest rates and reduced bank subsidies during the reporting period, which likely had adverse impact on the Fund's performance.
| | AVERAGE ANNUAL TOTAL RETURN FOR THE YEAR ENDED OCTOBER 31, 2022 |
| | One Year Return | Three Year Return | Five Year Return | Annualized Inception to Date* |
| | Net Asset Value | Market Price | Net Asset Value | Market Price | Net Asset Value | Market Price | Net Asset Value | Market Price |
| Global X DAX Germany ETF* | -28.29% | -28.51% | -3.50% | -3.54% | -3.67% | -3.85% | 1.07% | 1.05% |
| DAX® Index | -27.85% | -27.85% | -3.00% | -3.00% | -3.16% | -3.16% | 1.83% | 1.83% |
| MSCI EAFE Index (Net) | -23.00% | -23.00% | -1.27% | -1.27% | -0.09% | -0.09% | 2.48% | 2.48% |
|
| Management Discussion of Fund Performance (unaudited) |
Global X DAX Germany ETF
|
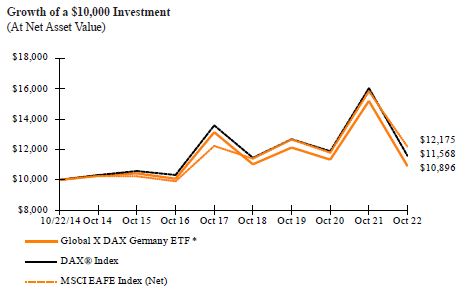
*Fund commenced operations on October 22, 2014. The financial statements include the financial information of the Predecessor Fund through December 21, 2018 (See Note 1 in Notes to Financial Statements).
The MSCI EAFE Index (Net) (Europe, Australasia, Far East) is a free float-adjusted market capitalization index that is designed to measure the equity market performance of developed markets, excluding the US & Canada.
The performance data quoted herein represents past performance and the return and value of an investment in the Fund will fluctuate so that, when redeemed, it may be worth less than its original cost. Past performance is no guarantee of future performance and should not be considered as a representation of the future results of the Fund. The Fund's performance assumes the reinvestment of all dividends and all capital gains. Index returns assume reinvestment of dividends and, unlike the Fund's returns, do not reflect any fees or expenses. If such fees and expenses were included in the index returns, the performance would have been lower. Please note that one cannot invest directly in an unmanaged index.
Performance figures for the periods shown may reflect contractual fee waivers and/or expense reimbursements. In the absence of fee waivers and/or expense reimbursements (if applicable), returns would have been lower.
There are no assurances that the Fund will meet its stated objectives.
The Fund’s holdings and allocations are subject to change and should not be considered recommendations to buy individual securities.
The graph and table do not reflect the deduction of taxes that a shareholder would pay on Fund distributions or the redemption or sale of Fund shares.
See definition of comparative indices above.
|
| Management Discussion of Fund Performance (unaudited) |
Global X MSCI Portugal ETF
|
Global X MSCI Portugal ETF
The Global X MSCI Portugal ETF (“Fund”) seeks to provide investment results that correspond generally to the price and yield performance, before fees and expenses, of the MSCI All Portugal Plus 25/50 Index (“Underlying Index”). The Fund is passively managed, which means the investment adviser does not attempt to take defensive positions in declining markets. The Fund generally seeks to fully replicate the Underlying Index.
The Underlying Index is designed to represent the performance of the broad Portugal equity universe, while including a minimum number of constituents, as defined by MSCI, Inc. ("MSCI"), the provider of the Underlying Index. The Broad Portugal Equity Universe includes securities that are classified in Portugal according to the MSCI Global Investable Market Index Methodology, together with companies that are headquartered or listed in Portugal and carry out the majority of their operations in Portugal.
For the 12-month period ended October 31, 2022 (the “reporting period”), the Fund decreased 17.55%, while the Underlying Index decreased 17.10%. The Fund had a net asset value of $11.71 per share on October 31, 2021 and ended the reporting period with a net asset value of $9.35 per share on October 31, 2022.
During the reporting period, the highest returns came from Altri Sgps SA and Greenvolt - Energias Renovaveis SA, which returned 16.64% and 14.06%, respectively. The worst performers were Fusion Fuel Green PLC and Fosun International Limited, which returned -65.66% and -46.00%, respectively.
Despite a rebound in the tourism industry and robust public investment in early 2022, the Portuguese economy was adversely affected by the war in Ukraine, rising inflation that weighed on private consumption, supply-chain disruptions, increases in energy and commodities prices as well as lowering consumer confidence and purchasing power. These events contributed to the Fund's negative performance during the reporting period. Furthermore, the Utilities sector was impacted by a severe drought in Iberia, which increased the production costs for Energias de Portugal, a leading Portuguese energy company and holding of the Fund. When combined with an extreme tax on the energy sector in Portugal, this resulted in net losses to the business and contributed to the Fund's negative returns. However, the negative effects of rising inflation and higher interest rates were partly mitigated by the labor market's strong performance, savings accumulated during the COVID-19 pandemic, and economic stimulus measures by the Portuguese government, which were a relief to the country’s economy.
| | AVERAGE ANNUAL TOTAL RETURN FOR THE YEAR ENDED OCTOBER 31, 2022 |
| | One Year Return | Three Year Return | Five Year Return | Annualized Inception to Date* |
| | Net Asset Value | Market Price | Net Asset Value | Market Price | Net Asset Value | Market Price | Net Asset Value | Market Price |
| Global X MSCI Portugal ETF | -17.55% | -17.50% | -1.43% | -1.43% | -1.82% | -1.87% | -1.88% | -1.90% |
| Hybrid FTSE Portugal 20 Index/MSCI All Portugal Plus 25/50 Index** | -17.10% | -17.10% | -1.25% | -1.25% | -1.71% | -1.71% | -1.74% | -1.74% |
| MSCI EAFE Index (Net) | -23.00% | -23.00% | -1.27% | -1.27% | -0.09% | -0.09% | 2.00% | 2.00% |
|
| Management Discussion of Fund Performance (unaudited) |
Global X MSCI Portugal ETF
|
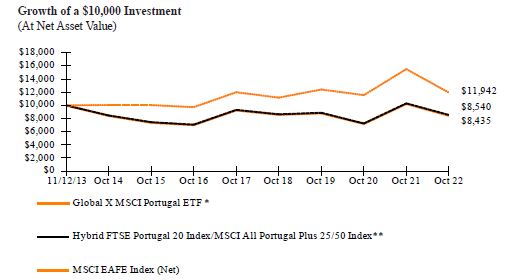
*Fund commenced operations on November 12, 2013.
** Hybrid index performance reflects the performance of the FTSE Portugal 20 Index through December 5, 2016, and the MSCI All Portugal Plus 25/50 Index thereafter.
The MSCI EAFE Index (Net) (Europe, Australasia, Far East) is a free float-adjusted market capitalization index that is designed to measure the equity market performance of developed markets, excluding the US & Canada.
The performance data quoted herein represents past performance and the return and value of an investment in the Fund will fluctuate so that, when redeemed, it may be worth less than its original cost. Past performance is no guarantee of future performance and should not be considered as a representation of the future results of the Fund. The Fund's performance assumes the reinvestment of all dividends and all capital gains. Index returns assume reinvestment of dividends and, unlike the Fund's returns, do not reflect any fees or expenses. If such fees and expenses were included in the index returns, the performance would have been lower. Please note that one cannot invest directly in an unmanaged index.
Performance figures for the periods shown may reflect contractual fee waivers and/or expense reimbursements. In the absence of fee waivers and/or expense reimbursements (if applicable), returns would have been lower.
There are no assurances that the Fund will meet its stated objectives.
The Fund’s holdings and allocations are subject to change and should not be considered recommendations to buy individual securities.
The graph and table do not reflect the deduction of taxes that a shareholder would pay on Fund distributions or the redemption or sale of Fund shares.
See definition of comparative indices above.
|
| Management Discussion of Fund Performance (unaudited) |
Global X MSCI Colombia ETF
|
Global X MSCI Colombia ETF
The Global X MSCI Colombia ETF (“Fund”) seeks to provide investment results that correspond generally to the price and yield performance, before fees and expenses, of the MSCI All Colombia Select 25/50 Index (“Underlying Index”). The Fund is passively managed, which means the investment adviser does not attempt to take defensive positions in declining markets. The Fund generally seeks to fully replicate the Underlying Index.
The Underlying Index is designed to represent the performance of the broad Colombia equity universe, as defined by MSCI, Inc. ("MSCI"), the provider of the Underlying Index. The Broad Colombia Equity Universe includes securities that are classified in Colombia according to the MSCI Global Investable
Market Index Methodology, together with companies that are headquartered or listed in Colombia and carry out the majority of their operations in Colombia.
For the 12-month period ended October 31, 2022 (the “reporting period”), the Fund decreased 31.39%, while the Underlying Index decreased 30.87%. The Fund had a net asset value of $30.76 per share on October 31, 2021 and ended the reporting period with a net asset value of $19.68 per share on October 31, 2022.
During the reporting period, the highest returns came from Grupo Nutresa SA and Grupo de Inversiones Suramericana SA, which returned 74.59% and 65.89%, respectively. The worst performers were Mineros SA and Banco de Bogota SA, which returned -63.52% and -63.37%, respectively.
The Fund generated negative returns during the reporting period as a result of macroeconomic challenges, risk-off sentiment in Columbia, and a contentious presidential election that damaged investor sentiment. During the reporting period, the Fund maintained a high allocation to Financials and Energy. Before May and June 2022, this allocation worked favorably for the Fund’s performance, as a rising interest rate environment, surging commodity prices and a wave of major tender offers boosted the Financials and Energy sectors. However, after two rounds of voting for the presidential election in May and June, Gustavo Petro was elected as president. As the first leftist president in the country’s history, Gustavo Petro created deep uncertainty for investors who speculated over how radical or moderate he would be. More importantly, Petro promised to rapidly move the country away from dependence on oil for revenue and even suggested tough actions against Ecopetrol, the largest holding in the Fund during the reporting period. This had a strongly adverse effect on the Fund’s performance in the latter part of the reporting period.
| | AVERAGE ANNUAL TOTAL RETURN FOR THE YEAR ENDED OCTOBER 31, 2022 |
| | One Year Return | Three Year Return | Five Year Return | Ten Year Return |
| | Net Asset Value | Market Price | Net Asset Value | Market Price | Net Asset Value | Market Price | Net Asset Value | Market Price |
| Global X MSCI Colombia ETF | -31.39% | -32.88% | -16.20% | -16.48% | -8.94% | -9.27% | -11.08% | -11.33% |
| Hybrid MSCI All Colombia Select 25/50 Index/MSCI All Colombia Capped Index/FTSE Colombia 20 Index** | -30.87% | -30.87% | -15.91% | -15.91% | -8.55% | -8.55% | -10.53% | -10.53% |
| MSCI Emerging Markets Index (Net) | -31.03% | -31.03% | -4.42% | -4.42% | -3.09% | -3.09% | 0.79% | 0.79% |
|
| Management Discussion of Fund Performance (unaudited) |
Global X MSCI Colombia ETF
|

*Fund commenced operations on February 5, 2009.
**Reflects performance of the FTSE Colombia 20 Index through July 14, 2014, the MSCI All Colombia Capped Index through August 30, 2016 and the MSCI All Colombia Select 25/50 Index, thereafter. The inception of the MSCI All Colombia Select 25/50 Index (“New Index”) was on July 15, 2016. Effective on or around August 31, 2016, the Fund began to track the New Index. This change was due to the planned migration to the New Index, potentially improving the trading characteristics of the Fund.
The MSCI Emerging Markets Index (Net) is a free float-adjusted market capitalization index that is designed to measure equity market performance of emerging markets.
The performance data quoted herein represents past performance and the return and value of an investment in the Fund will fluctuate so that, when redeemed, it may be worth less than its original cost. Past performance is no guarantee of future performance and should not be considered as a representation of the future results of the Fund. The Fund's performance assumes the reinvestment of all dividends and all capital gains. Index returns assume reinvestment of dividends and, unlike the Fund's returns, do not reflect any fees or expenses. If such fees and expenses were included in the index returns, the performance would have been lower. Please note that one cannot invest directly in an unmanaged index.
Performance figures for the periods shown may reflect contractual fee waivers and/or expense reimbursements. In the absence of fee waivers and/or expense reimbursements (if applicable), returns would have been lower.
There are no assurances that the Fund will meet its stated objectives.
The Fund’s holdings and allocations are subject to change and should not be considered recommendations to buy individual securities.
The graph and table do not reflect the deduction of taxes that a shareholder would pay on Fund distributions or the redemption or sale of Fund shares.
|
| Management Discussion of Fund Performance (unaudited) |
Global X MSCI Colombia ETF
|
See definition of comparative indices on previous page.
|
| Management Discussion of Fund Performance (unaudited) |
Global X MSCI Argentina ETF
|
Global X MSCI Argentina ETF
The Global X MSCI Argentina ETF (“Fund”) seeks to provide investment results that correspond generally to the price and yield performance, before fees and expenses, of the MSCI All Argentina 25/50 Index (“Underlying Index”). The Fund is passively managed, which means the investment adviser does not attempt to take defensive positions in declining markets. The Fund generally seeks to fully replicate the Underlying Index.
The Underlying Index is designed to represent the performance of the broad Argentina equity universe, while including a minimum number of constituents. The Broad Argentina Equity Universe includes securities that are classified in Argentina according to the MSCI Global Investable Market Index Methodology, together with companies that are headquartered or listed in Argentina and carry out the majority of their operations in Argentina. The Underlying Index targets a minimum of 25 securities and 20 issuers at construction.
For the 12-month period ended October 31, 2022 (the “reporting period”), the Fund decreased 3.42%, while the Underlying Index decreased 3.09%. The Fund had a net asset value of $33.00 per share on October 31, 2021 and ended the reporting period with a net asset value of $31.13 per share on October 31, 2022.
During the reporting period, the highest returns came from YPF SA and Transportadora de Gas del Sur SA, which returned 81.9% and 63.28%, respectively. The worst performers were Despegar.com, Corp and MercadoLibre, Inc. which returned -42.81% and -39.12%, respectively.
The Fund is well-diversified across cyclical and non-cyclical sectors. Argentina's growth slowed during the reporting period due to an increase in COVID-19 cases, interest rate hikes to combat surging inflation and higher energy import costs, including natural gas. This added to higher energy subsidy costs, hitting Argentina's savings and economic growth, resulting in the Fund's negative performance. During the reporting period, Argentina’s economic policy went through a period of deep uncertainty as the Minister of Economy was swapped out multiple times in the span of a month. Despite this uncertainty, Argentina reached a deal to restructure a Paris Club agreement to postpone the bulk of the billions of dollars of debt repayments until 2028, providing some relief to Argentina. Argentina's new economic team, under the guidance of Minister of Economy Sergio Massa, has implemented decisive, corrective measures that are restoring confidence, policy, and credibility among investors. This facilitated rapid recovery and strengthening prospects for growth, which likely contributed to better performance of the Fund in the last few months of the reporting period.
| | AVERAGE ANNUAL TOTAL RETURN FOR THE YEAR ENDED OCTOBER 31, 2022 |
| | One Year Return | Three Year Return | Five Year Return | Ten Year Return |
| | Net Asset Value | Market Price | Net Asset Value | Market Price | Net Asset Value | Market Price | Net Asset Value | Market Price |
| Global X MSCI Argentina ETF | -3.42% | -3.03% | 13.69% | 13.64% | 0.54% | 0.55% | 7.29% | 7.34% |
Hybrid FTSE Argentina 20 Index/ MSCI All Argentina 25/50 Index** | -3.09% | -3.09% | 14.15% | 14.15% | 0.48% | 0.48% | 7.84% | 7.84% |
| MSCI Emerging Markets Index (Net) | -31.03% | -31.03% | -4.42% | -4.42% | -3.09% | -3.09% | 0.79% | 0.79% |
|
| Management Discussion of Fund Performance (unaudited) |
Global X MSCI Argentina ETF
|
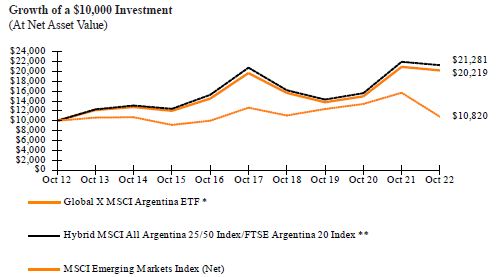
*Fund commenced operations on March 2, 2011.
**Reflects performance of the FTSE Argentina 20 Index through August 14, 2014 and the MSCI All Argentina 25/50 Index (“New Index”) thereafter.
The MSCI Emerging Markets Index (Net) is a free float-adjusted market capitalization index that is designed to measure equity market performance of emerging markets.
The performance data quoted herein represents past performance and the return and value of an investment in the Fund will fluctuate so that, when redeemed, it may be worth less than its original cost. Past performance is no guarantee of future performance and should not be considered as a representation of the future results of the Fund. The Fund's performance assumes the reinvestment of all dividends and all capital gains. Index returns assume reinvestment of dividends and, unlike the Fund's returns, do not reflect any fees or expenses. If such fees and expenses were included in the index returns, the performance would have been lower. Please note that one cannot invest directly in an unmanaged index.
Performance figures for the periods shown may reflect contractual fee waivers and/or expense reimbursements. In the absence of fee waivers and/or expense reimbursements (if applicable), returns would have been lower.
There are no assurances that the Fund will meet its stated objectives.
The Fund’s holdings and allocations are subject to change and should not be considered recommendations to buy individual securities.
The graph and table do not reflect the deduction of taxes that a shareholder would pay on Fund distributions or the redemption or sale of Fund shares.
See definition of comparative indices above.
\
|
| Management Discussion of Fund Performance (unaudited) |
Global X MSCI Pakistan ETF
|
Global X MSCI Pakistan ETF
The Global X MSCI Pakistan ETF (“Fund”) seeks to provide investment results that correspond generally to the price and yield performance, before fees and expenses, of the MSCI All Pakistan Select 25/50 Index (“Underlying Index”). The Fund is passively managed, which means the investment adviser does not attempt to take defensive positions in declining markets. The Fund generally seeks to fully replicate the Underlying Index.
The Underlying Index is designed to represent the performance of the broad Pakistan equity universe, while including a minimum number of constituents as defined by MSCI, Inc. ("MSCI"), the provider of the Underlying Index. The broad Pakistan equity universe includes securities that are classified in Pakistan according to the MSCI Global Investable Market Index Methodology, together with companies that are headquartered or listed in Pakistan and carry out the majority of their operations in Pakistan.
For the 12-month period ended October 31, 2022 (the “reporting period”), the Fund decreased 32.01%, while the Underlying Index decreased 30.66%. The Fund had a net asset value of $25.99 per share on October 31, 2021 and ended the reporting period with a net asset value of $16.45 per share on October 31, 2022.
During the reporting period, the highest returns came from Kot Addu Power Co Ltd and Millat Tractors Limited, which returned 15.37% and 7.61%, respectively. The worst performers were Searle Company Ltd and Habib Bank Limited, which returned -59.49% and -54.45%, respectively.
Despite the resumption of an International Monetary Fund funding program in August which depleted foreign reserves, a weakening local currency, political unrest, decades-high inflation levels, and a large fiscal deficit that inflated the cost of Pakistan imports all contributed to the Fund's negative performance during the reporting period. To combat rising inflationary pressures, Pakistan's central bank raised policy interest rates during the reporting period. Furthermore, floods in Pakistan submerged nearly a third of the country’s land and had a devastating impact on the economy. Political stability became a particular concern for international investors after former Prime Minister Imran Khan began rallying protestors and spreading the claim that the vote of no-confidence that ousted him was, in fact, a foreign-backed coup. The likelihood of political violence increased as many of Khan’s supporters viewed the incumbent leaders as illegitimate, thus dampening investor confidence in Pakistan and dampening the Fund’s returns.
| | AVERAGE ANNUAL TOTAL RETURN FOR THE YEAR ENDED OCTOBER 31, 2022 |
| | One Year Return | Three Year Return | Five Year Return | Annualized Inception to Date* |
| | Net Asset Value | Market Price | Net Asset Value | Market Price | Net Asset Value | Market Price | Net Asset Value | Market Price |
| Global X MSCI Pakistan ETF* | -32.01% | -31.35% | -10.06% | -9.85% | -16.11% | -16.09% | -11.69% | -11.75% |
| MSCI All Pakistan Select 25/50 Index | -30.66% | -30.66% | -8.63% | -8.63% | -14.92% | -14.92% | -10.10% | -10.10% |
| MSCI Emerging Markets Index (Net) | -31.03% | -31.03% | -4.42% | -4.42% | -3.09% | -3.09% | -0.38% | -0.38% |
|
| Management Discussion of Fund Performance (unaudited) |
Global X MSCI Pakistan ETF
|
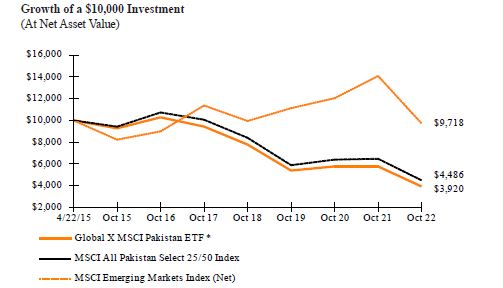
*Fund commenced operations on April 22, 2015.
The MSCI Emerging Markets Index (Net) is a free float-adjusted market capitalization index that is designed to measure equity market performance of emerging markets.
The performance data quoted herein represents past performance and the return and value of an investment in the Fund will fluctuate so that, when redeemed, it may be worth less than its original cost. Past performance is no guarantee of future performance and should not be considered as a representation of the future results of the Fund. The Fund's performance assumes the reinvestment of all dividends and all capital gains. Index returns assume reinvestment of dividends and, unlike the Fund's returns, do not reflect any fees or expenses. If such fees and expenses were included in the index returns, the performance would have been lower. Please note that one cannot invest directly in an unmanaged index.
Performance figures for the periods shown may reflect contractual fee waivers and/or expense reimbursements. In the absence of fee waivers and/or expense reimbursements (if applicable), returns would have been lower.
There are no assurances that the Fund will meet its stated objectives.
The Fund’s holdings and allocations are subject to change and should not be considered recommendations to buy individual securities.
The graph and table do not reflect the deduction of taxes that a shareholder would pay on Fund distributions or the redemption or sale of Fund shares.
See definition of comparative indices above.
|
| Management Discussion of Fund Performance (unaudited) |
Global X MSCI Nigeria ETF
|
Global X MSCI Nigeria ETF
The Global X MSCI Nigeria ETF (“Fund”) seeks to provide investment results that correspond generally to the price and yield performance, before fees and expenses, of the MSCI All Nigeria Select 25/50 Index (“Underlying Index”). The Fund is passively managed, which means the investment adviser does not attempt to take defensive positions in declining markets. The Fund generally seeks to fully replicate the Underlying Index.
The Underlying Index is designed to represent the performance of the broad Nigeria equity universe, while including a minimum number of constituents, as defined by MSCI, Inc. ("MSCI"), the provider of the Underlying Index. The broad Nigeria equity universe includes securities that are classified in Nigeria according to the MSCI Global Investable Market Index Methodology, together with companies that are headquartered or listed in Nigeria and carry out the majority of their operations in Nigeria.
For the 12-month period ended October 31, 2022 (the “reporting period”), the Fund decreased 13.69%, while the Underlying Index decreased 12.81%. The Fund had a net asset value of $15.73 per share on October 31, 2021 and ended the reporting period with a net asset value of $12.91 per share on October 31, 2022.
During the reporting period, the highest returns came from Fidelity Bank PLC and MTN Nigeria Communications PLC, which returned 59.08% and 12.77%, respectively. The worst performers were UPDC Real Estate Investment Trust and Guaranty Trust Holding Company Plc, which returned-47.41% and -33.30%, respectively.
The Nigerian economy’s recovery from the COVID-19 pandemic was aided by a recovery in mining & quarrying activities, transportation, and financial activities. However, macroeconomic stability was weakened by trade restrictions, deficit monetization, and higher global inflation, resulting in the Fund’s negative performance during the reporting period. The strong rally in global oil prices did not benefit Nigeria's oil sector during the reporting period due to Nigeria’s negligible refining capacity, massive theft of millions of barrels per day, and the cost of fuel subsidies. However, Nigeria's non-oil exposures boosted the country's economic growth rate, led primarily by the Information Technology and Telecommunications sectors. Nigeria's central bank raised interest rates to combat inflation and relieve pressure on its currency, the naira. At the same time, Nigeria’s system of multiple currency exchange rates continued to create market distortions and problems for investor liquidity, which made the market less appealing for international investors. The majority of Fund assets are in naira and naira-dominated securities. Assets denominated in naira are required to be converted to U.S. Dollars for financial reporting purposes. The currency situation in Nigeria was tenuous and unique, and impacted the Fund in executing repatriation transactions at the spot rate used for financial reporting translation, contributing to the Fund’s negative performance.
|
| Management Discussion of Fund Performance (unaudited) |
Global X MSCI Nigeria ETF
|
| | AVERAGE ANNUAL TOTAL RETURN FOR THE YEAR ENDED OCTOBER 31, 2022 |
| | One Year Return | Three Year Return | Five Year Return | Annualized Inception to Date* |
| | Net Asset Value | Market Price | Net Asset Value | Market Price | Net Asset Value | Market Price | Net Asset Value | Market Price |
| Global X MSCI Nigeria ETF | -13.69% | -30.58% | 5.52% | -12.09% | -5.38% | -14.45% | -11.91% | -16.43% |
| Hybrid MSCI All Nigeria Select 25/50 Index/Solactive Nigeria Index** | -12.81% | -12.81% | 7.65% | 7.65% | -2.98% | -2.98% | -9.90% | -9.90% |
| MSCI Emerging Markets Index (Net) | -31.03% | -31.03% | -4.42% | -4.42% | -3.09% | -3.09% | 0.42% | 0.42% |
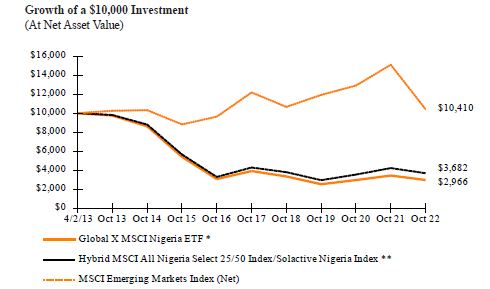
*Fund commenced operations on April 2, 2013.
**Reflects performance of the Solactive Nigeria Index through August 14, 2014 and the MSCI All Nigeria Select 25/50 Index thereafter.
The MSCI Emerging Markets Index (Net) is a free float-adjusted market capitalization index that is designed to measure equity market performance of emerging markets.
The performance data quoted herein represents past performance and the return and value of an investment in the Fund will fluctuate so that, when redeemed, it may be worth less than its original cost. Past performance is no guarantee of future performance and should not be considered as a representation of the future results of the Fund. The Fund's performance assumes the reinvestment of all dividends and all capital gains. Index returns assume reinvestment of dividends and, unlike the Fund's returns, do not reflect any fees or expenses. If such fees and expenses were included in the index returns, the performance would have been lower. Please note that one cannot invest directly in an unmanaged index.
|
| Management Discussion of Fund Performance (unaudited) |
Global X MSCI Nigeria ETF
|
Performance figures for the periods shown may reflect contractual fee waivers and/or expense reimbursements. In the absence of fee waivers and/or expense reimbursements (if applicable), returns would have been lower.
There are no assurances that the Fund will meet its stated objectives.
The Fund’s holdings and allocations are subject to change and should not be considered recommendations to buy individual securities.
The graph and table do not reflect the deduction of taxes that a shareholder would pay on Fund distributions or the redemption or sale of Fund shares.
See definition of comparative indices on previous page.
|
| Management Discussion of Fund Performance (unaudited) |
Global X MSCI Vietnam ETF
|
Global X MSCI Vietnam ETF
The Global X MSCI Vietnam ETF (“Fund”) seeks to provide investment results that correspond generally to the price and yield performance, before fees and expenses, of the MSCI Vietnam IMI Select 25/50 Index (“Underlying Index”). The Fund is passively managed, which means the investment adviser does not attempt to take defensive positions in declining markets. The Fund generally seeks to fully replicate the Underlying Index.
The Underlying Index is designed to represent the performance of the broad Vietnam equity universe, while including a minimum number of constituents, as defined by MSCI, Inc. ("MSCI"), the provider of the Underlying Index ("Index Provider"). The broad Vietnam equity universe includes securities that are classified in Vietnam according to the MSCI Global Investable Market Index Methodology, together with companies that are headquartered or listed in Vietnam and carry out the majority of their operations in Vietnam, as determined solely by the Index Provider.
From the inception of the Fund to the period ended October 31, 2022 (the “reporting period”), the Fund decreased 42.60%, while the Underlying Index decreased 42.33%. The Fund had a net asset value of $25.64 per share on December 07, 2021 and ended the reporting period with a net asset value of $14.67 per share on October 31, 2022.
During the reporting period, the highest returns came from Van Phu - Invest Investment JSC and Vinh Hoan Corp, which returned 36.58% and 12.22%, respectively. The worst performers were Thaiholdings JSC and An Phat Holdings JSC, which returned -84.95% and -77.16%, respectively.
Financial markets in Vietnam suffered a serious pullback during the reporting period, mainly due to a liquidity crunch in the property sector, strains on the financial sector, and adverse global developments, which negatively affected the Fund’s performance. A Vietnamese government crackdown on property lending aimed to reduce speculation in the property market, but had the effect of stalling projects, discouraging funding, and depressing homebuyer demand. The Fund was strongly impacted by the decline of Vietnam’s property sector, as Real Estate was the largest sector allocation of the Fund during the reporting period. The country also faced challenges from labor shortages and supply chain constraints owing to the Russia-Ukraine conflict and lockdowns in China, contributing to the Fund’s negative performance.
| | AVERAGE TOTAL RETURN FOR THE PERIOD ENDED OCTOBER 31, 2022 |
| | Cumulative Inception to Date* |
| | Net Asset Value | Market Price |
| Global X MSCI Vietnam ETF | -42.60% | -41.82% |
| MSCI Vietnam IMI Select 25-50 Index | -42.33% | -42.33% |
| MSCI Emerging Markets Index (Net) | -29.49% | -29.49% |
|
| Management Discussion of Fund Performance (unaudited) |
Global X MSCI Vietnam ETF
|
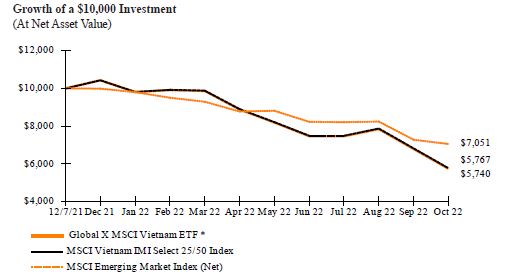
*Fund commenced operations on December 7, 2021.
The MSCI Emerging Markets Index (Net) is a free float-adjusted market capitalization index that is designed to measure equity market performance of emerging markets.
The performance data quoted herein represents past performance and the return and value of an investment in the Fund will fluctuate so that, when redeemed, it may be worth less than its original cost. Past performance is no guarantee of future performance and should not be considered as a representation of the future results of the Fund. The Fund's performance assumes the reinvestment of all dividends and all capital gains. Index returns assume reinvestment of dividends and, unlike the Fund's returns, do not reflect any fees or expenses. If such fees and expenses were included in the index returns, the performance would have been lower. Please note that one cannot invest directly in an unmanaged index.
Performance figures for the periods shown may reflect contractual fee waivers and/or expense reimbursements. In the absence of fee waivers and/or expense reimbursements (if applicable), returns would have been lower.
There are no assurances that the Fund will meet its stated objectives.
The Fund’s holdings and allocations are subject to change and should not be considered recommendations to buy individual securities.
The graph and table do not reflect the deduction of taxes that a shareholder would pay on Fund distributions or the redemption or sale of Fund shares.
See definition of comparative indices above.
|
| Management Discussion of Fund Performance (unaudited) |
Global X MSCI Next Emerging & Frontier ETF
|
Global X MSCI Next Emerging & Frontier ETF
The Global X MSCI Next Emerging & Frontier ETF (“Fund”) seeks to provide investment results that correspond generally to the price and yield performance, before fees and expenses, of the MSCI Select Emerging and Frontier Markets Access Index (“Underlying Index”). The Fund is passively managed, which means the investment adviser does not attempt to take defensive positions in declining markets. The Fund generally seeks to fully replicate the Underlying Index.
The Underlying Index is designed to reflect equity performance of select emerging markets and frontier markets companies while maintaining diversification across individual countries, sectors and issuers. The Underlying Index is constructed from the MSCI EFM ex BRICKT (Brazil, Russia, India, China, South Korea & Taiwan) Index (the "Parent Index"). Securities from the Parent Index are classified into emerging markets countries and frontier markets countries based on the market classification approach of MSCI Inc., the Index Provider.
For the 12-month period ended October 31, 2022 (the “reporting period”), the Fund decreased 11.75%, while the Underlying Index decreased 11.08%. The Fund had a net asset value of $21.00 per share on October 31, 2021 and ended the reporting period with a net asset value of $18.07 per share on October 31, 2022.
During the reporting period, the highest returns came from Grupo Financiero Inbursa SAB de CV and Abu Dhabi Islamic Bank which returned 83.11% and 68.27%, respectively. The worst performers were Thaiholdings JSC and PT Bank Jago Tbk, which returned -79.70% and -70.96%, respectively.
The negative performance of the Fund during the reporting period can be attributed to concerns among investors over the COVID-19 Omicron variant, the Russia–Ukraine crisis, and general risk-off sentiment. Rising commodity prices had mixed effects on emerging and frontier markets, while the rate hikes of the U.S. Federal Reserve weakened currencies around the world. At the same time, due to the relaxation of travel restrictions, tourism and export performance improved, mitigating the Fund’s losses. Sector weightings were the highest in Financials at 30.62%, followed by Communication Services (14.66%) during the reporting period. The highest average country exposures for the Fund were Indonesia (10.52%), Saudi Arabia (10.32%), South Africa (9.24%), and Vietnam (8.17%).
| | AVERAGE ANNUAL TOTAL RETURN FOR THE YEAR ENDED OCTOBER 31, 2022 |
| | One Year Return | Three Year Return | Five Year Return | Annualized Inception to Date* |
| | Net Asset Value | Market Price | Net Asset Value | Market Price | Net Asset Value | Market Price | Net Asset Value | Market Price |
Global X MSCI Next Emerging & Frontier ETF | -11.75% | -11.60% | -0.98% | -0.87% | -2.21% | -2.06% | -1.28% | -1.21% |
| Hybrid Solactive Next Emerging & Frontier Index/ MSCI Select Emerging and Frontier Markets Access Index** | -11.08% | -11.08% | -0.20% | -0.20% | -1.46% | -1.46% | -0.56% | -0.56% |
| MSCI Emerging Markets Index (Net) | -31.03% | -31.03% | -4.42% | -4.42% | -3.09% | -3.09% | 0.37% | 0.37% |
|
| Management Discussion of Fund Performance (unaudited) |
Global X MSCI Next Emerging & Frontier ETF
|

*Fund commenced operations on November 6, 2013.
** Reflects performance of the Solactive Next Emerging & Frontier Index through January 15, 2019 and the MSCI Select Emerging and Frontier Markets Access Index thereafter.
The MSCI Emerging Markets Index (Net) is a free float-adjusted market capitalization index that is designed to measure equity market performance of emerging markets.
The performance data quoted herein represents past performance and the return and value of an investment in the Fund will fluctuate so that, when redeemed, it may be worth less than its original cost. Past performance is no guarantee of future performance and should not be considered as a representation of the future results of the Fund. The Fund's performance assumes the reinvestment of all dividends and all capital gains. Index returns assume reinvestment of dividends and, unlike the Fund's returns, do not reflect any fees or expenses. If such fees and expenses were included in the index returns, the performance would have been lower. Please note that one cannot invest directly in an unmanaged index.
Performance figures for the periods shown may reflect contractual fee waivers and/or expense reimbursements. In the absence of fee waivers and/or expense reimbursements (if applicable), returns would have been lower.
There are no assurances that the Fund will meet its stated objectives.
The Fund’s holdings and allocations are subject to change and should not be considered recommendations to buy individual securities.
The graph and table do not reflect the deduction of taxes that a shareholder would pay on Fund distributions or the redemption or sale of Fund shares.
See definition of comparative indices above.
|
| Management Discussion of Fund Performance (unaudited) |
Global X MSCI Norway ETF
|
Global X MSCI Norway ETF
The Global X MSCI Norway ETF (“Fund”) seeks to provide investment results that correspond generally to the price and yield performance, before fees and expenses, of the MSCI Norway IMI 25/50 Index (“Underlying Index”). The Fund is passively managed, which means the investment adviser does not attempt to take defensive positions in declining markets. The Fund generally seeks to fully replicate the Underlying Index.
The Underlying Index is designed to reflect broad based equity market performance in Norway as defined by MSCI, Inc. ("MSCI"), the provider of the Underlying Index. The broad Norway equity universe includes securities that are classified in Norway according to the MSCI Global Investable Market Index Methodology, which is a methodology that seeks to identify the investable universe of companies globally in order to facilitate the construction of replicable indexes such as the Underlying Index.
For the 12-month period ended October 31, 2022 (the “reporting period”), the Fund decreased 21.72%, while the Underlying Index decreased 21.63%. The Fund had a net asset value of $32.01 per share on October 31, 2021 and ended the reporting period with a net asset value of $24.43 per share on October 31, 2022.
During the reporting period, the highest returns came from Hafnia Ltd and Golden Ocean Group Ltd, which returned 154.80% and 101.76%, respectively. The worst performers were LINK Mobility Group Holding ASA and Meltwater NV, which returned -75.62% and -73.43%, respectively.
During the reporting period, the Norwegian economy recovered from the COVID-19 pandemic, but the impact of the Russia-Ukraine war on global commodities prices, energy prices and surging inflation created housing market imbalances and outlays on electricity-bill subsidies in Norway. These factors contributed to the Fund’s negative returns during the reporting period. This was mitigated, to some extent, by Energy holdings in the Fund, particularly Equinor, that received a windfall from the sudden need for energy security in Europe as a result of the war in Ukraine. For the broader economy, Norway's central bank raised interest rates significantly during the period, tightening the Norwegian economy and creating a tougher environment for equities, which also negatively impacted the Fund during the reporting period.
| | AVERAGE ANNUAL TOTAL RETURN FOR THE YEAR ENDED OCTOBER 31, 2022 |
| | One Year Return | Three Year Return | Five Year Return | Ten Year Return |
| | Net Asset Value | Market Price | Net Asset Value | Market Price | Net Asset Value | Market Price | Net Asset Value | Market Price |
| Global X MSCI Norway ETF† | -21.72% | -22.51% | 2.51% | 2.62% | 0.69% | 0.60% | 1.07% | 1.08% |
Hybrid MSCI Norway IMI 25/50 Index/FTSE Norway 30 Index** | -21.63% | -21.63% | 2.79% | 2.79% | 0.98% | 0.98% | 1.47% | 1.47% |
| MSCI EAFE Index (Net) | -23.00% | -23.00% | -1.27% | -1.27% | -0.09% | -0.09% | 4.13% | 4.13% |
|
| Management Discussion of Fund Performance (unaudited) |
Global X MSCI Norway ETF
|
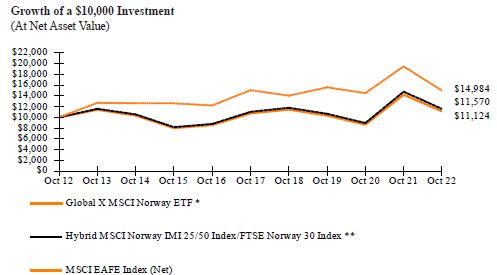
*Fund commenced operations on November 9, 2010.
**Reflects performance of the FTSE Norway 30 Index through July 14, 2014 and the MSCI Norway IMI 25/50 Index thereafter.
† Performance for periods prior to November 1, 2021 reflects the historical performance of the Global X MSCI Norway ETF, the predecessor fund. On October 29, 2021, the Global X MSCI Norway ETF (the “Acquired Fund”) was reorganized into the Global X FTSE Nordic Region ETF (the “Acquiring Fund”), each a separate series of the Trust (together, the “Combined Fund”) and the Combined Fund was renamed the Global X MSCI Norway ETF. As a result of the Reorganization as of the close of business on October 29, 2021, the Combined Fund assumed the performance and accounting history of the Acquired Fund. Accordingly, performance figures for the Combined Fund for periods prior to the date of the Reorganization represent the performance of the Acquired Fund (See Note 1 in Notes to Financial Statements).
The MSCI EAFE Index (Net) (Europe, Australasia, Far East) is a free float-adjusted market capitalization index that is designed to measure the equity market performance of developed markets, excluding the US & Canada.
The performance data quoted herein represents past performance and the return and value of an investment in the Fund will fluctuate so that, when redeemed, it may be worth less than its original cost. Past performance is no guarantee of future performance and should not be considered as a representation of the future results of the Fund. The Fund's performance assumes the reinvestment of all dividends and all capital gains. Index returns assume reinvestment of dividends and, unlike the Fund's returns, do not reflect any fees or expenses. If such fees and expenses were included in the index returns, the performance would have been lower. Please note that one cannot invest directly in an unmanaged index.
Performance figures for the periods shown may reflect contractual fee waivers and/or expense reimbursements. In the absence of fee waivers and/or expense reimbursements (if applicable), returns would have been lower.
There are no assurances that the Fund will meet its stated objectives.
|
| Management Discussion of Fund Performance (unaudited) |
Global X MSCI Norway ETF
|
The Fund’s holdings and allocations are subject to change and should not be considered recommendations to buy individual securities.
The graph and table do not reflect the deduction of taxes that a shareholder would pay on Fund distributions or the redemption or sale of Fund shares.
See definition of comparative indices on previous page.
|
| Management Discussion of Fund Performance (unaudited) |
Global X FTSE Southeast Asia ETF
|
Global X FTSE Southeast Asia ETF
The Global X FTSE Southeast Asia ETF (“Fund”) seeks to provide investment results that correspond generally to the price and yield performance, before fees and expenses, of the FTSE/ASEAN 40 Index (“Underlying Index”). The Fund is passively managed, which means the investment adviser does not attempt to take defensive positions in declining markets. The Fund generally seeks to fully replicate the Underlying Index.
The Underlying Index tracks the performance of the 40 largest companies in the five ASEAN regions: Indonesia, Philippines, Singapore, Malaysia and Thailand as defined by FTSE International Limited ("FTSE"), the provider of the Underlying Index. The Underlying Index is free-float adjusted and weighted by market capitalization and designed using eligible stocks within the FTSE All-World universe.
For the 12-month period ended October 31, 2022 (the “reporting period”), the Fund decreased 3.13%, while the Underlying Index decreased 2.43%. The Fund had a net asset value of $15.10 per share on October 31, 2021 and ended the reporting period with a net asset value of $14.02 on October 31, 2022.
During the reporting period, the highest returns came from PTT Exploration & Production PLC and PT Bank Mandiri (Persero) Tbk, which returned 41.53% and 39.85%, respectively. The worst performers were Press Metal Aluminium Holdings Berhad and Ayala Land Inc., which returned -38.84% and -36.57%, respectively.
The Underlying Index delivered negative returns during the reporting period, but a number of factors allowed it to outperform major indices in a time of general risk-off sentiment. In addition to the relaxation of COVID-19 restrictions boosting tourist inflows and strengthening the macroeconomic environment, investors started to become more optimistic on SoutheastAsian financials as interest rates rose. Financials holdings in the Fund generally performed well during the reporting period, which had positive implications for the Fund, as it has a high allocation to Financials. Southeast Asian currencies have held up relatively well against the rising dollar compared to developed-country currencies, with the Indonesian rupiah and Singapore dollar performing particularly well. Furthermore, as Vietnam’s property sector suffered, which in turn negatively impacted Vietnamese equities, the fact that the Fund has no direct exposure to Vietnam worked in its favor. Performance during the reporting period was hampered by supply-chain disruptions, accelerating inflation, and rising interest rates in the United States. Continuing political instability in Myanmar and the war in Ukraine raised additional risks for the Fund during the reporting period.
| | AVERAGE ANNUAL TOTAL RETURN FOR THE YEAR ENDED OCTOBER 31, 2022 |
| | One Year Return | Three Year Return | Five Year Return | Ten Year Return |
| | Net Asset Value | Market Price | Net Asset Value | Market Price | Net Asset Value | Market Price | Net Asset Value | Market Price |
| Global X FTSE Southeast Asia ETF | -3.13% | -2.38% | -1.32% | -0.92% | 0.48% | 0.67% | 1.22% | 1.30% |
| FTSE/ASEAN 40 Index | -2.43% | -2.43% | -0.64% | -0.64% | 1.18% | 1.18% | 1.89% | 1.89% |
| MSCI Emerging Markets Index (Net) | -31.03% | -31.03% | -4.42% | -4.42% | -3.09% | -3.09% | 0.79% | 0.79% |
|
| Management Discussion of Fund Performance (unaudited) |
Global X FTSE Southeast Asia ETF
|
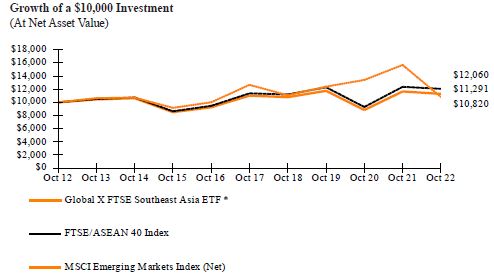
*Fund commenced operations on February 16, 2011.
The MSCI Emerging Markets Index (Net) is a free float-adjusted market capitalization index that is designed to measure equity market performance of emerging markets.
The performance data quoted herein represents past performance and the return and value of an investment in the Fund will fluctuate so that, when redeemed, it may be worth less than its original cost. Past performance is no guarantee of future performance and should not be considered as a representation of the future results of the Fund. The Fund's performance assumes the reinvestment of all dividends and all capital gains. Index returns assume reinvestment of dividends and, unlike the Fund's returns, do not reflect any fees or expenses. If such fees and expenses were included in the index returns, the performance would have been lower. Please note that one cannot invest directly in an unmanaged index.
Performance figures for the periods shown may reflect contractual fee waivers and/or expense reimbursements. In the absence of fee waivers and/or expense reimbursements (if applicable), returns would have been lower.
There are no assurances that the Fund will meet its stated objectives.
The Fund’s holdings and allocations are subject to change and should not be considered recommendations to buy individual securities.
The graph and table do not reflect the deduction of taxes that a shareholder would pay on Fund distributions or the redemption or sale of Fund shares.
See definition of comparative indices above.
|
|
|
| Schedule of Investments | | October 31, 2022 |
| Global X MSCI China Energy ETF |
| | | | |
| |
| | | Shares | | | Value | |
| COMMON STOCK — 99.8% | | | | | | |
| CHINA — 97.7% | | | | | | |
| Energy — 97.7% | | | | | | |
| CGN Mining * | | | 2,472,000 | | | $ | 229,885 | |
| China Coal Energy, Cl H . | | | 562,800 | | | | 414,401 | |
| China Merchants Energy Shipping, Cl A | | | 271,300 | | | | 257,972 | |
| China Oilfield Services, Cl H | | | 596,586 | | | | 671,837 | |
| China Petroleum & Chemical, Cl A . | | | 51,650 | | | | 28,678 | |
| China Petroleum & Chemical, Cl H | | | 1,966,597 | | | | 776,633 | |
| China Shenhua Energy, Cl A . | | | 7,000 | | | | 26,768 | |
| China Shenhua Energy, Cl H | | | 305,355 | | | | 803,274 | |
| China Suntien Green Energy, Cl H . | | | 749,400 | | | | 284,491 | |
| COSCO SHIPPING Energy Transportation, | | | | | | | | |
| | | 166,900 | | | | 385,026 | |
| Guanghui Energy, Cl A | | | 221,650 | | | | 310,850 | |
| Inner Mongolia Dian Tou Energy, Cl A | | | 121,200 | | | | 204,202 | |
| Inner Mongolia Yitai Coal, Cl B | | | 296,594 | | | | 419,384 | |
| Jizhong Energy Resources, Cl A | | | 242,900 | | | | 201,475 | |
| Offshore Oil Engineering, Cl A . | | | 476,575 | | | | 305,576 | |
| PetroChina, Cl A . | | | 40,800 | | | | 26,662 | |
| PetroChina, Cl H | | | 2,093,163 | | | | 799,950 | |
| Pingdingshan Tianan Coal Mining, Cl A . | | | 131,700 | | | | 197,996 | |
| Shaanxi Coal Industry, Cl A | | | 153,786 | | | | 416,664 | |
| Shan Xi Hua Yang Group New Energy, Cl A | | | 116,300 | | | | 267,978 | |
| Shanxi Coking Coal Energy Group, Cl A . | | | 193,853 | | | | 301,222 | |
| Shanxi Lu'an Environmental Energy | | | | | | | | |
| | | 156,565 | | | | 358,621 | |
| Sinopec Kantons Holdings | | | 971,300 | | | | 262,318 | |
| Yankuang Energy Group, Cl A . | | | 5,304 | | | | 29,378 | |
| Yankuang Energy Group, Cl H | | | 250,475 | | | | 705,172 | |
| Yantai Jereh Oilfield Services Group, Cl A | | | 58,910 | | |
| 241,584 | |
| TOTAL CHINA | | | | | |
| 8,927,997 | |
|
|
|
| Schedule of Investments | | October 31, 2022 |
| Global X MSCI China Energy ETF |
| | | | |
| |
| | | Shares | | | Value | |
| COMMON STOCK — continued | | | | | | |
| HONG KONG — 2.1% | | | | | | |
| Energy — 2.1% | | | | | | |
| AAG Energy Holdings . | | | 1,273,400 | | | $ | 193,041 | |
| TOTAL COMMON STOCK | | | | | | | | |
| (Cost $9,894,917) | | | | | | | 9,121,038 | |
| TOTAL INVESTMENTS — 99.8% | | | | | | | | |
| (Cost $9,894,917) | | | | | | $ | 9,121,038 | |
Percentages are based on Net Assets of $9,139,567.
* Non-income producing security.
As of October 31, 2022, all of the Fund's investments were considered Level 1, in accordance with authoritative guidance on fair value measurements and disclosure under U.S. GAAP.
See “Glossary” for abbreviations.
|
|
|
| Schedule of Investments | | October 31, 2022 |
| Global X MSCI China Materials ETF |
| | | | |
| |
| | | Shares | | | Value | |
| COMMON STOCK — 100.0% | | | | | | |
| CHINA — 98.1% | | | | | | |
| Materials — 98.1% | | | | | | |
| Aluminum Corp of China, Cl A | | | 51,300 | | | $ | 27,014 | |
| Aluminum Corp of China, Cl H . | | | 217,339 | | | | 62,019 | |
| Anhui Conch Cement, Cl A | | | 9,900 | | | | 32,792 | |
| Anhui Conch Cement, Cl H . | | | 61,670 | | | | 158,695 | |
| Anhui Honglu Steel Construction Group, Cl A . | | | 1,950 | | | | 9,066 | |
| Asia - Potash International Investment | | | | | | | | |
| | | 1,900 | | | | 6,610 | |
| Baoshan Iron & Steel, Cl A | | | 76,600 | | | | 50,265 | |
| BBMG, Cl A | | | 46,100 | | | | 14,654 | |
| Chengtun Mining Group, Cl A . | | | 8,900 | | | | 6,727 | |
| Chengxin Lithium Group, Cl A . | | | 1,400 | | | | 8,255 | |
| Chifeng Jilong Gold Mining, Cl A * | | | 4,800 | | | | 12,324 | |
| China Hongqiao Group | | | 123,000 | | | | 87,277 | |
| China Jushi, Cl A . | | | 15,659 | | | | 24,994 | |
| China National Building Material, Cl H | | | 200,000 | | | | 116,181 | |
| China Northern Rare Earth Group High-Tech, | | | | | | | | |
| Cl A | | | 12,600 | | | | 41,598 | |
| China Rare Earth Resources and Technology, | | | | | | | | |
| Cl A * | | | 2,300 | | | | 9,049 | |
| China Resources Cement Holdings | | | 134,100 | | | | 48,516 | |
| CMOC Group, Cl A . | | | 63,200 | | | | 35,781 | |
| CMOC Group, Cl H . | | | 192,854 | | | | 62,157 | |
| CNGR Advanced Material, Cl A . | | | 700 | | | | 6,888 | |
| CNNC Hua Yuan Titanium Dioxide, Cl A . | | | 9,570 | | | | 8,721 | |
| Do-Fluoride New Materials, Cl A | | | 1,725 | | | | 7,331 | |
| Dongyue Group . | | | 69,600 | | | | 60,469 | |
| Ganfeng Lithium, Cl A . | | | 5,440 | | | | 58,644 | |
| Ganfeng Lithium, Cl H | | | 18,960 | | | | 128,254 | |
| GEM, Cl A . | | | 20,400 | | | | 20,706 | |
| Guangzhou Tinci Materials Technology, Cl A .. | | | 5,060 | | | | 29,338 | |
| Hangzhou Oxygen Plant Group, Cl A . | | | 2,700 | | | | 15,504 | |
| Henan Shenhuo Coal & Power, Cl A . | | | 4,700 | | | | 8,996 | |
|
|
|
| Schedule of Investments | | October 31, 2022 |
| Global X MSCI China Materials ETF |
| | | | |
| |
| | | Shares | | | Value | |
| COMMON STOCK — continued | | | | | | |
| Materials — continued | | | | | | |
| Hengli Petrochemical, Cl A | | | 20,220 | | | $ | 42,315 | |
| Hengyi Petrochemical, Cl A | | | 17,200 | | | | 15,722 | |
| Hesteel, Cl A | | | 53,100 | | | | 15,720 | |
| Hoshine Silicon Industry, Cl A . | | | 750 | | | | 9,792 | |
| Huafon Chemical, Cl A | | | 8,200 | | | | 7,450 | |
| Huaibei Mining Holdings, Cl A | | | 4,100 | | | | 7,288 | |
| Huaxin Cement, Cl A . | | | 7,350 | | | | 13,456 | |
| Hubei Xingfa Chemicals Group, Cl A | | | 2,000 | | | | 7,713 | |
| Hunan Valin Steel, Cl A | | | 31,100 | | | | 16,971 | |
| Inner Mongolia BaoTou Steel Union, Cl A | | | 161,700 | | | | 38,825 | |
| Inner Mongolia ERDOS Resources, Cl A | | | 3,220 | | | | 6,115 | |
| Inner Mongolia Junzheng Energy & Chemical | | | | | | | | |
| Industry Group, Cl A | | | 37,900 | | | | 20,061 | |
| Inner Mongolia Yuan Xing Energy, Cl A | | | 7,700 | | | | 6,776 | |
| Jiangsu Eastern Shenghong, Cl A . | | | 8,200 | | | | 13,693 | |
| Jiangsu Yangnong Chemical, Cl A | | | 1,400 | | | | 17,646 | |
| Jiangsu Yoke Technology, Cl A | | | 1,200 | | | | 9,626 | |
| Jiangxi Copper, Cl A | | | 9,700 | | | | 20,379 | |
| Jiangxi Copper, Cl H | | | 61,591 | | | | 67,320 | |
| Kingfa Sci & Tech, Cl A . | | | 7,700 | | | | 10,169 | |
| LB Group, Cl A | | | 10,100 | | | | 21,178 | |
| Luxi Chemical Group, Cl A . | | | 4,700 | | | | 7,284 | |
| Maanshan Iron & Steel, Cl A . | | | 16,900 | | | | 5,810 | |
| MMG * | | | 145,800 | | | | 28,789 | |
| Ningbo Shanshan, Cl A | | | 4,100 | | | | 10,057 | |
| Ningxia Baofeng Energy Group, Cl A | | | 14,500 | | | | 22,689 | |
| Pangang Group Vanadium Titanium & | | | | | | | | |
| | | 34,100 | | | | 21,074 | |
| Qinghai Salt Lake Industry, Cl A * | | | 11,900 | | | | 34,920 | |
| Real Gold Mining *(A) | | | 97,864 | | | | — | |
| Rongsheng Petrochemical, Cl A . | | | 33,800 | | | | 49,339 | |
| Satellite Chemical, Cl A | | | 7,292 | | | | 12,336 | |
| Shandong Gold Mining, Cl A | | | 13,820 | | | | 32,617 | |
| Shandong Gold Mining, Cl H . | | | 38,700 | | | | 61,625 | |
| Shandong Hualu Hengsheng Chemical, Cl A | | | 8,320 | | | | 29,716 | |
| Shandong Nanshan Aluminum, Cl A . | | | 50,800 | | | | 21,345 | |
| Shandong Sun Paper Industry JSC, Cl A | | | 12,900 | | | | 18,461 | |
| Shanghai Putailai New Energy Technology, | | | | | | | | |
Cl A | | | 4,980 | | | | 33,908 | |
|
|
|
| Schedule of Investments | | October 31, 2022 |
| Global X MSCI China Materials ETF |
| | | | |
| |
| | | Shares | | | Value | |
| COMMON STOCK — continued | | | | | | |
Materials — continued | | | | | | |
| Shanxi Meijin Energy, Cl A . | | | 8,200 | | | $ | 9,800 | |
| Shanxi Taigang Stainless Steel, Cl A . | | | 27,600 | | | | 14,948 | |
| Shenghe Resources Holding, Cl A | | | 4,300 | | | | 7,837 | |
| Shenzhen Capchem Technology, Cl A | | | 1,720 | | | | 8,487 | |
| Shenzhen Dynanonic, Cl A . | | | 200 | | | | 7,039 | |
| Shenzhen Senior Technology Material, Cl A . | | | 3,500 | | | | 8,829 | |
| Sichuan Hebang Biotechnology . | | | 18,700 | | | | 7,373 | |
| Sichuan Yahua Industrial Group, Cl A . | | | 2,900 | | | | 10,583 | |
| Sinoma Science & Technology, Cl A . | | | 3,700 | | | | 9,040 | |
| Sinomine Resource Group, Cl A | | | 840 | | | | 10,314 | |
| Sinopec Shanghai Petrochemical, Cl A . | | | 33,100 | | | | 13,863 | |
| Skshu Paint, Cl A * | | | 993 | | | | 11,772 | |
| Suzhou TA&A Ultra Clean Technology, Cl A | | | 975 | | | | 8,227 | |
| Tangshan Jidong Cement, Cl A . | | | 5,600 | | | | 5,799 | |
| Tianqi Lithium, Cl A * | | | 3,300 | | | | 43,016 | |
| Tianshan Aluminum Group, Cl A . | | | 9,100 | | | | 7,747 | |
| Tibet Summit Resources, Cl A * | | | 2,675 | | | | 7,645 | |
| Tongkun Group, Cl A . | | | 10,600 | | | | 17,498 | |
| Tongling Nonferrous Metals Group, Cl A . | | | 49,600 | | | | 17,052 | |
| Transfar Zhilian, Cl A | | | 16,600 | | | | 11,165 | |
| Wanhua Chemical Group, Cl A . | | | 10,022 | | | | 109,871 | |
| Weihai Guangwei Composites, Cl A | | | 2,300 | | | | 24,349 | |
| Western Mining, Cl A | | | 5,000 | | | | 6,460 | |
| Western Superconducting Technologies, Cl A .. | | | 896 | | | | 14,260 | |
| Xiamen Tungsten, Cl A | | | 6,400 | | | | 17,532 | |
| Xinjiang Zhongtai Chemical, Cl A | | | 7,825 | | | | 6,277 | |
| Yintai Gold, Cl A . | | | 13,320 | | | | 25,949 | |
| YongXing Special Materials Technology, Cl A . | | | 675 | | | | 10,725 | |
| Youngy, Cl A * | | | 675 | | | | 10,147 | |
| Yunnan Aluminium, Cl A | | | 5,900 | | | | 7,381 | |
| Yunnan Energy New Material, Cl A | | | 2,900 | | | | 58,569 | |
| Yunnan Tin, Cl A | | | 3,600 | | | | 5,604 | |
| Yunnan Yuntianhua, Cl A * | | | 2,000 | | | | 5,501 | |
| Zangge Mining, Cl A | | | 1,600 | | | | 5,926 | |
| Zhaojin Mining Industry * | | | 42,000 | | | | 34,671 | |
| Zhejiang Huayou Cobalt, Cl A . | | | 5,459 | | | | 40,573 | |
| Zhejiang Juhua, Cl A . | | | 11,400 | | | | 24,386 | |
| Zhejiang Yongtai Technology, Cl A . | | | 2,100 | | | | 6,251 | |
| Zibo Qixiang Tengda Chemical, Cl A * | | | 8,100 | | | | 7,492 | |
|
|
|
| Schedule of Investments | | October 31, 2022 |
| Global X MSCI China Materials ETF |
| | | | |
| |
| | | Shares | | | Value | |
| COMMON STOCK — continued | | | | | | |
| Materials — continued | | | | | | |
| Zijin Mining Group, Cl A . | | | 38,700 | | | $ | 41,814 | |
| Zijin Mining Group, Cl H | | | 258,059 | | | | 246,558 | |
| TOTAL CHINA | | | | | | | 2,865,340 | |
| HONG KONG — 1.9% | | | | | | | | |
| Materials — 1.9% | | | | | | | | |
| China Lumena New Materials *(A) | | | 48 | | | | — | |
| Nine Dragons Paper Holdings | | | 90,970 | | | | 53,888 | |
| TOTAL HONG KONG | | | | | | | 53,888 | |
| TOTAL COMMON STOCK | | | | | | | | |
| (Cost $4,385,546) | | | | | | | 2,919,228 | |
| TOTAL INVESTMENTS — 100.0% | | | | | | | | |
| (Cost $4,385,546) | | | | | | $ | 2,919,228 | |
Percentages are based on Net Assets of $2,919,716.
* Non-income producing security.
(A) Level 3 security in accordance with fair value hierarchy.
The following is a summary of the level of inputs used as of October 31, 2022, in valuing the Fund's investments carried at value:
| | Level 1 | | | Level 2
| | | | Level 3(1)
| | | Total | |
Investments in Securities
| | | | | | | | | | | | | |
| Common Stock | | $ | $2,919,228 | | | $ | — | | | $ | —
| ^ | | $ | 2,919,228 | |
| Total Investments in | | | | | | | | | | | | | | | | |
| Securities | | $ | $2,919,228 | | | $ | — | | | $ | — | | | $ | 2,919,228 | |
(1) A reconciliation of Level 3 investments and disclosures of significant unobservable inputs are presented when the Fund has a significant amount of Level 3 investments at the end of the period in relation to Net Assets. Management has concluded that Level 3 investments are not material in relation to Net Assets.
^ Security is fair valued at zero.
Amounts designated as “—“ are $0 or have been rounded to $0.
See “Glossary” for abbreviations.
|
|
|
| Schedule of Investments | | October 31, 2022 |
| Global X MSCI China Industrials ETF |
| | | | |
| |
| | | Shares | | | Value | |
| COMMON STOCK — 99.8% | | | | | | |
| CHINA — 96.7% | | | | | | |
Industrials — 96.7% | | | | | | |
| AECC Aero-Engine Control, Cl A | | | 4,300 | | | $ | 17,599 | |
| AECC Aviation Power, Cl A . | | | 8,685 | | | | 57,631 | |
| Air China, Cl A * | | | 21,160 | | | | 27,915 | |
| Air China, Cl H * | | | 96,100 | | | | 66,843 | |
| AVIC Electromechanical Systems, Cl A | | | 12,360 | | | | 19,728 | |
| AviChina Industry & Technology, Cl H . | | | 132,810 | | | | 58,201 | |
| AVICOPTER, Cl A . | | | 1,940 | | | | 11,619 | |
| Beijing Capital International Airport, Cl H * | | | 100,781 | | | | 54,564 | |
| Beijing Easpring Material Technology, Cl A | | | 600 | | | | 4,829 | |
| Beijing New Building Materials, Cl A | | | 5,320 | | | | 14,392 | |
| Beijing Originwater Technology, Cl A . | | | 11,940 | | | | 7,672 | |
| Beijing United Information Technology, Cl A | | | 1,586 | | | | 26,830 | |
| Beijing-Shanghai High Speed Railway, Cl A | | | 130,100 | | | | 79,159 | |
| China Baoan Group, Cl A . | | | 8,080 | | | | 12,743 | |
| China Communications Services, Cl H . | | | 127,000 | | | | 35,431 | |
| China Conch Venture Holdings . | | | 85,730 | | | | 126,468 | |
| China CSSC Holdings, Cl A | | | 14,510 | | | | 52,497 | |
| China Eastern Airlines, Cl A * | | | 29,000 | | | | 18,990 | |
| China Energy Engineering | | | 105,800 | | | | 33,053 | |
| China Everbright Environment Group . | | | 194,250 | | | | 64,586 | |
| China Lesso Group Holdings . | | | 58,090 | | | | 47,139 | |
| China Merchants Port Holdings . | | | 70,381 | | | | 82,486 | |
| China National Chemical Engineering, Cl A . | | | 19,620 | | | | 18,924 | |
| China Railway Group, Cl A . | | | 65,200 | | | | 44,385 | |
| China Railway Group, Cl H | | | 215,648 | | | | 93,678 | |
| China Southern Airlines, Cl A * | | | 35,860 | | | | 31,603 | |
| China Southern Airlines, Cl H * | | | 89,650 | | | | 46,253 | |
| China State Construction Engineering, Cl A | | | 132,375 | | | | 85,781 | |
| China State Construction International | | | | | | | | |
| | | 104,810 | | | | 94,264 | |
| CITIC . | | | 301,150 | | | | 269,697 | |
|
|
|
| Schedule of Investments | | October 31, 2022 |
| Global X MSCI China Industrials ETF |
| | | | |
| |
| | | Shares | | | Value | |
| COMMON STOCK — continued | | | | | | |
Industrials — continued | | | | | | |
| Contemporary Amperex Technology, Cl A . | | | 7,142 | | | $ | 363,311 | |
| COSCO SHIPPING Development, Cl A . | | | 30,880 | | | | 10,279 | |
| COSCO SHIPPING Holdings, Cl A . | | | 37,010 | | | | 56,701 | |
| COSCO SHIPPING Holdings, Cl H . | | | 162,226 | | | | 175,042 | |
| COSCO SHIPPING Ports | | | 88,830 | | | | 43,793 | |
| CRRC, Cl A | | | 77,850 | | | | 50,448 | |
| CRRC, Cl H . | | | 231,700 | | | | 70,249 | |
| Daqin Railway, Cl A | | | 47,900 | | | | 41,887 | |
| Dongfang Electric, Cl A | | | 8,990 | | | | 28,466 | |
| Eve Energy, Cl A | | | 6,030 | | | | 68,312 | |
| Fangda Carbon New Material, Cl A * | | | 12,323 | | | | 10,104 | |
| Fosun International . | | | 130,570 | | | | 79,840 | |
| Ginlong Technologies, Cl A * | | | 1,155 | | | | 29,434 | |
| Gotion High-Tech, Cl A | | | 5,320 | | | | 21,809 | |
| Guangdong Kinlong Hardware Products, Cl A . | | | 1,054 | | | | 11,391 | |
| Haitian International Holdings . | | | 33,546 | | | | 67,179 | |
| Hongfa Technology, Cl A | | | 3,430 | | | | 16,055 | |
| Jiangsu Expressway, Cl H | | | 65,419 | | | | 46,086 | |
| Jiangsu Hengli Hydraulic, Cl A . | | | 4,258 | | | | 32,048 | |
| Jiangsu Zhongtian Technology, Cl A | | | 9,910 | | | | 29,703 | |
| Jiangxi Special Electric Motor, Cl A * | | | 2,400 | | | | 6,247 | |
| Keda Industrial Group, Cl A | | | 3,100 | | | | 6,585 | |
| Kuang-Chi Technologies, Cl A * | | | 7,240 | | | | 17,087 | |
| Liaoning Port, Cl A . | | | 29,400 | | | | 6,377 | |
| Luoyang Xinqianglian Slewing Bearing, Cl A . | | | 937 | | | | 8,925 | |
| Metallurgical Corp of China, Cl A | | | 57,100 | | | | 22,435 | |
| Ming Yang Smart Energy Group, Cl A | | | 6,750 | | | | 22,929 | |
| NARI Technology, Cl A | | | 21,204 | | | | 70,583 | |
| Ningbo Deye Technology, Cl A | | | 250 | | | | 11,158 | |
| Ningbo Orient Wires & Cables, Cl A . | | | 900 | | | | 9,454 | |
| Ningbo Ronbay New Energy Technology, | | | | | | | | |
| Cl A | | | 1,495 | | | | 15,972 | |
| North Industries Group Red Arrow, Cl A . | | | 4,590 | | | | 12,868 | |
| Power Construction Corp of China, Cl A . | | | 49,050 | | | | 47,109 | |
| Pylon Technologies, Cl A | | | 100 | | | | 4,209 | |
| Riyue Heavy Industry, Cl A . | | | 3,270 | | | | 9,854 | |
| Sany Heavy Equipment International Holdings | | | 58,900 | | | | 48,321 | |
| Sany Heavy Industry, Cl A | | | 27,180 | | | | 50,058 | |
| SF Holding, Cl A | | | 15,335 | | | | 100,963 | |
|
|
|
| Schedule of Investments | | October 31, 2022 |
| Global X MSCI China Industrials ETF |
| | | | |
| |
| | | Shares | | | Value | |
| COMMON STOCK — continued | | | | | | |
| Industrials — continued | | | | | | |
| Shanghai Construction Group, Cl A | | | 28,600 | | | $ | 10,027 | |
| Shanghai Electric Group, Cl A * | | | 40,500 | | | | 21,438 | |
| Shanghai International Airport, Cl A * | | | 4,065 | | | | 29,603 | |
| Shanghai International Port Group, Cl A | | | 30,630 | | | | 21,604 | |
| Shanghai M&G Stationery, Cl A . | | | 2,993 | | | | 16,455 | |
| Shenzhen Inovance Technology, Cl A . | | | 8,430 | | | | 76,708 | |
| Shenzhen International Holdings | | | 67,031 | | | | 45,087 | |
| Sichuan New Energy Power * | | | 3,990 | | | | 10,250 | |
| Sichuan Road & Bridge, Cl A . | | | 15,420 | | | | 23,666 | |
| Sieyuan Electric, Cl A . | | | 2,450 | | | | 11,180 | |
| Sinotrans, Cl A | | | 13,600 | | | | 6,587 | |
| Sinotruk Hong Kong . | | | 37,100 | | | | 33,083 | |
| Sungrow Power Supply, Cl A | | | 4,700 | | | | 83,945 | |
| Sunwoda Electronic, Cl A | | | 5,420 | | | | 17,228 | |
| Suzhou Maxwell Technologies, Cl A . | | | 513 | | | | 33,418 | |
| TBEA, Cl A . | | | 12,150 | | | | 33,831 | |
| Titan Wind Energy Suzhou, Cl A | | | 5,625 | | | | 9,009 | |
| Weichai Power, Cl A . | | | 21,760 | | | | 26,955 | |
| Weichai Power, Cl H . | | | 101,916 | | | | 97,633 | |
| Wuxi Shangji Automation, Cl A . | | | 1,202 | | | | 20,084 | |
| XCMG Construction Machinery, Cl A . | | | 25,720 | | | | 16,246 | |
| Xiamen C & D, Cl A . | | | 9,300 | | | | 15,212 | |
| Xinjiang Goldwind Science & Technology, | | | | | | | | |
| Cl A | | | 11,197 | | | | 15,963 | |
| Xinjiang Goldwind Science & Technology, | | | | | | | | |
| Cl H | | | 41,051 | | | | 35,613 | |
| YTO Express Group, Cl A . | | | 11,040 | | | | 28,405 | |
| Yunda Holding, Cl A . | | | 9,340 | | | | 16,794 | |
| Zhefu Holding Group, Cl A | | | 16,670 | | | | 8,892 | |
| Zhejiang Chint Electrics, Cl A | | | 6,950 | | | | 24,083 | |
| Zhejiang Dingli Machinery, Cl A | | | 1,623 | | | | 9,948 | |
| Zhejiang Expressway, Cl H | | | 73,560 | | | | 45,636 | |
| Zhejiang HangKe Technology, Cl A . | | | 1,313 | | | | 8,965 | |
| Zhejiang Weiming Environment Protection, | | | | | | | | |
| Cl A | | | 5,250 | | | | 13,558 | |
| Zhejiang Weixing New Building Materials, | | | | | | | | |
| Cl A | | | 5,010 | | | | 11,893 | |
| Zhuzhou CRRC Times Electric, Cl A | | | 981 | | | | 8,402 | |
| Zhuzhou CRRC Times Electric, Cl H . | | | 28,643 | | | | 124,244 | |
|
|
|
| Schedule of Investments | | October 31, 2022 |
| Global X MSCI China Industrials ETF |
| | | | |
| |
| | | Shares | | | Value | |
| COMMON STOCK — continued | | | | | | |
| Industrials — continued | | | | | | |
| Zhuzhou Kibing Group, Cl A . | | | 8,580 | | | $ | 9,189 | |
| Zoomlion Heavy Industry Science and | | | | | | | | |
| Technology, Cl A . | | | 22,500 | | | | 16,422 | |
| Zoomlion Heavy Industry Science and | | | | | | | | |
| | | 72,320 | | | | 23,309 | |
| ZTO Express Cayman ADR | | | 21,744 | | | | 367,256 | |
| TOTAL CHINA | | | | | | | 4,756,052 | |
| HONG KONG — 1.6% | | | | | | | | |
| Industrials — 1.6% | | | | | | | | |
| Orient Overseas International | | | 5,350 | | | | 78,173 | |
| SINGAPORE — 1.5% | | | | | | | | |
| Industrials — 1.5% | | | | | | | | |
| BOC Aviation . | | | 11,060 | | | | 74,040 | |
| TOTAL COMMON STOCK | | | | | | | | |
| (Cost $6,993,839) | | | | | | | 4,908,265 | |
| TOTAL INVESTMENTS — 99.8% | | | | | | | | |
| (Cost $6,993,839) | | | | | | $ | 4,908,265 | |
Percentages are based on Net Assets of $4,917,223.
* Non-income producing security.
As of October 31, 2022, all of the Fund's investments were considered Level 1, in accordance with authoritative guidance on fair value measurements and disclosure under U.S. GAAP.
See “Glossary” for abbreviations.
|
|
| Schedule of Investments | October 31, 2022 |
| Global X MSCI China Consumer Discretionary ETF |

| | | | |
| |
| | | Shares | | | Value | |
| COMMON STOCK — 99.9% | | | | | | |
| CHINA — 99.9% | | | | | | |
| Consumer Discretionary — 99.9% | | | | | | |
| Alibaba Group Holding * | | | 2,369,156 | | | $ | 18,546,168 | |
| Alibaba Health Information Technology * | | | 109,300 | | | | 46,227 | |
| ANTA Sports Products . | | | 698,196 | | | | 6,137,127 | |
| Beijing Roborock Technology, Cl A . | | | 10,745 | | | | 344,510 | |
| Bosideng International Holdings . | | | 5,932,000 | | | | 2,561,766 | |
| BTG Hotels Group, Cl A . | | | 131,300 | | | | 389,237 | |
| BYD, Cl A | | | 107,499 | | | | 3,617,519 | |
| BYD, Cl H . | | | 473,180 | | | | 10,590,995 | |
| Changzhou Xingyu Automotive Lighting | | | | | | | | |
| Systems, Cl A | | | 32,830 | | | | 548,383 | |
| China Meidong Auto Holdings | | | 844,800 | | | | 1,110,637 | |
| China Tourism Group Duty Free, Cl A | | | 135,650 | | | | 2,967,604 | |
| Chongqing Changan Automobile, Cl A | | | 958,908 | | | | 1,476,934 | |
| Dongfeng Motor Group, Cl H . | | | 4,342,946 | | | | 1,964,045 | |
| Ecovacs Robotics, Cl A . | | | 57,350 | | | | 456,134 | |
| FAW Jiefang Group, Cl A . | | | 367,700 | | | | 349,135 | |
| Fuyao Glass Industry Group, Cl A | | | 228,014 | | | | 1,039,891 | |
| Fuyao Glass Industry Group, Cl H . | | | 805,000 | | | | 2,886,775 | |
| Geely Automobile Holdings | | | 3,993,600 | | | | 4,293,838 | |
| Great Wall Motor, Cl A | | | 257,500 | | | | 1,024,365 | |
| Great Wall Motor, Cl H . | | | 2,436,697 | | | | 2,660,241 | |
| Gree Electric Appliances of Zhuhai, Cl A | | | 208,900 | | | | 817,064 | |
| Guangzhou Automobile Group, Cl A . | | | 394,400 | | | | 609,617 | |
| Guangzhou Automobile Group, Cl H | | | 4,004,223 | | | | 2,438,287 | |
| H World Group ADR | | | 149,841 | | | | 4,057,694 | |
| Haidilao International Holding * | | | 1,635,200 | | | | 2,428,891 | |
| Haier Smart Home, Cl A | | | 733,119 | | | | 2,080,309 | |
| Haier Smart Home, Cl H . | | | 1,831,360 | | | | 4,581,987 | |
| Hangzhou Robam Appliances, Cl A | | | 107,432 | | | | 300,454 | |
|
|
| Schedule of Investments | October 31, 2022 |
| Global X MSCI China Consumer Discretionary ETF |
| | | | |
| |
| | | Shares | | | Value | |
| COMMON STOCK — continued | | | | | | |
| Consumer Discretionary — continued | | | | | | |
| Huayu Automotive Systems, Cl A . | | | 372,080 | | | $ | 851,255 | |
| Huizhou Desay Sv Automotive, Cl A | | | 50,750 | | | | 717,275 | |
| Jason Furniture Hangzhou, Cl A | | | 91,710 | | | | 376,594 | |
| JD Health International * | | | 118,720 | | | | 651,082 | |
| JD.com, Cl A | | | 945,454 | | | | 17,476,178 | |
| Jiumaojiu International Holdings (A) | | | 1,383,200 | | | | 2,170,873 | |
| Li Auto ADR * | | | 352,129 | | | | 4,795,997 | |
| Li Ning | | | 1,402,700 | | | | 7,254,867 | |
| Meituan, Cl B * | | | 1,247,900 | | | | 19,839,605 | |
| Minth Group | | | 1,026,200 | | | | 2,026,293 | |
| New Oriental Education & Technology | | | | | | | | |
| | | 1,776,840 | | | | 4,350,512 | |
| Ningbo Joyson Electronic, Cl A * | | | 150,600 | | | | 315,372 | |
| Ningbo Tuopu Group, Cl A | | | 125,735 | | | | 1,111,530 | |
| NIO ADR * | | | 732,772 | | | | 7,085,905 | |
| Oppein Home Group, Cl A | | | 61,255 | | | | 680,398 | |
| Pinduoduo ADR * | | | 258,826 | | | | 14,191,430 | |
| Ping An Healthcare and Technology * (A) | | | 459,600 | | | | 847,788 | |
| Pop Mart International Group (A) | | | 504,200 | | | | 652,582 | |
| SAIC Motor, Cl A . | | | 908,100 | | | | 1,703,439 | |
| Sailun Group, Cl A | | | 361,153 | | | | 428,155 | |
| Shandong Linglong Tyre, Cl A | | | 184,334 | | | | 411,665 | |
| Shanghai Jinjiang International Hotels, Cl A . | | | 103,056 | | | | 765,950 | |
| Shanghai Yuyuan Tourist Mart Group, Cl A . | | | 453,728 | | | | 388,109 | |
| Shenzhen Kedali Industry, Cl A | | | 29,800 | | | | 372,597 | |
| Shenzhen Overseas Chinese Town, Cl A | | | 982,300 | | | | 562,838 | |
| Shenzhou International Group Holdings . | | | 553,892 | | | | 3,838,510 | |
| Songcheng Performance Development, Cl A | | | 288,480 | | | | 453,376 | |
| TAL Education Group ADR * | | | 719,491 | | | | 3,388,803 | |
| TCL Technology Group, Cl A . | | | 1,607,805 | | | | 857,630 | |
| Tongcheng Travel Holdings * | | | 1,756,700 | | | | 2,739,162 | |
| Topsports International Holdings | | | 2,971,200 | | | | 1,498,876 | |
| Trip.com Group ADR * | | | 345,108 | | | | 7,809,794 | |
| Vipshop Holdings ADR * | | | 466,332 | | | | 3,250,334 | |
| Wuchan Zhongda Group, Cl A . | | | 592,400 | | | | 337,009 | |
| Xiamen Intretech, Cl A | | | 86,540 | | | | 203,301 | |
| XPeng ADR, Cl A * | | | 256,113 | | | | 1,695,468 | |
| Xtep International Holdings | | | 959,300 | | | | 879,884 | |
| Yadea Group Holdings . | | | 1,842,000 | | | | 2,811,157 | |
|
|
| Schedule of Investments | October 31, 2022 |
| Global X MSCI China Consumer Discretionary ETF |
| | | Shares | | | Value | |
| COMMON STOCK — continued | | | | | | |
| Consumer Discretionary — continued | | | | | | |
| Yum China Holdings . | | | 259,773 | | | $ | 10,741,614 | |
| Zhejiang Semir Garment, Cl A . | | | 293,387 | | | | 179,312 | |
| Zhejiang Supor, Cl A | | | 68,226 | | | | 372,399 | |
| Zhongsheng Group Holdings . | | | 652,200 | | | | 2,475,915 | |
| TOTAL CHINA | | | | | | | 213,886,667 | |
| TOTAL COMMON STOCK | | | | | | | | |
| (Cost $497,752,051) | | | | | | | 213,886,667 | |
| SHORT-TERM INVESTMENT(B)(C) — 0.4% | | | | | | | | |
| Fidelity Investments Money Market | | | | | | | | |
| Government Portfolio, Cl Institutional, 2.910% | | | | | | | | |
| (Cost $843,398) | | | 843,398 | | | | 843,398 | |
| | | Face Amount | | | | | |
| REPURCHASE AGREEMENT(B) — 0.5% | | | | | | | | |
| BNP Paribas | | | | | | | | |
| 2.930%, dated 10/31/2022, to be repurchased | | | | | | | | |
| on 11/01/2022, repurchase price $1,171,917 | | | | | | | | |
| (collateralized by U.S. Treasury Obligations, | | | | | | | | |
| ranging in par value $23,292 - $136,931, | | | | | | | | |
| 2.500% - 2.750%, 03/31/2027 - 05/31/2029, | | | | | | | | |
| with a total market value of $1,193,831) | | | | | | | | |
| (Cost $1,171,822) | | $ | 1,171,822 | | | | 1,171,822 | |
| TOTAL INVESTMENTS — 100.8% | | | | | | | | |
| (Cost $499,767,271) | | | | | | $ | 215,901,887 | |
Percentages are based on Net Assets of $214,215,551.
* Non-income producing security.
(A) This security or a partial position of this security is on loan at October 31, 2022.
(B) Security was purchased with cash collateral held from securities on loan.
(C) The rate reported on the Schedule of Investments is the 7-day effective yield as of October 31, 2022.
|
|
| Schedule of Investments | October 31, 2022 |
| Global X MSCI China Consumer Discretionary ETF |
The following is a summary of the level of inputs used as of October 31, 2022, in valuing the Fund's investments carried at value:
| | Level 1 | | | Level 2
| | | | Level 3
| | | Total | |
Investments in Securities
| | | | | | | | | | | | | |
| Common Stock | | $ | 213,886,667 | | | $ | — | | | $ | —
|
| | $ | 213,886,667 | |
| Short-Term Investment | | | 843,398 | | | | — | | | | — | | | | 843,398 | |
| Repurchase Agreement | | | — | | | | 1,171,822 | | | | — | | | | 1,171,822 | |
| Total Investments in | | |
| | | |
| | | | | | | |
| |
| Securities | | $ | 214,730,065 | | | $ | 1,171,822 | | | $ | — | | | $ | 215,901,887 | |
Aounts designated as “—“ are $0 or have been rounded to $0.See “Glossary” for abbreviations.
|
|
|
| Schedule of Investments | | October 31, 2022 |
| Global X MSCI China Consumer Staples ETF |
| | | | |
| |
| | | Shares | | | Value | |
| COMMON STOCK — 99.8% | | | | | | |
| CHINA — 98.8% | | | | | | |
| Consumer Staples — 98.8% | | | | | | |
| Angel Yeast, Cl A | | | 8,054 | | | $ | 39,753 | |
| Anhui Gujing Distillery, Cl A | | | 3,326 | | | | 89,415 | |
| Anhui Gujing Distillery, Cl B | | | 13,400 | | | | 157,952 | |
| Anhui Kouzi Distillery, Cl A | | | 5,500 | | | | 30,388 | |
| Anhui Yingjia Distillery, Cl A . | | | 5,600 | | | | 35,983 | |
| Anjoy Foods Group, Cl A . | | | 2,400 | | | | 43,982 | |
| Beijing Dabeinong Technology Group, Cl A * | | | 49,900 | | | | 62,357 | |
| Beijing Shunxin Agriculture, Cl A | | | 8,030 | | | | 22,414 | |
| By-health, Cl A | | | 14,600 | | | | 34,896 | |
| Chacha Food, Cl A . | | | 4,300 | | | | 25,917 | |
| China Feihe . | | | 350,500 | | | | 201,820 | |
| China Mengniu Dairy | | | 244,100 | | | | 782,068 | |
| China Resources Beer Holdings . | | | 140,250 | | | | 661,064 | |
| Chongqing Brewery, Cl A | | | 4,072 | | | | 48,563 | |
| Chongqing Fuling Zhacai Group, Cl A | | | 6,800 | | | | 20,882 | |
| Dali Foods Group | | | 269,200 | | | | 110,768 | |
| DaShenLin Pharmaceutical Group, Cl A | | | 9,448 | | | | 46,982 | |
| Foshan Haitian Flavouring & Food, Cl A | | | 24,112 | | | | 196,314 | |
| Fujian Sunner Development, Cl A . | | | 11,900 | | | | 35,651 | |
| Guangdong Haid Group, Cl A . | | | 13,291 | | | | 104,713 | |
| Heilongjiang Agriculture, Cl A | | | 16,900 | | | | 31,817 | |
| Henan Shuanghui Investment & Development, | | | | | | | | |
| Cl A | | | 24,840 | | | | 77,196 | |
| Hengan International Group | | | 69,280 | | | | 268,741 | |
| Inner Mongolia Yili Industrial Group, Cl A . | | | 42,429 | | | | 146,097 | |
| Jiangsu King's Luck Brewery JSC, Cl A | | | 10,700 | | | | 54,565 | |
| Jiangsu Yanghe Brewery Joint-Stock, Cl A | | | 10,094 | | | | 179,913 | |
| Jiangxi Zhengbang Technology, Cl A * | | | 32,800 | | | | 15,661 | |
| JiuGui Liquor, Cl A . | | | 2,550 | | | | 35,501 | |
| Jonjee Hi-Tech Industrial And Commercial | | | | | | | | |
| | | 8,100 | | | | 29,946 | |
| Juewei Food, Cl A | | | 5,700 | | | | 36,836 | |
|
|
|
| Schedule of Investments | | October 31, 2022 |
| Global X MSCI China Consumer Staples ETF |
| | | | |
| |
| | | Shares | | | Value | |
| COMMON STOCK — continued | | | | | | |
| Consumer Staples — continued | | | | | | |
| Kweichow Moutai, Cl A . | | | 3,754 | | | $ | 691,382 | |
| Luzhou Laojiao, Cl A . | | | 9,347 | | | | 199,370 | |
| Muyuan Foods, Cl A . | | | 34,064 | | | | 217,393 | |
| New Hope Liuhe, Cl A * | | | 43,550 | | | | 76,583 | |
| Nongfu Spring, Cl H . | | | 168,700 | | | | 847,814 | |
| Proya Cosmetics, Cl A | | | 2,022 | | | | 46,108 | |
| RLX Technology ADR * | | | 53,685 | | | | 67,106 | |
| Shanghai Bairun Investment Holding Group, | | | | | | | | |
| Cl A | | | 10,064 | | | | 41,876 | |
| Shanxi Xinghuacun Fen Wine Factory, Cl A . | | | 7,878 | | | | 249,750 | |
| Sichuan Swellfun, Cl A | | | 4,068 | | | | 31,400 | |
| Smoore International Holdings | | | 177,100 | | | | 188,384 | |
| Tingyi Cayman Islands Holding | | | 206,100 | | | | 322,415 | |
| Toly Bread, Cl A . | | | 13,870 | | | | 21,306 | |
| Tongwei, Cl A | | | 31,000 | | | | 183,967 | |
| Tsingtao Brewery, Cl A | | | 5,850 | | | | 65,283 | |
| Tsingtao Brewery, Cl H . | | | 61,300 | | | | 429,499 | |
| Uni-President China Holdings | | | 163,500 | | | | 120,805 | |
| Want Want China Holdings | | | 502,900 | | | | 330,575 | |
| Wens Foodstuffs Group * | | | 49,944 | | | | 121,963 | |
| Wuliangye Yibin, Cl A | | | 20,598 | | | | 375,143 | |
| Yifeng Pharmacy Chain, Cl A . | | | 6,830 | | | | 52,310 | |
| Yihai International Holding . | | | 51,840 | | | | 85,323 | |
| Yihai Kerry Arawana Holdings, Cl A | | | 10,400 | | | | 54,269 | |
| Yuan Longping High-tech Agriculture, Cl A* | | | 12,200 | | | | 24,167 | |
| Yunnan Botanee Bio-Technology Group, Cl A . | | | 2,050 | | | | 39,993 | |
| TOTAL CHINA | | | | | | | 8,512,339 | |
| HONG KONG — 1.0% | | | | | | | | |
| Consumer Staples — 1.0% | | | | | | | | |
| Vinda International Holdings . | | | 45,200 | | | | 84,759 | |
| TOTAL COMMON STOCK | | | | | | | | |
| (Cost $12,058,652) | | | | | | | 8,597,098 | |
| TOTAL INVESTMENTS — 99.8% | | | | | | | | |
| (Cost $12,058,652) | | | | | | $ | 8,597,098 | |
Percentages are based on Net Assets of $8,618,620.
|
|
|
| Schedule of Investments | | October 31, 2022 |
| Global X MSCI China Consumer Staples ETF |
* Non-income producing security.
As of October 31, 2022, all of the Fund's investments were considered Level 1, in accordance with authoritative guidance on fair value measurements and disclosure under U.S. GAAP.
See “Glossary” for abbreviations.
|
|
|
| Schedule of Investments | | October 31, 2022 |
| Global X MSCI China Health Care ETF |
| | | | |
| |
| | | Shares | | | Value | |
| COMMON STOCK — 99.9% | | | | | | |
| CHINA — 92.3% | | | | | | |
| Health Care — 92.3% | | | | | | |
| 3SBio | | | 148,700 | | | $ | 104,944 | |
| Aier Eye Hospital Group, Cl A | | | 41,648 | | | | 140,340 | |
| Apeloa Pharmaceutical, Cl A . | | | 8,000 | | | | 22,723 | |
| Asymchem Laboratories Tianjin, Cl A | | | 1,838 | | | | 35,904 | |
| BeiGene ADR * | | | 3,689 | | | | 623,035 | |
| Beijing Tiantan Biological Products, Cl A | | | 10,080 | | | | 28,424 | |
| Beijing Tongrentang, Cl A . | | | 7,200 | | | | 47,885 | |
| Beijing Wantai Biological Pharmacy | | | | | | | | |
| Enterprise, Cl A | | | 3,090 | | | | 52,913 | |
| Betta Pharmaceuticals, Cl A | | | 2,920 | | | | 18,209 | |
| BGI Genomics, Cl A . | | | 2,633 | | | | 19,925 | |
| Bloomage Biotechnology, Cl A . | | | 1,801 | | | | 26,042 | |
| CanSino Biologics, Cl A | | | 830 | | | | 21,474 | |
| CanSino Biologics, Cl H | | | 7,900 | | | | 73,466 | |
| Changchun High & New Technology Industry | | | | | | | | |
| Group, Cl A | | | 2,328 | | | | 51,419 | |
| China Medical System Holdings . | | | 134,900 | | | | 147,276 | |
| China Resources Sanjiu Medical & | | | | | | | | |
| Pharmaceutical, Cl A . | | | 5,600 | | | | 41,667 | |
| China Traditional Chinese Medicine Holdings . | | | 322,600 | | | | 139,317 | |
| Chongqing Zhifei Biological Products, Cl A . | | | 8,733 | | | | 101,745 | |
| CSPC Pharmaceutical Group . | | | 726,808 | | | | 747,191 | |
| Daan Gene, Cl A . | | | 9,160 | | | | 22,344 | |
| Dong-E-E-Jiao, Cl E | | | 7,200 | | | | 36,874 | |
| Genscript Biotech * | | | 100,996 | | | | 255,261 | |
| Guangzhou Baiyunshan Pharmaceutical | | | | | | | | |
| Holdings, Cl A | | | 14,959 | | | | 55,080 | |
| Guangzhou Kingmed Diagnostics Group, Cl A . | | | 2,800 | | | | 28,863 | |
| Hangzhou Tigermed Consulting, Cl A . | | | 4,216 | | | | 47,940 | |
| Hangzhou Tigermed Consulting, Cl H . | | | 10,120 | | | | 68,779 | |
| Hansoh Pharmaceutical Group | | | 107,300 | | | | 165,669 | |
| Huadong Medicine, Cl A . | | | 16,711 | | | | 93,311 | |
|
|
|
| Schedule of Investments | | October 31, 2022 |
| Global X MSCI China Health Care ETF |
| | | | |
| |
| | | Shares | | | Value | |
| COMMON STOCK — continued | | | | | | |
| Health Care — continued | | | | | | |
| Hualan Biological Engineering, Cl A | | | 11,670 | | | $ | 28,227 | |
| Humanwell Healthcare Group, Cl A . | | | 9,800 | | | | 26,779 | |
| HUTCHMED China ADR * | | | 8,357 | | | | 73,876 | |
| Hygeia Healthcare Holdings * | | | 27,000 | | | | 116,945 | |
| Imeik Technology Development, Cl A . | | | 956 | | | | 54,907 | |
| Innovent Biologics * | | | 90,900 | | | | 321,920 | |
| Intco Medical Technology, Cl A . | | | 5,140 | | | | 14,950 | |
| Jafron Biomedical, Cl A | | | 4,700 | | | | 20,313 | |
| Jiangsu Hengrui Medicine, Cl A | | | 35,372 | | | | 193,988 | |
| Jiangsu Yuyue Medical Equipment & Supply, | | | | | | | | |
| Cl A | | | 6,300 | | | | 27,976 | |
| Jinxin Fertility Group . | | | 123,200 | | | | 60,738 | |
| Joincare Pharmaceutical Group Industry, Cl A . | | | 13,100 | | | | 20,892 | |
| Joinn Laboratories China, Cl A . | | | 2,640 | | | | 20,597 | |
| Jointown Pharmaceutical Group, Cl A . | | | 21,270 | | | | 36,446 | |
| Lepu Medical Technology Beijing, Cl A | | | 11,501 | | | | 39,680 | |
| Livzon Pharmaceutical Group, Cl A . | | | 4,400 | | | | 21,207 | |
| Meinian Onehealth Healthcare Holdings, | | | | | | | | |
| Cl A * | | | 41,020 | | | | 23,895 | |
| Microport Scientific * | | | 57,200 | | | | 120,815 | |
| Nanjing King-Friend Biochemical | | | | | | | | |
| Pharmaceutical, Cl A . | | | 10,036 | | | | 22,276 | |
| Ovctek China, Cl A . | | | 5,024 | | | | 20,370 | |
| Pharmaron Beijing, Cl A | | | 5,200 | | | | 36,889 | |
| Pharmaron Beijing, Cl H | | | 16,175 | | | | 54,398 | |
| Shandong Buchang Pharmaceuticals, Cl A | | | 13,087 | | | | 34,244 | |
| Shandong Weigao Group Medical Polymer, | | | | | | | | |
| Cl H | | | 221,300 | | | | 305,033 | |
| Shanghai Fosun Pharmaceutical Group, Cl A . | | | 13,574 | | | | 61,166 | |
| Shanghai Fosun Pharmaceutical Group, Cl H | | | 46,800 | | | | 118,165 | |
| Shanghai Junshi Biosciences, Cl A * | | | 3,960 | | | | 38,389 | |
| Shanghai Medicilon, Cl A | | | 585 | | | | 17,685 | |
| Shanghai Pharmaceuticals Holding, Cl A | | | 16,500 | | | | 39,572 | |
| Shanghai Pharmaceuticals Holding, Cl H | | | 87,400 | | | | 118,465 | |
| Shanghai RAAS Blood Products, Cl A | | | 39,100 | | | | 29,018 | |
| Shenzhen Kangtai Biological Products, Cl A | | | 6,548 | | | | 27,800 | |
| Shenzhen Mindray Bio-Medical Electronics, | | | | | | | | |
| Cl A | | | 5,861 | | | | 260,215 | |
|
|
|
| Schedule of Investments | | October 31, 2022 |
| Global X MSCI China Health Care ETF |
| | | | |
| |
| | | Shares | | | Value | |
| COMMON STOCK — continued | | | | | | |
| Health Care — continued | | | | | | |
| Shenzhen New Industries Biomedical | | | | | | |
| | | 4,800 | | | $ | 37,804 | |
| Shenzhen Salubris Pharmaceuticals, Cl A . | | | 10,200 | | | | 43,137 | |
| Shijiazhuang Yiling Pharmaceutical, Cl A | | | 10,627 | | | | 44,189 | |
| Sichuan Kelun Pharmaceutical, Cl A . | | | 15,800 | | | | 53,456 | |
| Sinopharm Group, Cl H | | | 123,300 | | | | 234,981 | |
| Topchoice Medical, Cl A * | | | 1,980 | | | | 33,022 | |
| Walvax Biotechnology, Cl A . | | | 9,600 | | | | 50,357 | |
| Winning Health Technology Group, Cl A | | | 15,870 | | | | 20,958 | |
| WuXi AppTec, Cl A . | | | 13,624 | | | | 142,000 | |
| WuXi AppTec, Cl H . | | | 28,156 | | | | 225,611 | |
| Wuxi Biologics Cayman * | | | 98,680 | | | | 446,268 | |
| Yunnan Baiyao Group, Cl A | | | 12,714 | | | | 94,634 | |
| Zai Lab ADR * | | | 6,857 | | | | 152,774 | |
| Zhangzhou Pientzehuang Pharmaceutical, | | | | | | | | |
| Cl A | | | 3,906 | | | | 121,495 | |
| Zhejiang Huahai Pharmaceutical, Cl A . | | | 9,210 | | | | 25,205 | |
| Zhejiang Jiuzhou Pharmaceutical, Cl A | | | 5,000 | | | | 24,229 | |
| Zhejiang NHU, Cl A | | | 19,368 | | | | 47,349 | |
| Zhejiang Orient Gene Biotech, Cl A | | | 1,211 | | | | 13,646 | |
| Zhejiang Wolwo Bio-Pharmaceutical, Cl A | | | 3,423 | | | | 21,948 | |
| TOTAL CHINA | | | | | | | 7,458,919 | |
| HONG KONG — 5.2% | | | | | | | | |
| Health Care — 5.2% | | | | | | | | |
| Sino Biopharmaceutical | | | 861,300 | | | | 418,040 | |
| UNITED STATES — 2.4% | | | | | | | | |
| Health Care — 2.4% | | | | | | | | |
| Legend Biotech ADR * | | | 3,852 | | | | 191,907 | |
| TOTAL COMMON STOCK | | | | | | | | |
| (Cost $13,864,931) | | | | | | | 8,068,866 | |
| TOTAL INVESTMENTS — 99.9% | | | | | | | | |
| (Cost $13,864,931) | | | | | | $ | 8,068,866 | |
Percentages are based on Net Assets of $8,075,437.
* Non-income producing security.
|
|
|
| Schedule of Investments | | October 31, 2022 |
| Global X MSCI China Health Care ETF |
As of October 31, 2022, all of the Fund's investments were considered Level 1, in accordance with authoritative guidance on fair value measurements and disclosure under U.S. GAAP.
See "Glossary" for abbreviations.
|
|
|
| Schedule of Investments | | October 31, 2022 |
| Global X MSCI China Financials ETF |
| | | | |
| |
| | | Shares | | | Value | |
| COMMON STOCK — 99.8% | | | | | | |
| CHINA — 99.8% | | | | | | |
| Financials — 99.8% | | | | | | |
| 360 DigiTech ADR | | | 11,809 | | | $ | 119,979 | |
| Agricultural Bank of China, Cl A . | | | 628,400 | | | | 236,611 | |
| Agricultural Bank of China, Cl H | | | 3,541,288 | | | | 1,010,527 | |
| AVIC Industry-Finance Holdings, Cl A | | | 114,400 | | | | 47,289 | |
| Bank of Beijing, Cl A | | | 185,900 | | | | 102,459 | |
| Bank of Changsha, Cl A . | | | 50,950 | | | | 44,763 | |
| Bank of Chengdu, Cl A | | | 55,300 | | | | 102,752 | |
| Bank of China, Cl A . | | | 113,800 | | | | 46,730 | |
| Bank of China, Cl H | | | 8,650,934 | | | | 2,788,189 | |
| Bank of Communications, Cl A | | | 316,100 | | | | 191,900 | |
| Bank of Communications, Cl H . | | | 1,312,171 | | | | 640,218 | |
| Bank of Hangzhou, Cl A | | | 72,095 | | | | 119,108 | |
| Bank of Jiangsu, Cl A | | | 150,530 | | | | 142,108 | |
| Bank of Nanjing, Cl A | | | 97,284 | | | | 136,966 | |
| Bank of Ningbo, Cl A | | | 54,620 | | | | 177,047 | |
| Bank of Shanghai, Cl A . | | | 122,498 | | | | 93,251 | |
| BOC International China, Cl A | | | 32,940 | | | | 47,230 | |
| Caitong Securities, Cl A | | | 64,910 | | | | 63,315 | |
| Changjiang Securities, Cl A | | | 69,000 | | | | 49,043 | |
| China Cinda Asset Management, Cl H | | | 2,227,900 | | | | 207,184 | |
| China CITIC Bank Corp Ltd., Cl H . | | | 1,469,622 | | | | 554,161 | |
| China Construction Bank, Cl A . | | | 20,800 | | | | 15,153 | |
| China Construction Bank, Cl H | | | 4,899,826 | | | | 2,602,887 | |
| China Everbright Bank, Cl A | | | 339,600 | | | | 126,016 | |
| China Everbright Bank, Cl H . | | | 977,200 | | | | 252,708 | |
| China Galaxy Securities, Cl A | | | 52,600 | | | | 64,655 | |
| China Galaxy Securities, Cl H . | | | 768,650 | | | | 287,882 | |
| China Great Wall Securities, Cl A | | | 55,500 | | | | 61,178 | |
| China International Capital, Cl A | | | 13,440 | | | | 63,514 | |
| China International Capital, Cl H . | | | 248,450 | | | | 345,621 | |
| China Life Insurance, Cl A | | | 26,702 | | | | 96,898 | |
| China Life Insurance, Cl H . | | | 845,790 | | | | 921,228 | |
|
|
|
| Schedule of Investments | | October 31, 2022 |
| Global X MSCI China Financials ETF |
| | | | |
| |
| | | Shares | | | Value | |
| COMMON STOCK — continued | | | | | | |
| Financials — continued | | | | | | |
| China Merchants Bank, Cl A | | | 140,434 | | | $ | 513,832 | |
| China Merchants Bank, Cl H . | | | 432,324 | | | | 1,420,914 | |
| China Merchants Securities, Cl A | | | 64,480 | | | | 109,958 | |
| China Minsheng Banking, Cl A | | | 288,400 | | | | 129,837 | |
| China Minsheng Banking, Cl H . | | | 1,059,426 | | | | 307,712 | |
| China Pacific Insurance Group, Cl A | | | 55,150 | | | | 143,177 | |
| China Pacific Insurance Group, Cl H | | | 360,362 | | | | 581,181 | |
| China Taiping Insurance Holdings | | | 315,130 | | | | 218,387 | |
| China Zheshang Bank, Cl A * | | | 170,200 | | | | 64,085 | |
| Chongqing Rural Commercial Bank, Cl A . | | | 123,400 | | | | 58,753 | |
| CITIC Securities, Cl A | | | 91,680 | | | | 215,251 | |
| CITIC Securities, Cl H . | | | 328,245 | | | | 490,913 | |
| CSC Financial, Cl A . | | | 38,425 | | | | 123,766 | |
| Dongxing Securities, Cl A . | | | 50,700 | | | | 53,743 | |
| East Money Information, Cl A . | | | 98,527 | | | | 209,821 | |
| Everbright Securities, Cl A . | | | 47,932 | | | | 91,678 | |
| Far East Horizon | | | 418,900 | | | | 323,386 | |
| First Capital Securities, Cl A | | | 83,500 | | | | 63,222 | |
| Founder Securities, Cl A | | | 88,000 | | | | 75,994 | |
| GF Securities Ltd., Cl A | | | 54,200 | | | | 100,783 | |
| GF Securities Ltd., Cl H . | | | 268,200 | | | | 272,988 | |
| Guangzhou Yuexiu Financial Holdings Group, | | | | | | | | |
| Cl A | | | 62,886 | | | | 47,786 | |
| Guolian Securities, Cl A . | | | 33,600 | | | | 42,859 | |
| Guosen Securities, Cl A | | | 62,045 | | | | 72,963 | |
| Guotai Junan Securities, Cl A | | | 66,144 | | | | 119,292 | |
| Guoyuan Securities, Cl A | | | 68,720 | | | | 58,594 | |
| Haitong Securities, Cl H | | | 574,500 | | | | 281,035 | |
| Haitong Securities Ltd., Cl A . | | | 84,100 | | | | 96,834 | |
| Hithink RoyalFlush Information Network, | | | | | | | | |
| Cl A | | | 6,460 | | | | 74,963 | |
| Huatai Securities Ltd., Cl A . | | | 62,350 | | | | 101,817 | |
| Huatai Securities Ltd., Cl H . | | | 307,350 | | | | 301,091 | |
| Huaxi Securities, Cl A . | | | 43,790 | | | | 43,849 | |
| Huaxia Bank, Cl A . | | | 123,100 | | | | 80,442 | |
| Industrial & Commercial Bank of China, Cl A . | | | 95,700 | | | | 54,181 | |
| Industrial & Commercial Bank of China, Cl H . | | | 5,855,137 | | | | 2,543,490 | |
| Industrial Bank, Cl A | | | 158,680 | | | | 325,365 | |
| Industrial Securities, Cl A * | | | 84,070 | | | | 62,507 | |
|
|
|
| Schedule of Investments | | October 31, 2022 |
| Global X MSCI China Financials ETF |
| | | | |
| |
| | | Shares | | | Value | |
| COMMON STOCK — continued | | | | | | |
| Financials — continued | | | | | | |
| Lufax Holding ADR | | | 97,085 | | | $ | 154,365 | |
| Nanjing Securities, Cl A | | | 48,500 | | | | 52,403 | |
| New China Life Insurance C, Cl A . | | | 21,037 | | | | 67,071 | |
| New China Life Insurance C, Cl H | | | 159,161 | | | | 252,635 | |
| Northeast Securities, Cl A | | | 44,500 | | | | 38,489 | |
| Orient Securities, Cl A | | | 84,824 | | | | 89,799 | |
| People's Insurance Group of China, Cl A . | | | 86,900 | | | | 57,498 | |
| People's Insurance Group of China, Cl H | | | 1,599,900 | | | | 442,274 | |
| PICC Property & Casualty, Cl H . | | | 965,463 | | | | 890,457 | |
| Ping An Bank, Cl A | | | 8,725 | | | | 12,308 | |
| Ping An Insurance Group of China, Cl A . | | | 2,300 | | | | 11,343 | |
| Ping An Insurance Group of China, Cl H . | | | 548,404 | | | | 2,193,658 | |
| Postal Savings Bank of China, Cl A | | | 210,200 | | | | 111,264 | |
| Postal Savings Bank of China, Cl H . | | | 1,205,600 | | | | 559,040 | |
| Qingdao Rural Commercial Bank, Cl A . | | | 100,100 | | | | 37,827 | |
| Sealand Securities, Cl A | | | 99,610 | | | | 44,165 | |
| Shanghai Pudong Development Bank, Cl A . | | | 225,714 | | | | 204,464 | |
| Shanxi Securities, Cl A | | | 65,740 | | | | 46,188 | |
| Shenwan Hongyuan Group, Cl A | | | 197,500 | | | | 104,811 | |
| Sinolink Securities, Cl A | | | 57,500 | | | | 61,892 | |
| SooChow Securities, Cl A | | | 77,084 | | | | 68,880 | |
| Southwest Securities, Cl A | | | 103,300 | | | | 52,143 | |
| Western Securities, Cl A . | | | 67,000 | | | | 54,568 | |
| Zheshang Securities, Cl A | | | 45,040 | | | | 62,490 | |
| ZhongAn Online P&C Insurance, Cl H * | | | 87,000 | | | | 162,034 | |
| Zhongtai Securities, Cl A | | | 64,100 | | | | 55,617 | |
| TOTAL CHINA | | | | | | | 27,522,702 | |
| TOTAL COMMON STOCK | | | | | | | | |
| (Cost $48,811,323) | | | | | | | 27,522,702 | |
| TOTAL INVESTMENTS — 99.8% | | | | | | | | |
| (Cost $48,811,323) | | | | | | $ | 27,522,702 | |
Percentages are based on Net Assets of $27,567,183.
* Non-income producing security.
|
|
|
| Schedule of Investments | | October 31, 2022 |
| Global X MSCI China Financials ETF |
As of October 31, 2022, all of the Fund's investments were considered Level 1, in accordance with authoritative guidance on fair value measurements and disclosure under U.S. GAAP.
See “Glossary” for abbreviations.
|
|
| Schedule of Investments | October 31, 2022 |
| Global X MSCI China Information Technology ETF |
| | | | |
| |
| | | Shares | | | Value | |
| COMMON STOCK — 100.0% | | | | | | |
| CHINA — 98.9% | | | | | | |
| Information Technology — 98.9% | | | | | | |
| 360 Security Technology, Cl A . | | | 50,559 | | | $ | 48,834 | |
| AAC Technologies Holdings * | | | 131,400 | | | | 240,709 | |
| Advanced Micro-Fabrication Equipment, | | | | | | | | |
| Cl A * | | | 4,158 | | | | 62,959 | |
| Amlogic Shanghai, Cl A * | | | 1,825 | | | | 14,281 | |
| Avary Holding Shenzhen, Cl A | | | 12,000 | | | | 48,703 | |
| Beijing Kingsoft Office Software, Cl A | | | 3,085 | | | | 122,363 | |
| Beijing Shiji Information Technology, Cl A | | | 37,992 | | | | 65,513 | |
| Beijing Sinnet Technology, Cl A | | | 17,000 | | | | 20,084 | |
| Beijing Yuanliu Hongyuan Electronic | | | | | | | | |
| Technology, Cl A . | | | 1,380 | | | | 21,617 | |
| BOE Technology Group, Cl A | | | 479,300 | | | | 218,396 | |
| BYD Electronic International | | | 131,700 | | | | 382,525 | |
| Chaozhou Three-Circle Group, Cl A | | | 33,089 | | | | 128,201 | |
| China Greatwall Technology Group, Cl A | | | 31,900 | | | | 48,524 | |
| China Railway Signal & Communication, | | | | | | | | |
| Cl A | | | 31,854 | | | | 19,686 | |
| China Resources Microelectronics, Cl A | | | 6,729 | | | | 46,506 | |
| China Zhenhua Group Science & Technology, | | | | | | | | |
| Cl A | | | 3,400 | | | | 62,549 | |
| Chinasoft International . | | | 374,700 | | | | 248,214 | |
| Daqo New Energy ADR * | | | 8,522 | | | | 374,883 | |
| DHC Software, Cl A | | | 69,700 | | | | 58,669 | |
| Fiberhome Telecommunication Technologies, | | | | | | | | |
| Cl A | | | 11,500 | | | | 21,619 | |
| Flat Glass Group, Cl A * | | | 10,800 | | | | 50,537 | |
| Flat Glass Group, Cl H * | | | 54,500 | | | | 127,609 | |
| Foxconn Industrial Internet, Cl A . | | | 70,250 | | | | 78,587 | |
| GCL System Integration Technology, Cl A * | | | 73,200 | | | | 32,655 | |
| GDS Holdings, Cl A * | | | 119,780 | | | | 144,959 | |
| GigaDevice Semiconductor, Cl A . | | | 7,243 | | | | 81,292 | |
| GoerTek, Cl A | | | 45,700 | | | | 135,165 | |
|
|
| Schedule of Investments | October 31, 2022 |
| Global X MSCI China Information Technology ETF |
| | | | |
| |
| | | Shares | | | Value | |
| COMMON STOCK — continued | | | | | | |
| Information Technology — continued | | | | | | |
| GRG Banking Equipment, Cl A . | | | 22,600 | | | $ | 29,044 | |
| Guangzhou Haige Communications Group, | | | | | | | | |
| Cl A | | | 50,200 | | | | 57,870 | |
| Guangzhou Shiyuan Electronic Technology, | | | | | | | | |
| Cl A | | | 7,000 | | | | 62,130 | |
| Hangzhou First Applied Material, Cl A | | | 10,892 | | | | 95,189 | |
| Hangzhou Lion Electronics, Cl A . | | | 3,300 | | | | 19,278 | |
| Hangzhou Silan Microelectronics, Cl A . | | | 12,100 | | | | 51,833 | |
| Hengtong Optic-electric, Cl A | | | 13,200 | | | | 35,025 | |
| Hua Hong Semiconductor * | | | 95,100 | | | | 222,672 | |
| Huagong Tech, Cl A . | | | 9,700 | | | | 22,192 | |
| Hundsun Technologies, Cl A | | | 34,628 | | | | 196,900 | |
| Iflytek . | | | 34,250 | | | | 163,678 | |
| Ingenic Semiconductor, Cl A | | | 3,800 | | | | 35,231 | |
| Inspur Electronic Information Industry, Cl A | | | 15,052 | | | | 47,270 | |
| JA Solar Technology, Cl A | | | 18,120 | | | | 154,500 | |
| JCET Group, Cl A | | | 17,200 | | | | 56,503 | |
| Kingboard Holdings | | | 117,000 | | | | 288,556 | |
| Kingdee International Software Group * | | | 408,700 | | | | 668,511 | |
| Lenovo Group | | | 1,138,100 | | | | 910,497 | |
| Lens Technology, Cl A | | | 72,600 | | | | 98,647 | |
| Lingyi iTech Guangdong, Cl A * | | | 66,697 | | | | 43,039 | |
| LONGi Green Energy Technology, Cl A . | | | 77,091 | | | | 504,608 | |
| Luxshare Precision Industry, Cl A . | | | 78,852 | | | | 306,583 | |
| Maxscend Microelectronics, Cl A | | | 4,502 | | | | 56,726 | |
| Ming Yuan Cloud Group Holdings . | | | 73,800 | | | | 33,939 | |
| Montage Technology, Cl A | | | 7,149 | | | | 55,338 | |
| National Silicon Industry, Cl A * | | | 16,340 | | | | 45,274 | |
| NAURA Technology Group, Cl A . | | | 5,608 | | | | 203,278 | |
| NavInfo, Cl A . | | | 12,100 | | | | 19,578 | |
| Ninestar, Cl A . | | | 25,270 | | | | 196,883 | |
| OFILM Group, Cl A * | | | 70,300 | | | | 44,884 | |
| Raytron Technology, Cl A | | | 3,300 | | | | 21,407 | |
| Sangfor Technologies, Cl A | | | 4,410 | | | | 75,805 | |
| SG Micro, Cl A . | | | 3,550 | | | | 72,481 | |
| Shanghai Baosight Software, Cl A | | | 14,962 | | | | 86,382 | |
| Shanghai Baosight Software, Cl B | | | 66,750 | | | | 201,118 | |
| Shanghai Friendess Electronic Technology, | | | | | | | | |
| Cl A | | | 768 | | | | 21,581 | |
|
|
| Schedule of Investments | October 31, 2022 |
| Global X MSCI China Information Technology ETF |
| | | | |
| |
| | | Shares | | | Value | |
| COMMON STOCK — continued | | | | | | |
| Information Technology — continued | | | | | | |
| Shengyi Technology, Cl A | | | 22,800 | | | $ | 43,142 | |
| Shennan Circuits, Cl A . | | | 5,082 | | | | 52,046 | |
| Shenzhen SC New Energy Technology, Cl A | | | 3,400 | | | | 62,962 | |
| Shenzhen Sunlord Electronics, Cl A . | | | 5,500 | | | | 16,057 | |
| Shenzhen Transsion Holdings, Cl A | | | 4,672 | | | | 39,600 | |
| StarPower Semiconductor, Cl A . | | | 1,140 | | | | 57,963 | |
| Sunny Optical Technology Group . | | | 101,680 | | | | 881,459 | |
| Suzhou Dongshan Precision Manufacturing, | | | | | | | | |
| Cl A | | | 32,000 | | | | 110,318 | |
| TCL Zhonghuan Renewable Energy | | | | | | | | |
| Technology, Cl A . | | | 33,700 | | | | 181,601 | |
| Thunder Software Technology, Cl A . | | | 4,500 | | | | 60,617 | |
| Tianjin 712 Communication & Broadcasting, | | | | | | | | |
| Cl A | | | 7,600 | | | | 40,840 | |
| Tianma Microelectronics, Cl A | | | 53,400 | | | | 64,400 | |
| Tianshui Huatian Technology, Cl A . | | | 31,600 | | | | 38,023 | |
| TongFu Microelectronics, Cl A * | | | 12,800 | | | | 32,881 | |
| TravelSky Technology, Cl H . | | | 192,000 | | | | 278,833 | |
| Trina Solar, Cl A . | | | 16,631 | | | | 150,721 | |
| Unigroup Guoxin Microelectronics, Cl A | | | 8,759 | | | | 196,101 | |
| Unisplendour, Cl A | | | 30,213 | | | | 70,688 | |
| Westone Information Industry, Cl A | | | 4,400 | | | | 21,802 | |
| Will Semiconductor Shanghai, Cl A . | | | 12,585 | | | | 125,968 | |
| Wingtech Technology, Cl A | | | 13,340 | | | | 87,136 | |
| Wuhan Guide Infrared, Cl A . | | | 32,765 | | | | 51,896 | |
| WUS Printed Circuit Kunshan, Cl A | | | 18,620 | | | | 27,663 | |
| Xiamen Faratronic, Cl A | | | 1,260 | | | | 30,444 | |
| Xiaomi, Cl B * | | | 1,079,500 | | | | 1,211,538 | |
| Xinyi Solar Holdings | | | 760,500 | | | | 754,702 | |
| Yangzhou Yangjie Electronic Technology, | | | | | | | | |
| Cl A | | | 2,300 | | | | 16,122 | |
| Yealink Network Technology, Cl A | | | 7,700 | | | | 72,356 | |
| Yonyou Network Technology, Cl A . | | | 52,256 | | | | 174,232 | |
| Zhejiang Dahua Technology, Cl A . | | | 59,593 | | | | 94,144 | |
| Zhejiang Jingsheng Mechanical & Electrical, | | | | | | | | |
| Cl A | | | 12,800 | | | | 124,436 | |
| Zhongji Innolight, Cl A | | | 7,800 | | | | 31,157 | |
| Zhuzhou Hongda Electronics, Cl A | | | 2,500 | | | | 15,126 | |
| ZTE, Cl A | | | 56,531 | | | | 170,979 | |
|
|
| Schedule of Investments | October 31, 2022 |
| Global X MSCI China Information Technology ETF |
| | |
| |
| | Shares | | Value | |
| COMMON STOCK — continued | | | | |
| Information Technology — continued | | | | |
| ZTE, Cl H . | | 151,200 | | $ | 269,661 | |
| TOTAL CHINA | | | | | 13,767,683 | |
| HONG KONG — 1.1% | | | | | | |
| Information Technology — 1.1% | | | | | | |
| Kingboard Laminates Holdings | | 190,900 | | | 152,480 | |
| TOTAL COMMON STOCK | | | | | | |
| (Cost $23,551,330) | | | | | 13,920,163 | |
| TOTAL INVESTMENTS — 100.0% | | | | | | |
| (Cost $23,551,330) | | | | $ | 13,920,163 | |
Percentages are based on Net Assets of $13,919,611.
* Non-income producing security.
As of October 31, 2022, all of the Fund's investments were considered Level 1, in accordance with authoritative guidance on fair value measurements and disclosure under U.S. GAAP.
See “Glossary” for abbreviations.
|
|
| Schedule of Investments | October 31, 2022 |
| Global X MSCI China Communication Services ETF |
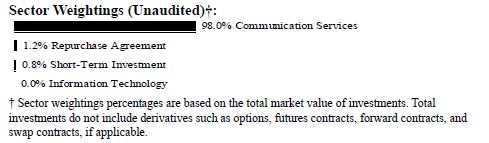
| | | | |
| |
| | | Shares | | | Value | |
| COMMON STOCK — 99.8% | | | | | | |
| CHINA — 97.5% | | | | | | |
| Communication Services — 97.5% | | | | | | |
| 37 Interactive Entertainment Network | | | | | | |
Technology Group, Cl A . | | | 84,751 | | | $ | 167,534 | |
| Autohome ADR . | | | 8,326 | | | | 217,475 | |
| Baidu, Cl A * | | | 41,458 | | | | 396,631 | |
| Beijing Enlight Media, Cl A | | | 177,800 | | | | 163,244 | |
| Bilibili, Cl Z * | | | 13,949 | | | | 120,657 | |
| China Literature * | | | 600 | | | | 1,617 | |
| China Ruyi Holdings * (A) | | | 804,000 | | | | 125,979 | |
| China Tower, Cl H . | | | 2,758,600 | | | | 249,509 | |
| China United Network Communications, Cl A . | | | 500,300 | | | | 229,330 | |
| Focus Media Information Technology, Cl A . | | | 280,500 | | | | 171,436 | |
| G-bits Network Technology Xiamen, Cl A * | | | 4,664 | | | | 162,029 | |
| Giant Network Group, Cl A . | | | 134,600 | | | | 142,127 | |
| iQIYI ADR * | | | 64,418 | | | | 130,124 | |
| JOYY ADR | | | 8,222 | | | | 207,441 | |
| Kanzhun ADR * | | | 12,802 | | | | 139,926 | |
| Kingsoft . | | | 90,100 | | | | 272,601 | |
| Kuaishou Technology, Cl B * | | | 59,700 | | | | 245,649 | |
| Kunlun Tech, Cl A | | | 79,600 | | | | 141,280 | |
| Mango Excellent Media, Cl A . | | | 53,820 | | | | 161,017 | |
| NetEase | | | 39,815 | | | | 434,169 | |
| Perfect World, Cl A . | | | 113,210 | | | | 175,913 | |
| Tencent Holdings . | | | 16,615 | | | | 435,173 | |
| Tencent Music Entertainment Group ADR * | | | 576 | | | | 2,079 | |
| Weibo ADR * | | | 11,990 | | | | 135,727 | |
| Zhejiang Century Huatong Group, Cl A * | | | 340,720 | | | | 171,520 | |
| | | | | | | | 4,800,187 | |
|
|
| Schedule of Investments | October 31, 2022 |
| Global X MSCI China Communication Services ETF |
| | | | | | |
| | | Shares | | | Value | |
| COMMON STOCK — continued | | | | | | |
| Information Technology — 0.0% | | | | | | |
| National Agricultural Holdings *(B) | | | 204,200 | | | $ | 2 | |
| TOTAL CHINA | | | | | | | 4,800,189 | |
| HONG KONG — 2.3% | | | | | | | | |
| Communication Services — 2.3% | | | | | | | | |
| Alibaba Pictures Group * | | | 3,061,300 | | | | 113,095 | |
| TOTAL COMMON STOCK | | | | | | | | |
| (Cost $10,104,188) | | | | | | | 4,913,284 | |
| SHORT-TERM INVESTMENT(C)(D) — 0.8% | | | | | | | | |
| Fidelity Investments Money Market | | | | | | | | |
| Government Portfolio, Cl Institutional, | | | | | | | | |
| | | | | | | | |
| (Cost $41,640) . | | | 41,640 | | | | 41,640 | |
| | | | Face Amount | | | | | |
| REPURCHASE AGREEMENT(C) — 1.2% | | | | | | | | |
| BNP Paribas | | | | | | | | |
| 2.930%, dated 10/31/2022, to be repurchased | | | | | | | | |
| on 11/01/2022, repurchase price $57,860 | | | | | | | | |
| (collateralized by U.S. Treasury Obligations, | | | | | | | | |
| ranging in par value $1,150 - $6,761, | | | | | | | | |
| 2.500% - 2.750%, 03/31/2027 - 05/31/2029, | | | | | | | | |
| with a total market value of $58,945) | | | | | | | | |
| (Cost $57,855) . | | $ | 57,855 | | | | 57,855 | |
| TOTAL INVESTMENTS — 101.8% | | | | | | | | |
| (Cost $10,203,683) | | | | | | $ | 5,012,779 | |
Percentages are based on Net Assets of $4,921,916.
* Non-income producing security.
(A) This security or a partial position of this security is on loan at October 31, 2022.
(B) Level 3 security in accordance with fair value hierarchy.
(C) Security was purchased with cash collateral held from securities on loan.
(D) The rate reported on the Schedule of Investments is the 7-day effective yield as of October 31, 2022.
|
|
| Schedule of Investments | October 31, 2022 |
| Global X MSCI China Communication Services ETF |
The following is a summary of the level of inputs used as of October 31, 2022, in valuing the Fund's investments carried at value:
| Investments in Securities | | Level 1 | | | Level 2 | | | Level 3(1) | | | Total | |
| Common Stock | | $ | 4,913,282 | | | $ | — | | | $ | 2 | | | $ | 4,913,284 | |
| Short-Term Investment | | | 41,640 | | | | — | | | | — | | | | 41,640 | |
| Repurchase Agreement | | | — | | | | 57,855 | | | | — | | | | 57,855 | |
| Total Investments in Securities | | $ | 4,954,922 | | | $ | 57,855 | | | $ | 2 | | | $ | 5,012,779 | |
(1) A reconciliation of Level 3 investments and disclosures of significant unobservable inputs are presented when the Fund has a significant amount of Level 3 investments at the end of the period in relation to Net Assets. Management has concluded that Level 3 investments are not material in relation to Net Assets.
Amounts designated as “—“ are $0 or have been rounded to $0.
See “Glossary” for abbreviations.
|
|
|
| Schedule of Investments | | October 31, 2022 |
| Global X MSCI China Utilities ETF |

| | | | |
| |
| | | Shares | | | Value | |
| COMMON STOCK — 99.9% | | | | | | |
| CHINA — 99.9% | | | | | | |
| Utilities — 99.9% | | | | | | |
| Beijing Enterprises Holdings | | | 41,700 | | | $ | 105,819 | |
| Beijing Enterprises Water Group | | | 377,100 | | | | 79,265 | |
| CECEP Solar Energy, Cl A . | | | 52,000 | | | | 47,956 | |
| CECEP Wind-Power, Cl A | | | 66,800 | | | | 39,004 | |
| CGN Power, Cl H . | | | 605,400 | | | | 122,625 | |
| China Gas Holdings . | | | 197,290 | | | | 174,925 | |
| China Longyuan Power Group, Cl H | | | 167,900 | | | | 191,859 | |
| China National Nuclear Power, Cl A | | | 99,400 | | | | 81,770 | |
| China Power International Development | | | 248,500 | | | | 71,861 | |
| China Resources Gas Group . | | | 60,720 | | | | 155,477 | |
| China Resources Power Holdings | | | 71,950 | | | | 104,673 | |
| China Three Gorges Renewables Group, Cl A . | | | 136,200 | | | | 103,496 | |
| China Yangtze Power, Cl A | | | 86,000 | | | | 237,699 | |
| ENN Energy Holdings | | | 18,390 | | | | 182,849 | |
| ENN Natural Gas, Cl A . | | | 5,000 | | | | 10,559 | |
| GD Power Development, Cl A * | | | 157,300 | | | | 93,778 | |
| Guangdong Investment | | | 149,760 | | | | 94,436 | |
| Huadian Power International, Cl A . | | | 91,700 | | | | 67,930 | |
| Huaneng Power International, Cl A * | | | 26,300 | | | | 24,039 | |
| Huaneng Power International, Cl H * | | | 215,400 | | | | 77,106 | |
| Kunlun Energy | | | 200,260 | | | | 119,648 | |
| SDIC Power Holdings, Cl A | | | 55,000 | | | | 75,783 | |
| Shenzhen Energy Group, Cl A | | | 57,780 | | | | 44,931 | |
| Sichuan Chuantou Energy, Cl A . | | | 37,500 | | | | 56,531 | |
| TOTAL CHINA | | | | | | | 2,364,019 | |
| TOTAL COMMON STOCK | | | | | | | | |
| (Cost $3,269,556) | | | | | | | 2,364,019 | |
|
|
|
| Schedule of Investments | | October 31, 2022 |
| Global X MSCI China Utilities ETF |
| | | | |
| |
| | | Face Amount | | | Value | |
| U.S. TREASURY OBLIGATION — 6.3% | | | | | | |
| U.S. Treasury Bill | | | | | | |
| 2.201%, 11/01/22(A) | | | | | | |
| (Cost $150,000) | | $ | 150,000 | | | | 150,000 | |
| TOTAL INVESTMENTS — 106.2% | | | | | | | | |
| (Cost $3,419,556) | | | | | | $ | 2,514,019 | |
Percentages are based on Net Assets of $2,367,777.
* Non-income producing security.
(A) Interest rate represents the security's effective yield at the time of purchase.
The following is a summary of the level of inputs used as of October 31, 2022, in valuing the Fund's investments carried at value:
| | | | | | | | | | |
| |
| Investments in Securities | | Level 1 | | | Level 2
| | | Level 3 | | | Total | |
| Common Stock | | $ | 2,364,019 | | | $ | — | | | $ | — | | | $ | 2,364,019 | |
| U.S. Treasury Obligation | | | — | | | | 150,000 | | | | — | | | | 150,000 | |
| Total Investments in Securities | | $ | 2,364,019 | | | $ | 150,000 | | | $ | — | | | $ | 2,514,019
| |
|
|
|
|
|
|
|
|
|
|
|
|
|
|
|
|
|
Amounts designated as “—“ are $0 or have been rounded to $0.
See “Glossary” for abbreviations.
|
|
|
| Schedule of Investments | | October 31, 2022 |
| Global X MSCI China Real Estate ETF |
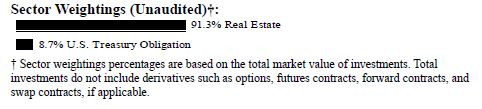
| | | | |
| |
| | | Shares | | | Value | |
| COMMON STOCK — 99.8% | | | | | | |
| CHINA — 99.8% | | | | | | |
| Real Estate — 99.8% | | | | | | |
| A-Living Smart City Services, Cl H | | | 182,550 | | | $ | 103,486 | |
| China Jinmao Holdings Group . | | | 923,300 | | | | 122,325 | |
| China Merchants Shekou Industrial Zone | | | | | | | | |
Holdings, Cl A | | | 81,700 | | | | 146,122 | |
| China Overseas Land & Investment . | | | 231,500 | | | | 441,775 | |
| China Overseas Property Holdings | | | 12,100 | | | | 7,615 | |
| China Resources Land | | | 148,700 | | | | 465,999 | |
| China Resources Mixc Lifestyle Services . | | | 2,450 | | | | 7,178 | |
| China Vanke, Cl A | | | 86,700 | | | | 159,914 | |
| China Vanke, Cl H . | | | 200,000 | | | | 256,820 | |
| CIFI Holdings Group (A) | | | 677,904 | | | | 44,907 | |
| Country Garden Holdings | | | 934,100 | | | | 120,186 | |
| Country Garden Services Holdings | | | 151,800 | | | | 132,658 | |
| Gemdale, Cl A . | | | 74,700 | | | | 79,692 | |
| Greentown China Holdings | | | 123,500 | | | | 117,524 | |
| Greentown Service Group . | | | 229,000 | | | | 93,936 | |
| Hopson Development Holdings | | | 135,567 | | | | 108,801 | |
| Jinke Properties Group, Cl A * | | | 114,000 | | | | 27,528 | |
| KE Holdings ADR * | | | 38,676 | | | | 393,722 | |
| Longfor Group Holdings . | | | 186,500 | | | | 237,584 | |
| Poly Developments and Holdings Group, Cl A . | | | 99,253 | | | | 186,858 | |
| Seazen Group * | | | 406,100 | | | | 65,184 | |
| Seazen Holdings, Cl A * | | | 39,200 | | | | 70,538 | |
| Shanghai Lingang Holdings, Cl A . | | | 51,500 | | | | 80,656 | |
| Shanghai Lujiazui Finance & Trade Zone | | | | | | | | |
| | | 197,085 | | | | 146,237 | |
| Shanghai Zhangjiang High-Tech Park | | | | | | | | |
| | | 33,200 | | | | 50,954 | |
| Wharf Holdings . | | | 79,800 | | | | 228,222 | |
| Youngor Group, Cl A | | | 99,600 | | | | 81,255 | |
| Yuexiu Property . | | | 196,820 | | | | 167,990 | |
|
|
|
| Schedule of Investments | | October 31, 2022 |
| Global X MSCI China Real Estate ETF |
| | | | |
| |
| | | Shares | | | Value | |
| COMMON STOCK — continued | | | | | | |
| Real Estate — continued | | | | | | |
| Zhejiang China Commodities City Group, | | | | | | |
| Cl A | | | 118,100 | | | $ | 67,508 | |
| TOTAL CHINA | | | | | | | 4,213,174 | |
| TOTAL COMMON STOCK | | | | | | | | |
| (Cost $8,891,291) | | | | | | | 4,213,174 | |
| | | | Face Amount
| | | | | |
| U.S. TREASURY OBLIGATION — 9.5% | | | | | | | | |
| U.S. Treasury Bill | | | | | | | | |
| 2.200%, 11/01/22(B) | | | | | | | | |
| (Cost $400,000) | | $ | 400,000 | | | | 400,000 | |
| TOTAL INVESTMENTS — 109.3% | | | | | | | | |
| (Cost $9,291,291) | | | | | | $ | 4,613,174 | |
Percentages are based on Net Assets of $4,219,269.
* Non-income producing security.
(A) Level 3 security in accordance with fair value hierarchy.
(B) Interest rate represents the security's effective yield at the time of purchase.
The following is a summary of the level of inputs used as of October 31, 2022, in valuing the Fund's investments carried at value:
| | | | | | | | | | |
| |
| Investments in Securities | | Level 1 | | | Level 2 | | | Level 3 | | | Total | |
| Common Stock | | $ | 4,168,267 | | | $
| — | | | $
| 44,907 | | | $ | 4,213,174 | |
| U.S. Treasury Obligation | | | — | | | | 400,000 | | | | — | | | | 400,000 | |
| Total Investments in | | | | | | | | | | | | | | | | |
| Securities | | $ | 4,168,267 | | | $ | 400,000 | | | $ | 44,907 | | | $ | 4,613,174 | |
|
|
|
| Schedule of Investments | | October 31, 2022 |
| Global X MSCI China Real Estate ETF |
The following is a reconciliation of investments in which significant unobservable inputs (Level 3) were used in determining fair value.
| |
| |
| | | Investments in | |
| | | Common Stock | |
| Beginning Balance as of October 31, 2021 | | $ | - | |
| Transfers out of Level 3 | | | - | |
| Transfers into Level 3 | | | 44,907 | |
| Net purchases | | | - | |
| Net sales | | | - | |
| Realized gain/(loss) | | | - | |
| Change in unrealized appreciation/(depreciation) | | | - | |
| Ending Balance as of October 31, 2022 | | $ | 44,907 | |
For the year ended October 31, 2022, transfers in and out of Level 3 were due to the availability of observable inputs to determine fair value.
The following table summarizes the quantitative inputs and assumptions used for items categorized as material Level 3 investments as of October 31, 2022. The disclosures below also include qualitative information on the sensitivity of the fair value measurements to changes in the significant unobservable inputs.
| | | Fair Value at | | Valuation | | Unobservable | | Discount |
| Assets | | 10/31/22 | | Technique(s) | | Input | | Percentage |
| | | | | | | Last Traded Price | | |
| | | | | | | Comparability | | |
| Common Stock | | $44,907 | | Last Traded Price | | Adjustment % | | 0.00% |
Amounts designated as “—“ are $0 or have been rounded to $0.
See “Glossary” for abbreviations.
|
|
|
| Schedule of Investments | | October 31, 2022 |
| Global X MSCI Greece ETF |
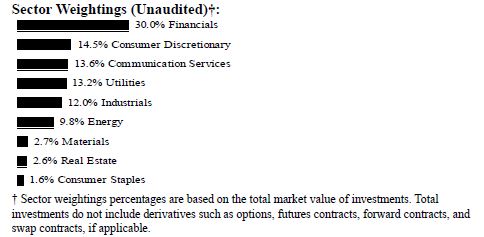
| | | | |
| |
| | | Shares | | | Value | |
| COMMON STOCK — 99.8% | | | | | | |
| CYPRUS — 0.1% | | | | | | |
| Financials — 0.1% | | | | | | |
| Galaxy Cosmos Mezz * | | | 368,897 | | | $ | 59,575 | |
| GREECE — 97.0% | | | | | | | | |
| Communication Services — 13.5% | | | | | | | | |
| Hellenic Telecommunications Organization . | | | 921,285 | | | | 14,477,739 | |
| Consumer Discretionary — 14.5% | | | | | | | | |
| FF Group *(A) | | | 452,712 | | | | 5 | |
| FF Group ADR *(A) | | | 200,300 | | | | 2 | |
| JUMBO | | | 325,786 | | | | 4,633,432 | |
| OPAP . | | | 887,091 | | | | 10,871,750 | |
| | | | | | | | 15,505,189 | |
| Consumer Staples — 1.6% | | | | | | | | |
| Sarantis . | | | 278,692 | | | | 1,749,073 | |
| Energy — 9.8% | | | | | | | | |
| GasLog Partners . | | | 188,686 | | | | 1,454,769 | |
| Helleniq Energy Holdings | | | 402,183 | | | | 2,746,701 | |
| Motor Oil Hellas Corinth Refineries | | | 276,051 | | | | 4,741,860 | |
|
|
|
| Schedule of Investments | | October 31, 2022 |
| Global X MSCI Greece ETF |
| | | | |
| |
| | | Shares | | | Value | |
| COMMON STOCK — continued | | | | | | |
| Energy — continued | | | | | | |
| Tsakos Energy Navigation . | | | 88,879 | | | $ | 1,537,607 | |
| | | | | | | | 10,480,937 | |
| Financials — 29.9% | | | | | | | | |
| Alpha Services and Holdings * | | | 10,123,730 | | | | 9,385,405 | |
| Eurobank Ergasias Services and Holdings * | | | 11,835,386 | | | | 11,697,473 | |
| Hellenic Exchanges - Athens Stock Exchange . | | | 498,585 | | | | 1,542,386 | |
| National Bank of Greece * | | | 1,440,265 | | | | 5,224,179 | |
| Piraeus Financial Holdings * | | | 3,386,113 | | | | 4,176,627 | |
| | | | | | | | 32,026,070 | |
| Industrials — 12.0% | | | | | | | | |
| Aegean Airlines * | | | 318,645 | | | | 1,574,660 | |
| Capital Product Partners (B) | | | 126,622 | | | | 1,811,961 | |
| Ellaktor * | | | 574,996 | | | | 986,561 | |
| GEK Terna Holding Real Estate Construction . | | | 341,812 | | | | 3,253,293 | |
| Mytilineos . | | | 308,628 | | | | 5,179,438 | |
| | | | | | | | 12,805,913 | |
| Real Estate — 2.5% | | | | | | | | |
| LAMDA Development * | | | 452,218 | | | | 2,739,794 | |
| Utilities — 13.2% | | | | | | | | |
| Athens Water Supply & Sewage | | | 297,129 | | | | 2,114,400 | |
| Holding ADMIE IPTO . | | | 943,254 | | | | 1,562,472 | |
| Public Power * | �� | | 835,112 | | | | 5,274,183 | |
| Terna Energy . | | | 278,371 | | | | 5,177,895 | |
| | | | | | | | 14,128,950 | |
| TOTAL GREECE | | | | | | | 103,913,665 | |
| UNITED STATES — 2.7% | | | | | | | | |
| Materials — 2.7% | | | | | | | | |
| Titan Cement International . | | | 261,486 | | | | 2,920,361 | |
| TOTAL COMMON STOCK | | | | | | | | |
| (Cost $131,521,438) | | | | | | | 106,893,601 | |
| TOTAL INVESTMENTS — 99.8% | | | | | | | | |
| (Cost $131,521,438) | | | | | | $ | 106,893,601 | |
Percentages are based on Net Assets of $107,078,219.
|
|
|
| Schedule of Investments | | October 31, 2022 |
| Global X MSCI Greece ETF |
* Non-income producing security.
(A) Level 3 security in accordance with fair value hierarchy.
(B) Security considered Master Limited Partnership. At October 31, 2022, these securities amounted to $1,811,961 or 1.7% of net assets.
The following is a summary of the level of inputs used as of October 31, 2022, in valuing the Fund's investments carried at value:
| | | | | | | | | | |
| |
| Investments in Securities | | Level 1 | | | Level 2 | | | Level 3(1) | | | Total | |
| Common Stock | | $ | 106,893,594 | | | $ | — | | | $ | 7 | | | $ | 106,893,601 | |
| Total Investments in | | | | | | | | | | | | | | | | |
| Securities | | $ | 106,893,594 | | | $ | — | | | $ | 7 | | | $ | 106,893,601 | |
(1) A reconciliation of Level 3 investments and disclosures of significant unobservable inputs are presented when the Fund has a significant amount of Level 3 investments at the end of the period in relation to Net Assets. Management has concluded that Level 3 investments are not material in relation to Net Assets.
Amounts designated as “—“ are $0 or have been rounded to $0.
See “Glossary” for abbreviations.
|
|
|
| Schedule of Investments | | October 31, 2022 |
| Global X DAX Germany ETF |
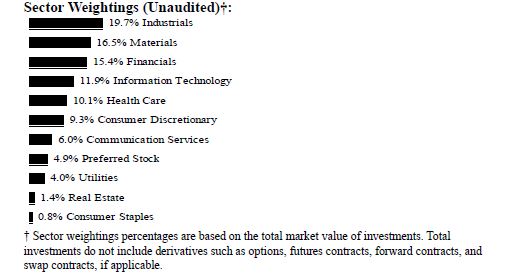
| | | | | | |
| | | Shares | | | Value | |
| COMMON STOCK — 95.0% | | | | | | |
| FRANCE — 5.8% | | | | | | |
| Industrials — 5.8% | | | | | | |
| Airbus . | | | 20,945 | | | $ | 2,267,995 | |
| GERMANY — 77.9% | | | | | | | | |
| Communication Services — 6.0% | | | | | | | | |
| Deutsche Telekom | | | 123,993 | | | | 2,348,513 | |
| Consumer Discretionary — 9.3% | | | | | | | | |
| adidas | | | 6,048 | | | | 591,656 | |
| Bayerische Motoren Werke | | | 11,276 | | | | 886,219 | |
| Continental | | | 3,823 | | | | 198,293 | |
| Mercedes-Benz Group | | | 28,218 | | | | 1,634,306 | |
| Puma | | | 3,586 | | | | 158,816 | |
| Zalando * | | | 8,243 | | | | 190,068 | |
| | | | | | | | 3,659,358 | |
| Consumer Staples — 0.8% | | | | | | | | |
| Beiersdorf | | | 3,469 | | | | 333,189 | |
| Financials — 15.3% | | | | | | | | |
| Allianz . | | | 14,486 | | | | 2,608,594 | |
|
|
|
| Schedule of Investments | | October 31, 2022 |
| Global X DAX Germany ETF |
| | | | |
| |
| | | Shares | | | Value | |
| COMMON STOCK — continued | | | | | | |
| Financials — continued | | | | | | |
| Deutsche Bank | | | 73,202 | | | $ | 698,892 | |
| Deutsche Boerse . | | | 6,585 | | | | 1,071,586 | |
| Hannover Rueck . | | | 2,110 | | | | 343,676 | |
| Muenchener Rueckversicherungs-Gesellschaft | | | | | | | | |
| | | 4,996 | | | | 1,320,363 | |
| | | | | | | | 6,043,111 | |
| Health Care — 9.2% | | | | | | | | |
| Bayer . | | | 35,277 | | | | 1,855,565 | |
| Fresenius & KGaA | | | 14,785 | | | | 340,476 | |
| Fresenius Medical Care & KGaA . | | | 7,065 | | | | 195,375 | |
| Merck KGaA . | | | 4,651 | | | | 758,473 | |
| Siemens Healthineers . | | | 9,940 | | | | 457,610 | |
| | | | | | | | 3,607,499 | |
| Industrials — 13.9% | | | | | | | | |
| Brenntag | | | 5,561 | | | | 337,686 | |
| Daimler Truck Holding * | | | 16,844 | | | | 449,489 | |
| Deutsche Post . | | | 34,760 | | | | 1,233,686 | |
| MTU Aero Engines . | | | 1,896 | | | | 339,646 | |
| Siemens | | | 26,691 | | | | 2,918,681 | |
| Siemens Energy . | | | 16,648 | | | | 194,404 | |
| | | | | | | | 5,473,592 | |
| Information Technology — 11.9% | | | | | | | | |
| Infineon Technologies | | | 46,735 | | | | 1,138,132 | |
| SAP . | | | 36,713 | | | | 3,543,975 | |
| | | | | | | | 4,682,107 | |
| Materials — 6.1% | | | | | | | | �� |
| BASF | | | 32,144 | | | | 1,443,444 | |
| Covestro | | | 6,750 | | | | 229,761 | |
| HeidelbergCement . | | | 5,018 | | | | 231,362 | |
| Symrise, Cl A | | | 4,769 | | | | 487,133 | |
| | | | | | | | 2,391,700 | |
| Real Estate — 1.4% | | | | | | | | |
| Vonovia | | | 25,611 | | | | 567,002 | |
|
|
|
| Schedule of Investments | | October 31, 2022 |
| Global X DAX Germany ETF |
| | | | |
| |
| | | Shares | | | Value | |
| COMMON STOCK — continued | | | | | | |
| Utilities — 4.0% | | | | | | |
| E.ON | | | 74,701 | | | $ | 625,788 | |
| RWE . | | | 24,255 | | | | 934,682 | |
| | | | | | | | 1,560,470 | |
| TOTAL GERMANY | | | | | | | 30,666,541 | |
| UNITED KINGDOM — 10.4% | | | | | | | | |
| Materials — 10.4% | | | | | | | | |
| Linde | | | 13,635 | | | | 4,078,547 | |
| UNITED STATES — 0.9% | | | | | | | | |
| Health Care — 0.9% | | | | | | | | |
| QIAGEN * | | | 8,092 | | | | 349,500 | |
| TOTAL COMMON STOCK | | | | | | | | |
| (Cost $42,879,747) | | | | | | | 37,362,583 | |
| PREFERRED STOCK — 4.9% | | | | | | | | |
| GERMANY— 4.9% | | | | | | | | |
| Consumer Discretionary — 3.2% | | | | | | | | |
| Porsche Automobil Holding (A) | | | 5,530 | | | | 309,351 | |
| Volkswagen (A) | | | 7,416 | | | | 948,008 | |
| | | | | | | | 1,257,359 | |
| Consumer Staples — 0.9% | | | | | | | | |
| Henkel & KGaA (A) | | | 6,038 | | | | 380,616 | |
| Health Care — 0.8% | | | | | | | | |
| Sartorius (A) | | | 869 | | | | 306,704 | |
| TOTAL GERMANY | | | | | | | 1,944,679 | |
| TOTAL PREFERRED STOCK | | | | | | | | |
| (Cost $2,724,177) | | | | | | | 1,944,679 | |
| TOTAL INVESTMENTS — 99.9% | | | | | | | | |
| (Cost $45,603,924) | | | | | | $ | 39,307,262 | |
Percentages are based on Net Assets of $39,338,868.
* Non-income producing security.
(A) There is currently no stated interest rate.
|
|
|
| Schedule of Investments | | October 31, 2022 |
| Global X DAX Germany ETF |
As of October 31, 2022, all of the Fund's investments were considered Level 1, in accordance with authoritative guidance on fair value measurements and disclosure under U.S. GAAP.
See “Glossary” for abbreviations.
|
|
|
| Schedule of Investments | | October 31, 2022 |
| Global X MSCI Portugal ETF |
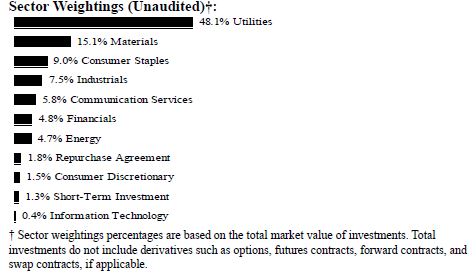
| | | | |
| |
| | | Shares | | | Value | |
| COMMON STOCK — 99.8% | | | | | | |
| CHINA — 2.9% | | | | | | |
| Industrials — 2.9% | | | | | | |
| Fosun International . | | | 731,190 | | | $ | 447,106 | |
| IRELAND — 0.4% | | | | | | | | |
| Industrials — 0.4% | | | | | | | | |
| Fusion Fuel Green, Cl A * | | | 14,709 | | | | 57,071 | |
| PORTUGAL — 77.2% | | | | | | | | |
| Communication Services — 5.9% | | | | | | | | |
| NOS SGPS . | | | 187,329 | | | | 733,919 | |
| Pharol SGPS * (A) | | | 1,107,591 | | | | 69,841 | |
| Sonaecom | | | 51,341 | | | | 96,411 | |
| | | | | | | | 900,171 | |
| Consumer Discretionary — 1.5% | | | | | | | | |
| Ibersol SGPS (A) | | | 39,056 | | | | 228,517 | |
| Consumer Staples — 9.3% | | | | | | | | |
| Jeronimo Martins . | | | 33,788 | | | | 700,612 | |
|
|
|
| Schedule of Investments | | October 31, 2022 |
| Global X MSCI Portugal ETF |
| | | | |
| |
| | | Shares | | | Value | |
| COMMON STOCK — continued | | | | | | |
| Consumer Staples — continued | | | | | | |
| Sonae . | | | 737,001 | | | $ | 709,110 | |
| | | | | | | | 1,409,722 | |
| Energy — 4.8% | | | | | | | | |
| Galp Energia | | | 71,959 | | | | 730,763 | |
| Financials — 5.0% | | | | | | | | |
| Banco Comercial Portugues, Cl R . | | | 5,256,995 | | | | 750,265 | |
| Industrials — 4.4% | | | | | | | | |
| CTT-Correios de Portugal (A) | | | 158,189 | | | | 488,580 | |
| Mota-Engil . | | | 152,472 | | | | 182,944 | |
| | | | | | | | 671,524 | |
| Information Technology — 0.4% | | | | | | | | |
| Novabase SGPS | | | 12,884 | | | | 53,355 | |
| Materials — 15.6% | | | | | | | | |
| Altri . | | | 113,447 | | | | 631,825 | |
| Corticeira Amorim SGPS | | | 64,280 | | | | 621,333 | |
| Navigator . | | | 180,854 | | | | 689,604 | |
| Ramada Investimentos E Industria . | | | 10,756 | | | | 73,989 | |
| Semapa-Sociedade de Investimento e Gestao | | | 26,992 | | | | 343,606 | |
| | | | | | | | 2,360,357 | |
| Utilities — 30.3% | | | | | | | | |
| Energias de Portugal | | | 758,285 | | | | 3,316,312 | |
| Greenvolt-Energias Renovaveis * | | | 70,500 | | | | 542,099 | |
| REN - Redes Energeticas Nacionais . | | | 281,012 | | | | 727,672 | |
| | | | | | | | 4,586,083 | |
| TOTAL PORTUGAL | | | | | | | 11,690,757 | |
| SPAIN — 19.3% | | | | | | | | |
| Utilities — 19.3% | | | | | | | | |
| EDP Renovaveis . | | | 138,974 | | | | 2,927,027 | |
| TOTAL COMMON STOCK | | | | | | | | |
| (Cost $17,715,133) | | | | | | | 15,121,961 | |
|
|
|
| Schedule of Investments | | October 31, 2022 |
| Global X MSCI Portugal ETF |
| | | | |
| |
| | | Shares | | | Value | |
| SHORT-TERM INVESTMENT(B)(C) — 1.3% | | | | | | |
| Fidelity Investments Money Market | | | | | | |
| Government Portfolio, Cl Institutional, 2,910% | | | | | | |
| (Cost $203,153) | | | 203,153 | | | $ | 203,153 | |
| | | | Face Amount | | | | | |
| REPURCHASE AGREEMENT(B) — 1.9% | | | | | | | | |
| BNP Paribas | | | | | | | | |
| 2.930%, dated 10/31/2022, to be repurchased | | | | | | | | |
| on 11/01/2022, repurchase price $282,285 | | | | | | | | |
| (collateralized by U.S. Treasury Obligations, | | | | | | | | |
| ranging in par value $5,610 - $32,983, | | | | | | | | |
| 2.500% - 2.750%, 03/31/2027 - 05/31/2029, | | | | | | | | |
| with a total market value of $287,562) | | | | | | | | |
| (Cost $282,262) | | $ | 282,262 | | | | 282,262 | |
| TOTAL INVESTMENTS — 103.0% | | | | | | | | |
| (Cost $18,200,548) | | | | | | $ | 15,607,376 | |
Percentages are based on Net Assets of $15,145,814.
* Non-income producing security.
(A) This security or a partial position of this security is on loan at October 31, 2022.
(B) Security was purchased with cash collateral held from securities on loan.
(C) The rate reported on the Schedule of Investments is the 7-day effective yield as of October 31, 2022.
The following is a summary of the level of inputs used as of October 31, 2022, in valuing the Fund's investments carried at value:
| | | | | | | | | | |
| |
| Investments in Securities | | Level 1 | | | Level 2 | | | Level 3 | | | Total | |
| Common Stock | | $ | 15,121,961 | | | $ | — | | | $ | — | | | $ | 15,121,961 | |
| Short-Term Investment | | | 203,153 | | | | — | | | | — | | | | 203,153 | |
| Repurchase Agreement | | | — | | | | 282,262 | | | | — | | | | 282,262 | |
| Total Investments in | | | | | | | | | | | | | | | | |
| Securities | | $ | 15,325,114 | | | $ | 282,262 | | | $ | — | | | $ | 15,607,376 | |
Amounts designated as “—“ are $0 or have been rounded to $0.
See “Glossary” for abbreviations.
|
|
|
| Schedule of Investments | | October 31, 2022 |
| Global X MSCI Colombia ETF |
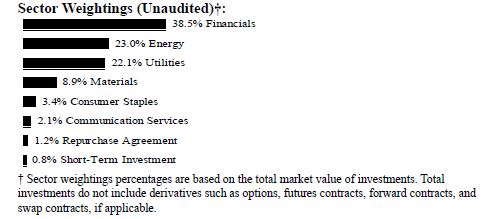
| | | | |
| |
| | | Shares | | | Value | |
| COMMON STOCK — 72.7% | | | | | | |
| BRAZIL — 3.5% | | | | | | |
| Consumer Staples — 3.5% | | | | | | |
| Cia Brasileira de Distribuicao | | | 173,605 | | | $ | 729,523 | |
| CANADA — 3.1% | | | | | | | | |
| Energy — 3.1% | | | | | | | | |
| Parex Resources | | | 42,721 | | | | 650,814 | |
| CHILE — 5.8% | | | | | | | | |
| Energy — 2.9% | | | | | | | | |
| Empresas Copec . | | | 87,195 | | | | 600,691 | |
| Utilities — 2.9% | | | | | | | | |
| Enel Americas | | | 6,064,727 | | | | 600,680 | |
| TOTAL CHILE | | | | | | | 1,201,371 | |
| COLOMBIA — 57.8% | | | | | | | | |
| Communication Services — 2.1% | | | | | | | | |
| Millicom International Cellular SDR * | | | 40,668 | | | | 440,889 | |
| Energy — 17.4% | | | | | | | | |
| Canacol Energy (A) | | | 377,200 | | | | 555,824 | |
| Ecopetrol | | | 6,143,848 | | | | 3,082,493 | |
| | | | | | | | 3,638,317 | |
|
|
|
| Schedule of Investments | | October 31, 2022 |
Global X MSCI Colombia ETF
|
| | | | |
| |
| | | Shares | | | Value | |
| COMMON STOCK — continued | | | | | | |
| Financials — 13.0% | | | | | | |
| Banco de Bogota | | | 68,924 | | | $ | 366,978 | |
| Bancolombia . | | | 219,340 | | | | 1,594,563 | |
| Financiera Colombiana * | | | 229,303 | | | | 756,016 | |
| | | | | | | | 2,717,557 | |
| Materials — 8.2% | | | | | | | | |
| Cementos Argos | | | 1,071,027 | | | | 730,365 | |
| Grupo Argos . | | | 348,652 | | | | 731,832 | |
| Mineros | | | 687,944 | | | | 236,678 | |
| | | | | | | | 1,698,875 | |
| Utilities — 17.1% | | | | | | | | |
| Celsia ESP | | | 1,123,144 | | | | 638,255 | |
| Grupo Energia Bogota ESP | | | 2,463,947 | | | | 831,037 | |
| Interconexion Electrica | | | 531,804 | | | | 2,098,596 | |
| | | | | | | | 3,567,888 | |
| TOTAL COLOMBIA | | | | | | | 12,063,526 | |
| UNITED STATES — 2.5% | | | | | | | | |
| Utilities — 2.5% | | | | | | | | |
| Brookfield Renewable, Cl A | | | 17,123 | | | | 531,371 | |
| TOTAL COMMON STOCK | | | | | | | | |
| (Cost $23,004,280) | | | | | | | 15,176,605 | |
| PREFERRED STOCK — 27.2% | | | | | | | | |
| COLOMBIA— 27.2% | | | | | | | | |
| Financials — 26.2% | | | | | | | | |
| Banco Davivienda (B) | | | 159,530 | | | | 849,398 | |
| Bancolombia (B) | | | 487,558 | | | | 3,120,124 | |
| Grupo Aval Acciones y Valores (B) | | | 6,932,770 | | | | 766,648 | |
| Grupo de Inversiones Suramericana (B) | | | 260,816 | | | | 729,593 | |
| | | | | | | | 5,465,763 | |
| Materials — 1.0% | | | | | | | | |
| Grupo Argos (B) | | | 166,960 | | | | 201,725 | |
| TOTAL COLOMBIA | | | | | | | 5,667,488 | |
| TOTAL PREFERRED STOCK | | | | | | | | |
| (Cost $11,483,648) | | | | | | | 5,667,488 | |
|
|
|
| Schedule of Investments | | October 31, 2022 |
| Global X MSCI Colombia ETF |
| | | | |
| |
| | | Shares | | | Value | |
| SHORT-TERM INVESTMENT(C)(D) — 0.9% | | | | | | |
| Fidelity Investments Money Market | | | | | | |
| Government Portfolio, Cl Institutional, | | | | | | |
| 2.910% | | | | | | |
| (Cost $177,853) | | | 177,853 | | | $ | 177,853 | |
| | | Face Amount | | | | | |
| REPURCHASE AGREEMENT(C) — 1.2% | | | | | | | | |
| BNP Paribas | | | | | | | | |
| 2.930%, dated 10/31/2022, to be repurchased | | | | | | | | |
| on 11/01/2022, repurchase price $247,131 | | | | | | | | |
| (collateralized by U.S. Treasury Obligations, | | | | | | | | |
| ranging in par value $4,912 - $28,876, | | | | | | | | |
| 2.500% - 2.750%, 03/31/2027 - 05/31/2029, | | | | | | | | |
| with a total market value of $251,755) | | | | | | | | |
| (Cost $247,111) | | $ | 247,111 | | | | 247,111 | |
| TOTAL INVESTMENTS — 102.0% | | | | | | | | |
| (Cost $34,912,892) | | | | | | $ | 21,269,057 | |
Percentages are based on Net Assets of $20,857,353.
* Non-income producing security.
(A) This security or a partial position of this security is on loan at October 31, 2022.
(B) There is currently no stated interest rate.
(C) Security was purchased with cash collateral held from securities on loan.
(D) The rate reported on the Schedule of Investments is the 7-day effective yield as of October 31, 2022.
The following is a summary of the level of inputs used as of October 31, 2022, in valuing the Fund's investments carried at value:
| Investments in Securities | | Level 1 | | | Level 2 | | | Level 3 | | | Total | |
| Common Stock | | $ | 13,975,234 | | | $ | 1,201,371 | | | $ | — | | | $ | 15,176,605 | |
| Preferred Stock | | | 5,667,488 | | | | — | | | | — | | | | 5,667,488 | |
| Short-Term Investment | | | 177,853 | | | | — | | | | — | | | | 177,853 | |
| Repurchase Agreement | | | — | | | | 247,111 | | | | — | | | | 247,111 | |
| Total Investments in | | | | | | | | | | | | | | | | |
| Securities | | $ | 19,820,575 | | | $ | 1,448,482 | | | $ | — | | | $ | 21,269,057 | |
Amounts designated as “—“ are $0 or have been rounded to $0.
See “Glossary” for abbreviations.
|
|
|
| Schedule of Investments | | October 31, 2022 |
| Global X MSCI Argentina ETF |
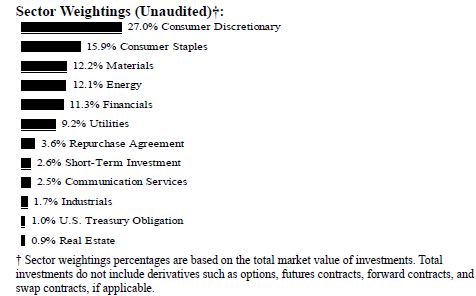
| | | | |
| |
| | | Shares | | | Value | |
| COMMON STOCK — 96.0% | | | | | | |
| ARGENTINA — 50.7% | | | | | | |
| Communication Services — 2.6% | | | | | | |
| Telecom Argentina ADR | | | 169,555 | | | $ | 707,044 | |
| Consumer Discretionary — 2.8% | | | | | | | | |
| Despegar.com * | | | 116,795 | | | | 742,816 | |
| Consumer Staples — 1.4% | | | | | | | | |
| Cresud SACIF y A ADR * | | | 68,127 | | | | 364,479 | |
| Energy — 13.0% | | | | | | | | |
| Transportadora de Gas del Sur ADR * (A) | | | 134,506 | | | | 1,166,167 | |
| YPF ADR * | | | 304,192 | | | | 2,324,027 | |
| | | | | | | | 3,490,194 | |
| Financials — 12.2% | | | | | | | | |
| Banco BBVA Argentina ADR . | | | 137,581 | | | | 414,119 | |
| Banco Macro ADR (A) | | | 85,085 | | | | 1,263,512 | |
| Grupo Financiero Galicia ADR (A) | | | 177,824 | | | | 1,379,914 | |
|
|
|
| Schedule of Investments | | October 31, 2022 |
| Global X MSCI Argentina ETF |
| | | | |
| |
| | | Shares | | | Value | |
| COMMON STOCK — continued | | | | | | |
| Financials — continued | | | | | | |
| Grupo Supervielle ADR | | | 121,219 | | | $ | 225,468 | |
| | | | | | | | 3,283,013 | |
| Industrials — 1.8% | | | | | | | | |
| America Airports * | | | 62,818 | | | | 493,750 | |
| Materials — 6.0% | | | | | | | | |
| Bioceres Crop Solutions * (A) | | | 59,701 | | | | 863,277 | |
| Loma Negra Cia Industrial Argentina ADR | | | 112,856 | | | | 760,649 | |
| | | | | | | | 1,623,926 | |
| Real Estate — 1.0% | | | | | | | | |
| IRSA Inversiones y Representaciones ADR * | | | 62,256 | | | | 265,833 | |
| Utilities — 9.9% | | | | | | | | |
| Central Puerto ADR * (A) | | | 190,421 | | | | 934,967 | |
| Empresa Distribuidora Y Comercializadora | | | | | | | | |
| | | 37,465 | | | | 270,872 | |
| Pampa Energia ADR * | | | 58,447 | | | | 1,471,111 | |
| | | | | | | | 2,676,950 | |
| TOTAL ARGENTINA | | | | | | | 13,648,005 | |
| BRAZIL — 30.3% | | | | | | | | |
| Consumer Discretionary — 26.2% | | | | | | | | |
| Arcos Dorados Holdings, Cl A . | | | 189,568 | | | | 1,429,343 | |
| MercadoLibre * | | | 6,263 | | | | 5,646,846 | |
| | | | | | | | 7,076,189 | |
| Consumer Staples — 4.1% | | | | | | | | |
| Adecoagro | | | 126,832 | | | | 1,098,365 | |
| TOTAL BRAZIL | | | | | | | 8,174,554 | |
| CANADA — 7.1% | | | | | | | | |
| Materials — 7.1% | | | | | | | | |
| SSR Mining | | | 70,825 | | | | 974,068 | |
| Yamana Gold | | | 213,877 | | | | 937,637 | |
| TOTAL CANADA | | | | | | | 1,911,705 | |
|
|
|
| Schedule of Investments | | October 31, 2022 |
| Global X MSCI Argentina ETF |
| | | | |
| |
| | | Shares | | | Value | |
| COMMON STOCK — continued | | | | | | |
| CHILE — 7.9% | | | | | | |
| Consumer Staples — 7.9% | | | | | | |
| Cencosud | | | 803,996 | | | $ | 1,081,859 | |
| Cia Cervecerias Unidas . | | | 190,273 | | | | 1,043,280 | |
| TOTAL CHILE | | | | | | | 2,125,139 | |
| TOTAL COMMON STOCK | | | | | | | | |
| (Cost $40,491,560) | | | | | | | 25,859,403 | |
| PREFERRED STOCK — 3.8% | | | | | | | | |
| CHILE— 3.8% | | | | | | | | |
| Consumer Staples — 3.8% | | | | | | | | |
| Embotelladora Andina (B) | | | | | | | | |
| (Cost $1,259,421) | | | 579,788 | | | | 1,013,599 | |
| | | | Face Amount | | | | | |
| U.S. TREASURY OBLIGATION — 1.1% | | | | | | | | |
| U.S. Treasury Bill | | | | | | | | |
| 1.000%, 11/01/22(C) | | | | | | | | |
| (Cost $300,000) | | $ | 300,000 | | | | 300,000 | |
| | | Shares | | | | | |
| SHORT-TERM INVESTMENT(D)(E) — 2.8% | | | | | | | | |
| Fidelity Investments Money Market | | | | | | | | |
| Government Portfolio, Cl Institutional, 2.910% | | | | | | | | |
| | | | | | | | |
| (Cost $754,096) | | | 754,096 | | | | 754,096 | |
|
|
|
| Schedule of Investments | | October 31, 2022 |
| Global X MSCI Argentina ETF |
| | | |
| |
| | | Face Amount | | Value | |
| REPURCHASE AGREEMENT(D) — 3.9% | | | |
| BNP Paribas | | | | | |
| 2.930%, dated 10/31/2022, to be repurchased | | | |
| on 11/01/2022, repurchase price $1,047,829 | | | |
| (collateralized by U.S. Treasury Obligations, | | | |
| ranging in par value $20,825 - $122,432, | | | |
| 2.500% - 2.750%, 03/31/2027 - 05/31/2029, | | | |
| with a total market value of $1,067,421) | | | |
| (Cost $1,047,744) | | $ | 1,047,744 | | $ | 1,047,744 | |
| TOTAL INVESTMENTS — 107.6% | | | | | | | |
| (Cost $43,852,821) | | | | | $ | 28,974,842 | |
Percentages are based on Net Assets of $26,930,312.
* Non-income producing security.
(A) This security or a partial position of this security is on loan at October 31, 2022
. (B) There is currently no stated interest rate.
(C) Interest rate represents the security's effective yield at the time of purchase.
(D) Security was purchased with cash collateral held from securities on loan.
(E) The rate reported on the Schedule of Investments is the 7-day effective yield as of October 31, 2022.
The following is a summary of the level of inputs used as of October 31, 2022, in valuing the Fund's investments carried at value:
| | | | | | | | | | | | |
| Investments in Securities | | Level 1 | | | Level 2
| | | Level 3 | | | Total | |
| Common Stock | | $ | 23,734,264 | | | $ | 2,125,139 | | | $ | — | | | $ | 25,859,403 | |
| Preferred Stock | | | — | | | | 1,013,599 | | | | — | | | | 1,013,599 | |
| U.S. Treasury Obligation | | | — | | | | 300,000 | | | | — | | | | 300,000 | |
| Short-Term Investment | | | 754,096 | | | | — | | | | — | | | | 754,096 | |
| Repurchase Agreement | | | — | | | | 1,047,744 | | | | — | | | | 1,047,744 | |
| Total Investments in Securities | | $ | 24,488,360 | | | $ | 4,486,482 | | | $ | — | | | $ | 28,974,842 | |
Amounts designated as “—“ are $0 or have been rounded to $0.
See “Glossary” for abbreviations.
|
|
|
| Schedule of Investments | | October 31, 2022 |
| Global X MSCI Pakistan ETF |
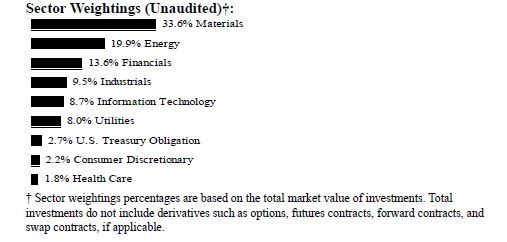
| | | | |
| |
| | | Shares | | | Value | |
| COMMON STOCK — 99.7% | | | | | | |
| PAKISTAN — 99.7% | | | | | | |
| Consumer Discretionary — 2.2% | | | | | | |
| Honda Atlas Cars Pakistan | | | 178,596 | | | $ | 133,605 | |
| Nishat Mills | | | 680,543 | | | | 187,634 | |
| | | | | | | | 321,239 | |
| Energy — 20.4% | | | | | | | | |
| Mari Petroleum | | | 90,107 | | | | 688,080 | |
| Oil & Gas Development . | | | 1,807,383 | | | | 574,590 | |
| Pakistan Oilfields | | | 364,831 | | | | 638,957 | |
| Pakistan Petroleum | | | 2,138,531 | | | | 500,147 | |
| Pakistan State Oil | | | 817,316 | | | | 520,190 | |
| | | | | | | | 2,921,964 | |
| Financials — 13.9% | | | | | | | | |
| Habib Bank . | | | 2,238,892 | | | | 708,420 | |
| MCB Bank . | | | 1,183,383 | | | | 653,297 | |
| United Bank . | | | 1,316,637 | | | | 640,171 | |
| | | | | | | | 2,001,888 | |
| Health Care — 1.9% | | | | | | | | |
| Searle | | | 787,188 | | | | 266,010 | |
| Industrials — 9.8% | | | | | | | | |
| Millat Tractors . | | | 204,564 | | | | 621,474 | |
|
|
|
| Schedule of Investments | | October 31, 2022 |
| Global X MSCI Pakistan ETF |
| | | | |
| |
| | | Shares | | | Value | |
| COMMON STOCK — continued | | | | | | |
| Industrials — continued | | | | | | |
| TRG Pakistan * | | | 1,562,765 | | | $ | 779,131 | |
| | | | | | | | 1,400,605 | |
| Information Technology — 8.9% | | | | | | | | |
| Systems | | | 631,520 | | | | 1,271,551 | |
| Materials — 34.4% | | | | | | | | |
| DG Khan Cement | | | 1,082,526 | | | | 256,171 | |
| Engro . | | | 1,088,831 | | | | 1,162,079 | |
| Engro Fertilizers . | | | 2,329,070 | | | | 853,209 | |
| Engro Polymer & Chemicals | | | 1,513,400 | | | | 360,606 | |
| Fauji Cement * | | | 3,819,249 | | | | 244,709 | |
| Fauji Fertilizer . | | | 1,493,748 | | | | 699,172 | |
| International Steels | | | 700,299 | | | | 163,432 | |
| Lucky Cement * | | | 434,172 | | | | 956,075 | |
| Maple Leaf Cement Factory * | | | 2,063,225 | | | | 247,259 | |
| | | | | | | | 4,942,712 | |
| Utilities — 8.2% | | | | | | | | |
| Hub Power . | | | 3,924,421 | | | | 1,175,323 | |
| TOTAL PAKISTAN | | | | | | | 14,301,292 | |
| TOTAL COMMON STOCK | | | | | | | | |
| (Cost $24,089,755) | | | | | | | 14,301,292 | |
| | | Face Amount | | | | | |
| U.S. TREASURY OBLIGATION — 2.8% | | | | | | | | |
| U.S. Treasury Bill | | | | | | | | |
| | | | | | | | |
| (Cost $400,000) | | | 400,000 | | | | 400,000 | |
| TOTAL INVESTMENTS — 102.5% | | | | | | | | |
| (Cost $24,489,755) | | | | | | $ | 14,701,292 | |
Percentages are based on Net Assets of $14,347,400.
* Non-income producing security.
(A) Interest rate represents the security's effective yield at the time of purchase.
|
|
|
| Schedule of Investments | | October 31, 2022 |
Global X MSCI Pakistan ETF
|
The following is a summary of the level of inputs used as of October 31, 2022, in valuing the Fund's investments carried at value:
| | | | | | | | | | |
| |
| Investments in Securities | | Level 1 | | | Level 2
| | | Level 3 | | | Total | |
| Common Stock | | $ | 14,301,292 | | | $ | — | | | $ | — | | | $ | 14,301,292 | |
| U.S. Treasury Obligation | | | — | | | | 400,000 | | | | — | | | | 400,000 | |
| Total Investments in Securities | | $ | 14,301,292 | | | $ | 400,000 | | | $ | — | | | $ | 14,701,292 | |
Amounts designated as “—“ are $0 or have been rounded to $0.
See “Glossary” for abbreviations.
|
|
| Schedule of Investments | | October 31, 2022 |
| Global X MSCI Nigeria ETF |
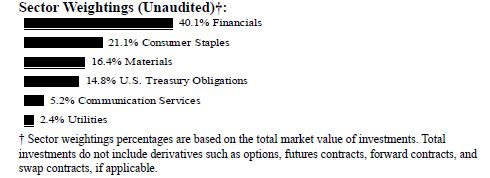
| | | | |
| |
| | | Shares | | | Value | |
| COMMON STOCK — 93.0% | | | | | | |
| NIGERIA — 88.8% | | | | | | |
| Communication Services — 5.7% | | | | | | |
| Nigeria Communications . | | | 4,864,255 | | | $ | 2,173,050 | |
| Consumer Staples — 23.0% | | | | | | | | |
| Dangote Sugar Refinery | | | 37,659,094 | | | | 1,392,724 | |
| Flour Mills of Nigeria | | | 24,002,438 | | | | 1,650,083 | |
| Nestle Nigeria | | | 1,149,667 | | | | 3,169,247 | |
| Nigerian Breweries . | | | 13,145,296 | | | | 1,248,169 | |
| UAC of Nigeria . | | | 38,120,465 | | | | 774,085 | |
| Unilever Nigeria . | | | 23,383,901 | | | | 570,339 | |
| | | | | | | | 8,804,647 | |
| Financials — 39.5% | | | | | | | | |
| Access Bank | | | 69,588,623 | | | | 1,231,517 | |
| FBN Holdings | | | 105,964,770 | | | | 2,368,129 | |
| FCMB Group | | | 162,598,933 | | | | 1,224,795 | |
| Fidelity Bank | | | 177,840,873 | | | | 1,694,683 | |
| Guaranty Trust Holding | | | 62,675,911 | | | | 2,502,771 | |
| Stanbic IBTC Holdings . | | | 19,605,429 | | | | 1,278,857 | |
| Sterling Bank | | | 201,593,633 | | | | 667,786 | |
| United Bank for Africa . | | | 89,619,784 | | | | 1,453,844 | |
| Zenith Bank | | | 59,101,971 | | | | 2,681,882 | |
| | | | | | | | 15,104,264 | |
| Materials — 17.9% | | | | | | | | |
| Dangote Cement . | | | 10,522,666 | | | | 5,264,317 | |
|
|
|
| Schedule of Investments | | October 31, 2022 |
| Global X MSCI Nigeria ETF |
| | | | |
| |
| | | Shares | | | Value | |
| COMMON STOCK — continued | | | | | | |
| Materials — continued | | | | | | |
| Lafarge Africa | | | 31,522,330 | | | $ | 1,591,315 | |
| | | | | | | | 6,855,632 | |
| Utilities — 2.7% | | | | | | | | |
| Transnational Corp of Nigeria | | | 417,740,027 | | | | 1,014,139 | |
| TOTAL NIGERIA | | | | | | | 33,951,732 | |
| TOGO — 4.2% | | | | | | | | |
| Financials — 4.2% | | | | | | | | |
| Ecobank Transnational . | | | 72,220,468 | | | | 1,630,388 | |
| TOTAL COMMON STOCK | | | | | | | | |
| (Cost $41,325,206) | | | | | | | 35,582,120 | |
| | Face Amount | | | | | |
| U.S. TREASURY OBLIGATIONS — 16.2% | | | | | | | | |
| U.S. Treasury Bills | | | | | | | | |
3.690%, 01/05/23(A) | | $ | 1,200,000 | | | | 1,191,817 | |
2.200%, 11/01/22(A) | | | 5,000,000 | | | | 5,000,000 | |
| TOTAL U.S. TREASURY OBLIGATIONS | | | | | | | | |
| (Cost $6,192,064) | | | | | | | 6,191,817 | |
| TOTAL INVESTMENTS — 109.2% | | | | | | | | |
| (Cost $47,517,270) | | | | | | $ | 41,773,937 | |
Percentages are based on Net Assets of $38,242,997.
(A) Interest rate represents the security's effective yield at the time of purchase.
The following is a summary of the level of inputs used as of October 31, 2022, in valuing the Fund's investments carried at value:
| | | | | | | | | | |
| |
| Investments in Securities | | Level 1 | | | Level 2
| | | Level 3 | | | Total | |
| Common Stock | | $ | 35,582,120 | | | $ | — | | | $
| — | | | $ | 35,582,120 | |
| U.S. Treasury Obligations | | | — | | | | 6,191,817 | | | | — | | | | 6,191,817 | |
| Total Investments in Securities | | $ | 35,582,120 | | | $ | 6,191,817 | | | $ | — | | | $ | 41,773,937 | |
Amounts designated as “—“ are $0 or have been rounded to $0.
See “Glossary” for abbreviations.
|
|
|
| Schedule of Investments | | October 31, 2022 |
| Global X MSCI Vietnam ETF |
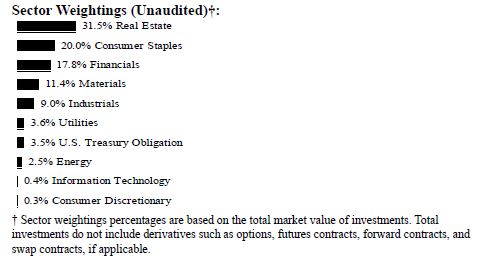
| | | | |
| |
| | | Shares | | | Value | |
| COMMON STOCK — 99.9% | | | | | | |
| VIETNAM — 99.9% | | | | | | |
| Consumer Discretionary — 0.3% | | | | | | |
| FPT DIGITAL RETAIL JSC | | | 2,900 | | | $ | 9,546 | |
| Consumer Staples — 20.7% | | | | | | | | |
| Hoang Anh Gia Lai International Agriculture | | | | | | | | |
| | | 36,100 | | | | 5,956 | |
| KIDO Group | | | 18,500 | | | | 45,785 | |
| Masan Group | | | 57,020 | | | | 196,185 | |
| Saigon Beer Alcohol Beverage | | | 6,900 | | | | 51,452 | |
| Thanh Thanh Cong - Bien Hoa JSC * | | | 43,300 | | | | 23,349 | |
| Vietnam Dairy Products JSC | | | 67,800 | | | | 214,177 | |
| Vinh Hoan . | | | 13,400 | | | | 39,364 | |
| | | | | | | | 576,268 | |
| Energy — 2.6% | | | | | | | | |
| PetroVietnam Drilling & Well Services JSC * | | | 42,152 | | | | 29,176 | |
| PetroVietnam Technical Service | | | 35,600 | | | | 30,657 | |
| Vietnam National Petroleum Group * | | | 10,300 | | | | 11,813 | |
| | | | | | | | 71,646 | |
| Financials — 18.4% | | | | | | | | |
| Bank for Foreign Trade of Vietnam JSC | | | 49,875 | | | | 147,518 | |
|
|
|
| Schedule of Investments | | October 31, 2022 |
| Global X MSCI Vietnam ETF |
| | | | |
| |
| | | Shares | | | Value | |
| COMMON STOCK — continued | | | | | | |
| Financials — continued | | | | | | |
| Bank for Investment and Development of | | | | | | |
| Vietnam JSC | | | 28,876 | | | $ | 40,147 | |
| Bao Viet Holdings | | | 11,800 | | | | 24,930 | |
| Ho Chi Minh City Development Joint Stock | | | | | | | | |
| Commercial Bank * | | | 30,375 | | | | 20,046 | |
| National Citizen Commercial JSC * | | | 10,528 | | | | 6,270 | |
| Saigon - Hanoi Commercial Joint Stock Bank *. | | | 68,300 | | | | 31,470 | |
| Saigon - Hanoi Securities JSC * | | | 25,375 | | | | 7,863 | |
| Saigon Thuong Tin Commercial JSB * | | | 72,000 | | | | 46,793 | |
| SSI Securities . | | | 116,650 | | | | 76,515 | |
| Viet Capital Securities JSC | | | 26,640 | | | | 28,087 | |
| Vietnam Joint Stock Commercial Bank for | | | | | | | | |
| Industry and Trade | | | 36,300 | | | | 35,935 | |
| VIX Securities JSC | | | 25,322 | | | | 7,642 | |
| VNDirect Securities . | | | 85,540 | | | | 39,586 | |
| | | | | | | | 512,802 | |
| Industrials — 9.3% | | | | | | | | |
| Bamboo Capital Group JSC | | | 12,935 | | | | 4,138 | |
| Development Investment Construction JSC * | | | 23,180 | | | | 16,510 | |
| Gelex Group JSC | | | 53,900 | | | | 29,065 | |
| Gemadept | | | 5,900 | | | | 10,910 | |
| Ha Do Group JSC | | | 8,308 | | | | 9,929 | |
| Hoang Huy Investment Financial Services | | | | | | | | |
| JSC | | | 48,416 | | | | 15,587 | |
| IDICO JSC | | | 13,040 | | | | 23,194 | |
| PC1 Group JSC * | | | 6,300 | | | | 5,235 | |
| Sai Gon Cargo Service . | | | 1,420 | | | | 4,109 | |
| Tan Tao Investment & Industry JSC * | | | 20,200 | | | | 3,024 | |
| Tasco JSC * | | | 9,800 | | | | 6,507 | |
| Thaiholdings JSC * | | | 19,200 | | | | 29,746 | |
| Vietjet Aviation JSC * | | | 19,800 | | | | 85,734 | |
| Vietnam Construction and Import-Export JSC . | | | 19,610 | | | | 12,587 | |
| Viettel Construction Joint Stock | | | 2,069 | | | | 4,604 | |
| | | | | | | | 260,879 | |
| Information Technology — 0.4% | | | | | | | | |
| Digiworld | | | 4,720 | | | | 11,586 | |
|
|
|
| Schedule of Investments | | October 31, 2022 |
| Global X MSCI Vietnam ETF |
| | | | |
| |
| | | Shares | | | Value | |
| COMMON STOCK — continued | | | | | | |
| Materials — 11.8% | | | | | | |
| An Phat Holdings JSC * | | | 15,475 | | | $ | 5,163 | |
| Duc Giang Chemicals JSC | | | 17,080 | | | | 52,855 | |
| Hoa Phat Group JSC | | | 295,540 | | | | 186,125 | |
| Hoa Sen Group * | | | 37,120 | | | | 17,029 | |
| Nam Kim Steel JSC | | | 6,460 | | | | 3,522 | |
| PetroVietNam Ca Mau Fertilizer JSC | | | 6,600 | | | | 8,765 | |
| Petrovietnam Fertilizer & Chemicals JSC | | | 20,900 | | | | 36,417 | |
| Phuoc Hoa Rubber JSC | | | 8,700 | | | | 14,144 | |
| Vietnam Rubber Group | | | 9,600 | | | | 5,563 | |
| | | | | | | | 329,583 | |
| Real Estate — 32.6% | | | | | | | | |
| Dat Xanh Group JSC * | | | 28,800 | | | | 16,225 | |
| Dat Xanh Real Estate Services JSC * | | | 8,627 | | | | 2,746 | |
| Hai Phat Investment JSC * | | | 8,800 | | | | 9,101 | |
| Khang Dien House Trading and Investment | | | | | | | | |
| JSC * | | | 38,260 | | | | 34,950 | |
| Kinh Bac City Development Share Holding * | | | 36,500 | | | | 25,704 | |
| Nam Long Investment . | | | 12,600 | | | | 11,561 | |
| No Va Land Investment Group * | | | 67,591 | | | | 190,397 | |
| Phat Dat Real Estate Development * | | | 33,989 | | | | 59,772 | |
| Van Phu - Invest Investment JSC * | | | 16,120 | | | | 37,624 | |
| Vincom Retail JSC * | | | 96,400 | | | | 95,430 | |
| Vingroup JSC * | | | 99,000 | | | | 220,708 | |
| Vinhomes JSC | | | 113,000 | | | | 204,628 | |
| | | | | | | | 908,846 | |
| Utilities — 3.8% | | | | | | | | |
| Binh Duong Water Enviroment JSC | | | 2,600 | | | | 4,761 | |
| PetroVietnam Gas JSC | | | 8,700 | | | | 38,896 | |
| PetroVietnam Nhon Trach 2 Power JSC | | | 20,000 | | | | 20,443 | |
| PetroVietnam Power * | | | 67,300 | | | | 28,030 | |
| Pha Lai Thermal Power JSC | | | 21,300 | | | | 12,857 | |
| | | | | | | | 104,987 | |
| TOTAL VIETNAM | | | | | | | 2,786,143 | |
| TOTAL COMMON STOCK | | | | | | | | |
| (Cost $4,214,590) | | | | | | | 2,786,143 | |
|
|
|
| Schedule of Investments | | October 31, 2022 |
| Global X MSCI Vietnam ETF |
| | | | |
| |
| | | Face Amount | | | Value | |
| U.S. TREASURY OBLIGATION — 3.6% | | | | | | |
| U.S. Treasury Bill | | | | | | |
| 2.200%, 11/01/22(A) | | | | | | |
| (Cost $100,000) | | $ | 100,000 | | | $ | 100,000 | |
| TOTAL INVESTMENTS — 103.5% | | | | | | | | |
| (Cost $4,314,590) | | | | | | $ | 2,886,143 | |
Percentages are based on Net Assets of $2,787,199.
* Non-income producing security.
(A) Interest rate represents the security's effective yield at the time of purchase.
The following is a summary of the level of inputs used as of October 31, 2022, in valuing the Fund's investments carried at value:
| | | | | | | | | | |
| |
| Investments in Securities | | Level 1 | | | Level 2 | | | Level 3 | | | Total | |
| Common Stock | | $ | 2,786,143 | | | $
| — | | | $ | — | | | $ | 2,786,143 | |
| U.S. Treasury Obligation | | | — | | | | 100,000 | | | | | | | | 100,000 | |
| Total Investments in Securities | | $ | 2,786,143 | | | $ | 100,000 | | | $ | — | | | $ | 2,886,143 | |
Amounts designated as “—“ are $0 or have been rounded to $0.
See “Glossary” for abbreviations.
|
|
|
| Schedule of Investments | | October 31, 2022 |
Global X MSCI Next Emerging & Frontier ETF
|
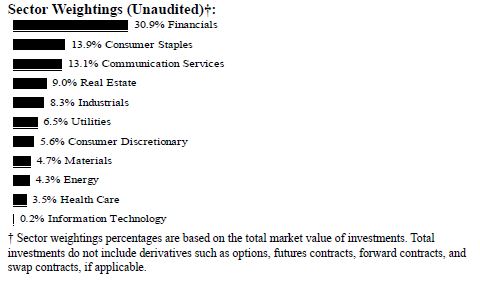
| | | Shares | | | Value | |
| COMMON STOCK — 99.9% | | | | | | |
| BANGLADESH — 0.9% | | | | | | |
| Health Care — 0.6% | | | | | | |
| Square Pharmaceuticals | | | 52,457 | | | $ | 108,642 | |
| Industrials — 0.3% | | | | | | | | |
| Bangladesh Export Import . | | | 52,931 | | | | 60,403 | |
| TOTAL BANGLADESH | | | | | | | 169,045 | |
| CHILE — 0.9% | | | | | | | | |
| Consumer Discretionary — 0.3% | | | | | | | | |
| Falabella | | | 32,412 | | | | 63,353 | |
| Financials — 0.6% | | | | | | | | |
| Banco de Chile . | | | 668,376 | | | | 61,108 | |
| Banco de Credito e Inversiones | | | 852 | | | | 23,732 | |
| Banco Santander Chile . | | | 964,956 | | | | 34,557 | |
| | | | | | | | 119,397 | |
| TOTAL CHILE | | | | | | | 182,750 | |
|
|
|
| Schedule of Investments | | October 31, 2022 |
Global X MSCI Next Emerging & Frontier ETF
|
| | | | |
| |
| | | Shares | | | Value | |
| COMMON STOCK — continued | | | | | | |
| COLOMBIA — 0.4% | | | | | | |
| Utilities — 0.4% | | | | | | |
| Interconexion Electrica | | | 18,693 | | | $ | 73,766 | |
| CYPRUS — 0.0% | | | | | | | | |
| Financials — 0.0% | | | | | | | | |
| Galaxy Cosmos Mezz * | | | 1,198 | | | | 193 | |
| CZECH REPUBLIC — 1.4% | | | | | | | | |
| Financials — 0.2% | | | | | | | | |
| Komercni Banka . | | | 1,110 | | | | 31,838 | |
| Moneta Money Bank | | | 5,128 | | | | 14,968 | |
| | | | | | | | 46,806 | |
| Utilities — 1.2% | | | | | | | | |
| CEZ . | | | 6,887 | | | | 225,205 | |
| TOTAL CZECH REPUBLIC | | | | | | | 272,011 | |
| EGYPT — 0.3% | | | | | | | | |
| Financials — 0.3% | | | | | | | | |
| Commercial International Bank Egypt SAE | | | 37,127 | | | | 49,810 | |
| GREECE — 1.8% | | | | | | | | |
| Communication Services — 0.7% | | | | | | | | |
| Hellenic Telecommunications Organization . | | | 8,558 | | | | 134,487 | |
| Consumer Discretionary — 0.5% | | | | | | | | |
| OPAP . | | | 8,200 | | | | 100,495 | |
| Financials — 0.3% | | | | | | | | |
| Alpha Services and Holdings * | | | 32,348 | | | | 29,989 | |
| National Bank of Greece * | | | 8,239 | | | | 29,885 | |
| | | | | | | | 59,874 | |
| Utilities — 0.3% | | | | | | | | |
| Public Power * | | | 9,137 | | | | 57,705 | |
| TOTAL GREECE | | | | | | | 352,561 | |
|
|
|
| Schedule of Investments | | October 31, 2022 |
Global X MSCI Next Emerging & Frontier ETF
|
| | | | |
| |
| | | Shares | | | Value | |
| COMMON STOCK — continued | | | | | | |
| ICELAND — 1.3% | | | | | | |
| Financials — 0.4% | | | | | | |
| Arion Banki HF . | | | 39,003 | | | $ | 43,709 | |
| Islandsbanki HF | | | 34,206 | | | | 30,336 | |
| | | | | | | | 74,045 | |
| Industrials — 0.9% | | | | | | | | |
| Marel HF | | | 49,162 | | | | 172,230 | |
| TOTAL ICELAND | | | | | | | 246,275 | |
| INDONESIA — 10.5% | | | | | | | | |
| Communication Services — 2.3% | | | | | | | | |
| Sarana Menara Nusantara . | | | 675,868 | | | | 50,048 | |
| Telkom Indonesia Persero | | | 1,353,112 | | | | 380,841 | |
| Tower Bersama Infrastructure . | | | 153,979 | | | | 24,285 | |
| | | | | | | | 455,174 | |
| Consumer Discretionary — 1.4% | | | | | | | | |
| Astra International . | | | 665,993 | | | | 283,946 | |
| Consumer Staples — 2.0% | | | | | | | | |
| Charoen Pokphand Indonesia | | | 240,315 | | | | 85,896 | |
| Gudang Garam | | | 15,424 | | | | 23,832 | |
| Indofood CBP Sukses Makmur . | | | 77,390 | | | | 48,252 | |
| Indofood Sukses Makmur | | | 146,166 | | | | 60,444 | |
| Sumber Alfaria Trijaya . | | | 540,129 | | | | 97,654 | |
| Unilever Indonesia . | | | 248,168 | | | | 73,826 | |
| | | | | | | | 389,904 | |
| Financials — 4.0% | | | | | | | | |
| Bank Central Asia . | | | 623,064 | | | | 351,528 | |
| Bank Jago * | | | 47,618 | | | | 15,570 | |
| Bank Mandiri | | | 207,837 | | | | 140,579 | |
| Bank Negara Indonesia Persero | | | 82,435 | | | | 49,680 | |
| Bank Rakyat Indonesia Persero | | | 766,564 | | | | 228,532 | |
| | | | | | | | 785,889 | |
| Health Care — 0.5% | | | | | | | | |
| Kalbe Farma | | | 686,022 | | | | 90,165 | |
|
|
|
| Schedule of Investments | | October 31, 2022 |
Global X MSCI Next Emerging & Frontier ETF
|
| | | | |
| |
| | | Shares | | | Value | |
| COMMON STOCK — continued | | | | | | |
| Materials — 0.3% | | | | | | |
| Semen Indonesia Persero | | | 98,295 | | | $ | 50,101 | |
| TOTAL INDONESIA | | | | | | | 2,055,179 | |
| KAZAKHSTAN — 1.4% | | | | | | | | |
| Energy — 0.8% | | | | | | | | |
| NAC Kazatomprom JSC GDR | | | 5,502 | | | | 145,253 | |
| Financials — 0.6% | | | | | | | | |
| Halyk Savings Bank of Kazakhstan JSC GDR . | | | 2,522 | | | | 25,472 | |
| Kaspi.KZ JSC GDR | | | 1,436 | | | | 94,058 | |
| | | | | | | | 119,530 | |
| TOTAL KAZAKHSTAN | | | | | | | 264,783 | |
| KENYA — 1.1% | | | | | | | | |
| Communication Services — 1.1% | | | | | | | | |
| Safaricom | | | 1,002,501 | | | | 207,357 | |
| KUWAIT — 3.3% | | | | | | | | |
| Financials — 2.9% | | | | | | | | |
| Gulf Bank KSCP | | | 24,011 | | | | 26,589 | |
| Kuwait Finance House . | | | 72,060 | | | | 188,439 | |
| National Bank of Kuwait SAK | | | 104,468 | | | | 363,572 | |
| | | | | | | | 578,600 | |
| Real Estate — 0.4% | | | | | | | | |
| Mabanee KPSC . | | | 26,782 | | | | 75,396 | |
| TOTAL KUWAIT | | | | | | | 653,996 | |
| LUXEMBOURG — 0.2% | | | | | | | | |
| Financials — 0.2% | | | | | | | | |
| Reinet Investments SCA | | | 1,953 | | | | 31,365 | |
| MALAYSIA — 6.9% | | | | | | | | |
| Communication Services — 1.6% | | | | | | | | |
| Axiata Group | | | 118,788 | | | | 71,604 | |
| DiGi.com . | | | 131,603 | | | | 105,494 | |
| Maxis | | | 101,293 | | | | 82,483 | |
|
|
|
| Schedule of Investments | | October 31, 2022 |
Global X MSCI Next Emerging & Frontier ETF
|
| | | | |
| |
| | | Shares | | | Value | |
| COMMON STOCK — continued | | | | | | |
| Communication Services — continued | | | | | | |
| Telekom Malaysia | | | 49,094 | | | $ | 57,733 | |
| | | | | | | | 317,314 | |
| Consumer Staples — 1.2% | | | | | | | | |
| Nestle Malaysia . | | | 3,024 | | | | 85,066 | |
| PPB Group . | | | 27,049 | | | | 95,541 | |
| QL Resources . | | | 47,393 | | | | 51,322 | |
| | | | | | | | 231,929 | |
| Energy — 0.3% | | | | | | | | |
| Petronas Dagangan | | | 12,914 | | | | 59,217 | |
| Financials — 2.0% | | | | | | | | |
| CIMB Group Holdings | | | 99,492 | | | | 116,158 | |
| Hong Leong Bank | | | 9,544 | | | | 42,714 | |
| Public Bank . | | | 212,253 | | | | 200,671 | |
| RHB Bank | | | 21,744 | | | | 26,306 | |
| | | | | | | | 385,849 | |
| Health Care — 0.2% | | | | | | | | |
| Top Glove | | | 229,529 | | | | 38,595 | |
| Utilities — 1.6% | | | | | | | | |
| Petronas Gas | | | 34,152 | | | | 123,519 | |
| Tenaga Nasional | | | 109,503 | | | | 195,012 | |
| | | | | | | | 318,531 | |
| TOTAL MALAYSIA | | | | | | | 1,351,435 | |
| MEXICO — 8.6% | | | | | | | | |
| Communication Services — 0.5% | | | | | | | | |
| Grupo Televisa | | | 102,082 | | | | 108,104 | |
| Consumer Staples — 2.9% | | | | | | | | |
| Kimberly-Clark de Mexico, Cl A | | | 64,458 | | | | 101,514 | |
| Wal-Mart de Mexico | | | 118,670 | | | | 457,545 | |
| | | | | | | | 559,059 | |
| Financials — 1.8% | | | | | | | | |
| Grupo Financiero Banorte, Cl O | | | 37,814 | | | | 306,814 | |
|
|
|
| Schedule of Investments | | October 31, 2022 |
Global X MSCI Next Emerging & Frontier ETF
|
| | | | |
| |
| | | Shares | | | Value | |
| COMMON STOCK — continued | | | | | | |
| Financials — continued | | | | | | |
| Grupo Financiero Inbursa, Cl O * | | | 30,876 | | | $ | 56,886 | |
| | | | | | | | 363,700 | |
| Industrials — 2.6% | | | | | | | | |
| Grupo Aeroportuario del Pacifico, Cl B . | | | 15,474 | | | | 239,255 | |
| Grupo Aeroportuario del Sureste, Cl B . | | | 8,236 | | | | 192,404 | |
| Promotora y Operadora de Infraestructura . | | | 9,836 | | | | 73,856 | |
| | | | | | | | 505,515 | |
| Real Estate — 0.8% | | | | | | | | |
| Fibra Uno Administracion ‡ | | | 128,650 | | | | 149,851 | |
| TOTAL MEXICO | | | | | | | 1,686,229 | |
| MOROCCO — 0.3% | | | | | | | | |
| Financials — 0.3% | | | | | | | | |
| Attijariwafa Bank | | | 1,256 | | | | 44,135 | |
| Banque Centrale Populaire . | | | 519 | | | | 10,422 | |
| TOTAL MOROCCO | | | | | | | 54,557 | |
| NIGERIA — 0.5% | | | | | | | | |
| Financials — 0.1% | | | | | | | | |
| Guaranty Trust Holding | | | 216,406 | | | | 8,641 | |
| Zenith Bank | | | 230,376 | | | | 10,454 | |
| | | | | | | | 19,095 | |
| Materials — 0.4% | | | | | | | | |
| Dangote Cement . | | | 146,538 | | | | 73,311 | |
| TOTAL NIGERIA | | | | | | | 92,406 | |
| OMAN — 0.2% | | | | | | | | |
| Financials — 0.2% | | | | | | | | |
| BankMuscat SAOG | | | 26,862 | | | | 39,904 | |
| PERU — 0.8% | | | | | | | | |
| Financials — 0.8% | | | | | | | | |
| Credicorp . | | | 1,034 | | | | 151,336 | |
|
|
|
| Schedule of Investments | | October 31, 2022 |
Global X MSCI Next Emerging & Frontier ETF
|
| | | | |
| |
| | | Shares | | | Value | |
| COMMON STOCK — continued | | | | | | |
| PHILIPPINES — 4.7% | | | | | | |
| Communication Services — 0.5% | | | | | | |
| PLDT | | | 3,654 | | | $ | 103,031 | |
| Consumer Staples — 0.4% | | | | | | | | |
| Universal Robina . | | | 36,908 | | | | 77,701 | |
| Financials — 0.7% | | | | | | | | |
| Bank of the Philippine Islands | | | 26,455 | | | | 43,826 | |
| BDO Unibank | | | 29,052 | | | | 63,819 | |
| Metropolitan Bank & Trust | | | 26,080 | | | | 23,267 | |
| | | | | | | | 130,912 | |
| Industrials — 0.7% | | | | | | | | |
| SM Investments . | | | 10,225 | | | | 144,685 | |
| Real Estate — 2.1% | | | | | | | | |
| Ayala Land . | | | 314,030 | | | | 138,184 | |
| SM Prime Holdings | | | 492,807 | | | | 267,876 | |
| | | | | | | | 406,060 | |
| Utilities — 0.3% | | | | | | | | |
| Manila Electric . | | | 9,727 | | | | 50,590 | |
| TOTAL PHILIPPINES | | | | | | | 912,979 | |
| POLAND — 2.5% | | | | | | | | |
| Communication Services — 0.2% | | | | | | | | |
| Cyfrowy Polsat . | | | 11,109 | | | | 41,676 | |
| Consumer Discretionary — 0.4% | | | | | | | | |
| Allegro.eu * | | | 15,868 | | | | 77,156 | |
| Consumer Staples — 0.7% | | | | | | | | |
| Dino Polska * | | | 2,079 | | | | 136,034 | |
| Financials — 1.0% | | | | | | | | |
| Bank Polska Kasa Opieki . | | | 2,706 | | | | 44,486 | |
| Powszechna Kasa Oszczednosci Bank Polski | | | 12,937 | | | | 70,686 | |
| Powszechny Zaklad Ubezpieczen | | | 8,901 | | | | 49,995 | |
|
|
|
| Schedule of Investments | | October 31, 2022 |
Global X MSCI Next Emerging & Frontier ETF
|
| | | | |
| |
| | | Shares | | | Value | |
| COMMON STOCK — continued | | | | | | |
| Financials — continued | | | | | | |
| Santander Bank Polska | | | 520 | | | $ | 27,704 | |
| | | | | | | | 192,871 | |
| Utilities — 0.2% | | | | | | | | |
| PGE Polska Grupa Energetyczna * | | | 38,765 | | | | 44,279 | |
| TOTAL POLAND | | | | | | | 492,016 | |
| QATAR — 5.9% | | | | | | | | |
| Energy — 1.2% | | | | | | | | |
| Qatar Fuel QSC . | | | 20,586 | | | | 107,855 | |
| Qatar Gas Transport . | | | 105,384 | | | | 118,645 | |
| | | | | | | | 226,500 | |
| Financials — 1.8% | | | | | | | | |
| Commercial Bank PSQC . | | | 46,691 | | | | 80,696 | |
| Masraf Al Rayan QSC | | | 80,465 | | | | 84,779 | |
| Qatar International Islamic Bank QSC | | | 10,711 | | | | 34,029 | |
| Qatar Islamic Bank SAQ . | | | 23,905 | | | | 160,100 | |
| | | | | | | | 359,604 | |
| Industrials — 1.4% | | | | | | | | |
| Industries Qatar QSC . | | | 64,513 | | | | 279,363 | |
| Materials — 0.6% | | | | | | | | |
| Mesaieed Petrochemical Holding . | | | 185,987 | | | | 115,931 | |
| Real Estate — 0.4% | | | | | | | | |
| Barwa Real Estate | | | 82,256 | | | | 76,795 | |
| Utilities — 0.5% | | | | | | | | |
| Qatar Electricity & Water QSC . | | | 18,582 | | | | 94,396 | |
| TOTAL QATAR | | | | | | | 1,152,589 | |
| ROMANIA — 1.8% | | | | | | | | |
| Energy — 1.0% | | | | | | | | |
| OMV Petrom . | | | 1,321,319 | | | | 120,211 | |
| Societatea Nationala de Gaze Naturale | | | | | | | | |
| | | 9,803 | | | | 75,669 | |
| | | | | | | | 195,880 | |
|
|
|
| Schedule of Investments | | October 31, 2022 |
Global X MSCI Next Emerging & Frontier ETF
|
| | | | |
| |
| | | Shares | | | Value | |
| COMMON STOCK — continued | | | | | | |
| Financials — 0.3% | | | | | | |
| Banca Transilvania | | | 15,640 | | | $ | 53,516 | |
| BRD-Groupe Societe Generale . | | | 6,025 | | | | 13,704 | |
| | | | | | | | 67,220 | |
| Real Estate — 0.5% | | | | | | | | |
| NEPI Rockcastle | | | 19,295 | | | | 97,118 | |
| TOTAL ROMANIA | | | | | | | 360,218 | |
| SAUDI ARABIA — 10.0% | | | | | | | | |
| Communication Services — 2.1% | | | | | | | | |
| Etihad Etisalat | | | 6,474 | | | | 63,059 | |
| Mobile Telecommunications Saudi Arabia * | | | 7,684 | | | | 26,544 | |
| Saudi Research & Media Group * | | | 614 | | | | 32,910 | |
| Saudi Telecom . | | | 26,079 | | | | 280,393 | |
| | | | | | | | 402,906 | |
| Consumer Discretionary — 0.2% | | | | | | | | |
| Jarir Marketing . | | | 1,038 | | | | 45,304 | |
| Consumer Staples — 0.5% | | | | | | | | |
| Almarai JSC | | | 4,288 | | | | 64,248 | |
| Savola Group | | | 4,466 | | | | 34,824 | |
| | | | | | | | 99,072 | |
| Financials — 4.3% | | | | | | | | |
| Al Rajhi Bank * | | | 11,637 | | | | 263,861 | |
| Alinma Bank . | | | 5,738 | | | | 57,265 | |
| Arab National Bank . | | | 3,480 | | | | 29,868 | |
| Bank AlBilad * | | | 2,856 | | | | 38,535 | |
| Bank Al-Jazira . | | | 2,402 | | | | 14,946 | |
| Banque Saudi Fransi . | | | 3,449 | | | | 39,653 | |
| Bupa Arabia for Cooperative Insurance . | | | 357 | | | | 18,337 | |
| Riyad Bank | | | 7,922 | | | | 75,793 | |
| Saudi British Bank . | | | 5,414 | | | | 62,676 | |
| Saudi Investment Bank | | | 3,083 | | | | 14,883 | |
| Saudi National Bank . | | | 13,031 | | | | 205,996 | |
| Saudi Tadawul Group Holding | | | 226 | | | | 13,064 | |
| | | | | | | | 834,877 | |
|
|
|
| Schedule of Investments | | October 31, 2022 |
Global X MSCI Next Emerging & Frontier ETF
|
| | | | |
| |
| | | Shares | | | Value | |
| COMMON STOCK — continued | | | | | | |
| Health Care — 0.7% | | | | | | |
| Dr Sulaiman Al Habib Medical Services | | | | | | |
| | | 1,504 | | | $ | 90,699 | |
| Mouwasat Medical Services . | | | 840 | | | | 48,957 | |
| | | | | | | | 139,656 | |
| Information Technology — 0.2% | | | | | | | | |
| Elm | | | 410 | | | | 36,117 | |
| Materials — 1.3% | | | | | | | | |
| SABIC Agri-Nutrients | | | 3,696 | | | | 156,395 | |
| Saudi Kayan Petrochemical * | | | 12,586 | | | | 44,080 | |
| Yanbu National Petrochemical . | | | 4,342 | | | | 51,653 | |
| | | | | | | | 252,128 | |
| Real Estate — 0.2% | | | | | | | | |
| Dar Al Arkan Real Estate Development * | | | 9,015 | | | | 32,197 | |
| Utilities — 0.5% | | | | | | | | |
| Saudi Electricity . | | | 14,344 | | | | 103,069 | |
| TOTAL SAUDI ARABIA | | | | | | | 1,945,326 | |
| SOUTH AFRICA — 8.3% | | | | | | | | |
| Communication Services — 0.5% | | | | | | | | |
| MultiChoice Group . | | | 15,894 | | | | 103,809 | |
| Consumer Discretionary — 1.0% | | | | | | | | |
| Mr Price Group | | | 10,858 | | | | 104,483 | |
| Pepkor Holdings . | | | 70,194 | | | | 86,589 | |
| | | | | | | | 191,072 | |
| Consumer Staples — 2.3% | | | | | | | | |
| Clicks Group . | | | 10,365 | | | | 175,546 | |
| Shoprite Holdings . | | | 21,375 | | | | 272,051 | |
| | | | | | | | 447,597 | |
| Financials — 3.8% | | | | | | | | |
| Absa Group . | | | 12,297 | | | | 133,653 | |
| Capitec Bank Holdings | | | 1,259 | | | | 130,204 | |
| Discovery * | | | 7,167 | | | | 46,884 | |
| Nedbank Group | | | 6,632 | | | | 78,512 | |
|
|
|
| Schedule of Investments | | October 31, 2022 |
Global X MSCI Next Emerging & Frontier ETF
|
| | | | |
| |
| | | Shares | | | Value | |
| COMMON STOCK — continued | | | | | | |
| Financials — continued | | | | | | |
| Old Mutual . | | | 67,389 | | | $ | 38,283 | |
| Remgro . | | | 7,602 | | | | 56,551 | |
| Sanlam . | | | 25,662 | | | | 74,623 | |
| Standard Bank Group . | | | 19,406 | | | | 181,256 | |
| | | | | | | | 739,966 | |
| Materials — 0.7% | | | | | | | | |
| African Rainbow Minerals | | | 4,840 | | | | 68,122 | |
| Harmony Gold Mining . | | | 23,940 | | | | 66,294 | |
| | | | | | | | 134,416 | |
| TOTAL SOUTH AFRICA | | | | | | | 1,616,860 | |
| SRI LANKA — 0.1% | | | | | | | | |
| Industrials — 0.1% | | | | | | | | |
| John Keells Holdings . | | | 58,710 | | | | 21,283 | |
| THAILAND — 10.3% | | | | | | | | |
| Communication Services — 1.1% | | | | | | | | |
| Advanced Info Service NVDR | | | 30,769 | | | | 154,411 | |
| Intouch Holdings PCL NVDR | | | 28,827 | | | | 54,533 | |
| | | | | | | | 208,944 | |
| Consumer Discretionary — 0.8% | | | | | | | | |
| Central Retail NVDR . | | | 46,394 | | | | 51,197 | |
| Home Product Center NVDR | | | 152,079 | | | | 58,338 | |
| PTT Oil & Retail Business NVDR . | | | 77,132 | | | | 48,841 | |
| | | | | | | | 158,376 | |
| Consumer Staples — 1.4% | | | | | | | | |
| Berli Jucker NVDR | | | 32,246 | | | | 29,018 | |
| CP ALL NVDR | | | 152,156 | | | | 239,868 | |
| | | | | | | | 268,886 | |
| Energy — 1.1% | | | | | | | | |
| PTT Exploration & Production NVDR . | | | 35,927 | | | | 171,328 | |
| Thai Oil NVDR . | | | 29,549 | | | | 42,313 | |
| | | | | | | | 213,641 | |
| Financials — 0.3% | | | | | | | | |
| Kasikornbank NVDR . | | | 5,098 | | | | 19,556 | |
|
|
|
| Schedule of Investments | | October 31, 2022 |
Global X MSCI Next Emerging & Frontier ETF
|
| | | | |
| |
| | | Shares | | | Value | |
| COMMON STOCK — continued | | | �� | | | |
| Financials — continued | | | | | | |
| Krungthai Card NVDR | | | 8,660 | | | $ | 12,970 | |
| SCB X NVDR . | | | 7,495 | | | | 20,874 | |
| Srisawad NVDR . | | | 5,640 | | | | 6,076 | |
| | | | | | | | 59,476 | |
| Health Care — 1.5% | | | | | | | | |
| Bangkok Dusit Medical Services NVDR . | | | 267,373 | | | | 207,238 | |
| Bumrungrad Hospital NVDR | | | 15,373 | | | | 91,689 | |
| | | | | | | | 298,927 | |
| Industrials — 1.6% | | | | | | | | |
| Airports of Thailand NVDR * | | | 111,050 | | | | 215,914 | |
| Bangkok Expressway & Metro NVDR . | | | 195,969 | | | | 48,400 | |
| BTS Group Holdings PCL NVDR | | | 202,607 | | | | 44,184 | |
| | | | | | | | 308,498 | |
| Materials — 0.2% | | | | | | | | |
| SCG Packaging NVDR . | | | 33,103 | | | | 45,228 | |
| Real Estate — 0.8% | | | | | | | | |
| Central Pattana NVDR . | | | 52,053 | | | | 94,026 | |
| Land & Houses NVDR | | | 214,608 | | | | 51,876 | |
| | | | | | | | 145,902 | |
| Utilities — 1.5% | | | | | | | | |
| Electricity Generating | | | 6,148 | | | | 27,541 | |
| Electricity Generating NVDR . | | | 900 | | | | 4,032 | |
| Energy Absolute NVDR . | | | 43,277 | | | | 109,727 | |
| Global Power Synergy NVDR . | | | 18,004 | | | | 29,329 | |
| Gulf Energy Development NVDR | | | 75,615 | | | | 100,330 | |
| Ratch Group NVDR | | | 27,714 | | | | 29,855 | |
| | | | | | | | 300,814 | |
| TOTAL THAILAND | | | | | | | 2,008,692 | |
| TURKEY — 2.0% | | | | | | | | |
| Communication Services — 0.4% | | | | | | | | |
| Turkcell Iletisim Hizmetleri | | | 52,320 | | | | 72,112 | |
|
|
|
| Schedule of Investments | | October 31, 2022 |
Global X MSCI Next Emerging & Frontier ETF
|
| | | | |
| |
| | | Shares | | | Value | |
| COMMON STOCK — continued | | | | | | |
| Consumer Staples — 0.7% | | | | | | |
| BIM Birlesik Magazalar . | | | 19,251 | | | $ | 138,668 | |
| Financials — 0.2% | | | | | | | | |
| Akbank Turk | | | 44,987 | | | | 35,355 | |
| Industrials — 0.2% | | | | | | | | |
| Aselsan Elektronik Sanayi Ve Ticaret . | | | 29,803 | | | | 51,619 | |
| Materials — 0.5% | | | | | | | | |
| Eregli Demir ve Celik Fabrikalari . | | | 59,113 | | | | 94,375 | |
| TOTAL TURKEY | | | | | | | 392,129 | |
| UNITED ARAB EMIRATES — 7.1% | | | | | | | | |
| Communication Services — 2.0% | | | | | | | | |
| Emirates Telecommunications Group PJSC | | | 56,795 | | | | 398,936 | |
| Consumer Discretionary — 0.8% | | | | | | | | |
| Abu Dhabi National Oil for Distribution PJSC . | | | 132,262 | | | | 162,399 | |
| Financials — 3.3% | | | | | | | | |
| Abu Dhabi Commercial Bank PJSC | | | 40,666 | | | | 104,625 | |
| Abu Dhabi Islamic Bank PJSC | | | 21,056 | | | | 54,459 | |
| Dubai Islamic Bank PJSC | | | 42,424 | | | | 67,222 | |
| Emirates NBD Bank PJSC | | | 27,695 | | | | 99,906 | |
| First Abu Dhabi Bank PJSC | | | 64,347 | | | | 313,584 | |
| | | | | | | | 639,796 | |
| Real Estate — 1.0% | | | | | | | | |
| Aldar Properties PJSC | | | 163,205 | | | | 191,951 | |
| TOTAL UNITED ARAB EMIRATES | | | | | | | 1,393,082 | |
| VIETNAM — 6.4% | | | | | | | | |
| Consumer Staples — 1.8% | | | | | | | | |
| Masan Group | | | 47,952 | | | | 164,986 | |
| Saigon Beer Alcohol Beverage | | | 50 | | | | 373 | |
| Vietnam Dairy Products JSC | | | 62,296 | | | | 196,790 | |
| | | | | | | | 362,149 | |
| Financials — 0.4% | | | | | | | | |
| Bank for Foreign Trade of Vietnam JSC | | | 13,706 | | | | 40,539 | |
|
|
|
| Schedule of Investments | | October 31, 2022 |
Global X MSCI Next Emerging & Frontier ETF
|
| | | | |
| |
| | | Shares | | | Value | |
| COMMON STOCK — continued | | | | | | |
| Financials — continued | | | | | | |
| Ho Chi Minh City Development Joint Stock | | | | | | |
| | | 10 | | | $ | 7 | |
| SSI Securities . | | | 31,350 | | | | 20,563 | |
| VNDirect Securities . | | | 27,500 | | | | 12,726 | |
| | | | | | | | 73,835 | |
| Industrials — 0.4% | | | | | | | | |
| Thaiholdings JSC * | | | 14,600 | | | | 22,620 | |
| Vietjet Aviation JSC * | | | 13,880 | | | | 60,100 | |
| | | | | | | | 82,720 | |
| Materials — 0.8% | | | | | | | | |
| Hoa Phat Group JSC | | | 242,321 | | | | 152,609 | |
| Real Estate — 3.0% | | | | | | | | |
| No Va Land Investment Group * | | | 57,246 | | | | 161,256 | |
| Vincom Retail JSC * | | | 78,590 | | | | 77,799 | |
| Vingroup JSC * | | | 81,329 | | | | 181,313 | |
| Vinhomes JSC | | | 92,757 | | | | 167,971 | |
| | | | | | | | 588,339 | |
| TOTAL VIETNAM | | | | | | | 1,259,652 | |
| TOTAL COMMON STOCK | | | | | | | | |
| (Cost $20,065,500) | | | | | | | 19,489,784 | |
| TOTAL INVESTMENTS — 99.9% | | | | | | | | |
| (Cost $20,065,500) | | | | | | $ | 19,489,784 | |
Percentages are based on Net Assets of $19,518,934.
* Non-income producing security.
‡ Real Estate Investment Trust
|
|
|
| Schedule of Investments | | October 31, 2022 |
Global X MSCI Next Emerging & Frontier ETF
|
The following is a summary of the level of inputs used as of October 31, 2022, in valuing the Fund's investments carried at value:
| | | | | | | | | | |
| |
| Investments in Securities | | Level 1 | | | Level 2 | | | Level 3 | | | Total | |
Common Stock
| | $ | 18,394,055 | | | $ | 1,095,729 | | | $ | — | | | $ | 19,489,784 | |
| Total Investments in | | | | | | | | | | | | | | | | |
| Securities | | $ | 18,394,055 | | | $ | 1,095,729 | | | $ | — | | | $ | 19,489,784 | |
Amounts designated as “—“ are $0 or have been rounded to $0.
See “Glossary” for abbreviations.
|
|
|
| Schedule of Investments | | October 31, 2022 |
Global X MSCI Norway ETF
|
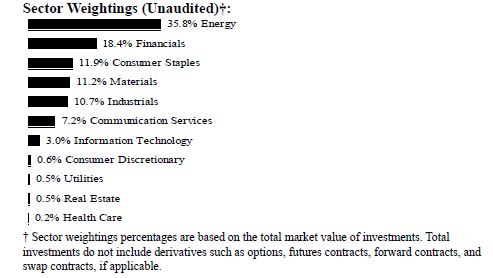
| | | | |
| |
| | | Shares | | | Value | |
| COMMON STOCK — 99.8% | | | | | | |
| BRAZIL — 4.5% | | | | | | |
| Materials — 4.5% | | | | | | |
| Yara International | | | 100,749 | | | $ | 4,496,317 | |
| FAROE ISLANDS — 1.6% | | | | | | | | |
| Consumer Staples — 1.6% | | | | | | | | |
| Bakkafrost P/F | | | 31,686 | | | | 1,583,256 | |
| FRANCE — 1.3% | | | | | | | | |
| Communication Services — 1.3% | | | | | | | | |
| Adevinta, Cl B * | | | 181,246 | | | | 1,241,214 | |
| GABON — 0.2% | | | | | | | | |
| Energy — 0.2% | | | | | | | | |
| BW Energy * | | | 57,323 | | | | 145,005 | |
| NETHERLANDS — 0.1% | | | | | | | | |
| Industrials — 0.1% | | | | | | | | |
| Meltwater * | | | 84,916 | | | | 104,544 | |
|
|
|
| Schedule of Investments | | October 31, 2022 |
Global X MSCI Norway ETF
|
| | | | |
| |
| | | Shares | | | Value | |
| COMMON STOCK — continued | | | | | | |
| NORWAY — 88.6% | | | | | | |
| Communication Services — 5.9% | | | | | | |
| Kahoot! * | | | 165,417 | | | $ | 352,731 | |
| Schibsted, Cl A . | | | 46,083 | | | | 709,627 | |
| Schibsted, Cl B . | | | 61,360 | | | | 910,646 | |
| Telenor | | | 427,694 | | | | 3,887,436 | |
| | | | | | | | 5,860,440 | |
| Consumer Discretionary — 0.6% | | | | | | | | |
| Europris . | | | 100,094 | | | | 595,932 | |
| Consumer Staples — 10.3% | | | | | | | | |
| Austevoll Seafood | | | 57,749 | | | | 427,139 | |
| Grieg Seafood | | | 32,209 | | | | 223,053 | |
| Leroy Seafood Group . | | | 187,748 | | | | 863,180 | |
| Mowi . | | | 275,465 | | | | 4,108,057 | |
| Norway Royal Salmon * | | | 7,673 | | | | 97,417 | |
| Orkla | | | 473,379 | | | | 3,194,455 | |
| Salmar | | | 36,970 | | | | 1,252,383 | |
| | | | | | | | 10,165,684 | |
| Energy — 32.9% | | | | | | | | |
| Aker BP . | | | 199,173 | | | | 6,348,647 | |
| Aker Solutions | | | 155,306 | | | | 594,524 | |
| BW Offshore . | | | 55,649 | | | | 141,734 | |
| DNO . | | | 276,710 | | | | 360,897 | |
| Equinor . | | | 614,592 | | | | 22,483,739 | |
| FLEX LNG . | | | 18,760 | | | | 582,819 | |
| Frontline | | | 75,639 | | | | 945,046 | |
| Odfjell Drilling * | | | 58,741 | | | | 153,677 | |
| TGS . | | | 73,936 | | | | 1,009,817 | |
| | | | | | | | 32,620,900 | |
| Financials — 18.4% | | | | | | | | |
| DNB Bank | | | 584,775 | | | | 10,349,154 | |
| Gjensidige Forsikring | | | 126,052 | | | | 2,302,358 | |
| Protector Forsikring . | | | 38,153 | | | | 454,305 | |
| Sparebank 1 Nord Norge . | | | 60,283 | | | | 500,385 | |
| Sparebank 1 Oestlandet . | | | 26,001 | | | | 281,096 | |
| SpareBank 1 SMN . | | | 81,830 | | | | 883,087 | |
| SpareBank 1 SR-Bank | | | 112,837 | | | | 1,148,247 | |
|
|
|
| Schedule of Investments | | October 31, 2022 |
Global X MSCI Norway ETF
|
| | | | |
| |
| | | Shares | | | Value | |
| COMMON STOCK — continued | | | | | | |
| Financials — continued | | | | | | |
| Storebrand | | | 295,971 | | | $ | 2,300,164 | |
| | | | | | | | 18,218,796 | |
| Health Care — 0.2% | | | | | | | | |
| Nykode Therapeutics * | | | 82,981 | | | | 199,055 | |
| Industrials — 10.5% | | | | | | | | |
| Aker ASA, Cl A . | | | 16,399 | | | | 1,155,376 | |
| Aker Carbon Capture * | | | 205,054 | | | | 230,361 | |
| Aker Horizons Holding * | | | 146,193 | | | | 183,570 | |
| Bonheur . | | | 13,186 | | | | 374,774 | |
| Golden Ocean Group | | | 82,110 | | | | 674,454 | |
| Hexagon Composites * | | | 73,911 | | | | 169,905 | |
| Hexagon Purus Holding * | | | 48,312 | | | | 93,679 | |
| Kongsberg Gruppen . | | | 56,356 | | | | 2,019,674 | |
| MPC Container Ships | | | 167,806 | | | | 264,697 | |
| NEL * | | | 920,571 | | | | 1,124,942 | |
| Norwegian Air Shuttle * | | | 401,516 | | | | 321,387 | |
| Stolt-Nielsen | | | 16,417 | | | | 393,970 | |
| TOMRA Systems | | | 149,268 | | | | 2,412,270 | |
| Veidekke . | | | 68,297 | | | | 568,219 | |
| Wallenius Wilhelmsen, Cl B . | | | 66,620 | | | | 473,850 | |
| | | | | | | | 10,461,128 | |
| Information Technology — 2.7% | | | | | | | | |
| Atea . | | | 53,131 | | | | 590,750 | |
| Crayon Group Holding * | | | 43,866 | | | | 363,481 | |
| LINK Mobility Group Holding * | | | 111,878 | | | | 87,054 | |
| Nordic Semiconductor * | | | 109,350 | | | | 1,545,037 | |
| Volue * | | | 31,862 | | | | 82,744 | |
| | | | | | | | 2,669,066 | |
| Materials — 6.6% | | | | | | | | |
| BEWi * | | | 29,722 | | | | 140,365 | |
| Borregaard | | | 59,872 | | | | 805,062 | |
| Elkem . | | | 199,946 | | | | 665,022 | |
| Elopak | | | 77,209 | | | | 174,144 | |
| Norsk Hydro | | | 752,995 | | | | 4,778,621 | |
| | | | | | | | 6,563,214 | |
|
|
|
| Schedule of Investments | | October 31, 2022 |
Global X MSCI Norway ETF
|
| | | | |
| |
| | | Shares | | | Value | |
| COMMON STOCK — continued | | | | | | |
| Real Estate — 0.5% | | | | | | |
| Entra . | | | 40,178 | | | $ | 365,383 | |
| Selvaag Bolig . | | | 28,439 | | | | 92,044 | |
| | | | | | | | 457,427 | |
| TOTAL NORWAY | | | | | | | 87,811,642 | |
| SINGAPORE — 0.8% | | | | | | | | |
| Energy — 0.8% | | | | | | | | |
| BW LPG . | | | 52,426 | | | | 424,073 | |
| Hafnia . | | | 72,851 | | | | 375,577 | |
| TOTAL SINGAPORE | | | | | | | 799,650 | |
| SOUTH AFRICA — 0.5% | | | | | | | | |
| Utilities — 0.5% | | | | | | | | |
| Scatec . | | | 75,097 | | | | 531,617 | |
| UNITED ARAB EMIRATES — 0.4% | | | | | | | | |
| Energy — 0.4% | | | | | | | | |
| Borr Drilling * | | | 83,903 | | | | 409,151 | |
| UNITED KINGDOM — 1.5% | | | | | | | | |
| Energy — 1.5% | | | | | | | | |
| Subsea 7 | | | 150,166 | | | | 1,502,115 | |
| UNITED STATES — 0.3% | | | | | | | | |
| Information Technology — 0.3% | | | | | | | | |
| REC Silicon * | | | 171,725 | | | | 330,010 | |
| TOTAL COMMON STOCK | | | | | | | | |
| (Cost $124,718,261) | | | | | | | 98,954,521 | |
| TOTAL INVESTMENTS — 99.8% | | | | | | | | |
| (Cost $124,718,261) | | | | | | $ | 98,954,521 | |
Percentages are based on Net Assets of $99,105,212.
* Non-income producing security.
|
|
|
| Schedule of Investments | | October 31, 2022 |
Global X MSCI Norway ETF
|
As of October 31, 2022, all of the Fund's investments were considered Level 1, in accordance with authoritative guidance on fair value measurements and disclosure under U.S. GAAP.
See "Glossary" for abbreviations.
|
|
|
| Schedule of Investments | | October 31, 2022 |
Global X FTSE Southeast Asia ETF
|
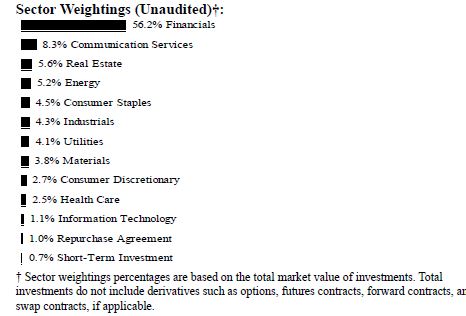
| | | | |
| |
| | | Shares | | | Value | |
| COMMON STOCK — 99.9% | | | | | | |
| CHINA — 1.5% | | | | | | |
| Consumer Staples — 1.5% | | | | | | |
| Wilmar International . | | | 210,682 | | | $ | 577,660 | |
| INDONESIA — 24.2% | | | | | | | | |
| Communication Services — 3.4% | | | | | | | | |
| Telkom Indonesia Persero | | | 4,651,742 | | | | 1,309,258 | |
| Consumer Discretionary — 2.3% | | | | | | | | |
| Astra International . | | | 2,025,512 | | | | 863,578 | |
| Consumer Staples — 0.6% | | | | | | | | |
| Hanjaya Mandala Sampoerna | | | 859,924 | | | | 55,408 | |
| Unilever Indonesia . | | | 569,437 | | | | 169,398 | |
| | | | | | | | 224,806 | |
| Financials — 17.9% | | | | | | | | |
| Bank Central Asia . | | | 5,559,596 | | | | 3,136,685 | |
| Bank Mandiri | | | 1,853,281 | | | | 1,253,541 | |
|
|
|
| Schedule of Investments | | October 31, 2022 |
Global X FTSE Southeast Asia ETF
|
| | | | |
| |
| | | Shares | | | Value | |
| COMMON STOCK — continued | | | | | | |
| Financials — continued | | | | | | |
| Bank Negara Indonesia Persero | | | 744,241 | | | $ | 448,525 | |
| Bank Rakyat Indonesia Persero | | | 6,516,898 | | | | 1,942,848 | |
| | | | | | | | 6,781,599 | |
| TOTAL INDONESIA | | | | | | | 9,179,241 | |
| MALAYSIA — 13.5% | | | | | | | | |
| Financials — 9.0% | | | | | | | | |
| CIMB Group Holdings | | | 665,954 | | | | 777,510 | |
| Malayan Banking | | | 711,779 | | | | 1,293,185 | |
| Public Bank . | | | 1,417,504 | | | | 1,340,153 | |
| | | | | | | | 3,410,848 | |
| Health Care — 0.7% | | | | | | | | |
| IHH Healthcare | | | 208,852 | | | | 262,832 | |
| Materials — 2.3% | | | | | | | | |
| Petronas Chemicals Group | | | 283,233 | | | | 522,376 | |
| Press Metal Aluminium Holdings | | | 350,729 | | | | 322,688 | |
| | | | | | | | 845,064 | |
| Utilities — 1.5% | | | | | | | | |
| Tenaga Nasional | | | 322,613 | | | | 574,535 | |
| TOTAL MALAYSIA | | | | | | | 5,093,279 | |
| PHILIPPINES — 4.5% | | | | | | | | |
| Financials — 1.1% | | | | | | | | |
| BDO Unibank | | | 196,611 | | | | 431,900 | |
| Industrials — 0.9% | | | | | | | | |
| Ayala | | | 27,889 | | | | 321,000 | |
| Real Estate — 2.5% | | | | | | | | |
| Ayala Land . | | | 799,327 | | | | 351,731 | |
| SM Prime Holdings | | | 1,058,424 | | | | 575,330 | |
| | | | | | | | 927,061 | |
| Utilities — 0.0% | | | | | | | | |
| ACEN . | | | 105,477 | | | | 11,376 | |
| TOTAL PHILIPPINES | | | | | | | 1,691,337 | |
|
|
|
| Schedule of Investments | | October 31, 2022 |
Global X FTSE Southeast Asia ETF
|
| | | | |
| |
| | | Shares | | | Value | |
| COMMON STOCK — continued | | | | | | |
| SINGAPORE — 34.3% | | | | | | |
| Communication Services — 3.5% | | | | | | |
| Singapore Telecommunications | | | 754,470 | | | $ | 1,332,892 | |
| Financials — 26.3% | | | | | | | | |
| DBS Group Holdings . | | | 181,619 | | | | 4,389,350 | |
| Oversea-Chinese Banking | | | 352,881 | | | | 3,024,837 | |
| United Overseas Bank . | | | 129,265 | | | | 2,535,790 | |
| | | | | | | | 9,949,977 | |
| Industrials — 1.3% | | | | | | | | |
| Singapore Airlines * | | | 128,005 | | | | 475,801 | |
| Real Estate — 3.2% | | | | | | | | |
| Capitaland Integrated Commercial Trust ‡ | | | 507,858 | | | | 674,704 | |
| Capitaland Investment | | | 255,526 | | | | 543,519 | |
| | | | | | | | 1,218,223 | |
| TOTAL SINGAPORE | | | | | | | 12,976,893 | |
| THAILAND — 21.9% | | | | | | | | |
| Communication Services — 1.5% | | | | | | | | |
| Advanced Info Service NVDR | | | 112,000 | | | | 562,060 | |
| Consumer Discretionary — 0.5% | | | | | | | | |
| PTT Oil & Retail Business | | | 280,908 | | | | 177,874 | |
| Consumer Staples — 2.5% | | | | | | | | |
| CP ALL NVDR | | | 596,390 | | | | 940,184 | |
| Energy — 5.3% | | | | | | | | |
| PTT NVDR . | | | 1,427,031 | | | | 1,349,793 | |
| PTT Exploration & Production NVDR . | | | 138,215 | | | | 659,118 | |
| | | | | | | | 2,008,911 | |
| Financials — 2.8% | | | | | | | | |
| Kasikornbank NVDR (A) | | | 152,099 | | | | 583,459 | |
| SCB X NVDR . | | | 168,628 | | | | 469,642 | |
| | | | | | | | 1,053,101 | |
|
|
|
| Schedule of Investments | | October 31, 2022 |
Global X FTSE Southeast Asia ETF
|
| | | | |
| |
| | | Shares | | | Value | |
| COMMON STOCK — continued | | | | | | |
| Health Care — 1.8% | | | | | | |
| Bangkok Dusit Medical Services NVDR . | | | 892,461 | | | $ | 691,739 | |
| Industrials — 2.2% | | | | | | | | |
| Airports of Thailand NVDR * | | | 429,811 | | | | 835,681 | |
| Information Technology — 1.1% | | | | | | | | |
| Delta Electronics Thailand NVDR (A) | | | 27,691 | | | | 421,986 | |
| Materials — 1.6% | | | | | | | | |
| Siam Cement NVDR | | | 72,307 | | | | 615,540 | |
| Utilities — 2.6% | | | | | | | | |
| Energy Absolute | | | 167,080 | | | | 423,626 | |
| Gulf Energy Development NVDR | | | 422,139 | | | | 560,116 | |
| | | | | | | | 983,742 | |
| TOTAL THAILAND | | | | | | | 8,290,818 | |
| TOTAL COMMON STOCK | | | | | | | | |
| (Cost $39,837,422) | | | | | | | 37,809,228 | |
| SHORT-TERM INVESTMENT(B)(C) — 0.8% | | | | | | | | |
| Fidelity Investments Money Market | | | | | | | | |
| Government Portfolio, Cl Institutional, | | | | | | | | |
2.910%
| | | | | | | | |
| (Cost $284,390) | | | 284,390 | | | | 284,390 | |
| | | Face Amount | | | | | |
| REPURCHASE AGREEMENT(B) — 1.0% | | | | | | | | |
| BNP Paribas | | | | | | | | |
| 2.930%, dated 10/31/2022, to be repurchased | | | | | | | | |
| on 11/01/2022, repurchase price $395,166 | | | | | | | | |
| (collateralized by U.S. Treasury Obligations, | | | | | | | | |
| ranging in par value $7,854 - $46,173, | | | | | | | | |
| 2.500% - 2.750%, 03/31/2027 - 05/31/2029, | | | | | | | | |
| with a total market value of $402,558) | | | | | | | | |
| (Cost $395,134) | | $ | 395,134 | | | | 395,134 | |
| TOTAL INVESTMENTS — 101.7% | | | | | | | | |
| (Cost $40,516,946) | | | | | | $ | 38,488,752 | |
Percentages are based on Net Assets of $37,860,754.
|
|
|
| Schedule of Investments | | October 31, 2022 |
| Global X FTSE Southeast Asia ETF |
* Non-income producing security.
‡ Real Estate Investment Trust
(A) This security or a partial position of this security is on loan at October 31, 2022.
(B) Security was purchased with cash collateral held from securities on loan.
(C) The rate reported on the Schedule of Investments is the 7-day effective yield as of October 31, 2022.
The following is a summary of the level of inputs used as of October 31, 2022, in valuing the Fund's investments carried at value:
| Investments in Securities | | Level 1 | | | Level 2
| | | | Level 3 | | | Total
| |
Common Stock
| | $ | 36,117,891 | | | $ | 1,691,337
| | | $ | — | | | $ | 37,809,228
| |
| Short-Term Investment | | | 284,390 | | | | —
| | | | | — | | | | 284,390
| |
Repurchase Agreement
| | | —
| | | | 395,134
| | | | | — | | | | 395,134
| |
Total Investments in Securities
| | $ | 36,402,281
| | | $ | 2,086,471 | | | $ | | —
| | | $
| 38,488,752 | |
Amounts designated as “—“ are $0 or have been rounded to $0.
See “Glossary” for abbreviations.
|
| October 31, 2022 |
Glossary: (abbreviations which may be used in the preceding Schedules of Investments)
|
Portfolio Abbreviations
ADR — American Depositary Receipt
Cl — Class
GDR — Global Depositary Receipt
JSC — Joint-Stock Company
NVDR — Non-Voting Depositary Receipt
PJSC — Public Joint-Stock Company
SDR — Swedish Depositary Receipt
Statements of Assets and Liabilities
October 31, 2022
| | | Global X MSCI China Energy ETF | | | Global X MSCI China Materials ETF | | | Global X MSCI China Industrials ETF | | | Global X MSCI China Consumer Discretionary ETF | |
| Assets: | | | | | | | | | | | | |
| Cost of Investments | | $ | 9,894,917 | | | $ | 4,385,546 | | | $ | 6,993,839 | | | $ | 498,595,449 | |
| Cost of Repurchase Agreement | | | — | | | | — | | | | — | | | | 1,171,822 | |
| Cost of Foreign Currency | | | 48,925 | | | | 2,050 | | | | 73 | | | | 18,824 | |
| Investments, at Value | | $ | 9,121,038 | | | $ | 2,919,228 | | | $ | 4,908,265 | | | $ | 214,730,065 | * |
| Repurchase Agreement, at Value | | | — | | | | — | | | | — | | | | 1,171,822 | |
| Cash | | | — | | | | 215 | | | | 540 | | | | 167,853 | |
| Foreign Currency, at Value | | | 48,922 | | | | 2,050 | | | | 72 | | | | 18,824 | |
| Unrealized Appreciation on Spot Contracts | | | 1 | | | | — | | | | — | | | | 5 | |
| Receivable for Investment Securities Sold | | | — | | | | — | | | | — | | | | 270,632 | |
| Dividend, Interest, and Securities Lending Income Receivable | | | — | | | | — | | | | 11,424 | | | | 12,652 | |
| Total Assets | | | 9,169,961 | | | | 2,921,493 | | | | 4,920,301 | | | | 216,371,853 | |
| Liabilities: | | | | | | | | | | | | | | | | |
| Obligation to Return Securities Lending Collateral | | | — | | | | — | | | | — | | | | 2,015,220 | |
| Payable due to Investment Adviser | | | 5,407 | | | | 1,769 | | | | 2,926 | | | | 141,082 | |
| Cash Overdraft | | | 24,968 | | | | — | | | | — | | | | — | |
| Custodian Fees Payable | | | 19 | | | | 8 | | | | 152 | | | | — | |
| Total Liabilities | | | 30,394 | | | | 1,777 | | | | 3,078 | | | | 2,156,302 | |
| Net Assets | | $ | 9,139,567 | | | $ | 2,919,716 | | | $ | 4,917,223 | | | $ | 214,215,551 | |
| Net Assets Consist of: | | | | | | | | | | | | | | | | |
| Paid-in Capital | | $ | 10,950,251 | | | $ | 7,256,883 | | | $ | 12,241,682 | | | $ | 646,267,350 | |
| Total Distributable Loss | | | (1,810,684 | ) | | | (4,337,167 | ) | | | (7,324,459 | ) | | | (432,051,799 | ) |
| Net Assets | | $ | 9,139,567 | | | $ | 2,919,716 | | | $ | 4,917,223 | | | $ | 214,215,551 | |
| Outstanding Shares of Beneficial Interest | | | | | | | | | | | | | | | | |
| (unlimited authorization — no par value) | | | 670,000 | | | | 199,971 | | | | 450,000 | | | | 14,720,000 | |
| Net Asset Value, Offering and Redemption Price Per Share | | $ | 13.64 | | | $ | 14.60 | | | $ | 10.93 | | | $ | 14.55 | |
*Includes Market Value of Securities on Loan | | $ | — | | | $ | — | | | $ | — | | | $ | 1,904,028 | |
Statements of Assets and Liabilities
October 31, 2022
| | | Global X MSCI China Consumer Staples ETF | | | Global X MSCI China Health Care ETF | | | Global X MSCI China Financials ETF | | | Global X MSCI China Information Technology ETF | |
| Assets: | | | | | | | | | | | | |
| Cost of Investments | | $ | 12,058,652 | | | $ | 13,864,931 | | | $ | 48,811,323 | | | $ | 23,551,330 | |
| Cost of Foreign Currency | | | 6,273 | | | | — | | | | 1,821 | | | | — | |
| Investments, at Value | | $ | 8,597,098 | | | $ | 8,068,866 | | | $ | 27,522,702 | | | $ | 13,920,163 | |
| Cash | | | 21,028 | | | | 9,435 | | | | 59,354 | | | | 5,474 | |
| Foreign Currency, at Value | | | 6,260 | | | | — | | | | 1,803 | | | | — | |
| Dividend, Interest, and Securities Lending Income Receivable | | | 1,239 | | | | 2,436 | | | | — | | | | 1,586 | |
| Prepaid Expenses | | | — | | | | — | | | | — | | | | 16 | |
| Total Assets | | | 8,625,625 | | | | 8,080,737 | | | | 27,583,859 | | | | 13,927,239 | |
| Liabilities: | | | | | | | | | | | | | | | | |
| Payable due to Investment Adviser | | | 6,923 | | | | 4,541 | | | | 16,601 | | | | 7,628 | |
| Unrealized Depreciation on Spot Contracts | | | — | | | | — | | | | 1 | | | | — | |
| Custodian Fees Payable | | | 82 | | | | 27 | | | | 74 | | | | — | |
| Due to Broker | | | — | | | | 732 | | | | — | | | | — | |
| Total Liabilities | | | 7,005 | | | | 5,300 | | | | 16,676 | | | | 7,628 | |
| Net Assets | | $ | 8,618,620 | | | $ | 8,075,437 | | | $ | 27,567,183 | | | $ | 13,919,611 | |
| Net Assets Consist of: | | | | | | | | | | | | | | | | |
| Paid-in Capital | | $ | 12,570,895 | | | $ | 17,145,071 | | | $ | 60,846,576 | | | $ | 28,407,159 | |
| Total Distributable Loss | | | (3,952,275 | ) | | | (9,069,634 | ) | | | (33,279,393 | ) | | | (14,487,548 | ) |
| Net Assets | | $ | 8,618,620 | | | $ | 8,075,437 | | | $ | 27,567,183 | | | $ | 13,919,611 | |
| Outstanding Shares of Beneficial Interest | | | | | | | | | | | | | | | | |
| (unlimited authorization — no par value) | | | 500,002 | | | | 600,002 | | | | 2,820,000 | | | | 940,002 | |
| Net Asset Value, Offering and Redemption Price Per Share | | $ | 17.24 | | | $ | 13.46 | | | $ | 9.78 | | | $ | 14.81 | |
Statements of Assets and Liabilities
October 31, 2022
| | | Global X MSCI China Communication Services ETF | | | Global X MSCI China Utilities ETF | | | Global X MSCI China Real Estate ETF‡ | | | Global X MSCI Greece ETF | |
| Assets: | | | | | | | | | | | | |
| Cost of Investments | | $ | 10,145,828 | | | $ | 3,419,556 | | | $ | 9,291,291 | | | $ | 131,521,438 | |
| Cost of Repurchase Agreement | | | 57,855 | | | | — | | | | — | | | | — | |
| Cost of Foreign Currency | | | — | | | | — | | | | 4,010 | | | | (1,455 | ) |
| Investments, at Value | | $ | 4,954,924 | * | | $ | 2,514,019 | | | $ | 4,613,174 | | | $ | 106,893,601 | |
| Repurchase Agreement, at Value | | | 57,855 | | | | — | | | | — | | | | — | |
| Cash | | | 11,731 | | | | — | | | | — | | | | — | |
| Foreign Currency, at Value | | | — | | | | — | | | | 4,007 | | | | — | |
| Dividend, Interest, and Securities Lending Income Receivable | | | 51 | | | | 1,871 | | | | 18,503 | | | | 301,253 | |
| Unrealized Appreciation on Spot Contracts | | | — | | | | — | | | | — | | | | 16 | |
| Receivable for Investment Securities Sold | | | — | | | | — | | | | — | | | | 40,084 | |
| Prepaid Expenses | | | — | | | | — | | | | 294 | | | | — | |
| Due from Broker | | | — | | | | — | | | | — | | | | 1,614 | |
| Total Assets | | | 5,024,561 | | | | 2,515,890 | | | | 4,635,978 | | | | 107,236,568 | |
| Liabilities: | | | | | | | | | | | | | | | | |
| Obligation to Return Securities Lending Collateral | | | 99,495 | | | | — | | | | — | | | | — | |
| Payable due to Investment Adviser | | | 3,150 | | | | 1,500 | | | | 3,069 | | | | 47,146 | |
| Overdraft of Foreign Currency | | | — | | | | — | | | | — | | | | 1,822 | |
| Cash Overdraft | | | — | | | | 146,565 | | | | 413,640 | | | | 61,069 | |
| Due to Custodian | | | — | | | | — | | | | — | | | | 33,933 | |
| Custodian Fees Payable | | | — | | | | 48 | | | | — | | | | 12,535 | |
| Due to Broker | | | — | | | | — | | | | — | | | | 1,844 | |
| Total Liabilities | | | 102,645 | | | | 148,113 | | | | 416,709 | | | | 158,349 | |
| Net Assets | | $ | 4,921,916 | | | $ | 2,367,777 | | | $ | 4,219,269 | | | $ | 107,078,219 | |
| Net Assets Consist of: | | | | | | | | | | | | | | | | |
| Paid-in Capital | | $ | 19,720,548 | | | $ | 3,224,966 | | | $ | 12,010,227 | | | $ | 369,092,453 | |
| Total Distributable Loss | | | (14,798,632 | ) | | | (857,189 | ) | | | (7,790,958 | ) | | | (262,014,234 | ) |
| Net Assets | | $ | 4,921,916 | | | $ | 2,367,777 | | | $ | 4,219,269 | | | $ | 107,078,219 | |
| Outstanding Shares of Beneficial Interest | | | | | | | | | | | | | | | | |
| (unlimited authorization — no par value) | | | 510,000 | | | | 200,002 | | | | 290,001 | | | | 4,435,644 | |
| Net Asset Value, Offering and Redemption Price Per Share | | $ | 9.65 | | | $ | 11.84 | | | $ | 14.55 | | | $ | 24.14 | |
*Includes Market Value of Securities on Loan | | $ | 94,485 | | | $ | — | | | $ | — | | | $ | — | |
| ‡ | The Outstanding Shares of Beneficial Interest and Net Asset Value, Offering and Redemption Price Per Share were updated to reflect the effect of a 1 for 3 reverse share split on December 19, 2022 (See Note 11 in the Notes to Financial Statements). |
Statements of Assets and Liabilities
October 31, 2022
| | | Global X DAX Germany ETF | | | Global X MSCI Portugal ETF | | | Global X MSCI Colombia ETF | | | Global X MSCI Argentina ETF | |
| Assets: | | | | | | | | | | | | |
| Cost of Investments | | $ | 45,603,924 | | | $ | 17,918,286 | | | $ | 34,665,781 | | | $ | 42,805,077 | |
| Cost of Repurchase Agreement | | | — | | | | 282,262 | | | | 247,111 | | | | 1,047,744 | |
| Cost of Foreign Currency | | | (6,110 | ) | | | 158 | | | | — | | | | 15,294 | |
| Investments, at Value | | $ | 39,307,262 | | | $ | 15,325,114 | * | | $ | 21,021,946 | * | | $ | 27,927,098 | * |
| Repurchase Agreement, at Value | | | — | | | | 282,262 | | | | 247,111 | | | | 1,047,744 | |
| Foreign Currency, at Value | | | — | | | | 160 | | | | — | | | | 15,157 | |
| Reclaim Receivable | | | 147,270 | | | | 203,552 | | | | — | | | | — | |
| Dividend, Interest, and Securities Lending Income Receivable | | | — | | | | 846 | | | | 103,328 | | | | 6,837 | |
| Total Assets | | | 39,454,532 | | | | 15,811,934 | | | | 21,372,385 | | | | 28,996,836 | |
| Liabilities: | | | | | | | | | | | | | | | | |
| Obligation to Return Securities Lending Collateral | | | — | | | | 485,415 | | | | 424,964 | | | | 1,801,840 | |
| Overdraft of Foreign Currency | | | 6,042 | | | | — | | | | — | | | | — | |
| Payable due to Investment Adviser | | | 5,982 | | | | 7,562 | | | | 10,978 | | | | 12,940 | |
| Cash Overdraft | | | 96,667 | | | | 171,166 | | | | 77,986 | | | | 251,744 | |
| Custodian Fees Payable | | | 923 | | | | 1,977 | | | | 1,104 | | | | — | |
| Due to Broker | | | 6,050 | | | | — | | | | — | | | | — | |
| Total Liabilities | | | 115,664 | | | | 666,120 | | | | 515,032 | | | | 2,066,524 | |
| Net Assets | | $ | 39,338,868 | | | $ | 15,145,814 | | | $ | 20,857,353 | | | $ | 26,930,312 | |
| Net Assets Consist of: | | | | | | | | | | | | | | | | |
| Paid-in Capital | | $ | 50,028,708 | | | $ | 37,057,066 | | | $ | 128,583,138 | | | $ | 72,551,363 | |
| Total Distributable Loss | | | (10,689,840 | ) | | | (21,911,252 | ) | | | (107,725,785 | ) | | | (45,621,051 | ) |
| Net Assets | | $ | 39,338,868 | | | $ | 15,145,814 | | | $ | 20,857,353 | | | $ | 26,930,312 | |
| Outstanding Shares of Beneficial Interest | | | | | | | | | | | | | | | | |
| (unlimited authorization — no par value) | | | 1,730,000 | | | | 1,620,000 | | | | 1,059,699 | | | | 864,975 | |
| Net Asset Value, Offering and Redemption Price Per Share | | $ | 22.74 | | | $ | 9.35 | | | $ | 19.68 | | | $ | 31.13 | |
*Includes Market Value of Securities on Loan | | $ | — | | | $ | 464,655 | | | $ | 398,970 | | | $ | 1,771,835 | |
Statements of Assets and Liabilities
October 31, 2022
| | | Global X MSCI Pakistan ETF | | | Global X MSCI Nigeria ETF | | | Global X MSCI Vietnam ETF | |
| Assets: | | | | | | | | | |
| Cost of Investments | | $ | 24,489,755 | | | $ | 47,517,270 | | | $ | 4,314,590 | |
| Cost of Foreign Currency | | | — | | | | 2,224,402 | | | | 3,588 | |
| Investments, at Value | | $ | 14,701,292 | | | $ | 41,773,937 | | | $ | 2,886,143 | |
| Foreign Currency, at Value | | | — | | | | 2,122,645 | | | | 3,583 | |
| Dividend, Interest, and Securities Lending Income Receivable | | | 411,447 | | | | 3,136 | | | | — | |
| Unrealized Appreciation on Spot Contracts | | | 323 | | | | — | | | | 2 | |
| Total Assets | | | 15,113,062 | | | | 43,899,718 | | | | 2,889,728 | |
| Liabilities: | | | | | | | | | | | | |
| Payable for Investment Securities Purchased | | | 63,571 | | | | — | | | | — | |
| Payable due to Investment Adviser | | | 8,405 | | | | 721,735 | | | | 1,590 | |
| Cash Overdraft | | | 680,350 | | | | 4,910,533 | | | | 100,869 | |
| Custodian Fees Payable | | | 13,336 | | | | 24,453 | | | | 70 | |
| Total Liabilities | | | 765,662 | | | | 5,656,721 | | | | 102,529 | |
| Net Assets | | $ | 14,347,400 | | | $ | 38,242,997 | | | $ | 2,787,199 | |
| Net Assets Consist of: | | | | | | | | | | | | |
| Paid-in Capital | | $ | 64,008,854 | | | $ | 71,665,504 | | | $ | 6,128,294 | |
| Total Distributable Loss | | | (49,661,454 | ) | | | (33,422,507 | ) | | | (3,341,095 | ) |
| Net Assets | | $ | 14,347,400 | | | $ | 38,242,997 | | | $ | 2,787,199 | |
| Outstanding Shares of Beneficial Interest | | | | | | | | | | | | |
| (unlimited authorization — no par value) | | | 872,293 | | | | 2,962,135 | | | | 190,000 | |
| Net Asset Value, Offering and Redemption Price Per Share | | $ | 16.45 | | | $ | 12.91 | | | $ | 14.67 | |
Statements of Assets and Liabilities
October 31, 2022
| | | Global X MSCI Next Emerging & Frontier ETF | | | Global X MSCI Norway ETF | | | Global X FTSE Southeast Asia ETF | |
| Assets: | | | | | | | | | |
| Cost of Investments | | $ | 20,065,500 | | | $ | 124,718,261 | | | $ | 40,121,812 | |
| Cost of Repurchase Agreement | | | — | | | | — | | | | 395,134 | |
| Cost of Foreign Currency | | | 70,693 | | | | — | | | | 27,046 | |
| Investments, at Value | | $ | 19,489,784 | | | $ | 98,954,521 | | | $ | 38,093,618 | * |
| Repurchase Agreement, at Value | | | — | | | | — | | | | 395,134 | |
| Cash | | | — | | | | — | | | | 63,215 | |
| Foreign Currency, at Value | | | 65,646 | | | | — | | | | 27,046 | |
| Dividend, Interest, and Securities Lending Income Receivable | | | 20,397 | | | | 86,964 | | | | 6,910 | |
| Reclaim Receivable | | | 3,665 | | | | 148,358 | | | | — | |
| Unrealized Appreciation on Spot Contracts | | | — | | | | — | | | | 74 | |
| Total Assets | | | 19,579,492 | | | | 99,189,843 | | | | 38,585,997 | |
| Liabilities: | | | | | | | | | | | | |
| Obligation to Return Securities Lending Collateral | | | — | | | | — | | | | 679,524 | |
| Payable due to Investment Adviser | | | 7,952 | | | | 40,077 | | | | 20,081 | |
| Unrealized Depreciation on Spot Contracts | | | 4 | | | | — | | | | — | |
| Payable for Investment Securities Purchased | | | — | | | | — | | | | 25,505 | |
| Cash Overdraft | | | 40,667 | | | | 43,942 | | | | — | |
| Custodian Fees Payable | | | 11,935 | | | | 612 | | | | 133 | |
| Total Liabilities | | | 60,558 | | | | 84,631 | | | | 725,243 | |
| Net Assets | | $ | 19,518,934 | | | $ | 99,105,212 | | | $ | 37,860,754 | |
| Net Assets Consist of: | | | | | | | | | | | | |
| Paid-in Capital | | $ | 45,247,034 | | | $ | 173,063,460 | | | $ | 49,251,718 | |
| Total Distributable Loss | | | (25,728,100 | ) | | | (73,958,248 | ) | | | (11,390,964 | ) |
| Net Assets | | $ | 19,518,934 | | | $ | 99,105,212 | | | $ | 37,860,754 | |
| Outstanding Shares of Beneficial Interest | | | | | | | | | | | | |
| (unlimited authorization — no par value) | | | 1,080,000 | | | | 4,056,111 | | | | 2,700,000 | |
| Net Asset Value, Offering and Redemption Price Per Share | | $ | 18.07 | | | $ | 24.43 | | | $ | 14.02 | |
*Includes Market Value of Securities on Loan | | $ | — | | | $ | — | | | $ | 643,778 | |
Statements of Operations
For the year ended October 31, 2022
| | | Global X MSCI China Energy ETF | | | Global X MSCI China Materials ETF | | | Global X MSCI China Industrials ETF | | | Global X MSCI China Consumer Discretionary ETF | |
| Investment Income: | | | | | | | | | | | | |
| Dividend Income | | $ | 403,472 | | | $ | 145,120 | | | $ | 230,139 | | | $ | 3,358,546 | |
| Interest Income | | | 231 | | | | 31 | | | | 159 | | | | 7,382 | |
| Security Lending Income | | | — | | | | — | | | | — | | | | 146,885 | |
| Less: Foreign Taxes Withheld | | | (38,490 | ) | | | (10,781 | ) | | | (10,284 | ) | | | (130,933 | ) |
| Total Investment Income | | | 365,213 | | | | 134,370 | | | | 220,014 | | | | 3,381,880 | |
Supervision and Administration Fees(1) | | | 43,997 | | | | 36,539 | | | | 75,330 | | | | 2,448,391 | |
Custodian Fees(2) | | | 864 | | | | 206 | | | | 397 | | | | 949 | |
| Total Expenses | | | 44,861 | | | | 36,745 | | | | 75,727 | | | | 2,449,340 | |
| Net Investment Income | | | 320,352 | | | | 97,625 | | | | 144,287 | | | | 932,540 | |
| Net Realized Gain (Loss) on: | | | | | | | | | | | | | | | | |
Investments(3) | | | 1,383,476 | | | | (213,037 | ) | | | (3,253,368 | ) | | | (67,214,838 | ) |
| Foreign Currency Transactions | | | (2,293 | ) | | | (1,943 | ) | | | (14,264 | ) | | | 576 | |
| Net Realized Gain (Loss) | | | 1,381,183 | | | | (214,980 | ) | | | (3,267,632 | ) | | | (67,214,262 | ) |
| Net Change in Unrealized Appreciation (Depreciation) on: | | | | | | | | | | | | | | | | |
| Investments | | | (1,326,525 | ) | | | (2,138,143 | ) | | | (2,360,372 | ) | | | (207,659,019 | ) |
| Foreign Currency Translations | | | 146 | | | | (29 | ) | | | (4 | ) | | | (116 | ) |
| Net Change in Unrealized Appreciation (Depreciation) | | | (1,326,379 | ) | | | (2,138,172 | ) | | | (2,360,376 | ) | | | (207,659,135 | ) |
| Net Realized and Unrealized Gain (Loss) | | | 54,804 | | | | (2,353,152 | ) | | | (5,628,008 | ) | | | (274,873,397 | ) |
| Net Increase (Decrease) in Net Assets Resulting from Operations | | $ | 375,156 | | | $ | (2,255,527 | ) | | $ | (5,483,721 | ) | | $ | (273,940,857 | ) |
| (1) | The Supervision and Administration fees reflect the supervisory and administrative fee, which includes fees paid by the Funds for the investment advisory services provided by the Adviser. (See Note 3 in Notes to Financial Statements.) |
| (2) | See Note 2 in the Notes to Financial Statements. |
| (3) | Includes realized gains (losses) as a result of in-kind redemptions. (See Note 4 in Notes to Financial Statements.) |
Statements of Operations
For the year ended October 31, 2022
| | | Global X MSCI China Consumer Staples ETF | | | Global X MSCI China Health Care ETF | | | Global X MSCI China Financials ETF | | | Global X MSCI China Information Technology ETF | |
| Investment Income: | | | | | | | | | | | | |
| Dividend Income | | $ | 374,649 | | | $ | 128,057 | | | $ | 2,377,605 | | | $ | 263,943 | |
| Interest Income | | | — | | | | — | | | | 454 | | | | — | |
| Security Lending Income | | | — | | | | — | | | | — | | | | 2,977 | |
| Less: Foreign Taxes Withheld | | | (16,601 | ) | | | (7,325 | ) | | | (224,258 | ) | | | (8,277 | ) |
| Total Investment Income | | | 358,048 | | | | 120,732 | | | | 2,153,801 | | | | 258,643 | |
Supervision and Administration Fees(1) | | | 98,056 | | | | 76,875 | | | | 400,660 | | | | 145,532 | |
Custodian Fees(2) | | | 172 | | | | 58 | | | | 4,086 | | | | 119 | |
| Total Expenses | | | 98,228 | | | | 76,933 | | | | 404,746 | | | | 145,651 | |
| Net Investment Income | | | 259,820 | | | | 43,799 | | | | 1,749,055 | | | | 112,992 | |
| Net Realized Gain (Loss) on: | | | | | | | | | | | | | | | | |
Investments(3) | | | (641,357 | ) | | | (2,773,473 | ) | | | (12,940,280 | ) | | | (3,909,232 | ) |
| Foreign Currency Transactions | | | (3,571 | ) | | | (232 | ) | | | (11,283 | ) | | | 154 | |
| Net Realized Gain (Loss) | | | (644,928 | ) | | | (2,773,705 | ) | | | (12,951,563 | ) | | | (3,909,078 | ) |
| Net Change in Unrealized Appreciation (Depreciation) on: | | | | | | | | | | | | | | | | |
| Investments | | | (5,093,366 | ) | | | (4,712,814 | ) | | | (11,700,389 | ) | | | (11,042,399 | ) |
| Foreign Currency Translations | | | (14 | ) | | | (2 | ) | | | (18 | ) | | | — | |
| Net Change in Unrealized Appreciation (Depreciation) | | | (5,093,380 | ) | | | (4,712,816 | ) | | | (11,700,407 | ) | | | (11,042,399 | ) |
| Net Realized and Unrealized Gain (Loss) | | | (5,738,308 | ) | | | (7,486,521 | ) | | | (24,651,970 | ) | | | (14,951,477 | ) |
| Net Decrease in Net Assets Resulting from Operations | | $ | (5,478,488 | ) | | $ | (7,442,722 | ) | | $ | (22,902,915 | ) | | $ | (14,838,485 | ) |
| (1) | The Supervision and Administration fees reflect the supervisory and administrative fee, which includes fees paid by the Funds for the investment advisory services provided by the Adviser. (See Note 3 in Notes to Financial Statements.) |
| (2) | See Note 2 in the Notes to Financial Statements. |
| (3) | Includes realized gains (losses) as a result of in-kind redemptions. (See Note 4 in Notes to Financial Statements.) |
Statements of Operations
For the year ended October 31, 2022
| | | Global X MSCI China Communication Services ETF | | | Global X MSCI China Utilities ETF | | | Global X MSCI China Real Estate ETF | | | Global X MSCI Greece ETF | |
| Investment Income: | | | | | | | | | | | | |
| Dividend Income | | $ | 172,369 | | | $ | 70,097 | | | $ | 329,045 | | | $ | 4,255,227 | |
| Interest Income | | | 77 | | | | 27 | | | | 298 | | | | 1,002 | |
| Security Lending Income | | | 700 | | | | — | | | | — | | | | 3,323 | |
| Less: Foreign Taxes Withheld | | | (8,262 | ) | | | (3,065 | ) | | | (11,234 | ) | | | (161,973 | ) |
| Total Investment Income | | | 164,884 | | | | 67,059 | | | | 318,109 | | | | 4,097,579 | |
Supervision and Administration Fees(1) | | | 59,401 | | | | 13,308 | | | | 46,218 | | | | 663,875 | |
Custodian Fees(2) | | | 56 | | | | 147 | | | | 885 | | | | 20,267 | |
| Total Expenses | | | 59,457 | | | | 13,455 | | | | 47,103 | | | | 684,142 | |
| Net Investment Income | | | 105,427 | | | | 53,604 | | | | 271,006 | | | | 3,413,437 | |
| Net Realized Gain (Loss) on: | | | | | | | | | | | | | | | | |
Investments(3) | | | (1,971,283 | ) | | | 66,391 | | | | (3,013,888 | ) | | | 4,378,476 | |
| Foreign Currency Transactions | | | (470 | ) | | | 770 | | | | (474 | ) | | | (31,698 | ) |
| Net Realized Gain (Loss) | | | (1,971,753 | ) | | | 67,161 | | | | (3,014,362 | ) | | | 4,346,778 | |
| Net Change in Unrealized Appreciation (Depreciation) on: | | | | | | | | | | | | | | | | |
| Investments | | | (3,936,947 | ) | | | (1,309,979 | ) | | | (2,950,499 | ) | | | (24,625,079 | ) |
| Foreign Currency Translations | | | — | | | | (1 | ) | | | (7 | ) | | | 3,346 | |
| Net Change in Unrealized Appreciation (Depreciation) | | | (3,936,947 | ) | | | (1,309,980 | ) | | | (2,950,506 | ) | | | (24,621,733 | ) |
| Net Realized and Unrealized Gain (Loss) | | | (5,908,700 | ) | | | (1,242,819 | ) | | | (5,964,868 | ) | | | (20,274,955 | ) |
| Net Decrease in Net Assets Resulting from Operations | | $ | (5,803,273 | ) | | $ | (1,189,215 | ) | | $ | (5,693,862 | ) | | $ | (16,861,518 | ) |
| (1) | The Supervision and Administration fees reflect the supervisory and administrative fee, which includes fees paid by the Funds for the investment advisory services provided by the Adviser. (See Note 3 in Notes to Financial Statements.) |
| (2) | See Note 2 in the Notes to Financial Statements. |
| (3) | Includes realized gains (losses) as a result of in-kind redemptions. (See Note 4 in Notes to Financial Statements.) |
.
Statements of Operations
For the year ended October 31, 2022
| | | Global X DAX Germany ETF | | | Global X MSCI Portugal ETF | | | Global X MSCI Colombia ETF | | | Global X MSCI Argentina ETF | |
| Investment Income: | | | | | | | | | | | | |
| Dividend Income | | $ | 1,367,716 | | | $ | 369,922 | | | $ | 3,003,031 | | | $ | 1,006,677 | |
| Interest Income | | | — | | | | 58 | | | | 192 | | | | 186 | |
| Security Lending Income | | | — | | | | 13,496 | | | | 12,754 | | | | 32,173 | |
| Reclaim Income | | | 104,911 | | | | 34,835 | | | | — | | | | — | |
| Less: Foreign Taxes Withheld | | | (237,150 | ) | | | (88,169 | ) | | | (158,740 | ) | | | (113,406 | ) |
| Total Investment Income | | | 1,235,477 | | | | 330,142 | | | | 2,857,237 | | | | 925,630 | |
Supervision and Administration Fees(1) | | | 66,212 | | | | 61,424 | | | | 201,989 | | | | 175,705 | |
Custodian Fees(2) | | | 3,377 | | | | 6,831 | | | | 4,541 | | | | 289 | |
| Total Expenses | | | 69,589 | | | | 68,255 | | | | 206,530 | | | | 175,994 | |
| Net Investment Income | | | 1,165,888 | | | | 261,887 | | | | 2,650,707 | | | | 749,636 | |
| Net Realized Gain (Loss) on: | | | | | | | | | | | | | | | | |
Investments(3) | | | 1,218,901 | | | | (3,341,560 | ) | | | (2,997,111 | ) | | | (5,418,378 | ) |
| Foreign Currency Transactions | | | (7,240 | ) | | | (1,001 | ) | | | (53,506 | ) | | | (17,155 | ) |
| Net Realized Gain (Loss) | | | 1,211,661 | | | | (3,342,561 | ) | | | (3,050,617 | ) | | | (5,435,533 | ) |
| Net Change in Unrealized Appreciation (Depreciation) on: | | | | | | | | | | | | | | | | |
| Investments | | | (11,857,413 | ) | | | 144,598 | | | | (9,362,425 | ) | | | 2,074,605 | |
| Foreign Currency Translations | | | (16,806 | ) | | | (31,302 | ) | | | (3,734 | ) | | | (140 | ) |
| Net Change in Unrealized Appreciation (Depreciation) | | | (11,874,219 | ) | | | 113,296 | | | | (9,366,159 | ) | | | 2,074,465 | |
| Net Realized and Unrealized Gain (Loss) | | | (10,662,558 | ) | | | (3,229,265 | ) | | | (12,416,776 | ) | | | (3,361,068 | ) |
| Net Decrease in Net Assets Resulting from Operations | | $ | (9,496,670 | ) | | $ | (2,967,378 | ) | | $ | (9,766,069 | ) | | $ | (2,611,432 | ) |
| (1) | The Supervision and Administration fees reflect the supervisory and administrative fee, which includes fees paid by the Funds for the investment advisory services provided by the Adviser. (See Note 3 in Notes to Financial Statements.) |
| (2) | See Note 2 in the Notes to Financial Statements. |
| (3) | Includes realized gains (losses) as a result of in-kind redemptions. (See Note 4 in Notes to Financial Statements.) |
Statements of Operations
For the year ended October 31, 2022
| | | Global X MSCI Pakistan ETF | | | Global X MSCI Nigeria ETF | | | Global X MSCI Vietnam ETF(1) | |
| Investment Income: | | | | | | | | | |
| Dividend Income | | $ | 1,789,794 | | | $ | 3,208,610 | | | $ | 85,679 | |
| Interest Income | | | 183 | | | | 5,944 | | | | 6 | |
| Less: Foreign Taxes Withheld | | | (251,658 | ) | | | (246,289 | ) | | | — | |
| Total Investment Income | | | 1,538,319 | | | | 2,968,265 | | | | 85,685 | |
Supervision and Administration Fees(2) | | | 123,776 | | | | 297,850 | | | | 26,577 | |
Custodian Fees(3) | | | 21,734 | | | | 63,584 | | | | 221 | |
| Total Expenses | | | 145,510 | | | | 361,434 | | | | 26,798 | |
| Net Investment Income | | | 1,392,809 | | | | 2,606,831 | | | | 58,887 | |
| Net Realized Gain (Loss) on: | | | | | | | | | | | | |
Investments(4) | | | (2,485,741 | ) | | | (76,151 | ) | | | (1,926,234 | ) |
| Forward Foreign Currency Contracts | | | — | | | | (263,677 | ) | | | — | |
| Foreign Currency Transactions | | | (159,044 | ) | | | (521,981 | ) | | | (29,321 | ) |
| Net Realized Gain (Loss) | | | (2,644,785 | ) | | | (861,809 | ) | | | (1,955,555 | ) |
| Net Change in Unrealized Appreciation (Depreciation) on: | | | | | | | | | | | | |
| Investments | | | (5,842,735 | ) | | | (8,047,464 | ) | | | (1,428,447 | ) |
| Foreign Currency Translations | | | (6,754 | ) | | | 119,227 | | | | (3 | ) |
| Net Change in Unrealized Appreciation (Depreciation) | | | (5,849,489 | ) | | | (7,928,237 | ) | | | (1,428,450 | ) |
| Net Realized and Unrealized Gain (Loss) | | | (8,494,274 | ) | | | (8,790,046 | ) | | | (3,384,005 | ) |
| Net Decrease in Net Assets Resulting from Operations | | $ | (7,101,465 | ) | | $ | (6,183,215 | ) | | $ | (3,325,118 | ) |
| (1) | The Fund commenced operations on December 7, 2021. |
| (2) | The Supervision and Administration fees reflect the supervisory and administrative fee, which includes fees paid by the Funds for the investment advisory services provided by the Adviser. (See Note 3 in Notes to Financial Statements.) |
| (3) | See Note 2 in the Notes to Financial Statements. |
| (4) | Includes realized gains (losses) as a result of in-kind redemptions. (See Note 4 in Notes to Financial Statements.) |
Statements of Operations
For the year ended October 31, 2022
| | | Global X MSCI Next Emerging & Frontier ETF | | | Global X MSCI Norway ETF | | | Global X FTSE Southeast Asia ETF | |
| Investment Income: | | | | | | | | | |
| Dividend Income | | $ | 689,383 | | | $ | 4,983,806 | | | $ | 1,347,927 | |
| Interest Income | | | 71 | | | | 691 | | | | 224 | |
| Security Lending Income | | | — | | | | — | | | | 757 | |
| Reclaim Income | | | — | | | | 391,131 | | | | — | |
| Less: Foreign Taxes Withheld | | | (62,631 | ) | | | (1,106,435 | ) | | | (81,749 | ) |
| Total Investment Income | | | 626,823 | | | | 4,269,193 | | | | 1,267,159 | |
Supervision and Administration Fees(1) | | | 101,497 | | | | 506,046 | | | | 248,178 | |
Custodian Fees(2) | | | 11,781 | | | | 2,639 | | | | 674 | |
| Total Expenses | | | 113,278 | | | | 508,685 | | | | 248,852 | |
| Net Investment Income | | | 513,545 | | | | 3,760,508 | | | | 1,018,307 | |
| Net Realized Gain (Loss) on: | | | | | | | | | | | | |
Investments(3) | | | (394,701 | ) | | | (1,871,952 | ) | | | (919,791 | ) |
| Foreign Currency Transactions | | | (18,226 | ) | | | (68,855 | ) | | | (17,166 | ) |
| Net Realized Gain (Loss) | | | (412,927 | ) | | | (1,940,807 | ) | | | (936,957 | ) |
| Net Change in Unrealized Appreciation (Depreciation) on: | | | | | | | | | | | | |
| Investments | | | (2,633,571 | ) | | | (29,657,682 | ) | | | (2,036,328 | ) |
| Foreign Currency Translations | | | (2,281 | ) | | | (16,043 | ) | | | (111 | ) |
| Net Change in Unrealized Appreciation (Depreciation) | | | (2,635,852 | ) | | | (29,673,725 | ) | | | (2,036,439 | ) |
| Net Realized and Unrealized Gain (Loss) | | | (3,048,779 | ) | | | (31,614,532 | ) | | | (2,973,396 | ) |
| Net Decrease in Net Assets Resulting from Operations | | $ | (2,535,234 | ) | | $ | (27,854,024 | ) | | $ | (1,955,089 | ) |
| (1) | The Supervision and Administration fees reflect the supervisory and administrative fee, which includes fees paid by the Funds for the investment advisory services provided by the Adviser. (See Note 3 in Notes to Financial Statements.) |
| (2) | See Note 2 in the Notes to Financial Statements. |
| (3) | Includes realized gains (losses) as a result of in-kind redemptions. (See Note 4 in Notes to Financial Statements.) |
Statements of Changes in Net Assets
| | | Global X MSCI China Energy ETF | | | Global X MSCI China Materials ETF | |
| | | Year Ended October 31, 2022 | | | Year Ended October 31, 2021 | | | Year Ended October 31, 2022 | | | Year Ended October 31, 2021 | |
| Operations: | | | | | | | | | | | | |
| Net Investment Income | | $ | 320,352 | | | $ | 134,694 | | | $ | 97,625 | | | $ | 79,985 | |
| Net Realized Gain (Loss) | | | 1,381,183 | | | | (92,471 | ) | | | (214,980 | ) | | | (23,187 | ) |
| Net Change in Unrealized Appreciation (Depreciation) | | | (1,326,379 | ) | | | 1,094,639 | | | | (2,138,172 | ) | | | 587,544 | |
| Net Increase (Decrease) in Net Assets Resulting from Operations | | | 375,156 | | | | 1,136,862 | | | | (2,255,527 | ) | | | 644,342 | |
| Distributions | | | (152,497 | ) | | | (61,017 | ) | | | (95,929 | ) | | | (85,767 | ) |
| Capital Share Transactions: | | | | | | | | | | | | | | | | |
| Issued | | | 16,176,723 | | | | 2,018,561 | | | | 7,850,722 | | | | 4,181,106 | |
| Redeemed | | | (11,911,829 | ) | | | — | | | | (9,137,160 | ) | | | — | |
| Increase (Decrease) in Net Assets from Capital Share Transactions | | | 4,264,894 | | | | 2,018,561 | | | | (1,286,438 | ) | | | 4,181,106 | |
| Total Increase (Decrease) in Net Assets | | | 4,487,553 | | | | 3,094,406 | | | | (3,637,894 | ) | | | 4,739,681 | |
| Net Assets: | | | | | | | | | | | | | | | | |
| Beginning of Year | | | 4,652,014 | | | | 1,557,608 | | | | 6,557,610 | | | | 1,817,929 | |
| End of Year | | $ | 9,139,567 | | | $ | 4,652,014 | | | $ | 2,919,716 | | | $ | 6,557,610 | |
| Share Transactions: | | | | | | | | | | | | | | | | |
| Issued | | | 1,200,000 | | | | 190,000 | | | | 320,000 | | | | 160,000 | |
| Redeemed | | | (920,000 | ) | | | — | | | | (380,000 | ) | | | — | |
| Net Increase (Decrease) in Shares Outstanding from Share Transactions | | | 280,000 | | | | 190,000 | | | | (60,000 | ) | | | 160,000 | |
Statements of Changes in Net Assets
| | | Global X MSCI China Industrials ETF | | | Global X MSCI China Consumer Discretionary ETF | |
| | | Year Ended October 31, 2022 | | | Year Ended October 31, 2021 | | | Year Ended October 31, 2022 | | | Year Ended October 31, 2021 | |
| Operations: | | | | | | | | | | | | |
| Net Investment Income (Loss) | | $ | 144,287 | | | $ | 39,484 | | | $ | 932,540 | | | $ | (33,596 | ) |
| Net Realized Gain (Loss) | | | (3,267,632 | ) | | | 110,632 | | | | (67,214,262 | ) | | | 96,720,744 | |
| Net Change in Unrealized Appreciation (Depreciation) | | | (2,360,376 | ) | | | 506,026 | | | | (207,659,135 | ) | | | (172,971,644 | ) |
| Net Increase (Decrease) in Net Assets Resulting from Operations | | | (5,483,721 | ) | | | 656,142 | | | | (273,940,857 | ) | | | (76,284,496 | ) |
| Distributions | | | (68,060 | ) | | | (44,984 | ) | | | (925,757 | ) | | | (380,749 | ) |
| Capital Share Transactions: | | | | | | | | | | | | | | | | |
| Issued | | | 28,588,729 | | | | 2,517,246 | | | | 73,113,390 | | | | 588,818,607 | |
| Redeemed | | | (21,277,458 | ) | | | (1,984,822 | ) | | | (233,534,253 | ) | | | (255,768,042 | ) |
| Increase (Decrease) in Net Assets from Capital Share Transactions | | | 7,311,271 | | | | 532,424 | | | | (160,420,863 | ) | | | 333,050,565 | |
| Total Increase (Decrease) in Net Assets | | | 1,759,490 | | | | 1,143,582 | | | | (435,287,477 | ) | | | 256,385,320 | |
| Net Assets: | | | | | | | | | | | | | | | | |
| Beginning of Year | | | 3,157,733 | | | | 2,014,151 | | | | 649,503,028 | | | | 393,117,708 | |
| End of Year | | $ | 4,917,223 | | | $ | 3,157,733 | | | $ | 214,215,551 | | | $ | 649,503,028 | |
| Share Transactions: | | | | | | | | | | | | | | | | |
| Issued | | | 1,720,000 | | | | 160,000 | | | | 3,150,000 | | | | 16,210,000 | |
| Redeemed | | | (1,460,000 | ) | | | (120,000 | ) | | | (10,120,000 | ) | | | (7,870,000 | ) |
| Net Increase (Decrease) in Shares Outstanding from Share Transactions | | | 260,000 | | | | 40,000 | | | | (6,970,000 | ) | | | 8,340,000 | |
Statements of Changes in Net Assets
| | | Global X MSCI China Consumer Staples ETF | | | Global X MSCI China Health Care ETF | |
| | | Year Ended October 31, 2022 | | | Year Ended October 31, 2021 | | | Year Ended October 31, 2022 | | | Year Ended October 31, 2021 | |
| Operations: | | | | | | | | | | | | |
| Net Investment Income (Loss) | | $ | 259,820 | | | $ | 167,186 | | | $ | 43,799 | | | $ | (8,868 | ) |
| Net Realized Gain (Loss) | | | (644,928 | ) | | | 878,489 | | | | (2,773,705 | ) | | | 1,644,823 | |
| Net Change in Unrealized Appreciation (Depreciation) | | | (5,093,380 | ) | | | (986,348 | ) | | | (4,712,816 | ) | | | (2,513,462 | ) |
| Net Increase (Decrease) in Net Assets Resulting from Operations | | | (5,478,488 | ) | | | 59,327 | | | | (7,442,722 | ) | | | (877,507 | ) |
| Distributions | | | (707,626 | ) | | | (165,719 | ) | | | (16,856 | ) | | | (7,709 | ) |
| Capital Share Transactions: | | | | | | | | | | | | | | | | |
| Issued | | | 14,177,959 | | | | 3,451,698 | | | | 2,063,554 | | | | 14,751,520 | |
| Redeemed | | | (14,947,194 | ) | | | (5,194,967 | ) | | | (3,148,309 | ) | | | (7,902,991 | ) |
| Increase (Decrease) in Net Assets from Capital Share Transactions | | | (769,235 | ) | | | (1,743,269 | ) | | | (1,084,755 | ) | | | 6,848,529 | |
| Total Increase (Decrease) in Net Assets | | | (6,955,349 | ) | | | (1,849,661 | ) | | | (8,544,333 | ) | | | 5,963,313 | |
| Net Assets: | | | | | | | | | | | | | | | | |
| Beginning of Year | | | 15,573,969 | | | | 17,423,630 | | | | 16,619,770 | | | | 10,656,457 | |
| End of Year | | $ | 8,618,620 | | | $ | 15,573,969 | | | $ | 8,075,437 | | | $ | 16,619,770 | |
| Share Transactions: | | | | | | | | | | | | | | | | |
| Issued | | | 630,000 | | | | 100,000 | | | | 110,000 | | | | 500,000 | |
| Redeemed | | | (660,000 | ) | | | (170,000 | ) | | | (180,000 | ) | | | (280,000 | ) |
| Net Increase (Decrease) in Shares Outstanding from Share Transactions | | | (30,000 | ) | | | (70,000 | ) | | | (70,000 | ) | | | 220,000 | |
Statements of Changes in Net Assets
| | | Global X MSCI China Financials ETF | | | Global X MSCI China Information Technology ETF | |
| | | Year Ended October 31, 2022 | | | Year Ended October 31, 2021 | | | Year Ended October 31, 2022 | | | Year Ended October 31, 2021 | |
| Operations: | | | | | | | | | | | | |
| Net Investment Income | | $ | 1,749,055 | | | $ | 2,318,915 | | | $ | 112,992 | | | $ | 132,770 | |
| Net Realized Gain (Loss) | | | (12,951,563 | ) | | | 503,715 | | | | (3,909,078 | ) | | | 787,182 | |
| Net Change in Unrealized Appreciation (Depreciation) | | | (11,700,407 | ) | | | (1,299,229 | ) | | | (11,042,399 | ) | | | (1,700,916 | ) |
| Net Increase (Decrease) in Net Assets Resulting from Operations | | | (22,902,915 | ) | | | 1,523,401 | | | | (14,838,485 | ) | | | (780,964 | ) |
| Distributions | | | (1,762,014 | ) | | | (1,869,196 | ) | | | (754,839 | ) | | | (266,120 | ) |
| Capital Share Transactions: | | | | | | | | | | | | | | | | |
| Issued | | | 78,469,847 | | | | 27,548,622 | | | | 4,888,873 | | | | 16,904,921 | |
| Redeemed | | | (74,994,024 | ) | | | (26,173,070 | ) | | | (6,189,174 | ) | | | (5,876,490 | ) |
| Increase (Decrease) in Net Assets from Capital Share Transactions | | | 3,475,823 | | | | 1,375,552 | | | | (1,300,301 | ) | | | 11,028,431 | |
| Total Increase (Decrease) in Net Assets | | | (21,189,106 | ) | | | 1,029,757 | | | | (16,893,625 | ) | | | 9,981,347 | |
| Net Assets: | | | | | | | | | | | | | | | | |
| Beginning of Year | | | 48,756,289 | | | | 47,726,532 | | | | 30,813,236 | | | | 20,831,889 | |
| End of Year | | $ | 27,567,183 | | | $ | 48,756,289 | | | $ | 13,919,611 | | | $ | 30,813,236 | |
| Share Transactions: | | | | | | | | | | | | | | | | |
| Issued | | | 5,340,000 | | | | 1,720,000 | | | | 170,000 | | | | 500,000 | |
| Redeemed | | | (5,900,000 | ) | | | (1,690,000 | ) | | | (290,000 | ) | | | (190,000 | ) |
| Net Increase (Decrease) in Shares Outstanding from Share Transactions | | | (560,000 | ) | | | 30,000 | | | | (120,000 | ) | | | 310,000 | |
Statements of Changes in Net Assets
| | | Global X MSCI China Communication Services ETF | | | Global X MSCI China Utilities ETF | |
| | | Year Ended October 31, 2022 | | | Year Ended October 31, 2021 | | | Year Ended October 31, 2022 | | | Year Ended October 31, 2021 | |
| Operations: | | | | | | | | | | | | |
| Net Investment Income | | $ | 105,427 | | | $ | 34,943 | | | $ | 53,604 | | | $ | 69,303 | |
| Net Realized Gain (Loss) | | | (1,971,753 | ) | | | (1,732,970 | ) | | | 67,161 | | | | 70,662 | |
| Net Change in Unrealized Appreciation (Depreciation) | | | (3,936,947 | ) | | | (1,335,467 | ) | | | (1,309,980 | ) | | | 505,954 | |
| Net Increase (Decrease) in Net Assets Resulting from Operations | | | (5,803,273 | ) | | | (3,033,494 | ) | | | (1,189,215 | ) | | | 645,919 | |
| Distributions | | | (91,893 | ) | | | (201,302 | ) | | | (80,857 | ) | | | (63,139 | ) |
| Return of Capital | | | — | | | | (30,513 | ) | | | — | | | | — | |
| Capital Share Transactions: | | | | | | | | | | | | | | | | |
| Issued | | | — | | | | — | | | | 1,868,732 | | | | — | |
| Redeemed | | | (1,520,074 | ) | | | (1,381,816 | ) | | | (183,465 | ) | | | — | |
| Increase (Decrease) in Net Assets from Capital Share Transactions | | | (1,520,074 | ) | | | (1,381,816 | ) | | | 1,685,267 | | | | — | |
| Total Increase (Decrease) in Net Assets | | | (7,415,240 | ) | | | (4,647,125 | ) | | | 415,195 | | | | 582,780 | |
| Net Assets: | | | | | | | | | | | | | | | | |
| Beginning of Year | | | 12,337,156 | | | | 16,984,281 | | | | 1,952,582 | | | | 1,369,802 | |
| End of Year | | $ | 4,921,916 | | | $ | 12,337,156 | | | $ | 2,367,777 | | | $ | 1,952,582 | |
| Share Transactions: | | | | | | | | | | | | | | | | |
| Issued | | | — | | | | — | | | | 110,000 | | | | — | |
| Redeemed | | | (90,000 | ) | | | (50,000 | ) | | | (10,000 | ) | | | — | |
| Net Increase (Decrease) in Shares Outstanding from Share Transactions | | | (90,000 | ) | | | (50,000 | ) | | | 100,000 | | | | — | |
Statements of Changes in Net Assets
| | | Global X MSCI China Real Estate ETF‡ | | | Global X MSCI Greece ETF | |
| | | Year Ended October 31, 2022 | | | Year Ended October 31, 2021 | | | Year Ended October 31, 2022 | | | Year Ended October 31, 2021 | |
| Operations: | | | | | | | | | | | | |
| Net Investment Income | | $ | 271,006 | | | $ | 216,343 | | | $ | 3,413,437 | | | $ | 2,748,557 | |
| Net Realized Gain (Loss) | | | (3,014,362 | ) | | | (344,770 | ) | | | 4,346,778 | | | | (22,332,006 | ) |
| Net Change in Unrealized Appreciation (Depreciation) | | | (2,950,506 | ) | | | (935,733 | ) | | | (24,621,733 | ) | | | 85,495,557 | |
| Net Increase (Decrease) in Net Assets Resulting from Operations | | | (5,693,862 | ) | | | (1,064,160 | ) | | | (16,861,518 | ) | | | 65,912,108 | |
| Distributions | | | (205,698 | ) | | | (311,838 | ) | | | (2,877,578 | ) | | | (3,402,946 | ) |
| Capital Share Transactions: | | | | | | | | | | | | | | | | |
| Issued | | | 8,122,602 | | | | 626,443 | | | | 11,142,137 | | | | 10,058,149 | |
| Redeemed | | | (2,408,522 | ) | | | (2,126,313 | ) | | | (36,152,985 | ) | | | (29,754,751 | ) |
| Increase (Decrease) in Net Assets from Capital Share Transactions | | | 5,714,080 | | | | (1,499,870 | ) | | | (25,010,848 | ) | | | (19,696,602 | ) |
| Total Increase (Decrease) in Net Assets | | | (185,480 | ) | | | (2,875,868 | ) | | | (44,749,944 | ) | | | 42,812,560 | |
| Net Assets: | | | | | | | | | | | | | | | | |
| Beginning of Year | | | 4,404,749 | | | | 7,280,617 | | | | 151,828,163 | | | | 109,015,603 | |
| End of Year | | $ | 4,219,269 | | | $ | 4,404,749 | | | $ | 107,078,219 | | | $ | 151,828,163 | |
| Share Transactions: | | | | | | | | | | | | | | | | |
| Issued | | | 270,000 | | | | 16,667 | | | | 400,000 | | | | 410,000 | |
| Redeemed | | | (103,333 | ) | | | (43,333 | ) | | | (1,390,000 | ) | | | (1,150,000 | ) |
| Net Increase (Decrease) in Shares Outstanding from Share Transactions | | | 166,667 | | | | (26,666 | ) | | | (990,000 | ) | | | (740,000 | ) |
| ‡ | Share transactions have been adjusted to reflect the effect of a 1 for 3 reverse share split on December 19, 2022 (See Note 11 in the Notes to Financial Statements). |
Statements of Changes in Net Assets
| | | Global X DAX Germany ETF | | | Global X MSCI Portugal ETF | |
| | | Year Ended October 31, 2022 | | | Year Ended October 31, 2021 | | | Year Ended October 31, 2022 | | | Year Ended October 31, 2021 | |
| Operations: | | | | | | | | | | | | |
| Net Investment Income | | $ | 1,165,888 | | | $ | 729,263 | | | $ | 261,887 | | | $ | 499,075 | |
| Net Realized Gain (Loss) | | | 1,211,661 | | | | (1,315,725 | ) | | | (3,342,561 | ) | | | (1,224,498 | ) |
| Net Change in Unrealized Appreciation (Depreciation) | | | (11,874,219 | ) | | | 9,284,357 | | | | 113,296 | | | | 5,936,190 | |
| Net Increase (Decrease) in Net Assets Resulting from Operations | | | (9,496,670 | ) | | | 8,697,895 | | | | (2,967,378 | ) | | | 5,210,767 | |
| Distributions | | | (1,178,656 | ) | | | (1,062,843 | ) | | | (300,309 | ) | | | (509,812 | ) |
| Capital Share Transactions: | | | | | | | | | | | | | | | | |
| Issued | | | 21,895,926 | | | | 12,449,491 | | | | 12,259,897 | | | | — | |
| Redeemed | | | (15,914,235 | ) | | | — | | | | (4,851,384 | ) | | | (6,865,055 | ) |
| Increase (Decrease) in Net Assets from Capital Share Transactions | | | 5,981,691 | | | | 12,449,491 | | | | 7,408,513 | | | | (6,865,055 | ) |
| Total Increase (Decrease) in Net Assets | | | (4,693,635 | ) | | | 20,084,543 | | | | 4,140,826 | | | | (2,164,100 | ) |
| Net Assets: | | | | | | | | | | | | | | | | |
| Beginning of Year | | | 44,032,503 | | | | 23,947,960 | | | | 11,004,988 | | | | 13,169,088 | |
| End of Year | | $ | 39,338,868 | | | $ | 44,032,503 | | | $ | 15,145,814 | | | $ | 11,004,988 | |
| Share Transactions: | | | | | | | | | | | | | | | | |
| Issued | | | 960,000 | | | | 390,000 | | | | 1,190,000 | | | | — | |
| Redeemed | | | (570,000 | ) | | | — | | | | (510,000 | ) | | | (610,000 | ) |
| Net Increase (Decrease) in Shares Outstanding from Share Transactions | | | 390,000 | | | | 390,000 | | | | 680,000 | | | | (610,000 | ) |
Statements of Changes in Net Assets
| | | Global X MSCI Colombia ETF | | | Global X MSCI Argentina ETF | |
| | | Year Ended October 31, 2022 | | | Year Ended October 31, 2021 | | | Year Ended October 31, 2022 | | | Year Ended October 31, 2021 | |
| Operations: | | | | | | | | | | | | |
| Net Investment Income | | $ | 2,650,707 | | | $ | 908,881 | | | $ | 749,636 | | | $ | 367,527 | |
| Net Realized Gain (Loss) | | | (3,050,617 | ) | | | (2,294,198 | ) | | | (5,435,533 | ) | | | 5,051,501 | |
| Net Change in Unrealized Appreciation (Depreciation) | | | (9,366,159 | ) | | | 13,372,523 | | | | 2,074,465 | | | | 8,391,450 | |
| Net Increase (Decrease) in Net Assets Resulting from Operations | | | (9,766,069 | ) | | | 11,987,206 | | | | (2,611,432 | ) | | | 13,810,478 | |
| Distributions | | | (2,097,252 | ) | | | (1,240,682 | ) | | | (647,649 | ) | | | (163,672 | ) |
| Capital Share Transactions: | | | | | | | | | | | | | | | | |
| Issued | | | 5,767,466 | | | | — | | | | 2,904,673 | | | | 7,640,472 | |
| Redeemed | | | (14,877,594 | ) | | | (3,096,228 | ) | | | (7,525,318 | ) | | | (24,897,995 | ) |
| Decrease in Net Assets from Capital Share Transactions | | | (9,110,128 | ) | | | (3,096,228 | ) | | | (4,620,645 | ) | | | (17,257,523 | ) |
| Total Increase (Decrease) in Net Assets | | | (20,973,449 | ) | | | 7,650,296 | | | | (7,879,726 | ) | | | (3,610,717 | ) |
| Net Assets: | | | | | | | | | | | | | | | | |
| Beginning of Year | | | 41,830,802 | | | | 34,180,506 | | | | 34,810,038 | | | | 38,420,755 | |
| End of Year | | $ | 20,857,353 | | | $ | 41,830,802 | | | $ | 26,930,312 | | | $ | 34,810,038 | |
| Share Transactions: | | | | | | | | | | | | | | | | |
| Issued | | | 200,000 | | | | — | | | | 80,000 | | | | 250,000 | |
| Redeemed | | | (500,000 | ) | | | (110,000 | ) | | | (270,000 | ) | | | (820,000 | ) |
| Net Decrease in Shares Outstanding from Share Transactions | | | (300,000 | ) | | | (110,000 | ) | | | (190,000 | ) | | | (570,000 | ) |
Statements of Changes in Net Assets
| | | Global X MSCI Pakistan ETF | | | Global X MSCI Nigeria ETF | |
| | | Year Ended October 31, 2022 | | | Year Ended October 31, 2021 | | | Year Ended October 31, 2022 | | | Year Ended October 31, 2021 | |
| Operations: | | | | | | | | | | | | |
| Net Investment Income | | $ | 1,392,809 | | | $ | 2,127,510 | | | $ | 2,606,831 | | | $ | 2,165,472 | |
| Net Realized Gain (Loss) | | | (2,644,785 | ) | | | 1,227,822 | | | | (861,809 | ) | | | 149,837 | |
| Net Change in Unrealized Appreciation (Depreciation) | | | (5,849,489 | ) | | | (2,514,010 | ) | | | (7,928,237 | ) | | | 4,351,171 | |
| Net Increase (Decrease) in Net Assets Resulting from Operations | | | (7,101,465 | ) | | | 841,322 | | | | (6,183,215 | ) | | | 6,666,480 | |
| Distributions | | | (1,339,067 | ) | | | (1,563,198 | ) | | | (2,165,774 | ) | | | (2,273,637 | ) |
| Capital Share Transactions: | | | | | | | | | | | | | | | | |
| Issued | | | — | | | | 7,796,942 | | | | — | | | | — | |
| Redeemed | | | (1,179,537 | ) | | | (17,662,995 | ) | | | — | | | | — | |
| Decrease in Net Assets from Capital Share Transactions | | | (1,179,537 | ) | | | (9,866,053 | ) | | | — | | | | — | |
| Total Increase (Decrease) in Net Assets | | | (9,620,069 | ) | | | (10,587,929 | ) | | | (8,348,989 | ) | | | 4,392,843 | |
| Net Assets: | | | | | | | | | | | | | | | | |
| Beginning of Year | | | 23,967,469 | | | | 34,555,398 | | | | 46,591,986 | | | | 42,199,143 | |
| End of Year | | $ | 14,347,400 | | | $ | 23,967,469 | | | $ | 38,242,997 | | | $ | 46,591,986 | |
| Share Transactions: | | | | | | | | | | | | | | | | |
| Issued | | | — | | | | 250,000 | | | | — | | | | — | |
| Redeemed | | | (50,000 | ) | | | (590,000 | ) | | | — | | | | — | |
| Net Decrease in Shares Outstanding from Share Transactions | | | (50,000 | ) | | | (340,000 | ) | | | — | | | | — | |
Statements of Changes in Net Assets
| | | Global X MSCI Vietnam ETF | | | Global X MSCI Next Emerging & Frontier ETF | |
| | | Period Ended October 31, 2022(1) | | | Year Ended October 31, 2022 | | | Year Ended October 31, 2021 | |
| Operations: | | | | | | | | | |
| Net Investment Income | | $ | 58,887 | | | $ | 513,545 | | | $ | 438,105 | |
| Net Realized Gain (Loss) | | | (1,955,555 | ) | | | (412,927 | ) | | | 270,765 | |
| Net Change in Unrealized Appreciation (Depreciation) | | | (1,428,450 | ) | | | (2,635,852 | ) | | | 3,879,134 | |
| Net Increase (Decrease) in Net Assets Resulting from Operations | | | (3,325,118 | ) | | | (2,535,234 | ) | | | 4,588,004 | |
| Distributions | | | (15,977 | ) | | | (507,163 | ) | | | (448,516 | ) |
| Capital Share Transactions: | | | | | | | | | | | | |
| Issued | | | 10,227,557 | | | | 933,599 | | | | 3,497,177 | |
| Redeemed | | | (4,099,263 | ) | | | — | | | | — | |
| Increase in Net Assets from Capital Share Transactions | | | 6,128,294 | | | | 933,599 | | | | 3,497,177 | |
| Total Increase (Decrease) in Net Assets | | | 2,787,199 | | | | (2,108,798 | ) | | | 7,636,665 | |
| Net Assets: | | | | | | | | | | | | |
| Beginning of Year/Period | | | — | | | | 21,627,732 | | | | 13,991,067 | |
| End of Year/Period | | $ | 2,787,199 | | | $ | 19,518,934 | | | $ | 21,627,732 | |
| Share Transactions: | | | | | | | | | | | | |
| Issued | | | 410,000 | | | | 50,000 | | | | 180,000 | |
| Redeemed | | | (220,000 | ) | | | — | | | | — | |
| Net Increase in Shares Outstanding from Share Transactions | | | 190,000 | | | | 50,000 | | | | 180,000 | |
| (1) | The Fund commenced operations on December 7, 2021. |
Statements of Changes in Net Assets
| | | Global X MSCI Norway ETF | | | Global X FTSE Southeast Asia ETF | |
| | | Year Ended October 31, 2022 | | | Year Ended October 31, 2021‡ | | | Year Ended October 31, 2022 | | | Year Ended October 31, 2021 | |
| Operations: | | | | | | | | | | | | |
| Net Investment Income | | $ | 3,760,508 | | | $ | 1,350,068 | | | $ | 1,018,307 | | | $ | 1,396,343 | |
| Net Realized Gain (Loss) | | | (1,940,807 | ) | | | 94,788 | | | | (936,957 | ) | | | (553,468 | ) |
| Net Change in Unrealized Appreciation (Depreciation) | | | (29,673,725 | ) | | | 18,083,257 | | | | (2,036,439 | ) | | | 6,420,014 | |
| Net Increase (Decrease) in Net Assets Resulting from Operations | | | (27,854,024 | ) | | | 19,528,113 | | | | (1,955,089 | ) | | | 7,262,889 | |
| Distributions | | | (2,606,650 | ) | | | (1,549,127 | ) | | | (1,542,635 | ) | | | (630,414 | ) |
| Return of Capital | | | — | | | | (28,009 | ) | | | — | | | | — | |
| Capital Share Transactions: | | | | | | | | | | | | | | | | |
| Issued | | | 57,122,800 | | | | 19,132,549 | | | | 10,665,350 | | | | 13,865,571 | |
| Redeemed | | | (31,492,167 | ) | | | (9,932,744 | ) | | | (5,083,072 | ) | | | (5,703,002 | ) |
| Merger | | | — | | | | 43,214,538 | | | | — | | | | — | |
| Increase in Net Assets from Capital Share Transactions | | | 25,630,633 | | | | 52,414,343 | | | | 5,582,278 | | | | 8,162,569 | |
| Total Increase (Decrease) in Net Assets | | | (4,830,041 | ) | | | 70,365,320 | | | | 2,084,554 | | | | 14,795,044 | |
| Net Assets: | | | | | | | | | | | | | | | | |
| Beginning of Year | | | 103,935,253 | | | | 33,569,933 | | | | 35,776,200 | | | | 20,981,156 | |
| End of Year | | $ | 99,105,212 | | | $ | 103,935,253 | | | $ | 37,860,754 | | | $ | 35,776,200 | |
| Share Transactions: | | | | | | | | | | | | | | | | |
| Issued | | | 1,900,000 | | | | 605,315 | | | | 700,000 | | | | 970,000 | |
| Redeemed | | | (1,090,860 | ) | | | (376,536 | ) | | | (370,000 | ) | | | (400,000 | ) |
Merger(1) | | | — | | | | 1,350,000 | | | | — | | | | — | |
| Net Increase in Shares Outstanding from Share Transactions | | | 809,140 | | | | 1,578,779 | | | | 330,000 | | | | 570,000 | |
| ‡ | On October 29, 2021, the Global X MSCI Norway ETF (the “Acquired Fund”) was reorganized into the Global X FTSE Nordic Region ETF (the “Acquiring Fund”), each a separate series of the Trust (together, the “Combined Fund”) and the Combined Fund was renamed the Global X MSCI Norway ETF. As a result of the Reorganization as of the close of business on October 29, 2021, the Combined Fund assumed the performance and accounting history of the Acquired Fund. Accordingly, the financial information for the Combined Fund for periods prior to the date of the Reorganization represent the performance of the Acquired Fund (See Note 10 in Notes to Financial Statements). |
| (1) | See Note 10 in Notes to Financial Statements |
Page intentionally left blank.
Financial Highlights
Selected Per Share Data & Ratios
For a Share Outstanding Throughout the Period
| | | Net Asset Value, Beginning of Period ($) | | | Net Investment Income ($)* | | | Net Realized and Unrealized Gain (Loss) on Investments ($) | | | Total from Operations ($) | | | Distribution from Net Investment Income ($) | | | Distribution from Capital Gains ($) | | | Return of Capital ($) | |
| Global X MSCI China Energy ETF | | | | | | | | | | | | | | | | | | | | | |
2022 | | | 11.93 | | | | 0.65 | | | | 1.34 | | | | 1.99 | | | | (0.28 | ) | | | — | | | | — | |
2021 | | | 7.79 | | | | 0.48 | | | | 3.93 | | | | 4.41 | | | | (0.27 | ) | | | — | | | | — | |
2020 | | | 10.43 | | | | 0.44 | | | | (2.66 | ) | | | (2.22 | ) | | | (0.42 | ) | | | — | | | | — | |
2019 | | | 11.82 | | | | 0.30 | | | | (1.12 | ) | | | (0.82 | ) | | | (0.57 | ) | | | — | | | | — | |
2018 | | | 11.69 | | | | 0.49 | | | | 0.05 | | | | 0.54 | | | | (0.41 | ) | | | — | | | | — | |
| Global X MSCI China Materials ETF | | | | | | | | | | | | | | | | | | | | | | | | | | | | |
2022 | | | 25.22 | | | | 0.38 | | | | (10.60 | ) | | | (10.22 | ) | | | (0.40 | ) | | | — | | | | — | |
2021 | | | 18.18 | | | | 0.43 | | | | 7.12 | | | | 7.55 | | | | (0.51 | ) | | | — | | | | — | |
2020 | | | 14.50 | | | | 0.32 | | | | 3.93 | | | | 4.25 | | | | (0.57 | ) | | | — | | | | — | |
2019 | | | 15.97 | | | | 0.52 | | | | (0.99 | ) | | | (0.47 | ) | | | (1.00 | ) | | | — | | | | — | |
2018 | | | 21.59 | | | | 0.46 | | | | (5.84 | ) | | | (5.38 | ) | | | (0.24 | ) | | | — | | | | — | |
| Global X MSCI China Industrials ETF | | | | | | | | | | | | | | | | | | | | | | | | | | | | |
2022 | | | 16.62 | | | | 0.19 | | | | (5.75 | ) | | | (5.56 | ) | | | (0.13 | ) | | | — | | | | — | |
2021 | | | 13.43 | | | | 0.21 | | | | 3.27 | | | | 3.48 | | | | (0.29 | ) | | | — | | | | — | |
2020 | | | 12.92 | | | | 0.23 | | | | 0.49 | | | | 0.72 | | | | (0.21 | ) | | | — | | | | — | |
2019 | | | 13.59 | | | | 0.27 | | | | (0.49 | ) | | | (0.22 | ) | | | (0.45 | ) | | | — | | | | — | |
2018 | | | 16.06 | | | | 0.29 | | | | (2.41 | ) | | | (2.12 | ) | | | (0.35 | ) | | | — | | | | — | |
| * | Per share data calculated using average shares method. |
| ** | Total Return is for the period indicated and has not been annualized. The return shown does not reflect the deduction of taxes that a shareholder would pay on Fund distributions or the redemption of Fund shares. |
| †† | Portfolio turnover rate is for the period indicated and periods of less than one year have not been annualized. Excludes effect of in-kind transfers. |
Amounts designated as “—” are either $0 or have been rounded to $0.
Financial Highlights
| Total from Distributions ($) | | | Net Asset Value, End of Period ($) | | | Total Return (%)** | | | Net Assets End of Period ($)(000) | | | Ratio of Expenses to Average Net Assets (%) | | | Ratio of Net Investment Income to Average Net Assets (%) | | | Portfolio Turnover (%)†† | |
| | (0.28 | ) | | | 13.64 | | | | 16.86 | | | | 9,140 | | | | 0.66 | | | | 4.73 | | | | 106.55 | |
| | (0.27 | ) | | | 11.93 | | | | 57.88 | | | | 4,652 | | | | 0.67 | | | | 4.74 | | | | 51.48 | |
| | (0.42 | ) | | | 7.79 | | | | (22.05 | ) | | | 1,558 | | | | 0.66 | | | | 5.02 | | | | 34.18 | |
| | (0.57 | ) | | | 10.43 | | | | (7.04 | ) | | | 1,564 | | | | 0.66 | | | | 2.67 | | | | 109.41 | |
| | (0.41 | ) | | | 11.82 | | | | 4.77 | | | | 2,955 | | | | 0.65 | | | | 4.00 | | | | 14.60 | |
| | | | | | | | | | | | | | | | | | | | | | | | | | | |
| | (0.40 | ) | | | 14.60 | | | | (41.03 | ) | | | 2,920 | | | | 0.65 | | | | 1.74 | | | | 101.99 | |
| | (0.51 | ) | | | 25.22 | | | | 41.80 | | | | 6,558 | | | | 0.66 | | | | 1.70 | | | | 26.64 | |
| | (0.57 | ) | | | 18.18 | | | | 29.88 | | | | 1,818 | | | | 0.66 | | | | 1.95 | | | | 36.02 | |
| | (1.00 | ) | | | 14.50 | | | | (3.13 | ) | | | 2,175 | | | | 0.66 | | | | 3.30 | | | | 65.67 | |
| | (0.24 | ) | | | 15.97 | | | | (25.20 | ) | | | 2,395 | | | | 0.66 | | | | 2.27 | | | | 26.95 | |
| | | | | | | | | | | | | | | | | | | | | | | | | | | |
| | (0.13 | ) | | | 10.93 | | | | (33.68 | ) | | | 4,917 | | | | 0.65 | | | | 1.25 | | | | 105.23 | |
| | (0.29 | ) | | | 16.62 | | | | 26.08 | | | | 3,158 | | | | 0.66 | | | | 1.28 | | | | 66.09 | |
| | (0.21 | ) | | | 13.43 | | | | 5.57 | | | | 2,014 | | | | 0.66 | | | | 1.71 | | | | 19.54 | |
| | (0.45 | ) | | | 12.92 | | | | (1.66 | ) | | | 1,938 | | | | 0.66 | | | | 1.99 | | | | 80.17 | |
| | (0.35 | ) | | | 13.59 | | | | (13.44 | ) | | | 2,038 | | | | 0.66 | | | | 1.92 | | | | 18.28 | |
Financial Highlights
Selected Per Share Data & Ratios
For a Share Outstanding Throughout the Period
| | | Net Asset Value, Beginning of Period ($) | | | Net Investment Income (Loss) ($)* | | | Net Realized and Unrealized Gain (Loss) on Investments ($) | | | Total from Operations ($) | | | Distribution from Net Investment Income ($) | | | Distribution from Capital Gains ($) | | | Return of Capital ($) | |
| Global X MSCI China Consumer Discretionary ETF | | | | | | | | | | | | | | | | | | | | | |
2022 | | | 29.94 | | | | 0.06 | | | | (15.39 | ) | | | (15.33 | ) | | | (0.06 | ) | | | — | | | | — | |
2021 | | | 29.45 | | | | — | | | 0.51 | ^ | | | 0.51 | | | | (0.02 | ) | | | — | | | | — | |
2020 | | | 17.68 | | | | 0.04 | | | | 11.89 | | | | 11.93 | | | | (0.16 | ) | | | — | | | | — | |
2019 | | | 13.57 | | | | 0.16 | | | | 4.35 | | | | 4.51 | | | | (0.40 | ) | | | — | | | | — | |
2018 | | | 17.44 | | | | 0.20 | | | | (3.95 | ) | | | (3.75 | ) | | | (0.12 | ) | | | — | | | | — | |
| Global X MSCI China Consumer Staples ETF | | | | | | | | | | | | | | | | | | | | | | | | | | | | |
2022 | | | 29.38 | | | | 0.42 | | | | (11.23 | ) | | | (10.81 | ) | | | (0.30 | ) | | | (1.03 | ) | | | — | |
2021 | | | 29.04 | | | | 0.26 | | | 0.34 | ^ | | | 0.60 | | | | (0.21 | ) | | | (0.05 | ) | | | — | |
2020 | | | 21.08 | | | | 0.31 | | | | 8.41 | | | | 8.72 | | | | (0.25 | ) | | | (0.51 | ) | | | — | |
2019(1) | | | 15.00 | | | | 0.28 | | | | 5.93 | | | | 6.21 | | | | (0.13 | ) | | | — | | | | — | |
| Global X MSCI China Health Care ETF | | | | | | | | | | | | | | | | | | | | | | | | | | | | |
2022 | | | 24.81 | | | | 0.07 | | | | (11.40 | ) | | | (11.33 | ) | | | (0.02 | ) | | | — | | | | — | |
2021 | | | 23.68 | | | | (0.01 | ) | | 1.16 | ^ | | | 1.15 | | | | (0.02 | ) | | | — | | | | — | |
2020 | | | 17.70 | | | | 0.03 | | | | 6.06 | | | | 6.09 | | | | (0.04 | ) | | | (0.07 | ) | | | — | |
2019(1) | | | 15.00 | | | | 0.09 | | | | 2.64 | | | | 2.73 | | | | (0.03 | ) | | | — | | | | — | |
| * | Per share data calculated using average shares method. |
| ** | Total Return is for the period indicated and has not been annualized. The return shown does not reflect the deduction of taxes that a shareholder would pay on Fund distributions or the redemption of Fund shares. |
| † | Annualized. |
| †† | Portfolio turnover rate is for the period indicated and periods of less than one year have not been annualized. Excludes effect of in-kind transfers. |
| ^ | The amount shown for a share outstanding throughout the period does not accord with the aggregate net gains on investments for the period because of the sales and repurchases of fund shares in relation to fluctuating market value of the investments of the Fund. |
| (1) | The Fund commenced operations on December 7, 2018. |
Amounts designated as “—” are either $0 or have been rounded to $0.
Financial Highlights
| Total from Distributions ($) | | | Net Asset Value, End of Period ($) | | | Total Return (%)** | | | Net Assets End of Period ($)(000) | | | Ratio of Expenses to Average Net Assets (%) | | | Ratio of Net Investment Income (Loss) to Average Net Assets (%) | | | Portfolio Turnover (%)†† | |
| | (0.06 | ) | | | 14.55 | | | | (51.28 | ) | | | 214,216 | | | | 0.65 | | | | 0.25 | | | | 22.64 | |
| | (0.02 | ) | | | 29.94 | | | | 1.73 | | | | 649,503 | | | | 0.65 | | | | — | | | | 34.56 | |
| | (0.16 | ) | | | 29.45 | | | | 67.98 | | | | 393,118 | | | | 0.65 | | | | 0.21 | | | | 32.56 | |
| | (0.40 | ) | | | 17.68 | | | | 34.20 | | | | 156,486 | | | | 0.65 | | | | 1.03 | | | | 83.41 | |
| | (0.12 | ) | | | 13.57 | | | | (21.70 | ) | | | 120,102 | | | | 0.65 | | | | 1.11 | | | | 17.92 | |
| | | | | | | | | | | | | | | | | | | | | | | | | | | |
| | (1.33 | ) | | | 17.24 | | | | (38.53 | ) | | | 8,619 | | | | 0.65 | | | | 1.72 | | | | 65.46 | |
| | (0.26 | ) | | | 29.38 | | | | 1.97 | | | | 15,574 | | | | 0.65 | | | | 0.82 | | | | 35.56 | |
| | (0.76 | ) | | | 29.04 | | | | 42.48 | | | | 17,424 | | | | 0.65 | | | | 1.21 | | | | 44.54 | |
| | (0.13 | ) | | | 21.08 | | | | 41.48 | | | | 2,109 | | | | 0.67 | † | | | 1.66 | † | | | 29.25 | |
| | | | | | | | | | | | | | | | | | | | | | | | | | | |
| | (0.02 | ) | | | 13.46 | | | | (45.67 | ) | | | 8,075 | | | | 0.65 | | | | 0.37 | | | | 20.49 | |
| | (0.02 | ) | | | 24.81 | | | | 4.84 | | | | 16,620 | | | | 0.65 | | | | (0.05 | ) | | | 29.41 | |
| | (0.11 | ) | | | 23.68 | | | | 34.62 | | | | 10,656 | | | | 0.65 | | | | 0.16 | | | | 31.60 | |
| | (0.03 | ) | | | 17.70 | | | | 18.22 | | | | 2,655 | | | | 0.66 | † | | | 0.60 | † | | | 12.20 | |
Financial Highlights
Selected Per Share Data & Ratios
For a Share Outstanding Throughout the Period
| | | Net Asset Value, Beginning of Period ($) | | | Net Investment Income ($)* | | | Net Realized and Unrealized Gain (Loss) on Investments ($) | | | Total from Operations ($) | | | Distribution from Net Investment Income ($) | | | Distribution from Capital Gains ($) | | | Return of Capital ($) | |
| Global X MSCI China Financials ETF | | | | | | | | | | | | | | | | | | | | | |
2022 | | | 14.42 | | | | 0.39 | | | | (4.62 | ) | | | (4.23 | ) | | | (0.41 | ) | | | — | | | | — | |
2021 | | | 14.25 | | | | 0.62 | | | 0.07 | ^
| | | 0.69 | | | | (0.52 | ) | | | — | | | | — | |
2020 | | | 15.83 | | | | 0.41 | | | | (1.50 | ) | | | (1.09 | ) | | | (0.49 | ) | | | — | | | | — | |
2019 | | | 15.39 | | | | 0.67 | | | | 0.65 | | | | 1.32 | | | | (0.88 | ) | | | — | | | | — | |
2018 | | | 17.63 | | | | 0.48 | | | | (2.38 | ) | | | (1.90 | ) | | | (0.34 | ) | | | — | | | | — | |
| Global X MSCI China Information Technology ETF | | | | | | | | | | | | | | | | | | | | | | | | | | | | |
2022 | | | 29.07 | | | | 0.11 | | | | (13.73 | ) | | | (13.62 | ) | | | (0.09 | ) | | | (0.55 | ) | | | — | |
2021 | | | 27.78 | | | | 0.12 | | | 1.46 | ^
| | | 1.58 | | | | (0.12 | ) | | | (0.17 | ) | | | — | |
2020 | | | 17.92 | | | | 0.09 | | | | 10.03 | | | | 10.12 | | | | (0.10 | ) | | | (0.16 | ) | | | — | |
2019(1) | | | 15.00 | | | | 0.19 | | | | 2.81 | | | | 3.00 | | | | (0.08 | ) | | | — | | | | — | |
| Global X MSCI China Communication Services ETF | | | | | | | | | | | | | | | | | | | | | | | | | | | | |
2022 | | | 20.56 | | | | 0.19 | | | | (10.92 | ) | | | (10.73 | ) | | | (0.18 | ) | | | — | | | | — | |
2021 | | | 26.13 | | | | 0.06 | | | | (5.27 | ) | | | (5.21 | ) | | | (0.31 | ) | | | — | | | | (0.05 | ) |
2020 | | | 22.18 | | | | 0.16 | | | | 3.96 | | | | 4.12 | | | | (0.17 | ) | | | — | | | | — | |
2019 | | | 22.40 | | | | 0.09 | | | | (0.21 | ) | | | (0.12 | ) | | | (0.10 | ) | | | — | | | | — | |
2018 | | | 29.24 | | | | 0.07 | | | | (6.23 | ) | | | (6.16 | ) | | | (0.68 | ) | | | — | | | | — | |
| * | Per share data calculated using average shares method. |
| ** | Total Return is for the period indicated and has not been annualized. The return shown does not reflect the deduction of taxes that a shareholder would pay on Fund distributions or the redemption of Fund shares. |
| † | Annualized. |
| †† | Portfolio turnover rate is for the period indicated and periods of less than one year have not been annualized. Excludes effect of in-kind transfers. |
| ^ | The amount shown for a share outstanding throughout the period does not accord with the aggregate net gains on investments for the period because of the sales and repurchases of fund shares in relation to fluctuating market value of the investments of the Fund. |
| (1) | The Fund commenced operations on December 7, 2018. |
Amounts designated as “—” are either $0 or have been rounded to $0.
Financial Highlights
| Total from Distributions ($) | | | Net Asset Value, End of Period ($) | | | Total Return (%)** | | | Net Assets End of Period ($)(000) | | | Ratio of Expenses to Average Net Assets (%) | | | Ratio of Net Investment Income to Average Net Assets (%) | | | Portfolio Turnover (%)†† | |
| | (0.41 | ) | | | 9.78 | | | | (30.18 | ) | | | 27,567 | | | | 0.66 | | | | 2.84 | | | | 37.97 | |
| | (0.52 | ) | | | 14.42 | | | | 4.65 | | | | 48,756 | | | | 0.65 | | | | 4.00 | | | | 21.42 | |
| | (0.49 | ) | | | 14.25 | | | | (7.24 | ) | | | 47,727 | | | | 0.65 | | | | 2.72 | | | | 21.72 | |
| | (0.88 | ) | | | 15.83 | | | | 8.95 | | | | 60,160 | | | | 0.66 | | | | 4.11 | | | | 54.17 | |
| | (0.34 | ) | | | 15.39 | | | | (11.04 | ) | | | 30,784 | | | | 0.66 | | | | 2.67 | | | | 15.09 | |
| | | | | | | | | | | | | | | | | | | | | | | | | | | |
| | (0.64 | ) | | | 14.81 | | | | (47.82 | ) | | | 13,920 | | | | 0.65 | | | | 0.50 | | | | 32.20 | |
| | (0.29 | ) | | | 29.07 | | | | 5.58 | | | | 30,813 | | | | 0.65 | | | | 0.39 | | | | 52.48 | |
| | (0.26 | ) | | | 27.78 | | | | 57.01 | | | | 20,832 | | | | 0.65 | | | | 0.37 | | | | 29.01 | |
| | (0.08 | ) | | | 17.92 | | | | 20.06 | | | | 1,792 | | | | 0.66 | † | | | 1.29 | † | | | 36.75 | |
| | | | | | | | | | | | | | | | | | | | | | | | | | | |
| | (0.18 | ) | | | 9.65 | | | | (52.56 | ) | | | 4,922 | | | | 0.65 | | | | 1.15 | | | | 30.28 | |
| | (0.36 | ) | | | 20.56 | | | | (20.27 | ) | | | 12,337 | | | | 0.65 | | | | 0.22 | | | | 65.54 | |
| | (0.17 | ) | | | 26.13 | | | | 18.61 | | | | 16,984 | | | | 0.65 | | | | 0.67 | | | | 27.78 | |
| | (0.10 | ) | | | 22.18 | | | | (0.54 | ) | | | 21,071 | | | | 0.66 | | | | 0.39 | | | | 114.67 | |
| | (0.68 | ) | | | 22.40 | | | | (21.70 | ) | | | 24,645 | | | | 0.65 | | | | 0.24 | | | | 33.79 | |
Financial Highlights
Selected Per Share Data & Ratios
For a Share Outstanding Throughout the Period
| | | Net Asset Value, Beginning of Period ($) | | | Net Investment Income ($)* | | | Net Realized and Unrealized Gain (Loss) on Investments ($) | | | Total from Operations ($) | | | Distribution from Net Investment Income ($) | | | Distribution from Capital Gains ($) | | | Return of Capital ($) | |
| Global X MSCI China Utilities ETF | | | | | | | | | | | | | | | | | | | | | |
2022 | | | 19.53 | | | | 0.43 | | | | (7.22 | ) | | | (6.79 | ) | | | (0.45 | ) | | | (0.45 | ) | | | — | |
2021 | | | 13.70 | | | | 0.69 | | | | 5.77 | | | | 6.46 | | | | (0.63 | ) | | | — | | | | — | |
2020 | | | 15.81 | | | | 0.39 | | | | (2.09 | ) | | | (1.70 | ) | | | (0.35 | ) | | | (0.06 | ) | | | — | |
2019(1) | | | 15.00 | | | | 0.33 | | | | 0.60 | | | | 0.93 | | | | (0.12 | ) | | | — | | | | — | |
| Global X MSCI China Real Estate ETF | | | | | | | | | | | | | | | | | | | | | | | | | | | | |
2022(2) | | | 35.70 | | | | 1.05 | | | | (21.23 | ) | | | (20.18 | ) | | | (0.97 | ) | | | — | | | | — | |
2021(2) | | | 48.54 | | | | 1.77 | | | | (12.27 | ) | | | (10.50 | ) | | | (2.34 | ) | | | — | | | | — | |
2020(2) | | | 51.69 | | | | 2.43 | | | | (3.51 | ) | | | (1.08 | ) | | | (2.07 | ) | | | — | | | | — | |
2019(1)(2) | | | 45.00 | | | | 2.01 | | | | 5.46 | | | | 7.47 | | | | (0.78 | ) | | | — | | | | — | |
| Global X MSCI Greece ETF | | | | | | | | | | | | | | | | | | | | | | | | | | | | |
2022 | | | 27.98 | | | | 0.73 | | | | (3.94 | ) | | | (3.21 | ) | | | (0.63 | ) | | | — | | | | — | |
2021 | | | 17.68 | | | | 0.47 | | | | 10.36 | | | | 10.83 | | | | (0.53 | ) | | | — | | | | — | |
2020(3) | | | 29.91 | | | | 0.66 | | | | (12.20 | ) | | | (11.54 | ) | | | (0.69 | ) | | | — | | | | — | |
2019(3) | | | 23.04 | | | | 0.63 | | | | 6.87 | | | | 7.50 | | | | (0.63 | ) | | | — | | | | — | |
2018(3) | | | 27.90 | | | | 0.57 | | | | (4.77 | ) | | | (4.20 | ) | | | (0.66 | ) | | | — | | | | — | |
| * | Per share data calculated using average shares method. |
| ** | Total Return is for the period indicated and has not been annualized. The return shown does not reflect the deduction of taxes that a shareholder would pay on Fund distributions or the redemption of Fund shares. |
| † | Annualized. |
| †† | Portfolio turnover rate is for the period indicated and periods of less than one year have not been annualized. Excludes effect of in-kind transfers. |
| (1) | The Fund commenced operations on December 7, 2018. |
| (2) | Per share amounts have been adjusted for a 1 for 3 reverse share split on December 19, 2022 (See Note 11 in the Notes to Financial Statements. |
| (3) | Per share amounts have been adjusted for a 1 for 3 reverse share split on April 28, 2020. (See Note 9 in the Notes to Financial Statements. |
Amounts designated as “—” are either $0 or have been rounded to $0.
Financial Highlights
| Total from Distributions ($) | | | Net Asset Value, End of Period ($) | | | Total Return (%)** | | | Net Assets End of Period ($)(000) | | | Ratio of Expenses to Average Net Assets (%) | | | Ratio of Net Investment Income to Average Net Assets (%) | | | Portfolio Turnover (%)†† | |
| | (0.90 | ) | | | 11.84 | | | | (36.59 | ) | | | 2,368 | | | | 0.66 | | | | 2.62 | | | | 38.78 | |
| | (0.63 | ) | | | 19.53 | | | | 48.14 | | | | 1,953 | | | | 0.67 | | | | 4.11 | | | | 44.06 | |
| | (0.41 | ) | | | 13.70 | | | | (10.92 | ) | | | 1,370 | | | | 0.66 | | | | 2.78 | | | | 37.12 | |
| | (0.12 | ) | | | 15.81 | | | | 6.24 | | | | 1,581 | | | | 0.66 | † | | | 2.42 | † | | | 28.26 | |
| | | | | | | | | | | | | | | | | | | | | | | | | | | |
| | (0.97 | ) | | | 14.55 | | | | (57.96 | ) | | | 4,219 | | | | 0.66 | | | | 3.81 | | | | 45.91 | |
| | (2.34 | ) | | | 35.70 | | | | (22.77 | ) | | | 4,405 | | | | 0.66 | | | | 3.80 | | | | 38.66 | |
| | (2.07 | ) | | | 48.54 | | | | (2.55 | ) | | | 7,281 | | | | 0.66 | | | | 4.73 | | | | 25.75 | |
| | (0.78 | ) | | | 51.69 | | | | 16.56 | | | | 1,723 | | | | 0.65 | † | | | 4.44 | † | | | 14.00 | |
| | | | | | | | | | | | | | | | | | | | | | | | | | | |
| | (0.63 | ) | | | 24.14 | | | | (11.63 | ) | | | 107,078 | | | | 0.57 | | | | 2.83 | | | | 24.34 | |
| | (0.53 | ) | | | 27.98 | | | | 61.52 | | | | 151,828 | | | | 0.56 | | | | 1.76 | | | | 38.42 | |
| | (0.69 | ) | | | 17.68 | | | | (39.39 | ) | | | 109,016 | | | | 0.58 | | | | 2.81 | | | | 28.48 | |
| | (0.63 | ) | | | 29.91 | | | | 33.57 | | | | 338,840 | | | | 0.57 | | | | 2.43 | | | | 12.67 | |
| | (0.66 | ) | | | 23.04 | | | | (15.63 | ) | | | 257,901 | | | | 0.59 | | | | 1.98 | | | | 16.38 | |
Financial Highlights
Selected Per Share Data & Ratios
For a Share Outstanding Throughout the Period
| | | Net Asset Value, Beginning of Period ($) | | | Net Investment Income ($)* | | | Net Realized and Unrealized Gain (Loss) on Investments ($) | | | Total from Operations ($) | | | Distribution from Net Investment Income ($) | | | Distribution from Capital Gains ($) | | | Return of Capital ($) | |
Global X DAX Germany ETF(1) | | | | | | | | | | | | | | | | | | | | | |
2022 | | | 32.86 | | | | 0.95 | | | | (10.13 | ) | | | (9.18 | ) | | | (0.94 | ) | | | — | | | | — | |
2021 | | | 25.21 | | | | 0.62 | | | | 7.95 | | | | 8.57 | | | | (0.92 | ) | | | — | | | | — | |
2020 | | | 27.28 | | | | 0.87 | | | | (2.64 | ) | | | (1.77 | ) | | | (0.30 | ) | | | — | | | | — | |
2019(2) | | | 25.92 | | | | 0.67 | | | | 1.82 | | | | 2.49 | | | | (1.11 | ) | | | — | | | | (0.02 | ) |
2018(2) | | | 31.25 | | | | 0.77 | | | | (5.75 | )‡ | | | (4.98 | ) | | | (0.35 | ) | | | — | | | | — | |
| Global X MSCI Portugal ETF | | | | | | | | | | | | | | | | | | | | | | | | | | | | |
2022 | | | 11.71 | | | | 0.24 | | | | (2.25 | ) | | | (2.01 | ) | | | (0.35 | ) | | | — | | | | — | |
2021 | | | 8.50 | | | | 0.36 | | | | 3.22 | | | | 3.58 | | | | (0.37 | ) | | | — | | | | — | |
2020 | | | 10.71 | | | | 0.23 | | | | (2.16 | ) | | | (1.93 | ) | | | (0.28 | ) | | | — | | | | — | |
2019 | | | 11.24 | | | | 0.36 | | | | (0.11 | ) | | | 0.25 | | | | (0.78 | ) | | | — | | | | — | |
2018 | | | 12.49 | | | | 0.36 | | | | (1.25 | ) | | | (0.89 | ) | | | (0.36 | ) | | | — | | | | — | |
| Global X MSCI Colombia ETF | | | | | | | | | | | | | | | | | | | | | | | | | | | | |
2022 | | | 30.76 | | | | 2.26 | | | | (11.49 | ) | | | (9.23 | ) | | | (1.85 | ) | | | — | | | | — | |
2021 | | | 23.26 | | | | 0.64 | | | | 7.73 | | | | 8.37 | | | | (0.87 | ) | | | — | | | | — | |
2020(3) | | | 38.16 | | | | 1.14 | | | | (15.00 | ) | | | (13.86 | ) | | | (1.04 | ) | | | — | | | | — | |
2019(3) | | | 34.72 | | | | 1.04 | | | | 3.96 | | | | 5.00 | | | | (1.56 | ) | | | — | | | | — | |
2018(3) | | | 38.24 | | | | 0.84 | | | | (3.64 | ) | | | (2.80 | ) | | | (0.72 | ) | | | — | | | | — | |
| * | Per share data calculated using average shares method. |
| ** | Total Return is for the period indicated and has not been annualized. The return shown does not reflect the deduction of taxes that a shareholder would pay on Fund distributions or the redemption of Fund shares. |
| †† | Portfolio turnover rate is for the period indicated and periods of less than one year have not been annualized. Excludes effect of in-kind transfers. |
| ‡ | Includes a $0.10 gain per share derived from a payment from the prior administrator of the Predecessor Fund |
| # | The ratio of Expenses to Average Net Assets includes the effect of a waiver. If these offsets were excluded, the ratio would have been 0.68% for the year ended October 31, 2018. |
| @ | Before payment from the prior administrator of the Predecessor Fund for the loss resulting from an error, the total return for the period would have been (16.37%). |
| + | Effective March 1, 2021, the Fund’s management fees were permanently lowered to 0.20%. Prior to March 1, 2021, the ratio of Expenses to Average Net Assets included the effect of a waiver. If these offsets were excluded, the ratio would have been 0.27%, 0.45% and 0.46% for the years ended October 31, 2021, October 31, 2020 and October 31, 2019, respectively. |
| (1) | The financial statements include the financial information of the Predecessor Fund through December 21, 2018 (See Note 1 in Notes to Financial Statements). |
| (2) | As a result of the Reorganization, the Fund assumed the performance and accounting history of the Predecessor Fund. Accordingly, performance figures for the Fund for periods prior to the date of the Reorganization represent the performance of the Predecessor Fund (See Note 1 in Notes to Financial Statements). |
| (3) | Per share amounts have been adjusted for a 1 for 4 reverse share split on April 28, 2020 (See Note 9 in the Notes to Financial Statements) |
Amounts designated as “—” are either $0 or have been rounded to $0.
Financial Highlights
| Total from Distributions ($) | | | Net Asset Value, End of Period ($) | | | Total Return (%)** | | | Net Assets End of Period ($)(000) | | | Ratio of Expenses to Average Net Assets (%) | | | Ratio of Net Investment Income to Average Net Assets (%) | | | Portfolio Turnover (%)†† | |
| | (0.94 | ) | | | 22.74 | | | | (28.29 | ) | | | 39,339 | | | | 0.21 | | | | 3.52 | | | | 10.74 | |
| | (0.92 | ) | | | 32.86 | | | | 34.06 | | | | 44,033 | | | | 0.20 | + | | | 1.90 | | | | 24.22 | |
| | (0.30 | ) | | | 25.21 | | | | (6.53 | ) | | | 23,948 | | | | 0.20 | + | | | 3.30 | | | | 10.93 | |
| | (1.13 | ) | | | 27.28 | | | | 9.98 | | | | 16,370 | | | | 0.21 | + | | | 2.65 | | | | 15.36 | |
| | (0.35 | ) | | | 25.92 | | | (16.05 | )@ | | | 16,851 | | | | 0.20 | | | | 2.57 | | | | 7.00 | |
| | | | | | | | | | | | | | | | | | | | | | | | | | | |
| | (0.35 | ) | | | 9.35 | | | | (17.55 | ) | | | 15,146 | | | | 0.61 | | | | 2.34 | | | | 40.76 | |
| | (0.37 | ) | | | 11.71 | | | | 42.30 | | | | 11,005 | | | | 0.58 | | | | 3.26 | | | | 53.05 | |
| | (0.28 | ) | | | 8.50 | | | | (18.37 | ) | | | 13,169 | | | | 0.58 | | | | 2.34 | | | | 25.19 | |
| | (0.78 | ) | | | 10.71 | | | | 2.72 | | | | 22,487 | | | | 0.58 | | | | 3.41 | | | | 20.74 | |
| | (0.36 | ) | | | 11.24 | | | | (7.26 | ) | | | 25,295 | | | | 0.57 | | | | 2.91 | | | | 21.05 | |
| | | | | | | | | | | | | | | | | | | | | | | | | | | |
| | (1.85 | ) | | | 19.68 | | | | (31.39 | ) | | | 20,857 | | | | 0.62 | | | | 8.01 | | | | 50.35 | |
| | (0.87 | ) | | | 30.76 | | | | 35.98 | | | | 41,831 | | | | 0.61 | | | | 2.21 | | | | 16.08 | |
| | (1.04 | ) | | | 23.26 | | | | (36.91 | ) | | | 34,181 | | | | 0.62 | | | | 3.91 | | | | 20.85 | |
| | (1.56 | ) | | | 38.16 | | | | 15.05 | | | | 72,282 | | | | 0.62 | | | | 2.81 | | | | 18.05 | |
| | (0.72 | ) | | | 34.72 | | | | (7.55 | ) | | | 82,282 | | | | 0.62 | # | | | 2.01 | | | | 39.15 | |
Financial Highlights
Selected Per Share Data & Ratios
For a Share Outstanding Throughout the Period
| | | Net Asset Value, Beginning of Period ($) | | | Net Investment Income ($)* | | | Net Realized and Unrealized Gain (Loss) on Investments ($) | | | Total from Operations ($) | | | Distribution from Net Investment Income ($) | | | Distribution from Capital Gains ($) | | | Return of Capital ($) | |
| Global X MSCI Argentina ETF | | | | | | | | | | | | | | | | | | | | | |
2022 | | | 33.00 | | | | 0.77 | | | | (1.99 | ) | | | (1.22 | ) | | | (0.65 | ) | | | — | | | | — | |
2021 | | | 23.64 | | | | 0.26 | | | | 9.21 | | | | 9.47 | | | | (0.11 | ) | | | — | | | | — | |
2020 | | | 21.83 | | | | 0.06 | | | | 1.83 | | | | 1.89 | | | | (0.08 | ) | | | — | | | | — | |
2019 | | | 25.36 | | | | 0.29 | | | | (3.26 | ) | | | (2.97 | ) | | | (0.56 | ) | | | — | | | | — | |
2018 | | | 32.05 | | | | 0.35 | | | | (6.87 | ) | | | (6.52 | ) | | | (0.17 | ) | | | — | | | | — | |
| Global X MSCI Pakistan ETF | | | | | | | | | | | | | | | | | | | | | | | | | | | | |
2022 | | | 25.99 | | | | 1.58 | | | | (9.63 | ) | | | (8.05 | ) | | | (1.49 | ) | | | — | | | | — | |
2021 | | | 27.38 | | | | 1.93 | | | | (1.77 | ) | | | 0.16 | | | | (1.55 | ) | | | — | | | | — | |
2020(1) | | | 26.32 | | | | 0.68 | | | | 1.17 | | | | 1.85 | | | | (0.79 | ) | | | — | | | | — | |
2019(1) | | | 41.04 | | | | 1.52 | | | | (13.88 | ) | | | (12.36 | ) | | | (2.36 | ) | | | — | | | | — | |
2018(1) | | | 54.24 | | | | 1.88 | | | | (10.72 | ) | | | (8.84 | ) | | | (1.76 | ) | | | (2.60 | ) | | | — | |
| Global X MSCI Nigeria ETF | | | | | | | | | | | | | | | | | | | | | | | | | | | | |
2022 | | | 15.73 | | | | 0.88 | | | | (2.97 | ) | | | (2.09 | ) | | | (0.73 | ) | | | — | | | | — | |
2021 | | | 14.25 | | | | 0.73 | | | | 1.52 | | | | 2.25 | | | | (0.77 | ) | | | — | | | | — | |
2020 | | | 12.23 | | | | 0.80 | | | | 1.30 | | | | 2.10 | | | | (0.08 | ) | | | — | | | | — | |
2019 | | | 17.98 | | | | 0.87 | | | | (4.96 | ) | | | (4.09 | ) | | | (1.66 | ) | | | — | | | | — | |
2018 | | | 21.43 | | | | 0.73 | | | | (3.76 | ) | | | (3.03 | ) | | | (0.42 | ) | | | — | | | | — | |
| * | Per share data calculated using average shares method. |
| ** | Total Return is for the period indicated and has not been annualized. The return shown does not reflect the deduction of taxes that a shareholder would pay on Fund distributions or the redemption of Fund shares. |
| †† | Portfolio turnover rate is for the period indicated and periods of less than one year have not been annualized. Excludes effect of in-kind transfers. |
| ‡ | The ratio of Expenses to Average Net Assets includes the effect of a waiver. If these offsets were excluded, the ratio would have been 0.66% for the year ended October 31, 2018. |
| (1) | Per share amounts have been adjusted for a 1 for 4 reverse share split on April 28, 2020 (See Note 9 in the Notes to Financial Statements) |
Amounts designated as “—” are either $0 or have been rounded to $0.
Financial Highlights
| Total from Distributions ($) | | | Net Asset Value, End of Period ($) | | | Total Return (%)** | | | Net Assets End of Period ($)(000) | | | Ratio of Expenses to Average Net Assets (%) | | | Ratio of Net Investment Income to Average Net Assets (%) | | | Portfolio Turnover (%)†† | |
| | (0.65 | ) | | | 31.13 | | | | (3.42 | ) | | | 26,930 | | | | 0.59 | | | | 2.52 | | | | 44.70 | |
| | (0.11 | ) | | | 33.00 | | | | 40.09 | | | | 34,810 | | | | 0.59 | | | | 0.85 | | | | 31.35 | |
| | (0.08 | ) | | | 23.64 | | | | 8.61 | | | | 38,421 | | | | 0.60 | | | | 0.25 | | | | 49.17 | |
| | (0.56 | ) | | | 21.83 | | | | (12.08 | ) | | | 59,482 | | | | 0.60 | | | | 1.08 | | | | 28.88 | |
| | (0.17 | ) | | | 25.36 | | | | (20.48 | ) | | | 89,391 | | | | 0.60 | ‡ | | | 1.07 | | | | 34.46 | |
| | | | | | | | | | | | | | | | | | | | | | | | | | | |
| | (1.49 | ) | | | 16.45 | | | | (32.01 | ) | | | 14,347 | | | | 0.80 | | | | 7.65 | | | | 28.59 | |
| | (1.55 | ) | | | 25.99 | | | | 0.02 | | | | 23,967 | | | | 0.76 | | | | 6.59 | | | | 41.83 | |
| | (0.79 | ) | | | 27.38 | | | | 6.99 | | | | 34,555 | | | | 0.90 | | | | 2.44 | | | | 52.38 | |
| | (2.36 | ) | | | 26.32 | | | | (30.73 | ) | | | 41,804 | | | | 0.88 | | | | 5.14 | | | | 19.09 | |
| | (4.36 | ) | | | 41.04 | | | | (17.53 | ) | | | 40,024 | | | | 0.87 | | | | 3.84 | | | | 44.05 | |
| | | | | | | | | | | | | | | | | | | | | | | | | | | |
| | (0.73 | ) | | | 12.91 | | | | (13.69 | ) | | | 38,243 | | | | 0.83 | | | | 5.95 | | | | 1.95 | |
| | (0.77 | ) | | | 15.73 | | | | 16.11 | | | | 46,592 | | | | 0.91 | | | | 5.02 | | | | 5.79 | |
| | (0.08 | ) | | | 14.25 | | | | 17.25 | | | | 42,199 | | | | 0.89 | | | | 6.81 | | | | 18.79 | |
| | (1.66 | ) | | | 12.23 | | | | (24.55 | ) | | | 32,561 | | | | 0.89 | | | | 5.70 | | | | 45.62 | |
| | (0.42 | ) | | | 17.98 | | | | (14.46 | ) | | | 40,675 | | | | 0.88 | | | | 3.29 | | | | 62.52 | |
Financial Highlights
Selected Per Share Data & Ratios
For a Share Outstanding Throughout the Period
| | | Net Asset Value, Beginning of Period ($) | | | Net Investment Income ($)* | | | Net Realized and Unrealized Gain (Loss) on Investments ($) | | | Total from Operations ($) | | | Distribution from Net Investment Income ($) | | | Distribution from Capital Gains ($) | | | Return of Capital ($) | |
| Global X MSCI Vietnam ETF | | | | | | | | | | | | | | | | | | | | | |
2022(1) | | | 25.64 | | | | 0.22 | | | | (11.12 | ) | | | (10.90 | ) | | | (0.07 | ) | | | — | | | | — | |
| Global X MSCI Next Emerging & Frontier ETF | | | | | | | | | | | | | | | | | | | | | | | | | | | | |
2022 | | | 21.00 | | | | 0.49 | | | | (2.93 | ) | | | (2.44 | ) | | | (0.49 | ) | | | — | | | | — | |
2021 | | | 16.46 | | | | 0.46 | | | | 4.56 | | | | 5.02 | | | | (0.48 | ) | | | — | | | | — | |
2020 | | | 20.09 | | | | 0.41 | | | | (3.55 | ) | | | (3.14 | ) | | | (0.49 | ) | | | — | | | | — | |
2019 | | | 20.22 | | | | 0.55 | | | | 0.31 | | | | 0.86 | | | | (0.99 | ) | | | — | | | | — | |
2018 | | | 23.28 | | | | 0.59 | | | | (3.24 | ) | | | (2.65 | ) | | | (0.41 | ) | | | — | | | | — | |
| * | Per share data calculated using average shares method. |
| ** | Total Return is for the period indicated and has not been annualized. The return shown does not reflect the deduction of taxes that a shareholder would pay on Fund distributions or the redemption of Fund shares. |
| † | Annualized. |
| †† | Portfolio turnover rate is for the period indicated and periods of less than one year have not been annualized. Excludes effect of in-kind transfers. |
| (1) | The Fund commenced operations on December 7, 2021. |
Amounts designated as “—” are either $0 or have been rounded to $0.
Financial Highlights
| Total from Distributions ($) | | | Net Asset Value, End of Period ($) | | | Total Return (%)** | | | Net Assets End of Period ($)(000) | | | Ratio of Expenses to Average Net Assets (%) | | | Ratio of Net Investment Income to Average Net Assets (%) | | | Portfolio Turnover (%)†† | |
| | (0.07 | ) | | | 14.67 | | | | (42.60 | ) | | | 2,787 | | | | 0.50 | ��� | | | 1.12 | † | | | 78.28 | |
| | | | | | | | | | | | | | | | | | | | | | | | | | | |
| | (0.49 | ) | | | 18.07 | | | | (11.75 | ) | | | 19,519 | | | | 0.55 | | | | 2.48 | | | | 20.09 | |
| | (0.48 | ) | | | 21.00 | | | | 30.74 | | | | 21,628 | | | | 0.63 | | | | 2.31 | | | | 28.62 | |
| | (0.49 | ) | | | 16.46 | | | | (15.85 | ) | | | 13,991 | | | | 0.70 | | | | 2.36 | | | | 31.66 | |
| | (0.99 | ) | | | 20.09 | | | | 4.29 | | | | 18,077 | | | | 0.66 | | | | 2.66 | | | | 78.67 | |
| | (0.41 | ) | | | 20.22 | | | | (11.66 | ) | | | 13,145 | | | | 0.55 | | | | 2.54 | | | | 14.62 | |
Financial Highlights
Selected Per Share Data & Ratios
For a Share Outstanding Throughout the Period
| | | Net Asset Value, Beginning of Period ($) | | | Net Investment Income ($)* | | | Net Realized and Unrealized Gain (Loss) on Investments ($) | | | Total from Operations ($) | | | Distribution from Net Investment Income ($) | | | Distribution from Capital Gains ($) | | | Return of Capital ($) | |
Global X MSCI Norway ETF(1) | | | | | | | | | | | | | | | | | | | | | |
2022 | | | 32.01 | | | | 1.05 | | | | (7.93 | ) | | | (6.88 | ) | | | (0.70 | ) | | | — | | | | — | |
2021 | | | 20.12 | | | | 0.42 | | | | 11.94 | | | | 12.36 | | | | (0.46 | ) | | | — | | | | (0.01 | ) |
2020(2) | | | 24.52 | | | | 0.42 | | | | (4.38 | ) | | | (3.96 | ) | | | (0.44 | ) | | | — | | | | — | |
2019(2) | | | 29.31 | | | | 0.88 | | | | (3.78 | ) | | | (2.90 | ) | | | (1.89 | ) | | | — | | | | — | |
2018(2) | | | 28.32 | | | | 0.78 | | | | 1.01 | | | | 1.79 | | | | (0.80 | ) | | | — | | | | — | |
| Global X FTSE Southeast Asia ETF | | | | | | | | | | | | | | | | | | | | | | | | | | | | |
2022 | | | 15.10 | | | | 0.39 | | | | (0.86 | ) | | | (0.47 | ) | | | (0.61 | ) | | | — | | | | — | |
2021 | | | 11.66 | | | | 0.62 | | | | 3.09 | | | | 3.71 | | | | (0.27 | ) | | | — | | | | — | |
2020 | | | 15.95 | | | | 0.37 | | | | (4.27 | ) | | | (3.90 | ) | | | (0.39 | ) | | | — | | | | — | |
2019 | | | 15.32 | | | | 0.44 | | | | 0.91 | | | | 1.35 | | | | (0.72 | ) | | | — | | | | — | |
2018 | | | 15.91 | | | | 0.49 | | | | (0.81 | ) | | | (0.32 | ) | | | (0.27 | ) | | | — | | | | — | |
| * | Per share data calculated using average shares method. |
| ** | Total Return is for the period indicated and has not been annualized. The return shown does not reflect the deduction of taxes that a shareholder would pay on Fund distributions or the redemption of Fund shares. |
| †† | Portfolio turnover rate is for the period indicated and periods of less than one year have not been annualized. Excludes effect of in-kind transfers. |
| (1) | On October 29, 2021, the Global X MSCI Norway ETF (the “Acquired Fund”) was reorganized into the Global X FTSE Nordic Region ETF (the “Acquiring Fund”), each a separate series of the Trust (together, the “Combined Fund”) and the Combined Fund was renamed the Global X MSCI Norway ETF. As a result of the Reorganization as of the close of business on October 29, 2021, the Combined Fund assumed the performance and accounting history of the Acquired Fund. Accordingly, performance figures for the Combined Fund for periods prior to the date of the Reorganization represent the performance of the Acquired Fund (See Note 1 in Notes to Financial Statements). |
| (2) | Per share data for the Acquired Fund has been restated for periods prior to the reorganization to reflect the conversion ratio of 0.4766 in effect on the reorganization date of October 29, 2021 (See Note 1 in Notes to Financial Statements). |
Amounts designated as “—” are either $0 or have been rounded to $0.
Financial Highlights
| Total from Distributions ($) | | | Net Asset Value, End of Period ($) | | | Total Return (%)** | | | Net Assets End of Period ($)(000) | | | Ratio of Expenses to Average Net Assets (%) | | | Ratio of Net Investment Income to Average Net Assets (%) | | | Portfolio Turnover (%)†† | |
| | (0.70 | ) | | | 24.43 | | | | (21.72 | ) | | | 99,105 | | | | 0.50 | | | | 3.72 | | | | 15.58 | |
| | (0.47 | ) | | | 32.01 | | | | 64.44 | | | | 103,935 | | | | 0.50 | | | | 3.09 | | | | 9.74 | |
| | (0.44 | ) | | | 20.12 | | | | (16.32 | ) | | | 33,570 | | | | 0.50 | | | | 1.92 | | | | 8.38 | |
| | (1.89 | ) | | | 24.52 | | | | (9.77 | ) | | | 78,323 | | | | 0.50 | | | | 3.36 | | | | 9.63 | |
| | (0.80 | ) | | | 29.31 | | | | 6.47 | | | | 163,471 | | | | 0.50 | | | | 2.64 | | | | 9.55 | |
| | | | | | | | | | | | | | | | | | | | | | | | | | | |
| | (0.61 | ) | | | 14.02 | | | | (3.13 | ) | | | 37,861 | | | | 0.65 | | | | 2.67 | | | | 13.92 | |
| | (0.27 | ) | | | 15.10 | | | | 31.94 | | | | 35,776 | | | | 0.65 | | | | 4.27 | | | | 13.46 | |
| | (0.39 | ) | | | 11.66 | | | | (24.82 | ) | | | 20,981 | | | | 0.65 | | | | 2.77 | | | | 5.98 | |
| | (0.72 | ) | | | 15.95 | | | | 8.94 | | | | 26,323 | | | | 0.65 | | | | 2.76 | | | | 7.01 | |
| | (0.27 | ) | | | 15.32 | | | | (2.15 | ) | | | 17,614 | | | | 0.65 | | | | 2.94 | | | | 11.98 | |
| The accompanying notes are an integral part of the financial statements. |
|
| Notes to Financial Statements |
October 31, 2022
|
1. ORGANIZATION
Global X Funds (the "Trust") is a Delaware statutory trust formed on March 6, 2008. The Trust is registered under the Investment Company Act of 1940, as amended, as an open-end management investment company. As of October 31, 2022, the Trust had one hundred and seven portfolios, ninety-seven of which were operational. The financial statements herein and the related notes pertain to the Global X MSCI China Energy ETF, Global X MSCI China Materials ETF, Global X MSCI China Industrials ETF, Global X MSCI China Consumer Discretionary ETF, Global X MSCI China Consumer Staples ETF, Global X MSCI China Health Care ETF, Global X MSCI China Financials ETF, Global X MSCI China Information Technology ETF, Global X MSCI China Communication Services ETF, Global X MSCI China Utilities ETF, Global X MSCI China Real Estate ETF, Global X MSCI Greece ETF, Global X DAX Germany ETF, Global X MSCI Portugal ETF, Global X MSCI Colombia ETF, Global X MSCI Argentina ETF, Global X MSCI Pakistan ETF, Global X MSCI Nigeria ETF, Global X MSCI Vietnam ETF, Global X MSCI Next Emerging & Frontier ETF, Global X MSCI Norway ETF and Global X FTSE Southeast Asia ETF (each a “Fund”, and collectively, the “Funds”). Each Fund (except for the Global X MSCI Next Emerging & Frontier ETF) has elected non-diversified status.
Global X MSCI Vietnam ETF commenced operations on December 7, 2021.
On August 4, 2021, the Board of Trustees (the “Board”) of the Trust unanimously approved an Agreement and Plan of Reorganization (the “Agreement”) providing for the tax-free reorganization (the “Reorganization”) of the Global X MSCI Norway ETF (the “Acquired Fund”) with and into the Global X FTSE Nordic Region ETF (the “Acquiring Fund”), each a separate series of the Trust (together, the “Combined Fund”). The Agreement provided for: (1) the transfer of all of the assets of the Acquired Fund to the Acquiring Fund solely in exchange for (A) the issuance of the shares of beneficial interest of the Acquiring Fund (collectively, the “Acquiring Fund Shares” and each, an “Acquiring Fund Share”) to the Acquired Fund, and (B) the assumption by the Acquiring Fund of all of the liabilities of the Acquired Fund on the closing date of the Reorganization (the “Closing Date”), and (2) the distribution by the Acquired Fund, on or promptly after the Closing Date as provided in the Agreement, of the Acquiring Fund Shares to the shareholders of the Acquired Fund in complete liquidation of the Acquired Fund. Effective as of the close of business on October 29, 2021, the Acquired Fund was reorganized into the Combined Fund, and the Combined Fund was renamed the Global X MSCI Norway ETF. The Acquiring Fund is the legal surviving entity in the Reorganization, while the Acquired Fund is the accounting survivor or continuing portfolio for purposes of financial and performance history of the Combined Fund. See Note 10 in the Notes to Financial Statements.
On December 24, 2018, the shareholders of the Horizons DAX Germany ETF (the “Predecessor Fund”) approved a proposed agreement and plan of reorganization (the “Reorganization”) that provided for (a) the transfer of all the assets to the Global X DAX Germany ETF (the “Germany Fund”) and the assumption of certain of the liabilities of
|
| Notes to Financial Statements (Continued) |
October 31, 2022
|
1. ORGANIZATION (continued)
the Predecessor Fund; (b) the issuance of shares of the Germany Fund to the shareholders of the Predecessor Fund; and (c) the liquidation and termination of the Predecessor Fund. The effective date of the Reorganization was December 24, 2018. The Germany Fund had no operations prior to the Reorganization. The Predecessor Fund had substantially similar investment objectives, investment strategies, policies and restrictions as those of the Germany Fund. The financial statements and financial highlights include the financial information of the Predecessor Fund through December 21, 2018.
2. SIGNIFICANT ACCOUNTING POLICIES
The following is a summary of the Significant Accounting Policies followed by the Funds.
USE OF ESTIMATES — The Funds are investment companies that apply the accounting and reporting guidance issued in Topic 946 by the U.S. Financial Accounting Standards Board. The preparation of financial statements in conformity with U.S. generally accepted accounting principles ("U.S. GAAP") requires management to make estimates and assumptions that affect the reported amounts of assets and liabilities and disclosure of contingent assets and liabilities at the date of the financial statements and the reported amounts of increases and decreases in net assets from operations during the reporting period. Actual results could materially differ from those estimates.
RETURN OF CAPITAL ESTIMATES — Distributions received by the Funds from underlying master limited partnership (“MLP”) and real estate investment trust (“REIT”) investments generally are comprised of income and return of capital. The Funds record investment income and return of capital based on estimates made at the time such distributions are received. Such estimates are based on historical information available from the MLPs, REITs and other industry sources. These estimates may subsequently be revised based on information received from the MLPs and REITs after their tax reporting periods are concluded.
SECURITY VALUATION — Securities listed on a securities exchange, market or automated quotation system for which quotations are readily available (except for securities traded on the NASDAQ Stock Market (“NASDAQ”)), including securities traded over the counter, are valued at the last quoted sale price on the primary exchange or market (foreign or domestic) on which they are traded (or at approximately 4:00 pm Eastern Standard Time if a security’s primary exchange is normally open at that time), or, if there is no such reported sale, at the most recent mean between the quoted bid and asked prices, which approximates fair value (absent both bid and asked prices on such exchange, the bid price may be used).
For securities traded on NASDAQ, the NASDAQ Official Closing Price will be used. If available, debt securities are priced based upon valuations provided by independent, third-party pricing agents. Such values generally reflect the last reported sales price if the
|
| Notes to Financial Statements (Continued) |
October 31, 2022
|
2. SIGNIFICANT ACCOUNTING POLICIES (continued)
security is actively traded. The third-party pricing agents may also value debt securities at an evaluated bid price by employing methodologies that utilize actual market transactions, broker-supplied valuations, or other methodologies designed to identify the market value for such securities. Debt obligations with remaining maturities of sixty days or less will be valued at amortized cost, which approximates market value. The prices for foreign securities are reported in local currency and converted to U.S. dollars using currency exchange rates as of the reporting date. The exchange rates used by the Trust for valuation are captured as of the New York or London close each day. Prices for most securities held by the Funds are provided daily by recognized independent pricing agents. If a security price cannot be obtained from an independent, third-party pricing agent, the Funds seek to obtain a bid price from at least one independent broker.
Securities for which market prices are not "readily available" are valued in accordance with fair value procedures (the "Fair Value Procedures") established by Global X Management LLC, the Funds’ investment adviser (the “Adviser”), and approved by the Board. Pursuant to Rule 2a-5 under the 1940 Act, the Board has designated the Adviser as the "valuation designee" to determine the fair value of securities and other instruments for which no readily available market quotations are available. The Fair Value Procedures are implemented through a fair value committee (the "Committee") of the Adviser. Some of the more common reasons that may necessitate that a security be valued using the Fair Value Procedures include: the security's trading has been halted or suspended; the security has been de-listed from its primary trading exchange; the security's primary trading market is temporarily closed at a time when, under normal conditions, it would be open; the security has not been traded for an extended period of time; the security's primary pricing source is not able or willing to provide a price; or trading of the security is subject to local government-imposed restrictions. In addition, the Funds may fair value a security if an event that may materially affect the value of the Funds’ security that traded outside of the United States (a “Significant Event”) has occurred between the time of the security's last close and the time that each Fund calculates its net asset value (“NAV”). A Significant Event may relate to a single issuer or to an entire market sector. Events that may be Significant Events include: government actions, natural disasters, armed conflict, acts of terrorism and significant market fluctuations. If the Adviser becomes aware of a Significant Event that has occurred with respect to a security or group of securities after the closing of the exchange or market on which the security or securities principally trade, but before the time at which the Funds calculate their NAVs, it may request that a Committee meeting be called. When a security is valued in accordance with the Fair Value Procedures, the Committee will determine the value after taking into consideration relevant information reasonably available to the Committee.
In accordance with the authoritative guidance on fair value measurements and disclosure under U.S. GAAP, the Funds disclose the fair value of their investments in a hierarchy that prioritizes the inputs to valuation techniques used to measure the fair value. The objective
|
| Notes to Financial Statements (Continued) |
October 31, 2022
|
2. SIGNIFICANT ACCOUNTING POLICIES (continued)
of a fair value measurement is to determine the price that would be received upon the sale of an asset or paid to transfer a liability in an orderly transaction between market participants at the measurement date (an exit price). Accordingly, the fair value hierarchy gives the highest priority to quoted prices (unadjusted) in active markets for identical assets or liabilities (Level 1) and the lowest priority to unobservable inputs (Level 3). The three levels of the fair value hierarchy are described below:
Level 1 – Unadjusted quoted prices in active markets for identical, unrestricted assets or liabilities that the Funds have the ability to access at the measurement date
Level 2 – Other significant observable inputs (including quoted prices in non-active markets, quoted prices for similar investments, fair value of investments for which the Funds have the ability to fully redeem tranches at NAV as of the measurement date or within the near term, and short-term investments valued at amortized cost)
Level 3 – Significant unobservable inputs (including the Funds’ own assumptions in determining the fair value of investments, and fair value of investments for which the Funds do not have the ability to fully redeem tranches at NAV as of the measurement date or within the near term)
Investments are classified within the level of the lowest significant input considered in determining fair value. Investments classified within Level 3 whose fair value measurement considers several inputs may include Level 1 or Level 2 inputs as components of the overall fair value measurement. For details of the investment classification, reference the Schedule of Investments.
The unobservable inputs used to determine fair value of Level 3 assets may have similar or diverging impacts on valuation. Significant increases and decreases in these inputs in isolation and interrelationships between those inputs could result in significantly higher or lower fair value measurement.
DUE TO/FROM BROKERS — Due to/from brokers includes cash and collateral balances with the Funds’ clearing brokers or counterparties as of October 31, 2022. The Funds continuously monitor the credit standing of each broker or counterparty with whom they conduct business. In the event a broker or counterparty is unable to fulfill its obligations, the Funds would be subject to counterparty credit risk.
REPURCHASE AGREEMENTS — Securities pledged as collateral for repurchase agreements by BNP Paribas are held by Brown Brothers Harriman & Co. (“BBH”), the Funds’ custodian (“Custodian”), and are designated as being held on each Fund’s behalf by the Custodian under a book-entry system. Each Fund monitors the adequacy of the collateral on a daily basis and can require the seller to provide additional collateral in the event the market value of the securities pledged falls below the carrying value of the
|
| Notes to Financial Statements (Continued) |
October 31, 2022
|
2. SIGNIFICANT ACCOUNTING POLICIES (continued)
repurchase agreement, including accrued interest. It is the Funds’ policy to only enter into repurchase agreements with banks and other financial institutions which are deemed by the Adviser to be creditworthy. The Funds bear the risk of loss in the event that the counterparty to a repurchase agreement defaults on its obligations and the Funds are prevented from exercising their rights to dispose of the underlying securities received as collateral and the risk of a possible decline in the value of the underlying securities during the period. For financial statement purposes, the Funds record the securities lending collateral (included in repurchase agreements, at value or restricted cash) as an asset and the obligation to return securities lending collateral as a liability on the Statements of Assets and Liabilities.
Repurchase agreements are entered into by the Funds under Master Repurchase Agreements (“MRA”) which permit the Funds, under certain circumstances, including an event of default (such as bankruptcy or insolvency), to offset payables and/or receivables under the MRA with collateral held and/or posted to the counterparty and create one single net payment due to or from the Funds.
As of October 31, 2022, the open repurchase agreements by counterparty which are subject to an MRA on a net payment basis are as follows:
| | | | | | | | | | |
| |
| | | | | | Fair Value | | | | | | | |
| | | | | | of Non-cash | | | Cash | | | | |
| | | Repurchase | | | Collateral | | | Collateral | | | | |
| | | Agreements* | | | Received(1) | | | Received | | | Net Amount(2) | |
| Global X MSCI China Consumer Discretionary | | | | | | | | | | | | |
| ETF | | | | | | | | | | | | |
| BNP Paribas | | $ | 1,171,822 | | | $ | 1,171,822 | | | $ | - | | | $ | - | |
| Global X MSCI China Communication Services | | | | | | | | | | | | | | | | |
| ETF | | | | | | | | | | | | | | | | |
| BNP Paribas | | | 57,855 | | | | 57,855 | | | | - | | | | - | |
| Global X MSCI Portugal ETF | | | | | | | | | | | | | | | | |
| BNP Paribas | | | 282,262 | | | | 282,262 | | | | - | | | | - | |
| Global X MSCI Colombia ETF | | | | | | | | | | | | | | | | |
| BNP Paribas | | | 247,111 | | | | 247,111 | | | | - | | | | - | |
| Global X MSCI Argentina ETF | | | | | | | | | | | | | | | | |
| BNP Paribas | | | 1,047,744 | | | | 1,047,744 | | | | - | | | | - | |
| Global X FTSE Southeast Asia ETF | | | | | | | | | | | | | | | | |
| BNP Paribas | | | 395,134 | | | | 395,134 | | | | - |
|
|
| - |
|
* Repurchase agreements with an overnight and continuous maturity.
(1) Excess collateral received is not presented in the table above. Please refer to the Schedules of Investments for the market value of the collateral received for each Fund.
(2) Net Amount represents the net amount receivable due from the counterparty in the event of default.
FEDERAL INCOME TAXES — It is each Fund’s intention to qualify or continue to qualify as a regulated investment company for Federal income tax purposes by complying with the appropriate provisions of Subchapter M of the Internal Revenue Code of 1986, as amended. Accordingly, no provisions for Federal income taxes have been made in the financial statements except as described below.
|
| Notes to Financial Statements (Continued) |
October 31, 2022
|
2. SIGNIFICANT ACCOUNTING POLICIES (continued)
The Funds evaluate tax positions taken or expected to be taken in the course of preparing the Funds’ tax returns to determine whether it is "more-likely-than-not" (i.e., greater than 50 percent) that each tax position will be sustained upon examination by a taxing authority based on the technical merits of the position. Tax positions not deemed to meet the more-likely-than-not threshold are recorded as a tax benefit or expense in the current year. The Funds did not record any tax positions in the current period; however, management’s conclusions regarding tax positions may be subject to review and adjustment at a later date based on factors including, but not limited to, examination by tax authorities (i.e., the last three tax year ends, as applicable), and on-going analysis of and changes to tax laws and regulations, and interpretations thereof.
If a Fund has foreign tax filings that have not been made, the tax years that remain subject to examination may date back to the inception of the Fund.
As of and during the reporting period October 31, 2022, the Funds did not have a liability for any unrecognized tax benefits. The Funds recognize interest and penalties, if any, related to unrecognized tax benefits as in income tax expense on the Statements of Operations. During the reporting period, the Funds did not incur any interest or penalties.
The Funds file withholding tax reclaims in certain jurisdictions to recover a portion of amounts previously withheld. The Funds may record a reclaim receivable based on collectability, which includes factors such as the jurisdiction’s applicable laws, payment history and market convention. The Statements of Operations includes tax reclaims recorded as well as professional and other fees, if any, associated with recovery of foreign withholding taxes.
SECURITY TRANSACTIONS AND INVESTMENT INCOME — Security transactions are accounted for on the trade date for financial reporting purposes. Costs used in determining realized gains and losses on the sale of investment securities are based on specific identification. Dividend income is recorded on the ex-dividend date. Interest income is recognized on the accrual basis from the settlement date. Amortization of premiums and accretion of discounts is included in interest income.
FOREIGN CURRENCY TRANSACTIONS AND TRANSLATION — The books and records of the Funds are maintained in U.S. dollars. Investment securities and other assets and liabilities denominated in a foreign currency are translated into U.S. dollars on the date of valuation. Purchases and sales of investment securities, income and expenses are translated into U.S. dollars at the relevant rates of exchange prevailing on the respective dates of such transactions. Foreign governments and their agencies may enact policies that delay or place limits on repatriation of local currency to U.S. dollars. Market quoted rates for immediate currency settlement may have access or transaction volume restrictions that are insufficient to convert a significant portion of a fund’s local currency denominated assets and liabilities to U.S. dollars. Monetary policies enacted by government agencies
|
| Notes to Financial Statements (Continued) |
October 31, 2022
|
2. SIGNIFICANT ACCOUNTING POLICIES (continued)
in Nigeria, limiting its local currency's repatriation to safeguard U.S. dollar reserves and exchange rates, significantly impacts the ability of the Global X MSCI Nigeria ETF and other Funds to convert local denominated assets and liabilities amounts to U.S. dollars using quoted immediate currency settlement rates. As of October 31, 2022, assets and liabilities denominated in Nigerian Naira are translated using the Nigerian Autonomous Foreign Exchange Rate Fixing (“NAFEX”) rate. The use of an alternative exchange rate would impact the effect of currency translation and the results of operations.
The Funds do not isolate that portion of realized or unrealized gains and losses resulting from changes in the foreign exchange rate from fluctuations arising from changes in the market prices of the securities. These gains and losses are included in net realized and unrealized gains and losses on investments on the Statement of Operations. Net realized and unrealized gains and losses on foreign currency transactions and translations represent net foreign exchange gains or losses from foreign currency spot contracts, disposition of foreign currencies, currency gains or losses realized between trade and settlement dates on securities transactions and the difference between the amount of the investment income and foreign withholding taxes recorded on the Funds’ books and the U.S. dollar equivalent amounts actually received or paid.
FOREIGN CURRENCY CONTRACTS - To the extent consistent with its investment policies, each Fund may invest in forward foreign currency exchange contracts and foreign currency futures contracts. No Fund, however, expects to engage in currency transactions for speculative purposes or for the purpose of hedging against declines in the value of Fund's assets that are denominated in a foreign currency. A Fund may enter into forward foreign currency exchange contracts and foreign currency futures contracts to facilitate local settlements or to protect against currency exposure in connection with its distributions to shareholders. Foreign currency exchange contracts involve an obligation to purchase or sell a specified currency on a future date at a price set at the time of the contract. Forward currency contracts do not eliminate fluctuations in the values of portfolio securities but rather allow a Fund to establish a rate of exchange for a future point in time. Foreign currency futures contracts involve an obligation to deliver or acquire the specified amount of a specific currency, at a specified price and at a specified future time. Such futures contracts may be settled on a net cash payment basis rather than by the sale and delivery of the underlying currency. A Fund may incur costs in connection with forward foreign currency exchange and futures contracts and conversions of foreign currencies and U.S dollars. The net realized gain or loss on forward foreign currency contracts is reflected in the Statements of Operations and the net unrealized gains (losses) are included as component of the net change in unrealized appreciation (depreciation) on forward foreign currency contracts in the Statements of Operations. As of October 31, 2022, there were no foreign currency exchange contracts and foreign currency futures contracts held by the Funds.
|
| Notes to Financial Statements (Continued) |
October 31, 2022
|
2. SIGNIFICANT ACCOUNTING POLICIES (continued)
For the period ended October 31, 2022, the average balances of forward foreign currency exchange contracts for Global X MSCI Nigeria ETF were as follows:
Average Monthly Notional Balance Short
| $1,305,616 |
DIVIDENDS AND DISTRIBUTIONS TO SHAREHOLDERS — The Funds distribute their net investment income on a pro rata basis. Any net investment income and net realized capital gains are distributed at least annually. All distributions are recorded on the ex-dividend date.
CASH OVERDRAFT CHARGES — Per the terms of an agreement with BBH, if a Fund has a cash overdraft on a given day, it will be assessed an overdraft charge of LIBOR plus 2.00%. Cash overdraft charges are included in custodian fees on the Statements of Operations.
CREATION UNITS — The Funds issue and redeem their shares (“Shares”) on a continuous basis at net asset value (“NAV”) and only in large blocks of 10,000 Shares, referred to as “Creation Units”. Purchasers of Creation Units (“Authorized Participants”) at NAV must pay a standard creation transaction fee per transaction. The fee is a single charge and will be the same regardless of the number of Creation Units purchased by an Authorized Participant on the same day. An Authorized Participant who holds Creation Units and wishes to redeem at NAV would also pay a standard redemption fee per transaction to BBH on the date of such redemption, regardless of the number of Creation Units redeemed that day. If a Creation Unit is purchased or redeemed for cash, an additional variable fee may be charged. The following table discloses Creation Unit breakdown:
|
| Notes to Financial Statements (Continued) |
October 31, 2022
|
2. SIGNIFICANT ACCOUNTING POLICIES (continued)
| | | | | | | | | | |
| |
| | | | | | | | | Value at | | | | |
| | | Creation Unit | | | Creation | | | October | | | Redemption | |
| | | Shares | | | Fee | | | | 31, 2022 | | | Fee | |
| Global X MSCI China Energy ETF | | | 10,000 | | | $ | 800 | | | $ | 136,400 | | | $ | 800 | |
| Global X MSCI China Materials ETF | | | 10,000 | | | | 1,500 | | | | 146,000 | | | | 1,500 | |
| Global X MSCI China Industrials ETF | | | 10,000 | | | | 2,100 | | | | 109,300 | | | | 2,100 | |
| Global X MSCI China Consumer Discretionary | | | | | | | | | | | | | | | | |
| ETF | | | 10,000 | | | | 3,500 | | | | 145,500 | | | | 3,500 | |
| Global X MSCI China Consumer Staples ETF | | | 10,000 | | | | 1,300 | | | | 172,400 | | | | 1,300 | |
| Global X MSCI China Health Care ETF | | | 10,000 | | | | 1,400 | | | | 134,600 | | | | 1,400 | |
| Global X MSCI China Financials ETF | | | 10,000 | | | | 4,500 | | | | 97,800 | | | | 4,500 | |
| Global X MSCI China Information Technology | | | 10,000 | | | | 1,900 | | | | 148,100 | | | | 1,900 | |
| ETF | | | | | | | | | | | | | | | | |
| Global X MSCI China Communication Services | | | 10,000 | | | | 800 | | | | 96,500 | | | | 800 | |
| ETF | | | | | | | | | | | | | | | | |
| Global X MSCI China Utilities ETF | | | 10,000 | | | | 1,000 | | | | 118,400 | | | | 1,000 | |
| Global X MSCI China Real Estate ETF | | | 10,000 | | | | 1,200 | | | | 145,500 | | | | 1,200 | |
| Global X MSCI Greece ETF | | | 10,000 | | | | 500 | | | | 241,400 | | | | 500 | |
| Global X DAX Germany ETF | | | 10,000 | | | | 500 | | | | 227,400 | | | | 500 | |
| Global X MSCI Portugal ETF | | | 10,000 | | | | 700 | | | | 93,500 | | | | 700 | |
| Global X MSCI Colombia ETF | | | 10,000 | | | | 1,500 | | | | 196,800 | | | | 1,500 | |
| Global X MSCI Argentina ETF | | | 10,000 | | | | 500 | | | | 311,300 | | | | 500 | |
| Global X MSCI Pakistan ETF | | | 10,000 | | | | 2,800 | | | | 164,500 | | | | 2,800 | |
| Global X MSCI Nigeria ETF | | | 10,000 | | | | 2,000 | | | | 129,100 | | | | 2,000 | |
| Global X MSCI Vietnam ETF | | | 10,000 | | | | 1,000 | | | | 146,700 | | | | 1,000 | |
| Global X MSCI Next Emerging & Frontier ETF | | | 10,000 | | | | 9,500 | | | | 180,700 | | | | 9,500 | |
| Global X MSCI Norway ETF | | | 10,000 | | | | 1,200 | | | | 244,300 | | | | 1,200 | |
| Global X FTSE Southeast Asia ETF | | | 10,000 | | | | 2,100 | | | | 140,200 | | | | 2,100 | |
3. RELATED PARTIES AND SERVICE PROVIDER TRANSACTIONS
On July 2, 2018, the Adviser consummated a transaction pursuant to which it became an indirect, wholly-owned subsidiary of Mirae Asset Global Investments Co., Ltd. (“Mirae”). In this manner, the Adviser is ultimately controlled by Mirae, which is a leading financial services company in Korea and is the headquarters for the Mirae Asset Global Investments Group.
|
| Notes to Financial Statements (Continued) |
October 31, 2022
|
3. RELATED PARTIES AND SERVICE PROVIDER TRANSACTIONS (continued)
The Adviser serves as the investment adviser and the administrator for the Funds. Subject to the supervision of the Board, the Adviser is responsible for managing the investment activities of the Funds and the Funds’ business affairs and other administrative matters and provides or causes to be furnished all supervisory, administrative and other services reasonably necessary for the operation of the Funds, including certain distribution services (provided pursuant to a separate distribution services agreement), certain shareholder and distribution-related services (provided pursuant to a separate Rule 12b-1 Plan and related agreements) and investment advisory services (provided pursuant to a separate Investment Advisory Agreement), under what is essentially an "all-in" fee structure.
For the Adviser’s service to the respective Funds, under a supervision and administration agreement (the "Supervision and Administration Agreement"), each Fund pays a monthly fee to the Adviser at the annual rate below (stated as a percentage of the average daily net assets of the Fund). In addition, the Funds bear other expenses, directly and indirectly that are not covered by the Supervision and Administration Agreement, which may vary and affect the total expense ratios of the Funds, such as taxes, brokerage fees, commissions, custodian fees and other transaction expenses, interest expenses, acquired fund fees and extraordinary expenses (such as litigation and indemnification expenses).
|
| Notes to Financial Statements (Continued) |
October 31, 2022
|
3. RELATED PARTIES AND SERVICE PROVIDER TRANSACTIONS (continued)
The following table discloses supervision and administration fees payable pursuant to the Supervision and Administration Agreement:
| |
| |
| | | Supervision and | |
| | | Administration Fee | |
| Global X MSCI China Energy ETF | | | 0.65 | % |
| Global X MSCI China Materials ETF | | | 0.65 | % |
| Global X MSCI China Industrials ETF | | | 0.65 | % |
| Global X MSCI China Consumer Discretionary ETF | | | 0.65 | % |
| Global X MSCI China Consumer Staples ETF | | | 0.65 | % |
| Global X MSCI China Health Care ETF | | | 0.65 | % |
| Global X MSCI China Financials ETF | | | 0.65 | % |
| Global X MSCI China Information Technology ETF | | | 0.65 | % |
| Global X MSCI China Communication Services ETF | | | 0.65 | % |
| Global X MSCI China Utilities ETF | | | 0.65 | % |
| Global X MSCI China Real Estate ETF | | | 0.65 | % |
| Global X MSCI Greece ETF | | | 0.55 | % |
| Global X DAX Germany ETF | | | 0.20 | % |
| Global X MSCI Portugal ETF | | | 0.55 | % |
| Global X MSCI Colombia ETF | | | 0.61 | % |
| Global X MSCI Argentina ETF | | | 0.59 | % |
| Global X MSCI Pakistan ETF | | | 0.68 | % |
| Global X MSCI Nigeria ETF | | | 0.68 | % |
| Global X MSCI Vietnam ETF | | | 0.50 | % |
| Global X MSCI Next Emerging & Frontier ETF | | | 0.49 | % |
| Global X MSCI Norway ETF | | | 0.50 | % |
| Global X FTSE Southeast Asia ETF | | | 0.65 | % |
SEI Investments Global Funds Services (“SEIGFS”) serves as sub-administrator to the Funds. As sub-administrator, SEIGFS provides the Funds with the required general administrative services, including, without limitation: office space, equipment, and personnel; clerical and general back office services; bookkeeping, internal accounting and secretarial services; the calculation of NAV; and assistance with the preparation and filing of reports, registration statements, proxy statements and other materials required to be filed or furnished by the Funds under federal and state securities laws. As compensation for these services, SEIGFS receives certain out-of-pocket costs, transaction fees and asset-based fees which are accrued daily and paid monthly by the Adviser.
|
| Notes to Financial Statements (Continued) |
October 31, 2022
|
3. RELATED PARTIES AND SERVICE PROVIDER TRANSACTIONS (continued)
SEI Investments Distribution Co. (“SIDCO”) serves as the Funds’ underwriter and distributor of Creation Units pursuant to a distribution agreement (the "Distribution Agreement"). SIDCO has no obligation to sell any specific quantity of Shares. SIDCO bears the following costs and expenses relating to the distribution of Shares: (i) the costs of processing and maintaining records of creations of Creation Units; (ii) all costs of maintaining the records required of a registered broker/dealer; (iii) the expenses of maintaining its registration or qualification as a dealer or broker under Federal or state laws; (iv) filing fees; and (v) all other expenses incurred in connection with the distribution services as contemplated in the Distribution Agreement. SIDCO receives no fee for its distribution services under the Distribution Agreement, rather the Adviser compensates SIDCO for certain expenses, out-of-pocket costs, and transaction fees.
BBH serves as transfer agent and Custodian of the Funds’ assets. As Custodian, BBH has agreed to (1) make receipts and disbursements of money on behalf of the Funds; (2) collect and receive all income and other payments and distributions on account of the Funds’ portfolio investments; (3) respond to correspondence from shareholders, security brokers and others relating to its duties; and (4) make periodic reports to the Funds concerning the Funds’ operations. BBH does not exercise any supervisory function over the purchase and sale of securities. As compensation for these services, BBH receives certain out-of-pocket costs, transaction fees and asset-based fees which are accrued daily and paid monthly by the Adviser from its fees. As transfer agent, BBH has agreed to (1) issue and redeem shares of each Fund; (2) make dividend and other distributions to shareholders of each Fund; (3) respond to correspondence by shareholders and others relating to its duties; (4) maintain shareholder accounts; and (5) make periodic reports to the Funds. As compensation for these services, BBH receives certain out of-pocket costs, transaction fees and asset-based fees which are accrued daily and paid monthly by the Adviser from its fees.
|
| Notes to Financial Statements (Continued) |
October 31, 2022
|
4. INVESTMENT TRANSACTIONS
For the year ended October 31, 2022, the purchases and sales of investments in securities, excluding in-kind transactions, long-term U.S. Government and short-term securities were:
| | | | |
| |
| | | | | | Sales and | |
| | | Purchases | | | Maturities | |
| Global X MSCI China Energy ETF | | $ | 18,917,005 | | | $ | 7,134,021 | |
| Global X MSCI China Materials ETF | | | 8,905,326 | | | | 5,555,491 | |
| Global X MSCI China Industrials ETF | | | 28,422,240 | | | | 12,350,458 | |
| Global X MSCI China Consumer Discretionary ETF | | | 112,863,378 | | | | 86,859,593 | |
| Global X MSCI China Consumer Staples ETF | | | 16,207,569 | | | | 9,862,891 | |
| Global X MSCI China Health Care ETF | | | 3,270,318 | | | | 2,436,895 | |
| Global X MSCI China Financials ETF | | | 83,255,233 | | | | 21,826,607 | |
| Global X MSCI China Information Technology ETF | | | 8,426,094 | | | | 7,237,854 | |
| Global X MSCI China Communication Services ETF | | | 2,769,572 | | | | 3,237,823 | |
| Global X MSCI China Utilities ETF | | | 2,617,186 | | | | 770,996 | |
| Global X MSCI China Real Estate ETF | | | 10,373,655 | | | | 3,147,164 | |
| Global X MSCI Greece ETF | | | 30,328,150 | | | | 29,449,163 | |
| Global X DAX Germany ETF | | | 3,595,418 | | | | 3,606,269 | |
| Global X MSCI Portugal ETF | | | 4,674,611 | | | | 4,452,717 | |
| Global X MSCI Colombia ETF | | | 16,602,889 | | | | 21,154,564 | |
| Global X MSCI Argentina ETF | | | 13,285,433 | | | | 13,802,802 | |
| Global X MSCI Pakistan ETF | | | 5,193,556 | | | | 6,315,607 | |
| Global X MSCI Nigeria ETF | | | 1,157,948 | | | | 810,387 | |
| Global X MSCI Vietnam ETF | | | 10,777,442 | | | | 4,636,618 | |
| Global X MSCI Next Emerging & Frontier ETF | | | 4,615,871 | | | | 4,149,485 | |
| Global X MSCI Norway ETF | | | 16,894,407 | | | | 15,617,372 | |
| Global X FTSE Southeast Asia ETF | | | 5,793,386 | | | | 5,269,909 | |
During the year ended October 31, 2022, there were no purchases or sales of long-term U.S. Government securities for the Funds.
|
| Notes to Financial Statements (Continued) |
October 31, 2022
|
4. INVESTMENT TRANSACTIONS (continued)
For the year ended October 31, 2022, in-kind transactions associated with creations and redemptions were:
| | | | | | | | | | | | Realized
| |
2022
| | | Purchases
| | | | Sales
| | | | Gains (Loss)
| |
| Global X MSCI China Energy ETF | | $ | – | | | $ | 7,232,812 | | | $ | 1,014,244 | |
| Global X MSCI China Materials ETF | | | – | | | | 4,632,446 | | | | 580,323 | |
| Global X MSCI China Industrials ETF | | | 2,982,873 | | | | 11,688,526 | | | | (835,733 | ) |
| Global X MSCI China Consumer Discretionary ETF | | | 18,955,296 | | | | 204,800,995 | | | | 2,257,587 | |
| Global X MSCI China Consumer Staples ETF | | | 126,090 | | | | 7,686,973 | | | | (65,036 | ) |
| Global X MSCI China Health Care ETF | | | 278,196 | | | | 2,159,620 | | | | (2,930 | ) |
| Global X MSCI China Financials ETF | | | 915,081 | | | | 58,866,374 | | | | (6,242,513 | ) |
| Global X MSCI China Information Technology ETF | | | 289,439 | | | | 3,378,521 | | | | 84,824 | |
| Global X MSCI China Communication Services ETF | | | – | | | | 1,040,304 | | | | 39,809 | |
| Global X MSCI China Utilities ETF | | | – | | | | 136,022 | | | | 40,192 | |
| Global X MSCI China Real Estate ETF | | | 490,541 | | | | 1,933,602 | | | | (159,997 | ) |
| Global X MSCI Greece ETF | | | 11,172,735 | | | | 36,152,405 | | | | 8,886,376 | |
| Global X DAX Germany ETF | | | 21,881,463 | | | | 15,897,038 | | | | 2,423,484 | |
| Global X MSCI Portugal ETF | | | 11,991,466 | | | | 4,844,829 | | | | (120,158 | ) |
| Global X MSCI Colombia ETF | | | 2,285,138 | | | | 6,249,153 | | | | 221,033 | |
| Global X MSCI Argentina ETF | | | 2,531,900 | | | | 6,539,079 | | | | 1,155,852 | |
| Global X MSCI Pakistan ETF | | | – | | | | – | | | | – | |
| Global X MSCI Nigeria ETF | | | – | | | | – | | | | – | |
| Global X MSCI Vietnam ETF | | | – | | | | – | | | | – | |
| Global X MSCI Next Emerging & Frontier ETF | | | 468,248 | | | | – | | | | – | |
| Global X MSCI Norway ETF | | | 57,064,489 | | | | 31,468,633 | | | | 3,686,331 | |
| Global X FTSE Southeast Asia ETF | | | 8,781,767 | | | | 4,262,352 | | | | 508,556 | |
5. TAX INFORMATION
The amount and character of income and capital gain distributions to be paid, if any, are determined in accordance with Federal income tax regulations, which may differ from U.S. GAAP. As a result, net investment income (loss) and net realized gain (loss) on investment transactions for a reporting period may differ significantly from distributions during such period. These book/tax differences may be temporary or permanent. To the extent these differences are permanent in nature, they are charged or credited to undistributed net investment income (loss), accumulated net realized gain (loss) or paid in capital, as appropriate, in the period that the differences arise.
|
| Notes to Financial Statements (Continued) |
October 31, 2022
|
5. TAX INFORMATION (continued)
The following differences, primarily attributable to redemptions in-kind, sales of passive foreign investment companies, and foreign currency, have been reclassified to/from the following accounts during the fiscal period ended October 31, 2022:
| | | | |
| |
| | | | | | Distributable | |
| | | Paid-in | | | Earnings | |
| Global X Funds | | Capital | | | (Loss) | |
| Global X MSCI China Energy ETF | | $ | 876,892 | | | $ | (876,892 | ) |
| Global X MSCI China Materials ETF | | | 544,827 | | | | (544,827 | ) |
| Global X MSCI China Industrials ETF | | | (846,518 | ) | | | 846,518 | |
| Global X MSCI China Consumer Discretionary ETF | | | (1,635,434 | ) | | | 1,635,434 | |
| Global X MSCI China Consumer Staples ETF | | | (87,890 | ) | | | 87,890 | |
| Global X MSCI China Health Care ETF | | | (40,723 | ) | | | 40,723 | |
| Global X MSCI China Financials ETF | | | (6,492,918 | ) | | | 6,492,918 | |
| Global X MSCI China Information Technology ETF | | | 45,214 | | | | (45,214 | ) |
| Global X MSCI China Communication Services ETF | | | (139,256 | ) | | | 139,256 | |
| Global X MSCI China Utilities ETF | | | 37,623 | | | | (37,623 | ) |
| Global X MSCI China Real Estate ETF | | | (168,395 | ) | | | 168,395 | |
| Global X MSCI Greece ETF | | | 7,634,229 | | | | (7,634,229 | ) |
| Global X DAX Germany ETF | | | 2,180,608 | | | | (2,180,608 | ) |
| Global X MSCI Portugal ETF | | | (138,355 | ) | | | 138,355 | |
| Global X MSCI Colombia ETF | | | 169,098 | | | | (169,098 | ) |
| Global X MSCI Argentina ETF | | | 1,135,018 | | | | (1,135,018 | ) |
| Global X MSCI Norway ETF | | | 3,538,185 | | | | (3,538,185 | ) |
| Global X FTSE Southeast Asia ETF | | | 462,606 | | | | (462,606 | ) |
These reclassifications have no impact on net assets or NAV per share.
|
| Notes to Financial Statements (Continued) |
October 31, 2022
|
5. TAX INFORMATION (continued)
The tax character of dividends and distributions declared during the periods ended October 31, 2022 and 2021 were as follows:
| | | | | | | | | | |
| |
| | | Long-Term | | | | | | | | | | |
| Global X Funds | | Ordinary Income | | | Capital Gain | | | Return of Capital | | | Totals | |
| Global X MSCI China Energy ETF | | | | | | | | | | |
| 2022 | | $ | 152,497 | | | $ | – | | | $ | – | | | $ | 152,497 | |
| 2021 | | | 61,017 | | | | – | | | | – | | | | 61,017 | |
| Global X MSCI China Materials ETF | | | | | | | | | | | | | |
| 2022 | | $ | 95,929 | | | $ | – | | | $ | – | | | $ | 95,929 | |
| 2021 | | | 85,767 | | | | – | | | | – | | | | 85,767 | |
| Global X MSCI China Industrials ETF | | | | | | | | | | | | | |
| 2022 | | $ | 68,060 | | | $ | – | | | $ | – | | | $ | 68,060 | |
| 2021 | | | 44,984 | | | | – | | | | – | | | | 44,984 | |
| Global X MSCI China Consumer Discretionary ETF | | | | | | | | | |
| 2022 | | $ | 925,757 | | | $ | – | | | $ | – | | | $ | 925,757 | |
| 2021 | | | 380,749 | | | | – | | | | – | | | | 380,749 | |
| Global X MSCI China Consumer Staples ETF | | | | | | | | | |
| 2022 | | $ | 203,537 | | | $ | 504,089 | | | $ | – | | | $ | 707,626 | |
| 2021 | | | 165,719 | | | | – | | | | – | | | | 165,719 | |
| Global X MSCI China Health Care ETF | | | | | | | | | | | | | |
| 2022 | | $ | 16,856 | | | $ | – | | | $ | – | | | $ | 16,856 | |
| 2021 | | | 7,709 | | | | – | | | | – | | | | 7,709 | |
Global X MSCI China Financials ETF | | | | | | | | | | | | | |
| 2022 | | $ | 1,762,014 | | | $ | – | | | $ | – | | | $ | 1,762,014 | |
| 2021 | | | 1,869,196 | | | | – | | | | – | | | | 1,869,196 | |
| Global X MSCI China Information Technology ETF | | | | | | | | | |
| 2022 | | $ | 92,279 | | | $ | 662,560 | | | $ | – | | | $ | 754,839 | |
| 2021 | | | 254,780 | | | | 11,340 | | | | – | | | | 266,120 | |
| Global X MSCI China Communication Services ETF | | | | | | | | | |
| 2022 | | $ | 91,893 | | | $ | – | | | $ | – | | | $ | 91,893 | |
| 2021 | | | 201,302 | | | | – | | | | 30,513 | | | | 231,815 | |
| Global X MSCI China Utilities ETF | | | | | | | | | | | | | |
| 2022 | | $ | 46,157 | | | $ | 34,700 | | | $ | – | | | $ | 80,857 | |
| 2021 | | | 63,139 | | | | – | | | | – | | | | 63,139 | |
| Global X MSCI China Real Estate ETF | | | | | | | | | | | | | |
| 2022 | | $ | 205,698 | | | $ | – | | | $ | – | | | $ | 205,698 | |
| 2021 | | | 311,838 | | | | – | | | | – | | | | 311,838 | |
| Global X MSCI Greece ETF | | | | | | | | | | | | | |
| 2022 | | $ | 2,877,578 | | | $ | – | | | $ | – | | | $ | 2,877,578 | |
| 2021 | | | 3,402,946 | | | | – | | | | – | | | | 3,402,946 | |
| Global X DAX Germany ETF | | | | | | | | | | | | | |
| 2022 | | $ | 1,178,656 | | | $ | – | | | $ | – | | | $ | 1,178,656 | |
| 2021 | | | 1,062,843 | | | | – | | | | – | | | | 1,062,843 | |
|
| Notes to Financial Statements (Continued) |
October 31, 2022
|
5. TAX INFORMATION (continued)
| | | | | | | | | | |
| |
| | | Long-Term | | | | | | | | | | |
| Global X Funds | | Ordinary Income | | | Capital Gain | | | Return of Capital | | | Totals | |
| Global X MSCI Portugal ETF | | | | | | | | | | |
| 2022 | | $ | 300,309 | | | $ | – | | | $ | – | | | $ | 300,309 | |
| 2021 | | | 509,812 | | | | – | | | | – | | | | 509,812 | |
| Global X MSCI Colombia ETF | | | | | | | | | | | | | |
| 2022 | | $ | 2,097,252 | | | $ | – | | | $ | – | | | $ | 2,097,252 | |
| 2021 | | | 1,240,682 | | | | – | | | | – | | | | 1,240,682 | |
| Global X MSCI Argentina ETF | | | | | | | | | | | | | |
| 2022 | | $ | 647,649 | | | $ | – | | | $ | – | | | $ | 647,649 | |
| 2021 | | | 163,672 | | | | – | | | | – | | | | 163,672 | |
| Global X MSCI Pakistan ETF | | | | | | | | | | | | | |
| 2022 | | $ | 1,339,067 | | | $ | – | | | $ | – | | | $ | 1,339,067 | |
| 2021 | | | 1,563,198 | | | | – | | | | – | | | | 1,563,198 | |
| Global X MSCI Nigeria ETF | | | | | | | | | | | | | |
| 2022 | | $ | 2,165,774 | | | $ | – | | | $ | – | | | $ | 2,165,774 | |
| 2021 | | | 2,273,637 | | | | – | | | | – | | | | 2,273,637 | |
| Global X MSCI Vietnam ETF | | | | | | | | | | | | | |
| 2022 | | $ | 15,977 | | | $ | – | | | $ | – | | | $ | 15,977 | |
| Global X MSCI Next Emerging & Frontier ETF | | | | | | | | | |
| 2022 | | $ | 507,163 | | | $ | – | | | $ | – | | | $ | 507,163 | |
| 2021 | | | 448,516 | | | | – | | | | – | | | | 448,516 | |
| Global X MSCI Norway ETF | | | | | | | | | | | | | |
| 2022 | | $ | 2,606,650 | | | $ | – | | | $ | – | | | $ | 2,606,650 | |
| 2021 | | | 1,549,127 | | | | – | | | | 28,009 | | | | 1,577,136 | |
| Global X FTSE Southeast Asia ETF | | | | | | | | | | | | | |
| 2022 | | $ | 1,542,635 | | | $ | – | | | $ | – | | | $ | 1,542,635 | |
| 2021 | | | 630,414 | | | | – | | | | – | | | | 630,414 | |
As of October 31, 2022, the components of tax basis accumulated losses were as follows:
| | | | | | | |
| |
| | |
Global X Funds |
| | | | Global X MSCI
| | | | Global X | | | | Global X
| |
| | | | China Energy
| | | | China Materials
| | | | MSCI China
| |
| | | | ETF
| | | | ETF
| | | | Industrials ETF
| |
| Undistributed Ordinary Income | | $ | 289,602 | | | $ | 37,508 | | | $ | 84,274 | |
| Capital Loss Carryforwards | | | (1,224,288 | ) | | | (2,768,409 | ) | | | (5,044,362 | ) |
| Unrealized Depreciation on Investments and | | | | | | | | | | | | |
| Foreign Currency | | | (875,993 | ) | | | (1,606,267 | ) | | | (2,364,366 | ) |
| Other Temporary Differences | | | (5 | ) | | | 1 | | | | (5 | ) |
| Total Accumulated Losses | | $ | (1,810,684 | ) | | $ | (4,337,167 | ) | | $ | (7,324,459 | ) |
|
| Notes to Financial Statements (Continued) |
October 31, 2022
|
5. TAX INFORMATION (continued)
| | | | | |
| |
| | | | | Global X Funds | | | |
| | | Global X | | | | | |
| | | MSCI China | | Global X | | | |
| | | Consumer | | MSCI China | | Global X MSCI | |
| | | Discretionary | | Consumer | | China Health | |
| | | ETF | | Staples ETF | | Care ETF | |
| Undistributed Ordinary Income | | $ | 233,832 | | $ | 133,383 | | $ | 27,342 | |
| Capital Loss Carryforwards | | | (139,200,177 | ) | | (534,002 | ) | | (3,080,893 | ) |
| Unrealized Depreciation on Investments and | | | | | | | | | | |
| Foreign Currency | | | (293,085,442 | ) | | (3,551,656 | ) | | (6,016,083 | ) |
| Other Temporary Differences | | | (12 | ) | | – | | | – | |
| Total Accumulated Losses | | $ | (432,051,799 | ) | $ | (3,952,275 | ) | $ | (9,069,634 | ) |
| | | | | |
| |
| | | | | Global X Funds | | | |
| | | | | Global X | | Global X | |
| | | Global X | | MSCI China | | MSCI China | |
| | | MSCI China
| | Information
| | Communication
| |
| | | Financials ETF
| | Technology ETF
| | Services ETF
| |
| Undistributed Ordinary Income | | $ | 1,606,157 | | $ | 45,783 | | $ | 13,635 | |
| Capital Loss Carryforwards | | | (12,762,794 | ) | | (3,937,847 | ) | | (9,315,617 | ) |
| Unrealized Depreciation on Investments and | | | | | | | | | | |
| Foreign Currency | | | (22,122,755 | ) | | (10,595,483 | ) | | (5,496,651 | ) |
| Other Temporary Differences | | | (1 | ) | | (1 | ) | | 1 | |
| Total Accumulated Losses | | $ | (33,279,393 | ) | $ | (14,487,548 | ) | $ | (14,798,632 | ) |
| | | | | |
| |
| | | | | Global X Funds | | | |
| | | | | Global X | | Global X | |
| | | Global X | | MSCI China | | MSCI | |
| | �� | MSCI China
| | Real Estate
| | Greece | |
| | | Utilities ETF
| | ETF
| | ETF
| |
| Undistributed Ordinary Income | | $ | 45,685 | | $ | 256,518 | | $ | 2,713,525 | |
Undistributed Long-Term Capital Gain
| | | 39,826
| | | –
| | | –
| |
| Capital Loss Carryforwards | | | – |
|
| (3,029,414 | )
|
| (226,844,784 | )
|
| Unrealized Depreciation on Investments and |
|
|
|
|
|
|
|
|
|
|
| Foreign Currency | | | (942,700 | ) | | (5,018,062 | ) | | (37,882,958 | ) |
| Other Temporary Differences | | | – |
| | – |
| | (17 | )
|
| Total Accumulated Losses | | $ | (857,189 | ) | $ | (7,790,958 | ) | $ | (262,014,234 | ) |
| | | | | |
| |
| | | | | Global X Funds | | | |
| | | | | Global X | | Global X | |
| | | Global X | | MSCI
| | MSCI | |
| | | Dax Germany
| | Portugal | | Colombia | |
| | | ETF
| | ETF
| | ETF
| |
| Undistributed Ordinary Income | | $ | 63,221 | | $ | 19,655
| | $ | 840,443
| |
| Capital Loss Carryforwards | | | (3,784,615 | )
| | (19,153,346 | )
| | (91,801,436 | )
|
| Unrealized Depreciation on Investments and | | |
| | |
|
| |
|
|
| Foreign Currency | | | (6,968,445 | ) | | (2,777,560 | )
| | (16,764,792 | )
|
| Other Temporary Differences | | | (1 | )
| | (1)
|
| | – |
|
| Total Accumulated Losses | | $ | (10,689,840 | ) | $ | (21,911,252 | ) | $ | (107,725,785 | )
|
|
| Notes to Financial Statements (Continued) |
October 31, 2022
|
5. TAX INFORMATION (continued)
| | | | | |
| |
| | | | | Global X Funds | | | |
| | | Global X MSCI | | Global X MSCI | | Global X MSC | |
| | | Argentina ETF | | Pakistan ETF | | Nigeria ETF | |
| Undistributed Ordinary Income | | $ | 307,087 | | $ | 575,371 | | $ | 1,740,480 | |
| Capital Loss Carryforwards | | | (27,761,223 | ) | | (36,960,330 | ) | | (23,712,374 | ) |
| Unrealized Depreciation on Investments and | | | | | | | | | | |
| Foreign Currency | | | (18,166,914 | ) | | (13,276,489 | ) | | (11,450,609 | ) |
| Other Temporary Differences | | | (1 | ) | | (6 | ) | | (4 | ) |
| Total Accumulated Losses | | $ | (45,621,051 | ) | $ | (49,661,454 | ) | $ | (33,422,507 | ) |
| | | | | |
| |
| | | | | Global X Funds | | | |
| | | | | Global X MSCI | | | |
| | | Global X MSCI | | Next Emerging | | Global X MSC | |
| | | Vietnam ETF | | & Frontier ETF | | Norway ETF | |
| Undistributed Ordinary Income | | $ | 13,589 | | $ | 181,771 | | $ | 1,149,217 | |
| Capital Loss Carryforwards | | | (1,152,132 | ) | | (24,970,057 | ) | | (46,192,377 | ) |
| Unrealized Depreciation on Investments and | | | | | | | | | | |
| Foreign Currency | | | (2,202,552 | ) | | (939,814 | ) | | (28,915,078 | ) |
| Other Temporary Differences | | | – | | | – | | | (10 | ) |
| Total Accumulated Losses | | $ | (3,341,095 | ) | $ | (25,728,100 | ) | $ | (73,958,248 | ) |
|
| |
| | Global X Funds | |
| | Global X FTSE | |
| | Southeast Asia | |
| | ETF | |
| Undistributed Ordinary Income | $ | 407,546 | |
| Capital Loss Carryforwards | | (8,952,059 | ) |
| Unrealized Depreciation on Investments and Foreign Currency | | (2,846,451 | ) |
| Total Accumulated Losses | $ | (11,390,964 | ) |
|
| Notes to Financial Statements (Continued) |
October 31, 2022
|
5. TAX INFORMATION (continued)
For taxable years beginning after December 22, 2010, a registered investment company (“RIC”) is permitted to carry forward net capital losses to offset capital gains realized in later years, and the losses carried forward retain their original character as either long-term or short-term losses. Losses carried forward under these new provisions are as follows:
| | | | | | | | | |
| | | Short-Term | | | Long-Term | | | | |
| | | Loss | | | Loss | | | Total | |
| Global X MSCI China Energy ETF | | $ | 257,956
| | | $ | 966,332
| | | $ | 1,224,288 | |
| Global X MSCI China Materials ETF | | | 907,141
| | | | 1,861,268 | | | | 2,768,409 | |
| Global X MSCI China Industrials ETF | | | 2,514,253
| | | | 2,530,109 | | | | 5,044,362 | |
| Global X MSCI China Consumer Discretionary ETF | | | 49,345,578
| | | | 89,854,599
| | | | 139,200,177
| |
| Global X MSCI China Consumer Staples ETF | | | 393,268
| | | | 140,734 | | | | 534,002 | |
| Global X MSCI China Health Care ETF | | | 560,189
| | | | 2,520,704 | | | | 3,080,893 | |
| Global X MSCI China Financials ETF | | | 8,698,309
| | | | 4,064,485 | | | | 12,762,794 | |
| Global X MSCI China Information Technology ETF | | | 1,239,797
| | | | 2,698,050 | | | | 3,937,847 | |
| Global X MSCI China Communication Services ETF | | | 4,477,286
| | | | 4,838,331 | | | | 9,315,617 | |
| Global X MSCI China Real Estate ETF | | | 1,312,341
| | | | 1,717,073 | | | | 3,029,414 | |
Global X MSCI Greece ETF
| | | 76,066,205
| | | | 150,778,579
| | | | 226,844,784
| |
| Global X DAX Germany ETF | | | 1,293,115
| | | | 2,491,500 | | | | 3,784,615 | |
| Global X MSCI Portugal ETF | | | 3,818,051
| | | | 15,335,295 | | | | 19,153,346 | |
| Global X MSCI Colombia ETF | | | 25,117,812
| | | | 66,683,624 | | | | 91,801,436 | |
| Global X MSCI Argentina ETF | | | 3,785,212
| | | | 23,976,011 | | | | 27,761,223 | |
| Global X MSCI Pakistan ETF | | | 1,390,733
| | | | 35,569,597 | | | | 36,960,330 | |
| Global X MSCI Nigeria ETF | | | 6,704,406
| | | | 17,007,968 | | | | 23,712,374 | |
| Global X MSCI Vietnam ETF | | | 1,152,132
| | | | – | | | | 1,152,132 | |
| Global X MSCI Next Emerging & Frontier ETF | | | 6,272,493
| | | | 18,697,564 | | | | 24,970,057 | |
| Global X MSCI Norway ETF | | | 12,648,729
| | | | 33,543,648 | | | | 46,192,377 | * |
Global X FTSE Southeast Asia ETF
| | | 3,149,354
| | | | 5,802,705
| | | | 8,952,059
| |
* The utilization of this amount is subject to limitation under IRC sections 382-384.
During the year ended October 31, 2022, the following Funds utilized capital loss carryforwards to offset capital gains amounting to:
| | | | | | | |
| |
| | | Short-Term | | | Long-Term | | | | |
| | | Loss | | | Loss | | | Total | |
| Global X MSCI China Energy ETF | | $ | 122,291
| | | $ | 324,498
| | | $ | 446,789 | |
| Global X MSCI Nigeria ETF | | | 1,885 | | | | – | | | | 1,885 | |
|
| Notes to Financial Statements (Continued) |
October 31, 2022
|
5. TAX INFORMATION (continued)
The Federal tax cost basis of investments and aggregate gross unrealized appreciation depreciation on investments held by the Funds at October 31, 2022 were as follows:
| | | | | | | | | | |
| |
| | | | | | Aggregated | | | Aggregated | | | | |
| | | | | | Gross | | | Gross | | | Net | |
| | | Federal Tax | | | Unrealized | | | Unrealized | | | Unrealized | |
| | | Cost
| | | Appreciation
| | | Depreciation
| | | Depreciation
| |
| Global X MSCI China Energy ETF | | $ | 9,997,031 | | | $ | 550,070 | | | $ | (1,426,063 | ) | | $ | (875,993 | ) |
| Global X MSCI China Materials ETF | | | 4,525,495 | | | | 184,666 | | | | (1,790,933 | ) | | | (1,606,267 | ) |
| Global X MSCI China Industrials ETF | | | 7,272,631 | | | | 95,233 | | | | (2,459,599 | ) | | | (2,364,366 | ) |
| Global X MSCI China Consumer | | | | | | | | | | | | | | | | |
| Discretionary ETF | | | 508,987,319 | | | | 4,860,323 | | | | (297,945,765 | ) | | | (293,085,442 | ) |
| Global X MSCI China Consumer Staples | | | | | | | | | | | | | | | | |
| ETF | | | 12,148,741 | | | | 590,803 | | | | (4,142,459 | ) | | | (3,551,656 | ) |
| Global X MSCI China Health Care ETF | | | 14,084,949 | | | | 171,292 | | | | (6,187,375 | ) | | | (6,016,083 | ) |
| Global X MSCI China Financials ETF | | | 49,645,438 | | | | 164,271 | | | | (22,287,026 | ) | | | (22,122,755 | ) |
| Global X MSCI China Information | | | | | | | | | | | | | | | | |
| Technology ETF | | | 24,515,646 | | | | 889,709 | | | | (11,485,192 | ) | | | (10,595,483 | ) |
| Global X MSCI China Communication | | | | | | | | | | | | | | | | |
| Services ETF | | | 10,509,430 | | | | 36,682 | | | | (5,533,333 | ) | | | (5,496,651 | ) |
| Global X MSCI China Utilities ETF | | | 3,456,719 | | | | 26,431 | | | | (969,131 | ) | | | (942,700 | ) |
| Global X MSCI China Real Estate ETF | | | 9,631,234 | | | | – | | | | (5,018,062 | ) | | | (5,018,062 | ) |
| Global X MSCI Greece ETF | | | 144,778,555 | | | | 12,232,118 | | | | (50,115,076 | ) | | | (37,882,958 | ) |
| Global X DAX Germany ETF | | | 46,258,984 | | | | 854,879 | | | | (7,823,324 | ) | | | (6,968,445 | ) |
| Global X MSCI Portugal ETF | | | 18,355,534 | | | | – | | | | (2,777,560 | ) | | | (2,777,560 | ) |
| Global X MSCI Colombia ETF | | | 38,030,115 | | | | 701,472 | | | | (17,466,264 | ) | | | (16,764,792 | ) |
| Global X MSCI Argentina ETF | | | 47,141,618 | | | | 654,319 | | | | (18,821,233 | ) | | | (18,166,914 | ) |
| Global X MSCI Pakistan ETF | | | 27,974,367 | | | | 73,740 | | | | (13,350,229 | ) | | | (13,276,489 | ) |
| Global X MSCI Nigeria ETF | | | 53,122,789 | | | | 3,141,312 | | | | (14,591,921 | ) | | | (11,450,609 | ) |
| Global X MSCI Vietnam ETF | | | 5,088,692 | | | | 19,045 | | | | (2,221,597 | ) | | | (2,202,552 | ) |
| Global X MSCI Next Emerging & Frontier | | | | | | | | | | | | | | | | |
| ETF | | | 20,424,820 | | | | 2,654,160 | | | | (3,593,974 | ) | | | (939,814 | ) |
| Global X MSCI Norway ETF | | | 127,846,899 | | | | 5,750,808 | | | | (34,665,886 | ) | | | (28,915,078 | ) |
| Global X FTSE Southeast Asia ETF | | | 41,335,160 | | | | 2,259,420 | | | | (5,105,871 | ) | | | (2,846,451 | ) |
The preceding differences between book and tax cost are primarily due to mark-to-market treatment of passive foreign investment companies and wash sales.
6. CONCENTRATION OF RISKS
The Funds invest in securities of foreign issuers in several countries. These investments may involve certain considerations and risks not typically associated with investments in the United States as a result of, among other factors, the possibility of future political and economic developments and the level of governmental supervision and regulation of securities markets in the respective countries.
The securities markets of emerging market countries are less liquid and subject to greater price volatility, and have a smaller market capitalization than the U.S. securities markets.
|
| Notes to Financial Statements (Continued) |
October 31, 2022
|
6. CONCENTRATION OF RISKS (continued)
In certain countries, there may be fewer publicly traded securities and the market may be dominated by a few issuers or sectors. Issuers and securities markets in such countries are not subject to as extensive and frequent accounting, financial and other reporting requirements or as comprehensive government regulations as issuers and securities markets in the United States. In particular, the assets and profits appearing on the financial statements of emerging market country issuers may not reflect their financial position or results of operations in the same manner as financial statements for U.S. issuers.
Substantially less information may be publicly available about emerging market country issuers than is available about issuers in the United States.
The Funds may be subject to taxes imposed by countries in which they invest. Such taxes are generally based on either income, gains earned or gains repatriated. The Funds accrue and apply such taxes to net investment income, net realized gains and net unrealized gains as income and/or capital gains are earned.
The Funds use a replication strategy. A replication strategy is an indexing strategy that involves investing in the securities of an underlying index in approximately the same proportions as the underlying index. A representative sampling strategy is an indexing strategy that involves investing in a representative sample of securities (including indirect investments through underlying ETFs) that collectively has an investment profile similar to an underlying index in terms of key risk factors, performance attributes and other characteristics. Each Fund may utilize a representative sampling strategy with respect to its underlying index when a replication strategy might be detrimental to its shareholders, such as when there are practical difficulties or substantial costs involved in compiling a portfolio of equity securities to follow its underlying index, or, in certain instances, when securities in the underlying index become temporarily illiquid, unavailable or less liquid, or due to legal restrictions (such as diversification requirements that apply to a Fund but not its underlying index).
Certain Funds may invest in commodity related securities, which are susceptible to fluctuations in certain commodity markets. Any negative changes in commodity markets could have a great impact on those securities.
The elimination of the London Inter-Bank Offered Rate (“LIBOR”) may adversely affect the interest rates on, and value of, certain Fund investments for which the value is tied to LIBOR. The U.K. Financial Conduct Authority has announced that it intends to stop compelling or inducing banks to submit LIBOR rates after 2021. On March 5, 2021, the administrator of LIBOR clarified that the publication of LIBOR on a representative basis will cease for the one-week and two-month U.S. dollar LIBOR settings immediately after December 31, 2021, and for the remaining U.S. dollar LIBOR settings immediately after June 30, 2023. Alternatives to LIBOR are established or in development in most major currencies, including the Secured Overnight Financing Rate (“SOFR”), which is intended
|
| Notes to Financial Statements (Continued) |
October 31, 2022
|
6. CONCENTRATION OF RISKS (continued)
to replace U.S. dollar LIBOR. Markets are slowly developing in response to these new rates. Questions regarding the impact of this transaction remain a concern for the Fund. Accordingly, it is difficult to predict the full impact of the transition away from LIBOR on the Funds until new reference rates and fallbacks for both legacy and new products, instruments and contracts are commercially accepted.
Economic conditions, such as volatile currency exchange rates and interest rates, political events, military action and other conditions may, without prior warning, lead to foreign government intervention (including intervention by the U.S. government with respect to foreign governments, economic sectors, foreign companies and related securities and interests) and the imposition of capital controls (i.e., government measures designed to limit the flow of foreign capital in and out of the domestic economy) and/or sanctions, which may also include retaliatory actions of one government against another government, such as the seizure of assets. Capital controls and/or sanctions include the prohibition of, or restrictions on, the ability to transfer currency, securities or other assets. Capital controls and/or sanctions may also impact the ability of a Fund to buy, sell or otherwise transfer securities or currency, negatively impact the value and/or liquidity of such instruments, adversely affect the trading market and price for Shares of a Fund, and cause a Fund to decline in value.
The Global X MSCI Nigeria ETF’s investments are largely denominated in naira. Assets denominated in naira are required to be translated to U.S. dollars for financial reporting purposes, which translation is effected utilizing the official exchange rate, i.e. NAFEX. However, the Central Bank of Nigeria has implemented capital controls to manage an official exchange rate that precludes the purchase or sale of naira outside of official markets. As a result, opportunities to repatriate naira into dollars have been limited or non-existent, and in instances where a fund has had a repatriation opportunity, it has experienced extreme delays in repatriating such naira, with such repatriation occurring at times through the Central Bank of Nigeria at a discount to the official exchange rate. These circumstances may create uncertainty regarding the liquidity of transactions repatriating naira to U.S. dollars, as well as uncertainty with respect to the translation of the naira and naira-denominated assets to U.S. dollars.
Special Risk Considerations of Investing in China – Variable Interest Entity Investments. For purposes of raising capital offshore on exchanges outside of China, including on U.S. exchanges, many Chinese-based operating companies are structured as Variable Interest Entities (“VIEs”). In this structure, the Chinese-based operating company is the VIE and establishes a shell company in a foreign jurisdiction, such as the Cayman Islands. The shell company lists on a foreign exchange and enters into contractual arrangements with the VIE. This structure allows Chinese companies in which the Chinese government restricts foreign ownership to raise capital from foreign investors. While the shell company has no equity ownership of the VIE, these contractual arrangements permit the shell company
|
| Notes to Financial Statements (Continued) |
October 31, 2022
|
6. CONCENTRATION OF RISKS (continued)
to consolidate the VIE’s financial statements with its own for accounting purposes and provide for economic exposure to the performance of the underlying Chinese operating company. Therefore, an investor in the listed shell company, such as certain of the Funds, will have exposure to the Chinese-based operating company only through contractual arrangements and has no ownership in the Chinese-based operating company. Furthermore, because the shell company only has specific rights provided for in these service agreements with the VIE, its abilities to control the activities at the Chinese-based operating company are limited and the operating company may engage in activities that negatively impact investment value. While the VIE structure has been widely adopted, it is not formally recognized under Chinese law and therefore there is a risk that the Chinese government could prohibit the existence of such structures or negatively impact the VIE’s contractual arrangements with the listed shell company by declaring them invalid. If these contracts were found to be unenforceable under Chinese law, investors in the listed shell company, such as a Fund, may suffer significant losses with little or no recourse available. If the Chinese government determines that the agreements establishing the VIE structures do not comply with Chinese law and regulations, including those related to restrictions on foreign ownership, it could subject a Chinese-based issuer to penalties, revocation of business and operating licenses, or forfeiture of ownership interest. In addition, the listed shell company’s control over a VIE may also be jeopardized if a natural person who holds the equity interest in the VIE breaches the terms of the agreement, is subject to legal proceedings or if any physical instruments for authenticating documentation, such as chops and seals, are used without the Chinese-based issuer’s authorization to enter into contractual arrangements in China. Chops and seals, which are carved stamps used to sign documents, represent a legally binding commitment by the company. Moreover, any future regulatory action may prohibit the ability of the shell company to receive the economic benefits of the Chinese-based operating company, which may cause the value of a Fund’s investment in the listed shell company to suffer a significant loss. For example, in 2021, the Chinese government prohibited use of the VIE structure for investment in after-school tutoring companies. There is no guarantee that the government will not place similar restrictions on other industries.
On June 3, 2021, President Biden expanded upon a previously issued executive order that prohibited U.S. persons from transacting in publicly traded securities designated by the U.S. Department of Defense as “Communist Chinese Military Companies” or “CCMCs” or in instruments that are derivative of, or are designed to provide investment exposure to, prohibited CCMC securities. President Biden’s executive order (the “Executive Order”) retains the structure of the investment-based CCMC sanctions program introduced in late 2020 but expands the prohibitions to address threats from the use of Chinese surveillance technology outside the People’s Republic of China and the development or use of Chinese surveillance technology to facilitate repression or serious human rights abuse.
Under the Executive Order, U.S. persons will be prohibited from engaging in the purchase or sale of publicly-traded securities, as well as securities derivative of, or designed to provide
|
| Notes to Financial Statements (Continued) |
October 31, 2022
|
6. CONCENTRATION OF RISKS (continued)
investment exposure to, such securities. This prohibition took effect on August 2, 2021 for entities listed in the Appendix to the Executive Order (and 60 days after designation, with respect to subsequently designated entities). In addition, U.S. persons will be required to divest of targeted securities of entities listed in the Appendix to the Executive Order by June 3, 2022 (or 365 days from designation, with respect to subsequently designated entities).
The Executive Order replaces the previous list of CCMCs with a new Non-SDN Chinese Military Industrial Complex Companies List. The U.S. Department of the Treasury, rather than the U.S. Department of Defense, will make designations going forward.
These actions, any future sanctions or other actions, or even the threat of further sanctions or other actions, may negatively affect the value and liquidity of certain of the Funds’ investments. For example, a Fund may be prohibited from investing in securities issued by companies subject to such sanctions. In addition, sanctions may require a Fund to freeze its existing investments, prohibiting such Fund from buying, selling or otherwise transacting in these investments.
Also, if an affected security is included in a Fund's underlying index, such Fund may, where practicable, seek to eliminate its holdings of the affected security by employing or augmenting its representative sampling strategy to seek to track the investment results of the underlying index. The use of (or increased use of) a representative sampling strategy may increase such Fund’s tracking error risk. Actions barring some or all transactions with a specific company will likely have a substantial, negative impact on the value of such company’s securities. These sanctions may also lead to changes in a Fund’s underlying index. A Fund’s index provider may remove securities from the underlying index or implement caps on the securities of certain issuers that have been subject to recent economic sanctions. In such an event, it is expected that a Fund will rebalance its portfolio to bring it in line with its respective underlying index as a result of any such changes, which may result in transaction costs and increased tracking error.
Please refer to each Fund’s prospectus and statement of additional information (“SAI”) for a more complete description of risks.
7. LOANS OF PORTFOLIO SECURITIES
Each Fund may lend portfolio securities having a market value up to one-third of its total assets. Security loans made pursuant to a securities lending agreement with BBH are initially required to be secured by collateral equal to at least 102% of the value of domestic equity securities and American Depositary Receipts ("ADRs") and 105% of the value of foreign equity securities (other than ADRs). Such collateral received in connection with these loans will be cash and can be invested in repurchase agreements, short-term investments or U.S. Treasury obligations, and is recognized in the Schedules
|
| Notes to Financial Statements (Continued) |
October 31, 2022
|
7. LOANS OF PORTFOLIO SECURITIES (continued)
of Investments and Statements of Assets and Liabilities. The obligation to return securities lending collateral is also recognized as a liability in the Statements of Assets and Liabilities. It is the Funds’ policy to obtain additional collateral from or return excess collateral to the borrower by the end of the next business day, following the valuation date of the securities loaned. Therefore, the value of the collateral held may be temporarily less than the value of the securities on loan.
Lending securities entails a risk of loss to the Funds if and to the extent that the market values of the securities loaned were to increase and the borrower did not increase the collateral accordingly, and the borrower failed to return the securities. In the event the borrower may not provide additional collateral when required or may not return the securities when due, the securities lending agency agreement requires the lending agent to indemnify the Funds by replacing either the security or the security’s current market value to the Funds. The Funds could suffer a loss if the value of an investment purchased with cash collateral falls below the market value of loaned securities or if the value of an investment purchased with cash collateral falls below the value of the original cash collateral received. The Funds could also experience delays and costs in gaining access to the collateral. The Funds bear the risk of any deficiency in the amount of the collateral available for return to the borrower due to any loss on the collateral invested.
|
| Notes to Financial Statements (Continued) |
October 31, 2022
|
7. LOANS OF PORTFOLIO SECURITIES (continued)
At October 31, 2022, the following Funds had securities on loan, by counterparty:
|
| | | | |
| |
| | | | | | | Cash | |
| | | | Market Value | | | Collateral(1) | |
| Global X MSCI China Consumer Discretionary ETF | | | | | | | |
| Barclays Capital Inc. | | | $ | 182,647 | | | $ | 200,013 | |
| Citigroup Global Markets Inc. | | | | 1,019,898 | | | | 1,077,696 | |
| Morgan Stanley & Co. LLC | | | | 701,483 | | | | 737,511 | |
| | Total | | $ | 1,904,028 | | | $ | 2,015,220 | |
| Global X MSCI China Communication Services ETF | | | | | | | | | |
| Citigroup Global Markets Inc. | | | $ | 94,485 | | | $ | 99,495 | |
| | Total | | $ | 94,485 | | | $ | 99,495 | |
| Global X MSCI Portugal ETF | | | | | | | | | |
| BofA Securities Inc. | | | $ | 154,315 | | | $ | 161,145 | |
| J.P. Morgan Securities LLC | | | | 36,948 | | | | 41,016 | |
| Morgan Stanley & Co. LLC | | | | 273,392 | | | | 283,254 | |
| | Total | | $ | 464,655 | | | $ | 485,415 | |
| Global X MSCI Colombia ETF | | | | | | | | | |
| BofA Securities Inc. | | | $ | 107,207 | | | $ | 120,044 | |
| Scotia Capital | | | | 232,821 | | | | 243,320 | |
| UBS AG London Branch | | | | 58,942 | | | | 61,600 | |
| | Total | | $ | 398,970 | | | $ | 424,964 | |
| Global X MSCI Argentina ETF | | | | | | | | | |
| BNP Paribas Securities Corp | | | $ | 141,708 | | | $ | 145,040 | |
| BofA Securities Inc. | | | | 72,168 | | | | 74,400 | |
| Citigroup Global Markets Inc. | | | | 101,220 | | | | 103,600 | |
| J.P. Morgan Securities LLC | | | | 1,456,739 | | | | 1,478,800 | |
| | Total | | $ | 1,771,835 | | | $ | 1,801,840 | |
| Global X FTSE Southeast Asia ETF | | | | | | | | | |
| Morgan Stanley & Co. LLC | | | $ | 643,778 | | | $ | 679,524 | |
| | Total | | $ | 643,778 | | | $ | 679,524 | |
(1) It is the Funds' policy to obtain additional collateral from or return excess collateral to the borrower by the end of the next business day, following the valuation date of the securities loaned. Therefore, the value of the collateral held may be temporarily less than the value of the securities on loan.
8. CONTRACTUAL OBLIGATION
The Funds enter into contracts in the normal course of business that contain a variety of indemnifications. The Funds’ maximum exposure under these contracts is unknown, however, the Funds have not had prior gains or losses pursuant to these contracts. Management has reviewed the Funds’ existing contracts and expects the risk of loss to be remote.
Pursuant to the Trust’s organizational documents, the Trustees of the Trust (the "Trustees") and the Trust’s officers are indemnified against certain liabilities that may arise out of the performance of their duties.
|
| Notes to Financial Statements (Continued) |
October 31, 2022
|
9. REVERSE SHARE SPLIT
Effective April 28, 2020, each of the Global X MSCI Colombia ETF, Global X MSCI Greece ETF and Global X MSCI Pakistan ETF executed a reverse share split for shareholders of record after the close of markets on April 27, 2020. The effect of this transaction for each Fund was to divide the number of outstanding Shares of the Fund by the applicable ratio below, resulting in a corresponding increase in the NAV per Share. The capital share activity presented in the Statement of Changes in Net Assets for each of the years in the period then ended, and per share data in the financial highlights for each of the years in the period then ended, have been given retroactive effect to reflect these reverse share splits. There were no changes in net assets, results of operations or total return as a result of these transactions. The details of the reverse splits are as follows:
|
|
| Fund Name | Ratio |
| Global X MSCI Colombia ETF | 1:4 |
| Global X MSCI Greece ETF | 1:3 |
| Global X MSCI Pakistan ETF | 1:4 |
10. MERGER
Effective October 29, 2021, the Global X FTSE Nordic Region ETF (the “Acquiring Fund”) acquired all of the assets and assumed all of the liabilities of the Global X MSCI Norway ETF (the “Acquired Fund”) pursuant to a Plan of Reorganization approved by the Board of Directors on August 4, 2021. Effective as of the close of business on October 29, 2021, the Acquired Fund was reorganized into the Acquiring Fund, each a separate series of the Trust (together, the “Combined Fund”) and the Combined Fund was renamed Global X MSCI Norway ETF. The Acquiring Fund is the legal surviving entity in the Reorganization, while the Acquired Fund is the accounting survivor or continuing portfolio for purposes of financial and performance history of the Combined Fund.
The acquisition was accomplished by a tax-free exchange as follows:
3,980,000 shares of the Acquired Fund, with net assets of $60,723,560 and including $673,023 of net unrealized depreciation for 1,896,973 shares of the Acquiring Fund with net assets of $43,214,538. For every 1 share of the Acquired Fund, shareholders received 0.4766 shares of the Acquiring Fund. Immediately following the acquisition, the Combined Fund held 3,246,971 shares with net assets of $103,938,098.
Assuming that the reorganization had been completed on November 1, 2020, the Acquiring Fund’s pro forma results of operations for the year ended October 31, 2021 would have been as follows:
| |
| |
| Net investment income | | $ | 2,153,445 | |
| Net Realized and unrealized gain (loss) from investments | | | 26,735,503 | |
| Net increase (decrease) in net assets from operations | | $ | 28,888,948 | |
|
| Notes to Financial Statements (Concluded) |
October 31, 2022
|
11. SUBSEQUENT EVENTS
The Board of the Trust approved a reverse share split of one to three (1:3) of the issued and outstanding shares of the Global X MSCI China Real Estate ETF (the "Reverse Share Split"). The Reverse Share Split was completed after the close of business on December 19, 2022. The effect of this transaction was to divide the number of outstanding Shares of the Fund by three, resulting in a corresponding increase in the NAV per Share. The capital share activity presented in the Statement of Changes in Net Assets for each of the years in the period then ended, and the per share data in the financial highlights for each of the years in the period then ended have been updated to reflect this reverse share split. There were no changes in net assets, results of operations or total return as a result of this transaction.
The Funds have been evaluated by management regarding the need for additional disclosures (other than what is disclosed in the preceding paragraph) and/or adjustments resulting from subsequent events. Based on this evaluation, no additional adjustments were required to the financial statements.
|
Report of Independent Registered Public Accounting Firm
|
To the Board of Trustees of Global X Funds and Shareholders of each of the twenty-two funds listed in the table below.
Opinions on the Financial Statements
We have audited the accompanying statements of assets and liabilities, including the schedules of investments, of each of the funds listed in the table below (twenty-two of the funds constituting Global X Funds, hereafter collectively referred to as the "Funds") as of October 31, 2022, the related statements of operations and of changes in net assets for each of the periods indicated in the table below, including the related notes, and the financial highlights for each of the periods indicated in the table below (collectively referred to as the “financial statements”). In our opinion, the financial statements present fairly, in all material respects, the financial position of each of the Funds as of October 31, 2022, the results of each of their operations, the changes in each of their net assets, and each of the financial highlights for each of the periods indicated in the table below, in conformity with accounting principles generally accepted in the United States of America.
|
|
| Global X MSCI Colombia ETF (1) | Global X MSCI Portugal ETF (1) |
| Global X MSCI Norway ETF (1) | Global X MSCI Pakistan ETF (1) |
| Global X MSCI China Industrials ETF (1) | Global X FTSE Southeast Asia ETF (1) |
| Global X MSCI China Consumer Discretionary ETF (1) | Global X MSCI Nigeria ETF (1) |
| Global X MSCI China Energy ETF (1) | Global X DAX Germany ETF (2) |
| Global X MSCI China Financials ETF (1) | Global X MSCI China Consumer Staples ETF (3) |
| Global X MSCI China Communication Services ETF (1) | Global X MSCI China Health Care ETF (3) |
| Global X MSCI China Materials ETF (1) | Global X MSCI China Information Technology ETF (3)
|
| Global X MSCI Argentina ETF (1) | Global X MSCI China Real Estate ETF (3) |
| Global X MSCI Greece ETF (1) | Global X MSCI China Utilities ETF (3) |
| Global X MSCI Next Emerging & Frontier ETF (1) | Global X MSCI Vietnam ETF (4) |
|
Report of Independent Registered Public Accounting Firm
|
| 1. | Statements of operations for the year ended October 31, 2022, the statements of changes in net assets for each of the two years in the period ended October 31, 2022 and the financial highlights for each of the five years in the period ended October 31, 2022. |
| 2. | Statement of operations for the year ended October 31, 2022, the statements of changes in net assets for each of the two years in the period ended October 31, 2022 and the financial highlights for each of the four years in the period ended October 31, 2022. |
| 3. | Statements of operations for the year ended October 31, 2022, the statements of changes in net assets for each of the two years in the period ended October 31, 2022 and the financial highlights for each of the three years in the period ended October 31, 2022, and for the period December 7, 2018 (commencement of operations) through October 31, 2019. |
| 4. | Statement of operations, statement of changes in net assets, and the financial highlights for the period December 7, 2021 (commencement of operations) through October 31, 2022. |
The financial statements of Global X DAX Germany ETF as of and for the year ended October 31, 2018 and the financial highlights for each of the periods ended on or prior to October 31, 2018 (not presented herein, other than the financial highlights) were audited by other auditors whose report dated December 28, 2018 expressed an unqualified opinion on those financial statements and financial highlights.
Basis for Opinions
These financial statements are the responsibility of the Funds’ management. Our responsibility is to express an opinion on the Funds’ financial statements based on our audits. We are a public accounting firm registered with the Public Company Accounting Oversight Board (United States) (PCAOB) and are required to be independent with respect to the Funds in accordance with the U.S. federal securities laws and the applicable rules and regulations of the Securities and Exchange Commission and the PCAOB.
We conducted our audits of these financial statements in accordance with the standards of the PCAOB. Those standards require that we plan and perform the audit to obtain reasonable assurance about whether the financial statements are free of material misstatement, whether due to error or fraud.
Our audits included performing procedures to assess the risks of material misstatement of the financial statements, whether due to error or fraud, and performing procedures that respond to those risks. Such procedures included examining, on a test basis, evidence regarding the amounts and disclosures in the financial statements. Our audits also included evaluating the accounting principles used and significant estimates made by management, as well as evaluating the overall presentation of the financial statements. Our procedures included confirmation of securities owned as of October 31, 2022, by correspondence with the custodian, transfer agent and brokers; when replies were not received from brokers, we
|
Report of Independent Registered Public Accounting Firm
|
performed other auditing procedures. We believe that our audits provide a reasonable basis for our opinions.
/s/ PricewaterhouseCoopers LLP
Philadelphia, Pennsylvania
December 29, 2022
We have served as the auditor of one or more investment companies in Global X Funds since 2016.
|
Disclosure of Fund Expenses (Unaudited)
|
ETFs (such as the Funds) have operating expenses. As a shareholder of an ETF, your investment is affected by these ongoing costs, which include (among others) costs for ETF management, administrative services, brokerage fees, and shareholder reports like this one. It is important for you to understand the impact of these costs on your investment returns. In addition, a shareholder is responsible for brokerage fees as a result of the shareholder’s investment in a Fund.
Operating expenses such as these are deducted from a Fund’s gross income and directly reduce their final investment returns. These expenses are expressed as a percentage of the ETF’s average net assets; this percentage is known as the ETF’s expense ratio. The following examples use the expense ratio and are intended to help you understand the ongoing costs (in dollars) of investing in a Fund and to compare these costs with those of other funds. The examples are based on an investment of $1,000 made at the beginning of the period shown and held for the entire period from May 1, 2022 through October 31, 2022.
The table on the next page illustrates the Funds’ costs in two ways:
Actual Fund Return. This section helps you to estimate the actual expenses that a Fund incurred over the period. The “Expenses Paid During Period” column shows the actual dollar expense cost incurred by a $1,000 investment in the Fund, and the “Ending Account Value” number is derived from deducting that expense cost from the Fund’s gross investment return.
You can use this information, together with the actual amount you invested in the Funds, to estimate the expenses you paid over that period. Simply divide your actual account value by $1,000 to arrive at a ratio (for example, an $8,600 account value divided by $1,000 = 8.6), then multiply that ratio by the number shown for your Funds under “Expenses Paid During Period.”
Hypothetical 5% Return. This section helps you compare a Fund’s costs with those of other funds. It assumes that the Funds had an annual 5% return before expenses during the year, but that the expense ratio (Column 3) for the period is unchanged. This example is useful in making comparisons because the SEC requires all funds to make this 5% calculation. You can assess your Fund’s comparative cost by comparing the hypothetical result for your Fund in the “Expenses Paid During Period” column with those that appear in the same charts in the shareholder reports for other funds.
NOTE: Because the return is set at 5% for comparison purposes — NOT your Fund’s actual return — the account values shown may not apply to your specific investment.
|
Disclosure of Fund Expenses (Unaudited) (Continued)
|
| | | | | | | | | | | |
| | | Beginning
| | | Ending | | | | | | |
| | | Account Value
| | | Account Value | | | Annualized Expenses | | | Expense Paid During
|
| | | 5/1/2022 | | | 10/31/2022 | | | Ratios | | | Period(1) |
| Global X MSCI China Energy ETF | | | | | | | | | | | |
| Actual Fund Return | | $ | 1,000.00 | | | $ | 980.50 | | | | 0.67 | % | | $ | 3.34 |
| Hypothetical 5% Return | | | 1,000.00 | | | | 1,021.83 | | | | 0.67 | | | | 3.41
|
| Global X MSCI China Materials ETF | | | | | | | | | | | | | | | |
| Actual Fund Return | | $ | 1,000.00 | | | $ | 712.60 | | | | 0.65 | % | | $ | 2.81 |
| Hypothetical 5% Return | | | 1,000.00 | | | | 1,021.93 | | | | 0.65 | | | | 3.31 |
| Global X MSCI China Industrials ETF | | | | | | | | | | | | | | | |
| Actual Fund Return | | $ | 1,000.00 | | | $ | 811.80 | | | | 0.66 | % | | $ | 3.01 |
| Hypothetical 5% Return | | | 1,000.00 | | | | 1,021.88 | | | | 0.66 | | | | 3.36
|
| Global X MSCI China Consumer Discretionary ETF | | | | | | | | | | | | |
| Actual Fund Return | | $ | 1,000.00 | | | $ | 734.90 | | | | 0.65 | % | | $ | 2.84 |
| Hypothetical 5% Return | | | 1,000.00 | | | | 1,021.93 | | | | 0.65 | | | | 3.31
|
| Global X MSCI China Consumer Staples ETF | | | | | | | | | | | | |
| Actual Fund Return | | $ | 1,000.00 | | | $ | 764.20 | | | | 0.65 | % | | $ | 2.89 |
| Hypothetical 5% Return | | | 1,000.00 | | | | 1,021.93 | | | | 0.65 | | | | 3.31
|
| Global X MSCI China Health Care ETF | | | | | | | | | | | | |
| Actual Fund Return | | $ | 1,000.00 | | | $ | 864.60 | | | | 0.65 | % | | $ | 3.05 |
| Hypothetical 5% Return | | | 1,000.00 | | | | 1,021.93 | | | | 0.65 | | | | 3.31 |
| Global X MSCI China Financials ETF | | | | | | | | | | | | | | | |
| Actual Fund Return | | $ | 1,000.00 | | | $ | 753.60 | | | | 0.67 | % | | $ | 2.96 |
| Hypothetical 5% Return | | | 1,000.00 | | | | 1,021.83 | | | | 0.67 | | | | 3.41
|
| Global X MSCI China Information Technology ETF | | | | | | | | | | | | |
| Actual Fund Return | | $ | 1,000.00 | | | $ | 801.50 | | | | 0.65 | % | | $ | 2.95 |
| Hypothetical 5% Return | | | 1,000.00 | | | | 1,021.93 | | | | 0.65 | | | | 3.31
|
| Global X MSCI China Communication Services ETF | | | | | | | | | | | | |
| Actual Fund Return | | $ | 1,000.00 | | | $ | 632.60 | | | | 0.65 | % | | $ | 2.67 |
| Hypothetical 5% Return | | | 1,000.00 | | | | 1,021.93 | | | | 0.65 | | | | 3.31
|
| Global X MSCI China Utilities ETF | | | | | | | | | | | | | | | |
| Actual Fund Return | | $ | 1,000.00 | | | $ | 768.30 | | | | 0.66 | % | | $ | 2.94 |
| Hypothetical 5% Return | | | 1,000.00 | | | | 1,021.88 | | | | 0.66 | | | | 3.36 |
|
Disclosure of Fund Expenses (Unaudited) (Continued)
|
| | | | | |
| | | | | | |
| | | Beginning
| | | Ending | | | Annualized | | | Expenses
|
| | | Account Value
| | | Account Value | | | Expense
| | | Paid During
|
| | | 5/1/2022 | | | 10/31/2022 | | | Ratios | | | Period(1) |
| Global X MSCI China Real Estate ETF | | | | | | | | | |
| Actual Fund Return | | $ | 1,000.00 | | | $ | 504.10 | | | | 0.67 | % | | $ | 2.54 |
| Hypothetical 5% Return | | | 1,000.00 | | | | 1,021.83 | | | | 0.67 | | | | 3.41 |
| Global X MSCI Greece ETF | | | | | | | | | | | | | | | |
| Actual Fund Return | | $ | 1,000.00 | | | $ | 900.00 | | | | 0.57 | % | | $ | 2.73 |
| Hypothetical 5% Return | | | 1,000.00 | | | | 1,022.33 | | | | 0.57 | | | | 2.91
|
| Global X DAX Germany ETF | | | | | | | | | | | | | | | |
| Actual Fund Return | | $ | 1,000.00 | | | $ | 876.40 | | | | 0.22 | % | | $ | 1.04 |
| Hypothetical 5% Return | | | 1,000.00 | | | | 1,024.10 | | | | 0.22 | | | | 1.12
|
| Global X MSCI Portugal ETF | | | | | | | | | | | | | | | |
| Actual Fund Return | | $ | 1,000.00 | | | $ | 906.60 | | | | 0.62 | % | | $ | 2.98 |
| Hypothetical 5% Return | | | 1,000.00 | | | | 1,022.08 | | | | 0.62 | | | | 3.16 |
| Global X MSCI Colombia ETF | | | | | | | | | | | | | | | |
| Actual Fund Return | | $ | 1,000.00 | | | $ | 651.50 | | | | 0.63 | % | | $ | 2.62 |
| Hypothetical 5% Return | | | 1,000.00 | | | | 1,022.03 | | | | 0.63 | | | | 3.21
|
| Global X MSCI Argentina ETF | | | | | | | | | | | | | | | |
| Actual Fund Return | | $ | 1,000.00 | | | $ | 994.40 | | | | 0.59 | % | | $ | 2.97 |
| Hypothetical 5% Return | | | 1,000.00 | | | | 1,022.23 | | | | 0.59 | | | | 3.01
|
| Global X MSCI Pakistan ETF | | | | | | | | | | | | | | | |
| Actual Fund Return | | $ | 1,000.00 | | | $ | 762.20 | | | | 0.84 | % | | $ | 3.73 |
| Hypothetical 5% Return | | | 1,000.00 | | | | 1,020.97 | | | | 0.84 | | | | 4.28
|
| Global X MSCI Nigeria ETF | | | | | | | | | | | | | | | |
| Actual Fund Return | | $ | 1,000.00 | | | $ | 813.50 | | | | 0.80 | % | | $ | 3.66 |
| Hypothetical 5% Return | | | 1,000.00 | | | | 1,021.17 | | | | 0.80 | | | | 4.08
|
| Global X MSCI Vietnam ETF | | | | | | | | | | | | | | | |
| Actual Fund Return | | $ | 1,000.00 | | | $ | 646.10 | | | | 0.50 | % | | $ | 2.07 |
| Hypothetical 5% Return | | | 1,000.00 | | | | 1,022.69 | | | | 0.50 | | | | 2.55
|
| Global X MSCI Next Emerging & Frontier ETF | | | | | | | | | | | | |
| Actual Fund Return | | $ | 1,000.00 | | | $ | 875.60 | | | | 0.51 | % | | $ | 2.41 |
| Hypothetical 5% Return | | | 1,000.00 | | | | 1,022.64 | | | | 0.51 | | | | 2.00
|
|
Disclosure of Fund Expenses (Unaudited) (Concluded)
|
| | | | | | | | | | |
| |
| | | | | | Ending | | | | | | | |
| | | Beginning | | | Account | | | Annualized | | | Expenses | |
| | | Account Value | | | Value | | | Expense | | | Paid During | |
| | | 5/1/2022 | | | 10/31/2022 | | | Ratios | | | Period(1) | |
| Global X MSCI Norway ETF | | | | | | | | | | | | |
| Actual Fund Return | | $ | 1,000.00 | | | $ | 835.40 | | | | 0.50 | % | | $ | 2.31 | |
| Hypothetical 5% Return | | | 1,000.00 | | | | 1,022.69 | | | | 0.50 | | | | 2.55 | |
| Global X FTSE Southeast Asia ETF | | | | | | | | | | | | | | | | |
| Actual Fund Return | | $ | 1,000.00 | | | $ | 921.50 | | | | 0.65 | % | | $ | 3.15 | |
| Hypothetical 5% Return | | | 1,000.00 | | | | 1,021.93 | | | | 0.65 | | | | 3.31 | |
(1) Expenses are equal to the Fund's annualized expense ratio multiplied by the average account value over the period, multiplied by 184/365 (to reflect the one-half year period).
|
Liquidity Risk Management Program (UNAUDITED)
|
Pursuant to Rule 22e-4 under the 1940 Act, the Funds’investment adviser has adopted, and the Board has approved, a liquidity risk management program (the “Program”) to govern the Funds’ approach to managing liquidity risk. The Program is overseen by the Funds’ Liquidity Risk Management Committee (the “Committee”), and the Program’s principal objectives include assessing, managing and periodically reviewing each Fund’s liquidity risk, based on factors specific to the circumstances of the Funds.
At a meeting of the Board held on May 20, 2022, the Trustees received a report from the Committee addressing the operations of the Program and assessing its adequacy and effectiveness of implementation for the period from January 1, 2021 through December 31, 2021. The Committee’s report noted that the Committee had determined that the Program is reasonably designed to assess and manage each Fund’s Liquidity Risk and operated adequately and effectively to manage each Fund’s Liquidity Risk for the period covered by the report. The Committee’s report noted that during the period covered by the report, there were no liquidity events that impacted the Funds or their ability to timely meet redemptions without dilution to existing shareholders. The Committee’s report noted that one Fund, the Global X Nigeria Fund, was classified as an In-Kind Fund for purposes of Liquidity Reporting. The Committee’s report noted that no other material changes have been made to the Program since its implementation.
There can be no assurance that the Program will achieve its objectives in the future. Please refer to the prospectus for more information regarding a Fund’s exposure to liquidity risk and other principal risks to which an investment in the Funds may be subject.
|
Supplemental Information (UNAUDITED)
|
NAV is the price per Share at which the Funds issue and redeem Shares. It is calculated in accordance with the standard formula for valuing mutual fund shares. The “Market Price” of the Funds generally is determined using the midpoint between the highest bid and the lowest offer on the stock exchange on which the Shares of the Funds are listed for trading, as of the time that the Funds’ NAV is calculated. The Funds’ Market Price may be at, above or below their NAV. The NAV of the Funds will fluctuate with changes in the market value of the Funds’ holdings. The Market Price of the Funds will fluctuate in accordance with changes in their NAV, as well as market supply and demand.
Premiums or discounts are the differences (expressed as a percentage) between the NAV and Market Price of the Funds on a given day, generally at the time NAV is calculated. A premium is the amount that the Funds are trading above the reported NAV, expressed as a percentage of the NAV. A discount is the amount that the Funds are trading below the reported NAV, expressed as a percentage of the NAV.
Further information regarding premiums and discounts is available on the Funds’ website at www.globalxetfs.com.
|
Trustees and Officers of the Trust (UNAUDITED)
|
Set forth below are the names, addresses, years of birth, positions with the Trust, Term of Office and Length of Time Served, the principal occupations for the last five years, number of Funds in Trust overseen by the Trustees, and other directorships outside the fund complex of each of the persons currently serving as Trustees and Officers of the Trust.
| | Position(s) | | Number of Funds in | |
| Name, Address | Held | Principal Occupation(s) During the Past | Trust Overseen by | Other Directorships |
| (Year of Birth) | with Trust | 5 Years | Trustee | Held by Trustees |
| Independent Trustees1 | | | | |
| Charles A. Baker | Trustee (since | Chief Executive Officer of Investment | 1072 | None. |
| 605 Third Avenue, | 07/2018) | Innovations LLC (investment | | |
| 43rd Floor | | consulting) (since 2013); Managing | | |
| New York, NY | | Director of NYSE Euronext (2003 to | | |
| 10158 | | 2012). | | |
| (1953) | | | | |
| Susan M. Ciccarone | Trustee (since | Partner, Further Global Capital | 1072 | Director of E78 |
| 605 Third Avenue, | 09/2019) | Management (private equity) (since | | Partners (since 2022); |
| 43rd Floor | | 2017); formerly Chief Operating Officer | | Director of ProSight |
| New York, NY | | (2014-2016) and Chief Financial | | Global, Inc. (since |
| 10158 | | Officer (2012-2016), Emerging Global | | 2021); Director of |
| (1973) | | Advisors, LLC (ETF issuer). | | Casa Holdco LP, |
| | | | | parent of Celink (since |
| | | | | 2018); Chairman, |
| | | | | Payment Alliance |
| | | | | International, Inc. |
| | | | | (2019-2021). |
| Clifford J. Weber | Trustee (since | Owner, Financial Products Consulting | 1072 | Chairman (since |
| 605 Third Avenue, | 07/2018) | Group LLC (consulting services to | | 2017) and Trustee |
| 43rd Floor | | financial institutions) (since 2015); | | (since 2015) of |
| New York, NY | | formerly, Executive Vice President of | | Clough Funds Trust; |
| 10158 | | Global Index and Exchange-Traded | | Chairman and Trustee |
| (1963) | | Products, NYSE Market, Inc., a | | of Clayton Street |
| | | subsidiary of Intercontinental Exchange | | Trust (since 2016); |
| | | (ETF/ETP listing exchange) (2013- | | Chairman and Trustee |
| | | 2015). | | of Janus Detroit Street |
| | | | | Trust (since 2016); |
| | | | | Chairman and Trustee |
| | | | | of Elevation ETF |
| | | | | Trust (2016-2018); |
| | | | | Trustee of Clough |
| | | | | Global Equity Fund |
| | | | | (since 2017); Trustee |
| | | | | of Clough Global |
| | | | | Dividend and Income |
| | | | | Fund (since 2017); |
| | | | | and Trustee of Clough |
| | | | | Global Opportunities |
| | | | | Fund (since 2017). |
|
Trustees and Officers of the Trust (UNAUDITED)
|
The Trust’s SAI includes additional information about the Trustees and Officers. The SAI may be obtained without charge by calling 1-888-493-8631. The following chart lists Trustees and Officers as of October 31, 2022.
| | Position(s) | | Number of Funds in | |
| Name, Address | Held | Principal Occupation(s) During the Past | Trust Overseen by | Other Directorships |
| (Year of Birth) | with Trust | 5 Years | Trustee | Held by Trustees |
| Interested Trustee/Officers1 | | | |
| Luis Berruga | Trustee (since | Chief Executive Officer, GXMC (since | 1072 | None. |
| 605 Third Avenue, | 07/2018); | 07/2018), Chief Financial Officer (since | | |
| 43rd Floor | President (since | 2/2014) and Chief Operating Officer | | |
| New York, NY | 2018) | (9/2015 - 7/2018); Investment Banker, | | |
| 10158 | | Jefferies (2012-2014). | | |
| (1977) | | | | |
| John Belanger | Chief Operating | Chief Operating Officer and Head of | N/A | N/A |
| 605 Third Avenue, | Officer and | Portfolio Management & Portfolio | | |
| 43rd Floor | Chief Financial | Administration, GXMC (since 12/2020); | | |
| New York, NY | Officer (since | Portfolio Manager (12/2020-4/2022); | | |
| 10158 | 12/2020) | Secretary of the Trust (3/2020-9/2020); | | |
| (1982) | | Head of Product Management, GXMC | | |
| | | (since 1/2020); Consultant to GXMC | | |
| | | (9/2018-12/2019); Chief Operating | | |
| | | Officer, Rex Shares, LLC (2014-2018). | | |
| Susan Lively | Secretary (since | General Counsel, GXMC (since | N/A | N/A |
| 605 Third Avenue, | 09/2020) | 9/2020); Senior Corporate Counsel | | |
| 43rd Floor | | at Franklin Templeton (previously, | | |
| New York, NY | | Managing Director and Associate | | |
| 10158 | | General Counsel at Legg Mason & Co., | | |
| (1981) | | LLC) (2014-2020). | | |
| Eric Griffith | Assistant | Counsel, SEI Investments (since | N/A | N/A |
| One Freedom | Secretary (since | 10/2019); Vice President and Assistant | | |
| Valley Drive | 02/2020) | General Counsel, JPMorgan Chase & | | |
| Oaks, PA 19456 | | Co. (2012-2018). | | |
| (1969) | | | | |
| Joe Costello | Chief | Chief Compliance Officer, FlexShares | N/A | N/A |
| 605 Third Avenue, | Compliance | Funds (2011-2015); Vice President, | | |
| 43rd Floor | Officer (since | Northern Trust Investments (2003 - | | |
| New York, NY | 09/2016) | 2015). | | |
| 10158 | | | | |
| (1974) | | | | |
| Ronnie Riven | Treasurer | Director of Finance, GXMC (since | N/A | N/A |
| 605 Third Avenue, | and Principal | 2018); Director of Accounting and | | |
| 43rd Floor | Accounting | Finance at Barclays Center (2016-2018); | | |
| New York, NY | Officer (since | Manager of External Reporting at | | |
| 10158 | 12/2020) | National Grid (2013-2015). | | |
| (1984) | | | | |
|
Trustees and Officers of the Trust (UNAUDITED)
|
| | Position(s) | | Number of Funds in | |
| Name, Address | Held | Principal Occupation(s) During the Past | Trust Overseen by | Other Directorships |
| (Year of Birth) | with Trust | 5 Years | Trustee | Held by Trustees |
| Interested Trustee/Officers1 | | | |
| Eric Olsen3 | Assistant | Director of Accounting, SEI Investment | N/A | N/A |
| One Freedom | Treasurer (since | Manager Services (March 2021 to | | |
| Valley Drive | 5/2021) | present); formerly, Deputy Head of Fund | | |
| Oaks, PA 19456 | | Operations, Traditional Assets, Aberdeen | | |
| (1970) | | Standard Investments (2013-2021). | | |
1 Each Trustee serves until his or her successor is duly elected or appointed and qualified.
2 As of October 31, 2022, the Trust had one hundred and seven investment portfolios, ninety-seven of which were operational.
3 This officer of the Trust also serves as an officer of one or more mutual funds for which SEI Investments Company or an affiliate acts as investment manager, administrator or distributor.
|
Notice to Shareholders (UNAUDITED)
|
For shareholders that do not have an October 31, 2022 tax year end, this notice is for informational purposes only. For shareholders with an October 31, 2022 tax year end, please consult your tax advisor as to the pertinence of this notice. For the fiscal year ended October 31, 2022, the Funds have designated the following items with regard to distributions paid during the year.
| | | | | | | | | Qualifying | | | |
| | | | | | | | | for Corporate | | | |
| | | | | | | | Dividends | | Qualifying | |
| | | Long-Term | | Ordinary Income | | Total | | Received | | Dividend | |
| Return of Capital | | Capital Gain | | Distributions | | Distributions | | Deduction(1) | | Income(2) | |
| Global X MSCI China Energy ETF | | | | | | | | | | | |
| 0.00 | | 0.00 | % | | 100.00 | % | | 100.00 | % | | 0.00 | % | | 100.00 | % |
| Global X MSCI China Materials ETF | | | | | | | | | | | | | |
| 0.00 | | 0.00 | % | | 100.00 | % | | 100.00 | % | | 0.00 | % | | 83.93 | % |
| Global X MSCI China Industrials ETF | | | | | | | | | | | | | |
| 0.00 | | 0.00 | % | | 100.00 | % | | 100.00 | % | | 0.00 | % | | 62.63 | % |
| Global X MSCI China Consumer Discretionary ETF | | | | | | | | | | | | | |
| 0.00 | | 0.00 | % | | 100.00 | % | | 100.00 | % | | 12.70 | % | | 100.00 | % |
| Global X MSCI China Consumer Staples ETF | | | | | | | | | | | | | |
| 0.00 | | 69.60 | % | | 30.40 | % | | 100.00 | % | | 0.00 | % | | 62.52 | % |
| Global X MSCI China Health Care ETF | | | | | | | | | | | | | |
| 0.00 | | 0.00 | % | | 100.00 | % | | 100.00 | % | | 0.00 | % | | 100.00 | % |
| Global X MSCI China Financials ETF | | | | | | | | | | | | | |
| 0.00 | | 0.00 | % | | 100.00 | % | | 100.00 | % | | 0.00 | % | | 100.00 | % |
| Global X MSCI China Information Technology ETF | | | | | | | | | | | | | |
| 0.00 | | 87.78 | % | | 12.22 | % | | 100.00 | % | | 0.00 | % | | 68.24 | % |
| Global X MSCI China Communication Services ETF | | | | | | | | | | | | | |
| 0.00 | | 0.00 | % | | 100.00 | % | | 100.00 | % | | 0.00 | % | | 80.85 | % |
| Global X MSCI China Utilities ETF | | | | | | | | | | | | | | | |
| 0.00 | | 42.92 | % | | 57.08 | % | | 100.00 | % | | 0.00 | % | | 33.95 | % |
| Global X MSCI China Real Estate ETF | | | | | | | | | | | | | |
| 0.00 | | 0.00 | % | | 100.00 | % | | 100.00 | % | | 0.00 | % | | 26.06 | % |
| Global X MSCI Greece ETF | | | | | | | | | | | | | | | |
| 0.00 | | 0.00 | % | | 100.00 | % | | 100.00 | % | | 0.00 | % | | 95.85 | % |
| Global X DAX Germany ETF | | | | | | | | | | | | | | | |
| 0.00 | | 0.00 | % | | 100.00 | % | | 100.00 | % | | 0.00 | % | | 73.87 | % |
| Global X MSCI Portugal ETF | | | | | | | | | | | | | | | |
| 0.00 | | 0.00 | % | | 100.00 | % | | 100.00 | % | | 0.00 | % | | 100.00 | % |
| Global X MSCI Colombia ETF | | | | | | | | | | | | | | | |
| 0.00 | | 0.00 | % | | 100.00 | % | | 100.00 | % | | 0.00 | % | | 15.46 | % |
| Global X MSCI Argentina ETF | | | | | | | | | | | | | | | |
| 0.00 | | 0.00 | % | | 100.00 | % | | 100.00 | % | | 0.00 | % | | 28.47 | % |
| Global X MSCI Pakistan ETF | | | | | | | | | | | | | | | |
| 0.00 | | 0.00 | % | | 100.00 | % | | 100.00 | % | | 0.00 | % | | 100.00 | % |
| Global X MSCI Nigeria ETF | | | | | | | | | | | | | | | |
| 0.00 | | 0.00 | % | | 100.00 | % | | 100.00 | % | | 0.00 | % | | 0.00 | % |
| Global X MSCI Vietnam ETF | | | | | | | | | | | | | | | |
| 0.00 | | 0.00 | % | | 100.00 | % | | 100.00 | % | | 0.00 | % | | 0.00 | % |
| Global X MSCI Next Emerging & Frontier ETF | | | | | | | | | | | | | |
| 0.00 | | 0.00 | % | | 100.00 | % | | 100.00 | % | | 0.00 | % | | 47.77 | % |
| Global X MSCI Norway ETF | | | | | | | | | | | | | | | |
| 0.00 | | 0.00 | % | | 100.00 | % | | 100.00 | % | | 0.00 | % | | 98.07 | % |
| Global X FTSE Southeast Asia ETF | | | | | | | | | | | | | | | |
| 0.00 | | 0.00 | % | | 100.00 | % | | 100.00 | % | | 0.00 | % | | 35.68 | % |
(1) Qualifying dividends represent dividends which qualify for the corporate dividends received deduction and is reflected as a percentage of ordinary income distributions (the total of short term capital gain and net investment income distributions).
(2) The percentage in this column represents the amount of "Qualifying Dividend Income" as created by the Jobs and Growth Relief Reconciliation Act of 2003 and its reflected as a percentage of ordinary income distributions (the total of short term capital gain and net investment income distributions). It is the intention of each of the aforementioned Funds to designate the maximum amount permitted by law.
|
Notice to Shareholders (UNAUDITED)
|
| | | | | | | | | | |
| |
| | | | | | | | | Short Term | | | | |
| | | U.S. Government | | | Interest Related | | | Capital Gain | | | Foreign Tax | |
| | | Interest(3) | | | Dividends(4) | | | Dividends (5) | | | Credit | |
| Global X MSCI China Energy ETF | | | | | | | | | | | | |
| | | | 0.03 | % | | | 0.03 | % | | | 0.00 | % | | | 20.07 | % |
| Global X MSCI China Materials ETF | | | | | | | | | | | | | | | | |
| | | | 0.00 | % | | | 0.02 | % | | | 0.00 | % | | | 10.10 | % |
| Global X MSCI China Industrials ETF | | | | | | | | | | | | | | | | |
| | | | 0.00 | % | | | 0.05 | % | | | 0.00 | % | | | 13.13 | % |
| Global X MSCI China Consumer Discretionary ETF | | | | | | | | | | | | | | | | |
| | | | 0.00 | % | | | 0.20 | % | | | 0.00 | % | | | 0.00 | % |
| Global X MSCI China Consumer Staples ETF | | | | | | | | | | | | | | | | |
| | | | 0.00 | % | | | 0.00 | % | | | 0.00 | % | | | 2.29 | % |
| Global X MSCI China Health Care ETF | | | | | | | | | | | | | | | | |
| | | | 0.00 | % | | | 0.00 | % | | | 0.00 | % | | | 0.00 | % |
| Global X MSCI China Financials ETF | | | | | | | | | | | | | | | | |
| | | | 0.00 | % | | | 0.02 | % | | | 0.00 | % | | | 11.29 | % |
| Global X MSCI China Information Technology ETF | | | | | | | | | | | | | | | | |
| | | | 0.00 | % | | | 0.00 | % | | | 0.00 | % | | | 0.00 | % |
| Global X MSCI China Communication Services ETF | | | | | | | | | | | | | | | | |
| | | | 0.00 | % | | | 0.04 | % | | | 0.00 | % | | | 0.00 | % |
| Global X MSCI China Utilities ETF | | | | | | | | | | | | | | | | |
| | | | 0.00 | % | | | 0.01 | % | | | 100.00 | % | | | 0.00 | % |
| Global X MSCI China Real Estate ETF | | | | | | | | | | | | | | | | |
| | | | 0.00 | % | | | 0.03 | % | | | 0.00 | % | | | 0.00 | % |
| Global X MSCI Greece ETF | | | | | | | | | | | | | | | | |
| | | | 0.00 | % | | | 0.04 | % | | | 0.00 | % | | | 5.33 | % |
| Global X DAX Germany ETF | | | | | | | | | | | | | | | | |
| | | | 0.00 | % | | | 0.00 | % | | | 0.00 | % | | | 10.08 | % |
| Global X MSCI Portugal ETF | | | | | | | | | | | | | | | | |
| | | | 0.02 | % | | | 0.02 | % | | | 0.00 | % | | | 14.93 | % |
| Global X MSCI Colombia ETF | | | | | | | | | | | | | | | | |
| | | | 0.00 | % | | | 0.01 | % | | | 0.00 | % | | | 6.72 | % |
| Global X MSCI Argentina ETF | | | | | | | | | | | | | | | | |
| | | | 0.00 | % | | | 0.01 | % | | | 0.00 | % | | | 0.00 | % |
| Global X MSCI Pakistan ETF | | | | | | | | | | | | | | | | |
| | | | 0.00 | % | | | 0.01 | % | | | 0.00 | % | | | 15.82 | % |
| Global X MSCI Nigeria ETF | | | | | | | | | | | | | | | | |
| | | | 0.05 | % | | | 0.03 | % | | | 0.00 | % | | | 10.22 | % |
| Global X MSCI Vietnam ETF | | | | | | | | | | | | | | | | |
| | | | 0.02 | % | | | 0.01 | % | | | 0.00 | % | | | 0.00 | % |
| Global X MSCI Next Emerging & Frontier ETF | | | | | | | | | | | | | | | | |
| | | | 0.00 | % | | | 0.01 | % | | | 0.00 | % | | | 10.99
| % |
| Global X MSCI Norway ETF | | | | | | | | | | | | | | | | |
| | | | 0.00 | % | | | 0.01 | % | | | 0.00 | % | | | 26.02 | % |
| Global X FTSE Southeast Asia ETF | | | | | | | | | | | | | | | | |
| | | | 0.00 | % | | | 0.01 | % | | | 0.00 | % | | | 5.03 | % |
(3) "U.S. Government Interest" represents the amount of interest that was derived from U.S. Government Obligations and distributed during the fiscal year. Generally, interest from direct U.S. Government obligations is exempt from state income tax. However, for shareholders who are residents of California, Connecticut and New York, the statutory threshold requirements were not satisfied to permit exemption of these amounts from state income.
(4) The percentage in this column represents the amount of "Interest Related Dividends" as created by the American Jobs Creation Act of 2004 and is a percentage of net investment income that is exempt from U.S. withholding tax when paid for foreign investors.
(5) The percentage of this column represents the amount of “Short Term Capital Gain Dividend” and is reflected as a percentage of short term capital gain distribution that is exempted from U.S. withholding tax when paid to foreign investors.
|
Notice to Shareholders (UNAUDITED)
|
The Funds intend to pass through a foreign tax credit to shareholders. For the fiscal year ended October 31, 2022, the total amount of foreign source income and foreign tax credit are as follows:
| | | | |
| |
| | | Foreign Source | | | Foreign Tax Credit | |
| Fund Name | | Income | | | Pass Through | |
| Global X MSCI China Energy ETF | | $ | 359,359 | | | $ | 38,289 | |
| Global X MSCI China Materials ETF | | | 111,764 | | | | 10,781 | |
| Global X MSCI China Industrials ETF | | | 150,259 | | | | 10,283 | |
| Global X MSCI China Consumer Staples ETF | | | 275,473 | | | | 16,599 | |
| Global X MSCI China Financials ETF | | | 1,971,247 | | | | 224,258 | |
| Global X MSCI Greece ETF | | | 3,587,787 | | | | 161,920 | |
| Global X DAX Germany ETF | | | 1,297,650 | | | | 132,149 | |
| Global X MSCI Portugal ETF | | | 303,295 | | | | 52,704 | |
| Global X MSCI Colombia ETF | | | 2,785,882 | | | | 151,075 | |
| Global X MSCI Pakistan ETF | | | 1,630,110 | | | | 251,658 | |
| Global X MSCI Nigeria ETF | | | 2,731,302 | | | | 246,432 | |
| Global X MSCI Next Emerging & Frontier ETF | | | 569,140 | | | | 62,624 | |
| Global X MSCI Norway ETF | | | 4,322,135 | | | | 916,703 | |
| Global X FTSE Southeast Asia ETF | | | 1,100,928 | | | | 81,620 | |
The information reported herein may differ from the information and distributions taxable to the shareholders for the calendar year ending December 31, 2022. Complete information will be computed and reported in conjunction with your 2022 Form 1099-DIV.
605 Third Avenue, 43rd floor
New York, NY 10158
1-888-493-8631
www.globalxetfs.com
Investment Adviser and Administrator:
Global X Management Company LLC
605 Third Avenue, 43rd floor
New York, NY 10158
Distributor:
SEI Investments Distribution Co.
One Freedom Valley Drive
Oaks, PA 19456
Sub-Administrator:
SEI Investments Global Funds Services
One Freedom Valley Drive
Oaks, PA 19456
Counsel for Global X Funds and the Independent Trustees:
Stradley Ronon Stevens & Young, LLP
2000 K Street, N.W. Suite 700
Washington, DC 20006
Custodian and Transfer Agent:
Brown Brothers Harriman & Co.
40 Water Street
Boston, MA 02109
Independent Registered Public Accounting Firm:
PricewaterhouseCoopers LLP
Two Commerce Square
Suite 1800
2001 Market Street
Philadelphia, PA 19103
This information must be preceded or accompanied by a prospectus for the funds described.
GLX-AR-002-1200
Item 2. Code of Ethics.
The registrant has adopted a code of ethics that applies to the registrant’s principal executive officer, principal financial officer, comptroller or principal accounting officer, and any person who performs a similar function.
Item 3. Audit Committee Financial Expert.
(a)(1) The registrant’s board of trustees has determined that the registrant has at least one audit committee financial expert serving on the audit committee.
(a)(2) The audit committee financial experts are Charles A. Baker and Susan M. Ciccarone and each is independent as defined in Form N-CSR Item 3(a)(2).
Item 4. Principal Accountant Fees and Services.
Fees billed by Pricewaterhouse Coopers LLP (“PwC”) relate to the registrant.
PWC billed the registrant aggregate fees for services rendered to the registrant for the last two fiscal years as follows:
| | | 2022 | | | 2021 | |
| | | | All fees and services to the Trust that were pre-approved | | | All fees and services to service affiliates that were pre-approved | | | All other fees and services to service affiliates that did not require pre-approval | | | All fees and services to the Trust that were pre-approved | | | All fees and services to service affiliates that were pre-approved | | | All other fees and services to service affiliates that did not require pre-approval | |
(a) | Audit Fees | | $ | 1,148,958 | | | $ | 0 | | | $ | 0 | | | $ | 929,467 | | | $ | 0 | | | $ | 0 | |
(b) | Audit-Related Fees | | $ | 0 | | | $ | 0 | | | $ | 0 | | | $ | 0 | | | $ | 0 | | | $ | 0 | |
(c) | Tax Fees(1) | | $ | 406,447 | | | $ | 0 | | | $ | 0 | | | $ | 334,184 | | | $ | 0 | | | $ | 0 | |
(d) | All Other Fees | | $ | 0 | | | $ | 0 | | | $ | 0 | | | $ | 0 | | | $ | 0 | | | $ | 0 | |
Notes:
| (1) | Tax Compliance and excise distribution services. |
(e) (1) Not applicable.
(e)(2) Percentage of fees billed applicable to non-audit services pursuant to waiver of pre-approval requirement were as follows (PwC):
| | | 2022 | | | 2021 | |
| Audit-Related Fees | | | 0 | % | | | 0 | % |
Tax Fees | | | 0 | % | | | 0 | % |
| All Other Fees | | | 0 | % | | | 0 | % |
(f) Not applicable.
(g) The aggregate non-audit fees and services billed by PwC for the last two fiscal years were $406,447 and $334,184, respectively.
(h) During the past fiscal year, all non-audit services provided by registrant’s principal accountant to either registrant’s investment adviser or to any entity controlling, controlled by, or under common control with registrant’s investment adviser that provides ongoing services to registrant were pre-approved by the audit committee of registrant’s Board of Trustees. Included in the audit committee’s pre-approval was the review and consideration as to whether the provision of these non-audit services is compatible with maintaining the principal accountant’s independence.
(i) Not applicable.
(j) Not applicable.
Item 5. Audit Committee of Listed Registrants.
The registrant has a separately-designated standing Audit Committee, which is composed of the registrant's Independent Trustees, Charles A. Baker, Susan M. Ciccarone and Clifford J. Weber.
Item 6. Investments.
Not applicable.
Item 7. Disclosure of Proxy Voting Policies and Procedures for Closed-End Management Investment Companies.
Not applicable to open-end management investment companies.
Item 8. Portfolio Managers of Closed-End Management Investment Companies.
Not applicable to open-end management investment companies.
Item 9. Purchases of Equity Securities by Closed-End Management Investment Company and Affiliated Purchasers.
Not applicable to open-end management investment companies.
Item 10. Submission of Matters to a Vote of Security Holders.
There have been no material changes.
Item 11. Controls and Procedures.
(a) The certifying officers, whose certifications are included herewith, have evaluated the registrant’s disclosure controls and procedures within 90 days of the filing date of this report. In their opinion, based on their evaluation, the registrant’s disclosure controls and procedures are adequately designed, and are operating effectively to ensure, that information required to be disclosed by the registrant in the reports it files or submits under the Securities Exchange Act of 1934 is recorded, processed, summarized and reported within the time periods specified in the Securities and Exchange Commission’s rules and forms.
(b) There were no significant changes in the registrant’s internal control over financial reporting that occurred during the period covered by this report that has materially affected, or is reasonably likely to materially affect, the registrant’s internal control over financial reporting.
Item 12. Disclosure of Securities Lending Activities for Closed-End Management Investment Companies.
Not applicable to open-end management investment companies.
Item 13. Exhibits.
SIGNATURES
Pursuant to the requirements of the Securities Exchange Act of 1934 and the Investment Company Act of 1940, the registrant has duly caused this report to be signed on its behalf by the undersigned, thereunto duly authorized.
/s/ Luis Berruga
Luis Berruga
President
Date: January 6, 2023
Pursuant to the requirements of the Securities Exchange Act of 1934 and the Investment Company Act of 1940, this report has been signed below by the following persons on behalf of the registrant and in the capacities and on the dates indicated.
Date: January 6, 2023
/s/ Luis Berruga
Luis Berruga
President
Date: January 6, 2023
/s/ John Belanger
John Belanger
Chief Financial Officer
Date: January 6, 2023