UNITED STATES
SECURITIES AND EXCHANGE COMMISSION
Washington, D.C. 20549
________
FORM N-CSR
________
CERTIFIED SHAREHOLDER REPORT OF REGISTERED MANAGEMENT
INVESTMENT COMPANIES
Investment Company Act file number 811-22209
Global X Funds
(Exact name of registrant as specified in charter)
________
605 Third Avenue, 43rd floor
New York, NY 10158
(Address of principal executive offices) (Zip code)
Luis Berruga
Global X Management Company LLC
605 Third Avenue, 43rd floor
New York, NY 10158
(Name and address of agent for service)
With a copy to:
Global X Management Company LLC 605 Third Avenue, 43rd floor New York, NY 10158 | Eric S. Purple, Esq. Stradley Ronon Stevens & Young, LLP 2000 K Street, N.W., Suite 700 Washington, DC 20006-1871 |
Registrant’s telephone number, including area code: (212) 644-6440
Date of fiscal year end: October 31, 2022
Date of reporting period: October 31, 2022
Item 1. Reports to Stockholders.
A copy of the report transmitted to stockholders pursuant to Rule 30e-1 under the Investment Company Act of 1940, as amended (the “Act”) (17 CFR § 270.30e-1), is attached hereto.

Global X Social Media ETF (ticker: SOCL)
Global X Lithium & Battery Tech ETF (ticker: LIT)
Global X Disruptive Materials ETF (ticker: DMAT)
Global X E-commerce ETF (ticker: EBIZ)
Global X Emerging Markets Internet & E-commerce ETF (ticker: EWEB)
Global X SuperDividend® ETF (ticker: SDIV)
Global X SuperDividend® U.S. ETF (ticker: DIV)
Global X MSCI SuperDividend® EAFE ETF (ticker: EFAS)
Global X MSCI SuperDividend® Emerging Markets ETF (ticker: SDEM)
Global X SuperDividend® REIT ETF (ticker: SRET)
Global X NASDAQ 100® Covered Call ETF (ticker: QYLD)
Global X S&P 500® Covered Call ETF (ticker: XYLD)
Global X Russell 2000 Covered Call ETF (ticker: RYLD)
Global X Dow 30® Covered Call ETF (ticker: DJIA)
Global X Nasdaq 100® Covered Call & Growth ETF (ticker: QYLG)
Global X S&P 500® Covered Call & Growth ETF (ticker: XYLG)
Global X Russell 2000 Covered Call & Growth ETF (ticker: RYLG)
Global X SuperIncome™ Preferred ETF (ticker: SPFF)
Global X Renewable Energy Producers ETF (ticker: RNRG)
Global X S&P 500® Catholic Values ETF (ticker: CATH)
Global X S&P Catholic Values Developed ex-U.S. ETF (ticker: CEFA)
Global X Guru® Index ETF (ticker: GURU)
Global X S&P 500® Tail Risk ETF (ticker: XTR)
Global X S&P 500® Risk Managed Income ETF (ticker: XRMI)
Global X S&P 500® Collar 95-110 ETF (ticker: XCLR)
Global X NASDAQ 100® Tail Risk ETF (ticker: QTR)
Global X NASDAQ 100® Risk Managed Income ETF (ticker: QRMI)
Global X NASDAQ 100® Collar 95-110 ETF (ticker: QCLR)
As permitted by regulations adopted by the Securities and Exchange Commission, paper copies of the Fund’s (defined below) shareholder reports will no longer be sent by mail, unless you specifically request paper copies of the reports from your financial intermediary (such as a broker-dealer or bank). Instead, shareholder reports will be available on the Fund’s website (www. globalxetfs.com/explore), and you will be notified by mail each time a report is posted and provided with a website link to access the report.
If you already elected to receive shareholder reports electronically, you will not be affected by this change and you need not take any action. You may elect to receive shareholder reports and other communications from the Funds electronically anytime by contacting your financial intermediary.
You may elect to receive all future Fund shareholder reports in paper free of charge. Please contact your financial intermediary to inform them that you wish to continue receiving paper copies of Fund shareholder reports and for details about whether your election to receive reports in paper will apply to all funds held with your financial intermediary.
|
|
| Management Discussion of Fund Performance | 1 |
| Schedule of Investments | |
| Global X Social Media ETF | 64 |
| Global X Lithium & Battery Tech ETF | 68 |
| Global X Disruptive Materials ETF | 73 |
| Global X E-commerce ETF | 77 |
| Global X Emerging Markets Internet & E-commerce ETF | 81 |
| Global X SuperDividend® ETF | 85 |
| Global X SuperDividend® U.S. ETF | 95 |
| Global X MSCI SuperDividend® EAFE ETF | 99 |
| Global X MSCI SuperDividend® Emerging Markets ETF | 105 |
| Global X SuperDividend® REIT ETF | 111 |
| Global X NASDAQ 100® Covered Call ETF | 114 |
| Global X S&P 500® Covered Call ETF | 120 |
| Global X Russell 2000 Covered Call ETF | 136 |
| Global X Dow 30® Covered Call ETF | 193 |
| Global X Nasdaq 100® Covered Call & Growth ETF | 196 |
| Global X S&P 500® Covered Call & Growth ETF | 202 |
| Global X Russell 2000 Covered Call & Growth ETF | 218 |
| Global X SuperIncome™ Preferred ETF | 220 |
| Global X Renewable Energy Producers ETF | 224 |
| Global X S&P 500® Catholic Values ETF | 230 |
| Global X S&P Catholic Values Developed ex-US ETF | 244 |
| Global X Guru® Index ETF | 269 |
| Global X S&P 500® Tail Risk ETF | 275 |
| Global X S&P 500® Risk Managed Income ETF | 291 |
| Global X S&P 500® Collar 95-110 ETF | 307 |
| Global X NASDAQ 100® Tail Risk ETF | 323 |
| Global X NASDAQ 100® Risk Managed Income ETF | 329 |
| Global X NASDAQ 100® Collar 95-110 ETF | 335 |
| Glossary | 341 |
| Statements of Assets and Liabilities | 342 |
| Statements of Operations | 349 |
| Statements of Changes in Net Assets | 356 |
| Financial Highlights | 370 |
| Notes to Financial Statements | 390 |
| Report of Independent Registered Public Accounting Firm | 426 |
| Disclosure of Fund Expenses | 430 |
| Liquidity Risk Management Program | 434 |
| Approval of Investment Advisory Agreement | 435 |
| Supplemental Information | 439 |
| Trustees and Officers of the Trust | 440 |
Shares are bought and sold at market price (not net asset value (“NAV”)) and are not individually redeemed from the Fund. Shares may only be redeemed directly from the Fund by Authorized Participants, in very large creation/ redemption units. Brokerage commissions will reduce returns.
The Fund files its complete schedule of Fund holdings with the Securities and Exchange Commission (the “SEC” or “Commission”) for the first and third quarters of each fiscal year as an exhibit to its reports on Form N-PORT. The Fund’s Forms N-PORT are available on the Commission’s website at https://www.sec.gov, and may be reviewed and copied at the Commission's Public Reference Room in Washington, DC. Information on the operation of the Public Reference Room may be obtained by calling 1-800-SEC-0330.
A description of the policies and procedures that Global X Funds uses to determine how to vote proxies relating to Fund securities, as well as information relating to how the Fund voted proxies relating to Fund securities during the most recent 12-month period ended June 30, is available (i) without charge, upon request, by calling 1-888-493-8631; and (ii) on the Commission’s website at https://www.sec.gov.
|
| Management Discussion of Fund Performance (unaudited) |
| Global X Social Media ETF |
Global X Social Media ETF
The Global X Social Media ETF (“Fund”) seeks to provide investment results that correspond generally to the price and yield performance, before fees and expenses, of the Solactive Social Media Total Return Index (“Underlying Index”). The Fund is passively managed, which means the investment adviser does not attempt to take defensive positions in declining markets. The Fund generally seeks to fully replicate the Underlying Index.
The Underlying Index is designed to reflect the performance of companies involved in the social media industry, including companies that provide social networking, file sharing, and other web-based media applications, as defined by Solactive AG, the provider of the Underlying Index.
For the 12-month period ended October 31, 2022 (the “reporting period”), the Fund decreased 59.24%, while the Underlying Index decreased 59.15%. The Fund had a net asset value of $61.26 per share on October 31, 2021 and ended the reporting period with a net asset value of $24.88 per share on October 31, 2022.
During the reporting period, the highest returns came from Zynga Inc. and Twitter Inc., which returned 10.84% and 0.30%, respectively. The worst performers were Vimeo, Inc. and Bilibili, Inc, which returned -88.73% and -87.83%, respectively.
Fund performance was negative over the reporting period as the COVID-19 pandemic-induced growth for the social media industry faded. Macroeconomic challenges, increased competition for user attention, a weaker economy, and inflationary pressures all contributed to this decline. Given tightened spending budgets, a significant portion of companies cut their digital advertisement spending which is the primary source of revenue for most social platforms. Additionally, as pandemic conditions continued to ease, consumers returned to spending more of their time offline. Sector weighting of the Fund was highest in Communication Services, at 98.10% during the reporting period. Geographically, the Fund maintained an average allocation of 49.66% to United States stocks, followed by China (30.06%) and South Korea (11.08%) during the reporting period.
| | AVERAGE ANNUAL TOTAL RETURN FOR THE YEAR ENDED OCTOBER 31, 2022 |
| | One Year Return | Three Year Return | Five Year Return | Ten Year Return |
| | Net Asset Value | Market Price | Net Asset Value | Market Price | Net Asset Value | Market Price | Net Asset Value | Market Price |
| Global X Social Media ETF | -59.24% | -59.13% | -7.86% | -7.73% | -4.96% | -5.00% | 7.16% | 7.26% |
Solactive Social Media Total Return Index (USD) | -59.15% | -59.15% | -7.43% | -7.43% | -4.46% | -4.46% | 7.67% | 7.67% |
| MSCI ACWI (Net) (USD) | -19.96% | -19.96% | 4.85% | 4.85% | 5.24% | 5.24% | 7.98% | 7.98% |
|
| Management Discussion of Fund Performance (unaudited) |
| Global X Social Media ETF |

* The Fund commenced operations on November 14, 2011.
The MSCI ACWI (Net) (All Country World Index) Index is a free float-adjusted market capitalization weighted index that is designed to measure the equity market performance of developed and emerging market
The performance data quoted herein represents past performance and the return and value of an investment in the Fund will fluctuate so that, when redeemed, it may be worth less than its original cost. Past performance is no guarantee of future performance and should not be considered as a representation of the future results of the Fund. The Fund's performance assumes the reinvestment of all dividends and all capital gains. Index returns assume reinvestment of dividends and, unlike the Fund's returns, do not reflect any fees or expenses. If such fees and expenses were included in the index returns, the performance would have been lower. Please note that one cannot invest directly in an unmanaged index. Performance figures for the periods shown may reflect contractual fee waivers and/or expense reimbursements. In the absence of fee waiver sand/or expense reimbursements (if applicable), returns would have been lower.
There are no assurances that the Fund will meet its stated objectives.
The Fund’s holdings and allocations are subject to change and should not be considered recommendations to buy individual securities.
The graph and table do not reflect the deduction of taxes that a shareholder would pay on Fund distributions or the redemption or sale of Fund shares.
See definition of comparative indices on the previous page.
|
| Management Discussion of Fund Performance (unaudited) |
| Global X Lithium & Battery Tech ETF |
Global X Lithium & Battery Tech ETF
The Global X Lithium & Battery Tech ETF (“Fund”) seeks to provide investment results that correspond generally to the price and yield performance, before fees and expenses, of the Solactive Global Lithium Index (“Underlying Index”). The Fund is passively managed, which means the investment adviser does not attempt to take defensive positions in declining markets. The Fund generally seeks to fully replicate the Underlying Index.
The Underlying Index is designed to measure broad-based equity market performance of global companies involved in the lithium industry, as defined by Solactive AG, the provider of the Underlying Index.
For the 12-month period ended October 31, 2022 (the “reporting period”), the Fund decreased 26.10%, while the Underlying Index decreased 25.65%. The Fund had a net asset value of $91.07 per share on October 31, 2021 and ended the reporting period with a net asset value of $67.13 per share on October 31, 2022.
During the reporting period, the highest returns came from Pilbara Minerals Limited and Sociedad Quimica y Minera de Chile SA, which returned 96.97% and 80.14%, respectively. The worst performers were Varta AG and QuantumScape Corporation, which returned -82.04% and -71.22%, respectively.
Over the reporting period, rising prices for raw material inputs used in battery manufacturing, as well as supply chain disruptions caused by the Russia-Ukraine war and COVID-19 pandemic-related lockdown measures in China contributed to the Fund's negative performance. Battery tech companies struggled to pass rising costs onto consumers through most of the reporting period, contributing to negative sentiments toward various Fund holdings. Lithium miners however, benefitted from the materials pricing environment, as lithium prices reached record highs and remained elevated. This dynamic directly translated into almost unanimous revenue growth and margin expansion amongst senior lithium miners. Strong returns from companies involved in lithium mining provided balance to performance, allowing the Fund to outperform major indexes despite a negative return. During the reporting period, the Fund had an average approximate stock exposure of 41.87% in China, 21.49% in the United States, 10.80% in South Korea, and 10.25% in Japan. By sector, it had the highest exposure to Materials, at 47.69%, followed by Industrials (20.33%), Information Technology (16.24%), and Consumer Discretionary (15.61%).
| | AVERAGE ANNUAL TOTAL RETURN FOR THE YEAR ENDED OCTOBER 31, 2022 |
| | One Year Return | Three Year Return | Five Year Return | Ten Year Return |
| | Net Asset Value | Market Price | Net Asset Value | Market Price | Net Asset Value | Market Price | Net Asset Value | Market Price |
| Global X Lithium & Battery Tech | -26.10% | -27.11% | 39.84% | 39.93% | 13.31% | 13.17% | 10.43% | 10.47% |
| Solactive Global Lithium Index (USD) | -25.65% | -25.65% | 40.29% | 40.29% | 13.53% | 13.53% | 10.96% | 10.96% |
| MSCI ACWI (Net) (USD) | -19.96% | -19.96% | 4.85% | 4.85% | 5.24% | 5.24% | 7.98% | 7.98% |
|
| Management Discussion of Fund Performance (unaudited) |
| Global X Lithium & Battery Tech ETF |

*Fund commenced operations on July 22, 2010.
The MSCI ACWI (All Country World Index) Index is a free float-adjusted market capitalization weighted index that is designed to measure the equity market performance of developed and emerging markets.
The performance data quoted herein represents past performance and the return and value of an investment in the Fund will fluctuate so that, when redeemed, it may be worth less than its original cost. Past performance is no guarantee of future performance and should not be considered as a representation of the future results of the Fund. The Fund's performance assumes the reinvestment of all dividends and all capital gains. Index returns assume reinvestment of dividends and, unlike the Fund's returns, do not reflect any fees or expenses. If such fees and expenses were included in the index returns, the performance would have been lower. Please note that one cannot invest directly in an unmanaged index. Performance figures for the periods shown may reflect contractual fee waivers and/or expense reimbursements. In the absence of fee waiver sand/or expense reimbursements (if applicable), returns would have been lower.
There are no assurances that the Fund will meet its stated objectives.
The Fund’s holdings and allocations are subject to change and should not be considered recommendations to buy individual securities.
The graph and table do not reflect the deduction of taxes that a shareholder would pay on Fund distributions or the redemption or sale of Fund shares.
See definition of comparative indices on the previous page.
|
| Management Discussion of Fund Performance (unaudited) |
| Global X Disruptive Materials ETF |
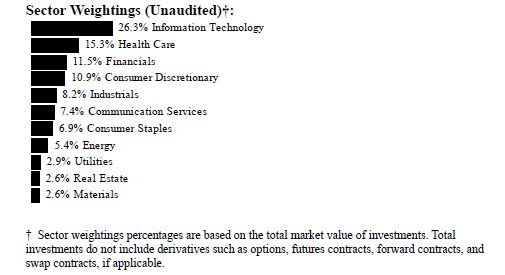
Global X Disruptive Materials ETF
The Global X Disruptive Materials ETF (“Fund”) seeks to provide investment results that correspond generally to the price and yield performance, before fees and expenses, of the Solactive Disruptive Materials Index (“Underlying Index”). The Fund is passively managed, which means the investment adviser does not attempt to take defensive positions in declining markets. The Fund generally seeks to fully replicate the Underlying Index.
The Underlying Index is designed to provide exposure to companies that produce metals and other raw or composite materials that have been identified as being essential to disruptive technologies such as lithium batteries, solar panels, wind turbines, fuel cells, robotics, and 3D printers. Each material has been determined by Solactive AG, the provider of the Underlying Index (the “Index Provider”) to be instrumental to the development and materialization of one or more disruptive technologies. Disruptive technologies refer to those technologies that are essential to the development and materialization of long-term, structural changes to existing products, services, industries, or sectors. Specifically, the Underlying Index will include securities issued by “Disruptive Materials Companies” as defined by the Index Provider.
From the inception of the Fund to period ended October 31, 2022 (the “reporting period”), the Fund decreased 22.98%, while the Underlying Index decreased 22.72%. The Fund had a net asset value of $23.75 per share on January 24, 2022 and ended the reporting period with a net asset value of $18.07 on October 31, 2022.
During the reporting period, the highest returns came from Livent Corp and Teck Resources Limited, which returned 44.09% and 34.82%, respectively. The worst performers were Nickel Industries Ltd. and Yunnan Tin Co Ltd, which returned -55.50% and -55.19%, respectively.
The Fund generated negative returns over the reporting period due to factors including investor concerns of an economic slowdown and geopolitical complications. Commodity prices generally entered 2022 at elevated levels due to strong demand and supply chain disruptions attributable to the COVID-19 pandemic. However, later in the reporting period, investor fears of recession lead to declining materials prices and, in turn, declining investor sentiment toward relevant suppliers. Additionally, disruptions in China as well as warfare in Ukraine contributed to negative sentiments. COVID-19 pandemic-related lockdowns caused decreased investor confidence in China, leading to speculation that demand for raw materials could falter. These lockdowns also generated negative sentiment as China is a key mining and processing center for several disruptive materials. Furthermore, conflict between Russian and Ukraine had a mixed impact on material suppliers. The conflict created supply chain disruptions that support higher pricing. However, the conflict also led to energy shortages that jeopardized European manufacturing capacity for raw materials throughout the reporting period. During the reporting period, the Fund had an average approximate stock exposure of 27.39% in China, 18.92% in the United States, 13.66% in South Africa, and 11% in Australia. By sector, it had the highest exposure to Materials, at 93.59%, followed by Industrials (5.94%), Information Technology (0.29%).
|
| Management Discussion of Fund Performance (unaudited) |
| Global X Disruptive Materials ETF |
| | AVERAGE ANNUAL TOTAL RETURN FOR THE PERIOD ENDED OCTOBER 31, 2022 |
| | Cumulative Inception to Date* |
| | Net Asset Value | Market Price |
Global X Disruptive Material ETF
| -22.98% | -23.40% |
Solactive Disruptive Materials Index
| -22.72% | -22.72% |
MSCI ACWI (Net)
| -15.86 | -15.86 |
|
| Management Discussion of Fund Performance (unaudited) |
| Global X Disruptive Materials ETF |
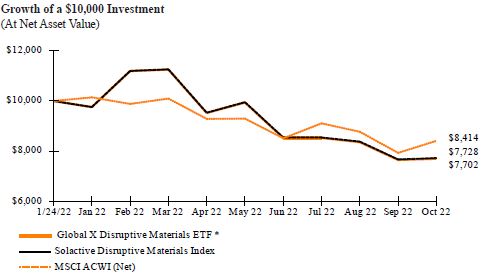
* The Fund commenced operations on January 24, 2022.
The performance data quoted herein represents past performance and the return and value of an investment in the Fund will fluctuate so that, when redeemed, it may be worth less than its original cost. Past performance is no guarantee of future performance and should not be considered as a representation of the future results of the Fund. The Fund's performance assumes the reinvestment of all dividends and all capital gains. Index returns assume reinvestment of dividends and, unlike the Fund's returns, do not reflect any fees or expenses. If such fees and expenses were included in the index returns, the performance would have been lower. Please note that one cannot invest directly in an unmanaged index. Performance figures for the periods shown may reflect contractual fee waivers and/or expense reimbursements. In the absence of fee waiver sand/or expense reimbursements (if applicable), returns would have been lower.
There are no assurances that the Fund will meet its stated objectives.
The Fund’s holdings and allocations are subject to change and should not be considered recommendations to buy individual securities.
The graph and table do not reflect the deduction of taxes that a shareholder would pay on Fund distributions or the redemption or sale of Fund shares.
See definition of comparative indices above.
|
| Management Discussion of Fund Performance (unaudited) |
| Global X E-commerce ETF |
Global X E-commerce ETF
The Global X E-commerce ETF (“Fund”) seeks to provide investment results that correspond generally to the price and yield performance, before fees and expenses, of the Solactive E-commerce Index (“Underlying Index”). The Fund is passively managed, which means the investment adviser does not attempt to take defensive positions in declining markets. The Fund generally seeks to fully replicate the Underlying Index.
The Underlying Index is designed to provide exposure to exchange-listed companies that are positioned to benefit from the increased adoption of e-commerce as a distribution model, including but not limited to companies whose principal business is in operating e-commerce platforms, providing e-commerce software and services, and/or selling goods and services online (collectively, "E-commerce Companies"), as defined by Solactive AG, the provider of the Underlying Index.
For the 12-month period ended October 31, 2022 (the “reporting period”), the Fund decreased 51.19%, while the Underlying Index decreased 51.02%. The Fund had a net asset value of $31.19 per share on October 31, 2021 and ended the reporting period with a net asset value of $15.14 per share on October 31, 2022.
During the reporting period, the highest returns came from GoDaddy, Inc. and 1stdibs.com, Inc., which returned 16.24% and 4.48%, respectively. The worst performers were eHealth, Inc. and Wayfair, Inc., which returned -93.96% and -84.78%, respectively.
Globally, E-Commerce Companies have been affected by supply chain issues, rising inflation, and rising interest rates which resulted in negative returns for the Fund during the reporting period. Despite underperformance relative to a period of acceleration in online sales growth driven by the COVID-19 pandemic, key business segments within the e-commerce industry continue to present attractive opportunities. Momentum in emerging markets remains a key driver of e-commerce growth. Furthermore, as a result of the expansive offerings and added convenience of e-commerce for consumers, e-commerce sales as a percentage of total retail sales in the United States increased. Importantly, its market share is still well above comparable periods before the COVID-19 pandemic. During the reporting period, sector weightings were highest in Consumer Discretionary at 67.60%, followed by Communication Services (11.34%). Geographically, the Fund maintained an average allocation of 55.21% to United States stocks, followed by China (25.71%) and the United Kingdom (4.99%) during the reporting period.
| | AVERAGE ANNUAL TOTAL RETURN FOR THE YEAR ENDED OCTOBER 31, 2022 |
| | One Year Return | Three Year Return | Annualized Inception to Date* |
| | Net Asset Value | Market Price | Net Asset Value | Market Price | Net Asset Value | Market Price |
| Global X E-Commerce ETF | -51.19% | -51.17% | -4.36% | -4.47% | 0.64% | 0.62% |
| Solactive E-Commerce Index | -51.02% | -51.02% | -4.00% | -4.00% | 1.08% | 1.08% |
| MSCI ACWI (Net) | -19.96% | -19.96% | 4.85% | 4.85% | 7.01% | 7.01% |
|
| Management Discussion of Fund Performance (unaudited) |
| Global X E-commerce ETF |
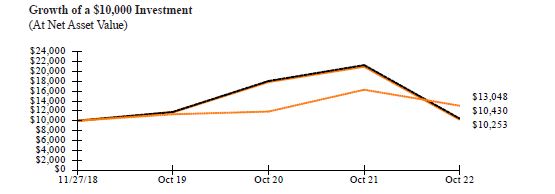
* The Fund commenced operations on November 27, 2018.
The MSCI ACWI (Net) (All Country World Index) Index is a free float-adjusted market capitalization weighted index that is designed to measure the equity market performance of developed and emerging markets.
The performance data quoted herein represents past performance and the return and value of an investment in the Fund will fluctuate so that, when redeemed, it may be worth less than its original cost. Past performance is no guarantee of future performance and should not be considered as a representation of the future results of the Fund. The Fund's performance assumes the reinvestment of all dividends and all capital gains. Index returns assume reinvestment of dividends and, unlike the Fund's returns, do not reflect any fees or expenses. If such fees and expenses were included in the index returns, the performance would have been lower. Please note that one cannot invest directly in an unmanaged index. Performance figures for the periods shown may reflect contractual fee waivers and/or expense reimbursements. In the absence of fee waiver sand/or expense reimbursements (if applicable), returns would have been lower.
There are no assurances that the Fund will meet its stated objectives.
The Fund’s holdings and allocations are subject to change and should not be considered recommendations to buy individual securities.
The graph and table do not reflect the deduction of taxes that a shareholder would pay on Fund distributions or the redemption or sale of Fund shares.
See definition of comparative indices above.
|
| Management Discussion of Fund Performance (unaudited) |
| Global X Emerging Markets Internet & E-commerce ETF |
Global X Emerging Markets Internet & E-commerce ETF
The Global X Emerging Markets Internet & E-commerce ETF (“Fund”) seeks to provide investment results that correspond generally to the price and yield performance, before fees and expenses, of the Nasdaq CTA Emerging Markets Internet & E-commerce Net Total Return Index (“Underlying Index”). The Fund is passively managed, which means the investment adviser does not attempt to take defensive positions in declining markets. The Fund generally seeks to fully replicate the Underlying Index.
The Underlying Index is designed to provide exposure to exchange-listed companies that are expected to benefit from further adoption of internet and e-commerce technologies in emerging markets countries (collectively, “Emerging Markets Internet & E-commerce Companies”), as defined by Nasdaq, Inc., the provider of the Underlying Index (the “Index Provider”) and the Consumer TechnologyAssociation (“CTA”). The Index Provider and the CTA have jointly developed the eligibility and selection criteria for the Underlying Index. In order to be eligible for inclusion in the Underlying Index, a company is considered by the CTA to be an Emerging Markets Internet & E-commerce Company if it derives at least 50% of its revenue, operating income, or assets from: (i) internet-related services (including social media and online entertainment), (ii) internet retail commerce, (iii) internet search engine services, and/or (iv) software delivered via the internet.
For the 12-month period ended October 31, 2022 (the “reporting period”), the Fund decreased 54.30%, while the Underlying Index decreased 54.12%. The Fund had a net asset value of $35.97 per share on October 31, 2021 and ended the reporting period with a net asset value of $16.38 per share on October 31, 2022 (as adjusted to account for a 1:3 reverse share split on December 19, 2022).
During the reporting period, the highest return came from Totvs SA, which returned 9.65%. The worst performers were Bilibili, Inc. and Iqiyi, Inc., which returned -87.83% and -75.60%, respectively.
Emerging markets, which are more vulnerable to global economic downturns, faced several challenges leading to negative returns during the reporting period. These included Russia's invasion of Ukraine, soaring energy and commodities prices and high global inflation. These factors, combined with logistical challenges, including supply chain disruptions caused by COVID-19 pandemic-related lockdowns in China, combined to slow growth in emerging markets. Overall, these macroeconomic challenges hurt the performance of many leading Chinese e-commerce companies, contributing to the Fund's negative returns. Despite these challenges, the opportunity for emerging market penetration into the e-commerce industry remains significantly higher than in developed markets, especially as new technologies enter these developing nations. In addition, fiscal policy in many emerging countries was eased after the COVID-19 pandemic, but it is now tightening as governments try to mitigate the impact of inflation. During the reporting period, sector weightings of the Fund were highest in Consumer Discretionary at 51.84%, ahead of Communication Services at 40.22%. Geographically, the Fund maintained an average allocation of 71.15% to Chinese stocks, followed by South Korean (10.97%) and Brazilian (9.23%) during the reporting period.
|
| Management Discussion of Fund Performance (unaudited) |
| Global X Emerging Markets Internet & E-commerce ETF |
| | AVERAGE ANNUAL TOTAL RETURN FOR THE YEAR ENDED OCTOBER 31, 2022 |
| | One Year Return | Annualized Inception to Date* |
| | Net Asset Value | Market Price | Net Asset Value | Market Price |
Global X Emerging Markets Internet & E-commerce ETF | -54.30% | -53.66% | -39.51% | -39.34% |
NASDAQ CTA Emerging Markets Internet & E-commerce Net Total Return Index | -54.12% | -54.12% | -39.19% | -39.19% |
| MSCI Emerging Markets Index (Net) | -31.03% | -31.03% | -13.76% | -13.76% |

* The Fund commenced operations on November 9, 2020.
The MSCI Emerging Markets Index (Net) is a free float-adjusted market capitalization index that is designed to measure equity market performance of emerging markets. The MSCI Emerging Markets Index consists of the following 21 emerging market country indices: Brazil, Chile, China, Colombia, Czech Republic, Egypt, Hungary, India, Indonesia, Korea, Malaysia, Mexico, Morocco, Peru, Philippines, Poland, Russia, South Africa, Taiwan, Thailand, and Turkey.
The performance data quoted herein represents past performance and the return and value of an investment in the Fund will fluctuate so that, when redeemed, it may be worth less than its original cost. Past performance is no guarantee of future performance and should not be considered as a representation of the future results of the Fund. The Fund's performance assumes the reinvestment of all dividends and all capital gains. Index returns assume reinvestment of dividends and, unlike the Fund's returns, do not reflect any fees or expenses. If such fees and expenses were included in the index returns, the performance would have been lower. Please note that one cannot invest directly in an unmanaged index. Performance figures for the periods shown may reflect contractual fee waivers and/or expense reimbursements. In the absence of fee waiver sand/or expense reimbursements (if applicable), returns would have been lower.
|
| Management Discussion of Fund Performance (unaudited) |
| Global X Emerging Markets Internet & E-commerce ETF |
There are no assurances that the Fund will meet its stated objectives.
The Fund’s holdings and allocations are subject to change and should not be considered recommendations to buy individual securities.
The graph and table do not reflect the deduction of taxes that a shareholder would pay on Fund distributions or the redemption or sale of Fund shares.
See definition of comparative indices above.
|
| Management Discussion of Fund Performance (unaudited) |
| Global X SuperDividend® ETF |
Global X SuperDividend® ETF
The Global X SuperDividend® ETF (“Fund”) seeks to provide investment results that correspond generally to the price and yield performance, before fees and expenses, of the Solactive Global SuperDividend® Index (“Underlying Index”). The Fund is passively managed, which means the investment adviser does not attempt to take defensive positions in declining markets. The Fund generally seeks to fully replicate the Underlying Index.
The Underlying Index tracks the performance of 100 equally-weighted companies that rank among the highest dividend yielding equity securities in the world, including emerging market countries, as defined by Solactive AG, the provider of the Underlying Index ("Index Provider"). The Index Provider applies certain dividend stability filters.
For the 12-month period ended October 31, 2022 (the “reporting period”), the Fund decreased 33.80%, while the Underlying Index decreased 35.81%. The Fund had a net asset value of $39.03 per share on October 31, 2021 and ended the reporting period with a net asset value of $23.05 per share on October 31, 2022 (as adjusted to account for a 1:3 reverse share split on December 19, 2022).
During the reporting period, the highest returns came from Yankuang Energy Group Company Limited and BW LPG Ltd., which returned 63.23% and 54.47%, respectively. The worst performers were PhosAgro PJSC and Evraz Plc, which returned -99.77% and -87.71%, respectively.
The stocks held by the Fund have some of the highest dividend yields in the world. The Fund generated negative returns in the reporting period as increasing volatility negatively impacted the global equity markets. High-dividend-yielding sectors such as real estate experienced a downturn as rising interest rates increased investors' financing costs and weaker consumer sentiment reduced demand for retail space, negatively impacting the Fund's performance. Furthermore, concerns about a global recession impacted the financial services sectors to which the Fund has the most exposure. However, the energy sector has supported the Fund with rising oil and natural gas prices, as many countries ended or eased COVID-19 pandemic-related restrictions. Geographically, the Fund maintained an average allocation of 28.16% to U.S. stocks, followed by China (15.81%), Hong Kong (11.45%) and Brazil (11.06%) during the reporting period. By sector, it averaged an approximate exposure of 29.91% to Financials, 21.94% to Real Estate, 9.25% to Materials, and 9.19% to Energy.
| | AVERAGE ANNUAL TOTAL RETURN FOR THE YEAR ENDED OCTOBER 31, 2022 |
| | One Year Return | Three Year Return | Five Year Return | Ten Year Return |
| | Net Asset Value | Market Price | Net Asset Value | Market Price | Net Asset Value | Market Price | Net Asset Value | Market Price |
| Global X SuperDividend® ETF | -33.80% | -33.47% | -16.22% | -16.01% | -11.11% | -11.01% | -2.59% | -2.55% |
| Solactive Global SuperDividend Index (USD) | -35.81% | -35.81% | -16.96% | -16.96% | -11.58% | -11.58% | -2.93% | -2.93% |
| MSCI ACWI (Net) (USD) | -19.96% | -19.96% | 4.85% | 4.85% | 5.24% | 5.24% | 7.98% | 7.98% |
|
| Management Discussion of Fund Performance (unaudited) |
| Global X SuperDividend® ETF |

* The Fund commenced operations on June 8, 2011.
The MSCI ACWI (Net) (All Country World Index) Index is a free float-adjusted market capitalization weighted index that is designed to measure the equity market performance of developed and emerging markets.
The performance data quoted herein represents past performance and the return and value of an investment in the Fund will fluctuate so that, when redeemed, it may be worth less than its original cost. Past performance is no guarantee of future performance and should not be considered as a representation of the future results of the Fund. The Fund's performance assumes the reinvestment of all dividends and all capital gains. Index returns assume reinvestment of dividends and, unlike the Fund's returns, do not reflect any fees or expenses. If such fees and expenses were included in the index returns, the performance would have been lower. Please note that one cannot invest directly in an unmanaged index. Performance figures for the periods shown may reflect contractual fee waivers and/or expense reimbursements. In the absence of fee waiver sand/or expense reimbursements (if applicable), returns would have been lower.
There are no assurances that the Fund will meet its stated objectives.
The Fund’s holdings and allocations are subject to change and should not be considered recommendations to buy individual securities.
The graph and table do not reflect the deduction of taxes that a shareholder would pay on Fund distributions or the redemption or sale of Fund shares.
See definition of comparative indices on the previous page.
|
| Management Discussion of Fund Performance (unaudited) |
| Global X SuperDividend® U.S. ETF |
Global X SuperDividend® U.S. ETF
The Global X SuperDividend® U.S. ETF (“Fund”) seeks to provide investment results that correspond generally to the price and yield performance, before fees and expenses, of the Indxx SuperDividend® U.S. Low Volatility Index (“Underlying Index”). The Fund is passively managed, which means the investment adviser does not attempt to take defensive positions in declining markets. The Fund generally seeks to fully replicate the Underlying Index.
The Underlying Index is maintained by Indxx, LCC (the "Index Provider"). The Underlying Index tracks the performance of 50 equally weighted common stocks, MLPs and REITs that rank among the highest dividend yielding equity securities in the United States, as defined by the Index Provider. The components of the Underlying Index will have also paid dividends consistently over the last two years. The Underlying Index is comprised of securities that the Index Provider determines to have lower relative volatility than the market.
For the 12-month period ended October 31, 2022 (the “reporting period”), the Fund increased 1.16%, while the Underlying Index increased 1.80%. The Fund had a net asset value of $20.13 per share on October 31, 2021 and ended the reporting period with a net asset value of $19.18 per share on October 31, 2022.
During the reporting period, the highest returns came from Sabine Royalty Trust and SpartanNash Company, which returned 76.86% and 58.85%, respectively. The worst performers were Warner Bros Discovery, Inc. and AGNC Investment Corp, which returned -46.79% and -41.76%, respectively.
The Fund invests in many of the highest-yielding stocks in the United States. High-dividend investing is a value-oriented strategy, which seeks to produce low-volatility returns. Equity market uncertainty, global growth concerns, and geopolitical crisis made dividend investing more appealing resulting in outperformance compared to the broader S&P 500® Index during the reporting period, contributing to the Fund's positive returns. The Fund’s exposure to sectors aided by the transition towards renewable energy and rise in energy prices, such as Utilities and Energy added to the Fund’s performance during the reporting period. During the fiscal year, by sector, the Fund averaged an exposure of 19.01% to Energy, 18.24% to Consumer Staples, 16.55% to Utilities, and 12.31% to Financials.
| | AVERAGE ANNUAL TOTAL RETURN FOR THE YEAR ENDED OCTOBER 31, 2022 |
| | One Year Return | Three Year Return | Five Year Return | Annualized Inception to Date* |
| | Net Asset Value | Market Price | Net Asset Value | Market Price | Net Asset Value | Market Price | Net Asset Value | Market Price |
| Global X SuperDividend® U.S. ETF | 1.16% | 1.17% | 0.25% | 0.30% | 1.39% | 1.41% | 3.90% | 3.97% |
Indxx SuperDividend U.S. Low Volatility Index | 1.80% | 1.80% | 0.47% | 0.47% | 1.74% | 1.74% | 4.47% | 4.47% |
| S&P 500 Index (Gross) | -14.61% | -14.61% | 10.22% | 10.22% | 10.44% | 10.44% | 12.04% | 12.04% |
|
| Management Discussion of Fund Performance (unaudited) |
| Global X SuperDividend® U.S. ETF |
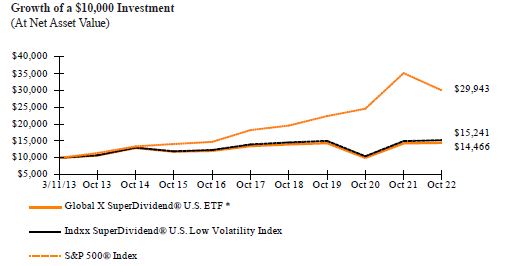
* The Fund commenced operations on March 11, 2013.
The S&P 500® Index is a market capitalization weighted composite index of 500 large capitalization U.S. companies.
The performance data quoted herein represents past performance and the return and value of an investment in the Fund will fluctuate so that, when redeemed, it may be worth less than its original cost. Past performance is no guarantee of future performance and should not be considered as a representation of the future results of the Fund. The Fund's performance assumes the reinvestment of all dividends and all capital gains. Index returns assume reinvestment of dividends and, unlike the Fund's returns, do not reflect any fees or expenses. If such fees and expenses were included in the index returns, the performance would have been lower. Please note that one cannot invest directly in an unmanaged index. Performance figures for the periods shown may reflect contractual fee waivers and/or expense reimbursements. In the absence of fee waiver sand/or expense reimbursements (if applicable), returns would have been lower.
There are no assurances that the Fund will meet its stated objectives.
The Fund’s holdings and allocations are subject to change and should not be considered recommendations to buy individual securities.
The graph and table do not reflect the deduction of taxes that a shareholder would pay on Fund distributions or the redemption or sale of Fund shares.
See definition of comparative indices on the previous page.
|
| Management Discussion of Fund Performance (unaudited) |
| Global X MSCI SuperDividend® EAFE ETF |
Global X MSCI SuperDividend® EAFE ETF
The Global X MSCI SuperDividend® EAFE ETF (“Fund”) seeks to provide investment results that correspond generally to the price and yield performance, before fees and expenses, of the MSCI EAFE Top 50 Dividend Index (“Underlying Index”). The Fund is passively managed, which means the investment adviser does not attempt to take defensive positions in declining markets. The Fund generally seeks to fully replicate the Underlying Index.
The Underlying Index tracks the performance of 50 equally-weighted companies that rank among the highest dividend yielding equity securities in Europe, Australasia and the Far East, as defined by MSCI, the provider of the Underlying Index.
For the 12-month period ended October 31, 2022 (the “reporting period”), the Fund decreased 18.12%, while the Underlying Index decreased 17.70%. The Fund had a net asset value of $15.62 per share on October 31, 2021 and ended the reporting period with a net asset value of $11.98 per share on October 31, 2022.
During the reporting period, the highest returns came from Telecom Italia Rsp and British American Tobacco PLC, which returned 27.73% and 21.28%, respectively. The worst performers were Persimmon PLC and Fortum Oyj, which returned -54.91% and -49.47%, respectively.
The Fund experienced negative returns during the reporting period. Performance suffered due to a fall in currencies of countries in developed markets, as the U.S. dollar continued to outperform, and power prices in Europe rose as a result of Russia's invasion of Ukraine, with worsening disruption of energy markets causing negative inflationary impacts. The shift in policy by central banks, including implementing higher interest rates, resulted in continued international equity losses. During the reporting period, sector weighting reported highest in Financials (31.13%), followed by Utilities (19.05%). The Fund has the highest average exposure to U.K. stocks at 22.36%, ahead of Australia (10.82%), Japan (9.98%), and Spain (8.22%).
| | AVERAGE ANNUAL TOTAL RETURN FOR THE YEAR ENDED OCTOBER 31, 2022 |
| | One Year Return | Three Year Return | Five Year Return | Annualized Inception to Date* |
| | Net Asset Value | Market Price | Net Asset Value | Market Price | Net Asset Value | Market Price | Net Asset Value | Market Price |
| Global X MSCI SuperDividend® EAFE ETF | -18.12% | -19.25% | -4.33% | -4.63% | -2.28% | -2.56% | 1.99% | 1.71% |
| MSCI EAFE Top 50 Dividend Index | -17.70% | -17.70% | -3.74% | -3.74% | -1.76% | -1.76% | 2.50% | 2.50% |
| MSCI EAFE Index (Net) (USD) | -23.00% | -23.00% | -1.27% | -1.27% | -0.09% | -0.09% | 3.90% | 3.90% |
|
| Management Discussion of Fund Performance (unaudited) |
| Global X MSCI SuperDividend® EAFE ETF |

* The Fund commenced operations on November 14, 2016.
The MSCI EAFE Index (Net) (Europe, Australasia, Far East) is a free float-adjusted market capitalization index that is designed to measure the equity market performance of developed markets, excluding the US & Canada.
The performance data quoted herein represents past performance and the return and value of an investment in the Fund will fluctuate so that, when redeemed, it may be worth less than its original cost. Past performance is no guarantee of future performance and should not be considered as a representation of the future results of the Fund. The Fund's performance assumes the reinvestment of all dividends and all capital gains. Index returns assume reinvestment of dividends and, unlike the Fund's returns, do not reflect any fees or expenses. If such fees and expenses were included in the index returns, the performance would have been lower. Please note that one cannot invest directly in an unmanaged index. Performance figures for the periods shown may reflect contractual fee waivers and/or expense reimbursements. In the absence of fee waiver sand/or expense reimbursements (if applicable), returns would have been lower.
There are no assurances that the Fund will meet its stated objectives.
The Fund’s holdings and allocations are subject to change and should not be considered recommendations to buy individual securities.
The graph and table do not reflect the deduction of taxes that a shareholder would pay on Fund distributions or the redemption or sale of Fund shares.
See definition of comparative indices on the previous page.
|
| Management Discussion of Fund Performance (unaudited) |
| Global X MSCI SuperDividend® Emerging Markets ETF |
Global X MSCI SuperDividend® Emerging Markets ETF
The Global X MSCI SuperDividend® Emerging Markets ETF (“Fund”) seeks to provide investment results that correspond generally to the price and yield performance, before fees and expenses, of the MSCI Emerging Markets Top 50 Dividend Index (“Underlying Index”). The Fund is passively managed, which means the investment adviser does not attempt to take defensive positions in declining markets. The Fund generally seeks to fully replicate the Underlying Index.
The Underlying Index is based on the MSCI Emerging Markets Index, its parent index (the "Parent Index"), which includes large and mid-cap stocks across 23 emerging markets countries. The Underlying Index aims to reflect the performance of 50 securities from the Parent Index, selected by dividend yield that have increased or maintained their dividend per share compared to the previous year or have increased or maintained their payout ratio (defined as dividend per share/earnings per share) if the dividend per share has dropped by up to 10%.
For the 12-month period ended October 31, 2022 (the “reporting period”), the Fund decreased 30.80%, while the Underlying Index decreased 31.08%. The Fund had a net asset value of $33.78 per share on October 31, 2021 and ended the reporting period with a net asset value of $21.36 per share on October 31, 2022 (as adjusted to account for a 1:3 reverse share split on December 19, 2022).
During the reporting period, the highest returns came from Yankuang Energy Group Company Limited and Coal India Ltd, which returned 109.90% and 62.86%, respectively. The worst performers were PhosAgro PJSC and Top Glove Corporation Bhd, which returned -99.77% and -74.26%, respectively.
The Fund's holdings include some of the stocks with the highest dividend yields in emerging markets. During the reporting period, tightening monetary policy by central banks, global supply chain issues resulting from Russia's invasion of Ukraine, COVID-19 pandemic-related lockdowns in China and a strong U.S. dollar all contributed to a slowdown in emerging markets economic growth, resulting in the Fund’s negative returns.Additionally, rising commodity prices pushed up inflation rates, negatively impacting consumer purchasing power. Investors also took more of a risk-off perspective with equity markets globally remaining volatile. During the reporting period, the Fund averaged an approximate stock exposure of 26.68% in China, 11.15% in Brazil, 9.37% in South Africa, and 8.73% in Taiwan. By sector, it had the highest exposure to Materials (27.20%), followed by Energy (18.46%), Financials (13.16%), and Real Estate (11.55%) during the reporting period.
| | AVERAGE ANNUAL TOTAL RETURN FOR THE YEAR ENDED OCTOBER 31, 2022 |
| | One Year Return | Three Year Return | Five Year Return | Annualized Inception to Date* |
| | Net Asset Value | Market Price | Net Asset Value | Market Price | Net Asset Value | Market Price | Net Asset Value | Market Price |
Global X MSCI SuperDividend® Emerging Markets ETF | -30.80% | -30.88% | -11.73% | -11.51% | -8.74% | -8.79% | -3.22% | -3.21% |
Hybrid INDXX SuperDividend Emerging Markets Index/MSCI Emerging Markets Top 50 Dividend Index | -31.08% | -31.08% | -11.01% | -11.01% | -8.00% | -8.00% | -2.11% | -2.11% |
| MSCI Emerging Markets Index (Net) | -31.03% | -31.03% | -4.42% | -4.42% | -3.09% | -3.09% | 1.07% | 1.07% |
|
| Management Discussion of Fund Performance (unaudited) |
| Global X MSCI SuperDividend® Emerging Markets ETF |

* The Fund commenced operations on March 16, 2015.
** Hybrid Index performance reflects the performance of the INDXX SuperDividend® Emerging Markets Index through November 15, 2016 and the MSCI Emerging Markets Top 50 Dividend Index thereafter.
The MSCI Emerging Markets Index (Net) is a free float-adjusted market capitalization index that is designed to measure equity market performance of emerging markets.
The performance data quoted herein represents past performance and the return and value of an investment in the Fund will fluctuate so that, when redeemed, it may be worth less than its original cost. Past performance is no guarantee of future performance and should not be considered as a representation of the future results of the Fund. The Fund's performance assumes the reinvestment of all dividends and all capital gains. Index returns assume reinvestment of dividends and, unlike the Fund's returns, do not reflect any fees or expenses. If such fees and expenses were included in the index returns, the performance would have been lower. Please note that one cannot invest directly in an unmanaged index.
Performance figures for the periods shown may reflect contractual fee waivers and/or expense reimbursements. In the absence of fee waiver sand/or expense reimbursements (if applicable), returns would have been lower.
There are no assurances that the Fund will meet its stated objectives.
The Fund’s holdings and allocations are subject to change and should not be considered recommendations to buy individual securities.
The graph and table do not reflect the deduction of taxes that a shareholder would pay on Fund distributions or the redemption or sale of Fund shares.
See definition of comparative indices on the previous page.
20
|
| Management Discussion of Fund Performance (unaudited) |
| Global X SuperDividend® REIT ETF |
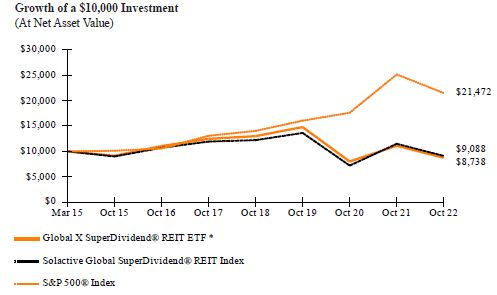
Global X SuperDividend® REIT ETF
The Global X SuperDividend® REIT ETF (“Fund”) seeks to provide investment results that correspond generally to the price and yield performance, before fees and expenses, of the Solactive Global SuperDividend® REIT Index (“Underlying Index”). The Fund is passively managed, which means the investment adviser does not attempt to take defensive positions in declining markets. The Fund generally seeks to fully replicate the Underlying Index.
The Underlying Index tracks the performance of Real Estate Investment Trusts (“REITs”) that rank among the highest yielding REITs globally, as determined by Solactive AG, the provider of the Underlying Index.
For the 12-month period ended October 31, 2022 (the “reporting period”), the Fund decreased 21.21%, while the Underlying Index decreased 20.88%. The Fund had a net asset value of $29.46 per share on October 31, 2021 and ended the reporting period with a net asset value of $21.65 per share on October 31, 2022 (as adjusted to account for a 1:3 reverse share split on December 19, 2022).
During the reporting period, the highest returns came from Fibra Uno Administracion SA and Getty Realty Corp, which returned 16.78% and 10.79%, respectively. The worst performers were AGNC Investment Corp and Armour Residential REIT, Inc., which returned -41.76% and -40.78%, respectively.
The Fund invests in real estate investment trusts (“REITs”), which have some of the highest dividend yields in the world. During the reporting period, the housing market experienced an inflection point as a rapid rise in interest rates, rising home prices, and escalating material costs globally made borrowing costlier for consumers, contributing to the Fund's negative performance. Mortgage REITs were affected by this trend, in addition to the impact on the housing market. These factors contributed to the Fund's negative performance. Rising interest rates generally affected REITs in an adverse manner. During the reporting period, the Fund averaged an approximate exposure of 60.36% to Real Estate and 38.87% to Financials. Geographically, the United States led average approximate exposure at 60.26%, followed by Singapore (23.28%) and Canada (8.15%).
| | AVERAGE ANNUAL TOTAL RETURN FOR THE YEAR ENDED OCTOBER 31, 2022 |
| | One Year Return | Three Year Return | Five Year Return | Annualized Inception to Date* |
| | Net Asset Value | Market Price | Net Asset Value | Market Price | Net Asset Value | Market Price | Net Asset Value | Market Price |
| Global X SuperDividend® REIT ETF | -21.21% | -21.54% | -16.06% | -16.22% | -6.86% | -6.98% | -1.75% | -1.82% |
Solactive Global SuperDividend® REIT Index | -20.88% | -20.88% | -15.87% | -15.87% | -6.50% | -6.50% | -1.25% | -1.25% |
| S&P 500® Index | -14.61% | -14.61% | 10.22% | 10.22% | 10.44% | 10.44% | 10.53% | 10.53% |
|
| Management Discussion of Fund Performance (unaudited) |
| Global X SuperDividend® REIT ETF |
* The Fund commenced operations on March 16, 2015.
The S&P 500® Index is a market capitalization weighted composite index of 500 large capitalization U.S. companies.
The performance data quoted herein represents past performance and the return and value of an investment in the Fund will fluctuate so that, when redeemed, it may be worth less than its original cost. Past performance is no guarantee of future performance and should not be considered as a representation of the future results of the Fund. The Fund's performance assumes the reinvestment of all dividends and all capital gains. Index returns assume reinvestment of dividends and, unlike the Fund's returns, do not reflect any fees or expenses. If such fees and expenses were included in the index returns, the performance would have been lower. Please note that one cannot invest directly in an unmanaged index. Performance figures for the periods shown may reflect contractual fee waivers and/or expense reimbursements. In the absence of fee waiver sand/or expense reimbursements (if applicable), returns would have been lower.
There are no assurances that the Fund will meet its stated objectives.
The Fund’s holdings and allocations are subject to change and should not be considered recommendations to buy individual securities.
The graph and table do not reflect the deduction of taxes that a shareholder would pay on Fund distributions or the redemption or sale of Fund shares.
See definition of comparative indices on the previous page.
|
| Management Discussion of Fund Performance (unaudited) |
| Global X NASDAQ 100® Covered Call ETF |
Global X NASDAQ 100® Covered Call ETF
The Global X Nasdaq 100® Covered Call ETF (“Fund”) seeks to provide investment results that correspond generally to the price and yield performance, before fees and expenses, of the CBOE Nasdaq-100® BuyWrite V2 Index (“Underlying Index”). The Fund is passively managed and the investment adviser does not attempt to take defensive positions in declining markets. The Fund generally seeks to fully replicate the Underlying Index.
The CBOE NASDAQ-100® BuyWrite Index (“BXN Index”) is a benchmark index that measures the performance of a theoretical portfolio that holds a portfolio of the stocks included in the NASDAQ-100® Index (“Reference Index”), and “writes” (or sells) a succession of one-month at-the-money ("ATM") covered call options on the Reference Index. The Underlying Index replicates the methodology used to calculate the BXN Index, with one exception: the written Reference Index covered call options are held until one day prior to the expiration date (i.e., generally the Thursday preceding the Third Friday of the month) and are liquidated at a volume weighted average price determined at the close.
For the 12-month period ended October 31, 2022 (the “reporting period”), the Fund decreased 19.18%, while the Underlying Index decreased 18.86%. The Fund had a net asset value of $22.82 per share on October 31, 2021 and ended the reporting period with a net asset value of $16.15 per share on October 31, 2022.
During the reporting period, the highest returns came from Constellation Energy Corporation and Vertex Pharmaceuticals Inc., which returned 91.35% and 68.71%, respectively. The worst performers were DocuSign, Inc. and Okta, Inc., which returned -82.64% and -77.30%, respectively.
The Fund invests in stocks on the Reference Index and “writes” or “sells” corresponding call options on the Reference Index. This strategy tends to produce higher yields in volatile and uncertain times when the Fund can collect higher option premiums. The Reference Index's performance suffered due to the negative performance of market-leading technology and tech-adjacent companies. High inflation, rate hikes implemented by central banks, and recessionary fears of investors gripped market sentiments during the reporting period, causing traditional equities to underperform, resulting in the Fund's negative returns. The Fund collected high option premiums when the market was volatile, but the rally by constituents of the Reference Index adversely affected ATM options writing and limited Fund performance. Due to its covered call strategy, the Fund loses profit potential if the Reference Index rises above the strike price of the index call option.
| | AVERAGE ANNUAL TOTAL RETURN FOR THE YEAR ENDED OCTOBER 31, 2022 |
| | One Year Return | Three Year Return | Five Year Return | Annualized Inception to Date* |
| | Net Asset Value | Market Price | Net Asset Value | Market Price | Net Asset Value | Market Price | Net Asset Value | Market Price |
| Global X NASDAQ 100® Covered Call ETF | -19.18% | -19.23% | 0.11% | 0.05% | 3.35% | 3.26% | 5.68% | 5.66% |
Hybrid CBOE NASDAQ-100® BuyWrite Index/CBOE NASDAQ-100® BuyWrite V2 Index** | -18.86% | -18.86% | 0.84% | 0.84% | 4.36% | 4.36% | 6.58% | 6.58% |
| NASDAQ 100® Total Return Index | -27.46% | -27.46% | 13.08% | 13.08% | 13.84% | 13.84% | 15.52% | 15.52% |
|
| Management Discussion of Fund Performance (unaudited) |
| Global X NASDAQ 100® Covered Call ETF |

* The Fund commenced operations on December 11, 2013.
** Hybrid Index performance reflects the performance of the CBOE NASDAQ-100® BuyWrite Index through October 14, 2015 and CBOE NASDAQ-100® BuyWrite V2 Index thereafter.
The Fund operated as the Horizons NASDAQ 100® Covered Call ETF (the “Predecessor Fund”), a series of Horizons ETF Trust I, prior to the Fund’s acquisition of the assets and assumption of the liabilities of the Predecessor Fund on December 24, 2018 (See Note 1 in Notes to Financial Statements).
On October 14, 2015, Global X Management Company LLC (The “Advisor”) changed the Fund’s primary benchmark from the BXN Index to BXNT Index in connection with a change in the Fund’s principal strategies. The Advisor believes the BXNT Index is a better measure of the Fund’s performance. Returns reflect a blended benchmark.
The Nasdaq-100® Index includes 100 of the largest domestic and international non-financial companies listed on The Nasdaq Stock Market based on market capitalization.
The performance data quoted herein represents past performance and the return and value of an investment in the Fund will fluctuate so that, when redeemed, it may be worth less than its original cost. Past performance is no guarantee of future performance and should not be considered as a representation of the future results of the Fund. The Fund's performance assumes the reinvestment of all dividends and all capital gains. Index returns assume reinvestment of dividends and, unlike the Fund's returns, do not reflect any fees or expenses. If such fees and expenses were included in the index returns, the performance would have been lower. Please note that one cannot invest directly in an unmanaged index. Performance figures for the periods shown may reflect contractual fee waivers and/or expense reimbursements. In the absence of fee waiver sand/or expense reimbursements (if applicable), returns would have been lower.
There are no assurances that the Fund will meet its stated objectives.
| Management Discussion of Fund Performance (unaudited) |
| Global X NASDAQ 100® Covered Call ETF |
The Fund’s holdings and allocations are subject to change and should not be considered recommendations to buy individual securities.
The graph and table do not reflect the deduction of taxes that a shareholder would pay on Fund distributions or the redemption or sale of Fund shares.
See definition of comparative indices on the previous page.
|
| Management Discussion of Fund Performance (unaudited) |
| Global X S&P 500® Covered Call ETF |
Global X S&P 500® Covered Call ETF
The Global X S&P 500® Covered Call ETF (“Fund”) seeks to provide investment results that correspond generally to the price and yield performance, before fees and expenses, of the CBOE S&P 500® BuyWrite Index (“Underlying Index”). The Fund is passively managed, and the investment adviser does not attempt to take defensive positions in declining markets. The Fund generally seeks to fully replicate the Underlying Index.
The Underlying Index is comprised of two parts: (1) all the equity securities in the S&P 500® Index (the "Reference Index") in substantially similar weight as the Reference Index; and (2) short (written) call options on up to 100% of the Reference Index.
For the 12-month period ended October 31, 2022 (the “reporting period”), the Fund decreased 10.72%, while the Index decreased 9.97%. The Fund had a net asset value of $50.37 per share on October 31, 2021 and ended the reporting period with a net asset value of $40 per share on October 31, 2022.
During the reporting period, the highest returns came from Occidental Petroleum Corporation and Devon Energy Corporation, which returned 117.95% and 108.22%, respectively. The worst performers were Generac Holdings Inc. and Match Group, Inc., which returned -76.75% and -71.35%, respectively.
The Fund invests in stocks listed on the Reference Index and “writes” or “sells” corresponding call options on the same index. The Reference Index generated negative returns during the reporting period as interest rates rose and global currencies experienced turmoil, which contributed to the Fund's negative returns. Investor concerns about the outlook for U.S. equities weighed on Fund performance. However, the Fund also collected higher option premiums in this environment, offsetting some of its equity losses. Because of the Fund's options-writing strategy, it forfeits potential profit when the Underlying Index rises above the strike price of the index call option.
| | AVERAGE ANNUAL TOTAL RETURN FOR THE YEAR ENDED OCTOBER 31, 2022 |
| | One Year Return | Three Year Return | Five Year Return | Annualized Inception to Date* |
| | Net Asset Value | Market Price | Net Asset Value | Market Price | Net Asset Value | Market Price | Net Asset Value | Market Price |
| Global X S&P 500® Covered Call ETF | -10.72% | -10.82% | 2.60% | 2.55% | 4.21% | 4.19% | 6.63% | 6.70% |
Hybrid S&P 500® Stock Covered Call Index/CBOE S&P 500 2% OTM BuyWrite Index/CBOE S&P 500 BuyWrite Index** | -9.97% | -9.97% | 3.37% | 3.37% | 5.11% | 5.11% | 6.95% | 6.95% |
| S&P 500® Index | -14.61% | -14.61% | 10.22% | 10.22% | 10.44% | 10.44% | 12.08% | 12.08% |
|
| Management Discussion of Fund Performance (unaudited) |
| Global X S&P 500® Covered Call ETF |

* The Fund commenced operations on June 21, 2013.
** Hybrid Index performance reflects the performance of the S&P 500® Stock Covered Call Index through September 14, 2017, the CBOE S&P 500 2% OTM BuyWrite Index through August 20, 2020 and the CBOE S&P 500 BuyWrite Index thereafter.
The Fund operated as the Horizons S&P 500® Covered Call ETF (the “Predecessor Fund”), a series of Horizons ETF Trust I, prior to the Fund’s acquisition of the assets and assumption of the liabilities of the Predecessor Fund on December 24, 2018 (See Note 1 in Notes to Financial Statements).
The S&P 500® Index is a market capitalization weighted composite index of 500 large capitalization U.S. companies.
The performance data quoted herein represents past performance and the return and value of an investment in the Fund will fluctuate so that, when redeemed, it may be worth less than its original cost. Past performance is no guarantee of future performance and should not be considered as a representation of the future results of the Fund. The Fund's performance assumes the reinvestment of all dividends and all capital gains. Index returns assume reinvestment of dividends and, unlike the Fund's returns, do not reflect any fees or expenses. If such fees and expenses were included in the index returns, the performance would have been lower. Please note that one cannot invest directly in an unmanaged index. Performance figures for the periods shown may reflect contractual fee waivers and/or expense reimbursements. In the absence of fee waiver sand/or expense reimbursements (if applicable), returns would have been lower.
There are no assurances that the Fund will meet its stated objectives.
The Fund’s holdings and allocations are subject to change and should not be considered recommendations to buy individual securities.
|
| Management Discussion of Fund Performance (unaudited) |
| Global X S&P 500® Covered Call ETF |
The graph and table do not reflect the deduction of taxes that a shareholder would pay on Fund distributions or the redemption or sale of Fund shares.
See definition of comparative indices on the previous page.
|
| Management Discussion of Fund Performance (unaudited) |
| Global X Russell 2000 Covered Call ETF |
Global X Russell 2000 Covered Call ETF
The Global X Russell 2000 Covered Call ETF (“Fund”) seeks to provide investment results that correspond generally to the price and yield performance, before fees and expenses, of the CBOE Russell 2000 BuyWrite Index (“Underlying Index”).The Fund is passively managed and the investment adviser does not attempt to take defensive positions in declining markets. The Fund generally seeks to fully replicate the Underlying Index.
The Underlying Index measures the performance of a theoretical portfolio that holds a portfolio of the stocks included in the Russell 2000 Index (the "Reference Index"), and "writes" (or sells) a succession of one-month at-the-money covered call options on the Reference Index. The written covered call options on the Reference Index are held until expiration. The Reference Index is an equity benchmark which measures the performance of the small-capitalization sector of the U.S. equity market, as defined by FTSE Russell, the provider of the Reference Index.
For the 12-month period ended October 31, 2022 (the “reporting period”), the Fund decreased 12.18%, while the Underlying Index decreased 11.63%. The Fund had a net asset value of $25.18 per share on October 31, 2021 and ended the reporting period with a net asset value of $19.55 per share on October 31, 2022.
During the reporting period, the highest returns came from Akero Therapeutics, Inc. and Amylyx Pharmaceuticals, Inc., which returned 277.32% and 227.55%, respectively. The worst performers were Tricida, Inc. and Starry Group Holdings, Inc. which returned -96.56% and -95.44%, respectively.
The Fund invests in the underlying holdings of the Russell 2000 Index and “writes” or “sells” corresponding call options on the same index. During the reporting period, the Russia-Ukraine conflict, soaring oil prices, raging inflation, rising interest rates, and widespread COVID-19 pandemic-related lockdown measures by China slowed global economic growth, negatively impacting equity markets. This led to negative Fund returns. However, high volatility in the small-cap space and the broader market allowed the Fund to collect higher option premiums during the reporting period, limiting the Fund's losses. Given the Fund’s options-writing strategy, it cedes potential profit when the Reference Index advances above the strike price of the index call option.
| | AVERAGE ANNUAL TOTAL RETURN FOR THE YEAR ENDED OCTOBER 31, 2022 |
| | One Year Return | Three Year Return | Annualized Inception to Date* |
| | Net Asset Value | Market Price | Net Asset Value | Market Price | Net Asset Value | Market Price |
| Global X Russell 2000 Covered Call ETF | -12.18% | -12.20% | 3.45% | 3.48% | 4.62% | 4.64% |
| CBOE Russell 2000 BuyWrite Index | -11.63% | -11.63% | 4.22% | 4.22% | 5.53% | 5.53% |
| Russell 2000 Index | -18.54% | -18.54% | 7.05% | 7.05% | 6.06% | 6.06% |
|
| Management Discussion of Fund Performance (unaudited) |
| Global X Russell 2000 Covered Call ETF |
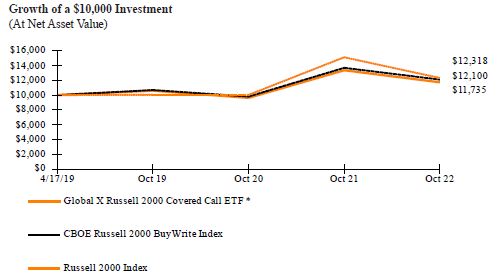
* The Fund commenced operations on April 17, 2019.
The Russell 2000 Index is an index measuring the performance of approximately 2,000 smallest-cap American companies in the Russell 3000 Index, which is made up of 3,000 of the largest U.S. stocks. It is a market-cap weighted index.
The performance data quoted herein represents past performance and the return and value of an investment in the Fund will fluctuate so that, when redeemed, it may be worth less than its original cost. Past performance is no guarantee of future performance and should not be considered as a representation of the future results of the Fund. The Fund's performance assumes the reinvestment of all dividends and all capital gains. Index returns assume reinvestment of dividends and, unlike the Fund's returns, do not reflect any fees or expenses. If such fees and expenses were included in the index returns, the performance would have been lower. Please note that one cannot invest directly in an unmanaged index. Performance figures for the periods shown may reflect contractual fee waivers and/or expense reimbursements. In the absence of fee waiver sand/or expense reimbursements (if applicable), returns would have been lower.
There are no assurances that the Fund will meet its stated objectives.
The Fund’s holdings and allocations are subject to change and should not be considered recommendations to buy individual securities.
The graph and table do not reflect the deduction of taxes that a shareholder would pay on Fund distributions or the redemption or sale of Fund shares. See definition of comparative indices above.
|
| Management Discussion of Fund Performance (unaudited) |
| Global X Dow 30® Covered Call ETF |
Global X Dow 30® Covered Call ETF
The Global X Dow 30® Covered Call ETF (“Fund”) seeks to provide investment results that correspond generally to the price and yield performance, before fees and expenses, of the DJIA CBOE BuyWrite v2 Index (“Underlying Index”). The Fund is passively managed, and the investment adviser does not attempt to take defensive positions in declining markets. The Fund generally seeks to fully replicate the Underlying Index.
The Underlying Index measures the performance of a covered call strategy that holds a theoretical portfolio of the underlying stocks of the Dow Jones Industrial Average® (the “Reference Index”) and “writes” (or sells) a succession of one-month at-the-money (“ATM”) covered call options on the Reference Index. The Underlying Index specifically reflects the performance of the component securities of the Reference Index, combined with written (sold) ATM call options corresponding to the value of the portfolio of stocks in the Reference Index.
From the inception of the Fund to period ended October 31, 2022 (the “reporting period”), the Fund decreased 2.77%, while the Underlying Index decreased 1.98%. The Fund had a net asset value of $24.13 per share on February 23, 2022 and ended the reporting period with a net asset value of $21.89 per share on October 31, 2022.
During the reporting period, the highest returns came from Chevron Corporation and Amgen Inc., which returned 64.35% and 34.96%, respectively. The worst performers were Salesforce, Inc. and Nike, Inc., which returned -45.75% and -44.07%, respectively.
The Fund invests in the Reference Index and “writes” or “sells” corresponding call options on the same index. Since its inception, the Fund has generated negative returns as investor concerns over rising interest rates, a consumer-spending downturn, and continued inflation led to a decline in equity markets, resulting in losses for the majority of the Reference Index's holdings. However, by the end of the reporting period, developed markets began to recover, with the U.S. outperforming the rest of the world, and the majority of the Fund's holdings posting gains, which attracted investors. High volatility in the equity market also allowed the Fund to collect higher option premiums. Given the Fund’s options-writing strategy, it cedes potential profit when the Reference Index advances above the strike price of the Fund's corresponding index call option.
| | AVERAGE ANNUAL TOTAL RETURN FOR THE PERIOD ENDED OCTOBER 31, 2022 |
| | Cumulative Inception to Date* |
| | Net Asset Value | Market Price |
| Global X Dow 30® Covered Call ETF | -2.77% | -2.52% |
| DJIA Cboe BuyWrite v2 Index | -1.98% | -1.98% |
| DJIA Index | 0.18% | 0.18% |
|
| Management Discussion of Fund Performance (unaudited) |
| Global X Dow 30® Covered Call ETF |
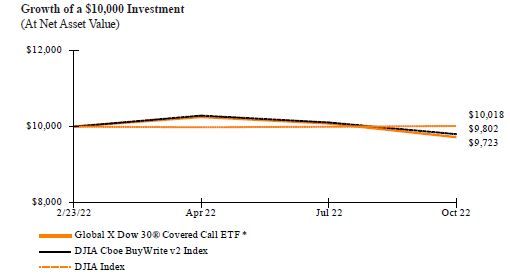
* The Fund commenced operations on February 23, 2022.
The Dow Jones Industrial Average, Dow Jones, or simply the Dow, is a stock market index of 30 prominent companies listed on stock exchanges in the United States. The DJIA is one of the oldest and most commonly followed equity indexes.
The performance data quoted herein represents past performance and the return and value of an investment in the Fund will fluctuate so that, when redeemed, it may be worth less than its original cost. Past performance is no guarantee of future performance and should not be considered as a representation of the future results of the Fund. The Fund's performance assumes the reinvestment of all dividends and all capital gains. Index returns assume reinvestment of dividends and, unlike the Fund's returns, do not reflect any fees or expenses. If such fees and expenses were included in the index returns, the performance would have been lower. Please note that one cannot invest directly in an unmanaged index. Performance figures for the periods shown may reflect contractual fee waivers and/or expense reimbursements. In the absence of fee waiver sand/or expense reimbursements (if applicable), returns would have been lower.
There are no assurances that the Fund will meet its stated objectives.
The Fund’s holdings and allocations are subject to change and should not be considered recommendations to buy individual securities.
The graph and table do not reflect the deduction of taxes that a shareholder would pay on Fund distributions or the redemption or sale of Fund shares.
See definition of comparative indices above.
|
| Management Discussion of Fund Performance (unaudited) |
| Global X Nasdaq 100® Covered Call & Growth ETF |
Global X Nasdaq 100® Covered Call & Growth ETF
The Global X NASDAQ 100® Covered Call & Growth ETF (“Fund”) seeks to provide investment results that correspond generally to the price and yield performance, before fees and expenses, of the Cboe NASDAQ-100® Half BuyWrite V2 Index (“Underlying Index”). The Fund is passively managed and the investment adviser does not attempt to take defensive positions in declining markets. The Fund generally seeks to fully replicate the Underlying Index.
The Underlying Index is a benchmark index that measures the performance of a theoretical portfolio that owns the portfolio of the stocks included in the NASDAQ-100® Index (the "Reference Index"), and “writes” (or sells) corresponding call options on approximately 50% of the value of the portfolio of stocks in the Reference Index.
For the 12-month period ended October 31, 2022 (the “reporting period”), the Fund decreased 23.57%, while the Underlying Index decreased 23.16%. The Fund had a net asset value of $33.09 per share on October 31, 2021 and ended the reporting period with a net asset value of $22.80 per share on October 31, 2022.
During the reporting period, the highest returns came from Constellation Energy Corporation and Vertex Pharmaceuticals Inc., which returned 91.35% and 68.71%, respectively. The worst performers were DocuSign, Inc. and Okta, Inc., which returned -82.64% and -77.30%, respectively.
The Fund follows a “covered call” or “buy-write” strategy, buying stocks on the Reference Index and “writing” or “selling” corresponding call options on approximately 50% of the value of the portfolio of stocks on the Reference Index. During the reporting period, the Fund performed slightly better than Nasdaq-100® as technology focused and tech-adjacent companies dragged down the Reference Index. Furthermore, the Fund was heavily weighted in mega-cap technology stocks, which were negatively impacted by high-interest rates and rising fears of a global economic slowdown, resulting in negative returns for the Fund. However, when the market was volatile, the Fund collected higher levels of option premiums, offsetting some of the negative equity performance.
| | AVERAGE ANNUAL TOTAL RETURN FOR THE YEAR ENDED OCTOBER 31, 2022 |
| | One Year Return | Annualized Inception to Date* |
| | Net Asset Value | Market Price | Net Asset Value | Market Price |
Global X Nasdaq 100® Covered Call & Growth ETF | -23.57% | -23.51% | 1.12% | 1.19% |
CBOE NASDAQ-100 Half BuyWrite V2 Index** | -23.16% | -23.16% | 1.69% | 1.69% |
| NASDAQ-100® Index | -27.46% | -27.46% | 2.76% | 2.76% |
|
| Management Discussion of Fund Performance (unaudited) |
| Global X Nasdaq 100® Covered Call & Growth ETF |
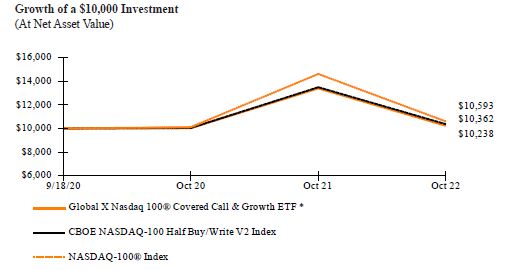
* The Fund commenced operations on September 18, 2020.
The Nasdaq-100® Index includes 100 of the largest domestic and international non-financial companies listed on The Nasdaq Stock Market based on market capitalization.
The performance data quoted herein represents past performance and the return and value of an investment in the Fund will fluctuate so that, when redeemed, it may be worth less than its original cost. Past performance is no guarantee of future performance and should not be considered as a representation of the future results of the Fund. The Fund's performance assumes the reinvestment of all dividends and all capital gains. Index returns assume reinvestment of dividends and, unlike the Fund's returns, do not reflect any fees or expenses. If such fees and expenses were included in the index returns, the performance would have been lower. Please note that one cannot invest directly in an unmanaged index. Performance figures for the periods shown may reflect contractual fee waivers and/or expense reimbursements. In the absence of fee waiver sand/or expense reimbursements (if applicable), returns would have been lower.
There are no assurances that the Fund will meet its stated objectives.
The Fund’s holdings and allocations are subject to change and should not be considered recommendations to buy individual securities.
The graph and table do not reflect the deduction of taxes that a shareholder would pay on Fund distributions or the redemption or sale of Fund shares.
See definition of comparative indices on the previous page.
|
| Management Discussion of Fund Performance (unaudited) |
| Global X S&P 500® Covered Call & Growth ETF |
Global X S&P 500® Covered Call & Growth ETF
The Global X S&P 500® Covered Call & Growth ETF (“Fund”) seeks to provide investment results that correspond generally to the price and yield performance, before fees and expenses, of the Cboe S&P 500® Half BuyWrite Index (“Underlying Index”). The Fund is passively managed and the investment adviser does not attempt to take defensive positions in declining markets. The Fund generally seeks to fully replicate the Underlying Index.
The Underlying Index is a benchmark index that measures the performance of a theoretical portfolio that owns the portfolio of the stocks included in the S&P 500® Index (the "Reference Index"), and “writes” (or sells) corresponding call options on approximately 50% of the value of the portfolio of stocks in the Reference Index.
For the 12-month period ended October 31, 2022 (the “reporting period”), the Fund decreased 12.63%, while the Underlying Index decreased 12.20%. The Fund had a net asset value of $31.83 per share on October 31, 2021 and ended the reporting period with a net asset value of $25.47 per share on October 31, 2022.
During the reporting period, the highest returns came from Occidental Petroleum Corporation and Devon Energy Corporation, which returned 117.95% and 108.22%, respectively. The worst performers were Generac Holdings Inc. and Match Group, Inc., which returned -76.75% and -71.35%, respectively.
The Fund invests in stocks listed on the Reference Index and “writes” or “sells” corresponding call options on the same index. The Reference Index generated negative returns during the reporting period due to rising interest rates, and elevated market volatility gripped the global equity markets. This contributed to the Fund's negative performance. The Fund collected higher levels of option premiums when the market was volatile, offsetting some of the Fund’s equity losses. Given the Fund’s options-writing strategy, it cedes potential profit when the Reference Index advances above the strike price of the Fund's corresponding index call option.
| | AVERAGE ANNUAL TOTAL RETURN FOR THE YEAR ENDED OCTOBER 31, 2022 |
| | One Year Return | Annualized Inception to Date* |
| | Net Asset Value | Market Price | Net Asset Value | Market Price |
Global X S&P 500® Covered Call & Growth ETF | -12.63% | -12.47% | 7.34% | 7.34% |
| CBOE S&P 500 Half BuyWrite Index** | -12.20% | -12.20% | 8.20% | 8.20% |
| S&P 500® Index | -14.61% | -14.61% | 9.16% | 9.16% |
|
| Management Discussion of Fund Performance (unaudited) |
| Global X S&P 500® Covered Call & Growth ETF |
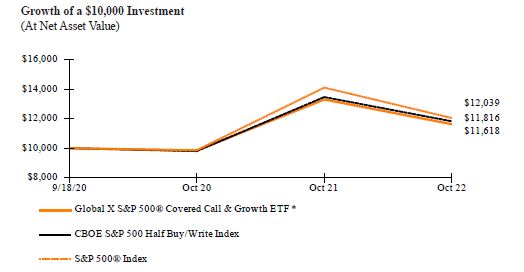
* The Fund commenced operations on September 18, 2020.
The S&P 500® Index is a market capitalization weighted composite index of 500 large capitalization U.S. companies.
The performance data quoted herein represents past performance and the return and value of an investment in the Fund will fluctuate so that, when redeemed, it may be worth less than its original cost. Past performance is no guarantee of future performance and should not be considered as a representation of the future results of the Fund. The Fund's performance assumes the reinvestment of all dividends and all capital gains. Index returns assume reinvestment of dividends and, unlike the Fund's returns, do not reflect any fees or expenses. If such fees and expenses were included in the index returns, the performance would have been lower. Please note that one cannot invest directly in an unmanaged index. Performance figures for the periods shown may reflect contractual fee waivers and/or expense reimbursements. In the absence of fee waiver sand/or expense reimbursements (if applicable), returns would have been lower.
There are no assurances that the Fund will meet its stated objectives.
The Fund’s holdings and allocations are subject to change and should not be considered recommendations to buy individual securities.
The graph and table do not reflect the deduction of taxes that a shareholder would pay on Fund distributions or the redemption or sale of Fund shares.
See definition of comparative indices above.
|
| Management Discussion of Fund Performance (unaudited) |
| Russell 2000 Covered Call & Growth ETF |
Global X Russell 2000 Covered Call & Growth ETF
The Global X Russell 2000 Covered Call & Growth ETF (“Fund”) seeks to provide investment results that correspond generally to the price and yield performance, before fees and expenses, of the CBOE Russell 2000 Half BuyWrite Index (“Underlying Index”). The Fund is passively managed and the investment adviser does not attempt to take defensive positions in declining markets. The Fund generally seeks to fully replicate the Underlying Index.
The Underlying Index measures the performance of a covered call strategy that holds a theoretical portfolio of the underlying stocks of the Russell 2000 Index (the "Reference Index") and "writes" (or sells) a succession of one-month at-the-money covered call options on the Reference Index. The written covered call options on the Reference Index correspond to approximately 50% of the value of the portfolio of stocks in the Reference Index.
From the inception of the Fund to the period ended October 31, 2022 (the “reporting period”), the Fund increased 3.14%, while the Underlying Index increased 2.98%. The Fund had a net asset value of $25.90 per share on October 04, 2022 and ended the reporting period with a net asset value of $26.58 per share on October 31, 2022.
During the reporting period, the Vanguard Russell 2000 ETF, the only holding of the Fund, returned 4.19%.
The Fund invests in the underlying holdings of the Russell 2000 Index and “writes” or “sells” corresponding call options on the same index. During the reporting period, U.S. small cap stocks strongly rallied from a rebound in cyclical stocks, such as those within the Energy and Financials sectors, contributing to the Fund's positive performance. Since the Fund write covered calls on only half of its stock exposure, it was able to capture a portion of this upside from its Russell 2000 exposure via the Vanguard Russell 2000 ETF.
| | AVERAGE ANNUAL TOTAL RETURN FOR THE PERIOD ENDED OCTOBER 31, 2022 |
| | Cumulative Inception to Date* |
| | Net Asset Value | Market Price |
Global X Russell 2000 Covered Call & Growth ETF | 3.14% | 3.22% |
Cboe Russell 2000 Half BuyWrite Index Russell 2000 Index | 2.98% | 2.98% |
| Russell 2000 Covered Call & Growth | 4.06% | 4.06% |
|
| Management Discussion of Fund Performance (unaudited) |
| Russell 2000 Covered Call & Growth ETF |
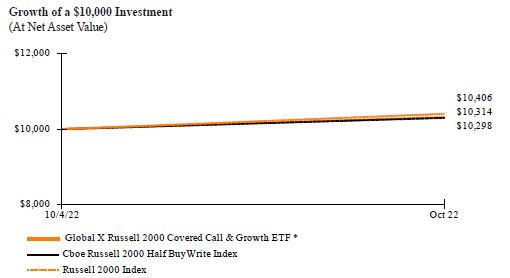
* The Fund commenced operations on October 4, 2022.
The Russell 2000 Index is a U.S. small-cap stock market index of the bottom 2,000 stocks in the Russell 3000 Index. The index is maintained by FTSE Russell, a subsidiary of the London Stock Exchange Group.
The performance data quoted herein represents past performance and the return and value of an investment in the Fund will fluctuate so that, when redeemed, it may be worth less than its original cost. Past performance is no guarantee of future performance and should not be considered as a representation of the future results of the Fund. The Fund's performance assumes the reinvestment of all dividends and all capital gains. Index returns assume reinvestment of dividends and, unlike the Fund's returns, do not reflect any fees or expenses. If such fees and expenses were included in the index returns, the performance would have been lower. Please note that one cannot invest directly in an unmanaged index. Performance figures for the periods shown may reflect contractual fee waivers and/or expense reimbursements. In the absence of fee waiver sand/or expense reimbursements (if applicable), returns would have been lower.
There are no assurances that the Fund will meet its stated objectives.
The Fund’s holdings and allocations are subject to change and should not be considered recommendations to buy individual securities.
The graph and table do not reflect the deduction of taxes that a shareholder would pay on Fund distributions or the redemption or sale of Fund shares.
See definition of comparative indices above.
|
| Management Discussion of Fund Performance (unaudited) |
| Global X SuperIncome™ Preferred ETF |
Global X SuperIncome™ Preferred ETF
The Global X SuperIncome Preferred ETF (“Fund”) seeks to provide investment results that correspond generally to the price and yield performance, before fees and expenses, of the S&P Enhanced Yield North American Preferred Stock Index (“Underlying Index”). The Fund is passively managed, which means the investment adviser does not attempt to take defensive positions in declining markets. The Fund generally seeks to fully replicate the Underlying Index.
The Underlying Index tracks the performance of the highest yielding preferred securities in the United States and Canada, as determined by Standard & Poor's Financial Services, LLC, a subsidiary of the McGraw-Hill Companies ("S&P"), the provider of the Underlying Index ("Index Provider"). The Underlying Index is comprised of preferred stocks that meet certain criteria relating to size, liquidity, issuer concentration and rating, maturity and other requirements, as determined by the Index Provider. The Underlying Index does not seek to directly reflect the performance of the companies issuing the preferred stock. The index is maintained by S&P.
For the 12-month period ended October 31, 2022 (the “reporting period”), the Fund decreased 13.81%, while the Underlying Index decreased 13.43%. The Fund had a net asset value of $11.94 per share on October 31, 2021 and ended the reporting period with a net asset value of $9.67 per share on October 31, 2022.
During the reporting period, the highest returns came from Citigroup Capital XIII and AGNC Investment Corp, which returned 7.27% and 6.40%, respectively. The worst performers were Qurate Retail Inc. and Clarivate PLC, which returned -51.04% and -46.08%, respectively.
The Fund invests in preferred stock, which has some of the highest dividend yields in the United States and Canada. During the reporting period, high and persistent inflation induced the U.S. Federal Reserve and other central banks to raise interest rates, resulting in the Fund's negative performance. Preferred stocks and the fixed-income market experienced a sell-off as interest rates rose, negatively impacting Fund performance. Fears about potential credit spread widening and default risk also affected performance of higher yielding preferred stocks. During the reporting period, the Fund had an approximate average sector exposure of 63.71% to Financials, 6.61% to Energy, and 5.22% to Health Care.
| | AVERAGE ANNUAL TOTAL RETURN FOR THE YEAR ENDED OCTOBER 31, 2022 |
| | One Year Return | Three Year Return | Five Year Return | Ten Year Return |
| | Net Asset Value | Market Price | Net Asset Value | Market Price | Net Asset Value | Market Price | Net Asset Value | Market Price |
| Global X SuperIncome™ Preferred ETF | -13.81% | -14.13% | -0.40% | -0.56% | 1.29% | 1.28% | 2.19% | 2.15% |
S&P Enhanced Yield North American Preferred Stock Index | -13.43% | -13.43% | 0.15% | 0.15% | 1.80% | 1.80% | 2.80% | 2.80% |
| S&P 500® Index | -14.61% | -14.61% | 10.22% | 10.22% | 10.44% | 10.44% | 12.79% | 12.79% |
|
| Management Discussion of Fund Performance (unaudited) |
| Global X SuperIncome™ Preferred ETF |
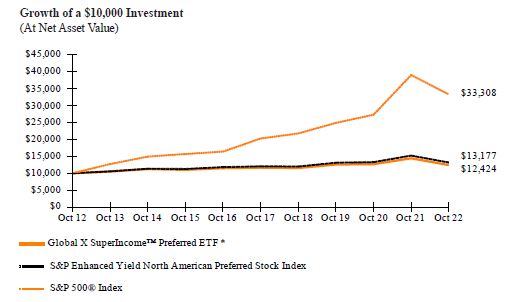
* Fund commenced operations on July 16, 2012.
The S&P 500® Index is a market capitalization weighted composite index of 500 large capitalization U.S. companies.
The performance data quoted herein represents past performance and the return and value of an investment in the Fund will fluctuate so that, when redeemed, it may be worth less than its original cost. Past performance is no guarantee of future performance and should not be considered as a representation of the future results of the Fund. The Fund's performance assumes the reinvestment of all dividends and all capital gains. Index returns assume reinvestment of dividends and, unlike the Fund's returns, do not reflect any fees or expenses. If such fees and expenses were included in the index returns, the performance would have been lower. Please note that one cannot invest directly in an unmanaged index. Performance figures for the periods shown may reflect contractual fee waivers and/or expense reimbursements. In the absence of fee waiver sand/or expense reimbursements (if applicable), returns would have been lower.
There are no assurances that the Fund will meet its stated objectives.
The Fund’s holdings and allocations are subject to change and should not be considered recommendations to buy individual securities.
The graph and table do not reflect the deduction of taxes that a shareholder would pay on Fund distributions or the redemption or sale of Fund shares.
See definition of comparative indices on the previous page.
|
| Management Discussion of Fund Performance (unaudited) |
| Global X Renewable Energy Producers ETF |
Global X Renewable Energy Producers ETF
The Global X Renewable Energy Producers ETF (“Fund”) seeks to provide investment results that correspond generally to the price and yield performance, before fees and expenses, of the Indxx Renewable Energy Producers Index (“Underlying Index”). The Fund is passively managed, which means the investment adviser does not attempt to take defensive positions in declining markets. The Fund generally seeks to fully replicate the Underlying Index.
The Underlying Index is designed to provide exposure to publicly traded companies that produce energy from renewable sources including wind, solar, hydroelectric, geothermal, and biofuels (including publicly traded companies that are formed to own operating assets that produce defined cash flows, as defined by Indxx LLC, the provider of the Underlying Index.
For the 12-month period ended October 31, 2022 (the “reporting period”), the Fund decreased 21.57%, while the Underlying Index decreased 21.30%. The Fund had a net asset value of $16.82 per share on October 31, 2021 and ended the reporting period with a net asset value of $13.05 per share on October 31, 2022.
During the reporting period, the highest returns came from Centrais Eletricas Brasileiras SA and Terna Energy S.A., which returned 61.25% and 41.95%, respectively. The worst performers were Azure Power Global Ltd and Gevo, Inc, which returned -75.98% and -68.88%, respectively.
The Fund generated negative returns over the reporting period as companies within the power sector were impacted by higher costs throughout the renewable energy value chains, supply chain challenges, and rising inflation. In addition, regulatory uncertainty within the U.S. solar power sector and permitting delays across Europe and the U.S. impacted renewables capacity and generation growth during the reporting period. These impacts outweighed the benefits of higher power prices and continued strong demand for renewable energy amid global concerns over climate change, energy security, and high fossil fuel prices. The enactment of the Inflation Reduction Act in the U.S. and the introduction of the REPowerEU plan in the European Union were two policy developments during the reporting period that may act as continued tailwinds for renewable energy development. Continued momentum for the development of a global green hydrogen industry could also continue to expand growth opportunities in renewable energy. Sector weightings of the Fund were reported to be the highest in Utilities, at 92.34%. Geographically, the Fund maintained an average allocation of 18.60% to the United States stocks, followed by Brazil (9.48%) and New Zealand (9.46%).
| | AVERAGE ANNUAL TOTAL RETURN FOR THE YEAR ENDED OCTOBER 31, 2022 |
| | One Year Return | Three Year Return | Five Year Return | Annualized Inception to Date* |
| | Net Asset Value | Market Price | Net Asset Value | Market Price | Net Asset Value | Market Price | Net Asset Value | Market Price |
Global X Renewable Energy Producers ETF | -21.57% | -21.56% | 0.26% | 0.13% | 3.87% | 3.92% | 1.53% | 1.53% |
Hybrid Indxx Renewable Energy Producers Index** | -21.30% | -21.30% | 0.63% | 0.63% | 4.27% | 4.27% | 1.92% | 1.92% |
| MSCI ACWI (Net) | -19.96% | -19.96% | 4.85% | 4.85% | 5.24% | 5.24% | 5.93% | 5.93% |
|
| Management Discussion of Fund Performance (unaudited) |
| Global X Renewable Energy Producers ETF |

* Fund commenced operations on May 27, 2015.
**Hybrid index performance reflects the performance of the Indxx Global YieldCo Index through November 18, 2018 and the Indxx YieldCo & Renewable Energy Income Index thereafter. Effective February 1, 2021, the name of the Underlying Index changed from Indxx YieldCo & Renewable Energy Income Index to the Indxx Renewable Energy Producers Index.
The MSCI ACWI (Net) (All Country World Index) Index is a free float-adjusted market capitalization weighted index that is designed to measure the equity market performance of developed and emerging markets.
The performance data quoted herein represents past performance and the return and value of an investment in the Fund will fluctuate so that, when redeemed, it may be worth less than its original cost. Past performance is no guarantee of future performance and should not be considered as a representation of the future results of the Fund. The Fund's performance assumes the reinvestment of all dividends and all capital gains. Index returns assume reinvestment of dividends and, unlike the Fund's returns, do not reflect any fees or expenses. If such fees and expenses were included in the index returns, the performance would have been lower. Please note that one cannot invest directly in an unmanaged index. Performance figures for the periods shown may reflect contractual fee waivers and/or expense reimbursements. In the absence of fee waiver sand/or expense reimbursements (if applicable), returns would have been lower.
There are no assurances that the Fund will meet its stated objectives.
The Fund’s holdings and allocations are subject to change and should not be considered recommendations to buy individual securities.
The graph and table do not reflect the deduction of taxes that a shareholder would pay on Fund distributions or the redemption or sale of Fund shares.
|
| Management Discussion of Fund Performance (unaudited) |
| Global X Renewable Energy Producers ETF |
High short term performance of the fund is unusual and investors should not expect such performance to be repeated.
See definition of comparative indices on the previous page
|
| Management Discussion of Fund Performance (unaudited) |
| Global X S&P 500® Catholic Values ETF |
Global X S&P 500® Catholic Values ETF
The Global X S&P 500® Catholic Values ETF (“Fund”) seeks to provide investment results that correspond generally to the price and yield performance, before fees and expenses, of the S&P 500® Catholic Values Index (“Underlying Index”). The Fund is passively managed, which means the investment adviser does not attempt to take defensive positions in declining markets. The Fund generally seeks to fully replicate the Underlying Index.
The Underlying Index applies exclusion criteria to the constituents of the S&P 500® Index in order to create a benchmark aligned with Catholic values. These values are consistent with the Socially Responsible Investment Guidelines outlined by the United States Conference of Catholic Bishops (“USCCB”). The index is designed for investors who wish to track a benchmark that is consistent with USCCB guidelines.
For the 12-month period ended October 31, 2022 (the “reporting period”), the Fund decreased 16.53%, while the Underlying Index decreased 16.34%. The Fund had a net asset value of $57.22 per share on October 31, 2021 and ended the reporting period with a net asset value of $47.19 per share on October 31, 2022.
During the reporting period, the highest returns came from Occidental Petroleum Corporation and Devon Energy Corporation, which returned 117% and 108%, respectively. The worst performers were Generac Holdings Inc and Meta Platforms Inc, which returned -76% and -71%, respectively.
The Fund provides exposure to companies within the S&P 500® Index whose business practices align with the investment guidelines set by the USCCB. As of October 31, 2022, the Fund had 441 equity holdings compared with the 503 holdings of the S&P 500® Index. To mitigate the potential performance differences between the S&P 500® Index and the Fund, the Fund’s sector exposures are reweighted to align with those of the S&P 500® Index every quarter. In November 2021, the USCCB updated new socially responsible investing guidelines for Catholic investing for the first time since 2003. The revised USCCB guidelines add restrictions to previously excluded themes such as certain healthcare practices, adult entertainment, controversial weapons, gambling, tobacco, and recreational cannabis.
The Fund’s underperformance during the reporting period largely resulted from broader market challenges due to economic pressures from rising interest rates in the U.S, high inflation, and increased recessionary fears among investors. Information Technology was also the largest sector of the Fund, which detracted from performance as the sector experienced reduced profitability during the reporting period, resulting in cost-cutting, staff layoffs, and hiring freezes. During the reporting period, Information Technology had the highest average sector weighting of 27.83% in the Fund, followed by Health Care at 13.53% and Consumer Discretionary at 11.84%.
|
| Management Discussion of Fund Performance (unaudited) |
| Global X S&P 500® Catholic Values ETF |
| | AVERAGE ANNUAL TOTAL RETURN FOR THE YEAR ENDED OCTOBER 31, 2022 |
| | One Year Return | Three Year Return | Five Year Return | Annualized Inception to Date* |
| | Net Asset Value | Market Price | Net Asset Value | Market Price | Net Asset Value | Market Price | Net Asset Value | Market Price |
| Global X S&P 500® Catholic ValuesETF | -16.53% | -16.59% | 9.60% | 9.60% | 9.88% | 9.89% | 11.50% | 11.51% |
| S&P 500 Catholic Values Index (Gross) | -16.34% | -16.34% | 9.92% | 9.92% | 10.21% | 10.21% | 11.40% | 11.40% |
| S&P 500 Index (Gross) | -14.61% | -14.61% | 10.22% | 10.22% | 10.44% | 10.44% | 11.89% | 11.89% |

* Fund commenced operations on April 18, 2016.
The S&P 500® Index is a market capitalization weighted composite index of 500 large capitalization U.S. companies.
The performance data quoted herein represents past performance and the return and value of an investment in the Fund will fluctuate so that, when redeemed, it may be worth less than its original cost. Past performance is no guarantee of future performance and should not be considered as a representation of the future results of the Fund. The Fund's performance assumes the reinvestment of all dividends and all capital gains. Index returns assume reinvestment of dividends and, unlike the Fund's returns, do not reflect any fees or expenses. If such fees and expenses were included in the index returns, the performance would have been lower. Please note that one cannot invest directly in an unmanaged index. Performance figures for the periods shown may reflect contractual fee waivers and/or expense reimbursements. In the absence of fee waiver sand/or expense reimbursements (if applicable), returns would have been lower.
There are no assurances that the Fund will meet its stated objectives.
|
| Management Discussion of Fund Performance (unaudited) |
| Global X S&P 500® Catholic Values ETF |
The Fund’s holdings and allocations are subject to change and should not be considered recommendations to buy individual securities.
The graph and table do not reflect the deduction of taxes that a shareholder would pay on Fund distributions or the redemption or sale of Fund shares.
See definition of comparative indices on the previous page.
|
| Management Discussion of Fund Performance (unaudited) |
| Global X S&P Catholic Values Developed ex-US ETF |
Global X S&P Catholic Values Developed ex-US ETF
The Global X S&P Catholic Values Developed ex-U.S. ETF (“Fund”) seeks to provide investment results that correspond generally to the price and yield performance, before fees and expenses, of the S&P Developed Ex-U.S. Catholic Values Index (“Underlying Index”). The Fund is passively managed, which means the investment adviser does not attempt to take defensive positions in declining markets. The Fund generally seeks to fully replicate the Underlying Index.
The Underlying Index is based on the S&P EPAC ex-Korea Large Cap Index (the "Reference Index"), a benchmark index that provides exposure to the large capitalization segment of developed markets within the Europe and Asia Pacific regions, excluding Korea. The Underlying Index excludes from the Reference Index certain activities that are not aligned with the Responsible Investment Guidelines of the U.S. Conference of Catholic Bishops (“USCCB”). The Underlying Index is designed for investors who do not want to breach religious norms in their passive investing strategies.
For the 12-month period ended October 31, 2022 (the “reporting period”), the Fund decreased 26.11%, while the Underlying Index decreased 25.98%. The Fund had a net asset value of $32.80 per share on October 31, 2021 and ended the reporting period with a net asset value of $23.30 per share on October 31, 2022.
During the reporting period, the highest returns came from Equinor ASA and Bezeq Group, which returned 49.83% and 45.33%, respectively. The worst performers were Sea Ltd and Kornit Digital Ltd, which returned -85.48% and -83.97%, respectively.
The Fund provides exposure to companies in developed markets outside of the U.S., whose business practices align with the investment guidelines set by the USCCB. To mitigate the potential performance differences between the Fund and traditional International equity benchmarks, the Fund’s sector exposures are reweighted to align with those of the S&P EPAC ex-Korea Large Cap Index on a quarterly basis. In November 2021, the USCCB updated new socially responsible investing guidelines for Catholic investing for the first time since 2003. The revised USCCB guidelines add restrictions to previously excluded themes such as certain healthcare practices, adult entertainment, controversial weapons, gambling, tobacco, and recreational cannabis.
The Fund’s underperformance during the reporting period resulted from multiple global challenges including the Russia-Ukraine War, European energy crisis, rising inflation, and stringent COVID-19 pandemic-related reopening policies in certain regions. The global equity market selloff also put pressure on broader markets.
During the reporting period, Financials had the highest average weighting of 17.85% in the Fund, followed by Industrials at 14.63% and Health Care at 13.79%. Geographically, the Fund had an approximate average exposure of 27.61% to Japan, followed by the United Kingdom (11.83%) and Australia (10.91%).
|
| Management Discussion of Fund Performance (unaudited) |
| Global X S&P Catholic Values Developed ex-US ETF |
| | AVERAGE ANNUAL TOTAL RETURN FOR THE YEAR ENDED OCTOBER 31, 2022 |
| | One Year Return | Annualized Inception to Date* |
| | Net Asset Value | Market Price | Net Asset Value | Market Price |
| Global X S&P Catholic Values Developed ex-U.S. ETF | -26.11% | -26.16% | -0.61% | -0.49% |
S&P Developed ex-U.S. Catholic Values Index | -25.98% | -25.98% | -0.29% | -0.29% |
| MSCI EAFE Index (Net) | -23.00% | -23.00% | 1.19% | 1.19% |
|
| Management Discussion of Fund Performance (unaudited) |
| Global X S&P Catholic Values Developed ex-US ETF |

* Fund commenced operations on June 22, 2020.
The MSCI EAFE Index (Net) (Europe, Australasia, Far East) is a free float-adjusted market capitalization index that is designed to measure the equity market performance of developed markets, excluding the US & Canada.
The performance data quoted herein represents past performance and the return and value of an investment in the Fund will fluctuate so that, when redeemed, it may be worth less than its original cost. Past performance is no guarantee of future performance and should not be considered as a representation of the future results of the Fund. The Fund's performance assumes the reinvestment of all dividends and all capital gains. Index returns assume reinvestment of dividends and, unlike the Fund's returns, do not reflect any fees or expenses. If such fees and expenses were included in the index returns, the performance would have been lower. Please note that one cannot invest directly in an unmanaged index. Performance figures for the periods shown may reflect contractual fee waivers and/or expense reimbursements. In the absence of fee waiver sand/or expense reimbursements (if applicable), returns would have been lower.
There are no assurances that the Fund will meet its stated objectives.
The Fund’s holdings and allocations are subject to change and should not be considered recommendations to buy individual securities.
The graph and table do not reflect the deduction of taxes that a shareholder would pay on Fund distributions or the redemption or sale of Fund shares.
See definition of comparative indices on the previous page.
|
| Management Discussion of Fund Performance (unaudited) |
| Global X Guru® Index ETF |
Global X Guru® Index ETF
The Global X Guru® Index ETF (“Fund”) seeks to provide investment results that correspond generally to the price and yield performance, before fees and expenses, of the Solactive Guru Index (“Underlying Index”). The Fund is passively managed, which means the investment adviser does not attempt to take defensive positions in declining markets. The Fund generally seeks to fully replicate the Underlying Index.
The Underlying Index is comprised of the top U.S. listed equity positions reported on Form 13F by a select group of entities characterized as hedge funds by Solactive AG, the provider of the Underlying Index ("Index Provider"). Hedge funds are selected from a pool of thousands of privately offered pooled investment vehicles based on the size of their reported equity holdings and the efficacy of replicating their publicly disclosed positions. Additional filters are applied to eliminate hedge funds that have high turnover rates for equity holdings. Only hedge funds with concentrated top holdings are included in the selection process. Once the hedge fund pool has been determined, the Index Provider utilizes 13F filings to compile the top stock holding from each of these hedge funds. The stocks are screened for liquidity and equal weighted.
For the 12-month period ended October 31, 2022 (the “reporting period”), the Fund decreased 33.28%, while the Underlying Index decreased 33.05%. The Fund had a net asset value of $50.24 per share on October 31, 2021 and ended the reporting period with a net asset value of $33.48 per share on October 31, 2022.
During the reporting period, the highest returns came from Texas Pacific Land Corporation and Chesapeake Energy Corporation, which returned 84.38% and 60.26%, respectively. The worst performers were GDS Holdings Ltd and Unity Software, Inc, which returned -85.47% and -80.5%, respectively.
The Fund’s investments are among the highest-conviction U.S.-listed equity positions reported on Form 13F by major hedge funds. During the reporting period, the Fund delivered negative performance and trailed the S&P 500® Index. Quarterly rebalancing results in dynamic exposures, which can change significantly through the year. The Fund's performance was impacted by its exposure to the Technology sector and Consumer Discretionary sector, which were affected by rising interest rates, increasing the cost of capital. The Fund’s underperformance relative to the S&P 500® Index was primarily the result of limited exposure in the Energy sector which fared well in the reporting period.
| | AVERAGE ANNUAL TOTAL RETURN FOR THE YEAR ENDED OCTOBER 31, 2022 |
| | One Year Return | Three Year Return | Five Year Return | Ten Year Return |
| | Net Asset Value
| Market Price
| Net Asset Value
| Market Price
| Net Asset Value
| Market Price | Net Asset Value
| Market Price
|
| Global X Guru® Index ETF | -33.28% | -33.31% | 0.54% | 0.55% | 4.06% | 4.09% | 8.16% | 8.17% |
| Solactive Guru Index | -33.05% | -33.05% | 0.67% | 0.67% | 4.26% | 4.26% | 8.50% | 8.50% |
| S&P 500® Index | -14.61% | -14.61% | 10.22% | 10.22% | 10.44% | 10.44% | 12.79% | 12.79% |
|
| Management Discussion of Fund Performance (unaudited) |
| Global X Guru® Index ETF |

* The Fund commenced operations on June 4, 2012.
The S&P 500® Index is a market capitalization weighted composite index of 500 large capitalization U.S. companies.
The performance data quoted herein represents past performance and the return and value of an investment in the Fund will fluctuate so that, when redeemed, it may be worth less than its original cost. Past performance is no guarantee of future performance and should not be considered as a representation of the future results of the Fund. The Fund's performance assumes the reinvestment of all dividends and all capital gains. Index returns assume reinvestment of dividends and, unlike the Fund's returns, do not reflect any fees or expenses. If such fees and expenses were included in the index returns, the performance would have been lower. Please note that one cannot invest directly in an unmanaged index. Performance figures for the periods shown may reflect contractual fee waivers and/or expense reimbursements. In the absence of fee waiver sand/or expense reimbursements (if applicable), returns would have been lower.
There are no assurances that the Fund will meet its stated objectives.
The Fund’s holdings and allocations are subject to change and should not be considered recommendations to buy individual securities.
The graph and table do not reflect the deduction of taxes that a shareholder would pay on Fund distributions or the redemption or sale of Fund shares.
See definition of comparative indices on the previous page.
|
| Management Discussion of Fund Performance (unaudited) |
| Global X S&P 500® Tail Risk ETF |
Global X S&P 500® Tail Risk ETF
The Global X S&P 500® Tail Risk ETF (“Fund”) seeks to provide investment results that correspond generally to the price and yield performance, before fees and expenses, of the Cboe S&P 500® Tail Risk Index (“Underlying Index”). The Fund is passively managed, and the investment adviser does not attempt to take defensive positions in declining markets. The Fund generally seeks to fully replicate the Underlying Index.
The Underlying Index measures the performance of a risk management strategy that holds the underlying stocks of the S&P 500® Index and applies a protective put strategy (i.e. long (purchased) put options) on the S&P 500® Index. The Underlying Index specifically reflects the performance of the component securities of the S&P 500® Index, combined with a long position in 10% out-of-the-money (“OTM”) put options that correspond to the value of the portfolio of stocks in the S&P 500® Index.
For the 12-month period ended October 31, 2022 (the “reporting period”), the Fund decreased 13.98%, while the Underlying Index decreased 13.36%. The Fund had a net asset value of $27.72 per share on October 31, 2021 and ended the reporting period with a net asset value of $23.21 per share on October 31, 2022.
During the reporting period, the highest returns came from Occidental Petroleum Corporation and Devon Energy Corporation, which returned 117.95% and 108.22%, respectively. The worst performers were Generac Holdings Inc. and Match Group, Inc, which returned -76.75% and -71.35%, respectively.
The Fund invests in the stocks in the S&P 500® Index, while buying OTM put options on the S&P 500® Index. While the strategy provides uncapped growth potential, it offers a measure of downside risk, mitigating significant selloffs of greater than approximately -10% between the purchase of the put option and its expiration in three months. During the reporting period, the Fund performed better than the S&P 500® Index, which experienced severe downward market conditions, due to its put option hedging strategy. Furthermore, growth stocks in both the Technology and Communication Services Sectors underperformed due to rising interest rates, contributing to the Fund’s negative returns.
| | AVERAGE ANNUAL TOTAL RETURN FOR THE YEAR ENDED OCTOBER 31, 2022 |
| | One Year Return | Annualized Inception to Date* |
| | Net Asset Value | Market Price | Net Asset Value | Market Price |
| Global X S&P 500® Tail Risk ETF | -13.98% | -14.00% | -10.88% | -10.82% |
Cboe S&P 500 Tail Risk Index
| -13.36% | -13.36% | -10.23% | -10.23% |
| S&P 500® Index | -14.61% | -14.61% | -10.53% | -10.53% |
|
| Management Discussion of Fund Performance (unaudited) |
| Global X S&P 500® Tail Risk ETF |

* The Fund commenced operations on August 25, 2021.
The S&P 500® Index is a market capitalization weighted composite index of 500 large capitalization U.S. companies.
The performance data quoted herein represents past performance and the return and value of an investment in the Fund will fluctuate so that, when redeemed, it may be worth less than its original cost. Past performance is no guarantee of future performance and should not be considered as a representation of the future results of the Fund. The Fund's performance assumes the reinvestment of all dividends and all capital gains. Index returns assume reinvestment of dividends and, unlike the Fund's returns, do not reflect any fees or expenses. If such fees and expenses were included in the index returns, the performance would have been lower. Please note that one cannot invest directly in an unmanaged index. Performance figures for the periods shown may reflect contractual fee waivers and/or expense reimbursements. In the absence of fee waiver sand/or expense reimbursements (if applicable), returns would have been lower.
There are no assurances that the Fund will meet its stated objectives.
The Fund’s holdings and allocations are subject to change and should not be considered recommendations to buy individual securities.
The graph and table do not reflect the deduction of taxes that a shareholder would pay on Fund distributions or the redemption or sale of Fund shares.
See definition of comparative indices above.
|
| Management Discussion of Fund Performance (unaudited) |
| Global X S&P 500® Risk Managed Income ETF |
Global X S&P 500® Risk Managed Income ETF
The Global X S&P 500® Risk Managed Income ETF (“Fund”) seeks to provide investment results that correspond generally to the price and yield performance, before fees and expenses, of the Cboe S&P 500 Risk Managed Income Index (“Underlying Index”). The Fund is passively managed and the investment adviser does not attempt to take defensive positions in declining markets. The Fund generally seeks to fully replicate the Underlying Index.
The Underlying Index measures the performance of a risk managed income strategy that holds the underlying stocks of the S&P 500® Index (the "Reference Index") and applies an options collar strategy which is a mix of short (sold) call options and long (purchased) put options on the Reference Index. The Underlying Index specifically reflects the performance of the component securities of the Reference Index, combined with a long position in the 5% out-of-the-money (“OTM”) put options and a short position in at-the-money (“ATM”) call options, each corresponding to the value of the portfolio of stocks in the Reference Index. The options collar seeks to generate a net-credit, meaning that the premium received from the sale of the call options will be greater than the premium paid when buying the put options.
For the 12-month period ended October 31, 2022 (the “reporting period”), the Fund decreased 12.39%, while the Underlying Index decreased 12.21%. The Fund had a net asset value of $26.83 per share on October 31, 2021 and ended the reporting period with a net asset value of $21.05 per share on October 31, 2022.
During the reporting period, the highest returns came from Occidental Petroleum Corporation and Devon Energy Corporation, which returned 117.95% and 108.22%, respectively. The worst performers were Generac Holdings Inc. and Match Group, Inc., which returned -76.75% and -71.35%, respectively.
The Fund’s options collar strategy tends to produce higher yields in volatile and uncertain times, allowing the Fund to collect higher option premiums and mitigate risks arising from a major market selloff through the purchase of protective puts. During the reporting period, rising 10-year treasury yields pressured growth stocks, weighing on the Reference Index. This resulted in the Fund's negative performance. However, the Fund's losses were mitigated because of volatility in equities markets; as volatility increases, option premiums become more expensive, resulting in a greater net credit from options premiums when selling the ATM call option and buying the OTM put option.
| | AVERAGE ANNUAL TOTAL RETURN FOR THE YEAR ENDED OCTOBER 31, 2022 |
| | One Year Return | Annualized Inception to Date* |
| | Net Asset Value | Market Price | Net Asset Value | Market Price |
Global X S&P 500® Risk Managed Income ETF | -12.39% | -12.51% | -9.37% | -9.44% |
CBOE S&P 500 Risk Managed Income Index | -12.21% | -12.21% | -9.04% | -9.04% |
| S&P 500® Index | -14.61% | -14.61% | -10.53% | -10.53% |
|
| Management Discussion of Fund Performance (unaudited) |
| Global X S&P 500® Risk Managed Income ETF |
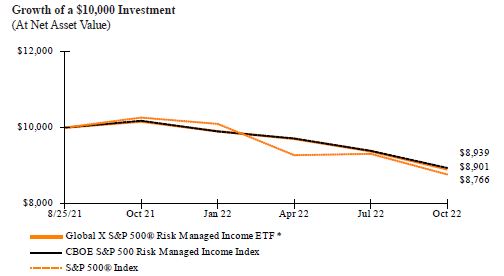
* The Fund commenced operations on August 25, 2021.
The S&P 500® Index is a market capitalization weighted composite index of 500 large capitalization U.S. companies.
The performance data quoted herein represents past performance and the return and value of an investment in the Fund will fluctuate so that, when redeemed, it may be worth less than its original cost. Past performance is no guarantee of future performance and should not be considered as a representation of the future results of the Fund. The Fund's performance assumes the reinvestment of all dividends and all capital gains. Index returns assume reinvestment of dividends and, unlike the Fund's returns, do not reflect any fees or expenses. If such fees and expenses were included in the index returns, the performance would have been lower. Please note that one cannot invest directly in an unmanaged index. Performance figures for the periods shown may reflect contractual fee waivers and/or expense reimbursements. In the absence of fee waiver sand/or expense reimbursements (if applicable), returns would have been lower.
There are no assurances that the Fund will meet its stated objectives.
The Fund’s holdings and allocations are subject to change and should not be considered recommendations to buy individual securities.
The graph and table do not reflect the deduction of taxes that a shareholder would pay on Fund distributions or the redemption or sale of Fund shares.
See definition of comparative indices on the previous page.
|
| Management Discussion of Fund Performance (unaudited) |
| Global X S&P 500® Collar 95-110 ETF |
Global X S&P 500® Collar 95-110 ETF
The Global X S&P 500® Collar 95-110 ETF (“Fund”) seeks to provide investment results that correspond generally to the price and yield performance, before fees and expenses, of the Cboe S&P 500® 3-Month Collar 95-110 Index (“Underlying Index”). The Fund is passively managed and the investment adviser does not attempt to take defensive positions in declining markets. The Fund generally seeks to fully replicate the Underlying Index.
The Underlying Index measures the performance of a risk management strategy that holds the underlying stocks of the S&P 500® Index (the "Reference Index") and applies an options collar strategy with a mix of short (sold) call options and long (purchased) put options on Reference Index. The Underlying Index specifically reflects the performance of the component securities of the Reference Index, combined with a long position in 5% out-of-the-money (“OTM”) put options and a short position in 10% OTM call options, each corresponding to the value of the portfolio of stocks in the Reference Index.
For the 12-month period ended October 31, 2022 (the “reporting period”), the Fund decreased 9.40%, while the Underlying Index decreased 9.05%. The Fund had a net asset value of $27.57 per share on October 31, 2021 and ended the reporting period with a net asset value of $24.47 per share on October 31, 2022.
During the reporting period, the highest returns came from Occidental Petroleum Corporation and Devon Energy Corporation, which returned 117.95% and 108.22%, respectively. The worst performers were Generac Holdings Inc. and Match Group, Inc., which returned -76.75% and -71.35%, respectively.
The Fund invests in the stocks in the Reference Index, while applying a net-debit options collar strategy, meaning the cost of the purchased put option is expected to exceed the premiums received from selling the call option. The strategy is intended to invest in a diverse basket of U.S. equities while capping potential gains at 10% over the three-month option period and limiting losses to 5% over the same period. The goal of this strategy is to strike a balance between limiting the downside and retaining upside potential while keeping the strategy affordable. During the reporting period, rising inflation, interest rate increases by the U.S. Federal Reserve and fears of a recession led investors to shift away from equities in favor of other asset classes, contributing to the Fund's negative returns.
| | AVERAGE ANNUAL TOTAL RETURN FOR THE YEAR ENDED OCTOBER 31, 2022 |
| | One Year Return | Annualized Inception to Date* |
| | Net Asset Value | Market Price | Net Asset Value | Market Price |
| Global X S&P 500® Collar 95-110 ETF | -9.40% | -9.46% | -7.17% | -7.14% |
| Cboe S&P 500 3-Month Collar 95-110 Index | -9.05% | -9.05% | -6.82% | -6.82% |
| S&P 500® Index | -14.61% | -14.61% | -10.53% | -10.53% |
|
| Management Discussion of Fund Performance (unaudited) |
| Global X S&P 500® Collar 95-110 ETF |
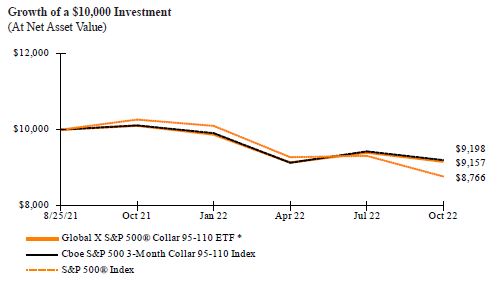
* The Fund commenced operations on August 25, 2021.
The S&P 500® Index is a market capitalization weighted composite index of 500 large capitalization U.S. companies.
The performance data quoted herein represents past performance and the return and value of an investment in the Fund will fluctuate so that, when redeemed, it may be worth less than its original cost. Past performance is no guarantee of future performance and should not be considered as a representation of the future results of the Fund. The Fund's performance assumes the reinvestment of all dividends and all capital gains. Index returns assume reinvestment of dividends and, unlike the Fund's returns, do not reflect any fees or expenses. If such fees and expenses were included in the index returns, the performance would have been lower. Please note that one cannot invest directly in an unmanaged index. Performance figures for the periods shown may reflect contractual fee waivers and/or expense reimbursements. In the absence of fee waiver sand/or expense reimbursements (if applicable), returns would have been lower.
There are no assurances that the Fund will meet its stated objectives.
The Fund’s holdings and allocations are subject to change and should not be considered recommendations to buy individual securities.
The graph and table do not reflect the deduction of taxes that a shareholder would pay on Fund distributions or the redemption or sale of Fund shares.
See definition of comparative indices above.
|
| Management Discussion of Fund Performance (unaudited) |
| Global X NASDAQ 100® Tail Risk ETF |
Global X NASDAQ 100® Tail Risk ETF
The Global X Nasdaq 100® Tail Risk ETF (“Fund”) seeks to provide investment results that correspond generally to the price and yield performance, before fees and expenses, of the Nasdaq-100 Quarterly Protective Put 90 Index (“Underlying Index”). The Fund is passively managed and the investment adviser does not attempt to take defensive positions in declining markets. The Fund generally seeks to fully replicate the Underlying Index.
The Underlying Index measures the performance of a risk management strategy that holds the underlying stocks of the NASDAQ 100® Index (the "Reference Index") and applies a protective put strategy with long (purchased) put options on the Reference Index. The Underlying Index specifically reflects the performance of the component securities of the Reference Index, combined with a long position in 10% out-of-the-money (“OTM”) put options that correspond to the value of the portfolio of stocks in the Reference Index.
For the 12-month period ended October 31, 2022 (the “reporting period”), the Fund decreased 23.90%, while the Underlying Index decreased 23.07%. The Fund had a net asset value of $25.59 per share on October 31, 2021 and ended the reporting period with a net asset value of $19.08 per share on October 31, 2022.
During the reporting period, the highest returns came from Constellation Energy Corporation and Vertex Pharmaceuticals Inc., which returned 91.35% and 68.71%, respectively. The worst performers were DocuSign, Inc. and Okta, Inc., which returned -82.64% and -77.3%, respectively.
The Fund invests in the stocks in the Reference Index, while buying OTM put options on the same index. While the strategy provides uncapped growth potential, it offers a measure of downside risk, mitigating significant selloffs of greater than approximately -10% between the purchase of the put option and its expiration in three months. Tail risk strategies can mitigate potential downside risks while helping investors participate in rising markets. During the reporting period, the Fund performed better than the Reference Index as market-leading technology and tech-adjacent companies dragged down Reference Index in severe macroeconomic conditions. Nonetheless, the Fund suffered negative returns during the reporting period, as the technology-centric companies of the Reference Index generally suffered increased losses against the rest of the market due to rising interest rates and investor fears of a global economic slowdown.
| | AVERAGE ANNUAL TOTAL RETURN FOR THE YEAR ENDED OCTOBER 31, 2022 |
| | One Year Return | Annualized Inception to Date* |
| | Net Asset Value | Market Price | Net Asset Value | Market Price |
| Global X NASDAQ 100® Tail Risk ETF | -23.90% | -23.76% | -19.38% | -19.20% |
| NASDAQ 100 Quarterly Protective Put 90 Index | -23.07% | -23.07% | -18.66% | -18.66% |
| NASDAQ-100® Index | -27.46% | -27.46% | -21.69% | -21.69% |
|
| Management Discussion of Fund Performance (unaudited) |
| Global X NASDAQ 100® Tail Risk ETF |

* The Fund commenced operations on August 25, 2021.
The Nasdaq-100® Index includes 100 of the largest domestic and international non-financial companies listed on The Nasdaq Stock Market based on market capitalization.
The performance data quoted herein represents past performance and the return and value of an investment in the Fund will fluctuate so that, when redeemed, it may be worth less than its original cost. Past performance is no guarantee of future performance and should not be considered as a representation of the future results of the Fund. The Fund's performance assumes the reinvestment of all dividends and all capital gains. Index returns assume reinvestment of dividends and, unlike the Fund's returns, do not reflect any fees or expenses. If such fees and expenses were included in the index returns, the performance would have been lower. Please note that one cannot invest directly in an unmanaged index. Performance figures for the periods shown may reflect contractual fee waivers and/or expense reimbursements. In the absence of fee waiver sand/or expense reimbursements (if applicable), returns would have been lower.
There are no assurances that the Fund will meet its stated objectives.
The Fund’s holdings and allocations are subject to change and should not be considered recommendations to buy individual securities.
The graph and table do not reflect the deduction of taxes that a shareholder would pay on Fund distributions or the redemption or sale of Fund shares.
See definition of comparative indices above.
|
| Management Discussion of Fund Performance (unaudited) |
| Global X NASDAQ 100® Risk Managed Income ETF |
Global X NASDAQ 100® Risk Managed Income ETF
The Global X Nasdaq 100® Risk Managed Income ETF (“Fund”) seeks to provide investment results that correspond generally to the price and yield performance, before fees and expenses, of the Nasdaq-100® Monthly Net Credit Collar 95-100 Index (“Underlying Index”). The Fund is passively managed and the investment adviser does not attempt to take defensive positions in declining markets. The Fund generally seeks to fully replicate the Underlying Index.
The Underlying Index measures the performance of a risk managed income strategy that holds the underlying stocks of the NASDAQ 100® Index (the "Reference Index") and applies an options collar strategy consisting of a mix of short (sold) call options and long (purchased) put options on the Reference Index. The Underlying Index specifically reflects the performance of the component securities of the Reference Index, combined with a long position in the 5% out-of-the-money (“OTM”) put options and a short position in at-the-money (“ATM”) call options, each corresponding to the value of the portfolio of stocks in the Reference Index. The options collar seeks to generate a net-credit, meaning that the premium received from the sale of the call options will be greater than the premium paid when buying the put options.
For the 12-month period ended October 31, 2022 (the “reporting period”), the Fund decreased 17.24%, while the Underlying Index decreased 17.12%. The Fund had a net asset value of $24.12 per share on October 31, 2021 and ended the reporting period with a net asset value of $18.17 per share on October 31, 2022.
During the reporting period, the highest returns came from Constellation Energy Corporation and Vertex Pharmaceuticals Inc., which returned 91.35% and 68.71%, respectively. The worst performers were DocuSign, Inc. and Okta, Inc., which returned -82.64% and -77.30%, respectively.
The Fund's options collar strategy seeks to generate higher yields in volatile and uncertain times by collecting option premiums and mitigating risks associated with a major market selloff through the purchase of protective puts. As volatility rises, option premiums rise in price, resulting in a higher net credit when selling ATM call options and buying OTM put options. During the reporting period, the Fund generated negative returns as rising bond yields affected technology and growth stocks, to which the Reference Index is heavily exposed. However, the net positive premiums generated by the Fund helped offset some of the losses.
| | AVERAGE ANNUAL TOTAL RETURN FOR THE YEAR ENDED OCTOBER 31, 2022 |
| | One Year Return | Annualized Inception to Date* |
| | Net Asset Value | Market Price | Net Asset Value | Market Price |
Global X NASDAQ 100® Risk Managed Income ETF | -17.24% | -17.15% | -15.27% | -15.20% |
NASDAQ 100 Monthly Net Credit Collar 95-100 Index | -17.12% | -17.12% | -15.47% | -15.47% |
| NASDAQ-100® Index | -27.46% | -27.46% | -21.69% | -21.69% |
|
| Management Discussion of Fund Performance (unaudited) |
| Global X NASDAQ 100® Risk Managed Income ETF |
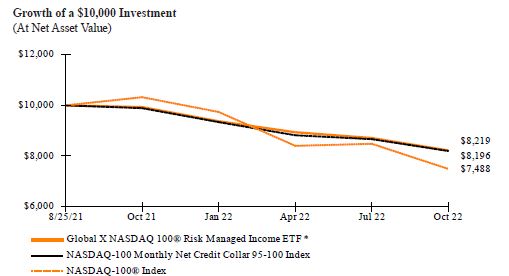
* The Fund commenced operations on August 25, 2021.
The Nasdaq-100® Index includes 100 of the largest domestic and international non-financial companies listed on The Nasdaq Stock Market based on market capitalization.
The performance data quoted herein represents past performance and the return and value of an investment in the Fund will fluctuate so that, when redeemed, it may be worth less than its original cost. Past performance is no guarantee of future performance and should not be considered as a representation of the future results of the Fund. The Fund's performance assumes the reinvestment of all dividends and all capital gains. Index returns assume reinvestment of dividends and, unlike the Fund's returns, do not reflect any fees or expenses. If such fees and expenses were included in the index returns, the performance would have been lower. Please note that one cannot invest directly in an unmanaged index. Performance figures for the periods shown may reflect contractual fee waivers and/or expense reimbursements. In the absence of fee waiver sand/or expense reimbursements (if applicable), returns would have been lower.
There are no assurances that the Fund will meet its stated objectives.
The Fund’s holdings and allocations are subject to change and should not be considered recommendations to buy individual securities.
The graph and table do not reflect the deduction of taxes that a shareholder would pay on Fund distributions or the redemption or sale of Fund shares.
See definition of comparative indices on the previous page.
|
| Management Discussion of Fund Performance (unaudited) |
| Global X NASDAQ 100® Collar 95-110 ETF |
Global X NASDAQ 100® Collar 95-110 ETF
The Global X Nasdaq 100® Collar 95-110 ETF (“Fund”) seeks to provide investment results that correspond generally to the price and yield performance, before fees and expenses, of the Nasdaq-100® Quarterly Collar 95-110 Index (“Underlying Index”). The Fund is passively managed and the investment adviser does not attempt to take defensive positions in declining markets. The Fund generally seeks to fully replicate the Underlying Index.
The Underlying Index measures the performance of a risk management strategy that holds the underlying stocks of the NASDAQ 100® Index (the "Underlying Index") and applies an options collar strategy with a mix of short (sold) call options and long (purchased) put options on the Reference Index. The Underlying Index specifically reflects the performance of the component securities of the Reference Index, combined with a long position in 5% out-of-the-money (“OTM”) put options and a short position in 10% OTM call options, each corresponding to the value of the portfolio of stocks in the Reference Index.
For the 12-month period ended October 31, 2022 (the “reporting period”), the Fund decreased 13.19%, while the Underlying Index decreased 12.05%. The Fund had a net asset value of $25.78 per share on October 31, 2021 and ended the reporting period with a net asset value of $22.00 per share on October 31, 2022.
During the reporting period, the highest returns came from Constellation Energy Corporation and Vertex Pharmaceuticals Inc., which returned 91.35% and 68.71%, respectively. The worst performers were DocuSign, Inc. and Okta, Inc., which returned -82.64% and -77.3%, respectively.
The Fund invests in stocks in the Reference Index using a net-debit options collar strategy, which means that the cost of the purchased put option is expected to exceed the premiums received from selling the call option. Furthermore, the strategy is intended to invest in a tech-heavy basket of US equities, with a 10% upside cap and a 5% downside limit over a three-month option horizon. The goal of this strategy is to strike a balance between limiting downside risk and retaining upside potential. During the reporting period, high inflation, rate hikes by the U.S. Federal Reserve, and a strong U.S. dollar made it more difficult for tech companies to grow sales as digital advertising and other revenue streams slowed. In turn, technology stocks suffered, contributing to the Fund's negative returns.
| | AVERAGE ANNUAL TOTAL RETURN FOR THE YEAR ENDED OCTOBER 31, 2022 |
| | One Year Return | Annualized Inception to Date* |
| | Net Asset Value | Market Price | Net Asset Value | Market Price |
| Global X NASDAQ 100® Collar 95-110 ETF | -13.19% | -13.45% | -9.76% | -9.90% |
| NASDAQ -100 Quarterly Collar 95-110 Index | -12.05% | -12.05% | -8.86% | -8.86% |
| NASDAQ-100® Index | -27.46% | -27.46% | -21.69% | -21.69% |
|
| Management Discussion of Fund Performance (unaudited) |
| Global X NASDAQ 100® Collar 95-110 ETF |

* The Fund commenced operations on August 25, 2021.
The Nasdaq-100® Index includes 100 of the largest domestic and international non-financial companies listed on The Nasdaq Stock Market based on market capitalization.
The performance data quoted herein represents past performance and the return and value of an investment in the Fund will fluctuate so that, when redeemed, it may be worth less than its original cost. Past performance is no guarantee of future performance and should not be considered as a representation of the future results of the Fund. The Fund's performance assumes the reinvestment of all dividends and all capital gains. Index returns assume reinvestment of dividends and, unlike the Fund's returns, do not reflect any fees or expenses. If such fees and expenses were included in the index returns, the performance would have been lower. Please note that one cannot invest directly in an unmanaged index. Performance figures for the periods shown may reflect contractual fee waivers and/or expense reimbursements. In the absence of fee waiver sand/or expense reimbursements (if applicable), returns would have been lower.
There are no assurances that the Fund will meet its stated objectives.
The Fund’s holdings and allocations are subject to change and should not be considered recommendations to buy individual securities.
The graph and table do not reflect the deduction of taxes that a shareholder would pay on Fund distributions or the redemption or sale of Fund shares.
See definition of comparative indices above.
| Schedule of Investments | October 31, 2022 |
| Global X Social Media ETF |

| | | Shares | | | Value | |
| COMMON STOCK — 99.8% | | | | | | |
| CHINA — 28.5% | | | | | | |
| Communication Services — 28.5% | | | | | | |
| Baidu ADR * | | | 59,721 | | | $ | 4,572,837 | |
| Bilibili ADR * | | | 216,191 | | | | 1,928,424 | |
| Hello Group ADR * | | | 100,414 | | | | 471,946 | |
| HUYA ADR * | | | 21,127 | | | | 39,507 | |
| JOYY ADR . | | | 20,582 | | | | 519,284 | |
| Kuaishou Technology, Cl B * | | | 862,288 | | | | 3,548,081 | |
| Meitu * | | | 2,666,600 | | | | 230,996 | |
| NetEase ADR . | | | 85,476 | | | | 4,754,175 | |
| Tencent Holdings . | | | 406,827 | | | | 10,655,443 | |
| Tencent Music Entertainment Group ADR * | | | 422,360 | | | | 1,524,720 | |
| Weibo ADR * | | | 101,760 | | | | 1,151,923 | |
| TOTAL CHINA | | | | | | | 29,397,336 | |
| GERMANY — 1.1% | | | | | | | | |
| Communication Services — 1.1% | | | | | | | | |
| United Internet | | | 64,056 | | | | 1,198,134 | |
| JAPAN — 8.2% | | | | | | | | |
| Communication Services — 8.2% | | | | | | | | |
| DeNA | | | 55,289 | | | | 722,010 | |
| giftee * | | | 13,050 | | | | 199,743 | |
| Gree | | | 35,508 | | | | 199,954 | |
| Kakaku.com | | | 91,314 | | | | 1,548,778 | |
Mixi
|
|
| 27,064
|
|
|
| 424,619
|
|
| Schedule of Investments | October 31, 2022 |
| Global X Social Media ETF |
| | | | |
| |
| | | Shares | | | Value | |
| COMMON STOCK — continued | | | | | | |
| Communication Services — continued | | | | | | |
| Nexon . | | | 319,812 | | | $ | 5,372,695 | |
| TOTAL JAPAN | | | | | | | 8,467,799 | |
| SOUTH KOREA — 13.7% | | | | | | | | |
| Communication Services — 13.7% | | | | | | | | |
| AfreecaTV | | | 5,661 | | | | 316,344 | |
| Com2uSCorp | | | 5,763 | | | | 287,654 | |
| Kakao . | | | 180,634 | | | | 6,429,249 | |
| NAVER | | | 59,626 | | | | 7,095,094 | |
| TOTAL SOUTH KOREA | | | | | | | 14,128,341 | |
| TAIWAN — 0.1% | | | | | | | | |
| Consumer Discretionary — 0.1% | | | | | | | | |
| PChome Online . | | | 69,544 | | | | 108,344 | |
| UNITED ARAB EMIRATES — 0.2% | | | | | | | | |
| Communication Services — 0.2% | | | | | | | | |
| Yalla Group ADR * (A) | | | 66,738 | | | | 206,220 | |
| UNITED STATES — 48.0% | | | | | | | | |
| Communication Services — 44.1% | | | | | | | | |
| Alphabet, Cl A * | | | 60,861 | | | | 5,751,973 | |
| Angi, Cl A * | | | 53,670 | | | | 115,391 | |
| Bumble, Cl A * | | | 58,401 | | | | 1,483,385 | |
| IAC * | | | 56,281 | | | | 2,739,759 | |
| Match Group * | | | 119,061 | | | | 5,143,435 | |
| Meta Platforms, Cl A * | | | 95,583 | | | | 8,904,512 | |
| Nextdoor Holdings * | | | 73,677 | | | | 199,665 | |
| Pinterest, Cl A * | | | 242,970 | | | | 5,977,062 | |
| Snap, Cl A * | | | 744,368 | | | | 7,376,687 | |
| Spotify Technology * | | | 70,159 | | | | 5,653,412 | |
| Vimeo * | | | 101,202 | | | | 384,568 | |
| Yelp, Cl A * | | | 46,797 | | | | 1,797,473 | |
| | | | | | | | 45,527,322 | |
| Consumer Discretionary — 1.2% | | | | | | | | |
| Fiverr International * | | | 22,169 | | | | 686,130 | |
| Groupon, Cl A * (A) | | | 11,989 | | | | 88,359 | |
| Schedule of Investments | October 31, 2022 |
| Global X Social Media ETF |
| | | | |
| |
| | | Shares | | | Value | |
| COMMON STOCK — continued | | | | | | |
| Consumer Discretionary — continued | | | | | | |
| Poshmark, Cl A * | | | 30,593 | | | $ | 546,391 | |
| | | | | | | | 1,320,880 | |
| Information Technology — 2.7% | | | | | | | | |
| Life360, Cl CDI * | | | 78,334 | | | | 346,128 | |
| Sprinklr, Cl A * | | | 51,009 | | | | 471,833 | |
| Sprout Social, Cl A * | | | 32,539 | | | | 1,963,078 | |
| | | | | | | | 2,781,039 | |
| TOTAL UNITED STATES | | | | | | | 49,629,241 | |
| TOTAL COMMON STOCK | | | | | | | | |
| (Cost $249,752,951) | | | | | | | 103,135,415 | |
| SHORT-TERM INVESTMENT(B)(C) — 0.4% | | | | | | | | |
| Fidelity Investments Money Market | | | | | | | | |
| Government Portfolio, Cl Institutional, | | | | | | | | |
2.910%
| | | | | | | | |
| (Cost $369,077) | | | 369,077 | | | | 369,077 | |
| | | | Face Amount
| | | | | |
| REPURCHASE AGREEMENT(B) — 0.5% | | |
| | | | | |
| BNP Paribas | | | | | | | | |
| 2.930%, dated 10/31/2022, to be repurchased | | | | | | | | |
| on 11/01/2022, repurchase price $512,839 | | | | | | | | |
| (collateralized by U.S. Treasury Obligations, | | | | | | | | |
| ranging in par value $10,193 - $59,922, | | | | | | | | |
| 2.500% - 2.750%, 03/31/2027 - 05/31/2029, | | | | | | | | |
| with a total market value of $522,429) | | | | | | | | |
| (Cost $512,797) | | $ | 512,797 | | | | 512,797 | |
| TOTAL INVESTMENTS — 100.7% | | | | | | | | |
| (Cost $250,634,825) | | | | | | $ | 104,017,289 | |
Percentages are based on Net Assets of $103,245,446.
* Non-income producing security.
(A) This security or a partial position of this security is on loan at October 31, 2022.
(B) Security was purchased with cash collateral held from securities on loan.
(C) The rate reported on the Schedule of Investments is the 7-day effective yield as of October 31, 2022.
| Schedule of Investments | October 31, 2022 |
| Global X Social Media ETF |
The following is a summary of the level of inputs used as of October 31, 2022, in valuing the Fund's investments carried at value:
| Investments in Securities | | Level 1 | | | Level 2 | | | Level 3 | | | Total | |
| Common Stock | | $ | 103,135,415 | | | $ | — | | | $ | — | | | $ | 103,135,415 | |
| Short-Term Investment | | | 369,077 | | | | — | | | | — | | | | 369,077 | |
| Repurchase Agreement | | | — | | | | 512,797 | | | | — | | | | 512,797 | |
| Total Investments in Securities | | $ | 103,504,492 | | | $ | 512,797 | | | $ | — | | | $ | 104,017,289 | |
Amounts designated as “—“ are $0 or have been rounded to $0.
See "Glossary" for abbreviations.
| Schedule of Investments | | October 31, 2022 |
| | Global X Lithium & Battery Tech ETF | |
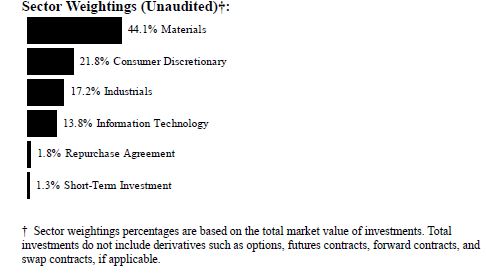
| | | | |
| |
| | | Shares | | | Value | |
| COMMON STOCK — 99.9% | | | | | | |
| AUSTRALIA — 11.6% | | | | | | |
| Materials — 11.6% | | | | | | |
| Allkem * | | | 7,773,018 | | | $ | 71,773,570 | |
| Core Lithium * | | | 21,501,734 | | | | 19,042,806 | |
| IGO | | | 9,755,577 | | | | 95,382,375 | |
| Liontown Resources * | | | 22,351,938 | | | | 26,942,272 | |
| Mineral Resources . | | | 2,168,671 | | | | 101,413,770 | |
| Pilbara Minerals * | | | 38,177,848 | | | | 124,261,591 | |
| Sayona Mining * | | | 82,846,213 | | | | 12,449,394 | |
| TOTAL AUSTRALIA | | | | | | | 451,265,778 | |
| BRAZIL — 0.6% | | | | | | | | |
| Materials — 0.6% | | | | | | | | |
| Sigma Lithium * | | | 683,706 | | | | 24,435,652 | |
| CANADA — 0.9% | | | | | | | | |
| Materials — 0.9% | | | | | | | | |
| Lithium Americas * (A) | | | 1,345,981 | | | | 33,450,941 | |
| Standard Lithium * (A) | | | 15,767 | | | | 63,112 | |
| TOTAL CANADA | | | | | | | 33,514,053 | |
|
|
|
| Schedule of Investments | | October 31, 2022 |
Global X Lithium & Battery Tech ETF
|
| | | | |
| |
| | | Shares | | | Value | |
| COMMON STOCK — continued | | | | | | |
| CHILE — 4.5% | | | | | | |
| Materials — 4.5% | | | | | | |
| Sociedad Quimica y Minera de Chile ADR | | | 1,887,967 | | | $ | 176,864,748 | |
| CHINA — 33.9% | | | | | | | | |
| Consumer Discretionary — 4.3% | | | | | | | | |
| BYD, Cl H . | | | 7,384,674 | | | | 165,288,155 | |
| Industrials — 12.0% | | | | | | | | |
| Beijing Easpring Material Technology, Cl A | | | 3,864,948 | | | | 31,103,707 | |
| Contemporary Amperex Technology, Cl A . | | | 3,044,905 | | | | 154,893,409 | |
| Eve Energy, Cl A | | | 14,288,668 | | | | 161,871,051 | |
| Sunwoda Electronic, Cl A | | | 14,200,991 | | | | 45,140,324 | |
| Wuxi Lead Intelligent Equipment, Cl A . | | | 10,993,897 | | | | 75,126,438 | |
| | | | | | | | 468,134,929 | |
| Information Technology — 2.8% | | | | | | | | |
| NAURA Technology Group, Cl A . | | | 3,011,041 | | | | 109,143,612 | |
| Materials — 14.8% | | | | | | | | |
| Ganfeng Lithium, Cl A . | | | 13,804,840 | | | | 148,819,042 | |
| Guangzhou Tinci Materials Technology, Cl A .. | | | 13,726,078 | | | | 79,583,950 | |
| Shanghai Putailai New Energy Technology, | | | | | | | | |
| | | 7,378,056 | | | | 50,236,528 | |
| Shenzhen Capchem Technology, Cl A | | | 4,204,190 | | | | 20,745,359 | |
| Tianqi Lithium, Cl A * | | | 12,726,641 | | | | 165,895,492 | |
| Yunnan Energy New Material, Cl A | | | 5,604,759 | | | | 113,194,707 | |
| | | | | | | | 578,475,078 | |
| TOTAL CHINA | | | | | | | 1,321,041,774 | |
| JAPAN — 9.6% | | | | | | | | |
| Consumer Discretionary — 4.8% | | | | | | | | |
| Panasonic Holdings | | | 25,959,229 | | | | 185,915,829 | |
| Industrials — 0.8% | | | | | | | | |
| GS Yuasa | | | 978,966 | | | | 14,931,314 | |
| Japan Steel Works . | | | 857,833 | | | | 17,747,075 | |
| | | | | | | | 32,678,389 | |
|
|
|
| Schedule of Investments | | October 31, 2022 |
Global X Lithium & Battery Tech ETF
|
| | | | |
| |
| | | Shares | | | Value | |
| COMMON STOCK — continued | | | | | | |
| Information Technology — 4.0% | | | | | | |
| TDK | | | 4,995,185 | | | $ | 156,440,853 | |
| TOTAL JAPAN | | | | | | | 375,035,071 | |
| NORWAY — 0.5% | | | | | | | | |
| Industrials — 0.5% | | | | | | | | |
| FREYR Battery * (A) | | | 1,299,651 | | | | 17,298,355 | |
| SOUTH KOREA — 9.8% | | | | | | | | |
| Industrials — 2.8% | | | | | | | | |
| LG Energy Solution * | | | 297,438 | | | | 110,251,160 | |
| Information Technology — 7.0% | | | | | | | | |
| L&F * (A) | | | 302,161 | | | | 47,728,053 | |
| Samsung SDI | | | 430,909 | | | | 222,949,161 | |
| | | | | | | | 270,677,214 | |
| TOTAL SOUTH KOREA | | | | | | | 380,928,374 | |
| TAIWAN — 0.4% | | | | | | | | |
| Information Technology — 0.4% | | | | | | | | |
| Simplo Technology . | | | 2,166,980 | | | | 17,249,759 | |
| UNITED STATES — 28.1% | | | | | | | | |
| Consumer Discretionary — 13.5% | | | | | | | | |
| Lucid Group * | | | 7,450,410 | | | | 106,466,359 | |
| QuantumScape, Cl A * (A) | | | 2,943,704 | | | | 24,521,054 | |
| Rivian Automotive, Cl A * | | | 5,915,616 | | | | 206,869,092 | |
| Tesla * | | | 827,892 | | | | 188,378,546 | |
| | | | | | | | 526,235,051 | |
| Industrials — 1.6% | | | | | | | | |
| EnerSys | | | 525,719 | | | | 34,849,912 | |
| Enovix * | | | 1,507,978 | | | | 28,455,545 | |
| | | | | | | | 63,305,457 | |
| Materials — 13.0% | | | | | | | | |
| Albemarle | | | 1,546,002 | | | | 432,679,580 | |
|
|
|
| Schedule of Investments | | October 31, 2022 |
| Global X Lithium & Battery Tech ETF |
| | Shares | | | Value | |
| COMMON STOCK — continued | | | | | | |
Materials — continued | | | | | | |
| Livent * | | | 2,347,645 | | | $ | 74,115,152 | |
| | | | | | | | 506,794,732 | |
TOTAL UNITED STATES | | | | | | | 1,096,335,240 | |
TOTAL COMMON STOCK | | | | | | | | |
| (Cost $3,569,341,406) | | | | | | | 3,893,968,804 | |
SHORT-TERM INVESTMENT(B)(C) — 1.3% | | | | | | | | |
| | | | | | | | | |
Fidelity Investments Money Market
Government Portfolio, Cl Institutional, 2.910% | | | | | | | | |
| (Cost $52,417,598) | | | 52,417,598 | | | | 52,417,598 | |
| | | Face Amount | | | | | |
REPURCHASE AGREEMENT(B) — 1.9% | | | | | | | | |
BNP Paribas
2.930%, dated 10/31/2022, to be
repurchased on 11/01/2022, repurchase price
$72,835,231 (collateralized by U.S. Treasury
Obligations, ranging in par value $1,447,585
- $8,510,349, 2.500% - 2.750%, 03/31/2027
- 05/31/2029, with a total market value of $74,197,322)
(Cost $72,829,304) | | $ | 72,829,304 | | | | 72,829,304 | |
TOTAL INVESTMENTS — 103.1% | | | | | | | | |
| (Cost $3,694,588,308) | | | | | | $ | 4,019,215,706 | |
Percentages are based on Net Assets of $3,899,509,347.
| * | Non-income producing security. |
| (A) | This security or a partial position of this security is on loan at October 31, 2022. |
| (B) | Security was purchased with cash collateral held from securities on loan. |
| (C) | The rate reported on the Schedule of Investments is the 7-day effective yield as of October 31, 2022. |
|
|
|
| Schedule of Investments | | October 31, 2022 |
Global X Lithium & Battery Tech ETF
|
The following is a summary of the level of inputs used as of October 31, 2022, in valuing the Fund’s investments carried at value:
| Investments in Securities | | Level 1 | | | Level 2 | | | Level 3 | | | Total | |
| Common Stock | | $ | 3,893,968,804 | | | $ | — | | | $ | — | | | $ | 3,893,968,804 | |
| Short-Term Investment | | | 52,417,598 | | | | — | | | | — | | | | 52,417,598 | |
| Repurchase Agreement | | | — | | | | 72,829,304 | | | | — | | | | 72,829,304 | |
| Total Investments in Securities | | $ | 3,946,386,402 | | | $ | 72,829,304 | | | $ | — | | | $ | 4,019,215,706 | |
Amounts designated as “—“ are $0 or have been rounded to $0.
See "Glossary" for abbreviations.
|
|
|
| Schedule of Investments | | October 31, 2022 |
Global X Disruptive Materials ETF
|

| | | | |
| |
| | | Shares | | | Value | |
| COMMON STOCK — 99.8% | | | | | | |
| AUSTRALIA — 12.1% | | | | | | |
| Materials — 12.1% | | | | | | |
| Allkem * | | | 14,130 | | | $ | 130,472 | |
| IGO | | | 14,284 | | | | 139,658 | |
| Lynas Rare Earths * | | | 22,726 | | | | 121,053 | |
| Syrah Resources * | | | 15,731 | | | | 24,041 | |
| TOTAL AUSTRALIA | | | | | | | 415,224 | |
| CANADA — 2.5% | | | | | | | | |
| Materials — 2.5% | | | | | | | | |
| HudBay Minerals | | | 5,632 | | | | 21,346 | |
| Lithium Americas * | | | 2,632 | | | | 65,412 | |
| TOTAL CANADA | | | | | | | 86,758 | |
| CHILE — 6.0% | | | | | | | | |
| Materials — 6.0% | | | | | | | | |
| Antofagasta . | | | 8,670 | | | | 117,340 | |
| Lundin Mining | | | 16,641 | | | | 87,106 | |
| TOTAL CHILE | | | | | | | 204,446 | |
| CHINA — 27.1% | | | | | | | | |
| Industrials — 5.0% | | | | | | | | |
| Eve Energy, Cl A | | | 11,100 | | | | 125,748 | |
| Fangda Carbon New Material, Cl A * | | | 56,800 | | | | 46,571 | |
| | | | | | | | 172,319 | |
| Materials — 22.1% | | | | | | | | |
| China Nonferrous Mining | | | 28,100 | | | | 10,202 | |
|
|
|
| Schedule of Investments | | October 31, 2022 |
Global X Disruptive Materials ETF
|
| | | | |
| |
| | | Shares | | | Value | |
| COMMON STOCK — continued | | | | | | |
| Materials — continued | | | | | | |
| China Northern Rare Earth Group High-Tech, | | | | | | |
| Cl A | | | 34,100 | | | $ | 112,580 | |
| China Rare Earth Resources and Technology, | | | | | | | | |
| Cl A * | | | 11,800 | | | | 46,427 | |
| Ganfeng Lithium, Cl H | | | 10,142 | | | | 68,605 | |
| MMG * | | | 69,100 | | | | 13,644 | |
| Nanjing Hanrui Cobalt, Cl A | | | 5,000 | | | | 27,414 | |
| Shenghe Resources Holding, Cl A | | | 36,400 | | | | 66,343 | |
| Sinofibers Technology, Cl A | | | 6,300 | | | | 47,469 | |
| South Manganese Investment * | | | 99,900 | | | | 6,045 | |
| Tongling Nonferrous Metals Group, Cl A . | | | 267,500 | | | | 91,963 | |
| Weihai Guangwei Composites, Cl A | | | 7,100 | | | | 75,164 | |
| Western Mining, Cl A | | | 42,400 | | | | 54,778 | |
| Yunnan Tin, Cl A | | | 23,900 | | | | 37,203 | |
| Zhejiang Huayou Cobalt, Cl A . | | | 13,630 | | | | 101,303 | |
| | | | | | | | 759,140 | |
| TOTAL CHINA | | | | | | | 931,459 | |
| FINLAND — 0.3% | | | | | | | | |
| Materials — 0.3% | | | | | | | | |
| Jervois Global * | | | 33,005 | | | | 10,342 | |
| FRANCE — 0.4% | | | | | | | | |
| Materials — 0.4% | | | | | | | | |
| Eramet . | | | 203 | | | | 13,312 | |
| GERMANY — 0.3% | | | | | | | | |
| Industrials — 0.3% | | | | | | | | |
| SGL Carbon * | | | 1,708 | | | | 12,129 | |
| INDONESIA — 1.1% | | | | | | | | |
| Materials — 1.1% | | | | | | | | |
| Nickel Mines . | | | 33,421 | | | | 15,601 | |
| Vale Indonesia * | | | 51,300 | | | | 21,378 | |
| TOTAL INDONESIA | | | | | | | 36,979 | |
|
|
|
| Schedule of Investments | | October 31, 2022 |
Global X Disruptive Materials ETF
|
| | | | |
| |
| | | Shares | | | Value | |
| COMMON STOCK — continued | | | | | | |
| JAPAN — 5.2% | | | | | | |
| Industrials — 0.3% | | | | | | |
| Nippon Carbon . | | | 411 | | | $ | 11,655 | |
| Materials — 4.9% | | | | | | | | |
| Nippon Denko . | | | 4,191 | | | | 9,587 | |
| Sumitomo Metal Mining | | | 4,518 | | | | 127,119 | |
| Tokai Carbon . | | | 4,635 | | | | 30,279 | |
| | | | | | | | 166,985 | |
| TOTAL JAPAN | | | | | | | 178,640 | |
| NETHERLANDS — 0.7% | | | | | | | | |
| Materials — 0.7% | | | | | | | | |
| AMG Advanced Metallurgical Group | | | 786 | | | | 24,595 | |
| PERU — 3.0% | | | | | | | | |
| Materials — 3.0% | | | | | | | | |
| Southern Copper . | | | 2,159 | | | | 101,408 | |
| SOUTH AFRICA — 15.7% | | | | | | | | |
| Materials — 15.7% | | | | | | | | |
| African Rainbow Minerals | | | 2,678 | | | | 37,692 | |
| Anglo American | | | 4,716 | | | | 141,635 | |
| Anglo American Platinum . | | | 1,439 | | | | 114,409 | |
| Impala Platinum Holdings . | | | 15,177 | | | | 155,342 | |
| Northam Platinum Holdings * | | | 7,831 | | | | 73,454 | |
| Royal Bafokeng Platinum | | | 1,976 | | | | 15,878 | |
| TOTAL SOUTH AFRICA | | | | | | | 538,410 | |
| SWEDEN — 4.0% | | | | | | | | |
| Materials — 4.0% | | | | | | | | |
| Boliden . | | | 4,744 | | | | 138,064 | |
| TAIWAN — 0.2% | | | | | | | | |
| Information Technology — 0.2% | | | | | | | | |
| Acme Electronics * | | | 11,200 | | | | 8,047 | |
|
|
|
| Schedule of Investments | | October 31, 2022 |
Global X Disruptive Materials ETF
|
| | | | |
| |
| | | Shares | | | Value | |
| COMMON STOCK — continued | | | | | | |
| UNITED STATES — 16.7% | | | | | | |
| Industrials — 0.7% | | | | | | |
| GrafTech International | | | 4,850 | | | $ | 24,686 | |
| Materials — 16.0% | | | | | | | | |
| Albemarle | | | 509 | | | | 142,454 | |
| Freeport-McMoRan . | | | 5,146 | | | | 163,077 | |
| Livent * | | | 4,490 | | | | 141,749 | |
| MP Materials * | | | 3,396 | | | | 102,016 | |
| | | | | | | | 549,296 | |
| TOTAL UNITED STATES | | | | | | | 573,982 | |
| ZAMBIA — 4.5% | | | | | | | | |
| Materials — 4.5% | | | | | | | | |
| First Quantum Minerals | | | 8,724 | | | | 153,688 | |
| TOTAL COMMON STOCK | | | | | | | | |
| (Cost $4,672,494) | | | | | | | 3,427,483 | |
| TOTAL INVESTMENTS — 99.8% | | | | | | | | |
| (Cost $4,672,494) | | | | | | $ | 3,427,483 | |
Percentages are based on Net Assets of $3,433,164.
* Non-income producing security.
As of October 31, 2022, all of the Fund's investments were considered Level 1, in accordance with authoritative guidance on fair value measurements and disclosure under U.S. GAAP.
See "Glossary" for abbreviations.
|
|
|
| Schedule of Investments | | October 31, 2022 |
Global X E-commerce ETF
|
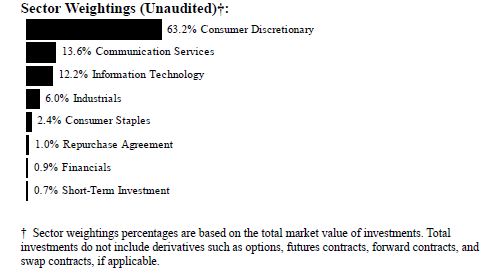
| | | | |
| |
| | | Shares | | | Value | |
| COMMON STOCK — 99.9% | | | | | | |
| AUSTRALIA — 0.6% | | | | | | |
| Consumer Discretionary — 0.6% | | | | | | |
| Temple & Webster Group * | | | 76,235 | | | $ | 272,992 | |
| BRAZIL — 6.5% | | | | | | | | |
| Communication Services — 0.5% | | | | | | | | |
| VTEX, Cl A * (A) | | | 47,366 | | | | 197,990 | |
| Consumer Discretionary — 6.0% | | | | | | | | |
| MercadoLibre * | | | 2,832 | | | | 2,553,388 | |
| TOTAL BRAZIL | | | | | | | 2,751,378 | |
| CANADA — 4.7% | | | | | | | | |
| Information Technology — 4.7% | | | | | | | | |
| Shopify, Cl A * | | | 57,587 | | | | 1,971,203 | |
| CHINA — 20.0% | | | | | | | | |
| Communication Services — 2.7% | | | | | | | | |
| NetEase ADR . | | | 20,680 | | | | 1,150,221 | |
|
|
|
| Schedule of Investments | | October 31, 2022 |
Global X E-commerce ETF
|
| | | | |
| |
| | | Shares | | | Value | |
| COMMON STOCK — continued | | | | | | |
| Consumer Discretionary — 17.0% | | | | | | |
| Alibaba Group Holding ADR * | | | 17,046 | | | $ | 1,083,785 | |
| Baozun ADR * | | | 40,078 | | | | 157,907 | |
| JD.com ADR * | | | 30,137 | | | | 1,123,809 | |
| Pinduoduo ADR * | | | 33,007 | | | | 1,809,774 | |
| Trip.com Group ADR * | | | 71,227 | | | | 1,611,867 | |
| Uxin ADR * | | | 23,773 | | | | 97,945 | |
| Vipshop Holdings ADR * | | | 185,178 | | | | 1,290,691 | |
| | | | | | | | 7,175,778 | |
| Financials — 0.3% | | | | | | | | |
| LexinFintech Holdings ADR * | | | 84,794 | | | | 115,320 | |
| TOTAL CHINA | | | | | | | 8,441,319 | |
| GERMANY — 0.7% | | | | | | | | |
| Consumer Discretionary — 0.7% | | | | | | | | |
| Jumia Technologies ADR * (A) | | | 63,347 | | | | 314,201 | |
| JAPAN — 4.3% | | | | | | | | |
| Consumer Discretionary — 4.3% | | | | | | | | |
| Rakuten Group * | | | 402,898 | | | | 1,805,295 | |
| SINGAPORE — 3.1% | | | | | | | | |
| Communication Services — 3.1% | | | | | | | | |
| Sea ADR * | | | 26,013 | | | | 1,292,326 | |
| UNITED KINGDOM — 3.4% | | | | | | | | |
| Consumer Discretionary — 1.0% | | | | | | | | |
| ASOS * | | | 63,619 | | | | 412,749 | |
| Consumer Staples — 2.4% | | | | | | | | |
| Ocado Group * | | | 191,359 | | | | 1,040,792 | |
| TOTAL UNITED KINGDOM | | | | | | | 1,453,541 | |
| UNITED STATES — 56.6% | | | | | | | | |
| Communication Services — 7.5% | | | | | | | | |
| Angi, Cl A * | | | 50,853 | | | | 109,334 | |
| Shutterstock | | | 23,094 | | | | 1,155,393 | |
|
|
|
| Schedule of Investments | | October 31, 2022 |
Global X E-commerce ETF
|
| | | | |
| |
| | | Shares | | | Value | |
| COMMON STOCK — continued | | | | | | |
| Communication Services — continued | | | | | | |
| TripAdvisor * | | | 80,864 | | | $ | 1,910,008 | |
| | | | | | | | 3,174,735 | |
| Consumer Discretionary — 34.6% | | | | | | | | |
| 1stdibs.com * | | | 23,983 | | | | 162,365 | |
| Amazon.com * | | | 16,790 | | | | 1,719,968 | |
| Booking Holdings * | | | 1,061 | | | | 1,983,518 | |
| eBay | | | 43,559 | | | | 1,735,390 | |
| Etsy * | | | 22,256 | | | | 2,090,061 | |
| Expedia Group * | | | 19,892 | | | | 1,859,305 | |
| Groupon, Cl A * (A) | | | 18,897 | | | | 139,271 | |
| Lands' End * | | | 21,185 | | | | 222,019 | |
| Overstock.com * | | | 29,831 | | | | 693,571 | |
| PetMed Express . | | | 13,300 | | | | 283,556 | |
| Qurate Retail, Cl A * | | | 237,745 | | | | 556,323 | |
| Wayfair, Cl A * (A) | | | 36,848 | | | | 1,397,276 | |
| Williams-Sonoma . | | | 14,225 | | | | 1,761,482 | |
| | | | | | | | 14,604,105 | |
| Financials — 0.6% | | | | | | | | |
| eHealth * | | | 17,043 | | | | 45,676 | |
| LendingTree * | | | 8,114 | | | | 204,716 | |
| | | | | | | | 250,392 | |
| Industrials — 6.1% | | | | | | | | |
| CoStar Group * | | | 31,242 | | | | 2,584,338 | |
| Information Technology — 7.8% | | | | | | | | |
| BigCommerce Holdings * | | | 46,272 | | | | 687,602 | |
| GoDaddy, Cl A * | | | 25,924 | | | | 2,084,290 | |
| LivePerson * | | | 47,392 | | | | 500,933 | |
| | | | | | | | 3,272,825 | |
| TOTAL UNITED STATES | | | | | | | 23,886,395 | |
| TOTAL COMMON STOCK | | | | | | | | |
| (Cost $104,853,364) | | | | | | | 42,188,650 | |
|
|
|
| Schedule of Investments | | October 31, 2022 |
Global X E-commerce ETF
|
| | Shares | | | Value | |
SHORT-TERM INVESTMENT(B)(C) — 0.7% | | | | | | |
Fidelity Investments Money Market
Government Portfolio, Cl Institutional, 2.910%
(Cost $304,001) | | | 304,001 | | | $ | 304,001 | |
| | | Face Amount | | | | | |
| REPURCHASE AGREEMENT(B) — 1.0% | | | | | | | | |
| | | | | | | | | |
| | | | | | | | | |
BNP Paribas
2.930%, dated 10/31/2022, to be repurchased
on 11/01/2022, repurchase price $422,414
(collateralized by U.S. Treasury Obligations,
ranging in par value $8,395 - $49,357,
2.500% - 2.750%, 03/31/2027 - 05/31/2029,
with a total market value of $430,317)
(Cost $422,380) | | $ | 422,380 | | | | 422,380 | |
TOTAL INVESTMENTS — 101.6% | | | | | | | | |
| (Cost $105,579,745) | | | | | | $ | 42,915,031 | |
Percentages are based on Net Assets of $42,240,518.
| * | Non-income producing security. |
| (A) | This security or a partial position of this security is on loan at October 31, 2022. |
| (B) | Security was purchased with cash collateral held from securities on loan. |
| (C) | The rate reported on the Schedule of Investments is the 7-day effective yield as of October 31, 2022. |
The following is a summary of the level of inputs used as of October 31, 2022, in valuing the Fund’s investments carried at value:
| Investments in Securities | | Level 1 | | | Level 2 | | | Level 3 | | | Total | |
| Common Stock | | $ | 42,188,650 | | | $ | — | | | $ | — | | | $ | 42,188,650 | |
| Short-Term Investment | | | 304,001 | | | | — | | | | — | | | | 304,001 | |
| Repurchase Agreement | | | — | | | | 422,380 | | | | — | | | | 422,380 | |
| Total Investments in Securities | | $ | 42,492,651 | | | $ | 422,380 | | | $ | — | | | $ | 42,915,031 | |
Amounts designated as “—“ are $0 or have been rounded to $0.
See "Glossary" for abbreviations.
|
|
| Schedule of Investments | October 31, 2022 |
Global X Emerging Markets Internet & E-commerce ETF
|
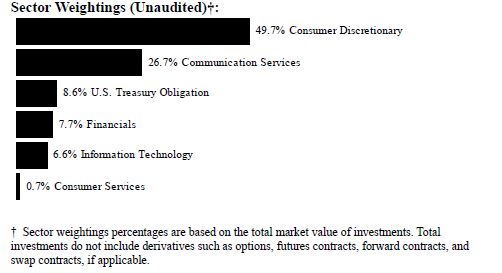
| | | | |
| |
| | | Shares | | | Value | |
| COMMON STOCK — 99.9% | | | | | | |
| BRAZIL — 18.2% | | | | | | |
| Consumer Discretionary — 6.7% | | | | | | |
| Magazine Luiza * | | | 22,849 | | | $ | 19,464 | |
| MercadoLibre * | | | 125 | | | | 112,703 | |
| | | | | | | | 132,167 | |
| Financials — 8.5% | | | | | | | | |
| NU Holdings, Cl A * | | | 21,787 | | | | 108,935 | |
| XP, Cl A * | | | 3,114 | | | | 57,079 | |
| | | | | | | | 166,014 | |
| Information Technology — 3.0% | | | | | | | | |
| Pagseguro Digital, Cl A * | | | 1,423 | | | | 19,467 | |
| StoneCo, Cl A * | | | 1,959 | | | | 20,569 | |
| TOTVS . | | | 2,997 | | | | 18,940 | |
| | | | | | | | 58,976 | |
| TOTAL BRAZIL | | | | | | | 357,157 | |
| CHILE — 0.6% | | | | | | | | |
| Consumer Discretionary — 0.6% | | | | | | | | |
| Falabella | | | 6,562 | | | | 12,826 | |
|
|
| Schedule of Investments | October 31, 2022 |
Global X Emerging Markets Internet & E-commerce ETF
|
| | | | |
| |
| | | Shares | | | Value | |
| COMMON STOCK — continued | | | | | | |
| CHINA — 58.5% | | | | | | |
| Communication Services — 18.7% | | | | | | |
| Autohome ADR . | | | 798 | | | $ | 20,844 | |
| Baidu ADR * | | | 741 | | | | 56,738 | |
| Bilibili ADR * | | | 2,422 | | | | 21,604 | |
| China Literature * | | | 2,940 | | | | 7,921 | |
| iQIYI ADR * | | | 2,545 | | | | 5,141 | |
| Kingsoft | | | 6,250 | | | | 18,910 | |
| NetEase ADR . | | | 1,206 | | | | 67,078 | |
| Tencent Holdings . | | | 5,080 | | | | 133,053 | |
| Tencent Music Entertainment Group ADR * | | | 5,051 | | | | 18,234 | |
| Weibo ADR * | | | 1,617 | | | | 18,305 | |
| | | | | | | | 367,828 | |
| Consumer Discretionary — 36.9% | | | | | | | | |
| Alibaba Group Holding ADR * | | | 2,238 | | | | 142,292 | |
| Alibaba Health Information Technology * | | | 34,800 | | | | 14,718 | |
| JD.com ADR * | | | 3,363 | | | | 125,406 | |
| Meituan, Cl B * | | | 8,830 | | | | 140,383 | |
| Pinduoduo ADR * | | | 2,995 | | | | 164,216 | |
| Ping An Healthcare and Technology * | | | 3,330 | | | | 6,143 | |
| Tongcheng Travel Holdings * | | | 7,050 | | | | 10,993 | |
| Trip.com Group ADR * | | | 4,151 | | | | 93,937 | |
| Vipshop Holdings ADR * | | | 3,995 | | | | 27,845 | |
| | | | | | | | 725,933 | |
| Information Technology — 2.9% | | | | | | | | |
| Kingdee International Software Group * | | | 17,250 | | | | 28,216 | |
| TravelSky Technology, Cl H . | | | 19,850 | | | | 28,827 | |
| | | | | | | | 57,043 | |
| TOTAL CHINA | | | | | | | 1,150,804 | |
| INDIA — 0.8% | | | | | | | | |
| Consumer Services — 0.8% | | | | | | | | |
| MakeMyTrip * | | | 535 | | | | 14,889 | |
| POLAND — 0.7% | | | | | | | | |
| Consumer Discretionary — 0.7% | | | | | | | | |
| Allegro.eu * | | | 2,917 | | | | 14,184 | |
|
|
| Schedule of Investments | October 31, 2022 |
Global X Emerging Markets Internet & E-commerce ETF
|
| | | | |
| |
| | | Shares | | | Value | |
| COMMON STOCK — continued | | | | | | |
| SOUTH AFRICA — 4.4% | | | | | | |
| Communication Services — 0.5% | | | | | | |
| MultiChoice Group . | | | 1,494 | | | $ | 9,758 | |
| Consumer Discretionary — 3.9% | | | | | | | | |
| Naspers, Cl N . | | | 750 | | | | 77,544 | |
| TOTAL SOUTH AFRICA | | | | | | | 87,302 | |
| SOUTH KOREA — 15.4% | | | | | | | | |
| Communication Services — 9.8% | | | | | | | | |
| Kakao . | | | 1,945 | | | | 69,228 | |
| Krafton * | | | 224 | | | | 27,912 | |
| NAVER | | | 595 | | | | 70,801 | |
| NCSoft | | | 92 | | | | 25,189 | |
| | | | | | | | 193,130 | |
| Consumer Discretionary — 5.6% | | | | | | | | |
| Coupang, Cl A * | | | 6,317 | | | | 109,095 | |
| TOTAL SOUTH KOREA | | | | | | | 302,225 | |
| URUGUAY — 1.3% | | | | | | | | |
| Information Technology — 1.3% | | | | | | | | |
| Dlocal, Cl A * | | | 1,121 | | | | 24,998 | |
| TOTAL COMMON STOCK | | | | | | | | |
| (Cost $4,353,604) | | | | | | | 1,964,385 | |
| | | Face Amount | | | | | |
| U.S. TREASURY OBLIGATION — 9.4% | | | | | | | | |
| U.S. Treasury Bill | | | | | | | | |
2.201%, 11/01/22(A) | | | | | | | | |
| (Cost $185,000) | | $ | 185,000 | | | | 185,000 | |
| TOTAL INVESTMENTS — 109.3% | | | | | | | | |
| (Cost $4,538,604) | | | | | | $ | 2,149,385 | |
Percentages are based on Net Assets of $1,966,169.
* Non-income producing security.
(A) Interest rate represents the security's effective yield at the time of purchase.
|
|
| Schedule of Investments | October 31, 2022 |
Global X Emerging Markets Internet & E-commerce ETF
|
The following is a summary of the level of inputs used as of October 31, 2022, in valuing the Fund’s investments carried at value:
| Investments in Securities | | Level 1 | | | Level 2 | | | Level 3 | | | Total | |
| Common Stock | | $ | 1,951,559 | | | $ | 12,826 | | | $ | — | | | $ | 1,964,385 | |
| U.S. Treasury Obligation | | | — | | | | 185,000 | | | | — | | | | 185,000 | |
| Total Investments in Securities | | $ | 1,951,559 | | | $ | 197,826 | | | $ | — | | | $ | 2,149,385 | |
Amounts designated as “—“ are $0 or have been rounded to $0.
See "Glossary" for abbreviations.
|
|
|
| Schedule of Investments | | October 31, 2022 |
Global X SuperDividend® ETF
|
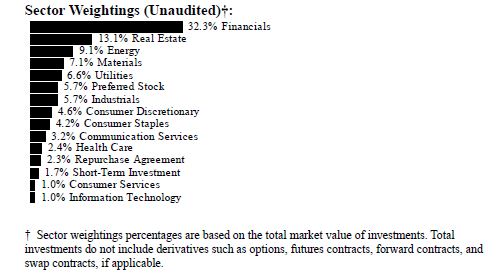
| | | | |
| |
| | | Shares | | | Value | |
| COMMON STOCK — 93.7% | | | | | | |
| AUSTRALIA — 4.7% | | | | | | |
| Consumer Discretionary — 0.7% | | | | | | |
| Harvey Norman Holdings | | | 1,710,090 | | | $ | 4,549,043 | |
| Energy — 0.1% | | | | | | | | |
| Woodside Energy Group | | | 22,238 | | | | 511,640 | |
| Financials — 2.3% | | | | | | | | |
| Magellan Financial Group (A) | | | 1,207,628 | | | | 7,668,141 | |
| Platinum Asset Management | | | 7,233,686 | | | | 8,279,810 | |
| | | | | | | | 15,947,951 | |
| Materials — 1.6% | | | | | | | | |
| BHP Group | | | 144,858 | | | | 3,460,645 | |
| Rio Tinto . | | | 62,247 | | | | 3,510,708 | |
| Rio Tinto ADR (A) | | | 69,869 | | | | 3,727,511 | |
| | | | | | | | 10,698,864 | |
| TOTAL AUSTRALIA | | | | | | | 31,707,498 | |
|
|
|
| Schedule of Investments | | October 31, 2022 |
Global X SuperDividend® ETF
|
| | | | |
| |
| | | Shares | | | Value | |
| COMMON STOCK — continued | | | | | | |
| BELGIUM — 1.1% | | | | | | |
| Consumer Services — 1.1% | | | | | | |
| Telenet Group Holding . | | | 469,844 | | | $ | 7,165,215 | |
| BRAZIL — 10.1% | | | | | | | | |
| Consumer Staples — 0.9% | | | | | | | | |
| Marfrig Global Foods | | | 3,153,226 | | | | 6,429,943 | |
| Financials — 1.3% | | | | | | | | |
| Banco Santander Brasil . | | | 1,524,306 | | | | 8,650,976 | |
| Health Care — 0.9% | | | | | | | | |
| Qualicorp Consultoria e Corretora de Seguros . | | | 4,355,561 | | | | 6,540,916 | |
| Materials — 2.2% | | | | | | | | |
| Dexco . | | | 4,413,168 | | | | 8,149,716 | |
| Vale ADR, Cl B . | | | 511,726 | | | | 6,621,734 | |
| | | | | | | | 14,771,450 | |
| Utilities — 4.8% | | | | | | | | |
| CPFL Energia . | | | 1,780,441 | | | | 12,018,337 | |
| EDP - Energias do Brasil . | | | 1,252,514 | | | | 5,506,789 | |
| Energisa . | | | 594,974 | | | | 5,498,173 | |
| Transmissora Alianca de Energia Eletrica . | | | 1,207,264 | | | | 9,246,737 | |
| | | | | | | | 32,270,036 | |
| TOTAL BRAZIL | | | | | | | 68,663,321 | |
| CANADA — 0.9% | | | | | | | | |
| Materials — 0.9% | | | | | | | | |
| Labrador Iron Ore Royalty | | | 307,790 | | | | 6,372,193 | |
| CHILE — 1.6% | | | | | | | | |
| Utilities — 1.6% | | | | | | | | |
| Colbun . | | | 108,850,165 | | | | 10,692,242 | |
| CHINA — 13.3% | | | | | | | | |
| Energy — 1.8% | | | | | | | | |
| China Petroleum & Chemical, Cl H | | | 10,637,600 | | | | 4,200,916 | |
|
|
|
| Schedule of Investments | | October 31, 2022 |
Global X SuperDividend® ETF
|
| | | | |
| |
| | | Shares | | | Value | |
| COMMON STOCK — continued | | | | | | |
| Energy — continued | | | | | | |
| China Shenhua Energy, Cl H | | | 2,990,300 | | | $ | 7,866,354 | |
| | | | | | | | 12,067,270 | |
| Financials — 2.4% | | | | | | | | |
| China Everbright Bank, Cl H . | | | 28,483,800 | | | | 7,366,015 | |
| Chongqing Rural Commercial Bank, Cl H . | | | 28,350,600 | | | | 8,595,633 | |
| | | | | | | | 15,961,648 | |
| Industrials — 2.2% | | | | | | | | |
| Lonking Holdings . | | | 44,998,000 | | | | 6,190,926 | |
| Sinopec Engineering Group, Cl H . | | | 24,068,500 | | | | 8,615,768 | |
| | | | | | | | 14,806,694 | |
| Materials — 0.4% | | | | | | | | |
| China Hongqiao Group | | | 4,056,400 | | | | 2,878,290 | |
| Real Estate — 6.0% | | | | | | | | |
| China Aoyuan Group *(B) | | | 45,196,900 | | | | 2,038,218 | |
| China Overseas Grand Oceans Group | | | 19,082,900 | | | | 5,396,796 | |
| China SCE Group Holdings | | | 67,492,200 | | | | 3,482,148 | |
| Country Garden Holdings (A) | | | 22,887,600 | | | | 2,944,830 | |
| Gemdale Properties & Investment | | | 79,934,400 | | | | 4,378,656 | |
| Midea Real Estate Holding (A) | | | 7,622,700 | | | | 5,321,426 | |
| Powerlong Real Estate Holdings (A) | | | 26,648,000 | | | | 2,172,617 | |
| Shenzhen Investment | | | 52,377,600 | | | | 7,139,503 | |
| Yuexiu Property . | | | 8,646,860 | | | | 7,380,264 | |
| | | | | | | | 40,254,458 | |
| Utilities — 0.5% | | | | | | | | |
| Huadian Power International, Cl H | | | 12,330,000 | | | | 3,706,924 | |
| TOTAL CHINA | | | | | | | 89,675,284 | |
| EGYPT — 1.0% | | | | | | | | |
| Consumer Staples — 1.0% | | | | | | | | |
| Eastern SAE . | | | 13,831,322 | | | | 6,809,707 | |
| GREECE — 0.6% | | | | | | | | |
| Industrials — 0.6% | | | | | | | | |
| Star Bulk Carriers (A) | | | 223,474 | | | | 3,892,917 | |
|
|
|
| Schedule of Investments | | October 31, 2022 |
Global X SuperDividend® ETF
|
| | | | |
| |
| | | Shares | | | Value | |
| COMMON STOCK — continued | | | | | | |
| HONG KONG — 4.7% | | | | | | |
| Communication Services — 2.1% | | | | | | |
| HKBN | | | 10,445,900 | | | $ | 7,052,781 | |
| PCCW | | | 18,639,800 | | | | 7,123,626 | |
| | | | | | | | 14,176,407 | |
| Consumer Discretionary — 1.1% | | | | | | | | |
| Pacific Textiles Holdings | | | 23,659,500 | | | | 7,052,776 | |
| Industrials — 0.5% | | | | | | | | |
| Orient Overseas International | | | 245,000 | | | | 3,579,877 | |
| Information Technology — 1.0% | | | | | | | | |
| VTech Holdings | | | 1,267,900 | | | | 6,743,419 | |
| TOTAL HONG KONG | | | | | | | 31,552,479 | |
| ISRAEL — 1.4% | | | | | | | | |
| Consumer Discretionary — 1.4% | | | | | | | | |
| Delek Automotive Systems | | | 730,875 | | | | 9,454,962 | |
| ITALY — 1.1% | | | | | | | | |
| Financials — 1.1% | | | | | | | | |
| BFF Bank | | | 1,038,460 | | | | 7,328,205 | |
| KAZAKHSTAN — 0.0% | | | | | | | | |
| Financials — 0.0% | | | | | | | | |
| Halyk Savings Bank of Kazakhstan JSC GDR . | | | 2,392 | | | | 24,159 | |
| KUWAIT — 1.3% | | | | | | | | |
| Consumer Discretionary — 1.3% | | | | | | | | |
| Humansoft Holding KSC | | | 803,164 | | | | 8,717,473 | |
| MALAYSIA — 0.7% | | | | | | | | |
| Health Care — 0.7% | | | | | | | | |
| Hartalega Holdings . | | | 10,586,907 | | | | 4,836,658 | |
|
|
|
| Schedule of Investments | | October 31, 2022 |
Global X SuperDividend® ETF
|
| | | | |
| |
| | | Shares | | | Value | |
| COMMON STOCK — continued | | | | | | |
| NETHERLANDS — 1.1% | | | | | | |
| Financials — 0.7% | | | | | | |
| Van Lanschot Kempen | | | 209,066 | | | $ | 4,514,862 | |
| Industrials — 0.4% | | | | | | | | |
| PostNL (A) | | | 1,739,835 | | | | 2,728,944 | |
| TOTAL NETHERLANDS | | | | | | | 7,243,806 | |
| NORWAY — 2.2% | | | | | | | | |
| Energy — 0.9% | | | | | | | | |
| FLEX LNG . | | | 185,371 | | | | 5,792,844 | |
| Industrials — 1.3% | | | | | | | | |
| Golden Ocean Group | | | 1,076,929 | | | | 8,970,818 | |
| TOTAL NORWAY | | | | | | | 14,763,662 | |
| PAKISTAN — 1.0% | | | | | | | | |
| Financials — 1.0% | | | | | | | | |
| United Bank . | | | 13,898,293 | | | | 6,757,582 | |
| RUSSIA — 0.0% | | | | | | | | |
| Materials — 0.0% | | | | | | | | |
| Magnitogorsk Iron & Steel Works PJSC (B)# | | | 6,332,020 | | | | 63,618 | |
| PhosAgro PJSC GDR (B)# | | | 122 | | | | 83 | |
| Severstal PJSC (B)# | | | 312,897 | | | | 80,329 | |
| | | | | | | | 144,030 | |
| Utilities — 0.0% | | | | | | | | |
| Unipro PJSC (B) ‡ | | | 209,143,887 | | | | 95,318 | |
| TOTAL RUSSIA | | | | | | | 239,348 | |
| SINGAPORE — 3.5% | | | | | | | | |
| Energy — 1.9% | | | | | | | | |
| BW LPG . | | | 1,603,029 | | | | 12,966,883 | |
| Health Care — 0.8% | | | | | | | | |
| Riverstone Holdings | | | 14,840,434 | | | | 5,663,087 | |
|
|
|
| Schedule of Investments | | October 31, 2022 |
Global X SuperDividend® ETF
|
| | | | | | |
| | | Shares | | | Value | |
| COMMON STOCK — continued | | | | | | |
| Real Estate — 0.8% | | | | | | |
| Manulife US Real Estate Investment Trust ‡ | | | 13,913,732 | | | $ | 5,078,512 | |
| TOTAL SINGAPORE | | | | | | | 23,708,482 | |
| SOUTH AFRICA — 4.1% | | | | | | | | |
| Energy — 1.1% | | | | | | | | |
| Exxaro Resources . | | | 658,589 | | | | 7,329,322 | |
| Financials — 1.1% | | | | | | | | |
| Coronation Fund Managers | | | 4,294,458 | | | | 7,669,385 | |
| Materials — 0.6% | | | | | | | | |
| African Rainbow Minerals | | | 285,209 | | | | 4,014,265 | |
| Real Estate — 1.3% | | | | | | | | |
| Redefine Properties ‡ | | | 41,030,645 | | | | 9,109,239 | |
| TOTAL SOUTH AFRICA | | | | | | | 28,122,211 | |
| THAILAND — 0.8% | | | | | | | | |
| Industrials — 0.8% | | | | | | | | |
| Regional Container Lines NVDR (A) | | | 7,565,858 | | | | 5,267,873 | |
| TURKEY — 0.9% | | | | | | | | |
| Materials — 0.9% | | | | | | | | |
| Iskenderun Demir ve Celik . | | | 4,479,025 | | | | 6,130,011 | |
| UKRAINE — 0.7% | | | | | | | | |
| Materials — 0.7% | | | | | | | | |
| Ferrexpo | | | 4,026,555 | | | | 4,733,306 | |
| UNITED KINGDOM — 4.8% | | | | | | | | |
| Consumer Discretionary — 0.5% | | | | | | | | |
| Persimmon . | | | 218,666 | | | | 3,285,466 | |
| Consumer Staples — 1.8% | | | | | | | | |
| Imperial Brands . | | | 504,611 | | | | 12,340,035 | |
| Financials — 2.5% | | | | | | | | |
| Direct Line Insurance Group | | | 2,863,831 | | | | 6,653,861 | |
|
|
|
| Schedule of Investments | | October 31, 2022 |
Global X SuperDividend® ETF
|
| | | | | | |
| | | Shares | | | Value | |
| COMMON STOCK — continued | | | | | | |
| Financials — continued | | | | | | |
| Jupiter Fund Management . | | | 2,635,067 | | | $ | 3,149,156 | |
| M&G . | | | 3,662,484 | | | | 7,387,798 | |
| | | | | | | | 17,190,815 | |
| TOTAL UNITED KINGDOM | | | | | | | 32,816,316 | |
| UNITED STATES — 32.1% | | | | | | | | |
| Communication Services — 1.3% | | | | | | | | |
| Lumen Technologies . | | | 1,132,976 | | | | 8,338,703 | |
| Consumer Staples — 0.6% | | | | | | | | |
| JBS . | | | 810,434 | | | | 3,855,054 | |
| Energy — 3.7% | | | | | | | | |
| Antero Midstream . | | | 931,678 | | | | 9,922,370 | |
| Diversified Energy | | | 7,227,892 | | | | 10,468,814 | |
| Kimbell Royalty Partners | | | 249,574 | | | | 4,751,889 | |
| | | | | | | | 25,143,073 | |
| Financials — 21.0% | | | | | | | | |
| AGNC Investment ‡ | | | 813,156 | | | | 6,684,142 | |
| Annaly Capital Management ‡ | | | 343,384 | | | | 6,369,773 | |
| Apollo Commercial Real Estate Finance ‡ | | | 843,531 | | | | 9,498,159 | |
| Arbor Realty Trust ‡ | | | 628,669 | | | | 8,656,772 | |
| ARMOUR Residential ‡ (A) | | | 1,210,092 | | | | 6,437,690 | |
| Blackstone Mortgage Trust, Cl A ‡ | | | 321,894 | | | | 8,034,474 | |
| Broadmark Realty Capital ‡ | | | 780,268 | | | | 4,541,160 | |
| Chimera Investment ‡ | | | 897,880 | | | | 6,060,690 | |
| Dynex Capital ‡ | | | 320,119 | | | | 3,822,221 | |
| Ellington Financial ‡ (A) | | | 562,195 | | | | 7,522,169 | |
| Granite Point Mortgage Trust ‡ | | | 496,881 | | | | 3,905,485 | |
| Invesco Mortgage Capital ‡ (A) | | | 548,423 | | | | 6,422,033 | |
| KKR Real Estate Finance Trust ‡ | | | 511,534 | | | | 8,910,922 | |
| MFA Financial ‡ | | | 389,448 | | | | 3,878,902 | |
| New York Mortgage Trust ‡ | | | 2,827,551 | | | | 7,606,112 | |
| PennyMac Mortgage Investment Trust ‡ | | | 607,488 | | | | 8,425,859 | |
| Ready Capital ‡ | | | 709,646 | | | | 8,600,910 | |
| Redwood Trust ‡ | | | 615,878 | | | | 4,391,210 | |
| Rithm Capital ‡ | | | 781,076 | | | | 6,584,471 | |
| Starwood Property Trust ‡ | | | 446,705 | | | | 9,228,925 | |
|
|
|
| Schedule of Investments | | October 31, 2022 |
Global X SuperDividend® ETF
|
| | | | |
| |
| | | Shares | | | Value | |
| COMMON STOCK — continued | | | | | | |
| Financials — continued | | | | | | |
| Two Harbors Investment ‡ | | | 1,850,009 | | | $ | 6,586,032 | |
| | | | | | | | 142,168,111 | |
| Real Estate — 5.5% | | | | | | | | |
| Global Net Lease ‡ | | | 706,520 | | | | 8,654,870 | |
| Necessity Retail REIT ‡ | | | 1,472,899 | | | | 10,074,629 | |
| Office Properties Income Trust ‡ | | | 451,591 | | | | 6,909,343 | |
| Omega Healthcare Investors ‡ | | | 370,458 | | | | 11,773,155 | |
| | | | | | | | 37,411,997 | |
| TOTAL UNITED STATES | | | | | | | 216,916,938 | |
| TOTAL COMMON STOCK | | | | | | | | |
| (Cost $867,308,506) | | | | | | | 633,591,848 | |
| PREFERRED STOCK — 5.9% | | | | | | | | |
| BRAZIL— 5.9% | | | | | | | | |
| Energy — 1.5% | | | | | | | | |
| Petroleo Brasileiro (C) | | | 1,792,049 | | | | 10,180,757 | |
| Materials — 2.9% | | | | | | | | |
| Gerdau (C) | | | 1,814,604 | | | | 8,904,865 | |
| Unipar Carbocloro (C) | | | 510,672 | | | | 10,392,999 | |
| | | | | | | | 19,297,864 | |
| Utilities — 1.5% | | | | | | | | |
| Cia Paranaense de Energia (C) | | | 7,258,330 | | | | 10,236,151 | |
| TOTAL BRAZIL | | | | | | | 39,714,772 | |
| TOTAL PREFERRED STOCK | | | | | | | | |
| (Cost $40,599,246) | | | | | | | 39,714,772 | |
| SHORT-TERM INVESTMENT(D)(E) — 1.7% | | | | | | | | |
| Fidelity Investments Money Market | | | | | | | | |
| Government Portfolio, Cl Institutional, | | | | | | | | |
2.910% | | | | | | | | |
(Cost $11,772,151) | | | 11,772,151 | | | | 11,772,151 | |
|
|
|
| Schedule of Investments | | October 31, 2022 |
| Global X SuperDividend® ETF |
| | | | |
| |
| | | Face Amount | | | Value | |
| REPURCHASE AGREEMENT(D) — 2.4% | | | | |
| BNP Paribas | | | | | | |
| 2.930%, dated 10/31/2022, to be repurchased | | | | |
| on 11/01/2022, repurchase price $16,357,623 | | | | |
| (collateralized by U.S. Treasury Obligations, | | | | |
| ranging in par value $325,104 - $1,911,288, | | | | |
| 2.500% - 2.750%, 03/31/2027 - 05/31/2029, | | | | |
| with a total market value of $16,663,529) | | | | |
| (Cost $16,356,292) | | $ | 16,356,292 | | | $ | 16,356,292 | |
| TOTAL INVESTMENTS — 103.7% | | | | | | | | |
| (Cost $936,036,195) | | | | | | $ | 701,435,063 | |
Percentages are based on Net Assets of $676,278,536.
* Non-income producing security.
‡ Real Estate Investment Trust
(A) This security or a partial position of this security is on loan at October 31, 2022.
(B) Level 3 security in accordance with fair value hierarchy.
(C) There is currently no stated interest rate.
(D) Security was purchased with cash collateral held from securities on loan.
(E) The rate reported on the Schedule of Investments is the 7-day effective yield as of October 31, 2022.
The following is a summary of the level of inputs used as of October 31, 2022, in valuing the Fund's investments carried at value:
| Investments in Securities | | Level 1 | | | Level 2 | | | Level 3(1)# | | | Total | |
| Common Stock | | $ | 620,622,040 | | | $ | 10,692,242 | | | $ | 2,277,566 | | | $ | 633,591,848 | |
| Preferred Stock | | | 39,714,772 | | | | — | | | | — | | | | 39,714,772 | |
| Short-Term Investment | | | 11,772,151 | | | | — | | | | — | | | | 11,772,151 | |
| Repurchase Agreement | | | — | | | | 16,356,292 | | | | — | | | | 16,356,292 | |
| Total Investments in Securities | | $ | 672,108,963 | | | $ | 27,048,534 | | | $ | 2,277,566 | | | $ | 701,435,063 | |
(1) A reconciliation of Level 3 investments and disclosures of significant unobservable inputs are presented when the Fund has a significant amount of Level 3 investments at the end of the period in relation to Net Assets. Management has concluded that Level 3 investments are not material in relation to Net Assets.
|
|
|
| Schedule of Investments | | October 31, 2022 |
Global X SuperDividend® ETF
|
# For the period ended October 31, 2022, there were no significant changes into/out of Level 3. The transfer into Level 3 investments for the Fund were immaterial, although the unrealized appreciation/(depreciation) on these investments was $ (21,208,277). These securities were impacted by the invasion of Ukraine and sanctions on market conditions in Russia. From the start of the conflict in Ukraine until October 31, 2022, Russian-held investments were valued at were valued at discount from their last traded prices.
Amounts designated as “—“ are $0 or have been rounded to $0.
See "Glossary" for abbreviations.
|
|
|
| Schedule of Investments | | October 31, 2022 |
Global X SuperDividend® U.S. ETF
|
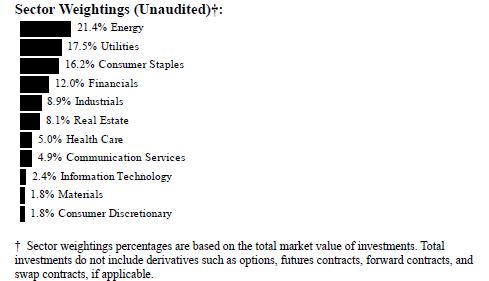
| | | | |
| |
| | | Shares | | | Value | |
| COMMON STOCK — 84.7% | | | | | | |
| UNITED STATES — 84.7% | | | | | | |
| Communication Services — 4.9% | | | | | | |
| Cogent Communications Holdings . | | | 230,299 | | | $ | 12,093,000 | |
| Lumen Technologies . | | | 1,515,197 | | | | 11,151,850 | |
| Verizon Communications | | | 276,556 | | | | 10,334,898 | |
| | | | | | | | 33,579,748 | |
| Consumer Discretionary — 1.7% | | | | | | | | |
| PetMed Express . | | | 558,267 | | | | 11,902,252 | |
| Consumer Staples — 16.2% | | | | | | | | |
| Altria Group . | | | 288,569 | | | | 13,352,088 | |
| B&G Foods . | | | 474,702 | | | | 7,775,619 | |
| Kellogg | | | 228,693 | | | | 17,568,196 | |
| Kraft Heinz | | | 392,311 | | | | 15,092,204 | |
| Philip Morris International | | | 132,443 | | | | 12,164,890 | |
| SpartanNash . | | | 540,034 | | | | 19,284,614 | |
| Universal | | | 271,841 | | | | 13,757,873 | |
| Walgreens Boots Alliance | | | 316,580 | | | | 11,555,170 | |
| | | | | | | | 110,550,654 | |
|
|
|
| Schedule of Investments | | October 31, 2022 |
Global X SuperDividend® U.S. ETF
|
| | | | |
| |
| | | Shares | | | Value | |
| COMMON STOCK — continued | | | | | | |
| Energy — 10.5% | | | | | | |
| Enviva | | | 210,954 | | | $ | 12,623,487 | |
| Kimbell Royalty Partners | | | 993,314 | | | | 18,912,699 | |
| Kinder Morgan | | | 815,015 | | | | 14,768,072 | |
| Sabine Royalty Trust . | | | 303,180 | | | | 25,448,929 | |
| | | | | | | | 71,753,187 | |
| Financials — 11.9% | | | | | | | | |
| AGNC Investment ‡ | | | 1,096,459 | | | | 9,012,893 | |
| ARMOUR Residential ‡ (A) | | | 1,732,367 | | | | 9,216,192 | |
| Invesco Mortgage Capital ‡ (A) | | | 609,167 | | | | 7,133,346 | |
| KKR Real Estate Finance Trust ‡ | | | 704,503 | | | | 12,272,442 | |
| New York Community Bancorp (A) | | | 1,277,604 | | | | 11,894,493 | |
| TFS Financial . | | | 873,877 | | | | 12,277,972 | |
| Two Harbors Investment ‡ | | | 2,848,926 | | | | 10,142,177 | |
| Virtu Financial, Cl A . | | | 422,902 | | | | 9,464,547 | |
| | | | | | | | 81,414,062 | |
| Health Care — 4.9% | | | | | | | | |
| AbbVie | | | 102,274 | | | | 14,972,913 | |
| Gilead Sciences | | | 241,934 | | | | 18,982,142 | |
| | | | | | | 33,955,055 | |
| Industrials — 6.7% | | | | | | | | |
| 3M | | | 99,708 | | | | 12,542,269 | |
| Ennis | | | 782,933 | | | | 17,662,969 | |
| MSC Industrial Direct, Cl A | | | 186,441 | | | | 15,470,874 | |
| | | | | | | | 45,676,112 | |
| Information Technology — 2.4% | | | | | | | | |
| International Business Machines . | | | 118,635 | | | | 16,406,034 | |
| Real Estate — 8.1% | | | | | | | | |
| Alexander's ‡ | | | 57,010 | | | | 13,391,079 | |
| Easterly Government Properties, Cl A ‡ | | | 705,766 | | | | 12,273,271 | |
| Global Net Lease ‡ | | | 1,020,674 | | | | 12,503,257 | |
| Iron Mountain ‡ | | | 340,319 | | | | 17,039,772 | |
| | | | | | | | 55,207,379 | |
| Utilities — 17.4% | | | | | | | | |
| American Electric Power | | | 173,432 | | | | 15,248,142 | |
|
|
|
| Schedule of Investments | | October 31, 2022 |
Global X SuperDividend® U.S. ETF
|
| | | | |
| |
| | | Shares | | | Value | |
| COMMON STOCK — continued | | | | | | |
| Utilities — continued | | | | | | |
| Avangrid . | | | 335,858 | | | $ | 13,662,704 | |
| Clearway Energy, Cl C . | | | 460,891 | | | | 16,011,353 | |
| Consolidated Edison | | | 182,042 | | | | 16,012,414 | |
| DTE Energy . | | | 125,049 | | | | 14,019,244 | |
| Duke Energy | | | 150,152 | | | | 13,991,163 | |
| Hawaiian Electric Industries . | | | 367,656 | | | | 13,985,634 | |
| National Fuel Gas . | | | 243,113 | | | | 16,407,696 | |
| | | | | | | | 119,338,350 | |
| TOTAL UNITED STATES | | | | | | | 579,782,833 | |
| TOTAL COMMON STOCK | | | | | | | | |
| (Cost $588,371,147) | | | | | | | 579,782,833 | |
| MASTER LIMITED PARTNERSHIPS — 14.9% | | | | | | | | |
| UNITED KINGDOM— 2.1% | | | | | | | | |
| Energy — 2.1% | | | | | | | | |
| KNOT Offshore Partners | | | 993,126 | | | | 14,440,052 | |
| UNITED STATES— 12.8% | | | | | | | | |
| Energy — 8.8% | | | | | | | | |
| CrossAmerica Partners . | | | 702,259 | | | | 13,708,096 | |
| Holly Energy Partners . | | | 820,490 | | | | 15,458,032 | |
| MPLX | | | 454,794 | | | | 15,253,791 | |
| USA Compression Partners | | | 873,261 | | | | 15,797,291 | |
| | | | | | | | 60,217,210 | |
| Industrials — 2.2% | | | | | | | | |
| Icahn Enterprises | | | 268,144 | | | | 14,624,574 | |
| Materials — 1.8% | | | | | | | | |
| Westlake Chemical Partners | | | 541,376 | | | | 12,494,958 | |
| TOTAL UNITED STATES | | | | | | | 87,336,742 | |
| TOTAL MASTER LIMITED PARTNERSHIPS | | | | | | | | |
| (Cost $78,659,537) | | | | | | | 101,776,794 | |
| SHORT-TERM INVESTMENT(B)(C) — 1.2% | | | | | | | | |
| Fidelity Investments Money Market | | | | | | | | |
| Government Portfolio, Cl Institutional, | | | | | | | | |
2.910% | | | | | | | | |
(Cost $8,140,625) | | | 8,140,625 | | | | 8,140,625 | |
|
|
|
| Schedule of Investments | | October 31, 2022 |
Global X SuperDividend® U.S. ETF
|
| | | Face Amount | | | Value | |
REPURCHASE AGREEMENT(B) — 1.7% | | | | | | |
BNP Paribas
2.930%, dated 10/31/2022, to be repurchased
on 11/01/2022, repurchase price $11,311,551
(collateralized by U.S. Treasury Obligations,
ranging in par value $224,815 - $1,321,685,
2.500% - 2.750%, 03/31/2027 - 05/31/2029,
with a total market value of $11,523,087)
(Cost $11,310,630) | | $ | 11,310,630 | | | $ | 11,310,630 | |
TOTAL INVESTMENTS — 102.5% | | | | | | | | |
| (Cost $686,481,939) | | | | | | $ | 701,010,882 | |
Percentages are based on Net Assets of $683,864,308.
| ‡ | Real Estate Investment Trust |
| (A) | This security or a partial position of this security is on loan at October 31, 2022. |
| (B) | Security was purchased with cash collateral held from securities on loan. |
| (C) | The rate reported on the Schedule of Investments is the 7-day effective yield as of October 31, 2022. |
The following is a summary of the level of inputs used as of October 31, 2022, in valuing the Fund’s investments carried at value:
| Investments in Securities | | Level 1 | | | Level 2 | | | Level 3 | | | Total | |
| Common Stock | | $ | 579,782,833 | | | $ | — | | | $ | — | | | $ | 579,782,833 | |
| Master Limited Partnerships | | | 101,776,794 | | | | — | | | | — | | | | 101,776,794 | |
| Short-Term Investment | | | 8,140,625 | | | | — | | | | — | | | | 8,140,625 | |
| Repurchase Agreement | | | — | | | | 11,310,630 | | | | — | | | | 11,310,630 | |
| Total Investments in Securities | | $ | 689,700,252 | | | $ | 11,310,630 | | | $ | — | | | $ | 701,010,882 | |
Amounts designated as “—“ are $0 or have been rounded to $0.
See "Glossary" for abbreviations.
|
|
|
| Schedule of Investments | | October 31, 2022 |
Global X MSCI SuperDividend® EAFE ETF
|
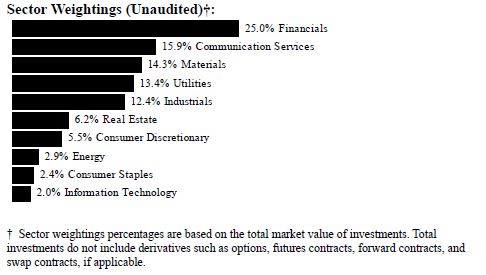
| | | | |
| |
| | | Shares | | | Value | |
| COMMON STOCK — 99.6% | | | | | | |
| AUSTRALIA — 12.8% | | | | | | |
| Energy — 0.7% | | | | | | |
| Woodside Energy Group | | | 2,435 | | | $ | 56,023 | |
| Industrials — 2.0% | | | | | | | | |
| Aurizon Holdings | | | 74,176 | | | | 171,704 | |
| Materials — 7.7% | | | | | | | | |
| BHP Group | | | 7,400 | | | | 176,786 | |
| Fortescue Metals Group | | | 15,562 | | | | 146,282 | |
| Rio Tinto . | | | 3,189 | | | | 166,582 | |
| Rio Tinto . | | | 2,828 | | | | 159,498 | |
| | | | | | | | 649,148 | |
| Real Estate — 2.4% | | | | | | | | |
| Vicinity Centres ‡ | | | 159,450 | | | | 198,313 | |
| TOTAL AUSTRALIA | | | | | | | 1,075,188 | |
| AUSTRIA — 2.3% | | | | | | | | |
| Energy — 2.3% | | | | | | | | |
| OMV | | | 4,104 | | | | 189,180 | |
|
|
|
| Schedule of Investments | | October 31, 2022 |
| Global X MSCI SuperDividend® EAFE ETF |
| | | | |
|
| | | Shares | | | Value |
| COMMON STOCK — continued | | | | | |
| BELGIUM — 1.9% | | | | | |
| Consumer Discretionary — 1.9% | | | | | |
| Ageas | | | 4,595 | | | $
| 159,087 |
| CHILE — 1.5% | | | | | | | |
| Materials — 1.5% | | | | | | | |
| Antofagasta . | | | 9,185 | | | | 124,310 |
| DENMARK — 1.8% | | | | | | | |
| Industrials — 1.8% | | | | | | | |
| AP Moller - Maersk, Cl A . | | | 77 | | | | 154,152 |
| FINLAND — 2.0% | | | | | | | |
| Utilities — 2.0% | | | | | | | |
| Fortum . | | | 11,651 | | | | 164,035 |
| FRANCE — 6.7% | | | | | | | |
| Communication Services — 2.0% | | | | | | | |
| Orange . | | | 17,429 | | | | 165,903 |
| Financials — 4.7% | | | | | | | |
| AXA . | | | 8,732 | | | | 215,756 |
| Credit Agricole . | | | 19,386 | | | | 176,005 |
| | | | | | | | 391,761 |
| TOTAL FRANCE | | | | | | | 557,664 |
| GERMANY — 5.6% | | | | | | | |
| Communication Services — 1.8% | | | | | | | |
| Telefonica Deutschland Holding . | | | 69,394 | | | | 151,299 |
| Materials — 3.8% | | | | | | | |
| BASF | | | 4,116 | | | | 184,832 |
| Covestro | | | 3,880 | | | | 132,070 |
| | | | | | | | 316,902 |
| TOTAL GERMANY | | | | | | | 468,201 |
|
|
|
| Schedule of Investments | | October 31, 2022 |
| Global X MSCI SuperDividend® EAFE ETF |
| | | | |
|
| | | Shares | | | Value |
| COMMON STOCK — continued | | | | | |
| HONG KONG — 7.1% | | | | | |
| Communication Services — 2.1% | | | | | |
| HKT Trust & HKT | | | 153,320 | | | $ | 173,245 |
| Real Estate — 1.5% | | | | | | | |
| Henderson Land Development | | | 52,700 | | | | 129,034 |
| Utilities — 3.5% | | | | | | | |
| CK Infrastructure Holdings | | | 31,000 | | | | 147,302 |
| Power Assets Holdings | | | 31,306 | | | | 149,753 |
| | | | | | | | 297,055 |
| TOTAL HONG KONG | | | | | | | 599,334 |
| ITALY — 6.1% | | | | | | | |
| Financials — 4.2% | | | | | | | |
| Assicurazioni Generali . | | | 11,107 | | | | 166,749 |
| Poste Italiane . | | | 21,095 | | | | 183,890 |
| | | | | | | | 350,639 |
| Utilities — 1.9% | | | | | | | |
| Snam | | | 36,719 | | | | 163,383 |
| TOTAL ITALY | | | | | | | 514,022 |
| JAPAN — 11.8% | | | | | | | |
| Communication Services — 2.2% | | | | | | | |
| SoftBank . | | | 18,384 | | | | 181,261 |
| Financials — 2.3% | | | | | | | |
| Japan Post Holdings . | | | 28,659 | | | | 192,738 |
| Industrials — 3.8% | | | | | | | |
| Mitsui OSK Lines | | | 8,292 | | | | 164,629 |
| Nippon Yusen . | | | 8,480 | | | | 153,985 |
| | | | | | | | 318,614 |
| Materials — 1.2% | | | | | | | |
| JFE Holdings | | | 11,228 | | | | 102,962 |
|
|
|
| Schedule of Investments | | October 31, 2022 |
| Global X MSCI SuperDividend® EAFE ETF |
| | | | |
|
| | | Shares | | | Value |
| COMMON STOCK — continued | | | | | |
| Real Estate — 2.3% | | | | | |
| Japan Metropolitan Fund Invest ‡ | | | 261 | | | $ | 192,280 |
| TOTAL JAPAN | | | | | | | 987,855 |
| NETHERLANDS — 2.2% | | | | | | | |
| Financials — 2.2% | | | | | | | |
| NN Group . | | | 4,349 | | | | 184,183 |
| NEW ZEALAND — 2.5% | | | | | | | |
| Communication Services — 2.5% | | | | | | | |
| Spark New Zealand | | | 69,989 | | | | 208,180 |
| NORWAY — 1.8% | | | | | | | |
| Communication Services — 1.8% | | | | | | | |
| Telenor | | | 16,499 | | | | 149,964 |
| PORTUGAL — 2.2% | | | | | | | |
| Utilities — 2.2% | | | | | | | |
| Energias de Portugal | | | 43,101 | | | | 188,499 |
| SPAIN — 4.4% | | | | | | | |
| Industrials — 2.6% | | | | | | | |
| ACS Actividades de Construccion y Servicios . | | | 8,529 | | | | 218,749 |
| Utilities — 1.8% | | | | | | | |
| Enagas . | | | 9,385 | | | | 152,352 |
| TOTAL SPAIN | | | | | | | 371,101 |
| SWEDEN — 3.7% | | | | | | | |
| Communication Services — 1.6% | | | | | | | |
| Tele2, Cl B . | | | 16,227 | | | | 132,924 |
| Consumer Discretionary — 2.1% | | | | | | | |
| Electrolux, Cl B . | | | 14,177 | | | | 174,812 |
| TOTAL SWEDEN | | | | | | | 307,736 |
|
|
|
| Schedule of Investments | | October 31, 2022 |
| Global X MSCI SuperDividend® EAFE ETF |
| | | | |
|
| | | Shares | | | Value |
| COMMON STOCK — continued | | | | | |
| SWITZERLAND — 2.4% | | | | | |
| Financials — 2.4% | | | | | |
| Zurich Insurance Group | | | 477 | | | $ | 203,669 |
| UNITED KINGDOM — 18.5% | | | | | | | |
| Communication Services — 2.0% | | | | | | | |
| Vodafone Group | | | 144,015 | | | | 168,530 |
| Consumer Discretionary — 1.5% | | | | | | | |
| Persimmon . | | | 8,157 | | | | 122,559 |
| Consumer Staples — 2.4% | | | | | | | |
| British American Tobacco | | | 4,971 | | | | 196,511 |
| Financials — 10.8% | | | | | | | |
| Admiral Group | | | 7,945 | | | | 184,504 |
| Aviva . | | | 41,724 | | | | 200,850 |
| Legal & General Group . | | | 69,154 | | | | 185,435 |
| M&G . | | | 82,628 | | | | 166,673 |
| Phoenix Group Holdings . | | | 27,479 | | | | 171,603 |
| | | | | | | | 909,065 |
| Utilities — 1.8% | | | | | | | |
| National Grid | | | 14,115 | | | | 154,127 |
| TOTAL UNITED KINGDOM | | | | | | | 1,550,792 |
| UNITED STATES — 2.3% | | | | | | | |
| Financials — 2.3% | | | | | | | |
| Swiss Re | | | 2,618 | | | | 194,633 |
| TOTAL COMMON STOCK | | | | | | | |
| (Cost $10,795,210) | | | | | | | 8,351,785 |
| TOTAL INVESTMENTS — 99.6% | | | | | | | |
| (Cost $10,795,210) | | | | | | $ | 8,351,785 |
Percentages are based on Net Assets of $8,383,568.
‡ Real Estate Investment Trust
|
|
|
| Schedule of Investments | | October 31, 2022 |
| Global X MSCI SuperDividend® EAFE ETF |
As of October 31, 2022, all of the Fund's investments were considered Level 1, in accordance with authoritative guidance on fair value measurements and disclosure under U.S. GAAP.
See "Glossary" for abbreviations.
|
|
| Schedule of Investments | October 31, 2022 |
| Global X MSCI SuperDividend® Emerging Markets ETF |
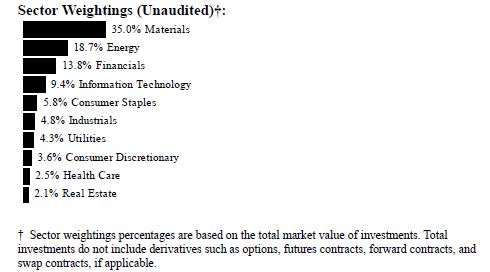
| | | | |
| |
| | | Shares | | | Value | |
| COMMON STOCK — 93.2% | | | | | | |
| BRAZIL — 7.7% | | | | | | |
| Financials — 2.2% | | | | | | |
| Banco Santander Brasil . | | | 153,405 | | | $ | 870,628 | |
| Materials — 3.7% | | | | | | | | |
| Cia Siderurgica Nacional | | | 265,471 | | | | 621,275 | |
| Vale | | | 63,371 | | | | 810,728 | |
| | | | | | | | 1,432,003 | |
| Utilities — 1.8% | | | | | | | | |
| CPFL Energia . | | | 107,564 | | | | 726,079 | |
| TOTAL BRAZIL | | | | | | | 3,028,710 | |
| CHILE — 4.1% | | | | | | | | |
| Industrials — 1.4% | | | | | | | | |
| Cia Sud Americana de Vapores . | | | 7,968,605 | | | | 553,015 | |
| Materials — 2.7% | | | | | | | | |
| Empresas CMPC | | | 669,625 | | | | 1,062,103 | |
| TOTAL CHILE | | | | | | | 1,615,118 | |
|
|
| Schedule of Investments | October 31, 2022 |
| Global X MSCI SuperDividend® Emerging Markets ETF |
| | | | |
| |
| | | Shares | | | Value | |
| COMMON STOCK — continued | | | | | | |
| CHINA — 27.6% | | | | | | |
| Consumer Discretionary — 3.6% | | | | | | |
| Gree Electric Appliances of Zhuhai, Cl A | | | 210,600 | | | $ | 823,713 | |
| Zhejiang Semir Garment, Cl A . | | | 977,300 | | | | 597,305 | |
| | | | | | | | 1,421,018 | |
| Energy — 8.3% | | | | | | | | |
| China Petroleum & Chemical, Cl H | | | 2,053,200 | | | | 810,833 | |
| China Shenhua Energy, Cl H | | | 319,864 | | | | 841,442 | |
| Jizhong Energy Resources, Cl A | | | 725,700 | | | | 601,937 | |
| Yankuang Energy Group, Cl H | | | 357,700 | | | | 1,007,047 | |
| | | | | | | | 3,261,259 | |
| Financials — 5.8% | | | | | | | | |
| Bank of China, Cl H | | | 2,658,300 | | | | 856,768 | |
| Bank of Communications, Cl H . | | | 1,548,780 | | | | 755,661 | |
| China CITIC Bank Corp Ltd., Cl H . | | | 1,771,700 | | | | 668,068 | |
| | | | | | | | 2,280,497 | |
| Information Technology — 1.7% | | | | | | | | |
| Kingboard Holdings | | | 260,500 | | | | 642,468 | |
| Materials — 6.1% | | | | | | | | |
| China Hongqiao Group | | | 761,600 | | | | 540,407 | |
| Luxi Chemical Group, Cl A . | | | 362,436 | | | | 561,694 | |
| Maanshan Iron & Steel, Cl A . | | | 1,680,700 | | | | 577,804 | |
| Shanxi Taigang Stainless Steel, Cl A . | | | 1,270,500 | | | | 688,106 | |
| | | | | | | | 2,368,011 | |
| Real Estate — 2.1% | | | | | | | | |
| Shanghai Lujiazui Finance & Trade Zone | | | | | | | | |
| Development, Cl B . | | | 1,110,200 | | | | 823,769 | |
| TOTAL CHINA | | | | | | | 10,797,022 | |
| EGYPT — 2.2% | | | | | | | | |
| Consumer Staples — 2.2% | | | | | | | | |
| Eastern SAE . | | | 1,713,858 | | | | 843,800 | |
|
|
| Schedule of Investments | October 31, 2022 |
| Global X MSCI SuperDividend® Emerging Markets ETF |
| | | | |
| |
| | | Shares | | | Value | |
| COMMON STOCK — continued | | | | | | |
| INDIA — 7.8% | | | | | | |
| Energy — 5.6% | | | | | | |
| Bharat Petroleum . | | | 242,200 | | | $ | 888,454 | |
| Coal India | | | 436,785 | | | | 1,297,784 | |
| | | | | | | | 2,186,238 | |
| Materials — 2.2% | | | | | | | | |
| Vedanta . | | | 260,547 | | | | 883,834 | |
| TOTAL INDIA | | | | | | | 3,070,072 | |
| MALAYSIA — 4.9% | | | | | | | | |
| Health Care — 2.5% | | | | | | | | |
| Hartalega Holdings . | | | 1,055,681 | | | | 482,291 | |
| Top Glove | | | 3,087,399 | | | | 519,137 | |
| | | | | | | | 1,001,428 | |
| Industrials — 2.4% | | | | | | | | |
| Sime Darby . | | | 1,949,056 | | | | 927,533 | |
| TOTAL MALAYSIA | | | | | | | 1,928,961 | |
| RUSSIA — 0.1% | | | | | | | | |
| Materials — 0.1% | | | | | | | | |
| Alrosa PJSC (A)‡ | | | 1,194,381 | | | | — | |
| Novolipetsk Steel PJSC (A)‡ | | | 500,486 | | | | 16,720 | |
| PhosAgro PJSC GDR (A)‡ | | | 42 | | | | 29 | |
| Severstal PJSC (A)‡ | | | 71,665 | | | | 18,398 | |
| TOTAL RUSSIA | | | | | | | 35,147 | |
| SOUTH AFRICA — 10.7% | | | | | | | | |
| Energy — 2.4% | | | | | | | | |
| Exxaro Resources . | | | 82,309 | | | | 916,003 | |
| Materials — 8.3% | | | | | | | | |
| African Rainbow Minerals | | | 67,590 | | | | 951,317 | |
| Impala Platinum Holdings . | | | 85,999 | | | | 880,229 | |
| Kumba Iron Ore | | | 33,016 | | | | 621,587 | |
| Sibanye Stillwater . | | | 340,880 | | | | 800,008 | |
| | | | | | | | 3,253,141 | |
| TOTAL SOUTH AFRICA | | | | | | | 4,169,144 | |
|
|
| Schedule of Investments | October 31, 2022 |
| Global X MSCI SuperDividend® Emerging Markets ETF |
| | | | |
| |
| | | Shares | | | Value | |
| COMMON STOCK — continued | | | | | | |
| SOUTH KOREA — 8.2% | | | | | | |
| Energy — 2.4% | | | | | | |
| HD Hyundai . | | | 21,472 | | | $ | 918,000 | |
| Financials — 5.8% | | | | | | | | |
| Korea Investment Holdings | | | 19,350 | | | | 673,097 | |
| NH Investment & Securities . | | | 129,447 | | | | 815,149 | |
| Samsung Securities . | | | 35,425 | | | | 789,598 | |
| | | | | | | | 2,277,844 | |
| TOTAL SOUTH KOREA | | | | | | | 3,195,844 | |
| TAIWAN — 14.2% | | | | | | | | |
| Industrials — 1.0% | | | | | | | | |
| Evergreen Marine Taiwan | | | 91,920 | | | | 392,241 | |
| Information Technology — 7.8% | | | | | | | | |
| Asustek Computer | | | 85,300 | | | | 624,744 | |
| Compal Electronics | | | 1,329,200 | | | | 870,389 | |
| Lite-On Technology ADR | | | 479,810 | | | | 952,994 | |
| Novatek Microelectronics | | | 83,400 | | | | 623,769 | |
| | | | | | | | 3,071,896 | |
| Materials — 5.4% | | | | | | | | |
| Asia Cement | | | 690,500 | | | | 799,307 | |
| China Steel . | | | 771,600 | | | | 642,950 | |
| Nan Ya Plastics . | | | 313,400 | | | | 664,294 | |
| | | | | | | | 2,106,551 | |
| TOTAL TAIWAN | | | | | | | 5,570,688 | |
| TURKEY — 5.7% | | | | | | | | |
| Consumer Staples — 3.6% | | | | | | | | |
| BIM Birlesik Magazalar . | | | 197,260 | | | | 1,420,899 | |
| Materials — 2.1% | | | | | | | | |
| Eregli Demir ve Celik Fabrikalari . | | | 506,542 | | | | 808,707 | |
| TOTAL TURKEY | | | | | | | 2,229,606 | |
| TOTAL COMMON STOCK | | | | | | | | |
| (Cost $49,351,568) | | | | | | | 36,484,112 | |
|
|
| Schedule of Investments | October 31, 2022 |
| Global X MSCI SuperDividend® Emerging Markets ETF |
| | | | |
| |
| | | Shares | | | Value | |
| PREFERRED STOCK — 6.8% | | | | | | |
| BRAZIL— 6.7% | | | | | | |
| Materials — 4.2% | | | | | | |
| Braskem (B) | | | 117,875 | | | $ | 757,266 | |
| Gerdau (B) | | | 187,079 | | | | 918,059 | |
| | | | | | | | 1,675,325 | |
| Utilities — 2.5% | | | | | | | | |
| Cia Energetica de Minas Gerais (B) | | | 451,235 | | | | 977,758 | |
| TOTAL BRAZIL | | | | | | | 2,653,083 | |
| RUSSIA— 0.1% | | | | | | | | |
| Energy — 0.1% | | | | | | | | |
| Surgutneftegas PJSC (A),(B) | | | 3,166,303 | | | | 26,331 | |
| TOTAL RUSSIA | | | | | | | 26,331 | |
| TOTAL PREFERRED STOCK | | | | | | | | |
| (Cost $4,527,287) | | | | | | | 2,679,414 | |
| TOTAL INVESTMENTS — 100.0% | | | | | | | | |
| (Cost $53,878,855) | | | | | | $ | 39,163,526 | |
Percentages are based on Net Assets of $39,168,134.
(A) Level 3 security in accordance with fair value hierarchy.
(B) There is currently no stated interest rate.
The following is a summary of the level of inputs used as of October 31, 2022, in valuing the Fund's investments carried at value:
| Investments in Securities | | Level 1 | | | Level 2 | | | Level 3(1)‡ | | | Total | |
| Common Stock | | $ | 34,833,847 | | | $ | 1,615,118 | | | $ | 35,147 | | | $ | 36,484,112 | |
| Preferred Stock | | | 2,653,083 | | | | — | | | | 26,331 | | | | 2,679,414 | |
| Total Investments in Securities | | $ | 37,486,930 | | | $ | 1,615,118 | | | $ | 61,478 | | | $ | 39,163,526 | |
(1) A reconciliation of Level 3 investments and disclosures of significant unobservable inputs are presented when the Fund has a significant amount of Level 3 investments at the end of the period in relation to Net Assets. Management has concluded that Level 3 investments are not material in relation to Net Assets.
|
|
| Schedule of Investments | October 31, 2022 |
| Global X MSCI SuperDividend® Emerging Markets ETF |
‡ For the period ended October 31, 2022, there were no significant changes into/out of Level 3. The transfer into Level 3 investments for the Fund were immaterial, although the unrealized appreciation/(depreciation) on these investments was $ (6,798,340). These securities were impacted by the invasion of Ukraine and sanctions on market conditions in Russia. From the start of the conflict in Ukraine until October 31, 2022, Russian-held investments were valued at were valued at discount from their last traded prices.
Amounts designated as “—“ are $0 or have been rounded to $0.
See "Glossary" for abbreviations.
|
|
|
| Schedule of Investments | | October 31, 2022 |
| Global X SuperDividend® REIT ETF |
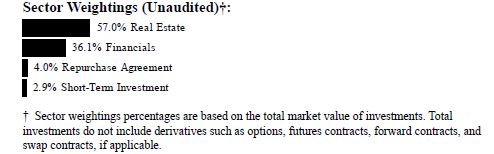
| | | | |
| |
| | | Shares | | | Value | |
| COMMON STOCK — 99.7% | | | | | | |
| AUSTRALIA — 7.3% | | | | | | |
| Real Estate — 7.3% | | | | | | |
| Charter Hall Long Wale ‡ | | | 3,552,575 | | | $ | 9,881,894 | |
| Waypoint ‡ | | | 6,308,863 | | | | 11,013,401 | |
| TOTAL AUSTRALIA | | | | | | | 20,895,295 | |
| CANADA — 6.9% | | | | | | | | |
| Real Estate — 6.9% | | | | | | | | |
| NorthWest Healthcare Properties Real Estate | | | | | | | | |
Investment Trust ‡ (A) | | | 1,209,296 | | | | 9,521,527 | |
| SmartCentres Real Estate Investment Trust ‡ (A). | | | 528,766 | | | | 10,350,099 | |
| TOTAL CANADA | | | | | | | 19,871,626 | |
| SINGAPORE — 28.1% | | | | | | | | |
| Real Estate — 28.1% | | | | | | | | |
| CapitaLand Integrated Commercial Trust ‡ | | | 8,289,879 | | | | 11,013,336 | |
| Frasers Logistics & Commercial Trust ‡ | | | 12,059,371 | | | | 9,374,114 | |
| Keppel ‡ | | | 14,995,021 | | | | 9,483,813 | |
| Keppel ‡ | | | 7,725,157 | | | | 9,607,997 | |
| Mapletree Industrial Trust ‡ | | | 6,709,341 | | | | 10,430,747 | |
| Mapletree Logistics Trust ‡ | | | 9,687,778 | | | | 10,405,924 | |
| Mapletree Pan Asia Commercial Trust ‡ | | | 9,370,960 | | | | 10,529,168 | |
| Suntec Real Estate Investment Trust ‡ | | | 10,843,912 | | | | 9,885,271 | |
| TOTAL SINGAPORE | | | | | | | 80,730,370 | |
| UNITED STATES — 57.4% | | | | | | | | |
| Financials — 38.8% | | | | | | | | |
| AGNC Investment ‡ | | | 899,540 | | | | 7,394,219 | |
|
|
|
| Schedule of Investments | | October 31, 2022 |
| Global X SuperDividend® REIT ETF |
| | | | |
| |
| | | Shares | | | Value | |
| COMMON STOCK — continued | | | | | | |
| Financials — continued | | | | | | |
| Annaly Capital Management ‡ | | | 427,008 | | | $ | 7,920,998 | |
| Ares Commercial Real Estate ‡ | | | 910,143 | | | | 11,231,165 | |
| ARMOUR Residential ‡(A) | | | 1,420,578 | | | | 7,557,475 | |
| Blackstone Mortgage Trust, Cl A ‡ | | | 411,140 | | | | 10,262,054 | |
| Broadmark Realty Capital ‡ | | | 1,423,756 | | | | 8,286,260 | |
| Dynex Capital ‡ | | | 784,223 | | | | 9,363,623 | |
| Ellington Financial ‡ | | | 731,762 | | | | 9,790,976 | |
| KKR Real Estate Finance Trust ‡ | | | 620,020 | | | | 10,800,748 | |
| MFA Financial ‡ | | | 732,279 | | | | 7,293,499 | |
| PennyMac Mortgage Investment Trust ‡ | | | 800,683 | | | | 11,105,473 | |
| Rithm Capital ‡ | | | 1,195,429 | | | | 10,077,466 | |
| | | | | | | | 111,083,956 | |
| Real Estate — 18.6% | | | | | | | | |
| Gaming and Leisure Properties ‡ | | | 288,810 | | | | 14,475,157 | |
| Getty Realty ‡ | | | 460,281 | | | | 14,494,249 | |
| Physicians Realty Trust ‡ | | | 747,956 | | | | 11,264,217 | |
| WP Carey ‡ | | | 172,879 | | | | 13,190,668 | |
| | | | | | | | 53,424,291 | |
| TOTAL UNITED STATES | | | | | | | 164,508,247 | |
| TOTAL COMMON STOCK | | | | | | | | |
| (Cost $359,603,919) | | | | | | | 286,005,538 | |
| SHORT-TERM INVESTMENT(B)(C) — 3.1% | | | | | | | | |
| Fidelity Investments Money Market | | | | | | | | |
| Government Portfolio, Cl Institutional, | | | | | | | | |
| 2.910% | | | | | | | | |
| | | 8,828,628 | | | | 8,828,628 | |
|
|
|
| Schedule of Investments | | October 31, 2022 |
| Global X SuperDividend® REIT ETF |
| | Face Amount | | | Value | |
REPURCHASE AGREEMENT(B) — 4.3% | | | | | | |
BNP Paribas
2.930%, dated 10/31/2022, to be repurchased
on 11/01/2022, repurchase price $12,267,543
(collateralized by U.S. Treasury Obligations,
ranging in par value $248,815 - $1,433,387,
2.500% - 2.750%, 03/31/2027 - 05/31/2029,
with a total market value of $12,496,959)
(Cost $12,266,545) | | $ | 12,266,545 | | | $ | 12,266,545 | |
TOTAL INVESTMENTS — 107.1% | | | | | | | | |
| (Cost $380,699,092) | | | | | | $ | 307,100,711 | |
Percentages are based on Net Assets of $286,654,636.
| ‡ | Real Estate Investment Trust |
| (A) | This security or a partial position of this security is on loan at October 31, 2022. |
| (B) | Security was purchased with cash collateral held from securities on loan. |
| (C) | The rate reported on the Schedule of Investments is the 7-day effective yield as of October 31, 2022. |
The following is a summary of the level of inputs used as of October 31, 2022, in valuing the Fund's investments carried at value:
| Investments in Securities | | Level 1 | | | Level 2 | | | Level 3 | | | Total | |
| Common Stock | | $ | 286,005,538 | | | $ | — | | | $ | — | | | $ | 286,005,538 | |
| Short-Term Investment | | | 8,828,628 | | | | — | | | | — | | | | 8,828,628 | |
| Repurchase Agreement | | | — | | | | 12,266,545 | | | | — | | | | 12,266,545 | |
| Total Investments in Securities | | $ | 294,834,166 | | | $ | 12,266,545 | | | $ | — | | | $ | 307,100,711 | |
Amounts designated as “—“ are $0 or have been rounded to $0.
See "Glossary" for abbreviations.
|
|
|
| Schedule of Investments | | October 31, 2022 |
| Global X NASDAQ 100® Covered Call ETF |
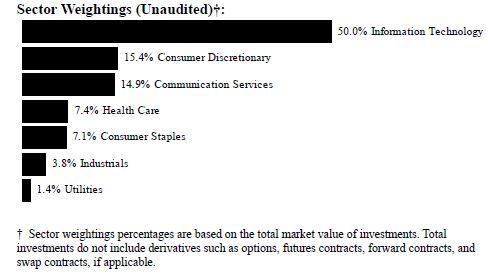
| | | | |
| |
| | | Shares | | | Value | |
| COMMON STOCK — 104.9%(A) | | | | | | |
| BRAZIL — 0.5% | | | | | | |
| Consumer Discretionary — 0.5% | | | | | | |
| MercadoLibre * | | | 32,403 | | | $ | 29,215,193 | |
| CHINA — 1.1% | | | | | | | | |
| Communication Services — 0.2% | | | | | | | | |
| Baidu ADR * | | | 112,164 | | | | 8,588,398 | |
| NetEase ADR . | | | 104,757 | | | | 5,826,584 | |
| | | | | | | | 14,414,982 | |
| Consumer Discretionary — 0.5% | | | | | | | | |
| JD.com ADR . | | | 311,574 | | | | 11,618,594 | |
| Pinduoduo ADR * | | | 301,902 | | | | 16,553,287 | |
| | | | | | | | 28,171,881 | |
| Information Technology — 0.4% | | | | | | | | |
| NXP Semiconductors . | | | 169,110 | | | | 24,703,589 | |
| TOTAL CHINA | | | | | | | 67,290,452 | |
|
|
|
| Schedule of Investments | | October 31, 2022 |
| Global X NASDAQ 100® Covered Call ETF |
| | | | |
| |
| | | Shares | | | Value | |
| COMMON STOCK — continued | | | | | | |
| NETHERLANDS — 0.4% | | | | | | |
| Information Technology — 0.4% | | | | | | |
| ASML Holding . | | | 55,437 | | | $ | 26,189,548 | |
| UNITED KINGDOM — 0.3% | | | | | | | | |
| Health Care — 0.3% | | | | | | | | |
| AstraZeneca ADR . | | | 381,392 | | | | 22,429,663 | |
| UNITED STATES — 102.6% | | | | | | | | |
| Communication Services — 15.4% | | | | | | | | |
| Activision Blizzard . | | | 503,115 | | | | 36,626,772 | |
| Alphabet, Cl A * | | | 2,319,064 | | | | 219,174,739 | |
| Alphabet, Cl C * | | | 2,383,626 | | | | 225,634,037 | |
| Charter Communications, Cl A * | | | 103,341 | | | | 37,990,218 | |
| Comcast, Cl A | | | 2,827,847 | | | | 89,755,864 | |
| Electronic Arts | | | 179,119 | | | | 22,561,829 | |
| Match Group * | | | 174,643 | | | | 7,544,578 | |
| Meta Platforms, Cl A * | | | 1,321,039 | | | | 123,067,993 | |
| Netflix * | | | 285,577 | | | | 83,354,215 | |
| Sirius XM Holdings . | | | 2,513,626 | | | | 15,182,301 | |
| T-Mobile US * | | | 805,072 | | | | 122,016,712 | |
| | | | | | | | 982,909,258 | |
| Consumer Discretionary — 15.4% | | | | | | | | |
| Airbnb, Cl A * | | | 256,846 | | | | 27,459,406 | |
| Amazon.com * | | | 3,939,406 | | | | 403,552,751 | |
| Booking Holdings * | | | 25,520 | | | | 47,709,130 | |
| Dollar Tree * | | | 144,321 | | | | 22,874,878 | |
| eBay | | | 338,625 | | | | 13,490,820 | |
| Lucid Group * | | | 1,036,364 | | | | 14,809,641 | |
| Lululemon Athletica * | | | 78,795 | | | | 25,926,707 | |
| Marriott International, Cl A | | | 208,810 | | | | 33,432,569 | |
| O'Reilly Automotive * | | | 40,744 | | | | 34,109,654 | |
| Ross Stores | | | 225,594 | | | | 21,587,090 | |
| Starbucks | | | 737,052 | | | | 63,821,333 | |
| Tesla * | | | 1,202,046 | | | | 273,513,547 | |
| | | | | | | | 982,287,526 | |
| Consumer Staples — 7.4% | | | | | | | | |
| Costco Wholesale | | | 284,326 | | | | 142,589,489 | |
|
|
|
| Schedule of Investments | | October 31, 2022 |
| Global X NASDAQ 100® Covered Call ETF |
| | | | |
| |
| | | Shares | | | Value | |
| COMMON STOCK — continued | | | | | | |
| Consumer Staples — continued | | | | | | |
| Keurig Dr Pepper | | | 910,900 | | | $ | 35,379,356 | |
| Kraft Heinz | | | 788,779 | | | | 30,344,328 | |
| Mondelez International, Cl A . | | | 880,796 | | | | 54,151,338 | |
| Monster Beverage * | | | 339,060 | | | | 31,776,703 | |
| PepsiCo | | | 885,648 | | | | 160,815,964 | |
| Walgreens Boots Alliance | | | 557,178 | | | | 20,336,997 | |
| | | | | | | | 475,394,175 | |
| Health Care — 7.4% | | | | | | | | |
| Align Technology * | | | 48,366 | | | | 9,397,514 | |
| Amgen . | | | 343,496 | | | | 92,864,144 | |
| Biogen * | | | 93,442 | | | | 26,485,200 | |
| Dexcom * | | | 252,830 | | | | 30,536,807 | |
| Gilead Sciences | | | 805,362 | | | | 63,188,702 | |
| IDEXX Laboratories * | | | 51,706 | | | | 18,597,614 | |
| Illumina * | | | 101,336 | | | | 23,187,704 | |
| Intuitive Surgical * | | | 229,502 | | | | 56,565,358 | |
| Moderna * | | | 251,676 | | | | 37,834,453 | |
| Regeneron Pharmaceuticals * | | | 68,888 | | | | 51,579,890 | |
| Seagen * | | | 119,055 | | | | 15,139,034 | |
| Vertex Pharmaceuticals * | | | 164,824 | | | | 51,425,088 | |
| | | | | | | | 476,801,508 | |
| Industrials — 3.9% | | | | | | | | |
| Cintas | | | 65,695 | | | | 28,087,897 | |
| Copart * | | | 153,336 | | | | 17,636,707 | |
| CSX | | | 1,376,967 | | | | 40,014,661 | |
| Fastenal | | | 370,742 | | | | 17,917,961 | |
| Honeywell International . | | | 432,647 | | | | 88,268,641 | |
| Old Dominion Freight Line | | | 72,069 | | | | 19,790,147 | |
| PACCAR | | | 224,108 | | | | 21,700,378 | |
| Verisk Analytics, Cl A . | | | 97,378 | | | | 17,803,620 | |
| | | | | | | | 251,220,012 | |
| Information Technology — 51.6% | | | | | | | | |
| Adobe * | | | 300,496 | | | | 95,707,976 | |
| Advanced Micro Devices * | | | 1,037,109 | | | | 62,288,767 | |
| Analog Devices | | | 330,571 | | | | 47,146,036 | |
| ANSYS * | | | 54,043 | | | | 11,952,150 | |
| Apple . | | | 6,213,736 | | | | 952,814,278 | |
|
|
|
| Schedule of Investments | | October 31, 2022 |
| Global X NASDAQ 100® Covered Call ETF |
| | | | |
| |
| | | Shares | | | Value | |
| COMMON STOCK — continued | | | | | | |
| Information Technology — continued | | | | | | |
| Applied Materials . | | | 552,998 | | | $ | 48,824,193 | |
| Atlassian, Cl A * | | | 93,439 | | | | 18,942,888 | |
| Autodesk * | | | 138,942 | | | | 29,775,271 | |
| Automatic Data Processing | | | 266,935 | | | | 64,518,189 | |
| Broadcom | | | 259,973 | | | | 122,218,507 | |
| Cadence Design Systems * | | | 176,282 | | | | 26,687,332 | |
| Cisco Systems | | | 2,658,332 | | | | 120,768,023 | |
| Cognizant Technology Solutions, Cl A | | | 333,734 | | | | 20,774,941 | |
| Crowdstrike Holdings, Cl A * | | | 138,424 | | | | 22,313,949 | |
| Datadog, Cl A * | | | 187,720 | | | | 15,113,337 | |
| DocuSign, Cl A * | | | 122,885 | | | | 5,935,345 | |
| Fiserv * | | | 411,244 | | | | 42,251,209 | |
| Fortinet * | | | 507,591 | | | | 29,013,902 | |
| Intel . | | | 2,637,252 | | | | 74,977,074 | |
| Intuit . | | | 181,160 | | | | 77,445,900 | |
| KLA | | | 90,178 | | | | 28,536,828 | |
| Lam Research | | | 88,131 | | | | 35,673,666 | |
| Marvell Technology . | | | 549,360 | | | | 21,798,605 | |
| Microchip Technology | | | 355,959 | | | | 21,976,909 | |
| Micron Technology . | | | 709,308 | | | | 38,373,563 | |
| Microsoft | | | 2,883,679 | | | | 669,388,406 | |
| NVIDIA . | | | 1,355,547 | | | | 182,958,179 | |
| Okta, Cl A * | | | 92,695 | | | | 5,202,043 | |
| Palo Alto Networks * | | | 192,325 | | | | 33,001,047 | |
| Paychex | | | 231,718 | | | | 27,414,557 | |
| PayPal Holdings * | | | 742,933 | | | | 62,094,340 | |
| QUALCOMM . | | | 721,150 | | | | 84,850,509 | |
| Skyworks Solutions | | | 98,339 | | | | 8,458,137 | |
| Splunk * | | | 99,695 | | | | 8,285,651 | |
| Synopsys * | | | 98,409 | | | | 28,789,553 | |
| Texas Instruments . | | | 586,671 | | | | 94,236,963 | |
| VeriSign * | | | 65,826 | | | | 13,195,480 | |
| Workday, Cl A * | | | 129,583 | | | | 20,191,623 | |
| Zoom Video Communications, Cl A * | | | 154,679 | | | | 12,906,416 | |
| Zscaler * | | | 87,758 | | | | 13,523,508 | |
| | | | | | | | 3,300,325,250 | |
| Utilities — 1.5% | | | | | | | | |
| American Electric Power | | | 330,649 | | | | 29,070,660 | |
| Constellation Energy . | | | 210,629 | | | | 19,912,866 | |
|
|
|
| Schedule of Investments | | October 31, 2022 |
| Global X NASDAQ 100® Covered Call ETF |
| | | | | | |
| | | Shares | | | Value | |
| COMMON STOCK — continued | | | | | | |
| Utilities — continued | | | | | | |
| Exelon | | | 639,853 | | | $ | 24,691,927 | |
| Xcel Energy | | | 352,438 | | | | 22,947,238 | |
| | | | | | | | 96,622,691 | |
TOTAL UNITED STATES
| | | | | | | 6,565,560,420
| |
| TOTAL COMMON STOCK | | | | | | | | |
(Cost $7,292,685,852)
| | | | | | | 6,710,685,276
| |
| TOTAL INVESTMENTS — 104.9% | | | | | | | | |
(Cost $7,292,685,852)
| | | | | | $ | 6,710,685,276 | |
WRITTEN OPTIONS— (5.0)%
|
|
|
|
|
|
|
|
|
(Premiums Received $(289,674,849))
|
|
|
|
|
| $
| (321,715,990 | )
|
| Percentages are based on Net Assets of $6,397,648,310. | | | |
| A list of the exchange traded option contracts held by the Fund at October 31, 2022, is as |
| follows: | | | | | | | |
| | | Number of | | | Notional | | |
| | | |
| Description | | Contracts | | | Amount | | | Exercise Price | | Expiration Date | | Value | |
| WRITTEN OPTIONS — (5.0)% | | | | | | | | | | | |
| Call Options | | | | | | | | | | | | | |
| Nasdaq-100 | | | (5,882 | ) | | $ | (6,499,610,000 | ) | | $ | 11,050.00 | | 11/18/22 | | $ | (321,715,990 | ) |
* Non-income producing security.
(A) All or a portion of these securities has been segregated as collateral for options contracts. The aggregate market value of collateral at October 31, 2022 was $6,710,685,276.
|
|
|
| Schedule of Investments | | October 31, 2022 |
| Global X NASDAQ 100® Covered Call ETF |
The following is a summary of the level of inputs used as of October 31, 2022, in valuing the Fund's investments and other financial instruments carried at value:
| Investments in Securities | | Level 1 | | | Level 2 | | | Level 3 | | | Total | |
| Common Stock | | $ | 6,710,685,276 | | | $ | — | | | $ | — | | | $ | 6,710,685,276 | |
| Total Investments in Securities | | $ | 6,710,685,276 | | | $ | — | | | $ | — | | | $ | 6,710,685,276 | |
| Other Financial Instruments | | Level 1 | | | Level 2 | | | Level 3 | | | Total | |
| Written Options | | $ | (321,715,990 | ) | | $ | – | | | $ | – | | | $ | (321,715,990 | ) |
| Total Other Financial Instruments | | $ | (321,715,990 | ) | | $ | – | | | $ | – | | | $ | (321,715,990 | ) |
Amounts designated as “—“ are $0 or have been rounded to $0.
See "Glossary" for abbreviations.
|
|
|
| Schedule of Investments | | October 31, 2022 |
| Global X S&P 500® Covered Call ETF |

| | | | |
| |
| | | Shares | | | Value | |
| COMMON STOCK — 106.0%(A) | | | | | | |
| CHINA — 0.1% | | | | | | |
| Information Technology — 0.1% | | | | | | |
| NXP Semiconductors . | | | 16,762 | | | $ | 2,448,593 | |
| SWITZERLAND — 0.2% | | | | | | | | |
| Information Technology — 0.2% | | | | | | | | |
| TE Connectivity | | | 20,424 | | | | 2,496,425 | |
| UNITED KINGDOM — 0.5% | | | | | | | | |
| Materials — 0.5% | | | | | | | | |
| Linde | | | 31,505 | | | | 9,368,012 | |
| UNITED STATES — 105.2% | | | | | | | | |
| Communication Services — 7.8% | | | | | | | | |
| Activision Blizzard . | | | 45,471 | | | | 3,310,289 | |
| Alphabet, Cl A * | | | 378,034 | | | | 35,727,993 | |
| Alphabet, Cl C * | | | 338,081 | | | | 32,002,747 | |
| AT&T | | | 450,747 | | | | 8,217,118 | |
| Charter Communications, Cl A * | | | 6,603 | | | | 2,427,395 | |
| Comcast, Cl A | | | 278,455 | | | | 8,838,162 | |
| DISH Network, Cl A * | | | 15,099 | | | | 225,126 | |
|
|
|
| Schedule of Investments | | October 31, 2022 |
| Global X S&P 500® Covered Call ETF |
| | | | |
| |
| | | Shares | | | Value | |
| COMMON STOCK — continued | | | | | | |
| Communication Services — continued | | | | | | |
| Electronic Arts | | | 15,931 | | | $ | 2,006,669 | |
| Fox, Cl A | | | 19,987 | | | | 577,025 | |
| Fox, Cl B | | | 9,997 | | | | 271,918 | |
| Interpublic Group | | | 23,787 | | | | 708,615 | |
| Live Nation Entertainment * | | | 9,035 | | | | 719,276 | |
| Lumen Technologies . | | | 61,148 | | | | 450,049 | |
| Match Group * | | | 18,728 | | | | 809,050 | |
| Meta Platforms, Cl A * | | | 143,915 | | | | 13,407,121 | |
| Netflix * | | | 28,123 | | | | 8,208,541 | |
| News, Cl A . | | | 24,999 | | | | 421,733 | |
| News, Cl B . | | | 9,630 | | | | 164,962 | |
| Omnicom Group . | | | 14,506 | | | | 1,055,311 | |
| Paramount Global, Cl B | | | 38,729 | | | | 709,515 | |
| Take-Two Interactive Software * | | | 10,520 | | | | 1,246,410 | |
| T-Mobile US * | | | 37,012 | | | | 5,609,539 | |
| Verizon Communications | | | 265,453 | | | | 9,919,979 | |
| Walt Disney * | | | 115,153 | | | | 12,268,401 | |
| Warner Bros Discovery * | | | 143,808 | | | | 1,869,504 | |
| | | | | | | | 151,172,448 | |
| Consumer Discretionary — 11.5% | | | | | | | | |
| Advance Auto Parts | | | 3,220 | | | | 611,542 | |
| Amazon.com * | | | 558,604 | | | | 57,223,394 | |
| Aptiv * | | | 17,636 | | | | 1,606,111 | |
| AutoZone * | | | 1,242 | | | | 3,145,837 | |
| Bath & Body Works . | | | 15,503 | | | | 517,490 | |
| Best Buy | | | 14,169 | | | | 969,301 | |
| Booking Holdings * | | | 2,495 | | | | 4,664,353 | |
| BorgWarner . | | | 14,483 | | | | 543,547 | |
| Caesars Entertainment * | | | 14,359 | | | | 627,919 | |
| CarMax * | | | 9,807 | | | | 617,939 | |
| Carnival * | | | 52,703 | | | | 477,489 | |
| Chipotle Mexican Grill, Cl A * | | | 1,674 | | | | 2,508,204 | |
| Darden Restaurants . | | | 9,037 | | | | 1,293,556 | |
| Dollar General . | | | 14,432 | | | | 3,680,882 | |
| Dollar Tree * | | | 12,907 | | | | 2,045,759 | |
| Domino's Pizza . | | | 1,781 | | | | 591,719 | |
| DR Horton | | | 19,705 | | | | 1,514,920 | |
| eBay | | | 31,339 | | | | 1,248,546 | |
| Etsy * | | | 9,152 | | | | 859,464 | |
|
|
|
| Schedule of Investments | | October 31, 2022 |
| Global X S&P 500® Covered Call ETF |
| | | | |
| |
| | | Shares | | | Value | |
| COMMON STOCK — continued | | | | | | |
| Consumer Discretionary — continued | | | | | | |
| Expedia Group * | | | 9,614 | | | $ | 898,621 | |
| Ford Motor . | | | 251,387 | | | | 3,361,044 | |
| Garmin | | | 9,776 | | | | 860,679 | |
| General Motors | | | 89,661 | | | | 3,519,194 | |
| Genuine Parts . | | | 9,275 | | | | 1,649,652 | |
| Hasbro . | | | 8,975 | | | | 585,619 | |
| Hilton Worldwide Holdings . | | | 17,518 | | | | 2,369,485 | |
| Home Depot . | | | 64,859 | | | | 19,206,696 | |
| Las Vegas Sands * | | | 22,856 | | | | 868,757 | |
| Lennar, Cl A . | | | 17,097 | | | | 1,379,728 | |
| LKQ | | | 17,410 | | | | 968,692 | |
| Lowe's | | | 40,437 | | | | 7,883,193 | |
| Marriott International, Cl A | | | 17,584 | | | | 2,815,374 | |
| McDonald's . | | | 46,470 | | | | 12,670,510 | |
| MGM Resorts International . | | | 23,685 | | | | 842,475 | |
| Mohawk Industries * | | | 4,312 | | | | 408,562 | |
| Newell Brands . | | | 24,951 | | | | 344,573 | |
| NIKE, Cl B | | | 79,963 | | | | 7,410,971 | |
| Norwegian Cruise Line Holdings * | | | 25,816 | | | | 436,032 | |
| NVR * | | | 202 | | | | 856,026 | |
| O'Reilly Automotive * | | | 3,835 | | | | 3,210,547 | |
| Pool . | | | 2,584 | | | | 786,130 | |
| PulteGroup . | | | 15,377 | | | | 614,926 | |
| Ralph Lauren, Cl A . | | | 4,474 | | | | 414,695 | |
| Ross Stores | | | 22,416 | | | | 2,144,987 | |
| Royal Caribbean Cruises * | | | 14,434 | | | | 770,487 | |
| Starbucks | | | 70,512 | | | | 6,105,634 | |
| Tapestry . | | | 18,348 | | | | 581,265 | |
| Target | | | 28,499 | | | | 4,680,961 | |
| Tesla * | | | 167,932 | | | | 38,211,247 | |
| TJX | | | 71,996 | | | | 5,190,912 | |
| Tractor Supply . | | | 7,007 | | | | 1,539,928 | |
| Ulta Beauty * | | | 3,408 | | | | 1,429,213 | |
| VF . | | | 19,730 | | | | 557,373 | |
| Whirlpool | | | 2,829 | | | | 391,081 | |
| Wynn Resorts * | | | 5,065 | | | | 323,654 | |
| Yum! Brands | | | 18,208 | | | | 2,153,096 | |
| | | | | | | | 223,189,991 | |
|
|
|
| Schedule of Investments | | October 31, 2022 |
| Global X S&P 500® Covered Call ETF |
| | | | | | |
| | | Shares | | | Value | |
| COMMON STOCK — continued | | | | | | |
| Consumer Staples — 7.4% | | | | | | |
| Altria Group . | | | 110,654 | | | $ | 5,119,961 | |
| Archer-Daniels-Midland | | | 35,665 | | | | 3,458,792 | |
| Brown-Forman, Cl B | | | 12,179 | | | | 828,172 | |
| Campbell Soup . | | | 14,246 | | | | 753,756 | |
| Church & Dwight | | | 16,085 | | | | 1,192,381 | |
| Clorox | | | 6,791 | | | | 991,758 | |
| Coca-Cola . | | | 245,751 | | | | 14,708,197 | |
| Colgate-Palmolive | | | 51,299 | | | | 3,787,918 | |
| Conagra Brands . | | | 30,080 | | | | 1,103,936 | |
| Constellation Brands, Cl A | | | 10,300 | | | | 2,544,924 | |
| Costco Wholesale | | | 27,970 | | | | 14,026,955 | |
| Estee Lauder, Cl A . | | | 14,760 | | | | 2,959,232 | |
| General Mills | | | 37,935 | | | | 3,094,737 | |
| Hershey | | | 9,344 | | | | 2,231,067 | |
| Hormel Foods | | | 19,445 | | | | 903,220 | |
| J M Smucker . | | | 7,147 | | | | 1,076,767 | |
| Kellogg | | | 15,388 | | | | 1,182,106 | |
| Keurig Dr Pepper | | | 52,313 | | | | 2,031,837 | |
| Kimberly-Clark | | | 21,546 | | | | 2,681,615 | |
| Kraft Heinz | | | 49,034 | | | | 1,886,338 | |
| Kroger | | | 42,420 | | | | 2,006,042 | |
| Lamb Weston Holdings . | | | 9,730 | | | | 838,921 | |
| McCormick . | | | 16,480 | | | | 1,295,987 | |
| Molson Coors Beverage, Cl B | | | 12,034 | | | | 606,875 | |
| Mondelez International, Cl A . | | | 86,889 | | | | 5,341,936 | |
| Monster Beverage * | | | 23,679 | | | | 2,219,196 | |
| PepsiCo | | | 87,121 | | | | 15,819,431 | |
| Philip Morris International | | | 98,017 | | | | 9,002,861 | |
| Procter & Gamble . | | | 150,776 | | | | 20,305,004 | |
| Sysco . | | | 32,489 | | | | 2,812,248 | |
| Tyson Foods, Cl A | | | 18,973 | | | | 1,296,804 | |
| Walgreens Boots Alliance | | | 46,682 | | | | 1,703,893 | |
| Walmart | | | 90,022 | | | | 12,812,831 | |
| | | | �� | | | | 142,625,698 | |
| Energy — 5.7% | | | | | | | | |
| APA . | | | 23,649 | | | | 1,075,083 | |
| Baker Hughes, Cl A | | | 60,151 | | | | 1,663,777 | |
| Chevron . | | | 113,627 | | | | 20,555,124 | |
| ConocoPhillips . | | | 80,448 | | | | 10,143,688 | |
|
|
|
| Schedule of Investments | | October 31, 2022 |
| Global X S&P 500® Covered Call ETF |
| | | | |
| |
| | | Shares | | | Value | |
| COMMON STOCK — continued | | | | | | |
| Energy — continued | | | | | | |
| Coterra Energy | | | 51,150 | | | $ | 1,592,299 | |
| Devon Energy | | | 40,236 | | | | 3,112,255 | |
| Diamondback Energy | | | 10,137 | | | | 1,592,624 | |
| EOG Resources | | | 35,965 | | | | 4,909,942 | |
| EQT . | | | 22,602 | | | | 945,668 | |
| Exxon Mobil | | | 262,839 | | | | 29,125,190 | |
| Halliburton . | | | 58,055 | | | | 2,114,363 | |
| Hess | | | 17,787 | | | | 2,509,390 | |
| Kinder Morgan | | | 126,689 | | | | 2,295,605 | |
| Marathon Oil . | | | 47,308 | | | | 1,440,529 | |
| Marathon Petroleum | | | 30,626 | | | | 3,479,726 | |
| Occidental Petroleum . | | | 45,772 | | | | 3,323,047 | |
| ONEOK | | | 28,216 | | | | 1,673,773 | |
| Phillips 66 . | | | 30,618 | | | | 3,193,151 | |
| Pioneer Natural Resources | | | 14,667 | | | | 3,760,765 | |
| Schlumberger | | | 86,945 | | | | 4,523,748 | |
| Targa Resources | | | 13,834 | | | | 945,831 | |
| Valero Energy . | | | 25,967 | | | | 3,260,157 | |
| Williams | | | 77,755 | | | | 2,544,921 | |
| | | | | | | | 109,780,656 | |
| Financials — 12.1% | | | | | | | | |
| Aflac | | | 33,777 | | | | 2,199,220 | |
| Allstate | | | 17,288 | | | | 2,182,610 | |
| American Express . | | | 38,012 | | | | 5,642,881 | |
| American International Group | | | 45,617 | | | | 2,600,169 | |
| Ameriprise Financial | | | 6,934 | | | | 2,143,438 | |
| Aon, Cl A . | | | 13,400 | | | | 3,771,966 | |
| Arch Capital Group * | | | 23,174 | | | | 1,332,505 | |
| Arthur J Gallagher | | | 13,431 | | | | 2,512,671 | |
| Assurant . | | | 4,357 | | | | 591,942 | |
| Bank of America | | | 441,283 | | | | 15,903,839 | |
| Bank of New York Mellon | | | 47,904 | | | | 2,017,237 | |
| Berkshire Hathaway, Cl B * | | | 113,807 | | | | 33,583,308 | |
| BlackRock, Cl A . | | | 9,269 | | | | 5,986,940 | |
| Brown & Brown . | | | 14,005 | | | | 823,354 | |
| Capital One Financial | | | 24,664 | | | | 2,614,877 | |
| Cboe Global Markets . | | | 6,748 | | | | 840,126 | |
| Charles Schwab . | | | 96,231 | | | | 7,666,724 | |
| Chubb . | | | 26,471 | | | | 5,688,353 | |
|
|
|
| Schedule of Investments | | October 31, 2022 |
| Global X S&P 500® Covered Call ETF |
| | | | |
| |
| | | Shares | | | Value | |
| COMMON STOCK — continued | | | | | | |
| Financials — continued | | | | | | |
| Cincinnati Financial . | | | 9,794 | | | $ | 1,011,916 | |
| Citigroup | | | 119,001 | | | | 5,457,386 | |
| Citizens Financial Group . | | | 32,732 | | | | 1,338,739 | |
| CME Group, Cl A . | | | 22,127 | | | | 3,834,609 | |
| Comerica | | | 9,534 | | | | 672,147 | |
| Discover Financial Services | | | 15,747 | | | | 1,644,932 | |
| Everest Re Group | | | 2,449 | | | | 790,194 | |
| FactSet Research Systems . | | | 2,383 | | | | 1,013,943 | |
| Fifth Third Bancorp | | | 42,912 | | | | 1,531,529 | |
| First Republic Bank . | | | 10,064 | | | | 1,208,686 | |
| Franklin Resources | | | 18,113 | | | | 424,750 | |
| Globe Life . | | | 4,952 | | | | 572,055 | |
| Goldman Sachs Group | | | 21,602 | | | | 7,442,105 | |
| Hartford Financial Services Group . | | | 20,458 | | | | 1,481,364 | |
| Huntington Bancshares | | | 92,954 | | | | 1,411,042 | |
| Intercontinental Exchange . | | | 35,523 | | | | 3,394,933 | |
| Invesco | | | 22,568 | | | | 345,742 | |
| JPMorgan Chase . | | | 184,999 | | | | 23,287,674 | |
| KeyCorp | | | 58,540 | | | | 1,046,110 | |
| Lincoln National . | | | 9,815 | | | | 528,734 | �� |
| Loews . | | | 13,391 | | | | 763,555 | |
| M&T Bank . | | | 10,143 | | | | 1,707,777 | |
| MarketAxess Holdings . | | | 2,263 | | | | 552,263 | |
| Marsh & McLennan . | | | 30,626 | | | | 4,945,793 | |
| MetLife . | | | 39,939 | | | | 2,923,934 | |
| Moody's . | | | 9,931 | | | | 2,630,424 | |
| Morgan Stanley | | | 82,480 | | | | 6,777,382 | |
| MSCI, Cl A | | | 5,064 | | | | 2,374,307 | |
| Nasdaq . | | | 21,290 | | | | 1,325,090 | |
| Northern Trust . | | | 13,832 | | | | 1,166,729 | |
| PNC Financial Services Group | | | 26,039 | | | | 4,213,891 | |
| Principal Financial Group | | | 14,719 | | | | 1,297,185 | |
| Progressive | | | 35,896 | | | | 4,609,046 | |
| Prudential Financial . | | | 24,310 | | | | 2,557,169 | |
| Raymond James Financial . | | | 12,292 | | | | 1,452,177 | |
| Regions Financial . | | | 59,851 | | | | 1,313,729 | |
| S&P Global . | | | 21,571 | | | | 6,929,684 | |
| Signature Bank NY . | | | 4,627 | | | | 733,518 | |
| State Street . | | | 23,743 | | | | 1,756,982 | |
|
|
|
| Schedule of Investments | | October 31, 2022 |
| Global X S&P 500® Covered Call ETF |
| | | | |
| |
| | | Shares | | | Value | |
| COMMON STOCK — continued | | | | | | |
| Financials — continued | | | | | | |
| SVB Financial Group * | | | 3,783 | | | $ | 873,722 | |
| Synchrony Financial | | | 34,439 | | | | 1,224,651 | |
| T Rowe Price Group | | | 14,236 | | | | 1,511,294 | |
| Travelers . | | | 15,130 | | | | 2,790,880 | |
| Truist Financial | | | 84,318 | | | | 3,776,603 | |
| US Bancorp . | | | 83,075 | | | | 3,526,534 | |
| W R Berkley | | | 14,328 | | | | 1,065,717 | |
| Wells Fargo . | | | 239,651 | | | | 11,021,550 | |
| Willis Towers Watson | | | 6,968 | | | | 1,520,487 | |
| Zions Bancorp . | | | 10,105 | | | | 524,854 | |
| | | | | | | | 234,407,677 | |
| Health Care — 16.2% | | | | | | | | |
| Abbott Laboratories . | | | 110,650 | | | | 10,947,711 | |
| AbbVie | | | 111,596 | | | | 16,337,654 | |
| ABIOMED * | | | 2,927 | | | | 737,838 | |
| Agilent Technologies | | | 19,062 | | | | 2,637,228 | |
| Align Technology * | | | 4,706 | | | | 914,376 | |
| AmerisourceBergen, Cl A . | | | 10,006 | | | | 1,573,143 | |
| Amgen . | | | 33,823 | | | | 9,144,048 | |
| Baxter International | | | 32,286 | | | | 1,754,744 | |
| Becton Dickinson | | | 17,559 | | | | 4,143,397 | |
| Biogen * | | | 9,437 | | | | 2,674,823 | |
| Bio-Rad Laboratories, Cl A * | | | 1,170 | | | | 411,501 | |
| Bio-Techne | | | 2,418 | | | | 716,357 | |
| Boston Scientific * | | | 87,968 | | | | 3,792,300 | |
| Bristol-Myers Squibb . | | | 134,948 | | | | 10,454,422 | |
| Cardinal Health | | | 17,593 | | | | 1,335,309 | |
| Catalent * | | | 11,661 | | | | 766,478 | |
| Centene * | | | 33,879 | | | | 2,884,119 | |
| Charles River Laboratories International * | | | 3,148 | | | | 668,163 | |
| Cigna . | | | 18,642 | | | | 6,022,484 | |
| Cooper . | | | 3,166 | | | | 865,553 | |
| CVS Health . | | | 83,042 | | | | 7,864,077 | |
| Danaher | | | 41,372 | | | | 10,412,091 | |
| DaVita * | | | 4,944 | | | | 360,961 | |
| DENTSPLY SIRONA . | | | 14,604 | | | | 450,095 | |
| Dexcom * | | | 25,062 | | | | 3,026,988 | |
| Edwards Lifesciences * | | | 39,427 | | | | 2,855,698 | |
| Elevance Health | | | 15,181 | | | | 8,300,515 | |
|
|
|
| Schedule of Investments | | October 31, 2022 |
| Global X S&P 500® Covered Call ETF |
| | | | |
| |
| | | Shares | | | Value | |
| COMMON STOCK — continued | | | | | | |
| Health Care — continued | | | | | | |
| Eli Lilly | | | 49,774 | | | $ | 18,022,668 | |
| Gilead Sciences | | | 77,006 | | | | 6,041,891 | |
| HCA Healthcare | | | 13,176 | | | | 2,865,385 | |
| Henry Schein * | | | 9,124 | | | | 624,629 | |
| Hologic * | | | 15,260 | | | | 1,034,628 | |
| Humana | | | 8,033 | | | | 4,483,057 | |
| IDEXX Laboratories * | | | 5,222 | | | | 1,878,249 | |
| Illumina * | | | 10,040 | | | | 2,297,353 | |
| Incyte * | | | 12,721 | | | | 945,679 | |
| Intuitive Surgical * | | | 21,986 | | | | 5,418,889 | |
| IQVIA Holdings * | | | 10,816 | | | | 2,267,791 | |
| Johnson & Johnson . | | | 165,813 | | | | 28,846,488 | |
| Laboratory Corp of America Holdings | | | 5,638 | | | | 1,250,847 | |
| McKesson | | | 9,139 | | | | 3,558,452 | |
| Medtronic | | | 83,734 | | | | 7,313,328 | |
| Merck . | | | 159,914 | | | | 16,183,297 | |
| Mettler-Toledo International * | | | 1,293 | | | | 1,635,554 | |
| Moderna * | | | 21,179 | | | | 3,183,839 | |
| Molina Healthcare * | | | 3,270 | | | | 1,173,472 | |
| Organon . | | | 15,101 | | | | 395,344 | |
| PerkinElmer | | | 6,949 | | | | 928,247 | |
| Pfizer | | | 354,255 | | | | 16,490,570 | |
| Quest Diagnostics . | | | 6,167 | | | | 885,890 | |
| Regeneron Pharmaceuticals * | | | 6,584 | | | | 4,929,770 | |
| ResMed | | | 9,371 | | | | 2,096,199 | |
| STERIS | | | 6,393 | | | | 1,103,304 | |
| Stryker . | | | 20,661 | | | | 4,736,328 | |
| Teleflex | | | 2,972 | | | | 637,672 | |
| Thermo Fisher Scientific | | | 24,745 | | | | 12,718,188 | |
| UnitedHealth Group | | | 58,984 | | | | 32,744,968 | |
| Universal Health Services, Cl B . | | | 4,977 | | | | 576,685 | |
| Vertex Pharmaceuticals * | | | 15,733 | | | | 4,908,696 | |
| Viatris * | | | 75,029 | | | | 760,044 | |
| Waters * | | | 3,810 | | | | 1,139,838 | |
| West Pharmaceutical Services | | | 4,704 | | | | 1,082,390 | |
| Zimmer Biomet Holdings . | | | 13,849 | | | | 1,569,784 | |
| Zoetis, Cl A . | | | 29,706 | | | | 4,479,071 | |
| | | | | | | | 313,260,557 | |
|
|
|
| Schedule of Investments | | October 31, 2022 |
| Global X S&P 500® Covered Call ETF |
| | | | |
| |
| | | Shares | | | Value | |
| COMMON STOCK — continued | | | | | | |
| Industrials — 8.8% | | | | | | |
| 3M | | | 35,147 | | | $ | 4,421,141 | |
| A O Smith . | | | 9,571 | | | | 524,299 | |
| Alaska Air Group * | | | 9,431 | | | | 419,302 | |
| Allegion . | | | 4,946 | | | | 518,192 | |
| American Airlines Group * | | | 42,183 | | | | 598,155 | |
| AMETEK | | | 13,055 | | | | 1,692,711 | |
| Boeing * | | | 34,283 | | | | 4,885,670 | |
| Carrier Global | | | 48,325 | | | | 1,921,402 | |
| Caterpillar . | | | 32,454 | | | | 7,024,993 | |
| CH Robinson Worldwide | | | 9,012 | | | | 880,653 | |
| Cintas | | | 5,498 | | | | 2,350,670 | |
| Copart * | | | 13,944 | | | | 1,603,839 | |
| CoStar Group * | | | 24,376 | | | | 2,016,383 | |
| CSX | | | 136,038 | | | | 3,953,264 | |
| Cummins | | | 9,016 | | | | 2,204,502 | |
| Deere . | | | 17,128 | | | | 6,779,605 | |
| Delta Air Lines * | | | 41,507 | | | | 1,408,333 | |
| Dover | | | 9,315 | | | | 1,217,377 | |
| Eaton | | | 25,319 | | | | 3,799,622 | |
| Emerson Electric | | | 37,629 | | | | 3,258,671 | |
| Equifax . | | | 6,941 | | | | 1,176,777 | |
| Expeditors International of Washington . | | | 11,058 | | | | 1,082,025 | |
| Fastenal | | | 36,584 | | | | 1,768,105 | |
| FedEx . | | | 15,266 | | | | 2,446,835 | |
| Fortive . | | | 23,756 | | | | 1,518,008 | |
| Fortune Brands Home & Security . | | | 9,146 | | | | 551,687 | |
| Generac Holdings * | | | 4,571 | | | | 529,825 | |
| General Dynamics | | | 14,296 | | | | 3,571,141 | |
| General Electric . | | | 69,514 | | | | 5,408,884 | |
| Honeywell International . | | | 42,612 | | | | 8,693,700 | |
| Howmet Aerospace . | | | 24,619 | | | | 875,205 | |
| Huntington Ingalls Industries | | | 2,383 | | | | 612,598 | |
| IDEX . | | | 4,860 | | | | 1,080,427 | |
| Illinois Tool Works | | | 17,911 | | | | 3,824,536 | |
| Ingersoll Rand . | | | 25,094 | | | | 1,267,247 | |
| Jacobs Solutions . | | | 9,040 | | | | 1,041,589 | |
| JB Hunt Transport Services | | | 4,897 | | | | 837,730 | |
| Johnson Controls International | | | 43,990 | | | | 2,544,382 | |
| L3Harris Technologies . | | | 12,183 | | | | 3,002,744 | |
|
|
|
| Schedule of Investments | | October 31, 2022 |
| Global X S&P 500® Covered Call ETF |
| | | | |
| |
| | | Shares | | | Value | |
| COMMON STOCK — continued | | | | | | |
| Industrials — continued | | | | | | |
| Leidos Holdings | | | 9,631 | | | $ | 978,413 | |
| Lockheed Martin | | | 14,495 | | | | 7,054,427 | |
| Masco . | | | 15,170 | | | | 701,916 | |
| Nordson . | | | 2,885 | | | | 649,125 | |
| Norfolk Southern . | | | 14,948 | | | | 3,409,190 | |
| Northrop Grumman | | | 9,221 | | | | 5,062,421 | |
| Old Dominion Freight Line | | | 5,943 | | | | 1,631,948 | |
| Otis Worldwide | | | 27,446 | | | | 1,938,785 | |
| PACCAR | | | 22,336 | | | | 2,162,795 | |
| Parker-Hannifin | | | 8,203 | | | | 2,383,956 | |
| Pentair | | | 10,051 | | | | 431,690 | |
| Quanta Services . | | | 9,573 | | | | 1,359,749 | |
| Raytheon Technologies | | | 93,369 | | | | 8,853,249 | |
| Republic Services, Cl A | | | 11,874 | | | | 1,574,730 | |
| Robert Half International | | | 5,885 | | | | 449,967 | |
| Rockwell Automation | | | 7,256 | | | | 1,852,457 | |
| Rollins . | | | 14,816 | | | | 623,457 | |
| Snap-On . | | | 2,830 | | | | 628,402 | |
| Southwest Airlines * | | | 38,058 | | | | 1,383,408 | |
| Stanley Black & Decker . | | | 9,787 | | | | 768,182 | |
| Textron | | | 14,508 | | | | 992,928 | |
| Trane Technologies . | | | 14,576 | | | | 2,326,767 | |
| TransDigm Group . | | | 3,447 | | | | 1,984,645 | |
| Union Pacific | | | 39,505 | | | | 7,788,016 | |
| United Airlines Holdings * | | | 19,608 | | | | 844,713 | |
| United Parcel Service, Cl B . | | | 46,294 | | | | 7,766,744 | |
| United Rentals * | | | 4,668 | | | | 1,473,734 | |
| Verisk Analytics, Cl A . | | | 8,946 | | | | 1,635,597 | |
| Waste Management . | | | 23,892 | | | | 3,783,776 | |
| Westinghouse Air Brake Technologies | | | 10,997 | | | | 1,025,800 | |
| WW Grainger . | | | 2,921 | | | | 1,706,886 | |
| Xylem . | | | 12,024 | | | | 1,231,618 | |
| | | | | | | | 169,771,720 | |
| Information Technology — 27.6% | | | | | | | | |
| Accenture, Cl A | | | 39,965 | | | | 11,346,063 | |
| Adobe * | | | 29,585 | | | | 9,422,822 | |
| Advanced Micro Devices * | | | 102,235 | | | | 6,140,234 | |
| Akamai Technologies * | | | 9,811 | | | | 866,606 | |
| Amphenol, Cl A . | | | 37,913 | | | | 2,874,943 | |
|
|
|
| Schedule of Investments | | October 31, 2022 |
| Global X S&P 500® Covered Call ETF |
| | | | |
| |
| | | Shares | | | Value | |
| COMMON STOCK — continued | | | | | | |
| Information Technology — continued | | | | | | |
| Analog Devices | | | 31,974 | | | $ | 4,560,132 | |
| ANSYS * | | | 5,686 | | | | 1,257,516 | |
| Apple . | | | 951,853 | | | | 145,957,139 | |
| Applied Materials . | | | 55,188 | | | | 4,872,549 | |
| Arista Networks * | | | 14,137 | | | | 1,708,598 | |
| Autodesk * | | | 13,844 | | | | 2,966,769 | |
| Automatic Data Processing | | | 25,496 | | | | 6,162,383 | |
| Broadcom | | | 25,510 | | | | 11,992,761 | |
| Broadridge Financial Solutions . | | | 6,330 | | | | 949,880 | |
| Cadence Design Systems * | | | 17,451 | | | | 2,641,907 | |
| CDW | | | 7,620 | | | | 1,316,812 | |
| Ceridian HCM Holding * | | | 9,114 | | | | 603,256 | |
| Cisco Systems | | | 261,599 | | | | 11,884,443 | |
| Cognizant Technology Solutions, Cl A | | | 33,142 | | | | 2,063,089 | |
| Corning . | | | 42,658 | | | | 1,372,308 | |
| DXC Technology * | | | 15,387 | | | | 442,376 | |
| Enphase Energy * | | | 8,658 | | | | 2,658,006 | |
| EPAM Systems * | | | 3,259 | | | | 1,140,650 | |
F5 *
| | | 4,621 | | | | 660,387 | |
| Fidelity National Information Services . | | | 38,704 | | | | 3,212,045 | |
| Fiserv * | | | 39,291 | | | | 4,036,757 | |
| FleetCor Technologies * | | | 4,858 | | | | 904,171 | |
| Fortinet * | | | 41,819 | | | | 2,390,374 | |
| Gartner * | | | 4,968 | | | | 1,499,939 | |
| Global Payments | | | 16,057 | | | | 1,834,673 | |
| Hewlett Packard Enterprise | | | 83,892 | | | | 1,197,139 | |
| HP | | | 59,932 | | | | 1,655,322 | |
| Intel . | | | 259,835 | | | | 7,387,109 | |
| International Business Machines . | | | 57,138 | | | | 7,901,614 | |
| Intuit . | | | 17,362 | | | | 7,422,255 | |
| Jack Henry & Associates . | | | 4,871 | | | | 969,621 | |
| Juniper Networks . | | | 20,645 | | | | 631,737 | |
| Keysight Technologies * | | | 11,369 | | | | 1,979,911 | |
| KLA | | | 8,686 | | | | 2,748,685 | |
| Lam Research | | | 8,714 | | | | 3,527,253 | |
| Mastercard, Cl A . | | | 53,854 | | | | 17,673,806 | |
| Microchip Technology | | | 35,319 | | | | 2,180,595 | |
| Micron Technology . | | | 70,057 | | | | 3,790,084 | |
| Microsoft | | | 469,943 | | | | 109,087,869 | |
|
|
|
| Schedule of Investments | | October 31, 2022 |
| Global X S&P 500® Covered Call ETF |
| | | | |
| |
| | | Shares | | | Value | |
| COMMON STOCK — continued | | | | | | |
| Information Technology — continued | | | | | | |
| Monolithic Power Systems . | | | 2,950 | | | $ | 1,001,377 | |
| Motorola Solutions | | | 10,451 | | | | 2,609,719 | |
| NetApp . | | | 14,079 | | | | 975,252 | |
| NortonLifeLock | | | 36,774 | | | | 828,518 | |
| NVIDIA . | | | 157,994 | | | | 21,324,450 | |
| ON Semiconductor * | | | 27,776 | | | | 1,706,280 | |
| Oracle . | | | 96,125 | | | | 7,504,479 | |
| Paychex | | | 20,461 | | | | 2,420,741 | |
| Paycom Software * | | | 3,108 | | | | 1,075,368 | |
| PayPal Holdings * | | | 71,056 | | | | 5,938,860 | |
| PTC * | | | 5,847 | | | | 688,952 | |
| Qorvo * | | | 7,164 | | | | 616,677 | |
| QUALCOMM . | | | 71,017 | | | | 8,355,860 | |
| Roper Technologies | | | 6,681 | | | | 2,769,542 | |
| Salesforce * | | | 62,878 | | | | 10,223,334 | |
| Seagate Technology Holdings . | | | 13,810 | | | | 685,805 | |
| ServiceNow * | | | 12,450 | | | | 5,238,213 | |
| Skyworks Solutions | | | 9,689 | | | | 833,351 | |
| SolarEdge Technologies * | | | 3,469 | | | | 797,974 | |
| Synopsys * | | | 9,743 | | | | 2,850,315 | |
| Teledyne Technologies * | | | 3,098 | | | | 1,232,942 | |
| Teradyne . | | | 9,781 | | | | 795,684 | |
| Texas Instruments . | | | 57,757 | | | | 9,277,507 | |
| Trimble * | | | 14,780 | | | | 889,165 | |
| Tyler Technologies * | | | 2,770 | | | | 895,624 | |
| VeriSign * | | | 5,761 | | | | 1,154,850 | |
| Visa, Cl A . | | | 103,165 | | | | 21,371,661 | |
| Western Digital * | | | 19,588 | | | | 673,240 | |
| Zebra Technologies, Cl A * | | | 3,347 | | | | 947,937 | |
| | | | | | | | 533,576,265 | |
| Materials — 2.2% | | | | | | | | |
| Air Products & Chemicals . | | | 13,651 | | | | 3,418,210 | |
| Albemarle | | | 7,289 | | | | 2,039,973 | |
| Amcor | | | 99,092 | | | | 1,147,485 | |
| Avery Dennison . | | | 4,934 | | | | 836,560 | |
| Ball | | | 19,779 | | | | 976,885 | |
| Celanese, Cl A . | | | 6,528 | | | | 627,471 | |
| CF Industries Holdings | | | 14,408 | | | | 1,530,994 | |
| Corteva . | | | 45,771 | | | | 2,990,677 | |
|
|
|
| Schedule of Investments | | October 31, 2022 |
| Global X S&P 500® Covered Call ETF |
| | | | |
| |
| | | Shares | | | Value | |
| COMMON STOCK — continued | | | | | | |
| Materials — continued | | | | | | |
| Dow | | | 46,994 | | | $ | 2,196,500 | |
| DuPont de Nemours . | | | 32,841 | | | | 1,878,505 | |
| Eastman Chemical . | | | 9,113 | | | | 699,970 | |
| Ecolab | | | 15,837 | | | | 2,487,518 | |
| FMC . | | | 8,968 | | | | 1,066,295 | |
| Freeport-McMoRan . | | | 91,071 | | | | 2,886,040 | |
| International Flavors & Fragrances | | | 16,081 | | | | 1,569,666 | |
| International Paper . | | | 24,608 | | | | 827,075 | |
| LyondellBasell Industries, Cl A | | | 16,742 | | | | 1,279,926 | |
| Martin Marietta Materials | | | 3,505 | | | | 1,177,610 | |
| Mosaic . | | | 23,166 | | | | 1,245,173 | |
| Newmont | | | 50,739 | | | | 2,147,275 | |
| Nucor | | | 16,727 | | | | 2,197,593 | |
| Packaging Corp of America . | | | 6,067 | | | | 729,314 | |
| PPG Industries | | | 13,374 | | | | 1,527,043 | |
| Sealed Air | | | 9,902 | | | | 471,533 | |
| Sherwin-Williams . | | | 15,011 | | | | 3,377,925 | |
| Vulcan Materials | | | 9,110 | | | | 1,491,307 | |
| Westrock . | | | 17,604 | | |
| 599,592 | |
| | | | | | |
| 43,424,115 | |
| Real Estate — 2.8% | | | | | | | | |
| Alexandria Real Estate Equities ‡ | | | 9,227 | | | | 1,340,683 | |
| American Tower ‡ | | | 28,601 | | | | 5,925,841 | |
| AvalonBay Communities ‡ | | | 9,256 | | | | 1,620,911 | |
| Boston Properties ‡ | | | 9,631 | | | | 700,174 | |
| Camden Property Trust ‡ | | | 6,755 | | | | 780,540 | |
| CBRE Group, Cl A * | | | 20,541 | | | | 1,457,179 | |
| Crown Castle | | | 26,559 | | | | 3,539,252 | |
| Digital Realty Trust ‡ | | | 18,608 | | | | 1,865,452 | |
| Equinix . | | | 5,583 | | | | 3,162,435 | |
| Equity Residential ‡ | | | 21,994 | | | | 1,386,062 | |
| Essex Property Trust ‡ | | | 3,602 | | | | 800,509 | |
| Extra Space Storage ‡ | | | 7,630 | | | | 1,353,867 | |
| Federal Realty Investment Trust ‡ | | | 4,546 | | | | 449,963 | |
| Healthpeak Properties ‡ | | | 34,132 | | | | 809,952 | |
| Host Hotels & Resorts ‡ | | | 46,805 | | | | 883,678 | |
| Invitation Homes ‡ | | | 35,703 | | | | 1,131,428 | |
| Iron Mountain ‡ | | | 18,508 | | | | 926,696 | |
| Kimco Realty ‡ | | | 37,738 | | | | 806,838 | |
|
|
|
| Schedule of Investments | | October 31, 2022 |
| Global X S&P 500® Covered Call ETF |
| | | | |
| |
| | | Shares | | | Value | |
| COMMON STOCK — continued | | | | | | |
| Real Estate — continued | | | | | | |
| Mid-America Apartment Communities ‡ | | | 6,252 | | | $ | 984,377 | |
| ProLogis ‡ | | | 57,117 | | | | 6,325,708 | |
| Public Storage ‡ | | | 9,713 | | | | 3,008,602 | |
| Realty Income ‡ | | | 38,001 | | | | 2,366,322 | |
| Regency Centers ‡ | | | 9,997 | | | | 604,919 | |
| SBA Communications, Cl A | | | 6,924 | | | | 1,868,788 | |
| Simon Property Group ‡ | | | 20,801 | | | | 2,266,893 | |
| UDR ‡ | | | 18,361 | | | | 730,033 | |
| Ventas ‡ | | | 26,832 | | | | 1,049,936 | |
| VICI Properties ‡ | | | 61,724 | | | | 1,976,403 | |
| Vornado Realty Trust ‡ | | | 9,836 | | | | 232,031 | |
| Welltower ‡ | | | 29,735 | | | | 1,815,024 | |
| Weyerhaeuser ‡ | | | 46,940 | | | | 1,451,854 | |
| | | | | | | | 53,622,350 | |
| Utilities — 3.1% | | | | | | | | |
| AES . | | | 43,167 | | | | 1,129,249 | |
| Alliant Energy . | | | 14,747 | | | | 769,351 | |
| Ameren . | | | 14,355 | | | | 1,170,220 | |
| American Electric Power | | | 31,627 | | | | 2,780,646 | |
| American Water Works | | | 11,298 | | | | 1,642,051 | |
| Atmos Energy | | | 8,994 | | | | 958,311 | |
| CenterPoint Energy . | | | 39,493 | | | | 1,129,895 | |
| CMS Energy | | | 18,585 | | | | 1,060,274 | |
| Consolidated Edison | | | 23,066 | | | | 2,028,885 | |
| Constellation Energy . | | | 21,900 | | | | 2,070,395 | |
| Dominion Energy | | | 51,197 | | | | 3,582,254 | |
| DTE Energy . | | | 12,797 | | | | 1,434,672 | |
| Duke Energy | | | 47,323 | | | | 4,409,557 | |
| Edison International . | | | 25,532 | | | | 1,532,941 | |
| Entergy | | | 11,442 | | | | 1,225,896 | |
| Evergy | | | 14,693 | | | | 898,183 | |
| Eversource Energy . | | | 22,041 | | | | 1,681,287 | |
| Exelon | | | 61,030 | | | | 2,355,148 | |
| FirstEnergy | | | 38,551 | | | | 1,453,758 | |
| NextEra Energy . | | | 124,204 | | | | 9,625,810 | |
| NiSource . | | | 25,084 | | | | 644,408 | |
| NRG Energy | | | 14,667 | | | | 651,215 | |
| PG&E * | | | 98,323 | | | | 1,467,962 | |
| Pinnacle West Capital | | | 7,928 | | | | 532,841 | |
|
|
|
| Schedule of Investments | | October 31, 2022 |
| Global X S&P 500® Covered Call ETF |
| | | | |
| |
| | | Shares | | | Value | |
| COMMON STOCK — continued | | | | | | |
| Utilities — continued | | | | | | |
| PPL | | | 47,176 | | | $ | 1,249,692 | |
| Public Service Enterprise Group . | | | 32,270 | | | | 1,809,379 | |
| Sempra Energy . | | | 20,020 | | | | 3,021,819 | |
| Southern | | | 65,254 | | | | 4,272,832 | |
| WEC Energy Group . | | | 19,828 | | | | 1,810,891 | |
| Xcel Energy | | | 34,974 | | | | 2,277,157 | |
| | | | | | | | 60,676,979 | |
| TOTAL UNITED STATES | | | | | | | 2,035,508,456 | |
| TOTAL COMMON STOCK | | | | | | | | |
| (Cost $2,181,828,476) | | | | | | | 2,049,821,486 | |
| TOTAL INVESTMENTS — 106.0% | | | | | | | | |
| (Cost $2,181,828,476) | | | | | | $ | 2,049,821,486 | |
WRITTEN OPTIONS— (6.1)%
| | | | | | | | |
(Premiums Received $(71,984,158))
| | | | | | | (117,689,855
| )
|
| Percentages are based on Net Assets of $1,934,545,080. |
A list of the exchange traded option contracts held by the Fund at October 31, 2022, is as follows:
| Description | | Number of Contracts | | | Notional Amount | | | Exercise Price | | Expiration Date | | Value | |
| WRITTEN OPTIONS — (6.1)% | | | | | | | | | | | | | |
| Call Options | | | | | | | | | | | | | |
| S&P 500 Index | | | (5,293 | ) | | $ | (1,947,824,000 | ) | | $ | 3,680.00 | | 11/18/22 | | $ | (117,689,855 | ) |
* Non-income producing security.
‡ Real Estate Investment Trust
(A) All or a portion of these securities has been segregated as collateral for options contracts. The aggregate market value of collateral at October 31, 2022 was $2,049,821,486.
|
|
|
| Schedule of Investments | | October 31, 2022 |
| Global X S&P 500® Covered Call ETF |
The following is a summary of the level of inputs used as of October 31, 2022, in valuing the Fund's investments and other financial instruments carried at value:
| Investments in Securities | | Level 1 | | | Level 2 | | | Level 3 | | | Total | |
| Common Stock | | $ | 2,049,821,486 | | | $ | — | | | $ | — | | | $ | 2,049,821,486 | |
| Total Investments in Securities | | $ | 2,049,821,486 | | | $ | — | | | $ | — | | | $ | 2,049,821,486 | |
| Other Financial Instruments | | Level 1 | | | Level 2 | | | Level 3 | | | Total | |
| Written Options | | $ | (117,689,855 | ) | | $ | – | | | $ | – | | | $ | (117,689,855 | ) |
| Total Other Financial Instruments | | $ | (117,689,855 | ) | | $ | – | | | $ | – | | | $ | (117,689,855 | ) |
Amounts designated as “—“ are $0 or have been rounded to $0.
See "Glossary" for abbreviations.
|
|
|
| Schedule of Investments | | October 31, 2022 |
| Global X Russell 2000 Covered Call ETF |
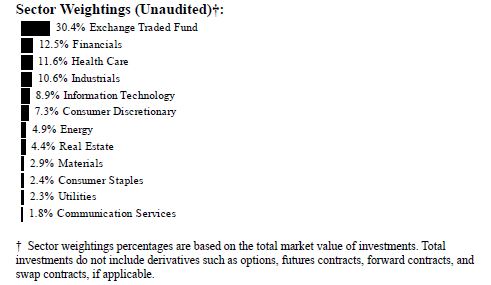
| | | | |
| |
| | | Shares | | | Value | |
| COMMON STOCK — 75.8%(A) | | | | | | |
| AUSTRALIA — 0.0% | | | | | | |
| Consumer Discretionary — 0.0% | | | | | | |
| Cenntro Electric Group * | | | 1 | | | $ | 1 | |
| BAHAMAS — 0.0% | | | | | | | | |
| Consumer Discretionary — 0.0% | | | | | | | | |
| OneSpaWorld Holdings * | | | 32,104 | | | | 291,183 | |
| BERMUDA — 0.2% | | | | | | | | |
| Communication Services — 0.0% | | | | | | | | |
| Wejo Group * | | | 1 | | | | 1 | |
| Energy — 0.0% | | | | | | | | |
| Teekay * | | | 1 | | | | 4 | |
| Financials — 0.1% | | | | | | | | |
| Bank of NT Butterfield & Son | | | 21,259 | | | | 734,286 | |
| SiriusPoint * | | | 36,721 | | | | 235,749 | |
| | | | | | | | 970,035 | |
|
|
|
| Schedule of Investments | | October 31, 2022 |
| Global X Russell 2000 Covered Call ETF |
| | | | |
| |
| | | Shares | | | Value | |
| COMMON STOCK — continued | | | | | | |
| Industrials — 0.1% | | | | | | |
| Triton International . | | | 27,834 | | | $ | 1,689,245 | |
| TOTAL BERMUDA | | | | | | | 2,659,285 | |
| BRAZIL — 0.1% | | | | | | | | |
| Information Technology — 0.1% | | | | | | | | |
| StoneCo, Cl A * | | | 121,326 | | | | 1,273,923 | |
| CAMEROON — 0.1% | | | | | | | | |
| Energy — 0.1% | | | | | | | | |
| Golar LNG * | | | 42,883 | | | | 1,193,005 | |
| CANADA — 0.4% | | | | | | | | |
| Consumer Staples — 0.0% | | | | | | | | |
| SunOpta * | | | 40,348 | | | | 453,108 | |
| Energy — 0.0% | | | | | | | | |
| Teekay Tankers, Cl A * | | | 10,308 | | | | 324,599 | |
| Health Care — 0.1% | | | | | | | | |
| AbCellera Biologics * | | | 91,454 | | | | 1,081,901 | |
| Aurinia Pharmaceuticals * | | | 55,542 | | | | 451,556 | |
| | | | | | | | 1,533,457 | |
| Industrials — 0.1% | | | | | | | | |
| Brookfield Business, Cl A | | | 10,831 | | | | 277,490 | |
| Li-Cycle Holdings * | | | 54,665 | | | | 325,804 | |
| | | | | | | | 603,294 | |
| Materials — 0.0% | | | | | | | | |
| Novagold Resources * | | | 98,097 | | | | 454,189 | |
| PolyMet Mining * | | | 1 | | | | 3 | |
| | | | | | | | 454,192 | |
| Utilities — 0.2% | | | | | | | | |
| Brookfield Infrastructure, Cl A | | | 42,506 | | | | 1,832,859 | |
| TOTAL CANADA | | | | | | | 5,201,509 | |
|
|
|
| Schedule of Investments | | October 31, 2022 |
| Global X Russell 2000 Covered Call ETF |
| | | | |
| |
| | | Shares | | | Value | |
| COMMON STOCK — continued | | | | | | |
| CHILE — 0.0% | | | | | | |
| Communication Services — 0.0% | | | | | | |
| Liberty Latin America, Cl A * | | | 16,493 | | | $ | 128,315 | |
| Liberty Latin America, Cl C * | | | 63,564 | | | | 495,164 | |
| TOTAL CHILE | | | | | | | 623,479 | |
| CHINA — 0.1% | | | | | | | | |
| Industrials — 0.1% | | | | | | | | |
| Textainer Group Holdings | | | 20,012 | | | | 598,759 | |
| Information Technology — 0.0% | | | | | | | | |
| indie Semiconductor, Cl A * | | | 41,295 | | | | 322,927 | |
| TOTAL CHINA | | | | | | | 921,686 | |
| GERMANY — 0.0% | | | | | | | | |
| Health Care — 0.0% | | | | | | | | |
| Affimed * | | | 1 | | | | 2 | |
| Materials — 0.0% | | | | | | | | |
| Orion Engineered Carbons | | | 25,840 | | | | 412,406 | |
| TOTAL GERMANY | | | | | | | 412,408 | |
| GHANA — 0.1% | | | | | | | | |
| Energy — 0.1% | | | | | | | | |
| Kosmos Energy * | | | 189,726 | | | | 1,231,322 | |
| GREECE — 0.0% | | | | | | | | |
| Industrials — 0.0% | | | | | | | | |
| Safe Bulkers . | | | 1 | | | | 3 | |
| IRELAND — 0.1% | | | | | | | | |
| Energy — 0.0% | | | | | | | | |
| Ardmore Shipping * | | | 14,392 | | | | 194,724 | |
| Health Care — 0.1% | | | | | | | | |
| Prothena * | | | 15,480 | | | | 951,091 | |
|
|
|
| Schedule of Investments | | October 31, 2022 |
| Global X Russell 2000 Covered Call ETF |
| | | | |
| |
| | | Shares | | | Value | |
| COMMON STOCK — continued | | | | | | |
| Industrials — 0.0% | | | | | | |
| Cimpress * | | | 7,544 | | | $ | 175,624 | |
| TOTAL IRELAND | | | | | | | 1,321,439 | |
| ISRAEL — 0.1% | | | | | | | | |
| Communication Services — 0.0% | | | | | | | | |
| Innovid * | | | 1 | | | | 4 | |
| Consumer Discretionary — 0.0% | | | | | | | | |
| NEOGAMES * | | | 4,684 | | | | 80,565 | |
| Health Care — 0.1% | | | | | | | | |
| Nano-X Imaging * | | | 22,381 | | | | 317,810 | |
| Information Technology — 0.0% | | | | | | | | |
| Sapiens International | | | 13,305 | | | | 261,709 | |
| TOTAL ISRAEL | | | | | | | 660,088 | |
| ITALY — 0.0% | | | | | | | | |
| Consumer Discretionary — 0.0% | | | | | | | | |
| Ermenegildo Zegna Holditalia . | | | 19,651 | | | | 215,375 | |
| Information Technology — 0.0% | | | | | | | | |
| Kaleyra * | | | 1 | | | | 1 | |
| TOTAL ITALY | | | | | | | 215,376 | |
| MALTA — 0.0% | | | | | | | | |
| Communication Services — 0.0% | | | | | | | | |
| Gambling.com Group * | | | 3,671 | | | | 30,763 | |
| MONACO — 0.1% | | | | | | | | |
| Energy — 0.1% | | | | | | | | |
| Scorpio Tankers . | | | 20,844 | | | | 999,261 | |
| Industrials — 0.0% | | | | | | | | |
| Costamare . | | | 21,890 | | | | 206,642 | |
| TOTAL MONACO | | | | | | | 1,205,903 | |
|
|
|
| Schedule of Investments | | October 31, 2022 |
| Global X Russell 2000 Covered Call ETF |
| | | | |
| |
| | | Shares | | | Value | |
| COMMON STOCK — continued | | | | | | |
| NORWAY — 0.2% | | | | | | |
| Energy — 0.1% | | | | | | |
| FLEX LNG . | | | 12,209 | | | $ | 381,531 | |
| Frontline | | | 62,115 | | | | 780,165 | |
| SFL | | | 49,682 | | | | 506,756 | |
| | | | | | | | 1,668,452 | |
| Industrials — 0.1% | | | | | | | | |
| Golden Ocean Group | | | 50,760 | | | | 422,831 | |
| TOTAL NORWAY | | | | | | | 2,091,283 | |
| PANAMA — 0.0% | | | | | | | | |
| Financials — 0.0% | | | | | | | | |
| Banco Latinoamericano de Comercio Exterior, | | | | | | | | |
Cl E | | | 12,522 | | | | 196,470 | |
| PUERTO RICO — 0.2% | | | | | | | | |
| Financials — 0.1% | | | | | | | | |
| First BanCorp . | | | 83,523 | | | | 1,318,828 | |
| OFG Bancorp . | | | 20,787 | | | | 579,542 | |
| | | | | | | | 1,898,370 | |
| Information Technology — 0.1% | | | | | | | | |
| EVERTEC | | | 27,646 | | | | 990,003 | |
| TOTAL PUERTO RICO | | | | | | | 2,888,373 | |
| SINGAPORE — 0.1% | | | | | | | | |
| Information Technology — 0.1% | | | | | | | | |
| Kulicke & Soffa Industries | | | 25,569 | | | | 1,072,364 | |
| THAILAND — 0.1% | | | | | | | | |
| Information Technology — 0.1% | | | | | | | | |
| Fabrinet * | | | 15,680 | | | | 1,793,792 | |
| UNITED ARAB EMIRATES — 0.0% | | | | | | | | |
| Energy — 0.0% | | | | | | | | |
| Borr Drilling * | | | 55,613 | | | | 273,060 | |
|
|
|
| Schedule of Investments | | October 31, 2022 |
| Global X Russell 2000 Covered Call ETF |
| | | | |
| |
| | | Shares | | | Value | |
| COMMON STOCK — continued | | | | | | |
| UNITED KINGDOM — 0.0% | | | | | | |
| Health Care — 0.0% | | | | | | |
| Babylon Holdings, Cl A * | | | 1 | | | $ | — | |
| Industrials — 0.0% | | | | | | | | |
| Luxfer Holdings | | | 12,150 | | | | 175,811 | |
| TOTAL UNITED KINGDOM | | | | | | | 175,811 | |
| UNITED STATES — 73.9% | | | | | | | | |
| Communication Services — 1.9% | | | | | | | | |
| AdTheorent Holding * | | | 1 | | | | 2 | |
| Advantage Solutions * | | | 1 | | | | 3 | |
| AMC Networks, Cl A * | | | 12,630 | | | | 284,301 | |
| Anterix * | | | 8,160 | | | | 312,936 | |
| Arena Group Holdings * | | | 4,773 | | | | 67,299 | |
| ATN International . | | | 4,813 | | | | 207,537 | |
| Audacy, Cl A * | | | 1 | | | | — | |
| Bandwidth, Cl A * | | | 10,053 | | | | 119,329 | |
| Boston Omaha, Cl A * | | | 8,923 | | | | 248,684 | |
| Bumble, Cl A * | | | 37,052 | | | | 941,121 | |
| Cardlytics * | | | 14,005 | | | | 132,067 | |
| Cargurus, Cl A * | | | 49,170 | | | | 715,915 | |
| Cars.com * | | | 28,236 | | | | 391,916 | |
| Charge Enterprises * | | | 1 | | | | 2 | |
| Cinemark Holdings * | | | 46,096 | | | | 489,079 | |
| Clear Channel Outdoor Holdings, Cl A * | | | 1 | | | | 1 | |
| Cogent Communications Holdings . | | | 18,937 | | | | 994,382 | |
| Consolidated Communications Holdings * | | | 30,392 | | | | 157,127 | |
| Cumulus Media, Cl A * | | | 7,667 | | | | 56,506 | |
| Daily Journal * | | | 617 | | | | 165,510 | |
| DHI Group * | | | 17,672 | | | | 113,101 | |
| EchoStar, Cl A * | | | 15,893 | | | | 299,901 | |
| Entravision Communications, Cl A | | | 24,808 | | | | 116,101 | |
| Eventbrite, Cl A * | | | 31,494 | | | | 206,916 | |
| EverQuote, Cl A * | | | 8,145 | | | | 49,603 | |
| EW Scripps, Cl A * | | | 24,766 | | | | 351,430 | |
| fuboTV * | | | 76,197 | | | | 278,881 | |
| Gannett * | | | 1 | | | | 1 | |
| Globalstar * | | | 1 | | | | 2 | |
| Gogo * | | | 24,224 | | | | 344,465 | |
|
|
|
| Schedule of Investments | | October 31, 2022 |
| Global X Russell 2000 Covered Call ETF |
| | | | |
| |
| | | Shares | | | Value | |
| COMMON STOCK — continued | | | | | | |
| Communication Services — continued | | | | | | |
| Gray Television | | | 36,295 | | | $ | 513,574 | |
| IDT, Cl B * | | | 6,419 | | | | 167,279 | |
| iHeartMedia, Cl A * | | | 47,175 | | | | 390,609 | |
| IMAX * | | | 21,399 | | | | 272,409 | |
| Integral Ad Science Holding * | | | 14,255 | | | | 120,027 | |
| Iridium Communications * | | | 54,199 | | | | 2,792,875 | |
| John Wiley & Sons, Cl A . | | | 18,232 | | | | 769,208 | |
| KORE Group Holdings * | | | 1 | | | | 3 | |
| Leafly Holdings * | | | 1 | | | | 1 | |
| Liberty Media -Liberty Braves * | | | 15,779 | | | | 491,674 | |
| Liberty Media -Liberty Braves, Cl A * | | | 4,604 | | | | 146,822 | |
| Lions Gate Entertainment, Cl A * | | | 23,892 | | | | 192,570 | |
| Lions Gate Entertainment, Cl B * | | | 48,530 | | | | 368,343 | |
| Loyalty Ventures * | | | 1 | | | | 1 | |
| Madison Square Garden Entertainment * | | | 11,001 | | | | 539,379 | |
| Magnite * | | | 53,587 | | | | 390,649 | |
| Marcus . | | | 9,401 | | | | 141,391 | |
| MediaAlpha, Cl A * | | | 9,028 | | | | 99,127 | |
| Ooma * | | | 9,231 | | | | 149,819 | |
| Outbrain * | | | 11,814 | | | | 50,564 | |
| Playstudios * | | | 1 | | | | 5 | |
| PubMatic, Cl A * | | | 20,006 | | | | 348,104 | |
| QuinStreet * | | | 20,804 | | | | 237,374 | |
| Radius Global Infrastructure, Cl A * | | | 31,105 | | | | 290,832 | |
| Reservoir Media * | | | 8,401 | | | | 48,726 | |
| Scholastic | | | 13,744 | | | | 524,196 | |
| Shenandoah Telecommunications | | | 20,650 | | | | 467,929 | |
| Shutterstock | | | 10,334 | | | | 517,010 | |
| Sinclair Broadcast Group, Cl A . | | | 19,040 | | | | 339,102 | |
| Skillz, Cl A * | | | 1 | | | | 1 | |
| Stagwell * | | | 37,731 | | | | 286,378 | |
| Starry Group Holdings, Cl A * | | | 1 | | | | — | |
| TechTarget * | | | 11,526 | | | | 744,003 | |
| TEGNA | | | 96,410 | | | | 2,013,041 | |
| Telephone and Data Systems | | | 42,969 | | | | 730,473 | |
| Thryv Holdings * | | | 10,500 | | | | 214,830 | |
| TrueCar * | | | 1 | | | | 2 | |
| United States Cellular * | | | 6,636 | | | | 206,844 | |
| Urban One * | | | 4,963 | | | | 24,666 | |
|
|
|
| Schedule of Investments | | October 31, 2022 |
| Global X Russell 2000 Covered Call ETF |
| | | | |
| |
| | | Shares | | | Value | |
| COMMON STOCK — continued | | | | | | |
| Communication Services — continued | | | | | | |
| Urban One, Cl A * | | | 3,388 | | | $ | 20,430 | |
| Vimeo * | | | 59,315 | | | | 225,397 | |
| Vinco Ventures * | | | 1 | | | | 1 | |
| WideOpenWest * | | | 22,515 | | | | 308,681 | |
| Yelp, Cl A * | | | 30,071 | | | | 1,155,027 | |
| Ziff Davis * | | | 20,781 | | | | 1,608,242 | |
| ZipRecruiter, Cl A * | | | 35,718 | | | | 598,991 | |
| | | | | | | | 25,550,727 | |
| Consumer Discretionary — 7.9% | | | | | | | | |
| 1-800-Flowers.com, Cl A * | | | 10,860 | | | | 79,169 | |
| 1stdibs.com * | | | 8,655 | | | | 58,594 | |
2U *
| | | 30,035 | | | | 185,917 | |
| Aaron's | | | 13,517 | | | | 140,847 | |
| Abercrombie & Fitch, Cl A * | | | 22,970 | | | | 403,813 | |
| Academy Sports & Outdoors . | | | 35,457 | | | | 1,561,172 | |
| Accel Entertainment, Cl A * | | | 23,519 | | | | 230,957 | |
| Acushnet Holdings | | | 14,665 | | | | 682,949 | |
| Adient * | | | 40,064 | | | | 1,401,439 | |
| Adtalem Global Education * | | | 20,529 | | | | 856,059 | |
| aka Brands Holding * | | | 1 | | | | 2 | |
| Allbirds, Cl A * | | | 39,065 | | | | 134,384 | |
| American Axle & Manufacturing Holdings * | | | 46,528 | | | | 450,856 | |
| American Eagle Outfitters | | | 65,419 | | | | 743,160 | |
| American Public Education * | | | 7,602 | | | | 97,382 | |
| America's Car-Mart * | | | 2,545 | | | | 173,976 | |
| AMMO * | | | 1 | | | | 3 | |
| Arko | | | 34,379 | | | | 352,385 | |
| Asbury Automotive Group * | | | 9,718 | | | | 1,533,014 | |
| Aterian * | | | 1 | | | | 1 | |
| Bally's * | | | 16,695 | | | | 376,305 | |
| BARK * | | | 1 | | | | 2 | |
| Beachbody * | | | 1 | | | | 1 | |
| Beazer Homes USA * | | | 11,946 | | | | 135,109 | |
| Bed Bath & Beyond * | | | 37,802 | | | | 172,755 | |
| Big 5 Sporting Goods | | | 8,688 | | | | 111,988 | |
| Big Lots . | | | 12,716 | | | | 239,951 | |
| Biglari Holdings, Cl B * | | | 301 | | | | 41,523 | |
| BJ's Restaurants * | | | 9,846 | | | | 323,441 | |
| Bloomin' Brands . | | | 37,575 | | | | 902,176 | |
|
|
|
| Schedule of Investments | | October 31, 2022 |
| Global X Russell 2000 Covered Call ETF |
| | | | |
| |
| | | Shares | | | Value | |
| COMMON STOCK — continued | | | | | | |
| Consumer Discretionary — continued | | | | | | |
| Bluegreen Vacations Holding, Cl A . | | | 6,233 | | | $ | 107,893 | |
| Boot Barn Holdings * | | | 12,417 | | | | 705,286 | |
| Bowlero * | | | 16,057 | | | | 233,790 | |
| Boxed * | | | 1 | | | | — | |
| Brinker International * | | | 18,873 | | | | 630,169 | |
| Buckle | | | 12,898 | | | | 507,278 | |
| Build-A-Bear Workshop, Cl A | | | 5,927 | | | | 104,256 | |
| Caleres . | | | 15,728 | | | | 429,846 | |
| Camping World Holdings, Cl A | | | 17,469 | | | | 486,162 | |
| Canoo * | | | 1 | | | | 1 | |
| CarParts.com * | | | 20,261 | | | | 94,821 | |
| Carriage Services, Cl A | | | 6,416 | | | | 156,615 | |
| Cato, Cl A | | | 7,975 | | | | 94,982 | |
| Cavco Industries * | | | 3,930 | | | | 890,813 | |
| Century Casinos * | | | 11,233 | | | | 89,302 | |
| Century Communities | | | 12,687 | | | | 564,698 | |
| Cheesecake Factory | | | 21,155 | | | | 757,561 | |
| Chegg * | | | 52,612 | | | | 1,134,841 | |
| Chico's FAS * | | | 49,956 | | | | 293,741 | |
| Children's Place * | | | 5,914 | | | | 239,399 | |
| Chuy's Holdings * | | | 8,607 | | | | 252,185 | |
| Citi Trends * | | | 3,707 | | | | 83,815 | |
| Clarus . | | | 11,872 | | | | 143,770 | |
| Conn's * | | | 6,922 | | | | 56,830 | |
| Container Store Group * | | | 13,032 | | | | 70,764 | |
| ContextLogic, Cl A * | | | 1 | | | | 1 | |
| Coursera * | | | 51,347 | | | | 661,863 | |
| Cracker Barrel Old Country Store . | | | 9,919 | | | | 1,132,948 | |
| Crocs * | | | 26,231 | | | | 1,855,843 | |
| Dana . | | | 59,278 | | | | 946,077 | |
| Dave & Buster's Entertainment * | | | 18,501 | | | | 737,265 | |
| Denny's * | | | 25,181 | | | | 285,301 | |
| Designer Brands, Cl A | | | 25,968 | | | | 395,493 | |
| Destination XL Group * | | | 24,746 | | | | 165,303 | |
| Dillard's, Cl A . | | | 2,131 | | | | 700,651 | |
| Dine Brands Global | | | 6,933 | | | | 499,800 | |
| Dorman Products * | | | 11,211 | | | | 915,042 | |
| Dream Finders Homes, Cl A * | | | 8,714 | | | | 96,725 | |
| Duluth Holdings, Cl B * | | | 5,057 | | | | 43,996 | |
|
|
|
| Schedule of Investments | | October 31, 2022 |
| Global X Russell 2000 Covered Call ETF |
| | | | |
| |
| | | Shares | | | Value | |
| COMMON STOCK — continued | | | | | | |
| Consumer Discretionary — continued | | | | | | |
| Duolingo, Cl A * | | | 9,981 | | | $ | 816,845 | |
| El Pollo Loco Holdings . | | | 8,129 | | | | 81,615 | |
| Ethan Allen Interiors . | | | 9,866 | | | | 252,471 | |
| European Wax Center, Cl A . | | | 12,564 | | | | 180,670 | |
| Everi Holdings * | | | 36,727 | | | | 697,078 | |
| EVgo * | | | 28,111 | | | | 208,303 | |
| Express * | | | 1 | | | | 1 | |
| F45 Training Holdings * | | | 1 | | | | 3 | |
| Faraday Future Intelligent Electric * | | | 1 | | | | 1 | |
| First Watch Restaurant Group * | | | 4,174 | | | | 71,167 | |
| Fisker * | | | 66,992 | | | | 545,985 | |
| Foot Locker . | | | 38,182 | | | | 1,210,369 | |
| Fossil Group * | | | 19,378 | | | | 82,357 | |
| Fox Factory Holding * | | | 18,445 | | | | 1,620,393 | |
| Franchise Group . | | | 12,078 | | | | 366,567 | |
| Frontdoor * | | | 35,141 | | | | 775,210 | |
| Full House Resorts * | | | 13,575 | | | | 95,161 | |
| Funko, Cl A * | | | 13,343 | | | | 275,533 | |
| Genesco * | | | 6,040 | | | | 284,122 | |
| Gentherm * | | | 14,112 | | | | 824,423 | |
| G-III Apparel Group * | | | 18,895 | | | | 368,453 | |
| Golden Entertainment * | | | 8,497 | | | | 358,743 | |
| Goodyear Tire & Rubber * | | | 122,600 | | | | 1,557,020 | |
| GoPro, Cl A * | | | 53,214 | | | | 290,016 | |
| Graham Holdings, Cl B . | | | 1,644 | | | | 1,025,642 | |
| Green Brick Partners * | | | 12,936 | | | | 299,210 | |
| Group 1 Automotive | | | 6,960 | | | | 1,204,080 | |
| Groupon, Cl A * | | | 9,434 | | | | 69,529 | |
| GrowGeneration * | | | 22,976 | | | | 82,024 | |
| Guess? . | | | 16,627 | | | | 282,326 | |
| Haverty Furniture | | | 6,949 | | | | 184,704 | |
| Helen of Troy * | | | 10,160 | | | | 961,339 | |
| Hibbett . | | | 5,909 | | | | 368,840 | |
| Hilton Grand Vacations * | | | 40,711 | | | | 1,597,500 | |
| Holley * | | | 21,339 | | | | 84,929 | |
| Hovnanian Enterprises, Cl A * | | | 2,388 | | | | 96,308 | |
| Inspirato * | | | 1 | | | | 2 | |
| Inspired Entertainment * | | | 9,225 | | | | 94,464 | |
| Installed Building Products | | | 10,289 | | | | 884,854 | |
|
|
|
| Schedule of Investments | | October 31, 2022 |
| Global X Russell 2000 Covered Call ETF |
| | | | |
| |
| | | Shares | | | Value | |
| COMMON STOCK — continued | | | | | | |
| Consumer Discretionary — continued | | | | | | |
| International Game Technology . | | | 42,430 | | | $ | 850,722 | |
| iRobot * | | | 11,437 | | | | 646,191 | |
| Jack in the Box . | | | 9,030 | | | | 796,717 | |
| JOANN . | | | 4,717 | | | | 24,953 | |
| Johnson Outdoors, Cl A | | | 2,348 | | | | 123,552 | |
| KB Home | | | 33,714 | | | | 971,637 | |
| Kontoor Brands | | | 23,921 | | | | 853,980 | |
| Krispy Kreme | | | 33,425 | | | | 479,649 | |
| Kura Sushi USA, Cl A * | | | 2,090 | | | | 165,173 | |
| Lands' End * | | | 5,973 | | | | 62,597 | |
| Landsea Homes * | | | 4,344 | | | | 21,112 | |
| Latham Group * | | | 17,919 | | | | 79,202 | |
| Laureate Education, Cl A | | | 50,092 | | | | 633,163 | |
| La-Z-Boy . | | | 18,671 | | | | 462,481 | |
| LCI Industries | | | 10,564 | | | | 1,120,946 | |
| Legacy Housing * | | | 4,026 | | | | 74,723 | |
| LGI Homes * | | | 9,127 | | | | 840,140 | |
| Life Time Group Holdings * | | | 18,174 | | | | 190,645 | |
| Lifetime Brands . | | | 5,430 | | | | 46,508 | |
| Light & Wonder * | | | 43,714 | | | | 2,454,104 | |
| Lindblad Expeditions Holdings * | | | 12,659 | | | | 106,209 | |
| Liquidity Services * | | | 9,944 | | | | 170,838 | |
| LL Flooring Holdings * | | | 11,946 | | | | 99,391 | |
| Lordstown Motors, Cl A * | | | 1 | | | | 2 | |
| Lovesac * | | | 5,716 | | | | 139,127 | |
| Lulu's Fashion Lounge Holdings * | | | 13,842 | | | | 86,651 | |
| Luminar Technologies, Cl A * | | | 108,339 | | | | 876,463 | |
| M/I Homes * | | | 12,118 | | | | 502,776 | |
| Malibu Boats, Cl A * | | | 8,938 | | | | 472,820 | |
| Marine Products | | | 3,258 | | | | 32,580 | |
| MarineMax * | | | 9,105 | | | | 294,183 | |
| MasterCraft Boat Holdings * | | | 8,121 | | | | 176,713 | |
| MDC Holdings . | | | 24,274 | | | | 739,386 | |
| Meritage Homes * | | | 15,509 | | | | 1,181,165 | |
| Modine Manufacturing * | | | 20,464 | | | | 366,715 | |
| Monarch Casino & Resort * | | | 5,670 | | | | 450,255 | |
| Monro . | | | 14,176 | | | | 676,904 | |
| Motorcar Parts of America * | | | 7,602 | | | | 144,438 | |
| Movado Group | | | 6,868 | | | | 227,125 | |
|
|
|
| Schedule of Investments | | October 31, 2022 |
| Global X Russell 2000 Covered Call ETF |
| | | | |
| |
| | | Shares | | | Value | |
| COMMON STOCK — continued | | | | | | |
| Consumer Discretionary — continued | | | | | | |
| Mullen Automotive * | | | 1 | | | $ | — | |
| Murphy USA . | | | 9,752 | | | | 3,067,102 | |
| National Vision Holdings * | | | 34,948 | | | | 1,294,474 | |
| Nerdy * | | | 1 | | | | 2 | |
| Noodles, Cl A * | | | 16,833 | | | | 97,968 | |
| ODP * | | | 19,146 | | | | 757,607 | |
| ONE Group Hospitality * | | | 8,858 | | | | 66,258 | |
| OneWater Marine, Cl A * | | | 4,828 | | | | 159,324 | |
| Overstock.com * | | | 18,329 | | | | 426,149 | |
| Oxford Industries . | | | 6,844 | | | | 696,240 | |
| Papa John's International . | | | 14,040 | | | | 1,019,725 | |
| Party City Holdco * | | | 1 | | | | 2 | |
| Patrick Industries . | | | 9,683 | | | | 442,610 | |
| Perdoceo Education * | | | 28,812 | | | | 329,321 | |
| PetMed Express . | | | 8,924 | | | | 190,260 | |
| PLBY Group * | | | 12,116 | | | | 43,860 | |
| Porch Group * | | | 1 | | | | 1 | |
| Portillo's, Cl A * | | | 9,729 | | | | 208,590 | |
| Poshmark, Cl A * | | | 19,097 | | | | 341,072 | |
| Purple Innovation, Cl A * | | | 1 | | | | 4 | |
| Quotient Technology * | | | 1 | | | | 2 | |
| Qurate Retail, Cl A | | | 1 | | | | 2 | |
| RCI Hospitality Holdings . | | | 3,926 | | | | 331,472 | |
| RealReal * | | | 1 | | | | 2 | |
| Red Rock Resorts, Cl A . | | | 22,732 | | | | 946,788 | |
| Rent the Runway, Cl A * | | | 1 | | | | 2 | |
| Rent-A-Center, Cl A | | | 26,432 | | | | 551,107 | |
| Revolve Group, Cl A * | | | 17,135 | | | | 411,240 | |
| Rocky Brands . | | | 3,095 | | | | 60,925 | |
| Rover Group, Cl A * | | | 38,428 | | | | 168,699 | |
| RumbleON, Cl B * | | | 4,322 | | | | 70,751 | |
| Rush Street Interactive * | | | 22,740 | | | | 94,371 | |
| Ruth's Hospitality Group . | | | 14,388 | | | | 298,983 | |
| Sally Beauty Holdings * | | | 45,102 | | | | 573,246 | |
| SeaWorld Entertainment * | | | 20,666 | | | | 1,201,935 | |
| Shake Shack, Cl A * | | | 15,916 | | | | 884,452 | |
| Shoe Carnival . | | | 7,699 | | | | 184,622 | |
| Signet Jewelers . | | | 21,575 | | | | 1,407,553 | |
| Skyline Champion * | | | 23,266 | | | | 1,354,314 | |
|
|
|
| Schedule of Investments | | October 31, 2022 |
| Global X Russell 2000 Covered Call ETF |
| | | | |
| |
| | | Shares | | | Value | |
| COMMON STOCK — continued | | | | | | |
| Consumer Discretionary — continued | | | | | | |
| Sleep Number * | | | 9,394 | | | $ | 260,590 | |
| Smith & Wesson Brands | | | 20,208 | | | | 228,148 | |
| Snap One Holdings * | | | 7,602 | | | | 90,616 | |
| Solid Power * | | | 55,332 | | | | 310,413 | |
| Solo Brands, Cl A * | | | 6,993 | | | | 28,881 | |
| Sonder Holdings * | | | 1 | | | | 2 | |
| Sonic Automotive, Cl A | | | 9,075 | | | | 424,256 | |
| Sonos * | | | 54,265 | | | | 874,752 | |
| Sportsman's Warehouse Holdings * | | | 17,919 | | | | 160,913 | |
| Standard Motor Products . | | | 8,885 | | | | 337,008 | |
| Steven Madden . | | | 33,883 | | | | 1,012,085 | |
| Stitch Fix, Cl A * | | | 33,496 | | | | 133,984 | |
| StoneMor * | | | 1 | | | | 3 | |
| Stoneridge * | | | 11,478 | | | | 239,546 | |
| Strategic Education . | | | 10,155 | | | | 700,695 | |
| Stride * | | | 17,635 | | | | 590,949 | |
| Sturm Ruger . | | | 7,367 | | | | 413,510 | |
| Superior Group . | | | 5,445 | | | | 54,014 | |
| Sweetgreen, Cl A * | | | 37,005 | | | | 688,293 | |
| Target Hospitality * | | | 15,056 | | | | 183,232 | |
| Taylor Morrison Home, Cl A * | | | 50,113 | | | | 1,319,976 | |
| Tenneco, Cl A * | | | 36,968 | | | | 728,270 | |
| Texas Roadhouse, Cl A | | | 29,276 | | | | 2,896,860 | |
| ThredUp, Cl A * | | | 1 | | | | 1 | |
| Tile Shop Holdings . | | | 1 | | | | 4 | |
| Tilly's, Cl A . | | | 9,231 | | | | 81,787 | |
| Topgolf Callaway Brands * | | | 59,208 | | | | 1,108,374 | |
| Torrid Holdings * | | | 7,092 | | | | 34,964 | |
| Traeger * | | | 1 | | | | 4 | |
| TravelCenters of America * | | | 5,434 | | | | 345,494 | |
| Tri Pointe Homes * | | | 45,804 | | | | 767,217 | |
| Tupperware Brands * | | | 19,581 | | | | 151,361 | |
| Udemy * | | | 29,822 | | | | 433,910 | |
| Unifi * | | | 5,803 | | | | 52,923 | |
| Universal Electronics * | | | 5,558 | | | | 113,439 | |
| Universal Technical Institute * | | | 13,347 | | | | 92,094 | |
| Urban Outfitters * | | | 28,997 | | | | 691,868 | |
| Vacasa, Cl A * | | | 25,506 | | | | 93,097 | |
| Vista Outdoor * | | | 23,860 | | | | 692,894 | |
|
|
|
| Schedule of Investments | | October 31, 2022 |
| Global X Russell 2000 Covered Call ETF |
| | | | |
| |
| | | Shares | | | Value | |
| COMMON STOCK — continued | | | | | | |
| Consumer Discretionary — continued | | | | | | |
| Visteon * | | | 11,777 | | | $ | 1,536,545 | |
| Vivid Seats, Cl A * | | | 10,306 | | | | 84,509 | |
| Vivint Smart Home * | | | 38,180 | | | | 292,077 | |
| Vizio Holding, Cl A * | | | 28,081 | | | | 314,507 | |
| Volta * | | | 1 | | | | 1 | |
| Vuzix * | | | 24,435 | | | | 122,175 | |
| Warby Parker, Cl A * | | | 37,732 | | | | 605,599 | |
| Weber, Cl A . | | | 9,368 | | | | 62,391 | |
| Weyco Group | | | 2,368 | | | | 61,165 | |
| Wingstop | | | 12,761 | | | | 2,021,215 | |
| Winmark . | | | 1,459 | | | | 367,143 | |
| Winnebago Industries | | | 13,733 | | | | 819,723 | |
| Wolverine World Wide . | | | 34,427 | | | | 589,735 | |
| Workhorse Group * | | | 1 | | | | 3 | |
| WW International * | | | 21,890 | | | | 98,943 | |
| Xometry, Cl A * | | | 14,340 | | | | 861,260 | |
| XPEL * | | | 9,677 | | | | 669,552 | |
| Xponential Fitness, Cl A * | | | 9,106 | | | | 176,201 | |
| Zumiez * | | | 8,005 | | | | 179,552 | |
| | | | | | | | 106,674,407 | |
| Consumer Staples — 2.6% | | | | | | | | |
| 22nd Century Group * | | | 1 | | | | 1 | |
| Alico | | | 2,643 | | | | 80,929 | |
| Andersons . | | | 13,522 | | | | 476,921 | |
| AppHarvest * | | | 1 | | | | 2 | |
| B&G Foods . | | | 32,279 | | | | 528,730 | |
| Beauty Health * | | | 41,532 | | | | 474,711 | |
| BellRing Brands * | | | 55,801 | | | | 1,351,500 | |
| Benson Hill * | | | 1 | | | | 3 | |
| Beyond Meat * | | | 26,170 | | | | 410,869 | |
| BRC, Cl A * | | | 10,574 | | | | 76,662 | |
| Calavo Growers . | | | 7,487 | | | | 258,975 | |
| Cal-Maine Foods . | | | 17,056 | | | | 963,835 | |
| Celsius Holdings * | | | 24,235 | | | | 2,207,324 | |
| Central Garden & Pet * | | | 4,269 | | | | 176,182 | |
| Central Garden & Pet, Cl A * | | | 17,179 | | | | 672,386 | |
| Chefs' Warehouse * | | | 14,322 | | | | 524,615 | |
| Coca-Cola Consolidated . | | | 2,172 | | | | 1,057,786 | |
| Duckhorn Portfolio * | | | 15,692 | | | | 229,417 | |
|
|
|
| Schedule of Investments | | October 31, 2022 |
| Global X Russell 2000 Covered Call ETF |
| | | | |
| |
| | | Shares | | | Value | |
| COMMON STOCK — continued | | | | | | |
| Consumer Staples — continued | | | | | | |
| Edgewell Personal Care | | | 22,938 | | | $ | 898,940 | |
| elf Beauty * | | | 20,616 | | | | 891,848 | |
| Energizer Holdings . | | | 28,300 | | | | 817,587 | |
| Fresh Del Monte Produce . | | | 14,078 | | | | 367,154 | |
| Hain Celestial Group * | | | 31,202 | | | | 583,789 | |
| Herbalife Nutrition * | | | 46,417 | | | | 986,825 | |
| HF Foods Group * | | | 15,391 | | | | 71,260 | |
| Honest * | | | 44,677 | | | | 147,881 | |
| Hostess Brands, Cl A * | | | 58,519 | | | | 1,549,583 | |
| Ingles Markets, Cl A | | | 6,078 | | | | 573,581 | |
| Inter Parfums | | | 7,729 | | | | 625,122 | |
| J & J Snack Foods | | | 6,605 | | | | 974,964 | |
| John B Sanfilippo & Son | | | 3,901 | | | | 325,382 | |
| Lancaster Colony . | | | 8,175 | | | | 1,473,789 | |
| Landec * | | | 10,860 | | | | 108,057 | |
| Local Bounti * | | | 1 | | | | 3 | |
| Medifast . | | | 4,948 | | | | 578,867 | |
| MGP Ingredients | | | 6,108 | | | | 684,401 | |
| Mission Produce * | | | 16,777 | | | | 279,169 | |
| National Beverage | | | 10,114 | | | | 479,606 | |
| Natural Grocers by Vitamin Cottage | | | 4,396 | | | | 50,554 | |
| Nature's Sunshine Products * | | | 5,057 | | | | 42,681 | |
| Nu Skin Enterprises, Cl A | | | 21,193 | | | | 809,361 | |
| PriceSmart | | | 10,519 | | | | 672,900 | |
| Primo Water | | | 66,785 | | | | 974,393 | |
| Rite Aid * | | | 22,636 | | | | 118,160 | |
| Seneca Foods, Cl A * | | | 2,565 | | | | 161,877 | |
| Simply Good Foods * | | | 38,138 | | | | 1,460,685 | |
| Sovos Brands * | | | 18,538 | | | | 256,937 | |
| SpartanNash . | | | 15,328 | | | | 547,363 | |
| Sprouts Farmers Market * | | | 47,480 | | | | 1,400,660 | |
| Tattooed Chef * | | | 19,718 | | | | 93,661 | |
| Thorne HealthTech * | | | 3,565 | | | | 17,326 | |
| Tootsie Roll Industries | | | 6,741 | | | | 272,269 | |
| TreeHouse Foods * | | | 21,900 | | | | 1,100,256 | |
| Turning Point Brands . | | | 6,435 | | | | 151,609 | |
| United Natural Foods * | | | 24,548 | | | | 1,041,081 | |
| Universal | | | 10,273 | | | | 519,917 | |
| USANA Health Sciences * | | | 4,988 | | | | 261,920 | |
|
|
|
| Schedule of Investments | | October 31, 2022 |
| Global X Russell 2000 Covered Call ETF |
| | | | |
| |
| | | Shares | | | Value | |
| COMMON STOCK — continued | | | | | | |
| Consumer Staples — continued | | | | | | |
| Utz Brands . | | | 27,434 | | | $ | 444,705 | |
| Vector Group . | | | 59,017 | | | | 626,761 | |
| Veru * | | | 27,607 | | | | 337,910 | |
| Village Super Market, Cl A | | | 3,880 | | | | 86,291 | |
| Vintage Wine Estates * | | | 1 | | | | 3 | |
| Vita Coco * | | | 11,690 | | | | 119,939 | |
| Vital Farms * | | | 13,185 | | | | 174,569 | |
| WD-40 . | | | 5,745 | | | | 920,119 | |
| Weis Markets | | | 6,966 | | | | 652,505 | |
| Whole Earth Brands * | | | 15,714 | | | | 54,213 | |
| | | | | | | | 35,279,281 | |
| Energy — 4.9% | | | | | | | | |
| Aemetis * | | | 11,573 | | | | 85,640 | |
| Alto Ingredients * | | | 29,322 | | | | 121,100 | |
| Amplify Energy * | | | 14,794 | | | | 146,313 | |
| Arch Resources | | | 6,466 | | | | 984,707 | |
| Archaea Energy, Cl A * | | | 25,423 | | | | 656,168 | |
| Archrock . | | | 55,759 | | | | 418,750 | |
| Battalion Oil * | | | 1,058 | | | | 13,892 | |
| Berry | | | 29,223 | | | | 259,208 | |
| Brigham Minerals, Cl A | | | 25,671 | | | | 795,801 | |
| Bristow Group * | | | 10,265 | | | | 307,334 | |
| Cactus, Cl A | | | 24,980 | | | | 1,291,966 | |
| California Resources . | | | 33,972 | | | | 1,532,477 | |
| Callon Petroleum * | | | 21,670 | | | | 952,613 | |
| Centrus Energy, Cl A * | | | 4,561 | | | | 215,781 | |
| ChampionX . | | | 88,429 | | | | 2,530,838 | |
| Chord Energy . | | | 18,021 | | | | 2,758,835 | |
| Civitas Resources | | | 31,869 | | | | 2,227,962 | |
| Clean Energy Fuels * | | | 77,361 | | | | 519,092 | |
| CNX Resources * | | | 83,943 | | | | 1,411,082 | |
| Comstock Resources * | | | 39,071 | | | | 733,753 | |
| CONSOL Energy . | | | 14,611 | | | | 920,785 | |
| Crescent Energy, Cl A | | | 13,170 | | | | 181,483 | |
| CVR Energy . | | | 12,664 | | | | 494,656 | |
| Delek US Holdings . | | | 31,089 | | | | 922,100 | |
| Denbury * | | | 21,348 | | | | 1,951,421 | |
| DHT Holdings . | | | 57,931 | | | | 516,165 | |
| Diamond Offshore Drilling * | | | 41,325 | | | | 407,051 | |
|
|
|
| Schedule of Investments | | October 31, 2022 |
| Global X Russell 2000 Covered Call ETF |
| | | | |
| |
| | | Shares | | | Value | |
| COMMON STOCK — continued | | | | | | |
| Energy — continued | | | | | | |
| DMC Global * | | | 8,306 | | | $ | 179,742 | |
| Dorian LPG . | | | 13,544 | | | | 244,740 | |
| Dril-Quip * | | | 14,976 | | | | 372,603 | |
| Earthstone Energy, Cl A * | | | 24,087 | | | | 389,246 | |
| Empire Petroleum * | | | 6,701 | | | | 107,216 | |
| Energy Fuels * | | | 63,904 | | | | 460,109 | |
| Equitrans Midstream . | | | 172,817 | | | | 1,455,119 | |
| Excelerate Energy, Cl A | | | 7,687 | | | | 212,315 | |
| Expro Group Holdings * | | | 35,114 | | | | 664,708 | |
| Gevo * | | | 1 | | | | 2 | |
| Green Plains * | | | 22,108 | | | | 638,700 | |
| Gulfport Energy * | | | 5,082 | | | | 454,890 | |
| Helix Energy Solutions Group * | | | 68,016 | | | | 476,112 | |
| Helmerich & Payne | | | 44,494 | | | | 2,202,898 | |
| HighPeak Energy . | | | 2,707 | | | | 63,127 | |
| International Seaways | | | 24,485 | | | | 1,038,409 | |
| Kinetik Holdings, Cl A | | | 8,446 | | | | 310,644 | |
| Laredo Petroleum * | | | 7,136 | | | | 461,342 | |
| Liberty Energy, Cl A * | | | 68,172 | | | | 1,152,788 | |
| Magnolia Oil & Gas, Cl A . | | | 70,545 | | | | 1,811,596 | |
| Matador Resources | | | 48,409 | | | | 3,216,778 | |
| Murphy Oil | | | 65,220 | | | | 3,163,822 | |
| Nabors Industries * | | | 3,823 | | | | 665,317 | |
| NACCO Industries, Cl A . | | | 1,669 | | | | 94,399 | |
| National Energy Services Reunited * | | | 15,747 | | | | 119,047 | |
| Newpark Resources * | | | 1 | | | | 4 | |
| NextDecade * | | | 12,755 | | | | 89,285 | |
| NexTier Oilfield Solutions * | | | 71,676 | | | | 722,494 | |
| Noble * | | | 31,737 | | | | 1,143,801 | |
| Nordic American Tankers . | | | 1 | | | | 3 | |
| Northern Oil and Gas . | | | 29,481 | | | | 1,006,481 | |
| Oceaneering International * | | | 41,098 | | | | 574,961 | |
| Oil States International * | | | 24,978 | | | | 161,608 | |
| Par Pacific Holdings * | | | 22,553 | | | | 516,013 | |
| Patterson-UTI Energy | | | 98,463 | | | | 1,737,872 | |
| PBF Energy, Cl A * | | | 42,021 | | | | 1,859,429 | |
| Peabody Energy * | | | 54,491 | | | | 1,302,335 | |
| Permian Resources, Cl A * | | | 90,733 | | | | 886,461 | |
| ProFrac Holding, Cl A * | | | 5,817 | | | | 127,450 | |
|
|
|
| Schedule of Investments | | October 31, 2022 |
| Global X Russell 2000 Covered Call ETF |
| | | | |
| |
| | | Shares | | | Value | |
| COMMON STOCK — continued | | | | | | |
| Energy — continued | | | | | | |
| ProPetro Holding * | | | 35,838 | | | $ | 424,322 | |
| Ranger Oil, Cl A . | | | 9,177 | | | | 375,339 | |
| REX American Resources * | | | 6,930 | | | | 207,831 | |
| Riley Exploration Permian | | | 4,819 | | | | 140,088 | |
| Ring Energy * | | | 1 | | | | 3 | |
| RPC . | | | 28,543 | | | | 317,684 | |
| SandRidge Energy * | | | 13,171 | | | | 248,800 | |
| Select Energy Services, Cl A * | | | 27,457 | | | | 264,960 | |
| SilverBow Resources * | | | 4,886 | | | | 173,306 | |
| Sitio Royalties . | | | 4,947 | | | | 140,297 | |
| SM Energy . | | | 52,252 | | | | 2,350,295 | |
| Solaris Oilfield Infrastructure, Cl A | | | 13,032 | | | | 177,496 | |
| Talos Energy * | | | 28,186 | | | | 599,798 | |
| Tellurian * | | | 1 | | | | 3 | |
| TETRA Technologies * | | | 50,669 | | | | 250,305 | |
| Tidewater * | | | 19,500 | | | | 661,050 | |
| Uranium Energy * | | | 143,298 | | | | 603,285 | |
| Ur-Energy * | | | 1 | | | | 1 | |
| US Silica Holdings * | | | 31,528 | | | | 453,688 | |
| VAALCO Energy | | | 24,202 | | | | 124,640 | |
| Valaris * | | | 25,745 | | | | 1,723,113 | |
| Vertex Energy * | | | 22,440 | | | | 191,413 | |
| W&T Offshore * | | | 38,553 | | | | 292,617 | |
| Weatherford International * | | | 29,969 | | | | 1,249,108 | |
| World Fuel Services . | | | 26,591 | | | | 677,805 | |
| | | | | | | | 65,088,086 | |
| Financials — 13.4% | | | | | | | | |
| 1st Source | | | 7,125 | | | | 414,390 | |
| ACNB | | | 3,437 | | | | 125,760 | |
| AFC Gamma ‡ | | | 6,892 | | | | 118,060 | |
| Alerus Financial | | | 6,611 | | | | 147,425 | |
| Amalgamated Financial | | | 6,281 | | | | 144,400 | |
| A-Mark Precious Metals | | | 7,890 | | | | 239,935 | |
| Ambac Financial Group * | | | 18,835 | | | | 264,632 | |
| Amerant Bancorp, Cl A . | | | 12,075 | | | | 363,457 | |
| American Equity Investment Life Holding | | | 34,467 | | | | 1,484,838 | |
| American National Bankshares . | | | 4,657 | | | | 170,306 | |
| Ameris Bancorp | | | 28,158 | | | | 1,450,419 | |
| AMERISAFE . | | | 8,161 | | | | 476,684 | |
|
|
|
| Schedule of Investments | | October 31, 2022 |
| Global X Russell 2000 Covered Call ETF |
| | | | |
| |
| | | Shares | | | Value | |
| COMMON STOCK — continued | | | | | | |
| Financials — continued | | | | | | |
| Angel Oak Mortgage ‡ | | | 4,141 | | | $ | 42,777 | |
| Apollo Commercial Real Estate Finance ‡ | | | 59,731 | | | | 672,571 | |
| Arbor Realty Trust ‡ | | | 70,167 | | | | 966,200 | |
| Ares Commercial Real Estate ‡ | | | 24,708 | | | | 304,897 | |
| Argo Group International Holdings . | | | 13,559 | | | | 337,212 | |
| ARMOUR Residential ‡ | | | 54,609 | | | | 290,520 | |
| Arrow Financial | | | 6,184 | | | | 215,327 | |
| Artisan Partners Asset Management, Cl A | | | 25,508 | | | | 727,233 | |
| AssetMark Financial Holdings * | | | 8,478 | | | | 175,579 | |
| Associated Banc-Corp | | | 62,987 | | | | 1,533,733 | |
| Associated Capital Group, Cl A | | | 880 | | | | 35,464 | |
| Atlantic Union Bankshares . | | | 31,853 | | | | 1,100,203 | |
| Atlanticus Holdings * | | | 2,185 | | | | 62,404 | |
| Axos Financial * | | | 24,244 | | | | 944,546 | |
| B Riley Financial . | | | 8,636 | | | | 351,312 | |
| Bakkt Holdings * | | | 1 | | | | 2 | |
| Banc of California | | | 23,480 | | | | 391,646 | |
| BancFirst | | | 8,220 | | | | 787,640 | |
| Bancorp * | | | 23,756 | | | | 655,190 | |
| Bank First | | | 2,896 | | | | 249,490 | |
| Bank of Marin Bancorp . | | | 6,821 | | | | 246,238 | |
| BankUnited . | | | 35,625 | | | | 1,280,719 | |
| Bankwell Financial Group . | | | 2,292 | | | | 70,227 | |
| Banner . | | | 14,563 | | | | 1,088,584 | |
| Bar Harbor Bankshares | | | 6,519 | | | | 195,635 | |
| BayCom . | | | 5,376 | | | | 103,380 | |
| BCB Bancorp . | | | 5,981 | | | | 117,527 | |
| Berkshire Hills Bancorp . | | | 20,596 | | | | 602,433 | |
| BGC Partners, Cl A . | | | 152,639 | | | | 604,450 | |
| Blackstone Mortgage Trust, Cl A ‡ | | | 72,523 | | | | 1,810,174 | |
| Blucora * | | | 20,685 | | | | 455,691 | |
| Blue Foundry Bancorp * | | | 11,233 | | | | 138,278 | |
| Blue Ridge Bankshares | | | 7,059 | | | | 92,120 | |
| Bread Financial Holdings . | | | 21,269 | | | | 768,024 | |
| Bridgewater Bancshares * | | | 9,415 | | | | 180,015 | |
| Bright Health Group * | | | 1 | | | | 1 | |
| Brightsphere Investment Group | | | 13,958 | | | | 262,690 | |
| BrightSpire Capital, Cl A ‡ | | | 36,112 | | | | 277,340 | |
| Broadmark Realty Capital ‡ | | | 53,214 | | | | 309,705 | |
|
|
|
| Schedule of Investments | | October 31, 2022 |
| Global X Russell 2000 Covered Call ETF |
| | | | |
| |
| | | Shares | | | Value | |
| COMMON STOCK — continued | | | | | | |
| Financials — continued | | | | | | |
| Brookline Bancorp . | | | 31,324 | | | $ | 430,705 | |
| BRP Group, Cl A * | | | 26,646 | | | | 755,414 | |
| Business First Bancshares | | | 8,710 | | | | 215,834 | |
| Byline Bancorp | | | 10,705 | | | | 247,500 | |
| Cadence Bank | | | 77,433 | | | | 2,141,022 | |
| Cambridge Bancorp . | | | 2,951 | | | | 259,245 | |
| Camden National . | | | 6,318 | | | | 274,959 | |
| Cannae Holdings * | | | 34,932 | | | | 809,025 | |
| Capital Bancorp . | | | 3,894 | | | | 96,104 | |
| Capital City Bank Group . | | | 5,960 | | | | 211,103 | |
| Capitol Federal Financial | | | 53,587 | | | | 438,342 | |
| Capstar Financial Holdings | | | 8,958 | | | | 158,377 | |
| Carter Bankshares * | | | 10,520 | | | | 188,308 | |
| Cathay General Bancorp | | | 30,682 | | | | 1,399,099 | |
| Central Pacific Financial | | | 11,758 | | | | 241,274 | |
| Chicago Atlantic Real Estate Finance . | | | 2,715 | | | | 40,236 | |
| Chimera Investment ‡ | | | 99,791 | | | | 673,589 | |
| Citizens & Northern . | | | 6,685 | | | | 158,969 | |
| City Holding | | | 6,342 | | | | 639,591 | |
| Civista Bancshares . | | | 6,568 | | | | 155,662 | |
| Claros Mortgage Trust ‡ | | | 38,046 | | | | 608,736 | |
| CNB Financial | | | 7,089 | | | | 180,202 | |
| CNO Financial Group . | | | 50,217 | | | | 1,107,787 | |
| Coastal Financial * | | | 4,561 | | | | 212,634 | |
| Cohen & Steers | | | 12,303 | | | | 740,148 | |
| Colony Bankcorp . | | | 6,722 | | | | 92,764 | |
| Columbia Banking System . | | | 33,242 | | | | 1,112,610 | |
| Columbia Financial * | | | 16,328 | | | | 335,377 | |
| Community Bank System . | | | 22,603 | | | | 1,411,105 | |
| Community Trust Bancorp | | | 6,796 | | | | 321,383 | |
| Compass Diversified Holdings | | | 25,835 | | | | 549,769 | |
| ConnectOne Bancorp . | | | 15,994 | | | | 400,650 | |
| Consumer Portfolio Services * | | | 5,964 | | | | 38,289 | |
| Cowen, Cl A . | | | 11,487 | | | | 443,628 | |
| Crawford, Cl A | | | 6,686 | | | | 40,049 | |
| CrossFirst Bankshares * | | | 18,835 | | | | 261,995 | |
| Curo Group Holdings . | | | 8,858 | | | | 45,796 | |
| Customers Bancorp * | | | 13,062 | | | | 440,059 | |
| CVB Financial | | | 57,783 | | | | 1,659,528 | |
|
|
|
| Schedule of Investments | | October 31, 2022 |
| Global X Russell 2000 Covered Call ETF |
| | | | |
| |
| | | Shares | | | Value | |
| COMMON STOCK — continued | | | | | | |
| Financials — continued | | | | | | |
| Diamond Hill Investment Group . | | | 1,276 | | | $ | 229,616 | |
| Dime Community Bancshares | | | 14,395 | | | | 497,059 | |
| Donegal Group, Cl A | | | 6,720 | | | | 98,381 | |
| Donnelley Financial Solutions * | | | 12,474 | | | | 504,324 | |
| Dynex Capital ‡ | | | 21,195 | | | | 253,068 | |
| Eagle Bancorp . | | | 13,508 | | | | 611,642 | |
| Eastern Bankshares . | | | 71,290 | | | | 1,366,629 | |
| eHealth * | | | 10,147 | | | | 27,194 | |
| Ellington Financial ‡ | | | 23,603 | | | | 315,808 | |
| Employers Holdings | | | 11,959 | | | | 521,532 | |
| Enact Holdings . | | | 12,603 | | | | 323,141 | |
| Encore Capital Group * | | | 10,437 | | | | 531,452 | |
| Enova International * | | | 14,981 | | | | 561,638 | |
| Enstar Group * | | | 5,200 | | | | 1,042,704 | |
| Enterprise Bancorp | | | 4,159 | | | | 130,094 | |
| Enterprise Financial Services . | | | 14,928 | | | | 798,200 | |
| Equity Bancshares, Cl A . | | | 6,268 | | | | 223,893 | |
| Esquire Financial Holdings | | | 2,831 | | | | 127,905 | |
| Essent Group . | | | 45,348 | | | | 1,794,874 | |
| EZCORP, Cl A * | | | 20,634 | | | | 199,324 | |
| Farmers & Merchants Bancorp . | | | 4,995 | | | | 146,154 | |
| Farmers National Banc | | | 13,032 | | | | 179,060 | |
| FB Financial | | | 15,114 | | | | 634,183 | |
| Federal Agricultural Mortgage, Cl C . | | | 3,950 | | | | 455,040 | |
| Federated Hermes, Cl B | | | 38,726 | | | | 1,345,729 | |
| Finance of America, Cl A * | | | 1 | | | | 2 | |
| Financial Institutions | | | 6,762 | | | | 161,138 | |
| First Bancorp | | | 4,511 | | | | 137,856 | |
| First Bancorp | | | 14,869 | | | | 662,711 | |
| First Bancshares | | | 8,758 | | | | 286,737 | |
| First Bank | | | 6,516 | | | | 102,432 | |
| First Busey . | | | 21,721 | | | | 573,652 | |
| First Business Financial Services . | | | 3,314 | | | | 126,429 | |
| First Commonwealth Financial . | | | 38,756 | | | | 555,761 | |
| First Community Bankshares | | | 7,213 | | | | 268,612 | |
| First Financial | | | 5,012 | | | | 243,032 | |
| First Financial Bancorp . | | | 39,444 | | | | 1,028,305 | |
| First Financial Bankshares | | | 56,049 | | | | 2,157,326 | |
| First Foundation | | | 21,500 | | | | 343,140 | |
|
|
|
| Schedule of Investments | | October 31, 2022 |
| Global X Russell 2000 Covered Call ETF |
| | | | |
| |
| | | Shares | | | Value | |
| COMMON STOCK — continued | | | | | | |
| Financials — continued | | | | | | |
| First Guaranty Bancshares . | | | 2,585 | | | $ | 59,636 | |
| First Internet Bancorp | | | 4,137 | | | | 106,280 | |
| First Interstate BancSystem, Cl A | | | 42,437 | | | | 1,935,552 | |
| First Merchants | | | 24,293 | | | | 1,090,756 | |
| First Mid Bancshares | | | 7,805 | | | | 279,497 | |
| First of Long Island | | | 9,890 | | | | 173,866 | |
| First Western Financial * | | | 3,278 | | | | 90,506 | |
| FirstCash Holdings | | | 16,665 | | | | 1,640,669 | |
| Five Star Bancorp . | | | 5,503 | | | | 159,642 | |
| Flagstar Bancorp | | | 22,121 | | | | 856,083 | |
| Flushing Financial | | | 12,626 | | | | 248,732 | |
| Focus Financial Partners, Cl A * | | | 26,737 | | | | 930,180 | |
| Franklin BSP Realty Trust ‡ | | | 34,794 | | | | 490,247 | |
| Fulton Financial | | | 71,035 | | | | 1,294,968 | |
| FVCBankcorp * | | | 4,948 | | | | 100,543 | |
| GCM Grosvenor . | | | 18,122 | | | | 149,869 | |
| Genworth Financial, Cl A * | | | 230,453 | | | | 1,076,216 | |
| German American Bancorp | | | 11,618 | | | | 456,471 | |
| Glacier Bancorp | | | 47,932 | | | | 2,745,545 | |
| Goosehead Insurance, Cl A * | | | 8,190 | | | | 339,967 | |
| Granite Point Mortgage Trust ‡ | | | 22,093 | | | | 173,651 | |
| Great Southern Bancorp . | | | 4,301 | | | | 266,576 | |
| Green Dot, Cl A * | | | 22,238 | | | | 423,189 | |
| Greene County Bancorp . | | | 1,479 | | | | 98,501 | |
| Greenlight Capital Re, Cl A * | | | 10,860 | | | | 91,658 | |
| Guaranty Bancshares | | | 3,591 | | | | 132,975 | |
| Hamilton Lane, Cl A . | | | 14,927 | | | | 892,933 | |
| Hancock Whitney | | | 36,552 | | | | 2,042,160 | |
| Hanmi Financial . | | | 13,221 | | | | 354,058 | |
| Hannon Armstrong Sustainable Infrastructure | | | | | | | | |
| | | 38,854 | | | | 1,056,052 | |
| HarborOne Bancorp . | | | 19,208 | | | | 292,538 | |
| HBT Financial . | | | 4,838 | | | | 98,647 | |
| HCI Group . | | | 2,957 | | | | 108,344 | |
| Heartland Financial USA | | | 17,268 | | | | 851,658 | |
| Heritage Commerce . | | | 24,249 | | | | 346,761 | |
| Heritage Financial | | | 14,909 | | | | 502,284 | |
| Hilltop Holdings . | | | 26,220 | | | | 759,069 | |
| Hingham Institution For Savings The . | | | 621 | | | | 153,542 | |
|
|
|
| Schedule of Investments | | October 31, 2022 |
| Global X Russell 2000 Covered Call ETF |
| | | | |
| |
| | | Shares | | | Value | |
| COMMON STOCK — continued | | | | | | |
| Financials — continued | | | | | | |
| Hippo Holdings * | | | 7,508 | | | $ | 129,738 | |
| Home Bancorp | | | 3,282 | | | | 140,306 | |
| Home BancShares | | | 85,272 | | | | 2,173,583 | |
| Home Point Capital | | | 1 | | | | 2 | |
| HomeStreet | | | 8,313 | | | | 215,805 | |
| HomeTrust Bancshares | | | 6,564 | | | | 157,733 | |
| Hope Bancorp | | | 48,432 | | | | 657,222 | |
| Horace Mann Educators . | | | 17,694 | | | | 698,205 | |
| Horizon Bancorp | | | 18,124 | | | | 270,229 | |
| Houlihan Lokey, Cl A | | | 21,513 | | | | 1,921,541 | |
| Independent Bank . | | | 8,963 | | | | 207,314 | |
| Independent Bank . | | | 21,216 | | | | 1,846,004 | |
| Independent Bank Group | | | 15,784 | | | | 995,813 | |
| International Bancshares | | | 22,917 | | | | 1,136,683 | |
| Invesco Mortgage Capital ‡ | | | 24,251 | | | | 283,979 | |
| Investors Title | | | 596 | | | | 87,582 | |
| Jackson Financial, Cl A . | | | 35,595 | | | | 1,365,424 | |
| James River Group Holdings . | | | 15,808 | | | | 399,468 | |
| John Marshall Bancorp | | | 4,789 | | | | 137,923 | |
| Kearny Financial | | | 26,640 | | | | 270,130 | |
| Kinsale Capital Group | | | 9,577 | | | | 3,018,383 | |
| KKR Real Estate Finance Trust ‡ | | | 26,071 | | | | 454,157 | |
| Ladder Capital, Cl A ‡ | | | 46,885 | | | | 500,263 | |
| Lakeland Bancorp . | | | 28,522 | | | | 531,935 | |
| Lakeland Financial | | | 10,321 | | | | 853,031 | |
| Lemonade * | | | 19,863 | | | | 480,685 | |
| LendingClub * | | | 42,768 | | | | 455,052 | |
| LendingTree * | | | 4,894 | | | | 123,476 | |
| Live Oak Bancshares | | | 13,811 | | | | 448,443 | |
| Luther Burbank | | | 6,346 | | | | 80,150 | |
| Macatawa Bank . | | | 10,860 | | | | 116,528 | |
| MarketWise * | | | 1 | | | | 2 | |
| MBIA * | | | 19,905 | | | | 214,178 | |
| Mercantile Bank . | | | 6,846 | | | | 239,268 | |
| Merchants Bancorp . | | | 6,715 | | | | 160,824 | |
| Mercury General | | | 11,468 | | | | 332,572 | |
| Metrocity Bankshares | | | 8,352 | | | | 185,832 | |
| Metropolitan Bank Holding * | | | 4,418 | | | | 291,588 | |
| MFA Financial ‡ | | | 44,422 | | | | 442,443 | |
|
|
|
| Schedule of Investments | | October 31, 2022 |
| Global X Russell 2000 Covered Call ETF |
| | | | |
| |
| | | Shares | | | Value | |
| COMMON STOCK — continued | | | | | | |
| Financials — continued | | | | | | |
| Mid Penn Bancorp . | | | 6,345 | | | $ | 216,872 | |
| Midland States Bancorp | | | 9,259 | | | | 259,622 | |
| MidWestOne Financial Group | | | 6,321 | | | | 212,386 | |
| Moelis, Cl A . | | | 27,034 | | | | 1,147,864 | |
| Moneylion * | | | 1 | | | | 1 | |
| Mr Cooper Group * | | | 30,724 | | | | 1,213,291 | |
| MVB Financial . | | | 4,562 | | | | 112,955 | |
| National Bank Holdings, Cl A | | | 12,368 | | | | 541,966 | |
| National Western Life Group, Cl A | | | 1,132 | | | | 224,159 | |
| Navient . | | | 59,581 | | | | 902,056 | |
| NBT Bancorp . | | | 17,849 | | | | 845,864 | |
| Nelnet, Cl A | | | 6,939 | | | | 618,196 | |
| NerdWallet, Cl A * | | | 10,558 | | | | 123,951 | |
| New York Mortgage Trust ‡ | | | 1 | | | | 3 | |
| Nexpoint Real Estate Finance ‡ | | | 3,263 | | | | 57,331 | |
| NI Holdings * | | | 4,022 | | | | 54,619 | |
| Nicolet Bankshares * | | | 5,193 | | | | 396,174 | |
| NMI Holdings, Cl A * | | | 35,934 | | | | 788,033 | |
| Northeast Bank . | | | 2,772 | | | | 116,701 | |
| Northfield Bancorp | | | 18,276 | | | | 293,147 | |
| Northwest Bancshares . | | | 54,150 | | | | 815,499 | |
| OceanFirst Financial . | | | 24,963 | | | | 563,665 | |
| Old National Bancorp | | | 124,281 | | | | 2,430,936 | |
| Old Second Bancorp . | | | 17,707 | | | | 283,312 | |
| Open Lending, Cl A * | | | 42,897 | | | | 307,571 | |
| Oportun Financial * | | | 9,538 | | | | 52,459 | |
| Oppenheimer Holdings, Cl A . | | | 4,139 | | | | 142,464 | |
| OppFi * | | | 1 | | | | 2 | |
| Orchid Island Capital, Cl A ‡ | | | 24,079 | | | | 242,476 | |
| Origin Bancorp . | | | 9,658 | | | | 399,165 | |
| Orrstown Financial Services . | | | 4,899 | | | | 129,677 | |
| Oscar Health, Cl A * | | | 48,925 | | | | 182,490 | |
| Pacific Premier Bancorp | | | 39,781 | | | | 1,448,426 | |
| Palomar Holdings * | | | 10,391 | | | | 924,383 | |
| Park National | | | 6,156 | | | | 908,010 | |
| Parke Bancorp . | | | 4,251 | | | | 91,652 | |
| Pathward Financial | | | 12,570 | | | | 528,317 | |
| PCB Bancorp | | | 4,859 | | | | 89,892 | |
| PCSB Financial . | | | 5,648 | | | | 110,080 | |
|
|
|
| Schedule of Investments | | October 31, 2022 |
| Global X Russell 2000 Covered Call ETF |
| | | | |
| |
| | | Shares | | | Value | |
| COMMON STOCK — continued | | | | | | |
| Financials — continued | | | | | | |
| Peapack-Gladstone Financial . | | | 7,668 | | | $ | 303,423 | |
| PennyMac Financial Services . | | | 12,726 | | | | 678,550 | |
| PennyMac Mortgage Investment Trust ‡ | | | 40,947 | | | | 567,935 | |
| Peoples Bancorp . | | | 11,943 | | | | 361,515 | |
| Peoples Financial Services | | | 3,065 | | | | 168,544 | |
| Perella Weinberg Partners, Cl A . | | | 19,276 | | | | 151,895 | |
| Pioneer Bancorp * | | | 4,887 | | | | 50,385 | |
| Piper Sandler . | | | 7,400 | | | | 946,978 | |
| PJT Partners . | | | 10,112 | | | | 752,333 | |
| PRA Group * | | | 17,980 | | | | 602,330 | |
| Preferred Bank | | | 5,793 | | | | 445,308 | |
| Premier Financial | | | 15,476 | | | | 446,483 | |
| Primis Financial | | | 9,604 | | | | 123,796 | |
| ProAssurance | | | 23,090 | | | | 512,829 | |
| Professional Holding, Cl A * | | | 5,398 | | | | 146,124 | |
| PROG Holdings * | | | 23,836 | | | | 393,771 | |
| Provident Bancorp . | | | 6,346 | | | | 78,437 | |
| Provident Financial Services | | | 31,866 | | | | 714,436 | |
| QCR Holdings . | | | 7,044 | | | | 357,201 | |
| Radian Group . | | | 75,251 | | | | 1,570,488 | |
| RBB Bancorp . | | | 6,395 | | | | 143,951 | |
| Ready Capital ‡ | | | 36,647 | | | | 444,162 | |
| Red River Bancshares . | | | 1,971 | | | | 112,189 | |
| Redwood Trust ‡ | | | 47,751 | | | | 340,465 | |
| Regional Management | | | 3,423 | | | | 116,245 | |
| Renasant | | | 23,256 | | | | 938,845 | |
| Republic Bancorp, Cl A | | | 4,109 | | | | 190,452 | |
| Republic First Bancorp * | | | 1 | | | | 3 | |
| RLI . | | | 16,714 | | | | 2,173,990 | |
| Root, Cl A * | | | 19,169 | | | | 163,512 | |
| S&T Bancorp | | | 16,572 | | | | 626,587 | |
| Safety Insurance Group . | | | 6,202 | | | | 539,264 | |
| Sandy Spring Bancorp | | | 18,777 | | | | 665,457 | |
| Sculptor Capital Management, Cl A | | | 9,741 | | | | 103,352 | |
| Seacoast Banking Corp of Florida . | | | 26,808 | | | | 828,367 | |
| Selective Insurance Group . | | | 25,779 | | | | 2,528,404 | |
| Selectquote * | | | 1 | | | | 1 | |
| ServisFirst Bancshares . | | | 21,738 | | | | 1,637,524 | |
| Shore Bancshares | | | 7,300 | | | | 145,562 | |
|
|
|
| Schedule of Investments | | October 31, 2022 |
| Global X Russell 2000 Covered Call ETF |
| | | | |
| |
| | | Shares | | | Value | |
| COMMON STOCK — continued | | | | | | |
| Financials — continued | | | | | | |
| Sierra Bancorp | | | 6,202 | | | $ | 136,754 | |
| Silvercrest Asset Management Group, Cl A | | | 4,027 | | | | 76,473 | |
| Silvergate Capital, Cl A * | | | 13,178 | | | | 747,983 | |
| Simmons First National, Cl A . | | | 52,706 | | | | 1,258,092 | |
| SmartFinancial | | | 6,435 | | | | 188,159 | |
| South Plains Financial | | | 4,784 | | | | 149,596 | |
| Southern First Bancshares * | | | 3,392 | | | | 151,555 | |
| Southern Missouri Bancorp . | | | 3,441 | | | | 176,351 | |
| Southside Bancshares | | | 13,245 | | | | 453,509 | |
| SouthState . | | | 32,149 | | | | 2,907,234 | |
| Stellar Bancorp . | | | 19,901 | | | | 653,549 | |
| StepStone Group, Cl A . | | | 23,922 | | | | 706,177 | |
| Sterling Bancorp * | | | 7,108 | | | | 45,278 | |
| Stewart Information Services . | | | 11,360 | | | | 442,586 | |
| Stock Yards Bancorp . | | | 12,049 | | | | 942,111 | |
| StoneX Group * | | | 7,360 | | | | 686,835 | |
| Summit Financial Group | | | 4,937 | | | | 143,519 | |
| Sunlight Financial Holdings * | | | 1 | | | | 1 | |
| SWK Holdings * | | | 1,528 | | | | 28,421 | |
| Texas Capital Bancshares * | | | 21,466 | | | | 1,287,960 | |
| Third Coast Bancshares * | | | 5,446 | | | | 105,652 | |
| Tiptree | | | 9,699 | | | | 118,134 | |
| Tompkins Financial | | | 6,121 | | | | 507,064 | |
| Towne Bank . | | | 28,623 | | | | 942,842 | |
| TPG RE Finance Trust ‡ | | | 29,673 | | | | 251,330 | |
| Trean Insurance Group * | | | 7,739 | | | | 28,402 | |
| TriCo Bancshares | | | 13,270 | | | | 768,466 | |
| Triumph Bancorp * | | | 10,156 | | | | 523,034 | |
| Trupanion * | | | 16,518 | | | | 833,663 | |
| TrustCo Bank NY . | | | 8,177 | | | | 305,166 | |
| Trustmark | | | 26,079 | | | | 953,709 | |
| Two Harbors Investment ‡ | | | 141,926 | | | | 505,257 | |
| UMB Financial . | | | 19,104 | | | | 1,589,835 | |
| United Bankshares . | | | 55,843 | | | | 2,364,951 | |
| United Community Banks . | | | 44,966 | | | | 1,731,191 | |
| United Fire Group | | | 9,153 | | | | 248,046 | |
| Unity Bancorp . | | | 2,864 | | | | 82,082 | |
| Universal Insurance Holdings . | | | 11,233 | | | | 112,779 | |
| Univest Financial . | | | 12,532 | | | | 352,650 | |
|
|
|
| Schedule of Investments | | October 31, 2022 |
| Global X Russell 2000 Covered Call ETF |
| | | | |
| |
| | | Shares | | | Value | |
| COMMON STOCK — continued | | | | | | |
| Financials — continued | | | | | | |
| USCB Financial Holdings * | | | 4,444 | | | $ | 59,683 | |
| Valley National Bancorp | | | 186,436 | | | | 2,212,995 | |
| Value Line . | | | 400 | | | | 21,440 | |
| Velocity Financial * | | | 3,631 | | | | 35,257 | |
| Veritex Holdings . | | | 22,047 | | | | 696,244 | |
| Victory Capital Holdings, Cl A | | | 6,759 | | | | 195,470 | |
| Virtus Investment Partners | | | 3,088 | | | | 529,561 | |
| Walker & Dunlop | | | 12,993 | | | | 1,168,850 | |
| Washington Federal | | | 27,603 | | | | 1,068,236 | |
| Washington Trust Bancorp | | | 7,398 | | | | 358,803 | |
| Waterstone Financial . | | | 9,316 | | | | 158,186 | |
| WesBanco . | | | 25,436 | | | | 1,028,632 | |
| West BanCorp | | | 7,091 | | | | 159,335 | |
| Westamerica BanCorp | | | 11,168 | | | | 700,569 | |
| WisdomTree Investments . | | | 55,743 | | | | 302,684 | |
| World Acceptance * | | | 1,811 | | | | 147,089 | |
| WSFS Financial | | | 27,342 | | | | 1,273,044 | |
| | | | | | | | 180,312,676 | |
| Health Care — 12.3% | | | | | | | | |
| 1Life Healthcare * | | | 76,207 | | | | 1,303,140 | |
| 23andMe Holding, Cl A * | | | 1 | | | | 3 | |
| 2seventy bio * | | | 15,596 | | | | 247,664 | |
| 4D Molecular Therapeutics * | | | 11,743 | | | | 101,694 | |
| Aadi Bioscience * | | | 6,012 | | | | 77,645 | |
| Absci * | | | 22,466 | | | | 70,993 | |
| ACADIA Pharmaceuticals * | | | 50,825 | | | | 814,725 | |
| Accolade * | | | 30,766 | | | | 331,658 | |
| Aclaris Therapeutics * | | | 29,447 | | | | 459,668 | |
| AdaptHealth, Cl A * | | | 30,631 | | | | 698,387 | |
| Adaptive Biotechnologies * | | | 46,172 | | | | 359,218 | |
| Addus HomeCare * | | | 6,644 | | | | 680,479 | |
| Adicet Bio * | | | 11,833 | | | | 195,126 | |
| ADMA Biologics * | | | 1 | | | | 3 | |
| Aerie Pharmaceuticals * | | | 22,338 | | | | 339,984 | |
| Aerovate Therapeutics * | | | 4,920 | | | | 95,989 | |
| Agenus * | | | 1 | | | | 3 | |
| Agiliti * | | | 11,565 | | | | 202,041 | |
| Agios Pharmaceuticals * | | | 23,277 | | | | 641,049 | |
| AirSculpt Technologies . | | | 3,395 | | | | 23,018 | |
|
|
|
| Schedule of Investments | | October 31, 2022 |
| Global X Russell 2000 Covered Call ETF |
| | | | |
| |
| | | Shares | | | Value | |
| COMMON STOCK — continued | | | | | | |
| Health Care — continued | | | | | | |
| Akero Therapeutics * | | | 12,039 | | | $ | 508,768 | |
| Akoya Biosciences * | | | 5,770 | | | | 79,338 | |
| Albireo Pharma * | | | 7,526 | | | | 154,434 | |
| Alector * | | | 26,855 | | | | 247,066 | |
| Alignment Healthcare * | | | 40,576 | | | | 537,226 | |
| Alkermes * | | | 68,930 | | | | 1,564,711 | |
| Allogene Therapeutics * | | | 38,828 | | | | 399,928 | |
| Allovir * | | | 12,116 | | | | 83,964 | |
| Allscripts Healthcare Solutions * | | | 50,685 | | | | 745,070 | |
| Alpha Teknova * | | | 2,715 | | | | 12,462 | |
| Alphatec Holdings * | | | 29,152 | | | | 298,517 | |
| Alpine Immune Sciences * | | | 5,397 | | | | 31,896 | |
| ALX Oncology Holdings * | | | 7,569 | | | | 91,888 | |
| American Well, Cl A * | | | 95,028 | | | | 388,665 | |
| Amicus Therapeutics * | | | 126,348 | | | | 1,263,480 | |
| AMN Healthcare Services * | | | 19,671 | | | | 2,468,711 | |
| Amneal Pharmaceuticals * | | | 1 | | | | 2 | |
| Amphastar Pharmaceuticals * | | | 16,004 | | | | 494,524 | |
| Amylyx Pharmaceuticals * | | | 14,885 | | | | 530,948 | |
| AN2 Therapeutics * | | | 1,836 | | | | 26,475 | |
| AnaptysBio * | | | 8,602 | | | | 248,168 | |
| Anavex Life Sciences * | | | 32,172 | | | | 391,533 | |
| AngioDynamics * | | | 16,160 | | | | 227,694 | |
| ANI Pharmaceuticals * | | | 5,495 | | | | 212,052 | |
| Anika Therapeutics * | | | 6,482 | | | | 184,218 | |
| Apellis Pharmaceuticals * | | | 40,146 | | | | 2,428,432 | |
| Apollo Medical Holdings * | | | 16,551 | | | | 586,898 | |
| Arbutus Biopharma * | | | 1 | | | | 2 | |
| Arcellx * | | | 13,232 | | | | 310,687 | |
| Arcturus Therapeutics Holdings * | | | 9,549 | | | | 169,017 | |
| Arcus Biosciences * | | | 21,543 | | | | 548,916 | |
| Arcutis Biotherapeutics * | | | 18,931 | | | | 334,700 | |
| Arrowhead Pharmaceuticals * | | | 44,774 | | | | 1,558,583 | |
| Artivion * | | | 16,495 | | | | 184,084 | |
| Arvinas * | | | 20,622 | | | | 1,025,120 | |
| Atara Biotherapeutics * | | | 36,348 | | | | 169,382 | |
| Atea Pharmaceuticals * | | | 27,967 | | | | 167,802 | |
| Athira Pharma * | | | 1 | | | | 3 | |
| ATI Physical Therapy * | | | 1 | | | | 1 | |
|
|
|
| Schedule of Investments | | October 31, 2022 |
| Global X Russell 2000 Covered Call ETF |
| | | | |
| |
| | | Shares | | | Value | |
| COMMON STOCK — continued | | | | | | |
| Health Care — continued | | | | | | |
| AtriCure * | | | 20,237 | | | $ | 852,382 | |
| Atrion . | | | 591 | | | | 354,783 | |
| Aura Biosciences * | | | 7,757 | | | | 96,109 | |
| Avanos Medical * | | | 20,339 | | | | 450,509 | |
| Aveanna Healthcare Holdings * | | | 1 | | | | 1 | |
| Avid Bioservices * | | | 27,782 | | | | 470,627 | |
| Avidity Biosciences * | | | 23,844 | | | | 340,492 | |
| Axogen * | | | 15,917 | | | | 181,772 | |
| Axonics * | | | 21,400 | | | | 1,565,196 | |
| Axsome Therapeutics * | | | 13,368 | | | | 603,565 | |
| Beam Therapeutics * | | | 27,153 | | | | 1,196,361 | |
| Berkeley Lights * | | | 20,941 | | | | 46,489 | |
| BioCryst Pharmaceuticals * | | | 84,528 | | | | 1,128,449 | |
| Biohaven * | | | 13,190 | | | | 218,558 | |
| BioLife Solutions * | | | 14,458 | | | | 340,052 | |
| Bionano Genomics * | | | 1 | | | | 2 | |
| Bioventus, Cl A * | | | 11,913 | | | | 96,972 | |
| Bioxcel Therapeutics * | | | 7,229 | | | | 91,013 | |
| Bluebird Bio * | | | 28,203 | | | | 176,833 | |
| Blueprint Medicines * | | | 26,739 | | | | 1,386,150 | |
| Bridgebio Pharma * | | | 43,643 | | | | 455,197 | |
| Brookdale Senior Living * | | | 76,393 | | | | 341,477 | |
| Butterfly Network * | | | 71,416 | | | | 349,938 | |
| C4 Therapeutics * | | | 16,257 | | | | 156,392 | |
| Cano Health * | | | 67,051 | | | | 240,043 | |
| Cara Therapeutics * | | | 18,462 | | | | 173,543 | |
| Cardiovascular Systems * | | | 17,260 | | | | 249,234 | |
| CareDx * | | | 21,596 | | | | 429,976 | |
| CareMax * | | | 24,709 | | | | 173,951 | |
| Caribou Biosciences * | | | 21,517 | | | | 209,576 | |
| Cassava Sciences * | | | 16,475 | | | | 600,349 | |
| Castle Biosciences * | | | 10,264 | | | | 261,937 | |
| Catalyst Pharmaceuticals * | | | 39,842 | | | | 552,609 | |
| Celldex Therapeutics * | | | 19,529 | | | | 686,054 | |
| Celularity * | | | 1 | | | | 2 | |
| Century Therapeutics * | | | 7,399 | | | | 77,690 | |
| Cerevel Therapeutics Holdings * | | | 22,647 | | | | 633,210 | |
| Cerus * | | | 69,844 | | | | 255,629 | |
| Chimerix * | | | 1 | | | | 2 | |
|
|
|
| Schedule of Investments | | October 31, 2022 |
| Global X Russell 2000 Covered Call ETF |
| | | | |
| |
| | | Shares | | | Value | |
| COMMON STOCK — continued | | | | | | |
| Health Care — continued | | | | | | |
| Chinook Therapeutics * | | | 22,795 | | | $ | 495,791 | |
| CinCor Pharma * | | | 8,884 | | | | 298,858 | |
| Clover Health Investments, Cl A * | | | 1 | | | | 2 | |
| Codexis * | | | 24,978 | | | | 140,376 | |
| Cogent Biosciences * | | | 27,999 | | | | 382,186 | |
| Coherus Biosciences * | | | 41,842 | | | | 364,025 | |
| Collegium Pharmaceutical * | | | 15,029 | | | | 269,620 | |
| Community Health Systems * | | | 1 | | | | 3 | |
| Computer Programs and Systems * | | | 6,264 | | | | 202,327 | |
| CONMED . | | | 12,787 | | | | 1,019,508 | |
| Corcept Therapeutics * | | | 36,864 | | | | 1,054,310 | |
| CorVel * | | | 3,801 | | | | 624,162 | |
| Crinetics Pharmaceuticals * | | | 22,094 | | | | 407,855 | |
| Cross Country Healthcare * | | | 15,769 | | | | 584,872 | |
| CryoPort * | | | 18,540 | | | | 514,670 | |
| CTI BioPharma * | | | 38,396 | | | | 188,140 | |
| Cue Health * | | | 1 | | | | 4 | |
| Cullinan Oncology * | | | 13,067 | | | | 171,700 | |
| Cutera * | | | 7,348 | | | | 337,788 | |
| Cytek Biosciences * | | | 47,580 | | | | 738,442 | |
| Cytokinetics * | | | 35,563 | | | | 1,552,681 | |
| Day One Biopharmaceuticals * | | | 13,431 | | | | 283,931 | |
| Deciphera Pharmaceuticals * | | | 21,215 | | | | 344,107 | |
| Denali Therapeutics * | | | 41,707 | | | | 1,196,157 | |
| Design Therapeutics * | | | 14,133 | | | | 220,757 | |
| DICE Therapeutics * | | | 11,807 | | | | 419,267 | |
| DocGo * | | | 37,175 | | | | 368,033 | |
| Dynavax Technologies * | | | 54,687 | | | | 626,166 | |
| Dyne Therapeutics * | | | 12,659 | | | | 144,313 | |
| Eagle Pharmaceuticals * | | | 4,884 | | | | 153,700 | |
| Edgewise Therapeutics * | | | 14,557 | | | | 138,437 | |
| Editas Medicine, Cl A * | | | 28,236 | | | | 354,362 | |
| Eiger BioPharmaceuticals * | | | 14,222 | | | | 72,674 | |
| Embecta . | | | 24,359 | | | | 753,180 | |
| Emergent BioSolutions * | | | 21,036 | | | | 438,811 | |
| Enanta Pharmaceuticals * | | | 8,484 | | | | 382,713 | |
| Enochian Biosciences * | | | 1 | | | | 2 | |
| Ensign Group | | | 24,061 | | | | 2,160,197 | |
| EQRx * | | | 91,641 | | | | 471,035 | |
|
|
|
| Schedule of Investments | | October 31, 2022 |
| Global X Russell 2000 Covered Call ETF |
| | | | |
| |
| | | Shares | | | Value | |
| COMMON STOCK — continued | | | | | | |
| Health Care — continued | | | | | | |
| Erasca * | | | 26,607 | | | $ | 217,379 | |
| Esperion Therapeutics * | | | 24,402 | | | | 198,388 | |
| Evolent Health, Cl A * | | | 34,688 | | | | 1,103,425 | |
| Evolus * | | | 13,915 | | | | 119,112 | |
| EyePoint Pharmaceuticals * | | | 10,487 | | | | 56,630 | |
| Fate Therapeutics * | | | 36,790 | | | | 769,647 | |
| FibroGen * | | | 39,282 | | | | 639,511 | |
| Figs, Cl A * | | | 52,803 | | | | 389,686 | |
| Foghorn Therapeutics * | | | 8,145 | | | | 71,187 | |
| Fulcrum Therapeutics * | | | 12,253 | | | | 68,127 | |
| Fulgent Genetics * | | | 8,972 | | | | 355,560 | |
| Gelesis Holdings * | | | 1 | | | | — | |
| Generation Bio * | | | 18,259 | | | | 93,486 | |
| Geron * | | | 1 | | | | 2 | |
| Glaukos * | | | 19,317 | | | | 1,083,104 | |
| Gossamer Bio * | | | 25,521 | | | | 283,283 | |
| GreenLight Biosciences Holdings PBC * | | | 1 | | | | 2 | |
| Haemonetics * | | | 22,036 | | | | 1,871,958 | |
| Halozyme Therapeutics * | | | 58,049 | | | | 2,775,323 | |
| Harmony Biosciences Holdings * | | | 11,013 | | | | 572,676 | |
| Health Catalyst * | | | 22,694 | | | | 200,161 | |
| HealthEquity * | | | 35,797 | | | | 2,788,944 | |
| HealthStream * | | | 10,872 | | | | 268,538 | |
| Heron Therapeutics * | | | 1 | | | | 4 | |
| Heska * | | | 4,135 | | | | 296,728 | |
| HilleVax * | | | 5,407 | | | | 115,602 | |
| Hims & Hers Health * | | | 50,188 | | | | 227,854 | |
| Humacyte * | | | 7,258 | | | | 25,004 | |
| Icosavax * | | | 9,604 | | | | 32,942 | |
| Ideaya Biosciences * | | | 14,960 | | | | 252,674 | |
| IGM Biosciences * | | | 4,241 | | | | 84,820 | |
| Imago Biosciences * | | | 11,091 | | | | 188,547 | |
| ImmunityBio * | | | 30,309 | | | | 166,700 | |
| ImmunoGen * | | | 88,542 | | | | 525,940 | |
| Immunovant * | | | 16,663 | | | | 186,626 | |
| Inari Medical * | | | 21,958 | | | | 1,689,229 | |
| Inhibrx * | | | 13,525 | | | | 435,235 | |
| Innovage Holding * | | | 13,867 | | | | 85,837 | |
| Innoviva * | | | 26,438 | | | | 358,499 | |
|
|
|
| Schedule of Investments | | October 31, 2022 |
| Global X Russell 2000 Covered Call ETF |
| | | | |
| |
| | | Shares | | | Value | |
| COMMON STOCK — continued | | | | | | |
| Health Care — continued | | | | | | |
| Inogen * | | | 9,588 | | | $ | 217,264 | |
| Inotiv * | | | 7,778 | | | | 161,627 | |
| Inovio Pharmaceuticals * | | | 1 | | | | 2 | |
| Insmed * | | | 50,281 | | | | 870,867 | |
| Inspire Medical Systems * | | | 12,033 | | | | 2,345,833 | |
| Instil Bio * | | �� | 24,133 | | | | 79,639 | |
| Integer Holdings * | | | 13,976 | | | | 871,124 | |
| Intellia Therapeutics * | | | 33,795 | | | | 1,783,700 | |
| Intercept Pharmaceuticals * | | | 10,861 | | | | 150,642 | |
| Intra-Cellular Therapies * | | | 40,880 | | | | 1,866,990 | |
| Invitae * | | | 1 | | | | 3 | |
| Invivyd * | | | 37,880 | | | | 149,626 | |
| Iovance Biotherapeutics * | | | 62,340 | | | | 582,256 | |
| iRadimed | | | 2,967 | | | | 86,191 | |
| iRhythm Technologies * | | | 13,312 | | | | 1,697,147 | |
| Ironwood Pharmaceuticals, Cl A * | | | 59,286 | | | | 648,589 | |
| iTeos Therapeutics * | | | 10,236 | | | | 199,397 | |
| IVERIC bio * | | | 51,985 | | | | 1,243,481 | |
| Janux Therapeutics * | | | 7,432 | | | | 134,371 | |
| Joint * | | | 6,430 | | | | 106,224 | |
| Jounce Therapeutics * | | | 1 | | | | 2 | |
| KalVista Pharmaceuticals * | | | 9,401 | | | | 47,663 | |
| Karuna Therapeutics * | | | 12,772 | | | | 2,801,410 | |
| Karyopharm Therapeutics * | | | 30,205 | | | | 143,776 | |
| Keros Therapeutics * | | | 8,470 | | | | 426,380 | |
| Kezar Life Sciences * | | | 26,195 | | | | 196,855 | |
| Kiniksa Pharmaceuticals, Cl A * | | | 15,634 | | | | 178,540 | |
| Kinnate Biopharma * | | | 11,200 | | | | 94,416 | |
| Kodiak Sciences * | | | 13,932 | | | | 100,032 | |
| Kronos Bio * | | | 16,460 | | | | 48,722 | |
| Krystal Biotech * | | | 9,549 | | | | 730,499 | |
| Kura Oncology * | | | 29,306 | | | | 454,829 | |
| Kymera Therapeutics * | | | 15,759 | | | | 478,128 | |
| Lantheus Holdings * | | | 29,507 | | | | 2,183,223 | |
| LeMaitre Vascular | | | 8,265 | | | | 358,701 | |
| Lexicon Pharmaceuticals * | | | 1 | | | | 2 | |
| LHC Group * | | | 12,728 | | | | 2,126,849 | |
| LifeStance Health Group * | | | 29,695 | | | | 224,197 | |
| Ligand Pharmaceuticals * | | | 6,385 | | | | 559,645 | |
|
|
|
| Schedule of Investments | | October 31, 2022 |
| Global X Russell 2000 Covered Call ETF |
| | | | |
| |
| | | Shares | | | Value | |
| COMMON STOCK — continued | | | | | | |
| Health Care — continued | | | | | | |
| Liquidia * | | | 19,771 | | | $ | 96,680 | |
| LivaNova * | | | 23,490 | | | | 1,106,379 | |
| Lyell Immunopharma * | | | 85,252 | | | | 501,282 | |
| MacroGenics * | | | 44,563 | | | | 228,163 | |
| Madrigal Pharmaceuticals * | | | 5,270 | | | | 373,221 | |
| MannKind * | | | 102,986 | | | | 348,093 | |
| MaxCyte * | | | 39,398 | | | | 272,634 | |
| Medpace Holdings * | | | 10,717 | | | | 2,378,960 | |
| MeiraGTx Holdings * | | | 12,489 | | | | 90,795 | |
| Meridian Bioscience * | | | 18,244 | | | | 583,261 | |
| Merit Medical Systems * | | | 23,645 | | | | 1,626,067 | |
| Mersana Therapeutics * | | | 42,996 | | | | 337,949 | |
| Mesa Laboratories | | | 2,172 | | | | 287,160 | |
| MiMedx Group * | | | 1 | | | | 3 | |
| Mirum Pharmaceuticals * | | | 9,212 | | | | 207,731 | |
| ModivCare * | | | 5,421 | | | | 527,138 | |
| Monte Rosa Therapeutics * | | | 11,946 | | | | 109,903 | |
| Morphic Holding * | | | 10,727 | | | | 300,463 | |
| Multiplan * | | | 1 | | | | 3 | |
| Myriad Genetics * | | | 33,799 | | | | 700,991 | |
| NanoString Technologies * | | | 19,749 | | | | 206,575 | |
| National HealthCare | | | 5,324 | | | | 324,338 | |
| National Research . | | | 6,216 | | | | 253,178 | |
| Nautilus Biotechnology, Cl A * | | | 1 | | | | 2 | |
| Nektar Therapeutics, Cl A * | | | 75,029 | | | | 282,109 | |
| Neogen * | | | 45,593 | | | | 601,828 | |
| NeoGenomics * | | | 63,547 | | | | 483,275 | |
| Nevro * | | | 14,732 | | | | 564,825 | |
| NextGen Healthcare * | | | 24,006 | | | | 481,080 | |
| NGM Biopharmaceuticals * | | | 21,169 | | | | 113,042 | |
| Nkarta * | | | 13,491 | | | | 170,122 | |
| Nurix Therapeutics * | | | 23,065 | | | | 293,617 | |
| Nutex Health * | | | 1 | | | | 1 | |
| Nuvalent, Cl A * | | | 7,432 | | | | 265,397 | |
| NuVasive * | | | 21,949 | | | | 968,609 | |
| Nuvation Bio * | | | 1 | | | | 2 | |
| Ocugen * | | | 1 | | | | 2 | |
| Ocular Therapeutix * | | | 31,494 | | | | 113,693 | |
| Omnicell * | | | 19,067 | | | | 1,474,260 | |
|
|
|
| Schedule of Investments | | October 31, 2022 |
| Global X Russell 2000 Covered Call ETF |
| | | | |
| |
| | | Shares | | | Value | |
| COMMON STOCK — continued | | | | | | |
| Health Care — continued | | | | | | |
| Oncology Institute * | | | 7,752 | | | $ | 35,194 | |
| OPKO Health * | | | 1 | | | | 2 | |
| OptimizeRx * | | | 7,556 | | | | 116,476 | |
| Option Care Health * | | | 67,472 | | | | 2,041,703 | |
| OraSure Technologies * | | | 39,618 | | | | 172,734 | |
| Organogenesis Holdings, Cl A * | | | 1 | | | | 3 | |
| Orthofix Medical * | | | 8,400 | | | | 134,904 | |
| OrthoPediatrics * | | | 6,113 | | | | 259,741 | |
| Outlook Therapeutics * | | | 1 | | | | 1 | |
| Outset Medical * | | | 20,197 | | | | 313,861 | |
| Owens & Minor | | | 30,992 | | | | 526,864 | |
| Owlet * | | | 1 | | | | 1 | |
| P3 Health Partners * | | | 10,506 | | | | 52,005 | |
| Pacific Biosciences of California * | | | 111,603 | | | | 941,929 | |
| Pacira BioSciences * | | | 19,697 | | | | 1,019,517 | |
| Paragon 28 * | | | 19,140 | | | | 382,226 | |
| Pardes Biosciences, Cl A * | | | 1 | | | | 1 | |
| Patterson . | | | 38,373 | | | | 996,547 | |
| Pear Therapeutics * | | | 1 | | | | 3 | |
| Pediatrix Medical Group * | | | 35,983 | | | | 698,070 | |
| Pennant Group * | | | 11,372 | | | | 139,989 | |
| PepGen * | | | 3,404 | | | | 41,801 | |
| PetIQ, Cl A * | | | 12,030 | | | | 98,887 | |
| Phathom Pharmaceuticals * | | | 8,485 | | | | 89,941 | |
| Phibro Animal Health, Cl A . | | | 8,983 | | | | 131,960 | |
| Phreesia * | | | 21,326 | | | | 582,626 | |
| PMV Pharmaceuticals * | | | 15,492 | | | | 190,707 | |
| Point Biopharma Global, Cl A * | | | 30,704 | | | | 286,468 | |
| Praxis Precision Medicines * | | | 1 | | | | 2 | |
| Precigen * | | | 1 | | | | 2 | |
| Prestige Consumer Healthcare * | | | 21,271 | | | | 1,158,844 | |
| Privia Health Group * | | | 19,928 | | | | 667,189 | |
| PROCEPT BioRobotics * | | | 10,926 | | | | 496,368 | |
| Progyny * | | | 34,468 | | | | 1,532,792 | |
| Prometheus Biosciences * | | | 12,789 | | | | 671,678 | |
| Protagonist Therapeutics * | | | 18,632 | | | | 150,919 | |
| Provention Bio * | | | 22,806 | | | | 158,274 | |
| PTC Therapeutics * | | | 30,525 | | | | 1,154,456 | |
| Pulmonx * | | | 14,391 | | | | 192,264 | |
|
|
|
| Schedule of Investments | | October 31, 2022 |
| Global X Russell 2000 Covered Call ETF |
| | | | |
| |
| | | Shares | | | Value | |
| COMMON STOCK — continued | | | | | | |
| Health Care — continued | | | | | | |
| Quanterix * | | | 13,935 | | | $ | 154,260 | |
| Quantum-Si * | | | 1 | | | | 3 | |
| R1 RCM * | | | 64,374 | | | | 1,136,845 | |
| RadNet * | | | 20,928 | | | | 400,143 | |
| Rallybio * | | | 7,262 | | | | 69,425 | |
| RAPT Therapeutics * | | | 10,985 | | | | 239,693 | |
| Reata Pharmaceuticals, Cl A * | | | 11,896 | | | | 383,051 | |
| Recursion Pharmaceuticals, Cl A * | | | 66,042 | | | | 696,743 | |
| REGENXBIO * | | | 17,074 | | | | 404,142 | |
| Relay Therapeutics * | | | 32,072 | | | | 712,640 | |
| Relmada Therapeutics * | | | 11,749 | | | | 75,076 | |
| Replimune Group * | | | 17,969 | | | | 329,911 | |
| Revance Therapeutics * | | | 31,618 | | | | 705,398 | |
| REVOLUTION Medicines * | | | 32,197 | | | | 652,311 | |
| Rigel Pharmaceuticals * | | | 1 | | | | 1 | |
| Rocket Pharmaceuticals * | | | 18,353 | | | | 342,467 | |
| RxSight * | | | 8,580 | | | | 106,735 | |
| Sage Therapeutics * | | | 24,928 | | | | 938,788 | |
| Sana Biotechnology * | | | 36,008 | | | | 208,846 | |
| Sangamo Therapeutics * | | | 48,870 | | | | 214,539 | |
| Schrodinger * | | | 22,538 | | | | 540,236 | |
| Science 37 Holdings * | | | 1 | | | | 1 | |
| SeaSpine Holdings * | | | 13,542 | | | | 87,075 | |
| Seer, Cl A * | | | 18,566 | | | | 145,372 | |
| Select Medical Holdings | | | 46,452 | | | | 1,192,887 | |
| Sema4 Holdings * | | | 1 | | | | 1 | |
| Senseonics Holdings * | | | 1 | | | | 1 | |
| Seres Therapeutics * | | | 50,102 | | | | 443,904 | |
| Sharecare * | | | 1 | | | | 2 | |
| Shockwave Medical * | | | 15,416 | | | | 4,519,200 | |
| SI-BONE * | | | 13,575 | | | | 263,898 | |
| SIGA Technologies . | | | 19,751 | | | | 181,512 | |
| Sight Sciences * | | | 9,061 | | | | 70,948 | |
| Silk Road Medical * | | | 14,762 | | | | 650,709 | |
| Simulations Plus . | | | 6,704 | | | | 278,216 | |
| Singular Genomics Systems * | | | 1 | | | | 3 | |
| SomaLogic * | | | 62,018 | | | | 215,202 | |
| Sorrento Therapeutics * | | | 1 | | | | 2 | |
| SpringWorks Therapeutics * | | | 14,513 | | | | 348,457 | |
|
|
|
| Schedule of Investments | | October 31, 2022 |
| Global X Russell 2000 Covered Call ETF |
| | | | |
| |
| | | Shares | | | Value | |
| COMMON STOCK — continued | | | | | | |
| Health Care — continued | | | | | | |
| STAAR Surgical * | | | 20,858 | | | $ | 1,478,206 | |
| Stoke Therapeutics * | | | 9,461 | | | | 140,496 | |
| Supernus Pharmaceuticals * | | | 20,967 | | | | 718,539 | |
| Surgery Partners * | | | 16,625 | | | | 452,034 | |
| Surmodics * | | | 5,882 | | | | 200,811 | |
| Sutro Biopharma * | | | 17,919 | | | | 131,346 | |
| Syndax Pharmaceuticals * | | | 23,923 | | | | 549,272 | |
| Tactile Systems Technology * | | | 8,145 | | | | 60,599 | |
| Talaris Therapeutics * | | | 1 | | | | 2 | |
| Tango Therapeutics * | | | 19,290 | | | | 155,092 | |
| Tarsus Pharmaceuticals * | | | 7,698 | | | | 141,797 | |
| Tenaya Therapeutics * | | | 11,776 | | | | 31,560 | |
| Tenon Medical * | | | 1 | | | | 2 | |
| TG Therapeutics * | | | 53,927 | | | | 313,855 | |
| Theravance Biopharma * | | | 25,318 | | | | 252,420 | |
| Theseus Pharmaceuticals * | | | 5,567 | | | | 29,950 | |
| TransMedics Group * | | | 13,240 | | | | 638,433 | |
| Travere Therapeutics * | | | 29,936 | | | | 649,012 | |
| Treace Medical Concepts * | | | 13,977 | | | | 342,157 | |
| Tricida * | | | 13,775 | | | | 4,577 | |
| Twist Bioscience * | | | 24,734 | | | | 812,017 | |
| Tyra Biosciences * | | | 5,057 | | | | 34,994 | |
| UFP Technologies * | | | 2,989 | | | | 280,518 | |
| US Physical Therapy | | | 5,518 | | | | 489,998 | |
| Utah Medical Products . | | | 1,629 | | | | 145,877 | |
| Vanda Pharmaceuticals * | | | 22,806 | | | | 238,779 | |
| Varex Imaging * | | | 16,527 | | | | 365,412 | |
| Vaxart * | | | 1 | | | | 2 | |
| Vaxcyte * | | | 24,312 | | | | 1,060,246 | |
| VBI Vaccines * | | | 1 | | | | 1 | |
| Ventyx Biosciences * | | | 11,410 | | | | 369,342 | |
| Vera Therapeutics, Cl A * | | | 6,191 | | | | 115,400 | |
| Veracyte * | | | 29,981 | | | | 602,918 | |
| Vericel * | | | 19,860 | | | | 533,837 | |
| Verve Therapeutics * | | | 19,653 | | | | 740,918 | |
| Vicarious Surgical * | | | 42,061 | | | | 162,776 | |
| ViewRay * | | | 1 | | | | 4 | |
| Vir Biotechnology * | | | 32,244 | | | | 708,723 | |
| Viridian Therapeutics * | | | 10,612 | | | | 211,179 | |
|
|
|
| Schedule of Investments | | October 31, 2022 |
| Global X Russell 2000 Covered Call ETF |
| | | | |
| |
| | | Shares | | | Value | |
| COMMON STOCK — continued | | | | | | |
| Health Care — continued | | | | | | |
| VistaGen Therapeutics * | | | 1 | | | $ | — | |
| Xencor * | | | 24,210 | | | | 677,880 | |
| Xeris Biopharma Holdings * | | | 1 | | | | 2 | |
| Y-mAbs Therapeutics * | | | 17,930 | | | | 64,727 | |
| Zentalis Pharmaceuticals * | | | 20,477 | | | | 513,768 | |
| Zimvie * | | | 8,673 | | | | 76,062 | |
| Zynex | | | 9,231 | | | | 105,233 | |
| | | | | | | | 165,002,546 | |
| Industrials — 11.3% | | | | | | | | |
| 3D Systems * | | | 53,869 | | | | 475,663 | |
| AAON . | | | 18,585 | | | | 1,198,547 | |
| AAR * | | | 14,389 | | | | 637,720 | |
| ABM Industries . | | | 28,404 | | | | 1,264,262 | |
| ACCO Brands | | | 38,553 | | | | 177,344 | |
| ACV Auctions, Cl A * | | | 46,706 | | | | 425,959 | |
| Aerojet Rocketdyne Holdings * | | | 33,573 | | | | 1,626,612 | |
| AeroVironment * | | | 10,824 | | | | 990,396 | |
| AerSale * | | | 6,516 | | | | 138,139 | |
| Air Transport Services Group * | | | 25,039 | | | | 731,139 | |
| Alamo Group | | | 4,344 | | | | 660,636 | |
| Albany International, Cl A . | | | 13,378 | | | | 1,225,692 | |
| Alight, Cl A * | | | 140,481 | | | | 1,164,587 | |
| Allegiant Travel * | | | 6,589 | | | | 494,504 | |
| Allied Motion Technologies | | | 5,587 | | | | 188,952 | |
| Alta Equipment Group . | | | 7,942 | | | | 97,131 | |
| Altra Industrial Motion | | | 27,529 | | | | 1,655,594 | |
| Ameresco, Cl A * | | | 13,484 | | | | 815,512 | |
| American Woodmark * | | | 7,051 | | | | 319,763 | |
| API Group * | | | 87,353 | | | | 1,440,451 | |
| Apogee Enterprises . | | | 10,237 | | | | 469,674 | |
| Applied Industrial Technologies | | | 16,255 | | | | 2,021,797 | |
| ArcBest . | | | 10,591 | | | | 841,243 | |
| Archer Aviation, Cl A * | | | 1 | | | | 3 | |
| Arcosa | | | 20,460 | | | | 1,313,532 | |
| Argan | | | 6,449 | | | | 223,587 | |
| Aris Water Solution, Cl A . | | | 9,049 | | | | 154,104 | |
| Array Technologies * | | | 68,835 | | | | 1,245,913 | |
| ASGN * | | | 21,442 | | | | 1,817,853 | |
| Astec Industries . | | | 9,714 | | | | 424,016 | |
|
|
|
| Schedule of Investments | | October 31, 2022 |
| Global X Russell 2000 Covered Call ETF |
| | | | |
| |
| | | Shares | | | Value | |
| COMMON STOCK — continued | | | | | | |
| Industrials — continued | | | | | | |
| Astra Space * | | | 1 | | | $ | 1 | |
| Astronics * | | | 10,317 | | | | 95,535 | |
| Atkore * | | | 18,653 | | | | 1,777,631 | |
| Atlas Air Worldwide Holdings * | | | 12,125 | | | | 1,226,322 | |
| Atlas Technical Consultants * | | | 6,313 | | | | 47,853 | |
| AZZ | | | 10,430 | | | | 419,286 | |
| Babcock & Wilcox Enterprises * | | | 23,316 | | | | 106,321 | |
| Barnes Group | | | 20,826 | | | | 736,616 | |
| Barrett Business Services | | | 3,154 | | | | 275,092 | |
| Beacon Roofing Supply * | | | 23,442 | | | | 1,320,957 | |
| Berkshire Grey * | | | 1 | | | | 1 | |
| Bird Global, Cl A * | | | 1 | | | | — | |
| Blade Air Mobility * | | | 23,195 | | | | 104,377 | |
| Blink Charging * | | | 15,870 | | | | 234,876 | |
| Bloom Energy, Cl A * | | | 75,523 | | | | 1,413,035 | |
| Blue Bird * | | | 7,059 | | | | 64,731 | |
| BlueLinx Holdings * | | | 3,990 | | | | 281,135 | |
| Boise Cascade | | | 16,737 | | | | 1,117,529 | |
| Brady, Cl A | | | 19,942 | | | | 912,346 | |
| BrightView Holdings * | | | 19,038 | | | | 169,819 | |
| Brink's | | | 20,167 | | | | 1,202,558 | |
| Cadre Holdings | | | 9,385 | | | | 275,637 | |
| Caesarstone . | | | 9,231 | | | | 81,971 | |
| Casella Waste Systems, Cl A * | | | 21,682 | | | | 1,773,804 | |
| CBIZ * | | | 20,852 | | | | 1,035,093 | |
| Chart Industries * | | | 15,705 | | | | 3,500,330 | |
| CIRCOR International * | | | 8,213 | | | | 169,763 | |
| Columbus McKinnon | | | 11,970 | | | | 341,384 | |
| Comfort Systems USA . | | | 15,126 | | | | 1,864,733 | |
| CompX International | | | 1,017 | | | | 18,133 | |
| Concrete Pumping Holdings * | | | 10,860 | | | | 69,558 | |
| Construction Partners, Cl A * | | | 17,136 | | | | 533,615 | |
| CoreCivic * | | | 49,413 | | | | 517,354 | |
| Covenant Logistics Group, Cl A | | | 5,292 | | | | 200,249 | |
| CRA International . | | | 3,063 | | | | 314,693 | |
| CSW Industrials | | | 6,341 | | | | 817,482 | |
| Custom Truck One Source * | | | 24,435 | | | | 169,335 | |
| Daseke * | | | 16,833 | | | | 100,325 | |
| Deluxe . | | | 18,431 | | | | 338,762 | |
|
|
|
| Schedule of Investments | | October 31, 2022 |
| Global X Russell 2000 Covered Call ETF |
| | | | |
| |
| | | Shares | | | Value | |
| COMMON STOCK — continued | | | | | | |
| Industrials — continued | | | | | | |
| Desktop Metal, Cl A * | | | 1 | | | $ | 3 | |
| Distribution Solutions Group * | | | 2,337 | | | | 70,297 | |
| Douglas Dynamics . | | | 9,782 | | | | 332,099 | |
| Ducommun * | | | 4,748 | | | | 224,153 | |
| DXP Enterprises * | | | 7,228 | | | | 206,793 | |
| Dycom Industries * | | | 12,463 | | | | 1,472,877 | |
| Eagle Bulk Shipping . | | | 5,582 | | | | 270,057 | |
| EMCOR Group | | | 22,142 | | | | 3,124,236 | |
| Encore Wire | | | 8,230 | | | | 1,132,366 | |
| Energy Recovery * | | | 23,354 | | | | 600,898 | |
| Energy Vault Holdings * | | | 32,190 | | | | 103,652 | |
| Enerpac Tool Group, Cl A | | | 25,913 | | | | 658,449 | |
| EnerSys | | | 17,531 | | | | 1,162,130 | |
| Eneti . | | | 9,437 | | | | 77,572 | |
| Ennis | | | 11,172 | | | | 252,040 | |
| Enovix * | | | 46,116 | | | | 870,209 | |
| EnPro Industries . | | | 8,852 | | | | 942,738 | |
| ESCO Technologies . | | | 10,845 | | | | 934,514 | |
| ESS Tech * | | | 53,701 | | | | 227,155 | |
| Evoqua Water Technologies * | | | 52,814 | | | | 2,069,253 | |
| Exponent | | | 21,925 | | | | 2,088,575 | |
| Fathom Digital Manufacturing C * | | | 1 | | | | 3 | |
| Federal Signal | | | 25,536 | | | | 1,191,254 | |
| First Advantage * | | | 25,204 | | | | 354,116 | |
| Fluence Energy, Cl A * | | | 14,867 | | | | 221,964 | |
| Fluor * | | | 61,708 | | | | 1,867,284 | |
| Forrester Research * | | | 5,000 | | | | 211,600 | |
| Forward Air . | | | 11,341 | | | | 1,200,672 | |
| Franklin Covey * | | | 5,441 | | | | 275,315 | |
| Franklin Electric . | | | 19,640 | | | | 1,609,302 | |
| Frontier Group Holdings * | | | 14,815 | | | | 194,225 | |
| FTC Solar * | | | 1 | | | | 2 | |
| FuelCell Energy * | | | 152,430 | | | | 475,582 | |
| GATX . | | | 15,006 | | | | 1,571,278 | |
| Genco Shipping & Trading . | | | 15,434 | | | | 206,816 | |
| GEO Group * | | | 48,700 | | | | 412,002 | |
| Gibraltar Industries * | | | 14,069 | | | | 718,645 | |
| Global Industrial . | | | 5,678 | | | | 180,220 | |
| GMS * | | | 18,301 | | | | 863,807 | |
|
|
|
| Schedule of Investments | | October 31, 2022 |
| Global X Russell 2000 Covered Call ETF |
| | | | |
| |
| | | Shares | | | Value | |
| COMMON STOCK — continued | | | | | | |
| Industrials — continued | | | | | | |
| Gorman-Rupp | | | 9,825 | | | $ | 266,650 | |
| GrafTech International | | | 82,229 | | | | 418,546 | |
| Granite Construction . | | | 19,436 | | | | 655,576 | |
| Great Lakes Dredge & Dock * | | | 28,107 | | | | 212,489 | |
| Greenbrier . | | | 13,618 | | | | 480,852 | |
| Griffon . | | | 21,335 | | | | 685,707 | |
| H&E Equipment Services | | | 13,743 | | | | 518,936 | |
| Harsco * | | | 32,410 | | | | 171,449 | |
| Hawaiian Holdings * | | | 21,780 | | | | 314,285 | |
| Healthcare Services Group . | | | 31,957 | | | | 446,120 | |
| Heartland Express . | | | 19,378 | | | | 288,345 | |
| Heidrick & Struggles International | | | 8,472 | | | | 238,572 | |
| Heliogen * | | | 1 | | | | 2 | |
| Helios Technologies . | | | 13,672 | | | | 775,066 | |
| Herc Holdings | | | 11,033 | | | | 1,297,591 | |
| Heritage-Crystal Clean * | | | 6,926 | | | | 190,257 | |
| Hillenbrand | | | 30,914 | | | | 1,365,781 | |
| Hillman Solutions * | | | 55,672 | | | | 434,798 | |
| HireRight Holdings * | | | 9,061 | | | | 121,961 | |
| HNI | | | 18,406 | | | | 533,590 | |
| Hub Group, Cl A * | | | 14,237 | | | | 1,104,791 | |
| Hudson Technologies * | | | 17,779 | | | | 163,745 | |
| Huron Consulting Group * | | | 9,216 | | | | 678,574 | |
| Hydrofarm Holdings Group * | | | 1 | | | | 3 | |
| Hyliion Holdings * | | | 1 | | | | 3 | |
| Hyster-Yale Materials Handling . | | | 4,533 | | | | 132,182 | |
| Hyzon Motors * | | | 1 | | | | 2 | |
| ICF International | | | 7,884 | | | | 943,163 | |
| IES Holdings * | | | 4,002 | | | | 132,226 | |
| Insperity . | | | 15,314 | | | | 1,807,358 | |
| Insteel Industries | | | 8,043 | | | | 211,933 | |
| Interface, Cl A | | | 23,892 | | | | 270,219 | |
| Janus International Group * | | | 33,735 | | | | 324,868 | |
| JELD-WEN Holding * | | | 38,292 | | | | 406,278 | |
| Joby Aviation * | | | 103,978 | | | | 501,174 | |
| John Bean Technologies . | | | 13,339 | | | | 1,216,517 | |
| Kadant | | | 4,946 | | | | 880,141 | |
| Kaman | | | 11,908 | | | | 382,247 | |
| KAR Auction Services * | | | 51,286 | | | | 745,186 | |
|
|
|
| Schedule of Investments | | October 31, 2022 |
| Global X Russell 2000 Covered Call ETF |
| | | | |
| |
| | | Shares | | | Value | |
| COMMON STOCK — continued | | | | | | |
| Industrials — continued | | | | | | |
| Karat Packaging * | | | 2,468 | | | $ | 40,426 | |
| Kelly Services, Cl A | | | 15,165 | | | | 247,796 | |
| Kennametal | | | 35,331 | | | | 943,691 | |
| Kforce | | | 8,608 | | | | 544,628 | |
| Kimball International, Cl B | | | 14,661 | | | | 108,345 | |
| Korn Ferry | | | 23,748 | | | | 1,320,151 | |
| Kratos Defense & Security Solutions * | | | 52,299 | | | | 579,473 | |
| Legalzoom.com * | | | 40,603 | | | | 375,578 | |
| Lightning eMotors * | | | 1 | | | | 2 | |
| Lindsay . | | | 4,619 | | | | 781,997 | |
| Manitowoc * | | | 14,118 | | | | 128,756 | |
| Markforged Holding * | | | 1 | | | | 2 | |
| Marten Transport . | | | 25,386 | | | | 476,495 | |
| Masonite International * | | | 9,960 | | | | 712,439 | |
| Matson . | | | 17,367 | | | | 1,277,864 | |
| Matthews International, Cl A . | | | 13,233 | | | | 355,703 | |
| Maxar Technologies . | | | 30,899 | | | | 690,284 | |
| McGrath RentCorp | | | 10,231 | | | | 962,226 | |
| Microvast Holdings * | | | 1 | | | | 2 | |
| Miller Industries . | | | 4,955 | | | | 126,006 | |
| MillerKnoll | | | 31,746 | | | | 672,380 | |
| Momentus * | | | 1 | | | | 1 | |
| Montrose Environmental Group * | | | 11,449 | | | | 501,237 | |
| Moog, Cl A | | | 12,323 | | | | 1,044,374 | |
| MRC Global * | | | 35,535 | | | | 356,416 | |
| Mueller Industries . | | | 23,737 | | | | 1,486,886 | |
| Mueller Water Products, Cl A | | | 66,100 | | | | 773,370 | |
| MYR Group * | | | 7,137 | | | | 624,559 | |
| National Presto Industries | | | 2,302 | | | | 162,268 | |
| Nikola * | | | 133,305 | | | | 505,226 | |
| NL Industries | | | 3,258 | | | | 28,540 | |
| Northwest Pipe * | | | 4,289 | | | | 145,783 | |
| NOW * | | | 45,442 | | | | 578,477 | |
| NuScale Power * | | | 14,378 | | | | 162,184 | |
| NV5 Global * | | | 5,743 | | | | 832,448 | |
| Omega Flex . | | | 1,329 | | | | 125,458 | |
| PAM Transportation Services * | | | 3,245 | | | | 90,373 | |
| Park Aerospace . | | | 8,145 | | | | 101,324 | |
| Parsons * | | | 14,330 | | | | 671,790 | |
|
|
|
| Schedule of Investments | | October 31, 2022 |
| Global X Russell 2000 Covered Call ETF |
| | | | |
| |
| | | Shares | | | Value | |
| COMMON STOCK — continued | | | | | | |
| Industrials — continued | | | | | | |
| PGT Innovations * | | | 24,789 | | | $ | 528,254 | |
| Pitney Bowes | | | 1 | | | | 3 | |
| Planet Labs PBC * | | | 64,369 | | | | 337,937 | |
| Powell Industries . | | | 4,181 | | | | 103,145 | |
| Preformed Line Products . | | | 1,339 | | | | 106,276 | |
| Primoris Services . | | | 22,811 | | | | 460,554 | |
| Proterra * | | | 91,471 | | | | 570,779 | |
| Proto Labs * | | | 11,886 | | | | 453,926 | |
| Quad * | | | 1 | | | | 3 | |
| Quanex Building Products . | | | 14,485 | | | | 320,988 | |
| Radiant Logistics * | | | 15,950 | | | | 96,817 | |
| RBC Bearings * | | | 12,358 | | | | 3,133,124 | |
| Red Violet * | | | 3,900 | | | | 68,016 | |
| Redwire * | | | 1 | | | | 3 | |
| Resideo Technologies * | | | 61,217 | | | | 1,445,946 | |
| Resources Connection . | | | 13,731 | | | | 250,865 | |
| REV Group . | | | 14,491 | | | | 199,106 | |
| Rocket Lab USA * | | | 88,202 | | | | 448,948 | |
| Rush Enterprises, Cl A | | | 17,974 | | | | 896,723 | |
| Rush Enterprises, Cl B . | | | 2,921 | | | | 156,624 | |
| Saia * | | | 11,463 | | | | 2,279,532 | |
| Sarcos Technology and Robotics * | | | 1 | | | | 2 | |
| Shoals Technologies Group, Cl A * | | | 47,322 | | | | 1,093,611 | |
| Shyft Group | | | 14,946 | | | | 343,459 | |
| Simpson Manufacturing . | | | 18,444 | | | | 1,576,593 | |
| Skillsoft * | | | 1 | | | | 2 | |
| SkyWest * | | | 21,369 | | | | 377,804 | |
| SP Plus * | | | 9,931 | | | | 367,745 | |
| Spire Global * | | | 1 | | | | 1 | |
| Spirit Airlines * | | | 46,200 | | | | 1,016,400 | |
| SPX Technologies * | | | 18,620 | | | | 1,225,941 | |
| Standex International | | | 5,121 | | | | 507,235 | |
| Steelcase, Cl A | | | 35,295 | | | | 274,242 | |
| Stem * | | | 67,907 | | | | 923,535 | |
| Sterling Check * | | | 9,977 | | | | 194,851 | |
| Sterling Construction * | | | 12,237 | | | | 330,277 | |
| Sun Country Airlines Holdings * | | | 14,033 | | | | 228,457 | |
| SunPower, Cl A * | | | 34,459 | | | | 637,147 | |
| Tennant . | | | 7,922 | | | | 461,457 | |
|
|
|
| Schedule of Investments | | October 31, 2022 |
| Global X Russell 2000 Covered Call ETF |
| | | | |
| |
| | | Shares | | | Value | |
| COMMON STOCK — continued | | | | | | |
| Industrials — continued | | | | | | |
| Terex | | | 28,963 | | | $ | 1,174,160 | |
| Terran Orbital * | | | 1 | | | | 3 | |
| Thermon Group Holdings * | | | 13,575 | | | | 241,092 | |
| Titan International * | | | 21,947 | | | | 328,327 | |
| Titan Machinery * | | | 8,585 | | | | 295,152 | |
| TPI Composites * | | | 15,204 | | | | 151,432 | |
| Transcat * | | | 3,071 | | | | 254,156 | |
| TriNet Group * | | | 16,734 | | | | 1,087,375 | |
| Trinity Industries | | | 34,936 | | | | 996,724 | |
| Triumph Group * | | | 26,421 | | | | 239,110 | |
| TrueBlue * | | | 14,853 | | | | 292,010 | |
| TuSimple Holdings, Cl A * | | | 57,877 | | | | 198,518 | |
| Tutor Perini * | | | 17,003 | | | | 126,162 | |
| UFP Industries . | | | 25,555 | | | | 1,820,283 | |
| UniFirst | | | 6,336 | | | | 1,165,887 | |
| Universal Logistics Holdings | | | 3,432 | | | | 109,824 | |
| Upwork * | | | 50,296 | | | | 676,481 | |
V2X *
| | | 5,145 | | | | 210,894 | |
| Velo3D * | | | 32,650 | | | | 128,641 | |
| Veritiv * | | | 6,132 | | | | 712,906 | |
| Viad * | | | 8,779 | | | | 327,281 | |
| Vicor * | | | 9,204 | | | | 439,675 | |
| View * | | | 1 | | | | 1 | |
| Virgin Galactic Holdings * | | | 94,537 | | | | 436,761 | |
| VSE . | | | 4,679 | | | | 216,591 | |
| Wabash National | | | 21,091 | | | | 456,620 | |
| Watts Water Technologies, Cl A . | | | 11,689 | | | | 1,710,802 | |
| Werner Enterprises | | | 27,539 | | | | 1,079,529 | |
| Wheels Up Experience * | | | 1 | | | | 2 | |
| Willdan Group * | | | 5,110 | | | | 70,620 | |
| Xos * | | | 1 | | | | 1 | |
| Zurn Elkay Water Solutions . | | | 56,541 | | | | 1,328,148 | |
| | | | | | | | 151,786,357 | |
| Information Technology — 9.3% | | | | | | | | |
| 8x8 * | | | 46,188 | | | | 195,375 | |
| 908 Devices * | | | 11,175 | | | | 178,688 | |
| A10 Networks | | | 28,192 | | | | 473,626 | |
| ACI Worldwide * | | | 49,474 | | | | 1,203,702 | |
| ACM Research, Cl A * | | | 19,835 | | | | 126,944 | |
|
|
|
| Schedule of Investments | | October 31, 2022 |
| Global X Russell 2000 Covered Call ETF |
| | | | |
| |
| | | Shares | | | Value | |
| COMMON STOCK — continued | | | | | | |
| Information Technology — continued | | | | | | |
| Adeia . | | | 44,483 | | | $ | 497,320 | |
| ADTRAN Holdings . | | | 32,362 | | | | 726,851 | |
| Advanced Energy Industries . | | | 15,914 | | | | 1,251,636 | |
| Aeva Technologies * | | | 1 | | | | 2 | |
| AEye * | | | 1 | | | | 1 | |
| Agilysys * | | | 8,973 | | | | 575,797 | |
| Akoustis Technologies * | | | 1 | | | | 3 | |
| Alarm.com Holdings * | | | 20,349 | | | | 1,197,335 | |
| Alkami Technology * | | | 15,049 | | | | 238,527 | |
| Alpha & Omega Semiconductor * | | | 9,427 | | | | 308,734 | |
| Altair Engineering, Cl A * | | | 22,018 | | | | 1,079,983 | |
| Ambarella * | | | 15,666 | | | | 857,400 | |
| American Software, Cl A | | | 17,436 | | | | 298,679 | |
| Amkor Technology | | | 43,240 | | | | 898,960 | |
| Amplitude, Cl A * | | | 25,695 | | | | 431,676 | |
| Appfolio, Cl A * | | | 8,044 | | | | 1,008,476 | |
| Appian, Cl A * | | | 16,787 | | | | 819,541 | |
| Applied Blockchain * | | | 1 | | | | 2 | |
| Arlo Technologies * | | | 34,752 | | | | 178,973 | |
| Arteris * | | | 3,702 | | | | 20,509 | |
| Asana, Cl A * | | | 31,159 | | | | 641,875 | |
| Atomera * | | | 8,145 | | | | 73,386 | |
| Avaya Holdings * | | | 1 | | | | 2 | |
| AvePoint * | | | 53,334 | | | | 233,070 | |
| Aviat Networks * | | | 4,839 | | | | 158,042 | |
| Avid Technology * | | | 15,484 | | | | 425,655 | |
| AvidXchange Holdings * | | | 60,636 | | | | 551,788 | |
| Axcelis Technologies * | | | 14,044 | | | | 814,552 | |
| AXT * | | | 16,833 | | | | 76,422 | |
| Badger Meter | | | 12,397 | | | | 1,394,415 | |
| Belden | | | 18,711 | | | | 1,302,847 | |
| Benchmark Electronics | | | 15,071 | | | | 427,866 | |
| Benefitfocus * | | | 10,317 | | | | 72,735 | |
| BigCommerce Holdings * | | | 26,674 | | | | 396,376 | |
| Blackbaud * | | | 20,102 | | | | 1,099,579 | |
| Blackline * | | | 23,352 | | | | 1,307,712 | |
| Blend Labs, Cl A * | | | 1 | | | | 3 | |
| Box, Cl A * | | | 59,752 | | | | 1,735,796 | |
| Brightcove * | | | 16,833 | | | | 112,781 | |
|
|
|
| Schedule of Investments | | October 31, 2022 |
| Global X Russell 2000 Covered Call ETF |
| | | | |
| |
| | | Shares | | | Value | |
| COMMON STOCK — continued | | | | | | |
| Information Technology — continued | | | | | | |
| BTRS Holdings, Cl 1 * | | | 39,606 | | | $ | 373,881 | |
| C3.ai, Cl A * | | | 28,826 | | | | 377,909 | |
| Calix * | | | 24,020 | | | | 1,768,833 | |
| Cambium Networks * | | | 4,514 | | | | 87,346 | |
| Cantaloupe * | | | 23,892 | | | | 80,038 | |
| Casa Systems * | | | 13,542 | | | | 42,657 | |
| Cass Information Systems . | | | 6,008 | | | | 257,022 | |
| Cepton * | | | 1 | | | | 2 | |
| Cerberus Cyber Sentinel * | | | 1 | | | | 3 | |
| Cerence * | | | 16,880 | | | | 290,336 | |
| CEVA * | | | 9,734 | | | | 269,242 | |
| ChannelAdvisor * | | | 12,946 | | | | 298,276 | |
| Cipher Mining * | | | 1 | | | | 1 | |
| Cleanspark * | | | 16,290 | | | | 56,689 | |
| Clear Secure, Cl A * | | | 26,476 | | | | 715,382 | |
| Clearfield * | | | 5,014 | | | | 609,051 | |
| Cohu * | | | 20,449 | | | | 673,181 | |
| CommScope Holding * | | | 95,899 | | | | 1,269,703 | |
| CommVault Systems * | | | 18,783 | | | | 1,143,697 | |
| CompoSecure * | | | 3,243 | | | | 17,318 | |
| Comtech Telecommunications . | | | 10,690 | | | | 118,124 | |
| Conduent * | | | 69,488 | | | | 286,291 | |
| Consensus Cloud Solutions * | | | 6,914 | | | | 388,152 | |
| Core Scientific * | | | 1 | | | | — | |
| Corsair Gaming * | | | 21,337 | | | | 294,451 | |
| Couchbase * | | | 11,134 | | | | 142,515 | |
| Credo Technology Group Holding * | | | 40,708 | | | | 559,328 | |
| CS Disco * | | | 9,381 | | | | 100,564 | |
| CSG Systems International . | | | 13,634 | | | | 881,711 | |
| CTS . | | | 13,645 | | | | 539,250 | |
| Cvent Holding, Cl A * | | | 34,758 | | | | 203,334 | |
| CyberOptics * | | | 2,900 | | | | 156,513 | |
| Cyxtera Technologies * | | | 17,618 | | | | 42,636 | |
| Diebold Nixdorf * | | | 1 | | | | 2 | |
| Digi International * | | | 14,962 | | | | 603,417 | |
| Digimarc * | | | 5,918 | | | | 96,700 | |
| Digital Turbine * | | | 42,333 | | | | 618,062 | |
| DigitalOcean Holdings * | | | 32,291 | | | | 1,159,893 | |
| Diodes * | | | 18,796 | | | | 1,347,109 | |
|
|
|
| Schedule of Investments | | October 31, 2022 |
| Global X Russell 2000 Covered Call ETF |
| | | | |
| |
| | | Shares | | | Value | |
| COMMON STOCK — continued | | | | | | |
| Information Technology — continued | | | | | | |
| Domo, Cl B * | | | 12,523 | | | $ | 221,281 | |
| Duck Creek Technologies * | | | 31,954 | | | | 381,531 | |
| DZS * | | | 7,059 | | | | 112,168 | |
| E2open Parent Holdings * | | | 81,823 | | | | 477,028 | |
| Eastman Kodak * | | | 19,992 | | | | 106,957 | |
| Ebix . | | | 11,454 | | | | 226,675 | |
| Edgio * | | | 1 | | | | 3 | |
| eGain * | | | 8,688 | | | | 69,938 | |
| Enfusion, Cl A * | | | 13,916 | | | | 197,190 | |
| EngageSmart * | | | 14,523 | | | | 285,232 | |
| Envestnet * | | | 23,278 | | | | 1,147,838 | |
| ePlus * | | | 11,340 | | | | 552,485 | |
| Everbridge * | | | 16,849 | | | | 527,879 | |
| EverCommerce * | | | 11,639 | | | | 101,376 | |
| Evo Payments, Cl A * | | | 20,350 | | | | 685,591 | |
| Evolv Technologies Holdings * | | | 1 | | | | 3 | |
| ExlService Holdings * | | | 13,755 | | | | 2,501,347 | |
| Extreme Networks * | | | 62,219 | | | | 1,116,209 | |
| FARO Technologies * | | | 7,967 | | | | 232,716 | |
| Fastly, Cl A * | | | 46,200 | | | | 392,238 | |
| Flywire * | | | 24,027 | | | | 527,393 | |
| Focus Universal * | | | 7,274 | | | | 74,049 | |
| ForgeRock, Cl A * | | | 14,973 | | | | 337,791 | |
| FormFactor * | | | 33,006 | | | | 667,051 | |
| Greenidge Generation Holdings * | | | 1 | | | | 1 | |
| Grid Dynamics Holdings * | | | 20,111 | | | | 273,711 | |
| Hackett Group . | | | 11,006 | | | | 240,371 | |
| Harmonic * | | | 41,650 | | | | 643,493 | |
| I3 Verticals, Cl A * | | | 9,502 | | | | 206,764 | |
| IBEX Holdings * | | | 2,842 | | | | 54,652 | |
| Ichor Holdings * | | | 12,094 | | | | 307,671 | |
| Identiv * | | | 8,858 | | | | 106,739 | |
| Impinj * | | | 8,826 | | | | 1,011,724 | |
| Infinera * | | | 75,987 | | | | 426,287 | |
| Information Services Group | | | 14,756 | | | | 80,125 | |
| Inseego * | | | 1 | | | | 2 | |
| Insight Enterprises * | | | 14,260 | | | | 1,347,713 | |
| Instructure Holdings * | | | 7,265 | | | | 171,599 | |
| Intapp * | | | 6,294 | | | | 141,363 | |
|
|
|
| Schedule of Investments | | October 31, 2022 |
| Global X Russell 2000 Covered Call ETF |
| | | | | | |
| | | Shares | | | Value | |
| COMMON STOCK — continued | | | | | | |
| Information Technology — continued | | | | | | |
| InterDigital | | | 13,103 | | | $ | 653,447 | |
| International Money Express * | | | 13,983 | | | | 377,960 | |
| IonQ * | | | 49,121 | | | | 289,323 | |
| IronNet * | | | 1 | | | | 1 | |
| Itron * | | | 19,185 | | | | 937,955 | |
| Kimball Electronics * | | | 10,579 | | | | 218,668 | |
| KnowBe4, Cl A * | | | 32,445 | | | | 797,498 | |
| Knowles * | | | 37,612 | | | | 517,165 | |
| Latch * | | | 1 | | | | 1 | |
| Lightwave Logic * | | | 46,256 | | | | 391,788 | |
| LivePerson * | | | 28,760 | | | | 303,993 | |
| LiveRamp Holdings * | | | 28,167 | | | | 517,146 | |
| LiveVox Holdings * | | | 1 | | | | 3 | |
| MACOM Technology Solutions Holdings * | | | 21,405 | | | | 1,238,707 | |
| Marathon Digital Holdings * | | | 50,182 | | | | 657,886 | |
| Marqeta, Cl A * | | | 183,127 | | | | 1,443,041 | |
| Matterport * | | | 90,675 | | | | 316,456 | |
| Maximus . | | | 25,901 | | | | 1,597,315 | |
| MaxLinear, Cl A * | | | 31,854 | | | | 983,652 | |
| MeridianLink * | | | 10,014 | | | | 180,252 | |
| Methode Electronics | | | 15,615 | | | | 643,806 | |
| MicroStrategy, Cl A * | | | 3,985 | | | | 1,066,027 | |
| MicroVision * | | | 67,875 | | | | 248,423 | |
| Mirion Technologies * | | | 56,698 | | | | 458,120 | |
| Mitek Systems * | | | 17,749 | | | | 200,741 | |
| Model N * | | | 15,547 | | | | 590,786 | |
| Momentive Global * | | | 54,673 | | | | 424,262 | |
| MoneyGram International * | | | 42,296 | | | | 447,915 | |
| N-able * | | | 28,175 | | | | 305,135 | |
| Napco Security Technologies * | | | 12,717 | | | | 361,417 | |
| NETGEAR * | | | 12,489 | | | | 245,409 | |
| NetScout Systems * | | | 29,782 | | | | 1,069,769 | |
| NextNav * | | | 1 | | | | 3 | |
| nLight * | | | 17,919 | | | | 192,988 | |
| Novanta * | | | 15,381 | | | | 2,174,873 | |
| Olo, Cl A * | | | 37,285 | | | | 328,481 | |
| ON24 * | | | 17,331 | | | | 141,074 | |
| Ondas Holdings * | | | 14,198 | | | | 56,792 | |
| OneSpan * | | | 19,473 | | | | 214,008 | |
|
|
|
| Schedule of Investments | | October 31, 2022 |
| Global X Russell 2000 Covered Call ETF |
| | | | |
| |
| | | Shares | | | Value | |
| COMMON STOCK — continued | | | | | | |
| Information Technology — continued | | | | | | |
| Onto Innovation * | | | 22,633 | | | $ | 1,512,790 | |
| OSI Systems * | | | 7,017 | | | | 576,657 | |
| Ouster * | | | 1 | | | | 1 | |
| PagerDuty * | | | 37,549 | | | | 936,472 | |
| PAR Technology * | | | 11,047 | | | | 317,933 | |
| Paya Holdings * | | | 35,465 | | | | 285,139 | |
| Payoneer Global * | | | 89,642 | | | | 694,726 | |
| Paysafe * | | | 1 | | | | 1 | |
| PC Connection | | | 4,792 | | | | 254,647 | |
| PDF Solutions * | | | 13,056 | | | | 307,860 | |
| Perficient * | | | 14,328 | | | | 959,546 | |
| PFSweb * | | | 6,766 | | | | 64,751 | |
| Photronics * | | | 25,435 | | | | 412,556 | |
| Plexus * | | | 11,862 | | | | 1,167,221 | |
| Power Integrations . | | | 24,647 | | | | 1,644,201 | |
| PowerSchool Holdings, Cl A * | | | 25,754 | | | | 515,080 | |
| Priority Technology Holdings * | | | 5,567 | | | | 28,559 | |
| Progress Software . | | | 18,658 | | | | 952,118 | |
| PROS Holdings * | | | 17,272 | | | | 430,936 | |
| Q2 Holdings * | | | 23,691 | | | | 735,369 | |
| Qualys * | | | 16,646 | | | | 2,373,054 | |
| Rackspace Technology * | | | 22,976 | | | | 118,326 | |
| Rambus * | | | 47,807 | | | | 1,441,859 | |
| Rapid7 * | | | 24,578 | | | | 1,112,646 | |
| Remitly Global * | | | 43,081 | | | | 500,601 | |
| Repay Holdings, Cl A * | | | 35,838 | | | | 218,253 | |
| Ribbon Communications * | | | 1 | | | | 3 | |
| Rigetti Computing * | | | 1 | | | | 2 | |
| Rimini Street * | | | 18,972 | | | | 106,433 | |
| Riot Blockchain * | | | 59,089 | | | | 407,123 | |
| Rockley Photonics Holdings * | | | 1 | | | | 1 | |
| Rogers * | | | 8,120 | | | | 1,910,880 | |
| Sabre * | | | 134,946 | | | | 784,036 | |
| Sanmina * | | | 26,208 | | | | 1,468,958 | |
| ScanSource * | | | 10,823 | | | | 335,297 | |
| SecureWorks, Cl A * | | | 3,801 | | | | 31,092 | |
| Semtech * | | | 27,230 | | | | 753,999 | |
| ShotSpotter * | | | 3,947 | | | | 149,986 | |
| Silicon Laboratories * | | | 15,745 | | | | 1,809,415 | |
|
|
|
| Schedule of Investments | | October 31, 2022 |
| Global X Russell 2000 Covered Call ETF |
| | | | |
| |
| | | Shares | | | Value | |
| COMMON STOCK — continued | | | | | | |
| Information Technology — continued | | | | | | |
| SiTime * | | | 6,813 | | | $ | 611,876 | |
| SkyWater Technology * | | | 8,716 | | | | 70,687 | |
| SMART Global Holdings * | | | 20,931 | | | | 283,196 | |
| SmartRent, Cl A * | | | 1 | | | | 3 | |
| SolarWinds * | | | 19,934 | | | | 185,984 | |
| Sprout Social, Cl A * | | | 19,368 | | | | 1,168,471 | |
| SPS Commerce * | | | 15,677 | | | | 1,983,454 | |
| Squarespace, Cl A * | | | 13,044 | | | | 289,707 | |
| Sumo Logic * | | | 49,874 | | | | 384,529 | |
| Super Micro Computer * | | | 19,224 | | | | 1,337,798 | |
| Synaptics * | | | 17,187 | | | | 1,522,768 | |
| Telos * | | | 31,762 | | | | 336,677 | |
| Tenable Holdings * | | | 47,669 | | | | 1,937,268 | |
| Terawulf * | | | 1 | | | | 1 | |
| Transphorm * | | | 8,855 | | | | 61,100 | |
| TTEC Holdings . | | | 7,923 | | | | 352,336 | |
| TTM Technologies * | | | 42,387 | | | | 648,945 | |
| Tucows, Cl A * | | | 4,255 | | | | 191,262 | |
| Turtle Beach * | | | 6,960 | | | | 54,288 | |
| Ultra Clean Holdings * | | | 19,048 | | | | 592,583 | |
| Unisys * | | | 27,150 | | | | 230,775 | |
| Upland Software * | | | 11,946 | | | | 96,046 | |
| UserTesting * | | | 31,788 | | | | 235,231 | |
| Varonis Systems, Cl B * | | | 46,106 | | | | 1,234,258 | |
| Veeco Instruments * | | | 21,434 | | | | 390,742 | |
| Velodyne Lidar * | | | 1 | | | | 1 | |
| Verint Systems * | | | 27,182 | | | | 963,058 | |
| Veritone * | | | 12,286 | | | | 91,039 | |
| Verra Mobility, Cl A * | | | 63,779 | | | | 1,088,708 | |
| Viant Technology, Cl A * | | | 5,227 | | | | 23,835 | |
| Viavi Solutions * | | | 96,702 | | | | 1,460,200 | |
| Vishay Intertechnology | | | 56,286 | | | | 1,176,940 | |
| Vishay Precision Group * | | | 5,452 | | | | 184,005 | |
| Weave Communications * | | | 18,813 | | | | 103,472 | |
| WM Technology * | | | 1 | | | | 2 | |
| Workiva, Cl A * | | | 21,809 | | | | 1,696,958 | |
| Xerox Holdings . | | | 51,039 | | | | 746,701 | |
| Xperi * | | | 17,793 | | | | 248,568 | |
| Yext * | | | 47,751 | | | | 254,035 | |
|
|
|
| Schedule of Investments | | October 31, 2022 |
| Global X Russell 2000 Covered Call ETF |
| | | | |
| |
| | | Shares | | | Value | |
| COMMON STOCK — continued | | | | | | |
| Information Technology — continued | | | | | | |
| Zeta Global Holdings, Cl A * | | | 46,142 | | | $ | 384,824 | |
| Zuora, Cl A * | | | 55,764 | | | | 428,825 | |
| | | | | | | | 124,178,414 | |
| Materials — 3.1% | | | | | | | | |
| 5E Advanced Materials * | | | 13,320 | | | | 178,222 | |
| AdvanSix . | | | 11,582 | | | | 421,353 | |
| Alpha Metallurgical Resources . | | | 7,727 | | | | 1,304,704 | |
| American Vanguard | | | 12,698 | | | | 295,482 | |
| Amyris * | | | 1 | | | | 3 | |
| Arconic * | | | 45,175 | | | | 937,833 | |
| Aspen Aerogels * | | | 12,014 | | | | 152,337 | |
| ATI * | | | 53,429 | | | | 1,590,047 | |
| Avient . | | | 38,385 | | | | 1,323,899 | |
| Balchem . | | | 13,587 | | | | 1,899,463 | |
| Cabot . | | | 23,685 | | | | 1,740,374 | |
| Carpenter Technology . | | | 20,324 | | | | 760,118 | |
| Century Aluminum * | | | 21,177 | | | | 152,686 | |
| Chase . | | | 3,301 | | | | 310,987 | |
| Clearwater Paper * | | | 7,291 | | | | 324,304 | |
| Coeur Mining * | | | 1 | | | | 4 | |
| Commercial Metals | | | 52,333 | | | | 2,381,151 | |
| Compass Minerals International | | | 14,620 | | | | 578,075 | |
| Constellium, Cl A * | | | 52,714 | | | | 580,908 | |
| Cryptyde * | | | 1 | | | | 1 | |
| Dakota Gold * | | | 40,385 | | | | 139,328 | |
| Danimer Scientific * | | | 1 | | | | 3 | |
| Diversey Holdings * | | | 32,386 | | | | 174,884 | |
| Ecovyst * | | | 35,883 | | | | 357,036 | |
| FutureFuel | | | 10,690 | | | | 73,120 | |
| Glatfelter . | | | 1 | | | | 3 | |
| Greif, Cl A | | | 10,921 | | | | 723,079 | |
| Greif, Cl B | | | 2,562 | | | | 181,415 | |
| Hawkins . | | | 8,416 | | | | 378,972 | |
| Haynes International . | | | 5,345 | | | | 261,424 | |
| HB Fuller . | | | 23,073 | | | | 1,608,419 | |
| Hecla Mining | | | 219,389 | | | | 1,002,608 | |
| Hycroft Mining Holding * | | | 1 | | | | 1 | |
| Ingevity * | | | 16,683 | | | | 1,122,265 | |
| Innospec | | | 10,490 | | | | 1,048,895 | |
|
|
|
| Schedule of Investments | | October 31, 2022 |
| Global X Russell 2000 Covered Call ETF |
| | | | |
| |
| | | Shares | | | Value | |
| COMMON STOCK — continued | | | | | | |
| Materials — continued | | | | | | |
| Intrepid Potash * | | | 4,844 | | | $ | 219,191 | |
| Ivanhoe Electric * | | | 6,126 | | | | 64,078 | |
| Kaiser Aluminum | | | 6,753 | | | | 545,575 | |
| Koppers Holdings | | | 8,967 | | | | 223,816 | |
| Kronos Worldwide | | | 9,880 | | | | 93,860 | |
| Livent * | | | 70,048 | | | | 2,211,415 | |
| LSB Industries * | | | 13,152 | | | | 231,870 | |
| Materion | | | 8,618 | | | | 738,649 | |
| Mativ Holdings | | | 23,562 | | | | 559,362 | |
| Minerals Technologies | | | 14,092 | | | | 775,201 | |
| Myers Industries . | | | 15,525 | | | | 315,002 | |
| O-I Glass * | | | 65,709 | | | | 1,071,714 | |
| Olympic Steel | | | 4,186 | | | | 113,901 | |
| Origin Materials * | | | 44,035 | | | | 250,119 | |
| Pactiv Evergreen | | | 17,919 | | | | 195,496 | |
| Perimeter Solutions * | | | 50,496 | | | | 403,463 | |
| Piedmont Lithium * | | | 7,418 | | | | 461,548 | |
| PureCycle Technologies * | | | 43,998 | | | | 363,863 | |
| Quaker Chemical . | | | 5,708 | | | | 928,349 | |
| Ramaco Resources . | | | 9,303 | | | | 105,031 | |
| Ranpak Holdings, Cl A * | | | 16,427 | | | | 62,423 | |
| Rayonier Advanced Materials * | | | 33,362 | | | | 151,797 | |
| Resolute Forest Products * | | | 19,096 | | | | 397,388 | |
| Ryerson Holding . | | | 9,456 | | | | 317,249 | |
| Schnitzer Steel Industries, Cl A . | | | 11,153 | | | | 301,019 | |
| Sensient Technologies . | | | 17,919 | | | | 1,280,492 | |
| Stepan . | | | 9,106 | | | | 951,031 | |
| Summit Materials, Cl A * | | | 50,210 | | | | 1,323,033 | |
| SunCoke Energy . | | | 34,209 | | | | 248,357 | |
| Sylvamo . | | | 15,129 | | | | 728,764 | |
| TimkenSteel * | | | 19,789 | | | | 345,120 | |
| Tredegar | | | 10,860 | | | | 118,265 | |
| TriMas . | | | 18,403 | | | | 420,509 | |
| Trinseo | | | 16,171 | | | | 304,338 | |
| Tronox Holdings, Cl A | | | 48,978 | | | | 587,736 | |
| United States Lime & Minerals | | | 1,086 | | | | 136,999 | |
| Valhi . | | | 1,238 | | | | 33,822 | |
| Warrior Met Coal . | | | 21,950 | | | | 815,223 | |
|
|
|
| Schedule of Investments | | October 31, 2022 |
| Global X Russell 2000 Covered Call ETF |
| | | | |
| |
| | | Shares | | | Value | |
| COMMON STOCK — continued | | | | | | |
| Materials — continued | | | | | | |
| Worthington Industries . | | | 13,943 | | | $ | 663,129 | |
| | | | | | | | 41,061,600 | |
| Real Estate — 4.8% | | | | | | | | |
| Acadia Realty Trust ‡ | | | 38,945 | | | | 544,062 | |
| Agree Realty ‡ | | | 33,626 | | | | 2,310,106 | |
| Alexander & Baldwin ‡ | | | 30,799 | | | | 599,964 | |
| Alexander's ‡ | | | 1,086 | | | | 255,091 | |
| American Assets Trust ‡ | | | 21,171 | | | | 581,779 | |
| American Realty Investors * | | | 597 | | | | 10,585 | |
| Anywhere Real Estate * | | | 47,614 | | | | 353,772 | |
| Apartment Investment and Management, Cl A ‡ | | | 62,105 | | | | 493,114 | |
| Apple Hospitality REIT ‡ | | | 90,827 | | | | 1,554,958 | |
| Armada Hoffler Properties ‡ | | | 27,523 | | | | 321,744 | |
| Ashford Hospitality Trust ‡ * | | | 23,790 | | | | 193,175 | |
| Bluerock Homes Trust ‡ * | | | 1,492 | | | | 37,748 | |
| Braemar Hotels & Resorts ‡ | | | 25,066 | | | | 123,575 | |
| Brandywine Realty Trust ‡ | | | 69,877 | | | | 458,393 | |
| Broadstone Net Lease, Cl A ‡ | | | 70,666 | | | | 1,211,215 | |
| BRT Apartments ‡ | | | 5,263 | | | | 116,628 | |
| CareTrust ‡ | | | 41,140 | | | | 768,495 | |
| CBL & Associates Properties ‡ | | | 11,017 | | | | 316,518 | |
| Centerspace ‡ | | | 6,501 | | | | 450,519 | |
| Chatham Lodging Trust ‡ * | | | 19,548 | | | | 253,538 | |
| City Office REIT ‡ | | | 17,733 | | | | 188,324 | |
| Clipper Realty ‡ | | | 4,887 | | | | 34,649 | |
| Community Healthcare Trust ‡ | | | 10,279 | | | | 355,653 | |
| Compass, Cl A * | | | 1 | | | | 3 | |
| Corporate Office Properties Trust ‡ | | | 47,823 | | | | 1,274,483 | |
| CTO Realty Growth ‡ | | | 7,736 | | | | 155,494 | |
| Cushman & Wakefield * | | | 66,227 | | | | 764,922 | |
| DiamondRock Hospitality ‡ | | | 88,446 | | | | 826,086 | |
| DigitalBridge Group | | | 68,715 | | | | 879,552 | |
| Diversified Healthcare Trust ‡ | | | 1 | | | | 1 | |
| Doma Holdings * | | | 1 | | | | 1 | |
| Douglas Elliman . | | | 30,205 | | | | 139,547 | |
| Easterly Government Properties, Cl A ‡ | | | 38,190 | | | | 664,124 | |
| Elme Communities ‡ | | | 37,148 | | | | 709,155 | |
| Empire State Realty Trust, Cl A ‡ | | | 58,337 | | | | 429,944 | |
| Equity Commonwealth ‡ | | | 45,930 | | | | 1,201,529 | |
|
|
|
| Schedule of Investments | | October 31, 2022 |
| Global X Russell 2000 Covered Call ETF |
| | | | |
| |
| | | Shares | | | Value | |
| COMMON STOCK — continued | | | | | | |
| Real Estate — continued | | | | | | |
| Essential Properties Realty Trust ‡ | | | 60,242 | | | $ | 1,296,408 | |
| eXp World Holdings | | | 30,921 | | | | 408,466 | |
| Farmland Partners ‡ | | | 23,223 | | | | 325,354 | |
| Forestar Group * | | | 7,939 | | | | 91,934 | |
| Four Corners Property Trust ‡ | | | 35,985 | | | | 921,936 | |
| Franklin Street Properties ‡ | | | 1 | | | | 3 | |
| FRP Holdings * | | | 2,952 | | | | 178,980 | |
| Getty Realty ‡ | | | 17,672 | | | | 556,491 | |
| Gladstone Commercial ‡ | | | 16,181 | | | | 284,624 | |
| Gladstone Land ‡ | | | 13,603 | | | | 276,821 | |
| Global Medical ‡ | | | 24,978 | | | | 228,299 | |
| Global Net Lease ‡ | | | 43,514 | | | | 533,046 | |
| Hersha Hospitality Trust, Cl A ‡ | | | 13,405 | | | | 122,656 | |
| Independence Realty Trust ‡ | | | 96,351 | | | | 1,614,843 | |
| Indus Realty Trust ‡ | | | 2,498 | | | | 129,371 | |
| Industrial Logistics Properties Trust ‡ | | | 28,107 | | | | 131,541 | |
| Innovative Industrial Properties, Cl A ‡ | | | 12,176 | | | | 1,316,226 | |
| InvenTrust Properties ‡ | | | 28,792 | | | | 725,558 | |
| iStar ‡ | | | 28,662 | | | | 300,378 | |
| Kennedy-Wilson Holdings | | | 50,313 | | | | 835,699 | |
| Kite Realty Group Trust ‡ | | | 94,557 | | | | 1,857,099 | |
| LTC Properties ‡ | | | 17,920 | | | | 692,966 | |
| LXP Industrial Trust ‡ | | | 118,423 | | | | 1,146,335 | |
| Macerich ‡ | | | 90,490 | | | | 1,007,154 | |
| Marcus & Millichap . | | | 11,849 | | | | 436,517 | |
| National Health Investors ‡ | | | 18,564 | | | | 1,052,579 | |
| Necessity Retail REIT ‡ | | | 52,589 | | | | 359,709 | |
| NETSTREIT ‡ | | | 26,555 | | | | 499,765 | |
| Newmark Group, Cl A | | | 66,614 | | | | 545,569 | |
| NexPoint Residential Trust ‡ | | | 9,520 | | | | 434,112 | |
| Offerpad Solutions * | | | 1 | | | | 1 | |
| Office Properties Income Trust ‡ | | | 20,542 | | | | 314,293 | |
| One Liberty Properties ‡ | | | 7,069 | | | | 159,335 | |
| Orion Office REIT ‡ | | | 23,633 | | | | 221,441 | |
| Outfront Media ‡ | | | 61,713 | | | | 1,113,920 | |
| Paramount Group ‡ | | | 76,766 | | | | 496,676 | |
| Pebblebrook Hotel Trust ‡ | | | 55,112 | | | | 883,996 | |
| Phillips Edison ‡ | | | 50,697 | | | | 1,528,008 | |
| Physicians Realty Trust ‡ | | | 101,740 | | | | 1,532,204 | |
|
|
|
| Schedule of Investments | | October 31, 2022 |
| Global X Russell 2000 Covered Call ETF |
| | | | |
| |
| | | Shares | | | Value | |
| COMMON STOCK — continued | | | | | | |
| Real Estate — continued | | | | | | |
| Piedmont Office Realty Trust, Cl A ‡ | | | 50,702 | | | $ | 529,836 | |
| Plymouth Industrial REIT ‡ | | | 15,729 | | | | 290,043 | |
| Postal Realty Trust, Cl A ‡ | | | 7,059 | | | | 110,685 | |
| PotlatchDeltic ‡ | | | 33,652 | | | | 1,497,177 | |
| RE/MAX Holdings, Cl A | | | 8,170 | | | | 158,988 | |
| Redfin * | | | 42,897 | | | | 206,335 | |
| Retail Opportunity Investments ‡ | | | 50,759 | | | | 734,990 | |
| RLJ Lodging Trust ‡ | | | 69,770 | | | | 849,101 | |
| RMR Group, Cl A . | | | 6,799 | | | | 186,089 | |
| RPT Realty ‡ | | | 34,582 | | | | 321,613 | |
| Ryman Hospitality Properties ‡ | | | 23,319 | | | | 2,073,525 | |
| Sabra Health Care ‡ | | | 101,067 | | | | 1,380,575 | |
| Safehold ‡ | | | 9,000 | | | | 263,250 | |
| Saul Centers ‡ | | | 5,174 | | | | 211,875 | |
| Seritage Growth Properties ‡ * | | | 20,964 | | | | 224,944 | |
| Service Properties Trust ‡ | | | 67,705 | | | | 549,088 | |
| SITE Centers ‡ | | | 86,001 | | | | 1,064,692 | |
| St. Joe . | | | 14,349 | | | | 509,820 | |
| STAG Industrial ‡ | | | 77,928 | | | | 2,461,745 | |
| Stratus Properties . | | | 2,367 | | | | 69,968 | |
| Summit Hotel Properties ‡ | | | 42,897 | | | | 370,630 | |
| Sunstone Hotel Investors ‡ | | | 91,604 | | | | 1,021,385 | |
| Tanger Factory Outlet Centers ‡ | | | 43,379 | | | | 781,256 | |
| Tejon Ranch * | | | 9,310 | | | | 157,711 | |
| Terreno Realty ‡ | | | 32,251 | | | | 1,842,822 | |
| Transcontinental Realty Investors * | | | 700 | | | | 28,763 | |
| UMH Properties ‡ | | | 20,689 | | | | 362,885 | |
| Uniti Group ‡ | | | 100,452 | | | | 779,507 | |
| Universal Health Realty Income Trust ‡ | | | 5,622 | | | | 273,623 | |
| Urban Edge Properties ‡ | | | 48,989 | | | | 691,725 | |
| Urstadt Biddle Properties, Cl A ‡ | | | 12,950 | | | | 242,683 | |
| Veris Residential ‡ * | | | 37,541 | | | | 594,274 | |
| Whitestone, Cl B ‡ | | | 19,005 | | | | 178,837 | |
| Xenia Hotels & Resorts ‡ | | | 48,455 | | | | 827,611 | |
| | | | | | | | 64,986,810 | |
| Utilities — 2.4% | | | | | | | | |
| ALLETE . | | | 24,205 | | | | 1,362,015 | |
| Altus Power, Cl A * | | | 17,423 | | | | 173,533 | |
| American States Water . | | | 15,662 | | | | 1,416,785 | |
|
|
|
| Schedule of Investments | | October 31, 2022 |
| Global X Russell 2000 Covered Call ETF |
| | | | |
| |
| | | Shares | | | Value | |
| COMMON STOCK — continued | | | | | | |
| Utilities — continued | | | | | | |
| Artesian Resources, Cl A . | | | 3,576 | | | $ | 186,953 | |
| Avista | | | 30,615 | | | | 1,256,133 | |
| Black Hills . | | | 28,909 | | | | 1,889,781 | |
| California Water Service Group . | | | 24,613 | | | | 1,527,483 | |
| Chesapeake Utilities | | | 7,318 | | | | 910,213 | |
| Clearway Energy, Cl A . | | | 14,893 | | | | 481,491 | |
| Clearway Energy, Cl C . | | | 34,810 | | | | 1,209,299 | |
| Global Water Resources | | | 5,430 | | | | 69,287 | |
| MGE Energy . | | | 15,354 | | | | 1,045,454 | |
| Middlesex Water . | | | 7,359 | | | | 658,410 | |
| Montauk Renewables * | | | 26,583 | | | | 397,948 | |
| New Jersey Resources . | | | 40,706 | | | | 1,817,116 | |
| Northwest Natural Holding | | | 15,526 | | | | 746,645 | |
| NorthWestern | | | 24,505 | | | | 1,294,599 | |
| ONE Gas | | | 22,954 | | | | 1,778,476 | |
| Ormat Technologies . | | | 19,685 | | | | 1,780,508 | |
| Otter Tail . | | | 17,444 | | | | 1,176,075 | |
| PNM Resources . | | | 36,120 | | | | 1,678,496 | |
| Portland General Electric | | | 37,907 | | | | 1,703,541 | |
| Pure Cycle * | | | 8,145 | | | | 70,291 | |
| SJW Group | | | 11,636 | | | | 822,432 | |
| South Jersey Industries | | | 55,155 | | | | 1,912,224 | |
| Southwest Gas Holdings | | | 28,984 | | | | 2,117,861 | |
| Spire . | | | 22,221 | | | | 1,551,248 | |
| Sunnova Energy International * | | | 42,044 | | | | 779,496 | |
| Unitil | | | 6,757 | | | | 356,161 | |
| Via Renewables, Cl A | | | 4,887 | | | | 34,160 | |
| York Water . | | | 5,886 | | | | 256,394 | |
| | | | | | | | 32,460,508 | |
| TOTAL UNITED STATES | | | | | | | 992,381,412 | |
| TOTAL COMMON STOCK | | | | | | | | |
| (Cost $1,018,203,356) | | | | | | | 1,018,113,938 | |
|
|
|
| Schedule of Investments | | October 31, 2022 |
| Global X Russell 2000 Covered Call ETF |
| | | | |
| |
| | | Shares | | | Value | |
| EXCHANGE TRADED FUND(A) — 33.1%# | | | | | | |
| Vanguard Russell 2000 ETF | | | | | | |
| (Cost $440,225,995) | | $ | 5,995,801 | | | $ | 444,049,022 | |
| TOTAL INVESTMENTS — 108.9% | | | | | | | | |
| (Cost $1,458,429,351) | | | | | | $ | 1,462,162,960 | |
| WRITTEN OPTIONS— (9.1)% | | | | | | | | |
| (Premiums Received $(59,618,614)) | | | | | | $ | (121,998,240 | ) |
Percentages are based on Net Assets of $1,342,241,164.
A list of the exchange traded option contracts held by the Fund at October 31, 2022, is as follows:
| Description | | Number of Contracts | | | Notional Amount | | | Exercise Price | | Expiration Date | | Value | |
| WRITTEN OPTIONS — (9.1)% | | | | | | | | | | | | | |
| Call Options | | | | | | | | | | | | | |
| Russell 2000 Index | | | (7,904 | ) | | $ | (1,347,632,000 | ) | | $ | 1,705.00 | | 11/18/22 | | $ | (121,998,240 | ) |
* Non-income producing security.
‡ Real Estate Investment Trust
# For financial information on the Vanguard Russell 2000 ETF, please go to the Securities Exchange Commission’s website at http://www.sec.gov.
(A) All or a portion of these securities has been segregated as collateral for options contracts. The aggregate market value of collateral at October 31, 2022 was $1,462,162,960.
The following is a summary of the level of inputs used as of October 31, 2022, in valuing the Fund's investments and other financial instruments carried at value:
| Investments in Securities | | Level 1 | | | Level 2 | | | Level 3 | | | Total | |
| Common Stock | | $ | 1,018,113,938 | | | $ | — | | | $ | — | | | $ | 1,018,113,938 | |
| Exchange Traded Fund | | | 444,049,022 | | | | — | | | | — | | | | 444,049,022 | |
| Total Investments in Securities | | $ | 1,462,162,960 | | | $ | — | | | $ | — | | | $ | 1,462,162,960 | |
| Other Financial Instruments | | Level 1 | | | Level 2 | | | Level 3 | | | Total | |
| Written Options | | $ | (121,998,240 | ) | | $ | – | | | $ | – | | | $ | (121,998,240 | ) |
| Total Other Financial Instruments | | $ | (121,998,240 | ) | | $ | – | | | $ | – | | | $ | (121,998,240 | ) |
Amounts designated as “—“ are $0 or have been rounded to $0.
See "Glossary" for abbreviations.
|
|
|
| Schedule of Investments | | October 31, 2022 |
| Global X Dow 30® Covered Call ETF |

| | | | |
| |
| | | Shares | | | Value | |
| COMMON STOCK — 107.6%(A) | | | | | | |
| UNITED STATES — 107.6% | | | | | | |
| Communication Services — 3.1% | | | | | | |
| Verizon Communications | | | 11,475 | | | $ | 428,821 | |
| Walt Disney * | | | 11,475 | | | | 1,222,546 | |
| | | | | | | | 1,651,367 | |
| Consumer Discretionary — 14.3% | | | | | | | | |
| Home Depot . | | | 11,475 | | | | 3,398,092 | |
| McDonald's . | | | 11,475 | | | | 3,128,773 | |
| NIKE, Cl B | | | 11,475 | | | | 1,063,503 | |
| | | | | | | | 7,590,368 | |
| Consumer Staples — 8.1% | | | | | | | | |
| Coca-Cola . | | | 11,475 | | | | 686,779 | |
| Procter & Gamble . | | | 11,475 | | | | 1,545,338 | |
| Walgreens Boots Alliance | | | 11,475 | | | | 418,837 | |
| Walmart | | | 11,475 | | | | 1,633,237 | |
| | | | | | | | 4,284,191 | |
| Energy — 3.9% | | | | | | | | |
| Chevron . | | | 11,475 | | | | 2,075,828 | |
|
|
|
| Schedule of Investments | | October 31, 2022 |
| Global X Dow 30® Covered Call ETF |
| | | | |
| |
| | | Shares | | | Value | |
| COMMON STOCK — continued | | | | | | |
| Financials — 17.4% | | | | | | |
| American Express . | | | 11,475 | | | $ | 1,703,464 | |
| Goldman Sachs Group | | | 11,475 | | | | 3,953,252 | |
| JPMorgan Chase . | | | 11,475 | | | | 1,444,473 | |
| Travelers . | | | 11,475 | | | | 2,116,678 | |
| | | | | | | | 9,217,867 | |
| Health Care — 23.9% | | | | | | | | |
| Amgen . | | | 11,475 | | | | 3,102,266 | |
| Johnson & Johnson . | | | 11,475 | | | | 1,996,306 | |
| Merck . | | | 11,475 | | | | 1,161,270 | |
| UnitedHealth Group | | | 11,475 | | | | 6,370,346 | |
| | | | | | | | 12,630,188 | |
| Industrials — 14.9% | | | | | | | | |
3M
| | | 11,475 | | | | 1,443,440 | |
| Boeing * | | | 11,475 | | | | 1,635,302 | |
| Caterpillar . | | | 11,475 | | | | 2,483,879 | |
| Honeywell International . | | | 11,475 | | | | 2,341,130 | |
| | | | | | | | 7,903,751 | |
| Information Technology — 21.0% | | | | | | | | |
| Apple . | | | 11,475 | | | | 1,759,577 | |
| Cisco Systems | | | 11,475 | | | | 521,309 | |
| Intel . | | | 11,475 | | | | 326,234 | |
| International Business Machines . | | | 11,475 | | | | 1,586,878 | |
| Microsoft | | | 11,475 | | | | 2,663,692 | |
| Salesforce * | | | 11,475 | | | | 1,865,720 | |
| Visa, Cl A . | | | 11,475 | | | | 2,377,161 | |
| | | | | | | | 11,100,571 | |
| Materials — 1.0% | | | | | | | | |
| Dow | | | 11,475 | | | | 536,342 | |
| TOTAL UNITED STATES | | | | | | | 56,990,473 | |
| TOTAL COMMON STOCK | | | | | | | | |
| (Cost $55,076,188) | | | | | | | 56,990,473 | |
| TOTAL INVESTMENTS — 107.6% | | | | | | | | |
| (Cost $55,076,188) | | | | | | $ | 56,990,473 | |
| Schedule of Investments | | October 31, 2022 |
| Global X Dow 30® Covered Call ETF |
| | | Value | |
| WRITTEN OPTIONS— (7.7)% | | | |
| (Premiums Received $(1,800,086)) | | $ | (4,086,998 | ) |
Percentages are based on Net Assets of $52,984,590
A list of the exchange traded option contracts held by the Fund at October 31, 2022, is as follows:
| Description | | Number of Contracts | | | Notional Amount | | | Exercise Price | | Expiration Date | | Value | |
| WRITTEN OPTIONS — (7.7)% | | | | | | | | | | | | | |
| Call Options | | | | | | | | | | | | | |
| Dow Jones Industrial Average | | | (1,741 | ) | | $ | (53,100,500 | ) | | $ | 305.00 | | 11/18/22 | | $ | (4,086,998 | ) |
* Non-income producing security.
(A) All or a portion of these securities has been segregated as collateral for options contracts. The aggregate market value of collateral at October 31, 2022 was $56,990,473.
The following is a summary of the level of inputs used as of October 31, 2022, in valuing the Fund’s investments and other financial instruments carried at value:
| Investments in Securities | | Level 1 | | | Level 2 | | | Level 3 | | | Total | |
| Common Stock | | $ | 56,990,473 | | | $ | — | | | $ | — | | | $ | 56,990,473 | |
| Total Investments in Securities | | $ | 56,990,473 | | | $ | — | | | $ | — | | | $ | 56,990,473 | |
| Other Financial Instruments | | Level 1 | | | Level 2 | | | Level 3 | | | Total | |
| Written Options | | $ | (4,086,998 | ) | | $ | – | | | $ | – | | | $ | (4,086,998 | ) |
| Total Other Financial Instruments | | $ | (4,086,998 | ) | | $ | – | | | $ | – | | | $ | (4,086,998 | ) |
Amounts designated as “—“ are $0 or have been rounded to $0.
See "Glossary" for abbreviations.
|
|
| Schedule of Investments | October 31, 2022 |
| Global X Nasdaq 100® Covered Call & Growth ETF |
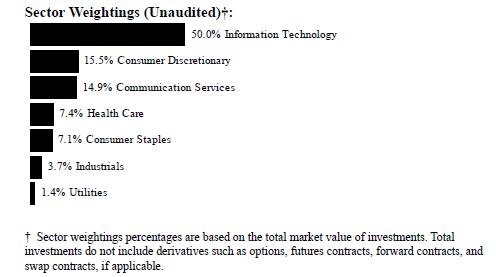
| | | | |
| |
| | | Shares | | | Value | |
| COMMON STOCK — 102.3%(A) | | | | | | |
| BRAZIL — 0.5% | | | | | | |
| Consumer Discretionary — 0.5% | | | | | | |
| MercadoLibre * | | | 297 | | | $ | 267,781 | |
| CHINA — 1.0% | | | | | | | | |
| Communication Services — 0.2% | | | | | | | | |
| Baidu ADR * | | | 1,066 | | | | 81,624 | |
| NetEase ADR . | | | 950 | | | | 52,839 | |
| | | | | | | | 134,463 | |
| Consumer Discretionary — 0.4% | | | | | | | | |
| JD.com ADR . | | | 3,013 | | | | 112,355 | |
| Pinduoduo ADR * | | | 2,798 | | | | 153,414 | |
| | | | | | | | 265,769 | |
| Information Technology — 0.4% | | | | | | | | |
| NXP Semiconductors . | | | 1,543 | | | | 225,401 | |
| TOTAL CHINA | | | | | | | 625,633 | |
|
|
| Schedule of Investments | October 31, 2022 |
| Global X Nasdaq 100® Covered Call & Growth ETF |
| | | | |
| |
| | | Shares | | | Value | |
| COMMON STOCK — continued | | | | | | |
| NETHERLANDS — 0.4% | | | | | | |
| Information Technology — 0.4% | | | | | | |
| ASML Holding . | | | 506 | | | $ | 239,045 | |
| UNITED KINGDOM — 0.3% | | | | | | | | |
| Health Care — 0.3% | | | | | | | | |
| AstraZeneca ADR . | | | 3,454 | | | | 203,130 | |
| UNITED STATES — 100.1% | | | | | | | | |
| Communication Services — 15.0% | | | | | | | | |
| Activision Blizzard . | | | 4,678 | | | | 340,558 | |
| Alphabet, Cl A * | | | 21,625 | | | | 2,043,779 | |
| Alphabet, Cl C * | | | 22,226 | | | | 2,103,913 | |
| Charter Communications, Cl A * | | | 965 | | | | 354,753 | |
| Comcast, Cl A | | | 26,347 | | | | 836,254 | |
| Electronic Arts | | | 1,661 | | | | 209,219 | |
| Match Group * | | | 1,685 | | | | 72,792 | |
| Meta Platforms, Cl A * | | | 12,316 | | | | 1,147,359 | |
| Netflix * | | | 2,661 | | | | 776,693 | |
| Sirius XM Holdings . | | | 23,435 | | | | 141,547 | |
| T-Mobile US * | | | 7,503 | | | | 1,137,155 | |
| | | | | | | | 9,164,022 | |
| Consumer Discretionary — 15.0% | | | | | | | | |
| Airbnb, Cl A * | | | 2,389 | | | | 255,408 | |
| Amazon.com * | | | 36,739 | | | | 3,763,543 | |
| Booking Holdings * | | | 238 | | | | 444,936 | |
| Dollar Tree * | | | 1,338 | | | | 212,073 | |
| eBay | | | 3,339 | | | | 133,026 | |
| Lucid Group * | | | 9,962 | | | | 142,357 | |
| Lululemon Athletica * | | | 720 | | | | 236,909 | |
| Marriott International, Cl A | | | 1,941 | | | | 310,773 | |
| O'Reilly Automotive * | | | 377 | | | | 315,613 | |
| Ross Stores | | | 2,094 | | | | 200,375 | |
| Starbucks | | | 6,867 | | | | 594,614 | |
| Tesla * | | | 11,209 | | | | 2,550,496 | |
| | | | | | | | 9,160,123 | |
| Consumer Staples — 7.2% | | | | | | | | |
| Costco Wholesale | | | 2,651 | | | | 1,329,477 | |
|
|
| Schedule of Investments | October 31, 2022 |
| Global X Nasdaq 100® Covered Call & Growth ETF |
| | | | |
| |
| | | Shares | | | Value | |
| COMMON STOCK — continued | | | | | | |
| Consumer Staples — continued | | | | | | |
| Keurig Dr Pepper | | | 8,475 | | | $ | 329,169 | |
| Kraft Heinz | | | 7,330 | | | | 281,985 | |
| Mondelez International, Cl A . | | | 8,202 | | | | 504,259 | |
| Monster Beverage * | | | 3,096 | | | | 290,157 | |
| PepsiCo | | | 8,257 | | | | 1,499,306 | |
| Walgreens Boots Alliance | | | 5,148 | | | | 187,902 | |
| | | | | | | | 4,422,255 | |
| Health Care — 7.3% | | | | | | | | |
| Align Technology * | | | 473 | | | | 91,904 | |
| Amgen . | | | 3,201 | | | | 865,390 | |
| Biogen * | | | 865 | | | | 245,176 | |
| Dexcom * | | | 2,305 | | | | 278,398 | |
| Gilead Sciences | | | 7,499 | | | | 588,371 | |
| IDEXX Laboratories * | | | 503 | | | | 180,919 | |
| Illumina * | | | 947 | | | | 216,693 | |
| Intuitive Surgical * | | | 2,137 | | | | 526,706 | |
| Moderna * | | | 2,342 | | | | 352,073 | |
| Regeneron Pharmaceuticals * | | | 639 | | | | 478,451 | |
| Seagen * | | | 1,093 | | | | 138,986 | |
| Vertex Pharmaceuticals * | | | 1,536 | | | | 479,232 | |
| | | | | | | | 4,442,299 | |
| Industrials — 3.8% | | | | | | | | |
| Cintas | | | 598 | | | | 255,675 | |
| Copart * | | | 1,405 | | | | 161,603 | |
| CSX | | | 12,812 | | | | 372,317 | |
| Fastenal | | | 3,433 | | | | 165,917 | |
| Honeywell International . | | | 4,031 | | | | 822,405 | |
| Old Dominion Freight Line | | | 666 | | | | 182,883 | |
| PACCAR | | | 2,080 | | | | 201,406 | |
| Verisk Analytics, Cl A . | | | 958 | | | | 175,151 | |
| | | | | | | | 2,337,357 | |
| Information Technology — 50.3% | | | | | | | | |
| Adobe * | | | 2,798 | | | | 891,163 | |
| Advanced Micro Devices * | | | 9,658 | | | | 580,059 | |
| Analog Devices | | | 3,075 | | | | 438,556 | |
| ANSYS * | | | 517 | | | | 114,340 | |
| Apple . | | | 57,955 | | | | 8,886,820 | |
|
|
| Schedule of Investments | October 31, 2022 |
| Global X Nasdaq 100® Covered Call & Growth ETF |
| | | | |
| |
| | | Shares | | | Value | |
| COMMON STOCK — continued | | | | | | |
| Information Technology — continued | | | | | | |
| Applied Materials . | | | 5,146 | | | $ | 454,340 | |
| Atlassian, Cl A * | | | 849 | | | | 172,118 | |
| Autodesk * | | | 1,268 | | | | 271,732 | |
| Automatic Data Processing | | | 2,485 | | | | 600,625 | |
| Broadcom | | | 2,423 | | | | 1,139,101 | |
| Cadence Design Systems * | | | 1,608 | | | | 243,435 | |
| Cisco Systems | | | 24,774 | | | | 1,125,483 | |
| Cognizant Technology Solutions, Cl A | | | 3,116 | | | | 193,971 | |
| Crowdstrike Holdings, Cl A * | | | 1,262 | | | | 203,434 | |
| Datadog, Cl A * | | | 1,675 | | | | 134,854 | |
| DocuSign, Cl A * | | | 1,191 | | | | 57,525 | |
| Fiserv * | | | 3,825 | | | | 392,981 | |
| Fortinet * | | | 4,720 | | | | 269,795 | |
| Intel . | | | 24,568 | | | | 698,468 | |
| Intuit . | | | 1,686 | | | | 720,765 | |
| KLA | | | 837 | | | | 264,869 | |
| Lam Research | | | 819 | | | | 331,515 | |
| Marvell Technology . | | | 5,005 | | | | 198,598 | |
| Microchip Technology | | | 3,275 | | | | 202,199 | |
| Micron Technology . | | | 6,602 | | | | 357,168 | |
| Microsoft | | | 26,894 | | | | 6,242,904 | |
| NVIDIA . | | | 12,637 | | | | 1,705,616 | |
| Okta, Cl A * | | | 858 | | | | 48,151 | |
| Palo Alto Networks * | | | 1,790 | | | | 307,146 | |
| Paychex | | | 2,113 | | | | 249,989 | |
| PayPal Holdings * | | | 6,920 | | | | 578,374 | |
| QUALCOMM . | | | 6,719 | | | | 790,558 | |
| Skyworks Solutions | | | 968 | | | | 83,258 | |
| Splunk * | | | 966 | | | | 80,284 | |
| Synopsys * | | | 896 | | | | 262,125 | |
| Texas Instruments . | | | 5,465 | | | | 877,843 | |
| VeriSign * | | | 628 | | | | 125,889 | |
| Workday, Cl A * | | | 1,177 | | | | 183,400 | |
| Zoom Video Communications, Cl A * | | | 1,512 | | | | 126,161 | |
| Zscaler * | | | 830 | | | | 127,903 | |
| | | | | | | | 30,733,515 | |
| Utilities — 1.5% | | | | | | | | |
| American Electric Power | | | 3,071 | | | | 270,002 | |
| Constellation Energy . | | | 1,953 | | | | 184,637 | |
|
|
| Schedule of Investments | October 31, 2022 |
| Global X Nasdaq 100® Covered Call & Growth ETF |
| | Shares | | | Value | |
| COMMON STOCK — continued | | | | | | |
Utilities — continued | | | | | | |
| Exelon | | | 5,833 | | | $ | 225,095 | |
| Xcel Energy | | | 3,223 | | | | 209,850 | |
| | | | | | | | 889,584 | |
TOTAL UNITED STATES | | | | | | | 61,149,155 | |
TOTAL COMMON STOCK | | | | | | | | |
| (Cost $77,853,060) | | | | | | | 62,484,744 | |
TOTAL INVESTMENTS — 102.3% | | | | | | | | |
(Cost $77,853,060) | | | | | | $ | 62,484,744 | |
WRITTEN OPTIONS— (2.4)% | | | | | | | | |
| (Premiums Received $(1,328,561)) | | | | | | $ | (1,488,595 | ) |
Percentages are based on Net Assets of $61,104,688.
A list of the exchange traded option contracts held by the Fund at October 31, 2022, is as follows:
| Description | | Number of Contracts | | | Notional Amount | | | Exercise Price | | Expiration Date | | Value | |
| WRITTEN OPTIONS — (2.4)% | | | | | | | | | | | | | |
| Call Options | | | | | | | | | | | | | |
| Nasdaq-100 | | | (25 | ) | | $ | (27,625,000 | ) | | $ | 11,050.00 | | 11/18/22 | | $ | (1,367,375 | ) |
Nasdaq-100® Reduced-Value Index | | | (11 | ) | | | (2,431,000 | ) | | | 2,210.00 | | 11/18/22 | | | (121,220 | ) |
| | | | | | | | | | | | | | | | | | |
| Total Written Options | | | | | | $ | (30,056,000 | ) | | | | | | | $ | (1,488,595 | ) |
* Non-income producing security.
(A) All or a portion of these securities has been segregated as collateral for options contracts. The aggregate market value of collateral at October 31, 2022 was $62,484,744.
|
|
| Schedule of Investments | October 31, 2022 |
| Global X Nasdaq 100® Covered Call & Growth ETF |
The following is a summary of the level of inputs used as of October 31, 2022, in valuing the Fund’s investments and other financial instruments carried at value:
| Investments in Securities | | Level 1 | | | Level 2 | | | Level 3 | | | Total | |
| Common Stock | | $ | 62,484,744 | | | $ | — | | | $ | — | | | $ | 62,484,744 | |
| Total Investments in Securities | | $ | 62,484,744 | | | $ | — | | | $ | — | | | $ | 62,484,744 | |
| Other Financial Instruments | | Level 1 | | | Level 2 | | | Level 3 | | | Total | |
| Written Options | | $ | (1,488,595 | ) | | $ | – | | | $ | – | | | $ | (1,488,595 | ) |
| Total Other Financial Instruments | | $ | (1,488,595 | ) | | $ | – | | | $ | – | | | $ | (1,488,595 | ) |
Amounts designated as “—“ are $0 or have been rounded to $0.
See "Glossary" for abbreviations.
The accompanying notes are an integral part of the financial statements.
|
|
| Schedule of Investments | October 31, 2022 |
| Global X S&P 500® Covered Call & Growth ETF |

| | | | |
| |
| | | Shares | | | Value | |
| COMMON STOCK — 102.8%(A) | | | | | | |
| CHINA — 0.1% | | | | | | |
| Information Technology — 0.1% | | | | | | |
| NXP Semiconductors . | | | 332 | | | $ | 48,498 | |
| SWITZERLAND — 0.1% | | | | | | | | |
| Information Technology — 0.1% | | | | | | | | |
| TE Connectivity | | | 404 | | | | 49,381 | |
| UNITED KINGDOM — 0.5% | | | | | | | | |
| Materials — 0.5% | | | | | | | | |
| Linde | | | 654 | | | | 194,467 | |
| UNITED STATES — 102.1% | | | | | | | | |
| Communication Services — 7.6% | | | | | | | | |
| Activision Blizzard . | | | 962 | | | | 70,034 | |
| Alphabet, Cl A * | | | 7,870 | | | | 743,794 | |
| Alphabet, Cl C * | | | 7,037 | | | | 666,122 | |
| AT&T | | | 9,353 | | | | 170,505 | |
| Charter Communications, Cl A * | | | 145 | | | | 53,305 | |
| Comcast, Cl A | | | 5,780 | | | | 183,457 | |
.
|
|
| Schedule of Investments | October 31, 2022 |
| Global X S&P 500® Covered Call & Growth ETF |
| | | | |
| |
| | | Shares | | | Value | |
| COMMON STOCK — continued | | | | | | |
| Communication Services — continued | | | | | | |
| DISH Network, Cl A * | | | 328 | | | $ | 4,891 | |
| Electronic Arts | | | 371 | | | | 46,731 | |
| Fox, Cl A | | | 351 | | | | 10,133 | |
| Fox, Cl B | | | 167 | | | | 4,542 | |
| Interpublic Group | | | 495 | | | | 14,746 | |
| Live Nation Entertainment * | | | 164 | | | | 13,056 | |
| Lumen Technologies . | | | 1,307 | | | | 9,620 | |
| Match Group * | | | 348 | | | | 15,034 | |
| Meta Platforms, Cl A * | | | 2,993 | | | | 278,828 | |
| Netflix * | | | 584 | | | | 170,458 | |
| News, Cl A . | | | 495 | | | | 8,351 | |
| News, Cl B . | | | 165 | | | | 2,826 | |
| Omnicom Group . | | | 283 | | | | 20,588 | |
| Paramount Global, Cl B | | | 805 | | | | 14,748 | |
| Take-Two Interactive Software * | | | 219 | | | | 25,947 | |
| T-Mobile US * | | | 802 | | | | 121,551 | |
| Verizon Communications | | | 5,501 | | | | 205,572 | |
| Walt Disney * | | | 2,380 | | | | 253,565 | |
| Warner Bros Discovery * | | | 2,855 | | | | 37,115 | |
| | | | | | | | 3,145,519 | |
| Consumer Discretionary — 11.2% | | | | | | | | |
| Advance Auto Parts | | | 68 | | | | 12,915 | |
| Amazon.com * | | | 11,633 | | | | 1,191,684 | |
| Aptiv * | | | 331 | | | | 30,144 | |
| AutoZone * | | | 26 | | | | 65,855 | |
| Bath & Body Works . | | | 328 | | | | 10,949 | |
| Best Buy | | | 279 | | | | 19,086 | |
| Booking Holdings * | | | 51 | | | | 95,343 | |
| BorgWarner . | | | 325 | | | | 12,197 | |
| Caesars Entertainment * | | | 320 | | | | 13,994 | |
| CarMax * | | | 229 | | | | 14,429 | |
| Carnival * | | | 1,106 | | | | 10,020 | |
| Chipotle Mexican Grill, Cl A * | | | 35 | | | | 52,442 | |
| Darden Restaurants . | | | 165 | | | | 23,618 | |
| Dollar General . | | | 288 | | | | 73,454 | |
| Dollar Tree * | | | 304 | | | | 48,184 | |
| Domino's Pizza . | | | 42 | | | | 13,954 | |
| DR Horton | | | 437 | | | | 33,597 | |
| eBay | | | 748 | | | | 29,800 | |
|
|
| Schedule of Investments | October 31, 2022 |
| Global X S&P 500® Covered Call & Growth ETF |
| | | | |
| |
| | | Shares | | | Value | |
| COMMON STOCK — continued | | | | | | |
| Consumer Discretionary — continued | | | | | | |
| Etsy * | | | 162 | | | $ | 15,213 | |
| Expedia Group * | | | 200 | | | | 18,694 | |
| Ford Motor . | | | 5,184 | | | | 69,310 | |
| Garmin | | | 203 | | | | 17,872 | |
| General Motors | | | 1,914 | | | | 75,124 | |
| Genuine Parts . | | | 186 | | | | 33,082 | |
| Hasbro . | | | 166 | | | | 10,831 | |
| Hilton Worldwide Holdings . | | | 364 | | | | 49,235 | |
| Home Depot . | | | 1,349 | | | | 399,479 | |
| Las Vegas Sands * | | | 489 | | | | 18,587 | |
| Lennar, Cl A . | | | 327 | | | | 26,389 | |
| LKQ | | | 332 | | | | 18,472 | |
| Lowe's | | | 835 | | | | 162,783 | |
| Marriott International, Cl A | | | 360 | | | | 57,640 | |
| McDonald's . | | | 966 | | | | 263,390 | |
| MGM Resorts International . | | | 498 | | | | 17,714 | |
| Mohawk Industries * | | | 69 | | | | 6,538 | |
| Newell Brands . | | | 494 | | | | 6,822 | |
| NIKE, Cl B | | | 1,659 | | | | 153,756 | |
| Norwegian Cruise Line Holdings * | | | 485 | | | | 8,192 | |
| NVR * | | | 4 | | | | 16,951 | |
| O'Reilly Automotive * | | | 86 | | | | 71,997 | |
| Pool . | | | 46 | | | | 13,995 | |
| PulteGroup . | | | 330 | | | | 13,197 | |
| Ralph Lauren, Cl A . | | | 78 | | | | 7,230 | |
| Ross Stores | | | 472 | | | | 45,166 | |
| Royal Caribbean Cruises * | | | 322 | | | | 17,188 | |
| Starbucks | | | 1,506 | | | | 130,405 | |
| Tapestry . | | | 332 | | | | 10,518 | |
| Target | | | 609 | | | | 100,028 | |
| Tesla * | | | 3,496 | | | | 795,480 | |
| TJX | | | 1,538 | | | | 110,890 | |
| Tractor Supply . | | | 136 | | | | 29,889 | |
| Ulta Beauty * | | | 68 | | | | 28,517 | |
| VF . | | | 382 | | | | 10,791 | |
| Whirlpool | | | 73 | | | | 10,092 | |
| Wynn Resorts * | | | 161 | | | | 10,288 | |
| Yum! Brands | | | 361 | | | | 42,688 | |
| | | | | | | | 4,646,098 | |
|
|
| Schedule of Investments | October 31, 2022 |
| Global X S&P 500® Covered Call & Growth ETF |
| | | | |
| |
| | | Shares | | | Value | |
| COMMON STOCK — continued | | | | | | |
| Consumer Staples — 7.1% | | | | | | |
| Altria Group . | | | 2,364 | | | $ | 109,382 | |
| Archer-Daniels-Midland | | | 736 | | | | 71,377 | |
| Brown-Forman, Cl B | | | 231 | | | | 15,708 | |
| Campbell Soup . | | | 232 | | | | 12,275 | |
| Church & Dwight | | | 328 | | | | 24,315 | |
| Clorox | | | 162 | | | | 23,658 | |
| Coca-Cola . | | | 5,088 | | | | 304,517 | |
| Colgate-Palmolive | | | 1,095 | | | | 80,855 | |
| Conagra Brands . | | | 657 | | | | 24,112 | |
| Constellation Brands, Cl A | | | 211 | | | | 52,134 | |
| Costco Wholesale | | | 581 | | | | 291,372 | |
| Estee Lauder, Cl A . | | | 307 | | | | 61,550 | |
| General Mills | | | 752 | | | | 61,348 | |
| Hershey | | | 191 | | | | 45,605 | |
| Hormel Foods | | | 332 | | | | 15,421 | |
| J M Smucker . | | | 129 | | | | 19,435 | |
| Kellogg | | | 330 | | | | 25,351 | |
| Keurig Dr Pepper | | | 1,115 | | | | 43,307 | |
| Kimberly-Clark | | | 422 | | | | 52,522 | |
| Kraft Heinz | | | 1,105 | | | | 42,509 | |
| Kroger | | | 865 | | | | 40,906 | |
| Lamb Weston Holdings . | | | 167 | | | | 14,399 | |
| McCormick . | | | 327 | | | | 25,715 | |
| Molson Coors Beverage, Cl B | | | 254 | | | | 12,809 | |
| Mondelez International, Cl A . | | | 1,799 | | | | 110,603 | |
| Monster Beverage * | | | 489 | | | | 45,829 | |
| PepsiCo | | | 1,804 | | | | 327,570 | |
| Philip Morris International | | | 2,035 | | | | 186,915 | |
| Procter & Gamble . | | | 3,136 | | | | 422,325 | |
| Sysco . | | | 653 | | | | 56,524 | |
| Tyson Foods, Cl A | | | 385 | | | | 26,315 | |
| Walgreens Boots Alliance | | | 985 | | | | 35,953 | |
| Walmart | | | 1,862 | | | | 265,018 | |
| | | | | | | | 2,947,634 | |
| Energy — 5.6% | | | | | | | | |
| APA . | | | 494 | | | | 22,457 | |
| Baker Hughes, Cl A | | | 1,253 | | | | 34,658 | |
| Chevron . | | | 2,364 | | | | 427,648 | |
| ConocoPhillips . | | | 1,671 | | | | 210,696 | |
|
|
| Schedule of Investments | October 31, 2022 |
| Global X S&P 500® Covered Call & Growth ETF |
| | | | |
| |
| | | Shares | | | Value | |
| COMMON STOCK — continued | | | | | | |
| Energy — continued | | | | | | |
| Coterra Energy | | | 1,107 | | | $ | 34,461 | |
| Devon Energy | | | 859 | | | | 66,444 | |
| Diamondback Energy | | | 233 | | | | 36,607 | |
| EOG Resources | | | 769 | | | | 104,984 | |
| EQT . | | | 485 | | | | 20,292 | |
| Exxon Mobil | | | 5,470 | | | | 606,131 | |
| Halliburton . | | | 1,160 | | | | 42,247 | |
| Hess | | | 368 | | | | 51,917 | |
| Kinder Morgan | | | 2,623 | | | | 47,529 | |
| Marathon Oil . | | | 936 | | | | 28,501 | |
| Marathon Petroleum | | | 673 | | | | 76,466 | |
| Occidental Petroleum . | | | 1,008 | | | | 73,181 | |
| ONEOK | | | 608 | | | | 36,067 | |
| Phillips 66 . | | | 636 | | | | 66,328 | |
| Pioneer Natural Resources | | | 322 | | | | 82,564 | �� |
| Schlumberger | | | 1,856 | | | | 96,568 | |
| Targa Resources | | | 292 | | | | 19,964 | |
| Valero Energy . | | | 535 | | | | 67,169 | |
| Williams | | | 1,600 | | | | 52,368 | |
| | | | | | | | 2,305,247 | |
| Financials — 11.8% | | | | | | | | |
| Aflac | | | 794 | | | | 51,697 | |
| Allstate | | | 338 | | | | 42,672 | |
| American Express . | | | 771 | | | | 114,455 | |
| American International Group | | | 1,044 | | | | 59,508 | |
| Ameriprise Financial | | | 149 | | | | 46,059 | |
| Aon, Cl A . | | | 269 | | | | 75,721 | |
| Arch Capital Group * | | | 483 | | | | 27,773 | |
| Arthur J Gallagher | | | 277 | | | | 51,821 | |
| Assurant . | | | 65 | | | | 8,831 | |
| Bank of America | | | 9,175 | | | | 330,667 | |
| Bank of New York Mellon | | | 1,008 | | | | 42,447 | |
| Berkshire Hathaway, Cl B * | | | 2,369 | | | | 699,068 | |
| BlackRock, Cl A . | | | 197 | | | | 127,244 | |
| Brown & Brown . | | | 310 | | | | 18,225 | |
| Capital One Financial | | | 508 | | | | 53,858 | |
| Cboe Global Markets . | | | 125 | | | | 15,562 | |
| Charles Schwab . | | | 2,014 | | | | 160,455 | |
| Chubb . | | | 548 | | | | 117,760 | |
|
|
| Schedule of Investments | October 31, 2022 |
| Global X S&P 500® Covered Call & Growth ETF |
| | | | |
| |
| | | Shares | | | Value | |
| COMMON STOCK — continued | | | | | | |
| Financials — continued | | | | | | |
| Cincinnati Financial . | | | 197 | | | $ | 20,354 | |
| Citigroup | | | 2,542 | | | | 116,576 | |
| Citizens Financial Group . | | | 637 | | | | 26,053 | |
| CME Group, Cl A . | | | 472 | | | | 81,798 | |
| Comerica | | | 165 | | | | 11,633 | |
| Discover Financial Services | | | 364 | | | | 38,023 | |
| Everest Re Group | | | 48 | | | | 15,488 | |
| FactSet Research Systems . | | | 44 | | | | 18,722 | |
| Fifth Third Bancorp | | | 948 | | | | 33,834 | |
| First Republic Bank . | | | 229 | | | | 27,503 | |
| Franklin Resources | | | 330 | | | | 7,739 | |
| Globe Life . | | | 128 | | | | 14,787 | |
| Goldman Sachs Group | | | 448 | | | | 154,340 | |
| Hartford Financial Services Group . | | | 447 | | | | 32,367 | |
| Huntington Bancshares | | | 1,901 | | | | 28,857 | |
| Intercontinental Exchange . | | | 732 | | | | 69,957 | |
| Invesco | | | 507 | | | | 7,767 | |
| JPMorgan Chase . | | | 3,849 | | | | 484,512 | |
| KeyCorp | | | 1,289 | | | | 23,034 | |
| Lincoln National . | | | 179 | | | | 9,643 | |
| Loews . | | | 270 | | | | 15,395 | |
| M&T Bank . | | | 226 | | | | 38,052 | |
| MarketAxess Holdings . | | | 42 | | | | 10,250 | |
| Marsh & McLennan . | | | 656 | | | | 105,937 | |
| MetLife . | | | 856 | | | | 62,668 | |
| Moody's . | | | 207 | | | | 54,828 | |
| Morgan Stanley | | | 1,770 | | | | 145,441 | |
| MSCI, Cl A | | | 104 | | | | 48,761 | |
| Nasdaq . | | | 489 | | | | 30,435 | |
| Northern Trust . | | | 294 | | | | 24,799 | |
| PNC Financial Services Group | | | 541 | | | | 87,550 | |
| Principal Financial Group | | | 330 | | | | 29,083 | |
| Progressive | | | 768 | | | | 98,611 | |
| Prudential Financial . | | | 495 | | | | 52,069 | |
| Raymond James Financial . | | | 243 | | | | 28,708 | |
| Regions Financial . | | | 1,304 | | | | 28,623 | |
| S&P Global . | | | 442 | | | | 141,993 | |
| Signature Bank NY . | | | 101 | | | | 16,012 | |
| State Street . | | | 491 | | | | 36,334 | |
|
|
| Schedule of Investments | October 31, 2022 |
| Global X S&P 500® Covered Call & Growth ETF |
| | | | |
| |
| | | Shares | | | Value | |
| COMMON STOCK — continued | | | | | | |
| Financials — continued | | | | | | |
| SVB Financial Group * | | | 67 | | | $ | 15,474 | |
| Synchrony Financial | | | 703 | | | | 24,999 | |
| T Rowe Price Group | | | 282 | | | | 29,937 | |
| Travelers . | | | 321 | | | | 59,212 | |
| Truist Financial | | | 1,742 | | | | 78,024 | |
| US Bancorp . | | | 1,775 | | | | 75,349 | |
| W R Berkley | | | 254 | | | | 18,893 | |
| Wells Fargo . | | | 4,973 | | | | 228,708 | |
| Willis Towers Watson | | | 151 | | | | 32,950 | |
| Zions Bancorp . | | | 170 | | | | 8,830 | |
| | | | | | | | 4,894,735 | |
| Health Care — 15.7% | | | | | | | | |
| Abbott Laboratories . | | | 2,296 | | | | 227,166 | |
| AbbVie | | | 2,309 | | | | 338,038 | |
| ABIOMED * | | | 51 | | | | 12,856 | |
| Agilent Technologies | | | 392 | | | | 54,233 | |
| Align Technology * | | | 108 | | | | 20,984 | |
| AmerisourceBergen, Cl A . | | | 204 | | | | 32,073 | |
| Amgen . | | | 702 | | | | 189,786 | |
| Baxter International | | | 651 | | | | 35,382 | |
| Becton Dickinson | | | 371 | | | | 87,545 | |
| Biogen * | | | 182 | | | | 51,586 | |
| Bio-Rad Laboratories, Cl A * | | | 26 | | | | 9,144 | |
| Bio-Techne | | | 43 | | | | 12,739 | |
| Boston Scientific * | | | 1,879 | | | | 81,004 | |
| Bristol-Myers Squibb . | | | 2,804 | | | | 217,226 | |
| Cardinal Health | | | 326 | | | | 24,743 | |
| Catalent * | | | 230 | | | | 15,118 | |
| Centene * | | | 735 | | | | 62,571 | |
| Charles River Laboratories International * | | | 59 | | | | 12,523 | |
| Cigna . | | | 395 | | | | 127,609 | |
| Cooper . | | | 55 | | | | 15,036 | |
| CVS Health . | | | 1,723 | | | | 163,168 | |
| Danaher | | | 855 | | | | 215,178 | |
| DaVita * | | | 68 | | | | 4,965 | |
| DENTSPLY SIRONA . | | | 319 | | | | 9,832 | |
| Dexcom * | | | 515 | | | | 62,202 | |
| Edwards Lifesciences * | | | 819 | | | | 59,320 | |
| Elevance Health | | | 315 | | | | 172,233 | |
|
|
| Schedule of Investments | October 31, 2022 |
| Global X S&P 500® Covered Call & Growth ETF |
| | | | |
| |
| | | Shares | | | Value | |
| COMMON STOCK — continued | | | | | | |
| Health Care — continued | | | | | | |
| Eli Lilly | | | 1,035 | | | $ | 374,763 | |
| Gilead Sciences | | | 1,645 | | | | 129,067 | |
| HCA Healthcare | | | 285 | | | | 61,979 | |
| Henry Schein * | | | 167 | | | | 11,433 | |
| Hologic * | | | 330 | | | | 22,374 | |
| Humana | | | 164 | | | | 91,525 | |
| IDEXX Laboratories * | | | 106 | | | | 38,126 | |
| Illumina * | | | 206 | | | | 47,137 | |
| Incyte * | | | 254 | | | | 18,882 | |
| Intuitive Surgical * | | | 469 | | | | 115,594 | |
| IQVIA Holdings * | | | 247 | | | | 51,789 | |
| Johnson & Johnson . | | | 3,451 | | | | 600,370 | |
| Laboratory Corp of America Holdings | | | 131 | | | | 29,064 | |
| McKesson | | | 185 | | | | 72,033 | |
| Medtronic | | | 1,744 | | | | 152,321 | |
| Merck . | | | 3,311 | | | | 335,073 | |
| Mettler-Toledo International * | | | 29 | | | | 36,683 | |
| Moderna * | | | 434 | | | | 65,243 | |
| Molina Healthcare * | | | 76 | | | | 27,273 | |
| Organon . | | | 327 | | | | 8,561 | |
| PerkinElmer | | | 163 | | | | 21,774 | |
| Pfizer | | | 7,334 | | | | 341,398 | |
| Quest Diagnostics . | | | 165 | | | | 23,702 | |
| Regeneron Pharmaceuticals * | | | 141 | | | | 105,574 | |
| ResMed | | | 192 | | | | 42,948 | |
| STERIS | | | 132 | | | | 22,781 | |
| Stryker . | | | 442 | | | | 101,324 | |
| Teleflex | | | 51 | | | | 10,943 | |
| Thermo Fisher Scientific | | | 511 | | | | 262,639 | |
| UnitedHealth Group | | | 1,228 | | | | 681,724 | |
| Universal Health Services, Cl B . | | | 85 | | | | 9,849 | |
| Vertex Pharmaceuticals * | | | 337 | | | | 105,144 | |
| Viatris * | | | 1,623 | | | | 16,441 | |
| Waters * | | | 79 | | | | 23,634 | |
| West Pharmaceutical Services | | | 94 | | | | 21,629 | |
| Zimmer Biomet Holdings . | | | 287 | | | | 32,531 | |
| Zoetis, Cl A . | | | 614 | | | | 92,579 | |
| | | | | | | | 6,520,164 | |
|
|
| Schedule of Investments | October 31, 2022 |
| Global X S&P 500® Covered Call & Growth ETF |
| | | | |
| |
| | | Shares | | | Value | |
| COMMON STOCK — continued | | | | | | |
| Industrials — 8.5% | | | | | | |
3M
| | | 712 | | | $ | 89,562 | |
| A O Smith . | | | 165 | | | | 9,039 | |
| Alaska Air Group * | | | 165 | | | | 7,336 | |
| Allegion . | | | 124 | | | | 12,991 | |
| American Airlines Group * | | | 814 | | | | 11,542 | |
| AMETEK | | | 311 | | | | 40,324 | |
| Boeing * | | | 733 | | | | 104,460 | |
| Carrier Global | | | 1,136 | | | | 45,167 | |
| Caterpillar . | | | 693 | | | | 150,007 | |
| CH Robinson Worldwide | | | 165 | | | | 16,124 | |
| Cintas | | | 110 | | | | 47,030 | |
| Copart * | | | 264 | | | | 30,365 | |
| CoStar Group * | | | 549 | | | | 45,413 | |
| CSX | | | 2,730 | | | | 79,334 | |
| Cummins | | | 187 | | | | 45,723 | |
| Deere . | | | 365 | | | | 144,474 | |
| Delta Air Lines * | | | 815 | | | | 27,653 | |
| Dover | | | 188 | | | | 24,570 | |
| Eaton | | | 525 | | | | 78,787 | |
| Emerson Electric | | | 777 | | | | 67,288 | |
| Equifax . | | | 163 | | | | 27,635 | |
| Expeditors International of Washington . | | | 238 | | | | 23,288 | |
| Fastenal | | | 775 | | | | 37,456 | |
| FedEx . | | | 299 | | | | 47,924 | |
| Fortive . | | | 483 | | | | 30,864 | |
| Fortune Brands Home & Security . | | | 165 | | | | 9,953 | |
| Generac Holdings * | | | 80 | | | | 9,273 | |
| General Dynamics | | | 290 | | | | 72,442 | |
| General Electric . | | | 1,439 | | | | 111,969 | |
| Honeywell International . | | | 884 | | | | 180,354 | |
| Howmet Aerospace . | | | 495 | | | | 17,597 | |
| Huntington Ingalls Industries | | | 45 | | | | 11,568 | |
| IDEX . | | | 111 | | | | 24,676 | |
| Illinois Tool Works | | | 370 | | | | 79,006 | |
| Ingersoll Rand . | | | 493 | | | | 24,896 | |
| Jacobs Solutions . | | | 165 | | | | 19,011 | |
| JB Hunt Transport Services | | | 116 | | | | 19,844 | |
| Johnson Controls International | | | 857 | | | | 49,569 | |
| L3Harris Technologies . | | | 244 | | | | 60,139 | |
|
|
| Schedule of Investments | October 31, 2022 |
| Global X S&P 500® Covered Call & Growth ETF |
| | | | |
| |
| | | Shares | | | Value | |
| COMMON STOCK — continued | | | | | | |
| Industrials — continued | | | | | | |
| Leidos Holdings | | | 165 | | | $ | 16,762 | |
| Lockheed Martin | | | 310 | | | | 150,871 | |
| Masco . | | | 330 | | | | 15,269 | |
| Nordson . | | | 65 | | | | 14,625 | |
| Norfolk Southern . | | | 299 | | | | 68,193 | |
| Northrop Grumman | | | 190 | | | | 104,312 | |
| Old Dominion Freight Line | | | 129 | | | | 35,423 | |
| Otis Worldwide | | | 523 | | | | 36,945 | |
| PACCAR | | | 468 | | | | 45,316 | |
| Parker-Hannifin | | | 163 | | | | 47,371 | |
| Pentair | | | 169 | | | | 7,259 | |
| Quanta Services . | | | 188 | | | | 26,704 | |
| Raytheon Technologies | | | 1,938 | | | | 183,761 | |
| Republic Services, Cl A | | | 277 | | | | 36,736 | |
| Robert Half International | | | 163 | | | | 12,463 | |
| Rockwell Automation | | | 156 | | | | 39,827 | |
| Rollins . | | | 327 | | | | 13,760 | |
| Snap-On . | | | 65 | | | | 14,433 | |
| Southwest Airlines * | | | 820 | | | | 29,807 | |
| Stanley Black & Decker . | | | 191 | | | | 14,992 | |
| Textron | | | 254 | | | | 17,384 | |
| Trane Technologies . | | | 314 | | | | 50,124 | |
| TransDigm Group . | | | 68 | | | | 39,152 | |
| Union Pacific | | | 820 | | | | 161,655 | |
| United Airlines Holdings * | | | 444 | | | | 19,128 | |
| United Parcel Service, Cl B . | | | 961 | | | | 161,227 | |
| United Rentals * | | | 90 | | | | 28,414 | |
| Verisk Analytics, Cl A . | | | 206 | | | | 37,663 | |
| Waste Management . | | | 495 | | | | 78,393 | |
| Westinghouse Air Brake Technologies | | | 239 | | | | 22,294 | |
| WW Grainger . | | | 59 | | | | 34,477 | |
| Xylem . | | | 236 | | | | 24,173 | |
| | | | | | | | 3,523,566 | |
| Information Technology — 26.8% | | | | | | | | |
| Accenture, Cl A | | | 830 | | | | 235,637 | |
| Adobe * | | | 614 | | | | 195,559 | |
| Advanced Micro Devices * | | | 2,119 | | | | 127,267 | |
| Akamai Technologies * | | | 210 | | | | 18,549 | |
| Amphenol, Cl A . | | | 799 | | | | 60,588 | |
|
|
| Schedule of Investments | October 31, 2022 |
| Global X S&P 500® Covered Call & Growth ETF |
| | | | |
| |
| | | Shares | | | Value | |
| COMMON STOCK — continued | | | | | | |
| Information Technology — continued | | | | | | |
| Analog Devices | | | 682 | | | $ | 97,267 | |
| ANSYS * | | | 123 | | | | 27,203 | |
| Apple . | | | 19,828 | | | | 3,040,426 | |
| Applied Materials . | | | 1,114 | | | | 98,355 | |
| Arista Networks * | | | 323 | | | | 39,038 | |
| Autodesk * | | | 273 | | | | 58,504 | |
| Automatic Data Processing | | | 545 | | | | 131,726 | |
| Broadcom | | | 530 | | | | 249,164 | |
| Broadridge Financial Solutions . | | | 163 | | | | 24,460 | |
| Cadence Design Systems * | | | 361 | | | | 54,652 | |
| CDW | | | 165 | | | | 28,514 | |
| Ceridian HCM Holding * | | | 168 | | | | 11,120 | |
| Cisco Systems | | | 5,435 | | | | 246,912 | |
| Cognizant Technology Solutions, Cl A | | | 653 | | | | 40,649 | |
| Corning . | | | 982 | | | | 31,591 | |
| DXC Technology * | | | 330 | | | | 9,487 | |
| Enphase Energy * | | | 178 | | | | 54,646 | |
| EPAM Systems * | | | 75 | | | | 26,250 | |
F5 *
| | | 74 | | | | 10,575 | |
| Fidelity National Information Services . | | | 766 | | | | 63,570 | |
| Fiserv * | | | 854 | | | | 87,740 | |
| FleetCor Technologies * | | | 113 | | | | 21,032 | |
| Fortinet * | | | 886 | | | | 50,644 | |
| Gartner * | | | 101 | | | | 30,494 | |
| Global Payments | | | 360 | | | | 41,134 | |
| Hewlett Packard Enterprise | | | 1,781 | | | | 25,415 | |
| HP | | | 1,275 | | | | 35,215 | |
| Intel . | | | 5,389 | | | | 153,209 | |
| International Business Machines . | | | 1,185 | | | | 163,874 | |
| Intuit . | | | 370 | | | | 158,175 | |
| Jack Henry & Associates . | | | 108 | | | | 21,498 | |
| Juniper Networks . | | | 489 | | | | 14,963 | |
| Keysight Technologies * | | | 237 | | | | 41,274 | |
| KLA | | | 185 | | | | 58,543 | |
| Lam Research | | | 178 | | | | 72,051 | |
| Mastercard, Cl A . | | | 1,120 | | | | 367,562 | |
| Microchip Technology | | | 744 | | | | 45,935 | |
| Micron Technology . | | | 1,476 | | | | 79,852 | |
| Microsoft | | | 9,789 | | | | 2,272,321 | |
|
|
| Schedule of Investments | October 31, 2022 |
| Global X S&P 500® Covered Call & Growth ETF |
| | | | |
| |
| | | Shares | | | Value | |
| COMMON STOCK — continued | | | | | | |
| Information Technology — continued | | | | | | |
| Monolithic Power Systems . | | | 54 | | | $ | 18,330 | |
| Motorola Solutions | | | 215 | | | | 53,688 | |
| NetApp . | | | 301 | | | | 20,850 | |
| NortonLifeLock | | | 819 | | | | 18,452 | |
| NVIDIA . | | | 3,289 | | | | 443,916 | |
| ON Semiconductor * | | | 575 | | | | 35,322 | |
| Oracle . | | | 1,987 | | | | 155,125 | |
| Paychex | | | 427 | | | | 50,518 | |
| Paycom Software * | | | 64 | | | | 22,144 | |
| PayPal Holdings * | | | 1,518 | | | | 126,874 | |
| PTC * | | | 159 | | | | 18,735 | |
| Qorvo * | | | 163 | | | | 14,031 | |
| QUALCOMM . | | | 1,474 | | | | 173,431 | |
| Roper Technologies | | | 143 | | | | 59,279 | |
| Salesforce * | | | 1,306 | | | | 212,343 | |
| Seagate Technology Holdings . | | | 249 | | | | 12,365 | |
| ServiceNow * | | | 265 | | | | 111,496 | |
| Skyworks Solutions | | | 192 | | | | 16,514 | |
| SolarEdge Technologies * | | | 64 | | | | 14,722 | |
| Synopsys * | | | 199 | | | | 58,217 | |
| Teledyne Technologies * | | | 62 | | | | 24,675 | |
| Teradyne . | | | 210 | | | | 17,084 | |
| Texas Instruments . | | | 1,199 | | | | 192,595 | |
| Trimble * | | | 328 | | | | 19,732 | |
| Tyler Technologies * | | | 50 | | | | 16,167 | |
| VeriSign * | | | 131 | | | | 26,260 | |
| Visa, Cl A . | | | 2,148 | | | | 444,980 | |
| Western Digital * | | | 420 | | | | 14,435 | |
| Zebra Technologies, Cl A * | | | 68 | | | | 19,259 | |
| | | | | | | | 11,134,179 | |
| Materials — 2.1% | | | | | | | | |
| Air Products & Chemicals . | | | 296 | | | | 74,118 | |
| Albemarle | | | 145 | | | | 40,581 | |
| Amcor | | | 2,090 | | | | 24,202 | |
| Avery Dennison . | | | 118 | | | | 20,007 | |
| Ball | | | 423 | | | | 20,892 | |
| Celanese, Cl A . | | | 147 | | | | 14,130 | |
| CF Industries Holdings | | | 286 | | | | 30,390 | |
| Corteva . | | | 902 | | | | 58,937 | |
|
|
| Schedule of Investments | October 31, 2022 |
| Global X S&P 500® Covered Call & Growth ETF |
| | | | |
| |
| | | Shares | | | Value | |
| COMMON STOCK — continued | | | | | | |
| Materials — continued | | | | | | |
| Dow | | | 982 | | | $ | 45,899 | |
| DuPont de Nemours . | | | 656 | | | | 37,523 | |
| Eastman Chemical . | | | 165 | | | | 12,674 | |
| Ecolab | | | 325 | | | | 51,048 | |
| FMC . | | | 165 | | | | 19,618 | |
| Freeport-McMoRan . | | | 1,796 | | | | 56,915 | |
| International Flavors & Fragrances | | | 328 | | | | 32,016 | |
| International Paper . | | | 495 | | | | 16,637 | |
| LyondellBasell Industries, Cl A | | | 330 | | | | 25,229 | |
| Martin Marietta Materials | | | 82 | | | | 27,550 | |
| Mosaic . | | | 491 | | | | 26,391 | |
| Newmont | | | 1,045 | | | | 44,224 | |
| Nucor | | | 330 | | | | 43,355 | |
| Packaging Corp of America . | | | 131 | | | | 15,748 | |
| PPG Industries | | | 325 | | | | 37,108 | |
| Sealed Air | | | 167 | | | | 7,953 | |
| Sherwin-Williams . | | | 300 | | | | 67,509 | |
| Vulcan Materials | | | 165 | | | | 27,011 | |
| Westrock . | | | 331 | | | | 11,274 | |
| | | | | | | | 888,939 | |
| Real Estate — 2.7% | | | | | | | | |
| Alexandria Real Estate Equities ‡ | | | 192 | | | | 27,898 | |
| American Tower ‡ | | | 611 | | | | 126,593 | |
| AvalonBay Communities ‡ | | | 186 | | | | 32,572 | |
| Boston Properties ‡ | | | 166 | | | | 12,068 | |
| Camden Property Trust ‡ | | | 148 | | | | 17,101 | |
| CBRE Group, Cl A * | | | 444 | | | | 31,497 | |
| Crown Castle | | | 568 | | | | 75,692 | |
| Digital Realty Trust ‡ | | | 380 | | | | 38,095 | |
| Equinix . | | | 117 | | | | 66,274 | |
| Equity Residential ‡ | | | 461 | | | | 29,052 | |
| Essex Property Trust ‡ | | | 95 | | | | 21,113 | |
| Extra Space Storage ‡ | | | 165 | | | | 29,278 | |
| Federal Realty Investment Trust ‡ | | | 98 | | | | 9,700 | |
| Healthpeak Properties ‡ | | | 673 | | | | 15,970 | |
| Host Hotels & Resorts ‡ | | | 984 | | | | 18,578 | |
| Invitation Homes ‡ | | | 830 | | | | 26,303 | |
| Iron Mountain ‡ | | | 333 | | | | 16,673 | |
| Kimco Realty ‡ | | | 761 | | | | 16,270 | |
|
|
| Schedule of Investments | October 31, 2022 |
| Global X S&P 500® Covered Call & Growth ETF |
| | | | |
| |
| | | Shares | | | Value | |
| COMMON STOCK — continued | | | | | | |
| Real Estate — continued | | | | | | |
| Mid-America Apartment Communities ‡ | | | 163 | | | $ | 25,664 | |
| ProLogis ‡ | | | 1,212 | | | | 134,229 | |
| Public Storage ‡ | | | 199 | | | | 61,640 | |
| Realty Income ‡ | | | 804 | | | | 50,065 | |
| Regency Centers ‡ | | | 167 | | | | 10,105 | |
| SBA Communications, Cl A | | | 144 | | | | 38,866 | |
| Simon Property Group ‡ | | | 439 | | | | 47,842 | |
| UDR ‡ | | | 342 | | | | 13,598 | |
| Ventas ‡ | | | 493 | | | | 19,291 | |
| VICI Properties ‡ | | | 1,283 | | | | 41,082 | |
| Vornado Realty Trust ‡ | | | 167 | | | | 3,940 | |
| Welltower ‡ | | | 587 | | | | 35,830 | |
| Weyerhaeuser ‡ | | | 988 | | | | 30,559 | |
| | | | | | | | 1,123,438 | |
| Utilities — 3.0% | | | | | | | | |
| AES . | | | 918 | | | | 24,015 | |
| Alliant Energy . | | | 329 | | | | 17,164 | |
| Ameren . | | | 328 | | | | 26,739 | |
| American Electric Power | | | 655 | | | | 57,588 | |
| American Water Works | | | 235 | | | | 34,155 | |
| Atmos Energy | | | 161 | | | | 17,155 | |
| CenterPoint Energy . | | | 815 | | | | 23,317 | |
| CMS Energy | | | 333 | | | | 18,998 | |
| Consolidated Edison | | | 475 | | | | 41,781 | |
| Constellation Energy . | | | 447 | | | | 42,259 | |
| Dominion Energy | | | 1,117 | | | | 78,156 | |
| DTE Energy . | | | 259 | | | | 29,036 | |
| Duke Energy | | | 1,011 | | | | 94,205 | |
| Edison International . | | | 486 | | | | 29,179 | |
| Entergy | | | 280 | | | | 29,999 | |
| Evergy | | | 327 | | | | 19,990 | |
| Eversource Energy . | | | 426 | | | | 32,495 | |
| Exelon | | | 1,308 | | | | 50,476 | |
| FirstEnergy | | | 769 | | | | 28,999 | |
| NextEra Energy . | | | 2,579 | | | | 199,872 | |
| NiSource . | | | 496 | | | | 12,742 | |
| NRG Energy | | | 328 | | | | 14,563 | |
| PG&E * | | | 2,104 | | | | 31,413 | |
| Pinnacle West Capital | | | 163 | | | | 10,955 | |
|
|
| Schedule of Investments | October 31, 2022 |
| Global X S&P 500® Covered Call & Growth ETF |
| | | | |
| |
| | | Shares | | | Value | |
| COMMON STOCK — continued | | | | | | |
| Utilities — continued | | | | | | |
| PPL | | | 997 | | | $ | 26,411 | |
| Public Service Enterprise Group . | | | 658 | | | | 36,894 | |
| Sempra Energy . | | | 413 | | | | 62,338 | |
| Southern | | | 1,395 | | | | 91,345 | |
| WEC Energy Group . | | | 420 | | | | 38,359 | |
| Xcel Energy | | | 677 | | | | 44,079 | |
| | | | | | | | 1,264,677 | |
| TOTAL UNITED STATES | | | | | | | 42,394,196 | |
| TOTAL COMMON STOCK | | | | | | | | |
| (Cost $48,370,800) | | | | | | | 42,686,542 | |
| TOTAL INVESTMENTS — 102.8% | | | | | | | | |
| (Cost $48,370,800) | | | | | | $ | 42,686,542 | |
| WRITTEN OPTIONS— (3.0)% | | | | | | | | |
| (Premiums Received $(743,280)) | | | | | | $ | (1,225,516 | ) |
| | | | | | | | |
Percentages are based on Net Assets of $41,510,539.
A list of the exchange traded option contracts held by the Fund at October 31, 2022, is as follows:
| | | | | | | | | |
| |
| |
| | | Number of | | | Notional | | | Exercise | | Expiration | | | |
| Description | | Contracts | | | Amount | | | Price | | Date | | Value | |
| WRITTEN OPTIONS — (3.0)% | | | | | | | | | | | |
| Call Options | | | | | | | | | | | | | |
| Mini-SPX Index | | | (21 | ) | | $ | (772,800 | ) | | $ | 368.00 | | 11/18/22 | | $ | (47,061 | ) |
| S&P 500 Index | | | (53 | ) | | | (19,504,000 | ) | | | 3,680.00 | | 11/18/22 | | | (1,178,455 | ) |
| Total Written | | | | | | | | | | | | | | | | | |
| Options | | | | | | $ | (20,276,800 | ) | | | | | | | $ | (1,225,516 | ) |
* Non-income producing security.
‡ Real Estate Investment Trust
(A) All or a portion of these securities has been segregated as collateral for options contracts. The aggregate market value of collateral at October 31, 2022 was $42,686,542.
|
|
| Schedule of Investments | October 31, 2022 |
| Global X S&P 500® Covered Call & Growth ETF |
The following is a summary of the level of inputs used as of October 31, 2022, in valuing the Fund’s investments and other financial instruments carried at value:
| Investments in Securities | | Level 1 | | | Level 2 | | | Level 3 | | | Total | |
| Common Stock | | $ | 42,686,542 | | | $ | — | | | $ | — | | | $ | 42,686,542 | |
| Total Investments in Securities | | $ | 42,686,542 | | | $ | — | | | $ | — | | | $ | 42,686,542 | |
| Other Financial Instruments | | Level 1 | | | Level 2 | | | Level 3 | | | Total | |
| Written Options | | $ | (1,225,516 | ) | | $ | – | | | $ | – | | | $ | (1,225,516 | ) |
| Total Other Financial Instruments | | $ | (1,225,516 | ) | | $ | – | | | $ | – | | | $ | (1,225,516 | ) |
Amounts designated as “—“ are $0 or have been rounded to $0.
See "Glossary" for abbreviations.
|
|
| Schedule of Investments | October 31, 2022 |
| Global X Russell 2000 Covered Call & Growth ETF |
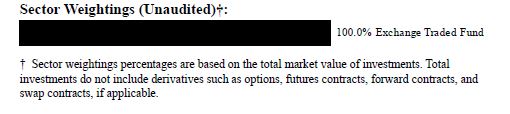
| | | | |
| |
| | | Shares | | | Value | |
| EXCHANGE TRADED FUND — 104.2%(A) | | | | | | |
| Vanguard Russell 2000 ETF (Cost $2,657,252).$ | | | 37,399 | | | $ | 2,769,770 | |
| TOTAL INVESTMENTS — 104.2% | | | | | | | | |
| (Cost $2,657,252) | | | | | | $ | 2,769,770 | |
| WRITTEN OPTIONS— (4.3)% | | | | | | | | |
| (Premiums Received $(56,428)) | | | | | | $ | (114,419 | ) |
Percentages are based on Net Assets of $2,658,191.
A list of the exchange traded option contracts held by the Fund at October 31, 2022, is as follows:
| Description | | Number of Contracts | | | Notional Amount | | | Exercise Price | | Expiration Date | | Value | |
| WRITTEN OPTIONS — (4.3)% | | | | | | | | | | | | | |
| Call Options | | | | | | | | | | | | | |
| Cboe Mini-Russell 2000 Index | | | (4 | ) | | $ | (68,000 | ) | | $ | 170.00 | | 11/18/22 | | $ | (6,374 | ) |
| Russell 2000 Index | | | (7 | ) | | | (1,193,500 | ) | | | 1,705.00 | | 11/18/22 | | | (108,045 | ) |
| | | | | | | | | | | | | | | | | | |
| Total Written Options | | | | | | $ | (1,261,500 | ) | | | | | | | $ | (114,419 | ) |
(A) All or a portion of these securities has been segregated as collateral for options contracts. The aggregate market value of collateral at October 31, 2022 was $1,377,516.
|
|
| Schedule of Investments | October 31, 2022 |
| Global X Russell 2000 Covered Call & Growth ETF |
The following is a summary of the level of inputs used as of October 31, 2022, in valuing the Fund's investments and other financial instruments carried at value:
| Investments in Securities | | Level 1 | | | Level 2 | | | Level 3 | | | Total | |
| Exchange Traded Fund | | | 2,769,770 | | | | — | | | | — | | | | 2,769,770 | |
| Total Investments in Securities | | $ | 2,769,770 | | | $ | — | | | $ | — | | | $ | 2,769,770 | |
| Other Financial Instruments | | Level 1 | | | Level 2 | | | Level 3 | | | Total | |
| Written Options | | $ | (114,419 | ) | | $ | – | | | $ | – | | | $ | (114,419 | ) |
| Total Other Financial Instruments | | $ | (114,419 | ) | | $ | – | | | $ | – | | | $ | (114,419 | ) |
Amounts designated as “—“ are $0 or have been rounded to $0.
See "Glossary" for abbreviations.
|
|
|
| Schedule of Investments | | October 31, 2022 |
| Global X SuperIncome™ Preferred ETF |

| | | | |
| |
| | | Shares | | | Value | |
| PREFERRED STOCK — 99.4% | | | | | | |
| UNITED STATES— 99.4% | | | | | | |
| Communication Services — 4.5% | | | | | | |
| Paramount Global, 5.750% * | | | 76,247 | | | $ | 2,214,975 | |
| Telephone and Data Systems, 6.625% | | | 133,550 | | | | 2,683,020 | |
| Telephone and Data Systems, 6.000% | | | 219,218 | | | | 3,880,159 | |
| | | | | | | | 8,778,154 | |
| Consumer Discretionary — 2.3% | | | | | | | | |
| Qurate Retail, 8.000% | | | 94,327 | | | | 4,548,448 | |
| Energy — 7.5% | | | | | | | | |
| Crestwood Equity Partners, 9.250% | | | 528,118 | | | | 4,874,529 | |
| Energy Transfer, 7.625%, ICE LIBOR USD 3 | | | | | | | | |
| Month + 4.738% (A) | | | 110,973 | | | | 2,536,843 | |
| Energy Transfer, 7.600%, ICE LIBOR USD 3 | | | | | | | | |
| Month + 5.161% (A) (B) | | | 202,342 | | | | 4,659,936 | |
| Energy Transfer, 7.375%, ICE LIBOR USD 3 | | | | | | | | |
| Month + 4.530% (A) (B) | | | 109,459 | | | | 2,451,882 | |
| | | | | | | | 14,523,190 | |
| Financials — 71.9% | | | | | | | | |
| AGNC Investment, 9.190%, ICE LIBOR USD | | | | | | | | |
| 3 Month + 5.111% ‡,(A) | | | 96,620 | | | | 2,280,232 | |
| AGNC Investment, 6.500%, ICE LIBOR USD | | | | | | | | |
| 3 Month + 4.993% ‡,(A) | | | 123,658 | | | | 2,423,697 | |
|
|
|
| Schedule of Investments | | October 31, 2022 |
| Global X SuperIncome™ Preferred ETF |
| | | | |
| |
| | | Shares | | | Value | |
| PREFERRED STOCK — continued | | | | | | |
| Financials — continued | | | | | | |
| AGNC Investment, 6.125%, ICE LIBOR USD | | | | | | |
| 3 Month + 4.697% ‡,(A) | | | 174,517 | | | $ | 3,246,016 | |
| Allstate, 5.625% | | | 170,263 | | | | 3,698,112 | |
| American International Group, 5.850% | | | 151,121 | | | | 3,324,662 | |
| Annaly Capital Management, 8.667%, ICE | | | | | | | | |
| LIBOR USD 3 Month + 4.993% ‡,(A) | | | 198,194 | | | | 4,774,493 | |
| Annaly Capital Management, 6.750%, ICE | | | | | | | | |
| LIBOR USD 3 Month + 4.989% ‡,(A) | | | 122,475 | | | | 2,549,929 | |
| Annaly Capital Management, 6.500%, ICE | | | | | | | | |
| LIBOR USD 3 Month + 4.172% ‡,(A) | | | 118,551 | | | | 2,423,182 | |
| Athene Holding, 6.350%, ICE LIBOR USD 3 | | | | | | | | |
| Month + 4.253% (A) | | | 258,293 | | | | 6,149,956 | |
| Athene Holding, 4.875% | | | 175,724 | | | | 3,024,210 | |
| Bank of America, 6.000% | | | 249,339 | | | | 5,934,268 | |
| Bank of America, 5.875% | | | 160,708 | | | | 3,726,819 | |
| Brighthouse Financial, 5.375% | | | 173,148 | | | | 3,109,738 | |
| Capital One Financial, 5.000% | | | 232,308 | | | | 4,304,667 | |
| Capital One Financial, 4.800% | | | 192,295 | | | | 3,345,933 | |
| Capital One Financial, 4.375% | | | 104,455 | | | | 1,660,835 | |
| Charles Schwab, 5.950% | | | 222,457 | | | | 5,123,185 | |
| Citigroup, Ser J, 7.125%, ICE LIBOR USD 3 | | | | | | | | |
| Month + 4.040% (A) | | | 75,101 | | | | 1,874,521 | |
| Citigroup, 6.875%, ICE LIBOR USD 3 Month | | | | | | | | |
| + 4.130% (A) (C) | | | 118,920 | | | | 3,001,541 | |
| Citigroup Capital XIII, 10.785%, ICE LIBOR | | | | | | | | |
| USD 3 Month + 6.370% (A) | | | 175,602 | | | | 4,820,275 | |
| Citizens Financial Group, 5.000% | | | 135,918 | | | | 2,620,499 | |
| Fifth Third Bancorp, 6.625%, ICE LIBOR | | | | | | | | |
| USD 3 Month + 3.710% (A) (C) | | | 135,912 | | | | 3,427,701 | |
| Goldman Sachs Group, 6.375%, ICE LIBOR | | | | | | | | |
| USD 3 Month + 3.550% (A) | | | 207,795 | | | | 5,142,926 | |
| JPMorgan Chase, 6.000% | | | 392,089 | | | | 9,566,972 | |
| KeyCorp, 6.200%, US Treas Yield Curve Rate | | | | | | | | |
| T Note Const Mat 5 Yr + 3.132% (A) | | | 176,459 | | | | 4,302,070 | |
| Morgan Stanley, Ser E, 7.125%, ICE LIBOR | | | | | | | | |
| USD 3 Month + 4.320% (A) | | | 125,223 | | | | 3,136,836 | |
| Morgan Stanley, Ser F, 6.875%, ICE LIBOR | | | | | | | | |
| USD 3 Month + 3.940% (A) | | | 121,762 | | | | 3,046,485 | |
| Morgan Stanley, 6.500% (C) | | | 143,740 | | | | 3,564,752 | |
|
|
|
| Schedule of Investments | | October 31, 2022 |
| Global X SuperIncome™ Preferred ETF |
| | | | |
| |
| | | Shares | | | Value | |
| PREFERRED STOCK — continued | | | | | | |
| Financials — continued | | | | | | |
| PacWest Bancorp, 7.750%, US Treas Yield | | | | | | |
| Curve Rate T Note Const Mat 5 Yr + | | | | | | |
| 4.820% (A) | | | 152,214 | | | $ | 3,777,951 | |
| Regions Financial, Ser B, 6.375%, ICE LIBOR | | | | | | | | |
| USD 3 Month + 3.536% (A) | | | 152,943 | | | | 3,777,692 | |
| Reinsurance Group of America, 7.663%, ICE | | | | | | | | |
| LIBOR USD 3 Month + 4.370% (A) | | | 74,590 | | | | 1,888,619 | |
| Rithm Capital, 7.000%, US Treas Yield Curve | | | | | | | | |
| Rate T Note Const Mat 5 Yr + 6.223% ‡,(A) | | | 144,896 | | | | 2,542,925 | |
| Signature Bank NY, 5.000% | | | 221,130 | | | | 3,896,311 | |
| State Street, 5.900%, ICE LIBOR USD 3 | | | | | | | | |
| Month + 3.108% (A) | | | 226,676 | | | | 5,524,094 | |
| Synchrony Financial, 5.625% | | | 223,351 | | | | 3,790,266 | |
| Wells Fargo, 6.625%, ICE LIBOR USD 3 | | | | | | | | |
| Month + 3.690% (A) | | | 102,066 | | | | 2,552,671 | |
| Wells Fargo, 5.850%, ICE LIBOR USD 3 | | | | | | | | |
| Month + 3.090% (A) | | | 203,836 | | | | 4,637,269 | |
| Wells Fargo, 4.700% | | | 141,489 | | | | 2,539,728 | |
| | | | | | | | 140,532,038 | |
| Health Care — 5.2% | | | | | | | | |
| Becton Dickinson, 6.000% * | | | 208,690 | | | | 10,171,551 | |
| Industrials — 2.5% | | | | | | | | |
| Clarivate, 5.250% | | | 106,591 | | | | 4,872,275 | |
| Utilities — 5.5% | | | | | | | | |
| Duke Energy, 5.750% | | | 298,553 | | | | 7,054,807 | |
| NiSource, 6.500%, US Treas Yield Curve Rate | | | | | | | | |
| T Note Const Mat 5 Yr + 3.632% (A) | | | 149,496 | | | | 3,694,046 | |
| | | | | | | | 10,748,853 | |
| TOTAL UNITED STATES | | | | | | | 194,174,509 | |
| TOTAL PREFERRED STOCK | | | | | | | | |
| (Cost $219,245,296) | | | | | | | 194,174,509 | |
| SHORT-TERM INVESTMENT(D)(E) — 0.6% | | | | | | | | |
| Fidelity Investments Money Market | | | | | | | | |
| Government Portfolio, Cl Institutional, | | | | | | | | |
| 2.910% | | | | | | | | |
| (Cost $1,086,479) | | | 1,086,479 | | | | 1,086,479 | |
|
|
|
| Schedule of Investments | | October 31, 2022 |
| Global X SuperIncome™ Preferred ETF |
| | | |
| |
| | | Face Amount | | Value | |
| REPURCHASE AGREEMENT(D) — 0.8% | | | |
| BNP Paribas | | | | | |
| 2.930%, dated 10/31/2022, to be repurchased | | | |
| on 11/01/2022, repurchase price $1,509,682 | | | |
| (collateralized by U.S. Treasury Obligations, | | | |
| ranging in par value $30,005 - $176,397, | | | |
| 2.500% - 2.750%, 03/31/2027 - 05/31/2029, | | | |
| with a total market value of $1,537,914) | | | |
| (Cost $1,509,559) | | $ | 1,509,559 | | $ | 1,509,559 | |
| TOTAL INVESTMENTS — 100.8% | | | | | | | |
| (Cost $221,841,334) | | | | | $ | 196,770,547 | |
Percentages are based on Net Assets of $195,159,250.
* Non-income producing security.
‡ Real Estate Investment Trust
(A) Variable or floating rate security. The rate shown is the effective interest rate as of period end. The rates on certain securities are not based on published reference rates and spreads and are either determined by the issuer or agent based on current market conditions; by using a formula based on the rates of underlying loans; or by adjusting periodically based on prevailing interest rates.
(B) This security or a partial position of this security is on loan at October 31, 2022.
(C) Security was purchased with cash collateral held from securities on loan.
(D) The rate reported on the Schedule of Investments is the 7-day effective yield as of October 31, 2022.
The following is a summary of the level of inputs used as of October 31, 2022, in valuing the Fund's investments carried at value:
| Investments in Securities | | Level 1 | | | Level 2 | | | Level 3 | | | Total | |
| Preferred Stock | | $ | 194,174,509 | | | $ | — | | | $ | — | | | $ | 194,174,509 | |
| Short-Term Investment | | | 1,086,479 | | | | — | | | | — | | | | 1,086,479 | |
| Repurchase Agreement | | | — | | | | 1,509,559 | | | | — | | | | 1,509,559 | |
| Total Investments in Securities | | $ | 195,260,988 | | | $ | 1,509,559 | | | $ | — | | | $ | 196,770,547 | |
Amounts designated as “—“ are $0 or have been rounded to $0.
See "Glossary" for abbreviations.
|
|
|
| Schedule of Investments | | October 31, 2022 |
| Global X Renewable Energy Producers ETF |
| | | | | | |
| | | Shares | | | Value | |
| COMMON STOCK — 95.1% | | | | | | |
| AUSTRIA — 4.9% | | | | | | |
| Utilities — 4.9% | | | | | | |
| Verbund | | | 56,658 | | | $ | 4,437,824 | |
| BRAZIL — 12.9% | | | | | | | | |
| Utilities — 12.9% | | | | | | | | |
| AES Brasil Energia . | | | 328,216 | | | | 619,246 | |
| Centrais Eletricas Brasileiras . | | | 740,695 | | | | 7,032,526 | |
| Engie Brasil Energia | | | 449,784 | | | | 3,447,580 | |
| Omega Energia * | | | 308,462 | | | | 631,944 | |
| TOTAL BRAZIL | | | | | | | 11,731,296 | |
| CANADA — 8.9% | | | | | | | | |
| Utilities — 8.9% | | | | | | | | |
| Boralex, Cl A | | | 56,629 | | | | 1,603,738 | |
| Innergex Renewable Energy . | | | 112,524 | | | | 1,237,389 | |
| Northland Power | | | 127,595 | | | | 3,707,977 | |
| TransAlta Renewables | | | 147,143 | | | | 1,578,169 | |
| TOTAL CANADA | | | | | | | 8,127,273 | |
|
|
|
| Schedule of Investments | | October 31, 2022 |
| Global X Renewable Energy Producers ETF |
| | | | |
| |
| | | Shares | | | Value | |
| COMMON STOCK — continued | | | | | | |
| CHINA — 3.8% | | | | | | |
| Utilities — 3.8% | | | | | | |
| China Datang Renewable Power, Cl H . | | | 1,347,000 | | | $ | 363,783 | |
| China Longyuan Power Group, Cl H | | | 1,841,400 | | | | 2,104,162 | |
| Xinyi Energy Holdings | | | 4,023,000 | | | | 1,024,988 | |
| TOTAL CHINA | | | | | | | 3,492,933 | |
| DENMARK — 5.0% | | | | | | | | |
| Utilities — 5.0% | | | | | | | | |
| Orsted . | | | 55,427 | | | | 4,572,467 | |
| FRANCE — 2.3% | | | | | | | | |
| Utilities — 2.3% | | | | | | | | |
| Neoen . | | | 59,277 | | | | 2,069,267 | |
| GERMANY — 4.8% | | | | | | | | |
| Energy — 3.0% | | | | | | | | |
| VERBIO Vereinigte BioEnergie | | | 34,952 | | | | 2,753,214 | |
| Utilities — 1.8% | | | | | | | | |
| Encavis . | | | 88,777 | | | | 1,653,946 | |
| TOTAL GERMANY | | | | | | | 4,407,160 | |
| GREECE — 1.3% | | | | | | | | |
| Utilities — 1.3% | | | | | | | | |
| Terna Energy . | | | 63,870 | | | | 1,188,027 | |
| HONG KONG — 0.4% | | | | | | | | |
| Utilities — 0.4% | | | | | | | | |
| Concord New Energy Group | | | 4,848,000 | | | | 370,555 | |
| INDIA — 1.2% | | | | | | | | |
| Utilities — 1.2% | | | | | | | | |
| Azure Power Global * (A) | | | 34,601 | | | | 200,340 | |
| ReNew Energy Global, Cl A * | | | 155,709 | | | | 904,669 | |
| TOTAL INDIA | | | | | | | 1,105,009 | |
|
|
|
| Schedule of Investments | | October 31, 2022 |
| Global X Renewable Energy Producers ETF |
| | | | |
| |
| | | Shares | | | Value | |
| COMMON STOCK — continued | | | | | | |
| ISRAEL — 2.3% | | | | | | |
| Utilities — 2.3% | | | | | | |
| Energix-Renewable Energies . | | | 283,748 | | | $ | 996,484 | |
| Enlight Renewable Energy * | | | 521,323 | | | | 1,061,310 | |
| TOTAL ISRAEL | | | | | | | 2,057,794 | |
| ITALY — 2.9% | | | | | | | | |
| Utilities — 2.9% | | | | | | | | |
| ERG | | | 82,871 | | | | 2,599,675 | |
| JAPAN — 1.9% | | | | | | | | |
| Utilities — 1.9% | | | | | | | | |
| RENOVA * | | | 43,538 | | | | 957,845 | |
| West Holdings . | | | 24,957 | | | | 748,030 | |
| TOTAL JAPAN | | | | | | | 1,705,875 | |
| NEW ZEALAND — 9.3% | | | | | | | | |
| Utilities — 9.3% | | | | | | | | |
| Contact Energy . | | | 430,369 | | | | 1,887,671 | |
| Mercury NZ | | | 761,814 | | | | 2,575,789 | |
| Meridian Energy . | | | 1,421,016 | | | | 4,028,628 | |
| TOTAL NEW ZEALAND | | | | | | | 8,492,088 | |
| PORTUGAL — 0.6% | | | | | | | | |
| Utilities — 0.6% | | | | | | | | |
| Greenvolt-Energias Renovaveis * | | | 75,339 | | | | 579,307 | |
| RUSSIA — 0.0% | | | | | | | | |
| Utilities — 0.0% | | | | | | | | |
| RusHydro PJSC (B)‡ | | | 271,804,543 | | | | 44 | |
| SOUTH AFRICA — 0.7% | | | | | | | | |
| Utilities — 0.7% | | | | | | | | |
| Scatec . | | | 86,191 | | | | 610,152 | |
| SPAIN — 9.0% | | | | | | | | |
| Utilities — 9.0% | | | | | | | | |
| Atlantica Sustainable Infrastructure | | | 62,902 | | | | 1,743,015 | |
|
|
|
| Schedule of Investments | | October 31, 2022 |
| Global X Renewable Energy Producers ETF |
| | | | |
| |
| | | Shares | | | Value | |
| COMMON STOCK — continued | | | | | | |
| Utilities — continued | | | | | | |
| EDP Renovaveis . | | | 254,906 | | | $ | 5,368,749 | |
| Solaria Energia y Medio Ambiente * | | | 68,885 | | | | 1,089,317 | |
| TOTAL SPAIN | | | | | | | 8,201,081 | |
| THAILAND — 7.7% | | | | | | | | |
| Utilities — 7.7% | | | | | | | | |
| Absolute Clean Energy NVDR (A) | | | 5,526,636 | | | | 397,871 | |
| BCPG NVDR (A) | | | 1,572,800 | | | | 394,646 | |
| Energy Absolute NVDR . | | | 2,056,345 | | | | 5,213,802 | |
| Gunkul Engineering NVDR | | | 4,840,380 | | | | 654,965 | |
| Super Energy NVDR | | | 15,954,998 | | | | 293,445 | |
| TOTAL THAILAND | | | | | | | 6,954,729 | |
| UNITED KINGDOM — 1.5% | | | | | | | | |
| Utilities — 1.5% | | | | | | | | |
| Drax Group . | | | 220,917 | | | | 1,325,171 | |
| UNITED STATES — 13.7% | | | | | | | | |
| Energy — 2.7% | | | | | | | | |
| Enviva | | | 36,756 | | | | 2,199,479 | |
| Gevo * (A) | | | 126,470 | | | | 284,558 | |
| | | | | | | | 2,484,037 | |
| Industrials — 2.9% | | | | | | | | |
| Sunrun * | | | 115,836 | | | | 2,607,468 | |
| Utilities — 8.1% | | | | | | | | |
| NextEra Energy Partners . | | | 46,258 | | | | 3,426,330 | |
| Ormat Technologies . | | | 30,913 | | | | 2,796,081 | |
| Sunnova Energy International * | | | 63,193 | | | | 1,171,598 | |
| | | | | | | | 7,394,009 | |
| TOTAL UNITED STATES | | | | | | | 12,485,514 | |
| TOTAL COMMON STOCK | | | | | | | | |
| (Cost $116,045,553) | | | | | | | 86,513,241 | |
|
|
|
| Schedule of Investments | | October 31, 2022 |
| Global X Renewable Energy Producers ETF |
| | | | |
| |
| | | Shares | | | Value | |
| MASTER LIMITED PARTNERSHIP — 4.8% | | | | | | |
| CANADA— 4.8% | | | | | | |
| Utilities — 4.8% | | | | | | |
| Brookfield Renewable Partners, Cl A (C) | | | | | | |
| (Cost $3,930,947) | | | 151,662 | | | $ | 4,395,146 | |
| | | Number of | | | | | |
| | | Rights | | | | | |
| RIGHT — 0.0% | | | | | | | | |
| Brazil — 0.0% | | | | | | | | |
| Omega Energia* | | | 41,123 | | | | 157 | |
| TOTAL RIGHT (Cost $–) | | | | | | | 157 | |
| | | Shares | | | | | |
| SHORT-TERM INVESTMENT(D)(E) — 0.3% | | | | | | | | |
| Fidelity Investments Money Market | | | | | | | | |
| Government Portfolio, Cl Institutional, | | | | | | | | |
2.910%
| | | | | | | | |
| (Cost $272,957) | | | 272,957 | | | | 272,957 | |
| | | | Face Amount
| | | | | |
| REPURCHASE AGREEMENT(D) — 0.4% | | | | | | | | |
| BNP Paribas | | | | | | | | |
| 2.930%, dated 10/31/2022, to be repurchased | | | | | | | | |
| on 11/01/2022, repurchase price $379,280 | | | | | | | | |
| (collateralized by U.S. Treasury Obligations, | | | | | | | | |
| ranging in par value $7,538 - $44,316, | | | | | | | | |
| 2.500% - 2.750%, 03/31/2027 - 05/31/2029, | | | | | | | | |
| with a total market value of $386,368) | | | | | | | | |
| (Cost $379,249) | | $ | 379,249 | | | | 379,249 | |
| TOTAL INVESTMENTS — 100.6% | | | | | | | | |
| (Cost $120,628,706) | | | | | | $ | 91,560,750 | |
Percentages are based on Net Assets of $90,969,526.
* Non-income producing security.
(A) This security or a partial position of this security is on loan at October 31, 2022.
(B) Level 3 security in accordance with fair value hierarchy.
(C) Security was purchased with cash collateral held from securities on loan.
(D) The rate reported on the Schedule of Investments is the 7-day effective yield as of October 31, 2022.
|
|
|
| Schedule of Investments | | October 31, 2022 |
| Global X Renewable Energy Producers ETF |
The following is a summary of the level of inputs used as of October 31, 2022, in valuing the Fund's investments carried at value:
| Investments in Securities | | Level 1 | | | Level 2 | | | Level 3(1)‡ | | | Total | |
| Common Stock | | $ | 86,513,197 | | | $ | — | | | $ | 44 | | | $ | 86,513,241 | |
| Master Limited Partnership | | | 4,395,146 | | | | — | | | | — | | | | 4,395,146 | |
| Right | | | 157 | | | | — | | | | — | | | | 157 | |
| Short-Term Investment | | | 272,957 | | | | — | | | | — | | | | 272,957 | |
| Repurchase Agreement | | | — | | | | 379,249 | | | | — | | | | 379,249 | |
| Total Investments in Securities | | $ | 91,181,457 | | | $ | 379,249 | | | $ | 44 | | | $ | 91,560,750 | |
(1) A reconciliation of Level 3 investments and disclosures of significant unobservable inputs are presented when the Fund has a significant amount of Level 3 investments at the end of the period in relation to Net Assets. Management has concluded that Level 3 investments are not material in relation to Net Assets.
‡ For the period ended October 31, 2022, there were no significant changes into/out of Level 3. The transfer into Level 3 investments for the Fund were immaterial, although the unrealized appreciation/(depreciation) on these investments was $ (2,923,498). These securities were impacted by the invasion of Ukraine and sanctions on market conditions in Russia. From the start of the conflict in Ukraine until October 31, 2022, Russian-held investments were valued at were valued at discount from their last traded prices.
Amounts designated as “—“ are $0 or have been rounded to $0.
See "Glossary" for abbreviations.
|
|
|
| Schedule of Investments | | October 31, 2022 |
| Global X S&P 500® Catholic Values ETF |

| | | | |
| |
| | | Shares | | | Value | |
| COMMON STOCK — 99.9% | | | | | | |
| CHINA — 0.1% | | | | | | |
| Information Technology — 0.1% | | | | | | |
| NXP Semiconductors . | | | 4,559 | | | $ | 665,979 | |
| SWITZERLAND — 0.1% | | | | | | | | |
| Information Technology — 0.1% | | | | | | | | |
| TE Connectivity | | | 5,637 | | | | 689,011 | |
| UNITED KINGDOM — 0.5% | | | | | | | | |
| Materials — 0.5% | | | | | | | | |
| Linde | | | 8,586 | | | | 2,553,047 | |
| UNITED STATES — 99.2% | | | | | | | | |
| Communication Services — 7.4% | | | | | | | | |
| Activision Blizzard . | | | 11,565 | | | | 841,932 | |
| Alphabet, Cl A * | | | 102,115 | | | | 9,650,889 | |
| Alphabet, Cl C * | | | 91,300 | | | | 8,642,458 | |
| AT&T | | | 120,787 | | | | 2,201,947 | |
| Charter Communications, Cl A * | | | 1,775 | | | | 652,525 | |
| Comcast, Cl A | | | 74,194 | | | | 2,354,918 | |
| DISH Network, Cl A * | | | 4,627 | | | | 68,989 | |
|
|
|
| Schedule of Investments | | October 31, 2022 |
| Global X S&P 500® Catholic Values ETF |
| | | | |
| |
| | | Shares | | | Value | |
| COMMON STOCK — continued | | | | | | |
| Communication Services — continued | | | | | | |
| Electronic Arts | | | 4,817 | | | $ | 606,749 | |
| Fox, Cl A | | | 4,330 | | | | 125,007 | |
| Fox, Cl B | | | 2,850 | | | | 77,520 | |
| Interpublic Group | | | 7,276 | | | | 216,752 | |
| Lumen Technologies . | | | 18,023 | | | | 132,649 | |
| Match Group * | | | 4,503 | | | | 194,530 | |
| Meta Platforms, Cl A * | | | 38,670 | | | | 3,602,497 | |
| Netflix * | | | 7,478 | | | | 2,182,679 | |
| News, Cl A . | | | 7,173 | | | | 121,008 | |
| News, Cl B . | | | 2,245 | | | | 38,457 | |
| Omnicom Group . | | | 3,549 | | | | 258,190 | |
| Paramount Global, Cl B | | | 10,186 | | | | 186,608 | |
| Take-Two Interactive Software * | | | 2,911 | | | | 344,895 | |
| T-Mobile US * | | | 10,108 | | | | 1,531,968 | |
| Verizon Communications | | | 70,583 | | | | 2,637,687 | |
| Walt Disney * | | | 30,926 | | | | 3,294,856 | |
| Warner Bros Discovery * | | | 37,742 | | | | 490,646 | |
| | | | | | | | 40,456,356 | |
| Consumer Discretionary — 11.0% | | | | | | | | |
| Advance Auto Parts | | | 910 | | | | 172,827 | |
| Amazon.com * | | | 152,308 | | | | 15,602,432 | |
| Aptiv * | | | 4,922 | | | | 448,247 | |
| AutoZone * | | | 338 | | | | 856,113 | |
| Bath & Body Works . | | | 4,464 | | | | 149,008 | |
| Best Buy | | | 3,395 | | | | 232,252 | |
| Booking Holdings * | | | 720 | | | | 1,346,026 | |
| BorgWarner . | | | 4,015 | | | | 150,683 | |
| CarMax * | | | 2,723 | | | | 171,576 | |
| Carnival * | | | 13,662 | | | | 123,778 | |
| Chipotle Mexican Grill, Cl A * | | | 499 | | | | 747,667 | |
| Darden Restaurants . | | | 2,339 | | | | 334,804 | |
| Dollar General . | | | 4,093 | | | | 1,043,920 | |
| Dollar Tree * | | | 3,890 | | | | 616,565 | |
| Domino's Pizza . | | | 581 | | | | 193,031 | |
| DR Horton | | | 5,624 | | | | 432,373 | |
| eBay | | | 8,362 | | | | 333,142 | |
| Etsy * | | | 2,271 | | | | 213,270 | |
| Expedia Group * | | | 2,457 | | | | 229,656 | |
| Ford Motor . | | | 67,984 | | | | 908,946 | |
|
|
|
| Schedule of Investments | | October 31, 2022 |
| Global X S&P 500® Catholic Values ETF |
| | | | |
| |
| | | Shares | | | Value | |
| COMMON STOCK — continued | | | | | | |
| Consumer Discretionary — continued | | | | | | |
| Garmin | | | 2,566 | | | $ | 225,911 | |
| General Motors | | | 25,270 | | | | 991,847 | |
| Genuine Parts . | | | 2,699 | | | | 480,044 | |
| Hasbro . | | | 2,280 | | | | 148,770 | |
| Hilton Worldwide Holdings . | | | 4,787 | | | | 647,490 | |
| Home Depot . | | | 17,545 | | | | 5,195,601 | |
| Las Vegas Sands * | | | 6,206 | | | | 235,890 | |
| Lennar, Cl A . | | | 4,703 | | | | 379,532 | |
| LKQ | | | 4,548 | | | | 253,051 | |
| Lowe's | | | 11,019 | | | | 2,148,154 | |
| Marriott International, Cl A | | | 4,715 | | | | 754,919 | |
| McDonald's . | | | 12,501 | | | | 3,408,523 | |
| Mohawk Industries * | | | 952 | | | | 90,202 | |
| NIKE, Cl B | | | 21,281 | | | | 1,972,323 | |
| Norwegian Cruise Line Holdings * | | | 6,109 | | | | 103,181 | |
| NVR * | | | 50 | | | | 211,887 | |
| O'Reilly Automotive * | | | 1,045 | | | | 874,843 | |
| Pool . | | | 787 | | | | 239,429 | |
| PulteGroup . | | | 5,046 | | | | 201,790 | |
| Ralph Lauren, Cl A . | | | 1,057 | | | | 97,973 | |
| Ross Stores | | | 6,125 | | | | 586,101 | |
| Starbucks | | | 19,664 | | | | 1,702,706 | |
| Tapestry . | | | 5,211 | | | | 165,084 | |
| Target | | | 8,260 | | | | 1,356,705 | |
| Tesla * | | | 45,645 | | | | 10,386,063 | |
| TJX | | | 20,964 | | | | 1,511,504 | |
| Tractor Supply . | | | 2,000 | | | | 439,540 | |
| Ulta Beauty * | | | 843 | | | | 353,529 | |
| VF . | | | 5,081 | | | | 143,538 | |
| Whirlpool | | | 1,177 | | | | 162,708 | |
| Wynn Resorts * | | | 1,961 | | | | 125,308 | |
| Yum! Brands | | | 5,045 | | | | 596,571 | |
| | | | | | | | 60,497,033 | |
| Consumer Staples — 6.9% | | | | | | | | |
| Altria Group . | | | 44,332 | | | | 2,051,242 | |
| Archer-Daniels-Midland | | | 14,054 | | | | 1,362,957 | |
| Brown-Forman, Cl B | | | 3,958 | | | | 269,144 | |
| Campbell Soup . | | | 4,241 | | | | 224,391 | |
| Clorox | | | 2,799 | | | | 408,766 | |
|
|
|
| Schedule of Investments | | October 31, 2022 |
| Global X S&P 500® Catholic Values ETF |
| | | | |
| |
| | | Shares | | | Value | |
| COMMON STOCK — continued | | | | | | |
| Consumer Staples — continued | | | | | | |
| Coca-Cola . | | | 97,139 | | | $ | 5,813,769 | |
| Colgate-Palmolive | | | 20,386 | | | | 1,505,302 | |
| Conagra Brands . | | | 11,996 | | | | 440,253 | |
| Constellation Brands, Cl A | | | 3,879 | | | | 958,423 | |
| Costco Wholesale | | | 11,052 | | | | 5,542,578 | |
| Estee Lauder, Cl A . | | | 5,611 | | | | 1,124,949 | |
| General Mills | | | 14,446 | | | | 1,178,505 | |
| Hormel Foods | | | 8,064 | | | | 374,573 | |
| J M Smucker . | | | 2,657 | | | | 400,304 | |
| Kellogg | | | 6,388 | | | | 490,726 | |
| Keurig Dr Pepper | | | 20,242 | | | | 786,199 | |
| Kimberly-Clark | | | 8,138 | | | | 1,012,855 | |
| Kraft Heinz | | | 18,900 | | | | 727,083 | |
| Kroger | | | 15,777 | | | | 746,094 | |
| Lamb Weston Holdings . | | | 4,166 | | | | 359,193 | |
| McCormick . | | | 5,747 | | | | 451,944 | |
| Molson Coors Beverage, Cl B | | | 5,378 | | | | 271,213 | |
| Monster Beverage * | | | 9,640 | | | | 903,461 | |
| Procter & Gamble . | | | 59,761 | | | | 8,048,014 | |
| Sysco . | | | 12,308 | | | | 1,065,380 | |
| Tyson Foods, Cl A | | | 6,745 | | | | 461,021 | |
| Walgreens Boots Alliance | | | 16,843 | | | | 614,770 | |
| | | | | | | | 37,593,109 | |
| Energy — 5.3% | | | | | | | | |
| APA . | | | 7,028 | | | | 319,493 | |
| Baker Hughes, Cl A | | | 17,113 | | | | 473,346 | |
| Chevron . | | | 30,512 | | | | 5,519,621 | |
| ConocoPhillips . | | | 21,952 | | | | 2,767,928 | |
| Coterra Energy | | | 14,713 | | | | 458,016 | |
| Devon Energy | | | 10,595 | | | | 819,523 | |
| Diamondback Energy | | | 2,859 | | | | 449,177 | |
| EOG Resources | | | 10,050 | | | | 1,372,026 | |
| Exxon Mobil | | | 71,226 | | | | 7,892,553 | |
| Halliburton . | | | 16,172 | | | | 588,984 | |
| Hess | | | 4,844 | | | | 683,391 | |
| Kinder Morgan | | | 33,244 | | | | 602,381 | |
| Marathon Oil . | | | 10,088 | | | | 307,180 | |
| Marathon Petroleum | | | 8,538 | | | | 970,088 | |
| Occidental Petroleum . | | | 12,075 | | | | 876,645 | |
|
|
|
| Schedule of Investments | | October 31, 2022 |
| Global X S&P 500® Catholic Values ETF |
| | | | |
| |
| | | Shares | | | Value | |
| COMMON STOCK — continued | | | | | | |
| Energy — continued | | | | | | |
| ONEOK | | | 7,589 | | | $ | 450,179 | |
| Phillips 66 . | | | 8,151 | | | | 850,068 | |
| Pioneer Natural Resources | | | 3,889 | | | | 997,178 | |
| Schlumberger | | | 24,553 | | | | 1,277,493 | |
| Valero Energy . | | | 7,188 | | | | 902,453 | |
| Williams | | | 20,724 | | | | 678,297 | |
| | | | | | | | 29,256,020 | |
| Financials — 11.5% | | | | | | | | |
| Aflac | | | 10,455 | | | | 680,725 | |
| Allstate | | | 4,988 | | | | 629,735 | |
| American Express . | | | 10,412 | | | | 1,545,661 | |
| American International Group | | | 12,208 | | | | 695,856 | |
| Ameriprise Financial | | | 1,978 | | | | 611,439 | |
| Aon, Cl A . | | | 3,434 | | | | 966,637 | |
| Arthur J Gallagher | | | 3,504 | | | | 655,528 | |
| Assurant . | | | 1,097 | | | | 149,038 | |
| Bank of America | | | 118,383 | | | | 4,266,523 | |
| Bank of New York Mellon | | | 13,517 | | | | 569,201 | |
| Berkshire Hathaway, Cl B * | | | 30,549 | | | | 9,014,704 | |
| BlackRock, Cl A . | | | 2,497 | | | | 1,612,837 | |
| Brown & Brown . | | | 3,344 | | | | 196,594 | |
| Capital One Financial | | | 6,979 | | | | 739,914 | |
| Cboe Global Markets . | | | 2,127 | | | | 264,811 | |
| Charles Schwab . | | | 25,806 | | | | 2,055,964 | |
| Chubb . | | | 6,899 | | | | 1,482,526 | |
| Cincinnati Financial . | | | 2,722 | | | | 281,237 | |
| Citigroup | | | 33,211 | | | | 1,523,056 | |
| Citizens Financial Group . | | | 7,364 | | | | 301,188 | |
| CME Group, Cl A . | | | 6,117 | | | | 1,060,076 | |
| Comerica | | | 2,189 | | | | 154,325 | |
| Discover Financial Services | | | 5,041 | | | | 526,583 | |
| Everest Re Group | | | 833 | | | | 268,776 | |
| FactSet Research Systems . | | | 545 | | | | 231,892 | |
| Fifth Third Bancorp | | | 10,651 | | | | 380,134 | |
| First Republic Bank . | | | 3,131 | | | | 376,033 | |
| Franklin Resources | | | 5,403 | | | | 126,700 | |
| Globe Life . | | | 1,806 | | | | 208,629 | |
| Goldman Sachs Group | | | 5,810 | | | | 2,001,603 | |
| Hartford Financial Services Group . | | | 5,850 | | | | 423,599 | |
|
|
|
| Schedule of Investments | | October 31, 2022 |
| Global X S&P 500® Catholic Values ETF |
| | | | |
| |
| | | Shares | | | Value | |
| COMMON STOCK — continued | | | | | | |
| Financials — continued | | | | | | |
| Huntington Bancshares | | | 24,856 | | | $ | 377,314 | |
| Intercontinental Exchange . | | | 9,614 | | | | 918,810 | |
| Invesco | | | 5,562 | | | | 85,210 | |
| JPMorgan Chase . | | | 49,670 | | | | 6,252,460 | |
| KeyCorp | | | 16,051 | | | | 286,831 | |
| Lincoln National . | | | 2,896 | | | | 156,008 | |
| Loews . | | | 3,336 | | | | 190,219 | |
| M&T Bank . | | | 2,967 | | | | 499,554 | |
| MarketAxess Holdings . | | | 576 | | | | 140,567 | |
| Marsh & McLennan . | | | 8,632 | | | | 1,393,982 | |
| MetLife . | | | 10,800 | | | | 790,668 | |
| Moody's . | | | 2,720 | | | | 720,446 | |
| Morgan Stanley | | | 23,479 | | | | 1,929,269 | |
| MSCI, Cl A | | | 1,380 | | | | 647,027 | |
| Nasdaq . | | | 6,542 | | | | 407,174 | |
| Northern Trust . | | | 3,505 | | | | 295,647 | |
| PNC Financial Services Group | | | 7,260 | | | | 1,174,886 | |
| Principal Financial Group | | | 4,176 | | | | 368,031 | |
| Progressive | | | 10,055 | | | | 1,291,062 | |
| Prudential Financial . | | | 6,595 | | | | 693,728 | |
| Raymond James Financial . | | | 3,496 | | | | 413,017 | |
| Regions Financial . | | | 17,945 | | | | 393,893 | |
| S&P Global . | | | 5,703 | | | | 1,832,089 | |
| Signature Bank NY . | | | 930 | | | | 147,433 | |
| State Street . | | | 5,739 | | | | 424,686 | |
| SVB Financial Group * | | | 1,018 | | | | 235,117 | |
| Synchrony Financial | | | 9,556 | | | | 339,811 | |
| T Rowe Price Group | | | 3,829 | | | | 406,487 | |
| Travelers . | | | 4,260 | | | | 785,800 | |
| Truist Financial | | | 22,901 | | | | 1,025,736 | |
| US Bancorp . | | | 23,179 | | | | 983,949 | |
| W R Berkley | | | 3,423 | | | | 254,603 | |
| Wells Fargo . | | | 64,374 | | | | 2,960,560 | |
| Willis Towers Watson | | | 1,671 | | | | 364,629 | |
| Zions Bancorp . | | | 2,579 | | | | 133,953 | |
| | | | | | | | 63,322,180 | |
| Health Care — 15.2% | | | | | | | | |
| ABIOMED * | | | 2,353 | | | | 593,144 | |
| Align Technology * | | | 3,884 | | | | 754,661 | |
|
|
|
| Schedule of Investments | | October 31, 2022 |
| Global X S&P 500® Catholic Values ETF |
| | | | | | |
| | | Shares | | | Value | |
| COMMON STOCK — continued | | | | | | |
| Health Care — continued | | | | | | |
| AmerisourceBergen, Cl A . | | | 8,483 | | | $ | 1,333,697 | |
| Baxter International | | | 27,542 | | | | 1,496,908 | |
| Boston Scientific * | | | 79,064 | | | | 3,408,449 | |
| Cardinal Health | | | 15,333 | | | | 1,163,775 | |
| Cigna . | | | 16,915 | | | | 5,464,560 | |
| CVS Health . | | | 73,370 | | | | 6,948,139 | |
| DaVita * | | | 3,261 | | | | 238,086 | |
| DENTSPLY SIRONA . | | | 12,646 | | | | 389,750 | |
| Dexcom * | | | 21,467 | | | | 2,592,784 | |
| Edwards Lifesciences * | | | 34,444 | | | | 2,494,779 | |
| Elevance Health | | | 13,313 | | | | 7,279,149 | |
| Gilead Sciences | | | 69,801 | | | | 5,476,586 | |
| Henry Schein * | | | 8,020 | | | | 549,049 | |
| Hologic * | | | 13,580 | | | | 920,724 | |
| Humana | | | 7,001 | | | | 3,907,118 | |
| IDEXX Laboratories * | | | 4,566 | | | | 1,642,299 | |
| Incyte * | | | 9,790 | | | | 727,789 | |
| Intuitive Surgical * | | | 19,949 | | | | 4,916,830 | |
| IQVIA Holdings * | | | 10,389 | | | | 2,178,262 | |
| Laboratory Corp of America Holdings | | | 4,954 | | | | 1,099,094 | |
| McKesson | | | 8,017 | | | | 3,121,579 | |
| Medtronic | | | 73,378 | | | | 6,408,835 | |
| Mettler-Toledo International * | | | 1,226 | | | | 1,550,804 | |
| Molina Healthcare * | | | 3,309 | | | | 1,187,468 | |
| Quest Diagnostics . | | | 6,617 | | | | 950,532 | |
| ResMed | | | 7,967 | | | | 1,782,138 | |
| STERIS | | | 5,425 | | | | 936,246 | |
| Stryker . | | | 18,696 | | | | 4,285,871 | |
| Teleflex | | | 2,456 | | | | 526,959 | |
| Waters * | | | 3,281 | | | | 981,577 | |
| West Pharmaceutical Services | | | 3,997 | | | | 919,710 | |
| Zimmer Biomet Holdings . | | | 11,302 | | | | 1,281,082 | |
| Zoetis, Cl A . | | | 26,189 | | | | 3,948,777 | |
| | | | | | | | 83,457,210 | |
| Industrials — 8.0% | | | | | | | | |
| 3M | | | 13,444 | | | | 1,691,121 | |
| A O Smith . | | | 3,002 | | | | 164,449 | |
| Alaska Air Group * | | | 3,288 | | | | 146,184 | |
| Allegion . | | | 2,048 | | | | 214,569 | |
|
|
|
| Schedule of Investments | | October 31, 2022 |
| Global X S&P 500® Catholic Values ETF |
| | | | |
| |
| | | Shares | | | Value | |
| COMMON STOCK — continued | | | | | | |
| Industrials — continued | | | | | | |
| American Airlines Group * | | | 14,581 | | | $ | 206,758 | |
| AMETEK | | | 5,359 | | | | 694,848 | |
| Carrier Global | | | 20,209 | | | | 803,510 | |
| Caterpillar . | | | 12,848 | | | | 2,781,078 | |
| CH Robinson Worldwide | | | 3,010 | | | | 294,137 | |
| Cintas | | | 2,125 | | | | 908,544 | |
| Copart * | | | 4,997 | | | | 574,755 | |
| CSX | | | 51,931 | | | | 1,509,115 | |
| Cummins | | | 3,317 | | | | 811,040 | |
| Deere . | | | 6,658 | | | | 2,635,369 | |
| Delta Air Lines * | | | 14,673 | | | | 497,855 | |
| Dover | | | 3,307 | | | | 432,192 | |
| Eaton | | | 9,214 | | | | 1,382,745 | |
| Emerson Electric | | | 13,812 | | | | 1,196,119 | |
| Equifax . | | | 2,822 | | | | 478,442 | |
| Expeditors International of Washington . | | | 3,790 | | | | 370,851 | |
| Fastenal | | | 13,127 | | | | 634,428 | |
| FedEx . | | | 5,695 | | | | 912,795 | |
| Fortive . | | | 8,181 | | | | 522,766 | |
| Fortune Brands Home & Security . | | | 3,141 | | | | 189,465 | |
| Generac Holdings * | | | 1,408 | | | | 163,201 | |
| Howmet Aerospace . | | | 8,712 | | | | 309,712 | |
| IDEX . | | | 1,686 | | | | 374,815 | |
| Illinois Tool Works | | | 6,661 | | | | 1,422,323 | |
| Ingersoll Rand . | | | 9,232 | | | | 466,216 | |
| JB Hunt Transport Services | | | 1,947 | | | | 333,073 | |
| Johnson Controls International | | | 16,373 | | | | 947,014 | |
| Masco . | | | 6,110 | | | | 282,710 | |
| Nordson . | | | 1,111 | | | | 249,975 | |
| Norfolk Southern . | | | 5,714 | | | | 1,303,192 | |
| Old Dominion Freight Line | | | 2,167 | | | | 595,058 | |
| Otis Worldwide | | | 10,173 | | | | 718,621 | |
| PACCAR | | | 7,966 | | | | 771,348 | |
| Parker-Hannifin | | | 3,029 | | | | 880,288 | |
| Pentair | | | 3,687 | | | | 158,357 | |
| Quanta Services . | | | 3,185 | | | | 452,397 | |
| Republic Services, Cl A | | | 4,780 | | | | 633,924 | |
| Robert Half International | | | 2,476 | | | | 189,315 | |
| Rockwell Automation | | | 2,622 | | | | 669,397 | |
|
|
|
| Schedule of Investments | | October 31, 2022 |
| Global X S&P 500® Catholic Values ETF |
| | | | |
| |
| | | Shares | | | Value | |
| COMMON STOCK — continued | | | | | | |
| Industrials — continued | | | | | | |
| Rollins . | | | 5,722 | | | $ | 240,782 | |
| Snap-On . | | | 1,200 | | | | 266,460 | |
| Southwest Airlines * | | | 13,962 | | | | 507,519 | |
| Stanley Black & Decker . | | | 3,701 | | | | 290,491 | |
| Trane Technologies . | | | 5,510 | | | | 879,561 | |
| TransDigm Group * | | | 1,317 | | | | 758,276 | |
| Union Pacific | | | 14,619 | | | | 2,881,990 | |
| United Airlines Holdings * | | | 7,253 | | | | 312,459 | |
| United Parcel Service, Cl B . | | | 17,391 | | | | 2,917,688 | |
| United Rentals * | | | 1,603 | | | | 506,083 | |
| Verisk Analytics, Cl A . | | | 3,672 | | | | 671,352 | |
| Waste Management . | | | 8,984 | | | | 1,422,796 | |
| Westinghouse Air Brake Technologies | | | 4,320 | | | | 402,970 | |
| WW Grainger . | | | 1,012 | | | | 591,362 | |
| Xylem . | | | 4,175 | | | | 427,645 | |
| | | | | | | | 44,051,505 | |
| Information Technology — 26.3% | | | | | | | | |
| Accenture, Cl A | | | 10,674 | | | | 3,030,349 | |
| Adobe * | | | 8,092 | | | | 2,577,302 | |
| Advanced Micro Devices * | | | 27,773 | | | | 1,668,046 | |
| Akamai Technologies * | | | 2,979 | | | | 263,135 | |
| Amphenol, Cl A . | | | 10,259 | | | | 777,940 | |
| Analog Devices | | | 8,561 | | | | 1,220,970 | |
| ANSYS * | | | 1,482 | | | | 327,759 | |
| Apple . | | | 257,390 | | | | 39,468,183 | |
| Applied Materials . | | | 15,146 | | | | 1,337,240 | |
| Arista Networks * | | | 4,076 | | | | 492,625 | |
| Autodesk * | | | 3,742 | | | | 801,911 | |
| Automatic Data Processing | | | 7,244 | | | | 1,750,875 | |
| Broadcom | | | 6,968 | | | | 3,275,796 | |
| Broadridge Financial Solutions . | | | 1,996 | | | | 299,520 | |
| Cadence Design Systems * | | | 4,724 | | | | 715,166 | |
| CDW | | | 2,328 | | | | 402,302 | |
| Ceridian HCM Holding * | | | 1,949 | | | | 129,004 | |
| Cisco Systems | | | 71,366 | | | | 3,242,157 | |
| Cognizant Technology Solutions, Cl A | | | 9,013 | | | | 561,059 | |
| DXC Technology * | | | 4,796 | | | | 137,885 | |
| Enphase Energy * | | | 2,272 | | | | 697,504 | |
| EPAM Systems * | | | 853 | | | | 298,550 | |
|
|
|
| Schedule of Investments | | October 31, 2022 |
| Global X S&P 500® Catholic Values ETF |
| | | | | | |
| | | Shares | | | Value | |
| COMMON STOCK — continued | | | | | | |
| Information Technology — continued | | | | | | |
F5 *
| | | 1,183 | | | $ | 169,063 | |
| Fidelity National Information Services . | | | 10,605 | | | | 880,109 | |
| Fiserv * | | | 10,486 | | | | 1,077,332 | |
| FleetCor Technologies * | | | 1,501 | | | | 279,366 | |
| Fortinet * | | | 11,580 | | | | 661,913 | |
| Gartner * | | | 1,384 | | | | 417,857 | |
| Global Payments | | | 4,980 | | | | 569,015 | |
| Hewlett Packard Enterprise | | | 24,387 | | | | 348,002 | |
| HP | | | 16,117 | | | | 445,152 | |
| Intel . | | | 68,966 | | | | 1,960,703 | |
| International Business Machines . | | | 15,420 | | | | 2,132,432 | |
| Intuit . | | | 4,711 | | | | 2,013,952 | |
| Jack Henry & Associates . | | | 1,216 | | | | 242,057 | |
| Juniper Networks . | | | 6,532 | | | | 199,879 | |
| Keysight Technologies * | | | 3,178 | | | | 553,449 | |
| KLA | | | 2,583 | | | | 817,390 | |
| Lam Research | | | 2,438 | | | | 986,854 | |
| Mastercard, Cl A . | | | 14,554 | | | | 4,776,332 | |
| Microchip Technology | | | 9,362 | | | | 578,010 | |
| Micron Technology . | | | 19,354 | | | | 1,047,051 | |
| Microsoft | | | 127,023 | | | | 29,485,849 | |
| Monolithic Power Systems . | | | 781 | | | | 265,110 | |
| Motorola Solutions | | | 2,821 | | | | 704,432 | |
| NetApp . | | | 3,732 | | | | 258,516 | |
| NortonLifeLock | | | 9,738 | | | | 219,397 | |
| NVIDIA . | | | 42,645 | | | | 5,755,796 | |
| ON Semiconductor * | | | 6,687 | | | | 410,782 | |
| Oracle . | | | 25,350 | | | | 1,979,075 | |
| Paychex | | | 5,498 | | | | 650,468 | |
| Paycom Software * | | | 903 | | | | 312,438 | |
| PayPal Holdings * | | | 19,922 | | | | 1,665,081 | |
| PTC * | | | 1,817 | | | | 214,097 | |
| Qorvo * | | | 1,924 | | | | 165,618 | |
| QUALCOMM . | | | 18,892 | | | | 2,222,833 | |
| Roper Technologies | | | 1,703 | | | | 705,962 | |
| Salesforce * | | | 16,766 | | | | 2,725,984 | |
| Seagate Technology Holdings . | | | 3,500 | | | | 173,810 | |
| ServiceNow * | | | 3,427 | | | | 1,441,876 | |
| Skyworks Solutions | | | 2,743 | | | | 235,925 | |
|
|
|
| Schedule of Investments | | October 31, 2022 |
| Global X S&P 500® Catholic Values ETF |
| | | | |
| |
| | | Shares | | | Value | |
| COMMON STOCK — continued | | | | | | |
| Information Technology — continued | | | | | | |
| SolarEdge Technologies * | | | 759 | | | $ | 174,593 | |
| Synopsys * | | | 2,577 | | | | 753,901 | |
| Teledyne Technologies * | | | 830 | | | | 330,323 | |
| Teradyne . | | | 2,832 | | | | 230,383 | |
| Texas Instruments . | | | 15,313 | | | | 2,459,727 | |
| Trimble * | | | 4,295 | | | | 258,387 | |
| Tyler Technologies * | | | 744 | | | | 240,558 | |
| VeriSign * | | | 1,580 | | | | 316,727 | |
| Visa, Cl A . | | | 27,691 | | | | 5,736,468 | |
| Western Digital * | | | 5,625 | | | | 193,331 | |
| Zebra Technologies, Cl A * | | | 939 | | | | 265,944 | |
| | | | | | | | 144,184,587 | |
| Materials — 2.2% | | | | | | | | |
| Air Products & Chemicals . | | | 3,749 | | | | 938,750 | |
| Albemarle | | | 2,114 | | | | 591,645 | |
| Amcor | | | 28,055 | | | | 324,877 | |
| Avery Dennison . | | | 1,486 | | | | 251,951 | |
| Ball | | | 5,565 | | | | 274,856 | |
| Celanese, Cl A . | | | 1,884 | | | | 181,090 | |
| CF Industries Holdings | | | 2,974 | | | | 316,017 | |
| Corteva . | | | 12,444 | | | | 813,091 | |
| Dow | | | 12,696 | | | | 593,411 | |
| DuPont de Nemours . | | | 8,941 | | | | 511,425 | |
| Eastman Chemical . | | | 2,549 | | | | 195,789 | |
| Ecolab | | | 4,304 | | | | 676,029 | |
| FMC . | | | 2,488 | | | | 295,823 | |
| Freeport-McMoRan . | | | 25,071 | | | | 794,500 | |
| International Flavors & Fragrances | | | 4,547 | | | | 443,833 | |
| International Paper . | | | 6,579 | | | | 221,120 | |
| LyondellBasell Industries, Cl A | | | 4,608 | | | | 352,282 | |
| Martin Marietta Materials | | | 1,062 | | | | 356,811 | |
| Mosaic . | | | 6,475 | | | | 348,031 | |
| Newmont | | | 13,650 | | | | 577,668 | |
| Nucor | | | 4,938 | | | | 648,755 | |
| Packaging Corp of America . | | | 1,649 | | | | 198,226 | |
| PPG Industries | | | 4,187 | | | | 478,072 | |
| Sealed Air | | | 2,710 | | | | 129,050 | |
| Sherwin-Williams . | | | 4,174 | | | | 939,275 | |
| Vulcan Materials | | | 2,437 | | | | 398,937 | |
|
|
|
| Schedule of Investments | | October 31, 2022 |
| Global X S&P 500® Catholic Values ETF |
| | | | |
| |
| | | Shares | | | Value | |
| COMMON STOCK — continued | | | | | | |
| Materials — continued | | | | | | |
| Westrock . | | | 4,772 | | | $ | 162,534 | |
| | | | | | | | 12,013,848 | |
| Real Estate — 2.5% | | | | | | | | |
| Alexandria Real Estate Equities ‡ | | | 2,428 | | | | 352,788 | |
| American Tower ‡ | | | 8,288 | | | | 1,717,191 | |
| AvalonBay Communities ‡ | | | 2,553 | | | | 447,081 | |
| Boston Properties ‡ | | | 2,753 | | | | 200,143 | |
| Camden Property Trust ‡ | | | 1,566 | | | | 180,951 | |
| CBRE Group, Cl A * | | | 5,920 | | | | 419,965 | |
| Crown Castle | | | 7,779 | | | | 1,036,630 | |
| Digital Realty Trust ‡ | | | 4,992 | | | | 500,448 | |
| Equinix . | | | 1,585 | | | | 897,807 | |
| Equity Residential ‡ | | | 5,980 | | | | 376,860 | |
| Essex Property Trust ‡ | | | 1,251 | | | | 278,022 | |
| Extra Space Storage ‡ | | | 2,347 | | | | 416,452 | |
| Federal Realty Investment Trust ‡ | | | 1,273 | | | | 126,002 | |
| Host Hotels & Resorts ‡ | | | 13,600 | | | | 256,768 | |
| Iron Mountain ‡ | | | 4,954 | | | | 248,047 | |
| Kimco Realty ‡ | | | 10,567 | | | | 225,922 | |
| Mid-America Apartment Communities ‡ | | | 2,069 | | | | 325,764 | |
| ProLogis ‡ | | | 16,459 | | | | 1,822,834 | |
| Public Storage ‡ | | | 2,744 | | | | 849,954 | |
| Realty Income ‡ | | | 10,568 | | | | 658,069 | |
| Regency Centers ‡ | | | 2,837 | | | | 171,667 | |
| SBA Communications, Cl A | | | 1,990 | | | | 537,101 | |
| Simon Property Group ‡ | | | 5,834 | | | | 635,789 | |
| UDR ‡ | | | 5,179 | | | | 205,917 | |
| Vornado Realty Trust ‡ | | | 3,062 | | | | 72,233 | |
| Welltower ‡ | | | 7,780 | | | | 474,891 | |
| Weyerhaeuser ‡ | | | 13,948 | | | | 431,412 | |
| | | | | | | | 13,866,708 | |
| Utilities — 2.9% | | | | | | | | |
| AES . | | | 12,252 | | | | 320,512 | |
| Alliant Energy . | | | 4,453 | | | | 232,313 | |
| Ameren . | | | 4,578 | | | | 373,199 | |
| American Electric Power | | | 8,475 | | | | 745,122 | |
| American Water Works | | | 3,129 | | | | 454,769 | |
| Atmos Energy | | | 2,162 | | | | 230,361 | |
|
|
|
| Schedule of Investments | | October 31, 2022 |
| Global X S&P 500® Catholic Values ETF |
| | | | |
| |
| | | Shares | | | Value | |
| COMMON STOCK — continued | | | | | | |
| Utilities — continued | | | | | | |
| CenterPoint Energy . | | | 9,888 | | | $ | 282,896 | |
| CMS Energy | | | 5,199 | | | | 296,603 | |
| Consolidated Edison | | | 5,943 | | | | 522,746 | |
| Constellation Energy . | | | 5,556 | | | | 525,264 | |
| Dominion Energy | | | 13,849 | | | | 969,015 | |
| DTE Energy . | | | 3,445 | | | | 386,219 | |
| Duke Energy | | | 13,334 | | | | 1,242,462 | |
| Edison International . | | | 6,450 | | | | 387,258 | |
| Entergy | | | 3,512 | | | | 376,276 | |
| Evergy | | | 4,325 | | | | 264,387 | |
| Eversource Energy . | | | 5,959 | | | | 454,552 | |
| Exelon | | | 16,639 | | | | 642,099 | |
| FirstEnergy | | | 9,506 | | | | 358,471 | |
| NextEra Energy . | | | 33,772 | | | | 2,617,330 | |
| NiSource . | | | 6,409 | | | | 164,647 | |
| NRG Energy | | | 4,848 | | | | 215,251 | |
| Pinnacle West Capital | | | 2,114 | | | | 142,082 | |
| PPL | | | 13,302 | | | | 352,370 | |
| Public Service Enterprise Group . | | | 8,514 | | | | 477,380 | |
| Sempra Energy . | | | 5,487 | | | | 828,208 | |
| Southern | | | 18,158 | | | | 1,188,986 | |
| WEC Energy Group . | | | 5,394 | | | | 492,634 | |
| Xcel Energy | | | 9,620 | | | | 626,358 | |
| | | | | | | | 16,169,770 | |
| TOTAL UNITED STATES | | | | | | | 544,868,326 | |
| TOTAL COMMON STOCK | | | | | | | | |
| (Cost $508,572,240) | | | | | | | 548,776,363 | |
| TOTAL INVESTMENTS — 99.9% | | | | | | | | |
| (Cost $508,572,240) | | | | | | $ | 548,776,363 | |
Percentages are based on Net Assets of $549,287,646.
* Non-income producing security.
‡ Real Estate Investment Trust
|
|
|
| Schedule of Investments | | October 31, 2022 |
| Global X S&P 500® Catholic Values ETF |
As of October 31, 2022, all of the Fund's investments were considered Level 1, in accordance with authoritative guidance on fair value measurements and disclosure under U.S. GAAP.
See "Glossary" for abbreviations.
|
|
| Schedule of Investments | October 31, 2022 |
| Global X S&P Catholic Values Developed ex-US ETF |
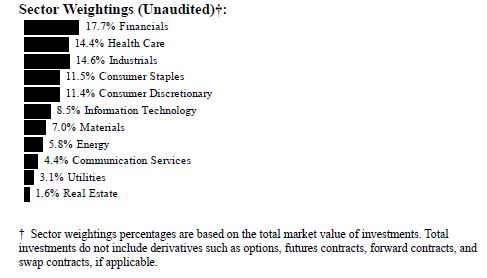
| | | | |
| |
| | | Shares | | | Value | |
| COMMON STOCK — 99.4% | | | | | | |
| AUSTRALIA — 9.4% | | | | | | |
| Communication Services — 0.1% | | | | | | |
| REA Group | | | 24 | | | $ | 1,866 | |
| Telstra Group | | | 2,185 | | | | 5,477 | |
| TPG Telecom | | | 281 | | | | 881 | |
| | | | | | | | 8,224 | |
| Consumer Discretionary — 0.6% | | | | | | | | |
| Aristocrat Leisure . | | | 360 | | | | 8,534 | |
| Flutter Entertainment * | | | 78 | | | | 10,322 | |
| Wesfarmers | | | 598 | | | | 17,384 | |
| | | | | | | | 36,240 | |
| Consumer Staples — 0.7% | | | | | | | | |
| Coles Group . | | | 1,258 | | | | 13,137 | |
| Woolworths Group | | | 1,117 | | | | 23,585 | |
| | | | | | | | 36,722 | |
| Energy — 0.5% | | | | | | | | |
| Santos . | | | 1,596 | | | | 7,858 | |
| Woodside Energy Group | | | 917 | | | | 21,098 | |
| | | | | | | | 28,956 | |
|
|
| Schedule of Investments | October 31, 2022 |
| Global X S&P Catholic Values Developed ex-US ETF |
| | | | |
| |
| | | Shares | | | Value | |
| COMMON STOCK — continued | | | | | | |
| Financials — 3.2% | | | | | | |
| ASX | | | 98 | | | $ | 4,242 | |
| Australia & New Zealand Banking Group | | | 1,468 | | | | 23,994 | |
| Commonwealth Bank of Australia | | | 838 | | | | 56,094 | |
| Insurance Australia Group . | | | 1,247 | | | | 3,907 | |
| Macquarie Group . | | | 178 | | | | 19,293 | |
| National Australia Bank | | | 1,539 | | | | 31,905 | |
| QBE Insurance Group . | | | 767 | | | | 6,003 | |
| Suncorp Group | | | 654 | | | | 4,772 | |
| Westpac Banking . | | | 1,762 | | | | 27,165 | |
| | | | | | | | 177,375 | |
| Health Care — 0.7% | | | | | | | | |
| Cochlear | | | 142 | | | | 18,134 | |
| Sonic Healthcare | | | 1,038 | | | | 21,751 | |
| | | | | | | | 39,885 | |
| Industrials — 0.4% | | | | | | | | |
| Brambles | | | 861 | | | | 6,431 | |
| Reece . | | | 139 | | | | 1,380 | |
| Transurban Group . | | | 1,720 | | | | 14,584 | |
| | | | | | | | 22,395 | |
| Materials — 2.8% | | | | | | | | |
| BHP Group | | | 2,538 | | | | 60,633 | |
| Fortescue Metals Group | | | 906 | | | | 8,516 | |
| Glencore | | | 6,033 | | | | 34,695 | |
| Newcrest Mining . | | | 446 | | | | 4,948 | |
| Rio Tinto . | | | 193 | | | | 10,885 | |
| Rio Tinto . | | | 544 | | | | 28,417 | |
| South32 | | | 2,536 | | | | 5,838 | |
| | | | | | | | 153,932 | |
| Real Estate — 0.3% | | | | | | | | |
| Dexus ‡ | | | 560 | | | | 2,779 | |
| Goodman Group ‡ | | | 870 | | | | 9,457 | |
| Scentre Group ‡ | | | 2,686 | | | | 4,981 | |
| | | | | | | | 17,217 | |
|
|
| Schedule of Investments | October 31, 2022 |
| Global X S&P Catholic Values Developed ex-US ETF |
| | | | |
| |
| | | Shares
| | | Value | |
| COMMON STOCK — continued | | | | | | |
| Utilities — 0.1% | | | | | | |
| APA Group | | | 588 | | | $ | 3,952 | |
| TOTAL AUSTRALIA | | | | | | | 524,898 | |
| AUSTRIA — 0.3% | | | | | | | | |
| Communication Services — 0.0% | | | | | | | | |
| Telekom Austria, Cl A . | | | 74 | | | | 430 | |
| Energy — 0.1% | | | | | | | | |
| OMV | | | 74 | | | | 3,411 | |
| Financials — 0.1% | | | | | | | | |
| BAWAG Group | | | 36 | | | | 1,741 | |
| Erste Group Bank | | | 164 | | | | 4,046 | |
| Raiffeisen Bank International | | | 72 | | | | 1,001 | |
| | | | | | | | 6,788 | |
| Industrials — 0.1% | | | | | | | | |
| ANDRITZ | | | 46 | | | | 2,140 | |
| Information Technology — 0.0% | | | | | | | | |
| ams-OSRAM * | | | 145 | | | | 822 | |
| Materials — 0.0% | | | | | | | | |
| voestalpine . | | | 59 | | | | 1,282 | |
| Utilities — 0.0% | | | | | | | | |
| Verbund | | | 13 | | | | 1,018 | |
| TOTAL AUSTRIA | | | | | | | 15,891 | |
| BELGIUM — 1.6% | | | | | | | | |
| Consumer Staples — 0.8% | | | | | | | | |
| Anheuser-Busch InBev | | | 908 | | | | 45,409 | |
| Financials — 0.3% | | | | | | | | |
| Groupe Bruxelles Lambert | | | 46 | | | | 3,392 | |
| KBC Group | | | 169 | | | | 8,468 | |
| Sofina | | | 9 | | | | 1,757 | |
| | | | | | | | 13,617 | |
|
|
| Schedule of Investments | October 31, 2022 |
| Global X S&P Catholic Values Developed ex-US ETF |
| | | | |
| |
| | | Shares | | | Value | |
| COMMON STOCK — continued | | | | | | |
| Health Care — 0.4% | | | | | | |
| UCB | | | 273 | | | $ | 20,593 | |
| Materials — 0.1% | | | | | | | | |
| Solvay | | | 44 | | | | 3,968 | |
| Umicore . | | | 105 | | | | 3,461 | |
| | | | | | | | 7,429 | |
| TOTAL BELGIUM | | | | | | | 87,048 | |
| BRAZIL — 0.1% | | | | | | | | |
| Materials — 0.1% | | | | | | | | |
| Yara International | | | 78 | | | | 3,481 | |
| CHILE — 0.0% | | | | | | | | |
| Materials — 0.0% | | | | | | | | |
| Antofagasta . | | | 154 | | | | 2,084 | |
| CHINA — 0.9% | | | | | | | | |
| Consumer Discretionary — 0.5% | | | | | | | | |
| Prosus . | | | 632 | | | | 27,509 | |
| Consumer Staples — 0.2% | | | | | | | | |
| Budweiser Brewing APAC | | | 1,400 | | | | 2,946 | |
| Wilmar International . | | | 3,012 | | | | 8,259 | |
| | | | | | | | 11,205 | |
| Financials — 0.1% | | | | | | | | |
| BOC Hong Kong Holdings | | | 1,700 | | | | 5,284 | |
| Health Care — 0.0% | | | | | | | | |
| China Evergrande New Energy Vehicle Group | | | | | | | | |
*(A) | | | 5,700 | | | | 1,278 | |
| Utilities — 0.1% | | | | | | | | |
| ENN Energy Holdings | | | 400 | | | | 3,977 | |
| TOTAL CHINA | | | | | | | 49,253 | |
|
|
| Schedule of Investments | October 31, 2022 |
| Global X S&P Catholic Values Developed ex-US ETF |
| | | | |
| |
| | | Shares | | | Value | |
| COMMON STOCK — continued | | | | | | |
| DENMARK — 1.5% | | | | | | |
| Consumer Staples — 0.2% | | | | | | |
| Carlsberg, Cl B . | | | 93 | | | $ | 10,964 | |
| Health Care — 0.5% | | | | | | | | |
| Coloplast, Cl B . | | | 258 | | | | 28,771 | |
| Industrials — 0.7% | | | | | | | | |
| AP Moller - Maersk, Cl A . | | | 2 | | | | 4,004 | |
| AP Moller - Maersk, Cl B | | | 3 | | | | 6,276 | |
| DSV | | | 109 | | | | 14,760 | |
| Vestas Wind Systems | | | 566 | | | | 11,151 | |
| | | | | | | | 36,191 | |
| Utilities — 0.1% | | | | | | | | |
| Orsted . | | | 98 | | | | 8,085 | |
| TOTAL DENMARK | | | | | | | 84,011 | |
| FINLAND — 1.2% | | | | | | | | |
| Energy — 0.2% | | | | | | | | |
| Neste | | | 216 | | | | 9,466 | |
| Financials — 0.5% | | | | | | | | |
| Nordea Bank Abp | | | 1,570 | | | | 14,992 | |
| Sampo, Cl A . | | | 243 | | | | 11,115 | |
| | | | | | | | 26,107 | |
| Industrials — 0.2% | | | | | | | | |
| Kone, Cl B . | | | 227 | | | | 9,299 | |
| Information Technology — 0.2% | | | | | | | | |
| Nokia . | | | 2,724 | | | | 12,134 | |
| Materials — 0.1% | | | | | | | | |
| Stora Enso, Cl R . | | | 325 | | | | 4,237 | |
| Utilities — 0.0% | | | | | | | | |
| Fortum . | | | 227 | | | | 3,196 | |
| TOTAL FINLAND | | | | | | | 64,439 | |
|
|
| Schedule of Investments | October 31, 2022 |
| Global X S&P Catholic Values Developed ex-US ETF |
| | | | |
| |
| | | Shares | | | Value | |
| COMMON STOCK — continued | | | | | | |
| FRANCE — 9.2% | | | | | | |
| Communication Services — 0.0% | | | | | | |
| Adevinta, Cl B * | | | 146 | | | $ | 1,000 | |
| Consumer Discretionary — 2.3% | | | | | | | | |
| Christian Dior | | | 1 | | | | 619 | |
| Hermes International | | | 19 | | | | 24,609 | |
| Kering | | | 38 | | | | 17,415 | |
| LVMH Moet Hennessy Louis Vuitton | | | 138 | | | | 87,155 | |
| | | | | | | | 129,798 | |
| Consumer Staples — 2.4% | | | | | | | | |
| Danone | | | 581 | | | | 28,907 | |
| L'Oreal . | | | 232 | | | | 72,939 | |
| Pernod Ricard | | | 188 | | | | 33,018 | |
| | | | | | | | 134,864 | |
| Energy — 1.2% | | | | | | | | |
| TotalEnergies | | | 1,204 | | | | 65,568 | |
| Financials — 1.0% | | | | | | | | |
| AXA . | | | 971 | | | | 23,992 | |
| BNP Paribas . | | | 563 | | | | 26,428 | |
| Credit Agricole . | | | 697 | | | | 6,328 | |
| | | | | | | | 56,748 | |
| Health Care — 0.5% | | | | | | | | |
| EssilorLuxottica | | | 164 | | | | 25,991 | |
| Industrials — 0.7% | | | | | | | | |
| Cie de Saint-Gobain . | | | 297 | | | | 12,153 | |
| Vinci . | | | 306 | | | | 28,181 | |
| | | | | | | | 40,334 | |
| Information Technology — 0.2% | | | | | | | | |
| Dassault Systemes | | | 353 | | | | 11,845 | |
| Materials — 0.6% | | | | | | | | |
| Air Liquide | | | 260 | | | | 33,997 | |
|
|
| Schedule of Investments | October 31, 2022 |
| Global X S&P Catholic Values Developed ex-US ETF |
| | | | |
| |
| | | Shares | | | Value | |
| COMMON STOCK — continued | | | | | | |
| Utilities — 0.3% | | | | | | |
| Electricite de France | | | 282 | | | $ | 3,330 | |
| Engie | | | 893 | | | | 11,610 | |
| | | | | | | | 14,940 | |
| TOTAL FRANCE | | | | | | | 515,085 | |
| GERMANY — 7.4% | | | | | | | | |
| Communication Services — 0.6% | | | | | | | | |
| Deutsche Telekom | | | 1,707 | | | | 32,332 | |
| Consumer Discretionary — 0.9% | | | | | | | | |
| adidas | | | 96 | | | | 9,392 | |
| Bayerische Motoren Werke | | | 174 | | | | 13,675 | |
| Mercedes-Benz Group | | | 408 | | | | 23,630 | |
| Volkswagen . | | | 13 | | | | 2,223 | |
| | | | | | | | 48,920 | |
| Consumer Staples — 0.3% | | | | | | | | |
| Beiersdorf | | | 93 | | | | 8,932 | |
| Henkel & KGaA . | | | 92 | | | | 5,406 | |
| | | | | | | | 14,338 | |
| Financials — 1.2% | | | | | | | | |
| Allianz . | | | 197 | | | | 35,475 | |
| Deutsche Boerse . | | | 90 | | | | 14,646 | |
| Muenchener Rueckversicherungs-Gesellschaft | | | | | | | | |
| | | 69 | | | | 18,236 | |
| | | | | | | | 68,357 | |
| Health Care — 1.2% | | | | | | | | |
| BioNTech ADR | | | 200 | | | | 27,528 | |
| Fresenius Medical Care & KGaA . | | | 459 | | | | 12,693 | |
| Siemens Healthineers . | | | 612 | | | | 28,175 | |
| | | | | | | | 68,396 | |
| Industrials — 1.3% | | | | | | | | |
| Daimler Truck Holding * | | | 282 | | | | 7,525 | |
| Deutsche Post . | | | 563 | | | | 19,982 | |
| Hapag-Lloyd . | | | 5 | | | | 904 | |
|
|
| Schedule of Investments | October 31, 2022 |
| Global X S&P Catholic Values Developed ex-US ETF |
| | | | |
| |
| | | Shares | | | Value | |
| COMMON STOCK — continued | | | | | | |
| Industrials — continued | | | | | | |
| Siemens | | | 428 | | | $ | 46,802 | |
| | | | | | | | 75,213 | |
| Information Technology — 1.2% | | | | | | | | |
| Infineon Technologies | | | 654 | | | | 15,927 | |
| SAP . | | | 546 | | | | 52,706 | |
| | | | | | | | 68,633 | |
| Materials — 0.4% | | | | | | | | |
| BASF | | | 451 | | | | 20,252 | |
| Real Estate — 0.1% | | | | | | | | |
| Vonovia | | | 385 | | | | 8,524 | |
| Utilities — 0.2% | | | | | | | | |
| E.ON | | | 1,149 | | | | 9,625 | |
| TOTAL GERMANY | | | | | | | 414,590 | |
| HONG KONG — 2.3% | | | | | | | | |
| Financials — 1.4% | | | | | | | | |
| AIA Group . | | | 5,765 | | | | 43,661 | |
| Hang Seng Bank . | | | 380 | | | | 5,349 | |
| Hong Kong Exchanges & Clearing | | | 594 | | | | 15,815 | |
| Prudential | | | 1,329 | | | | 12,406 | |
| | | | | | | | 77,231 | |
| Industrials — 0.3% | | | | | | | | |
| Jardine Matheson Holdings | | | 160 | | | | 7,363 | |
| MTR . | | | 900 | | | | 3,961 | |
| Techtronic Industries . | | | 932 | | | | 8,828 | |
| | | | | | | | 20,152 | |
| Real Estate — 0.4% | | | | | | | | |
| CK Asset Holdings | | | 1,000 | | | | 5,528 | |
| Henderson Land Development | | | 700 | | | | 1,714 | |
| Link ‡ | | | 1,000 | | | | 5,911 | |
| Sun Hung Kai Properties | | | 790 | | | | 8,499 | |
| | | | | | | | 21,652 | |
|
|
| Schedule of Investments | October 31, 2022 |
| Global X S&P Catholic Values Developed ex-US ETF |
| | | | |
| |
| | | Shares | | | Value | |
| COMMON STOCK — continued | | | | | | |
| Utilities — 0.2% | | | | | | |
| CLP Holdings . | | | 800 | | | $ | 5,371 | |
| Hong Kong & China Gas | | | 5,110 | | | | 3,945 | |
| | | | | | | | 9,316 | |
| TOTAL HONG KONG | | | | | | | 128,351 | |
| IRELAND — 0.3% | | | | | | | | |
| Industrials — 0.1% | | | | | | | | |
| Kingspan Group | | | 88 | | | | 4,444 | |
| Materials — 0.2% | | | | | | | | |
| CRH | | | 382 | | | | 13,773 | |
| TOTAL IRELAND | | | | | | | 18,217 | |
| ISRAEL — 0.9% | | | | | | | | |
| Communication Services — 0.0% | | | | | | | | |
| Bezeq The Israeli Telecommunication . | | | 970 | | | | 1,725 | |
| Consumer Discretionary — 0.0% | | | | | | | | |
| Global-e Online, Cl E * | | | 38 | | | | 961 | |
| Consumer Staples — 0.0% | | | | | | | | |
| Strauss Group . | | | 47 | | | | 1,181 | |
| Financials — 0.4% | | | | | | | | |
| Bank Hapoalim | | | 602 | | | | 5,833 | |
| Bank Leumi Le-Israel | | | 757 | | | | 7,259 | |
| First International Bank of Israel | | | 27 | | | | 1,171 | |
| Israel Discount Bank, Cl A | | | 605 | | | | 3,459 | |
| Mizrahi Tefahot Bank | | | 72 | | | | 2,735 | |
| Plus500 . | | | 54 | | | | 1,122 | |
| | | | | | | | 21,579 | |
| Industrials — 0.0% | | | | | | | | |
| Kornit Digital * | | | 28 | | | | 748 | |
| Shapir Engineering and Industry . | | | 77 | | | | 637 | |
| ZIM Integrated Shipping Services | | | 38 | | | | 893 | |
| | | | | | | | 2,278 | |
| Information Technology — 0.4% | | | | | | | | |
| Check Point Software Technologies * | | | 54 | | | | 6,979 | |
|
|
| Schedule of Investments | October 31, 2022 |
| Global X S&P Catholic Values Developed ex-US ETF |
| | | | |
| |
| | | Shares | | | Value | |
| COMMON STOCK — continued | | | | | | |
| Information Technology — continued | | | | | | |
| ironSource, Cl A * | | | 97 | | | $ | 313 | |
| JFrog * | | | 36 | | | | 914 | |
| Nice * | | | 34 | | | | 6,471 | |
| Nova * | | | 15 | | | | 1,106 | |
| Tower Semiconductor * | | | 42 | | | | 1,804 | |
| Wix.com * | | | 26 | | | | 2,187 | |
| | | | | | | | 19,774 | |
| Real Estate — 0.1% | | | | | | | | |
| Amot Investments . | | | 6 | | | | 37 | |
| Azrieli Group | | | 22 | | | | 1,638 | |
| Big Shopping Centers | | | 1 | | | | 113 | |
| Melisron | | | 11 | | | | 820 | |
| Mivne Real Estate KD | | | 193 | | | | 603 | |
| | | | | | | | 3,211 | |
| TOTAL ISRAEL | | | | | | | 50,709 | |
| ITALY — 2.0% | | | | | | | | |
| Consumer Discretionary — 0.3% | | | | | | | | |
| Ferrari . | | | 71 | | | | 14,000 | |
| Moncler | | | 113 | | | | 4,879 | |
| PRADA | | | 300 | | | | 1,366 | |
| | | | | | | | 20,245 | |
| Consumer Staples — 0.1% | | | | | | | | |
| Davide Campari-Milano . | | | 516 | | | | 4,638 | |
| Energy — 0.3% | | | | | | | | |
| Eni | | | 1,221 | | | | 15,995 | |
| Financials — 0.7% | | | | | | | | |
| Assicurazioni Generali . | | | 610 | | | | 9,158 | |
| Intesa Sanpaolo | | | 8,543 | | | | 16,287 | |
| Poste Italiane . | | | 235 | | | | 2,049 | |
| UniCredit . | | | 960 | | | | 11,906 | |
| | | | | | | | 39,400 | |
| Industrials — 0.1% | | | | | | | | |
| Atlantia . | | | 285 | | | | 6,360 | |
|
|
| Schedule of Investments | October 31, 2022 |
| Global X S&P Catholic Values Developed ex-US ETF |
| | | | |
| |
| | | Shares | | | Value | |
| COMMON STOCK — continued | | | | | | |
| Utilities — 0.5% | | | | | | |
| Enel . | | | 3,859 | | | $ | 17,236 | |
| Snam | | | 1,091 | | | | 4,854 | |
| Terna - Rete Elettrica Nazionale | | | 726 | | | | 4,813 | |
| | | | | | | | 26,903 | |
| TOTAL ITALY | | | | | | | 113,541 | |
| JAPAN — 27.6% | | | | | | | | |
| Communication Services — 2.1% | | | | | | | | |
| Dentsu Group . | | | 130 | | | | 4,054 | |
| KDDI | | | 790 | | | | 23,359 | |
| Nexon . | | | 248 | | | | 4,166 | |
| Nintendo . | | | 554 | | | | 22,624 | |
| Nippon Telegraph & Telephone | | | 571 | | | | 15,728 | |
| SoftBank . | | | 1,382 | | | | 13,626 | |
| SoftBank Group | | | 611 | | | | 26,309 | |
| Toho | | | 74 | | | | 2,639 | |
| Z Holdings . | | | 1,383 | | | | 3,579 | |
| | | | | | | | 116,084 | |
| Consumer Discretionary — 4.6% | | | | | | | | |
| Aisin . | | | 96 | | | | 2,464 | |
| Bandai Namco Holdings | | | 120 | | | | 7,946 | |
| Bridgestone . | | | 334 | | | | 12,049 | |
| Denso | | | 283 | | | | 14,071 | |
| Fast Retailing | | | 32 | | | | 17,867 | |
| Hikari Tsushin . | | | 4 | | | | 484 | |
| Honda Motor . | | | 954 | | | | 21,649 | |
| Isuzu Motors | | | 365 | | | | 4,283 | |
| Koito Manufacturing | | | 140 | | | | 1,991 | |
| Nissan Motor | | | 1,367 | | | | 4,363 | |
| Nitori Holdings | | | 46 | | | | 4,189 | |
| Oriental Land | | | 126 | | | | 16,912 | |
| Pan Pacific International Holdings | | | 307 | | | | 5,042 | |
| Panasonic Holdings | | | 1,304 | | | | 9,339 | |
| Rakuten Group | | | 496 | | | | 2,222 | |
| Sekisui Chemical . | | | 245 | | | | 3,066 | |
| Sekisui House | | | 369 | | | | 6,144 | |
| Sharp | | | 116 | | | | 695 | |
| Shimano . | | | 48 | | | | 7,452 | |
|
|
| Schedule of Investments | October 31, 2022 |
| Global X S&P Catholic Values Developed ex-US ETF |
| | | | |
| |
| | | Shares | | | Value | |
| COMMON STOCK — continued | | | | | | |
| Consumer Discretionary — continued | | | | | | |
| Subaru | | | 342 | | | $ | 5,328 | |
| Sumitomo Electric Industries | | | 426 | | | | 4,454 | |
| Suzuki Motor | | | 280 | | | | 9,457 | |
| Toyota Motor | | | 6,696 | | | | 92,780 | |
| Yamaha . | | | 94 | | | | 3,554 | |
| ZOZO . | | | 84 | | | | 1,789 | |
| | | | | | | | 259,590 | |
| Consumer Staples — 2.7% | | | | | | | | |
| Aeon . | | | 813 | | | | 15,187 | |
| Asahi Group Holdings | | | 480 | | | | 13,447 | |
| Japan Tobacco . | | | 1,042 | | | | 17,274 | |
| Kao | | | 435 | | | | 16,360 | |
| Kirin Holdings | | | 769 | | | | 11,328 | |
| Kobe Bussan | | | 125 | | | | 2,720 | |
| Kose | | | 28 | | | | 2,801 | |
| Nissin Foods Holdings . | | | 78 | | | | 5,054 | |
| Seven & i Holdings | | | 747 | | | | 27,913 | |
| Shiseido . | | | 373 | | | | 12,936 | |
| Suntory Beverage & Food . | | | 124 | | | | 4,155 | |
| Unicharm . | | | 418 | | | | 12,745 | |
| Welcia Holdings | | | 86 | | | | 1,799 | |
| Yakult Honsha . | | | 143 | | | | 7,928 | |
| | | | | | | | 151,647 | |
| Energy — 0.2% | | | | | | | | |
| ENEOS Holdings | | | 1,647 | | | | 5,428 | |
| Inpex | | | 513 | | | | 5,239 | |
| | | | | | | | 10,667 | |
| Financials — 2.4% | | | | | | | | |
| Dai-ichi Life Holdings | | | 487 | | | | 7,724 | |
| Daiwa Securities Group | | | 774 | | | | 3,020 | |
| Japan Exchange Group | | | 277 | | | | 3,641 | |
| Japan Post Bank | | | 199 | | | | 1,326 | |
| Japan Post Insurance . | | | 112 | | | | 1,656 | |
| Mitsubishi UFJ Financial Group . | | | 6,098 | | | | 28,698 | |
| Mizuho Financial Group | | | 1,216 | | | | 13,139 | |
| MS&AD Insurance Group Holdings | | | 248 | | | | 6,576 | |
| Nomura Holdings | | | 1,512 | | | | 4,901 | |
|
|
| Schedule of Investments | October 31, 2022 |
| Global X S&P Catholic Values Developed ex-US ETF |
| | | | |
| |
| | | Shares | | | Value | |
| COMMON STOCK — continued | | | | | | |
| Financials — continued | | | | | | |
| ORIX . | | | 563 | | | $ | 8,276 | |
| Resona Holdings | | | 1,220 | | | | 4,594 | |
| Sompo Holdings . | | | 185 | | | | 7,708 | |
| Sumitomo Mitsui Financial Group . | | | 662 | | | | 18,586 | |
| Sumitomo Mitsui Trust Holdings . | | | 194 | | | | 5,582 | |
| T&D Holdings | | | 273 | | | | 2,694 | |
| Tokio Marine Holdings | | | 981 | | | | 17,761 | |
| | | | | | | | 135,882 | |
| Health Care — 5.2% | | | | | | | | |
| Eisai | | | 627 | | | | 37,856 | |
| Hoya . | | | 816 | | | | 76,173 | |
| Kyowa Kirin | | | 540 | | | | 12,734 | |
M3
| | | 903 | | | | 27,010 | |
| Otsuka Holdings . | | | 1,214 | | | | 38,927 | |
| Shionogi | | | 602 | | | | 27,906 | |
| Sysmex . | | | 358 | | | | 19,336 | |
| Terumo | | | 1,661 | | | | 50,556 | |
| | | | | | | | 290,498 | |
| Industrials — 5.4% | | | | | | | | |
| ANA Holdings * | | | 84 | | | | 1,634 | |
| Central Japan Railway | | | 121 | | | | 14,055 | |
| Daifuku . | | | 72 | | | | 3,304 | |
| Daikin Industries | | | 170 | | | | 25,603 | |
| East Japan Railway . | | | 215 | | | | 11,630 | |
| FANUC | | | 115 | | | | 15,188 | |
| Hankyu Hanshin Holdings | | | 149 | | | | 4,426 | |
| ITOCHU . | | | 825 | | | | 21,364 | |
| Japan Airlines * | | | 73 | | | | 1,363 | |
| Keio | | | 72 | | | | 2,529 | |
| Komatsu | | | 557 | | | | 10,673 | |
| Kubota | | | 697 | | | | 9,737 | |
| Makita | | | 182 | | | | 3,330 | |
| Marubeni | | | 1,000 | | | | 8,766 | |
| MINEBEA MITSUMI | | | 247 | | | | 3,663 | |
| MISUMI Group . | | | 170 | | | | 3,637 | |
| Mitsubishi Electric . | | | 1,208 | | | | 10,647 | |
| Mitsui . | | | 926 | | | | 20,515 | |
| MonotaRO | | | 148 | | | | 2,258 | |
|
|
| Schedule of Investments | October 31, 2022 |
| Global X S&P Catholic Values Developed ex-US ETF |
| | | | |
| |
| | | Shares
| | | Value | |
| COMMON STOCK — continued | | | | | | |
| Industrials — continued | | | | | | |
| Nidec . | | | 317 | | | $ | 17,569 | |
| Nihon M&A Center Holdings . | | | 191 | | | | 2,163 | |
| Nippon Yusen . | | | 288 | | | | 5,230 | |
| Odakyu Electric Railway | | | 197 | | | | 2,345 | |
| Recruit Holdings | | | 952 | | | | 29,399 | |
| Secom . | | | 127 | | | | 7,255 | |
| SG Holdings | | | 322 | | | | 4,272 | |
| SMC . | | | 32 | | | | 12,943 | |
| Sumitomo | | | 730 | | | | 9,309 | |
| Taisei . | | | 129 | | | | 3,519 | |
| Tokyu | | | 368 | | | | 4,249 | |
| Toshiba | | | 244 | | | | 8,505 | |
| TOTO . | | | 94 | | | | 2,688 | |
| Toyota Industries | | | 116 | | | | 5,978 | |
| West Japan Railway . | | | 128 | | | | 5,082 | |
| Yamato Holdings . | | | 215 | | | | 3,188 | |
| Yaskawa Electric | | | 153 | | | | 4,251 | |
| | | | | | | | 302,267 | |
| Information Technology — 3.1% | | | | | | | | |
| Advantest . | | | 102 | | | | 5,394 | |
| Canon . | | | 474 | | | | 10,058 | |
| Disco | | | 14 | | | | 3,363 | |
| Fujitsu | | | 97 | | | | 11,176 | |
| GMO Payment Gateway | | | 24 | | | | 1,733 | |
| Itochu Techno-Solutions | | | 36 | | | | 836 | |
| Keyence | | | 96 | | | | 36,376 | |
| Kyocera | | | 183 | | | | 9,161 | |
| Lasertec | | | 46 | | | | 6,589 | |
| Murata Manufacturing | | | 339 | | | | 16,649 | |
| NEC | | | 144 | | | | 4,771 | |
| Nomura Research Institute | | | 217 | | | | 4,825 | |
| NTT Data . | | | 352 | | | | 5,108 | |
| Obic | | | 30 | | | | 4,515 | |
| Omron | | | 107 | | | | 5,008 | |
| Oracle Japan . | | | 22 | | | | 1,175 | |
| Otsuka | | | 54 | | | | 1,706 | |
| Renesas Electronics * | | | 722 | | | | 6,055 | |
| Rohm . | | | 50 | | | | 3,522 | |
| Shimadzu . | | | 146 | | | | 3,855 | |
|
|
| Schedule of Investments | October 31, 2022 |
| Global X S&P Catholic Values Developed ex-US ETF |
| | | | | | |
| | | Shares
| | | Value | |
| COMMON STOCK — continued | | | | | | |
| Information Technology — continued | | | | | | |
| TDK | | | 198 | | | $ | 6,201 | |
| Tokyo Electron . | | | 79 | | | | 20,989 | |
| Trend Micro | | | 70 | | | | 3,537 | |
| | | | | | | | 172,602 | |
| Materials — 1.0% | | | | | | | | |
| Asahi Kasei | | | 733 | | | | 4,707 | |
| JFE Holdings | | | 310 | | | | 2,843 | |
| Mitsubishi Chemical Holdings | | | 630 | | | | 2,849 | |
| Nippon Paint Holdings . | | | 509 | | | | 3,253 | |
| Nippon Sanso Holdings | | | 117 | | | | 1,867 | |
| Nippon Steel | | | 492 | | | | 6,761 | |
| Nitto Denko | | | 82 | | | | 4,320 | |
| Shin-Etsu Chemical | | | 200 | | | | 20,910 | |
| Sumitomo Metal Mining | | | 146 | | | | 4,108 | |
| Toray Industries . | | | 903 | | | | 4,401 | |
| | | | | | | | 56,019 | |
| Real Estate — 0.7% | | | | | | | | |
| Daiwa House Industry . | | | 344 | | | | 6,971 | |
| Hulic | | | 263 | | | | 1,911 | |
| Mitsubishi Estate . | | | 702 | | | | 8,846 | |
| Mitsui Fudosan . | | | 484 | | | | 9,279 | |
| Nippon Prologis ‡ | | | 1 | | | | 2,095 | |
| Nomura Real Estate Master Fund ‡ | | | 2 | | | | 2,281 | |
| Sumitomo Realty & Development | | | 250 | | | | 5,744 | |
| | | | | | | | 37,127 | |
| Utilities — 0.2% | | | | | | | | |
| Chubu Electric Power | | | 395 | | | | 3,218 | |
| Kansai Electric Power | | | 443 | | | | 3,359 | |
| Osaka Gas . | | | 217 | | | | 3,215 | |
| Tokyo Gas . | | | 204 | | | | 3,647 | |
| | | | | | | | 13,439 | |
| TOTAL JAPAN | | | | | | | 1,545,822 | |
| LUXEMBOURG — 0.1% | | | | | | | | |
| Materials — 0.1% | | | | | | | | |
| ArcelorMittal | | | 318 | | | | 7,120 | |
|
|
| Schedule of Investments | October 31, 2022 |
| Global X S&P Catholic Values Developed ex-US ETF |
| | | | |
| |
| | | Shares | | | Value | |
| COMMON STOCK — continued | | | | | | |
| MACAO — 0.1% | | | | | | |
| Consumer Discretionary — 0.1% | | | | | | |
| Galaxy Entertainment Group . | | | 1,120 | | | $ | 5,115 | |
| Sands China * | | | 1,600 | | | | 2,792 | |
| TOTAL MACAO | | | | | | | 7,907 | |
| NETHERLANDS — 5.9% | | | | | | | | |
| Communication Services — 0.1% | | | | | | | | |
| Universal Music Group . | | | 355 | | | | 6,965 | |
| Consumer Staples — 0.8% | | | | | | | | |
| Heineken | | | 220 | | | | 18,395 | |
| Koninklijke Ahold Delhaize | | | 963 | | | | 26,888 | |
| | | | | | | | 45,283 | |
| Energy — 1.9% | | | | | | | | |
| Shell | | | 3,743 | | | | 103,600 | |
| Financials — 0.4% | | | | | | | | |
| EXOR * | | | 51 | | | | 3,428 | |
| ING Groep . | | | 1,812 | | | | 17,826 | |
| | | | | | | | 21,254 | |
| Health Care — 0.4% | | | | | | | | |
| Koninklijke Philips . | | | 1,934 | | | | 24,501 | |
| Information Technology — 2.1% | | | | | | | | |
| Adyen * | | | 16 | | | | 22,971 | |
| ASML Holding . | | | 203 | | | | 95,903 | |
| | | | | | | | 118,874 | |
| Materials — 0.2% | | | | | | | | |
| Koninklijke DSM | | | 92 | | | | 10,848 | |
| TOTAL NETHERLANDS | | | | | | | 331,325 | |
| NEW ZEALAND — 0.6% | | | | | | | | |
| Communication Services — 0.0% | | | | | | | | |
| Spark New Zealand | | | 983 | | | | 2,924 | |
|
|
| Schedule of Investments | October 31, 2022 |
| Global X S&P Catholic Values Developed ex-US ETF |
| | | | |
| |
| | | Shares | | | Value | |
| COMMON STOCK — continued | | | | | | |
| Health Care — 0.3% | | | | | | |
| Fisher & Paykel Healthcare . | | | 1,321 | | | $ | 15,026 | |
| Ryman Healthcare | | | 847 | | | | 4,124 | |
| | | | | | | | 19,150 | |
| Industrials — 0.1% | | | | | | | | |
| Auckland International Airport * | | | 706 | | | | 3,158 | |
| Information Technology — 0.1% | | | | | | | | |
| Xero * | | | 68 | | | | 3,395 | |
| Utilities — 0.1% | | | | | | | | |
| Contact Energy . | | | 387 | | | | 1,697 | |
| Mercury NZ | | | 325 | | | | 1,099 | |
| Meridian Energy . | | | 639 | | | | 1,812 | |
| | | | | | | | 4,608 | |
| TOTAL NEW ZEALAND | | | | | | | 33,235 | |
| NORWAY — 1.0% | | | | | | | | |
| Communication Services — 0.1% | | | | | | | | |
| Schibsted, Cl A . | | | 46 | | | | 708 | |
| Schibsted, Cl B . | | | 52 | | | | 772 | |
| Telenor | | | 341 | | | | 3,099 | |
| | | | | | | | 4,579 | |
| Consumer Staples — 0.2% | | | | | | | | |
| Mowi . | | | 409 | | | | 6,100 | |
| Orkla | | | 705 | | | | 4,757 | |
| Salmar | | | 50 | | | | 1,694 | |
| | | | | | | | 12,551 | |
| Energy — 0.4% | | | | | | | | |
| Aker BP . | | | 150 | | | | 4,781 | |
| Equinor . | | | 502 | | | | 18,365 | |
| Var Energi . | | | 105 | | | | 358 | |
| | | | | | | | 23,504 | |
| Financials — 0.2% | | | | | | | | |
| DNB Bank | | | 470 | | | | 8,318 | |
|
|
| Schedule of Investments | October 31, 2022 |
| Global X S&P Catholic Values Developed ex-US ETF |
| | | | |
| |
| | | Shares | | | Value | |
| COMMON STOCK — continued | | | | | | |
| Financials — continued | | | | | | |
| Gjensidige Forsikring | | | 98 | | | $ | 1,790 | |
| | | | | | | | 10,108 | |
| Industrials — 0.0% | | | | | | | | |
| AutoStore Holdings * | | | 353 | | | | 666 | |
| TOMRA Systems | | | 142 | | | | 2,295 | |
| | | | | | | | 2,961 | |
| Materials — 0.1% | | | | | | | | |
| Norsk Hydro | | | 730 | | |
| 4,633 | |
| TOTAL NORWAY | | | | | |
| 58,336 | |
| PORTUGAL — 0.1% | | | | | | | | |
| Utilities — 0.1% | | | | | | | | |
| Energias de Portugal | | | 1,465 | | | | 6,407 | |
| SINGAPORE — 1.7% | | | | | | | | |
| Communication Services — 0.3% | | | | | | | | |
| Sea ADR * | | | 176 | | | | 8,744 | |
| Singapore Telecommunications | | | 3,590 | | | | 6,342 | |
| | | | | | | | 15,086 | |
| Financials — 1.0% | | | | | | | | |
| DBS Group Holdings . | | | 935 | | | | 22,597 | |
| Oversea-Chinese Banking | | | 1,994 | | | | 17,092 | |
| United Overseas Bank . | | | 779 | | | | 15,282 | |
| | | | | | | | 54,971 | |
| Industrials — 0.1% | | | | | | | | |
| Singapore Airlines * | | | 863 | | | | 3,208 | |
| Singapore Technologies Engineering | | | 928 | | | | 2,164 | |
| | | | | | | | 5,372 | |
| Information Technology — 0.2% | | | | | | | | |
| STMicroelectronics | | | 325 | | | | 10,150 | |
| Real Estate — 0.1% | | | | | | | | |
| CapitaLand Ascendas Real Estate Investment | | | | | | | | |
| | | 1,713 | | | | 3,172 | |
| Capitaland Integrated Commercial Trust ‡ | | | 2,234 | | | | 2,968 | |
|
|
| Schedule of Investments | October 31, 2022 |
| Global X S&P Catholic Values Developed ex-US ETF |
| | | | |
| |
| | | Shares | | | Value | |
| COMMON STOCK — continued | | | | | | |
| Real Estate — continued | | | | | | |
| Capitaland Investment | | | 1,229 | | | $ | 2,614 | |
| | | | | | | | 8,754 | |
| TOTAL SINGAPORE | | | | | | | 94,333 | |
| SOUTH AFRICA — 0.4% | | | | | | | | |
| Materials — 0.4% | | | | | | | | |
| Anglo American | | | 661 | | | | 19,852 | |
| SOUTH KOREA — 0.1% | | | | | | | | |
| Consumer Discretionary — 0.1% | | | | | | | | |
| Delivery Hero * | | | 99 | | | | 3,263 | |
| SPAIN — 2.2% | | | | | | | | |
| Communication Services — 0.3% | | | | | | | | |
| Cellnex Telecom . | | | 286 | | | | 9,356 | |
| Telefonica | | | 2,711 | | | | 9,338 | |
| | | | | | | | 18,694 | |
| Consumer Discretionary — 0.2% | | | | | | | | |
| Industria de Diseno Textil | | | 596 | | | | 13,513 | |
| Financials — 0.7% | | | | | | | | |
| Banco Bilbao Vizcaya Argentaria | | | 3,249 | | | | 16,727 | |
| Banco Santander . | | | 8,280 | | | | 21,457 | |
| | | | | | | | 38,184 | |
| Industrials — 0.1% | | | | | | | | |
| Aena SME * | | | 46 | | | | 5,417 | |
| Information Technology — 0.2% | | | | | | | | |
| Amadeus IT Group * | | | 231 | | | | 12,041 | |
| Utilities — 0.7% | | | | | | | | |
| EDP Renovaveis . | | | 127 | | | | 2,675 | |
| Endesa . | | | 167 | | | | 2,787 | |
| Iberdrola | | | 2,802 | | | | 28,455 | |
| Naturgy Energy Group . | | | 78 | | | | 2,001 | |
| | | | | | | | 35,918 | |
| TOTAL SPAIN | | | | | | | 123,767 | |
|
|
| Schedule of Investments | October 31, 2022 |
| Global X S&P Catholic Values Developed ex-US ETF |
| | | | |
| |
| | | Shares | | | Value | |
| COMMON STOCK — continued | | | | | | |
| SWEDEN — 3.7% | | | | | | |
| Communication Services — 0.1% | | | | | | |
| Telia | | | 1,324 | | | $ | 3,505 | |
| Consumer Discretionary — 0.2% | | | | | | | | |
| Evolution | | | 100 | | | | 9,348 | |
| Volvo Car, Cl B * | | | 238 | | | | 1,010 | |
| | | | | | | | 10,358 | |
| Consumer Staples — 0.5% | | | | | | | | |
| Essity, Cl B | | | 553 | | | | 11,680 | |
| Swedish Match . | | | 1,464 | | | | 15,050 | |
| | | | | | | | 26,730 | |
| Financials — 0.9% | | | | | | | | |
| EQT . | | | 135 | | | | 2,658 | |
| Industrivarden, Cl A . | | | 98 | | | | 2,219 | |
| Industrivarden, Cl C | | | 92 | | | | 2,066 | |
| Investor, Cl A | | | 266 | | | | 4,523 | |
| Investor, Cl B | | | 880 | | | | 14,363 | |
| Kinnevik, Cl A * | | | 1 | | | | 12 | |
| Kinnevik, Cl B * | | | 124 | | | | 1,532 | |
| L E Lundbergforetagen, Cl B . | | | 28 | | | | 1,105 | |
| Skandinaviska Enskilda Banken, Cl A . | | | 837 | | | | 8,824 | |
| Skandinaviska Enskilda Banken, Cl C . | | | 4 | | | | 46 | |
| Svenska Handelsbanken, Cl A | | | 793 | | | | 7,366 | |
| Svenska Handelsbanken, Cl B | | | 22 | | | | 240 | |
| Swedbank, Cl A . | | | 482 | | | | 7,182 | |
| | | | | | | | 52,136 | |
| Industrials — 1.6% | | | | | | | | |
| Alfa Laval . | | | 175 | | | | 4,309 | |
| Assa Abloy, Cl B | | | 555 | | | | 11,200 | |
| Atlas Copco, Cl A . | | | 1,449 | | | | 15,478 | |
| Atlas Copco, Cl B . | | | 858 | | | | 8,303 | |
| Epiroc, Cl A | | | 344 | | | | 5,263 | |
| Epiroc, Cl B | | | 229 | | | | 3,074 | |
| Investment Latour, Cl B . | | | 76 | | | | 1,284 | |
| Nibe Industrier, Cl B . | | | 851 | | | | 6,785 | |
| Sandvik . | | | 612 | | | | 9,559 | |
| Skanska, Cl B . | | | 206 | | | | 3,203 | |
|
|
| Schedule of Investments | October 31, 2022 |
| Global X S&P Catholic Values Developed ex-US ETF |
| | | | |
| |
| | | Shares | | | Value | |
| COMMON STOCK — continued | | | | | | |
| Industrials — continued | | | | | | |
| SKF, Cl B | | | 199 | | | $ | 2,878 | |
| Volvo, Cl A | | | 92 | | | | 1,570 | |
| Volvo, Cl B | | | 894 | | | | 14,627 | |
| | | | | | | | 87,533 | |
| Information Technology — 0.3% | | | | | | | | |
| Hexagon, Cl B . | | | 1,064 | | | | 10,514 | |
| Telefonaktiebolaget LM Ericsson, Cl B . | | | 1,482 | | | | 8,235 | |
| | | | | | | | 18,749 | |
| Materials — 0.1% | | | | | | | | |
| Alleima * | | | 122 | | | | 415 | |
| Svenska Cellulosa, Cl B . | | | 323 | | | | 3,809 | |
| | | | | | | | 4,224 | |
| Real Estate — 0.0% | | | | | | | | |
| Fastighets Balder, Cl B * | | | 277 | | | | 1,040 | |
| Sagax, Cl B . | | | 69 | | | | 1,271 | |
| Sagax, Cl D . | | | 1 | | | | 3 | |
| | | | | | | | 2,314 | |
| TOTAL SWEDEN | | | | | | | 205,549 | |
| SWITZERLAND — 4.1% | | | | | | | | |
| Consumer Discretionary — 0.5% | | | | | | | | |
| Cie Financiere Richemont, Cl A . | | | 282 | | | | 27,598 | |
| Financials — 1.3% | | | | | | | | |
| Partners Group Holding | | | 11 | | | | 9,886 | |
| UBS Group | | | 1,774 | | | | 28,168 | |
| Zurich Insurance Group | | | 75 | | | | 32,023 | |
| | | | | | | | 70,077 | |
| Health Care — 1.2% | | | | | | | | |
| Alcon . | | | 1,092 | | | | 66,497 | |
| Industrials — 0.6% | | | | | | | | |
| ABB | | | 973 | | | | 27,068 | |
| Accelleron Industries * | | | 48 | | | | 814 | |
|
|
| Schedule of Investments | October 31, 2022 |
| Global X S&P Catholic Values Developed ex-US ETF |
| | | | |
| |
| | | Shares | | | Value | |
| COMMON STOCK — continued | | | | | | |
| Industrials — continued | | | | | | |
| Kuehne + Nagel International . | | | 31 | | | $ | 6,611 | |
| | | | | | | | 34,493 | |
| Materials — 0.5% | | | | | | | | |
| Givaudan | | | 4 | | | | 11,951 | |
| Sika | | | 75 | | | | 16,922 | |
| | | | | | | | 28,873 | |
| TOTAL SWITZERLAND | | | | | | | 227,538 | |
| UNITED KINGDOM — 9.4% | | | | | | | | |
| Communication Services — 0.5% | | | | | | | | |
| BT Group, Cl A | | | 3,199 | | | | 4,781 | |
| Vodafone Group | | | 13,439 | | | | 15,727 | |
| WPP | | | 579 | | | | 5,106 | |
| | | | | | | | 25,614 | |
| Consumer Discretionary — 0.5% | | | | | | | | |
| Compass Group . | | | 953 | | | | 20,151 | |
| Entain . | | | 303 | | | | 4,406 | |
| | | | | | | | 24,557 | |
| Consumer Staples — 2.6% | | | | | | | | |
| Associated British Foods . | | | 330 | | | | 5,127 | |
| Coca-Cola Europacific Partners | | | 193 | | | | 9,081 | |
| Diageo . | | | 2,158 | | | | 89,396 | |
| Imperial Brands . | | | 893 | | | | 21,838 | |
| Ocado Group * | | | 614 | | | | 3,339 | |
| Tesco | | | 7,085 | | | | 17,546 | |
| | | | | | | | 146,327 | |
| Energy — 1.0% | | | | | | | | |
| BP | | | 10,117 | | | | 55,888 | |
| Financials — 2.3% | | | | | | | | |
| 3i Group | | | 471 | | | | 6,293 | |
| Aviva . | | | 1,506 | | | | 7,250 | |
| Barclays . | | | 7,823 | | | | 13,309 | |
| HSBC Holdings . | | | 9,728 | | | | 50,099 | |
| Legal & General Group . | | | 3,082 | | | | 8,264 | |
| Lloyds Banking Group . | | | 33,695 | | | | 16,301 | |
|
|
| Schedule of Investments | October 31, 2022 |
| Global X S&P Catholic Values Developed ex-US ETF |
| | | | |
| |
| | | Shares | | | Value | |
| COMMON STOCK — continued | | | | | | |
| Financials — continued | | | | | | |
| London Stock Exchange Group | | | 165 | | | $ | 14,373 | |
| NatWest Group . | | | 2,506 | | | | 6,775 | |
| Standard Chartered | | | 1,280 | | | | 7,666 | |
| | | | | | | | 130,330 | |
| Health Care — 0.4% | | | | | | | | |
| Smith & Nephew . | | | 1,915 | | | | 22,710 | |
| Industrials — 1.4% | | | | | | | | |
| Ashtead Group | | | 256 | | | | 13,411 | |
| CK Hutchison Holdings | | | 1,620 | | | | 8,048 | |
| CNH Industrial . | | | 550 | | | | 7,124 | |
| Experian | | | 548 | | | | 17,502 | |
| RELX . | | | 1,151 | | | | 31,023 | |
| | | | | | | | 77,108 | |
| Materials — 0.1% | | | | | | | | |
| Croda International . | | | 71 | | | | 5,526 | |
| Real Estate — 0.1% | | | | | | | | |
| Segro ‡ | | | 616 | | | | 5,567 | |
| Utilities — 0.5% | | | | | | | | |
| National Grid | | | 1,934 | | | | 21,118 | |
| SSE | | | 483 | | | | 8,653 | |
| | | | | | | | 29,771 | |
| TOTAL UNITED KINGDOM | | | | | | | 523,398 | |
| UNITED STATES — 5.3% | | | | | | | | |
| Communication Services — 0.1% | | | | | | | | |
| Spotify Technology * | | | 67 | | | | 5,399 | |
| Consumer Discretionary — 0.3% | | | | | | | | |
| Fiverr International * | | | 22 | | | | 681 | |
| Stellantis . | | | 1,189 | | | | 16,052 | |
| | | | | | | | 16,733 | |
| Health Care — 3.5% | | | | | | | | |
| CSL . | | | 1,060 | | | | 190,115 | |
|
|
| Schedule of Investments | October 31, 2022 |
| Global X S&P Catholic Values Developed ex-US ETF |
| | | | | | |
| | | Shares
| | | Value | |
| COMMON STOCK — continued | | | | | | |
| Health Care — continued | | | | | | |
| Inmode * | | | 141 | | | $ | 4,839 | |
| | | | | | | | 194,954 | |
| Industrials — 1.0% | | | | | | | | |
| Ferguson . | | | 131 | | | | 14,344 | |
| Schneider Electric . | | | 331 | | | | 41,959 | |
| | | | | | | | 56,303 | |
| Information Technology — 0.3% | | | | | | | | |
| Atlassian, Cl A * | | | 72 | | | | 14,597 | |
| CyberArk Software * | | | 22 | | | | 3,452 | |
| Monday.com * | | | 6 | | | | 642 | |
| Sinch * | | | 274 | | | | 644 | |
| | | | | | | | 19,335 | |
| Materials — 0.1% | | | | | | | | |
| James Hardie Industries | | | 237 | | | | 5,152 | |
| TOTAL UNITED STATES | | | | | | | 297,876 | |
| TOTAL COMMON STOCK | | | | | | | | |
| (Cost $6,542,729) | | | | | | | 5,557,326 | |
| PREFERRED STOCK — 0.5% | | | | | | | | |
| GERMANY— 0.5% | | | | | | | | |
| Consumer Discretionary — 0.3% | | | | | | | | |
| Bayerische Motoren Werke (B) | | | 26 | | | | 1,920 | |
| Porsche Automobil Holding (B) | | | 79 | | | | 4,419 | |
| Volkswagen (B) | | | 101 | | | | 12,911 | |
| | | | | | | | 19,250 | |
| Consumer Staples — 0.2% | | | | | | | | |
| Henkel & KGaA (B) | | | 166 | | | | 10,464 | |
| TOTAL GERMANY | | | | | | | 29,714 | |
| TOTAL PREFERRED STOCK | | | | | | | | |
| (Cost $44,676) | | | | | | | 29,714 | |
| TOTAL INVESTMENTS — 99.9% | | | | | | | | |
| (Cost $6,587,405) | | | | | | $ | 5,587,040 | |
Percentages are based on Net Assets of $5,592,322.
* Non-income producing security.
|
|
| Schedule of Investments | October 31, 2022 |
| Global X S&P Catholic Values Developed ex-US ETF |
‡ Real Estate Investment Trust
(A) Level 3 security in accordance with fair value hierarchy.
(B) There is currently no stated interest rate.
The following is a summary of the level of inputs used as of October 31, 2022, in valuing the Fund's investments carried at value:
| Investments in Securities | | Level 1 | | | Level 2 | | | Level 3(1) | | | Total | |
| Common Stock | | $ | 5,556,048 | | | $ | — | | | $ | 1,278 | | | $ | 5,557,326 | |
| Preferred Stock | | | 29,714 | | | | — | | | | — | | | | 29,714 | |
| Total Investments in Securities | | $ | 5,585,762 | | | $ | — | | | $ | 1,278 | | | $ | 5,587,040 | |
(1) A reconciliation of Level 3 investments and disclosures of significant unobservable inputs are presented when the Fund has a significant amount of Level 3 investments at the end of the period in relation to Net Assets. Management has concluded that Level 3 investments are not material in relation to Net Assets.
Amounts designated as “—“ are $0 or have been rounded to $0.
See "Glossary" for abbreviations.
|
|
|
| Schedule of Investments | | October 31, 2022 |
| Global X Guru® Index ETF |

| | | | |
| |
| | | Shares | | | Value | |
| COMMON STOCK — 98.4% | | | | | | |
| CANADA — 3.3% | | | | | | |
| Health Care — 1.9% | | | | | | |
| Repare Therapeutics * (A) | | | 59,021 | | | $ | 888,856 | |
| Industrials — 1.4% | | | | | | | | |
| Canadian Pacific Railway | | | 8,468 | | | | 630,782 | |
| TOTAL CANADA | | | | | | | 1,519,638 | |
| CHINA — 3.0% | | | | | | | | |
| Communication Services — 0.5% | | | | | | | | |
| Bilibili ADR * (A) | | | 28,299 | | | | 252,427 | |
| Consumer Discretionary — 2.0% | | | | | | | | |
| Alibaba Group Holding ADR * | | | 7,513 | | | | 477,676 | |
| JD.com ADR . | | | 12,148 | | | | 452,999 | |
| | | | | | | | 930,675 | |
| Information Technology — 0.5% | | | | | | | | |
| GDS Holdings ADR * | | | 24,176 | | | | 208,639 | |
| TOTAL CHINA | | | | | | | 1,391,741 | |
|
|
|
| Schedule of Investments | | October 31, 2022 |
| Global X Guru® Index ETF |
| | | | |
| |
| | | Shares | | | Value | |
| COMMON STOCK — continued | | | | | | |
| DENMARK — 1.7% | | | | | | |
| Health Care — 1.7% | | | | | | |
| Ascendis Pharma ADR * | | | 6,966 | | | $ | 801,090 | |
| ISRAEL — 1.2% | | | | | | | | |
| Information Technology — 1.2% | | | | | | | | |
| NICE ADR * | | | 3,080 | | | | 584,861 | |
| TAIWAN — 1.0% | | | | | | | | |
| Information Technology — 1.0% | | | | | | | | |
| Taiwan Semiconductor Manufacturing ADR | | | 7,656 | | | | 471,227 | |
| UNITED KINGDOM — 1.1% | | | | | | | | |
| Communication Services — 1.1% | | | | | | | | |
| Liberty Global, Cl C * | | | 29,476 | | | | 520,546 | |
| UNITED STATES — 87.1% | | | | | | | | |
| Communication Services — 7.5% | | | | | | | | |
| Activision Blizzard . | | | 8,511 | | | | 619,601 | |
| Alphabet, Cl C * | | | 5,620 | | | | 531,989 | |
| Charter Communications, Cl A * | | | 1,435 | | | | 527,535 | |
| Liberty Broadband, Cl C * | | | 5,791 | | | | 488,934 | |
| New York Times, Cl A | | | 20,866 | | | | 604,279 | |
| T-Mobile US * | | | 4,748 | | | | 719,607 | |
| | | | | | | | 3,491,945 | |
| Consumer Discretionary — 11.3% | | | | | | | | |
| Amazon.com * | | | 4,757 | | | | 487,307 | |
| Churchill Downs | | | 3,192 | | | | 663,649 | |
| Expedia Group * | | | 5,878 | | | | 549,416 | |
| Floor & Decor Holdings, Cl A * | | | 6,922 | | | | 507,867 | |
| Home Depot . | | | 2,104 | | | | 623,057 | |
| Lithia Motors, Cl A . | | | 2,505 | | | | 496,366 | |
| Lowe's | | | 3,216 | | | | 626,959 | |
| MGM Resorts International . | | | 19,038 | | | | 677,182 | |
| Rivian Automotive, Cl A * | | | 18,008 | | | | 629,740 | |
| | | | | | | | 5,261,543 | |
|
|
|
| Schedule of Investments | | October 31, 2022 |
| Global X Guru® Index ETF |
| | | | |
| |
| | | Shares | | | Value | |
| COMMON STOCK — continued | | | | | | |
| Consumer Staples — 2.9% | | | | | | |
| Mondelez International, Cl A . | | | 10,441 | | | $ | 641,913 | |
| Post Holdings * | | | 7,623 | | | | 689,271 | |
| | | | | | | | 1,331,184 | |
| Energy — 5.1% | | | | | | | | |
| Chesapeake Energy . | | | 7,174 | | | | 733,685 | |
| Gulfport Energy * | | | 7,642 | | | | 684,035 | |
| Texas Pacific Land | | | 415 | | | | 956,106 | |
| | | | | | | | 2,373,826 | |
| Financials — 10.1% | | | | | | | | |
| Allstate | | | 5,309 | | | | 670,261 | |
| Arch Capital Group * | | | 14,653 | | | | 842,547 | |
| First American Financial | | | 11,624 | | | | 585,850 | |
| First Horizon . | | | 29,811 | | | | 730,668 | |
| KKR | | | 12,037 | | | | 585,359 | |
| S&P Global . | | | 1,771 | | | | 568,934 | |
| Wells Fargo . | | | 14,950 | | | | 687,551 | |
| | | | | | | | 4,671,170 | |
| Health Care — 15.0% | | | | | | | | |
| Amicus Therapeutics * | | | 58,039 | | | | 580,390 | |
| Bausch Health * | | | 108,245 | | | | 703,592 | |
| Cigna . | | | 2,396 | | | | 774,052 | |
| Fate Therapeutics * | | | 20,928 | | | | 437,814 | |
| Humana | | | 1,406 | | | | 784,660 | |
| Mettler-Toledo International * | | | 507 | | | | 641,320 | |
| Rocket Pharmaceuticals * | | | 38,825 | | | | 724,475 | |
| Seagen * | | | 4,038 | | | | 513,472 | |
| Tenet Healthcare * | | | 10,683 | | | | 473,898 | |
| United Therapeutics * | | | 3,108 | | | | 716,487 | |
| Viatris * | | | 62,369 | | | | 631,798 | |
| | | | | | | | 6,981,958 | |
| Industrials — 9.3% | | | | | | | | |
| Avis Budget Group * | | | 3,550 | | | | 839,433 | |
| Enovix * | | | 27,893 | | | | 526,341 | |
| Ferguson . | | | 5,379 | | | | 587,710 | |
| Howmet Aerospace . | | | 17,780 | | | | 632,079 | |
| Otis Worldwide | | | 8,468 | | | | 598,179 | |
|
|
|
| Schedule of Investments | | October 31, 2022 |
| Global X Guru® Index ETF |
| | | | |
| |
| | | Shares | | | Value | |
| COMMON STOCK — continued | | | | | | |
| Industrials — continued | | | | | | |
| TransDigm Group . | | | 1,029 | | | $ | 592,457 | |
| Uber Technologies * | | | 21,263 | | | | 564,958 | |
| | | | | | | | 4,341,157 | |
| Information Technology — 17.6% | | | | | | | | |
| Apple . | | | 3,979 | | | | 610,140 | |
| Datadog, Cl A * | | | 6,064 | | | | 488,213 | |
| Elastic * | | | 8,288 | | | | 530,018 | |
| Fidelity National Information Services . | | | 6,652 | | | | 552,050 | |
| Fiserv * | | | 6,219 | | | | 638,940 | |
| GoDaddy, Cl A * | | | 8,258 | | | | 663,943 | |
| Microsoft | | | 2,379 | | | | 552,237 | |
| New Relic * | | | 10,197 | | | | 604,070 | |
| Palo Alto Networks * | | | 3,981 | | | | 683,100 | |
| Pegasystems . | | | 16,467 | | | | 612,737 | |
| SentinelOne, Cl A * | | | 24,324 | | | | 555,560 | |
| Snowflake, Cl A * | | | 4,114 | | | | 659,474 | |
| Unity Software * | | | 12,834 | | | | 378,603 | |
| Visa, Cl A . | | | 3,171 | | | | 656,904 | |
| | | | | | | | 8,185,989 | |
| Materials — 4.8% | | | | | | | | |
| Berry Global Group * | | | 11,248 | | | | 532,255 | |
| Element Solutions . | | | 33,378 | | | | 574,102 | |
| International Flavors & Fragrances | | | 5,528 | | | | 539,588 | |
| Sherwin-Williams . | | | 2,688 | | | | 604,881 | |
| | | | | | | | 2,250,826 | |
| Real Estate — 3.5% | | | | | | | | |
| American Tower ‡ | | | 2,473 | | | | 512,381 | |
| ProLogis ‡ | | | 5,023 | | | | 556,297 | |
| Zillow Group, Cl C * | | | 18,000 | | | | 555,480 | |
| | | | | | | | 1,624,158 | |
| TOTAL UNITED STATES | | | | | | | 40,513,756 | |
| TOTAL COMMON STOCK | | | | | | | | |
| (Cost $52,379,479) | | | | | | | 45,802,859 | |
|
|
|
| Schedule of Investments | | October 31, 2022 |
| Global X Guru® Index ETF |
| | | Shares | | | Value | |
| MASTER LIMITED PARTNERSHIP — 1.5% | | | | | | |
| UNITED STATES— 1.5% | | | | | | |
Industrials — 1.5% | | | | | | |
| Icahn Enterprises (B) | | | | | | |
| (Cost $584,030) | | | 12,548 | | | $ | 684,368 | |
| SHORT-TERM INVESTMENT(C)(D) — 0.7% | | | | | | | | |
Fidelity Investments Money Market
Government Portfolio, Cl Institutional, 2.910%
(Cost $329,505) | | | 329,505 | | | | 329,505 | |
| | | Face Amount | | | | | |
| REPURCHASE AGREEMENT(C) — 1.0% | | | | | | | | |
BNP Paribas
2.930%, dated 10/31/2022, to be repurchased
on 11/01/2022, repurchase price $457,852
(collateralized by U.S. Treasury Obligations,
ranging in par value $9,100 - $53,497,
2.500% - 2.750%, 03/31/2027 - 05/31/2029,
with a total market value of $466,413)
(Cost $457,815) | | $ | 457,815 | | | | 457,815 | |
TOTAL INVESTMENTS — 101.6% | | | | | | | | |
| (Cost $53,750,829) | | | | | | $ | 47,274,547 | |
Percentages are based on Net Assets of $46,535,087.
* Non-income producing security.
‡ Real Estate Investment Trust
(A) This security or a partial position of this security is on loan at October 31, 2022.
(B) Security was purchased with cash collateral held from securities on loan.
(C) The rate reported on the Schedule of Investments is the 7-day effective yield as of October 31, 2022.
|
|
|
| Schedule of Investments | | October 31, 2022 |
| Global X Guru® Index ETF |
The following is a summary of the level of inputs used as of October 31, 2022, in valuing the Fund’s investments carried at value:
| Investments in Securities | | Level 1 | | | Level 2 | | | Level 3 | | | Total | |
| Common Stock | | $ | 45,802,859 | | | $ | — | | | $ | — | | | $ | 45,802,859 | |
| Master Limited Partnership | | | 684,368 | | | | — | | | | — | | | | 684,368 | |
| Short-Term Investment | | | 329,505 | | | | — | | | | — | | | | 329,505 | |
| Repurchase Agreement | | | — | | | | 457,815 | | | | — | | | | 457,815 | |
| Total Investments in Securities | | $ | 46,816,732 | | | $ | 457,815 | | | $ | — | | | $ | 47,274,547 | |
Amounts designated as “—“ are $0 or have been rounded to $0.
See "Glossary" for abbreviations.
|
|
|
| Schedule of Investments | | October 31, 2022 |
| Global X S&P 500® Tail Risk ETF |
| | | | |
| |
| | | Shares
| | | Value | |
| COMMON STOCK — 99.2%(A) | | | | | | |
| CHINA — 0.1% | | | | | | |
| Information Technology — 0.1% | | | | | | |
| NXP Semiconductors . | | | 26 | | | $ | 3,798 | |
| SWITZERLAND — 0.1% | | | | | | | | |
| Information Technology — 0.1% | | | | | | | | |
| TE Connectivity | | | 29 | | | | 3,545 | |
| UNITED KINGDOM — 0.5% | | | | | | | | |
| Materials — 0.5% | | | | | | | | |
| Linde | | | 46 | | | | 13,678 | |
| UNITED STATES — 98.5% | | | | | | | | |
| Communication Services — 7.3% | | | | | | | | |
| Activision Blizzard . | | | 65 | | | | 4,732 | |
| Alphabet, Cl A * | | | 551 | | | | 52,075 | |
| Alphabet, Cl C * | | | 493 | | | | 46,667 | |
| AT&T | | | 682 | | | | 12,433 | |
| Charter Communications, Cl A * | | | 11 | | | | 4,044 | |
| Comcast, Cl A | | | 404 | | | | 12,823 | |
| DISH Network, Cl A * | | | 26 | | | | 388 | |
|
|
|
| Schedule of Investments | | October 31, 2022 |
| Global X S&P 500® Tail Risk ETF |
| | | | |
| |
| | | Shares
| | | Value | |
| COMMON STOCK — continued | | | | | | |
| Communication Services — continued | | | | | | |
| Electronic Arts | | | 26 | | | $ | 3,275 | |
| Fox, Cl A | | | 26 | | | | 750 | |
| Fox, Cl B | | | 13 | | | | 353 | |
| Interpublic Group | | | 39 | | | | 1,162 | |
| Live Nation Entertainment * | | | 13 | | | | 1,035 | |
| Lumen Technologies . | | | 91 | | | | 670 | |
| Match Group * | | | 25 | | | | 1,080 | |
| Meta Platforms, Cl A * | | | 210 | | | | 19,563 | |
| Netflix * | | | 41 | | | | 11,967 | |
| News, Cl A . | | | 39 | | | | 658 | |
| News, Cl B . | | | 13 | | | | 223 | |
| Omnicom Group . | | | 16 | | | | 1,164 | |
| Paramount Global, Cl B | | | 52 | | | | 953 | |
| Take-Two Interactive Software * | | | 14 | | | | 1,659 | |
| T-Mobile US * | | | 57 | | | | 8,639 | |
| Verizon Communications | | | 386 | | | | 14,425 | |
| Walt Disney * | | | 167 | | | | 17,792 | |
| Warner Bros Discovery * | | | 189 | | | | 2,457 | |
| | | | | | | | 220,987 | |
| Consumer Discretionary — 10.8% | | | | | | | | |
| Advance Auto Parts | | | 5 | | | | 950 | |
| Amazon.com * | | | 817 | | | | 83,693 | |
| Aptiv * | | | 26 | | | | 2,368 | |
| AutoZone * | | | 2 | | | | 5,066 | |
| Bath & Body Works . | | | 26 | | | | 868 | |
| Best Buy | | | 22 | | | | 1,505 | |
| Booking Holdings * | | | 4 | | | | 7,478 | |
| BorgWarner . | | | 26 | | | | 976 | |
| Caesars Entertainment * | | | 21 | | | | 918 | |
| CarMax * | | | 13 | | | | 819 | |
| Carnival * | | | 68 | | | | 616 | |
| Chipotle Mexican Grill, Cl A * | | | 3 | | | | 4,495 | |
| Darden Restaurants . | | | 13 | | | | 1,861 | |
| Dollar General . | | | 22 | | | | 5,611 | |
| Dollar Tree * | | | 19 | | | | 3,011 | |
| Domino's Pizza . | | | 3 | | | | 997 | |
| DR Horton | | | 26 | | | | 1,999 | |
| eBay | | | 55 | | | | 2,191 | |
| Etsy * | | | 13 | | | �� | 1,221 | |
|
|
|
| Schedule of Investments | | October 31, 2022 |
| Global X S&P 500® Tail Risk ETF |
| | | | |
| |
| | | Shares
| | | Value | |
| COMMON STOCK — continued | | | | | | |
| Consumer Discretionary — continued | | | | | | |
| Expedia Group * | | | 13 | | | $ | 1,215 | |
| Ford Motor . | | | 344 | �� | | | 4,599 | |
| Garmin | | | 13 | | | | 1,145 | |
| General Motors | | | 132 | | | | 5,181 | |
| Genuine Parts . | | | 13 | | | | 2,312 | |
| Hasbro . | | | 13 | | | | 848 | |
| Hilton Worldwide Holdings . | | | 26 | | | | 3,517 | |
| Home Depot . | | | 94 | | | | 27,836 | |
| Las Vegas Sands * | | | 26 | | | | 988 | |
| Lennar, Cl A . | | | 26 | | | | 2,098 | |
| LKQ | | | 26 | | | | 1,447 | |
| Lowe's | | | 59 | | | | 11,502 | |
| Marriott International, Cl A | | | 24 | | | | 3,843 | |
| McDonald's . | | | 68 | | | | 18,541 | |
| MGM Resorts International . | | | 31 | | | | 1,103 | |
| Mohawk Industries * | | | 4 | | | | 379 | |
| Newell Brands . | | | 29 | | | | 400 | |
| NIKE, Cl B | | | 116 | | | | 10,751 | |
| Norwegian Cruise Line Holdings * | | | 29 | | | | 490 | |
| O'Reilly Automotive * | | | 6 | | | | 5,023 | |
| Pool . | | | 4 | | | | 1,217 | |
| PulteGroup . | | | 26 | | | | 1,040 | |
| Ralph Lauren, Cl A . | | | 3 | | | | 278 | |
| Ross Stores | | | 34 | | | | 3,253 | |
| Royal Caribbean Cruises * | | | 22 | | | | 1,174 | |
| Starbucks | | | 104 | | | | 9,005 | |
| Tapestry . | | | 26 | | | | 824 | |
| Target | | | 42 | | | | 6,898 | |
| Tesla * | | | 245 | | | | 55,747 | |
| TJX | | | 107 | | | | 7,715 | |
| Tractor Supply . | | | 9 | | | | 1,978 | |
| Ulta Beauty * | | | 5 | | | | 2,097 | |
| VF . | | | 26 | | | | 734 | |
| Whirlpool | | | 5 | | | | 691 | |
| Wynn Resorts * | | | 13 | | | | 831 | |
| Yum! Brands | | | 26 | | | | 3,075 | |
| | | | | | | | 326,418 | |
| Consumer Staples — 6.9% | | | | | | | | |
| Altria Group . | | | 175 | | | | 8,097 | |
|
|
|
| Schedule of Investments | | October 31, 2022�� |
| Global X S&P 500® Tail Risk ETF |
| | | | |
| |
| | | Shares
| | | Value | |
| COMMON STOCK — continued | | | | | | |
| Consumer Staples — continued | | | | | | |
| Archer-Daniels-Midland | | | 52 | | | $ | 5,043 | |
| Brown-Forman, Cl B | | | 13 | | | | 884 | |
| Campbell Soup . | | | 13 | | | | 688 | |
| Church & Dwight | | | 21 | | | | 1,557 | |
| Clorox | | | 13 | | | | 1,899 | |
| Coca-Cola . | | | 358 | | | | 21,426 | |
| Colgate-Palmolive | | | 78 | | | | 5,760 | |
| Conagra Brands . | | | 39 | | | | 1,431 | |
| Constellation Brands, Cl A | | | 15 | | | | 3,706 | |
| Costco Wholesale | | | 41 | | | | 20,561 | |
| Estee Lauder, Cl A . | | | 23 | | | | 4,611 | |
| General Mills | | | 52 | | | | 4,242 | |
| Hershey | | | 13 | | | | 3,104 | |
| Hormel Foods | | | 26 | | | | 1,208 | |
| J M Smucker . | | | 9 | | | | 1,356 | |
| Kellogg | | | 26 | | | | 1,997 | |
| Keurig Dr Pepper | | | 76 | | | | 2,952 | |
| Kimberly-Clark | | | 30 | | | | 3,734 | |
| Kraft Heinz | | | 73 | | | | 2,808 | |
| Kroger | | | 58 | | | | 2,743 | |
| Lamb Weston Holdings . | | | 13 | | | | 1,121 | |
| McCormick . | | | 22 | | | | 1,730 | |
| Molson Coors Beverage, Cl B | | | 13 | | | | 656 | |
| Mondelez International, Cl A . | | | 126 | | | | 7,746 | |
| Monster Beverage * | | | 35 | | | | 3,280 | |
| PepsiCo | | | 127 | | | | 23,061 | |
| Philip Morris International | | | 142 | | | | 13,043 | |
| Procter & Gamble . | | | 220 | | | | 29,627 | |
| Sysco . | | | 48 | | | | 4,155 | |
| Tyson Foods, Cl A | | | 26 | | | | 1,777 | |
| Walgreens Boots Alliance | | | 65 | | | | 2,373 | |
| Walmart | | | 133 | | | | 18,930 | |
| | | | | | | | 207,306 | |
| Energy — 5.3% | | | | | | | | |
| APA . | | | 29 | | | | 1,318 | |
| Baker Hughes, Cl A | | | 96 | | | | 2,655 | |
| Chevron . | | | 166 | | | | 30,029 | |
| ConocoPhillips . | | | 117 | | | | 14,753 | |
| Coterra Energy | | | 63 | | | | 1,961 | |
|
|
|
| Schedule of Investments | | October 31, 2022 |
| Global X S&P 500® Tail Risk ETF |
| | | | |
| |
| | | Shares
| | | Value | |
| COMMON STOCK — continued | | | | | | |
| Energy — continued | | | | | | |
| Devon Energy | | | 60 | | | $ | 4,641 | |
| Diamondback Energy | | | 16 | | | | 2,514 | |
| EOG Resources | | | 52 | | | | 7,099 | |
| EQT . | | | 34 | | | | 1,423 | |
| Exxon Mobil | | | 383 | | | | 42,440 | |
| Halliburton . | | | 78 | | | | 2,841 | |
| Hess | | | 26 | | | | 3,668 | |
| Kinder Morgan | | | 172 | | | | 3,117 | |
| Marathon Oil . | | | 68 | | | | 2,071 | |
| Marathon Petroleum | | | 46 | | | | 5,227 | |
| Occidental Petroleum . | | | 68 | | | | 4,937 | |
| ONEOK | | | 39 | | | | 2,313 | |
| Phillips 66 . | | | 48 | | | | 5,006 | |
| Pioneer Natural Resources | | | 22 | | | | 5,641 | |
| Schlumberger | | | 139 | | | | 7,232 | |
| Targa Resources | | | 21 | | | | 1,436 | |
| Valero Energy . | | | 39 | | | | 4,896 | |
| Williams | | | 107 | | | | 3,502 | |
| | | | | | | | 160,720 | |
| Financials — 11.3% | | | | | | | | |
| Aflac | | | 52 | | | | 3,386 | |
| Allstate | | | 26 | | | | 3,282 | |
| American Express . | | | 55 | | | | 8,165 | |
| American International Group | | | 69 | | | | 3,933 | |
| Ameriprise Financial | | | 10 | | | | 3,091 | |
| Aon, Cl A . | | | 19 | | | | 5,348 | |
| Arch Capital Group * | | | 34 | | | | 1,955 | |
| Arthur J Gallagher | | | 21 | | | | 3,929 | |
| Assurant . | | | 4 | | | | 543 | |
| Bank of America | | | 642 | | | | 23,138 | |
| Bank of New York Mellon | | | 68 | | | | 2,863 | |
| Berkshire Hathaway, Cl B * | | | 166 | | | | 48,985 | |
| BlackRock, Cl A . | | | 14 | | | | 9,043 | |
| Brown & Brown . | | | 22 | | | | 1,293 | |
| Capital One Financial | | | 36 | | | | 3,817 | |
| Cboe Global Markets . | | | 9 | | | | 1,120 | |
| Charles Schwab . | | | 145 | | | | 11,552 | |
| Chubb . | | | 39 | | | | 8,381 | |
| Cincinnati Financial . | | | 13 | | | | 1,343 | |
|
|
|
| Schedule of Investments | | October 31, 2022 |
| Global X S&P 500® Tail Risk ETF |
| | | | |
| |
| | | Shares
| | | Value | |
| COMMON STOCK — continued | | | | | | |
| Financials — continued | | | | | | |
| Citigroup | | | 178 | | | $ | 8,163 | |
| Citizens Financial Group . | | | 39 | | | | 1,595 | |
| CME Group, Cl A . | | | 35 | | | | 6,065 | |
| Comerica | | | 13 | | | | 917 | |
| Discover Financial Services | | | 26 | | | | 2,716 | |
| Everest Re Group | | | 4 | | | | 1,291 | |
| FactSet Research Systems . | | | 3 | | | | 1,276 | |
| Fifth Third Bancorp | | | 65 | | | | 2,320 | |
| First Republic Bank . | | | 16 | | | | 1,922 | |
| Franklin Resources | | | 26 | | | | 610 | |
| Globe Life . | | | 8 | | | | 924 | |
| Goldman Sachs Group | | | 31 | | | | 10,680 | |
| Hartford Financial Services Group . | | | 26 | | | | 1,883 | |
| Huntington Bancshares | | | 130 | | | | 1,973 | |
| Intercontinental Exchange . | | | 49 | | | | 4,683 | |
| Invesco | | | 26 | | | | 398 | |
| JPMorgan Chase . | | | 270 | | | | 33,988 | |
| KeyCorp | | | 81 | | | | 1,447 | |
| Lincoln National . | | | 13 | | | | 700 | |
| Loews . | | | 13 | | | | 741 | |
| M&T Bank . | | | 17 | | | | 2,862 | |
| MarketAxess Holdings . | | | 3 | | | | 732 | |
| Marsh & McLennan . | | | 46 | | | | 7,429 | |
| MetLife . | | | 65 | | | | 4,759 | |
| Moody's . | | | 14 | | | | 3,708 | |
| Morgan Stanley | | | 123 | | | | 10,107 | |
| MSCI, Cl A | | | 7 | | | | 3,282 | |
| Nasdaq . | | | 27 | | | | 1,680 | |
| Northern Trust . | | | 18 | | | | 1,518 | |
| PNC Financial Services Group | | | 37 | | | | 5,988 | |
| Principal Financial Group | | | 26 | | | | 2,291 | |
| Progressive | | | 52 | | | | 6,677 | |
| Prudential Financial . | | | 38 | | | | 3,997 | |
| Raymond James Financial . | | | 18 | | | | 2,127 | |
| Regions Financial . | | | 81 | | | | 1,778 | |
| S&P Global . | | | 31 | | | | 9,959 | |
| Signature Bank NY . | | | 5 | | | | 793 | |
| State Street . | | | 32 | | | | 2,368 | |
| SVB Financial Group * | | | 5 | | | | 1,155 | |
|
|
|
| Schedule of Investments | | October 31, 2022 |
| Global X S&P 500® Tail Risk ETF |
| | | | |
| |
| | | Shares
| | | Value | |
| COMMON STOCK — continued | | | | | | |
| Financials — continued | | | | | | |
| Synchrony Financial | | | 44 | | | $ | 1,565 | |
| T Rowe Price Group | | | 18 | | | | 1,911 | |
| Travelers . | | | 21 | | | | 3,874 | |
| Truist Financial | | | 130 | | | | 5,823 | |
| US Bancorp . | | | 120 | | | | 5,094 | |
| W R Berkley | | | 19 | | | | 1,413 | |
| Wells Fargo . | | | 348 | | | | 16,005 | |
| Willis Towers Watson | | | 11 | | | | 2,400 | |
| Zions Bancorp . | | | 13 | | | | 675 | |
| | | | | | | | 341,429 | |
| Health Care — 15.2% | | | | | | | | |
| Abbott Laboratories . | | | 161 | | | | 15,929 | |
| AbbVie | | | 162 | | | | 23,717 | |
| ABIOMED * | | | 4 | | | | 1,008 | |
| Agilent Technologies | | | 26 | | | | 3,597 | |
| Align Technology * | | | 6 | | | | 1,166 | |
| AmerisourceBergen, Cl A . | | | 13 | | | | 2,044 | |
| Amgen . | | | 49 | | | | 13,247 | |
| Baxter International | | | 47 | | | | 2,554 | |
| Becton Dickinson | | | 26 | | | | 6,135 | |
| Biogen * | | | 13 | | | | 3,685 | |
| Bio-Rad Laboratories, Cl A * | | | 2 | | | | 703 | |
| Bio-Techne | | | 4 | | | | 1,185 | |
| Boston Scientific * | | | 130 | | | | 5,604 | |
| Bristol-Myers Squibb . | | | 196 | | | | 15,184 | |
| Cardinal Health | | | 26 | | | | 1,973 | |
| Catalent * | | | 19 | | | | 1,249 | |
| Centene * | | | 52 | | | | 4,427 | |
| Charles River Laboratories International * | | | 4 | | | | 849 | |
| Cigna . | | | 28 | | | | 9,046 | |
| Cooper . | | | 4 | | | | 1,094 | |
| CVS Health . | | | 121 | | | | 11,459 | |
| Danaher | | | 59 | | | | 14,849 | |
| DaVita * | | | 5 | | | | 365 | |
| DENTSPLY SIRONA . | | | 16 | | | | 493 | |
| Dexcom * | | | 36 | | | | 4,348 | |
| Edwards Lifesciences * | | | 56 | | | | 4,056 | |
| Elevance Health | | | 22 | | | | 12,029 | |
| Eli Lilly | | | 73 | | | | 26,433 | |
|
|
|
| Schedule of Investments | | October 31, 2022 |
| Global X S&P 500® Tail Risk ETF |
| | | | |
| |
| | | Shares
| | | Value | |
| COMMON STOCK — continued | | | | | | |
| Health Care — continued | | | | | | |
| Gilead Sciences | | | 115 | | | $ | 9,023 | |
| HCA Healthcare | | | 21 | | | | 4,567 | |
| Henry Schein * | | | 13 | | | | 890 | |
| Hologic * | | | 26 | | | | 1,763 | |
| Humana | | | 12 | | | | 6,697 | |
| IDEXX Laboratories * | | | 8 | | | | 2,877 | |
| Illumina * | | | 13 | | | | 2,975 | |
| Incyte * | | | 13 | | | | 966 | |
| Intuitive Surgical * | | | 33 | | | | 8,134 | |
| IQVIA Holdings * | | | 18 | | | | 3,774 | |
| Johnson & Johnson . | | | 244 | | | | 42,449 | |
| Laboratory Corp of America Holdings | | | 8 | | | | 1,775 | |
| McKesson | | | 13 | | | | 5,062 | |
| Medtronic | | | 122 | | | | 10,655 | |
| Merck . | | | 233 | | | | 23,580 | |
| Mettler-Toledo International * | | | 2 | | | | 2,530 | |
| Moderna * | | | 31 | | | | 4,660 | |
| Molina Healthcare * | | | 5 | | | | 1,794 | |
| Organon . | | | 26 | | | | 681 | |
| PerkinElmer | | | 11 | | | | 1,469 | |
| Pfizer | | | 516 | | | | 24,020 | |
| Quest Diagnostics . | | | 10 | | | | 1,436 | |
| Regeneron Pharmaceuticals * | | | 10 | | | | 7,487 | |
| ResMed | | | 13 | | | | 2,908 | |
| STERIS | | | 10 | | | | 1,726 | |
| Stryker . | | | 30 | | | | 6,877 | |
| Teleflex | | | 4 | | | | 858 | |
| Thermo Fisher Scientific | | | 36 | | | | 18,503 | |
| UnitedHealth Group | | | 86 | | | | 47,743 | |
| Universal Health Services, Cl B . | | | 8 | | | | 927 | |
| Vertex Pharmaceuticals * | | | 23 | | | | 7,176 | |
| Viatris * | | | 107 | | | | 1,084 | |
| Waters * | | | 5 | | | | 1,496 | |
| West Pharmaceutical Services | | | 7 | | | | 1,611 | |
| Zimmer Biomet Holdings . | | | 18 | | | | 2,040 | |
| Zoetis, Cl A . | | | 43 | | | | 6,484 | |
| | | | | | | | 457,125 | |
| Industrials — 8.2% | | | | | | | | |
| 3M | | | 52 | | | | 6,541 | |
|
|
|
| Schedule of Investments | | October 31, 2022 |
| Global X S&P 500® Tail Risk ETF |
| | | | | | |
| | | Shares
| | | Value | |
| COMMON STOCK — continued | | | | | | |
| Industrials — continued | | | | | | |
| A O Smith . | | | 13 | | | $ | 712 | |
| Alaska Air Group * | | | 13 | | | | 578 | |
| Allegion . | | | 9 | | | | 943 | |
| American Airlines Group * | | | 55 | | | | 780 | |
| AMETEK | | | 22 | | | | 2,853 | |
| Boeing * | | | 54 | | | | 7,696 | |
| Carrier Global | | | 79 | | | | 3,141 | |
| Caterpillar . | | | 48 | | | | 10,390 | |
| CH Robinson Worldwide | | | 13 | | | | 1,270 | |
| Cintas | | | 8 | | | | 3,420 | |
| Copart * | | | 21 | | | | 2,415 | |
| CoStar Group * | | | 36 | | | | 2,978 | |
| CSX | | | 198 | | | | 5,754 | |
| Cummins | | | 13 | | | | 3,179 | |
| Deere . | | | 26 | | | | 10,291 | |
| Delta Air Lines * | | | 55 | | | | 1,866 | |
| Dover | | | 13 | | | | 1,699 | |
| Eaton | | | 39 | | | | 5,853 | |
| Emerson Electric | | | 52 | | | | 4,503 | |
| Equifax . | | | 10 | | | | 1,695 | |
| Expeditors International of Washington . | | | 13 | | | | 1,272 | |
| Fastenal | | | 52 | | | | 2,513 | |
| FedEx . | | | 21 | | | | 3,366 | |
| Fortive . | | | 29 | | | | 1,853 | |
| Fortune Brands Home & Security . | | | 13 | | | | 784 | |
| Generac Holdings * | | | 5 | | | | 580 | |
| General Dynamics | | | 20 | | | | 4,996 | |
| General Electric . | | | 100 | | | | 7,781 | |
| Honeywell International . | | | 62 | | | | 12,649 | |
| Howmet Aerospace . | | | 39 | | | | 1,386 | |
| Huntington Ingalls Industries | | | 4 | | | | 1,028 | |
| IDEX . | | | 6 | | | | 1,334 | |
| Illinois Tool Works | | | 26 | | | | 5,552 | |
| Ingersoll Rand . | | | 39 | | | | 1,970 | |
| Jacobs Solutions . | | | 13 | | | | 1,498 | |
| JB Hunt Transport Services | | | 7 | | | | 1,198 | |
| Johnson Controls International | | | 65 | | | | 3,760 | |
| L3Harris Technologies . | | | 17 | | | | 4,190 | |
| Leidos Holdings | | | 13 | | | | 1,321 | |
|
|
|
| Schedule of Investments | | October 31, 2022 |
| Global X S&P 500® Tail Risk ETF |
| | | | | | |
| | | Shares
| | | Value | |
| COMMON STOCK — continued | | | | | | |
| Industrials — continued | | | | | | |
| Lockheed Martin | | | 22 | | | $ | 10,707 | |
| Masco . | | | 26 | | | | 1,203 | |
| Nordson . | | | 5 | | | | 1,125 | |
| Norfolk Southern . | | | 21 | | | | 4,789 | |
| Northrop Grumman | | | 13 | | | | 7,137 | |
| Old Dominion Freight Line | | | 9 | | | | 2,471 | |
| Otis Worldwide | | | 39 | | | | 2,755 | |
| PACCAR | | | 35 | | | | 3,389 | |
| Parker-Hannifin | | | 11 | | | | 3,197 | |
| Pentair | | | 13 | | | | 558 | |
| Quanta Services . | | | 13 | | | | 1,847 | |
| Raytheon Technologies | | | 136 | | | | 12,896 | |
| Republic Services, Cl A | | | 18 | | | | 2,387 | |
| Robert Half International | | | 9 | | | | 688 | |
| Rockwell Automation | | | 11 | | | | 2,808 | |
| Rollins . | | | 16 | | | | 673 | |
| Snap-On . | | | 5 | | | | 1,110 | |
| Southwest Airlines * | | | 52 | | | | 1,890 | |
| Stanley Black & Decker . | | | 13 | | | | 1,020 | |
| Textron | | | 16 | | | | 1,095 | |
| Trane Technologies . | | | 20 | | | | 3,193 | |
| TransDigm Group . | | | 5 | | | | 2,879 | |
| Union Pacific | | | 57 | | | | 11,237 | |
| United Airlines Holdings * | | | 26 | | | | 1,120 | |
| United Parcel Service, Cl B . | | | 67 | | | | 11,241 | |
| United Rentals * | | | 6 | | | | 1,894 | |
| Verisk Analytics, Cl A . | | | 13 | | | | 2,377 | |
| Waste Management . | | | 34 | | | | 5,385 | |
| Westinghouse Air Brake Technologies | | | 13 | | | | 1,213 | |
| WW Grainger . | | | 4 | | | | 2,337 | |
| Xylem . | | | 17 | | | | 1,741 | |
| | | | | | | | 245,950 | |
| Information Technology — 25.9% | | | | | | | | |
| Accenture, Cl A | | | 58 | | | | 16,466 | |
| Adobe * | | | 44 | | | | 14,014 | |
| Advanced Micro Devices * | | | 148 | | | | 8,889 | |
| Akamai Technologies * | | | 13 | | | | 1,148 | |
| Amphenol, Cl A . | | | 52 | | | | 3,943 | |
| Analog Devices | | | 48 | | | | 6,846 | |
|
|
|
| Schedule of Investments | | October 31, 2022 |
| Global X S&P 500® Tail Risk ETF |
| | | | |
| |
| | | Shares | | | Value | |
| COMMON STOCK — continued | | | | | | |
| Information Technology — continued | | | | | | |
| ANSYS * | | | 7 | | | $ | 1,548 | |
| Apple . | | | 1,390 | | | | 213,143 | |
| Applied Materials . | | | 80 | | | | 7,063 | |
| Arista Networks * | | | 20 | | | | 2,417 | |
| Autodesk * | | | 19 | | | | 4,072 | |
| Automatic Data Processing | | | 38 | | | | 9,185 | |
| Broadcom | | | 37 | | | | 17,394 | |
| Broadridge Financial Solutions . | | | 10 | | | | 1,501 | |
| Cadence Design Systems * | | | 26 | | | | 3,936 | |
| CDW | | | 13 | | | | 2,247 | |
| Ceridian HCM Holding * | | | 12 | | | | 794 | |
| Cisco Systems | | | 380 | | | | 17,263 | |
| Cognizant Technology Solutions, Cl A | | | 49 | | | | 3,050 | |
| Corning . | | | 65 | | | | 2,091 | |
| DXC Technology * | | | 26 | | | | 747 | |
| Enphase Energy * | | | 13 | | | | 3,991 | |
| EPAM Systems * | | | 5 | | | | 1,750 | |
| F5 * | | | 4 | | | | 572 | |
| Fidelity National Information Services . | | | 60 | | | | 4,979 | |
| Fiserv * | | | 59 | | | | 6,062 | |
| FleetCor Technologies * | | | 7 | | | | 1,303 | |
| Fortinet * | | | 60 | | | | 3,430 | |
| Gartner * | | | 8 | | | | 2,415 | |
| Global Payments | | | 26 | | | | 2,971 | |
| Hewlett Packard Enterprise | | | 117 | | | | 1,670 | |
| HP | | | 92 | | | | 2,541 | |
| Intel . | | | 389 | | | | 11,059 | |
| International Business Machines . | | | 86 | | | | 11,893 | |
| Intuit . | | | 26 | | | | 11,115 | |
| Jack Henry & Associates . | | | 8 | | | | 1,592 | |
| Juniper Networks . | | | 26 | | | | 796 | |
| Keysight Technologies * | | | 16 | | | | 2,786 | |
| KLA | | | 13 | | | | 4,114 | |
| Lam Research | | | 13 | | | | 5,262 | |
| Mastercard, Cl A . | | | 78 | | | | 25,598 | |
| Microchip Technology | | | 52 | | | | 3,210 | |
| Micron Technology . | | | 109 | | | | 5,897 | |
| Microsoft | | | 686 | | | | 159,241 | |
| Monolithic Power Systems . | | | 4 | | | | 1,358 | |
|
|
|
| Schedule of Investments | | October 31, 2022 |
| Global X S&P 500® Tail Risk ETF |
| | | | |
| |
| | | Shares
| | | Value | |
| COMMON STOCK — continued | | | | | | |
| Information Technology — continued | | | | | | |
| Motorola Solutions | | | 15 | | | $ | 3,746 | |
| NetApp . | | | 22 | | | | 1,524 | |
| NortonLifeLock | | | 52 | | | | 1,172 | |
| NVIDIA . | | | 230 | | | | 31,043 | |
| ON Semiconductor * | | | 45 | | | | 2,764 | |
| Oracle . | | | 139 | | | | 10,852 | |
| Paychex | | | 32 | | | | 3,786 | |
| Paycom Software * | | | 4 | | | | 1,384 | |
| PayPal Holdings * | | | 106 | | | | 8,859 | |
| PTC * | | | 9 | | | | 1,060 | |
| Qorvo * | | | 9 | | | | 775 | |
| QUALCOMM . | | | 103 | | | | 12,119 | |
| Roper Technologies | | | 9 | | | | 3,731 | |
| Salesforce * | | | 94 | | | | 15,283 | |
| Seagate Technology Holdings . | | | 18 | | | | 894 | |
| ServiceNow * | | | 19 | | | | 7,994 | |
| Skyworks Solutions | | | 13 | | | | 1,118 | |
| SolarEdge Technologies * | | | 4 | | | | 920 | |
| Synopsys * | | | 15 | | | | 4,388 | |
| Teledyne Technologies * | | | 4 | | | | 1,592 | |
| Teradyne . | | | 13 | | | | 1,058 | |
| Texas Instruments . | | | 84 | | | | 13,493 | |
| Trimble * | | | 26 | | | | 1,564 | |
| Tyler Technologies * | | | 3 | | | | 970 | |
| VeriSign * | | | 10 | | | | 2,005 | |
| Visa, Cl A . | | | 150 | | | | 31,074 | |
| Western Digital * | | | 26 | | | | 894 | |
| Zebra Technologies, Cl A * | | | 4 | | | | 1,133 | |
| | | | | | | | 780,557 | |
| Materials — 2.1% | | | | | | | | |
| Air Products & Chemicals . | | | 22 | | | | 5,509 | |
| Albemarle | | | 12 | | | | 3,358 | |
| Amcor | | | 133 | | | | 1,540 | |
| Avery Dennison . | | | 9 | | | | 1,526 | |
| Ball | | | 26 | | | | 1,284 | |
| Celanese, Cl A . | | | 8 | | | | 769 | |
| CF Industries Holdings | | | 16 | | | | 1,700 | |
| Corteva . | | | 65 | | | | 4,247 | |
| Dow | | | 65 | | | | 3,038 | |
|
|
|
| Schedule of Investments | | October 31, 2022 |
| Global X S&P 500® Tail Risk ETF |
| | | | |
| |
| | | Shares
| | | Value | |
| COMMON STOCK — continued | | | | | | |
| Materials — continued | | | | | | |
| DuPont de Nemours . | | | 45 | | | $ | 2,574 | |
| Eastman Chemical . | | | 13 | | | | 998 | |
| Ecolab | | | 22 | | | | 3,455 | |
| FMC . | | | 13 | | | | 1,546 | |
| Freeport-McMoRan . | | | 130 | | | | 4,120 | |
| International Flavors & Fragrances | | | 22 | | | | 2,147 | |
| International Paper . | | | 39 | | | | 1,311 | |
| LyondellBasell Industries, Cl A | | | 26 | | | | 1,988 | |
| Martin Marietta Materials | | | 6 | | | | 2,016 | |
| Mosaic . | | | 33 | | | | 1,774 | |
| Newmont | | | 78 | | | | 3,301 | |
| Nucor | | | 26 | | | | 3,416 | |
| Packaging Corp of America . | | | 10 | | | | 1,202 | |
| PPG Industries | | | 23 | | | | 2,626 | |
| Sealed Air | | | 13 | | | | 619 | |
| Sherwin-Williams . | | | 23 | | | | 5,176 | |
| Vulcan Materials | | | 13 | | | | 2,128 | |
| Westrock . | | | 26 | | | | 886 | |
| | | | | | | | 64,254 | |
| Real Estate — 2.6% | | | | | | | | |
| Alexandria Real Estate Equities ‡ | | | 13 | | | | 1,889 | |
| American Tower ‡ | | | 42 | | | | 8,702 | |
| AvalonBay Communities ‡ | | | 13 | | | | 2,277 | |
| Boston Properties ‡ | | | 13 | | | | 945 | |
| Camden Property Trust ‡ | | | 10 | | | | 1,155 | |
| CBRE Group, Cl A * | | | 26 | | | | 1,844 | |
| Crown Castle | | | 39 | | | | 5,197 | |
| Digital Realty Trust ‡ | | | 26 | | | | 2,606 | |
| Equinix . | | | 8 | | | | 4,531 | |
| Equity Residential ‡ | | | 35 | | | | 2,206 | |
| Essex Property Trust ‡ | | | 5 | | | | 1,111 | |
| Extra Space Storage ‡ | | | 13 | | | | 2,307 | |
| Federal Realty Investment Trust ‡ | | | 5 | | | | 495 | |
| Healthpeak Properties ‡ | | | 52 | | | | 1,234 | |
| Host Hotels & Resorts ‡ | | | 65 | | | | 1,227 | |
| Invitation Homes ‡ | | | 53 | | | | 1,680 | |
| Iron Mountain ‡ | | | 26 | | | | 1,302 | |
| Kimco Realty ‡ | | | 52 | | | | 1,112 | |
| Mid-America Apartment Communities ‡ | | | 9 | | | | 1,417 | |
|
|
|
| Schedule of Investments | | October 31, 2022 |
| Global X S&P 500® Tail Risk ETF |
| | | | |
| |
| | | Shares
| | | Value | |
| COMMON STOCK — continued | | | | | | |
| Real Estate — continued | | | | | | |
| ProLogis ‡ | | | 88 | | | $ | 9,746 | |
| Public Storage ‡ | | | 15 | | | | 4,646 | |
| Realty Income ‡ | | | 51 | | | | 3,176 | |
| Regency Centers ‡ | | | 13 | | | | 787 | |
| SBA Communications, Cl A | | | 9 | | | | 2,429 | |
| Simon Property Group ‡ | | | 33 | | | | 3,596 | |
| UDR ‡ | | | 26 | | | | 1,034 | |
| Ventas ‡ | | | 42 | | | | 1,643 | |
| VICI Properties ‡ | | | 99 | | | | 3,170 | |
| Vornado Realty Trust ‡ | | | 13 | | | | 307 | |
| Welltower ‡ | | | 39 | | | | 2,381 | |
| Weyerhaeuser ‡ | | | 65 | | | | 2,010 | |
| | | | | | | | 78,162 | |
| Utilities — 2.9% | | | | | | | | |
| AES . | | | 55 | | | | 1,439 | |
| Alliant Energy . | | | 26 | | | | 1,356 | |
| Ameren . | | | 26 | | | | 2,119 | |
| American Electric Power | | | 47 | | | | 4,132 | |
| American Water Works | | | 16 | | | | 2,325 | |
| Atmos Energy | | | 13 | | | | 1,385 | |
| CenterPoint Energy . | | | 52 | | | | 1,488 | |
| CMS Energy | | | 26 | | | | 1,483 | |
| Consolidated Edison | | | 31 | | | | 2,727 | |
| Constellation Energy . | | | 30 | | | | 2,836 | |
| Dominion Energy | | | 75 | | | | 5,248 | |
| DTE Energy . | | | 17 | | | | 1,906 | |
| Duke Energy | | | 71 | | | | 6,616 | |
| Edison International . | | | 40 | | | | 2,402 | |
| Entergy | | | 17 | | | | 1,821 | |
| Evergy | | | 19 | | | | 1,161 | |
| Eversource Energy . | | | 31 | | | | 2,365 | |
| Exelon | | | 90 | | | | 3,473 | |
| FirstEnergy | | | 52 | | | | 1,961 | |
| NextEra Energy . | | | 180 | | | | 13,950 | |
| NiSource . | | | 39 | | | | 1,002 | |
| NRG Energy | | | 26 | | | | 1,154 | |
| PG&E * | | | 148 | | | | 2,210 | |
| Pinnacle West Capital | | | 13 | | | | 874 | |
| PPL | | | 65 | | | | 1,722 | |
|
|
|
| Schedule of Investments | | October 31, 2022 |
| Global X S&P 500® Tail Risk ETF |
| | | | | | |
| | | Shares
| | | Value | |
| COMMON STOCK — continued | | | | | | |
| Utilities — continued | | | | | | |
| Public Service Enterprise Group . | | | 42 | | | $ | 2,355 | |
| Sempra Energy . | | | 31 | | | | 4,679 | |
| Southern | | | 97 | | | | 6,352 | |
| WEC Energy Group . | | | 26 | | | | 2,375 | |
| Xcel Energy | | | 52 | | | | 3,386 | |
| | | | | | | | 88,302 | |
| TOTAL UNITED STATES | | | | | | | 2,971,210 | |
| TOTAL COMMON STOCK | | | | | | | | |
| (Cost $3,402,408) | | | | | | | 2,992,231 | |
| PURCHASED OPTIONS — 0.7% | | | | | | | | |
| (Cost $54,657) | | | | | | | 20,828 | |
| TOTAL INVESTMENTS — 99.9% | | | | | | | | |
| (Cost $3,457,065) | | | | | | $ | 3,013,059 | |
Percentages are based on Net Assets of $3,017,408.
A list of the exchange traded option contracts held by the Fund at October 31, 2022, is as follows:
| Description | | Number of Contracts | | | Notional Amount | | | Exercise Price | | Expiration Date | | Value | |
| PURCHASED OPTIONS — 0.7% | | | | | | | | | | | | | |
| Put Options | | | | | | | | | | | | | |
| Mini-SPX Index | | | 7 | | | $ | 242,900 | | | $ | 347.00 | | 12/16/22 | | $ | 1,928 | |
| S&P 500 Index | | | 7 | | | | 2,429,000 | | | | 3,470.00 | | 12/16/22 | | | 18,900 | |
| | | | | | | | | | | | | | | | | | |
| Total Purchased Options | | | | | | $ | 2,671,900 | | | | | | | | $ | 20,828 | |
* Non-income producing security.
‡ Real Estate Investment Trust
(A) All or a portion of these securities has been segregated as collateral for options contracts. The aggregate market value of collateral at October 31, 2022 was $2,992,231.
|
|
|
| Schedule of Investments | | October 31, 2022 |
| Global X S&P 500® Tail Risk ETF |
The following is a summary of the level of inputs used as of October 31, 2022, in valuing the Fund's investments carried at value:
| Investments in Securities | | Level 1 | | | Level 2 | | | Level 3 | | | Total | |
| Common Stock | | $ | 2,992,231 | | | $ | — | | | $ | — | | | $ | 2,992,231 | |
| Purchased Options | | | 20,828 | | | | — | | | | — | | | | 20,828 | |
| Total Investments in Securities | | $ | 3,013,059 | | | $ | — | | | $ | — | | | $ | 3,013,059 | |
Amounts designated as “—“ are $0 or have been rounded to $0.
See "Glossary" for abbreviations.
|
|
|
| Schedule of Investments | | October 31, 2022 |
| Global X S&P 500® Risk Managed Income ETF |

| | | | |
| |
| | | Shares | | | Value | |
| COMMON STOCK — 105.7%(A) | | | | | | |
| CHINA — 0.1% | | | | | | |
| Information Technology — 0.1% | | | | | | |
| NXP Semiconductors . | | | 216 | | | $ | 31,553 | |
| SWITZERLAND — 0.1% | | | | | | | | |
| Information Technology — 0.1% | | | | | | | | |
| TE Connectivity | | | 257 | | | | 31,413 | |
| UNITED KINGDOM — 0.5% | | | | | | | | |
| Materials — 0.5% | | | | | | | | |
| Linde | | | 393 | | | | 116,859 | |
| UNITED STATES — 105.0% | | | | | | | | |
| Communication Services — 7.8% | | | | | | | | |
| Activision Blizzard . | | | 547 | | | | 39,822 | |
| Alphabet, Cl A * | | | 4,810 | | | | 454,593 | |
| Alphabet, Cl C * | | | 4,302 | | | | 407,227 | |
| AT&T | | | 5,622 | | | | 102,489 | |
| Charter Communications, Cl A * | | | 86 | | | | 31,615 | |
| Comcast, Cl A | | | 3,474 | | | | 110,265 | |
| DISH Network, Cl A * | | | 234 | | | | 3,489 | |
|
|
|
| Schedule of Investments | | October 31, 2022 |
| Global X S&P 500® Risk Managed Income ETF |
| | | | |
| |
| | | Shares | | | Value | |
| COMMON STOCK — continued | | | | | | |
| Communication Services — continued | | | | | | |
| Electronic Arts | | | 234 | | | $ | 29,475 | |
| Fox, Cl A | | | 234 | | | | 6,756 | |
| Fox, Cl B | | | 117 | | | | 3,182 | |
| Interpublic Group | | | 351 | | | | 10,456 | |
| Live Nation Entertainment * | | | 117 | | | | 9,314 | |
| Lumen Technologies . | | | 749 | | | | 5,513 | |
| Match Group * | | | 234 | | | | 10,109 | |
| Meta Platforms, Cl A * | | | 1,833 | | | | 170,762 | |
| Netflix * | | | 351 | | | | 102,450 | |
| News, Cl A . | | | 330 | | | | 5,567 | |
| News, Cl B . | | | 117 | | | | 2,004 | |
| Omnicom Group . | | | 134 | | | | 9,749 | |
| Paramount Global, Cl B | | | 468 | | | | 8,574 | |
| Take-Two Interactive Software * | | | 126 | | | | 14,928 | |
| T-Mobile US * | | | 475 | | | | 71,991 | |
| Verizon Communications | | | 3,312 | | | | 123,769 | |
| Walt Disney * | | | 1,468 | | | | 156,401 | |
| Warner Bros Discovery * | | | 1,855 | | | | 24,115 | |
| | | | | | | | 1,914,615 | |
| Consumer Discretionary — 11.5% | | | | | | | | |
| Advance Auto Parts | | | 53 | | | | 10,066 | |
| Amazon.com * | | | 7,105 | | | | 727,836 | |
| Aptiv * | | | 234 | | | | 21,310 | |
| AutoZone * | | | 15 | | | | 37,993 | |
| Bath & Body Works . | | | 235 | | | | 7,844 | |
| Best Buy | | | 161 | | | | 11,014 | |
| Booking Holdings * | | | 32 | | | | 59,823 | |
| BorgWarner . | | | 234 | | | | 8,782 | |
| Caesars Entertainment * | | | 130 | | | | 5,685 | |
| CarMax * | | | 117 | | | | 7,372 | |
| Carnival * | | | 632 | | | | 5,726 | |
| Chipotle Mexican Grill, Cl A * | | | 21 | | | | 31,465 | |
| Darden Restaurants . | | | 105 | | | | 15,030 | |
| Dollar General . | | | 185 | | | | 47,184 | |
| Dollar Tree * | | | 164 | | | | 25,994 | |
| Domino's Pizza . | | | 24 | | | | 7,974 | |
| DR Horton | | | 267 | | | | 20,527 | |
| eBay | | | 489 | | | | 19,482 | |
| Etsy * | | | 111 | | | | 10,424 | |
|
|
|
| Schedule of Investments | | October 31, 2022 |
| Global X S&P 500® Risk Managed Income ETF |
| | | | |
| |
| | | Shares | | | Value | |
| COMMON STOCK — continued | | | | | | |
| Consumer Discretionary — continued | | | | | | |
| Expedia Group * | | | 117 | | | $ | 10,936 | |
| Ford Motor . | | | 3,120 | | | | 41,714 | |
| Garmin | | | 117 | | | | 10,301 | |
| General Motors | | | 1,169 | | | | 45,883 | |
| Genuine Parts . | | | 117 | | | | 20,810 | |
| Hasbro . | | | 117 | | | | 7,634 | |
| Hilton Worldwide Holdings . | | | 225 | | | | 30,434 | |
| Home Depot . | | | 826 | | | | 244,603 | |
| Las Vegas Sands * | | | 230 | | | | 8,742 | |
| Lennar, Cl A . | | | 216 | | | | 17,431 | |
| LKQ | | | 234 | | | | 13,020 | |
| Lowe's | | | 516 | | | | 100,594 | |
| Marriott International, Cl A | | | 218 | | | | 34,904 | |
| McDonald's . | | | 592 | | | | 161,415 | |
| MGM Resorts International . | | | 271 | | | | 9,639 | |
| Mohawk Industries * | | | 23 | | | | 2,179 | |
| Newell Brands . | | | 320 | | | | 4,419 | |
| NIKE, Cl B | | | 997 | | | | 92,402 | |
| Norwegian Cruise Line Holdings * | | | 333 | | | | 5,624 | |
| NVR * | | | 2 | | | | 8,476 | |
| O'Reilly Automotive * | | | 52 | | | | 43,533 | |
| Pool . | | | 27 | | | | 8,214 | |
| PulteGroup . | | | 202 | | | | 8,078 | |
| Ralph Lauren, Cl A . | | | 31 | | | | 2,873 | |
| Ross Stores | | | 274 | | | | 26,219 | |
| Royal Caribbean Cruises * | | | 208 | | | | 11,103 | |
| Starbucks | | | 906 | | | | 78,451 | |
| Tapestry . | | | 234 | | | | 7,413 | |
| Target | | | 366 | | | | 60,116 | |
| Tesla * | | | 2,137 | | | | 486,253 | |
| TJX | | | 925 | | | | 66,693 | |
| Tractor Supply . | | | 98 | | | | 21,537 | |
| Ulta Beauty * | | | 43 | | | | 18,033 | |
| VF . | | | 234 | | | | 6,611 | |
| Whirlpool | | | 34 | | | | 4,700 | |
| Wynn Resorts * | | | 91 | | | | 5,815 | |
| Yum! Brands | | | 234 | | | | 27,671 | |
| | | | | | | | 2,836,004 | |
|
|
|
| Schedule of Investments | | October 31, 2022 |
| Global X S&P 500® Risk Managed Income ETF |
| | | | |
| |
| | | Shares | | | Value | |
| COMMON STOCK — continued | | | | | | |
| Consumer Staples — 7.4% | | | | | | |
| Altria Group . | | | 1,421 | | | $ | 65,750 | |
| Archer-Daniels-Midland | | | 457 | | | | 44,320 | |
| Brown-Forman, Cl B | | | 149 | | | | 10,132 | |
| Campbell Soup . | | | 162 | | | | 8,571 | |
| Church & Dwight | | | 207 | | | | 15,345 | |
| Clorox | | | 104 | | | | 15,188 | |
| Coca-Cola . | | | 3,131 | | | | 187,390 | |
| Colgate-Palmolive | | | 659 | | | | 48,661 | |
| Conagra Brands . | | | 347 | | | | 12,735 | |
| Constellation Brands, Cl A | | | 129 | | | | 31,873 | |
| Costco Wholesale | | | 356 | | | | 178,534 | |
| Estee Lauder, Cl A . | | | 189 | | | | 37,893 | |
| General Mills | | | 488 | | | | 39,811 | |
| Hershey | | | 117 | | | | 27,936 | |
| Hormel Foods | | | 234 | | | | 10,869 | |
| J M Smucker . | | | 99 | | | | 14,915 | |
| Kellogg | | | 213 | | | | 16,363 | |
| Keurig Dr Pepper | | | 626 | | | | 24,314 | |
| Kimberly-Clark | | | 266 | | | | 33,106 | |
| Kraft Heinz | | | 659 | | | | 25,352 | |
| Kroger | | | 527 | | | | 24,922 | |
| Lamb Weston Holdings . | | | 117 | | | | 10,088 | |
| McCormick . | | | 211 | | | | 16,593 | |
| Molson Coors Beverage, Cl B | | | 117 | | | | 5,900 | |
| Mondelez International, Cl A . | | | 1,082 | | | | 66,521 | |
| Monster Beverage * | | | 306 | | | | 28,678 | |
| PepsiCo | | | 1,110 | | | | 201,554 | |
| Philip Morris International | | | 1,222 | | | | 112,241 | |
| Procter & Gamble . | | | 1,920 | | | | 258,566 | |
| Sysco . | | | 408 | | | | 35,316 | |
| Tyson Foods, Cl A | | | 234 | | | | 15,994 | |
| Walgreens Boots Alliance | | | 585 | | | | 21,353 | |
| Walmart | | | 1,147 | | | | 163,253 | |
| | | | | | | | 1,810,037 | |
| Energy — 5.7% | | | | | | | | |
| APA . | | | 268 | | | | 12,183 | |
| Baker Hughes, Cl A | | | 788 | | | | 21,796 | |
| Chevron . | | | 1,447 | | | | 261,762 | |
| ConocoPhillips . | | | 1,005 | | | | 126,721 | |
|
|
|
| Schedule of Investments | | October 31, 2022 |
| Global X S&P 500® Risk Managed Income ETF |
| | | | |
| |
| | | Shares | | | Value | |
| COMMON STOCK — continued | | | | | | |
| Energy — continued | | | | | | |
| Coterra Energy | | | 661 | | | $ | 20,577 | |
| Devon Energy | | | 535 | | | | 41,382 | |
| Diamondback Energy | | | 131 | | | | 20,581 | |
| EOG Resources | | | 463 | | | | 63,209 | |
| EQT . | | | 287 | | | | 12,008 | |
| Exxon Mobil | | | 3,345 | | | | 370,659 | |
| Halliburton . | | | 698 | | | | 25,421 | |
| Hess | | | 234 | | | | 33,013 | |
| Kinder Morgan | | | 1,523 | | | | 27,597 | |
| Marathon Oil . | | | 607 | | | | 18,483 | |
| Marathon Petroleum | | | 392 | | | | 44,539 | |
| Occidental Petroleum . | | | 630 | | | | 45,738 | |
| ONEOK | | | 351 | | | | 20,821 | |
| Phillips 66 . | | | 380 | | | | 39,630 | |
| Pioneer Natural Resources | | | 189 | | | | 48,462 | |
| Schlumberger | | | 1,141 | | | | 59,366 | |
| Targa Resources | | | 177 | | | | 12,102 | |
| Valero Energy . | | | 321 | | | | 40,302 | |
| Williams | | | 963 | | | | 31,519 | |
| | | | | | | | 1,397,871 | |
| Financials — 12.1% | | | | | | | | |
| Aflac | | | 468 | | | | 30,471 | |
| Allstate | | | 200 | | | | 25,250 | |
| American Express . | | | 473 | | | | 70,217 | |
| American International Group | | | 640 | | | | 36,480 | |
| Ameriprise Financial | | | 92 | | | | 28,439 | |
| Aon, Cl A . | | | 172 | | | | 48,416 | |
| Arch Capital Group * | | | 295 | | | | 16,963 | |
| Arthur J Gallagher | | | 158 | | | | 29,559 | |
| Assurant . | | | 48 | | | | 6,521 | |
| Bank of America | | | 5,621 | | | | 202,581 | |
| Bank of New York Mellon | | | 605 | | | | 25,477 | |
| Berkshire Hathaway, Cl B * | | | 1,448 | | | | 427,290 | |
| BlackRock, Cl A . | | | 119 | | | | 76,863 | |
| Brown & Brown . | | | 178 | | | | 10,465 | |
| Capital One Financial | | | 289 | | | | 30,640 | |
| Cboe Global Markets . | | | 102 | | | | 12,699 | |
| Charles Schwab . | | | 1,204 | | | | 95,923 | |
| Chubb . | | | 330 | | | | 70,914 | |
|
|
|
| Schedule of Investments | | October 31, 2022 |
| Global X S&P 500® Risk Managed Income ETF |
| | | | |
| |
| | | Shares | | | Value | |
| COMMON STOCK — continued | | | | | | |
| Financials — continued | | | | | | |
| Cincinnati Financial . | | | 117 | | | $ | 12,088 | |
| Citigroup | | | 1,528 | | | | 70,074 | |
| Citizens Financial Group . | | | 348 | | | | 14,233 | |
| CME Group, Cl A . | | | 292 | | | | 50,604 | |
| Comerica | | | 117 | | | | 8,249 | |
| Discover Financial Services | | | 234 | | | | 24,444 | |
| Everest Re Group | | | 27 | | | | 8,712 | |
| FactSet Research Systems . | | | 26 | | | | 11,063 | |
| Fifth Third Bancorp | | | 564 | | | | 20,129 | |
| First Republic Bank . | | | 139 | | | | 16,694 | |
| Franklin Resources | | | 234 | | | | 5,487 | |
| Globe Life . | | | 87 | | | | 10,050 | |
| Goldman Sachs Group | | | 269 | | | | 92,673 | |
| Hartford Financial Services Group . | | | 273 | | | | 19,768 | |
| Huntington Bancshares | | | 1,145 | | | | 17,381 | |
| Intercontinental Exchange . | | | 441 | | | | 42,146 | |
| Invesco | | | 234 | | | | 3,585 | |
| JPMorgan Chase . | | | 2,355 | | | | 296,447 | |
| KeyCorp | | | 726 | | | | 12,974 | |
| Lincoln National . | | | 117 | | | | 6,303 | |
| Loews . | | | 157 | | | | 8,952 | |
| M&T Bank . | | | 137 | | | | 23,067 | |
| MarketAxess Holdings . | | | 26 | | | | 6,345 | |
| Marsh & McLennan . | | | 405 | | | | 65,403 | |
| MetLife . | | | 530 | | | | 38,801 | |
| Moody's . | | | 128 | | | | 33,903 | |
| Morgan Stanley | | | 1,082 | | | | 88,908 | |
| MSCI, Cl A | | | 66 | | | | 30,945 | |
| Nasdaq . | | | 297 | | | | 18,485 | |
| Northern Trust . | | | 162 | | | | 13,665 | |
| PNC Financial Services Group | | | 324 | | | | 52,433 | |
| Principal Financial Group | | | 202 | | | | 17,802 | |
| Progressive | | | 462 | | | | 59,321 | |
| Prudential Financial . | | | 297 | | | | 31,241 | |
| Raymond James Financial . | | | 157 | | | | 18,548 | |
| Regions Financial . | | | 726 | | | | 15,936 | |
| S&P Global . | | | 275 | | | | 88,344 | |
| Signature Bank NY . | | | 43 | | | | 6,817 | |
| State Street . | | | 302 | | | | 22,348 | |
|
|
|
| Schedule of Investments | | October 31, 2022 |
| Global X S&P 500® Risk Managed Income ETF |
| | | | |
| |
| | | Shares | | | Value | |
| COMMON STOCK — continued | | | | | | |
| Financials — continued | | | | | | |
| SVB Financial Group * | | | 46 | | | $ | 10,624 | |
| Synchrony Financial | | | 400 | | | | 14,224 | |
| T Rowe Price Group | | | 177 | | | | 18,790 | |
| Travelers . | | | 194 | | | | 35,785 | |
| Truist Financial | | | 1,047 | | | | 46,895 | |
| US Bancorp . | | | 1,068 | | | | 45,337 | |
| W R Berkley | | | 157 | | | | 11,678 | |
| Wells Fargo . | | | 2,992 | | | | 137,602 | |
| Willis Towers Watson | | | 97 | | | | 21,166 | |
| Zions Bancorp . | | | 117 | | | | 6,077 | |
| | | | | | | | 2,977,714 | |
| Health Care — 16.1% | | | | | | | | |
| Abbott Laboratories . | | | 1,381 | | | | 136,636 | |
| AbbVie | | | 1,421 | | | | 208,034 | |
| ABIOMED * | | | 31 | | | | 7,814 | |
| Agilent Technologies | | | 236 | | | | 32,651 | |
| Align Technology * | | | 53 | | | | 10,298 | |
| AmerisourceBergen, Cl A . | | | 117 | | | | 18,395 | |
| Amgen . | | | 422 | | | | 114,088 | |
| Baxter International | | | 404 | | | | 21,957 | |
| Becton Dickinson | | | 225 | | | | 53,093 | |
| Biogen * | | | 117 | | | | 33,162 | |
| Bio-Rad Laboratories, Cl A * | | | 13 | | | | 4,572 | |
| Bio-Techne | | | 27 | | | | 7,999 | |
| Boston Scientific * | | | 1,147 | | | | 49,447 | |
| Bristol-Myers Squibb . | | | 1,684 | | | | 130,459 | |
| Cardinal Health | | | 234 | | | | 17,761 | |
| Catalent * | | | 147 | | | | 9,662 | |
| Centene * | | | 431 | | | | 36,691 | |
| Charles River Laboratories International * | | | 45 | | | | 9,551 | |
| Cigna . | | | 241 | | | | 77,857 | |
| Cooper . | | | 33 | | | | 9,022 | |
| CVS Health . | | | 1,036 | | | | 98,109 | |
| Danaher | | | 516 | | | | 129,862 | |
| DaVita * | | | 24 | | | | 1,752 | |
| DENTSPLY SIRONA . | | | 141 | | | | 4,346 | |
| Dexcom * | | | 315 | | | | 38,046 | |
| Edwards Lifesciences * | | | 500 | | | | 36,215 | |
| Elevance Health | | | 194 | | | | 106,073 | |
|
|
|
| Schedule of Investments | | October 31, 2022 |
| Global X S&P 500® Risk Managed Income ETF |
| | | | |
| |
| | | Shares | | | Value | |
| COMMON STOCK — continued | | | | | | |
| Health Care — continued | | | | | | |
| Eli Lilly | | | 634 | | | $ | 229,565 | |
| Gilead Sciences | | | 989 | | | | 77,597 | |
| HCA Healthcare | | | 175 | | | | 38,057 | |
| Henry Schein * | | | 117 | | | | 8,010 | |
| Hologic * | | | 210 | | | | 14,238 | |
| Humana | | | 103 | | | | 57,482 | |
| IDEXX Laboratories * | | | 61 | | | | 21,940 | |
| Illumina * | | | 126 | | | | 28,831 | |
| Incyte * | | | 153 | | | | 11,374 | |
| Intuitive Surgical * | | | 289 | | | | 71,230 | |
| IQVIA Holdings * | | | 146 | | | | 30,612 | |
| Johnson & Johnson . | | | 2,110 | | | | 367,077 | |
| Laboratory Corp of America Holdings | | | 81 | | | | 17,971 | |
| McKesson | | | 117 | | | | 45,556 | |
| Medtronic | | | 1,048 | | | | 91,532 | |
| Merck . | | | 2,037 | | | | 206,144 | |
| Mettler-Toledo International * | | | 18 | | | | 22,769 | |
| Moderna * | | | 272 | | | | 40,890 | |
| Molina Healthcare * | | | 46 | | | | 16,508 | |
| Organon . | | | 234 | | | | 6,126 | |
| PerkinElmer | | | 107 | | | | 14,293 | |
| Pfizer | | | 4,512 | | | | 210,034 | |
| Quest Diagnostics . | | | 101 | | | | 14,509 | |
| Regeneron Pharmaceuticals * | | | 83 | | | | 62,146 | |
| ResMed | | | 117 | | | | 26,172 | |
| STERIS | | | 84 | | | | 14,497 | |
| Stryker . | | | 266 | | | | 60,978 | |
| Teleflex | | | 32 | | | | 6,866 | |
| Thermo Fisher Scientific | | | 315 | | | | 161,901 | |
| UnitedHealth Group | | | 751 | | | | 416,918 | |
| Universal Health Services, Cl B . | | | 46 | | | | 5,330 | |
| Vertex Pharmaceuticals * | | | 203 | | | | 63,336 | |
| Viatris * | | | 960 | | | | 9,725 | |
| Waters * | | | 51 | | | | 15,258 | |
| West Pharmaceutical Services | | | 51 | | | | 11,735 | |
| Zimmer Biomet Holdings . | | | 163 | | | | 18,476 | |
| Zoetis, Cl A . | | | 369 | | | | 55,638 | |
| | | | | | | | 3,974,873 | |
|
|
|
| Schedule of Investments | | October 31, 2022 |
| Global X S&P 500® Risk Managed Income ETF |
| | | | |
| |
| | | Shares | | | Value | |
| COMMON STOCK — continued | | | | | | |
| Industrials — 8.7% | | | | | | |
| 3M | | | 450 | | | $ | 56,605 | |
| A O Smith . | | | 117 | | | | 6,409 | |
| Alaska Air Group * | | | 117 | | | | 5,202 | |
| Allegion . | | | 82 | | | | 8,591 | |
| American Airlines Group * | | | 492 | | | | 6,977 | |
| AMETEK | | | 179 | | | | 23,209 | |
| Boeing * | | | 441 | | | | 62,847 | |
| Carrier Global | | | 683 | | | | 27,156 | |
| Caterpillar . | | | 427 | | | | 92,428 | |
| CH Robinson Worldwide | | | 117 | | | | 11,433 | |
| Cintas | | | 71 | | | | 30,356 | |
| Copart * | | | 173 | | | | 19,898 | |
| CoStar Group * | | | 314 | | | | 25,974 | |
| CSX | | | 1,690 | | | | 49,111 | |
| Cummins | | | 117 | | | | 28,608 | |
| Deere . | | | 220 | | | | 87,080 | |
| Delta Air Lines * | | | 492 | | | | 16,694 | |
| Dover | | | 117 | | | | 15,291 | |
| Eaton | | | 324 | | | | 48,623 | |
| Emerson Electric | | | 483 | | | | 41,828 | |
| Equifax . | | | 88 | | | | 14,920 | |
| Expeditors International of Washington . | | | 139 | | | | 13,601 | |
| Fastenal | | | 468 | | | | 22,618 | |
| FedEx . | | | 196 | | | | 31,415 | |
| Fortive . | | | 296 | | | | 18,914 | |
| Fortune Brands Home & Security . | | | 117 | | | | 7,057 | |
| Generac Holdings * | | | 43 | | | | 4,984 | |
| General Dynamics | | | 183 | | | | 45,713 | |
| General Electric . | | | 865 | | | | 67,306 | |
| Honeywell International . | | | 532 | | | | 108,539 | |
| Howmet Aerospace . | | | 329 | | | | 11,696 | |
| Huntington Ingalls Industries | | | 27 | | | | 6,941 | |
| IDEX . | | | 64 | | | | 14,228 | |
| Illinois Tool Works | | | 223 | | | | 47,617 | |
| Ingersoll Rand . | | | 351 | | | | 17,725 | |
| Jacobs Solutions . | | | 117 | | | | 13,481 | |
| JB Hunt Transport Services | | | 74 | | | | 12,659 | |
| Johnson Controls International | | | 564 | | | | 32,622 | |
| L3Harris Technologies . | | | 148 | | | | 36,478 | |
|
|
|
| Schedule of Investments | | October 31, 2022 |
| Global X S&P 500® Risk Managed Income ETF |
| | | | |
| |
| | | Shares | | | Value | |
| COMMON STOCK — continued | | | | | | |
| Industrials — continued | | | | | | |
| Leidos Holdings | | | 117 | | | $ | 11,886 | |
| Lockheed Martin | | | 191 | | | | 92,956 | |
| Masco . | | | 202 | | | | 9,347 | |
| Nordson . | | | 47 | | | | 10,575 | |
| Norfolk Southern . | | | 192 | | | | 43,789 | |
| Northrop Grumman | | | 115 | | | | 63,136 | |
| Old Dominion Freight Line | | | 66 | | | | 18,124 | |
| Otis Worldwide | | | 351 | | | | 24,795 | |
| PACCAR | | | 272 | | | | 26,338 | |
| Parker-Hannifin | | | 106 | | | | 30,806 | |
| Pentair | | | 117 | | | | 5,025 | |
| Quanta Services . | | | 117 | | | | 16,619 | |
| Raytheon Technologies | | | 1,165 | | | | 110,465 | |
| Republic Services, Cl A | | | 157 | | | | 20,821 | |
| Robert Half International | | | 95 | | | | 7,264 | |
| Rockwell Automation | | | 100 | | | | 25,530 | |
| Rollins . | | | 203 | | | | 8,542 | |
| Snap-On . | | | 36 | | | | 7,994 | |
| Southwest Airlines * | | | 468 | | | | 17,012 | |
| Stanley Black & Decker . | | | 117 | | | | 9,183 | |
| Textron | | | 154 | | | | 10,540 | |
| Trane Technologies . | | | 172 | | | | 27,456 | |
| TransDigm Group . | | | 38 | | | | 21,879 | �� |
| Union Pacific | | | 492 | | | | 96,993 | |
| United Airlines Holdings * | | | 234 | | | | 10,081 | |
| United Parcel Service, Cl B . | | | 577 | | | | 96,803 | |
| United Rentals * | | | 51 | | | | 16,101 | |
| Verisk Analytics, Cl A . | | | 132 | | | | 24,134 | |
| Waste Management . | | | 306 | | | | 48,461 | |
| Westinghouse Air Brake Technologies | | | 140 | | | | 13,059 | |
| WW Grainger . | | | 36 | | | | 21,037 | |
| Xylem . | | | 147 | | | | 15,057 | |
| | | | | | | | 2,154,642 | |
| Information Technology — 27.5% | | | | | | | | |
| Accenture, Cl A | | | 499 | | | | 141,666 | |
| Adobe * | | | 369 | | | | 117,527 | |
| Advanced Micro Devices * | | | 1,274 | | | | 76,516 | |
| Akamai Technologies * | | | 117 | | | | 10,335 | |
| Amphenol, Cl A . | | | 470 | | | | 35,640 | |
|
|
|
| Schedule of Investments | | October 31, 2022 |
| Global X S&P 500® Risk Managed Income ETF |
| | | | |
| |
| | | Shares | | | Value | |
| COMMON STOCK — continued | | | | | | |
| Information Technology — continued | | | | | | |
| Analog Devices | | | 421 | | | $ | 60,043 | |
| ANSYS * | | | 78 | | | | 17,251 | |
| Apple . | | | 12,105 | | | | 1,856,181 | |
| Applied Materials . | | | 687 | | | | 60,655 | |
| Arista Networks * | | | 181 | | | | 21,876 | |
| Autodesk * | | | 178 | | | | 38,145 | |
| Automatic Data Processing | | | 328 | | | | 79,278 | |
| Broadcom | | | 319 | | | | 149,968 | |
| Broadridge Financial Solutions . | | | 84 | | | | 12,605 | |
| Cadence Design Systems * | | | 224 | | | | 33,911 | |
| CDW | | | 117 | | | | 20,219 | |
| Ceridian HCM Holding * | | | 117 | | | | 7,744 | |
| Cisco Systems | | | 3,334 | | | | 151,464 | |
| Cognizant Technology Solutions, Cl A | | | 415 | | | | 25,834 | |
| Corning . | | | 581 | | | | 18,691 | |
| DXC Technology * | | | 235 | | | | 6,756 | |
| Enphase Energy * | | | 107 | | | | 32,849 | |
| EPAM Systems * | | | 45 | | | | 15,750 | |
| F5 * | | | 53 | | | | 7,574 | |
| Fidelity National Information Services . | | | 480 | | | | 39,835 | |
| Fiserv * | | | 505 | | | | 51,884 | |
| FleetCor Technologies * | | | 59 | | | | 10,981 | |
| Fortinet * | | | 534 | | | | 30,523 | |
| Gartner * | | | 58 | | | | 17,511 | |
| Global Payments | | | 234 | | | | 26,737 | |
| Hewlett Packard Enterprise | | | 1,028 | | | | 14,670 | |
| HP | | | 852 | | | | 23,532 | |
| Intel . | | | 3,240 | | | | 92,113 | |
| International Business Machines . | | | 712 | | | | 98,462 | |
| Intuit . | | | 223 | | | | 95,333 | |
| Jack Henry & Associates . | | | 52 | | | | 10,351 | |
| Juniper Networks . | | | 234 | | | | 7,160 | |
| Keysight Technologies * | | | 148 | | | | 25,774 | |
| KLA | | | 121 | | | | 38,290 | |
| Lam Research | | | 112 | | | | 45,335 | |
| Mastercard, Cl A . | | | 686 | | | | 225,131 | |
| Microchip Technology | | | 455 | | | | 28,092 | |
| Micron Technology . | | | 871 | | | | 47,121 | |
| Microsoft | | | 5,977 | | | | 1,387,441 | |
|
|
|
| Schedule of Investments | | October 31, 2022 |
| Global X S&P 500® Risk Managed Income ETF |
| | | | |
| |
| | | Shares | | | Value | |
| COMMON STOCK — continued | | | | | | |
| Information Technology — continued | | | | | | |
| Monolithic Power Systems . | | | 38 | | | $ | 12,899 | |
| Motorola Solutions | | | 132 | | | | 32,962 | |
| NetApp . | | | 156 | | | | 10,806 | |
| NortonLifeLock | | | 468 | | | | 10,544 | |
| NVIDIA . | | | 2,012 | | | | 271,560 | |
| ON Semiconductor * | | | 370 | | | | 22,729 | |
| Oracle . | | | 1,198 | | | | 93,528 | |
| Paychex | | | 256 | | | | 30,287 | |
| Paycom Software * | | | 33 | | | | 11,418 | |
| PayPal Holdings * | | | 913 | | | | 76,309 | |
| PTC * | | | 93 | | | | 10,958 | |
| Qorvo * | | | 107 | | | | 9,211 | |
| QUALCOMM . | | | 886 | | | | 104,247 | |
| Roper Technologies | | | 87 | | | | 36,065 | |
| Salesforce * | | | 785 | | | | 127,633 | |
| Seagate Technology Holdings . | | | 159 | | | | 7,896 | |
| ServiceNow * | | | 159 | | | | 66,898 | |
| Skyworks Solutions | | | 117 | | | | 10,063 | |
| SolarEdge Technologies * | | | 38 | | | | 8,741 | |
| Synopsys * | | | 124 | | | | 36,276 | |
| Teledyne Technologies * | | | 40 | | | | 15,919 | |
| Teradyne . | | | 117 | | | | 9,518 | |
| Texas Instruments . | | | 721 | | | | 115,814 | |
| Trimble * | | | 210 | | | | 12,634 | |
| Tyler Technologies * | | | 36 | | | | 11,640 | |
| VeriSign * | | | 82 | | | | 16,438 | |
| Visa, Cl A . | | | 1,314 | | | | 272,208 | |
| Western Digital * | | | 234 | | | | 8,043 | |
| Zebra Technologies, Cl A * | | | 36 | | | | 10,196 | |
| | | | | | | | 6,778,194 | |
| Materials — 2.3% | | | | | | | | |
| Air Products & Chemicals . | | | 181 | | | | 45,322 | |
| Albemarle | | | 97 | | | | 27,147 | |
| Amcor | | | 1,194 | | | | 13,827 | |
| Avery Dennison . | | | 72 | | | | 12,208 | |
| Ball | | | 267 | | | | 13,187 | |
| Celanese, Cl A . | | | 95 | | | | 9,131 | |
| CF Industries Holdings | | | 156 | | | | 16,577 | |
| Corteva . | | | 585 | | | | 38,224 | |
|
|
|
| Schedule of Investments | | October 31, 2022 |
| Global X S&P 500® Risk Managed Income ETF |
| | | | |
| |
| | | Shares | | | Value | |
| COMMON STOCK — continued | | | | | | |
| Materials — continued | | | | | | |
| Dow | | | 585 | | | $ | 27,343 | |
| DuPont de Nemours . | | | 407 | | | | 23,280 | |
| Eastman Chemical . | | | 117 | | | | 8,987 | |
| Ecolab | | | 204 | | | | 32,042 | |
| FMC . | | | 117 | | | | 13,911 | |
| Freeport-McMoRan . | | | 1,131 | | | | 35,841 | |
| International Flavors & Fragrances | | | 184 | | | | 17,960 | |
| International Paper . | | | 291 | | | | 9,781 | |
| LyondellBasell Industries, Cl A | | | 217 | | | | 16,590 | |
| Martin Marietta Materials | | | 52 | | | | 17,471 | |
| Mosaic . | | | 291 | | | | 15,641 | |
| Newmont | | | 642 | | | | 27,170 | |
| Nucor | | | 222 | | | | 29,166 | |
| Packaging Corp of America . | | | 86 | | | | 10,338 | |
| PPG Industries | | | 171 | | | | 19,525 | |
| Sealed Air | | | 105 | | | | 5,000 | |
| Sherwin-Williams . | | | 193 | | | | 43,431 | |
| Vulcan Materials | | | 117 | | | | 19,153 | |
| Westrock . | | | 234 | | | | 7,970 | |
| | | | | | | | 556,223 | |
| Real Estate — 2.8% | | | | | | | | |
| Alexandria Real Estate Equities ‡ | | | 117 | | | | 17,000 | |
| American Tower ‡ | | | 367 | | | | 76,039 | |
| AvalonBay Communities ‡ | | | 117 | | | | 20,489 | |
| Boston Properties ‡ | | | 117 | | | | 8,506 | |
| Camden Property Trust ‡ | | | 91 | | | | 10,515 | |
| CBRE Group, Cl A * | | | 259 | | | | 18,374 | |
| Crown Castle | | | 342 | | | | 45,575 | |
| Digital Realty Trust ‡ | | | 234 | | | | 23,459 | |
| Equinix . | | | 73 | | | | 41,350 | |
| Equity Residential ‡ | | | 268 | | | | 16,889 | |
| Essex Property Trust ‡ | | | 55 | | | | 12,223 | |
| Extra Space Storage ‡ | | | 97 | | | | 17,212 | |
| Federal Realty Investment Trust ‡ | | | 50 | | | | 4,949 | |
| Healthpeak Properties ‡ | | | 447 | | | | 10,607 | |
| Host Hotels & Resorts ‡ | | | 585 | | | | 11,045 | |
| Invitation Homes ‡ | | | 460 | | | | 14,577 | |
| Iron Mountain ‡ | | | 234 | | | | 11,716 | |
| Kimco Realty ‡ | | | 464 | | | | 9,920 | |
|
|
|
| Schedule of Investments | | October 31, 2022 |
| Global X S&P 500® Risk Managed Income ETF |
| | | | |
| |
| | | Shares | | | Value | |
| COMMON STOCK — continued | | | | | | |
| Real Estate — continued | | | | | | |
| Mid-America Apartment Communities ‡ | | | 100 | | | $ | 15,745 | |
| ProLogis ‡ | | | 736 | | | | 81,512 | |
| Public Storage ‡ | | | 123 | | | | 38,099 | |
| Realty Income ‡ | | | 487 | | | | 30,326 | |
| Regency Centers ‡ | | | 117 | | | | 7,080 | |
| SBA Communications, Cl A | | | 79 | | | | 21,322 | |
| Simon Property Group ‡ | | | 260 | | | | 28,335 | |
| UDR ‡ | | | 234 | | | | 9,304 | |
| Ventas ‡ | | | 341 | | | | 13,343 | |
| VICI Properties ‡ | | | 806 | | | | 25,808 | |
| Vornado Realty Trust ‡ | | | 117 | | | | 2,760 | |
| Welltower ‡ | | | 367 | | | | 22,402 | |
| Weyerhaeuser ‡ | | | 585 | | | | 18,094 | |
| | | | | | | | 684,575 | |
| Utilities — 3.1% | | | | | | | | |
| AES . | | | 545 | | | | 14,257 | |
| Alliant Energy . | | | 211 | | | | 11,008 | |
| Ameren . | | | 216 | | | | 17,608 | |
| American Electric Power | | | 405 | | | | 35,608 | |
| American Water Works | | | 141 | | | | 20,493 | |
| Atmos Energy | | | 117 | | | | 12,466 | |
| CenterPoint Energy . | | | 465 | | | | 13,304 | |
| CMS Energy | | | 234 | | | | 13,350 | |
| Consolidated Edison | | | 283 | | | | 24,893 | |
| Constellation Energy . | | | 260 | | | | 24,580 | |
| Dominion Energy | | | 658 | | | | 46,040 | |
| DTE Energy . | | | 148 | | | | 16,592 | |
| Duke Energy | | | 608 | | | | 56,653 | |
| Edison International . | | | 320 | | | | 19,213 | |
| Entergy | | | 154 | | | | 16,500 | |
| Evergy | | | 177 | | | | 10,820 | |
| Eversource Energy . | | | 270 | | | | 20,596 | |
| Exelon | | | 798 | | | | 30,795 | |
| FirstEnergy | | | 469 | | | | 17,686 | |
| NextEra Energy . | | | 1,549 | | | | 120,047 | |
| NiSource . | | | 351 | | | | 9,017 | |
| NRG Energy | | | 234 | | | | 10,390 | |
| PG&E * | | | 1,252 | | | | 18,692 | |
| Pinnacle West Capital | | | 97 | | | | 6,519 | |
|
|
|
| Schedule of Investments | | October 31, 2022 |
| Global X S&P 500® Risk Managed Income ETF |
| | | | |
| |
| | | Shares
| | | Value | |
| COMMON STOCK — continued | | | | | | |
| Utilities — continued | | | | | | |
| PPL | | | 585 | | | $ | 15,497 | |
| Public Service Enterprise Group . | | | 417 | | | | 23,381 | |
| Sempra Energy . | | | 252 | | | | 38,037 | |
| Southern | | | 839 | | | | 54,938 | |
| WEC Energy Group . | | | 264 | | | | 24,111 | |
| Xcel Energy | | | 450 | | | | 29,300 | |
| | | | | | | | 772,391 | |
| TOTAL UNITED STATES | | | | | | | 25,857,139 | |
| TOTAL COMMON STOCK | | | | | | | | |
| (Cost $29,384,340) | | | | | | | 26,036,964 | |
| PURCHASED OPTIONS — 0.2% | | | | | | | | |
| (Cost $273,521) | | | | | | | 45,768 | |
| TOTAL INVESTMENTS — 105.9% | | | | | | | | |
| (Cost $29,657,861) | | | | | | $ | 26,082,732 | |
| WRITTEN OPTIONS— (6.1)% | | | | | | | | |
| (Premiums Received $(907,794)) | | | | | | $ | (1,494,402 | ) |
Percentages are based on Net Assets of $24,633,665.
A list of the exchange traded option contracts held by the Fund at October 31, 2022, is as follows:
| Description | | Number of Contracts | | | Notional Amount | | | Exercise Price | | Expiration Date | | Value | |
| PURCHASED OPTIONS — 0.2% | | | | | | | | | | | | | |
| Put Options | | | | | | | | | | | | | |
| Mini-SPX Index | | | 12 | | | $ | 420,000 | | | $ | 350.00 | | 11/18/22 | | $ | 888 | |
| S&P 500 Index | | | 66 | | | | 23,067,000 | | | | 3,495.00 | | 11/18/22 | | | 44,880 | |
| Total Purchased Options | | | | | | $ | 23,487,000 | | | | | | | | $ | 45,768 | |
| | | | | | | | | | | | | | | | | | |
| WRITTEN OPTIONS — (6.1)% | | | | | | | | | | | | | | | | | |
| Call Options | | | | | | | | | | | | | | | | | |
| Mini-SPX Index | | | (12 | ) | | $ | (441,600 | ) | | | 368.00 | | 11/18/22 | | $ | (26,892 | ) |
| S&P 500 Index | | | (66 | ) | | | (24,288,000 | ) | | | 3,680.00 | | 11/18/22 | | | (1,467,510 | ) |
|
|
|
| Schedule of Investments | | October 31, 2022 |
| Global X S&P 500® Risk Managed Income ETF |
| Description | Number of Contracts | | Notional Amount | | Exercise Price | Expiration Date | | Value | |
| WRITTEN OPTIONS (continued) | | | | | | | | | |
| Total Written Options | | | $ | (24,729,600 | ) | | | | $ | (1,494,402 | ) |
* Non-income producing security.
‡ Real Estate Investment Trust
(A) All or a portion of these securities has been segregated as collateral for options contracts. The aggregate market value of collateral at October 31, 2022 was $26,036,964.
The following is a summary of the level of inputs used as of October 31, 2022, in valuing the Fund’s investments and other financial instruments carried at value:
| Investments in Securities | | Level 1 | | | Level 2 | | | Level 3 | | | Total | |
| Common Stock | | $ | 26,036,964 | | | $ | — | | | $ | — | | | $ | 26,036,964 | |
| Purchased Options | | | 45,768 | | | | — | | | | — | | | | 45,768 | |
| Total Investments in Securities | | $ | 26,082,732 | | | $ | — | | | $ | — | | | $ | 26,082,732 | |
| Other Financial Instruments | | Level 1 | | | Level 2 | | | Level 3 | | | Total | |
| Written Options | | $ | (1,494,402 | ) | | $ | – | | | $ | – | | | $ | (1,494,402 | ) |
| Total Other Financial Instruments | | $ | (1,494,402 | ) | | $ | – | | | $ | – | | | $ | (1,494,402 | ) |
Amounts designated as “—“ are $0 or have been rounded to $0.
See "Glossary" for abbreviations.
|
|
|
| Schedule of Investments | | October 31, 2022 |
| Global X S&P 500® Collar 95-110 ETF |
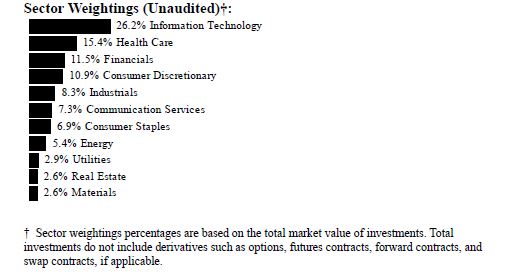
| | | | |
| |
| | | Shares
| | | Value | |
| COMMON STOCK — 99.0%(A) | | | | | | |
| CHINA — 0.1% | | | | | | |
| Information Technology — 0.1% | | | | | | |
| NXP Semiconductors . | | | 33 | | | $ | 4,820 | |
| SWITZERLAND — 0.1% | | | | | | | | |
| Information Technology — 0.1% | | | | | | | | |
| TE Connectivity | | | 40 | | | | 4,889 | |
| UNITED KINGDOM — 0.5% | | | | | | | | |
| Materials — 0.5% | | | | | | | | |
| Linde | | | 59 | | | | 17,544 | |
| UNITED STATES — 98.3% | | | | | | | | |
| Communication Services — 7.3% | | | | | | | | |
| Activision Blizzard . | | | 83 | | | | 6,042 | |
| Alphabet, Cl A * | | | 712 | | | | 67,291 | |
| Alphabet, Cl C * | | | 637 | | | | 60,298 | |
| AT&T | | | 839 | | | | 15,295 | |
| Charter Communications, Cl A * | | | 14 | | | | 5,147 | |
| Comcast, Cl A | | | 520 | | | | 16,505 | |
| DISH Network, Cl A * | | | 32 | | | | 477 | |
|
|
|
| Schedule of Investments | | October 31, 2022 |
| Global X S&P 500® Collar 95-110 ETF |
| | | | |
| |
| | | Shares | | | Value | |
| COMMON STOCK — continued | | | | | | |
| Communication Services — continued | | | | | | |
| Electronic Arts | | | 32 | | | $ | 4,031 | |
| Fox, Cl A | | | 32 | | | | 924 | |
| Fox, Cl B | | | 16 | | | | 435 | |
| Interpublic Group | | | 48 | | | | 1,430 | |
| Live Nation Entertainment * | | | 16 | | | | 1,274 | |
| Lumen Technologies . | | | 108 | | | | 795 | |
| Match Group * | | | 31 | | | | 1,339 | |
| Meta Platforms, Cl A * | | | 270 | | | | 25,153 | |
| Netflix * | | | 52 | | | | 15,178 | |
| News, Cl A . | | | 48 | | | | 810 | |
| News, Cl B . | | | 16 | | | | 274 | |
| Omnicom Group . | | | 28 | | | | 2,037 | |
| Paramount Global, Cl B | | | 64 | | | | 1,172 | |
| Take-Two Interactive Software * | | | 19 | | | | 2,251 | |
| T-Mobile US * | | | 73 | | | | 11,064 | |
| Verizon Communications | | | 496 | | | | 18,535 | |
| Walt Disney * | | | 216 | | | | 23,013 | |
| Warner Bros Discovery * | | | 279 | | | | 3,627 | |
| | | | | | | | 284,397 | |
| Consumer Discretionary — 10.8% | | | | | | | | |
| Advance Auto Parts | | | 7 | | | | 1,330 | |
| Amazon.com * | | | 1,058 | | | | 108,382 | |
| Aptiv * | | | 32 | | | | 2,914 | |
| AutoZone * | | | 2 | | | | 5,066 | |
| Bath & Body Works . | | | 32 | | | | 1,068 | |
| Best Buy | | | 24 | | | | 1,642 | |
| Booking Holdings * | | | 5 | | | | 9,347 | |
| BorgWarner . | | | 32 | | | | 1,201 | |
| Caesars Entertainment * | | | 21 | | | | 918 | |
| CarMax * | | | 16 | | | | 1,008 | |
| Carnival * | | | 82 | | | | 743 | |
| Chipotle Mexican Grill, Cl A * | | | 3 | | | | 4,495 | |
| Darden Restaurants . | | | 16 | | | | 2,290 | |
| Dollar General . | | | 28 | | | | 7,141 | |
| Dollar Tree * | | | 28 | | | | 4,438 | |
| Domino's Pizza . | | | 5 | | | | 1,661 | |
| DR Horton | | | 38 | | | | 2,921 | |
| eBay | | | 71 | | | | 2,829 | |
| Etsy * | | | 16 | | | | 1,503 | |
|
|
|
| Schedule of Investments | | October 31, 2022 |
| Global X S&P 500® Collar 95-110 ETF |
| | | | |
| |
| | | Shares
| | | Value | |
| COMMON STOCK — continued | | | | | | |
| Consumer Discretionary — continued | | | | | | |
| Expedia Group * | | | 16 | | | $ | 1,496 | |
| Ford Motor . | | | 493 | | | | 6,591 | |
| Garmin | | | 16 | | | | 1,409 | |
| General Motors | | | 182 | | | | 7,144 | |
| Genuine Parts . | | | 16 | | | | 2,846 | |
| Hasbro . | | | 16 | | | | 1,044 | |
| Hilton Worldwide Holdings . | | | 32 | | | | 4,328 | |
| Home Depot . | | | 122 | | | | 36,128 | |
| Las Vegas Sands * | | | 32 | | | | 1,216 | |
| Lennar, Cl A . | | | 32 | | | | 2,582 | |
| LKQ | | | 32 | | | | 1,781 | |
| Lowe's | | | 75 | | | | 14,621 | |
| Marriott International, Cl A | | | 34 | | | | 5,444 | |
| McDonald's . | | | 87 | | | | 23,721 | |
| MGM Resorts International . | | | 48 | | | | 1,707 | |
| Mohawk Industries * | | | 4 | | | | 379 | |
| Newell Brands . | | | 38 | | | | 525 | |
| NIKE, Cl B | | | 149 | | | | 13,809 | |
| Norwegian Cruise Line Holdings * | | | 38 | | | | 642 | |
| O'Reilly Automotive * | | | 8 | | | | 6,697 | |
| Pool . | | | 4 | | | | 1,217 | |
| PulteGroup . | | | 32 | | | | 1,280 | |
| Ralph Lauren, Cl A . | | | 3 | | | | 278 | |
| Ross Stores | | | 39 | | | | 3,732 | |
| Royal Caribbean Cruises * | | | 27 | | | | 1,441 | |
| Starbucks | | | 141 | | | | 12,209 | |
| Tapestry . | | | 32 | | | | 1,014 | |
| Target | | | 57 | | | | 9,362 | |
| Tesla * | | | 317 | | | | 72,130 | |
| TJX | | | 145 | | | | 10,455 | |
| Tractor Supply . | | | 14 | | | | 3,077 | |
| Ulta Beauty * | | | 7 | | | | 2,936 | |
| VF . | | | 32 | | | | 904 | |
| Whirlpool | | | 5 | | | | 691 | |
| Wynn Resorts * | | | 16 | | | | 1,022 | |
| Yum! Brands | | | 32 | | | | 3,784 | |
| | | | | | | | 420,539 | |
| Consumer Staples — 6.8% | | | | | | | | |
| Altria Group . | | | 223 | | | | 10,318 | |
|
|
|
| Schedule of Investments | | October 31, 2022 |
| Global X S&P 500® Collar 95-110 ETF |
| | | | |
| |
| | | Shares
| | | Value | |
| COMMON STOCK — continued | | | | | | |
| Consumer Staples — continued | | | | | | |
| Archer-Daniels-Midland | | | 64 | | | $ | 6,207 | |
| Brown-Forman, Cl B | | | 16 | | | | 1,088 | |
| Campbell Soup . | | | 25 | | | | 1,323 | |
| Church & Dwight | | | 31 | | | | 2,298 | |
| Clorox | | | 16 | | | | 2,337 | |
| Coca-Cola . | | | 461 | | | | 27,591 | |
| Colgate-Palmolive | | | 96 | | | | 7,089 | |
| Conagra Brands . | | | 48 | | | | 1,762 | |
| Constellation Brands, Cl A | | | 18 | | | | 4,447 | |
| Costco Wholesale | | | 53 | | | | 26,579 | |
| Estee Lauder, Cl A . | | | 29 | | | | 5,814 | |
| General Mills | | | 75 | | | | 6,118 | |
| Hershey | | | 16 | | | | 3,820 | |
| Hormel Foods | | | 32 | | | | 1,486 | |
| J M Smucker . | | | 13 | | | | 1,959 | |
| Kellogg | | | 32 | | | | 2,458 | |
| Keurig Dr Pepper | | | 94 | | | | 3,651 | |
| Kimberly-Clark | | | 42 | | | | 5,227 | |
| Kraft Heinz | | | 91 | | | | 3,501 | |
| Kroger | | | 80 | | | | 3,783 | |
| Lamb Weston Holdings . | | | 16 | | | | 1,380 | |
| McCormick . | | | 27 | | | | 2,123 | |
| Molson Coors Beverage, Cl B | | | 16 | | | | 807 | |
| Mondelez International, Cl A . | | | 161 | | | | 9,898 | |
| Monster Beverage * | | | 44 | | | | 4,124 | |
| PepsiCo | | | 163 | | | | 29,598 | |
| Philip Morris International | | | 183 | | | | 16,809 | |
| Procter & Gamble . | | | 283 | | | | 38,112 | |
| Sysco . | | | 64 | | | | 5,540 | |
| Tyson Foods, Cl A | | | 32 | | | | 2,187 | |
| Walgreens Boots Alliance | | | 80 | | | | 2,920 | |
| Walmart | | | 171 | | | | 24,338 | |
| | | | | | | | 266,692 | |
| Energy — 5.3% | | | | | | | | |
| APA . | | | 34 | | | | 1,546 | |
| Baker Hughes, Cl A | | | 119 | | | | 3,292 | |
| Chevron . | | | 213 | | | | 38,532 | |
| ConocoPhillips . | | | 150 | | | | 18,914 | |
| Coterra Energy | | | 92 | | | | 2,864 | |
|
|
|
| Schedule of Investments | | October 31, 2022 |
| Global X S&P 500® Collar 95-110 ETF |
| | | | |
| |
| | | Shares
| | | Value | |
| COMMON STOCK — continued | | | | | | |
| Energy — continued | | | | | | |
| Devon Energy | | | 77 | | | $ | 5,956 | |
| Diamondback Energy | | | 22 | | | | 3,456 | |
| EOG Resources | | | 72 | | | | 9,829 | |
| EQT . | | | 48 | | | | 2,008 | |
| Exxon Mobil | | | 494 | | | | 54,740 | |
| Halliburton . | | | 109 | | | | 3,970 | |
| Hess | | | 32 | | | | 4,515 | |
| Kinder Morgan | | | 239 | | | | 4,331 | |
| Marathon Oil . | | | 82 | | | | 2,497 | |
| Marathon Petroleum | | | 58 | | | | 6,590 | |
| Occidental Petroleum . | | | 86 | | | | 6,244 | |
| ONEOK | | | 48 | | | | 2,847 | |
| Phillips 66 . | | | 60 | | | | 6,257 | |
| Pioneer Natural Resources | | | 28 | | | | 7,179 | |
| Schlumberger | | | 176 | | | | 9,157 | |
| Targa Resources | | | 27 | | | | 1,846 | |
| Valero Energy . | | | 48 | | | | 6,026 | |
| Williams | | | 153 | | | | 5,008 | |
| | | | | | | | 207,604 | |
| Financials — 11.3% | | | | | | | | |
| Aflac | | | 64 | | | | 4,167 | |
| Allstate | | | 32 | | | | 4,040 | |
| American Express . | | | 70 | | | | 10,392 | |
| American International Group | | | 96 | | | | 5,472 | |
| Ameriprise Financial | | | 14 | | | | 4,328 | |
| Aon, Cl A . | | | 26 | | | | 7,319 | |
| Arch Capital Group * | | | 45 | | | | 2,588 | |
| Arthur J Gallagher | | | 23 | | | | 4,303 | |
| Assurant . | | | 6 | | | | 815 | |
| Bank of America | | | 828 | | | | 29,841 | |
| Bank of New York Mellon | | | 82 | | | | 3,453 | |
| Berkshire Hathaway, Cl B * | | | 214 | | | | 63,149 | |
| BlackRock, Cl A . | | | 18 | | | | 11,626 | |
| Brown & Brown . | | | 28 | | | | 1,646 | |
| Capital One Financial | | | 49 | | | | 5,195 | |
| Cboe Global Markets . | | | 10 | | | | 1,245 | |
| Charles Schwab . | | | 185 | | | | 14,739 | |
| Chubb . | | | 49 | | | | 10,530 | |
| Cincinnati Financial . | | | 16 | | | | 1,653 | |
|
|
|
| Schedule of Investments | | October 31, 2022 |
| Global X S&P 500® Collar 95-110 ETF |
| | | | |
| |
| | | Shares
| | | Value | |
| COMMON STOCK — continued | | | | | | |
| Financials — continued | | | | | | |
| Citigroup | | | 227 | | | $ | 10,410 | |
| Citizens Financial Group . | | | 60 | | | | 2,454 | |
| CME Group, Cl A . | | | 44 | | | | 7,625 | |
| Comerica | | | 16 | | | | 1,128 | |
| Discover Financial Services | | | 32 | | | | 3,343 | |
| Everest Re Group | | | 4 | | | | 1,291 | |
| FactSet Research Systems . | | | 5 | | | | 2,128 | |
| Fifth Third Bancorp | | | 80 | | | | 2,855 | |
| First Republic Bank . | | | 23 | | | | 2,762 | |
| Franklin Resources | | �� | 32 | | | | 750 | |
| Globe Life . | | | 8 | | | | 924 | |
| Goldman Sachs Group | | | 40 | | | | 13,780 | |
| Hartford Financial Services Group . | | | 42 | | | | 3,041 | |
| Huntington Bancshares | | | 160 | | | | 2,429 | |
| Intercontinental Exchange . | | | 69 | | | | 6,594 | |
| Invesco | | | 32 | | | | 490 | |
| JPMorgan Chase . | | | 348 | | | | 43,806 | |
| KeyCorp | | | 98 | | | | 1,751 | |
| Lincoln National . | | | 16 | | | | 862 | |
| Loews . | | | 27 | | | | 1,540 | |
| M&T Bank . | | | 23 | | | | 3,873 | |
| MarketAxess Holdings . | | | 3 | | | | 732 | |
| Marsh & McLennan . | | | 62 | | | | 10,012 | |
| MetLife . | | | 80 | | | | 5,857 | |
| Moody's . | | | 20 | | | | 5,297 | |
| Morgan Stanley | | | 158 | | | | 12,983 | |
| MSCI, Cl A | | | 10 | | | | 4,689 | |
| Nasdaq . | | | 36 | | | | 2,241 | |
| Northern Trust . | | | 27 | | | | 2,277 | |
| PNC Financial Services Group | | | 51 | | | | 8,253 | |
| Principal Financial Group | | | 32 | | | | 2,820 | |
| Progressive | | | 72 | | | | 9,245 | |
| Prudential Financial . | | | 47 | | | | 4,944 | |
| Raymond James Financial . | | | 21 | | | | 2,481 | |
| Regions Financial . | | | 98 | | | | 2,151 | |
| S&P Global . | | | 41 | | | | 13,171 | |
| Signature Bank NY . | | | 6 | | | | 951 | |
| State Street . | | | 39 | | | | 2,886 | |
| SVB Financial Group * | | | 6 | | | | 1,386 | |
|
|
|
| Schedule of Investments | | October 31, 2022 |
| Global X S&P 500® Collar 95-110 ETF |
| | | | |
| |
| | | Shares
| | | Value | |
| COMMON STOCK — continued | | | | | | |
| Financials — continued | | | | | | |
| Synchrony Financial | | | 64 | | | $ | 2,276 | |
| T Rowe Price Group | | | 25 | | | | 2,654 | |
| Travelers . | | | 30 | | | | 5,534 | |
| Truist Financial | | | 165 | | | | 7,390 | |
| US Bancorp . | | | 167 | | | | 7,089 | |
| W R Berkley | | | 24 | | | | 1,785 | |
| Wells Fargo . | | | 448 | | | | 20,604 | |
| Willis Towers Watson | | | 13 | | | | 2,837 | |
| Zions Bancorp . | | | 16 | | | | 831 | |
| | | | | | | | 443,713 | |
| Health Care — 15.2% | | | | | | | | |
| Abbott Laboratories . | | | 207 | | | | 20,481 | |
| AbbVie | | | 209 | | | | 30,598 | |
| ABIOMED * | | | 4 | | | | 1,008 | |
| Agilent Technologies | | | 38 | | | | 5,257 | |
| Align Technology * | | | 8 | | | | 1,554 | |
| AmerisourceBergen, Cl A . | | | 16 | | | | 2,516 | |
| Amgen . | | | 65 | | | | 17,573 | |
| Baxter International | | | 55 | | | | 2,989 | |
| Becton Dickinson | | | 35 | | | | 8,259 | |
| Biogen * | | | 16 | | | | 4,535 | |
| Bio-Rad Laboratories, Cl A * | | | 2 | | | | 703 | |
| Bio-Techne | | | 5 | | | | 1,481 | |
| Boston Scientific * | | | 178 | | | | 7,674 | |
| Bristol-Myers Squibb . | | | 252 | | | | 19,522 | |
| Cardinal Health | | | 32 | | | | 2,429 | |
| Catalent * | | | 23 | | | | 1,512 | |
| Centene * | | | 66 | | | | 5,619 | |
| Charles River Laboratories International * | | | 7 | | | | 1,486 | |
| Cigna . | | | 36 | | | | 11,630 | |
| Cooper . | | | 7 | | | | 1,914 | |
| CVS Health . | | | 155 | | | | 14,678 | |
| Danaher | | | 79 | | | | 19,882 | |
| DaVita * | | | 5 | | | | 365 | |
| DENTSPLY SIRONA . | | | 18 | | | | 555 | |
| Dexcom * | | | 44 | | | | 5,314 | |
| Edwards Lifesciences * | | | 77 | | | | 5,577 | |
| Elevance Health | | | 29 | | | | 15,856 | |
| Eli Lilly | | | 93 | | | | 33,674 | |
|
|
|
| Schedule of Investments | | October 31, 2022 |
| Global X S&P 500® Collar 95-110 ETF |
| | | | |
| |
| | | Shares
| | | Value | |
| COMMON STOCK — continued | | | | | | |
| Health Care — continued | | | | | | |
| Gilead Sciences | | | 155 | | | $ | 12,161 | |
| HCA Healthcare | | | 25 | | | | 5,437 | |
| Henry Schein * | | | 16 | | | | 1,095 | |
| Hologic * | | | 32 | | | | 2,170 | |
| Humana | | | 15 | | | | 8,371 | |
| IDEXX Laboratories * | | | 10 | | | | 3,597 | |
| Illumina * | | | 20 | | | | 4,576 | |
| Incyte * | | | 25 | | | | 1,859 | |
| Intuitive Surgical * | | | 44 | | | | 10,845 | |
| IQVIA Holdings * | | | 24 | | | | 5,032 | |
| Johnson & Johnson . | | | 312 | | | | 54,279 | |
| Laboratory Corp of America Holdings | | | 12 | | | | 2,662 | |
| McKesson | | | 18 | | | | 7,009 | |
| Medtronic | | | 156 | | | | 13,625 | |
| Merck . | | | 300 | | | | 30,360 | |
| Mettler-Toledo International * | | | 3 | | | | 3,795 | |
| Moderna * | | | 43 | | | | 6,464 | |
| Molina Healthcare * | | | 8 | | | | 2,871 | |
| Organon . | | | 32 | | | | 838 | |
| PerkinElmer | | | 14 | | | | 1,870 | |
| Pfizer | | | 665 | | | | 30,956 | |
| Quest Diagnostics . | | | 16 | | | | 2,298 | |
| Regeneron Pharmaceuticals * | | | 13 | | | | 9,734 | |
| ResMed | | | 16 | | | | 3,579 | |
| STERIS | | | 13 | | | | 2,244 | |
| Stryker . | | | 39 | | | | 8,940 | |
| Teleflex | | | 4 | | | | 858 | |
| Thermo Fisher Scientific | | | 46 | | | | 23,643 | |
| UnitedHealth Group | | | 111 | | | | 61,622 | |
| Universal Health Services, Cl B . | | | 7 | | | | 811 | |
| Vertex Pharmaceuticals * | | | 30 | | | | 9,360 | |
| Viatris * | | | 128 | | | | 1,297 | |
| Waters * | | | 7 | | | | 2,094 | |
| West Pharmaceutical Services | | | 9 | | | | 2,071 | |
| Zimmer Biomet Holdings . | | | 27 | | | | 3,060 | |
| Zoetis, Cl A . | | | 58 | | | | 8,745 | |
| | | | | | | | 594,869 | |
| Industrials — 8.2% | | | | | | | | |
| 3M | | | 65 | | | | 8,176 | |
|
|
|
| Schedule of Investments | | October 31, 2022 |
| Global X S&P 500® Collar 95-110 ETF |
| | | | |
| |
| | | Shares
| | | Value | |
| COMMON STOCK — continued | | | | | | |
| Industrials — continued | | | | | | |
| A O Smith . | | | 16 | | | $ | 876 | |
| Alaska Air Group * | | | 16 | | | | 711 | |
| Allegion . | | | 12 | | | | 1,257 | |
| American Airlines Group * | | | 66 | | | | 936 | |
| AMETEK | | | 28 | | | | 3,630 | |
| Boeing * | | | 69 | | | | 9,833 | |
| Carrier Global | | | 97 | | | | 3,857 | |
| Caterpillar . | | | 65 | | | | 14,070 | |
| CH Robinson Worldwide | | | 16 | | | | 1,564 | |
| Cintas | | | 11 | | | | 4,703 | |
| Copart * | | | 27 | | | | 3,106 | |
| CoStar Group * | | | 45 | | | | 3,722 | |
| CSX | | | 250 | | | | 7,265 | |
| Cummins | | | 16 | | | | 3,912 | |
| Deere . | | | 34 | | | | 13,458 | |
| Delta Air Lines * | | | 78 | | | | 2,647 | |
| Dover | | | 16 | | | | 2,091 | |
| Eaton | | | 50 | | | | 7,504 | |
| Emerson Electric | | | 74 | | | | 6,408 | |
| Equifax . | | | 13 | | | | 2,204 | |
| Expeditors International of Washington . | | | 16 | | | | 1,566 | |
| Fastenal | | | 64 | | | | 3,093 | |
| FedEx . | | | 30 | | | | 4,808 | |
| Fortive . | | | 47 | | | | 3,003 | |
| Fortune Brands Home & Security . | | | 16 | | | | 965 | |
| Generac Holdings * | | | 7 | | | | 811 | |
| General Dynamics | | | 26 | | | | 6,495 | |
| General Electric . | | | 136 | | | | 10,582 | |
| Honeywell International . | | | 79 | | | | 16,118 | |
| Howmet Aerospace . | | | 48 | | | | 1,706 | |
| Huntington Ingalls Industries | | | 4 | | | | 1,028 | |
| IDEX . | | | 9 | | | | 2,001 | |
| Illinois Tool Works | | | 32 | | | | 6,833 | |
| Ingersoll Rand . | | | 48 | | | | 2,424 | |
| Jacobs Solutions . | | | 16 | | | | 1,844 | |
| JB Hunt Transport Services | | | 8 | | | | 1,369 | |
| Johnson Controls International | | | 80 | | | | 4,627 | |
| L3Harris Technologies . | | | 24 | | | | 5,915 | |
| Leidos Holdings | | | 16 | | | | 1,625 | |
|
|
|
| Schedule of Investments | | October 31, 2022 |
| Global X S&P 500® Collar 95-110 ETF |
| | | | |
| |
| | | Shares
| | | Value | |
| COMMON STOCK — continued | | | | | | |
| Industrials — continued | | | | | | |
| Lockheed Martin | | | 29 | | | $ | 14,114 | |
| Masco . | | | 32 | | | | 1,481 | |
| Nordson . | | | 5 | | | | 1,125 | |
| Norfolk Southern . | | | 27 | | | | 6,158 | |
| Northrop Grumman | | | 18 | | | | 9,882 | |
| Old Dominion Freight Line | | | 12 | | | | 3,295 | |
| Otis Worldwide | | | 48 | | | | 3,391 | |
| PACCAR | | | 38 | | | | 3,680 | |
| Parker-Hannifin | | | 16 | | | | 4,650 | |
| Pentair | | | 16 | | | | 687 | |
| Quanta Services . | | | 16 | | | | 2,273 | |
| Raytheon Technologies | | | 174 | | | | 16,499 | |
| Republic Services, Cl A | | | 27 | | | | 3,581 | |
| Robert Half International | | | 16 | | | | 1,223 | |
| Rockwell Automation | | | 14 | | | | 3,574 | |
| Rollins . | | | 22 | | | | 926 | |
| Snap-On . | | | 5 | | | | 1,110 | |
| Southwest Airlines * | | | 64 | | | | 2,326 | |
| Stanley Black & Decker . | | | 16 | | | | 1,256 | |
| Textron | | | 29 | | | | 1,985 | |
| Trane Technologies . | | | 30 | | | | 4,789 | |
| TransDigm Group . | | | 6 | | | | 3,455 | |
| Union Pacific | | | 74 | | | | 14,588 | |
| United Airlines Holdings * | | | 32 | | | | 1,379 | |
| United Parcel Service, Cl B . | | | 86 | | | | 14,428 | |
| United Rentals * | | | 9 | | | | 2,841 | |
| Verisk Analytics, Cl A . | | | 20 | | | | 3,657 | |
| Waste Management . | | | 47 | | | | 7,443 | |
| Westinghouse Air Brake Technologies | | | 24 | | | | 2,239 | |
| WW Grainger . | | | 5 | | | | 2,922 | |
| Xylem . | | | 22 | | | | 2,253 | |
| | | | | | | | 321,953 | |
| Information Technology — 25.8% | | | | | | | | |
| Accenture, Cl A | | | 75 | | | | 21,293 | |
| Adobe * | | | 56 | | | | 17,836 | |
| Advanced Micro Devices * | | | 190 | | | | 11,411 | |
| Akamai Technologies * | | | 16 | | | | 1,413 | |
| Amphenol, Cl A . | | | 75 | | | | 5,687 | |
| Analog Devices | | | 61 | | | | 8,700 | |
|
|
|
| Schedule of Investments | | October 31, 2022 |
| Global X S&P 500® Collar 95-110 ETF |
| | | | |
| |
| | | Shares | | | Value | |
| COMMON STOCK — continued | | | | | | |
| Information Technology — continued | | | | | | |
| ANSYS * | | | 10 | | | $ | 2,212 | |
| Apple . | | | 1,802 | | | | 276,319 | |
| Applied Materials . | | | 102 | | | | 9,006 | |
| Arista Networks * | | | 29 | | | | 3,505 | |
| Autodesk * | | | 26 | | | | 5,572 | |
| Automatic Data Processing | | | 51 | | | | 12,327 | |
| Broadcom | | | 48 | | | | 22,566 | |
| Broadridge Financial Solutions . | | | 12 | | | | 1,801 | |
| Cadence Design Systems * | | | 32 | | | | 4,844 | |
| CDW | | | 16 | | | | 2,765 | |
| Ceridian HCM Holding * | | | 15 | | | | 993 | |
| Cisco Systems | | | 489 | | | | 22,215 | |
| Cognizant Technology Solutions, Cl A | | | 61 | | | | 3,797 | |
| Corning . | | | 80 | | | | 2,574 | |
| DXC Technology * | | | 32 | | | | 920 | |
| Enphase Energy * | | | 16 | | | | 4,912 | |
| EPAM Systems * | | | 7 | | | | 2,450 | |
| 3M | | | 7 | | | | 1,000 | |
| Fidelity National Information Services . | | | 76 | | | | 6,307 | |
| Fiserv * | | | 77 | | | | 7,911 | |
| FleetCor Technologies * | | | 9 | | | | 1,675 | |
| Fortinet * | | | 80 | | | | 4,573 | |
| Gartner * | | | 10 | | | | 3,019 | |
| Global Payments | | | 32 | | | | 3,656 | |
| Hewlett Packard Enterprise | | | 144 | | | | 2,055 | |
| HP | | | 103 | | | | 2,845 | |
| Intel . | | | 500 | | | | 14,215 | |
| International Business Machines . | | | 110 | | | | 15,212 | |
| Intuit . | | | 33 | | | | 14,108 | |
| Jack Henry & Associates . | | | 10 | | | | 1,991 | |
| Juniper Networks . | | | 32 | | | | 979 | |
| Keysight Technologies * | | | 22 | | | | 3,831 | |
| KLA | | | 16 | | | | 5,063 | |
| Lam Research | | | 17 | | | | 6,881 | |
| Mastercard, Cl A . | | | 101 | | | | 33,146 | |
| Microchip Technology | | | 64 | | | | 3,951 | |
| Micron Technology . | | | 138 | | | | 7,466 | |
| Microsoft | | | 890 | | | | 206,596 | |
| Monolithic Power Systems . | | | 6 | | | | 2,037 | |
|
|
|
| Schedule of Investments | | October 31, 2022 |
| Global X S&P 500® Collar 95-110 ETF |
| | | | |
| |
| | | Shares
| | | Value | |
| COMMON STOCK — continued | | | | | | |
| Information Technology — continued | | | | | | |
| Motorola Solutions | | | 21 | | | $ | 5,244 | |
| NetApp . | | | 27 | | | | 1,870 | |
| NortonLifeLock | | | 64 | | | | 1,442 | |
| NVIDIA . | | | 297 | | | | 40,086 | |
| ON Semiconductor * | | | 56 | | | | 3,440 | |
| Oracle . | | | 179 | | | | 13,975 | |
| Paychex | | | 40 | | | | 4,732 | |
| Paycom Software * | | | 6 | | | | 2,076 | |
| PayPal Holdings * | | | 136 | | | | 11,367 | |
| PTC * | | | 10 | | | | 1,178 | |
| Qorvo * | | | 11 | | | | 947 | |
| QUALCOMM . | | | 132 | | | | 15,531 | |
| Roper Technologies | | | 13 | | | | 5,389 | |
| Salesforce * | | | 121 | | | | 19,673 | |
| Seagate Technology Holdings . | | | 22 | | | | 1,093 | |
| ServiceNow * | | | 25 | | | | 10,519 | |
| Skyworks Solutions | | | 16 | | | | 1,376 | |
| SolarEdge Technologies * | | | 5 | | | | 1,150 | |
| Synopsys * | | | 19 | | | | 5,558 | |
| Teledyne Technologies * | | | 6 | | | | 2,388 | |
| Teradyne . | | | 16 | | | | 1,302 | |
| Texas Instruments . | | | 108 | | | | 17,348 | |
| Trimble * | | | 32 | | | | 1,925 | |
| Tyler Technologies * | | | 4 | | | | 1,293 | |
| VeriSign * | | | 11 | | | | 2,205 | |
| Visa, Cl A . | | | 194 | | | | 40,189 | |
| Western Digital * | | | 32 | | | | 1,100 | |
| Zebra Technologies, Cl A * | | | 5 | | | | 1,416 | |
| | | | | | | | 1,009,447 | |
| Materials — 2.1% | | | | | | | | |
| Air Products & Chemicals . | | | 28 | | | | 7,011 | |
| Albemarle | | | 14 | | | | 3,918 | |
| Amcor | | | 162 | | | | 1,876 | |
| Avery Dennison . | | | 11 | | | | 1,865 | |
| Ball | | | 32 | | | | 1,581 | |
| Celanese, Cl A . | | | 11 | | | | 1,057 | |
| CF Industries Holdings | | | 24 | | | | 2,550 | |
| Corteva . | | | 80 | | | | 5,227 | |
| Dow | | | 91 | | | | 4,253 | |
|
|
|
| Schedule of Investments | | October 31, 2022 |
| Global X S&P 500® Collar 95-110 ETF |
| | | | |
| |
| | | Shares
| | | Value | |
| COMMON STOCK — continued | | | | | | |
| Materials — continued | | | | | | |
| DuPont de Nemours . | | | 60 | | | $ | 3,432 | |
| Eastman Chemical . | | | 16 | | | | 1,229 | |
| Ecolab | | | 29 | | | | 4,555 | |
| FMC . | | | 16 | | | | 1,903 | |
| Freeport-McMoRan . | | | 180 | | | | 5,704 | |
| International Flavors & Fragrances | | | 32 | | | | 3,124 | |
| International Paper . | | | 48 | | | | 1,613 | |
| LyondellBasell Industries, Cl A | | | 32 | | | | 2,446 | |
| Martin Marietta Materials | | | 8 | | | | 2,688 | |
| Mosaic . | | | 36 | | | | 1,935 | |
| Newmont | | | 99 | | | | 4,190 | |
| Nucor | | | 32 | | | | 4,204 | |
| Packaging Corp of America . | | | 13 | | | | 1,563 | |
| PPG Industries | | | 30 | | | | 3,425 | |
| Sealed Air | | | 16 | | | | 762 | |
| Sherwin-Williams . | | | 27 | | | | 6,076 | |
| Vulcan Materials | | | 16 | | | | 2,619 | |
| Westrock . | | | 32 | | | | 1,090 | |
| | | | | | | | 81,896 | |
| Real Estate — 2.6% | | | | | | | | |
| Alexandria Real Estate Equities ‡ | | | 16 | | | | 2,325 | |
| American Tower ‡ | | | 57 | | | | 11,810 | |
| AvalonBay Communities ‡ | | | 16 | | | | 2,802 | |
| Boston Properties ‡ | | | 16 | | | | 1,163 | |
| Camden Property Trust ‡ | | | 11 | | | | 1,271 | |
| CBRE Group, Cl A * | | | 42 | | | | 2,980 | |
| Crown Castle | | | 54 | | | | 7,196 | |
| Digital Realty Trust ‡ | | | 32 | | | | 3,208 | |
| Equinix . | | | 11 | | | | 6,231 | |
| Equity Residential ‡ | | | 44 | | | | 2,773 | |
| Essex Property Trust ‡ | | | 9 | | | | 2,000 | |
| Extra Space Storage ‡ | | | 16 | | | | 2,839 | |
| Federal Realty Investment Trust ‡ | | | 5 | | | | 495 | |
| Healthpeak Properties ‡ | | | 64 | | | | 1,519 | |
| Host Hotels & Resorts ‡ | | | 80 | | | | 1,510 | |
| Invitation Homes ‡ | | | 65 | | | | 2,060 | |
| Iron Mountain ‡ | | | 32 | | | | 1,602 | |
| Kimco Realty ‡ | | | 64 | | | | 1,368 | |
| Mid-America Apartment Communities ‡ | | | 12 | | | | 1,889 | |
|
|
|
| Schedule of Investments | | October 31, 2022 |
| Global X S&P 500® Collar 95-110 ETF |
| | | | |
| |
| | | Shares
| | | Value | |
| COMMON STOCK — continued | | | | | | |
| Real Estate — continued | | | | | | |
| ProLogis ‡ | | | 114 | | | $ | 12,626 | |
| Public Storage ‡ | | | 19 | | | | 5,885 | |
| Realty Income ‡ | | | 75 | | | | 4,670 | |
| Regency Centers ‡ | | | 16 | | | | 968 | |
| SBA Communications, Cl A | | | 12 | | | | 3,239 | |
| Simon Property Group ‡ | | | 42 | | | | 4,577 | |
| UDR ‡ | | | 32 | | | | 1,272 | |
| Ventas ‡ | | | 52 | | | | 2,035 | |
| VICI Properties ‡ | | | 123 | | | | 3,939 | |
| Vornado Realty Trust ‡ | | | 16 | | | | 378 | |
| Welltower ‡ | | | 57 | | | | 3,479 | |
| Weyerhaeuser ‡ | | | 80 | | | | 2,474 | |
| | | | | | | | 102,583 | |
| Utilities — 2.9% | | | | | | | | |
| AES . | | | 70 | | | | 1,831 | |
| Alliant Energy . | | | 32 | | | | 1,669 | |
| Ameren . | | | 32 | | | | 2,609 | |
| American Electric Power | | | 64 | | | | 5,627 | |
| American Water Works | | | 19 | | | | 2,762 | |
| Atmos Energy | | | 16 | | | | 1,705 | |
| CenterPoint Energy . | | | 64 | | | | 1,831 | |
| CMS Energy | | | 32 | | | | 1,826 | |
| Consolidated Edison | | | 39 | | | | 3,430 | |
| Constellation Energy . | | | 35 | | | | 3,309 | |
| Dominion Energy | | | 101 | | | | 7,067 | |
| DTE Energy . | | | 25 | | | | 2,803 | |
| Duke Energy | | | 95 | | | | 8,852 | |
| Edison International . | | | 49 | | | | 2,942 | |
| Entergy | | | 26 | | | | 2,786 | |
| Evergy | | | 32 | | | | 1,956 | |
| Eversource Energy . | | | 37 | | | | 2,822 | |
| Exelon | | | 110 | | | | 4,245 | |
| FirstEnergy | | | 64 | | | | 2,413 | |
| NextEra Energy . | | | 232 | | | | 17,980 | |
| NiSource . | | | 48 | | | | 1,233 | |
| NRG Energy | | | 32 | | | | 1,421 | |
| PG&E * | | | 200 | | | | 2,986 | |
| Pinnacle West Capital | | | 16 | | | | 1,075 | |
| PPL | | | 80 | | | | 2,119 | |
|
|
|
| Schedule of Investments | | October 31, 2022 |
| Global X S&P 500® Collar 95-110 ETF |
| | | | |
| |
| | | Shares
| | | Value | |
| COMMON STOCK — continued | | | | | | |
| Utilities — continued | | | | | | |
| Public Service Enterprise Group . | | | 63 | | | $ | 3,532 | |
| Sempra Energy . | | | 39 | | | | 5,887 | |
| Southern | | | 131 | | | | 8,578 | |
| WEC Energy Group . | | | 40 | | | | 3,653 | |
| Xcel Energy | | | 64 | | | | 4,167 | |
| | | | | | | | 115,116 | |
| TOTAL UNITED STATES | | | | | | | 3,848,809 | |
| TOTAL COMMON STOCK | | | | | | | | |
| (Cost $4,352,383) | | | | | | | 3,876,062 | |
| PURCHASED OPTIONS — 1.5% | | | | | | | | |
| (Cost $115,867) | | | | | | | 59,515 | |
| TOTAL INVESTMENTS — 100.5% | | | | | | | | |
| (Cost $4,468,250) | | | | | | $ | 3,935,577 | |
| WRITTEN OPTIONS— (0.5)% | | | | | | | | |
| (Premiums Received $(42,899)) | | | | | | $ | (20,585 | ) |
Percentages are based on Net Assets of $3,914,681.
A list of the exchange traded option contracts held by the Fund at October 31, 2022, is as follows:
| Description | | Number of Contracts | | | Notional Amount | | | Exercise Price | | Expiration Date | | Value | |
| PURCHASED OPTIONS — 1.5% | | | | | | | | | | | | | |
| Put Options | | | | | | | | | | | | | |
| Mini-SPX Index | | | 10 | | | $ | 366,000 | | | $ | 366.00 | | 12/16/22 | | $ | 6,010 | |
| S&P 500 Index | | | 9 | | | | 3,294,000 | | | | 3,660.00 | | 12/16/22 | | | 53,505 | |
| Total Purchased Options | | | | | | $ | 3,660,000 | | | | | | | | $ | 59,515 | |
| | | | | | | | | | | | | | | | | | |
| WRITTEN OPTIONS — (0.5)% | | | | | | | | | | | | | | | | | |
| Call Options | | | | | | | | | | | | | | | | | |
| Mini-SPX Index | | | (10 | ) | | $ | (424,000 | ) | | | 424.00 | | 12/16/22 | | $ | (2,090 | ) |
| S&P 500 Index | | | (9 | ) | | | (3,816,000 | ) | | | 4,240.00 | | 12/16/22 | | | (18,495 | ) |
|
|
|
| Schedule of Investments | | October 31, 2022 |
| Global X S&P 500® Collar 95-110 ETF |
| Description | Number of Contracts | | Notional Amount | | Exercise Price | Expiration Date | | Value | |
| WRITTEN OPTIONS (continued) | | | | | | | | | |
| Total Written Options | | | $ | (4,240,000 | ) | | | | $ | (20,585 | ) |
* Non-income producing security.
‡ Real Estate Investment Trust
(A) All or a portion of these securities has been segregated as collateral for options contracts. The aggregate market value of collateral at October 31, 2022 was $3,876,062.
The following is a summary of the level of inputs used as of October 31, 2022, in valuing the Fund’s investments and other financial instruments carried at value:
| Investments in Securities | | Level 1 | | | Level 2 | | | Level 3 | | | Total | |
| Common Stock | | $ | 3,876,062 | | | $ | — | | | $ | — | | | $ | 3,876,062 | |
| Purchased Options | | | 59,515 | | | | — | | | | — | | | | 59,515 | |
| Total Investments in Securities | | $ | 3,935,577 | | | $ | — | | | $ | — | | | $ | 3,935,577 | |
| Other Financial Instruments | | Level 1 | | | Level 2 | | | Level 3 | | | Total | |
| Written Options | | $ | (20,585 | ) | | $ | – | | | $ | – | | | $ | (20,585 | ) |
| Total Other Financial Instruments | | $ | (20,585 | ) | | $ | – | | | $ | – | | | $ | (20,585 | ) |
Amounts designated as “—“ are $0 or have been rounded to $0.
See "Glossary" for abbreviations.
|
|
|
| Schedule of Investments | | October 31, 2022 |
| Global X NASDAQ 100® Tail Risk ETF |
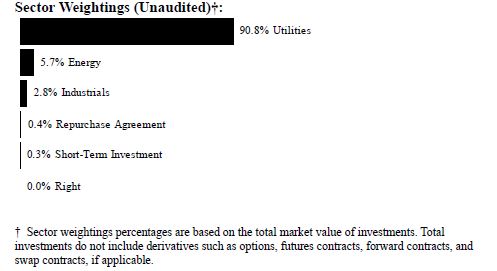
| | | | |
| |
| | | Shares
| | | Value | |
| COMMON STOCK — 98.3%(A) | | | | | | |
| BRAZIL — 0.4% | | | | | | |
| Consumer Discretionary — 0.4% | | | | | | |
| MercadoLibre * | | | 9 | | | $ | 8,115 | |
| CHINA — 1.0% | | | | | | | | |
| Communication Services — 0.2% | | | | | | | | |
| Baidu ADR * | | | 32 | | | | 2,450 | |
| NetEase ADR . | | | 31 | | | | 1,724 | |
| | | | | | | | 4,174 | |
| Consumer Discretionary — 0.4% | | | | | | | | |
| JD.com ADR . | | | 90 | | | | 3,356 | |
| Pinduoduo ADR * | | | 82 | | | | 4,496 | |
| | | | | | | | 7,852 | |
| Information Technology — 0.4% | | | | | | | | |
| NXP Semiconductors . | | | 47 | | | | 6,866 | |
| TOTAL CHINA | | | | | | | 18,892 | |
|
|
|
| Schedule of Investments | | October 31, 2022 |
| Global X NASDAQ 100® Tail Risk ETF |
| | | | |
| |
| | | Shares | | | Value | |
| COMMON STOCK — continued | | | | | | |
| NETHERLANDS — 0.4% | | | | | | |
| Information Technology — 0.4% | | | | | | |
| ASML Holding . | | | 15 | | | $ | 7,086 | |
| UNITED KINGDOM — 0.3% | | | | | | | | |
| Health Care — 0.3% | | | | | | | | |
| AstraZeneca ADR . | | | 108 | | | | 6,352 | |
| UNITED STATES — 96.2% | | | | | | | | |
| Communication Services — 14.4% | | | | | | | | |
| Activision Blizzard . | | | 143 | | | | 10,410 | |
| Alphabet, Cl A * | | | 648 | | | | 61,243 | |
| Alphabet, Cl C * | | | 666 | | | | 63,044 | |
| Charter Communications, Cl A * | | | 29 | | | | 10,661 | |
| Comcast, Cl A | | | 788 | | | | 25,011 | |
| Electronic Arts | | | 49 | | | | 6,172 | |
| Match Group * | | | 53 | | | | 2,290 | |
| Meta Platforms, Cl A * | | | 369 | | | | 34,376 | |
| Netflix * | | | 80 | | | | 23,350 | |
| Sirius XM Holdings . | | | 732 | | | | 4,421 | |
| T-Mobile US * | | | 224 | | | | 33,949 | |
| | | | | | | | 274,927 | |
| Consumer Discretionary — 14.4% | | | | | | | | |
| Airbnb, Cl A * | | | 71 | | | | 7,591 | |
| Amazon.com * | | | 1,101 | | | | 112,787 | |
| Booking Holdings * | | | 7 | | | | 13,086 | |
| Dollar Tree * | | | 40 | | | | 6,340 | |
| eBay | | | 99 | | | | 3,944 | |
| Lucid Group * | | | 310 | | | | 4,430 | |
| Lululemon Athletica * | | | 22 | | | | 7,239 | |
| Marriott International, Cl A | | | 58 | | | | 9,286 | |
| O'Reilly Automotive * | | | 11 | | | | 9,209 | |
| Ross Stores | | | 65 | | | | 6,220 | |
| Starbucks | | | 208 | | | | 18,011 | |
| Tesla * | | | 336 | | | | 76,453 | |
| | | | | | | | 274,596 | |
| Consumer Staples — 7.0% | | | | | | | | |
| Costco Wholesale | | | 79 | | | | 39,618 | |
|
|
|
| Schedule of Investments | | October 31, 2022 |
| Global X NASDAQ 100® Tail Risk ETF |
| | | | |
| |
| | | Shares | | | Value | |
| COMMON STOCK — continued | | | | | | |
| Consumer Staples — continued | | | | | | |
| Keurig Dr Pepper | | | 252 | | | $ | 9,788 | |
| Kraft Heinz | | | 217 | | | | 8,348 | |
| Mondelez International, Cl A . | | | 245 | | | | 15,063 | |
| Monster Beverage * | | | 94 | | | | 8,810 | |
| PepsiCo | | | 247 | | | | 44,850 | |
| Walgreens Boots Alliance | | | 161 | | | | 5,876 | |
| | | | | | | | 132,353 | |
| Health Care — 7.0% | | | | | | | | |
| Align Technology * | | | 15 | | | | 2,915 | |
| Amgen . | | | 97 | | | | 26,224 | |
| Biogen * | | | 27 | | | | 7,653 | |
| Dexcom * | | | 69 | | | | 8,334 | |
| Gilead Sciences | | | 224 | | | | 17,575 | |
| IDEXX Laboratories * | | | 15 | | | | 5,395 | |
| Illumina * | | | 29 | | | | 6,636 | |
| Intuitive Surgical * | | | 64 | | | | 15,774 | |
| Moderna * | | | 70 | | | | 10,523 | |
| Regeneron Pharmaceuticals * | | | 19 | | | | 14,226 | |
| Seagen * | | | 34 | | | | 4,323 | |
| Vertex Pharmaceuticals * | | | 46 | | | | 14,352 | |
| | | | | | | | 133,930 | |
| Industrials — 3.7% | | | | | | | | |
| Cintas | | | 18 | | | | 7,696 | |
| Copart * | | | 44 | | | | 5,061 | |
| CSX | | | 381 | | | | 11,072 | |
| Fastenal | | | 100 | | | | 4,833 | |
| Honeywell International . | | | 120 | | | | 24,482 | |
| Old Dominion Freight Line | | | 20 | | | | 5,492 | |
| PACCAR | | | 65 | | | | 6,294 | |
| Verisk Analytics, Cl A . | | | 29 | | | | 5,302 | |
| | | | | | | | 70,232 | |
| Information Technology — 48.3% | | | | | | | | |
| Adobe * | | | 84 | | | | 26,754 | |
| Advanced Micro Devices * | | | 289 | | | | 17,357 | |
| Analog Devices | | | 92 | | | | 13,121 | |
| ANSYS * | | | 16 | | | | 3,538 | |
| Apple . | | | 1,738 | | | | 266,505 | |
|
|
|
| Schedule of Investments | | October 31, 2022 |
| Global X NASDAQ 100® Tail Risk ETF |
| | | | |
| |
| | | Shares
| | | Value | |
| COMMON STOCK — continued | | | | | | |
| Information Technology — continued | | | | | | |
| Applied Materials . | | | 153 | | | $ | 13,508 | |
| Atlassian, Cl A * | | | 27 | | | | 5,474 | |
| Autodesk * | | | 38 | | | | 8,143 | |
| Automatic Data Processing | | | 74 | | | | 17,886 | |
| Broadcom | | | 72 | | | | 33,849 | |
| Cadence Design Systems * | | | 49 | | | | 7,418 | |
| Cisco Systems | | | 741 | | | | 33,664 | |
| Cognizant Technology Solutions, Cl A | | | 92 | | | | 5,727 | |
| Crowdstrike Holdings, Cl A * | | | 38 | | | | 6,126 | |
| Datadog, Cl A * | | | 53 | | | | 4,267 | |
| DocuSign, Cl A * | | | 33 | | | | 1,594 | |
| Fiserv * | | | 114 | | | | 11,712 | |
| Fortinet * | | | 140 | | | | 8,002 | |
| Intel . | | | 734 | | | | 20,868 | |
| Intuit . | | | 50 | | | | 21,375 | |
| KLA | | | 25 | | | | 7,911 | |
| Lam Research | | | 24 | | | | 9,715 | |
| Marvell Technology . | | | 158 | | | | 6,269 | |
| Microchip Technology | | | 103 | | | | 6,359 | |
| Micron Technology . | | | 196 | | | | 10,604 | |
| Microsoft | | | 806 | | | | 187,097 | |
| NVIDIA . | | | 378 | | | | 51,019 | |
| Okta, Cl A * | | | 26 | | | | 1,459 | |
| Palo Alto Networks * | | | 54 | | | | 9,266 | |
| Paychex | | | 64 | | | | 7,572 | |
| PayPal Holdings * | | | 207 | | | | 17,301 | |
| QUALCOMM . | | | 201 | | | | 23,650 | |
| Skyworks Solutions | | | 27 | | | | 2,322 | |
| Splunk * | | | 27 | | | | 2,244 | |
| Synopsys * | | | 28 | | | | 8,191 | |
| Texas Instruments . | | | 163 | | | | 26,183 | |
| VeriSign * | | | 20 | | | | 4,009 | |
| Workday, Cl A * | | | 37 | | | | 5,765 | |
| Zoom Video Communications, Cl A * | | | 47 | | | | 3,922 | |
| Zscaler * | | | 26 | | | | 4,007 | |
| | | | | | | | 921,753 | |
| Utilities — 1.4% | | | | | | | | |
| American Electric Power | | | 91 | | | | 8,001 | |
| Constellation Energy . | | | 56 | | | | 5,294 | |
|
|
|
| Schedule of Investments | | October 31, 2022 |
| Global X NASDAQ 100® Tail Risk ETF |
| | | | |
| |
| | | Shares
| | | Value | |
| COMMON STOCK — continued | | | | | | |
| Utilities — continued | | | | | | |
| Exelon | | | 183 | | | $ | 7,062 | |
| Xcel Energy | | | 101 | | | | 6,576 | |
| | | | | | | | 26,933 | |
| TOTAL UNITED STATES | | | | | | | 1,834,724 | |
| TOTAL COMMON STOCK | | | | | | | | |
| (Cost $2,510,060) | | | | | | | 1,875,169 | |
| PURCHASED OPTIONS — 1.6% | | | | | | | | |
| (Cost $50,732) | | | | | | | 30,870 | |
| TOTAL INVESTMENTS — 99.9% | | | | | | | | |
| (Cost $2,560,792) | | | | | | $ | 1,906,039 | |
Percentages are based on Net Assets of $1,907,984.
A list of the exchange traded option contracts held by the Fund at October 31, 2022, is as follows:
| Description | | Number of Contracts | | | Notional Amount | | | Exercise Price | | Expiration Date | | Value | |
| PURCHASED OPTIONS — 1.6% | | | | | | | | | | | | | |
| Put Options | | | | | | | | | | | | | |
| Nasdaq-100 | | | 1 | | | $ | 1,057,500 | | | $ | 10,575.00 | | 12/16/22 | | $ | 19,365 | |
Nasdaq-100® Reduced-Value Index | | | 3 | | | | 633,000 | | | | 2,110.00 | | 12/16/22 | | | 11,505 | |
| Total Purchased Options | | | | | | $ | 1,690,500 | | | | | | | | $ | 30,870 | |
* Non-income producing security.
(A) All or a portion of these securities has been segregated as collateral for options contracts. The aggregate market value of collateral at October 31, 2022 was $1,875,169.
|
|
|
| Schedule of Investments | | October 31, 2022 |
| Global X NASDAQ 100® Tail Risk ETF |
The following is a summary of the level of inputs used as of October 31, 2022, in valuing the Fund's investments carried at value:
| Investments in Securities | | Level 1 | | | Level 2 | | | Level 3 | | | Total | |
| Common Stock | | $ | 1,875,169 | | | $ | — | | | $ | — | | | $ | 1,875,169 | |
| Purchased Options | | | 30,870 | | | | — | | | | — | | | | 30,870 | |
| Total Investments in Securities | | $ | 1,906,039 | | | $ | — | | | $ | — | | | $ | 1,906,039 | |
Amounts designated as “—“ are $0 or have been rounded to $0.
See "Glossary" for abbreviations.
|
|
| Schedule of Investments | October 31, 2022 |
| Global X NASDAQ 100® Risk Managed Income ETF |
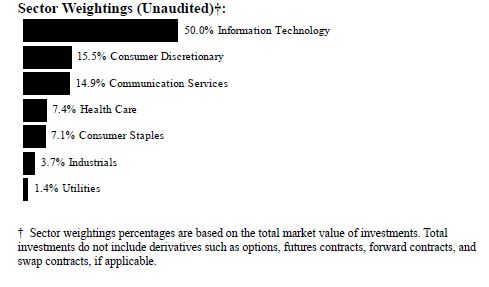
| | | | |
| |
| | | Shares
| | | Value | |
| COMMON STOCK — 104.3%(A) | | | | | | |
| BRAZIL — 0.5% | | | | | | |
| Consumer Discretionary — 0.5% | | | | | | |
| MercadoLibre * | | | 53 | | | $ | 47,786 | |
| CHINA — 1.0% | | | | | | | | |
| Communication Services — 0.2% | | | | | | | | |
| Baidu ADR * | | | 187 | | | | 14,319 | |
| NetEase ADR . | | | 173 | | | | 9,622 | |
| | | | | | | | 23,941 | |
| Consumer Discretionary — 0.4% | | | | | | | | |
| JD.com ADR . | | | 524 | | | | 19,540 | |
| Pinduoduo ADR * | | | 484 | | | | 26,538 | |
| | | | | | | | 46,078 | |
| Information Technology — 0.4% | | | | | | | | |
| NXP Semiconductors . | | | 275 | | | | 40,172 | |
| TOTAL CHINA | | | | | | | 110,191 | |
|
|
| Schedule of Investments | October 31, 2022 |
| Global X NASDAQ 100® Risk Managed Income ETF |
| | | | |
| |
| | | Shares | | | Value | |
| COMMON STOCK — continued | | | | | | |
| NETHERLANDS — 0.4% | | | | | | |
| Information Technology — 0.4% | | | | | | |
| ASML Holding . | | | 93 | | | $ | 43,935 | |
| UNITED KINGDOM — 0.3% | | | | | | | | |
| Health Care — 0.3% | | | | | | | | |
| AstraZeneca ADR . | | | 611 | | | | 35,933 | |
| UNITED STATES — 102.1% | | | | | | | | |
| Communication Services — 15.3% | | | | | | | | |
| Activision Blizzard . | | | 853 | | | | 62,099 | |
| Alphabet, Cl A * | | | 3,863 | | | | 365,092 | |
| Alphabet, Cl C * | | | 3,971 | | | | 375,895 | |
| Charter Communications, Cl A * | | | 168 | | | | 61,760 | |
| Comcast, Cl A | | | 4,755 | | | | 150,924 | |
| Electronic Arts | | | 289 | | | | 36,403 | |
| Match Group * | | | 275 | | | | 11,880 | |
| Meta Platforms, Cl A * | | | 2,214 | | | | 206,256 | |
| Netflix * | | | 480 | | | | 140,102 | |
| Sirius XM Holdings . | | | 4,035 | | | | 24,371 | |
| T-Mobile US * | | | 1,352 | | | | 204,909 | |
| | | | | | | | 1,639,691 | |
| Consumer Discretionary — 15.3% | | | | | | | | |
| Airbnb, Cl A * | | | 414 | | | | 44,261 | |
| Amazon.com * | | | 6,568 | | | | 672,826 | |
| Booking Holdings * | | | 43 | | | | 80,388 | |
| Dollar Tree * | | | 233 | | | | 36,930 | |
| eBay | | | 617 | | | | 24,581 | |
| Lucid Group * | | | 1,736 | | | | 24,807 | |
| Lululemon Athletica * | | | 126 | | | | 41,459 | |
| Marriott International, Cl A | | | 339 | | | | 54,277 | |
| O'Reilly Automotive * | | | 69 | | | | 57,765 | |
| Ross Stores | | | 362 | | | | 34,640 | |
| Starbucks | | | 1,242 | | | | 107,545 | |
| Tesla * | | | 2,003 | | | | 455,763 | |
| | | | | | | | 1,635,242 | |
| Consumer Staples — 7.4% | | | | | | | | |
| Costco Wholesale | | | 477 | | | | 239,216 | |
|
|
| Schedule of Investments | October 31, 2022 |
| Global X NASDAQ 100® Risk Managed Income ETF |
| | | | |
| |
| | | Shares | | | Value | |
| COMMON STOCK — continued | | | | | | |
| Consumer Staples — continued | | | | | | |
| Keurig Dr Pepper | | | 1,546 | | | $ | 60,047 | |
| Kraft Heinz | | | 1,275 | | | | 49,049 | |
| Mondelez International, Cl A . | | | 1,488 | | | | 91,482 | |
| Monster Beverage * | | | 577 | | | | 54,076 | |
| PepsiCo | | | 1,485 | | | | 269,646 | |
| Walgreens Boots Alliance | | | 895 | | | | 32,668 | |
| | | | | | | | 796,184 | |
| Health Care — 7.4% | | | | | | | | |
| Align Technology * | | | 78 | | | | 15,156 | |
| Amgen . | | | 578 | | | | 156,262 | |
| Biogen * | | | 154 | | | | 43,650 | |
| Dexcom * | | | 408 | | | | 49,278 | |
| Gilead Sciences | | | 1,359 | | | | 106,627 | |
| IDEXX Laboratories * | | | 92 | | | | 33,091 | |
| Illumina * | | | 165 | | | | 37,755 | |
| Intuitive Surgical * | | | 388 | | | | 95,630 | |
| Moderna * | | | 407 | | | | 61,184 | |
| Regeneron Pharmaceuticals * | | | 116 | | | | 86,855 | |
| Seagen * | | | 189 | | | | 24,033 | |
| Vertex Pharmaceuticals * | | | 270 | | | | 84,240 | |
| | | | | | | | 793,761 | |
| Industrials — 3.9% | | | | | | | | |
| Cintas | | | 107 | | | | 45,748 | |
| Copart * | | | 245 | | | | 28,180 | |
| CSX | | | 2,334 | | | | 67,826 | |
| Fastenal | | | 595 | | | | 28,756 | |
| Honeywell International . | | | 728 | | | | 148,526 | |
| Old Dominion Freight Line | | | 116 | | | | 31,854 | |
| PACCAR | | | 360 | | | | 34,859 | |
| Verisk Analytics, Cl A . | | | 165 | | | | 30,167 | |
| | | | | | | | 415,916 | |
| Information Technology — 51.4% | | | | | | | | |
| Adobe * | | | 505 | | | | 160,842 | |
| Advanced Micro Devices * | | | 1,748 | | | | 104,985 | |
| Analog Devices | | | 559 | | | | 79,725 | |
| ANSYS * | | | 94 | | | | 20,789 | |
| Apple . | | | 10,364 | | | | 1,589,216 | |
|
|
| Schedule of Investments | October 31, 2022 |
| Global X NASDAQ 100® Risk Managed Income ETF |
| | | | |
| |
| | | Shares | | | Value | |
| COMMON STOCK — continued | | | | | | |
| Information Technology — continued | | | | | | |
| Applied Materials . | | | 935 | | | $ | 82,551 | |
| Atlassian, Cl A * | | | 154 | | | | 31,220 | |
| Autodesk * | | | 226 | | | | 48,432 | |
| Automatic Data Processing | | | 450 | | | | 108,765 | |
| Broadcom | | | 436 | | | | 204,972 | |
| Cadence Design Systems * | | | 286 | | | | 43,298 | |
| Cisco Systems | | | 4,463 | | | | 202,754 | |
| Cognizant Technology Solutions, Cl A | | | 536 | | | | 33,366 | |
| Crowdstrike Holdings, Cl A * | | | 225 | | | | 36,270 | |
| Datadog, Cl A * | | | 301 | | | | 24,234 | |
| DocuSign, Cl A * | | | 195 | | | | 9,418 | |
| Fiserv * | | | 697 | | | | 71,610 | |
| Fortinet * | | | 819 | | | | 46,814 | |
| Intel . | | | 4,440 | | | | 126,229 | |
| Intuit . | | | 305 | | | | 130,387 | |
| KLA | | | 156 | | | | 49,366 | |
| Lam Research | | | 150 | | | | 60,717 | |
| Marvell Technology . | | | 884 | | | | 35,077 | |
| Microchip Technology | | | 575 | | | | 35,501 | |
| Micron Technology . | | | 1,201 | | | | 64,974 | |
| Microsoft | | | 4,809 | | | | 1,116,313 | |
| NVIDIA . | | | 2,256 | | | | 304,492 | |
| Okta, Cl A * | | | 146 | | | | 8,194 | |
| Palo Alto Networks * | | | 327 | | | | 56,110 | |
| Paychex | | | 371 | | | | 43,893 | |
| PayPal Holdings * | | | 1,252 | | | | 104,642 | |
| QUALCOMM . | | | 1,213 | | | | 142,722 | |
| Skyworks Solutions | | | 157 | | | | 13,504 | |
| Splunk * | | | 157 | | | | 13,048 | |
| Synopsys * | | | 161 | | | | 47,101 | |
| Texas Instruments . | | | 986 | | | | 158,381 | |
| VeriSign * | | | 107 | | | | 21,449 | |
| Workday, Cl A * | | | 212 | | | | 33,034 | |
| Zoom Video Communications, Cl A * | | | 282 | | | | 23,530 | |
| Zscaler * | | | 143 | | | | 22,036 | |
| | | | | | | | 5,509,961 | |
| Utilities — 1.4% | | | | | | | | |
| American Electric Power | | | 533 | | | | 46,861 | |
| Constellation Energy . | | | 341 | | | | 32,238 | |
|
|
| Schedule of Investments | October 31, 2022 |
| Global X NASDAQ 100® Risk Managed Income ETF |
| | | | |
| |
| | | Shares | | | Value | |
| COMMON STOCK — continued | | | | | | |
| Utilities — continued | | | | | | |
| Exelon | | | 1,027 | | | $ | 39,632 | |
| Xcel Energy | | | 570 | | | | 37,113 | |
| | | | | | | | 155,844 | |
| TOTAL UNITED STATES | | | | | | | 10,946,599 | |
| TOTAL COMMON STOCK | | | | | | | | |
| (Cost $14,396,724) | | | | | | | 11,184,444 | |
| PURCHASED OPTIONS — 0.6% | | | | | | | | |
| (Cost $176,881) | | | | | | | 60,740 | |
| TOTAL INVESTMENTS — 104.9% | | | | | | | | |
| (Cost $14,573,605) | | | | | | $ | 11,245,184 | |
| WRITTEN OPTIONS— (5.0)% | | | | | | | | |
| (Premiums Received $(476,649)) | | | | | | $ | (536,740 | ) |
Percentages are based on Net Assets of $10,719,550.
A list of the exchange traded option contracts held by the Fund at October 31, 2022, is as follows:
| Description | | Number of Contracts | | | Notional Amount | | | Exercise Price | | Expiration Date | | Value | |
| PURCHASED OPTIONS — 0.6% | | | | | | | | | | | | | |
| Put Options | | | | | | | | | | | | | |
| Nasdaq-100 | | | 8 | | | $ | 8,400,000 | | | $ | 10,500.00 | | 11/18/22 | | $ | 49,040 | |
Nasdaq-100® Reduced-Value Index | | | 9 | | | | 1,890,000 | | | | 2,100.00 | | 11/18/22 | | | 11,700 | |
| Total Purchased Options | | | | | | $ | 10,290,000 | | | | | | | | $ | 60,740 | |
| WRITTEN OPTIONS — (5.0)% | | | | | | | | | | | | | |
| Call Options | | | | | | | | | | | | | |
| Nasdaq-100 | | | (8 | ) | | $ | (8,840,000 | ) | | | 11,050.00 | | 11/18/22 | | $ | (437,560 | ) |
Nasdaq-100® Reduced-Value Index | | | (9 | ) | | | (1,989,000 | ) | | | 2,210.00 | | 11/18/22 | | | (99,180 | ) |
|
|
| Schedule of Investments | October 31, 2022 |
| Global X NASDAQ 100® Risk Managed Income ETF |
| Description | Number of Contracts | | Notional Amount | | Exercise Price | Expiration Date | | Value | |
| WRITTEN OPTIONS (continued) | | | | | | | | | |
Total Written Options | | | $ | (10,829,000 | ) | | | | $ | (536,740 | ) |
* Non-income producing security.
(A) All or a portion of these securities has been segregated as collateral for options contracts. The aggregate market value of collateral at October 31, 2022 was $11,184,444.
The following is a summary of the level of inputs used as of October 31, 2022, in valuing the Fund’s investments carried at value:
| Investments in Securities | | Level 1 | | | Level 2 | | | Level 3 | | | Total | |
| Common Stock | | $ | 11,184,444 | | | $ | — | | | $ | — | | | $ | 11,184,444 | |
| Purchased Options | | | 60,740 | | | | — | | | | — | | | | 60,740 | |
| Total Investments in Securities | | $ | 11,245,184 | | | $ | — | | | $ | — | | | $ | 11,245,184 | |
| Other Financial Instruments | | Level 1 | | | Level 2 | | | Level 3 | | | Total | |
| Written Options | | $ | (536,740 | ) | | $ | – | | | $ | – | | | $ | (536,740 | ) |
| Total Other Financial Instruments | | $ | (536,740 | ) | | $ | – | | | $ | – | | | $ | (536,740 | ) |
Amounts designated as “—“ are $0 or have been rounded to $0.
See "Glossary" for abbreviations.
|
|
|
| Schedule of Investments | | October 31, 2022 |
| Global X NASDAQ 100® Collar 95-110 ETF |

| | | | |
| |
| | | Shares | | | Value | |
| COMMON STOCK — 97.2%(A) | | | | | | |
| BRAZIL — 0.4% | | | | | | |
| Consumer Discretionary — 0.4% | | | | | | |
| MercadoLibre * | | | 14 | | | $ | 12,623 | |
| CHINA — 1.0% | | | | | | | | |
| Communication Services — 0.2% | | | | | | | | |
| Baidu ADR * | | | 48 | | | | 3,675 | |
| NetEase ADR . | | | 43 | | | | 2,392 | |
| | | | | | | | 6,067 | |
| Consumer Discretionary — 0.4% | | | | | | | | |
| JD.com ADR . | | | 149 | | | | 5,556 | |
| Pinduoduo ADR * | | | 126 | | | | 6,909 | |
| | | | | | | | 12,465 | |
| Information Technology — 0.4% | | | | | | | | |
| NXP Semiconductors . | | | 78 | | | | 11,394 | |
| TOTAL CHINA | | | | | | | 29,926 | |
|
|
|
| Schedule of Investments | | October 31, 2022 |
| Global X NASDAQ 100® Collar 95-110 ETF |
| | | | |
| |
| | | Shares | | | Value | |
| COMMON STOCK — continued | | | | | | |
| NETHERLANDS — 0.3% | | | | | | |
| Information Technology — 0.3% | | | | | | |
| ASML Holding . | | | 24 | | | $ | 11,338 | |
| UNITED KINGDOM — 0.3% | | | | | | | | |
| Health Care — 0.3% | | | | | | | | |
| AstraZeneca ADR . | | | 168 | | | | 9,880 | |
| UNITED STATES — 95.2% | | | | | | | | |
| Communication Services — 14.3% | | | | | | | | |
| Activision Blizzard . | | | 229 | | | | 16,671 | |
| Alphabet, Cl A * | | | 1,035 | | | | 97,818 | |
| Alphabet, Cl C * | | | 1,064 | | | | 100,718 | |
| Charter Communications, Cl A * | | | 46 | | | | 16,910 | |
| Comcast, Cl A | | | 1,255 | | | | 39,834 | |
| Electronic Arts | | | 81 | | | | 10,203 | |
| Match Group * | | | 83 | | | | 3,586 | |
| Meta Platforms, Cl A * | | | 590 | | | | 54,964 | |
| Netflix * | | | 127 | | | | 37,069 | |
| Sirius XM Holdings . | | | 1,150 | | | | 6,946 | |
| T-Mobile US * | | | 356 | | | | 53,955 | |
| | | | | | | | 438,674 | |
| Consumer Discretionary — 14.2% | | | | | | | | |
| Airbnb, Cl A * | | | 111 | | | | 11,867 | |
| Amazon.com * | | | 1,761 | | | | 180,397 | |
| Booking Holdings * | | | 11 | | | | 20,564 | |
| Dollar Tree * | | | 64 | | | | 10,144 | |
| eBay | | | 165 | | | | 6,574 | |
| Lucid Group * | | | 487 | | | | 6,959 | |
| Lululemon Athletica * | | | 34 | | | | 11,187 | |
| Marriott International, Cl A | | | 94 | | | | 15,050 | |
| O'Reilly Automotive * | | | 18 | | | | 15,069 | |
| Ross Stores | | | 103 | | | | 9,856 | |
| Starbucks | | | 323 | | | | 27,969 | |
| Tesla * | | | 539 | | | | 122,644 | |
| | | | | | | | 438,280 | |
| Consumer Staples — 6.9% | | | | | | | | |
| Costco Wholesale | | | 127 | | | | 63,690 | |
|
|
|
| Schedule of Investments | | October 31, 2022 |
| Global X NASDAQ 100® Collar 95-110 ETF |
| | | | |
| |
| | | Shares | | | Value | |
| COMMON STOCK — continued | | | | | | |
| Consumer Staples — continued | | | | | | |
| Keurig Dr Pepper | | | 415 | | | $ | 16,119 | |
| Kraft Heinz | | | 358 | | | | 13,772 | |
| Mondelez International, Cl A . | | | 388 | | | | 23,854 | |
| Monster Beverage * | | | 154 | | | | 14,433 | |
| PepsiCo | | | 395 | | | | 71,724 | |
| Walgreens Boots Alliance | | | 251 | | | | 9,162 | |
| | | | | | | | 212,754 | |
| Health Care — 6.9% | | | | | | | | |
| Align Technology * | | | 21 | | | | 4,080 | |
| Amgen . | | | 152 | | | | 41,093 | |
| Biogen * | | | 43 | | | | 12,188 | |
| Dexcom * | | | 115 | | | | 13,890 | |
| Gilead Sciences | | | 366 | | | | 28,716 | |
| IDEXX Laboratories * | | | 23 | | | | 8,273 | |
| Illumina * | | | 47 | | | | 10,755 | |
| Intuitive Surgical * | | | 102 | | | | 25,140 | |
| Moderna * | | | 110 | | | | 16,536 | |
| Regeneron Pharmaceuticals * | | | 31 | | | | 23,211 | |
| Seagen * | | | 53 | | | | 6,740 | |
| Vertex Pharmaceuticals * | | | 73 | | | | 22,776 | |
| | | | | | | | 213,398 | |
| Industrials — 3.7% | | | | | | | | |
| Cintas | | | 30 | | | | 12,827 | |
| Copart * | | | 69 | | | | 7,936 | |
| CSX | | | 601 | | | | 17,465 | |
| Fastenal | | | 167 | | | | 8,071 | |
| Honeywell International . | | | 191 | | | | 38,968 | |
| Old Dominion Freight Line | | | 32 | | | | 8,787 | |
| PACCAR | | | 102 | | | | 9,877 | |
| Verisk Analytics, Cl A . | | | 47 | | | | 8,593 | |
| | | | | | | | 112,524 | |
| Information Technology — 47.8% | | | | | | | | |
| Adobe * | | | 132 | | | | 42,042 | |
| Advanced Micro Devices * | | | 459 | | | | 27,567 | |
| Analog Devices | | | 143 | | | | 20,395 | |
| ANSYS * | | | 24 | | | | 5,308 | |
| Apple . | | | 2,779 | | | | 426,132 | |
|
|
|
| Schedule of Investments | | October 31, 2022 |
| Global X NASDAQ 100® Collar 95-110 ETF |
| | | | |
| |
| | | Shares | | | Value | |
| COMMON STOCK — continued | | | | | | |
| Information Technology — continued | | | | | | |
| Applied Materials . | | | 241 | | | $ | 21,278 | |
| Atlassian, Cl A * | | | 41 | | | | 8,312 | |
| Autodesk * | | | 61 | | | | 13,072 | |
| Automatic Data Processing | | | 119 | | | | 28,762 | |
| Broadcom | | | 117 | | | | 55,004 | |
| Cadence Design Systems * | | | 79 | | | | 11,960 | |
| Cisco Systems | | | 1,180 | | | | 53,607 | |
| Cognizant Technology Solutions, Cl A | | | 151 | | | | 9,400 | |
| Crowdstrike Holdings, Cl A * | | | 64 | | | | 10,317 | |
| Datadog, Cl A * | | | 82 | | | | 6,602 | |
| DocuSign, Cl A * | | | 58 | | | | 2,801 | |
| Fiserv * | | | 180 | | | | 18,493 | |
| Fortinet * | | | 224 | | | | 12,804 | |
| Intel . | | | 1,174 | | | | 33,377 | |
| Intuit . | | | 81 | | | | 34,627 | |
| KLA | | | 39 | | | | 12,341 | |
| Lam Research | | | 38 | | | | 15,382 | |
| Marvell Technology . | | | 250 | | | | 9,920 | |
| Microchip Technology | | | 163 | | | | 10,064 | |
| Micron Technology . | | | 308 | | | | 16,663 | |
| Microsoft | | | 1,289 | | | | 299,216 | |
| NVIDIA . | | | 605 | | | | 81,657 | |
| Okta, Cl A * | | | 44 | | | | 2,469 | |
| Palo Alto Networks * | | | 87 | | | | 14,928 | |
| Paychex | | | 107 | | | | 12,659 | |
| PayPal Holdings * | | | 327 | | | | 27,331 | |
| QUALCOMM . | | | 320 | | | | 37,651 | |
| Skyworks Solutions | | | 48 | | | | 4,128 | |
| Splunk * | | | 48 | | | | 3,989 | |
| Synopsys * | | | 45 | | | | 13,165 | |
| Texas Instruments . | | | 259 | | | | 41,603 | |
| VeriSign * | | | 33 | | | | 6,615 | |
| Workday, Cl A * | | | 58 | | | | 9,038 | |
| Zoom Video Communications, Cl A * | | | 74 | | | | 6,175 | |
| Zscaler * | | | 41 | | | | 6,318 | |
| | | | | | | | 1,473,172 | |
| Utilities — 1.4% | | | | | | | | |
| American Electric Power | | | 148 | | | | 13,012 | |
| Constellation Energy . | | | 94 | | | | 8,887 | |
|
|
|
| Schedule of Investments | | October 31, 2022 |
| Global X NASDAQ 100® Collar 95-110 ETF |
| | | | |
| |
| | | Shares
| | | Value | |
| COMMON STOCK — continued | | | | | | |
| Utilities — continued | | | | | | |
| Exelon | | | 287 | | | $ | 11,075 | |
| Xcel Energy | | | 160 | | | | 10,418 | |
| | | | | | | | 43,392 | |
| TOTAL UNITED STATES | | | | | | | 2,932,194 | |
| TOTAL COMMON STOCK | | | | | | | | |
| (Cost $4,060,088) | | | | | | | 2,995,961 | |
| PURCHASED OPTIONS — 3.1% | | | | | | | | |
| (Cost $124,554) | | | | | | | 94,325 | |
| TOTAL INVESTMENTS — 100.3% | | | | | | | | |
| (Cost $4,184,642) | | | | | | $ | 3,090,286 | |
| WRITTEN OPTIONS— (0.5)% | | | | | | | | |
| (Premiums Received $(66,535)) | | | | | | $ | (15,280 | ) |
Percentages are based on Net Assets of $3,080,540.
A list of the exchange traded option contracts held by the Fund at October 31, 2022, is as follows:
| Description | | Number of Contracts | | | Notional Amount | | | Exercise Price | | Expiration Date | | Value | |
| | | | | | | | | | | | | | |
| PURCHASED OPTIONS — 3.1% | | | | | | | | | | | | | |
| Put Options | | | | | | | | | | | | | |
| Nasdaq-100 | | | 2 | | | $ | 2,230,000 | | | $ | 11,150.00 | | 12/16/22 | | $ | 72,410 | |
Nasdaq-100® Reduced-Value Index | | | 3 | | | | 669,000 | | | | 2,230.00 | | 12/16/22 | | | 21,915 | |
| Total Purchased Options | | | | | | $ | 2,899,000 | | | | | | | | $ | 94,325 | |
| | | | | | | | | | | | | | | | | | |
| WRITTEN OPTIONS — (0.5)% | | | | | | | | | | | | | | | | | |
| Call Options | | | | | | | | | | | | | | | | | |
| Nasdaq-100 | | | (2 | ) | | $ | (2,585,000 | ) | | | 12,925.00 | | 12/16/22 | | $ | (11,650 | ) |
Nasdaq-100® Reduced-Value Index | | | (3 | ) | | | (775,500 | ) | | | 2,585.00 | | 12/16/22 | | | (3,630 | ) |
|
|
|
| Schedule of Investments | | October 31, 2022 |
| Global X NASDAQ 100® Collar 95-110 ETF |
| Description | | Number of Contracts | | | Notional Amount | | | | Exercise Price | | Expiration Date | | Value | |
| WRITTEN OPTIONS (continued) | | | | | | | | | | | | | | |
| Total Written Options | | | | | $ | (3,360,500 | ) | | | | | | | $ | (15,280 | ) |
* Non-income producing security.
(A) All or a portion of these securities has been segregated as collateral for options contracts. The aggregate market value of collateral at October 31, 2022 was $2,995,961.
The following is a summary of the level of inputs used as of October 31, 2022, in valuing the Fund’s investments and other financial instruments carried at value:
| Investments in Securities | | Level 1 | | | Level 2 | | | Level 3 | | | Total | |
| Common Stock | | $ | 2,995,961 | | | $ | — | | | $ | — | | | $ | 2,995,961 | |
| Purchased Options | | | 94,325 | | | | — | | | | — | | | | 94,325 | |
| Total Investments in Securities | | $ | 3,090,286 | | | $ | — | | | $ | — | | | $ | 3,090,286 | |
| Other Financial Instruments | | Level 1 | | | Level 2 | | | Level 3 | | | Total | |
| Written Options | | $ | (15,280 | ) | | $ | – | | | $ | – | | | $ | (15,280 | ) |
| Total Other Financial Instruments | | $ | (15,280 | ) | | $ | – | | | $ | – | | | $ | (15,280 | ) |
Amounts designated as “—“ are $0 or have been rounded to $0.
See "Glossary" for abbreviations.
|
|
| Schedule of Investments | October 31, 2022 |
| Glossary: (abbreviations used in preceding Schedule of Investments) |
| Portfolio Abbreviations |
ADR — American Depositary Receipt |
Cl — Class |
ETF — Exchange-Traded Fund |
GDR — Global Depositary Receipt |
LIBOR— London Interbank Offered Rate |
NVDR — Non-Voting Depositary Receipt |
REIT — Real Estate Investment Trust |
Ser — Series |
USD — U.S. Dollar |
Statements of Assets and Liabilities
October 31, 2022
| | | Global X Social Media ETF | | | Global X Lithium & Battery Tech ETF | | | Global X Disruptive Materials ETF | | | Global X E-commerce ETF | |
| Assets: | | | | | | | | | | | | |
| Cost of Investments | | $ | 250,122,028 | | | $ | 3,621,759,004 | | | $ | 4,672,494 | | | $ | 105,157,365 | |
| Cost of Repurchase Agreement | | | 512,797 | | | | 72,829,304 | | | | — | | | | 422,380 | |
| Cost of Foreign Currency | | | — | | | | 5,360 | | | | — | | | | — | |
| Investments, at Value | | $ | 103,504,492 | * | | $ | 3,946,386,402 | * | | $ | 3,427,483 | | | $ | 42,492,651 | * |
| Repurchase Agreement, at Value | | | 512,797 | | | | 72,829,304 | | | | — | | | | 422,380 | |
| Cash | | | 14,723,513 | | | | 266,330,853 | | | | 4,540 | | | | 58,439 | |
| Foreign Currency, at Value | | | 1 | | | | 5,208 | | | | — | | | | — | |
| Receivable for Investment Securities Sold | | | 3,622,457 | | | | 493,274,787 | | | | — | | | | — | |
| Dividend, Interest, and Securities Lending Income Receivable | | | 19,713 | | | | 4,679,150 | | | | 2,559 | | | | 11,627 | |
| Reclaim Receivable | | | 5,074 | | | | 36,288 | | | | 347 | | | | — | |
| Unrealized Appreciation on Spot Contracts | | | 1,056 | | | | 69,048 | | | | — | | | | — | |
| Due from Broker | | | — | | | | 22,141 | | | | — | | | | — | |
| Total Assets | | | 122,389,103 | | | | 4,783,633,181 | | | | 3,434,929 | | | | 42,985,097 | |
| Liabilities: | | | | | | | | | | | | | | | | |
| Obligation to Return Securities Lending Collateral | | | 881,874 | | | | 125,246,902 | | | | — | | | | 726,381 | |
| Payable for Investment Securities Purchased | | | 18,060,170 | | | | 721,587,274 | | | | — | | | | — | |
| Payable due to Investment Adviser | | | 65,539 | | | | 2,533,812 | | | | 1,765 | | | | 18,198 | |
| Payable for Capital Shares Redeemed | | | — | | | | 34,755,846 | | | | — | | | | — | |
| Due to Broker | | | 136,074 | | | | — | | | | — | | | | — | |
| Total Liabilities | | | 19,143,657 | | | | 884,123,834 | | | | 1,765 | | | | 744,579 | |
| Net Assets | | $ | 103,245,446 | | | $ | 3,899,509,347 | | | $ | 3,433,164 | | | $ | 42,240,518 | |
| Net Assets Consist of: | | | | | | | | | | | | | | | | |
| Paid-in Capital | | $ | 329,802,348 | | | $ | 3,986,760,045 | | | $ | 4,892,040 | | | $ | 117,759,557 | |
| Total Distributable Loss | | | (226,556,902 | ) | | | (87,250,698 | ) | | | (1,458,876 | ) | | | (75,519,039 | ) |
| Net Assets | | $ | 103,245,446 | | | $ | 3,899,509,347 | | | $ | 3,433,164 | | | $ | 42,240,518 | |
| Outstanding Shares of Beneficial Interest | | | | | | | | | | | | | | | | |
| (unlimited authorization — no par value) | | | 4,150,000 | | | | 58,084,628 | | | | 190,000 | | | | 2,790,002 | |
| Net Asset Value, Offering and Redemption Price Per Share | | $ | 24.88 | | | $ | 67.13 | | | $ | 18.07 | | | $ | 15.14 | |
| *Includes Market Value of Securities on Loan | | $ | 852,592 | | | $ | 119,253,061 | | | $ | — | | | $ | 623,392 | |
| The accompanying notes are an integral part of the financial statements. |
Statements of Assets and Liabilities
October 31, 2022
| | | Global X Emerging Markets Internet & E-commerce ETF‡ | | | Global X SuperDividend® ETF‡ | | | Global X SuperDividend® U.S. ETF | | | Global X MSCI SuperDividend® EAFE ETF | |
| Assets: | | | | | | | | | | | | |
| Cost of Investments | | $ | 4,538,604 | | | $ | 919,679,903 | | | $ | 675,171,309 | | | $ | 10,795,210 | |
| Cost of Repurchase Agreement | | | — | | | | 16,356,292 | | | | 11,310,630 | | | | — | |
| Cost of Foreign Currency | | | — | | | | 9,165,578 | | | | — | | | | 6,184 | |
| Investments, at Value | | $ | 2,149,385 | | | $ | 685,078,771 | * | | $ | 689,700,252 | * | | $ | 8,351,785 | |
| Repurchase Agreement, at Value | | | — | | | | 16,356,292 | | | | 11,310,630 | | | | — | |
| Cash | | | — | | | | — | | | | 213,384 | | | | — | |
| Foreign Currency, at Value | | | 2 | | | | 8,060,632 | | | | — | | | | 4,770 | |
| Unrealized Appreciation on Spot Contracts | | | — | | | | 10 | | | | — | | | | 27 | |
| Receivable for Capital Shares Sold | | | — | | | | 65,537 | | | | 575,321 | | | | — | |
| Receivable for Investment Securities Sold | | | — | | | | 155,093 | | | | 2,295,231 | | | | — | |
| Dividend, Interest, and Securities Lending Income Receivable | | | — | | | | 3,343,039 | | | | 2,342,504 | | | | 45,748 | |
| Reclaim Receivable | | | — | | | | 369,870 | | | | 8,115 | | | | 49,272 | |
| Due from Broker | | | — | | | | 305,272 | | | | — | | | | — | |
| Total Assets | | | 2,149,387 | | | | 713,734,516 | | | | 706,445,437 | | | | 8,451,602 | |
| Liabilities: | | | | | | | | | | | | | | | | |
| Obligation to Return Securities Lending Collateral | | | — | | | | 28,128,443 | | | | 19,451,255 | | | | — | |
| Payable due to Investment Adviser | | | 1,181 | | | | 417,694 | | | | 251,909 | | | | 4,503 | |
| Payable for Investment Securities Purchased | | | — | | | | — | | | | 573,827 | | | | — | |
| Payable for Capital Shares Redeemed | | | — | | | | 231,088 | | | | 2,301,282 | | | | — | |
| Cash Overdraft | | | 182,037 | | | | 8,304,884 | | | | — | | | | 63,531 | |
| Due to Broker | | | — | | | | 373,871 | | | | 2,856 | | | | — | |
| Total Liabilities | | | 183,218 | | | | 37,455,980 | | | | 22,581,129 | | | | 68,034 | |
| Net Assets | | $ | 1,966,169 | | | $ | 676,278,536 | | | $ | 683,864,308 | | | $ | 8,383,568 | |
| Net Assets Consist of: | | | | | | | | | | | | | | | | |
| Paid-in Capital | | $ | 5,961,883 | | | $ | 1,622,077,132 | | | $ | 811,489,097 | | | $ | 12,149,646 | |
| Total Distributable Loss | | | (3,995,714 | ) | | | (945,798,596 | ) | | | (127,624,789 | ) | | | (3,766,078 | ) |
| Net Assets | | $ | 1,966,169 | | | $ | 676,278,536 | | | $ | 683,864,308 | | | $ | 8,383,568 | |
| Outstanding Shares of Beneficial Interest | | | | | | | | | | | | | | | | |
| (unlimited authorization — no par value) | | | 120,000 | | | | 29,333,333 | | | | 35,660,000 | | | | 700,000 | |
| Net Asset Value, Offering and Redemption Price Per Share | | $ | 16.38 | | | $ | 23.05 | | | $ | 19.18 | | | $ | 11.98 | |
| *Includes Market Value of Securities on Loan | | $ | — | | | $ | 26,684,995 | | | $ | 19,049,555 | | | $ | — | |
| ‡ | The Outstanding Shares of Beneficial Interest and Net Asset Value, Offering and Redemption Price Per Share were updated to reflect the effect of a 1 for 3 reverse share split on December 19, 2022 (See Note 11 in the Notes to Financial Statements). |
| The accompanying notes are an integral part of the financial statements. |
Statements of Assets and Liabilities
October 31, 2022
| | | Global X MSCI SuperDividend® Emerging Markets ETF‡ | | | Global X SuperDividend® REIT ETF‡ | | | Global X NASDAQ 100® Covered Call ETF | | | Global X S&P 500® Covered Call ETF | |
| Assets: | | | | | | | | | | | | |
| Cost of Investments | | $ | 53,878,855 | | | $ | 368,432,547 | | | $ | 7,292,685,852 | | | $ | 2,181,828,476 | |
| Cost of Repurchase Agreement | | | — | | | | 12,266,545 | | | | — | | | | — | |
| Cost of Foreign Currency | | | 54,868 | | | | — | | | | — | | | | — | |
| Investments, at Value | | $ | 39,163,526 | | | $ | 294,834,166 | * | | $ | 6,710,685,276 | | | $ | 2,049,821,486 | |
| Repurchase Agreement, at Value | | | — | | | | 12,266,545 | | | | — | | | | — | |
| Cash | | | — | | | | 78,918 | | | | 75,091,038 | | | | 20,872,846 | |
| Foreign Currency, at Value | | | 1 | | | | 1,858 | | | | — | | | | — | |
| Dividend, Interest, and Securities Lending Income Receivable | | | 258,013 | | | | 853,448 | | | | 1,100,221 | | | | 1,443,439 | |
| Reclaim Receivable | | | 18,804 | | | | — | | | | — | | | | 10,527 | |
| Receivable for Investment Securities Sold | | | — | | | | — | | | | 7,829,594 | | | | 2,246,156 | |
| Due from Broker | | | 18,055 | | | | 5,750 | | | | 127,769 | | | | — | |
| Total Assets | | | 39,458,399 | | | | 308,040,685 | | | | 6,794,833,898 | | | | 2,074,394,454 | |
| Liabilities: | | | | | | | | | | | | | | | | |
| Obligation to Return Securities Lending Collateral | | | — | | | | 21,095,173 | | | | — | | | | — | |
| Accrued Foreign Capital Gains Tax on Appreciated Securities | | | 39,328 | | | | — | | | | — | | | | — | |
| Payable due to Investment Adviser | | | 25,388 | | | | 141,004 | | | | 3,242,318 | | | | 953,818 | |
| Payable for Investment Securities Purchased | | | — | | | | — | | | | 379,431 | | | | 1,332,678 | |
| Payable for Capital Shares Redeemed | | | — | | | | — | | | | 7,428,981 | | | | — | |
| Options Written at Value (Premiums received $–, $–, $289,674,849 and $71,984,158, respectively) | | | — | | | | — | | | | 321,715,990 | | | | 117,689,855 | |
| Payable for Income Distributions | | | — | | | | — | | | | 64,418,868 | | | | 19,385,866 | |
| Cash Overdraft | | | 225,549 | | | | — | | | | — | | | | — | |
| Due to Broker | | | — | | | | 149,872 | | | | — | | | | 487,157 | |
| Total Liabilities | | | 290,265 | | | | 21,386,049 | | | | 397,185,588 | | | | 139,849,374 | |
| Net Assets | | $ | 39,168,134 | | | $ | 286,654,636 | | | $ | 6,397,648,310 | | | $ | 1,934,545,080 | |
| Net Assets Consist of: | | | | | | | | | | | | | | | | |
| Paid-in Capital | | $ | 76,660,565 | | | $ | 589,072,843 | | | $ | 8,102,107,713 | | | $ | 2,195,958,538 | |
| Total Distributable Loss | | | (37,492,431 | ) | | | (302,418,207 | ) | | | (1,704,459,403 | ) | | | (261,413,458 | ) |
| Net Assets | | $ | 39,168,134 | | | $ | 286,654,636 | | | $ | 6,397,648,310 | | | $ | 1,934,545,080 | |
| Outstanding Shares of Beneficial Interest | | | | | | | | | | | | | | | | |
| (unlimited authorization — no par value) | | | 1,833,333 | | | | 13,243,333 | | | | 396,140,000 | | | | 48,360,000 | |
| Net Asset Value, Offering and Redemption Price Per Share | | $ | 21.36 | | | $ | 21.65 | | | $ | 16.15 | | | $ | 40.00 | |
| *Includes Market Value of Securities on Loan | | $ | — | | | $ | 20,008,218 | | | $ | — | | | $ | — | |
| ‡ | The Outstanding Shares of Beneficial Interest and Net Asset Value, Offering and Redemption Price Per Share were updated to reflect the effect of a 1 for 3 reverse share split on December 19, 2022 (See Note 10 in the Notes to Financial Statements). |
| The accompanying notes are an integral part of the financial statements. |
Statements of Assets and Liabilities
October 31, 2022
| | | Global X Russell 2000 Covered Call ETF | | | Global X Dow 30® Covered Call ETF | | | Global X Nasdaq 100® Covered Call & Growth ETF | | | Global X S&P 500® Covered Call & Growth ETF | |
| Assets: | | | | | | | | | | | | |
| Cost of Investments | | $ | 1,458,429,351 | | | $ | 55,076,188 | | | $ | 77,853,060 | | | $ | 48,370,800 | |
| Investments, at Value | | $ | 1,462,162,960 | | | $ | 56,990,473 | | | $ | 62,484,744 | | | $ | 42,686,542 | |
| Cash | | | 15,201,196 | | | | 558,917 | | | | 422,311 | | | | 268,095 | |
| Dividend, Interest, and Securities Lending Income Receivable | | | 293,064 | | | | 33,545 | | | | 10,162 | | | | 30,732 | |
| Receivable for Investment Securities Sold | | | 67,766 | | | | 9,288 | | | | — | | | | 24,390 | |
| Reclaim Receivable | | | — | | | | — | | | | — | | | | 217 | |
| Due from Broker | | | 487,157 | | | | — | | | | — | | | | — | |
| Total Assets | | | 1,478,212,143 | | | | 57,592,223 | | | | 62,917,217 | | | | 43,009,976 | |
| Liabilities: | | | | | | | | | | | | | | | | |
| Options Written at Value (Premiums received $59,618,614, $1,800,086, $1,328,561 and $743,280, respectively) | | | 121,998,240 | | | | 4,086,998 | | | | 1,488,595 | | | | 1,225,516 | |
| Payable for Income Distributions | | | 13,251,285 | | | | 496,110 | | | | 292,456 | | | | 199,675 | |
| Payable due to Investment Adviser | | | 721,454 | | | | 24,525 | | | | 31,478 | | | | 22,732 | |
| Payable for Investment Securities Purchased | | | — | | | | — | | | | — | | | | 51,514 | |
| Total Liabilities | | | 135,970,979 | | | | 4,607,633 | | | | 1,812,529 | | | | 1,499,437 | |
| Net Assets | | $ | 1,342,241,164 | | | $ | 52,984,590 | | | $ | 61,104,688 | | | $ | 41,510,539 | |
| Net Assets Consist of: | | | | | | | | | | | | | | | | |
| Paid-in Capital | | $ | 1,520,843,943 | | | $ | 54,449,450 | | | $ | 81,196,412 | | | $ | 48,914,928 | |
| Total Distributable Loss | | | (178,602,779 | ) | | | (1,464,860 | ) | | | (20,091,724 | ) | | | (7,404,389 | ) |
| Net Assets | | $ | 1,342,241,164 | | | $ | 52,984,590 | | | $ | 61,104,688 | | | $ | 41,510,539 | |
| Outstanding Shares of Beneficial Interest | | | | | | | | | | | | | | | | |
| (unlimited authorization — no par value) | | | 68,650,000 | | | | 2,420,000 | | | | 2,680,000 | | | | 1,630,000 | |
| Net Asset Value, Offering and Redemption Price Per Share | | $ | 19.55 | | | $ | 21.89 | | | $ | 22.80 | | | $ | 25.47 | |
| The accompanying notes are an integral part of the financial statements. |
Statements of Assets and Liabilities
October 31, 2022
| | | Global X Russell 2000 Covered Call & Growth ETF | | | Global X SuperIncome™ Preferred ETF | | | Global X Renewable Energy Producers ETF | | | Global X S&P 500® Catholic Values ETF | |
| Assets: | | | | | | | | | | | | |
| Cost of Investments | | $ | 2,657,252 | | | $ | 220,331,775 | | | $ | 120,249,457 | | | $ | 508,572,240 | |
| Cost of Repurchase Agreement | | | — | | | | 1,509,559 | | | | 379,249 | | | | — | |
| Cost of Foreign Currency | | | — | | | | — | | | | 6,967 | | | | — | |
| Investments, at Value | | $ | 2,769,770 | | | $ | 195,260,988 | * | | $ | 91,181,501 | * | | $ | 548,776,363 | |
| Repurchase Agreement, at Value | | | — | | | | 1,509,559 | | | | 379,249 | | | | — | |
| Cash | | | 16,607 | | | | 328,881 | | | | — | | | | 1,100,905 | |
| Foreign Currency, at Value | | | — | | | | — | | | | 6,975 | | | | — | |
| Receivable for Investment Securities Sold | | | — | | | | 580,071 | | | | — | | | | — | |
| Dividend, Interest, and Securities Lending Income Receivable | | | — | | | | 730,936 | | | | 84,594 | | | | 389,434 | |
| Reclaim Receivable | | | — | | | | — | | | | 74,665 | | | | 2,885 | |
| Due from Broker | | | — | | | | 23,170 | | | | 17,761 | | | | 6,695 | |
| Total Assets | | | 2,786,377 | | | | 198,433,605 | | | | 91,744,745 | | | | 550,276,282 | |
| Liabilities: | | | | | | | | | | | | | | | | |
| Obligation to Return Securities Lending Collateral | | | — | | | | 2,596,038 | | | | 652,206 | | | | — | |
| Options Written at Value (Premiums received $56,428, $–, $– and $–, respectively) | | | 114,419 | | | | — | | | | — | | | | — | |
| Payable for Income Distributions | | | 12,860 | | | | — | | | | — | | | | — | |
| Payable due to Investment Adviser | | | 907 | | | | 98,062 | | | | 53,389 | | | | 128,078 | |
| Payable for Investment Securities Purchased | | | — | | | | — | | | | — | | | | 856,379 | |
| Payable for Capital Shares Redeemed | | | — | | | | 580,255 | | | | — | | | | — | |
| Unrealized Depreciation on Spot Contracts | | | — | | | | — | | | | 9 | | | | — | |
| Cash Overdraft | | | — | | | | — | | | | 67,978 | | | | — | |
| Due to Broker | | | — | | | | — | | | | 1,637 | | | | 4,179 | |
| Total Liabilities | | | 128,186 | | | | 3,274,355 | | | | 775,219 | | | | 988,636 | |
| Net Assets | | $ | 2,658,191 | | | $ | 195,159,250 | | | $ | 90,969,526 | | | $ | 549,287,646 | |
| Net Assets Consist of: | | | | | | | | | | | | | | | | |
| Paid-in Capital | | $ | 2,590,000 | | | $ | 291,838,192 | | | $ | 127,987,795 | | | $ | 514,431,354 | |
| Total Distributable Earnings/(Loss) | | | 68,191 | | | | (96,678,942 | ) | | | (37,018,269 | ) | | | 34,856,292 | |
| Net Assets | | $ | 2,658,191 | | | $ | 195,159,250 | | | $ | 90,969,526 | | | $ | 549,287,646 | |
| Outstanding Shares of Beneficial Interest | | | | | | | | | | | | | | | | |
| (unlimited authorization — no par value) | | | 100,000 | | | | 20,180,000 | | | | 6,970,000 | | | | 11,640,000 | |
| Net Asset Value, Offering and Redemption Price Per Share | | $ | 26.58 | | | $ | 9.67 | | | $ | 13.05 | | | $ | 47.19 | |
| *Includes Market Value of Securities on Loan | | $ | — | | | $ | 2,547,226 | | | $ | 627,763 | | | $ | — | |
| The accompanying notes are an integral part of the financial statements. |
Statements of Assets and Liabilities
October 31, 2022
| | | Global X S&P Catholic Values Developed ex-U.S. ETF | | | Global X Guru® Index ETF | | | Global X S&P 500® Tail Risk ETF | | | Global X S&P 500® Risk Managed Income ETF | |
| Assets: | | | | | | | | | | | | |
| Cost of Investments | | $ | 6,587,405 | | | $ | 53,293,014 | | | $ | 3,457,065 | | | $ | 29,657,861 | |
| Cost of Repurchase Agreement | | | — | | | | 457,815 | | | | — | | | | — | |
| Investments, at Value | | $ | 5,587,040 | | | $ | 46,816,732 | * | | $ | 3,013,059 | | | $ | 26,082,732 | |
| Repurchase Agreement, at Value | | | — | | | | 457,815 | | | | — | | | | — | |
| Cash | | | — | | | | 62,558 | | | | 6,899 | | | | 276,905 | |
| Foreign Currency, at Value | | | 152 | | | | — | | | | — | | | | — | |
| Dividend, Interest, and Securities Lending Income Receivable | | | 13,259 | | | | 14,095 | | | | 2,184 | | | | 18,728 | |
| Reclaim Receivable | | | 2,452 | | | | — | | | | 16 | | | | 136 | |
| Unrealized Appreciation on Spot Contracts | | | 2 | | | | — | | | | — | | | | — | |
| Receivable for Investment Securities Sold | | | — | | | | — | | | | — | | | | 28,618 | |
| Due from Broker | | | 1,074 | | | | — | | | | — | | | | — | |
| Total Assets | | | 5,603,979 | | | | 47,351,200 | | | | 3,022,158 | | | | 26,407,119 | |
| Liabilities: | | | | | | | | | | | | | | | | |
| Obligation to Return Securities Lending Collateral | | | — | | | | 787,320 | | | | — | | | | — | |
| Payable due to Investment Adviser | | | 1,645 | | | | 28,793 | | | | 1,494 | | | | 14,750 | |
| Payable for Capital Shares Redeemed | | | 1,074 | | | | — | | | | — | | | | — | |
| Payable for Investment Securities Purchased | | | — | | | | — | | | | 3,256 | | | | 16,964 | |
| Options Written at Value (Premiums received $–, $–, $– and $907,794, respectively) | | | — | | | | — | | | | — | | | | 1,494,402 | |
| Payable for Income Distributions | | | — | | | | — | | | | — | | | | 247,338 | |
| Cash Overdraft | | | 8,938 | | | | — | | | | — | | | | — | |
| Total Liabilities | | | 11,657 | | | | 816,113 | | | | 4,750 | | | | 1,773,454 | |
| Net Assets | | $ | 5,592,322 | | | $ | 46,535,087 | | | $ | 3,017,408 | | | $ | 24,633,665 | |
| Net Assets Consist of: | | | | | | | | | | | | | | | | |
| Paid-in Capital | | $ | 6,672,279 | | | $ | 70,694,757 | | | $ | 3,526,120 | | | $ | 28,577,970 | |
| Total Distributable Loss | | | (1,079,957 | ) | | | (24,159,670 | ) | | | (508,712 | ) | | | (3,944,305 | ) |
| Net Assets | | $ | 5,592,322 | | | $ | 46,535,087 | | | $ | 3,017,408 | | | $ | 24,633,665 | |
| Outstanding Shares of Beneficial Interest | | | | | | | | | | | | | | | | |
| (unlimited authorization — no par value) | | | 240,000 | | | | 1,390,000 | | | | 130,000 | | | | 1,170,000 | |
| Net Asset Value, Offering and Redemption Price Per Share | | $ | 23.30 | | | $ | 33.48 | | | $ | 23.21 | | | $ | 21.05 | |
| *Includes Market Value of Securities on Loan | | $ | — | | | $ | 749,336 | | | $ | — | | | $ | — | |
| The accompanying notes are an integral part of the financial statements. |
Statements of Assets and Liabilities
October 31, 2022
| | | Global X S&P 500® Collar 95-110 ETF | | | Global X NASDAQ 100® Tail Risk ETF | | | Global X NASDAQ 100® Risk Managed Income ETF | | | Global X NASDAQ 100® Collar 95-110 ETF | |
| Assets: | | | | | | | | | | | | |
| Cost of Investments | | $ | 4,468,250 | | | $ | 2,560,792 | | | $ | 14,573,605 | | | $ | 4,184,642 | |
| Investments, at Value | | $ | 3,935,577 | | | $ | 1,906,039 | | | $ | 11,245,184 | | | $ | 3,090,286 | |
| Cash | | | 5,462 | | | | 2,613 | | | | 123,614 | | | | 7,065 | |
| Receivable for Investment Securities Sold | | | 4,652 | | | | — | | | | — | | | | — | |
| Dividend, Interest, and Securities Lending Income Receivable | | | 2,803 | | | | 304 | | | | 1,836 | | | | 487 | |
| Reclaim Receivable | | | 20 | | | | — | | | | — | | | | — | |
| Total Assets | | | 3,948,514 | | | | 1,908,956 | | | | 11,370,634 | | | | 3,097,838 | |
| Liabilities: | | | | | | | | | | | | | | | | |
| Options Written at Value (Premiums received $42,899, $–, $476,649 and $66,535, respectively) | | | 20,585 | | | | — | | | | 536,740 | | | | 15,280 | |
| Payable for Investment Securities Purchased | | | 10,829 | | | | — | | | | — | | | | — | |
| Payable due to Investment Adviser | | | 2,419 | | | | 972 | | | | 5,902 | | | | 2,018 | |
| Payable for Income Distributions | | | — | | | | — | | | | 108,442 | | | | — | |
| Total Liabilities | | | 33,833 | | | | 972 | | | | 651,084 | | | | 17,298 | |
| Net Assets | | $ | 3,914,681 | | | $ | 1,907,984 | | | $ | 10,719,550 | | | $ | 3,080,540 | |
| Net Assets Consist of: | | | | | | | | | | | | | | | | |
| Paid-in Capital | | $ | 4,298,873 | | | $ | 2,652,279 | | | $ | 13,123,481 | | | $ | 3,612,367 | |
| Total Distributable Loss | | | (384,192 | ) | | | (744,295 | ) | | | (2,403,931 | ) | | | (531,827 | ) |
| Net Assets | | $ | 3,914,681 | | | $ | 1,907,984 | | | $ | 10,719,550 | | | $ | 3,080,540 | |
| Outstanding Shares of Beneficial Interest | | | | | | | | | | | | | | | | |
| (unlimited authorization — no par value) | | | 160,000 | | | | 100,000 | | | | 590,000 | | | | 140,000 | |
| Net Asset Value, Offering and Redemption Price Per Share | | $ | 24.47 | | | $ | 19.08 | | | $ | 18.17 | | | $ | 22.00 | |
| The accompanying notes are an integral part of the financial statements. |
Statements of Operations
For the year ended October 31, 2022
| | | Global X Social Media ETF | | | Global X Lithium & Battery Tech ETF | | | Global X Disruptive Materials ETF(1) | | | Global X E-commerce ETF | |
| Investment Income: | | | | | | | | | | | | |
| Dividend Income | | $ | 1,682,647 | | | $ | 48,077,082 | | | $ | 110,418 | | | $ | 878,893 | |
| Interest Income | | | — | | | | 169 | | | | — | | | | — | |
| Security Lending Income | | | 22,663 | | | | 11,973,691 | | | | — | | | | 14,128 | |
| Less: Foreign Taxes Withheld | | | (25,523 | ) | | | (7,948,349 | ) | | | (10,904 | ) | | | (2,851 | ) |
| Total Investment Income | | | 1,679,787 | | | | 52,102,593 | | | | 99,514 | | | | 890,170 | |
Supervision and Administration Fees(2) | | | 1,527,640 | | | | 35,950,931 | | | | 17,940 | | | | 527,219 | |
| Tax Expense | | | — | | | | 70,214 | | | | — | | | | — | |
Custodian Fees(3) | | | 4,510 | | | | 35,317 | | | | 92 | | | | 108 | |
| Total Expenses | | | 1,532,150 | | | | 36,056,462 | | | | 18,032 | | | | 527,327 | |
| Net Investment Income | | | 147,637 | | | | 16,046,131 | | | | 81,482 | | | | 362,843 | |
| Net Realized Gain (Loss) on: | | | | | | | | | | | | | | | | |
Investments(4) | | | (59,046,229 | ) | | | (89,527,108 | ) | | | (201,997 | ) | | | (31,321,990 | ) |
| Foreign Currency Transactions | | | (2,800 | ) | | | (1,208,560 | ) | | | (1,579 | ) | | | (3,260 | ) |
| Net Realized Gain (Loss) | | | (59,049,029 | ) | | | (90,735,668 | ) | | | (203,576 | ) | | | (31,325,250 | ) |
| Net Change in Unrealized Appreciation (Depreciation) on: | | | | | | | | | | | | | | | | |
| Investments | | | (148,545,589 | ) | | | (1,486,830,833 | ) | | | (1,245,011 | ) | | | (50,085,062 | ) |
| Foreign Currency Translations | | | 843 | | | | 438,339 | | | | (82 | ) | | | — | |
| Net Change in Unrealized Appreciation (Depreciation) | | | (148,544,746 | ) | | | (1,486,392,494 | ) | | | (1,245,093 | ) | | | (50,085,062 | ) |
| Net Realized and Unrealized Gain (Loss) | | | (207,593,775 | ) | | | (1,577,128,162 | ) | | | (1,448,669 | ) | | | (81,410,312 | ) |
| Net Decrease in Net Assets Resulting from Operations | | $ | (207,446,138 | ) | | $ | (1,561,082,031 | ) | | $ | (1,367,187 | ) | | $ | (81,047,469 | ) |
| (1) | The Fund commenced operations on January 24, 2022. |
| (2) | The Supervision and Administration fees reflect the supervisory and administrative fee, which includes fees paid by the Funds for the investment advisory services provided by the Adviser. (See Note 3 in Notes to Financial Statements.) |
| (3) | See Note 2 in the Notes to Financial Statements. |
| (4) | Includes realized gains (losses) as a result of in-kind redemptions. (See Note 4 in Notes to Financial Statements.) |
| The accompanying notes are an integral part of the financial statements. |
Statements of Operations
For the year ended October 31, 2022
| | | Global X Emerging Markets Internet & E-commerce ETF | | | Global X SuperDividend® ETF | | | Global X SuperDividend® U.S. ETF | | | Global X MSCI SuperDividend® EAFE ETF | |
| Investment Income: | | | | | | | | | | | | |
| Dividend Income | | $ | 24,491 | | | $ | 66,287,339 | | | $ | 26,274,279 | | | $ | 907,252 | |
| Interest Income | | | 11 | | | | 4,802 | | | | 1,992 | | | | (1 | ) |
| Security Lending Income | | | — | | | | 1,835,869 | | | | 144,272 | | | | — | |
| Less: Foreign Taxes Withheld | | | (612 | ) | | | (2,303,254 | ) | | | — | | | | (74,265 | ) |
| Total Investment Income | | | 23,890 | | | | 65,824,756 | | | | 26,420,543 | | | | 832,986 | |
Supervision and Administration Fees(1) | | | 19,552 | | | | 4,770,868 | | | | 3,136,379 | | | | 61,466 | |
Custodian Fees(2) | | | 36 | | | | 256,427 | | | | 13,725 | | | | 1,900 | |
| Total Expenses | | | 19,588 | | | | 5,027,295 | | | | 3,150,104 | | | | 63,366 | |
| Net Investment Income | | | 4,302 | | | | 60,797,461 | | | | 23,270,439 | | | | 769,620 | |
| Net Realized Gain (Loss) on: | | | | | | | | | | | | | | | | |
Investments(3) | | | (1,481,838 | ) | | | (160,369,279 | ) | | | 64,409,036 | | | | 171,043 | |
| Foreign Currency Transactions | | | (733 | ) | | | (1,234,832 | ) | | | — | | | | (10,201 | ) |
| Net Realized Gain (Loss) | | | (1,482,571 | ) | | | (161,604,111 | ) | | | 64,409,036 | | | | 160,842 | |
| Net Change in Unrealized Appreciation (Depreciation) on: | | | | | | | | | | | | | | | | |
| Investments | | | (927,025 | ) | | | (229,337,330 | ) | | | (82,329,930 | ) | | | (2,893,092 | ) |
| Foreign Currency Translations | | | 6 | | | | (376,642 | ) | | | — | | | | (6,301 | ) |
| Net Change in Unrealized Appreciation (Depreciation) | | | (927,019 | ) | | | (229,713,972 | ) | | | (82,329,930 | ) | | | (2,899,393 | ) |
| Net Realized and Unrealized Gain (Loss) | | | (2,409,590 | ) | | | (391,318,083 | ) | | | (17,920,894 | ) | | | (2,738,551 | ) |
| Net Increase (Decrease) in Net Assets Resulting from Operations | | $ | (2,405,288 | ) | | $ | (330,520,622 | ) | | $ | 5,349,545 | | | $ | (1,968,931 | ) |
| (1) | The Supervision and Administration fees reflect the supervisory and administrative fee, which includes fees paid by the Funds for the investment advisory services provided by the Adviser. (See Note 3 in Notes to Financial Statements.) |
| (2) | See Note 2 in the Notes to Financial Statements. |
| (3) | Includes realized gains (losses) as a result of in-kind redemptions. (See Note 4 in Notes to Financial Statements.) |
| The accompanying notes are an integral part of the financial statements. |
Statements of Operations
For the year ended October 31, 2022
| | | Global X MSCI SuperDividend® Emerging Markets ETF | | | Global X SuperDividend® REIT ETF | | | Global X NASDAQ 100® Covered Call ETF | | | Global X S&P 500® Covered Call ETF | |
| Investment Income: | | | | | | | | | | | | |
| Dividend Income | | $ | 4,874,772 | | | $ | 19,001,666 | | | $ | 55,229,125 | | | $ | 22,615,241 | |
| Interest Income | | | 1,726 | | | | — | | | | 152,144 | | | | 32,593 | |
| Security Lending Income | | | — | | | | 38,666 | | | | — | | | | — | |
| Less: Foreign Taxes Withheld | | | (546,923 | ) | | | (768,516 | ) | | | (114,168 | ) | | | (20,154 | ) |
| Total Investment Income | | | 4,329,575 | | | | 18,271,816 | | | | 55,267,101 | | | | 22,627,680 | |
Supervision and Administration Fees(1) | | | 429,924 | | | | 2,142,347 | | | | 38,866,576 | | | | 8,472,002 | |
Custodian Fees(2) | | | 10,572 | | | | 21,701 | | | | 208,799 | | | | 39,205 | |
| Total Expenses | | | 440,496 | | | | 2,164,048 | | | | 39,075,375 | | | | 8,511,207 | |
| Net Investment Income | | | 3,889,079 | | | | 16,107,768 | | | | 16,191,726 | | | | 14,116,473 | |
| Net Realized Gain (Loss) on: | | | | | | | | | | | | | | | | |
Investments(3) | | | (15,614,832 | ) | | | 14,080,595 | | | | (171,432,824 | ) | | | (30,084,701 | ) |
| Purchased Options | | | — | | | | — | | | | 309,965,446 | | | | — | |
| Written Options | | | — | | | | — | | | | 236,530,037 | | | | 66,176,874 | |
| Foreign Currency Transactions | | | (82,364 | ) | | | (117,393 | ) | | | — | | | | — | |
| Net Realized Gain (Loss) | | | (15,697,196 | ) | | | 13,963,202 | | | | 375,062,659 | | | | 36,092,173 | |
| Net Change in Unrealized Appreciation (Depreciation) on: | | | | | | | | | | | | | | | | |
| Investments | | | (11,826,184 | ) | | | (114,867,084 | ) | | | (1,949,409,093 | ) | | | (221,141,223 | ) |
| Written Options | | | — | | | | — | | | | 137,334,997 | | | | (32,226,391 | ) |
| Foreign Capital Gains Tax on Appreciated Securities | | | 100,820 | | | | — | | | | — | | | | — | |
| Foreign Currency Translations | | | 9,418 | | | | (16,700 | ) | | | — | | | | — | |
| Net Change in Unrealized Appreciation (Depreciation) | | | (11,715,946 | ) | | | (114,883,784 | ) | | | (1,812,074,096 | ) | | | (253,367,614 | ) |
| Net Realized and Unrealized Gain (Loss) | | | (27,413,142 | ) | | | (100,920,582 | ) | | | (1,437,011,437 | ) | | | (217,275,441 | ) |
| Net Decrease in Net Assets Resulting from Operations | | $ | (23,524,063 | ) | | $ | (84,812,814 | ) | | $ | (1,420,819,711 | ) | | $ | (203,158,968 | ) |
| (1) | The Supervision and Administration fees reflect the supervisory and administrative fee, which includes fees paid by the Funds for the investment advisory services provided by the Adviser. (See Note 3 in Notes to Financial Statements.) |
| (2) | See Note 2 in the Notes to Financial Statements. |
| (3) | Includes realized gains (losses) as a result of in-kind redemptions. (See Note 4 in Notes to Financial Statements.) |
| The accompanying notes are an integral part of the financial statements. |
Statements of Operations
For the year ended October 31, 2022
| �� | | Global X Russell 2000 Covered Call ETF | | | Global X Dow 30® Covered Call ETF(1) | | | Global X Nasdaq 100® Covered Call & Growth ETF | | | Global X S&P 500® Covered Call & Growth ETF | |
| Investment Income: | | | | | | | | | | | | |
| Dividend Income | | $ | 15,782,088 | | | $ | 341,877 | | | $ | 485,730 | | | $ | 591,086 | |
| Interest Income | | | 11,118 | | | | — | | | | — | | | | — | |
| Less: Foreign Taxes Withheld | | | (13,550 | ) | | | — | | | | (1,066 | ) | | | (127 | ) |
| Total Investment Income | | | 15,779,656 | | | | 341,877 | | | | 484,664 | | | | 590,959 | |
Supervision and Administration Fees(2) | | | 6,700,656 | | | | 101,108 | | | | 349,272 | | | | 227,859 | |
Custodian Fees(3) | | | 195,367 | | | | 2,090 | | | | 3,673 | | | | 5,124 | |
| Total Expenses | | | 6,896,023 | | | | 103,198 | | | | 352,945 | | | | 232,983 | |
| Waiver of Supervision and Administration Fees | | | (719,490 | ) | | | – | | | | – | | | | – | |
| Net Expenses | | | 6,176,533 | | | | 103,198 | | | | 352,945 | | | | 232,983 | |
| Net Investment Income | | | 9,603,123 | | | | 238,679 | | | | 131,719 | | | | 357,976 | |
| Net Realized Gain (Loss) on: | | | | | | | | | | | | | | | | |
Investments(4) | | | (187,735,875 | ) | | | (337,758 | ) | | | 756,311 | | | | 1,333,018 | |
| Purchased Options | | | — | | | | — | | | | 1,035,116 | | | | 382,385 | |
| Written Options | | | 111,479,681 | | | | (258,366 | ) | | | 1,512,432 | | | | 695,347 | |
| Net Realized Gain (Loss) | | | (76,256,194 | ) | | | (596,124 | ) | | | 3,303,859 | | | | 2,410,750 | |
| Net Change in Unrealized Appreciation (Depreciation) on: | | | | | | | | | | | | | | | | |
| Investments | | | (22,844,248 | ) | | | 1,914,285 | | | | (20,433,190 | ) | | | (7,590,036 | ) |
| Written Options | | | (63,527,543 | ) | | | (2,286,912 | ) | | | 572,453 | | | | (120,239 | ) |
| Net Change in Unrealized Appreciation (Depreciation) | | | (86,371,791 | ) | | | (372,627 | ) | | | (19,860,737 | ) | | | (7,710,275 | ) |
| Net Realized and Unrealized Gain (Loss) | | | (162,627,985 | ) | | | (968,751 | ) | | | (16,556,878 | ) | | | (5,299,525 | ) |
| Net Decrease in Net Assets Resulting from Operations | | $ | (153,024,862 | ) | | $ | (730,072 | ) | | $ | (16,425,159 | ) | | $ | (4,941,549 | ) |
| (1) | The Fund commenced operations on February 23, 2022. |
| (2) | The Supervision and Administration fees reflect the supervisory and administrative fee, which includes fees paid by the Funds for the investment advisory services provided by the Adviser. (See Note 3 in Notes to Financial Statements.) |
| (3) | See Note 2 in the Notes to Financial Statements. |
| (4) | Includes realized gains (losses) as a result of in-kind redemptions. (See Note 4 in Notes to Financial Statements.) |
| The accompanying notes are an integral part of the financial statements. |
Statements of Operations
For the year ended October 31, 2022
| | | Global X Russell 2000 Covered Call & Growth ETF(1) | | | Global X SuperIncome™ Preferred ETF | | | Global X Renewable Energy Producers ETF | | | Global X S&P 500® Catholic Values ETF | |
| Investment Income: | | | | | | | | | | | | |
| Dividend Income | | $ | — | | | $ | 11,629,621 | | | $ | 1,907,672 | | | $ | 8,549,702 | |
| Interest Income | | | — | | | | 926 | | | | 215,714 | | | | 2,857 | |
| Security Lending Income | | | — | | | | 202,723 | | | | 70,260 | | | | — | |
| Less: Foreign Taxes Withheld | | | — | | | | (4,401 | ) | | | (239,351 | ) | | | (2,047 | ) |
| Total Investment Income | | | — | | | | 11,828,869 | | | | 1,954,295 | | | | 8,550,512 | |
Supervision and Administration Fees(2) | | | 1,091 | | | | 1,220,587 | | | | 763,510 | | | | 1,696,326 | |
Custodian Fees(3) | | | — | | | | 4,253 | | | | 7,124 | | | | 399 | |
| Total Expenses | | | 1,091 | | | | 1,224,840 | | | | 770,634 | | | | 1,696,725 | |
| Waiver of Supervision and Administration Fees | | | (183 | ) | | | – | | | | – | | | | – | |
| Net Expenses | | | 908 | | | | 1,224,840 | | | | 770,634 | | | | 1,696,725 | |
| Net Investment Income (Loss) | | | (908 | ) | | | 10,604,029 | | | | 1,183,661 | | | | 6,853,787 | |
| Net Realized Gain (Loss) on: | | | | | | | | | | | | | | | | |
Investments(4) | | | — | | | | (9,393,788 | ) | | | 1,053,246 | | | | 21,294,231 | |
| Written Options | | | 27,432 | | | | — | | | | — | | | | — | |
| Foreign Currency Transactions | | | — | | | | — | | | | (113,535 | ) | | | — | |
| Net Realized Gain (Loss) | | | 27,432 | | | | (9,393,788 | ) | | | 939,711 | | | | 21,294,231 | |
| Net Change in Unrealized Appreciation (Depreciation) on: | | | | | | | | | | | | | | | | |
| Investments | | | 112,518 | | | | (32,526,988 | ) | | | (31,391,702 | ) | | | (137,525,098 | ) |
| Written Options | | | (57,991 | ) | | | — | | | | — | | | | — | |
| Foreign Currency Translations | | | — | | | | — | | | | (4,383 | ) | | | — | |
| Net Change in Unrealized Appreciation (Depreciation) | | | 54,527 | | | | (32,526,988 | ) | | | (31,396,085 | ) | | | (137,525,098 | ) |
| Net Realized and Unrealized Gain (Loss) | | | 81,959 | | | | (41,920,776 | ) | | | (30,456,374 | ) | | | (116,230,867 | ) |
| Net Increase (Decrease) in Net Assets Resulting from Operations | | $ | 81,051 | | | $ | (31,316,747 | ) | | $ | (29,272,713 | ) | | $ | (109,377,080 | ) |
| (1) | The Fund commenced operations on October 4, 2022. |
| (2) | The Supervision and Administration fees reflect the supervisory and administrative fee, which includes fees paid by the Funds for the investment advisory services provided by the Adviser. (See Note 3 in Notes to Financial Statements.) |
| (3) | See Note 2 in the Notes to Financial Statements. |
| (4) | Includes realized gains (losses) as a result of in-kind redemptions. (See Note 4 in Notes to Financial Statements.) |
| The accompanying notes are an integral part of the financial statements. |
Statements of Operations
For the year ended October 31, 2022
| | | Global X S&P Catholic Values Developed ex-U.S. ETF | | | Global X Guru® Index ETF | | | Global X S&P 500® Tail Risk ETF | | | Global X S&P 500® Risk Managed Income ETF | |
| Investment Income: | | | | | | | | | | | | |
| Dividend Income | | $ | 188,764 | | | $ | 416,392 | | | $ | 49,803 | | | $ | 308,328 | |
| Interest Income | | | 2 | | | | 220 | | | | — | | | | — | |
| Security Lending Income | | | — | | | | 22,531 | | | | — | | | | — | |
| Less: Foreign Taxes Withheld | | | (19,713 | ) | | | (1,600 | ) | | | (13 | ) | | | (73 | ) |
| Total Investment Income | | | 169,053 | | | | 437,543 | | | | 49,790 | | | | 308,255 | |
Supervision and Administration Fees(1) | | | 18,596 | | | | 427,935 | | | | 19,622 | | | | 115,866 | |
Custodian Fees(2) | | | 141 | | | | 331 | | | | 235 | | | | 5,906 | |
| Total Expenses | | | 18,737 | | | | 428,266 | | | | 19,857 | | | | 121,772 | |
| Net Investment Income | | | 150,316 | | | | 9,277 | | | | 29,933 | | | | 186,483 | |
| Net Realized Gain (Loss) on: | | | | | | | | | | | | | | | | |
Investments(3) | | | (110,074 | ) | | | (10,085,129 | ) | | | (10,803 | ) | | | (180,697 | ) |
| Purchased Options | | | — | | | | — | | | | 12,305 | | | | 1,034,185 | |
| Written Options | | | — | | | | — | | | | — | | | | 302,290 | |
| Foreign Currency Transactions | | | (3,129 | ) | | | — | | | | — | | | | — | |
| Net Realized Gain (Loss) | | | (113,203 | ) | | | (10,085,129 | ) | | | 1,502 | | | | 1,155,778 | |
| Net Change in Unrealized Appreciation (Depreciation) on: | | | | | | | | | | | | | | | | |
| Investments | | | (1,701,045 | ) | | | (14,494,976 | ) | | | (520,696 | ) | | | (3,536,984 | ) |
| Purchased Options | | | — | | | | — | | | | (1,120 | ) | | | (204,000 | ) |
| Written Options | | | — | | | | — | | | | — | | | | (471,113 | ) |
| Foreign Currency Translations | | | (444 | ) | | | — | | | | — | | | | — | |
| Net Change in Unrealized Appreciation (Depreciation) | | | (1,701,489 | ) | | | (14,494,976 | ) | | | (521,816 | ) | | | (4,212,097 | ) |
| Net Realized and Unrealized Gain (Loss) | | | (1,814,692 | ) | | | (24,580,105 | ) | | | (520,314 | ) | | | (3,056,319 | ) |
| Net Decrease in Net Assets Resulting from Operations | | $ | (1,664,376 | ) | | $ | (24,570,828 | ) | | $ | (490,381 | ) | | $ | (2,869,836 | ) |
(1) | The Supervision and Administration fees reflect the supervisory and administrative fee, which includes fees paid by the Funds for the investment advisory services provided by the Adviser. (See Note 3 in Notes to Financial Statements.) |
(2) | See Note 2 in the Notes to Financial Statements. |
(3) | Includes realized gains (losses) as a result of in-kind redemptions. (See Note 4 in Notes to Financial Statements.) |
| The accompanying notes are an integral part of the financial statements. |
Statements of Operations
For the year ended October 31, 2022
| | | Global X S&P 500® Collar 95-110 ETF | | | Global X NASDAQ 100® Tail Risk ETF | | | Global X NASDAQ 100® Risk Managed Income ETF | | | Global X NASDAQ 100® Collar 95-110 ETF | |
| Investment Income: | | | | | | | | | | | | |
| Dividend Income | | $ | 57,864 | | | $ | 22,809 | | | $ | 89,337 | | | $ | 30,596 | |
| Less: Foreign Taxes Withheld | | | (14 | ) | | | (42 | ) | | | (184 | ) | | | (64 | ) |
| Total Investment Income | | | 57,850 | | | | 22,767 | | | | 89,153 | | | | 30,532 | |
Supervision and Administration Fees(1) | | | 22,585 | | | | 17,228 | | | | 66,424 | | | | 22,722 | |
Custodian Fees(2) | | | 1,356 | | | | 214 | | | | 2,208 | | | | 905 | |
| Total Expenses | | | 23,941 | | | | 17,442 | | | | 68,632 | | | | 23,627 | |
| Net Investment Income | | | 33,909 | | | | 5,325 | | | | 20,521 | | | | 6,905 | |
| Net Realized Gain (Loss) on: | | | | | | | | | | | | | | | | |
Investments(3) | | | (20,957 | ) | | | (65,872 | ) | | | (855,385 | ) | | | (92,597 | ) |
| Purchased Options | | | 101,661 | | | | 1,806 | | | | 1,331,844 | | | | 391,807 | |
| Written Options | | | 79,581 | | | | — | | | | 484,654 | | | | 210,467 | |
| Net Realized Gain (Loss) | | | 160,285 | | | | (64,066 | ) | | | 961,113 | | | | 509,677 | |
| Net Change in Unrealized Appreciation (Depreciation) on: | | | | | | | | | | | | | | | | |
| Investments | | | (571,552 | ) | | | (738,492 | ) | | | (3,381,535 | ) | | | (1,147,801 | ) |
| Purchased Options | | | (9,261 | ) | | | 17,998 | | | | (91,059 | ) | | | 14,841 | |
| Written Options | | | 22,060 | | | | — | | | | 90,428 | | | | 49,958 | |
| Net Change in Unrealized Appreciation (Depreciation) | | | (558,753 | ) | | | (720,494 | ) | | | (3,382,166 | ) | | | (1,083,002 | ) |
| Net Realized and Unrealized Gain (Loss) | | | (398,468 | ) | | | (784,560 | ) | | | (2,421,053 | ) | | | (573,325 | ) |
| Net Decrease in Net Assets Resulting from Operations | | $ | (364,559 | ) | | $ | (779,235 | ) | | $ | (2,400,532 | ) | | $ | (566,420 | ) |
| (1) | The Supervision and Administration fees reflect the supervisory and administrative fee, which includes fees paid by the Funds for the investment advisory services provided by the Adviser. (See Note 3 in Notes to Financial Statements.) |
| (2) | See Note 2 in the Notes to Financial Statements. |
| (3) | Includes realized gains (losses) as a result of in-kind redemptions. (See Note 4 in Notes to Financial Statements.) |
| The accompanying notes are an integral part of the financial statements. |
Statements of Changes in Net Assets
| | | Global X Social Media ETF | | | Global X Lithium & Battery Tech ETF | |
| | | Year Ended October 31, 2022 | | | Year Ended October 31, 2021 | | | Year Ended October 31, 2022 | | | Year Ended October 31, 2021 | |
| Operations: | | | | | | | | | | | | |
| Net Investment Income (Loss) | | $ | 147,637 | | | $ | (1,911,606 | ) | | $ | 16,046,131 | | | $ | 5,390,819 | |
| Net Realized Gain (Loss) | | | (59,049,029 | ) | | | 103,952,942 | | | | (90,735,668 | ) | | | 274,489,561 | |
| Net Change in Unrealized Appreciation (Depreciation) | | | (148,544,746 | ) | | | (71,438,661 | ) | | | (1,486,392,494 | ) | | | 1,628,377,103 | |
| Net Increase (Decrease) in Net Assets Resulting from Operations | | | (207,446,138 | ) | | | 30,602,675 | | | | (1,561,082,031 | ) | | | 1,908,257,483 | |
| Distributions | | | — | | | | — | | | | (13,550,903 | ) | | | (4,617,167 | ) |
| Return of Capital | | | (663,636 | ) | | | — | | | | — | | | | — | |
| Capital Share Transactions: | | | | | | | | | | | | | | | | |
| Issued | | | 4,148,772 | | | | 312,935,286 | | | | 987,083,874 | | | | 3,085,540,584 | |
| Redeemed | | | (94,686,332 | ) | | | (167,644,538 | ) | | | (888,340,328 | ) | | | (482,676,020 | ) |
| Increase (Decrease) in Net Assets from Capital Share Transactions | | | (90,537,560 | ) | | | 145,290,748 | | | | 98,743,546 | | | | 2,602,864,564 | |
| Total Increase (Decrease) in Net Assets | | | (298,647,334 | ) | | | 175,893,423 | | | | (1,475,889,388 | ) | | | 4,506,504,880 | |
| Net Assets: | | | | | | | | | | | | | | | | |
| Beginning of Year | | | 401,892,780 | | | | 225,999,357 | | | | 5,375,398,735 | | | | 868,893,855 | |
| End of Year | | $ | 103,245,446 | | | $ | 401,892,780 | | | $ | 3,899,509,347 | | | $ | 5,375,398,735 | |
| Share Transactions: | | | | | | | | | | | | | | | | |
| Issued | | | 130,000 | | | | 4,480,000 | | | | 11,480,000 | | | | 45,050,000 | |
| Redeemed | | | (2,540,000 | ) | | | (2,270,000 | ) | | | (12,420,000 | ) | | | (6,300,000 | ) |
| Net Increase (Decrease) in Shares Outstanding from Share Transactions | | | (2,410,000 | ) | | | 2,210,000 | | | | (940,000 | ) | | | 38,750,000 | |
| The accompanying notes are an integral part of the financial statements. |
Statements of Changes in Net Assets
| | | Global X Disruptive Materials ETF | | | Global X E-commerce ETF | |
| | | Period Ended October 31, 2022(1) | | | Year Ended October 31, 2022 | | | Year Ended October 31, 2021 | |
| Operations: | | | | | | | | | |
| Net Investment Income (Loss) | | $ | 81,482 | | | $ | 362,843 | | | $ | (220,637 | ) |
| Net Realized Gain (Loss) | | | (203,576 | ) | | | (31,325,250 | ) | | | 20,994,579 | |
| Net Change in Unrealized Appreciation (Depreciation) | | | (1,245,093 | ) | | | (50,085,062 | ) | | | (15,365,762 | ) |
| Net Increase (Decrease) in Net Assets Resulting from Operations | | | (1,367,187 | ) | | | (81,047,469 | ) | | | 5,408,180 | |
| Distributions | | | (47,516 | ) | | | (897,920 | ) | | | (1,105,636 | ) |
| Return of Capital | | | — | | | | (66,565 | ) | | | — | |
| Capital Share Transactions: | | | | | | | | | | | | |
| Issued | | | 6,008,659 | | | | 21,458,714 | | | | 157,633,184 | |
| Redeemed | | | (1,160,792 | ) | | | (94,957,434 | ) | | | (55,267,404 | ) |
| Increase (Decrease) in Net Assets from Capital Share Transactions | | | 4,847,867 | | | | (73,498,720 | ) | | | 102,365,780 | |
| Total Increase (Decrease) in Net Assets | | | 3,433,164 | | | | (155,510,674 | ) | | | 106,668,324 | |
| Net Assets: | | | | | | | | | | | | |
| Beginning of Year | | | — | | | | 197,751,192 | | | | 91,082,868 | |
| End of Year | | $ | 3,433,164 | | | $ | 42,240,518 | | | $ | 197,751,192 | |
| Share Transactions: | | | | | | | | | | | | |
| Issued | | | 240,000 | | | | 1,000,000 | | | | 4,640,000 | |
| Redeemed | | | (50,000 | ) | | | (4,550,000 | ) | | | (1,700,000 | ) |
| Net Increase (Decrease) in Shares Outstanding from Share Transactions | | | 190,000 | | | | (3,550,000 | ) | | | 2,940,000 | |
| (1) | The Fund commenced operations on January 24, 2022. |
| The accompanying notes are an integral part of the financial statements. |
Statements of Changes in Net Assets
| | | Global X Emerging Markets Internet & E-commerce ETF‡ | | | Global X SuperDividend® ETF‡ | |
| | | Year Ended October 31, 2022 | | | Period Ended October 31, 2021(1) | | | Year Ended October 31, 2022 | | | Year Ended October 31, 2021 | |
| Operations: | | | | | | | | | | | | |
| Net Investment Income (Loss) | | $ | 4,302 | | | $ | (27,611 | ) | | $ | 60,797,461 | | | $ | 61,535,540 | |
| Net Realized Gain (Loss) | | | (1,482,571 | ) | | | (323,485 | ) | | | (161,604,111 | ) | | | 73,981,878 | |
| Net Change in Unrealized Appreciation (Depreciation) | | | (927,019 | ) | | | (1,462,197 | ) | | | (229,713,972 | ) | | | 61,523,433 | |
| Net Increase (Decrease) in Net Assets Resulting from Operations | | | (2,405,288 | ) | | | (1,813,293 | ) | | | (330,520,622 | ) | | | 197,040,851 | |
| Distributions | | | — | | | | — | | | | (68,726,670 | ) | | | (65,648,210 | ) |
| Return of Capital | | | (9,979 | ) | | | — | | | | (25,091,152 | ) | | | — | |
| Capital Share Transactions: | | | | | | | | | | | | | | | | |
| Issued | | | — | | | | 7,267,793 | | | | 193,866,024 | | | | 177,439,475 | |
| Redeemed | | | (173,768 | ) | | | (899,296 | ) | | | (23,680,516 | ) | | | (5,271,538 | ) |
| Increase (Decrease) in Net Assets from Capital Share Transactions | | | (173,768 | ) | | | 6,368,497 | | | | 170,185,508 | | | | 172,167,937 | |
| Total Increase (Decrease) in Net Assets | | | (2,589,035 | ) | | | 4,555,204 | | | | (254,152,936 | ) | | | 303,560,578 | |
| Net Assets: | | | | | | | | | | | | | | | | |
| Beginning of Year | | | 4,555,204 | | | | — | | | | 930,431,472 | | | | 626,870,894 | |
| End of Year | | $ | 1,966,169 | | | $ | 4,555,204 | | | $ | 676,278,536 | | | $ | 930,431,472 | |
| Share Transactions: | | | | | | | | | | | | | | | | |
| Issued | | | — | | | | 150,000 | | | | 6,286,667 | | | | 4,276,667 | |
| Redeemed | | | (6,667 | ) | | | (23,333 | ) | | | (796,667 | ) | | | (133,333 | ) |
| Net Increase (Decrease) in Shares Outstanding from Share Transactions | | | (6,667 | ) | | | 126,667 | | | | 5,490,000 | | | | 4,143,334 | |
| (1) | The Fund commenced operations on November 9, 2020. |
| ‡ | Share transactions have been adjusted to reflect the effect of a 1 for 3 reverse share split on December 19, 2022 (See Note 11 in the Notes to Financial Statements). |
| The accompanying notes are an integral part of the financial statements. |
Statements of Changes in Net Assets
| | | Global X SuperDividend® U.S. ETF | | | Global X MSCI SuperDividend® EAFE ETF | |
| | | Year Ended October 31, 2022 | | | Year Ended October 31, 2021 | | | Year Ended October 31, 2022 | | | Year Ended October 31, 2021 | |
| Operations: | | | | | | | | | | | | |
| Net Investment Income | | $ | 23,270,439 | | | $ | 21,001,659 | | | $ | 769,620 | | | $ | 600,163 | |
| Net Realized Gain (Loss) | | | 64,409,036 | | | | 53,431,904 | | | | 160,842 | | | | 1,264,371 | |
| Net Change in Unrealized Appreciation (Depreciation) | | | (82,329,930 | ) | | | 114,820,912 | | | | (2,899,393 | ) | | | 1,338,122 | |
| Net Increase (Decrease) in Net Assets Resulting from Operations | | | 5,349,545 | | | | 189,254,475 | | | | (1,968,931 | ) | | | 3,202,656 | |
| Distributions | | | (27,892,254 | ) | | | (31,364,614 | ) | | | (742,260 | ) | | | (542,165 | ) |
| Return of Capital | | | (13,969,909 | ) | | | (3,660,741 | ) | | | — | | | | — | |
| Capital Share Transactions: | | | | | | | | | | | | | | | | |
| Issued | | | 157,123,738 | | | | 143,549,897 | | | | 135,570 | | | | 4,890,027 | |
| Redeemed | | | (106,481,128 | ) | | | (40,154,269 | ) | | | (3,098,512 | ) | | | (928,933 | ) |
| Increase (Decrease) in Net Assets from Capital Share Transactions | | | 50,642,610 | | | | 103,395,628 | | | | (2,962,942 | ) | | | 3,961,094 | |
| Total Increase (Decrease) in Net Assets | | | 14,129,992 | | | | 257,624,748 | | | | (5,674,133 | ) | | | 6,621,585 | |
| Net Assets: | | | | | | | | | | | | | | | | |
| Beginning of Year | | | 669,734,316 | | | | 412,109,568 | | | | 14,057,701 | | | | 7,436,116 | |
| End of Year | | $ | 683,864,308 | | | $ | 669,734,316 | | | $ | 8,383,568 | | | $ | 14,057,701 | |
| Share Transactions: | | | | | | | | | | | | | | | | |
| Issued | | | 7,750,000 | | | | 7,860,000 | | | | 10,000 | | | | 310,000 | |
| Redeemed | | | (5,360,000 | ) | | | (2,090,000 | ) | | | (210,000 | ) | | | (60,000 | ) |
| Net Increase (Decrease) in Shares Outstanding from Share Transactions | | | 2,390,000 | | | | 5,770,000 | | | | (200,000 | ) | | | 250,000 | |
| The accompanying notes are an integral part of the financial statements. |
Statements of Changes in Net Assets
| | | Global X MSCI SuperDividend® Emerging Markets ETF‡ | | | Global X SuperDividend® REIT ETF‡ | |
| | | Year Ended October 31, 2022 | | | Year Ended October 31, 2021 | | | Year Ended October 31, 2022 | | | Year Ended October 31, 2021 | |
| Operations: | | | | | | | | | | | | |
| Net Investment Income | | $ | 3,889,079 | | | $ | 3,890,630 | | | $ | 16,107,768 | | | $ | 17,999,548 | |
| Net Realized Gain (Loss) | | | (15,697,196 | ) | | | 1,547,026 | | | | 13,963,202 | | | | (7,237,478 | ) |
| Net Change in Unrealized Appreciation (Depreciation) | | | (11,715,946 | ) | | | (1,736,940 | ) | | | (114,883,784 | ) | | | 115,855,547 | |
| Net Increase (Decrease) in Net Assets Resulting from Operations | | | (23,524,063 | ) | | | 3,700,716 | | | | (84,812,814 | ) | | | 126,617,617 | |
| Distributions | | | (5,018,224 | ) | | | (2,831,439 | ) | | | (15,789,114 | ) | | | (19,492,525 | ) |
| Return of Capital | | | (1,057,591 | ) | | | — | | | | (9,960,386 | ) | | | (9,729,725 | ) |
| Capital Share Transactions: | | | | | | | | | | | | | | | | |
| Issued | | | 23,410,044 | | | | 41,819,662 | | | | 2,797,978 | | | | 112,985,429 | |
| Redeemed | | | (17,338,196 | ) | | | — | | | | (73,515,296 | ) | | | (54,071,703 | ) |
| Increase (Decrease) in Net Assets from Capital Share Transactions | | | 6,071,848 | | | | 41,819,662 | | | | (70,717,318 | ) | | | 58,913,726 | |
| Total Increase (Decrease) in Net Assets | | | (23,528,030 | ) | | | 42,688,939 | | | | (181,279,632 | ) | | | 156,309,093 | |
| Net Assets: | | | | | | | | | | | | | | | | |
| Beginning of Year | | | 62,696,164 | | | | 20,007,225 | | | | 467,934,268 | | | | 311,625,175 | |
| End of Year | | $ | 39,168,134 | | | $ | 62,696,164 | | | $ | 286,654,636 | | | $ | 467,934,268 | |
| Share Transactions: | | | | | | | | | | | | | | | | |
| Issued | | | 720,000 | | | | 1,156,667 | | | | 113,333 | | | | 3,993,333 | |
| Redeemed | | | (743,333 | ) | | | — | | | | (2,750,000 | ) | | | (1,846,667 | ) |
| Net Increase (Decrease) in Shares Outstanding from Share Transactions | | | (23,333 | ) | | | 1,156,667 | | | | (2,636,667 | ) | | | 2,146,666 | |
| ‡ | Share transactions have been adjusted to reflect the effect of a 1 for 3 reverse share split on December 19, 2022 (See Note 11 in the Notes to Financial Statements). |
| The accompanying notes are an integral part of the financial statements. |
Statements of Changes in Net Assets
| | | Global X NASDAQ 100® Covered Call ETF | | | Global X S&P 500® Covered Call ETF | |
| | | Year Ended October 31, 2022 | | | Year Ended October 31, 2021 | | | Year Ended October 31, 2022 | | | Year Ended October 31, 2021 | |
| Operations: | | | | | | | | | | | | |
| Net Investment Income | | $ | 16,191,726 | | | $ | 3,013,239 | | | $ | 14,116,473 | | | $ | 2,258,752 | |
| Net Realized Gain (Loss) | | | 375,062,659 | | | | (230,364,474 | ) | | | 36,092,173 | | | | (3,328,421 | ) |
| Net Change in Unrealized Appreciation (Depreciation) | | | (1,812,074,096 | ) | | | 735,524,124 | | | | (253,367,614 | ) | | | 65,289,214 | |
| Net Increase (Decrease) in Net Assets Resulting from Operations | | | (1,420,819,711 | ) | | | 508,172,889 | | | | (203,158,968 | ) | | | 64,219,545 | |
| Distributions | | | (211,906,795 | ) | | | (320,053,733 | ) | | | (35,714,783 | ) | | | (26,627,258 | ) |
| Return of Capital | | | (642,111,562 | ) | | | — | | | | (133,893,882 | ) | | | — | |
| Capital Share Transactions: | | | | | | | | | | | | | | | | |
| Issued | | | 4,057,801,963 | | | | 3,548,421,512 | | | | 1,708,732,044 | | | | 535,288,406 | |
| Redeemed | | | (421,530,332 | ) | | | (25,968,248 | ) | | | (71,274,199 | ) | | | (7,017,545 | ) |
| Increase in Net Assets from Capital Share Transactions | | | 3,636,271,631 | | | | 3,522,453,264 | | | | 1,637,457,845 | | | | 528,270,861 | |
| Total Increase in Net Assets | | | 1,361,433,563 | | | | 3,710,572,420 | | | | 1,264,690,212 | | | | 565,863,148 | |
| Net Assets: | | | | | | | | | | | | | | | | |
| Beginning of Year | | | 5,036,214,747 | | | | 1,325,642,327 | | | | 669,854,868 | | | | 103,991,720 | |
| End of Year | | $ | 6,397,648,310 | | | $ | 5,036,214,747 | | | $ | 1,934,545,080 | | | $ | 669,854,868 | |
| Share Transactions: | | | | | | | | | | | | | | | | |
| Issued | | | 200,110,000 | | | | 157,690,000 | | | | 36,750,000 | | | | 11,000,000 | |
| Redeemed | | | (24,700,000 | ) | | | (1,160,000 | ) | | | (1,690,000 | ) | | | (150,000 | ) |
| Net Increase in Shares Outstanding from Share Transactions | | | 175,410,000 | | | | 156,530,000 | | | | 35,060,000 | | | | 10,850,000 | |
| (1) | See Note 10 in Notes to Financial Statements |
| The accompanying notes are an integral part of the financial statements. |
Statements of Changes in Net Assets
| | | Global X Russell 2000 Covered Call ETF | | | Global X Dow 30® Covered Call ETF | |
| | | Year Ended October 31, 2022 | | | Year Ended October 31, 2021 | | | Period Ended October 31, 2022(1) | |
| Operations: | | | | | | | | | |
| Net Investment Income | | $ | 9,603,123 | | | $ | 931,659 | | | $ | 238,679 | |
| Net Realized Gain (Loss) | | | (76,256,194 | ) | | | 5,915,793 | | | | (596,124 | ) |
| Net Change in Unrealized Appreciation (Depreciation) | | | (86,371,791 | ) | | | 26,525,513 | | | | (372,627 | ) |
| Net Increase (Decrease) in Net Assets Resulting from Operations | | | (153,024,862 | ) | | | 33,372,965 | | | | (730,072 | ) |
| Distributions | | | (32,998,311 | ) | | | (21,788,088 | ) | | | (734,788 | ) |
| Return of Capital | | | (105,055,357 | ) | | | — | | | | (1,115,840 | ) |
| Capital Share Transactions: | | | | | | | | | | | | |
| Issued | | | 1,143,457,691 | | | | 521,879,514 | | | | 55,565,290 | |
| Redeemed | | | (64,583,797 | ) | | | (493,345 | ) | | | — | |
| Increase in Net Assets from Capital Share Transactions | | | 1,078,873,894 | | | | 521,386,169 | | | | 55,565,290 | |
| Total Increase in Net Assets | | | 787,795,364 | | | | 532,971,046 | | | | 52,984,590 | |
| Net Assets: | | | | | | | | | | | | |
| Beginning of Year | | | 554,445,800 | | | | 21,474,754 | | | | — | |
| End of Year | | $ | 1,342,241,164 | | | $ | 554,445,800 | | | $ | 52,984,590 | |
| Share Transactions: | | | | | | | | | | | | |
| Issued | | | 49,770,000 | | | | 20,990,000 | | | | 2,420,000 | |
| Redeemed | | | (3,140,000 | ) | | | (20,000 | ) | | | — | |
| Net Increase in Shares Outstanding from Share Transactions | | | 46,630,000 | | | | 20,970,000 | | | | 2,420,000 | |
| (1) | The Fund commenced operations on February 23, 2022. |
| (2) | See Note 10 in Notes to Financial Statements |
| The accompanying notes are an integral part of the financial statements. |
Statements of Changes in Net Assets
| | | Global X Nasdaq 100® Covered Call & Growth ETF | | | Global X S&P 500® Covered Call & Growth ETF | |
| | | Year Ended October 31, 2022 | | | Year Ended October 31, 2021 | | | Year Ended October 31, 2022 | | | Year Ended October 31, 2021 | |
| Operations: | | | | | | | | | | | | |
| Net Investment Income | | $ | 131,719 | | | $ | 9,199 | | | $ | 357,976 | | | $ | 62,067 | |
| Net Realized Gain (Loss) | | | 3,303,859 | | | | (254,466 | ) | | | 2,410,750 | | | | 553,356 | |
| Net Change in Unrealized Appreciation (Depreciation) | | | (19,860,737 | ) | | | 4,363,334 | | | | (7,710,275 | ) | | | 1,561,682 | |
| Net Increase (Decrease) in Net Assets Resulting from Operations | | | (16,425,159 | ) | | | 4,118,067 | | | | (4,941,549 | ) | | | 2,177,105 | |
| Distributions | | | (3,262,405 | ) | | | (919,727 | ) | | | (1,865,684 | ) | | | (376,497 | ) |
| Return of Capital | | | (2,741,520 | ) | | | — | | | | (1,465,030 | ) | | | — | |
| Capital Share Transactions: | | | | | | | | | | | | | | | | |
| Issued | | | 55,565,131 | | | | 37,707,138 | | | | 28,875,885 | | | | 33,611,221 | |
| Redeemed | | | (16,702,729 | ) | | | (2,801,664 | ) | | | (14,111,207 | ) | | | (4,097,596 | ) |
| Increase in Net Assets from Capital Share Transactions | | | 38,862,402 | | | | 34,905,474 | | | | 14,764,678 | | | | 29,513,625 | |
| Total Increase in Net Assets | | | 16,433,318 | | | | 38,103,814 | | | | 6,492,415 | | | | 31,314,233 | |
| Net Assets: | | | | | | | | | | | | | | | | |
| Beginning of Year | | | 44,671,370 | | | | 6,567,556 | | | | 35,018,124 | | | | 3,703,891 | |
| End of Year | | $ | 61,104,688 | | | $ | 44,671,370 | | | $ | 41,510,539 | | | $ | 35,018,124 | |
| Share Transactions: | | | | | | | | | | | | | | | | |
| Issued | | | 1,900,000 | | | | 1,200,000 | | | | 1,020,000 | | | | 1,100,000 | |
| Redeemed | | | (570,000 | ) | | | (100,000 | ) | | | (490,000 | ) | | | (150,000 | ) |
| Net Increase in Shares Outstanding from Share Transactions | | | 1,330,000 | | | | 1,100,000 | | | | 530,000 | | | | 950,000 | |
| (1) | See Note 10 in Notes to Financial Statements |
| The accompanying notes are an integral part of the financial statements. |
Statements of Changes in Net Assets
| | | Global X Russell 2000 Covered Call & Growth ETF | | | Global X SuperIncome™ Preferred ETF | |
| | | Period Ended October 31, 2022(1) | | | Year Ended October 31, 2022 | | | Year Ended October 31, 2021 | |
| Operations: | | | | | | | | | |
| Net Investment Income (Loss) | | $ | (908 | ) | | $ | 10,604,029 | | | $ | 10,851,739 | |
| Net Realized Gain (Loss) | | | 27,432 | | | | (9,393,788 | ) | | | 7,442,457 | |
| Net Change in Unrealized Appreciation (Depreciation) | | | 54,527 | | | | (32,526,988 | ) | | | 7,403,025 | |
| Net Increase (Decrease) in Net Assets Resulting from Operations | | | 81,051 | | | | (31,316,747 | ) | | | 25,697,221 | |
| Distributions | | | (12,860 | ) | | | (12,532,497 | ) | | | (12,037,890 | ) |
| Return of Capital | | | — | | | | (653,473 | ) | | | — | |
| Capital Share Transactions: | | | | | | | | | | | | |
| Issued | | | 2,590,000 | | | | 24,951,801 | | | | 44,774,820 | |
| Redeemed | | | — | | | | (20,242,558 | ) | | | (7,496,771 | ) |
| Increase in Net Assets from Capital Share Transactions | | | 2,590,000 | | | | 4,709,243 | | | | 37,278,049 | |
| Total Increase (Decrease) in Net Assets | | | 2,658,191 | | | | (39,793,474 | ) | | | 50,937,380 | |
| Net Assets: | | | | | | | | | | | | |
| Beginning of Year | | | — | | | | 234,952,724 | | | | 184,015,344 | |
| End of Year | | $ | 2,658,191 | | | $ | 195,159,250 | | | $ | 234,952,724 | |
| Share Transactions: | | | | | | | | | | | | |
| Issued | | | 100,000 | | | | 2,370,000 | | | | 3,760,000 | |
| Redeemed | | | — | | | | (1,870,000 | ) | | | (630,000 | ) |
| Net Increase in Shares Outstanding from Share Transactions | | | 100,000 | | | | 500,000 | | | | 3,130,000 | |
| (1) | The Fund commenced operations on October 4, 2022. |
| The accompanying notes are an integral part of the financial statements. |
Statements of Changes in Net Assets
| | | Global X Renewable Energy Producers ETF | | | Global X S&P 500® Catholic Values ETF | |
| | | Year Ended October 31, 2022 | | | Year Ended October 31, 2021 | | | Year Ended October 31, 2022 | | | Year Ended October 31, 2021 | |
| Operations: | | | | | | | | | | | | |
| Net Investment Income | | $ | 1,183,661 | | | $ | 1,617,480 | | | $ | 6,853,787 | | | $ | 5,643,588 | |
| Net Realized Gain | | | 939,711 | | | | 7,157,351 | | | | 21,294,231 | | | | 39,989,880 | |
| Net Change in Unrealized Appreciation (Depreciation) | | | (31,396,085 | ) | | | (677,351 | ) | | | (137,525,098 | ) | | | 128,170,186 | |
| Net Increase (Decrease) in Net Assets Resulting from Operations | | | (29,272,713 | ) | | | 8,097,480 | | | | (109,377,080 | ) | | | 173,803,654 | |
| Distributions | | | (1,233,925 | ) | | | (1,854,987 | ) | | | (7,163,403 | ) | | | (5,511,704 | ) |
| Capital Share Transactions: | | | | | | | | | | | | | | | | |
| Issued | | | 31,092,956 | | | | 127,915,612 | | | | 145,015,222 | | | | 127,314,441 | |
| Redeemed | | | (56,593,086 | ) | | | (53,373,821 | ) | | | (73,172,445 | ) | | | (80,673,768 | ) |
| Increase (Decrease) in Net Assets from Capital Share Transactions | | | (25,500,130 | ) | | | 74,541,791 | | | | 71,842,777 | | | | 46,640,673 | |
| Total Increase (Decrease) in Net Assets | | | (56,006,768 | ) | | | 80,784,284 | | | | (44,697,706 | ) | | | 214,932,623 | |
| Net Assets: | | | | | | | | | | | | | | | | |
| Beginning of Year | | | 146,976,294 | | | | 66,192,010 | | | | 593,985,352 | | | | 379,052,729 | |
| End of Year | | $ | 90,969,526 | | | $ | 146,976,294 | | | $ | 549,287,646 | | | $ | 593,985,352 | |
| Share Transactions: | | | | | | | | | | | | | | | | |
| Issued | | | 2,050,000 | | | | 7,360,000 | | | | 2,730,000 | | | | 2,520,000 | |
| Redeemed | | | (3,820,000 | ) | | | (3,070,000 | ) | | | (1,470,000 | ) | | | (1,540,000 | ) |
| Net Increase (Decrease) in Shares Outstanding from Share Transactions | | | (1,770,000 | ) | | | 4,290,000 | | | | 1,260,000 | | | | 980,000 | |
| The accompanying notes are an integral part of the financial statements. |
Statements of Changes in Net Assets
| | | Global X S&P Catholic Values Developed ex-U.S. ETF | | | Global X Guru® Index ETF | |
| | | Year Ended October 31, 2022 | | | Year Ended October 31, 2021 | | | Year Ended October 31, 2022 | | | Year Ended October 31, 2021 | |
| Operations: | | | | | | | | | | | | |
| Net Investment Income | | $ | 150,316 | | | $ | 71,854 | | | $ | 9,277 | | | $ | 1,047,788 | |
| Net Realized Gain (Loss) | | | (113,203 | ) | | | 59,259 | | | | (10,085,129 | ) | | | 16,693,239 | |
| Net Change in Unrealized Appreciation (Depreciation) | | | (1,701,489 | ) | | | 723,798 | | | | (14,494,976 | ) | | | 3,201,689 | |
| Net Increase (Decrease) in Net Assets Resulting from Operations | | | (1,664,376 | ) | | | 854,911 | | | | (24,570,828 | ) | | | 20,942,716 | |
| Distributions | | | (203,751 | ) | | | (59,322 | ) | | | (14,584 | ) | | | (1,352,859 | ) |
| Return of Capital | | | — | | | | — | | | | (63,227 | ) | | | — | |
| Capital Share Transactions: | | | | | | | | | | | | | | | | |
| Issued | | | 3,196,433 | | | | 970,818 | | | | 2,097,530 | | | | 22,506,630 | |
| Redeemed | | | — | | | | — | | | | (6,769,839 | ) | | | (22,201,951 | ) |
| Increase (Decrease) in Net Assets from Capital Share Transactions | | | 3,196,433 | | | | 970,818 | | | | (4,672,309 | ) | | | 304,679 | |
| Total Increase (Decrease) in Net Assets | | | 1,328,306 | | | | 1,766,407 | | | | (29,320,948 | ) | | | 19,894,536 | |
| Net Assets: | | | | | | | | | | | | | | | | |
| Beginning of Year | | | 4,264,016 | | | | 2,497,609 | | | | 75,856,035 | | | | 55,961,499 | |
| End of Year | | $ | 5,592,322 | | | $ | 4,264,016 | | | $ | 46,535,087 | | | $ | 75,856,035 | |
| Share Transactions: | | | | | | | | | | | | | | | | |
| Issued | | | 110,000 | | | | 30,000 | | | | 50,000 | | | | 480,000 | |
| Redeemed | | | — | | | | — | | | | (170,000 | ) | | | (470,000 | ) |
| Net Increase (Decrease) in Shares Outstanding from Share Transactions | | | 110,000 | | | | 30,000 | | | | (120,000 | ) | | | 10,000 | |
| The accompanying notes are an integral part of the financial statements. |
Statements of Changes in Net Assets
| | | Global X S&P 500® Tail Risk ETF | | | Global X S&P 500® Risk Managed Income ETF | |
| | | Year Ended October 31, 2022 | | | Period Ended October 31, 2021(1) | | | Year Ended October 31, 2022 | | | Period Ended October 31, 2021(1) | |
| Operations: | | | | | | | | | | | | |
| Net Investment Income | | $ | 29,933 | | | $ | 3,080 | | | $ | 186,483 | | | $ | 3,407 | |
| Net Realized Gain (Loss) | | | 1,502 | | | | (2,887 | ) | | | 1,155,778 | | | | 34,336 | |
| Net Change in Unrealized Appreciation (Depreciation) | | | (521,816 | ) | | | 77,810 | | | | (4,212,097 | ) | | | 50,360 | |
| Net Increase (Decrease) in Net Assets Resulting from Operations | | | (490,381 | ) | | | 78,003 | | | | (2,869,836 | ) | | | 88,103 | |
| Distributions | | | (96,334 | ) | | | — | | | | (472,058 | ) | | | (51,640 | ) |
| Return of Capital | | | — | | | | — | | | | (1,738,194 | ) | | | — | |
| Capital Share Transactions: | | | | | | | | | | | | | | | | |
| Issued | | | — | | | | 3,526,120 | | | | 30,428,544 | | | | 5,865,129 | |
| Redeemed | | | — | | | | — | | | | (6,616,383 | ) | | | — | |
| Increase in Net Assets from Capital Share Transactions | | | — | | | | 3,526,120 | | | | 23,812,161 | | | | 5,865,129 | |
| Total Increase (Decrease) in Net Assets | | | (586,715 | ) | | | 3,604,123 | | | | 18,732,073 | | | | 5,901,592 | |
| Net Assets: | | | | | | | | | | | | | | | | |
| Beginning of Year | | | 3,604,123 | | | | — | | | | 5,901,592 | | | | — | |
| End of Year | | $ | 3,017,408 | | | $ | 3,604,123 | | | $ | 24,633,665 | | | $ | 5,901,592 | |
| Share Transactions: | | | | | | | | | | | | | | | | |
| Issued | | | — | | | | 130,000 | | | | 1,240,000 | | | | 220,000 | |
| Redeemed | | | — | | | | — | | | | (290,000 | ) | | | — | |
| Net Increase in Shares Outstanding from Share Transactions | | | — | | | | 130,000 | | | | 950,000 | | | | 220,000 | |
| (1) | The Fund commenced operations on August 25, 2021. |
| (2) | See Note 10 in Notes to Financial Statements |
| The accompanying notes are an integral part of the financial statements. |
Statements of Changes in Net Assets
| | | Global X S&P 500® Collar 95-110 ETF | | | Global X NASDAQ 100® Tail Risk ETF | |
| | | Year Ended October 31, 2022 | | | Period Ended October 31, 2021(1) | | | Year Ended October 31, 2022 | | | Period Ended October 31, 2021(1) | |
| Operations: | | | | | | | | | | | | |
| Net Investment Income (Loss) | | $ | 33,909 | | | $ | 2,996 | | | $ | 5,325 | | | $ | (625 | ) |
| Net Realized Gain (Loss) | | | 160,285 | | | | (115 | ) | | | (64,066 | ) | | | (1,786 | ) |
| Net Change in Unrealized Appreciation (Depreciation) | | | (558,753 | ) | | | 48,394 | | | | (720,494 | ) | | | 65,741 | |
| Net Increase (Decrease) in Net Assets Resulting from Operations | | | (364,559 | ) | | | 51,275 | | | | (779,235 | ) | | | 63,330 | |
| Distributions | | | (70,908 | ) | | | — | | | | (66,715 | ) | | | — | |
| Capital Share Transactions: | | | | | | | | | | | | | | | | |
| Issued | | | 1,041,732 | | | | 3,257,141 | | | | 1,394,296 | | | | 3,262,936 | |
| Redeemed | | | — | | | | — | | | | (1,966,628 | ) | | | — | |
| Increase (Decrease) in Net Assets from Capital Share Transactions | | | 1,041,732 | | | | 3,257,141 | | | | (572,332 | ) | | | 3,262,936 | |
| Total Increase (Decrease) in Net Assets | | | 606,265 | | | | 3,308,416 | | | | (1,418,282 | ) | | | 3,326,266 | |
| Net Assets: | | | | | | | | | | | | | | | | |
| Beginning of Year | | | 3,308,416 | | | | — | | | | 3,326,266 | | | | — | |
| End of Year | | $ | 3,914,681 | | | $ | 3,308,416 | | | $ | 1,907,984 | | | $ | 3,326,266 | |
| Share Transactions: | | | | | | | | | | | | | | | | |
| Issued | | | 40,000 | | | | 120,000 | | | | 60,000 | | | | 130,000 | |
| Redeemed | | | — | | | | — | | | | (90,000 | ) | | | — | |
| Net Increase (Decrease) in Shares Outstanding from Share Transactions | | | 40,000 | | | | 120,000 | | | | (30,000 | ) | | | 130,000 | |
| (1) | The Fund commenced operations on August 25, 2021. |
| The accompanying notes are an integral part of the financial statements. |
Statements of Changes in Net Assets
| | | Global X NASDAQ 100® Risk Managed Income ETF | | | Global X NASDAQ 100® Collar 95-110 ETF | |
| | | Year Ended October 31, 2022 | | | Period Ended October 31, 2021(1) | | | Year Ended October 31, 2022 | | | Period Ended October 31, 2021(1) | |
| Operations: | | | | | | | | | | | | |
| Net Investment Income (Loss) | | $ | 20,521 | | | $ | (941 | ) | | $ | 6,905 | | | $ | (560 | ) |
| Net Realized Gain | | | 961,113 | | | | 897 | | | | 509,677 | | | | 14,840 | |
| Net Change in Unrealized Appreciation (Depreciation) | | | (3,382,166 | ) | | | (6,346 | ) | | | (1,083,002 | ) | | | 39,901 | |
| Net Increase (Decrease) in Net Assets Resulting from Operations | | | (2,400,532 | ) | | | (6,390 | ) | | | (566,420 | ) | | | 54,181 | |
| Distributions | | | (128,024 | ) | | | — | | | | (57,957 | ) | | | — | |
| Return of Capital | | | (869,114 | ) | | | (52,273 | ) | | | — | | | | — | |
| Capital Share Transactions: | | | | | | | | | | | | | | | | |
| Issued | | | 15,545,690 | | | | 4,400,103 | | | | 1,741,889 | | | | 2,782,080 | |
| Redeemed | | | (5,769,910 | ) | | | — | | | | (873,233 | ) | | | — | |
| Increase in Net Assets from Capital Share Transactions | | | 9,775,780 | | | | 4,400,103 | | | | 868,656 | | | | 2,782,080 | |
| Total Increase in Net Assets | | | 6,378,110 | | | | 4,341,440 | | | | 244,279 | | | | 2,836,261 | |
| Net Assets: | | | | | | | | | | | | | | | | |
| Beginning of Year | | | 4,341,440 | | | | — | | | | 2,836,261 | | | | — | |
| End of Year | | $ | 10,719,550 | | | $ | 4,341,440 | | | $ | 3,080,540 | | | $ | 2,836,261 | |
| Share Transactions: | | | | | | | | | | | | | | | | |
| Issued | | | 690,000 | | | | 180,000 | | | | 70,000 | | | | 110,000 | |
| Redeemed | | | (280,000 | ) | | | — | | | | (40,000 | ) | | | — | |
| Net Increase in Shares Outstanding from Share Transactions | | | 410,000 | | | | 180,000 | | | | 30,000 | | | | 110,000 | |
| (1) | The Fund commenced operations on August 25, 2021. |
| The accompanying notes are an integral part of the financial statements. |
Financial Highlights
Selected Per Share Data & Ratios
For a Share Outstanding Throughout the Period
| | | Net Asset Value, Beginning of Period ($) | | | Net Investment Income (Loss) ($)* | | | Net Realized and Unrealized Gain (Loss) on Investments ($) | | | Total from Operations ($) | | | Distribution from Net Investment Income ($) | | | Distribution from Capital Gains ($) | | | Return of Capital ($) | |
| Global X Social Media ETF | | | | | | | | | | | | | | | | | | | | | |
2022 | | | 61.26 | | | | 0.03 | | | | (36.29 | ) | | | (36.26 | ) | | | — | | | | — | | | | (0.12 | ) |
2021 | | | 51.95 | | | | (0.31 | ) | | | 9.62 | | | | 9.31 | | | | — | | | | — | | | | — | |
2020 | | | 31.92 | | | | (0.11 | ) | | | 20.14 | | | | 20.03 | �� | | | — | | | | — | | | | — | |
2019 | | | 29.10 | | | | (0.10 | ) | | | 2.92 | | | | 2.82 | | | | — | | | | — | | | | — | |
2018 | | | 32.67 | | | | (0.06 | ) | | | (3.02 | ) | | | (3.08 | ) | | | (0.49 | ) | | | — | | | | — | |
| Global X Lithium & Battery Tech ETF | | | | | | | | | | | | | | | | | | | | | | | | | | | | |
2022 | | | 91.07 | | | | 0.26 | | | | (23.99 | ) | | | (23.73 | ) | | | (0.21 | ) | | | — | | | | — | |
2021 | | | 42.86 | | | | 0.12 | | | | 48.21 | | | | 48.33 | | | | (0.12 | ) | | | — | | | | — | |
2020 | | | 25.04 | | | | 0.40 | | | | 17.86 | | | | 18.26 | | | | (0.44 | ) | | | — | | | | — | |
2019 | | | 30.32 | | | | 0.48 | | | | (4.86 | ) | | | (4.38 | ) | | | (0.90 | ) | | | — | | | | — | |
2018 | | | 39.14 | | | | 0.33 | | | | (7.89 | ) | | | (7.56 | ) | | | (1.26 | ) | | | — | | | | — | |
| Global X Disruptive Materials ETF | | | | | | | | | | | | | | | | | | | | | | | | | | | | |
2022(1) | | | 23.75 | | | | 0.45 | | | | (5.88 | ) | | | (5.43 | ) | | | (0.25 | ) | | | — | | | | — | |
| * | Per share data calculated using average shares method. |
| ** | Total Return is for the period indicated and has not been annualized. The return shown does not reflect the deduction of taxes that a shareholder would pay on Fund distributions or the redemption of Fund shares. |
| † | Annualized. |
| †† | Portfolio turnover rate is for the period indicated and periods of less than one year have not been annualized. Excludes effect of in-kind transfers. |
| (1) | The Fund commenced operations on January 24, 2022. |
Amounts designated as “—” are either $0 or have been rounded to $0.
| The accompanying notes are an integral part of the financial statements. |
Financial Highlights
| Total from Distributions ($) | | | Net Asset Value, End of Period ($) | | | Total Return (%)** | | | Net Assets End of Period ($)(000) | | | Ratio of Expenses to Average Net Assets (%) | | | Ratio of Net Investment Income (Loss) to Average Net Assets (%) | | | Portfolio Turnover (%)†† | |
| | (0.12 | ) | | | 24.88 | | | | (59.24 | ) | | | 103,245 | | | | 0.65 | | | | 0.06 | | | | 21.59 | |
| | — | | | | 61.26 | | | | 17.94 | | | | 401,893 | | | | 0.65 | | | | (0.48 | ) | | | 30.89 | |
| | — | | | | 51.95 | | | | 62.75 | | | | 225,999 | | | | 0.65 | | | | (0.28 | ) | | | 19.23 | |
| | — | | | | 31.92 | | | | 9.69 | | | | 121,289 | | | | 0.65 | | | | (0.33 | ) | | | 16.92 | |
| | (0.49 | ) | | | 29.10 | | | | (9.61 | ) | | | 129,496 | | | | 0.65 | | | | (0.16 | ) | | | 21.36 | |
| | | | | | | | | | | | | | | | | | | | | | | | | | | |
| | (0.21 | ) | | | 67.13 | | | | (26.10 | ) | | | 3,899,509 | | | | 0.75 | | | | 0.33 | | | | 38.73 | |
| | (0.12 | ) | | | 91.07 | | | | 112.89 | | | | 5,375,399 | | | | 0.75 | | | | 0.17 | | | | 39.09 | |
| | (0.44 | ) | | | 42.86 | | | | 73.82 | | | | 868,894 | | | | 0.75 | | | | 1.30 | | | | 65.14 | |
| | (0.90 | ) | | | 25.04 | | | | (14.61 | ) | | | 455,124 | | | | 0.75 | | | | 1.75 | | | | 35.28 | |
| | (1.26 | ) | | | 30.32 | | | | (20.01 | ) | | | 739,153 | | | | 0.75 | | | | 0.96 | | | | 16.48 | |
| | | | | | | | | | | | | | | | | | | | | | | | | | | |
| | (0.25 | ) | | | 18.07 | | | | (22.98 | ) | | | 3,433 | | | | 0.60 | † | | | 2.72 | † | | | 25.34 | |
| The accompanying notes are an integral part of the financial statements. |
Financial Highlights
Selected Per Share Data & Ratios
For a Share Outstanding Throughout the Period
| | | Net Asset Value, Beginning of Period ($) | | | Net Investment Income (Loss) ($)* | | | Net Realized and Unrealized Gain (Loss) on Investments ($) | | | Total from Operations ($) | | | Distribution from Net Investment Income ($) | | | Distribution from Capital Gains ($) | | | Return of Capital ($) | |
| Global X E-commerce ETF | | | | | | | | | | | | | | | | | | | | | |
2022 | | | 31.19 | | | | 0.08 | | | | (15.97 | ) | | | (15.89 | ) | | | (0.05 | ) | | | (0.10 | ) | | | (0.01 | ) |
2021 | | | 26.79 | | | | (0.04 | ) | | | 4.70 | | | | 4.66 | | | | (0.13 | ) | | | (0.13 | ) | | | — | |
2020 | | | 17.58 | | | | 0.19 | | | | 9.05 | | | | 9.24 | | | | (0.03 | ) | | | — | | | | — | |
2019(1) | | | 15.00 | | | | (0.05 | ) | | | 2.63 | | | | 2.58 | | | | — | | | | — | | | | — | |
| Global X Emerging Markets Internet & E-commerce ETF | | | | | | | | | | | | | | | | | | | | | | | | | | | | |
2022(2) | | | 35.97 | | | | 0.04 | | | | (19.55 | ) | | | (19.51 | ) | | | — | | | | — | | | | (0.08 | ) |
2021(2)(3) | | | 44.37 | | | | (0.21 | ) | | | (8.19 | ) | | | (8.40 | ) | | | — | | | | — | | | | — | |
Global X SuperDividend® ETF | | | | | | | | | | | | | | | | | | | | | | | | | | | | |
2022(2) | | | 39.03 | | | | 2.31 | | | | (14.68 | ) | | | (12.37 | ) | | | (2.65 | ) | | | — | | | | (0.96 | ) |
2021(2) | | | 31.83 | | | | 2.82 | | | | 7.38 | | | | 10.20 | | | | (3.00 | ) | | | — | | | | — | |
2020(2) | | | 51.75 | | | | 2.58 | | | | (19.02 | ) | | | (16.44 | ) | | | (3.12 | ) | | | — | | | | (0.36 | ) |
2019(2) | | | 57.18 | | | | 3.72 | | | | (4.41 | ) | | | (0.69 | ) | | | (4.14 | ) | | | — | | | | (0.60 | ) |
2018(2) | | | 64.53 | | | | 4.05 | | | | (6.78 | ) | | | (2.73 | ) | | | (4.29 | ) | | | — | | | | (0.33 | ) |
| * | Per share data calculated using average shares method. |
| ** | Total Return is for the period indicated and has not been annualized. The return shown does not reflect the deduction of taxes that a shareholder would pay on Fund distributions or the redemption of Fund shares. |
| † | Annualized. |
| †† | Portfolio turnover rate is for the period indicated and periods of less than one year have not been annualized. Excludes effect of in-kind transfers. |
| (1) | The Fund commenced operations on November 27, 2018. |
| (2) | Per share amounts have been adjusted for a 1 for 3 reverse share split on December 19, 2022 (See Note 11 in the Notes to Financial Statements). |
| (3) | The Fund commenced operations on November 9, 2020. |
Amounts designated as “—” are either $0 or have been rounded to $0.
| The accompanying notes are an integral part of the financial statements. |
Financial Highlights
| Total from Distributions ($) | | | Net Asset Value, End of Period ($) | | | Total Return (%)** | | | Net Assets End of Period ($)(000) | | | Ratio of Expenses to Average Net Assets (%) | | | Ratio of Net Investment Income (Loss) to Average Net Assets (%) | | | Portfolio Turnover (%)†† | |
| | (0.16 | ) | | | 15.14 | | | | (51.19 | ) | | | 42,241 | | | | 0.50 | | | | 0.34 | | | | 25.82 | |
| | (0.26 | ) | | | 31.19 | | | | 17.39 | | | | 197,751 | | | | 0.50 | | | | (0.11 | ) | | | 14.64 | |
| | (0.03 | ) | | | 26.79 | | | | 52.67 | | | | 91,083 | | | | 0.50 | | | | 0.75 | | | | 42.01 | |
| | — | | | | 17.58 | | | | 17.20 | | | | 3,517 | | | | 0.68 | † | | | (0.32 | )† | | | 23.50 | |
| | | | | | | | | | | | | | | | | | | | | | | | | | | |
| | (0.08 | ) | | | 16.38 | | | | (54.30 | ) | | | 1,966 | | | | 0.65 | | | | 0.14 | | | | 26.27 | |
| | — | | | | 35.97 | | | | (18.93 | ) | | | 4,555 | | | | 0.65 | † | | | (0.49 | )† | | | 23.61 | |
| | | | | | | | | | | | | | | | | | | | | | | | | | | |
| | (3.61 | ) | | | 23.05 | | | | (33.80 | ) | | | 676,279 | | | | 0.61 | | | | 7.39 | | | | 91.10 | |
| | (3.00 | ) | | | 39.03 | | | | 32.21 | | | | 930,431 | | | | 0.58 | | | | 6.98 | | | | 82.37 | |
| | (3.48 | ) | | | 31.83 | | | | (32.80 | ) | | | 626,871 | | | | 0.59 | | | | 6.62 | | | | 124.55 | |
| | (4.74 | ) | | | 51.75 | | | | (1.02 | ) | | | 932,111 | | | | 0.59 | | | | 7.03 | | | | 56.85 | |
| | (4.62 | ) | | | 57.18 | | | | (4.65 | ) | | | 912,968 | | | | 0.59 | | | | 6.48 | | | | 59.48 | |
| The accompanying notes are an integral part of the financial statements. |
Financial Highlights
Selected Per Share Data & Ratios
For a Share Outstanding Throughout the Period
| | | Net Asset Value, Beginning of Period ($) | | | Net Investment Income ($)* | | | Net Realized and Unrealized Gain (Loss) on Investments ($) | | | Total from Operations ($) | | | Distribution from Net Investment Income ($) | | | Distribution from Capital Gains ($) | | | Return of Capital ($) | |
Global X SuperDividend® U.S. ETF | | | | | | | | | | | | | | | | | | | | | |
2022 | | | 20.13 | | | | 0.67 | | | | (0.41 | ) | | | 0.26 | | | | (0.81 | ) | | | — | | | | (0.40 | ) |
2021 | | | 14.99 | | | | 0.65 | | | | 5.59 | | | | 6.24 | | | | (0.99 | ) | | | — | | | | (0.11 | ) |
2020 | | | 23.34 | | | | 0.62 | | | | (7.45 | ) | | | (6.83 | ) | | | (1.14 | ) | | | — | | | | (0.38 | ) |
2019 | | | 24.53 | | | | 1.12 | | | | (0.56 | ) | | | 0.56 | | | | (1.49 | ) | | | — | | | | (0.26 | ) |
2018 | | | 25.18 | | | | 1.07 | | | | (0.17 | ) | | | 0.90 | | | | (1.35 | ) | | | — | | | | (0.20 | ) |
Global X MSCI SuperDividend® EAFE ETF | | | | | | | | | | | | | | | | | | | | | | | | | | | | |
2022 | | | 15.62 | | | | 1.00 | | | | (3.70 | ) | | | (2.70 | ) | | | (0.94 | ) | | | — | | | | — | |
2021 | | | 11.44 | | | | 0.79 | | | | 4.10 | | | | 4.89 | | | | (0.71 | ) | | | — | | | | — | |
2020 | | | 16.11 | | | | 0.56 | | | | (4.53 | ) | | | (3.97 | ) | | | (0.55 | ) | | | — | | | | (0.15 | ) |
2019 | | | 15.96 | | | | 0.82 | | | | 0.36 | | | | 1.18 | | | | (1.03 | ) | | | — | | | | — | |
2018 | | | 18.13 | | | | 1.12 | | | | (2.04 | ) | | | (0.92 | ) | | | (1.10 | ) | | | (0.15 | ) | | | — | |
Global X MSCI SuperDividend® Emerging Markets ETF | | | | | | | | | | | | | | | | | | | | | | | | | | | | |
2022(1) | | | 33.78 | | | | 1.67 | | | | (11.44 | ) | | | (9.77 | ) | | | (2.19 | ) | | | — | | | | (0.46 | ) |
2021(1) | | | 28.59 | | | | 3.06 | | | | 4.35 | | | | 7.41 | | | | (2.22 | ) | | | — | | | | — | |
2020(1) | | | 38.85 | | | | 1.65 | | | | (9.51 | ) | | | (7.86 | ) | | | (1.98 | ) | | | — | | | | (0.42 | ) |
2019(1) | | | 38.73 | | | | 2.61 | | | | 0.15 | | | | 2.76 | | | | (2.64 | ) | | | — | | | | — | |
2018(1) | | | 47.82 | | | | 2.70 | | | | (9.06 | ) | | | (6.36 | ) | | | (2.73 | ) | | | — | | | | — | |
| * | Per share data calculated using average shares method. |
| ** | Total Return is for the period indicated and has not been annualized. The return shown does not reflect the deduction of taxes that a shareholder would pay on Fund distributions or the redemption of Fund shares. |
| †† | Portfolio turnover rate is for the period indicated and periods of less than one year have not been annualized. Excludes effect of in-kind transfers. |
| (1) | Per share amounts have been adjusted for a 1 for 3 reverse share split on December 19, 2022 (See Note 11 in the Notes to Financial Statements.) |
Amounts designated as “—” are either $0 or have been rounded to $0.
| The accompanying notes are an integral part of the financial statements. |
Financial Highlights
| Total from Distributions ($) | | | Net Asset Value, End of Period ($) | | | Total Return (%)** | | | Net Assets End of Period ($)(000) | | | Ratio of Expenses to Average Net Assets (%) | | | Ratio of Net Investment Income to Average Net Assets (%) | | | Portfolio Turnover (%)†† | |
| | (1.21 | ) | | | 19.18 | | | | 1.16 | | | | 683,864 | | | | 0.45 | | | | 3.34 | | | | 38.51 | |
| | (1.10 | ) | | | 20.13 | | | | 42.53 | | | | 669,734 | | | | 0.45 | | | | 3.41 | | | | 60.53 | |
| | (1.52 | ) | | | 14.99 | | | | (30.12 | ) | | | 412,110 | | | | 0.45 | | | | 3.50 | | | | 93.44 | |
| | (1.75 | ) | | | 23.34 | | | | 2.61 | | | | 544,884 | | | | 0.46 | | | | 4.83 | | | | 60.00 | |
| | (1.55 | ) | | | 24.53 | | | | 3.66 | | | | 413,311 | | | | 0.46 | | | | 4.31 | | | | 33.25 | |
| | | | | | | | | | | | | | | | | | | | | | | | | | | |
| | (0.94 | ) | | | 11.98 | | | | (18.12 | ) | | | 8,384 | | | | 0.57 | | | | 6.89 | | | | 34.00 | |
| | (0.71 | ) | | | 15.62 | | | | 43.05 | | | | 14,058 | | | | 0.55 | | | | 5.12 | | | | 88.53 | |
| | (0.70 | ) | | | 11.44 | | | | (25.24 | ) | | | 7,436 | | | | 0.56 | | | | 4.07 | | | | 59.28 | |
| | (1.03 | ) | | | 16.11 | | | | 7.81 | | | | 18,527 | | | | 0.56 | | | | 5.23 | | | | 29.81 | |
| | (1.25 | ) | | | 15.96 | | | | (5.59 | ) | | | 4,788 | | | | 0.56 | | | | 6.36 | | | | 52.96 | |
| | | | | | | | | | | | | | | | | | | | | | | | | | | |
| | (2.65 | ) | | | 21.36 | | | | (30.80 | ) | | | 39,168 | | | | 0.67 | | | | 5.88 | | | | 101.78 | |
| | (2.22 | ) | | | 33.78 | | | | 25.83 | | | | 62,696 | | | | 0.72 | | | | 8.59 | | | | 102.27 | |
| | (2.40 | ) | | | 28.59 | | | | (21.01 | ) | | | 20,007 | | | | 0.67 | | | | 5.04 | | | | 93.04 | |
| | (2.64 | ) | | | 38.85 | | | | 7.14 | | | | 17,489 | | | | 0.66 | | | | 6.51 | | | | 66.65 | |
| | (2.73 | ) | | | 38.73 | | | | (14.10 | ) | | | 12,260 | | | | 0.67 | | | | 5.89 | | | | 79.52 | |
| The accompanying notes are an integral part of the financial statements. |
Financial Highlights
Selected Per Share Data & Ratios
For a Share Outstanding Throughout the Period
| | | Net Asset Value, Beginning of Period ($) | | | Net Investment Income ($)* | | | Net Realized and Unrealized Gain (Loss) on Investments ($) | | | Total from Operations ($) | | | Distribution from Net Investment Income ($) | | | Distribution from Capital Gains ($) | | | Return of Capital ($) | |
Global X SuperDividend® REIT ETF | | | | | | | | | | | | | | | | | | | | | |
2022(1) | | | 29.46 | | | | 1.13 | | | | (7.14 | ) | | | (6.01 | ) | | | (1.10 | ) | | | — | | | | (0.70 | ) |
2021(1) | | | 22.68 | | | | 1.14 | | | | 7.50 | | | | 8.64 | | | | (1.23 | ) | | | — | | | | (0.63 | ) |
2020(1) | | | 45.99 | | | | 1.68 | | | | (22.23 | ) | | | (20.55 | ) | | | (2.58 | ) | | | — | | | | (0.18 | ) |
2019(1) | | | 43.86 | | | | 2.97 | | | | 2.73 | | | | 5.70 | | | | (3.57 | ) | | | — | | | | — | |
2018(1) | | | 45.87 | | | | 2.76 | | | | (0.84 | ) | | | 1.92 | | | | (3.93 | ) | | | — | | | | — | |
Global X NASDAQ 100® Covered Call ETF(2) | | | | | | | | | | | | | | | | | | | | | | | | | | | | |
2022 | | | 22.82 | | | | 0.05 | | | | (4.13 | ) | | | (4.08 | ) | | | (0.24 | ) | | | (0.50 | ) | | | (1.85 | ) |
2021 | | | 20.65 | | | | 0.02 | | | | 4.73 | | | | 4.75 | | | | (2.58 | ) | | | — | | | | — | |
2020 | | | 23.10 | | | | 0.06 | | | | (0.06 | ) | | | — | | | | (0.06 | ) | | | — | | | | (2.39 | ) |
2019 | | | 23.45 | | | | 0.06 | | | | 1.95 | | | | 2.01 | | | | (1.83 | ) | | | — | | | | (0.53 | ) |
2018 | | | 24.30 | | | | 0.07 | | | | 1.71 | | | | 1.78 | | | | (0.87 | ) | | | (0.11 | ) | | | (1.65 | ) |
Global X S&P 500® Covered Call ETF(2) | | | | | | | | | | | | | | | | | | | | | | | | | | | | |
2022 | | | 50.37 | | | | 0.45 | | | | (5.50 | ) | | | (5.05 | ) | | | (1.05 | ) | | | (0.11 | ) | | | (4.16 | ) |
2021 | | | 42.45 | | | | 0.39 | | | | 12.14 | | | | 12.53 | | | | (4.61 | ) | | | — | | | | — | |
2020 | | | 49.39 | | | | 0.56 | | | | (4.17 | ) | | | (3.61 | ) | | | (0.58 | ) | | | — | | | | (2.75 | ) |
2019 | | | 48.56 | | | | 0.56 | | | | 3.30 | | | | 3.86 | | | | (2.27 | ) | | | (0.39 | ) | | | (0.37 | ) |
2018 | | | 50.10 | | | | 0.62 | | | | 1.88 | | | | 2.50 | | | | (0.22 | ) | | | (1.22 | ) | | | (2.60 | ) |
| * | Per share data calculated using average shares method. |
| ** | Total Return is for the period indicated and has not been annualized. The return shown does not reflect the deduction of taxes that a shareholder would pay on Fund distributions or the redemption of Fund shares. |
| †† | Portfolio turnover rate is for the period indicated and periods of less than one year have not been annualized. Excludes effect of in-kind transfers. |
| (1) | Per share amounts have been adjusted for a 1 for 3 reverse share split on December 19, 2022 (See Note 11 in the Notes to Financial Statements.) |
| (2) | The financial statements include the financial information of the Predecessor Funds through December 21, 2018 (See Note 1 in Notes to Financial Statements). As a result of the Reorganization, the Fund assumed the performance and accounting history of the Predecessor Fund. Accordingly, performance figures for the Fund for periods prior to the date of the Reorganization represent the performance of the Predecessor Fund. |
| (3) | Excluding broker fees on written options, the ratio of expenses to average net assets would have been 0.60% and 0.60% for the year ended October 31, 2020 and October 31, 2019, respectively. The ratio of Expenses to Average Net Assets includes the effect of a waiver. If these offsets were excluded, the ratio would have been 0.60% and 0.60% for the year ended October 31, 2020 and year ended October 31, 2019. |
| (4) | Includes excise tax. If this excise expense was not included, the ratio would have been 0.60%. |
| (5) | Excluding broker fees on written options, the ratio of expenses to average net assets would have been 0.64% and 0.65% for the year ended October 31, 2020 and year ended October 31, 2019, respectively The ratio of Expenses to Average Net Assets includes the effect of a waiver. If these offsets were excluded, the ratio would have been 0.64% and 0.65% for the year ended October 31, 2020 and year ended October 31, 2019. |
Amounts designated as “—” are either $0 or have been rounded to $0.
| The accompanying notes are an integral part of the financial statements. |
Financial Highlights
| Total from Distributions ($) | | | Net Asset Value, End of Period ($) | | | Total Return (%)** | | | Net Assets End of Period ($)(000) | | | Ratio of Expenses to Average Net Assets (%) | | | Ratio of Net Investment Income to Average Net Assets (%) | | | Portfolio Turnover (%)†† | |
| | (1.80 | ) | | | 21.65 | | | | (21.21 | ) | | | 286,655 | | | | 0.59 | | | | 4.36 | | | | 82.67 | |
| | (1.86 | ) | | | 29.46 | | | | 38.84 | | | | 467,934 | | | | 0.58 | | | | 3.99 | | | | 59.44 | |
| | (2.76 | ) | | | 22.68 | | | | (45.94 | ) | | | 311,625 | | | | 0.58 | | | | 5.74 | | | | 106.23 | |
| | (3.57 | ) | | | 45.99 | | | | 13.68 | | | | 364,790 | | | | 0.59 | | | | 6.71 | | | | 34.16 | |
| | (3.93 | ) | | | 43.86 | | | | 4.30 | | | | 118,408 | | | | 0.59 | | | | 6.15 | | | | 41.61 | |
| | | | | | | | | | | | | | | | | | | | | | | | | | | |
| | (2.59 | ) | | | 16.15 | | | | (19.18 | ) | | | 6,397,648 | | | | 0.60 | | | | 0.25 | | | | 31.11 | |
| | (2.58 | ) | | | 22.82 | | | | 23.89 | | | | 5,036,215 | | | | 0.60 | | | | 0.11 | | | | 19.99 | |
| | (2.45 | ) | | | 20.65 | | | | 0.21 | | | | 1,325,642 | | | | 0.67 | (3) | | | 0.27 | | | | 27.87 | |
| | (2.36 | ) | | | 23.10 | | | | 9.39 | | | | 768,036 | | | | 0.85 | (3) | | | 0.26 | | | | 11.82 | |
| | (2.63 | ) | | | 23.45 | | | | 7.44 | | | | 395,202 | | | | 0.68 | (4) | | | 0.30 | | | | 15.00 | |
| | | | | | | | | | | | | | | | | | | | | | | | | | | |
| | (5.32 | ) | | | 40.00 | | | | (10.72 | ) | | | 1,934,545 | | | | 0.60 | | | | 1.00 | | | | 15.60 | |
| | (4.61 | ) | | | 50.37 | | | | 30.67 | | | | 669,855 | | | | 0.60 | | | | 0.80 | | | | 4.84 | |
| | (3.33 | ) | | | 42.45 | | | | (7.42 | ) | | | 103,992 | | | | 0.71 | (5) | | | 1.22 | | | | 7.29 | |
| | (3.03 | ) | | | 49.39 | | | | 8.40 | | | | 133,353 | | | | 0.87 | (5) | | | 1.16 | | | | 3.92 | |
| | (4.04 | ) | | | 48.56 | | | | 4.97 | | | | 77,701 | | | | 0.65 | | | | 1.22 | | | | 4.00 | |
| The accompanying notes are an integral part of the financial statements. |
Financial Highlights
Selected Per Share Data & Ratios
For a Share Outstanding Throughout the Period
| | | Net Asset Value, Beginning of Period ($) | | | Net Investment Income ($)* | | | Net Realized and Unrealized Gain (Loss) on Investments ($) | | | Total from Operations ($) | | | Distribution from Net Investment Income ($) | | | Distribution from Capital Gains ($) | | | Return of Capital ($) | |
| Global X Russell 2000 Covered Call ETF | | | | | | | | | | | | | | | | | | | | | |
2022 | | | 25.18 | | | | 0.19 | | | | (3.10 | ) | | | (2.91 | ) | | | (0.44 | ) | | | (0.31 | ) | | | (1.97 | ) |
2021 | | | 20.45 | | | | 0.13 | | | | 7.50 | | | | 7.63 | | | | (2.90 | ) | | | — | | | | — | |
2020 | | | 25.24 | | | | 0.12 | | | | (2.51 | ) | | | (2.39 | ) | | | (0.11 | ) | | | (0.17 | ) | | | (2.12 | ) |
2019(3) | | | 25.00 | | | | 0.09 | | | | 1.37 | | | | 1.46 | | | | (1.22 | ) | | | — | | | | — | |
Global X Dow 30® Covered Call ETF | | | | | | | | | | | | | | | | | | | | | | | | | | | | |
2022(4) | | | 24.13 | | | | 0.22 | | | | (0.86 | ) | | | (0.64 | ) | | | (0.64 | ) | | | — | | | | (0.96 | ) |
Global X Nasdaq 100® Covered Call & Growth ETF | | | | | | | | | | | | | | | | | | | | | | | | | | | | |
2022 | | | 33.09 | | | | 0.06 | | | | (7.29 | ) | | | (7.23 | ) | | | (0.20 | ) | | | (1.60 | ) | | | (1.26 | ) |
2021 | | | 26.27 | | | | 0.02 | | | | 8.56 | | | | 8.58 | | | | (1.76 | ) | | | — | | | | — | |
2020(6) | | | 26.30 | | | | — | | | | 0.11 | | | | 0.11 | | | | — | | | | — | | | | (0.14 | ) |
| * | Per share data calculated using average shares method. |
| ** | Total Return is for the period indicated and has not been annualized. The return shown does not reflect the deduction of taxes that a shareholder would pay on Fund distributions or the redemption of Fund shares. |
| † | Annualized. |
| †† | Portfolio turnover rate is for the period indicated and periods of less than one year have not been annualized. Excludes effect of in-kind transfers. |
| (1) | The ratio of Expenses to Average Net Assets includes the effect of a waiver due to acquired fund fees and expenses. The ratio to Average Net Assets does not include acquired fund fees and expenses of the underlying investments, if applicable. If these offsets were excluded, the ratio would have been 0.60%, 0.60%, 0.68% and 0.97% for the year ended October 31, 2022 to the year ended October 31, 2019, respectively. |
| (2) | Includes fees charged by the Fund custodian that were reimbursed by the custodian to the Fund subsequent to the reporting period. Excluding these fees, the ratio to average net assets would have been 0.54%. |
| (3) | The Fund commenced operations on April 17, 2019. |
| (4) | The Fund commenced operations on February 23, 2022. |
| (5) | Includes fees charged by the Fund custodian that were reimbursed by the custodian to the Fund subsequent to the reporting period. Excluding these fees, the ratio to average net assets would have been 0.60%. |
| (6) | The Fund commenced operations on September 18, 2020. |
Amounts designated as “—” are either $0 or have been rounded to $0.
| The accompanying notes are an integral part of the financial statements. |
Financial Highlights
| Total from Distributions ($) | | | Net Asset Value, End of Period ($) | | | Total Return (%)** | | | Net Assets End of Period ($)(000) | | | Ratio of Expenses to Average Net Assets (%) | | | Ratio of Net Investment Income (Loss) to Average Net Assets (%) | | | Portfolio Turnover (%)†† | |
| | (2.72 | ) | | | 19.55 | | | | (12.18 | ) | | | 1,342,241 | | | | 0.55 | (1)(2) | | | 0.86 | | | | 186.48 | |
| | (2.90 | ) | | | 25.18 | | | | 38.82 | | | | 554,446 | | | | 0.50 | (1) | | | 0.53 | | | | 8.94 | |
| | (2.40 | ) | | | 20.45 | | | | (9.18 | ) | | | 21,475 | | | | 0.56 | (1) | | | 0.68 | | | | 11.16 | |
| | (1.22 | ) | | | 25.24 | | | | 5.99 | | | | 8,833 | | | | 0.82 | †(1) | | | 0.68 | † | | | 5.82 | |
| | | | | | | | | | | | | | | | | | | | | | | | | | | |
| | (1.60 | ) | | | 21.89 | | | | (2.77 | ) | | | 52,985 | | | | 0.61 | †(5) | | | 1.42 | † | | | 8.82 | |
| | | | | | | | | | | | | | | | | | | | | | | | | | | |
| | (3.06 | ) | | | 22.80 | | | | (23.57 | ) | | | 61,105 | | | | 0.61 | (5) | | | 0.23 | | | | 18.12 | |
| | (1.76 | ) | | | 33.09 | | | | 33.42 | | | | 44,671 | | | | 0.60 | | | | 0.06 | | | | 11.21 | |
| | (0.14 | ) | | | 26.27 | | | | 0.40 | | | | 6,568 | | | | 0.60 | † | | | (0.10 | )† | | | 1.65 | |
| The accompanying notes are an integral part of the financial statements. |
Financial Highlights
Selected Per Share Data & Ratios
For a Share Outstanding Throughout the Period
| | | Net Asset Value, Beginning of Period ($) | | | Net Investment Income (Loss) ($)* | | | Net Realized and Unrealized Gain (Loss) on Investments ($) | | | Total from Operations ($) | | | Distribution from Net Investment Income ($) | | | Distribution from Capital Gains ($) | | | Return of Capital ($) | |
Global X S&P 500® Covered Call & Growth ETF | | | | | | | | | | | | | | | | | | | | | |
2022 | | | 31.83 | | | | 0.27 | | | | (4.03 | ) | | | (3.76 | ) | | | (0.42 | ) | | | (1.10 | ) | | | (1.08 | ) |
2021 | | | 24.69 | | | | 0.22 | | | | 8.29 | | | | 8.51 | | | | (1.37 | ) | | | — | | | | — | |
2020(2) | | | 25.22 | | | | 0.02 | | | | (0.41 | ) | | | (0.39 | ) | | | (0.02 | ) | | | — | | | | (0.12 | ) |
| Global X Russell 2000 Covered Call & Growth ETF | | | | | | | | | | | | | | | | | | | | | | | | | | | | |
2022(3) | | | 25.90 | | | | (0.01 | ) | | | 0.82 | | | | 0.81 | | | | (0.13 | ) | | | — | | | | — | |
| Global X SuperIncome™ Preferred ETF | | | | | | | | | | | | | | | | | | | | | | | | | | | | |
2022 | | | 11.94 | | | | 0.54 | | | | (2.13 | ) | | | (1.59 | ) | | | (0.65 | ) | | | — | | | | (0.03 | ) |
2021 | | | 11.12 | | | | 0.61 | | | | 0.89 | | | | 1.50 | | | | (0.68 | ) | | | — | | | | — | |
2020 | | | 11.73 | | | | 0.60 | | | | (0.53 | ) | | | 0.07 | | | | (0.65 | ) | | | — | | | | (0.03 | ) |
2019 | | | 11.49 | | | | 0.66 | | | | 0.32 | | | | 0.98 | | | | (0.73 | ) | | | — | | | | (0.01 | ) |
2018 | | | 12.44 | | | | 0.78 | | | | (0.88 | ) | | | (0.10 | ) | | | (0.85 | ) | | | — | | | | — | |
| * | Per share data calculated using average shares method. |
| ** | Total Return is for the period indicated and has not been annualized. The return shown does not reflect the deduction of taxes that a shareholder would pay on Fund distributions or the redemption of Fund shares. |
| † | Annualized. |
| †† | Portfolio turnover rate is for the period indicated and periods of less than one year have not been annualized. Excludes effect of in-kind transfers. |
| @ | The ratio of Expenses to Average Net Assets includes the effect of a waiver due to acquired fund fees and expenses. The ratio to Average Net Assets does not include acquired fund fees and expenses of the underlying investments, if applicable. If these offsets were excluded, the ratio would have been 0.60% for the year ended October 31, 2022. |
| (1) | | Includes fees charged by the Fund custodian that were reimbursed by the custodian to the Fund subsequent to the reporting period. Excluding these fees, the ratio to average net assets would have been 0.60%. |
| (2) | The Fund commenced operations on September 18, 2020. |
| (3) | The Fund commenced operations on October 4, 2022. |
Amounts designated as “—” are either $0 or have been rounded to $0.
| The accompanying notes are an integral part of the financial statements. |
Financial Highlights
| Total from Distributions ($) | | | Net Asset Value, End of Period ($) | | | Total Return (%)** | | | Net Assets End of Period ($)(000) | | | Ratio of Expenses to Average Net Assets (%) | | | Ratio of Net Investment Income (Loss) to Average Net Assets (%) | | | Portfolio Turnover (%)†† | |
| | (2.60 | ) | | | 25.47 | | | | (12.63 | ) | | | 41,511 | | | | 0.61 | (1) | | | 0.94 | | | | 9.36 | |
| | (1.37 | ) | | | 31.83 | | | | 35.18 | | | | 35,018 | | | | 0.60 | | | | 0.74 | | | | 12.17 | |
| | (0.14 | ) | | | 24.69 | | | | (1.60 | ) | | | 3,704 | | | | 0.60 | † | | | 0.75 | † | | | 0.75 | |
| | | | | | | | | | | | | | | | | | | | | | | | | | | |
| | (0.13 | ) | | | 26.58 | | | | 3.14 | | | | 2,658 | | | | 0.50 | †@ | | | (0.50 | )† | | | — | |
| | | | | | | | | | | | | | | | | | | | | | | | | | | |
| | (0.68 | ) | | | 9.67 | | | | (13.81 | ) | | | 195,159 | | | | 0.58 | | | | 5.04 | | | | 39.39 | |
| | (0.68 | ) | | | 11.94 | | | | 13.71 | | | | 234,953 | | | | 0.58 | | | | 5.13 | | | | 98.47 | |
| | (0.68 | ) | | | 11.12 | | | | 0.81 | | | | 184,015 | | | | 0.58 | | | | 5.47 | | | | 67.65 | |
| | (0.74 | ) | | | 11.73 | | | | 8.87 | | | | 201,092 | | | | 0.58 | | | | 5.72 | | | | 55.98 | |
| | (0.85 | ) | | | 11.49 | | | | (0.87 | ) | | | 186,154 | | | | 0.58 | | | | 6.48 | | | | 105.48 | |
| The accompanying notes are an integral part of the financial statements. |
Financial Highlights
Selected Per Share Data & Ratios
For a Share Outstanding Throughout the Period
| | | Net Asset Value, Beginning of Period ($) | | | Net Investment Income ($)* | | | Net Realized and Unrealized Gain (Loss) on Investments ($) | | | Total from Operations ($) | | | Distribution from Net Investment Income ($) | | | Distribution from Capital Gains ($) | | | Return of Capital ($) | |
| Global X Renewable Energy Producers ETF | | | | | | | | | | | | | | | | | | | | | |
2022 | | | 16.82 | | | | 0.15 | | | | (3.76 | ) | | | (3.61 | ) | | | (0.16 | ) | | | — | | | | — | |
2021 | | | 14.87 | | | | 0.23 | | | | 2.05 | | | | 2.28 | | | | (0.30 | ) | | | (0.03 | ) | | | — | |
2020 | | | 13.79 | | | | 0.41 | | | | 1.13 | | | | 1.54 | | | | (0.46 | ) | | | — | | | | — | |
2019 | | | 11.52 | | | | 0.13 | | | | 2.61 | | | | 2.74 | | | | (0.47 | ) | | | — | | | | — | |
2018 | | | 12.53 | | | | 0.37 | | | | (0.80 | ) | | | (0.43 | ) | | | (0.50 | ) | | | — | | | | (0.08 | ) |
Global X S&P 500® Catholic Values ETF | | | | | | | | | | | | | | | | | | | | | | | | | | | | |
2022 | | | 57.22 | | | | 0.61 | | | | (9.99 | ) | | | (9.38 | ) | | | (0.57 | ) | | | (0.08 | ) | | | — | |
2021 | | | 40.32 | | | | 0.56 | | | | 16.89 | | | | 17.45 | | | | (0.55 | ) | | | — | | | | — | |
2020 | | | 37.23 | | | | 0.58 | | | | 3.08 | | | | 3.66 | | | | (0.55 | ) | | | (0.02 | ) | | | — | |
2019 | | | 33.59 | | | | 0.58 | | | | 3.92 | | | | 4.50 | | | | (0.81 | ) | | | (0.05 | ) | | | — | |
2018 | | | 31.83 | | | | 0.58 | | | | 1.60 | | | | 2.18 | | | | (0.41 | ) | | | (0.01 | ) | | | — | |
| Global X S&P Catholic Values Developed ex-U.S. ETF | | | | | | | | | | | | | | | | | | | | | | | | | | | | |
2022 | | | 32.80 | | | | 0.77 | | | | (9.11 | ) | | | (8.34 | ) | | | (0.79 | ) | | | (0.37 | ) | | | — | |
2021 | | | 24.98 | | | | 0.70 | | | | 7.71 | | | | 8.41 | | | | (0.59 | ) | | | — | | | | — | |
2020(1) | | | 25.05 | | | | 0.19 | | | | (0.26 | ) | | | (0.07 | ) | | | — | | | | — | | | | — | |
| * | Per share data calculated using average shares method. |
| ** | Total Return is for the period indicated and has not been annualized. The return shown does not reflect the deduction of taxes that a shareholder would pay on Fund distributions or the redemption of Fund shares. |
| † | Annualized. |
| †† | Portfolio turnover rate is for the period indicated and periods of less than one year have not been annualized. Excludes effect of in-kind transfers. |
| @ | The ratio of Expenses to Average Net Assets includes the effect of a waiver. If these offsets were excluded, the ratio would have been 0.32% for the years ended October 31, 2018. |
| (1) | The Fund commenced operations on June 22, 2020. |
Amounts designated as “—” are either $0 or have been rounded to $0.
| The accompanying notes are an integral part of the financial statements. |
Financial Highlights
| Total from Distributions ($) | | | Net Asset Value, End of Period ($) | | | Total Return (%)** | | | Net Assets End of Period ($)(000) | | | Ratio of Expenses to Average Net Assets (%) | | | Ratio of Net Investment Income to Average Net Assets (%) | | | Portfolio Turnover (%)†† | |
| | (0.16 | ) | | | 13.05 | | | | (21.57 | ) | | | 90,970 | | | | 0.66 | | | | 1.01 | | | | 18.33 | |
| | (0.33 | ) | | | 16.82 | | | | 15.37 | | | | 146,976 | | | | 0.65 | | | | 1.39 | | | | 55.97 | |
| | (0.46 | ) | | | 14.87 | | | | 11.39 | | | | 66,192 | | | | 0.65 | | | | 2.89 | | | | 29.27 | |
| | (0.47 | ) | | | 13.79 | | | | 24.34 | | | | 26,205 | | | | 0.65 | | | | 1.01 | | | | 87.06 | |
| | (0.58 | ) | | | 11.52 | | | | (3.50 | ) | | | 15,556 | | | | 0.65 | | | | 3.07 | | | | 33.50 | |
| | | | | | | | | | | | | | | | | | | | | | | | | | | |
| | (0.65 | ) | | | 47.19 | | | | (16.53 | ) | | | 549,288 | | | | 0.29 | | | | 1.17 | | | | 6.79 | |
| | (0.55 | ) | | | 57.22 | | | | 43.54 | | | | 593,985 | | | | 0.29 | | | | 1.09 | | | | 8.29 | |
| | (0.57 | ) | | | 40.32 | | | | 9.89 | | | | 379,053 | | | | 0.29 | | | | 1.51 | | | | 5.55 | |
| | (0.86 | ) | | | 37.23 | | | | 13.86 | | | | 275,511 | | | | 0.29 | | | | 1.66 | | | | 8.54 | |
| | (0.42 | ) | | | 33.59 | | | | 6.86 | | | | 147,789 | | | 0.29 | @ | | | 1.72 | | | | 4.33 | |
| | | | | | | | | | | | | | | | | | | | | | | | | | | |
| | (1.16 | ) | | | 23.30 | | | | (26.11 | ) | | | 5,592 | | | | 0.35 | | | | 2.83 | | | | 12.83 | |
| | (0.59 | ) | | | 32.80 | | | | 33.79 | | | | 4,264 | | | | 0.35 | | | | 2.22 | | | | 17.17 | |
| | — | | | | 24.98 | | | | (0.28 | ) | | | 2,498 | | | | 0.35 | † | | | 2.02 | † | | | 4.04 | |
| The accompanying notes are an integral part of the financial statements. |
Financial Highlights
Selected Per Share Data & Ratios
For a Share Outstanding Throughout the Period
| | | Net Asset Value, Beginning of Period ($) | | | Net Investment Income ($)* | | | Net Realized and Unrealized Gain (Loss) on Investments ($) | | | Total from Operations ($) | | | Distribution from Net Investment Income ($) | | | Distribution from Capital Gains ($) | | | Return of Capital ($) | |
Global X Guru® Index ETF | | | | | | | | | | | | | | | | | | | | | |
2022 | | | 50.24 | | | | 0.01 | | | | (16.72 | ) | | | (16.71 | ) | | | (0.01 | ) | | | — | | | | (0.04 | ) |
2021 | | | 37.31 | | | | 0.69 | | | | 13.14 | | | | 13.83 | | | | (0.90 | ) | | | — | | | | — | |
2020 | | | 34.02 | | | | 0.33 | | | | 3.32 | | | | 3.65 | | | | (0.34 | ) | | | — | | | | (0.02 | ) |
2019 | | | 30.09 | | | | 0.12 | | | | 4.02 | | | | 4.14 | | | | (0.17 | ) | | | — | | | | (0.04 | ) |
2018 | | | 28.70 | | | | 0.11 | | | | 1.44 | | | | 1.55 | | | | (0.16 | ) | | | — | | | | — | |
Global X S&P 500® Tail Risk ETF | | | | | | | | | | | | | | | | | | | | | | | | | | | | |
2022 | | | 27.72 | | | | 0.23 | | | | (4.00 | ) | | | (3.77 | ) | | | (0.16 | ) | | | (0.58 | ) | | | — | |
2021(1) | | | 27.33 | | | | 0.03 | | | | 0.36 | | | | 0.39 | | | | — | | | | — | | | | — | |
Global X S&P 500® Risk Managed Income ETF | | | | | | | | | | | | | | | | | | | | | | | | | | | | |
2022 | | | 26.83 | | | | 0.23 | | | | (3.38 | ) | | | (3.15 | ) | | | (0.52 | ) | | | (0.07 | ) | | | (2.04 | ) |
2021(1) | | | 26.77 | | | | 0.03 | | | | 0.39 | | | | 0.42 | | | | (0.36 | ) | | | — | | | | — | |
| * | Per share data calculated using average shares method. |
| ** | Total Return is for the period indicated and has not been annualized. The return shown does not reflect the deduction of taxes that a shareholder would pay on Fund distributions or the redemption of Fund shares. |
| † | Annualized. |
| †† | Portfolio turnover rate is for the period indicated and periods of less than one year have not been annualized. Excludes effect of in-kind transfers. |
| (1) | The Fund commenced operations on August 25, 2021. |
| (2) | Includes fees charged by the Fund custodian that were reimbursed by the custodian to the Fund subsequent to the reporting period. Excluding these fees, the ratio to average net assets would have been 0.61%. |
Amounts designated as “—” are either $0 or have been rounded to $0.
| The accompanying notes are an integral part of the financial statements. |
Financial Highlights
| Total from Distributions ($) | | | Net Asset Value, End of Period ($) | | | Total Return (%)** | | | Net Assets End of Period ($)(000) | | | Ratio of Expenses to Average Net Assets (%) | | | Ratio of Net Investment Income to Average Net Assets (%) | | | Portfolio Turnover (%)†† | |
| | (0.05 | ) | | | 33.48 | | | | (33.28 | ) | | | 46,535 | | | | 0.75 | | | | 0.02 | | | | 111.39 | |
| | (0.90 | ) | | | 50.24 | | | | 37.43 | | | | 75,856 | | | | 0.75 | | | | 1.47 | | | | 121.91 | |
| | (0.36 | ) | | | 37.31 | | | | 10.84 | | | | 55,961 | | | | 0.75 | | | | 0.96 | | | | 124.90 | |
| | (0.21 | ) | | | 34.02 | | | | 13.90 | | | | 56,134 | | | | 0.75 | | | | 0.38 | | | | 126.44 | |
| | (0.16 | ) | | | 30.09 | | | | 5.40 | | | | 57,180 | | | | 0.75 | | | | 0.36 | | | | 112.64 | |
| | | | | | | | | | | | | | | | | | | | | | | | | | | |
| | (0.74 | ) | | | 23.21 | | | | (13.98 | ) | | | 3,017 | | | | 0.61 | | | | 0.92 | | | | 7.40 | |
| | — | | | | 27.72 | | | | 1.43 | | | | 3,604 | | | | 0.60 | † | | | 0.58 | † | | | 6.21 | |
| | | | | | | | | | | | | | | | | | | | | | | | | | | |
| | (2.63 | ) | | | 21.05 | | | | (12.39 | ) | | | 24,634 | | | | 0.63 | (2) | | | 0.97 | | | | 21.62 | |
| | (0.36 | ) | | | 26.83 | | | | 1.60 | | | | 5,902 | | | | 0.60 | † | | | 0.57 | † | | | 7.08 | |
| The accompanying notes are an integral part of the financial statements. |
Financial Highlights
Selected Per Share Data & Ratios
For a Share Outstanding Throughout the Period
| | | Net Asset Value, Beginning of Period ($) | | | Net Investment Income (Loss) ($)* | | | Net Realized and Unrealized Gain (Loss) on Investments ($) | | | Total from Operations ($) | | | Distribution from Net Investment Income ($) | | | Distribution from Capital Gains ($) | | | Return of Capital ($) | |
Global X S&P 500® Collar 95-110 ETF | | | | | | | | | | | | | | | | | | | | | |
2022 | | | 27.57 | | | | 0.23 | | | | (2.77 | ) | | | (2.54 | ) | | | (0.16 | ) | | | (0.40 | ) | | | — | |
2021(2) | | | 27.28 | | | | 0.03 | | | | 0.26 | | | | 0.29 | | | | — | | | | — | | | | — | |
Global X NASDAQ 100® Tail Risk ETF | | | | | | | | | | | | | | | | | | | | | | | | | | | | |
2022 | | | 25.59 | | | | 0.04 | | | | (6.03 | ) | | | (5.99 | ) | | | (0.03 | ) | | | (0.49 | ) | | | — | |
2021(2) | | | 25.13 | | | | (0.01 | ) | | | 0.47 | | | | 0.46 | | | | — | | | | — | | | | — | |
| * | Per share data calculated using average shares method. |
| ** | Total Return is for the period indicated and has not been annualized. The return shown does not reflect the deduction of taxes that a shareholder would pay on Fund distributions or the redemption of Fund shares. |
| † | Annualized. |
| †† | Portfolio turnover rate is for the period indicated and periods of less than one year have not been annualized. Excludes effect of in-kind transfers. |
| (1) | Includes fees charged by the Fund custodian that were reimbursed by the custodian to the Fund subsequent to the reporting period. Excluding these fees, the ratio to average net assets would have been 0.61%. |
| (2) | The Fund commenced operations on August 25, 2021. |
Amounts designated as “—” are either $0 or have been rounded to $0.
| The accompanying notes are an integral part of the financial statements. |
Financial Highlights
| Total from Distributions ($) | | | Net Asset Value, End of Period ($) | | | Total Return (%)** | | | Net Assets End of Period ($)(000) | | | Ratio of Expenses to Average Net Assets (%) | | | Ratio of Net Investment Income (Loss) to Average Net Assets (%) | | | Portfolio Turnover (%)†† | |
| | (0.56 | ) | | | 24.47 | | | | (9.40 | ) | | | 3,915 | | | | 0.64 | (1) | | | 0.90 | | | | 8.96 | |
| | — | | | | 27.57 | | | | 1.06 | | | | 3,308 | | | | 0.60 | † | | | 0.58 | † | | | 6.44 | |
| | | | | | | | | | | | | | | | | | | | | | | | | | | |
| | (0.52 | ) | | | 19.08 | | | | (23.90 | ) | | | 1,908 | | | | 0.61 | | | | 0.19 | | | | 13.88 | |
| | — | | | | 25.59 | | | | 1.83 | | | | 3,326 | | | | 0.60 | † | | | (0.12 | )† | | | 1.71 | |
| The accompanying notes are an integral part of the financial statements. |
Financial Highlights
Selected Per Share Data & Ratios
For a Share Outstanding Throughout the Period
| | | Net Asset Value, Beginning of Period ($) | | | Net Investment Income (Loss) ($)* | | | Net Realized and Unrealized Gain (Loss) on Investments ($) | | | Total from Operations ($) | | | Distribution from Net Investment Income ($) | | | Distribution from Capital Gains ($) | | | Return of Capital ($) | |
Global X NASDAQ 100® Risk Managed Income ETF | | | | | | | | | | | | | | | | | | | | | |
2022 | | | 24.12 | | | | 0.04 | | | | (4.04 | ) | | | (4.00 | ) | | | (0.25 | ) | | | — | | | | (1.70 | ) |
2021(2) | | | 24.60 | | | | (0.01 | ) | | | (0.16 | ) | | | (0.17 | ) | | | — | | | | — | | | | (0.31 | ) |
Global X NASDAQ 100® Collar 95-110 ETF | | | | | | | | | | | | | | | | | | | | | | | | | | | | |
2022 | | | 25.78 | | | | 0.04 | | | | (3.38 | ) | | | (3.34 | ) | | | (0.02 | ) | | | (0.42 | ) | | | — | |
2021(2) | | | 25.27 | | | | (0.01 | ) | | | 0.52 | | | | 0.51 | | | | — | | | | — | | | | — | |
| * | Per share data calculated using average shares method. |
| ** | Total Return is for the period indicated and has not been annualized. The return shown does not reflect the deduction of taxes that a shareholder would pay on Fund distributions or the redemption of Fund shares. |
| † | Annualized. |
| †† | Portfolio turnover rate is for the period indicated and periods of less than one year have not been annualized. Excludes effect of in-kind transfers. |
| (1) | Includes fees charged by the Fund custodian that were reimbursed by the custodian to the Fund subsequent to the reporting period. Excluding these fees, the ratio to average net assets would have been 0.61%. |
| (2) | The Fund commenced operations on August 25, 2021. |
Amounts designated as “—” are either $0 or have been rounded to $0.
| The accompanying notes are an integral part of the financial statements. |
Financial Highlights
| Total from Distributions ($) | | | Net Asset Value, End of Period ($) | | | Total Return (%)** | | | Net Assets End of Period ($)(000) | | | Ratio of Expenses to Average Net Assets (%) | | | Ratio of Net Investment Income (Loss) to Average Net Assets (%) | | | Portfolio Turnover (%)†† | |
| | (1.95 | ) | | | 18.17 | | | | (17.24 | ) | | | 10,720 | | | | 0.62 | (1) | | | 0.19 | | | | 27.40 | |
| | (0.31 | ) | | | 24.12 | | | | (0.69 | ) | | | 4,341 | | | | 0.60 | † | | | (0.15 | )† | | | 2.16 | |
| | | | | | | | | | | | | | | | | | | | | | | | | | | |
| | (0.44 | ) | | | 22.00 | | | | (13.19 | ) | | | 3,081 | | | | 0.62 | (1) | | | 0.18 | | | | 9.89 | |
| | — | | | | 25.78 | | | | 2.06 | | | | 2,836 | | | | 0.60 | † | | | (0.11 | )† | | | 2.11 | |
| The accompanying notes are an integral part of the financial statements. |
|
| Notes to Financial Statements |
| October 31, 2022 |
1. ORGANIZATION
Global X Funds (the "Trust") is a Delaware statutory trust formed on March 6, 2008. The Trust is registered under the Investment Company Act of 1940, as amended, as an open end management investment company. As of October 31, 2022, the Trust had one hundred and seven portfolios, ninety-seven of which were operational. The financial statements herein and the related notes pertain to the Global X Social Media ETF, Global X Lithium & Battery Tech ETF, Global X Disruptive Materials ETF, Global X E-commerce ETF, Global X Emerging Markets Internet & E-commerce ETF, Global X SuperDividend® ETF, Global X SuperDividend® U.S. ETF, Global X MSCI SuperDividend® EAFE ETF, Global X MSCI SuperDividend® Emerging Markets ETF, Global X SuperDividend® REIT ETF, Global X NASDAQ 100® Covered Call ETF, Global X S&P 500® Covered Call ETF, Global X Russell 2000 Covered Call ETF, Global X Dow 30® Covered Call ETF, Global X Nasdaq 100® Covered Call & Growth ETF, Global X S&P 500® Covered Call & Growth ETF, Global X Russell 2000 Covered Call & Growth ETF, Global X SuperIncome™ Preferred ETF, Global X Renewable Energy Producers ETF, Global X S&P 500® Catholic Values ETF, Global X S&P Catholic Values Developed ex-U.S. ETF, Global X Guru® Index ETF, Global X S&P 500® Tail Risk ETF, Global X S&P 500® Risk Managed Income ETF, Global X S&P 500® Collar 95-110 ETF, Global X NASDAQ 100® Tail Risk ETF, Global X NASDAQ 100® Risk Managed Income ETF and Global X NASDAQ 100® Collar 95-110 ETF (each a “Fund”, collectively, the “Funds”).
Each Fund (except the Global X SuperDividend® ETF, Global X SuperDividend® U.S. ETF, Global X MSCI SuperDividend® Emerging Markets ETF, Global X MSCI SuperDividend® EAFE ETF, Global X SuperDividend® REIT ETF, Global X SuperIncomeTM Preferred ETF, Global X Guru® Index ETF, Global X S&P 500® Catholic Values ETF, Global X Russell 2000 Covered Call ETF, Global X Dow 30® Covered Call ETF, Global X S&P 500® Covered Call ETF, Global X S&P 500® Covered Call & Growth ETF, Global X S&P 500® Tail Risk ETF, Global X S&P 500® Risk Managed Income ETF, and Global X S&P 500® Collar 95-110 ETF) has elected non-diversified status.
Global X Disruptive Materials ETF commenced operations on January 24, 2022.
Global X Dow 30® Covered Call ETF commenced operations on February 23, 2022.
Global X Russell 2000 Covered Call & Growth ETF commenced operations on October 4, 2022.
On December 24, 2018, the shareholders of the Horizons NASDAQ 100® Covered Call ETF and Horizons S&P 500® Covered Call ETF (each, a “Predecessor Fund” and together, the "Predecessor Funds") approved a proposed agreement and plan of reorganization (the "Reorganization") that provided for (a) the transfer of all the assets and assumption of certain of the liabilities of each Predecessor Fund to the Global X Nasdaq 100® Covered Call ETF and the Global X S&P 500® Covered Call ETF (together, the “Successor Funds”), respectively; (b) the issuance of shares of the Successor Fund to the shareholders of the
|
| Notes to Financial Statements (Continued) |
| October 31, 2022 |
1. ORGANIZATION (continued)
corresponding Predecessor Fund; and (c) the liquidation and termination of the Predecessor Funds. The effective date of the Reorganization of each Predecessor Fund was December 24, 2018. The Successor Funds had no operations prior to the Reorganization. The Predecessor Funds had substantially similar investment objectives, investment strategies, policies and restrictions as those of the Successor Funds. The financial statements and financial highlights include the financial information of the Predecessor Funds through December 21, 2018.
2. SIGNIFICANT ACCOUNTING POLICIES
The following is a summary of the significant accounting policies followed by the Funds:
USE OF ESTIMATES – The Funds are investment companies that apply the accounting and reporting guidance issued in Topic 946 by the U.S. Financial Accounting Standards Board. The preparation of financial statements in conformity with U.S. generally accepted accounting principles ("U.S. GAAP") requires management to make estimates and assumptions that affect the reported amounts of assets and liabilities and disclosure of contingent assets and liabilities at the date of the financial statements and the reported amounts of increases and decreases in net assets from operations during the reporting period. Actual results could materially differ from those estimates.
RETURN OF CAPITAL ESTIMATES – Distributions received by the Funds from underlying master limited partnership (“MLP”) and real estate investment trust (“REIT”) investments generally are comprised of income and return of capital. The Funds record investment income and return of capital based on estimates made at the time such distributions are received. Such estimates are based on historical information available from the MLPs, REITs and other industry sources. These estimates may subsequently be revised based on information received from the MLPs and REITs after their tax reporting periods are concluded.
MLPs – Certain Funds may invest in MLPs. MLPs are publicly traded partnerships engaged in the transportation, storage and processing of minerals and natural resources. By confining their operations to these specific activities, their interests, or units, are able to trade on public securities exchanges exactly like the shares of a corporation, without entity level taxation. To qualify as an MLP and to not be taxed as a corporation, a partnership must receive at least 90% of its income from qualifying sources as set forth in Section 7704(d) of the Internal Revenue Code of 1986, as amended (the “Code”). These qualifying sources include natural resource-based activities such as the processing, transportation and storage of mineral or natural resources. MLPs generally have two classes of owners: the general partner and limited partners. The general partner of an MLP is typically owned by a major energy company, an investment fund, the direct management of the MLP, or is an entity owned by one or more of such parties. The general partner may be structured as a private or publicly traded corporation or other entity.
|
| Notes to Financial Statements (Continued) |
| October 31, 2022 |
2. SIGNIFICANT ACCOUNTING POLICIES (continued)
The general partner typically controls the operations and management of the MLP through an up to 2% equity interest in the MLP plus, in many cases, ownership of common units and subordinated units.
Limited partners typically own the remainder of the partnership through ownership of common units, and have a limited role in the partnership’s operations and management. MLPs are typically structured such that common units and general partner interests have first priority to receive quarterly cash distributions up to an established minimum amount (“minimum quarterly distributions” or “MQD”). Common and general partner interests also accrue arrearages in distributions to the extent the MQD is not paid. Once common and general partner interests have been paid, subordinated units receive distributions of up to the MQD; however, subordinated units do not accrue arrearages. Distributable cash in excess of the MQD is paid to both common and subordinated units and is distributed to both common and subordinated units generally on a pro rata basis. The general partner is also eligible to receive incentive distributions if the general partner operates the business in a manner which results in distributions paid per common unit surpassing specified target levels. As the general partner increases cash distributions to the limited partners, the general partner receives an increasingly higher percentage of the incremental cash distributions.
SECURITY VALUATION - Securities listed on a securities exchange, market or automated quotation system for which quotations are readily available (except for securities traded on the NASDAQ Stock Market ("NASDAQ")), including securities traded over the counter, are valued at the last quoted sale price on the primary exchange or market (foreign or domestic) on which they are traded (or at approximately 4:00 pm Eastern Standard Time if a security’s primary exchange is normally open at that time), or, if there is no such reported sale, at the most recent mean between the quoted bid and asked prices, which approximates fair value (absent both bid and asked prices on such exchange, the bid price may be used).
For securities traded on NASDAQ, the NASDAQ official closing price will be used.
If available, debt securities are priced based upon valuations provided by independent, third-party pricing agents. Such values generally reflect the last reported sales price if the security is actively traded. The third-party pricing agents may also value debt securities at an evaluated bid price by employing methodologies that utilize actual market transactions, broker-supplied valuations, or other methodologies designed to identify the market value for such securities. Debt obligations with remaining maturities of sixty days or less may be valued at their amortized cost, which approximates market value. The prices for foreign securities are reported in local currency and converted to U.S. dollars using currency exchange rates as of the reporting date. The exchange rates used by the Trust for valuation are captured as of the New York or London close each day. Prices for most securities held in the Funds are provided daily by recognized independent pricing agents. If a security price cannot be obtained from an independent, third-party pricing agent, the Funds seek to obtain a bid price from at least one independent broker.
|
| Notes to Financial Statements (Continued) |
| October 31, 2022 |
2. SIGNIFICANT ACCOUNTING POLICIES (continued)
Options traded on an exchange will be valued at the mean of the bid and ask quotations for the current day at the close of the market. If either the bid or the ask is not available, the last closing price will be used.
Securities for which market prices are not "readily available" are valued in accordance with fair value procedures (the “Fair Value Procedures”) established by Global X Management Company LLC, the Funds' investment adviser (the "Adviser"), and approved by the Funds' Board of Trustees (the “Board”). Pursuant to Rule 2a-5 under the 1940 Act, the Board has designated the Adviser as the "valuation designee" to determine the fair value of securities and other instruments for which no readily available market quotations are available. The Fair Value Procedures are implemented through a fair value committee (the “Committee”) of the Adviser. Some of the more common reasons that may necessitate that a security be valued using the Fair Value Procedures include: the security's trading has been halted or suspended; the security has been de-listed from its primary trading exchange; the security's primary trading market is temporarily closed at a time when, under normal conditions, it would be open; the security has not been traded for an extended period of time; the security's primary pricing source is not able or willing to provide a price; or trading of the security is subject to local government-imposed restrictions. In addition, the Funds may fair value a security if an event that may materially affect the value of the Funds’ security that is traded outside the United States (a “Significant Event”) has occurred between the time of the security's last close and the time that each Fund calculates its net asset value ("NAV"). A Significant Event may relate to a single issuer or to an entire market sector. Events that may be Significant Events include: government actions, natural disasters, armed conflict, acts of terrorism and significant market fluctuations. If the Adviser becomes aware of a Significant Event that has occurred with respect to a security or group of securities after the closing of the exchange or market on which the security or securities principally trade, but before the time at which the Funds calculate their NAVs, it may request that a Committee meeting be called. When a security is valued in accordance with the Fair Value Procedures, the Committee will determine the value after taking into consideration all relevant information reasonably available to the Committee.
In accordance with the authoritative guidance on fair value measurements and disclosure under U.S. GAAP, the Funds disclose the fair value of their investments in a hierarchy that prioritizes the inputs to valuation techniques used to measure the fair value. The objective of a fair value measurement is to determine the price that would be received to sell an asset or paid to transfer a liability in an orderly transaction between market participants at the measurement date (an exit price). Accordingly, the fair value hierarchy gives the highest priority to quoted prices (unadjusted) in active markets for identical assets or liabilities
|
| Notes to Financial Statements (Continued) |
| October 31, 2022 |
2. SIGNIFICANT ACCOUNTING POLICIES (continued)
(Level 1) and the lowest priority to unobservable inputs (Level 3). The three levels of the fair value hierarchy are described below:
Level 1 – Unadjusted quoted prices in active markets for identical, unrestricted assets or liabilities that the Funds have the ability to access at the measurement date
Level 2 – Other significant observable inputs (including quoted prices in non-active markets, quoted prices for similar investments, fair value of investments for which the Funds have the ability to fully redeem tranches at NAV as of the measurement date or within the near term, and short-term investments valued at amortized cost)
Level 3 – Significant unobservable inputs (including the Funds’ own assumptions in determining the fair value of investments, and fair value of investments for which the Funds do not have the ability to fully redeem tranches at NAV as of the measurement date or within the near term)
Investments are classified within the level of the lowest significant input considered in determining fair value. Investments classified within Level 3 whose fair value measurement considers several inputs may include Level 1 or Level 2 inputs as components of the overall fair value measurement.
For the year ended October 31, 2022, there have been no significant changes to the Funds’ fair valuation methodologies.
The unobservable inputs used to determine fair value of Level 3 assets may have similar or diverging impacts on valuation. Significant increases and decreases in these inputs in isolation and interrelationships between those inputs could result in significantly higher or lower fair value measurement.
DUE TO/FROM BROKERS – Due to/from brokers includes cash and collateral balances with the Funds’ clearing brokers or counterparties as of October 31, 2022. The Funds continuously monitor the credit standing of each broker or counterparty with whom they conduct business. In the event a broker or counterparty is unable to fulfill its obligations, the Funds would be subject to counterparty credit risk.
REPURCHASE AGREEMENTS - Securities pledged as collateral for repurchase agreements by BNP Paribas are held by Brown Brothers Harriman & Co. (“BBH”) or the
Bank of New York Mellon ("BNY Mellon"), as appropriate, in their roles as Custodian to respective Funds (each, a "Custodian" and together, the "Custodians"), and are designated as being held on each Fund’s behalf by the Custodian under a book-entry system. Each Fund monitors the adequacy of the collateral on a daily basis and can require the seller to
|
| Notes to Financial Statements (Continued) |
| October 31, 2022 |
2. SIGNIFICANT ACCOUNTING POLICIES (continued)
provide additional collateral in the event the market value of the securities pledged falls below the carrying value of the repurchase agreement, including accrued interest.
It is the Funds’ policy to only enter into repurchase agreements with banks and other financial institutions which are deemed by the Adviser to be creditworthy. The Funds bear the risk of loss in the event that the counterparty to a repurchase agreement defaults on its obligations, and the Funds are prevented from exercising their rights to dispose of the underlying securities received as collateral and the risk of a possible decline in the value of the underlying securities during the period. For financial statement purposes, the Funds record the securities lending collateral (included in repurchase agreements, at value or restricted cash) as an asset and the obligation to return securities lending collateral as a liability on the Statements of Assets and Liabilities.
Repurchase agreements are entered into by the Funds under Master Repurchase Agreements
(“MRA”) which permit the Funds, under certain circumstances, including an event of default (such as bankruptcy or insolvency), to offset payables and/or receivables under an MRA with collateral held and/or posted to the counterparty and create one single net payment due to or from the Funds.
As of October 31, 2022, the open repurchase agreements by counterparty which are subject to an MRA on a net payment basis are as follows:
| | | | | | | | |
| |
| | | | | | Fair Value | | | | | |
| | | | | | of Non-cash | | Cash | | | |
| | | Repurchase | | | Collateral | | Collateral | | | |
| | | Agreements* | | | Received(1) | | Received | | Net Amount(2) | |
| Global X Social Media ETF | | | | | | | | | | |
| BNP Paribas | | $ | 512,797 | | | $ | 512,797 | | $ | - | | $ | - | |
| Global X Lithium & Battery Tech ETF | | | | | | | | | | | | | | |
| BNP Paribas | | $ | 72,829,304 | | | $ | 72,829,304 | | $ | - | | $ | - | |
| Global X E-commerce ETF | | | | | | | | | | | | | | |
| BNP Paribas | | $ | 422,380 | | | $ | 422,380 | | $ | - | | $ | - | |
| Global X SuperDividend® ETF | | | | | | | | | | | | | | |
| BNP Paribas | | $ | 16,356,292 | | | $ | 16,356,292 | | $ | - | | $ | - | |
| Global X SuperDividend® U.S. ETF | | | | | | | | | | | | | | |
| BNP Paribas | | $ | 11,310,630 | | | $ | 11,310,630 | | $ | - | | $ | - | |
| Global X SuperDividend® REIT ETF | | | | | | | | | | | | | | |
| BNP Paribas | | $ | 12,266,545 | | | $ | 12,266,545 | | $ | - | | $ | - | |
| Global X SuperIncome™ Preferred ETF | | | | | | | | | | | | | | |
| BNP Paribas | | $ | 1,509,559 | | | $ | 1,509,559 | | $ | - | | $ | - | |
| Global X Renewable Energy Producers ETF | | | | | | | | | | | | | | |
| BNP Paribas | | $ | 379,249 | | | $ | 379,249 | | $ | - | | $ | - | |
| Global X Guru® Index ETF | | | | | | | | | | | | | | |
| BNP Paribas | | $ | 457,815 | | | $ | 457,815 | | $ | - | | $ | - | |
| * Repurchase agreements with an overnight and continuous maturity. | | | | | | | | | | | |
| (1) Excess collateral received is not presented in the table above. Please refer to the Schedules of Investments for the market value of | |
| the collateral received for each Fund. | | | | | | | | | | | | | | |
| (2) Net Amount represents the net amount receivable due from the counterparty in the event of default. | | | | |
|
| Notes to Financial Statements (Continued) |
| October 31, 2022 |
2. SIGNIFICANT ACCOUNTING POLICIES (continued)
FEDERAL INCOME TAXES – It is each Fund’s intention to qualify, or continue to qualify, as a regulated investment company for Federal income tax purposes by complying with the appropriate provisions of Subchapter M of the Code. Accordingly, no provisions for Federal income taxes have been made in the financial statements except as described below.
The Funds evaluate tax positions taken or expected to be taken in the course of preparing the Funds’ tax returns to determine whether it is "more-likely-than-not" (i.e., greater than 50 percent) that each tax position will be sustained upon examination by a taxing authority based on the technical merits of the position. Tax positions not deemed to meet the more-likely-than-not threshold are recorded as a tax benefit or expense in the current year. The
Funds did not record any tax positions in the current period; however, management’s conclusions regarding tax positions may be subject to review and adjustment at a later date based on factors including, but not limited to, examination by tax authorities (i.e., the last three tax year ends, as applicable), and on-going analysis of and changes to tax laws and regulations, and interpretations thereof.
If a Fund has foreign tax filings that have not been made, the tax years that remain subject to examination may date back to the inception of the Fund.
As of and during the reporting period ended October 31, 2022, the Funds did not have a liability for any unrecognized tax benefits. The Funds recognize interest and penalties, if any, related to unrecognized tax benefits as income tax expense on the Statements of
Operations. During the reporting period, the Funds did not incur any interest or penalties.
SECURITY TRANSACTIONS AND INVESTMENT INCOME – Security transactions are accounted for on the trade date for financial reporting purposes. Costs used in determining realized gains and losses on the sale of investment securities are based on specific identification. Dividend income is recorded on the ex-dividend date. Interest income is recognized on the accrual basis from the settlement date. Amortization of premiums and accretion of discounts is included in interest income.
FOREIGN CURRENCY TRANSACTIONS AND TRANSLATION – The books and records of the Funds are maintained in U.S. dollars. Investment securities and other assets and liabilities denominated in a foreign currency are translated into U.S. dollars on the date of valuation. Purchases and sales of investment securities, income and expenses are translated into U.S. dollars at the relevant rates of exchange prevailing on the respective dates of such transactions. The Funds do not isolate that portion of realized or unrealized gains and losses resulting from changes in the foreign exchange rate from fluctuations arising from changes in the market prices of the securities. These gains and losses are included in net realized and unrealized gains and losses on investments on the Statements of Operations. Net realized and unrealized gains and losses on foreign currency transactions and translations represent net foreign exchange gains or losses from foreign currency spot
|
| Notes to Financial Statements (Continued) |
| October 31, 2022 |
2. SIGNIFICANT ACCOUNTING POLICIES (continued)
contracts, disposition of foreign currencies, currency gains or losses realized between trade and settlement dates on securities transactions and the difference between the amount of the investment income and foreign withholding taxes recorded on the Funds’ books and the U.S. dollar equivalent amounts actually received or paid.
DIVIDENDS AND DISTRIBUTIONS TO SHAREHOLDERS – The Funds distribute their net investment income on a pro rata basis. Any net investment income and net realized capital gains are distributed at least annually. All distributions are recorded on ex-dividend date.
INVESTMENTS IN REITs – With respect to the Funds, dividend income is recorded based on the income included in distributions received from REIT investments using published
REIT reclassifications, including some management estimates when actual amounts are not available. Distributions received in excess of these estimated amounts are recorded as a reduction of the cost of investments or reclassified to capital gains. The actual amounts of income, return of capital, and capital gains are only determined by each REIT after its fiscal year end, and may differ from the estimated amounts.
CREATION UNITS – The Funds issue and redeem their shares (“Shares”) on a continuous basis at net asset value (“NAV”) and only in large blocks of 10,000 Shares, referred to as “Creation Units”. Purchasers of Creation Units (“Authorized Participants”) at NAV must pay a standard creation transaction fee per transaction. The fee is a single charge and will be the same regardless of the number of Creation Units purchased by an Authorized Participant on the same day.
An Authorized Participant who holds Creation Units and wishes to redeem at NAV would also pay a standard redemption fee per transaction to the Fund’s Custodian, on the date of such redemption, regardless of the number of Creation Units redeemed that day.
|
| Notes to Financial Statements (Continued) |
| October 31, 2022 |
2. SIGNIFICANT ACCOUNTING POLICIES (continued)
If a Creation Unit is purchased or redeemed for cash, an additional variable fee may be charged. The following table discloses Creation Unit breakdown:
| | | | | | | | | | |
| |
| | | | | | | | | Value at | | | | |
| | | Creation Unit | | | Creation | | | October | | | Redemption | |
| | | Shares | | | Fee | | | | 31, 2022 | | | Fee | |
| Global X Social Media ETF | | | 10,000 | | | $ | 300 | | | $ | 248,800 | | | $ | 300 | |
| Global X Lithium & Battery Tech ETF | | | 10,000 | | | | 1500 | | | | 671,300 | | | | 1500 | |
| Global X Disruptive Materials ETF | | | 10,000 | | | | 800 | | | | 180,700 | | | | 800 | |
| Global X E-commerce ETF | | | 10,000 | | | | 500 | | | | 151,400 | | | | 500 | |
| Global X Emerging Markets Internet & | | | 10,000 | | | | 800 | | | | 163,800 | | | | 800 | |
| E-commerce ETF | | | | | | | | | | | | | | | | |
| Global X SuperDividend® ETF | | | 10,000 | | | | 2000 | | | | 230,500 | | | | 2000 | |
| Global X SuperDividend® U.S. ETF | | | 10,000 | | | | 150 | | | | 191,800 | | | | 150 | |
| Global X MSCI SuperDividend® EAFE ETF | | | 10,000 | | | | 1000 | | | | 119,800 | | | | 1000 | |
| Global X MSCI SuperDividend® Emerging | | | 10,000 | | | | 1600 | | | | 213,600 | | | | 3000 | |
| Markets ETF | | | | | | | | | | | | | | | | |
| Global X SuperDividend® REIT ETF | | | 10,000 | | | | 250 | | | | 216,600 | | | | 250 | |
| Global X NASDAQ 100® Covered Call ETF | | | 10,000 | | | | 500 | | | | 161,500 | | | | 500 | |
| Global X S&P 500® Covered Call ETF | | | 10,000 | | | | 2000 | | | | 400,000 | | | | 2000 | |
| Global X Russell 2000 Covered Call ETF | | | 10,000 | | | | 250 | | | | 195,500 | | | | 250 | |
| Global X Dow 30® Covered Call ETF | | | 10,000 | | | | 250 | | | | 218,900 | | | | 250 | |
| Global X Nasdaq 100® Covered Call & Growth | | | 10,000 | | | | 500 | | | | 228,000 | | | | 500 | |
| ETF | | | | | | | | | | | | | | | | |
| Global X S&P 500® Covered Call & Growth ETF | | | 10,000 | | | | 1500 | | | | 254,700 | | | | 1500 | |
| Global X Russell 2000® Covered Call & Growth | | | 10,000 | | | | 250 | | | | 265,800 | | | | 250 | |
| ETF | | | | | | | | | | | | | | | | |
| Global X SuperIncome™ Preferred ETF | | | 10,000 | | | | 300 | | | | 96,700 | | | | 300 | |
| Global X Renewable Energy Producers ETF | | | 10,000 | | | | 800 | | | | 130,500 | | | | 500 | |
| Global X S&P 500® Catholic Values ETF | | | 10,000 | | | | 1300 | | | | 471,900 | | | | 1300 | |
| Global X S&P Catholic Values Developed ex- | | | 10,000 | | | | 8900 | | | | 233,000 | | | | 8900 | |
| U.S. ® ETF | | | | | | | | | | | | | | | | |
| Global X Guru® Index ETF | | | 10,000 | | | | 250 | | | | 334,800 | | | | 250 | |
| Global X S&P 500® Tail Risk ETF | | | 10,000 | | | | 2000 | | | | 232,100 | | | | 2000 | |
| Global X S&P 500® Risk Managed Income ETF | | | 10,000 | | | | 2000 | | | | 210,500 | | | | 2000 | |
| Global X S&P 500® Collar 95-110 ETF | | | 10,000 | | | | 2000 | | | | 244,700 | | | | 2000 | |
| Global X NASDAQ 100® Tail Risk ETF | | | 10,000 | | | | 500 | | | | 190,800 | | | | 500 | |
|
| Notes to Financial Statements (Continued) |
| October 31, 2022 |
2. SIGNIFICANT ACCOUNTING POLICIES (continued)
| | | | | | | |
|
| | | | | | | Value at | | |
| | | Creation Unit | | Creation | | October | | Redemption |
| | | Shares | | Fee | | | 31, 2022 | | Fee |
| Global X NASDAQ 100® Risk Managed Income | | | 10,000 | | | 500 | | | 181,700 | | | 500 |
| ETF | | | | | | | | | | | | |
| Global X NASDAQ 100® Collar 95-110 ETF | | | 10,000 | | | 500 | | | 220,000 | | | 500 |
CASH OVERDRAFT CHARGES – Per the terms of an agreement with BBH, if a Fund for which BBH is Custodian has a cash overdraft on a given day, it will be assessed an overdraft charge of LIBOR plus 2.00%. Per the terms of an agreement with BNY Mellon, if a Fund for which BNY Mellon is Custodian has a cash overdraft, it will be charged interest at a rate then charged by BNY Mellon to its institutional custody clients in the relevant currency. Cash overdraft charges are included in custodian fees on the Statements of Operations.
3. RELATED PARTIES AND SERVICE PROVIDER TRANSACTIONS
On July 2, 2018, the Adviser consummated a transaction pursuant to which it became an indirect, wholly-owned subsidiary of Mirae Asset Global Investments Co., Ltd. (“Mirae”). In this manner, the Adviser is ultimately controlled by Mirae, which is a leading financial services company in Korea and is the headquarters for the Mirae Asset Global Investments
Group.
The Adviser serves as the investment adviser and the administrator for the Funds. Subject to the supervision of the Board, the Adviser is responsible for managing the investment activities of the Funds and the Funds’ business affairs and other administrative matters and provides, or causes to be furnished, all supervisory, administrative and other services reasonably necessary for the operation of the Funds, including certain distribution services (provided pursuant to a separate distribution agreement), certain shareholder and distribution-related services (provided pursuant to a separate Rule 12b-1 Plan and related agreements) and investment advisory services (provided pursuant to a separate Investment Advisory Agreement), under what is essentially an "all-in" fee structure. For the Adviser’s service to the respective Funds, under a supervision and administration agreement (the "Supervision and Administration Agreement"), each Fund pays a monthly fee to the Adviser at the annual rate below (stated as a percentage of the average daily net assets of the Fund). In addition, the Funds bear other expenses, directly and indirectly, that are not covered by the Supervision and Administration Agreement, which may vary and affect the total expense ratios of the Funds, such as taxes, brokerage fees, commissions, custodian fees, acquired fund fees, and other transaction expenses, interest expenses and extraordinary expenses (such as litigation and indemnification expenses).
|
| Notes to Financial Statements (Continued) |
| October 31, 2022 |
3. RELATED PARTIES AND SERVICE PROVIDER TRANSACTIONS (continued)
The following table discloses supervision and administration fees payable pursuant to the Supervision and Administration Agreement:
| |
| |
| | | Supervision and | |
| | | Administration Fee | |
| Global X Social Media ETF | | | 0.65 | % |
| Global X Lithium & Battery Tech ETF | | | 0.75 | % |
| Global X Disruptive Materials ETF | | | 0.59 | % |
| Global X E-commerce ETF | | | 0.50 | % |
| Global X Emerging Markets Internet & E-commerce ETF | | | 0.65 | % |
| Global X SuperDividend® ETF | | | 0.58 | % |
| Global X SuperDividend® U.S. ETF | | | 0.45 | % |
| Global X MSCI SuperDividend® EAFE ETF | | | 0.55 | % |
| Global X MSCI SuperDividend® Emerging Markets ETF | | | 0.65 | % |
| Global X SuperDividend® REIT ETF | | | 0.58 | % |
| Global X NASDAQ 100® Covered Call ETF | | | 0.60 | % |
| Global X S&P 500® Covered Call ETF | | | 0.60 | % |
| Global X Russell 2000 Covered Call ETF* | | | 0.60 | % |
| Global X Dow 30® Covered Call ETF | | | 0.60 | % |
| Global X Nasdaq 100® Covered Call & Growth ETF | | | 0.60 | % |
| Global X S&P 500® Covered Call & Growth ETF | | | 0.60 | % |
| Global X Russell 2000 Covered Call & Growth ETF** | | | 0.60 | % |
| Global X SuperIncomeTM Preferred ETF | | | 0.58 | % |
| Global X Renewable Energy Producers ETF | | | 0.65 | % |
| Global X S&P 500® Catholic Values ETF | | | 0.29 | % |
| Global X S&P Catholic Values Developed ex-U.S. ETF | | | 0.35 | % |
| Global X Guru® Index ETF | | | 0.75 | % |
| Global X S&P 500® Tail Risk ETF | | | 0.60 | % |
| Global X S&P 500® Risk Managed Income ETF | | | 0.60 | % |
| Global X S&P 500® Collar 95-110 ETF | | | 0.60 | % |
| Global X NASDAQ 100® Tail Risk ETF | | | 0.60 | % |
| Global X NASDAQ 100® Risk Managed Income ETF | | | 0.60 | % |
| Global X NASDAQ 100® Collar 95-110 ETF | | | 0.60 | % |
*Pursuant to an expense limitation agreement in existence between the Global X Russell 2000 Covered Call ETF (the "Fund") and the Adviser, the Adviser agreed to waive or reimburse fees and/or limit Fund expenses to the extent necessary to assure that the operating expenses of the Fund, exclusive
|
| Notes to Financial Statements (Continued) |
| October 31, 2022 |
3. RELATED PARTIES AND SERVICE PROVIDER TRANSACTIONS (continued)
of taxes, brokerage fees, commissions, and other transaction expenses, interest, and extraordinary expenses (such as litigation and indemnification expenses) will not exceed 0.60% of the Fund’s average daily net assets per year, until at least March 1, 2024.
**Pursuant to an expense limitation agreement in existence between the Global X Russell 2000 Covered Call & Growth ETF (the "Fund") and the Adviser, the Adviser agreed to waive or reimburse fees and/or limit Fund expenses to the extent necessary to assure that the operating expenses of the Fund, exclusive of taxes, brokerage fees, commissions, and other transaction expenses, interest, and extraordinary expenses (such as litigation and indemnification expenses) will not exceed 0.60% of the
Fund’s average daily net assets per year, until at least September 27, 2023.
SEI Investments Global Funds Services (“SEIGFS”) serves as sub-administrator to the Funds. As sub-administrator, SEIGFS provides the Funds with required general administrative services, including, without limitation: office space, equipment, and personnel; clerical and general back office services; bookkeeping, internal accounting and secretarial services; the calculation of NAV; and assistance with the preparation and filing of reports, registration statements, proxy statements, and other materials required to be filed or furnished by the Funds under federal and state securities laws. As compensation for these services, SEIGFS receives certain out-of-pocket costs, transaction fees, and asset-based fees which are accrued daily and paid monthly by the Adviser.
SEI Investments Distribution Co. (“SIDCO”) serves as the Funds’ underwriter and distributor of Creation Units pursuant to a distribution agreement. SIDCO has no obligation to sell any specific quantity of Shares.
SIDCO bears the following costs and expenses relating to the distribution of Shares: (1) the costs of processing and maintaining records of creations of Creation Units; (2) all costs of maintaining the records required of a registered broker/dealer; (3) the expenses of maintaining its registration or qualification as a dealer or broker under Federal or state laws; (4) filing fees; and (5) all other expenses incurred in connection with the distribution services as contemplated in the distribution agreement. SIDCO receives no fee from the Funds for its distribution services under the distribution agreement, rather, the Adviser compensates SIDCO for certain expenses, out-of-pocket costs, and transaction fees.
BBH serves as Custodian and transfer agent of the Funds’ assets, with the exception of the Global X Russell 2000 Covered Call & Growth ETF. As a Custodian, BBH has agreed, for the Funds which it serves as Custodian, to (1) make receipts and disbursements of money on behalf of the Funds; (2) collect and receive all income and other payments and distributions on account of the Funds’ portfolio investments; (3) respond to correspondence from shareholders, security brokers and others relating to its duties; and (4) make periodic reports to the Funds concerning the Funds’ operations. BBH does not exercise any supervisory function over the purchase and sale of securities. As transfer agent, BBH has agreed to (1) issue and redeem Shares of each Fund; (2) make dividend and other distributions to shareholders of each Fund; (3) respond to correspondence by
|
| Notes to Financial Statements (Continued) |
| October 31, 2022 |
3. RELATED PARTIES AND SERVICE PROVIDER TRANSACTIONS (continued)
shareholders and others relating to its duties; (4) maintain shareholder accounts; and (5) make periodic reports to the Funds. As compensation for these services, BBH receives certain out-of-pocket costs, transaction fees and asset-based fees which are accrued daily and paid monthly by the Adviser from its fees.
BNY Mellon serves as Custodian and transfer agent to the Global X Russell 2000 Covered Call & Growth ETF. BNY Mellon may appoint domestic and foreign sub-custodians and use depositories from time to time to hold securities and other instruments purchased by the Trust in foreign countries and to hold cash and currencies for the Trust. BNY Mellon also serves as the Global X Russell 2000 Covered Call & Growth ETF's transfer agent. Under its transfer agency agreement with the Trust, BNY Mellon has undertaken with the Trust to provide the following services with respect to the Global X Russell 2000 Covered Call & Growth ETF: (i) perform and facilitate the performance of purchases and redemptions of Creation Units, (ii) prepare and transmit by means of Depository Trust Company’s book-entry system payments for dividends and distributions on or with respect to the Shares declared by the Trust on behalf of the Fund, as applicable, (iii) prepare and deliver reports, information and documents as specified in the transfer agency agreement, (iv) perform the customary services of a transfer agent and dividend disbursing agent, and (v) render certain other miscellaneous services as specified in the transfer agency agreement or as otherwise agreed upon.
|
| Notes to Financial Statements (Continued) |
| October 31, 2022 |
4. INVESTMENT TRANSACTIONS
For the year ended October 31, 2022, the purchases and sales of investments in securities, excluding in-kind transactions, long-term U.S. Government and short-term securities
| | | | | | | | Sales and
| |
| | | | Purchases
| | | | Maturities
| |
| Global X Social Media ETF | | $ | 51,201,085 | | | $ | 60,642,317 | |
| Global X Lithium & Battery Tech ETF | | | 1,965,674,898 | | | | 1,846,039,750 | |
| Global X Disruptive Materials ETF | | | 2,492,173 | | | | 971,555 | |
| Global X E-commerce ETF | | | 27,416,932 | | | | 28,432,218 | |
| Global X Emerging Markets Internet & E-commerce ETF | | | 798,182 | | | | 826,592 | |
Global X SuperDividend® ETF | | | 814,733,517 | | | | 743,082,048 | |
Global X SuperDividend® U.S. ETF | | | 266,303,132 | | | | 294,651,401 | |
Global X MSCI SuperDividend® EAFE ETF | | | 3,952,207 | | | | 3,813,319 | |
Global X MSCI SuperDividend® Emerging Markets ETF | | | 70,513,629 | | | | 65,685,720 | |
Global X SuperDividend® REIT ETF | | | 304,888,230 | | | | 313,304,597 | |
Global X NASDAQ 100® Covered Call ETF | | | 2,066,382,898 | | | | 2,266,781,914 | |
Global X S&P 500® Covered Call ETF | | | 224,116,910 | | | | 303,725,383 | |
| Global X Russell 2000 Covered Call ETF | | | 2,131,176,431 | | | | 2,126,300,401 | |
Global X Dow 30® Covered Call ETF | | | 2,332,057 | | | | 3,751,546 | |
| Global X Nasdaq 100® Covered Call & Growth ETF | | | 10,597,774 | | | | 13,703,727 | |
Global X S&P 500® Covered Call & Growth ETF | | | 3,619,647 | | | | 4,948,212 | |
| Global X Russell 2000 Covered Call & Growth ETF | | | 67,807 | | | | – | |
| Global X SuperIncome™ Preferred ETF | | | 82,916,537 | | | | 83,560,478 | |
| Global X Renewable Energy Producers ETF | | | 21,438,205 | | | | 24,976,306 | |
Global X S&P 500® Catholic Values ETF | | | 40,621,362 | | | | 39,474,866 | |
| Global X S&P Catholic Values Developed ex-U.S. ETF | | | 760,133 | | | | 675,727 | |
Global X Guru® Index ETF | | | 63,775,704 | | | | 63,712,704 | |
Global X S&P 500® Tail Risk ETF | | | 238,579 | | | | 293,972 | |
Global X S&P 500® Risk Managed Income ETF | | | 4,242,444 | | | | 4,386,747 | |
Global X S&P 500® Collar 95-110 ETF | | | 517,937 | | | | 330,938 | |
Global X NASDAQ 100® Tail Risk ETF | | | 390,852 | | | | 423,574 | |
Global X NASDAQ 100® Risk Managed Income ETF | | | 4,143,076 | | | | 3,021,014 | |
Global X NASDAQ 100® Collar 95-110 ETF | | | 915,705 | | | | 366,693 | |
During the year ended October 31, 2022, there were no purchases or sales of long-term U.S. Government securities for the Funds.
|
| Notes to Financial Statements (Continued) |
| October 31, 2022 |
4. INVESTMENT TRANSACTIONS (continued)
For the year ended October 31, 2022, in-kind transactions associated with creations and redemptions were:
| | | | | | | | Sales and
| | | | Realized
| |
2022
| | | Purchases
| | | | Maturities
| | | | Gain/(Loss)
| |
| Global X Social Media ETF | | $ | 3,068,353 | | | $ | 83,988,831 | | | $ | (9,540,595 | ) |
| Global X Lithium & Battery Tech ETF | | | 450,406,166 | | | | 490,596,683 | | | | 201,189,438 | |
| Global X Disruptive Materials ETF | | | 4,336,469 | | | | 982,594 | | | | 44,173 | |
| Global X E-commerce ETF | | | 21,340,199 | | | | 94,186,377 | | | | (19,348,684 | ) |
| Global X Emerging Markets Internet & E-commerce ETF | | | – | | | | 155,764 | | | | (74,102 | ) |
Global X SuperDividend® ETF | | | 85,863,761 | | | | 18,953,294 | | | | 2,334,467 | |
Global X SuperDividend® U.S. ETF | | | 151,468,436 | | | | 89,175,458 | | | | 13,338,234 | |
Global X MSCI SuperDividend® EAFE ETF | | | – | | | | 3,097,137 | | | | 169,109 | |
Global X MSCI SuperDividend® Emerging Markets ETF | | | 5,479,273 | | | | 6,352,526 | | | | 563,637 | |
| Global X SuperDividend® REIT ETF | | | 2,790,082 | | | | 72,814,635 | | | | 6,195,344 | |
| Global X NASDAQ 100® Covered Call ETF | | | 4,172,134,826 | | | | 429,153,207 | | | | 203,029,105 | |
Global X S&P 500® Covered Call ETF | | | 1,762,470,120 | | | | 73,555,060 | | | | 24,601,078 | |
| Global X Russell 2000 Covered Call ETF | | | 1,168,841,485 | | | | 64,274,433 | | | | 2,562,052 | |
Global X Dow 30® Covered Call ETF | | | 56,833,434 | | | | – | | | | – | |
Global X Nasdaq 100® Covered Call & Growth ETF | | | 56,398,638 | | | | 16,836,948 | | | | 3,242,388 | |
Global X S&P 500® Covered Call & Growth ETF | | | 28,899,595 | | | | 14,157,393 | | | | 1,900,165 | |
| Global X Russell 2000 Covered Call & Growth ETF | | | 2,589,444 | | | | – | | | | – | |
| Global X SuperIncome™ Preferred ETF | | | 23,318,563 | | | | 20,187,398 | | | | 525,934 | |
| Global X Renewable Energy Producers ETF | | | 26,235,712 | | | | 47,968,614 | | | | 4,674,235 | |
Global X S&P 500® Catholic Values ETF | | | 144,509,166 | | | | 72,947,409 | | | | 27,191,057 | |
| Global X S&P Catholic Values Developed ex-U.S. ETF | | | 3,061,738 | | | | – | | | | – | |
Global X Guru® Index ETF | | | 2,090,830 | | | | 6,742,607 | | | | 768,480 | |
Global X S&P 500® Tail Risk ETF | | | – | | | | – | | | | – | |
Global X S&P 500® Risk Managed Income ETF | | | 30,889,711 | | | | 7,071,974 | | | | 639,015 | |
Global X S&P 500® Collar 95-110 ETF | | | 1,001,485 | | | | – | | | | – | |
Global X NASDAQ 100® Tail Risk ETF | | | 1,334,937 | | | | 1,934,246 | | | | (38,325 | ) |
Global X NASDAQ 100® Risk Managed Income ETF | | | 15,602,681 | | | | 5,869,329 | | | | (131,015 | ) |
Global X NASDAQ 100® Collar 95-110 ETF | | | 1,704,952 | | | | 832,444 | | | | (38,369 | ) |
To the extent consistent with their investment policies, certain Funds may either purchase or write options.
When a Fund purchases an option, the premium paid by it is recorded as an asset of the Fund. When a Fund writes an option, an amount equal to the net premium (the premium less the commission) received by the Fund is included in the liability section of the Fund’s Statement of Assets and Liabilities as a deferred credit. The amount of this asset or deferred credit will be subsequently marked-to-market to reflect the current value of the option purchased or written. The current value of the traded option is the last sale price or, in the absence of a sale, the current bid price. If an option purchased by a Fund expires unexercised, the Fund realizes a loss equal to the premium paid. If a Fund enters into a closing sale transaction on an option purchased by it, the Fund will realize a gain if the premium received by the Fund on the closing transaction is more than the premium paid to purchase the option, or a loss if it is less. If an option written by a Fund expires on the
|
| Notes to Financial Statements (Continued) |
| October 31, 2022 |
4. INVESTMENT TRANSACTIONS (continued)
stipulated expiration date or if a Fund enters into a closing purchase transaction, it will realize a gain (or loss if the cost of a closing purchase transaction exceeds the net premium received when the option is sold) and the deferred credit related to such option will be eliminated. If an option written by a Fund is exercised, the proceeds of the sale will be increased by the net premium originally received and the Fund will realize a gain or loss.
Risks may arise from an imperfect correlation between the change in market value of the securities held and the prices of options relating to the securities purchased or sold and from possible lack of a liquid secondary market for an option. The maximum exposure to loss for any purchased option is limited to the premium initially paid for the option. Written uncovered call options subject a Fund to unlimited risk of loss. Written covered call options limit the upside potential of a security above the strike price. Written put options expose a Fund to risk of loss if the value of the security declines below the strike price.
The Global X NASDAQ 100® Covered Call ETF, Global X S&P 500® Covered Call ETF, Global X Russell 2000 Covered Call ETF, Global X Dow 30® Covered Call ETF, Global X Nasdaq 100® Covered Call & Growth ETF, Global X S&P 500® Covered Call & Growth ETF, Global X Russell 2000 Covered Call & Growth ETF, Global X S&P 500® Tail Risk ETF, Global X S&P 500® Risk Managed Income ETF, Global X S&P 500® Collar 95-110 ETF, Global X Nasdaq 100® Tail Risk ETF, Global X Nasdaq 100® Risk Managed Income ETF, and Global X Nasdaq 100® Collar 95-110 ETF may write covered call and/ or put options that correspond to their respective reference index. By writing a covered call option, a Fund, in exchange for the premium, foregoes the opportunity for capital appreciation above the strike price should the market price of the underlying security increase. Conversely, by writing a put option, the Fund, in exchange for the premium, accepts the risk of having to purchase a security at a fixed strike price even should the price of the underlying security decrease, exposing the Fund to downside risk in the underlying security.
When the written option expires, is terminated or is sold, a Fund will record a gain or loss. The net realized gain or loss on options contracts is reflected in the Statements of Operations and the net unrealized gains/(losses) are included as a component of the net change in unrealized appreciation/(depreciation) on options contracts in the Statements of Operations.
5. DERIVATIVE TRANSACTIONS
The following tables show the derivatives categorized by underlying risk exposure.
The fair value of derivative instruments as of October 31, 2022 was as follows:
|
| Notes to Financial Statements (Continued) |
| October 31, 2022 |
5. DERIVATIVE TRANSACTIONS (continued)
| Asset Derivatives | | Liability Derivatives | |
Statements of Assets and Liability Location | | Fair Value | | Statements of Assets and Liability Location | | Fair Value | |
| Derivatives not accounted for as hedging instruments: | |
Global X NASDAQ 100® Covered Call ETF | |
| Equity contracts | Investments purchased, at value | | $ | – | | Equity contracts | Options written, at value | | $ | 321,715,990 | |
Total Derivatives not accounted for as hedging instruments
| | | $
| –
| | | | | $ | 321,715,990
| |
| Asset Derivatives | | Liability Derivatives | |
Statements of Assets and Liability Location | | Fair Value | | Statements of Assets and Liability Location | | Fair Value | |
| Derivatives not accounted for as hedging instruments: | |
Global X S&P 500® Covered Call ETF | |
| Equity contracts | Investments purchased, at value | | $ | – | | Equity contracts | Options written, at value | | $ | 117,689,855 | |
| Total Derivatives not accounted for as hedging instruments | | | $ | –
| | | | | $ | 117,689,855
| |
| Asset Derivatives | | Liability Derivatives | |
Statements of Assets and Liability Location | | Fair Value | | Statements of Assets and Liability Location | | Fair Value | |
| Derivatives not accounted for as hedging instruments: | |
| Global X Russell 2000 Covered Call ETF | |
| Equity contracts | Investments purchased, at value | | $ | – | | Equity contracts | Options written, at value | | $ | 121,998,740 | |
| Total Derivatives not accounted for as hedging instruments | | | $ | –
| | | | | $ | 121,998,740
| |
| Asset Derivatives | | Liability Derivatives | |
Statements of Assets and Liability Location | | Fair Value | | Statements of Assets and Liability Location | | Fair Value | |
| Derivatives not accounted for as hedging instruments: | |
Global X Dow 30® Covered Call ETF | |
| Equity contracts | Investments purchased, at value | | $ | – | | Equity contracts | Options written, at value | | $ | 4,086,998 | |
| Total Derivatives not accounted for as hedging instruments | | | $ | –
| | | | | $ | 4,086,998
| |
|
| Notes to Financial Statements (Continued) |
| October 31, 2022 |
5. DERIVATIVE TRANSACTIONS (continued)
| Asset Derivatives | | Liability Derivatives | |
Statements of Assets and Liability Location | | Fair Value | | Statements of Assets and Liability Location | | Fair Value | |
| Derivatives not accounted for as hedging instruments: | |
Global X Nasdaq 100® Covered Call & Growth ETF | |
| Equity contracts | Investments purchased, at value | | $ | – | | Equity contracts | Options written, at value | | $ | 1,488,595 | |
| Total Derivatives not accounted for as hedging instruments | | | $ | –
| | | | | $ | 1,488,595
| |
| Asset Derivatives | | Liability Derivatives | |
Statements of Assets and Liability Location | | Fair Value | | Statements of Assets and Liability Location | | Fair Value | |
| Derivatives not accounted for as hedging instruments: | |
Global X S&P 500® Covered Call & Growth ETF | |
| Equity contracts | Investments purchased, at value | | $ | – | | Equity contracts | Options written, at value | | $ | 1,225,516 | |
| Total Derivatives not accounted for as hedging instruments | | | $ | –
| | | | | $ | 1,225,516
| |
| Asset Derivatives | | Liability Derivatives | |
Statements of Assets and Liability Location | | Fair Value | | Statements of Assets and Liability Location | | Fair Value | |
| Derivatives not accounted for as hedging instruments: | |
| Global X Russell 2000 Covered Call & Growth ETF | |
| Equity contracts | Investments purchased, at value | | $ | – | | Equity contracts | Options written, at value | | $ | 114,419 | |
| Total Derivatives not accounted for as hedging instruments | | | $ | –
| | | | | $ | 114,419
| |
| Asset Derivatives | | Liability Derivatives | |
Statements of Assets and Liability Location | | Fair Value | | Statements of Assets and Liability Location | | Fair Value | |
| Derivatives not accounted for as hedging instruments: | |
Global X S&P 500® Tail Risk ETF | |
| Equity contracts | Investments purchased, at value | | $ | 20,828 | | Equity contracts | Options written, at value | | $ | – | |
| Total Derivatives not accounted for as hedging instruments | | | $ | 20,828 | | | | | $ | –
| |
|
| Notes to Financial Statements (Continued) |
| October 31, 2022 |
5. DERIVATIVE TRANSACTIONS (continued)
| Asset Derivatives | | Liability Derivatives | |
Statements of Assets and Liability Location | | Fair Value | | Statements of Assets and Liability Location | | Fair Value | |
| Derivatives not accounted for as hedging instruments: | |
Global X S&P 500® Risk Management Income ETF | |
| Equity contracts | Investments purchased, at value | | $ | 45,768 | | Equity contracts | Options written, at value | | $ | 1,494,402 | |
| Total Derivatives not accounted for as hedging instruments | | | $ | 45,768 | | | | | $ | 1,494,402
| |
| Asset Derivatives | | Liability Derivatives | |
Statements of Assets and Liability Location | | Fair Value | | Statements of Assets and Liability Location | | Fair Value | |
| Derivatives not accounted for as hedging instruments: | |
Global X S&P 500® Collar 95-110 ETF | |
| Equity contracts | Investments purchased, at value | | $ | 59,515 | | Equity contracts | Options written, at value | | $ | 20,585 | |
| Total Derivatives not accounted for as hedging instruments | | | $ | 59,515 | | | | | $ | 20,585
| |
| Asset Derivatives | | Liability Derivatives | |
Statements of Assets and Liability Location | | Fair Value | | Statements of Assets and Liability Location | | Fair Value | |
| Derivatives not accounted for as hedging instruments: | |
Global X Nasdaq 100® Tail Risk ETF | |
| Equity contracts | Investments purchased, at value | | $ | 30,870 | | Equity contracts | Options written, at value | | $ | – | |
| Total Derivatives not accounted for as hedging instruments | | | $ | 30,870 | | | | | $ | –
| |
| Asset Derivatives | | Liability Derivatives | |
Statements of Assets and Liability Location | | Fair Value | | Statements of Assets and Liability Location | | Fair Value | |
| Derivatives not accounted for as hedging instruments: | |
Global X Nasdaq 100® Risk Management Income ETF | |
| Equity contracts | Investments purchased, at value | | $ | 60,740 | | Equity contracts | Options written, at value | | $ | 536,740 | |
| Total Derivatives not accounted for as hedging instruments | | | $ | 60,740 | | | | | $ | 536,740
| |
5. DERIVATIVE TRANSACTIONS (continued)
| Asset Derivatives | | Liability Derivatives | |
Statements of Assets and Liability Location | | Fair Value | | Statements of Assets and Liability Location | | Fair Value | |
| Derivatives not accounted for as hedging instruments: | |
Global X Nasdaq 100® Collar 95-110 ETF | |
| Equity contracts | Investments purchased, at value | | $ | 94,325
| | Equity contracts | Options written, at value | | $ | 15,280 | |
| Total Derivatives not accounted for as hedging instruments | | | $ | 94,325 | | | | | $ | 15,280
| |
The effect of derivative instruments on the Statements of Operations for the year ended October 31, 2022: Amount of realized gain or (loss) on derivatives recognized in income:
| | | Purchased Options | | | Written Options | | | Total | |
Global X NASDAQ 100® Covered Call ETF | | | | | | | | | |
| Equity contracts | | $ | 309,965,446 | | | $ | 236,530,037 | | | $ | 546,495,483 | |
Global X S&P 500® Covered Call ETF | | | | | | | | | | | | |
| Equity contracts | | $ | – | | | $ | 66,176,874 | | | $ | 66,176,874 | |
| Global X Russell 2000 Covered Call ETF | | | | | | | | | | | | |
| Equity contracts | | $ | – | | | $ | 111,479,681 | | | $ | 111,479,681 | |
Global X Dow 30® Covered Call ETF | | | | | | | | | | | | |
| Equity contracts | | $ | – | | | $ | (258,366 | ) | | $ | (258,366 | ) |
Global X Nasdaq 100® Covered Call & Growth ETF | | | | | | | | | | | | |
| Equity contracts | | $ | 1,035,116 | | | $ | 1,512,432 | | | $ | 2,547,548 | |
Global X S&P 500® Covered Call & Growth ETF | | | | | | | | | | | | |
| Equity contracts | | $ | 382,385 | | | $ | 695,347 | | | $ | 1,077,732 | |
| Global X Russell 2000 Covered Call & Growth ETF | | | | | | | | | | | | |
| Equity contracts | | $ | – | | | $ | 27,432 | | | $ | 27,432 | |
Global X S&P 500® Tail Risk ETF | | | | | | | | | | | | |
| Equity contracts | | $ | 12,305 | | | $ | – | | | $ | 12,305 | |
Global X S&P 500® Risk Managed Income ETF | | | | | | | | | | | | |
| Equity contracts | | $ | 1,034,185 | | | $ | 302,290 | | | $ | 1,336,475 | |
Global X S&P 500® Collar 95-110 ETF | | | | | | | | | | | | |
| Equity contracts | | $ | 101,661 | | | $ | 79,581 | | | $ | 181,242 | |
Global X NASDAQ 100® Tail Risk ETF | | | | | | | | | | | | |
| Equity contracts | | $ | 1,806 | | | $ | – | | | $ | 1,806 | |
Global X NASDAQ 100® Risk Managed Income ETF | | | | | | | | | | | | |
| Equity contracts | | $ | 1,331,844 | | | $ | 484,654 | | | $ | 1,816,498 | |
Global X NASDAQ 100® Collar 95-110 ETF | | | | | | | | | | | | |
| Equity contracts | | $ | 391,807 | | | $ | 210,467 | | | $ | 602,274 | |
|
| Notes to Financial Statements (Continued) |
| October 31, 2022 |
Change in unrealized appreciation or (depreciation) on derivatives recognized in income:
| | | Purchased Options | | | Written Options | | | Total | |
Global X NASDAQ 100® Covered Call ETF | | | | | | | | | |
| Equity contracts | | $ | – | | | $ | 137,334,997 | | | $ | 137,334,997 | |
Global X S&P 500® Covered Call ETF | | | | | | | | | | | | |
| Equity contracts | | $ | – | | | $ | (32,226,391 | ) | | $ | (32,226,391 | ) |
| Global X Russell 2000 Covered Call ETF | | | | | | | | | | | | |
| Equity contracts | | $ | – | | | $ | (63,527,543 | ) | | $ | (63,527,543 | ) |
Global X Dow 30® Covered Call ETF | | | | | | | | | | | | |
| Equity contracts | | $ | – | | | $ | (2,286,912 | ) | | $ | (2,286,912 | ) |
Global X Nasdaq 100® Covered Call & Growth ETF | | | | | | | | | | | | |
| Equity contracts | | $ | – | | | $ | 572,453 | | | $ | 572,453 | |
Global X S&P 500® Covered Call & Growth ETF | | | | | | | | | | | | |
| Equity contracts | | $ | – | | | $ | (120,239 | ) | | $ | (120,239 | ) |
| Global X Russell 2000 Covered Call & Growth ETF | | | | | | | | | | | | |
| Equity contracts | | $ | – | | | $ | (57,991 | ) | | $ | (57,991 | ) |
Global X S&P 500® Tail Risk ETF | | | | | | | | | | | | |
| Equity contracts | | $ | (1,120 | ) | | $ | – | | | $ | (1,120 | ) |
Global X S&P 500® Risk Managed Income ETF | | | | | | | | | | | | |
| Equity contracts | | $ | (204,000 | ) | | $ | (471,113 | ) | | $ | (675,113 | ) |
Global X S&P 500® Collar 95-110 ETF | | | | | | | | | | | | |
| Equity contracts | | $ | (9,261 | ) | | $ | 22,060 | | | $ | 12,799 | |
Global X NASDAQ 100® Tail Risk ETF | | | | | | | | | | | | |
| Equity contracts | | $ | 17,998 | | | $ | – | | | $ | 17,998 | |
Global X NASDAQ 100® Risk Managed Income ETF | | | | | | | | | | | | |
| Equity contracts | | $ | (91,059 | ) | | $ | 90,428 | | | $ | (631 | ) |
Global X NASDAQ 100® Collar 95-110 ETF | | | | | | | | | | | | |
| Equity contracts | | $ | 14,841 | | | $ | 49,958 | | | $ | 64,799 | |
|
| Notes to Financial Statements (Continued) |
| October 31, 2022 |
5. DERIVATIVE TRANSACTIONS (continued)
The following table discloses the average quarterly balances of the Funds' derivative activity during the year ended October 31, 2022:
| | | | |
| |
| | | Short Avg | | | Long Avg | |
| Global X NASDAQ 100® Covered Call ETF | | $ | (215,175,083 | ) | | $ | - | |
| Global X S&P 500® Covered Call ETF | | | (38,574,523 | ) | | | - | |
| Global X Russell 2000 Covered Call ETF | | | (36,599,863 | ) | | | - | |
| Global X Dow 30® Covered Call ETF | | | (582,340 | ) | | | - | |
| Global X Nasdaq 100® Covered Call & Growth ETF | | | (957,605 | ) | | | - | |
| Global X S&P 500® Covered Call & Growth ETF | | | (478,242 | ) | | | - | |
| Global X Russell 2000 Covered Call & Growth ETF | | | (56,428 | ) | | | - | |
| Global X S&P 500® Tail Risk ETF | | | - | | | | 55,528 | |
| Global X S&P 500® Risk Managed Income ETF | | | (517,224 | ) | | | 246,907 | |
| Global X S&P 500® Collar 95-110 ETF | | | (26,810 | ) | | | 104,369 | |
| Global X NASDAQ 100® Tail Risk ETF | | | - | | | | 68,390 | |
| Global X NASDAQ 100® Risk Managed Income ETF | | | (352,767 | ) | | | 199,901 | |
| Global X NASDAQ 100® Collar 95-110 ETF | | | (61,379 | ) | | | 130,033 | |
6. TAX INFORMATION
The Global X SuperDividend® REIT ETF has a tax year that ends on December 31. The following tax disclosures are representative as of October 31, 2022. Accordingly, the disclosures are for informational use by shareholders and are subject to change attributable to activity through the end of the tax year ending December 31, 2022.
The amount and character of income and capital gain distributions to be paid, if any, are determined in accordance with Federal income tax regulations, which may differ from U.S. GAAP. As a result, net investment income (loss) and net realized gain (loss) on investment transactions for a reporting period may differ significantly from distributions during such period. These book/tax differences may be temporary or permanent. To the extent these differences are permanent in nature, they are charged or credited to undistributed net investment income (loss), accumulated net realized gain (loss) or paid-in capital, as appropriate, in the period that the differences arise.
The following differences, primarily attributable to preferred stock interest, foreign currency, redemptions in-kind, REIT adjustments, MLP adjustments, net operating loss, return of capital distribution and sales of passive foreign investment companies have been reclassified to/from the following accounts during the fiscal year ended October 31, 2022:
|
| Notes to Financial Statements (Continued) |
| October 31, 2022 |
6. TAX INFORMATION (continued)
| | | | |
| |
| | | | | | Distributable | |
| | | Paid-in | | | Earnings | |
| Global X Funds | | Capital | | | (Loss) | |
| Global X Social Media ETF | | $ | (12,137,083 | ) | | $ | 12,137,083 | |
| Global X Lithium & Battery Tech ETF | | | 195,470,832 | | | | (195,470,832 | ) |
| Global X Disruptive Materials ETF | | | 44,173 | | | | (44,173 | ) |
| Global X E-commerce ETF | | | (20,089,013 | ) | | | 20,089,013 | |
| Global X Emerging Markets Internet & E-commerce ETF | | | (98,280 | ) | | | 98,280 | |
| Global X SuperDividend® ETF | | | 2,068,202 | | | | (2,068,202 | ) |
| Global X SuperDividend® U.S. ETF | | | 10,585,698 | | | | (10,585,698 | ) |
| Global X MSCI SuperDividend® EAFE ETF | | | 141,193 | | | | (141,193 | ) |
| Global X MSCI SuperDividend® Emerging Markets ETF | | | 556,704 | | | | (556,704 | ) |
| Global X SuperDividend® REIT ETF | | | 12,936,051 | | | | (12,936,051 | ) |
| Global X NASDAQ 100® Covered Call ETF | | | 203,028,884 | | | | (203,028,884 | ) |
| Global X S&P 500® Covered Call ETF | | | 24,549,893 | | | | (24,549,893 | ) |
| Global X Russell 2000 Covered Call ETF | | | 2,562,029 | | | | (2,562,029 | ) |
| Global X Nasdaq 100® Covered Call & Growth ETF | | | 3,242,386 | | | | (3,242,386 | ) |
| Global X S&P 500® Covered Call & Growth ETF | | | 1,899,560 | | | | (1,899,560 | ) |
| Global X SuperIncome™ Preferred ETF | | | 60,529 | | | | (60,529 | ) |
| Global X Renewable Energy Producers ETF | | | 4,383,742 | | | | (4,383,742 | ) |
| Global X S&P 500® Catholic Values ETF | | | 26,664,012 | | | | (26,664,012 | ) |
| Global X Guru® Index ETF | | | 694,675 | | | | (694,675 | ) |
| Global X S&P 500® Risk Managed Income ETF | | | 638,874 | | | | (638,874 | ) |
| Global X NASDAQ 100® Tail Risk ETF | | | (38,325 | ) | | | 38,325 | |
| Global X NASDAQ 100® Risk Managed Income ETF | | | (131,015 | ) | | | 131,015 | |
| Global X NASDAQ 100® Collar 95-110 ETF | | | (38,369 | ) | | | 38,369 | |
6. TAX INFORMATION (continued)
The tax character of dividends and distributions declared during the periods ended October 31, 2022 and October 31, 2021 were as follows:
|
| Notes to Financial Statements (Continued) |
| October 31, 2022 |
| | Long-Term | | | | | | | | |
| |
| Global X Funds | | Ordinary Income | | | Capital Gain | | | Return of Capital | | | Totals | |
| Global X Social Media ETF | | | | | | | | | | |
| 2022 | | $ | – | | | $ | – | | | $ | 663,636 | | | $ | 663,636 | |
| 2021 | | | – | | | | – | | | | – | | | | – | |
| Global X Lithium & Battery Tech ETF | | | | | | | | | | | | | |
| 2022 | | $ | 13,550,903 | | | $ | – | | | $ | – | | | $ | 13,550,903 | |
| 2021 | | | 4,617,167 | | | | – | | | | – | | | | 4,617,167 | |
| Global X Disruptive Materials ETF | | | | | | | | | | | | | |
| 2022 | | $ | 47,516 | | | $ | – | | | $ | – | | | $ | 47,516 | |
| Global X E-commerce ETF | | | | | | | | | | | | | |
| 2022 | | $ | 283,940 | | | $ | 613,980 | | | $ | 66,565 | | | $ | 964,485 | |
| 2021 | | | 1,105,636 | | | | – | | | | – | | | | 1,105,636 | |
| Global X Emerging Markets Internet & E-commerce ETF | | | | | | | | | |
| 2022 | | $ | – | | | $ | – | | | $ | 9,979 | | | $ | 9,979 | |
| 2021 | | | – | | | | – | | | | – | | | | – | |
| Global X SuperDividend® ETF | | | | | | | | | | | | | |
| 2022 | | $ | 68,726,670 | | | $ | – | | | $ | 25,091,152 | | | $ | 93,817,822 | |
| 2021 | | | 65,648,210 | | | | – | | | | – | | | | 65,648,210 | |
| Global X SuperDividend® U.S. ETF | | | | | | | | | | | | | |
| 2022 | | $ | 27,892,254 | | | $ | – | | | $ | 13,969,909 | | | $ | 41,862,163 | |
| 2021 | | | 31,364,614 | | | | – | | | | 3,660,741 | | | | 35,025,355 | |
| Global X MSCI SuperDividend® EAFE ETF | | | | | | | | | |
| 2022 | | $ | 742,260 | | | $ | – | | | $ | – | | | $ | 742,260 | |
| 2021 | | | 542,165 | | | | – | | | | – | | | | 542,165 | |
| Global X MSCI SuperDividend® Emerging Markets ETF | | | | | | | | | |
| 2022 | | $ | 5,018,224 | | | $ | – | | | $ | 1,057,591 | | | $ | 6,075,815 | |
| 2021 | | | 2,831,439 | | | | – | | | | – | | | | 2,831,439 | |
| Global X SuperDividend® REIT ETF | | | | | | | | | | | | | |
| 2022 | | $ | 19,134,864 | | | $ | – | | | $ | 9,960,386 | | | $ | 29,095,250 | |
| 2021 | | | 21,690,155 | | | | – | | | | 9,729,725 | | | | 31,419,880 | |
| Global X NASDAQ 100® Covered Call ETF | | | | | | | | | | | | | |
| 2022 | | $ | 211,906,795 | | | $ | – | | | $ | 642,111,562 | | | $ | 854,018,357 | |
| 2021 | | | 320,053,733 | | | | – | | | | – | | | | 320,053,733 | |
| Global X S&P 500® Covered Call ETF | | | | | | | | | | | | | |
| 2022 | | $ | 35,714,783 | | | $ | – | | | $ | 133,893,882 | | | $ | 169,608,665 | |
| 2021 | | | 26,627,258 | | | | – | | | | – | | | | 26,627,258 | |
| Global X Russell 2000 Covered Call ETF | | | | | | | | | | | | | |
| 2022 | | $ | 32,998,311 | | | $ | – | | | $ | 105,055,357 | | | $ | 138,053,668 | |
| 2021 | | | 21,788,088 | | | | – | | | | – | | | | 21,788,088 | |
| Global X Dow 30® Covered Call ETF | | | | | | | | | | | | | |
| 2022 | | $ | 734,788 | | | $ | – | | | $ | 1,115,840 | | | $ | 1,850,628 | |
|
| Notes to Financial Statements (Continued) |
| October 31, 2022 |
6. TAX INFORMATION (continued)
| | Long-Term | | | | | | | | |
| |
| Global X Funds | | Ordinary Income | | | Capital Gain | | | Return of Capital | | | Totals | |
| Global X Nasdaq 100® Covered Call & Growth ETF | | | | | | | |
| 2022 | | $ | 3,262,405 | | | $ | – | | | $ | 2,741,520 | | | $ | 6,003,925 | |
| 2021 | | | 919,727 | | | | – | | | | – | | | | 919,727 | |
| Global X S&P 500® Covered Call & Growth ETF | | | | | | | | | |
| 2022 | | $ | 1,862,038 | | | $ | 3,646 | | | $ | 1,465,030 | | | $ | 3,330,714 | |
| 2021 | | | 376,497 | | | | – | | | | – | | | | 376,497 | |
| Global X Russell 2000 Covered Call & Growth ETF | | | | | | | | | |
| 2022 | | $ | 12,860 | | | $ | – | | | $ | – | | | $ | 12,860 | |
| Global X SuperIncome™ Preferred ETF | | | | | | | | | | | | | |
| 2022 | | $ | 12,532,497 | | | $ | – | | | $ | 653,473 | | | $ | 13,185,970 | |
| 2021 | | | 12,037,890 | | | | – | | | | – | | | | 12,037,890 | |
| Global X Renewable Energy Producers ETF | | | | | | | | | | | | | |
| 2022 | | $ | 1,233,925 | | | $ | – | | | $ | – | | | $ | 1,233,925 | |
| 2021 | | | 1,677,449 | | | | 177,538 | | | | – | | | | 1,854,987 | |
| Global X S&P 500® Catholic Values ETF | | | | | | | | | | | | | |
| 2022 | | $ | 6,232,670 | | | $ | 930,733 | | | $ | – | | | $ | 7,163,403 | |
| 2021 | | | 5,511,704 | | | | – | | | | – | | | | 5,511,704 | |
| Global X S&P Catholic Values Developed ex-U.S. ETF | | | | | | | | | |
| 2022 | | $ | 188,641 | | | $ | 15,110 | | | $ | – | | | $ | 203,751 | |
| 2021 | | | 59,322 | | | | – | | | | – | | | | 59,322 | |
| Global X Guru® Index ETF | | | | | | | | | | | | | |
| 2022 | | $ | 14,584 | | | $ | – | | | $ | 63,227 | | | $ | 77,811 | |
| 2021 | | | 1,352,859 | | | | – | | | | – | | | | 1,352,859 | |
| Global X S&P 500® Tail Risk ETF | | | | | | | | | | | | | |
| 2022 | | $ | 91,737 | | | $ | 4,597 | | | $ | – | | | $ | 96,334 | |
| 2021 | | | – | | | | – | | | | – | | | | – | |
| Global X S&P 500® Risk Managed Income ETF | | | | | | | | | |
| 2022 | | $ | 472,058 | | | $ | – | | | $ | 1,738,194 | | | $ | 2,210,252 | |
| 2021 | | | 51,640 | | | | – | | | | – | | | | 51,640 | |
| Global X S&P 500® Collar 95-110 ETF | | | | | | | | | | | | | |
| 2022 | | $ | 70,495 | | | $ | 413 | | | $ | – | | | $ | 70,908 | |
| 2021 | | | – | | | | – | | | | – | | | | – | |
| Global X NASDAQ 100® Tail Risk ETF | | | | | | | | | | | | | |
| 2022 | | $ | 66,715 | | | $ | – | | | $ | – | | | $ | 66,715 | |
| 2021 | | | – | | | | – | | | | – | | | | – | |
| Global X NASDAQ 100® Risk Managed Income ETF | | | | | | | | | |
| 2022 | | $ | 128,024 | | | $ | – | | | $ | 869,114 | | | $ | 997,138 | |
| 2021 | | | – | | | | – | | | | 52,273 | | | | 52,273 | |
| Global X NASDAQ 100® Collar 95-110 ETF | | | | | | | | | |
| 2022 | | $ | 55,614 | | | $ | 2,343 | | | $ | – | | | $ | 57,957 | |
| 2021 | | | – | | | | – | | | | – | | | | – | |
|
| Notes to Financial Statements (Continued) |
| October 31, 2022 |
6. TAX INFORMATION (continued)
As of October 31, 2022, the components of tax basis accumulated losses were as follows:
| | | Global X Funds
| |
| | | | | | | | | | | | | |
| | | | | | | | Global X
| | | | | |
| | | | | | | | Lithium &
| | | | | |
| | | | Global X Social
| | | | Battery Tech
| | | | Global X
| |
| | | | Media ETF
| | | | ETF
| | | | Materials ETF
| |
| Undistributed Ordinary Income | | $ | – | | | $ | 26,883,131 | | | $ | 32,402 | |
| Capital Loss Carryforwards | | | (77,229,843 | ) | | | (335,683,668 | ) | | | (200,454 | ) |
| Unrealized Appreciation (Depreciation) on Investments and Foreign Currency | | | (149,327,060 | ) | | | 221,549,847 | | | | (1,290,732 | ) |
| Other Temporary Differences | | | 1 | | | | (8 | ) | | | (92 | ) |
| Total Accumulated Losses | | $ | (226,556,902 | ) | | $ | (87,250,698 | ) | | $ | (1,458,876 | ) |
| | | | Global X Funds
| |
| | | | | | | | Global X
| | | | | |
| | | | | | | | Emerging
| | | | | |
| | | | | | | | Markets
| | | | | |
| | | | Global X
| | | | Internet &
| | | | Global X
| |
| | | | E-commerce
| | | | E-commerce
| | | | SuperDividend®
| |
| | | | ETF
| | | | ETF
| | | | ETF
| |
| Capital Loss Carryforwards | | | (12,071,474 | ) | | | (1,599,773 | ) | | | (699,715,191 | ) |
| Unrealized Depreciation on Investments and Foreign Currency | | | (63,385,153 | ) | | | (2,395,942 | ) | | | (246,083,387 | ) |
| Late Year Loss Deferral | | | (62,414 | ) | | | – | | | | – | |
| Other Temporary Differences | | | 2 | | | | 1 | | | | (18 | ) |
| Total Accumulated Losses | | $ | (75,519,039 | ) | | $ | (3,995,714 | ) | | $ | (945,798,596 | ) |
| | | | Global X Funds
| |
| | | | | | | | | | | | Global X
| |
| | | | Global X
| | | | Global X MSCI
| | | | SuperDividend®
| |
| | | | SuperDividend®
| | | | SuperDividend®
| | | | Emerging
| |
| | | | U.S. ETF
| | | | EAFE ETF
| | | | Markets ETF
| |
| Undistributed Ordinary Income | | $ | – | | | $ | 95,160 | | | $ | – | |
| Capital Loss Carryforwards | | | (134,969,709 | ) | | | (1,384,198 | ) | | | (22,388,003 | ) |
| Unrealized Appreciation (Depreciation) on Investments and Foreign Currency | | | 7,344,913 | | | | (2,477,036 | ) | | | (15,104,428 | ) |
| Other Temporary Differences | | | 7 | | | | (4 | ) | | | – | |
| Total Accumulated Losses | | $ | (127,624,789 | ) | | $ | (3,766,078 | ) | | $ | (37,492,431 | ) |
|
| Notes to Financial Statements (Continued) |
| October 31, 2022 |
6. TAX INFORMATION (continued)
| | | | Global X Funds
| |
| | | | | | | | Global X
| | | | | |
| | | | Global X
| | | | NASDAQ 100®
| | | | Global X S&P
| |
| | | | SuperDividend®
| | | | Covered Call
| | | | 500® Covered
| |
| | | | REIT ETF(1)
| | | | ETF
| | | | Call ETF
| |
| Capital Loss Carryforwards | | | (225,141,660 | ) | | | (1,640,040,541 | ) | | | (242,032,972 | ) |
| Unrealized Appreciation (Depreciation) on Investments and Foreign Currency | | | 21,078,674 | | | | (1 | ) | | | – | |
| Other Temporary Differences | | | (2,248,500 | ) | | | (64,418,861 | ) | | | (19,380,486 | ) |
| Total Accumulated Losses | | $ | (206,311,486 | ) | | $ | (1,704,459,403 | ) | | $ | (261,413,458 | ) |
| | | | Global X Funds
| |
| | | |
| | | | | | | | Global X
| |
| | | | Global X Russell
| | | | Global X Dow
| | | | Nasdaq 100®
| |
| | | | 2000 Covered
| | | | 30® Covered
| | | | Covered Call &
| |
| | | | Call ETF
| | | | Call ETF
| | | | Growth ETF
| |
| Capital Loss Carryforwards | | | (165,351,194 | ) | | | (968,750 | ) | | | (19,799,268 | ) |
| Unrealized Appreciation (Depreciation) on Investments and Foreign Currency | | | (307 | ) | | | 1 | | | | 1 | |
| Other Temporary Differences | | | (13,251,278 | ) | | | (496,111 | ) | | | (292,457 | ) |
| Total Accumulated Losses | | $ | (178,602,779 | ) | | $ | (1,464,860 | ) | | $ | (20,091,724 | ) |
| | | | Global X Funds | |
| | | | Global X S&P
| | | | Global X Russell
| | | | | |
| | | | 500® Covered
| | | | 2000 Covered
| | | | Global X
| |
| | | | Call & Growth
| | | | Call & Growth
| | | | SuperIncome™
| |
| | | | ETF
| | | | ETF
| | | | Preferred ETF
| |
| Undistributed Ordinary Income | | $ | – | | | $ | 78,834 | | | $ | – | |
| Undistributed Long-Term Capital Gain | | | – | | | | 2,217 | | | | – | |
| Capital Loss Carryforwards | | | (7,204,713 | ) | | | – | | | | (68,984,053 | ) |
| Unrealized Depreciation on Investments and Foreign Currency | | | – | | | | (1 | ) | | | (27,694,893 | ) |
| Other Temporary Differences | | | (199,676 | ) | | | (12,859 | ) | | | 4 | |
| Total Distributable Earnings (Accumulated Losses) | | $ | (7,404,389 | ) | | $ | 68,191 | | | $ | (96,678,942 | ) |
| | | | Global X Funds | |
| | | | Global X
| | | | | | | | Global X S&P
| |
| | | | Renewable
| | | | Global X
| | | | Catholic Values
| |
| | | | Energy
| | | | 500® Catholic
| | | | Developed ex-
| |
| | | | Producers ETF
| | | | Values ETF
| | | | U.S. ETF
| |
| Undistributed Ordinary Income | | $ | 190,789 | | | $ | 2,815,266 | | | $ | 37,069 | |
| Capital Loss Carryforwards | | | (6,143,058 | ) | | | (2,533,395 | ) | | | (46,396 | ) |
| Unrealized Appreciation (Depreciation) on Investments and Foreign Currency | | | (31,066,005 | ) | | | 34,574,417 | | | | (1,070,631 | ) |
| Other Temporary Differences | | | 5 | | | | 4 | | | | 1 | |
| Total Distributable Earnings (Accumulated Losses) | | $ | (37,018,269 | ) | | $ | 34,856,292 | | | $ | (1,079,957 | ) |
|
| Notes to Financial Statements (Continued) |
| October 31, 2022 |
6. TAX INFORMATION (continued)
| | | | Global X Funds
| |
| | | | | | | | | | | | Global X S&P
| |
| | | | | | | | Global X S&P
| | | | 500® Risk
| |
| | | | Global X Guru®
| | | | 500® Tail Risk
| | | | Managed
| |
| | | | Index ETF
| | | | ETF
| | | | Income ETF
| |
| Undistributed Ordinary Income | | $ | – | | | $ | 11,918 | | | $ | – | |
| Capital Loss Carryforwards | | | (17,381,906 | ) | | | (520,630 | ) | | | (3,696,968 | ) |
| Unrealized Appreciation (Depreciation) on Investments and Foreign Currency | | | (6,777,757 | ) | | | – | | | | 1 | |
| Other Temporary Differences | | | (7 | ) | | | – | | | | (247,338 | ) |
| Total Accumulated Losses | | $ | (24,159,670 | ) | | $ | (508,712 | ) | | $ | (3,944,305 | ) |
| | | | Global X Funds
| |
| | | | | | | | | | | | Global X
| |
| | | | Global X S&P
| | | | Global X
| | | | NASDAQ 100®
| |
| | | | 500® Collar 95-
| | | | NASDAQ 100®
| | | | Risk Managed
| |
| | | | 110 ETF
| | | | Tail Risk ETF
| | | | Income ETF
| |
| Undistributed Ordinary Income | | $ | 14,640 | | | $ | 1,938 | | | $ | – | |
| Capital Loss Carryforwards | | | (398,833 | ) | | | (746,234 | ) | | | (2,295,488 | ) |
| Unrealized Depreciation on Investments and Foreign Currency | | | (1 | ) | | | – | | | | – | |
| Other Temporary Differences | | | 2 | | | | 1 | | | | (108,443 | ) |
| Total Accumulated Losses | | $ | (384,192 | ) | | $ | (744,295 | ) | | $ | (2,403,931 | ) |
| | | | Global X Funds
| |
| | | | | |
| | | | Global X
| |
| | | | NASDAQ 100®
| |
| | | | Collar 95-110
| |
| Undistributed Ordinary Income | | $ | 3,127 | |
| Capital Loss Carryforwards | | | (534,957 | ) |
| Unrealized Depreciation on Investments and Foreign Currency | | | (1 | ) |
| Other Temporary Differences | | | 4 | |
| Total Accumulated Losses | | $ | (531,827 | ) |
(1) The Global X SuperDividend® REIT ETF has a tax year that ends on December 31.
For taxable years beginning after December 22, 2010, a Registered Investment Company within the meaning of the 1940 Act is permitted to carry forward net capital losses to offset capital gains realized in later years, and the losses carried forward retain their original character as either long-term or short-term losses. Losses carried forward under these provisions are as follows:
|
| Notes to Financial Statements (Continued) |
| October 31, 2022 |
6. TAX INFORMATION (continued)
| | | | Short-Term
| | | | Long-Term
| | | | | |
| | | | Loss
| | | | Loss
| | | | Total *
| |
| Global X Social Media ETF | | $ | 16,502,288 | | | $ | 60,727,555 | | | $ | 77,229,843 | |
| Global X Lithium & Battery Tech ETF | | | 226,806,120 | | | | 108,877,548 | | | | 335,683,668 | |
| Global X Disruptive Materials ETF | | | 200,454 | | | | – | | | | 200,454 | |
| Global X E-commerce ETF | | | 3,035,267 | | | | 9,036,207 | | | | 12,071,474 | |
| Global X Emerging Markets Internet & E-commerce ETF | | | 431,967 | | | | 1,167,806 | | | | 1,599,773 | |
Global X SuperDividend® ETF | | | 286,175,435 | | | | 413,539,756 | | | | 699,715,191 | |
Global X SuperDividend® U.S. ETF | | | 123,337,380 | | | | 11,632,329 | | | | 134,969,709 | |
Global X MSCI SuperDividend® EAFE ETF | | | 126,722 | | | | 1,257,475 | | | | 1,384,197 | |
Global X MSCI SuperDividend® Emerging Markets ETF | | | 17,992,277 | | | | 4,395,726 | | | | 22,388,003 | |
Global X SuperDividend® REIT ETF | | | 156,084,925 | | | | 69,056,735 | | | | 225,141,660 | |
Global X NASDAQ 100® Covered Call ETF | | | 656,016,216 | | | | 984,024,325 | | | | 1,640,040,541 | |
Global X S&P 500® Covered Call ETF | | | 96,805,692 | | | | 145,227,280 | | | | 242,032,972 | |
| Global X Russell 2000 Covered Call ETF | | | 66,140,478 | | | | 99,210,716 | | | | 165,351,194 | |
Global X Dow 30® Covered Call ETF | | | 387,500 | | | | 581,250 | | | | 968,750 | |
Global X Nasdaq 100® Covered Call & Growth ETF | | | 7,919,707 | | | | 11,879,561 | | | | 19,799,268 | |
Global X S&P 500® Covered Call & Growth ETF | | | 2,881,662 | | | | 4,323,051 | | | | 7,204,713 | |
| Global X SuperIncome™ Preferred ETF | | | 18,580,766 | | | | 50,403,287 | | | | 68,984,053 | |
| Global X Renewable Energy Producers ETF | | | 2,371,921 | | | | 3,771,137 | | | | 6,143,058 | |
Global X S&P 500® Catholic Values ETF | | | 2,533,395 | | | | – | | | | 2,533,395 | |
| Global X S&P Catholic Values Developed ex-U.S. ETF | | | 46,396 | | | | – | | | | 46,396 | |
Global X Guru® Index ETF | | | 16,182,473 | | | | 1,199,433 | | | | 17,381,906 | |
Global X S&P 500® Tail Risk ETF | | | 208,231 | | | | 312,399 | | | | 520,630 | |
Global X S&P 500® Risk Managed Income ETF | | | 1,478,770 | | | | 2,218,198 | | | | 3,696,968 | |
Global X S&P 500® Collar 95-110 ETF | | | 159,512 | | | | 239,321 | | | | 398,833 | |
Global X NASDAQ 100® Risk Managed Income ETF | | | 918,195 | | | | 1,377,293 | | | | 2,295,488 | |
Global X NASDAQ 100® Tail Risk ETF | | | 298,494 | | | | 447,741 | | | | 746,235 | |
Global X NASDAQ 100A® Collar 95-110 ETF | | | 213,983 | | | | 320,974 | | | | 534,957 | |
During the year ended October 31, 2022, the following Funds utilized capital loss carryforwards to offset capital gains amounting to:
| | | | Short-Term
| | | | Long-Term
| | | | | |
| | | | Loss
| | | | Loss
| | | | Total *
| |
Global X SuperDividend® U.S. ETF | | $ | 11,468,082 | | | $ | 33,700,368 | | | $ | 45,168,450 | |
Global X MSCI SuperDividend® EAFE ETF | | | – | | | | 133,985 | | | | 133,985 | |
Global X SuperDividend® REIT ETF | | | 1,491,829 | | | | – | | | | 1,491,829 | |
|
| Notes to Financial Statements (Continued) |
| October 31, 2022 |
6. TAX INFORMATION (continued)
The Federal tax cost basis of investments and aggregate gross unrealized appreciation and depreciation on investments held by the Funds at October 31, 2022 were as follows:
| | | | | | | | | | |
| |
| | | | | | Aggregated | | | Aggregated | | | Net | |
| | | | | | Gross | | | Gross | | | Unrealized | |
| | | Federal Tax | | | Unrealized | | | Unrealized | | | Appreciation | |
Global X Funds
| | Cost
| | | Appreciation
| | | Depreciation
| | | (Depreciation)
| |
| Global X Social Media ETF | | $ | 253,343,686 | | | $ | 3,028,654 | | | $ | (152,355,714 | ) | | $ | (149,327,060 | ) |
| Global X Lithium & Battery Tech ETF | | | 3,797,609,058 | | | | 718,703,636 | | | | (497,153,789 | ) | | | 221,549,847 | |
| Global X Disruptive Materials ETF | | | 4,718,225 | | | | 116,267 | | | | (1,406,999 | ) | | | (1,290,732 | ) |
| Global X E-commerce ETF | | | 106,300,184 | | | | 7,588 | | | | (63,392,741 | ) | | | (63,385,153 | ) |
| Global X Emerging Markets Internet & | | | | | | | | | | | | | | | | |
| E-commerce ETF | | | 4,545,327 | | | | 2,791 | | | | (2,398,733 | ) | | | (2,395,942 | ) |
| Global X SuperDividend® ETF | | | 947,122,033 | | | | 25,276,002 | | | | (271,359,389 | ) | | | (246,083,387 | ) |
| Global X SuperDividend® U.S. ETF | | | 693,665,968 | | | | 83,018,320 | | | | (75,673,407 | ) | | | 7,344,913 | |
| Global X MSCI SuperDividend® EAFE ETF | | | 10,821,955 | | | | 107,250 | | | | (2,584,286 | ) | | | (2,477,036 | ) |
| Global X MSCI SuperDividend® Emerging | | | | | | | | | | | | | | | | |
| Markets ETF | | | 54,276,023 | | | | 1,722,792 | | | | (16,827,220 | ) | | | (15,104,428 | ) |
| Global X SuperDividend® REIT ETF | | | 383,036,781 | | | | 6,189,615 | | | | (82,128,457 | ) | | | (75,938,842 | ) |
| Global X NASDAQ 100® Covered Call ETF | | | 6,388,969,287 | | | | 375,988,467 | | | | (375,988,468 | ) | | | (1 | ) |
| Global X S&P 500® Covered Call ETF | | | 1,932,131,631 | | | | 93,172,733 | | | | (93,172,733 | ) | | | – | |
| Global X Russell 2000 Covered Call ETF | | | 1,340,165,027 | | | | 100,534,374 | | | | (100,534,681 | ) | | | (307 | ) |
| Global X Dow 30® Covered Call ETF | | | 52,903,475 | | | | 3,100,079 | | | | (3,100,078 | ) | | | 1 | |
| Global X Nasdaq 100® Covered Call & | | | | | | | | | | | | | | | | |
| Growth ETF | | | 60,996,148 | | | | 1,118,929 | | | | (1,118,928 | ) | | | 1 | |
| Global X S&P 500® Covered Call & Growth | | | | | | | | | | | | | | | | |
| ETF | | | 41,461,026 | | | | 1,729,860 | | | | (1,729,860 | ) | | | – | |
| Global X Russell 2000 Covered Call & | | | | | | | | | | | | | | | | |
| Growth ETF | | | 2,655,352 | | | | (1 | ) | | | – | | | | (1 | ) |
| Global X SuperIncome™ Preferred ETF | | | 224,465,443 | | | | 3,257,161 | | | | (30,952,054 | ) | | | (27,694,893 | ) |
| Global X Renewable Energy Producers ETF | | | 122,615,961 | | | | 4,522,946 | | | | (35,588,951 | ) | | | (31,066,005 | ) |
| Global X S&P 500® Catholic Values ETF | | | 514,201,946 | | | | 78,717,755 | | | | (44,143,338 | ) | | | 34,574,417 | |
| Global X S&P Catholic Values Developed | | | | | | | | | | | | | | | | |
| ex-U.S. ETF | | | 6,657,095 | | | | 143,017 | | | | (1,213,648 | ) | | | (1,070,631 | ) |
| Global X Guru® Index ETF | | | 54,052,304 | | | | 3,449,418 | | | | (10,227,175 | ) | | | (6,777,757 | ) |
| Global X S&P 500® Tail Risk ETF | | | 3,013,059 | | | | 195,747 | | | | (195,747 | ) | | | – | |
| Global X S&P 500® Risk Managed Income | | | | | | | | | | | | | | | | |
| ETF | | | 24,588,329 | | | | 869,020 | | | | (869,019 | ) | | | 1 | |
| Global X S&P 500® Collar 95-110 ETF | | | 3,914,993 | | | | 222,523 | | | | (222,524 | ) | | | (1 | ) |
| Global X NASDAQ 100® Tail Risk ETF | | | 1,906,039 | | | | 33,906 | | | | (33,906 | ) | | | – | |
| Global X NASDAQ 100® Risk Managed | | | | | | | | | | | | | | | | |
| Income ETF | | | 10,708,444 | | | | 168,411 | | | | (168,411 | ) | | | – | |
| Global X NASDAQ 100® Collar 95-110 ETF | | | 3,075,007 | | | | 49,688 | | | | (49,689 | ) | | | (1 | ) |
The preceding differences between book and tax cost are primarily due to mark-to-market treatment of passive foreign investment companies, mixed straddles, MLP adjustments, wash sales, late year loss deferrals and differences due to preferred debt securities.
|
| Notes to Financial Statements (Continued) |
| October 31, 2022 |
7. CONCENTRATION OF RISKS
The Funds invest in securities of foreign issuers in various countries. These investments may involve certain considerations and risks not typically associated with investments in the United States as a result of, among other factors, the possibility of future political and economic developments, the level of governmental supervision and regulation of securities markets in the respective countries.
The securities markets of emerging countries are less liquid, subject to greater price volatility, and have a smaller market capitalization than those of U.S. securities markets. In certain countries, there may be fewer publicly traded securities and the market may be dominated by a few issuers or sectors. Issuers and securities markets in such countries are not subject to as extensive and frequent accounting, financial and other reporting requirements or as comprehensive government regulations as are issuers and securities markets in the U.S. In particular, the assets and profits appearing on the financial statements of emerging country issuers may not reflect their financial position or results of operations in the same manner as financial statements for U.S. issuers. Substantially less information may be publicly available about emerging country issuers than is available about issuers in the United States.
The Funds may be subject to taxes imposed by countries in which they invest. Such taxes are generally based on either income or gains earned or repatriated. The Funds accrue and apply such taxes to net investment income, net realized gains and net unrealized gains as income and/or capital gains are earned.
Except for the Global X Russell 2000® Covered Call ETF, which uses a representative sampling strategy, the Funds use a replication strategy. A replication strategy is an indexing strategy that involves investing in the securities of an underlying index in approximately the same proportions as in the underlying index. A representative sampling strategy is an indexing strategy that involves investing in a representative sample of securities (including indirect investments through underlying ETFs) that collectively has an investment profile similar to an underlying index in terms of key risk factors, performance attributes and other characteristics. Each Fund may utilize a representative sampling strategy with respect to its underlying indices when a replication strategy might be detrimental to its shareholders, such as when there are practical difficulties or substantial costs involved in compiling a portfolio of equity securities to follow their underlying indices, or, in certain instances, when securities in the underlying indices become temporarily illiquid, unavailable or less liquid, or due to legal restrictions (such as diversification requirements that apply to a Fund but not the underlying index).
The elimination of the London Inter-Bank Offered Rate (“LIBOR”) may adversely affect the interest rates on, and value of, certain Fund investments for which the value is tied to LIBOR. The U.K. Financial Conduct Authority has announced that it intends to stop compelling or inducing banks to submit LIBOR rates after 2021. On March 5, 2021, the
|
| Notes to Financial Statements (Continued) |
| October 31, 2022 |
7. CONCENTRATION OF RISKS (continued)
administrator of LIBOR clarified that the publication of LIBOR on a representative basis will cease for the one-week and two-month U.S. dollar LIBOR settings immediately after December 31, 2021, and for the remaining U.S. dollar LIBOR settings immediately after June 30, 2023. Alternatives to LIBOR are established or in development in most major currencies, including the Secured Overnight Financing Rate (“SOFR”), which is intended to replace U.S. dollar LIBOR. Markets are slowly developing in response to these new rates. Questions regarding the impact of this transition remain a concern for the Funds. Accordingly, it is difficult to predict the full impact of the transition away from LIBOR on the Funds until new reference rates and fallbacks for both legacy and new products, instruments and contracts are commercially accepted. Please refer to each Fund’s prospectus and statement of additional information (“SAI”) for a more complete description of risks.
8. LOANS OF PORTFOLIO SECURITIES
Each Fund may lend portfolio securities having a market value up to one-third of its total assets. Security loans made pursuant to a securities lending agreement with BBH are initially required to be secured by collateral equal to at least 102% of the value of domestic equity securities and American Depositary Receipts (“ADRs”) and 105% of the value of foreign equity securities (other than ADRs). Such collateral received in connection with these loans will be cash and can be invested in repurchase agreements, short term investments or U.S. Treasury obligations, and is recognized in the Schedules of Investments and Statements of Assets and Liabilities. The obligation to return securities lending collateral is also recognized as a liability in the Statements of Assets and Liabilities. It is the Funds’ policy to obtain additional collateral from or return excess collateral to the borrower by the end of the next business day, following the valuation date of the securities loaned. Therefore, the value of the collateral held may be temporarily less than the value of the securities on loan.
Lending securities entails a risk of loss to the Funds if and to the extent that the market values of the securities loaned were to increase and the borrower did not increase the collateral accordingly, and the borrower failed to return the securities. In the event the borrower may not provide additional collateral when required or may not return the securities when due, the securities lending agency agreement requires the lending agent to indemnify the Funds by replacing either the security or the security’s current market value to the Funds. The Funds could suffer a loss if the value of an investment purchased with cash collateral falls below the market value of loaned securities or if the value of an investment purchased with cash collateral falls below the value of the original cash collateral received. The Funds could also experience delays and costs in gaining access to the collateral. The Funds bear the risk of any deficiency in the amount of the collateral available for return to the borrower due to any loss on the collateral invested.
|
| Notes to Financial Statements (Continued) |
| October 31, 2022 |
8. LOANS OF PORTFOLIO SECURITIES (continued)
At October 31, 2022, the following Funds had securities on loan, by counterparty:
| | | | | | | Cash
| |
| | | | Market Value | | | Collateral(1) | |
| Global X Social Media ETF | | | | | | | |
| Barclays Capital Inc. | | | $ | 105,256 | | | $ | 109,150 | |
| Citigroup Global Markets Inc. | | | | 12,070 | | | | 12,493 | |
| J.P. Morgan Securities LLC | | | | 109,836 | | | | 116,251 | |
| Morgan Stanley & Co. LLC | | | | 625,431 | | | | 643,980 | |
| | Total | | $ | 852,593 | | | $ | 881,874 | |
| | | | | | | | | Cash
| |
| | | | | Market Value
| | | | Collateral(1)
| |
| Global X Lithium & Battery Tech ETF | | | | | | | | | |
| Barclays Bank PLC | | | $ | 26,035,092 | | | $ | 27,570,808 | |
| BNP Paribas Securities Corp | | | | 5,707,471 | | | | 5,995,754 | |
| BofA Securities Inc. | | | | 19,571,620 | | | | 20,418,109 | |
| Citigroup Global Markets Inc. | | | | 3,122,874 | | | | 3,339,300 | |
| Goldman Sachs & Co. | | | | 21,773,081 | | | | 22,877,887 | |
| J.P. Morgan Securities LLC | | | | 3,561,969 | | | | 3,660,506 | |
| Morgan Stanley & Co. LLC | | | | 35,051,051 | | | | 36,524,572 | |
| SG Americas Securities LLC | | | | 637,885 | | | | 1,047,296 | |
| UBS Securities LLC | | | | 2,228,094 | | | | 2,226,420 | |
| Wells Fargo Securities LLC | | | | 1,563,925 | | | | 1,586,250 | |
| | Total | | $ | 119,253,062 | | | $ | 125,246,902 | |
| | | | | | | | Cash | |
| | | | Market Value | | | Collateral(1) | |
| Global X E-commerce ETF | | | | | | | | | |
| BMO Capital Markets | | | $ | 246,480 | | | $ | 240,175 | |
| BNP Paribas Securities Corp | | | | 18,810 | | | | 19,350 | |
| Morgan Stanley & Co. LLC | | | | 339,517 | | | | 358,650 | |
| UBS AG London Branch | | | | 18,585 | | | | 108,206 | |
| | Total | | $ | 623,392 | | | $ | 726,381 | |
|
| Notes to Financial Statements (Continued) |
| October 31, 2022 |
8. LOANS OF PORTFOLIO SECURITIES (continued)
| | | | | |
| |
| | | | | | | Cash | |
| | | | Market Value | | | Collateral(1) | |
| Global X SuperDividend® ETF | | | | | | | |
| Barclays Capital Inc. | | | $ | 1,913,616 | | | $ | 2,426,968 | |
| BMO Capital Markets | | | | 2,218,400 | | | | 2,241,270 | |
| BNP Paribas Securities Corp | | | | 2,903,253 | | | | 2,990,110 | |
| BofA Securities Inc. | | | | 2,036,677 | | | | 2,096,847 | |
| Citigroup Global Markets Inc. | | | | 3,517,117 | | | | 3,627,250 | |
| Goldman Sachs & Co. | | | | 4,944,739 | | | | 5,166,951 | |
| J.P. Morgan Securities LLC | | | | 6,106,887 | | | | 6,339,759 | |
| Morgan Stanley & Co. LLC | | | | 1,520,667 | | | | 1,646,568 | |
| UBS AG London Branch | | | | 506,550 | | | | 538,365 | |
| UBS Securities LLC | | | | 872,742 | | | | 904,305 | |
| Wells Fargo Securities LLC | | | | 144,348 | | | | 150,050 | |
| | Total | | $ | 26,684,996 | | | $ | 28,128,443 | |
| | | | | | | | Cash | |
| | | | Market Value | | | Collateral(1) | |
| Global X SuperDividend® U.S. ETF | | | | | | | | | |
| BNP Paribas Securities Corp | | | $ | 259,962 | | | $ | 266,400 | |
| Citigroup Global Markets Inc. | | | | 2,268,944 | | | | 2,324,716 | |
| Goldman Sachs & Co. | | | | 10,483,018 | | | | 10,684,198 | |
| J.P. Morgan Securities LLC | | | | 3,113,264 | | | | 3,207,300 | |
| Scotia Capital Inc | | | | 2,908,407 | | | | 2,952,141 | |
| Wells Fargo Securities LLC | | | | 15,960 | | | | 16,500 | |
| | Total | | $ | 19,049,555 | | | $ | 19,451,255 | |
| | | | | | | | Cash | |
| | | | Market Value | | | Collateral(1) | |
| Global X SuperDividend® REIT ETF | | | | | | | | | |
| BNP Paribas Securities Corp | | | $ | 2,988,244 | | | $ | 3,065,545 | |
| BofA Securities Inc. | | | | 292,150 | | | | 354,353 | |
| Citigroup Global Markets Inc. | | | | 1,690,872 | | | | 1,732,190 | |
| Goldman Sachs & Co. | | | | 1,146,460 | | | | 1,174,475 | |
| Nomura Securities International Inc | | | | 5,308,389 | | | | 5,582,376 | |
| Scotia Capital Inc | | | | 7,842,027 | | | | 8,407,714 | |
| UBS AG London Branch | | | | 740,076 | | | | 778,520 | |
| | Total | | $ | 20,008,218 | | | $ | 21,095,173 | |
| | | | | | | | Cash | |
| | | | Market Value | | | Collateral(1) | |
| Global X SuperIncome™ Preferred ETF | | | | | | | | | |
| BofA Securities Inc. | | | $ | 515,412 | | | $ | 530,450 | |
| Goldman Sachs & Co. | | | | 2,031,814 | | | | 2,065,588 | |
| | Total | | $ | 2,547,226 | | | $ | 2,596,038 | |
|
| Notes to Financial Statements (Continued) |
| October 31, 2022 |
8. LOANS OF PORTFOLIO SECURITIES (continued)
| | | | | |
| |
| | | | | | | Cash | |
| | | | Market Value | | | Collateral(1) | |
| Global X Renewable Energy Producers ETF | | | | | | | |
| Barclays Capital Inc. | | | $ | 282,558 | | | $ | 309,300 | |
| BNP Paribas Securities Corp | | | | 35,550 | | | | 35,550 | |
| BofA Securities Inc. | | | | 161,721 | | | | 161,721 | |
| Citigroup Global Markets Inc. | | | | 147,935 | | | | 145,635 | |
| | Total | | $ | 627,764 | | | $ | 652,206 | |
| | | | | | | | Cash | |
| | | | Market Value | | | Collateral(1) | |
| Global X Guru® Index ETF | | | | | | | | | |
| Morgan Stanley & Co. LLC | | | $ | 189,104 | | | $ | 193,980 | |
| Scotia Capital Inc | | | | 560,232 | | | | 593,340 | |
| | Total | | $ | 749,336 | | | $ | 787,320 | |
(1) It is the Funds' policy to obtain additional collateral from or return excess collateral to the borrower by the end of the next business day, following the valuation date of the securities loaned. Therefore, the value of the collateral held may be temporarily less than the value of the securities on loan.
9. CONTRACTUAL OBLIGATION
The Funds enter into contracts in the normal course of business that contain a variety of indemnifications. The Funds’ maximum exposure under these contracts is unknown; however, the Funds have not had prior gains or losses pursuant to these contracts. Management has reviewed the Funds’ existing contracts and expects the risk of loss to be remote.
Pursuant to the Trust’s organizational documents, the Trustees of the Trust (the “Trustees”) and the Trust’s officers are indemnified against certain liabilities that may arise out of the performance of their duties.
10. SUBSEQUENT EVENTS
The Board of the Trust approved a reverse share split of one to three (1:3) of the issued and outstanding shares of the Global X Emerging Markets Internet & E-commerce ETF, Global X SuperDividend® ETF, Global X MSCI SuperDividend® Emerging Markets ETF and Global X SuperDividend® REIT ETF (the "Reverse Share Split"). The Reverse Share Split was completed after the close of business on December 19, 2022. The effect of this transaction for each Fund was to divide the number of outstanding Shares of the Fund by three, resulting in a corresponding increase in the NAV per Share. The capital share activity presented on the Statement of Changes in Net Assets for each of the years in the period then ended, and the per share data in the financial highlights for each of the years in the period then ended have been updated to reflect this reverse share split. There were no changes in net assets, results of operations or total return as a result of this transaction.
|
| Notes to Financial Statements (Concluded) |
| October 31, 2022 |
10. SUBSEQUENT EVENTS (continued)
The Funds have been evaluated by management regarding the need for additional disclosures (other than what is disclosed in the preceding paragraph) and/or adjustments resulting from subsequent events. Based on this evaluation, no additional adjustments were required to the financial statements.
|
| Report of Independent Registered Public Accounting Firm |
To the Board of Trustees of Global X Funds and Shareholders of each of the twenty-eight funds listed in the table below.
Opinions on the Financial Statements
We have audited the accompanying statements of assets and liabilities, including the schedules of investments, of each of the funds listed in the table below (twenty-eight of the funds constituting Global X Funds, hereafter collectively referred to as the "Funds") as of October 31, 2022, the related statements of operations and of changes in net assets for each of the periods indicated in the table below, including the related notes, and the financial highlights for each of the periods indicated in the table below (collectively referred to as the “financial statements”). In our opinion, the financial statements present fairly, in all material respects, the financial position of each of the Funds as of October 31, 2022, the results of each of their operations, the changes in each of their net assets, and each of the financial highlights for each of the periods indicated in the table below, in conformity with accounting principles generally accepted in the United States of America.
Global X SuperDividend® ETF (1) | Global X S&P 500® Covered Call & Growth ETF (5) |
Global X SuperDividend® U.S. ETF (1) | Global X Nasdaq 100® Covered Call & Growth ETF (5) |
Global X Guru® Index ETF (1) | Global X Emerging Markets Internet & E-commerce ETF (6) |
Global X MSCI SuperDividend® Emerging Markets ETF (1) | Global X Nasdaq 100® Tail Risk ETF (7) |
Global X SuperDividend® REIT ETF (1) | Global X Nasdaq 100® Risk Managed Income ETF (7) |
| Global X SuperIncome™ Preferred ETF (1) | Global X Nasdaq 100® Collar 95-110 ETF (7) |
| Global X Social Media ETF (1) | Global X S&P 500® Tail Risk ETF (7) |
| Global X Renewable Energy Producers ETF (1) | Global X S&P 500® Collar 95-110 ETF (7) |
| Global X Lithium & Battery Tech ETF (1) | Global X S&P 500® Risk Managed Income ETF (7) |
Global X MSCI SuperDividend® EAFE ETF (1) | Global X Disruptive Materials ETF (8) |
Global X S&P 500® Catholic Values ETF (1) | Global X Dow 30® Covered Call ETF (9) |
|
| Report of Independent Registered Public Accounting Firm |
| Global X E-commerce ETF (2) | Global X Russell 2000 Covered Call & Growth ETF (10) |
| Global X Russell 2000 Covered Call ETF (3) | Global X S&P 500® Covered Call ETF (11) |
| Global X S&P Catholic Values Developed ex-U.S. ETF (4) | Global X NASDAQ 100® Covered Call ETF (11) |
1. | Statements of operations for the year ended October 31, 2022, the statements of changes in net assets for each of the two years in the period ended October 31, 2022, and the financial highlights for each of the five years in the period ended October 31, 2022. |
2. | Statement of operations for the year ended October 31, 2022, the statements of changes in net assets for each of the two years in the period ended October 31, 2022, and the financial highlights for each of the three years in the period ended October 31, 2022 and for the period November 27, 2018 (commencement of operations) through October 31, 2019. |
3. | Statement of operations for the year ended October 31, 2022, the statements of changes in net assets for each of the two years in the period ended October 31, 2022, and the financial highlights for each of the three years in the period ended October 31, 2022 and for the period April 17, 2019 (commencement of operations) through October 31, 2019. |
4. | Statement of operations for the year ended October 31, 2022, the statements of changes in net assets for each of the two years in the period ended October 31, 2022, and the financial highlights for each of the two years in the period ended October 31, 2022 and for the period June 22, 2020 (commencement of operations) through October 31, 2020. |
5. | Statements of operations for the year ended October 31, 2022, the statements of changes in net assets for each of the two years in the period ended October 31, 2022, and the financial highlights for each of the two years in the period ended October 31, 2022 and for the period September 18, 2020 (commencement of operations) through October 31, 2020. |
6. | Statement of operations for the year ended October 31, 2022 and the statements of changes in net assets and the financial highlights for the year ended October 31, 2022 and the period November 9, 2020 (commencement of operations) through October 31, 2021. |
7. | Statements of operations for the year ended October 31, 2022 and the statements of changes in net assets and the financial highlights for the year ended October 31, 2022 and the period August 25, 2021 (commencement of operations) through October 31, 2021. |
8. | Statement of operations, the statement of changes in net assets and the financial highlights for the period January 24, 2022 (commencement of operations) through October 31, 2022. |
|
| Report of Independent Registered Public Accounting Firm |
9. | Statement of operations, the statement of changes in net assets and the financial highlights for the period February 23, 2022 (commencement of operations) through October 31, 2022. |
10. | Statement of operations, the statement of changes in net assets and the financial highlights for the period October 4, 2022 (commencement of operations) through October 31, 2022. |
11. | Statement of operations for the year ended October 31, 2022, the statements of changes in net assets for each of the two years in the period ended October 31, 2022 and the financial highlights for each of the four years in the period ended October 31, 2022. |
The financial statements of Global X S&P 500® Covered Call ETF and Global X NASDAQ 100® Covered Call ETF as of and for the year ended October 31, 2018 and the financial highlights for each of the periods ended on or prior to October 31, 2018 (not presented herein, other than the financial highlights) were audited by other auditors whose report dated December 28, 2018 expressed an unqualified opinion on those financial statements and financial highlights.
Basis for Opinions
These financial statements are the responsibility of the Funds’ management. Our responsibility is to express an opinion on the Funds’ financial statements based on our audits. We are a public accounting firm registered with the Public Company Accounting Oversight Board (United States) (PCAOB) and are required to be independent with respect to the Funds in accordance with the U.S. federal securities laws and the applicable rules and regulations of the Securities and Exchange Commission and the PCAOB.
We conducted our audits of these financial statements in accordance with the standards of the PCAOB. Those standards require that we plan and perform the audit to obtain reasonable assurance about whether the financial statements are free of material misstatement, whether due to error or fraud.
Our audits included performing procedures to assess the risks of material misstatement of the financial statements, whether due to error or fraud, and performing procedures that respond to those risks. Such procedures included examining, on a test basis, evidence regarding the amounts and disclosures in the financial statements. Our audits also included evaluating the accounting principles used and significant estimates made by management, as well as evaluating the overall presentation of the financial statements. Our procedures included confirmation of securities owned as of October 31, 2022, by correspondence with the custodian, transfer agent and brokers; when replies were not received from brokers, we
|
| Report of Independent Registered Public Accounting Firm |
performed other auditing procedures. We believe that our audits provide a reasonable basis for our opinions.
/s/ PricewaterhouseCoopers LLP
Philadelphia, Pennsylvania
December 29, 2022
We have served as the auditor of one or more investment companies in Global X Funds since 2016.
|
| Disclosure of Fund Expenses (Unaudited) |
All ETFs (such as the Funds) have operating expenses. As a shareholder of an ETF, your investment is affected by these ongoing costs, which include (among others) costs for ETF management, administrative services, commissions, and shareholder reports like this one. It is important for you to understand the impact of these costs on your investment returns. In addition, a shareholder is responsible for brokerage fees as a result of the shareholder’s investment in a Fund.
Operating expenses such as these are deducted from a Fund’s gross income and directly reduce their final investment returns. These expenses are expressed as a percentage of the Fund’s average net assets; this percentage is known as the Fund’s expense ratio.
The following examples use the expense ratio and are intended to help you understand the ongoing costs (in dollars) of investing in a Fund and to compare these costs with those of other funds. The examples are based on an investment of $1,000 made at the beginning of the period shown and held for the entire period (May 1, 2020 through October 31, 2021).
The table on the next page illustrates the Funds’ costs in two ways:
Actual Fund Return. This section helps you to estimate the actual expenses that your Fund incurred over the period. The “Expenses Paid During Period” column shows the actual dollar expense cost incurred by a $1,000 investment in the Fund, and the “Ending Account Value” number is derived from deducting that expense cost from the Fund’s gross investment return.
You can use this information, together with the actual amount you invested in the Fund, to estimate the expenses you paid over that period. Simply divide your actual account value by $1,000 to arrive at a ratio (for example, an $8,600 account value divided by $1,000 = 8.6), then multiply that ratio by the number shown for your Fund under “Expenses Paid During Period.”
Hypothetical 5% Return. This section helps you compare your Fund’s costs with those of other funds. It assumes that the Fund had an annual 5% return before expenses during the year, but that the expense ratio (Column 3) for the period is unchanged. This example is useful in making comparisons because the SEC requires all funds to make this 5% calculation. You can assess your Fund’s comparative cost by comparing the hypothetical result for your Fund in the “Expenses Paid During Period” column with those that appear in the same charts in the shareholder reports for other funds.
NOTE: Because the return is set at 5% for comparison purposes — NOT your Fund’s actual return — the account values shown may not apply to your specific investment.
|
| Disclosure of Fund Expenses (Unaudited) (Continued) |
| | | | Beginning
| | | | Ending
| | | | Annualized
| | | | Expense
| |
| | | | Account Value
| | | | Account Value
| | | | Expense
| | | | Paid During
| |
| | | 5/1/2022
| | | | 10/31/2022
| | | | Ratios
| | | | Period(1)
| |
Global X Social Media ETF
| | | | | | | | | | | | | | | | |
| Actual Fund Return | | $ | 1,000.00 | | | $ | 650.90 | | | | 0.66 | % | | $ | 2.75 | |
| Hypothetical 5% Return | | | 1,000.00 | | | | 1,021.88 | | | | 0.66 | | | | 3.36 | |
| Global X Lithium & Battery Tech ETF | |
| Actual Fund Return | | $ | 1,000.00 | | | $ | 1,012.00 | | | | 0.75 | % | | $ | 3.80 | |
| Hypothetical 5% Return | | | 1,000.00 | | | | 1,021.43 | | | | 0.75 | | | | 3.82 | |
| Global X Disruptive Materials ETF | |
| Actual Fund Return | | $ | 1,000.00 | | | $ | 771.40 | | | | 0.60 | % | | $ | 1.19 | |
| Hypothetical 5% Return | | | 1,000.00 | | | | 4.08 | | | | 0.60 | | | | 4.68 | |
| Global X E-commerce ETF | |
| Actual Fund Return | | $ | 1,000.00 | | | $ | 775.60 | | | | 0.50 | % | | $ | 2.24 | |
| Hypothetical 5% Return | | | 1,000.00 | | | | 1,022.69 | | | | 0.50 | | | | 2.55 | |
| Global X Emerging Markets Internet & E-commerce ETF | |
| Actual Fund Return | | $ | 1,000.00 | | | $ | 750.60 | | | | 0.65 | % | | $ | 2.87 | |
| Hypothetical 5% Return | | | 1,000.00 | | | | 1,021.93 | | | | 0.65 | | | | 3.31 | |
Global X SuperDividend® ETF | |
| Actual Fund Return | | $ | 1,000.00 | | | $ | 768.30 | | | | 0.64 | % | | $ | 2.85 | |
| Hypothetical 5% Return | | | 1,000.00 | | | | 1,021.98 | | | | 0.64 | | | | 3.26 | |
Global X SuperDividend® U.S. ETF | |
| Actual Fund Return | | $ | 1,000.00 | | | $ | 977.40 | | | | 0.45 | % | | $ | 2.24 | |
| Hypothetical 5% Return | | | 1,000.00 | | | | 1,022.94 | | | | 0.45 | | | | 2.29 | |
Global X MSCI SuperDividend® EAFE ETF | |
| Actual Fund Return | | $ | 1,000.00 | | | $ | 831.30 | | | | 0.58 | % | | $ | 2.68 | |
| Hypothetical 5% Return | | | 1,000.00 | | | | 1,022.28 | | | | 0.58 | | | | 2.96 | |
Global X MSCI SuperDividend® Emerging Markets ETF | |
| Actual Fund Return | | $ | 1,000.00 | | | $ | 776.60 | | | | 0.68 | % | | $ | 3.05 | |
| Hypothetical 5% Return | | | 1,000.00 | | | | 1,021.78 | | | | 0.68 | | | | 3.47 | |
Global X SuperDividend® REIT ETF | |
| Actual Fund Return | | $ | 1,000.00 | | | $ | 857.10 | | | | 0.59 | % | | $ | 2.76 | |
| Hypothetical 5% Return | | | 1,000.00 | | | | 1,022.23 | | | | 0.59 | | | | 3.01 | |
|
| Disclosure of Fund Expenses (Unaudited) (Continued) |
| | | | Beginning
| | | | Ending
| | | | Annualized
| | | | Expense
| |
| | | | Account Value
| | | | Account Value
| | | | Expense
| | | | Paid During
| |
| | | 5/1/2022
| | | | 10/31/2022
| | | | Ratios
| | | | Period(1)
| |
Global X NASDAQ 100® Covered Call ETF | |
| Actual Fund Return | | $ | 1,000.00 | | | $ | 889.80 | | | | 0.61 | % | | $ | 2.91 | |
| Hypothetical 5% Return | | | 1,000.00 | | | | 1,022.13 | | | | 0.61 | | | | 3.11 | |
Global X S&P 500® Covered Call ETF | |
| Actual Fund Return | | $ | 1,000.00 | | | $ | 912.80 | | | | 0.60 | % | | $ | 2.89 | |
| Hypothetical 5% Return | | | 1,000.00 | | | | 1,022.18 | | | | 0.60 | | | | 3.06 | |
| Global X Russell 2000 Covered Call ETF | |
| Actual Fund Return | | $ | 1,000.00 | | | $ | 939.30 | | | | 0.59 | % | | $ | 2.88 | |
| Hypothetical 5% Return | | | 1,000.00 | | | | 1,022.23 | | | | 0.59 | | | | 3.01 | |
Global X Dow 30® Covered Call ETF | |
| Actual Fund Return | | $ | 1,000.00 | | | $ | 948.30 | | | | 0.61 | % | | $ | 3.00 | |
| Hypothetical 5% Return | | | 1,000.00 | | | | 1,022.13 | | | | 0.61 | | | | 3.11 | |
Global X Nasdaq 100® Covered Call & Growth ETF | |
| Actual Fund Return | | $ | 1,000.00 | | | $ | 890.50 | | | | 0.61 | % | | $ | 2.91 | |
| Hypothetical 5% Return | | | 1,000.00 | | | | 1,022.13 | | | | 0.61 | | | | 3.11 | |
Global X S&P 500® Covered Call & Growth ETF | |
| Actual Fund Return | | $ | 1,000.00 | | | $ | 928.60 | | | | 0.62 | % | | $ | 3.01 | |
| Hypothetical 5% Return | | | 1,000.00 | | | | 1,022.08 | | | | 0.62 | | | | 3.16 | |
| Global X Russell 2000 Covered Call & Growth ETF | |
| Actual Fund Return | | $ | 1,000.00 | | | $ | 1,000.00 | | | | 0.50 | % | | $ | 0.45(2 | ) |
| Hypothetical 5% Return | | | 1,000.00 | | | | 1,004.07 | | | | 0.50 | | | | 0.45 | |
| Global X SuperIncome™ Preferred ETF | |
| Actual Fund Return | | $ | 1,000.00 | | | $ | 931.10 | | | | 0.58 | % | | $ | 2.82 | |
| Hypothetical 5% Return | | | 1,000.00 | | | | 1,022.28 | | | | 0.58 | | | | 2.96 | |
| Global X Renewable Energy Producers ETF | |
| Actual Fund Return | | $ | 1,000.00 | | | $ | 877.20 | | | | 0.66 | % | | $ | 3.12 | |
| Hypothetical 5% Return | | | 1,000.00 | | | | 1,021.88 | | | | 0.66 | | | | 3.36 | |
Global X S&P 500® Catholic Values ETF | |
| Actual Fund Return | | $ | 1,000.00 | | | $ | 938.40 | | | | 0.29 | % | | $ | 1.42 | |
| Hypothetical 5% Return | | | 1,000.00 | | | | 1,023.74 | | | | 0.29 | | | | 1.48 | |
|
| Disclosure of Fund Expenses (Unaudited) (Concluded) |
| | | | Beginning
| | | | Ending
| | | | Annualized
| | | | Expense
| |
| | | | Account Value
| | | | Account Value
| | | | Expense
| | | | Paid During
| |
| | | 5/1/2022
| | | | 10/31/2022
| | | | Ratios
| | | | Period(1)
| |
| Global X S&P Catholic Values Developed ex-U.S. ETF | |
| Actual Fund Return | | $ | 1,000.00 | | | $ | 869.60 | | | | 0.35 | % | | $ | 1.65 | |
| Hypothetical 5% Return | | | 1,000.00 | | | | 1,023.44 | | | | 0.35 | | | | 1.79 | |
Global X Guru® Index ETF | |
| Actual Fund Return | | $ | 1,000.00 | | | $ | 903.90 | | | | 0.75 | % | | $ | 3.60 | |
| Hypothetical 5% Return | | | 1,000.00 | | | | 1,021.43 | | | | 0.75 | | | | 3.82 | |
Global X S&P 500® Tail Risk ETF | |
| Actual Fund Return | | $ | 1,000.00 | | | $ | 963.50 | | | | 0.62 | % | | $ | 3.07 | |
| Hypothetical 5% Return | | | 1,000.00 | | | | 1,022.08 | | | | 0.62 | | | | 3.16 | |
Global X S&P 500® Risk Managed Income ETF | |
| Actual Fund Return | | $ | 1,000.00 | | | $ | 917.20 | | | | 0.65 | % | | $ | 3.14 | |
| Hypothetical 5% Return | | | 1,000.00 | | | | 1,021.93 | | | | 0.65 | | | | 3.31 | |
Global X S&P 500® Collar 95-110 ETF | |
| Actual Fund Return | | $ | 1,000.00 | | | $ | 1,002.50 | | | | 0.66 | % | | $ | 3.33 | |
| Hypothetical 5% Return | | | 1,000.00 | | | | 1,021.88 | | | | 0.66 | | | | 3.36 | |
Global X NASDAQ 100® Tail Risk ETF | |
| Actual Fund Return | | $ | 1,000.00 | | | $ | 924.90 | | | | 0.62 | % | | $ | 3.01 | |
| Hypothetical 5% Return | | | 1,000.00 | | | | 1,022.08 | | | | 0.62 | | | | 3.16 | |
Global X NASDAQ 100® Risk Managed Income ETF | |
| Actual Fund Return | | $ | 1,000.00 | | | $ | 919.50 | | | | 0.64 | % | | $ | 3.10 | |
| Hypothetical 5% Return | | | 1,000.00 | | | | 1,021.98 | | | | 0.64 | | | | 3.26 | |
Global X NASDAQ 100® Collar 95-110 ETF | |
| Actual Fund Return | | $ | 1,000.00 | | | $ | 980.00 | | | | 0.64 | % | | $ | 3.19 | |
| Hypothetical 5% Return | | | 1,000.00 | | | | 1,021.98 | | | | 0.64 | | | | 3.26 | |
| (1) | Expenses are equal to the Fund's annualized expense ratio multiplied by the average account value over the period, multiplied by 184/365 (to reflect the one-half year period). |
| (2) | Expenses are equal to the Fund's annualized expense ratio multiplied by the average account value over the period, multiplied by 27/365 (to reflect the one-half year period). |
|
| Liquidity Risk Management Program (UNAUDITED) |
Pursuant to Rule 22e-4 under the 1940 Act, the Funds’ investment adviser has adopted, and the Board has approved, a liquidity risk management program (the “Program”) to govern the Funds’ approach to managing liquidity risk. The Program is overseen by the Funds’ Liquidity Risk Management Committee (the “Committee”), and the Program’s principal objectives include assessing, managing and periodically reviewing each Fund’s liquidity risk, based on factors specific to the circumstances of the Funds.
At a meeting of the Board held on May 20, 2022, the Trustees received a report from the Committee addressing the operations of the Program and assessing its adequacy and effectiveness of implementation for the period from January 1, 2021 through December 31, 2021. The Committee’s report noted that the Committee had determined that the Program is reasonably designed to assess and manage each Fund’s Liquidity Risk and operated adequately and effectively to manage each Fund’s Liquidity Risk for the period covered by the report. The Committee’s report noted that during the period covered by the report, there were no liquidity events that impacted the Funds or their ability to timely meet redemptions without dilution to existing shareholders. The Committee’s report noted that one Fund of the Trust, the Global X Nigeria Fund, was classified as an In-Kind Fund for purposes of Liquidity Reporting. The Committee’s report noted that no other material changes have been made to the Program since its implementation.
There can be no assurance that the Program will achieve its objectives in the future. Please refer to the prospectus for more information regarding a Fund’s exposure to liquidity risk and other principal risks to which an investment in the Funds may be subject.
|
| Approval of Investment Advisory Agreement (Unaudited) |
Section 15(c) of the Investment Company Act of 1940, as amended (“1940 Act”), requires that the board of trustees of an exchange-traded fund (“ETF”), including a majority of those trustees who are not “interested persons” of the ETF, as defined in the 1940 Act (“Independent Trustees”), consider on an initial basis and periodically thereafter (as required by the 1940 Act), at an in person meeting called for such purpose, the terms of each ETF’s investment advisory agreement and whether to approve entering into, or renewing, each agreement.
At a Board meeting of the Global X Funds (the “Trust”) held at the office of Global X Management Company LLC, the Trust’s investment adviser (“Global X Management”), on August 10, 2022 (the “New Fund Board Meeting”), the Board of Trustees (the “Board”) (including the Trust’s Independent Trustees, voting separately) considered and unanimously approved (i) the initial Investment Advisory Agreement (“New Investment Advisory Agreement”) for the Global X Russell 2000 Covered Call & Growth ETF (“New Fund”) and (ii) the initial Supervision and Administration Agreement between the Trust (“New Supervision and Administration Agreement”), on behalf of the New Fund, and
Global X Management. The New Investment Advisory Agreement and New Supervision and Administration Agreement are referred to collectively as the “New Fund Agreements.”
In advance of the Board meeting, the Board (including the Trust’s Independent Trustees) and the Independent Trustees’ independent legal counsel requested (in writing) detailed information from Global X Management in connection with the Board’s consideration of the New Fund Agreements and received and reviewed written responses from Global X Management and supporting materials relating to those requests for information. In the course of their consideration of the New Fund Agreements, the Trust’s Independent Trustees were advised by their independent legal counsel and, in addition to meetings with management of Global X Management, the Independent Trustees met separately in executive sessions with their counsel.
In determining to approve the New Fund Agreements for the New Fund, the Board considered a variety of factors, including the factors discussed in greater detail below.
Nature, Extent and Quality of Services
With respect to this factor, the Board considered:
| • | the terms of the New Fund Agreements and the range of services proposed to be provided to the New Funds in accordance with the New Fund Agreements; |
| • | Global X Management’s key personnel and the portfolio managers who would provide investment advisory, supervision and administrative services to the New Fund; |
| • | Global X Management’s responsibilities under the New Fund Agreements to, among other things, (i) manage the investment operations of the New Fund and the composition of the New Fund’s assets, including the purchase, retention and disposition of its holdings, (ii) provide quarterly reports to the Trust’s officers and the Board and |
|
| Approval of Investment Advisory Agreement (Unaudited) (Continued) |
| • | other reports as the Board deems necessary or appropriate, (iii) vote proxies, exercise consents, and exercise all other rights appertaining to securities and assets held by the New Fund, (iv) select broker-dealers to execute portfolio transactions for the New Fund when necessary, (v) assist in the preparation and filing of reports and proxy statements (if any) to the shareholders of the New Fund, and the periodic updating of the registration statements, prospectuses, statements of additional information, and other reports and documents for the New Fund that are required to be filed by the Trust with the U.S. Securities and Exchange Commission (“SEC”) and other regulatory or governmental bodies, and (vi) monitor anticipated purchases and redemptions of the shares (including Creation Units) of the New Fund by shareholders and new investors; |
| • | the nature, extent and quality of all of the services (including advisory, administrative and compliance services) that are proposed to be provided by Global X Management or made available to the New Fund; and |
| • | the quality of Global X Management’s resources and personnel that would be made available to the New Fund, including Global X Management’s experience and the professional qualifications of Global X Management’s key personnel. |
Based on these considerations, the Board concluded, at the New Fund Board Meeting, that it was satisfied with the nature, extent and quality of the services proposed to be provided to the New Fund by Global X Management.
Performance
The Board determined that, because the New Fund had not yet begun investment operations as of the date of the New Fund Board Meeting, meaningful data relating to the investment performance of the New Fund was not available and, therefore, could not be a factor in approving the New Fund Agreements.
Cost of Services and Profitability
With respect to this factor, the Board considered:
| • | Global X Management’s expected costs to provide investment management, supervision and administrative and related services to the New Fund; |
| • | The management fee (including the proposed investment advisory fee) (“Management Fee”) that was proposed to be borne by the New Fund under the New Fund Agreements for the various investment advisory, supervisory and administrative services that the New Fund requires under a unitary fee structure (including the types of fees and |
|
| Approval of Investment Advisory Agreement (Unaudited) (Continued) |
| • | expenses that are not included within the unitary fee and would be borne by the New Fund); and |
| • | the expected profitability to Global X Management, if any, from all of the services proposed to be provided to the New Fund by Global X Management and all aspects of the relationship between Global X Management and the New Fund. |
Based on these considerations, the Board concluded that the proposed Management Fee to be paid by the New Fund to Global X Management, in light of the nature, extent and quality of the services to be provided, was reasonable and in the best interests of the New Fund’s shareholders.
Comparison of Fees and Services
With respect to this factor, the Board considered:
| • | comparative information with respect to the proposed Management Fee to be paid to Global X Management by the New Fund. In connection with this consideration, Global X Management provided the Board with comparative expense data for the New Fund, including fees and expenses paid by unaffiliated similar specialized and/ or focused ETFs, and/or other similar registered funds. |
| • | the structure of the proposed unitary Management Fee (which includes as one component the proposed investment advisory fee for the New Fund) and the expected total expense ratio for the New Fund. In this regard, the Board took into consideration that the purpose of adopting a unitary Management Fee structure for the New Fund was to create a simple, all-inclusive fee that would provide a level of predictability with respect to the overall expense ratio (i.e., the total fees) of the New Fund and that the proposed Management Fee for the New Fund was set at a competitive level to make the New Fund viable in the marketplace; and |
| • | that, under the proposed unified Management Fee structure, Global X Management would be responsible for most ordinary expenses of the New Fund, including the costs of various third-party services required by the New Fund, including investment advisory, administrative, audit, certain custody, portfolio accounting, legal, transfer agency and printing costs, but that the New Fund would bear other expenses not covered under the proposed all-inclusive Management Fee, such as taxes, brokerage fees, commissions, and other transaction expenses, interest expenses, and extraordinary expenses. |
Based on these considerations, the Board concluded, at the New Fund Board Meeting, that the services to be received and the fees to be charged under the New Fund Agreements were reasonable on a comparative basis.
|
| Approval of Investment Advisory Agreement (Unaudited) (Concluded) |
Based on these considerations, the Board concluded, at the New Fund Board Meeting, that the services to be received and the fees to be charged under the New Fund Agreements were reasonable on a comparative basis.
Economies of Scale
With respect to this factor, the Board considered:
| • | the extent to which economies of scale would be realized as the New Fund grows and whether the proposed unitary Management Fee for the New Fund reflected these economies of scale; |
| • | the significant investment of time, personnel and other resources that Global X Management intends to make in the New Fund in order to seek to assure that the New Fund is attractive to investors; and |
| • | that the proposed unitary Management Fee would provide a high level of certainty as to the total level of expenses for the New Fund and its shareholders. |
Based on these considerations, the Board concluded, at the New Fund Board Meeting, that the proposed unitary Management Fee for the New Fund appropriately addressed economies of scale.
Other Benefits
In considering the New Fund Agreements, in addition to the factors discussed above, the
Board considered other benefits that may be realized by Global X Management as a result of its relationships with the New Fund. As a result, the Board concluded that, in the case of the New Fund, in the exercise of the Board’s business judgement, all information the Board considered supported approval of the New Fund Agreements.
Conclusion
After full consideration of the factors above, as well as other factors that were instructive in their consideration, the Board, including all of the Trust’s Independent Trustees voting separately, concluded, in the exercise of its business judgement, that the New Fund Agreements were fair and reasonable and in the best interest of the New Fund.
In reaching this decision, the Board did not assign relative weights to the factors above nor did the Board deem any one factor or group of them to be controlling in and of themselves. Each member of the Board may have assigned different weights to the various factors.
|
| Supplemental Information (UNAUDITED) |
NAV is the price per Share at which the Funds issue and redeem Shares. It is calculated in accordance with the standard formula for valuing mutual fund shares. The “Market Price” of the Funds generally is determined using the midpoint between the highest bid and the lowest offer on the stock exchange on which the Shares of the Funds are listed for trading, as of the time that the Funds’ NAV is calculated. The Funds’ Market Price may be at, above or below their NAV. The NAV of the Funds will fluctuate with changes in the market value of the Funds’ holdings. The Market Price of the Funds will fluctuate in accordance with changes in their NAV, as well as market supply and demand.
Premiums or discounts are the differences (expressed as a percentage) between the NAV and Market Price of the Funds on a given day, generally at the time NAV is calculated. A premium is the amount that the Funds are trading above the reported NAV, expressed as a percentage of the NAV. A discount is the amount that the Funds are trading below the reported NAV, expressed as a percentage of the NAV.
Further information regarding premiums and discounts is available on the Funds’ website at www.globalxetfs.com.
|
| Trustees and Officers of the Trustees (UNAUDITED) |
Set forth below are the names, addresses, years of birth, positions with the Trust, Term of Office and Length of Time Served, the principal occupations for the last five years, number of Funds in Trust overseen by the Trustees, and other directorships outside the fund complex of each of the persons currently serving as Trustees and Officers of the Trust.
| | Position(s) | | Number of Funds in | |
| Name, Address | Held | Principal Occupation(s) During the Past | Trust Overseen by | Other Directorships |
| (Year of Birth) | with Trust | 5 Years | Trustee | Held by Trustees |
| Independent Trustees1 | | | | |
| Charles A. Baker | Trustee (since | Chief Executive Officer of Investment | 1072 | None. |
| 605 Third Avenue, | 07/2018) | Innovations LLC (investment | | |
| 43rd Floor | | consulting) (since 2013); Managing | | |
| New York, NY | | Director of NYSE Euronext (2003 to | | |
| 10158 | | 2012). | | |
| (1953) | | | | |
| Susan M. Ciccarone | Trustee (since | Partner, Further Global Capital | 1072 | Director of E78 |
| 605 Third Avenue, | 09/2019) | Management (private equity) (since | | Partners (since 2022); |
| 43rd Floor | | 2017); formerly Chief Operating Officer | | Director of ProSight |
| New York, NY | | (2014-2016) and Chief Financial | | Global, Inc. (since |
| 10158 | | Officer (2012-2016), Emerging Global | | 2021); Director of |
| (1973) | | Advisors, LLC (ETF issuer). | | Casa Holdco LP, |
| | | | | parent of Celink (since |
| | | | | 2018); Chairman, |
| | | | | Payment Alliance |
| | | | | International, Inc. |
| | | | | (2019-2021). |
| Clifford J. Weber | Trustee (since | Owner, Financial Products Consulting | 1072 | Chairman (since |
| 605 Third Avenue, | 07/2018) | Group LLC (consulting services to | | 2017) and Trustee |
| 43rd Floor | | financial institutions) (since 2015); | | (since 2015) of |
| New York, NY | | formerly, Executive Vice President of | | Clough Funds Trust; |
| 10158 | | Global Index and Exchange-Traded | | Chairman and Trustee |
| (1963) | | Products, NYSE Market, Inc., a | | of Clayton Street |
| | | subsidiary of Intercontinental Exchange | | Trust (since 2016); |
| | | (ETF/ETP listing exchange) (2013- | | Chairman and Trustee |
| | | 2015). | | of Janus Detroit Street |
| | | | | Trust (since 2016); |
| | | | | Chairman and Trustee |
| | | | | of Elevation ETF |
| | | | | Trust (2016-2018); |
| | | | | Trustee of Clough |
| | | | | Global Equity Fund |
| | | | | (since 2017); Trustee |
| | | | | of Clough Global |
| | | | | Dividend and Income |
| | | | | Fund (since 2017); |
| | | | | and Trustee of Clough |
| | | | | Global Opportunities |
| | | | | Fund (since 2017). |
|
| Trustees and Officers of the Trustees (UNAUDITED) |
The Trust’s SAI includes additional information about the Trustees and Officers. The SAI may be obtained without charge by calling 1-888-493-8631. The following chart lists Trustees and Officers as of October 31, 2022.
| | Position(s) | | Number of Funds in | |
| Name, Address | Held | Principal Occupation(s) During the Past | Trust Overseen by | Other Directorships |
| (Year of Birth) | with Trust | 5 Years | Trustee | Held by Trustees |
| Interested Trustee/Officers1 | | | |
| Luis Berruga | Trustee (since | Chief Executive Officer, GXMC (since | 1072 | None. |
| 605 Third Avenue, | 07/2018); | 07/2018), Chief Financial Officer (since | | |
| 43rd Floor | President (since | 2/2014) and Chief Operating Officer | | |
| New York, NY | 2018) | (9/2015 - 7/2018); Investment Banker, | | |
| 10158 | | Jefferies (2012-2014). | | |
| (1977) | | | | |
| John Belanger | Chief Operating | Chief Operating Officer and Head of | N/A | N/A |
| 605 Third Avenue, | Officer and | Portfolio Management & Portfolio | | |
| 43rd Floor | Chief Financial | Administration, GXMC (since 12/2020); | | |
| New York, NY | Officer (since | Portfolio Manager (12/2020-4/2022); | | |
| 10158 | 12/2020) | Secretary of the Trust (3/2020-9/2020); | | |
| (1982) | | Head of Product Management, GXMC | | |
| | | (since 1/2020); Consultant to GXMC | | |
| | | (9/2018-12/2019); Chief Operating | | |
| | | Officer, Rex Shares, LLC (2014-2018). | | |
| Susan Lively | Secretary (since | General Counsel, GXMC (since | N/A | N/A |
| 605 Third Avenue, | 09/2020) | 9/2020); Senior Corporate Counsel | | |
| 43rd Floor | | at Franklin Templeton (previously, | | |
| New York, NY | | Managing Director and Associate | | |
| 10158 | | General Counsel at Legg Mason & Co., | | |
| (1981) | | LLC) (2014-2020). | | |
| Eric Griffith | Assistant | Counsel, SEI Investments (since | N/A | N/A |
| One Freedom | Secretary (since | 10/2019); Vice President and Assistant | | |
| Valley Drive | 02/2020) | General Counsel, JPMorgan Chase & | | |
| Oaks, PA 19456 | | Co. (2012-2018). | | |
| (1969) | | | | |
| Joe Costello | Chief | Chief Compliance Officer, FlexShares | N/A | N/A |
| 605 Third Avenue, | Compliance | Funds (2011-2015); Vice President, | | |
| 43rd Floor | Officer (since | Northern Trust Investments (2003 - | | |
| New York, NY | 09/2016) | 2015). | | |
| 10158 | | | | |
| (1974) | | | | |
| Ronnie Riven | Treasurer | Director of Finance, GXMC (since | N/A | N/A |
| 605 Third Avenue, | and Principal | 2018); Director of Accounting and | | |
| 43rd Floor | Accounting | Finance at Barclays Center (2016-2018); | | |
| New York, NY | Officer (since | Manager of External Reporting at | | |
| 10158 | 12/2020) | National Grid (2013-2015). | | |
| (1984) | | | | |
|
| Trustees and Officers of the Trustees (UNAUDITED) |
|
|
|
|
|
| | Position(s) | | Number of Funds in | |
| Name, Address | Held | Principal Occupation(s) During the Past | Trust Overseen by | Other Directorships |
| (Year of Birth) | with Trust | 5 Years | Trustee | Held by Trustees |
| Interested Trustee/Officers1 | | | |
| Eric Olsen3 | Assistant | Director of Accounting, SEI Investment | N/A | N/A |
| One Freedom | Treasurer (since | Manager Services (March 2021 to | | |
| Valley Drive | 5/2021) | present); formerly, Deputy Head of Fund | | |
| Oaks, PA 19456 | | Operations, Traditional Assets, Aberdeen | | |
| (1970) | | Standard Investments (2013-2021). | | |
1 Each Trustee serves until his or her successor is duly elected or appointed and qualified.
2 As of October 31, 2022, the Trust had one hundred and seven investment portfolios, ninety-seven of which were operational.
3 This officer of the Trust also serves as an officer of one or more mutual funds for which SEI Investments Company or an affiliate acts as investment manager, administrator or distributor.
|
| Notice to Shareholders (UNAUDITED) |
For shareholders that do not have an October 31, 2022 tax year end, this notice is for informational purposes only. For shareholders with an October 31, 2022 tax year end, please consult your tax advisor as to the pertinence of this notice. For the fiscal year ended October 31, 2022, the Funds have designated the following items with regard to distributions paid during the year.
| | | | | | | | | | | | | |
| |
| | | | | | | | | | | | Qualifying | | | | |
| | | | | | | | | | | | for Corporate | | | | |
| | |
| | | | | |
| | | Dividends | | | Qualifying | |
| | | Long-Term
| | | Ordinary Income | | | Total | | | Received
| | | Dividend | |
| Return of Capital | | Capital Gain
| | | Distributions | | | Distributions | | | Deduction(1)
| | | Income(2)
| |
| Global X Social Media ETF | | | | | | | | | | | | | | | |
| 100.00% | | | 0.00 | % | | | 0.00 | % | | | 100.00 | % | | | 0.00 | % | | | 100.00 | % |
| Global Global X Lithium & Battery Tech ETF | | | | | | | | | | | | | | | | | |
| 0.00% | | | 0.00 | % | | | 100.00 | % | | | 100.00 | % | | | 48.14 | % | | | 100.00 | % |
| Global X Disruptive Materials ETF | | | | | | | | | | | | | | | | | |
| 0.00% | | | 0.00 | % | | | 100.00 | % | | | 100.00 | % | | | 0.00 | % | | | 0.00 | % |
| Global X E-Commerce ETF | | | | | | | | | | | | | | | | | | | | |
| 7.41% | | | 68.38 | % | | | 24.21 | % | | | 100.00 | % | | | 100.00 | % | | | 100.00 | % |
| Global X Emerging Markets Internet & E-commerce ETF | | | | | | | | | | | | | |
| 100.00% | | | 0.00 | % | | | 0.00 | % | | | 100.00 | % | | | 0.00 | % | | | 0.00 | % |
| Global X SuperDividend® ETF | | | | | | | | | | | | | | | | | | | | |
| 35.52% | | | 0.00 | % | | | 64.48 | % | | | 100.00 | % | | | 0.17 | % | | | 33.07 | % |
| Global X SuperDividend® U.S. ETF | | | | | | | | | | | | | | | | | |
| 50.09% | | | 0.00 | % | | | 49.91 | % | | | 100.00 | % | | | 68.61 | % | | | 68.95 | % |
| Global X MSCI SuperDividend® EAFE ETF | | | | | | | | | | | | | | | | | |
| 0.00 | | | 0.00 | % | | | 100.00 | % | | | 100.00 | % | | | 0.00 | % | | | 93.17 | % |
| Global X MSCI SuperDividend® Emerging Markets ETF | | | | | | | | | | | | | |
| 19.01% | | | 0.00 | % | | | 80.99 | % | | | 100.00 | % | | | 0.00 | % | | | 67.69 | % |
| Global X SuperDividend® REIT ETF | | | | | | | | | | | | | | | | | |
| 51.71% | | | 0.00 | % | | | 48.29 | % | | | 100.00 | % | | | 0.00 | % | | | 0.00 | % |
| Global X NASDAQ 100® Covered Call ETF | | | | | | | | | | | | | | | | | |
| 81.32% | | | 0.00 | % | | | 18.68 | % | | | 100.00 | % | | | 0.00 | % | | | 0.00 | % |
| Global X S&P 500® Covered Call ETF | | | | | | | | | | | | | | | | | |
| 89.13% | | | 0.00 | % | | | 10.87 | % | | | 100.00 | % | | | 0.00 | % | | | 0.00 | % |
| Global X Russell 2000 Covered Call ETF | | | | | | | | | | | | | | | | | |
| 84.18% | | | 0.00 | % | | | 15.82 | % | | | 100.00 | % | | | 0.00 | % | | | 0.00 | % |
| Global X Dow 30® Covered Call ETF | | | | | | | | | | | | | | | | | |
| 82.38% | | | 0.00 | % | | | 17.62 | % | | | 100.00 | % | | | 0.00 | % | | | 0.00 | % |
| Global X Nasdaq 100® Covered Call & Growth ETF | | | | | | | | | | | | | | | | | |
| 92.31% | | | 0.00 | % | | | 7.69 | % | | | 100.00 | % | | | 0.00 | % | | | 0.00 | % |
| Global X S&P 500® Covered Call & Growth ETF | | | | | | | | | | | | | | | | | |
| 46.79% | | | 0.12 | % | | | 53.09 | % | | | 100.00 | % | | | 0.00 | % | | | 0.00 | % |
| Global X Russell 2000 Covered Call & Growth ETF | | | | | | | | | | | | | | | | | |
| 0.00% | | | 0.00 | % | | | 0.00 | % | | | 0.00 | % | | | 0.00 | % | | | 0.00 | % |
| Global X SuperIncome™ Preferred ETF | | | | | | | | | | | | | | | | | |
| 5.21% | | | 0.00 | % | | | 94.79 | % | | | 100.00 | % | | | 74.04 | % | | | 74.03 | % |
| Global X Renewable Energy Producers ETF | | | | | | | | | | | | | | | | | |
| 0.00% | | | 0.00 | % | | | 100.00 | % | | | 100.00 | % | | | 12.55 | % | | | 99.22 | % |
| Global X S&P 500® Catholic Values ETF | | | | | | | | | | | | | | | | | |
| 0.00% | | | 12.99 | % | | | 87.01 | % | | | 100.00 | % | | | 70.46 | % | | | 75.06 | % |
| Global X S&P Catholic Values Developed ex-U.S. ETF | | | | | | | | | | | | | | | | | |
| 0.00% | | | 6.92 | % | | | 93.08 | % | | | 100.00 | % | | | 0.00 | % | | | 82.05 | % |
| Global X Guru® Index ETF | | | | | | | | | | | | | | | | | | | | |
| 81.26% | | | 0.00 | % | | | 18.74 | % | | | 100.00 | % | | | 100.00 | % | | | 100.00 | % |
| Global X S&P 500® Tail Risk ETF | | | | | | | | | | | | | | | | | |
| 0.00% | | | 4.77 | % | | | 95.23 | % | | | 100.00 | % | | | 0.00 | % | | | 0.00 | % |
| Global X S&P 500® Risk Managed Income ETF | | | | | | | | | | | | | | | | | |
| 88.55% | | | 0.00 | % | | | 11.45 | % | | | 100.00 | % | | | 0.00 | % | | | 0.00 | % |
| Global X S&P 500® Collar 95-110 ETF | | | | | | | | | | | | | | | | | |
| 0.00% | | | 0.58 | % | | | 99.42 | % | | | 100.00 | % | | | 0.00 | % | | | 0.00 | % |
| Global X NASDAQ 100® Tail Risk ETF | | | | | | | | | | | | | | | | | |
| 0.00% | | | 0.00 | % | | | 100.00 | % | | | 100.00 | % | | | 0.00 | % | | | 0.00 | % |
| Global X NASDAQ 100® Risk Managed Income ETF | | | | | | | | | | | | | | | | | |
| 97.80% | | | 0.00 | % | | | 2.20 | % | | | 100.00 | % | | | 0.00 | % | | | 0.00 | % |
| Global X NASDAQ 100® Collar 95-110 ETF | | | | | | | | | | | | | | | | | |
| 0.00% | | | 4.04 | % | | | 95.96 | % | | | 100.00 | % | | | 0.00 | % | | | 0.00 | % |
(1) Qualifying dividends represent dividends which qualify for the corporate dividends received deduction and is reflected as a percentage of ordinary income distributions (the total of short term capital gain and net investment income distributions).
|
| Notice to Shareholders (UNAUDITED) |
(2) The percentage in this column represents the amount of "Qualifying Dividend Income" as created by the Jobs and Growth Relief Reconciliation Act of 2003 and its reflected as a percentage of ordinary income distributions (the total of short term capital gain and net investment income distributions). It is the intention of each of the aforementioned Funds to designate the maximum amount permitted by law.
| | | | | | | | | | |
| |
| | | | | | Short Term | | | Qualifying | | | | |
| U.S. Government | | Interest Related | | | Capital Gain | | | Business | | | Foreign Tax | |
| Interest(3) | | Dividends(4) | | | Dividends(5) | | | Income(6) | | | Credit | |
| Global X Social Media ETF | | | | | | | | | | | | |
| 0.00% | | | 0.00 | % | | | 0.00 | % | | | 0.00 | % | | | 0.00 | % |
| Global X Lithium & Battery Tech ETF | | | | | | | | | | | | | | | | |
| 0.00% | | | 0.02 | % | | | 0.00 | % | | | 0.00 | % | | | 0.00 | % |
| Global X Disruptive Materials ETF | | | | | | | | | | | | | | | | |
| 0.00% | | | 0.00 | % | | | 0.00 | % | | | 0.00 | % | | | 17.28 | % |
| Global X E-Commerce ETF | | | | | | | | | | | | | | | | |
| 0.00% | | | 0.00 | % | | | 0.00 | % | | | 0.00 | % | | | 0.00 | % |
| Global X Emerging Markets Internet & E-commerce ETF | | | | | | | | | | | | | |
| 0.00% | | | 0.00 | % | | | 0.00 | % | | | 0.00 | % | | | 0.00 | % |
| Global X SuperDividend® ETF | | | | | | | | | | | | | | | | |
| 0.00% | | | 0.01 | % | | | 0.00 | % | | | 10.71 | % | | | 2.00 | % |
| Global X SuperDividend® U.S. ETF | | | | | | | | | | | | | | | | |
| 0.00% | | | 0.55 | % | | | 0.00 | % | | | 70.13 | % | | | 0.00 | % |
| Global X MSCI SuperDividend® EAFE ETF | | | | | | | | | | | | | | | | |
| 0.00% | | | 0.00 | % | | | 0.00 | % | | | 0.00 | % | | | 7.05 | % |
| Global X MSCI SuperDividend® Emerging Markets ETF | | | | | | | | | | | | | |
| 0.00 | | | 0.03 | % | | | 0.00 | % | | | 0.00 | % | | | 8.22 | % |
| Global X SuperDividend® REIT ETF | | | | | | | | | | | | | | | | |
| 0.00 | | | 0.00 | % | | | 0.00 | % | | | 67.82 | % | | | 0.00 | % |
| Global X NASDAQ 100® Covered Call ETF | | | | | | | | | | | | | | | | |
| 0.00% | | | 0.03 | % | | | 100.00 | % | | | 0.00 | % | | | 0.00 | % |
| Global X S&P 500® Covered Call ETF | | | | | | | | | | | | | | | | |
| 0.00% | | | 0.13 | % | | | 100.00 | % | | | 0.73 | % | | | 0.00 | % |
| Global X Russell 2000 Covered Call ETF | | | | | | | | | | | | | | | | |
| 0.00% | | | 0.03 | % | | | 100.00 | % | | | 0.00 | % | | | 0.00 | % |
| Global X Dow 30® Covered Call ETF | | | | | | | | | | | | | | | | |
| 0.00% | | | 0.00 | % | | | 0.00 | % | | | 0.00 | % | | | 0.00 | % |
| Global X NASDAQ 100® Covered Call & Growth ETF | | | | | | | | | | | | | |
| 0.00% | | | 0.00 | % | | | 100.00 | % | | | 0.00 | % | | | 0.00 | % |
| Global X S&P 500® Covered Call & Growth ETF | | | | | | | | | | | | | | | | |
| 0.00% | | | 0.00 | % | | | 100.00 | % | | | 0.24 | % | | | 0.00 | % |
| Global X Russell 2000 Covered Call & Growth ETF | | | | | | | | | | | | | | | | |
| 0.00% | | | 0.00 | % | | | 0.00 | % | | | 0.00 | % | | | 0.00 | % |
| Global X SuperIncome™ Preferred ETF | | | | | | | | | | | | | | | | |
| 0.00% | | | 0.00 | % | | | 0.00 | % | | | 3.97 | % | | | 0.00 | % |
| Global X Renewable Energy Producers ETF | | | | | | | | | | | | | | | | |
| 0.00 | | | 0.22 | % | | | 0.00 | % | | | 0.00 | % | | | 12.37 | % |
| Global X S&P 500® Catholic Values ETF | | | | | | | | | | | | | | | | |
| 0.00% | | | 0.03 | % | | | 0.00 | % | | | 3.31 | % | | | 0.00 | % |
| Global X S&P Catholic Values Developed ex-U.S. ETF | | | | | | | | | | | | | |
| 0.00% | | | 0.00 | % | | | 100.00 | % | | | 0.00 | % | | | 6.64 | % |
| Global X Guru® Index ETF | | | | | | | | | | | | | | | | |
| 0.00% | | | 0.32 | % | | | 0.00 | % | | | 0.00 | % | | | 0.00 | % |
| Global X S&P 500® Tail Risk ETF | | | | | | | | | | | | | | | | |
| 0.00% | | | 0.00 | % | | | 100.00 | % | | | 0.35 | % | | | 0.00 | % |
| Global X S&P 500® Risk Managed Income ETF | | | | | | | | | | | | | | | | |
| 0.00% | | | 0.00 | % | | | 100.00 | % | | | 0.31 | % | | | 0.00 | % |
| Global X S&P 500® Collar 95-110 ETF | | | | | | | | | | | | | | | | |
| 0.00% | | | 0.00 | % | | | 100.00 | % | | | 0.42 | % | | | 0.00 | % |
| Global X NASDAQ 100® Tail Risk ETF | | | | | | | | | | | | | | | | |
| 0.00% | | | 0.00 | % | | | 100.00 | % | | | 0.00 | % | | | 0.00 | % |
| Global X NASDAQ 100® Risk Managed Income ETF | | | | | | | | | | | | | | | | |
| 0.00% | | | 0.00 | % | | | 0.00 | % | | | 0.00 | % | | | 0.00 | % |
| Global X NASDAQ 100® Collar 95-110 ETF | | | | | | | | | | | | | | | | |
| 0.00% | | | 0.00 | % | | | 100.00 | % | | | 0.00 | % | | | 0.00 | % |
(3) "U.S. Government Interest" represents the amount of interest that was derived from U.S. Government obligations and distributed during the fiscal year. Generally, interest from direct U.S. Government obligations is exempt from state income tax. However, for shareholders who are residents of California, Connecticut and New York, the statutory threshold requirements were not satisfied to permit exemption of these amounts from state income.
|
| Notice to Shareholders (UNAUDITED) |
(4) The percentage in this column represents the amount of "Interest Related Dividends" as created by the American Jobs Creation Act of 2004 and is a percentage of net investment income that is exempt from U.S. withholding tax when paid for foreign investors.
(5) The percentage of this column represents the amount of “Short Term Capital Gain Dividend” and is reflected as a percentage of short term capital gain distribution that is exempted from U.S. withholding tax when paid to foreign investors.
(6) The percentage of this column represents that amount of ordinary dividend income that qualified for 20% Business Income Deduction.
Certain Funds intend to pass through a foreign tax credit to shareholders. For the fiscal year ended October 31, 2022 the total amount of foreign source income and foreign tax credit are as follows:
| | | | Foreign Source
| | | | Foreign Tax Credit
| |
Fund Name
| | | Income
| | | | Pass Through
| |
| Global X Disruptive Materials ETF | | $ | 83,661
| | | $ | 9,925
| |
Global X Superdividend® ETF | | | 46,660,747 | | | | 1,917,262 | |
Global X MSCI SuperDividend® EAFE ETF | | | 821,599 | | | | 56,262 | |
Global X MSCI SuperDividend® Emerging Markets ETF | | | 4,439,537 | | | | 544,311 | |
| Global X Renewable Energy Producers ETF | | | 1,393,112 | | | | 174,127 | |
| Global X S&P Catholic Values Developed ex-U.S. ETF | | | 163,141 | | | | 14,486 | |
The information reported herein may differ from the information and distributions taxable to the shareholders for the calendar year ending December 31, 2022. Complete information will be computed and reported in conjunction with your 2022 Form 1099-DIV.
605 3rd Avenue, 43rd Floor
New York, NY 10158
1-888-493-8631
www.globalxetfs.com
Investment Adviser and Administrator:
Global X Management Company LLC
605 3rd Avenue, 43rd Floor
New York, NY 10158
Distributor:
SEI Investments Distribution Co.
One Freedom Valley Drive
Oaks, PA 19456
Sub-Administrator:
SEI Investments Global Funds Services
One Freedom Valley Drive
Oaks, PA 19456
Counsel for Global X Funds and the Independent Trustees:
Stradley Ronon Stevens & Young, LLP
2000 K Street, N.W.
Suite 700
Washington, DC 20006
Custodians and Transfer Agents:
Brown Brothers Harriman & Co.
40 Water Street
Boston, MA 02109
The Bank of New York Mellon
500 Grant Street
Pittsburgh, PA 15258
Independent Registered Public Accounting Firm:
PricewaterhouseCoopers LLP
Two Commerce Square
Suite 1800
2001 Market Street
Philadelphia, PA 19103
This information must be preceded or accompanied by a current prospectus for the Funds described.
GLX-AR-003-1200
Item 2. Code of Ethics.
The registrant has adopted a code of ethics that applies to the registrant’s principal executive officer, principal financial officer, comptroller or principal accounting officer, and any person who performs a similar function.
Item 3. Audit Committee Financial Expert.
(a)(1) The registrant’s board of trustees has determined that the registrant has at least one audit committee financial expert serving on the audit committee.
(a)(2) The audit committee financial experts are Charles A. Baker and Susan M. Ciccarone and each is independent as defined in Form N-CSR Item 3(a)(2).
Item 4. Principal Accountant Fees and Services.
Fees billed by Pricewaterhouse Coopers LLP (“PwC”) relate to the registrant.
PWC billed the registrant aggregate fees for services rendered to the registrant for the last two fiscal years as follows:
| | | 2022 | | | 2021 | |
| | | | All fees and services to the Trust that were pre-approved | | | All fees and services to service affiliates that were pre-approved | | | All other fees and services to service affiliates that did not require pre-approval | | | All fees and services to the Trust that were pre-approved | | | All fees and services to service affiliates that were pre-approved | | | All other fees and services to service affiliates that did not require pre-approval | |
(a) | Audit Fees | | $ | 1,148,958 | | | $ | 0 | | | $ | 0 | | | $ | 929,467 | | | $ | 0 | | | $ | 0 | |
(b) | Audit-Related Fees | | $ | 0 | | | $ | 0 | | | $ | 0 | | | $ | 0 | | | $ | 0 | | | $ | 0 | |
(c) | Tax Fees(1) | | $ | 406,447 | | | $ | 0 | | | $ | 0 | | | $ | 334,184 | | | $ | 0 | | | $ | 0 | |
(d) | All Other Fees | | $ | 0 | | | $ | 0 | | | $ | 0 | | | $ | 0 | | | $ | 0 | | | $ | 0 | |
Notes:
| (1) | Tax Compliance and excise distribution services. |
(e) (1) Not applicable.
(e)(2) Percentage of fees billed applicable to non-audit services pursuant to waiver of pre-approval requirement were as follows (PwC):
| | | 2022 | | | 2021 | |
| Audit-Related Fees | | | 0 | % | | | 0 | % |
Tax Fees | | | 0 | % | | | 0 | % |
| All Other Fees | | | 0 | % | | | 0 | % |
(f) Not applicable.
(g) The aggregate non-audit fees and services billed by PwC for the last two fiscal years were $406,447 and $334,184, respectively.
(h) During the past fiscal year, all non-audit services provided by registrant’s principal accountant to either registrant’s investment adviser or to any entity controlling, controlled by, or under common control with registrant’s investment adviser that provides ongoing services to registrant were pre-approved by the audit committee of registrant’s Board of Trustees. Included in the audit committee’s pre-approval was the review and consideration as to whether the provision of these non-audit services is compatible with maintaining the principal accountant’s independence.
(i) Not applicable.
(j) Not applicable.
Item 5. Audit Committee of Listed Registrants.
The registrant has a separately-designated standing Audit Committee, which is composed of the registrant's Independent Trustees, Charles A. Baker, Susan M. Ciccarone and Clifford J. Weber.
Item 6. Investments.
Not applicable.
Item 7. Disclosure of Proxy Voting Policies and Procedures for Closed-End Management Investment Companies.
Not applicable to open-end management investment companies.
Item 8. Portfolio Managers of Closed-End Management Investment Companies.
Not applicable to open-end management investment companies.
Item 9. Purchases of Equity Securities by Closed-End Management Investment Company and Affiliated Purchasers.
Not applicable to open-end management investment companies.
Item 10. Submission of Matters to a Vote of Security Holders.
There have been no material changes.
Item 11. Controls and Procedures.
(a) The certifying officers, whose certifications are included herewith, have evaluated the registrant’s disclosure controls and procedures within 90 days of the filing date of this report. In their opinion, based on their evaluation, the registrant’s disclosure controls and procedures are adequately designed, and are operating effectively to ensure, that information required to be disclosed by the registrant in the reports it files or submits under the Securities Exchange Act of 1934 is recorded, processed, summarized and reported within the time periods specified in the Securities and Exchange Commission’s rules and forms.
(b) There were no significant changes in the registrant’s internal control over financial reporting that occurred during the period covered by this report that has materially affected, or is reasonably likely to materially affect, the registrant’s internal control over financial reporting.
Item 12. Disclosure of Securities Lending Activities for Closed-End Management Investment Companies.
Not applicable to open-end management investment companies.
Item 13. Exhibits.
SIGNATURES
Pursuant to the requirements of the Securities Exchange Act of 1934 and the Investment Company Act of 1940, the registrant has duly caused this report to be signed on its behalf by the undersigned, thereunto duly authorized.
/s/ Luis Berruga
Luis Berruga
President
Date: January 6, 2023
Pursuant to the requirements of the Securities Exchange Act of 1934 and the Investment Company Act of 1940, this report has been signed below by the following persons on behalf of the registrant and in the capacities and on the dates indicated.
Date: January 6, 2023
/s/ Luis Berruga
Luis Berruga
President
Date: January 6, 2023
/s/ John Belanger
John Belanger
Chief Financial Officer
Date: January 6, 2023