UNITED STATES
SECURITIES AND EXCHANGE COMMISSION
Washington, D.C. 20549
FORM N-CSR
CERTIFIED SHAREHOLDER REPORT OF REGISTERED MANAGEMENT
INVESTMENT COMPANIES
Investment Company Act file number 811-22209
Global X Funds
(Exact name of registrant as specified in charter)
623 Fifth Avenue, 15th Floor
New York, NY 10022
(Address of principal executive offices) (Zip code)
Bruno del Ama
Global X Management Company LLC
623 Fifth Avenue, 15th Floor
New York, NY 10022
(Name and address of agent for service)
With a copy to:
Daphne Tippens Chisolm, Esq.
Law Offices of DT Chisolm, P.C.
11524 C Providence Road, Suite 236
Charlotte, NC 28277
Registrant’s telephone number, including area code: (212) 644-6440
Date of fiscal year end: October 31, 2013
Date of reporting period: October 31, 2013
Item 1. Reports to Stockholders.
| Global X Silver Miners ETF (ticker: SIL) |
| Global X Gold Explorers ETF (ticker: GLDX) |
| Global X Pure Gold Miners ETF (ticker: GGGG) |
| Global X Copper Miners ETF (ticker: COPX) |
| Global X Uranium ETF (ticker: URA) |
| Global X Lithium ETF (ticker: LIT) |
| Global X Fertilizers/Potash ETF (ticker: SOIL) |
| Global X Junior Miners ETF (ticker: JUNR) |
Annual Report
October 31, 2013

Table of Contents
| | |
| Management Discussion of Fund Performance (unaudited) | 1 |
| | |
| Schedules of Investments | |
| | |
| Global X Silver Miners ETF | 9 |
| | |
| Global X Gold Explorers ETF | 12 |
| | |
| Global X Pure Gold Miners ETF | 14 |
| | |
| Global X Copper Miners ETF | 17 |
| | |
| Global X Uranium ETF | 20 |
| | |
| Global X Lithium ETF | 22 |
| | |
| Global X Fertilizers/Potash ETF | 25 |
| | |
| Global X Junior Miners ETF | 28 |
| | |
| Statements of Assets and Liabilities | 33 |
| | |
| Statements of Operations | 35 |
| | |
| Statements of Changes in Net Assets | 37 |
| | |
| Financial Highlights | 41 |
| | |
| Notes to Financial Statements | 43 |
| | |
| Report of Independent Registered Public Accounting Firm | 56 |
| | |
| Disclosure of Fund Expenses (unaudited) | 57 |
| | |
| Supplemental Information (unaudited) | 59 |
| | |
| Trustees and Officers of the Trust (unaudited) | 60 |
| | |
| Notice to Shareholders (unaudited) | 63 |
The Funds file their complete schedules of Fund holdings with the Securities and Exchange Commission (the “Commission”) for the first and third quarters of each fiscal year on Form N-Q within sixty days after the end of the period. The Funds’ Forms N-Q are available on the Commission’s website at http://www.sec.gov, and may be reviewed and copied at the Commission's Public Reference Room in Washington, DC. Information on the operation of the Public Reference Room may be obtained by calling 1-800-SEC-0330.
A description of the policies and procedures that Global X Funds uses to determine how to vote proxies relating to Fund securities, as well as information relating to how the Funds voted proxies relating to Fund securities during the most recent 12-month period ended June 30, will be available (i) without charge, upon request, by calling 1-888-GXFund-1; and (ii) on the Commission’s website at http://www.sec.gov.
| Management Discussion of Fund Performance (unaudited) |
| Global X Silver Miners ETF |
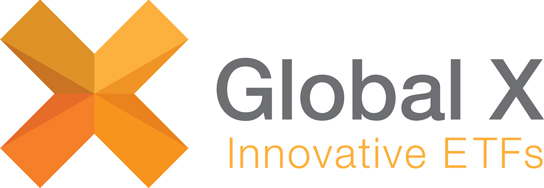
Global X Silver Miners ETF
The Global X Silver Miners ETF (the “Fund”) seeks to provide investment results that correspond generally to the price and yield performance, before fees and expenses, of the Solactive Global Silver Miners Index (the “Index”). The Fund generally seeks to replicate the Index but may at times invest in a representative sample of securities that collectively has an investment profile similar to the Index and as a result may or may not hold all the securities that are included in the Index.
The Index is designed to reflect the performance of the silver mining industry. It is comprised of selected companies globally that are actively engaged in some aspect of the silver mining industry, such as silver mining, refining, or exploration. The Fund is the first ETF globally focused exclusively on the silver mining sector.
For the 12-month period ended October 31, 2013 (the “reporting period”), the Fund decreased 47.97%, while the Index decreased 47.70%. The Fund had a net asset value of $24.98 per share on October 31, 2012 and ended the reporting period with a net asset value of $12.88 on October 31, 2013.
The S&P 500 Index is a market capitalization weighted composite index of 500 large capitalization U.S. companies.
During the reporting period, the highest returns came from Aurcana and Excellon Resources Inc., which returned 80.94% and 14.34%, respectively. The worst performers were Alcyone Resources and Golden Minerals, which returned -90.85% and -82.38%, respectively.
| | | AVERAGE ANNUAL TOTAL RETURN FOR THE PERIOD ENDED OCTOBER 31, 2013 | |
| | | One Year Return | | | Three Year Return | | | Annualized Inception to Date* | |
| | | Net Asset Value | | | Market Price | | | Net Asset Value | | | Market Price | | | Net Asset Value | | | Market Price | |
| Global X Silver Miners ETF | | | -47.97 | % | | | -48.57 | % | | | -13.36 | % | | | -13.45 | % | | | -2.75 | % | | | -2.73 | % |
| Solactive Global Silver Miners Index | | | -47.70 | % | | | -47.70 | % | | | -12.83 | % | | | -12.83 | % | | | -2.10 | % | | | -2.10 | % |
| S&P 500 Index | | | 27.18 | % | | | 27.18 | % | | | 16.56 | % | | | 16.56 | % | | | 13.84 | % | | | 13.84 | % |
Growth of a $10,000 Investment
(at Net Asset Value)
*Fund commenced operations on April 19, 2010.
The performance data quoted herein represents past performance and the return and value of an investment in the Fund will fluctuate so that, when redeemed, may be worth less than its original cost. Past performance is no guarantee of future performance and should not be considered as a representation of the future results of the Fund. The Fund's performance assumes the reinvestment of all dividends and all capital gains. Index returns assume reinvestment of dividends and, unlike a Fund's returns, do not reflect any fees or expenses. If such fees and expenses were included in the index returns, the performance would have been lower. Please note that one cannot invest directly in an unmanaged index.
There are no assurances that the Fund will meet its stated objectives.
The Fund’s holdings and allocations are subject to change and should not be considered recommendations to buy individual securities.
Returns shown do not reflect the deduction of taxes that a shareholder would pay on Fund distributions or the redemption of Fund shares.
See definition of comparative indices above.
| Management Discussion of Fund Performance (unaudited) |
| Global X Gold Explorers ETF |
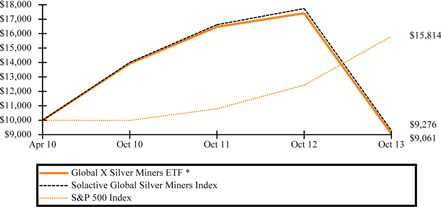
Global X Gold Explorers ETF
The Global X Gold Explorers ETF (the “Fund”) seeks to provide investment results that correspond generally to the price and yield performance, before fees and expenses, of the Solactive Global Gold Explorers Index (the “Index”). The Fund generally seeks to replicate the Index but may at times invest in a representative sample of securities that collectively has an investment profile similar to the Index and as a result may or may not hold all the securities that are included in the Index.
The Index is designed to track the performance of the largest and most liquid listed companies that are active in the exploration for gold.
For the 12-month period ended October 31, 2013 (the “reporting period”), the Fund decreased 59.16%, while the Index decreased 57.61%. The Fund had a net asset value of $34.72 per share on October 31, 2012 and ended the reporting period with a net asset value of $13.48 on October 31, 2013.
The S&P 500 Index is a market capitalization weighted composite index of 500 large capitalization U.S. companies.
During the reporting period, the highest returns came from International Tower Hill Mines and Exeter Resource, which returned -1.90% and -10.39%, respectively. The worst performers were Gryphon Minerals and International Tower Hill Mines, which returned -81.85% and -78.42%, respectively.
| | | AVERAGE ANNUAL TOTAL RETURN FOR THE PERIOD ENDED OCTOBER 31, 2013 | |
| | | One Year Return | | | Annualized Inception to Date* | |
| | | Net Asset Value | | | Market Price | | | Net Asset Value | | | Market Price | |
| Global X Gold Explorers ETF | | | -59.16 | % | | | -59.04 | % | | | -38.41 | % | | | -38.02 | % |
| Solactive Global Gold Explorers Index | | | -57.61 | % | | | -57.61 | % | | | -37.77 | % | | | -37.77 | % |
| S&P 500 Index | | | 27.18 | % | | | 27.18 | % | | | 16.11 | % | | | 16.11 | % |
Growth of a $10,000 Investment
(at Net Asset Value)
*Fund commenced operations on November 3, 2010.
The performance data quoted herein represents past performance and the return and value of an investment in the Fund will fluctuate so that, when redeemed, may be worth less than its original cost. Past performance is no guarantee of future performance and should not be considered as a representation of the future results of the Fund. The Fund's performance assumes the reinvestment of all dividends and all capital gains. Index returns assume reinvestment of dividends and, unlike a Fund's returns, do not reflect any fees or expenses. If such fees and expenses were included in the index returns, the performance would have been lower. Please note that one cannot invest directly in an unmanaged index.
There are no assurances that the Fund will meet its stated objectives.
The Fund’s holdings and allocations are subject to change and should not be considered recommendations to buy individual securities.
Returns shown do not reflect the deduction of taxes that a shareholder would pay on Fund distributions or the redemption of Fund shares.
See definition of comparative indices above.
| Management Discussion of Fund Performance (unaudited) |
| Global X Pure Gold Miners ETF |
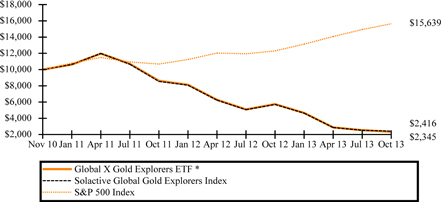
Global X Pure Gold Miners ETF
The Global X Pure Gold Miners ETF (the “Fund”) seeks to provide investment results that correspond generally to the price and yield performance, before fees and expenses, of the Solactive Global Pure Gold Miners Index (the “Index”). The
Fund generally seeks to replicate the Index but may at times invest in a representative sample of securities that collectively has an investment profile similar to the Index and as a result may or may not hold all the securities that are included in the Index.
The Index tracks the performance of the largest and most liquid gold mining companies globally. Only companies that generate the vast majority of their business from gold mining are eligible to be included in the index.
For the 12-month period ended October 31, 2013 (the “reporting period”), the Fund decreased 47.95%, while the Index decreased 47.99%. The Fund had a net asset value of $23.24 per share on October 31, 2012 and ended the reporting period with a net asset value of $12.08 on October 31, 2013.
The S&P 500 Index is a market capitalization weighted composite index of 500 large capitalization U.S. companies.
During the reporting period, the highest returns came from Sibanye Gold ADR and Eldorado Gold, which returned 0.01% and -1.89%, respectively. The worst performers were Petropavlovsk and Perseus Mining, which returned -84.48% and
-78.81%, respectively.
| | | AVERAGE ANNUAL TOTAL RETURN FOR THE PERIOD ENDED OCTOBER 31, 2013 | |
| | | One Year Return | | | Annualized Inception to Date* | |
| | | Net Asset Value | | | Market Price | | | Net Asset Value | | | Market Price | |
| Global X Pure Gold Miners ETF | | | -47.95 | % | | | -48.44 | % | | | -28.92 | % | | | -28.93 | % |
| Solactive Global Pure Gold Miners Index | | | -47.99 | % | | | -47.99 | % | | | -28.74 | % | | | -28.74 | % |
| S&P 500 Index | | | 27.18 | % | | | 27.18 | % | | | 14.65 | % | | | 14.65 | % |
Growth of a $10,000 Investment
(at Net Asset Value)
*Fund commenced operations on March 14, 2011.
The performance data quoted herein represents past performance and the return and value of an investment in the Fund will fluctuate so that, when redeemed, may be worth less than its original cost. Past performance is no guarantee of future performance and should not be considered as a representation of the future results of the Fund. The Fund's performance assumes the reinvestment of all dividends and all capital gains. Index returns assume reinvestment of dividends and, unlike a Fund's returns, do not reflect any fees or expenses. If such fees and expenses were included in the index returns, the performance would have been lower. Please note that one cannot invest directly in an unmanaged index.
There are no assurances that the Fund will meet its stated objectives.
The Fund’s holdings and allocations are subject to change and should not be considered recommendations to buy individual securities.
Returns shown do not reflect the deduction of taxes that a shareholder would pay on Fund distributions or the redemption of Fund shares.
See definition of comparative indices above.
| Management Discussion of Fund Performance (unaudited) |
| Global X Copper Miners ETF |
Global X Copper Miners ETF
The Global X Copper Miners ETF (the “Fund”) seeks to provide investment results that correspond generally to the price and yield performance, before fees and expenses, of the Solactive Global Copper Miners Index (the “Index”). The Fund generally seeks to replicate the Index but may at times invest in a representative sample of securities that collectively has an investment profile similar to the Index and as a result may or may not hold all the securities that are included in the Index.
The Index is designed to reflect the performance of the copper mining industry. It is comprised of selected companies globally that are actively engaged in some aspect of the copper mining industry, such as copper mining, refining, or exploration.
For the 12-month period ended October 31, 2013 (the “reporting period”), the Fund decreased 21.69%, while the Index decreased 22.15%. The Fund had a net asset value of $12.93 per share on October 31, 2012 and ended the reporting period with a net asset value of $9.80 on October 31, 2013.
The S&P 500 Index is a market capitalization weighted composite index of 500 large capitalization U.S. companies.
During the reporting period, the highest returns came from Palabora Mining and Grupo Mexico, Class B, which returned 19.01% and 18.31%, respectively. The worst performers were Kazakhmys and Northern Dynasty Minerals, which returned -62.62% and -61.86%, respectively.
| | | AVERAGE ANNUAL TOTAL RETURN FOR THE PERIOD ENDED OCTOBER 31, 2013 | |
| | | One Year Return | | | Three Year Return | | | Annualized Inception to Date* | |
| | | Net Asset Value | | | Market Price | | | Net Asset Value | | | Market Price | | | Net Asset Value | | | Market Price | |
| Global X Copper Miners ETF | | | -21.69 | % | | | -22.21 | % | | | -13.11 | % | | | -13.38 | % | | | -7.56 | % | | | -7.71 | % |
| Solactive Global Copper Miners Index | | | -22.15 | % | | | -22.15 | % | | | -13.15 | % | | | -13.15 | % | | | -7.43 | % | | | -7.43 | % |
| S&P 500 Index | | | 27.18 | % | | | 27.18 | % | | | 16.56 | % | | | 16.56 | % | | | 13.84 | % | | | 13.84 | % |
Growth of a $10,000 Investment
(at Net Asset Value)
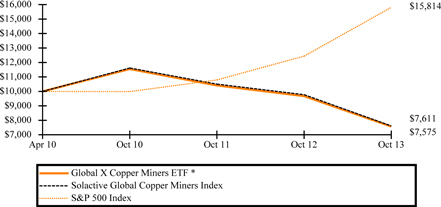
*Fund commenced operations on April 19, 2010.
The performance data quoted herein represents past performance and the return and value of an investment in the Fund will fluctuate so that, when redeemed, may be worth less than its original cost. Past performance is no guarantee of future performance and should not be considered as a representation of the future results of the Fund. The Fund's performance assumes the reinvestment of all dividends and all capital gains. Index returns assume reinvestment of dividends and, unlike a Fund's returns, do not reflect any fees or expenses. If such fees and expenses were included in the index returns, the performance would have been lower. Please note that one cannot invest directly in an unmanaged index.
There are no assurances that the Fund will meet its stated objectives.
The Fund’s holdings and allocations are subject to change and should not be considered recommendations to buy individual securities.
Returns shown do not reflect the deduction of taxes that a shareholder would pay on Fund distributions or the redemption of Fund shares.
See definition of comparative indices above.
| Management Discussion of Fund Performance (unaudited) |
| Global X Uranium ETF |
Global X Uranium ETF
The Global X Uranium ETF (the “Fund”) seeks to provide investment results that correspond generally to the price and yield performance, before fees and expenses, of the Solactive Global Uranium Index (the “Index”). The Fund generally seeks to replicate the Index but may at times invest in a representative sample of securities that collectively has an investment profile similar to the Index and as a result may or may not hold all the securities that are included in the Index.
The Index is designed to reflect the performance of the uranium mining industry. It is comprised of selected companies globally that are primarily engaged in some aspect of the uranium mining industry, such as mining, refining, exploration, and manufacturing of equipment for the uranium industry. The Fund is the nation’s first ETF focused exclusively on the uranium industry.
For the 12-month period ended October 31, 2013 (the “reporting period”), the Fund decreased 29.88%, while the Index decreased 31.02%. The Fund had a net asset value of $21.03 per share on October 31, 2012 and ended the reporting period with a net asset value of $14.47 on October 31, 2013.
The S&P 500 Index is a market capitalization weighted composite index of 500 large capitalization U.S. companies.
During the reporting period, the highest returns came from Areva and Uranium One, which returned 33.90% and 26.52%, respectively. The worst performers were Paladin Energy and Mega Uranium, which returned -66.21% and -64.88%, respectively.
| | | AVERAGE ANNUAL TOTAL RETURN FOR THE PERIOD ENDED OCTOBER 31, 2013 | |
| | | One Year Return | | | Annualized Inception to Date* | |
| | | Net Asset Value | | | Market Price | | | Net Asset Value | | | Market Price | |
| Global X Uranium ETF | | | -29.88 | % | | | -29.71 | % | | | -33.26 | % | | | -32.99 | % |
| Solactive Global Uranium Index | | | -31.02 | % | | | -31.02 | % | | | -33.95 | % | | | -33.95 | % |
| S&P 500 Index | | | 27.18 | % | | | 27.18 | % | | | 15.38 | % | | | 15.38 | % |
Growth of a $10,000 Investment
(at Net Asset Value)
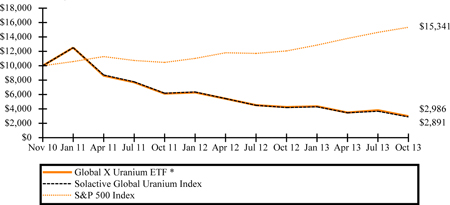
*Fund commenced operations on November 4, 2010.
The performance data quoted herein represents past performance and the return and value of an investment in the Fund will fluctuate so that, when redeemed, may be worth less than its original cost. Past performance is no guarantee of future performance and should not be considered as a representation of the future results of the Fund. The Fund's performance assumes the reinvestment of all dividends and all capital gains. Index returns assume reinvestment of dividends and, unlike a Fund's returns, do not reflect any fees or expenses. If such fees and expenses were included in the index returns, the performance would have been lower. Please note that one cannot invest directly in an unmanaged index.
There are no assurances that the Fund will meet its stated objectives.
The Fund’s holdings and allocations are subject to change and should not be considered recommendations to buy individual securities.
Returns shown do not reflect the deduction of taxes that a shareholder would pay on Fund distributions or the redemption of Fund shares.
See definition of comparative indices above.
| Management Discussion of Fund Performance (unaudited) |
| Global X Lithium ETF |
Global X Lithium ETF
The Global X Lithium ETF (the “Fund”) seeks to provide investment results that correspond generally to the price and yield performance, before fees and expenses, of the Solactive Global Lithium Index (the “Index”). The Fund generally seeks to replicate the Index but may at times invest in a representative sample of securities that collectively has an investment profile similar to the Index and as a result may or may not hold all the securities that are included in the Index.
The Index is designed to reflect the performance of the largest and most liquid listed companies that are active in the exploration and/or mining of Lithium or the production of Lithium batteries. The Fund is the first ETF globally focused exclusively on the lithium sector.
For the 12-month period ended October 31, 2013 (the “reporting period”), the Fund decreased 8.00%, while the Index decreased 7.72%. The Fund had a net asset value of $14.41 per share on October 31, 2012 and ended the reporting period with a net asset value of $12.94 on October 31, 2013.
The S&P 500 Index is a market capitalization weighted composite index of 500 large capitalization U.S. companies.
During the reporting period, the highest returns came from Electovaya and Coslight Technology International Group, which returned 116.67% and 90.14%, respectively. The worst performers were Exide Technologies and Reed Resources which returned -95.78% and -88.33%, respectively.
| | | AVERAGE ANNUAL TOTAL RETURN FOR THE PERIOD ENDED OCTOBER 31, 2013 | |
| | | One Year Return | | | Three Year Return | | | Annualized Inception to Date* | |
| | | Net Asset Value | | | Market Price | | | Net Asset Value | | | Market Price | | | Net Asset Value | | | Market Price | |
| Global X Lithium ETF | | | -8.00 | % | | | -6.85 | % | | | -12.18 | % | | | -12.11 | % | | | -4.30 | % | | | -4.16 | % |
| Solactive Global Lithium Index | | | -7.72 | % | | | -7.72 | % | | | -11.80 | % | | | -11.80 | % | | | -3.88 | % | | | -3.88 | % |
| S&P 500 Index | | | 27.18 | % | | | 27.18 | % | | | 16.56 | % | | | 16.56 | % | | | 18.04 | % | | | 18.04 | % |
Growth of a $10,000 Investment
(at Net Asset Value)
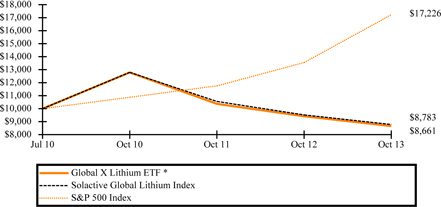
*Fund commenced operations on July 22, 2010.
The performance data quoted herein represents past performance and the return and value of an investment in the Fund will fluctuate so that, when redeemed, may be worth less than its original cost. Past performance is no guarantee of future performance and should not be considered as a representation of the future results of the Fund. The Fund's performance assumes the reinvestment of all dividends and all capital gains. Index returns assume reinvestment of dividends and, unlike a Fund's returns, do not reflect any fees or expenses. If such fees and expenses were included in the index returns, the performance would have been lower. Please note that one cannot invest directly in an unmanaged index.
There are no assurances that the Fund will meet its stated objectives.
The Fund’s holdings and allocations are subject to change and should not be considered recommendations to buy individual securities.
Returns shown do not reflect the deduction of taxes that a shareholder would pay on Fund distributions or the redemption of Fund shares.
See definition of comparative indices above.
| Management Discussion of Fund Performance (unaudited) |
| Global X Fertilizers/Potash ETF |
Global X Fertilizers/Potash ETF
The Global X Fertilizers/Potash ETF (the “Fund”) seeks to provide investment results that correspond generally to the price and yield performance, before fees and expenses, of the Solactive Global Fertilizers/Potash Total Return Index (the “Index”). The Fund generally seeks to replicate the Index but may at times invest in a representative sample of securities that collectively has an investment profile similar to the Index and as a result may or may not hold all the securities that are included in the Index.
The Index tracks the performance of the largest and most liquid listed companies globally that are active in some aspect of the fertilizer industry. The Fund is the nation’s first ETF focused exclusively on the fertilizers industry.
For the 12-month period ended October 31, 2013 (the “reporting period”), the Fund decreased 14.33%, while the Index decreased 14.26%. The Fund had a net asset value of $13.85 per share on October 31, 2012 and ended the reporting period with a net asset value of $11.73 on October 31, 2013.
The S&P 500 Index is a market capitalization weighted composite index of 500 large capitalization U.S. companies.
During the reporting period, the highest returns came from The Scotts Miracle-Gro and Guebre Fabrikalari which returned 41.32% and 20.22%, respectively. The worst performers were Sociedad Quimica Y Minera De Chile and K+S which returned -51.38% and -43.71%, respectively.
| | | AVERAGE ANNUAL TOTAL RETURN FOR THE PERIOD ENDED OCTOBER 31, 2013 | |
| | | One Year Return | | | Annualized Inception to Date* | |
| | | Net Asset Value | | | Market Price | | | Net Asset Value | | | Market Price | |
| Global X Fertilizers/Potash ETF | | | -14.33 | % | | | -14.48 | % | | | -8.98 | % | | | -9.04 | % |
| Solactive Global Fertilizers/Potash Total Return Index | | | -14.26 | % | | | -14.26 | % | | | -8.66 | % | | | -8.66 | % |
| S&P 500 Index | | | 27.18 | % | | | 27.18 | % | | | 14.90 | % | | | 14.90 | % |
Growth of a $10,000 Investment
(at Net Asset Value)
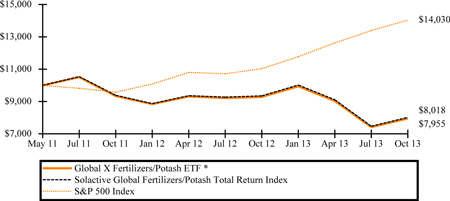
*Fund commenced operations on May 25, 2011.
The performance data quoted herein represents past performance and the return and value of an investment in the Fund will fluctuate so that, when redeemed, may be worth less than its original cost. Past performance is no guarantee of future performance and should not be considered as a representation of the future results of the Fund. The Fund's performance assumes the reinvestment of all dividends and all capital gains. Index returns assume reinvestment of dividends and, unlike a Fund's returns, do not reflect any fees or expenses. If such fees and expenses were included in the index returns, the performance would have been lower. Please note that one cannot invest directly in an unmanaged index.
There are no assurances that the Fund will meet its stated objectives.
The Fund’s holdings and allocations are subject to change and should not be considered recommendations to buy individual securities.
Returns shown do not reflect the deduction of taxes that a shareholder would pay on Fund distributions or the redemption of Fund shares.
See definition of comparative indices above.
| Management Discussion of Fund Performance (unaudited) |
| Global X Junior Miners ETF |
Global X Junior Miners ETF
The Global X Junior Miners ETF seeks to provide investment results that correspond generally to the price and yield performance, before fees and expenses, of the Solactive Global Junior Miners Index (“Index”). The Fund generally seeks to replicate the Index but may at times invest in a representative sample of securities that collectively has an investment profile similar to the Index and as a result may or may not hold all the securities that are included in the Index.
The Index is designed to track the market performance of small-capitalization mining companies globally, as defined by Solactive AG.
For the 12-month period ended October 31, 2013 (the “reporting period”), the Fund decreased 42.49%, while the Index decreased 41.92%. The Fund had a net asset value of $32.52 per share on October 31, 2012 and ended the reporting period with a net asset value of $16.62 on October 31, 2013.
The S&P 500 Index is a market capitalization weighted composite index of 500 large capitalization U.S. companies.
During the reporting period, the highest returns came from Aurcana and Arrium which returned 109.79% and 50.43%, respectively. The worst performers were Discovery Metals and Colossus Minerals which returned -92.00% and -88.00%, respectively.
| | | AVERAGE ANNUAL TOTAL RETURN FOR THE PERIOD ENDED OCTOBER 31, 2013 | |
| | | One Year Return | | | Annualized Inception to Date* | |
| | | Net Asset Value | | | Market Price | | | Net Asset Value | | | Market Price | |
| Global X Junior Miners ETF | | | -42.49 | % | | | -42.94 | % | | | -27.70 | % | | | -27.77 | % |
| Solactive Global Junior Miners Index ** | | | -41.92 | % | | | -41.92 | % | | | -25.76 | % | | | -25.76 | % |
| S&P 500 Index | | | 27.18 | % | | | 27.18 | % | | | 16.04 | % | | | 16.04 | % |
Growth of a $10,000 Investment
(at Net Asset Value)
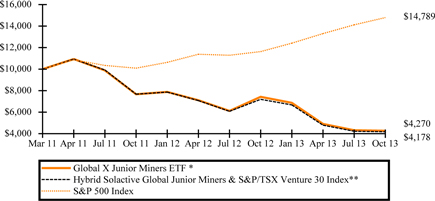
*Fund commenced operations on March 16, 2011.
**Annualized Inception to Date return reflects performance of S&P/TSX Venture 30 Index through September 6, 2012 and Solactive Global Junior Miners Index thereafter.
The performance data quoted herein represents past performance and the return and value of an investment in the Fund will fluctuate so that, when redeemed, may be worth less than its original cost. Past performance is no guarantee of future performance and should not be considered as a representation of the future results of the Fund. The Fund's performance assumes the reinvestment of all dividends and all capital gains. Index returns assume reinvestment of dividends and, unlike a Fund's returns, do not reflect any fees or expenses. If such fees and expenses were included in the index returns, the performance would have been lower. Please note that one cannot invest directly in an unmanaged index.
There are no assurances that the Fund will meet its stated objectives.
The Fund’s holdings and allocations are subject to change and should not be considered recommendations to buy individual securities.
Returns shown do not reflect the deduction of taxes that a shareholder would pay on Fund distributions or the redemption of Fund shares.
See definition of comparative indices above.
| Schedule of Investments | October 31, 2013 |
| Global X Silver Miners ETF |
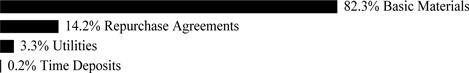
Sector Weightings (unaudited)†:
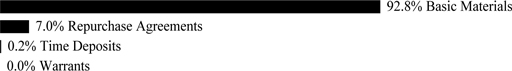
† Percentages based on total investments. Repurchase agreements purchased from cash collateral received for securities lending activity are included in total investments. Please see Note 8 in the Notes to Financial Statements for more detailed information.
| | | Shares | | | Value | |
| | | | | | | |
| COMMON STOCK — 100.2% | | | | | | | | |
| AUSTRALIA— 0.0% | | | | | | | | |
| Basic Materials — 0.0% | | | | | | | | |
| Alcyone Resources * | | | 12,857,590 | | | $ | 36,457 | |
| CANADA— 51.0% | | | | | | | | |
| Basic Materials — 51.0% | | | | | | | | |
| Alexco Resource * (A) | | | 1,010,896 | | | | 1,435,472 | |
| Aurcana * (A) | | | 1,136,959 | | | | 2,224,521 | |
| AuRico Gold | | | 1,340,031 | | | | 5,507,527 | |
| Bear Creek Mining * (A) | | | 1,538,136 | | | | 3,835,567 | |
| Endeavour Silver * (A) | | | 1,729,618 | | | | 7,229,803 | |
| Excellon Resources * | | | 841,400 | | | | 1,113,635 | |
| First Majestic Silver * (A) | | | 132,000 | | | | 1,493,886 | |
| Fortuna Silver Mines * | | | 2,158,852 | | | | 8,551,344 | |
| International Minerals | | | 774,198 | | | | 2,101,357 | |
| MAG Silver * (A) | | | 998,404 | | | | 5,690,903 | |
| Pan American Silver | | | 940,177 | | | | 9,975,278 | |
| Primero Mining * | | | 634,166 | | | | 3,612,858 | |
| Scorpio Mining * | | | 4,139,038 | | | | 1,091,676 | |
| Silver Standard Resources * | | | 1,210,493 | | | | 6,802,971 | |
| Silver Wheaton | | | 1,117,605 | | | | 25,336,105 | |
| Silvercorp Metals (A) | | | 2,954,407 | | | | 9,365,470 | |
| Silvercrest Mines * (A) | | | 2,015,346 | | | | 3,575,879 | |
| Tahoe Resources * | | | 574,662 | | | | 11,034,128 | |
| US Silver & Gold * | | | 1,030,500 | | | | 543,591 | |
| Wildcat Silver * | | | 2,106,000 | | | | 848,338 | |
| TOTAL CANADA | | | | | | | 111,370,309 | |
| MEXICO— 22.0% | | | | | | | | |
| Basic Materials — 22.0% | | | | | | | | |
| Fresnillo | | | 1,687,932 | | | | 26,401,425 | |
| Industrias Penoles | | | 742,281 | | | | 21,552,305 | |
| TOTAL MEXICO | | | | | | | 47,953,730 | |
| PERU— 3.1% | | | | | | | | |
| Basic Materials — 3.1% | | | | | | | | |
| Hochschild Mining | | | 2,515,621 | | | | 6,675,570 | |
The accompanying notes are an integral part of the financial statements.
| Schedule of Investments | October 31, 2013 |
| Global X Silver Miners ETF |
| | | Shares/Number
of Warrants/
Face Amount(1) | | | Value | |
| COMMON STOCK — continued | | | | | | | | |
UNITED KINGDOM— 5.1% | | | | | | | | |
| Basic Materials — 5.1% | | | | | | | | |
| Arian Silver * | | | 596,441 | | | $ | 349,064 | |
| Polymetal International | | | 1,116,501 | | | | 10,732,316 | |
| TOTAL UNITED KINGDOM | | | | | | | 11,081,380 |
|
UNITED STATES— 19.0% | | | | | | | | |
| Basic Materials — 19.0% | | | | | | | | |
| Coeur d'Alene Mines* | | | 823,357 | | | | 10,053,189 | |
| First Majestic Silver * | | | 765,034 | | | | 8,652,534 | |
| Golden Minerals * (A) | | | 666,363 | | | | 513,099 | |
| Great Panther Silver * (A) | | | 2,739,659 | | | | 2,493,090 | |
| Hecla Mining (A) | | | 3,164,755 | | | | 9,874,036 | |
| McEwen Mining * (A) | | | 4,620,626 | | | | 9,888,140 | |
| TOTAL UNITED STATES | | | | | | | 41,474,088 | |
| TOTAL COMMON STOCK | | | | | | | | |
| (Cost $348,823,553) | | | | | | | 218,591,534 | |
| | | | | | | | | |
| WARRANTS — 0.0% | | | | | | | | |
| Coeur d'Alene Mines, Expires 4/16/17 * (A) | | | | | | | | |
| (Cost $–) | | | 18,472 | | | | 37,128 | |
| | | | | | | | | |
| REPURCHASE AGREEMENTS — 7.6% | | | | | | | | |
| Barclays | | | | | | | | |
0.080%, dated 10/31/13, to be repurchased on 11/01/13, repurchase price
$15,695,799 (collateralized by U.S. Treasury Bills, ranging in par value
$5,701,129-$10,311,511 0.000%, 01/09/14-04/03/14 with a total market | | | | | | | | |
| value of $16,009,683) (B) | | $ | 15,695,762 | | | | 15,695,762 | |
| Deutsche Bank | | | | | | | | |
0.090%, dated 10/31/13, to be repurchased on 11/01/13, repurchase price
$829,295 (collateralized by U.S. Treasury Bills, par value $829,294, | | | | | | | | |
| 0.090%, 09/30/12 with a total market value of $846,170) (B) | | | 829,293 | | | | 829,293 | |
| TOTAL REPURCHASE AGREEMENTS | | | | | | | | |
| (Cost $16,525,055) | | | | | | | 16,525,055 | |
| | | | | | | | | |
| TIME DEPOSITS — 0.2% | | | | | | | | |
| Brown Brothers Harriman | | | | | | | | |
| 0.030%, 11/01/13 | | | 445,231 | | | | 445,231 | |
| 0.309%, 11/01/13, CAD | | | 2 | | | | 2 | |
| TOTAL TIME DEPOSITS | | | | | | | | |
| (Cost $445,233) | | | | | | | 445,233 | |
| | | | | | | | | |
| TOTAL INVESTMENTS — 108.0% | | | | | | | | |
| (Cost $365,793,841) | | | | | | $ | 235,598,950 | |
The accompanying notes are an integral part of the financial statements.
| Schedule of Investments | October 31, 2013 |
| Global X Silver Miners ETF |
Percentages are based on Net Assets of $218,239,756.
| * | Non-income producing security. |
| (A) | This security or a partial position of this security is on loan at October 31, 2013. The total value of securities on loan at October 31, 2013 was $13,553,602. |
| (B) | This security was purchased with cash collateral held from securities on loan. The total value of such securities as of October 31, 2013 was $16,525,055. |
| (1) | In U.S. Dollars unless otherwise indicated. |
CAD — Canadian Dollar
The following is a summary of the inputs used as of October 31, 2013, in valuing the Fund's investments carried at value:
| Investments in Securities | | Level 1 | | | Level 2 | | | Level 3 | | | Total | |
| Common Stock | | $ | 218,591,534 | | | $ | — | | | $ | — | | | $ | 218,591,534 | |
| Warrants | | | — | | | | 37,128 | | | | — | | | | 37,128 | |
| Repurchase Agreements | | | — | | | | 16,525,055 | | | | — | | | | 16,525,055 | |
| Time Deposits | | | — | | | | 445,233 | | | | — | | | | 445,233 | |
| Total Investments in Securities | | $ | 218,591,534 | | | $ | 17,007,416 | | | $ | — | | | $ | 235,598,950 | |
|
For the year ended October 31, 2013, there have been no transfers between Level 1, Level 2 and Level 3 investments.
As of October 31, 2013, there were no Level 3 investments.
The accompanying notes are an integral part of the financial statements.
| Schedule of Investments | October 31, 2013 |
Global X Gold Explorers ETF |
Sector Weightings (unaudited)†:
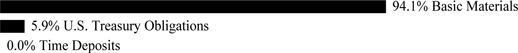
† Percentages based on total investments
| | | Shares/Face
Amount | | | Value | |
| COMMON STOCK — 99.9% | | | | | | | | |
| AUSTRALIA— 5.5% | | | | | | | | |
| Basic Materials — 5.5% | | | | | | | | |
| Gryphon Minerals * | | | 12,115,039 | | | $ | 1,774,837 | |
| CANADA— 94.4% | | | | | | | | |
| Basic Materials — 94.4% | | | | | | | | |
| Asanko Gold * | | | 646,961 | | | | 1,520,217 | |
| Atac Resources * | | | 1,802,988 | | | | 1,279,635 | |
| Chesapeake Gold * | | | 488,345 | | | | 1,564,353 | |
| Continental Gold * | | | 425,812 | | | | 1,613,156 | |
| Exeter Resource * | | | 1,944,614 | | | | 1,341,784 | |
| Gold Canyon Resources * | | | 6,485,930 | | | | 2,457,145 | |
| International Tower Hill Mines * | | | 2,623,073 | | | | 1,338,029 | |
| Kaminak Gold, Cl A * | | | 1,987,269 | | | | 1,238,886 | |
| Lydian International, Cl A * | | | 1,340,038 | | | | 1,028,179 | |
| Newstrike Capital * | | | 1,767,525 | | | | 1,525,701 | |
| Novagold Resources * | | | 797,441 | | | | 1,730,447 | |
| Paramount Gold and Silver * | | | 1,208,743 | | | | 1,462,579 | |
| Pretium Resources * | | | 238,396 | | | | 779,677 | |
| Rubicon Minerals * | | | 1,388,670 | | | | 1,917,887 | |
| Sabina Gold & Silver * | | | 1,489,088 | | | | 1,213,950 | |
| Seabridge Gold * | | | 183,708 | | | | 1,736,041 | |
| Torex Gold Resources * | | | 1,459,418 | | | | 1,623,675 | |
| Volta Resources * (A) | | | 13,486,144 | | | | 4,850,434 | |
| TOTAL CANADA | | | | | | | 30,221,775 | |
| TOTAL COMMON STOCK | | | | | | | | |
| (Cost $57,507,371) | | | | | | | 31,996,612 | |
| | | | | | | | | |
| U.S. TREASURY OBLIGATIONS — 6.3% | | | | | | | | |
| U.S. Treasury Bills | | | | | | | | |
| 0.015%, 11/07/13 (B) | | | | | | | | |
| (Cost $1,999,995) | | $ | 2,000,000 | | | | 1,999,994 | |
The accompanying notes are an integral part of the financial statements.
| Schedule of Investments | October 31, 2013 |
| Global X Gold Explorers ETF |
| | | Face Amount | | | Value | |
| TIME DEPOSITS — 0.0% | | | | | | | | |
| Brown Brothers Harriman | | | | | | | | |
| 1.754%, 11/01/13, AUD | | | 12 | | | $ | 11 | |
| 0.005%, 11/01/13, HKD | | | 2 | | | | — | |
| TOTAL TIME DEPOSITS | | | | | | | | |
| (Cost $11) | | | | | | | 11 | |
| TOTAL INVESTMENTS — 106.2% | | | | | | | | |
| (Cost $59,507,377) | | | | | | $ | 33,996,617 | |
Percentages are based on Net Assets of $32,019,620.
| * | Non-income producing security. |
| (A) | Affiliated investment (see Note 3). |
| (B) | The rate reported on the Schedule of Investments is the effective yield at time of purchase. |
Amounts designated as “—“ are $0.
| AUD — Australian Dollar |
| Cl — Class |
| HKD — Hong Kong Dollar |
| |
The following is a summary of the inputs used as of October 31, 2013, in valuing the Fund's investments carried at value:
| Investments in Securities | | | Level 1 | | | | Level 2 | | | | Level 3 | | | | Total | |
| Common Stock | | $ | 31,996,612 | | | $ | — | | | $ | — | | | $ | 31,996,612 | |
| U.S. Treasury Obligations | | | 1,999,994 | | | | — | | | | — | | | | 1,999,994 | |
| Time Deposits | | | — | | | | 11 | | | | — | | | | 11 | |
| Total Investments in Securities | | $ | 33,996,606 | | | $ | 11 | | | $ | — | | | $ | 33,996,617 | |
For the year ended October 31, 2013, there have been no transfers between Level 1, Level 2 or Level 3 investments.
As of October 31, 2013, there were no Level 3 investments.
The accompanying notes are an integral part of the financial statements.
| Schedule of Investments | October 31, 2013 |
Global X Pure Gold Miners ETF |
Sector Weightings (unaudited)†:

† Percentages based on total investments.
| | | Shares | | | Value | |
| COMMON STOCK — 100.2% | | | | | | | | |
AUSTRALIA— 6.2% | | | | | | | | |
| Basic Materials — 6.2% | | | | | | | | |
| Medusa Mining * (A) | | | 74,753 | | | $ | 139,893 | |
| Perseus Mining * | | | 197,842 | | | | 81,341 | |
| TOTAL AUSTRALIA | | | | | | | 221,234 | |
| CANADA— 37.5% | | | | | | | | |
| Basic Materials — 37.5% | | | | | | | | |
| African Barrick Gold | | | 45,439 | | | | 140,251 | |
| Alamos Gold | | | 11,762 | | | | 187,375 | |
| Argonaut Gold * | | | 25,547 | | | | 142,112 | |
| B2Gold * | | | 64,785 | | | | 160,308 | |
| Centerra Gold | | | 29,821 | | | | 119,267 | |
| Detour Gold * | | | 16,302 | | | | 133,212 | |
| Eldorado Gold * | | | 20,520 | | | | 138,510 | |
| Kinross Gold | | | 32,232 | | | | 163,416 | |
| Osisko Mining * | | | 35,916 | | | | 175,335 | |
| TOTAL CANADA | | | | | | | 1,359,786 | |
| CHINA— 5.2% | | | | | | | | |
| Basic Materials — 5.2% | | | | | | | | |
| Real Gold Mining * (A) (B) | | | 36,500 | | | | 4,171 | |
| Zhaojin Mining Industry, Cl H | | | 226,073 | | | | 183,121 | |
| TOTAL CHINA | | | | | | | 187,292 | |
| EGYPT— 6.8% | | | | | | | | |
| Basic Materials — 6.8% | | | | | | | | |
| Centamin * | | | 305,105 | | | | 245,583 | |
| JERSEY— 4.8% | | | | | | | | |
| Basic Materials — 4.8% | | | | | | | | |
| Randgold Resources ADR | | | 2,332 | | | | 172,335 | |
| RUSSIA— 4.9% | | | | | | | | |
| Basic Materials — 4.9% | | | | | | | | |
| Polyus Gold International | | | 57,761 | | | | 178,978 | |
| SOUTH AFRICA— 21.7% | | | | | | | | |
| Basic Materials — 21.7% | | | | | | | | |
| AngloGold Ashanti ADR | | | 13,188 | | | | 199,139 | |
| Gold Fields ADR | | | 33,404 | | | | 153,658 | |
| Harmony Gold Mining ADR | | | 47,056 | | | | 159,990 | |
The accompanying notes are an integral part of the financial statements.
| Schedule of Investments | October 31, 2013 |
| Global X Pure Gold Miners ETF |
| | | Shares/Face
Amount | | | Value | |
| COMMON STOCK — continued | | | | | | | | |
| Basic Materials — continued | | | | | | | | |
| Sibanye Gold ADR | | | 48,561 | | | $ | 272,913 | |
| TOTAL SOUTH AFRICA | | | | | | | 785,700 | |
| TURKEY— 6.0% | | | | | | | | |
| Basic Materials — 6.0% | | | | | | | | |
| Koza Altin Isletmeleri | | | 12,329 | | | | 218,633 | |
| UNITED KINGDOM— 2.5% | | | | | | | | |
| Basic Materials — 2.5% | | | | | | | | |
| Petropavlovsk | | | 71,709 | | | | 91,983 | |
| UNITED STATES— 4.6% | | | | | | | | |
| Basic Materials — 4.6% | | | | | | | | |
| Alacer Gold | | | 60,648 | | | | 168,103 | |
| TOTAL COMMON STOCK | | | | | | | | |
| (Cost $5,931,503) | | | | | | | 3,629,627 | |
| | | | | | | | | |
| TIME DEPOSITS — 0.0% | | | | | | | | |
| Brown Brothers Harriman | | | | | | | | |
| 1.754%, 11/01/13, AUD | | | 1 | | | | — | |
| 0.309%, 11/01/13, CAD | | | 2 | | | | 2 | |
| 0.076%, 11/01/13, GBP | | | 7 | | | | 12 | |
| TOTAL TIME DEPOSITS | | | | | | | | |
| (Cost $14) | | | | | | | 14 | |
| TOTAL INVESTMENTS — 100.2% | | | | | | | | |
| (Cost $5,931,517) | | | | | | $ | 3,629,641 | |
Percentages are based on Net Assets of $3,622,145.
| * | Non-income producing security. |
| (A) | Security is fair valued using methods determined in good faith by the Fair Value Committee of the Fund. The total value of such security as of October 31, 2013 was $144,064 and represents 4.0% of Net Assets. |
| (B) | Security is considered illiquid. The total value of such security as of October 31, 2013 was $4,171 and represented 0.1% of Net Assets. |
Amounts designated as “—“ are $0.
ADR — American Depositary Receipt
AUD — Australian Dollar
CAD — Canadian Dollar
Cl — Class
GBP — Great British Pound
The accompanying notes are an integral part of the financial statements.
| Schedule of Investments | October 31, 2013 |
| Global X Pure Gold Miners ETF |
The following is a summary of the inputs used as of October 31, 2013, in valuing the Fund's investments carried at value:
| Investments in Securities | | Level 1 | | | Level 2 | | | Level 3 (1) | | | Total | |
| Common Stock | | $ | 3,485,563 | | | $ | 139,893 | | | $ | 4,171 | | | $ | 3,629,627 | |
| Time Deposits | | | — | | | | 14 | | | | — | | | | 14 | |
| Total Investments in Securities | | $ | 3,485,563 | | | $ | 139,907 | | | $ | 4,171 | | | $ | 3,629,641 | |
(1) A reconciliation of Level 3 investments and disclosures of significant unobservable inputs are presented when the Fund has a significant amount of Level 3 investments during the period in relation to net assets. Management has concluded that Level 3 investments are not material in relation to net assets.
For the year ended October 31, 2013, there was a transfer from Level 1 to Level 2 in the amount of $139,893 due to securities being fair valued. There were no transfers in or out of Level 3.
The accompanying notes are an integral part of the financial statements.
| Schedule of Investments | October 31, 2013 |
Global X Copper Miners ETF |
Sector Weightings (unaudited)†:
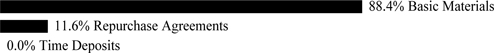
† Percentages based on total investments. Repurchase agreements purchased from cash collateral received for securities lending activity are included in total investments. Please see Note 8 in the Notes to Financial Statements for more detailed information.
\]
| | | Shares | | | Value | |
| COMMON STOCK — 99.7% | | | | | | | | |
| AUSTRALIA— 14.4% | | | | | | | | |
| Basic Materials — 14.4% | | | | | | | | |
| Cudeco * (A) | | | 371,474 | | | $ | 705,710 | |
| OZ Minerals | | | 423,592 | | | | 1,449,300 | |
| PanAust | | | 684,485 | | | | 1,306,825 | |
| Sandfire Resources * | | | 202,834 | | | | 1,251,861 | |
| TOTAL AUSTRALIA | | | | | | | 4,713,696 | |
| CANADA— 40.6% | | | | | | | | |
| Basic Materials — 40.6% | | | | | | | | |
| Capstone Mining * (A) | | | 574,818 | | | | 1,527,114 | |
| Copper Mountain Mining * (A) | | | 280,662 | | | | 462,992 | |
| Copper Mountain Mining * ^ | | | 12,300 | | | | 21,033 | |
| First Quantum Minerals (A) | | | 84,180 | | | | 1,596,970 | |
| HudBay Minerals, Cl B | | | 190,635 | | | | 1,554,115 | |
| Imperial Metals * | | | 128,230 | | | | 1,622,168 | |
| Lumina Copper * (A) | | | 145,964 | | | | 769,963 | |
| Lundin Mining * | | | 349,718 | | | | 1,576,439 | |
| Northern Dynasty Minerals * (A) | | | 233,688 | | | | 315,479 | |
| Taseko Mines * | | | 631,739 | | | | 1,547,761 | |
| Teck Resources, Cl B | | | 27,900 | | | | 746,569 | |
| Turquoise Hill Resources * (A) | | | 330,048 | | | | 1,590,831 | |
| TOTAL CANADA | | | | | | | 13,331,434 | |
| CHINA— 4.7% | | | | | | | | |
| Basic Materials — 4.7% | | | | | | | | |
| Jiangxi Copper, Cl H | | | 797,006 | | | | 1,531,715 | |
| MEXICO— 4.4% | | | | | | | | |
| Basic Materials — 4.4% | | | | | | | | |
| Grupo Mexico, Cl B | | | 453,527 | | | | 1,437,341 | |
| PERU— 4.5% | | | | | | | | |
| Basic Materials — 4.5% | | | | | | | | |
| Southern Copper | | | 53,444 | | | | 1,493,760 | |
| POLAND— 4.7% | | | | | | | | |
| Basic Materials — 4.7% | | | | | | | | |
| KGHM Polska Miedz | | | 38,287 | | | | 1,548,086 | |
The accompanying notes are an integral part of the financial statements.
|
| | |
| Schedule of Investments | October 31, 2013 |
| | |
| Global X Copper Miners ETF |
| | | Shares/Face
Amount(1) | | | Value | |
| COMMON STOCK — continued | | | | | | | | |
| | | | | | | | | |
| SOUTH AFRICA— 1.9% | | | | | | | | |
| | | | | | | | | |
| Basic Materials — 1.9% | | | | | | | | |
| Palabora Mining * | | | 54,361 | | | $ | 626,637 | |
| | | | | | | | | |
| SWITZERLAND— 4.7% | | | | | | | | |
| | | | | | | | | |
| Basic Materials — 4.7% | | | | | | | | |
| Glencore Xstrata | | | 285,565 | | | | 1,556,786 | |
| | | | | | | | | |
| TURKEY— 1.0% | | | | | | | | |
| | | | | | | | | |
| Basic Materials — 1.0% | | | | | | | | |
| Park Elektrik Uretim Madencilik Sanayi ve Ticaret * | | | 109,398 | | | | 316,754 | |
| | | | | | | | | |
| UNITED KINGDOM— 13.9% | | | | | | | | |
| | | | | | | | | |
| Basic Materials — 13.9% | | | | | | | | |
| Antofagasta | | | 106,299 | | | | 1,457,271 | |
| Kazakhmys | | | 365,056 | | | | 1,532,993 | |
| Vedanta Resources | | | 91,595 | | | | 1,561,170 | |
| TOTAL UNITED KINGDOM | | | | | | | 4,551,434 | |
| | | | | | | | | |
| UNITED STATES— 4.9% | | | | | | | | |
| | | | | | | | | |
| Basic Materials — 4.9% | | | | |
| Freeport-McMoRan Copper & Gold | | | 43,860 | | | | 1,612,293 | |
| TOTAL COMMON STOCK | | | | | | | | |
| (Cost $42,575,387) | | | | | | | 32,719,936 | |
| | | | | | | | | |
| REPURCHASE AGREEMENTS — 13.1% | | | | | | | | |
| | | | | | | | | |
| Barclays | | | | | | | | |
| 0.080%, dated 10/31/13, to be repurchased on 11/01/13, repurchase price $4,085,160 (collateralized by U.S. Treasury Bills, ranging in par value $1,483,378-$2,683,797, 0.000%, 01/09/14-04/03/14 with a total market value of $4,166,856) (B) | | | 4,085,151 | | | | 4,085,151 | |
| Deutsche Bank | | | | | | | | |
| 0.090%, dated 10/31/13, to be repurchased on 11/01/13, repurchase price $215,008 (collateralized by U.S. Treasury Bills, par value $215,008,0.090%, 09/30/12 with a total market value of $219,384) (B) | | | 215,008 | | | | 215,008 | |
| TOTAL REPURCHASE AGREEMENTS | | | | | | | | |
| (Cost $4,300,159) | | | | | | | 4,300,159 | |
| | | | | | | | | |
| TIME DEPOSITS — 0.0% |
| |
| Brown Brothers Harriman | | | | | | | | |
| 1.754%, 11/01/13, AUD | | | 2 | | | | 2 | |
| 0.005%, 11/01/13, HKD | | | 1 | | | | — | |
| TOTAL TIME DEPOSITS | | | | | | | | |
| (Cost $2) | | | | | | | 2 | |
| TOTAL INVESTMENTS — 112.8% | | | | | | | | |
| (Cost $46,875,548) | | | | | | $ | 37,020,097 | |
The accompanying notes are an integral part of the financial statements.
|
| | |
| Schedule of Investments | October 31, 2013 |
| | |
| Global X Copper Miners ETF |
| Percentages are based on Net Assets of $32,828,193. |
| * | Non-income producing security. |
| ^ | Traded on U.S. stock exchange. |
| (A) | This security or a partial position of this security is on loan at October 31, 2013. The total value of securities on loan at October 31, 2013 was $4,058,611. |
| (B) | This security was purchased with cash collateral held from securities on loan. The total value of such securities as of October 31, 2013 was $4,300,159. |
| (1) | In U.S. Dollars unless otherwise indicated. |
Amounts designated as “—“ are $0.
| AUD — Australian Dollar |
| Cl — Class |
| HKD — Hong Kong Dollar |
The following is a summary of the inputs used as of October 31, 2013, in valuing the Fund's investments carried at value:
| Investments in Securities | | Level 1 | | | Level 2 | | | Level 3 | | | Total | |
| Common Stock | | $ | 32,719,936 | | | $ | — | | | $ | — | | | $ | 32,719,936 | |
| Repurchase Agreements | | | — | | | | 4,300,159 | | | | — | | | | 4,300,159 | |
| Time Deposits | | | — | | | | 2 | | | | — | | | | 2 | |
| Total Investments in Securities | | $ | 32,719,936 | | | $ | 4,300,161 | | | $ | — | | | $ | 37,020,097 | |
For the year ended October 31, 2013, there have been no transfers between Level 1, Level 2 or Level 3 investments.
As of October 31, 2013, there were no Level 3 investments.
The accompanying notes are an integral part of the financial statements.
|
| | |
| Schedule of Investments | October 31, 2013 |
| | |
| Global X Uranium ETF |
| Sector Weightings (unaudited)†: |
 |
|
| |
† Percentages based on total investments. Repurchase agreements purchased from cash collateral received for securities lending activity are included in total investments. Please see Note 8 in the Notes to Financial Statements for more detailed information. |
| | | Shares | | | Value | |
| COMMON STOCK — 99.8% | | | | | | | | |
| | | | | | | | | |
| AUSTRALIA— 30.4% | | | | | | | | |
| Basic Materials — 30.4% | | | | |
| Bannerman Resources * (A) | | | 18,384,511 | | | $ | 868,809 | |
| Berkeley Resources * (B) | | | 7,278,649 | | | | 1,788,653 | |
| Energy Resources of Australia * | | | 4,638,405 | | | | 5,611,522 | |
| Greenland Minerals & Energy * (B) | | | 27,786,124 | | | | 7,878,640 | |
| Paladin Energy * (B) | | | 19,616,012 | | | | 7,786,854 | |
| Silex Systems * | | | 2,409,198 | | | | 5,464,944 | |
| Syrah Resources * (B) | | | 2,538,750 | | | | 6,718,618 | |
| TOTAL AUSTRALIA | | | | | | | 36,118,040 | |
| | | | | | | | | |
| CANADA— 51.7% | | | | | | | | |
| Basic Materials — 51.7% | | | | | | | | |
| Alpha Minerals * | | | 395,652 | | | | 2,037,742 | |
| Cameco | | | 1,462,196 | | | | 27,753,186 | |
| Denison Mines * (B) | | | 8,988,239 | | | | 9,913,657 | |
| Energy Fuels * (B) | | | 30,283,968 | | | | 4,066,327 | |
| Fission Uranium * (B) | | | 2,626,410 | | | | 2,644,924 | |
| Laramide Resources * (B) | | | 2,888,853 | | | | 1,039,006 | |
| Mega Uranium * (B) | | | 13,188,021 | | | | 695,671 | |
| Rockgate Capital * (B) | | | 5,034,658 | | | | 1,062,317 | |
| UEX * (A) (B) | | | 11,824,727 | | | | 3,969,361 | |
| Uranium Participation * (B) | | | 1,776,523 | | | | 8,314,806 | |
| TOTAL CANADA | | | | | | | 61,496,997 | |
| | | | | | | | | |
| FRANCE— 3.8% | | | | | | | | |
| Utilities — 3.8% | | | | | | | | |
| Areva * | | | 190,266 | | | | 4,515,688 | |
| | | | | | | | | |
| UNITED STATES— 13.9% | | | | | | | | |
| Basic Materials — 13.9% | | | | | | | | |
| Uranerz Energy * (B) | | | 3,420,946 | | | | 3,147,270 | |
| Uranium Energy * (B) | | | 2,521,680 | | | | 4,438,157 | |
| Uranium Resources * (B) | | | 577,281 | | | | 1,362,383 | |
| Ur-Energy * (B) | | | 5,204,746 | | | | 5,464,983 | |
|
The accompanying notes are an integral part of the financial statements.
|
| | |
| Schedule of Investments | October 31, 2013 |
| | |
| Global X Uranium ETF |
| | | Shares/Face Amount(1) | | | Value | |
| COMMON STOCK — continued | | | | | | | | |
| | | | | | | | | |
| Basic Materials — continued | | | | | | | | |
| USEC * (A) (B) | | | 263,743 | | | $ | 2,125,769 | |
| TOTAL UNITED STATES | | | | | | | 16,538,562 | |
| TOTAL COMMON STOCK | | | | | | | | |
| (Cost $174,579,530) | | | | | | | 118,669,287 | |
| | | | | | | | | |
| REPURCHASE AGREEMENTS — 16.6% | | | | | | | | |
| Barclays | | | | | | | | |
0.080%, dated 10/31/13, to be repurchased on 11/01/13, repurchase price
$18,706,666 (collateralized by U.S. Treasury Bills, ranging in par value
$6,794,579-$12,289,579, 0.000%, 01/09/14-04/03/14 with a total market
value of $19,080,764) (C) | | | 18,706,624 | | | | 18,706,624 | |
| Deutsche Bank | | | | | | | | |
0.090%, dated 10/31/13, to be repurchased on 11/01/13, repurchase price
$984,561 (collateralized by U.S. Treasury Bills, par value $984,559,
0.090%, 09/30/12 with a total market value of $1,004,596) (C) | | | 984,559 | | | | 984,559 | |
| | | | | | | | | |
| TOTAL REPURCHASE AGREEMENTS | | | | | | | | |
| (Cost $19,691,183) | | | | | | | 19,691,183 | |
| | | | | | | | | |
| TIME DEPOSITS — 0.2% | | | | | | | | |
| | | | | | | | | |
| Brown Brothers Harriman | | | | | | | | |
| 0.030%, 11/01/13 | | | 256,926 | | | | 256,926 | |
| 0.076%, 11/01/13, GBP | | | 5 | | | | 8 | |
| TOTAL TIME DEPOSITS | | | | | | | | |
| (Cost $256,934) | | | | | | | 256,934 | |
| TOTAL INVESTMENTS — 116.6% | | | | | | | | |
| (Cost $194,527,647) | | | | | | $ | 138,617,404 | |
Percentages are based on Net Assets of $118,870,993.
| * | Non-income producing security. |
| (A) | Affiliated investment (see Note 3). |
| (B) | This security or a partial position of this security is on loan at October 31, 2013. The total value of securities on loan at October 31, 2013 was $17,583,325. |
| (C) | This security was purchased with cash collateral held from securities on loan. The total value of such securities as of October 31, 2013 was $19,691,183. |
| (1) | In U.S. Dollars unless otherwise indicated. |
| GBP — Great British Pound |
The following is a summary of the inputs used as of October 31, 2013, in valuing the Fund's investments carried at value:
| Investments in Securities | | Level 1 | | | Level 2 | | | Level 3 | | | Total | |
| Common Stock | | $ | 118,669,287 | | | $ | — | | | $ | — | | | $ | 118,669,287 | |
| Repurchase Agreements | | | — | | | | 19,691,183 | | | | — | | | | 19,691,183 | |
| Time Deposits | | | — | | | | 256,934 | | | | — | | | | 256,934 | |
| Total Investments in Securities | | $ | 118,669,287 | | | $ | 19,948,117 | | | $ | — | | | $ | 138,617,404 | |
For the year ended October 31, 2013, there have been no transfers between Level 1, Level 2 or Level 3 investments.
As of October 31, 2013, there were no Level 3 investments.
The accompanying notes are an integral part of the financial statements.
|
| | |
| Schedule of Investments | October 31, 2013 |
| | |
| Global X Lithium ETF |
Sector Weightings (unaudited)†:
† Percentages based on total investments. Repurchase agreements purchased from cash collateral received for securities lending activity are included in total investments. Please see Note 8 in the Notes to Financial Statements for more detailed information.
| | | Shares | | | Value | |
| COMMON STOCK — 99.9% | | | | | | | | |
| | | | | | | | | |
| AUSTRALIA— 11.2% | | | | | | | | |
| Basic Materials — 11.2% | | | | | | | | |
| Galaxy Resources * (B) | | | 11,107,227 | | | $ | 619,384 | |
| Orocobre * | | | 1,999,780 | | | | 4,517,333 | |
| Reed Resources * (A) | | | 27,050,255 | | | | 588,032 | |
| TOTAL AUSTRALIA | | | | | | | 5,724,749 | |
| | | | | | | | | |
| CANADA— 4.8% | | | | | | | | |
| Basic Materials — 4.8% | | | | | | | | |
| Avalon Rare Metals * (B) | | | 785,040 | | | | 639,988 | |
| Canada Lithium * (B) | | | 3,279,746 | | | | 1,242,507 | |
| Lithium Americas * | | | 1,973,180 | | | | 577,202 | |
| TOTAL CANADA | | | | | | | 2,459,697 | |
| | | | | | | | | |
| CHILE— 7.1% | | | | | | | | |
| Basic Materials — 7.1% | | | | | | | | |
| Sociedad Quimica y Minera de Chile ADR | | | 131,197 | | | | 3,622,349 | |
| | | | | | | | | |
| CHINA— 2.0% | | | | | | | | |
| Industrials — 2.0% | | | | | | | | |
| Byd, Cl H | | | 203,200 | | | | 1,006,434 | |
| | | | | | | | | |
| FRANCE— 5.1% | | | | | | | | |
| Industrials — 5.1% | | | | | | | | |
| Saft Groupe | | | 81,627 | | | | 2,591,193 | |
| | | | | | | | | |
| HONG KONG— 9.4% | | | | | | | | |
| Industrials — 9.4% | | | | | | | | |
| Coslight Technology International Group | | | 5,745,973 | | | | 3,312,847 | |
| Sinopoly Battery * | | | 31,549,200 | | | | 1,505,637 | |
| TOTAL HONG KONG | | | | | | | 4,818,484 | |
| | | | | | | | | |
| JAPAN— 7.1% | | | | | | | | |
| Industrials — 7.1% | | | | | | | | |
| GS Yuasa | | | 390,394 | | | | 2,338,473 | |
| Panasonic | | | 130,500 | | | | 1,307,256 | |
| TOTAL JAPAN | | | | | | | 3,645,729 | |
The accompanying notes are an integral part of the financial statements.
|
| | |
| Schedule of Investments | October 31, 2013 |
| | |
| Global X Lithium ETF |
| | | Shares/Number of Warrants/
Face Amount | | | Value | |
| COMMON STOCK — continued | | | | | | | | |
| | | | | | | | | |
| SOUTH KOREA— 9.0% | | | | | | | | |
| Basic Materials — 4.5% | | | | | | | | |
| LG Chemical | | | 8,249 | | | $ | 2,329,084 | |
| Industrials — 4.5% | | | | |
| Samsung SDI | | | 13,785 | | | | 2,300,207 | |
| TOTAL SOUTH KOREA | | | | | | | 4,629,291 | |
| | | | | | | | | |
| UNITED STATES— 44.2% | | | | | | | | |
| Basic Materials — 38.5% | | | | | | | | |
| Avalon Rare Metals * (B) | | | 1,511,549 | | | | 1,224,355 | |
| FMC | | | 142,475 | | | | 10,366,481 | |
| Rockwood Holdings | | | 127,508 | | | | 8,064,881 | |
| | | | | | | | 19,655,717 | |
| Industrials — 5.7% | | | | | | | | |
| Johnson Controls | | | 36,084 | | | | 1,665,276 | |
| Ultralife * | | | 324,213 | | | | 1,264,431 | |
| | | | | | | | 2,929,707 | |
| TOTAL UNITED STATES | | | | | | | 22,585,424 | |
| TOTAL COMMON STOCK | | | | | | | | |
| (Cost $56,463,452) | | | | | | | 51,083,350 | |
| | | | | | | | | |
| WARRANTS — 1.6% |
| Dynapack International, Expires 1/20/15* | | | 123,000 | | | | 350,550 | |
| Simplo Technology, Expires 1/20/15* | | | 94,000 | | | | 461,728 | |
| TOTAL WARRANTS | | | | | | | | |
| (Cost $813,070) | | | | | | | 812,278 | |
| | | | | | | | | |
| REPURCHASE AGREEMENTS — 5.5% |
| |
| Barclays | | | | | | | | |
0.080%, dated 10/31/13, to be repurchased on 11/01/13, repurchase price
$2,576,973 (collateralized by U.S. Treasury Bills, ranging in par value
$936,025-$1,692,975, 0.000%, 01/09/14-04/03/14 with a total market
value of $2,628,507) (C) | | $ | 2,576,967 | | | | 2,576,967 | |
| Deutsche Bank | | | | | | | | |
0.090%, dated 10/31/13, to be repurchased on 11/01/13, repurchase price
$234,020 (collateralized by U.S. Treasury Bills, par value $234,019,
0.090%, 09/30/12 with a total market value of $238,782) (C) | | | 234,019 | | | | 234,019 | |
| | | | | | | | | |
| TOTAL REPURCHASE AGREEMENTS | | | | | | | | |
| (Cost $2,810,986) | | | | | | | 2,810,986 | |
The accompanying notes are an integral part of the financial statements.
|
| | |
| Schedule of Investments | October 31, 2013 |
| | |
| Global X Lithium ETF |
| | | Face Amount(1) | | | Value | |
| TIME DEPOSITS — 1.7% | | | | | | | | |
| | | | | | | | | |
| Brown Brothers Harriman | | | | | | | | |
| 0.030%, 11/01/13 | | | 845,788 | | | $ | 845,788 | |
| 0.309%, 11/01/13, CAD | | | 24 | | | | 23 | |
| 0.005%, 11/01/13, HKD | | | 1 | | | | — | |
| 0.005%, 11/01/13, JPY | | | 2,293,706 | | | | 23,327 | |
| TOTAL TIME DEPOSITS | | | | | | | | |
| (Cost $869,138) | | | | | | | 869,138 | |
| TOTAL INVESTMENTS — 108.7% | | | | | | | | |
| (Cost $60,956,646) | | | | | | $ | 55,575,752 | |
Percentages are based on Net Assets of $51,105,477.
| * | Non-income producing security. |
| (A) | Affiliated investment (see Note 3). |
| (B) | This security or a partial position of this security is on loan at October 31, 2013. The total value of securities on loan at October 31, 2013 was $1,946,033. |
| (C) | This security was purchased with cash collateral held from securities on loan. The total value of such security as of October 31, 2013 was $2,810,986. |
| (1) | In U.S. Dollars unless otherwise indicated. |
| ADR — American Depositary Receipt |
| CAD — Canadian Dollar |
| Cl — Class |
| HKD — Hong Kong Dollar |
| JPY — Japanese Yen |
| The following is a summary of the inputs used as of October 31, 2013, in valuing the Fund's investments carried at value: |
| Investments in Securities | | | Level 1 | | | | Level 2 | | | | Level 3 | | | | Total | |
| Common Stock | | $ | 51,083,350 | | | $ | — | | | $ | — | | | $ | 51,083,350 | |
| Warrants | | | — | | | | 812,278 | | | | — | | | | 812,278 | |
| Repurchase Agreements | | | — | | | | 2,810,986 | | | | — | | | | 2,810,986 | |
| Time Deposits | | | — | | | | 869,138 | | | | — | | | | 869,138 | |
| Total Investments in Securities | | $ | 51,083,350 | | | $ | 4,482,402 | | | $ | — | | | $ | 55,575,752 | |
|
For the year ended October 31, 2013, there have been no transfers between Level 1, Level 2 and Level 3 investments.
As of October 31, 2013, there were no Level 3 investments.
The accompanying notes are an integral part of the financial statements.
|
| | |
| Schedule of Investments | October 31, 2013 |
| | |
| Global X Fertilizers/Potash ETF |
Sector Weightings (unaudited)†:

† Percentages based on total investments.
| | | Shares | | | Value | |
| COMMON STOCK — 99.7% | | | | | | | | |
| | | | | | | | | |
| AUSTRALIA— 10.7% | | | | | | | | |
| Basic Materials — 10.7% | | | | |
| Incitec Pivot | | | 441,632 | | | $ | 1,110,310 | |
| Nufarm | | | 287,672 | | | | 1,329,561 | |
| TOTAL AUSTRALIA | | | | | | | 2,439,871 | |
| | | | | | | | | |
| CANADA— 8.9% | | | | | | | | |
| Basic Materials — 8.9% | | | | | | | | |
| Agrium | | | 348 | | | | 29,705 | |
| Agrium ^ | | | 13,131 | | | | 1,120,337 | |
| Potash Corp of Saskatchewan | | | 28,450 | | | | 884,795 | |
| TOTAL CANADA | | | | | | | 2,034,837 | |
| | | | | | | | | |
| CHILE— 3.1% | | | | | | | | |
| Basic Materials — 3.1% | | | | | | | | |
| Sociedad Quimica y Minera de Chile ADR | | | 25,550 | | | | 705,436 | |
| | | | | | | | | |
| CHINA— 9.5% | | | | | | | | |
| Basic Materials — 9.5% | | | | | | | | |
| China BlueChemical, Cl H | | | 2,028,416 | | | | 1,302,916 | |
| Sinofert Holdings | | | 5,363,285 | | | | 871,629 | |
| TOTAL CHINA | | | | | | | 2,174,545 | |
| | | | | | | | | |
| GERMANY— 3.2% | | | | | | | | |
| Basic Materials — 3.2% | | | | | | | | |
| K+S | | | 28,993 | | | | 739,676 | |
| | | | | | | | | |
| ISRAEL— 8.8% | | | | | | | | |
| Basic Materials — 8.8% | | | | | | | | |
| Israel Chemicals | | | 115,521 | | | | 955,945 | |
| The Israel Corp * | | | 2,079 | | | | 1,048,860 | |
| TOTAL ISRAEL | | | | | | | 2,004,805 | |
| | | | | | | | | |
| NORWAY— 5.2% | | | | | | | | |
| Basic Materials — 5.2% | | | | | | | | |
| Yara International | | | 27,669 | | | | 1,194,502 | |
| | | | | | | | | |
| RUSSIA— 4.0% | | | | | | | | |
| Basic Materials — 4.0% | | | | | | | | |
| Uralkali GDR | | | 34,150 | | | | 912,147 | |
The accompanying notes are an integral part of the financial statements.
|
| | |
| Schedule of Investments | October 31, 2013 |
| | |
| Global X Fertilizers/Potash ETF |
| | | Shares/Face Amount(1) | | | Value | |
| COMMON STOCK — continued | | | | | | |
| | | | | | | |
| SOUTH KOREA— 2.8% | | | | | | |
| Basic Materials — 2.8% | | | | |
| Namhae Chemical | | | 94,578 | | | $ | 646,420 | |
| | | | | | | | | |
| SWITZERLAND— 5.3% | | | | | | | | |
| Basic Materials — 5.3% | | | | | | | | |
| Syngenta | | | 3,013 | | | | 1,217,022 | |
| | | | | | | | | |
| TAIWAN— 5.2% | | | | | | | | |
| Basic Materials — 5.2% | | | | | | | | |
| Taiwan Fertilizer | | | 500,282 | | | | 1,191,979 | |
| | | | | | | | | |
| TURKEY— 6.9% | | | | | | | | |
| Basic Materials — 6.9% | | | | | | | | |
| Bagfas Bandirma Gubre Fabrik | | | 36,689 | | | | 771,916 | |
| Gubre Fabrikalari * | | | 94,522 | | | | 793,109 | |
| TOTAL TURKEY | | | | | | | 1,565,025 | |
| | | | | | | | | |
| UNITED STATES— 26.1% | | | | | | | | |
| Basic Materials — 26.1% | | | | | | | | |
| CF Industries Holdings | | | 6,455 | | | | 1,391,698 | |
| Intrepid Potash | | | 67,272 | | | | 998,989 | |
| Mosaic | | | 20,249 | | | | 928,417 | |
| Scotts Miracle-Gro, Cl A | | | 25,282 | | | | 1,484,559 | |
| Terra Nitrogen | | | 5,716 | | | | 1,167,950 | |
| TOTAL UNITED STATES | | | | | | | 5,971,613 | |
| TOTAL COMMON STOCK | | | | | | | | |
| (Cost $28,146,512) | | | | | | | 22,797,878 | |
| | | | | | | | | |
| TIME DEPOSITS — 0.2% | | | | | | | | |
| | | | | | | | | |
| Brown Brothers Harriman | | | | | | | | |
| 0.030%, 11/01/13 | | | 34,705 | | | | 34,705 | |
| 1.754%, 11/01/13, AUD | | | 2 | | | | 2 | |
| 0.309%, 11/01/13, CAD | | | 9 | | | | 8 | |
| 0.628%, 11/01/13, NOK | | | 9 | | | | 2 | |
| TOTAL TIME DEPOSITS | | | | | | | | |
| (Cost $34,717) | | | | | | | 34,717 | |
| TOTAL INVESTMENTS — 99.9% | | | | | | | | |
| (Cost $28,181,229) | | | | | | $ | 22,832,595 | |
Percentages are based on Net Assets of $22,863,889.
| * | Non-income producing security. |
| ^ | Traded on U.S. stock exchange. |
| (1) | In U.S. Dollars unless otherwise indicated. |
The accompanying notes are an integral part of the financial statements.
|
| | |
| Schedule of Investments | October 31, 2013 |
| | |
Global X Fertilizers/Potash ETF |
| ADR — American Depositary Receipt |
| AUD —Australian Dollar |
| CAD — Canadian Dollar |
| Cl — Class |
| NOK — Norwegian Krone |
| GDR — Global Depositary Receipt |
The following is a summary of the inputs used as of October 31, 2013, in valuing the Fund's investments carried at value:
| Investments in Securities | | Level 1 | | | Level 2 | | | Level 3 | | | Total | |
| Common Stock | | $ | 22,797,878 | | | $ | — | | | $ | — | | | $ | 22,797,878 | |
| Time Deposits | | | — | | | | 34,717 | | | | — | | | | 34,717 | |
| Total Investments in Securities | | $ | 22,797,878 | | | $ | 34,717 | | | $ | — | | | $ | 22,832,595 | |
For the year ended October 31, 2013, there have been no transfers between Level 1, Level 2 or Level 3 investments.
As of October 31, 2013, there were no Level 3 investments.
The accompanying notes are an integral part of the financial statements.
|
| | |
| Schedule of Investments | October 31, 2013 |
| | |
| Global X Junior Miners ETF |
Sector Weightings (unaudited)†:

† Percentages based on total investments.
| | | Shares | | | Value | |
| COMMON STOCK — 99.8% | | | | | | | | |
| | | | | | | | | |
| AUSTRALIA— 20.4% | | | | | | | | |
| Basic Materials — 20.4% | | | | | | | | |
| Aquila Resources * | | | 15,297 | | | $ | 32,675 | |
| Arrium | | | 107,588 | | | | 140,837 | |
| Atlas Iron | | | 76,784 | | | | 75,113 | |
| Beadell Resources * | | | 76,277 | | | | 67,047 | |
| Energy Resources of Australia * | | | 21,301 | | | | 25,770 | |
| Evolution Mining | | | 42,139 | | | | 33,455 | |
| Independence Group | | | 18,726 | | | | 70,088 | |
| Kingsgate Consolidated | | | 16,541 | | | | 22,434 | |
| Lynas * | | | 189,603 | | | | 61,825 | |
| Medusa Mining (A) | | | 18,602 | | | | 34,812 | |
| Mount Gibson Iron | | | 50,469 | | | | 42,454 | |
| Northern Star Resources | | | 41,559 | | | | 34,959 | |
| OceanaGold * | | | 27,070 | | | | 44,518 | |
| Paladin Energy * | | | 67,805 | | | | 26,916 | |
| PanAust | | | 44,320 | | | | 84,616 | |
| Perseus Mining * | | | 46,492 | | | | 19,115 | |
| Regis Resources | | | 26,600 | | | | 87,742 | |
| Resolute Mining * | | | 61,095 | | | | 37,245 | |
| Sandfire Resources * | | | 8,413 | | | | 51,924 | |
| Silver Lake Resources * | | | 31,493 | | | | 22,920 | |
| St. Barbara * | | | 45,618 | | | | 20,696 | |
| Sundance Resources * | | | 302,496 | | | | 30,020 | |
| Syrah Resources * | | | 6,436 | | | | 17,032 | |
| Troy Resources | | | 10,030 | | | | 12,703 | |
| Western Areas | | | 11,550 | | | | 30,566 | |
| TOTAL AUSTRALIA | | | | | | | 1,127,482 | |
| | | | | | | | | |
| BELGIUM— 1.2% | | | | | | | | |
| Basic Materials — 1.2% | | | | | | | | |
| Nyrstar | | | 16,007 | | | | 65,853 | |
| | | | | | | | | |
| BRAZIL— 0.2% | | | | | | | | |
| Basic Materials — 0.2% | | | | | | | | |
| MMX Mineracao e Metalicos * | | | 26,546 | | | | 10,072 | |
The accompanying notes are an integral part of the financial statements.
|
| | |
| Schedule of Investments | October 31, 2013 |
| | |
| Global X Junior Miners ETF |
| | | Shares | | | Value | |
| COMMON STOCK — continued | | | | | | | | |
| | | | | | | | | |
| CANADA— 42.5% | | | | | | | | |
| | | | | | | | | |
| Basic Materials — 42.5% | | | | | | | | |
| Alamos Gold | | | 12,196 | | | $ | 194,289 | |
| Argonaut Gold * | | | 12,807 | | | | 71,242 | |
| AuRico Gold | | | 23,424 | | | | 96,273 | |
| B2Gold * | | | 58,236 | | | | 144,103 | |
| Barisan Gold * | | | 4,920 | | | | 425 | |
| Capstone Mining * | | | 32,152 | | | | 85,418 | |
| Centerra Gold | | | 15,128 | | | | 60,503 | |
| Continental Gold * | | | 9,826 | | | | 37,225 | |
| Denison Mines * | | | 39,751 | | | | 43,844 | |
| Detour Gold * | | | 11,853 | | | | 96,857 | |
| Dundee Precious Metals * | | | 9,266 | | | | 39,547 | |
| Endeavour Silver * | | | 9,947 | | | | 41,578 | |
| Fortuna Silver Mines * | | | 12,522 | | | | 49,600 | |
| Gabriel Resources * | | | 23,558 | | | | 20,109 | |
| HudBay Minerals, Cl B | | | 16,352 | | | | 133,306 | |
| IAMGOLD | | | 5,313 | | | | 27,160 | |
| IAMGOLD ^ | | | 30,052 | | | | 153,265 | |
| Kirkland Lake Gold * | | | 5,165 | | | | 18,032 | |
| MAG Silver * | | | 4,575 | | | | 25,011 | |
| Nevsun Resources | | | 2,788 | | | | 10,161 | |
| Nevsun Resources ^ | | | 15,746 | | | | 57,473 | |
| Novagold Resources * | | | 22,736 | | | | 49,337 | |
| Osisko Mining * | | | 38,298 | | | | 186,963 | |
| Pan American Silver | | | 13,275 | | | | 140,848 | |
| Premier Gold Mines * | | | 14,844 | | | | 32,887 | |
| Rio Alto Mining * | | | 17,299 | | | | 28,537 | |
| Rubicon Minerals * | | | 3,930 | | | | 5,428 | |
| Rubicon Minerals * ^ | | | 24,652 | | | | 34,266 | |
| Sandstorm Gold * ^ | | | 7,373 | | | | 39,740 | |
| Sandstorm Gold * | | | 1,240 | | | | 6,684 | |
| Seabridge Gold * | | | 3,949 | | | | 37,318 | |
| SEMAFO | | | 27,946 | | | | 75,852 | |
| Sherritt International | | | 27,979 | | | | 95,799 | |
| Silver Standard Resources * | | | 8,077 | | | | 45,393 | |
| Silvercorp Metals | | | 17,187 | | | | 54,483 | |
| Thompson Creek Metals * | | | 13,701 | | | | 43,980 | |
| Torex Gold Resources * | | | 60,464 | | | | 67,269 | |
| TOTAL CANADA | | | | | | | 2,350,205 | |
The accompanying notes are an integral part of the financial statements.
|
| | |
| Schedule of Investments | October 31, 2013 |
| | |
| Global X Junior Miners ETF |
| | | Shares | | | Value | |
| COMMON STOCK — continued | | | | | | | | |
| | | | | | | | | |
| CHINA— 1.1% | | | | | | | | |
| Basic Materials — 1.1% | | | | | | | | |
| Hidili Industry International Development | | | 87,293 | | | $ | 14,524 | |
| Zhaojin Mining Industry, Cl H | | | 57,900 | | | | 46,900 | |
| TOTAL CHINA | | | | | | | 61,424 | |
| EGYPT— 1.3% | | | | | | | | |
| Basic Materials — 1.3% | | | | | | | | |
| Centamin * | | | 92,362 | | | | 74,343 | |
| FINLAND— 0.3% | | | | | | | | |
| Basic Materials — 0.3% | | | | | | | | |
| Talvivaara Mining * | | | 171,763 | | | | 16,791 | |
| HONG KONG— 2.4% | | | | | | | | |
| Basic Materials — 2.4% | | | | | | | | |
| Shougang Fushan Resources Group | | | 392,236 | | | | 132,044 | |
| INDONESIA— 0.9% | | | | | | | | |
| Basic Materials — 0.9% | | | | | | | | |
| Aneka Tambang Persero | | | 357,147 | | | | 50,693 | |
| IRELAND— 1.2% | | | | | | | | |
| Basic Materials — 1.2% | | | | | | | | |
| Kenmare Resources * | | | 204,619 | | | | 66,766 | |
| JAPAN— 2.1% | | | | | | | | |
| Basic Materials — 2.1% | | | | | | | | |
| Pacific Metals | | | 12,865 | | | | 46,970 | |
| Toho Zinc | | | 14,347 | | | | 43,042 | |
| UACJ | | | 7,462 | | | | 24,436 | |
| TOTAL JAPAN | | | | | | | 114,448 | |
| RUSSIA— 0.2% | | | | | | | | |
| Basic Materials — 0.2% | | | | | | | | |
| Raspadskaya * (A) | | | 18,627 | | | | 17,813 | |
| SINGAPORE— 0.2% | | | | | | | | |
| Basic Materials — 0.2% | | | | | | | | |
| LionGold * | | | 70,109 | | | | 11,288 | |
| SOUTH AFRICA— 3.1% | | | | | | | | |
| Basic Materials — 3.1% | | | | | | | | |
| Harmony Gold Mining ADR | | | 17,114 | | | | 58,188 | |
| Northam Platinum | | | 28,017 | | | | 114,984 | |
| TOTAL SOUTH AFRICA | | | | | | | 173,172 | |
The accompanying notes are an integral part of the financial statements.
|
| | |
| Schedule of Investments | October 31, 2013 |
| | |
| Global X Junior Miners ETF |
| | | Shares/Face
Amount(1) | | | Value | |
| COMMON STOCK — continued | | | | | | | | |
| | | | | | | | | |
| UNITED KINGDOM— 2.7% | | | | | | | | |
| Basic Materials — 2.7% | | | | | | | | |
| African Minerals * | | | 27,033 | | | $ | 80,839 | |
| Ferrexpo | | | 13,315 | | | | 38,771 | |
| Highland Gold Mining | | | 3,981 | | | | 4,452 | |
| Petropavlovsk | | | 18,404 | | | | 23,607 | |
| TOTAL UNITED KINGDOM | | | | | | | 147,669 | |
| | | | | | | | | |
| UNITED STATES — 20.0% | | | | | | | | |
| Basic Materials — 20.0% | | | | | | | | |
| Alacer Gold | | | 21,616 | | | | 59,915 | |
| Allied Nevada Gold | | | 7,360 | | | | 30,029 | |
| Alpha Natural Resources * | | | 20,734 | | | | 145,138 | |
| Arch Coal | | | 21,268 | | | | 90,176 | |
| Century Aluminum | | | 4,850 | | | | 42,098 | |
| Cloud Peak Energy * | | | 5,728 | | | | 89,414 | |
| Coeur d'Alene Mines | | | 9,120 | | | | 111,355 | |
| First Majestic Silver * | | | 9,736 | | | | 110,114 | |
| Gold Resource | | | 3,411 | | | | 17,703 | |
| Hecla Mining | | | 26,978 | | | | 84,171 | |
| McEwen Mining * | | | 18,229 | | | | 39,010 | |
| Molycorp * | | | 12,052 | | | | 61,104 | |
| RTI International Metals * | | | 3,085 | | | | 104,582 | |
| Stillwater Mining * | | | 11,042 | | | | 120,469 | |
| TOTAL UNITED STATES | | | | | | | 1,105,278 | |
| TOTAL COMMON STOCK | | | | | | | | |
| (Cost $6,577,262) | | | | | | | 5,525,341 | |
| | | | | | | | | |
| TIME DEPOSITS — 2.6% | | | | | | | | |
| Brown Brothers Harriman | | | | | | | | |
| 0.030%, 11/01/13 | | | 143,988 | | | | 143,988 | |
| 0.309%, 11/01/13, CAD | | | 1 | | | | 1 | |
| TOTAL TIME DEPOSITS | | | | | | | | |
| (Cost $143,989) | | | | | | | 143,989 | |
| TOTAL INVESTMENTS — 102.4% | | | | | | | | |
| (Cost $6,721,251) | | | | | | $ | 5,669,330 | |
Percentages are based on Net Assets of $5,536,762.
| * | Non-income producing security. |
| ^ | Traded on U.S. stock exchange. |
| (A) | Security is fair valued using methods determined in good faith by the Fair Value Committee of the Fund. The total value of such security as of October 31, 2013 was $52,625 and represents 1.0% of Net Assets. |
The accompanying notes are an integral part of the financial statements.
|
| | |
| Schedule of Investments | October 31, 2013 |
| | |
| Global X Junior Miners ETF |
| (1) | In U.S. Dollars unless otherwise indicated. |
ADR — American Depositary Receipt
CAD — Canadian Dollar
Cl — Class
The following is a summary of the inputs used as of October 31, 2013, in valuing the Fund's investments carried at value:
| Investments in Securities | | Level 1 | | | Level 2 | | | Level 3 | | | Total | |
| Common Stock | | $ | 5,490,529 | | | $ | 34,812 | | | $ | — | | | $ | 5,525,341 | |
| Time Deposits | | | — | | | | 143,989 | | | | — | | | | 143,989 | |
| Total Investments in Securities | | $ | 5,490,529 | | | $ | 178,801 | | | $ | — | | | $ | 5,669,330 | |
For the year ended October 31, 2013, there was a transfer from Level 1 to Level 2 in the amount of $34,812 due to securities being fair valued. There were no transfers in or out of Level 3.
As of October 31, 2013, there were no Level 3 investments.
The accompanying notes are an integral part of the financial statements.
| Statements of Assets and Liabilities |
| October 31, 2013 |
| | | Global X Silver
Miners ETF | | | Global X Gold
Explorers ETF | | | Global X Pure
Gold Miners ETF | | | Global X Copper
Miners ETF | |
| Assets: | | | | | | | | | | | | | | | | |
| Cost of Investments | | $ | 349,268,786 | | | $ | 54,292,226 | | | $ | 5,931,517 | | | $ | 42,575,389 | |
| Cost of Repurchase Agreements | | | 16,525,055 | | | | — | | | | — | | | | 4,300,159 | |
| Cost of Affiliated Investments | | | — | | | | 5,215,151 | | | | — | | | | — | |
| Investments, at Value | | $ | 219,073,895 | * | | $ | 29,146,183 | | | $ | 3,629,641 | | | $ | 32,719,938 | * |
| Repurchase Agreement, at Value | | | 16,525,055 | | | | — | | | | — | | | | 4,300,159 | |
| Affiliated Investments, at Value | | | — | | | | 4,850,434 | | | | — | | | | — | |
| Receivable for Capital Share Sold | | | 1,227 | | | | 1,025,357 | | | | — | | | | — | |
| Receivable for Investment Securities Sold | | | 19,022,483 | | | | 342,323 | | | | — | | | | 4,675,097 | |
| Due From Broker | | | 112,690 | | | | — | | | | — | | | | — | |
| Dividend and Interest Receivable | | | 393,234 | | | | — | | | | — | | | | 76,477 | |
| Total Assets | | | 255,128,584 | | | | 35,364,297 | | | | 3,629,641 | | | | 41,771,671 | |
| | | | | | | | | | | | | | | | | |
| Liabilities: | | | | | | | | | | | | | | | | |
| | | | | | | | | | | | | | | | | |
| Payable for Investment Securities Purchased | | | 20,243,658 | | | | 1,025,357 | | | | 5,662 | | | | 3,999,203 | |
| Obligation to Return Securities Lending Collateral | | | 16,525,055 | | | | — | | | | — | | | | 4,300,159 | |
| Cash Overdraft | | | — | | | | 1,916,134 | | | | 40 | | | | 9,348 | |
| Payable due to Investment Adviser | | | 120,115 | | | | 15,873 | | | | 1,794 | | | | 18,157 | |
| Due To Broker | | | — | | | | 387,313 | | | | — | | | | 121,111 | |
| Payable for Capital Shares Redeemed | | | — | | | | — | | | | — | | | | 495,500 | |
| Total Liabilities | | | 36,888,828 | | | | 3,344,677 | | | | 7,496 | | | | 8,943,478 | |
| Net Assets | | $ | 218,239,756 | | | $ | 32,019,620 | | | $ | 3,622,145 | | | $ | 32,828,193 | |
| Net Assets Consist of: | | | | | | | | | | | | | | | | |
| Paid-in Capital | | $ | 430,364,789 | | | $ | 82,833,118 | | | $ | 7,016,672 | | | $ | 48,945,514 | |
| Undistributed (Distributions in Excess of) Net Investment Income | | | 342,851 | | | | (1,387,052 | ) | | | (35,465 | ) | | | (43,214 | ) |
| Accumulated Net Realized Loss on Investments, Affiliated Investments and Foreign Currency Transactions | | | (82,262,723 | ) | | | (23,915,712 | ) | | | (1,057,186 | ) | | | (6,213,872 | ) |
| Net Unrealized Depreciation on Investments and Affiliated Investments | | | (130,194,891 | ) | | | (25,510,760 | ) | | | (2,301,876 | ) | | | (9,855,451 | ) |
| Net Unrealized Appreciation (Depreciation) on Foreign Currency Translations | | | (10,270 | ) | | | 26 | | | | — | | | | (4,784 | ) |
| Net Assets | | $ | 218,239,756 | | | $ | 32,019,620 | | | $ | 3,622,145 | | | $ | 32,828,193 | |
| Outstanding Shares of Beneficial Interest (unlimited authorization — no par value) | | | 16,950,000 | | | | 2,374,758 | | | | 299,960 | | | | 3,350,000 | |
| | | | | | | | | | | | | | | | | |
| Net Asset Value, Offering and Redemption Price Per Share | | $ | 12.88 | | | $ | 13.48 | | | $ | 12.08 | | | $ | 9.80 | |
| *Includes Market Value of Securities on Loan | | $ | 13,553,602 | | | $ | — | | | $ | — | | | $ | 4,058,611 | |
The accompanying notes are an integral part of the financial statements.
| Statements of Assets and Liabilities |
| October 31, 2013 |
| | | Global X Uranium
ETF | | | Global X Lithium
ETF | | | Global X
Fertilizers/Potash
ETF | | | Global X Junior
Miners ETF | |
| Assets: | | | | | | | | | | | | | | | | |
| Cost of Investments | | $ | 161,369,438 | | | $ | 52,539,495 | | | $ | 28,181,229 | | | $ | 6,721,251 | |
| Cost of Repurchase Agreements | | | 19,691,183 | | | | 2,810,986 | | | | — | | | | — | |
| Cost of Affiliated Investments | | | 13,467,026 | | | | 5,606,165 | | | | — | | | | — | |
| Investments, at Value | | $ | 111,962,282 | * | | $ | 52,176,734 | * | | $ | 22,832,595 | | | $ | 5,669,330 | |
| Repurchase Agreement, at Value | | | 19,691,183 | | | | 2,810,986 | | | | — | | | | — | |
| Affiliated Investments, at Value | | | 6,963,939 | | | | 588,032 | | | | — | | | | — | |
| Cash | | | 969 | | | | — | | | | — | | | | — | |
| Receivable for Investment Securities Sold | | | 1,120,147 | | | | 6,525,003 | | | | — | | | | — | |
| Dividend and Interest Receivable | | | 65,572 | | | | 16,318 | | | | 20,019 | | | | 491 | |
| Receivable for Capital Shares Sold | | | 280,345 | | | | — | | | | — | | | | 846,500 | |
| Reclaim Receivable | | | — | | | | 14,991 | | | | 24,657 | | | | 592 | |
| Total Assets | | | 140,084,437 | | | | 62,132,064 | | | | 22,877,271 | | | | 6,516,913 | |
| Liabilities: | | | | | | | | | | | | | | | | |
| Obligation to Return Securities Lending Collateral | | | 19,691,183 | | | | 2,810,986 | | | | — | | | | — | |
| Payable for Investment Securities Purchased | | | 1,421,198 | | | | 7,367,113 | | | | — | | | | 844,778 | |
| Payable due to Investment Adviser | | | 69,546 | | | | 33,713 | | | | 13,382 | | | | 2,756 | |
| Due To Broker | | | 31,517 | | | | 814,775 | | | | — | | | | — | |
| Cash Overdraft | | | — | | | | — | | | | — | | | | 132,617 | |
| Total Liabilities | | | 21,213,444 | | | | 11,026,587 | | | | 13,382 | | | | 980,151 | |
| Net Assets | | $ | 118,870,993 | | | $ | 51,105,477 | | | $ | 22,863,889 | | | $ | 5,536,762 | |
| Net Assets Consist of: | | | | | | | | | | | | | | | | |
| Paid-in Capital | | $ | 373,269,145 | | | $ | 97,284,940 | | | $ | 29,338,578 | | | $ | 9,174,850 | |
| Undistributed (Distributions in Excess of) Net Investment Income | | | 15,720 | | | | (95,185 | ) | | | 302,042 | | | | (32,081 | ) |
| Accumulated Net Realized Loss on Investments, Affiliated Investments and Foreign Currency Transactions | | | (198,503,623 | ) | | | (40,705,868 | ) | | | (1,428,755 | ) | | | (2,554,128 | ) |
| Net Unrealized Depreciation on Investments and Affiliated Investments | | | (55,910,243 | ) | | | (5,380,894 | ) | | | (5,348,634 | ) | | | (1,051,921 | ) |
| Net Unrealized Appreciation (Depreciation) on Foreign Currency Translations | | | (6 | ) | | | 2,484 | | | | 658 | | | | 42 | |
| Net Assets | | $ | 118,870,993 | | | $ | 51,105,477 | | | $ | 22,863,889 | | | $ | 5,536,762 | |
| Outstanding Shares of Beneficial Interest | | | | | | | | | | | | | | | | |
| (unlimited authorization — no par value) | | | 8,215,071 | | | | 3,950,000 | | | | 1,950,000 | | | | 333,201 | |
| | | | | | | | | | | | | | | | | |
| Net Asset Value, Offering and Redemption Price Per Share | | $ | 14.47 | | | $ | 12.94 | | | $ | 11.73 | | | $ | 16.62 | |
| *Includes Market Value of Securities on Loan | | $ | 17,583,325 | | | $ | 1,946,033 | | | $ | — | | | $ | — | |
The accompanying notes are an integral part of the financial statements.
| Statements of Operations |
| For the year ended October 31, 2013 |
| | | Global X Silver
Miners ETF | | | Global X Gold
Explorers ETF | | | Global X Pure
Gold Miners
ETF | | | Global X Copper
Miners ETF | |
| Investment Income: | | | | | | | | | | | | | | | | |
| Dividend Income | | $ | 3,573,010 | | | $ | — | | | $ | 52,107 | | | $ | 728,084 | |
| Interest Income | | | 188 | | | | 24 | | | | 7,049 | | | | 61 | |
| Security Lending Income | | | 152,624 | | | | — | | | | — | | | | 14,985 | |
| Less: Foreign Taxes Withheld | | | (189,563 | ) | | | — | | | | (7,180 | ) | | | (38,272 | ) |
| Total Investment Income | | | 3,536,259 | | | | 24 | | | | 51,976 | | | | 704,858 | |
| Supervision and Administration(1) | | | 1,736,731 | | | | 219,030 | | | | 21,142 | | | | 201,305 | |
| Total Expenses | | | 1,736,731 | | | | 219,030 | | | | 21,142 | | | | 201,305 | |
| Net Investment Income (Loss) | | | 1,799,528 | | | | (219,006 | ) | | | 30,834 | | | | 503,553 | |
| Net Realized Gain (Loss) on: | | | – | | | | – | | | | – | | | | – | |
| Investments | | | (52,704,382 | )(2) | | | (14,397,195 | )(2) | | | (834,953 | ) | | | (4,404,261 | )(2) |
| Affiliated Investments | | | – | | | | (370,858 | ) | | | – | | | | – | |
| Foreign Currency Transactions | | | (19,041 | ) | | | (3,408 | ) | | | 5,188 | | | | 609 | |
| Net Realized Loss on Investments, Affiliated Investments and Foreign Currency Transactions | | | (52,723,423 | ) | | | (14,771,461 | ) | | | (829,765 | ) | | | (4,403,652 | ) |
| Net Change in Unrealized Appreciation (Depreciation) on: | | | | | | | | | | | | | | | | |
| Investments | | | (137,279,249 | ) | | | (17,192,527 | ) | | | (1,351,090 | ) | | | (2,846,356 | ) |
| Affiliated Investments | | | — | | | | 409,191 | | | | — | | | | — | |
| Foreign Currency Translations | | | (12,821 | ) | | | 174 | | | | (8 | ) | | | (13,859 | ) |
| Net Change in Unrealized Depreciation on Investments, Affiliated Investments and Foreign Currency Translations | | | (137,292,070 | ) | | | (16,783,162 | ) | | | (1,351,098 | ) | | | (2,860,215 | ) |
| Net Realized and Unrealized Loss on Investments, Affiliated Investments and Foreign Currency Transactions and Translations | | | (190,015,493 | ) | | | (31,554,623 | ) | | | (2,180,863 | ) | | | (7,263,867 | ) |
| Net Decrease in Net Assets Resulting from Operations | | $ | (188,215,965 | ) | | $ | (31,773,629 | ) | | $ | (2,150,029 | ) | | $ | (6,760,314 | ) |
| (1) | The Supervision and Administration fees reflect the supervisory and administrative fee, which includes fees paid by the Funds for the investment advisory services provided by the Adviser. (See Note 3 in Notes to Financial Statements.) |
| (2) | Includes realized gains (losses) as a result of in-kind redemptions. (See Note 4 in Notes to Financial Statements.) |
The accompanying notes are an integral part of the financial statements.
| Statements of Operations |
| For the year ended October 31, 2013 |
| | | Global X
Uranium ETF | | | Global X
Lithium ETF | | | Global X
Fertilizers/Potash
ETF | | | Global X
Junior Miners
ETF | |
| Investment Income: | | | | | | | | | | | | | | | | |
| Dividend Income | | $ | 514,752 | | | $ | 539,219 | | | $ | 637,755 | | | $ | 52,769 | |
| Interest Income | | | 346 | | | | 29 | | | | 94,439 | | | | 3 | |
| Security Lending Income | | | 1,153,340 | | | | 60,053 | | | | — | | | | — | |
| Less: Foreign Taxes Withheld | | | (77,213 | ) | | | (54,651 | ) | | | (73,839 | ) | | | (4,084 | ) |
| Total Investment Income | | | 1,591,225 | | | | 544,650 | | | | 658,355 | | | | 48,688 | |
| Supervision and Administration Fees(1) | | | 912,042 | | | | 425,431 | | | | 173,264 | | | | 25,828 | |
| Total Expenses | | | 912,042 | | | | 425,431 | | | | 173,264 | | | | 25,828 | |
| Net Investment Income | | | 679,183 | | | | 119,219 | | | | 485,091 | | | | 22,860 | |
| Net Realized Gain (Loss) on: | | | | | | | | | | | | | | | | |
| Investments (2) | | | (89,052,687 | ) | | | (6,479,929 | ) | | | (102,099 | ) | | | (601,182 | ) |
| Affiliated Investments | | | (28,657,704 | ) | | | (234,345 | ) | | | – | | | | – | |
| Foreign Currency Transactions | | | (8,258 | ) | | | 4,649 | | | | 77 | | | | 1,018 | |
| Net Realized Loss on Investments, Affiliated Investments and Foreign Currency Transactions | | | (117,718,649 | ) | | | (6,709,625 | ) | | | (102,022 | ) | | | (600,164 | ) |
| Net Change in Unrealized Appreciation (Depreciation) on: | | | | | | | | | | | | | | | | |
| Investments | | | 52,266,195 | | | | 4,832,309 | | | | (3,833,115 | ) | | | (1,296,333 | ) |
| Affiliated Investments | | | 17,951,176 | | | | (3,037,894 | ) | | | — | | | | — | |
| Foreign Currency Translations | | | (16 | ) | | | 3,843 | | | | 950 | | | | 38 | |
| Net Change in Unrealized Appreciation (Depreciation) on Investments, Affiliated Investments and Foreign Currency Translations | | | 70,217,355 | | | | 1,798,258 | | | | (3,832,165 | ) | | | (1,296,295 | ) |
| Net Realized and Unrealized Loss on Investments, Affiliated Investments and Foreign Currency Transactions and Translations | | | (47,501,294 | ) | | | (4,911,367 | ) | | | (3,934,187 | ) | | | (1,896,459 | ) |
| Net Decrease in Net Assets Resulting from Operations | | $ | (46,822,111 | ) | | $ | (4,792,148 | ) | | $ | (3,449,096 | ) | | $ | (1,873,599 | ) |
| (1) | The Supervision and Administration fees reflect the supervisory and administrative fee, which includes fees paid by the Funds for the investment advisory services provided by the Adviser. (See Note 3 in Notes to Financial Statements.) |
| (2) | Includes realized gain (loss) as a result of in-kind transactions. (See Note 4 in Notes to Financial Statements.) |
The accompanying notes are an integral part of the financial statements.
| Statements of Changes in Net Assets |
| | | Global X Silver Miners ETF | | | Global X Gold Explorers ETF | |
| | | Year Ended
October 31, 2013 | | | Year Ended
October 31, 2012 | | | Year Ended
October 31, 2013 | | | Year Ended
October 31, 2012 | |
| Operations: | | | | | | | | | | | | | | | | |
| Net Investment Income (Loss) | | $ | 1,799,528 | | | $ | 2,004,573 | | | $ | (219,006 | ) | | $ | (192,120 | ) |
| Net Realized Loss on Investments, Affiliated Investments and Foreign Currency Transactions | | | (52,723,423 | )(1) | | | (9,604,385 | )(1) | | | (14,771,461 | )(1) | | | (8,399,444 | ) |
| Net Change in Unrealized Appreciation (Depreciation) on Investments, Affiliated Investments and Foreign Currency Translations | | | (137,292,070 | ) | | | 24,956,898 | | | | (16,783,162 | ) | | | (2,231,114 | ) |
| Net Increase (Decrease) in Net Assets Resulting from Operations | | | (188,215,965 | ) | | | 17,357,086 | | | | (31,773,629 | ) | | | (10,822,678 | ) |
| Dividends and Distributions from: | | | | | | | | | | | | | | | | |
| Net Investment Income | | | (3,117,053 | ) | | | (528,916 | ) | | | (1,890,494 | ) | | | (545,816 | ) |
| Total Dividends and Distributions | | | (3,117,053 | ) | | | (528,916 | ) | | | (1,890,494 | ) | | | (545,816 | ) |
| Capital Share Transactions: | | | | | | | | | | | | | | | | |
| Issued | | | 62,405,000 | | | | 80,704,000 | | | | 25,777,500 | | | | 25,228,000 | |
| Redeemed | | | (38,799,000 | ) | | | (74,671,000 | ) | | | (1,345,123 | ) | | | — | |
| Increase in Net Assets from Capital Share Transactions | | | 23,606,000 | | | | 6,033,000 | | | | 24,432,377 | | | | 25,228,000 | |
| Total Increase (Decrease) in Net Assets | | | (167,727,018 | ) | | | 22,861,170 | | | | (9,231,746 | ) | | | 13,859,506 | |
| Net Assets: | | | | | | | | | | | | | | | | |
| Beginning of Year | | | 385,966,774 | | | | 363,105,604 | | | | 41,251,366 | | | | 27,391,860 | |
| End of Year | | $ | 218,239,756 | | | $ | 385,966,774 | | | $ | 32,019,620 | | | $ | 41,251,366 | |
| Undistributed (Distributions in Excess of) Net Investment Income | | $ | 342,851 | | | $ | 1,403,715 | | | $ | (1,387,052 | ) | | $ | (604,602 | ) |
| Share Transactions: | | | | | | | | | | | | | | | | |
| Issued | | | 3,450,000 | | | | 3,550,000 | | | | 1,287,500 | (2) | | | 675,000 | (2) |
| Redeemed | | | (1,950,000 | ) | | | (3,450,000 | ) | | | (100,242 | )(2) | | | — | |
| Net Increase in Shares Outstanding from Share Transactions | | | 1,500,000 | | | | 100,000 | | | | 1,187,258 | | | | 675,000 | |
| (1) | Includes realized gain (loss) as a result of in-kind transactions. (See Note 4 in Notes to Financial Statements.) |
| (2) | Adjusted to reflect the effect of a 1 for 4 reverse share split on May 16, 2013. (See Note 10 in the Notes to Financial Statements). |
The accompanying notes are an integral part of the financial statements.
| Statements of Changes in Net Assets |
| | | Global X Pure Gold Miners ETF | | | Global X Copper Miners ETF | |
| | | Year Ended
October 31, 2013 | | | Year Ended
October 31, 2012 | | | Year Ended
October 31, 2013 | | | Year Ended
October 31, 2012 | |
| Operations: | | | | | | | | | | | | | | | | |
| Net Investment Income | | $ | 30,834 | | | $ | 15,131 | | | $ | 503,553 | | | $ | 624,672 | |
| Net Realized Loss on Investments and Foreign Currency Transactions | | | (829,765 | ) | | | (212,334 | ) | | | (4,403,652 | )(1) | | | (3,016,842 | )(1) |
| Net Change in Unrealized Depreciation on Investments and Foreign Currency Translations | | | (1,351,098 | ) | | | (836,592 | ) | | | (2,860,215 | ) | | | (257,877 | ) |
| Net Decrease in Net Assets Resulting from Operations | | | (2,150,029 | ) | | | (1,033,795 | ) | | | (6,760,314 | ) | | | (2,650,047 | ) |
| Dividends and Distributions from: | | | | | | | | | | | | | | | | |
| Net Investment Income | | | (5,222 | ) | | | (86,778 | ) | | | (1,026,703 | ) | | | (1,669,576 | ) |
| Net Realized Gains | | | — | | | | — | | | | — | | | | (1,004,380 | ) |
| Total Dividends and Distributions | | | (5,222 | ) | | | (86,778 | ) | | | (1,026,703 | ) | | | (2,673,956 | ) |
| Capital Share Transactions: | | | | | | | | | | | | | | | | |
| Issued | | | 1,128,500 | | | | 636,000 | | | | 13,827,500 | | | | 2,635,500 | |
| Redeemed | | | (517 | ) | | | — | | | | (4,253,000 | ) | | | (11,788,000 | ) |
| Increase (Decrease) in Net Assets from Capital Share Transactions | | | 1,127,983 | | | | 636,000 | | | | 9,574,500 | | | | (9,152,500 | ) |
| Total Increase (Decrease) in Net Assets | | | (1,027,268 | ) | | | (484,573 | ) | | | 1,787,483 | | | | (14,476,503 | ) |
| Net Assets: | | | | | | | | | | | | | | | | |
| Beginning of Year | | | 4,649,413 | | | | 5,133,986 | | | | 31,040,710 | | | | 45,517,213 | |
| End of Year | | $ | 3,622,145 | | | $ | 4,649,413 | | | $ | 32,828,193 | | | $ | 31,040,710 | |
| Undistributed (Distributions in Excess of) Net Investment Income | | $ | (35,465 | ) | | $ | (68,820 | ) | | $ | (43,214 | ) | | $ | 365,329 | |
| Share Transactions: | | | | | | | | | | | | | | | | |
| Issued | | | 100,000 | (2) | | | 25,000 | (2) | | | 1,350,000 | | | | 200,000 | |
| Redeemed | | | (40 | )(2) | | | — | | | | (400,000 | ) | | | (850,000 | ) |
| Net Increase (Decrease) in Shares Outstanding from Share Transactions | | | 99,960 | | | | 25,000 | | | | 950,000 | | | | (650,000 | ) |
| (1) | Includes realized gain (loss) as a result of in- kind transactions. (See Note 4 in Notes to Financial Statements.) |
| (2) | Adjusted to reflect the effect of a 1 for 2 reverse share split on May 16, 2013. (See Note 10 in the Notes to Financial Statements). |
The accompanying notes are an integral part of the financial statements.
| Statements of Changes in Net Assets |
| | | Global X Uranium ETF | | | Global X Lithium ETF | |
| | | Year Ended
October 31, 2013 | | | Year Ended
October 31, 2012 | | | Year Ended
October 31, 2013 | | | Year Ended
October 31, 2012 | |
| Operations: | | | | | | | | | | | | | | | | |
| Net Investment Income | | $ | 679,183 | | | $ | 494,660 | | | $ | 119,219 | | | $ | 1,208,946 | |
| Net Realized Loss on Investments, Affiliated Investments and Foreign Currency Transactions(1) | | | (117,718,649 | ) | | | (56,656,512 | ) | | | (6,709,625 | ) | | | (29,748,967 | ) |
| Net Change in Unrealized Appreciation (Depreciation) on Investments, Affiliated Investments and Foreign Currency Translations | | | 70,217,355 | | | | (3,760,381 | ) | | | 1,798,258 | | | | 19,806,215 | |
| Net Decrease in Net Assets Resulting from Operations | | | (46,822,111 | ) | | | (59,922,233 | ) | | | (4,792,148 | ) | | | (8,733,806 | ) |
| Dividends and Distributions from: | | | | | | | | | | | | | | | | |
| Net Investment Income | | | (2,536,311 | ) | | | — | | | | (1,597,778 | ) | | | (114,415 | ) |
| Total Dividends and Distributions | | | (2,536,311 | ) | | | — | | | | (1,597,778 | ) | | | (114,415 | ) |
| Capital Share Transactions: | | | | | | | | | | | | | | | | |
| Issued | | | 33,324,000 | | | | 14,424,500 | | | | — | | | | 11,966,000 | |
| Redeemed | | | (762,848 | ) | | | (18,183,000 | ) | | | (12,375,500 | ) | | | (40,547,500 | ) |
| Increase (Decrease) in Net Assets from Capital Share Transactions | | | 32,561,152 | | | | (3,758,500 | ) | | | (12,375,500 | ) | | | (28,581,500 | ) |
| Total Decrease in Net Assets | | | (16,797,270 | ) | | | (63,680,733 | ) | | | (18,765,426 | ) | | | (37,429,721 | ) |
| Net Assets: | | | | | | | | | | | | | | | | |
| Beginning of Year | | | 135,668,263 | | | | 199,348,996 | | | | 69,870,903 | | | | 107,300,624 | |
| End of Year | | $ | 118,870,993 | | | $ | 135,668,263 | | | $ | 51,105,477 | | | $ | 69,870,903 | |
| Undistributed (Distributions in Excess of) Net Investment Income | | $ | 15,720 | | | $ | 1,881,106 | | | $ | (95,185 | ) | | $ | 1,175,127 | |
| Share Transactions: | | | | | | | | | | | | | | | | |
| Issued | | | 1,816,667 | (2) | | | 516,667 | (2) | | | — | | | | 750,000 | |
| Redeemed | | | (51,596 | )(2) | | | (650,000 | )(2) | | | (900,000 | ) | | | (2,650,000 | ) |
| Net Increase (Decrease) in Shares Outstanding from Share Transactions | | | 1,765,071 | | | | (133,333 | ) | | | (900,000 | ) | | | (1,900,000 | ) |
| (1) | Includes realized gain (loss) as a result of in-kind transactions. (See Note 4 in Notes to Financial Statements.) |
| (2) | Adjusted to reflect the effect of a 1 for 3 reverse share split on May 16, 2013. (See Note 10 in the Notes to Financial Statements). |
The accompanying notes are an integral part of the financial statements.
| Statements of Changes in Net Assets |
| | | Global X Fertilizers/Potash ETF | | | Global X Junior Miners ETF | |
| | | Year Ended
October 31, 2013 | | | Year Ended
October 31, 2012 | | | Year Ended
October 31, 2013 | | | Year Ended
October 31, 2012 | |
| Operations: | | | | | | | | | | | | | | | | |
| Net Investment Income (Loss) | | $ | 485,091 | | | $ | 394,044 | | | $ | 22,860 | | | $ | (13,782 | ) |
| Net Realized Loss on Investments and Foreign Currency Transactions(1) | | | (102,022 | ) | | | (2,916,229 | ) | | | (600,164 | ) | | | (1,127,606 | ) |
| Net Change in Unrealized Appreciation (Depreciation) on Investments and Foreign Currency Translations | | | (3,832,165 | ) | | | 1,379,636 | | | | (1,296,295 | ) | | | 942,998 | |
| Net Decrease in Net Assets Resulting from Operations | | | (3,449,096 | ) | | | (1,142,549 | ) | | | (1,873,599 | ) | | | (198,390 | ) |
| Dividends and Distributions from: | | | | | | | | | | | | | | | | |
| Net Investment Income | | | (330,509 | ) | | | (185,936 | ) | | | (337,710 | ) | | | (71,812 | ) |
| Net Realized Gains | | | — | | | | (32,332 | ) | | | — | | | | — | |
| Total Dividends and Distributions | | | (330,509 | ) | | | (218,268 | ) | | | (337,710 | ) | | | (71,812 | ) |
| Capital Share Transactions: | | | | | | | | | | | | | | | | |
| Issued | | | 4,105,000 | | | | 6,730,500 | | | | 5,786,500 | | | | 568,000 | |
| Redeemed | | | (5,845,000 | ) | | | (12,146,000 | ) | | | (748,458 | ) | | | (469,500 | ) |
| Increase (Decrease) in Net Assets from Capital Share Transactions | | | (1,740,000 | ) | | | (5,415,500 | ) | | | 5,038,042 | | | | 98,500 | |
| Total Increase (Decrease) in Net Assets | | | (5,519,605 | ) | | | (6,776,317 | ) | | | 2,826,733 | | | | (171,702 | ) |
| Net Assets: | | | | | | | | | | | | | | | | |
| Beginning of Year | | | 28,383,494 | | | | 35,159,811 | | | | 2,710,029 | | | | 2,881,731 | |
| End of Year | | $ | 22,863,889 | | | $ | 28,383,494 | | | $ | 5,536,762 | | | $ | 2,710,029 | |
| Undistributed (Distributions in Excess of) Net Investment Income | | $ | 302,042 | | | $ | 191,947 | | | $ | (32,081 | ) | | $ | 272,164 | |
| Share Transactions: | | | | | | | | | | | | | | | | |
| Issued | | | 350,000 | | | | 500,000 | | | | 300,000 | (2) | | | 16,667 | (2) |
| Redeemed | | | (450,000 | ) | | | (950,000 | ) | | | (50,132 | )(2) | | | (16,667 | )(2) |
| Net Increase (Decrease) in Shares Outstanding from Share Transactions | | | (100,000 | ) | | | (450,000 | ) | | | 249,868 | | | | — | |
| (1) | Includes realized gain (loss) as a result of in-kind transactions. (See Note 4 in Notes to Financial Statements.) |
| (2) | Adjusted to reflect the effect of a 1 for 3 reverse share split on May 16, 2013. (See Note 10 in the Notes to Financial Statements). |
The accompanying notes are an integral part of the financial statements.
Selected Per Share Data & Ratios
For a Share Outstanding Throughout the Period
| | | Net Asset Value, Beginning of Period
($) | | Net Investment Income (Loss) ($)* | | Net Realized and Unrealized Gain (Loss) on Investments ($) | | Total from Operations ($) | | Distribution from Net Investment Income ($) | | Distribution from Net Realized Gains ($) | | Total from Distributions ($) | | Net Asset Value, End of Period ($) | | Total Return (%)** | | Net Assets End of Period ($) (000) | | Ratio of Expenses to Average Net Assets (%) | | | Ratio of Net Investment Income (Loss) to Average Net Assets (%) | | | Portfolio Turnover (%) | |
| Global X Silver Miners ETF | | | | | | | | | | | | | | | | | | | | | | | | | | | | | | |
| 2013 | | | 24.98 | | | 0.11 | | (12.01 | ) | (11.90 | ) | | (0.20 | ) | | — | | | (0.20 | ) | | 12.88 | | (47.97 | ) | | 218,240 | | 0.65 | | | 0.67 | | | 23 79 | |
| 2012 | | | 23.66 | | | 0.13 | | 1.23 | | 1.36 | | | (0.04 | ) | | — | | | (0.04 | ) | | 24.98 | | 5.76 | | | 385,967 | | 0.65 | | | 0.62 | | | 18.13 | |
| 2011 | | | 20.20 | | | 0.04 | | 3.66 | | 3.70 | | | (0.24 | ) | | — | | | (0.24 | ) | | 23.66 | | 18.20 | | | 363,106 | | 0.65 | | | 0.16 | | | 26.50 | |
| 2010(1) | | | 14.50 | | | 0.05 | | 5.65 | | 5.70 | | | — | | | — | | | — | | | 20.20 | | 39.31 | | | 171,672 | | 0.65 | † | | 0.61 | † | | 0.35 | †† |
| Global X Gold Explorers ETF | | | | | | | | | | | | | | | | | | | | | | | | | | | | | | |
| 2013(2) | | | 34.72 | | | (0.12 | ) | (19.68 | ) | (19.80 | ) | | (1.44 | ) | | — | | | (1.44 | ) | | 13.48 | | (59.16 | ) | | 32,020 | | 0.65 | | | (0.65 | ) | | 31.73 | |
| 2012(2) | | | 53.44 | | | (0.24 | ) | (17.46 | ) | (17.70 | ) | | (1.02 | ) | | — | | | (1.02 | ) | | 34.72 | | (33.42 | ) | | 41,251 | | 0.65 | | | (0.65 | ) | | 43.12 | |
| 2011(2)(3) | | | 61.96 | | | (0.42 | ) | (8.10 | ) | (8.52 | ) | | — | | | — | | | — | | | 53.44 | | (13.75 | ) | | 27,392 | | 0.65 | † | | (0.65 | )† | | 29.96 | †† |
| Global X Pure Gold Miners ETF | | | | | | | | | | | | | | | | | | | | | | | | | | | | | | |
| 2013(4) | | | 23.24 | | | 0.13 | | (11.26 | ) | (11.13 | ) | | (0.03 | ) | | — | | | (0.03 | ) | | 12.08 | | (47.95 | ) | | 3,622 | | 0.59 | | | 0.86 | | | 35.86 | |
| 2012(4) | | | 29.34 | | | 0.08 | | (5.68 | ) | (5.60 | ) | | (0.50 | ) | | — | | | (0.50 | ) | | 23.24 | | (19.13 | ) | | 4,649 | | 0.59 | | | 0.32 | | | 19.23 | |
| 2011(4)(5) | | | 30.30 | | | 0.02 | | (0.98 | ) | (0.96 | ) | | — | | | — | | | — | | | 29.34 | | (3.17 | ) | | 5,134 | | 0.59 | † | | 0.10 | † | | 7.61 | †† |
| Global X Copper Miners ETF | | | | | | | | | | | | | | | | | | | | | | | | | | | | | | |
| 2013 | | | 12.93 | | | 0.17 | | (2.87 | ) | (2.70 | ) | | (0.43 | ) | | — | | | (0.43 | ) | | 9.80 | | (21.69 | ) | | 32,828 | | 0.65 | | | 1.63 | | | 37.06 | |
| 2012 | | | 14.92 | | | 0.24 | | (1.32 | ) | (1.08 | ) | | (0.57 | ) | | (0.34 | ) | | (0.91 | ) | | 12.93 | | (7.08 | ) | | 31,041 | | 0.65 | | | 1.84 | | | 28.90 | |
| 2011 | | | 16.63 | | | 0.35 | | (1.97 | ) | (1.62 | ) | | (0.09 | ) | | — | | | (0.09 | ) | | 14.92 | | (9.85 | ) | | 45,517 | | 0.65 | | | 1.91 | | | 15.78 | |
| 2010(1) | | | 14.40 | | | — | | 2.23 | | 2.23 | | | — | | | — | | | — | | | 16.63 | | 15.49 | | | 29,929 | | 0.65 | † | | 0.06 | † | | 1.36 | †† |
| | | | | | | | | | | | | | | | | | | | | | | | | | | | | | | | | | | | | | |
| (1) | The Fund commenced operations on April 19, 2010. |
| (2) | Per share amounts have been adjusted for a 1 for 4 reverse share split on May 16, 2013. For more information see Note 10 in the Notes to Financial Statements |
| (3) | The Fund commenced operations on November 3, 2010. |
| (4) | Per share amounts have been adjusted for a 1 for 2 reverse share split on May 16, 2013. For more information see Note 10 in the Notes to Financial Statements |
| (5) | The Fund commenced operations on March 14, 2011. |
| * | Per share data calculated using average shares method. |
| ** | Total return is based on the change in net asset value of a share during the year or period and assumes reinvestment of dividends and distributions at net asset value. Total return is for the period indicated and periods of less than one year have not been annualized. The return shown does not reflect the deduction of taxes that a shareholder would pay on Fund distributions or the redemption of Fund shares. |
| † | Annualized. |
| †† | Portfolio turnover rate is for the period indicated and periods of less than one year have not been annualized. Excludes effect of in-kind transfers. |
Amounts designated as “—” are either $0 or have been rounded to $0.
The accompanying notes are an integral part of the financial statements.
Selected Per Share Data & Ratios
For a Share Outstanding Throughout the Period
| | | Net Asset
Value,
Beginning
of Period
($) | | Net
Investment
Income
(Loss)
($)* | | Net Realized
and
Unrealized
Gain (Loss)
on
Investments
($) | | Total from
Operations
($) | | Distribution
from Net
Investment
Income
($) | | Distribution
from Net
Realized
Gains
($) | | Total from
Distributions
($) | | Net
Asset
Value,
End of
Period
($) | | Total
Return
(%)** | | Net Assets
End of
Period ($)
(000) | | Ratio of
Expenses
to
Average
Net
Assets
(%) | | Ratio of
Net
Investment
Income
(Loss) to
Average
Net Assets
(%) | | Portfolio
Turnover
(%) | |
| Global X Uranium ETF | | | | | | | | | | | | | | | | | | | | | | | | | | | | | | | | | | |
| 2013(1) | | | 21.03 | | | 0.09 | | | (6.28 | ) | | (6.19 | ) | | (0.37 | ) | | — | | | (0.37 | ) | | 14.47 | | | (29.88 | ) | | 118,871 | | | 0.69 | | | 0.51 | | | 73.16 | |
| 2012(1) | | | 30.27 | | | 0.08 | | | (9.32 | ) | | (9.24 | ) | | — | | | — | | | — | | | 21.03 | | | (30.53 | ) | | 135,668 | | | 0.69 | | | 0.30 | | | 55.90 | |
| 2011(1)(2) | | | 50.34 | | | 0.44 | | | (19.34 | ) | | (18.90 | ) | | (1.17 | ) | | — | | | (1.17 | ) | | 30.27 | | | (38.70 | ) | | 199,349 | | | 0.69 | † | | 1.10 | † | | 24.17 | †† |
| Global X Lithium ETF | | | | | | | | | | | | | | | | | | | | | | | | | | | | | | | | | | |
| 2013 | | | 14.41 | | | 0.03 | | | (1.15 | ) | | (1.12 | ) | | (0.35 | ) | | — | | | (0.35 | ) | | 12.94 | | | (8.00 | ) | | 51,105 | | | 0.75 | | | 0.21 | | | 38.46 | |
| 2012 | | | 15.90 | | | 0.21 | | | (1.68 | ) | | (1.47 | ) | | (0.02 | ) | | — | | | (0.02 | ) | | 14.41 | | | (9.25 | ) | | 69,871 | | | 0.75 | | | 1.40 | | | 28.78 | |
| 2011 | | | 19.83 | | | (0.04 | ) | | (3.62 | ) | | (3.66 | ) | | (0.25 | ) | | (0.02 | ) | | (0.27 | ) | | 15.90 | | | (18.86 | ) | | 107,301 | | | 0.75 | | | (0.22 | ) | | 24.87 | |
| 2010(3) | | | 15.51 | | | (0.03 | ) | | 4.35 | | | 4.32 | | | — | | | — | | | — | | | 19.83 | | | 27.85 | | | 78,317 | | | 0.75 | † | | (0.62 | )† | | 5.55 | †† |
| Global X Fertilizers/Potash ETF | | | | | | | | | | | | | | | | | | | | | | | | | | | | | | | | |
| 2013 | | | 13.85 | | | 0.25 | | | (2.21 | ) | | (1.96 | ) | | (0.16 | ) | | — | | | (0.16 | ) | | 11.73 | | | (14.33 | ) | | 22,864 | | | 0.69 | | | 1.93 | | | 14.12 | |
| 2012 | | | 14.06 | | | 0.19 | | | (0.29 | ) | | (0.10 | ) | | (0.09 | ) | | (0.02 | ) | | (0.11 | ) | | 13.85 | | | (0.61 | ) | | 28,383 | | | 0.69 | | | 1.42 | | | 24.05 | |
| 2011(4) | | | 15.05 | | | 0.06 | | | (1.05 | ) | | (0.99 | ) | | — | | | — | | | — | | | 14.06 | | | (6.58 | ) | | 35,160 | | | 0.69 | † | | 0.90 | † | | 7.55 | †† |
| Global X Junior Miners ETF | | | | | | | | | | | | | | | | | | | | | | | | | | | | | | | | |
| 2013(1) | | | 32.52 | | | 0.12 | | | (12.64 | ) | | (12.52 | ) | | (3.38 | ) | | — | | | (3.38 | ) | | 16.62 | | | (42.49 | ) | | 5,537 | | | 0.69 | | | 0.60 | | | 37.23 | |
| 2012(1) | | | 34.59 | | | (0.18 | ) | | (1.03 | ) | | (1.21 | ) | | (0.86 | ) | | — | | | (0.86 | ) | | 32.52 | | | (3.16 | ) | | 2,710 | | | 0.75 | | | (0.57 | ) | | 167.10 | |
| 2011(1)(5) | | | 45.12 | | | (0.20 | ) | | (10.33 | ) | | (10.53 | ) | | — | | | — | | | — | | | 34.59 | | | (23.34 | ) | | 2,882 | | | 0.75 | † | | (0.77 | )† | | 28.23 | †† |
| (1) | Per share amounts have been adjusted for a 1 for 3 reverse share split on May 16, 2013. For more information see Note 10 in the Notes to Financial Statements. |
| (2) | The Fund commenced operations on November 4, 2010. |
| (3) | The Fund commenced operations on July 22, 2010. |
| (4) | The Fund commenced operations on May 25, 2011. |
| (5) | The Fund commenced operations on March 16, 2011. |
| * | Per share data calculated using average shares method. |
| ** | Total return is based on the change in net asset value of a share during the year or period and assumes reinvestment of dividends and distributions at net asset value. Total return is for the period indicated and periods of less than one year have not been annualized. The return shown does not reflect the deduction of taxes that a shareholder would pay on Fund distributions or the redemption of Fund shares. |
| † | Annualized. |
| †† | Portfolio turnover rate is for the period indicated and periods of less than one year have not been annualized. Excludes effect of in-kind transfers. |
Amounts designated as “—” are either $0 or have been rounded to $0.
The accompanying notes are an integral part of the financial statements.
| Notes to Financial Statements |
| October 31, 2013 |
1. ORGANIZATION
The Global X Funds (the “Trust”) is a Delaware Statutory Trust formed on March 6, 2008. The Trust is registered under the Investment Company Act of 1940, as amended, as an open-end management investment company. As of October 31, 2013, the Trust had seventy-nine portfolios, thirty-six of which were operational. The financial statements herein and the related notes pertain to the Global X Silver Miners ETF, Global X Gold Explorers ETF, Global X Pure Gold Miners ETF, Global X Copper Miners ETF, Global X Uranium ETF, Global X Lithium ETF, Global X Fertilizers/Potash ETF and Global X Junior Miners ETF (the “Funds”). Each Fund is non-diversified.
2. SIGNIFICANT ACCOUNTING POLICIES
The following is a summary of the significant accounting policies followed by the Funds.
USE OF ESTIMATES — The preparation of financial statements in conformity with U.S. generally accepted accounting principles ("U.S. GAAP") requires management to make estimates and assumptions that affect the reported amounts of assets and liabilities and disclosure of contingent assets and liabilities at the date of the financial statements and the reported amounts of increases and decreases in net assets from operations during the reporting period. Actual results could materially differ from those estimates.
SECURITY VALUATION — Securities listed on a securities exchange, market or automated quotation system for which quotations are readily available (except for securities traded on NASDAQ), including securities traded over the counter, are valued at the last quoted sale price on the primary exchange or market (foreign or domestic) on which they are traded (or at approximately 4:00 pm if a security’s primary exchange is normally open at that time), or, if there is no such reported sale, at the most recent mean between the quoted bid and asked prices (absent both bid and asked prices on such exchange, the bid price may be used).
For securities traded on NASDAQ, the NASDAQ Official Closing Price will be used. If available, debt securities are priced based upon valuations provided by independent, third-party pricing agents. Such values generally reflect the last reported sales price if the security is actively traded. The third-party pricing agents may also value debt securities at an evaluated bid price by employing methodologies that utilize actual market transactions, broker-supplied valuations, or other methodologies designed to identify the market value for such securities. Debt obligations with remaining maturities of sixty days or less may be valued at their amortized cost, which approximates market value. The prices for foreign securities are reported in local currency and converted to U.S. dollars using currency exchange rates. Prices for most securities held in the Funds are provided daily by recognized independent pricing agents. If a security price cannot be obtained from an independent, third-party pricing agent, the Funds seek to obtain a bid price from at least one independent broker.
Securities for which market prices are not “readily available” are valued in accordance with Fair Value Procedures established by the Board of Directors (the “Board”). The Funds’ Fair Value Procedures are implemented through a Fair Value Committee (the “Committee”) designated by the Board. Some of the more common reasons that may necessitate that a security be valued using Fair Value Procedures include: the security's trading has been halted or suspended; the security has been
| Notes to Financial Statements (continued) |
| October 31, 2013 |
2. SIGNIFICANT ACCOUNTING POLICIES (continued)
SECURITY VALUATION (continued)
de-listed from its primary trading exchange; the security's primary trading market is temporarily closed at a time when under normal conditions it would be open; the security has not been traded for an extended period of time; the security's primary pricing source is not able or willing to provide a price; or trading of the security is subject to local government-imposed restrictions. In addition, the Funds may fair value their securities if an event that may materially affect the value of the Funds’ securities that traded outside of the United States (a “Significant Event”) has occurred between the time of the security's last close and the time that the Funds calculate their net asset value. A Significant Event may relate to a single issuer or to an entire market sector. Events that may be Significant Events include: government actions, natural disasters, armed conflict, acts of terrorism and significant market fluctuations. If Global X Management Company LLC (“Adviser”) becomes aware of a Significant Event that has occurred with respect to a security or group of securities after the closing of the exchange or market on which the security or securities principally trade, but before the time at which the Funds calculate net asset value, it may request that a Committee meeting be called. When a security is valued in accordance with the Fair Value Procedures, the Committee will determine the value after taking into consideration all relevant information reasonably available to the Committee. As of October 31, 2013, there were $144,064 and $52,625 of fair valued securities in the Global X Pure Gold Miners ETF and the Global X Junior Miners ETF, respectively. There were no other securities priced using the fair value procedures.
In accordance with the authoritative guidance on fair value measurements and disclosure under U.S. GAAP, the Funds disclose the fair value of their investments in a hierarchy that prioritizes the inputs to valuation techniques used to measure the fair value. The objective of a fair value measurement is to determine the price that would be received to sell an asset or paid to transfer a liability in an orderly transaction between market participants at the measurement date (an exit price). Accordingly, the fair value hierarchy gives the highest priority to quoted prices (unadjusted) in active markets for identical assets or liabilities (Level 1) and the lowest priority to unobservable inputs (Level 3). The three levels of the fair value hierarchy are described below:
The three levels of the fair value hierarchy are described below:
Level 1 – Unadjusted quoted prices in active markets for identical, unrestricted assets or liabilities that the Fund has the ability to access at the measurement date
Level 2 – Other significant observable inputs (including quoted prices in non-active markets, quoted prices for similar investments, fair value of investments for which the Fund has the ability to fully redeem tranches at net asset value as of the measurement date or within the near term, and short-term investments valued at amortized cost)
Level 3 – Significant unobservable inputs (including the Funds’ own assumptions in determining the fair value of investments, fair value of investments for which the Fund does not have the ability to fully redeem tranches at net asset value as of the measurement date or within the near term)
Investments are classified within the level of the lowest significant input considered in determining fair value. Investments classified within Level 3 whose fair value measurement considers several inputs may include Level 1 or Level 2 inputs as components of the overall fair value measurement.
| Notes to Financial Statements (continued) |
| October 31, 2013 |
2. SIGNIFICANT ACCOUNTING POLICIES (continued)
SECURITY VALUATION (continued)
For the period ended October 31, 2013 there have been no significant changes to the Funds’ fair valuation methodologies.
DUE TO/FROM BROKERS — Due to/from brokers includes cash and collateral balances with the Funds’ clearing brokers or counterparties at October 31, 2013. The Funds continuously monitor the credit standing of each broker or counterparty with whom they conduct business. In the event a broker or counterparty is unable to fulfill its obligations, the Funds would be subject to counterparty credit risk.
REPURCHASE AGREEMENTS — Securities pledged as collateral for repurchase agreements are held by Citibank N.A. and Bank of New York Mellon and are designated as being held on each Fund’s behalf by its custodian under a book-entry system. Each Fund monitors the adequacy of the collateral on a daily basis and can require the seller to provide additional collateral in the event the market value of the securities pledged falls below the carrying value of the repurchase agreement, including accrued interest. It is the Funds’ policy to only enter into repurchase agreements with banks and other financial institutions which are deemed by the investment adviser to be creditworthy. The Funds bear the risk of loss in the event that the other party to a repurchase agreement defaults on its obligations and the Funds are prevented from exercising their rights to dispose of the underlying securities received as collateral and the risk of a possible decline in the value of the underlying securities during the period.
FEDERAL INCOME TAXES — It is each Fund’s intention to qualify or continue to qualify as a regulated investment company for Federal income tax purposes by complying with the appropriate provisions of Subchapter M of the Internal Revenue Code of 1986, as amended. Accordingly, no provisions for Federal income taxes have been made in the financial statements.
The Funds evaluate tax positions taken or expected to be taken in the course of preparing the Funds’ tax returns to determine whether it is “more-likely-than-not” (i.e., greater than 50 percent) that each tax position will be sustained upon examination by a taxing authority based on the technical merits of the position.Tax positions not deemed to meet the more-likely-than-not threshold are recorded as a tax benefit or expense in the current year. The Funds did not record any tax provision in the current period.
However, management’s conclusions regarding tax positions may be subject to review and adjustment at a later date based on factors including, but not limited to, examination by tax authorities (i.e., the last three tax year ends, as applicable), on-going analysis of and changes to tax laws, regulations and interpretations thereof.
As of and during the year ended October 31, 2013, the Funds did not have a liability for any unrecognized tax benefits. The Funds recognize interest and penalties, if any, related to unrecognized tax benefits as income tax expense in the Statement of Operations. During the period, the Funds did not incur any interest or penalties.
| Notes to Financial Statements (continued) |
| October 31, 2013 |
2. SIGNIFICANT ACCOUNTING POLICIES (continued)
SECURITY TRANSACTIONS AND INVESTMENT INCOME — Security transactions are accounted for on the trade date for financial reporting purposes. Costs used in determining realized gains and losses on the sale of investment securities are based on specific identification. Dividend income is recorded on the ex-dividend date. Interest income is recognized on the accrual basis from the settlement date.
FOREIGN CURRENCY TRANSLATION — The books and records of the Funds are maintained in U.S. dollars. Investment securities and other assets and liabilities denominated in a foreign currency are translated into U.S. dollars on the date of valuation. Purchases and sales of investment securities, income and expenses are translated into U.S. dollars at the relevant rates of exchange prevailing on the respective dates of such transactions. The Funds do not isolate that portion of realized or unrealized gains and losses resulting from changes in the foreign exchange rate from fluctuations arising from changes in the market prices of the securities. These gains and losses are included in net realized and unrealized gains and losses on investments on the Statement of Operations. Net realized and unrealized gains and losses on foreign currency transactions represent net foreign exchange gains or losses from foreign currency exchange contracts, disposition of foreign currencies, currency gains or losses realized between trade and settlement dates on securities transactions and the difference between the amount of the investment income and foreign withholding taxes recorded on the Funds’ books and the U.S. dollar equivalent amounts actually received or paid.
DIVIDENDS AND DISTRIBUTIONS TO SHAREHOLDERS — The Funds distribute their net investment income on a pro rata basis. Any net realized capital gains are distributed annually. All distributions are recorded on ex-dividend date.
CREATION UNITS — The Funds issue and redeem shares (“Shares”) at Net Asset Value (“NAV”) and only in large blocks of Shares (each block of Shares for a Fund is called a “Creation Unit” or multiples thereof). Purchasers of Creation Units (“Authorized Participants“) at NAV must pay a standard creation transaction fee per transaction. The fee is a single charge and will be the same regardless of the number of Creation Units purchased by an investor on the same day.
An Authorized Participant who holds Creation Units and wishes to redeem at NAV would also pay a standard Redemption Fee per transaction to the custodian on the date of such redemption, regardless of the number of Creation Units redeemed that day.
If a Creation Unit is purchased or redeemed for cash, a higher transaction fee will be charged. The following table discloses Creation Unit breakdown:
| | | Creation Unit | | | | | | | | | Redemption | |
| Fund | | Shares | | | Creation Fee | | | Value | | | Fee | |
| Global X Silver Miners ETF | | | 50,000 | | | $ | 1,000 | | | $ | 644,000 | | | $ | 1,000 | |
| Global X Gold Explorers ETF | | | 50,000 | | | | 1,000 | | | | 674,000 | | | | 1,000 | |
| Global X Pure Gold Miners ETF | | | 50,000 | | | | 1,000 | | | | 604,000 | | | | 1,000 | |
| Global X Copper Miners ETF | | | 50,000 | | | | 1,000 | | | | 490,000 | | | | 1,000 | |
| Global X Uranium ETF | | | 50,000 | | | | 1,000 | | | | 723,500 | | | | 1,000 | |
| Global X Lithium ETF | | | 50,000 | | | | 1,000 | | | | 647,000 | | | | 1,000 | |
| Global X Fertilizers/Potash ETF | | | 50,000 | | | | 1,000 | | | | 586,500 | | | | 1,000 | |
| Global X Junior Miners ETF | | | 50,000 | | | | 1,000 | | | | 831,000 | | | | 1,000 | |
| Notes to Financial Statements (continued) |
| October 31, 2013 |
3. RELATED PARTY TRANSACTIONS
The Adviser serves as the investment adviser and the administrator for the Funds. Subject to the supervision of the Board of Trustees, the Adviser is responsible for managing the investment activities of the Funds and the Funds’ business affairs and other administrative matters and provides or causes to be furnished all supervisory, administrative and other services reasonably necessary for the operation of the Funds, including certain distribution services (provided pursuant to a separate Distribution Agreement), certain shareholder and distribution-related services (provided pursuant to a separate Rule 12b-1 Plan and related agreements) and investment advisory services (provided pursuant to a separate Investment Advisory Agreement), under what is essentially an "all-in" fee structure. For its service to the Funds, under the Supervision and Administration Agreement, each Fund pays a monthly fee to the Adviser at the annual rate (stated as a percentage of the average daily net assets of the Fund). In addition, the Funds bear other expenses, directly and indirectly, that are not covered by the Supervision and Administration Agreement, which may vary and affect the total expense ratios of the Funds, such as taxes, brokerage fees, commissions, acquired fund fees and other transaction expenses, interest expenses, and extraordinary expenses (such as litigation and indemnification expenses).
| | | Supervision and
Administration Fee | |
| Global X Silver Miners ETF | | | 0.65 | % |
| Global X Gold Explorers ETF | | | 0.65 | % |
| Global X Pure Gold Miners ETF | | | 0.59 | % |
| Global X Copper Miners ETF | | | 0.65 | % |
| Global X Uranium ETF | | | 0.69 | % |
| Global X Lithium ETF | | | 0.75 | % |
| Global X Fertilizers/Potash ETF | | | 0.69 | % |
| Global X Junior Miners ETF | | | 0.69 | % |
The Adviser and MCCA Lithium ETF, LLC (“MCCA”), a single purpose limited liability firm, have an agreement, pursuant to which MCCA has agreed to assist the Adviser, in its capacity as sponsor of the Global X Lithium ETF, by providing initial capital and additional financial resources to the Adviser in connection with the listing, launch and the continuing operation of the Global X Lithium Fund. In return, the Adviser has agreed to compensate MCCA for its financial assistance to the Adviser with respect to the Global X Lithium ETF by sharing with MCCA fifty percent (50%) of the Adviser’s Net Profits with respect to the Global X Lithium ETF. For this purpose, the term Net Profits means, for any calendar quarter, the total management fees received by the Adviser with respect to the Global X Lithium ETF less direct expenses, marketing expenses and overhead expenses for the Global X Lithium ETF during such quarter. In the event that there are no Net Profits with respect to the Global X Lithium ETF in any calendar quarter, MCCA shall pay fifty percent of the negative shortfall in Net Profits to the Adviser. The agreement between the parties does not contemplate that MCCA or any of its affiliates will be involved directly or indirectly in the distribution of shares of the Global X Lithium ETF.
SEI Investments Global Funds Services (“SEIGFS”) serves as Sub-Administrator to the Funds. As Sub-Administrator, SEIGFS provides the Funds with the required general administrative services, including, without limitation: office space, equipment, and personnel; clerical and general back office services; bookkeeping, internal accounting and secretarial services; the calculation of NAV;
| Notes to Financial Statements (continued) |
| October 31, 2013 |
3. RELATED PARTY TRANSACTIONS (continued)
and assistance with the preparation and filing of reports, registration statements, proxy statements and other materials required to be filed or furnished by the Funds under federal and state securities laws. As compensation for these services, the Sub-Administrator receives certain out-of-pocket costs, transaction fees and asset-based fees which are accrued daily and paid monthly by the Adviser.
SEI Investments Distribution Co. (“SIDCO”) serves as each Funds’ underwriter and distributor of Shares pursuant to a Distribution Agreement. Under the Distribution Agreement, SIDCO, as agent, receives orders to create and redeem Shares in Creation Unit Aggregations and transmits such orders to the Trust’s custodian and transfer agent. The Distributor has no obligation to sell any specific quantity of Fund Shares. SIDCO bears the following costs and expenses relating to the distribution of Shares: (i) the costs of processing and maintaining records of creations of Creation Units; (ii) all costs of maintaining the records required of a registered broker/dealer; (iii) the expenses of maintaining its registration or qualification as a dealer or broker under Federal or state laws; (iv) filing fees; and (v) all other expenses incurred in connection with the distribution services as contemplated in the Distribution Agreement. SIDCO receives no fee for its distribution services under the Distribution Agreement.
At October 31, 2013, Global X Gold Explorers ETF, Global X Uranium ETF, and Global X Lithium ETF own greater than 5% of the outstanding shares of the following common stocks. These investments are noted as “Affiliated Investment” in the Schedules of Investments.
The following is a summary of the transactions with affiliates for the period ended October 31, 2013:
| | | | | | | | | Changes in | | | | | | | | | | |
| | | | | | | | | Unrealized | | | | | | | | | | |
| Value At | | Purchases at | | | Proceeds from | | | Appreciation | | | | | | Value at | | | Dividend | |
| 10/31/2012 | | Cost | | | Sales | | | (Depreciation) | | | Realized Loss | | | 10/31/2013 | | | Income | |
| Global X Gold Explorers ETF | | | | | | | | | | | | | | | | | | | | | | | | |
| Volta Resources | | | | | | | | | | | | | | | | | | | | | | | | |
| $1,813,740 | | $ | 3,240,075 | | | $ | (241,714 | ) | | $ | 409,191 | | | $ | (370,858 | ) | | $ | 4,850,434 | | | $ | — | |
| Global X Uranium ETF | | | | | | | | | | | | | | | | | | | | | | | | |
| Bannerman Resources | | | | | | | | | | | | | | | | | | | | | | | | |
| $1,108,882 | | $ | 490,749 | | | $ | (60,918 | ) | | $ | (24,254 | ) | | $ | (645,650 | ) | | $ | 868,809 | | | $ | — | |
| UEX | | | | | | | | | | | | | | | | | | | | | | | | |
| $5,210,426 | | $ | 5,877,467 | | | $ | (4,571,965 | ) | | $ | 2,865,892 | | | $ | (5,412,459 | ) | | $ | 3,969,361 | | | $ | — | |
| USEC | | | | | | | | | | | | | | | | | | | | | | | | |
| $4,950,337 | | $ | 17,717,811 | | | $ | (13,052,322 | ) | | $ | 15,109,538 | | | $ | (22,599,595 | ) | | $ | 2,125,769 | | | $ | — | |
| Totals: | | | | | | | | | | | | | | | | | | | | | | | | |
| $11,269,645 | | $ | 24,086,027 | | | $ | (17,685,205 | ) | | $ | 17,951,176 | | | $ | (28,657,704 | ) | | $ | 6,963,939 | | | $ | — | |
| Global X Lithium ETF | | | | | | | | | | | | | | | | | | | | | | | | |
| Reed Resources | | | | | | | | | | | | | | | | | | | | | | | | |
| $2,647,698 | | $ | 1,765,021 | | | $ | (552,448 | ) | | $ | (3,037,894 | ) | | $ | (234,345 | ) | | $ | 588,032 | | | $ | — | |
| Notes to Financial Statements (continued) |
| October 31, 2013 |
4. INVESTMENT TRANSACTIONS
For the year ended October 31, 2013, the purchases and sales of investments in securities, excluding in-kind transactions, long-term U.S. Government and short-term securities were:
| | | | | | Sales and | |
| | | Purchases | | | Maturities | |
| Global X Silver Miners ETF | | $ | 64,626,723 | | | $ | 64,482,545 | |
| Global X Gold Explorers ETF | | | 10,854,373 | | | | 12,874,688 | |
| Global X Pure Gold Miners ETF | | | 1,365,560 | | | | 1,308,783 | |
| Global X Copper Miners ETF | | | 11,418,059 | | | | 12,665,761 | |
| Global X Uranium ETF | | | 97,049,033 | | | | 98,256,678 | |
| Global X Lithium ETF | | | 21,892,162 | | | | 24,639,413 | |
| Global X Fertilizers/Potash ETF | | | 3,533,084 | | | | 3,521,861 | |
| Global X Junior Miners ETF | | | 1,428,180 | | | | 1,731,405 | |
For the years ended October 31, 2012 and October 31, 2013, respectively, in-kind transactions associated with creations and redemptions were:
| | | | | | Sales and | | | Realized | |
| | | Purchases | | | Maturities | | | Gain/(Loss) | |
| Global X Silver Miners ETF | | $ | 80,721,501 | | | $ | 82,625,848 | | | $ | 5,762,523 | |
| Global X Gold Explorers ETF | | | 25,250,157 | | | | - | | | | - | |
| Global X Pure Gold Miners ETF | | | 628,887 | | | | - | | | | - | |
| Global X Copper Miners ETF | | | 2,635,573 | | | | 11,780,495 | | | | (1,997,983 | ) |
| Global X Uranium ETF | | | 14,456,617 | | | | 18,183,895 | | | | 1,104,450 | |
| Global X Lithium ETF | | | - | | | | 39,923,151 | | | | (5,229,061 | ) |
| Global X Fertilizers/Potash ETF | | | 6,305,309 | | | | 11,054,840 | | | | (1,634,109 | ) |
| Global X Junior Miners ETF | | | 563,708 | | | | 470,367 | | | | (41,821 | ) |
| | | | | | Sales and | | | Realized | |
| | | Purchases | | | Maturities | | | Gain/(Loss) | |
| Global X Silver Miners ETF | | $ | 62,443,359 | | | $ | 38,771,921 | | | $ | 1,251,715 | |
| Global X Gold Explorers ETF | | | 25,834,037 | | | | 1,349,849 | | | | 155,061 | |
| Global X Pure Gold Miners ETF | | | 1,123,530 | | | | - | | | | - | |
| Global X Copper Miners ETF | | | 13,814,170 | | | | 4,245,214 | | | | 436,241 | |
| Global X Uranium ETF | | | 32,740,034 | | | | 732,362 | | | | 81,522 | |
| Global X Lithium ETF | | | - | | | | 11,644,475 | | | | 1,923,524 | |
| Global X Fertilizers/Potash ETF | | | 3,815,379 | | | | 5,411,456 | | | | 251,851 | |
| Global X Junior Miners ETF | | | 5,760,364 | | | | 742,029 | | | | (19,792 | ) |
During the year ended October 31, 2013, there were no purchases or sales of long-term U.S. Government securities for the Funds.
5. TAX INFORMATION
The amount and character of income and capital gain distributions to be paid, if any, are determined in accordance with Federal income tax regulations, which may differ from U.S. GAAP. As a result, net investment income (loss) and net realized gain (loss) on investment transactions for a reporting period may differ significantly from distributions during such period. These book/tax differences may be temporary or permanent. To the extent these differences are permanent in nature, they are charged or credited to undistributed net investment income (loss), accumulated net realized gain (loss) or paid-in capital, as appropriate, in the period that the differences arise.
| Notes to Financial Statements (continued) |
| October 31, 2013 |
5. TAX INFORMATION (continued)
The following differences, primarily attributable to distribution reclassifications, investment in master limited partnership, return of capital, foreign currency, redemptions in-kind and sales of passive foreign investment companies have been reclassified to/from the following accounts during the fiscal year ended October 31, 2013.
| Global X Funds | | Paid-in Capital | | | Undistributed Net
Investment Income | | | Accumulated Net
Realized (Gain) Loss | |
| Global X Silver Miners ETF | | $ | 309,391 | | | $ | 256,661 | | | $ | (566,052 | ) |
| Global X Gold Explorers ETF | | | (1,054,364 | ) | | | 1,327,050 | | | | (272,686 | ) |
| Global X Pure Gold Miners ETF | | | – | | | | 7,743 | | | | (7,743 | ) |
| Global X Copper Miners ETF | | | 339,610 | | | | 114,607 | | | | (454,217 | ) |
| Global X Uranium ETF | | | 81,522 | | | | (8,258 | ) | | | (73,264 | ) |
| Global X Lithium ETF | | | 1,693,100 | | | | 208,247 | | | | (1,901,347 | ) |
| Global X Fertilizers/Potash ETF | | | 220,662 | | | | (44,487 | ) | | | (176,175 | ) |
| Global X Junior Miners ETF | | | (24,233 | ) | | | 10,605 | | | | 13,628 | |
These reclassifications have no impact on net assets or net asset value per share.
The tax character of dividends and distributions declared during the years ended October 31, 2013 and 2012 were as follows:
| Global X Funds | | Ordinary
Income | | | Long-Term
Capital Gain | | | Totals | |
| | | | |
| Global X Silver Miners ETF | | | | | | | | | | | | |
| 2013 | | $ | 3,117,053 | | | $ | – | | | $ | 3,117,053 | |
| 2012 | | | 528,916 | | | | – | | | | 528,916 | |
| Global X Gold Explorers ETF | | | | | | | | | | | | |
| 2013 | | $ | 1,890,494 | | | $ | – | | | $ | 1,890,494 | |
| 2012 | | | 545,816 | | | | – | | | | 545,816 | |
| Global X Pure Gold Miners ETF | | | | | | | | | | | | |
| 2013 | | $ | 5,222 | | | $ | – | | | $ | 5,222 | |
| 2012 | | | 86,778 | | | | – | | | | 86,778 | |
| Global X Copper Miners ETF | | | | | | | | | | | | |
| 2013 | | $ | 1,026,703 | | | $ | – | | | $ | 1,026,703 | |
| 2012 | | | 2,658,157 | | | | 15,799 | | | | 2,673,956 | |
| Global X Uranium ETF | | | | | | | | | | | | |
| 2013 | | $ | 2,536,311 | | | $ | – | | | $ | 2,536,311 | |
| 2012 | | | – | | | | – | | | | – | |
| Global X Lithium ETF | | | | | | | | | | | | |
| 2013 | | $ | 1,597,778 | | | $ | – | | | $ | 1,597,778 | |
| 2012 | | | 114,415 | | | | – | | | | 114,415 | |
| Global X Fertilizers/Potash ETF | | | | | | | | | | | | |
| 2013 | | $ | 330,509 | | | $ | – | | | $ | 330,509 | |
| 2012 | | | 218,268 | | | | – | | | | 218,268 | |
| Global X Junior Miners ETF | | | | | | | | | | | | |
| 2013 | | $ | 337,710 | | | $ | – | | | $ | 337,710 | |
| 2012 | | | 71,812 | | | | – | | | | 71,812 | |
| Notes to Financial Statements (continued) |
| October 31, 2013 |
5. TAX INFORMATION (continued)
As of October 31, 2013, the components of tax basis accumulated losses were as follows:
| | | Global X Silver
Miners ETF | | | Global X Gold
Explorers ETF | | | Global X Pure
Gold Miners ETF | |
| Undistributed Ordinary Income | | $ | 742,690 | | | $ | – | | | $ | 34,586 | |
| Capital Loss Carryforwards | | | (63,730,060 | ) | | | (12,854,466 | ) | | | (1,051,271 | ) |
| Unrealized Depreciation on Investments and Foreign Currency | | | (149,137,664 | ) | | | (37,783,462 | ) | | | (2,377,842 | ) |
| Late Year Loss Deferral | | | – | | | | (175,569 | ) | | | – | |
| Other Temporary Differences | | | 1 | | | | (1 | ) | | | – | |
| Total Accumulated Losses | | $ | (212,125,033 | ) | | $ | (50,813,498 | ) | | $ | (3,394,527 | ) |
| | | Global X Copper
Miners ETF | | | Global X
Uranium ETF | | | Global X
Lithium ETF | |
| Undistributed Ordinary Income | | $ | 204,347 | | | $ | 677,437 | | | $ | – | |
| Capital Loss Carryforwards | | | (5,139,722 | ) | | | (166,764,902 | ) | | | (40,546,818 | ) |
| Unrealized Depreciation on Investments and Foreign Currency | | | (11,181,938 | ) | | | (88,310,682 | ) | | | (5,604,393 | ) |
| Late Year Loss Deferral | | | – | | | | – | | | | (28,248 | ) |
| Other Temporary Differences | | | (8 | ) | | | (5 | ) | | | (4 | ) |
| Total Accumulated Losses | | $ | (16,117,321 | ) | | $ | (254,398,152 | ) | | $ | (46,179,463 | ) |
| | | Global X
Fertilizers/Potash
ETF | | | Global X
Junior Miners
ETF | |
| Undistributed Ordinary Income | | $ | 302,042 | | | $ | – | |
| Capital Loss Carryforwards | | | (1,295,027 | ) | | | (2,507,709 | ) |
| Unrealized Depreciation on Investments and Foreign Currency | | | (5,481,702 | ) | | | (1,130,380 | ) |
| Other Temporary Differences | | | (2 | ) | | | 1 | |
| Total Accumulated Losses | | $ | (6,474,689 | ) | | $ | (3,638,088 | ) |
Deferred late-year losses represent ordinary losses realized on investment transactions from January 1, 2013 through October 31, 2013.
For Federal income tax purposes, capital losses incurred in taxable years beginning before December 22, 2010 may be carried forward for a maximum period of eight years and applied against future gains. As of October 31, 2013, the Funds that had capital loss carryforwards are listed below:
| | | Global X Silver | | | Global X Gold | | | Global X Uranium | | | Global X | | | Global X Junior | |
| Expiration Date | | Miners ETF | | | Explorers ETF | | | ETF | | | Lithium ETF | | | Miners ETF | |
| Oct. 2019 | | $ | 8,433,465 | | | $ | 130,976 | | | $ | 12,705,798 | | | $ | 7,329,308 | | | $ | 506,011 | |
During the fiscal year ended October 31, 2013, no Funds utilized capital loss carryforwards to offset capital gains.
Under the Regulated Investment Company Modernization Act of 2010, the Funds will be permitted to carry forward capital losses incurred in taxable years beginning after December 22, 2010 for an unlimited period. However, any losses incurred during those future taxable years are required to be used prior to the losses incurred in pre-enactment taxable years. As a result of this ordering rule, preenactment capital loss carryforwards may be more likely to expire unused. Additionally, post-enactment capital losses that are carried forward will retain their character as either short-term or long-term capital losses rather than being considered all short-term as under previous law.
| Notes to Financial Statements (continued) |
| October 31, 2013 |
5. TAX INFORMATION (continued)
Losses carried forward under these new provisions are as follows:
| Global X Funds | | Short-Term Loss | | | Long-Term Loss | | | Total | |
| Global X Silver Miners ETF | | $ | 14,673,133 | | | $ | 40,623,462 | | | $ | 55,296,595 | |
| Global X Gold Explorers ETF | | | 5,368,890 | | | | 7,354,600 | | | | 12,723,490 | |
| Global X Pure Gold Miners ETF | | | 307,847 | | | | 743,424 | | | | 1,051,271 | |
| Global X Copper Miners ETF | | | 1,488,456 | | | | 3,651,266 | | | | 5,139,722 | |
| Global X Uranium ETF | | | 37,696,172 | | | | 116,362,932 | | | | 154,059,104 | |
| Global X Lithium ETF | | | 8,782,727 | | | | 24,434,783 | | | | 33,217,510 | |
| Global X Fertilizers/Potash ETF | | | 893,126 | | | | 401,901 | | | | 1,295,027 | |
| Global X Junior Miners ETF | | | 1,496,460 | | | | 505,238 | | | | 2,001,698 | |
The Federal tax cost and aggregate gross unrealized appreciation and depreciation on investments held by the Funds at October 31, 2013 were as follows:
| Global X Funds | | Federal
Tax Cost | | | Aggregated
Gross
Unrealized
Appreciation | | | Aggregated
Gross
Unrealized
Depreciation | | | Net
Unrealized
Depreciation | |
| Global X Silver Miners ETF | | $ | 384,726,344 | | | $ | 208,090 | | | $ | (149,335,484 | ) | | $ | (149,127,394 | ) |
| Global X Gold Explorers ETF | | | 71,780,105 | | | | – | | | | (37,783,488 | ) | | | (37,783,488 | ) |
| Global X Pure Gold Miners ETF | | | 6,007,483 | | | | 134,028 | | | | (2,511,870 | ) | | | (2,377,842 | ) |
| Global X Copper Miners ETF | | | 48,197,251 | | | | 669,007 | | | | (11,846,161 | ) | | | (11,177,154 | ) |
| Global X Uranium ETF | | | 226,928,080 | | | | 896,930 | | | | (89,207,606 | ) | | | (88,310,676 | ) |
| Global X Lithium ETF | | | 61,182,629 | | | | 10,491,891 | | | | (16,098,768 | ) | | | (5,606,877 | ) |
| Global X Fertilizers/Potash ETF | | | 28,314,955 | | | | 1,140,702 | | | | (6,623,062 | ) | | | (5,482,360 | ) |
| Global X Junior Miners ETF | | | 6,799,752 | | | | 192,119 | | | | (1,322,541 | ) | | | (1,130,422 | ) |
The preceding differences between book and tax cost are primarily due to mark-to-market treatment of passive foreign investment companies and wash sales.
6. CONCENTRATION OF RISKS
The Funds invest in securities of foreign issuers in several countries. These investments may involve certain considerations and risks not typically associated with investments in the United States as a result of, among other factors, the possibility of future political and economic developments and the level of governmental supervision and regulation of securities markets in the respective countries.
The securities markets of emerging countries are less liquid and subject to greater price volatility, and have a smaller market capitalization, than the U.S. securities markets. In certain countries, there may be fewer publicly traded securities and the market may be dominated by a few issues or sectors. Issuers and securities markets in such countries are not subject to as extensive and frequent accounting, financial and other reporting requirements or as comprehensive government regulations as are issuers and securities markets in the U.S. In particular, the assets and profits appearing on the financial statements of emerging country issuers may not reflect their financial position or results of operations in the same manner as financial statements for U.S. issuers. Substantially less information may be publicly available about emerging country issuers than is available about issuers in the United States.
| Notes to Financial Statements (continued) |
| October 31, 2013 |
6. CONCENTRATION OF RISKS (continued)
The Funds may be subject to taxes imposed by countries in which they invest. Such taxes are generally based on either income or gains earned or repatriated. The Funds accrue and apply such taxes to net investment income, net realized gains and net unrealized gains as income and/or capital gains are earned.
The Funds use a replication strategy. A replication strategy is an indexing strategy that involves investing in the securities of the Underlying Index in approximately the same proportions as in the Underlying Index. The Funds may utilize a representative sampling strategy with respect to their Underlying Indices when a replication strategy might be detrimental to their shareholders, such as when there are practical difficulties or substantial costs involved in compiling a portfolio of equity securities to follow its Underlying Index, or, in certain instances, when securities in the Underlying Index becomes temporarily illiquid, unavailable or less liquid, or due to legal restrictions (such as diversification requirements that apply to the Funds but not the Underlying Indexes). Commodity related securities, are susceptible to fluctuations in certain commodity markets. Any negative changes in commodity markets could have a great impact on these Funds.
7. AUTHORIZED PARTICIPANTS
At October 31, 2013, the total Shares outstanding that were held by Authorized Participants were as follows. The Authorized Participants have entered into an agreement with the Funds’ Distributor.
| | | | | Percentage of |
| | | Authorized | | Shares |
| | | Participants | | Outstanding |
| Global X Silver Miners ETF | | 5 | | 100% |
| Global X Gold Explorers ETF | | 5 | | 100% |
| Global X Pure Gold Miners ETF | | 3 | | 100% |
| Global X Copper Miners ETF | | 5 | | 100% |
| Global X Uranium ETF | | 7 | | 100% |
| Global X Lithium ETF | | 4 | | 100% |
| Global X Fertilizers/Potash ETF | | 5 | | 100% |
| Global X Junior Miners ETF | | 4 | | 100% |
Pursuant to the Trust’s organizational documents, the Trustees of the Trust and the Trust’s officers are indemnified against certain liabilities that may arise out of the performance of their duties.
8. LOANS OF PORTFOLIO SECURITIES
The Funds may lend portfolio securities having a market value up to one-third of the Funds’ total assets. Security loans made pursuant to the securities lending agreement are required at all times to be secured by collateral equal to at least 102% for U.S. based securities and 105% for foreign based securities. Such collateral received in connection with these loans will be cash and can be invested in repurchase agreements or U.S. Treasury obligations and is recognized in the schedule of investments and statement of asset and liabilities. The obligation to return securities lending collateral is also recognized as a liability in the statement of assets and liabilities.
| Notes to Financial Statements (concluded) |
| October 31, 2013 |
8. LOANS OF PORTFOLIO SECURITIES (continued)
It is the Funds’ policy to obtain additional collateral from or return excess collateral to the borrower by the end of the next business day, following the valuation date of the securities loaned. Therefore, the value of the collateral held may be temporarily less than the value of the securities on loan. Lending securities entails a risk of loss to the Funds if and to the extent that the market value of the securities loans were to increase and the borrower did not increase the collateral accordingly, and the borrower fails to return the securities. The Funds could also experience delays and costs in gaining access to the collateral. The Funds bear the risk of any deficiency in the amount of the collateral available for return to the borrower due to any loss on the collateral invested. As of October 31, 2013, the value of securities on loan was $13,553,602, $4,058,611, $17,583,325 and $1,946,033 for the Global X Silver Miners ETF, Global X Copper Miners ETF, Global X Uranium ETF and Global X Lithium ETF, respectively and the value of securities purchased with the cash collateral held from securities on loan was $16,525,055, $4,300,159, $19,691,183, and $2,810,986 for the Global X Silver Miners ETF, Global X Copper Miners ETF, Global X Uranium ETF and Global X Lithium ETF, respectively.
9. CONTRACTUAL OBLIGATIONS
The Funds enter into contracts in the normal course of business that contain a variety of indemnifications. The Funds’ maximum exposure under these arrangements is unknown. However the Funds have not had prior gains or losses pursuant to these contracts. Management has reviewed the Funds’ existing contracts and expects the risk of loss to be remote.
10. REVERSE SHARE SPLIT
Effective May 16, 2013, the Global X Gold Explorers ETF, Global X Pure Gold Miners ETF, Global X Uranium ETF and the Global X Junior Miners ETF executed a reverse share split for shareholders of record after the close of markets on May 15, 2013. The effect of this transaction was to divide the number of outstanding shares of the Fund by the ratio below, resulting in a corresponding increase in the net asset value per share. The capital share activity presented in the statement of changes in net assets for each of the years in the period then ended, and per share data in the financial highlights for each of the years in the period then ended have been given retroactive effect to reflect these reverse share splits. There were no changes in net assets, results of operations or total return as a result of these transactions. The details of the reverse split are as follows:
| Fund Name | | | Ratio |
| Global X Gold Explorers ETF | | | 1:4 |
| Global X Pure Gold Miners ETF | | | 1:2 |
| Global X Uranium ETF | | | 1:3 |
| Global X Junior Miners ETF | | | 1:3 |
11. RECENT ACCOUNTING PRONOUCEMENT
In January 2013, Accounting Standards Update 2013-01 (“ASU 2013-01”), Clarifying the Scope of Disclosures about Offsetting Assets and Liabilities, replaced Accounting Standards Update 2011-11 (“ASU 2011-11”), Disclosures about Offsetting Assets and Liabilities. ASU 2013-01 is effective for fiscal years beginning on or after January 1, 2013, and interim periods within those annual periods. ASU 2011-11 was intended to enhance disclosure requirements on the offsetting of financial assets and liabilities. ASU 2013-01 limits the scope of the new balance sheet offsetting disclosures to
| Notes to Financial Statements (concluded) |
| October 31, 2013 |
11. RECENT ACCOUNTING PRONOUCEMENT (continued)
derivative instruments, repurchase and reverse-repurchase agreements, and securities lending and borrowing transactions to the extent that they are (1) offset in the financial statements or (2) subject to an enforceable master netting arrangement or similar agreement. Management is currently evaluating the application of ASU 2013-01 and its impact, if any, on the Funds’ financial statements.
12. SUBSEQUENT EVENTS
The Funds have evaluated the need for additional disclosures and/or adjustments resulting from subsequent events. Based on this evaluation, no additional disclosures or adjustments were required to the financial statements as of the date the financial statements were issued, except as follows.
Subsequent to the October 31, 2013 fiscal year end, the following portfolios were added to the Trust.
Fund Name
Global X Guru Small Cap Index ETF
Global X Guru International Index ETF
Subsequent to the October 31, 2013 fiscal year end, the following portfolios of the Trust commenced operations.
| Fund Name | | Commenced Operations |
| | | |
| Global X Next Emerging & Frontier ETF | | November 6, 2013 |
| Global X FTSE Portugal 20 ETF | | November 12, 2013 |
| Report of Independent Registered Public Accounting Firm |
| October 31, 2013 |
To the Shareholders and Board of Trustees of Global X Funds
We have audited the accompanying statements of assets and liabilities, including the schedules of investments, of Global X Silver Miners ETF, Global X Gold Explorers ETF, Global X Pure Gold Miners ETF, Global X Copper Miners ETF, Global X Uranium ETF, Global X Lithium ETF, Global X Fertilizers/Potash ETF, and Global X Junior Miners ETF (eight of the series constituting Global X Funds) (the “Funds”) as of October 31, 2013, and the related statements of operations for the year then ended, the statements of changes in net assets for each of the two years then ended, and the financial highlights for each of the three years or periods then ended. These financial statements and financial highlights are the responsibility of the Funds’ management. Our responsibility is to express an opinion on these financial statements and financial highlights based on our audits. The financial highlights of the Global X Silver Miners ETF, Global X Copper Miners ETF and Global X Lithium ETF for each of the periods presented through October 31, 2010 were audited by other auditors whose report dated December 23, 2010, expressed an unqualified opinion on those financial statements and financial highlights
We conducted our audits in accordance with the standards of the Public Company Accounting Oversight Board (United States). Those standards require that we plan and perform the audit to obtain reasonable assurance about whether the financial statements and financial highlights are free of material misstatement. We were not engaged to perform an audit of the Funds’ internal control over financial reporting. Our audits included consideration of internal control over financial reporting as a basis for designing audit procedures that are appropriate in the circumstances, but not for the purpose of expressing an opinion on the effectiveness of the Funds’ internal control over financial reporting. Accordingly, we express no such opinion. An audit also includes examining, on a test basis, evidence supporting the amounts and disclosures in the financial statements and financial highlights, assessing the accounting principles used and significant estimates made by management, and evaluating the overall financial statement presentation. Our procedures included confirmation of securities owned as of October 31, 2013, by correspondence with the custodian and brokers, or by other appropriate auditing procedures where replies from brokers were not received. We believe that our audits provide a reasonable basis for our opinion.
In our opinion, the financial statements and financial highlights referred to above present fairly, in all material respects, the financial position of each of the Funds listed above at October 31, 2013, and the results of their operations for the year then ended, the changes in their net assets for each of the two years then ended, and the financial highlights for each of the three years or periods then ended, in conformity with U.S. generally accepted accounting principles.
Philadelphia, Pennsylvania
December 27, 2013
| Disclosure of Fund Expenses (unaudited) |
All Exchange Traded Funds (“ETF”) have operating expenses. As a shareholder of an ETF, your investment is affected by these ongoing costs, which include (among others) costs for ETF management, administrative services, commissions, and shareholder reports like this one. It is important for you to understand the impact of these costs on your investment returns. In addition, a shareholder is responsible for brokerage fees as a result of their investment in the Fund.
Operating expenses such as these are deducted from an ETF’s gross income and directly reduce its final investment return. These expenses are expressed as a percentage of the ETF’s average net assets; this percentage is known as the ETF’s expense ratio.
The following examples use the expense ratio and are intended to help you understand the ongoing costs (in dollars) of investing in your Fund and to compare these costs with those of other funds. The examples are based on an investment of $1,000 made at the beginning of the period shown and held for the entire period.
The table on the next page illustrates your Fund’s costs in two ways:
Actual Fund Return. This section helps you to estimate the actual expenses that your Fund incurred over the period. The “Expenses Paid During Period” column shows the actual dollar expense cost incurred by a $1,000 investment in the Fund, and the “Ending Account Value” number is derived from deducting that expense cost from the Fund’s gross investment return.
You can use this information, together with the actual amount you invested in the Funds, to estimate the expenses you paid over that period. Simply divide your actual account value by $1,000 to arrive at a ratio (for example, an $8,600 account value divided by $1,000 = 8.6), then multiply that ratio by the number shown for your Funds under “Expenses Paid During Period.”
Hypothetical 5% Return. This section helps you compare your Fund’s costs with those of other funds. It assumes that the Funds had an annual 5% return before expenses during the year, but that the expense ratio (Column 3) for the period is unchanged. This example is useful in making comparisons because the Securities and Exchange Commission requires all funds to make this 5% calculation. You can assess your Fund’s comparative cost by comparing the hypothetical result for your Fund in the “Expenses Paid During Period” column with those that appear in the same charts in the shareholder reports for other funds.
NOTE: Because the return is set at 5% for comparison purposes — NOT your Fund’s actual return — the account values shown may not apply to your specific investment.
Disclosure of Fund Expenses (unaudited) (concluded)
| | | Beginning
Account
Value
5/1/2013 | | | Ending
Account
Value
10/31/2013 | | | Annualized
Expense
Ratios | | | Expenses
Paid
During
Period(1) | |
| Global X Silver Miners ETF |
| Actual Fund Return | | $ | 1,000.00 | | | $ | 862.20 | | | | 0.65 | % | | $ | 3.05 | |
| Hypothetical 5% Return | | | 1,000.00 | | | | 1,021.93 | | | | 0.65 | | | | 3.31 | |
| Global X Gold Explorers ETF |
| Actual Fund Return | | $ | 1,000.00 | | | $ | 815.97 | | | | 0.65 | % | | $ | 2.98 | |
| Hypothetical 5% Return | | | 1,000.00 | | | | 1,021.93 | | | | 0.65 | | | | 3.31 | |
| Global X Pure Gold Miners ETF |
| Actual Fund Return | | $ | 1,000.00 | | | $ | 883.00 | | | | 0.59 | % | | $ | 2.80 | |
| Hypothetical 5% Return | | | 1,000.00 | | | | 1,022.23 | | | | 0.59 | | | | 3.01 | |
| Global X Copper Miners ETF |
| Actual Fund Return | | $ | 1,000.00 | | | $ | 926.30 | | | | 0.65 | % | | $ | 3.16 | |
| Hypothetical 5% Return | | | 1,000.00 | | | | 1,021.93 | | | | 0.65 | | | | 3.31 | |
| Global X Uranium ETF |
| Actual Fund Return | | $ | 1,000.00 | | | $ | 855.10 | | | | 0.69 | % | | $ | 3.23 | |
| Hypothetical 5% Return | | | 1,000.00 | | | | 1,021.73 | | | | 0.69 | | | | 3.52 | |
| Global X Lithium ETF |
| Actual Fund Return | | $ | 1,000.00 | | | $ | 1,008.60 | | | | 0.75 | % | | $ | 3.80 | |
| Hypothetical 5% Return | | | 1,000.00 | | | | 1,021.42 | | | | 0.75 | | | | 3.82 | |
| Global X Fertilizers/Potash ETF |
| Actual Fund Return | | $ | 1,000.00 | | | $ | 880.60 | | | | 0.69 | % | | $ | 3.27 | |
| Hypothetical 5% Return | | | 1,000.00 | | | | 1,021.73 | | | | 0.69 | | | | 3.52 | |
| Global X Junior Miners ETF |
| Actual Fund Return | | $ | 1,000.00 | | | $ | 868.60 | | | | 0.69 | % | | $ | 3.25 | |
| Hypothetical 5% Return | | | 1,000.00 | | | | 1,021.73 | | | | 0.69 | | | | 3.52 | |
| (1) | Expenses are equal to the Fund’s annualized expense ratio multiplied by the average account value over the period, multiplied 184/365 (to reflect the one-half year period.) |
| Supplemental Information (unaudited) |
Net asset value, or “NAV”, is the price per Share at which the Funds issue and redeem Shares. It is calculated in accordance with the standard formula for valuing mutual fund shares. The “Market Price” of the Funds generally is determined using the midpoint between the highest bid and the lowest offer on the stock exchange on which the Shares of the Funds are listed for trading, as of the time that the Funds’ NAV is calculated. The Funds’ Market Price may be at, above or below their NAV. The NAV of the Funds will fluctuate with changes in the market value of their Funds holdings. The Market Price of the Funds will fluctuate in accordance with changes in its NAV, as well as market supply and demand.
Premiums or discounts are the differences (expressed as a percentage) between the NAV and Market Price of the Funds on a given day, generally at the time NAV is calculated. A premium is the amount that the Funds are trading above the reported NAV, expressed as a percentage of the NAV. A discount is the amount that the Funds are trading below the reported NAV, expressed as a percentage of the NAV.
Further information regarding premiums and discounts is available on the Funds’ website at www.GlobalXFunds.com.
| Trustees and Officers of the Trust (unaudited) |
Set forth below are the names, addresses, year of birth, position with the Trust, Term of Office and Length of Time Served, the principal occupations for the last five years, number of Funds in fund complex overseen by trustee, and other directorships outside the fund complex of each of the persons currently serving as Trustees and Officers of the Trust.
Name,
Address (Year of
Birth) | Position(s)
Held with Funds | Principal Occupation(s) During the Past 5 Years | Number of
Funds in
Trust
Overseen by
Trustee | Other
Directorships
Held by Trustees |
| Independent Trustees2 | |
Sanjay Ram Bharwani 623 Fifth Ave, 15th floor New York, NY 10022 (1974) | Trustee (since 2008) | CEO of Risk Advisors Inc. (since 2007) (consulting firm). | 363 | None. |
Scott R. Chichester1 623 Fifth Ave, 15th floor New York, NY 10022 (1970) | Trustee (since 2008) | CFO, Sterling Seal & Supply Inc. (since 2011), Director, President & Treasurer, Bayview Acquisition Corp (since 2010), CPA, Penda Aiken Inc. (2009-2011) (consultant); Founder and President, DirectPay USA LLC (since 2006) (payroll company); Chief Financial Officer, Ong Corporation (2002-2010) (technology company); Proprietor, Scott R. Chichester CPA (since 2001) (CPA firm). | 363 | Director of Bayview Acquisition Corp. (since 2010). |
Kartik Kiran Shah 623 Fifth Ave, 15th floor New York, NY 10022 (1977) | Trustee (since 2008) | Vice President, Business Development, Cynvenio Biosystems (2012-present); Independent Consultant, Self-Employed (2011-2012) (non-financial services); Director, Wireless Generation (2008-2011) (software). | 363 | None. |
| Trustees and Officers of the Trust (unaudited) |
The Trust’s Statement of Additional Information (“SAI”) includes additional information about the Trustees and Officers. The SAI may be obtained without charge by calling 1-888-493-8631. The following chart lists Trustees and Officers as of October 31, 2013.
Name, Address (Year of Birth) | Position(s) Held with Funds | Principal Occupation(s)
During the Past 5 Years | Number of Funds
in Trust
Overseen by
Trustee | Other
Directorships Held by Trustees |
| Interested Trustee / Officers2 | |
Bruno del Ama 623 Fifth Ave, 15th floor New York, NY 10022 (1976) | Trustee (since 2008), President, Chief Executive Officer (since 2008) | Chief Executive Officer and Chief Compliance Officer, Global X Management Company LLC (since 2008); Head of Global Structured Products Operations at Radian Asset Assurance (2004-2008) (financial services firm). | 363 | None. |
Jose C. Gonzalez 623 Fifth Ave, 15th floor New York, NY 10022 (1976) | Chief Operating Officer, Chief Compliance Officer, Treasurer, Principal Accounting Officer and Chief Financial Officer (since 2008) | Chief Operating Officer, Global X Management Company LLC (since 2008); Founder and President of GWM Group, Inc. (since 2006) (broker-dealer firm). | N/A | N/A |
Daphne Tippens Chisolm 11524-C Providence Road, Suite 236 Charlotte, NC 28277 (1969) | Secretary (since 2012) | General Counsel, Global X Management Company LLC (since 2011); Founder and President of Law Offices of DT Chisolm, P.C. (since 2009) (law firm); Counsel, Dechert (2007-2009) (law firm) | N/A | N/A |
Dianne M. Descoteaux4 One Freedom Valley Drive Oaks, PA 19456 (1977) | Assistant Secretary (since 2011) | Counsel, SEI Investments (since 2010); Associate, Morgan, Lewis & Bockius LLP (2006-2010). | N/A | N/A |
| Trustees and Officers of the Trust (unaudited) |
Name, Address (Year of Birth) | Position(s) Held with Funds | Principal Occupation(s) During the Past 5 Years | Other Directorships
Held by Trustees |
Lisa Whittaker4 One Freedom Valley Drive Oaks, PA 19456 (1978) | Assistant Secretary (since 2013) | Counsel at SEI Investments (since 2012); Associate Counsel and Compliance Officer at The Glendale Trust Company (2011-2012); Associate of Drinker Biddle & Reath LLP (2006-2011). | N/A |
Peter Rodriguez4 One Freedom Valley Drive Oaks, PA 19456 (1962) | Assistant Treasurer (since 2011) | Fund Accounting Director, SEI Investments Global Funds Services (since 2011); Mutual Fund Trading Director, SEI Global Trust Company (2009-2011); Asset Data Services Director, SEI Global Wealth Services (2006-2009). | N/A |
| 1 | Mr. Chichester is currently married to a sister of Mr. del Ama’s wife. While an “immediate family member” (as defined in Section 2(a)(19) of the 1940 Act) of Mr. del Ama would be considered an Interested Person, Mr. Chichester is not considered an immediate family member for this purpose. Although this fact was taken into consideration in determining whether Mr. Chichester should be considered to be an Independent Trustee for purposes of the Section 2(a)(19) of the 1940 Act, it was determined that this relationship was not one that should disqualify Mr. Chichester from serving as an Independent Trustee of the Trust. |
| 2 | Each Trustee serves until his or her successor is duly elected or appointed and qualified. |
| 3 | As of October 31, 2013, the Trust had seventy-nine investment portfolios, thirty-six of which were operational. |
| 4 | These officers of the Trust also serve as officers of one or more mutual funds for which SEI Investments Company or an affiliate acts as investment manager, administrator or distributor. |
| Notice to Shareholders (unaudited) |
For shareholders that do not have an October 31, 2013 tax year end, this notice is for informational purposes only. For shareholders with an October 31, 2013 tax year end, please consult your tax advisor as to the pertinence of this notice. For the fiscal year ended October 31, 2013, the Funds have designated the following items with regard to distributions paid during the year.
| | | Long-Term
Capital Gain
Distributions | | | Ordinary
Income
Distributions | | | Total
Distributions | | | Qualifying
for
Corporate
Dividends
Received
Deduction (1) | | | Qualifying
Dividend
Income (2) | | | U.S.
Government
Interest (3) | | | Interest
Related
Dividends (4) | | | Short
Term
Capital
Gain
Dividends | |
| Global X Silver Miners ETF | | | 0.00 | % | | | 100.00 | % | | | 100.00 | % | | | 27.28 | % | | | 100.00 | % | | | 0.00 | % | | | 0.00 | % | | | 0.00 | % |
| Global X Gold Explorers ETF | | | 0.00 | % | | | 100.00 | % | | | 100.00 | % | | | 0.00 | % | | | 0.00 | % | | | 0.00 | % | | | 0.00 | % | | | 0.00 | % |
| Global X Pure Gold Miners ETF | | | 0.00 | % | | | 100.00 | % | | | 100.00 | % | | | 43.70 | % | | | 100.00 | % | | | 0.00 | % | | | 0.02 | % | | | 0.00 | % |
| Global X Copper Miners ETF | | | 0.00 | % | | | 100.00 | % | | | 100.00 | % | | | 22.77 | % | | | 89.29 | % | | | 0.00 | % | | | 0.00 | % | | | 0.00 | % |
| Global X Uranium ETF | | | 0.00 | % | | | 100.00 | % | | | 100.00 | % | | | 0.00 | % | | | 28.79 | % | | | 0.00 | % | | | 0.06 | % | | | 0.00 | % |
| Global X Lithium ETF | | | 0.00 | % | | | 100.00 | % | | | 100.00 | % | | | 10.52 | % | | | 61.47 | % | | | 0.00 | % | | | 0.00 | % | | | 0.00 | % |
| Global X Fertilizers/Potash ETF | | | 0.00 | % | | | 100.00 | % | | | 100.00 | % | | | 26.85 | % | | | 100.00 | % | | | 0.00 | % | | | 0.00 | % | | | 0.00 | % |
| Global X Junior Miners ETF | | | 0.00 | % | | | 100.00 | % | | | 100.00 | % | | | 0.00 | % | | | 1.12 | % | | | 0.00 | % | | | 0.00 | % | | | 0.00 | % |
(1) Qualifying dividends represent dividends which qualify for the corporate dividends received deduction and is reflected as a percentage of ordinary Income distributions (the total of short term capital gain and net investment income distributions).
(2) The percentage in this column represents the amount of "Qualifying Dividend Income" as created by the Jobs and Growth Relief Reconciliation Act of 2003 and is reflected as a percentage of ordinary income distributions (the total of short term capital gain and net investment income distributions). It is the intention of each of the aforementioned funds to designate the maximum amount permitted by law.
(3) "U.S. Government Interest represents the amount of interest that was derived from U.S. Government obligations and distributed during the fiscal year. Generally, interest from direct U.S. Government obligations is exempt from state income tax. However, for shareholders who are residents of California, Connecticut and New York, the statutory threshold requirements were not satisfied to permit exemption of these amounts from state income.
(4) The percentage in this column represents the amount of "Qualifying Interest Income" as created by the American Jobs Creation Act of 2004 and is a percentage of net investment income that is exempt from U.S. withholding tax when paid for foreign investors.
The Funds intend to pass through a foreign tax credit to shareholders. For the fiscal year ended October 31, 2013, the total amount of foreign source income and foreign tax credit are as follows:
| | | | | | Foreign Tax Credit Pass | |
| Fund Name | | Foreign Source Income | | | Through | |
| Global X Silver Miners ETF | | $ | 3,521,040 | | | $ | 189,564 | |
| Global X Gold Explorers ETF | | | - | | | | - | |
| Global X Pure Gold Miners ETF | | | 59,923 | | | | 7,180 | |
| Global X Copper Miners ETF | | | 514,283 | | | | 36,419 | |
| Global X Uranium ETF | | | 514,883 | | | | 58,741 | |
| Global X Lithium ETF | | | - | | | | - | |
| Global X Fertizers/Potash ETF | | | 524,108 | | | | 73,839 | |
| Global X Junior Miners ETF | | | - | | | | - | |
The information reported herein may differ from the information and distributions taxable to the shareholders for the calendar year ending December 31, 2013. Complete information will be computed and reported in conjunction with your 2013 Form 1099-DIV.

623 Fifth Avenue, 15th floor
New York, NY 10022
1-888-GXFund-1
(1-888-493-8631)
www.globalxfunds.com
Investment Adviser:
Global X Management Company LLC
623 Fifth Avenue, 15th floor
New York, NY 10022
Distributor:
SEI Investments Distribution Co.
One Freedom Valley Drive
Oaks, PA 19456
Sub-Administrator:
SEI Investments Global Funds Services
One Freedom Valley Drive
Oaks, PA 19456
Counsel for the Independent Trustees:
Dechert LLP
1900 K Street N.W.
Washington, DC 20006
This information must be preceded or accompanied by a current prospectus for the Funds described.
GLX-AR-001-0500
| Global X China Consumer ETF (ticker: CHIQ) |
| Global X China Energy ETF (ticker: CHIE) |
| Global X China Financials ETF (ticker: CHIX) |
| Global X China Industrials ETF (ticker: CHII) |
| Global X China Materials ETF (ticker: CHIM) |
| Global X NASDAQ China Technology ETF (ticker: QQQC) |
| Global X FTSE ASEAN 40 ETF (ticker: ASEA) |
| Global X FTSE Andean 40 ETF (ticker: AND) |
| Global X FTSE Colombia 20 ETF (ticker: GXG) |
| Global X Brazil Mid Cap ETF (ticker: BRAZ) |
| Global X Brazil Consumer ETF (ticker: BRAQ) |
| Global X Brazil Financials ETF (ticker: BRAF) |
| Global X FTSE Argentina 20 ETF (ticker: ARGT) |
| Global X FTSE Greece 20 ETF (ticker: GREK) |
| Global X FTSE Norway 30 ETF (ticker: NORW) |
| Global X FTSE Nordic Region ETF (ticker: GXF) |
| Global X Central Asia & Mongolia Index ETF (ticker: AZIA) |
| Global X Nigeria Index ETF (ticker: NGE) |
Annual Report
October 31, 2013
Table of Contents
| Management Discussion of Fund Performance (unaudited) | 1 |
| | |
| Schedule of Investments | |
| | |
| Global X China Consumer ETF | 19 |
| | |
| Global X China Energy ETF | 22 |
| | |
| Global X China Financials ETF | 24 |
| | |
| Global X China Industrials ETF | 26 |
| | |
| Global X China Materials ETF | 28 |
| | |
| Global X NASDAQ China Technology ETF | 30 |
| | |
| Global X FTSE ASEAN 40 ETF | 32 |
| | |
| Global X FTSE Andean 40 ETF | 35 |
| | |
| Global X FTSE Colombia 20 ETF | 38 |
| | |
| Global X Brazil Mid Cap ETF | 41 |
| | |
| Global X Brazil Consumer ETF | 44 |
| | |
| Global X Brazil Financials ETF | 47 |
| | |
| Global X FTSE Argentina 20 ETF | 49 |
| | |
| Global X FTSE Greece 20 ETF | 51 |
| | |
| Global X FTSE Norway 30 ETF | 53 |
| | |
| Global X FTSE Nordic Region ETF | 56 |
| | |
| Global X Central Asia & Mongolia Index ETF | 59 |
| | |
| Global X Nigeria Index ETF | 61 |
| | |
| Statements of Assets and Liabilities | 64 |
| | |
| Statements of Operations | 69 |
| | |
| Statements of Changes in Net Assets | 74 |
| | |
| Financial Highlights | 83 |
| | |
| Notes to Financial Statements | 86 |
| | |
| Report of Independent Registered Public Accounting Firm | 102 |
| | |
| Disclosure of Fund Expenses (unaudited) | 103 |
| | |
| Supplemental Information (unaudited) | 106 |
| | |
| Trustees and Officers of the Trust (unaudited) | 107 |
| | |
| Notice to Shareholders (unaudited) | 110 |
The Funds file their complete schedules of Fund holdings with the Securities and Exchange Commission (the “Commission”) for the first and third quarters of each fiscal year on Form N-Q within sixty days after the end of the period. The Funds’ Forms N-Q are available on the Commission’s website at http://www.sec.gov, and may be reviewed and copied at the Commission's Public Reference Room in Washington, DC. Information on the operation of the Public Reference Room may be obtained by calling 1-800-SEC-0330.
A description of the policies and procedures that Global X Funds uses to determine how to vote proxies relating to Fund securities, as well as information relating to how the Funds voted proxies relating to Fund securities during the most recent 12-month period ended June 30, will be available (i) without charge, upon request, by calling 1-888-GXFund-1; and (ii) on the Commission’s website at http://www.sec.gov.
Management Discussion of Fund Performance (unaudited)
Global X China Consumer ETF
Global X China Consumer ETF
The Global X China Consumer ETF (the “Fund”) seeks to provide investment results that correspond generally to the price and yield performance, before fees and expenses, of the Solactive China Consumer Index (the “Index”). The Fund generally seeks to replicate the Index but may at times invest in a representative sample of securities that collectively has an investment profile similar to the Index and as a result may or may not hold all the securities that are included in the Index.
The Index is designed to reflect the performance of the consumer sector in China. It is comprised of selected companies which have their main business operations in the consumer sector and are domiciled in China or have their main business operations in this country. Only securities which are tradable for foreign investors without restrictions are eligible. The Fund is the first ETF globally focused exclusively on the China consumer sector.
The S&P 500 Index is a market capitalization weighted composite index of 500 large capitalization U.S. companies.
For the 12-month period ended October 31, 2013 (the “reporting period”), the Fund increased 14.66%, while the Index increased 15.27%. The Fund had a net asset value of $14.00 per share on October 31, 2012 and ended the reporting period with a net asset value of $15.87 on October 31, 2013.
During the reporting period, the highest returns came from Shenzhou International Group Holdings and ANTA Sports Products, which returned 81.43% and 78.49%, respectively. The worst performers were Parkson Retail Group and Daphne International Holdings, which returned -57.68% and -55.82%, respectively.
| | | AVERAGE ANNUAL TOTAL RETURN FOR THE YEAR ENDED OCTOBER 31, 2013 | |
| | | One Year Return | | | Three Year Return | | | Annualized Inception to Date* | |
| | | Net Asset Value | | | Market Price | | | Net Asset Value | | | Market Price | | | Net Asset Value | | | Market Price | |
| Global X China Consumer ETF | | | 14.66 | % | | | 13.38 | % | | | -7.12 | % | | | -7.64 | % | | | 1.03 | % | | | 0.85 | % |
| Solactive China Consumer Index | | | 15.27 | % | | | 15.27 | % | | | -6.67 | % | | | -6.67 | % | | | 1.49 | % | | | 1.49 | % |
| S&P 500 Index | | | 27.18 | % | | | 27.18 | % | | | 16.56 | % | | | 16.56 | % | | | 15.19 | % | | | 15.19 | % |
Growth of a $10,000 Investment
(At Net Asset Value)
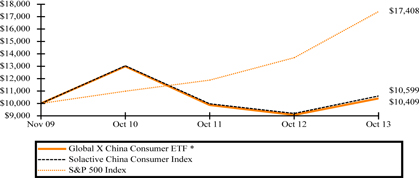
*Fund commenced operations on November 30, 2009.
The performance data quoted herein represents past performance and the return and value of an investment in the Fund will fluctuate so that, when redeemed, may be worth less than its original cost. Past performance is no guarantee of future performance and should not be considered as a representation of the future results of the Fund. The Fund's performance assumes the reinvestment of all dividends and all capital gains. Index returns assume reinvestment of dividends and, unlike a Fund's returns, do not reflect any fees or expenses. If such fees and expenses were included in the index returns, the performance would have been lower. Please note that one cannot invest directly in an unmanaged index.
There are no assurances that the Fund will meet its stated objectives.
The Fund’s holdings and allocations are subject to change and should not be considered recommendations to buy individual securities.
Returns shown do not reflect the deduction of taxes that a shareholder would pay on Fund distributions or the redemption of Fund shares.
See definition of comparative indices above.
Management Discussion of Fund Performance (unaudited)
Global X China Energy ETF
Global X China Energy ETF
The Global X China Energy ETF (the “Fund”) seeks to provide investment results that correspond generally to the price and yield performance, before fees and expenses, of the Solactive China Energy Index (the “Index”). The Fund generally seeks to replicate the Index but may at times invest in a representative sample of securities that collectively has an investment profile similar to the Index and as a result may or may not hold all the securities that are included in the Index.
The Index is designed to reflect the performance of the energy sector in China. It is comprised of selected companies which have their main business operations in the energy sector and are domiciled in China or have their main business operations in this country. Only securities which are tradable for foreign investors without restrictions are eligible. The Fund is the nation’s first ETF focused exclusively on the China energy sector.
The S&P 500 Index is a market capitalization weighted composite index of 500 large capitalization U.S. companies.
For the 12-month period ended October 31, 2013 (the “reporting period”), the Fund increased 11.72%, while the Index increased 12.72%. The Fund had a net asset value of $13.76 per share on October 31, 2012 and ended the reporting period with a net asset value of $15.11 on October 31, 2013.
During the reporting period, the highest returns came from Yingli Green Energy Holding and Trina Solar, which returned 255.03% and 253.49%, respectively. The worst performers were China Coal Energy and Tianneng Power International, which returned -43.77% and -41.21%, respectively.
| | | AVERAGE ANNUAL TOTAL RETURN FOR THE YEAR ENDED OCTOBER 31, 2013 | |
| | | One Year Return | | | Three Year Return | | | Annualized Inception to Date* | |
| | | Net Asset Value | | | Market Price | | | Net Asset Value | | | Market Price | | | Net Asset Value | | | Market Price | |
| Global X China Energy ETF | | | 11.72 | % | | | 12.10 | % | | | 0.21 | % | | | -0.16 | % | | | 1.35 | % | | | 1.25 | % |
| Solactive China Energy Index | | | 12.72 | % | | | 12.72 | % | | | 0.96 | % | | | 0.96 | % | | | 2.22 | % | | | 2.22 | % |
| S&P 500 Index | | | 27.18 | % | | | 27.18 | % | | | 16.56 | % | | | 16.56 | % | | | 15.01 | % | | | 15.01 | % |
Growth of a $10,000 Investment
(At Net Asset Value)

*Fund commenced operations on December 15, 2009.
The performance data quoted herein represents past performance and the return and value of an investment in the Fund will fluctuate so that, when redeemed, may be worth less than its original cost. Past performance is no guarantee of future performance and should not be considered as a representation of the future results of the Fund. The Fund's performance assumes the reinvestment of all dividends and all capital gains. Index returns assume reinvestment of dividends and, unlike a Fund's returns, do not reflect any fees or expenses. If such fees and expenses were included in the index returns, the performance would have been lower. Please note that one cannot invest directly in an unmanaged index.
There are no assurances that the Fund will meet its stated objectives.
The Fund’s holdings and allocations are subject to change and should not be considered recommendations to buy individual securities.
Returns shown do not reflect the deduction of taxes that a shareholder would pay on Fund distributions or the redemption of Fund shares.
See definition of comparative indices above.
Management Discussion of Fund Performance (unaudited)
Global X China Financials ETF
Global X China Financials ETF
The Global X China Financials ETF (the “Fund”) seeks to provide investment results that correspond generally to the price and yield performance, before fees and expenses, of the Solactive China Financials Index (the “Index”). The Fund generally seeks to replicate the Index but may at times invest in a representative sample of securities that collectively has an investment profile similar to the Index and as a result may or may not hold all the securities that are included in the Index.
The Index is designed to reflect the performance of the financial sector in China. It is comprised of selected companies which have their main business operations in the financial sector and are domiciled in China or have their main business operations in this country. Only securities which are tradable for foreign investors without restrictions are eligible. The Fund is the nation’s first ETF focused exclusively on the China financial sector.
The S&P 500 Index is a market capitalization weighted composite index of 500 large capitalization U.S. companies.
For the 12-month period ended October 31, 2013 (the “reporting period”), the Fund increased 13.61%, while the Index increased 14.35%. The Fund had a net asset value of $12.03 per share on October 31, 2012 and ended the reporting period with a net asset value of $13.29 on October 31, 2013.
During the reporting period, the highest returns came from Country Garden Holdings and Greentown China Holdings, which returned 77.15% and 70.25%, respectively. The worst performers were New China Life Insurance and China Life Insurance, which returned -15.01% and -10.08%, respectively.
| | | AVERAGE ANNUAL TOTAL RETURN FOR THE YEAR ENDED OCTOBER 31, 2013 | |
| | | One Year Return | | | Three Year Return | | | Annualized Inception to Date* | |
| | | Net Asset Value | | | Market Price | | | Net Asset Value | | | Market Price | | | Net Asset Value | | | Market Price | |
| Global X China Financials ETF | | | 13.61 | % | | | 13.86 | % | | | -1.74 | % | | | -2.14 | % | | | -1.57 | % | | | -1.72 | % |
| Solactive China Financials Index | | | 14.35 | % | | | 14.35 | % | | | -1.57 | % | | | -1.57 | % | | | -1.27 | % | | | -1.27 | % |
| S&P 500 Index | | | 27.18 | % | | | 27.18 | % | | | 16.56 | % | | | 16.56 | % | | | 15.10 | % | | | 15.10 | % |
Growth of a $10,000 Investment
(At Net Asset Value)
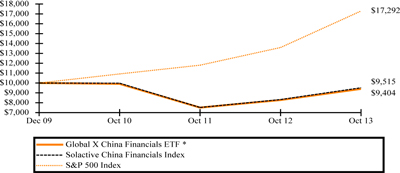
*Fund commenced operations on December 10, 2009.
The performance data quoted herein represents past performance and the return and value of an investment in the Fund will fluctuate so that, when redeemed, may be worth less than its original cost. Past performance is no guarantee of future performance and should not be considered as a representation of the future results of the Fund. The Fund's performance assumes the reinvestment of all dividends and all capital gains. Index returns assume reinvestment of dividends and, unlike a Fund's returns, do not reflect any fees or expenses. If such fees and expenses were included in the index returns, the performance would have been lower. Please note that one cannot invest directly in an unmanaged index.
There are no assurances that the Fund will meet its stated objectives.
The Fund’s holdings and allocations are subject to change and should not be considered recommendations to buy individual securities.
Returns shown do not reflect the deduction of taxes that a shareholder would pay on Fund distributions or the redemption of Fund shares.
See definition of comparative indices above.
Management Discussion of Fund Performance (unaudited)
Global X China Industrials ETF
Global X China Industrials ETF
The Global X China Industrials ETF (the “Fund”) seeks to provide investment results that correspond generally to the price and yield performance, before fees and expenses, of the Solactive China Industrials Index (the “Index”). The Fund generally seeks to replicate the Index but may at times invest in a representative sample of securities that collectively has an investment profile similar to the Index and as a result may or may not hold all the securities that are included in the Index.
The Index is designed to reflect the performance of the industrial sector in China. It is comprised of selected companies which have their main business operations in the industrial sector and are domiciled in China or have their main business operations in this country. Only securities which are tradable for foreign investors without restrictions are eligible. The Fund is the first ETF globally focused exclusively on the China industrial sector.
The S&P 500 Index is a market capitalization weighted composite index of 500 large capitalization U.S. companies.
For the 12-month period ended October 31, 2013 (the “reporting period”), the Fund increased 7.89%, while the Index increased 8.47%. The Fund had a net asset value of $11.40 per share on October 31, 2012 and ended the reporting period with a net asset value of $12.14 on October 31, 2013.
During the reporting period, the highest returns came from BYD and Haitian International Holdings, which returned 150.88% and 99.09%, respectively. The worst performers were China Shanshui Cement Group. and China Rongsheng Heavy Industries Group, which returned -49.63% and -44.33%, respectively.
| | | AVERAGE ANNUAL TOTAL RETURN FOR THE YEAR ENDED OCTOBER 31, 2013 | |
| | | One Year Return | | | Three Year Return | | | Annualized Inception to Date* | |
| | | Net Asset Value | | | Market Price | | | Net Asset Value | | | Market Price | | | Net Asset Value | | | Market Price | |
| Global X China Industrials ETF | | | 7.89 | % | | | 7.28 | % | | | -9.97 | % | | | -10.37 | % | | | -5.34 | % | | | -5.54 | % |
| Solactive China Industrials Index | | | 8.47 | % | | | 8.47 | % | | | -9.49 | % | | | -9.49 | % | | | -4.78 | % | | | -4.78 | % |
| S&P 500 Index | | | 27.18 | % | | | 27.18 | % | | | 16.56 | % | | | 16.56 | % | | | 15.19 | % | | | 15.19 | % |
Growth of a $10,000 Investment
(At Net Asset Value)
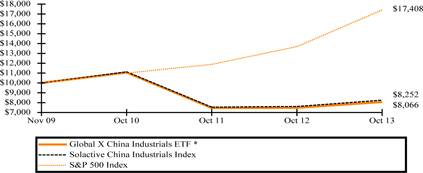
*Fund commenced operations on November 30, 2009.
The performance data quoted herein represents past performance and the return and value of an investment in the Fund will fluctuate so that, when redeemed, may be worth less than its original cost. Past performance is no guarantee of future performance and should not be considered as a representation of the future results of the Fund. The Fund's performance assumes the reinvestment of all dividends and all capital gains. Index returns assume reinvestment of dividends and, unlike a Fund's returns, do not reflect any fees or expenses. If such fees and expenses were included in the index returns, the performance would have been lower. Please note that one cannot invest directly in an unmanaged index.
There are no assurances that the Fund will meet its stated objectives.
The Fund’s holdings and allocations are subject to change and should not be considered recommendations to buy individual securities.
Returns shown do not reflect the deduction of taxes that a shareholder would pay on Fund distributions or the redemption of Fund shares.
See definition of comparative indices above.
Management Discussion of Fund Performance (unaudited)
Global X China Materials ETF
Global X China Materials ETF
The Global X China Materials ETF (the “Fund”) seeks to provide investment results that correspond generally to the price and yield performance, before fees and expenses, of the Solactive China Materials Index (the “Index”). The Fund generally seeks to replicate the Index but may at times invest in a representative sample of securities that collectively has an investment profile similar to the Index and as a result may or may not hold all the securities that are included in the Index.
The Index is designed to reflect the performance of the materials sector in China. It is comprised of selected companies which have their main business operations in the materials sector and are domiciled in China or have their main business operations in this country. Only securities which are tradable for foreign investors without restrictions are eligible. The Fund is the nation’s first ETF focused exclusively on the China materials sector.
The S&P 500 Index is a market capitalization weighted composite index of 500 large capitalization U.S. companies.
For the 12-month period ended October 31, 2013 (the “reporting period”), the Fund decreased 5.63%, while the Index decreased 4.54%. The Fund had a net asset value of $16.28 per share on October 31, 2012 and ended the period with a net asset value of $15.13 on October 31, 2013.
During the reporting period, the highest returns came from China Hongqiao Group and Sinopec Yizheng Chemical Fibre, which returned 44.37% and 31.85%, respectively. The worst performers were Zhaojin Mining Industry and Zijin Mining Group, which returned -43.76% and -38.88% respectively.
| | | AVERAGE ANNUAL TOTAL RETURN FOR THE YEAR ENDED OCTOBER 31, 2013 | |
| | | One Year Return | | | Three Year Return | | | Annualized Inception to Date* | |
| | | Net Asset Value | | | Market Price | | | Net Asset Value | | | Market Price | | | Net Asset Value | | | Market Price | |
| Global X China Materials ETF | | | -5.63 | % | | | -5.12 | % | | | -18.99 | % | | | -19.22 | % | | | -15.85 | % | | | -15.92 | % |
| Solactive China Materials Index | | | -4.54 | % | | | -4.54 | % | | | -18.38 | % | | | -18.38 | % | | | -15.21 | % | | | -15.21 | % |
| S&P 500 Index | | | 27.18 | % | | | 27.18 | % | | | 16.56 | % | | | 16.56 | % | | | 14.53 | % | | | 14.53 | % |
Growth of a $10,000 Investment
(At Net Asset Value)
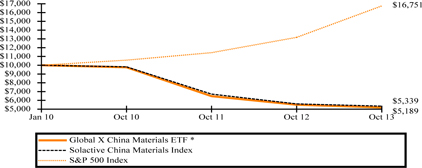
*Fund commenced operations on January 12, 2010.
The performance data quoted herein represents past performance and the return and value of an investment in the Fund will fluctuate so that, when redeemed, may be worth less than its original cost. Past performance is no guarantee of future performance and should not be considered as a representation of the future results of the Fund. The Fund's performance assumes the reinvestment of all dividends and all capital gains. Index returns assume reinvestment of dividends and, unlike a Fund's returns, do not reflect any fees or expenses. If such fees and expenses were included in the index returns, the performance would have been lower. Please note that one cannot invest directly in an unmanaged index.
There are no assurances that the Fund will meet its stated objectives.
The Fund’s holdings and allocations are subject to change and should not be considered recommendations to buy individual securities.
Returns shown do not reflect the deduction of taxes that a shareholder would pay on Fund distributions or the redemption of Fund shares.
See definition of comparative indices above.
Management Discussion of Fund Performance (unaudited)
Global X NASDAQ China Technology ETF
Global X NASDAQ China Technology ETF
The Global X NASDAQ China Technology ETF (the “Fund”) seeks to provide investment results that correspond generally to the price and yield performance, before fees and expenses, of the NASDAQ OMX China Technology Index (the “Index”). The Fund generally seeks to replicate the Index but may at times invest in a representative sample of securities that collectively has an investment profile similar to the Index and as a result may or may not hold all the securities that are included in the Index.
The Index is designed to reflect the performance of the technology sector in China. It is made up of securities of companies which have their main business operations in the technology sector and generally includes companies whose businesses involve: computer services; internet; software; computer hardware; electronic office equipment; semiconductors; and telecommunications equipment. Only securities which are tradable for foreign investors without restrictions are eligible.
The S&P 500 Index is a market capitalization weighted composite index of 500 large capitalization U.S. companies.
For the 12-month period ended October 31, 2013 (the “reporting period”), the Fund increased 50.68%, while the Index increased 50.17%. The Fund had a net asset value of $13.77 per share on October 31, 2012 and ended the reporting period with a net asset value of $20.63 on October 31, 2013.
During the reporting period, the highest returns came from Qihoo 360 Technology and YY, which returned 301.75% and 213.78%, respectively. The worst performers were TPV Technology and ASM Pacific Technology, which returned -32.71% and -21.08%, respectively.
| | | AVERAGE ANNUAL TOTAL RETURN FOR THE YEAR ENDED OCTOBER 31, 2013 | |
| | | One Year Return | | | Three Year Return | | | Annualized Inception to Date* | |
| | | Net Asset Value | | | Market Price | | | Net Asset Value | | | Market Price | | | Net Asset Value | | | Market Price | |
| Global X NASDAQ China Technology ETF | | | 50.68 | % | | | 50.84 | % | | | 7.27 | % | | | 6.98 | % | | | 9.53 | % | | | 9.40 | % |
| Solactive China Technology Index | | | 50.17 | % | | | 50.17 | % | | | 9.65 | % | | | 9.65 | % | | | 11.55 | % | | | 11.55 | % |
| Hybrid NASDAQ/Solactive China Technology Index** | | | 53.03 | % | | | 53.03 | % | | | 7.94 | % | | | 7.94 | % | | | 10.20 | % | | | 10.20 | % |
| S&P 500 Index | | | 27.18 | % | | | 27.18 | % | | | 16.56 | % | | | 16.56 | % | | | 15.37 | % | | | 15.37 | % |
Growth of a $10,000 Investment
(At Net Asset Value)
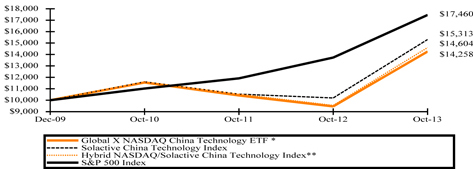
*Fund commenced operations on December 8, 2009.
** Reflects performance of Solactive China Technology Index through December 12, 2011 and NASDAQ OMX China Technology Index thereafter.
The performance data quoted herein represents past performance and the return and value of an investment in the Fund will fluctuate so that, when redeemed, may be worth less than its original cost. Past performance is no guarantee of future performance and should not be considered as a representation of the future results of the Fund. The Fund's performance assumes the reinvestment of all dividends and all capital gains. Index returns assume reinvestment of dividends and, unlike a Fund's returns, do not reflect any fees or expenses. If such fees and expenses were included in the index returns, the performance would have been lower. Please note that one cannot invest directly in an unmanaged index.
There are no assurances that the Fund will meet its stated objectives.
The Fund’s holdings and allocations are subject to change and should not be considered recommendations to buy individual securities.
Returns shown do not reflect the deduction of taxes that a shareholder would pay on Fund distributions or the redemption of Fund shares.
See definition of comparative indices on previous page.
Management Discussion of Fund Performance (unaudited)
Global X FTSE ASEAN 40 ETF
Global X FTSE ASEAN 40 ETF
The Global X FTSE ASEAN 40 ETF (the “Fund”) seeks to provide investment results that correspond generally to the price and yield performance, before fees and expenses, of the FTSE/ASEAN 40 Index (the “Index”). The Fund generally seeks to replicate the Index but may at times invest in a representative sample of securities that collectively has an investment profile similar to the Index and as a result may or may not hold all the securities that are included in the Index.
The Index tracks the performance of the 40 largest companies in the five ASEAN regions: Indonesia, Philippines, Singapore, Malaysia and Thailand. The index is free float adjusted and weighted by market capitalization and designed using eligible stocks within the FTSE All-World universe. The Fund is the nation’s first ETF focused exclusively on the ASEAN region.
The S&P 500 Index is a market capitalization weighted composite index of 500 large capitalization U.S. companies.
For the 12-month period ended October 31, 2013 (the “reporting period”), the Fund increased 4.50%, while the Index increased 5.17%. The Fund had a net asset value of $16.75 per share on October 31, 2012 and ended the reporting period with a net asset value of $17.12 on October 31, 2013.
During the reporting period, the highest returns came from Tenaga Nasional and Advanced Info Service Public, which returned 35.47% and 32.88%, respectively. The worst performers were Gudang Garam and Astra International, which returned -34.92% and -27.47%, respectively.
| | | AVERAGE ANNUAL TOTAL RETURN FOR THE YEAR ENDED
OCTOBER 31, 2013 | |
| | | One Year Return | | | Annualized Inception to Date* | |
| | | Net Asset Value | | | Market Price | | | Net Asset Value | | | Market Price | |
| Global X FTSE ASEAN 40 ETF | | | 4.50 | % | | | 4.02 | % | | | 6.67 | % | | | 6.52 | % |
| FTSE/ASEAN 40 Index | | | 5.17 | % | | | 5.17 | % | | | 7.28 | % | | | 7.28 | % |
| S&P 500 Index | | | 27.18 | % | | | 27.18 | % | | | 13.04 | % | | | 13.04 | % |
Growth of a $10,000 Investment
(At Net Asset Value)
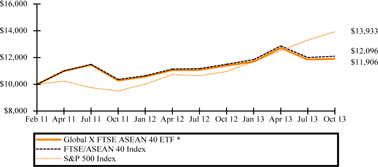
*Fund commenced operations on February 16, 2011.
The performance data quoted herein represents past performance and the return and value of an investment in the Fund will fluctuate so that, when redeemed, may be worth less than its original cost. Past performance is no guarantee of future performance and should not be considered as a representation of the future results of the Fund. The Fund's performance assumes the reinvestment of all dividends and all capital gains. Index returns assume reinvestment of dividends and, unlike a Fund's returns, do not reflect any fees or expenses. If such fees and expenses were included in the index returns, the performance would have been lower. Please note that one cannot invest directly in an unmanaged index.
There are no assurances that the Fund will meet its stated objectives.
The Fund’s holdings and allocations are subject to change and should not be considered recommendations to buy individual securities.
Returns shown do not reflect the deduction of taxes that a shareholder would pay on Fund distributions or the redemption of Fund shares.
See definition of comparative indices above.
Management Discussion of Fund Performance (unaudited)
Global X FTSE Andean 40 ETF
Global X FTSE Andean 40 ETF
The Global X FTSE Andean 40 ETF (the “Fund”) seeks to provide investment results that correspond generally to the price and yield performance, before fees and expenses, of the FTSE Andean 40 Index (the “Index”). The Fund generally seeks to replicate the Index but may at times invest in a representative sample of securities that collectively has an investment profile similar to the Index and as a result may or may not hold all the securities that are included in the Index.
The Index is designed to represent the performance of the 40 largest and most liquid companies listed on the Chile, Colombia, and Peru stock exchanges. The Index is designed to provide investors with a comprehensive and transparent way to measure the performance of the constituent companies. The Fund is the nation’s first ETF focused exclusively on the Andean region.
The S&P 500 Index is a market capitalization weighted composite index of 500 large capitalization U.S. companies.
For the 12-month period ended October 31, 2013 (the “reporting period”), the Fund decreased 13.52%, while the Index decreased 12.74%. The Fund had a net asset value of $14.37 per share on October 31, 2012 and ended the reporting period with a net asset value of $12.21 on October 31, 2013.
During the reporting period, the highest returns came from Peruvian New Sol and Grupo Nutresa, which returned 34.64% and 12.82%, respectively. The worst performers were Cia de Minas Buenaventura and Sociedad Quimica Y Minera de Chile, which returned -58.73% and -51.38%, respectively.
| | | AVERAGE ANNUAL TOTAL RETURN FOR THE YEAR ENDED
OCTOBER 31, 2013 | |
| | | One Year Return | | | Annualized Inception to Date* | |
| | | Net Asset Value | | | Market Price | | | Net Asset Value | | | Market Price | |
| Global X FTSE Andean 40 ETF | | | -13.52 | % | | | -13.12 | % | | | -5.70 | % | | | -5.61 | % |
| FTSE Andean 40 Index | | | -12.74 | % | | | -12.74 | % | | | -4.81 | % | | | -4.81 | % |
| S&P 500 Index | | | 27.18 | % | | | 27.18 | % | | | 13.91 | % | | | 13.91 | % |
Growth of a $10,000 Investment
(At Net Asset Value)
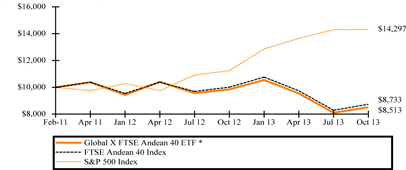
*Fund commenced operations on February 2, 2011.
The performance data quoted herein represents past performance and the return and value of an investment in the Fund will fluctuate so that, when redeemed, may be worth less than its original cost. Past performance is no guarantee of future performance and should not be considered as a representation of the future results of the Fund. The Fund's performance assumes the reinvestment of all dividends and all capital gains. Index returns assume reinvestment of dividends and, unlike a Fund's returns, do not reflect any fees or expenses. If such fees and expenses were included in the index returns, the performance would have been lower. Please note that one cannot invest directly in an unmanaged index.
There are no assurances that the Fund will meet its stated objectives.
The Fund’s holdings and allocations are subject to change and should not be considered recommendations to buy individual securities.
Returns shown do not reflect the deduction of taxes that a shareholder would pay on Fund distributions or the redemption of Fund shares.
See definition of comparative indices above.
Management Discussion of Fund Performance (unaudited)
Global X FTSE Colombia 20 ETF
Global X FTSE Colombia 20 ETF
The Global X FTSE Colombia 20 ETF (the “Fund”) seeks to provide investment results that correspond generally to the price and yield performance, before fees and expenses, of the FTSE Colombia 20 Index (the “Index”). The Fund generally seeks to replicate the Index but may at times invest in a representative sample of securities that collectively has an investment profile similar to the Index and as a result may or may not hold all the securities that are included in the Index.
The Index is a market capitalization-weighted index of the 20 most liquid stocks in the Colombian market. The Index is designed to measure broad based equity market performance in Colombia. The Fund is the first ETF globally focused exclusively on Colombia.
The S&P 500 Index is a market capitalization weighted composite index of 500 large capitalization U.S. companies.
For the 12-month period ended October 31, 2013 (the “reporting period”), the Fund decreased 4.21%, while the Index decreased 3.91%. The Fund had a net asset value of $21.89 per share on October 31, 2012 and ended the reporting period with a net asset value of $20.55 on October 31, 2013.
During the reporting period, the highest returns came from Canacol Energy and Empresa de Energia de Bogota, which returned 65.37% and 20.31%, respectively. The worst performers were Textiles Fabricato Tejicondor and Tablemac, which returned -84.56% and -30.33%, respectively.
| | | AVERAGE ANNUAL TOTAL RETURN FOR THE YEAR ENDED OCTOBER 31, 2013 | |
| | | One Year Return | | | Three Year Return | | | Annualized Inception to Date* | |
| | | Net Asset Value | | | Market Price | | | Net Asset Value | | | Market Price | | | Net Asset Value | | | Market Price | |
| Global X FTSE Colombia 20 ETF | | | -4.21 | % | | | -5.12 | % | | | -2.32 | % | | | -2.39 | % | | | 25.78 | % | | | 25.78 | % |
| FTSE Colombia 20 Index | | | -3.91 | % | | | -3.91 | % | | | -1.68 | % | | | -1.68 | % | | | 26.95 | % | | | 26.95 | % |
| S&P 500 Index | | | 27.18 | % | | | 27.18 | % | | | 16.56 | % | | | 16.56 | % | | | 19.23 | % | | | 19.23 | % |
Growth of a $10,000 Investment
(At Net Asset Value)
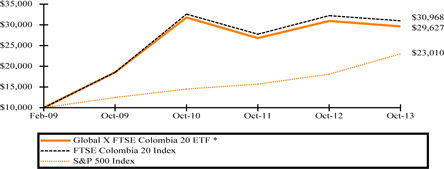
*Fund commenced operations on February 5, 2009.
The performance data quoted herein represents past performance and the return and value of an investment in the Fund will fluctuate so that, when redeemed, may be worth less than its original cost. Past performance is no guarantee of future performance and should not be considered as a representation of the future results of the Fund. The Fund's performance assumes the reinvestment of all dividends and all capital gains. Index returns assume reinvestment of dividends and, unlike a Fund's returns, do not reflect any fees or expenses. If such fees and expenses were included in the index returns, the performance would have been lower. Please note that one cannot invest directly in an unmanaged index.
There are no assurances that the Fund will meet its stated objectives.
The Fund’s holdings and allocations are subject to change and should not be considered recommendations to buy individual securities.
Returns shown do not reflect the deduction of taxes that a shareholder would pay on Fund distributions or the redemption of Fund shares.
See definition of comparative indices above.
Management Discussion of Fund Performance (unaudited)
Global X Brazil Mid Cap ETF
Global X Brazil Mid Cap ETF
The Global X Brazil Mid Cap ETF (the “Fund”) seeks to provide investment results that correspond generally to the price and yield performance, before fees and expenses, of the Solactive Brazil Mid Cap Index (the “Index”). The Fund generally seeks to replicate the Index but may at times invest in a representative sample of securities that collectively has an investment profile similar to the Index and as a result may or may not hold all the securities that are included in the Index.
The Index is designed to reflect the performance of Brazilian mid cap companies. It is comprised of mid-market capitalization securities of companies that are domiciled or have their main business operations in Brazil. The Fund is the first ETF globally focused exclusively on Brazil mid cap companies.
The S&P 500 Index is a market capitalization weighted composite index of 500 large capitalization U.S. companies.
For the 12-month period ended October 31, 2013 (the “reporting period”), the Fund decreased 3.52%, while the Index decreased 2.85%. The Fund had a net asset value of $15.55 per share on October 31, 2012 and ended the reporting period with a net asset value of $14.58 on October 31, 2013.
During the reporting period, the highest returns came from TIM Participacoes and Fibria Celulose, which returned 51.09% and 48.13%, respectively. The worst performers were OGX Petroleo e Gas Participacoes and OI, which returned -97.16% and -49.56%, respectively.
| | | AVERAGE ANNUAL TOTAL RETURN FOR THE YEAR ENDED OCTOBER 31, 2013 | |
| | | One Year Return | | | Three Year Return | | | Annualized Inception to Date* | |
| | | Net Asset Value | | | Market Price | | | Net Asset Value | | | Market Price | | | Net Asset Value | | | Market Price | |
| Global X Brazil Mid Cap ETF | | | -3.52 | % | | | -3.52 | % | | | -5.18 | % | | | -5.71 | % | | | 0.83 | % | | | 0.74 | % |
| Solactive Brazil Mid Cap Index | | | -2.85 | % | | | -2.85 | % | | | -4.28 | % | | | -4.28 | % | | | 1.69 | % | | | 1.69 | % |
| S&P 500 Index | | | 27.18 | % | | | 27.18 | % | | | 16.56 | % | | | 16.56 | % | | | 16.98 | % | | | 16.98 | % |
Growth of a $10,000 Investment
(At Net Asset Value)
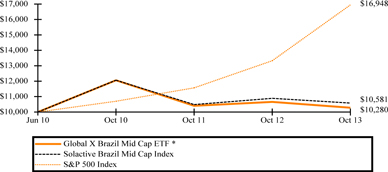
*Fund commenced operations on June 21, 2010.
The performance data quoted herein represents past performance and the return and value of an investment in the Fund will fluctuate so that, when redeemed, may be worth less than its original cost. Past performance is no guarantee of future performance and should not be considered as a representation of the future results of the Fund. The Fund's performance assumes the reinvestment of all dividends and all capital gains. Index returns assume reinvestment of dividends and, unlike a Fund's returns, do not reflect any fees or expenses. If such fees and expenses were included in the index returns, the performance would have been lower. Please note that one cannot invest directly in an unmanaged index.
There are no assurances that the Fund will meet its stated objectives.
The Fund’s holdings and allocations are subject to change and should not be considered recommendations to buy individual securities.
Returns shown do not reflect the deduction of taxes that a shareholder would pay on Fund distributions or the redemption of Fund shares.
See definition of comparative indices above.
Management Discussion of Fund Performance (unaudited)
Global X Brazil Consumer ETF
Global X Brazil Consumer ETF
The Global X Brazil Consumer ETF (the “Fund”) seeks to provide investment results that correspond generally to the price and yield performance, before fees and expenses, of the Solactive Brazil Consumer Index (the “Index”). The Fund generally seeks to replicate the Index but may at times invest in a representative sample of securities that collectively has an investment profile similar to the Index and as a result may or may not hold all the securities that are included in the Index.
The Index is designed to reflect the performance of the consumer sector in Brazil. It is comprised of selected companies which have their main business operations in the consumer sector and are domiciled or have their main business operations in Brazil. The Fund is the nation’s first ETF focused exclusively on the Brazil consumer sector.
The S&P 500 Index is a market capitalization weighted composite index of 500 large capitalization U.S. companies.
For the 12-month period ended October 31, 2013 (the “reporting period”), the Fund decreased 6.80%, while the Index decreased 6.00%. The Fund had a net asset value of $19.43 per share on October 31, 2012 and ended the reporting period with a net asset value of $17.89 on October 31, 2013.
During the reporting period, the highest returns came from B2W - Cia Digital and M. Dias Branco, which returned 54.80% and 42.53%, respectively. The worst performers were Marfrig Alimentos and Multiplus, which returned -60.43% and -43.23%, respectively.
| | | AVERAGE ANNUAL TOTAL RETURN FOR THE YEAR ENDED OCTOBER 31, 2013 | |
| | | One Year Return | | | Three Year Return | | | Annualized Inception to Date* | |
| | | Net Asset Value | | | Market Price | | | Net Asset Value | | | Market Price | | | Net Asset Value | | | Market Price | |
| Global X Brazil Consumer ETF | | | -6.80 | % | | | -6.58 | % | | | -2.65 | % | | | -3.26 | % | | | 5.36 | % | | | 5.29 | % |
| Solactive Brazil Consumer Index | | | -6.00 | % | | | -6.00 | % | | | -1.66 | % | | | -1.66 | % | | | 6.43 | % | | | 6.43 | % |
| S&P 500 Index | | | 27.18 | % | | | 27.18 | % | | | 16.56 | % | | | 16.56 | % | | | 18.91 | % | | | 18.91 | % |
Growth of a $10,000 Investment
(At Net Asset Value)
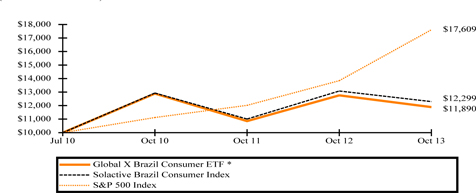
*Fund commenced operations on July 7, 2010.
The performance data quoted herein represents past performance and the return and value of an investment in the Fund will fluctuate so that, when redeemed, may be worth less than its original cost. Past performance is no guarantee of future performance and should not be considered as a representation of the future results of the Fund. The Fund's performance assumes the reinvestment of all dividends and all capital gains. Index returns assume reinvestment of dividends and, unlike a Fund's returns, do not reflect any fees or expenses. If such fees and expenses were included in the index returns, the performance would have been lower. Please note that one cannot invest directly in an unmanaged index.
There are no assurances that the Fund will meet its stated objectives.
The Fund’s holdings and allocations are subject to change and should not be considered recommendations to buy individual securities.
Returns shown do not reflect the deduction of taxes that a shareholder would pay on Fund distributions or the redemption of Fund shares.
See definition of comparative indices above.
Management Discussion of Fund Performance (unaudited)
Global X Brazil Financials ETF
Global X Brazil Financials ETF
The Global X Brazil Financials ETF (the “Fund”) seeks to provide investment results that correspond generally to the price and yield performance, before fees and expenses, of the Solactive Brazil Financials Index (the “Index”). The Fund generally seeks to replicate the Index but may at times invest in a representative sample of securities that collectively has an investment profile similar to the Index and as a result may or may not hold all the securities that are included in the Index.
The Index is designed to reflect the performance of the financial sector in Brazil. It is comprised of selected companies which have their main business operations in the financial sector and are domiciled or have their main business operations in Brazil. The Fund is the first ETF globally focused exclusively on the Brazil financial sector.
The S&P 500 Index is a market capitalization weighted composite index of 500 large capitalization U.S. companies.
For the 12-month period ended October 31, 2013 (the “reporting period”), the Fund decreased 1.87%, while the Index decreased 1.25%. The Fund had a net asset value of $12.82 per share on October 31, 2012 and ended the reporting period with a net asset value of $12.12 on October 31, 2013.
During the reporting period, the highest returns came from Cielo and Banco do Brasil, which returned 54.40% and 38.78%, respectively. The worst performers were Brookfield Incorporacoes and PDG Realty SA Empreendimentos e Participacoes, which returned -63.73% and -45.80%, respectively.
| | | AVERAGE ANNUAL TOTAL RETURN FOR THE YEAR ENDED OCTOBER 31, 2013 | |
| | | One Year Return | | | Three Year Return | | | Annualized Inception to Date* | |
| | | Net Asset Value | | | Market Price | | | Net Asset Value | | | Market Price | | | Net Asset Value | | | Market Price | |
| Global X Brazil Financials ETF | | | -1.87 | % | | | -1.65 | % | | | -8.62 | % | | | -9.17 | % | | | -3.83 | % | | | -3.86 | % |
| Solactive Brazil Financials Index | | | -1.25 | % | | | -1.25 | % | | | -8.03 | % | | | -8.03 | % | | | -3.21 | % | | | -3.21 | % |
| S&P 500 Index | | | 27.18 | % | | | 27.18 | % | | | 16.56 | % | | | 16.56 | % | | | 17.72 | % | | | 17.72 | % |
Growth of a $10,000 Investment
(At Net Asset Value)
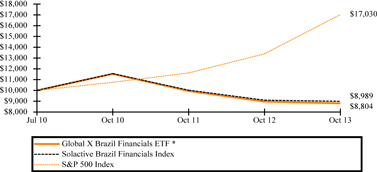
*Fund commenced operations on July 28, 2010.
The performance data quoted herein represents past performance and the return and value of an investment in the Fund will fluctuate so that, when redeemed, may be worth less than its original cost. Past performance is no guarantee of future performance and should not be considered as a representation of the future results of the Fund. The Fund's performance assumes the reinvestment of all dividends and all capital gains. Index returns assume reinvestment of dividends and, unlike a Fund's returns, do not reflect any fees or expenses. If such fees and expenses were included in the index returns, the performance would have been lower. Please note that one cannot invest directly in an unmanaged index.
There are no assurances that the Fund will meet its stated objectives.
The Fund’s holdings and allocations are subject to change and should not be considered recommendations to buy individual securities.
Returns shown do not reflect the deduction of taxes that a shareholder would pay on Fund distributions or the redemption of Fund shares.
See definition of comparative indices above.
Management Discussion of Fund Performance (unaudited)
Global X FTSE Argentina 20 ETF
Global X FTSE Argentina 20 ETF
The Global X FTSE Argentina 20 ETF (the “Fund”) seeks to provide investment results that correspond generally to the price and yield performance, before fees and expenses, of the FTSE Argentina 20 Index (the “Index”). The Fund generally seeks to replicate the Index but may at times invest in a representative sample of securities that collectively has an investment profile similar to the Index and as a result may or may not hold all the securities that are included in the Index.
The Index represents the performance of the 20 largest and most liquid companies that directly participate in the Argentine economy, but are not listed in Argentina. The index is designed to provide investors with a comprehensive and transparent way to measure the performance of these companies. The Fund is the nation’s first ETF focused exclusively on Argentina.
The S&P 500 Index is a market capitalization weighted composite index of 500 large capitalization U.S. companies.
For the 12-month period ended October 31, 2013 (the “reporting period”), the Fund increased 21.73%, while the Index increased 23.19%. The Fund had a net asset value of $16.84 per share on October 31, 2012 and ended the reporting period with a net asset value of $20.29 on October 31, 2013.
During the reporting period, the highest returns came from Telecom Argentina and BBVA Banco Frances, which returned 98.88% and 98.63%, respectively. The worst performers were Silver Standard Resources and McEwen Mining, which returned -63.07% and -55.97%, respectively.
| | | AVERAGE ANNUAL TOTAL RETURN FOR THE YEAR ENDED
OCTOBER 31, 2013 | |
| | | One Year Return | | | Annualized Inception to Date* | |
| | | Net Asset Value | | | Market Price | | | Net Asset Value | | | Market Price | |
| Global X FTSE Argentina 20 ETF | | | 21.73 | % | | | 22.74 | % | | | -12.27 | % | | | -12.15 | % |
| FTSE Argentina 20 Index | | | 23.19 | % | | | 23.19 | % | | | -11.43 | % | | | -11.43 | % |
| S&P 500 Index | | | 27.18 | % | | | 27.18 | % | | | 14.10 | % | | | 14.10 | % |
Growth of a $10,000 Investment
(At Net Asset Value)
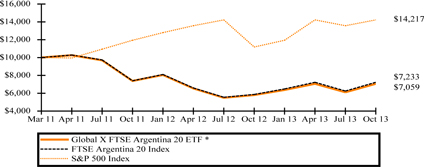
*Fund commenced operations on March 2, 2011.
The performance data quoted herein represents past performance and the return and value of an investment in the Fund will fluctuate so that, when redeemed, may be worth less than its original cost. Past performance is no guarantee of future performance and should not be considered as a representation of the future results of the Fund. The Fund's performance assumes the reinvestment of all dividends and all capital gains. Index returns assume reinvestment of dividends and, unlike a Fund's returns, do not reflect any fees or expenses. If such fees and expenses were included in the index returns, the performance would have been lower. Please note that one cannot invest directly in an unmanaged index.
There are no assurances that the Fund will meet its stated objectives.
The Fund’s holdings and allocations are subject to change and should not be considered recommendations to buy individual securities.
Returns shown do not reflect the deduction of taxes that a shareholder would pay on Fund distributions or the redemption of Fund shares.
See definition of comparative indices above.
Management Discussion of Fund Performance (unaudited)
Global X FTSE Greece 20 ETF
Global X FTSE Greece 20 ETF
The Global X FTSE Greece 20 ETF (“Fund”) seeks to provide investment results that correspond generally to the price and yield performance, before fees and expenses, of the FTSE/ATHEX Custom Capped Index (the “Index”). The Fund generally seeks to replicate the Index but may at times invest in a representative sample of securities that collectively has an investment profile similar to the Index and as a result may or may not hold all the securities that are included in the Index.
The Index is designed to reflect broad based equity market performance in Greece. The Fund is the nation’s first ETF focused exclusively on Greece.
The S&P 500 Index is a market capitalization weighted composite index of 500 large capitalization U.S. companies.
For the 12-month period ended October 31, 2013 (the “reporting period”), the Fund increased 40.14%, while the Index increased 40.80%. The Fund had a net asset value of $16.16 per share on October 31, 2012 and ended the reporting period with a net asset value of $22.60 on October 31, 2013.
During the reporting period, the highest returns came from Bank of Cyprus and Hellenic Telecommunications Organization, which returned 186.67% and 161.15%, respectively. The worst performers were National Bank of Greece and Eurobank Ergasias, which returned -95.96% and -75.32%, respectively.
| | | AVERAGE ANNUAL TOTAL RETURN FOR THE YEAR ENDED
OCTOBER 31, 2013 | |
| | | One Year Return | | | Annualized Inception to Date* | |
| | | Net Asset Value | | | Market Price | | | Net Asset Value | | | Market Price | |
| Global X FTSE Greece 20 ETF | | | 40.14 | % | | | 40.72 | % | | | 23.61 | % | | | 24.04 | % |
| FTSE/ATHEX Custom Capped Index | | | 40.80 | % | | | 40.80 | % | | | 25.45 | % | | | 25.45 | % |
| S&P 500 Index | | | 27.18 | % | | | 27.18 | % | | | 21.64 | % | | | 21.64 | % |
Growth of a $10,000 Investment
(At Net Asset Value)
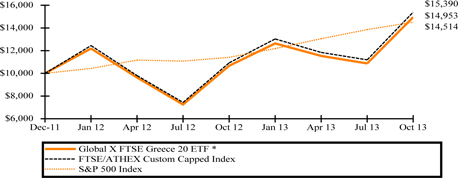
*Fund commenced operations on December 7, 2011.
The performance data quoted herein represents past performance and the return and value of an investment in the Fund will fluctuate so that, when redeemed, may be worth less than its original cost. Past performance is no guarantee of future performance and should not be considered as a representation of the future results of the Fund. The Fund's performance assumes the reinvestment of all dividends and all capital gains. Index returns assume reinvestment of dividends and, unlike a Fund's returns, do not reflect any fees or expenses. If such fees and expenses were included in the index returns, the performance would have been lower. Please note that one cannot invest directly in an unmanaged index.
There are no assurances that the Fund will meet its stated objectives.
The Fund’s holdings and allocations are subject to change and should not be considered recommendations to buy individual securities.
Returns shown do not reflect the deduction of taxes that a shareholder would pay on Fund distributions or the redemption of Fund shares.
See definition of comparative indices above.
Management Discussion of Fund Performance (unaudited)
Global X FTSE Norway 30 ETF
Global X FTSE Norway 30 ETF
The Global X FTSE Norway 30 ETF (the “Fund”) seeks to provide investment results that correspond generally to the price and yield performance, before fees and expenses, of the FTSE Norway 30 Index (the “Index”). The Fund generally seeks to replicate the Index but may at times invest in a representative sample of securities that collectively has an investment profile similar to the Index and as a result may or may not hold all the securities that are included in the Index.
The Index is designed to reflect broad based equity market performance in Norway. The Fund is the nation’s first ETF focused exclusively on Norway.
The S&P 500 Index is a market capitalization weighted composite index of 500 large capitalization U.S. companies.
For the 12-month period ended October 31, 2013 (the “reporting period”), the Fund increased 14.21%, while the Index increased 15.77%. The Fund had a net asset value of $15.09 per share on October 31, 2012 and ended the reporting period with a net asset value of $16.76 on October 31, 2013.
During the reporting period, the highest returns came from Opera Software and Norwegian Air Shuttle, which returned 121.21% and 91.12%, respectively. The worst performers were Kvaerner and Petroleum Geo-Services, which returned -28.20% and -28.16%, respectively.
| | | AVERAGE ANNUAL TOTAL RETURN FOR THE YEAR ENDED
OCTOBER 31, 2013 | |
| | | One Year Return | | | Annualized Inception to Date* | |
| | | Net Asset Value | | | Market Price | | | Net Asset Value | | | Market Price | |
| Global X FTSE Norway 30 ETF | | | 14.21 | % | | | 14.51 | % | | | 6.29 | % | | | 6.32 | % |
| FTSE Norway 30 Index | | | 15.77 | % | | | 15.77 | % | | | 7.55 | % | | | 7.55 | % |
| S&P 500 Index | | | 27.18 | % | | | 27.18 | % | | | 15.68 | % | | | 15.68 | % |
Growth of a $10,000 Investment
(At Net Asset Value)
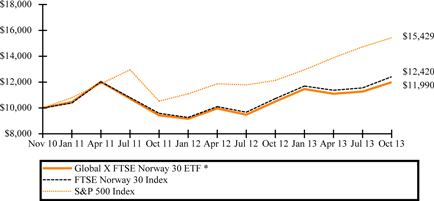
*Fund commenced operations on November 9, 2010.
The performance data quoted herein represents past performance and the return and value of an investment in the Fund will fluctuate so that, when redeemed, may be worth less than its original cost. Past performance is no guarantee of future performance and should not be considered as a representation of the future results of the Fund. The Fund's performance assumes the reinvestment of all dividends and all capital gains. Index returns assume reinvestment of dividends and, unlike a Fund's returns, do not reflect any fees or expenses. If such fees and expenses were included in the index returns, the performance would have been lower. Please note that one cannot invest directly in an unmanaged index.
There are no assurances that the Fund will meet its stated objectives.
The Fund’s holdings and allocations are subject to change and should not be considered recommendations to buy individual securities.
Returns shown do not reflect the deduction of taxes that a shareholder would pay on Fund distributions or the redemption of Fund shares.
See definition of comparative indices above.
Management Discussion of Fund Performance (unaudited)
Global X FTSE Nordic Region ETF
Global X FTSE Nordic Region ETF
The Global X FTSE Nordic Region ETF (the “Fund”) seeks to provide investment results that correspond generally to the price and yield performance, before fees and expenses, of the FTSE Nordic 30 Index (the “Index”). The Fund generally seeks to replicate the Index but may at times invest in a representative sample of securities that collectively has an investment profile similar to the Index and as a result may or may not hold all the securities that are included in the Index.
The Index is a market capitalization-weighted index of the 30 largest and most liquid stocks in Sweden, Denmark, Norway and Finland. The Index is designed to measure broad based equity market performance in these countries. The Fund is the nation’s first ETF focused exclusively on the Nordic region.
The S&P 500 Index is a market capitalization weighted composite index of 500 large capitalization U.S. companies.
For the 12-month period ended October 31, 2013 (the “reporting period”), the Fund increased 30.54%, while the Index increased 30.00%. The Fund had a net asset value of $18.65 per share on October 31, 2012 and ended the reporting period with a net asset value of $23.74 on October 31, 2013.
During the reporting period, the highest returns came from Nokia and Sampo, which returned 185.77% and 58.61%, respectively. The worst performers were Yara International and Volvo, which returned -3.55% and -1.12%, respectively.
| | | AVERAGE ANNUAL TOTAL RETURN FOR THE YEAR ENDED OCTOBER 31, 2013 | |
| | | One Year Return | | | Three Year Return | | | Annualized Inception to Date* | |
| | | Net Asset Value | | | Market Price | | | Net Asset Value | | | Market Price | | | Net Asset Value | | | Market Price | |
| Global X FTSE Nordic Region ETF | | | 30.54 | % | | | 31.18 | % | | | 9.87 | % | | | 9.76 | % | | | 14.37 | % | | | 14.42 | % |
| FTSE Nordic 30 Index | | | 30.00 | % | | | 30.00 | % | | | 9.74 | % | | | 9.74 | % | | | 14.36 | % | | | 14.36 | % |
| S&P 500 Index | | | 27.18 | % | | | 27.18 | % | | | 16.56 | % | | | 16.56 | % | | | 17.32 | % | | | 17.32 | % |
Growth of a $10,000 Investment
(At Net Asset Value)
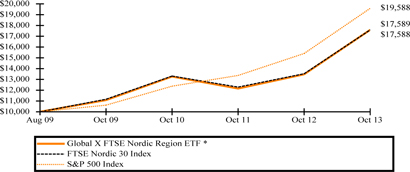
*Fund commenced operations on August 17, 2009.
The performance data quoted herein represents past performance and the return and value of an investment in the Fund will fluctuate so that, when redeemed, may be worth less than its original cost. Past performance is no guarantee of future performance and should not be considered as a representation of the future results of the Fund. The Fund's performance assumes the reinvestment of all dividends and all capital gains. Index returns assume reinvestment of dividends and, unlike a Fund's returns, do not reflect any fees or expenses. If such fees and expenses were included in the index returns, the performance would have been lower. Please note that one cannot invest directly in an unmanaged index.
There are no assurances that the Fund will meet its stated objectives.
The Fund’s holdings and allocations are subject to change and should not be considered recommendations to buy individual securities.
Returns shown do not reflect the deduction of taxes that a shareholder would pay on Fund distributions or the redemption of Fund shares.
See definition of comparative indices above.
Management Discussion of Fund Performance (unaudited)
Global X Central Asia & Mongolia Index ETF
Global X Central Asia & Mongolia Index ETF
The Global X Central Asia & Mongolia Index ETF (the “Fund”) seeks to provide investment results that correspond generally to the price and yield performance, before fees and expenses, of the Solactive Central Asia & Mongolia Index ETF (the “Index”). The Fund generally seeks to replicate the Index but may at times invest in a representative sample of securities that collectively has an investment profile similar to the Index and as a result may or may not hold all the securities that are included in the Index.
The Index is designed to reflect broad based equity market performance in Central Asia & Mongolia. The Fund is the nation’s first ETF focused exclusively on Central Asia & Mongolia.
The S&P 500 Index is a market capitalization weighted composite index of 500 large capitalization U.S. companies.
For the period from the Fund’s commencement date on April 2, 2013 through October 31, 2013 (the “reporting period”), the Fund decreased 7.41%, while the Index decreased 7.19%. The Fund had a net asset value of $14.84 per share on April 2, 2013 and ended the reporting period with a net asset value of $13.74 on October 31, 2013.
During the reporting period, the highest returns came from Central Asia Metals and Bank of Georgia Holdings, which returned 41.08% and 38.01%, respectively. The worst performers were Mongolian Mining and Dundee Precious Metals, which returned -53.42% and -39.52%, respectively.
| | | TOTAL RETURN FOR THE PERIOD ENDED
OCTOBER 31, 2013 | |
| | | Cumulative Inception to Date* | |
| | | Net Asset Value | | | Market Price | |
| Global X Central Asia & Mongolia Index ETF | | | -7.41 | % | | | -7.47 | % |
| Solactive Central Asia & Mongolia Index | | | -7.19 | % | | | -7.19 | % |
| S&P 500 Index | | | 13.20 | % | | | 13.20 | % |
Growth of a $10,000 Investment
(At Net Asset Value)
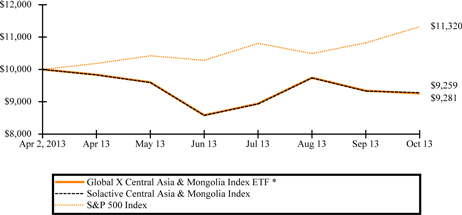
*Fund commenced operations on April 2, 2013. Total Return is for the period indicated and has not been annualized.
The performance data quoted herein represents past performance and the return and value of an investment in the Fund will fluctuate so that, when redeemed, may be worth less than its original cost. Past performance is no guarantee of future performance and should not be considered as a representation of the future results of the Fund. The Fund's performance assumes the reinvestment of all dividends and all capital gains. Index returns assume reinvestment of dividends and, unlike a Fund's returns, do not reflect any fees or expenses. If such fees and expenses were included in the index returns, the performance would have been lower. Please note that one cannot invest directly in an unmanaged index.
There are no assurances that the Fund will meet its stated objectives.
The Fund’s holdings and allocations are subject to change and should not be considered recommendations to buy individual securities.
Returns shown do not reflect the deduction of taxes that a shareholder would pay on Fund distributions or the redemption of Fund shares.
See definition of comparative indices above.
Management Discussion of Fund Performance (unaudited)
Global X Nigeria Index ETF
Global X Nigeria Index ETF
The Global X Nigeria Index ETF (the “Fund”) seeks to provide investment results that correspond generally to the price and yield performance, before fees and expenses, of the Solactive Nigeria Index (the “Index”). The Fund generally seeks to replicate the Index but may at times invest in a representative sample of securities that collectively has an investment profile similar to the Index and as a result may or may not hold all the securities that are included in the Index.
The Index is designed to reflect broad based equity market performance in Nigeria. The Fund is the nation’s first ETF focused exclusively on Nigeria.
The S&P 500 Index is a market capitalization weighted composite index of 500 large capitalization U.S. companies.
For the period from the Fund’s commencement date on April 2, 2013 through October 31, 2013 (the “reporting period”), the Fund decreased 2.55%, while the Index decreased 1.92%. The Fund had a net asset value of $15.31 per share on April 2, 2013 and ended the reporting period with a net asset value of $14.92 on October 31, 2013.
During the reporting period, the highest returns came from UAC of Nigeria and Dangote Sugar Refinery, which returned 37.02% and 34.61%, respectively. The worst performers were Oando and Skye Bank, which returned -34.40% and -32.65%, respectively.
| | | TOTAL RETURN FOR THE PERIOD ENDED
OCTOBER 31, 2013 | |
| | | Cumulative Inception to Date* | |
| | | Net Asset Value | | | Market Price | |
| Global X Nigeria Index ETF | | | -2.55 | % | | | 0.87 | % |
| Solactive Nigeria Index | | | -1.92 | % | | | -1.92 | % |
| S&P 500 Index | | | 13.20 | % | | | 13.20 | % |
Growth of a $10,000 Investment
(At Net Asset Value)
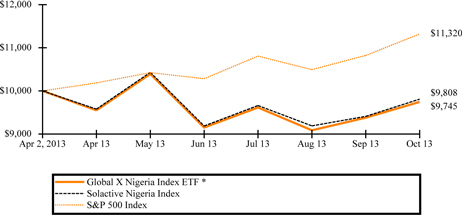
*Fund commenced operations on April 2, 2013. Total return is for the period indicated and has not been annualized.
The performance data quoted herein represents past performance and the return and value of an investment in the Fund will fluctuate so that, when redeemed, may be worth less than its original cost. Past performance is no guarantee of future performance and should not be considered as a representation of the future results of the Fund. The Fund's performance assumes the reinvestment of all dividends and all capital gains. Index returns assume reinvestment of dividends and, unlike a Fund's returns, do not reflect any fees or expenses. If such fees and expenses were included in the index returns, the performance would have been lower. Please note that one cannot invest directly in an unmanaged index.
There are no assurances that the Fund will meet its stated objectives.
The Fund’s holdings and allocations are subject to change and should not be considered recommendations to buy individual securities.
Returns shown do not reflect the deduction of taxes that a shareholder would pay on Fund distributions or the redemption of Fund shares.
See definition of comparative indices above.
|
| | |
| Schedule of Investments | October 31, 2013 |
| | |
| Global X China Consumer ETF |
Sector Weightings (unaudited)†:
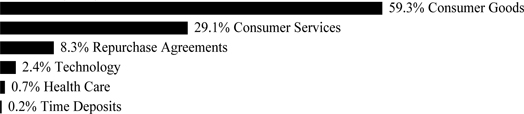
| † Percentages based on total investments. Repurchase agreements purchased from cash collateral received for securities lending activity are included in total investments. Please see Note 9 in Notes to Financial Statements for more detailed information. |
| | | Shares | | | Value | |
| COMMON STOCK — 99.7% | | | | | | | | |
| | | | | | | | | |
| CHINA— 72.7% | | | | | | | | |
| | | | | | | | | |
| Consumer Goods — 44.2% | | | | | | | | |
| ANTA Sports Products | | | 2,248,296 | | | $ | 3,224,694 | |
| China Yurun Food Group (C)* | | | 3,912,488 | | | | 2,593,859 | |
| Daphne International Holdings (C) | | | 2,419,024 | | | | 1,260,526 | |
| Dongfeng Motor Group, Cl H | | | 5,603,646 | | | | 7,921,574 | |
| Great Wall Motor, Cl H | | | 1,352,629 | | | | 7,946,892 | |
| Guangzhou Automobile Group, Cl H | | | 6,485,817 | | | | 7,696,313 | |
| Hengan International Group | | | 679,206 | | | | 8,318,149 | |
| Labixiaoxin Snacks Group | | | 990,000 | | | | 514,601 | |
| Li Ning (C)* | | | 3,030,969 | | | | 2,775,684 | |
| Shenzhou International Group Holdings | | | 1,398,462 | | | | 4,816,063 | |
| Tingyi Cayman Islands Holding | | | 3,099,318 | | | | 8,754,684 | |
| Tsingtao Brewery, Cl H | | | 960,964 | | | | 7,870,658 | |
| Uni-President China Holdings | | | 3,112,961 | | | | 3,111,756 | |
| Want Want China Holdings | | | 5,623,697 | | | | 8,646,262 | |
| | | | | | | | 75,451,715 | |
| Consumer Services — 27.6% | | | | | | | | |
| Air China, Cl H | | | 5,045,828 | | | | 3,442,852 | |
| Ajisen China Holdings | | | 1,532,993 | | | | 1,609,514 | |
| China Southern Airlines, Cl H | | | 5,161,195 | | | | 1,903,910 | |
| Chow Tai Fook Jewellery Group | | | 3,118,279 | | | | 5,172,329 | |
| Ctrip.com International ADR * | | | 81,555 | | | | 4,424,359 | |
| E-Commerce China Dangdang ADR, Cl A * | | | 104,607 | | | | 925,772 | |
| Golden Eagle Retail Group (C) | | | 1,519,410 | | | | 2,281,173 | |
| GOME Electrical Appliances Holding (C) | | | 33,548,257 | | | | 5,192,559 | |
| Home Inns & Hotels Management ADR (C) * | | | 47,807 | | | | 1,665,596 | |
| Intime Retail Group | | | 2,933,996 | | | | 3,492,942 | |
| New Oriental Education & Technology Group ADR* | | | 117,328 | | | | 3,075,167 | |
| Parkson Retail Group (C) | | | 3,979,212 | | | | 1,365,240 | |
| PCD Stores Group (A)(B) * | | | 5,916,138 | | | | 857,027 | |
| Sun Art Retail Group | | | 3,934,500 | | | | 6,445,008 | |
The accompanying notes are an integral part of the financial statements.
|
| | |
| Schedule of Investments | October 31, 2013 |
| | |
| Global X China Consumer ETF |
| | | Shares/Face
Amount | | | Value | |
| COMMON STOCK — continued | | | | | | | | |
| | | | | | | | | |
| Consumer Services — continued | | | | | | | | |
| Wumart Stores, Cl H | | | 1,428,711 | | | $ | 2,384,564 | |
| Youku.com ADR * | | | 105,827 | | | | 2,882,728 | |
| | | | | | | | 47,120,740 | |
| Health Care — 0.9% | | | | | | | | |
| Shandong Weigao Group Medical Polymer, Cl H | | | 287,247 | | | | 269,722 | |
| Sinopharm Group, Cl H | | | 426,170 | | | | 1,154,336 | |
| | | | | | | | 1,424,058 | |
| TOTAL CHINA | | | | | | | 123,996,513 | |
| | | | | | | | | |
| HONG KONG— 27.0% | | | | | | | | |
| | | | | | | | | |
| Consumer Goods — 20.4% | | | | | | | | |
| Belle International Holdings, Cl A | | | 5,524,696 | | | | 7,795,714 | |
| Biostime International Holdings * | | | 338,000 | | | | 2,561,267 | |
| Bosideng International Holdings (C) | | | 8,154,562 | | | | 1,882,712 | |
| China Agri-Industries Holdings | | | 5,918,956 | | | | 2,778,924 | |
| China Foods* | | | 2,122,313 | | | | 963,568 | |
| China Mengniu Dairy | | | 1,753,126 | | | | 7,710,769 | |
| China Resources Enterprise | | | 2,390,913 | | | | 8,465,183 | |
| Skyworth Digital Holdings | | | 5,293,900 | | | | 2,567,402 | |
| | | | | | | | 34,725,539 | |
| Consumer Services — 6.6% | | | | |
| AviChina Industry & Technology, Cl H | | | 2,352,822 | | | | 1,116,779 | |
| China Dongxiang Group | | | 8,254,788 | | | | 1,288,313 | |
| China Travel International Investment Hong Kong | | | 6,307,502 | | | | 1,220,335 | |
| Melco Crown Entertainment ADR (C)* | | | 232,846 | | | | 7,721,173 | |
| | | | | | | | 11,346,600 | |
| TOTAL HONG KONG | | | | | | | 46,072,139 | |
| TOTAL COMMON STOCK | | | | | | | | |
| (Cost $169,969,971) | | | | | | | 170,068,652 | |
| | | | | | | | | |
| REPURCHASE AGREEMENTS — 9.1% |
| |
| Barclays | | | | | | | | |
| 0.080%, dated 10/31/13, to be repurchased on 11/01/13, repurchase price $14,725,018 (collateralized by U.S. Treasury Bills, ranging in par value $5,348,516 - 9,673,786, 0.000%, 01/09/14-04/03/14 with a total market value of $15,019,490) (D) | | $ | 14,724,985 | | | | 14,724,985 | |
The accompanying notes are an integral part of the financial statements.
|
| | |
| Schedule of Investments | October 31, 2013 |
| | |
| Global X China Consumer ETF |
| | | Shares/Face
Amount(1) | | | Value | |
| REPURCHASE AGREEMENTS —continued | | | | | | | | |
| Deutsche Bank | | | | | | | | |
0.090%, dated 10/31/13, to be repurchased on 11/01/13, repurchase price
$775,001 (collateralized by U.S. Treasury Bills, par value $775,000,
2.375%, 09/30/14 with a total market value of $790,771) (D) | | | 774,999 | | | $ | 774,999 | |
| TOTAL REPURCHASE AGREEMENTS (Cost $15,499,984) | | | | | | | 15,499,984 | |
| | | | | | | | | |
| TIME DEPOSITS — 0.2% | | | | | | | | |
| | | | | | | | | |
| Brown Brothers Harriman | | | | | | | | |
| 0.030%, 11/01/13 | | | 265,611 | | | | 265,611 | |
| 0.005%, 11/01/13 HKD | | | 1,028,183 | | | | 132,617 | |
| TOTAL TIME DEPOSITS | | | | | | | | |
| (Cost $398,228) | | | | | | | 398,228 | |
| | | | | | | | | |
| TOTAL INVESTMENTS — 109.0% | | | | | | | | |
| (Cost $185,868,183) | | | | | | $ | 185,966,864 | |
Percentages are based on Net Assets of $170,553,888.
* Non-income producing security. ADR — American Depositary Receipt | |
| Cl — Class | |
| HKD — Hong Kong Dollar | |
| (A) | Securities considered illiquid. The total value of such securities as of October 31, 2013 was $857,027 and represented 0.5% of Net Assets. |
| (B) | Security is fair valued using methods determined in good faith by the Fair Value Committee of the Fund. The total value of such securities as of October 31, 2013, was $857,027 and represents 0.5% of Net Assets. |
| (C) | This security or a partial position of this security is on loan at October 31, 2013. The total value of securities on loan at October 31, 2013 was $12,858,803. |
| (D) | This security was purchased with cash collateral held from securities on loan. The total value of such securities as of October 31, 2013 was $15,499,984. |
| (1) | In U.S. Dollars unless otherwise indicated. |
The following is a summary of the inputs used as of October 31, 2013, in valuing the Fund's investments carried at value:
| Investments in Securities | | Level 1 | | | Level 2 | | | Level 3(a) | | | Total | |
| Common Stock | | $ | 169,211,625 | | | $ | — | | | $ | 857,027 | | | $ | 170,068,652 | |
| Repurchase Agreements | | | — | | | | 15,499,984 | | | | — | | | | 15,499,984 | |
| Time Deposits | | | — | | | | 398,228 | | | | — | | | | 398,228 | |
| Total Investments in Securities | | $ | 169,211,625 | | | $ | 15,898,212 | | | $ | 857,027 | | | $ | 185,966,864 | |
(a) A reconciliation of Level 3 investments and disclosures of significant unobservable inputs are presented when the Fund has a significant amount of Level 3 investments at the beginning and/or end of the period in relation to net assets. Management has concluded that Level 3 investments are not material in relation to net assets.
For the year ended October 31, 2013, the transfers in and out of Level 3 were due to changes in the availability of observable inputs to determine fair value. Transfers between levels are recognized at period end.
The accompanying notes are an integral part of the financial statements.
|
| | |
| Schedule of Investments | October 31, 2013 |
| | |
| Global X China Energy ETF |
Sector Weightings (unaudited)†:
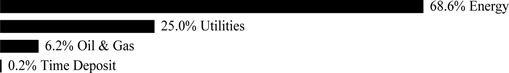
† Percentages based on total investments.
| | | Shares | | | Value | |
| COMMON STOCK — 99.5% |
| | | | | | | | | |
| CHINA— 56.8% | | | | | | | | |
| | | | | | | | | |
| Energy — 44.6% | | | | | | | | |
| Anton Oilfield Services Group | | | 59,728 | | | $ | 37,749 | |
| China Coal Energy, Cl H | | | 224,791 | | | | 138,012 | |
| China Longyuan Power Group, Cl H | | | 173,776 | | | | 199,709 | |
| China Oilfield Services, Cl H | | | 80,856 | | | | 226,309 | |
| China Petroleum & Chemical, Cl H | | | 566,397 | | | | 462,439 | |
| China Shenhua Energy, Cl H | | | 67,940 | | | | 206,808 | |
| Daqo New Energy ADR * | | | 351 | | | | 10,962 | |
| Hanwha SolarOne ADR * | | | 4,552 | | | | 19,756 | |
| JA Solar Holdings ADR * | | | 2,376 | | | | 22,904 | |
| JinkoSolar Holding ADR * | | | 1,445 | | | | 32,541 | |
| LDK Solar ADR * | | | 6,985 | | | | 9,430 | |
| PetroChina, Cl H | | | 388,513 | | | | 444,989 | |
| ReneSola ADR * | | | 4,166 | | | | 18,122 | |
| Tianneng Power International | | | 47,215 | | | | 17,844 | |
| Trina Solar ADR * | | | 2,393 | | | | 35,105 | |
| Yanzhou Coal Mining, Cl H | | | 101,775 | | | | 105,543 | |
| Yingli Green Energy Holding ADR * | | | 5,693 | | | | 34,158 | |
| | | | | | | | 2,022,380 | |
| Oil & Gas — 4.7% | | | | |
| ENN Energy Holdings | | | 36,161 | | | | 214,317 | |
| Utilities — 7.5% | | | | |
| Datang International Power Generation, Cl H | | | 152,512 | | | | 69,833 | |
| Huadian Power International, Cl H | | | 77,061 | | | | 35,782 | |
| Huaneng Power International, Cl H | | | 175,121 | | | | 182,959 | |
| Huaneng Renewables, Cl H | | | 126,500 | | | | 48,786 | |
| | | | | | | | 337,360 | |
| TOTAL CHINA | | | | | | | 2,574,057 | |
The accompanying notes are an integral part of the financial statements.
|
| | |
| Schedule of Investments | October 31, 2013 |
| | |
| Global X China Energy ETF |
| | | Shares/Face
Amount | | | Value | |
| COMMON STOCK — continued |
| | | | | | | | | |
| HONG KONG— 42.7% | | | | | | | | |
| | | | | | | | | |
| Energy — 23.9% | | | | | | | | |
| Beijing Enterprises Holdings | | | 27,773 | | | $ | 228,009 | |
| China Gas Holdings | | | 87,137 | | | | 97,106 | |
| CNOOC | | | 218,285 | | | | 448,226 | |
| Kunlun Energy | | | 139,705 | | | | 228,487 | |
| Shougang Fushan Resources Group | | | 235,815 | | | | 79,385 | |
| | | | | | | | 1,081,213 | |
| Oil & Gas — 1.3% | | | | |
| China Oil & Gas Group | | | 219,600 | | | | 35,122 | |
| Xinjiang Goldwind Science & Technology * | | | 25,200 | | | | 25,743 | |
| | | | | | | | 60,865 | |
| Utilities — 17.5% | | | | |
| China Power International Development | | | 136,484 | | | | 53,516 | |
| China Resources Gas Group | | | 45,900 | | | | 118,702 | |
| China Resources Power Holdings | | | 85,601 | | | | 224,133 | |
| GCL-Poly Energy Holdings * | | | 598,411 | | | | 183,699 | |
| Hong Kong & China Gas | | | 91,425 | | | | 213,675 | |
| | | | | | | | 793,725 | |
| TOTAL HONG KONG | | | | | | | 1,935,803 | |
| TOTAL COMMON STOCK | | | | | | | | |
| (Cost $4,173,445) | | | | | | | 4,509,860 | |
| | | | | | | | | |
| TIME DEPOSIT — 0.2% |
| Brown Brothers Harriman, 0.030%, 11/01/13 | | | | | | | | |
| (Cost $10,675) | | $ | 10,675 | | | | 10,675 | |
| | | | | | | | | |
| TOTAL INVESTMENTS — 99.7% | | | | | | | | |
| (Cost $4,184,120) | | | | | | $ | 4,520,535 | |
Percentages are based on Net Assets of $4,534,350.
* Non-income producing security.
ADR — American Depositary Receipt
Cl — Class
The following is a summary of the inputs used as of October 31, 2013, in valuing the Fund's investments carried at value:
| Investments in Securities | | | Level 1 | | | | Level 2 | | | | Level 3 | | | | Total | |
| Common Stock | | $ | 4,509,860 | | | $ | — | | | $ | — | | | $ | 4,509,860 | |
| Time Deposit | | | — | | | | 10,675 | | | | — | | | | 10,675 | |
| Total Investments in Securities | | $ | 4,509,860 | | | $ | 10,675 | | | $ | — | | | $ | 4,520,535 | |
For the year ended October 31, 2013, there have been no transfers between Level 1, Level 2 or Level 3 investments.
As of October 31, 2013, there were no Level 3 investments.
The accompanying notes are an integral part of the financial statements.
|
| | |
| Schedule of Investments | October 31, 2013 |
| | |
| Global X China Financials ETF |
Sector Weightings (unaudited)†:
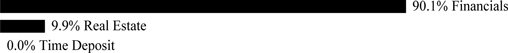
† Percentages based on total investments.
| | | Shares | | | Value | |
| COMMON STOCK — 100.0% |
| | | | | | | | | |
| CHINA— 80.0% | | | | | | | | |
| | | | | | | | | |
| Financials — 71.3% | | | | | | | | |
| Agricultural Bank of China, Cl H | | | 4,297,488 | | | $ | 2,067,539 | |
| Bank of China, Cl H | | | 9,148,134 | | | | 4,283,210 | |
| Bank of Communications, Cl H | | | 2,741,671 | | | | 2,005,066 | |
| China Citic Bank, Cl H | | | 1,741,752 | | | | 977,250 | |
| China Construction Bank, Cl H | | | 5,473,626 | | | | 4,250,126 | |
| China Life Insurance, Cl H | | | 764,740 | | | | 2,031,942 | |
| China Merchants Bank, Cl H | | | 1,016,834 | | | | 2,019,766 | |
| China Minsheng Banking, Cl H | | | 1,104,113 | | | | 1,266,034 | |
| China Pacific Insurance Group, Cl H | | | 450,712 | | | | 1,627,749 | |
| Chongqing Rural Commercial Bank, Cl H | | | 556,867 | | | | 280,840 | |
| CITIC Securities, Cl H | | | 221,896 | | | | 464,800 | |
| E-House China Holdings ADR | | | 22,191 | | | | 205,710 | |
| Industrial & Commercial Bank of China, Cl H | | | 6,037,137 | | | | 4,228,254 | |
| PICC Property & Casualty, Cl H | | | 935,042 | | | | 1,432,774 | |
| Ping An Insurance Group of China, Cl H | | | 268,007 | | | | 2,110,386 | |
| Sino-Ocean Land Holdings | | | 1,147,321 | | | | 728,082 | |
| SOHO China | | | 337,059 | | | | 295,193 | |
| | | | | | | | 30,274,721 | |
| Real Estate — 8.7% | | | | |
| Agile Property Holdings | | | 272,012 | | | | 328,042 | |
| Country Garden Holdings | | | 950,093 | | | | 649,490 | |
| Evergrande Real Estate Group * | | | 1,301,661 | | | | 549,004 | |
| Greentown China Holdings | | | 131,593 | | | | 255,616 | |
| Guangzhou R&F Properties | | | 216,593 | | | | 379,939 | |
| Longfor Properties | | | 263,638 | | | | 429,819 | |
| Renhe Commercial Holdings | | | 1,382,468 | | | | 77,567 | |
| Shimao Property Holdings | | | 272,404 | | | | 685,841 | |
| Shui On Land | | | 1,041,101 | | | | 362,566 | |
| | | | | | | | 3,717,884 | |
| TOTAL CHINA | | | | | | | 33,992,605 | |
| | | | | | | | | |
| HONG KONG— 20.0% | | | | | | | | |
| | | | | | | | | |
| Financials — 18.7% | | | | | | | | |
| Cheung Kong Holdings | | | 126,600 | | | | 1,979,095 | |
| China Everbright | | | 188,841 | | | | 279,620 | |
The accompanying notes are an integral part of the financial statements.
|
| | |
| Schedule of Investments | October 31, 2013 |
| | |
| Global X China Financials ETF |
| | | Shares/Face
Amount | | | Value | |
| COMMON STOCK — continued | | | | | | |
| | | | | | | |
| Financials — continued | | | | | | |
| China Overseas Land & Investment | | | 641,966 | | | $ | 1,987,254 | |
| China Resources Land | | | 411,808 | | | | 1,192,453 | |
| Franshion Properties China | | | 657,258 | | | | 228,044 | |
| Haitong Securities, Cl H | | | 282,000 | | | | 427,747 | |
| Hopson Development Holdings * | | | 131,461 | | | | 161,592 | |
| KWG Property Holding | | | 252,847 | | | | 163,716 | |
| New China Life Insurance, Cl H * | | | 147,011 | | | | 414,316 | |
| People's Insurance Group of China, Cl H | | | 899,600 | | | | 424,679 | |
| Shenzhen Investment | | | 465,627 | | | | 186,179 | |
| Sunac China Holdings | | | 316,900 | | | | 219,905 | |
| Yuexiu Property | | | 1,036,545 | | | | 288,783 | |
| | | | | | | | 7,953,383 | |
| Real Estate — 1.3% | | | | |
| China Taiping Insurance Holdings * | | | 175,230 | | | | 273,479 | |
| Poly Property Group | | | 445,507 | | | | 272,947 | |
| | | | | | | | 546,426 | |
| TOTAL HONG KONG | | | | | | | 8,499,809 | |
| TOTAL COMMON STOCK | | | | | | | | |
| (Cost $41,347,762) | | | | | | | 42,492,414 | |
| | | | | | | | | |
| TIME DEPOSIT — 0.0% |
| |
| Brown Brothers Harriman, 0.030%, 11/01/13 | | | | | | | | |
| (Cost $17,047) | | $ | 17,047 | | | | 17,047 | |
| | | | | | | | | |
| TOTAL INVESTMENTS — 100.0% | | | | | | | | |
| (Cost $41,364,809) | | | | | | $ | 42,509,461 | |
Percentages are based on Net Assets of $42,517,946.
| * Non-income producing security. |
| ADR — American Depositary Receipt |
| Cl — Class |
| The following is a summary of the inputs used as of October 31, 2013, in valuing the Fund's investments carried at value: |
| |
| Investments in Securities | | | Level 1 | | | | Level 2 | | | | Level 3 | | | | Total | |
| Common Stock | | $ | 42,492,414 | | | $ | — | | | $ | — | | | $ | 42,492,414 | |
| Time Deposit | | | — | | | | 17,047 | | | | — | | | | 17,047 | |
| Total Investments in Securities | | $ | 42,492,414 | | | $ | 17,047 | | | $ | — | | | $ | 42,509,461 | |
For the year ended October 31, 2013, there have been no transfers between Level 1, Level 2 or Level 3 investments.
As of October 31, 2013, there were no Level 3 investments.
The accompanying notes are an integral part of the financial statements.
|
| | |
| Schedule of Investments | October 31, 2013 |
| | |
| Global X China Industrials ETF |
Sector Weightings (unaudited)†:

† Percentages based on total investments.
| | | Shares | | | Value | |
| COMMON STOCK — 99.8% |
| | | | | | | | | |
| CHINA— 77.4% | | | | | | | | |
| | | | | | | | | |
| Industrials — 77.4% | | | | | | | | |
| Anhui Conch Cement, Cl H | | | 56,637 | | | $ | 197,605 | |
| BYD, Cl H * | | | 40,044 | | | | 198,335 | |
| China Communications Construction, Cl H | | | 240,783 | | | | 196,589 | |
| China COSCO Holdings, Cl H | | | 251,462 | | | | 119,357 | |
| China Lesso Group Holdings | | | 91,345 | | | | 58,438 | |
| China National Building Material, Cl H | | | 198,017 | | | | 193,598 | |
| China National Materials | | | 119,246 | | | | 25,993 | |
| China Railway Construction, Cl H | | | 183,911 | | | | 201,631 | |
| China Railway Group, Cl H | | | 360,868 | | | | 203,870 | |
| China Rongsheng Heavy Industry Group * | | | 345,718 | | | | 41,470 | |
| China Shanshui Cement Group | | | 190,052 | | | | 67,657 | |
| China Shipping Container Lines, Cl H * | | | 365,452 | | | | 90,503 | |
| China Shipping Development, Cl H * | | | 116,044 | | | | 65,708 | |
| China South Locomotive and Rolling Stock | | | 187,313 | | | | 156,074 | |
| China Zhongwang Holdings * | | | 159,508 | | | | 51,846 | |
| Dongfang Electric, Cl H | | | 38,643 | | | | 62,204 | |
| First Tractor, Cl H | | | 45,541 | | | | 32,542 | |
| Guangshen Railway, Cl H | | | 139,488 | | | | 74,305 | |
| Haitian International Holdings | | | 62,096 | | | | 149,614 | |
| Harbin Power Equipment, Cl H | | | 75,271 | | | | 47,281 | |
| Hollysys Automation Technologies * | | | 3,600 | | | | 60,372 | |
| Jiangsu Expressway, Cl H | | | 119,079 | | | | 149,905 | |
| Metallurgical Corp of China, Cl H * | | | 327,141 | | | | 67,091 | |
| Sany Heavy Equipment International Holdings | | | 90,894 | | | | 26,261 | |
| Shanghai Electric Group, Cl H | | | 272,051 | | | | 96,146 | |
| Weichai Power, Cl H | | | 47,359 | | | | 189,668 | |
| Yangzijiang Shipbuilding Holdings | | | 186,443 | | | | 177,107 | |
| Zhejiang Expressway | | | 139,700 | | | | 128,654 | |
| Zhuzhou CSR Times Electric, Cl H | | | 44,393 | | | | 159,180 | |
| TOTAL CHINA | | | | | | | 3,289,004 | |
| | | | | | | | | |
| HONG KONG— 22.4% | | | | | | | | |
| | | | | | | | | |
| Industrials — 22.4% | | | | | | | | |
| AviChina Industry & Technology, Cl H | | | 192,300 | | | | 91,276 | |
| Beijing Capital International Airport, Cl H | | | 142,771 | | | | 100,730 | |
The accompanying notes are an integral part of the financial statements.
|
| | |
| Schedule of Investments | October 31, 2013 |
| | |
| Global X China Industrials ETF |
| | | Shares/Face
Amount(1) | | | Value | |
| COMMON STOCK — continued | | | | | | | | |
| | | | | | | | | |
| Industrials — continued | | | | | | | | |
| Chaowei Power Holdings | | | 50,300 | | | $ | 21,475 | |
| China High Speed Transmission Equipment Group * | | | 90,750 | | | | 48,693 | |
| China International Marine Containers Group, Cl H | | | 42,800 | | | | 80,046 | |
| China Resources Cement Holdings | | | 170,241 | | | | 113,963 | |
| CITIC Resources Holdings * | | | 247,741 | | | | 34,830 | |
| Shanghai Industrial Holdings | | | 60,799 | | | | 201,147 | |
| Shenzhen International Holdings | | | 759,325 | | | | 93,042 | |
| Sunny Optical Technology Group | | | 55,864 | | | | 54,113 | |
| Zoomlion Heavy Industry Science and Technology | | | 122,700 | | | | 113,157 | |
| TOTAL HONG KONG | | | | | | | 952,472 | |
| | | | | | | | | |
| TOTAL COMMON STOCK | | | | | | | | |
| (Cost $5,317,217) | | | | | | | 4,241,476 | |
| | | | | | | | | |
| TIME DEPOSITS — 0.1% |
| |
| Brown Brothers Harriman | | | | | | | | |
| 0.030%, 11/01/13 | | | 3,076 | | | | 3,076 | |
| 0.005%, 11/01/13 HKD | | | 8,824 | | | | 1,138 | |
| TOTAL TIME DEPOSITS | | | | | | | | |
| (Cost $4,214) | | | | | | | 4,214 | |
| TOTAL INVESTMENTS — 99.9% | | | | | | | | |
| (Cost $5,321,431) | | | | | | $ | 4,245,690 | |
Percentages are based on Net Assets of $4,248,245.
* Non-income producing security.
Cl — Class
HKD — Hong Kong Dollar
(1) In U.S. Dollars unless otherwise indicated.
The following is a summary of the inputs used as of October 31, 2013, in valuing the Fund's investments carried at value:
| Investments in Securities | | Level 1 | | | Level 2 | | | Level 3 | | | Total | |
| Common Stock | | $ | 4,241,476 | | | $ | — | | | $ | — | | | $ | 4,241,476 | |
| Time Deposits | | | — | | | | 4,214 | | | | — | | | | 4,214 | |
| Total Investments in Securities | | $ | 4,241,476 | | | $ | 4,214 | | | $ | — | | | $ | 4,245,690 | |
For the year ended October 31, 2013, there have been no transfers between Level 1, Level 2 or Level 3 investments.
As of October 31, 2013, there were no Level 3 investments.
The accompanying notes are an integral part of the financial statements.
|
| | |
| Schedule of Investments | October 31, 2013 |
| | |
| Global X China Materials ETF |
Sector Weightings (unaudited)†:

† Percentages based on total investments.
| | | Shares | | | Value | |
| COMMON STOCK — 99.8% | | | | | | | | |
| CHINA— 63.8% | | | | | | | | |
| Basic Materials — 63.8% | | | | | | | | |
| Aluminum Corp of China, Cl H * | | | 294,499 | | | $ | 110,157 | |
| Angang Steel, Cl H * | | | 142,984 | | | | 86,679 | |
| BBMG, Cl H | | | 146,200 | | | | 104,846 | |
| China BlueChemical | | | 170,529 | | | | 109,536 | |
| China Hongqiao Group | | | 122,582 | | | | 77,473 | |
| China Molybdenum, Cl H | | | 165,088 | | | | 66,861 | |
| China Rare Earth Holdings * | | | 153,738 | | | | 23,597 | |
| Dongyue Group | | | 149,557 | | | | 70,602 | |
| Fosun International * | | | 120,700 | | | | 115,983 | |
| Hidili Industry International Development * | | | 127,116 | | | | 21,151 | |
| Hunan Non-Ferrous Metal, Cl H * | | | 203,987 | | | | 56,568 | |
| Jiangxi Copper, Cl H | | | 55,341 | | | | 106,356 | |
| Maanshan Iron & Steel, Cl H * | | | 240,025 | | | | 61,299 | |
| Real Gold Mining (A)(B)* | | | 97,864 | | | | 11,184 | |
| Sinofert Holdings | | | 244,130 | | | | 39,676 | |
| Sinopec Shanghai Petrochemical, Cl H | | | 416,410 | | | | 110,105 | |
| Sinopec Yizheng Chemical Fibre, Cl H | | | 193,743 | | | | 53,727 | |
| Yongye International * | | | 4,287 | | | | 27,008 | |
| Zhaojin Mining Industry | | | 109,244 | | | | 88,489 | |
| Zijin Mining Group, Cl H | | | 461,649 | | | | 106,585 | |
| TOTAL CHINA | | | | | | | 1,447,882 | |
| | | | | | | | | |
| HONG KONG— 33.6% | | | | | | | | |
| Basic Materials — 33.6% | | | | | | | | |
| China Lumena New Materials | | | 477,750 | | | | 101,675 | |
| China Precious Metal Resources Holdings * | | | 469,200 | | | | 75,648 | |
| Citic Pacific | | | 75,700 | | | | 107,794 | |
| Fufeng Group | | | 123,844 | | | | 52,554 | |
| Kingboard Chemical Holdings | | | 42,400 | | | | 111,565 | |
| Kingboard Laminates Holdings | | | 149,828 | | | | 61,647 | |
| North Mining Shares, Cl C * | | | 1,176,456 | | | | 52,351 | |
| Shougang Concord International Enterprises | | | 853,924 | | | | 42,404 | |
The accompanying notes are an integral part of the financial statements.
|
| | |
| Schedule of Investments | October 31, 2013 |
| | |
| Global X China Materials ETF |
| | | Shares/Face Amount(1) | | | Value | |
| COMMON STOCK — continued | | | | | | | | |
| Basic Materials — continued | | | | | | | | |
| West China Cement | | | 354,300 | | | $ | 53,010 | |
| Yingde Gases | | | 101,049 | | | | 103,747 | |
| TOTAL HONG KONG | | | | | | | 762,395 | |
| SINGAPORE— 2.4% | | | | | | | | |
| Basic Materials — 2.4% | | | | | | | | |
| Midas Holdings | | | 133,266 | | | | 53,641 | |
| TOTAL COMMON STOCK | | | | | | | | |
| (Cost $2,810,143) | | | | | | | 2,263,918 | |
| | | | | | | | | |
| TIME DEPOSITS — 0.2% | | | | | | | | |
| Brown Brothers Harriman | | | | | | | | |
| 0.030%, 11/01/13 | | | 4,779 | | | | 4,779 | |
| 0.005%, 11/01/13 HKD | | | 1 | | | | — | |
| TOTAL TIME DEPOSITS | | | | | | | | |
| (Cost $4,779) | | | | | | | 4,779 | |
| TOTAL INVESTMENTS — 100.0% | | | | | | | | |
| (Cost $2,814,922) | | | | | | $ | 2,268,697 | |
Percentages are based on Net Assets of $2,268,980.
| * | Non-income producing security. |
Cl — Class
HKD — Hong Kong Dollar
| (A) | Securities considered illiquid. The total value of such securities as of October 31, 2013 was $11,184 and represented 0.5% of Net Assets. |
| (B) | Security is fair valued using methods determined in good faith by the Fair Value Committee of the Fund. The total value of such securities as of October 31, 2013, was $11,184 and represents 0.5% of Net Assets. |
| (1) | In U.S. Dollars unless otherwise indicated. |
The following is a summary of the inputs used as of October 31, 2013, in valuing the Fund's investments carried at value:
| Investments in Securities | | Level 1 | | | Level 2 | | | Level 3 (a) | | | Total | |
| Common Stock | | $ | 2,252,734 | | | $ | — | | | $ | 11,184 | | | $ | 2,263,918 | |
| Time Deposits | | | — | | | | 4,779 | | | | — | | | | 4,779 | |
| Total Investments in Securities | | $ | 2,252,734 | | | $ | 4,779 | | | $ | 11,184 | | | $ | 2,268,697 | |
(a) A reconciliation of Level 3 investments and disclosures of significant unobservable inputs are presented when the Fund has a significant amount of Level 3 investments at the beginning and/or end of the period in relation to net assets. Management has concluded that Level 3 investments are not material in relation to net assets.
For the year ended October 31, 2013, there have been no transfers between Level 1, Level 2 and Level 3 investments.
Amounts designated as “—“ are either $0 or have been rounded to $0.
The accompanying notes are an integral part of the financial statements.
|
| | |
| Schedule of Investments | October 31, 2013 |
| | |
| Global X NASDAQ China Technology ETF |
Sector Weightings (unaudited)†:

† Percentages based on total investments.
| | | Shares | | | Value | |
| COMMON STOCK — 100.1% | | | | | | | | |
| | | | | | | | | |
| CHINA— 82.6% | | | | | | | | |
| Technology — 82.6% | | | | | | | | |
| 21Vianet Group ADR * | | | 20,225 | | | $ | 364,050 | |
| AsiaInfo Holdings * | | | 25,641 | | | | 297,436 | |
| AutoNavi Holdings ADR * | | | 5,432 | | | | 83,979 | |
| Baidu ADR * | | | 5,633 | | | | 906,350 | |
| BYD Electronic International * | | | 396,404 | | | | 185,599 | |
| China Communications Services, Cl H | | | 444,721 | | | | 272,465 | |
| China Wireless Technologies | | | 794,202 | | | | 297,070 | |
| FIH Mobile * | | | 587,259 | | | | 331,010 | |
| Kingdee International Software Group * | | | 887,137 | | | | 286,062 | |
| Lenovo Group | | | 789,180 | | | | 844,859 | |
| NetEase ADR * | | | 5,395 | | | | 364,216 | |
| Pactera Technology International ADR * | | | 10,378 | | | | 73,269 | |
| Qihoo 360 Technology ADR * | | | 9,796 | | | | 809,541 | |
| Semiconductor Manufacturing International * | | | 5,381,317 | | | | 402,575 | |
| SINA * | | | 9,860 | | | | 823,902 | |
| Sohu.com * | | | 6,130 | | | | 410,465 | |
| Tencent Holdings | | | 16,281 | | | | 888,704 | |
| Travelsky Technology, Cl H | | | 164,035 | | | | 140,275 | |
| YY ADR * | | | 6,366 | | | | 313,016 | |
| ZTE, Cl H * | | | 197,437 | | | | 430,373 | |
| TOTAL CHINA | | | | | | | 8,525,216 | |
| | | | | | | | | |
| HONG KONG— 17.5% | | | | | | | | |
| Technology — 17.5% | | | | | | | | |
| ASM Pacific Technology | | | 37,020 | | | | 356,926 | |
| Comba Telecom Systems Holdings * | | | 230,052 | | | | 75,962 | |
| Digital China Holdings | | | 346,624 | | | | 455,131 | |
| Ju Teng International Holdings | | | 433,544 | | | | 315,386 | |
| TPV Technology | | | 412,595 | | | | 87,277 | |
| VODone * | | | 1,652,031 | | | | 142,765 | |
| VTech Holdings | | | 25,951 | | | | 372,546 | |
| TOTAL HONG KONG | | | | | | | 1,805,993 | |
| TOTAL COMMON STOCK | | | | | | | | |
| (Cost $8,972,992) | | | | | | | 10,331,209 | |
| TOTAL INVESTMENTS — 100.1% | | | | | | | | |
| (Cost $8,972,992) | | | | | | $ | 10,331,209 | |
The accompanying notes are an integral part of the financial statements.
|
| | |
| Schedule of Investments | October 31, 2013 |
| | |
| Global X NASDAQ China Technology ETF |
Percentages are based on Net Assets of $10,317,454.
* Non-income producing security.
ADR — American Depositary Receipt
Cl — Class
As of October 31, 2013, all of the Fund’s investments in securities were considered Level 1, in accordance with the authoritative guidance on fair value measurements and disclosure under U.S. GAAP.
For the year ended October 31, 2013, there have been no transfers between Level 1, Level 2 or Level 3 investments.
As of October 31, 2013, there were no Level 3 investments.
The accompanying notes are an integral part of the financial statements.
|
| | |
| Schedule of Investments | October 31, 2013 |
| | |
| Global X FTSE ASEAN 40 ETF |
Sector Weightings (unaudited)†:
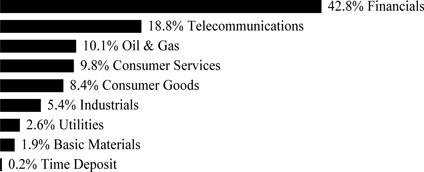
† Percentages based on total investments.
| | | Shares | | | Value | |
| COMMON STOCK — 99.8% | | | | | | | | |
| | | | | | | | | |
| INDONESIA— 16.7% | | | | | | | | |
| Consumer Goods — 4.8% | | | | | | | | |
| Astra International | | | 2,870,731 | | | $ | 1,693,534 | |
| Gudang Garam | | | 81,260 | | | | 266,001 | |
| Unilever Indonesia | | | 161,096 | | | | 428,732 | |
| | | | | | | | 2,388,267 | |
| Financials — 7.5% | | | | | | | | |
| Bank Central Asia | | | 1,751,256 | | | | 1,623,475 | |
| Bank Mandiri | | | 1,332,660 | | | | 1,016,711 | |
| Bank Rakyat Indonesia Persero | | | 1,535,160 | | | | 1,075,872 | |
| | | | | | | | 3,716,058 | |
| Telecommunications — 3.0% | | | | |
| Telekomunikasi Indonesia ADR | | | 37,270 | | | | 1,519,125 | |
| Utilities — 1.4% | | | | |
| Perusahaan Gas Negara | | | 1,521,939 | | | | 688,569 | |
| TOTAL INDONESIA | | | | | | | 8,312,019 | |
| MALAYSIA— 25.5% | | | | | | | | |
| Basic Materials — 1.9% | | | | | | | | |
| Petronas Chemicals Group | | | 411,024 | | | | 926,108 | |
| Consumer Goods — 1.9% | | | | | | | | |
| IOI | | | 530,793 | | | | 915,059 | |
| Consumer Services — 2.1% | | | | | | | | |
| Genting | | | 315,715 | | | | 1,048,531 | |
| Financials — 9.1% | | | | |
| CIMB Group Holdings | | | 717,397 | | | | 1,698,264 | |
| Malayan Banking | | | 632,264 | | | | 1,955,569 | |
| Public Bank | | | 151,929 | | | | 881,083 | |
| | | | | | | | 4,534,916 | |
The accompanying notes are an integral part of the financial statements.
|
| | |
| Schedule of Investments | October 31, 2013 |
| | |
| Global X FTSE ASEAN 40 ETF |
| | | Shares | | | Value | |
| COMMON STOCK — continued | | | | | | | | |
| | | | | | | | | |
| Industrials — 2.7% | | | | | | | | |
| Sime Darby | | | 445,247 | | | $ | 1,344,680 | |
| Oil & Gas — 1.8% | | | | | | | | |
| Petronas Gas | | | 114,739 | | | | 891,572 | |
| Telecommunications — 4.8% | | | | | | | | |
| Axiata Group | | | 711,528 | | | | 1,549,080 | |
| Maxis | | | 374,506 | | | | 853,321 | |
| | | | | | | | 2,402,401 | |
| Utilities — 1.2% | | | | | | | | |
| Tenaga Nasional | | | 199,455 | | | | 596,048 | |
| TOTAL MALAYSIA | | | | | | | 12,659,315 | |
| PHILIPPINES— 3.6% | | | | | | | | |
| Consumer Services — 1.9% | | | | | | | | |
| SM Investments | | | 46,147 | | | | 914,183 | |
| Telecommunications — 1.7% | | | | | | | | |
| Philippine Long Distance Telephone ADR | | | 12,815 | | | | 847,712 | |
| TOTAL PHILIPPINES | | | | | | | 1,761,895 | |
| SINGAPORE— 38.4% | | | | | | | | |
| Consumer Goods — 1.7% | | | | | | | | |
| Wilmar International | | | 300,221 | | | | 836,230 | |
| Consumer Services — 4.2% | | | | | | | | |
| Genting Singapore | | | 867,345 | | | | 1,064,805 | |
| Jardine Cycle & Carriage | | | 13,937 | | | | 411,199 | |
| Singapore Airlines | | | 73,173 | | | | 614,389 | |
| | | | | | | | 2,090,393 | |
| Financials — 20.9% | | | | |
| CapitaLand | | | 361,188 | | | | 907,186 | |
| DBS Group Holdings | | | 250,394 | | | | 3,374,332 | |
| Oversea-Chinese Banking | | | 388,708 | | | | 3,254,358 | |
| United Overseas Bank | | | 168,862 | | | | 2,832,945 | |
| | | | | | | | 10,368,821 | |
| Industrials — 1.5% | | | | | | | | |
| Singapore Technologies Engineering | | | 221,545 | | | | 752,632 | |
| Oil & Gas — 3.6% | | | | | | | | |
| Keppel | | | 206,007 | | | | 1,799,369 | |
| Real Estate Investment Trust — 0.0% | | | | |
| K-REIT Asia | | | 16,280 | | | | 15,858 | |
| Telecommunications — 6.5% | | | | | | | | |
| Singapore Telecommunications | | | 1,055,634 | | | | 3,212,282 | |
| TOTAL SINGAPORE | | | | | | | 19,075,585 | |
The accompanying notes are an integral part of the financial statements.
|
| | |
| Schedule of Investments | October 31, 2013 |
| | |
| Global X FTSE ASEAN 40 ETF |
| | | Shares/Face
Amount | | | Value | |
| COMMON STOCK — continued | | | | | | | | |
| | | | | | | | | |
| THAILAND— 15.6% | | | | | | | | |
| Consumer Services — 1.6% | | | | | | | | |
| CP ALL | | | 628,263 | | | $ | 792,267 | |
| Financials — 5.3% | | | | | | | | |
| Bangkok Bank | | | 66,751 | | | | 441,790 | |
| Kasikornbank | | | 166,318 | | | | 1,015,275 | |
| Siam Commercial Bank | | | 222,371 | | | | 1,175,262 | |
| | | | | | | | 2,632,327 | |
| Industrials — 1.2% | | | | | | | | |
| Siam Cement | | | 43,566 | | | | 599,076 | |
| Oil & Gas — 4.7% | | | | | | | | |
| PTT | | | 121,814 | | | | 1,240,644 | |
| PTT Exploration & Production | | | 198,480 | | | | 1,074,502 | |
| | | | | | | | 2,315,146 | |
| Telecommunications — 2.8% | | | | | | | | |
| Advanced Info Service | | | 169,971 | | | | 1,392,533 | |
| TOTAL THAILAND | | | | | | | 7,731,349 | |
| TOTAL COMMON STOCK | | | | | | | | |
| (Cost $50,638,057) | | | | | | | 49,540,163 | |
| | | | | | | | | |
| TIME DEPOSIT — 0.2% | | | | | | | | |
| Brown Brothers Harriman, 0.030%, 11/01/13 | | | | | | | | |
| (Cost $104,085) | | $ | 104,085 | | | | 104,085 | |
| TOTAL INVESTMENTS — 100.0% | | | | | | | | |
| (Cost $50,742,142) | | | | | | $ | 49,644,248 | |
Percentages are based on Net Assets of $49,634,319.
ADR — American Depositary Receipt
The following is a summary of the inputs used as of October 31, 2013, in valuing the Fund's investments carried at value:
| Investments in Securities | | Level 1 | | | Level 2 | | | Level 3 | | | Total | |
| Common Stock | | $ | 49,540,163 | | | $ | — | | | $ | — | | | $ | 49,540,163 | |
| Time Deposit | | | — | | | | 104,085 | | | | — | | | | 104,085 | |
| Total Investments in Securities | | $ | 49,540,163 | | | $ | 104,085 | | | $ | — | | | $ | 49,644,248 | |
For the year ended October 31, 2013, there have been no transfers between Level 1, Level 2 or Level 3 investments.
As of October 31, 2013, there were no Level 3 investments.
The accompanying notes are an integral part of the financial statements.
|
| | |
| Schedule of Investments | October 31, 2013 |
| | |
| Global X FTSE Andean 40 ETF |
Sector Weightings (unaudited)†:
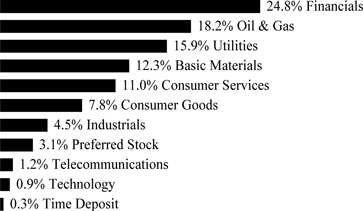
† Percentages based on total investments.
| | | Shares | | | Value | |
| COMMON STOCK — 96.6% | | | | | | | | |
| | | | | | | | | |
| CHILE— 48.9% | | | | | | | | |
| Basic Materials — 6.2% | | | | | | | | |
| CAP | | | 5,561 | | | $ | 115,791 | |
| Empresas CMPC | | | 112,465 | | | | 333,498 | |
| Sociedad Quimica y Minera de Chile ADR | | | 6,985 | | | | 192,856 | |
| | | | | | | | 642,145 | |
| Consumer Goods — 2.5% | | | | | | | | |
| Cia Cervecerias Unidas ADR | | | 5,725 | | | | 152,800 | |
| Embotelladora Andina ADR, Cl B | | | 3,099 | | | | 105,986 | |
| | | | | | | | 258,786 | |
| Consumer Services — 11.0% | | | | | | | | |
| Cencosud | | | 86,387 | | | | 352,344 | |
| Latam Airlines Group ADR | | | 22,222 | | | | 367,774 | |
| Ripley | | | 68,882 | | | | 60,512 | |
| SACI Falabella | | | 36,974 | | | | 367,957 | |
| | | | | | | | 1,148,587 | |
| Financials — 10.6% | | | | | | | | |
| Banco de Chile ADR | | | 4,700 | | | | 431,601 | |
| Banco de Credito e Inversiones | | | 3,161 | | | | 185,920 | |
| Banco Santander Chile ADR | | | 11,510 | | | | 282,686 | |
| Corpbanca ADR | | | 8,043 | | | | 138,340 | |
| Parque Arauco | | | 30,500 | | | | 58,926 | |
| | | | | | | | 1,097,473 | |
| Oil & Gas — 4.1% | | | | | | | | |
| Empresas COPEC | | | 29,025 | | | | 424,884 | |
The accompanying notes are an integral part of the financial statements.
|
| | |
| Schedule of Investments | October 31, 2013 |
| | |
| Global X FTSE Andean 40 ETF |
| | | Shares | | | Value | |
| COMMON STOCK — continued | | | | | | | | |
| Technology — 0.9% | | | | | | | | |
| Sonda | | | 34,810 | | | $ | 90,306 | |
| Telecommunications — 1.2% | | | | | | | | |
| ENTEL Chile | | | 8,095 | | | | 124,616 | |
| Utilities — 12.4% | | | | | | | | |
| AES Gener | | | 181,000 | | | | 108,731 | |
| Aguas Andinas, Cl A | | | 216,171 | | | | 145,840 | |
| Colbun | | | 525,924 | | | | 130,626 | |
| E.CL | | | 39,454 | | | | 61,538 | |
| Empresa Nacional de Electricidad ADR | | | 8,573 | | | | 386,642 | |
| Enersis ADR | | | 28,016 | | | | 462,264 | |
| | | | | | | | 1,295,641 | |
| TOTAL CHILE | | | | | | | 5,082,438 | |
| | | | | | | | | |
| COLOMBIA— 36.5% | | | | | | | | |
| Consumer Goods — 5.3% | | | | | | | | |
| Almacenes Exito | | | 18,279 | | | | 306,204 | |
| Grupo Nutresa | | | 16,890 | | | | 240,986 | |
| | | | | | | | 547,190 | |
| Financials — 9.1% | | | | | | | | |
| BanColombia ADR | | | 6,991 | | | | 392,405 | |
| Financiera Colombiana | | | 7,773 | | | | 161,757 | |
| Financiera Colombiana (Pro Rata) * | | | 252 | | | | 5,090 | |
| Grupo de Inversiones Suramericana | | | 19,057 | | | | 377,645 | |
| | | | | | | | 936,897 | |
| Industrials — 4.5% | | | | | | | | |
| Cementos Argos | | | 31,960 | | | | 168,721 | |
| Grupo Argos | | | 26,176 | | | | 303,486 | |
| | | | | | | | 472,207 | |
| Oil & Gas — 14.1% | | | | | | | | |
| Ecopetrol ADR | | | 20,069 | | | | 950,468 | |
| Pacific Rubiales Energy ^ | | | 24,854 | | | | 514,171 | |
| | | | | | | | 1,464,639 | |
| Utilities — 3.5% | | | | | | | | |
| Empresa de Energia de Bogota | | | 149,878 | | | | 125,931 | |
| Interconexion Electrica | | | 27,180 | | | | 134,439 | |
| Isagen | | | 66,800 | | | | 106,606 | |
| | | | | | | | 366,976 | |
| TOTAL COLOMBIA | | | | | | | 3,787,909 | |
| | | | | | | | | |
| PERU— 11.2% | | | | | | | | |
| Basic Materials — 6.1% | | | | | | | | |
| Cia de Minas Buenaventura ADR | | | 16,801 | | | | 243,615 | |
The accompanying notes are an integral part of the financial statements.
|
| | |
| Schedule of Investments | October 31, 2013 |
| | |
Global X FTSE Andean 40 ETF |
| | | Shares/Face
Amount | | | Value | |
| COMMON STOCK — continued | | | | | | | | |
| Southern Copper | | | 13,837 | | | $ | 386,744 | |
| | | | | | | | 630,359 | |
| Financials — 5.1% | | | | | | | | |
| Credicorp | | | 1,056 | | | | 145,516 | |
| Credicorp † | | | 2,833 | | | | 386,988 | |
| | | | | | | | 532,504 | |
| TOTAL PERU | | | | | | | 1,162,863 | |
| TOTAL COMMON STOCK | | | | | | | | |
| (Cost $11,393,915) | | | | | | | 10,033,210 | |
| | | | | | | | | |
| PREFERRED STOCK — 3.1% | | | | | | | | |
| | | | | | | | | |
| COLOMBIA— 3.1% | | | | | | | | |
| Financials — 2.0% | | | | | | | | |
| Banco Davivienda | | | 8,545 | | | | 112,076 | |
| Grupo Aval Acciones y Valores | | | 143,171 | | | | 99,490 | |
| | | | | | | | 211,566 | |
| Industrials — 1.1% | | | | | | | | |
| Grupo Argos | | | 9,610 | | | | 111,520 | |
| TOTAL PREFERRED STOCK | | | | | | | | |
| (Cost $293,833) | | | | | | | 323,086 | |
| | | | | | | | | |
| TIME DEPOSIT — 0.3% | | | | | | | | |
| Brown Brothers Harriman, 0.030%, 11/01/13 | | | | | | | | |
| (Cost $29,363) | | $ | 29,363 | | | | 29,363 | |
| TOTAL INVESTMENTS — 100.0% | | | | | | | | |
| (Cost $11,717,111) | | | | | | $ | 10,385,659 | |
Percentages are based on Net Assets of $10,382,290.
* Non-income producing security.
^ Security traded on the Toronto Stock Exchange
† Security traded on the New York Stock Exchange
ADR — American Depositary Receipt
Cl — Class
The following is a summary of the inputs used as of October 31, 2013, in valuing the Fund's investments carried at value:
| Investments in Securities | | Level 1 | | | Level 2 | | | Level 3 | | | Total | |
| Common Stock | | $ | 10,033,210 | | | $ | — | | | $ | — | | | $ | 10,033,210 | |
| Preferred Stock | | | 323,086 | | | | — | | | | — | | | | 323,086 | |
| Time Deposit | | | — | | | | 29,363 | | | | — | | | | 29,363 | |
| Total Investments in Securities | | $ | 10,356,296 | | | $ | 29,363 | | | $ | — | | | $ | 10,385,659 | |
For the year ended October 31, 2013, there have been no transfers between Level 1, Level 2 and Level 3 investments.
As of October 31, 2013, there were no Level 3 investments.
The accompanying notes are an integral part of the financial statements.
|
| | |
| Schedule of Investments | October 31, 2013 |
| | |
| Global X FTSE Colombia 20 ETF |
Sector Weightings (unaudited)†:
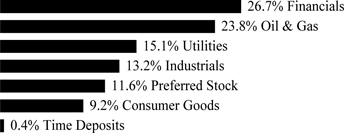
† Percentages based on total investments.
| | | Shares | | | Value | |
| COMMON STOCK — 88.0% | | | | | | | | |
| | | | | | | | | |
| COLOMBIA— 88.0% | | | | | | | | |
| Consumer Goods — 9.2% | | | | | | | | |
| Almacenes Exito | | | 409,035 | | | $ | 6,852,015 | |
| Fabricato * | | | 8,922,000 | | | | 68,364 | |
| Grupo Nutresa | | | 483,145 | | | | 6,893,500 | |
| | | | | | | | 13,813,879 | |
| Financials — 26.7% | | | | | | | | |
| Banco de Bogota | | | 194,240 | | | | 6,879,258 | |
| BanColombia ADR | | | 289,960 | | | | 16,275,455 | |
| Bolsa de Valores de Colombia | | | 63,493,446 | | | | 808,620 | |
| Financiera Colombiana | | | 337,901 | | | | 7,031,755 | |
| Financiera Colombiana (Pro Rata) * | | | 11,037 | | | | 222,916 | |
| Grupo de Inversiones Suramericana | | | 435,839 | | | | 8,636,860 | |
| Interbolsa (A)(B)* | | | 1,320,603 | | | | 6,839 | |
| | | | | | | | 39,861,703 | |
| Industrials — 13.2% | | | | | | | | |
| Cementos Argos | | | 1,427,143 | | | | 7,534,103 | |
| Cemex Latam Holdings * | | | 691,412 | | | | 5,290,589 | |
| Grupo Argos | | | 599,913 | | | | 6,955,421 | |
| | | | | | | | 19,780,113 | |
| Oil & Gas — 23.8% | | | | | | | | |
| Canacol Energy * | | | 353,506 | | | | 1,624,029 | |
| Ecopetrol ADR (C) | | | 458,515 | | | | 21,715,270 | |
| Pacific Rubiales Energy ^ | | | 593,052 | | | | 12,268,865 | |
| | | | | | | | 35,608,164 | |
| Utilities — 15.1% | | | | | | | | |
| Celsia ESP | | | 1,223,214 | | | | 3,930,109 | |
| Empresa de Energia de Bogota | | | 7,614,988 | | | | 6,398,304 | |
| Interconexion Electrica | | | 1,377,962 | | | | 6,815,718 | |
| Isagen | | | 3,391,841 | | | | 5,413,037 | |
| | | | | | | | 22,557,168 | |
The accompanying notes are an integral part of the financial statements.
|
| | |
| Schedule of Investments | October 31, 2013 |
| | |
| Global X FTSE Colombia 20 ETF |
| | | Shares/Face
Amount(1) | | | Value | |
| TOTAL COMMON STOCK | | | | | | | | |
| (Cost $129,615,633) | | | | | | $ | 131,621,027 | |
| | | | | | | | | |
| PREFERRED STOCK — 11.6% | | | | | | | | |
| COLOMBIA— 11.6% | | | | | | | | |
| Consumer Services — 0.6% | | | | | | | | |
| Avianca Holdings | | | 406,516 | | | | 911,914 | |
| Financials — 9.3% | | | | | | | | |
| Banco Davivienda | | | 416,684 | | | | 5,465,213 | |
| Grupo Aval Acciones y Valores | | | 7,265,265 | | | | 5,048,656 | |
| Grupo de Inversiones Suramericana | | | 173,889 | | | | 3,455,083 | |
| | | | | | | | 13,968,952 | |
| Industrials — 1.7% | | | | | | | | |
| Grupo Argos | | | 220,337 | | | | 2,556,927 | |
| TOTAL PREFERRED STOCK | | | | | | | | |
| (Cost $15,306,851) | | | | | | | 17,437,793 | |
| | | | | | | | | |
| TIME DEPOSITS — 0.4% | | | | | | | | |
| Brown Brothers Harriman | | | | | | | | |
| 0.030%, 11/01/13 | | | 569,380 | | | | 569,380 | |
| 0.309%, 11/01/13 CAD | | | 36 | | | | 35 | |
| TOTAL TIME DEPOSITS | | | | | | | | |
| (Cost $569,415) | | | | | | | 569,415 | |
| TOTAL INVESTMENTS — 100.0% | | | | | | | | |
| (Cost $145,491,899) | | | | | | $ | 149,628,235 | |
Percentages are based on Net Assets of $149,624,554.
* Non-income producing security.
^ Security traded on the Toronto Stock Exchange.
ADR — American Depositary Receipt
CAD — Canadian Dollar
| (A) | Securities considered illiquid. The total value of such securities as of October 31, 2013 was $6,839 and represented 0.0% of Net Assets. |
| (B) | Security is fair valued using methods determined in good faith by the Fair Value Committee of the Fund. The total value of such securities as of October 31, 2013, was $6,839 and represents 0.0% of Net Assets. |
| (C) | This security or a partial position of this security is on loan at October 31, 2013. The total value of securities on loan at October 31, 2013 was $13,076,096. These securities are collateralized by cash in the amount of $13,360,650, which is held at Citibank. |
| (1) | In U.S. Dollars unless otherwise indicated. |
The accompanying notes are an integral part of the financial statements.
|
| | |
| Schedule of Investments | October 31, 2013 |
| | |
| Global X FTSE Colombia 20 ETF |
The following is a summary of the inputs used as of October 31, 2013, in valuing the Fund's investments carried at value:
| Investments in Securities | | Level 1 | | | Level 2 | | | Level 3(a) | | | Total | |
| Common Stock | | $ | 131,614,188 | | | $ | — | | | $ | 6,839 | | | $ | 131,621,027 | |
| Preferred Stock | | | 17,437,793 | | | | — | | | | — | | | | 17,437,793 | |
| Time Deposits | | | — | | | | 569,415 | | | | — | | | | 569,415 | |
| Total Investments in Securities | | $ | 149,051,981 | | | $ | 569,415 | | | $ | 6,839 | | | $ | 149,628,235 | |
(a) A reconciliation of Level 3 investments and disclosures of significant unobservable inputs are presented when the Fund has a significant amount of Level 3 investments at the beginning and/or end of the period in relation to net assets. Management has concluded that Level 3 investments are not material in relation to net assets.
For the year ended October 31, 2013, the transfers in and out of Level 3 were due to changes in the availability of observable inputs to determine fair value. Transfers between levels are recognized at period end.
The accompanying notes are an integral part of the financial statements.
|
| | |
| Schedule of Investments | October 31, 2013 |
| | |
| Global X Brazil Mid Cap ETF |
Sector Weightings (unaudited)†:
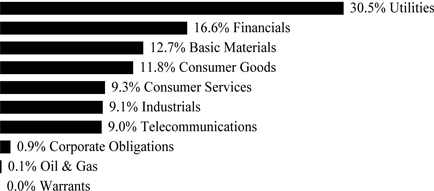
† Percentages based on total investments.
| | | Shares | | | Value | |
| COMMON STOCK — 86.8% | | | | | | | | |
| BRAZIL— 86.8% | | | | | | | | |
| Basic Materials — 10.5% | | | | | | | | |
| Cia Siderurgica Nacional ADR | | | 126,838 | | | $ | 702,683 | |
| Fibria Celulose ADR * | | | 45,408 | | | | 592,574 | |
| | | | | | | | 1,295,257 | |
| Consumer Goods — 11.8% | | | | | | | | |
| Cia Hering | | | 12,013 | | | | 174,548 | |
| Cosan, Cl A | | | 15,116 | | | | 238,228 | |
| Cosan Industria e Comercio | | | 9,349 | | | | 187,464 | |
| Hypermarcas | | | 31,227 | | | | 272,515 | |
| JBS | | | 83,143 | | | | 298,768 | |
| Natura Cosmeticos | | | 14,678 | | | | 293,534 | |
| | | | | | | | 1,465,057 | |
| Consumer Services — 7.3% | | | | | | | | |
| Cia Brasileira de Distribuicao Grupo Pao de Acucar ADR | | | 11,662 | | | | 587,998 | |
| Lojas Renner | | | 10,575 | | | | 318,638 | |
| | | | | | | | 906,636 | |
| Financials — 14.0% | | | | | | | | |
| BM&F Bovespa | | | 147,971 | | | | 834,244 | |
| BR Malls Participacoes | | | 32,311 | | | | 312,985 | |
| CETIP - Mercados Organizados | | | 17,014 | | | | 188,656 | |
| Cyrela Brazil Realty Empreendimentos e Participacoes | | | 20,679 | | | | 154,617 | |
| Multiplan Empreendimentos Imobiliarios | | | 6,638 | | | | 155,831 | |
| Porto Seguro | | | 8,059 | | | | 101,268 | |
| | | | | | | | 1,747,601 | |
| Industrials — 7.3% | | | | | | | | |
| All America Latina Logistica | | | 35,962 | | | | 128,745 | |
| Duratex * | | | 21,133 | | | | 131,787 | |
The accompanying notes are an integral part of the financial statements.
|
| | |
| Schedule of Investments | October 31, 2013 |
| | |
| Global X Brazil Mid Cap ETF |
| | | Shares | | | Value | |
| COMMON STOCK — continued | | | | | | | | |
| Industrials — continued | | | | | | | | |
| EcoRodovias Infraestrutura e Logistica | | | 16,519 | | | $ | 112,083 | |
| Embraer ADR | | | 10,391 | | | | 305,392 | |
| WEG | | | 18,081 | | | | 234,871 | |
| | | | | | | | 912,878 | |
| Oil & Gas — 0.1% | | | | | | | | |
| OGX Petroleo e Gas Participacoes * | | | 108,201 | | | | 6,279 | |
| Telecommunications — 7.7% | | | | | | | | |
| TIM Participacoes ADR | | | 37,703 | | | | 958,410 | |
| Utilities — 28.1% | | | | | | | | |
| Cia de Saneamento Basico do Estado de Sao Paulo ADR * | | | 54,309 | | | | 576,219 | |
| Cia Energetica de Minas Gerais ADR | | | 41,824 | | | | 375,161 | |
| Cia Paranaense de Energia ADR | | | 9,141 | | | | 126,877 | |
| CPFL Energia ADR | | | 42,412 | | | | 715,915 | |
| EDP - Energias do Brasil | | | 19,050 | | | | 108,847 | |
| Tractebel Energia | | | 17,860 | | | | 303,752 | |
| Ultrapar Participacoes ADR | | | 47,455 | | | | 1,263,727 | |
| | | | | | | | 3,470,498 | |
| TOTAL COMMON STOCK | | | | | | | | |
| (Cost $10,347,159) | | | | | | | 10,762,616 | |
| | | | | | | | | |
| PREFERRED STOCK — 12.0% | | | | | | | | |
| | | | | | | | | |
| BRAZIL— 12.0% | | | | | | | | |
| Basic Materials — 2.2% | | | | | | | | |
| Braskem * | | | 11,700 | | | | 103,828 | |
| Metalurgica Gerdau | | | 17,323 | | | | 177,081 | |
| | | | | | | | 280,909 | |
| Consumer Services — 1.9% | | | | | | | | |
| Lojas Americanas | | | 31,395 | | | | 232,358 | |
| Financials — 2.6% | | | | | | | | |
| Banco do Estado do Rio Grande do Sul | | | 14,434 | | | | 104,057 | |
| Bradespar | | | 18,803 | | | | 223,769 | |
| | | | | | | | 327,826 | |
| Industrials — 1.7% | | | | | | | | |
| Klabin | | | 39,200 | | | | 208,232 | |
| Telecommunications — 1.2% | | | | | | | | |
| OI | | | 85,189 | | | | 147,377 | |
| Utilities — 2.4% | | | | | | | | |
| AES Tiete | | | 7,720 | | | | 75,470 | |
| Centrais Eletricas Brasileiras * | | | 15,852 | | | | 84,277 | |
| Cia Energetica de Sao Paulo | | | 12,364 | | | | 129,314 | |
| | | | | | | | 289,061 | |
The accompanying notes are an integral part of the financial statements.
|
| | |
| Schedule of Investments | October 31, 2013 |
| | |
| Global X Brazil Mid Cap ETF |
| | | Face
Amount/Number
of Warrants | | | Value | |
| TOTAL PREFERRED STOCK | | | | | | | | |
| (Cost $1,996,091) | | | | | | $ | 1,485,763 | |
| | | | | | | | | |
| CORPORATE OBLIGATIONS — 0.9% | | | | | | | | |
| Hypermarcas | | | | | | | | |
| 11.300%, 10/15/18 (A)(B) | | $ | 59,000 | | | | 26,773 | |
| 3.000%, 10/15/15 (A)(B) | | | 59,000 | | | | 26,773 | |
| Marfrig Alimentos, Convertible | | | | | | | | |
| 1.040%, 07/15/15(A)(B)(C) | | | 12 | | | | 54,301 | |
| TOTAL CORPORATE OBLIGATION | | | | | | | | |
| (Cost $141,511) | | | | | | | 107,847 | |
| | | | | | | | | |
| WARRANTS — 0.0% | | | | | | | | |
| Brazil — 0.0% | | | | | | | | |
| Hypermarcas | | | | | | | | |
| Strike Price $29.48, Expires 10/15/15 (A)(B)* | | | 59 | | | | — | |
| | | | | | | | | |
| TOTAL WARRANTS (Cost $—) | | | | | | | — | |
| TOTAL INVESTMENTS — 99.7% | | | | | | | | |
| (Cost $12,484,761) | | | | | | $ | 12,356,226 | |
Percentages are based on Net Assets of $12,390,168.
| * | Non-income producing security. |
ADR — American Depositary Receipt
Cl — Class
| (A) | Securities considered illiquid. The total value of such securities as of October 31, 2013 was $107,847 and represented 0.9% of Net Assets. |
| (B) | Securities are fair valued using methods determined in good faith by the Fair Value Committee of the Board of Trustees. The total value of such securities as of October 31, 2013, was $107,847 and represented 0.9% of Net Assets. |
| (C) | Floating rate security. Rate disclosed is the rate in effect on October 31, 2013. |
The following is a summary of the inputs used as of October 31, 2013, in valuing the Fund's investments carried at value:
| Investments in Securities | | Level 1 | | | Level 2 | | | Level 3(a) | | | Total | |
| Common Stock | | $ | 10,762,616 | | | $ | — | | | $ | — | | | $ | 10,762,616 | |
| Preferred Stock | | | 1,485,763 | | | | — | | | | — | | | | 1,485,763 | |
| Corporate Obligations | | | — | | | | — | | | | 107,847 | | | | 107,847 | |
| Warrants | | | — | | | | — | | | | — | | | | — | |
| Total Investments in Securities | | $ | 12,248,379 | | | $ | — | | | $ | 107,847 | | | $ | 12,356,226 | |
(a) A reconciliation of Level 3 investments and disclosures of significant unobservable inputs are presented when the Fund has a significant amount of Level 3 investments at the beginning and/or end of the period in relation to net assets. Management has concluded that Level 3 investments are not material in relation to net assets.
For the year ended October 31, 2013, there have been no transfers between Level 1, Level 2 and Level 3 investments.
Amounts designated as “—“ are either $0 or have been rounded to $0.
The accompanying notes are an integral part of the financial statements.
|
| | |
| Schedule of Investments | October 31, 2013 |
| | |
| Global X Brazil Consumer ETF |
Sector Weightings (unaudited)†:

† Percentages based on total investments.
| | | Shares | | | Value | |
| COMMON STOCK — 86.7% | | | | | | | | |
| | | | | | | | | |
| BRAZIL— 86.7% | | | | | | | | |
| Consumer Goods — 54.5% | | | | | | | | |
| Arezzo Industria e Comercio * | | | 18,128 | | | $ | 271,086 | |
| BRF ADR | | | 43,123 | | | | 1,010,372 | |
| Cia Hering | | | 49,046 | | | | 712,636 | |
| Cosan, Cl A | | | 51,947 | | | | 818,685 | |
| Cosan Industria e Comercio | | | 46,011 | | | | 922,602 | |
| Gafisa ADR * | | | 110,328 | | | | 296,782 | |
| Grendene | | | 42,641 | | | | 386,400 | |
| Hypermarcas | | | 121,907 | | | | 1,063,870 | |
| JBS | | | 306,670 | | | | 1,101,997 | |
| M. Dias Branco * | | | 22,438 | | | | 1,052,388 | |
| Marfrig Alimentos * | | | 121,107 | | | | 245,977 | |
| Natura Cosmeticos | | | 41,101 | | | | 821,947 | |
| Sao Martinho | | | 27,677 | | | | 390,409 | |
| SLC Agricola | | | 23,853 | | | | 222,537 | |
| Souza Cruz | | | 72,442 | | | | 783,533 | |
| Technos | | | 17,821 | | | | 138,419 | |
| | | | | | | | 10,239,640 | |
| Consumer Services — 32.2% | | | | | | | | |
| Anhanguera Educacional Participacoes | | | 160,420 | | | | 959,570 | |
| B2W Cia Digital * | | | 33,109 | | | | 247,556 | |
| Cia Brasileira de Distribuicao Grupo Pao de Acucar ADR | | | 18,635 | | | | 939,577 | |
| Gol Linhas Aereas Inteligentes ADR * | | | 50,795 | | | | 262,610 | |
| International Meal Holdings * | | | 26,210 | | | | 259,152 | |
| Localiza Rent a Car | | | 63,128 | | | | 1,028,556 | |
| Lojas Renner | | | 27,015 | | | | 813,995 | |
| Marisa Lojas | | | 26,661 | | | | 222,552 | |
| Multiplus | | | 24,835 | | | | 307,638 | |
| Raia Drogasil * | | | 89,779 | | | | 656,450 | |
| Restoque Comercio e Confeccoes de Roupas | | | 56,047 | | | | 166,625 | |
| Rossi Residencial * | | | 148,400 | | | | 182,834 | |
| | | | | | | | 6,047,115 | |
The accompanying notes are an integral part of the financial statements.
|
| | |
| Schedule of Investments | October 31, 2013 |
| | |
| Global X Brazil Consumer ETF |
| | | Shares/Face
Amount/Number
of Warrants | | | Value | |
| COMMON STOCK — continued | | | | | | | | |
| TOTAL COMMON STOCK | | | | | | | | |
| (Cost $15,427,698) | | | | | | $ | 16,286,755 | |
| | | | | | | | | |
| PREFERRED STOCK — 12.6% | | | | | | | | |
BRAZIL— 12.6% | | | | | | | | |
| Consumer Goods — 7.1% | | | | | | | | |
| Alpargatas | | | 61,401 | | | | 424,835 | |
| Cia de Bebidas das Americas ADR | | | 24,468 | | | | 910,209 | |
| | | | | | | | 1,335,044 | |
| Consumer Services — 5.5% | | | | | | | | |
| Lojas Americanas | | | 121,563 | | | | 899,703 | |
| Saraiva Livreiros Editores * | | | 10,693 | | | | 136,467 | |
| | | | | | | | 1,036,170 | |
| TOTAL PREFERRED STOCK | | | | | | | | |
| (Cost $2,022,845) | | | | | | | 2,371,214 | |
| | | | | | | | | |
| CORPORATE OBLIGATIONS — 0.6% | | | | | | | | |
| Hypermarcas | | | | | | | | |
| 11.300%, 10/15/18(A)(B) | | $ | 84,000 | | | | 38,118 | |
| 3.000%, 10/15/15(A)(B) | | | 84,000 | | | | 38,118 | |
| Marfrig Alimentos, Convertible | | | | | | | | |
| 1.040%, 07/15/15(A)(B)(C) | | | 6 | | | | 27,132 | |
| TOTAL CORPORATE OBLIGATIONS | | | | | | | | |
| (Cost $136,027) | | | | | | | 103,368 | |
| | | | | | | | | |
| WARRANTS — 0.0% | | | | | | | | |
| Brazil — 0.0% | | | | | | | | |
| Hypermarcas | | | | | | | | |
| Strike Price $29.48, Expires 10/15/15 (A)(B)* | | | 84 | | | | — | |
| TOTAL WARRANTS (Cost $–) | | | | | | | — | |
| | | | | | | | | |
| TIME DEPOSIT — 0.1% | | | | | | | | |
| Brown Brothers Harriman, 0.030%, 11/01/13 | | | | | | | | |
| (Cost $19,913) | | $ | 19,913 | | | | 19,913 | |
| TOTAL INVESTMENTS — 100.0% | | | | | | | | |
| (Cost $17,606,483) | | | | | | $ | 18,781,250 | |
Percentages are based on Net Assets of $18,786,549.
| * | Non-income producing security. |
ADR — American Depositary Receipt
Cl — Class
The accompanying notes are an integral part of the financial statements.
|
| | |
| Schedule of Investments | October 31, 2013 |
| | |
| Global X Brazil Consumer ETF |
| (A) | Securities considered illiquid. The total value of such securities as of October 31, 2013 was $103,368 and represented 0.6% of Net Assets. |
| (B) | Securities are fair valued using methods determined in good faith by the Fair Value Committee of the Board of Trustees. The total value of such securities as of October 31, 2013, was $103,368 and represented 0.6% of Net Assets. |
| (C) | Floating rate security. Rate disclosed is the rate in effect on October 31, 2013. |
The following is a summary of the inputs used as of October 31, 2013, in valuing the Fund's investments carried at value:
| Investments in Securities | | Level 1 | | | Level 2 | | | Level 3 (a) | | | Total | |
| Common Stock | | $ | 16,286,755 | | | $ | — | | | $ | — | | | $ | 16,286,755 | |
| Preferred Stock | | | 2,371,214 | | | | — | | | | — | | | | 2,371,214 | |
| Corporate Obligations | | | — | | | | — | | | | 103,368 | | | | 103,368 | |
| Time Deposit | | | — | | | | 19,913 | | | | — | | | | 19,913 | |
| Warrants | | | — | | | | — | | | | — | | | | — | |
| Total Investments in Securities | | $ | 18,657,969 | | | $ | 19,913 | | | $ | 103,368 | | | $ | 18,781,250 | |
(a) A reconciliation of Level 3 investments and disclosures of significant unobservable inputs are presented when the Fund has a significant amount of Level 3 investments at the beginning and/or end of the period in relation to net assets. Management has concluded that Level 3 investments are not material in relation to net assets.
For the year ended October 31, 2013, there have been no transfers between Level 1, Level 2 and Level 3 investments.
Amounts designated as “—“ are either $0 or have been rounded to $0.
The accompanying notes are an integral part of the financial statements.
|
| | |
| Schedule of Investments | October 31, 2013 |
| | |
| Global X Brazil Financials ETF |
Sector Weightings (unaudited)†:

† Percentages based on total investments.
| | | Shares | | | Value | |
| COMMON STOCK — 94.8% | | | | | | | | |
| | | | | | | | | |
| BRAZIL— 94.8% | | | | | | | | |
| Financials — 94.8% | | | | | | | | |
| Banco Bradesco ADR | | | 15,904 | | | $ | 229,336 | |
| Banco do Brasil | | | 10,953 | | | | 145,456 | |
| Banco Santander Brasil ADR | | | 37,408 | | | | 259,237 | |
| BM&F Bovespa | | | 18,966 | | | | 106,928 | |
| BR Malls Participacoes | | | 10,774 | | | | 104,364 | |
| BR Properties | | | 11,574 | | | | 98,163 | |
| Brasil Brokers Participacoes | | | 6,834 | | | | 17,785 | |
| Brookfield Incorporacoes * | | | 14,083 | | | | 8,864 | |
| CETIP - Mercados Organizados | | | 9,954 | | | | 110,373 | |
| Cielo | | | 4,888 | | | | 148,373 | |
| Cyrela Brazil Realty Empreendimentos e Participacoes | | | 14,285 | | | | 106,809 | |
| Even Construtora e Incorporadora | | | 14,529 | | | | 54,154 | |
| Ez Tec Empreendimentos e Participacoes | | | 2,885 | | | | 42,434 | |
| Grupo BTG Pactual | | | 7,837 | | | | 104,846 | |
| Iguatemi Empresa de Shopping Centers | | | 2,744 | | | | 31,541 | |
| Itau Unibanco Holding ADR | | | 15,582 | | | | 240,119 | |
| MRV Engenharia e Participacoes | | | 19,969 | | | | 86,198 | |
| Multiplan Empreendimentos Imobiliarios | | | 4,388 | | | | 103,011 | |
| PDG Realty Empreendimentos e Participacoes * | | | 84,022 | | | | 76,138 | |
| Porto Seguro | | | 5,511 | | | | 69,250 | |
| Rossi Residencial * | | | 17,074 | | | | 21,036 | |
| Sul America | | | 18,310 | | | | 134,044 | |
| TOTAL COMMON STOCK | | | | | | | | |
| (Cost $2,703,804) | | | | | | | 2,298,459 | |
| | | | | | | | | |
| PREFERRED STOCK — 5.0% | | | | | | | | |
| | | | | | | | | |
| BRAZIL— 5.0% | | | | | | | | |
| Financials — 5.0% | | | | | | | | |
| Banco ABC Brasil* | | | 2,699 | | | | 16,614 | |
| Banco do Estado do Rio Grande do Sul | | | 11,158 | | | | 80,440 | |
| Banco Panamericano* | | | 9,871 | | | | 23,266 | |
| TOTAL PREFERRED STOCK | | | | | | | | |
| (Cost $138,939) | | | | | | | 120,320 | |
The accompanying notes are an integral part of the financial statements.
|
| | |
| Schedule of Investments | October 31, 2013 |
| | |
| Global X Brazil Financials ETF |
| | | Face Amount | | | Value | |
| TIME DEPOSIT — 0.1% | | | | | | | | |
| Brown Brothers Harriman, 0.030%, 11/01/13 | | | | | | | | |
| (Cost $2,802) | | $ | 2,802 | | | $ | 2,802 | |
| TOTAL INVESTMENTS — 99.9% | | | | | | | | |
| (Cost $2,845,545) | | | | | | $ | 2,421,581 | |
Percentages are based on Net Assets of $2,424,756.
* Non-income producing security.
ADR — American Depositary Receipt
The following is a summary of the inputs used as of October 31, 2013, in valuing the Fund's investments carried at value:
| Investments in Securities | | Level 1 | | | Level 2 | | | Level 3 | | | Total | |
| Common Stock | | $ | 2,298,459 | | | $ | — | | | $ | — | | | $ | 2,298,459 | |
| Preferred Stock | | | 120,320 | | | | — | | | | — | | | | 120,320 | |
| Time Deposit | | | — | | | | 2,802 | | | | — | | | | 2,802 | |
| Total Investments in Securities | | $ | 2,418,779 | | | $ | 2,802 | | | $ | — | | | $ | 2,421,581 | |
For the year ended October 31, 2013, there have been no transfers between Level 1, Level 2 and Level 3 investments.
As of October 31, 2013, there were no Level 3 investments.
The accompanying notes are an integral part of the financial statements.
|
| | |
| Schedule of Investments | October 31, 2013 |
| | |
| Global X FTSE Argentina 20 ETF |
Sector Weightings (unaudited)†:
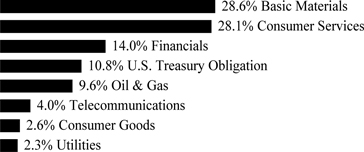
† Percentages based on total investments.
| | | Shares | | | Value | |
| COMMON STOCK — 100.2% | | | | | | | | |
| | | | | | | | | |
| ARGENTINA— 81.5% | | | | | | | | |
| Basic Materials — 18.9% | | | | | | | | |
| Tenaris ADR | | | 26,610 | | | $ | 1,245,614 | |
| Consumer Goods — 2.9% | | | | | | | | |
| Cresud SACIF y A ADR | | | 18,280 | | | | 191,026 | |
| Consumer Services — 27.6% | | | | | | | | |
| Arcos Dorados Holdings, Cl A | | | 41,475 | | | | 499,359 | |
| MercadoLibre | | | 9,816 | | | | 1,321,577 | |
| | | | | | | | 1,820,936 | |
| Financials — 15.8% | | | | | | | | |
| Banco Macro ADR * | | | 14,131 | | | | 366,134 | |
| BBVA Banco Frances ADR * | | | 22,749 | | | | 164,930 | |
| Grupo Financiero Galicia ADR | | | 34,879 | | | | 337,629 | |
| IRSA Inversiones y Representaciones ADR | | | 15,115 | | | | 173,067 | |
| | | | | | | | 1,041,760 | |
| Oil & Gas — 9.3% | | | | | | | | |
| Petrobras Argentina ADR | | | 37,485 | | | | 231,657 | |
| Transportadora de Gas del Sur ADR | | | 21,284 | | | | 48,102 | |
| YPF ADR | | | 16,145 | | | | 336,623 | |
| | | | | | | | 616,382 | |
| Telecommunications — 4.4% | | | | | | | | |
| Telecom Argentina ADR * | | | 14,945 | | | | 292,474 | |
| Utilities — 2.6% | | | | | | | | |
| Pampa Energia ADR * | | | 31,935 | | | | 168,617 | |
| TOTAL ARGENTINA | | | | | | | 5,376,809 | |
| | | | | | | | | |
| CANADA— 12.0% | | | | | | | | |
| Basic Materials — 12.0% | | | | | | | | |
| Goldcorp | | | 9,201 | | | | 233,981 | |
| Pan American Silver | | | 18,028 | | | | 191,277 | |
The accompanying notes are an integral part of the financial statements.
|
| | |
| Schedule of Investments | October 31, 2013 |
| | |
| Global X FTSE Argentina 20 ETF |
| | | Shares/Face
Amount | | | Value | |
| COMMON STOCK — continued | | | | | | | | |
| | | | | | | | | |
| Basic Materials — continued | | | | | | | | |
| Silver Standard Resources * | | | 24,275 | | | $ | 136,426 | |
| Yamana Gold | | | 23,263 | | | | 231,002 | |
| TOTAL CANADA | | | | | | | 792,686 | |
| | | | | | | | | |
| CHILE— 4.1% | | | | | | | | |
| Consumer Services — 4.1% | | | | | | | | |
| Cencosud | | | 65,549 | | | | 267,353 | |
| | | | | | | | | |
| UNITED STATES— 2.6% | | | | | | | | |
| Basic Materials — 1.3% | | | | | | | | |
| McEwen Mining * | | | 39,416 | | | | 84,350 | |
| Oil & Gas — 1.3% | | | | | | | | |
| Apco Oil and Gas International * | | | 5,723 | | | | 87,104 | |
| TOTAL UNITED STATES | | | | | | | 171,454 | |
| TOTAL COMMON STOCK | | | | | | | | |
| (Cost $6,419,931) | | | | | | | 6,608,302 | |
| | | | | | | | | |
| U.S. TREASURY OBLIGATION — 12.1% | | | | | | | | |
| United States Treasury Bills | | | | | | | | |
| 0.150%, 11/07/13(A) | | | | | | | | |
| (Cost $799,998) | | $ | 800,000 | | | | 799,997 | |
| TOTAL INVESTMENTS — 112.3% | | | | | | | | |
| (Cost $7,219,929) | | | | | | $ | 7,408,299 | |
Percentages are based on Net Assets of $6,595,190.
* Non-income producing security.
ADR — American Depositary Receipt
Cl — Class
(A) The rate reported on the Schedule of Investments is the effective yield at time of purchase.
As of October 31, 2013, all of the Fund’s investments in securities were considered Level 1, in accordance with the authoritative guidance on fair value measurements and disclosure under U.S. GAAP.
For the year ended October 31, 2013, there have been no transfers between Level 1, Level 2 and Level 3 investments.
As of October 31, 2013, there were no Level 3 investments.
The accompanying notes are an integral part of the financial statements.
|
| | |
| Schedule of Investments | October 31, 2013 |
| | |
| Global X FTSE Greece 20 ETF |
Sector Weightings (unaudited)†:
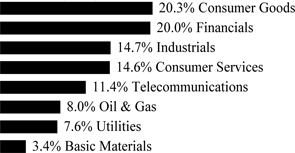
† Percentages based on total investments.
| | | Shares | | | Value | |
| COMMON STOCK — 99.0% | | | | | | | | |
| | | | | | | | | |
| CYPRUS— 0.1% | | | | | | | | |
| Financials — 0.1% | | | | | | | | |
| Bank of Cyprus (A)(B) * | | | 3,387,287 | | | $ | 95,201 | |
| | | | | | | | | |
| GREECE— 98.9% | | | | | | | | |
| Basic Materials — 3.4% | | | | | | | | |
| Mytilineos Holdings * | | | 400,725 | | | | 3,248,195 | |
| Consumer Goods — 20.1% | | | | | | | | |
| Coca-Cola HBC | | | 296,637 | | | | 8,570,877 | |
| Coca-Cola HBC ADR | | | 213,250 | | | | 6,154,395 | |
| JUMBO * | | | 323,221 | | | | 4,344,663 | |
| | | | | | | | 19,069,935 | |
| Consumer Services — 14.4% | | | | | | | | |
| Folli Follie * | | | 156,388 | | | | 4,650,171 | |
| OPAP | | | 729,225 | | | | 9,059,495 | |
| | | | | | | | 13,709,666 | |
| Financials — 19.6% | | | | | | | | |
| Alpha Bank AE * | | | 4,918,444 | | | | 4,420,863 | |
| Marfin Investment Group Holdings * | | | 2,414,190 | | | | 1,540,603 | |
| National Bank of Greece ADR * | | | 1,382,605 | | | | 8,088,239 | |
| Piraeus Bank * | | | 2,214,500 | | | | 4,600,325 | |
| | | | | | | | 18,650,030 | |
| Industrials — 14.7% | | | | | | | | |
| Ellaktor * | | | 503,347 | | | | 2,193,784 | |
| Metka | | | 115,661 | | | | 2,174,994 | |
| Piraeus Port Authority | | | 30,946 | | | | 752,106 | |
| Titan Cement * | | | 162,806 | | | | 4,443,118 | |
| Viohalco Hellenic Copper and Aluminum Industry * | | | 433,511 | | | | 4,296,792 | |
| | | | | | | | 13,860,794 | |
The accompanying notes are an integral part of the financial statements.
|
| | |
| Schedule of Investments | October 31, 2013 |
| | |
| Global X FTSE Greece 20 ETF |
| | | Shares | | | Value | |
| COMMON STOCK — continued | | | | | | | | |
| Oil & Gas — 7.9% | | | | | | | | |
| Hellenic Petroleum | | | 333,469 | | | $ | 4,346,584 | |
| Motor Oil Hellas Corinth Refineries | | | 267,374 | | | | 3,187,389 | |
| | | | | | | | 7,533,973 | |
| Telecommunications — 11.3% | | | | | | | | |
| Hellenic Telecommunications Organization * | | | 850,788 | | | | 10,731,450 | |
| Utilities — 7.5% | | | | | | | | |
| Athens Water Supply & Sewage | | | 154,241 | | | | 1,740,292 | |
| Public Power | | | 309,020 | | | | 4,598,524 | |
| Terna Energy * | | | 154,388 | | | | 765,117 | |
| | | | | | | | 7,103,933 | |
| TOTAL GREECE | | | | | | | 93,907,976 | |
| TOTAL COMMON STOCK | | | | | | | | |
| (Cost $73,534,399) | | | | | | | 94,003,177 | |
| TOTAL INVESTMENTS — 99.0% | | | | | | | | |
| (Cost $73,534,399) | | | | | | $ | 94,003,177 | |
Percentages are based on Net Assets of $94,937,937.
* Non-income producing security.
ADR — American Depositary Receipt
(A) Securities considered illiquid. The total value of such securities as of October 31, 2013 was $95,201 and represented 0.1% of Net Assets.
(B) Securities are fair valued using methods determined in good faith by the Fair Value Committee of the Board of Trustees. The total value of such securities as of October 31, 2013, was $95,201 and represented 0.1% of Net Assets.
The following is a summary of the inputs used as of October 31, 2013, in valuing the Fund's investments carried at value:
| Investments in Securities | | Level 1 | | | Level 2 | | | Level 3 (a) | | | Total | |
| Common Stock | | $ | 93,907,976 | | | $ | — | | | $ | 95,201 | | | $ | 94,003,177 | |
| Total Investments in Securities | | $ | 93,907,976 | | | $ | — | | | $ | 95,201 | | | $ | 94,003,177 | |
|
(a) A reconciliation of Level 3 investments and disclosures of significant unobservable inputs are presented when the Fund has a significant amount of Level 3 investments at the beginning and/or end of the period in relation to net assets. Management has concluded that Level 3 investments are not material in relation to net assets.
For the year ended October 31, 2013, the transfers in and out of Level 3 were due to changes in the availability of observable inputs to determine fair value. Transfers between levels are recognized at period end.
The accompanying notes are an integral part of the financial statements.
|
| | |
| Schedule of Investments | October 31, 2013 |
| | |
| Global X FTSE Norway 30 ETF |
Sector Weightings (unaudited)†:

† Percentages based on total investments. Repurchase agreements purchased from cash collateral received for securities lending activity are included in total investments. Please see Note 9 in Notes to Financial Statements for more detailed information.
| | | Shares | | | Value | |
| COMMON STOCK — 99.8% | | | | | | | | |
| NORWAY— 95.3% | | | | | | | | |
| Basic Materials — 8.1% | | | | | | | | |
| Norsk Hydro (A) | | | 588,245 | | | $ | 2,628,454 | |
| Yara International | | | 88,713 | | | | 3,829,842 | |
| | | | | | | | 6,458,296 | |
| Consumer Goods — 9.6% | | | | | | | | |
| Aker, Cl A | | | 17,830 | | | | 561,582 | |
| Austevoll Seafood | | | 54,400 | | | | 338,113 | |
| Cermaq | | | 39,137 | | | | 693,586 | |
| Marine Harvest (A) | | | 1,852,840 | | | | 2,172,470 | |
| Orkla | | | 489,131 | | | | 3,964,450 | |
| | | | | | | | 7,730,201 | |
| Consumer Services — 5.0% | | | | | | | | |
| Norwegian Air Shuttle * | | | 7,721 | | | | 317,631 | |
| Schibsted | | | 60,312 | | | | 3,687,785 | |
| | | | | | | | 4,005,416 | |
| Financials — 18.3% | | | | | | | | |
| DnB | | | 574,865 | | | | 10,187,762 | |
| Gjensidige Forsikring | | | 125,634 | | | | 2,344,670 | |
| SpareBank 1 SR Bank | | | 76,393 | | | | 686,543 | |
| Storebrand * | | | 241,770 | | | | 1,561,156 | |
| | | | | | | | 14,780,131 | |
| Health Care — 1.6% | | | | | | | | |
| Algeta * | | | 31,448 | | | | 1,249,351 | |
| Industrials — 1.2% | | | | | | | | |
| Tomra Systems | | | 109,379 | | | | 1,005,955 | |
The accompanying notes are an integral part of the financial statements.
|
| | |
| Schedule of Investments | October 31, 2013 |
| | |
| Global X FTSE Norway 30 ETF |
| | | Shares/Face
Amount | | | Value | |
| COMMON STOCK — continued | | | | | | | | |
| | | | | | | | | |
| Oil & Gas — 40.0% | | | | | | | | |
| Aker Solutions | | | 120,053 | | | $ | 1,659,714 | |
| BW Offshore | | | 280,564 | | | | 385,048 | |
| Det Norske Oljeselskap * | | | 57,601 | | | | 820,514 | |
| DNO International * | | | 757,211 | | | | 2,145,816 | |
| Fred Olsen Energy | | | 17,360 | | | | 731,079 | |
| Kvaerner | | | 120,785 | | | | 196,809 | |
| Petroleum Geo-Services | | | 162,237 | | | | 1,967,649 | |
| ProSafe | | | 141,470 | | | | 1,213,167 | |
| Seadrill | | | 188,967 | | | | 8,745,166 | |
| Statoil | | | 513,630 | | | | 12,165,500 | |
| TGS Nopec Geophysical | | | 77,713 | | | | 2,138,297 | |
| | | | | | | | 32,168,759 | |
| Technology — 1.8% | | | | | | | | |
| Atea | | | 67,292 | | | | 746,050 | |
| Opera Software | | | 61,990 | | | | 749,747 | |
| | | | | | | | 1,495,797 | |
| Telecommunications — 9.7% | | | | | | | | |
| Telenor | | | 324,182 | | | | 7,787,273 | |
| TOTAL NORWAY | | | | | | | 76,681,179 | |
| | | | | | | | | |
| UNITED KINGDOM— 4.5% | | | | | | | | |
| Oil & Gas — 4.5% | | | | | | | | |
| Subsea 7 | | | 173,281 | | | | 3,664,689 | |
| TOTAL COMMON STOCK | | | | | | | | |
| (Cost $74,322,231) | | | | | | | 80,345,868 | |
| | | | | | | | | |
| REPURCHASE AGREEMENTS — 3.3% | | | | | | | | |
| Barclays | | | | | | | | |
0.080%, dated 10/31/13, to be repurchased on 11/01/13, repurchase price
$2,503,446 (collateralized by U.S. Treasury Bills, ranging in par value
$909,318 - $1,644,670, 0.000%, 01/09/14-04/03/14 with a total market
value of $2,553,510) (B) | | $ | 2,503,440 | | | | 2,503,440 | |
| Deutsche Bank | | | | | | | | |
0.090%, dated 10/31/13, to be repurchased on 11/01/13, repurchase price
131,761 (collateralized by U.S. Treasury Bills, par value $131,760,
2.375%, 09/30/14 with a total market value of $134,442) (B) | | | 131,760 | | | | 131,760 | |
| TOTAL REPURCHASE AGREEMENTS | | | | | | | | |
| (Cost $2,635,200) | | | | | | | 2,635,200 | |
| | | | | | | | | |
| TIME DEPOSIT — 0.2% | | | | | | | | |
| Brown Brothers Harriman, 0.030%, 11/01/13 | | | | | | | | |
| (Cost $152,039) | | | 152,039 | | | | 152,039 | |
| TOTAL INVESTMENTS — 103.3% | | | | | | | | |
| (Cost $77,109,470) | | | | | | $ | 83,133,107 | |
The accompanying notes are an integral part of the financial statements.
|
| | |
| Schedule of Investments | October 31, 2013 |
| | |
| Global X FTSE Norway 30 ETF |
Percentages are based on Net Assets of $80,464,774.
* Non-income producing security.
Cl — Class
| (A) | This security or a partial position of this security is on loan at October 31, 2013. The total value of securities on loan at October 31, 2013 was $2,470,566. |
| (B) | This security was purchased with cash collateral held from securities on loan. The total value of such securities as of October 31, 2013 was $2,635,200. |
The following is a summary of the inputs used as of October 31, 2013, in valuing the Fund's investments carried at value:
| Investments in Securities | | Level 1 | | | Level 2 | | | Level 3 | | | Total | |
| Common Stock | | $ | 80,345,868 | | | $ | — | | | $ | — | | | $ | 80,345,868 | |
| Repurchase Agreements | | | — | | | | 2,635,200 | | | | — | | | | 2,635,200 | |
| Time Deposit | | | — | | | | 152,039 | | | | — | | | | 152,039 | |
| Total Investments in Securities | | $ | 80,345,868 | | | $ | 2,787,239 | | | $ | — | | | $ | 83,133,107 | |
For the year ended October 31, 2013, there have been no transfers between Level 1, Level 2 and Level 3 investments.
As of October 31, 2013, there were no Level 3 investments.
The accompanying notes are an integral part of the financial statements.
|
| | |
| Schedule of Investments | October 31, 2013 |
| | |
| Global X FTSE Nordic Region ETF |
Sector Weightings (unaudited)†:
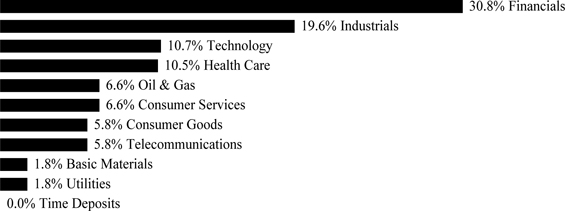
† Percentages based on total investments.
| | | Shares | | | Value | |
| COMMON STOCK — 99.9% | | | | | | | | |
| | | | | | | | | |
| DENMARK— 17.6% | | | | | | | | |
| Consumer Goods — 1.8% | | | | | | | | |
| Carlsberg, Cl B | | | 10,365 | | | $ | 1,034,943 | |
| Financials — 3.0% | | | | | | | | |
| Danske Bank * | | | 71,503 | | | | 1,670,020 | |
| Health Care — 10.5% | | | | | | | | |
| Novo Nordisk ADR | | | 35,160 | | | | 5,860,117 | |
| Industrials — 2.3% | | | | | | | | |
| A P Moller - Maersk, Cl B | | | 133 | | | | 1,286,843 | |
| TOTAL DENMARK | | | | | | | 9,851,923 | |
| | | | | | | | | |
| FINLAND— 13.6% | | | | | | | | |
| Financials — 3.9% | | | | | | | | |
| Sampo, Cl A | | | 46,571 | | | | 2,206,164 | |
| Industrials — 2.9% | | | | | | | | |
| Kone, Cl B | | | 18,684 | | | | 1,647,671 | |
| Technology — 5.0% | | | | | | | | |
| Nokia ADR * | | | 366,545 | | | | 2,796,738 | |
| Utilities — 1.8% | | | | | | | | |
| Fortum | | | 44,489 | | | | 990,645 | |
| TOTAL FINLAND | | | | | | | 7,641,218 | |
| | | | | | | | | |
| NORWAY— 15.4% | | | | | | | | |
| Basic Materials — 1.8% | | | | | | | | |
| Norsk Hydro | | | 76,913 | | | | 343,670 | |
| Yara International | | | 15,526 | | | | 670,276 | |
| | | | | | | | 1,013,946 | |
The accompanying notes are an integral part of the financial statements.
|
| | |
| Schedule of Investments | October 31, 2013 |
| | |
| Global X FTSE Nordic Region ETF |
| | | Shares | | | Value | |
| COMMON STOCK — continued | | | | | | | | |
| | | | | | | | | |
| Consumer Goods — 1.1% | | | | | | | | |
| Orkla | | | 76,868 | | | $ | 623,022 | |
| Financials — 3.3% | | | | | | | | |
| DnB | | | 105,981 | | | | 1,878,196 | |
| Oil & Gas — 6.6% | | | | | | | | |
| Seadrill | | | 34,567 | | | | 1,599,719 | |
| Statoil ADR | | | 87,381 | | | | 2,064,813 | |
| | | | | | | | 3,664,532 | |
| Telecommunications — 2.6% | | | | | | | | |
| Telenor | | | 59,820 | | | | 1,436,954 | |
| TOTAL NORWAY | | | | | | | 8,616,650 | |
| | | | | | | | | |
| SWEDEN— 53.3% | | | | | | | | |
| Consumer Goods — 2.9% | | | | | | | | |
| Svenska Cellulosa, Cl B | | | 57,503 | | | | 1,632,789 | |
| Consumer Services — 6.6% | | | | | | | | |
| Hennes & Mauritz, Cl B | | | 85,655 | | | | 3,701,114 | |
| Financials — 20.6% | | | | | | | | |
| Investor, Cl B | | | 44,811 | | | | 1,439,750 | |
| Nordea Bank | | | 286,618 | | | | 3,671,159 | |
| Skandinaviska Enskilda Banken, Cl A | | | 143,925 | | | | 1,743,522 | |
| Svenska Handelsbanken, Cl A | | | 43,357 | | | | 1,964,432 | |
| Swedbank, Cl A | | | 103,370 | | | | 2,695,894 | |
| | | | | | | | 11,514,757 | |
| Industrials — 14.3% | | | | | | | | |
| Assa Abloy, Cl B | | | 30,749 | | | | 1,526,524 | |
| Atlas Copco, Cl A | | | 61,343 | | | | 1,702,066 | |
| Sandvik | | | 98,306 | | | | 1,330,458 | |
| Scania, Cl B | | | 30,384 | | | | 609,551 | |
| SKF, Cl B | | | 40,920 | | | | 1,084,245 | |
| Volvo, Cl B | | | 136,798 | | | | 1,757,461 | |
| | | | | | | | 8,010,305 | |
| Technology — 5.7% | | | | | | | | |
| Ericsson ADR | | | 268,562 | | | | 3,220,058 | |
| Telecommunications — 3.2% | | | | | | | | |
| TeliaSonera | | | 214,481 | | | | 1,777,398 | |
| TOTAL SWEDEN | | | | | | | 29,856,421 | |
| TOTAL COMMON STOCK | | | | | | | | |
| (Cost $48,160,642) | | | | | | | 55,966,212 | |
The accompanying notes are an integral part of the financial statements.
| Schedule of Investments | October 31, 2013 |
| | |
| Global X FTSE Nordic Region ETF |
| | | Face Amount | | | Value | |
| TIME DEPOSITS — 0.0% | | | | | | | | |
| Brown Brothers Harriman | | | | | | | | |
| 0.628%, 11/01/13 NOK | | | 9 | | | $ | 2 | |
| 0.360%, 11/01/13 SEK | | | 42 | | | | 6 | |
| TOTAL TIME DEPOSITS | | | | | | | | |
| (Cost $8) | | | | | | | 8 | |
| | | | | | | | | |
| TOTAL INVESTMENTS — 99.9% | | | | | | | | |
| (Cost $48,160,650) | | | | | | $ | 55,966,220 | |
Percentages are based on Net Assets of $56,014,679.
* Non-income producing security.
ADR — American Depositary Receipt
Cl — Class
NOK — Norwegian Krone
SEK — Swedish Krona
The following is a summary of the inputs used as of October 31, 2013, in valuing the Fund's investments carried at value:
| Investments in Securities | | Level 1 | | | Level 2 | | | Level 3 | | | Total | |
| Common Stock | | $ | 55,966,212 | | | $ | — | | | $ | — | | | $ | 55,966,212 | |
| Time Deposits | | | — | | | | 8 | | | | — | | | | 8 | |
| Total Investments in Securities | | $ | 55,966,212 | | | $ | 8 | | | $ | — | | | $ | 55,966,220 | |
For the year ended October 31, 2013, there have been no transfers between Level 1, Level 2 and Level 3 investments.
As of October 31, 2013, there were no Level 3 investments.
The accompanying notes are an integral part of the financial statements.
| Schedule of Investments | October 31, 2013 |
| | |
| Global X Central Asia & Mongolia Index ETF |
Sector Weightings (unaudited)†:
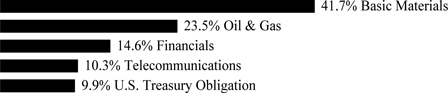
† Percentages based on total investments.
| | | Shares | | | Value | |
| COMMON STOCK — 99.6% | | | | | | | | |
| CANADA— 17.1% | | | | | | | | |
| Basic Materials — 17.1% | | | | | | | | |
| Centerra Gold | | | 30,314 | | | $ | 121,239 | |
| Dundee Precious Metals * | | | 13,074 | | | | 55,799 | |
| SouthGobi Resources * | | | 6,300 | | | | 7,963 | |
| Turquoise Hill Resources * | | | 10,377 | | | | 50,017 | |
| TOTAL CANADA | | | | | | | 235,018 | |
| CHINA— 4.2% | | | | | | | | |
| Oil & Gas — 4.2% | | | | | | | | |
| SPT Energy Group | | | 103,700 | | | | 57,113 | |
| HONG KONG— 1.0% | | | | | | | | |
| Basic Materials — 1.0% | | | | | | | | |
| Mongolia Energy * | | | 398,600 | | | | 13,881 | |
| KAZAKHSTAN— 25.7% | | | | | | | | |
| Financials — 5.3% | | | | | | | | |
| Halyk Savings Bank of Kazakhstan JSC GDR | | | 8,874 | | | | 72,767 | |
| Oil & Gas — 14.3% | | | | | | | | |
| KazMunaiGas Exploration Production JSC GDR | | | 8,533 | | | | 121,083 | |
| Zhaikmunai GDR | | | 5,773 | | | | 75,049 | |
| | | | | | | | 196,132 | |
| Telecommunications — 6.1% | | | | | | | | |
| KCell JSC GDR | | | 4,845 | | | | 83,819 | |
| TOTAL KAZAKHSTAN | | | | | | | 352,718 | |
| MONGOLIA— 2.3% | | | | | | | | |
| Basic Materials — 2.3% | | | | | | | | |
| Mongolian Mining * | | | 189,900 | | | | 31,107 | |
| SWEDEN— 5.3% | | | | | | | | |
| Telecommunications — 5.3% | | | | | | | | |
| TeliaSonera | | | 8,826 | | | | 73,141 | |
The accompanying notes are an integral part of the financial statements.
| Schedule of Investments | October 31, 2013 |
| | |
| Global X Central Asia & Mongolia Index ETF |
| | | Shares/Face
Amount | | | Value | |
| COMMON STOCK — continued | | | | | | | | |
| UNITED ARAB EMIRATES— 5.0% | | | | | | | | |
| Oil & Gas — 5.0% | | | | | | | | |
| Dragon Oil | | | 7,338 | | | $ | 69,301 | |
| UNITED KINGDOM— 39.0% | | | | | | | | |
| Basic Materials — 25.8% | | | | | | | | |
| Central Asia Metals | | | 7,400 | | | | 18,629 | |
| Eurasian Natural Resources * | | | 35,600 | | | | 128,576 | |
| Kazakhmys | | | 28,584 | | | | 120,034 | |
| Kryso Resources * | | | 31,600 | | | | 19,317 | |
| Polymetal International | | | 7,020 | | | | 67,479 | |
| | | | | | | | 354,035 | |
| Financials — 10.8% | | | | | | | | |
| Bank of Georgia Holdings | | | 4,684 | | | | 148,255 | |
| Oil & Gas — 2.4% | | | | | | | | |
| Max Petroleum * | | | 159,500 | | | | 9,795 | |
| Tethys Petroleum * | | | 37,200 | | | | 23,411 | |
| | | | | | | | 33,206 | |
| TOTAL UNITED KINGDOM | | | | | | | 535,496 | |
| TOTAL COMMON STOCK | | | | | | | | |
| (Cost $1,497,704) | | | | | | | 1,367,775 | |
| U.S. TREASURY OBLIGATION — 10.9% | | | | | | | | |
| United States Treasury Bills | | | | | | | | |
| 0.015%, 11/07/13(A) | | | | | | | | |
| (Cost $150,000) | | $ | 150,000 | | | | 150,000 | |
| TOTAL INVESTMENTS — 110.5% | | | | | | | | |
| (Cost $1,647,704) | | | | | | $ | 1,517,775 | |
Percentages are based on Net Assets of $1,373,626.
* Non-income producing security.
GDR — Global Depositary Receipt
(A) The rate reported on the Schedule of Investments is the effective yield at time of purchase.
As of October 31, 2013, all of the Fund’s investments in securities were considered Level 1, in accordance with the authoritative guidance on fair value measurements and disclosure under U.S. GAAP.
For the period ended October 31, 2013, there have been no transfers between Level 1, Level 2 or Level 3 investments.
As of October 31, 2013, there were no Level 3 investments.
The accompanying notes are an integral part of the financial statements.
| Schedule of Investments | October 31, 2013 |
| | |
| Global X Nigeria Index ETF |
Sector Weightings (unaudited)†:
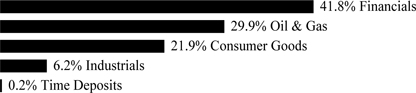
† Percentages based on total investments.
| | | Shares | | | Value | |
| COMMON STOCK — 97.4% | | | | | | | | |
| CANADA— 1.5% | | | | | | | | |
| Oil & Gas — 1.5% | | | | | | | | |
| Mart Resources | | | 87,932 | | | $ | 90,239 | |
| FRANCE— 1.1% | | | | | | | | |
| Oil & Gas — 1.1% | | | | | | | | |
| MPI | | | 15,565 | | | | 67,838 | |
| ITALY— 5.1% | | | | | | | | |
| Oil & Gas — 5.1% | | | | | | | | |
| Saipem | | | 12,980 | | | | 304,184 | |
| NIGERIA— 69.7% | | | | | | | | |
| Consumer Goods — 21.3% | | | | | | | | |
| Dangote Sugar Refinery | | | 665,100 | | | | 45,987 | |
| Flour Mills of Nigeria | | | 213,100 | | | | 114,065 | |
| Guinness Nigeria * | | | 126,300 | | | | 200,426 | |
| Nestle Nigeria | | | 40,300 | | | | 279,156 | |
| Nigerian Breweries | | | 391,700 | | | | 431,659 | |
| PZ Cussons Nigeria | | | 263,400 | | | | 62,400 | |
| Unilever Nigeria | | | 367,000 | | | | 140,976 | |
| | | | | | | | 1,274,669 | |
| Financials — 40.8% | | | | | | | | |
| Access Bank | | | 3,875,100 | | | | 236,459 | |
| Diamond Bank * | | | 2,147,500 | | | | 89,930 | |
| Ecobank Transnational | | | 48,911 | | | | 4,275 | |
| FBN Holdings | | | 4,105,700 | | | | 418,844 | |
| Fidelity Bank | | | 6,175,000 | | | | 103,046 | |
| First City Monument Bank * | | | 3,560,520 | | | | 80,269 | |
| Guaranty Trust Bank | | | 3,358,700 | | | | 535,108 | |
| Intercontinental Wapic Insurance * | | | 826,916 | | | | 4,687 | |
| Skye Bank | | | 2,812,400 | | | | 72,612 | |
| Transnational Corp of Nigeria * | | | 1,552,000 | | | | 17,787 | |
| UAC of Nigeria | | | 346,580 | | | | 144,045 | |
| United Bank for Africa | | | 5,238,762 | | | | 257,979 | |
The accompanying notes are an integral part of the financial statements.
| Schedule of Investments | October 31, 2013 |
| | |
| Global X Nigeria Index ETF |
| | | Shares/Face
Amount (1) | | | Value | |
| COMMON STOCK — continued | | | | | | | | |
| Financials — continued | | | | | | | | |
| Zenith Bank | | | 3,452,600 | | | $ | 468,319 | |
| | | | | | | | 2,433,360 | |
| Industrials — 6.1% | | | | | | | | |
| Dangote Cement | | | 170,600 | | | | 204,118 | |
| Lafarge Cement WAPCO Nigeria | | | 246,600 | | | | 158,411 | |
| | | | | | | | 362,529 | |
| Oil & Gas — 1.5% | | | | | | | | |
| Oando | | | 1,321,900 | | | | 92,816 | |
| TOTAL NIGERIA | | | | | | | 4,163,374 | |
| NORWAY— 5.1% | | | | | | | | |
| Oil & Gas — 5.1% | | | | | | | | |
| TGS Nopec Geophysical | | | 10,980 | | | | 302,118 | |
| UNITED KINGDOM— 10.2% | | | | | | | | |
| Oil & Gas — 10.2% | | | | | | | | |
| Afren * | | | 117,300 | | | | 296,602 | |
| Essar Energy * | | | 21,000 | | | | 40,137 | |
| Subsea 7 | | | 12,741 | | | | 269,457 | |
| TOTAL UNITED KINGDOM | | | | | | | 606,196 | |
| UNITED STATES— 4.7% | | | | | | | | |
| Oil & Gas — 4.7% | | | | | | | | |
| SEACOR Holdings * | | | 2,853 | | | | 279,024 | |
| TOTAL COMMON STOCK | | | | | | | | |
| (Cost $6,098,666) | | | | | | | 5,812,973 | |
| | | | | | | | | |
| TIME DEPOSITS — 0.2% | | | | | | | | |
| Brown Brothers Harriman | | | | | | | | |
| 0.030%, 11/01/13 | | | 13,096 | | | | 13,096 | |
| 0.628%, 11/01/13 NOK | | | 2 | | | | — | |
| TOTAL TIME DEPOSITS | | | | | | | | |
| (Cost $13,096) | | | | | | | 13,096 | |
| TOTAL INVESTMENTS — 97.6% | | | | | | | | |
| (Cost $6,111,762) | | | | | | $ | 5,826,069 | |
Percentages are based on Net Assets of $5,969,534.
* Non-income producing security.
NOK — Norwegian Krone
(1) In U.S. Dollars unless otherwise indicated.
The accompanying notes are an integral part of the financial statements.
| Schedule of Investments | October 31, 2013 |
| | |
| Global X Nigeria Index ETF |
The following is a summary of the inputs used as of October 31, 2013, in valuing the Fund's investments carried at value:
| Investments in Securities | | Level 1 | | | Level 2 | | | Level 3 | | | Total | |
| Common Stock | | $ | 5,812,973 | | | $ | — | | | $ | — | | | $ | 5,812,973 | |
| Time Deposits | | | — | | | | 13,096 | | | | — | | | | 13,096 | |
| Total Investments in Securities | | $ | 5,812,973 | | | $ | 13,096 | | | $ | — | | | $ | 5,826,069 | |
For the period ended October 31, 2013, there have been no transfers between Level 1, Level 2 or Level 3 investments.
As of October 31, 2013, there were no Level 3 investments.
Amounts designated as “—“ are either $0 or have been rounded to $0.
The accompanying notes are an integral part of the financial statements.
| Statements of Assets and Liabilities |
| October 31, 2013 |
| | | Global X China
Consumer ETF | | | Global X China
Energy ETF | | | Global X China
Financials ETF | | | Global X China
Industrials ETF | |
| Assets: | | | | | | | | | | | | | | | | |
| Cost of Investments | | $ | 170,368,199 | | | $ | 4,184,120 | | | $ | 41,364,809 | | | $ | 5,321,431 | |
| Cost of Repurchase Agreements | | | 15,499,984 | | | | — | | | | — | | | | — | |
| Investments, at Value | | $ | 170,466,880 | * | | $ | 4,520,535 | | | $ | 42,509,461 | | | $ | 4,245,690 | |
| Repurchase Agreements, at Value | | | 15,499,984 | | | | — | | | | — | | | | — | |
| Cash | | | — | | | | — | | | | 632 | | | | — | |
| Receivable for Investment Securities Sold | | | 20,230,814 | | | | 526,856 | | | | 3,821,482 | | | | 597,569 | |
| Dividend and Interest Receivable | | | 128,175 | | | | — | | | | 71,776 | | | | — | |
| Due from Broker | | | 33,640 | | | | — | | | | — | | | | — | |
| Receivable for Capital Shares Sold | | | 1,386,206 | | | | — | | | | 647,500 | | | | — | |
| Total Assets | | | 207,745,699 | | | | 5,047,391 | | | | 47,050,851 | | | | 4,843,259 | |
| | | | | | | | | | | | | | | | | |
| Liabilities: | | | | | | | | | | | | | | | | |
| | | | | | | | | | | | | | | | | |
| Payable for Investment Securities Purchased | | | 19,992,336 | | | | 510,572 | | | | 4,511,858 | | | | 592,705 | |
| Obligation to Return Securities Lending Collateral | | | 15,499,984 | | | | — | | | | — | | | | — | |
| Payable for Capital Shares Redeemed | | | 1,604,502 | | | | — | | | | — | | | | — | |
| Payable due to Investment Adviser | | | 94,989 | | | | 2,469 | | | | 21,047 | | | | 2,309 | |
| Total Liabilities | | | 37,191,811 | | | | 513,041 | | | | 4,532,905 | | | | 595,014 | |
| Net Assets | | $ | 170,553,888 | | | $ | 4,534,350 | | | $ | 42,517,946 | | | $ | 4,248,245 | |
| Net Assets Consist of: | | | | | | | | | | | | | | | | |
| Paid-in Capital | | $ | 181,541,141 | | | $ | 4,583,633 | | | $ | 42,500,945 | | | $ | 6,514,000 | |
| Undistributed Net Investment Income | | | 1,780,604 | | | | 85,001 | | | | 243,279 | | | | 50,774 | |
| Accumulated Net Realized Loss on Investments | | | (12,866,060 | ) | | | (470,698 | ) | | | (1,370,934 | ) | | | (1,240,865 | ) |
| Net Unrealized Appreciation/(Depreciation) on Investments | | | 98,681 | | | | 336,415 | | | | 1,144,652 | | | | (1,075,741 | ) |
| Net Unrealized Appreciation/(Depreciation) on Foreign Currency Translation | | | (478 | ) | | | (1 | ) | | | 4 | | | | 77 | |
| Net Assets | | $ | 170,553,888 | | | $ | 4,534,350 | | | $ | 42,517,946 | | | $ | 4,248,245 | |
| Outstanding Shares of Beneficial Interest (unlimited authorization — no par value) | | | 10,750,000 | | | | 300,000 | | | | 3,200,000 | | | | 350,000 | |
| | | | | | | | | | | | | | | | | |
| Net Asset Value, Offering and Redemption Price Per Share | | $ | 15.87 | | | $ | 15.11 | | | $ | 13.29 | | | $ | 12.14 | |
| | | | | | | | | | | | | | | | | |
| *Includes Market Value of Securities on Loan | | $ | 12,858,803 | | | $ | — | | | $ | — | | | $ | — | |
The accompanying notes are an integral part of the financial statements.
| Statements of Assets and Liabilities |
| October 31, 2013 |
| | | Global X China
Materials ETF | | | Global X
NASDAQ China
Technology ETF | | | Global X ASEAN
40 ETF | | | Global X FTSE
Andean 40 ETF | |
| Assets: | | | | | | | | | | | | | | | | |
| Cost of Investments | | $ | 2,814,922 | | | $ | 8,972,992 | | | $ | 50,742,142 | | | $ | 11,717,111 | |
| Cost of Foreign Currency | | | — | | | | — | | | | 13,854 | | | | 2,458 | |
| Investments, at Value | | $ | 2,268,697 | | | $ | 10,331,209 | | | $ | 49,644,248 | | | $ | 10,385,659 | |
| Foreign Currency, at Value | | | — | | | | — | | | | 13,854 | | | | 2,446 | |
| Receivable for Investment Securities Sold | | | 496,131 | | | | — | | | | — | | | | — | |
| Dividend and Interest Receivable | | | 1,891 | | | | — | | | | 163 | | | | 584 | |
| Reclaim Receivable | | | — | | | | — | | | | 3,179 | | | | — | |
| Total Assets | | | 2,766,719 | | | | 10,331,209 | | | | 49,661,444 | | | | 10,388,689 | |
| Liabilities: | | | | | | | | | | | | | | | | |
| Payable for Investment Securities Purchased | | | 496,488 | | | | — | | | | — | | | | — | |
| Cash Overdraft | | | — | | | | 8,984 | | | | — | | | | — | |
| Payable due to Investment Adviser | | | 1,251 | | | | 4,771 | | | | 27,125 | | | | 6,399 | |
| Total Liabilities | | | 497,739 | | | | 13,755 | | | | 27,125 | | | | 6,399 | |
| Net Assets | | $ | 2,268,980 | | | $ | 10,317,454 | | | $ | 49,634,319 | | | $ | 10,382,290 | |
| Net Assets Consist of: | | | | | | | | | | | | | | | | |
| Paid-in Capital | | $ | 3,599,439 | | | $ | 9,937,286 | | | $ | 50,961,293 | | | $ | 12,256,967 | |
| Undistributed Net Investment Income | | | 36,867 | | | | 3,667 | | | | 1,285,520 | | | | 121,253 | |
| Accumulated Net Realized Loss on Investments | | | (821,168 | ) | | | (981,716 | ) | | | (1,514,352 | ) | | | (664,463 | ) |
| Net Unrealized Appreciation/(Depreciation) on Investments | | | (546,225 | ) | | | 1,358,217 | | | | (1,097,894 | ) | | | (1,331,452 | ) |
| Net Unrealized Appreciation/(Depreciation) on Foreign Currency Translation | | | 67 | | | | — | | | | (248 | ) | | | (15 | ) |
| Net Assets | | $ | 2,268,980 | | | $ | 10,317,454 | | | $ | 49,634,319 | | | $ | 10,382,290 | |
| Outstanding Shares of Beneficial Interest (unlimited authorization — no par value) | | | 149,971 | | | | 500,000 | | | | 2,900,000 | | | | 850,000 | |
| | | | | | | | | | | | | | | | | |
| Net Asset Value, Offering and Redemption Price Per Share | | $ | 15.13 | | | $ | 20.63 | | | $ | 17.12 | | | $ | 12.21 | |
The accompanying notes are an integral part of the financial statements.
| Statements of Assets and Liabilities |
| October 31, 2013 |
| | | Global X FTSE
Colombia 20 ETF | | | Global X Brazil
Mid Cap ETF | | | Global X Brazil
Consumer ETF | | | Global X Brazil
Financials ETF | |
| Assets: | | | | | | | | | | | | | | | | |
| Cost of Investments | | $ | 145,491,899 | | | $ | 12,484,761 | | | $ | 17,606,483 | | | $ | 2,845,545 | |
| Cost of Foreign Currency | | | 125,685 | | | | 2,908 | | | | 6,778 | | | | — | |
| Investments, at Value | | $ | 149,628,235 | * | | $ | 12,356,226 | | | $ | 18,781,250 | | | $ | 2,421,581 | |
| Cash | | | 13,364,891 | | | | — | | | | — | | | | — | |
| Foreign Currency, at Value | | | 125,070 | | | | 2,875 | | | | 6,649 | | | | — | |
| Receivable for Investment Securities Sold | | | 1,034,125 | | | | — | | | | — | | | | — | |
| Dividend and Interest Receivable | | | 63,971 | | | | 41,447 | | | | 11,280 | | | | 4,634 | |
| Reclaim Receivable | | | — | | | | — | | | | — | | | | 139 | |
| Total Assets | | | 164,216,292 | | | | 12,400,548 | | | | 18,799,179 | | | | 2,426,354 | |
| Liabilities: | | | | | | | | | | | | | | | | |
| Obligation to Return Securities Lending Collateral | | | 13,360,650 | | | | — | | | | — | | | | — | |
| Payable for Capital Shares Redeemed | | | 1,038,000 | | | | — | | | | — | | | | — | |
| Payable due to Custodian | | | 121,531 | | | | — | | | | — | | | | — | |
| Payable due to Investment Adviser | | | 71,557 | | | | 7,330 | | | | 12,630 | | | | 1,598 | |
| Cash Overdraft | | | — | | | | 3,050 | | | | — | | | | — | |
| Total Liabilities | | | 14,591,738 | | | | 10,380 | | | | 12,630 | | | | 1,598 | |
| Net Assets | | $ | 149,624,554 | | | $ | 12,390,168 | | | $ | 18,786,549 | | | $ | 2,424,756 | |
| Net Assets Consist of: | | | | | | | | | | | | | | | | |
| Paid-in Capital | | $ | 169,626,762 | | | $ | 16,525,566 | | | $ | 20,702,181 | | | $ | 4,052,959 | |
| Undistributed Net Investment Income | | | 2,094,412 | | | | 487,665 | | | | 150,412 | | | | 15,512 | |
| Accumulated Net Realized Loss on Investments | | | (26,228,823 | ) | | | (4,493,891 | ) | | | (3,240,404 | ) | | | (1,219,625 | ) |
| Net Unrealized Appreciation/(Depreciation) on Investments | | | 4,136,336 | | | | (128,535 | ) | | | 1,174,767 | | | | (423,964 | ) |
| Net Unrealized Depreciation on Foreign Currency Translations | | | (4,133 | ) | | | (637 | ) | | | (407 | ) | | | (126 | ) |
| Net Assets | | $ | 149,624,554 | | | $ | 12,390,168 | | | $ | 18,786,549 | | | $ | 2,424,756 | |
| Outstanding Shares of Beneficial Interest (unlimited authorization — no par value) | | | 7,280,000 | | | | 850,000 | | | | 1,050,000 | | | | 200,000 | |
| | | | | | | | | | | | | | | | | |
| Net Asset Value, Offering and Redemption Price Per Share | | $ | 20.55 | | | $ | 14.58 | | | $ | 17.89 | | | $ | 12.12 | |
| | | | | | | | | | | | | | | | | |
| *Includes Market Value of Securities on Loan | | $ | 13,076,096 | | | $ | — | | | $ | — | | | $ | — | |
The accompanying notes are an integral part of the financial statements.
| Statements of Assets and Liabilities |
| October 31, 2013 |
| | | Global X FTSE
Argentina 20 ETF | | | Global X FTSE
Greece 20 ETF | | | Global X FTSE
Norway 30 ETF | | | Global X FTSE
Nordic Region
ETF | |
| Assets: | | | | | | | | | | | | | | | | |
| Cost of Investments | | $ | 7,219,929 | | | $ | 73,534,399 | | | $ | 74,474,270 | | | $ | 48,160,650 | |
| Cost of Repurchase Agreements | | | — | | | | — | | | | 2,635,200 | | | | — | |
| Investments, at Value | | $ | 7,408,299 | | | $ | 94,003,177 | | | $ | 80,497,907 | * | | $ | 55,966,220 | |
| Repurchase Agreements, at Value | | | — | | | | — | | | | 2,635,200 | | | | — | |
| Receivable for Investment Securities Sold | | | — | | | | 986,787 | | | | — | | | | — | |
| Dividend and Interest Receivable | | | — | | | | — | | | | 280 | | | | — | |
| Receivable for Capital Shares Sold | | | — | | | | 106,861 | | | | — | | | | — | |
| Reclaim Receivable | | | — | | | | — | | | | — | | | | 182,996 | |
| Total Assets | | | 7,408,299 | | | | 95,096,825 | | | | 83,133,387 | | | | 56,149,216 | |
| Liabilities: | | | | | | | | | | | | | | | | |
| Obligation to Return Securities Lending Collateral | | | — | | | | — | | | | 2,635,200 | | | | — | |
| Payable for Investment Securities Purchased | | | — | | | | 106,861 | | | | — | | | | — | |
| Cash Overdraft | | | 808,825 | | | | 975 | | | | — | | | | 110,916 | |
| Payable due to Investment Adviser | | | 4,184 | | | | 36,859 | | | | 33,413 | | | | 23,621 | |
| Payable due to Custodian | | | 100 | | | | 14,193 | | | | — | | | | — | |
| Total Liabilities | | | 813,109 | | | | 158,888 | | | | 2,668,613 | | | | 134,537 | |
| Net Assets | | $ | 6,595,190 | | | $ | 94,937,937 | | | $ | 80,464,774 | | | $ | 56,014,679 | |
| Net Assets Consist of: | | | | | | | | | | | | | | | | |
| Paid-in Capital | | $ | 8,050,557 | | | $ | 82,796,221 | | | $ | 77,477,579 | | | $ | 48,276,957 | |
| Undistributed Net Investment Income | | | 4,223 | | | | 53,064 | | | | 1,818,785 | | | | 1,143,775 | |
| Accumulated Net Realized Loss on Investments | | | (1,647,960 | ) | | | (8,380,885 | ) | | | (4,855,227 | ) | | | (1,214,805 | ) |
| Net Unrealized Appreciation on Investments | | | 188,370 | | | | 20,468,778 | | | | 6,023,637 | | | | 7,805,570 | |
| Net Unrealized Appreciation on Foreign Currency Translation | | | — | | | | 759 | | | | — | | | | 3,182 | |
| Net Assets | | $ | 6,595,190 | | | $ | 94,937,937 | | | $ | 80,464,774 | | | $ | 56,014,679 | |
| Outstanding Shares of Beneficial Interest (unlimited authorization — no par value) | | | 324,975 | | | | 4,200,000 | | | | 4,800,000 | | | | 2,360,000 | |
| | | | | | | | | | | | | | | | | |
| Net Asset Value, Offering and Redemption Price Per Share | | $ | 20.29 | | | $ | 22.60 | | | $ | 16.76 | | | $ | 23.74 | |
| | | | | | | | | | | | | | | | | |
| *Includes Market Value of Securities on Loan | | $ | — | | | $ | — | | | $ | 2,470,566 | | | $ | — | |
The accompanying notes are an integral part of the financial statements.
| Statements of Assets and Liabilities |
| October 31, 2013 |
| | | Global X Central
Asia & Mongolia
Index ETF | | | Global X Nigeria
Index ETF | |
| Assets: | | | | | | | | |
| Cost of Investments | | $ | 1,647,704 | | | $ | 6,111,762 | |
| Investments at Value | | $ | 1,517,775 | | | $ | 5,826,069 | |
| Receivable for Capital Shares Sold | | | — | | | | 746,000 | |
| Receivable for Investment Securities Sold | | | — | | | | 178,113 | |
| Reclaim Receivable | | | 1,009 | | | | — | |
| Dividend and Interest Receivable | | | 475 | | | | 5,024 | |
| Total Assets | | | 1,519,259 | | | | 6,755,206 | |
| Liabilities: | | | | | | | | |
| Cash Overdraft | | | 144,746 | | | | — | |
| Payable due to Investment Adviser | | | 791 | | | | 2,963 | |
| Payable due to Custodian | | | 96 | | | | — | |
| Payable for Investment Securities Purchased | | | — | | | | 782,709 | |
| Total Liabilities | | | 145,633 | | | | 785,672 | |
| Net Assets | | $ | 1,373,626 | | | $ | 5,969,534 | |
| Net Assets Consist of: | | | | | | | | |
| Paid-in Capital | | $ | 1,471,879 | | | $ | 6,162,500 | |
| Undistributed Net Investment Income | | | 48,449 | | | | 76,054 | |
| Accumulated Net Realized Gain (Loss) on Investments | | | (16,750 | ) | | | 16,785 | |
| Net Unrealized Depreciation on Investments | | | (129,929 | ) | | | (285,693 | ) |
| Net Unrealized Depreciation on Foreign Currency Translation | | | (23 | ) | | | (112 | ) |
| Net Assets | | $ | 1,373,626 | | | $ | 5,969,534 | |
| Outstanding Shares of Beneficial Interest (unlimited authorization — no par value) | | | 100,000 | | | | 400,000 | |
| | | | | | | | | |
| Net Asset Value, Offering and Redemption Price Per Share | | $ | 13.74 | | | $ | 14.92 | |
The accompanying notes are an integral part of the financial statements.
| Statements of Operations |
| For the year ended October 31, 2013 |
| | | Global X
China
Consumer ETF | | | Global X
China
Energy ETF | | | Global X
China
Financials
ETF | | | Global X
China
Industrials
ETF | |
| Investment Income: | | | | | | | | | | | | | | | | |
| Dividend Income | | $ | 2,887,768 | | | $ | 127,600 | | | $ | 347,011 | | | $ | 89,995 | |
| Interest Income | | | 136 | | | | 3 | | | | 4 | | | | 2 | |
| Security Lending Income | | | 402,269 | | | | — | | | | — | | | | — | |
| Less: Foreign Taxes Withheld | | | (88,086 | ) | | | (12,302 | ) | | | (27,159 | ) | | | (5,143 | ) |
| Total Investment Income | | | 3,202,087 | | | | 115,301 | | | | 319,856 | | | | 84,854 | |
| Supervision and Administration Fees(1) | | | 1,184,505 | | | | 30,367 | | | | 75,787 | | | | 28,614 | |
| Total Expenses | | | 1,184,505 | | | | 30,367 | | | | 75,787 | | | | 28,614 | |
| Net Investment Income | | | 2,017,582 | | | | 84,934 | | | | 244,069 | | | | 56,240 | |
| Net Realized Gain (Loss) on: | | | | | | | | | | | | | | | | |
| Investments (2) | | | 5,996,926 | | | | (83,635 | ) | | | (163,659 | ) | | | (227,765 | ) |
| Foreign Currency Transactions | | | (1,285 | ) | | | 42 | | | | 40 | | | | (187 | ) |
| Net Realized Gain (Loss) on Investments and Foreign Currency Transactions | | | 5,995,641 | | | | (83,593 | ) | | | (163,619 | ) | | | (227,952 | ) |
| Net Change in Unrealized Appreciation/(Depreciation) on: | | | | | | | | | | | | | | | | |
| Investments | | | 10,377,253 | | | | 541,292 | | | | 1,634,218 | | | | 499,087 | |
| Foreign Currency Translation | | | (530 | ) | | | (3 | ) | | | 5 | | | | (997 | ) |
| Net Change in Unrealized Appreciation on Investments and Foreign Currency Translation | | | 10,376,723 | | | | 541,289 | | | | 1,634,223 | | | | 498,090 | |
| Net Realized and Unrealized Gain on Investments and Foreign Currency Transactions and Translation | | | 16,372,364 | | | | 457,696 | | | | 1,470,604 | | | | 270,138 | |
| Net Increase in Net Assets Resulting from Operations | | $ | 18,389,946 | | | $ | 542,630 | | | $ | 1,714,673 | | | $ | 326,378 | |
| (1) | The Supervision and Administration fees reflect the supervisory and administrative fee, which includes fees paid by the Funds for the investment advisory services provided by the Adviser. (See Note 3 in Notes to Financial Statements.) |
| (2) | Includes realized gains/(losses) as a result of in-kind transactions. (See Note 4 in Notes to Financial Statements). |
The accompanying notes are an integral part of the financial statements.
| Statements of Operations |
| For the year ended October 31, 2013 |
| | | Global X
China
Materials
ETF | | | Global X
NASDAQ
China
Technology
ETF | | | Global X
ASEAN 40
ETF | | | Global X FTSE
Andean 40
ETF | |
| Investment Income: | | | | | | | | | | | | | | | | |
| Dividend Income | | $ | 57,593 | | | $ | 32,144 | | | $ | 1,740,049 | | | $ | 244,845 | |
| Interest Income | | | 1 | | | | 4 | | | | 51 | | | | 4,310 | |
| Less: Foreign Taxes Withheld | | | (2,890 | ) | | | (2,091 | ) | | | (75,500 | ) | | | (25,184 | ) |
| Total Investment Income | | | 54,704 | | | | 30,057 | | | | 1,664,600 | | | | 223,971 | |
| Supervision and Administration Fees(1) | | | 15,464 | | | | 24,612 | | | | 319,807 | | | | 66,248 | |
| Total Expenses | | | 15,464 | | | | 24,612 | | | | 319,807 | | | | 66,248 | |
| Net Investment Income | | | 39,240 | | | | 5,445 | | | | 1,344,793 | | | | 157,723 | |
| Net Realized Gain (Loss) on: | | | | | | | | | | | | | | | | |
| Investments (2) | | | (651,339 | ) | | | (201,625 | ) | | | 404,667 | | | | (275,855 | ) |
| Foreign Currency Transactions | | | 130 | | | | (36 | ) | | | 32,543 | | | | 3,351 | |
| Net Realized Gain (Loss) on Investments and Foreign Currency Transactions | | | (651,209 | ) | | | (201,661 | ) | | | 437,210 | | | | (272,504 | ) |
| Net Change in Unrealized Appreciation/(Depreciation) on: | | | | | | | | | | | | | | | | |
| Investments | | | 480,223 | | | | 1,654,249 | | | | (2,149,644 | ) | | | (1,313,313 | ) |
| Foreign Currency Translation | | | 67 | | | | (1 | ) | | | (200 | ) | | | 126 | |
| Net Change in Unrealized Appreciation/(Depreciation) on Investments and Foreign Currency Translation | | | 480,290 | | | | 1,654,248 | | | | (2,149,844 | ) | | | (1,313,187 | ) |
| Net Realized and Unrealized Gain (Loss) on Investments and Foreign Currency Transactions and Translation | | | (170,919 | ) | | | 1,452,587 | | | | (1,712,634 | ) | | | (1,585,691 | ) |
| Net Increase(Decrease) in Net Assets Resulting from Operations | | $ | (131,679 | ) | | $ | 1,458,032 | | | $ | (367,841 | ) | | $ | (1,427,968 | ) |
| (1) | The Supervision and Administration fees reflect the supervisory and administrative fee, which includes fees paid by the Funds for the investment advisory services provided by the Adviser. (See Note 3 in Notes to Financial Statements.) |
| (2) | Includes realized gains/(losses) as a result of in-kind transactions. (See Note 4 in Notes to Financial Statements). |
The accompanying notes are an integral part of the financial statements.
| Statements of Operations |
| For the year ended October 31, 2013 |
| | | Global X FTSE
Colombia 20
ETF | | | Global X
Brazil Mid
Cap ETF | | | Global X
Brazil
Consumer
ETF | | | Global X
Brazil
Financials
ETF | |
| Investment Income: | | | | | | | | | | | | | | | | |
| Dividend Income | | $ | 4,723,742 | | | $ | 637,677 | | | $ | 341,033 | | | $ | 104,020 | |
| Interest Income | | | 115 | | | | 8,562 | | | | 12,183 | | | | 4 | |
| Security Lending Income | | | 89,769 | | | | — | | | | — | | | | — | |
| Less: Foreign Taxes Withheld | | | (49,087 | ) | | | — | | | | — | | | | — | |
| Total Investment Income | | | 4,764,539 | | | | 646,239 | | | | 353,216 | | | | 104,024 | |
| Supervision and Administration Fees(1) | | | 1,159,717 | | | | 111,144 | | | | 172,884 | | | | 25,607 | |
| Custodian Fees | | | 197,511 | | | | – | | | | – | | | | – | |
| Total Expenses | | | 1,357,228 | | | | 111,144 | | | | 172,884 | | | | 25,607 | |
| Waiver of Supervision and Administration Fees | | | (84,928 | ) | | | – | | | | – | | | | – | |
| Net Expenses | | | 1,272,300 | | | | 111,144 | | | | 172,884 | | | | 25,607 | |
| Net Investment Income | | | 3,492,239 | | | | 535,095 | | | | 180,332 | | | | 78,417 | |
| Net Realized Gain (Loss) on: | | | | | | | | | | | | | | | | |
| Investments (2) | | | (6,181,802 | ) | | | (941,975 | ) | | | 149,483 | | | | (633,542 | ) |
| Foreign Currency Transactions | | | 49,046 | | | | 4,318 | | | | (6,530 | ) | | | 6,946 | |
| Net Realized Gain (Loss) on Investments and Foreign Currency Transactions | | | (6,132,756 | ) | | | (937,657 | ) | | | 142,953 | | | | (626,596 | ) |
| Net Change in Unrealized Appreciation/(Depreciation) on: | | | | | | | | | | | | | | | | |
| Investments | | | (9,053,325 | ) | | | (414,915 | ) | | | (1,992,672 | ) | | | 366,383 | |
| Foreign Currency Translation | | | 2,922 | | | | (543 | ) | | | 187 | | | | (126 | ) |
| Net Change in Unrealized Appreciation/(Depreciation) on Investments and Foreign Currency Translation | | | (9,050,403 | ) | | | (415,458 | ) | | | (1,992,485 | ) | | | 366,257 | |
| Net Realized and Unrealized Loss on Investments and Foreign Currency Transactions and Translation | | | (15,183,159 | ) | | | (1,353,115 | ) | | | (1,849,532 | ) | | | (260,339 | ) |
| Net Decrease in Net Assets Resulting from Operations | | $ | (11,690,920 | ) | | $ | (818,020 | ) | | $ | (1,669,200 | ) | | $ | (181,922 | ) |
| (1) | The Supervision and Administration fees reflect the supervisory and administrative fee, which includes fees paid by the Funds for the investment advisory services provided by the Adviser. (See Note 3 in Notes to Financial Statements.) |
| (2) | Includes realized gains/(losses) as a result of in-kind transactions. (See Note 4 in Notes to Financial Statements). |
The accompanying notes are an integral part of the financial statements.
| Statements of Operations |
| For the year ended October 31, 2013 |
| | | Global X
FTSE
Argentina 20
ETF | | | Global X FTSE
Greece 20 ETF | | | Global X
FTSE
Norway 30
ETF | | | Global X FTSE
Nordic Region
ETF | |
| Investment Income: | | | | | | | | | | | | | | | | |
| Dividend Income | | $ | 58,303 | | | $ | 706,835 | | | $ | 2,667,527 | | | $ | 1,421,237 | |
| Interest Income | | | 1 | | | | 40 | | | | 42 | | | | 24 | |
| Security Lending Income | | | — | | | | — | | | | 159,643 | | | | 18,221 | |
| Less: Foreign Taxes Withheld | | | (5,277 | ) | | | (127,799 | ) | | | (497,322 | ) | | | (28,573 | ) |
| Total Investment Income | | | 53,027 | | | | 579,076 | | | | 2,329,890 | | | | 1,410,909 | |
| Supervision and Administration Fees(1) | | | 29,929 | | | | 219,680 | | | | 311,916 | | | | 206,435 | |
| Custodian Fees | | | 140 | | | | 22,969 | | | | – | | | | – | |
| Total Expenses | | | 30,069 | | | | 242,649 | | | | 311,916 | | | | 206,435 | |
| Net Investment Income | | | 22,958 | | | | 336,427 | | | | 2,017,974 | | | | 1,204,474 | |
| Net Realized Gain (Loss) on: | | | | | | | | | | | | | | | | |
| Investments (2) | | | (754,449 | ) | | | (1,132,594 | ) | | | 865,940 | | | | (453,320 | ) |
| Foreign Currency Transactions | | | 1,952 | | | | 17,334 | | | | (4,165 | ) | | | (8,778 | ) |
| Net Realized Gain (Loss) on Investments and Foreign Currency Transactions | | | (752,497 | ) | | | (1,115,260 | ) | | | 861,775 | | | | (462,098 | ) |
| Net Change in Unrealized Appreciation/(Depreciation) on: | | | | | | | | | | | | | | | | |
| Investments | | | 1,578,925 | | | | 16,321,043 | | | | 5,669,971 | | | | 9,572,544 | |
| Foreign Currency Translation | | | — | | | | 759 | | | | (72 | ) | | | 3,392 | |
| Net Change in Unrealized Appreciation on Investments and Foreign Currency Translation | | | 1,578,925 | | | | 16,321,802 | | | | 5,669,899 | | | | 9,575,936 | |
| Net Realized and Unrealized Gain on Investments and Foreign Currency Transactions and Translation | | | 826,428 | | | | 15,206,542 | | | | 6,531,674 | | | | 9,113,838 | |
| Net Increase in Net Assets Resulting from Operations | | $ | 849,386 | | | $ | 15,542,969 | | | $ | 8,549,648 | | | $ | 10,318,312 | |
| (1) | The Supervision and Administration fees reflect the supervisory and administrative fee, which includes fees paid by the Funds for the investment advisory services provided by the Adviser. (See Note 3 in Notes to Financial Statements.) |
| (2) | Includes realized gains/(losses) as a result of in-kind transactions. (See Note 4 in Notes to Financial Statements). |
The accompanying notes are an integral part of the financial statements.
| Statements of Operations |
| For the period ended October 31, 2013 |
| | | Global X
Central Asia
& Mongolia
Index ETF(3) | | | Global X
Nigeria Index
ETF(3) | |
| Investment Income: | | | | | | | | |
| Dividend Income | | $ | 60,926 | | | $ | 108,827 | |
| Interest Income | | | — | | | | 2 | |
| Less: Foreign Taxes Withheld | | | (5,980 | ) | | | (12,197 | ) |
| Total Investment Income | | | 54,946 | | | | 96,632 | |
| Supervision and Administration Fees(1) | | | 6,526 | | | | 15,495 | |
| Custodian Fees | | | 96 | | | | 5,469 | |
| Total Expenses | | | 6,622 | | | | 20,964 | |
| Waiver of Supervision and Administration Fees | | | — | | | | (5,469 | ) |
| Net Expenses | | | 6,622 | | | | 15,495 | |
| Net Investment Income | | | 48,324 | | | | 81,137 | |
| Net Realized Gain (Loss) on: | | | | | | | | |
| Investments (2) | | | (70,371 | ) | | | 16,785 | |
| Foreign Currency Transactions | | | 125 | | | | (5,083 | ) |
| Net Realized Gain (Loss) on Investments and Foreign Currency Transactions | | | (70,246 | ) | | | 11,702 | |
| Net Change in Unrealized Depreciation on: | | | | | | | | |
| Investments | | | (129,929 | ) | | | (285,693 | ) |
| Foreign Currency Translation | | | (23 | ) | | | (112 | ) |
| Net Change in Unrealized Depreciation on Investments and Foreign Currency Translation | | | (129,952 | ) | | | (285,805 | ) |
| Net Realized and Unrealized Loss on Investments and Foreign Currency Transactions and Translation | | | (200,198 | ) | | | (274,103 | ) |
| Net Decrease in Net Assets Resulting from Operations | | $ | (151,874 | ) | | $ | (192,966 | ) |
| (1) | The Supervision and Administration fees reflect the supervisory and administrative fee, which includes fees paid by the Funds for the investment advisory services provided by the Adviser. (See Note 3 in Notes to Financial Statements.) |
| (2) | Includes realized gains (losses) as a result of in-kind redemptions. (See Note 4 in Notes to Financial Statements.) |
| (3) | The Fund commenced operations on April 2, 2013. |
The accompanying notes are an integral part of the financial statements.
| Statements of Changes in Net Assets |
| |
| | | Global X China Consumer ETF | | | Global X China Energy ETF | |
| | | Year Ended
October 31, 2013 | | | Year Ended
October 31, 2012 | | | Year Ended
October 31, 2013 | | | Year Ended
October 31, 2012 | |
| Operations: | | | | | | | | | | | | | | | | |
| Net Investment Income | | $ | 2,017,582 | | | $ | 2,143,351 | | | $ | 84,934 | | | $ | 88,567 | |
| Net Realized Gain (Loss) on Investments and Foreign Currency Transactions(1) | | | 5,995,641 | | | | (24,420,329 | ) | | | (83,593 | ) | | | (251,146 | ) |
| Net Change in Unrealized Appreciation on Investments and Foreign Currency Translation | | | 10,376,723 | | | | 11,897,215 | | | | 541,289 | | | | 183,932 | |
| Net Increase (Decrease) in Net Assets Resulting from Operations | | | 18,389,946 | | | | (10,379,763 | ) | | | 542,630 | | | | 21,353 | |
| Dividends and Distributions from: | | | | | | | | | | | | | | | | |
| Net Investment Income | | | (2,128,638 | ) | | | (487,644 | ) | | | (88,625 | ) | | | (78,332 | ) |
| Total Dividends and Distributions | | | (2,128,638 | ) | | | (487,644 | ) | | | (88,625 | ) | | | (78,332 | ) |
| Capital Share Transactions: | | | | | | | | | | | | | | | | |
| Issued | | | 84,722,000 | | | | 61,626,500 | | | | — | | | | 1,388,000 | |
| Redeemed | | | (57,144,000 | ) | | | (60,902,500 | ) | | | (736,000 | ) | | | (1,336,500 | ) |
| Increase (Decrease) in Net Assets from Capital Share Transactions | | | 27,578,000 | | | | 724,000 | | | | (736,000 | ) | | | 51,500 | |
| Total Increase (Decrease) in Net Assets | | | 43,839,308 | | | | (10,143,407 | ) | | | (281,995 | ) | | | (5,479 | ) |
| Net Assets: | | | | | | | | | | | | | | | | |
| Beginning of Year | | | 126,714,580 | | | | 136,857,987 | | | | 4,816,345 | | | | 4,821,824 | |
| End of Year | | $ | 170,553,888 | | | $ | 126,714,580 | | | $ | 4,534,350 | | | $ | 4,816,345 | |
| Undistributed Net Investment Income | | $ | 1,780,604 | | | $ | 1,588,304 | | | $ | 85,001 | | | $ | 88,650 | |
| Share Transactions: | | | | | | | | | | | | | | | | |
| Issued | | | 5,750,000 | | | | 4,250,000 | | | | — | | | | 100,000 | |
| Redeemed | | | (4,050,000 | ) | | | (4,150,000 | ) | | | (50,000 | ) | | | (100,000 | ) |
| Net Increase (Decrease) in Shares Outstanding from Share Transactions | | | 1,700,000 | | | | 100,000 | | | | (50,000 | ) | | | — | |
| (1) | Includes realized gains/(losses) as a result of in-kind transactions. (See Note 4 in Notes to Financial Statements). |
The accompanying notes are an integral part of the financial statements.
| Statements of Changes in Net Assets |
| |
| | | Global X China Financials ETF | | | Global X China Industrials ETF | |
| | | Year Ended
October 31, 2013 | | | Year Ended
October 31, 2012 | | | Year Ended
October 31, 2013 | | | Year Ended
October 31, 2012 | |
| Operations: | | | | | | | | | | | | | | | | |
| Net Investment Income | | $ | 244,069 | | | $ | 185,315 | | | $ | 56,240 | | | $ | 65,072 | |
| Net Realized Gain (Loss) on Investments and Foreign Currency Transactions(1) | | | (163,619 | ) | | | 521,875 | | | | (227,952 | ) | | | (945,050 | ) |
| Net Change in Unrealized Appreciation on Investments and Foreign Currency Translation | | | 1,634,223 | | | | 152,783 | | | | 498,090 | | | | 892,011 | |
| Net Increase in Net Assets Resulting from Operations | | | 1,714,673 | | | | 859,973 | | | | 326,378 | | | | 12,033 | |
| Dividends and Distributions from: | | | | | | | | | | | | | | | | |
| Net Investment Income | | | (186,317 | ) | | | (14,611 | ) | | | (64,616 | ) | | | (8,938 | ) |
| Total Dividends and Distributions | | | (186,317 | ) | | | (14,611 | ) | | | (64,616 | ) | | | (8,938 | ) |
| Capital Share Transactions: | | | | | | | | | | | | | | | | |
| Issued | | | 38,748,500 | | | | 3,928,000 | | | | — | | | | — | |
| Redeemed | | | (3,771,500 | ) | | | (9,684,500 | ) | | | (574,500 | ) | | | — | |
| Increase (Decrease) in Net Assets from Capital Share Transactions | | | 34,977,000 | | | | (5,756,500 | ) | | | (574,500 | ) | | | — | |
| Total Increase (Decrease) in Net Assets | | | 36,505,356 | | | | (4,911,138 | ) | | | (312,738 | ) | | | 3,095 | |
| Net Assets: | | | | | | | | | | | | | | | | |
| Beginning of Year | | | 6,012,590 | | | | 10,923,728 | | | | 4,560,983 | | | | 4,557,888 | |
| End of Year | | $ | 42,517,946 | | | $ | 6,012,590 | | | $ | 4,248,245 | | | $ | 4,560,983 | |
| Undistributed Net Investment Income | | $ | 243,279 | | | $ | 185,487 | | | $ | 50,774 | | | $ | 59,337 | |
| Share Transactions: | | | | | | | | | | | | | | | | |
| Issued | | | 3,000,000 | | | | 350,000 | | | | — | | | | — | |
| Redeemed | | | (300,000 | ) | | | (850,000 | ) | | | (50,000 | ) | | | — | |
| Net Increase (Decrease) in Shares Outstanding from Share Transactions | | | 2,700,000 | | | | (500,000 | ) | | | (50,000 | ) | | | — | |
| (1) | Includes realized gains/(losses) as a result of in-kind transactions. (See Note 4 in Notes to Financial Statements). |
The accompanying notes are an integral part of the financial statements.
| Statements of Changes in Net Assets |
| |
| | | Global X China Materials ETF | | | Global X NASDAQ China Technology
ETF | |
| | | Year Ended
October 31, 2013 | | | Year Ended
October 31, 2012 | | | Year Ended
October 31, 2013 | | | Year Ended
October 31, 2012 | |
| Operations: | | | | | | | | | | | | | | | | |
| Net Investment Income | | $ | 39,240 | | | $ | 37,835 | | | $ | 5,445 | | | $ | 14,122 | |
| Net Realized Loss on Investments and Foreign Currency Transactions(1) | | | (651,209 | ) | | | (924,388 | ) | | | (201,661 | ) | | | (146,960 | ) |
| Net Change in Unrealized Appreciation (Depreciation) on Investments and Foreign Currency Translation | | | 480,290 | | | | 439,407 | | | | 1,654,248 | | | | (284,138 | ) |
| Net Increase (Decrease) in Net Assets Resulting from Operations | | | (131,679 | ) | | | (447,146 | ) | | | 1,458,032 | | | | (416,976 | ) |
| Dividends and Distributions from: | | | | | | | | | | | | | | | | |
| Net Investment Income | | | (40,384 | ) | | | — | | | | (16,025 | ) | | | (57,614 | ) |
| Total Dividends and Distributions | | | (40,384 | ) | | | — | | | | (16,025 | ) | | | (57,614 | ) |
| Capital Share Transactions: | | | | | | | | | | | | | | | | |
| Issued | | | — | | | | 898,000 | | | | 6,121,500 | | | | 1,391,000 | |
| Redeemed | | | (438 | ) | | | (884,000 | ) | | | — | | | | (2,776,500 | ) |
| Increase (Decrease) in Net Assets from Capital Share Transactions | | | (438 | ) | | | 14,000 | | | | 6,121,500 | | | | (1,385,500 | ) |
| Total Increase (Decrease) in Net Assets | | | (172,501 | ) | | | (433,146 | ) | | | 7,563,507 | | | | (1,860,090 | ) |
| Net Assets: | | | | | | | | | | | | | | | | |
| Beginning of Year | | | 2,441,481 | | | | 2,874,627 | | | | 2,753,947 | | | | 4,614,037 | |
| End of Year | | $ | 2,268,980 | | | $ | 2,441,481 | | | $ | 10,317,454 | | | $ | 2,753,947 | |
| Undistributed Net Investment Income | | $ | 36,867 | | | $ | 37,881 | | | $ | 3,667 | | | $ | 14,283 | |
| Share Transactions: | | | | | | | | | | | | | | | | |
| Issued | | | — | | | | 100,000 | | | | 300,000 | | | | 100,000 | |
| Redeemed | | | (29 | )(2) | | | (100,000 | ) | | | — | | | | (200,000 | ) |
| Net Increase (Decrease) in Shares Outstanding from Share Transactions | | | (29 | ) | | | — | | | | 300,000 | | | | (100,000 | ) |
| (1) | Includes realized gains/(losses) as a result of in-kind transactions. (See Note 4 in Notes to Financial Statements). |
| (2) | Adjusted to reflect the effect of a 1 for 2 share split on May 16, 2013. (See Note 8 in the Notes to Financial Statements). |
The accompanying notes are an integral part of the financial statements.
| Statements of Changes in Net Assets |
| |
| |
| | | Global X ASEAN 40 ETF | | | Global X FTSE Andean 40 ETF | |
| | | Year Ended
October 31, 2013 | | | Year Ended
October 31, 2012 | | | Year Ended
October 31, 2013 | | | Year Ended
October 31, 2012 | |
| Operations: | | | | | | | | | | | | | | | | |
| Net Investment Income | | $ | 1,344,793 | | | $ | 880,478 | | | $ | 157,723 | | | $ | 129,929 | |
| Net Realized Gain (Loss) on Investments and Foreign Currency Transactions(1) | | | 437,210 | | | | (639,423 | ) | | | (272,504 | ) | | | (212,252 | ) |
| Net Change in Unrealized Appreciation (Depreciation) on Investments and Foreign Currency Translation | | | (2,149,844 | ) | | | 2,392,834 | | | | (1,313,187 | ) | | | 442,908 | |
| Net Increase (Decrease) in Net Assets Resulting from Operations | | | (367,841 | ) | | | 2,633,889 | | | | (1,427,968 | ) | | | 360,585 | |
| Dividends and Distributions from: | | | | | | | | | | | | | | | | |
| Net Investment Income | | | (806,416 | ) | | | (517,045 | ) | | | (155,634 | ) | | | (120,234 | ) |
| Total Dividends and Distributions | | | (806,416 | ) | | | (517,045 | ) | | | (155,634 | ) | | | (120,234 | ) |
| Capital Share Transactions: | | | | | | | | | | | | | | | | |
| Issued | | | 40,455,000 | | | | 8,732,000 | | | | 3,345,500 | | | | 2,269,000 | |
| Redeemed | | | (22,302,500 | ) | | | (1,455,000 | ) | | | — | | | | (695,000 | ) |
| Increase in Net Assets from Capital Share Transactions | | | 18,152,500 | | | | 7,277,000 | | | | 3,345,500 | | | | 1,574,000 | |
| Total Increase in Net Assets | | | 16,978,243 | | | | 9,393,844 | | | | 1,761,898 | | | | 1,814,351 | |
| Net Assets: | | | | | | | | | | | | | | | | |
| Beginning of Year | | | 32,656,076 | | | | 23,262,232 | | | | 8,620,392 | | | | 6,806,041 | |
| End of Year | | $ | 49,634,319 | | | $ | 32,656,076 | | | $ | 10,382,290 | | | $ | 8,620,392 | |
| Undistributed Net Investment Income | | $ | 1,285,520 | | | $ | 639,906 | | | $ | 121,253 | | | $ | 114,701 | |
| Share Transactions: | | | | | | | | | | | | | | | | |
| Issued | | | 2,300,000 | | | | 550,000 | | | | 250,000 | | | | 150,000 | |
| Redeemed | | | (1,350,000 | ) | | | (100,000 | ) | | | — | | | | (50,000 | ) |
| Net Increase in Shares Outstanding from Share Transactions | | | 950,000 | | | | 450,000 | | | | 250,000 | | | | 100,000 | |
| (1) | Includes realized gains/(losses) as a result of in-kind transactions. (See Note 4 in Notes to Financial Statements). |
The accompanying notes are an integral part of the financial statements.
| Statements of Changes in Net Assets |
| |
| | | Global X FTSE Colombia 20 ETF | | | Global X Brazil Mid Cap ETF | |
| | | Year Ended
October 31, 2013 | | | Year Ended
October 31, 2012 | | | Year Ended
October 31, 2013 | | | Year Ended
October 31, 2012 | |
| Operations: | | | | | | | | | | | | | | | | |
| Net Investment Income | | $ | 3,492,239 | | | $ | 3,105,851 | | | $ | 535,095 | | | $ | 662,219 | |
| Net Realized Loss on Investments and Foreign Currency Transactions(1) | | | (6,132,756 | ) | | | (4,740,110 | ) | | | (937,657 | ) | | | (1,901,725 | ) |
| Net Change in Unrealized Appreciation (Depreciation) on Investments and Foreign Currency Translation | | | (9,050,403 | ) | | | 17,279,659 | | | | (415,458 | ) | | | 1,685,394 | |
| Net Increase (Decrease) in Net Assets Resulting from Operations | | | (11,690,920 | ) | | | 15,645,400 | | | | (818,020 | ) | | | 445,888 | |
| Dividends and Distributions from: | | | | | | | | | | | | | | | | |
| Net Investment Income | | | (3,654,817 | ) | | | (1,467,527 | ) | | | (544,000 | ) | | | (495,614 | ) |
| Total Dividends and Distributions | | | (3,654,817 | ) | | | (1,467,527 | ) | | | (544,000 | ) | | | (495,614 | ) |
| Capital Share Transactions: | | | | | | | | | | | | | | | | |
| Issued | | | 42,301,000 | | | | 136,925,500 | | | | — | | | | 1,448,000 | |
| Redeemed | | | (59,709,500 | ) | | | (110,337,500 | ) | | | (7,242,000 | ) | | | (3,733,500 | ) |
| Increase (Decrease) in Net Assets from Capital Share Transactions | | | (17,408,500 | ) | | | 26,588,000 | | | | (7,242,000 | ) | | | (2,285,500 | ) |
| Total Increase (Decrease) in Net Assets | | | (32,754,237 | ) | | | 40,765,873 | | | | (8,604,020 | ) | | | (2,335,226 | ) |
| Net Assets: | | | | | | | | | | | | | | | | |
| Beginning of Year | | | 182,378,791 | | | | 141,612,918 | | | | 20,994,188 | | | | 23,329,414 | |
| End of Year | | $ | 149,624,554 | | | $ | 182,378,791 | | | $ | 12,390,168 | | | $ | 20,994,188 | |
| Undistributed Net Investment Income | | $ | 2,094,412 | | | $ | 2,059,597 | | | $ | 487,665 | | | $ | 492,252 | |
| Share Transactions: | | | | | | | | | | | | | | | | |
| Issued | | | 2,000,000 | | | | 6,400,000 | | | | — | | | | 100,000 | |
| Redeemed | | | (3,050,000 | ) | | | (5,450,000 | ) | | | (500,000 | ) | | | (250,000 | ) |
| Net Increase (Decrease) in Shares Outstanding from Share Transactions | | | (1,050,000 | ) | | | 950,000 | | | | (500,000 | ) | | | (150,000 | ) |
| (1) | Includes realized gains(losses) as a result of in-kind transactions. (See Note 4 in Notes to Financial Statements). |
The accompanying notes are an integral part of the financial statements.
| Statements of Changes in Net Assets |
| |
| | | Global X Brazil Consumer ETF | | | Global X Brazil Financials ETF | |
| | | Year Ended
October 31, 2013 | | | Year Ended
October 31, 2012 | | | Year Ended
October 31, 2013 | | | Year Ended
October 31, 2012 | |
| Operations: | | | | | | | | | | | | | | | | |
| Net Investment Income | | $ | 180,332 | | | $ | 241,816 | | | $ | 78,417 | | | $ | 120,320 | |
| Net Realized Gain (Loss) on Investments and Foreign Currency Transactions(1) | | | 142,953 | | | | (1,566,256 | ) | | | (626,596 | ) | | | (686,342 | ) |
| Net Change in Unrealized Appreciation (Depreciation) on Investments and Foreign Currency Translation | | | (1,992,485 | ) | | | 5,437,960 | | | | 366,257 | | | | 8,774 | |
| Net Increase (Decrease) in Net Assets Resulting from Operations | | | (1,669,200 | ) | | | 4,113,520 | | | | (181,922 | ) | | | (557,248 | ) |
| Dividends and Distributions from: | | | | | | | | | | | | | | | | |
| Net Investment Income | | | (293,164 | ) | | | (392,931 | ) | | | (149,310 | ) | | | (256,178 | ) |
| Total Dividends and Distributions | | | (293,164 | ) | | | (392,931 | ) | | | (149,310 | ) | | | (256,178 | ) |
| Capital Share Transactions: | | | | | | | | | | | | | | | | |
| Issued | | | — | | | | 13,388,000 | | | | — | | | | — | |
| Redeemed | | | (4,508,500 | ) | | | (21,212,500 | ) | | | (1,089,000 | ) | | | (2,803,000 | ) |
| Decrease in Net Assets from Capital Share Transactions | | | (4,508,500 | ) | | | (7,824,500 | ) | | | (1,089,000 | ) | | | (2,803,000 | ) |
| Total Decrease in Net Assets | | | (6,470,864 | ) | | | (4,103,911 | ) | | | (1,420,232 | ) | | | (3,616,426 | ) |
| Net Assets: | | | | | | | | | | | | | | | | |
| Beginning of Year | | | 25,257,413 | | | | 29,361,324 | | | | 3,844,988 | | | | 7,461,414 | |
| End of Year | | $ | 18,786,549 | | | $ | 25,257,413 | | | $ | 2,424,756 | | | $ | 3,844,988 | |
| Undistributed Net Investment Income | | $ | 150,412 | | | $ | 269,774 | | | $ | 15,512 | | | $ | 77,358 | |
| Share Transactions: | | | | | | | | | | | | | | | | |
| Issued | | | — | | | | 750,000 | | | | — | | | | — | |
| Redeemed | | | (250,000 | ) | | | (1,200,000 | ) | | | (100,000 | ) | | | (200,000 | ) |
| Net Decrease in Shares Outstanding from Share Transactions | | | (250,000 | ) | | | (450,000 | ) | | | (100,000 | ) | | | (200,000 | ) |
| (1) | Includes realized gains/(losses) as a result of in-kind transactions. (See Note 4 in Notes to Financial Statements). |
The accompanying notes are an integral part of the financial statements.
| Statements of Changes in Net Assets |
| |
| | | Global X FTSE Argentina 20 ETF | | | Global X FTSE Greece 20 ETF | |
| | | Year Ended
October 31, 2013 | | | Year Ended
October 31, 2012 | | | Year Ended
October 31, 2013 | | | Period Ended
October 31, 2012(1) | |
| Operations: | | | | | | | | | | | | | | | | |
| Net Investment Income | | $ | 22,958 | | | $ | 42,329 | | | $ | 336,427 | | | $ | 117,722 | |
| Net Realized Gain (Loss) on Investments and Foreign Currency Transactions(1) | | | (752,497 | ) | | | (457,569 | ) | | | (1,115,260 | ) | | | 14,471 | |
| Net Change in Unrealized Appreciation (Depreciation) on Investments and Foreign Currency Translation | | | 1,578,925 | | | | (393,454 | ) | | | 16,321,802 | | | | 4,147,735 | |
| Net Increase (Decrease) in Net Assets Resulting from Operations | | | 849,386 | | | | (808,694 | ) | | | 15,542,969 | | | | 4,279,928 | |
| Dividends and Distributions from: | | | | | | | | | | | | | | | | |
| Net Investment Income | | | (31,297 | ) | | | (102,814 | ) | | | (30,671 | ) | | | (4,711 | ) |
| Net Realized Gains | | | — | | | | — | | | | (17,078 | ) | | | — | |
| Total Dividends and Distributions | | | (31,297 | ) | | | (102,814 | ) | | | (47,749 | ) | | | (4,711 | ) |
| Capital Share Transactions: | | | | | | | | | | | | | | | | |
| Issued | | | 2,832,000 | | | | — | | | | 72,034,500 | | | | 23,308,000 | |
| Redeemed | | | (443 | ) | | | — | | | | (18,455,000 | ) | | | (1,720,000 | ) |
| Increase in Net Assets from Capital Share Transactions | | | 2,831,557 | | | | — | | | | 53,579,500 | | | | 21,588,000 | |
| Total Increase (Decrease) in Net Assets | | | 3,649,646 | | | | (911,508 | ) | | | 69,074,720 | | | | 25,863,217 | |
| Net Assets: | | | | | | | | | | | | | | | | |
| Beginning of Period | | | 2,945,544 | | | | 3,857,052 | | | | 25,863,217 | | | | — | |
| End of Period | | $ | 6,595,190 | | | $ | 2,945,544 | | | $ | 94,937,937 | | | $ | 25,863,217 | |
| Undistributed Net Investment Income | | $ | 4,223 | | | $ | 10,610 | | | $ | 53,064 | | | $ | 30,671 | |
| Share Transactions: | | | | | | | | | | | | | | | | |
| Issued | | | 150,000 | (2) | | | — | | | | 3,700,000 | | | | 1,700,000 | |
| Redeemed | | | (25 | )(2) | | | — | | | | (1,100,000 | ) | | | (100,000 | ) |
| Net Increase in Shares Outstanding from Share Transactions | | | 149,975 | | | | — | | | | 2,600,000 | | | | 1,600,000 | |
| (1) | Commenced operations on December 7, 2011. |
| (2) | Adjusted to reflect the effect of a 1 for 2 share split on May 16, 2013. (See Note 8 in the Notes to Financial Statements). |
The accompanying notes are an integral part of the financial statements.
| Statements of Changes in Net Assets |
| |
| | | Global X FTSE Norway 30 ETF | | | Global X FTSE Nordic Region ETF | |
| | | Year Ended
October 31, 2013 | | | Year Ended
October 31, 2012 | | | Year Ended
October 31, 2013 | | | Year Ended
October 31, 2012 | |
| Operations: | | | | | | | | | | | | | | | | |
| Net Investment Income | | $ | 2,017,974 | | | $ | 1,805,432 | | | $ | 1,204,474 | | | $ | 731,475 | |
| Net Realized Gain (Loss) on Investments and Foreign Currency Transactions(1) | | | 861,775 | | | | (5,402,275 | ) | | | (462,098 | ) | | | (339,377 | ) |
| Net Change in Unrealized Appreciation on Investments and Foreign Currency Translation | | | 5,669,899 | | | | 6,129,970 | | | | 9,575,936 | | | | 1,941,642 | |
| Net Increase in Net Assets Resulting from Operations | | | 8,549,648 | | | | 2,533,127 | | | | 10,318,312 | | | | 2,333,740 | |
| Dividends and Distributions from: | | | | | | | | | | | | | | | | |
| Net Investment Income | | | (1,583,434 | ) | | | (1,360,544 | ) | | | (698,310 | ) | | | (742,231 | ) |
| Net Realized Gains | | | — | | | | — | | | | — | | | | (90,580 | ) |
| Total Dividends and Distributions | | | (1,583,434 | ) | | | (1,360,544 | ) | | | (698,310 | ) | | | (832,811 | ) |
| Capital Share Transactions: | | | | | | | | | | | | | | | | |
| Issued | | | 29,239,000 | | | | 14,196,000 | | | | 20,101,500 | | | | 1,653,000 | |
| Redeemed | | | (16,869,000 | ) | | | (28,947,000 | ) | | | — | | | | (5,865,500 | ) |
| Increase (Decrease) in Net Assets from Capital Share Transactions | | | 12,370,000 | | | | (14,751,000 | ) | | | 20,101,500 | | | | (4,212,500 | ) |
| Total Increase (Decrease) in Net Assets | | | 19,336,214 | | | | (13,578,417 | ) | | | 29,721,502 | | | | (2,711,571 | ) |
| Net Assets: | | | | | | | | | | | | | | | | |
| Beginning of Year | | | 61,128,560 | | | | 74,706,977 | | | | 26,293,177 | | | | 29,004,748 | |
| End of Year | | $ | 80,464,774 | | | $ | 61,128,560 | | | $ | 56,014,679 | | | $ | 26,293,177 | |
| Undistributed Net Investment Income | | $ | 1,818,785 | | | $ | 1,388,410 | | | $ | 1,143,775 | | | $ | 644,769 | |
| Share Transactions: | | | | | | | | | | | | | | | | |
| Issued | | | 1,850,000 | | | | 950,000 | | | | 950,000 | | | | 100,000 | |
| Redeemed | | | (1,100,000 | ) | | | (2,250,000 | ) | | | — | | | | (350,000 | ) |
| Net Increase (Decrease) in Shares Outstanding from Share Transactions | | | 750,000 | | | | (1,300,000 | ) | | | 950,000 | | | | (250,000 | ) |
| (1) | Includes realized gains/(losses) as a result of in-kind transactions. (See Note 4 in Notes to Financial Statements). |
The accompanying notes are an integral part of the financial statements.
| Statements of Changes in Net Assets |
| |
| | | Global X Central
Asia & Mongolia
Index ETF | | | Global X Nigeria
Index ETF | |
| | | Period Ended
October 31, 2013(1) | | | Period Ended
October 31, 2013(1) | |
| Operations: | | | | | | | | |
| Net Investment Income | | $ | 48,324 | | | $ | 81,137 | |
| Net Realized Gain (Loss) on Investments and Foreign Currency Transactions(1) | | | (70,246 | ) | | | 11,702 | |
| Net Change in Unrealized Depreciation on Investments and Foreign Currency Translation | | | (129,952 | ) | | | (285,805 | ) |
| Net Decrease in Net Assets Resulting from Operations | | | (151,874 | ) | | | (192,966 | ) |
| Capital Share Transactions: | | | | | | | | |
| Issued | | | 2,207,000 | | | | 6,162,500 | |
| Redeemed | | | (681,500 | ) | | | — | |
| Increase in Net Assets from Capital Share Transactions | | | 1,525,500 | | | | 6,162,500 | |
| Total Increase in Net Assets | | | 1,373,626 | | | | 5,969,534 | |
| Net Assets: | | | | | | | | |
| Beginning of Period | | | — | | | | — | |
| End of Period | | $ | 1,373,626 | | | $ | 5,969,534 | |
| Undistributed Net Investment Income | | $ | 48,449 | | | $ | 76,054 | |
| Share Transactions: | | | | | | | | |
| Issued | | | 150,000 | | | | 400,000 | |
| Redeemed | | | (50,000 | ) | | | — | |
| Net Increase in Shares Outstanding from Share Transactions | | | 100,000 | | | | 400,000 | |
| (1) | Commenced operations on April 2, 2013. |
The accompanying notes are an integral part of the financial statements.
| Selected Per Share Data & Ratios |
| For a Share Outstanding Throughout the Period |
| | | Net Asset
Value,
Beginning
of Period
($) | | | Net
Investment
Income
($)* | | | Net Realized
and
Unrealized
Gain (Loss)
on
Investments
($) | | | Total from
Operations
($) | | | Distribution
from Net
Investment
Income ($) | | | Distribution
from Net
Realized
Gains ($) | | | Total from
Distributions
($) | | | Net Asset
Value,
End of
Period ($) | | | Total
Return
(%)** | | | Net
Assets
End of
Period
($)(000) | | | Ratio of
Expenses
to
Average
Net Assets
(%) | | | Ratio of
Net
Investment
Income to
Average
Net Assets
(%) | | | Portfolio
Turnover
(%) | |
| Global X China Consumer ETF | | | | | | | | | | | | | | | | | | | | | | | | | | | | | | | | | | | | | | | | | | | | | |
| 2013 | | | 14.00 | | | | 0.16 | | | | 1.88 | | | | 2.04 | | | | (0.17 | ) | | | — | | | | (0.17 | ) | | | 15.87 | | | | 14.66 | | | | 170,554 | | | | 0.65 | | | | 1.11 | | | | 27.76 | |
| 2012 | | | 15.29 | | | | 0.24 | | | | (1.47 | ) | | | (1.23 | ) | | | (0.06 | ) | | | — | | | | (0.06 | ) | | | 14.00 | | | | (8.06 | ) | | | 126,715 | | | | 0.65 | | | | 1.73 | | | | 17.32 | |
| 2011 | | | 20.33 | | | | 0.17 | | | | (5.02 | ) | | | (4.85 | ) | | | (0.19 | ) | | | — | | | | (0.19 | ) | | | 15.29 | | | | (23.99 | ) | | | 136,858 | | | | 0.65 | | | | 0.98 | | | | 12.37 | |
| 2010(1) | | | 15.65 | | | | 0.17 | | | | 4.51 | | | | 4.68 | | | | — | | | | — | | | | — | | | | 20.33 | | | | 29.90 | | | | 174,875 | | | | 0.65 | † | | | 1.03 | † | | | 3.91 | †† |
| Global X China Energy ETF | | | | | | | | | | | | | | | | | | | | | | | | | | | | | | | | | | | | | | | | | | |
| 2013 | | | 13.76 | | | | 0.26 | | | | 1.34 | | | | 1.60 | | | | (0.25 | ) | | | — | | | | (0.25 | ) | | | 15.11 | | | | 11.72 | | | | 4,534 | | | | 0.65 | | | | 1.82 | | | | 24.41 | |
| 2012 | | | 13.78 | | | | 0.25 | | | | (0.01 | ) | | | 0.24 | | | | (0.26 | ) | | | — | | | | (0.26 | ) | | | 13.76 | | | | 1.87 | | | | 4,816 | | | | 0.65 | | | | 1.85 | | | | 17.22 | |
| 2011 | | | 15.72 | | | | 0.27 | | | | (2.07 | ) | | | (1.80 | ) | | | (0.14 | ) | | | — | | | | (0.14 | ) | | | 13.78 | | | | (11.57 | ) | | | 4,822 | | | | 0.65 | | | | 1.70 | | | | 11.39 | |
| 2010(2) | | | 15.02 | | | | 0.23 | | | | 0.47 | | | | 0.70 | | | | — | | | | — | | | | — | | | | 15.72 | | | | 4.66 | | | | 4,717 | | | | 0.65 | † | | | 1.80 | † | | | 20.55 | †† |
| Global X China Financials ETF | | | | | | | | | | | | | | | | | | | | | | | | | | | | | | | | | | | | | | | | | |
| 2013 | | | 12.03 | | | | 0.27 | | | | 1.36 | | | | 1.63 | | | | (0.37 | ) | | | — | | | | (0.37 | ) | | | 13.29 | | | | 13.61 | | | | 42,518 | | | | 0.65 | | | | 2.09 | | | | 33.49 | |
| 2012 | | | 10.92 | | | | 0.20 | | | | 0.92 | | | | 1.12 | | | | (0.01 | ) | | | — | | | | (0.01 | ) | | | 12.03 | | | | 10.28 | | | | 6,013 | | | | 0.65 | | | | 1.76 | | | | 14.02 | |
| 2011 | | | 14.77 | | | | 0.03 | | | �� | (3.56 | ) | | | (3.53 | ) | | | (0.32 | ) | | | — | | | | (0.32 | ) | | | 10.92 | | | | (24.29 | ) | | | 10,924 | | | | 0.65 | | | | 0.25 | | | | 41.54 | |
| 2010(3) | | | 14.90 | | | | 0.27 | | | | (0.40 | ) | | | (0.13 | ) | | | — | | | | — | | | | — | | | | 14.77 | | | | (0.87 | ) | | | 70,158 | | | | 0.65 | † | | | 2.26 | † | | | 14.42 | †† |
| Global X China Industrials ETF | | | | | | | | | | | | | | | | | | | | | | | | | | | | | | | | | | | | | | | | |
| 2013 | | | 11.40 | | | | 0.15 | | | | 0.75 | | | | 0.90 | | | | (0.16 | ) | | | — | | | | (0.16 | ) | | | 12.14 | | | | 7.89 | | | | 4,248 | | | | 0.65 | | | | 1.28 | | | | 19.01 | |
| 2012 | | | 11.39 | | | | 0.16 | | | | (0.13 | ) | | | 0.03 | | | | (0.02 | ) | | | — | | | | (0.02 | ) | | | 11.40 | | | | 0.30 | | | | 4,561 | | | | 0.65 | | | | 1.48 | | | | 23.00 | |
| 2011 | | | 17.13 | | | | 0.13 | | | | (5.64 | ) | | | (5.51 | ) | | | (0.23 | ) | | | — | | | | (0.23 | ) | | | 11.39 | | | | (32.56 | ) | | | 4,558 | | | | 0.65 | | | | 0.88 | | | | 20.13 | |
| 2010(1) | | | 15.50 | | | | 0.08 | | | | 1.55 | | | | 1.63 | | | | — | | | | — | | | | — | | | | 17.13 | | | | 10.52 | | | | 12,850 | | | | 0.65 | † | | | 0.61 | † | | | 12.74 | †† |
| Global X China Materials ETF | | | | | | | | | | | | | | | | | | | | | | | | | | | | | | | | | | | | | | | | |
| 2013(4) | | | 16.28 | | | | 0.17 | | | | (1.05 | ) | | | (0.88 | ) | | | (0.27 | ) | | | — | | | | (0.27 | ) | | | 15.13 | | | | (5.63 | ) | | | 2,269 | | | | 0.65 | | | | 1.65 | | | | 31.07 | |
| 2012(4) | | | 19.16 | | | | 0.25 | | | | (3.13 | ) | | | (2.88 | ) | | | — | | | | — | | | | — | | | | 16.28 | | | | (15.03 | ) | | | 2,441 | | | | 0.65 | | | | 1.50 | | | | 50.30 | |
| 2011(4) | | | 29.18 | | | | 0.01 | | | | (9.74 | ) | | | (9.73 | ) | | | (0.29 | ) | | | — | | | | (0.29 | ) | | | 19.16 | | | | (33.69 | ) | | | 2,875 | | | | 0.65 | | | | 0.05 | | | | 36.82 | |
| 2010(4)(5) | | | 29.90 | | | | 0.05 | | | | (0.77 | ) | | | (0.72 | ) | | | — | | | | — | | | | — | | | | 29.18 | | | | (2.41 | ) | | | 57,642 | | | | 0.65 | † | | | 0.23 | † | | | 6.13 | †† |
| Global X NASDAQ China Technology ETF | | | | | | | | | | | | | | | | | | | | | | | | | | | | | | | | | | |
| 2013 | | | 13.77 | | | | 0.02 | | | | 6.92 | | | | 6.94 | | | | (0.08 | ) | | | — | | | | (0.08 | ) | | | 20.63 | | | | 50.68 | | | | 10,317 | | | | 0.65 | | | | 0.14 | | | | 57.24 | |
| 2012 | | | 15.38 | | | | 0.05 | | | | (1.47 | ) | | | (1.42 | ) | | | (0.19 | ) | | | — | | | | (0.19 | ) | | | 13.77 | | | | (9.17 | ) | | | 2,754 | | | | 0.65 | | | | 0.35 | | | | 53.45 | |
| 2011 | | | 17.21 | | | | 0.38 | | | | (2.05 | ) | | | (1.67 | ) | | | (0.03 | ) | | | (0.13 | ) | | | (0.16 | ) | | | 15.38 | | | | (9.81 | ) | | | 4,614 | | | | 0.65 | | | | 2.26 | | | | 16.79 | |
| 2010(6) | | | 14.90 | | | | 0.03 | | | | 2.28 | | | | 2.31 | | | | — | | | | — | | | | — | | | | 17.21 | | | | 15.50 | | | | 4,301 | | | | 0.65 | † | | | 0.24 | † | | | 5.15 | †† |
| Global X ASEAN 40 ETF | | | | | | | | | | | | | | | | | | | | | | | | | | | | | | | | | | | | | | | |
| 2013 | | | 16.75 | | | | 0.47 | | | | 0.28 | ^ | | | 0.75 | | | | (0.38 | ) | | | — | | | | (0.38 | ) | | | 17.12 | | | | 4.50 | | | | 49,634 | | | | 0.65 | | | | 2.73 | | | | 24.07 | |
| 2012 | | | 15.51 | | | | 0.51 | | | | 1.10 | | | | 1.61 | | | | (0.37 | ) | | | — | | | | (0.37 | ) | | | 16.75 | | | | 10.77 | | | | 32,656 | | | | 0.65 | | | | 3.23 | | | | 9.69 | |
| 2011(7) | | | 15.08 | | | | 0.38 | | | | 0.05 | | | | 0.43 | | | | — | | | | — | | | | — | | | | 15.51 | | | | 2.85 | | | | 23,262 | | | | 0.62 | † | | | 3.46 | † | | | 2.68 | †† |
| (1) | The Fund commenced operations on November 30, 2009. |
| (2) | The Fund commenced operations on December 15, 2009. |
| (3) | The Fund commenced operations on December 10, 2009. |
| (4) | Per share amounts have been restated for a 1 for 2 reverse share split. See Note 8 in the Notes to Financial Statements for additional information. |
| (5) | The Fund commenced operations on January 12, 2010. |
| (6) | The Fund commenced operations on December 8, 2009. |
| (7) | The Fund commenced operations on February 16, 2011. |
| ^ | The amount shown for a share outstanding throughout the period does not accord with the aggregate net gains on investments for the period because of the sales and repurchases of fund shares in relation to fluctuating market value of the investments of the Fund. |
| * | Per share data calculated using average shares method. |
| ** | Total Return is for the period indicated and has not been annualized. The return shown does not reflect the deduction of taxes that a shareholder would pay on Fund distributions or the redemption of Fund shares. |
| † | Annualized. |
| †† | Portfolio turnover rate is for the period indicated and has not been annualized. Excludes effect of in-kind transfers. |
Amounts designated as “—” are either $0 or have been rounded to $0.
The accompanying notes are an integral part of the financial statements.
| Selected Per Share Data & Ratios |
| For a Share Outstanding Throughout the Period |
| | | Net Asset
Value,
Beginning
of Period
($) | | | Net
Investment
Income
($)* | | | Net Realized
and
Unrealized
Gain (Loss)
on
Investments
($) | | | Total from
Operations
($) | | | Distribution
from Net
Investment
Income ($) | | | Distribution
from Net
Realized
Gains ($) | | | Total from
Distributions
($) | | | Net Asset
Value,
End of
Period ($) | | | Total
Return
(%)** | | | Net
Assets
End of
Period
($)(000) | | | Ratio of
Expenses
to
Average
Net Assets
(%) | | | Ratio of
Net
Investment
Income to
Average
Net Assets
(%) | | | Portfolio
Turnover
(%) | |
| Global X FTSE Andean 40 ETF | | | | | | | | | | | | | | | | | | | | | | | | | | | | | | | | | | | | | | | | | |
| 2013 | | | 14.37 | | | | 0.23 | | | | (2.13 | ) | | | (1.90 | ) | | | (0.26 | ) | | | — | | | | (0.26 | ) | | | 12.21 | | | | (13.52 | ) | | | 10,382 | | | | 0.72 | | | | 1.71 | | | | 22.05 | |
| 2012 | | | 13.61 | | | | 0.23 | | | | 0.77 | | | | 1.00 | | | | (0.24 | ) | | | — | | | | (0.24 | ) | | | 14.37 | | | | 7.63 | | | | 8,620 | | | | 0.72 | | | | 1.65 | | | | 25.80 | |
| 2011(1) | | | 14.88 | | | | 0.19 | | | | (1.46 | ) | | | (1.27 | ) | | | — | | | | — | | | | — | | | | 13.61 | | | | (8.53 | ) | | | 6,806 | | | | 0.72 | † | | | 1.81 | † | | | 15.83 | †† |
| Global X FTSE Colombia 20 ETF | | | | | | | | | | | | | | | | | | | | | | | | | | | | | | | | | | | | | | | | |
| 2013 | | | 21.89 | | | | 0.42 | | | | (1.31 | ) | | | (0.89 | ) | | | (0.45 | ) | | | — | | | | (0.45 | ) | | | 20.55 | | | | (4.21 | ) | | | 149,625 | | | | 0.75 | @ | | | 2.05 | | | | 52.06 | |
| 2012 | | | 19.19 | | | | 0.39 | | | | 2.52 | | | | 2.91 | | | | (0.21 | ) | | | — | | | | (0.21 | ) | | | 21.89 | | | | 15.41 | | | | 182,379 | | | | 0.78 | @ | | | 1.92 | | | | 61.70 | |
| 2011 | | | 22.99 | | | | 0.29 | | | | (3.88 | ) | | | (3.59 | ) | | | (0.13 | ) | | | (0.08 | ) | | | (0.21 | ) | | | 19.19 | | | | (15.69 | ) | | | 141,613 | | | | 0.81 | @ | | | 1.39 | | | | 63.11 | |
| 2010 | | | 13.92 | | | | 0.16 | | | | 9.44 | | | | 9.60 | | | | (0.53 | ) | | | — | | | | (0.53 | ) | | | 22.99 | | | | 71.28 | | | | 196,355 | | | | 0.86 | @ | | | 0.77 | | | | 40.95 | |
| 2009(2) | | | 7.50 | | | | 0.25 | | | | 6.17 | | | | 6.42 | | | | — | | | | — | | | | — | | | | 13.92 | | | | 85.60 | | | | 6,960 | | | | 0.86 | †@ | | | 2.93 | † | | | 1.94 | †† |
| Global X Brazil Mid Cap ETF | | | | | | | | | | | | | | | | | | | | | | | | | | | | | | | | | | | | | | | |
| 2013 | | | 15.55 | | | | 0.50 | | | | (1.02 | ) | | | (0.52 | ) | | | (0.45 | ) | | | — | | | | (0.45 | ) | | | 14.58 | | | | (3.52 | ) | | | 12,390 | | | | 0.69 | | | | 3.32 | | | | 16.38 | |
| 2012 | | | 15.55 | | | | 0.47 | | | | (0.13 | ) | | | 0.34 | | | | (0.34 | ) | | | — | | | | (0.34 | ) | | | 15.55 | | | | 2.42 | | | | 20,994 | | | | 0.69 | | | | 2.98 | | | | 34.81 | |
| 2011 | | | 18.28 | | | | 0.46 | | | | (2.94 | ) | | | (2.48 | ) | | | (0.23 | ) | | | (0.02 | ) | | | (0.25 | ) | | | 15.55 | | | | (13.73 | ) | | | 23,329 | | | | 0.69 | | | | 2.68 | | | | 16.90 | |
| 2010(3) | | | 15.16 | | | | 0.08 | | | | 3.04 | | | | 3.12 | | | | — | | | | — | | | | — | | | | 18.28 | | | | 20.58 | | | | 29,242 | | | | 0.69 | † | | | 1.24 | † | | | 2.69 | †† |
| Global X Brazil Consumer ETF | | | | | | | | | | | | | | | | | | | | | | | | | | | | | | | | | | | | | | | | |
| 2013 | | | 19.43 | | | | 0.15 | | | | (1.45 | ) | | | (1.30 | ) | | | (0.24 | ) | | | — | | | | (0.24 | ) | | | 17.89 | | | | (6.80 | ) | | | 18,787 | | | | 0.77 | | | | 0.80 | | | | 15.01 | |
| 2012 | | | 16.78 | | | | 0.14 | | | | 2.73 | | | | 2.87 | | | | (0.22 | ) | | | — | | | | (0.22 | ) | | | 19.43 | | | | 17.49 | | | | 25,257 | | | | 0.77 | | | | 0.83 | | | | 49.88 | |
| 2011 | | | 19.95 | | | | 0.28 | | | | (3.42 | ) | | | (3.14 | ) | | | (0.02 | ) | | | (0.01 | ) | | | (0.03 | ) | | | 16.78 | | | | (15.74 | ) | | | 29,361 | | | | 0.77 | | | | 1.53 | | | | 37.28 | |
| 2010(4) | | | 15.48 | | | | — | | | | 4.47 | | | | 4.47 | | | | — | | | | — | | | | — | | | | 19.95 | | | | 28.88 | | | | 24,934 | | | | 0.77 | † | | | 0.07 | † | | | 4.72 | †† |
| Global X Brazil Financials ETF | | | | | | | | | | | | | | | | | | | | | | | | | | | | | | | | | | | | | | |
| 2013 | | | 12.82 | | | | 0.30 | | | | (0.50 | ) | | | (0.20 | ) | | | (0.50 | ) | | | — | | | | (0.50 | ) | | | 12.12 | | | | (1.87 | ) | | | 2,425 | | | | 0.77 | | | | 2.36 | | | | 14.87 | |
| 2012 | | | 14.92 | | | | 0.34 | | | | (1.80 | ) | | | (1.46 | ) | | | (0.64 | ) | | | — | | | | (0.64 | ) | | | 12.82 | | | | (9.79 | ) | | | 3,845 | | | | 0.77 | | | | 2.47 | | | | 24.79 | |
| 2011 | | | 17.40 | | | | 0.46 | | | | (2.85 | ) | | | (2.39 | ) | | | (0.09 | ) | | | — | | | | (0.09 | ) | | | 14.92 | | | | (13.80 | ) | | | 7,461 | | | | 0.77 | | | | 2.85 | | | | 37.24 | |
| 2010(5) | | | 15.08 | | | | 0.05 | | | | 2.27 | | | | 2.32 | | | | — | | | | — | | | | — | | | | 17.40 | | | | 15.38 | | | | 7,829 | | | | 0.77 | † | | | 1.15 | † | | | — | †† |
| Global X FTSE Argentina 20 ETF | | | | | | | | | | | | | | | | | | | | | | | | | | | | | | | | | | | | | |
| 2013(6) | | | 16.84 | | | | 0.10 | | | | 3.53 | | | | 3.63 | | | | (0.18 | ) | | | — | | | | (0.18 | ) | | | 20.29 | | | | 21.73 | | | | 6,595 | | | | 0.74 | | | | 0.57 | | | | 26.52 | |
| 2012(6) | | | 22.04 | | | | 0.24 | | | | (4.85 | ) | | | (4.61 | ) | | | (0.59 | ) | | | — | | | | (0.59 | ) | | | 16.84 | | | | (21.44 | ) | | | 2,946 | | | | 0.74 | | | | 1.25 | | | | 29.51 | |
| 2011(6)(7) | | | 29.86 | | | | 0.45 | | | | (8.27 | ) | | | (7.82 | ) | | | — | | | | — | | | | — | | | | 22.04 | | | | (26.19 | ) | | | 3,857 | | | | 0.75 | † | | | 2.53 | † | | | 40.86 | †† |
| (1) | The Fund commenced operations on February 2, 2011. |
| (2) | The Fund commenced operations on February 5, 2009. |
| (3) | The Fund commenced operations on June 21, 2010. |
| (4) | The Fund commenced operations on July 7, 2010. |
| (5) | The Fund commenced operations on July 28, 2010. |
| (6) | Per share amounts have been restated for a 1 for 2 reverse share split. See Note 8 in the Notes to Financial Statements for additional information. |
| (7) | The Fund commenced operations on March 2, 2011. |
| * | Per share data calculated using average shares method. |
| ** | Total Return is for the period indicated and has not been annualized. The return shown does not reflect the deduction of taxes that a shareholder would pay on Fund distributions or the redemption of Fund shares. |
| † | Annualized. |
| †† | Portfolio turnover rate is for the period indicated and has not been annualized. Excludes effect of in-kind transfers. |
| @ | The Ratio of Expenses to Average Net Assets includes the effect of a waiver. If these expense offsets were excluded, the ratio would have been 0.80%, 0.83%, 0.83%, 0.86% and 0.86% for the years or periods ended October 31, 2013, 2012, 2011, 2010 and 2009, respectively. |
Amounts designated as “—” are either $0 or have been rounded to $0.
The accompanying notes are an integral part of the financial statements.
| Selected Per Share Data & Ratios |
| For a Share Outstanding Throughout the Period |
| | | Net Asset
Value,
Beginning
of Period ($) | | | Net
Investment
Income
(Loss) ($)* | | | Net Realized
and
Unrealized
Gain (Loss)
on
Investments
($) | | | Total from
Operations
($) | | | Distribution
from Net
Investment
Income ($) | | | Distribution
from Net
Realized
Gains ($) | | | Total from
Distributions
($) | | | Net Asset
Value, End
of Period
($) | | | Total
Return
(%)** | | | Net
Assets
End of
Period
($)(000) | | | Ratio of
Expenses
to
Average
Net Assets
(%) | | | Ratio of
Net
Investment
Income
(Loss) to
Average
Net Assets
(%) | | | Portfolio
Turnover
(%) | |
| Global X FTSE Greece 20 ETF | | | | | | | | | | | | | | | | | | | | | | | | | | | | | | | | | | | | | | |
| 2013 | | | 16.16 | | | | 0.15 | | | | 6.32 | | | | 6.47 | | | | (0.02 | ) | | | (0.01 | ) | | | (0.03 | ) | | | 22.60 | | | | 40.14 | | | | 94,938 | | | | 0.61 | | | | 0.84 | | | | 77.29 | |
| 2012(1) | | | 15.18 | | | | 0.25 | | | | 0.76 | | | | 1.01 | | | | (0.03 | ) | | | — | | | | (0.03 | ) | | | 16.16 | | | | 6.70 | | | | 25,863 | | | | 0.62 | † | | | 1.93 | † | | | 23.99 | †† |
| Global X FTSE Norway 30 ETF | | | | | | | | | | | | | | | | | | | | | | | | | | | | | | | | | | | | | | | | |
| 2013 | | | 15.09 | | | | 0.50 | | | | 1.60 | | | | 2.10 | | | | (0.43 | ) | | | — | | | | (0.43 | ) | | | 16.76 | | | | 14.21 | | | | 80,465 | | | | 0.50 | | | | 3.23 | | | | 11.01 | |
| 2012 | | | 13.96 | | | | 0.49 | | | | 1.00 | | | | 1.49 | | | | (0.36 | ) | | | — | | | | (0.36 | ) | | | 15.09 | | | | 11.24 | | | | 61,129 | | | | 0.50 | | | | 3.52 | | | | 23.39 | |
| 2011(2) | | | 14.80 | | | | 0.44 | | | | (1.27 | ) | | | (0.83 | ) | | | (0.01 | ) | | | — | | | | (0.01 | ) | | | 13.96 | | | | (5.62 | ) | | | 74,707 | | | | 0.50 | † | | | 3.03 | † | | | 24.26 | †† |
| Global X FTSE Nordic Region ETF | | | | | | | | | | | | | | | | | | | | | | | | | | | | | | | | | | | | | | |
| 2013 | | | 18.65 | | | | 0.62 | | | | 4.97 | | | | 5.59 | | | | (0.50 | ) | | | — | | | | (0.50 | ) | | | 23.74 | | | | 30.54 | | | | 56,015 | | | | 0.50 | | | | 2.92 | | | | 8.95 | |
| 2012 | | | 17.47 | | | | 0.50 | | | | 1.27 | | | | 1.77 | | | | (0.53 | ) | | | (0.06 | ) | | | (0.59 | ) | | | 18.65 | | | | 10.84 | | | | 26,293 | | | | 0.50 | | | | 2.88 | | | | 10.15 | |
| 2011 | | | 19.22 | | | | 0.53 | | | | (2.11 | ) | | | (1.58 | ) | | | (0.17 | ) | | | — | | | | (0.17 | ) | | | 17.47 | | | | (8.34 | ) | | | 29,005 | | | | 0.50 | | | | 2.74 | | | | 3.59 | |
| 2010 | | | 16.07 | | | | 0.32 | | | | 2.84 | | | | 3.16 | | | | (0.01 | ) | | | — | | | | (0.01 | ) | | | 19.22 | | | | 19.68 | | | | 12,683 | | | | 0.50 | | | | 1.91 | | | | 4.07 | |
| 2009(3) | | | 14.50 | | | | (0.02 | ) | | | 1.59 | | | | 1.57 | | | | — | | | | — | | | | — | | | | 16.07 | | | | 10.83 | | | | 3,375 | | | | 0.50 | † | | | (0.50 | )† | | | 0.70 | †† |
| Global X Central Asia & Mongolia Index ETF | | | | | | | | | | | | | | | | | | | | | | | | | | | | | | | | | | | | |
| 2013(4) | | | 14.84 | | | | 0.41 | | | | (1.51 | ) | | | (1.10 | ) | | | — | | | | — | | | | — | | | | 13.74 | | | | (7.41 | ) | | | 1,374 | | | | 0.69 | † | | | 5.01 | † | | | 11.01 | †† |
| Global X Nigeria Index ETF | | | | | | | | | | | | | | | | | | | | | | | | | | | | | | | | | | | | | | |
| 2013(4) | | | 15.31 | | | | 0.30 | | | | (0.69 | ) | | | (0.39 | ) | | | — | | | | — | | | | — | | | | 14.92 | | | | (2.55 | ) | | | 5,970 | | | | 0.68 | †@ | | | 3.54 | † | | | 5.44 | †† |
| (1) | The Fund commenced operations on December 7, 2011. |
| (2) | The Fund commenced operations on November 9, 2010. |
| (3) | The Fund commenced operations on August 17, 2009. |
| (4) | The Fund commenced operations on April 2, 2013. |
| * | Per share data calculated using average shares method. |
| ** | Total Return is for the period indicated and has not been annualized. The return shown does not reflect the deduction of taxes that a shareholder would pay on Fund distributions or the redemption of Fund shares. |
| † | Annualized. |
| †† | Portfolio turnover rate is for the period indicated and has not been annualized. Excludes effect of in-kind transfers. |
| @ | The Ratio of Expenses to Average Net Assets includes the effect of a waiver. If these expense offsets were excluded, the ratio would have been 0.92% for the period ended October 31, 2013. |
Amounts designated as “—” are either $0 or have been rounded to $0.
The accompanying notes are an integral part of the financial statements.
| Notes to Financial Statements |
| October 31, 2013 |
1. ORGANIZATION
The Global X Funds (the "Trust") is a Delaware Statutory Trust formed on March 6, 2008. The Trust is registered under the Investment Company Act of 1940, as amended, as an open-end management investment company. As of October 31, 2013, the Trust had seventy-nine portfolios, thirty-six of which were operational. The financial statements herein and the related notes pertain to the Global X China Consumer ETF, Global X China Energy ETF, Global X China Financials ETF, Global X China Industrials ETF, Global X China Materials ETF, Global X NASDAQ China Technology ETF, Global X FTSE ASEAN 40 ETF, Global X FTSE Andean 40 ETF, Global X FTSE Colombia 20 ETF, Global X Brazil Mid Cap ETF, Global X Brazil Consumer ETF, Global X Brazil Financials ETF, Global X FTSE Argentina 20 ETF, Global X FTSE Greece 20 ETF, Global X FTSE Norway 30 ETF, Global X FTSE Nordic Region ETF, Global X Central Asia & Mongolia Index ETF and Global X Nigeria Index ETF (each a “Fund”, collectively, the “Funds”). Each Fund is non-diversified.
2. SIGNIFICANT ACCOUNTING POLICIES
The following is a summary of the Significant Accounting Policies followed by the Funds.
USE OF ESTIMATES — The preparation of financial statements in conformity with U.S. generally accepted accounting principles ("U.S. GAAP") requires management to make estimates and assumptions that affect the reported amounts of assets and liabilities and disclosure of contingent assets and liabilities at the date of the financial statements and the reported amounts of increases and decreases in net assets from operations during the reporting period. Actual results could materially differ from those estimates.
SECURITY VALUATION — Securities listed on a securities exchange, market or automated quotation system for which quotations are readily available (except for securities traded on NASDAQ), including securities traded over the counter, are valued at the last quoted sale price on the primary exchange or market (foreign or domestic) on which they are traded (or at approximately 4:00 pm if a security’s primary exchange is normally open at that time), or, if there is no such reported sale, at the most recent mean between the quoted bid and asked prices (absent both bid and asked prices on such exchange, the bid price may be used).
For securities traded on NASDAQ, the NASDAQ Official Closing Price will be used. If available, debt securities are priced based upon valuations provided by independent, third-party pricing agents. Such values generally reflect the last reported sales price if the security is actively traded. The third-party pricing agents may also value debt securities at an evaluated bid price by employing methodologies that utilize actual market transactions, broker-supplied valuations, or other methodologies designed to identify the market value for such securities. Debt obligations with remaining maturities of sixty days or less may be valued at their amortized cost, which approximates market value. The prices for foreign securities are reported in local currency and converted to U.S. dollars using currency exchange rates. Prices for most securities held in the Funds are provided daily by recognized independent pricing agents. If a security price cannot be obtained from an independent, third-party pricing agent, the Funds seek to obtain a bid price from at least one independent broker.
| Notes to Financial Statements |
| October 31, 2013 (continued) |
2. SIGNIFICANT ACCOUNTING POLICIES (continued)
Securities for which market prices are not "readily available" are valued in accordance with Fair Value Procedures established by the Board of Trustees (the “Board”). The Funds’ Fair Value Procedures are implemented through a Fair Value Committee (the "Committee") designated by the Board. Some of the more common reasons that may necessitate that a security be valued using Fair Value Procedures include: the security's trading has been halted or suspended; the security has been de-listed from its primary trading exchange; the security's primary trading market is temporarily closed at a time when under normal conditions it would be open; the security has not been traded for an extended period of time; the security's primary pricing source is not able or willing to provide a price; or trading of the security is subject to local government-imposed restrictions. In addition, the Funds may fair value their securities if an event that may materially affect the value of the Funds’ securities that traded outside of the United States (a “Significant Event”) has occurred between the time of the security's last close and the time that the Funds calculate net asset value. A Significant Event may relate to a single issuer or to an entire market sector. Events that may be Significant Events include: government actions, natural disaster, armed conflict, acts of terrorism and significant market fluctuations. If Global X Management Company LLC (the “Adviser”) becomes aware of a Significant Event that has occurred with respect to a security or group of securities after the closing of the exchange or market on which the security or securities principally trade, but before the time at which the Funds calculate net asset value, it may request that a Committee meeting be called. When a security is valued in accordance with the Fair Value Procedures, the Committee will determine the value after taking into consideration relevant information reasonably available to the Committee. As of October 31, 2013, there were securities valued using Fair Value Procedures of $857,027, $11,184, $6,839, $107,847, $103,368 and $95,201 in Global X China Consumer ETF, Global X China Materials ETF, Global X Colombia 20 ETF, Global X Brazil Mid Cap ETF, Global X Brazil Consumer ETF Funds, and Global X FTSE Greece 20 ETF, respectively. There were no other securities priced using the Fair Value Procedures.
In accordance with the authoritative guidance on fair value measurements and disclosure under U.S. GAAP, the Funds disclose the fair value of their investments in a hierarchy that prioritizes the inputs to valuation techniques used to measure the fair value. The objective of a fair value measurement is to determine the price that would be received to sell an asset or paid to transfer a liability in an orderly transaction between market participants at the measurement date (an exit price). Accordingly, the fair value hierarchy gives the highest priority to quoted prices (unadjusted) in active markets for identical assets or liabilities (Level 1) and the lowest priority to unobservable inputs (Level 3). The three levels of the fair value hierarchy are described below:
Level 1 – Unadjusted quoted prices in active markets for identical, unrestricted assets or liabilities that the Funds have the ability to access at the measurement date
Level 2 – Other significant observable inputs (including quoted prices in non-active markets, quoted prices for similar investments, fair value of investments for which the Funds have the ability to fully redeem tranches at net asset value as of the measurement date or within the near term, and short-term investments valued at amortized cost)
Level 3 – Significant unobservable inputs (including the Funds’ own assumptions in determining the fair value of investments, fair value of investments for which the Funds do not have the ability to fully redeem tranches at net asset value as of the measurement date or within the near term)
| Notes to Financial Statements |
| October 31, 2013 (continued) |
2. SIGNIFICANT ACCOUNTING POLICIES (continued)
Investments are classified within the level of the lowest significant input considered in determining fair value. Investments classified within Level 3 whose fair value measurement considers several inputs may include Level 1 or Level 2 inputs as components of the overall fair value measurement.
For the year ended October 31, 2013, there have been no significant changes to the Funds’ fair valuation methodologies.
The unobservable inputs used to determine fair value of Level 3 assets may have similar or diverging impacts on valuation. Significant increases and decreases in these inputs in isolation and interrelationships between those inputs could result in significantly higher or lower fair value measurement.
DUE TO/FROM BROKERS —Due to/from brokers includes cash and collateral balances with the Funds’ clearing brokers or counterparties at October 31, 2013. The Funds continuously monitor the credit standing of each broker or counterparty with whom they conduct business. In the event a broker or counterparty is unable to fulfill its obligations, the Funds would be subject to counterparty credit risk.
REPURCHASE AGREEMENTS — Securities pledged as collateral for repurchase agreements are held by Citibank, N.A. and BNY Mellon and are designated as being held on each Fund’s behalf by its custodian under a book-entry system. Each Fund monitors the adequacy of the collateral on a daily basis and can require the seller to provide additional collateral in the event the market value of the securities pledged falls below the carrying value of the repurchase agreement, including accrued interest. It is the Funds’ policy to only enter into repurchase agreements with banks and other financial institutions which are deemed by the Adviser to be creditworthy. The Fund bears the risk of loss in the event that the other party to a repurchase agreement defaults on its obligations and the Fund is prevented from exercising its rights to dispose of the underlying securities received as collateral and the risk of a possible decline in the value of the underlying securities during the period.
FEDERAL INCOME TAXES — It is each Fund’s intention to qualify or continue to qualify as a regulated investment company for Federal income tax purposes by complying with the appropriate provisions of Subchapter M of the Internal Revenue Code of 1986, as amended. Accordingly, no provisions for Federal income taxes have been made in the financial statements.
The Funds evaluate tax positions taken or expected to be taken in the course of preparing the Funds’ tax returns to determine whether it is "more-likely-than-not" (i.e., greater than 50 percent) that each tax position will be sustained upon examination by a taxing authority based on the technical merits of the position. Tax positions not deemed to meet the more-likely-than-not threshold are recorded as a tax benefit or expense in the current year. The Funds did not record any tax provision in the current period. However, management’s conclusions regarding tax positions may be subject to review and adjustment at a later date based on factors including, but not limited to, examination by tax authorities (i.e., the last three tax year ends, as applicable), on-going analysis of and changes to tax laws, regulations and interpretations thereof.
| Notes to Financial Statements |
| October 31, 2013 (continued) |
2. SIGNIFICANT ACCOUNTING POLICIES (concluded)
As of and during the year ended October 31, 2013, the Funds did not have a liability for any unrecognized tax benefits. The Funds recognize interest and penalties, if any, related to unrecognized tax benefits as income tax expense in the Statement of Operations. During the period, the Funds did not incur any interest or penalties.
SECURITY TRANSACTIONS AND INVESTMENT INCOME — Security transactions are accounted for on the trade date for financial reporting purposes. Costs used in determining realized gains and losses on the sale of investment securities are based on specific identification. Dividend income is recorded on the ex-dividend date. Interest income is recognized on the accrual basis from the settlement date.
FOREIGN CURRENCY TRANSLATION — The books and records of the Funds are maintained in U.S. dollars. Investment securities and other assets and liabilities denominated in a foreign currency are translated into U.S. dollars on the date of valuation. Purchases and sales of investment securities, income and expenses are translated into U.S. dollars at the relevant rates of exchange prevailing on the respective dates of such transactions. The Funds do not isolate that portion of realized or unrealized gains and losses resulting from changes n the foreign exchange rate from fluctuations arising from changes in the market prices of the securities. These gains and losses are included in net realized and unrealized gains and losses on investments on the Statement of Operations. Net realized and unrealized gains and losses on foreign currency transactions represent net foreign exchange gains or losses from foreign currency exchange contracts, disposition of foreign currencies, currency gains or losses realized between trade and settlement dates on securities transactions and the difference between the amount of the investment income and foreign withholding taxes recorded on the Funds’ books and the U.S. dollar equivalent amounts actually received or paid.
DIVIDENDS AND DISTRIBUTIONS TO SHAREHOLDERS — The Funds distribute their net investment income on a pro rata basis. Any net realized capital gains are distributed annually. All distributions are recorded on ex-dividend date.
CREATION UNITS — The Funds issue and redeem shares ("Shares") at Net Asset Value (“NAV”) and only in large blocks of Shares, (each block of Shares for a Fund is called a "Creation Unit" or multiples thereof). Purchasers of Creation Units ("Authorized Participants") at NAV must pay a standard creation transaction fee per transaction. The fee is a single charge and will be the same regardless of the number of Creation Units purchased by an investor on the same day. An Authorized Participant who holds Creation Units and wishes to redeem at NAV would also pay a standard Redemption Fee per transaction payable to the Custodian on the date of such redemption, regardless of the number of Creation Units redeemed that day.
| Notes to Financial Statements |
| October 31, 2013 (continued) |
2. SIGNIFICANT ACCOUNTING POLICIES (concluded)
If a Creation Unit is purchased or redeemed for cash, a higher Transaction Fee will be charged. The following table discloses Creation Unit breakdown:
| | | Creation Unit | | | | | | | | | Redemption | |
| | | Shares | | | Creation Fee | | | Value | | | Fee | |
| Global X China Consumer ETF | | | 50,000 | | | $ | 1,900 | | | $ | 793,500 | | | $ | 1,900 | |
| Global X China Energy ETF | | | 50,000 | | | | 1,900 | | | | 755,500 | | | | 1,900 | |
| Global X China Financials ETF | | | 50,000 | | | | 1,900 | | | | 664,500 | | | | 1,900 | |
| Global X China Industrials ETF | | | 50,000 | | | | 1,900 | | | | 607,000 | | | | 1,900 | |
| Global X China Materials ETF | | | 50,000 | | | | 1,900 | | | | 756,500 | | | | 1,900 | |
| Global X NASDAQ China Technology ETF | | | 50,000 | | | | 1,900 | | | | 1,031,500 | | | | 1,900 | |
| Global X FTSE ASEAN 40 ETF | | | 50,000 | | | | 2,300 | | | | 856,000 | | | | 2,300 | |
| Global X FTSE Andean 40 ETF | | | 50,000 | | | | 2,300 | | | | 610,500 | | | | 2,300 | |
| Global X FTSE Colombia 20 ETF | | | 50,000 | | | | 2,500 | | | | 1,027,500 | | | | 2,500 | |
| Global X Brazil Mid Cap ETF | | | 50,000 | | | | 1,900 | | | | 729,000 | | | | 1,900 | |
| Global X Brazil Consumer ETF | | | 50,000 | | | | 1,500 | | | | 894,500 | | | | 1,500 | |
| Global X Brazil Financials ETF | | | 50,000 | | | | 1,500 | | | | 606,000 | | | | 1,500 | |
| Global X FTSE Argentina 20 ETF | | | 50,000 | | | | 1,000 | | | | 1,014,500 | | | | 1,000 | |
| Global X FTSE Greece 20 ETF | | | 50,000 | | | | 1,000 | | | | 1,130,000 | | | | 1,000 | |
| Global X FTSE Norway 30 ETF | | | 50,000 | | | | 1,400 | | | | 838,000 | | | | 1,400 | |
| Global X FTSE Nordic Region ETF | | | 50,000 | | | | 1,400 | | | | 1,187,000 | | | | 1,400 | |
| Global X Central Asia & Mongolia Index ETF | | | 50,000 | | | | 2,700 | | | | 687,000 | | | | 2,700 | |
| Global X Nigeria Index ETF | | | 50,000 | | | | 2,300 | | | | 746,000 | | | | 2,300 | |
3. RELATED PARTY TRANSACTIONS
The Adviser serves as the investment adviser and the administrator for the Funds. Subject to the supervision of the Board of Trustees, the Adviser is responsible for managing the investment activities of the Funds and the Funds’ business affairs and other administrative matters and provides or causes to be furnished all supervisory, administrative and other services reasonably necessary for the operation of the Funds, including certain distribution services (provided pursuant to a separate Distribution Agreement), certain shareholder and distribution-related services (provided pursuant to a separate Rule 12b-1 Plan and related agreements) and investment advisory services (provided pursuant to a separate Investment Advisory Agreement), under what is essentially an "all-in" fee structure. For its service to the Funds, under the Supervision and Administration Agreement, each Fund pays a monthly fee to the Adviser at the annual rate (stated as a percentage of the average daily net assets of the Fund). In addition, the Funds bear other expenses, directly and indirectly that are not covered by the Supervision and Administration Agreement, which may vary and affect the total expense ratios of the Funds, such as taxes, brokerage fees, commissions and other transaction expenses, interest expenses, acquired fund fees and extraordinary expenses (such as litigation and indemnification expenses). In addition, the Global X FTSE Colombia 20 ETF, Global X FTSE Argentina 20 ETF, Global X FTSE Greece 20 ETF, Global X Central Asia & Mongolia Index ETF and Global X Nigeria Index ETF pay custodial fees that are not covered by the Supervision and Administration Agreement. Pursuant to an agreement with the Custodian, the Global X FTSE Colombia 20 ETF, Global X FTSE Argentina 20 ETF, Global X FTSE Greece 20 ETF, Global X Central Asia & Mongolia Index ETF and Global X Nigeria Index ETF may pay up to 0.11%, 0.01%, 0.10%, 0.01% and 0.24% respectively in Custody Fees (in addition to the Supervision and Administration Fee).
| Notes to Financial Statements |
| October 31, 2013 (continued) |
3. RELATED PARTY TRANSACTIONS (concluded)
| | | Supervision and | |
| | | Administration | |
| | | Fee | |
| Global X China Consumer ETF | | | 0.65 | % |
| Global X China Energy ETF | | | 0.65 | % |
| Global X China Financials ETF | | | 0.65 | % |
| Global X China Industrials ETF | | | 0.65 | % |
| Global X China Materials ETF | | | 0.65 | % |
| Global X NASDAQ China Technology ETF | | | 0.65 | % |
| Global X FTSE ASEAN 40 ETF | | | 0.65 | % |
| Global X FTSE Andean 40 ETF | | | 0.72 | % |
| Global X FTSE Colombia 20 ETF* | | | 0.68 | % |
| Global X Brazil Mid Cap ETF | | | 0.69 | % |
| Global X Brazil Consumer ETF | | | 0.77 | % |
| Global X Brazil Financials ETF | | | 0.77 | % |
| Global X FTSE Argentina 20 ETF | | | 0.74 | % |
| Global X FTSE Greece 20 ETF | | | 0.55 | % |
| Global X FTSE Norway 30 ETF | | | 0.50 | % |
| Global X FTSE Nordic Region ETF | | | 0.50 | % |
| Global X Central Asia & Mongolia Index ETF | | | 0.68 | % |
| Global X Nigeria Index ETF* | | | 0.68 | % |
*Pursuant to an Expense Limitation Agreement, the Adviser has agreed to waive or reimburse fees and/or limit Fund expenses to the extent necessary to assure that the operating expenses of the Fund (exclusive of taxes, brokerage fees, commissions, and other transaction expenses, interest and extraordinary expenses (such as litigation and indemnification expenses)) will not exceed 0.68% of the Fund’s average daily net assets per year until at least July 1, 2014 for the Global X FTSE Colombia 20 Fund and April 1, 2014 for the Global X Nigeria Index Fund. Pursuant to the Expense Limitation Agreement, the Fund (at a later date) may reimburse the Adviser for the fees and expenses it waived or reimbursed and/or limited pursuant to the Expense Limitation Agreement during any of the prior three fiscal years, provided that, among other things, any reimbursement made to the Adviser does not cause Total Annual Fund Operating Expenses of the Fund to exceed 0.68% during the period in which it is paid and the Board of Trustees has approved in advance such reimbursement to the Adviser.
The Adviser and InterBolsa S.A. ("InterBolsa"), entered into an agreement dated January, 2009, pursuant to which InterBolsa agreed to provide certain marketing, marketing-related and other services with respect to the Global X FTSE Colombia 20 ETF. Under this agreement, InterBolsa agreed to make an initial payment to the Adviser regarding certain start up expenses for the Fund and the Adviser agreed to share with InterBolsa fifty percent (50%) of the Adviser’s legitimate profits and losses with respect to the Global X FTSE Colombia 20 ETF. The agreement was terminated on November 7, 2012.
| Notes to Financial Statements |
| October 31, 2013 (continued) |
3. RELATED PARTY TRANSACTIONS (concluded)
SEI Investments Global Fund Services (“SEIGFS”) serves as Sub-Administrator to the Funds. As Sub-Administrator, SEIGFS provides the Funds with the required general administrative services, including, without limitation: office space, equipment, and personnel; clerical and general back office services; bookkeeping, internal accounting and secretarial services; the calculation of NAV; and assistance with the preparation and filing of reports, registration statements, proxy statements and other materials required to be filed or furnished by the Funds under federal and state securities laws. As compensation for these services, the Sub-Administrator receives certain out-of-pocket costs, transaction fees and asset-based fees which are accrued daily and paid monthly by the Adviser.
SEI Investments Distribution Co. (“SIDCO”) serves as each Funds underwriter and distributor of Shares pursuant to a Distribution Agreement. Under the Distribution Agreement, SIDCO, as agent, receives orders to create and redeem Shares in Creation Unit Aggregations and transmits such orders to the Trust’s custodian and transfer agent. The Distributor has no obligation to sell any specific quantity of Fund Shares. SIDCO bears the following costs and expenses relating to the distribution of Shares: (i) the costs of processing and maintaining records of creations of Creation Units; (ii) all costs of maintaining the records required of a registered broker/dealer; (iii) the expenses of maintaining its registration or qualification as a dealer or broker under Federal or state laws; (iv) filing fees; and (v) all other expenses incurred in connection with the distribution services as contemplated in the Distribution Agreement. SIDCO receives no fee for its distribution services under the Distribution Agreement.
4. INVESTMENT TRANSACTIONS
For the period ended October 31, 2013, the purchases and sales of investments in securities, excluding in-kind transactions, long-term U.S. Government and short-term securities were:
| | | Purchases | | | Sales and
Maturities | |
| Global X China Consumer ETF | | $ | 49,550,600 | | | $ | 49,844,064 | |
| Global X China Energy ETF | | | 1,138,175 | | | | 1,153,299 | |
| Global X China Financials ETF | | | 4,364,429 | | | | 4,297,053 | |
| Global X China Industrials ETF | | | 830,839 | | | | 872,876 | |
| Global X China Materials ETF | | | 731,798 | | | | 749,775 | |
| Global X NASDAQ China Technology ETF | | | 2,297,878 | | | | 2,295,168 | |
| Global X FTSE ASEAN 40 ETF | | | 16,665,088 | | | | 11,533,498 | |
| Global X FTSE Andean 40 ETF | | | 3,556,545 | | | | 2,026,601 | |
| Global X FTSE Colombia 20 ETF | | | 88,241,481 | | | | 97,794,858 | |
| Global X Brazil Mid Cap ETF | | | 2,615,442 | | | | 6,169,996 | |
| Global X Brazil Consumer ETF | | | 3,328,329 | | | | 6,901,135 | |
| Global X Brazil Financials ETF | | | 484,988 | | | | 1,270,770 | |
| Global X FTSE Argentina 20 ETF | | | 1,203,484 | | | | 1,086,959 | |
| Global X FTSE Greece 20 ETF | | | 33,892,710 | | | | 31,536,014 | |
| Global X FTSE Norway 30 ETF | | | 7,278,996 | | | | 6,904,917 | |
| Global X FTSE Nordic Region ETF | | | 4,168,804 | | | | 3,634,820 | |
| Global X Central Asia & Mongolia Index ETF | | | 218,312 | | | | 174,076 | |
| Global X Nigeria Index ETF | | | 4,944,086 | | | | 224,013 | |
| Notes to Financial Statements |
| October 31, 2013 (continued) |
4. INVESTMENT TRANSACTIONS (concluded)
During the year or period ended October 31, 2013, there were no purchases or sales of long-term U.S. Government securities for the Funds.
For the year or period ended October 31, 2012 and October 31, 2013, in-kind transactions associated with creations and redemptions were, respectively:
| | | | | | Sales and | | | Realized | |
| | | Purchases | | | Maturities | | | Gain/(Loss) | |
| Global X China Consumer ETF | | $ | 58,127,422 | | | $ | 60,602,543 | | | $ | (14,971,205 | ) |
| Global X China Energy ETF | | | 1,387,260 | | | | 1,337,430 | | | | (69,263 | ) |
| Global X China Financials ETF | | | 3,926,565 | | | | 9,690,527 | | | | 936,142 | |
| Global X China Materials ETF | | | 898,865 | | | | 884,664 | | | | (757,417 | ) |
| Global X NASDAQ China Technology ETF | | | - | | | | 2,314,245 | | | | 390,361 | |
| Global X FTSE ASEAN 40 ETF | | | 6,222,348 | | | | 1,021,509 | | | | (207,923 | ) |
| Global X FTSE Andean 40 ETF | | | 1,415,510 | | | | 413,410 | | | | 39,468 | |
| Global X FTSE Colombia 20 ETF | | | 52,446,557 | | | | 41,442,085 | | | | 2,673,694 | |
| Global X Brazil Mid Cap ETF | | | 270,057 | | | | 2,599,515 | | | | 135,361 | |
| Global X Brazil Consumer ETF | | | 3,594,611 | | | | 6,452,371 | | | | 917,960 | |
| Global X Brazil Financials ETF | | | - | | | | 749,909 | | | | (130,497 | ) |
| Global X FTSE Greece 20 ETF | | | 18,896,843 | | | | 1,718,402 | | | | 195,351 | |
| Global X FTSE Norway 30 ETF | | | 14,195,676 | | | | 28,918,670 | | | | (3,714,967 | ) |
| Global X FTSE Nordic Region ETF | | | 1,652,853 | | | | 5,863,959 | | | | 415,958 | |
| | | | | | Sales and | | | Realized | |
| | | Purchases | | | Maturities | | | Gain/(Loss) | |
| Global X China Consumer ETF | | $ | 84,769,686 | | | $ | 56,960,691 | | | $ | 8,039,568 | |
| Global X China Energy ETF | | | - | | | | 736,908 | | | | 151,578 | |
| Global X China Financials ETF | | | 38,715,376 | | | | 3,760,719 | | | | 306,039 | |
| Global X China Industrials ETF | | | - | | | | 571,688 | | | | 20,684 | |
| Global X NASDAQ China Technology ETF | | | 6,127,853 | | | | - | | | | - | |
| Global X FTSE ASEAN 40 ETF | | | 30,200,196 | | | | 16,631,937 | | | | 1,496,471 | |
| Global X FTSE Andean ETF | | | 1,803,820 | | | | - | | | | - | |
| Global X FTSE Colombia 20 ETF | | | 14,471,052 | | | | 19,928,936 | | | | (87,329 | ) |
| Global X Brazil Mid Cap ETF | | | - | | | | 3,589,792 | | | | 589,045 | |
| Global X Brazil Consumer ETF | | | - | | | | 1,031,963 | | | | 50,747 | |
| Global X Brazil Financials ETF | | | - | | | | 325,739 | | | | (39,490 | ) |
| Global X FTSE Argentina 20 ETF | | | 2,735,472 | | | | - | | | | - | |
| Global X FTSE Greece 20 ETF | | | 69,281,318 | | | | 18,417,422 | | | | 6,681,268 | |
| Global X FTSE Norway 30 ETF | | | 29,193,965 | | | | 16,855,364 | | | | 2,326,541 | |
| Global X FTSE Nordic Region ETF | | | 20,050,713 | | | | - | | | | - | |
| Global X Central Asia & Mongolia Index ETF | | | 2,205,126 | | | | 681,289 | | | | (53,621 | ) |
| Global X Nigeria Index ETF | | | 1,361,807 | | | | - | | | | - | |
| Notes to Financial Statements |
| October 31, 2013 (continued) |
5. TAX INFORMATION
The amount and character of income and capital gain distributions to be paid, if any, are determined in accordance with Federal income tax regulations, which may differ from U.S. GAAP. As a result, net investment income (loss) and net realized gain (loss) on investment transactions for a reporting period may differ significantly from distributions during such period. These book/tax differences may be temporary or permanent. To the extent these differences are permanent in nature, they are charged or credited to undistributed net investment income (loss), accumulated net realized gain (loss) or paid-in capital, as appropriate, in the period that the differences arise.
The following differences, primarily attributable to utilization of earnings and profits on shareholder redemptions and distributions reclassifications, foreign currency, redemptions in-kind and sales of passive foreign investment companies, have been reclassified to/from the following accounts during the fiscal period ended October 31, 2013.
| Global X Funds | | Paid-in
Capital | | | Undistributed
Net Investment
Income/(Loss) | | | Accumulated
Net Realized
Gain/(Loss) | |
| Global X China Consumer ETF | | $ | 5,670,758 | | | $ | 303,356 | | | $ | (5,974,114 | ) |
| Global X China Energy ETF | | | 149,485 | | | | 42 | | | | (149,527 | ) |
| Global X China Financials ETF | | | 230,741 | | | | 40 | | | | (230,781 | ) |
| Global X China Industrials ETF | | | (30,553 | ) | | | (187 | ) | | | 30,740 | |
| Global X China Materials ETF | | | – | | | | 130 | | | | (130 | ) |
| Global X NASDAQ China Technology ETF | | | – | | | | (36 | ) | | | 36 | |
| Global X FTSE ASEAN 40 ETF | | | 1,389,159 | | | | 107,237 | | | | (1,496,396 | ) |
| Global X FTSE Andean 40 ETF | | | – | | | | 4,463 | | | | (4,463 | ) |
| Global X FTSE Colombia 20 ETF | | | (90,337 | ) | | | 197,393 | | | | (107,056 | ) |
| Global X Brazil Mid Cap ETF | | | 573,364 | | | | 4,318 | | | | (577,682 | ) |
| Global X Brazil Consumer ETF | | | 46,828 | | | | (6,530 | ) | | | (40,298 | ) |
| Global X Brazil Financials ETF | | | (39,489 | ) | | | 9,047 | | | | 30,442 | |
| Global X FTSE Argentina 20 ETF | | | – | | | | 1,952 | | | | (1,952 | ) |
| Global X FTSE Greece 20 ETF | | | 7,292,593 | | | | (283,363 | ) | | | (7,009,230 | ) |
| Global X FTSE Norway 30 ETF | | | 1,771,253 | | | | (4,165 | ) | | | (1,767,088 | ) |
| Global X FTSE Nordic Region ETF | | | – | | | | (7,158 | ) | | | 7,158 | |
| Global X Central Asia & Mongolia Index ETF* | | | (53,621 | ) | | | 125 | | | | 53,496 | |
| Global X Nigeria Index ETF* | | | – | | | | (5,083 | ) | | | 5,083 | |
* Commenced operations April 2, 2013.
| Notes to Financial Statements |
| October 31, 2013 (continued) |
5. TAX INFORMATION (continued)
The tax character of dividends and distributions declared during the periods ended October 31, 2013 and 2012 were as follows:
| Global X Funds | | Ordinary
Income | | | Long-Term
Capital Gain | | | Totals | |
| Global X China Consumer ETF | | | | | | | | | | | | |
| 2013 | | $ | 2,128,638 | | | $ | – | | | $ | 2,128,638 | |
| 2012 | | | 487,644 | | | | – | | | | 487,644 | |
| Global X China Energy ETF | | | | | | | | | | | | |
| 2013 | | $ | 88,625 | | | $ | – | | | $ | 88,625 | |
| 2012 | | | 78,332 | | | | – | | | | 78,332 | |
| Global X China Financials ETF | | | | | | | | | | | | |
| 2013 | | $ | 186,317 | | | $ | – | | | $ | 186,317 | |
| 2012 | | | 14,611 | | | | – | | | | 14,611 | |
| Global X China Industrials ETF | | | | | | | | | | | | |
| 2013 | | $ | 64,616 | | | $ | – | | | $ | 64,616 | |
| 2012 | | | 8,938 | | | | – | | | | 8,938 | |
| Global X China Materials ETF | | | | | | | | | | | | |
| 2013 | | $ | 40,384 | | | $ | – | | | $ | 40,384 | |
| 2012 | | | – | | | | – | | | | – | |
| Global X NASDAQ China Technology ETF | | | | | | | | | | | | |
| 2013 | | $ | 16,025 | | | $ | – | | | $ | 16,025 | |
| 2012 | | | 57,614 | | | | – | | | | 57,614 | |
| Global X FTSE ASEAN 40 ETF | | | | | | | | | | | | |
| 2013 | | $ | 806,416 | | | $ | – | | | $ | 806,416 | |
| 2012 | | | 517,045 | | | | – | | | | 517,045 | |
| Global X FTSE Andean 40 ETF | | | | | | | | | | | | |
| 2013 | | $ | 155,634 | | | $ | – | | | $ | 155,634 | |
| 2012 | | | 120,234 | | | | – | | | | 120,234 | |
| Global X FTSE Colombia 20 ETF | | | | | | | | | | | | |
| 2013 | | $ | 3,654,817 | | | $ | – | | | $ | 3,654,817 | |
| 2012 | | | 1,467,527 | | | | – | | | | 1,467,527 | |
| Global X Brazil Mid Cap ETF | | | | | | | | | | | | |
| 2013 | | $ | 544,000 | | | $ | – | | | $ | 544,000 | |
| 2012 | | | 495,614 | | | | – | | | | 495,614 | |
| Global X Brazil Consumer ETF | | | | | | | | | | | | |
| 2013 | | $ | 293,164 | | | $ | – | | | $ | 293,164 | |
| 2012 | | | 392,931 | | | | – | | | | 392,931 | |
| Global X Brazil Financials ETF | | | | | | | | | | | | |
| 2013 | | $ | 149,310 | | | $ | – | | | $ | 149,310 | |
| 2012 | | | 256,178 | | | | – | | | | 256,178 | |
| Global X FTSE Argentina 20 ETF | | | | | | | | | | | | |
| 2013 | | $ | 31,297 | | | $ | – | | | $ | 31,297 | |
| 2012 | | | 102,814 | | | | – | | | | 102,814 | |
| Global X FTSE Greece 20 ETF | | | | | | | | | | | | |
| 2013 | | $ | 47,749 | | | $ | – | | | $ | 47,749 | |
| 2012 | | | 4,711 | | | | – | | | | 4,711 | |
| Global X FTSE Norway 30 ETF | | | | | | | | | | | | |
| 2013 | | $ | 1,583,434 | | | $ | – | | | $ | 1,583,434 | |
| 2012 | | | 1,360,544 | | | | – | | | | 1,360,544 | |
| Global X FTSE Nordic Region ETF | | | | | | | | | | | | |
| 2013 | | $ | 698,310 | | | $ | – | | | $ | 698,310 | |
| 2012 | | | 825,103 | | | | 7,708 | | | | 832,811 | |
| Global X Central Asia & Mongolia Index ETF* | | | | | | | | | | | | |
| 2013 | | $ | – | | | $ | – | | | $ | – | |
| Global X Nigeria Index ETF* | | | | | | | | | | | | |
| 2013 | | $ | – | | | $ | – | | | $ | – | |
*Commenced operations April 2, 2013.
| Notes to Financial Statements |
| October 31, 2013 (continued) |
5. TAX INFORMATION (continued)
As of October 31, 2013, the components of tax basis distributable earnings (accumulated losses) were as follows:
| | | Global X China
Consumer ETF | | | Global X China
Energy ETF | | | Global X China
Financials ETF | |
| Undistributed Ordinary Income | | $ | 1,981,740 | | | $ | 85,001 | | | $ | 243,280 | |
| Capital Loss Carryforwards | | | (6,049,213 | ) | | | (458,715 | ) | | | (926,122 | ) |
| Unrealized Appreciation/(Depreciation) on Investments and Foreign Currency | | | (6,919,782 | ) | | | 324,432 | | | | 699,844 | |
| Other Temporary Differences | | | 2 | | | | (1 | ) | | | (1 | ) |
| Total Accumulated Gains/(Losses) | | $ | (10,987,253 | ) | | $ | (49,283 | ) | | $ | 17,001 | |
| | | Global X China
Industrials ETF | | | Global X China
Materials ETF | | | Global X
NASDAQ China
Technology ETF | |
| Undistributed Ordinary Income | | $ | 59,640 | | | $ | 36,867 | | | $ | 3,666 | |
| Capital Loss Carryforwards | | | (1,187,021 | ) | | | (812,455 | ) | | | (916,999 | ) |
| Unrealized Appreciation/(Depreciation) on Investments and Foreign Currency | | | (1,138,372 | ) | | | (554,870 | ) | | | 1,293,501 | |
| Other Temporary Differences | | | (2 | ) | | | (1 | ) | | | — | |
| Total Accumulated Gains/(Losses) | | $ | (2,265,755 | ) | | $ | (1,330,459 | ) | | $ | 380,168 | |
| | | Global X FTSE
ASEAN 40 ETF | | | Global X FTSE
Andean 40 ETF | | | Global X FTSE
Colombia 20 ETF | |
| Undistributed Ordinary Income | | $ | 1,313,145 | | | $ | 137,847 | | | $ | 4,381,503 | |
| Capital Loss Carryforwards | | | (1,158,747 | ) | | | (555,450 | ) | | | (18,964,122 | ) |
| Unrealized Depreciation on Investments and Foreign Currency | | | (1,481,370 | ) | | | (1,457,074 | ) | | | (5,419,585 | ) |
| Other Temporary Differences | | | (2 | ) | | | — | | | | (4 | ) |
| Total Accumulated Losses | | $ | (1,326,974 | ) | | $ | (1,874,677 | ) | | $ | (20,002,208 | ) |
| | | Global X Brazil
Mid Cap ETF | | | Global X Brazil
Consumer ETF | | | Global X Brazil
Financials ETF | |
| Undistributed Ordinary Income | | $ | 487,664 | | | $ | 150,412 | | | $ | 15,515 | |
| Capital Loss Carryforwards | | | (4,436,046 | ) | | | (2,248,892 | ) | | | (990,674 | ) |
| Unrealized Appreciation/(Depreciation) on Investments and Foreign Currency | | | (187,016 | ) | | | 182,847 | | | | (653,040 | ) |
| Other Temporary Differences | | | — | | | | 1 | | | | (4 | ) |
| Total Accumulated Losses | | $ | (4,135,398 | ) | | $ | (1,915,632 | ) | | $ | (1,628,203 | ) |
| | | Global X FTSE
Argentina 20 ETF | | | Global X FTSE
Greece 20 ETF | | | Global X FTSE
Norway 30 ETF | |
| Undistributed Ordinary Income | | $ | 4,223 | | | $ | 118,988 | | | $ | 1,818,788 | |
| Capital Loss Carryforwards | | | (1,248,913 | ) | | | — | | | | (4,229,407 | ) |
| Undistributed Long-Term Capital Gains | | | — | | | | 33,492 | | | | — | |
| Unrealized Appreciation/(Depreciation) on Investments and Foreign Currency | | | (210,675 | ) | | | 11,989,237 | | | | 5,397,818 | |
| Other Temporary Differences | | | (2 | ) | | | (1 | ) | | | (4 | ) |
| Total Accumulated Gains/(Losses) | | $ | (1,455,367 | ) | | $ | 12,141,716 | | | $ | 2,987,195 | |
| | | Global X FTSE
Nordic Region ETF | | | Global X Central
Asia & Mongolia
Index ETF* | | | Global X Nigeria
Index ETF* | |
| Undistributed Ordinary Income | | $ | 1,463,463 | | | $ | 52,316 | | | $ | 92,838 | |
| Capital Loss Carryforwards | | | (622,538 | ) | | | (16,751 | ) | | | — | |
| Unrealized Appreciation/(Depreciation) on Investments and Foreign Currency | | | 6,896,799 | | | | (133,819 | ) | | | (285,805 | ) |
| Other Temporary Differences | | | (2 | ) | | | 1 | | | | 1 | |
| Total Accumulated Gains/(Losses) | | $ | 7,737,722 | | | $ | (98,253 | ) | | $ | (192,966 | ) |
* Commenced operations April 2, 2013.
| Notes to Financial Statements |
| October 31, 2013 (continued) |
5. TAX INFORMATION (continued)
For Federal income tax purposes, capital loss carryforwards represent realized losses of the Funds that may be carried forward for a maximum period of eight years and applied against future gains. As of October 31, 2013, the Funds that had capital loss carryforwards are listed below.
| Expiration Date | | Global X China
Consumer ETF | | | Global X
China
Energy
ETF | | | Global X
China
Financials
ETF | | | Global X
China
Industrials
ETF | | | Global X
China
Materials
ETF | | | Global X NASDAQ
China Technology
ETF | |
| Oct. 2019 | | $ | 1,341,121 | | | $ | 33,912 | | | $ | — | | | $ | — | | | $ | — | | | $ | 236,466 | |
| Oct. 2018 | | | 173,208 | | | | — | | | | 551,954 | | | | 94,810 | | | | — | | | | — | |
| Total | | $ | 1,514,329 | | | $ | 33,912 | | | $ | 551,954 | | | $ | 94,810 | | | $ | — | | | $ | 236,466 | |
| Expiration Date | | Global X FTSE
ASEAN 40 ETF | | | Global X
FTSE
Andean 40
ETF | | | Global X
FTSE
Colombia 20
ETF | | | Global X
Brazil Mid
Cap ETF | | | Global X
Brazil
Consumer
ETF | | | Global X
Brazil
Financials
ETF | |
| Oct. 2019 | | $ | — | | | $ | 120,886 | | | $ | 8,249,654 | | | $ | 918,379 | | | $ | 563,593 | | | $ | — | |
| Oct. 2018 | | | — | | | | — | | | | — | | | | — | | | | — | | | | — | |
| Total | | $ | — | | | $ | 120,886 | | | $ | 8,249,654 | | | $ | 918,379 | | | $ | 563,593 | | | $ | — | |
| Expiration Date | | Global X
Argentina 20
ETF | | | Global X
FTSE
Greece 20
ETF | | | Global X
FTSE
Norway 30
ETF | | | Global X
FTSE Nordic
Region ETF | | | Global X
Central Asia &
Mongolia
Index ETF | | | Global X
Nigeria Index
ETF | |
| Oct. 2019 | | $ | 414,683 | | | $ | — | | | $ | 1,802,290 | | | $ | — | | | $ | — | | | $ | — | |
| Oct. 2018 | | | — | | | | — | | | | — | | | | — | | | | — | | | | — | |
| Total | | $ | 414,683 | | | $ | — | | | $ | 1,802,290 | | | $ | — | | | $ | — | | | $ | — | |
Under the Regulated Investment Company Modernization Act of 2010, the Funds are permitted to carry forward capital losses incurred in taxable years beginning after December 22, 2010 for an unlimited period. However, any losses incurred during those future taxable years are required to be used prior to the losses incurred in pre-enactment taxable years. As a result of this ordering rule, preenactment capital loss carryforwards may be more likely to expire unused. Additionally, post-enactment capital losses that are carried forward will retain their character as either short-term or long-term capital losses rather than being considered all short-term as under previous law. Losses carried forward under these new provisions are as follows:
| Global X Funds | | Short-Term Loss | | | Long-Term Loss | | | Total | |
| Global X China Consumer ETF | | $ | 88,359 | | | $ | 4,446,525 | | | $ | 4,534,884 | |
| Global X China Energy ETF | | | 33,989 | | | | 390,814 | | | | 424,803 | |
| Global X China Financials ETF | | | 141,647 | | | | 232,521 | | | | 374,168 | |
| Global X China Industrials ETF | | | 560 | | | | 1,091,651 | | | | 1,092,211 | |
| Global X China Materials ETF | | | 30,358 | | | | 782,097 | | | | 812,455 | |
| Global X NASDAQ China Technology ETF | | | 152,056 | | | | 528,477 | | | | 680,533 | |
| Global X FTSE ASEAN 40 ETF | | | 1,074,094 | | | | 84,653 | | | | 1,158,747 | |
| Global X FTSE Andean 40 ETF | | | 245,063 | | | | 189,501 | | | | 434,564 | |
| Global X FTSE Colombia 20 ETF | | | 6,532,044 | | | | 4,182,424 | | | | 10,714,468 | |
| Global X Brazil Mid Cap ETF | | | 686,397 | | | | 2,831,270 | | | | 3,517,667 | |
| Global X Brazil Consumer ETF | | | 590,186 | | | | 1,095,113 | | | | 1,685,299 | |
| Global X Brazil Financials ETF | | | 124,936 | | | | 865,738 | | | | 990,674 | |
| Global X FTSE Argentina 20 ETF | | | 235,160 | | | | 599,070 | | | | 834,230 | |
| Global X FTSE Norway 30 ETF | | | 987,418 | | | | 1,439,699 | | | | 2,427,117 | |
| Global X FTSE Nordic Region ETF | | | 418,219 | | | | 204,319 | | | | 622,538 | |
| Global X Central Asia & Mongolia Index ETF | | | 16,751 | | | | — | | | | 16,751 | |
*Commenced operations April 2, 2013.
| Notes to Financial Statements |
| October 31, 2013 (continued) |
5. TAX INFORMATION (concluded)
The Federal tax cost and aggregate gross unrealized appreciation and depreciation on investments held by the Funds at October 31, 2013 were as follows:
| Global X Funds | | Federal Tax
Cost | | | Aggregated
Gross
Unrealized
Appreciation | | | Aggregated
Gross
Unrealized
Depreciation | | | Net
Unrealized
Appreciation
(Depreciation) | |
| Global X China Consumer ETF | | $ | 192,886,168 | | | $ | 23,243,078 | | | $ | (30,162,382 | ) | | $ | (6,919,304 | ) |
| Global X China Energy ETF | | | 4,196,102 | | | | 805,880 | | | | (481,447 | ) | | | 324,433 | |
| Global X China Financials ETF | | | 41,809,621 | | | | 1,226,825 | | | | (526,985 | ) | | | 699,840 | |
| Global X China Industrials ETF | | | 5,384,139 | | | | 464,471 | | | | (1,602,920 | ) | | | (1,138,449 | ) |
| Global X China Materials ETF | | | 2,823,634 | | | | 31,620 | | | | (586,557 | ) | | | (554,937 | ) |
| Global X NASDAQ China Technology ETF | | | 9,037,708 | | | | 1,429,458 | | | | (135,957 | ) | | | 1,293,501 | |
| Global X FTSE ASEAN 40 ETF | | | 51,125,370 | | | | 1,945,928 | | | | (3,427,050 | ) | | | (1,481,122 | ) |
| Global X FTSE Andean 40 ETF | | | 11,842,718 | | | | 338,860 | | | | (1,795,919 | ) | | | (1,457,059 | ) |
| Global X FTSE Colombia 20 ETF | | | 155,043,687 | | | | 16,532,097 | | | | (21,947,549 | ) | | | (5,415,452 | ) |
| Global X Brazil Mid Cap ETF | | | 12,542,605 | | | | 1,671,352 | | | | (1,857,731 | ) | | | (186,379 | ) |
| Global X Brazil Consumer ETF | | | 18,597,996 | | | | 6,497,104 | | | | (6,313,850 | ) | | | 183,254 | |
| Global X Brazil Financials ETF | | | 3,074,495 | | | | 342,297 | | | | (995,211 | ) | | | (652,914 | ) |
| Global X FTSE Argentina 20 ETF | | | 7,618,974 | | | | 855,434 | | | | (1,066,109 | ) | | | (210,675 | ) |
| Global X FTSE Greece 20 ETF | | | 82,014,699 | | | | 21,493,118 | | | | (9,504,640 | ) | | | 11,988,478 | |
| Global X FTSE Norway 30 ETF | | | 77,735,289 | | | | 18,112,242 | | | | (12,714,424 | ) | | | 5,397,818 | |
| Global X FTSE Nordic Region ETF | | | 49,072,603 | | | | 8,749,868 | | | | (1,856,251 | ) | | | 6,893,617 | |
| Global X Central Asia & Mongolia Index ETF* | | | 1,651,571 | | | | 94,224 | | | | (228,020 | ) | | | (133,796 | ) |
| Global X Nigeria Index ETF* | | | 6,111,762 | | | | 137,820 | | | | (423,513 | ) | | | (285,693 | ) |
*Commenced operation April 2, 2013
The preceding differences between book and tax cost are primarily due to mark to market treatment of passive foreign investment companies and wash sales.
6. CONCENTRATION OF RISKS
The Funds invest in securities of foreign issuers in several countries. These investments may involve certain considerations and risks not typically associated with investments in the United States as a result of, among other factors, the possibility of future political and economic developments and the level of governmental supervision and regulation of securities markets in the respective countries.
The securities markets of emerging countries are less liquid and subject to greater price volatility, and have a smaller market capitalization, than the U.S. securities markets. In certain countries, there may be fewer publicly traded securities and the market may be dominated by a few issues or sectors.
Issuers and securities markets in such countries are not subject to as extensive and frequent accounting, financial and other reporting requirements or as comprehensive government regulations are issuers and securities markets in the U.S. In particular, the assets and profits appearing on the financial statements of emerging country issuers may not reflect their financial position or results of operations in the same manner as financial statements for U.S. issuers. Substantially less information may be publicly available about emerging country issuers than is available about issuers in the United States.
The Funds may be subject to taxes imposed by countries in which it invests. Such taxes are generally based on either income or gains earned or repatriated. The Funds accrue and apply such taxes to net investment income, net realized gains and net unrealized gains as income and/or capital gains are earned.
| Notes to Financial Statements |
| October 31, 2013 (continued) |
6. CONCENTRATION OF RISKS (concluded)
The Funds use a replication strategy. A replication strategy is an indexing strategy that involves investing in the securities of the Underlying Index in approximately the same proportions as in the Underlying Index. The Funds may utilize a representative sampling strategy with respect to its Underlying Index when a replication strategy might be detrimental to its shareholders, such as when there are practical difficulties or substantial costs involved in compiling a portfolio of equity securities to follow its Underlying Index, or, in certain instances, when securities in the Underlying Index become temporarily illiquid, unavailable or less liquid, or due to legal restrictions (such as diversification requirements that apply to the Funds but not the Underlying Indexes).
Certain Funds may invest in commodity related securities, which are susceptible to fluctuations in certain commodity markets. Any negative changes in commodity markets could have a great impact on those securities.
7. AUTHORIZED PARTICIPANTS
At October 31, 2013, the total Shares outstanding that were held by Authorized Participants were as follows. The Authorized Participants have entered into an agreement with the Funds’ Distributor.
| | | | | | Percentage of | |
| | | Authorized | | | Shares | |
| | | Participants | | | Outstanding | |
| Global X China Consumer ETF | | | 4 | | | | 100 | % |
| Global X China Energy ETF | | | 2 | | | | 100 | % |
| Global X China Financials ETF | | | 3 | | | | 100 | % |
| Global X China Industrials ETF | | | 1 | | | | 100 | % |
| Global X China Materials ETF | | | 2 | | | | 100 | % |
| Global X NASDAQ China Technology ETF | | | 3 | | | | 100 | % |
| Global X FTSE ASEAN 40 ETF | | | 3 | | | | 100 | % |
| Global X FTSE Andean 40 ETF | | | 3 | | | | 100 | % |
| Global X FTSE Colombia 20 ETF | | | 5 | | | | 100 | % |
| Global X Brazil Mid Cap ETF | | | 1 | | | | 100 | % |
| Global X Brazil Consumer ETF | | | 3 | | | | 100 | % |
| Global X Brazil Financials ETF | | | 2 | | | | 100 | % |
| Global X FTSE Argentina 20 ETF | | | 5 | | | | 100 | % |
| Global X FTSE Greece 20 ETF | | | 6 | | | | 100 | % |
| Global X FTSE Norway 30 ETF | | | 7 | | | | 100 | % |
| Global X FTSE Nordic Region ETF | | | 5 | | | | 100 | % |
| Global X Central Asia & Mongolia Index ETF | | | 2 | | | | 100 | % |
| Global X Nigeria Index ETF | | | 2 | | | | 100 | % |
Pursuant to the Trust’s organizational documents, the Trustees of the Trust and the Trust’s officers are indemnified against certain liabilities that may arise out of the performance of their duties.
| Notes to Financial Statements |
| October 31, 2013 (continued) |
8. REVERSE SHARE SPLIT
Effective May 16, 2013, the Global X China Materials ETF and the Global X FTSE Argentina 20 ETF executed a 1-for-2 reverse share split for shareholders of record after the close of markets on May 15, 2013. The effect of this transaction was to divide the number of outstanding shares of the Funds by two, resulting in a corresponding increase in the net asset value per share. The capital share activity presented in the statement of changes in net assets for each of the years in the period then ended, and per share data in the financial highlights for each of the years in the period then ended have been given retroactive effect to reflect these reverse share splits. There were no changes in net assets, results of operations or total return as a result of these transactions.
9. LOANS OF PORTFOLIO SECURITIES
The Funds may lend portfolio securities having a market value up to one-third of the Funds’ total assets. Security loans made pursuant to the securities lending agreement are required at all times to be secured by collateral equal to at least 102% for U.S. based securities and 105% for foreign based securities. Such collateral received in connection with these loans will be cash and can be invested in repurchase agreements or U.S. Treasury obligations and is recognized in the schedule of investments and statement of asset and liabilities. The obligation to return securities lending collateral is also recognized as a liability in the statement of assets and liabilities. It is the Funds’ policy to obtain additional collateral from or return excess collateral to the borrower by the end of the next business day, following the valuation date of the securities loaned. Therefore, the value of the collateral held may be temporarily less than the value of the securities on loan. Lending securities entails a risk of loss to the Funds if and to the extent that the market value of the securities loans were to increase and the borrower did not increase the collateral accordingly, and the borrower fails to return the securities. The Funds could also experience delays and costs in gaining access to the collateral. The Funds bear the risk of any deficiency in the amount of the collateral available for return to the borrower due to any loss on the collateral invested. As of October 31, 2013, the value of the securities on loan was $12,858,803, $13,076,096, and $2,470,566 for the Global X China Consumer ETF, Global X FTSE Colombia 20 ETF and Global X FTSE Norway 30 ETF, respectively. The value of securities purchased with the cash collateral held from securities on loan was $15,499,984 and $2,635,200 for the Global X China Consumer ETF and Global X FTSE Norway 30 ETF, respectively. The value of the cash collateral held from securities on loan was $13,360,650 for the Global X FTSE Colombia 20 ETF.
10. CONTRACTUAL OBLIGATIONS
The Funds enter into contracts in the normal course of business that contain a variety of indemnifications. The Funds maximum exposure under these arrangements is unknown. However the Funds have not had prior gains or losses pursuant to these contracts. Management has reviewed the Funds’ existing contracts and expects the risk of loss to be remote.
| Notes to Financial Statements |
| October 31, 2013 (concluded) |
11. NEW ACCOUNTING PRONOUNCEMENT
In January 2013, Accounting Standards Update 2013-01 (“ASU 2013-01”), Clarifying the Scope of Disclosures about Offsetting Assets and Liabilities, replaced Accounting Standards Update 2011-11 (“ASU 2011-11”), Disclosures about Offsetting Assets and Liabilities. ASU 2013-01 is effective for fiscal years beginning on or after January 1, 2013, and interim periods within those annual periods. ASU 2011-11 was intended to enhance disclosure requirements on the offsetting of financial assets and liabilities. ASU 2013-01 limits the scope of the new balance sheet offsetting disclosures to derivative instruments, repurchase and reverse-repurchase agreements, and securities lending and borrowing transactions to the extent that they are (1) offset in the financial statements or (2) subject to an enforceable master netting arrangement or similar agreement. Management is currently evaluating the application of ASU 2013-01 and its impact, if any, on the Funds’ financial statements.
12. SUBSEQUENT EVENTS
The Funds have evaluated the need for additional disclosures and/or adjustments resulting from subsequent events. Based on this evaluation, no additional disclosures or adjustments were required to the financial statements as of the date the financial statements were issued, except as follows:
Subsequent to the October 31, 2013 fiscal year end, the following portfolios were added to the Trust.
Fund Name
Global X Guru Small Cap Index ETF
Global X Guru International Index ETF
Subsequent to the October 31, 2013 fiscal year end, the following portfolios of the Trust commenced operations.
| Fund Name | Commenced Operations |
| | |
| Global X Next Emerging & Frontier ETF | November 6, 2013 |
| Global X FTSE Portugal 20 ETF | November 12, 2013 |
| Report of Independent Registered Public Accounting Firm |
| |
The Board of Trustees and Shareholders of Global X Funds
We have audited the accompanying statements of assets and liabilities, including the schedules of investments, of Global X China Consumer ETF, Global X China Energy ETF, Global X China Financials ETF, Global X China Industrials ETF, Global X China Materials ETF, Global X NASDAQ China Technology ETF, Global X FTSE ASEAN 40 ETF, Global X FTSE Andean 40 ETF, Global X FTSE Colombia 20 ETF, Global X Brazil Mid Cap ETF, Global X Brazil Consumer ETF, Global X Brazil Financials ETF, Global X FTSE Argentina 20 ETF, Global X FTSE Greece 20 ETF, Global X FTSE Norway 30 ETF, Global X FTSE Nordic Region ETF, Global X Central Asia & Mongolia Index ETF, and Global X Nigeria Index ETF, (eighteen of the series constituting the Global X Funds) (the “Funds”) as of October 31, 2013, and the related statements of operations for the year or period then ended, the statements of changes in net assets for the two years or periods then ended, and the financial highlights for each of the three years or periods then ended. These financial statements and financial highlights are the responsibility of the Funds’ management. Our responsibility is to express an opinion on these financial statements and financial highlights based on our audits. The financial highlights of the Global X China Consumer ETF, Global X China Energy ETF, Global X China Financials ETF, Global X China Industrials ETF, Global X China Materials ETF , Global X NASDAQ China Technology ETF, Global X FTSE Colombia 20 ETF, Global X Brazil Mid Cap ETF, Global X Brazil Consumer ETF, Global X Brazil Financials ETF and Global X FTSE Nordic Region ETF for each of the periods presented through October 31, 2010 were audited by other auditors whose report dated December 23, 2010, expressed an unqualified opinion on those financial statements and financial highlights.
We conducted our audits in accordance with the standards of the Public Company Accounting Oversight Board (United States). Those standards require that we plan and perform the audit to obtain reasonable assurance about whether the financial statements and financial highlights are free of material misstatement. We were not engaged to perform an audit of the Funds’ internal control over financial reporting. Our audits included consideration of internal control over financial reporting as a basis for designing audit procedures that are appropriate in the circumstances, but not for the purpose of expressing an opinion on the effectiveness of the Funds’ internal control over financial reporting. Accordingly, we express no such opinion. An audit also includes examining, on a test basis, evidence supporting the amounts and disclosures in the financial statements and financial highlights, assessing the accounting principles used and significant estimates made by management, and evaluating the overall financial statement presentation. Our procedures included confirmation of securities owned as of October 31, 2013, by correspondence with the custodian and brokers, or by other appropriate auditing procedures where replies from brokers were not received. We believe that our audits provide a reasonable basis for our opinion.
In our opinion, the financial statements and financial highlights referred to above present fairly, in all material respects, the financial position of each of the Funds listed above at October 31, 2013, and the results of their operations for the year or period then ended, the changes in their net assets for each of the two years or periods then ended, and their financial highlights for each of three years or periods then ended, in conformity with U.S. generally accepted accounting principles.
Philadelphia, Pennsylvania
December 27, 2013
| Disclosure of Fund Expenses (unaudited) |
| |
All Exchange Traded Funds (“ETF”) have operating expenses. As a shareholder of an ETF, your investment is affected by these ongoing costs, which include (among others) costs for ETF management, administrative services, brokerage fees, and shareholder reports like this one. It is important for you to understand the impact of these costs on your investment returns. In addition, a shareholder is responsible for brokerage fees as a result of their investment in the Fund.
Operating expenses such as these are deducted from an ETF’s gross income and directly reduce your final investment return. These expenses are expressed as a percentage of the ETF’s average net assets; this percentage is known as the ETF’s expense ratio.
The following examples use the expense ratio and are intended to help you understand the ongoing costs (in dollars) of investing in your Fund and to compare these costs with those of other funds. The examples are based on an investment of $1,000 made at the beginning of the period shown and held for the entire period.
The table on the next page illustrates your Fund’s costs in two ways:
Actual Fund Return. This section helps you to estimate the actual expenses that your Fund incurred over the period. The “Expenses Paid During Period” column shows the actual dollar expense cost incurred by a $1,000 investment in the Fund, and the “Ending Account Value” number is derived from deducting that expense cost from the Fund’s gross investment return.
You can use this information, together with the actual amount you invested in the Funds, to estimate the expenses you paid over that period. Simply divide your actual account value by $1,000 to arrive at a ratio (for example, an $8,600 account value divided by $1,000 = 8.6), then multiply that ratio by the number shown for your Funds under “Expenses Paid During Period.”
Hypothetical 5% Return. This section helps you compare your Fund’s costs with those of other funds. It assumes that the Funds had an annual 5% return before expenses during the year, but that the expense ratio (Column 3) for the period is unchanged. This example is useful in making comparisons because the Securities and Exchange Commission requires all funds to make this 5% calculation. You can assess your Fund’s comparative cost by comparing the hypothetical result for your Fund in the “Expenses Paid During Period” column with those that appear in the same charts in the shareholder reports for other funds.
NOTE: Because the return is set at 5% for comparison purposes — NOT your Fund’s actual return — the account values shown may not apply to your specific investment.
| Disclosure of Fund Expenses (unaudited) |
| |
| | | Beginning
Account
Value
5/1/2013 | | | Ending
Account
Value
10/31/2013 | | | Annualized
Expense
Ratios | | | Expenses
Paid
During
Period(1) | |
| Global X China Consumer ETF |
| Actual Fund Return | | $ | 1,000.00 | | | $ | 1,116.80 | | | 0.65 | % | | $ | 3.47 | |
| Hypothetical 5% Return | | | 1,000.00 | | | | 1,021.93 | | | 0.65 | | | | 3.31 | |
| Global X China Energy ETF |
| Actual Fund Return | | $ | 1,000.00 | | | $ | 1,026.50 | | | 0.65 | % | | $ | 3.32 | |
| Hypothetical 5% Return | | | 1,000.00 | | | | 1,021.93 | | | 0.65 | | | | 3.31 | |
| Global X China Financials ETF |
| Actual Fund Return | | $ | 1,000.00 | | | $ | 1,016.80 | | | 0.65 | % | | $ | 3.30 | |
| Hypothetical 5% Return | | | 1,000.00 | | | | 1,021.93 | | | 0.65 | | | | 3.31 | |
| Global X China Industrials ETF |
| Actual Fund Return | | $ | 1,000.00 | | | $ | 1,083.00 | | | 0.65 | % | | $ | 3.41 | |
| Hypothetical 5% Return | | | 1,000.00 | | | | 1,021.93 | | | 0.65 | | | | 3.31 | |
| Global X China Materials ETF |
| Actual Fund Return | | $ | 1,000.00 | | | $ | 998.70 | | | 0.65 | % | | $ | 3.27 | |
| Hypothetical 5% Return | | | 1,000.00 | | | | 1,021.93 | | | 0.65 | | | | 3.31 | |
| Global X NASDAQ China Technology ETF |
| Actual Fund Return | | $ | 1,000.00 | | | $ | 1,406.30 | | | 0.65 | % | | $ | 3.94 | |
| Hypothetical 5% Return | | | 1,000.00 | | | | 1,021.93 | | | 0.65 | | | | 3.31 | |
| Global X FTSE ASEAN 40 ETF |
| Actual Fund Return | | $ | 1,000.00 | | | $ | 936.00 | | | 0.65 | % | | $ | 3.17 | |
| Hypothetical 5% Return | | | 1,000.00 | | | | 1,021.93 | | | 0.65 | | | | 3.31 | |
| Global X FTSE Andean 40 ETF |
| Actual Fund Return | | $ | 1,000.00 | | | $ | 891.90 | | | 0.72 | % | | $ | 3.43 | |
| Hypothetical 5% Return | | | 1,000.00 | | | | 1,021.58 | | | 0.72 | | | | 3.67 | |
| Global X FTSE Colombia 20 ETF |
| Actual Fund Return | | $ | 1,000.00 | | | $ | 1,021.40 | | | 0.70 | % | | $ | 3.56 | |
| Hypothetical 5% Return | | | 1,000.00 | | | | 1,021.69 | | | 0.70 | | | | 3.56 | |
| Global X Brazil Mid Cap ETF |
| Actual Fund Return | | $ | 1,000.00 | | | $ | 920.50 | | | 0.69 | % | | $ | 3.34 | |
| Hypothetical 5% Return | | | 1,000.00 | | | | 1,021.73 | | | 0.69 | | | | 3.52 | |
| Global X Brazil Consumer ETF |
| Actual Fund Return | | $ | 1,000.00 | | | $ | 861.30 | | | 0.77 | % | | $ | 3.61 | |
| Hypothetical 5% Return | | | 1,000.00 | | | | 1,021.32 | | | 0.77 | | | | 3.92 | |
| Global X Brazil Financials ETF |
| Actual Fund Return | | $ | 1,000.00 | | | $ | 916.80 | | | 0.77 | % | | $ | 3.72 | |
| Hypothetical 5% Return | | | 1,000.00 | | | | 1,021.32 | | | 0.77 | | | | 3.92 | |
| Global X FTSE Argentina 20 ETF |
| Actual Fund Return | | $ | 1,000.00 | | | $ | 1,159.40 | | | 0.74 | % | | $ | 4.04 | |
| Hypothetical 5% Return | | | 1,000.00 | | | | 1,021.46 | | | 0.74 | | | | 3.79 | |
| Global X FTSE Greece 20 ETF |
| Actual Fund Return | | $ | 1,000.00 | | | $ | 1,296.40 | | | 0.59 | % | | $ | 3.41 | |
| Hypothetical 5% Return | | | 1,000.00 | | | | 1,022.23 | | | 0.59 | | | | 3.01 | |
| Global X FTSE Norway 30 ETF |
| Actual Fund Return | | $ | 1,000.00 | | | $ | 1,079.90 | | | 0.50 | % | | $ | 2.62 | |
| Hypothetical 5% Return | | | 1,000.00 | | | | 1,022.68 | | | 0.50 | | | | 2.55 | |
| Global X FTSE Nordic Region ETF |
| Actual Fund Return | | $ | 1,000.00 | | | $ | 1,099.10 | | | 0.50 | % | | $ | 2.65 | |
| Hypothetical 5% Return | | | 1,000.00 | | | | 1,022.68 | | | 0.50 | | | | 2.55 | |
| Disclosure of Fund Expenses (unaudited) |
| |
| | | Beginning
Account
Value
5/1/2013 | | | Ending
Account
Value
10/31/2013 | | | Annualized
Expense
Ratios | | | Expenses
Paid
During
Period(1) | |
| | | | | | | | | | | | | |
| Global X Central Asia & Mongolia Index ETF |
| Actual Fund Return | | $ | 1,000.00 | | | $ | 941.10 | | | | 0.69 | % | | $ | 3.38 | |
| Hypothetical 5% Return | | | 1,000.00 | | | | 1,021.73 | | | | 0.69 | | | | 3.52 | |
| Global X Nigeria Index ETF |
| Actual Fund Return | | $ | 1,000.00 | | | $ | 1,020.50 | | | | 0.68 | % | | $ | 3.46 | |
| Hypothetical 5% Return | | | 1,000.00 | | | | 1,021.78 | | | | 0.68 | | | | 3.47 | |
| (1) | Expenses are equal to the Fund’s annualized expense ratio multiplied by the average account value over the period, multiplied by 184/365 (to reflect the one-half year period.). |
| Supplemental Information (unaudited) |
| |
Net asset value, or “NAV”, is the price per Share at which the Funds issue and redeem Shares. It is calculated in accordance with the standard formula for valuing mutual fund shares. The “Market Price” of the Funds generally is determined using the midpoint between the highest bid and the lowest offer on the stock exchange on which the Shares of the Funds are listed for trading, as of the time that the Funds’ NAV is calculated. The Funds’ Market Price may be at, above or below their NAV. The NAV of the Funds will fluctuate with changes in the market value of their Funds holdings. The Market Price of the Funds will fluctuate in accordance with changes in its NAV, as well as market supply and demand.
Premiums or discounts are the differences (expressed as a percentage) between the NAV and Market Price of the Funds on a given day, generally at the time NAV is calculated. A premium is the amount that the Funds are trading above the reported NAV, expressed as a percentage of the NAV. A discount is the amount that the Funds are trading below the reported NAV, expressed as a percentage of the NAV.
Further information regarding premiums and discounts is available on the Funds’ website at www.GlobalXFunds.com.
| Trustees and Officers of the Trust (unaudited) |
| |
Set forth below are the names, addresses, year of birth, position with the Trust, Term of Office and Length of Time Served, the principal occupations for the last five years, number of Funds in fund complex overseen by trustee, and other directorships outside the fund complex of each of the persons currently serving as Trustees and Officers of the Trust.
Name,
Address
(Year of
Birth) | Position(s)
Held
with Funds | Principal Occupation(s) During
the Past 5 Years | Number of
Funds in
Trust
Overseen by
Trustee | Other
Directorships
Held
by Trustees |
| Independent Trustees2 | |
Sanjay Ram Bharwani 623 Fifth Ave, 15th floor New York,
NY 10022
(1974) | Trustee (since 2008) | CEO of Risk Advisors Inc. (since 2007) (consulting firm). | 363 | None. |
Scott R. Chichester1 623 Fifth Ave, 15th floor New York,
NY 10022 (1970) | Trustee (since 2008) | CFO, Sterling Seal & Supply Inc. (since 2011), President & Treasurer, Bayview Acquisition Corp (since 2010), CPA, Penda Aiken Inc. (2009-2011) (consultant); Founder and President, DirectPay USA LLC (since 2006) (payroll company); Chief Financial Officer, Ong Corporation (2002-2010) (technology company); Proprietor, Scott R. Chichester CPA (since 2001) (CPA firm). | 363 | Director of Bayview Acquisition Corp. (since 2010). |
Kartik Kiran Shah 623 Fifth Ave, 15th floor New York, NY 10022 (1977) | Trustee (since 2008) | Vice President, Business Development, Cynvenio Biosystems (2012-present); Independent Consultant, Self-Employed (2011-2012) (non-financial services); Director, Wireless Generation (2008-2011) (software). | 363 | None. |
| Trustees and Officers of the Trust (unaudited) (continued) |
| |
The Trust’s Statement of Additional Information (“SAI”) includes additional information about the Trustees and Officers. The SAI may be obtained without charge by calling 1-888-493-8631. The following chart lists Trustees and Officers as of October 31, 2013.
Name, Address
(Year of Birth) | Position(s) Held
with Funds | Principal Occupation(s)
During
the Past 5 Years | Number of Funds
in Trust
Overseen by
Trustee | Other
Directorships Held
by Trustees |
| Interested Trustee / Officers2 | |
Bruno del Ama 623 Fifth Ave, 15th floor New York, NY
10022 (1976) | Trustee (since 2008), President, Chief Executive Officer (since 2008) | Chief Executive Officer and Chief Compliance Officer, Global X Management Company LLC (since 2008); Head of Global Structured Products Operations at Radian Asset Assurance (2004-2008)
(financial services firm). | 363 | None. |
Jose C. Gonzalez 623 Fifth Ave, 15th floor New York, NY
10022 (1976) | Chief Operating Officer, Chief Compliance Officer, Treasurer, Principal Accounting Officer and Chief Financial Officer (since 2008) | Chief Operating Officer, Global X Management Company LLC (since 2008); Founder and President of GWM Group, Inc. (since 2006) (broker dealer). | N/A | N/A |
Daphne Tippens Chisolm 11524-C
Providence Road, Suite 236 Charlotte, NC
28277 (1969) | Secretary (since 2012) | General Counsel, Global X Management Company LLC (since 2011); Founder and President of Law Offices of DT Chisolm, P.C. (since 2009) (law firm); Counsel, Dechert (2007-2009) (law firm) | N/A | N/A |
Dianne M.
Descoteaux4 One Freedom
Valley Drive Oaks, PA 19456 (1977) | Assistant Secretary (since 2011) | Counsel, SEI Investments (since 2010); Associate, Morgan, Lewis & Bockius LLP (2006-2010). | N/A | N/A |
| Trustees and Officers of the Trust (unaudited) (concluded) |
| |
Name, Address
(Year of Birth) | Position(s) Held
with Funds | Principal Occupation(s) During
the Past 5 Years | Other Directorships
Held
by Trustees |
Lisa Whittaker4 One Freedom Valley Drive Oaks, PA 19456 (1978) | Assistant Secretary (since 2013) | Counsel at SEI Investments (since 2012); Associate Counsel and Compliance Officer at The Glendale Trust Company (2011-2012); Associate of Drinker Biddle & Reath LLP (2006-2011). | N/A |
Peter Rodriguez4 One Freedom Valley Drive Oaks, PA 19456 (1962) | Assistant Treasurer (since 2011) | Fund Accounting Director, SEI Investments Global Fund Services (since 2011); Mutual Fund Trading Director, SEI Global Trust Company (2009-2011); Asset Data Services Director, SEI Global Wealth Services (2006-2009). | N/A |
| 1 | Mr. Chichester is currently married to a sister of Mr. del Ama’s wife. While an “immediate family member” (as defined in Section 2(a)(19) of the 1940 Act) of Mr. del Ama would be considered an Interested Person, Mr. Chichester is not considered an immediate family member for this purpose. Although this fact was taken into consideration in determining whether Mr. Chichester should be considered to be an Independent Trustee for purposes of the Section 2(a)(19) of the 1940 Act, it was determined that this relationship was not one that should disqualify Mr. Chichester from serving as an Independent Trustee of the Trust. |
2 Each Trustee serves until his or her successor is duly elected or appointed and qualified.
| 3 | As of October 31, 2013, the Trust had seventy-nine investment portfolios, thirty-six of which were operational. |
4 These officers of the Trust also serve as officers of one or more mutual funds for which SEI Investments Company or an affiliate acts as investment manager, administrator or distributor.
| Notice to Shareholders (unaudited) |
| |
For shareholders that do not have an October 31, 2013 tax year end, this notice is for informational purposes only. For shareholders with an October 31, 2013 tax year end, please consult your tax advisor as to the pertinence of this notice. For the fiscal year ended October 31, 2013, the Funds have designated the following items with regard to distributions paid during the year.
| | | Long-Term
Capital Gain
Distributions | | | Ordinary
Income
Distributions | | | Total
Distributions | | | Qualifying for
Corporate
Dividends
Received
Deduction (1) | | | Qualifying
Dividend
Income (2) | | | U.S.
Government
Interest (3) | | | Interest
Related
Dividends
(4) | | | Short
Term
Capital
Gain
Dividends | |
| Global X China Consumer ETF | | | 0.00 | % | | | 100.00 | % | | | 100.00 | % | | | 0.00 | % | | | 31.67 | % | | | 0.00 | % | | | 0.00 | % | | | 0.00 | % |
| Global X China Energy ETF | | | 0.00 | % | | | 100.00 | % | | | 100.00 | % | | | 0.00 | % | | | 100.00 | % | | | 0.00 | % | | | 0.00 | % | | | 0.00 | % |
| Global X China Financials ETF | | | 0.00 | % | | | 100.00 | % | | | 100.00 | % | | | 0.00 | % | | | 100.00 | % | | | 0.00 | % | | | 0.00 | % | | | 0.00 | % |
| Global X China Industrials ETF | | | 0.00 | % | | | 100.00 | % | | | 100.00 | % | | | 0.00 | % | | | 98.59 | % | | | 0.00 | % | | | 0.00 | % | | | 0.00 | % |
| Global X China Materials ETF | | | 0.00 | % | | | 100.00 | % | | | 100.00 | % | | | 0.00 | % | | | 100.00 | % | | | 0.00 | % | | | 0.00 | % | | | 0.00 | % |
| Global X NASDAQ China Technology ETF | | | 0.00 | % | | | 100.00 | % | | | 100.00 | % | | | 0.00 | % | | | 100.00 | % | | | 0.00 | % | | | 0.00 | % | | | 0.00 | % |
| Global X FTSE ASEAN 40 ETF | | | 0.00 | % | | | 100.00 | % | | | 100.00 | % | | | 0.00 | % | | | 87.86 | % | | | 0.00 | % | | | 0.00 | % | | | 0.00 | % |
| Global X FTSE Andean 40 ETF | | | 0.00 | % | | | 100.00 | % | | | 100.00 | % | | | 10.82 | % | | | 96.18 | % | | | 0.00 | % | | | 0.00 | % | | | 0.00 | % |
| Global X FTSE Colombia 20 ETF | | | 0.00 | % | | | 100.00 | % | | | 100.00 | % | | | 0.00 | % | | | 40.03 | % | | | 0.00 | % | | | 0.00 | % | | | 0.00 | % |
| Global X Brazil Mid Cap ETF | | | 0.00 | % | | | 100.00 | % | | | 100.00 | % | | | 0.00 | % | | | 79.10 | % | | | 0.00 | % | | | 1.35 | % | | | 0.00 | % |
| Global X Brazil Consumer ETF | | | 0.00 | % | | | 100.00 | % | | | 100.00 | % | | | 0.00 | % | | | 34.06 | % | | | 0.00 | % | | | 0.64 | % | | | 0.00 | % |
| Global X Brazil Financials ETF | | | 0.00 | % | | | 100.00 | % | | | 100.00 | % | | | 0.00 | % | | | 39.95 | % | | | 0.00 | % | | | 0.00 | % | | | 0.00 | % |
| Global X FTSE Argentina 20 ETF | | | 0.00 | % | | | 100.00 | % | | | 100.00 | % | | | 39.47 | % | | | 100.00 | % | | | 0.00 | % | | | 0.00 | % | | | 0.00 | % |
| Global X FTSE Greece 20 ETF | | | 19.24 | % | | | 80.76 | % | | | 100.00 | % | | | 0.85 | % | | | 79.76 | % | | | 0.01 | % | | | 0.01 | % | | | 100.00 | % |
| Global X FTSE Norway 30 ETF | | | 0.00 | % | | | 100.00 | % | | | 100.00 | % | | | 0.00 | % | | | 62.84 | % | | | 0.00 | % | | | 0.00 | % | | | 0.00 | % |
| Global X FTSE Nordic Region ETF | | | 0.00 | % | | | 100.00 | % | | | 100.00 | % | | | 14.33 | % | | | 98.85 | % | | | 0.00 | % | | | 0.00 | % | | | 0.00 | % |
| Global X Central Asia & Mongolia Index ETF | | | 0.00 | % | | | 100.00 | % | | | 100.00 | % | | | 0.00 | % | | | 100.00 | % | | | 0.00 | % | | | 0.00 | % | | | 0.00 | % |
| Global X Nigeria Index ETF | | | 0.00 | % | | | 100.00 | % | | | 100.00 | % | | | 0.00 | % | | | 100.00 | % | | | 0.00 | % | | | 0.00 | % | | | 0.00 | % |
(1) Qualifying dividends represent dividends which qualify for the corporate dividends received deduction and is reflected as a percentage of ordinary Income distributions (the total of short term capital gain and net investment income distributions).
(2) The percentage in this column represents the amount of "Qualifying Dividend Income" as created by the Jobs and Growth Relief Reconciliation Act of 2003 and its reflected as a percentage of ordinary income distributions (the total of short term capital gain and net investment income distributions). It is the intention of each of the aforementioned funds to designate the maximum amount permitted by law.
(3) "U.S. Government Interest represents the amount of interest that was derived from U.S. Government obligations and distributed during the fiscal year. Generally, interest from direct U.S. Government obligations is exempt from state income tax. However, for shareholders who are residents of California, Connecticut and New York, the statutory threshold requirements were not satisfied to permit exemption of these amounts from state income.
(4) The percentage in this column represents the amount of "Qualifying Interest Income" as created by the American Jobs Creation Act of 2004 and is a percentage of net investment income that is exempt from U.S. withholding tax when paid for foreign investors.
| Notice to Shareholders (unaudited) |
| |
The Funds intend to pass through a foreign tax credit to shareholders. For the fiscal year ended October 31, 2013, the total amount of foreign source income and foreign tax credit are as follows:
| | | Foreign Source | | | Foreign Tax Credit Pass- | |
| Global X Funds | | Income | | | Through | |
| Global X China Consumer ETF | | $ | 3,290,173 | | | $ | 83,077 | |
| Global X China Energy ETF | | | 127,600 | | | | 12,302 | |
| Global X China Financial ETF | | | 347,011 | | | | 27,158 | |
| Global X China Industrials ETF | | | 89,996 | | | | 5,143 | |
| Global X China Materials ETF | | | 57,593 | | | | 2,890 | |
| Global X NASDAQ China Technology ETF | | | 32,145 | | | | 2,091 | |
| Global X FTSE ASEAN 40 ETF | | | 1,750,855 | | | | 75,499 | |
| Global X FTSE Andean 40 ETF | | | 222,120 | | | | 25,183 | |
| Global X FTSE Colombia 20 ETF | | | 4,723,829 | | | | 49,087 | |
| Global X FTSE Greece 20 ETF | | | 706,784 | | | | 127,799 | |
| Global X FTSE Norway ETF | | | 2,827,212 | | | | 281,633 | |
| Global X FTSE Nordic Region ETF | | | 1,421,235 | | | | 28,573 | |
| Global X Central Asia & Mongolia Index ETF | | | 61,737 | | | | 5,979 | |
| Global X Nigeria Index ETF | | | 108,829 | | | | 12,197 | |
The information reported herein may differ from the information and distributions taxable to the shareholders for the calendar year ending December 31, 2013. Complete information will be computed and reported in conjunction with your 2013 Form 1099-DIV.
Notes
623 Fifth Avenue, 15th floor
New York, NY 10022
1-888-GXFund-1
(1-888-493-8631)
www.globalxfunds.com
Investment Adviser:
Global X Management Company LLC
623 Fifth Avenue, 15th floor
New York, NY 10022
Distributor:
SEI Investments Distribution Co.
One Freedom Valley Drive
Oaks, PA 19456
Sub-Administrator:
SEI Investments Global Funds Services
One Freedom Valley Drive
Oaks, PA 19456
Counsel for the Independent Trustees:
Dechert LLP
1900 K Street N.W.
Washington, DC 20006
This information must be preceded or accompanied by a prospectus for the funds described.
GLX-AR-002-0300
Global X SuperDividend ETF (ticker: SDIV)
Global X SuperDividend U.S. ETF (ticker: DIV)
Global X Canada Preferred ETF (ticker: CNPF)
Global X Social Media Index ETF (ticker: SOCL)
Global X Permanent ETF (ticker: PERM)
Global X Guru Index ETF (formerly Global X Top Guru Holdings Index ETF) (ticker: GURU)
Global X SuperIncome Preferred ETF (ticker: SPFF)
Annual Report
October 31, 2013
| Management Discussion of Fund Performance (unaudited) | 1 |
| Schedules of Investments | |
| Global X SuperDividend ETF | 10 |
| Global X SuperDividend U.S. ETF | 17 |
| Global X Canada Preferred ETF | 20 |
| Global X Social Media Index ETF | 23 |
| Global X Permanent ETF | 25 |
| Global X Guru Index ETF | 30 |
| Global X SuperIncome Preferred ETF | 34 |
| Statements of Assets and Liabilities | 37 |
| Statements of Operations | 39 |
| Statements of Changes in Net Assets | 42 |
| Financial Highlights | 47 |
| Notes to Financial Statements | 48 |
| Report of Independent Registered Public Accounting Firm | 62 |
| Disclosure of Fund Expenses (unaudited) | 63 |
| Supplemental Information (unaudited) | 65 |
| Trustees and Officers of the Trust (unaudited) | 66 |
| Notice to Shareholders (unaudited) | 69 |
The Funds file their complete schedules of Fund holdings with the Securities and Exchange Commission (the “Commission”) for the first and third quarters of each fiscal year on Form N-Q within sixty days after the end of the period. The Funds’ Forms N-Q are available on the Commission’s website at http://www.sec.gov, and may be reviewed and copied at the Commission's Public Reference Room in Washington, DC. Information on the operation of the Public Reference Room may be obtained by calling 1-800-SEC-0330.
A description of the policies and procedures that Global X Funds use to determine how to vote proxies relating to Fund securities, as well as information relating to how the Funds voted proxies relating to Fund securities during the most recent 12-month period ended June 30, will be available (i) without charge, upon request, by calling 1-888-GXFund-1; and (ii) on the Commission’s website at http://www.sec.gov.
| Management Discussion of Fund Performance (unaudited) |
| Global X SuperDividend ETF |
Global X SuperDividend ETF
The Global X SuperDividend ETF (the “Fund”) seeks to provide investment results that correspond generally to the price and yield performance, before fees and expenses, of the Solactive Global SuperDividend™ Index (the “Index”). The Fund generally seeks to replicate the Index but may at times invest in a representative sample of securities that collectively has an investment profile similar to the Index and as a result may or may not hold all the securities that are included in the Index.
The Index tracks the performance of 100 equally weighted companies that rank among the highest dividend yielding equity securities in the world.
The S&P 500 Index is a market capitalization weighted composite index of 500 large capitalization U.S. companies.
For the 12-month period ended October 31, 2013 (the “reporting period”), the Fund increased 17.34%, while the Index increased 17.18%. The Fund had a net asset value of $21.86 per share on October 31, 2012 and ended the reporting period with a net asset value of $23.74 on October 31, 2013.
During the reporting period, the highest returns came from RR Donnelley & Sons and Electricite de France which returned 102.88% and 92.54%, respectively. The worst performers were Atlantic Power and Fleetwood Limited, which returned -72.87% and -71.44%, respectively.
| | | AVERAGE ANNUAL TOTAL RETURN FOR | |
| | | THE YEAR ENDED OCTOBER 31, 2013 | |
| | | One Year Return | | | Annualized Inception to Date* | |
| | | Net Asset Value | | | Market Price | | | Net Asset Value | | | Market Price | |
| Global X SuperDividend ETF | | | 17.34 | % | | | 17.29 | % | | | 6.00 | % | | | 6.08 | % |
| Solactive Global SuperDividendTM Index | | | 17.18 | % | | | 17.18 | % | | | 5.32 | % | | | 5.32 | % |
| S&P 500 Index | | | 27.18 | % | | | 27.18 | % | | | 16.63 | % | | | 16.63 | % |
Growth of a $10,000 Investment
(at Net Asset Value)
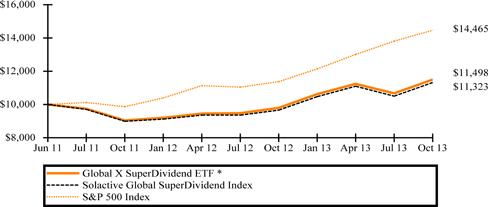
* The Fund commenced operations on June 8, 2011.
The performance data quoted herein represents past performance and the return and value of an investment in the Fund will fluctuate so that, when redeemed, may be worth less than its original cost. Past performance is no guarantee of future performance and should not be considered as a representation of the future results of the Fund. The Fund's performance assumes the reinvestment of all dividends and all capital gains. Index returns assume reinvestment of dividends and, unlike a Fund's returns, do not reflect any fees or expenses. If such fees and expenses were included in the index returns, the performance would have been lower. Please note that one cannot invest directly in an unmanaged index.
There are no assurances that the Fund will meet its stated objectives.
The Fund’s holdings and allocations are subject to change and should not be considered recommendations to buy individual securities.
Returns shown do not reflect the deduction of taxes that a shareholder would pay on Fund distributions or the redemption of Fund shares.
See definition of comparative indices above.
| Management Discussion of Fund Performance (unaudited) |
| Global X SuperDividend U.S. ETF |
Global X SuperDividend U.S. ETF
The Global X SuperDividend U.S. ETF (the “Fund”) seeks to provide investment results that correspond generally to the price and yield performance, before fees and expenses, of the INDXX SuperDividend™ U.S. Low Volatility Index (the “Index”). The Fund generally seeks to replicate the Index but may at times invest in a representative sample of securities that collectively has an investment profile similar to the Index and as a result may or may not hold all the securities that are included in the Index.
The Index tracks the performance of 50 equally weighted common stocks, MLPs and REITs that rank among the highest dividend yielding equity securities in the United States, as defined by INDXX, LLC.
The S&P 500 Index is a market capitalization weighted composite index of 500 large capitalization U.S. companies.
For the period from the Fund’s commencement date on March 11, 2013 through October 31, 2013 (the “reporting period”), the Fund total return was 7.32% vs. 7.66% for the Index. The Fund had a net asset value of $25.15 per share on March 11, 2013 and ended the reporting period with a net asset value of $25.94 on October 31, 2013.
During the reporting period, the highest returns came from World Wrestling Entertainment and Lockheed Martin which returned 51.48% and 50.25%, respectively. The worst performers were Linn Energy, LLC and Hatteras Financial, which returned -34.21% and -29.21%, respectively.
| | | TOTAL RETURN FOR THE | |
| | | PERIOD ENDED | |
| | | OCTOBER 31, 2013* | |
| | | Cumulative Inception to Date* | |
| | | Net Asset Value | | | Market Price | |
| Global X SuperDividend U.S. ETF | | | 7.32 | % | | | 8.08 | % |
| INDXX SuperDividendTM U.S. Low Volatility Index | | | 7.66 | % | | | 7.66 | % |
| S&P 500 Index | | | 14.33 | % | | | 14.33 | % |
Growth of a $10,000 Investment
(at Net Asset Value)
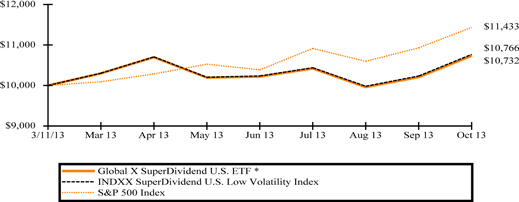
* The Fund commenced operations on March 11, 2013. Total return is for the period indicated and has not been annualized.
The performance data quoted herein represents past performance and the return and value of an investment in the Fund will fluctuate so that, when redeemed, may be worth less than its original cost. Past performance is no guarantee of future performance and should not be considered as a representation of the future results of the Fund. The Fund's performance assumes the reinvestment of all dividends and all capital gains. Index returns assume reinvestment of dividends and, unlike a Fund's returns, do not reflect any fees or expenses. If such fees and expenses were included in the index returns, the performance would have been lower. Please note that one cannot invest directly in an unmanaged index.
There are no assurances that the Fund will meet its stated objectives.
The Fund’s holdings and allocations are subject to change and should not be considered recommendations to buy individual securities.
Returns shown do not reflect the deduction of taxes that a shareholder would pay on Fund distributions or the redemption of Fund shares.
See definition of comparative indices above.
| Management Discussion of Fund Performance (unaudited) |
| Global X Canada Preferred ETF |
Global X Canada Preferred ETF
The Global X Canada Preferred ETF (the “Fund”) seeks to provide investment results that correspond generally to the price and yield performance, before fees and expenses, of the Solactive Canada Preferred Stock Index (the “Index”). The Fund generally seeks to replicate the Index but may at times invest in a representative sample of securities that collectively has an investment profile similar to the Index and as a result may or may not hold all the securities that are included in the Index.
The Index tracks the performance of a select group of preferred stocks from Canadian issues that trade on the Toronto Stock Exchange. It is comprised of preferred shares that meet certain criteria relating to size, liquidity, issuer rating, maturity, and other requirements as determined by Solactive AG. Only securities which are tradable for foreign investors without restrictions are eligible. The Fund is the nation’s first ETF focused exclusively on preferred stock of Canadian companies.
The S&P 500 Index is a market capitalization weighted composite index of 500 large capitalization U.S. companies.
For the 12-month period ended October 31, 2013 (the “reporting period”), the Fund decreased 7.03%, while the Index decreased 7.01%. The Fund had a net asset value of $14.49 per share on October 31, 2012 and ended the reporting period with a net asset value of $12.99 on October 31, 2013.
During the reporting period, the highest returns came from BCE, Series AA and BCE, Series AC, which returned 7.56% and 3.53%, respectively. The worst performers were Transalta, Series A and TransCanada, Series 3, which returned -20.22% and -19.78%, respectively.
| | | AVERAGE ANNUAL TOTAL RETURN FOR | |
| | | THE YEAR ENDED OCTOBER 31, 2013 | |
| | | One Year Return | | | Annualized Inception to Date* | |
| | | Net Asset Value | | | Market Price | | | Net Asset Value | | | Market Price | |
| Global X Canada Preferred ETF | | | -7.03 | % | | | -7.59 | % | | | -2.25 | % | | | -2.47 | % |
| Solactive Canada Preferred Stock Index | | | -7.01 | % | | | -7.01 | % | | | -2.12 | % | | | -2.12 | % |
| S&P 500 Index | | | 27.18 | % | | | 27.18 | % | | | 15.03 | % | | | 15.03 | % |
Growth of a $10,000 Investment
(at Net Asset Value)

* The Fund commenced operations on May 24, 2011.
The performance data quoted herein represents past performance and the return and value of an investment in the Fund will fluctuate so that, when redeemed, may be worth less than its original cost. Past performance is no guarantee of future performance and should not be considered as a representation of the future results of the Fund. The Fund's performance assumes the reinvestment of all dividends and all capital gains. Index returns assume reinvestment of dividends and, unlike a Fund's returns, do not reflect any fees or expenses. If such fees and expenses were included in the index returns, the performance would have been lower. Please note that one cannot invest directly in an unmanaged index.
There are no assurances that the Fund will meet its stated objectives.
The Fund’s holdings and allocations are subject to change and should not be considered recommendations to buy individual securities.
Returns shown do not reflect the deduction of taxes that a shareholder would pay on Fund distributions or the redemption of Fund shares.
See definition of comparative indices above.
| Management Discussion of Fund Performance (unaudited) |
| Global X Social Media Index ETF |
Global X Social Media Index ETF
The Global X Social Media Index ETF (“Fund”) seeks to provide investment results that correspond generally to the price and yield performance, before fees and expenses, of the Solactive Social Media Index (“Index”). The Fund generally seeks to replicate the Index but may at times invest in a representative sample of securities that collectively has an investment profile similar to the Index and as a result may or may not hold all the securities that are included in the Index.
The Index tracks the equity performance of the largest and most liquid companies involved in the social media industry, including companies that provide social networking, file sharing, and other web-based media applications.
The S&P 500 Index is a market capitalization weighted composite index of 500 large capitalization U.S. companies.
For the 12-month period ended October 31, 2013 (the “reporting period”), the Fund increased 52.34%, while the Index increased 53.19%. The Fund had a net asset value of $12.83 per share on October 31, 2012 and ended the reporting period with a net asset value of $19.38 on October 31, 2013.
During the reporting period, the highest returns came from Pandora Media and Yelp, which returned 198.46% and 181.12% respectively. The worst performers were Gree and MeetMe, which returned -49.70% and -48.23% respectively.
| | | AVERAGE ANNUAL TOTAL RETURN FOR | |
| | | THE YEAR ENDED OCTOBER 31, 2013 | |
| | | One Year Return | | | Annualized Inception to Date* | |
| | | Net Asset Value | | | Market Price | | | Net Asset Value | | | Market Price | |
| Global X Social Media Index ETF | | | 52.34 | % | | | 53.07 | % | | | 14.72 | % | | | 14.41 | % |
| Solactive Social Media Index | | | 53.19 | % | | | 53.19 | % | | | 15.52 | % | | | 15.52 | % |
| S&P 500 Index | | | 27.18 | % | | | 27.18 | % | | | 21.46 | % | | | 21.46 | % |
Growth of a $10,000 Investment
(at Net Asset Value)
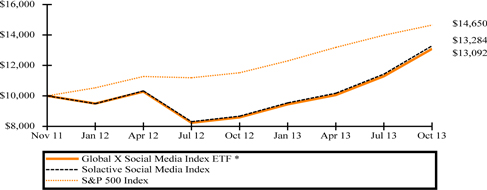
* The Fund commenced operations on November 14, 2011.
The performance data quoted herein represents past performance and the return and value of an investment in the Fund will fluctuate so that, when redeemed, may be worth less than its original cost. Past performance is no guarantee of future performance and should not be considered as a representation of the future results of the Fund. The Fund's performance assumes the reinvestment of all dividends and all capital gains. Index returns assume reinvestment of dividends and, unlike a Fund's returns, do not reflect any fees or expenses. If such fees and expenses were included in the index returns, the performance would have been lower. Please note that one cannot invest directly in an unmanaged index.
There are no assurances that the Fund will meet its stated objectives.
The Fund’s holdings and allocations are subject to change and should not be considered recommendations to buy individual securities.
Returns shown do not reflect the deduction of taxes that a shareholder would pay on Fund distributions or the redemption of Fund shares.
See definition of comparative indices on previous page.
| Management Discussion of Fund Performance (unaudited) |
| Global X Permanent ETF |
Global X Permanent ETF
The Global X Permanent ETF (the “Fund”) seeks to provide investment results that correspond generally to the price and yield performance, before fees and expenses, of the Solactive Permanent Index (the “Index”). The Fund generally seeks to replicate the Index but may at times invest in a representative sample of securities that collectively has an investment profile similar to the Index and as a result may or may not hold all the securities that are included in the Index.
The Index tracks the performance of four asset class categories that are designed to perform differently across different economic environments, as defined by Solactive AG (the “Index Provider”). On each rebalance, the Underlying Index allocates 25% each to four asset class categories, as follows:
| Asset Class | | Allocation | |
| Stocks: | | | | |
| · U.S. Large Cap Stocks | | | 9 | % |
| · U.S. Small Cap Stocks | | | 3 | % |
| · International Stocks | | | 3 | % |
| · U.S. Real Estate Stocks | | | 5 | % |
| · U.S. and Foreign Natural Resource Stocks | | | 5 | % |
| U.S. Treasury Bonds (Long-Term) | | | 25 | % |
| (remaining maturity greater than 20 years) | | | | |
| U.S. Treasury Bills and Bonds (Short-Term) | | | 25 | % |
| (remaining maturity of less than three years) | | | | |
| Gold & Silver: | | | | |
| · Physical Gold ETFs and ETCs | | | 20 | % |
| · Physical Silver ETFs and ETCs | | | 5 | % |
| Total | | | 100 | % |
The S&P 500 Index is a market capitalization weighted composite index of 500 large capitalization U.S. companies.
For the 12-month period ended October 31, 2013 (the “reporting period”), the Fund decreased 4.78%, while the Index decreased 4.77%. The Fund had a net asset value of $25.55 per share on October 31, 2012 and ended the reporting period with a net asset value of $24.13 on October 31, 2013.
73 of the Fund’s 101 investments held during the reporting period ended October 31, 2013 increased in value for the reporting period, led by Boeing and Bristol-Myers Squibb, which returned 89.46% and 63.50%, respectively. The worst performers were Petroleo Brasileiro ADR and ETFS Physical Silver, which returned -36.16% and -32.67%, respectively.
| Management Discussion of Fund Performance (unaudited) |
| Global X Permanent ETF |
| | | AVERAGE ANNUAL TOTAL RETURN FOR | |
| | | THE YEAR ENDED OCTOBER 31, 2013 | |
| | | One Year Return | | | Annualized Inception to Date* | |
| | | Net Asset Value | | | Market Price | | | Net Asset Value | | | Market Price | |
| Global X Permanent ETF | | | -4.78 | % | | | -4.41 | % | | | -1.65 | % | | | -1.21 | % |
| Solactive Permanent Index | | | -4.77 | % | | | -4.77 | % | | | -1.47 | % | | | -1.47 | % |
| S&P 500 Index | | | 27.18 | % | | | 27.18 | % | | | 19.17 | % | | | 19.17 | % |
Growth of a $10,000 Investment
(at Net Asset Value)
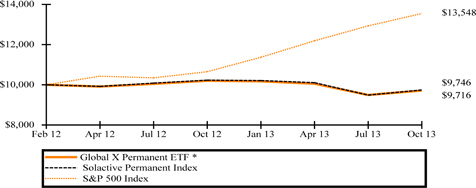
* Fund commenced operations on February 7, 2012.
The performance data quoted herein represents past performance and the return and value of an investment in the Fund will fluctuate so that, when redeemed, may be worth less than its original cost. Past performance is no guarantee of future performance and should not be considered as a representation of the future results of the Fund. The Fund's performance assumes the reinvestment of all dividends and all capital gains. Index returns assume reinvestment of dividends and, unlike a Fund's returns, do not reflect any fees or expenses. If such fees and expenses were included in the index returns, the performance would have been lower. Please note that one cannot invest directly in an unmanaged index.
There are no assurances that the Fund will meet its stated objectives.
The Fund’s holdings and allocations are subject to change and should not be considered recommendations to buy individual securities.
Returns shown do not reflect the deduction of taxes that a shareholder would pay on Fund distributions or the redemption of Fund shares.
See definition of comparative indices on previous page.
| Management Discussion of Fund Performance (unaudited) |
| Global X Guru Index ETF |
Global X Guru Index ETF
The Global X Guru Index ETF (the “Fund”) seeks to provide investment results that correspond generally to the price and yield performance, before fees and expenses, of the Solactive Guru Index (the “Index”). The Fund generally seeks to replicate the Index but may at times invest in a representative sample of securities that collectively has an investment profile similar to the Index and as a result may or may not hold all the securities that are included in the Index.
The Index is comprised of the top U.S. listed equity positions reported on Form 13F by a select group of entities that Solactive AG (the “Index Provider”) characterizes as hedge funds. Hedge funds are selected from a pool of thousands of privately offered pooled investment vehicles based on the size of their reported equity holdings and the efficacy of replicating their publicly disclosed positions. Hedge funds must have minimum reported holdings of $500 million in their form 13F to be considered for the Index. Additional filters are applied to eliminate hedge funds that have high turnover rates for equity holdings.
For the 12-month period ended October 31, 2013 (the “reporting period”), the Fund increased 47.42%, while the Index increased 48.70%. This performance exceeded the return of the S&P 500 Index, which returned 27.18% during the same period. The Fund had a net asset value of $17.20 per share on October 31, 2012 and ended the reporting period with a net asset value of $23.99 on October 31, 2013.
Over the course of the reporting period, hedge fund top conviction picks represented in the Solactive Guru Index demonstrated an increasing bias towards large capitalization equities, particularly those designated as growth1 stocks. At the beginning of the period, the Index had a 41.67% allocation to large cap stocks, of which 22.92% were considered growth. By the end of the period, 61.11% of the index components were large cap, with 38.89% considered growth picks.
The S&P 500 Index is a market capitalization weighted composite index of 500 large capitalization U.S. companies.
70 of the Fund’s 89 investments held during the year ended October 31, 2013 increased in value for the reporting period, led by Education Management and Pandora Media, which returned 305.15% and 198.46%, respectively. The worst performers were VIVUS and AngloGold Ashanti Ltd., which returned -36.98% and -33.21%, respectively.
1 Morningstar states that “Growth is defined based on fast growth (high growth rates for earnings, sales, book value, and cash flow) and high valuations (high price ratios and low dividend yields).”
| Management Discussion of Fund Performance (unaudited) |
| Global X Guru Index ETF |
| | | AVERAGE ANNUAL TOTAL RETURN FOR THE | |
| | | YEAR ENDED OCTOBER 31, 2013 | |
| | | One Year Return | | | Annualized Inception to Date* | |
| | | Net Asset Value | | | Market Price | | | Net Asset Value | | | Market Price | |
| Global X Guru Index ETF | | | 47.42 | % | | | 47.69 | % | | | 45.56 | % | | | 45.68 | % |
| Solactive Guru Index | | | 48.70 | % | | | 48.70 | % | | | 46.56 | % | | | 46.56 | % |
| S&P 500 Index | | | 27.18 | % | | | 27.18 | % | | | 28.08 | % | | | 28.08 | % |
Growth of a $10,000 Investment
(at Net Asset Value)
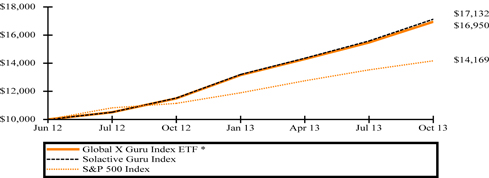
* Fund commenced operations on June 4, 2012.
The performance data quoted herein represents past performance and the return and value of an investment in the Fund will fluctuate so that, when redeemed, may be worth less than its original cost. Past performance is no guarantee of future performance and should not be considered as a representation of the future results of the Fund. The Fund's performance assumes the reinvestment of all dividends and all capital gains. Index returns assume reinvestment of dividends and, unlike a Fund's returns, do not reflect any fees or expenses. If such fees and expenses were included in the index returns, the performance would have been lower. Please note that one cannot invest directly in an unmanaged index.
There are no assurances that the Fund will meet its stated objectives.
The Fund’s holdings and allocations are subject to change and should not be considered recommendations to buy individual securities.
Returns shown do not reflect the deduction of taxes that a shareholder would pay on Fund distributions or the redemption of Fund shares.
See definition of comparative Indices on the previous page.
| Management Discussion of Fund Performance (unaudited) |
| Global X SuperIncome Preferred ETF |
Global X SuperIncome Preferred ETF
The Global X SuperIncome Preferred ETF (“Fund”) seeks investment results that correspond generally to the price and yield performance, before fees and expenses, of the S&P Enhanced Yield North American Preferred Stock Index (the “Index”). The Fund generally seeks to replicate the Index but may at times invest in a representative sample of securities that collectively has an investment profile similar to the Index and as a result may or may not hold all the securities that are included in the Index.
The Index tracks the performance of the highest yielding preferred securities in the U.S., as determined by Standard & Poor’s (the “Index Provider”). The Index is comprised of preferred stocks that meet certain criteria relating to size, liquidity, issuer concentration and rating, maturity and other requirements, as determined by the Index Provider.
The S&P 500 Index is a market capitalization weighted composite index of 500 large capitalization U.S. companies.
For the 12-month period ended October 31, 2013 (the “reporting period”), the Fund increased 5.08%, while the Index increased 5.54%. The Fund had a net asset value of $15.14 per share on October 31, 2012 and ended the reporting period with a net asset value of $14.81 on October 31, 2013.
61 of the Fund’s 82 investments held during the period ended October 31, 2013 increased in value for the reporting period, led by Goodyear Tire & Rubber 5.875% and Cliffs Natural Resources 7.000%, which returned 53.94% and 33.02%, respectively. The worst performers were Anglogold Ashanti Holdings Finance 6.000% and Qwest 7.000 %, which returned -59.08% and -5.88%, respectively.
| | | AVERAGE ANNUAL TOTAL RETURN FOR | |
| | | THE YEAR ENDED OCTOBER 31, 2013 | |
| | | One Year Return | | | Annualized Inception to Date* | |
| | | Net Asset Value | | | Market Price | | | Net Asset Value | | | Market Price | |
| Global X SuperIncome Preferred ETF | | | 5.08 | % | | | 5.70 | % | | | 6.14 | % | | | 8.08 | % |
| S&P Enhanced Yield North American Preferred Stock Index | | | 5.54 | % | | | 5.54 | % | | | 6.66 | % | | | 6.66 | % |
| S&P 500 Index | | | 27.18 | % | | | 27.18 | % | | | 25.02 | % | | | 25.02 | % |
Growth of a $10,000 Investment
(at Net Asset Value)
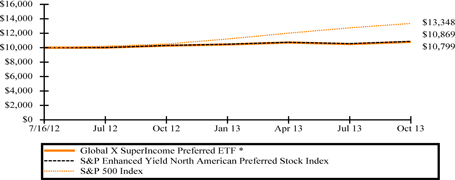
* Fund commenced operations on July 16, 2012.
The performance data quoted herein represents past performance and the return and value of an investment in the Fund will fluctuate so that, when redeemed, may be worth less than its original cost. Past performance is no guarantee of future performance and should not be considered as a representation of the future results of the Fund. The Fund's performance assumes the reinvestment of all dividends and all capital gains. Index returns assume reinvestment of dividends and, unlike a Fund's returns, do not reflect any fees or expenses. If such fees and expenses were included in the index returns, the performance would have been lower. Please note that one cannot invest directly in an unmanaged index.
There are no assurances that the Fund will meet its stated objectives.
The Fund’s holdings and allocations are subject to change and should not be considered recommendations to buy individual securities.
Returns shown do not reflect the deduction of taxes that a shareholder would pay on Fund distributions or the redemption of Fund shares.
See definition of comparative Indices above.
| Schedule of Investments | October 31, 2013 |
| | |
| Global X SuperDividend ETF |
Sector Weightings (unaudited) †:
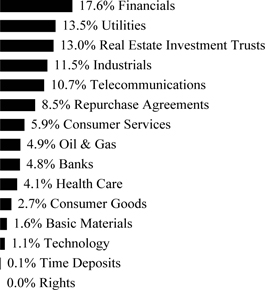
† Percentages based on total investments. Repurchase agreements purchased from cash collateral received for securities lending activity are included in total investments. Please see Note 8 in Notes to Financial Statements for more detailed information.
| | | Shares | | | Value | |
| COMMON STOCK — 97.8% | | | | | | | | |
| | | | | | | | | |
| AUSTRALIA— 20.5% | | | | | | | | |
| | | | | | | | | |
| Banks — 5.2% | | | | | | | | |
| Bank of Queensland | | | 790,023 | | | $ | 9,020,045 | |
| Bendigo and Adelaide Bank | | | 722,639 | | | | 7,444,746 | |
| Commonwealth Bank of Australia | | | 110,459 | | | | 7,942,800 | |
| National Australia Bank | | | 242,859 | | | | 8,105,017 | |
| Westpac Banking | | | 242,664 | | | | 7,864,568 | |
| | | | | | | | 40,377,176 | |
| Consumer Goods — 0.7% | | | | | | | | |
| GUD Holdings | | | 994,093 | | | | 5,571,649 | |
| | | | | | | | | |
| Consumer Services — 4.6% | | | | | | | | |
| David Jones (A) | | | 2,692,738 | | | | 6,922,533 | |
| Metcash (A) | | | 1,778,294 | | | | 5,630,544 | |
| Myer Holdings (A) | | | 2,681,712 | | | | 6,336,569 | |
| Navitas | | | 1,383,537 | | | | 7,584,392 | |
| Southern Cross Media Group | | | 5,132,909 | | | | 9,169,114 | |
| | | | | | | | 35,643,152 | |
| Financials — 3.6% | | | | | | | | |
| Abacus Property Group | | | 2,600,280 | | | | 5,726,352 | |
| ASX | | | 201,732 | | | | 6,995,593 | |
| IOOF Holdings | | | 883,866 | | | | 7,510,142 | |
| Stockland | | | 1,927,836 | | | | 7,306,619 | |
| | | | | | | | 27,538,706 | |
The accompanying notes are an integral part of the financial statements.
| Schedule of Investments | October 31, 2013 |
| | |
| Global X SuperDividend ETF |
| | | Shares | | | Value | |
| COMMON STOCK — continued | | | | | | | | |
| | | | | | | | | |
| Industrials — 2.8% | | | | | | | | |
| Cabcharge Australia (A) | | | 1,521,435 | | | $ | 5,795,094 | |
| GWA Group | | | 2,934,958 | | | | 8,599,350 | |
| Sydney Airport | | | 1,903,293 | | | | 7,537,402 | |
| | | | | | | | 21,931,846 | |
| Oil & Gas — 0.9% | | | | | | | | |
| APA Group | | | 1,179,991 | | | | 6,758,547 | |
| Telecommunications — 1.0% | | | | | | | | |
| Telstra | | | 1,579,352 | | | | 7,732,336 | |
| Utilities — 1.7% | | | | | | | | |
| DUET Group | | | 3,294,638 | | | | 6,694,963 | |
| Spark Infrastructure Group | | | 4,254,985 | | | | 6,816,630 | |
| | | | | | | | 13,511,593 | |
| TOTAL AUSTRALIA | | | | | | | 159,065,005 | |
| | | | | | | | | |
| BELGIUM— 1.0% | | | | | | | | |
| Telecommunications — 1.0% | | | | | | | | |
| Belgacom | | | 274,242 | | | | 7,508,506 | |
| BERMUDA— 1.0% | | | | | | | | |
| Industrials — 1.0% | | | | | | | | |
| Ship Finance International | | | 449,243 | | | | 7,434,972 | |
| CANADA— 5.1% | | | | | | | | |
| Consumer Services — 0.9% | | | | | | | | |
| Parkland Fuel (A) | | | 387,702 | | | | 7,105,918 | |
| | | | | | | | | |
| Oil & Gas — 3.3% | | | | | | | | |
| Crescent Point Energy (A) | | | 167,523 | | | | 6,505,545 | |
| Freehold Royalties (A) | | | 322,274 | | | | 7,334,735 | |
| Lightstream Resources (A) | | | 973,438 | | | | 6,255,248 | |
| Veresen (A) | | | 454,033 | | | | 5,617,442 | |
| | | | | | | | 25,712,970 | |
| Telecommunications — 0.9% | | | | | | | | |
| Bell Aliant (A) | | | 260,145 | | | | 6,589,392 | |
| TOTAL CANADA | | | | | | | 39,408,280 | |
| | | | | | | | | |
| FINLAND— 4.0% | | | | | | | | |
| Basic Materials — 1.1% | | | | | | | | |
| UPM-Kymmene | | | 512,195 | | | | 8,143,547 | |
| Health Care — 0.8% | | | | | | | | |
| Orion, Cl B | | | 243,818 | | | | 6,551,382 | |
| Telecommunications — 1.2% | | | | | | | | |
| Elisa | | | 358,049 | | | | 8,959,611 | |
| Utilities — 0.9% | | | | | | | | |
| Fortum | | | 320,244 | | | | 7,130,930 | |
The accompanying notes are an integral part of the financial statements.
| Schedule of Investments | October 31, 2013 |
| | |
| Global X SuperDividend ETF |
| | | Shares | | | Value | |
| COMMON STOCK — continued | | | | | | | | |
| | | | | | | | | |
| TOTAL FINLAND | | | | | | $ | 30,785,470 | |
| | | | | | | | | |
| FRANCE— 9.3% | | | | | | | | |
| Financials — 2.3% | | | | | | | | |
| Euler Hermes | | | 85,464 | | | | 11,283,648 | |
| Fonciere Des Regions | | | 81,599 | | | | 6,998,695 | |
| | | | | | | | 18,282,343 | |
| Industrials — 2.5% | | | | | | | | |
| Bouygues | | | 287,899 | | | | 11,253,903 | |
| Veolia Environnement | | | 471,394 | | | | 8,077,273 | |
| | | | | | | | 19,331,176 | |
| Utilities — 4.5% | | | | | | | | |
| Electricite de France | | | 390,527 | | | | 13,701,399 | |
| GDF Suez | | | 395,043 | | | | 9,837,054 | |
| Suez Environnement | | | 647,900 | | | | 11,308,407 | |
| | | | | | | | 34,846,860 | |
| TOTAL FRANCE | | | | | | | 72,460,379 | |
| | | | | | | | | |
| GERMANY— 2.0% | | | | | | | | |
| Telecommunications — 1.2% | | | | | | | | |
| Freenet | | | 351,519 | | | | 9,156,552 | |
| Utilities — 0.8% | | | | | | | | |
| RWE | | | 177,528 | | | | 6,553,864 | |
| TOTAL GERMANY | | | | | | | 15,710,416 | |
| | | | | | | | | |
| HONG KONG— 1.9% | | | | | | | | |
| Technology — 1.2% | | | | | | | | |
| VTech Holdings | | | 640,099 | | | | 9,189,091 | |
| Telecommunications — 0.7% | | | | | | | | |
| SmarTone Telecommunications Holdings | | | 4,298,915 | | | | 5,666,827 | |
| TOTAL HONG KONG | | | | | | | 14,855,918 | |
| | | | | | | | | |
| HUNGARY— 0.8% | | | | | | | | |
| Telecommunications — 0.8% | | | | | | | | |
| Magyar Telekom Telecommunications | | | 4,349,165 | | | | 5,972,797 | |
| ITALY— 2.3% | | | | | | | | |
| Utilities — 2.3% | | | | | | | | |
| Enel | | | 1,990,124 | | | | 8,781,826 | |
| Hera | | | 4,371,623 | | | | 8,826,226 | |
| TOTAL ITALY | | | | | | | 17,608,052 | |
| | | | | | | | | |
| NETHERLANDS— 0.7% | | | | | | | | |
| Financials — 0.7% | | | | | | | | |
| Corio | | | 131,150 | | | | 5,722,265 | |
The accompanying notes are an integral part of the financial statements.
| Schedule of Investments | October 31, 2013 |
| | |
| Global X SuperDividend ETF |
| | | Shares | | | Value | |
| COMMON STOCK — continued | | | | | | | | |
| | | | | | | | | |
| NEW ZEALAND— 1.4% | | | | | | | | |
| Health Care — 1.4% | | | | | | | | |
| Fisher & Paykel Healthcare | | | 3,468,551 | | | $ | 10,543,318 | |
| NORWAY— 1.2% | | | | | | | | |
| Oil & Gas — 1.2% | | | | | | | | |
| Seadrill | | | 201,604 | | | | 9,329,991 | |
| POLAND— 0.7% | | | | | | | | |
| Basic Materials — 0.7% | | | | | | | | |
| KGHM Polska Miedz | | | 130,475 | | | | 5,275,589 | |
| PORTUGAL— 1.2% | | | | | | | | |
| Utilities — 1.2% | | | | | | | | |
| EDP - Energias de Portugal | | | 2,503,151 | | | | 9,217,180 | |
| RUSSIA— 1.0% | | | | | | | | |
| Consumer Services — 1.0% | | | | | | | | |
| CTC Media ADR | | | 596,997 | | | | 7,546,042 | |
| SINGAPORE— 4.5% | | | | | | | | |
| Industrials — 0.9% | | | | | | | | |
| Venture | | | 1,079,061 | | | | 6,758,247 | |
| Real Estate Investment Trusts — 2.6% | | | | | | | | |
| Ascendas | | | 3,438,049 | | | | 6,559,472 | |
| Mapletree Logistics Trust | | | 7,637,663 | | | | 6,732,604 | |
| Suntec Real Estate Investment Trust | | | 5,117,285 | | | | 7,065,001 | |
| | | | | | | | 20,357,077 | |
| Telecommunications — 1.0% | | | | | | | | |
| StarHub | | | 2,165,406 | | | | 7,757,251 | |
| TOTAL SINGAPORE | | | | | | | 34,872,575 | |
| | | | | | | | | |
| SOUTH AFRICA— 1.0% | | | | | | | | |
| Financials — 1.0% | | | | | | | | |
| Redefine Properties | | | 7,377,725 | | | | 7,569,724 | |
| SWEDEN— 0.9% | | | | | | | | |
| Telecommunications — 0.9% | | | | | | | | |
| TeliaSonera | | | 879,817 | | | | 7,291,020 | |
| TAIWAN— 1.0% | | | | | | | | |
| Industrials — 1.0% | | | | | | | | |
| Coretronic | | | 9,124,426 | | | | 8,012,736 | |
| TURKEY— 1.2% | | | | | | | | |
| Consumer Goods — 1.2% | | | | | | | | |
| Ford Otomotiv Sanayi | | | 675,184 | | | | 9,504,155 | |
The accompanying notes are an integral part of the financial statements.
| Schedule of Investments | October 31, 2013 |
| | |
| Global X SuperDividend ETF |
| | | Shares | | | Value | |
| COMMON STOCK — continued | | | | | | | | |
| | | | | | | | | |
| UNITED KINGDOM— 9.7% | | | | | | | | |
| Financials — 7.4% | | | | | | | | |
| Admiral Group | | | 289,857 | | | $ | 5,944,283 | |
| Amlin | | | 1,168,778 | | | | 7,985,254 | |
| Intermediate Capital Group | | | 1,290,026 | | | | 9,918,186 | |
| Man Group | | | 4,894,240 | | | | 6,984,260 | |
| Provident Financial | | | 323,022 | | | | 8,183,410 | |
| Resolution | | | 1,864,521 | | | | 10,684,814 | |
| Standard Life | | | 1,420,223 | | | | 8,015,753 | |
| | | | | | | | 57,715,960 | |
| Industrials — 1.3% | | | | | | | | |
| Interserve | | | 1,028,788 | | | | 10,128,367 | |
| Utilities — 1.0% | | | | | | | | |
| SSE | | | 337,133 | | | | 7,654,374 | |
| TOTAL UNITED KINGDOM | | | | | | | 75,498,701 | |
| | | | | | | | | |
| UNITED STATES— 25.4% | | | | | | | | |
| Consumer Goods — 1.0% | | | | | | | | |
| Vector Group (A) | | | 480,412 | | | | 7,768,262 | |
| Financials — 4.1% | | | | | | | | |
| BGC Partners, Cl A | | | 1,724,690 | | | | 9,175,351 | |
| Franklin Street Properties | | | 543,093 | | | | 7,168,828 | |
| New York Community Bancorp (A) | | | 546,843 | | | | 8,864,325 | |
| OneBeacon Insurance Group, Cl A | | | 422,637 | | | | 6,745,287 | |
| | | | | | | | 31,953,791 | |
| Health Care — 2.2% | | | | | | | | |
| AstraZeneca | | | 164,291 | | | | 8,716,772 | |
| PDL BioPharma (A) | | | 1,069,516 | | | | 8,652,384 | |
| | | | | | | | 17,369,156 | |
| Industrials — 3.0% | | | | | | | | |
| Costamare | | | 496,279 | | | | 9,215,901 | |
| RR Donnelley & Sons (A) | | | 760,280 | | | | 14,118,400 | |
| | | | | | | | 23,334,301 | |
| Real Estate Investment Trusts — 11.6% | | | | | | | | |
| American Capital Mortgage Investment | | | 292,978 | | | | 5,598,810 | |
| Annaly Capital Management | | | 493,739 | | | | 5,821,183 | |
| ARMOUR Residential (A) | | | 1,131,700 | | | | 4,662,604 | |
| Capstead Mortgage | | | 606,883 | | | | 7,179,426 | |
| Chimera Investment | | | 2,528,511 | | | | 7,661,388 | |
| Hospitality Properties Trust | | | 275,473 | | | | 8,093,397 | |
| Invesco Mortgage Capital | | | 364,383 | | | | 5,629,717 | |
| Investors Real Estate Trust | | | 780,170 | | | | 6,725,065 | |
The accompanying notes are an integral part of the financial statements.
| Schedule of Investments | October 31, 2013 |
| | |
| Global X SuperDividend ETF |
| | | Shares/Number | | | | |
| | | of Rights/Face | | | | |
| | | Amount | | | Value | |
| COMMON STOCK — continued | | | | | | | | |
| | | | | | | | | |
| Real Estate Investment Trusts — continued | | | | | | | | |
| Medical Properties Trust | | | 515,279 | | | $ | 6,719,238 | |
| NorthStar Realty Finance | | | 880,850 | | | | 8,218,331 | |
| Omega Healthcare Investors (A) | | | 266,193 | | | | 8,848,255 | |
| Sabra Health Care | | | 277,227 | | | | 7,457,406 | |
| Starwood Property Trust | | | 283,380 | | | | 7,280,032 | |
| | | | | | | | 89,894,852 | |
| Telecommunications — 3.1% | | | | | | | | |
| Consolidated Communications Holdings | | | 439,572 | | | | 8,189,226 | |
| Frontier Communications (A) | | | 1,829,994 | | | | 8,070,273 | |
| Windstream Holdings (A) | | | 881,912 | | | | 7,540,348 | |
| | | | | | | | 23,799,847 | |
| Utilities — 0.4% | | | | | | | | |
| Atlantic Power (A) | | | 155,740 | | | | 702,036 | |
| Atlantic Power ^ | | | 552,775 | | | | 2,481,960 | |
| | | | | | | | 3,183,996 | |
| TOTAL UNITED STATES | | | | | | | 197,304,205 | |
| TOTAL COMMON STOCK | | | | | | | | |
| (Cost $705,013,740) | | | | | | | 758,497,296 | |
| | | | | | | | | |
| PREFERRED STOCK — 1.9% | | | | | | | | |
| BRAZIL— 1.9% | | | | | | | | |
| Utilities — 1.9% | | | | | | | | |
| AES Tiete, 0.000% | | | 698,956 | | | | 6,832,933 | |
| Centrais Eletricas Brasileiras, 0.000% | | | 1,421,975 | | | | 7,559,915 | |
| TOTAL PREFERRED STOCK | | | | | | | | |
| (Cost $15,361,612) | | | | | | | 14,392,848 | |
| | | | | | | | | |
| RIGHTS — 0.0% | | | | | | | | |
| Italy — 0.0% | | | | | | | | |
| Hera SPA | | | 4,371,623 | | | | 78,943 | |
| TOTAL RIGHTS | | | | | | | | |
| (Cost $—) | | | | | | | 78,943 | |
| | | | | | | | | |
| REPURCHASE AGREEMENTS — 9.3% | | | | | | | | |
| Barclays | | | | | | | | |
| 0.080%, dated 10/31/13, to be repurchased on 11/01/13, repurchase price $68,612,342 (collateralized by U.S. Treasury Bills, ranging in par value $24,921,819-$45,075,742, 0.000%, 01/09/14-04/03/14, with a total market value of $69,984,460) (B) | | $ | 68,612,190 | | | | 68,612,190 | |
The accompanying notes are an integral part of the financial statements.
| Schedule of Investments | October 31, 2013 |
| | |
| Global X SuperDividend ETF |
| | | Face Amount(1) | | | Value | |
| REPURCHASE AGREEMENTS — continued | | | | | | | | |
| Deutsche Bank | | | | | | | | |
| 0.090%, dated 10/31/13, to be repurchased on 11/01/13, repurchase price $3,611,176 (collateralized by U.S. Treasury Bills, par value $3,611,174, 2.375%, 09/30/14, with a total market value of $3,684,661) (B) | | | 3,611,168 | | | $ | 3,611,168 | |
| TOTAL REPURCHASE AGREEMENT | | | | | | | | |
| (Cost $72,223,358) | | | | | | | 72,223,358 | |
| | | | | | | | | |
| TIME DEPOSITS — 0.1% | | | | | | | | |
| Brown Brothers Harriman | | | | | | | | |
| 1.754%, 11/01/13 AUD | | | 79,759 | | | | 75,385 | |
| 0.309%, 11/01/13 CAD | | | 621,350 | | | | 595,933 | |
| 0.005%, 11/01/13 HKD | | | 1 | | | | — | |
| TOTAL TIME DEPOSITS | | | | | | | | |
| (Cost $671,318) | | | | | | | 671,318 | |
| TOTAL INVESTMENTS — 109.1% | | | | | | | | |
| (Cost $793,270,028) | | | | | | $ | 845,863,763 | |
Percentages are based on Net Assets of $775,237,995.
ADR — American Depositary Receipt
AUD — Australian Dollar
CAD — Canadian Dollar
Cl — Class
HKD — Hong Kong Dollar
| ^ | Traded on U.S. Stock exchange. |
| (1) | In U.S. Dollars unless otherwise indicated. |
| (A) | This security or a partial position of this security was on loan at October 31, 2013. The total value of securities on loan at October 31, 2013 was $69,078,558. |
| (B) | This security was purchased with cash collateral held from securities on loan. The total value of such securities as of October 31, 2013 was $72,223,358. |
Amounts designated as "—" are $0.
The following is a summary of the inputs used as of October 31, 2013, in valuing the Fund's investments carried at value:
| Investments in Securities | | Level 1 | | | Level 2 | | | Level 3 | | | Total | |
| Common Stock | | $ | 758,497,296 | | | $ | — | | | $ | — | | | $ | 758,497,296 | |
| Preferred Stock | | | 14,392,848 | | | | — | | | | — | | | | 14,392,848 | |
| Rights | | | 78,943 | | | | — | | | | — | | | | 78,943 | |
| Repurchase Agreements | | | — | | | | 72,223,358 | | | | — | | | | 72,223,358 | |
| Time Deposits | | | — | | | | 671,318 | | | | — | | | | 671,318 | |
| Total Investments in Securities | | $ | 772,969,087 | | | $ | 72,894,676 | | | $ | — | | | $ | 845,863,763 | |
For the year ended October 31, 2013, there have been no transfers between Level 1, Level 2 or Level 3 investments.
As of October 31, 2013, there were no Level 3 investments.
The accompanying notes are an integral part of the financial statements.
| Schedule of Investments | October 31, 2013 |
| | |
| Global X SuperDividend U.S. ETF |
Sector Weightings (unaudited)†:
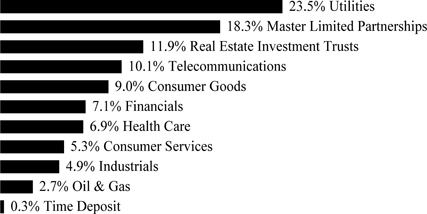
† Percentages based on total investments.
| | | Shares | | | Value | |
| COMMON STOCK — 81.3% | | | | | | | | |
| | | | | | | | | |
| Consumer Goods — 9.0% | | | | | | | | |
| Altria Group | | | 29,604 | | | $ | 1,102,157 | |
| Lorillard | | | 25,558 | | | | 1,303,714 | |
| Reynolds American | | | 22,836 | | | | 1,173,085 | |
| Vector Group | | | 65,760 | | | | 1,063,339 | |
| | | | | | | | 4,642,295 | |
| Consumer Services — 5.3% | | | | | | | | |
| Regal Entertainment Group, Cl A | | | 63,482 | | | | 1,206,793 | |
| World Wrestling Entertainment, Cl A | | | 119,321 | | | | 1,545,207 | |
| | | | | | | | 2,752,000 | |
| Financials — 7.0% | | | | | | | | |
| BlackRock Kelso Capital | | | 71,995 | | | | 676,033 | |
| Fifth Street Finance | | | 68,182 | | | | 695,456 | |
| New Mountain Finance | | | 48,540 | | | | 688,297 | |
| Prospect Capital | | | 63,961 | | | | 725,318 | |
| Resource Capital | | | 140,893 | | | | 866,492 | |
| | | | | | | | 3,651,596 | |
| Health Care — 6.9% | | | | | | | | |
| Bristol-Myers Squibb | | | 26,638 | | | | 1,399,028 | |
| Merck | | | 23,167 | | | | 1,044,600 | |
| PDL BioPharma | | | 140,653 | | | | 1,137,882 | |
| | | | | | | | 3,581,510 | |
| Industrials — 4.9% | | | | | | | | |
| Air Castle Ltd. | | | 55,231 | | | | 1,042,209 | |
The accompanying notes are an integral part of the financial statements.
| Schedule of Investments | October 31, 2013 |
| | |
| Global X SuperDividend U.S. ETF |
| | | Shares | | | Value | |
| COMMON STOCK — continued | | | | | | | | |
| | | | | | | | | |
| Industrials — continued | | | | | | | | |
| Lockheed Martin | | | 11,159 | | | $ | 1,487,941 | |
| | | | | | | | 2,530,150 | |
| Oil & Gas — 2.7% | | | | | | | | |
| Spectra Energy | | | 39,640 | | | | 1,409,995 | |
| Real Estate Investment Trusts — 11.9% | | | | | | | | |
| Anworth Mortgage Asset | | | 163,490 | | | | 802,736 | |
| Capstead Mortgage | | | 80,027 | | | | 946,719 | |
| Dynex Capital | | | 92,773 | | | | 801,559 | |
| Invesco Mortgage Capital | | | 46,355 | | | | 716,185 | |
| MFA Financial | | | 118,650 | | | | 879,196 | |
| PennyMac Mortgage Investment Trust | | | 38,839 | | | | 896,016 | |
| WP Carey | | | 16,653 | | | | 1,109,256 | |
| | | | | | | | 6,151,667 | |
| Telecommunications — 10.1% | | | | | | | | |
| AT&T | | | 27,501 | | | | 995,536 | |
| Consolidated Communications Holdings | | | 59,197 | | | | 1,102,840 | |
| Frontier Communications | | | 243,755 | | | | 1,074,960 | |
| Verizon Communications | | | 21,201 | | | | 1,070,863 | |
| Windstream Holdings | | | 117,486 | | | | 1,004,505 | |
| | | | | | | | 5,248,704 | |
| Utilities — 23.5% | | | | | | | | |
| Ameren | | | 29,369 | | | | 1,062,571 | |
| Avista | | | 37,590 | | | | 1,044,626 | |
| Consolidated Edison | | | 16,653 | | | | 969,538 | |
| Entergy | | | 15,800 | | | | 1,022,576 | |
| Ferrellgas Partners | | | 49,120 | | | | 1,122,883 | |
| FirstEnergy | | | 24,916 | | | | 943,569 | |
| Great Plains Energy | | | 44,970 | | | | 1,054,097 | |
| Hawaiian Electric Industries | | | 36,388 | | | | 966,829 | |
| Integrys Energy Group | | | 17,409 | | | | 1,021,560 | |
| Pepco Holdings | | | 49,038 | | | | 945,452 | |
| Pinnacle West Capital | | | 17,624 | | | | 987,473 | |
| Vectren | | | 29,836 | | | | 1,041,873 | |
| | | | | | | | 12,183,047 | |
| TOTAL COMMON STOCK | | | | | | | | |
| (Cost $41,093,433) | | | | | | | 42,150,964 | |
| | | | | | | | | |
| MASTER LIMITED PARTNERSHIPS — 18.2% | | | | | | | | |
| Basic Materials — 3.4% | | | | | | | | |
| Natural Resource Partners | | | 45,313 | | | | 969,698 | |
The accompanying notes are an integral part of the financial statements.
| Schedule of Investments | October 31, 2013 |
| | |
| Global X SuperDividend U.S. ETF |
| | | Shares/Face Amount | | | Value | |
| MASTER LIMITED PARTNERSHIPS — continued | | | | | | | | |
| | | | | | | | | |
| Basic Materials — continued | | | | | | | | |
| PVR Partners | | | 30,619 | | | $ | 801,912 | |
| | | | | | | | 1,771,610 | |
| Oil & Gas — 14.8% | | | | | | | | |
| Enbridge Energy Partners | | | 35,591 | | | | 1,077,340 | |
| Energy Transfer Partners | | | 20,581 | | | | 1,090,176 | |
| Enterprise Products Partners | | | 17,373 | | | | 1,099,363 | |
| Niska Gas Storage Partners, Cl U | | | 83,513 | | | | 1,319,505 | |
| ONEOK Partners | | | 18,026 | | | | 969,258 | |
| QR Energy | | | 56,891 | | | | 1,030,865 | |
| TC Pipelines | | | 21,491 | | | | 1,096,256 | |
| | | | | | | | 7,682,763 | |
| TOTAL MASTER LIMITED PARTNERSHIPS | | | | | | | | |
| (Cost $8,989,502) | | | | | | | 9,454,373 | |
| | | | | | | | | |
| TIME DEPOSIT — 0.3% | | | | | | | | |
| Brown Brothers Harriman, 0.030%, 11/01/13 | | | | | | | | |
| (Cost $166,492) | | $ | 166,492 | | | | 166,492 | |
| TOTAL INVESTMENTS — 99.8% | | | | | | | | |
| (Cost $50,249,427) | | | | | | $ | 51,771,829 | |
Percentages are based on Net Assets of $51,879,340.
Cl — Class
The following is a summary of the inputs used as of October 31, 2013, in valuing the Fund's investments carried at value:
| Investments in Securities | | Level 1 | | | Level 2 | | | Level 3 | | | Total | |
| Common Stock | | $ | 42,150,964 | | | $ | — | | | $ | — | | | $ | 42,150,964 | |
| Master Limited Partnerships | | | 9,454,373 | | | | — | | | | — | | | | 9,454,373 | |
| Time Deposit | | | — | | | | 166,492 | | | | — | | | | 166,492 | |
| Total Investments in Securities | | $ | 51,605,337 | | | $ | 166,492 | | | $ | — | | | $ | 51,771,829 | |
For the period ended October 31, 2013, there have been no transfers between Level 1, Level 2 or Level 3 investments.
As of October 31, 2013, there were no Level 3 investments.
The accompanying notes are an integral part of the financial statements.
| Schedule of Investments | October 31, 2013 |
| | |
| Global X Canada Preferred ETF |
Sector Weightings (unaudited)†:
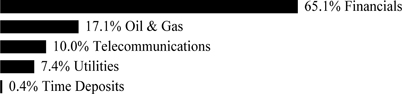
† Percentages based on total investments.
| | | Shares | | | Value | |
| PREFERRED STOCK — 99.5% | | | | | | | | |
| | | | | | | | | |
| CANADA— 99.5% | | | | | | | | |
| Financials — 65.1% | | | | | | | | |
| Bank of Montreal, Ser 13, 4.500% | | | 5,293 | | | $ | 129,958 | |
| Bank of Montreal, Ser 23, 5.400%(A) | | | 6,046 | | | | 151,926 | |
| Bank of Montreal, Ser 25, 3.900%(A) | | | 4,392 | | | | 103,034 | |
| Bank of Nova Scotia, Ser 16, 5.250% | | | 6,770 | | | | 167,521 | |
| Bank of Nova Scotia, Ser 20, 5.000%(A) | | | 6,869 | | | | 163,580 | |
| Bank of Nova Scotia, Ser 32, 3.700%(A) | | | 7,831 | | | | 178,303 | |
| Brookfield Asset Management, Ser 22, 7.000%(A) | | | 5,325 | | | | 132,020 | |
| Brookfield Asset Management, Ser 24, 5.400%(A) | | | 4,887 | | | | 117,740 | |
| Brookfield Asset Management, Ser 32, 4.500%(A) | | | 5,337 | | | | 127,967 | |
| Canadian Imperial Bank of Commerce, Ser 27, 5.600% | | | 4,996 | | | | 120,558 | |
| Canadian Imperial Bank of Commerce, Ser 33, 5.350%(A) | | | 4,994 | | | | 122,186 | |
| Canadian Imperial Bank of Commerce, Ser 35, 6.500%(A) | | | 5,398 | | | | 131,967 | |
| Fairfax Financial Holdings, Ser C, 5.750%(A) | | | 4,904 | | | | 114,387 | |
| Fairfax Financial Holdings, Ser G, 5.000%(A) | | | 4,904 | | | | 96,373 | |
| Fairfax Financial Holdings, Ser I, 5.000%(A) | | | 5,887 | | | | 120,998 | |
| Great-West Lifeco, Ser G, 5.200% | | | 5,629 | | | | 132,269 | |
| Great-West Lifeco, Ser I, 4.500% | | | 5,629 | | | | 119,690 | |
| Great-West Lifeco, Ser P, 5.400% | | | 4,750 | | | | 114,804 | |
| HSBC Bank Canada, Ser E, 6.600%(A) | | | 4,899 | | | | 120,801 | |
| Industrial Alliance Insurance & Financial Services, Ser G, 4.300%(A) | | | 4,925 | | | | 120,687 | |
| Intact Financial, Ser 1, 4.200%(A) | | | 7,156 | | | | 165,199 | |
| Intact Financial, Ser 3, 4.200%(A) | | | 2,664 | | | | 64,514 | |
| Manulife Financial, Ser 1, 5.600%(A) | | | 6,894 | | | | 169,862 | |
| Manulife Financial, Ser 2, 4.650% | | | 6,894 | | | | 145,464 | |
| Manulife Financial, Ser 4, 6.600%(A) | | | 8,861 | | | | 218,667 | |
| Power Financial, Ser P, 4.400%(A) | | | 5,500 | | | | 125,176 | |
| Power Financial, Ser S, 4.800% | | | 5,892 | | | | 130,933 | |
| Royal Bank of Canada, Ser AJ, 5.000%(A) | | | 7,857 | | | | 190,048 | |
| Royal Bank of Canada, Ser AR, 6.250%(A) | | | 6,869 | | | | 166,150 | |
| Royal Bank of Canada, Ser AV, 6.250%(A) | | | 7,848 | | | | 192,916 | |
| Sun Life Financial, Ser 1, 4.750% | | | 6,473 | | | | 141,734 | |
| Sun Life Financial, Ser 2, 4.800% | | | 5,262 | | | | 116,328 | |
The accompanying notes are an integral part of the financial statements.
| Schedule of Investments | October 31, 2013 |
| | |
| Global X Canada Preferred ETF |
| | | Shares/Face Amount(1) | | | Value | |
| PREFERRED STOCK — continued | | | | | | | | |
| | | | | | | | | |
| Financials — continued | | | | | | | | |
| Sun Life Financial, Ser 4, 4.450% | | | 4,857 | | | $ | 101,505 | |
| Toronto-Dominion Bank, Ser AG, 6.250%(A) | | | 7,356 | | | | 179,623 | |
| Toronto-Dominion Bank, Ser AK, 6.250%(A) | | | 6,869 | | | | 168,983 | |
| Toronto-Dominion Bank, Ser O, 4.850% | | | 8,348 | | | | 205,367 | |
| | | | | | | | 5,069,238 | |
| Oil & Gas — 17.0% | | | | | | | | |
| Enbridge, Ser B, 4.000%(A) | | | 9,852 | | | | 229,233 | |
| Enbridge, Ser F, 4.000%(A) | | | 9,852 | | | | 227,721 | |
| Enbridge, Ser N, 4.000%(A) | | | 8,864 | | | | 209,135 | |
| Husky Energy, Ser I, 4.450%(A) | | | 5,908 | | | | 128,966 | |
| TransCanada, Ser 1, 4.600%(A) | | | 10,833 | | | | 250,500 | |
| TransCanada, Ser 3, 4.000%(A) | | | 6,895 | | | | 132,457 | |
| TransCanada, Ser 5, 4.400%(A) | | | 6,870 | | | | 149,899 | |
| | | | | | | | 1,327,911 | |
| Telecommunications — 10.0% | | | | | | | | |
| BCE, Ser AF, 4.541%(A) | | | 7,151 | | | | 153,356 | |
| BCE, Ser AG, 4.500%(A) | | | 5,320 | | | | 116,079 | |
| BCE, Ser AK, 4.150%(A) | | | 12,311 | | | | 260,944 | |
| Bell Aliant, Ser A, 4.850%(A) | | | 5,644 | | | | 115,949 | |
| Shaw Communications, Ser A, 4.500%(A) | | | 5,888 | | | | 129,433 | |
| | | | | | | | 775,761 | |
| Utilities — 7.4% | | | | | | | | |
| Brookfield Renewable Power Preferred Equity, Ser I, 5.250%(A) | | | 4,909 | | | | 104,757 | |
| Canadian Utilities, Ser Y, 4.000%(A) | | | 6,404 | | | | 154,841 | |
| Emera, Ser C, 4.100%(A) | | | 4,913 | | | | 113,088 | |
| TransAlta, Ser A, 4.600%(A) | | | 5,907 | | | | 101,864 | |
| TransAlta, Ser C, 4.600%(A) | | | 5,415 | | | | 102,987 | |
| | | | | | | | 577,537 | |
| TOTAL CANADA | | | | | | | 7,750,447 | |
| TOTAL PREFERRED STOCK | | | | | | | | |
| (Cost $8,671,078) | | | | | | | 7,750,447 | |
| | | | | | | | | |
| TIME DEPOSITS — 0.4% | | | | | | | | |
| Brown Brothers Harriman | | | | | | | | |
| 0.030%, 11/01/13 | | | 17,051 | | | | 17,051 | |
| 0.309%, 11/01/13 CAD | | | 13,690 | | | | 13,130 | |
| TOTAL TIME DEPOSITS | | | | | | | | |
| (Cost $30,181) | | | | | | | 30,181 | |
| TOTAL INVESTMENTS — 99.9% | | | | | | | | |
| (Cost $8,701,259) | | | | | | $ | 7,780,628 | |
The accompanying notes are an integral part of the financial statements.
| Schedule of Investments | October 31, 2013 |
| | |
| Global X Canada Preferred ETF |
Percentages are based on Net Assets of $7,791,163.
CAD — Canadian Dollar
Ser — Series
| (1) | In U.S. Dollars unless otherwise indicated. |
| (A) | Floating rate security - Rate disclosed is the rate in effect on October 31, 2013. |
The following is a summary of the inputs used as of October 31, 2013, in valuing the Fund's investments carried at value:
| Investments in Securities | | Level 1 | | | Level 2 | | | Level 3 | | | Total | |
| Preferred Stock | | $ | 7,750,447 | | | $ | — | | | $ | — | | | $ | 7,750,447 | |
| Time Deposits | | | — | | | | 30,181 | | | | — | | | | 30,181 | |
| Total Investments in Securities | | $ | 7,750,447 | | | $ | 30,181 | | | $ | — | | | $ | 7,780,628 | |
For the year ended October 31, 2013, there have been no transfers between Level 1, Level 2 or Level 3 investments.
As of October 31, 2013, there were no Level 3 investments.
The accompanying notes are an integral part of the financial statements.
| Schedule of Investments | October 31, 2013 |
| | |
| Global X Social Media Index ETF |
Sector Weightings (unaudited)†:

† Percentages based on total investments.
| | | Shares | | | Value | |
| COMMON STOCK — 100.0% | | | | | | | | |
| | | | | | | | | |
| CHINA— 27.0% | | | | | | | | |
| Technology — 27.0% | | | | | | | | |
| Changyou.com ADR | | | 13,161 | | | $ | 365,349 | |
| NetEase ADR | | | 29,081 | | | | 1,963,258 | |
| Renren ADR * | | | 349,560 | | | | 1,157,044 | |
| SINA * | | | 113,329 | | | | 9,469,771 | |
| Tencent Holdings | | | 181,483 | | | | 9,906,308 | |
| Youku.com ADR * | | | 110,090 | | | | 2,998,852 | |
| TOTAL CHINA | | | | | | | 25,860,582 | |
| | | | | | | | | |
| GERMANY— 0.8% | | | | | | | | |
| Technology — 0.8% | | | | | | | | |
| XING | | | 7,856 | | | | 794,336 | |
| JAPAN— 12.5% | | | | | | | | |
| Technology — 12.5% | | | | | | | | |
| Dena | | | 225,251 | | | | 4,899,948 | |
| Gree | | | 297,435 | | | | 2,556,011 | |
| Mixi | | | 19,440 | | | | 228,346 | |
| Nexon | | | 369,322 | | | | 4,304,312 | |
| TOTAL JAPAN | | | | | | | 11,988,617 | |
| | | | | | | | | |
| RUSSIA— 7.3% | | | | | | | | |
| Technology — 7.3% | | | | | | | | |
| Mail.ru Group GDR | | | 71,014 | | | | 2,618,996 | |
| Yandex, Cl A * | | | 119,321 | | | | 4,398,172 | |
| TOTAL RUSSIA | | | | | | | 7,017,168 | |
| | | | | | | | | |
| TAIWAN— 0.9% | | | | | | | | |
| Technology — 0.9% | | | | | | | | |
| PChome Online | | | 139,730 | | | | 813,283 | |
| UNITED STATES— 51.5% | | | | | | | | |
| Technology — 51.5% | | | | | | | | |
| Angie's List * | | | 126,574 | | | | 1,783,428 | |
| Demand Media * | | | 130,989 | | | | 626,127 | |
| Facebook, Cl A * | | | 192,161 | | | | 9,658,012 | |
The accompanying notes are an integral part of the financial statements.
| Schedule of Investments | October 31, 2013 |
| Global X Social Media Index ETF |
| | | Shares/Face
Amount | | | Value | |
| COMMON STOCK — continued |
| |
| Technology — continued | | | | | | | | |
| Google, Cl A * | | | 5,263 | | | $ | 5,423,943 | |
| Groupon, Cl A * | | | 442,004 | | | | 4,035,497 | |
| Jive Software * | | | 106,687 | | | | 1,161,821 | |
| LinkedIn, Cl A * | | | 41,051 | | | | 9,181,877 | |
| Nutrisystem | | | 83,873 | | | | 1,576,812 | |
| Pandora Media * | | | 172,685 | | | | 4,339,574 | |
| United Online | | | 275,496 | | | | 2,380,285 | |
| Yelp, Cl A * | | | 67,921 | | | | 4,601,648 | |
| Zynga, Cl A * | | | 1,299,937 | | | | 4,666,774 | |
| TOTAL UNITED STATES | | | | | | | 49,435,798 | |
| TOTAL COMMON STOCK | | | | | | | | |
| (Cost $93,317,437) | | | | | | | 95,909,784 | |
| |
| TIME DEPOSIT — 0.0% |
| Brown Brothers Harriman, 0.030%, 11/01/13 | | | | | | | | |
| (Cost $1,628) | | $ | 1,628 | | | | 1,628 | |
| TOTAL INVESTMENTS — 100.0% | | | | | | | | |
| (Cost $93,319,065) | | | | | | $ | 95,911,412 | |
Percentages are based on Net Assets of $95,947,554.
| * | Non-income producing security. |
ADR — American Depositary Receipt
Cl — Class
GDR — Global Depositary Receipt
The following is a summary of the inputs used as of October 31, 2013, in valuing the Fund's investments carried at value:
| Investments in Securities | | Level 1 | | | Level 2 | | | Level 3 | | | Total | |
| Common Stock | | $ | 95,909,784 | | | $ | — | | | $ | — | | | $ | 95,909,784 | |
| Time Deposit | | | — | | | | 1,628 | | | | — | | | | 1,628 | |
| Total Investments in Securities | | $ | 95,909,784 | | | $ | 1,628 | | | $ | — | | | $ | 95,911,412 | |
For the year ended October 31, 2013, there have been no transfers between Level 1, Level 2 or Level 3 investments.
As of October 31, 2013, there were no Level 3 investments.
The accompanying notes are an integral part of the financial statements.
| Schedule of Investments | October 31, 2013 |
| Sector Weightings (unaudited)†: | |
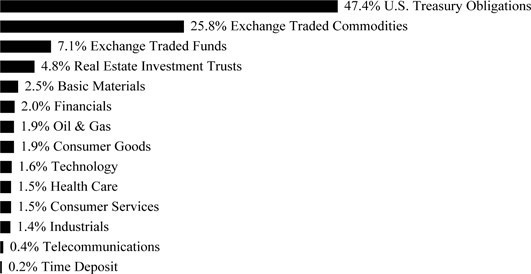
† Percentages based on total investments.
| | | Face Amount/
Shares | | | Value | |
| U.S. TREASURY OBLIGATIONS — 47.2% |
| U.S. Treasury Bonds | | | | | | | | |
| 4.625%, 02/15/40 | | $ | 667,000 | | | $ | 793,000 | |
| 4.375%, 11/15/39 | | | 891,000 | | | | 1,019,917 | |
| 4.375%, 05/15/40 | | | 679,000 | | | | 776,925 | |
| 3.875%, 08/15/40 | | | 758,000 | | | | 798,979 | |
| U.S. Treasury Notes | | | | | | | | |
| 2.625%, 12/31/14 | | | 878,000 | | | | 902,934 | |
| 2.500%, 03/31/15 | | | 691,000 | | | | 713,160 | |
| 2.375%, 02/28/15 | | | 882,000 | | | | 907,254 | |
| 2.125%, 11/30/14 | | | 894,000 | | | | 912,893 | |
| TOTAL U.S. TREASURY OBLIGATIONS | | | | | | | | |
| (Cost $7,088,123) | | | | | | | 6,825,062 | |
| | | | | | | | | |
| EXCHANGE TRADED COMMODITIES — 25.7% |
| ETFS Physical Gold * | | | 11,648 | | | | 1,502,010 | |
| ETFS Physical Silver * | | | 33,086 | | | | 701,307 | |
| Gold Bullion Securities * | | | 11,926 | | | | 1,516,868 | |
| TOTAL EXCHANGE TRADED COMMODITIES | | | | | | | | |
| (Cost $4,635,485) | | | | | | | 3,720,185 | |
| | | | | | | | | |
| COMMON STOCK — 19.4% |
| |
| AUSTRALIA— 0.4% | | | | | | | | |
| Basic Materials — 0.4% | | | | | | | | |
| BHP Billiton ADR | | | 756 | | | | 53,441 | |
The accompanying notes are an integral part of the financial statements.
| Schedule of Investments | October 31, 2013 |
| | | Shares | | | Value | |
| COMMON STOCK — continued |
| |
| BRAZIL— 0.4% | | | | | | | | |
| Basic Materials — 0.4% | | | | | | | | |
| Vale ADR, Cl B | | | 3,508 | | | $ | 56,163 | |
| CANADA— 0.2% | | | | | | | | |
| Basic Materials — 0.2% | | | | | | | | |
| Potash Corp of Saskatchewan | | | 1,045 | | | | 32,500 | |
| CHINA— 0.3% | | | | | | | | |
| Oil & Gas — 0.3% | | | | | | | | |
| PetroChina ADR | | | 443 | | | | 50,179 | |
| NETHERLANDS— 0.4% | | | | | | | | |
| Oil & Gas — 0.4% | | | | | | | | |
| Royal Dutch Shell ADR, Cl A | | | 763 | | | | 50,862 | |
| SINGAPORE— 0.3% | | | | | | | | |
| Consumer Goods — 0.3% | | | | | | | | |
| Wilmar International | | | 14,913 | | | | 41,539 | |
| SWITZERLAND— 0.4% | | | | | | | | |
| Basic Materials — 0.4% | | | | | | | | |
| Glencore Xstrata | | | 10,989 | | | | 59,908 | |
| UNITED KINGDOM— 1.2% | | | | | | | | |
| Basic Materials — 0.8% | | | | | | | | |
| Anglo American | | | 2,436 | | | | 58,003 | |
| Rio Tinto ADR | | | 1,143 | | | | 57,950 | |
| | | | | | | | 115,953 | |
| Oil & Gas — 0.4% | | | | | | | | |
| BP | | | 6,712 | | | | 51,949 | |
| TOTAL UNITED KINGDOM | | | | | | | 167,902 | |
| UNITED STATES— 15.8% | | | | | | | | |
| Basic Materials — 0.3% | | | | | | | | |
| Mosaic | | | 887 | | | | 40,669 | |
| Consumer Goods — 1.6% | | | | | | | | |
| Altria Group | | | 783 | | | | 29,151 | |
| Archer-Daniels-Midland | | | 1,369 | | | | 55,992 | |
| Coca-Cola | | | 617 | | | | 24,415 | |
| Monsanto | | | 460 | | | | 48,245 | |
| PepsiCo | | | 305 | | | | 25,647 | |
| Philip Morris International | | | 267 | | | | 23,795 | |
| Procter & Gamble | | | 303 | | | | 24,467 | |
| | | | | | | | 231,712 | |
| Consumer Services — 1.5% | | | | | | | | |
| Amazon.com * | | | 90 | | | | 32,763 | |
The accompanying notes are an integral part of the financial statements.
| Schedule of Investments | October 31, 2013 |
| | | Shares | | | Value | |
| COMMON STOCK — continued |
| |
| Consumer Services — continued | | | | | | | | |
| Comcast, Cl A | | | 613 | | | $ | 29,167 | |
| CVS Caremark | | | 434 | | | | 27,021 | |
| eBay * | | | 480 | | | | 25,301 | |
| Home Depot | | | 328 | | | | 25,548 | |
| McDonald's | | | 280 | | | | 27,025 | |
| Wal-Mart Stores | | | 330 | | | | 25,327 | |
| Walt Disney | | | 392 | | | | 26,887 | |
| | | | | | | | 219,039 | |
| Financials — 2.0% | | | | | | | | |
| American Express | | | 332 | | | | 27,158 | |
| American International Group * | | | 566 | | | | 29,234 | |
| Bank of America | | | 1,940 | | | | 27,082 | |
| Berkshire Hathaway, Cl B * | | | 221 | | | | 25,432 | |
| Citigroup | | | 518 | | | | 25,268 | |
| Goldman Sachs Group | | | 161 | | | | 25,898 | |
| JPMorgan Chase | | | 470 | | | | 24,224 | |
| Mastercard, Cl A | | | 43 | | | | 30,835 | |
| US Bancorp | | | 692 | | | | 25,853 | |
| Visa, Cl A | | | 129 | | | | 25,371 | |
| Wells Fargo | | | 601 | | | | 25,657 | |
| | | | | | | | 292,012 | |
| Health Care — 1.5% | | | | | | | | |
| AbbVie | | | 479 | | | | 23,207 | |
| Amgen | | | 245 | | | | 28,420 | |
| Bristol-Myers Squibb | | | 540 | | | | 28,361 | |
| Gilead Sciences | | | 484 | | | | 34,359 | |
| Johnson & Johnson | | | 287 | | | | 26,579 | |
| Merck | | | 531 | | | | 23,943 | |
| Pfizer | | | 832 | | | | 25,526 | |
| UnitedHealth Group | | | 380 | | | | 25,939 | |
| | | | | | | | 216,334 | |
| Industrials — 1.4% | | | | | | | | |
| 3M | | | 227 | | | | 28,568 | |
| Boeing | | | 245 | | | | 31,973 | |
| General Electric | | | 1,067 | | | | 27,891 | |
| Honeywell International | | | 310 | | | | 26,886 | |
| Union Pacific | | | 161 | | | | 24,376 | |
| United Parcel Service, Cl B | | | 347 | | | | 34,089 | |
| United Technologies | | | 269 | | | | 28,581 | |
| | | | | | | | 202,364 | |
The accompanying notes are an integral part of the financial statements.
| Schedule of Investments | October 31, 2013 |
| | | Shares | | | Value | |
| COMMON STOCK — continued |
| |
| Oil & Gas — 0.8% | | | | | | | | |
| Chevron | | | 387 | | | $ | 46,424 | |
| Exxon Mobil | | | 512 | | | | 45,885 | |
| Schlumberger | | | 354 | | | | 33,177 | |
| | | | | | | | 125,486 | |
| Real Estate Investment Trusts — 4.8% | | | | | | | | |
| American Tower, Cl A | | | 931 | | | | 73,875 | |
| AvalonBay Communities | | | 509 | | | | 63,650 | |
| Equity Residential | | | 1,263 | | | | 66,131 | |
| General Growth Properties | | | 3,467 | | | | 73,604 | |
| HCP | | | 1,531 | | | | 63,537 | |
| Health Care | | | 1,040 | | | | 67,444 | |
| ProLogis | | | 1,838 | | | | 73,428 | |
| Public Storage | | | 454 | | | | 75,804 | |
| Simon Property Group | | | 450 | | | | 69,548 | |
| Ventas | | | 1,000 | | | | 65,240 | |
| | | | | | | | 692,261 | |
| Technology — 1.5% | | | | | | | | |
| Apple | | | 63 | | | | 32,908 | |
| Cisco Systems | | | 1,014 | | | | 22,815 | |
| Google, Cl A * | | | 29 | | | | 29,887 | |
| Intel | | | 997 | | | | 24,357 | |
| International Business Machines | | | 142 | | | | 25,448 | |
| Microsoft | | | 721 | | | | 25,487 | |
| Oracle | | | 940 | | | | 31,490 | |
| QUALCOMM | | | 460 | | | | 31,956 | |
| | | | | | | | 224,348 | |
| Telecommunications — 0.4% | | | | | | | | |
| AT&T | | | 753 | | | | 27,259 | |
| Verizon Communications | | | 487 | | | | 24,598 | |
| | | | | | | | 51,857 | |
| TOTAL UNITED STATES | | | | | | | 2,296,082 | |
| TOTAL COMMON STOCK | | | | | | | | |
| (Cost $2,672,313) | | | | | | | 2,808,576 | |
| | | | | | | | | |
| EXCHANGE TRADED FUNDS — 7.1% |
| ETFS Physical Silver | | | 3,802 | | | | 80,488 | |
| Vanguard FTSE All-World ex-US ETF | | | 9,429 | | | | 473,524 | |
| Vanguard Small-Cap ETF | | | 4,452 | | | | 470,799 | |
| TOTAL EXCHANGE TRADED FUNDS | | | | | | | | |
| (Cost $938,533) | | | | | | | 1,024,811 | |
The accompanying notes are an integral part of the financial statements.
| Schedule of Investments | October 31, 2013 |
| | | Face Amount | | | Value | |
| TIME DEPOSIT — 0.2% |
| Brown Brothers Harriman, 0.030%, 11/01/13 | | | | | | | | |
| (Cost $33,800) | | $ | 33,800 | | | $ | 33,800 | |
| | | | | | | | | |
| TOTAL INVESTMENTS — 99.6% | | | | | | |
| (Cost $15,368,254) | | | | | | $ | 14,412,434 | |
Percentages are based on Net Assets of $14,476,591.
| * | Non-income producing security. |
ADR — American Depositary Receipt
Cl — Class
ETF — Exchange Traded Fund
FTSE — Financial Times and London Stock Exchange
The following is a summary of the inputs used as of October 31, 2013, in valuing the Fund's investments carried at value:
| Investments in Securities | | Level 1 | | | Level 2 | | | Level 3 | | | Total | |
| U.S. Treasury Obligations | | $ | — | | | $ | 6,825,062 | | | $ | — | | | $ | 6,825,062 | |
| Exchange Traded Commodities | | | 3,720,185 | | | | — | | | | — | | | | 3,720,185 | |
| Common Stock | | | 2,808,576 | | | | — | | | | — | | | | 2,808,576 | |
| Exchange Traded Funds | | | 1,024,811 | | | | — | | | | — | | | | 1,024,811 | |
| Time Deposit | | | — | | | | 33,800 | | | | — | | | | 33,800 | |
| Total Investments in Securities | | $ | 7,553,572 | | | $ | 6,858,862 | | | $ | — | | | $ | 14,412,434 | |
For the period ended October 31, 2013, there have been no transfers between Level 1, Level 2 or Level 3 investments.
As of October 31, 2013, there were no Level 3 investments.
The accompanying notes are an integral part of the financial statements.
| Schedule of Investments | October 31, 2013 |
Sector Weightings (unaudited)†:
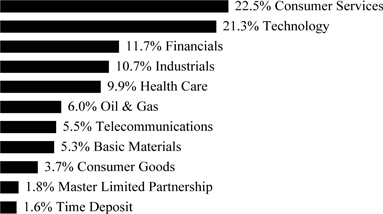
† Percentages based on total investments.
| | | Shares | | | Value | |
| COMMON STOCK — 98.2% |
| |
| CANADA— 3.6% | | | | | | | | |
| Basic Materials — 1.6% | | | | | | | | |
| Agrium | | | 46,322 | | | $ | 3,952,193 | |
| Industrials — 2.0% | | | | | | | | |
| Canadian Pacific Railway | | | 33,265 | | | | 4,759,224 | |
| TOTAL CANADA | | | | | | | 8,711,417 | |
| CHINA— 2.0% | | | | | | | | |
| Technology — 2.0% | | | | | | | | |
| Baidu ADR * | | | 29,905 | | | | 4,811,715 | |
| MEXICO— 1.7% | | | | | | | | |
| Telecommunications — 1.7% | | | | | | | | |
| America Movil ADR, Ser L | | | 195,342 | | | | 4,182,272 | |
| UNITED KINGDOM— 3.9% | | | | | | | | |
| Oil & Gas — 1.9% | | | | | | | | |
| BP ADR | | | 98,155 | | | | 4,564,207 | |
| Telecommunications — 2.0% | | | | | | | | |
| Vodafone Group ADR | | | 134,241 | | | | 4,942,754 | |
| TOTAL UNITED KINGDOM | | | | | | | 9,506,961 | |
| UNITED STATES— 87.0% | | | | | | | | |
| Basic Materials — 3.7% | | | | | | | | |
| Celanese, Cl A | | | 81,702 | | | | 4,576,129 | |
| Cytec Industries | | | 52,801 | | | | 4,387,235 | |
| | | | | | | | 8,963,364 | |
| Consumer Goods — 3.8% | | | | | | | | |
| Deckers Outdoor * | | | 71,624 | | | | 4,929,880 | |
The accompanying notes are an integral part of the financial statements.
| Schedule of Investments | October 31, 2013 |
| | | Shares | | | Value | |
| COMMON STOCK — continued |
| |
| Consumer Goods — continued | | | | | | | | |
| Delphi Automotive * | | | 74,260 | | | $ | 4,247,672 | |
| | | | | | | | 9,177,552 | |
| Consumer Services — 22.9% | | | | | | | | |
| Comcast, Cl A | | | 93,699 | | | | 4,458,198 | |
| Cumulus Media, Cl A * | | | 926,581 | | | | 5,540,954 | |
| Education Management * | | | 573,538 | | | | 8,775,131 | |
| Hertz Global Holdings * | | | 163,033 | | | | 3,743,238 | |
| Liberty Global, Cl A * | | | 53,176 | | | | 4,167,403 | |
| Liberty Media * | | | 28,738 | | | | 4,394,328 | |
| Pandora Media * | | | 202,745 | | | | 5,094,982 | |
| Priceline.com * | | | 4,261 | | | | 4,490,370 | |
| Time Warner | | | 65,821 | | | | 4,524,536 | |
| Twenty-First Century Fox | | | 126,224 | | | | 4,291,616 | |
| US Airways Group | | | 256,427 | | | | 5,633,701 | |
| | | | | | | | 55,114,457 | |
| Financials — 11.9% | | | | | | | | |
| American International Group * | | | 85,606 | | | | 4,421,550 | |
| CIT Group * | | | 81,759 | | | | 3,937,513 | |
| Citigroup | | | 79,227 | | | | 3,864,693 | |
| Hartford Financial Services Group | | | 130,157 | | | | 4,386,291 | |
| Hudson Pacific Properties | | | 199,636 | | | | 4,130,469 | |
| MBIA * | | | 319,381 | | | | 3,631,362 | |
| Nationstar Mortgage Holdings * | | | 83,375 | | | | 4,278,805 | |
| | | | | | | | 28,650,683 | |
| Health Care — 10.1% | | | | | | | | |
| Gilead Sciences | | | 58,376 | | | | 4,144,112 | |
| HCA Holdings | | | 104,782 | | | | 4,939,424 | |
| Life Technologies * | | | 54,016 | | | | 4,067,945 | |
| Merck | | | 83,973 | | | | 3,786,342 | |
| Pfizer | | | 139,748 | | | | 4,287,469 | |
| Vivus * | | | 321,826 | | | | 3,021,946 | |
| | | | | | | | 24,247,238 | |
| Industrials — 8.9% | | | | | | | | |
| Lockheed Martin | | | 33,034 | | | | 4,404,753 | |
| Nortek * | | | 59,659 | | | | 4,186,272 | |
| Owens-Illinois | | | 133,867 | | | | 4,255,632 | |
| Sensata Technologies Holding * | | | 108,094 | | | | 4,067,577 | |
| Spirit Aerosystems Holdings, Cl A * | | | 170,642 | | | | 4,554,435 | |
| | | | | | | | 21,468,669 | |
| Oil & Gas — 4.2% | | | | | | | | |
| Diamondback Energy | | | 101,298 | | | | 5,232,042 | |
The accompanying notes are an integral part of the financial statements.
| Schedule of Investments | October 31, 2013 |
| | | Shares/Face
Amount | | | Value | |
| COMMON STOCK — continued |
| |
| Oil & Gas — continued | | | | | | | | |
| Pioneer Natural Resources | | | 23,838 | | | $ | 4,881,546 | |
| | | | | | | | 10,113,588 | |
| Technology — 19.6% | | | | | | | | |
| Allscripts Healthcare Solutions * | | | 271,579 | | | | 3,755,938 | |
| Apple | | | 8,071 | | | | 4,215,887 | |
| EMC | | | 154,821 | | | | 3,726,541 | |
| Equinix | | | 24,309 | | | | 3,925,417 | |
| Google, Cl A * | | | 4,652 | | | | 4,794,258 | |
| Intel | | | 182,938 | | | | 4,469,175 | |
| Magnachip Semiconductor * | | | 204,958 | | | | 3,830,665 | |
| Microsoft | | | 126,582 | | | | 4,474,674 | |
| Motorola Solutions | | | 70,681 | | | | 4,418,976 | |
| NXP Semiconductor * | | | 115,410 | | | | 4,861,069 | |
| Yahoo! * | | | 148,356 | | | | 4,885,363 | |
| | | | | | | | 47,357,963 | |
| Telecommunications — 1.9% | | | | | | | | |
| Crown Castle International * | | | 58,933 | | | | 4,480,087 | |
| TOTAL UNITED STATES | | | | | | | 209,573,601 | |
| TOTAL COMMON STOCK | | | | | | | | |
| (Cost $215,999,609) | | | | | | | 236,785,966 | |
| |
| MASTER LIMITED PARTNERSHIP — 1.8% |
| UNITED STATES — 1.8% | | | | | | | | |
| Oil & Gas — 1.8% | | | | | | | | |
| Enterprise Products Partners | | | 67,373 | | | | 4,263,364 | |
| TOTAL MASTER LIMITED PARTNERSHIP — 1.8% | | | | | | | | |
| (Cost $4,055,636) | | | | | | | 4,263,364 | |
| TIME DEPOSIT — 1.6% |
| Brown Brothers Harriman, 0.030%, 11/01/13 | | | | | | | | |
| (Cost $3,993,280) | | $ | 3,993,280 | | | | 3,993,280 | |
| TOTAL INVESTMENTS — 101.6% | | | | | | | | |
| (Cost $224,048,525) | | | | | | $ | 245,042,610 | |
Percentages are based on Net Assets of $241,059,507.
| * | Non-income producing security. |
ADR — American Depositary Receipt
Cl — Class
Ser — Series
The accompanying notes are an integral part of the financial statements.
| Schedule of Investments | October 31, 2013 |
The following is a summary of the inputs used as of October 31, 2013, in valuing the Fund's investments carried at value:
| Investments in Securities | | Level 1 | | | Level 2 | | | Level 3 | | | Total | |
| Common Stock | | $ | 236,785,966 | | | $ | — | | | $ | — | | | $ | 236,785,966 | |
| Master Limited Partnership | | | 4,263,364 | | | | — | | | | — | | | | 4,263,364 | |
| Time Deposit | | | — | | | | 3,993,280 | | | | — | | | | 3,993,280 | |
| Total Investments in Securities | | $ | 241,049,330 | | | $ | 3,993,280 | | | $ | — | | | $ | 245,042,610 | |
For the period ended October 31, 2013, there have been no transfers between Level 1, Level 2 or Level 3 investments.
As of October 31, 2013, there were no Level 3 investments.
The accompanying notes are an integral part of the financial statements.
| Schedule of Investments | October 31, 2013 |
| Global X SuperIncome Preferred ETF |
Sector Weightings (unaudited) †:
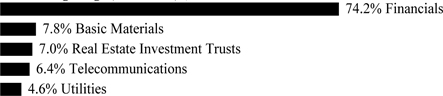
† Percentages based on total investments.
| | | Shares | | | Value | |
| PREFERRED STOCK — 99.9% |
| |
| Basic Materials — 7.8% | | | | | | | | |
| ArcelorMittal, 6.000% | | | 128,379 | | | $ | 3,059,272 | |
| Cliffs Natural Resources, 7.000% | | | 72,372 | | | | 1,643,568 | |
| | | | | | | | 4,702,840 | |
| Financials — 74.1% | | | | | | | | |
| Aegon, 8.000% | | | 28,933 | | | | 781,480 | |
| Aegon, 7.250% | | | 57,549 | | | | 1,455,414 | |
| Aegon, 6.875% | | | 30,070 | | | | 745,435 | |
| Ally Financial, Ser A, 8.500% | | | 24,942 | | | | 673,434 | |
| Ally Financial, 7.375% | | | 21,805 | | | | 551,885 | |
| Annaly Capital Management, Ser D, 7.500% | | | 44,868 | | | | 1,072,345 | |
| Aviva, 8.250% | | | 39,927 | | | | 1,086,414 | |
| Barclays Bank, Ser 3, 7.100% | | | 31,234 | | | | 787,097 | |
| Barclays Bank, Ser 4, 7.750% | | | 26,075 | | | | 663,087 | |
| Barclays Bank, Ser 5, 8.125% | | | 59,985 | | | | 1,530,217 | |
| Capital One Financial, Ser B, 6.000% | | | 86,826 | | | | 1,935,351 | |
| Citigroup, Ser J, 7.125% | | | 31,924 | | | | 827,151 | |
| Citigroup Capital XIII, 7.875% | | | 77,307 | | | | 2,125,942 | |
| Countrywide Capital V, 7.000% | | | 56,510 | | | | 1,415,575 | |
| Deutsche Bank Capital Funding Trust X, 7.350% | | | 22,021 | | | | 557,572 | |
| Deutsche Bank Contingent Capital Trust III, 7.600% | | | 54,014 | | | | 1,434,072 | |
| Deutsche Bank Contingent Capital Trust V, 8.050% | | | 37,837 | | | | 1,023,869 | |
| Discover Financial Services, Ser B, 6.500% | | | 56,459 | | | | 1,350,499 | |
| GMAC Capital Trust I, Ser 2, 8.125% | | | 65,123 | | | | 1,749,204 | |
| Hartford Financial Services Group, 7.875% | | | 58,818 | | | | 1,697,488 | |
| HSBC Holdings, 8.125% | | | 41,138 | | | | 1,058,481 | |
| HSBC Holdings, Ser 2, 8.000% | | | 70,515 | | | | 1,928,585 | |
| ING Groep, 8.500% | | | 50,897 | | | | 1,312,125 | |
| ING Groep, 7.375% | | | 38,292 | | | | 966,490 | |
| ING Groep, 7.200% | | | 28,066 | | | | 706,141 | |
| Lloyds Banking Group, 7.750% | | | 84,559 | | | | 2,270,409 | |
| Merrill Lynch Preferred Capital Trust III, 7.000% | | | 28,540 | | | | 719,493 | |
The accompanying notes are an integral part of the financial statements.
| Schedule of Investments | October 31, 2013 |
| Global X SuperIncome Preferred ETF |
| | | Shares | | | Value | |
| PREFERRED STOCK — continued |
| |
| Financials — continued | | | | | | | | |
| Merrill Lynch Preferred Capital Trust V, Ser F, 7.280% | | | 32,309 | | | $ | 817,095 | |
| PartnerRe, Ser E, 7.250% | | | 36,682 | | | | 940,160 | |
| PPL Capital Funding, Ser B, 5.900% | | | 44,473 | | | | 957,059 | |
| Regions Financial, Ser A, 6.375% | | | 50,376 | | | | 1,153,611 | |
| Royal Bank of Scotland Group, Ser Q, 6.750% | | | 27,545 | | | | 618,385 | |
| Royal Bank of Scotland Group, Ser S, 6.600% | | | 35,290 | | | | 776,733 | |
| Royal Bank of Scotland Group, Ser T, 7.250% | | | 68,248 | | | | 1,642,729 | |
| Santander Finance Preferred SAU, Ser 10, 10.500% | | | 81,015 | | | | 2,175,253 | |
| Wachovia Preferred Funding, Ser A, 7.250% | | | 27,818 | | | | 724,381 | |
| Wells Fargo, Ser J, 8.000% | | | 78,455 | | | | 2,231,260 | |
| | | | | | | | 44,461,921 | |
| Real Estate Investment Trusts — 7.0% | | | | | | | | |
| CHS, Ser B, 7.875% | | | 27,049 | | | | 773,872 | |
| Kimco Realty, Ser I, 6.000% | | | 38,774 | | | | 841,784 | |
| National Retail Properties, Ser D, 6.625% | | | 28,604 | | | | 653,315 | |
| PS Business Parks, Ser T, 6.000% | | | 35,036 | | | | 727,698 | |
| Vornado Realty, 7.875% | | | 44,854 | | | | 1,186,388 | |
| | | | | | | | 4,183,057 | |
| Telecommunications — 6.4% | | | | | | | | |
| Qwest, 7.500% | | | 41,971 | | | | 1,058,509 | |
| Qwest, 7.375% | | | 48,171 | | | | 1,206,684 | |
| Qwest, 7.000% | | | 29,804 | | | | 733,178 | |
| United States Cellular, 6.950% | | | 33,528 | | | | 825,459 | |
| | | | | | | | 3,823,830 | |
| Utilities — 4.6% | | | | | | | | |
| Dominion Resources, Ser A, 8.375% | | | 67,604 | | | | 1,763,788 | |
| SCE Trust I, 5.625% | | | 45,978 | | | | 980,251 | |
| | | | | | | | 2,744,039 | |
| TOTAL PREFERRED STOCK | | | | | | | | |
| (Cost $59,483,445) | | | | | | | 59,915,687 | |
| TOTAL INVESTMENTS — 99.9% | | | | | | | | |
| (Cost $59,483,445) | | | | | | $ | 59,915,687 | |
Percentages are based on Net Assets of $59,964,923.
Ser — Series
The accompanying notes are an integral part of the financial statements.
| Schedule of Investments | October 31, 2013 |
| Global X SuperIncome Preferred ETF |
The following is a summary of the inputs used as of October 31, 2013, in valuing the Fund's investments carried at value:
| Investments in Securities | | Level 1 | | | Level 2 | | | Level 3 | | | Total | |
| Preferred Stock | | $ | 59,915,687 | | | $ | — | | | $ | — | | | $ | 59,915,687 | |
| Total Investments in Securities | | $ | 59,915,687 | | | $ | — | | | $ | — | | | $ | 59,915,687 | |
For the period ended October 31, 2013, there have been no transfers between Level 1, Level 2 or Level 3 investments.
As of October 31, 2013, there were no Level 2 or Level 3 investments.
The accompanying notes are an integral part of the financial statements.
Statements of Assets and Liabilities
| | | Global X
SuperDividend
ETF | | | Global X
SuperDividend
U.S. ETF | | | Global X Canada
Preferred ETF | | | Global X Social
Media Index ETF | |
| Assets: | | | | | | | | | | | | | | | | |
| Cost of Investments | | $ | 721,046,670 | | | $ | 50,249,427 | | | $ | 8,701,259 | | | $ | 93,319,065 | |
| Cost of Repurchase Agreements | | | 72,223,358 | | | | — | | | | — | | | | — | |
| Investments, at Value | | $ | 773,640,405 | * | | $ | 51,771,829 | | | $ | 7,780,628 | | | $ | 95,911,412 | |
| Repurchase Agreements, at Value | | | 72,223,358 | | | | — | | | | — | | | | — | |
| Cash | | | 59,887 | | | | — | | | | — | | | | — | |
| Foreign Currency at Value | | | — | | | | — | | | | — | | | | 566 | |
| Dividend and Interest Receivable | | | 2,230,831 | | | | 113,835 | | | | 14,580 | | | | — | |
| Receivable for Investment Securities Sold | | | 751,986 | | | | 1,423,673 | | | | 13,113 | | | | 10,656,740 | |
| Receivable for Capital Shares Sold | | | 377,577 | | | | — | | | | — | | | | 3,075,093 | |
| Reclaim Receivable | | | 193,917 | | | | — | | | | — | | | | 441 | |
| Total Assets | | | 849,477,961 | | | | 53,309,337 | | | | 7,808,321 | | | | 109,644,252 | |
| | | | | | | | | | | | | | | | | |
| Liabilities: | | | | | | | | | | | | | | | | |
| Obligation to Return Securities Lending Collateral | | | 72,223,358 | | | | — | | | | — | | | | — | |
| Payable for Investment Securities Purchased | | | 1,048,895 | | | | 1,411,354 | | | | 13,130 | | | | 13,652,962 | |
| Cash Overdraft | | | 595,933 | | | | — | | | | — | | | | — | |
| Payable due to Investment Adviser | | | 371,780 | | | | 18,643 | | | | 4,028 | | | | 43,736 | |
| Total Liabilities | | | 74,239,966 | | | | 1,429,997 | | | | 17,158 | | | | 13,696,698 | |
| Net Assets | | $ | 775,237,995 | | | $ | 51,879,340 | | | $ | 7,791,163 | | | $ | 95,947,554 | |
| | | | | | | | | | | | | | | | | |
| Net Assets Consist of: | | | | | | | | | | | | | | | | |
| Paid-in Capital | | $ | 746,341,918 | | | $ | 51,219,431 | | | $ | 9,010,840 | | | $ | 95,687,074 | |
| Undistributed (Distributions in Excess of) Net Investment Income | | | (4,150,471 | ) | | | (148,344 | ) | | | 15,503 | | | | (1,350 | ) |
| Accumulated Net Realized Loss | | | (19,558,327 | ) | | | (714,149 | ) | | | (314,432 | ) | | | (2,329,527 | ) |
| Net Unrealized Appreciation (Depreciation) on Investments | | | 52,593,735 | | | | 1,522,402 | | | | (920,631 | ) | | | 2,592,347 | |
| Net Unrealized Appreciation (Depreciation) on Foreign Currency Translations | | | 11,140 | | | | — | | | | (117 | ) | | | (990 | ) |
| Net Assets | | $ | 775,237,995 | | | $ | 51,879,340 | | | $ | 7,791,163 | | | $ | 95,947,554 | |
| Outstanding Shares of Beneficial Interest | | | | | | | | | | | | | | | | |
| (unlimited authorization — no par value) | | | 32,650,000 | | | | 2,000,000 | | | | 600,000 | | | | 4,950,000 | |
| | | | | | | | | | | | | | | | | |
| Net Asset Value, Offering and Redemption Price Per Share | | $ | 23.74 | | | $ | 25.94 | | | $ | 12.99 | | | $ | 19.38 | |
| *Includes Market Value of Securities on Loan | | $ | 69,078,558 | | | $ | — | | | $ | — | | | $ | — | |
The accompanying notes are an integral part of the financial statements.
Statements of Assets and Liabilities
| | | Global X
Permanent ETF | | | Global X Guru
Index ETF | | | Global X
SuperIncome
Preferred ETF | |
| Assets: | | | | | | | | | | | | |
| Cost of Investments | | $ | 15,368,254 | | | $ | 224,048,525 | | | $ | 59,483,445 | |
| Investments, at Value | | $ | 14,412,434 | | | $ | 245,042,610 | | | $ | 59,915,687 | |
| Dividend and Interest Receivable | | | 69,948 | | | | 60,326 | | | | 102,364 | |
| Reclaim Receivable | | | 66 | | | | — | | | | — | |
| Receivable for Capital Shares Sold | | | — | | | | 9,641,000 | | | | 2,221,500 | |
| Receivable for Investment Securities Sold | | | — | | | | 60,390 | | | | 19,225 | |
| Total Assets | | | 14,482,448 | | | | 254,804,326 | | | | 62,258,776 | |
| | | | | | | | | | | | | |
| Liabilities: | | | | | | | | | | | | |
| Payable for Investment Securities Purchased | | | — | | | | 13,587,129 | | | | 2,230,188 | |
| Payable due to Investment Adviser | | | 5,857 | | | | 121,350 | | | | 27,208 | |
| Cash Overdraft | | | — | | | | 36,340 | | | | 36,457 | |
| Total Liabilities | | | 5,857 | | | | 13,744,819 | | | | 2,293,853 | |
| Net Assets | | $ | 14,476,591 | | | $ | 241,059,507 | | | $ | 59,964,923 | |
| Net Assets Consist of: | | | | | | | | | | | | |
| Paid-in Capital | | $ | 15,536,135 | | | $ | 220,170,981 | | | $ | 60,313,098 | |
| Undistributed Net Investment Income | | | 151,779 | | | | 10,057 | | | | 228,167 | |
| Accumulated Net Realized Loss | | | (255,503 | ) | | | (115,616 | ) | | | (1,008,584 | ) |
| Net Unrealized Appreciation (Depreciation) on Investments | | | (955,820 | ) | | | 20,994,085 | | | | 432,242 | |
| Net Assets | | $ | 14,476,591 | | | $ | 241,059,507 | | | $ | 59,964,923 | |
| Outstanding Shares of Beneficial Interest | | | | | | | | | | | | |
| (unlimited authorization — no par value) | | | 600,000 | | | | 10,050,000 | | | | 4,050,000 | |
| | | | | | | | | | | | | |
| Net Asset Value, Offering and Redemption Price Per Share | | $ | 24.13 | | | $ | 23.99 | | | $ | 14.81 | |
The accompanying notes are an integral part of the financial statements.
Statements of Operations
| For the year or period ended October 31, 2013 |
| | | Global X
SuperDividend
ETF | | | Global X
SuperDividend
U.S. ETF(1) | | | Global X
Canada
Preferred
ETF | | | Global X
Social Media
Index ETF | |
| Investment Income: | | | | | | | | | | | | | | | | |
| Dividend Income | | $ | 33,214,193 | | | $ | 1,559,006 | | | $ | 608,388 | | | $ | 125,251 | |
| Interest Income | | | 1,100 | | | | 14 | | | | 13 | | | | 893 | |
| Security Lending Income | | | 561,102 | | | | — | | | | — | | | | — | |
| Less: Foreign Taxes Withheld | | | (1,767,613 | ) | | | — | | | | (91,137 | ) | | | (3,790 | ) |
| Total Investment Income | | | 32,008,782 | | | | 1,559,020 | | | | 517,264 | | | | 122,354 | |
| Supervision and Administration Fees(2) | | | 2,853,325 | | | | 108,481 | | | | 74,113 | | | | 123,617 | |
| Total Expenses | | | 2,853,325 | | | | 108,481 | | | | 74,113 | | | | 123,617 | |
| Net Investment Income (Loss) | | | 29,155,457 | | | | 1,450,539 | | | | 443,151 | | | | (1,263 | ) |
| Net Realized Gain (Loss) on: | | | | | | | | | | | | | | | | |
| Investments | | | (14,316,708 | ) | | | (979,751 | ) | | | (402,593 | ) | | | (263,889 | ) |
| Foreign Currency Transactions | | | 32,607 | | | | — | | | | (3,360 | ) | | | (88 | ) |
| Net Realized Loss on Investments and Foreign Currency Transactions | | | (14,284,101 | ) | | | (979,751 | ) | | | (405,953 | ) | | | (263,977 | ) |
| Net Change in Unrealized Appreciation (Depreciation) on: | | | | | | | | | | | | | | | | |
| Investments | | | 52,393,693 | | | | 1,522,402 | | | | (897,879 | ) | | | 4,168,951 | |
| Foreign Currency Translations | | | 6,828 | | | | — | | | | 60 | | | | (611 | ) |
| Net Change in Unrealized Appreciation (Depreciation) on Investments and Foreign Currency Translations | | | 52,400,521 | | | | 1,522,402 | | | | (897,819 | ) | | | 4,168,340 | |
| Net Realized and Unrealized Gain (Loss) on Investments and Foreign Currency Transactions and Translations | | | 38,116,420 | | | | 542,651 | | | | (1,303,772 | ) | | | 3,904,363 | |
| Net Increase (Decrease) in Net Assets Resulting from Operations | | $ | 67,271,877 | | | $ | 1,993,190 | | | $ | (860,621 | ) | | $ | 3,903,100 | |
| (1) | The Fund commenced operations on March 11, 2013 |
| (2) | The Supervision and Administration fees reflect the supervisory and administrative fee, which includes fees paid by the Funds for the investment advisory services provided by the Adviser. (See Note 3 in Notes to Financial Statements.) |
The accompanying notes are an integral part of the financial statements.
Statements of Operations
| For the period ended October 31, 2013 and the year ended June 30, 2013 |
| | | Global X Permanent ETF | | | Global X Guru Index ETF | |
| | | 10/31/2013(1) | | | 6/30/2013(2) | | | 10/31/2013(1) | | | 6/30/2013(2) | |
| Investment Income: | | | | | | | | | | | | | | | | |
| Dividend Income | | $ | 24,588 | | | $ | 114,693 | | | $ | 387,517 | | | $ | 171,923 | |
| Interest Income | | | 42,410 | | | | 133,194 | | | | 22 | | | | 4 | |
| Less: Foreign Taxes Withheld | | | (250 | ) | | | (481 | ) | | | (5,320 | ) | | | (1,410 | ) |
| Total Investment Income | | | 66,748 | | | | 247,406 | | | | 382,219 | | | | 170,517 | |
| Supervision and Administration Fees(3) | | | 23,224 | | | | 81,424 | | | | 337,090 | | | | 80,159 | |
| Total Expenses | | | 23,224 | | | | 81,424 | | | | 337,090 | | | | 80,159 | |
| Net Investment Income | | | 43,524 | | | | 165,982 | | | | 45,129 | | | | 90,358 | |
| Net Realized Gain (Loss) on: | | | | | | | | | | | | | | | | |
| Investments | | | 19,200 | | | | 53,149 | | | | 80,579 | | | | 1,013,450 | |
| Foreign Currency Transactions | | | (36 | ) | | | 1,428 | | | | — | | | | 10 | |
| Net Realized Gain on Investments and Foreign Currency Transactions | | | 19,164 | | | | 54,577 | | | | 80,579 | | | | 1,013,460 | |
| Net Change in Unrealized Appreciation (Depreciation) on: | | | | | | | | | | | | | | | | |
| Investments | | | 528,279 | | | | (1,434,987 | ) | | | 19,607,750 | | | | 1,093,978 | |
| Foreign Currency Translations | | | (228 | ) | | | 228 | | | | — | | | | — | |
| Net Change in Unrealized Appreciation (Depreciation) on Investments and Foreign Currency Translations | | | 528,051 | | | | (1,434,759 | ) | | | 19,607,750 | | | | 1,093,978 | |
| Net Realized and Unrealized Gain (Loss) on Investments and Foreign Currency Transactions and Translations | | | 547,215 | | | | (1,380,182 | ) | | | 19,688,329 | | | | 2,107,438 | |
| Net Increase (Decrease) in Net Assets Resulting from Operations | | $ | 590,739 | | | $ | (1,214,200 | ) | | $ | 19,733,458 | | | $ | 2,197,796 | |
| (1) | For the period July 1, 2013 to October 31, 2013. Effective July 1, 2013 the Global X Permanent ETF and Global X Guru Index ETF (formerly Global X Top Guru Holdings Index ETF each changed their fiscal year end to October 31 (See Note 1 in Notes to Financial Statements). |
| (2) | For the year ended June 30, 2013. |
| (3) | The Supervision and Administration fees reflect the supervisory and administrative fee, which includes fees paid by the Funds for the investment advisory services provided by the Adviser. (See Note 3 in Notes to Financial Statements.) |
The accompanying notes are an integral part of the financial statements.
Statements of Operations
| For the periods ended October 31, 2013 and June 30, 2013 |
| | | Global X SuperIncome
Preferred ETF | |
| | | 10/31/2013(1) | | | 6/30/2013(2) | |
| Investment Income: | | | | | | | | |
| Dividend Income | | $ | 1,110,989 | | | $ | 1,073,733 | |
| Interest Income | | | 94 | | | | 58 | |
| Less: Foreign Taxes Withheld | | | — | | | | — | |
| Total Investment Income | | | 1,111,083 | | | | 1,073,791 | |
| Supervision and Administration Fees(3) | | | 93,160 | | | | 73,890 | |
| Total Expenses | | | 93,160 | | | | 73,890 | |
| Net Investment Income | | | 1,017,923 | | | | 999,901 | |
| Net Realized Loss on: | | | | | | | | |
| Investments | | | (823,814 | ) | | | (173,657 | ) |
| Net Realized Loss on Investments | | | (823,814 | ) | | | (173,657 | ) |
| Net Change in Unrealized Appreciation (Depreciation) on: | | | | | | | | |
| Investments | | | 1,490,613 | | | | (1,058,371 | ) |
| Net Change in Unrealized Appreciation (Depreciation) on Investments | | | 1,490,613 | | | | (1,058,371 | ) |
| Net Realized and Unrealized Gain (Loss) on Investments | | | 666,799 | | | | (1,232,028 | ) |
| Net Increase (Decrease) in Net Assets Resulting from Operations | | $ | 1,684,722 | | | $ | (232,127 | ) |
| (1) | For the period July 1, 2013 to October 31, 2013. Effective July 1, 2013 the Global X SuperIncome Preferred ETF changed its fiscal year end to October 31 (See Note 1 in Notes to Financial Statements). |
| (2) | For the period ended June 30, 2013. Fund commenced operations on July 16, 2012. |
| (3) | The Supervision and Administration fees reflect the supervisory and administrative fee, which includes fees paid by the Funds for the investment advisory services provided by the Adviser. (See Note 3 in Notes to Financial Statements.) |
The accompanying notes are an integral part of the financial statements.
| Statements of Changes in Net Assets |
| |
| | | Global X SuperDividend ETF | | | Global X
SuperDividend
U.S. ETF | |
| | | Year Ended
October 31, 2013 | | | Year Ended
October 31, 2012 | | | Period Ended
October 31, 2013(1) | |
| Operations: | | | | | | | | | | | | |
| Net Investment Income | | $ | 29,155,457 | | | $ | 5,086,960 | | | $ | 1,450,539 | |
| Net Realized Loss on Investments and Foreign Currency Transactions | | | (14,284,101 | ) | | | (2,112,857 | ) | | | (979,751 | ) |
| Net Change in Unrealized Appreciation on Investments and Foreign Currency Translations | | | 52,400,521 | | | | 2,746,077 | | | | 1,522,402 | |
| Net Increase in Net Assets Resulting from Operations | | | 67,271,877 | | | | 5,720,180 | | | | 1,993,190 | |
| Dividends and Distributions from: | | | | | | | | | | | | |
| Net Investment Income | | | (35,106,732 | ) | | | (4,983,491 | ) | | | (1,333,281 | ) |
| Return of Capital | | | — | | | | — | | | | (145,569 | ) |
| Total Dividends and Distributions | | | (35,106,732 | ) | | | (4,983,491 | ) | | | (1,478,850 | ) |
| Capital Share Transactions: | | | | | | | | | | | | |
| Issued | | | 586,001,500 | | | | 132,719,500 | | | | 51,365,000 | |
| Redeemed | | | (5,757,000 | ) | | | — | | | | — | |
| Increase in Net Assets from Capital Share Transactions | | | 580,244,500 | | | | 132,719,500 | | | | 51,365,000 | |
| Total Increase in Net Assets | | | 612,409,645 | | | | 133,456,189 | | | | 51,879,340 | |
| Net Assets: | | | | | | | | | | | | |
| Beginning of Year/Period | | | 162,828,350 | | | | 29,372,161 | | | | — | |
| End of Year/Period | | $ | 775,237,995 | | | $ | 162,828,350 | | | $ | 51,879,340 | |
| Undistributed (Distributions in Excess of) Net Investment Income | | $ | (4,150,471 | ) | | $ | 571,506 | | | $ | (148,344 | ) |
| Share Transactions: | | | | | | | | | | | | |
| Issued | | | 25,450,000 | | | | 6,100,000 | | | | 2,000,000 | |
| Redeemed | | | (250,000 | ) | | | — | | | | — | |
| Net Increase in Shares Outstanding from Share Transactions | | | 25,200,000 | | | | 6,100,000 | | | | 2,000,000 | |
| (1) | Commenced operations on March 11, 2013. |
The accompanying notes are an integral part of the financial statements.
| Statements of Changes in Net Assets |
| |
| | | Global X Canada Preferred ETF | | | Global X Social Media Index ETF | |
| | | Year Ended
October 31, 2013 | | | Year Ended
October 31, 2012 | | | Year Ended
October 31, 2013 | | | Period Ended
October 31, 2012(1) | |
| Operations: | | | | | | | | | | | | | | | | |
| Net Investment Income (Loss) | | $ | 443,151 | | | $ | 448,023 | | | $ | (1,263 | ) | | $ | 95,441 | |
| Net Realized Loss on Investments and Foreign Currency Transactions | | | (405,953 | ) | | | (283,704 | ) | | | (263,977 | ) | | | (1,525,644 | ) |
| Net Change in Unrealized Appreciation (Depreciation) on Investments and Foreign Currency Translations | | | (897,819 | ) | | | 315,539 | | | | 4,168,340 | | | | (1,576,983 | ) |
| Net Increase (Decrease) in Net Assets Resulting from Operations | | | (860,621 | ) | | | 479,858 | | | | 3,903,100 | | | | (3,007,186 | ) |
| Dividends and Distributions from: | | | | | | | | | | | | | | | | |
| Net Investment Income | | | (468,097 | ) | | | (426,223 | ) | | | (98,361 | ) | | | — | |
| Total Dividends and Distributions | | | (468,097 | ) | | | (426,223 | ) | | | (98,361 | ) | | | — | |
| Capital Share Transactions: | | | | | | | | | | | | | | | | |
| Issued | | | 726,000 | | | | 7,185,500 | | | | 84,127,501 | | | | 27,517,000 | |
| Redeemed | | | (6,100,500 | ) | | | (707,000 | ) | | | (5,456,000 | ) | | | (11,038,500 | ) |
| Increase (Decrease) in Net Assets from Capital Share Transactions | | | (5,374,500 | ) | | | 6,478,500 | | | | 78,671,501 | | | | 16,478,500 | |
| Total Increase (Decrease) in Net Assets | | | (6,703,218 | ) | | | 6,532,135 | | | | 82,476,240 | | | | 13,471,314 | |
| Net Assets: | | | | | | | | | | | | | | | | |
| Beginning of Year/Period | | | 14,494,381 | | | | 7,962,246 | | | | 13,471,314 | | | | — | |
| End of Year/Period | | $ | 7,791,163 | | | $ | 14,494,381 | | | $ | 95,947,554 | | | $ | 13,471,314 | |
| Undistributed (Distributions in Excess of) Net Investment Income | | $ | 15,503 | | | $ | 43,809 | | | $ | (1,350 | ) | | $ | 98,362 | |
| Share Transactions: | | | | | | | | | | | | | | | | |
| Issued | | | 50,000 | | | | 500,000 | | | | 4,300,000 | | | | 1,900,000 | |
| Redeemed | | | (450,000 | ) | | | (50,000 | ) | | | (400,000 | ) | | | (850,000 | ) |
| Net Increase (Decrease) in Shares Outstanding from Share Transactions | | | (400,000 | ) | | | 450,000 | | | | 3,900,000 | | | | 1,050,000 | |
(1) The Fund commenced operations on November 14, 2011
The accompanying notes are an integral part of the financial statements.
| Statements of Changes in Net Assets |
| |
| | | Global X Permanent ETF | |
| | | Period Ended
October 31, 2013(1) | | | Year Ended
June 30, 2013 | | | Period Ended
June 30, 2012(2) | |
| Operations: | | | | | | | | | | | | |
| Net Investment Income | | $ | 43,524 | | | $ | 165,982 | | | $ | 36,536 | |
| Net Realized Gain (Loss) on Investments and Foreign Currency Transactions | | | 19,164 | | | | 54,577 | | | | (10,857 | ) |
| Net Change in Unrealized Appreciation (Depreciation) on Investments and Foreign Currency Translations | | | 528,051 | | | | (1,434,759 | ) | | | (49,112 | ) |
| Net Increase (Decrease) in Net Assets Resulting from Operations | | | 590,739 | | | | (1,214,200 | ) | | | (23,433 | ) |
| Dividends and Distributions from: | | | | | | | | | | | | |
| Net Investment Income | | | — | | | | (114,515 | ) | | | — | |
| Total Dividends and Distributions | | | — | | | | (114,515 | ) | | | — | |
| Capital Share Transactions: | | | | | | | | | | | | |
| Issued | | | — | | | | 17,655,500 | | | | 14,882,500 | |
| Redeemed | | | (1,162,000 | ) | | | (16,138,000 | ) | | | — | |
| Increase (Decrease) in Net Assets from Capital Share Transactions | | | (1,162,000 | ) | | | 1,517,500 | | | | 14,882,500 | |
| Total Increase (Decrease) in Net Assets | | | (571,261 | ) | | | 188,785 | | | | 14,859,067 | |
| Net Assets: | | | | | | | | | | | | |
| Beginning of Year/Period | | | 15,047,852 | | | | 14,859,067 | | | | — | |
| End of Year/Period | | $ | 14,476,591 | | | $ | 15,047,852 | | | $ | 14,859,067 | |
| Undistributed Net Investment Income | | $ | 151,779 | | | $ | 62,178 | | | $ | 40,850 | |
| Share Transactions: | | | | | | | | | | | | |
| Issued | | | — | | | | 700,000 | | | | 600,000 | |
| Redeemed | | | (50,000 | ) | | | (650,000 | ) | | | — | |
| Net Increase (Decrease) in Shares Outstanding from Share Transactions | | | (50,000 | ) | | | 50,000 | | | | 600,000 | |
| (1) | For the period July 1, 2013 to October 31, 2013. Effective July 1, 2013 the Global X Permanent ETF changed its fiscal year end to October 31 (See Note 1 in Notes to Financial Statements). |
| (2) | The Fund commenced operations on February 7, 2012. |
The accompanying notes are an integral part of the financial statements.
| Statements of Changes in Net Assets |
| |
| | | Global X Guru Index ETF | |
| | | Period Ended
October 31, 2013(1) | | | Year Ended
June 30, 2013 | | | Period Ended
June 30, 2012(2) | |
| Operations: | | | | | | | | | | | | |
| Net Investment Income | | $ | 45,129 | | | $ | 90,358 | | | $ | 7,013 | |
| Net Realized Gain on Investments and Foreign Currency Transactions | | | 80,579 | | | | 1,013,460 | | | | 3,914 | |
| Net Change in Unrealized Appreciation on Investments and Foreign Currency Translations | | | 19,607,750 | | | | 1,093,978 | | | | 292,357 | |
| Net Increase in Net Assets Resulting from Operations | | | 19,733,458 | | | | 2,197,796 | | | | 303,284 | |
| Dividends and Distributions from: | | | | | | | | | | | | |
| Net Investment Income | | | — | | | | (20,046 | ) | | | — | |
| Net Realized Gains | | | — | | | | (77,984 | ) | | | — | |
| Total Dividends and Distributions | | | — | | | | (98,030 | ) | | | — | |
| Capital Share Transactions: | | | | | | | | | | | | |
| Issued | | | 168,586,499 | | | | 59,344,500 | | | | 5,236,000 | |
| Redeemed | | | — | | | | (14,244,000 | ) | | | — | |
| Increase in Net Assets from Capital Share Transactions | | | 168,586,499 | | | | 45,100,500 | | | | 5,236,000 | |
| Total Increase in Net Assets | | | 188,319,957 | | | | 47,200,266 | | | | 5,539,284 | |
| Net Assets: | | | | | | | | | | | | |
| Beginning of Year/Period | | | 52,739,550 | | | | 5,539,284 | | | | — | |
| End of Year/Period | | $ | 241,059,507 | | | $ | 52,739,550 | | | $ | 5,539,284 | |
| Undistributed Net Investment Income | | $ | 10,057 | | | $ | 10,056 | | | $ | 7,013 | |
| Share Transactions: | | | | | | | | | | | | |
| Issued | | | 7,500,000 | | | | 2,950,000 | | | | 350,000 | |
| Redeemed | | | — | | | | (750,000 | ) | | | — | |
| Net Increase in Shares Outstanding from Share Transactions | | | 7,500,000 | | | | 2,200,000 | | | | 350,000 | |
| (1) | For the period July 1, 2013 to October 31, 2013. Effective July 1, 2013 the Global X Guru Index ETF (formerly Global X Top Guru Holdings Index ETF) changed its fiscal year end to October 31 (See Note 1 in Notes to Financial Statements). |
| (2) | The Fund commenced operations on June 4, 2012 |
The accompanying notes are an integral part of the financial statements.
| Statements of Changes in Net Assets |
| |
| | | Global X SuperIncome Preferred ETF | |
| | | Period Ended
October 31, 2013(1) | | | Period Ended
June 30, 2013(2) | |
| Operations: | | | | | | | | |
| Net Investment Income | | $ | 1,017,923 | | | $ | 999,901 | |
| Net Realized Loss on Investments and Foreign Currency Transactions | | | (823,814 | ) | | | (173,657 | ) |
| Net Change in Unrealized Appreciation on Investments and Foreign Currency Translations | | | 1,490,613 | | | | (1,058,371 | ) |
| Net Increase (Decrease) in Net Assets Resulting from Operations | | | 1,684,722 | | | | (232,127 | ) |
| Dividends and Distributions from: | | | | | | | | |
| Net Investment Income | | | (978,675 | ) | | | (796,414 | ) |
| Net Realized Gains | | | — | | | | (6,583 | ) |
| Total Dividends and Distributions | | | (978,675 | ) | | | (802,997 | ) |
| Capital Share Transactions: | | | | | | | | |
| Issued | | | 24,089,500 | | | | 37,687,000 | |
| Redeemed | | | — | | | | (1,482,500 | ) |
| Increase in Net Assets from Capital Share Transactions | | | 24,089,500 | | | | 36,204,500 | |
| Total Increase in Net Assets | | | 24,795,547 | | | | 35,169,376 | |
| Net Assets: | | | | | | | | |
| Beginning of Period | | | 35,169,376 | | | | — | |
| End of Period | | $ | 59,964,923 | | | $ | 35,169,376 | |
| Undistributed Net Investment Income | | $ | 228,167 | | | $ | 188,919 | |
| Share Transactions: | | | | | | | | |
| Issued | | | 1,650,000 | | | | 2,500,000 | |
| Redeemed | | | — | | | | (100,000 | ) |
| Net Increase in Shares Outstanding from Share Transactions | | | 1,650,000 | | | | 2,400,000 | |
| (1) | For the period July 1, 2013 to October 31, 2013. Effective July 1, 2013 the Global X SuperIncome Preferred ETF changed its fiscal year end to October 31 (See Note 1 in Notes to Financial Statements). |
| (2) | The Fund commenced operations on July 16, 2012 |
The accompanying notes are an integral part of the financial statements.
Selected Per Share Data & Ratios
For a Share Outstanding Throughout the Period
| | | Net Asset
Value,
Beginning
of Period
($) | | | Net
Investment
Income
($)* | | | Net Realized
and
Unrealized
Gain (Loss)
on
Investments
($) | | | Total from
Operations
($) | | | Distribution
from Net
Investment
Income
($) | | | Distribution
from Net
Realized
Gains
($) | | | Return of
Capital
($) | | | Total from
Distributions
($) | | | Net Asset
Value, End
of Period
($) | | | Total
Return
(%)** | | | Net
Assets
End of
Period
($)(000) | | | Ratio of
Expenses
to
Average
Net Assets
(%) | | | Ratio of
Net
Investment
Income
(Loss) to
Average
Net Assets
(%) | | | Portfolio
Turnover
(%)†† | |
| Global X SuperDividend ETF | | | | | | | | | | | | | | | | | | | | | | | | | | | | | | | | | | | | |
| 2013 | | | 21.86 | | | | 1.34 | | | | 2.27 | | | | 3.61 | | | | (1.73 | ) | | | — | | | | — | | | | (1.73 | ) | | | 23.74 | | | | 17.34 | | | | 775,238 | | | | 0.58 | | | | 5.93 | | | | 43.64 | |
| 2012 | | | 21.76 | | | | 1.62 | | | | 0.09 | | | | 1.71 | | | | (1.61 | ) | | | — | | | | — | | | | (1.61 | ) | | | 21.86 | | | | 8.34 | | | | 162,828 | | | | 0.58 | | | | 7.53 | | | | 34.03 | |
| 2011(1) | | | 24.70 | | | | 0.64 | | | | (3.02 | ) | | | (2.38 | ) | | | (0.56 | ) | | | — | | | | — | | | | (0.56 | ) | | | 21.76 | | | | (9.56 | ) | | | 29,372 | | | | 0.58 | † | | | 7.22 | † | | | 4.58 | |
| Global X SuperDividend U.S. ETF | | | | | | | | | | | | | | | | | | | | | | | | | | | | | | | | | | | | |
| 2013(2) | | | 25.15 | | | | 0.98 | | | | 0.82 | | | | 1.80 | | | | (0.91 | ) | | | — | | | | (0.10 | ) | | | (1.01 | ) | | | 25.94 | | | | 7.32 | | | | 51,879 | | | | 0.45 | † | | | 6.02 | † | | | 20.36 | |
| Global X Canada Preferred ETF | | | | | | | | | | | | | | | | | | | | | | | | | | | | | | | | | | | | |
| 2013 | | | 14.49 | | | | 0.49 | | | | (1.48 | ) | | | (0.99 | ) | | | (0.51 | ) | | | — | | | | — | | | | (0.51 | ) | | | 12.99 | | | | (7.03 | ) | | | 7,791 | | | | 0.58 | | | | 3.47 | | | | 36.48 | |
| 2012 | | | 14.48 | | | | 0.54 | | | | — | | | | 0.54 | | | | (0.53 | ) | | | — | | | | — | | | | (0.53 | ) | | | 14.49 | | | | 3.78 | | | | 14,494 | | | | 0.58 | | | | 3.73 | | | | 38.15 | |
| 2011(3) | | | 14.97 | | | | 0.27 | | | | (0.56 | ) | | | (0.29 | ) | | | (0.20 | ) | | | — | | | | — | | | | (0.20 | ) | | | 14.48 | | | | (1.94 | ) | | | 7,962 | | | | 0.58 | † | | | 4.28 | † | | | 3.02 | |
| Global X Social Media Index ETF | | | | | | | | | | | | | | | | | | | | | | | | | | | | | | | | | | | | |
| 2013 | | | 12.83 | | | | — | | | | 6.66 | | | | 6.66 | | | | (0.11 | ) | | | — | | | | — | | | | (0.11 | ) | | | 19.38 | | | | 52.34 | | | | 95,948 | | | | 0.65 | | | | (0.01 | ) | | | 55.96 | |
| 2012(4) | | | 14.93 | | | | 0.12 | | | | (2.22 | ) | | | (2.10 | ) | | | — | | | | �� | | | | — | | | | — | | | | 12.83 | | | | (14.07 | ) | | | 13,471 | | | | 0.65 | † | | | 0.88 | † | | | 91.78 | |
| Global X Permanent ETF | | | | | | | | | | | | | | | | | | | | | | | | | | | | | | | | | | | | |
| 2013^ | | | 23.15 | | | | 0.07 | | | | 0.91 | | | | 0.98 | | | | — | | | | — | | | | — | | | | — | | | | 24.13 | | | | 4.23 | | | | 14,477 | | | | 0.48 | † | | | 0.90 | † | | | 3.08 | |
| 2013 | | | 24.77 | | | | 0.25 | | | | (1.66 | ) | | | (1.41 | ) | | | (0.21 | ) | | | — | | | | — | | | | (0.21 | ) | | | 23.15 | | | | (5.77 | ) | | | 15,048 | | | | 0.48 | | | | 0.98 | | | | 44.44 | |
| 2012(5) | | | 25.04 | | | | 0.09 | | | | (0.36 | ) | | | (0.27 | ) | | | — | | | | — | | | | — | | | | — | | | | 24.77 | | | | (1.08 | ) | | | 14,859 | | | | 0.48 | † | | | 0.92 | † | | | 14.89 | |
| Global X Guru Index ETF | | | | | | | | | | | | | | | | | | | | | | | | | | | | | | | | | | | | |
| 2013^ | | | 20.68 | | | | 0.01 | | | | 3.30 | | | | 3.31 | | | | — | | | | — | | | | — | | | | — | | | | 23.99 | | | | 16.01 | | | | 241,060 | | | | 0.75 | † | | | 0.10 | † | | | 24.89 | |
| 2013 | | | 15.83 | | | | 0.17 | | | | 5.66 | | | | 5.83 | | | | (0.20 | ) | | | (0.78 | ) | | | — | | | | (0.98 | ) | | | 20.68 | | | | 38.08 | | | | 52,740 | | | | 0.75 | | | | 0.85 | | | | 77.25 | |
| 2012(6) | | | 14.96 | | | | 0.02 | | | | 0.85 | | | | 0.87 | | | | — | | | | — | | | | — | | | | — | | | | 15.83 | | | | 5.82 | | | | 5,539 | | | | 0.75 | † | | | 1.90 | † | | | 1.90 | |
| Global X SuperIncome Preferred ETF | | | | | | | | | | | | | | | | | | | | | | | | | | | | | | | | | | | | |
| 2013^ | | | 14.65 | | | | 0.31 | | | | 0.18 | | | | 0.49 | | | | (0.33 | ) | | | — | | | | — | | | | (0.33 | ) | | | 14.81 | | | | 3.38 | | | | 59,965 | | | | 0.58 | † | | | 6.34 | † | | | 61.86 | |
| 2013(7) | | | 15.02 | | | | 1.13 | | | | (0.47 | ) | | | 0.66 | | | | (1.02 | ) | | | (0.01 | ) | | | — | | | | (1.03 | ) | | | 14.65 | | | | 4.46 | | | | 35,169 | | | | 0.58 | † | | | 7.84 | † | | | 91.98 | |
| (1) | The Fund commenced operations on June 8, 2011. |
| (2) | The Fund commenced operations on March 11, 2013. |
| (3) | The Fund commenced operations on May 24, 2011. |
| (4) | The Fund commenced operations on November 14, 2011. |
| (5) | The Fund commenced operations on February 7, 2012. |
| (6) | The Fund commenced operations on June 4, 2012. |
| (7) | The Fund commenced operations on July 16, 2012. |
| ^ | For the period July 1, 2013 to October 31, 2013. Effective July 1, 2013 the Global X Permanent ETF, Global X Guru Index ETF (formerly Global X Top Guru Holdings Index ETF) and Global X SuperIncome Preferred ETF each changed their fiscal year end to October 31 (See Note 1 in Notes to Financial Statements). |
| * | Per share data calculated using average shares method. |
| ** | Total Return is based on the change in net asset value of a share during the year or period and assumes reinvestment of dividends and distributions at net asset value. Total Return is for the period indicated and has not been annualized. The return shown does not reflect the deduction of taxes that a shareholder would pay on Fund distributions or the redemption of Fund shares. |
| † | Annualized. |
| †† | Portfolio turnover rate is for the period indicated and periods of less than one year have not been annualized. Excludes effect of in-kind transfers. |
Amounts designated as “—” are $0 or have been rounded to $0.
The accompanying notes are an integral part of the financial statements.
| Notes to Financial Statements |
| October 31, 2013 |
1. ORGANIZATION
The Global X Funds (the "Trust") is a Delaware Statutory Trust formed on March 6, 2008. The Trust is registered under the Investment Company Act of 1940, as amended, as an open-end management investment company. As of October 31, 2013, the Trust had seventy-nine portfolios, thirty-six of which were operational. The financial statements herein and the related notes pertain to the Global X SuperDividend ETF, Global X SuperDividend U.S. ETF, Global X Canada Preferred ETF, Global X Social Media Index ETF, Global X Permanent ETF, Global X Guru Index ETF (formerly Global X Top Guru Holdings Index ETF) and Global X SuperIncome Preferred ETF (each a “Fund”, collectively, the “Funds”). Each Fund is non-diversified.
Effective July 1, 2013 the Global X Permanent ETF, Global X Guru Index ETF (formerly Global X Top Guru Holdings Index ETF) and Global X SuperIncome Preferred ETF each changed their fiscal year end to October 31. Their previous fiscal year end was June 30.
2. SIGNIFICANT ACCOUNTING POLICIES
The following is a summary of the significant accounting policies followed by the Funds.
USE OF ESTIMATES — The preparation of financial statements in conformity with U.S. generally accepted accounting principles ("U.S. GAAP") requires management to make estimates and assumptions that affect the reported amounts of assets and liabilities and disclosure of contingent assets and liabilities at the date of the financial statements and the reported amounts of increases and decreases in net assets from operations during the reporting period. Actual results could materially differ from those estimates.
MASTER LIMITED PARTNERSHIPS (“MLPs”) — MLPs are publicly traded partnerships engaged in the transportation, storage and processing of minerals and natural resources. By confining their operations to these specific activities, their interests, or units, are able to trade on public securities exchanges exactly like the shares of a corporation, without entity level taxation. To qualify as a MLP and to not be taxed as a corporation, a partnership must receive at least 90% of its income from qualifying sources as set forth in Section 7704(d) of the Internal Revenue Code of 1986, as amended (the “Code”). These qualifying sources include natural resource based activities such as the processing, transportation and storage of mineral or natural resources. MLPs generally have two classes of owners, the general partner and limited partners. The general partner of an MLP is typically owned by a major energy company, an investment fund, the direct management of the MLP, or is an entity owned by one or more of such parties. The general partner may be structured as a private or publicly traded corporation or other entity. The general partner typically controls the operations and management of the MLP through an up to 2% equity interest in the MLP plus, in many cases, ownership of common units and subordinated units.
| Notes to Financial Statements (continued) |
| October 31, 2013 |
2. SIGNIFICANT ACCOUNTING POLICIES (continued)
Limited partners typically own the remainder of the partnership, through ownership of common units, and have a limited role in the partnership’s operations and management. MLPs are typically structured such that common units and general partner interests have first priority to receive quarterly cash distributions up to an established minimum amount (“minimum quarterly distributions” or “MQD”). Common and general partner interests also accrue arrearages in distributions to the extent the MQD is not paid. Once common and general partner interests have been paid, subordinated units receive distributions of up to the MQD; however, subordinated units do not accrue arrearages. Distributable cash in excess of the MQD is paid to both common and subordinated units and is distributed to both common and subordinated units generally on a pro rata basis. The general partner is also eligible to receive incentive distributions if the general partner operates the business in a manner which results in distributions paid per common unit surpassing specified target levels. As the general partner increases cash distributions to the limited partners, the general partner receives an increasingly higher percentage of the incremental cash distributions
SECURITY VALUATION — Securities listed on a securities exchange, market or automated quotation system for which quotations are readily available (except for securities traded on NASDAQ), including securities traded over the counter, are valued at the last quoted sale price on the primary exchange or market (foreign or domestic) on which they are traded (or at approximately 4:00 pm if a security’s primary exchange is normally open at that time), or, if there is no such reported sale, at the most recent mean between the quoted bid and asked prices (absent both bid and asked prices on such exchange, the bid price may be used).
For securities traded on NASDAQ, the NASDAQ Official Closing Price will be used. If available, debt securities are priced based upon valuations provided by independent, third-party pricing agents. Such values generally reflect the last reported sales price if the security is actively traded. The third-party pricing agents may also value debt securities at an evaluated bid price by employing methodologies that utilize actual market transactions, broker-supplied valuations, or other methodologies designed to identify the market value for such securities. Debt obligations with remaining maturities of sixty days or less may be valued at their amortized cost, which approximates market value. The prices for foreign securities are reported in local currency and converted to U.S. dollars using currency exchange rates. Prices for most securities held in the Funds are provided daily by recognized independent pricing agents. If a security price cannot be obtained from an independent, third-party pricing agent, the Funds seek to obtain a bid price from at least one independent broker.
| Notes to Financial Statements (continued) |
| October 31, 2013 |
2. SIGNIFICANT ACCOUNTING POLICIES (continued)
SECURITY VALUATION (continued)
Securities for which market prices are not "readily available" are valued in accordance with Fair Value Procedures established by the Board of Trustees (the “Board”). The Funds’ Fair Value Procedures are implemented through a fair value committee (the “Committee”) designated by the Board. Some of the more common reasons that may necessitate that a security be valued using Fair Value Procedures include: the security's trading has been halted or suspended; the security has been de-listed from its primary trading exchange; the security's primary trading market is temporarily closed at a time when under normal conditions it would be open; the security has not been traded for an extended period of time; the security's primary pricing source is not able or willing to provide a price; or, trading of the security is subject to local government-imposed restrictions. In addition, the Funds may fair value their securities if an event that may materially affect the value of the Funds’ securities that traded outside of the United States (a “Significant Event”) has occurred between the time of the security's last close and the time that the Funds calculate their net asset value. A Significant Event may relate to a single issuer or to an entire market sector. Events that may be Significant Events include: government actions, natural disasters, armed conflict, acts of terrorism and significant market fluctuations. If Global X Management Company LLC (the “Adviser”) becomes aware of a Significant Event that has occurred with respect to a security or group of securities after the closing of the exchange or market on which the security or securities principally trade, but before the time at which the Funds calculate net asset value, it may request that a Committee meeting be called. When a security is valued in accordance with the Fair Value Procedures, the Committee will determine the value after taking into consideration all relevant information reasonably available to the Committee. As of October 31, 2013, there were no securities priced using the Fair Value Procedures.
In accordance with the authoritative guidance on fair value measurements and disclosure under U.S. GAAP, the Funds disclose the fair value of their investments in a hierarchy that prioritizes the inputs to valuation techniques used to measure the fair value. The objective of a fair value measurement is to determine the price that would be received to sell an asset or paid to transfer a liability in an orderly transaction between market participants at the measurement date (an exit price). Accordingly, the fair value hierarchy gives the highest priority to quoted prices (unadjusted) in active markets for identical assets or liabilities (Level 1) and the lowest priority to unobservable inputs (Level 3). The three levels of the fair value hierarchy are described below:
Level 1 – Unadjusted quoted prices in active markets for identical, unrestricted assets or liabilities that the Funds have the ability to access at the measurement date
Level 2 – Other significant observable inputs (including quoted prices in non-active markets, quoted prices for similar investments, fair value of investments for which the Funds have the ability to fully redeem tranches at net asset value as of the measurement date or within the near term, and short-term investments valued at amortized cost)
Level 3 – Significant unobservable inputs (including the Funds own assumptions in determining the fair value of investments, fair value of investments for which the Funds’ do not have the ability to fully redeem tranches at net asset value as of the measurement date or within the near term)
| Notes to Financial Statements (continued) |
| October 31, 2013 |
2. SIGNIFICANT ACCOUNTING POLICIES (continued)
SECURITY VALUATION (concluded)
Investments are classified within the level of the lowest significant input considered in determining fair value. Investments classified within Level 3 whose fair value measurement considers several inputs may include Level 1 or Level 2 inputs as components of the overall fair value measurement.
For the year or period ended October 31, 2013 there have been no significant changes to the Funds’ fair valuation methodologies.
DUE TO/FROM BROKERS — Due to/from brokers includes cash and collateral balances with the Funds’ clearing brokers or counterparties at October 31, 2013. The Funds continuously monitor the credit standing of each broker or counterparty with whom they conduct business. In the event a broker or counterparty is unable to fulfill its obligations, the Funds would be subject to counterparty credit risk.
REPURCHASE AGREEMENTS — Securities pledged as collateral for repurchase agreements are held by Citibank, N.A. and BNY Mellon and are designated as being held on each Fund’s behalf by its custodian under a book-entry system. Each Fund monitors the adequacy of the collateral on a daily basis and can require the seller to provide additional collateral in the event the market value of the securities pledged falls below the carrying value of the repurchase agreement, including accrued interest. It is the Funds’ policy to only enter into repurchase agreements with banks and other financial institutions which are deemed by the Adviser to be creditworthy. The Funds bear the risk of loss in the event that the other party to a repurchase agreement defaults on its obligations and the Funds are prevented from exercising their rights to dispose of the underlying securities received as collateral and the risk of a possible decline in the value of the underlying securities during the period.
FEDERAL INCOME TAXES – It is each Fund’s intention to qualify or continue to qualify as a regulated investment company for Federal income tax purposes by complying with the appropriate provisions of Subchapter M of the Internal Revenue Code of 1986, as amended. Accordingly, no provisions for Federal income taxes have been made in the financial statements.
| Notes to Financial Statements (continued) |
| October 31, 2013 |
2. SIGNIFICANT ACCOUNTING POLICIES (continued)
The Funds evaluate tax positions taken or expected to be taken in the course of preparing the Funds’ tax returns to determine whether it is "more-likely-than-not" (i.e., greater than 50 percent) that each tax position will be sustained upon examination by a taxing authority based on the technical merits of the position. Tax positions not deemed to meet the more-likely-than-not threshold are recorded as a tax benefit or expense in the current year. The Funds did not record any tax provisions in the current period; however, management’s conclusions regarding tax positions may be subject to review and adjustment at a later date based on factors including, but not limited to, examination by tax authorities (i.e., the last three tax year ends, as applicable), on-going analysis of and changes to tax laws, regulations and interpretations thereof.
As of and during the year or period ended October 31, 2013, the Funds did not have a liability for any unrecognized tax benefits. The Funds recognize interest and penalties, if any, related to unrecognized tax benefits as income tax expense in the Statement of Operations. During the period, the Funds did not incur any interest or penalties.
SECURITY TRANSACTIONS AND INVESTMENT INCOME — Security transactions are accounted for on the trade date for financial reporting purposes. Costs used in determining realized gains and losses on the sale of investment securities are based on specific identification. Dividend income is recorded on the ex-dividend date. Interest income is recognized on the accrual basis from the settlement date.
FOREIGN CURRENCY TRANSLATION — The books and records of the Funds are maintained in U.S. dollars. Investment securities and other assets and liabilities denominated in a foreign currency are translated into U.S. dollars on the date of valuation. Purchases and sales of investment securities, income and expenses are translated into U.S. dollars at the relevant rates of exchange prevailing on the respective dates of such transactions. The Funds do not isolate that portion of realized or unrealized gains and losses resulting from changes in the foreign exchange rate from fluctuations arising from changes in the market prices of the securities. These gains and losses are included in net realized and unrealized gains and losses on investments on the Statement of Operations. Net realized and unrealized gains and losses on foreign currency transactions represent net foreign exchange gains or losses from foreign currency exchange contracts, disposition of foreign currencies, currency gains or losses realized between trade and settlement dates on securities transactions and the difference between the amount of the investment income and foreign withholding taxes recorded on the Funds’ books and the U.S. dollar equivalent amounts actually received or paid.
DIVIDENDS AND DISTRIBUTIONS TO SHAREHOLDERS — The Funds distribute their net investment income on a pro rata basis. Any net realized capital gains are distributed annually. All distributions are recorded on the ex-dividend date.
INVESTMENTS IN REITS — With respect to the Funds, dividend income is recorded based on the income included in distributions received from the Real Estate Investment Trust (“REIT”) investments using published REIT reclassifications including some management estimates when actual amounts are not available. Distributions received in excess of these estimated amounts are recorded as a reduction of the cost of investments or reclassified to capital gains. The actual amounts of income, return of capital, and capital gains are only determined by each REIT after its fiscal year end, and may differ from the estimated amounts.
| Notes to Financial Statements (continued) |
| October 31, 2013 |
2. SIGNIFICANT ACCOUNTING POLICIES (concluded)
CREATION UNITS — The Funds issue and redeem shares (“Shares”) at Net Asset Value (“NAV”) and only in large blocks of Shares, (each block of Shares for a Fund is called a “Creation Unit” or multiples thereof). Purchasers of Creation Units (“Authorized Participants”) at NAV must pay a standard creation transaction fee per transaction. The fee is a single charge and will be the same regardless of the number of Creation Units purchased by an investor on the same day. An Authorized Participant who holds Creation Units and wishes to redeem at NAV would also pay a standard Redemption Fee per transaction to the custodian on the date of such redemption, regardless of the number of Creation Units redeemed that day.
If a Creation Unit is purchased or redeemed for cash, a higher transaction fee will be charged. The following table discloses Creation Unit breakdown:
| | | Creation
Unit Shares | | | Creation Fee | | | Value | | | Redemption
Fee | |
| Global X SuperDividend ETF | | | 50,000 | | | $ | 3,800 | | | $ | 1,187,000 | | | $ | 3,800 | |
| Global X SuperDividend U.S. ETF | | | 50,000 | | | | 750 | | | | 1,297,000 | | | | 750 | |
| Global X Canada Preferred ETF | | | 50,000 | | | | 1,000 | | | | 649,500 | | | | 1,000 | |
| Global X Social Media Index ETF | | | 50,000 | | | | 1,000 | | | | 969,000 | | | | 1,000 | |
| Global X Permanent ETF | | | 50,000 | | | | 1,000 | | | | 1,206,500 | | | | 1,000 | |
| Global X Guru Index ETF | | | 50,000 | | | | 750 | | | | 1,199,500 | | | | 750 | |
| Global X SuperIncome Preferred ETF | | | 50,000 | | | | 500 | | | | 740,500 | | | | 500 | |
3. RELATED PARTY TRANSACTIONS
The Adviser serves as the investment adviser and the administrator for the Funds. Subject to the supervision of the Board of Trustees, the Adviser is responsible for managing the investment activities of the Funds and the Funds’ business affairs and other administrative matters and provides or causes to be furnished all supervisory, administrative and other services reasonably necessary for the operation of the Funds, including certain distribution services (provided pursuant to a separate Distribution Agreement), certain shareholder and distribution-related services (provided pursuant to a separate Rule 12b-1 Plan and related agreements) and investment advisory services (provided pursuant to a separate Investment Advisory Agreement), under what is essentially an "all-in" fee structure. For its service to the Funds, under the Supervision and Administration Agreement, each Fund pays a monthly fee to the Adviser at the annual rate (stated as a percentage of the average daily net assets of the Fund). In addition, the Funds bear other expenses, directly and indirectly, that are not covered by the Supervision and Administration Agreement, which may vary and affect the total expense ratios of the Funds, such as taxes, brokerage fees, commissions, acquired fund fees, and other transaction expenses, interest expenses and extraordinary expenses (such as litigation and indemnification expenses).
| Notes to Financial Statements (continued) |
| October 31, 2013 |
3. RELATED PARTY TRANSACTIONS (concluded)
| | | Supervision and
Administration Fee | |
| Global X SuperDividend ETF | | | 0.58 | % |
| Global X SuperDividend U.S. ETF | | | 0.45 | % |
| Global X Canada Preferred ETF | | | 0.58 | % |
| Global X Social Media Index ETF | | | 0.65 | % |
| Global X Permanent ETF | | | 0.48 | % |
| Global X Guru Index ETF | | | 0.75 | % |
| Global X SuperIncome Preferred ETF | | | 0.58 | % |
SEI Investments Global Funds Services (“SEIGFS”) serves as Sub-Administrator to the Funds. As Sub-Administrator, SEIGFS provides the Funds with the required general administrative services, including, without limitation: office space, equipment, and personnel; clerical and general back office services; bookkeeping, internal accounting and secretarial services; the calculation of NAV; and assistance with the preparation and filing of reports, registration statements, proxy statements and other materials required to be filed or furnished by the Funds under federal and state securities laws. As compensation for these services, the Sub-Administrator receives certain out-of-pocket costs, transaction fees and asset-based fees which are accrued daily and paid monthly by the Adviser.
SEI Investments Distribution Co. (“SIDCO”) serves as each Fund’s underwriter and distributor of Shares pursuant to a Distribution Agreement. Under the Distribution Agreement, SIDCO, as agent, receives orders to create and redeem Shares in Creation Unit Aggregations and transmits such orders to the Trust’s custodian and transfer agent. The Distributor has no obligation to sell any specific quantity of Fund Shares. SIDCO bears the following costs and expenses relating to the distribution of Shares: (i) the costs of processing and maintaining records of creations of Creation Units; (ii) all costs of maintaining the records required of a registered broker/dealer; (iii) the expenses of maintaining its registration or qualification as a dealer or broker under Federal or state laws; (iv) filing fees; and (v) all other expenses incurred in connection with the distribution services as contemplated in the Distribution Agreement. SIDCO receives no fee for its distribution services under the Distribution Agreement.
4. INVESTMENT TRANSACTIONS
For the year or period ended October 31, 2013, the purchases and sales of investments in securities excluding in-kind transactions, long-term U.S. Government and short-term securities were:
| | | Purchases | | | Sales and
Maturities | |
| Global X SuperDividend ETF | | $ | 231,660,680 | | | $ | 211,930,080 | |
| Global X SuperDividend U.S. ETF | | | 7,966,437 | | | | 8,103,631 | |
| Global X Canada Preferred ETF | | | 4,595,412 | | | | 4,564,295 | |
| Global X Social Media Index ETF | | | 12,499,613 | | | | 12,197,374 | |
| Global X Permanent ETF | | | 443,449 | | | | 426,820 | |
| Global X Guru Index ETF | | | 33,565,041 | | | | 33,451,203 | |
| Global X SuperIncome Preferred ETF | | | 30,879,271 | | | | 28,669,037 | |
| Notes to Financial Statements (continued) |
| October 31, 2013 |
4. INVESTMENT TRANSACTIONS (concluded)
For the period ended October 31, 2013, the purchases and sales of long-term U.S. Government securities were:
| | | Purchases | | | Sales and
Maturities | |
| Global X Permanent ETF | | $ | - | | | $ | 568,828 | |
For the year ended October 31, 2012 in-kind transactions associated with creations and redemptions were:
| | | | | | Sales and | | | Realized | |
| | | Purchases | | | Maturities | | | Gain/(Loss) | |
| Global X SuperDividend ETF | | $ | 127,543,715 | | | $ | - | | | $ | - | |
| Global X Canada Preferred ETF | | | 7,187,559 | | | | 707,521 | | | | (36,950 | ) |
| Global X Social Media Index ETF | | | 27,197,875 | | | | 10,895,592 | | | | 132,351 | |
For the year or periods ended June 30, 2013 in-kind transactions associated with creations and redemptions were:
| | | | | | Sales and | | | Realized | |
| | | Purchases | | | Maturities | | | Gain | |
| Global X Permanent ETF | | $ | 11,729,628 | | | $ | 10,171,012 | | | $ | 186,744 | |
| Global X Guru Index ETF | | | 59,260,722 | | | | 12,391,609 | | | | 1,219,288 | |
| Global X SuperIncome Preferred ETF | | | 37,655,138 | | | | 1,438,509 | | | | 3,348 | |
For the year or periods ended October 31, 2013, in-kind transactions associated with creations and redemptions were:
| | | | | | Sales and | | | Realized | |
| | | Purchases | | | Maturities | | | Gain/(Loss) | |
| Global X SuperDividend ETF | | $ | 559,947,524 | | | $ | 5,170,131 | | | $ | 751,728 | |
| Global X SuperDividend U.S. ETF | | | 51,281,379 | | | | - | | | | - | |
| Global X Canada Preferred ETF | | | 725,588 | | | | 6,087,812 | | | | (311,795 | ) |
| Global X Social Media Index ETF | | | 83,598,308 | | | | 5,418,926 | | | | 546,004 | |
| Global X Permanent ETF | | | - | | | | 592,624 | | | | 16,079 | |
| Global X Guru Index ETF | | | 168,558,609 | | | | - | | | | - | |
| Global X SuperIncome Preferred ETF | | | 24,107,356 | | | | - | | | | - | |
5. TAX INFORMATION
The amount and character of income and capital gain distributions to be paid, if any, are determined in accordance with Federal income tax regulations, which may differ from U.S. GAAP. As a result, net investment income (loss) and net realized gain (loss) on investment transactions for a reporting period may differ significantly from distributions during such period. These book/tax differences may be temporary or permanent. To the extent these differences are permanent in nature, they are charged or credited to undistributed net investment income (loss), accumulated net realized gain (loss) or paid-in capital, as appropriate, in the period that the differences arise.
| Notes to Financial Statements (continued) |
| October 31, 2013 |
5. TAX INFORMATION (continued)
The following differences, primarily attributable to foreign currency, redemptions in-kind, REIT adjustments, MLP dividends, return of capital distribution and sales of passive foreign investment companies have been reclassified to/from the following accounts during the fiscal year ended October 31, 2013.
| Global X Funds | | Paid-in
Capital | | | Undistributed
Net
Investment
Income | | | Accumulated
Net Realized
Gain (Loss) | |
| Global X SuperDividend ETF | | $ | 735,790 | | | $ | 1,229,298 | | | $ | (1,965,088 | ) |
| Global X SuperDividend U.S. ETF | | | (145,569 | ) | | | (120,033 | ) | | | 265,602 | |
| Global X Canada Preferred ETF | | | (335,746 | ) | | | (3,360 | ) | | | 339,106 | |
| Global X Social Media Index ETF | | | 404,722 | | | | (88 | ) | | | (404,634 | ) |
| Global X Permanent ETF | | | 15,619 | | | | 46,077 | | | | (61,696 | ) |
| Global X Guru Index ETF | | | (7,414 | ) | | | (45,128 | ) | | | 52,542 | |
| Global X SuperIncome Preferred ETF | | | – | | | | – | | | | – | |
These reclassifications have no impact on net assets or net asset value per share.
The tax character of dividends and distributions declared during the years or periods ended October 31, 2013 and October 31, 2012 were as follows:
| Global X Funds | | Ordinary
Income | | | Long-Term
Capital Gain | | | Return of Capital | | | Totals | |
| Global X SuperDividend ETF | | | | | | | | | | | | | | | | |
| 2013 | | $ | 35,106,732 | | | $ | – | | | $ | – | | | $ | 35,106,732 | |
| 2012 | | | 4,983,491 | | | | – | | | | – | | | | 4,983,491 | |
| Global X SuperDividend U.S. ETF | | | | | | | | | | | | | | | | |
| 2013 | | $ | 1,333,281 | | | $ | – | | | $ | 145,569 | | | $ | 1,478,850 | |
| Global X Canada Preferred ETF | | | | | | | | | | | | | | | | |
| 2013 | | $ | 468,097 | | | $ | – | | | $ | – | | | $ | 468,097 | |
| 2012 | | | 426,223 | | | | – | | | | – | | | | 426,223 | |
| Global X Social Media Index ETF | | | | | | | | | | | | | | | | |
| 2013 | | $ | 98,361 | | | $ | – | | | $ | – | | | $ | 98,361 | |
| 2012 | | | – | | | | – | | | | – | | | | – | |
| Global X Permanent ETF | | | | | | | | | | | | | | | | |
| 2013* | | $ | – | | | $ | – | | | $ | – | | | $ | – | |
| 2013** | | | 114,515 | | | | – | | | | – | | | | 114,515 | |
| 2012 | | | – | | | | – | | | | – | | | | – | |
| Global X Guru Index ETF | | | | | | | | | | | | | | | | |
| 2013* | | $ | – | | | $ | – | | | $ | – | | | $ | – | |
| 2013** | | | 98,030 | | | | – | | | | – | | | | 98,030 | |
| 2012 | | | – | | | | – | | | | – | | | | – | |
| Global X SuperIncome Preferred ETF | | | | | | | | | | | | | | | | |
| 2013* | | $ | 978,675 | | | $ | – | | | $ | – | | | $ | 978,675 | |
| 2013** | | | 802,997 | | | | – | | | | – | | | | 802,997 | |
*For the period from July 1, 2013 to October 31, 2013
**For the year or period ended June 30, 2013
| Notes to Financial Statements (continued) |
| October 31, 2013 |
5. TAX INFORMATION (continued)
As of October 31, 2013, the components of tax basis distributable earnings (accumulated losses) were as follows:
| | | Global X
SuperDividend
ETF | | | Global X
SuperDividend
U.S. ETF | | | Global X Canada
Preferred ETF | |
| Undistributed Ordinary Income | | $ | 2,820,999 | | | $ | – | | | $ | 15,503 | |
| Capital Loss Carryforwards | | | (18,271,023 | ) | | | (1,039,239 | ) | | | (290,539 | ) |
| Unrealized Appreciation (Depreciation) on Investments and Foreign Currency | | | 44,346,098 | | | | 1,699,147 | | | | (944,640 | ) |
| Other Temporary Differences | | | 3 | | | | 1 | | | | (1 | ) |
| Total Distributable Earnings (Accumulated Losses) | | $ | 28,896,077 | | | $ | 659,909 | | | $ | (1,219,677 | ) |
| | | Global X Social
Media Index ETF | | | Global X
Permanent ETF | | | Global X Guru
Index ETF | |
| Undistributed Ordinary Income | | $ | 1,764 | | | $ | 185,867 | | | $ | 10,055 | |
| Undistributed Long-Term Capital Gain | | | – | | | | 47,821 | | | | 50,646 | |
| Capital Loss Carryforwards | | | (923,567 | ) | | | (286,005 | ) | | | – | |
| Unrealized Appreciation (Depreciation) on Investments and Foreign Currency | | | 1,182,282 | | | | (1,007,227 | ) | | | 20,827,824 | |
| Other Temporary Differences | | | 1 | | | | – | | | | 1 | |
| Total Distributable Earnings (Accumulated Losses) | | $ | 260,480 | | | $ | (1,059,544 | ) | | $ | 20,888,526 | |
| | | Global X
SuperIncome
Preferred ETF | |
| Undistributed Ordinary Income | | $ | 402,086 | |
| Capital Loss Carryforwards | | | (566,439 | ) |
| Unrealized Depreciation on Investments and Foreign Currency | | | (9,901 | ) |
| Other Temporary Differences | | | (173,921 | ) |
| Total Accumulated Losses | | $ | (348,175 | ) |
Deferred late-year losses represent ordinary losses realized on investment transactions from January 1, 2013 through October 31, 2013.
| Notes to Financial Statements (continued) |
| October 31, 2013 |
5. TAX INFORMATION (concluded)
For Federal income tax purposes, capital losses incurred in taxable years beginning before December 22, 2010 be carried forward for a maximum period of eight years and applied against future gains. As of October 31, 2013, the Funds that had capital loss carryforwards are listed below:
| | | Global X | |
| | | SuperDividend | |
| Expiration date | | ETF | |
| October 2019 | | $ | 838,578 | |
Under the Regulated Investment Company Modernization Act of 2010, the Funds are permitted to carry forward capital losses incurred in taxable years beginning after December 22, 2010 for an unlimited period. However, any losses incurred during those future taxable years are required to be used prior to the losses incurred in pre-enactment taxable years. As a result of this ordering rule, preenactment capital loss carryforwards may be more likely to expire unused. Additionally, post-enactment capital losses that are carried forward will retain their character as either short-term or long-term capital losses rather than being considered all short-term as under previous law. Losses carried forward under these new provisions are as follows:
| | | Short-Term | | | Long-Term | | | | |
| Global X Funds | | Loss | | | Loss | | | Total | |
| Global X SuperDividend ETF | | $ | 14,307,276 | | | $ | 3,125,169 | | | $ | 17,432,445 | |
| Global X SuperDividend U.S. ETF | | | 1,039,239 | | | | - | | | | 1,039,239 | |
| Global X Canada Preferred ETF | | | 232,921 | | | | 57,618 | | | | 290,539 | |
| Global X Social Media Index ETF | | | 923,567 | | | | - | | | | 923,567 | |
| Global X Permanent ETF | | | 286,005 | | | | - | | | | 286,005 | |
| Global X SuperIncome Preferred ETF | | | 484,935 | | | | 81,504 | | | | 566,439 | |
The Federal tax cost and aggregate gross unrealized appreciation and depreciation on investments held by the Funds at October 31, 2013 were as follows:
| Global X Funds | | Federal Tax
Cost | | | Aggregated
Gross
Unrealized
Appreciation | | | Aggregated
Gross
Unrealized
Depreciation | | | Net
Unrealized
Appreciation
(Depreciation) | |
| Global X SuperDividend ETF | | $ | 801,528,805 | | | $ | 80,591,701 | | | $ | (36,256,743 | ) | | $ | 44,334,958 | |
| Global X SuperDividend U.S. ETF | | | 50,072,682 | | | | 2,733,406 | | | | (1,034,259 | ) | | | 1,699,147 | |
| Global X Canada Preferred ETF | | | 8,725,151 | | | | – | | | | (944,523 | ) | | | (944,523 | ) |
| Global X Social Media Index ETF | | | 94,728,140 | | | | 5,311,819 | | | | (4,128,547 | ) | | | 1,183,272 | |
| Global X Permanent ETF | | | 15,419,661 | | | | 408,392 | | | | (1,415,619 | ) | | | (1,007,227 | ) |
| Global X Guru Index ETF | | | 224,214,786 | | | | 23,406,590 | | | | (2,578,766 | ) | | | 20,827,824 | |
| Global X SuperIncome Preferred ETF | | | 59,925,588 | | | | 861,153 | | | | (871,054 | ) | | | (9,901 | ) |
The preceding differences between book and tax cost are primarily due to mark-to-market treatment of passive foreign investment companies, MLP adjustments and wash sales.
| Notes to Financial Statements (continued) |
| October 31, 2013 |
6. CONCENTRATION OF RISKS
The Funds invest in securities of foreign issuers in several countries. These investments may involve certain considerations and risks not typically associated with investments in the United States as a result of, among other factors, the possibility of future political and economic developments and the level of governmental supervision and regulation of securities markets in the respective countries.
The securities markets of emerging countries are less liquid and subject to greater price volatility, and have a smaller market capitalization, than those of U.S. securities markets. In certain countries, there may be fewer publicly traded securities and the market may be dominated by a few issuers or sectors. Issuers and securities markets in such countries are not subject to as extensive and frequent accounting, financial and other reporting requirements or as comprehensive government regulations as are issuers and securities markets in the U.S. In particular, the assets and profits appearing on the financial statements of emerging country issuers may not reflect their financial position or results of operations in the same manner as financial statements for U.S. issuers. Substantially less information may be publicly available about emerging country issuers than is available about issuers in the United States.
The Funds may be subject to taxes imposed by countries in which they invest. Such taxes are generally based on either income or gains earned or repatriated. The Funds accrue and apply such taxes to net investment income, net realized gains and net unrealized gains as income and/or capital gains are earned.
The Funds use a replication strategy. A replication strategy is an indexing strategy that involves investing in the securities of an Underlying Index in approximately the same proportions as in the Underlying Index. The Funds may utilize a representative sampling strategy with respect to their Underlying Indices when a replication strategy might be detrimental to their shareholders, such as when there are practical difficulties or substantial costs involved in compiling a portfolio of equity securities to follow their Underlying Indices, or, in certain instances, when securities in the Underlying Indices become temporarily illiquid, unavailable or less liquid, or due to legal restrictions (such as diversification requirements that apply to the Funds but not the Underlying Indices).
7. AUTHORIZED PARTICIPANTS
At October 31, 2013, the total Shares outstanding that were held by Authorized Participants were as follows. The Authorized Participants have entered into an agreement with the Funds’ Distributor.
| | | | | | Percentage of | |
| | | Authorized | | | Shares | |
| | | Participants | | | Outstanding | |
| Global X SuperDividend ETF | | | 4 | | | | 100 | % |
| Global X SuperDividend U.S. ETF | | | 5 | | | | 100 | % |
| Global X Canada Preferred ETF | | | 3 | | | | 100 | % |
| Global X Social Media Index ETF | | | 4 | | | | 100 | % |
| Global X Permanent ETF | | | 4 | | | | 100 | % |
| Global X Guru Index ETF | | | 6 | | | | 100 | % |
| Global X SuperIncome Preferred ETF | | | 4 | | | | 100 | % |
Pursuant to the Trust’s organizational documents, the Trustees of the Trust and the Trust’s officers are indemnified against certain liabilities that may arise out of the performance of their duties.
| Notes to Financial Statements (continued) |
| October 31, 2013 |
8. LOANS OF PORTFOLIO SECURITIES
The Funds may lend portfolio securities having a market value up to one-third of the Funds’ total assets. Security loans made pursuant to the securities lending agreement are required at all times to be secured by collateral equal to at least 102% for U.S. based securities and 105% for foreign based securities. Such collateral received in connection with these loans will be cash and can be invested in repurchase agreements or U.S. Treasury obligations and is recognized in the schedule of investments and statement of assets and liabilities. The obligation to return securities lending collateral is also recognized as a liability in the statement of assets and liabilities. It is the Funds’ policy to obtain additional collateral from or return excess collateral to the borrower by the end of the next business day, following the valuation date of the securities loaned. Therefore, the value of the collateral held may be temporarily less than the value of the securities on loan. Lending securities entails a risk of loss to the Funds if and to the extent that the market value of the securities loans were to increase and the borrower did not increase the collateral accordingly, and the borrower fails to return the securities. The Funds could also experience delays and costs in gaining access to the collateral. The Funds bear the risk of any deficiency in the amount of the collateral available for return to the borrower due to any loss on the collateral invested. As of October 31, 2013, the value of securities on loan was $69,078,558 and the value of securities purchased with the cash collateral held from securities on loan was $72,223,358 for Global X SuperDividend ETF.
9. CONTRACTUAL OBLIGATIONS
The Funds enter into contracts in the normal course of business that contain a variety of indemnifications. The Funds maximum exposure under these arrangements is unknown. However the Funds have not had prior gains or losses pursuant to these contracts. Management has reviewed the Funds’ existing contracts and expects the risk of loss to be remote.
10. RECENT ACCOUNTING PRONOUNCEMENT
In January 2013, Accounting Standards Update 2013-01 (“ASU 2013-01”), Clarifying the Scope of Disclosures about Offsetting Assets and Liabilities, replaced Accounting Standards Update 2011-11 (“ASU 2011-11”), Disclosures about Offsetting Assets and Liabilities. ASU 2013-01 is effective for fiscal years beginning on or after January 1, 2013, and interim periods within those annual periods. ASU 2011-11 was intended to enhance disclosure requirements on the offsetting of financial assets and liabilities. ASU 2013-01 limits the scope of the new balance sheet offsetting disclosures to derivative instruments, repurchase and reverse-repurchase agreements, and securities lending and borrowing transactions to the extent that they are (1) offset in the financial statements or (2) subject to an enforceable master netting arrangement or similar agreement. Management is currently evaluating the application of ASU 2013-01 and its impact, if any, on the Funds’ financial statements.
11. SUBSEQUENT EVENTS
The Funds have evaluated the need for additional disclosures and/or adjustments resulting from subsequent events. Based on this evaluation, no additional disclosures or adjustments were required to the financial statements as of the date the financial statements were issued, except as follows:
| Notes to Financial Statements (concluded) |
| October 31, 2013 |
11. SUBSEQUENT EVENTS (continued)
Subsequent to the October 31, 2013 fiscal year end, the following portfolios were added to the Trust.
Fund Name
Global X Guru Small Cap Index ETF
Global X Guru International Index ETF
Subsequent to the October 31, 2013 fiscal year end, the following portfolios of the Trust commenced operations.
| Fund Name | Commenced Operations |
| | |
| Global X Next Emerging & Frontier ETF | November 6, 2013 |
| Global X FTSE Portugal 20 ETF | November 12, 2013 |
| Report of Independent Registered Public Accounting Firm |
| October 31, 2013 |
To the Shareholders and Board of Trustees of Global X Funds
We have audited the accompanying statements of assets and liabilities, including the schedules of investments, of Global X SuperDividendTM ETF, Global X SuperDividendTM U.S. ETF, Global X Canada Preferred ETF, Global X Social Media Index ETF, Global X Permanent ETF, Global X Guru Index ETF, and Global X SuperIncome Preferred ETF (seven of the series constituting the Global X Funds) (the “Funds”) as of October 31, 2013 and the related statements of operations, statements of changes in net assets, and financial highlights for each of the years or periods indicated therein. These financial statements and financial highlights are the responsibility of the Funds’ management. Our responsibility is to express an opinion on these financial statements and financial highlights based on our audits.
We conducted our audits in accordance with the standards of the Public Company Accounting Oversight Board (United States). Those standards require that we plan and perform the audit to obtain reasonable assurance about whether the financial statements and financial highlights are free of material misstatement. We were not engaged to perform an audit of the Funds’ internal control over financial reporting. Our audits included consideration of internal control over financial reporting as a basis for designing audit procedures that are appropriate in the circumstances, but not for the purpose of expressing an opinion on the effectiveness of the Funds’ internal control over financial reporting. Accordingly, we express no such opinion. An audit also includes examining, on a test basis, evidence supporting the amounts and disclosures in the financial statements and financial highlights, assessing the accounting principles used and significant estimates made by management, and evaluating the overall financial statement presentation. Our procedures included confirmation of securities owned as of October 31, 2013, by correspondence with the custodian and brokers, or by other appropriate auditing procedures where replies from brokers were not received. We believe that our audits provide a reasonable basis for our opinion.
In our opinion, the financial statements and financial highlights referred to above present fairly, in all material respects, the financial position of each of the Funds listed above at October 31, 2013, and the results of their operations, the changes in their net assets, and their financial highlights for each of the years or periods indicated therein, in conformity with U.S. generally accepted accounting principles.
Philadelphia, Pennsylvania
December 27, 2013
| Disclosure of Fund Expenses (unaudited) |
| |
All Exchange Traded Funds (“ETF”) have operating expenses. As a shareholder of an ETF, your investment is affected by these ongoing costs, which include (among others) costs for ETF management, administrative services, commissions, and shareholder reports like this one. It is important for you to understand the impact of these costs on your investment returns. In addition, a shareholder is responsible for brokerage fees as a result of their investment in the Fund.
Operating expenses such as these are deducted from an ETF’s gross income and directly reduce its final investment return. These expenses are expressed as a percentage of the ETF’s average net assets; this percentage is known as the ETF’s expense ratio.
The following examples use the expense ratio and are intended to help you understand the ongoing costs (in dollars) of investing in your Fund and to compare these costs with those of other funds. The examples are based on an investment of $1,000 made at the beginning of the period shown and held for the entire period.
The table on the next page illustrates your Fund’s costs in two ways:
Actual Fund Return. This section helps you to estimate the actual expenses that your Fund incurred over the period. The “Expenses Paid During Period” column shows the actual dollar expense cost incurred by a $1,000 investment in the Fund, and the “Ending Account Value” number is derived from deducting that expense cost from the Fund’s gross investment return.
You can use this information, together with the actual amount you invested in the Fund, to estimate the expenses you paid over that period. Simply divide your actual account value by $1,000 to arrive at a ratio (for example, an $8,600 account value divided by $1,000 = 8.6), then multiply that ratio by the number shown for your Fund under “Expenses Paid During Period.”
Hypothetical 5% Return. This section helps you compare your Fund’s costs with those of other funds. It assumes that the Fund had an annual 5% return before expenses during the year, but that the expense ratio (Column 3) for the period is unchanged. This example is useful in making comparisons because the Securities and Exchange Commission requires all funds to make this 5% calculation. You can assess your Fund’s comparative cost by comparing the hypothetical result for your Fund in the “Expenses Paid During Period” column with those that appear in the same charts in the shareholder reports for other funds.
NOTE: Because the return is set at 5% for comparison purposes — NOT your Fund’s actual return — the account values shown may not apply to your specific investment.
| Disclosure of Fund Expenses (unaudited) (concluded) |
| |
| | | Beginning
Account
Value
5/1/2013 | | | Ending
Account
Value
10/31/2013 | | | Annualized
Expense
Ratios | | | Expenses
Paid
During
Period(1) | |
| Global X SuperDividend ETF | | | | | | | | | | | | | | | | |
| Actual Fund Return | | $ | 1,000.00 | | | $ | 1,022.70 | | | | 0.58 | % | | $ | 2.96 | |
| Hypothetical 5% Return | | | 1,000.00 | | | | 1,022.28 | | | | 0.58 | | | | 2.96 | |
| Global X SuperDividend U.S. ETF | | | | | | | | | | | | | | | | |
| Actual Fund Return | | $ | 1,000.00 | | | $ | 1,003.10 | | | | 0.45 | % | | $ | 2.27 | |
| Hypothetical 5% Return | | | 1,000.00 | | | | 1,022.94 | | | | 0.45 | | | | 2.29 | |
| Global X Canada Preferred ETF | | | | | | | | | | | | | | | | |
| Actual Fund Return | | $ | 1,000.00 | | | $ | 915.00 | | | | 0.58 | % | | $ | 2.80 | |
| Hypothetical 5% Return | | | 1,000.00 | | | | 1,022.28 | | | | 0.58 | | | | 2.96 | |
| Global X Social Media Index ETF | | | | | | | | | | | | | | | | |
| Actual Fund Return | | $ | 1,000.00 | | | $ | 1,301.50 | | | | 0.65 | % | | $ | 3.77 | |
| Hypothetical 5% Return | | | 1,000.00 | | | | 1,021.93 | | | | 0.65 | | | | 3.31 | |
| Global X Permanent ETF | | | | | | | | | | | | | | | | |
| Actual Fund Return | | $ | 1,000.00 | | | $ | 966.00 | | | | 0.48 | % | | $ | 2.38 | |
| Hypothetical 5% Return | | | 1,000.00 | | | | 1,022.79 | | | | 0.48 | | | | 2.45 | |
| Global X Guru Index ETF | | | | | | | | | | | | | | | | |
| Actual Fund Return | | $ | 1,000.00 | | | $ | 1,185.90 | | | | 0.75 | % | | $ | 4.13 | |
| Hypothetical 5% Return | | | 1,000.00 | | | | 1,021.42 | | | | 0.75 | | | | 3.82 | |
| Global X SuperIncome Preferred ETF | | | | | | | | | | | | | | | | |
| Actual Fund Return | | $ | 1,000.00 | | | $ | 1,008.50 | | | | 0.58 | % | | $ | 2.94 | |
| Hypothetical 5% Return | | | 1,000.00 | | | | 1,022.28 | | | | 0.58 | | | | 2.96 | |
| (1) | Expenses are equal to the Fund’s annualized expense ratio multiplied by the average account value over the period, multiplied 184/365 (to reflect the one-half year period.) |
| Supplemental Information (unaudited) |
| |
Net asset value, or “NAV”, is the price per Share at which the Funds issue and redeem Shares. It is calculated in accordance with the standard formula for valuing mutual fund shares. The “Market Price” of the Funds generally is determined using the midpoint between the highest bid and the lowest offer on the stock exchange on which the Shares of the Funds are listed for trading, as of the time that the Funds’ NAV is calculated. The Funds’ Market Price may be at, above or below their NAV. The NAV of the Funds will fluctuate with changes in the market value of their Funds’ holdings. The Market Price of the Funds will fluctuate in accordance with changes in its NAV, as well as market supply and demand.
Premiums or discounts are the differences (expressed as a percentage) between the NAV and Market Price of the Funds on a given day, generally at the time NAV is calculated. A premium is the amount that the Funds are trading above the reported NAV, expressed as a percentage of the NAV. A discount is the amount that the Funds are trading below the reported NAV, expressed as a percentage of the NAV.
Further information regarding premiums and discounts is available on the Funds’ website at www.GlobalXFunds.com
| Trustees and Officers of the Trust (unaudited) |
| |
Set forth below are the names, addresses, year of birth, position with the Trust, Term of Office and Length of Time Served, the principal occupations for the last five years, number of Funds in fund complex overseen by trustee, and other directorships outside the fund complex of each of the persons currently serving as Trustees and Officers of the Trust.
Name,
Address
(Year of
Birth) | Position(s)
Held
with Funds | Principal Occupation(s) During
the Past 5 Years | Number of
Funds in
Trust
Overseen by
Trustee | Other
Directorships
Held
by Trustees |
| Independent Trustees2 | |
Sanjay Ram Bharwani 623 Fifth Ave, 15th floor New York,
NY 10022 (1974) | Trustee
(since
2008) | CEO of Risk Advisors Inc. (since 2007) (consulting firm). | 363 | None. |
Scott R. Chichester1 623 Fifth Ave, 15th floor New York,
NY 10022 (1970) | Trustee
(since
2008) | CFO, Sterling Seal & Supply Inc. (since 2011), Director, President & Treasurer, Bayview Acquisition Corp (since 2010), CPA, Penda Aiken Inc. (2009-2011) (consultant); Founder and President, DirectPay USA LLC (since 2006) (payroll company); Chief Financial Officer, Ong Corporation (2002-2010) (technology company); Proprietor, Scott R. Chichester CPA (since 2001) (CPA firm). | 363 | Director of
Bayview
Acquisition Corp.
(since 2010). |
Kartik Kiran Shah 623 Fifth Ave, 15th floor New York,
NY 10022 (1977) | Trustee
(since
2008) | Vice President, Business Development, Cynvenio Biosystems (2012-present); Independent Consultant, Self-Employed (2011-2012) (non-financial services); Director, Wireless Generation (2008-2011) (software). | 363 | None. |
| Trustees and Officers of the Trust (unaudited) |
| |
The Trust’s Statement of Additional Information (“SAI”) includes additional information about the Trustees and Officers. The SAI may be obtained without charge by calling 1-888-493-8631. The following chart lists Trustees and Officers as of October 31, 2013.
Name, Address
(Year of Birth) | Position(s) Held
with Funds | Principal Occupation(s)
During
the Past 5 Years | Number of Funds
in Trust
Overseen by
Trustee | Other
Directorships Held
by Trustees |
| Interested Trustee / Officers2 | |
Bruno del Ama 623 Fifth Ave, 15th floor New York, NY 10022 (1976) | Trustee (since 2008), President, Chief Executive Officer (since 2008) | Chief Executive Officer and Chief Compliance Officer, Global X Management Company LLC (since 2008); Head of Global Structured Products Operations at Radian Asset Assurance (2004-2008)
(financial services firm). | 363 | None. |
Jose C. Gonzalez 623 Fifth Ave, 15th floor New York, NY 10022 (1976) | Chief Operating Officer, Chief Compliance Officer, Treasurer, Principal Accounting Officer and Chief Financial Officer (since 2008) | Chief Operating Officer, Global X Management Company LLC (since 2008); Founder and President of GWM Group, Inc. (since 2006) (broker-dealer firm). | N/A | N/A |
Daphne Tippens Chisolm 11524-C Providence Road, Suite 236 Charlotte, NC 28277 (1969) | Secretary (since 2012) | General Counsel, Global X Management Company LLC (since 2011); Founder and President of Law Offices of DT Chisolm, P.C. (since 2009) (law firm); Counsel, Dechert (2007-2009) (law firm) | N/A | N/A |
Dianne M. Descoteaux4 One Freedom Valley Drive Oaks, PA 19456 (1977) | Assistant Secretary (since 2011) | Counsel, SEI Investments (since 2010); Associate, Morgan, Lewis & Bockius LLP (2006-2010). | N/A | N/A |
| Trustees and Officers of the Trust (unaudited) |
| |
Name, Address
(Year of Birth) | Position(s) Held
with Funds | Principal Occupation(s) During
the Past 5 Years | Other Directorships
Held
by Trustees |
Lisa Whittaker4 One Freedom Valley Drive Oaks, PA 19456 (1978) | Assistant Secretary
(since 2013) | Counsel at SEI Investments (since 2012); Associate Counsel and Compliance Officer at The Glendale Trust Company (2011-2012); Associate of Drinker Biddle & Reath LLP (2006-2011). | N/A |
Peter Rodriguez4 One Freedom Valley Drive Oaks, PA 19456 (1962) | Assistant Treasurer (since 2011) | Fund Accounting Director, SEI Investments Global Funds Services (since 2011); Mutual Fund Trading Director, SEI Global Trust Company (2009-2011); Asset Data Services Director, SEI Global Wealth Services (2006-2009). | N/A |
| 1 | Mr. Chichester is currently married to a sister of Mr. del Ama’s wife. While an “immediate family member” (as defined in Section 2(a)(19) of the 1940 Act) of Mr. del Ama would be considered an Interested Person, Mr. Chichester is not considered an immediate family member for this purpose. Although this fact was taken into consideration in determining whether Mr. Chichester should be considered to be an Independent Trustee for purposes of the Section 2(a)(19) of the 1940 Act, it was determined that this relationship was not one that should disqualify Mr. Chichester from serving as an Independent Trustee of the Trust. |
2 Each Trustee serves until his or her successor is duly elected or appointed and qualified.
| 3 | As of October 31, 2013, the Trust had seventy-nine investment portfolios, thirty-six of which were operational. |
4 These officers of the Trust also serve as officers of one or more mutual funds for which SEI Investments Company or an affiliate acts as investment manager, administrator or distributor.
| Notice to Shareholders (unaudited) |
| |
For shareholders that do not have an October 31, 2013 tax year end, this notice is for informational purposes only. For shareholders with an October 31, 2013 tax year end, please consult your tax advisor as to the pertinence of this notice. For the fiscal year ended October 31, 2013, the Funds are designating the following items with regard to distributions paid during the year.
| | | Return of
Capital | | | Long-Term
Capital Gain
Distributions | | | Ordinary
Income
Distributions | | | Total
Distributions | | | Qualifying
for
Corporate
Dividends
Received
Deduction
(1) | | | Qualifying
Dividend
Income (2) | | | Interest
Related
Dividends (3) | | | Short Term
Capital Gain
Dividends(4) | |
| Global X SuperDividend ETF | | | 0.00 | % | | | 0.00 | % | | | 100.00 | % | | | 100.00 | % | | | 0.40 | % | | | 57.31 | % | | | 0.00 | % | | | 0.00 | % |
| Global X SuperDividend U.S. ETF | | | 9.84 | % | | | 0.00 | % | | | 90.16 | % | | | 100.00 | % | | | 74.71 | % | | | 74.34 | % | | | 0.00 | % | | | 0.00 | % |
| Global X Canada Preferred ETF | | | 0.00 | % | | | 0.00 | % | | | 100.00 | % | | | 100.00 | % | | | 0.00 | % | | | 100.00 | % | | | 0.00 | % | | | 0.00 | % |
| Global X Social Media Index ETF | | | 0.00 | % | | | 0.00 | % | | | 100.00 | % | | | 100.00 | % | | | 100.00 | % | | | 100.00 | % | | | 0.00 | % | | | 0.00 | % |
| Global X Permanent ETF | | | 0.00 | % | | | 0.00 | % | | | 0.00 | % | | | 0.00 | % | | | 0.00 | % | | | 0.00 | % | | | 0.00 | % | | | 0.00 | % |
| Global X Guru Index ETF | | | 0.00 | % | | | 0.00 | % | | | 0.00 | % | | | 0.00 | % | | | 0.00 | % | | | 0.00 | % | | | 0.00 | % | | | 0.00 | % |
| Global X SuperIncome Preferred ETF | | | 0.00 | % | | | 0.00 | % | | | 100.00 | % | | | 100.00 | % | | | 61.59 | % | | | 64.79 | % | | | 44.35 | % | | | 0.00 | % |
(1) Qualifying dividends represent dividends which qualify for the corporate dividends received deduction and is reflected as a percentage of ordinary income distributions (the total of short term capital gain and net investment income distributions).
(2) The percentage in this column represents the amount of "Qualifying Dividend Income" as created by the Jobs and Growth Relief Reconciliation Act of 2003 and is reflected as a percentage of ordinary income distributions (the total of short term capital gain and net investment income distributions). It is the intention of each of the aforementioned funds to designate the maximum amount permitted by law.
(3) The percentage in this column represents the amount of "Interest Related Dividends" as created by the American Jobs Creation Act of 2004 and is reflected as a percentage of net investment income distributions that is exempt from U.S. withholding tax when paid for foreign investors.
(4) The percentage in this column represents the amount of "Short-Term Capital Gain Dividends" as created by the American Jobs Creation Act of 2004 and is reflected as a percentage of short-term capital gain distributions that is exempt from U.S. withholding tax when paid to foreign investors.
The Funds intend to pass through a foreign tax credit to shareholders. For the fiscal year ended October 31, 2013, the total amount of foreign source income and foreign tax credit are as follows:
| | | | | | Foreign Tax | |
| | | Foreign | | | Credit Pass | |
| Global X Funds | | Source Income | | | Through | |
| Global X SuperDividend ETF | | $ | 23,340,181 | | | $ | 802,495 | |
| Global X Canada Preferred ETF | | | 608,385 | | | | 91,137 | |
The information reported herein may differ from the information and distributions taxable to the shareholders for the calendar year ending December 31, 2013. Complete information will be computed and reported in conjunction with your 2013 Form 1099-DIV.
Notes
Notes
Notes
623 Fifth Avenue, 15th floor
New York, NY 10022
1-888-GXFund-1
(1-888-493-8631)
www.globalxfunds.com
Investment Adviser:
Global X Management Company LLC
623 Fifth Avenue, 15th floor
New York, NY 10022
Distributor:
SEI Investments Distribution Co.
One Freedom Valley Drive
Oaks, PA 19456
Sub-Administrator:
SEI Investments Global Funds Services
One Freedom Valley Drive
Oaks, PA 19456
Counsel for the Independent Trustees:
Dechert LLP
1900 K Street N.W.
Washington, DC 20006
This information must be preceded or accompanied by a current prospectus for the Funds described.
GLX-AR-003-0300
Item 2. Code of Ethics.
The registrant has adopted a code of ethics that applies to the registrant’s principal executive officer, principal financial officer, comptroller or principal accounting officer, and any person who performs a similar function.
Item 3. Audit Committee Financial Expert.
(a)(1) The registrant’s board of trustees has determined that the registrant has at least one audit committee financial expert serving on the audit committee.
(a)(2) The audit committee financial expert is Scott Chichester and is independent as defined in Form N-CSR Item 3(a)(2).
Item 4. Principal Accountant Fees and Services.
Fees billed by Ernst & Young LLP in 2013 and 2012 related to the registrant.
In 2013 and 2012, Ernst & Young, LLP billed the registrant aggregate fees for services rendered to the registrant for the last two fiscal years as follows:
| | | 2013 | | | 2012 | |
| | | | | All fees and
services to
the Trust that
were pre-
approved | | | All fees and
services to
service
affiliates that
were pre-
approved | | | All other fees
and services
to service
affiliates that
did not
require pre-
approval | | | All fees and
services to
the Trust that
were pre-
approved | | | All fees and
services to
service
affiliates that
were pre-
approved | | | All other fees
and services
to service
affiliates that
did not
require pre-
approval | |
| (a) | | Audit Fees | | $ | 413,900 | | | $ | 0 | | | $ | 0 | | | $ | 320,025 | | | $ | 0 | | | $ | 0 | |
| (b) | | Audit-Related Fees | | $ | 0 | | | $ | 0 | | | $ | 0 | | | $ | 0 | | | $ | 0 | | | $ | 0 | |
| (c) | | Tax Fees | | $ | 139,650 | | | $ | 0 | | | $ | 0 | | | $ | 105,375 | | | $ | 0 | | | $ | 0 | |
| (d) | | All Other Fees | | $ | 0 | | | $ | 0 | | | $ | 0 | | | $ | 0 | | | $ | 0 | | | $ | 0 | |
(e)(1) Not applicable.
(e)(2) Percentage of fees billed applicable to non-audit services pursuant to waiver of pre-approval requirement were as follows for Ernst & Young LLP in 2013 and 2012:
| | | 2013 | | | 2012 | |
| Audit-Related Fees | | | 0 | % | | | 0 | % |
| | | | | | | | | |
| Tax Fees | | | 0 | % | | | 0 | % |
| | | | | | | | | |
| All Other Fees | | | 0 | % | | | 0 | % |
(f) Not applicable.
(g) The aggregate non-audit fees and services billed by Ernst & Young, LLP in 2013 and 2012 for the last two fiscal years were $139,650 and $105,375, respectively.
(h) During the past fiscal year, all non-audit services provided by registrant’s principal accountant to either registrant’s investment adviser or to any entity controlling, controlled by, or under common control with registrant’s investment adviser that provides ongoing services to registrant were pre-approved by the audit committee of registrant’s Board of Trustees. Included in the audit committee’s pre-approval was the review and consideration as to whether the provision of these non-audit services is compatible with maintaining the principal accountant’s independence.
Item 5. Audit Committee of Listed Registrants.
Not applicable to open-end management investment companies.
Item 6. Schedule of Investments.
Not applicable.
Item 7. Disclosure of Proxy Voting Policies and Procedures for Closed-End Management Investment Companies.
Not applicable to open-end management investment companies.
Item 8. Portfolio Managers of Closed-End Management Investment Companies.
Not applicable to open-end management investment companies. Effective for closed-end management investment companies for fiscal years ending on or after December 31, 2005.
Item 9. Purchases of Equity Securities by Closed-End Management Company and Affiliated Purchasers.
Not applicable to open-end management investment companies.
Item 10. Submission of Matters to a Vote of Security Holders.
There have been no material changes.
Item 11. Controls and Procedures.
(a) The certifying officers, whose certifications are included herewith, have evaluated the registrant’s disclosure controls and procedures within 90 days of the filing date of this report. In their opinion, based on their evaluation, the registrant’s disclosure controls and procedures are adequately designed, and are operating effectively to ensure, that information required to be disclosed by the registrant in the reports it files or submits under the Securities Exchange Act of 1934 is recorded, processed, summarized and reported within the time periods specified in the Securities and Exchange Commission’s rules and forms.
(b) There were no significant changes in the registrant’s internal control over financial reporting that occurred during the second fiscal quarter of the period covered by this report that has materially affected, or is reasonably likely to materially affect, the registrants internal control over financial reporting.
Items 12. Exhibits.
(a)(1) Code of Ethics attached hereto.
(a)(2) A separate certification for the principal executive officer and the principal financial officer of the registrant as required by Rule 30a-2(a) under the Investment Company Act of 1940, as amended (17 CFR 270.30a-2(a)), are filed herewith.
(b) Officer certifications as required by Rule 30a-2(b) under the Investment Company Act of 1940, as amended (17 CFR 270.30a-2(b)) also accompany this filing as an Exhibit.
SIGNATURES
Pursuant to the requirements of the Securities Exchange Act of 1934 and the Investment Company Act of 1940, the registrant has duly caused this report to be signed on its behalf by the undersigned, thereunto duly authorized.
| (Registrant) | Global X Funds |
| | |
| By (Signature and Title)* | /s/ Bruno del Ama |
| | Bruno del Ama |
| | President |
Date: January 7, 2014
Pursuant to the requirements of the Securities Exchange Act of 1934 and the Investment Company Act of 1940, this report has been signed below by the following persons on behalf of the registrant and in the capacities and on the dates indicated.
| By (Signature and Title)* | /s/ Bruno del Ama |
| | Bruno del Ama |
| | President |
Date: January 7, 2014
| By (Signature and Title)* | /s/ Jose C. Gonzalez |
| | Jose C. Gonzalez |
| | Chief Financial Officer |
Date: January 7, 2014
| * | Print the name and title of each signing officer under his or her signature. |