UNITED STATES
SECURITIES AND EXCHANGE COMMISSION
Washington, D.C. 20549
________
FORM N-CSR
________
CERTIFIED SHAREHOLDER REPORT OF REGISTERED MANAGEMENT
INVESTMENT COMPANIES
Investment Company Act file number 811-22209
Global X Funds
(Exact name of registrant as specified in charter)
________
623 Fifth Avenue, 15th Floor
New York, NY 10022
(Address of principal executive offices) (Zip code)
Bruno del Ama
Global X Management Company LLC
623 Fifth Avenue, 15th Floor
New York, NY 10022
(Name and address of agent for service)
With a copy to:
Daphne Tippens Chisolm, Esq.
Law Offices of DT Chisolm, P.C.
11524 C Providence Road, Suite 236
Charlotte, NC 28277
Registrant’s telephone number, including area code: (212) 644-6440
Date of fiscal year end: June 30, 2013
Date of reporting period: June 30, 2013
Item 1. Reports to Stockholders.

Global X Permanent ETF (ticker: PERM)
Global X Top Guru Holdings Index ETF (ticker: GURU)
Global X SuperIncome Preferred ETF (ticker: SPFF)
Annual Report
June 30, 2013

| Table of Contents |
| |
| | |
| Management Discussion of Fund Performance (unaudited) | 1 |
| | |
| Schedules of Investments | |
| | |
| Global X Permanent ETF | 7 |
| | |
| Global X Top Guru Holdings Index ETF | 12 |
| | |
| Global X SuperIncome Preferred ETF | 15 |
| | |
| Statements of Assets and Liabilities | 18 |
| | |
| Statements of Operations | 19 |
| | |
| Statements of Changes in Net Assets | 20 |
| | |
| Financial Highlights | 22 |
| | |
| Notes to Financial Statements | 23 |
| | |
| Report of Independent Registered Public Accounting Firm | 32 |
| | |
| Disclosure of Fund Expenses (unaudited) | 33 |
| | |
| Supplemental Information (unaudited) | 35 |
| | |
| Trustees and Officers of the Trust (unaudited) | 36 |
| | |
| Notice to Shareholders (unaudited) | 39 |
The Funds file their complete schedules of Fund holdings with the Securities and Exchange Commission (the “Commission”) for the first and third quarters of each fiscal year on Form N-Q within sixty days after the end of the period. The Funds’ Forms N-Q are available on the Commission’s website at http://www.sec.gov, and may be reviewed and copied at the Commission's Public Reference Room in Washington, DC. Information on the operation of the Public Reference Room may be obtained by calling 1-800-SEC-0330.
A description of the policies and procedures that Global X Funds uses to determine how to vote proxies relating to Fund securities, as well as information relating to how the Funds voted proxies relating to Fund securities during the most recent 12-month period ended June 30, will be available (i) without charge, upon request, by calling 1-888-GXFund-1; and (ii) on the Commission’s website at http://www.sec.gov.
|
| |
| Management discussion of fund performance (Unaudited) |
| Global X Permanent ETF |
Global X Permanent ETF (ticker: PERM)
The Global X Permanent ETF (the “Fund”) seeks to provide investment results that correspond generally to the price and yield performance, before fees and expenses, of the Solactive Permanent Index (the “Underlying Index”). The Fund generally seeks to replicate the Underlying Index but may at times invest in a representative sample of securities that collectively has an investment profile similar to the Underlying Index and as a result may or may not hold all the securities that are included in the Underlying Index.
The Underlying Index tracks the performance of four asset class categories that are designed to perform differently across different economic environments, as defined by Solactive AG (the “Index Provider”). On each rebalance, the Underlying Index allocates 25% each to four asset class categories, as follows:
| Asset Class | | Allocation | |
| Stocks: | | | | |
| · U.S. Large Cap Stocks | | | 9 | % |
| · U.S. Small Cap Stocks | | | 3 | % |
| · International Stocks | | | 3 | % |
| · U.S. Real Estate Stocks | | | 5 | % |
| · U.S. and Foreign Natural Resource Stocks | | | 5 | % |
| U.S. Treasury Bonds (Long-Term) | | | 25 | % |
| (remaining maturity greater than 20 years) | | | | |
| U.S. Treasury Bills and Bonds (Short-Term) | | | 25 | % |
| (remaining maturity of less than three years) | | | | |
| Gold & Silver: | | | | |
| · Physical Gold ETFs and ETCs | | | 20 | % |
| · Physical Silver ETFs and ETCs | | | 5 | % |
| Total | | | 100 | % |
For the period from July 1, 2012 through June 30, 2013 (the “reporting period”), the Fund decreased 5.77%, while the Underlying Index decreased 5.82%. The Fund commenced the reporting period with a net asset value of $24.77 per share on July 1, 2012 and ended the reporting period with a net asset value of $23.15 on June 30, 2013.
65 of the Fund’s 98 investments held during the year ended June 30, 2013 increased in value for the reporting period, led by Citigroup and Bank of America, which returned 75.20% and 57.82%, respectively. The worst performers were Anglo American PLC and Vale ADR, which returned -39.61% and -30.30%, respectively.
|
| |
| Management discussion of fund performance (Unaudited) |
| Global X Permanent ETF |
Growth of a $10,000 Investment
| | | AVERAGE ANNUAL TOTAL RETURN FOR THE PERIOD ENDED JUNE 30, 2013 | |
| | | One Year Return | | | Annualized Inception to Date* | |
| | | Net Asset Value | | | Market Price | | | Net Asset Value | | | Market Price | |
| Global X Permanent ETF | | | (5.77 | )% | | | (5.77 | )% | | | (4.91 | )% | | | (4.82 | )% |
| Solactive Permanent Index | | | (5.82 | )% | | | (5.82 | )% | | | (4.78 | )% | | | (4.78 | )% |
| S&P 500 Index | | | 20.60 | % | | | 20.60 | % | | | 16.05 | % | | | 16.05 | % |
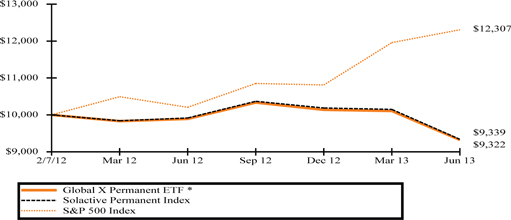
*Fund commenced operations on February 7, 2012.
The performance data quoted herein represents past performance and the return and value of an investment in the Fund will fluctuate so that, when redeemed, may be worth less than its original cost. Past performance is no guarantee of future performance and should not be considered as a representation of the future results of the Fund. The Fund's performance assumes the reinvestment of all dividends and all capital gains. Index returns assume reinvestment of dividends and, unlike a Fund's returns, do not reflect any fees or expenses. If such fees and expenses were included in the index returns, the performance would have been lower. Please note that one cannot invest directly in an unmanaged index.
There are no assurances that the Fund will meet its stated objectives.
The Fund’s holdings and allocations are subject to change and should not be considered recommendations to buy individual securities.
Returns shown do not reflect the deduction of taxes that a shareholder would pay on Fund distributions or the redemption of Fund shares.
See definition of Solactive Permanent Index on previous page.
The S&P 500 Index is a market capitalization weighted composite index of 500 large capitalization U.S. companies.
|
| |
| Management discussion of fund performance (Unaudited) |
| Global X Top Guru Holdings Index ETF |
Global X Top Guru Holdings Index ETF (ticker: GURU)
The Global X Top Guru Holdings Index ETF (the “Fund”) seeks to provide investment results that correspond generally to the price and yield performance, before fees and expenses, of the Solactive Top Guru Holdings Index (the “Underlying Index”). The Fund generally seeks to replicate the Underlying Index but may at times invest in a representative sample of securities that collectively has an investment profile similar to the Underlying Index and as a result may or may not hold all the securities that are included in the Underlying Index.
The Underlying Index is comprised of the top U.S. listed equity positions reported on Form 13F by a select group of entities that Solactive AG (the “Index Provider”) characterizes as hedge funds. Hedge funds are selected from a pool of thousands of privately offered pooled investment vehicles based on the size of their reported equity holdings and the efficacy of replicating their publicly disclosed positions. Hedge funds must have minimum reported holdings of $500 million in their form 13F to be considered for the Underlying index. Additional filters are applied to eliminate hedge funds that have high turnover rates for equity holdings.
For the period from July 1, 2012 through June 30, 2013 (the “reporting period”), the Fund increased 38.08%, while the Underlying Index increased 38.85%. The Fund commenced the reporting period with a net asset value of $15.83 per share on July 1, 2012 and ended the reporting period with a net asset value of $20.68 on June 30, 2013.
65 of the Fund’s 86 investments held during the year ended June 30, 2013 increased in value for the reporting period, led by MagnaChip Semiconductor and Hartford Financial Services Group, which returned 91.71% and 78.50%, respectively. The worst performers were VIVUS and AngloGold Ashanti Ltd., which returned -55.92% and -33.21%, respectively.
Growth of a $10,000 Investment
| | | AVERAGE ANNUAL TOTAL RETURN FOR THE PERIOD ENDED JUNE 30, 2013 | |
| | | One Year Return | | | Annualized Inception to Date* | |
| | | Net Asset Value | | | Market Price | | | Market Price | | | Market Price | |
| Global X Top Guru Holdings Index ETF | | | 38.08 | % | | | 36.90 | % | | | 42.42 | % | | | 42.87 | % |
| Solactive Top Guru Holdings Index | | | 38.85 | % | | | 38.85 | % | | | 43.11 | % | | | 43.11 | % |
| S&P 500 Index | | | 20.60 | % | | | 20.60 | % | | | 26.57 | % | | | 26.57 | % |
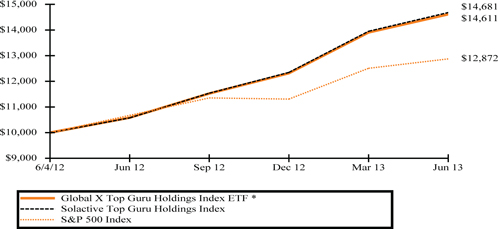
*Fund commenced operations on June 4, 2012.
|
| |
| Management discussion of fund performance (Unaudited) |
| Global X Top Guru Holdings Index ETF |
The performance data quoted herein represents past performance and the return and value of an investment in the Fund will fluctuate so that, when redeemed, may be worth less than its original cost. Past performance is no guarantee of future performance and should not be considered as a representation of the future results of the Fund. The Fund's performance assumes the reinvestment of all dividends and all capital gains. Index returns assume reinvestment of dividends and, unlike a Fund's returns, do not reflect any fees or expenses. If such fees and expenses were included in the index returns, the performance would have been lower. Please note that one cannot invest directly in an unmanaged index.
There are no assurances that the Fund will meet its stated objectives.
The Fund’s holdings and allocations are subject to change and should not be considered recommendations to buy individual securities.
Returns shown do not reflect the deduction of taxes that a shareholder would pay on Fund distributions or the redemption of Fund shares.
See definition of Solactive Top Guru Holdings Index on previous page.
The S&P 500 Index is a market capitalization weighted composite index of 500 large capitalization U.S. companies.
|
| |
| Management discussion of fund performance (Unaudited) |
| Global X SuperIncome Preferred ETF |
Global X SuperIncome Preferred ETF (ticker: SPFF)
The Global X SuperIncome Preferred ETF (“Fund”) seeks investment results that correspond generally to the price and yield performance, before fees and expenses, of the S&P Enhanced Yield North American Preferred Stock Index (the “Underlying Index”). The Fund generally seeks to replicate the Underlying Index but may at times invest in a representative sample of securities that collectively has an investment profile similar to the Underlying Index and as a result may or may not hold all the securities that are included in the Underlying Index.
The Underlying Index tracks the performance of the highest yielding preferred securities in the U.S., as determined by Standard & Poor’s (the “Index Provider”). The Underlying Index is comprised of preferred stocks that meet certain criteria relating to size, liquidity, issuer concentration and rating, maturity and other requirements, as determined by the Index Provider.
For the period from the Fund’s commencement date on July 16, 2012 through June 30, 2013 (the “reporting period”), the Fund increased 4.46%, while the Underlying Index increased 4.96%. The Fund commenced operations with a net asset value of $15.02 per share on July 16, 2012 and ended the reporting period with a net asset value of $14.65 on June 30, 2013.
56 of the Fund’s 73 investments held during the period ended June 30, 2013 increased in value for the reporting period, led by Hartford Financial Services Group 7.875% and Goodyear Tire & Rubber 5.875%, which returned 40.69% and 34.12%, respectively. The worst performers were Anglogold Ashanti Holdings Finance 6.000% and ArcelorMittal 6.000%, which returned -52.94% and -3.33%, respectively.
Growth of a $10,000 Investment
| | | AVERAGE ANNUAL TOTAL RETURN FOR | |
| | | THE PERIOD ENDED JUNE 30, 2013 | |
| | | Cumulative Inception to Date* | |
| | | Net Asset Value | | | Market Price | |
| Global X SuperIncome Preferred ETF | | | 4.46 | % | | | 5.93 | % |
| S&P Enhanced Yield North American Preferred Stock Index | | | 4.96 | % | | | 4.96 | % |
| S&P 500 Index | | | 21.26 | % | | | 21.26 | % |
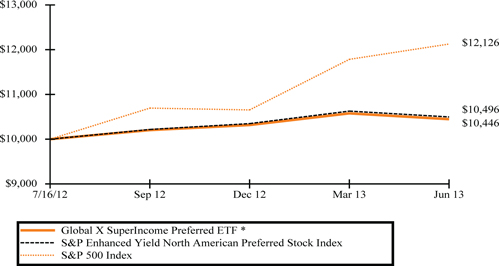
*Fund commenced operations on July 16, 2012. Total return is for the period indicated and has not been annualized.
|
| |
| Management discussion of fund performance (Unaudited) |
| Global X SuperIncome Preferred ETF |
The performance data quoted herein represents past performance and the return and value of an investment in the Fund will fluctuate so that, when redeemed, may be worth less than its original cost. Past performance is no guarantee of future performance and should not be considered as a representation of the future results of the Fund. The Fund's performance assumes the reinvestment of all dividends and all capital gains. Index returns assume reinvestment of dividends and, unlike a Fund's returns, do not reflect any fees or expenses. If such fees and expenses were included in the index returns, the performance would have been lower. Please note that one cannot invest directly in an unmanaged index.
There are no assurances that the Fund will meet its stated objectives.
The Fund’s holdings and allocations are subject to change and should not be considered recommendations to buy individual securities.
Returns shown do not reflect the deduction of taxes that a shareholder would pay on Fund distributions or the redemption of Fund shares.
See definition of S&P Enhanced Yield North American Preferred Stock Index on previous page.
The S&P 500 Index is a market capitalization weighted composite index of 500 large capitalization U.S. companies.
|
| |
| Schedule of Investments | June 30, 2013 |
| | |
| Global X Permanent ETF |
Sector Weightings (unaudited)†:
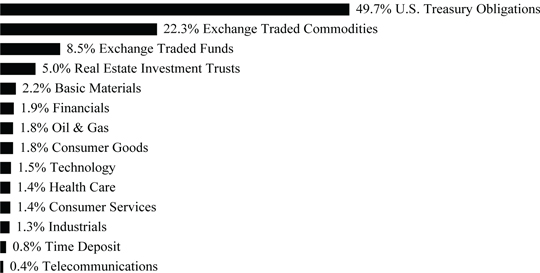
† Percentages based on total investments.
| | | Face Amount/ | | | | |
| | | Shares | | | Value | |
| U.S. TREASURY OBLIGATIONS — 49.9% | | | | | | | | |
| | | | | | | | | |
| U.S. Treasury Bonds | | | | | | | | |
| 4.625%, 02/15/40 | | $ | 726,000 | | | $ | 884,699 | |
| 4.375%, 11/15/39 | | | 953,000 | | | | 1,117,095 | |
| 4.375%, 05/15/40 | | | 741,000 | | | | 869,054 | |
| 3.875%, 08/15/40 | | | 825,000 | | | | 891,774 | |
| U.S. Treasury Notes | | | | | | | | |
| 2.625%, 12/31/14 | | | 947,000 | | | | 980,589 | |
| 2.500%, 03/31/15 | | | 760,000 | | | | 788,945 | |
| 2.375%, 02/28/15 | | | 952,000 | | | | 984,911 | |
| 2.125%, 11/30/14 | | | 965,000 | | | | 990,671 | |
| TOTAL U.S. TREASURY OBLIGATIONS | | | | | | | | |
| (Cost $7,715,901) | | | | | | | 7,507,738 | |
| | | | | | | | | |
| EXCHANGE TRADED COMMODITIES — 22.4% | | | | | | | | |
| ETFS Physical Gold * | | | 12,620 | | | | 1,495,975 | |
| ETFS Physical Silver * | | | 20,643 | | | | 386,844 | |
| Gold Bullion Securities * | | | 12,758 | | | | 1,492,750 | |
| TOTAL EXCHANGE TRADED COMMODITIES | | | | | | | | |
| (Cost $4,661,146) | | | | | | | 3,375,569 | |
| | | | | | | | | |
| COMMON STOCK — 18.8% | | | | | | | | |
| AUSTRALIA— 0.3% | | | | | | | | |
| Basic Materials — 0.3% | | | | | | | | |
| BHP Billiton ADR | | | 822 | | | | 47,397 | |
| BRAZIL— 0.3% | | | | | | | | |
| Basic Materials — 0.3% | | | | | | | | |
| Vale ADR, Cl B | | | 3,803 | | | | 50,009 | |
The accompanying notes are an integral part of the financial statements.
|
| | |
| Schedule of Investments | June 30, 2013 |
| |
| Global X Permanent ETF |
| | | Shares | | | Value | |
| COMMON STOCK — continued | | | | | | | | |
| | | | | | | | | |
| CANADA— 0.3% | | | | | | | | |
| Basic Materials — 0.3% | | | | | | | | |
| Potash Corp of Saskatchewan | | | 1,145 | | | $ | 43,659 | |
| CHINA— 0.3% | | | | | | | | |
| Oil & Gas — 0.3% | | | | | | | | |
| PetroChina ADR | | | 380 | | | | 42,055 | |
| SINGAPORE— 0.3% | | | | | | | | |
| Consumer Goods — 0.3% | | | | | | | | |
| Wilmar International | | | 16,513 | | | | 41,038 | |
| SWITZERLAND— 0.3% | | | | | | | | |
| Basic Materials — 0.3% | | | | | | | | |
| Glencore Xstrata | | | 11,889 | | | | 49,212 | |
| UNITED KINGDOM— 1.4% | | | | | | | | |
| Basic Materials — 0.7% | | | | | | | | |
| Anglo American | | | 2,606 | | | | 50,179 | |
| Rio Tinto ADR | | | 1,009 | | | | 41,450 | |
| | | | | | | | 91,629 | |
| Oil & Gas — 0.7% | | | | | | | | |
| BP | | | 7,226 | | | | 50,034 | |
| Royal Dutch Shell ADR, Cl A | | | 813 | | | | 51,869 | |
| | | | | | | | 101,903 | |
| TOTAL UNITED KINGDOM | | | | | | | 193,532 | |
| | | | | | | | | |
| UNITED STATES— 15.6% | | | | | | | | |
| Basic Materials — 0.3% | | | | | | | | |
| Mosaic | | | 959 | | | | 51,604 | |
| Consumer Goods — 1.5% | | | | | | | | |
| Altria Group | | | 842 | | | | 29,462 | |
| Archer-Daniels-Midland | | | 1,484 | | | | 50,323 | |
| Coca-Cola | | | 669 | | | | 26,834 | |
| Monsanto | | | 499 | | | | 49,301 | |
| PepsiCo | | | 331 | | | | 27,072 | |
| Philip Morris International | | | 291 | | | | 25,206 | |
| Procter & Gamble | | | 330 | | | | 25,407 | |
| | | | | | | | 233,605 | |
| Consumer Services — 1.5% | | | | | | | | |
| Amazon.com * | | | 98 | | | | 27,214 | |
| Comcast, Cl A | | | 665 | | | | 27,850 | |
| CVS Caremark | | | 470 | | | | 26,875 | |
| eBay * | | | 520 | | | | 26,894 | |
| Home Depot | | | 355 | | | | 27,502 | |
| McDonald's | | | 301 | | | | 29,799 | |
The accompanying notes are an integral part of the financial statements.
|
| | |
| Schedule of Investments | June 30, 2013 |
| | |
Global X Permanent ETF |
| | | Shares | | | Value | |
| | | | | | | |
| COMMON STOCK — continued | | | | | | | | |
| | | | | | | | | |
| Consumer Services — continued | | | | | | | | |
| Wal-Mart Stores | | | 358 | | | $ | 26,667 | |
| Walt Disney | | | 425 | | | | 26,839 | |
| | | | | | | | 219,640 | |
| Financials — 2.0% | | | | | | | | |
| American Express | | | 360 | | | | 26,914 | |
| American International Group * | | | 613 | | | | 27,401 | |
| Bank of America | | | 2,101 | | | | 27,019 | |
| Berkshire Hathaway, Cl B * | | | 239 | | | | 26,749 | |
| Citigroup | | | 561 | | | | 26,911 | |
| Goldman Sachs Group | | | 175 | | | | 26,469 | |
| JPMorgan Chase | | | 509 | | | | 26,870 | |
| Mastercard, Cl A | | | 47 | | | | 27,001 | |
| US Bancorp | | | 750 | | | | 27,112 | |
| Visa, Cl A | | | 140 | | | | 25,585 | |
| Wells Fargo | | | 651 | | | | 26,867 | |
| | | | | | | | 294,898 | |
| Health Care — 1.4% | | | | | | | | |
| AbbVie | | | 527 | | | | 21,786 | |
| Amgen | | | 266 | | | | 26,244 | |
| Bristol-Myers Squibb | | | 585 | | | | 26,144 | |
| Gilead Sciences | | | 525 | | | | 26,885 | |
| Johnson & Johnson | | | 311 | | | | 26,702 | |
| Merck | | | 575 | | | | 26,709 | |
| Pfizer | | | 906 | | | | 25,377 | |
| UnitedHealth Group | | | 412 | | | | 26,978 | |
| | | | | | | | 206,825 | |
| Industrials — 1.3% | | | | | | | | |
| 3M | | | 246 | | | | 26,900 | |
| Boeing | | | 265 | | | | 27,147 | |
| General Electric | | | 1,157 | | | | 26,831 | |
| Honeywell International | | | 336 | | | | 26,658 | |
| Union Pacific | | | 174 | | | | 26,845 | |
| United Parcel Service, Cl B | | | 371 | | | | 32,084 | |
| United Technologies | | | 291 | | | | 27,045 | |
| | | | | | | | 193,510 | |
| Oil & Gas — 0.8% | | | | | | | | |
| Chevron | | | 420 | | | | 49,703 | |
| Exxon Mobil | | | 555 | | | | 50,144 | |
| Schlumberger | | | 383 | | | | 27,446 | |
| | | | | | | | 127,293 | |
The accompanying notes are an integral part of the financial statements.
|
| | |
| Schedule of Investments | June 30, 2013 |
| | |
Global X Permanent ETF |
| | | Shares/Face | | | | |
| | | Amount | | | Value | |
| | | | | | | | | |
| COMMON STOCK — continued | | | | | | | | |
| | | | | | | | | |
| Real Estate Investment Trusts — 4.9% | | | | | | | | |
| American Tower, Cl A | | | 1,009 | | | $ | 73,829 | |
| AvalonBay Communities | | | 552 | | | | 74,470 | |
| Equity Residential | | | 1,362 | | | | 79,078 | |
| General Growth Properties | | | 3,757 | | | | 74,652 | |
| HCP | | | 1,658 | | | | 75,339 | |
| Health Care REIT | | | 1,126 | | | | 75,476 | |
| ProLogis | | | 1,991 | | | | 75,100 | |
| Public Storage | | | 492 | | | | 75,438 | |
| Simon Property Group | | | 486 | | | | 76,749 | |
| Ventas | | | 1,083 | | | | 75,225 | |
| | | | | | | | 755,356 | |
| Technology — 1.5% | | | | | | | | |
| Apple | | | 68 | | | | 26,933 | |
| Cisco Systems | | | 1,099 | | | | 26,717 | |
| Google, Cl A * | | | 31 | | | | 27,291 | |
| Intel | | | 1,084 | | | | 26,255 | |
| International Business Machines | | | 153 | | | | 29,240 | |
| Microsoft | | | 781 | | | | 26,968 | |
| Oracle | | | 1,008 | | | | 30,966 | |
| QUALCOMM | | | 494 | | | | 30,173 | |
| | | | | | | | 224,543 | |
| Telecommunications — 0.4% | | | | | | | | |
| AT&T | | | 812 | | | | 28,745 | |
| Verizon Communications | | | 528 | | | | 26,579 | |
| | | | | | | | 55,324 | |
| TOTAL UNITED STATES | | | | | | | 2,362,598 | |
| TOTAL COMMON STOCK | | | | | | | | |
| (Cost $2,853,502) | | | | | | | 2,829,500 | |
| | | | | | | | | |
| EXCHANGE TRADED FUNDS — 8.6% | | | | | | | | |
| Vanguard FTSE All-World ex-US ETF | | | 10,215 | | | | 451,707 | |
| Vanguard Small-Cap ETF | | | 4,822 | | | | 451,870 | |
| ZKB Silver ETF * | | | 6,479 | | | | 389,611 | |
| TOTAL EXCHANGE TRADED FUNDS | | | | | | | | |
| (Cost $1,259,545) | | | | | | | 1,293,188 | |
| | | | | | | | | |
| TIME DEPOSIT — 0.8% | | | | | | | | |
| Brown Brothers Harriman, 0.030%, 07/01/13 | | | | | | | | |
| (Cost $114,008) | | $ | 114,008 | | | | 114,008 | |
| TOTAL INVESTMENTS — 100.5% | | | | | | | | |
| (Cost $16,604,102) | | | | | | $ | 15,120,003 | |
Percentages are based on Net Assets of $15,047,852.
The accompanying notes are an integral part of the financial statements.
|
| | |
| Schedule of Investments | June 30, 2013 |
| | |
Global X Permanent ETF |
| * | Non-income producing security. |
ADR — American Depositary Receipt
Cl — Class
ETF — Exchange Traded Fund
FTSE — Financial Times and London Stock Exchange
REIT — Real Estate Investment Trust
The following is a summary of the inputs used as of June 30, 2013, in valuing the Fund's investments carried at value:
| Investments in Securities | | Level 1 | | | Level 2 | | | Level 3 | | | Total | |
| U.S. Treasury Obligations | | $ | — | | | $ | 7,507,738 | | | $ | — | | | $ | 7,507,738 | |
| Exchange Traded Commodities | | | 3,375,569 | | | | — | | | | — | | | | 3,375,569 | |
| Common Stock | | | 2,829,500 | | | | — | | | | — | | | | 2,829,500 | |
| Exchange Traded Funds | | | 1,293,188 | | | | — | | | | — | | | | 1,293,188 | |
| Time Deposit | | | — | | | | 114,008 | | | | — | | | | 114,008 | |
| Total Investments in Securities | | $ | 7,498,257 | | | $ | 7,621,746 | | | $ | — | | | $ | 15,120,003 | |
For the year ended June 30, 2013, there have been no transfers between Level 1, Level 2 or Level 3 investments.
For the year ended June 30, 2013, there were no Level 3 investments.
The accompanying notes are an integral part of the financial statements.
|
| | |
| Schedule of Investments | June 30, 2013 |
| | |
Global X Top Guru Holdings Index ETF |
Sector Weightings (unaudited)†:
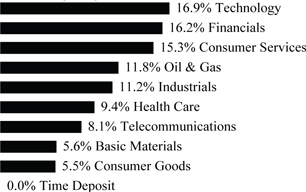
† Percentages based on total investments.
| | | Shares | | | Value | |
| | | | | | | |
| COMMON STOCK — 99.9% | | | | | | | | |
| | | | | | | | | |
| BRAZIL— 1.6% | | | | | | | | |
| Consumer Goods — 1.6% | | | | | | | | |
| Cosan, Cl A | | | 51,086 | | | $ | 825,550 | |
| CANADA— 3.6% | | | | | | | | |
| Basic Materials — 1.9% | | | | | | | | |
| Agrium | | | 11,315 | | | | 983,953 | |
| Industrials — 1.7% | | | | | | | | |
| Canadian Pacific Railway | | | 7,489 | | | | 909,015 | |
| TOTAL CANADA | | | | | | | 1,892,968 | |
| MEXICO— 2.0% | | | | | | | | |
| Telecommunications — 2.0% | | | | | | | | |
| America Movil ADR, Ser L | | | 48,900 | | | | 1,063,575 | |
| UNITED KINGDOM— 1.9% | | | | | | | | |
| Oil & Gas — 1.9% | | | | | | | | |
| BP ADR | | | 23,998 | | | | 1,001,676 | |
| UNITED STATES— 90.8% | | | | | | | | |
| Basic Materials — 3.7% | | | | | | | | |
| Celanese, Ser A | | | 21,053 | | | | 943,174 | |
| Cytec Industries | | | 13,979 | | | | 1,023,962 | |
| | | | | | | | 1,967,136 | |
| Consumer Goods — 3.9% | | | | | | | | |
| Deckers Outdoor * | | | 19,415 | | | | 980,651 | |
| Delphi Automotive * | | | 21,672 | | | | 1,098,554 | |
| | | | | | | | 2,079,205 | |
| Consumer Services — 15.3% | | | | | | | | |
| Cumulus Media, Cl A * | | | 269,460 | | | | 913,470 | |
The accompanying notes are an integral part of the financial statements.
|
| | |
| Schedule of Investments | June 30, 2013 |
| | |
Global X Top Guru Holdings Index ETF |
| | | Shares | | | Value | |
| | | | | | | |
| COMMON STOCK — continued | | | | | | | | |
| | | | | | | | | |
| Consumer Services — continued | | | | | | | | |
| GameStop, Cl A | | | 26,770 | | | $ | 1,125,143 | |
| Liberty Global, Cl A * | | | 13,429 | | | | 994,820 | |
| Liberty Media * | | | 8,116 | | | | 1,028,784 | |
| News, Cl B | | | 30,868 | | | | 1,013,088 | |
| Pandora Media * | | | 61,806 | | | | 1,137,230 | |
| Time Warner | | | 16,775 | | | | 969,931 | |
| US Airways Group | | | 53,277 | | | | 874,808 | |
| | | | | | | | 8,057,274 | |
| Financials — 16.1% | | | | | | | | |
| American Capital Agency | | | 34,510 | | | | 793,385 | |
| American International Group * | | | 22,684 | | | | 1,013,975 | |
| CBRE Group, Cl A * | | | 41,204 | | | | 962,525 | |
| CIT Group * | | | 23,202 | | | | 1,081,909 | |
| Hartford Financial Services Group | | | 33,085 | | | | 1,022,988 | |
| Hudson Pacific Properties | | | 43,249 | | | | 920,339 | |
| JPMorgan Chase | | | 19,985 | | | | 1,055,008 | |
| Nationstar Mortgage Holdings * | | | 22,895 | | | | 857,189 | |
| Spirit Realty Capital | | | 45,086 | | | | 798,924 | |
| | | | | | | | 8,506,242 | |
| Health Care — 9.4% | | | | | | | | |
| HCA Holdings | | | 25,796 | | | | 930,204 | |
| Life Technologies * | | | 13,863 | | | | 1,026,000 | |
| Merck | | | 21,970 | | | | 1,020,507 | |
| Pfizer | | | 34,825 | | | | 975,448 | |
| Vivus * | | | 81,128 | | | | 1,020,590 | |
| | | | | | | | 4,972,749 | |
| Industrials — 9.5% | | | | | | | | |
| Lockheed Martin | | | 9,793 | | | | 1,062,149 | |
| Nortek * | | | 14,268 | | | | 919,287 | |
| Owens-Illinois | | | 35,751 | | | | 993,521 | |
| Sensata Technologies Holding * | | | 29,080 | | | | 1,014,892 | |
| Spirit Aerosystems Holdings, Cl A * | | | 47,053 | | | | 1,010,698 | |
| | | | | | | | 5,000,547 | |
| Oil & Gas — 9.9% | | | | | | | | |
| Diamondback Energy | | | 34,018 | | | | 1,133,480 | |
| Energy Transfer Equity | | | 17,350 | | | | 1,037,877 | |
| Pioneer Natural Resources | | | 7,348 | | | | 1,063,623 | |
| SemGroup, Cl A | | | 18,304 | | | | 985,853 | |
| Targa Resources | | | 15,029 | | | | 966,816 | |
| | | | | | | | 5,187,649 | |
The accompanying notes are an integral part of the financial statements.
|
| | |
| Schedule of Investments | June 30, 2013 |
| | |
Global X Top Guru Holdings Index ETF |
| | | Shares/ | | | | |
| | | Face Amount | | | Value | |
| | | | | | | |
| COMMON STOCK — continued | | | | | | | | |
| | | | | | | | | |
| Technology — 16.9% | | | | | | | | |
| Allscripts Healthcare Solutions * | | | 72,829 | | | $ | 942,407 | |
| Apple | | | 2,345 | | | | 928,808 | |
| Equinix | | | 4,474 | | | | 826,437 | |
| Google, Cl A * | | | 1,125 | | | | 990,416 | |
| Magnachip Semiconductor * | | | 63,298 | | | | 1,156,454 | |
| Microsoft | | | 29,886 | | | | 1,031,964 | |
| Motorola Solutions | | | 17,696 | | | | 1,021,590 | |
| NXP Semiconductor * | | | 33,708 | | | | 1,044,274 | |
| Yahoo! * | | | 38,314 | | | | 962,065 | |
| | | | | | | | 8,904,415 | |
| Telecommunications — 6.1% | | | | | | | | |
| Crown Castle International * | | | 13,100 | | | | 948,309 | |
| Sprint Nextel * | | | 139,918 | | | | 982,224 | |
| T-Mobile US | | | 51,724 | | | | 1,283,273 | |
| | | | | | | | 3,213,806 | |
| TOTAL UNITED STATES | | | | | | | 47,889,023 | |
| TOTAL COMMON STOCK | | | | | | | | |
| (Cost $51,286,457) | | | | | | | 52,672,792 | |
| | | | | | | | | |
| TIME DEPOSIT — 0.0% | | | | | | | | |
| Brown Brothers Harriman, 0.030%, 07/01/13 | | | | | | | | |
| (Cost $18,070) | | $ | 18,070 | | | | 18,070 | |
| TOTAL INVESTMENTS — 99.9% | | | | | | | | |
| (Cost $51,304,527) | | | | | | $ | 52,690,862 | |
Percentages are based on Net Assets of $52,739,550.
| * | Non-income producing security. |
ADR — American Depositary Receipt
Cl — Class
Ser — Series
The following is a summary of the inputs used as of June 30, 2013, in valuing the Fund's investments carried at value:
| Investments in Securities | | Level 1 | | | Level 2 | | | Level 3 | | | Total | |
| Common Stock | | $ | 52,672,792 | | | $ | — | | | $ | — | | | $ | 52,672,792 | |
| Time Deposit | | | — | | | | 18,070 | | | | — | | | | 18,070 | |
| Total Investments in Securities | | $ | 52,672,792 | | | $ | 18,070 | | | $ | — | | | $ | 52,690,862 | |
For the year ended June 30, 2013, there have been no transfers between Level 1, Level 2 or Level 3 investments.
For the year ended June 30, 2013, there were no Level 3 investments.
The accompanying notes are an integral part of the financial statements.
|
| | |
| Schedule of Investments | June 30, 2013 |
| | |
Global X SuperIncome Preferred ETF |
Sector Weightings (unaudited)†:
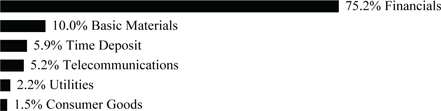
† Percentages based on total investments.
| | | Shares | | | Value | |
| | | | | | | |
| PREFERRED STOCK — 93.6% | | | | | | | | |
| | | | | | | | | |
| UNITED STATES— 93.6% | | | | | | | | |
| Basic Materials — 10.0% | | | | | | | | |
| AngloGold Ashanti Holdings Finance, 6.000% | | | 19,143 | | | $ | 329,451 | |
| ArcelorMittal, 6.000% | | | 92,619 | | | | 1,738,458 | |
| Cliffs Natural Resources, 7.000% | | | 31,036 | | | | 550,579 | |
| NuStar Logistics, 7.625% | | | 16,905 | | | | 442,911 | |
| Pitney Bowes, 6.700% | | | 18,104 | | | | 457,126 | |
| | | | | | | | 3,518,525 | |
| Consumer Goods — 1.5% | | | | | | | | |
| Goodyear Tire & Rubber, 5.875% | | | 10,458 | | | | 515,161 | |
| Financials — 74.8% | | | | | | | | |
| Aegon, 8.000% | | | 22,198 | | | | 617,327 | |
| Aegon, 7.250% | | | 44,957 | | | | 1,128,870 | |
| Ally Financial, Ser A, 8.500% | | | 15,781 | | | | 408,096 | |
| Ally Financial, 7.375% | | | 13,764 | | | | 344,926 | |
| Annaly Capital Management, Ser D, 7.500% | | | 19,344 | | | | 476,443 | |
| Bank of America, Ser J, 7.250% | | | 11,003 | | | | 280,026 | |
| Barclays Bank, Ser 3, 7.100% | | | 19,700 | | | | 492,697 | |
| Barclays Bank, Ser 4, 7.750% | | | 16,475 | | | | 415,994 | |
| Barclays Bank, Ser 5, 8.125% | | | 37,774 | | | | 956,815 | |
| Citigroup Capital XIII, 7.875% | | | 66,077 | | | | 1,840,244 | |
| Deutsche Bank Capital Funding Trust X, 7.350% | | | 13,233 | | | | 335,324 | |
| Deutsche Bank Contingent Capital Trust III, 7.600% | | | 32,337 | | | | 863,398 | |
| Deutsche Bank Contingent Capital Trust V, 8.050% | | | 22,431 | | | | 617,526 | |
| GMAC Capital Trust I, Ser 2, 8.125% | | | 41,038 | | | | 1,069,040 | |
| Hartford Financial Services Group, 7.875% | | | 24,996 | | | | 736,882 | |
| HSBC Holdings, 8.125% | | | 25,556 | | | | 648,100 | |
| HSBC Holdings, Ser 2, 8.000% | | | 43,614 | | | | 1,181,939 | |
| ING Groep, 8.500% | | | 32,036 | | | | 810,831 | |
| ING Groep, 7.375% | | | 24,028 | | | | 600,220 | |
| ING Groep, 7.200% | | | 17,628 | | | | 441,229 | |
| JPMorgan Chase, Ser J, 8.625% | | | 30,488 | | | | 774,090 | |
The accompanying notes are an integral part of the financial statements.
|
| | |
| Schedule of Investments | June 30, 2013 |
| | |
Global X SuperIncome Preferred ETF |
| | | Shares/Face | | | | |
| | | Amount | | | Value | |
| | | | | | | |
| PREFERRED STOCK — continued | | | | | | | | |
| | | | | | | | | |
| Financials — continued | | | | | | | | |
| JPMorgan Chase Capital XXIX, 6.700% | | | 25,222 | | | $ | 639,630 | |
| KKR Financial Holdings, 7.375% | | | 15,852 | | | | 410,567 | |
| Lloyds Banking Group, 7.750% | | | 36,298 | | | | 969,883 | |
| MetLife, 6.500% | | | 62,904 | | | | 1,590,213 | |
| Morgan Stanley Capital Trust VI, 6.600% | | | 33,062 | | | | 835,807 | |
| Morgan Stanley Capital Trust VII, 6.600% | | | 41,719 | | | | 1,037,134 | |
| NorthStar Realty Finance, 8.250% | | | 14,775 | | | | 363,465 | |
| Royal Bank of Scotland Group, Ser Q, 6.750% | | | 17,399 | | | | 388,172 | |
| Royal Bank of Scotland Group, Ser T, 7.250% | | | 42,223 | | | | 1,011,663 | |
| Royal Bank of Scotland Group, 6.400% | | | 19,569 | | | | 415,450 | |
| Santander Finance Preferred, Ser 10, 10.500% | | | 34,836 | | | | 940,224 | |
| Wachovia Preferred Funding, Ser A, 7.250% | | | 16,676 | | | | 446,917 | |
| Wells Fargo, Ser J, 8.000% | | | 47,576 | | | | 1,376,849 | |
| Zions Bancorporation, Ser C, 9.500% | | | 33,714 | | | | 856,336 | |
| | | | | | | | 26,322,327 | |
| Telecommunications — 5.2% | | | | | | | | |
| Qwest, 7.500% | | | 24,339 | | | | 649,121 | |
| Qwest, 7.375% | | | 27,515 | | | | 728,047 | |
| Qwest, 7.000% | | | 16,920 | | | | 438,736 | |
| | | | | | | | 1,815,904 | |
| Utilities — 2.1% | | | | | | | | |
| Dominion Resources, Ser A, 8.375% | | | 28,899 | | | | 759,755 | |
| TOTAL UNITED STATES | | | | | | | 32,931,672 | |
| TOTAL PREFERRED STOCK | | | | | | | | |
| (Cost $33,990,043) | | | | | | | 32,931,672 | |
| | | | | | | | | |
| TIME DEPOSIT — 5.9% | | | | | | | | |
| Brown Brothers Harriman, 0.030%, 07/01/13 | | | | | | | | |
| (Cost $2,063,366) | | $ | 2,063,366 | | | | 2,063,366 | |
| TOTAL INVESTMENTS — 99.5% | | | | | | | | |
| (Cost $36,053,409) | | | | | | $ | 34,995,038 | |
Percentages are based on Net Assets of $35,169,376.
Ser — Series
The accompanying notes are an integral part of the financial statements.
|
| | |
| Schedule of Investments | June 30, 2013 |
| | |
Global X SuperIncome Preferred ETF |
The following is a summary of the inputs used as of June 30, 2013, in valuing the Fund's investments carried at value:
| Investments in Securities | | Level 1 | | | Level 2 | | | Level 3 | | | Total | |
| Preferred Stock | | $ | 32,931,672 | | | $ | — | | | $ | — | | | $ | 32,931,672 | |
| Time Deposit | | | — | | | | 2,063,366 | | | | — | | | | 2,063,366 | |
| Total Investments in Securities | | $ | 32,931,672 | | | $ | 2,063,366 | | | $ | — | | | $ | 34,995,038 | |
For the period ended June 30, 2013, there have been no transfers between Level 1, Level 2 or Level 3 investments.
For the period ended June 30, 2013, there were no Level 3 investments.
The accompanying notes are an integral part of the financial statements.
|
| |
| Statements of Assets and Liabilities |
| June 30, 2013 |
| | | Global X | | | Global X Top
Guru Holdings | | | Global X
SuperIncome | |
| | Permanent ETF | | | Index ETF | | | Preferred ETF | |
| | | | | | | | | | |
| Assets: | | | | | | | | | |
| Cost of Investments | | $ | 16,604,102 | | | $ | 51,304,527 | | | $ | 36,053,409 | |
| Investments at Value | | $ | 15,120,003 | | | $ | 52,690,862 | | | $ | 34,995,038 | |
| Receivable for Investment Securities Sold | | | 1,255,781 | | | | — | | | | — | |
| Dividend and Interest Receivable | | | 55,696 | | | | 79,045 | | | | 191,328 | |
| Reclaim Receivable | | | 65 | | | | — | | | | — | |
| Total Assets | | | 16,431,545 | | | | 52,769,907 | | | | 35,186,366 | |
| | | | | | | | | | | | | |
| Liabilities: | | | | | | | | | | | | |
| Payable for Investment Securities Purchased | | | 1,376,635 | | | | — | | | | — | |
| Payable due to Investment Adviser | | | 7,058 | | | | 30,357 | | | | 16,990 | |
| Total Liabilities | | | 1,383,693 | | | | 30,357 | | | | 16,990 | |
| Net Assets | | $ | 15,047,852 | | | $ | 52,739,550 | | | $ | 35,169,376 | |
| Net Assets Consist of: | | | | | | | | | | | | |
| Paid-in Capital | | $ | 16,682,516 | | | $ | 51,591,896 | | | $ | 36,223,598 | |
| Undistributed Net Investment Income | | | 62,178 | | | | 10,056 | | | | 188,919 | |
| Accumulated Net Realized Loss on Investments and Foreign Currency Transactions | | | (212,971 | ) | | | (248,737 | ) | | | (184,770 | ) |
| Net Unrealized Appreciation (Depreciation) on Investments | | | (1,484,099 | ) | | | 1,386,335 | | | | (1,058,371 | ) |
| Net Unrealized Appreciation on Foreign Currency Translations | | | 228 | | | | — | | | | — | |
| Net Assets | | $ | 15,047,852 | | | $ | 52,739,550 | | | $ | 35,169,376 | |
| Outstanding Shares of Beneficial Interest (unlimited authorization — no par value) | | | 650,000 | | | | 2,550,000 | | | | 2,400,000 | |
| | | | | | | | | | | | | |
| Net Asset Value, Offering and Redemption Price Per Share | | $ | 23.15 | | | $ | 20.68 | | | $ | 14.65 | |
The accompanying notes are an integral part of the financial statements.
|
| |
| Statements of Operations |
| For the Period Ended June 30, 2013 |
| | | | | | Global X Top | | | Global X | |
| | | Global X | | | Guru | | | SuperIncome | |
| | | Permanent | | | Holdings | | | Preferred | |
| | | ETF | | | Index ETF | | | ETF(1) | |
| Investment Income: | | | | | | | | | | | | |
| Dividend Income | | $ | 114,693 | | | $ | 171,923 | | | $ | 1,073,733 | |
| Interest Income | | | 133,194 | | | | 4 | | | | 58 | |
| Less: Foreign Taxes Withheld, Net | | | (481 | ) | | | (1,410 | ) | | | — | |
| Total Investment Income | | | 247,406 | | | | 170,517 | | | | 1,073,791 | |
| Supervision and Administration Fees(2) | | | 81,424 | | | | 80,159 | | | | 73,890 | |
| Total Expenses | | | 81,424 | | | | 80,159 | | | | 73,890 | |
| Net Investment Income | | | 165,982 | | | | 90,358 | | | | 999,901 | |
| | | | | | | | | | | | | |
| Net Realized Gain (Loss) on: | | | | | | | | | | | | |
| Investments | | | 53,149 | | | | 1,013,450 | | | | (173,657 | ) |
| Foreign Currency Transactions | | | 1,428 | | | | 10 | | | | — | |
| | | | | | | | | | | | | |
| Net Realized Gain (Loss) on Investments and Foreign Currency Transactions | | | 54,577 | | | | 1,013,460 | | | | (173,657 | ) |
| | | | | | | | | | | | | |
| Net Change in Unrealized Appreciation (Depreciation) on: | | | | | | | | | | | | |
| Investments | | | (1,434,987 | ) | | | 1,093,978 | | | | (1,058,371 | ) |
| Foreign Currency Translations | | | 228 | | | | — | | | | — | |
| | | | | | | | | | | | |
| Net Change in Unrealized Appreciation (Depreciation) on Investments and Foreign Currency Translations | | | (1,434,759 | ) | | | 1,093,978 | | | | (1,058,371 | ) |
| | | | | | | | | | | | | |
| Net Realized and Unrealized Gain (Loss) on Investments and Foreign Currency Transactions and Translations | | | (1,380,182 | ) | | | 2,107,438 | | | | (1,232,028 | ) |
| | | | | | | | | | | | | |
| Net Increase (Decrease) in Net Assets Resulting from Operations | | $ | (1,214,200 | ) | | $ | 2,197,796 | | | $ | (232,127 | ) |
| (1) | The Fund commenced operations on July 16, 2012. |
| (2) | The Supervision and Administration fees reflect the supervisory and administrative fee, which includes fees paid by the Funds for the investment advisory services provided by the Adviser. See Note 3 in Notes to Financial Statements. |
The accompanying notes are an integral part of the financial statements.
| Statements of Changes in Net Assets |
| |
| | | | | | | | | Global X Top Guru Holdings Index | |
| | | Global X Permanent ETF | | | ETF | |
| | | Year Ended | | | Period Ended | | | Year Ended | | | Period Ended | |
| | | June 30, 2013 | | | June 30, 2012(1) | | | June 30, 2013 | | | June 30, 2012(2) | |
| Operations: | | | | | | | | | | | | | | | | |
| Net Investment Income | | $ | 165,982 | | | $ | 36,536 | | | $ | 90,358 | | | $ | 7,013 | |
| Net Realized Gain (Loss) on Investments and Foreign Currency Transactions | | | 54,577 | | | | (10,857 | ) | | | 1,013,460 | | | | 3,914 | |
| Net Change in Unrealized Appreciation | | | | | | | | | | | | | | | | |
| (Depreciation) on Investments and Foreign Currency Translations | | | (1,434,759 | ) | | | (49,112 | ) | | | 1,093,978 | | | | 292,357 | |
| Net Increase (Decrease) in Net Assets Resulting from Operations | | | (1,214,200 | ) | | | (23,433 | ) | | | 2,197,796 | | | | 303,284 | |
| Dividends and Distributions from: | | | | | | | | | | | | | | | | |
| Net Investment Income | | | (114,515 | ) | | | — | | | | (20,046 | ) | | | — | |
| Net Capital Gains | | | — | | | | — | | | | (77,984 | ) | | | — | |
| Total Dividends and Distributions | | | (114,515 | ) | | | — | | | | (98,030 | ) | | | — | |
| Capital Share Transactions: | | | | | | | | | | | | | | | | |
| Issued | | | 17,655,500 | | | | 14,882,500 | | | | 59,344,500 | | | | 5,236,000 | |
| Redeemed | | | (16,138,000 | ) | | | — | | | | (14,244,000 | ) | | | — | |
| Increase in Net Assets from Capital Share Transactions | | | 1,517,500 | | | | 14,882,500 | | | | 45,100,500 | | | | 5,236,000 | |
| Total Increase in Net Assets | | | 188,785 | | | | 14,859,067 | | | | 47,200,266 | | | | 5,539,284 | |
| Net Assets: | | | | | | | | | | | | | | | | |
| Beginning of Year/Period | | | 14,859,067 | | | | — | | | | 5,539,284 | | | | — | |
| End of Year/Period | | $ | 15,047,852 | | | $ | 14,859,067 | | | $ | 52,739,550 | | | $ | 5,539,284 | |
| | | | | | | | | | | | | | | | | |
| Undistributed Net Investment Income | | $ | 62,178 | | | $ | 40,850 | | | $ | 10,056 | | | $ | 7,013 | |
| | | | | | | | | | | | | | | | | |
| Share Transactions: | | | | | | | | | | | | | | | | |
| Issued | | | 700,000 | | | | 600,000 | | | | 2,950,000 | | | | 350,000 | |
| Redeemed | | | (650,000 | ) | | | — | | | | (750,000 | ) | | | — | |
| Net Increase in Shares Outstanding from Share Transactions | | | 50,000 | | | | 600,000 | | | | 2,200,000 | | | | 350,000 | |
| (1) | The Fund commenced operations on February 7, 2012. |
| (2) | The Fund commenced operations on June 4, 2012. |
The accompanying notes are an integral part of the financial statements.
| Statements of Changes in Net Assets |
| |
| | | Global X | |
| | | SuperIncome | |
| | | Preferred ETF | |
| | | Period Ended | |
| | | June 30, 2013(1) | |
| Operations: | | | | |
| Net Investment Income | | $ | 999,901 | |
| Net Realized Loss on Investments and Foreign Currency Transactions | | | (173,657 | ) |
| Net Change in Unrealized Depreciation on Investments and Foreign Currency Translations | | | (1,058,371 | ) |
| Net Decrease in Net Assets Resulting from Operations | | | (232,127 | ) |
| Dividends and Distributions from: | | | | |
| Net Investment Income | | | (796,414 | ) |
| Net Capital Gains | | | (6,583 | ) |
| Total Dividends and Distributions | | | (802,997 | ) |
| Capital Share Transactions: | | | | |
| Issued | | | 37,687,000 | |
| Redeemed | | | (1,482,500 | ) |
| Increase in Net Assets from Capital Share Transactions | | | 36,204,500 | |
| Total Increase in Net Assets | | | 35,169,376 | |
| Net Assets: | | | | |
| Beginning of Period | | | — | |
| End of Period | | $ | 35,169,376 | |
| | | | | |
| Undistributed Net Investment Income | | $ | 188,919 | |
| | | | | |
| Share Transactions: | | | | |
| Issued | | | 2,500,000 | |
| Redeemed | | | (100,000 | ) |
| Net Increase in Shares Outstanding from Share Transactions | | | 2,400,000 | |
| (1) | The Fund commenced operations on July 16, 2012. |
The accompanying notes are an integral part of the financial statements.
Selected Per Share Data & Ratios
For a Share Outstanding Throughout the Period
| | | | | | | | | Net Realized | | | | | | | | | | | | | | | | | | | | | | | | | | | Ratio of | | | | |
| | | | | | | | | and | | | | | | | | | | | | | | | | | | | | | | | | Ratio of | | | Net | | | | |
| | | | | | | | | Unrealized | | | | | | | | | | | | | | | | | | | | | Net | | | Expenses | | | Investment | | | | |
| | | Net Asset | | | Net | | | Gain (Loss) | | | | | | Distribution | | | Distribution | | | | | | Net Asset | | | | | | Assets | | | to | | | Income to | | | | |
| | | Value, | | | Investment | | | on | | | Total from | | | from Net | | | from | | | Total from | | | Value, End | | | Total | | | End of | | | Average | | | Average | | | Portfolio | |
| | | Beginning | | | Income | | | Investments | | | Operations | | | Investment | | | Capital | | | Distributions | | | of Period | | | Return | | | Period | | | Net Assets | | | Net Assets | | | Turnover | |
| | | of Period ($) | | | ($)* | | | ($) | | | ($) | | | Income ($) | | | Gains ($) | | | ($) | | | ($) | | | (%)** | | | ($)(000) | | | (%) | | | (%) | | | (%)†† | |
| Global X Permanent ETF | | | | | | | | | | | | | | | | | | | | | | | | | | | | | | | | | | | | | | | | | |
| 2013 | | | 24.77 | | | | 0.25 | | | | (1.66 | ) | | | (1.41 | ) | | | (0.21 | ) | | | — | | | | (0.21 | ) | | | 23.15 | | | | (5.77 | ) | | | 15,048 | | | | 0.48 | | | | 0.98 | | | | 44.44 | |
| 2012(1) | | | 25.04 | | | | 0.09 | | | | (0.36 | ) | | | (0.27 | ) | | | — | | | | — | | | | — | | | | 24.77 | | | | (1.08 | ) | | | 14,859 | | | | 0.48 | † | | | 0.92 | † | | | 14.89 | |
| Global X Top Guru Holdings Index ETF | | | | | | | | | | | | | | | | | | | | | | | | | | | | | | | | | | | | | | | | | | |
| 2013 | | | 15.83 | | | | 0.17 | | | | 5.66 | | | | 5.83 | | | | (0.20 | ) | | | (0.78 | ) | | | (0.98 | ) | | | 20.68 | | | | 38.08 | | | | 52,740 | | | | 0.75 | | | | 0.85 | | | | 77.25 | |
| 2012(2) | | | 14.96 | | | | 0.02 | | | | 0.85 | | | | 0.87 | | | | — | | | | — | | | | — | | | | 15.83 | | | | 5.82 | | | | 5,539 | | | | 0.75 | † | | | 1.90 | † | | | 1.90 | |
| Global X SuperIncome Preferred ETF | | | | | | | | | | | | | | | | | | | | | | | | | | | | | | | | | | | | | | | | | | |
| 2013(3) | | | 15.02 | | | | 1.13 | | | | (0.47 | ) | | | 0.66 | | | | (1.02 | ) | | | (0.01 | ) | | | (1.03 | ) | | | 14.65 | | | | 4.46 | | | | 35,169 | | | | 0.58 | † | | | 7.84 | † | | | 91.98 | |
| (1) | The Fund commenced operations on February 7, 2012. |
| (2) | The Fund commenced operations on June 4, 2012. |
| (3) | The Fund commenced operations on July 16, 2012. |
| * | Per share data calculated using average shares method. |
| ** | Total return is based on the change in net asset value of a share during the year or period and assumes reinvestment of dividends and distributions at net asset value. Total return is for the period indicated and has not been annualized. The return shown does not reflect the deduction of taxes that a shareholder would pay on Fund distributions or the redemption of Fund shares. |
| †† | Portfolio turnover rate is for the period indicated and periods of less than one year have not been annualized. Excludes effect of in-kind transfers. |
Amounts designated as “—” are either $0 or have been rounded to $0.
The accompanying notes are an integral part of the financial statements.
| Notes to Financial Statements |
| June 30, 2013 |
1. ORGANIZATION
The Global X Funds (the "Trust") is a Delaware Statutory Trust formed on March 6, 2008. The Trust is registered under the Investment Company Act of 1940, as amended, as an open- end management investment company with seventy-nine portfolios (thirty-five of which were operational) as of June 30, 2013. The financial statements herein and the related notes pertain to the Global X Permanent ETF, Global X Top Guru Holdings Index ETF and Global X SuperIncome Preferred ETF (each a “Fund”, collectively, the “Funds”). Each Fund is non-diversified.
2. SIGNIFICANT ACCOUNTING POLICIES
The following is a summary of the significant accounting policies followed by the Funds.
USE OF ESTIMATES — The preparation of financial statements in conformity with U.S. generally accepted accounting principles ("U.S. GAAP") requires management to make estimates and assumptions that affect the reported amounts of assets and liabilities and disclosure of contingent assets and liabilities at the date of the financial statements and the reported amounts of increases and decreases in net assets from operations during the reporting period. Actual results could differ from those estimates, and could have a material impact to the Funds.
SECURITY VALUATION — Securities listed on a securities exchange, market or automated quotation system for which quotations are readily available (except for securities traded on NASDAQ), including securities traded over the counter, are valued at the last quoted sale price on the primary exchange or market (foreign or domestic) on which they are traded (or at approximately 4:00 pm if a security’s primary exchange is normally open at that time), or, if there is no such reported sale, at the most recent mean between the quoted bid and asked prices (absent both bid and asked prices on such exchange, the bid price may be used).
For securities traded on NASDAQ, the NASDAQ Official Closing Price will be used. If available, debt securities are priced based upon valuations provided by independent, third-party pricing agents. Such values generally reflect the last reported sales price if the security is actively traded. The third-party pricing agents may also value debt securities at an evaluated bid price by employing methodologies that utilize actual market transactions, broker-supplied valuations, or other methodologies designed to identify the market value for such securities. Debt obligations with remaining maturities of sixty days or less may be valued at their amortized cost, which approximates market value. The prices for foreign securities are reported in local currency and converted to U.S. dollars using currency exchange rates. Prices for most securities held in the Funds are provided daily by recognized independent pricing agents. If a security price cannot be obtained from an independent, third-party pricing agent, the Funds seek to obtain a bid price from at least one independent broker.
| Notes to Financial Statements (Continued) |
| June 30, 2013 |
2. SIGNIFICANT ACCOUNTING POLICIES (continued)
SECURITY VALUATION (continued)
Securities for which market prices are not "readily available" are valued in accordance with Fair Value Procedures established by the Board of Trustees (the “Board”). The Funds’ Fair Value Procedures are implemented through a Fair Value Committee (the “Committee”) designated by the Board. Some of the more common reasons that may necessitate that a security be valued using Fair Value Procedures include: the security's trading has been halted or suspended; the security has been de-listed from its primary trading exchange; the security's primary trading market is temporarily closed at a time when under normal conditions it would be open; the security has not been traded for an extended period of time; the security's primary pricing source is not able or willing to provide a price; or trading of the security is subject to local government-imposed restrictions. In addition, the Funds may fair value their securities if an event that may materially affect the value of the Funds’ securities that traded outside of the United States (a “Significant Event”) has occurred between the time of the security's last close and the time that the Funds calculate their net asset value. A Significant Event may relate to a single issuer or to an entire market sector. Events that may be Significant Events include: government actions, natural disasters, armed conflict, acts of terrorism and significant market fluctuations. If Global X Management Company LLC (“Adviser”) becomes aware of a Significant Event that has occurred with respect to a security or group of securities after the closing of the exchange or market on which the security or securities principally trade, but before the time at which the Funds calculate net asset value, it may request that a Committee meeting be called. When a security is valued in accordance with the Fair Value Procedures, the Committee will determine the value after taking into consideration all relevant information reasonably available to the Committee. As of June 30, 2013, there were no securities priced using the Fair Value Procedures.
In accordance with the authoritative guidance on fair value measurements and disclosure under U.S. GAAP, the Funds disclose the fair value of their investments in a hierarchy that prioritizes the inputs to valuation techniques used to measure the fair value. The objective of a fair value measurement is to determine the price that would be received to sell an asset or paid to transfer a liability in an orderly transaction between market participants at the measurement date (an exit price). Accordingly, the fair value hierarchy gives the highest priority to quoted prices (unadjusted) in active markets for identical assets or liabilities (Level 1) and the lowest priority to unobservable inputs (Level 3). The three levels of the fair value hierarchy are described below:
Level 1 – Unadjusted quoted prices in active markets for identical, unrestricted assets or liabilities that the Funds have the ability to access at the measurement date
Level 2 – Other significant observable inputs (including quoted prices in non-active markets, quoted prices for similar investments, fair value of investments for which the Funds have the ability to fully redeem tranches at net asset value as of the measurement date or within the near-term, and short-term investments valued at amortized cost)
Level 3 – Significant unobservable inputs (including the Funds own assumptions in determining the fair value of investments, fair value of investments for which the Funds do not have the ability to fully redeem tranches at net asset value as of the measurement date or within the near-term)
| Notes to Financial Statements (Continued) |
| June 30, 2013 |
2. SIGNIFICANT ACCOUNTING POLICIES (continued)
SECURITY VALUATION (concluded)
Investments are classified within the level of the lowest significant input considered in determining fair value. Investments classified within Level 3 whose fair value measurement considers several inputs may include Level 1 or Level 2 inputs as components of the overall fair value measurement.
For the year or period ended June 30, 2013, there have been no significant changes to the Funds’ fair valuation methodologies.
FEDERAL INCOME TAXES — It is each Fund’s intention to qualify or continue to qualify as a regulated investment company for Federal income tax purposes by complying with the appropriate provisions of Subchapter M of the Internal Revenue Code of 1986, as amended. Accordingly, no provisions for Federal income taxes have been made in the financial statements.
The Funds evaluate tax positions taken or expected to be taken in the course of preparing the Funds’ tax returns to determine whether it is "more-likely-than-not" (i.e., greater than 50 percent) that each tax position will be sustained upon examination by a taxing authority based on the technical merits of the position. Tax positions not deemed to meet the more-likely-than-not threshold are recorded as a tax benefit or expense in the current year. The Funds did not record any tax provisions in the current period. However, management’s conclusions regarding tax positions may be subject to review and adjustment at a later date based on factors including, but not limited to, examination by tax authorities (i.e., the last three tax year ends, as applicable), on-going analysis of and changes to tax laws, regulations and interpretations thereof.
As of and during the year or period ended June 30, 2013, the Funds did not have a liability for any unrecognized tax benefits. The Funds recognize interest and penalties, if any, related to unrecognized tax benefits as income tax expense in the Statement of Operations. During the year or period, the Funds did not incur any interest or penalties.
| Notes to Financial Statements (Continued) |
| June 30, 2013 |
2. SIGNIFICANT ACCOUNTING POLICIES (concluded)
SECURITY TRANSACTIONS AND INVESTMENT INCOME — Security transactions are accounted for on the trade date for financial reporting purposes. Costs used in determining realized gains and losses on the sale of investment securities are based on specific identification. Dividend income is recorded on the ex-dividend date. Interest income is recognized on the accrual basis from the settlement date.
FOREIGN CURRENCY TRANSLATION — The books and records of the Funds are maintained in U.S. dollars. Investment securities and other assets and liabilities denominated in a foreign currency are translated into U.S. dollars on the date of valuation. Purchases and sales of investment securities, income and expenses are translated into U.S. dollars at the relevant rates of exchange prevailing on the respective dates of such transactions. The Funds do not isolate that portion of realized or unrealized gains and losses resulting from changes in the foreign exchange rate from fluctuations arising from changes in the market prices of the securities. These gains and losses are included in net realized and unrealized gains and losses on investments on the Statement of Operations. Net realized and unrealized gains and losses on foreign currency transactions represent net foreign exchange gains or losses from foreign currency exchange contracts, disposition of foreign currencies, currency gains or losses realized between trade and settlement dates on securities transactions and the difference between the amount of the investment income and foreign withholding taxes recorded on the Funds’ books and the U.S. dollar equivalent amounts actually received or paid.
DIVIDENDS AND DISTRIBUTIONS TO SHAREHOLDERS — The Funds distribute their net investment income on a pro rata basis. Any net realized capital gains are distributed annually. All distributions are recorded on the ex-dividend date.
INVESTMENTS IN REITS — With respect to the Funds, dividend income is recorded based on the income included in distributions received from the Real Estate Investment Trust (“REIT”) investments using published REIT reclassifications including some management estimates when actual amounts are not available. Distributions received in excess of these estimated amounts are recorded as a reduction of the cost of investments or reclassified to capital gains. The actual amounts of income, return of capital, and capital gains are only determined by each REIT after its fiscal year end, and may differ from the estimated amounts.
CREATION UNITS — The Funds issue and redeem shares (“Shares”) at Net Asset Value (“NAV”), and only in large blocks of Shares (each block of Shares for a Fund is called a “Creation Unit” or multiples thereof). Purchasers of Creation Units (“Authorized Participants”) at NAV must pay a standard creation transaction fee per transaction (“Transaction Fee”). The fee is a single charge and will be the same regardless of the number of Creation Units purchased by an investor on the same day. An Authorized Participant who holds Creation Units and wishes to redeem at NAV would also pay a standard Redemption Fee per transaction on the date of such redemption, regardless of the number of Creation Units redeemed that day.
If a Creation Unit is purchased or redeemed for cash, a higher Transaction Fee or Redemption Fee, respectively, will be charged. The following table discloses Creation Unit breakdown:
| | | Creation | | | Transaction | | | | | | Redemption | |
| | | Unit Shares | | | Fee | | | Value | | | Fee | |
| Global X Permanent ETF | | | 50,000 | | | $ | 1,000 | | | $ | 1,157,500 | | | $ | 1,000 | |
| Global X Top Guru Holdings Index ETF | | | 50,000 | | | | 750 | | | | 1,034,000 | | | | 750 | |
| Global X SuperIncome Preferred ETF | | | 50,000 | | | | 500 | | | | 732,500 | | | | 500 | |
| Notes to Financial Statements (Continued) |
| June 30, 2013 |
3. RELATED PARTY TRANSACTIONS
The Adviser serves as the investment adviser and the administrator for the Funds. Subject to the supervision of the Board, the Adviser is responsible for managing the investment activities of the Funds and the Funds’ business affairs and other administrative matters and provides or causes to be furnished all supervisory, administrative and other services reasonably necessary for the operation of the Funds, including certain distribution services (provided pursuant to a separate Distribution Agreement), certain shareholder and distribution-related services (provided pursuant to a separate Rule 12b-1 Plan and related agreements) and investment advisory services (provided pursuant to a separate Investment Advisory Agreement), under what is essentially an "all-in" fee structure. For its service to the Funds, under the Supervision and Administration Agreement, each Fund pays a monthly fee to the Adviser at the annual rate (stated as a percentage of the average daily net assets of the Fund). In addition, the Funds bear other expenses that are not covered by the Supervision and Administration Agreement, which may vary and affect the total expense ratios of the Funds, such as taxes, brokerage fees, commissions, acquired fund fees, and other transaction expenses, interest expenses and extraordinary expenses (such as litigation and indemnification expenses).
| | Supervision and |
| | Administration Fee |
| Global X Permanent ETF | 0.48% |
| Global X Top Guru Holdings Index ETF | 0.75% |
| Global X SuperIncome Preferred ETF | 0.58% |
SEI Investments Global Funds Services (“SEIGFS”) serves as Sub-Administrator to the Funds pursuant to a Sub-Administration Agreement. As Sub-Administrator, SEIGFS provides the Funds with the required general administrative services, including, without limitation: office space, equipment, and personnel; clerical and general back office services; bookkeeping, internal accounting and secretarial services; the calculation of NAV; and assistance with the preparation and filing of reports, registration statements, proxy statements and other materials required to be filed or furnished by the Funds under federal and state securities laws. As compensation for these services, the Sub-Administrator receives certain out-of-pocket costs, transaction fees and asset-based fees which are accrued daily and paid monthly by the Adviser.
SEI Investments Distribution Co. (“SIDCO” or the “Distributor”) serves as each Fund’s underwriter and distributor of Shares pursuant to a Distribution Agreement. Under the Distribution Agreement, SIDCO, as agent, receives orders to create and redeem Shares in Creation Unit Aggregations and transmits such orders to the Trust’s custodian and transfer agent. The Distributor has no obligation to sell any specific quantity of Fund Shares. SIDCO bears the following costs and expenses relating to the distribution of Shares: (i) the costs of processing and maintaining records of creations of Creation Units; (ii) all costs of maintaining the records required of a registered broker/dealer; (iii) the expenses of maintaining its registration or qualification as a dealer or broker under Federal or state laws; (iv) filing fees; and (v) all other expenses incurred in connection with the distribution services as contemplated in the Distribution Agreement. SIDCO receives no fee for its distribution services under the Distribution Agreement.
| Notes to Financial Statements (Continued) |
| June 30, 2013 |
4. INVESTMENT TRANSACTIONS
For the year or period ended June 30, 2013, the purchases and sales of investments in securities excluding in-kind transactions, long-term U.S. Government and short-term securities were:
| | | | | | Sales and | |
| | | Purchases | | | Maturities | |
| Global X Permanent ETF | | $ | 7,764,752 | | | $ | 7,594,036 | |
| Global X Top Guru Holdings Index ETF | | | 9,286,251 | | | | 11,113,007 | |
| Global X SuperIncome Preferred ETF | | | 12,853,343 | | | | 14,904,206 | |
For the year or period ended June 30, 2013, in-kind transactions associated with creations and redemptions were:
| | | | | | Sales and | | | Realized | |
| | | Purchases | | | Maturities | | | Gain/loss | |
| Global X Permanent ETF | | $ | 11,729,628 | | | $ | 10,171,012 | | | $ | 186,744 | |
| Global X Top Guru Holdings Index ETF | | | 59,260,722 | | | | 12,391,609 | | | | 1,219,288 | |
| Global X SuperIncome Preferred ETF | | | 37,655,138 | | | | 1,438,509 | | | | 3,348 | |
5. TAX INFORMATION
The amount and character of income and capital gain distributions to be paid, if any, are determined in accordance with Federal income tax regulations, which may differ from U.S. GAAP. As a result investment income (loss) and net realized gain (loss) on investment transactions for a reporting period may differ significantly from distributions during such period. These book/tax differences may be temporary or permanent. To the extent these differences are permanent in nature, they are charged or credited to undistributed (accumulated) net investment income (loss), accumulated net realized gain (loss) or paid-in capital, as appropriate, in the period that the differences arise.
The following differences, primarily attributable to foreign currency, equalization, passive foreign investment companies (“PFIC”) gain reclass and redemption in-kind gains or losses have been reclassified to/from the following accounts during the fiscal year ended June 30, 2013.
| | | | | | Accumulated | | | | |
| | | | | | Net | | | Accumulated | |
| | | Paid-in | | | Investment | | | Net Realized | |
| Global X Funds | | Capital | | | Loss | | | Loss | |
| Global X Permanent ETF | | $ | 282,516 | | | $ | (30,139 | ) | | $ | (252,377 | ) |
| Global X Top Guru Holdings Index ETF | | | 1,255,396 | | | | (67,269 | ) | | | (1,188,127 | ) |
| Global X SuperIncome Preferred ETF | | | 19,098 | | | | (14,568 | ) | | | (4,530 | ) |
These reclassifications have no impact on net assets or net asset value per share.
| Notes to Financial Statements (Continued) |
| June 30, 2013 |
5. TAX INFORMATION (concluded)
The tax character of dividends and distributions paid during the years or periods ended June 30, 2013 and 2012 were as follows:
| | | Ordinary | | | Long-Term | | | | |
| Global X Funds | | Income | | | Capital Gain | | | Totals | |
| Global X Permanent ETF | | | | | | | | | | | | |
| 2013 | | $ | 114,515 | | | $ | – | | | $ | 114,515 | |
| 2012 | | | – | | | | – | | | | – | |
| Global X Top Guru Holdings Index ETF | | | | | | | | | | | | |
| 2013 | | $ | 98,030 | | | $ | – | | | $ | 98,030 | |
| 2012 | | | – | | | | – | | | | – | |
| Global X SuperIncome Preferred ETF | | | | | | | | | | | | |
| 2013 | | $ | 802,997 | | | $ | – | | | $ | 802,997 | |
As of June 30, 2013, the components of tax basis distributable earnings (accumulated losses) were as follows:
| | | | | | Global X Top | | | Global X | |
| | | Global X | | | Guru Holdings | | | SuperIncome | |
| | | Permanent ETF | | | Index ETF | | | Preferred ETF | |
| Undistributed Ordinary Income | | $ | 67,631 | | | $ | 10,056 | | | $ | 286,115 | |
| Undistributed Long-Term Capital Gain | | | 47,821 | | | | – | | | | – | |
| Post October losses | | | (245,668 | ) | | | (139,465 | ) | | | (109,364 | ) |
| Unrealized Appreciation (Depreciation) on Investments and Foreign Currency | | | (1,504,448 | ) | | | 1,277,063 | | | | (1,133,776 | ) |
| Other Temporary Differences | | | – | | | | – | | | | (97,197 | ) |
| Total Distributable Earnings (Accumulated Losses) | | $ | (1,634,664 | ) | | $ | 1,147,654 | | | $ | (1,054,222 | ) |
The Federal tax cost and aggregated gross unrealized appreciation and depreciation on investments held by the Funds at June 30, 2013, were as follows:
| | | | | | Aggregated | | | Aggregated | | | Net | |
| | | | | | Gross | | | Gross | | | Unrealized | |
| | | Federal | | | Unrealized | | | Unrealized | | | Appreciation | |
| Global X Funds | | Tax Cost | | | Appreciation | | | (Depreciation) | | | (Depreciation) | |
| Global X Permanent ETF | | $ | 16,624,679 | | | $ | 199,554 | | | $ | (1,704,230 | ) | | $ | (1,504,676 | ) |
| Global X Top Guru Holdings Index ETF | | | 51,413,799 | | | | 2,604,410 | | | | (1,327,347 | ) | | | 1,277,063 | |
| Global X SuperIncome Preferred ETF | | | 36,128,814 | | | | 51,287 | | | | (1,185,063 | ) | | | (1,133,776 | ) |
The preceding differences between book and tax cost are primarily due to mark to market treatment of PFIC, partnership adjustments and wash sales.
| Notes to Financial Statements (Continued) |
| June 30, 2013 |
6. CONCENTRATION OF RISKS
The Funds invest in securities of foreign issuers in several countries. These investments may involve certain considerations and risks not typically associated with investments in the U.S. as a result of, among other factors, the possibility of future political and economic developments and the level of governmental supervision and regulation of securities markets in the respective countries.
The securities markets of emerging countries are less liquid and subject to greater price volatility, and have a smaller market capitalization, than the U.S. securities markets. In certain countries, there may be fewer publicly traded securities and the market may be dominated by a few issuers or sectors. Issuers and securities markets in such countries are not subject to as extensive and frequent accounting, financial and other reporting requirements or as comprehensive government regulations as are issuers and securities markets in the U.S. In particular, the assets and profits appearing on the financial statements of emerging country issuers may not reflect their financial position or results of operations in the same manner as financial statements for U.S. issuers. Substantially less information may be publicly available about emerging country issuers than is available about issuers in the U.S.
The Funds may be subject to taxes imposed by countries in which they invest. Such taxes are generally based on either income or gains earned or repatriated. The Funds accrue and apply such taxes to net investment income, net realized gains and net unrealized gains as income and/or capital gains are earned.
The Global X Permanent ETF may hold Exchange Traded Commodities (“ETC”) to gain exposure to gold and silver. As a result, the Fund is subject to the same risks as the underlying ETCs. While the risks of owning shares of an underlying ETC generally reflect the risks of owning the underlying commodities the ETC is designed to track, lack of liquidity in an underlying ETC can result in its value being more volatile than the underlying portfolio securities. The Fund will pay brokerage commissions in connection with the purchase and sale of shares of ETCs. ETCs that invest in commodities may be, or may become, subject to regulatory trading limits that could hurt the value of their securities and could affect the Fund’s ability to pursue its investment program. Additionally, ETCs are not registered under the Investment Company of 1940 Act and, therefore, are not subject to the regulatory scheme and investor protections of the Investment Company Act of 1940.
The Funds use a replication strategy. A replication strategy is an indexing strategy that involves investing in the securities of the Underlying Index in approximately the same proportions as in the Underlying Indices. The Funds may utilize a representative sampling strategy with respect to their Underlying Index when a replication strategy might be detrimental to their shareholders, such as when there are practical difficulties or substantial costs involved in compiling a portfolio of equity securities to follow its Underlying Index, or, in certain instances, when securities in the Underlying Indices become temporarily illiquid, unavailable or less liquid, or due to legal restrictions (such as diversification requirements that apply to the Funds but not the Underlying Indices).
| Notes to Financial Statements (Continued) |
| June 30, 2013 |
7. AUTHORIZED PARTICIPANT SHARES
At June 30, 2013, the total Shares outstanding that were held by Authorized Participants were as follows. The Authorized Participants have entered into an agreement with the Funds’ Distributor.
| | | | | Percentage of | |
| | | Authorized | | Shares | |
| | | Participants | | Outstanding | |
| Global X Permanent ETF | | 4 | | 100% | |
| Global X Top Guru Holdings Index ETF | | 4 | | 100% | |
| Global X SuperIncome Preferred ETF | | 3 | | 100% | |
Pursuant to the Trust’s organizational documents, the Trustees of the Trust and the Trust’s officers are indemnified against certain liabilities that may arise out of the performance of their duties.
8. CONTRACTUAL OBLIGATIONS
The Funds enter into contracts in the normal course of business that contain a variety of indemnifications. The Funds maximum exposure under these arrangements is unknown. However, the Funds have not had prior gains or losses pursuant to these contracts. Management has reviewed the Funds’ existing contracts and expects the risk of loss to be remote.
9. RECENT ACCOUNTING PRONOUNCEMENT
In June 2013, the Financial Accounting Standards Board issued an update (“ASU 2013-08”) to ASC Topic 946, Financial Services – Investment Companies (“Topic 946”). ASU 2013-08 amends the guidance in Topic 946 for determining whether an entity qualifies as an investment company and requires certain additional disclosures. ASU 2013-08 is effective for interim and annual reporting periods in fiscal years that begin after December 15, 2013. Management is currently evaluating the impact, if any, of ASU 2013-08 on the Funds’ financial statements.
10. SUBSEQUENT EVENTS
The Funds have evaluated the need for additional disclosures and/or adjustments resulting from subsequent events.
Effective July 1, 2013, the fiscal year-end of the Global X Permanent ETF, Global X Top Guru Holdings Index ETF and Global X SuperIncome Preferred ETF changed from June 30th to October 31st.
| Report of Independent Registered Public Accounting Firm |
| |
To the Shareholders and Board of Trustees of Global X Funds
We have audited the accompanying statements of assets and liabilities of Global X Permanent ETF, Global X Top Guru Holdings Index ETF and Global X SuperIncome Preferred ETF (three of the series constituting the Global X Funds) (the “Funds”), including the schedules of investments, as of June 30, 2013, and the related statements of operations, statements of changes in net assets, and financial highlights for each of the periods indicated therein. These financial statements and financial highlights are the responsibility of the Funds’ management. Our responsibility is to express an opinion on these financial statements and financial highlights based on our audits.
We conducted our audits in accordance with the standards of the Public Company Accounting Oversight Board (United States). Those standards require that we plan and perform the audit to obtain reasonable assurance about whether the financial statements and financial highlights are free of material misstatement. We were not engaged to perform an audit of the Funds’ internal control over financial reporting. Our audits included consideration of internal control over financial reporting as a basis for designing audit procedures that are appropriate in the circumstances, but not for the purpose of expressing an opinion on the effectiveness of the Funds’ internal control over financial reporting. Accordingly, we express no such opinion. An audit also includes examining, on a test basis, evidence supporting the amounts and disclosures in the financial statements and financial highlights, assessing the accounting principles used and significant estimates made by management, and evaluating the overall financial statement presentation. Our procedures included confirmation of securities owned as of June 30, 2013, by correspondence with the custodian and broker. We believe that our audits provide a reasonable basis for our opinion.
In our opinion, the financial statements and financial highlights referred to above present fairly, in all material respects, the financial positions of Global X Permanent ETF, Global X Top Guru Holdings Index ETF and Global X SuperIncome Preferred ETF at June 30, 2013, and the results of their operations, the changes in their net assets, and their financial highlights for each of the periods indicated therein, in conformity with U.S. generally accepted accounting principles.
Philadelphia, Pennsylvania
August 29, 2013
| Disclosure of Fund Expenses (Unaudited) |
| |
All Exchange Traded Funds (“ETF”) have operating expenses. As a shareholder of an ETF, your investment is affected by these ongoing costs, which include (among others) costs for ETF management, administrative services, commissions, and shareholder reports like this one. It is important for you to understand the impact of these costs on your investment returns. In addition, a shareholder is responsible for brokerage fees as a result of their investment in the Fund.
Operating expenses such as these are deducted from an ETF’s gross income and directly reduce its final investment return. These expenses are expressed as a percentage of the ETF’s average net assets; this percentage is known as the ETF’s expense ratio.
The following examples use the expense ratio and are intended to help you understand the ongoing costs (in dollars) of investing in your Fund and to compare these costs with those of other funds. The examples are based on an investment of $1,000 made at the beginning of the period shown and held for the entire period.
The table on the next page illustrates your Fund’s costs in two ways:
Actual Fund Return: This section helps you to estimate the actual expenses that your Fund incurred over the period. The “Expenses Paid During Period” column shows the actual dollar expense cost incurred by a $1,000 investment in the Fund, and the “Ending Account Value” number is derived from deducting that expense cost from the Fund’s gross investment return.
You can use this information, together with the actual amount you invested in the Fund, to estimate the expenses you paid over that period. Simply divide your actual account value by $1,000 to arrive at a ratio (for example, an $8,600 account value divided by $1,000 = 8.6), then multiply that ratio by the number shown for your Fund under “Expenses Paid During Period.”
Hypothetical 5% Return: This section helps you compare your Fund’s costs with those of other funds. It assumes that the Fund had an annual 5% return before expenses during the year, but that the annualized expense ratio (Column 3) for the period is unchanged. This example is useful in making comparisons because the Securities and Exchange Commission requires all funds to make this 5% calculation. You can assess your Fund’s comparative cost by comparing the hypothetical result for your Fund in the “Expenses Paid During Period” column with those that appear in the same charts in the shareholder reports for other funds.
NOTE: Because the return is set at 5% for comparison purposes — NOT your Fund’s actual return — the account values shown may not apply to your specific investment.
| Disclosure of Fund Expenses (Unaudited) (Concluded) |
| |
| | | Beginning | | | Ending | | | | | | Expenses | |
| | | Account | | | Account | | | Annualized | | | Paid | |
| | | Value | | | Value | | | Expense | | | During | |
| | | 1/1/2013 | | | 6/30/2013 | | | Ratios | | | Period(1) | |
| Global X Permanent ETF | | | | | | | | | | | | |
| Actual Fund Return | | $ | 1,000.00 | | | $ | 919.40 | | | | 0.48 | % | | $ | 2.29 | |
| Hypothetical 5% Return | | | 1,000.00 | | | | 1,022.41 | | | | 0.48 | | | | 2.41 | |
| Global X Top Guru Holdings Index ETF | | | | | | | | | | | | | | | | |
| Actual Fund Return | | $ | 1,000.00 | | | $ | 1,186.50 | | | | 0.75 | % | | $ | 4.07 | |
| Hypothetical 5% Return | | | 1,000.00 | | | | 1,021.08 | | | | 0.75 | | | | 3.76 | |
| Global X SuperIncome Preferred ETF | | | | | | | | | | | | | | | | |
| Actual Fund Return | | $ | 1,000.00 | | | $ | 1,012.60 | | | | 0.58 | % | | $ | 2.89 | |
| Hypothetical 5% Return | | | 1,000.00 | | | | 1,021.92 | | | | 0.58 | | | | 2.91 | |
| (1) | Expenses are equal to the Fund’s annualized expense ratio multiplied by the average account value over the period, multiplied 181/365 (to reflect the one-half year period.) |
| Supplemental Information (Unaudited) |
| |
|
Net asset value, or “NAV”, is the price per Share at which the Funds issue and redeem Shares. It is calculated in accordance with the standard formula for valuing mutual fund shares. The “Market Price” of the Funds generally is determined using the midpoint between the highest bid and the lowest offer on the stock exchange on which the Shares of the Funds are listed for trading, as of the time that the Funds’ NAV is calculated. The Funds’ Market Price may be at, above or below their NAV. The NAV of the Funds will fluctuate with changes in the market value of their Funds’ holdings. The Market Price of the Funds will fluctuate in accordance with changes in its NAV, as well as market supply and demand.
Premiums or discounts are the differences (expressed as a percentage) between the NAV and Market Price of the Funds on a given day, generally at the time NAV is calculated. A premium is the amount that the Funds are trading above the reported NAV, expressed as a percentage of the NAV. A discount is the amount that the Funds are trading below the reported NAV, expressed as a percentage of the NAV.
Further information regarding premiums and discounts is available on the Funds’ website at GlobalXFunds.com
| Trustees and Officers of the Trust (Unaudited) |
| |
Set forth below are the names, addresses, years of birth, position with the Trust, Term of Office and Length of Time Served, the principal occupations for the last five years, number of Funds in fund complex overseen by trustee, and other directorships outside the fund complex of each of the persons currently serving as Trustees and Officers of the Trust. The Trust’s Statement of Additional Information (“SAI”) includes additional information about the Trustees and Officers. The SAI may be obtained without charge by calling 1-888-493-8631. The following chart lists Trustees and Officers as of June 30, 2013.
| | | | Number of | |
| Name, | | | Funds in | Other |
| Address | Position(s) | | Trust | Directorships |
| (Year of | Held | Principal Occupation(s) During | Overseen by | Held |
| Birth) | with Funds | the Past 5 Years | Director(3) | by Trustees |
| Independent Trustees2 | | | |
| Sanjay | Trustee | CEO of Risk Advisors Inc. (since 2007) (consulting | 79 | None. |
| Ram | (since | firm); Chief Information Officer, M. Safra & Co | | |
| Bharwani | 2008) | (2004-2006) (hedge fund). | | |
| 623 Fifth | | | | |
| Ave, | | | | |
| 15th floor | | | | |
| New York, | | | | |
| NY 10022 | | | | |
| (1974) | | | | |
| Scott R. | Trustee | CFO, Sterling Seal & Supply Inc. (since 2011), | 79 | Director of |
| Chichester1 | (since | Director, President & Treasurer, Bayview | | Bayview |
| 623 Fifth | 2008) | Acquisition Corp (since 2010); CPA, Penda Aiken | | Acquisition Corp |
| Ave, | | Inc. (2009-2011) (consultant); Founder and | | (since 2010). |
| 15th floor | | President, DirectPay USA LLC (since 2006) (payroll | | |
| New York, | | company); Chief Financial Officer, Ong Corporation | | |
| NY 10022 | | (2002-2010) (technology company); Proprietor, | | |
| (1970) | | Scott R. Chichester CPA (since 2001) (CPA firm). | | |
| | | | | |
| Kartik | Trustee | Vice President, Business Development, Cynvenio | 79 | None. |
| Kiran Shah | (since | Biosystems (2012-present); Independent Consultant, | | |
| 623 Fifth | 2008) | Self-Employed (2011-2012) (non-financial | | |
| Ave, | | services); Director, Wireless Generation (since | | |
| 15th floor | | 2008) (software). | | |
| New York, | | | | |
| NY 10022 | | | | |
| (1977) | | | | |
| Trustees and Officers of the Trust (Unaudited) |
| |
| | | | Number of Funds | |
| | | Principal Occupation(s) | in Trust | Other |
| Name, Address | Position(s) Held | During | Overseen by | Directorships Held |
| (Year of Birth) | with Funds | the Past 5 Years | Director(3) | by Trustees |
| Interested Trustee / Officers2 | | | |
| Bruno del Ama | Trustee (since 2008), | Chief Executive Officer and | 79 | None. |
| 623 Fifth Ave, | President, Chief | Chief Compliance Officer, | | |
| 15th floor | Executive Officer | Global X Management Company | | |
| New York, NY | (since 2008) | LLC (since 2008); Head of | | |
| 10022 | | Global Structured Products | | |
| (1976) | | Operations at Radian Asset | | |
| | | Assurance (2004-2008) | | |
| | | (financial services firm). | | |
| | | | | |
| Jose C. Gonzalez | Chief Operating | Chief Operating Officer, Global | N/A | N/A |
| 623 Fifth Ave, | Officer, Chief | X Management Company LLC | | |
| 15th floor | Compliance Officer, | (since 2008); Founder and | | |
| New York, NY | Treasurer, Principal | President of GWM Group, Inc. | | |
| 10022 | Accounting Officer | (since 2006) (broker-dealer | | |
| (1976) | and Chief Financial | firm). | | |
| | Officer (since 2008) | | | |
| | | | | |
| Daphne Tippens | Secretary (since 2012) | General Counsel, Global X | N/A | N/A |
| Chisolm | | Management Company LLC | | |
| 11524-C | | (since 2011); Founder and | | |
| Providence Road | | President of Law Offices of DT | | |
| Suite 236 | | Chisolm, P.C. (since 2009) (law | | |
| Charlotte, NC | | firm); Counsel, Dechert (2007- | | |
| 28277 | | 2009) (law firm). | | |
| (1969) | | | | |
| | | | | |
| Dianne | Assistant Secretary | Corporate Counsel, SEI | N/A | N/A |
| Sulzbach4 | (since 2011) | Investments (since 2010); | | |
| One Freedom | | Associate, Morgan, Lewis & | | |
| Valley Drive | | Bockius LLP (2006-2010). | | |
| Oaks, PA 19456 | | | | |
| (1977) | | | | |
| | | | | |
| Trustees and Officers of the Trust (Unaudited) |
| |
| | | | Number of Funds | Other Directorships | |
| | | Principal Occupation(s) | in Trust | |
| Name, Address | Position(s) Held | During | Overseen by | Held | |
| (Year of Birth) | with Funds | the Past 5 Years | Director(3) | by Trustees | |
| Lisa K. | Assistant Secretary | Counsel at SEI Investments | N/A | N/A | |
| Whittaker4 | (since 2013) | (since 2012); Associate | | | |
| One Freedom | | Counsel and Compliance | | | |
| Valley Drive | | Officer at The Glendale Trust | | | |
| Oaks, PA 19456 | | Company (2011-2012); | | | |
| (1978) | | Associate of Drinker Biddle & | | | |
| | | Reath LLP (2006-2011). | | | |
| | | | | | |
| Peter | Assistant Treasurer | Fund Accounting Director of | N/A | N/A | |
| Rodriguez4 | (since 2011) | the Administrator (since 2011); | | | |
| One Freedom | | Mutual Fund Trading Director, | | | |
| Valley Drive | | SEI Global Trust Company | | | |
| Oaks, PA 19456 | | (2009-2011); Asset Data | | | |
| (1962) | | Services Director at the | | | |
| | | Administrator (2006-2009). | | | |
| | | | | | |
| 1 | Mr. Chichester is currently married to a sister of Mr. del Ama’s wife. While an “immediate family member” (as defined in Section 2(a)(19) of the 1940 Act) of Mr. del Ama would be considered an Interested Person, Mr. Chichester is not considered an immediate family member for this purpose. Although this fact was taken into consideration in determining whether Mr. Chichester should be considered to be an Independent Trustee for purposes of the Section 2(a)(19) of the 1940 Act, it was determined that this relationship was not one that should disqualify Mr. Chichester from serving as an Independent Trustee of the Trust. |
| 2 | Each Trustee serves until his or her successor is duly elected or appointed and qualified. |
| 3 | As of June 30, 2013, the Trust had seventy-nine investment portfolios, thirty-five of which were operational. |
| 4 | These officers of the Trust also serve as officers of one or more mutual funds for which SEI Investments Company or an affiliate acts as investment manager, administrator or distributor. |
| Notice to Shareholders (Unaudited) |
| |
For shareholders that do not have a June 30, 2013 tax year end, this notice is for informational purposes only. For shareholders with a June 30, 2013 tax year end, please consult your tax advisor as to the pertinence of this notice. For the fiscal year ended June 30, 2013, the Funds are designating the following items with regard to distributions paid during the year.
| | | | | | | | | | | | Qualifying | | | | | | | | | | | | | |
| | | | | | | | | | | | for | | | | | | | | | | | | | |
| | | | | | | | | | | | Corporate | | | | | | | | | | | | | |
| | | Long-Term | | | Ordinary | | | | | | Dividends | | | Qualifying | | | U.S. | | | Interest | | | Short Term | |
| | | Capital Gain | | | Income | | | Total | | | Received | | | Dividend | | | Government | | | Related | | | Capital Gain | |
| | | Distributions | | | Distributions | | | Distributions | | | Deduction(1) | | | Income(2) | | | Interest(3) | | | Dividends(4) | | | Dividends(5) | |
| Global X Permanent ETF | | | 22.88 | % | | | 77.12 | % | | | 100.00 | % | | | 32.29 | % | | | 38.22 | % | | | 83.92 | % | | | 45.19 | % | | | 0.00 | % |
| Global X Top Guru Holdings Index ETF | | | 0.00 | % | | | 100.00 | % | | | 100.00 | % | | | 74.62 | % | | | 48.22 | % | | | 0.00 | % | | | 0.00 | % | | | 100.00 | % |
| Global X SuperIncome Preferred ETF | | | 0.00 | % | | | 100.00 | % | | | 100.00 | % | | | 32.56 | % | | | 43.50 | % | | | 0.00 | % | | | 41.38 | % | | | 100.00 | % |
(1) Qualifying dividends represent dividends which qualify for the corporate dividends received deduction and is reflected as a percentage of ordinary income distributions (the total of short term capital gain and net investment income distributions).
(2) The percentage in this column represents the amount of "Qualifying Dividend Income" as created by the Jobs and Growth Relief Reconciliation Act of 2003 and is reflected as a percentage of ordinary income distributions (the total of short term capital gain and net investment income distributions). It is the intention of each of the aforementioned funds to designate the maximum amount permitted by law.
(3) “U.S. Government Interest” represents the amount of interest that was derived from direct U.S. Government obligations and distributed during the fiscal year. This amount is reflected as a percentage of ordinary income. Generally, interest from direct U.S. Government obligations is exempt from state income tax. However, for shareholders of the Global X SuperIncome Preferred ETF who are residents of California, Connecticut and New York, the statutory threshold requirements were not satisfied to permit exemption of these amounts from state income.
(4) The percentage in this column represents the amount of "Interest Related Dividends" as created by the American Jobs Creation Act of 2004 and is reflected as a percentage of net investment income distributions that is exempt from U.S. withholding tax when paid for foreign investors.
(5) The percentage in this column represents the amount of "Short-Term Capital Gain Dividends" as created by the American Jobs Creation Act of 2004 and is reflected as a percentage of short-term capital gain distributions that is exempt from U.S. withholding tax when paid to foreign investors.
The information reported herein may differ from the information and distributions taxable to the shareholders for the calendar year ending December 31, 2013. Complete information will be computed and reported in conjunction with your 2013 Form 1099-DIV.
623 Fifth Ave, 15th floor
New York, NY 10022
1-888-GXFund-1
(1-888-493-8631)
www.globalxfunds.com
Investment Adviser:
Global X Management Company LLC
623 Fifth Avenue, 15th floor
New York, NY 10022
Distributor:
SEI Investments Distribution Co.
One Freedom Valley Drive
Oaks, PA 19456
Sub-Administrator:
SEI Investments Global Funds Services
One Freedom Valley Drive
Oaks, PA 19456
Counsel for the Independent Trustees:
Dechert LLP
1175 I Street N.W.
Washington, DC 20007
This information must be preceded or accompanied by a current prospectus for the Funds described.
GLX-SA-004-0200
Item 2. Code of Ethics.
The registrant has adopted a code of ethics that applies to the registrant’s principal executive officer, principal financial officer, comptroller or principal accounting officer, and any person who performs a similar function.
Item 3. Audit Committee Financial Expert.
(a)(1) The registrant’s board of trustees has determined that the registrant has at least one audit committee financial expert serving on the audit committee.
(a)(2) The audit committee financial expert is Scott Chichester and is independent as defined in Form N-CSR Item 3(a)(2).
Item 4. Principal Accountant Fees and Services.
Fees billed by Ernst & Young LLP in 2013 and 2012 related to the Trust.
In 2013 and 2012, Ernst & Young, LLP billed the Trust aggregate fees for services rendered to the Trust for the last two fiscal years was as follows:
| | 2013 | 2012 |
| | | All fees and
services to
the Trust that
were pre-approved | All fees and
services to
service affiliates
that were
pre-approved | All other fees
and services to
service affiliates
that did not
require
pre-approval | All fees and
services to the
Trust that were
pre-approved | All fees and
services to
service affiliates
that were
pre-approved | All other fees
and services to
service affiliates
that did not
require
pre-approval |
| (a) | Audit Fees | $360,215 | $0 | $0 | $378,175 | $0 | $0 |
| (b) | Audit-Related Fees | $0 | $0 | $0 | $0 | $0 | $0 |
| (c) | Tax Fees | $112,500 | $0 | $0 | $127,300 | $0 | $0 |
| (d) | All Other Fees | $0 | $0 | $0 | $0 | $0 | $0 |
(e)(1) Not applicable.
(e)(2) Percentage of fees billed applicable to non-audit services pursuant to waiver of pre-approval requirement were as follows for Ernst & Young LLP in 2013 and 2012:
| | 2013 | 2012 |
Audit-Related Fees | 0% | 0% |
| Tax Fees | 0% | 0% |
All Other Fees | 0% | 0% |
(f) Not applicable.
(g) The aggregate non-audit fees and services billed by Ernst & Young, LLP in 2013 and 2012 for the last two fiscal years were $112,500 and $127,300, respectively.
(h) During the past fiscal year, all non-audit services provided by Registrant’s principal accountant to either Registrant’s investment adviser or to any entity controlling, controlled by, or under common control with Registrant’s investment adviser that provides ongoing services to Registrant were pre-approved by the audit committee of Registrant’s Board of Trustees. Included in the audit committee’s pre-approval was the review and consideration as to whether the provision of these non-audit services is compatible with maintaining the principal accountant’s independence.
Item 5. Audit Committee of Listed Registrants.
Not applicable to open-end management investment companies.
Item 6. Schedule of Investments.
Not applicable.
Item 7. Disclosure of Proxy Voting Policies and Procedures for Closed-End Management Investment Companies.
Not applicable to open-end management investment companies.
Item 8. Portfolio Managers of Closed-End Management Investment Companies.
Not applicable to open-end management investment companies. Effective for closed-end management investment companies for fiscal years ending on or after December 31, 2005
Item 9. Purchases of Equity Securities by Closed-End Management Company and Affiliated Purchasers.
Not applicable to open-end management investment companies.
Item 10. Submission of Matters to a Vote of Security Holders.
There have been no material changes.
Item 11. Controls and Procedures.
(a) The certifying officers, whose certifications are included herewith, have evaluated the registrant’s disclosure controls and procedures within 90 days of the filing date of this report. In their opinion, based on their evaluation, the registrant’s disclosure controls and procedures are adequately designed, and are operating effectively to ensure, that information required to be disclosed by the registrant in the reports it files or submits under the Securities Exchange Act of 1934 is recorded, processed, summarized and reported within the time periods specified in the Securities and Exchange Commission’s rules and forms.
(b) There were no significant changes in the registrant’s internal control over financial reporting that occurred during the registrant’s last fiscal half-year that has materially affected, or is reasonably likely to materially affect, the registrants internal control over financial reporting.
Items 12. Exhibits.
(a)(1) Code of Ethics attached hereto.
(a)(2) A separate certification for the principal executive officer and the principal financial officer of the registrant as required by Rule 30a-2(a) under the Investment Company Act of 1940, as amended (17 CFR 270.30a-2(a)), are filed herewith.
(b) Officer certifications as required by Rule 30a-2(b) under the Investment Company Act of 1940, as amended (17 CFR 270.30a-2(b)) also accompany this filing as an Exhibit.
SIGNATURES
Pursuant to the requirements of the Securities Exchange Act of 1934 and the Investment Company Act of 1940, the registrant has duly caused this report to be signed on its behalf by the undersigned, thereunto duly authorized.
| (Registrant) | Global X Funds |
| | |
| | |
| By (Signature and Title)* | /s/ Bruno del Ama |
| | Bruno del Ama |
| | President |
Date: September 6, 2013
Pursuant to the requirements of the Securities Exchange Act of 1934 and the Investment Company Act of 1940, this report has been signed below by the following persons on behalf of the registrant and in the capacities and on the dates indicated.
| By (Signature and Title)* | /s/ Bruno del Ama |
| | Bruno del Ama |
| | President |
Date: September 6, 2013
| By (Signature and Title)* | /s/ Jose C. Gonzalez |
| | Jose C. Gonzalez |
| | Chief Financial Officer |
Date: September 6, 2013
* Print the name and title of each signing officer under his or her signature.