UNITED STATES
SECURITIES AND EXCHANGE COMMISSION
Washington, D.C. 20549
FORM N-CSR
CERTIFIED SHAREHOLDER REPORT OF REGISTERED MANAGEMENT
INVESTMENT COMPANIES
Investment Company Act file number 811-22209
Global X Funds
(Exact name of registrant as specified in charter)
399 Park Avenue, 32nd Floor
New York, NY 10022
(Address of principal executive offices) (Zip code)
SEI Investments Global Fund Services
One Freedom Valley Drive
Oaks, PA 19456
(Name and address of agent for service)
Registrant’s telephone number, including area code: (888) 493-8631
Date of fiscal year end: October 31, 2011
Date of reporting period: October 31, 2011
| Item 1. | Reports to Stockholders. |

Global X Gold Explorers ETF (ticker: GLDX)
Global X Silver Miners ETF (ticker: SIL)
Global X Copper Miners ETF (ticker: COPX)
Global X Uranium ETF (ticker: URA)
Global X Lithium ETF (ticker: LIT)
Global X Aluminum ETF (ticker: ALUM)
Global X Pure Gold Miners ETF (ticker: GGGG)
(formerly, Global X Gold Miners ETF)
Global X Oil Equities ETF (ticker: XOIL)
Global X S&P/TSX Venture 30 Canada ETF (ticker: TSXV)
(formerly, Global X S&P/TSX Venture Canada ETF)
Global X Fertilizers/Potash ETF (ticker: SOIL)
Annual Report
October 31, 2011

TABLEOF CONTENTS
The Funds file their complete schedules of Fund holdings with the Securities and Exchange Commission (the “Commission”) for the first and third quarters of each fiscal year on Form N-Q within sixty days after the end of the period. The Funds’ Forms N-Q are available on the Commission’s website at http://www.sec.gov, and may be reviewed and copied at the Commission’s Public Reference Room in Washington, DC. Information on the operation of the Public Reference Room may be obtained by calling 1-800-SEC-0330.
A description of the policies and procedures that Global X Funds uses to determine how to vote proxies relating to Fund securities, as well as information relating to how the Funds voted proxies relating to Fund securities during the most recent 12-month period ended June 30, will be available (i) without charge, upon request, by calling 1-888-GXFund-1; and (ii) on the Commission’s website at http://www.sec.gov.
|
| MANAGEMENT DISCUSSIONOF FUND PERFORMANCE |
GLOBAL X GOLD EXPLORERS ETF |
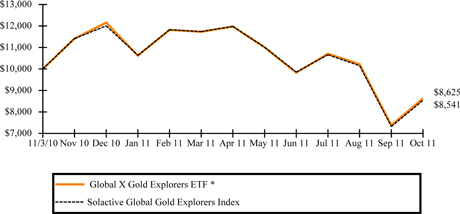
Global X Gold Explorers ETF
The Global X Gold Explorers ETF (the “Fund”) seeks to provide investment results that correspond generally to the price and yield performance, before fees and expenses, of the Solactive Global Gold Explorers Index (the “Index”). The Fund generally seeks to replicate the Index but may at times invest in a representative sample of securities that collectively has an investment profile similar to the Index and as a result may or may not hold all the securities that are included in the Index.
The Solactive Global Gold Explorers Index is designed to track the performance of the largest and most liquid listed companies that are active in the exploration for gold.
For the 12-month period ended October 31, 2011 (the “reporting period”), the Fund decreased 13.75%, while the Index decreased 14.59%. The Fund had a net asset value of $15.49 per share on November 3, 2010 and ended the period with a net asset value of $13.36 on October 31, 2011.
Sixteen of the Fund’s twenty-seven holdings as of October 31, 2011 increased in value for the reporting period, led by Newstrike Capital and Gold Canyon Resources, which returned 477.35% and 199.24% respectively. The worst performers were Atac Resources and East Asia Minerals, which returned -46.48% and -86.82% respectively.
Growth of a $10,000 Investment
| | | | | | |
| | | AVERAGE ANNUAL TOTAL RETURN FOR THE PERIOD ENDED OCTOBER 31, 2011* | | |
| | Cumulative Inception to Date | |
Global X Gold Explorers ETF | | Net Asset Value | | Market Price | |
| | (13.75%) | | (13.49%) | |
Solactive Global Gold Explorers Index | | (14.59%) | | (14.59%) | |
*Fund commenced operations on November 3, 2010.
The performance data quoted herein represents past performance and the return and value of an investment in the Fund will fluctuate so that, when redeemed, may be worth less than its original cost. Past performance is no guarantee of future performance and should not be considered as a representation of the future results of the Fund. The Fund’s performance assumes the reinvestment of all dividends and all capital gains. Index returns assume reinvestment of dividends and, unlike a Fund’s returns, do not reflect any fees or expenses. If such fees and expenses were included in the index returns, the performance would have been lower. Please note that one cannot invest directly in an unmanaged index.
There are no assurances that the Fund will meet its stated objectives.
The Fund’s holdings and allocations are subject to change and should not be considered recommendations to buy individual securities.
Returns shown do not reflect the deduction of taxes that a shareholder would pay on Fund distributions or the redemption of Fund shares.
See definition of comparative index above.
1
|
| MANAGEMENT DISCUSSIONOF FUND PERFORMANCE |
GLOBAL X SILVER MINERS ETF |
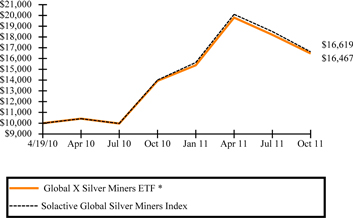
Global X Silver Miners ETF
The Global X Silver Miners ETF (the “Fund”) seeks to provide investment results that correspond generally to the price and yield performance, before fees and expenses, of the Solactive Global Silver Miners Index (the “Index”). The Fund generally seeks to replicate the Index but may at times invest in a representative sample of securities that collectively has an investment profile similar to the Index and as a result may or may not hold all the securities that are included in the Index.
The Index is designed to reflect the performance of the silver mining industry. It is comprised of selected companies globally that are actively engaged in some aspect of the silver mining industry, such as silver mining, refining, or exploration. The Fund is the first ETF globally focused exclusively on the silver mining sector.
For the 12-month period ended October 31, 2011 (the “reporting period”), the Fund increased 18.20%, while the Index increased 18.68%. The Fund had a net asset value of $20.20 per share on October 31, 2010 and ended the period with a net asset value of $23.66 on October 31, 2011.
Twenty-two of the Fund’s thirty-three holdings as of October 31, 2011 increased in value for the reporting period, led by Wildcat Silver and Scorpio Mining, which returned 289.74% and 137.88% respectively. The worst performers were Bear Creek Mining and Golden Minerals, which returned -49.08% and -73.30% respectively.
Growth of a $10,000 Investment
| | | | | | | | | | |
| | AVERAGE ANNUAL TOTAL RETURN FOR THE YEAR ENDED OCTOBER 31, 2011* | | |
| | One Year Return | | Annualized Inception to Date | |
Global X Silver Miners ETF | | Net Asset Value | | Market Price | | Net Asset Value | | Market Price | |
| | 18.20% | | 17.80% | | 38.52% | | 38.57% | |
Solactive Global Silver Miners Index | | 18.68% | | 18.68% | | 39.25% | | 39.25% | |
*Fund commenced operations on April 19, 2010.
The performance data quoted herein represents past performance and the return and value of an investment in the Fund will fluctuate so that, when redeemed, may be worth less than its original cost. Past performance is no guarantee of future performance and should not be considered as a representation of the future results of the Fund. The Fund’s performance assumes the reinvestment of all dividends and all capital gains. Index returns assume reinvestment of dividends and, unlike a Fund’s returns, do not reflect any fees or expenses. If such fees and expenses were included in the index returns, the performance would have been lower. Please note that one cannot invest directly in an unmanaged index.
There are no assurances that the Fund will meet its stated objectives.
The Fund’s holdings and allocations are subject to change and should not be considered recommendations to buy individual securities.
Returns shown do not reflect the deduction of taxes that a shareholder would pay on Fund distributions or the redemption of Fund shares.
See definition of comparative index above.
2
MANAGEMENT DISCUSSIONOF FUND PERFORMANCE
GLOBAL X COPPER MINERS ETF
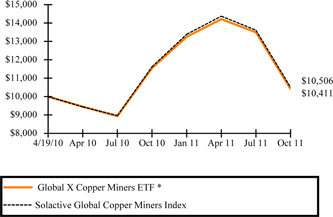
Global X Copper Miners ETF
The Global X Copper Miners ETF (the “Fund”) seeks to provide investment results that correspond generally to the price and yield performance, before fees and expenses, of the Solactive Global Copper Miners Index (the “Index”). The Fund generally seeks to replicate the Index but may at times invest in a representative sample of securities that collectively has an investment profile similar to the Index and as a result may or may not hold all the securities that are included in the Index.
The Index is designed to reflect the performance of the copper mining industry. It is comprised of selected companies globally that are actively engaged in some aspect of the copper mining industry, such as copper mining, refining, or exploration.
For the 12-month period ended October 31, 2011 (the “reporting period”), the Fund decreased 9.85%, while the Index decreased 9.56%. The Fund had a net asset value of $16.63 per share on October 31, 2010 and ended the period with a net asset value of $14.92 on October 31, 2011.
Eleven of the Fund’s thirty-three holdings as of October 31, 2011 increased in value for the reporting period, led by Metorex and Cudeco, which returned 65.63% and 41.75% respectively. The worst performers were Lundin Mining and Taseko Mines, which returned -37.99% and -42.00% respectively.
Growth of a $10,000 Investment
| | | | | | | | |
| |
| | AVERAGE ANNUAL TOTAL RETURN FOR THE YEAR ENDED
OCTOBER 31, 2011* |
| | One Year Return | | Annualized Inception to Date |
| | Net Asset Value | | Market Price | | Net Asset Value | | Market Price |
Global X Copper Miners ETF | | (9.85%) | | (11.26%) | | 2.66% | | 1.85% |
Solactive Global Copper Miners Index | | (9.56%) | | (9.56%) | | 3.27% | | 3.27% |
*Fund commenced operations on April 19, 2010.
The performance data quoted herein represents past performance and the return and value of an investment in the Fund will fluctuate so that, when redeemed, may be worth less than its original cost. Past performance is no guarantee of future performance and should not be considered as a representation of the future results of the Fund. The Fund’s performance assumes the reinvestment of all dividends and all capital gains. Index returns assume reinvestment of dividends and, unlike a Fund’s returns, do not reflect any fees or expenses. If such fees and expenses were included in the index returns, the performance would have been lower. Please note that one cannot invest directly in an unmanaged index.
There are no assurances that the Fund will meet its stated objectives.
The Fund’s holdings and allocations are subject to change and should not be considered recommendations to buy individual securities.
Returns shown do not reflect the deduction of taxes that a shareholder would pay on Fund distributions or the redemption of Fund shares.
See definition of comparative index above.
3
MANAGEMENT DISCUSSIONOF FUND PERFORMANCE
GLOBAL X URANIUM ETF
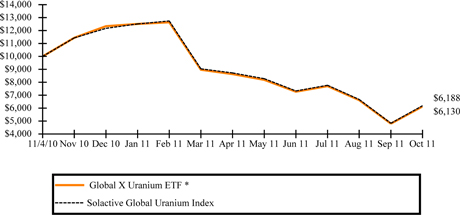
Global X Uranium ETF
The Global X Uranium ETF (the “Fund”) seeks to provide investment results that correspond generally to the price and yield performance, before fees and expenses, of the Solactive Global Uranium Index (the “Index”). The Fund generally seeks to replicate the Index but may at times invest in a representative sample of securities that collectively has an investment profile similar to the Index and as a result may or may not hold all the securities that are included in the Index.
The Solactive Global Uranium Index is designed to reflect the performance of the uranium mining industry. It is comprised of selected companies globally that are primarily engaged in some aspect of the uranium mining industry, such as mining, refining, exploration, and manufacturing of equipment for the uranium industry. The Fund is the nation’s first ETF focused exclusively on the uranium industry.
For the 12-month period ended October 31, 2011 (the “reporting period”), the Fund decreased 38.70%, while the Index decreased 38.12%. The Fund had a net asset value of $16.78 per share on November 4, 2010 and ended the period with a net asset value of $10.09 on October 31, 2011.
Six of the Fund’s twenty-two holdings as of October 31, 2011 increased in value for the reporting period, led by Hathor Exploration and Kalahari Minerals, which returned 72.71% and 24.43% respectively. The worst performers were Energy Resources of Australia and Berkeley Resources, which returned -75.70% and -80.93% respectively.
Growth of a $10,000 Investment
| | | | | | |
| | | AVERAGE ANNUAL TOTAL RETURN FOR THE PERIOD ENDED OCTOBER 31, 2011* | | |
| | Cumulative Inception to Date | | |
| | Net Asset Value | | Market Price | | |
| Global X Uranium ETF | | (38.70%) | | (39.93%) | | |
| Solactive Global Uranium Index | | (38.12%) | | (38.12%) | | |
*Fund commenced operations on November 4, 2010.
The performance data quoted herein represents past performance and the return and value of an investment in the Fund will fluctuate so that, when redeemed, may be worth less than its original cost. Past performance is no guarantee of future performance and should not be considered as a representation of the future results of the Fund. The Fund’s performance assumes the reinvestment of all dividends and all capital gains. Index returns assume reinvestment of dividends and, unlike a Fund’s returns, do not reflect any fees or expenses. If such fees and expenses were included in the index returns, the performance would have been lower. Please note that one cannot invest directly in an unmanaged index.
There are no assurances that the Fund will meet its stated objectives.
The Fund’s holdings and allocations are subject to change and should not be considered recommendations to buy individual securities.
Returns shown do not reflect the deduction of taxes that a shareholder would pay on Fund distributions or the redemption of Fund shares.
See definition of comparative index above.
4
|
| MANAGEMENT DISCUSSIONOF FUND PERFORMANCE |
GLOBAL X LITHIUM ETF |
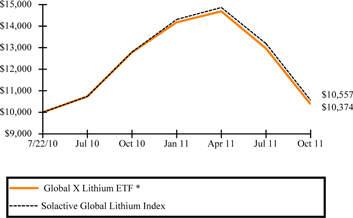
Global X Lithium ETF
The Global X Lithium ETF (the “Fund”) seeks to provide investment results that correspond generally to the price and yield performance, before fees and expenses, of the Solactive Global Lithium Index (the “Index”). The Fund generally seeks to replicate the Index but may at times invest in a representative sample of securities that collectively has an investment profile similar to the Index and as a result may or may not hold all the securities that are included in the Index.
The Index is designed to reflect the performance of the largest and most liquid listed companies that are active in the exploration and/or mining of Lithium or the production of Lithium batteries. The Fund is the first ETF globally focused exclusively on the lithium sector.
For the 12-month period ended October 31, 2011 (the “reporting period”), the Fund decreased 18.86%, while the Index decreased 17.52%. The Fund had a net asset value of $19.83 per share on October 31, 2010 and ended the period with a net asset value of $15.90 on October 31, 2011.
Three of the Fund’s twenty-one holdings as of October 31, 2011 increased in value for the reporting period, led by Rockwood Holdings and Sociedad Quimica y Minera de Chile ADR, which returned 35.73% and 17.18% respectively. The worst performers were Advanced Battery Technologies and Ener1, which returned -75.94% and -96.66% respectively.
Growth of a $10,000 Investment
| | | | | | | | |
| | AVERAGE ANNUAL TOTAL RETURN FOR THE YEAR ENDED OCTOBER 31, 2011* |
| | One Year Return | | Annualized Inception to Date |
| | Net Asset Value | | Market Price | | Net Asset Value | | Market Price |
| Global X Lithium ETF | | (18.86%) | | (20.82%) | | 2.92% | | 1.16% |
| Solactive Global Lithium Index | | (17.52%) | | (17.52%) | | 4.34% | | 4.34% |
*Fund commenced operations on November 4, 2010.
The performance data quoted herein represents past performance and the return and value of an investment in the Fund will fluctuate so that, when redeemed, may be worth less than its original cost. Past performance is no guarantee of future performance and should not be considered as a representation of the future results of the Fund. The Fund’s performance assumes the reinvestment of all dividends and all capital gains. Index returns assume reinvestment of dividends and, unlike a Fund’s returns, do not reflect any fees or expenses. If such fees and expenses were included in the index returns, the performance would have been lower. Please note that one cannot invest directly in an unmanaged index.
There are no assurances that the Fund will meet its stated objectives.
The Fund’s holdings and allocations are subject to change and should not be considered recommendations to buy individual securities.
Returns shown do not reflect the deduction of taxes that a shareholder would pay on Fund distributions or the redemption of Fund shares.
See definition of comparative index above.
5
|
| MANAGEMENT DISCUSSIONOF FUND PERFORMANCE |
GLOBAL X ALUMINUM ETF |
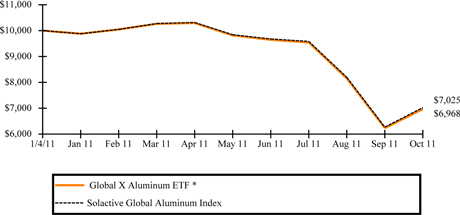
Global X Aluminum ETF
The Global X Aluminum ETF (the “Fund”) seeks to provide investment results that correspond generally to the price and yield performance, before fees and expenses, of the Solactive Global Aluminum Index (the “Index”). The Fund generally seeks to replicate the Index but may at times invest in a representative sample of securities that collectively has an investment profile similar to the Index and as a result may or may not hold all the securities that are included in the Index.
The Index is designed to reflect the performance of the global aluminum industry. The Solactive Global Aluminum Index tracks the performance of the largest and most liquid listed companies that are active in some aspect of the aluminum industry, such as bauxite aluminum ore mining, production, or refinement. The Fund is the nation’s first ETF focused exclusively on the aluminum industry.
For the period from the Fund’s commencement date on January 4, 2011 through October 31, 2011 (the “reporting period”), the Fund decreased 30.32% while the Index decreased 29.75%. The Fund commenced operations with a net asset value of $15.27 per share on January 4, 2011 and ended the period with a net asset value of $10.64 on October 31, 2011.
Three of the Fund’s twenty-two holdings as of October 31, 2011 increased in value for the reporting period, led by Alconix and Daiki Aluminum Industry, which returned 9.18% and 9.00% respectively. The worst performers were Aluminum Corp of China and Midas Holdings, which returned -46.02% and -55.82% respectively.
Growth of a $10,000 Investment
| | | | |
| | AVERAGE ANNUAL TOTAL RETURN FOR THE PERIOD ENDED OCTOBER 31, 2011* |
| | Cumulative Inception to Date |
| | Net Asset Value | | Market Price |
| Global X Aluminum ETF | | (30.32%) | | (31.37%) |
| Solactive Global Aluminum Index | | (29.75%) | | (29.75%) |
*Fund commenced operations on January 4, 2011.
The performance data quoted herein represents past performance and the return and value of an investment in the Fund will fluctuate so that, when redeemed, may be worth less than its original cost. Past performance is no guarantee of future performance and should not be considered as a representation of the future results of the Fund. The Fund’s performance assumes the reinvestment of all dividends and all capital gains. Index returns assume reinvestment of dividends and, unlike a Fund’s returns, do not reflect any fees or expenses. If such fees and expenses were included in the index returns, the performance would have been lower. Please note that one cannot invest directly in an unmanaged index.
There are no assurances that the Fund will meet its stated objectives.
The Fund’s holdings and allocations are subject to change and should not be considered recommendations to buy individual securities.
Returns shown do not reflect the deduction of taxes that a shareholder would pay on Fund distributions or the redemption of Fund shares.
See definition of comparative index above.
6
MANAGEMENT DISCUSSIONOF FUND PERFORMANCE
GLOBAL X PURE GOLD MINERS ETF
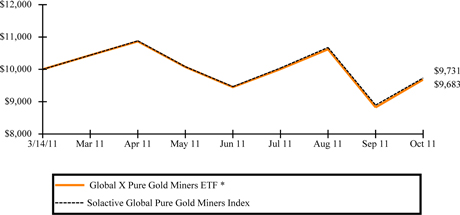
Global X Pure Gold Miners ETF
The Global X Pure Gold Miners ETF (the “Fund”) seeks to provide investment results that correspond generally to the price and yield performance, before fees and expenses, of the Solactive Global Pure Gold Miners Index (the “Index”). The Fund generally seeks to replicate the Index but may at times invest in a representative sample of securities that collectively has an investment profile similar to the Index and as a result may or may not hold all the securities that are included in the Index.
The Solactive Global Pure Gold Miners Index tracks the performance of the largest and most liquid gold mining companies globally. Only companies that generate the vast majority of their business from gold mining are eligible to be included in the index. As of 2010, over 95% of the revenues from the companies in the Underlying Index were derived from gold mining, according to Structured Solutions AG.
For the period from the Fund’s commencement date on March 14, 2011 through October 31, 2011 (the “reporting period”), the Fund decreased 3.17% while the Index decreased 2.69%. The Fund commenced operations with a net asset value of $15.15 per share on March 14, 2011 and ended the period with a net asset value of $14.67 on October 31, 2011.
Sixteen of the Fund’s thirty holdings as of October 31, 2011 increased in value for the reporting period, led by Randgold Resources ADR and Alacer Gold, which returned 50.85% and 36.21% respectively. The worst performers were Zhaojin Mining Industry and Lake Shore Gold, which returned -61.01% and -62.98% respectively.
Growth of a $10,000 Investment
| | | | | | |
| | | AVERAGE ANNUAL TOTAL RETURN FOR THE PERIOD ENDED OCTOBER 31, 2011* | | |
| | Cumulative Inception to Date | | |
| | Net Asset Value | | Market Price | | |
Global X Pure Gold Miners ETF | | (3.17%) | | (3.43%) | | |
Solactive Global Pure Gold Miners Index | | (2.69%) | | (2.69%) | | |
*Fund commenced operations on March 14, 2011.
The performance data quoted herein represents past performance and the return and value of an investment in the Fund will fluctuate so that, when redeemed, may be worth less than its original cost. Past performance is no guarantee of future performance and should not be considered as a representation of the future results of the Fund. The Fund’s performance assumes the reinvestment of all dividends and all capital gains. Index returns assume reinvestment of dividends and, unlike a Fund’s returns, do not reflect any fees or expenses. If such fees and expenses were included in the index returns, the performance would have been lower. Please note that one cannot invest directly in an unmanaged index.
There are no assurances that the Fund will meet its stated objectives.
The Fund’s holdings and allocations are subject to change and should not be considered recommendations to buy individual securities.
Returns shown do not reflect the deduction of taxes that a shareholder would pay on Fund distributions or the redemption of Fund shares.
See definition of comparative index above.
7
MANAGEMENT DISCUSSIONOF FUND PERFORMANCE
GLOBAL X OIL EQUITIES ETF
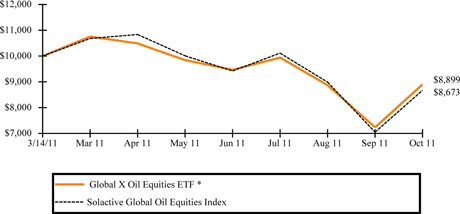
Global X Oil Equities ETF
The Global X Oil Equities ETF (the “Fund”) seeks to provide investment results that correspond generally to the price and yield performance, before fees and expenses, of the Solactive Global Oil Equities Index (the “Index”). The Fund generally seeks to replicate the Index but may at times invest in a representative sample of securities that collectively has an investment profile similar to the Index and as a result may or may not hold all the securities that are included in the Index.
The Solactive Global Oil Equities Index tracks the performance of 25 equal-weighted companies globally that have shown a high correlation to the spot price of oil. It is comprised of companies that derive the majority of their revenues from the exploration and production of oil and/or have significant oil reserves.
For the period from the Fund’s commencement date on March 14, 2011 through October 31, 2011 (the “reporting period”), the Fund decreased 11.01%, while the Index decreased 13.27%. The Fund commenced operations with a net asset value of $15.08 per share on March 14, 2011 and ended the period with a net asset value of $13.42 on October 31, 2011.
Six of the Fund’s twenty-five holdings as of October 31, 2011 increased in value for the reporting period, led by Petrohawk Energy and Range Resources, which returned 80.78%% and 38.09% respectively. The worst performers were Newfield Exploration and Forest Oil, which returned -43.34% and -51.19% respectively.
Growth of a $10,000 Investment
| | | | | | |
| | | AVERAGE ANNUAL TOTAL RETURN FOR THE PERIOD ENDED OCTOBER 31, 2011* | | |
| | Cumulative Inception to Date | | |
| | Net Asset Value | | Market Price | | |
Global X Oil Equities ETF | | (11.01%) | | (11.34%) | | |
Solactive Global Oil Equities Index | | (13.27%) | | (13.27%) | | |
*Fund commenced operations on March 14, 2011.
The performance data quoted herein represents past performance and the return and value of an investment in the Fund will fluctuate so that, when redeemed, may be worth less than its original cost. Past performance is no guarantee of future performance and should not be considered as a representation of the future results of the Fund. The Fund’s performance assumes the reinvestment of all dividends and all capital gains. Index returns assume reinvestment of dividends and, unlike a Fund’s returns, do not reflect any fees or expenses. If such fees and expenses were included in the index returns, the performance would have been lower. Please note that one cannot invest directly in an unmanaged index.
There are no assurances that the Fund will meet its stated objectives.
The Fund’s holdings and allocations are subject to change and should not be considered recommendations to buy individual securities.
Returns shown do not reflect the deduction of taxes that a shareholder would pay on Fund distributions or the redemption of Fund shares.
See definition of comparative index above.
8
|
| MANAGEMENT DISCUSSIONOF FUND PERFORMANCE |
GLOBAL X S&P/TSX VENTURE 30 CANADA ETF |
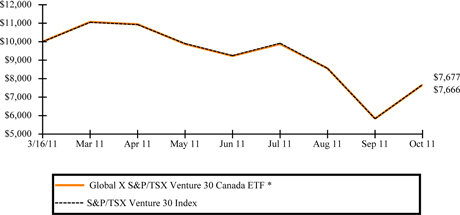
Global X S&P/TSX Venture 30 Canada ETF
The Global X S&P/TSX Venture 30 Canada ETF (the “Fund”) seeks to provide investment results that correspond generally to the price and yield performance, before fees and expenses, of the S&P/TSX Venture 30 Index (the “Index”). The Fund generally seeks to replicate the Index but may at times invest in a representative sample of securities that collectively has an investment profile similar to the Index and as a result may or may not hold all the securities that are included in the Index.
The S&P/TSX Venture 30 Index is designed to provide exposure to 30 most liquid securities of the S&P/TSX Venture Composite Index. The Fund is the nation’s first ETF focused exclusively on the TSX Venture Exchange.
For the period from the Fund’s commencement date on March 16, 2011 through October 31, 2011 (the “reporting period”), the Fund decreased 23.34% while the Index decreased 23.23%. The Fund commenced operations with a net asset value of $15.04 per share on March 16, 2011 and ended the period with a net asset value of $11.53 on October 31, 2011.
Thirteen of the Fund’s thirty-two holdings as of October 31, 2011 increased in value for the reporting period, led by Hathor Exploration and Barisan Gold, which returned 153.89% and 107.50% respectively. The worst performers were Canaco Resources and East Asia Minerals, which returned -66.73% and -84.23% respectively.
| | | | | | |
| | | AVERAGE ANNUAL TOTAL RETURN FOR THE PERIOD ENDED OCTOBER 31, 2011* | | |
| | Cumulative Inception to Date | | |
| | Net Asset Value | | Market Price | | |
Global X S&P/TSX Venture 30 Canada ETF | | (23.34%) | | (23.67%) | | |
S&P/TSX Venture 30 Index | | (23.23%) | | (23.23%) | | |
*Fund commenced operations on March 16, 2011.
The performance data quoted herein represents past performance and the return and value of an investment in the Fund will fluctuate so that, when redeemed, may be worth less than its original cost. Past performance is no guarantee of future performance and should not be considered as a representation of the future results of the Fund. The Fund’s performance assumes the reinvestment of all dividends and all capital gains. Index returns assume reinvestment of dividends and, unlike a Fund's returns, do not reflect any fees or expenses. If such fees and expenses were included in the index returns, the performance would have been lower. Please note that one cannot invest directly in an unmanaged index.
There are no assurances that the Fund will meet its stated objectives.
The Fund’s holdings and allocations are subject to change and should not be considered recommendations to buy individual securities.
Returns shown do not reflect the deduction of taxes that a shareholder would pay on Fund distributions or the redemption of Fund shares.
See definition of comparative index above.
9
|
| MANAGEMENT DISCUSSIONOF FUND PERFORMANCE |
GLOBAL X FERTILIZERS/POTASH ETF |
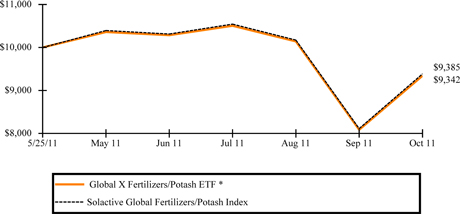
Global X Fertilizers/Potash ETF
The Global X Fertilizers/Potash ETF (the “Fund”) seeks to provide investment results that correspond generally to the price and yield performance, before fees and expenses, of the Solactive Global Fertilizers/Potash Index (the “Index”). The Fund generally seeks to replicate the Index but may at times invest in a representative sample of securities that collectively has an investment profile similar to the Index and as a result may or may not hold all the securities that are included in the Index.
The Solactive Global Fertilizers/Potash Index tracks the performance of the largest and most liquid listed companies globally that are active in some aspect of the fertilizer industry. The Fund is the nation’s first ETF focused exclusively on the fertilizers industry.
For the period from the Fund’s commencement date on May 25, 2011 through October 31, 2011 (the “reporting period”), the Fund decreased 6.58%, while the Index decreased 6.15%. The Fund commenced operations with a net asset value of $15.05 per share on May 25, 2011 and ended the period with a net asset value of $14.06 on October 31, 2011.
Nine of the Fund’s twenty-eight holdings as of October 31, 2011 increased in value for the reporting period, led by Terra Nitrogen and Vale Fertilizantes, which returned 45.03% and 38.57% respectively. The worst performers were Allana Potash and Hanfeng Evergreen, which returned -42.31% and -44.33% respectively.
Growth of a $10,000 Investment
| | | | | | | | |
| | | | | AVERAGE ANNUAL TOTAL RETURN FOR THE PERIOD ENDED OCTOBER 31, 2011* | | |
| | | | Cumulative Inception to Date | | |
| | | | Net Asset Value | | Market Price | | |
| | Global X Fertilizers/Potash ETF | | (6.58%) | | (6.71%) | | |
| | Solactive Global Fertilizers/Potash Index | | (6.15%) | | (6.15%) | | |
*Fund commenced operations on May 25, 2011.
The performance data quoted herein represents past performance and the return and value of an investment in the Fund will fluctuate so that, when redeemed, may be worth less than its original cost. Past performance is no guarantee of future performance and should not be considered as a representation of the future results of the Fund. The Fund’s performance assumes the reinvestment of all dividends and all capital gains. Index returns assume reinvestment of dividends and, unlike a Fund’s returns, do not reflect any fees or expenses. If such fees and expenses were included in the index returns, the performance would have been lower. Please note that one cannot invest directly in an unmanaged index.
There are no assurances that the Fund will meet its stated objectives.
The Fund’s holdings and allocations are subject to change and should not be considered recommendations to buy individual securities.
Returns shown do not reflect the deduction of taxes that a shareholder would pay on Fund distributions or the redemption of Fund shares.
See definition of comparative index above.
10

| | | | |
| Schedule of Investments | | October 31, 2011 | | |
Global X Gold Explorers ETF
Sector Weightings (unaudited)†:

† Percentages based on total investments.
| | | | | | | | |
| | | Shares | | | Value | |
COMMON STOCK — 100.0% | | | | | | | | |
| | |
AUSTRALIA— 8.2% | | | | | | | | |
| | |
Basic Materials — 8.2% | | | | | | | | |
Ampella Mining * | | | 571,821 | | | $ | 1,090,675 | |
Gryphon Minerals * | | | 783,214 | | | | 1,151,360 | |
| | | | | | | | |
TOTAL AUSTRALIA | | | | | | | 2,242,035 | |
| | | | | | | | |
| | |
CANADA— 86.3% | | | | | | | | |
| | |
Basic Materials — 86.3% | | | | | | | | |
Atac Resources * | | | 167,515 | | | | 705,892 | |
Auryx Gold * | | | 547,753 | | | | 456,140 | |
Canaco Resources * | | | 440,409 | | | | 720,243 | |
Chesapeake Gold * | | | 118,294 | | | | 1,609,378 | |
Continental Gold * | | | 219,487 | | | | 1,796,944 | |
Eco Oro Minerals * | | | 164,172 | | | | 415,083 | |
Exeter Resource * | | | 291,296 | | | | 1,052,138 | |
Extorre Gold Mines * | | | 127,802 | | | | 951,431 | |
Gold Canyon Resources * | | | 273,137 | | | | 802,941 | |
Guyana Goldfields * | | | 193,586 | | | | 1,701,428 | |
International Tower Hill Mines * | | | 211,891 | | | | 1,067,215 | |
Kaminak Gold, Cl A * | | | 234,922 | | | | 700,028 | |
Keegan Resources * | | | 201,125 | | | | 1,200,656 | |
Levon Resources * | | | 642,983 | | | | 832,194 | |
Lydian International * | | | 231,769 | | | | 558,087 | |
Newstrike Capital * | | | 213,672 | | | | 621,700 | |
Novagold Resources * | | | 161,630 | | | | 1,491,845 | |
Rainy River Resources * | | | 138,800 | | | | 1,033,306 | |
Rubicon Minerals * | | | 387,658 | | | | 1,571,324 | |
Sabina Gold & Silver * | | | 273,110 | | | | 1,183,742 | |
Seabridge Gold * | | | 58,060 | | | | 1,378,925 | |
Tigray Resources * | | | 53,928 | | | | 78,455 | |
Trelawney Mining and Exploration * | | | 310,649 | | | | 1,140,740 | |
Volta Resources * | | | 415,374 | | | | 575,114 | |
| | | | | | | | |
TOTAL CANADA | | | | | | | 23,644,949 | |
| | | | | | | | |
The accompanying notes are an integral part of the financial statements.
11
| | | | |
| Schedule of Investments | | October 31, 2011 | | |
Global X Gold Explorers ETF
| | | | | | | | |
| | | Shares/Face
Amount | | | Value | |
COMMON STOCK — continued | | | | | | | | |
| | |
HONG KONG— 5.5% | | | | | | | | |
Basic Materials — 5.5% | | | | | | | | |
China Precious Metal Resources Holdings * | | | 7,684,290 | | | $ | 1,503,523 | |
| | | | | | | | |
TOTAL COMMON STOCK
(Cost $33,886,967) | | | | | | | 27,390,507 | |
| | | | | | | | |
| | |
TIME DEPOSIT — 0.1% | | | | | | | | |
Brown Brothers Harriman, 0.030%
(Cost $15,042) | | $ | 15,042 | | | | 15,042 | |
| | | | | | | | |
TOTAL INVESTMENTS — 100.1%
(Cost $33,902,009) | | | | | | $ | 27,405,549 | |
| | | | | | | | |
| | |
Percentages are based on Net Assets of $27,391,860. | | | | | | | | |
| | |
* Non-income producing security. | | | | | | | | |
Cl — Class
The following is a summary of the inputs used as of October 31, 2011, in valuing the Fund’s investments carried at value:
| | | | | | | | | | | | | | | | |
| Investments in Securities | | Level 1 | | | Level 2 | | | Level 3 | | | Total | |
Common Stock | | $ | 27,390,507 | | | $ | — | | | $ | — | | | $ | 27,390,507 | |
Time Deposit | | | — | | | | 15,042 | | | | — | | | | 15,042 | |
| | | | | | | | | | | | | | | | |
Total Investments in Securities | | $ | 27,390,507 | | | $ | 15,042 | | | $ | — | | | $ | 27,405,549 | |
| | | | | | | | | | | | | | | | |
For the period ended October 31, 2011, there have been no significant transfers between Level 1 & Level 2 investments.
For the period ended October 31, 2011, there were no Level 3 investments.
The accompanying notes are an integral part of the financial statements.
12
| | | | |
| Schedule of Investments | | October 31, 2011 | | |
|
Global X Silver Miners ETF |
Sector Weightings (unaudited)†:

† Percentages based on total investments.
| | | | | | | | |
| | | Shares | | | Value | |
COMMON STOCK — 99.9% | | | | | | | | |
| | |
AUSTRALIA— 0.4% | | | | | | | | |
| | |
Basic Materials — 0.4% | | | | | | | | |
Alcyone Resources * | | | 12,666,302 | | | $ | 1,334,770 | |
| | | | | | | | |
| | |
CANADA— 48.9% | | | | | | | | |
| | |
Basic Materials — 48.9% | | | | | | | | |
Alexco Resource * | | | 615,758 | | | | 4,716,706 | |
Aurcana * | | | 3,860,045 | | | | 2,904,619 | |
Bear Creek Mining * | | | 828,692 | | | | 3,184,399 | |
Endeavour Silver * | | | 912,017 | | | | 9,886,264 | |
Excellon Resources * | | | 3,017,462 | | | | 1,937,570 | |
First Majestic Silver * | | | 986,090 | | | | 16,749,778 | |
Fortuna Silver Mines * | | | 1,357,778 | | | | 8,623,191 | |
Great Panther Silver * | | | 1,451,205 | | | | 3,814,746 | |
Impact Silver * | | | 643,756 | | | | 1,324,069 | |
MAG Silver * | | | 483,125 | | | | 4,536,544 | |
Minco Silver * | | | 310,324 | | | | 716,108 | |
Minefinders * | | | 883,884 | | | | 12,524,636 | |
Orko Silver * | | | 1,404,712 | | | | 2,875,100 | |
Pan American Silver | | | 607,597 | | | | 16,988,412 | |
Scorpio Mining * | | | 2,114,701 | | | | 4,285,839 | |
Silver Standard Resources * | | | 879,471 | | | | 17,228,837 | |
Silver Wheaton | | | 1,261,441 | | | | 43,645,859 | |
Silvercorp Metals | | | 1,816,031 | | | | 17,161,493 | |
Silvermex Resources * | | | 2,453,371 | | | | 1,206,132 | |
US Silver * | | | 3,249,359 | | | | 1,793,065 | |
Wildcat Silver * | | | 1,029,656 | | | | 1,570,259 | |
| | | | | | | | |
TOTAL CANADA | | | | | | | 177,673,626 | |
| | | | | | | | |
| | |
MEXICO— 23.2% | | | | | | | | |
| | |
Basic Materials — 23.2% | | | | | | | | |
Fresnillo | | | 1,607,582 | | | | 43,898,848 | |
Industrias Penoles | | | 998,942 | | | | 40,198,416 | |
| | | | | | | | |
TOTAL MEXICO | | | | | | | 84,097,264 | |
| | | | | | | | |
| | |
PERU— 3.4% | | | | | | | | |
| | |
Basic Materials — 3.4% | | | | | | | | |
Hochschild Mining | | | 1,741,736 | | | | 12,540,409 | |
| | | | | | | | |
The accompanying notes are an integral part of the financial statements.
13
| | | | |
| Schedule of Investments | | October 31, 2011 | | |
Global X Silver Miners ETF
| | | | | | | | |
| | | Shares/Face
Amount | | | Value | |
COMMON STOCK — continued | | | | | | | | |
| | |
RUSSIA— 4.9% | | | | | | | | |
| | |
Basic Materials — 4.9% | | | | | | | | |
Polymetal GDR * | | | 1,093,115 | | | $ | 17,828,706 | |
| | | | | | | | |
| | |
UNITED KINGDOM— 4.1% | | | | | | | | |
| | |
Basic Materials — 4.1% | | | | | | | | |
Polymetal International * | | | 1,015,559 | | | | 15,025,720 | |
| | | | | | | | |
| | |
UNITED STATES— 15.0% | | | | | | | | |
| | |
Basic Materials — 15.0% | | | | | | | | |
Coeur d’Alene Mines * | | | 672,428 | | | | 17,193,984 | |
Golden Minerals * | | | 211,206 | | | | 1,480,554 | |
Hecla Mining * | | | 2,750,468 | | | | 17,245,434 | |
Mines Management * | | | 268,007 | | | | 670,018 | |
Revett Minerals * | | | 240,443 | | | | 1,001,142 | |
Tahoe Resources * | | | 885,548 | | | | 16,712,309 | |
| | | | | | | | |
TOTAL UNITED STATES | | | | | | | 54,303,441 | |
| | | | | | | | |
TOTAL COMMON STOCK
(Cost $380,614,090) | | | | | | | 362,803,936 | |
| | | | | | | | |
| | |
TIME DEPOSIT — 0.0% | | | | | | | | |
Brown Brothers Harriman, 0.030%
(Cost $143,985) | | $ | 143,985 | | | | 143,985 | |
| | | | | | | | |
TOTAL INVESTMENTS — 99.9%
(Cost $380,758,075) | | | | | | $ | 362,947,921 | |
| | | | | | | | |
Percentages are based on Net Assets of $363,105,604.
| * | Non-income producing security. |
GDR — Global Depositary Receipt
The following is a summary of the inputs used as of October 31, 2011, in valuing the Fund’s investments carried at value:
| | | | | | | | | | | | | | | | |
| Investments in Securities | | Level 1 | | | Level 2 | | | Level 3 | | | Total | |
Common Stock | | $ | 362,803,936 | | | $ | — | | | $ | — | | | $ | 362,803,936 | |
Time Deposit | | | — | | | | 143,985 | | | | — | | | | 143,985 | |
| | | | | | | | | | | | | | | | |
Total Investments in Securities | | $ | 362,803,936 | | | $ | 143,985 | | | $ | — | | | $ | 362,947,921 | |
| | | | | | | | | | | | | | | | |
For the year ended October 31, 2011, there have been no significant transfers between Level 1 & Level 2 investments.
For the year ended October 31, 2011, there were no Level 3 investments.
The accompanying notes are an integral part of the financial statements.
14
| | | | |
| Schedule of Investments | | October 31, 2011 | | |
|
Global X Copper Miners ETF |
Sector Weightings (unaudited)†:

† Percentages based on total investments.
| | | | | | | | |
| | | Shares | | | Value | |
COMMON STOCK — 99.8% | | | | | | | | |
| | |
AUSTRALIA— 7.3% | | | | | | | | |
| | |
Basic Materials — 7.3% | | | | | | | | |
Aditya Birla Minerals | | | 220,074 | | | $ | 228,434 | |
Cudeco * | | | 187,190 | | | | 617,424 | |
OZ Minerals | | | 178,492 | | | | 2,185,655 | |
Straits Resources * | | | 361,757 | | | | 264,947 | |
| | | | | | | | |
TOTAL AUSTRALIA | | | | | | | 3,296,460 | |
| | | | | | | | |
| | |
CANADA— 46.6% | | | | | | | | |
| | |
Basic Materials— 46.6% | | | | | | | | |
Augusta Resource * | | | 140,237 | | | | 535,705 | |
Capstone Mining * | | | 525,431 | | | | 1,781,837 | |
Copper Mountain Mining (CAD) * | | | 134,331 | | | | 717,007 | |
Copper Mountain Mining (USD) * | | | 12,300 | | | | 67,021 | |
Duluth Metals * | | | 153,823 | | | | 412,067 | |
First Quantum Minerals | | | 101,374 | | | | 2,126,749 | |
HudBay Minerals, Cl B | | | 197,082 | | | | 2,159,261 | |
Imperial Metals * | | | 51,224 | | | | 1,081,835 | |
Inmet Mining | | | 36,915 | | | | 2,203,715 | |
Ivanhoe Mines * | | | 108,364 | | | | 2,222,546 | |
Katanga Mining * | | | 350,942 | | | | 499,988 | |
Lundin Mining * | | | 551,734 | | | | 2,164,422 | |
Mercator Minerals * | | | 387,000 | | | | 788,211 | |
Northern Dynasty Minerals * | | | 110,609 | | | | 908,100 | |
Polymet Mining * | | | 201,603 | | | | 272,164 | |
Quadra FNX Mining * | | | 188,049 | | | | 2,169,724 | |
Taseko Mines * | | | 302,053 | | | | 1,105,514 | |
| | | | | | | | |
TOTAL CANADA | | | | | | | 21,215,866 | |
| | | | | | | | |
| | |
CHINA— 4.8% | | | | | | | | |
| | |
Basic Materials— 4.8% | | | | | | | | |
Jiangxi Copper, Cl H | | | 882,023 | | | | 2,191,291 | |
| | | | | | | | |
MEXICO— 4.7% | | | | | | | | |
| | |
Basic Materials— 4.7% | | | | | | | | |
Grupo Mexico, Cl B | | | 770,053 | | | | 2,135,567 | |
| | | | | | | | |
The accompanying notes are an integral part of the financial statements.
15
| | | | |
| Schedule of Investments | | October 31, 2011 | | |
Global X Copper Miners ETF
| | | | | | | | |
| | | Shares/Number
of
Warrants/Face
Amount | | | Value | |
COMMON STOCK—continued | | | | | | | | |
| | |
POLAND— 4.6% | | | | | | | | |
Basic Materials — 4.6% | | | | | | | | |
KGHM Polska Miedz * | | | 43,047 | | | $ | 2,091,303 | |
| | | | | | | | |
SOUTH AFRICA— 3.1% | | | | | | | | |
Basic Materials — 3.1% | | | | | | | | |
Metorex * | | | 1,305,676 | | | | 1,347,645 | |
Palabora Mining | | | 5,554 | | | | 80,284 | |
| | | | | | | | |
TOTAL SOUTH AFRICA | | | | | | | 1,427,929 | |
| | | | | | | | |
| | |
SWITZERLAND— 4.6% | | | | | | | | |
| | |
Basic Materials — 4.6% | | | | | | | | |
Xstrata | | | 125,397 | | | | 2,108,402 | |
| | | | | | | | |
| | |
TURKEY— 1.1% | | | | | | | | |
| | |
Basic Materials — 1.1% | | | | | | | | |
Park Elektrik Uretim Madencilik Sanayi ve Ticaret * | | | 235,500 | | | | 510,508 | |
| | | | | | | | |
| | |
UNITED KINGDOM— 13.6% | | | | | | | | |
| | |
Basic Materials — 13.6% | | | | | | | | |
Antofagasta | | | 110,630 | | | | 2,076,281 | |
Kazakhmys | | | 137,307 | | | | 2,048,089 | |
Vedanta Resources | | | 99,221 | | | | 2,039,279 | |
| | | | | | | | |
TOTAL UNITED KINGDOM | | | | | | | 6,163,649 | |
| | | | | | | | |
| | |
UNITED STATES— 9.4% | | | | | | | | |
| | |
Basic Materials — 9.4% | | | | | | | | |
Freeport-McMoRan Copper & Gold | | | 53,144 | | | | 2,139,577 | |
Southern Copper | | | 70,073 | | | | 2,149,840 | |
| | | | | | | | |
TOTAL UNITED STATES | | | | | | | 4,289,417 | |
| | | | | | | | |
TOTAL COMMON STOCK
(Cost $52,176,116) | | | | | | | 45,430,392 | |
| | | | | | | | |
| | |
WARRANTS — 0.0% | | | | | | | | |
CANADA — 0.0% | | | | | | | | |
Duluth Exploration*, expiration date 1/18/13 1,2
(Cost $—) | | | 11,771 | | | | — | |
| | | | | | | | |
| | |
TIME DEPOSIT — 0.1% | | | | | | | | |
Brown Brothers Harriman, 0.030%
(Cost $60,821) | | $ | 60,821 | | | | 60,821 | |
| | | | | | | | |
TOTAL INVESTMENTS — 99.9%
(Cost $52,236,937) | | | | | | $ | 45,491,213 | |
| | | | | | | | |
Percentages are based on Net Assets of $45,517,213.
The accompanying notes are an integral part of the financial statements.
16
| | |
| Schedule of Investments | | October 31, 2011 |
Global X Copper Miners ETF
| * | Non-income producing security. |
| 1 | Security is fair valued using methods determined in good faith by the Fair Value Committee of the Fund. The total value of such security as of October 31 2011 was $0 and represents 0.0% of Net Assets. |
| 2 | Securities considered illiquid. The total value of such security as of October 31, 2011 was $0 and represents 0.0% of Net Assets. |
CAD — Canadian Dollar
Cl — Class
USD — U.S. Dollar
The following is a summary of the inputs used as of October 31, 2011, in valuing the Fund’s investments carried at value:
| | | | | | | | | | | | | | | | |
| Investments in Securities | | Level 1 | | | Level 2 | | | Level 3 | | | Total | |
Common Stock | | $ | 45,430,392 | | | $ | — | | | $ | — | �� | | $ | 45,430,392 | |
Warrants | | | — | | | | — | | | | — | | | | — | |
Time Deposit | | | — | | | | 60,821 | | | | — | | | | 60,821 | |
| | | | | | | | | | | | | | | | |
Total Investments in Securities | | $ | 45,430,392 | | | $ | 60,821 | | | $ | — | | | $ | 45,491,213 | |
| | | | | | | | | | | | | | | | |
For the year ended October 31, 2011, there have been no significant transfers between Level 1 & Level 2 investments.
For the year ended October 31, 2011, there were no Level 3 investments.
The accompanying notes are an integral part of the financial statements.
17
| | | | |
| Schedule of Investments | | October 31, 2011 | | |
Global X Uranium ETF
Sector Weightings (unaudited)†:

| | | | | | | | |
| | | Shares | | | Value | |
COMMON STOCK — 100.1% | | | | | | | | |
| | |
AUSTRALIA— 21.2% | | | | | | | | |
| | |
Basic Materials — 21.2% | | | | | | | | |
Bannerman Resources * | | | 5,646,250 | | | $ | 1,636,249 | |
Berkeley Resources * | | | 4,437,698 | | | | 1,519,840 | |
Deep Yellow * | | | 12,317,039 | | | | 1,622,456 | |
Energy Resources of Australia * | | | 3,552,315 | | | | 7,430,682 | |
Extract Resources * | | | 1,381,351 | | | | 11,237,715 | |
Greenland Minerals & Energy * | | | 7,920,096 | | | | 4,423,469 | |
Paladin Energy * | | | 9,060,790 | | | | 14,322,340 | |
| | | | | | | | |
TOTAL AUSTRALIA | | | | | | | 42,192,751 | |
| | | | | | | | |
| | |
CANADA— 53.7% | | | | | | | | |
| | |
Basic Materials — 53.7% | | | | | | | | |
Cameco | | | 1,880,949 | | | | 40,366,709 | |
Denison Mines * | | | 5,639,724 | | | | 8,883,683 | |
Forsys Metals * | | | 1,782,093 | | | | 1,233,715 | |
Hathor Exploration * | | | 2,980,223 | | | | 13,724,515 | |
Laramide Resources * | | | 1,657,534 | | | | 1,563,241 | |
Mega Uranium * | | | 7,879,485 | | | | 2,529,784 | |
Rockgate Capital* | | | 3,478,759 | | | | 4,048,721 | |
Uex * | | | 4,821,685 | | | | 3,579,860 | |
Uranium One | | | 10,321,616 | | | | 31,067,370 | |
| | | | | | | | |
TOTAL CANADA | | | | | | | 106,997,598 | |
| | | | | | | | |
| | |
SOUTH AFRICA— 0.9% | | | | | | | | |
| | |
Basic Materials — 0.9% | | | | | | | | |
First Uranium * | | | 6,368,957 | | | | 1,757,262 | |
| | | | | | | | |
| | |
UNITED KINGDOM— 5.7% | | | | | | | | |
| | |
Basic Materials — 5.7% | | | | | | | | |
Kalahari Minerals * | | | 3,115,703 | | | | 11,487,028 | |
| | | | | | | | |
| | |
UNITED STATES— 18.6% | | | | | | | | |
| | |
Basic Materials — 18.6% | | | | | | | | |
Uranerz Energy * | | | 2,875,414 | | | | 6,555,944 | |
Uranium Energy * | | | 3,020,489 | | | | 10,148,843 | |
Uranium Resources * | | | 6,728,240 | | | | 8,073,888 | |
Ur-Energy * | | | 3,808,383 | | | | 4,912,814 | |
The accompanying notes are an integral part of the financial statements.
18
| | |
| Schedule of Investments | | October 31, 2011 |
Global X Uranium ETF
| | | | | | | | |
| | | Shares | | | Value | |
COMMON STOCK — continued | | | | | | | | |
| | |
Basic Materials — continued | | | | | | | | |
USEC * | |
| 3,496,425
|
| | $ | 7,342,493 | |
| | | | | | | | |
TOTAL UNITED STATES | | | | | | | 37,033,982 | |
| | | | | | | | |
TOTAL COMMON STOCK
(Cost $321,831,768) | | | | | | | 199,468,621 | |
| | | | | | | | |
| | |
TOTAL INVESTMENTS — 100.1%
(Cost $321,831,768) | | | | | | $ | 199,468,621 | |
| | | | | | | | |
| | |
Percentages are based on Net Assets of $199,348,996. | | | | | | | | |
| * | Non-income producing security. |
The following is a summary of the inputs used as of October 31, 2011, in valuing the Fund’s investments carried at value:
| | | | | | | | | | | | | | | | |
| Investments in Securities | | Level 1 | | | Level 2 | | | Level 3 | | | Total | |
Common Stock | | $ | 199,468,621 | | | $ | — | | | $ | — | | | $ | 199,468,621 | |
| | | | | | | | | | | | | | | | |
Total Investments in Securities | | $ | 199,468,621 | | | $ | — | | | $ | — | | | $ | 199,468,621 | |
| | | | | | | | | | | | | | | | |
| | | | |
| | | Level 1 | | | Level 2 | | | Level 3 | | | Total | |
Other Financial Instruments** | | $ | — | | | $ | 44,193 | | | $ | — | | | $ | 44,193 | |
| | | | | | | | | | | | | | | | |
** Other Financial Instruments includes net unrealized appreciation on spot foreign currency contracts.
For the period ended October 31, 2011, there have been no significant transfers between Level 1 & Level 2 investments.
For the period ended October 31, 2011, there were no Level 3 investments.
The accompanying notes are an integral part of the financial statements.
19
| | | | |
| Schedule of Investments | | October 31, 2011 | | |
Global X Lithium ETF
Sector Weightings (unaudited)†:

† Percentages based on total investments.
| | | | | | | | |
| | | Shares | | | Value | |
COMMON STOCK — 99.9% | | | | | | | | |
| | |
AUSTRALIA— 11.5% | | | | | | | | |
| | |
Basic Materials — 11.5% | | | | | | | | |
Galaxy Resources * | | | 7,058,653 | | | $ | 4,834,948 | |
Orocobre * | | | 2,022,540 | | | | 2,536,301 | |
Reed Resources * | | | 5,077,303 | | �� | | 1,952,912 | |
Talison Lithium * | | | 854,808 | | | | 2,976,005 | |
| | | | | | | | |
TOTAL AUSTRALIA | | | | | | | 12,300,166 | |
| | | | | | | | |
| | |
CANADA— 10.1% | | | | | | | | |
| | |
Basic Materials — 9.2% | | | | | | | | |
Avalon Rare Metals * | | | 849,507 | | | | 2,829,702 | |
Canada Lithium * | | | 7,407,619 | | | | 3,790,394 | |
Lithium Americas * | | | 1,296,751 | | | | 1,353,086 | |
Lithium One * | | | 1,871,434 | | | | 1,933,959 | |
| | | | | | | | |
| | | | | | | 9,907,141 | |
| | | | | | | | |
| | |
Industrials — 0.9% | | | | | | | | |
Electrovaya * | | | 801,485 | | | | 997,132 | |
| | | | | | | | |
TOTAL CANADA | | | | | | | 10,904,273 | |
| | | | | | | | |
| | |
CHILE— 24.3% | | | | | | | | |
| | |
Basic Materials — 24.3% | | | | | | | | |
Sociedad Quimica y Minera de Chile ADR | | | 446,020 | | | | 26,092,170 | |
| | | | | | | | |
| | |
CHINA— 1.1% | | | | | | | | |
| | |
Industrials — 1.1% | | | | | | | | |
China BAK Battery * | | | 1,261,185 | | | | 1,160,416 | |
| | | | | | | | |
| | |
FRANCE— 5.3% | | | | | | | | |
| | |
Industrials — 5.3% | | | | | | | | |
Saft Groupe | | | 187,961 | | | | 5,723,063 | |
| | | | | | | | |
| | |
HONG KONG— 1.0% | | | | | | | | |
| | |
Industrials — 1.0% | | | | | | | | |
Coslight Technology International Group * | | | 3,667,792 | | | | 1,071,750 | |
| | | | | | | | |
| | |
JAPAN— 5.2% | | | | | | | | |
| | |
Basic Materials — 5.2% | | | | | | | | |
GS Yuasa | | | 1,033,000 | | | | 5,525,902 | |
| | | | | | | | |
The accompanying notes are an integral part of the financial statements.
20
| | | | |
| Schedule of Investments | | October 31, 2011 | | |
Global X Lithium ETF
| | | | | | | | |
| | | Shares | | | Value | |
COMMON STOCK — continued | | | | | | | | |
| | |
UNITED STATES— 41.4% | | | | | | | | |
Basic Materials — 29.1% | | | | | | | | |
FMC | | | 253,529 | | | $ | 20,000,903 | |
Rockwood Holdings * | | | 242,383 | | | | 11,159,313 | |
| | | | | | | | |
| | | | | | | 31,160,216 | |
| | | | | | | | |
| | |
Industrials — 12.3% | | | | | | | | |
A123 Systems * | | | 1,083,314 | | | | 3,715,767 | |
Advanced Battery Technologies * | | | 2,259,529 | | | | 2,147,682 | |
Exide Technologies * | | | 666,838 | | | | 3,000,771 | |
Ultralife * | | | 386,893 | | | | 1,748,756 | |
Valence Technology * | | | 2,704,644 | | | | 2,593,754 | |
| | | | | | | | |
| | | | | | | 13,206,730 | |
| | | | | | | | |
TOTAL UNITED STATES | | | | | | | 44,366,946 | |
| | | | | | | | |
TOTAL COMMON STOCK
(Cost $134,127,260) | | | | | | | 107,144,686 | |
| | | | | | | | |
TOTAL INVESTMENTS — 99.9%
(Cost $134,127,260) | | | | | | $ | 107,144,686 | |
| | | | | | | | |
Percentages are based on Net Assets of $107,300,624.
| * | Non-income producing security. |
ADR — American Depositary Receipt
The following is a summary of the inputs used as of October 31, 2011, in valuing the Fund’s investments carried at value:
| | | | | | | | | | | | | | | | |
| Investments in Securities | | Level 1 | | | Level 2 | | | Level 3 | | | Total | |
Common Stock | | $ | 107,144,686 | | | $ | — | | | $ | — | | | $ | 107,144,686 | |
| | | | | | | | | | | | | | | | |
Total Investments in Securities | | $ | 107,144,686 | | | $ | — | | | $ | — | | | $ | 107,144,686 | |
| | | | | | | | | | | | | | | | |
For the year ended October 31, 2011, there have been no significant transfers between Level 1 & Level 2 investments.
For the year ended October 31, 2011, there were no Level 3 investments.
The accompanying notes are an integral part of the financial statements.
21
| | | | |
| Schedule of Investments | | October 31, 2011 | | |
Global X Aluminum ETF
Sector Weightings (unaudited)†:

† Percentages based on total investments.
| | | | | | | | |
| | | Shares | | | Value | |
COMMON STOCK — 100.1% | | | | | | | | |
| | |
AUSTRALIA— 6.1% | | | | | | | | |
| | |
Basic Materials — 6.1% | | | | | | | | |
Alumina | | | 144,553 | | | $ | 225,448 | |
| | | | | | | | |
| | |
CHINA— 15.3% | | | | | | | | |
| | |
Basic Materials — 15.3% | | | | | | | | |
Aluminum Corp of China, Cl H | | | 280,062 | | | | 156,461 | |
China Hongqiao Group * | | | 369,535 | | | | 218,815 | |
China Zhongwang Holdings * | | | 513,860 | | | | 171,981 | |
XinRen Aluminum Holdings * | | | 98,666 | | | | 24,370 | |
| | | | | | | | |
TOTAL CHINA | | | | | | | 571,627 | |
| | | | | | | | |
| | |
GREECE— 4.1% | | | | | | | | |
| | |
Basic Materials — 4.1% | | | | | | | | |
Mytilineos Holdings | | | 32,843 | | | | 153,638 | |
| | | | | | | | |
| | |
HONG KONG— 4.9% | | | | | | | | |
| | |
Basic Materials — 4.9% | | | | | | | | |
Minmetals Resources * 1 | | | 357,384 | | | | 183,557 | |
| | | | | | | | |
| | |
JAPAN— 12.8% | | | | | | | | |
| | |
Basic Materials — 12.8% | | | | | | | | |
Alconix | | | 1,798 | | | | 39,922 | |
Nippon Light Metal | | | 115,349 | | | | 171,237 | |
Sky Aluminum | | | 31,799 | | | | 96,040 | |
Sumitomo Light Metal Industries | | | 193,517 | | | | 168,405 | |
| | | | | | | | |
TOTAL JAPAN | | | | | | | 475,604 | |
| | | | | | | | |
| | |
MALAYSIA— 1.6% | | | | | | | | |
| | |
Basic Materials — 1.6% | | | | | | | | |
Press Metal | | | 94,840 | | | | 59,681 | |
| | | | | | | | |
| | |
NORWAY— 6.6% | | | | | | | | |
| | |
Basic Materials — 6.6% | | | | | | | | |
Norsk Hydro | | | 46,890 | | | | 245,064 | |
| | | | | | | | |
| | |
RUSSIA— 4.5% | | | | | | | | |
| | |
Basic Materials — 4.5% | | | | | | | | |
United RUSAL * | | | 180,046 | | | | 166,870 | |
| | | | | | | | |
The accompanying notes are an integral part of the financial statements.
22
| | | | |
| Schedule of Investments | | October 31, 2011 | | |
Global X Aluminum ETF
| | | | | | | | |
| | | Shares | | | Value | |
COMMON STOCK — continued | | | | | | | | |
| | |
SINGAPORE— 3.3% | | | | | | | | |
| | |
Basic Materials — 3.3% | | | | | | | | |
Midas Holdings | | | 372,774 | | | $ | 123,258 | |
| | | | | | | | |
| | |
SOUTH KOREA— 0.9% | | | | | | | | |
| | |
Basic Materials — 0.9% | | | | | | | | |
Daeho AL | | | 6,518 | | | | 15,653 | |
Dayou Smart Aluminum | | | 12,103 | | | | 15,566 | |
| | | | | | | | |
TOTAL SOUTH KOREA | | | | | | | 31,219 | |
| | | | | | | | |
| | |
UNITED KINGDOM— 16.1% | | | | | | | | |
| | |
Basic Materials — 16.1% | | | | | | | | |
Rio Tinto | | | 10,997 | | | | 598,652 | |
| | | | | | | | |
| | |
UNITED STATES— 23.9% | | | | | | | | |
| | |
Basic Materials — 23.9% | | | | | | | | |
Alcoa | | | 34,601 | | | | 372,306 | |
Century Aluminum * | | | 18,648 | | | | 208,112 | |
Kaiser Aluminum | | | 4,331 | | | | 201,218 | |
Noranda Aluminum Holding | | | 11,704 | | | | 108,379 | |
| | | | | | | | |
TOTAL UNITED STATES | | | | | | | 890,015 | |
| | | | | | | | |
TOTAL COMMON STOCK
(Cost $5,249,501) | | | | | | | 3,724,633 | |
| | | | | | | | |
TOTAL INVESTMENTS — 100.1%
(Cost $5,249,501) | | | | | | $ | 3,724,633 | |
| | | | | | | | |
Percentages are based on Net Assets of $3,722,753.
| * | Non-income producing security. |
| 1 | Security is fair valued using methods determined in good faith by the Fair Value Committee of the Fund. The total value of such security as of October 31 2011 was $183,557 and represents 4.9% of Net Assets. |
Cl — Class
The accompanying notes are an integral part of the financial statements.
23
| | | | |
| Schedule of Investments | | October 31, 2011 | | |
Global X Aluminum ETF
The following is a summary of the inputs used as of October 31, 2011, in valuing the Fund’s investments carried at value:
| | | | | | | | | | | | | | | | |
| Investments in Securities | | Level 1 | | | Level 2 | | | Level 3 | | | Total | |
Common Stock | | | | | | | | | | | | | | | | |
Australia | | $ | 225,448 | | | $ | - | | | $ | - | | | $ | 225,448 | |
China | | | 571,627 | | | | - | | | | - | | | | 571,627 | |
Greece | | | 153,638 | | | | - | | | | - | | | | 153,638 | |
Hong Kong | | | - | | | | - | | | | 183,557 | | | | 183,557 | |
Japan | | | 475,604 | | | | - | | | | - | | | | 475,604 | |
Malaysia | | | 59,681 | | | | - | | | | - | | | | 59,681 | |
Norway | | | 245,064 | | | | - | | | | - | | | | 245,064 | |
Russia | | | 166,870 | | | | - | | | | - | | | | 166,870 | |
Singapore | | | 123,258 | | | | - | | | | - | | | | 123,258 | |
South Korea | | | 31,219 | | | | - | | | | - | | | | 31,219 | |
United Kingdom | | | 598,652 | | | | - | | | | - | | | | 598,652 | |
United States | | | 890,015 | | | | - | | | | - | | | | 890,015 | |
| | | | | | | | | | | | | | | | |
Total Investments in Securities | | $ | 3,541,076 | | | $ | - | | | $ | 183,557 | | | $ | 3,724,633 | |
| | | | | | | | | | | | | | | | |
The following is a reconciliation of investments in which significant unobservable inputs (Level 3) were used in determining fair value:
| | | | |
| | | Hong Kong | |
| | | Investments in
Common Stock | |
Beginning balance as of January 4, 2011 | | $ | - | |
Accrued discounts/premiums | | | - | |
Realized gain/(loss) | | | - | |
Change in unrealized appreciation/(depreciation) | | | - | |
Net purchases | | | - | |
Net sales | | | - | |
Transfers into Level 3 | | | 183,557 | |
Transfers out of Level 3 | | | - | |
| | | | |
Ending balance as of October 31, 2011 | | $ | 183,557 | |
| | | | |
Net change in unrealized appreciation (depreciation) from investments (Level 3) still held as of October 31, 2011 is $—.
For the period ended October 31, 2011, there have been no significant transfers between Level 1 & Level 2 investments.
For the period ended October 31, 2011, transfers between Level 1 and Level 3 assets and liabilities totaled $183,557.
The Level 3 investment presented above was considered a Level 1 investment at the beginning of the reporting period. The reason for the transfer was a temporary trading suspension of the investment’s shares, which necessitated a fair value determination by the Fair Value Committee at the end of the reporting period. The Fund’s policy is to transfer investments into/out of Level 3 at the end of the reporting period.
The accompanying notes are an integral part of the financial statements.
24
| | |
| Schedule of Investments | | October 31, 2011 |
Global X Pure Gold Miners ETF
Sector Weightings (unaudited)†:

† Percentages based on total investments.
| | | | | | | | |
| | | Shares | | | Value | |
COMMON STOCK — 99.6% | | | | | | | | |
| | |
AUSTRALIA— 9.4% | | | | | | | | |
| | |
Basic Materials — 9.4% | | | | | | | | |
Centamin Egypt * | | | 97,524 | | | $ | 172,209 | |
CGA Mining * | | | 27,448 | | | | 68,296 | |
Medusa Mining | | | 15,933 | | | | 111,654 | |
Perseus Mining * | | | 39,532 | | | | 130,392 | |
| | | | | | | | |
TOTAL AUSTRALIA | | | | | | | 482,551 | |
| | | | | | | | |
| | |
CANADA— 38.0% | | | | | | | | |
| | |
Basic Materials — 38.0% | | | | | | | | |
Alamos Gold | | | 11,346 | | | | 210,027 | |
Aurizon Mines * | | | 14,999 | | | | 84,874 | |
Centerra Gold | | | 12,528 | | | | 248,373 | |
China Gold International Resources * | | | 23,665 | | | | 71,467 | |
Detour Gold * | | | 7,138 | | | | 236,334 | |
Eldorado Gold | | | 13,486 | | | | 253,429 | |
Kinross Gold | | | 15,252 | | | | 217,448 | |
Kirkland Lake Gold * | | | 5,619 | | | | 105,029 | |
Lake Shore Gold * | | | 35,251 | | | | 52,344 | |
Osisko Mining * | | | 18,172 | | | | 219,151 | |
Romarco Minerals * | | | 49,129 | | | | 48,306 | |
SEMAFO * | | | 26,618 | | | | 204,302 | |
| | | | | | | | |
TOTAL CANADA | | | | | | | 1,951,084 | |
| | | | | | | | |
| | |
CHINA— 3.4% | | | | | | | | |
| | |
Basic Materials — 3.4% | | | | | | | | |
Real Gold Mining 1,2 | | | 22,800 | | | | 17,433 | |
Zhaojin Mining Industry | | | 85,545 | | | | 153,724 | |
| | | | | | | | |
TOTAL CHINA | | | | | | | 171,157 | |
| | | | | | | | |
| | |
JERSEY— 5.4% | | | | | | | | |
| | |
Basic Materials — 5.4% | | | | | | | | |
Randgold Resources ADR | | | 2,532 | | | | 277,431 | |
| | | | | | | | |
| | |
SOUTH AFRICA— 17.0% | | | | | | | | |
| | |
Basic Materials — 17.0% | | | | | | | | |
AngloGold Ashanti ADR | | | 5,950 | | | | 269,000 | |
The accompanying notes are an integral part of the financial statements.
25
| | | | |
| Schedule of Investments | | October 31, 2011 | | |
Global X Pure Gold Miners ETF
| | | | | | | | |
| | | Shares/Face
Amount | | | Value | |
COMMON STOCK — continued | | | | | | | | |
| | |
Basic Materials — continued | | | | | | | | |
Gold Fields ADR | | | 16,086 | | | $ | 280,379 | |
Great Basin Gold * | | | 43,224 | | | | 60,714 | |
Harmony Gold Mining ADR | | | 20,085 | | | | 263,716 | |
| | | | | | | | |
TOTAL SOUTH AFRICA | | | | | | | 873,809 | |
| | | | | | | | |
| | |
TURKEY— 4.0% | | | | | | | | |
| | |
Basic Materials — 4.0% | | | | | | | | |
Koza Altin Isletmeleri | | | 15,016 | | | | 206,100 | |
| | | | | | | | |
| | |
UNITED KINGDOM— 5.5% | | | | | | | | |
| | |
Basic Materials — 5.5% | | | | | | | | |
African Barrick Gold | | | 10,508 | | | | 91,255 | |
Petropavlovsk | | | 16,145 | | | | 191,229 | |
| | | | | | | | |
TOTAL UNITED KINGDOM | | | | | | | 282,484 | |
| | | | | | | | |
| | |
UNITED STATES— 16.9% | | | | | | | | |
| | |
Basic Materials — 16.9% | | | | | | | | |
Alacer Gold * | | | 23,863 | | | | 275,333 | |
Allied Nevada Gold * | | | 6,308 | | | | 239,578 | |
Gold Resource | | | 4,587 | | | | 103,208 | |
Polyus Gold International GDR * | | | 75,670 | | | | 248,198 | |
| | | | | | | | |
TOTAL UNITED STATES | | | | | | | 866,317 | |
| | | | | | | | |
TOTAL COMMON STOCK
(Cost $5,225,216) | | | | | | | 5,110,933 | |
| | | | | | | | |
| | |
TIME DEPOSIT — 0.2% | | | | | | | | |
Brown Brothers Harriman, 0.030%
(Cost $11,355) | | $ | 11,355 | | | | 11,355 | |
| | | | | | | | |
| | |
TOTAL INVESTMENTS — 99.8%
(Cost $5,236,571) | | | | | | $ | 5,122,288 | |
| | | | | | | | |
Percentages are based on Net Assets of $5,133,986.
| * | Non-income producing security. |
| 1 | Security is fair valued using methods determined in good faith by the Fair Value Committee of the Fund. The total value of such security as of October 31 2011 was $17,433 and represents 0.3% of Net Assets. |
| 2 | Security considered illiquid. The total value of such security as of October 31, 2011 was $17,433 and represents 0.3% of Net Assets. |
ADR — American Depositary Receipt
GDR — Global Depositary Receipt
The accompanying notes are an integral part of the financial statements.
26
| | |
| Schedule of Investments | | October 31, 2011 |
Global X Pure Gold Miners ETF
The following is a summary of the inputs used as of October 31, 2011, in valuing the Fund’s investments carried at value:
| | | | | | | | | | | | | | | | |
| Investments in Securities | | Level 1 | | | Level 2 | | | Level 3 | | | Total | |
Common Stock | | | | | | | | | | | | | | | | |
Australia | | $ | 482,551 | | | $ | - | | | $ | - | | | $ | 482,551 | |
Canada | | | 1,951,084 | | | | - | | | | - | | | | 1,951,084 | |
China | | | 153,724 | | | | - | | | | 17,433 | | | | 171,157 | |
Jersey | | | 277,431 | | | | - | | | | - | | | | 277,431 | |
South Africa | | | 873,809 | | | | - | | | | - | | | | 873,809 | |
Turkey | | | 206,100 | | | | - | | | | - | | | | 206,100 | |
United Kingdom | | | 282,484 | | | | - | | | | - | | | | 282,484 | |
United States | | | 866,317 | | | | - | | | | - | | | | 866,317 | |
| | | | | | | | | | | | | | | | |
Total Common Stock | | | 5,093,500 | | | | - | | | | 17,433 | | | | 5,110,933 | |
| | | | | | | | | | | | | | | | |
Time Deposit | | | - | | | | 11,355 | | | | - | | | | 11,355 | |
| | | | | | | | | | | | | | | | |
Total Investments in Securities | | $ | 5,093,500 | | | $ | 11,355 | | | $ | 17,433 | | | $ | 5,122,288 | |
| | | | | | | | | | | | | | | | |
The following is a reconciliation of investments in which significant unobservable inputs (Level 3) were used in determining fair value:
| | | | |
| | | China | |
| | | Investments in
Common Stock | |
Beginning balance as of March 14, 2011 | | $ | - | |
Accrued discounts/premiums | | | - | |
Realized gain/(loss) | | | - | |
Change in unrealized appreciation/(depreciation) | | | - | |
Net purchases | | | | |
Net sales | | | - | |
Transfers into Level 3 | | | 17,433 | |
Transfers out of Level 3 | | | - | |
| | | | |
Ending balance as of October 31, 2011 | | $ | 17,433 | |
| | | | |
Net change in unrealized appreciation (depreciation) from investments (Level 3) still held as of October 31, 2011 is $—.
For the period ended October 31, 2011, there have been no significant transfers between Level 1 & Level 2 investments.
For the period ended October 31, 2011, transfers between Level 1 and Level 3 assets and liabilities totaled $17,433.
The Level 3 investment presented above was considered a Level 1 investment at the beginning of the reporting period. The reason for the transfer change was a temporary trading suspension of the investment’s shares, which necessitated a fair value determination by the Fair Value Committee at the end of the reporting period. The Fund’s policy is to transfer investments into/out of Level 3 at the end of the reporting period.
The accompanying notes are an integral part of the financial statements.
27
| | |
| Schedule of Investments | | October 31, 2011 |
Global X Oil Equities ETF
Sector Weightings (unaudited)†:

† Percentages based on total investments.
| | | | | | | | |
| | | Shares | | | Value | |
COMMON STOCK —100.00% | | | | | | | | |
| | |
CANADA— 38.2% | | | | | | | | |
| | |
Oil & Gas — 38.2% | | | | | | | | |
Baytex Energy | | | 2,628 | | | $ | 138,929 | |
Canadian Natural Resources | | | 3,578 | | | | 126,219 | |
Cenovus Energy | | | 3,779 | | | | 129,428 | |
Crescent Point Energy | | | 3,003 | | | | 128,280 | |
Enerplus | | | 4,681 | | | | 130,188 | |
Imperial Oil | | | 3,294 | | | | 136,426 | |
MEG Energy * | | | 2,859 | | | | 128,966 | |
Nexen | | | 6,283 | | | | 106,721 | |
Pengrowth Energy | | | 11,788 | | | | 122,997 | |
Suncor Energy | | | 4,207 | | | | 134,026 | |
| | | | | | | | |
TOTAL CANADA | | | | | | | 1,282,180 | |
| | | | | | | | |
| | |
UNITED STATES— 61.8% | | | | | | | | |
| | |
Oil & Gas — 61.8% | | | | | | | | |
Apache | | | 1,300 | | | | 129,519 | |
Berry Petroleum, Cl A | | | 2,670 | | | | 92,248 | |
Brigham Exploration * | | | 4,455 | | | | 162,229 | |
Clayton Williams Energy * | | | 2,344 | | | | 153,157 | |
Concho Resources * | | | 1,465 | | | | 138,765 | |
ConocoPhillips | | | 1,995 | | | | 138,952 | |
Continental Resources * | | | 2,335 | | | | 141,618 | |
Denbury Resources * | | | 8,367 | | | | 131,362 | |
Devon Energy | | | 1,979 | | | | 128,536 | |
Noble Energy | | | 1,531 | | | | 136,780 | |
Northern Oil and Gas * | | | 6,380 | | | | 154,205 | |
Pioneer Natural Resources | | | 1,738 | | | | 145,818 | |
Range Resources | | | 2,036 | | | | 140,158 | |
SM Energy | | | 1,751 | | | | 145,175 | |
Whiting Petroleum * | | | 2,846 | | | | 132,481 | |
| | | | | | | | |
TOTAL UNITED STATES | | | | | | | 2,071,003 | |
| | | | | | | | |
TOTAL COMMON STOCK
(Cost $3,796,521) | | | | | | | 3,353,183 | |
| | | | | | | | |
The accompanying notes are an integral part of the financial statements.
28
| | |
| Schedule of Investments | | October 31, 2011 |
Global X Oil Equities ETF
| | | | | | | | |
| | | Face Amount | | | Value | |
TIME DEPOSIT — 0.0% | | | | | | | | |
Brown Brothers Harriman, 0.030%
(Cost $941) | | $ | 941 | | | $ | 941 | |
| | | | | | | | |
TOTAL INVESTMENTS — 100.0%
(Cost $3,797,462) | | | | | | $ | 3,354,124 | |
| | | | | | | | |
Percentages are based on Net Assets of $3,355,537.
| * | Non-income producing security. |
Cl — Class
The following is a summary of the inputs used as of October 31, 2011, in valuing the Fund’s investments carried at value:
| | | | | | | | | | | | | | | | |
| Investments in Securities | | Level 1 | | | Level 2 | | | Level 3 | | | Total | |
Common Stock | | $ | 3,353,183 | | | $ | — | | | $ | — | | | $ | 3,353,183 | |
Time Deposit | | | — | | | | 941 | | | | — | | | | 941 | |
| | | | | | | | | | | | | | | | |
Total Investments in Securities | | $ | 3,353,183 | | | $ | 941 | | | $ | — | | | $ | 3,354,124 | |
| | | | | | | | | | | | | | | | |
For the period ended October 31, 2011, there have been no significant transfers between Level 1 & Level 2 investments.
For the period ended October 31, 2011, there were no Level 3 investments.
The accompanying notes are an integral part of the financial statements.
29
| | |
| Schedule of Investments | | October 31, 2011 |
|
| Global X S&P/TSX Venture 30 Canada ETF |
Sector Weightings (unaudited)†:
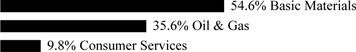
† Percentages based on total investments.
| | | | | | | | |
| | | Shares | | | Value | |
COMMON STOCK — 101.4% | | | | | | | | |
| | |
CANADA— 101.4% | | | | | | | | |
| | |
Basic Materials — 55.4% | | | | | | | | |
Allana Potash * | | | 160,989 | | | $ | 176,059 | |
Atac Resources * | | | 6,760 | | | | 28,486 | |
Aurcana * | | | 76,769 | | | | 57,767 | |
Barisan Gold * 1,2 | | | 4,920 | | | | — | |
Bear Creek Mining * | | | 35,145 | | | | 135,051 | |
Canaco Resources * | | | 34,138 | | | | 55,829 | |
Clifton Star Resources * 1,2 | | | 15,605 | | | | 34,914 | |
East Asia Minerals * | | | 35,207 | | | | 31,085 | |
Gold Canyon Resources * | | | 22,405 | | | | 65,864 | |
Great Western Minerals Group * | | | 109,534 | | | | 70,334 | |
Hana Mining * | | | 56,542 | | | | 90,767 | |
New Millennium Iron * | | | 37,901 | | | | 62,744 | |
Orbite Aluminae * | | | 89,253 | | | | 246,258 | |
Orko Silver * | | | 27,320 | | | | 55,917 | |
Quest Rare Minerals * | | | 23,587 | | | | 78,095 | |
Rainy River Resources * | | | 15,621 | | | | 116,292 | |
Rio Alto Mining * | | | 37,018 | | | | 103,251 | |
Sandstorm Gold * | | | 36,535 | | | | 46,553 | |
Stans Energy * | | | 61,296 | | | | 55,349 | |
Trelawney Mining and Exploration * | | | 22,972 | | | | 84,356 | |
| | | | | | | | |
| | | | | | | 1,594,971 | |
| | | | | | | | |
| | |
Consumer Services — 9.9% | | | | | | | | |
Entertainment Media * | | | 547,686 | | | | 285,740 | |
| | | | | | | | |
Oil & Gas — 36.1% | | | | | | | | |
Arcan Resources * | | | 20,690 | | | | 110,643 | |
Ithaca Energy * | | | 66,427 | | | | 147,956 | |
Novus Energy * | | | 53,767 | | | | 44,235 | |
Painted Pony Petroleum, Cl A * | | | 9,410 | | | | 115,088 | |
Petrolia * | | | 24,178 | | | | 43,179 | |
Pinecrest Energy * | | | 52,084 | | | | 126,461 | |
Renegade Petroleum * | | | 18,700 | | | | 50,657 | |
Shamaran Petroleum, Common Subscription Receipt * | | | 112,772 | | | | 44,127 | |
Sterling Resources * | | | 71,168 | | | | 128,526 | |
Surge Energy, Common Subscription Receipt * | | | 14,031 | | | | 123,600 | |
The accompanying notes are an integral part of the financial statements.
30
| | | | |
| Schedule of Investments | | October 31, 2011 | | |
Global X S&P/TSX Venture 30 Canada ETF
| | | | | | | | |
| | | Shares | | | Value | |
COMMON STOCK — continued | | | | | | | | |
| | |
Oil & Gas — continued | | | | | | | | |
Wild Stream Exploration * | | | 10,832 | | | $ | 107,157 | |
| | | | | | | | |
| | | | | | | 1,041,629 | |
| | | | | | | | |
TOTAL CANADA | | | | | | | 2,922,340 | |
| | | | | | | | |
TOTAL COMMON STOCK
(Cost $3,620,922) | | | | | | | 2,922,340 | |
| | | | | | | | |
TOTAL INVESTMENTS — 101.4%
(Cost $3,620,922) | | | . | | | $ | 2,922,340 | |
| | | | | | | | |
| | |
Percentages are based on Net Assets of $2,881,731. | | | | | | | | |
| | |
* Non-income producing security. | | | | | | | | |
| 1 | Securities are fair valued using methods determined in good faith by the Fair Value Committee of the Fund. The total value of such securities as of October 31 2011 was $34,914 and represents 1.2% of Net Assets. |
| 2 | Securities considered illiquid. The total value of such securities as of October 31, 2011 was $34,914 and represents 1.2% of Net Assets. |
Cl — Class
Amounts designated as”—”are $0 or rounded to zero.
The following is a summary of the inputs used as of October 31, 2011, in valuing the Fund’s investments carried at value:
| | | | | | | | | | | | | | | | |
| Investments in Securities | | Level 1 | | | Level 2 | | | Level 3 | | | Total | |
Common Stock | | | | | | | | | | | | | | | | |
Canada | | | | | | | | | | | | | | | | |
Basic Materials | | $ | 1,560,057 | | | $ | - | | | $ | 34,914 | | | $ | 1,594,971 | |
Consumer Services | | | 285,740 | | | | - | | | | - | | | | 285,740 | |
Oil & Gas | | | 1,041,629 | | | | - | | | | - | | | | 1,041,629 | |
| | | | | | | | | | | | | | | | |
Total Investments in Securities | | $ | 2,887,426 | | | $ | - | | | $ | 34,914 | | | $ | 2,922,340 | |
| | | | | | | | | | | | | | | | |
The following is a reconciliation of investments in which significant unobservable inputs (Level 3) were used in determining fair value:
| | | | |
| | | Canada | |
| | | Investments in
Common Stock | |
Beginning balance as of March 16, 2011 | | $ | - | |
Accrued discounts/premiums | | | - | |
Realized gain/(loss) | | | - | |
Change in unrealized appreciation/(depreciation) | | | - | |
Net purchases | | | - | |
Net sales | | | - | |
Transfers into Level 3 | | | 34,914 | |
Transfers out of Level 3 | | | - | |
| | | | |
Ending balance as of October 31, 2011 | | $ | 34,914 | |
| | | | |
Net change in unrealized appreciation (depreciation) from investments (Level 3) still held as of October 31, 2011 is $—.
For the period ended October 31, 2011, there have been no significant transfers between Level 1 & Level 2 investments.
The accompanying notes are an integral part of the financial statements.
31
| | | | |
| Schedule of Investments | | October 31, 2011 | | |
Global X S&P/TSX Venture 30 Canada ETF
For the period ended October 31, 2011, transfers between Level 1 and Level 3 assets and liabilities totaled $34,914.
The Level 3 investment presented above was considered a Level 1 investment at the beginning of the reporting period. The reason for the transfer was a temporary trading suspension of the investment’s shares, which necessitated a fair value determination by the Fair Value Committee at the end of the reporting period. The Fund’s policy is to transfer investments into/out of Level 3 at the end of the reporting period.
The accompanying notes are an integral part of the financial statements.
32
| | |
| Schedule of Investments | | October 31, 2011 |
Global X Fertilizers/Potash ETF
Sector Weightings (unaudited)†:

† Percentages based on total investments.
| | | | | | | | |
| | | Shares | | | Value | |
COMMON STOCK — 94.6% | | | | | | | | |
| | |
AUSTRALIA— 10.0% | | | | | | | | |
| | |
Basic Materials — 10.0% | | | | | | | | |
Incitec Pivot | | | 477,357 | | | $ | 1,760,629 | |
Nufarm * | | | 349,232 | | | | 1,740,732 | |
| | | | | | | | |
TOTAL AUSTRALIA | | | | | | | 3,501,361 | |
| | | | | | | | |
| | |
CANADA— 11.8% | | | | | | | | |
| | |
Basic Materials — 11.8% | | | | | | | | |
Agrium | | | 23,224 | | | | 1,914,867 | |
Allana Potash * | | | 147,162 | | | | 160,938 | |
Hanfeng Evergreen * | | | 50,948 | | | | 157,950 | |
Migao * | | | 49,666 | | | | 192,844 | |
Potash Corp. of Saskatchewan | | | 36,342 | | | | 1,720,282 | |
| | | | | | | | |
TOTAL CANADA | | | | | | | 4,146,881 | |
| | | | | | | | |
| | |
CHILE— 5.4% | | | | | | | | |
| | |
Basic Materials — 5.4% | | | | | | | | |
Sociedad Quimica y Minera de Chile ADR | | | 32,758 | | | | 1,916,343 | |
| | | | | | | | |
| | |
CHINA— 5.1% | | | | | | | | |
| | |
Basic Materials — 5.1% | | | | | | | | |
China BlueChemical | | | 2,249,255 | | | | 1,783,537 | |
| | | | | | | | |
| | |
HONG KONG— 2.6% | | | | | | | | |
| | |
Basic Materials — 2.6% | | | | | | | | |
Sinofert Holdings | | | 2,700,425 | | | | 903,792 | |
| | | | | | | | |
| | |
ISRAEL— 7.5% | | | | | | | | |
| | |
Basic Materials — 7.5% | | | | | | | | |
Israel | | | 1,637 | | | | 1,207,067 | |
Israel Chemicals | | | 118,466 | | | | 1,427,088 | |
| | | | | | | | |
TOTAL ISRAEL | | | | | | | 2,634,155 | |
| | | | | | | | |
| | |
JAPAN— 1.0% | | | | | | | | |
| | |
Basic Materials — 1.0% | | | | | | | | |
Nihon Nohyaku | | | 75,071 | | | | 334,332 | |
| | | | | | | | |
The accompanying notes are an integral part of the financial statements.
33
| | |
| Schedule of Investments | | October 31, 2011 |
Global X Fertilizers/Potash ETF
| | | | | | | | |
| | | Shares | | | Value | |
COMMON STOCK — continued | | | | | | | | |
| | |
NORWAY— 4.8% | | | | | | | | |
| | |
Basic Materials — 4.8% | | | | | | | | |
Yara International | | | 35,706 | | | $ | 1,702,426 | |
| | | | | | | | |
| | |
RUSSIA— 5.9% | | | | | | | | |
| | |
Basic Materials — 5.9% | | | | | | | | |
Uralkali GDR | | | 47,664 | | | | 2,068,618 | |
| | | | | | | | |
| | |
SOUTH KOREA— 1.3% | | | | | | | | |
| | |
Basic Materials — 1.3% | | | | | | | | |
Namhae Chemical | | | 27,512 | | | | 273,425 | |
Dongbu HiTek * | | | 27,009 | | | | 200,894 | |
| | | | | | | | |
TOTAL SOUTH KOREA | | | | | | | 474,319 | |
| | | | | | | | |
| | |
SWITZERLAND— 4.9% | | | | | | | | |
| | |
Basic Materials — 4.9% | | | | | | | | |
Syngenta | | | 5,652 | | | | 1,730,007 | |
| | | | | | | | |
| | |
TAIWAN— 4.2% | | | | | | | | |
| | |
Basic Materials — 4.2% | | | | | | | | |
Taiwan Fertilizer | | | 568,798 | | | | 1,487,327 | |
| | | | | | | | |
| | |
TURKEY— 1.2% | | | | | | | | |
| | |
Basic Materials — 1.2% | | | | | | | | |
Bagfas Bandirma Gubre Fabrik | | | 2,819 | | | | 268,051 | |
Gubre Fabrikalari * | | | 22,500 | | | | 154,729 | |
| | | | | | | | |
TOTAL TURKEY | | | | | | | 422,780 | |
| | | | | | | | |
| | |
UNITED STATES— 28.9% | | | | | | | | |
| | |
Basic Materials — 28.9% | | | | | | | | |
CF Industries Holdings | | | 13,999 | | | | 2,355,529 | |
Intrepid Potash * | | | 64,497 | | | | 1,794,951 | |
K+S | | | 25,424 | | | | 1,618,425 | |
Mosaic | | | 27,728 | | | | 1,623,752 | |
Scotts Miracle-Gro, Cl A | | | 32,004 | | | | 1,552,514 | |
Terra Nitrogen | | | 7,107 | | | | 1,210,962 | |
| | | | | | | | |
TOTAL UNITED STATES | | | | | | | 10,156,133 | |
| | | | | | | | |
TOTAL COMMON STOCK
(Cost $36,131,100) | | | | | | | 33,262,011 | |
| | | | | | | | |
The accompanying notes are an integral part of the financial statements.
34
| | | | |
| Schedule of Investments | | October 31, 2011 | | |
Global X Fertilizers/Potash ETF
| | | | | | | | |
| | | Shares/Face
Amount | | | Value | |
PREFERRED STOCK — 5.4% | | | | | | | | |
| | |
BRAZIL— 5.4% | | | | | | | | |
Basic Materials — 5.4%
| | | | | | | | |
| | |
Vale Fertilizantes
(Cost $1,917,202) | | | 133,943 | | | $ | 1,890,731 | |
| | | | | | | | |
| | |
TIME DEPOSIT — 0.0% | | | | | | | | |
| | |
Brown Brothers Harriman, 0.030%
(Cost $18,586) | | $ | 18,586 | | | | 18,586 | |
| | | | | | | | |
TOTAL INVESTMENTS — 100.00%
(Cost $38,066,888) | | | | | | $ | 35,171,328 | |
| | | | | | | | |
Percentages are based on Net Assets of $35,159,811.
| * | Non-income producing security. |
ADR — American Depositary Receipt
Cl — Class
GDR — Global Depositary Receipt
The following is a summary of the inputs used as of October 31, 2011, in valuing the Fund’s investments carried at value:
| | | | | | | | | | | | | | | | |
| Investments in Securities | | Level 1 | | | Level 2 | | | Level 3 | | | Total | |
Common Stock | | $ | 33,262,011 | | | $ | — | | | $ | — | | | $ | 33,262,011 | |
Preferred Stock | | | 1,890,731 | | | | — | | | | — | | | | 1,890,731 | |
Time Deposit | | | — | | | | 18,586 | | | | — | | | | 18,586 | |
| | | | | | | | | | | | | | | | |
Total Investments in Securities | | $ | 35,152,742 | | | $ | 18,586 | | | $ | — | | | $ | 35,171,328 | |
| | | | | | | | | | | | | | | | |
For the period ended October 31, 2011, there have been no significant transfers between Level 1 & Level 2 investments.
For the period ended October 31, 2011, there were no Level 3 investments.
The accompanying notes are an integral part of the financial statements.
35
|
STATEMENTSOF ASSETSAND LIABILITIES October 31, 2011 |
|
| | | | | | | | | | | | | | | | |
| | | Global X Gold
Explorers ETF | | | Global X Silver
Miners ETF | | | Global X Copper
Miners ETF | | | Global X Uranium
ETF | |
Assets: | | | | | | | | | | | | | | | | |
Cost of Investments | | $ | 33,902,009 | | | $ | 380,758,075 | | | $ | 52,236,937 | | | $ | 321,831,768 | |
Cost of Foreign Currency | | | — | | | | — | | | | 15,874 | | | | 39 | |
| | | | | | | | | | | | | | | | |
Investments at Value | | $ | 27,405,549 | | | $ | 362,947,921 | | | $ | 45,491,213 | | | $ | 199,468,621 | |
Foreign Currency at Value | | | 2 | | | | — | | | | 17,301 | | | | 39 | |
Unrealized Appreciation on Spot Foreign Currency Contracts | | | — | | | | — | | | | — | | | | 44,922 | |
Dividend and Interest Receivable | | | — | | | | — | | | | 14,306 | | | | — | |
Receivable for Capital Shares Sold | | | — | | | | 14,196,000 | | | | — | | | | — | |
Receivable for Investment Securities Sold | | | — | | | | 31,085,908 | | | | 3,298,632 | | | | 5,133,770 | |
Reclaim Receivable | | | — | | | | — | | | | 11,937 | | | | — | |
| | | | | | | | | | | | | | | | |
| | | | |
Total Assets | | | 27,405,551 | | | | 408,229,829 | | | | 48,833,389 | | | | 204,647,352 | |
| | | | | | | | | | | | | | | | |
| | | | |
Liabilities: | | | | | | | | | | | | | | | | |
| | | | |
Payable for Investment Securities Purchased | | | — | | | | 30,722,954 | | | | 3,293,761 | | | | — | |
Payable for Capital Shares Redeemed | | | — | | | | 14,196,000 | | | | — | | | | — | |
Payable due to Investment Adviser | | | 13,691 | | | | 193,067 | | | | 22,415 | | | | 104,087 | |
Unrealized Depreciation on Spot Foreign Currency Contracts | | | — | | | | — | | | | — | | | | 729 | |
Overdraft of Foreign Currency* | | | — | | | | 12,204 | | | | — | | | | — | |
Due to Custodian | | | — | | | | — | | | | — | | | | 5,193,540 | |
| | | | | | | | | | | | | | | | |
| | | | |
Total Liabilities | | | 13,691 | | | | 45,124,225 | | | | 3,316,176 | | | | 5,298,356 | |
| | | | | | | | | | | | | | | | |
| | | | |
Net Assets | | $ | 27,391,860 | | | $ | 363,105,604 | | | $ | 45,517,213 | | | $ | 199,348,996 | |
| | | | | | | | | | | | | | | | |
| | | | |
*Proceeds of Foreign Currency | | $ | — | | | $ | 12,296 | | | $ | — | | | $ | — | |
| | | | | | | | | | | | | | | | |
| | | | |
Net Assets Consist of: | | | | | | | | | | | | | | | | |
| | | | |
Paid-in Capital | | $ | 34,227,105 | | | $ | 396,045,094 | | | $ | 50,411,377 | | | $ | 345,722,055 | |
Undistributed (Distributions in Excess of) Net Investment Income/Accumulated Investment Loss | | | (98,158 | ) | | | (97,015 | ) | | | 1,198,992 | | | | (393,842 | ) |
Accumulated Net Realized Gain (Loss) on Investments and Foreign Currency Translations | | | (240,629 | ) | | | (14,972,486 | ) | | | 648,987 | | | | (23,611,994 | ) |
Net Unrealized Depreciation on Investments | | | (6,496,460 | ) | | | (17,810,154 | ) | | | (6,745,724 | ) | | | (122,363,147 | ) |
Net Unrealized Appreciation (Depreciation) on Foreign Currency Translations | | | 2 | | | | (59,835 | ) | | | 3,581 | | | | (4,076 | ) |
| | | | | | | | | | | | | | | | |
| | | | |
Net Assets | | $ | 27,391,860 | | | $ | 363,105,604 | | | $ | 45,517,213 | | | $ | 199,348,996 | |
| | | | | | | | | | | | | | | | |
Outstanding Shares of Beneficial Interest (unlimited authorization — no par value) | | | 2,050,000 | | | | 15,350,000 | | | | 3,050,000 | | | | 19,750,000 | |
| | | | | | | | | | | | | | | | |
| | | | |
Net Asset Value, Offering and Redemption Price Per Share | | $ | 13.36 | | | $ | 23.66 | | | $ | 14.92 | | | $ | 10.09 | |
| | | | | | | | | | | | | | | | |
The accompanying notes are an integral part of the financial statements.
36
|
| STATEMENTSOF ASSETSAND LIABILITIES |
October 31, 2011 |
| | | | | | | | | | | | | | | | |
| | | Global X
Lithium ETF | | | Global X
Aluminum ETF | | | Global X Pure
Gold Miners ETF | | | Global X Oil
Equities ETF | |
Assets: | | | | | | | | | | | | | | | | |
Cost of Investments | | $ | 134,127,260 | | | $ | 5,249,501 | | | $ | 5,236,571 | | | $ | 3,797,462 | |
Cost of Foreign Currency | | | 44,698 | | | | 453 | | | | 1,981 | | | | — | |
| | | | | | | | | | | | | | | | |
Investments at Value | | $ | 107,144,686 | | | $ | 3,724,633 | | | $ | 5,122,288 | | | $ | 3,354,124 | |
Cash | | | — | | | | — | | | | — | | | | — | |
Foreign Currency at Value | | | 44,388 | | | | 44,196 | | | | 2,035 | | | | — | |
Receivable for Investment Securities Sold | | | 190,075 | | | | — | | | | — | | | | — | |
Receivable from Broker | | | — | | | | — | | | | 10,476 | | | | — | |
Dividend and Interest Receivable | | | — | | | | 2,710 | | | | 1,348 | | | | 3,340 | |
| | | | | | | | | | | | | | | | |
Total Assets | | | 107,379,149 | | | | 3,771,539 | | | | 5,136,147 | | | | 3,357,464 | |
| | | | | | | | | | | | | | | | |
| | | | |
Liabilities: | | | | | | | | | | | | | | | | |
| | | | |
Payable due to Investment Adviser | | | 64,586 | | | | 2,040 | | | | 2,161 | | | | 1,281 | |
Payable for Investments Securities Purchased | | | — | | | | 43,746 | | | | — | | | | — | |
Due to Custodian | | | 13,939 | | | | 3,000 | | | | — | | | | — | |
Overdraft of Foreign Currency* | | | — | | | | — | | | | — | | | | 646 | |
| | | | | | | | | | | | | | | | |
Total Liabilities | | | 78,525 | | | | 48,786 | | | | 2,161 | | | | 1,927 | |
| | | | | | | | | | | | | | | | |
| | | | |
Net Assets | | $ | 107,300,624 | | | $ | 3,722,753 | | | $ | 5,133,986 | | | $ | 3,355,537 | |
| | | | | | | | | | | | | | | | |
| | | | |
*Proceeds of Foreign Currency | | $ | — | | | $ | 44,199 | | | $ | — | | | $ | 640 | |
| | | | | | | | | | | | | | | | |
Net Assets Consist of: | | | | | | | | | | | | | | | | |
| | | | |
Paid-in Capital | | $ | 141,861,582 | | | $ | 5,266,176 | | | $ | 5,249,500 | | | $ | 3,854,000 | |
Undistributed (Distributions in Excess of) Net Investment Income | | | (70,303 | ) | | | 20,250 | | | | 1,087 | | | | 8,451 | |
Accumulated Net Realized Loss on Investments and Foreign Currency Translations | | | (7,507,772 | ) | | | (38,768 | ) | | | (2,415 | ) | | | (63,561 | ) |
Net Unrealized Depreciation on Investments | | | (26,982,574 | ) | | | (1,524,868 | ) | | | (114,283 | ) | | | (443,338 | ) |
Net Unrealized Appreciation (Depreciation) on Foreign Currency Translations | | | (309 | ) | | | (37 | ) | | | 97 | | | | (15 | ) |
| | | | | | | | | | | | | | | | |
Net Assets | | $ | 107,300,624 | | | $ | 3,722,753 | | | $ | 5,133,986 | | | $ | 3,355,537 | |
| | | | | | | | | | | | | | | | |
| | | | |
Outstanding Shares of Beneficial Interest (unlimited authorization — no par value) | | | 6,750,000 | | | | 350,000 | | | | 350,000 | | | | 250,000 | |
| | | | | | | | | | | | | | | | |
Net Asset Value, Offering and Redemption Price Per Share | | $ | 15.90 | | | $ | 10.64 | | | $ | 14.67 | | | $ | 13.42 | |
| | | | | | | | | | | | | | | | |
The accompanying notes are an integral part of the financial statements.
37
|
| STATEMENTSOF ASSETSAND LIABILITIES |
October 31, 2011 |
| | | | | | | | |
| | | Global X S&P/TSX
Venture 30 Canada
ETF | | | Global X
Fertilizers/Potash
ETF | |
Assets: | | | | | | | | |
Cost of Investments | | $ | 3,620,922 | | | $ | 38,066,888 | |
Cost of Foreign Currency | | | — | | | | 7,453 | |
| | | | | | | | |
Investments at Value | | $ | 2,922,340 | | | $ | 35,171,328 | |
Foreign Currency at Value | | | — | | | | 7,501 | |
Dividend and Interest Receivable | | | — | | | | 84,055 | |
| | | | | | | | |
Total Assets | | | 2,922,340 | | | | 35,262,884 | |
| | | | | | | | |
| | |
Liabilities: | | | | | | | | |
| | |
Payable for Investment Securities Purchased | | | — | | | | 83,911 | |
| | |
Due to Custodian | | | 38,976 | | | | — | |
Payable due to Investment Adviser | | | 1,633 | | | | 19,162 | |
| | | | | | | | |
Total Liabilities | | | 40,609 | | | | 103,073 | |
| | | | | | | | |
| | |
Net Assets | | $ | 2,881,731 | | | $ | 35,159,811 | |
| | | | | | | | |
| | |
Net Assets Consist of: | | | | | | | | |
Paid-in Capital | | $ | 4,112,312 | | | $ | 37,904,500 | |
Undistributed (Accumulated Net Investment Loss) Net Investment Income | | | (20,517 | ) | | | 100,542 | |
Accumulated Net Realized Gain (Loss) on Investments and Foreign Currency Translations | | | (511,482 | ) | | | 50,216 | |
Net Unrealized Depreciation on Investments | | | (698,582 | ) | | | (2,895,560 | ) |
Net Unrealized Appreciation on Foreign Currency Translations | | | — | | | | 113 | |
| | | | | | | | |
Net Assets | | $ | 2,881,731 | | | $ | 35,159,811 | |
| | | | | | | | |
Outstanding Shares of Beneficial Interest (unlimited authorization — no par value) | | | 250,000 | | | | 2,500,000 | |
| | | | | | | | |
| | |
Net Asset Value, Offering and Redemption Price Per Share | | $ | 11.53 | | | $ | 14.06 | |
| | | | | | | | |
The accompanying notes are an integral part of the financial statements.
38
|
| STATEMENTSOF OPERATIONS |
For the year or period ended October 31, 2011 |
| | | | | | | | | | | | | | | | | | | | |
| | | Global X Gold
Explorers
ETF(1) | | | Global X Silver
Miners ETF | | | Global X
Copper Miners
ETF | | | Global X
Uranium
ETF(2) | | | Global X
Lithium ETF | |
Investment Income: | | | | | | | | | | | | | | | | | | | | |
Dividend Income | | $ | — | | | $ | 3,674,222 | | | $ | 2,126,111 | | | $ | 3,297,916 | | | $ | 923,339 | |
Interest Income | | | 179 | | | | 834 | | | | 104 | | | | 8,768 | | | | 464 | |
Security Lending Income | | | — | | | | — | | | | — | | | | 282,315 | | | | — | |
Less: Foreign Taxes Withheld | | | — | | | | (204,683 | ) | | | (107,624 | ) | | | (142,156 | ) | | | (162,568 | ) |
| | | | | | | | | | | | | | | | | | | | |
Total Investment Income | | | 179 | | | | 3,470,373 | | | | 2,018,591 | | | | 3,446,843 | | | | 761,235 | |
| | | | | | | | | | | | | | | | | | | | |
Supervision and Administration Fees(3) | | | 150,948 | | | | 2,773,066 | | | | 512,493 | | | | 1,323,783 | | | | 1,085,885 | |
| | | | | | | | | | | | | | | | | | | | |
| | | | | |
Total Expenses | | | 150,948 | | | | 2,773,066 | | | | 512,493 | | | | 1,323,783 | | | | 1,085,885 | |
| | | | | | | | | | | | | | | | | | | | |
| | | | | |
Net Expenses | | | 150,948 | | | | 2,773,066 | | | | 512,493 | | | | 1,323,783 | | | | 1,085,885 | |
| | | | | | | | | | | | | | | | | | | | |
| | | | | |
Net Investment Income (Loss) | | | (150,769 | ) | | | 697,307 | | | | 1,506,098 | | | | 2,123,060 | | | | (324,650 | ) |
| | | | | | | | | | | | | | | | | | | | |
| | | | | |
Net Realized Gain (Loss) on: | | | | | | | | | | | | | | | | | | | | |
| | | | | |
Investments | | | 422,302 | (4) | | | 49,262,824 | (4) | | | (8,180,300 | ) (4) | | | (19,699,769 | ) (4) | | | (1,133,362 | ) (4) |
Foreign Currency | | | 173,785 | | | | 643,864 | | | | 101,875 | | | | (73,987 | ) | | | (323,067 | ) |
| | | | | | | | | | | | | | | | | | | | |
| | | | | |
Net Realized Gain (Loss) on Investments and Foreign Currency Transactions | | | 596,087 | | | | 49,906,688 | | | | (8,078,425 | ) | | | (19,773,756 | ) | | | (1,456,429 | ) |
| | | | | | | | | | | | | | | | | | | | |
| | | | | |
Net Change in Unrealized Appreciation (Depreciation) on: | | | | | | | | | | | | | | | | | | | | |
Investments | | | (6,496,460 | ) | | | (47,107,335 | ) | | | (7,509,616 | ) | | | (122,363,147 | ) | | | (34,182,113 | ) |
Foreign Currency Transactions | | | 2 | | | | (60,021 | ) | | | 3,432 | | | | (4,076 | ) | | | (892 | ) |
| | | | | | | | | | | | | | | | | | | | |
| | | | | |
Net Change in Unrealized Depreciation on Investments and Foreign Currency | | | (6,496,458 | ) | | | (47,167,356 | ) | | | (7,506,184 | ) | | | (122,367,223 | ) | | | (34,183,005 | ) |
| | | | | | | | | | | | | | | | | | | | |
| | | | | |
Net Realized and Unrealized Gain (Loss) on Investments and Foreign Currency Transactions | | | (5,900,371 | ) | | | 2,739,332 | �� | | | (15,584,609 | ) | | | (142,140,979 | ) | | | (35,639,434 | ) |
| | | | | | | | | | | | | | | | | | | | |
| | | | | |
Net Increase (Decrease) in Net Assets Resulting from Operations | | $ | (6,051,140 | ) | | $ | 3,436,639 | | | $ | (14,078,511 | ) | | $ | (140,017,919 | ) | | $ | (35,964,084 | ) |
| | | | | | | | | | | | | | | | | | | | |
| (1) | The Fund commenced operations on November 3, 2010. |
| (2) | The Fund commenced operations on November 4, 2010. |
| (3) | The Supervision and Administration fees includes fees paid by the Funds for the investment advisory services provided by the Adviser. (See Note 3 in Notes to Financial Statements.) |
| (4) | Includes realized gains (losses) as a result of in-kind transactions. (See Note 4 in Notes to Financial Statements.) |
The accompanying notes are an integral part of the financial statements.
39
|
| STATEMENTSOF OPERATIONS |
For the period ended October 31, 2011 |
| | | | | | | | | | | | | | | | | | | | |
| | | Global X
Aluminum
ETF(1) | | | Global X
Pure Gold
Miners
ETF(2) | | | Global X Oil
Equities
ETF(2) | | | Global X
S&P/TSX
Venture 30
Canada ETF(3) | | | Global X
Fertilizers/Potash
ETF(4) | |
| | | | | |
Investment Income: | | | | | | | | | | | | | | | | | | | | |
Dividend Income | | $ | 59,847 | | | $ | 17,764 | | | $ | 21,110 | | | $ | — | | | $ | 188,380 | |
Interest Income | | | 134 | | | | 4 | | | | 1 | | | | 11 | | | | 8 | |
Less: Foreign Taxes Withheld | | | (3,861 | ) | | | (2,161 | ) | | | (2,112 | ) | | | (416 | ) | | | (26,936 | ) |
| | | | | | | | | | | | | | | | | | | | |
Total Investment Income | | | 56,120 | | | | 15,607 | | | | 18,999 | | | | (405 | ) | | | 161,452 | |
| | | | | | | | | | | | | | | | | | | | |
Supervision and Administration Fees(5) | | | 25,317 | | | | 13,407 | | | | 10,453 | | | | 15,687 | | | | 69,793 | |
| | | | | | | | | | | | | | | | | | | | |
Total Expenses | | | 25,317 | | | | 13,407 | | | | 10,453 | | | | 15,687 | | | | 69,793 | |
| | | | | | | | | | | | | | | | | | | | |
| | | | | |
Net Expenses | | | 25,317 | | | | 13,407 | | | | 10,453 | | | | 15,687 | | | | 69,793 | |
| | | | | | | | | | | | | | | | | | | | |
| | | | | |
Net Investment Income (Loss) | | | 30,803 | | | | 2,200 | | | | 8,546 | | | | (16,092 | ) | | | 91,659 | |
| | | | | | | | | | | | | | | | | | | | |
| | | | | |
Net Realized Gain (Loss) on: | | | | | | | | | | | | | | | | | | | | |
Investments | | | (99,593 | ) (6) | | | (2,406 | ) | | | (63,561 | ) | | | (399,170 | ) (6) | | | 32,332 | |
Foreign Currency Transactions | | | (10,552 | ) | | | (1,122 | ) | | | (95 | ) | | | (4,425 | ) | | | 26,767 | |
| | | | | | | | | | | | | | | | | | | | |
| | | | | |
Net Realized Gain (Loss) on Investments and Foreign Currency Transactions | | | (110,145 | ) | | | (3,528 | ) | | | (63,656 | ) | | | (403,595 | ) | | | 59,099 | |
| | | | | | | | | | | | | | | | | | | | |
| | | | | |
Net Change in Unrealized Appreciation (Depreciation) on: | | | | | | | | | | | | | | | | | | | | |
| | | | | |
Investments | | | (1,524,868 | ) | | | (114,283 | ) | | | (443,338 | ) | | | (698,582 | ) | | | (2,895,560 | ) |
Foreign Currency Transactions | | | (37 | ) | | | 97 | | | | (15 | ) | | | — | | | | 113 | |
| | | | | | | | | | | | | | | | | | | | |
| | | | | |
Net Change in Unrealized Depreciation on Investments and Foreign Currency Transactions | | | (1,524,905 | ) | | | (114,186 | ) | | | (443,353 | ) | | | (698,582 | ) | | | (2,895,447 | ) |
| | | | | | | | | | | | | | | | | | | | |
| | | | | |
Net Realized and Unrealized Loss on Investments and Foreign Currency Transactions | | | (1,635,050 | ) | | | (117,714 | ) | | | (507,009 | ) | | | (1,102,177 | ) | | | (2,836,348 | ) |
| | | | | | | | | | | | | | | | | | | | |
| | | | | |
Net Decrease in Net Assets Resulting from Operations | | $ | (1,604,247 | ) | | $ | (115,514 | ) | | $ | (498,463 | ) | | $ | (1,118,269 | ) | | $ | (2,744,689 | ) |
| | | | | | | | | | | | | | | | | | | | |
| (1) | The Fund commenced operations on January 4, 2011. |
| (2) | The Fund commenced operations on March 14, 2011. |
| (3) | The Fund commenced operations on March 16, 2011. |
| (4) | The Fund commenced operations on May 25, 2011. |
| (5) | The Supervision and Administration fees includes fees paid by the Funds for the investment advisory services provided by the Adviser. (See Note 3 in Notes to Financial Statements.) |
| (6) | Includes realized losses as a result of in-kind transactions. (See Note 4 in Notes to Financial Statements.) |
The accompanying notes are an integral part of the financial statements.
40
|
| STATEMENTSOF CHANGESIN NET ASSETS |
|
| | | | | | | | | | | | |
| | | Global X Gold
Explorers ETF | | | Global X Silver Miners ETF | |
| | | Period Ended
October 31,
2011(1) | | | Year Ended
October 31,
2011 | | | Period Ended
October 31,
2010(2) | |
Operations: | | | | | | | | | | | | |
Net Investment Income (Loss) | | $ | (150,769 | ) | | $ | 697,307 | | | $ | 229,608 | |
Net Realized Gain on Investments and Foreign Currency Transactions | | | 596,087 | (3) | | | 49,906,688 | (3) | | | 276,359 | (4) |
Net Change in Unrealized Appreciation (Depreciation) on Investments and Foreign Currency Transactions | | | (6,496,458 | ) | | | (47,167,356 | ) | | | 29,297,367 | |
| | | | | | | | | | | | |
| | | |
Net Increase (Decrease) in Net Assets Resulting from Operations | | | (6,051,140 | ) | | | 3,436,639 | | | | 29,803,334 | |
| | | | | | | | | | | | |
| | | |
Dividends and Distributions: | | | | | | | | | | | | |
Net Investment Income | | | — | | | | (3,208,369 | ) | | | — | |
| | | | | | | | | | | | |
Total Dividends and Distributions | | | — | | | | (3,208,369 | ) | | | — | |
| | | | | | | | | | | | |
| | | |
Capital Share Transactions: | | | | | | | | | | | | |
Issued | | | 41,769,000 | | | | 449,418,000 | | | | 143,459,000 | |
Redeemed | | | (8,326,000 | ) | | | (258,212,500 | ) | | | (1,590,500 | ) |
| | | | | | | | | | | | |
| | | |
Increase in Net Assets from Capital Share Transactions | | | 33,443,000 | | | | 191,205,500 | | | | 141,868,500 | |
| | | | | | | | | | | | |
| | | |
Total Increase in Net Assets | | | 27,391,860 | | | | 191,433,770 | | | | 171,671,834 | |
| | | | | | | | | | | | |
Net Assets: | | | | | | | | | | | | |
Beginning of Period | | | — | | | | 171,671,834 | | | | — | |
| | | | | | | | | | | | |
| | | |
End of Period | | $ | 27,391,860 | | | $ | 363,105,604 | | | $ | 171,671,834 | |
| | | | | | | | | | | | |
| | | |
Undistributed Net Investment Income/ (Accumulated Net Investment Loss) | | $ | (98,158 | ) | | $ | (97,015 | ) | | $ | 221,096 | |
| | | | | | | | | | | | |
| | | |
Share Transactions: | | | | | | | | | | | | |
Issued | | | 2,550,000 | | | | 17,400,000 | | | | 8,600,000 | |
Redeemed | | | (500,000 | ) | | | (10,550,000 | ) | | | (100,000 | ) |
| | | | | | | | | | | | |
Net Increase in Shares Outstanding from Share Transactions | | | 2,050,000 | | | | 6,850,000 | | | | 8,500,000 | |
| | | | | | | | | | | | |
| (1) | The Fund commenced operations on November 3, 2010. |
| (2) | The Fund commenced operations on April 19, 2010. |
| (3) | Includes realized gains as a result of in-kind transactions. (See Note 4 in Notes to Financial Statements.) |
| (4) | Includes realized gains as a result of in-kind transactions. |
The accompanying notes are an integral part of the financial statements.
41
|
| STATEMENTSOF CHANGESIN NET ASSETS |
|
| | | | | | | | | | | | |
| | | Global X Copper Miners ETF | | | Global X
Uranium ETF | |
| | | Year Ended
October 31,
2011 | | | Period Ended
October 31,
2010(1) | | | Period Ended
October 31,
2011(2) | |
Operations: | | | | | | | | | | | | |
Net Investment Income | | $ | 1,506,098 | | | $ | 1,341 | | | $ | 2,123,060 | |
Net Realized Loss on Investments and Foreign Currency Transactions | | | (8,078,425 | ) (3) | | | (6,805 | ) | | | (19,773,756 | ) (3) |
Net Change in Unrealized Appreciation (Depreciation) on Investments and Foreign Currency Transactions | | | (7,506,184 | ) | | | 764,041 | | | | (122,367,223 | ) |
| | | | | | | | | | | | |
Net Increase (Decrease) in Net Assets Resulting from Operations | | | (14,078,511 | ) | | | 758,577 | | | | (140,017,919 | ) |
| | | | | | | | | | | | |
Dividends and Distributions: | | | | | | | | | | | | |
Net Investment Income | | | (388,853 | ) | | | — | | | | (2,682,085 | ) |
| | | | | | | | | | | | |
Total Dividends and Distributions | | | (388,853 | ) | | | — | | | | (2,682,085 | ) |
| | | | | | | | | | | | |
Capital Share Transactions: | | | | | | | | | | | | |
Issued | | | 116,788,000 | | | | 29,170,000 | | | | 406,784,000 | |
Redeemed | | | (86,732,000 | ) | | | — | | | | (64,735,000 | ) |
| | | | | | | | | | | | |
Increase in Net Assets from Capital Share Transactions | | | 30,056,000 | | | | 29,170,000 | | | | 342,049,000 | |
| | | | | | | | | | | | |
Total Increase in Net Assets | | | 15,588,636 | | | | 29,928,577 | | | | 199,348,996 | |
| | | | | | | | | | | | |
Net Assets: | | | | | | | | | | | | |
Beginning of Period | | | 29,928,577 | | | | — | | | | — | |
| | | | | | | | | | | | |
End of Period | | $ | 45,517,213 | | | $ | 29,928,577 | | | $ | 199,348,996 | |
| | | | | | | | | | | | |
Undistributed (Distributions in Excess of) Net Investment Income | | $ | 1,198,992 | | | $ | 4,749 | | | $ | (393,842 | ) |
| | | | | | | | | | | | |
| | | |
Share Transactions: | | | | | | | | | | | | |
Issued | | | 6,150,000 | | | | 1,800,000 | | | | 23,900,000 | |
Redeemed | | | (4,900,000 | ) | | | — | | | | (4,150,000 | ) |
| | | | | | | | | | | | |
Net Increase in Shares Outstanding from Share Transactions | | | 1,250,000 | | | | 1,800,000 | | | | 19,750,000 | |
| | | | | | | | | | | | |
| (1) | The Fund commenced operations on April 19, 2010. |
| (2) | The Fund commenced operations on November 4, 2010. |
| (3) | Includes realized loss as a result of in-kind transactions. (See Note 4 in Notes to Financial Statements.) |
The accompanying notes are an integral part of the financial statements.
42
|
STATEMENTSOF CHANGESIN NET ASSETS |
|
| | | | | | | | | | | | |
| | | Global X Lithium ETF | | | Global X
Aluminum
ETF | |
| | | Year Ended
October 31, 2011 | | | Period Ended
October 31,
2010(1) | | | Period Ended
October 31,
2011(2) | |
Operations: | | | | | | | | | | | | |
Net Investment Income (Loss) | | $ | (324,650 | ) | | $ | (60,245 | ) | | $ | 30,803 | |
Net Realized Gain (Loss) on Investments and Foreign Currency Transactions | | | (1,456,429 | )(3) | | | 114,188 | | | | (110,145 | )(3) |
Net Change in Unrealized Appreciation (Depreciation) on Investments and Foreign Currency Transactions | | | (34,183,005 | ) | | | 7,200,122 | | | | (1,524,905 | ) |
| | | | | | | | | | | | |
Net Increase (Decrease) in Net Assets Resulting from Operations | | | (35,964,084 | ) | | | 7,254,065 | | | | (1,604,247 | ) |
| | | | | | | | | | | | |
| | | |
Dividends and Distributions: | | | | | | | | | | | | |
Net Investment Income | | | (1,533,031 | ) | | | — | | | | — | |
Net Realized Gains | | | (105,326 | ) | | | — | | | | — | |
| | | | | | | | | | | | |
Total Dividends and Distributions | | | (1,638,357 | ) | | | — | | | | — | |
| | | | | | | | | | | | |
| | | |
Capital Share Transactions: | | | | | | | | | | | | |
Issued | | | 140,851,000 | | | | 71,062,500 | | | | 5,989,000 | |
Redeemed | | | (74,264,500 | ) | | | — | | | | (662,000 | ) |
| | | | | | | | | | | | |
Increase in Net Assets from Capital Share Transactions | | | 66,586,500 | | | | 71,062,500 | | | | 5,327,000 | |
| | | | | | | | | | | | |
Total Increase in Net Assets | | | 28,984,059 | | | | 78,316,565 | | | | 3,722,753 | |
| | | | | | | | | | | | |
Net Assets: | | | | | | | | | | | | |
Beginning of Period | | | 78,316,565 | | | | — | | | | — | |
| | | | | | | | | | | | |
End of Period | | $ | 107,300,624 | | | $ | 78,316,565 | | | $ | 3,722,753 | |
| | | | | | | | | | | | |
Undistributed (Distributions in Excess of) Net Investment Income/Accumulated Net Investment Loss | | $ | (70,303 | ) | | $ | (50,941 | ) | | $ | 20,250 | |
| | | | | | | | | | | | |
| | | |
Share Transactions: | | | | | | | | | | | | |
Issued | | | 6,550,000 | | | | 3,950,000 | | | | 400,000 | |
Redeemed | | | (3,750,000 | ) | | | — | | | | (50,000 | ) |
| | | | | | | | | | | | |
Net Increase in Shares Outstanding from Share Transactions | | | 2,800,000 | | | | 3,950,000 | | | | 350,000 | |
| | | | | | | | | | | | |
| (1) | The Fund commenced operations on July 22, 2010. |
| (2) | The Fund commenced operations on January 4, 2011. |
| (3) | Includes realized loss as a result of in-kind transactions. (See Note 4 in Notes to Financial Statements.) |
The accompanying notes are an integral part of the financial statements.
43
|
STATEMENTSOF CHANGESIN NET ASSETS |
|
| | | | | | | | | | | | | | | | |
| | | Global X Pure
Gold Miners
ETF | | | Global X Oil
Equities ETF | | | Global X S&P/
TSX Venture 30
Canada ETF | | | Global X
Fertilizers/Potash
ETF | |
| | | Period Ended
October 31,
2011(1) | | | Period Ended
October 31,
2011(1) | | | Period
Ended October 31,
2011(2) | | | Period Ended
October 31,
2011(3) | |
Operations: | | | | | | | | | | | | | | | | |
Net Investment Income (Loss) | | $ | 2,200 | | | $ | 8,546 | | | $ | (16,092 | ) | | $ | 91,659 | |
Net Realized Gain (Loss) on Investments and Foreign Currency Transactions | | | (3,528 | ) | | | (63,656 | ) | | | (403,595 | )(4) | | | 59,099 | |
Net Change in Unrealized Depreciation on Investments and Foreign Currency Transactions | | | (114,186 | ) | | | (443,353 | ) | | | (698,582 | ) | | | (2,895,447 | ) |
| | | | | | | | | | | | | | | | |
Net Decrease in Net Assets Resulting from Operations | | | (115,514 | ) | | | (498,463 | ) | | | (1,118,269 | ) | | | (2,744,689 | ) |
| | | | | | | | | | | | | | | | |
| | | | |
Capital Share Transactions: | | | | | | | | | | | | | | | | |
Issued | | | 5,249,500 | | | | 3,854,000 | | | | 6,060,000 | | | | 37,904,500 | |
Redeemed | | | — | | | | — | | | | (2,060,000 | ) | | | — | |
| | | | | | | | | | | | | | | | |
Increase in Net Assets from Capital Share Transactions | | | 5,249,500 | | | | 3,854,000 | | | | 4,000,000 | | | | 37,904,500 | |
| | | | | | | | | | | | | | | | |
Total Increase in Net Assets | | | 5,133,986 | | | | 3,355,537 | | | | 2,881,731 | | | | 35,159,811 | |
| | | | | | | | | | | | | | | | |
Net Assets: | | | | | | | | | | | | | | | | |
Beginning of Period | | | — | | | | — | | | | — | | | | — | |
| | | | | | | | | | | | | | | | |
End of Period | | $ | 5,133,986 | | | $ | 3,355,537 | | | $ | 2,881,731 | | | $ | 35,159,811 | |
| | | | | | | | | | | | | | | | |
| | | | |
Undistributed Net Investment Income/Accumulated Net Investment Loss | | $ | 1,087 | | | $ | 8,451 | | | $ | (20,517 | ) | | $ | 100,542 | |
| | | | | | | | | | | | | | | | |
| | | | |
Share Transactions: | | | | | | | | | | | | | | | | |
Issued | | | 350,000 | | | | 250,000 | | | | 400,000 | | | | 2,500,000 | |
Redeemed | | | — | | | | — | | | | (150,000 | ) | | | — | |
| | | | | | | | | | | | | | | | |
Net Increase in Shares Outstanding from Share Transactions | | | 350,000 | | | | 250,000 | | | | 250,000 | | | | 2,500,000 | |
| | | | | | | | | | | | | | | | |
| (1) | The Fund commenced operations on March 14, 2011 |
| (2) | The Fund commenced operations on March 16, 2011 |
| (3) | The Fund commenced operations on May 25, 2011 |
| (4) | Includes realized loss as a result of in-kind transactions. (See Note 4 in Notes to Financial Statements.) |
The accompanying notes are an integral part of the financial statements.
44
Selected Per Share Data & Ratios
For a Share Outstanding Throughout the Period
| | | | | | | | | | | | | | | | | | | | | | | | | | | | | | | | | | | | | | | | | | | | | | | | | | | | |
Net Asset Value, Beginning of Period ($) | | | Net
Investment
Income
(Loss) ($)* | | | Net Realized and
Unrealized
Gain (Loss) on
Investments ($) | | | Total from
Operations
($) | | | Distribution
from Net
Investment
Income ($) | | | Distribution
from
Capital
Gains ($) | | | Total from
Distributions
($) | | | Net
Assets Value,
End of
Period
($) | | | Total
Return
(%)** | | | Net Asset
End of
Period
($)(000) | | | Ratio of
Expenses
to
Average
Net
Assets
(%) | | | Ratio of
Net
Investment
Income
(Loss) to
Average
Net Assets
(%) | | | Portfolio
Turnover
(%) | |
Global X Gold Explorers ETF(1) | | | | | | | | | | | | | | | | | | | | | | | | | | | | | | | | | | | | | | | | | |
2011 | | | 15.49 | | | | (0 .10) | | | | (2.03) | | | | (2.13) | | | | — | | | | — | | | | — | | | | 13 .36 | | | | (13 .75) | | | | 27,392 | | | | 0.65 | † | | | (0 .65 | )† | | | 29.96 | †† |
Global X Silver Miners ETF | | | | | | | | | | | | | | | | | | | | | | | | | | | | | | | | | | | | | | | | | |
2011 | | | 20 .20 | | | | 0 .04 | | | | 3 .66 | | | | 3 .70 | | | | (0.24) | | | | — | | | | (0.24) | | | | 23 .66 | | | | 18 .20 | | | | 363,106 | | | | 0.65 | | | | 0 .16 | | | | 26.50 | |
2010(2) | | | 14 .50 | | | | 0 .05 | | | | 5 .65 | | | | 5 .70 | | | | — | | | | — | | | | — | | | | 20 .20 | | | | 39 .31 | | | | 171,672 | | | | 0 .65 | † | | | 0 .61 | † | | | 0 .35 | †† |
Global X Copper Miners ETF | | | | | | | | | | | | | | | | | | | | | | | | | | | | | | | | | | | | | | | | | |
2011 | | | 16 .63 | | | | 0 .35 | | | | (1 .97) | | | | (1 .62) | | | | (0.09) | | | | — | | | | (0.09) | | | | 14 .92 | | | | (9 .85) | | | | 45,517 | | | | 0.65 | | | | 1 .91 | | | | 15.78 | |
2010(2) | | | 14 .40 | | | | — | | | | 2 .23 | | | | 2 .23 | | | | — | | | | — | | | | — | | | | 16 .63 | | | | 15 .49 | | | | 29,929 | | | | 0 .65 | † | | | 0 .06 | † | | | 1 .36 | †† |
Global X Uranium ETF(3) | | | | | | | | | | | | | | | | | | | | | | | | | | | | | | | | | | | | | | | | | |
2011 | | | 16.78 | | | | 0 .15 | | | | (6.45) | | | | (6.30) | | | | (0.39) | | | | — | | | | (0.39) | | | | 10 .09 | | | | (38 .70) | | | | 199,349 | | | | 0.69 | † | | | 1 .10 | † | | | 24.17 | †† |
Global X Lithium ETF | | | | | | | | | | | | | | | | | | | | | | | | | | | | | | | | | | | | | | | | | | | | | |
2011 | | | 19 .83 | | | | (0 .04) | | | | (3 .62) | | | | (3 .66) | | | | (0.25) | | | | (0.02) | | | | (0.27) | | | | 15 .90 | | | | (18 .86) | | | | 107,301 | | | | 0.75 | | | | (0 .22 | ) | | | 24.87 | |
2010(4) | | | 15 .51 | | | | (0 .03) | | | | 4 .35 | | | | 4 .32 | | | | — | | | | — | | | | — | | | | 19 .83 | | | | 27 .85 | | | | 78,317 | | | | 0 .75 | † | | | (0 .62 | )† | | | 5 .55 | †† |
| (1) | The Fund commenced operations on November 3, 2010. |
| (2) | The Fund commenced operations on April 19, 2010. |
| (3) | The Fund commenced operations on November 4, 2010. |
| (4) | The Fund commenced operations on July 22, 2010. |
| * | Per share data calculated using average shares method. |
| ** | Total Return is for the period indicated and has not been annualized. The return shown does not reflect the deduction of taxes that a shareholder would pay on Fund distributions or the redemption of Fund shares. |
| †† | Portfolio turnover rate is for the period indicated and has not been annualized. Excludes effect of in-kind transfers. |
Amounts designated as “—” are either $0 or have been rounded to $0.
The accompanying notes are an integral part of the financial statements.
45
Selected Per Share Data & Ratios
For a Share Outstanding Throughout the Period
| | | | | | | | | | | | | | | | | | | | | | | | | | | | | | | | | | | | | | | | | | | | | | | | | | |
Net Asset Value, Beginning of Period ($) | | Net
Investment
Income
(Loss) ($)* | | | Net Realized and
Unrealized Loss on
Investments
($) | | | Total from
Operations
($) | | | Distribution
from Net
Investment
Income ($) | | | Distribution
from
Capital
Gains ($) | | | Total from
Distributions
($) | | | Net
Asset Value,
End of
Period
($) | | | Total
Return
(%)** | | | Net
Assets
End of
Period
($)(000) | | | Ratio of Expenses
to Average
Net
Assets
(%) | | | Ratio of Net Investment
Income (Loss) to
Average
Net Assets
(%) | | | Portfolio
Turnover
(%) | |
Global X Aluminum ETF(1) | | | | | | | | | | | | | | | | | | | | | | | | | | | | | | | | | | | | | | | | | |
2011 | | 15.27 | | | 0 .09 | | | | (4.72 | ) | | | (4.63 | ) | | | — | | | | — | | | | — | | | | 10 .64 | | | | (30 .32 | ) | | | 3,723 | | | | 0.69 | † | | | 0 .84† | | | | 15.47 | †† |
Global X Pure Gold Miners ETF(2) | | | | | | | | | | | | | | | | | | | | | | | | | | | | | | | | | | | | | | | | | |
2011 | | 15.15 | | | 0.01 | | | | (0.49 | ) | | | (0.48 | ) | | | — | | | | — | | | | — | | | | 14 .67 | | | | (3 .17 | ) | | | 5,134 | | | | 0.59 | † | | | 0 .10† | | | | 7.61 | †† |
Global X Oil Equities ETF(2) | | | | | | | | | | | | | | | | | | | | | | | | | | | | | | | | | | | | | | | | | |
2011 | | 15.08 | | | 0 .04 | | | | (1.70 | ) | | | (1.66 | ) | | | — | | | | — | | | | — | | | | 13 .42 | | | | (11 .01 | ) | | | 3,356 | | | | 0.49 | † | | | 0 .40† | | | | 25.30 | †† |
Global X S&P/TSX Venture 30 Canada ETF(3) | | | | | | | | | | | | | | | | | | | | | | | | | | | | | | | | | | | | | | | | | |
2011 | | 15.04 | | | (0 .07) | | | | (3.44 | ) | | | (3.51 | ) | | | — | | | | — | | | | — | | | | 11 .53 | | | | (23 .34 | ) | | | 2,882 | | | | 0.75 | † | | | (0 .77)† | | | | 28.23 | †† |
Global X Fertilizers/Potash ETF(4) | | | | | | | | | | | | | | | | | | | | | | | | | | | | | | | | | | | | | | | | | |
2011 | | 15.05 | | | 0 .06 | | | | (1.05 | ) | | | (0.99 | ) | | | — | | | | — | | | | — | | | | 14 .06 | | | | (6 .58 | ) | | | 35,160 | | | | 0.69 | † | | | 0 .90† | | | | 7.55 | †† |
| (1) | The Fund commenced operations on January 4, 2011. |
| (2) | The Fund commenced operations on March 14, 2011. |
| (3) | The Fund commenced operations on March 16, 2011. |
| (4) | The Fund commenced operations on May 25, 2011. |
| * | Per share data calculated using average shares method. |
| ** | Total Return is for the period indicated and has not been annualized. The return shown does not reflect the deduction of taxes that a shareholder would pay on Fund distributions or the redemption of Fund shares. |
| †† | Portfolio turnover rate is for the period indicated and has not been annualized. Excludes effect of in-kind transfers. |
Amounts designated as “—” are either $0 or have been rounded to $0.
The accompanying notes are an integral part of the financial statements.
46
|
NOTES TO FINANCIAL STATEMENTS OCTOBER 31, 2011 |
|
1. ORGANIZATION
The Global X Funds (the “Trust”) is a Delaware Statutory Trust formed on March 6, 2008. The Trust is registered under the Investment Company Act of 1940, as amended, as an open-end management investment company with eighty-six portfolios as of October 31, 2011. The financial statements herein and the related notes pertain to the Global X Gold Explorers ETF, Global X Silver Miners ETF, Global X Copper Miners ETF, Global X Uranium ETF, Global X Lithium ETF, Global X Aluminum ETF, Global X Pure Gold Miners ETF (formerly, Global X Gold Miners ETF), Global X Oil Equities ETF, Global X S&P/TSX Venture 30 Canada ETF (formerly, Global X S&P/TSX Venture Canada ETF) and Global X Fertilizers/Potash ETF (the “Funds”). Each Fund is non-diversified.
2. SIGNIFICANT ACCOUNTING POLICIES
The following is a summary of the Significant Accounting Policies followed by the Funds.
USE OF ESTIMATES -- The preparation of financial statements in conformity with U.S. Generally Accepted Accounting Principles (“U.S. GAAP”) requires management to make estimates and assumptions that affect the reported amounts of assets and liabilities and disclosure of contingent assets and liabilities at the date of the financial statements and the reported amounts of increases and decreases in net assets from operations during the reporting period. Actual results could differ from those estimates, and could have a material impact to the Funds.
SECURITY VALUATION -- Securities listed on a securities exchange, market or automated quotation system for which quotations are readily available (except for securities traded on NASDAQ), including securities traded over the counter, are valued at the last quoted sale price on the primary exchange or market (foreign or domestic) on which they are traded (or at approximately 4:00 pm if a security’s primary exchange is normally open at that time), or, if there is no such reported sale, at the most recent mean between the quoted bid and asked prices (absent both bid and asked prices on such exchange, the bid price may be used).
For securities traded on NASDAQ, the NASDAQ Official Closing Price will be used. If available, debt securities are priced based upon valuations provided by independent, third-party pricing agents. Such values generally reflect the last reported sales price if the security is actively traded. The third-party pricing agents may also value debt securities at an evaluated bid price by employing methodologies that utilize actual market transactions, broker-supplied valuations, or other methodologies designed to identify the market value for such securities. Debt obligations with remaining maturities of sixty days or less may be valued at their amortized cost, which approximates market value. The prices for foreign securities are reported in local currency and converted to U.S. dollars using currency exchange rates. Prices for most securities held in the Funds are provided daily by recognized independent pricing agents. If a security price cannot be obtained from an independent, third-party pricing agent, the Funds seek to obtain a bid price from at least one independent broker.
Securities for which market prices are not “readily available” are valued in accordance with Fair Value Procedures established by the Board of Directors (the “Board”). The Funds’ Fair Value Procedures are implemented through a Fair Value Committee (the “Committee”) designated by the Board. Some of the more common reasons that may necessitate that a security be valued using Fair Value Procedures include: the security’s trading has been halted or suspended; the security has been
47
|
NOTESTO FINANCIAL STATEMENTS (CONTINUED) OCTOBER 31, 2011 |
|
2. SIGNIFICANT ACCOUNTING POLICIES (continued)
SECURITY VALUATION (continued)
de-listed from a national exchange; the security’s primary trading market is temporarily closed at a time when under normal conditions it would be open; the security has not been traded for an extended period of time; the security’s primary pricing source is not able or willing to provide a price; or trading of the security is subject to local government-imposed restrictions. When a security is valued in accordance with the Fair Value Procedures, the Committee will determine the value after taking into consideration relevant information reasonably available to the Committee. As of October 31, 2011, there were $—, $183,557, $17,433 and $34,914 of fair valued securities in the Global X Copper Miners ETF, Global X Aluminum ETF, Global X Pure Gold Miners ETF and Global X S&P/TSX 30 Canada ETF, respectively. There were no other securities priced using the fair value procedures.
For securities that principally trade on a foreign market or exchange, a significant gap in time can exist between the time of a particular security’s last trade and the time at which the Fund’s calculated their net asset value. The closing prices of such securities may no longer reflect their market value at the time the Funds calculated net asset value if an event that could materially affect the value of those securities (a “Significant Event”) has occurred between the time of the security’s last close and the time that the Funds calculate net asset value. A Significant Event may relate to a single issuer or to an entire market sector. If Global X Management Company LLC the “Adviser”) becomes aware of a Significant Event that has occurred with respect to a security or group of securities after the closing of the exchange or market on which the security or securities principally trade, but before the time at which the Funds calculate net asset value, it may request that a Committee meeting be called. In addition, the Funds’ Sub-administrator, SEI Investments Global Funds Services (“SEIGFS”), monitors price movements among certain selected indices, securities and/or baskets of securities that may be an indicator that the closing prices received earlier from foreign exchanges or markets may not reflect market value at the time the Funds calculate net asset value. If price movements in a monitored index or security exceed levels established by the Sub-administrator, the Sub-administrator notifies the Adviser that such limits have been exceeded. In such event, the Adviser makes the determination whether a Committee meeting should be called based on the information provided.
In accordance with the authoritative guidance on fair value measurements and disclosure under U.S. GAAP, the Funds disclose the fair value of their investments in a hierarchy that prioritizes the inputs to valuation techniques used to measure the fair value. The objective of a fair value measurement is to determine the price that would be received to sell an asset or paid to transfer a liability in an orderly transaction between market participants at the measurement date (an exit price). Accordingly, the fair value hierarchy gives the highest priority to quoted prices (unadjusted) in active markets for identical assets or liabilities (Level 1) and the lowest priority to unobservable inputs (Level 3). The three levels of the fair value hierarchy are described below:
The three levels of the fair value hierarchy are described below:
Level 1 – Unadjusted quoted prices in active markets for identical, unrestricted assets or liabilities that the Fund has the ability to access at the measurement date
48
|
NOTESTO FINANCIAL STATEMENTS (CONTINUED) OCTOBER 31, 2011 |
|
2. SIGNIFICANT ACCOUNTING POLICIES (continued)
SECURITY VALUATION (concluded)
Level 2 – Other significant observable inputs (including quoted prices for similar investments, fair value of investments for which the Fund has the ability to fully redeem tranches at net asset value as of the measurement date or within the near term, and short-term investments valued at amortized cost)
Level 3 – Significant unobservable inputs (including the Fund’s own assumptions in determining the fair value of investments, fair value of investments for which the Fund does not have the ability to fully redeem tranches at net asset value as of the measurement date or within the near term)
Investments are classified within the level of the lowest significant input considered in determining fair value. Investments classified within Level 3 whose fair value measurement considers several inputs may include Level 1 or Level 2 inputs as components of the overall fair value measurement.
For the period ended October 31, 2011 there has been no significant changes to the Funds’ fair valuation methodologies.
FEDERAL INCOME TAXES -- It is each Fund’s intention to qualify or continue to qualify as a regulated investment company for Federal income tax purposes by complying with the appropriate provisions of Subchapter M of the Internal Revenue Code of 1986, as amended. Accordingly, no provisions for Federal income taxes have been made in the financial statements.
The Funds evaluate tax positions taken or expected to be taken in the course of preparing the Funds’ tax returns to determine whether it is “more-likely-than-not” (i.e., greater than 50 percent) that each tax position will be sustained upon examination by a taxing authority based on the technical merits of the position. Tax positions not deemed to meet the more-likely-than-not threshold are recorded as a tax benefit or expense in the current year. The Funds did not record any tax provision in the current period. However, management’s conclusions regarding tax positions may be subject to review and adjustment at a later date based on factors including, but not limited to, examination by tax authorities (i.e., the last three tax year ends, as applicable), on-going analysis of and changes to tax laws, regulations and interpretations thereof.
SECURITY TRANSACTIONS AND INVESTMENT INCOME -- Security transactions are accounted for on the trade date for financial reporting purposes. Costs used in determining realized gains and losses on the sale of investment securities are based on specific identification. Dividend income is recorded on the ex-dividend date. Interest income is recognized on the accrual basis from the settlement date.
FOREIGN CURRENCY TRANSLATION -- The books and records of the Funds are maintained in U.S. dollars. Investment securities and other assets and liabilities denominated in a foreign currency are translated into U.S. dollars on the date of valuation. Purchases and sales of investment securities, income and expenses are translated into U.S. dollars at the relevant rates of exchange prevailing on the respective dates of such transactions. The Funds’ do not isolate that portion of realized or unrealized gains and losses resulting from changes in the foreign exchange rate from fluctuations arising from changes in the market prices of the securities. These gains and losses are included in net
49
|
NOTESTO FINANCIAL STATEMENTS (CONTINUED) OCTOBER 31, 2011 |
|
2. SIGNIFICANT ACCOUNTING POLICIES (concluded)
FOREIGN CURRENCY TRANSLATION (concluded)
realized and unrealized gains and losses on investments on the Statement of Operations. Net realized and unrealized gains and losses on foreign currency transactions represent net foreign exchange gains or losses from foreign currency exchange contracts, disposition of foreign currencies, currency gains or losses realized between trade and settlement dates on securities transactions and the difference between the amount of the investment income and foreign withholding taxes recorded on the Funds’ books and the U.S. dollar equivalent amounts actually received or paid.
DIVIDENDS AND DISTRIBUTIONS TO SHAREHOLDERS -- The Funds distribute their net investment income on a pro rata basis. Any net realized capital gains are distributed annually. All distributions are recorded on ex-dividend date.
CREATION UNITS -- The Funds issue and redeem shares (“Shares”) at Net Asset Value (“NAV”) and only in large blocks of Shares, (each block of Shares for a Fund is called a “Creation Unit” or multiples thereof). Purchasers of Creation Units (“Authorized Participants”) at NAV must pay a standard creation transaction fee per transaction. The fee is a single charge and will be the same regardless of the number of Creation Units purchased by an investor on the same day. An Authorized Participant who holds Creation Units and wishes to redeem at NAV would also pay a standard Redemption Fee per transaction on the date of such redemption, regardless of the number of Creation Units redeemed that day.
If a Creation Unit is purchased or redeemed for cash, a higher Transaction Fee will be charged. The following table discloses Creation Unit breakdown:
| | | | | | | | | | | | | | | | |
| | | Creation
Unit Shares | | | Transaction
Fee | | | Value | | | Redemption
Fee | |
Global X Gold Explorers ETF | | | 50,000 | | | $ | 1,000 | | | $ | 668,000 | | | $ | 1,000 | |
Global X Silver Miners ETF | | | 50,000 | | | | 1,000 | | | | 1,183,000 | | | | 1,000 | |
Global X Copper Miners ETF | | | 50,000 | | | | 1,000 | | | | 746,000 | | | | 1,000 | |
Global X Uranium ETF | | | 50,000 | | | | 1,000 | | | | 504,500 | | | | 1,000 | |
Global X Lithium ETF | | | 50,000 | | | | 1,000 | | | | 795,000 | | | | 1,000 | |
Global X Aluminum ETF | | | 50,000 | | | | 1,000 | | | | 532,000 | | | | 1,000 | |
Global X Pure Gold Miners ETF | | | 50,000 | | | | 1,000 | | | | 733,500 | | | | 1,000 | |
Global X Oil Equities ETF | | | 50,000 | | | | 1,000 | | | | 671,000 | | | | 1,000 | |
Global X S&P/TSX Venture 30 Canada ETF | | | 50,000 | | | | 1,000 | | | | 576,500 | | | | 1,000 | |
Global X Fertilizers/Potash ETF | | | 50,000 | | | | 1,000 | | | | 703,000 | | | | 1,000 | |
3. RELATED PARTY TRANSACTIONS
The Adviser serves as the investment adviser and the administrator for the Funds. Subject to the supervision of the Board of Trustees, the Adviser is responsible for managing the investment activities of the Funds and the Funds’ business affairs and other administrative matters and provides or causes to be furnished all supervisory, administrative and other services reasonably necessary for the operation of the Funds, including certain distribution services (provided pursuant to a separate Distribution Agreement), certain shareholder and distribution-related services (provided pursuant to
50
|
| NOTESTO FINANCIAL STATEMENTS (CONTINUED) |
OCTOBER 31, 2011 |
3. RELATED PARTY TRANSACTIONS (continued)
a separate Rule 12b-1 Plan and related agreements) and investment advisory services (provided pursuant to a separate Investment Advisory Agreement), under what is essentially an “all-in” fee structure. For its service to the Funds, under the Supervision and Administration Agreement, each Fund pays a monthly fee to the Adviser at the annual rate (stated as a percentage of the average daily net assets of the Fund). In addition, the Funds bear other expenses that are not covered by the Supervision and Administration Agreement, which may vary and affect the total expense ratios of the Funds, such as taxes, brokerage fees, commissions and other transaction expenses, interest expenses, and extraordinary expenses (such as litigation and indemnification expenses).
| | | | |
| | | | Supervision and
Administration Fee |
Global X Gold Explorers ETF | | | | 0.65% |
Global X Silver Miners ETF | | | | 0.65% |
Global X Copper Miners ETF | | | | 0.65% |
Global X Uranium ETF | | | | 0.69% |
Global X Lithium ETF | | | | 0.75% |
Global X Aluminum ETF | | | | 0.69% |
Global X Pure Gold Miners ETF | | | | 0.59% |
Global X Oil Equities ETF | | | | 0.49% |
Global X S&P/TSX Venture 30 Canada ETF | | | | 0.75% |
Global X Fertilizer/Potash ETF | | | | 0.69% |
The Adviser and MCCA Lithium ETF, LLC (“MCCA”), a single purpose limited liability firm, have entered into an agreement, pursuant to which MCCA has agreed to assist the Adviser, in its capacity as sponsor of the Global X Lithium ETF, by providing initial capital and additional financial resources to the Adviser in connection with the listing, launch and the continuing operation of the Global X Lithium Fund. In return, the Adviser has agreed to compensate MCCA for its financial assistance to the Adviser with respect to the Global X Lithium ETF by sharing with MCCA fifty percent (50%) of the Adviser’s Net Profits with respect to the Global X Lithium ETF. For this purpose, the term Net Profits means, for any calendar quarter, the total management fees received by the Adviser with respect to the Global X Lithium ETF less direct expenses, marketing expenses and overhead expenses for the Global X Lithium ETF during such quarter. In the event that there are no Net Profits with respect to the Global X Lithium ETF in any calendar quarter, MCCA shall pay fifty percent of the negative shortfall in Net Profits to the Adviser. The agreement between the parties does not contemplate that MCCA or any of its affiliates will be involved directly or indirectly in the distribution of shares of the Global X Lithium ETF.
SEIGFS serves as Sub-Administrator to the Funds. As Sub-Administrator, SEIGFS provides the Funds with the required general administrative services, including, without limitation: office space, equipment, and personnel; clerical and general back office services; bookkeeping, internal accounting and secretarial services; the calculation of NAV; and assistance with the preparation and filing of reports, registration statements, proxy statements and other materials required to be filed or furnished by the Funds under federal and state securities laws. As compensation for these services, the Sub-Administrator receives certain out-of-pocket costs, transaction fees and asset-based fees which are accrued daily and paid monthly by the Adviser.
51
|
| NOTESTO FINANCIAL STATEMENTS (CONTINUED) |
OCTOBER 31, 2011 |
3. RELATED PARTY TRANSACTIONS (concluded)
SEI Investments Distribution Co. (“SIDCO”) serves as each Funds underwriter and distributor of Shares pursuant to a Distribution Agreement. Under the Distribution Agreement, SIDCO, as agent, receives orders to create and redeem Shares in Creation Unit Aggregations and transmits such orders to the Trust’s custodian and transfer agent. The Distributor has no obligation to sell any specific quantity of Fund Shares. SIDCO bears the following costs and expenses relating to the distribution of Shares: (i) the costs of processing and maintaining records of creations of Creation Units; (ii) all costs of maintaining the records required of a registered broker/dealer; (iii) the expenses of maintaining its registration or qualification as a dealer or broker under Federal or state laws; (iv) filing fees; and (v) all other expenses incurred in connection with the distribution services as contemplated in the Distribution Agreement. SIDCO receives no fee for its distribution services under the Distribution Agreement.
4. INVESTMENT TRANSACTIONS
For the period ended October 31, 2011, the purchases and sales of investments in securities, excluding in-kind transactions, long-term U.S. Government and short-term securities were:
| | | | | | | | | | |
| | | Purchases | | | | | Sales | |
Global X Gold Explorers ETF | | $ | 14,941,625 | | | | | $ | 7,293,145 | |
Global X Silver Miners ETF | | | 134,584,345 | | | | | | 110,590,792 | |
Global X Copper Miners ETF | | | 20,953,861 | | | | | | 12,131,584 | |
Global X Uranium ETF | | | 81,305,746 | | | | | | 48,936,817 | |
Global X Lithium ETF | | | 47,000,294 | | | | | | 35,300,061 | |
Global X Aluminum ETF | | | 960,782 | | | | | | 724,946 | |
Global X Pure Gold Miners ETF | | | 292,920 | | | | | | 296,694 | |
Global X Oil Equities ETF | | | 897,988 | | | | | | 890,942 | |
Global X S&P/TSX Venture 30 Canada ETF | | | 1,800,461 | | | | | | 974,864 | |
Global X Fertilizers/Potash ETF | | | 6,442,921 | | | | | | 1,806,741 | |
During the period ended October 31, 2011, there were no purchases or sales of long-term U.S. Government securities for the Funds.
52
|
| NOTESTO FINANCIAL STATEMENTS (CONTINUED) |
OCTOBER 31, 2011 |
4. INVESTMENT TRANSACTIONS (concluded)
For the period ended October 31, 2011, in-kind transactions associated with creations and redemptions were:
| | | | | | | | | | | | |
| | | Purchases | | | Sales | | | Realized
Gain/(Loss) | |
Global X Gold Explorers ETF | | $ | 33,432,262 | | | $ | 7,616,073 | | | $ | 654,517 | |
Global X Silver Miners ETF | | | 402,094,872 | | | | 237,098,769 | | | | 64,219,953 | |
Global X Copper Miners ETF | | | 102,159,483 | | | | 79,785,883 | | | | (8,966,405 | ) |
Global X Uranium ETF | | | 372,214,203 | | | | 63,051,969 | | | | 3,912,226 | |
Global X Lithium ETF | | | 100,350,670 | | | | 47,935,094 | | | | 4,216,095 | |
Global X Aluminum ETF | | | 5,732,053 | | | | 618,803 | | | | (60,824 | ) |
Global X Pure Gold Miners ETF | | | 5,241,873 | | | | - | | | | - | |
Global X Oil Equities ETF | | | 3,853,036 | | | | - | | | | - | |
Global X S&P/TSX Venture 30 Canada ETF | | | 4,829,680 | | | | 1,635,188 | | | | 112,312 | |
Global X Fertilizers/Potash ETF | | | 33,295,879 | | | | - | | | | - | |
5. TAX INFORMATION
The amount and character of income and capital gain distributions to be paid, if any, are determined in accordance with Federal income tax regulations, which may differ from U.S. GAAP. As a result, net investment income (loss) and net realized gain (loss) on investment transactions for a reporting period may differ significantly from distributions during such period. These book/tax differences may be temporary or permanent. To the extent these differences are permanent in nature, they are charged or credited to undistributed net investment income (loss), accumulated net realized gain (loss) or paid-in capital, as appropriate, in the period that the differences arise.
The following differences, primarily attributable to utilization of earnings and profits on shareholder redemptions and distribution reclassifications, investment in master limited partnership, foreign currency, redemptions in-kind, sales of passive foreign investment companies, wash sales and net operating losses, have been reclassified to/from the following accounts during the fiscal period ended October 31, 2011.
| | | | | | | | | | | | |
Global X Funds | | Paid-in
Capital | | | Undistributed
Net
Investment
Income/(Loss) | | | Accumulated
Net Realized
Gain/(Loss) | |
Global X Gold Explorers ETF | | $ | 784,105 | | | $ | 52,611 | | | $ | (836,716 | ) |
Global X Silver Miners ETF | | | 62,689,228 | | | | 2,192,951 | | | | (64,882,179 | ) |
Global X Copper Miners ETF | | | (8,814,623 | ) | | | 76,998 | | | | 8,737,625 | |
Global X Uranium ETF | | | 3,673,055 | | | | 165,183 | | | | (3,838,238 | ) |
Global X Lithium ETF | | | 4,212,582 | | | | 1,838,319 | | | | (6,050,901 | ) |
Global X Aluminum ETF | | | (60,824 | ) | | | (10,553 | ) | | | 71,377 | |
Global X Pure Gold Miners ETF | | | – | | | | (1,113 | ) | | | 1,113 | |
Global X Oil Equities ETF | | | – | | | | (95 | ) | | | 95 | |
Global X S&P/TSX Venture 30 Canada ETF | | | 112,312 | | | | (4,425 | ) | | | (107,887 | ) |
Global X Fertilizers/Potash ETF | | | – | | | | 8,883 | | | | (8,883 | ) |
These reclassifications have no impact on net assets or net asset value per share.
53
|
| NOTESTO FINANCIAL STATEMENTS (CONTINUED) |
OCTOBER 31, 2011 |
5. TAX INFORMATION (continued)
The tax character of dividends and distributions paid during the last period ended October 31, 2011 and 2010 were as follows:
| | | | | | | | | | | | |
Global X Funds | | Ordinary
Income | | | Return of
Capital | | | Totals | |
Global X Silver Miners ETF | | | | | | | | | | | | |
2011 | | $ | 3,208,369 | | | $ | – | | | $ | 3,208,369 | |
2010 | | | – | | | | | | | | – | |
Global X Copper Miners ETF | | | | | | | | | | | | |
2011 | | $ | 388,853 | | | $ | – | | | $ | 388,853 | |
2010 | | | – | | | | | | | | – | |
Global X Uranium ETF | | | | | | | | | | | | |
2011 | | $ | 2,442,914 | | | $ | 239,171 | | | $ | 2,682,085 | |
Global X Lithium ETF | | | | | | | | | | | | |
2011 | | $ | 1,638,357 | | | $ | – | | | $ | 1,638,357 | |
2010 | | | – | | | | – | | | | – | |
As of October 31, 2011, the Components of Tax Basis Distributable Earnings (Accumulated Losses) were as follows:
| | | | | | | | | | | | |
| | | Global X Funds | |
| | | Global X Gold
Explorers ETF | | | Global X Silver
Miners ETF | | | Global X Copper
Miners ETF | |
Undistributed Ordinary Income | | $ | 545,816 | | | $ | – | | | $ | 2,582,213 | |
Undistributed Long-Term Capital Gain | | | – | | | | – | | | | 15,799 | |
Capital Loss Carryforwards | | | (130,976 | ) | | | (8,433,466 | ) | | | – | |
Unrealized Depreciation on Investments and Foreign Currency | | | (7,250,085 | ) | | | (24,506,024 | ) | | | (7,492,168 | ) |
Other Temporary Differences | | | – | | | | – | | | | (8 | ) |
| | | | | | | | | | | | |
Total Accumulated Losses | | $ | (6,835,245 | ) | | $ | (32,939,490 | ) | | $ | (4,894,164 | ) |
| | | | | | | | | | | | |
| |
| | | Global X Funds | |
| | | Global X Uranium
ETF | | | Global X Lithium
ETF | | | Global X
Aluminum ETF | |
Undistributed Ordinary Income | | $ | – | | | $ | – | | | $ | 20,251 | |
Capital Loss Carryforwards | | | (12,705,798 | ) | | | (7,329,311 | ) | | | (14,836 | ) |
Unrealized Depreciation on Investments and Foreign Currency | | | (133,623,067 | ) | | | (27,231,647 | ) | | | (1,548,838 | ) |
Other Temporary Differences | | | (44,194 | ) | | | – | | | | – | |
| | | | | | | | | | | | |
Total Accumulated Losses | | $ | (146,373,059 | ) | | $ | (34,560,958 | ) | | $ | (1,543,423 | ) |
| | | | | | | | | | | | |
| |
| | | Global X Funds | |
| | | Global X Pure
Gold Miners ETF | | | Global X Oil
Equities ETF | | | Global X
S&P/TSX Venture
30 Canada ETF | |
Undistributed Ordinary Income | | $ | 89,967 | | | $ | 8,451 | | | $ | 71,812 | |
Capital Loss Carryforwards | | | – | | | | (63,419 | ) | | | (506,011 | ) |
Unrealized Depreciation on Investments and Foreign Currency | | | (205,481 | ) | | | (443,495 | ) | | | (796,382 | ) |
| | | | | | | | | | | | |
Total Accumulated Losses | | $ | (115,514 | ) | | $ | (498,463 | ) | | $ | (1,230,581 | ) |
| | | | | | | | | | | | |
54
|
| NOTESTO FINANCIAL STATEMENTS (CONTINUED) |
OCTOBER 31, 2011 |
5. TAX INFORMATION (continued)
| | | | |
| | | Global X Funds | |
| | | Global X
Fertilizers/Potash
ETF | |
Undistributed Ordinary Income | | $ | 132,874 | |
Unrealized Depreciation on Investments and Foreign Currency | | | (2,877,563 | ) |
| | | | |
Total Accumulated Losses | | $ | (2,744,689 | ) |
| | | | |
For Federal income tax purposes, capital loss carryforwards represent realized losses of the Funds that may be carried forward for a maximum period of eight years and applied against future gains. As of October 31, 2011, the Funds that had capital loss carryforwards are listed below.
| | | | | | | | | | | | |
Expiration Date | | Global X
Silver Miners
ETF | | | Global X
Uranium ETF | | | Global X
Lithium ETF | |
Oct. 2019 | | $ | 8,433,466 | | | $ | 12,705,798 | | | $ | 7,329,311 | |
| | | | | | | | | | | | |
Total | | $ | 8,433,466 | | | $ | 12,705,798 | | | $ | 7,329,311 | |
| | | | | | | | | | | | |
During the fiscal year ended October 31, 2011, Global X Copper Miners ETF utilized $10,213 of capital loss carry forwards to offset capital gains.
Under the recently enacted Regulated Investment Company Modernization Act of 2010, the Funds will be permitted to carry forward capital losses incurred in taxable years beginning after December 22, 2010 for an unlimited period. However, any losses incurred during those future taxable years will be required to be used prior to the losses incurred in pre-enactment taxable years. As a result of this ordering rule, preenactment capital loss carryforwards may be more likely to expire unused. Additionally, post-enactment capital losses that are carried forward will retain their character as either short-term or long-term capital losses rather than being considered all short-term as under previous law. Losses carried forward under these new provisions are as follows:
| | | | | | | | | | | | |
Global X Funds | | Short-Term
Loss | | | Long-Term
Loss | | | Total | |
Global X Gold Explorers ETF | | $ | 130,976 | | | $ | - | | | $ | 130,976 | |
Global X Aluminum ETF | | | 14,836 | | | | - | | | | 14,836 | |
Global X Oil Equities ETF | | | 63,419 | | | | - | | | | 63,419 | |
Global X S&P/TSX Venture 30 Canada ETF | | | 506,011 | | | | - | | | | 506,011 | |
55
|
| NOTESTO FINANCIAL STATEMENTS (CONTINUED) |
OCTOBER 31, 2011 |
5. TAX INFORMATION (concluded)
The Federal tax cost and aggregate gross unrealized appreciation and depreciation on investments held by the Funds at October 31, 2011 were as follows:
| | | | | | | | | | | | | | | | |
Global X Funds | | Federal Tax
Cost | | | Aggregated
Gross
Unrealized
Appreciation | | | Aggregated
Gross
Unrealized
Depreciation | | | Net
Unrealized
Depreciation | |
Global X Gold Explorers ETF | | | $34,655,636 | | | | $309,199 | | | | $(7,559,286 | ) | | | $(7,250,087 | ) |
Global X Silver Miners ETF | | | 387,394,110 | | | | 28,686,282 | | | | (53,132,471 | ) | | | (24,446,189 | ) |
Global X Copper Miners ETF | | | 52,986,962 | | | | 1,275,388 | | | | (8,771,137 | ) | | | (7,495,749 | ) |
Global X Uranium ETF | | | 333,087,612 | | | | 5,331,759 | | | | (138,950,750 | ) | | | (133,618,991 | ) |
Global X Lithium ETF | | | 134,376,024 | | | | 6,512,285 | | | | (33,743,623 | ) | | | (27,231,338 | ) |
Global X Aluminum ETF | | | 5,273,434 | | | | 196 | | | | (1,548,997 | ) | | | (1,548,801 | ) |
Global X Pure Gold Miners ETF | | | 5,327,866 | | | | 329,160 | | | | (534,738 | ) | | | (205,578 | ) |
Global X Oil Equities ETF | | | 3,797,604 | | | | 72,360 | | | | (515,840 | ) | | | (443,480 | ) |
Global X S&P/TSX Venture 30 Canada ETF | | | 3,718,722 | | | | 121,410 | | | | (917,792 | ) | | | (796,382 | ) |
Global X Fertilizers/Potash ETF | | | 38,049,004 | | | | 401,863 | | | | (3,279,539 | ) | | | (2,877,676 | ) |
The preceding differences between book and tax cost are primarily due to mark to market treatment of passive foreign investment companies and wash sales.
6. CONCENTRATION OF RISKS
The Funds invest in securities of foreign issuers in several countries. These investments may involve certain considerations and risks not typically associated with investments in the United States as a result of, among other factors, the possibility of future political and economic developments and the level of governmental supervision and regulation of securities markets in the respective countries.
The securities markets of emerging countries are less liquid and subject to greater price volatility, and have a smaller market capitalization, than the U.S. securities markets. In certain countries, there may be fewer publicly traded securities and the market may be dominated by a few issues or sectors. Issuers and securities markets in such countries are not subject to as extensive and frequent accounting, financial and other reporting requirements or as comprehensive government regulations as are issuers and securities markets in the U.S. In particular, the assets and profits appearing on the financial statements of emerging country issuers may not reflect their financial position or results of operations in the same manner as financial statements for U.S. issuers. Substantially less information may be publicly available about emerging country issuers than is available about issuers in the United States.
The Funds may be subject to taxes imposed by countries in which it invests. Such taxes are generally based on either income or gains earned or repatriated. The Funds accrue and apply such taxes to net investment income, net realized gains and net unrealized gains as income and/or capital gains are earned.
The Funds use a replication strategy. A replication strategy is an indexing strategy that involves investing in the securities of the Underlying Index in approximately the same proportions as in the Underlying Index. The Funds may utilize a representative sampling strategy with respect to its Underlying Index when a replication strategy might be detrimental to its shareholders, such as when
56
|
| NOTESTO FINANCIAL STATEMENTS (CONTINUED) |
OCTOBER 31, 2011 |
6. CONCENTRATION OF RISKS (concluded)
there are practical difficulties or substantial costs involved in compiling a portfolio of equity securities to follow its Underlying Index, or, in certain instances, when securities in the Underlying Index become temporarily illiquid, unavailable or less liquid, or due to legal restrictions (such as diversification requirements that apply to the Funds but not the Underlying Indexes).
Commodity related securities, are susceptible to fluctuations in certain commodity markets. Any negative changes in commodity markets could have a great impact on these Funds.
7. OTHER
At October 31, 2011, the total Shares outstanding that were held by Authorized Participants were as follows. The Authorized Participants have entered into an agreement with the Funds’ Distributor.
| | | | |
| | | Authorized Participants | | Percentage of Shares
Outstanding |
Global X Gold Explorers ETF | | 4 | | 100% |
Global X Silver Miners ETF | | 5 | | 100% |
Global X Copper Miners ETF | | 4 | | 100% |
Global X Uranium ETF | | 6 | | 100% |
Global X Lithium ETF | | 4 | | 100% |
Global X Aluminum ETF | | 2 | | 100% |
Global X Pure Gold Miners ETF | | 2 | | 100% |
Global X Oil Equities ETF | | 1 | | 100% |
Global X S&P/TSX Venture 30 Canada ETF | | 2 | | 100% |
Global X Fertilizers/Potash ETF | | 4 | | 100% |
Pursuant to the Trust’s organizational documents, the Trustees of the Trust and the Trust’s officers are indemnified against certain liabilities that may arise out of the performance of their duties.
8. CHANGE OF INDEPENDENT REGISTERED PUBLIC ACCOUNTING FIRM
The Global X Funds have selected Ernst & Young LLP (“E&Y”) to serve as the Funds’ independent registered public accounting firm for the Funds’ fiscal year ended October 31, 2011. The decision to select E&Y was recommended by the Funds’ Audit Committee on December 21, 2010 and was approved by the Funds’ Board of Trustees on January 28, 2011. During the Global X Funds’ fiscal years ended October 31, 2009 and October 31, 2010, neither the Funds, their portfolios, nor anyone on their behalf, consulted with E&Y on items which: (i) concerned the application of accounting principles to a specified transaction, either completed or proposed, or the type of audit opinion that might be rendered on the Global X Funds’ financial statements; or (ii) concerned the subject of a disagreement (as defined in paragraph (a)(1)(iv) of Item 304 of Regulation S-K) or reportable events (as described in paragraph (a)(1)(iv) of said Item 304).
57
|
| NOTESTO FINANCIAL STATEMENTS (CONTINUED) |
OCTOBER 31, 2011 |
8. CHANGE OF INDEPENDENT REGISTERED PUBLIC ACCOUNTING FIRM (concluded)
The selection of E&Y does not reflect any disagreements with or dissatisfaction by the Global X Funds or the Funds’ Board of Trustees with the performance of the Global X Funds’ prior independent registered public accounting firm, Sanville & Company (“Sanville”). The decision not to renew the engagement of Sanville, effective upon its completion of its audit for the fiscal year ended October 31, 2010, and to select E&Y was recommended by the Funds’ Audit Committee and approved by the Funds’ Board of Trustees. Sanville’s report on the Global X Funds’ financial statements for the fiscal years ended October 31, 2009 and October 31, 2010 contained no adverse opinion or disclaimer of opinion, nor were they qualified or modified as to uncertainty, audit scope, or accounting principles. During the Global X Funds’ fiscal years ended October 31, 2009 and October 31, 2010 (i) there were no disagreements with Sanville on any matter of accounting principles or practices, financial statement disclosure, or auditing scope or procedure, which disagreements, if not resolved to the satisfaction of Sanville, would have caused them to make reference to the subject matter of the disagreements in connection with their reports on the Global X Funds’ financial statements for such years; and (ii) there were no “reportable events” of the kind described in Item 304(a)(1)(v) of Regulation S-K.
9. LOANS OF PORTFOLIO SECURITIES
The Funds may lend portfolio securities having a market value up to one-third of the Funds’ total assets. Such loans are secured by collateral equal to no less than the market value of the loaned securities determined daily. Such collateral will be cash or debt securities issued or guaranteed by the U.S. Government or any agencies. Cash collateral received in connection with these loans is invested in short-term money market instruments. It is the Funds’ policy to obtain additional collateral from or return excess collateral to the borrower by the end of the next business day, following the valuation date of the securities loaned. Therefore, the value of the collateral held may be temporarily less than the value of the securities on loan. Lending securities entails a risk of loss to the Funds if and to the extent that the market value of the securities loans were to increase and the borrower did not increase the collateral accordingly, and the borrower fails to return the securities. The Funds could also experience delays and costs in gaining access to the collateral. The Funds bear the risk of any deficiency in the amount of the collateral available for return to the borrower due to any loss on the collateral invested. As of October 31, 2011, there were no securities on loan for any of the Funds.
| 10. | CONTRACTUAL OBLIGATIONS |
The Funds enter into contracts in the normal course of business that contain a variety of indemnifications. The Funds maximum exposure under these arrangements is unknown. However the Funds have not had prior gains or losses pursuant to these contracts. Management has reviewed the Funds’ existing contracts and expects the risk of loss to be remote.
58
|
| NOTESTO FINANCIAL STATEMENTS (CONTINUED) |
OCTOBER 31, 2011 |
| 11. | NEW ACCOUNTING PROUNCEMENTS |
In May 2011, the FASB issued ASU No. 2011-04 “Amendments to Achieve Common Fair Value Measurement and Disclosure Requirements in U.S. GAAP and International Financial Reporting Standards(“IFRS”)”. ASU 2011-04 includes common requirements for measurement of and disclosure about fair value between U.S. GAAP and IFRS. ASU 2011-04 will require reporting entities to disclose the following information for fair value measurements categorized within Level 3 of the fair value hierarchy: quantitative information about the unobservable inputs used in the fair value measurement, the valuation processes used by the reporting entity, and a narrative description of the sensitivity of the fair value measurement to changes in unobservable inputs and the interrelationships between those unobservable inputs. In addition, ASU 2011-04 will require reporting entities to make disclosures about amounts and reasons for all transfers in and out of Level 1 and Level 2 fair value measurements. The new and revised disclosures are effective for interim and annual reporting periods beginning after December 15, 2011. At this time, management is evaluating the implications of ASU 2011-04 and its impact on the financial statements.
The Funds have evaluated the need for additional disclosures and/or adjustments resulting from subsequent events. Based on this evaluation, no additional disclosures or adjustments were required to the financial statements as of the date the financial statements were issued.
Subsequent to fiscal year end, on November 11, 2011, the continuation of the Investment Advisory Agreement and Supervision and Administration Agreement for the Funds was considered and approved by the Board of Trustees of the Trust.
Subsequent to fiscal year end, on December, 19, 2011, the Board of Trustees of the Trust, based upon the recommendation of the Adviser, determined to liquidate and terminate the Global X Oil Equities ETF (the “Liquidating Fund”). Due to the Liquidating Fund’s low levels of assets, the Adviser does not believe that it can continue to conduct the Liquidating Fund’s business and operations in an economically efficient manner. As such, the Board concluded that it would be in the best interests of the Liquidating Fund and its shareholders to liquidate and terminate the Liquidating Fund. As of the close of regular trading on the NYSE Arca, Inc. (“NYSE”) on February 16, 2012 (“Closing Date”), the shares of the Liquidating Fund will cease trading on the NYSE and will close to purchases by investors.
Shareholders may sell their holdings in the Liquidating Fund prior to the Closing Date and customary brokerage charges may apply to these transactions. However, from February 17, 2012, through February 27, 2012 (“Liquidation Date”), shareholders only may be able to sell their shares to certain broker-dealers and there is no assurance that there will be a market for the Liquidating Fund during this time period. Between the Closing Date and the Liquidation Date, the Liquidating Fund will be in the process of winding up its operations and liquidating its portfolio. This process will result in the Liquidating Fund not tracking its underlying indexes and its cash holdings increasing, which may not be consistent with the Liquidating Fund’s investment objective and strategy.
59
|
| NOTESTO FINANCIAL STATEMENTS (CONCLUDED) |
OCTOBER 31, 2011 |
| 12. | SUBSEQUENT EVENT (concluded) |
On or about the Liquidation Date, the Liquidating Fund will liquidate its assets and distribute cash pro rata to all remaining shareholders who have not previously redeemed their shares. These distributions are taxable events. In addition, these payments to shareholders will include accrued capital gains and dividends, if any. Once the distributions are complete, the Liquidating Fund will terminate.
Subsequent to fiscal year end, on December 21, 2011, based on the recommendation of the Adviser, the Board of Trustees of the Trust approved the discontinuance of the Global X Philippines PSEi ETF and Global X Shipping ETF, each a separate investment portfolio of the Trust that had never commenced operations.
Subsequent to year end, the following investment portfolios were added to the Trust.
Global X NASDAQ 100 Global Technology Index ETF
Global X NASDAQ 500 ETF
Global X NASDAQ 400 Mid Cap ETF
Global X FTSE Permanent ETF
Subsequent to year end, the following investment portfolios Trust commenced operations.
| | | | |
Fund Name | | Commenced Operations | | |
Global X Social Media Index ETF | | November 14, 2011 | | |
Global X NASDAQ 500 ETF | | December 5, 2011 | | |
Global X NASDAQ 400 Mid Cap ETF | | December 5, 2011 | | |
Global X FTSE Greece 20 ETF | | December 7, 2011 | | |
60
|
REPORTOF INDEPENDENT REGISTERED PUBLIC ACCOUNTING FIRM |
|
To the Shareholders and Board of Trustees of Global X Funds
We have audited the accompanying statements of assets and liabilities, including the schedules of investments, of Global X Gold Explorers ETF, Global X Silver Miners ETF, Global X Copper Miners ETF, Global X Uranium ETF, Global X Lithium ETF, Global X Aluminum ETF, Global X Pure Gold Miners ETF, Global X Oil Equities ETF, Global X S&P/TSX Venture 30 Canada ETF and Global X Fertilizers/Potash ETF (ten of the series constituting the Global X Funds) (the “Funds”) as of October 31, 2011, and the related statements of operations, statements of changes in net assets, and financial highlights for the year or period then ended. These financial statements and financial highlights are the responsibility of the Funds’ management. Our responsibility is to express an opinion on these financial statements and financial highlights based on our audits. The statements of changes in net assets and financial highlights of the Global X Silver Miners ETF, Global X Copper Miners ETF and Global X Lithium ETF for each of the periods presented through October 31, 2010 were audited by other auditors whose report dated December 23, 2010, expressed an unqualified opinion on those financial statements and financial highlights.
We conducted our audits in accordance with the standards of the Public Company Accounting Oversight Board (United States). Those standards require that we plan and perform the audit to obtain reasonable assurance about whether the financial statements and financial highlights are free of material misstatement. We were not engaged to perform an audit of the Funds’ internal control over financial reporting. Our audits included consideration of internal control over financial reporting as a basis for designing audit procedures that are appropriate in the circumstances, but not for the purpose of expressing an opinion on the effectiveness of the Funds’ internal control over financial reporting. Accordingly, we express no such opinion. An audit also includes examining, on a test basis, evidence supporting the amounts and disclosures in the financial statements and financial highlights, assessing the accounting principles used and significant estimates made by management, and evaluating the overall financial statement presentation. Our procedures included confirmation of securities owned as of October 31, 2011, by correspondence with the custodian and brokers, or by other appropriate auditing procedures where replies from brokers were not received. We believe that our audits provide a reasonable basis for our opinion.
In our opinion, the 2011 financial statements and financial highlights referred to above present fairly, in all material respects, the financial position of each of the Funds listed above at October 31, 2011, and the results of their operations, the changes in their net assets, and their financial highlights for the year or period then ended, in conformity with U.S. generally accepted accounting principles.
Philadelphia, Pennsylvania
December 22, 2011
61
|
DISCLOSUREOF FUND EXPENSES (unaudited) |
|
All Exchange Traded Funds (“ETF”) have operating expenses. As a shareholder of an ETF, your investment is affected by these ongoing costs, which include (among others) costs for ETF management, administrative services, brokerage fees, and shareholder reports like this one. It is important for you to understand the impact of these costs on your investment returns.
Operating expenses such as these are deducted from an ETF’s gross income and directly reduce your final investment return. These expenses are expressed as a percentage of the ETF’s average net assets; this percentage is known as the ETF’s expense ratio.
The following examples use the expense ratio and are intended to help you understand the ongoing costs (in dollars) of investing in your Fund and to compare these costs with those of other funds. The examples are based on an investment of $1,000 made at the beginning of the period shown and held for the entire period.
The table on the next page illustrates your Fund’s costs in two ways:
Actual Fund Return. This section helps you to estimate the actual expenses that your Fund incurred over the period. The “Expenses Paid During Period” column shows the actual dollar expense cost incurred by a $1,000 investment in the Fund, and the “Ending Account Value” number is derived from deducting that expense cost from the Fund’s gross investment return.
You can use this information, together with the actual amount you invested in the Funds, to estimate the expenses you paid over that period. Simply divide your actual account value by $1,000 to arrive at a ratio (for example, an $8,600 account value divided by $1,000 = 8.6), then multiply that ratio by the number shown for your Funds under “Expenses Paid During Period.”
Hypothetical 5% Return. This section helps you compare your Fund’s costs with those of other funds. It assumes that the Funds had an annual 5% return before expenses during the year, but that the expense ratio (Column 3) for the period is unchanged. This example is useful in making comparisons because the Securities and Exchange Commission requires all funds to make this 5% calculation. You can assess your Fund’s comparative cost by comparing the hypothetical result for your Fund in the “Expense Paid During Period” column with those that appear in the same charts in the shareholder reports for other funds.
NOTE: Because the return is set at 5% for comparison purposes — NOT your Fund’s actual return — the account values shown may not apply to your specific investment.
62
|
DISCLOSUREOF FUND EXPENSES (unaudited) (concluded) |
|
| | | | | | | | | | | | | | | | |
| | | Beginning
Account
Value
5/1/2011 | | | Ending
Account
Value
10/31/2011 | | | Annualized
Expense
Ratios | | | Expenses
Paid
During
Period(1) | |
Global X Gold Explorers ETF | | | | | | | | | | | | | | | | |
| | | | |
Actual Fund Return | | $ | 1,000.00 | | | $ | 720.20 | | | | 0.65 | % | | $ | 2.82 | |
Hypothetical 5% Return | | | 1,000.00 | | | | 1,021.93 | | | | 0.65 | | | | 3 .31 | |
Global X Silver Miners ETF | | | | | | | | | | | | | | | | |
| | | | |
Actual Fund Return | | $ | 1,000.00 | | | | 831.60 | | | | 0.65 | | | | 3 .00 | |
Hypothetical 5% Return | | | 1,000.00 | | | | 1,021.93 | | | | 0.65 | | | | 3 .31 | |
Global X Copper Miners ETF | | | | | | | | | | | | | | | | |
| | | | |
Actual Fund Return | | $ | 1,000.00 | | | | 732.80 | | | | 0.65 | | | | 2 .84 | |
Hypothetical 5% Return | | | 1,000.00 | | | | 1,021.93 | | | | 0.65 | | | | 3 .31 | |
Global X Uranium ETF | | | | | | | | | | | | | | | | |
| | | | |
Actual Fund Return | | $ | 1,000.00 | | | | 710.10 | | | | 0.69 | | | | 2.97 | |
Hypothetical 5% Return | | | 1,000.00 | | | | 1,021.73 | | | | 0.69 | | | | 3.52 | |
Global X Lithium ETF | | | | | | | | | | | | | | | | |
| | | | |
Actual Fund Return | | $ | 1,000.00 | | | | 706.40 | | | | 0.75 | | | | 3 .23 | |
Hypothetical 5% Return | | | 1,000.00 | | | | 1,021.42 | | | | 0.75 | | | | 3 .82 | |
Global X Aluminum ETF | | | | | | | | | | | | | | | | |
| | | | |
Actual Fund Return | | $ | 1,000.00 | | | | 676.80 | | | | 0.69 | | | | 2 .92 | |
Hypothetical 5% Return | | | 1,000.00 | | | | 1,021.73 | | | | 0.69 | | | | 3 .52 | |
Global X Pure Gold Miners ETF | | | | | | | | | | | | | | | | |
| | | | |
Actual Fund Return | | $ | 1,000.00 | | | | 891.30 | | | | 0.59 | | | | 2 .81 | |
Hypothetical 5% Return | | | 1,000.00 | | | | 1,022.23 | | | | 0.59 | | | | 3 .01 | |
Global X Oil Equities ETF | | | | | | | | | | | | | | | | |
| | | | |
Actual Fund Return | | $ | 1,000.00 | | | | 700.50 | | | | 0.49 | | | | 2 .28 | |
Hypothetical 5% Return | | | 1,000.00 | | | | 1,022.74 | | | | 0.49 | | | | 2 .50 | |
Global X S&P/TSX Venture 30 Canada ETF | | | | | | | | | | | | | | | | |
| | | | |
Actual Fund Return | | $ | 1,000.00 | | | | 848.30 | | | | 0.75 | | | | 3 .21 | |
Hypothetical 5% Return | | | 1,000.00 | | | | 1,021.42 | | | | 0.75 | | | | 3 .82 | |
Global X Fertilizers/Potash ETF | | | | | | | | | | | | | | | | |
| | | | |
Actual Fund Return | | $ | 1,000.00 | | | | 1,065.80 | | | | 0.69 | | | | 3 .12 | |
Hypothetical 5% Return(2) | | | 1,000.00 | | | | 1,021.73 | | | | 0.69 | | | | 3 .52 | |
| (1) | Expenses are equal to the Fund’s annualized expense ratio multiplied by the average account value over the period, multiplied 184/365 (to reflect the one-half year period.) |
| (2) | Expenses are equal to the Fund’s annualized expense ratio multiplied by the average account value over the period, multiplied 160/365 (to reflect the period from inception to date.) |
63
|
APPROVALOF INVESTMENT ADVISORY AGREEMENT (unaudited) |
|
Section 15(c) of the Investment Company Act of 1940, as amended (“1940 Act”), requires that the mutual fund’s board of trustees, including a majority of those trustees who are not “interested persons” of the mutual fund, as defined in the 1940 Act (“Independent Trustees”), consider on an initial basis and periodically thereafter (as required by the 1940 Act), at an in person meeting called for such purpose, the terms of the fund’s investment advisory agreement and approve the agreement with such changes as the Independent Trustees deem appropriate.
At a quarterly Board meeting held on February 25, 2011, the Board of Trustees (“Board”) (including the Independent Trustees) of the Global X Fund (“Trust”) initially considered and unanimously approved (i) the initial Investment Advisory Agreement for the Global X Fertilizers/Potash ETF (the “Fertilizers/Potash Fund”) and (ii) the Supervision and Administration Agreement between the Trust, on behalf the Fertilizers/Potash Fund, and Global X Management Company (“Global X Management”).1
The Investment Advisory Agreement and Supervision and Administration Agreement for the Fertilizers/Potash Fund are referred to herein as the “Agreements.”
In advance of the Board meetings noted above, the Board (including the Independent Trustees) requested (in writing) detailed information from Global X Management in connection with their consideration of the Agreements and received and reviewed written responses from Global X Management and supporting materials relating to those requests for information.
In determining to approve the Agreements for the Fertilizers/Potash Fund, the Board concluded that the Agreements are fair and reasonable and in the best interests of the Fertilizers/Potash Fund and its shareholders, respectively. In approving Agreements for the Fertilizers/Potash Fund, the Board considered among other things the following categories of material factors.
In reaching this decision, the Board did not assign relative weights to the factors discussed below nor did the Board deem any one factor or group of them to be controlling in and of themselves.
Nature, extent and quality of services
With respect to this factor, the Board considered:
| | • | | the terms of the Agreements and the range of services to be provided to the Fertilizers/Potash Fund in accordance with the Agreements; |
| | • | | Global X Management’s key personnel and the portfolio managers who would provide investment advisory services to the Fertilizers/Potash Fund; |
| | • | | Global X Management’s responsibilities under the Agreements to, among other things, (i) manage the investment operations of the Fertilizers/Potash Fund and the composition of the Fertilizers/Potash Fund’s assets, including the purchase, retention and disposition of its holdings, (ii) provide quarterly reports to the Trust’s officers and Board and other |
1 At the Feburary 25, 2011 quarterly Board meeting, the Board also approved the (i) initial Investment Advisory Agreement for the Global X UK Small-Cap ETF, Global X Germany Small-Cap ETF, Global X Mexico Small-Cap ETF, Global X Hong Kong Small-Cap ETF, Global X Singapore Small-Cap ETF, Global X South Korea Small-Cap ETF, Global X Taiwan Small-Cap ETF, Global X Rare Earths ETF, Global X Strategic Metals ETF, Global X SuperDividend ETF and Global X Canada Preferred ETF (the “Funds”) and (ii) the Supervision and Administration Agreement between the Trust, on behalf of each of these Funds, and Global X Management.
64
|
APPROVALOF INVESTMENT ADVISORY AGREEMENT (unaudited)(continued) |
|
| | reports as the Board deems necessary or appropriate, (iii) vote proxies, exercise consents, and exercise all other rights appertaining to securities and assets held by the Fertilizers/Potash Fund, (iv) select broker-dealers to execute portfolio transactions for the Fertilizers/Potash Fund when necessary, (v) provide or arrange for the provision of various third-party services required by the Fertilizers/Potash Fund, (vi) assist in the preparation and filing of reports and proxy statements (if any) to the shareholders of the Fertilizers/Potash Fund, draft and periodically update the registration statement and other reports and documents for the Fertilizers/Potash Fund that are required to be filed by the Trust with the Securities and Exchange Commission (“SEC”) and other regulatory or governmental bodies, and (vii) monitor anticipated purchases and redemptions of the shares (including creation units) of the Fertilizers/Potash Fund by shareholders and new investors; |
| | • | | the nature, extent and quality of Global X Management’s services (including advisory, administrative and compliance services) that would be made available to the Fertilizers/Potash Fund; and |
| | • | | the quality of Global X Management’s resources and personnel that would be made available to the Fertilizers/Potash Fund, including Global X Management’s experience and the qualifications of Global X Management’s key personnel and the portfolio managers who would provide investment advisory services to the Fertilizers/Potash Fund. |
Based on these considerations, the Board concluded that it was satisfied with the nature, extent and quality of the services to be provided to the Fertilizers/Potash Fund.
Performance
The Board determined that because the Fertilizers/Potash Fund had not commenced operations, meaningful data relating to investment performance of the Fertilizers/Potash Fund was not available and, therefore, could not be a factor in approving the Agreements.
Cost of Services and Profitability
With respect to this factor, the Board considered:
| | • | | Global X Management’s expected cost to provide investment management, supervision and administrative and related services to the Fertilizers/Potash Fund; |
| | • | | the unitary Management Fee (including the proposed investment advisory fee) that was proposed to be borne by the Fertilizers/Potash Fund under the Agreements for the investment advisory, supervisory and administrative services that the Fertilizers/Potash Fund requires under a unitary fee structure (including the types of fees and expenses that are not included within the unitary fee and would be borne by the Fertilizers/Potash Fund); and |
| | • | | the expected profitability to Global X Management, if any, from all services to be provided to the Fertilizers/Potash Fund and all aspects of the relationship between Global X Management and the Fertilizers/Potash Fund. In connection with these considerations, the Board noted that Global X Management advised the Board that it was expected that it would not generate profits from its services to any of the Fertilizers/Potash Fund during the first 12 months of the Fertilizers/Potash Fund’s operations, but expected to do so after that initial start up period. |
65
|
APPROVALOF INVESTMENT ADVISORY AGREEMENT (unaudited)(continued) |
|
Based on these considerations, the Board concluded that the profits anticipated to be realized by Global X Management from its relationship with the Fertilizers/Potash Fund would not be excessive.
Comparison of Fees and Services
With respect to this factor, the Board considered:
| | • | | comparative information with respect to the Management Fee proposed to be paid to Global X Management by the Fertilizers/Potash Fund. In connection with this consideration, Global X Management provided the Board with detailed comparative expense data for the Fertilizers/Potash Fund, including fees and expenses paid by comparable affiliated and unaffiliated exchange-traded funds and other registered funds and the reasons for any differences in the proposed expense ratios for the Fertilizers/Potash Fund and those presented for comparison; |
| | • | | the proposed unified Management Fee structure (which includes as one component the proposed investment advisory fee for the Fertilizers/Potash Fund), the expected total expense ratios for the Fertilizers/Potash Fund and that Global X Management would be responsible for paying all of designated expenses of the Fertilizers/Potash Fund (discussed in more detail below). In this regard, the Board took into consideration that the purpose of having a unitary Management Fee structure was to create a simple, all-inclusive fee that would provide a level of predictability with respect to the overall expense ratio (i.e., the total fees) of the Fertilizers/Potash Fund and that the proposed Management Fee for the Fertilizers/Potash Fund was set at a competitive rate to make the Fertilizers/Potash Fund viable in the marketplace; and |
| | • | | that Global X Management would be responsible for most ordinary expenses of the Fertilizers/Potash Fund, including the costs of various third-party services required by the Fertilizers/Potash Fund, including investment advisory, administrative, audit, certain custody, portfolio accounting, legal, transfer agency services, printing costs and other services for the Fertilizers/Potash Fund, but that the Fertilizers/Potash Fund would bear other expenses not covered under the proposed all-inclusive Management Fee, such as taxes, brokerage fees, commissions, and other transaction expenses, costs of borrowing money, including interest expenses, and extraordinary expenses. |
Based on these considerations, the Board concluded that the proposed Management Fee and expected total expense ratio of the Fertilizers/Potash Fund should not preclude approval of the Agreements.
Economies of Scale
With respect to this factor, the Board considered:
| | • | | the extent to which economies of scale would be realized as the Fertilizers/Potash Fund grows and whether the proposed unitary Management Fee for the Fertilizers/Potash Fund reflected these economies of scale; |
| | • | | the significant investment of time, personnel and other resources that Global X Management intends to made in the Fertilizers/Potash Fund in order to seek to assure that the Fertilizers/Potash Fund are attractive to investors; and |
| | • | | that the proposed unitary Management Fee would provide a significant amount of certainty regarding the total fees and expenses of the Fertilizers/Potash Fund and its shareholders. |
66
|
APPROVALOF INVESTMENT ADVISORY AGREEMENT (unaudited)(concluded) |
|
Based on these considerations, the Board concluded that approval of the proposed Management Fee for the Fertilizers/Potash Fund was reasonable.
Other Benefits
In considering the Agreement, in addition to the categories discussed above, the Board considered other benefits that may be realized by Global X Management as a result of its relationships with the Fertilizers/Potash Fund.
67
|
SUPPLEMENTAL INFORMATION (unaudited) |
|
Net asset value, or “NAV”, is the price per Share at which the Funds issue and redeems Shares. It is calculated in accordance with the standard formula for valuing mutual fund shares. The “Market Price” of the Funds generally is determined using the midpoint between the highest bid and the lowest offer on the stock exchange on which the Shares of the Funds are listed for trading, as of the time that the Funds’ NAV is calculated. The Funds’ Market Price may be at, above or below their NAV. The NAV of the Funds will fluctuate with changes in the market value of their Funds holdings. The Market Price of the Funds will fluctuate in accordance with changes in its NAV, as well as market supply and demand.
Premiums or discounts are the differences (expressed as a percentage) between the NAV and Market Price of the Funds on a given day, generally at the time NAV is calculated. A premium is the amount that the Funds are trading above the reported NAV, expressed as a percentage of the NAV. A discount is the amount that the Funds are trading below the reported NAV, expressed as a percentage of the NAV.
The following information shows the frequency distributions of premiums and discounts for the Funds. The information shown is for the full calendar quarter completed after the inception date through the date of the most recent calendar quarter end.
Each line in the table shows the number of trading days in which the Funds traded within the premium/discount range indicated. The number of trading days in each premium/discount range is also shown as a percentage of the total number of trading days in the period covered by each table. All data presented here represents past performance, which cannot be used to predict future results.
68
|
SUPPLEMENTAL INFORMATION (unaudited) (continued) |
|
| | | | | | | | | | | | | | | | | | | | |
| | | Percentage of Total Days | |
| | | | | |
| Premium/Discount Range | | Global X Gold
Explorers
ETF(1) | | | Global X Silver
Miners ETF | | | Global X
Copper
Miners ETF | | | Global X
Uranium ETF(2) | | | Global X
Lithium
ETF(3) | |
Greater than 4.0% and Less than 4.5% | | | 0.42% | | | | - | | | | - | | | | - | | | | - | |
Greater than 3.5% and Less than 4.0% | | | 0.42% | | | | - | | | | - | | | | 0.42% | | | | 0.82% | |
Greater than 3.0% and Less than 3.5% | | | - | | | | 0.41% | | | | - | | | | - | | | | - | |
Greater than 2.5% and Less than 3.0% | | | - | | | | 0.41% | | | | 0.41% | | | | 1.26% | | | | 0.41% | |
Greater than 2.0% and Less than 2.5% | | | - | | | | - | | | | 0.41% | | | | 1.26% | | | | - | |
Greater than 1.5% and Less than 2.0% | | | 2.51% | | | | 1.24% | | | | 2.07% | | | | 6.30% | | | | - | |
Greater than 1.0% and Less than 1.5% | | | 25.10% | | | | 12.81% | | | | 16.94% | | | | 20.59% | | | | 4.96% | |
Greater than 0.5% and Less than 1.0% | | | 58.16% | | | | 45.88% | | | | 30.99% | | | | 42.86% | | | | 30.99% | |
Between 0.5% and -0.5% | | | 11.30% | | | | 28.10% | | | | 26.04% | | | | 15.97% | | | | 45.88% | |
Less than -0.5% and Greater than -1.0% | | | 1.67% | | | | 8.68% | | | | 17.36% | | | | 7.98% | | | | 15.70% | |
Less than -1.0% and Greater than -1.5% | | | 0.42% | | | | 0.83% | | | | 4.13% | | | | 2.10% | | | | 0.83% | |
Less than -1.5% and Greater than -2.0% | | | - | | | | 0.41% | | | | 0.83% | | | | - | | | | 0.41% | |
Less than -2.0% and Greater than -2.5% | | | - | | | | 0.41% | | | | 0.41% | | | | 0.42% | | | | - | |
Less than -2.5% and Greater than -3.0% | | | - | | | | 0.41% | | | | 0.41% | | | | 0.42% | | | | - | |
Less than -3.0% and Greater than -3.5% | | | - | | | | 0.41% | | | | - | | | | 0.42% | | | | - | |
Less than -3.5% and Greater than -4.0% | | | - | | | | | | | | - | | | | - | | | | - | |
Total | | | 100.00% | | | | 100.00% | | | | 100.00% | | | | 100.00% | | | | 100.00% | |
| |
| | | Number of Business Days | |
| | | | | |
| Premium/Discount Range | | Global X Gold
Explorers
ETF(1) | | | Global X
Silver
Miners
ETF | | | Global X
Copper
Miners ETF | | | Global X
Uranium ETF(2) | | | Global X
Lithium
ETF(3) | |
Greater than 4.0% and Less than 4.5% | | | 1 | | | | - | | | | - | | | | - | | | | - | |
Greater than 3.5% and Less than 4.0% | | | 1 | | | | - | | | | - | | | | 1 | | | | 2 | |
Greater than 3.0% and Less than 3.5% | | | - | | | | 1 | | | | - | | | | - | | | | - | |
Greater than 2.5% and Less than 3.0% | | | - | | | | 1 | | | | 1 | | | | 3 | | | | 1 | |
Greater than 2.0% and Less than 2.5% | | | - | | | | - | | | | 1 | | | | 3 | | | | - | |
Greater than 1.5% and Less than 2.0% | | | 6 | | | | 3 | | | | 5 | | | | 15 | | | | - | |
Greater than 1.0% and Less than 1.5% | | | 60 | | | | 31 | | | | 41 | | | | 49 | | | | 12 | |
Greater than 0.5% and Less than 1.0% | | | 139 | | | | 111 | | | | 75 | | | | 102 | | | | 75 | |
Between 0.5% and -0.5% | | | 27 | | | | 68 | | | | 63 | | | | 38 | | | | 111 | |
Less than -0.5% and Greater than -1.0% | | | 4 | | | | 21 | | | | 42 | | | | 19 | | | | 38 | |
Less than -1.0% and Greater than -1.5% | | | 1 | | | | 2 | | | | 10 | | | | 5 | | | | 2 | |
Less than -1.5% and Greater than -2.0% | | | - | | | | 1 | | | | 2 | | | | - | | | | 1 | |
Less than -2.0% and Greater than -2.5% | | | - | | | | 1 | | | | 1 | | | | 1 | | | | - | |
Less than -2.5% and Greater than -3.0% | | | - | | | | 1 | | | | 1 | | | | 1 | | | | - | |
Less than -3.0% and Greater than -3.5% | | | - | | | | 1 | | | | - | | | | 1 | | | | - | |
Less than -3.5% and Greater than -4.0% | | | - | | | | - | | | | - | | | | - | | | | - | |
Total | | | 239 | | | | 242 | | | | 242 | | | | 238 | | | | 242 | |
69
|
SUPPLEMENTAL INFORMATION (unaudited) (continued) |
|
| | | | | | | | | | | | | | | | | | | | |
| | | Percentage of Total Days | |
| | | | | |
| Premium/Discount Range | | Global X
Aluminum
ETF(4) | | | Global X Pure Gold Miners ETF(5) | | | Global X Oil
Equities
ETF(5) | | | Global X
S&P/TSX
Venture 30
Canada ETF(6) | | | Global X
Fertilizers/Po tash ETF(7) | |
Greater than 4.0% and Less than 4.5% | | | - | | | | - | | | | - | | | | - | | | | - | |
Greater than 3.5% and Less than 4.0% | | | - | | | | 0.65% | | | | - | | | | - | | | | - | |
Greater than 3.0% and Less than 3.5% | | | - | | | | - | | | | - | | | | 0.66% | | | | - | |
Greater than 2.5% and Less than 3.0% | | | - | | | | - | | | | - | | | | - | | | | - | |
Greater than 2.0% and Less than 2.5% | | | 0.51% | | | | 0.65% | | | | - | | | | 0.66% | | | | - | |
Greater than 1.5% and Less than 2.0% | | | 7.11% | | | | 1.31% | | | | 1.96% | | | | - | | | | 7.84% | |
Greater than 1.0% and Less than 1.5% | | | 25.89% | | | | 16.34% | | | | 3.92% | | | | 1.32% | | | | 26.47% | |
Greater than 0.5% and Less than 1.0% | | | 25.38% | | | | 52.94% | | | | 32.03% | | | | 29.80% | | | | 31.37% | |
Between 0.5% and -0.5% | | | 21.32% | | | | 25.49% | | | | 23.53% | | | | 59.60% | | | | 19.61% | |
Less than -0.5% and Greater than -1.0% | | | 11.17% | | | | 2.62% | | | | 33.33% | | | | 6.63% | | | | 7.84% | |
Less than -1.0% and Greater than -1.5% | | | 5.08% | | | | - | | | | 5.23% | | | | 1.33% | | | | 4.91% | |
Less than -1.5% and Greater than -2.0% | | | 1.02% | | | | - | | | | - | | | | - | | | | 0.98% | |
Less than -2.0% and Greater than -2.5% | | | 1.52% | | | | - | | | | - | | | | - | | | | 0.98% | |
Less than -2.5% and Greater than -3.0% | | | 0.50% | | | | - | | | | - | | | | - | | | | - | |
Less than -3.0% and Greater than -3.5% | | | - | | | | - | | | | - | | | | - | | | | - | |
Less than -3.5% and Greater than -4.0% | | | 0.50% | | | | - | | | | - | | | | - | | | | - | |
Total | | | 100.00% | | | | 100.00% | | | | 100.00% | | | | 100.00% | | | | 100.00% | |
| |
| | | Number of Business Days | |
| | | | | |
| Premium/Discount Range | | Global X
Aluminum
ETF(4) | | | Global X Pure Gold Miners ETF(5) | | | Global X Oil
Equities
ETF(5) | | | Global X
S&P/TSX
Venture 30
Canada ETF(6) | | | Global X
Fertilizers/Po tash ETF(7) | |
Greater than 4.0% and Less than 4.5% | | | - | | | | - | | | | - | | | | - | | | | - | |
Greater than 3.5% and Less than 4.0% | | | - | | | | 1 | | | | - | | | | - | | | | - | |
Greater than 3.0% and Less than 3.5% | | | - | | | | - | | | | - | | | | 1 | | | | - | |
Greater than 2.5% and Less than 3.0% | | | - | | | | - | | | | - | | | | - | | | | - | |
Greater than 2.0% and Less than 2.5% | | | 1 | | | | 1 | | | | - | | | | 1 | | | | - | |
Greater than 1.5% and Less than 2.0% | | | 14 | | | | 2 | | | | 3 | | | | - | | | | 8 | |
Greater than 1.0% and Less than 1.5% | | | 51 | | | | 25 | | | | 6 | | | | 2 | | | | 27 | |
Greater than 0.5% and Less than 1.0% | | | 50 | | | | 81 | | | | 49 | | | | 45 | | | | 32 | |
Between 0.5% and -0.5% | | | 42 | | | | 39 | | | | 36 | | | | 90 | | | | 20 | |
Less than -0.5% and Greater than -1.0% | | | 22 | | | | 4 | | | | 51 | | | | 10 | | | | 8 | |
Less than -1.0% and Greater than -1.5% | | | 10 | | | | - | | | | 8 | | | | 2 | | | | 5 | |
Less than -1.5% and Greater than -2.0% | | | 2 | | | | - | | | | - | | | | - | | | | 1 | |
Less than -2.0% and Greater than -2.5% | | | 3 | | | | - | | | | - | | | | - | | | | 1 | |
Less than -2.5% and Greater than -3.0% | | | 1 | | | | - | | | | - | | | | - | | | | - | |
Less than -3.0% and Greater than -3.5% | | | - | | | | - | | | | - | | | | - | | | | - | |
Less than -3.5% and Greater than -4.0% | | | 1 | | | | - | | | | - | | | | - | | | | - | |
Total | | | 197 | | | | 153 | | | | 153 | | | | 151 | | | | 102 | |
70
|
| SUPPLEMENTAL INFORMATION (unaudited) (concluded) |
|
| (1) | The Fund commenced operations on Novenber 3, 2010. |
| (2) | The Fund commenced operations on Novenber 4, 2010. |
| (3) | The Fund commenced operations on July 22, 2010. |
| (4) | The Fund commenced operations on January 4, 2011. |
| (5) | The Fund commenced operations on March 14, 2011. |
| (6) | The Fund commenced operations on March 16, 2011. |
| (7) | The Fund commenced operations on May 25, 2011. |
71
|
| TRUSTEESAND OFFICERSOFTHE TRUST (unaudited) |
|
Set forth below are the names, addresses, ages, position with the Trust, Term of Office and Length of Time Served, the principal occupations for the last five years, number of Funds in fund complex overseen by trustee, and other directorships outside the fund complex of each of the persons currently serving as Trustees and Officers of the Trust.
| | | | | | | | |
Name, Address (Year of Birth) | | Position(s) Held with Funds | | Principal Occupation(s) During the Past 5 Years | | Number of Funds in Trust Overseen by Director | | Other Directorships Held by Trustees |
Independent Trustees2 |
| Sanjay Ram Bharwani 399 Park Ave, 32nd floor New York, NY 10022 (1974) | | Trustee
(since
2008) | | CEO of Risk Advisors Inc. (since 2007) (consulting firm); Chief Information Officer, M. Safra & Co (2004-2006) (hedge fund). | | 353 | | None. |
| Scott R. Chichester1 399 Park Ave, 32nd floor New York, NY 10022 (1970) | | Trustee
(since
2008) | | President & Treasurer, Bayview Acquisition Corp (since 2010), CPA, Penda Aiken Inc. (since 2009) (consultant); Founder and President, DirectPay USA LLC (since 2006) (payroll company); Chief Financial Officer, Ong Corporation (2002-2010) (technology company); Proprietor, Scott R. Chichester CPA (since 2001) (CPA firm). | | 353 | | None. |
| Kartik Kiran Shah 399 Park Ave, 32nd floor New York, NY 10022 (1977) | | Trustee
(since
2008) | | Director, Wireless Generation (since 2008) (software); Manager, Amgen (2003-2006) (biotechnology firm). | | 353 | | None. |
72
|
| TRUSTEESAND OFFICERSOFTHE TRUST (unaudited) (continued) |
|
The Trust’s Statement of Additional Information (“SAI”) includes additional information about the Trustees and Officers. The SAI may be obtained without charge by calling 1-888-493-8631. The following chart lists Trustees and Officers as of October 31, 2011.
| | | | | | | | |
Name, Address (Year of Birth) | | Position(s) Held with Funds | | Principal Occupation(s) During the Past 5 Years | | Number of Funds in Trust Overseen by Director | | Other Directorships Held by Trustees |
Interested Trustee / Officers2 |
Bruno del Ama 399 Park Ave, 32nd floor New York, NY 10022 (1976) | | Trustee (since 2008), President, Chief Executive Officer (since 2008) | | Chief Executive Officer and Chief Compliance Officer, Global X Management Company LLC (since 2008); Head of Global Structured Products Operations at Radian Asset Assurance (2004-2008) (financial services firm). | | 353 | | None. |
Jose C. Gonzalez 399 Park Ave, 32nd floor New York, NY 10022 (1976) | | Chief Operating Officer, Chief Compliance Officer and Chief Financial Officer, Secretary (since 2008) | | Chief Executive Officer and Chief Compliance Officer, Global X Management Company LLC (since 2008); Head of Global Structured Products Operations at Radian Asset Assurance (2004-2008) (financial services firm). | | N/A | | N/A |
Dianne Sulzbach4 One Freedom Valley Drive Oaks, PA 19456 (1977) | | Assistant Secretary (since 2011) | | Corporate Counsel, SEI Investments (since 2010); Associate, Morgan, Lewis & Bockius LLP (2006-2010). | | N/A | | N/A |
73
|
| TRUSTEESAND OFFICERSOFTHE TRUST (unaudited) (concluded) |
|
| | | | | | |
Name, Address (Year of Birth) | | Position(s) Held with Funds | | Principal Occupation(s) During the Past 5 Years | | Other Directorships
Held by Trustees |
Peter Rodriguez4 One Freedom Valley Drive Oaks, PA 19456 (1962) | | Assistant Treasurer (since 2011) | | Fund Accounting Director of the Administrator (since 2011); Mutual Fund Trading Director, SEI Global Trust Company (2009- 2011); Asset Data Services Director at the Administrator (2006-2009). | | N/A |
| 1 | Mr. Chichester is currently married to a sister of Mr. del Ama’s wife. While an “immediate family member” (as defined in Section 2(a)(19) of the 1940 Act) of Mr. del Ama would be considered an Interested Person, Mr. Chichester is not considered an immediate family member for this purpose. Although this fact was taken into consideration in determining whether Mr. Chichester should be considered to be an Independent Trustee for purposes of the Section 2(a)(19) of the 1940 Act, it was determined that this relationship was not one that should disqualify Mr. Chichester from serving as an Independent Trustee of the Trust. |
| 2 | Each Trustee serves until his or her successor is duly elected or appointed and qualified. |
| 3 | As of October 31, 2011, the Trust had eighty-six investment portfolios, thirty-five of which were operational. |
| 4 | These officers of the Trust also serve as officers of one or more mutual funds for which SEI Investments Company or an affiliate acts as investment manager, administrator or distributor. |
74
For shareholders that do not have an October 31, 2011 tax year end, this notice is for informational purposes only. For shareholders with an October 31, 2011 tax year end, please consult your tax advisor as to the pertinence of this notice. For the fiscal year ended October 31, 2011, the Funds are designating the following items with regard to distributions paid during the year.
| | | | | | | | | | | | | | | | | | | | | | | | | | | | | | | | |
| | | Return
of
Capital | | | Long-Term
Capital Gain
Distributions | | | Ordinary
Income
Distributions | | | Total
Distributions | | | Qualifying
for
Corporate
Dividends
Received
Deduction(1) | | | Qualifying
Dividend
Income(2) | | | Interest
Related
Dividends(3) | | | Short-Term
Capital Gain
Dividends(4) | |
Global X Gold Explorers ETF | | | 0.00% | | | | 0.00% | | | | 100.00% | | | | 100.00% | | | | 0.00% | | | | 0.00% | | | | 0.02% | | | | 0.00% | |
Global X Silver Miners ETF | | | 0.00% | | | | 0.00% | | | | 100.00% | | | | 100.00% | | | | 0.00% | | | | 41.76% | | | | 0.00% | | | | 100.00% | |
Global X Copper Miners ETF | | | 0.00% | | | | 0.22% | | | | 99.78% | | | | 100.00% | | | | 6.73% | | | | 37.99% | | | | 0.00% | | | | 100.00% | |
Global X Uranium ETF | | | 8.92% | | | | 0.00% | | | | 91.08% | | | | 100.00% | | | | 0.00% | | | | 0.00% | | | | 0.01% | | | | 0.00% | |
Global X Lithium ETF | | | 0.00% | | | | 0.00% | | | | 100.00% | | | | 100.00% | | | | 7.08% | | | | 19.18% | | | | 0.00% | | | | 100.00% | |
Global X Aluminum 20 ETF | | | 0.00% | | | | 0.00% | | | | 100.00% | | | | 100.00% | | | | 0.00% | | | | 100.00% | | | | 0.03% | | | | 0.00% | |
Global X Pure Gold Miners ETF | | | 0.00% | | | | 0.00% | | | | 100.00% | | | | 100.00% | | | | 1.09% | | | | 19.16% | | | | 0.00% | | | | 0.00% | |
Global X Oil Equities ETF | | | 0.00% | | | | 0.00% | | | | 0.00% | | | | 0.00% | | | | 0.00% | | | | 0.00% | | | | 0.00% | | | | 0.00% | |
Global X S&P/TSX Venture 30 Canada ETF | | | 0.00% | | | | 0.00% | | | | 0.00% | | | | 0.00% | | | | 0.00% | | | | 0.00% | | | | 0.00% | | | | 0.00% | |
Global X Fertilizers/Potash Miners ETF | | | 0.00% | | | | 0.00% | | | | 100.00% | | | | 100.00% | | | | 30.04% | | | | 48.53% | | | | 0.00% | | | | 0.00% | |
(1) Qualifying dividends represent dividends which qualify for the corporate dividends received deduction and is reflected as a percentage of ordinary income distributions (the total of short term capital gain and net investment income distributions).
(2) The percentage in this column represents the amount of “Qualifying Dividend Income” as created by the Jobs and Growth Relief Reconciliation Act of 2003 and is reflected as a percentage of ordinary income distributions (the total of short term capital gain and net investment income distributions). It is the intention of each of the aforementioned funds to designate the maximum amount permitted by law.
(3) The percentage in this column represents the amount of “Interest Related Dividends” as created by the American Jobs Creation Act of 2004 and is reflected as a percentage of net investment income distributions that is exempt from U.S. withholding tax when paid for foreign investors.
(4) The percentage in this column represents the amount of “Short-Term Capital Gain Dividends” as created by the American Jobs Creation Act of 2004 and is reflected as a percentage of short-term capital gain distributions that is exempt from U.S. withholding tax when paid to foreign investors.
The Fund intends to pass through a foreign tax credit to shareholders. For the fiscal year ended October 31, 2011, the total amount of foreign source income and foreign tax credit are as follows:
| | | | | | | | |
Global X Funds | | Foreign Source
Income | | | Foreign Tax
Credit Pass
through | |
Global X Gold Explorers ETF | | $ | - | | | $ | - | |
| | |
Global X Silver Miners ETF | | | 3,674,222 | | | | 62,024 | |
| | |
Global X Copper Miners ETF | | | 1,970,874 | | | | 95,731 | |
| | |
Global X Uranium ETF | | | - | | | | - | |
| | |
Global X Lithium ETF | | | 744,180 | | | | 162,568 | |
| | |
Global X Aluminum ETF | | | 52,161 | | | | 2,570 | |
| | |
Global X Pure Gold Miners ETF | | | 16,850 | | | | 1,854 | |
| | |
Global X Oil Equities ETF | | | - | | | | - | |
| | |
Global X S&P/TSX Venture 30 Canada ETF | | | - | | | | - | |
| | |
Global X Fertilizers/Potash ETF | | | 139,760 | | | | 26,936 | |
The information reported herein may differ from the information and distributions taxable to the shareholders for the calendar year ending December 31, 2011. Complete information will be computed and reported in conjunction with your 2011 Form 1099-DIV.
75

399 Park Ave, 32nd floor
New York, NY 10022
1-888-GXFund-1
(1-888-493-8631)
www.globalxfunds.com
Investment Adviser:
Global X Management Company LLC
399 Park Avenue, 32nd floor
New York, NY 10022
Distributor:
SEI Investments Distribution Co.
One Freedom Valley Drive
Oaks, PA 19456
Sub-Administrator:
SEI Investments Global Funds Services
One Freedom Valley Drive
Oaks, PA 19456
Counsel for the Independent Trustees:
Dechert LLP
1175 I Street N.W.
Washington, DC 20007
This information must be preceded or accompanied by a current prospectus for the Funds described.
GLX-AR-001-0300

Global X China Consumer ETF (ticker: CHIQ)
Global X China Energy ETF (ticker: CHIE)
Global X China Financials ETF (ticker: CHIX)
Global X China Industrials ETF (ticker: CHII)
Global X China Materials ETF (ticker: CHIM)
Global X NASDAQ China Technology ETF (ticker: QQQC)
(formerly, Global X China Technology ETF)
Global X FTSE ASEAN 40 ETF (ticker: ASEA)
Global X FTSE Andean 40 ETF (ticker: AND)
Global X FTSE Colombia 20 ETF (ticker: GXG)
(formerly, Global X/InterBolsa FTSE Colombia 20 ETF)
Global X FTSE Argentina 20 ETF (ticker: ARGT)
Global X Brazil Mid Cap ETF (ticker: BRAZ)
Global X Brazil Consumer ETF (ticker: BRAQ)
Global X Brazil Financials ETF (ticker: BRAF)
Global X Mexico Small-Cap ETF (ticker: MEXS)
Global X Russell Emerging Markets Growth ETF (ticker: EMGX)
Global X Russell Emerging Markets Value ETF (ticker: EMVX)
Global X FTSE Nordic Region ETF (ticker: GXF)
(formerly, Global X Nordic 30 ETF)
Global X FTSE Norway 30 ETF (ticker: NORW)
Annual Report
October 31, 2011

TABLEOF CONTENTS
The Funds file their complete schedules of Fund holdings with the Securities and Exchange Commission (the “Commission”) for the first and third quarters of each fiscal year on Form N-Q within sixty days after the end of the period. The Funds’ Forms N-Q are available on the Commission’s website at http://www.sec.gov, and may be reviewed and copied at the Commission’s Public Reference Room in Washington, DC. Information on the operation of the Public Reference Room may be obtained by calling 1-800-SEC-0330.
A description of the policies and procedures that Global X Funds uses to determine how to vote proxies relating to Fund securities, as well as information relating to how the Funds voted proxies relating to Fund securities during the most recent 12-month period ended June 30, will be available (i) without charge, upon request, by calling 1-888-GXFund-1; and (ii) on the Commission’s website at http://www.sec.gov.
MANAGEMENT DISCUSSIONOF FUND PERFORMANCE
GLOBAL X CHINA CONSUMER ETF
Global X China Consumer ETF
The Global X China Consumer ETF (the “Fund”) seeks to provide investment results that correspond generally to the price and yield performance, before fees and expenses, of the Solactive China Consumer Index (the “Index”). The Fund generally seeks to replicate the Index but may at times invest in a representative sample of securities that collectively has an investment profile similar to the Index and as a result may or may not hold all the securities that are included in the Index.
The Index is designed to reflect the performance of the consumer sector in China. It is comprised of selected companies which have their main business operations in the consumer sector and are domiciled in China or have their main business operations in this country. Only securities which are tradable for foreign investors without restrictions are eligible. The Fund is the first ETF globally focused exclusively on the China consumer sector.
For the 12-month period ended October 31, 2011 (the “reporting period”), the Fund decreased 23.99%, while the Index decreased 23.52%. The Fund had a net asset value of $20.33 per share on October 31, 2010 and ended the period with a net asset value of $15.29 on October 31, 2011.
Four of the Fund’s forty holdings as of October 31, 2011 increased in value for the reporting period, led by Shenzhou International Group Holdings and Focus Media Holding ADR, which returned 15.99% and 9.91% respectively. The worst performers were Li Ning and BaWang International Group Holding, which returned -66.69% and -72.44% respectively.
Growth of a $10,000 Investment
| | | | | | | | | | | | | | | | | | |
| | | AVERAGE ANNUAL TOTAL RETURN FOR THE YEAR ENDED OCTOBER 31, 2011* | | | |
| | | One Year Return | | | Annualized Inception to Date | | | |
| | | Net Asset Value | | | | Market Price | | | | Net Asset Value | | | | Market Price | | | |
Global X China Consumer ETF | | | (23.99%) | | | | (27.62%) | | | | (0.66%) | | | | (2.67%) | | | |
Solactive China Consumer Index | | | (23.52%) | | | | (23.52%) | | | | (0.15%) | | | | (0.15%) | | | |
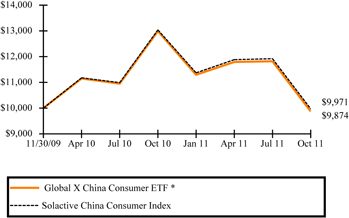
*Fund commenced operations on November 30, 2009.
The performance data quoted herein represents past performance and the return and value of an investment in the Fund will fluctuate so that, when redeemed, may be worth less than its original cost. Past performance is no guarantee of future performance and should not be considered as a representation of the future results of the Fund. The Fund’s performance assumes the reinvestment of all dividends and all capital gains. Index returns assume reinvestment of dividends and, unlike a Fund’s returns, do not reflect any fees or expenses. If such fees and expenses were included in the index returns, the performance would have been lower. Please note that one cannot invest directly in an unmanaged index.
There are no assurances that the Fund will meet its stated objectives.
The Fund’s holdings and allocations are subject to change and should not be considered recommendations to buy individual securities.
Returns shown do not reflect the deduction of taxes that a shareholder would pay on Fund distributions or the redemption of Fund shares.
See definition of comparative index above.
1
MANAGEMENT DISCUSSIONOF FUND PERFORMANCE
GLOBAL X CHINA ENERGY ETF
Global X China Energy ETF
The Global X China Energy ETF (the “Fund”) seeks to provide investment results that correspond generally to the price and yield performance, before fees and expenses, of the Solactive China Energy Index (the “Index”). The Fund generally seeks to replicate the Index but may at times invest in a representative sample of securities that collectively has an investment profile similar to the Index and as a result may or may not hold all the securities that are included in the Index.
The Index is designed to reflect the performance of the energy sector in China. It is comprised of selected companies which have their main business operations in the energy sector and are domiciled in China or have their main business operations in this country. Only securities which are tradable for foreign investors without restrictions are eligible. The Fund is the nation’s first ETF focused exclusively on the China energy sector.
For the 12-month period ended October 31, 2011 (the “reporting period”), the Fund decreased 11.57%, while the Index decreased 10.94%. The Fund had a net asset value of $15.72 per share on October 31, 2010 and ended the period with a net asset value of $13.78 on October 31, 2011.
Eight of the Fund’s thirty holdings as of October 31, 2011 increased in value for the reporting period, led by ENN Energy Holdings and United Energy Group, which returned 23.20% and 14.10% respectively. The worst performers were JA Solar Holdings ADR and Hanwha SolarOne ADR, which returned -73.47% and -78.06% respectively.
Growth of a $10,000 Investment
| | | | | | | | | | | | | | | | | | |
| | | AVERAGE ANNUAL TOTAL RETURN FOR THE YEAR ENDED OCTOBER 31, 2011* | | | |
| | | One Year Return | | | Annualized Inception to Date | | | |
| | | Net Asset Value | | | | Market Price | | | | Net Asset Value | | | | Market Price | | | |
Global X China Energy ETF | | | (11.57%) | | | | (15.47%) | | | | (4.04%) | | | | (5.94%) | | | |
Solactive China Energy Index | | | (10.94%) | | | | (10.94%) | | | | (3.12%) | | | | (3.12%) | | | |
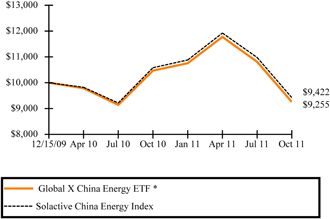
*Fund commenced operations on December 15, 2009.
The performance data quoted herein represents past performance and the return and value of an investment in the Fund will fluctuate so that, when redeemed, may be worth less than its original cost. Past performance is no guarantee of future performance and should not be considered as a representation of the future results of the Fund. The Fund’s performance assumes the reinvestment of all dividends and all capital gains. Index returns assume reinvestment of dividends and, unlike a Fund’s returns, do not reflect any fees or expenses. If such fees and expenses were included in the index returns, the performance would have been lower. Please note that one cannot invest directly in an unmanaged index.
There are no assurances that the Fund will meet its stated objectives.
The Fund’s holdings and allocations are subject to change and should not be considered recommendations to buy individual securities.
Returns shown do not reflect the deduction of taxes that a shareholder would pay on Fund distributions or the redemption of Fund shares.
See definition of comparative index above.
2
MANAGEMENT DISCUSSIONOF FUND PERFORMANCE
GLOBAL X CHINA FINANCIALS ETF
Global X China Financials ETF
The Global X China Financials ETF (the “Fund”) seeks to provide investment results that correspond generally to the price and yield performance, before fees and expenses, of the Solactive China Financials Index (the “Index”). The Fund generally seeks to replicate the Index but may at times invest in a representative sample of securities that collectively has an investment profile similar to the Index and as a result may or may not hold all the securities that are included in the Index.
The Index is designed to reflect the performance of the financial sector in China. It is comprised of selected companies which have their main business operations in the financial sector and are domiciled in China or have their main business operations in this country. Only securities which are tradable for foreign investors without restrictions are eligible. The Fund is the nation’s first ETF focused exclusively on the China financial sector.
For the 12-month period ended October 31, 2011 (the “reporting period”), the Fund decreased 24.29%, while the Index decreased 24.62%. The Fund had a net asset value of $14.77 per share on October 31, 2010 and ended the period with a net asset value of $10.92 on October 31, 2011.
Four of the Fund’s thirty-six holdings as of October 31, 2011 increased in value for the reporting period, led by Country Garden Holdings and Longfor Properties, which returned 17.95% and 10.45% respectively. The worst performers were Poly Hong Kong Investments and E-House China Holdings ADR, which returned -48.98% and -52.15% respectively.
Growth of a $10,000 Investment
| | | | | | | | | | |
| | | AVERAGE ANNUAL TOTAL RETURN FOR THE YEAR ENDED OCTOBER 31, 2011* | | |
| | One Year Return | | Annualized Inception to Date | | |
| | Net Asset Value | | Market Price | | Net Asset Value | | Market Price | | |
Global X China Financials ETF | | (24.29%) | | (27.86%) | | (14.09%) | | (15.99%) | | |
Solactive China Financials Index | | (24.62%) | | (24.62%) | | (13.99%) | | (13.99%) | | |
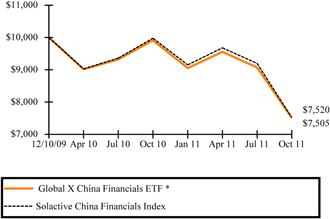
*Fund commenced operations on December 10, 2009.
The performance data quoted herein represents past performance and the return and value of an investment in the Fund will fluctuate so that, when redeemed, may be worth less than its original cost. Past performance is no guarantee of future performance and should not be considered as a representation of the future results of the Fund. The Fund’s performance assumes the reinvestment of all dividends and all capital gains. Index returns assume reinvestment of dividends and, unlike a Fund’s returns, do not reflect any fees or expenses. If such fees and expenses were included in the index returns, the performance would have been lower. Please note that one cannot invest directly in an unmanaged index.
There are no assurances that the Fund will meet its stated objectives.
The Fund’s holdings and allocations are subject to change and should not be considered recommendations to buy individual securities.
Returns shown do not reflect the deduction of taxes that a shareholder would pay on Fund distributions or the redemption of Fund shares.
See definition of comparative index above.
3
MANAGEMENT DISCUSSIONOF FUND PERFORMANCE
GLOBAL X CHINA INDUSTRIALS ETF
Global X China Industrials ETF
The Global X China Industrials ETF (the “Fund”) seeks to provide investment results that correspond generally to the price and yield performance, before fees and expenses, of the Solactive China Industrials Index (the “Index”). The Fund generally seeks to replicate the Index but may at times invest in a representative sample of securities that collectively has an investment profile similar to the Index and as a result may or may not hold all the securities that are included in the Index.
The Index is designed to reflect the performance of the industrial sector in China. It is comprised of selected companies which have their main business operations in the industrial sector and are domiciled in China or have their main business operations in this country. Only securities which are tradable for foreign investors without restrictions are eligible. The Fund is the first ETF globally focused exclusively on the China industrial sector.
For the 12-month period ended October 31, 2011 (the “reporting period”), the Fund decreased 32.56%, while the Index decreased 30.16%. The Fund had a net asset value of $17.13 per share on October 31, 2010 and ended the period with a net asset value of $11.39 on October 31, 2011.
Four of the Fund’s thirty-nine holdings as of October 31, 2011 increased in value for the reporting period, led by China Resources Cement Holdings and China Shanshui Cement Group, which returned 16.21% and 12.28% respectively. The worst performers were China High Speed Transmission Equipment Group and Duoyuan Global Water ADR, which returned -67.67% and -68.98% respectively.
Growth of a $10,000 Investment
| | | | | | | | | | |
| | | AVERAGE ANNUAL TOTAL RETURN FOR THE YEAR ENDED OCTOBER 31, 2011* | | |
| | | One Year Return | | Annualized Inception to Date | | |
| | | Net Asset Value | | Market Price | | Net Asset Value | | Market Price | | |
Global X China Industrials ETF | | (32.56%) | | (35.31%) | | (14.22%) | | (15.83%) | | |
Solactive China Industrials Index | | (30.16%) | | (30.16%) | | (12.30%) | | (12.30%) | | |
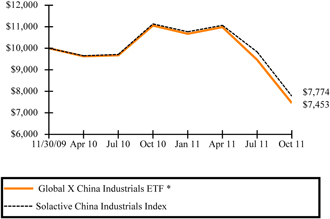
*Fund commenced operations on November 30, 2009.
The performance data quoted herein represents past performance and the return and value of an investment in the Fund will fluctuate so that, when redeemed, may be worth less than its original cost. Past performance is no guarantee of future performance and should not be considered as a representation of the future results of the Fund. The Fund’s performance assumes the reinvestment of all dividends and all capital gains. Index returns assume reinvestment of dividends and, unlike a Fund’s returns, do not reflect any fees or expenses. If such fees and expenses were included in the index returns, the performance would have been lower. Please note that one cannot invest directly in an unmanaged index.
There are no assurances that the Fund will meet its stated objectives.
The Fund’s holdings and allocations are subject to change and should not be considered recommendations to buy individual securities.
Returns shown do not reflect the deduction of taxes that a shareholder would pay on Fund distributions or the redemption of Fund shares.
See definition of comparative index above.
4
MANAGEMENT DISCUSSIONOF FUND PERFORMANCE
GLOBAL X CHINA MATERIALS ETF
Global X China Materials ETF
The Global X China Materials ETF (the “Fund”) seeks to provide investment results that correspond generally to the price and yield performance, before fees and expenses, of the Solactive China Materials Index (the “Index”). The Fund generally seeks to replicate the Index but may at times invest in a representative sample of securities that collectively has an investment profile similar to the Index and as a result may or may not hold all the securities that are included in the Index.
The Index is designed to reflect the performance of the materials sector in China. It is comprised of selected companies which have their main business operations in the materials sector and are domiciled in China or have their main business operations in this country. Only securities which are tradable for foreign investors without restrictions are eligible. The Fund is the nation’s first ETF focused exclusively on the China materials sector.
For the 12-month period ended October 31, 2011 (the “reporting period”), the Fund decreased 33.69%, while the Index decreased 31.62%. The Fund had a net asset value of $14.59 per share on October 31, 2010 and ended the period with a net asset value of $9.58 on October 31, 2011.
Three of the Fund’s twenty-nine holdings as of October 31, 2011 increased in value for the reporting period, led by Dongyue Group and Yingde Gases, which returned 83.62% and 27.89% respectively. The worst performers were China Agritech and ShengdaTech, which returned -94.55% and -99.29% respectively.
Growth of a $10,000 Investment
| | | | | | | | | | |
| | | AVERAGE ANNUAL TOTAL RETURN FOR THE YEAR ENDED OCTOBER 31, 2011* | | |
| | | One Year Return | | Annualized Inception to Date | | |
| | | Net Asset Value | | Market Price | | Net Asset Value | | Market
Price | | |
Global X China Materials ETF | | (33.69%) | | (35.79%) | | (21.47%) | | (22.62%) | | |
Solactive China Materials Index | | (31.62%) | | (31.62%) | | (19.86%) | | (19.86%) | | |
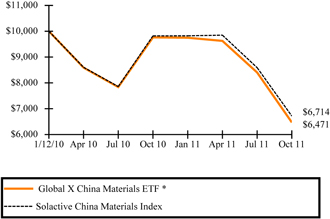
*Fund commenced operations on January 12, 2010.
The performance data quoted herein represents past performance and the return and value of an investment in the Fund will fluctuate so that, when redeemed, may be worth less than its original cost. Past performance is no guarantee of future performance and should not be considered as a representation of the future results of the Fund. The Fund’s performance assumes the reinvestment of all dividends and all capital gains. Index returns assume reinvestment of dividends and, unlike a Fund’s returns, do not reflect any fees or expenses. If such fees and expenses were included in the index returns, the performance would have been lower. Please note that one cannot invest directly in an unmanaged index.
There are no assurances that the Fund will meet its stated objectives.
The Fund’s holdings and allocations are subject to change and should not be considered recommendations to buy individual securities.
Returns shown do not reflect the deduction of taxes that a shareholder would pay on Fund distributions or the redemption of Fund shares.
See definition of comparative index above.
5
MANAGEMENT DISCUSSIONOF FUND PERFORMANCE
GLOBAL X NASDAQ CHINA TECHNOLOGY ETF
Global X NASDAQ China Technology ETF
The Global X NASDAQ China Technology ETF (the “Fund”) seeks to provide investment results that correspond generally to the price and yield performance, before fees and expenses, of the Solactive China Technology Index (the “Index”). The Fund generally seeks to replicate the Index but may at times invest in a representative sample of securities that collectively has an investment profile similar to the Index and as a result may or may not hold all the securities that are included in the Index.
The Index is designed to reflect the performance of the technology sector in China. It is comprised of selected companies which have their main business operations in the technology sector and are domiciled in China or have their main business operations in this country. Only securities which are tradable for foreign investors without restrictions are eligible.
For the 12-month period ended October 31, 2011 (the “reporting period”), the Fund decreased 9.81%, while the Index decreased 9.31%. The Fund had a net asset value of $17.21 per share on October 31, 2010 and ended the period with a net asset value of $15.38 on October 31, 2011.
Eight of the Fund’s twenty-nine holdings as of October 31, 2011 increased in value for the reporting period, led by Spreadtrum Communications ADR and China Unicom Hong Kong, which returned 87.08% and 46.96% respectively. The worst performers were Camelot Information Systems and Longtop Financial Technologies which returned -79.66% and -99.39% respectively.
Growth of a $10,000 Investment
| | | | | | | | | | |
| | | AVERAGE ANNUAL TOTAL RETURN FOR THE YEAR ENDED OCTOBER 31, 2011* | | |
| | | One Year Return | | Annualized Inception to Date | | |
| | | Net Asset Value | | Market Price | | Net Asset Value | | Market Price | | |
Global X NASDAQ China Technology ETF | | (9.81%) | | (11.99%) | | 2.18% | �� | 1.06% | | |
Solactive China Technology Index | | (9.31%) | | (9.31%) | | 2.78% | | 2.78% | | |
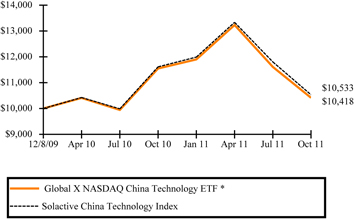
*Fund commenced operations on December 8, 2009.
The performance data quoted herein represents past performance and the return and value of an investment in the Fund will fluctuate so that, when redeemed, may be worth less than its original cost. Past performance is no guarantee of future performance and should not be considered as a representation of the future results of the Fund. The Fund’s performance assumes the reinvestment of all dividends and all capital gains. Index returns assume reinvestment of dividends and, unlike a Fund’s returns, do not reflect any fees or expenses. If such fees and expenses were included in the index returns, the performance would have been lower. Please note that one cannot invest directly in an unmanaged index.
There are no assurances that the Fund will meet its stated objectives.
The Fund’s holdings and allocations are subject to change and should not be considered recommendations to buy individual securities.
Returns shown do not reflect the deduction of taxes that a shareholder would pay on Fund distributions or the redemption of Fund shares.
See definition of comparative index above.
6
MANAGEMENT DISCUSSIONOF FUND PERFORMANCE
GLOBAL X FTSE ASEAN 40 ETF
Global X FTSE ASEAN 40 ETF
The Global X FTSE ASEAN 40 ETF (the “Fund”) seeks to provide investment results that correspond generally to the price and yield performance, before fees and expenses, of the FTSE ASEAN 40 Index (the “Index”). The Fund generally seeks to replicate the Index but may at times invest in a representative sample of securities that collectively has an investment profile similar to the Index and as a result may or may not hold all the securities that are included in the Index.
The FTSE/ASEAN 40 Index tracks the performance of the 40 largest companies in the five ASEAN regions: Indonesia, Philippines, Singapore, Malaysia and Thailand. The index is free float adjusted and weighted by market capitalization and designed using eligible stocks within the FTSE All-World universe. The Fund is the nation’s first ETF focused exclusively on the ASEAN region.
For the period from the Fund’s commencement date on February 16, 2011 through October 31, 2011 (the “reporting period”), the Fund increased 2.85%, while the Index increased 3.65%. The Fund commenced operations with a net asset value of $15.08 per share on February 16, 2011 and ended the period with a net asset value of $15.51 on October 31, 2011.
Twenty-three of the Fund’s forty holdings as of October 31, 2011 increased in value for the reporting period, led by Advanced Info Service and Jardine Cycle & Carriage, which returned 71.68% and 52.15% respectively. The worst performers were Singapore Airlines and Noble Group, which returned -21.03% and -23.51% respectively.
Growth of a $10,000 Investment
| | | | |
| | | AVERAGE ANNUAL TOTAL RETURN FOR
THE PERIOD ENDED OCTOBER 31, 2011* |
| | | Cumulative Inception to Date |
| | | Net Asset Value | | Market Price |
Global X FTSE ASEAN 40 ETF | | 2.85% | | 2.12% |
FTSE ASEAN 40 Index | | 3.65% | | 3.65% |
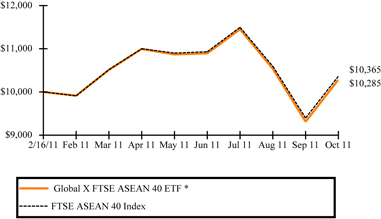
*Fund commenced operations on February 16, 2011.
The performance data quoted herein represents past performance and the return and value of an investment in the Fund will fluctuate so that, when redeemed, may be worth less than its original cost. Past performance is no guarantee of future performance and should not be considered as a representation of the future results of the Fund. The Fund’s performance assumes the reinvestment of all dividends and all capital gains. Index returns assume reinvestment of dividends and, unlike a Fund’s returns, do not reflect any fees or expenses. If such fees and expenses were included in the index returns, the performance would have been lower. Please note that one cannot invest directly in an unmanaged index.
There are no assurances that the Fund will meet its stated objectives.
The Fund’s holdings and allocations are subject to change and should not be considered recommendations to buy individual securities.
Returns shown do not reflect the deduction of taxes that a shareholder would pay on Fund distributions or the redemption of Fund shares.
See definition of comparative index above.
7
MANAGEMENT DISCUSSIONOF FUND PERFORMANCE
GLOBAL X FTSE ANDEAN 40 ETF
Global X FTSE Andean 40 ETF
The Global X Andean 40 ETF (the “Fund”) seeks to provide investment results that correspond generally to the price and yield performance, before fees and expenses, of the FTSE Andean 40 Index (the “Index”). The Fund generally seeks to replicate the Index but may at times invest in a representative sample of securities that collectively has an investment profile similar to the Index and as a result may or may not hold all the securities that are included in the Index.
The FTSE Andean 40 Index is designed to represent the performance of the 40 largest and most liquid companies listed on the Chile, Colombia, and Peru stock exchanges. The Index is designed to provide investors with a comprehensive and transparent way to measure the performance of the constituent companies. The Fund is the nation’s first ETF focused exclusively on the Andean region.
For the period from the Fund’s commencement date on February 2, 2011 through October 31, 2011 (the “reporting period”), the Fund decreased 8.53% while the Index decreased 7.11%. The Fund commenced operations with a net asset value of $14.88 per share on February 2, 2011 and ended the period with a net asset value of $13.61 on October 31, 2011.
Sixteen of the Fund’s forty-one holdings as of October 31, 2011 increased in value for the reporting period, led by Fabricato and AES Gener, which returned 136.46% and 22.23% respectively. The worst performers were Empresas La Polar and Empresas CMPC, which returned -89.17% and -91.22% respectively.
Growth of a $10,000 Investment
| | | | | | | | |
| | | AVERAGE ANNUAL TOTAL RETURN FOR
THE PERIOD ENDED OCTOBER 31, 2011* | | | | |
| | | Cumulative Inception to Date | | | | |
| | Net Asset Value | | Market Price | | | | |
Global X FTSE Andean 40 ETF | | (8.53%) | | (9.01%) | | | | |
FTSE Andean 40 Index | | (7.11%) | | (7.11%) | | | | |
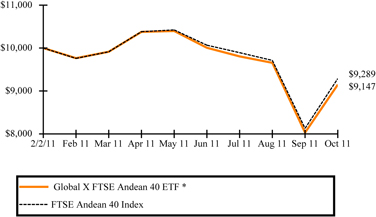
*Fund commenced operations on February 2, 2011.
The performance data quoted herein represents past performance and the return and value of an investment in the Fund will fluctuate so that, when redeemed, may be worth less than its original cost. Past performance is no guarantee of future performance and should not be considered as a representation of the future results of the Fund. The Fund’s performance assumes the reinvestment of all dividends and all capital gains. Index returns assume reinvestment of dividends and, unlike a Fund’s returns, do not reflect any fees or expenses. If such fees and expenses were included in the index returns, the performance would have been lower. Please note that one cannot invest directly in an unmanaged index.
There are no assurances that the Fund will meet its stated objectives.
The Fund’s holdings and allocations are subject to change and should not be considered recommendations to buy individual securities.
Returns shown do not reflect the deduction of taxes that a shareholder would pay on Fund distributions or the redemption of Fund shares.
See definition of comparative index above.
8
MANAGEMENT DISCUSSIONOF FUND PERFORMANCE
GLOBAL X FTSE COLOMBIA 20 ETF
Global X FTSE Colombia 20 ETF
The Global X FTSE Colombia 20 ETF (the “Fund”) seeks to provide investment results that correspond generally to the price and yield performance, before fees and expenses, of the FTSE Colombia 20 Index (the “Index”). The Fund generally seeks to replicate the Index but may at times invest in a representative sample of securities that collectively has an investment profile similar to the Index and as a result may or may not hold all the securities that are included in the Index.
The Index is a market capitalization-weighted index of the 20 most liquid stocks in the Colombian market. The Index is designed to measure broad based equity market performance in Colombia. The Fund is the first ETF globally focused exclusively on Colombia.
For the 12-month period ended October 31, 2011 (the “reporting period”), the Fund decreased 15.69%, while the Index decreased 14.87%. The Fund had a net asset value of $22.99 per share on October 31, 2010 and ended the period with a net asset value of $19.19 on October 31, 2011.
Two of the Fund’s twenty-one holdings as of October 31, 2011 increased in value for the reporting period, led by Fabricato and Corporacion Financiera Colombiana, which returned 166.90% and 9.38% respectively. The worst performers were Helm Bank and Cia Colombiana de Inversiones, which returned -33.22% and -35.05% respectively.
Growth of a $10,000 Investment
| | | | | | | | |
| | | AVERAGE ANNUAL TOTAL RETURN FOR THE YEAR ENDED OCTOBER 31, 2011* |
| | | One Year Return | | Annualized Inception to Date |
| | | Net Asset Value | | Market Price | | Net Asset Value | | Market Price |
Global X FTSE Colombia 20 ETF | | (15.69%) | | (16.11%) | | 43.40% | | 41.33% |
FTSE Colombia 20 Index | | (14.87%) | | (14.87%) | | 45.23% | | 45.23% |
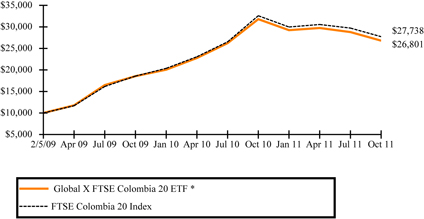
*Fund commenced operations on February 5, 2009.
The performance data quoted herein represents past performance and the return and value of an investment in the Fund will fluctuate so that, when redeemed, may be worth less than its original cost. Past performance is no guarantee of future performance and should not be considered as a representation of the future results of the Fund. The Fund’s performance assumes the reinvestment of all dividends and all capital gains. Index returns assume reinvestment of dividends and, unlike a Fund’s returns, do not reflect any fees or expenses. If such fees and expenses were included in the index returns, the performance would have been lower. Please note that one cannot invest directly in an unmanaged index.
There are no assurances that the Fund will meet its stated objectives.
The Fund’s holdings and allocations are subject to change and should not be considered recommendations to buy individual securities.
Returns shown do not reflect the deduction of taxes that a shareholder would pay on Fund distributions or the redemption of Fund shares.
See definition of comparative index above.
9
MANAGEMENT DISCUSSIONOF FUND PERFORMANCE
GLOBAL X FTSE ARGENTINA 20 ETF
Global X FTSE Argentina 20 ETF
The Global X FTSE Argentina 20 (the “Fund”) seeks to provide investment results that correspond generally to the price and yield performance, before fees and expenses, of the FTSE Argentina 20 Index (the “Index”). The Fund generally seeks to replicate the Index but may at times invest in a representative sample of securities that collectively has an investment profile similar to the Index and as a result may or may not hold all the securities that are included in the Index.
The FTSE Argentina 20 Index represents the performance of the twenty largest and most liquid companies that directly participate in the Argentine economy, but are not listed in Argentina. The index is designed to provide investors with a comprehensive and transparent way to measure the performance of these companies. The Fund is the nation’s first ETF focused exclusively on Argentina.
For the period from the Fund’s commencement date on March 2, 2011 through October 31, 2011 (the “reporting period”), the Fund decreased 26.19%, while the Index decreased 26.06%. The Fund commenced operations with a net asset value of $14.93 per share on March 2, 2011 and ended the period with a net asset value of $11.02 on October 31, 2011.
Two of the Fund’s twenty holdings as of October 31, 2011 increased in value for the reporting period, led by Yamana Gold and Telecom Argentina ADR, which returned 16.94% and 1.66% respectively. The worst performers were Grupo Financiero Galicia ADR, and Banco Macro ADR which returned -32.50% and -40.70% respectively.
Growth of a $10,000 Investment
| | | | | | | | |
| | | AVERAGE ANNUAL TOTAL RETURN FOR
THE PERIOD ENDED OCTOBER 31, 2011* | | | | |
| | | Cumulative Inception to Date | | | | |
| | | Net Asset Value | | Market Price | | | | |
Global X FTSE Argentina 20 ETF | | (26.19%) | | (26.66%) | | | | |
FTSE Argentina 20 Index | | (26.06%) | | (26.06%) | | | | |
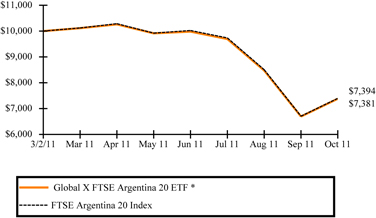
*Fund commenced operations on March 2, 2011.
The performance data quoted herein represents past performance and the return and value of an investment in the Fund will fluctuate so that, when redeemed, may be worth less than its original cost. Past performance is no guarantee of future performance and should not be considered as a representation of the future results of the Fund. The Fund’s performance assumes the reinvestment of all dividends and all capital gains. Index returns assume reinvestment of dividends and, unlike a Fund’s returns, do not reflect any fees or expenses. If such fees and expenses were included in the index returns, the performance would have been lower. Please note that one cannot invest directly in an unmanaged index.
There are no assurances that the Fund will meet its stated objectives.
The Fund’s holdings and allocations are subject to change and should not be considered recommendations to buy individual securities.
Returns shown do not reflect the deduction of taxes that a shareholder would pay on Fund distributions or the redemption of Fund shares.
See definition of comparative index above.
10
MANAGEMENT DISCUSSIONOF FUND PERFORMANCE
GLOBAL X BRAZIL MID CAP ETF
Global X Brazil Mid Cap ETF
The Global X Brazil Mid Cap ETF (the “Fund”) seeks to provide investment results that correspond generally to the price and yield performance, before fees and expenses, of the Solactive Brazil Mid Cap Index (the “Index”). The Fund generally seeks to replicate the Index but may at times invest in a representative sample of securities that collectively has an investment profile similar to the Index and as a result may or may not hold all the securities that are included in the Index.
The Index is designed to reflect the performance of Brazilian mid cap companies. It is comprised of mid-market capitalization securities of companies that are domiciled or have their main business operations in Brazil. The Fund is the first ETF globally focused exclusively on Brazil mid cap companies.
For the 12-month period ended October 31, 2011 (the “reporting period”), the Fund decreased 13.73%, while the Index decreased 13.12%. The Fund had a net asset value of $18.28 per share on October 31, 2010 and ended the period with a net asset value of $15.55 on October 31, 2011.
Fifteen of the Fund’s forty-two holdings as of October 31, 2011 increased in value for the reporting period, led by Redecard and Eletropaulo Metropolitana Electricidade, which returned 41.53% and 30.28% respectively. The worst performers were GOL Linhas Aereas Inteligentes and Hypermarcas, which returned -53.50% and -66.75% respectively.
Growth of a $10,000 Investment
| | | | | | | | | | | | |
| | | AVERAGE ANNUAL TOTAL RETURN FOR THE YEAR
ENDED OCTOBER 31, 2011* | | | | |
| | | One Year Return | | Annualized Inception to Date | | | | |
| | | Net Asset Value | | Market Price | | Net Asset Value | | Market Price | | | | |
Global X Brazil Mid Cap ETF | | (13.73%) | | (16.72%) | | 2.95% | | 1.36% | | | | |
Solactive Brazil Mid Cap Index | | (13.12%) | | (13.12%) | | 3.51% | | 3.51% | | | | |
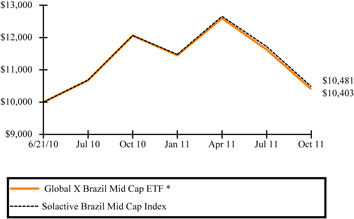
*Fund commenced operations on June 21, 2010.
The performance data quoted herein represents past performance and the return and value of an investment in the Fund will fluctuate so that, when redeemed, may be worth less than its original cost. Past performance is no guarantee of future performance and should not be considered as a representation of the future results of the Fund. The Fund’s performance assumes the reinvestment of all dividends and all capital gains. Index returns assume reinvestment of dividends and, unlike a Fund’s returns, do not reflect any fees or expenses. If such fees and expenses were included in the index returns, the performance would have been lower. Please note that one cannot invest directly in an unmanaged index.
There are no assurances that the Fund will meet its stated objectives.
The Fund’s holdings and allocations are subject to change and should not be considered recommendations to buy individual securities.
Returns shown do not reflect the deduction of taxes that a shareholder would pay on Fund distributions or the redemption of Fund shares.
See definition of comparative index above.
11
MANAGEMENT DISCUSSION OF FUND PERFORMANCE
GLOBAL X BRAZIL CONSUMER ETF
Global X Brazil Consumer ETF
The Global X Brazil Consumer ETF (the “Fund”) seeks to provide investment results that correspond generally to the price and yield performance, before fees and expenses, of the Solactive Brazil Consumer Index (the “Index”). The Fund generally seeks to replicate the Index but may at times invest in a representative sample of securities that collectively has an investment profile similar to the Index and as a result may or may not hold all the securities that are included in the Index.
The Index is designed to reflect the performance of the consumer sector in Brazil. It is comprised of selected companies which have their main business operations in the consumer sector and are domiciled or have their main business operations in Brazil. The Fund is the nation’s first ETF focused exclusively on the Brazil consumer sector.
For the 12-month period ended October 31, 2011 (the “reporting period”), the Fund decreased 15.74%, while the Index decreased 14.87%. The Fund had a net asset value of $19.95 per share on October 31, 2010 and ended the period with a net asset value of $16.78 on October 31, 2011.
Nine of the Fund’s thirty holdings as of October 31, 2011 increased in value for the reporting period, led by BRF Brasil Foods ADR and Cia Hering, which returned 48.21% and 40.49% respectively. The worst performers were B2W Companhia Global do Varejo and Hypermarcas, which returned -54.50% and -66.75% respectively.
Growth of a $10,000 Investment
| | | | | | | | | | | | |
| | | AVERAGE ANNUAL TOTAL RETURN FOR THE YEAR ENDED OCTOBER 31, 2011* | | | | |
| | | One Year Return | | Annualized Inception to Date | | | | |
| | | Net Asset Value | | Market Price | | Net Asset Value | | Market Price | | | | |
Global X Brazil Consumer ETF | | (15.74%) | | (15.83%) | | 6.47% | | 7.72% | | | | |
Solactive Brazil Consumer Index | | (14.87%) | | (14.87%) | | 7.56% | | 7.56% | | | | |
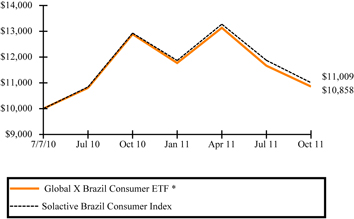
*Fund commenced operations on July 7, 2010.
The performance data quoted herein represents past performance and the return and value of an investment in the Fund will fluctuate so that, when redeemed, may be worth less than its original cost. Past performance is no guarantee of future performance and should not be considered as a representation of the future results of the Fund. The Fund’s performance assumes the reinvestment of all dividends and all capital gains. Index returns assume reinvestment of dividends and, unlike a Fund's returns, do not reflect any fees or expenses. If such fees and expenses were included in the index returns, the performance would have been lower. Please note that one cannot invest directly in an unmanaged index.
There are no assurances that the Fund will meet its stated objectives.
The Fund’s holdings and allocations are subject to change and should not be considered recommendations to buy individual securities.
Returns shown do not reflect the deduction of taxes that a shareholder would pay on Fund distributions or the redemption of Fund shares.
See definition of comparative index above.
12
MANAGEMENT DISCUSSION OF FUND PERFORMANCE
GLOBAL X BRAZIL FINANCIALS ETF
Global X Brazil Financials ETF
The Global X Brazil Financials ETF (the “Fund”) seeks to provide investment results that correspond generally to the price and yield performance, before fees and expenses, of the Solactive Brazil Financials Index (the “Index”). The Fund generally seeks to replicate the Index but may at times invest in a representative sample of securities that collectively has an investment profile similar to the Index and as a result may or may not hold all the securities that are included in the Index.
The Index is designed to reflect the performance of the financial sector in Brazil. It is comprised of selected companies which have their main business operations in the financial sector and are domiciled or have their main business operations in Brazil. The Fund is the first ETF globally focused exclusively on the Brazil financial sector.
For the 12-month period ended October 31, 2011 (the “reporting period”), the Fund decreased 13.80%, while the Index decreased 13.27%. The Fund had a net asset value of $17.40 per share on October 31, 2010 and ended the period with a net asset value of $14.92 on October 31, 2011.
Six of the Fund’s twenty-five holdings as of October 31, 2011 increased in value for the reporting period, led by Redecard and Cielo, which returned 41.53% and 33.22% respectively. The worst performers were Cyrela Brazil Realty and Banco Industrial e Comercial, which returned -34.69% and -48.06% respectively.
Growth of a $10,000 Investment
| | | | | | | | | | | | |
| | | AVERAGE ANNUAL TOTAL RETURN FOR THE YEAR ENDED OCTOBER 31, 2011* | | | | |
| | | One Year Return | | Annualized Inception to Date | | | | |
| | | Net Asset Value | | Market Price | | Net Asset Value | | Market Price | | | | |
Global X Brazil Financials ETF | | (13.80%) | | (16.21%) | | (0.43%) | | (1.32%) | | | | |
Solactive Brazil Financials Index | | (13.27%) | | (13.27%) | | 0.18% | | 0.18% | | | | |
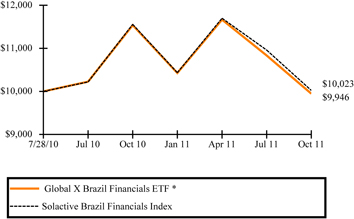
*Fund commenced operations on July 28. 2010.
The performance data quoted herein represents past performance and the return and value of an investment in the Fund will fluctuate so that, when redeemed, may be worth less than its original cost. Past performance is no guarantee of future performance and should not be considered as a representation of the future results of the Fund. The Fund’s performance assumes the reinvestment of all dividends and all capital gains. Index returns assume reinvestment of dividends and, unlike a Fund’s returns, do not reflect any fees or expenses. If such fees and expenses were included in the index returns, the performance would have been lower. Please note that one cannot invest directly in an unmanaged index.
There are no assurances that the Fund will meet its stated objectives.
The Fund’s holdings and allocations are subject to change and should not be considered recommendations to buy individual securities.
Returns shown do not reflect the deduction of taxes that a shareholder would pay on Fund distributions or the redemption of Fund shares.
See definition of comparative index above.
13
MANAGEMENT DISCUSSIONOF FUND PERFORMANCE
GLOBAL X MEXICO SMALL-CAP ETF
Global X Mexico Small-Cap ETF
The Global X Mexico Small-Cap ETF (the “Fund”) seeks to provide investment results that correspond generally to the price and yield performance, before fees and expenses, of the Solactive Mexico Small-Cap Index (the “Index”). The Fund generally seeks to replicate the Index but may at times invest in a representative sample of securities that collectively has an investment profile similar to the Index and as a result may or may not hold all the securities that are included in the Index.
The Solactive Mexico Small-Cap Index is designed to reflect the performance of Mexican small cap companies. The index is comprised of companies that are domiciled or have their main business operations in Mexico. The Fund is the nation’s first ETF focused exclusively on the Mexico small cap sector.
For the period from the Fund’s commencement date on May 4, 2011 through October 31, 2011 (the “reporting period”), the Fund decreased 23.33%, while the Index decreased 23.46%. The Fund commenced operations with a net asset value of $14.53 per share on May 4, 2011 and ended the period with a net asset value of $11.14 on October 31, 2011.
Three of the Fund’s twenty-seven holdings as of October 31, 2011 increased in value for the reporting period, led by Grupo Aeroportuario del Sureste ADR and Gruma, which returned 2.58% and 0.63% respectively. The worst performers were Compania Minera Autlan and Sare Holding, which returned -60.71% and -62.98% respectively.
Growth of a $10,000 Investment
| | | | | | | | |
| | | AVERAGE ANNUAL TOTAL RETURN FOR
THE PERIOD ENDED OCTOBER 31, 2011* | | | | |
| | | Cumulative Inception to Date | | | | |
| | | Net Asset Value | | Market Price | | | | |
Global X Mexico Small-Cap ETF | | (23.33%) | | (23.33%) | | | | |
Solactive Mexico Small-Cap Index | | (23.46%) | | (23.46%) | | | | |
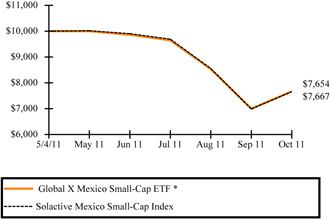
*Fund commenced operations on May 4. 2011.
The performance data quoted herein represents past performance and the return and value of an investment in the Fund will fluctuate so that, when redeemed, may be worth less than its original cost. Past performance is no guarantee of future performance and should not be considered as a representation of the future results of the Fund. The Fund’s performance assumes the reinvestment of all dividends and all capital gains. Index returns assume reinvestment of dividends and, unlike a Fund’s returns, do not reflect any fees or expenses. If such fees and expenses were included in the index returns, the performance would have been lower. Please note that one cannot invest directly in an unmanaged index.
There are no assurances that the Fund will meet its stated objectives.
The Fund’s holdings and allocations are subject to change and should not be considered recommendations to buy individual securities.
Returns shown do not reflect the deduction of taxes that a shareholder would pay on Fund distributions or the redemption of Fund shares.
See definition of comparative index above.
14
MANAGEMENT DISCUSSIONOF FUND PERFORMANCE
GLOBAL X RUSSELL EMERGING MARKETS GROWTH ETF
Global X Russell Emerging Markets Growth ETF
The Global X Russell Emerging Markets Growth ETF (the “Fund”) seeks to provide investment results that correspond generally to the price and yield performance, before fees and expenses, of the Russell Emerging Market MegaCap Growth Index (the “Index”). The Fund uses a representative sample of securities that collectively has an investment profile similar to the Index and as a result may or may not hold all the securities that are included in the Index.
The Russell Emerging Market MegaCap Growth Index measures the performance of the mega-cap growth segment of the emerging markets equity universe. It includes those mega-cap emerging market companies with higher price-to-book ratios and higher expected growth values. It is constructed to provide a comprehensive and unbiased barometer for the mega-cap growth segment.
For the period from the Fund’s commencement date on January 24, 2011 through October 31, 2011 (the “reporting period”), the Fund decreased 13.34%, while the Index decreased 9.81%. The Fund commenced operations with a net asset value of $25.11 per share on January 24, 2011 and ended the period with a net asset value of $21.76 on October 31, 2011.
Thirty-three of the Fund’s one hundred and twenty-three holdings as of October 31, 2011 increased in value for the reporting period, led by Grupo Elektra and Novatek, which returned 87.38% and 63.75% respectively. The worst performers were China Railway Construction and China Railway Group, which returned -50.58% and -52.54% respectively.
Growth of a $10,000 Investment
| | | | | | |
| | | AVERAGE ANNUAL TOTAL RETURN FOR
THE PERIOD ENDED OCTOBER 31, 2011* | | |
| | Cumulative Inception to Date | | |
| | Net Asset Value | | Market Price | | |
Global X Russell Emerging Markets Growth ETF | | (13.34%) | | (13.74%) | | |
Russell Emerging Market MegaCap Growth Index | | (9.81%) | | (9.81%) | | |
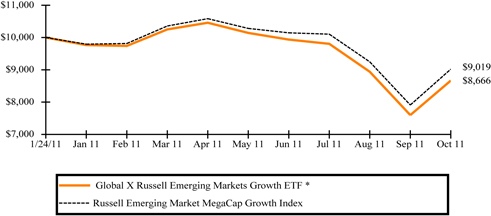
*Fund commenced operations on January 24, 2011.
The performance data quoted herein represents past performance and the return and value of an investment in the Fund will fluctuate so that, when redeemed, may be worth less than its original cost. Past performance is no guarantee of future performance and should not be considered as a representation of the future results of the Fund. The Fund’s performance assumes the reinvestment of all dividends and all capital gains. Index returns assume reinvestment of dividends and, unlike a Fund’s returns, do not reflect any fees or expenses. If such fees and expenses were included in the index returns, the performance would have been lower. Please note that one cannot invest directly in an unmanaged index.
There are no assurances that the Fund will meet its stated objectives.
The Fund’s holdings and allocations are subject to change and should not be considered recommendations to buy individual securities.
Returns shown do not reflect the deduction of taxes that a shareholder would pay on Fund distributions or the redemption of Fund shares.
See definition of comparative index above.
15
MANAGEMENT DISCUSSIONOF FUND PERFORMANCE
GLOBAL X RUSSELL EMERGING MARKETS VALUE ETF
Global X Russell Emerging Markets Value ETF
The Global X Russell Emerging Markets Value ETF (the “Fund”) seeks to provide investment results that correspond generally to the price and yield performance, before fees and expenses, of the Russell Emerging Market MegaCap Value Index (the “Index”). The Fund uses a representative sample of securities that collectively has an investment profile similar to the Index and as a result may or may not hold all the securities that are included in the Index.
The Russell Emerging Market MegaCap Value Index measures the performance of the mega-cap value segment of the emerging markets equity universe. It includes those mega-cap emerging market companies with lower price-to-book ratios and lower expected growth values. It is constructed to provide a comprehensive and unbiased barometer for the mega-cap value segment.
For the period from the Fund’s commencement date on January 24, 2011 through October 31, 2011 (the “reporting period”), the Fund decreased 10.33%, while the Index decreased 8.26%. The Fund commenced operations with a net asset value of $24.98 per share on January 24, 2011 and ended the period with a net asset value of $22.40 on October 31, 2011.
Eighteen of the Fund’s fifty-three holdings as of October 31, 2011 increased in value for the reporting period, led by China Unicom and Telefonica Brasil, which returned 32.86% and 30.57% respectively. The worst performers were Aluminum Corp of China and China COSCO Holdings, which returned -41.71% and -55.02% respectively.
Growth of a $10,000 Investment
| | | | | | |
| | | AVERAGE ANNUAL TOTAL RETURN FOR
THE PERIOD ENDED OCTOBER 31, 2011* | | |
| | Cumulative Inception to Date | | |
| | Net Asset Value | | Market Price | | |
Global X Russell Emerging Markets Value ETF | | (10.33%) | | (10.53%) | | |
Russell Emerging Market MegaCap Value Index | | (8.26%) | | (8.26%) | | |
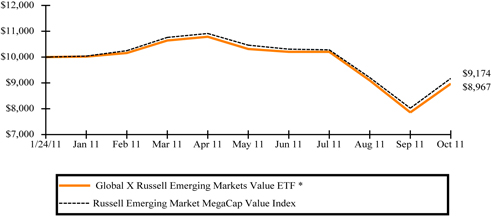
*Fund commenced operations on January 24, 2011.
The performance data quoted herein represents past performance and the return and value of an investment in the Fund will fluctuate so that, when redeemed, may be worth less than its original cost. Past performance is no guarantee of future performance and should not be considered as a representation of the future results of the Fund. The Fund’s performance assumes the reinvestment of all dividends and all capital gains. Index returns assume reinvestment of dividends and, unlike a Fund’s returns, do not reflect any fees or expenses. If such fees and expenses were included in the index returns, the performance would have been lower. Please note that one cannot invest directly in an unmanaged index.
There are no assurances that the Fund will meet its stated objectives.
The Fund’s holdings and allocations are subject to change and should not be considered recommendations to buy individual securities.
Returns shown do not reflect the deduction of taxes that a shareholder would pay on Fund distributions or the redemption of Fund shares.
See definition of comparative index above.
16
MANAGEMENT DISCUSSIONOF FUND PERFORMANCE
GLOBAL X FTSE NORDIC REGION ETF
Global X FTSE Nordic Region ETF
The Global X FTSE Nordic Region ETF (the “Fund”) seeks to provide investment results that correspond generally to the price and yield performance, before fees and expenses, of the FTSE Nordic 30 Index (the “Index”). The Fund generally seeks to replicate the Index but may at times invest in a representative sample of securities that collectively has an investment profile similar to the Index and as a result may or may not hold all the securities that are included in the Index.
The Index is a market capitalization-weighted index of the 30 largest and most liquid stocks in Sweden, Denmark, Norway and Finland. The Index is designed to measure broad based equity market performance in these countries. The Fund is the nation’s first ETF focused exclusively on the Nordic region.
For the 12-month period ended October 31, 2011 (the “reporting period”), the Fund decreased 8.34%, while the Index decreased 6.87%. The Fund had a net asset value of $19.22 per share on October 31, 2010 and ended the period with a net asset value of $17.47 on October 31, 2011.
Nine of the Fund’s thirty holdings as of October 31, 2011 increased in value for the reporting period, led by Statoil ADR and Seadrill, which returned 24.06% and 21.25% respectively. The worst performers were Danske Bank and Vestas Wind Systems, which returned -43.18% and -50.39% respectively.
Growth of a $10,000 Investment
| | | | | | | | | | |
| | | AVERAGE ANNUAL TOTAL RETURN FOR THE YEAR ENDED OCTOBER 31, 2011* | | |
| | One Year Return | | Annualized Inception to Date | | |
| | Net Asset Value | | Market Price | | Net Asset Value | | Market Price | | |
Global X FTSE Nordic Region ETF | | (8.34%) | | (10.36%) | | 9.26% | | 8.37% | | |
FTSE Nordic 30 Index | | (6.87%) | | (6.87%) | | 10.62% | | 10.62% | | |
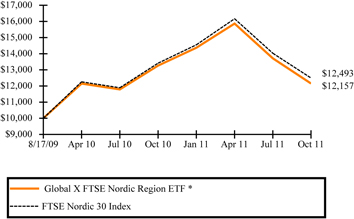
*Fund commenced operations on August 17, 2009.
The performance data quoted herein represents past performance and the return and value of an investment in the Fund will fluctuate so that, when redeemed, may be worth less than its original cost. Past performance is no guarantee of future performance and should not be considered as a representation of the future results of the Fund. The Fund’s performance assumes the reinvestment of all dividends and all capital gains. Index returns assume reinvestment of dividends and, unlike a Fund’s returns, do not reflect any fees or expenses. If such fees and expenses were included in the index returns, the performance would have been lower. Please note that one cannot invest directly in an unmanaged index.
There are no assurances that the Fund will meet its stated objectives.
The Fund’s holdings and allocations are subject to change and should not be considered recommendations to buy individual securities.
Returns shown do not reflect the deduction of taxes that a shareholder would pay on Fund distributions or the redemption of Fund shares.
See definition of comparative index above.
17
MANAGEMENT DISCUSSIONOF FUND PERFORMANCE
GLOBAL X FTSE NORWAY 30 ETF
Global X FTSE Norway 30 ETF
The Global X FTSE Norway 30 ETF (the “Fund”) seeks to provide investment results that correspond generally to the price and yield performance, before fees and expenses, of the FTSE Norway 30 Index (the “Index”). The Fund generally seeks to replicate the Index but may at times invest in a representative sample of securities that collectively has an investment profile similar to the Index and as a result may or may not hold all the securities that are included in the Index.
The FTSE Norway 30 Index is designed to reflect broad based equity market performance in Norway. The Fund is the nation’s first ETF focused exclusively on Norway.
For the 12-month period ended October 31, 2011 (the “reporting period”), the Fund decreased 5.62%, while the Index decreased 4.10%. The Fund had a net asset value of $14.80 per share on November 9, 2010 and ended the period with a net asset value of $13.96 on October 31, 2011.
Thirteen of the Fund’s thirty holdings as of October 31, 2011 increased in value for the reporting period, led by Algeta and Aker, which returned 85.97% and 37.58% respectively. The worst performers were Renewable Energy and Frontline, which returned -70.79% and -80.88% respectively.
Growth of a $10,000 Investment
| | | | | | |
| | | AVERAGE ANNUAL TOTAL RETURN FOR
THE PERIOD ENDED OCTOBER 31, 2011* | | |
| | Cumulative Inception to Date | | |
| | Net Asset Value | | Market Price | | |
Global X FTSE Norway 30 ETF | | (5.62%) | | (6.15%) | | |
FTSE Norway 30 Index | | (4.10%) | | (4.10%) | | |
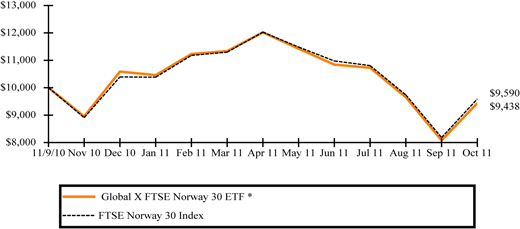
*Fund commenced operations on November 9, 2010.
The performance data quoted herein represents past performance and the return and value of an investment in the Fund will fluctuate so that, when redeemed, may be worth less than its original cost. Past performance is no guarantee of future performance and should not be considered as a representation of the future results of the Fund. The Fund’s performance assumes the reinvestment of all dividends and all capital gains. Index returns assume reinvestment of dividends and, unlike a Fund’s returns, do not reflect any fees or expenses. If such fees and expenses were included in the index returns, the performance would have been lower. Please note that one cannot invest directly in an unmanaged index.
There are no assurances that the Fund will meet its stated objectives.
The Fund’s holdings and allocations are subject to change and should not be considered recommendations to buy individual securities.
Returns shown do not reflect the deduction of taxes that a shareholder would pay on Fund distributions or the redemption of Fund shares.
See definition of comparative index above.
18

| | |
| Schedule of Investments | | October 31, 2011 |
Global X China Consumer ETF
Sector Weightings (unaudited)†:
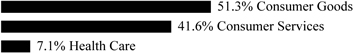
† Percentages based on total investments.
| | | | | | |
| | | Shares | | Value | |
COMMON STOCK — 99.8% | | | | | | |
| | |
CHINA— 86.1% | | | | | | |
| | |
Consumer Goods — 39.6% | | | | | | |
361 Degrees International | | 1,601,116 | | $ | 791,438 | |
Anta Sports Products | | 2,038,525 | | | 1,891,970 | |
BaWang International Group Holding | | 2,702,158 | | | 313,051 | |
China Huiyuan Juice Group | | 1,101,587 | | | 347,415 | |
China Yurun Food Group | | 3,627,298 | | | 6,452,888 | |
Dongfeng Motor Group, Cl H | | 3,681,601 | | | 6,122,969 | |
Great Wall Motor, Cl H | | 2,734,642 | | | 3,787,700 | |
Guangzhou Automobile Group, Cl H | | 5,929,951 | | | 6,007,429 | |
Hengan International Group | | 724,766 | | | 6,353,423 | |
Li Ning | | 1,859,131 | | | 1,787,695 | |
Shenzhou International Group Holdings | | 784,141 | | | 1,017,460 | |
Tingyi Cayman Islands Holding | | 2,248,057 | | | 6,453,198 | |
Tsingtao Brewery, Cl H | | 764,536 | | | 3,931,675 | |
Uni-President China Holdings | | 2,538,671 | | | 1,519,575 | |
Want Want China Holdings | | 7,135,686 | | | 6,686,979 | |
Zhongpin * | | 81,884 | | | 755,789 | |
| | | | | | |
| | | | | 54,220,654 | |
| | | | | | |
| | |
Consumer Services — 39.4% | | | | | | |
Air China, Cl H | | 5,300,721 | | | 4,189,538 | |
Ajisen China Holdings | | 1,245,488 | | | 1,795,645 | |
China Southern Airlines, Cl H * | | 4,718,848 | | | 2,690,931 | |
Focus Media Holding ADR * | | 239,417 | | | 6,507,354 | |
Golden Eagle Retail Group | | 1,652,774 | | | 4,208,260 | |
GOME Electrical Appliances Holding | | 20,652,879 | | | 6,460,256 | |
Home Inns & Hotels Management ADR * | | 99,450 | | | 3,397,212 | |
Intime Department Store Group | | 3,207,056 | | | 4,648,446 | |
New Oriental Education & Technology Group ADR * | | 218,955 | | | 6,489,826 | |
Parkson Retail Group | | 3,649,547 | | | 4,697,879 | |
PCD Stores Group | | 7,887,372 | | | 1,198,056 | |
Peak Sport Products | | 1,798,452 | | | 539,408 | |
Wumart Stores, Cl H | | 1,370,611 | | | 2,784,095 | |
Youku.com ADR * | | 206,688 | | | 4,390,053 | |
| | | | | | |
| | | | | 53,996,959 | |
| | | | | | |
The accompanying notes are an integral part of the financial statements.
19
| | |
| Schedule of Investments | | October 31, 2011 |
Global X China Consumer ETF
| | | | | | |
| | |
| | | Shares | | Value | |
COMMON STOCK — continued | | | | | | |
| | |
Health Care — 7.1% | | | | | | |
Shandong Weigao Group Medical Polymer, Cl H | | 4,181,879 | | $ | 4,398,011 | |
Sinopharm Group, Cl H | | 1,915,608 | | | 5,276,953 | |
| | | | | | |
| | | | | 9,674,964 | |
| | | | | | |
TOTAL CHINA | | | | | 117,892,577 | |
| | | | | | |
| | |
HONG KONG— 13.7% | | | | | | |
| | |
Consumer Goods — 11.5% | | | | | | |
AviChina Industry & Technology, Cl H | | 4,713,561 | | | 2,099,366 | |
Bosideng International Holdings | | 6,804,341 | | | 1,909,437 | |
China Agri-Industries Holdings | | 4,180,065 | | | 3,389,896 | |
China Foods | | 1,927,799 | | | 1,536,085 | |
China Resources Enterprise | | 1,821,007 | | | 6,739,261 | |
| | | | | | |
| | | | | 15,674,045 | |
| | | | | | |
Consumer Services — 2.2% | | | | | | |
China Dongxiang Group | | 7,016,133 | | | 1,273,444 | |
China Travel International Investment Hong Kong | | 7,171,130 | | | 1,098,493 | |
New World Department Store China | | 1,020,189 | | | 686,824 | |
| | | | | | |
| | | | | 3,058,761 | |
| | | | | | |
TOTAL HONG KONG | | | | | 18,732,806 | |
| | | | | | |
TOTAL COMMON STOCK
(Cost $158,801,941) | | | | | 136,625,383 | |
| | | | | | |
TOTAL INVESTMENTS — 99.8%
(Cost $158,801,941) | | | | $ | 136,625,383 | |
| | | | | | |
Percentages are based on Net Assets of $136,857,987.
| * | Non-income producing security. |
ADR — American Depositary Receipt
Cl — Class
The following is a summary of the inputs used as of October 31, 2011, in valuing the Fund’s investments carried at value:
| | | | | | | | | | | | |
Investments in Securities | | Level 1 | | Level 2 | | | Level 3 | | Total | |
Common Stock | | $ 136,625,383 | | $ | — | | | $ — | | $ | 136,625,383 | |
| | | | | | | | | | | | |
Total Investments in Securities | | $ 136,625,383 | | $ | — | | | $ — | | $ | 136,625,383 | |
| | | | | | | | | | | | |
For the year ended October 31, 2011, there have been no significant transfers between Level 1 and Level 2 investments.
For the year ended October 31, 2011, there were no Level 3 investments.
The accompanying notes are an integral part of the financial statements.
20
| | |
| Schedule of Investments | | October 31, 2011 |
Global X China Energy ETF
Sector Weightings (unaudited)†:

† Percentages based on total investments.
| | | | | | |
| | | Shares | | Value | |
COMMON STOCK — 99.8% | | | | | | |
| | |
CHINA— 64.4% | | | | | | |
| | |
Energy — 55.4% | | | | | | |
China Coal Energy, Cl H | | 181,732 | | $ | 231,361 | |
China Longyuan Power Group, Cl H | | 247,476 | | | 208,659 | |
China Oilfield Services, Cl H | | 133,154 | | | 226,251 | |
China Petroleum & Chemical, Cl H | | 496,326 | | | 475,339 | |
China Shenhua Energy, Cl H | | 105,892 | | | 493,440 | |
Hanwha SolarOne ADR * | | 6,152 | | | 13,781 | |
JA Solar Holdings ADR * | | 14,078 | | | 31,112 | |
JinkoSolar Holding ADR * | | 2,172 | | | 20,091 | |
LDK Solar ADR * | | 13,206 | | | 54,673 | |
PetroChina, Cl H | | 366,745 | | | 484,367 | |
Renesola ADR * | | 7,239 | | | 16,505 | |
Suntech Power Holdings ADR * | | 15,098 | | | 41,369 | |
Tianneng Power International | | 55,615 | | | 26,488 | |
Trina Solar ADR * | | 7,228 | | | 58,330 | |
Trony Solar Holdings * | | 93,759 | | | 19,793 | |
Yanzhou Coal Mining, Cl H | | 89,296 | | | 230,467 | |
Yingli Green Energy Holding ADR * | | 9,148 | | | 37,141 | |
| | | | | | |
| | | | | 2,669,167 | |
| | | | | | |
| | |
Utilities — 9.0% | | | | | | |
Datang International Power Generation, Cl H | | 258,822 | | | 67,300 | |
ENN Energy Holdings | | 62,004 | | | 226,674 | |
Huadian Power International, Cl H | | 97,544 | | | 15,319 | |
Huaneng Power International, Cl H | | 277,098 | | | 126,983 | |
| | | | | | |
| | | | | 436,276 | |
| | | | | | |
TOTAL CHINA | | | | | 3,105,443 | |
| | | | | | |
| | |
HONG KONG— 35.4% | | | | | | |
| | |
Energy — 25.0% | | | | | | |
Beijing Enterprises Holdings | | 41,569 | | | 232,500 | |
China Gas Holdings | | 242,282 | | | 70,484 | |
CNOOC | | 246,875 | | | 484,947 | |
Kunlun Energy | | 159,457 | | | 227,019 | |
Shougang Fushan Resources Group | | 347,941 | | | 146,011 | |
United Energy Group * | | 319,379 | | | 42,756 | |
| | | | | | |
| | | | | 1,203,717 | |
| | | | | | |
The accompanying notes are an integral part of the financial statements.
21
| | |
| Schedule of Investments | | October 31, 2011 |
Global X China Energy ETF
| | | | | | |
| | | Shares | | Value | |
| COMMON STOCK — continued | | | | | | |
| | |
Utilities — 10.4% | | | | | | |
China Power International Development | | 144,040 | | $ | 30,779 | |
China Resources Power Holdings | | 135,347 | | | 242,870 | |
GCL-Poly Energy Holdings | | 692,811 | | | 230,090 | |
| | | | | | |
| | | | | 503,739 | |
| | | | | | |
TOTAL HONG KONG | | | | | 1,707,456 | |
| | | | | | |
TOTAL COMMON STOCK
(Cost $5,201,716) | | | | | 4,812,899 | |
| | | | | | |
TOTAL INVESTMENTS — 99.8%
(Cost $5,201,716) | | | | $ | 4,812,899 | |
| | | | | | |
Percentages are based on Net Assets of $4,821,824.
| * | Non-income producing security. |
ADR — American Depositary Receipt
Cl — Class
The following is a summary of the inputs used as of October 31, 2011, in valuing the Fund’s investments carried at value:
| | | | | | | | | | | | | | | | |
Investments in Securities | | | Level 1 | | | | Level 2 | | | | Level 3 | | | | Total | |
| | | | | | | | | | | | | | | | |
Common Stock | | $ | 4,812,899 | | | $ | — | | | $ | — | | | $ | 4,812,899 | |
| | | | | | | | | | | | | | | | |
Total Investments in Securities | | $ | 4,812,899 | | | $ | — | | | $ | — | | | $ | 4,812,899 | |
| | | | | | | | | | | | | | | | |
For the year ended October 31, 2011, there have been no significant transfers between Level 1 and Level 2 investments.
For the year ended October 31, 2011, there were no Level 3 investments.
The accompanying notes are an integral part of the financial statements.
22
| | |
| Schedule of Investments | | October 31, 2011 |
Global X China Financials ETF
Sector Weightings (unaudited)†:

† Percentages based on total investments.
| | | | | | |
| | | Shares | | Value | |
COMMON STOCK — 100.3% | | | | | | |
| | |
CHINA— 88.9% | | | | | | |
| | |
Financials — 88.9% | | | | | | |
Agile Property Holdings | | 120,753 | | $ | 111,450 | |
Agricultural Bank of China, Cl H | | 1,128,791 | | | 515,828 | |
Bank of China, Cl H | | 3,008,858 | | | 1,092,229 | |
Bank of Communications, Cl H | | 615,050 | | | 430,697 | |
China Citic Bank, Cl H | | 728,457 | | | 398,525 | |
China Construction Bank, Cl H | | 1,483,578 | | | 1,109,556 | |
China Life Insurance, Cl H | | 436,008 | | | 1,164,596 | |
China Merchants Bank, Cl H | | 249,602 | | | 514,080 | |
China Minsheng Banking, Cl H | | 392,474 | | | 323,841 | |
China Pacific Insurance Group, Cl H | | 169,845 | | | 529,092 | |
Chongqing Rural Commercial Bank, Cl H * | | 246,567 | | | 111,088 | |
CNinsure ADR * | | 3,595 | | | 27,142 | |
Country Garden Holdings | | 334,226 | | | 134,663 | |
E-House China Holdings ADR | | 6,873 | | | 53,953 | |
Evergrande Real Estate Group | | 369,472 | | | 164,083 | |
Greentown China Holdings | | 53,556 | | | 34,746 | |
Guangzhou R&F Properties | | 93,556 | | | 92,611 | |
Industrial & Commercial Bank of China, Cl H | | 1,721,616 | | | 1,094,778 | |
Kaisa Group Holdings * | | 168,764 | | | 34,541 | |
Longfor Properties | | 117,934 | | | 153,632 | |
PICC Property & Casualty, Cl H | | 333,271 | | | 471,904 | |
Ping An Insurance Group, Cl H | | 70,376 | | | 531,772 | |
Renhe Commercial Holdings | | 964,977 | | | 137,880 | |
Shimao Property Holdings | | 125,404 | | | 124,621 | |
Shui On Land | | 148,337 | | | 46,782 | |
Sino-Ocean Land Holdings | | 400,817 | | | 181,099 | |
Soho China | | 178,890 | | | 129,415 | |
| | | | | | |
TOTAL CHINA | | | | | 9,714,604 | |
| | | | | | |
| | |
HONG KONG— 11.4% | | | | | | |
| | |
Financials — 11.4% | | | | | | |
China Everbright | | 82,047 | | | 123,992 | |
China Overseas Land & Investment | | 263,909 | | | 498,025 | |
China Resources Land | | 131,326 | | | 195,083 | |
China Taiping Insurance Holdings * | | 72,750 | | | 159,575 | |
Franshion Properties China | | 295,258 | | | 61,571 | |
The accompanying notes are an integral part of the financial statements.
23
| | |
| Schedule of Investments | | October 31, 2011 |
Global X China Financials ETF
| | | | | | |
| | | Shares/Face
Amount | | Value | |
COMMON STOCK — continued | | | | | | |
| | |
Financials — continued | | | | | | |
Hopson Development Holdings | | 54,329 | | $ | 34,338 | |
KWG Property Holding | | 103,217 | | | 45,440 | |
Poly Hong Kong Investments | | 166,007 | | | 85,050 | |
Shenzhen Investment | | 189,591 | | | 41,001 | |
| | | | | | |
TOTAL HONG KONG | | | | | 1,244,075 | |
| | | | | | |
TOTAL COMMON STOCK
(Cost $11,601,597) | | | | | 10,958,679 | |
| | | | | | |
| | |
TIME DEPOSIT — 1.0% | | | | | | |
Brown Brothers Harriman, 0.030%
(Cost $103,741) | | $ 103,741 | | | 103,741 | |
| | | | | | |
TOTAL INVESTMENTS — 101.3%
(Cost $11,705,338) | | | | $ | �� 11,062,420 | |
| | | | | | |
Percentages are based on Net Assets of $10,923,728.
| * | Non-income producing security. |
ADR — American Depositary Receipt
Cl — Class
The following is a summary of the inputs used as of October 31, 2011, in valuing the Fund’s investments carried at value:
| | | | | | | | | | | | | | | | |
Investments in Securities | | | Level 1 | | | | Level 2 | | | | Level 3 | | | | Total | |
| | | | | | | | | | | | | | | | |
Common Stock | | $ | 10,958,679 | | | $ | — | | | $ | — | | | $ | 10,958,679 | |
Time Deposit | | | — | | | | 103,741 | | | | — | | | | 103,741 | |
| | | | | | | | | | | | | | | | |
Total Investments in Securities | | $ | 10,958,679 | | | $ | 103,741 | | | $ | — | | | $ | 11,062,420 | |
| | | | | | | | | | | | | | | | |
For the year ended October 31, 2011, there have been no significant transfers between Level 1 and Level 2 investments.
For the year ended October 31, 2011, there were no Level 3 investments.
The accompanying notes are an integral part of the financial statements.
24
| | |
| Schedule of Investments | | October 31, 2011 |
Global X China Industrials ETF
Sector Weightings (unaudited)†:

† Percentages based on total investments.
| | | | |
| | | Shares | | Value |
COMMON STOCK — 99.9% | | | | |
| | |
CHINA — 83.5% | | | | |
| | |
Industrials — 83.5% | | | | |
Anhui Conch Cement, Cl H | | 57,700 | | $ 214,653 |
Asia Cement China Holdings | | 54,973 | | 26,536 |
BBMG, Cl H | | 148,021 | | 132,044 |
Byd, Cl H | | 96,167 | | 236,441 |
China Communications Construction, Cl H | | 295,465 | | 227,061 |
China COSCO Holdings, Cl H | | 321,218 | | 171,184 |
China National Building Material, Cl H | | 172,578 | | 227,483 |
China National Materials | | 135,446 | | 69,741 |
China Railway Construction, Cl H | | 239,095 | | 144,654 |
China Railway Group, Cl H | | 521,045 | | 176,398 |
China Rongsheng Heavy Industry Group | | 372,962 | | 132,506 |
China Shanshui Cement Group | | 243,723 | | 191,377 |
China Shipping Container Lines, Cl H * | | 444,438 | | 86,387 |
China Shipping Development, Cl H | | 164,098 | | 118,292 |
China South Locomotive and Rolling Stock | | 250,647 | | 151,643 |
China Zhongwang Holdings | | 173,638 | | 58,114 |
Dongfang Electric, Cl H | | 42,093 | | 131,939 |
Duoyuan Global Water ADR * 1, 2 | | 3,967 | | 3,848 |
First Tractor, Cl H | | 50,741 | | 46,309 |
Guangshen Railway, Cl H | | 177,253 | | 62,062 |
Haitian International Holdings | | 69,200 | | 62,176 |
Harbin Electric * | | 2,503 | | 58,795 |
Harbin Power Equipment, Cl H | | 86,146 | | 88,159 |
Metallurgical Corp of China, Cl H | | 349,069 | | 76,837 |
Sany Heavy Equipment International Holdings | | 109,161 | | 97,519 |
Shanghai Electric Group, Cl H | | 345,632 | | 154,830 |
Sinotrans, Cl H | | 204,694 | | 42,686 |
Sinotruk Hong Kong | | 167,542 | | 99,208 |
Weichai Power, Cl H | | 41,444 | | 212,062 |
Yangzijiang Shipbuilding Holdings | | 221,438 | | 166,727 |
Zhuzhou CSR Times Electric, Cl H | | 57,404 | | 137,294 |
| | | | |
TOTAL CHINA | | | | 3,804,965 |
| | | | |
The accompanying notes are an integral part of the financial statements.
25
| | |
| Schedule of Investments | | October 31, 2011 |
Global X China Industrials ETF
| | | | | | |
| | | Shares/Face
Amount | | Value | |
COMMON STOCK — continued | | | | | | |
| | |
HONG KONG — 16.4% | | | | | | |
| | |
Industrials — 16.4% | | | | | | |
Beijing Capital International Airport, Cl H | | 187,796 | | $ | 85,334 | |
China High Speed Transmission Equipment Group | | 134,150 | | | 85,652 | |
China Resources Cement Holdings | | 219,725 | | | 178,190 | |
Citic Resources Holdings * | | 336,598 | | | 48,528 | |
Shanghai Industrial Holdings | | 68,139 | | | 226,297 | |
Shenzhen International Holdings | | 839,258 | | | 55,097 | |
Sinotrans Shipping | | 173,907 | | | 44,101 | |
Tianjin Development Holdings | | 54,912 | | | 25,941 | |
| | | | | | |
TOTAL HONG KONG | | | | | 749,140 | |
| | | | | | |
TOTAL COMMON STOCK
(Cost $7,019,845) | | | | | 4,554,105 | |
| | | | | | |
| | |
TIME DEPOSIT — 0.1% | | | | | | |
Brown Brothers Harriman, 0.030%
(Cost $4,865) | | $ 4,865 | | | 4,865 | |
| | | | | | |
TOTAL INVESTMENTS — 100.0%
(Cost $7,024,710) | | | | $ | 4,558,970 | |
| | | | | | |
Percentages are based on Net Assets of $4,557,888.
| * | Non-income producing security. |
| 1 | Security is fair valued using methods determined in good faith by the Fair Value Committee of the Fund. The total value of such security as of October 31, 2011 was $3,848 and represents 0.1% of Net Assets. |
| 2 | Security considered illiquid. The total value of such security as of October 31, 2011 was $3,848 and represented 0.1% of Net Assets. |
ADR — American Depositary Receipt
Cl — Class
The following is a summary of the inputs used as of October 31, 2011, in valuing the Fund’s investments carried at value:
| | | | | | | | | | | | | | | | |
| Investments in Securities | | Level 1 | | | Level 2 | | | Level 3 | | | Total | |
Common Stock | | | | | | | | | | | | | | | | |
China | | $ | 3,801,117 | | | $ | - | | | $ | 3,848 | | | $ | 3,804,965 | |
Hong Kong | | | 749,140 | | | | - | | | | - | | | | 749,140 | |
| | | | | | | | | | | | | | | | |
Total Common Stock | | | 4,550,257 | | | | - | | | | 3,848 | | | | 4,554,105 | |
| | | | | | | | | | | | | | | | |
Time Deposit | | | - | | | | 4,865 | | | | - | | | | 4,865 | |
| | | | | | | | | | | | | | | | |
Total Investments in Securities | | $ | 4,550,257 | | | $ | 4,865 | | | $ | 3,848 | | | $ | 4,558,970 | |
| | | | | | | | | | | | | | | | |
The accompanying notes are an integral part of the financial statements.
26
| | |
| Schedule of Investments | | October 31, 2011 |
Global X China Industrials ETF
The following is a reconciliation of investments in which significant unobservable inputs (Level 3) were used in determining fair value:
| | | | |
| | | China | |
| | | Investments in
Common Stock | |
Beginning balance as of October 31, 2010 | | $ | - | |
Accrued discounts/premiums | | | - | |
Realized gain/(loss) | | | - | |
Change in unrealized appreciation/(depreciation) | | | - | |
Net purchases | | | - | |
Net sales | | | - | |
Transfers into Level 3 | | | 3,848 | |
Transfers out of Level 3 | | | - | |
| | | | |
Ending balance as of October 31, 2011 | | $ | 3,848 | |
| | | | |
Net change in unrealized appreciation/(depreciation) from investments (Level 3) still held as of October 31, 2011 is $—.
For the year ended October 31, 2011, there have been no significant transfers between Level 1 and Level 2 investments.
For the year ended October 31, 2011, transfers between Level 1 and Level 3 assets and liabilities totaled $3,848.
The Level 3 investment presented above was considered a Level 1 investment at the beginning of the reporting period. The reason for the transfer was a temporary trading suspension of the investment’s shares, which necessitated a fair value determination by the Fair Value Committee at the end of the reporting period. The Fund’s policy is to transfer investments into/out of level 3 at the end of the reporting period.
The accompanying notes are an integral part of the financial statements.
27
| | |
| Schedule of Investments | | October 31, 2011 |
Global X China Materials ETF
Sector Weightings (unaudited)†:

† Percentages based on total investments.
| | | | | | |
| | | Shares | | Value | |
COMMON STOCK — 99.0% | | | | | | |
| | |
CHINA— 71.0% | | | | | | |
| | |
Basic Materials — 71.0% | | | | | | |
Aluminum Corp of China, Cl H | | 238,676 | | $ | 133,340 | |
Angang Steel, Cl H | | 212,835 | | | 132,602 | |
China BlueChemical | | 174,107 | | | 138,057 | |
China Green Agriculture * | | 3,490 | | | 14,099 | |
China Hongqiao Group * | | 204,744 | | | 121,236 | |
China Molybdenum, Cl H | | 270,719 | | | 135,908 | |
China Rare Earth Holdings * | | 245,006 | | | 54,562 | |
China Vanadium Titano - Magnetite Mining | | 199,620 | | | 42,142 | |
Dongyue Group | | 175,806 | | | 139,631 | |
Gulf Resources * | | 3,171 | | | 7,484 | |
Hidili Industry International Development | | 202,838 | | | 86,425 | |
Hunan Non-Ferrous Metal, Cl H | | 371,854 | | | 103,871 | |
Jiangxi Copper, Cl H | | 54,661 | | | 135,799 | |
Lingbao Gold, Cl H | | 64,198 | | | 29,006 | |
Maanshan Iron & Steel, Cl H | | 381,426 | | | 115,874 | |
Real Gold Mining 1,2 | | 97,864 | | | 74,830 | |
Sinopec Shanghai Petrochemical, Cl H | | 359,204 | | | 134,092 | |
Sinopec Yizheng Chemical Fibre, Cl H | | 316,897 | | | 77,914 | |
Xinjiang Xinxin Mining Industry, Cl H | | 156,094 | | | 52,443 | |
Yongye International * | | 8,879 | | | 44,750 | |
Zhaojin Mining Industry | | 74,566 | | | 133,995 | |
Zijin Mining Group, Cl H | | 302,858 | | | 131,381 | |
| | | | | | |
TOTAL CHINA | | | | | 2,039,441 | |
| | | | | | |
| | |
HONG KONG— 28.0% | | | | | | |
| | |
Basic Materials — 28.0% | | | | | | |
China Lumena New Materials | | 587,611 | | | 133,127 | |
Citic Pacific | | 77,339 | | | 142,562 | |
Fufeng Group | | 164,402 | | | 89,730 | |
North Mining Shares, Cl C * | | 2,953,059 | | | 79,067 | |
Shougang Concord International Enterprises | | 1,160,526 | | | 82,164 | |
Sinofert Holdings | | 402,160 | | | 134,597 | |
Yingde Gases | | 133,812 | | | 144,345 | |
| | | | | | |
TOTAL HONG KONG | | | | | 805,592 | |
| | | | | | |
The accompanying notes are an integral part of the financial statements.
28
| | |
| Schedule of Investments | | October 31, 2011 |
Global X China Materials ETF
| | | | | | |
| | | | | Value | |
COMMON STOCK — continued | | | | | | |
TOTAL COMMON STOCK
(Cost $4,310,922) | | | | $ | 2,845,033 | |
| | | | | | |
TOTAL INVESTMENTS — 99.0%
(Cost $4,310,922) | | | | $ | 2,845,033 | |
| | | | | | |
Percentages are based on Net Assets of $2,874,627.
| * | Non-income producing security. |
| 1 | Security is fair valued using methods determined in good faith by the Fair Value Committee of the Fund. The total value of such security as of October 31, 2011 was $74,830 and represents 2.6% of Net Assets. |
| 2 | Security considered illiquid. The total value of such security as of October 31, 2011 was $74,830 and represented 2.6% of Net Assets |
Cl — Class
The following is a summary of the inputs used as of October 31, 2011, in valuing the Fund’s investments carried at value:
| | | | | | | | | | | | | | | | |
Investments in Securities | | Level 1 | | | Level 2 | | | Level 3 | | | Total | |
Common Stock | | | | | | | | | | | | | | | | |
China | | $ | 1,964,611 | | | $ | - | | | $ | 74,830 | | | $ | 2,039,441 | |
Hong Kong | | | 805,592 | | | | - | | | | - | | | | 805,592 | |
| | | | | | | | | | | | | | | | |
Total Investments in Securities | | $ | 2,770,203 | | | $ | - | | | $ | 74,830 | | | $ | 2,845,033 | |
| | | | | | | | | | | | | | | | |
The following is a reconciliation of investments in which significant unobservable inputs (Level 3) were used in determining fair value:
| | | | |
| | | China | |
| | | Investments in
Common Stock | |
Beginning balance as of October 31, 2010 | | $ | 1,048,393 | |
Accrued discounts/premiums | | | - | |
Realized gain/(loss) | | | - | |
Change in unrealized appreciation/(depreciation) | | | - | |
Net purchases | | | - | |
Net sales | | | - | |
Transfers into Level 3 | | | 74,830 | |
Transfers out of Level 3 | | | (1,048,393) | |
| | | | |
Ending balance as of October 31, 2011 | | $ | 74,830 | |
| | | | |
Net change in unrealized appreciation/(depreciation) from investments (Level 3) still held as of October 31, 2011 is $—.
For the year ended October 31, 2011, there have been no significant transfers between Level 1 and Level 2 investments.
For the year ended October 31, 2011, transfers between Level 1 and Level 3 assets and liabilities totaled $74,830.
The Level 3 investments at the end of the reporting period were considered Level 1 investments at the beginning of the reporting period. The reason for the transfer was a temporary suspension of the investments’ shares, which necessitated a fair value determination by the Fair Value Committee at the end of the reporting period. The Fund’s policy is to transfer investments into/out of Level 3 at the end of the reporting period.
The Level 3 investment at the beginning of the period resumed trading and was transferred to Level 1.
The accompanying notes are an integral part of the financial statements.
29
| | |
| Schedule of Investments | | October 31, 2011 |
Global X NASDAQ China Technology ETF
Sector Weightings (unaudited)†:
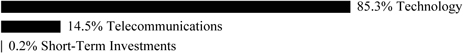
† Percentages based on total investments.
| | | | | | | | |
| | | Shares | | | Value | |
COMMON STOCK — 99.4% | | | | | | | | |
| | |
CHINA— 84.4% | | | | | | | | |
| | |
Technology — 79.6% | | | | | | | | |
AAC Acoustic Technologies Holdings | | | 89,044 | | | $ | 207,007 | |
Alibaba.com | | | 179,362 | | | | 213,568 | |
AsiaInfo Holdings * | | | 6,452 | | | | 64,649 | |
Baidu ADR * | | | 1,546 | | | | 216,718 | |
BYD Electronic International | | | 89,092 | | | | 32,341 | |
China Communications Services, Cl H | | | 294,341 | | | | 137,537 | |
Ctrip.com International ADR * | | | 6,140 | | | | 214,040 | |
Foxconn International Holdings * | | | 310,048 | | | | 210,730 | |
Giant Interactive Group ADR | | | 33,051 | | | | 128,568 | |
Kingdee International Software Group | | | 236,683 | | | | 97,190 | |
Kingsoft | | | 93,271 | | | | 41,782 | |
Lenovo Group | | | 317,208 | | | | 216,821 | |
Netease.com ADR * | | | 4,631 | | | | 219,371 | |
Perfect World ADR * | | | 6,268 | | | | 81,547 | |
Qihoo 360 Technology ADR * | | | 5,330 | | | | 107,719 | |
Semiconductor Manufacturing International * | | | 2,676,939 | | | | 149,896 | |
Shanda Interactive Entertainment ADR * | | | 5,576 | | | | 221,646 | |
Sina * | | | 2,138 | | | | 173,798 | |
Sohu.com * | | | 3,241 | | | | 195,756 | |
Spreadtrum Communications ADR | | | 6,125 | | | | 162,741 | |
Tencent Holdings | | | 9,482 | | | | 223,486 | |
Travelsky Technology, Cl H | | | 137,170 | | | | 68,863 | |
VanceInfo Technologies ADR * | | | 5,224 | | | | 60,651 | |
ZTE, Cl H | | | 78,839 | | | | 227,835 | |
| | | | | | | | |
| | | | | | | 3,674,260 | |
| | | | | | | | |
Telecommunications — 4.8%
China Telecom, Cl H | | | 348,739 | | | | 219,070 | |
| | | | | | | | |
TOTAL CHINA | | | | | | | 3,893,330 | |
| | | | | | | | |
| | |
HONG KONG— 14.3% | | | | | | | | |
| | |
Technology — 4.6%
Digital China Holdings | | | 134,710 | | | | 213,635 | |
| | | | | | | | |
The accompanying notes are an integral part of the financial statements.
30
| | |
| Schedule of Investments | | October 31, 2011 |
Global X NASDAQ China Technology ETF
| | | | | | | | |
| | | Shares/Face
Amount | | | Value | |
COMMON STOCK — continued | | | | | | | | |
| | |
Telecommunications — 9.7%
China Mobile | | | 23,051 | | | $ | 221,504 | |
China Unicom Hong Kong | | | 108,954 | | | | 226,085 | |
| | | | | | | | |
| | | | | | | 447,589 | |
| | | | | | | | |
TOTAL HONG KONG | | | | | | | 661,224 | |
| | | | | | | | |
| | |
UNITED STATES— 0.7% | | | | | | | | |
| | |
Technology — 0.7%
Sina * | | | 392 | | | | 31,866 | |
| | | | | | | | |
TOTAL COMMON STOCK
(Cost $4,598,372) | | | | | | | 4,586,420 | |
| | | | | | | | |
| | |
TIME DEPOSIT — 0.2% | | | | | | | | |
Brown Brothers Harriman, 0.030%
(Cost $7,095) | | $ | 7,095 | | | | 7,095 | |
| | | | | | | | |
TOTAL INVESTMENTS — 99.6%
(Cost $4,605,467) | | | | | | $ | 4,593,515 | |
| | | | | | | | |
Percentages are based on Net Assets of $4,614,037.
| * | Non-income producing security. |
ADR — American Depositary Receipt
Cl — Class
The following is a summary of the inputs used as of October 31, 2011, in valuing the Fund’s investments carried at value:
| | | | | | | | | | | | | | | | |
Investments in Securities | | | Level 1 | | | | Level 2 | | | | Level 3 | | | | Total | |
| | | | | | | | | | | | | | | | |
Common Stock | | $ | 4,586,420 | | | $ | — | | | $ | — | | | $ | 4,586,420 | |
Time Deposit | | | — | | | | 7,095 | | | | — | | | | 7,095 | |
| | | | | | | | | | | | | | | | |
Total Investments in Securities | | $ | 4,586,420 | | | $ | 7,095 | | | $ | — | | | $ | 4,593,515 | |
| | | | | | | | | | | | | | | | |
For the year ended October 31, 2011, there have been no significant transfers between Level 1 and Level 2 investments.
For the year ended October 31, 2011, there were no Level 3 investments.
The accompanying notes are an integral part of the financial statements.
31
| | |
| Schedule of Investments | | October 31, 2011 |
Global X FTSE ASEAN 40 ETF
Sector Weightings (unaudited)†:
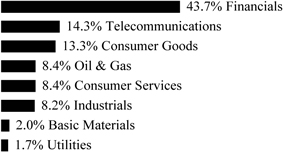
† Percentages based on total investments.
| | | | | | | | |
| | | Shares | | | Value | |
COMMON STOCK — 100.0% | | | | | | | | |
| | |
INDONESIA— 19.1% | | | | | | | | |
| | |
Consumer Goods — 7.6% | | | | | | | | |
Astra International | | | 204,928 | | | $ | 1,597,744 | |
Unilever Indonesia | | | 102,000 | | | | 180,373 | |
| | | | | | | | |
| | | | | | | 1,778,117 | |
| | | | | | | | |
Financials — 8.1% | | | | | | | | |
Bank Central Asia | | | 820,400 | | | | 750,875 | |
Bank Mandiri | | | 618,759 | | | | 499,901 | |
Bank Rakyat Indonesia Persero | | | 817,700 | | | | 623,669 | |
| | | | | | | | |
| | | | | | | 1,874,445 | |
| | | | | | | | |
Telecommunications — 2.5% | | | | | | | | |
Telekomunikasi Indonesia ADR | | | 16,866 | | | | 570,071 | |
| | | | | | | | |
Utilities — 0.9% | | | | | | | | |
Perusahaan Gas Negara | | | 649,500 | | | | 216,500 | |
| | | | | | | | |
TOTAL INDONESIA | | | | | | | 4,439,133 | |
| | | | | | | | |
MALAYSIA— 30.4% | | | | | | | | |
Basic Materials — 2.0% | | | | | | | | |
Petronas Chemicals Group | | | 222,166 | | | | 467,222 | |
| | | | | | | | |
Consumer Goods — 2.4% | | | | | | | | |
IOI | | | 323,800 | | | | 554,271 | |
| | | | | | | | |
Consumer Services — 2.8% | | | | | | | | |
Genting | | | 186,000 | | | | 652,546 | |
| | | | | | | | |
Financials — 12.7% | | | | | | | | |
CIMB Group Holdings | | | 381,114 | | | | 940,669 | |
Malayan Banking | | | 382,705 | | | | 1,043,174 | |
Public Bank | | | 237,000 | | | | 981,383 | |
| | | | | | | | |
| | | | | | | 2,965,226 | |
| | | | | | | | |
Industrials — 4.7% | | | | | | | | |
PLUS Expressways | | | 134,700 | | | | 194,123 | |
The accompanying notes are an integral part of the financial statements.
32
| | |
| Schedule of Investments | | October 31, 2011 |
Global X FTSE ASEAN 40 ETF
| | | | | | | | |
| | | Shares | | | Value | |
COMMON STOCK — continued | | | | | | | | |
Industrials — continued | | | | | | | | |
Sime Darby | | | 307,582 | | | $ | 892,559 | |
| �� | | | | | | | |
| | | | | | | 1,086,682 | |
| | | | | | | | |
Oil & Gas — 1.0% | | | | | | | | |
Petronas Gas | | | 54,000 | | | | 230,649 | |
| | | | | | | | |
Telecommunications — 4.0% | | | | | | | | |
Axiata Group | | | 423,800 | | | | 674,322 | |
Maxis | | | 150,600 | | | | 262,703 | |
| | | | | | | | |
| | | | | | | 937,025 | |
| | | | | | | | |
Utilities — 0.8% | | | | | | | | |
Tenaga Nasional | | | 90,000 | | | | 175,481 | |
| | | | | | | | |
TOTAL MALAYSIA | | | | | | | 7,069,102 | |
| | | | | | | | |
PHILIPPINES— 0.6% | | | | | | | | |
Telecommunications — 0.6% | | | | | | | | |
Philippine Long Distance Telephone ADR | | | 2,526 | | | | 140,294 | |
| | | | | | | | |
SINGAPORE— 38.7% | | | | | | | | |
Consumer Goods — 3.2% | | | | | | | | |
Wilmar International | | | 171,000 | | | | 745,255 | |
| | | | | | | | |
Consumer Services — 5.6% | | | | | | | | |
Genting Singapore * | | | 406,500 | | | | 561,929 | |
Jardine Cycle & Carriage | | | 9,592 | | | | 347,730 | |
Singapore Airlines | | | 41,008 | | | | 382,929 | |
| | | | | | | | |
| | | | | | | 1,292,588 | |
| | | | | | | | |
Financials — 18.4% | | | | | | | | |
CapitaLand | | | 213,000 | | | | 463,302 | |
City Developments | | | 45,300 | | | | 393,772 | |
DBS Group Holdings | | | 118,900 | | | | 1,170,906 | |
Oversea-Chinese Banking | | | 171,101 | | | | 1,154,669 | |
United Overseas Bank | | | 79,880 | | | | 1,091,500 | |
| | | | | | | | |
| | | | | | | 4,274,149 | |
| | | | | | | | |
Industrials — 2.7% | | | | | | | | |
Noble Group | | | 319,047 | | | | 395,282 | |
Singapore Technologies Engineering | | | 102,000 | | | | 229,990 | |
| | | | | | | | |
| | | | | | | 625,272 | |
| | | | | | | | |
Oil & Gas — 2.9% | | | | | | | | |
Keppel | | | 89,280 | | | | 675,059 | |
| | | | | | | | |
Telecommunications — 5.9% | | | | | | | | |
Singapore Telecommunications | | | 542,820 | | | | 1,379,648 | |
| | | | | | | | |
TOTAL SINGAPORE | | | | | | | 8,991,971 | |
| | | | | | | | |
THAILAND— 11.2% | | | | | | | | |
Financials — 4.4% | | | | | | | | |
Bangkok Bank | | | 63,000 | | | | 306,592 | |
The accompanying notes are an integral part of the financial statements.
33
| | |
| Schedule of Investments | | October 31, 2011 |
Global X FTSE ASEAN 40 ETF
| | | | | | | | |
| | | Shares | | | Value | |
COMMON STOCK — continued | | | | | | | | |
Financials — continued | | | | | | | | |
Kasikornbank | | | 78,000 | | | $ | 314,844 | |
Siam Commercial Bank | | | 105,000 | | | | 401,611 | |
| | | | | | | | |
| | | | | | | 1,023,047 | |
| | | | | | | | |
Industrials — 0.9% | | | | | | | | |
Siam Cement | | | 20,750 | | | | 212,769 | |
| | | | | | | | |
Oil & Gas — 4.5% | | | | | | | | |
PTT | | | 57,000 | | | | 567,773 | |
PTT Exploration & Production | | | 90,778 | | | | 475,757 | |
| | | | | | | | |
| | | | | | | 1,043,530 | |
| | | | | | | | |
Telecommunications — 1.4% | | | | | | | | |
Advanced Info Service | | | 78,900 | | | | 335,171 | |
| | | | | | | | |
TOTAL THAILAND | | | | | | | 2,614,517 | |
| | | | | | | | |
TOTAL COMMON STOCK
(Cost $24,596,635) | | | | | | | 23,255,017 | |
| | | | | | | | |
TOTAL INVESTMENTS — 100.0%
(Cost $24,596,635) | | | | | | $ | 23,255,017 | |
| | | | | | | | |
Percentages are based on Net Assets of $23,262,232.
| * | Non-income producing security. |
ADR — American Depositary Receipt
The following is a summary of the inputs used as of October 31, 2011, in valuing the Fund’s investments carried at value:
| | | | | | | | | | | | | | | | |
| Investments in Securities | | Level 1 | | | Level 2 | | | Level 3 | | | Total | |
Common Stock | | $ | 23,255,017 | | | $ | — | | | $ | — | | | $ | 23,255,017 | |
| | | | | | | | | | | | | | | | |
Total Investments in Securities | | $ | 23,255,017 | | | $ | — | | | $ | — | | | $ | 23,255,017 | |
| | | | | | | | | | | | | | | | |
For the period ended October 31, 2011, there have been no significant transfers between Level 1 and Level 2 investments.
For the period ended October 31, 2011, there were no Level 3 investments.
The accompanying notes are an integral part of the financial statements.
34
| | |
| Schedule of Investments | | October 31, 2011 |
Global X FTSE Andean 40 ETF
Sector Weightings (unaudited)†:
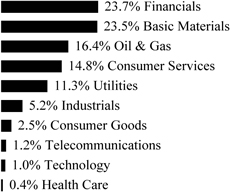
† Percentages based on total investments.
| | | | | | | | |
| | | Shares | | | Value | |
COMMON STOCK — 99.8% | | | | | | | | |
| | |
CHILE— 50.6% | | | | | | | | |
| | |
Basic Materials — 10.0% | | | | | | | | |
CAP | | | 4,867 | | | $ | 189,304 | |
Empresas CMPC | | | 46,005 | | | | 191,206 | |
Sociedad Quimica y Minera de Chile ADR | | | 5,153 | | | | 301,450 | |
| | | | | | | | |
| | | | | | | 681,960 | |
| | | | | | | | |
Consumer Goods — 2.3% | | | | | | | | |
AquaChile * | | | 20,095 | | | | 15,223 | |
Cia Cervecerias Unidas ADR | | | 1,061 | | | | 60,774 | |
Embotelladora Andina ADR, Cl B | | | 1,319 | | | | 37,592 | |
Vina Concha y Toro ADR | | | 1,166 | | | | 43,142 | |
| | | | | | | | |
| | | | | | | 156,731 | |
| | | | | | | | |
Consumer Services — 12.8% | | | | | | | | |
Cencosud | | | 39,324 | | | | 252,974 | |
Lan Airlines ADR | | | 10,892 | | | | 273,062 | |
Ripley | | | 45,400 | | | | 48,099 | |
SACI Falabella | | | 31,170 | | | | 293,377 | |
| | | | | | | | |
| | | | | | | 867,512 | |
| | | | | | | | |
Financials — 7.7% | | | | | | | | |
Banco de Chile ADR | | | 2,517 | | | | 204,104 | |
Banco de Credito e Inversiones | | | 1,802 | | | | 100,820 | |
Banco Santander Chile ADR | | | 1,575 | | | | 128,646 | |
Corpbanca ADR | | | 2,520 | | | | 52,542 | |
Parque Arauco | | | 19,137 | | | | 36,678 | |
| | | | | | | | |
| | | | | | | 522,790 | |
| | | | | | | | |
Health Care — 0.4% | | | | | | | | |
CFR Pharmaceuticals * | | | 109,629 | | | | 25,966 | |
| | | | | | | | |
The accompanying notes are an integral part of the financial statements.
35
| | |
| Schedule of Investments | | October 31, 2011 |
Global X FTSE Andean 40 ETF
| | | | | | |
| | | Shares | | Value | |
COMMON STOCK — continued | | | | | | |
| | |
Industrials — 1.2% | | | | | | |
Cia Sud Americana de Vapores | | 89,444 | | $ | 24,447 | |
Salfacorp | | 18,500 | | | 57,357 | |
| | | | | | |
| | | | | 81,804 | |
| | | | | | |
Oil & Gas — 4.6% | | | | | | |
Empresas COPEC | | 20,414 | | | 313,065 | |
| | | | | | |
Technology — 1.0% | | | | | | |
Sonda | | 26,700 | | | 65,203 | |
| | | | | | |
Telecommunications — 1.1% | | | | | | |
ENTEL Chile | | 3,940 | | | 77,971 | |
| | | | | | |
Utilities — 9.5% | | | | | | |
AES Gener | | 113,000 | | | 64,586 | |
Colbun | | 293,024 | | | 79,701 | |
Empresa Nacional de Electricidad ADR | | 5,935 | | | 286,305 | |
Enersis ADR | | 11,342 | | | 222,643 | |
| | | | | | |
| | | | | 653,235 | |
| | | | | | |
TOTAL CHILE | | | | | 3,446,237 | |
| | | | | | |
| | |
COLOMBIA— 30.7% | | | | | | |
| | |
Consumer Goods — 0.2% | | | | | | |
Fabricato * | | 360,615 | | | 13,729 | |
| | | | | | |
Consumer Services — 2.1% | | | | | | |
Almacenes Exito | | 11,236 | | | 144,592 | |
| | | | | | |
Financials — 11.0% | | | | | | |
BanColombia ADR | | 8,553 | | | 533,536 | |
Grupo de Inversiones Suramericana | | 12,125 | | | 213,114 | |
| | | | | | |
| | | | | 746,650 | |
| | | | | | |
Industrials — 4.0% | | | | | | |
Cementos Argos | | 18,372 | | | 105,799 | |
Inversiones Argos | | 17,197 | | | 165,054 | |
| | | | | | |
| | | | | 270,853 | |
| | | | | | |
Oil & Gas — 11.8% | | | | | | |
Ecopetrol ADR | | 11,734 | | | 499,164 | |
Pacific Rubiales Energy (CAD) | | 13,125 | | | 306,035 | |
| | | | | | |
| | | | | 805,199 | |
| | | | | | |
Utilities — 1.6% | | | | | | |
Interconexion Electrica | | 17,808 | | | 113,628 | |
| | | | | | |
TOTAL COLOMBIA | | | | | 2,094,651 | |
| | | | | | |
| | |
PERU— 18.5% | | | | | | |
| | |
Basic Materials — 13.5% | | | | | | |
Cia de Minas Buenaventura ADR | | 10,617 | | | 434,554 | |
Sociedad Minera Cerro Verde SAA | | 1,476 | | | 53,874 | |
The accompanying notes are an integral part of the financial statements.
36
| | |
| Schedule of Investments | | October 31, 2011 |
Global X FTSE Andean 40 ETF
| | | | | | | | |
| | | Shares | | | Value | |
COMMON STOCK — continued | | | | | | | | |
| | |
Basic Materials — continued | | | | | | | | |
Southern Copper | | | 10,627 | | | $ | 326,036 | |
Volcan Cia Minera SAA | | | 102,641 | | | | 100,543 | |
| | | | | | | | |
| | | | | | | 915,007 | |
| | | | | | | | |
Financials — 5.0% | | | | | | | | |
Credicorp | | | 1,285 | | | | 140,052 | |
Credicorp Ltd. | | | 1,868 | | | | 203,201 | |
| | | | | | | | |
| | | | | | | 343,253 | |
| | | | | | | | |
TOTAL PERU | | | | | | | 1,258,260 | |
| | | | | | | | |
TOTAL COMMON STOCK
(Cost $7,260,366) | | | | | | | 6,799,148 | |
| | | | | | | | |
TOTAL INVESTMENTS — 99.8%
(Cost $7,260,366) | | | | | | $ | 6,799,148 | |
| | | | | | | | |
Percentages are based on Net Assets of $6,806,041.
| * | Non-income producing security. |
ADR — American Depositary Receipt
CAD — Canadian Dollar
Cl — Class
Ltd. — Limited
The following is a summary of the inputs used as of October 31, 2011, in valuing the Fund’s investments carried at value:
| | | | | | | | | | | | | | | | |
Investments in Securities | | | Level 1 | | | | Level 2 | | | | Level 3 | | | | Total | |
| | | | | | | | | | | | | | | | |
Common Stock | | $ | 6,799,148 | | | $ | — | | | $ | — | | | $ | 6,799,148 | |
| | | | | | | | | | | | | | | | |
Total Investments in Securities | | $ | 6,799,148 | | | $ | — | | | $ | — | | | $ | 6,799,148 | |
| | | | | | | | | | | | | | | | |
For the period ended October 31, 2011, there have been no significant transfers between Level 1 & Level 2 investments.
For the period ended October 31, 2011, there were no Level 3 investments.
The accompanying notes are an integral part of the financial statements.
37
| | |
| Schedule of Investments | | October 31, 2011 |
Global X FTSE Colombia 20 ETF
Sector Weightings (unaudited)†:
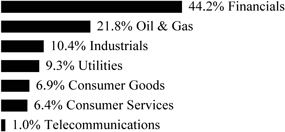
† Percentages based on total investments.
| | | | | | | | |
| | | Shares | | | Value | |
COMMON STOCK — 99.5% | | | | | | | | |
| | |
COLOMBIA— 99.5% | | | | | | | | |
| | |
Consumer Goods — 6.9% | | | | | | | | |
Fabricato * | | | 78,134,754 | | | $ | 2,974,567 | |
Grupo Nutresa | | | 561,596 | | | | 6,805,399 | |
| | | | | | | | |
| | | | | | | 9,779,966 | |
| | | | | | | | |
Consumer Services — 6.4% | | | | | | | | |
Almacenes Exito | | | 702,461 | | | | 9,039,712 | |
| | | | | | | | |
Financials — 44.0% | | | | | | | | |
Banco Davivienda | | | 590,416 | | | | 6,401,186 | |
BanColombia ADR | | | 320,925 | | | | 20,019,302 | |
Bolsa de Valores de Colombia | | | 220,322,625 | | | | 3,933,911 | |
Cia Colombiana de Inversiones | | | 2,558,721 | | | | 5,872,025 | |
Financiera Colombiana | | | 358,206 | | | | 6,749,254 | |
Grupo Aval Acciones y Valores | | | 13,478,162 | | | | 8,852,948 | |
Grupo de Inversiones Suramericana | | | 450,640 | | | | 7,920,632 | |
Helm Bank | | | 6,387,007 | | | | 1,061,647 | |
Interbolsa * | | | 1,167,693 | | | | 1,427,528 | |
| | | | | | | | |
| | | | | | | 62,238,433 | |
| | | | | | | | |
Industrials — 10.3% | | | | | | | | |
Cementos Argos | | | 1,131,453 | | | | 6,515,713 | |
Inversiones Argos | | | 689,128 | | | | 6,614,151 | |
Tableros y Maderas de Caldas | | | 285,476,806 | | | | 1,467,948 | |
| | | | | | | | |
| | | | | | | 14,597,812 | |
| | | | | | | | |
Oil & Gas — 21.7% | | | | | | | | |
Ecopetrol ADR | | | 437,245 | | | | 18,600,402 | |
Pacific Rubiales Energy (CAD) | | | 504,870 | | | | 11,772,027 | |
Pacific Rubiales Energy (USD) | | | 15,000 | | | | 351,000 | |
| | | | | | | | |
| | | | | | | 30,723,429 | |
| | | | | | | | |
Telecommunications — 1.0% | | | | | | | | |
Empresa de Telecomunicaciones de Bogota | | | 4,740,779 | | | | 1,443,840 | |
| | | | | | | | |
The accompanying notes are an integral part of the financial statements.
38
| | |
| Schedule of Investments | | October 31, 2011 |
Global X FTSE Colombia 20 ETF
| | | | | | | | |
| | | Shares | | | Value | |
COMMON STOCK — continued | | | | | | | | |
| | |
Utilities — 9.2% | | | | | | | | |
Interconexion Electrica | | | 1,040,683 | | | $ | 6,640,283 | |
Isagen | | | 5,469,665 | | | | 6,452,152 | |
| | | | | | | | |
| | | | | | | 13,092,435 | |
| | | | | | | | |
TOTAL COMMON STOCK
(Cost $145,016,559) | | | | | | | 140,915,627 | |
| | | | | | | | |
TOTAL INVESTMENTS — 99.5%
(Cost $145,016,559) | | | | | | $ | 140,915,627 | |
| | | | | | | | |
Percentages are based on Net Assets of $141,612,918.
| * | Non-income producing security. |
ADR — American Depositary Receipt
CAD — Canadian Dollar
USD — U.S. Dollar
The following is a summary of the inputs used as of October 31, 2011, in valuing the Fund’s investments carried at value:
| | | | | | | | | | | | | | | | |
| Investments in Securities | | Level 1 | | | Level 2 | | | Level 3 | | | Total | |
Common Stock | | $ | 140,915,627 | | | $ | — | | | $ | — | | | $ | 140,915,627 | |
| | | | | | | | | | | | | | | | |
Total Investments in Securities | | $ | 140,915,627 | | | $ | — | | | $ | — | | | $ | 140,915,627 | |
| | | | | | | | | | | | | | | | |
For the year ended October 31, 2011, there have been no significant transfers between Level 1 & Level 2 investments.
For the year ended October 31, 2011, there were no Level 3 investments.
The accompanying notes are an integral part of the financial statements.
39
| | |
| Schedule of Investments | | October 31, 2011 |
Global X FTSE Argentina 20 ETF
Sector Weightings (unaudited)†:
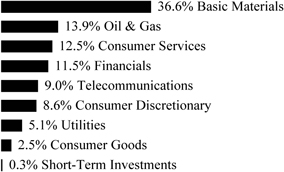
† Percentages based on total investments.
| | | | | | | | |
| | | Shares | | | Value | |
COMMON STOCK — 99.7% | | | | | | | | |
| | |
ARGENTINA— 81.5% | | | | | | | | |
| | |
Basic Materials — 22.8% | | | | | | | | |
Tenaris ADR | | | 27,671 | | | $ | 880,215 | |
| | | | | | | | |
Consumer Discretionary — 8.5% | | | | | | | | |
Arcos Dorados Holdings | | | 14,087 | | | | 329,636 | |
| | | | | | | | |
Consumer Goods — 2.5% | | | | | | | | |
Cresud SA ADR | | | 8,390 | | | | 97,408 | |
| | | | | | | | |
Consumer Services — 8.1% | | | | | | | | |
MercadoLibre | | | 4,810 | | | | 313,612 | |
| | | | | | | | |
Financials — 11.5% | | | | | | | | |
Banco Macro ADR | | | 8,412 | | | | 168,661 | |
BBVA Banco Frances ADR | | | 11,963 | | | | 74,290 | |
Grupo Financiero Galicia ADR | | | 16,061 | | | | 132,664 | |
IRSA Inversiones y Representaciones ADR | | | 6,453 | | | | 64,917 | |
| | | | | | | | |
| | | | | | | 440,532 | |
| | | | | | | | |
Oil & Gas — 14.0% | | | | | | | | |
Petrobras Argentina ADR | | | 9,007 | | | | 126,098 | |
Transportadora de Gas del Sur ADR | | | 8,683 | | | | 27,351 | |
YPF ADR | | | 11,407 | | | | 383,389 | |
| | | | | | | | |
| | | | | | | 536,838 | |
| | | | | | | | |
Telecommunications — 9.0% | | | | | | | | |
Nortel Inversora ADR * | | | 6,559 | | | | 156,563 | |
Telecom Argentina ADR | | | 9,527 | | | | 191,302 | |
| | | | | | | | |
| | | | | | | 347,865 | |
| | | | | | | | |
Utilities — 5.1% | | | | | | | | |
Empresa Distribuidora Y Comercializadora Norte ADR * | | | 2,466 | | | | 19,728 | |
Pampa Energia ADR | | | 11,725 | | | | 177,138 | |
| | | | | | | | |
| | | | | | | 196,866 | |
| | | | | | | | |
TOTAL ARGENTINA | | | | | | | 3,142,972 | |
| | | | | | | | |
The accompanying notes are an integral part of the financial statements.
40
| | |
| Schedule of Investments | | October 31, 2011 |
Global X FTSE Argentina 20 ETF
| | | | | | | | |
| | | Shares/Face
Amount | | | Value | |
COMMON STOCK — continued | | | | | | | | |
| | |
CANADA— 13.8% | | | | | | | | |
Basic Materials — 13.8% | | | | | | | | |
Goldcorp | | | 2,962 | | | $ | 144,664 | |
Pan American Silver | | | 4,878 | | | | 136,389 | |
Silver Standard Resources * | | | 5,533 | | | | 108,391 | |
Yamana Gold | | | 9,623 | | | | 144,056 | |
| | | | | | | | |
TOTAL CANADA | | | | | | | 533,500 | |
| | | | | | | | |
CHILE— 4.4% | | | | | | | | |
Consumer Services — 4.4% | | | | | | | | |
Cencosud | | | 26,353 | | | | 169,531 | |
| | | | | | | | |
TOTAL COMMON STOCK
(Cost $4,843,075) | | | | | | | 3,846,003 | |
| | | | | | | | |
TIME DEPOSIT — 0.3% | | | | | | | | |
Brown Brothers Harriman, 0.030%
(Cost $12,932) | | $ | 12,932 | | | | 12,932 | |
| | | | | | | | |
TOTAL INVESTMENTS — 100.0%
(Cost $4,856,007) | | | | | | $ | 3,858,935 | |
| | | | | | | | |
Percentages are based on Net Assets of $3,857,052.
| * | Non-income producing security. |
ADR — American Depositary Receipt
The following is a summary of the inputs used as of October 31, 2011, in valuing the Fund’s investments carried at value:
| | | | | | | | | | | | | | | | |
| Investments in Securities | | Level 1 | | | Level 2 | | | Level 3 | | | Total | |
Common Stock | | $ | 3,846,003 | | | $ | — | | | $ | — | | | $ | 3,846,003 | |
Time Deposit | | | — | | | | 12,932 | | | | — | | | | 12,932 | |
| | | | | | | | | | | | | | | | |
Total Investments in Securities | | $ | 3,846,003 | | | $ | 12,932 | | | $ | — | | | $ | 3,858,935 | |
| | | | | | | | | | | | | | | | |
For the period ended October 31, 2011, there have been no significant transfers between Level 1 and Level 2 investments.
For the period ended October 31, 2011, there were no Level 3 investments.
The accompanying notes are an integral part of the financial statements.
41
| | |
| Schedule of Investments | | October 31, 2011 |
Global X Brazil Mid Cap ETF
Sector Weightings (unaudited)†:
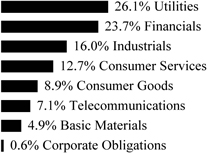
† Percentages based on total investments.
| | | | | | | | |
| | | Shares | | | Value | |
COMMON STOCK — 79.3% | | | | | | | | |
| | |
BRAZIL— 79.3% | | | | | | | | |
| | |
Basic Materials — 1.3% | | | | | | | | |
Fibria Celulose ADR | | | 35,806 | | | $ | 317,599 | |
| | | | | | | | |
Consumer Goods — 8.8% | | | | | | | | |
Cosan, Cl A | | | 21,845 | | | | 262,140 | |
Cosan Industria e Comercio | | | 20,620 | | | | 321,583 | |
Hypermarcas | | | 77,233 | | | | 420,248 | |
JBS * | | | 100,731 | | | | 302,809 | |
Marfrig Alimentos | | | 24,302 | | | | 104,910 | |
Natura Cosmeticos | | | 32,909 | | | | 642,267 | |
| | | | | | | | |
| | | | | | | 2,053,957 | |
| | | | | | | | |
Consumer Services — 5.6% | | | | | | | | |
Gol Linhas Aereas Inteligentes ADR | | | 25,402 | | | | 203,724 | |
Lojas Renner | | | 23,285 | | | | 708,114 | |
TAM ADR | | | 19,126 | | | | 384,241 | |
| | | | | | | | |
| | | | | | | 1,296,079 | |
| | | | | | | | |
Financials — 18.5% | | | | | | | | |
BR Malls Participacoes | | | 77,814 | | | | 845,459 | |
Cyrela Brazil Realty Empreendimentos e Participacoes | | | 54,918 | | | | 484,392 | |
MRV Engenharia e Participacoes | | | 62,820 | | | | 445,029 | |
Multiplan Empreendimentos Imobiliarios | | | 12,462 | | | | 251,709 | |
PDG Realty Empreendimentos e Participacoes | | | 214,056 | | | | 945,263 | |
Porto Seguro | | | 18,927 | | | | 202,998 | |
Redecard | | | 68,617 | | | | 1,140,885 | |
| | | | | | | | |
| | | | | | | 4,315,735 | |
| | | | | | | | |
Industrials — 16.1% | | | | | | | | |
All America Latina Logistica | | | 99,880 | | | | 499,836 | |
CCR | | | 41,031 | | | | 1,131,131 | |
Duratex | | | 52,399 | | | | 287,867 | |
Embraer ADR | | | 35,221 | | | | 979,848 | |
The accompanying notes are an integral part of the financial statements.
42
| | |
| Schedule of Investments | | October 31, 2011 |
Global X Brazil Mid Cap ETF
| | | | | | | | |
| | | Shares | | | Value | |
COMMON STOCK — continued | | | | | | | | |
| | |
Industrials — continued | | | | | | | | |
LLX Logistica * | | | 92,028 | | | $ | 205,877 | |
Weg | | | 58,174 | | | | 656,131 | |
| | | | | | | | |
| | | | | | | 3,760,690 | |
| | | | | | | | |
Telecommunications — 4.9% | | | | | | | | |
Telegraph Norte Leste Participacoes ADR | | | 55,173 | | | | 598,627 | |
Tim Participacoes ADR | | | 20,628 | | | | 537,153 | |
| | | | | | | | |
| | | | | | | 1,135,780 | |
| | | | | | | | |
Utilities — 24.1% | | | | | | | | |
Cia de Saneamento Basico do Estado de Sao Paulo ADR | | | 10,755 | | | | 583,566 | |
Cia Energetica de Minas Gerais ADR | | | 73,178 | | | | 1,246,953 | |
Cia Paranaense de Energia ADR | | | 24,427 | | | | 492,937 | |
CPFL Energia ADR | | | 48,975 | | | | 1,272,860 | |
EDP - Energias do Brasil | | | 10,609 | | | | 229,424 | |
Tractebel Energia | | | 38,881 | | | | 622,685 | |
Ultrapar Participacoes ADR | | | 66,035 | | | | 1,172,782 | |
| | | | | | | | |
| | | | | | | 5,621,207 | |
| | | | | | | | |
TOTAL COMMON STOCK
(Cost $19,643,759) | | | | | | | 18,501,047 | |
| | | | | | | | |
| | |
PREFERRED STOCK — 20.0% | | | | | | | | |
| | |
BRAZIL — 20.0% | | | | | | | | |
| | |
Basic Materials — 3.4% | | | | | | | | |
Metalurgica Gerdau, Cl A | | | 51,210 | | | | 576,989 | |
Suzano Papel e Celulose | | | 44,013 | | | | 221,283 | |
| | | | | | | | |
| | | | | | | 798,272 | |
| | | | | | | | |
Consumer Services — 7.2% | | | | | | | | |
Cia Brasileira de Distribuicao Grupo Pao de Acucar ADR | | | 30,373 | | | | 1,190,318 | |
Lojas Americanas | | | 55,145 | | | | 493,141 | |
| | | | | | | | |
| | | | | | | 1,683,459 | |
| | | | | | | | |
Financials — 5.2% | | | | | | | | |
Banco do Estado do Rio Grande do Sul | | | 33,975 | | | | 358,652 | |
Bradespar | | | 42,617 | | | | 868,974 | |
| | | | | | | | |
| | | | | | | 1,227,626 | |
| | | | | | | | |
Telecommunications — 2.2% | | | | | | | | |
Telemar Norte Leste | | | 18,708 | | | | 510,288 | |
| | | | | | | | |
| | |
Utilities — 2.0% | | | | | | | | |
Cia Energetica de Sao Paulo | | | 26,283 | | | | 456,144 | |
| | | | | | | | |
TOTAL PREFERRED STOCK
(Cost $4,931,257) | | | | | | | 4,675,789 | |
| | | | | | | | |
The accompanying notes are an integral part of the financial statements.
43
| | |
| Schedule of Investments | | October 31, 2011 |
Global X Brazil Mid Cap ETF
| | | | | | | | |
| | | Face
Amount/Number
of Warrants | | | Value | |
CORPORATE OBLIGATIONS — 0.6% | | | | | | | | |
BRAZIL— 0.6% | | | | | | | | |
Hypermarcus 1,2 | | | | | | | | |
11.300%, 10/15/18 | | $ | 59,000 | | | $ | 34,941 | |
3.000%, 10/15/15 | | | 59,000 | | | | 34,941 | |
Marfrig Alimentos, Convertible 1,2,3 | | | | | | | | |
1.04%, 07/15/15 | | | 12 | | | | 70,868 | |
| | | | | | | | |
TOTAL CORPORATE OBLIGATIONS
(Cost $141,511) | | | | | | | 140,750 | |
| | | | | | | | |
| | |
WARRANTS — 0.0% | | | | | | | | |
Hypermarcas* 1,2
(Cost $—) | | | 59 | | | | — | |
| | | | | | | | |
TOTAL INVESTMENTS — 99.9%
(Cost $24,716,527) | | | | | | $ | 23,317,586 | |
| | | | | | | | |
Percentages are based on Net Assets of $23,329,414.
| * | Non-income producing security. |
| 1 | Securities are fair valued using methods determined in good faith by the Fair Value Committee of the Board of Trustees. The total value of such securities as of October 31, 2011, was $140,750 and represented 0.6% of Net Assets. |
| 2 | Securities considered illiquid. The total value of such securities as of October 31, 2011 was $140,750 and represented 0.6% of Net Assets. |
| 3 | Floating rate security. Rate disclosed is the rate in effect on October 31, 2011. |
ADR — American Depositary Receipt
Cl — Class
The following is a summary of the inputs used as of October 31, 2011, in valuing the Fund’s investments carried at value:
| | | | | | | | | | | | | | | | |
Investments in Securities | | | Level 1 | | | | Level 2 | | | | Level 3 | | | | Total | |
| | | | | | | | | | | | | | | | |
Common Stock | | $ | 18,501,047 | | | $ | — | | | $ | — | | | $ | 18,501,047 | |
Preferred Stock | | | 4,675,789 | | | | — | | | | — | | | | 4,675,789 | |
Corporate Obligations | | | — | | | | — | | | | 140,750 | | | | 140,750 | |
Warrants | | | — | | | | — | | | | — | | | | — | |
| | | | | | | | | | | | | | | | |
Total Investments in Securities | | $ | 23,176,836 | | | $ | — | | | $ | 140,750 | | | $ | 23,317,586 | |
| | | | | | | | | | | | | | | | |
The accompanying notes are an integral part of the financial statements.
44
| | |
| Schedule of Investments | | October 31, 2011 |
Global X Brazil Mid Cap ETF
The following is a reconciliation of investments in which significant unobservable inputs (Level 3) were used in determining fair value:
| | | | |
| | | Brazil | |
| | | Investments in
Corporate
Obligations | |
Beginning balance as of October 31, 2010 | | $ | 71,750 | |
Accrued discounts/premiums | | | - | |
Realized gain/(loss) | | | - | |
Change in unrealized appreciation/(depreciation) | | | (882) | |
Net purchases | | | 69,882 | |
Net sales | | | - | |
Transfers into Level 3 | | | - | |
Transfers out of Level 3 | | | - | |
| | | | |
Ending balance as of October 31, 2011 | | $ | 140,750 | |
| | | | |
Net change in unrealized appreciation/(depreciation) from investments still held as of October 31, 2011 is $(882).
For the year ended October 31, 2011, there have been no significant transfers between Level 1 & Level 2 investments.
The accompanying notes are an integral part of the financial statements.
45
| | |
| Schedule of Investments | | October 31, 2011 |
Global X Brazil Consumer ETF
Sector Weightings (unaudited)†:
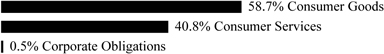
† Percentages based on total investments.
| | | | | | |
| | | Shares | | Value | |
COMMON STOCK — 81.1% | | | | | | |
| | |
BRAZIL — 81.1% | | | | | | |
Consumer Goods — 51.1% | | | | | | |
Arezzo Industria e Comercio | | 31,331 | | $ | 414,339 | |
BRF - Brasil Foods ADR | | 86,534 | | | 1,821,541 | |
Cia Hering | | 72,780 | | | 1,630,289 | |
Cosan, Cl A | | 99,387 | | | 1,192,644 | |
Cosan Industria e Comercio | | 93,754 | | | 1,462,158 | |
Gafisa ADR | | 148,476 | | | 1,104,661 | |
Hypermarcas | | 170,082 | | | 925,468 | |
JBS * | | 454,939 | | | 1,367,600 | |
M Dias Branco | | 36,106 | | | 935,832 | |
Marfrig Alimentos | | 109,761 | | | 473,830 | |
Natura Cosmeticos | | 62,250 | | | 1,214,900 | |
Sao Martinho | | 24,137 | | | 288,266 | |
SLC Agricola | | 40,494 | | | 402,227 | |
Souza Cruz | | 135,595 | | | 1,682,594 | |
Tereos Internacional | | 76,167 | | | 109,159 | |
| | | | | | |
| | | | | 15,025,508 | |
| | | | | | |
| | |
Consumer Services — 30.0% | | | | | | |
Anhanguera Educacional Participacoes | | 74,867 | | | 1,112,646 | |
B2W Cia Global Do Varejo | | 80,674 | | | 656,108 | |
Drogasil | | 95,821 | | | 603,452 | |
Gol Linhas Aereas Inteligentes ADR | | 114,935 | | | 921,779 | |
Localiza Rent a Car | | 96,794 | | | 1,453,179 | |
Lojas Renner | | 43,556 | | | 1,324,569 | |
Marisa Lojas | | 39,910 | | | 548,952 | |
Multiplus | | 41,872 | | | 707,421 | |
TAM ADR | | 73,135 | | | 1,469,282 | |
| | | | | | |
| | | | | 8,797,388 | |
| | | | | | |
TOTAL COMMON STOCK
(Cost $26,589,125) | | | | | 23,822,896 | |
| | | | | | |
The accompanying notes are an integral part of the financial statements.
46
| | |
| Schedule of Investments | | October 31, 2011 |
Global X Brazil Consumer ETF
| | | | | | | | |
| | |
| | | Shares/Face
Amount/Number
of Warrants | | | Value | |
PREFERRED STOCK — 18.4% | | | | | | | | |
| | |
BRAZIL— 18.4% | | | | | | | | |
Consumer Goods — 7.5% | | | | | | | | |
| | |
Alpargatas | | | 68,871 | | | $ | 457,401 | |
Cia de Bebidas das Americas ADR | | | 51,455 | | | | 1,735,063 | |
| | | | | | | | |
| | | | | | | 2,192,464 | |
| | | | | | | | |
Consumer Services — 10.9% | | | | | | | | |
Cia Brasileira de Distribuicao Grupo Pao de Acucar ADR | | | 38,913 | | | | 1,525,000 | |
Lojas Americanas | | | 165,026 | | | | 1,475,764 | |
Saraiva Livreiros Editores | | | 14,567 | | | | 211,313 | |
| | | | | | | | |
| | | | | | | 3,212,077 | |
| | | | | | | | |
TOTAL PREFERRED STOCK
(Cost $4,905,764) | | | | | | | 5,404,541 | |
| | | | | | | | |
CORPORATE OBLIGATIONS — 0.5% | | | | | | | | |
BRAZIL— 0.5% | | | | | | | | |
Hypermarcus 1,2 | | | | | | | | |
11.300%, 10/15/18 | | $ | 84,000 | | | | 49,747 | |
3.000%, 10/15/15 | | | 84,000 | | | | 49,746 | |
Marfrig Alimentos, Convertible 1,2,3 | | | | | | | | |
1.04%, 07/15/15 | | | 6 | | | | 35,412 | |
| | | | | | | | |
TOTAL CORPORATE OBLIGATIONS
(Cost $136,027) | | | | | | | 134,905 | |
| | | | | | | | |
| | |
WARRANTS — 0.0% | | | | | | | | |
Hypermarcas* 1,2 | | | | | | | | |
(Cost $—) | | | 84 | | | | — | |
| | | | | | | | |
TOTAL INVESTMENTS — 100.0%
(Cost $31,630,916) | | | | | | $ | 29,362,342 | |
| | | | | | | | |
Percentages are based on Net Assets of $29,361,324.
| * | Non-income producing security. |
| 1 | Securities are fair valued using methods determined in good faith by the Fair Value Committee of the Board of Trustees. The total value of such securities as of October 31, 2011, was $134,905 and represented 0.5% of Net Assets. |
| 2 | Securities considered illiquid. The total value of such securities as of October 31, 2011 was $134,905 and represented 0.5% of Net Assets. |
| 3 | Floating rate security. Rate disclosed is the rate in effect on October 31, 2011. |
ADR — American Depositary Receipt
Cl — Class
The following is a summary of the inputs used as of October 31, 2011, in valuing the Fund’s investments carried at value:
| | | | | | | | | | | | | | | | |
| Investments in Securities | | Level 1 | | | Level 2 | | | Level 3 | | | Total | |
Common Stock | | $ | 23,822,896 | | | $ | — | | | $ | — | | | $ | 23,822,896 | |
Preferred Stock | | | 5,404,541 | | | | — | | | | — | | | | 5,404,541 | |
Corporate Obligations | | | — | | | | — | | | | — | | | | — | |
Warrants | | | — | | | | — | | | | 134,905 | | | | 134,905 | |
| | | | | | | | | | | | | | | | |
Total Investments in Securities | | $ | 29,227,437 | | | $ | — | | | $ | 134,905 | | | $ | 29,362,342 | |
| | | | | | | | | | | | | | | | |
The accompanying notes are an integral part of the financial statements.
47
| | |
| Schedule of Investments | | October 31, 2011 |
Global X Brazil Consumer ETF
The following is a reconciliation of investments in which significant unobservable inputs (Level 3) were used in determining fair value:
| | | | |
| | | Brazil | |
| | | Investments in
Corporate
Obligations | |
Beginning balance as of October 31, 2010 | | $ | 35,852 | |
Accrued discounts/premiums | | | - | |
Realized gain/(loss) | | | - | |
Change in unrealized appreciation/(depreciation) | | | (440) | |
Net purchases | | | 99,493 | |
Net sales | | | - | |
Transfers into Level 3 | | | - | |
Transfers out of Level 3 | | | - | |
| | | | |
Ending balance as of October 31, 2011 | | $ | 134,905 | |
| | | | |
Net change in unrealized appreciation/(depreciation) from investments still held as of October 31, 2011 is $(440).
For the year ended October 31, 2011, there have been no significant transfers between Level 1 and Level 2 investments.
The accompanying notes are an integral part of the financial statements.
48
| | |
| Schedule of Investments | | October 31, 2011 |
Global X Brazil Financials ETF
Sector Weightings (unaudited)†:

† Percentages based on total investments.
| | | | |
| | | Shares | | Value |
COMMON STOCK — 94.0% | | | | |
| | |
BRAZIL— 94.0% | | | | |
| | |
Financials — 94.0% | | | | |
Banco Bradesco ADR | | 43,554 | | $ 792,683 |
Banco do Brasil | | 50,332 | | 768,248 |
Banco Santander Brasil ADR | | 36,668 | | 333,679 |
BM&F Bovespa | | 59,379 | | 357,346 |
BR Malls Participacoes | | 35,620 | | 387,016 |
BR Properties | | 22,538 | | 227,809 |
Brasil Brokers Participacoes | | 30,851 | | 125,094 |
Brookfield Incorporacoes | | 5,035 | | 19,624 |
CETIP - Balcao Organizado de Ativos e Derivativos | | 26,671 | | 365,299 |
Cielo | | 17,088 | | 456,244 |
Cyrela Brazil Realty Empreendimentos e Participacoes | | 38,419 | | 338,866 |
Even Construtora e Incorporadora | | 28,014 | | 105,756 |
Itau Unibanco Holding ADR | | 38,014 | | 726,828 |
Iguatemi Empresa de Shopping Centers | | 5,897 | | 114,917 |
MRV Engenharia e Participacoes | | 44,654 | | 316,337 |
Multiplan Empreendimentos Imobiliarios | | 10,547 | | 213,029 |
PDG Realty Empreendimentos e Participacoes | | 65,641 | | 289,868 |
Porto Seguro | | 15,939 | | 170,951 |
Redecard | | 28,214 | | 469,110 |
Rossi Residencial | | 27,027 | | 171,940 |
Sul America | | 32,509 | | 264,958 |
| | | | |
TOTAL COMMON STOCK
(Cost $7,775,608) | | | | 7,015,602 |
| | | | |
| | |
PREFERRED STOCK — 5.9% | | | | |
| | |
BRAZIL— 5.9% | | | | |
| | |
Financials — 5.9% | | | | |
Banco ABC Brasil | | 8,220 | | 55,071 |
Banco do Estado do Rio Grande do Sul | | 28,158 | | 297,246 |
Banco Industrial e Comercial | | 10,440 | | 47,562 |
The accompanying notes are an integral part of the financial statements.
49
| | |
| Schedule of Investments | | October 31, 2011 |
Global X Brazil Financials ETF
| | | | |
| | | Shares | | Value |
PREFERRED STOCK — continued | | | | |
Financials — continued
Banco Panamericano* | | 8,330 | | $ 37,028 |
| | | | |
TOTAL PREFERRED STOCK
(Cost $476,648) | | | | 436,907 |
| | | | |
TOTAL INVESTMENTS — 99.9%
(Cost $8,252,256) | | | | $ 7,452,509 |
| | | | |
Percentages are based on Net Assets of $7,461,414.
| * | Non-income producing security. |
ADR — American Depositary Receipt
The following is a summary of the inputs used as of October 31, 2011, in valuing the Fund’s investments carried at value:
| | | | | | | | | | | | | | | | |
| Investments in Securities | | Level 1 | | | Level 2 | | | Level 3 | | | Total | |
Common Stock | | $ | 7,015,602 | | | $ | — | | | $ | — | | | $ | 7,015,602 | |
Preferred Stock | | | 436,907 | | | | — | | | | — | | | | 436,907 | |
| | | | | | | | | | | | | | | | |
Total Investments in Securities | | $ | 7,452,509 | | | $ | — | | | $ | — | | | $ | 7,452,509 | |
| | | | | | | | | | | | | | | | |
For the year ended October 31, 2011, there have been no significant transfers between Level 1 & Level 2 investments.
For the year ended October 31, 2011, there were no Level 3 investments.
The accompanying notes are an integral part of the financial statements.
50
| | |
| Schedule of Investments | | October 31, 2011 |
Global X Mexico Small-Cap ETF
Sector Weightings (unaudited)†:
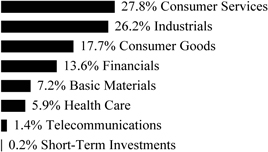
† Percentages based on total investments.
| | | | |
| | | Shares | | Value |
COMMON STOCK — 99.8% | | | | |
| | |
MEXICO— 99.8% | | | | |
| | |
Basic Materials — 7.2% | | | | |
Cia Minera Autlan | | 9,200 | | $ 9,566 |
Grupo Simec, Cl B * | | 7,100 | | 15,858 |
Industrias CH, Cl B * | | 4,500 | | 14,655 |
| | | | |
| | | | 40,079 |
| | | | |
| | |
Consumer Goods — 17.7% | | | | |
Consorcio ARA | | 49,936 | | 13,721 |
Corporacion GEO * | | 11,500 | | 15,877 |
Desarrolladora Homex ADR * | | 521 | | 7,794 |
Gruma, Cl B * | | 2,500 | | 4,891 |
Grupo Herdez | | 16,568 | | 30,450 |
Industrias Bachoco | | 3,100 | | 5,760 |
Sare Holding, Cl B * | | 19,900 | | 1,912 |
Urbi Desarrollos Urbanos * | | 14,200 | | 18,113 |
| | | | |
| | | | 98,518 |
| | | | |
| | |
Consumer Services — 27.8% | | | | |
Alsea | | 21,600 | | 22,362 |
Controladora Comercial Mexicana * | | 20,700 | | 29,916 |
Grupo Comercial Chedraui | | 11,857 | | 28,574 |
Grupo Famsa, Cl A * | | 4,100 | | 3,675 |
Megacable Holdings * | | 17,182 | | 36,119 |
TV Azteca | | 56,364 | | 34,233 |
| | | | |
| | | | 154,879 |
| | | | |
| | |
Financials — 13.7% | | | | |
Bolsa Mexicana de Valores | | 19,193 | | 31,398 |
Compartamos | | 21,721 | | 33,593 |
Inmuebles Carso * | | 14,500 | | 11,049 |
| | | | |
| | | | 76,040 |
| | | | |
| | |
Health Care — 5.9% | | | | |
Genomma Lab Internacional, Cl B * | | 15,958 | | 32,946 |
| | | | |
The accompanying notes are an integral part of the financial statements.
51
| | |
| Schedule of Investments | | October 31, 2011 |
Global X Mexico Small-Cap ETF
| | | | |
| | | Shares/Face
Amount | | Value |
COMMON STOCK — continued | | | | |
| | |
Industrials — 26.1% | | | | |
Empresas ICA ADR * | | 3,466 | | $ 18,474 |
Grupo Aeroportuario del Pacifico ADR | | 986 | | 34,175 |
Grupo Aeroportuario del Sureste ADR | | 702 | | 40,435 |
OHL Mexico * | | 19,178 | | 29,818 |
Promotora y Operadora de Infraestructura * | | 5,600 | | 22,618 |
| | | | |
| | | | 145,520 |
| | | | |
| | |
Telecommunications — 1.4% | | | | |
Axtel * | | 23,800 | | 7,808 |
| | | | |
TOTAL COMMON STOCK
(Cost $726,839) | | | | 555,790 |
| | | | |
| | |
TIME DEPOSIT — 0.2% | | | | |
| | |
Brown Brothers Harriman, 0.030%
(Cost $1,082) | | $ 1,082 | | 1,082 |
| | | | |
TOTAL INVESTMENTS — 100.0%
(Cost $727,921) | | | | $ 556,872 |
| | | | |
Percentages are based on Net Assets of $556,805.
| * | Non-income producing security. |
ADR — American Depositary Receipt
Cl — Class
The following is a summary of the inputs used as of October 31, 2011, in valuing the Fund’s investments carried at value:
| | | | | | | | |
| Investments in Securities | | Level 1 | | Level 2 | | Level 3 | | Total |
Common Stock | | $ 555,790 | | $ — | | $ — | | $ 555,790 |
Time Deposit | | — | | 1,082 | | — | | 1,082 |
| | | | | | | | |
Total Investments in Securities | | $ 555,790 | | $ 1,082 | | $ — | | $ 556,872 |
| | | | | | | | |
For the period ended October 31, 2011, there have been no significant transfers between Level 1 and Level 2 investments.
For the period ended October 31, 2011, there were no Level 3 investments.
The accompanying notes are an integral part of the financial statements.
52
| | |
| Schedule of Investments | | October 31, 2011 |
Global X Russell Emerging Markets Growth ETF
Sector Weightings (unaudited)†:
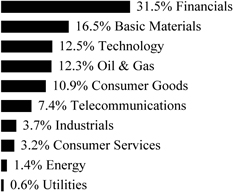
† Percentages based on total investments.
| | | | |
| | | Shares | | Value |
COMMON STOCK — 93.3% | | | | |
| | |
BRAZIL— 12.3% | | | | |
| | |
Basic Materials — 3.0% | | | | |
Cia Siderurgica Nacional ADR | | 1,110 | | $ 10,390 |
Gerdau ADR | | 26 | | 234 |
Vale ADR, Cl B | | 2,158 | | 54,835 |
| | | | |
| | | | 65,459 |
| | | | |
| | |
Consumer Goods — 1.3% | | | | |
BRF - Brasil Foods ADR | | 1,096 | | 23,071 |
Cia de Bebidas das Americas ADR | | 228 | | 6,140 |
| | | | |
| | | | 29,211 |
| | | | |
| | |
Financials — 7.3% | | | | |
Banco Bradesco ADR | | 4,032 | | 73,383 |
Banco do Brasil | | 106 | | 1,618 |
Cielo | | 344 | | 9,184 |
Itau Unibanco Holding ADR | | 3,302 | | 63,134 |
Itausa - Investimentos Itau | | 1,440 | | 11,325 |
| | | | |
| | | | 158,644 |
| | | | |
| | |
Oil & Gas — 0.7% | | | | |
OGX Petroleo e Gas Participacoes * | | 1,820 | | 15,247 |
| | | | |
TOTAL BRAZIL | | | | 268,561 |
| | | | |
| | |
CHILE— 1.2% | | | | |
| | |
Consumer Services — 0.4% | | | | |
SACI Falabella | | 900 | | 8,471 |
| | | | |
Oil & Gas — 0.4% | | | | |
Empresas COPEC | | 626 | | 9,600 |
| | | | |
Utilities — 0.4% | | | | |
Empresa Nacional de Electricidad ADR | | 162 | | 7,815 |
| | | | |
TOTAL CHILE | | | | 25,886 |
| | | | |
The accompanying notes are an integral part of the financial statements.
53
| | |
| Schedule of Investments | | October 31, 2011 |
Global X Russell Emerging Markets Growth ETF
| | | | |
| | | Shares | | Value |
COMMON STOCK — continued | | | | |
| | |
CHINA— 16.5% | | | | |
| | |
Basic Materials — 0.5% | | | | |
Aluminum Corp of China ADR | | 30 | | $ 399 |
Yanzhou Coal Mining ADR | | 302 | | 7,460 |
Zijin Mining Group, Cl H | | 9,000 | | 3,904 |
| | | | |
| | | | 11,763 |
| | | | |
| | |
Consumer Goods — 0.4% | | | | |
Tingyi Cayman Islands Holding | | 2,800 | | 8,038 |
| | | | |
Consumer Services — 0.1% | | | | |
Air China, Cl H | | 3,200 | | 2,529 |
| | | | |
Energy — 1.4% | | | | |
China Coal Energy, Cl H | | 6,000 | | 7,639 |
China Shenhua Energy, Cl H | | 4,800 | | 22,367 |
| | | | |
| | | | 30,006 |
| | | | |
| | |
Financials — 9.5% | | | | |
Agricultural Bank of China, Cl H | | 24,000 | | 10,967 |
Bank of Communications, Cl H | | 9,900 | | 6,932 |
China Citic Bank, Cl H | | 10,000 | | 5,471 |
China Construction Bank, Cl H | | 94,000 | | 70,302 |
China Life Insurance ADR | | 738 | | 28,597 |
China Merchants Bank, Cl H | | 5,800 | | 11,946 |
China Pacific Insurance Group, Cl H | | 1,460 | | 4,548 |
Industrial & Commercial Bank of China, Cl H | | 82,000 | | 52,144 |
Ping An Insurance Group, Cl H | | 2,200 | | 16,624 |
| | | | |
| | | | 207,531 |
| | | | |
| | |
Industrials — 0.5% | | | | |
Byd, Cl H | | 840 | | 2,065 |
China Communications Construction, Cl H | | 6,000 | | 4,611 |
China Railway Construction, Cl H | | 3,000 | | 1,815 |
China Railway Group, Cl H | | 6,000 | | 2,031 |
| | | | |
| | | | 10,522 |
| | | | |
| | |
Oil & Gas — 0.5% | | | | |
China Petroleum & Chemical ADR | | 38 | | 3,587 |
PetroChina ADR | | 56 | | 7,258 |
| | | | |
| | | | 10,845 |
| | | | |
| | |
Technology — 3.6% | | | | |
Baidu ADR * | | 370 | | 51,867 |
Tencent Holdings | | 1,100 | | 25,926 |
| | | | |
| | | | 77,793 |
| | | | |
TOTAL CHINA | | | | 359,027 |
| | | | |
The accompanying notes are an integral part of the financial statements.
54
| | |
| Schedule of Investments | | October 31, 2011 |
Global X Russell Emerging Markets Growth ETF
| | | | |
| | | Shares | | Value |
COMMON STOCK — continued | | | | |
| | |
COLOMBIA— 0.6% | | | | |
| | |
Oil & Gas — 0.6% | | | | |
Ecopetrol ADR | | 306 | | $ 13,017 |
| | | | |
| | |
CZECH REPUBLIC— 0.2% | | | | |
| | |
Utilities — 0.2% | | | | |
CEZ | | 100 | | 4,231 |
| | | | |
| | |
HONG KONG— 4.4% | | | | |
| | |
Consumer Goods — 0.6% | | | | |
Belle International Holdings, Cl A | | 6,786 | | 13,487 |
| | | | |
| | |
Financials — 1.2% | | | | |
BOC Hong Kong Holdings | | 4,129 | | 9,982 |
China Overseas Land & Investment | | 5,600 | | 10,568 |
China Resources Land | | 3,000 | | 4,456 |
| | | | |
| | | | 25,006 |
| | | | |
| | |
Oil & Gas — 1.9% | | | | |
CNOOC ADR | | 222 | | 41,871 |
| | | | |
| | |
Telecommunications — 0.7% | | | | |
China Mobile ADR | | 326 | | 15,505 |
| | | | |
TOTAL HONG KONG | | | | 95,869 |
| | | | |
| | |
INDIA— 10.1% | | | | |
| | |
Basic Materials — 0.4% | | | | |
Sterlite Industries India ADR | | 730 | | 7,534 |
| | | | |
| | |
Financials — 3.1% | | | | |
HDFC Bank ADR | | 1,240 | | 39,259 |
ICICI Bank ADR | | 408 | | 15,161 |
State Bank of India GDR | | 186 | | 14,657 |
| | | | |
| | | | 69,077 |
| | | | |
| | |
Industrials — 0.6% | | | | |
Larsen & Toubro GDR | | 410 | | 11,898 |
| | | | |
| | |
Oil & Gas — 2.8% | | | | |
Reliance Industries GDR 1 | | 1,694 | | 61,323 |
| | | | |
| | |
Technology — 3.2% | | | | |
Infosys ADR | | 1,110 | | 65,035 |
Wipro ADR | | 512 | | 5,355 |
| | | | |
| | | | 70,390 |
| | | | |
TOTAL INDIA | | | | 220,222 |
| | | | |
| | |
INDONESIA— 3.5% | | | | |
| | |
Consumer Goods — 1.2% | | | | |
Astra International | | 3,000 | | 23,390 |
Unilever Indonesia | | 1,720 | | 3,042 |
| | | | |
| | | | 26,432 |
| | | | |
The accompanying notes are an integral part of the financial statements.
55
| | |
| Schedule of Investments | | October 31, 2011 |
Global X Russell Emerging Markets Growth ETF
| | | | |
| | | Shares | | Value |
COMMON STOCK — continued | | | | |
| | |
Financials — 1.8% | | | | |
Bank Central Asia | | 18,800 | | $ 17,207 |
Bank Mandiri | | 12,257 | | 9,903 |
Bank Rakyat Indonesia Persero | | 14,415 | | 10,994 |
| | | | |
| | | | 38,104 |
| | | | |
| | |
Telecommunications — 0.5% | | | | |
Telekomunikasi Indonesia ADR | | 348 | | 11,762 |
| | | | |
TOTAL INDONESIA | | | | 76,298 |
| | | | |
| | |
MALAYSIA— 2.1% | | | | |
| | |
Financials — 1.6% | | | | |
CIMB Group Holdings | | 5,200 | | 12,835 |
Malayan Banking | | 3,684 | | 10,042 |
Public Bank | | 2,600 | | 10,783 |
| | | | |
| | | | 33,660 |
| | | | |
| | |
Industrials — 0.3% | | | | |
Sime Darby | | 2,600 | | 7,545 |
| | | | |
| | |
Telecommunications — 0.2% | | | | |
Maxis | | 2,800 | | 4,884 |
| | | | |
TOTAL MALAYSIA | | | | 46,089 |
| | | | |
| | |
MEXICO— 5.8% | | | | |
| | |
Basic Materials — 0.7% | | | | |
Grupo Mexico, Cl B | | 5,400 | | 14,976 |
| | | | |
| | |
Consumer Goods — 1.3% | | | | |
Fomento Economico Mexicano ADR | | 318 | | 21,322 |
Grupo Modelo | | 920 | | 5,856 |
| | | | |
| | | | 27,178 |
| | | | |
| | |
Consumer Services — 1.3% | | | | |
Grupo Elektra | | 100 | | 7,710 |
Wal-Mart de Mexico | | 8,200 | | 21,177 |
| | | | |
| | | | 28,887 |
| | | | |
| | |
Telecommunications — 2.5% | | | | |
America Movil ADR, Ser L | | 1,988 | | 50,535 |
Telefonos de Mexico ADR | | 308 | | 4,817 |
| | | | |
| | | | 55,352 |
| | | | |
TOTAL MEXICO | | | | 126,393 |
| | | | |
| | |
MOROCCO— 0.2% | | | | |
| | |
Telecommunications — 0.2% | | | | |
Maroc Telecom | | 204 | | 3,597 |
| | | | |
The accompanying notes are an integral part of the financial statements.
56
| | |
| Schedule of Investments | | October 31, 2011 |
Global X Russell Emerging Markets Growth ETF
| | | | |
| | | Shares | | Value |
COMMON STOCK — continued | | | | |
| | |
POLAND— 0.8% | | | | |
| | |
Financials — 0.8% | | | | |
Bank Pekao | | 130 | | $ 6,050 |
Powszechna Kasa Oszczednosci Bank Polski | | 898 | | 10,250 |
| | | | |
TOTAL POLAND | | | | 16,300 |
| | | | |
| | |
RUSSIA— 6.3% | | | | |
| | |
Basic Materials — 2.3% | | | | |
MMC Norilsk Nickel ADR | | 1,668 | | 32,643 |
Novolipetsk Steel GDR | | 186 | | 5,063 |
Uralkali | | 1,424 | | 12,672 |
| | | | |
| | | | 50,378 |
| | | | |
| | |
Financials — 1.6% | | | | |
Sberbank of Russia | | 11,749 | | 32,956 |
VTB Bank GDR | | 504 | | 2,425 |
| | | | |
| | | | 35,381 |
| | | | |
| | |
Oil & Gas — 1.6% | | | | |
NovaTek OAO | | 2,694 | | 34,807 |
| | | | |
| | |
Telecommunications — 0.8% | | | | |
Mobile Telesystems ADR | | 560 | | 8,002 |
Rostelecom | | 1,787 | | 9,196 |
| | | | |
| | | | 17,198 |
| | | | |
TOTAL RUSSIA | | | | 137,764 |
| | | | |
| | |
SOUTH AFRICA— 9.9% | | | | |
| | |
Basic Materials — 2.5% | | | | |
Anglo American Platinum | | 102 | | 7,430 |
AngloGold Ashanti ADR | | 562 | | 25,408 |
Impala Platinum Holdings | | 672 | | 15,633 |
Kumba Iron Ore | | 116 | | 6,942 |
| | | | |
| | | | 55,413 |
| | | | |
| | |
Consumer Services — 1.4% | | | | |
Naspers, Cl N | | 608 | | 29,295 |
| | | | |
| | |
Financials — 1.7% | | | | |
ABSA Group | | 472 | | 8,546 |
FirstRand | | 5,022 | | 12,570 |
Standard Bank Group | | 1,194 | | 14,807 |
| | | | |
| | | | 35,923 |
| | | | |
| | |
Oil & Gas — 1.9% | | | | |
Sasol ADR | | 926 | | 41,892 |
| | | | |
The accompanying notes are an integral part of the financial statements.
57
| | |
| Schedule of Investments | | October 31, 2011 |
Global X Russell Emerging Markets Growth ETF
| | | | |
| | | Shares | | Value |
COMMON STOCK — continued | | | | |
| | |
Telecommunications — 2.4% | | | | |
MTN Group | | 2,730 | | $ 47,950 |
Vodacom Group | | 340 | | 3,876 |
| | | | |
| | | | 51,826 |
| | | | |
TOTAL SOUTH AFRICA | | | | 214,349 |
| | | | |
| | |
SOUTH KOREA— 8.1% | | | | |
| | |
Basic Materials — 1.1% | | | | |
LG Chemical | | 66 | | 21,607 |
POSCO ADR | | 20 | | 1,718 |
| | | | |
| | | | 23,325 |
| | | | |
| | |
Consumer Goods — 4.4% | | | | |
Hyundai Mobis | | 100 | | 29,051 |
Hyundai Motor | | 208 | | 42,466 |
Kia Motors | | 362 | | 23,540 |
| | | | |
| | | | 95,057 |
| | | | |
| | |
Financials — 0.8% | | | | |
KB Financial Group ADR | | 90 | | 3,514 |
Samsung Life Insurance | | 125 | | 9,759 |
Shinhan Financial Group ADR | | 50 | | 3,980 |
| | | | |
| | | | 17,253 |
| | | | |
| | |
Industrials — 0.6% | | | | |
Hyundai Heavy Industries | | 49 | | 13,331 |
| | | | |
| | |
Oil & Gas — 0.6% | | | | |
SK Innovation | | 83 | | 12,728 |
| | | | |
| | |
Technology — 0.6% | | | | |
Hynix Semiconductor | | 274 | | 5,631 |
Samsung Electronics | | 9 | | 7,836 |
| | | | |
| | | | 13,467 |
| | | | |
TOTAL SOUTH KOREA | | | | 175,161 |
| | | | |
| | |
TAIWAN— 10.0% | | | | |
| | |
Basic Materials — 2.6% | | | | |
Formosa Chemicals & Fibre | | 7,276 | | 21,288 |
Formosa Plastics | | 7,178 | | 21,362 |
Nan Ya Plastics | | 6,000 | | 13,623 |
| | | | |
| | | | 56,273 |
| | | | |
| | |
Financials — 0.5% | | | | |
Cathay Financial Holding | | 9,792 | | 11,836 |
| | | | |
| | |
Industrials — 1.7% | | | | |
Hon Hai Precision Industry | | 13,420 | | 37,380 |
| | | | |
| | |
Oil & Gas — 0.4% | | | | |
Formosa Petrochemical | | 3,000 | | 9,490 |
| | | | |
The accompanying notes are an integral part of the financial statements.
58
| | |
| Schedule of Investments | | October 31, 2011 |
Global X Russell Emerging Markets Growth ETF
| | | | |
| | | Shares | | Value |
COMMON STOCK — continued | | | | |
| | |
Technology — 4.8% | | | | |
HTC | | 1,050 | | $ 24,085 |
Taiwan Semiconductor Manufacturing ADR | | 6,284 | | 79,304 |
| | | | |
| | | | 103,389 |
| | | | |
TOTAL TAIWAN | | | | 218,368 |
| | | | |
| | |
THAILAND— 0.9% | | | | |
| | |
Oil & Gas — 0.9% | | | | |
PTT | | 1,080 | | 10,758 |
PTT Exploration & Production | | 1,720 | | 9,014 |
| | | | |
TOTAL THAILAND | | | | 19,772 |
| | | | |
| | |
TURKEY— 0.4% | | | | |
| | |
Financials — 0.3% | | | | |
Turkiye Garanti Bankasi | | 818 | | 2,889 |
Turkiye Is Bankasi, Cl C | | 2,078 | | 4,857 |
| | | | |
| | | | 7,746 |
| | | | |
| | |
Telecommunications — 0.1% | | | | |
Turkcell Iletisim Hizmetleri ADR | | 114 | | 1,405 |
| | | | |
TOTAL TURKEY | | | | 9,151 |
| | | | |
TOTAL COMMON STOCK
(Cost $2,343,806) | | | | 2,030,055 |
| | | | |
| | |
PREFERRED STOCK — 6.1% | | | | |
| | |
BRAZIL— 6.1% | | | | |
| | |
Basic Materials — 3.2% | | | | |
Vale ADR, Cl B | | 2,978 | | 70,281 |
| | | | |
| | |
Consumer Goods — 1.7% | | | | |
Cia de Bebidas das Americas ADR | | 1,078 | | 36,350 |
| | | | |
| | |
Financials — 1.0% | | | | |
Itausa - Investimentos Itau | | 3,600 | | 22,630 |
| | | | |
| | |
Technology — 0.2% | | | | |
Samsung Electronics | | 7 | | 4,029 |
| | | | |
TOTAL BRAZIL | | | | 133,290 |
| | | | |
TOTAL PREFERRED STOCK
(Cost $155,807) | | | | 133,290 |
| | | | |
TOTAL INVESTMENTS — 99.4%
(Cost $2,499,613) | | | | $ 2,163,345 |
| | | | |
The accompanying notes are an integral part of the financial statements.
59
| | |
| Schedule of Investments | | October 31, 2011 |
Global X Russell Emerging Markets Growth ETF
Percentages are based on Net Assets of $2,176,455.
| * | Non-income producing security. |
| 1 | Securities sold within terms of a private placement memorandum, exempt from registration under Section 144A of the Securities Act of 1933, as amended, and may be sold only to dealers in that program or other “accredited investors.” These securities have been determined to be liquid under guidelines established by the board of Trustees. |
ADR — American Depositary Receipt
Cl — Class
GDR — Global Depositary Receipt
Ser — Series
The following is a summary of the inputs used as of October 31, 2011, in valuing the Fund’s investments carried at value:
| | | | | | | | |
| Investments in Securities | | Level 1 | | Level 2 | | Level 3 | | Total |
Common Stock | | $ 2,030,055 | | $ — | | $ — | | $ 2,030,055 |
Preferred Stock | | 133,290 | | — | | — | | 133,290 |
| | | | | | | | |
Total Investments in Securities | | $ 2,163,345 | | $ — | | $ — | | $ 2,163,345 |
| | | | | | | | |
For the period ended October 31, 2011, there have been no significant transfers between Level 1 and Level 2 investments.
For the period ended October 31, 2011, there were no Level 3 investments.
The accompanying notes are an integral part of the financial statements.
60
| | |
| Schedule of Investments | | October 31, 2011 |
Global X Russell Emerging Markets Value ETF
Sector Weightings (unaudited)†:
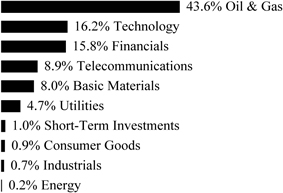
† Percentages based on total investments.
| | | | |
| | | Shares | | Value |
COMMON STOCK — 97.4% | | | | |
| | |
BRAZIL— 20.7% | | | | |
| | |
Basic Materials — 1.3% | | | | |
Gerdau ADR | | 3,420 | | $ 30,848 |
| | | | |
| | |
Financials — 4.3% | | | | |
Banco do Brasil | | 2,614 | | 39,899 |
Banco Santander Brasil ADR | | 2,400 | | 21,840 |
BM&F Bovespa | | 5,800 | | 34,905 |
| | | | |
| | | | 96,644 |
| | | | |
| | |
Oil & Gas — 14.2% | | | | |
Petroleo Brasileiro ADR | | 5,603 | | 151,337 |
Petroleo Brasileiro ADR, Cl A | | 6,529 | | 165,118 |
| | | | |
| | | | 316,455 |
| | | | |
| | |
Utilities — 0.9% | | | | |
Centrais Eletricas Brasileiras ADR | | 968 | | 9,632 |
Centrais Eletricas Brasileiras ADR, Cl B | | 718 | | 10,016 |
| | | | |
| | | | 19,648 |
| | | | |
| | |
TOTAL BRAZIL | | | | 463,595 |
| | | | |
| | |
CHILE— 0.8% | | | | |
| | |
Utilities — 0.8% | | | | |
Enersis ADR | | 884 | | 17,353 |
| | | | |
| | |
CHINA— 12.0% | | | | |
| | |
Basic Materials — 0.3% | | | | |
Aluminum Corp of China ADR | | 480 | | 6,379 |
| | | | |
| | |
Energy — 0.2% | | | | |
China Shenhua Energy, Cl H | | 1,000 | | 4,660 |
| | | | |
The accompanying notes are an integral part of the financial statements.
61
| | |
| Schedule of Investments | | October 31, 2011 |
Global X Russell Emerging Markets Value ETF
| | | | |
| | | Shares | | Value |
COMMON STOCK — continued | | | | |
| | |
Financials — 4.1% | | | | |
Bank of China, Cl H | | 203,615 | | $ 73,913 |
China Citic Bank, Cl H | | 20,223 | | 11,064 |
China Minsheng Banking, Cl H | | 9,000 | | 7,426 |
| | | | |
| | | | 92,403 |
| | | | |
| | |
Industrials — 0.7% | | | | |
China Communications Construction, Cl H | | 14,588 | | 11,211 |
China COSCO Holdings, Cl H | | 9,000 | | 4,796 |
| | | | |
| | | | 16,007 |
| | | | |
| | |
Oil & Gas — 5.3% | | | | |
China Petroleum & Chemical ADR | | 486 | | 45,878 |
PetroChina ADR | | 560 | | 72,582 |
| | | | |
| | | | 118,460 |
| | | | |
| | |
Telecommunications — 1.4% | | | | |
China Telecom ADR | | 486 | | 29,695 |
| | | | |
TOTAL CHINA | | | | 267,604 |
| | | | |
| | |
CZECH REPUBLIC— 0.6% | | | | |
| | |
Utilities — 0.6% | | | | |
CEZ | | 340 | | 14,387 |
| | | | |
| | |
HONG KONG— 5.6% | | | | |
| | |
Telecommunications — 5.6% | | | | |
China Mobile ADR | | 2,263 | | 107,628 |
China Unicom Hong Kong ADR | | 901 | | 18,119 |
| | | | |
TOTAL HONG KONG | | | | 125,747 |
| | | | |
| | |
INDIA— 0.8% | | | | |
| | |
Basic Materials — 0.8% | | | | |
Sterlite Industries India ADR | | 608 | | 6,274 |
Tata Steel GDR | | 1,106 | | 10,673 |
| | | | |
TOTAL INDIA | | | | 16,947 |
| | | | |
| | |
MEXICO— 0.0% | | | | |
| | |
Telecommunications — 0.0% | | | | |
Telefonos de Mexico ADR | | 50 | | 782 |
| | | | |
| | |
POLAND— 0.5% | | | | |
| | |
Utilities — 0.5% | | | | |
PGE | | 1,892 | | 11,661 |
| | | | |
| | |
RUSSIA— 25.6% | | | | |
| | |
Basic Materials — 0.1% | | | | |
United RUSAL * | | 2,800 | | 2,595 |
| | | | |
Financials — 0.7% | | | | |
VTB Bank GDR | | 3,056 | | 14,706 |
| | | | |
The accompanying notes are an integral part of the financial statements.
62
| | |
| Schedule of Investments | | October 31, 2011 |
Global X Russell Emerging Markets Value ETF
| | | | |
| | | Shares | | Value |
COMMON STOCK — continued | | | | |
| | |
Oil & Gas — 23.8% | | | | |
Gazprom OAO ADR | | 18,501 | | $ 214,797 |
Lukoil OAO ADR | | 2,571 | | 148,347 |
Rosneft Oil GDR | | 4,454 | | 31,690 |
Surgutneftegas ADR | | 13,504 | | 116,810 |
Tatneft ADR | | 724 | | 21,495 |
| | | | |
| | | | 533,139 |
| | | | |
| | |
Utilities — 1.0% | | | | |
Federal Grid Unified Energy System JSC, Cl T | | 922,788 | | 8,623 |
Federal Hydrogenerating JSC ADR | | 3,936 | | 14,839 |
| | | | |
| | | | 23,462 |
| | | | |
TOTAL RUSSIA | | | | 573,902 |
| | | | |
| | |
SOUTH AFRICA— 0.8% | | | | |
| | |
Financials — 0.8% | | | | |
Standard Bank Group | | 1,506 | | 18,676 |
| | | | |
| | |
SOUTH KOREA— 22.8% | | | | |
| | |
Basic Materials — 2.9% | | | | |
POSCO ADR | | 782 | | 67,190 |
| | | | |
| | |
Consumer Goods — 0.9% | | | | |
LG Electronics | | 308 | | 20,693 |
| | | | |
| | |
Financials — 3.7% | | | | |
KB Financial Group ADR | | 1,042 | | 40,690 |
Samsung Life Insurance | | 20 | | 1,561 |
Shinhan Financial Group ADR | | 511 | | 40,676 |
| | | | |
| | | | 82,927 |
| | | | |
| | |
Technology — 14.4% | | | | |
Hynix Semiconductor | | 1,067 | | 21,928 |
Samsung Electronics GDR 1 | | 696 | | 299,489 |
| | | | |
| | | | 321,417 |
| | | | |
| | |
Utilities — 0.9% | | | | |
Korea Electric Power ADR* | | 1,742 | | 19,214 |
| | | | |
TOTAL SOUTH KOREA | | | | 511,441 |
| | | | |
| | |
TAIWAN— 4.9% | | | | |
| | |
Basic Materials — 2.4% | | | | |
China Steel | | 36,344 | | 36,337 |
Nan Ya Plastics | | 7,800 | | 17,710 |
| | | | |
| | | | 54,047 |
| | | | |
| | |
Technology — 0.5% | | | | |
Taiwan Semiconductor Manufacturing ADR | | 860 | | 10,853 |
| | | | |
| | |
Telecommunications — 2.0% | | | | |
Chunghwa Telecom ADR | | 1,340 | | 45,064 |
| | | | |
TOTAL TAIWAN | | | | 109,964 |
| | | | |
The accompanying notes are an integral part of the financial statements.
63
| | |
| Schedule of Investments | | October 31, 2011 |
Global X Russell Emerging Markets Value ETF
| | | | |
| | | Shares/Face
Amount | | Value |
COMMON STOCK — continued | | | | |
| | |
THAILAND— 0.2% | | | | |
| | |
Oil & Gas — 0.2% | | | | |
PTT | | 380 | | $ 3,785 |
| | | | |
| | |
TURKEY— 2.1% | | | | |
| | |
Financials — 2.1% | | | | |
Akbank | | 5,173 | | 18,914 |
Turkiye Garanti Bankasi | | 5,066 | | 17,892 |
Turkiye Is Bankasi, Cl C | | 4,503 | | 10,526 |
| | | | |
TOTAL TURKEY | | | | 47,332 |
| | | | |
TOTAL COMMON STOCK
(Cost $2,541,646) | | | | 2,183,176 |
| | | | |
| | |
PREFERRED STOCK — 1.3% | | | | |
| | |
SOUTH KOREA— 1.3% | | | | |
| | |
Technology — 1.3% | | | | |
Samsung Electronics
(Cost $27,600) | | 49 | | 28,205 |
| | | | |
| | |
TIME DEPOSIT — 1.0% | | | | |
Brown Brothers Harriman, 0.030%
(Cost $22,845) | | $ 22,845 | | 22,845 |
| | | | |
| | |
TOTAL INVESTMENTS — 99.7%
(Cost $2,592,091) | | | | $ 2,234,226 |
| | | | |
Percentages are based on Net Assets of $2,239,887.
| * | Non-income producing security. |
| 1 | Securities sold within terms of a private placement memorandum, exempt from registration under Section 144A of the Securities Act of 1933, as amended, and may be sold only to dealers in that program or other “accredited investors.” These securities have been determined to be liquid under guidelines established by the board of Trustees. |
ADR — American Depositary Receipt
Cl — Class
GDR — Global Depositary Receipt
The accompanying notes are an integral part of the financial statements.
64
| | |
| Schedule of Investments | | October 31, 2011 |
Global X Russell Emerging Markets Value ETF
The following is a summary of the inputs used as of October 31, 2011, in valuing the Fund’s investments carried at value:
| | | | | | | | |
| Investments in Securities | | Level 1 | | Level 2 | | Level 3 | | Total |
Common Stock | | $ 2,183,176 | | $ — | | $ — | | $ 2,183,176 |
Preferred Stock | | 28,205 | | — | | — | | 28,205 |
Time Deposit | | — | | 22,845 | | — | | 22,845 |
| | | | | | | | |
Total Investments in Securities | | $ 2,211,381 | | $ 22,845 | | $ — | | $ 2,234,226 |
| | | | | | | | |
For the period ended October 31, 2011, there have been no significant transfers between Level 1 and Level 2 investments.
For the period ended October 31, 2011, there were no Level 3 investments.
The accompanying notes are an integral part of the financial statements.
65
| | |
| Schedule of Investments | | October 31, 2011 |
Global X FTSE Nordic Region ETF
Sector Weightings (unaudited)†:
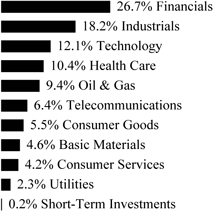
† Percentages based on total investments.
| | | | |
| | | Shares | | Value |
COMMON STOCK — 99.7% | | | | |
| | |
DENMARK— 17.3% | | | | |
| | |
Consumer Goods — 1.7% | | | | |
Carlsberg, Cl B | | 7,410 | | $ 504,579 |
| | | | |
Financials — 2.8% | | | | |
Danske Bank | | 58,095 | | 805,239 |
| | | | |
Health Care — 10.4% | | | | |
Novo Nordisk ADR | | 28,374 | | 3,016,156 |
| | | | |
Industrials — 2.4% | | | | |
AP Moller - Maersk, Cl B | | 102 | | 696,080 |
| | | | |
TOTAL DENMARK | | | | 5,022,054 |
| | | | |
| | |
FINLAND— 14.3% | | | | |
| | |
Basic Materials — 1.3% | | | | |
UPM-Kymmene | | 32,090 | | 376,620 |
| | | | |
Financials — 3.3% | | | | |
Sampo, Cl A | | 34,861 | | 963,510 |
| | | | |
Industrials — 2.0% | | | | |
Kone, Cl B | | 10,299 | | 569,300 |
| | | | |
Technology — 5.4% | | | | |
Nokia ADR | | 233,421 | | 1,570,923 |
| | | | |
Utilities — 2.3% | | | | |
Fortum | | 27,690 | | 675,637 |
| | | | |
TOTAL FINLAND | | | | 4,155,990 |
| | | | |
| | |
NORWAY— 20.8% | | | | |
| | |
Basic Materials — 3.3% | | | | |
Norsk Hydro | | 62,503 | | 326,663 |
The accompanying notes are an integral part of the financial statements.
66
| | |
| Schedule of Investments | | October 31, 2011 |
Global X FTSE Nordic Region ETF
| | | | |
| | | Shares | | Value |
COMMON STOCK — continued | | | | |
| | |
Basic Materials — continued | | | | |
Yara International | | 13,609 | | $ 648,863 |
| | | | |
| | | | 975,526 |
| | | | |
| | |
Consumer Goods — 1.9% | | | | |
Orkla | | 64,011 | | 558,148 |
| | | | |
Financials — 3.1% | | | | |
DnB | | 75,899 | | 886,275 |
| | | | |
Oil & Gas — 9.3% | | | | |
Seadrill | | 20,699 | | 685,104 |
Statoil ADR | | 79,499 | | 2,021,660 |
| | | | |
| | | | 2,706,764 |
| | | | |
Telecommunications — 3.2% | | | | |
Telenor | | 51,665 | | 923,286 |
| | | | |
TOTAL NORWAY | | | | 6,049,999 |
| | | | |
| | |
SWEDEN— 47.3% | | | | |
| | |
Consumer Goods — 1.9% | | | | |
Svenska Cellulosa, Cl B | | 36,965 | | 541,015 |
| | | | |
Consumer Services — 4.2% | | | | |
Hennes & Mauritz, Cl B | | 36,335 | | 1,204,768 |
| | | | |
Financials — 17.5% | | | | |
Investor, Cl B | | 27,685 | | 544,652 |
Nordea Bank | | 187,637 | | 1,718,916 |
Skandinaviska Enskilda Banken, Cl A | | 135,142 | | 854,470 |
Svenska Handelsbanken, Cl A | | 38,449 | | 1,109,526 |
Swedbank, Cl A | | 59,309 | | 836,614 |
| | | | |
| | | | 5,064,178 |
| | | | |
| | |
Industrials — 13.8% | | | | |
Atlas Copco, Cl A | | 39,246 | | 860,092 |
Sandvik | | 73,824 | | 1,022,090 |
Scania, Cl B | | 24,937 | | 421,272 |
SKF, Cl B | | 25,516 | | 570,558 |
Volvo, Cl B | | 90,204 | | 1,131,117 |
| | | | |
| | | | 4,005,129 |
| | | | |
Technology — 6.7% | | | | |
Ericsson ADR | | 187,710 | | 1,954,061 |
| | | | |
Telecommunications — 3.2% | | | | |
TeliaSonera | | 134,685 | | 940,110 |
| | | | |
TOTAL SWEDEN | | | | 13,709,261 |
| | | | |
TOTAL COMMON STOCK
(Cost $32,646,292) | | | | 28,937,304 |
| | | | |
The accompanying notes are an integral part of the financial statements.
67
| | |
| Schedule of Investments | | October 31, 2011 |
Global X FTSE Nordic Region ETF
| | | | |
| | | Face Amount | | Value |
TIME DEPOSIT — 0.2% | | | | |
Brown Brothers Harriman, 0.030%
(Cost $48,759) | | $ 48,759 | | $ 48,759 |
| | | | |
TOTAL INVESTMENTS — 99.9%
(Cost $32,695,051) | | | | $ 28,986,063 |
| | | | |
Percentages are based on Net Assets of $29,004,748.
ADR — American Depositary Receipt
Cl — Class
The following is a summary of the inputs used as of October 31, 2011, in valuing the Fund’s investments carried at value:
| | | | | | | | | | |
| Investments in Securities | | Level 1 | | Level 2 | | Level 3 | | Total | |
Common Stock | | $ 28,937,304 | | $ — | | $ — | | $ | 28,937,304 | |
Time Deposit | | — | | 48,759 | | — | | | 48,759 | |
| | | | | | | | | | |
Total Investments in Securities | | $ 28,937,304 | | $ 48,759 | | $ — | | $ | 28,986,063 | |
| | | | | | | | | | |
For the year ended October 31, 2011, there have been no significant transfers between Level 1 & Level 2 investments.
For the year ended October 31, 2011, there were no Level 3 investments.
The accompanying notes are an integral part of the financial statements.
68
| | |
| Schedule of Investments | | October 31, 2011 |
Global X FTSE Norway 30 ETF
Sector Weightings (unaudited)†:
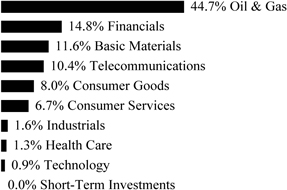
† Percentages based on total investments.
| | | | |
| | | Shares | | Value |
COMMON STOCK — 99.8% | | | | |
| | |
NORWAY— 99.8% | | | | |
| | |
Basic Materials — 11.6% | | | | |
Norsk Hydro | | 616,916 | | $ 3,224,219 |
Yara International | | 114,685 | | 5,468,063 |
| | | | |
| | | | 8,692,282 |
| | | | |
| | |
Consumer Goods — 8.0% | | | | |
Aker, Cl A | | 20,991 | | 600,045 |
Austevoll Seafood | | 58,631 | | 232,955 |
Cermaq | | 49,834 | | 555,483 |
Marine Harvest | | 1,939,192 | | 868,108 |
Orkla | | 429,591 | | 3,745,850 |
| | | | |
| | | | 6,002,441 |
| | | | |
| | |
Consumer Services — 6.6% | | | | |
Royal Caribbean Cruises | | 115,215 | | 3,426,083 |
Schibsted | | 58,580 | | 1,534,484 |
| | | | |
| | | | 4,960,567 |
| | | | |
| | |
Financials — 14.8% | | | | |
DnB | | 638,906 | | 7,460,527 |
Gjensidige Forsikring | | 144,508 | | 1,589,999 |
Storebrand | | 328,735 | | 2,028,958 |
| | | | |
| | | | 11,079,484 |
| | | | |
| | |
Health Care — 1.3% | | | | |
Algeta * | | 28,584 | | 1,002,100 |
| | | | |
| | |
Industrials — 1.6% | | | | |
Stolt-Nielsen | | 18,485 | | 365,566 |
Tomra Systems | | 106,964 | | 790,374 |
| | | | |
| | | | 1,155,940 |
| | | | |
The accompanying notes are an integral part of the financial statements.
69
| | |
| Schedule of Investments | | October 31, 2011 |
Global X FTSE Norway 30 ETF
| | | | |
| | | Shares/Face
Amount | | Value |
COMMON STOCK — continued | | | | |
| | |
Oil & Gas — 44.6% | | | | |
Aker Solutions | | 149,216 | | $ 1,737,035 |
Archer * | | 116,964 | | 496,059 |
BW Offshore | | 373,685 | | 702,062 |
DNO International * | | 686,126 | | 809,827 |
Fred Olsen Energy | | 19,274 | | 651,799 |
Petroleum Geo-Services * | | 157,847 | | 1,731,090 |
ProSafe | | 166,106 | | 1,263,817 |
Renewable Energy * | | 360,669 | | 350,800 |
Seadrill | | 107,826 | | 3,568,870 |
Statoil | | 628,976 | | 16,068,730 |
Statoil Fuel & Retail | | 108,181 | | 861,410 |
Subsea 7 | | 152,333 | | 3,316,588 |
TGS Nopec Geophysical | | 75,520 | | 1,725,683 |
| | | | |
| | | | 33,283,770 |
| | | | |
| | |
Technology — 0.9% | | | | |
Atea | | 72,598 | | 644,770 |
| | | | |
Telecommunications — 10.4% | | | | |
Telenor | | 434,618 | | 7,766,896 |
| | | | |
TOTAL COMMON STOCK
(Cost $80,366,089) | | | | 74,588,250 |
| | | | |
| | |
TIME DEPOSIT — 0.0% | | | | |
Brown Brothers Harriman, 0.030%
(Cost $3,532) | | $ 3,532 | | 3,532 |
| | | | |
| | |
TOTAL INVESTMENTS — 99.8%
(Cost $80,369,621) | | | | $ 74,591,782 |
| | | | |
Percentages are based on Net Assets of $74,706,977.
| * | Non-income producing security. |
Cl — Class
The following is a summary of the inputs used as of October 31, 2011, in valuing the Fund’s investments carried at value:
| | | | | | | | |
| Investments in Securities | | Level 1 | | Level 2 | | Level 3 | | Total |
Common Stock | | $ 74,588,250 | | $ — | | $ — | | $ 74,588,250 |
Time Deposit | | — | | 3,532 | | — | | 3,532 |
| | | | | | | | |
Total Investments in Securities | | $ 74,588,250 | | $ 3,532 | | $ — | | $ 74,591,782 |
| | | | | | | | |
For the period ended October 31, 2011, there have been no significant transfers between Level 1 & Level 2 investments.
For the period ended October 31, 2011, there were no Level 3 investments.
The accompanying notes are an integral part of the financial statements.
70
STATEMENTSOF ASSETSAND LIABILITIES
October 31, 2011
| | | | | | | | | | | | | | | | |
| | | Global X China
Consumer ETF | | | Global X China
Energy ETF | | | Global X China
Financials ETF | | | Global X China
Industrials ETF | |
Assets: | | | | | | | | | | | | | | | | |
Cost of Investments | | $ | 158,801,941 | | | $ | 5,201,716 | | | $ | 11,705,338 | | | $ | 7,024,710 | |
Cost of Foreign Currency | | | 311,249 | | | | 13,363 | | | | 14,253 | | | | 11,801 | |
| | | | | | | | | | | | | | | | |
Investments at Value | | $ | 136,625,383 | | | $ | 4,812,899 | | | $ | 11,062,420 | | | $ | 4,558,970 | |
Foreign Currency at Value | | | 311,736 | | | | 13,372 | | | | 14,280 | | | | 11,837 | |
Receivable for Investment Securities Sold | | | 10,684,525 | | | | 419,876 | | | | 506,207 | | | | 174,785 | |
Dividend and Interest Receivable | | | 132,300 | | | | — | | | | 5,767 | | | | 642 | |
Receivable for Capital Shares Sold | | | — | | | | — | | | | 2,785,000 | | | | — | |
| | | | | | | | | | | | | | | | |
Total Assets | | | 147,753,944 | | | | 5,246,147 | | | | 14,373,674 | | | | 4,746,234 | |
| | | | | | | | | | | | | | | | |
Liabilities: | | | | | | | | | | | | | | | | |
Payable for Investment Securities Purchased | | | 10,810,342 | | | | 418,966 | | | | 3,447,474 | | | | 186,170 | |
Payable due to Investment Adviser | | | 70,619 | | | | 2,483 | | | | 2,472 | | | | 2,176 | |
Due to Custodian | | | 14,996 | | | | 2,874 | | | | — | | | | — | |
| | | | | | | | | | | | | | | | |
Total Liabilities | | | 10,895,957 | | | | 424,323 | | | | 3,449,946 | | | | 188,346 | |
| | | | | | | | | | | | | | | | |
Net Assets | | $ | 136,857,987 | | | $ | 4,821,824 | | | $ | 10,923,728 | | | $ | 4,557,888 | |
| | | | | | | | | | | | | | | | |
Net Assets Consist of: | | | | | | | | | | | | | | | | |
Paid-in Capital | | $ | 163,522,021 | | | $ | 5,192,860 | | | $ | 12,370,697 | | | $ | 7,119,053 | |
Undistributed (Distributions in Excess of) Net Investment Income | | | (646,350) | | | | 78,332 | | | | 14,611 | | | | 3,261 | |
Accumulated Net Realized Loss on Investments and Foreign Currency Translations | | | (3,841,949) | | | | (60,561) | | | | (819,230) | | | | (98,661) | |
Net Unrealized Depreciation on Investments | | | (22,176,558) | | | | (388,817) | | | | (642,918) | | | | (2,465,740) | |
Net Unrealized Appreciation (Depreciation) on Foreign Currency Translations | | | 823 | | | | 10 | | | | 568 | | | | (25) | |
| | | | | | | | | | | | | | | | |
Net Assets | | $ | 136,857,987 | | | $ | 4,821,824 | | | $ | 10,923,728 | | | $ | 4,557,888 | |
| | | | | | | | | | | | | | | | |
Outstanding Shares of Beneficial Interest (unlimited authorization — no par value) | | | 8,950,000 | | | | 350,000 | | | | 1,000,000 | | | | 400,000 | |
| | | | | | | | | | | | | | | | |
Net Asset Value, Offering and Redemption Price Per Share | | $ | 15.29 | | | $ | 13.78 | | | $ | 10.92 | | | $ | 11.39 | |
| | | | | | | | | | | | | | | | |
The accompanying notes are an integral part of the financial statements.
71
STATEMENTSOF ASSETSAND LIABILITIES
October 31, 2011
| | | | | | | | | | | | | | | | |
| | | Global X China
Materials ETF | | | Global X NASDAQ
China Technology
ETF | | | Global X FTSE
ASEAN 40 ETF | | | Global X FTSE
Andean 40 ETF | |
Assets: | | | | | | | | | | | | | | | | |
Cost of Investments | | $ | 4,310,922 | | | $ | 4,605,467 | | | $ | 24,596,635 | | | $ | 7,260,366 | |
Cost of Foreign Currency | | | 13,226 | | | | 22,177 | | | | 10,719 | | | | 4,762 | |
| | | | | | | | | | | | | | | | |
Investments at Value | | $ | 2,845,033 | | | $ | 4,593,515 | | | $ | 23,255,017 | | | $ | 6,799,148 | |
Foreign Currency at Value | | | 13,260 | | | | 22,237 | | | | 11,094 | | | | 4,792 | |
Receivable for Investment Securities Sold | | | 301,401 | | | | 498,452 | | | | — | | | | — | |
Dividend and Interest Receivable | | | 630 | | | | — | | | | 16,642 | | | | 7,217 | |
| | | | | | | | | | | | | | | | |
Total Assets | | | 3,160,324 | | | | 5,114,204 | | | | 23,282,753 | | | | 6,811,157 | |
| | | | | | | | | | | | | | | | |
Liabilities: | | | | | | | | | | | | | | | | |
Payable for Investment Securities Purchased | | | 282,338 | | | | 497,424 | | | | — | | | | — | |
Due to Custodian | | | 1,959 | | | | — | | | | 8,479 | | | | 1,246 | |
Payable due to Investment Adviser | | | 1,400 | | | | 2,743 | | | | 12,042 | | | | 3,870 | |
| | | | | | | | | | | | | | | | |
Total Liabilities | | | 285,697 | | | | 500,167 | | | | 20,521 | | | | 5,116 | |
| | | | | | | | | | | | | | | | |
Net Assets | | $ | 2,874,627 | | | $ | 4,614,037 | | | $ | 23,262,232 | | | $ | 6,806,041 | |
| | | | | | | | | | | | | | | | |
Net Assets Consist of: | | | | | | | | | | | | | | | | |
Paid-in Capital | | $ | 4,343,294 | | | $ | 4,810,925 | | | $ | 24,350,557 | | | $ | 7,298,000 | |
Undistributed Net Investment Income | | | — | | | | 57,615 | | | | 259,838 | | | | 105,342 | |
Accumulated Net Realized Loss on Investments and Foreign Currency Translations | | | (2,812) | | | | (242,610) | | | | (7,031) | | | | (136,113) | |
Net Unrealized Depreciation on Investments | | | (1,465,889) | | | | (11,952) | | | | (1,341,618) | | | | (461,218) | |
Net Unrealized Appreciation on Foreign Currency Translations | | | 34 | | | | 59 | | | | 486 | | | | 30 | |
| | | | | | | | | | | | | | | | |
Net Assets | | $ | 2,874,627 | | | $ | 4,614,037 | | | $ | 23,262,232 | | | $ | 6,806,041 | |
| | | | | | | | | | | | | | | | |
Outstanding Shares of Beneficial Interest (unlimited authorization — no par value) | | | 300,000 | | | | 300,000 | | | | 1,500,000 | | | | 500,000 | |
| | | | | | | | | | | | | | | | |
Net Asset Value, Offering and Redemption Price Per Share | | $ | 9.58 | | | $ | 15.38 | | | $ | 15.51 | | | $ | 13.61 | |
| | | | | | | | | | | | | | | | |
The accompanying notes are an integral part of the financial statements.
72
STATEMENTSOF ASSETSAND LIABILITIES
October 31, 2011
| | | | | | | | | | | | | | | | |
| | | Global X FTSE
Colombia 20 ETF | | | Global X FTSE
Argentina 20 ETF | | | Global X Brazil
Mid Cap ETF | | | Global X Brazil
Consumer ETF | |
Assets: | | | | | | | | | | | | | | | | |
Cost of Investments | | $ | 145,016,559 | | | $ | 4,856,007 | | | $ | 24,716,527 | | | $ | 31,630,916 | |
Cost of Foreign Currency | | | 7,389,882 | | | | 761 | | | | 4,834 | | | | 6,866 | |
| | | | | | | | | | | | | | | | |
Investments at Value | | $ | 140,915,627 | | | $ | 3,858,935 | | | $ | 23,317,586 | | | $ | 29,362,342 | |
Foreign Currency at Value | | | 7,388,324 | | | | 733 | | | | 4,894 | | | | 7,029 | |
Receivable for Capital Shares Sold | | | 4,858,500 | | | | — | | | | — | | | | 1,678,000 | |
Dividend and Interest Receivable | | | 280,134 | | | | — | | | | 61,373 | | | | 70,188 | |
| | | | | | | | | | | | | | | | |
Total Assets | | | 153,442,585 | | | | 3,859,668 | | | | 23,383,853 | | | | 31,117,559 | |
| | | | | | | | | | | | | | | | |
Liabilities: | | | | | | | | | | | | | | | | |
Payable for Investment Securities Purchased | | | 4,246,896 | | | | — | | | | — | | | | 1,677,095 | |
Due to Custodian | | | 7,370,120 | | | | — | | | | 41,470 | | | | 61,946 | |
Payable due to Investment Adviser | | | 79,857 | | | | 2,355 | | | | 12,669 | | | | 16,192 | |
Payable due to Custody | | | 132,794 | | | | 261 | | | | — | | | | — | |
Other Payables | | | — | | | | — | | | | 300 | | | | 1,002 | |
| | | | | | | | | | | | | | | | |
Total Liabilities | | | 11,829,667 | | | | 2,616 | | | | 54,439 | | | | 1,756,235 | |
| | | | | | | | | | | | | | | | |
Net Assets | | $ | 141,612,918 | | | $ | 3,857,052 | | | $ | 23,329,414 | | | $ | 29,361,324 | |
| | | | | | | | | | | | | | | | |
Net Assets Consist of: | | | | | | | | | | | | | | | | |
Paid-in Capital | | $ | 158,205,828 | | | $ | 5,219,000 | | | $ | 25,344,341 | | | $ | 32,070,393 | |
Undistributed Net Investment Income | | | 300,006 | | | | 71,114 | | | | 408,624 | | | | 392,930 | |
Accumulated Net Realized Loss on Investments and Foreign Currency Translations | | | (12,795,863) | | | | (435,961) | | | | (1,024,443) | | | | (830,884) | |
Net Unrealized Depreciation on Investments | | | (4,100,932) | | | | (997,072) | | | | (1,398,941) | | | | (2,268,574) | |
Net Unrealized Appreciation (Depreciation) on Foreign Currency Translations | | | 3,879 | | | | (29) | | | | (167) | | | | (2,541) | |
| | | | | | | | | | | | | | | | |
Net Assets | | $ | 141,612,918 | | | $ | 3,857,052 | | | $ | 23,329,414 | | | $ | 29,361,324 | |
| | | | | | | | | | | | | | | | |
Outstanding Shares of Beneficial Interest (unlimited authorization — no par value) | | | 7,380,000 | | | | 350,000 | | | | 1,500,000 | | | | 1,750,000 | |
| | | | | | | | | | | | | | | | |
Net Asset Value, Offering and Redemption Price Per Share | | $ | 19.19 | | | $ | 11.02 | | | $ | 15.55 | | | $ | 16.78 | |
| | | | | | | | | | | | | | | | |
The accompanying notes are an integral part of the financial statements.
73
STATEMENTSOF ASSETSAND LIABILITIES
October 31, 2011
| | | | | | | | | | | | | | | | |
| | | Global X Brazil
Financials ETF | | | Global X Mexico
Small-Cap ETF | | | Global X Russell
Emerging Markets
Growth ETF | | | Global X Russell
Emerging Markets
Value ETF | |
Assets: | | | | | | | | | | | | | | | | |
Cost of Investments | | $ | 8,252,256 | | | $ | 727,921 | | | $ | 2,499,613 | | | $ | 2,592,091 | |
Cost of Foreign Currency | | | — | | | | 244 | | | | 11,581 | | | | 6,487 | |
| | | | | | | | | | | | | | | | |
Investments at Value | | $ | 7,452,509 | | | $ | 556,872 | | | $ | 2,163,345 | | | $ | 2,234,226 | |
Foreign Currency at Value | | | — | | | | 250 | | | | 11,313 | | | | 6,276 | |
Dividend and Interest Receivable | | | 13,846 | | | | — | | | | 3,989 | | | | 602 | |
| | | | | | | | | | | | | | | | |
Total Assets | | | 7,466,355 | | | | 557,122 | | | | 2,178,647 | | | | 2,241,104 | |
| | | | | | | | | | | | | | | | |
Liabilities: | | | | | | | | | | | | | | | | |
Payable due to Investment Adviser | | | 4,470 | | | | 317 | | | | 1,186 | | | | 1,217 | |
Due to Custodian | | | 471 | | | | — | | | | 1,006 | | | | — | |
| | | | | | | | | | | | | | | | |
Total Liabilities | | | 4,941 | | | | 317 | | | | 2,192 | | | | 1,217 | |
| | | | | | | | | | | | | | | | |
Net Assets | | $ | 7,461,414 | | | $ | 556,805 | | | $ | 2,176,455 | | | $ | 2,239,887 | |
| | | | | | | | | | | | | | | | |
Net Assets Consist of: | | | | | | | | | | | | | | | | |
Paid-in Capital | | $ | 8,159,523 | | | $ | 719,614 | | | $ | 2,511,000 | | | $ | 2,498,000 | |
Undistributed Net Investment Income | | | 216,360 | | | | 6,225 | | | | 37,049 | | | | 31,438 | |
Accumulated Net Realized Gain (Loss) on Investments and Foreign Currency Translations | | | (115,348) | | | | 2,010 | | | | (35,055) | | | | 68,493 | |
Net Unrealized Depreciation on Investments | | | (799,747) | | | | (171,049) | | | | (336,268) | | | | (357,865) | |
Net Unrealized Appreciation (Depreciation) on Foreign Currency Translations | | | 626 | | | | 5 | | | | (271) | | | | (179) | |
| | | | | | | | | | | | | | | | |
Net Assets | | $ | 7,461,414 | | | $ | 556,805 | | | $ | 2,176,455 | | | $ | 2,239,887 | |
| | | | | | | | | | | | | | | | |
Outstanding Shares of Beneficial Interest (unlimited authorization — no par value) | | | 500,000 | | | | 50,000 | | | | 100,000 | | | | 100,000 | |
| | | | | | | | | | | | | | | | |
Net Asset Value, Offering and Redemption Price Per Share | | | $14.92 | | | | $11.14 | | | | $21.76 | | | | $22.40 | |
| | | | | | | | | | | | | | | | |
The accompanying notes are an integral part of the financial statements.
74
STATEMENTSOF ASSETSAND LIABILITIES
October 31, 2011
| | | | | | | | |
| | | Global X FTSE
Nordic Region ETF | | | Global X FTSE
Norway 30 ETF | |
Assets: | | | | | | | | |
Cost of Investments | | $ | 32,695,051 | | | $ | 80,369,621 | |
Cost of Foreign Currency | | | 15,772 | | | | 139,448 | |
| | | | | | | | |
Investments at Value | | $ | 28,986,063 | | | $ | 74,591,782 | |
Foreign Currency at Value | | | 16,022 | | | | 141,055 | |
Reclaim Receivable | | | 11,305 | | | | — | |
Receivable from Custodian | | | 3,250 | | | | — | |
| | | | | | | | |
Total Assets | | | 29,016,640 | | | | 74,732,837 | |
| | | | | | | | |
Liabilities: | | | | | | | | |
Payable due to Investment Adviser | | | 11,892 | | | | 25,860 | |
| | | | | | | | |
Total Liabilities | | | 11,892 | | | | 25,860 | |
| | | | | | | | |
Net Assets | | $ | 29,004,748 | | | $ | 74,706,977 | |
| | | | | | | | |
Net Assets Consist of: | | | | | | | | |
Paid-in Capital | | $ | 31,954,132 | | | $ | 83,208,985 | |
Undistributed Net Investment Income | | | 694,530 | | | | 995,926 | |
Accumulated Net Realized Gain (Loss) on Investments and Foreign Currency Translations | | | 64,912 | | | | (3,721,702) | |
Net Unrealized Depreciation on Investments | | | (3,708,988) | | | | (5,777,839) | |
Net Unrealized Appreciation on Foreign Currency Translations | | | 162 | | | | 1,607 | |
| | | | | | | | |
Net Assets | | $ | 29,004,748 | | | $ | 74,706,977 | |
| | | | | | | | |
Outstanding Shares of Beneficial Interest (unlimited authorization — no par value) | | | 1,660,000 | | | | 5,350,000 | |
| | | | | | | | |
Net Asset Value, Offering and Redemption Price Per Share | | | $17.47 | | | | $13.96 | |
| | | | | | | | |
The accompanying notes are an integral part of the financial statements.
75
STATEMENTSOF OPERATIONS
For the year ended October 31, 2011
| | | | | | | | | | | | | | | | |
| | | Global X China
Consumer ETF | | | Global X
China Energy
ETF | | | Global X China
Financials ETF | | | Global X
China
Industrials
ETF | |
Investment Income: | | | | | | | | | | | | | | | | |
Dividend Income | | $ | 2,932,933 | | | $ | 189,727 | | | $ | 158,169 | | | $ | 129,440 | |
Interest Income | | | 220 | | | | 7 | | | | 7 | | | | 7 | |
Less: Foreign Taxes Withheld | | | (79,553) | | | | (16,122) | | | | (11,879) | | | | (8,223) | |
| | | | | | | | | | | | | | | | |
Total Investment Income | | | 2,853,600 | | | | 173,612 | | | | 146,297 | | | | 121,224 | |
| | | | | | | | | | | | | | | | |
Supervision and Administration Fees(1) | | | 1,139,644 | | | | 47,985 | | | | 106,172 | | | | 51,562 | |
| | | | | | | | | | | | | | | | |
Total Expenses | | | 1,139,644 | | | | 47,985 | | | | 106,172 | | | | 51,562 | |
| | | | | | | | | | | | | | | | |
Net Expenses | | | 1,139,644 | | | | 47,985 | | | | 106,172 | | | | 51,562 | |
| | | | | | | | | | | | | | | | |
Net Investment Income | | | 1,713,956 | | | | 125,627 | | | | 40,125 | | | | 69,662 | |
| | | | | | | | | | | | | | | | |
Net Realized Gain (Loss) on: | | | | | | | | | | | | | | | | |
Investments | | | (11,428,389) | (2) | | | (322,121) | (2) | | | (1,777,734) | (2) | | | 366,112 | (2) |
Foreign Currency Transactions | | | 6,584 | | | | 434 | | | | 1,562 | | | | 280 | |
| | | | | | | | | | | | | | | | |
Net Realized Gain (Loss) on Investments and Foreign Currency Transactions | | | (11,421,805) | | | | (321,687) | | | | (1,776,172) | | | | 366,392 | |
| | | | | | | | | | | | | | | | |
Net Change in Unrealized Appreciation (Depreciation) on: | | | | | | | | | | | | | | | | |
Investments | | | (43,411,948) | | | | (602,952) | | | | (3,649,752) | | | | (3,005,370) | |
Foreign Currency Transactions | | | 250 | | | | 13 | | | | 431 | | | | (735) | |
| | | | | | | | | | | | | | | | |
Net Change in Unrealized Depreciation on Investments and Foreign Currency Transactions | | | (43,411,698) | | | | (602,939) | | | | (3,649,321) | | | | (3,006,105) | |
| | | | | | | | | | | | | | | | |
Net Realized and Unrealized Loss on Investments and Foreign Currency Transactions | | | (54,833,503) | | | | (924,626) | | | | (5,425,493) | | | | (2,639,713) | |
| | | | | | | | | | | | | | | | |
Net Decrease in Net Assets Resulting from Operations | | $ | (53,119,547) | | | $ | (798,999) | | | $ | (5,385,368) | | | $ | (2,570,051) | |
| | | | | | | | | | | | | | | | |
| (1) | The Supervision and Administration fees include fees paid by the Funds for the investment advisory services provided by the Adviser. (See Note 3 in Notes to Financial Statements.) |
| (2) | Includes realized gains as a result of in-kind transactions (See Note 4 in Notes to Financial Statements). |
The accompanying notes are an integral part of the financial statements.
76
STATEMENTSOF OPERATIONS
For the period ended October 31, 2011
| | | | | | | | | | | | | | | | |
| | | Global X China
Materials ETF | | | Global X
NASDAQ
China
Technology
ETF | | | Global X FTSE
ASEAN 40
ETF(1) | | | Global X
FTSE Andean
40 ETF(2) | |
Investment Income: | | | | | | | | | | | | | | | | |
Dividend Income | | $ | 103,822 | | | $ | 170,080 | | | $ | 323,019 | | | $ | 143,306 | |
Interest Income | | | 8 | | | | 5 | | | | 10 | | | | 2 | |
Less: Foreign Taxes Withheld | | | (7,016) | | | | (4,068) | | | | (12,118) | | | | (17,730) | |
| | | | | | | | | | | | | | | | |
Total Investment Income | | | 96,814 | | | | 166,017 | | | | 310,911 | | | | 125,578 | |
| | | | | | | | | | | | | | | | |
Supervision and Administration Fees(3) | | | 89,639 | | | | 37,043 | | | | 48,969 | | | | 35,613 | |
| | | | | | | | | | | | | | | | |
Total Expenses | | | 89,639 | | | | 37,043 | | | | 48,969 | | | | 35,613 | |
| | | | | | | | | | | | | | | | |
Net Expenses | | | 89,639 | | | | 37,043 | | | | 48,969 | | | | 35,613 | |
| | | | | | | | | | | | | | | | |
Net Investment Income | | | 7,175 | | | | 128,974 | | | | 261,942 | | | | 89,965 | |
| | | | | | | | | | | | | | | | |
Net Realized Gain (Loss) on: | | | | | | | | | | | | | | | | |
Investments | | | 11,781,411 (4) | | | | (583,709)(4) | | | | (15,942)(4) | | | | (129,057) | |
Foreign Currency Transactions | | | (3,033) | | | | 166 | | | | (636) | | | | 8,321 | |
| | | | | | | | | | | | | | | | |
Net Realized Gain (Loss) on Investments and Foreign Currency Transactions | | | 11,778,378 | | | | (583,543) | | | | (16,578) | | | | (120,736) | |
| | | | | | | | | | | | | | | | |
Net Change in Unrealized Appreciation (Depreciation) on: | | | | | | | | | | | | | | | | |
Investments | | | (12,377,480) | | | | (505,816) | | | | (1,341,618) | | | | (461,218) | |
Foreign Currency Transactions | | | (40) | | | | 22 | | | | 486 | | | | 30 | |
| | | | | | | | | | | | | | | | |
Net Change in Unrealized Depreciation on Investments and Foreign Currency Transactions | | | (12,377,520) | | | | (505,794) | | | | (1,341,132) | | | | (461,188) | |
| | | | | | | | | | | | | | | | |
Net Realized and Unrealized Loss on Investments and Foreign Currency Transactions | | | (599,142) | | | | (1,089,337) | | | | (1,357,710) | | | | (581,924) | |
| | | | | | | | | | | | | | | | |
Net Decrease in Net Assets Resulting from Operations | | $ | (591,967) | | | $ | (960,363) | | | $ | (1,095,768) | | | $ | (491,959) | |
| | | | | | | | | | | | | | | | |
| (1) | The Fund commenced operations on February 16, 2011. |
| (2) | The Fund commenced operations on February 2, 2011. |
| (3) | The Supervision and Administration fees include fees paid by the Funds for the investment advisory services provided by the Adviser. (See Note 3 in Notes to Financial Statements.) |
| (4) | Includes realized gains as a result of in-kind transactions (See Note 4 in Notes to Financial Statements). |
The accompanying notes are an integral part of the financial statements.
77
STATEMENTSOF OPERATIONS
For the period ended October 31, 2011
| | | | | | | | | | | | | | | | |
| | | Global X FTSE
Colombia 20 ETF | | | Global X
FTSE
Argentina 20
ETF(1) | | | Global X Brazil
Mid Cap ETF | | | Global X Brazil
Consumer ETF | |
Investment Income: | | | | | | | | | | | | | | | | |
Dividend Income | | $ | 3,552,532 | | | $ | 93,647 | | | $ | 1,035,080 | | | $ | 713,181 | |
Interest Income | | | 129 | | | | 4 | | | | 9,635 | | | | 5,033 | |
Less: Foreign Taxes Withheld | | | (36,114) | | | | (1,871) | | | | (57,687) | | | | (41,508) | |
| | | | | | | | | | | | | | | | |
Total Investment Income | | | 3,516,547 | | | | 91,780 | | | | 987,028 | | | | 676,706 | |
| | | | | | | | | | | | | | | | |
Supervision and Administration Fees(2) | | | 1,087,176 | | | | 20,666 | | | | 202,169 | | | | 226,242 | |
Custodian Fees | | | 234,007 | | | | 280 | | | | — | | | | — | |
| | | | | | | | | | | | | | | | |
Total Expenses | | | 1,321,183 | | | | 20,946 | | | | 202,169 | | | | 226,242 | |
| | | | | | | | | | | | | | | | |
Waiver of Supervision and Administration Fees | | | (27,799) | | | | — | | | | — | | | | — | |
| | | | | | | | | | | | | | | | |
Net Expenses | | | 1,293,384 | | | | 20,946 | | | | 202,169 | | | | 226,242 | |
| | | | | | | | | | | | | | | | |
Net Investment Income | | | 2,223,163 | | | | 70,834 | | | | 784,859 | | | | 450,464 | |
| | | | | | | | | | | | | | | | |
Net Realized Gain (Loss) on: | | | | | | | | | | | | | | | | |
Investments | | | (9,703,681)(3) | | | | (435,961) | | | | (1,213,440)(3) | | | | (954,780)(3) | |
Foreign Currency Transactions | | | 151,360 | | | | 280 | | | | (17,225) | | | | (6,026) | |
| | | | | | | | | | | | | | | | |
Net Realized Loss on Investments and Foreign Currency Transactions | | | (9,552,321) | | | | (435,681) | | | | (1,230,665) | | | | (960,806) | |
| | | | | | | | | | | | | | | | |
Net Change in Unrealized Appreciation (Depreciation) on: | | | | | | | | | | | | | | | | |
Investments | | | (26,032,969) | | | | (997,072) | | | | (3,992,645) | | | | (4,579,419) | |
Foreign Currency Transactions | | | 7,943 | | | | (29) | | | | (777) | | | | (2,705) | |
| | | | | | | | | | | | | | | | |
Net Change in Unrealized Depreciation on Investments and Foreign Currency Transactions | | | (26,025,026) | | | | (997,101) | | | | (3,993,422) | | | | (4,582,124) | |
| | | | | | | | | | | | | | | | |
Net Realized and Unrealized Loss on Investments and Foreign Currency Transactions | | | (35,577,347) | | | | (1,432,782) | | | | (5,224,087) | | | | (5,542,930) | |
| | | | | | | | | | | | | | | | |
Net Decrease in Net Assets Resulting from Operations | | $ | (33,354,184) | | | $ | (1,361,948) | | | $ | (4,439,228) | | | $ | (5,092,466) | |
| | | | | | | | | | | | | | | | |
| (1) | The Fund commenced operations on March 2, 2011. |
| (2) | The Supervision and Administration fees include fees paid by the Funds for the investment advisory services provided by the Adviser. (See Note 3 in Notes to Financial Statements.) |
| (3) | Includes realized gains as a result of in-kind transactions (See Note 4 in Notes to Financial Statements). |
The accompanying notes are an integral part of the financial statements.
78
STATEMENTSOF OPERATIONS
For the period ended October 31, 2011
| | | | | | | | | | | | | | | | |
| | | Global X Brazil
Financials ETF | | | Global X
Mexico
Small-Cap
ETF(1) | | | Global X
Russell
Emerging
Markets
Growth ETF(2) | | | Global X
Russell
Emerging
Markets Value
ETF(2) | |
Investment Income: | | | | | | | | | | | | | | | | |
Dividend Income | | $ | 332,454 | | | $ | 9,423 | | | $ | 61,226 | | | $ | 49,878 | |
Interest Income | | | 1 | | | | — | | | | — | | | | 1 | |
Less: Foreign Taxes Withheld | | | (22,674) | | | | — | | | | (6,511) | | | | (7,165) | |
| | | | | | | | | | | | | | | | |
Total Investment Income | | | 309,781 | | | | 9,423 | | | | 54,715 | | | | 42,714 | |
| | | | | | | | | | | | | | | | |
Supervision and Administration Fees(3) | | | 65,842 | | | | 2,988 | | | | 12,472 | | | | 12,763 | |
| | | | | | | | | | | | | | | | |
Total Expenses | | | 65,842 | | | | 2,988 | | | | 12,472 | | | | 12,763 | |
| | | | | | | | | | | | | | | | |
Net Expenses | | | 65,842 | | | | 2,988 | | | | 12,472 | | | | 12,763 | |
| | | | | | | | | | | | | | | | |
Net Investment Income | | | 243,939 | | | | 6,435 | | | | 42,243 | | | | 29,951 | |
| | | | | | | | | | | | | | | | |
Net Realized Gain (Loss) on: | | | | | | | | | �� | | | | | | | |
Investments | | | (164,524) | (4) | | | (10,377) | (4) | | | (35,055) | | | | 68,493 | |
Foreign Currency Transactions | | | 15,469 | | | | (209) | | | | (5,194) | | | | 1,487 | |
| | | | | | | | | | | | | | | | |
Net Realized Gain (Loss) on Investments and Foreign Currency Transactions | | | (149,055) | | | | (10,586) | | | | (40,249) | | | | 69,980 | |
| | | | | | | | | | | | | | | | |
Net Change in Unrealized Appreciation (Depreciation) on: | | | | | | | | | | | | | | | | |
Investments | | | (1,295,157) | | | | (171,049) | | | | (336,268) | | | | (357,865) | |
Foreign Currency Transactions | | | 522 | | | | 5 | | | | (271) | | | | (179) | |
| | | | | | | | | | | | | | | | |
Net Change in Unrealized Depreciation on Investments and Foreign Currency Transactions | | | (1,294,635) | | | | (171,044) | | | | (336,539) | | | | (358,044) | |
| | | | | | | | | | | | | | | | |
Net Realized and Unrealized Loss on Investments and Foreign Currency Transactions | | | (1,443,690) | | | | (181,630) | | | | (376,788) | | | | (288,064) | |
| | | | | | | | | | | | | | | | |
Net Decrease in Net Assets Resulting from Operations | | $ | (1,199,751) | | | $ | (175,195) | | | $ | (334,545) | | | $ | (258,113) | |
| | | | | | | | | | | | | | | | |
| (1) | The Fund commenced operations on May 4, 2011. |
| (2) | The Fund commenced operations on January 24, 2011. |
| (3) | The Supervision and Administration fees include fees paid by the Funds for the investment advisory services provided by the Adviser. (See Note 3 in Notes to Financial Statements.) |
| (4) | Includes realized gains as a result of in-kind transactions (See Note 4 in Notes to Financial Statements). |
The accompanying notes are an integral part of the financial statements.
79
STATEMENTSOF OPERATIONS
For the period ended October 31, 2011
| | | | | | | | |
| | | Global X
FTSE Nordic
Region ETF | | | Global X FTSE
Norway 30
ETF(1) | |
Investment Income: | | | | | | | | |
Dividend Income | | $ | 1,081,825 | | | $ | 1,844,748 | |
Interest Income | | | 112 | | | | 40 | |
Less: Foreign Taxes Withheld | | | (193,224) | | | | (391,291) | |
| | | | | | | | |
Total Investment Income | | | 888,713 | | | | 1,453,497 | |
| | | | | | | | |
Supervision and Administration Fees(2) | | | 137,085 | | | | 205,421 | |
| | | | | | | | |
Total Expenses | | | 137,085 | | | | 205,421 | |
| | | | | | | | |
Net Expenses | | | 137,085 | | | | 205,421 | |
| | | | | | | | |
Net Investment Income | | | 751,628 | | | | 1,248,076 | |
| | | | | | | | |
Net Realized Gain (Loss) on: | | | | | | | | |
Investments | | | 150,017(3) | | | | (3,783,797)(3) | |
Foreign Currency Transactions | | | 8,302 | | | | (41,087) | |
| | | | | | | | |
Net Realized Gain (Loss) on Investments and Foreign Currency Transactions | | | 158,319 | | | | (3,824,884) | |
| | | | | | | | |
Net Change in Unrealized Appreciation (Depreciations) on: | | | | | | | | |
Investments | | | (5,266,855) | | | | (5,777,839) | |
Foreign Currency Transactions | | | (238) | | | | 1,607 | |
| | | | | | | | |
Net Change in Unrealized Depreciation on Investments and Foreign Currency Transactions | | | (5,267,093) | | | | (5,776,232) | |
| | | | | | | | |
Net Realized and Unrealized Loss on Investments and Foreign Currency Transactions | | | (5,108,774) | | | | (9,601,116) | |
| | | | | | | | |
Net Decrease in Net Assets Resulting from Operations | | $ | (4,357,146) | | | $ | (8,353,040) | |
| | | | | | | | |
| (1) | The Fund commenced operations on November 9, 2010. |
| (2) | The Supervision and Administration fees include fees paid by the Funds for the investment advisory services provided by the Adviser. (See Note 3 in Notes to Financial Statements.) |
| (3) | Includes realized gains as a result of in-kind transactions (See Note 4 in Notes to Financial Statements). |
The accompanying notes are an integral part of the financial statements.
80
STATEMENTSOF CHANGESIN NET ASSETS
| | | | | | | | | | | | | | | | |
| | | Global X China Consumer ETF | | | Global X China Energy ETF | |
| | | Year Ended
October 31, 2011 | | | Period Ended
October 31,
2010(1) | | | Year Ended
October 31,
2011 | | | Period Ended
October 31,
2010(2) | |
Operations: | | | | | | | | | | | | | | | | |
Net Investment Income | | $ | 1,713,956 | | | $ | 513,308 | | | $ | 125,627 | | | $ | 57,846 | |
Net Realized Loss on Investments and Foreign Currency Transactions | | | (11,421,805)(3) | | | | (264,708) | | | | (321,687)(3) | | | | (54,664) | |
Net Change in Unrealized Appreciation (Depreciation) on Investments and Foreign Currency Transactions | | | (43,411,698) | | | | 21,235,963 | | | | (602,939) | | | | 214,132 | |
| | | | | | | | | | | | | | | | |
Net Increase (Decrease) in Net Assets Resulting from Operations | | | (53,119,547) | | | | 21,484,563 | | | | (798,999) | | | | 217,314 | |
| | | | | | | | | | | | | | | | |
Dividends and Distributions: | | | | | | | | | | | | | | | | |
Net Investment Income | | | (1,734,529) | | | | — | | | | (61,491) | | | | — | |
| | | | | | | | | | | | | | | | |
Total Dividends and Distributions | | | (1,734,529) | | | | — | | | | (61,491) | | | | — | |
| | | | | | | | | | | | | | | | |
Capital Share Transactions: | | | | | | | | | | | | | �� | | | |
Issued | | | 91,602,500 | | | | 153,390,500 | | | | 5,637,000 | | | | 4,500,000 | |
Redeemed | | | (74,765,500) | | | | — | | | | (4,672,000) | | | | — | |
| | | | | | | | | | | | | | | | |
Increase in Net Assets from Capital Share Transactions | | | 16,837,000 | | | | 153,390,500 | | | | 965,000 | | | | 4,500,000 | |
| | | | | | | | | | | | | | | | |
Total Increase (Decrease) in Net Assets | | | (38,017,076) | | | | 174,875,063 | | | | 104,510 | | | | 4,717,314 | |
| | | | | | | | | | | | | | | | |
Net Assets: | | | | | | | | | | | | | | | | |
Beginning of Period | | | 174,875,063 | | | | — | | | | 4,717,314 | | | | — | |
| | | | | | | | | | | | | | | | |
End of Period | | $ | 136,857,987 | | | $ | 174,875,063 | | | $ | 4,821,824 | | | $ | 4,717,314 | |
| | | | | | | | | | | | | | | | |
Undistributed Net Investment Income (Distributions in Excess) | | $ | (646,350) | | | $ | 513,701 | | | $ | 78,332 | | | $ | 58,057 | |
| | | | | | | | | | | | | | | | |
| | | | |
Share Transactions: | | | | | | | | | | | | | | | | |
Issued | | | 4,800,000 | | | | 8,600,000 | | | | 350,000 | | | | 300,000 | |
Redeemed | | | (4,450,000) | | | | — | | | | (300,000) | | | | — | |
| | | | | | | | | | | | | | | | |
Net Increase in Shares Outstanding from Share Transactions | | | 350,000 | | | | 8,600,000 | | | | 50,000 | | | | 300,000 | |
| | | | | | | | | | | | | | | | |
| (1) | The Fund commenced operations on November 30, 2009. |
| (2) | The Fund commenced operations on December 15, 2009. |
| (3) | Includes realized gains as a result of in-kind transactions (See Note 4 in Notes to Financial Statements). |
The accompanying notes are an integral part of the financial statements.
81
STATEMENTSOF CHANGESIN NET ASSETS
| | | | | | | | | | | | | | | | |
| | | Global X China Financials ETF | | | Global X China Industrials ETF | |
| | | Year Ended
October 31, 2011 | | | Period Ended
October 31,
2010(1) | | | Year Ended
October 31,
2011 | | | Period Ended
October 31,
2010(2) | |
Operations: | | | | | | | | | | | | | | | | |
Net Investment Income | | $ | 40,125 | | | $ | 1,175,125 | | | $ | 69,662 | | | $ | 135,007 | |
Net Realized Gain (Loss) on Investments and Foreign Currency Transactions | | | (1,776,172)(3) | | | | 1,589,811 (4) | | | | 366,392 (3) | | | | 1,515,803 (4) | |
Net Change in Unrealized Appreciation (Depreciation) on Investments and Foreign Currency Transactions | | | (3,649,321) | | | | 3,006,971 | | | | (3,006,105) | | | | 540,340 | |
| | | | | | | | | | | | | | | | |
Net Increase (Decrease) in Net Assets Resulting from Operations | | | (5,385,368) | | | | 5,771,907 | | | | (2,570,051) | | | | 2,191,150 | |
| | | | | | | | | | | | | | | | |
Dividends and Distributions: | | | | | | | | | | | | | | | | |
Net Investment Income | | | (1,177,311) | | | | — | | | | (149,711) | | | | — | |
| | | | | | | | | | | | | | | | |
Total Dividends and Distributions | | | (1,177,311) | | | | — | | | | (149,711) | | | | — | |
| | | | | | | | | | | | | | | | |
Capital Share Transactions: | | | | | | | | | | | | | | | | |
Issued | | | 7,974,500 | | | | 82,874,000 | | | | 839,000 | | | | 27,227,000 | |
Redeemed | | | (60,646,500) | | | | (18,487,500) | | | | (6,411,500) | | | | (16,568,000) | |
| | | | | | | | | | | | | | | | |
Increase (Decrease) in Net Assets from Capital Share Transactions | | | (52,672,000) | | | | 64,386,500 | | | | (5,572,500) | | | | 10,659,000 | |
| | | | | | | | | | | | | | | | |
Total Increase (Decrease) in Net Assets | | | (59,234,679) | | | | 70,158,407 | | | | (8,292,262) | | | | 12,850,150 | |
| | | | | | | | | | | | | | | | |
Net Assets: | | | | | | | | | | | | | | | | |
Beginning of Period | | | 70,158,407 | | | | — | | | | 12,850,150 | | | | — | |
| | | | | | | | | | | | | | | | |
End of Period | | $ | 10,923,728 | | | $ | 70,158,407 | | | $ | 4,557,888 | | | $ | 12,850,150 | |
| | | | | | | | | | | | | | | | |
Undistributed Net Investment Income | | $ | 14,611 | | | $ | 1,177,309 | | | $ | 3,261 | | | $ | 149,709 | |
| | | | | | | | | | | | | | | | |
Share Transactions: | | | | | | | | | | | | | | | | |
Issued | | | 750,000 | | | | 6,000,000 | | | | 50,000 | | | | 1,700,000 | |
Redeemed | | | (4,500,000) | | | | (1,250,000) | | | | (400,000) | | | | (950,000) | |
| | | | | | | | | | | | | | | | |
Net Increase (Decrease) in Shares Outstanding from Share Transactions | | | (3,750,000) | | | | 4,750,000 | | | | (350,000) | | | | 750,000 | |
| | | | | | | | | | | | | | | | |
| (1) | The Fund commenced operations on December 10, 2009. |
| (2) | The Fund commenced operations on November 30, 2009. |
| (3) | Includes realized gains as a result of in-kind transactions (See Note 4 in Notes to Financial Statements). |
| (4) | Includes realized gains as a result of in-kind transactions. |
The accompanying notes are an integral part of the financial statements.
82
STATEMENTSOF CHANGESINNET ASSETS
| | | | | | | | | | | | | | | | |
| | | Global X China Materials ETF | | | Global X NASDAQ China
Technology ETF | |
| | | Year Ended
October 31, 2011 | | | Period Ended
October 31,
2010(1) | | | Year Ended
October 31,
2011 | | | Period Ended
October 31,
2010(2) | |
Operations: | | | | | | | | | | | | | | | | |
Net Investment Income | | $ | 7,175 | | | $ | 46,418 | | | $ | 128,974 | | | $ | 7,404 | |
Net Realized Gain (Loss) on Investments and Foreign Currency Transactions | | | 11,778,378(3) | | | | (17,369) | | | | (583,543)(3) | | | | 38,475 | |
Net Change in Unrealized Appreciation (Depreciation) on Investments and Foreign Currency Transactions | | | (12,377,520) | | | | 10,911,665 | | | | (505,794) | | | | 493,901 | |
| | | | | | | | | | | | | | | | |
Net Increase (Decrease) in Net Assets Resulting from Operations | | | (591,967) | | | | 10,940,714 | | | | (960,363) | | | | 539,780 | |
| | | | | | | | | | | | | | | | |
Dividends and Distributions: | | | | | | | | | | | | | | | | |
Net Investment Income | | | (336,120) | | | | — | | | | (7,571) | | | | — | |
Net Realized Gains | | | — | | | | — | | | | (38,309) | | | | — | |
| | | | | | | | | | | | | | | | |
Total Dividends and Distributions | | | (336,120) | | | | — | | | | (45,880) | | | | — | |
| | | | | | | | | | | | | | | | |
Capital Share Transactions: | | | | | | | | | | | | | | | | |
Issued | | | 2,226,000 | | | | 46,701,000 | | | | 3,666,000 | | | | 3,761,500 | |
Redeemed | | | (56,065,000) | | | | — | | | | (2,347,000) | | | | — | |
| | | | | | | | | | | | | | | | |
Increase (Decrease) in Net Assets from Capital Share Transactions | | | (53,839,000) | | | | 46,701,000 | | | | 1,319,000 | | | | 3,761,500 | |
| | | | | | | | | | | | | | | | |
Total Increase (Decrease) in Net Assets | | | (54,767,087) | | | | 57,641,714 | | | | 312,757 | | | | 4,301,280 | |
| | | | | | | | | | | | | | | | |
Net Assets: | | | | | | | | | | | | | | | | |
Beginning of Period | | | 57,641,714 | | | | — | | | | 4,301,280 | | | | — | |
| | | | | | | | | | | | | | | | |
End of Period | | $ | 2,874,627 | | | $ | 57,641,714 | | | $ | 4,614,037 | | | $ | 4,301,280 | |
| | | | | | | | | | | | | | | | |
Undistributed Net Investment Income | | $ | — | | | $ | 44,666 | | | $ | 57,615 | | | $ | 7,571 | |
| | | | | | | | | | | | | | | | |
Share Transactions: | | | | | | | | | | | | | | | | |
Issued | | | 150,000 | | | | 3,950,000 | | | | 200,000 | | | | 250,000 | |
Redeemed | | | (3,800,000) | | | | — | | | | (150,000) | | | | — | |
| | | | | | | | | | | | | | | | |
Net Increase (Decrease) in Shares Outstanding from Share Transactions | | | (3,650,000) | | | | 3,950,000 | | | | 50,000 | | | | 250,000 | |
| | | | | | | | | | | | | | | | |
| (1) | The Fund commenced operations on January 12, 2010. |
| (2) | The Fund commenced operations on December 8, 2009. |
| (3) | Includes realized gains as a result of in-kind transactions (See Note 4 in Notes to Financial Statements). |
The accompanying notes are an integral part of the financial statements.
83
STATEMENTSOF CHANGESIN NET ASSETS
| | | | | | | | |
| | | Global X FTSE
ASEAN 40 ETF | | | Global X FTSE
Andean 40
ETF | |
| | | Period Ended
October 31,
2011(1) | | | Period Ended
October 31,
2011(2) | |
Operations: | | | | | | | | |
Net Investment Income | | $ | 261,942 | | | $ | 89,965 | |
Net Realized Loss on Investments and Foreign Currency Transactions | | | (16,578)(3) | | | | (120,736) | |
Net Change in Unrealized Depreciation on Investments and Foreign Currency Transactions | | | (1,341,132) | | | | (461,188) | |
| | | | | | | | |
Net Decrease in Net Assets Resulting from Operations | | | (1,095,768) | | | | (491,959) | |
| | | | | | | | |
Capital Share Transactions: | | | | | | | | |
Issued | | | 25,223,500 | | | | 7,298,000 | |
Redeemed | | | (865,500) | | | | — | |
| | | | | | | | |
Increase in Net Assets from Capital Share Transactions | | | 24,358,000 | | | | 7,298,000 | |
| | | | | | | | |
Total Increase in Net Assets | | | 23,262,232 | | | | 6,806,041 | |
| | | | | | | | |
Net Assets: | | | | | | | | |
Beginning of Period | | | — | | | | — | |
| | | | | | | | |
End of Period | | $ | 23,262,232 | | | $ | 6,806,041 | |
| | | | | | | | |
Undistributed Net Investment Income | | $ | 259,838 | | | $ | 105,342 | |
| | | | | | | | |
Share Transactions: | | | | | | | | |
Issued | | | 1,550,000 | | | | 500,000 | |
Redeemed | | | (50,000) | | | | — | |
| | | | | | | | |
Net Increase in Shares Outstanding from Share Transactions | | | 1,500,000 | | | | 500,000 | |
| | | | | | | | |
| (1) | The Fund commenced operations on February 16, 2011. |
| (2) | The Fund commenced operations on February 2, 2011. |
| (3) | Includes realized gains as a result of in-kind transactions (See Note 4 in Notes to Financial Statements). |
The accompanying notes are an integral part of the financial statements.
84
STATEMENTSOF CHANGESIN NET ASSETS
| | | | | | | | | | | | |
| | | Global X FTSE Colombia 20 ETF | | | Global X FTSE
Argentina 20
ETF | |
| | | Year Ended
October 31,
2011 | | | Year Ended
October 31, 2010 | | | Period Ended
October 31,
2011(1) | |
Operations: | | | | | | | | | | | | |
Net Investment Income | | $ | 2,223,163 | | | $ | 248,896 | | | $ | 70,834 | |
Net Realized Gain (Loss) on Investments and Foreign Currency Transactions | | | (9,552,321)(2) | | | | 148,195 | | | | (435,681) | |
Net Change in Unrealized Appreciation (Depreciation) on Investments and Foreign Currency Transactions | | | (26,025,026) | | | | 20,392,508 | | | | (997,101) | |
| | | | | | | | | | | | |
Net Increase (Decrease) in Net Assets Resulting from Operations | | | (33,354,184) | | | | 20,789,599 | | | | (1,361,948) | |
| | | | | | | | | | | | |
Dividends and Distributions: | | | | | | | | | | | | |
Net Investment Income | | | (1,100,701) | | | | (264,734) | | | | — | |
Net Realized Gains | | | (643,516) | | | | — | | | | — | |
| | | | | | | | | | | | |
Total Dividends and Distributions | | | (1,744,217) | | | | (264,734) | | | | — | |
| | | | | | | | | | | | |
Capital Share Transactions: | | | | | | | | | | | | |
Issued | | | 108,003,500 | | | | 168,870,000 | | | | 5,219,000 | |
Redeemed | | | (127,647,100) | | | | — | | | | — | |
| | | | | | | | | | | | |
Increase (Decrease) in Net Assets from Capital Share Transactions | | | (19,643,600) | | | | 168,870,000 | | | | 5,219,000 | |
| | | | | | | | | | | | |
Total Increase (Decrease) in Net Assets | | | (54,742,001) | | | | 189,394,865 | | | | 3,857,052 | |
| | | | | | | | | | | | |
Net Assets: | | | | | | | | | | | | |
Beginning of Period | | | 196,354,919 | | | | 6,960,054 | | | | — | |
| | | | | | | | | | | | |
End of Period | | $ | 141,612,918 | | | $ | 196,354,919 | | | $ | 3,857,052 | |
| | | | | | | | | | | | |
Undistributed Net Investment Income | | $ | 300,006 | | | $ | 87,541 | | | $ | 71,114 | |
| | | | | | | | | | | | |
Share Transactions: | | | | | | | | | | | | |
Issued | | | 5,130,000 (4) | �� | | | 8,040,000 (3) | | | | 350,000 | |
Redeemed | | | (6,290,000)(4) | | | | — | | | | — | |
| | | | | | | | | | | | |
Net Increase (Decrease) in Shares Outstanding from Share Transactions | | | (1,160,000) | | | | 8,040,000 (3) | | | | 350,000 | |
| | | | | | | | | | | | |
| (1) | The Fund commenced operations on March 2, 2011. |
| (2) | Includes realized gains as a result of in-kind transactions (See Note 4 in Notes to Financial Statements). |
| (3) | Restated to reflect the effect of a 2 for 1 share split on April 12, 2011. (See Note 8 in Notes to Financial Statement) |
| (4) | Adjusted to reflect the effect of a 2 for 1 share split on April 12, 2011. (See Note 8 in the Notes to Financial Statement) |
The accompanying notes are an integral part of the financial statements.
85
STATEMENTSOF CHANGESIN NET ASSETS
| | | | | | | | | | | | | | | | |
| | | Global X Brazil Mid Cap ETF | | | Global X Brazil Consumer ETF | |
| | | Year Ended
October 31,
2011 | | | Period Ended
October 31,
2010(1) | | | Year Ended
October 31,
2011 | | | Period Ended
October 31,
2010(2) | |
Operations: | | | | | | | | | | | | | | | | |
Net Investment Income | | $ | 784,859 | | | $ | 60,548 | | | $ | 450,464 | | | $ | 3,140 | |
Net Realized Gain (Loss) on Investments and Foreign Currency Transactions | | | (1,230,665)(3) | | | | 31,759 | | | | (960,806)(3) | | | | 23,620 | |
Net Change in Unrealized Appreciation (Depreciation) on Investments and Foreign Currency Transactions | | | (3,993,422) | | | | 2,594,314 | | | | (4,582,124) | | | | 2,311,009 | |
| | | | | | | | | | | | | | | | |
Net Increase (Decrease) in Net Assets Resulting from Operations | | | (4,439,228) | | | | 2,686,621 | | | | (5,092,466) | | | | 2,337,769 | |
| | | | | | | | | | | | | | | | |
Dividends and Distributions: | | | | | | | | | | | | | | | | |
Net Investment Income | | | (417,712) | | | | — | | | | (34,888) | | | | — | |
Net Realized Gains | | | (35,267) | | | | — | | | | (23,091) | | | | — | |
| | | | | | | | | | | | | | | | |
Total Dividends and Distributions | | | (452,979) | | | | — | | | | (57,979) | | | | — | |
| | | | | | | | | | | | | | | | |
Capital Share Transactions: | | | | | | | | | | | | | | | | |
Issued | | | 6,216,500 | | | | 26,555,500 | | | | 18,461,000 | | | | 22,596,500 | |
Redeemed | | | (7,237,000) | | | | — | | | | (8,883,500) | | | | — | |
| | | | | | | | | | | | | | | | |
Increase (Decrease) in Net Assets from Capital Share Transactions | | | (1,020,500) | | | | 26,555,500 | | | | 9,577,500 | | | | 22,596,500 | |
| | | | | | | | | | | | | | | | |
Total Increase (Decrease) in Net Assets | | | (5,912,707) | | | | 29,242,121 | | | | 4,427,055 | | | | 24,934,269 | |
| | | | | | | | | | | | | | | | |
Net Assets: | | | | | | | | | | | | | | | | |
Beginning of Period | | | 29,242,121 | | | | — | | | | 24,934,269 | | | | — | |
| | | | | | | | | | | | | | | | |
End of Period | | $ | 23,329,414 | | | $ | 29,242,121 | | | $ | 29,361,324 | | | $ | 24,934,269 | |
| | | | | | | | | | | | | | | | |
Undistributed Net Investment Income | | $ | 408,624 | | | $ | 57,041 | | | $ | 392,930 | | | $ | 3,670 | |
| | | | | | | | | | | | | | | | |
Share Transactions: | | | | | | | | | | | | | | | | |
Issued | | | 350,000 | | | | 1,600,000 | | | | 1,000,000 | | | | 1,250,000 | |
Redeemed | | | (450,000) | | | | — | | | | (500,000) | | | | — | |
| | | | | | | | | | | | | | | | |
Net Increase (Decrease) in Shares Outstanding from Share Transactions | | | (100,000) | | | | 1,600,000 | | | | 500,000 | | | | 1,250,000 | |
| | | | | | | | | | | | | | | | |
| (1) | The Fund commenced operations on June 21, 2010. |
| (2) | The Fund commenced operations on July 7, 2010. |
| (3) | Includes realized gains as a result of in-kind transactions (See Note 4 in Notes to Financial Statements). |
The accompanying notes are an integral part of the financial statements.
86
STATEMENTSOF CHANGESIN NET ASSETS
| | | | | | | | | | | | |
| | | Global X Brazil Financials ETF | | | Global X
Mexico Small-
Cap ETF | |
| | | Year Ended
October 31,
2011 | | | Period Ended
October 31,
2010(1) | | | Period Ended
October 31,
2011(2) | |
Operations: | | | | | | | | | | | | |
Net Investment Income | | $ | 243,939 | | | $ | 12,403 | | | $ | 6,435 | |
Net Realized Gain (Loss) on Investments and Foreign Currency Transactions | | | (149,055)(3) | | | | 1,420 | | | | (10,586)(3) | |
Net Change in Unrealized Appreciation (Depreciation) on Investments and Foreign Currency Transactions | | | (1,294,635) | | | | 495,514 | | | | (171,044) | |
| | | | | | | | | | | | |
Net Increase (Decrease) in Net Assets Resulting from Operations | | | (1,199,751) | | | | 509,337 | | | | (175,195) | |
| | | | | | | | | | | | |
Dividends and Distributions: | | | | | | | | | | | | |
Net Investment Income | | | (49,172) | | | | — | | | | — | |
| | | | | | | | | | | | |
Total Dividends and Distributions | | | (49,172) | | | | — | | | | — | |
| | | | | | | | | | | | |
Capital Share Transactions: | | | | | | | | | | | | |
Issued | | | 1,676,000 | | | | 7,320,000 | | | | 1,453,000 | |
Redeemed | | | (795,000) | | | | — | | | | (721,000) | |
| | | | | | | | | | | | |
Increase in Net Assets from Capital Share Transactions | | | 881,000 | | | | 7,320,000 | | | | 732,000 | |
| | | | | | | | | | | | |
Total Increase (Decrease) in Net Assets | | | (367,923) | | | | 7,829,337 | | | | 556,805 | |
| | | | | | | | | | | | |
Net Assets: | | | | | | | | | | | | |
Beginning of Period | | | 7,829,337 | | | | — | | | | — | |
| | | | | | | | | | | | |
End of Period | | $ | 7,461,414 | | | $ | 7,829,337 | | | $ | 556,805 | |
| | | | | | | | | | | | |
Undistributed Net Investment Income | | $ | 216,360 | | | $ | 13,826 | | | $ | 6,225 | |
| | | | | | | | | | | | |
Share Transactions: | | | | | | | | | | | | |
Issued | | | 100,000 | | | | 450,000 | | | | 100,000 | |
Redeemed | | | (50,000) | | | | — | | | | (50,000) | |
| | | | | | | | | | | | |
Net Increase in Shares Outstanding from Share Transactions | | | 50,000 | | | | 450,000 | | | | 50,000 | |
| | | | | | | | | | | | |
| (1) | The Fund commenced operations on July 28, 2010. |
| (2) | The Fund commenced operations on May 4, 2011. |
| (3) | Includes realized gains as a result of in-kind transactions (See Note 4 in Notes to Financial Statements). |
The accompanying notes are an integral part of the financial statements.
87
STATEMENTSOF CHANGESIN NET ASSETS
| | | | | | | | |
| | | Global X
Russell
Emerging
Markets
Growth ETF | | | Global X Russell
Emerging
Markets Value
ETF | |
| | | Period Ended
October 31,
2011(1) | | | Period Ended
October 31,
2011(1) | |
Operations: | | | | | | | | |
Net Investment Income | | $ | 42,243 | | | $ | 29,951 | |
Net Realized Gain (Loss) on Investments and Foreign Currency Transactions | | | (40,249) | | | | 69,980 | |
Net Change in Unrealized Depreciation on Investments and Foreign Currency Transactions | | | (336,539) | | | | (358,044) | |
| | | | | | | | |
Net Decrease in Net Assets Resulting from Operations | | | (334,545) | | | | (258,113) | |
| | | | | | | | |
Capital Share Transactions: | | | | | | | | |
Issued | | | 2,511,000 | | | | 2,498,000 | |
| | | | | | | | |
Increase in Net Assets from Capital Share Transactions | | | 2,511,000 | | | | 2,498,000 | |
| | | | | | | | |
Total Increase in Net Assets | | | 2,176,455 | | | | 2,239,887 | |
| | | | | | | | |
Net Assets: | | | | | | | | |
Beginning of Period | | | — | | | | — | |
| | | | | | | | |
End of Period | | $ | 2,176,455 | | | $ | 2,239,887 | |
| | | | | | | | |
Undistributed Net Investment Income | | $ | 37,049 | | | $ | 31,438 | |
| | | | | | | | |
Share Transactions: | | | | | | | | |
Issued | | | 100,000 | | | | 100,000 | |
| | | | | | | | |
Net Increase in Shares Outstanding from Share Transactions | | | 100,000 | | | | 100,000 | |
| | | | | | | | |
| (1) | The Fund commenced operations on January 24, 2011. |
The accompanying notes are an integral part of the financial statements.
88
STATEMENTSOF CHANGESIN NET ASSETS
| | | | | | | | | | | | |
| | | Global X FTSE Nordic Region ETF | | | Global X FTSE
Norway 30 ETF | |
| | | Year Ended
October 31,
2011 | | | Year Ended
October 31,
2010 | | | Period Ended
October 31,
2011(1) | |
Operations: | | | | | | | | | | | | |
Net Investment Income | | $ | 751,628 | | | $ | 129,926 | | | $ | 1,248,076 | |
Net Realized Gain (Loss) on Investments and Foreign | | | | | | | | | | | | |
Currency Transactions | | | 158,319(2) | | | | 412,087(3) | | | | (3,824,884)(2) | |
Net Change in Unrealized Appreciation (Depreciation) on Investments and Foreign Currency Transactions | | | (5,267,093) | | | | 1,293,175 | | | | (5,776,232) | |
| | | | | | | | | | | | |
Net Increase (Decrease) in Net Assets Resulting from Operations | | | (4,357,146) | | | | 1,835,188 | | | | (8,353,040) | |
| | | | | | | | | | | | |
Dividends and Distributions: | | | | | | | | | | | | |
Net Investment Income | | | (150,580) | | | | (2,158) | | | | (6,983) | |
| | | | | | | | | | | | |
Total Dividends and Distributions | | | (150,580) | | | | (2,158) | | | | (6,983) | |
| | | | | | | | | | | | |
Capital Share Transactions: | | | | | | | | | | | | |
Issued | | | 23,507,000 | | | | 9,938,400 | | | | 95,823,000 | |
Redeemed | | | (2,678,000) | | | | (2,462,600) | | | | (12,756,000) | |
| | | | | | | | | | | | |
Increase in Net Assets from Capital Share Transactions | | | 20,829,000 | | | | 7,475,800 | | | | 83,067,000 | |
| | | | | | | | | | | | |
Total Increase in Net Assets | | | 16,321,274 | | | | 9,308,830 | | | | 74,706,977 | |
| | | | | | | | | | | | |
Net Assets: | | | | | | | | | | | | |
Beginning of Period | | | 12,683,474 | | | | 3,374,644 | | | | — | |
| | | | | | | | | | | | |
End of Period | | $ | 29,004,748 | | | $ | 12,683,474 | | | $ | 74,706,977 | |
| | | | | | | | | | | | |
Undistributed Net Investment Income | | $ | 694,530 | | | $ | 127,846 | | | $ | 995,926 | |
| | | | | | | | | | | | |
| | | |
Share Transactions: | | | | | | | | | | | | |
Issued | | | 1,150,000 | | | | 590,000 | | | | 6,200,000 | |
Redeemed | | | (150,000) | | | | (140,000) | | | | (850,000) | |
| | | | | | | | | | | | |
Net Increase in Shares Outstanding from Share Transactions | | | 1,000,000 | | | | 450,000 | | | | 5,350,000 | |
| | | | | | | | | | | | |
| (1) | The Fund commenced operations on November 9, 2010. |
| (2) | Includes realized gains as a result of in-kind transactions (See Note 4 in Notes to Financial Statements). |
| (3) | Includes realized gains as a result of in-kind transactions. |
The accompanying notes are an integral part of the financial statements.
89
FINANCIAL HIGHLIGHTS
Selected Per Share Data & Ratios
For a Share Outstanding Throughout the Period
| | | | | | | | | | | | | | | | | | | | | | | | | | | | | | | | | | | | | | | | | | | | | | |
| | | Net Asset
Value,
Beginning
of Period
($) | | | Net
Investment
Income
($)* | | | Net
Realized
and
Unrealized
Gain (Loss)
on
Investments
($) | | | Total from
Operations
($) | | | Distribution
from Net
Investment
Income ($) | | Distribution
from
Capital
Gains ($) | | Total from
Distributions
($) | | Net
Asset
Value,
End of
Period
($) | | | Total
Return
(%)** | | | Net Assets
End of
Period
($)(000) | | | Ratio of
Expenses
to
Average
Net
Assets
(%) | | | Ratio of
Net
Investment
Income to
Average
Net Assets
(%) | | | Portfolio
Turnover
(%) | |
Global X China Consumer ETF(1) | | | | | | | | | | | | | | | | | | | | | | | | | | | | | | | |
2011 | | | 20.33 | | | | 0.17 | | | | (5.02) | | | | (4.85) | | | (0.19) | | — | | (0.19) | | | 15.29 | | | | (23.99) | | | | 136,858 | | | | 0.65 | | | | 0.98 | | | | 12.37 | |
2010 | | | 15.65 | | | | 0.17 | | | | 4.51 | | | | 4.68 | | | — | | — | | — | | | 20.33 | | | | 29.90 | | | | 174,875 | | | | 0.65† | | | | 1.03† | | | | 3.91†† | |
Global X China Energy ETF(2) | | | | | | | | | | | | | | | | | | | | | | | | | | | | | | | |
2011 | | | 15.72 | | | | 0.27 | | | | (2.07) | | | | (1.80) | | | (0.14) | | — | | (0.14) | | | 13.78 | | | | (11.57) | | | | 4,822 | | | | 0.65 | | | | 1.70 | | | | 11.39 | |
2010 | | | 15.02 | | | | 0.23 | | | | 0.47 | | | | 0.70 | | | — | | — | | — | | | 15.72 | | | | 4.66 | | | | 4,717 | | | | 0.65† | | | | 1.80† | | | | 20.55†† | |
Global X China Financials ETF(3) | | | | | | | | | | | | | | | | | | | | | | | | | | | | | | | |
2011 | | | 14.77 | | | | 0.03 | | | | (3.56) | | | | (3.53) | | | (0.32) | | — | | (0.32) | | | 10.92 | | | | (24.29) | | | | 10,924 | | | | 0.65 | | | | 0.25 | | | | 41.54 | |
2010 | | | 14.90 | | | | 0.27 | | | | (0.40) | | | | (0.13) | | | — | | — | | — | | | 14.77 | | | | (0.87) | | | | 70,158 | | | | 0.65† | | | | 2.26† | | | | 14.42†† | |
Global X China Industrials ETF(1) | | | | | | | | | | | | | | | | | | | | | | | | | | | | | | | |
2011 | | | 17.13 | | | | 0.13 | | | | (5.64) | | | | (5.51) | | | (0.23) | | — | | (0.23) | | | 11.39 | | | | (32.56) | | | | 4,558 | | | | 0.65 | | | | 0.88 | | | | 20.13 | |
2010 | | | 15.50 | | | | 0.08 | | | | 1.55 | | | | 1.63 | | | — | | — | | — | | | 17.13 | | | | 10.52 | | | | 12,850 | | | | 0.65† | | | | 0.61† | | | | 12.74†† | |
Global X China Materials ETF(4) | | | | | | | | | | | | | | | | | | | | | | | | | | | | | | | |
2011 | | | 14.59 | | | | 0.01 | | | | (4.88) | | | | (4.87) | | | (0.14) | | — | | (0.14) | | | 9.58 | | | | (33.69) | | | | 2,875 | | | | 0.65 | | | | 0.05 | | | | 36.82 | |
2010 | | | 14.95 | | | | 0.02 | | | | (0.38) | | | | (0.36) | | | — | | — | | — | | | 14.59 | | | | (2.41) | | | | 57,642 | | | | 0.65† | | | | 0.23† | | | | 6.13†† | |
Global X NASDAQ China Technology ETF(5) | | | | | | | | | | | | | | | | | | | | | | | | | | | | | | | |
2011 | | | 17.21 | | | | 0.38 | | | | (2.05) | | | | (1.67) | | | (0.03) | | (0.13) | | (0.16) | | | 15.38 | | | | (9.81) | | | | 4,614 | | | | 0.65 | | | | 2.26 | | | | 16.79 | |
2010 | | | 14.90 | | | | 0.03 | | | | 2.28 | | | | 2.31 | | | — | | — | | — | | | 17.21 | | | | 15.50 | | | | 4,301 | | | | 0.65† | | | | 0.24† | | | | 5.15†† | |
Global X FTSE ASEAN 40 ETF(6) | | | | | | | | | | | | | | | | | | | | | | | | | | | | | | | |
2011 | | | 15.08 | | | | 0.38 | | | | 0.05 | | | | 0.43 | | | — | | — | | — | | | 15.51 | | | | 2.85 | | | | 23,262 | | | | 0.65† | | | | 3.46† | | | | 2.68†† | |
| (1) | The Fund commenced operations on November 30, 2009. |
| (2) | The Fund commenced operations on December 15, 2009. |
| (3) | The Fund commenced operations on December 10, 2009. |
| (4) | The Fund commenced operations on January 12, 2010. |
| (5) | The Fund commenced operations on December 8, 2009. |
| (6) | The Fund commenced operations on February 16, 2011. |
| * | Per share data calculated using average shares method. |
| ** | Total Return is for the period indicated and has not been annualized. The return shown does not reflect the deduction of taxes that a shareholder would pay on Fund distributions or the redemption of Fund shares. |
| †† | Portfolio turnover rate is for the period indicated and has not been annualized. Excludes effect of in-kind transfers. |
Amounts designated as “—” are either $0 or have been rounded to $0.
The accompanying notes are an integral part of the financial statements.
90
FINANCIAL HIGHLIGHTS
Selected Per Share Data & Ratios
For a Share Outstanding Throughout the Period
| | | | | | | | | | | | | | | | | | | | | | | | | | | | | | | | | | | | | | | | | | | | | | |
| | | Net Asset
Value,
Beginning
of Period
($) | | | Net
Investment
Income
($)* | | | Net
Realized
and
Unrealized
Gain (Loss)
on
Investments
($) | | | Total from
Operations
($) | | | Distribution
from Net
Investment
Income ($) | | Distribution
from
Capital
Gains ($) | | Total from
Distributions
($) | | Net
Asset
Value,
End of
Period
($) | | | Total
Return
(%)** | | | Net Assets
End of
Period
($)(000) | | | Ratio of
Expenses
to Average
Net Assets
(%) | | | Ratio of
Net
Investment
Income to
Average
Net Assets
(including
waivers)
(%) | | | Portfolio
Turnover
(%) | |
Global X FTSE Andean 40 ETF(1) | | | | | | | | | | | | | | | | | | | | | | | | | | | | | | | | | | | |
2011 | | | 14.88 | | | | 0.19 | | | | (1.46) | | | | (1.27) | | | — | | — | | — | | | 13.61 | | | | (8.53) | | | | 6,806 | | | | 0.72† | | | | 1.81† | | | | 15.83†† | |
Global X FTSE Colombia 20 ETF(2) | | | | | | | | | | | | | | | | | | | | | | | | | | | | | | | | | | | |
2011(9) | | | 22.99 | | | | 0.29 | | | | (3.88) | | | | (3.59) | | | (0.13) | | (0.08) | | (0.21) | | | 19.19 | | | | (15.69) | | | | 141,613 | | | | 0.83@ | | | | 1.39 | | | | 63.11 | |
2010(8) | | | 13.92 | | | | 0.16 | | | | 9.44 | | | | 9 .60 | | | (0.53) | | — | | (0.53) | | | 22.99 | | | | 71.28 | | | | 196,355 | | | | 0.86 | | | | 0.77 | | | | 40.95 | |
2009(8) | | | 7.50 | | | | 0.25 | | | | 6.17 | | | | 6.42 | | | — | | — | | — | | | 13.92 | | | | 85.60 | | | | 6,960 | | | | 0.86† | | | | 2.93† | | | | 1.94†† | |
Global X FTSE Argentina 20 ETF(3) | | | | | | | | | | | | | | | | | | | | | | | | | | | | | | | | | | | |
2011 | | | 14.93 | | | | 0.23 | | | | (4.14) | | | | (3.91) | | | — | | — | | — | | | 11.02 | | | | (26.19) | | | | 3,857 | | | | 0.75† | | | | 2.53 | | | | 40.86†† | |
Global X Brazil Mid Cap ETF(4) | | | | | | | | | | | | | | | | | | | | | | | | | | | | | | | | | | | |
2011 | | | 18.28 | | | | 0.46 | | | | (2.94) | | | | (2.48) | | | (0.23) | | (0.02) | | (0.25) | | | 15.55 | | | | (13.73) | | | | 23,329 | | | | 0.69 | | | | 2.68 | | | | 16.90 | |
2010 | | | 15.16 | | | | 0.08 | | | | 3.04 | | | | 3.12 | | | — | | — | | — | | | 18.28 | | | | 20.58 | | | | 29,242 | | | | 0.69† | | | | 1.24† | | | | 2.69†† | |
Global X Brazil Consumer ETF(5) | | | | | | | | | | | | | | | | | | | | | | | | | | | | | | | | | | | |
2011 | | | 19.95 | | | | 0.28 | | | | (3.42) | | | | (3.14) | | | (0.02) | | (0.01) | | (0.03) | | | 16.78 | | | | (15.74) | | | | 29,361 | | | | 0.77 | | | | 1.53 | | | | 37.28 | |
2010 | | | 15.48 | | | | — | | | | 4.47 | | | | 4.47 | | | — | | — | | — | | | 19.95 | | | | 28.88 | | | | 24,934 | | | | 0.77† | | | | 0.07† | | | | 4.72†† | |
Global X Brazil Financials ETF(6) | | | | | | | | | | | | | | | | | | | | | | | | | | | | | | | | | | | |
2011 | | | 17.40 | | | | 0.46 | | | | (2.85) | | | | (2.39) | | | (0.09) | | — | | (0.09) | | | 14.92 | | | | (13.80) | | | | 7,461 | | | | 0.77 | | | | 2.85 | | | | 37.24 | |
2010 | | | 15.08 | | | | 0.05 | | | | 2.27 | | | | 2.32 | | | — | | — | | — | | | 17.40 | | | | 15.38 | | | | 7,829 | | | | 0.77† | | | | 1.15† | | | | — †† | |
Global X Mexico Small-Cap ETF(7) | | | | | | | | | | | | | | | | | | | | | | | | | | | | | | | | | | | |
2011 | | | 14.53 | | | | 0.10 | | | | (3.49) | | | | (3.39) | | | — | | — | | — | | | 11.14 | | | | (23.33) | | | | 557 | | | | 0.69† | | | | 1.48† | | | | 8.31†† | |
| | (1) | The Fund commenced operations on February 2, 2011. |
| | (2) | The Fund commenced operations on February 5, 2009. |
| | (3) | The Fund commenced operations on March 2, 2011. |
| | (4) | The Fund commenced operations on June 21, 2010. |
| | (5) | The Fund commenced operations on July 7, 2010. |
| | (6) | The Fund commenced operations on July 28, 2010. |
| | (7) | The Fund commenced operations on May 4, 2011. |
| | (8) | Per share amounts have been restated for a 2 for 1 share split on April 12, 2011. (See Note 8 in Notes to Financial Statements) |
| | (9) | Per share amounts have been adjusted for a 2 for 1 share split on April 12, 2011. (See Note 8 in Notes to Financial Statements) |
| | * | Per share data calculated using average shares method. |
| | ** | Total Return is for the period indicated and has not been annualized. The return shown does not reflect the deduction of taxes that a shareholder would pay on Fund distributions or the redemption of Fund shares. |
| | †† | Portfolio turnover rate is for the period indicated and has not been annualized. Excludes effect of in-kind transfers. |
| | @ | The Ratio of Expenses to Average Net Assets includes the effect of a waiver. If these expense offsets were excluded, the ratio would have been 0.81%, 0.86% and 0.86% for the periods ended 2011, 2010 and 2009, respectively. |
Amounts designated as “—” are either $0 or have been rounded to $0.
The accompanying notes are an integral part of the financial statements.
91
FINANCIAL HIGHLIGHTS
Selected Per Share Data & Ratios
For a Share Outstanding Throughout the Period
| | | | | | | | | | | | | | | | | | | | | | | | | | | | | | | | | | | | | | | | | | | | | | | | | | | | |
| | | Net Asset
Value,
Beginning
of Period
($) | | | Net
Investment
Income
(Loss) ($)* | | | Net
Realized
and
Unrealized
Gain (Loss)
on
Investments
($) | | | Total from
Operations
($) | | | Distribution
from Net
Investment
Income ($) | | | Distribution
from
Capital
Gains ($) | | | Total from
Distributions
($) | | | Net
Asset
Value,
End of
Period
($) | | | Total
Return
(%)** | | | Net
Assets
End of
Period
($)(000) | | | Ratio of
Expenses
to
Average
Net
Assets
(%) | | | Ratio of
Net
Investment
Income
(Loss) to
Average
Net Assets
(%) | | | Portfolio
Turnover
(%) | |
Global X Russell Emerging Markets Growth ETF(1) | | | | | | | | | | | | | | | | | | | | | | | | | | | | | | | | | | | | | |
2011 | | | 25.11 | | | | 0.42 | | | | (3.77 | ) | | | (3.35 | ) | | | — | | | | — | | | | — | | | | 21.76 | | | | (13.34 | ) | | | 2,176 | | | | 0.69 | † | | | 2.33 | † | | | 15.71 | †† |
Global X Russell Emerging Markets Value ETF(1) | | | | | | | | | | | | | | | | | | | | | | | | | | | | | | | | | | | | | |
2011 | | | 24.98 | | | | 0.30 | | | | (2.88 | ) | | | (2.58 | ) | | | — | | | | — | | | | — | | | | 22.40 | | | | (10.33 | ) | | | 2,240 | | | | 0.69 | † | | | 1.61 | † | | | 33.15 | †† |
Global X FTSE Nordic Region ETF(2) | | | | | | | | | | | | | | | | | | | | | | | | | | | | | | | | | | | | | |
2011 | | | 19.22 | | | | 0.53 | | | | (2.11 | ) | | | (1.58 | ) | | | (0.17 | ) | | | — | | | | (0.17 | ) | | | 17.47 | | | | (8.34 | ) | | | 29,005 | | | | 0.50 | | | | 2.74 | | | | 3.59 | |
2010 | | | 16.07 | | | | 0.32 | | | | 2.84 | | | | 3.16 | | | | (0.01 | ) | | | — | | | | (0.01 | ) | | | 19.22 | | | | 19.68 | | | | 12,683 | | | | 0.50 | | | | 1.91 | | | | 4.07 | |
2009 | | | 14.50 | | | | (0.02 | ) | | | 1.59 | | | | 1.57 | | | | — | | | | — | | | | — | | | | 16.07 | | | | 10.83 | | | | 3,375 | | | | 0.50 | † | | | (0.50 | )† | | | 0.70 | †† |
Global X FTSE Norway 30 ETF(3) | | | | | | | | | | | | | | | | | | | | | | | | | | | | | | | | | | | | | |
2011 | | | 14.80 | | | | 0.44 | | | | (1.27 | ) | | | (0.83 | ) | | | (0.01 | ) | | | — | | | | (0.01 | ) | | | 13.96 | | | | (5.62 | ) | | | 74,707 | | | | 0.50 | † | | | 3.03 | † | | | 24.26 | †† |
| | (1) | The Fund commenced operations on January 24, 2011. |
| | (2) | The Fund commenced operations on August 17, 2009. |
| | (3) | The Fund commenced operations on November 9, 2010. |
| | * | Per share data calculated using average shares method. |
| | ** | Total Return is for the period indicated and has not been annualized. The return shown does not reflect the deduction of taxes that a shareholder would pay on Fund distributions or the redemption of Fund shares. |
| | †† | Portfolio turnover rate is for the period indicated and has not been annualized. Excludes effect of in-kind transfers. |
Amounts designated as “—” are either $0 or have been rounded to $0.
The accompanying notes are an integral part of the financial statements.
92
NOTESTO FINANCIAL STATEMENTS
OCTOBER 31, 2011
1. ORGANIZATION
The Global X Funds (the “Trust”) is a Delaware Statutory Trust formed on March 6, 2008. The Trust is registered under the Investment Company Act of 1940, as amended, as an open-end management investment company with eighty-six portfolios as of October 31, 2011. The financial statements herein and the related notes pertain to the Global X China Consumer ETF, Global X China Energy ETF, Global X China Financials ETF, Global X China Industrials ETF, Global X China Materials ETF, Global X NASDAQ China Technology ETF (formerly, Global X China Technology ETF), Global X FTSE ASEAN 40 ETF, Global X FTSE Andean 40 ETF, Global X FTSE Colombia 20 ETF (formerly, Global X/InterBolsa FTSE Colombia 20 ETF), Global X FTSE Argentina 20 ETF, Global X Brazil Mid Cap ETF, Global X Brazil Consumer ETF, Global X Brazil Financials ETF, Global X Mexico Small-Cap ETF, Global X Russell Emerging Markets Growth ETF, Global X Russell Emerging Markets Value ETF, Global X FTSE Nordic Region ETF (formerly, Global X Nordic 30 ETF), Global X FTSE Norway 30 ETF (each a “Fund”, collectively, the “Funds”). Each Fund is non-diversified.
2. SIGNIFICANT ACCOUNTING POLICIES
The following is a summary of the Significant Accounting Policies followed by the Funds.
USE OF ESTIMATES — The preparation of financial statements in conformity with U.S. Generally Accepted Accounting Principles (“U.S. GAAP”) requires management to make estimates and assumptions that affect the reported amounts of assets and liabilities and disclosure of contingent assets and liabilities at the date of the financial statements and the reported amounts of increases and decreases in net assets from operations during the reporting period. Actual results could differ from those estimates, and could have a material impact to the Funds.
SECURITY VALUATION — Securities listed on a securities exchange, market or automated quotation system for which quotations are readily available (except for securities traded on NASDAQ), including securities traded over the counter, are valued at the last quoted sale price on the primary exchange or market (foreign or domestic) on which they are traded (or at approximately 4:00 pm if a security’s primary exchange is normally open at that time), or, if there is no such reported sale, at the most recent mean between the quoted bid and asked prices (absent both bid and asked prices on such exchange, the bid price may be used).
For securities traded on NASDAQ, the NASDAQ Official Closing Price will be used. If available, debt securities are priced based upon valuations provided by independent, third-party pricing agents. Such values generally reflect the last reported sales price if the security is actively traded. The third-party pricing agents may also value debt securities at an evaluated bid price by employing methodologies that utilize actual market transactions, broker-supplied valuations, or other methodologies designed to identify the market value for such securities. Debt obligations with remaining maturities of sixty days or less may be valued at their amortized cost, which approximates market value. The prices for foreign securities are reported in local currency and converted to U.S. dollars using currency exchange rates. Prices for most securities held in the Funds are provided daily by recognized independent pricing agents. If a security price cannot be obtained from an independent, third-party pricing agent, the Funds seek to obtain a bid price from at least one independent broker.
93
NOTESTO FINANCIAL STATEMENTS (CONTINUED)
OCTOBER 31, 2011
2. SIGNIFICANT ACCOUNTING POLICIES (continued)
SECURITY VALUATION (continued)
Securities for which market prices are not “readily available” are valued in accordance with Fair Value Procedures established by the Board of Trustees (the “Board”). The Funds’ Fair Value Procedures are implemented through a Fair Value Committee (the “Committee”) designated by the Board. Some of the more common reasons that may necessitate that a security be valued using Fair Value Procedures include: the security’s trading has been halted or suspended; the security has been de-listed from a national exchange; the security’s primary trading market is temporarily closed at a time when under normal conditions it would be open; the security has not been traded for an extended period of time; the security’s primary pricing source is not able or willing to provide a price; or trading of the security is subject to local government-imposed restrictions. When a security is valued in accordance with the Fair Value Procedures, the Committee will determine the value after taking into consideration relevant information reasonably available to the Committee. As of October 31, 2011, there were securities valued using Fair Value Procedures of $3,848, $74,830, $140,750, and $134,905 in Global X China Industrials ETF, Global X China Materials ETF, Global X Brazil Mid Cap ETF and Global X Brazil Consumer ETF Funds, respectively. There were no other securities priced using the Fair Value Procedures.
For securities that principally trade on a foreign market or exchange, a significant gap in time can exist between the time of a particular security’s last trade and the time at which the Funds calculated their net asset value. The closing prices of such securities may no longer reflect their market value at the time the Funds calculated net asset value if an event that could materially affect the value of those securities (a “Significant Event”) has occurred between the time of the security’s last close and the time that the Funds calculate net asset value. A Significant Event may relate to a single issuer or to an entire market sector. If Global X Management Company LLC (the “Adviser”) becomes aware of a Significant Event that has occurred with respect to a security or group of securities after the closing of the exchange or market on which the security or securities principally trade, but before the time at which the Funds calculate net asset value, it may request that a Committee meeting be called. In addition, the Funds’ Sub-administrator, SEI Investments Global Funds Services (“SEIGFS”), monitors price movements among certain selected indices, securities and/or baskets of securities that may be an indicator that the closing prices received earlier from foreign exchanges or markets may not reflect market value at the time the Funds calculate net asset value. If price movements in a monitored index or security exceed levels established by the Sub-administrator, the Sub-administrator notifies the Adviser that such limits have been exceeded. In such event, the Adviser makes the determination whether a Committee meeting should be called based on the information provided.
In accordance with the authoritative guidance on fair value measurements and disclosure under U.S. GAAP, the Funds disclose the fair value of their investments in a hierarchy that prioritizes the inputs to valuation techniques used to measure the fair value. The objective of a fair value measurement is to determine the price that would be received to sell an asset or paid to transfer a liability in an orderly transaction between market participants at the measurement date (an exit price). Accordingly, the fair value hierarchy gives the highest priority to quoted prices (unadjusted) in active markets for identical assets or liabilities (Level 1) and the lowest priority to unobservable inputs (Level 3). The three levels of the fair value hierarchy are described below:
Level 1 – Unadjusted quoted prices in active markets for identical, unrestricted assets or liabilities that the Funds have the ability to access at the measurement date
94
NOTESTO FINANCIAL STATEMENTS (CONTINUED)
OCTOBER 31, 2011
2. SIGNIFICANT ACCOUNTING POLICIES (continued)
SECURITY VALUATION (concluded)
Level 2 – Other significant observable inputs (including quoted prices for similar investments, fair value of investments for which the Funds have the ability to fully redeem tranches at net asset value as of the measurement date or within the near term, and short-term investments valued at amortized cost)
Level 3 – Significant unobservable inputs (including the Funds’ own assumptions in determining the fair value of investments, fair value of investments for which the Funds do not have the ability to fully redeem tranches at net asset value as of the measurement date or within the near term)
Investments are classified within the level of the lowest significant input considered in determining fair value. Investments classified within Level 3 whose fair value measurement considers several inputs may include Level 1 or Level 2 inputs as components of the overall fair value measurement.
For the period ended October 31, 2011, there have been no significant changes to the Funds’ fair valuation methodologies.
FEDERAL INCOME TAXES — It is each Fund’s intention to qualify or continue to qualify as regulated investment company for Federal income tax purposes by complying with the appropriate provisions of Subchapter M of the Internal Revenue Code of 1986, as amended. Accordingly, no provisions for Federal income taxes have been made in the financial statements.
The Funds evaluate tax positions taken or expected to be taken in the course of preparing the Funds’ tax returns to determine whether it is “more-likely-than-not” (i.e., greater than 50 percent) that each tax position will be sustained upon examination by a taxing authority based on the technical merits of the position. Tax positions not deemed to meet the more-likely-than-not threshold are recorded as a tax benefit or expense in the current year. The Funds did not record any tax provision in the current period. However, management’s conclusions regarding tax positions may be subject to review and adjustment at a later date based on factors including, but not limited to, examination by tax authorities (i.e., the last three tax year ends, as applicable), on-going analysis of and changes to tax laws, regulations and interpretations thereof.
As of and during the period ended October 31, 2011, the Funds did not have a liability for any unrecognized tax benefits. The Funds recognize interest and penalties, if any, related to unrecognized tax benefits as income tax expense in the Statement of Operations. During the period, the Funds did not incur any interest or penalties.
SECURITY TRANSACTIONS AND INVESTMENT INCOME — Security transactions are accounted for on the trade date for financial reporting purposes. Costs used in determining realized gains and losses on the sale of investment securities are based on specific identification. Dividend income is recorded on the ex-dividend date. Interest income is recognized on the accrual basis from the settlement date.
FOREIGN CURRENCY TRANSLATION — The books and records of the Funds are maintained in U.S. dollars. Investment securities and other assets and liabilities denominated in a foreign currency
95
NOTESTO FINANCIAL STATEMENTS (CONTINUED)
OCTOBER 31, 2011
2. SIGNIFICANT ACCOUNTING POLICIES (concluded)
FOREIGN CURRENCY TRANSLATION (concluded)
are translated into U.S. dollars on the date of valuation. Purchases and sales of investment securities, income and expenses are translated into U.S. dollars at the relevant rates of exchange prevailing on the respective dates of such transactions. The Funds do not isolate that portion of realized or unrealized gains and losses resulting from changes in the foreign exchange rate from fluctuations arising from changes in the market prices of the securities. These gains and losses are included in net realized and unrealized gains and losses on investments on the Statement of Operations. Net realized and unrealized gains and losses on foreign currency transactions represent net foreign exchange gains or losses from foreign currency exchange contracts, disposition of foreign currencies, currency gains or losses realized between trade and settlement dates on securities transactions and the difference between the amount of the investment income and foreign withholding taxes recorded on the Funds’ books and the U.S. dollar equivalent amounts actually received or paid.
DIVIDENDS AND DISTRIBUTIONS TO SHAREHOLDERS — The Funds distribute their net investment income on a pro rata basis. Any net realized capital gains are distributed annually. All distributions are recorded on ex-dividend date.
CREATION UNITS — The Funds issue and redeem shares (“Shares”) at Net Asset Value (“NAV”) and only in large blocks of Shares, (each block of Shares for a Fund is called a “Creation Unit” or multiples thereof). Purchasers of Creation Units (“Authorized Participants”) at NAV must pay a standard creation transaction fee per transaction. The fee is a single charge and will be the same regardless of the number of Creation Units purchased by an investor on the same day. An Authorized Participant who holds Creation Units and wishes to redeem at NAV would also pay a standard Redemption Fee per transaction on the date of such redemption, regardless of the number of Creation Units redeemed that day.
If a Creation Unit is purchased or redeemed for cash, a higher Transaction Fee will be charged. The following table discloses Creation Unit breakdown:
| | | | | | | | | | | | | | | | |
| | | Creation
Unit Shares | | | Transaction
Fee | | | Value | | | Redemption
Fee | |
Global X China Consumer ETF | | | 50,000 | | | $ | 1,900 | | | $ | 764,500 | | | $ | 1,900 | |
Global X China Energy ETF | | | 50,000 | | | | 1,900 | | | | 689,000 | | | | 1,900 | |
Global X China Financials ETF | | | 50,000 | | | | 1,900 | | | | 546,000 | | | | 1,900 | |
Global X China Industrials ETF | | | 50,000 | | | | 1,900 | | | | 569,500 | | | | 1,900 | |
Global X China Materials ETF | | | 50,000 | | | | 1,900 | | | | 479,000 | | | | 1,900 | |
Global X NASDAQ China Technology ETF | | | 50,000 | | | | 1,900 | | | | 769,000 | | | | 1,900 | |
Global X FTSE ASEAN 40 ETF | | | 50,000 | | | | 2,300 | | | | 775,500 | | | | 2,300 | |
Global X FTSE Andean 40 ETF | | | 50,000 | | | | 2,300 | | | | 680,500 | | | | 2,300 | |
Global X FTSE Colombia 20 ETF | | | 50,000 | | | | 2,500 | | | | 959,500 | | | | 2,500 | |
Global X FTSE Argentina 20 ETF | | | 50,000 | | | | 1,000 | | | | 551,000 | | | | 1,000 | |
Global X Brazil Mid Cap ETF | | | 50,000 | | | | 1,900 | | | | 777,500 | | | | 1,900 | |
Global X Brazil Consumer ETF | | | 50,000 | | | | 1,500 | | | | 839,000 | | | | 1,500 | |
Global X Brazil Financials ETF | | | 50,000 | | | | 1,500 | | | | 746,000 | | | | 1,500 | |
Global X Mexico Small-Cap ETF | | | 50,000 | | | | 1,200 | | | | 557,000 | | | | 1,200 | |
Global X Russell Emerging Markets Growth ETF | | | 50,000 | | | | 4,500 | | | | 1,088,000 | | | | 4,500 | |
Global X Russell Emerging Markets Value ETF | | | 50,000 | | | | 4,500 | | | | 1,120,000 | | | | 4,500 | |
Global X FTSE Nordic Region ETF | | | 50,000 | | | | 1,400 | | | | 873,500 | | | | 1,400 | |
Global X FTSE Norway 30 ETF | | | 50,000 | | | | 1,400 | | | | 698,000 | | | | 1,400 | |
96
NOTESTO FINANCIAL STATEMENTS (CONTINUED)
OCTOBER 31, 2011
3. RELATED PARTY TRANSACTIONS
The Adviser serves as the investment adviser and the administrator for the Funds. Subject to the supervision of the Board of Trustees, the Adviser is responsible for managing the investment activities of the Funds and the Funds’ business affairs and other administrative matters and provides or causes to be furnished all supervisory, administrative and other services reasonably necessary for the operation of the Funds, including certain distribution services (provided pursuant to a separate Distribution Agreement), certain shareholder and distribution-related services (provided pursuant to a separate Rule 12b-1 Plan and related agreements) and investment advisory services (provided pursuant to a separate Investment Advisory Agreement), under what is essentially an “all-in” fee structure. For its service to the Funds, under the Supervision and Administration Agreement, each Fund pays a monthly fee to the Adviser at the annual rate (stated as a percentage of the average daily net assets of the Fund). In addition, the Funds bear other expenses that are not covered by the Supervision and Administration Agreement, which may vary and affect the total expense ratios of the Funds, such as taxes, brokerage fees, commissions and other transaction expenses, interest expenses and extraordinary expenses (such as litigation and indemnification expenses). In addition, the Global X FTSE Colombia 20 ETF and Global X FTSE Argentina 20 ETF pay custodial fees that are not covered by the Supervision and Administration Agreement.
| | |
| | | Supervision and
Administration Fee |
Global X China Consumer ETF | | 0.65% |
Global X China Energy ETF | | 0.65% |
Global X China Financials ETF | | 0.65% |
Global X China Industrials ETF | | 0.65% |
Global X China Materials ETF | | 0.65% |
Global X NASDAQ China Technology ETF | | 0.65% |
Global X ASEAN 40 ETF | | 0.65% |
Global X FTSE Andean 40 ETF | | 0.72% |
Global X FTSE Colombia 20 ETF* | | 0.68% |
Global X FTSE Argentina 20 ETF* | | 0.74% |
Global X Brazil Mid Cap ETF | | 0.69% |
Global X Brazil Financials ETF | | 0.77% |
Global X Brazil Consumer ETF | | 0.77% |
Global X Mexico Small-Cap ETF | | 0.69% |
Global X Russell Emerging Markets Growth ETF | | 0.69% |
Global X Russell Emerging Markets Value ETF | | 0.69% |
Global X FTSE Nordic Region ETF | | 0.50% |
Global X FTSE Norway 30 ETF | | 0.50% |
*The Global X FTSE Colombia 20 ETF and the Global X FTSE Argentina 20 ETF paid 0.15% and 0.01%, respectively in Custody Fees (in addition to the Supervision and Administration Fee) during the period ended October 31, 2011.
The Adviser and InterBolsa S.A. (“InterBolsa”), one of the leading broker-dealers located in Colombia, entered into an agreement, pursuant to which InterBolsa has agreed to provide certain marketing, marketing-related and other services and allows the use of InterBolsa’s name and brand with respect to the Global X FTSE Colombia 20 ETF. Under this agreement, InterBolsa agreed to make an initial payment to the Adviser regarding certain start up expenses for the Fund and the Adviser has agreed to share with InterBolsa fifty percent (50%) of the Adviser’s legitimate profits and losses with respect to the Global X FTSE Colombia 20 ETF.
97
NOTESTO FINANCIAL STATEMENTS (CONTINUED)
OCTOBER 31, 2011
3. RELATED PARTY TRANSACTIONS (concluded)
SEIGFS serves as Sub-Administrator to the Funds. As Sub-Administrator, SEIGFS provides the Funds with the required general administrative services, including, without limitation: office space, equipment, and personnel; clerical and general back office services; bookkeeping, internal accounting and secretarial services; the calculation of NAV; and assistance with the preparation and filing of reports, registration statements, proxy statements and other materials required to be filed or furnished by the Funds under federal and state securities laws. As compensation for these services, the Sub-Administrator receives certain out-of-pocket costs, transaction fees and asset-based fees which are accrued daily and paid monthly by the Adviser.
SEI Investments Distribution Co. (“SIDCO”) serves as each Funds underwriter and distributor of Shares pursuant to a Distribution Agreement. Under the Distribution Agreement, SIDCO, as agent, receives orders to create and redeem Shares in Creation Unit Aggregations and transmits such orders to the Trust’s custodian and transfer agent. The Distributor has no obligation to sell any specific quantity of Fund Shares. SIDCO bears the following costs and expenses relating to the distribution of Shares: (i) the costs of processing and maintaining records of creations of Creation Units; (ii) all costs of maintaining the records required of a registered broker/dealer; (iii) the expenses of maintaining its registration or qualification as a dealer or broker under Federal or state laws; (iv) filing fees; and (v) all other expenses incurred in connection with the distribution services as contemplated in the Distribution Agreement. SIDCO receives no fee for its distribution services under the Distribution Agreement
4. INVESTMENT TRANSACTIONS
For the period ended October 31, 2011, the purchases and sales of investments in securities, excluding in-kind transactions, long-term U.S. Government and short-term securities were:
| | | | | | | | |
| | | Purchases | | | Sales | |
Global X China Consumer ETF | | $ | 48,621,811 | | | $ | 21,509,662 | |
Global X China Energy ETF | | | 1,705,610 | | | | 821,246 | |
Global X China Financials ETF | | | 11,654,966 | | | | 7,155,849 | |
Global X China Industrials ETF | | | 2,072,254 | | | | 1,599,841 | |
Global X China Materials ETF | | | 6,080,434 | | | | 5,755,174 | |
Global X NASDAQ China Technology ETF | | | 1,599,401 | | | | 949,211 | |
Global X FTSE ASEAN 40 ETF | | | 7,937,837 | | | | 294,906 | |
Global X FTSE Andean 40 ETF | | | 4,495,175 | | | | 1,112,638 | |
Global X FTSE Colombia 20 ETF | | | 111,256,691 | | | | 101,548,447 | |
Global X FTSE Argentina 20 ETF | | | 2,048,633 | | | | 1,774,222 | |
Global X Brazil Mid Cap ETF | | | 4,948,019 | | | | 9,060,964 | |
Global X Brazil Consumer ETF | | | 10,951,628 | | | | 11,312,518 | |
Global X Brazil Financials ETF | | | 3,182,341 | | | | 3,540,004 | |
Global X Mexico Small-Cap ETF | | | 79,496 | | | | 72,813 | |
Global X Russell Emerging Markets Growth ETF | | | 819,001 | | | | 375,317 | |
Global X Russell Emerging Markets Value ETF | | | 1,175,200 | | | | 811,004 | |
Global X FTSE Nordic Region ETF | | | 2,165,477 | | | | 978,321 | |
Global X FTSE Norway 30 ETF | | | 14,103,470 | | | | 10,926,192 | |
During the period ended October 31, 2011, there were no purchases or sales of long-term U.S. Government securities for the Funds.
98
NOTESTO FINANCIAL STATEMENTS (CONTINUED)
OCTOBER 31, 2011
4. INVESTMENT TRANSACTIONS (concluded)
For the period ended October 31, 2011, in-kind transactions associated with creations and redemptions were:
| | | | | | | | | | | | |
| | | Purchases | | | Sales | | | Realized
Gain/(Loss) | |
Global X China Consumer ETF | | $ | 61,752,198 | | | $ | 72,188,988 | | | $ | (7,838,991) | |
Global X China Energy ETF | | | 4,758,439 | | | | 4,624,950 | | | | (283,274) | |
Global X China Financials ETF | | | 2,978,779 | | | | 61,103,223 | | | | (1,605,000) | |
Global X China Industrials ETF | | | - | | | | 6,126,046 | | | | 244,654 | |
Global X China Materials ETF | | | 1,528,181 | | | | 56,099,645 | | | | 11,367,066 | |
Global X NASDAQ China Technology ETF | | | 2,677,853 | | | | 1,956,019 | | | | (341,101) | |
Global X FTSE ASEAN 40 ETF | | | 17,582,540 | | | | 612,893 | | | | (8,915) | |
Global X FTSE Andean 40 ETF | | | 4,006,971 | | | | - | | | | - | |
Global X FTSE Colombia 20 ETF | | | 30,855,838 | | | | 62,252,269 | | | | 2,690,734 | |
Global X FTSE Argentina 20 ETF | | | 5,004,623 | | | | - | | | | - | |
Global X Brazil Mid Cap ETF | | | 6,181,675 | | | | 2,849,430 | | | | (190,659) | |
Global X Brazil Consumer ETF | | | 13,287,750 | | | | 3,118,341 | | | | (123,897) | |
Global X Brazil Financials ETF | | | 1,675,018 | | | | 196,619 | | | | (49,247) | |
Global X Mexico Small-Cap ETF | | | 1,452,635 | | | | 722,110 | | | | (12,386) | |
Global X Russell Emerging Markets Growth ETF | | | 2,090,985 | | | | - | | | | - | |
Global X Russell Emerging Markets Value ETF | | | 2,136,553 | | | | - | | | | - | |
Global X FTSE Nordic Region ETF | | | 22,424,541 | | | | 2,242,230 | | | | 65,667 | |
Global X FTSE Norway 30 ETF | | | 90,533,529 | | | | 9,560,947 | | | | (62,096) | |
5. TAX INFORMATION
The amount and character of income and capital gain distributions to be paid, if any, are determined in accordance with Federal income tax regulations, which may differ from U.S. GAAP. As a result, net investment income (loss) and net realized gain (loss) on investment transactions for a reporting period may differ significantly from distributions during such period. These book/tax differences may be temporary or permanent. To the extent these differences are permanent in nature, they are charged or credited to undistributed net investment income (loss), accumulated net realized gain (loss) or paid-in capital, as appropriate, in the period that the differences arise.
99
NOTESTO FINANCIAL STATEMENTS (CONTINUED)
OCTOBER 31, 2011
5. TAX INFORMATION (continued)
The following differences, primarily attributable to utilization of earnings and profits on shareholder redemptions and distributions reclassifications, foreign currency, redemptions in-kind, sales of passive foreign investment companies and net operating losses, have been reclassified to/from the following accounts during the fiscal period ended October 31, 2011.
| | | | | | |
Global X Funds | | Paid-in
Capital | | Undistributed
Net
Investment
Income/(Loss) | | Accumulated
Net Realized
Gain/(Loss) |
Global X China Consumer ETF | | $(6,705,479) | | $(1,139,478) | | $7,844,957 |
Global X China Energy ETF | | (272,140) | | (43,861) | | 316,001 |
Global X China Financials ETF | | (2,324,182) | | (25,512) | | 2,349,694 |
Global X China Industrials ETF | | 311,332 | | (66,399) | | (244,933) |
Global X China Materials ETF | | 11,481,294 | | 284,279 | | (11,765,573) |
Global X NASDAQ China Technology ETF | | (269,575) | | (71,359) | | 340,934 |
Global X FTSE ASEAN 40 ETF | | (7,443) | | (2,104) | | 9,547 |
Global X FTSE Andean 40 ETF | | – | | 15,377 | | (15,377) |
Global X FTSE Colombia 20 ETF | | 3,674,928 | | (909,997) | | (2,764,931) |
Global X FTSE Argentina 20 ETF | | – | | 280 | | (280) |
Global X Brazil Mid Cap ETF | | (190,659) | | (15,564) | | 206,223 |
Global X Brazil Consumer ETF | | (103,607) | | (26,316) | | 129,923 |
Global X Brazil Financials ETF | | (41,477) | | 7,767 | | 33,710 |
Global X Mexico Small-Cap ETF | | (12,386) | | (210) | | 12,596 |
Global X Russell Emerging Markets Growth ETF | | – | | (5,194) | | 5,194 |
Global X Russell Emerging Markets Value ETF | | – | | 1,487 | | (1,487) |
Global X FTSE Nordic Region ETF | | 114,488 | | (34,364) | | (80,124) |
Global X FTSE Norway 30 ETF | | 141,985 | | (245,167) | | 103,182 |
These reclassifications have no impact on net assets or net asset value per share.
100
NOTESTO FINANCIAL STATEMENTS (CONTINUED)
OCTOBER 31, 2011
5. TAX INFORMATION (continued)
The tax character of dividends and distributions paid during the last period ended October 31, 2011 and 2010 were as follows:
| | | | | | | | | | | | |
Global X Funds | | Ordinary
Income | | | Long-Term
Capital Gain | | | Totals | |
Global X China Consumer ETF | | | | | | | | | | | | |
2011 | | $ | 1,734,529 | | | $ | – | | | $ | 1,734,529 | |
2010 | | | – | | | | – | | | | – | |
Global X China Energy ETF | | | | | | | | | | | | |
2011 | | $ | 61,491 | | | $ | – | | | $ | 61,491 | |
2010 | | | – | | | | – | | | | – | |
Global X China Financials ETF | | | | | | | | | | | | |
2011 | | $ | 1,177,311 | | | $ | – | | | $ | 1,177,311 | |
2010 | | | – | | | | – | | | | – | |
Global X China Industrials ETF | | | | | | | | | | | | |
2011 | | $ | 149,711 | | | $ | – | | | $ | 149,711 | |
2010 | | | – | | | | – | | | | – | |
Global X China Materials ETF | | | | | | | | | | | | |
2011 | | $ | 336,120 | | | $ | – | | | $ | 336,120 | |
2010 | | | – | | | | – | | | | – | |
Global X NASDAQ China Technology ETF | | | | | | | | | | | | |
2011 | | $ | 45,880 | | | $ | – | | | $ | 45,880 | |
2010 | | | – | | | | – | | | | – | |
Global X FTSE Colombia 20 ETF | | | | | | | | | | | | |
2011 | | $ | 1,288,147 | | | $ | 456,070 | | | $ | 1,744,217 | |
2010 | | | 264,734 | | | | – | | | | 264,734 | |
Global X Brazil Mid Cap ETF | | | | | | | | | | | | |
2011 | | $ | 452,979 | | | $ | – | | | $ | 452,979 | |
2010 | | | – | | | | – | | | | – | |
Global X Brazil Consumer ETF | | | | | | | | | | | | |
2011 | | $ | 57,979 | | | $ | – | | | $ | 57,979 | |
2010 | | | – | | | | – | | | | – | |
Global X Brazil Financials ETF | | | | | | | | | | | | |
2011 | | $ | 49,172 | | | $ | – | | | $ | 49,172 | |
2010 | | | – | | | | – | | | | – | |
Global X FTSE Nordic Region ETF | | | | | | | | | | | | |
2011 | | $ | 150,580 | | | $ | – | | | $ | 150,580 | |
2010 | | | 2,158 | | | | – | | | | 2,158 | |
Global X FTSE Norway 30 ETF | | | | | | | | | | | | |
2011 | | $ | 6,983 | | | $ | – | | | $ | 6,983 | |
101
NOTESTO FINANCIAL STATEMENTS (CONTINUED)
OCTOBER 31, 2011
5. TAX INFORMATION (continued)
As of October 31, 2011, the Components of Tax Basis Distributable Earnings (Accumulated Losses) were as follows:
| | | | | | | | | | | | |
| | | Global X Funds | |
| | | Global X China
Consumer ETF | | | Global X China
Energy ETF | | | Global X China
Financials ETF | |
Undistributed Ordinary Income | | $ | 418,113 | | | $ | 78,332 | | | $ | 14,611 | |
Capital Loss Carryforwards | | | (1,514,329) | | | | (33,911) | | | | (551,954) | |
Unrealized Depreciation on Investments and Foreign Currency | | | (24,503,355) | | | | (415,457) | | | | (909,626) | |
Other Temporary Differences | | | (1,064,463) | | | | – | | | | – | |
| | | | | | | | | | | | |
Total Accumulated Losses | | $ | (26,664,034) | | | $ | (371,036) | | | $ | (1,446,969) | |
| | | | | | | | | | | | |
| |
| | | Global X Funds | |
| | | Global X China
Industrials ETF | | | Global X China
Materials ETF | | | Global X
NASDAQ China
Technology ETF | |
Undistributed Ordinary Income | | $ | 3,261 | | | $ | – | | | $ | 57,614 | |
Capital Loss Carryforwards | | | (94,810) | | | | – | | | | (236,466) | |
Unrealized Depreciation on Investments and Foreign Currency | | | (2,469,616) | | | | (1,468,667) | | | | (18,036) | |
| | | | | | | | | | | | |
Total Accumulated Losses | | $ | (2,561,165) | | | $ | (1,468,667) | | | $ | (196,888) | |
| | | | | | | | | | | | |
| |
| | | Global X Funds | |
| | | Global X FTSE
ASEAN 40 ETF | | | Global X FTSE
Andean 40 ETF | | | Global X FTSE
Colombia 20 ETF | |
Undistributed Ordinary Income | | $ | 265,345 | | | $ | 105,342 | | | $ | 1,305,906 | |
Capital Loss Carryforwards | | | – | | | | (120,886) | | | | (8,249,654) | |
Unrealized Depreciation on Investments and Foreign Currency | | | (1,353,670) | | | | (476,415) | | | | (9,649,162) | |
| | | | | | | | | | | | |
Total Accumulated Losses | | $ | (1,088,325) | | | $ | (491,959) | | | $ | (16,592,910) | |
| | | | | | | | | | | | |
| |
| | | Global X Funds | |
| | | Global X FTSE
Argentina 20 ETF | | | Global X Brazil Mid
Cap ETF | | | Global X Brazil
Consumer ETF | |
Undistributed Ordinary Income | | $ | 71,114 | | | $ | 431,261 | | | $ | 392,931 | |
Capital Loss Carryforwards | | | (414,683) | | | | (918,379) | | | | (563,593) | |
Unrealized Depreciation on Investments and Foreign Currency | | | (1,018,379) | | | | (1,527,809) | | | | (2,538,407) | |
| | | | | | | | | | | | |
Total Accumulated Losses | | $ | (1,361,948) | | | $ | (2,014,927) | | | $ | (2,709,069) | |
| | | | | | | | | | | | |
| |
| | | Global X Funds | |
| | | Global X Brazil
Financials ETF | | | Global X Mexico
Small-Cap ETF | | | Global X Russell
Emerging Markets
Growth ETF | |
Undistributed Ordinary Income | | $ | 218,222 | | | $ | 8,235 | | | $ | 37,049 | |
Capital Loss Carryforwards | | | – | | | | – | | | | (35,055) | |
Unrealized Depreciation on Investments and Foreign Currency | | | (916,331) | | | | (171,044) | | | | (336,539) | |
| | | | | | | | | | | | |
Total Accumulated Losses | | $ | (698,109) | | | $ | (162,809) | | | $ | (334,545) | |
| | | | | | | | | | | | |
102
NOTESTO FINANCIAL STATEMENTS (CONTINUED)
OCTOBER 31, 2011
5. TAX INFORMATION (continued)
| | | | | | | | | | | | |
| | | Global X Funds | |
| | | Global X Russell
Emerging
Markets Value
ETF | | | Global X FTSE
Nordic Region
ETF | | | Global X FTSE
Norway 30 ETF | |
Undistributed Ordinary Income | | $ | 99,931 | | | $ | 788,538 | | | $ | 995,925 | |
Undistributed Long-Term Capital Gain | | | – | | | | 7,708 | | | | – | |
Capital Loss Carryforwards | | | – | | | | – | | | | (1,802,290) | |
Unrealized Depreciation on Investments and Foreign Currency | | | (358,044) | | | | (3,745,630) | | | | (7,695,643) | |
| | | | | | | | | | | | |
Total Accumulated Losses | | $ | (258,113) | | | $ | (2,949,384) | | | $ | (8,502,008) | |
| | | | | | | | | | | | |
For Federal income tax purposes, capital loss carryforwards represent realized losses of the Funds that may be carried forward for a maximum period of eight years and applied against future gains. As of October 31, 2011, the Funds that had capital loss carryforwards are listed below.
| | | | | | | | | | | | | | | | | | | | |
Expiration date | | Global X
China
Consumer
ETF | | | Global X
China
Energy
ETF | | | Global X
China
Financials
ETF | | | Global X
China
Industrials
ETF | | | Global X
NASDAQ
China
Technology
ETF | |
Oct. 2019 | | $ | 1,341,121 | | | $ | 33,911 | | | $ | — | | | $ | — | | | $ | 236,466 | |
Oct. 2018 | | | 173,208 | | | | — | | | | 551,954 | | | | 94,810 | | | | — | |
| | | | | | | | | | | | | | | | | | | | |
Total | | $ | 1,514,329 | | | $ | 33,911 | | | $ | 551,954 | | | $ | 94,810 | | | $ | 236,466 | |
| | | | | | | | | | | | | | | | | | | | |
Expiration date | | Global X
FTSE
Colombia
ETF | | | Global X
Brazil Mid
Cap ETF | | | Global X
Brazil
Consumer
ETF | | | Global X
FTSE Norway
30 ETF | | | | |
Oct. 2019 | | $ | 8,249,654 | | | $ | 918,379 | | | $ | 563,593 | | | $ | 1,802,290 | | | | | |
Oct. 2018 | | | — | | | | — | | | | — | | | | — | | | | | |
| | | | | | | | | | | | | | | | | | | | |
Total | | $ | 8,249,654 | | | $ | 918,379 | | | $ | 563,593 | | | $ | 1,802,290 | | | | | |
| | | | | | | | | | | | | | | | | | | | |
For the year ended October 31, 2011, Global X China Financials ETF, Global X China Industrials ETF, Global X Brazil Financials ETF and Global X FTSE Nordic Region ETF utilized $74,505, $125,310, $3 and $7,319, respectively of capital loss carryforwards.
103
NOTESTO FINANCIAL STATEMENTS (CONTINUED)
OCTOBER 31, 2011
5. TAX INFORMATION (concluded)
Under the recently enacted Regulated Investment Company Modernization Act of 2010, the Funds will be permitted to carry forward capital losses incurred in taxable years beginning after December 22, 2010 for an unlimited period. However, any losses incurred during those future taxable years will be required to be used prior to the losses incurred in pre-enactment taxable years. As a result of this ordering rule, preenactment capital loss carryforwards may be more likely to expire unused. Additionally, post-enactment capital losses that are carried forward will retain their character as either short-term or long-term capital losses rather than being considered all short-term as under previous law. Losses carried forward under these new provisions are as follows:
| | | | | | | | | | | | |
Global X Funds | | Short-Term
Loss | | | Long-Term
Loss | | | Total | |
Global X FTSE Andean 40 ETF | | $ | 120,886 | | | $ | - | | | $ | 120,886 | |
Global X FTSE Argentina 20 ETF | | | 414,683 | | | | - | | | | 414,683 | |
Global X Russell Emerging Markets Growth ETF | | | 35,055 | | | | - | | | | 35,055 | |
The Federal tax cost and aggregate gross unrealized appreciation and depreciation on investments held by the Funds at October 31, 2011 were as follows:
| | | | | | | | | | | | | | | | |
Global X Funds | | Federal Tax
Cost | | | Aggregated
Gross
Unrealized
Appreciation | | | Aggregated
Gross
Unrealized
Depreciation | | | Net
Unrealized
Depreciation | |
Global X China Consumer ETF | | | 161,129,561 | | | | 7,656,442 | | | | (32,160,620 | ) | | | (24,504,178 | ) |
Global X China Energy ETF | | | 5,228,366 | | | | 350,849 | | | | (766,316 | ) | | | (415,467 | ) |
Global X China Financials ETF | | | 11,972,614 | | | | 116,045 | | | | (1,026,239 | ) | | | (910,194 | ) |
Global X China Industrials ETF | | | 7,028,561 | | | | 293,712 | | | | (2,763,303 | ) | | | (2,469,591 | ) |
Global X China Materials ETF | | | 4,313,734 | | | | 84,694 | | | | (1,553,395 | ) | | | (1,468,701 | ) |
Global X NASDAQ China Technology ETF | | | 4,611,610 | | | | 632,942 | | | | (651,037 | ) | | | (18,095 | ) |
Global X FTSE ASEAN 40 ETF | | | 24,609,173 | | | | 167,016 | | | | (1,521,172 | ) | | | (1,354,156 | ) |
Global X FTSE Andean 40 ETF | | | 7,275,593 | | | | 114,988 | | | | (591,433 | ) | | | (476,445 | ) |
Global X FTSE Colombia 20 ETF | | | 150,568,668 | | | | 3,857,675 | | | | (13,510,716 | ) | | | (9,653,041 | ) |
Global X FTSE Argentina 20 ETF | | | 4,877,285 | | | | 23,246 | | | | (1,041,596 | ) | | | (1,018,350 | ) |
Global X Brazil Mid Cap ETF | | | 24,845,228 | | | | 1,817,428 | | | | (3,345,070 | ) | | | (1,527,642 | ) |
Global X Brazil Consumer ETF | | | 31,898,208 | | | | 2,256,768 | | | | (4,792,634 | ) | | | (2,535,866 | ) |
Global X Brazil Financials ETF | | | 8,369,466 | | | | 384,012 | | | | (1,300,969 | ) | | | (916,957 | ) |
Global X Mexico Small-Cap ETF | | | 727,921 | | | | 149 | | | | (171,198 | ) | | | (171,049 | ) |
Global X Russell Emerging Markets Growth ETF | | | 2,499,613 | | | | 51,771 | | | | (388,039 | ) | | | (336,268 | ) |
Global X Russell Emerging Markets Value ETF | | | 2,592,091 | | | | 16,675 | | | | (374,540 | ) | | | (357,865 | ) |
Global X FTSE Nordic Region ETF | | | 32,731,855 | | | | 444,539 | | | | (4,190,331 | ) | | | (3,745,792 | ) |
Global X FTSE Norway 30 ETF | | | 82,289,032 | | | | 1,797,169 | | | | (9,494,419 | ) | | | (7,697,250 | ) |
The preceding differences between book and tax cost are primarily due to mark to market treatment of passive foreign investment companies and wash sales.
104
NOTESTO FINANCIAL STATEMENTS (CONTINUED)
OCTOBER 31, 2011
6. CONCENTRATION OF RISKS
The Funds invest in securities of foreign issuers in several countries. These investments may involve certain considerations and risks not typically associated with investments in the United States as a result of, among other factors, the possibility of future political and economic developments and the level of governmental supervision and regulation of securities markets in the respective countries.
The securities markets of emerging countries are less liquid and subject to greater price volatility, and have a smaller market capitalization, than the U.S. securities markets. In certain countries, there may be fewer publicly traded securities and the market may be dominated by a few issues or sectors. Issuers and securities markets in such countries are not subject to as extensive and frequent accounting, financial and other reporting requirements or as comprehensive government regulations as are issuers and securities markets in the U.S. In particular, the assets and profits appearing on the financial statements of emerging country issuers may not reflect their financial position or results of operations in the same manner as financial statements for U.S. issuers. Substantially less information may be publicly available about emerging country issuers than is available about issuers in the United States.
The Funds may be subject to taxes imposed by countries in which it invests. Such taxes are generally based on either income or gains earned or repatriated. The Funds accrue and apply such taxes to net investment income, net realized gains and net unrealized gains as income and/or capital gains are earned.
The Funds (other than the Global X Russell Emerging Markets Growth ETF and the Global X Russell Emerging Markets Value ETF) use a replication strategy. A replication strategy is an indexing strategy that involves investing in the securities of the Underlying Index in approximately the same proportions as in the Underlying Index. The Funds may utilize a representative sampling strategy with respect to its Underlying Index when a replication strategy might be detrimental to its shareholders, such as when there are practical difficulties or substantial costs involved in compiling a portfolio of equity securities to follow its Underlying Index, or, in certain instances, when securities in the Underlying Index become temporarily illiquid, unavailable or less liquid, or due to legal restrictions (such as diversification requirements that apply to the Funds but not the Underlying Indexes).
Certain Funds may invest in commodity related securities, which are susceptible to fluctuations in certain commodity markets. Any negative changes in commodity markets could have a great impact on those securities.
105
NOTESTO FINANCIAL STATEMENTS (CONTINUED)
OCTOBER 31, 2011
7. OTHER
At October 31, 2011, the total Shares outstanding that were held by Authorized Participants were as follows. The Authorized Participants have entered into an agreement with the Funds’ Distributor.
| | | | |
| | | Authorized
Participants | | Percentage of
Shares
Outstanding |
Global X China Consumer ETF | | 5 | | 100% |
Global X China Energy ETF | | 2 | | 100% |
Global X China Financials ETF | | 3 | | 100% |
Global X China Industrials ETF | | 1 | | 100% |
Global X China Materials ETF | | 2 | | 100% |
Global X NASDAQ China Technology ETF | | 2 | | 100% |
Global X FTSE ASEAN 40 ETF | | 3 | | 100% |
Global X FTSE Andean 40 ETF | | 3 | | 100% |
Global X FTSE Colombia 20 ETF | | 5 | | 100% |
Global X FTSE Argentina 20 ETF | | 3 | | 100% |
Global X Brazil Mid Cap ETF | | 3 | | 100% |
Global X Brazil Consumer ETF | | 3 | | 100% |
Global X Brazil Financials ETF | | 2 | | 100% |
Global X Mexico Small-Cap ETF | | 1 | | 100% |
Global X Russell Emerging Markets Growth ETF | | 1 | | 100% |
Global X Russell Emerging Markets Value ETF | | 1 | | 100% |
Global X FTSE Nordic Region ETF | | 4 | | 100% |
Global X FTSE Norway 30 ETF | | 6 | | 100% |
Pursuant to the Trust’s organizational documents, the Trustees of the Trust and the Trust’s officers are indemnified against certain liabilities that may arise out of the performance of their duties.
8. SHARE SPLIT
Effective April 12, 2011, the Global X FTSE Colombia 20 ETF Fund underwent a 2-for-1 share split. The effect of this transaction was to multiply the number of outstanding shares of the Fund by two, resulting in a corresponding decrease in the net asset value per share. The capital share activity presented in the statement of changes in net assets for each of the years in the period then ended, and per share data in the financial highlights for each of the years in the three-year period then ended have been given retroactive effect to reflect these share splits. There were no changes in net assets, results of operations or total return as a result of these transactions.
9. CHANGE OF INDEPENDENT REGISTERED PUBLIC ACCOUNTING FIRM
The Global X Funds have selected Ernst & Young LLP (“E&Y”) to serve as the Funds’ independent registered public accounting firm for the Funds’ fiscal year ended October 31, 2011. The decision to select E&Y was recommended by the Funds’ Audit Committee on December 21, 2010 and was approved by the Funds’ Board of Trustees on January 28, 2011. During the Global X Funds’ fiscal years ended October 31, 2009 and October 31, 2010, neither the Funds, their portfolios, nor anyone on their behalf, consulted with E&Y on items which: (i) concerned the application of accounting principles to a specified transaction, either completed or proposed, or the type of audit opinion that
106
NOTESTO FINANCIAL STATEMENTS (CONTINUED)
OCTOBER 31, 2011
9. CHANGE OF INDEPENDENT REGISTERED PUBLIC ACCOUNTING FIRM (concluded)
might be rendered on the Global X Funds’ financial statements; or (ii) concerned the subject of a disagreement (as defined in paragraph (a)(1)(iv) of Item 304 of Regulation S-K) or reportable events (as described in paragraph (a)(1)(iv) of said Item 304). The selection of E&Y does not reflect any disagreements with or dissatisfaction by the Global X Funds or the Funds’ Board of Trustees with the performance of the Global X Funds’ prior independent registered public accounting firm, Sanville & Company (“Sanville”). The decision not to renew the engagement of Sanville, effective upon its completion of its audit for the fiscal year ended October 31, 2010, and to select E&Y was recommended by the Funds’ Audit Committee and approved by the Funds’ Board of Trustees. Sanville’s report on the Global X Funds’ financial statements for the fiscal years ended October 31, 2009 and October 31, 2010 contained no adverse opinion or disclaimer of opinion, nor were they qualified or modified as to uncertainty, audit scope, or accounting principles. During the Global X Funds’ fiscal years ended October 31, 2009 and October 31, 2010 (i) there were no disagreements with Sanville on any matter of accounting principles or practices, financial statement disclosure, or auditing scope or procedure, which disagreements, if not resolved to the satisfaction of Sanville, would have caused them to make reference to the subject matter of the disagreements in connection with their reports on the Global X Funds’ financial statements for such years; and (ii) there were no “reportable events” of the kind described in Item 304(a)(1)(v) of Regulation S-K.
10. LOANS OF PORTFOLIO SECURITIES
The Funds may lend portfolio securities having a market value up to one-third of the Funds’ total assets. Such loans are secured by collateral equal to no less than the market value of the loaned securities determined daily. Such collateral will be cash or debt securities issued or guaranteed by the U.S. Government or any agencies. Cash collateral received in connection with these loans is invested in short-term money market instruments. It is the Funds’ policy to obtain additional collateral from or return excess collateral to the borrower by the end of the next business day, following the valuation date of the securities loaned. Therefore, the value of the collateral held may be temporarily less than the value of the securities on loan. Lending securities entails a risk of loss to the Funds if and to the extent that the market value of the securities loans were to increase and the borrower did not increase the collateral accordingly, and the borrower fails to return the securities. The Funds could also experience delays and costs in gaining access to the collateral. The Funds bear the risk of any deficiency in the amount of the collateral available for return to the borrower due to any loss on the collateral invested. As of October 31, 2011, there were no securities on loan for any of the Funds.
11. CONTRACTUAL OBLIGATIONS
The Funds enter into contracts in the normal course of business that contain a variety of indemnifications. The Funds maximum exposure under these arrangements is unknown. However the Funds have not had prior gains or losses pursuant to these contracts. Management has reviewed the Funds’ existing contracts and expects the risk of loss to be remote.
107
NOTESTO FINANCIAL STATEMENTS (CONTINUED)
OCTOBER 31, 2011
12. NEW ACCOUNTING PROUNCEMENTS
In May 2011, the Financial Accounting Standards Board issued Accounting Standards Updates (“ASU”) No. 2011-04 “Amendments to Achieve Common Fair Value Measurement and Disclosure Requirements in U.S. GAAP and International Financial Reporting Standards (“IFRS”).” ASU 2011-04 includes common requirements for measurement of and disclosure about fair value between U.S. GAAP and IFRS.ASU 2011-04 will require reporting entities to disclose the following information for fair value measurements categorized within Level 3 of the fair value hierarchy: quantitative information about the unobservable inputs used in the fair value measurement, the valuation processes used by the reporting entity, and a narrative description of the sensitivity of the fair value measurement to changes in unobservable inputs and the interrelationships between those unobservable inputs. In addition, ASU 2011-04 will require reporting entities to make disclosures about amounts and reasons for all transfers in and out of Level 1 and Level 2 fair value measurements. The new and revised disclosures are effective for interim and annual reporting periods beginning after December 15, 2011. At this time, management is evaluating the implications of ASU 2011-04 and its impact on the financial statements.
13. SUBSEQUENT EVENT
The Funds have evaluated the need for additional disclosures and/or adjustments resulting from subsequent events. Based on this evaluation, no additional disclosures or adjustments were required to the financial statements as of the date the financial statements were issued.
Subsequent to fiscal year end, on November 11, 2011, the continuation of the Investment Advisory Agreement and Supervision and Administration Agreement for the Funds was considered and approved by the Board of Trustees of the Trust.
Subsequent to fiscal year end, on December, 19, 2011, the Board of Trustees of the Trust, based upon the recommendation of the Adviser, determined to liquidate and terminate the Global X Mexico Small-Cap ETF, Global X Russell Emerging Markets Growth ETF and Global X Russell Emerging Markets Value ETF (the “Liquidating Funds.”). Due to the Liquidating Funds’ low levels of assets, the Adviser does not believe that it can continue to conduct the Liquidating Funds’ business and operations in an economically efficient manner. As such, the Board concluded that it would be in the best interests of the Liquidating Funds and their shareholders to liquidate and terminate the Liquidating Funds. As of the close of regular trading on the NYSE Arca, Inc. (“NYSE”) on February 16, 2012 (“Closing Date”), the shares of the Liquidating Funds will cease trading on the NYSE and will close to purchases by investors.
Shareholders may sell their holdings in the Liquidating Funds prior to the Closing Date and customary brokerage charges may apply to these transactions. However, from February 17, 2012, through February 27, 2012 (“Liquidation Date”), shareholders only may be able to sell their shares to certain broker-dealers and there is no assurance that there will be a market for the Liquidating Funds during this time period. Between the Closing Date and the Liquidation Date, the Liquidating Funds will be in the process of winding up their operations and liquidating their portfolio. This process will result in the Liquidating Funds not tracking their underlying indexes and their cash holdings increasing, which may not be consistent with the Liquidating Funds’ investment objective and strategy.
108
NOTESTO FINANCIAL STATEMENTS (CONCLUDED)
OCTOBER 31, 2011
13. SUBSEQUENT EVENT (concluded)
On or about the Liquidation Date, the Liquidating Funds will liquidate their assets and distribute cash pro rata to all remaining shareholders who have not previously redeemed their shares. These distributions are taxable events. In addition, these payments to shareholders will include accrued capital gains and dividends, if any. Once the distributions are complete, the Liquidating Funds will terminate.
Subsequent to fiscal year end, on December 21, 2011, based on the recommendation of the Adviser, the Board of Trustees of the Trust approved the discontinuance of the Global X Philippines PSEi ETF and Global X Shipping ETF, each a separate investment portfolio of the Trust that had never commenced operations.
Subsequent to year end, the following investment portfolios were added to the Trust.
|
Fund Name |
Global X NASDAQ 100 Global Technology Index ETF |
Global X NASDAQ 500 ETF |
Global X NASDAQ 400 Mid Cap ETF |
Global X FTSE Permanent ETF |
Subsequent to year end, the following investment portfolios of the Trust commenced operations.
| | |
Fund Name | | Commenced Operations |
Global X Social Media Index ETF | | November 14, 2011 |
Global X NASDAQ 500 ETF | | December 5, 2011 |
Global X NASDAQ 400 Mid Cap ETF | | December 5, 2011 |
Global X FTSE Greece 20 ETF | | December 7, 2011 |
109
REPORTOF INDEPENDENT REGISTERED PUBLIC ACCOUNTING FIRM
To the Shareholders and Board of Trustees of Global X Funds
We have audited the accompanying statements of assets and liabilities, including the schedules of investments, of Global X China Consumer ETF, Global X China Energy ETF, Global X China Financials ETF, Global X China Industrials ETF, Global X China Materials ETF, Global X NASDAQ China Technology ETF, Global X FTSE ASEAN 40 ETF, Global X FTSE Andean 40 ETF, Global X FTSE Colombia 20 ETF, Global X FTSE Argentina 20 ETF, Global X Brazil Mid Cap ETF, Global X Brazil Consumer ETF, Global X Brazil Financials ETF, Global X Mexico Small-Cap ETF, Global X Russell Emerging Markets Growth ETF, Global X Russell Emerging Markets Value ETF, Global X FTSE Nordic Region ETF and Global X FTSE Norway 30 ETF (eighteen of the series constituting the Global X Funds) (the “Funds”) as of October 31, 2011, and the related statements of operations, statements of changes in net assets, and financial highlights for the year or period then ended. These financial statements and financial highlights are the responsibility of the Funds’ management. Our responsibility is to express an opinion on these financial statements and financial highlights based on our audits. The statements of changes in net assets and financial highlights of the Global X Brazil Mid Cap ETF, Global X Brazil Financials ETF, Global X Brazil Consumer ETF, Global X FTSE Colombia 20 ETF, Global X FTSE Nordic Region ETF, Global X China Consumer ETF, Global X China Energy ETF, Global X China Financials ETF, Global X China Industrials ETF, Global X NASDAQ China Technology ETF and Global X China Materials ETF for each of the periods presented through October 31, 2010 were audited by other auditors whose report dated December 23, 2010, expressed an unqualified opinion on those financial statements and financial highlights.
We conducted our audits in accordance with the standards of the Public Company Accounting Oversight Board (United States). Those standards require that we plan and perform the audit to obtain reasonable assurance about whether the financial statements and financial highlights are free of material misstatement. We were not engaged to perform an audit of the Funds’ internal control over financial reporting. Our audits included consideration of internal control over financial reporting as a basis for designing audit procedures that are appropriate in the circumstances, but not for the purpose of expressing an opinion on the effectiveness of the Funds’ internal control over financial reporting. Accordingly, we express no such opinion. An audit also includes examining, on a test basis, evidence supporting the amounts and disclosures in the financial statements and financial highlights, assessing the accounting principles used and significant estimates made by management, and evaluating the overall financial statement presentation. Our procedures included confirmation of securities owned as of October 31, 2011, by correspondence with the custodian and brokers, or by other appropriate auditing procedures where replies from brokers were not received. We believe that our audits provide a reasonable basis for our opinion.
In our opinion, the 2011 financial statements and financial highlights referred to above present fairly, in all material respects, the financial position of each of the Funds listed above at October 31, 2011, and the results of their operations, the changes in their net assets, and their financial highlights for the year or period then ended, in conformity with U.S. generally accepted accounting principles.

Philadelphia, Pennsylvania
December 22, 2011
110
DISCLOSUREOF FUND EXPENSES (unaudited)
All Exchange Traded Funds (“ETF”) have operating expenses. As a shareholder of an ETF, your investment is affected by these ongoing costs, which include (among others) costs for ETF management, administrative services, brokerage fees, and shareholder reports like this one. It is important for you to understand the impact of these costs on your investment returns.
Operating expenses such as these are deducted from an ETF’s gross income and directly reduce your final investment return. These expenses are expressed as a percentage of the ETF’s average net assets; this percentage is known as the ETF’s expense ratio.
The following examples use the expense ratio and are intended to help you understand the ongoing costs (in dollars) of investing in your Fund and to compare these costs with those of other funds. The examples are based on an investment of $1,000 made at the beginning of the period shown and held for the entire period.
The table on the next page illustrates your Fund’s costs in two ways:
Actual Fund Return. This section helps you to estimate the actual expenses that your Fund incurred over the period. The “Expenses Paid During Period” column shows the actual dollar expense cost incurred by a $1,000 investment in the Fund, and the “Ending Account Value” number is derived from deducting that expense cost from the Fund’s gross investment return.
You can use this information, together with the actual amount you invested in the Funds, to estimate the expenses you paid over that period. Simply divide your actual account value by $1,000 to arrive at a ratio (for example, an $8,600 account value divided by $1,000 = 8.6), then multiply that ratio by the number shown for your Funds under “Expenses Paid During Period.”
Hypothetical 5% Return. This section helps you compare your Fund’s costs with those of other funds. It assumes that the Funds had an annual 5% return before expenses during the year, but that the expense ratio (Column 3) for the period is unchanged. This example is useful in making comparisons because the Securities and Exchange Commission requires all funds to make this 5% calculation. You can assess your Fund’s comparative cost by comparing the hypothetical result for your Fund in the “Expense Paid During Period” column with those that appear in the same charts in the shareholder reports for other funds.
NOTE: Because the return is set at 5% for comparison purposes — NOT your Fund’s actual return — the account values shown may not apply to your specific investment.
111
DISCLOSUREOF FUND EXPENSES (unaudited)
| | | | | | | | | | | | | | |
| | | Beginning
Account
Value
5/1/2011 | | | Ending
Account
Value
10/31/2011 | | | Annualized
Expense
Ratios | | Expenses
Paid
During
Period(1) | |
Global X China Consumer ETF | | | | | | | | | | | | | | |
| | | | |
Actual Fund Return | | | $1,000.00 | | | | $837.30 | | | 0.65% | | | $3.01 | |
Hypothetical 5% Return | | | 1,000.00 | | | | 1,021.93 | | | 0.65 | | | 3.31 | |
Global X China Energy ETF | | | | | | | | | | | | | | |
Actual Fund Return | | | 1,000.00 | | | | 786.10 | | | 0.65 | | | 2.93 | |
Hypothetical 5% Return | | | 1,000.00 | | | | 1,021.93 | | | 0.65 | | | 3.31 | |
Global X China Financials ETF | | | | | | | | | | | | | | |
| | | | |
Actual Fund Return | | | 1,000.00 | | | | 785.60 | | | 0.65 | | | 2.93 | |
Hypothetical 5% Return | | | 1,000.00 | | | | 1,021.93 | | | 0.65 | | | 3.31 | |
Global X China Industrials ETF | | | | | | | | | | | | | | |
Actual Fund Return | | | 1,000.00 | | | | 678.80 | | | 0.65 | | | 2.75 | |
Hypothetical 5% Return | | | 1,000.00 | | | | 1,021.93 | | | 0.65 | | | 3.31 | |
Global X China Materials ETF | | | | | | | | | | | | | | |
| | | | |
Actual Fund Return | | | 1,000.00 | | | | 672.30 | | | 0.65 | | | 2.74 | |
Hypothetical 5% Return | | | 1,000.00 | | | | 1,021.93 | | | 0.65 | | | 3.31 | |
Global X NASDAQ China Technology ETF | | | | | | | | | | | | | | |
Actual Fund Return | | | 1,000.00 | | | | 787.10 | | | 0.65 | | | 2.93 | |
Hypothetical 5% Return | | | 1,000.00 | | | | 1,021.93 | | | 0.65 | | | 3.31 | |
Global X FTSE ASEAN 40 ETF | | | | | | | | | | | | | | |
| | | | |
Actual Fund Return | | | 1,000.00 | | | | 935.50 | | | 0.65 | | | 3.17 | |
Hypothetical 5% Return | | | 1,000.00 | | | | 1,021.93 | | | 0.65 | | | 3.31 | |
Global X FTSE Andean 40 ETF | | | | | | | | | | | | | | |
Actual Fund Return | | | 1,000.00 | | | | 881.50 | | | 0.72 | | | 3.41 | |
Hypothetical 5% Return | | | 1,000.00 | | | | 1,021.58 | | | 0.72 | | | 3.67 | |
Global X FTSE Colombia 20 ETF | | | | | | | | | | | | | | |
| | | | |
Actual Fund Return | | | 1,000.00 | | | | 900.90 | | | 0.78 | | | 3.74 | |
Hypothetical 5% Return | | | 1,000.00 | | | | 1,021.27 | | | 0.78 | | | 3.97 | |
Global X FTSE Argentina 20 ETF | | | | | | | | | | | | | | |
Actual Fund Return | | | 1,000.00 | | | | 719.30 | | | 0.75 | | | 3.25 | |
Hypothetical 5% Return | | | 1,000.00 | | | | 1,021.42 | | | 0.75 | | | 3.82 | |
Global X Brazil Mid Cap ETF | | | | | | | | | | | | | | |
| | | | |
Actual Fund Return | | | 1,000.00 | | | | 825.80 | | | 0.69 | | | 3.18 | |
Hypothetical 5% Return | | | 1,000.00 | | | | 1,021.73 | | | 0.69 | | | 3.52 | |
Global X Brazil Consumer ETF | | | | | | | | | | | | | | |
Actual Fund Return | | | 1,000.00 | | | | 826.60 | | | 0.77 | | | 3.55 | |
Hypothetical 5% Return | | | 1,000.00 | | | | 1,021.32 | | | 0.77 | | | 3.92 | |
Global X Brazil Financials ETF | | | | | | | | | | | | | | |
| | | | |
Actual Fund Return | | | 1,000.00 | | | | 852.60 | | | 0.77 | | | 3.60 | |
Hypothetical 5% Return | | | 1,000.00 | | | | 1,021.32 | | | 0.77 | | | 3.92 | |
112
DISCLOSUREOF FUND EXPENSES (unaudited)
| | | | | | | | | | | | | | |
| | | Beginning
Account
Value
5/1/2011 | | | Ending
Account
Value
10/31/2011 | | | Annualized
Expense
Ratios | | Expenses
Paid
During
Period(1) | |
Global X Mexico Small-Cap ETF | | | | | | | | | | | | | | |
| | | | |
Actual Fund Return(2) | | | $1,000.00 | | | | $766.70 | | | 0.69% | | | $3.02 | |
Hypothetical 5% Return | | | 1,000.00 | | | | 1,021.73 | | | 0.69 | | | 3.52 | |
Global X Russell Emerging Markets Growth ETF | | | | | | | | | | | | | | |
Actual Fund Return | | | 1,000.00 | | | | 828.60 | | | 0.69 | | | 3.18 | |
Hypothetical 5% Return | | | 1,000.00 | | | | 1,021.73 | | | 0.69 | | | 3.52 | |
Global X Russell Emerging Markets Value ETF | | | | | | | | | | | | | | |
| | | | |
Actual Fund Return | | | 1,000.00 | | | | 831.50 | | | 0.69 | | | 3.19 | |
Hypothetical 5% Return | | | 1,000.00 | | | | 1,021.73 | | | 0.69 | | | 3.52 | |
Global X FTSE Nordic Region ETF | | | | | | | | | | | | | | |
Actual Fund Return | | | 1,000.00 | | | | 766.20 | | | 0.50 | | | 2.23 | |
Hypothetical 5% Return | | | 1,000.00 | | | | 1,022.68 | | | 0.50 | | | 2.55 | |
Global X FTSE Norway 30 ETF | | | | | | | | | | | | | | |
| | | | |
Actual Fund Return | | | 1,000.00 | | | | 785.20 | | | 0.50 | | | 2.25 | |
Hypothetical 5% Return | | | 1,000.00 | | | | 1,022.68 | | | 0.50 | | | 2.55 | |
| (1) | Expenses are equal to the Fund’s annualized expense ratio multiplied by the average account value over the period, multiplied 184/365 (to reflect the one-half year period.) |
| (2) | Expenses are equal to the Fund’s annualized expense ratio multiplied by the average account value over the period, multiplied 181/365 (to reflect the period from inception to date.) |
113
APPROVALOF INVESTMENT ADVISORY AGREEMENT (unaudited)
The discussion below is with respect to the Global X Mexico Small-Cap ETF and other portfolios of Global X Funds that had not launched as of October 31, 2011.
Section 15(c) of the Investment Company Act of 1940, as amended (“1940 Act”), requires that each mutual fund’s board of trustees, including a majority of those trustees who are not “interested persons” of the mutual fund, as defined in the 1940 Act (“Independent Trustees”), consider on an initial basis and periodically thereafter (as required by the 1940 Act), at an in person meeting called for such purpose, the terms of each fund’s investment advisory agreement and approve each agreement with such changes as the Independent Trustees deem appropriate.
At a quarterly Board meeting held on February 25, 2011, the Board of Trustees (“Board”) (including the Independent Trustees) of the Global X Funds (“Trust”) initially considered and unanimously approved (i) the initial Investment Advisory Agreement for the Global X Mexico Small-Cap ETF ( a “New Fund”) and (ii) the Supervision and Administration Agreement between the Trust, on behalf the New Fund, and Global X Management Company (“Global X Management”).1
At a special Board meeting held on August 19, 2011, the Board of Trustees (“Board”) (including the Independent Trustees) initially considered and unanimously approved (i) the initial Investment Advisory Agreement for the Global X FTSE Portugal 20 ETF, Global X FTSE Ukraine ETF, Global X FTSE Greece 20 ETF, Global X Hungary ETF, Global X Luxembourg ETF, Global X FTSE Morocco 20 ETF, Global X Czech Republic ETF, Global X Slovakia ETF, Global X Qatar ETF, Global X Kuwait ETF, Global X Nigeria ETF, Global X FTSE Bangladesh ETF, Global X FTSE Sri Lanka ETF, Global X Kazakhstan ETF, Global X FTSE Frontier Markets ETF, Global X Central America ETF, Global X Central and Northern Europe ETF, Global X Southern Europe ETF, Global X Eastern Europe ETF, Global X Central Asia ETF, Global X Sub-Saharan Africa ETF, Global X S&P Pan Arab & Saudi Arabia ETF, Global X FTSE Toll Roads & Ports ETF, Global X FTSE Railroads ETF, Global X Farmland & Timberland ETF, Global X Cement ETF, Global X Advanced Materials ETF and Global X Social Media Index ETF (each a “New Fund”) and (ii) the Supervision and Administration Agreement between the Trust, on behalf each of each New Fund, and Global X Management.
The Investment Advisory Agreements and Supervision and Administration Agreements for each of the New Funds are referred to herein as the “Agreements.”
In advance of each of the Board meetings noted above, the Board (including the Independent Trustees) requested (in writing) detailed information from Global X Management in connection with their consideration of the Agreements and received and reviewed written responses from Global X Management and supporting materials relating to those requests for information.
In determining to approve the Agreements for each New Fund, the Board concluded that the Agreements are fair and reasonable and in the best interests of each New Fund and its shareholders, respectively. In approving Agreements for each New Fund, the Board considered among other things the following categories of material factors.
1 At the February 25, 2011 quarterly Board meeting, the Board also approved the (i) initial Investment Advisory Agreement for the Global X UK Small-Cap ETF, Global X Germany Small-Cap ETF, Global X Hong Kong Small-Cap ETF, Global X Singapore Small-Cap ETF, Global X South Korea Small-Cap ETF, Global X Taiwan Small-Cap ETF, Global X Rare Earths ETF, Global X Strategic Metals ETF, Global X Fertilizers/Potash ETF, Global X SuperDividend ETF and Global X Canada Preferred ETF (the “Funds”) and (ii) the Supervision and Administration Agreement between the Trust, on behalf of each of these Funds, and Global X Management.
114
APPROVALOF INVESTMENT ADVISORY AGREEMENT (unaudited)(continued)
In reaching this decision, the Board did not assign relative weights to the factors discussed below nor did the Board deem any one factor or group of them to be controlling in and of themselves.
Nature, extent and quality of services
With respect to this factor, the Board considered:
| | • | | the terms of the Agreements and the range of services to be provided to the New Funds in accordance with the Agreements; |
| | • | | Global X Management’s key personnel and the portfolio managers who would provide investment advisory services to the New Funds; |
| | • | | Global X Management’s responsibilities under the Agreements to, among other things, (i) manage the investment operations of each New Fund and the composition of each New Fund’s assets, including the purchase, retention and disposition of its holdings, (ii) provide quarterly reports to the Trust’s officers and Board and other reports as the Board deems necessary or appropriate, (iii) vote proxies, exercise consents, and exercise all other rights appertaining to securities and assets held by each of the New Funds, (iv) select broker-dealers to execute portfolio transactions for each of the New Funds when necessary, (v) provide or arrange for the provision of various third-party services required by the New Funds, (vi) assist in the preparation and filing of reports and proxy statements (if any) to the shareholders of each of the New Funds, draft and periodically update the registration statement and other reports and documents for each of the New Funds that are required to be filed by the Trust with the Securities and Exchange Commission (“SEC”) and other regulatory or governmental bodies, and (vii) monitor anticipated purchases and redemptions of the shares (including creation units) of each of the New Funds by shareholders and new investors; |
| | • | | the nature, extent and quality of Global X Management’s services (including advisory, administrative and compliance services) that would be made available to each of the New Funds; and |
| | • | | the quality of Global X Management’s resources and personnel that would be made available to each of the New Funds, including Global X Management’s experience and the qualifications of Global X Management’s key personnel and the portfolio managers who would provide investment advisory services to the New Funds. |
In evaluating the Agreements for certain of the New Funds (Global X Slovakia ETF, Global X FTSE Bangladesh ETF, Global X FTSE Sri Lanka ETF, and Global X Kazakhstan ETF), the Board took into account that (i) at the time the such Agreements were considered, the securities to be held by such New Funds and/or the markets in which the New Funds would operate were not believed to be sufficiently liquid, (ii) that such New Funds will not commence operations until Global X Management is able to adequately assure the Board that the securities to be held by such New Funds and/or the markets in which the New Funds operate are sufficient liquidity and (iii) Global X Management will obtain prior Board approval with respect to the decision to commence operation of any such New Funds.
In addition, the Board considered the fact that any New Funds that is not launched within a reasonable period of time following approval of the Agreements for such New Funds, would be subject to further Board consideration and approval prior to launch of any such New Funds. Finally,
115
APPROVALOF INVESTMENT ADVISORY AGREEMENT (unaudited)(continued)
the Board considered that Global X Management conducts extensive due diligence of all New Funds to confirm that various local and regional issues will not adversely impact the operation of any New Fund.
Based on these considerations, the Board concluded that it was satisfied with the nature, extent and quality of the services to be provided to each of the New Funds.
Performance
The Board determined that because each of the New Funds had not commenced operations, meaningful data relating to investment performance of each New Fund was not available and, therefore, could not be a factor in approving the Agreements.
Cost of Services and Profitability
With respect to this factor, the Board considered:
| | • | | Global X Management’s expected cost to provide investment management, supervision and administrative and related services to each of the New Funds; |
| | • | | the unitary Management Fee (including the proposed investment advisory fee) that was proposed to be borne by each New Fund under the Agreements for the investment advisory, supervisory and administrative services that each New Fund requires under a unitary fee structure (including the types of fees and expenses that are not included within the unitary fee and would be borne by each New Fund); and |
| | • | | the expected profitability to Global X Management, if any, from all services to be provided to each of the New Funds and all aspects of the relationship between Global X Management and each of the New Funds. In connection with these considerations, the Board noted that Global X Management advised the Board that it was expected that it would not generate profits from its services to any of the New Funds during the first 12 months of each New Fund’s operations, but expected to do so after that initial start up period. |
Based on these considerations, the Board concluded that the profits anticipated to be realized by Global X Management from its relationship with each of the New Funds would not be excessive.
Comparison of Fees and Services
With respect to this factor, the Board considered:
| | • | | comparative information with respect to the Management Fee proposed to be paid to Global X Management by each of the New Funds. In connection with this consideration, Global X Management provided the Board with detailed comparative expense data for each of the New Funds, including fees and expenses paid by comparable affiliated and unaffiliated exchange-traded funds and other registered funds and the reasons for any differences in the proposed expense ratios for the New Funds and those presented for comparison; |
| | • | | the proposed unified Management Fee structure (which includes as one component the proposed investment advisory fee for each New Fund), the expected total expense ratios for each of the New Funds and that Global X Management would be responsible for paying all of designated expenses of the New Funds (discussed in more detail below). In this regard, the Board took into consideration that the purpose of having a unitary Management Fee structure was to create a simple, all-inclusive fee that would provide a level of predictability |
116
APPROVALOF INVESTMENT ADVISORY AGREEMENT (unaudited)(concluded)
| | with respect to the overall expense ratio (i.e., the total fees) of each of the New Funds and that the proposed Management Fee for each New Fund was set at a competitive rate to make each New Fund viable in the marketplace; |
| | • | | that Global X Management would be responsible for most ordinary expenses of the New Funds, including the costs of various third-party services required by the New Funds, including investment advisory, administrative, audit, certain custody, portfolio accounting, legal, transfer agency services, printing costs and other services for the New Funds, but that each New Fund would bear other expenses not covered under the proposed all-inclusive Management Fee, such as such as certain asset-based custody fees for certain New Funds, taxes, brokerage fees, commissions, and other transaction expenses, interest expenses, and extraordinary expenses; and |
| | • | | that, pursuant to Expense Limitation Agreements applicable to the Global X FTSE Greece 20 ETF, Global X Management has agreed, until at least April 1, 2013, to assume, waive and/or limit the fees and expenses payable by Global X FTSE Greece 20 ETF to a specific total expense ratio (excluding certain fees and expenses) for the Global X FTSE Greece 20 ETF in order to keep the total expense ratio for each the Global X FTSE Greece 20 ETF below a designated level. |
Based on these considerations, the Board concluded that the proposed Management Fee and expected total expense ratio of each New Fund should not preclude approval of the Agreements.
Economies of Scale
With respect to this factor, the Board considered:
| | • | | the extent to which economies of scale would be realized as each of the New Funds grows and whether the proposed unitary Management Fee for each New Fund reflected these economies of scale; |
| | • | | the significant investment of time, personnel and other resources that Global X Management intends to made in each of the New Funds in order to seek to assure that the New Funds are attractive to investors; |
| | • | | that the proposed unitary Management Fee would provide a significant amount of certainty regarding the total fees and expenses of each of the New Funds and its shareholders; and |
| | • | | with respect to the Global X FTSE Greece 20 ETF that is subject to an Expense Limitation Agreement, the total fees and expenses of the Global X FTSE Greece 20 ETF would be further reduced until at least April 1, 2013. |
Based on these considerations, the Board concluded that approval of the proposed Management Fee for each New Fund was reasonable.
Other Benefits
In considering the Agreement, in addition to the categories discussed above, the Board considered other benefits that may be realized by Global X Management as a result of its relationships with each of the New Funds.
117
SUPPLEMENTAL INFORMATION (unaudited)
Net asset value, or “NAV”, is the price per Share at which the Funds issue and redeems Shares. It is calculated in accordance with the standard formula for valuing mutual fund shares. The “Market Price” of the Funds generally is determined using the midpoint between the highest bid and the lowest offer on the stock exchange on which the Shares of the Funds are listed for trading, as of the time that the Funds’ NAV is calculated. The Funds’ Market Price may be at, above or below their NAV. The NAV of the Funds will fluctuate with changes in the market value of their Funds holdings. The Market Price of the Funds will fluctuate in accordance with changes in its NAV, as well as market supply and demand.
Premiums or discounts are the differences (expressed as a percentage) between the NAV and Market Price of the Funds on a given day, generally at the time NAV is calculated. A premium is the amount that the Funds are trading above the reported NAV, expressed as a percentage of the NAV. A discount is the amount that the Funds are trading below the reported NAV, expressed as a percentage of the NAV.
The following information shows the frequency distributions of premiums and discounts for the Funds. The information shown is for the full calendar quarter completed after the inception date through the date of the most recent calendar quarter end.
Each line in the table shows the number of trading days in which the Funds traded within the premium/discount range indicated. The number of trading days in each premium/discount range is also shown as a percentage of the total number of trading days in the period covered by each table. All data presented here represents past performance, which cannot be used to predict future results.
118
SUPPLEMENTAL INFORMATION (unaudited) (continued)
| | | | | | | | | | | | | | | | | | | | | | | | | | | | |
| | | Percentage of Total Days | |
| Premium/Discount Range | | Global X
China
Consumer
ETF | | | Global X
China Energy
ETF | | | Global X
China
Financials
ETF | | | Global X
China
Industrials
ETF | | | Global X
China
Materials ETF | | | Global X
NASDAQ
China
Technology
ETF | | | Global X
FTSE ASEAN
40 ETF(1) | |
Greater than 7.0% and Less than 7.5% | | | 0.41 | % | | | - | | | | 0.41 | % | | | - | | | | 0.41 | % | | | - | | | | - | |
Greater than 6.5% and Less than 7.0% | | | - | | | | - | | | | 0.41 | % | | | - | | | | 0.41 | % | | | - | | | | - | |
Greater than 6.0% and Less than 6.5% | | | - | | | | - | | | | - | | | | 0.41 | % | | | - | | | | - | | | | - | |
Greater than 5.5% and Less than 6.0% | | | - | | | | 0.41 | % | | | - | | | | - | | | | - | | | | - | | | | - | |
Greater than 5.0% and Less than 5.5% | | | 0.41 | % | | | - | | | | - | | | | - | | | | - | | | | - | | | | - | |
Greater than 4.5% and Less than 5.0% | | | - | | | | - | | | | 0.82 | % | | | - | | | | - | | | | - | | | | - | |
Greater than 4.0% and Less than 4.5% | | | - | | | | 0.41 | % | | | - | | | | - | | | | - | | | | - | | | | - | |
Greater than 3.5% and Less than 4.0% | | | - | | | | - | | | | 0.41 | % | | | 1.24 | % | | | 1.65 | % | | | 0.41 | % | | | 0.59 | % |
Greater than 3.0% and Less than 3.5% | | | 0.83 | % | | | 0.83 | % | | | 1.24 | % | | | 0.41 | % | | | 2.89 | % | | | - | | | | - | |
Greater than 2.5% and Less than 3.0% | | | 2.07 | % | | | 0.41 | % | | | 2.07 | % | | | 2.07 | % | | | - | | | | 0.41 | % | | | 0.59 | % |
Greater than 2.0% and Less than 2.5% | | | 2.48 | % | | | 3.72 | % | | | 1.65 | % | | | 1.65 | % | | | 3.32 | % | | | 0.41 | % | | | 8.82 | % |
Greater than 1.5% and Less than 2.0% | | | 10.74 | % | | | 5.37 | % | | | 3.72 | % | | | 3.72 | % | | | 4.14 | % | | | 2.07 | % | | | 10.59 | % |
Greater than 1.0% and Less than 1.5% | | | 20.25 | % | | | 15.71 | % | | | 12.81 | % | | | 11.57 | % | | | 8.68 | % | | | 7.02 | % | | | 28.24 | % |
Greater than 0.5% and Less than 1.0% | | | 28.11 | % | | | 23.98 | % | | | 19.01 | % | | | 21.90 | % | | | 21.07 | % | | | 25.62 | % | | | 21.76 | % |
Between 0.5% and -0.5% | | | 13.64 | % | | | 19.42 | % | | | 19.01 | % | | | 26.03 | % | | | 19.83 | % | | | 29.34 | % | | | 11.76 | % |
Less than -0.5% and Greater than -1.0% | | | 10.74 | % | | | 12.40 | % | | | 18.60 | % | | | 14.88 | % | | | 19.83 | % | | | 15.29 | % | | | 10.00 | % |
Less than -1.0% and Greater than -1.5% | | | 4.55 | % | | | 9.09 | % | | | 11.57 | % | | | 8.68 | % | | | 9.09 | % | | | 12.40 | % | | | 2.94 | % |
Less than -1.5% and Greater than -2.0% | | | 1.65 | % | | | 4.13 | % | | | 4.55 | % | | | 2.89 | % | | | 4.13 | % | | | 2.49 | % | | | 0.59 | % |
Less than -2.0% and Greater than -2.5% | | | 0.41 | % | | | 0.41 | % | | | 0.41 | % | | | 1.24 | % | | | 2.07 | % | | | 2.89 | % | | | 2.35 | % |
Less than -2.5% and Greater than -3.0% | | | 1.24 | % | | | 0.41 | % | | | 0.83 | % | | | 0.83 | % | | | 0.83 | % | | | 1.24 | % | | | 1.18 | % |
Less than -3.0% and Greater than -3.5% | | | 0.41 | % | | | 1.65 | % | | | 0.83 | % | | | 0.83 | % | | | 0.41 | % | | | - | | | | 0.59 | % |
Less than -3.5% and Greater than -4.0% | | | 1.24 | % | | | 0.41 | % | | | 1.24 | % | | | - | | | | 0.83 | % | | | - | | | | - | |
Less than -4.0% and Greater than -4.5% | | | 0.41 | % | | | 0.41 | % | | | 0.41 | % | | | 1.24 | % | | | - | | | | 0.41 | % | | | - | |
Less than -4.5% and Greater than -5.0% | | | - | | | | 0.83 | % | | | - | | | | - | | | | - | | | | - | | | | - | |
Less than -5.0% and Greater than -5.5% | | | 0.41 | % | | | - | | | | - | | | | - | | | | 0.41 | % | | | - | | | | - | |
Less than -5.5% and Greater than -6.0% | | | - | | | | - | | | | - | | | | 0.41 | % | | | - | | | | - | | | | - | |
Less than -6.0% and Greater than -6.5% | | | - | | | | - | | | | - | | | | - | | | | - | | | | - | | | | - | |
Less than -6.5% and Greater than -7.0% | | | - | | | | - | | | | - | | | | - | | | | - | | | | - | | | | - | |
Less than -7.0% and Greater than -7.5% | | | - | | | | - | | | | - | | | | - | | | | - | | | | - | | | | - | |
| | | | |
Total | | | 100.00 | % | | | 100.00 | % | | | 100.00 | % | | | 100.00 | % | | | 100.00 | % | | | 100.00 | % | | | 100.00 | % |
| | | | |
| |
| | | Number of Business Days | |
| Premium/Discount Range | | Global X
China
Consumer
ETF | | | Global X
China Energy
ETF | | | Global X
China
Financials
ETF | | | Global X
China
Industrials
ETF | | | Global X
China
Materials ETF | | | Global X
NASDAQ
China
Technology
ETF | | | Global X
FTSE ASEAN
40 ETF(1) | |
Greater than 7.0% and Less than 7.5% | | | 1 | | | | - | | | | 1 | | | | - | | | | 1 | | | | - | | | | - | |
Greater than 6.5% and Less than 7.0% | | | - | | | | - | | | | 1 | | | | - | | | | 1 | | | | - | | | | - | |
Greater than 6.0% and Less than 6.5% | | | - | | | | - | | | | - | | | | 1 | | | | - | | | | - | | | | - | |
Greater than 5.5% and Less than 6.0% | | | - | | | | 1 | | | | - | | | | - | | | | - | | | | - | | | | - | |
Greater than 5.0% and Less than 5.5% | | | 1 | | | | - | | | | - | | | | - | | | | - | | | | - | | | | - | |
Greater than 4.5% and Less than 5.0% | | | - | | | | - | | | | 2 | | | | - | | | | - | | | | - | | | | - | |
Greater than 4.0% and Less than 4.5% | | | - | | | | 1 | | | | - | | | | - | | | | - | | | | - | | | | - | |
Greater than 3.5% and Less than 4.0% | | | - | | | | - | | | | 1 | | | | 3 | | | | 4 | | | | 1 | | | | 1 | |
Greater than 3.0% and Less than 3.5% | | | 2 | | | | 2 | | | | 3 | | | | 1 | | | | 7 | | | | - | | | | - | |
Greater than 2.5% and Less than 3.0% | | | 5 | | | | 1 | | | | 5 | | | | 5 | | | | - | | | | 1 | | | | 1 | |
Greater than 2.0% and Less than 2.5% | | | 6 | | | | 9 | | | | 4 | | | | 4 | | | | 8 | | | | 1 | | | | 15 | |
Greater than 1.5% and Less than 2.0% | | | 26 | | | | 13 | | | | 9 | | | | 9 | | | | 10 | | | | 5 | | | | 18 | |
Greater than 1.0% and Less than 1.5% | | | 49 | | | | 38 | | | | 31 | | | | 28 | | | | 21 | | | | 17 | | | | 48 | |
Greater than 0.5% and Less than 1.0% | | | 68 | | | | 58 | | | | 46 | | | | 53 | | | | 51 | | | | 62 | | | | 37 | |
Between 0.5% and -0.5% | | | 33 | | | | 47 | | | | 46 | | | | 63 | | | | 48 | | | | 71 | | | | 20 | |
Less than -0.5% and Greater than -1.0% | | | 26 | | | | 30 | | | | 45 | | | | 36 | | | | 48 | | | | 37 | | | | 17 | |
Less than -1.0% and Greater than -1.5% | | | 11 | | | | 22 | | | | 28 | | | | 21 | | | | 22 | | | | 30 | | | | 5 | |
Less than -1.5% and Greater than -2.0% | | | 4 | | | | 10 | | | | 11 | | | | 7 | | | | 10 | | | | 6 | | | | 1 | |
Less than -2.0% and Greater than -2.5% | | | 1 | | | | 1 | | | | 1 | | | | 3 | | | | 5 | | | | 7 | | | | 4 | |
Less than -2.5% and Greater than -3.0% | | | 3 | | | | 1 | | | | 2 | | | | 2 | | | | 2 | | | | 3 | | | | 2 | |
Less than -3.0% and Greater than -3.5% | | | 1 | | | | 4 | | | | 2 | | | | 2 | | | | 1 | | | | - | | | | 1 | |
Less than -3.5% and Greater than -4.0% | | | 3 | | | | 1 | | | | 3 | | | | - | | | | 2 | | | | - | | | | - | |
Less than -4.0% and Greater than -4.5% | | | - | | | | 1 | | | | 1 | | | | 3 | | | | - | | | | 1 | | | | - | |
Less than -4.5% and Greater than -5.0% | | | 1 | | | | 2 | | | | - | | | | - | | | | - | | | | - | | | | - | |
Less than -5.0% and Greater than -5.5% | | | 1 | | | | - | | | | - | | | | - | | | | 1 | | | | - | | | | - | |
Less than -5.5% and Greater than -6.0% | | | - | | | | - | | | | - | | | | 1 | | | | - | | | | - | | | | - | |
Less than -6.0% and Greater than -6.5% | | | - | | | | - | | | | - | | | | - | | | | - | | | | - | | | | - | |
Less than -6.5% and Greater than -7.0% | | | - | | | | - | | | | - | | | | - | | | | - | | | | - | | | | - | |
Less than -7.0% and Greater than -7.5% | | | - | | | | - | | | | - | | | | - | | | | - | | | | - | | | | - | |
| | | | |
Total | | | 242 | | | | 242 | | | | 242 | | | | 242 | | | | 242 | | | | 242 | | | | 170 | |
| | | | |
119
SUPPLEMENTAL INFORMATION (unaudited) (continued)
| | | | | | | | | | | | | | | | | | | | | | | | | | | | |
| | | Percentage of Total Days | |
| Premium/Discount Range | | Global X
FTSE
Andean 40
(2) | | | Global X
FTSE
Colombia
20 ETF | | | Global X
FTSE
Argentina
20 ETF(3) | | | Global X
Brazil Mid
Cap ETF | | | Global X
Brazil
Consumer
ETF | | | Global X
Brazil
Financials
ETF | | | Global X
Mexico Small-
Cap ETF(4) | |
Greater than 7.0% and Less than 7.5% | | | - | | | | 0.41% | | | | - | | | | - | | | | - | | | | - | | | | - | |
Greater than 6.5% and Less than 7.0% | | | - | | | | - | | | | - | | | | - | | | | - | | | | - | | | | - | |
Greater than 6.0% and Less than 6.5% | | | - | | | | - | | | | - | | | | - | | | | - | | | | - | | | | - | |
Greater than 5.5% and Less than 6.0% | | | - | | | | - | | | | - | | | | - | | | | - | | | | - | | | | - | |
Greater than 5.0% and Less than 5.5% | | | - | | | | - | | | | - | | | | - | | | | - | | | | - | | | | - | |
Greater than 4.5% and Less than 5.0% | | | - | | | | - | | | | - | | | | - | | | | - | | | | - | | | | - | |
Greater than 4.0% and Less than 4.5% | | | - | | | | - | | | | - | | | | - | | | | - | | | | - | | | | - | |
Greater than 3.5% and Less than 4.0% | | | - | | | | - | | | | - | | | | - | | | | 0.41% | | | | - | | | | - | |
Greater than 3.0% and Less than 3.5% | | | - | | | | - | | | | - | | | | - | | | | 0.41% | | | | 0.41% | | | | - | |
Greater than 2.5% and Less than 3.0% | | | - | | | | - | | | | - | | | | 2.07% | | | | 2.89% | | | | 1.66% | | | | - | |
Greater than 2.0% and Less than 2.5% | | | - | | | | - | | | | - | | | | 13.22% | | | | 15.70% | | | | 14.89% | | | | - | |
Greater than 1.5% and Less than 2.0% | | | 1.11% | | | | 1.24% | | | | - | | | | 16.12% | | | | 12.81% | | | | 22.32% | | | | 0.85% | |
Greater than 1.0% and Less than 1.5% | | | 10.56% | | | | 11.16% | | | | 0.62% | | | | 4.13% | | | | 5.79% | | | | 9.50% | | | | 0.85% | |
Greater than 0.5% and Less than 1.0% | | | 70.56% | | | | 26.86% | | | | 48.45% | | | | 13.22% | | | | 7.44% | | | | 9.50% | | | | 5.13% | |
Between 0.5% and -0.5% | | | 17.22% | | | | 34.30% | | | | 37.27% | | | | 40.50% | | | | 45.87% | | | | 31.40% | | | | 52.99% | |
Less than -0.5% and Greater than -1.0% | | | 0.55% | | | | 23.13% | | | | 13.66% | | | | 9.92% | | | | 7.85% | | | | 9.50% | | | | 36.76% | |
Less than -1.0% and Greater than -1.5% | | | - | | | | 2.07% | | | | - | | | | 0.41% | | | | 0.83% | | | | 0.41% | | | | 1.71% | |
Less than -1.5% and Greater than -2.0% | | | - | | | | 0.83% | | | | - | | | | 0.41% | | | | - | | | | 0.41% | | | | 1.71% | |
Less than -2.0% and Greater than -2.5% | | | - | | | | - | | | | - | | | | - | | | | - | | | | - | | | | - | |
Less than -2.5% and Greater than -3.0% | | | - | | | | - | | | | - | | | | - | | | | - | | | | - | | | | - | |
Less than -3.0% and Greater than -3.5% | | | - | | | | - | | | | - | | | | - | | | | - | | | | - | | | | - | |
Less than -3.5% and Greater than -4.0% | | | - | | | | - | | | | - | | | | - | | | | - | | | | - | | | | - | |
Less than -4.0% and Greater than -4.5% | | | - | | | | - | | | | - | | | | - | | | | - | | | | - | | | | - | |
Less than -4.5% and Greater than -5.0% | | | - | | | | - | | | | - | | | | - | | | | - | | | | - | | | | - | |
Less than -5.0% and Greater than -5.5% | | | - | | | | - | | | | - | | | | - | | | | - | | | | - | | | | - | |
Less than -5.5% and Greater than -6.0% | | | - | | | | - | | | | - | | | | - | | | | - | | | | - | | | | - | |
Less than -6.0% and Greater than -6.5% | | | - | | | | - | | | | - | | | | - | | | | - | | | | - | | | | - | |
Less than -6.5% and Greater than -7.0% | | | - | | | | - | | | | - | | | | - | | | | - | | | | - | | | | - | |
Less than -7.0% and Greater than -7.5% | | | - | | | | - | | | | - | | | | - | | | | - | | | | - | | | | - | |
| | | | |
Total | | | 100.00% | | | | 100.00% | | | | 100.00% | | | | 100.00% | | | | 100.00% | | | | 100.00% | | | | 100.00% | |
| | | | |
| |
| | | Number of Business Days | |
| Premium/Discount Range | | Global X
FTSE
Andean 40
(1) | | | Global X
FTSE
Colombia
20 ETF | | | Global X
FTSE
Argentina
20 ETF(3) | | | Global X
Brazil Mid
Cap ETF | | | Global X
Brazil
Consumer
ETF | | | Global X
Brazil
Financials
ETF | | | Global X
Mexico Small-
Cap ETF(4) | |
Greater than 7.0% and Less than 7.5% | | | - | | | | 1 | | | | - | | | | - | | | | - | | | | - | | | | - | |
Greater than 6.5% and Less than 7.0% | | | - | | | | - | | | | - | | | | - | | | | - | | | | - | | | | - | |
Greater than 6.0% and Less than 6.5% | | | - | | | | - | | | | - | | | | - | | | | - | | | | - | | | | - | |
Greater than 5.5% and Less than 6.0% | | | - | | | | - | | | | - | | | | - | | | | - | | | | - | | | | - | |
Greater than 5.0% and Less than 5.5% | | | - | | | | - | | | | - | | | | - | | | | - | | | | - | | | | - | |
Greater than 4.5% and Less than 5.0% | | | - | | | | - | | | | - | | | | - | | | | - | | | | - | | | | - | |
Greater than 4.0% and Less than 4.5% | | | - | | | | - | | | | - | | | | - | | | | - | | | | - | | | | - | |
Greater than 3.5% and Less than 4.0% | | | - | | | | - | | | | - | | | | - | | | | 1 | | | | - | | | | - | |
Greater than 3.0% and Less than 3.5% | | | - | | | | - | | | | - | | | | - | | | | 1 | | | | 1 | | | | - | |
Greater than 2.5% and Less than 3.0% | | | - | | | | - | | | | - | | | | 5 | | | | 7 | | | | 4 | | | | - | |
Greater than 2.0% and Less than 2.5% | | | - | | | | - | | | | - | | | | 32 | | | | 38 | | | | 36 | | | | - | |
Greater than 1.5% and Less than 2.0% | | | 2 | | | | 3 | | | | - | | | | 39 | | | | 31 | | | | 54 | | | | 1 | |
Greater than 1.0% and Less than 1.5% | | | 19 | | | | 27 | | | | 1 | | | | 10 | | | | 14 | | | | 23 | | | | 1 | |
Greater than 0.5% and Less than 1.0% | | | 127 | | | | 65 | | | | 78 | | | | 32 | | | | 18 | | | | 23 | | | | 6 | |
Between 0.5% and -0.5% | | | 31 | | | | 83 | | | | 60 | | | | 98 | | | | 111 | | | | 76 | | | | 62 | |
Less than -0.5% and Greater than -1.0% | | | 1 | | | | 56 | | | | 22 | | | | 24 | | | | 19 | | | | 23 | | | | 43 | |
Less than -1.0% and Greater than -1.5% | | | - | | | | 5 | | | | - | | | | 1 | | | | 2 | | | | 1 | | | | 2 | |
Less than -1.5% and Greater than -2.0% | | | - | | | | 2 | | | | - | | | | 1 | | | | - | | | | 1 | | | | 2 | |
Less than -2.0% and Greater than -2.5% | | | - | | | | - | | | | - | | | | - | | | | - | | | | - | | | | - | |
Less than -2.5% and Greater than -3.0% | | | - | | | | - | | | | - | | | | - | | | | - | | | | - | | | | - | |
Less than -3.0% and Greater than -3.5% | | | - | | | | - | | | | - | | | | - | | | | - | | | | - | | | | - | |
Less than -3.5% and Greater than -4.0% | | | - | | | | - | | | | - | | | | - | | | | - | | | | - | | | | - | |
Less than -4.0% and Greater than -4.5% | | | - | | | | - | | | | - | | | | - | | | | - | | | | - | | | | - | |
Less than -4.5% and Greater than -5.0% | | | - | | | | - | | | | - | | | | - | | | | - | | | | - | | | | - | |
Less than -5.0% and Greater than -5.5% | | | - | | | | - | | | | - | | | | - | | | | - | | | | - | | | | - | |
Less than -5.5% and Greater than -6.0% | | | - | | | | - | | | | - | | | | - | | | | - | | | | - | | | | - | |
Less than -6.0% and Greater than -6.5% | | | - | | | | - | | | | - | | | | - | | | | - | | | | - | | | | - | |
Less than -6.5% and Greater than -7.0% | | | - | | | | - | | | | - | | | | - | | | | - | | | | - | | | | - | |
Less than -7.0% and Greater than -7.5% | | | - | | | | - | | | | - | | | | - | | | | - | | | | - | | | | - | |
| | | | |
Total | | | 180 | | | | 242 | | | | 161 | | | | 242 | | | | 242 | | | | 242 | | | | 117 | |
| | | | |
120
SUPPLEMENTAL INFORMATION (unaudited) (continued)
| | | | | | | | | | | | | | | | |
| | | Percentage of Total Days | |
| Premium/Discount Range | | Russell
Emerging
Markets
Growth
ETF(5) | | | Russell
Emerging
Markets
Value
ETF(5) | | | Global X
FTSE
Nordic
Region ETF | | | Global X
FTSE Norway
30 ETF | |
Greater than 7.0% and Less than 7.5% | | | – | | | | – | | | | – | | | | – | |
Greater than 6.5% and Less than 7.0% | | | – | | | | – | | | | – | | | | – | |
Greater than 6.0% and Less than 6.5% | | | – | | | | – | | | | – | | | | – | |
Greater than 5.5% and Less than 6.0% | | | – | | | | – | | | | – | | | | – | |
Greater than 5.0% and Less than 5.5% | | | – | | | | – | | | | – | | | | – | |
Greater than 4.5% and Less than 5.0% | | | – | | | | – | | | | – | | | | – | |
Greater than 4.0% and Less than 4.5% | | | – | | | | – | | | | – | | | | – | |
Greater than 3.5% and Less than 4.0% | | | – | | | | – | | | | – | | | | – | |
Greater than 3.0% and Less than 3.5% | | | – | | | | – | | | | – | | | | – | |
Greater than 2.5% and Less than 3.0% | | | – | | | | – | | | | – | | | | 1.28% | |
Greater than 2.0% and Less than 2.5% | | | 0.53% | | | | – | | | | – | | | | 0.43% | |
Greater than 1.5% and Less than 2.0% | | | 2.67% | | | | 0.53% | | | | 0.83% | | | | 7.23% | |
Greater than 1.0% and Less than 1.5% | | | 18.73% | | | | 28.88% | | | | 15.70% | | | | 18.30% | |
Greater than 0.5% and Less than 1.0% | | | 47.60% | | | | 52.41% | | | | 48.76% | | | | 40.00% | |
Between 0.5% and -0.5% | | | 23.53% | | | | 15.51% | | | | 22.31% | | | | 17.86% | |
Less than -0.5% and Greater than -1 .0% | | | 2.67% | | | | 2.14% | | | | 7.45% | | | | 9.79% | |
Less than -1.0% and Greater than -1 .5% | | | 2.67% | | | | 0.53% | | | | 2.89% | | | | 3.83% | |
Less than -1.5% and Greater than -2 .0% | | | 1.07% | | | | – | | | | 1.24% | | | | 0.85% | |
Less than -2.0% and Greater than -2 .5% | | | 0.53% | | | | – | | | | 0.41% | | | | 0.43% | |
Less than -2.5% and Greater than -3 .0% | | | – | | | | – | | | | 0.41% | | | | – | |
Less than -3.0% and Greater than -3 .5% | | | – | | | | – | | | | – | | | | – | |
Less than -3.5% and Greater than -4 .0% | | | – | | | | – | | | | – | | | | – | |
Less than -4.0% and Greater than -4 .5% | | | – | | | | – | | | | – | | | | – | |
Less than -4.5% and Greater than -5 .0% | | | – | | | | – | | | | – | | | | – | |
Less than -5.0% and Greater than -5 .5% | | | – | | | | – | | | | – | | | | – | |
Less than -5.5% and Greater than -6 .0% | | | – | | | | – | | | | – | | | | – | |
Less than -6.0% and Greater than -6 .5% | | | – | | | | – | | | | – | | | | – | |
Less than -6.5% and Greater than -7 .0% | | | – | | | | – | | | | – | | | | – | |
Less than -7.0% and Greater than -7 .5% | | | – | | | | – | | | | – | | | | – | |
| | | | | | | | | | | | | | | | |
Total | | | 100.00% | | | | 100.00% | | | | 100.00% | | | | 100.00% | |
| | | | | | | | | | | | | | | | |
| | | | | | | | | | | | | | | | |
| | | Number of Business Days | |
| Premium/Discount Range | | Russell
Emerging
Markets
Growth
ETF(5) | | | Russell
Emerging
Markets
Value
ETF(5) | | | Global X
FTSE
Nordic
Region ETF | | | Global X
FTSE Norway
30 ETF | |
Greater than 7.0% and Less than 7.5% | | | – | | | | – | | | | – | | | | – | |
Greater than 6.5% and Less than 7.0% | | | – | | | | – | | | | – | | | | – | |
Greater than 6.0% and Less than 6.5% | | | – | | | | – | | | | – | | | | – | |
Greater than 5.5% and Less than 6.0% | | | – | | | | – | | | | – | | | | – | |
Greater than 5.0% and Less than 5.5% | | | – | | | | – | | | | – | | | | – | |
Greater than 4.5% and Less than 5.0% | | | – | | | | – | | | | – | | | | – | |
Greater than 4.0% and Less than 4.5% | | | – | | | | – | | | | – | | | | – | |
Greater than 3.5% and Less than 4.0% | | | – | | | | – | | | | – | | | | – | |
Greater than 3.0% and Less than 3.5% | | | – | | | | – | | | | – | | | | – | |
Greater than 2.5% and Less than 3.0% | | | – | | | | – | | | | – | | | | 3 | |
Greater than 2.0% and Less than 2.5% | | | 1 | | | | – | | | | – | | | | 1 | |
Greater than 1.5% and Less than 2.0% | | | 5 | | | | 1 | | | | 2 | | | | 17 | |
Greater than 1.0% and Less than 1.5% | | | 35 | | | | 54 | | | | 38 | | | | 43 | |
Greater than 0.5% and Less than 1.0% | | | 89 | | | | 98 | | | | 118 | | | | 94 | |
Between 0.5% and -0.5% | | | 44 | | | | 29 | | | | 54 | | | | 42 | |
Less than -0.5% and Greater than -1 .0% | | | 5 | | | | 4 | | | | 18 | | | | 23 | |
Less than -1.0% and Greater than -1 .5% | | | 5 | | | | 1 | | | | 7 | | | | 9 | |
Less than -1.5% and Greater than -2 .0% | | | 2 | | | | – | | | | 3 | | | | 2 | |
Less than -2.0% and Greater than -2 .5% | | | 1 | | | | – | | | | 1 | | | | 1 | |
Less than -2.5% and Greater than -3 .0% | | | – | | | | – | | | | 1 | | | | – | |
Less than -3.0% and Greater than -3 .5% | | | – | | | | – | | | | – | | | | – | |
Less than -3.5% and Greater than -4 .0% | | | – | | | | – | | | | – | | | | – | |
Less than -4.0% and Greater than -4 .5% | | | – | | | | – | | | | – | | | | – | |
Less than -4.5% and Greater than -5 .0% | | | – | | | | – | | | | – | | | | – | |
Less than -5.0% and Greater than -5 .5% | | | – | | | | – | | | | – | | | | – | |
Less than -5.5% and Greater than -6 .0% | | | – | | | | – | | | | – | | | | – | |
Less than -6.0% and Greater than -6 .5% | | | – | | | | – | | | | – | | | | – | |
Less than -6.5% and Greater than -7 .0% | | | – | | | | – | | | | – | | | | – | |
Less than -7.0% and Greater than -7 .5% | | | – | | | | – | | | | – | | | | – | |
| | | | | | | | | | | | | | | | |
Total | | | 187 | | | | 187 | | | | 242 | | | | 235 | |
| | | | | | | | | | | | | | | | |
121
SUPPLEMENTAL INFORMATION (unaudited) (concluded)
| (1) | The Fund commenced operations on February 16, 2011. |
| (2) | The Fund commenced operations on February 2, 2011. |
| (3) | The Fund commenced operations on March 2, 2011. |
| (4) | The Fund commenced operations on May 4, 2011. |
| (5) | The Fund commenced operations on January 24, 2011. |
122
TRUSTEESAND OFFICERSOFTHE TRUST (unaudited)
Set forth below are the names, addresses, ages, position with the Trust, Term of Office and Length of Time Served, the principal occupations for the last five years, number of Funds in fund complex overseen by trustee, and other directorships outside the fund complex of each of the persons currently serving as Trustees and Officers of the Trust.
| | | | | | | | |
Name,
Address
(Year of
Birth) | | Position(s)
Held
with Funds | | Principal Occupation(s) During
the Past 5 Years | | Number of
Funds in
Trust
Overseen by
Director | | Other
Directorships
Held
by Trustees |
Independent Trustees2 |
| Sanjay Ram Bharwani 399 Park Ave, 32nd floor New York, NY 10022 (1974) | | Trustee (since 2008) | | CEO of Risk Advisors Inc. (since 2007) (consulting firm); Chief Information Officer, M. Safra & Co (2004-2006) (hedge fund). | | 353 | | None. |
| Scott R. Chichester1 399 Park Ave, 32nd floor New York, NY 10022 (1970) | | Trustee (since 2008) | | President & Treasurer, Bayview Acquisition Corp (since 2010), CPA, Penda Aiken Inc. (since 2009) (consultant); Founder and President, DirectPay USA LLC (since 2006) (payroll company); Chief Financial Officer, Ong Corporation (2002-2010) (technology company); Proprietor, Scott R. Chichester CPA (since 2001) (CPA firm). | | 353 | | None. |
| Kartik Kiran Shah 399 Park Ave, 32nd floor New York, NY 10022 (1977) | | Trustee (since 2008) | | Director, Wireless Generation (since 2008) (software); Manager, Amgen (2003-2006) (biotechnology firm). | | 353 | | None. |
123
TRUSTEESAND OFFICERSOFTHE TRUST (unaudited) (continued)
The Trust’s Statement of Additional Information (“SAI”) includes additional information about the Trustees and Officers. The SAI may be obtained without charge by calling 1-888-493-8631. The following chart lists Trustees and Officers as of October 31, 2011.
| | | | | | | | |
Name, Address
(Year of Birth) | | Position(s) Held
with Funds | | Principal Occupation(s)
During
the Past 5 Years | | Number of Funds
in Trust
Overseen by
Director | | Other
Directorships Held
by Trustees |
Interested Trustee / Officers2 |
Bruno del Ama 399 Park Ave, 32nd floor New York, NY 10022
(1976) | �� | Trustee (since 2008), President, Chief Executive Officer (since 2008) | | Chief Executive Officer and Chief Compliance Officer, Global X Management Company LLC (since 2008); Head of Global Structured Products Operations at Radian Asset Assurance (2004-2008) (financial services firm). | | 353 | | None. |
Jose C. Gonzalez 399 Park Ave, 32nd floor New York, NY 10022
(1976) | | Chief Operating Officer, Chief Compliance Officer and Chief Financial Officer, Secretary (since 2008) | | Chief Operating Officer, Global X Management Company (since 2008); Founder and President of GWM Group, Inc. (since 2006) (broker-dealer firm). | | N/A | | N/A |
Dianne Sulzbach4 One Freedom Valley Drive Oaks, PA 19456
(1977) | | Assistant Secretary (since 2011) | | Corporate Counsel, SEI Investments (since 2010); Associate, Morgan, Lewis & Bockius LLP (2006-2010). | | N/A | | N/A |
124
TRUSTEESAND OFFICERSOFTHE TRUST (unaudited) (concluded)
| | | | | | |
Name, Address
(Year of Birth) | | Position(s) Held
with Funds | | Principal Occupation(s) During
the Past 5 Years | | Other Directorships
Held
by Trustees |
Peter Rodriguez4 One Freedom Valley Drive Oaks, PA 19456
(1962) | | Assistant Treasurer (since 2011) | | Fund Accounting Director of the Administrator (since 2011); Mutual Fund Trading Director, SEI Global Trust Company (2009- 2011); Asset Data Services Director at the Administrator (2006-2009). | | N/A |
| 1 | Mr. Chichester is currently married to a sister of Mr. del Ama’s wife. While an “immediate family member” (as defined in Section 2(a)(19) of the 1940 Act) of Mr. del Ama would be considered an Interested Person, Mr. Chichester is not considered an immediate family member for this purpose. Although this fact was taken into consideration in determining whether Mr. Chichester should be considered to be an Independent Trustee for purposes of the Section 2(a)(19) of the 1940 Act, it was determined that this relationship was not one that should disqualify Mr. Chichester from serving as an Independent Trustee of the Trust. |
| 2 | Each Trustee serves until his or her successor is duly elected or appointed and qualified. |
| 3 | As of October 31, 2011, the Trust had eighty-six investment portfolios, thirty-five of which were operational. |
| 4 | These officers of the Trust also serve as officers of one or more mutual funds for which SEI Investments Company or an affiliate acts as investment manager, administrator or distributor. |
125
NOTICETO SHAREHOLDERS
For shareholders that do not have an October 31, 2011 tax year end, this notice is for informational purposes only. For shareholders with an October 31, 2011 tax year end, please consult your tax advisor as to the pertinence of this notice. For the fiscal year ended October 31, 2011, the Funds are designating the following items with regard to distributions paid during the year.
| | | | | | | | | | | | | | | | | | | | | | | | | | | | |
| | | Long-Term
Capital Gain
Distributions | | | Ordinary
Income
Distributions | | | Total
Distributions | | | Qualifying
for
Corporate
Dividends
Received
Deduction(1) | | | Qualifying
Dividend
Income(2) | | | Interest
Related
Dividends(3 ) | | | Short Term
Capital
Gain
Dividends(4) | |
Global X China Consumer ETF | | | 0.00 | % | | | 100.00 | % | | | 100.00 | % | | | 0.00 | % | | | 0.00 | % | | | 0.00 | % | | | 0.00 | % |
Global X China Energy ETF | | | 0.00 | % | | | 100.00 | % | | | 100.00 | % | | | 0.00 | % | | | 86.42 | % | | | 0.00 | % | | | 100.00 | % |
Global X China Financials ETF | | | 0.00 | % | | | 100.00 | % | | | 100.00 | % | | | 0.12 | % | | | 100.00 | % | | | 0.00 | % | | | 0.00 | % |
Global X China Industrials ETF | | | 0.00 | % | | | 100.00 | % | | | 100.00 | % | | | 0.00 | % | | | 100.00 | % | | | 0.00 | % | | | 0.00 | % |
Global X China Materials ETF | | | 0.00 | % | | | 100.00 | % | | | 100.00 | % | | | 0.00 | % | | | 22.51 | % | | | 0.00 | % | | | 100.00 | % |
Global X NASDAQ China Technology ETF | | | 0.00 | % | | | 100.00 | % | | | 100.00 | % | | | 0.00 | % | | | 78.51 | % | | | 0.00 | % | | | 100.00 | % |
Global X FTSE ASEAN 40 ETF | | | 0.00 | % | | | 100.00 | % | | | 100.00 | % | | | 0.00 | % | | | 53.59 | % | | | 0.00 | % | | | 0.00 | % |
Global X FTSE Andean 40 ETF | | | 0.00 | % | | | 100.00 | % | | | 100.00 | % | | | 19.26 | % | | | 100.00 | % | | | 0.00 | % | | | 0.00 | % |
Global X FTSE Colombia 20 ETF | | | 15.85 | % | | | 84.15 | % | | | 100.00 | % | | | 1.72 | % | | | 72.63 | % | | | 0.00 | % | | | 100.00 | % |
Global X FTSE Argentina 20 ETF | | | 0.00 | % | | | 100.00 | % | | | 100.00 | % | | | 5.97 | % | | | 100.00 | % | | | 0.00 | % | | | 0.00 | % |
Global X Brazil Mid Cap ETF | | | 0.00 | % | | | 100.00 | % | | | 100.00 | % | | | 0.00 | % | | | 34.29 | % | | | 0.00 | % | | | 100.00 | % |
Global X Brazil Consumer ETF | | | 0.00 | % | | | 100.00 | % | | | 100.00 | % | | | 11.04 | % | | | 52.59 | % | | | 0.00 | % | | | 100.00 | % |
Global X Brazil Financials ETF | | | 0.00 | % | | | 100.00 | % | | | 100.00 | % | | | 0.00 | % | | | 28.85 | % | | | 0.01 | % | | | 100.00 | % |
Global X Mexico Small-Cap ETF | | | 0.00 | % | | | 0.00 | % | | | 0.00 | % | | | 0.00 | % | | | 0.00 | % | | | 0.00 | % | | | 0.00 | % |
Global X Russell Emerging Markets Growth ETF | | | 0.00 | % | | | 100.00 | % | | | 100.00 | % | | | 0.00 | % | | | 100.00 | % | | | 0.00 | % | | | 0.00 | % |
Global X Russell Emerging Markets Value ETF | | | 0.00 | % | | | 100.00 | % | | | 100.00 | % | | | 0.00 | % | | | 43.62 | % | | | 0.00 | % | | | 0.00 | % |
Global X FTSE Nordic Region ETF | | | 0.13 | % | | | 99.87 | % | | | 100.00 | % | | | 0.00 | % | | | 99.20 | % | | | 0.01 | % | | | 100.00 | % |
Global X FTSE Norway 30 ETF | | | 0.00 | % | | | 100.00 | % | | | 100.00 | % | | | 0.00 | % | | | 100.00 | % | | | 0.00 | % | | | 0.00 | % |
(1) Qualifying dividends represent dividends which qualify for the corporate dividends received deduction and is reflected as a percentage of ordinary income distributions (the total of short term capital gain and net investment income distributions).
(2) The percentage in this column represents the amount of “Qualifying Dividend Income” as created by the Jobs and Growth Relief Reconciliation Act of 2003 and is reflected as a percentage of ordinary income distributions (the total of short term capital gain and net investment income distributions). It is the intention of each of the aforementioned funds to designate the maximum amount permitted by law.
(3) The percentage in this column represents the amount of “Interest Related Dividends” as created by the American Jobs Creation Act of 2004 and is reflected as a percentage of net investment income distributions that is exempt from U.S. withholding tax when paid for foreign investors.
(4) The percentage in this column represents the amount of “Short-Term Capital Gain Dividends” as created by the American Jobs Creation Act of 2004 and is reflected as a percentage of short-term capital gain distributions that is exempt from U.S. withholding tax when paid to foreign investors.
126
NOTICETO SHAREHOLDERS (concluded)
The Fund intends to pass through a foreign tax credit to shareholders. For the fiscal year ended October 31, 2011, the total amount of foreign source income and foreign tax credit are as follows:
| | | | | | | | |
Global X Funds | | Foreign Source
Income | | | Foreign Tax
Credit Pass
through | |
Global X China Consumer ETF | | $ | 2,932,932 | | | $ | 79,553 | |
Global X China Energy ETF | | | 189,726 | | | | 16,122 | |
Global X China Financials ETF | | | 158,297 | | | | 11,879 | |
Global X China Industrials ETF | | | 129,440 | | | | 8,222 | |
Global X China Materials ETF | | | 103,822 | | | | 7,015 | |
Global X NASDAQ China Technology ETF | | | 170,079 | | | | 4,068 | |
Global X FTSE ASEAN 40 ETF | | | 323,019 | | | | 10,567 | |
Global X FTSE Andean 40 ETF | | | 125,084 | | | | 17,730 | |
Global X FTSE Colombia 20 ETF | | | 3,552,535 | | | | 36,114 | |
Global X FTSE Argentina 20 ETF | | | 93,210 | | | | 1,871 | |
Global X Brazil Mid Cap ETF | | | - | | | | - | |
Global X Brazil Consumer ETF | | | - | | | | - | |
Global X Brazil Financials ETF | | | - | | | | - | |
Global X Mexico Small-Cap ETF | | | - | | | | - | |
Global X Russell Emerging Markets Growth ETF | | | 61,226 | | | | 4,540 | |
Global X Russell Emerging Markets Value ETF | | | 49,878 | | | | 5,092 | |
Global X FTSE Nordic Region ETF | | | 1,081,825 | | | | 193,224 | |
Global X FTSE Norway 30 ETF | | | 1,844,746 | | | | 391,291 | |
The information reported herein may differ from the information and distributions taxable to the shareholders for the calendar year ending December 31, 2011. Complete information will be computed and reported in conjunction with your 2011 Form 1099-DIV.
127

399 Park Ave, 32nd floor
New York, NY 10022
1-888-GXFund-1
(1-888-493-8631)
www.globalxfunds.com
Investment Adviser:
Global X Management Company LLC
399 Park Ave, 32nd floor
New York, NY 10022
Distributor:
SEI Investments Distribution Co.
One Freedom Valley Drive
Oaks, PA 19456
Sub-Administrator:
SEI Investments Global Funds Services
One Freedom Valley Drive
Oaks, PA 19456
Counsel for the Independent Trustees:
Dechert LLP
1175 I Street N.W.
Washington, DC 20007
This information must be preceded or accompanied by a current prospectus for the Funds described.
GLX-AR-002-0100

Global X Waste Management ETF (ticker: WSTE)
Global X Food ETF (ticker: EATX)
Global X Fishing Industry ETF (ticker: FISN)
Global X Farming ETF (ticker: BARN)
Global X Auto ETF (ticker: VROM)
Global X Canada Preferred ETF (ticker: CNPF)
Global X SuperDividend ETF (ticker: SDIV)
Annual Report
October 31, 2011

TABLEOF CONTENTS
The Funds file their complete schedules of Fund holdings with the Securities and Exchange Commission (the “Commission”) for the first and third quarters of each fiscal year on Form N-Q within sixty days after the end of the period. The Funds’ Forms N-Q are available on the Commission’s website at http://www.sec.gov, and may be reviewed and copied at the Commission’s Public Reference Room in Washington, DC. Information on the operation of the Public Reference Room may be obtained by calling 1-800-SEC-0330.
A description of the policies and procedures that Global X Funds uses to determine how to vote proxies relating to Fund securities, as well as information relating to how the Funds voted proxies relating to Fund securities during the most recent 12-month period ended June 30, will be available (i) without charge, upon request, by calling 1-888-GXFund-1; and (ii) on the Commission’s website at http://www.sec.gov.
MANAGEMENT DISCUSSIONOF FUND PERFORMANCE
GLOBAL X WASTE MANAGEMENT ETF
Global X Waste Management ETF
The Global X Waste Management ETF (the “Fund”) seeks to provide investment results that correspond generally to the price and yield performance, before fees and expenses, of the Solactive Global Waste Management Index (the “Index”). The Fund generally seeks to replicate the Index but may at times invest in a representative sample of securities that collectively has an investment profile similar to the Index and as a result may or may not hold all the securities that are included in the Index.
The Solactive Global Waste Management Index is designed to reflect the performance of the waste management industry. It is comprised of selected companies globally that are actively engaged in the waste management, recovery and recycling industry.
For the period from the Fund’s commencement date on April 12, 2011 through October 31, 2011 (the “reporting period”), the Fund decreased 15.27% while the Index decreased 15.36%. The Fund commenced operations with a net asset value of $14.87 per share on April 12, 2011 and ended the period with a net asset value of $12.60 on October 31, 2011.
Six of the Fund’s twenty-seven holdings as of October 31, 2011 increased in value for the reporting period, led by Clean Harbors and Waste Connections, which returned 14.67% and 14.65% respectively. The worst performers were Seche Environment and Veolia Environment, which returned -49.99% and -52.94% respectively.
Growth of a $10,000 Investment
| | | | | | |
| | AVERAGE ANNUAL TOTAL RETURN FOR | | |
| | THE PERIOD ENDED OCTOBER 31, 2011* | | |
| | Cumulative Inception to Date | | |
| | Net Asset Value | | Market Price | | |
| Global X Waste Management ETF | | (15.27%) | | (16.48%) | | |
| Solactive Global Waste Management Index | | (15.36%) | | (15.36%) | | |
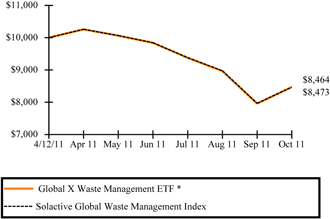
*Fund commenced operations on April 12, 2011.
The performance data quoted herein represents past performance and the return and value of an investment in the Fund will fluctuate so that, when redeemed, may be worth less than its original cost. Past performance is no guarantee of future performance and should not be considered as a representation of the future results of the Fund. The Fund’s performance assumes the reinvestment of all dividends and all capital gains. Index returns assume reinvestment of dividends and, unlike a Fund’s returns, do not reflect any fees or expenses. If such fees and expenses were included in the index returns, the performance would have been lower. Please note that one cannot invest directly in an unmanaged index.
There are no assurances that the Fund will meet its stated objectives.
The Fund’s holdings and allocations are subject to change and should not be considered recommendations to buy individual securities.
Returns shown do not reflect the deduction of taxes that a shareholder would pay on Fund distributions or the redemption of Fund shares.
See definition of comparative index above.
1
MANAGEMENT DISCUSSIONOF FUND PERFORMANCE
GLOBAL X FOOD ETF
Global X Food ETF
The Global X Food ETF (the “Fund”) seeks to provide investment results that correspond generally to the price and yield performance, before fees and expenses, of the Solactive Global Food Index (the “Index”). The Fund generally seeks to replicate the Index but may at times invest in a representative sample of securities that collectively has an investment profile similar to the Index and as a result may or may not hold all the securities that are included in the Index.
The Solactive Global Food Index is designed to reflect the performance of the food industry. It is comprised of selected companies globally that are primarily engaged in the agriproduct or livestock operations or in the manufacture, sale, or distribution of food products, agriproducts, and products related to the development of new food technologies.
For the period from the Fund’s commencement date on May 2, 2011 through October 31, 2011 (the “reporting period”), the Fund decreased 2.11% while the Index decreased 1.99%. The Fund commenced operations with a net asset value of $15.17 per share on May 2, 2011 and ended the period with a net asset value of $14.85 on October 31, 2011.
Twenty-five of the Fund’s forty-nine holdings as of October 31, 2011 increased in value for the reporting period, led by CJ CheilJedang and Tingyi Holding, which returned 19.38% and 9.78% respectively. The worst performers were China Yurun Food Group and Marfrig Alimentos, which returned -50.43% and -53.88% respectively.
Growth of a $10,000 Investment
| | | | | | |
| | AVERAGE ANNUAL TOTAL RETURN FOR | | |
| | THE PERIOD ENDED OCTOBER 31, 2011* | | |
| | Cumulative Inception to Date | | |
| | Net Asset Value | | Market Price | | |
| Global X Food ETF | | (2.11%) | | (1.91%) | | |
| Solactive Global Food Index | | (1.99%) | | (1.99%) | | |
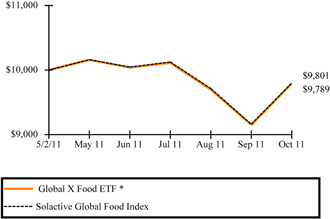
*Fund commenced operations on May 2, 2011.
The performance data quoted herein represents past performance and the return and value of an investment in the Fund will fluctuate so that, when redeemed, may be worth less than its original cost. Past performance is no guarantee of future performance and should not be considered as a representation of the future results of the Fund. The Fund’s performance assumes the reinvestment of all dividends and all capital gains. Index returns assume reinvestment of dividends and, unlike a Fund’s returns, do not reflect any fees or expenses. If such fees and expenses were included in the index returns, the performance would have been lower. Please note that one cannot invest directly in an unmanaged index.
There are no assurances that the Fund will meet its stated objectives.
The Fund’s holdings and allocations are subject to change and should not be considered recommendations to buy individual securities.
Returns shown do not reflect the deduction of taxes that a shareholder would pay on Fund distributions or the redemption of Fund shares.
See definition of comparative index above.
2
MANAGEMENT DISCUSSIONOF FUND PERFORMANCE
GLOBAL X FISHING INDUSTRY ETF
Global X Fishing Industry ETF
The Global X Fishing Industry ETF (the “Fund”) seeks to provide investment results that correspond generally to the price and yield performance, before fees and expenses, of the Solactive Global Fishing Index (the “Index”). The Fund generally seeks to replicate the Index but may at times invest in a representative sample of securities that collectively has an investment profile similar to the Index and as a result may or may not hold all the securities that are included in the Index.
The Solactive Global Fishing Index is designed to reflect the performance of the fishing industry. It is comprised of selected companies globally that are engaged in commercial fishing, fish farming, fish processing or the marketing and sale of fish and fish products. The Fund is the nation’s first ETF focused exclusively on the fishing industry.
For the period from the Fund’s commencement date on May 3, 2011 through October 31, 2011 (the “reporting period”), the Fund decreased 25.47% while the Index decreased 25.76%. The Fund commenced operations with a net asset value of $14.92 per share on May 3, 2011 and ended the period with a net asset value of $11.12 on October 31, 2011.
Four of the Fund’s twenty holdings as of October 31, 2011 increased in value for the reporting period, led by Maruha Nichiro Holdings and Nippon Suisan Kaisha, which returned 22.87% and 22.83% respectively. The worst performers were China Marine Food Group and Marine Harvest, which returned -54.83% and -61.47% respectively.
Growth of a $10,000 Investment
| | | | | | |
| | AVERAGE ANNUAL TOTAL RETURN FOR | | |
| | THE PERIOD ENDED OCTOBER 31, 2011* | | |
| | Cumulative Inception to Date | | |
| | Net Asset Value | | Market Price | | |
| Global X Fishing Industry ETF | | (25.47%) | | (26.14%) | | |
| Solactive Global Fishing Index | | (25.76%) | | (25.76%) | | |
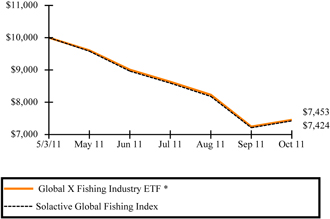
*Fund commenced operations on May 3, 2011.
The performance data quoted herein represents past performance and the return and value of an investment in the Fund will fluctuate so that, when redeemed, may be worth less than its original cost. Past performance is no guarantee of future performance and should not be considered as a representation of the future results of the Fund. The Fund’s performance assumes the reinvestment of all dividends and all capital gains. Index returns assume reinvestment of dividends and, unlike a Fund’s returns, do not reflect any fees or expenses. If such fees and expenses were included in the index returns, the performance would have been lower. Please note that one cannot invest directly in an unmanaged index.
There are no assurances that the Fund will meet its stated objectives.
The Fund’s holdings and allocations are subject to change and should not be considered recommendations to buy individual securities.
Returns shown do not reflect the deduction of taxes that a shareholder would pay on Fund distributions or the redemption of Fund shares.
See definition of comparative index above.
3
MANAGEMENT DISCUSSIONOF FUND PERFORMANCE
GLOBAL X FARMING ETF
Global X Farming ETF
The Global X Farming ETF (the “Fund”) seeks to provide investment results that correspond generally to the price and yield performance, before fees and expenses, of the Solactive Global Farming Index (the “Index”). The Fund generally seeks to replicate the Index but may at times invest in a representative sample of securities that collectively has an investment profile similar to the Index and as a result may or may not hold all the securities that are included in the Index.
The Solactive Global Farming Index is designed to reflect the performance of the farming industry. It is comprised of common stocks, ADRs, and GDRs of selected companies globally that are primarily engaged in agriproduct or livestock operations or in the manufacture, sale, or distribution of farming products.
For the period from the Fund’s commencement date on June 1, 2011 through October 31, 2011 (the “reporting period”), the Fund decreased 10.01% while the Index decreased 12.49%. The Fund commenced operations with a net asset value of $14.89 per share on June 1, 2011 and ended the period with a net asset value of $13.40 on October 31, 2011.
Five of the Fund’s fifty holdings as of October 31, 2011 increased in value for the reporting period, led by Cosan S.A. Industria e Comercio and Tate & Lyle, which returned 5.99% and 5.95% respectively. The worst performers were Asian Bamboo and Chaoda Modern Agriculture., which returned -64.66% and 65.40% respectively.
Growth of a $10,000 Investment
| | | | | | |
| | AVERAGE ANNUAL TOTAL RETURN FOR | | |
| | THE PERIOD ENDED OCTOBER 31, 2011* | | |
| | Cumulative Inception to Date | | |
| | Net Asset Value | | Market Price | | |
| Global X Farming ETF | | (10.01%) | | (10.88%) | | |
| Solactive Global Farming Index | | (12.49%) | | (12.49%) | | |
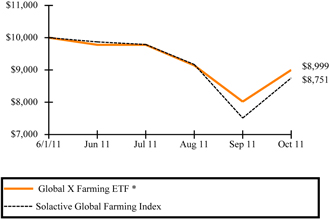
*Fund commenced operations on June 1, 2011.
The performance data quoted herein represents past performance and the return and value of an investment in the Fund will fluctuate so that, when redeemed, may be worth less than its original cost. Past performance is no guarantee of future performance and should not be considered as a representation of the future results of the Fund. The Fund’s performance assumes the reinvestment of all dividends and all capital gains. Index returns assume reinvestment of dividends and, unlike a Fund’s returns, do not reflect any fees or expenses. If such fees and expenses were included in the index returns, the performance would have been lower. Please note that one cannot invest directly in an unmanaged index.
There are no assurances that the Fund will meet its stated objectives.
The Fund’s holdings and allocations are subject to change and should not be considered recommendations to buy individual securities.
Returns shown do not reflect the deduction of taxes that a shareholder would pay on Fund distributions or the redemption of Fund shares.
See definition of comparative index above.
4
MANAGEMENT DISCUSSIONOF FUND PERFORMANCE
GLOBAL X AUTO ETF
Global X Auto ETF
The Global X Auto ETF (the “Fund”) seeks to provide investment results that correspond generally to the price and yield performance, before fees and expenses, of the S-Network Global Automotive Index (the “Index”). The Fund generally seeks to replicate the Index but may at times invest in a representative sample of securities that collectively has an investment profile similar to the Index and as a result may or may not hold all the securities that are included in the Index.
The S-Network Global Automotive Index is a modified capitalization weighted, float adjusted index comprising publicly traded companies engaged in the production of automobiles, automobile parts, tires, and related activities. It strives to include the fifty largest and most actively traded companies worldwide that are principally engaged (derive greater than 50% of revenues from sources listed above) in the automobile industry.
For the period from the Fund’s commencement date on May 18, 2011 through October 31, 2011 (the “reporting period”), the Fund decreased 14.93% while the Index decreased 14.74%. The Fund commenced operations with a net asset value of $15.20 per share on May 18, 2011 and ended the period with a net asset value of $12.93 on October 31, 2011.
Ten of the Fund’s fifty holdings as of October 31, 2011 increased in value for the reporting period, led by Astra International and Daihatsu Motor, which returned 16.32% and 16.18% respectively. The worst performers were Fiat SpA and Peugeot, which returned -36.46% and -45.49% respectively.
Growth of a $10,000 Investment
| | | | | | |
| | AVERAGE ANNUAL TOTAL RETURN FOR | | |
| | THE PERIOD ENDED OCTOBER 31, 2011* | | |
| | Cumulative Inception to Date | | |
| | Net Asset Value | | Market Price | | |
| Global X Auto ETF | | (14.93%) | | (15.72%) | | |
| S-Network Global Automotive Index | | (14.74%) | | (14.74%) | | |
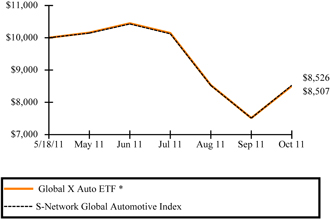
*Fund commenced operations on May 18, 2011.
The performance data quoted herein represents past performance and the return and value of an investment in the Fund will fluctuate so that, when redeemed, may be worth less than its original cost. Past performance is no guarantee of future performance and should not be considered as a representation of the future results of the Fund. The Fund’s performance assumes the reinvestment of all dividends and all capital gains. Index returns assume reinvestment of dividends and, unlike a Fund’s returns, do not reflect any fees or expenses. If such fees and expenses were included in the index returns, the performance would have been lower. Please note that one cannot invest directly in an unmanaged index.
There are no assurances that the Fund will meet its stated objectives.
The Fund’s holdings and allocations are subject to change and should not be considered recommendations to buy individual securities.
Returns shown do not reflect the deduction of taxes that a shareholder would pay on Fund distributions or the redemption of Fund shares.
See definition of comparative index above.
5
MANAGEMENT DISCUSSIONOF FUND PERFORMANCE
GLOBAL X CANADA PREFERRED ETF
Global X Canada Preferred ETF
The Global X Canada Preferred ETF (the “Fund”) seeks to provide investment results that correspond generally to the price and yield performance, before fees and expenses, of the Solactive Canada Preferred Stock Index (the “Index”). The Fund generally seeks to replicate the Index but may at times invest in a representative sample of securities that collectively has an investment profile similar to the Index and as a result may or may not hold all the securities that are included in the Index.
The Solactive Canada Preferred Stock Index tracks the performance of a select group of preferred stocks from Canadian issues that trade on the Toronto Stock Exchange. It is comprised of preferred shares that meet certain criteria relating to size, liquidity, issuer rating, maturity, and other requirements as determined by Structured Solutions AG. Only securities which are tradable for foreign investors without restrictions are eligible. The Fund is the nation’s first ETF focused exclusively on preferred stock of Canadian companies.
For the period from the Fund’s commencement date on May 24, 2011 through October 31, 2011 (the “reporting period”), the Fund decreased 1.94%, while the Index decreased 2.17%. The Fund commenced operations with a net asset value of $14.97 per share on May 24, 2011 and ended the period with a net asset value of $14.48 on October 31, 2011.
Thirty-one of the Fund’s twenty-four holdings as of October 31, 2011 increased in value for the reporting period, led by Weston George and Power Corp Canada, which returned 8.18% and 4.67% respectively. The worst performers were BCE and Yellow Media, which returned -10.51% and -79.70% respectively.
Growth of a $10,000 Investment
| | | | | | |
| | AVERAGE ANNUAL TOTAL RETURN FOR | | |
| | THE PERIOD ENDED OCTOBER 31, 2011* | | |
| | Cumulative Inception to Date | | |
| | Net Asset Value | | Market Price | | |
| Global X Canada Preferred ETF | | (1.94%) | | (3.61%) | | |
| Solactive Canada Preferred Stock Index | | (2.17%) | | (2.17%) | | |
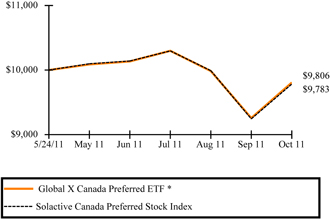
*Fund commenced operations on May 24, 2011.
The performance data quoted herein represents past performance and the return and value of an investment in the Fund will fluctuate so that, when redeemed, may be worth less than its original cost. Past performance is no guarantee of future performance and should not be considered as a representation of the future results of the Fund. The Fund’s performance assumes the reinvestment of all dividends and all capital gains. Index returns assume reinvestment of dividends and, unlike a Fund’s returns, do not reflect any fees or expenses. If such fees and expenses were included in the index returns, the performance would have been lower. Please note that one cannot invest directly in an unmanaged index.
There are no assurances that the Fund will meet its stated objectives.
The Fund’s holdings and allocations are subject to change and should not be considered recommendations to buy individual securities.
Returns shown do not reflect the deduction of taxes that a shareholder would pay on Fund distributions or the redemption of Fund shares.
See definition of comparative index above.
6
MANAGEMENT DISCUSSIONOF FUND PERFORMANCE
GLOBAL X SUPERDIVIDEND ETF
Global X SuperDividend ETF
The Global X SuperDividend ETF (the “Fund”) seeks to provide investment results that correspond generally to the price and yield performance, before fees and expenses, of the Solactive Global SuperDividend Index (the “Index”). The Fund generally seeks to replicate the Index but may at times invest in a representative sample of securities that collectively has an investment profile similar to the Index and as a result may or may not hold all the securities that are included in the Index.
The Solactive Global SuperDividend™ Index tracks the performance of 100 equally weighted companies that rank among the highest dividend yielding equity securities in the world. The index provider applies certain dividend stability filters.
For the period from the Fund’s commencement date on June 8, 2011 through October 31, 2011 (the “reporting period”), the Fund decreased 9.56% while the Index decreased 10.30%. The Fund commenced operations with a net asset value of $24.70 per share on June 8, 2011 and ended the period with a net asset value of $21.76 on October 31, 2011.
Thirty of the Fund’s one hundred holdings as of October 31, 2011 increased in value for the reporting period, led by Fleetwood and Foster’s Group, which returned 22.01% and 19.07% respectively. The worst performers were Thomas Cook Group and Yellow Media, which returned -61.13% and -89.35% respectively.
Growth of a $10,000 Investment
| | | | | | |
| | AVERAGE ANNUAL TOTAL RETURN FOR | | |
| | THE PERIOD ENDED OCTOBER 31, 2011* | | |
| | Cumulative Inception to Date | | |
| | Net Asset Value | | Market Price | | |
| Global X SuperDividend ETF | | (9.56%) | | (12.31%) | | |
| Solactive Global SuperDividend Index | | (10.30%) | | (10.30%) | | |
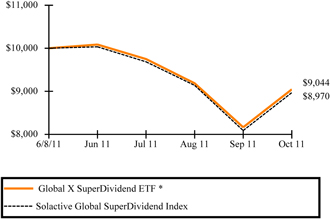
*Fund commenced operations on June 8, 2011.
The performance data quoted herein represents past performance and the return and value of an investment in the Fund will fluctuate so that, when redeemed, may be worth less than its original cost. Past performance is no guarantee of future performance and should not be considered as a representation of the future results of the Fund. The Fund’s performance assumes the reinvestment of all dividends and all capital gains. Index returns assume reinvestment of dividends and, unlike a Fund’s returns, do not reflect any fees or expenses. If such fees and expenses were included in the index returns, the performance would have been lower. Please note that one cannot invest directly in an unmanaged index.
There are no assurances that the Fund will meet its stated objectives.
The Fund’s holdings and allocations are subject to change and should not be considered recommendations to buy individual securities.
Returns shown do not reflect the deduction of taxes that a shareholder would pay on Fund distributions or the redemption of Fund shares.
See definition of comparative index above.
7

| | |
| Schedule of Investments | | October 31, 2011 |
Global X Waste Management ETF
Sector Weightings (unaudited)†:
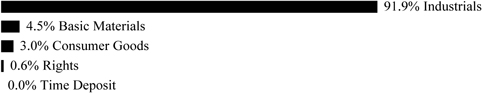
† Percentages based on total investments.
| | | | | | | | |
| | | Shares | | | Value | |
COMMON STOCK — 99.1% | | | | | | | | |
AUSTRALIA— 4.6% | | | | | | | | |
Industrials — 4.6% | | | | | | | | |
Tox Free Solutions | | | 15,334 | | | $ | 35,065 | |
Transpacific Industries Group * | | | 65,605 | | | | 51,505 | |
| | | | | | | | |
TOTAL AUSTRALIA | | | | | | | 86,570 | |
| | | | | | | | |
CANADA— 5.6% | | | | | | | | |
Industrials — 5.6% | | | | | | | | |
Newalta | | | 3,697 | | | | 43,806 | |
Progressive Waste Solutions | | | 2,925 | | | | 61,628 | |
| | | | | | | | |
TOTAL CANADA | | | | | | | 105,434 | |
| | | | | | | | |
CHINA— 2.1% | | | | | | | | |
Industrials — 2.1% | | | | | | | | |
Chiho-Tiande Group | | | 71,554 | | | | 39,791 | |
| | | | | | | | |
FRANCE— 10.6% | | | | | | | | |
Industrials — 10.6% | | | | | | | | |
Seche Environnement | | | 725 | | | | 32,891 | |
Veolia Environnement | | | 11,818 | | | | 168,060 | |
| | | | | | | | |
TOTAL FRANCE | | | | | | | 200,951 | |
| | | | | | | | |
GERMANY— 2.2% | | | | | | | | |
Industrials — 2.2% | | | | | | | | |
Interseroh | | | 596 | | | | 41,903 | |
| | | | | | | | |
HONG KONG— 8.1% | | | | | | | | |
Industrials — 8.1% | | | | | | | | |
China Everbright International | | | 151,100 | | | | 44,541 | |
China Metal Recycling Holdings | | | 45,761 | | | | 49,952 | |
China Water Affairs Group | | | 102,300 | | | | 29,630 | |
Fook Woo Group Holdings * | | | 152,700 | | | | 29,288 | |
| | | | | | | | |
TOTAL HONG KONG | | | | | | | 153,411 | |
| | | | | | | | |
JAPAN— 2.0% | | | | | | | | |
Basic Materials — 2.0% | | | | | | | | |
Asahi Holdings | | | 1,877 | | | | 37,473 | |
| | | | | | | | |
The accompanying notes are an integral part of the financial statements.
8
| | |
| Schedule of Investments | | October 31, 2011 |
Global X Waste Management ETF
| | | | | | | | |
| | | Shares/Number
of Rights/Face
Amount | | | Value | |
COMMON STOCK — continued | | | | | | | | |
NORWAY— 3.1% | | | | | | | | |
Industrials — 3.1% | | | | | | | | |
Tomra Systems | | | 7,800 | | | $ | 57,635 | |
| | | | | | | | |
UNITED KINGDOM— 2.1% | | | | | | | | |
Industrials — 2.1% | | | | | | | | |
Shanks Group | | | 22,200 | | | | 39,380 | |
| | | | | | | | |
UNITED STATES— 58.7% | | | | | | | | |
Basic Materials — 2.4% | | | | | | | | |
Calgon Carbon * | | | 2,946 | | | | 46,989 | |
| | | | | | | | |
Consumer Goods — 3.0% | | | | | | | | |
Darling International * | | | 3,990 | | | | 55,940 | |
| | | | | | | | |
Industrials — 53.3% | | | | | | | | |
Casella Waste Systems, Cl A * | | | 5,143 | | | | 32,298 | |
Clean Harbors * | | | 1,854 | | | | 108,033 | |
EnergySolutions * | | | 11,153 | | | | 42,047 | |
Metalico * | | | 6,574 | | | | 29,714 | |
Republic Services, Cl A | | | 6,314 | | | | 179,696 | |
Sims Metal Management | | | 7,237 | | | | 105,701 | |
Stericycle * | | | 2,235 | | | | 186,801 | |
US Ecology | | | 2,370 | | | | 42,802 | |
Waste Connections | | | 2,552 | | | | 86,896 | |
Waste Management | | | 5,842 | | | | 192,377 | |
| | | | | | | | |
| | | | | | | 1,006,365 | |
| | | | | | | | |
TOTAL UNITED STATES | | | | | | | 1,109,294 | |
| | | | | | | | |
TOTAL COMMON STOCK
(Cost $2,225,230) | | | | | | | 1,871,842 | |
| | | | | | | | |
RIGHTS — 0.6% | | | | | | | | |
Transpacific Industries Group *, expires 11/18/11 (Cost $—) | | | 42,175 | | | | 10,888 | |
| | | | | | | | |
| | |
TIME DEPOSIT — 0.0% | | | | | | | | |
Brown Brothers Harriman, 0.030% (Cost $639) | | $ | 639 | | | | 639 | |
| | | | | | | | |
TOTAL INVESTMENTS — 99.7%
(Cost $2,225,869) | | | | | | $ | 1,883,369 | |
| | | | | | | | |
The accompanying notes are an integral part of the financial statements.
9
| | |
| Schedule of Investments | | October 31, 2011 |
Global X Waste Management ETF
Percentages are based on Net Assets of $1,889,590.
| * | Non-income producing security. |
Cl — Class
Amounts designated as “—” are $0 or are rounded to $0.
The following is a summary of the inputs used as of October 31, 2011, in valuing the Fund’s investments carried at value:
| | | $1,871,842 | | | | $1,871,842 | | | | $1,871,842 | | | | $1,871,842 | |
| Investments in Securities | | Level 1 | | | Level 2 | | | Level 3 | | | Total | |
Common Stock | | $ | 1,871,842 | | | $ | — | | | $ | — | | | $ | 1,871,842 | |
Rights | | | 10,888 | | | | — | | | | — | | | | 10,888 | |
Time Deposit | | | — | | | | 639 | | | | — | | | | 639 | |
| | | | | | | | | | | | | | | | |
Total Investments in Securities | | $ | 1,882,730 | | | $ | 639 | | | $ | — | | | $ | 1,883,369 | |
| | | | | | | | | | | | | | | | |
For the period ended October 31, 2011, there have been no significant transfers between Level 1 and Level 2 investments.
For the period ended October 31, 2011, there were no Level 3 investments.
The accompanying notes are an integral part of the financial statements.
10
| | |
| Schedule of Investments | | October 31, 2011 |
Global X Food ETF
Sector Weightings (unaudited)†:

† Percentages based on total investments.
| | | | | | | | |
| | | Shares | | | Value | |
COMMON STOCK — 97.8% | | | | | | | | |
BRAZIL— 6.0% | | | | | | | | |
Consumer Goods — 6.0% | | | | | | | | |
BRF - Brasil Foods ADR | | | 8,313 | | | $ | 174,989 | |
JBS * | | | 8,585 | | | | 25,808 | |
M Dias Branco | | | 550 | | | | 14,255 | |
Marfrig Alimentos | | | 1,550 | | | | 6,691 | |
| | | | | | | | |
TOTAL BRAZIL | | | | | | | 221,743 | |
| | | | | | | | |
CANADA�� 5.1% | | | | | | | | |
Consumer Goods — 5.1% | | | | | | | | |
George Weston | | | 1,686 | | | | 116,871 | |
Saputo | | | 1,719 | | | | 71,023 | |
| | | | | | | | |
TOTAL CANADA | | | | | | | 187,894 | |
| | | | | | | | |
CHINA— 4.6% | | | | | | | | |
Consumer Goods — 4.6% | | | | | | | | |
China Yurun Food Group | | | 17,500 | | | | 31,132 | |
Tingyi Cayman Islands Holding | | | 25,045 | | | | 71,893 | |
Want Want China Holdings | | | 71,000 | | | | 66,536 | |
| | | | | | | | |
TOTAL CHINA | | | | | | | 169,561 | |
| | | | | | | | |
DENMARK— 1.1% | | | | | | | | |
Consumer Goods — 1.1% | | | | | | | | |
Christian Hansen Holding | | | 1,856 | | | | 40,574 | |
| | | | | | | | |
FRANCE— 4.7% | | | | | | | | |
Consumer Goods — 4.7% | | | | | | | | |
Danone | | | 2,484 | | | | 172,925 | |
| | | | | | | | |
INDONESIA— 1.1% | | | | | | | | |
Consumer Goods — 1.1% | | | | | | | | |
Indofood CBP Sukses Makmur TBK | | | 15,200 | | | | 9,103 | |
Indofood Sukses Makmur | | | 56,800 | | | | 33,695 | |
| | | | | | | | |
TOTAL INDONESIA | | | | | | | 42,798 | |
| | | | | | | | |
JAPAN— 7.1% | | | | | | | | |
Consumer Goods — 7.1% | | | | | | | | |
Ajinomoto | | | 8,750 | | | | 98,877 | |
MEIJI Holdings | | | 900 | | | | 39,909 | |
The accompanying notes are an integral part of the financial statements.
11
| | |
| Schedule of Investments | | October 31, 2011 |
Global X Food ETF
| | | | | | | | |
| | | Shares | | | Value | |
COMMON STOCK — continued | | | | | | | | |
| | |
Consumer Goods — continued | | | | | | | | |
Nippon Meat Packers | | | 2,750 | | | $ | 34,806 | |
Nisshin Seifun Group | | | 2,550 | | | | 31,753 | |
Nissin Foods Holdings | | | 850 | | | | 32,797 | |
Yamazaki Baking | | | 1,800 | | | | 24,003 | |
| | | | | | | | |
TOTAL JAPAN | | | | | | | 262,145 | |
| | | | | | | | |
| | |
MEXICO— 3.5% | | | | | | | | |
Consumer Goods — 3.5% | | | | | | | | |
Grupo Bimbo, Ser A | | | 63,195 | | | | 130,233 | |
| | | | | | | | |
NETHERLANDS— 0.7% | | | | | | | | |
Consumer Goods — 0.7% | | | | | | | | |
Nutreco | | | 411 | | | | 27,417 | |
| | | | | | | | |
NORWAY— 2.1% | | | | | | | | |
Consumer Goods — 2.1% | | | | | | | | |
Orkla | | | 8,750 | | | | 76,296 | |
| | | | | | | | |
SOUTH AFRICA— 1.4% | | | | | | | | |
Consumer Goods — 1.4% | | | | | | | | |
Tiger Brands | | | 1,850 | | | | 53,650 | |
| | | | | | | | |
SOUTH KOREA— 0.6% | | | | | | | | |
Consumer Goods — 0.6% | | | | | | | | |
CJ CheilJedang | | | 85 | | | | 23,546 | |
| | | | | | | | |
SPAIN— 0.5% | | | | | | | | |
Consumer Goods — 0.5% | | | | | | | | |
Ebro Foods | | | 900 | | | | 18,286 | |
| | | | | | | | |
SWITZERLAND— 6.5% | | | | | | | | |
Consumer Goods — 6.5% | | | | | | | | |
Aryzta | | | 1,000 | | | | 48,393 | |
Barry Callebaut | | | 20 | | | | 19,026 | |
Nestle | | | 3,010 | | | | 174,657 | |
| | | | | | | | |
TOTAL SWITZERLAND | | | | | | | 242,076 | |
| | | | | | | | |
TAIWAN— 1.7% | | | | | | | | |
Consumer Goods — 1.7% | | | | | | | | |
Uni-President Enterprises | | | 46,112 | | | | 64,451 | |
| | | | | | | | |
THAILAND— 1.2% | | | | | | | | |
Consumer Goods — 1.2% | | | | | | | | |
Charoen Pokphand Foods | | | 44,100 | | | | 43,425 | |
| | | | | | | | |
The accompanying notes are an integral part of the financial statements.
12
| | |
| Schedule of Investments | | October 31, 2011 |
Global X Food ETF
| | | | | | | | |
| | | Shares | | | Value | |
COMMON STOCK — continued | | | | | | | | |
| | |
UNITED KINGDOM— 5.6% | | | | | | | | |
Consumer Goods — 5.6% | | | | | | | | |
Associated British Foods | | | 4,512 | | | $ | 80,254 | |
Kerry Group, Cl A | | | 1,736 | | | | 64,391 | |
Tate & Lyle | | | 6,195 | | | | 65,007 | |
| | | | | | | | |
TOTAL UNITED KINGDOM | | | | | | | 209,652 | |
| | | | | | | | |
| | |
UNITED STATES— 44.3% | | | | | | | | |
Consumer Goods — 44.3% | | | | | | | | |
Campbell Soup | | | 2,247 | | | | 74,713 | |
ConAgra Foods | | | 5,550 | | | | 140,582 | |
Corn Products International | | | 974 | | | | 47,239 | |
Flowers Foods | | | 1,598 | | | | 32,264 | |
General Mills | | | 4,550 | | | | 175,311 | |
Hershey | | | 2,235 | | | | 127,909 | |
HJ Heinz | | | 3,301 | | | | 176,405 | |
Hormel Foods | | | 1,770 | | | | 52,162 | |
JM Smucker | | | 1,453 | | | | 111,910 | |
Kellogg | | | 2,635 | | | | 142,843 | |
Kraft Foods, Cl A | | | 5,030 | | | | 176,955 | |
McCormick | | | 1,544 | | | | 74,977 | |
Ralcorp Holdings * | | | 695 | | | | 56,184 | |
Sara Lee | | | 7,660 | | | | 136,348 | |
Smithfield Foods * | | | 1,859 | | | | 42,497 | |
Tyson Foods, Cl A | | | 3,856 | | | | 74,421 | |
| | | | | | | | |
TOTAL UNITED STATES | | | | | | | 1,642,720 | |
| | | | | | | | |
TOTAL COMMON STOCK
(Cost $3,643,457) | | | | | | | 3,629,392 | |
| | | | | | | | |
TOTAL INVESTMENTS — 97.8%
(Cost $3,643,457) | | | | | | $ | 3,629,392 | |
| | | | | | | | |
Percentages are based on Net Assets of $3,711,382.
* Non-income producing security.
ADR — American Depositary Receipt
Cl — Class
Ser — Series
The accompanying notes are an integral part of the financial statements.
13
| | |
| Schedule of Investments | | October 31, 2011 |
Global X Food ETF
The following is a summary of the inputs used as of October 31, 2011, in valuing the Fund’s investments carried at value:
| | | $3,629,392zz | | | | $3,629,392zz | | | | $3,629,392zz | | | | $3,629,392zz | |
| Investments in Securities | | Level 1 | | | Level 2 | | | Level 3 | | | Total | |
Common Stock | | $ | 3,629,392 | | | $ | — | | | $ | — | | | $ | 3,629,392 | |
| | | | | | | | | | | | | | | | |
Total Investments in Securities | | $ | 3,629,392 | | | $ | — | | | $ | — | | | $ | 3,629,392 | |
| | | | | | | | | | | | | | | | |
For the period ended October 31, 2011, there have been no significant transfers between Level 1 and Level 2 investments.
For the period ended October 31, 2011, there were no Level 3 investments.
The accompanying notes are an integral part of the financial statements.
14
| | |
| Schedule of Investments | | October 31, 2011 |
Global X Fishing Industry ETF
Sector Weightings (unaudited)†:

† Percentages based on total investments.
| | | | | | | | |
| | | Shares | | | Value | |
COMMON STOCK — 101.2% | | | | | | | | |
CHILE— 11.1% | | | | | | | | |
Consumer Goods — 11.1% | | | | | | | | |
Cia Pesquera Camanchaca * | | | 1,064,500 | | | $ | 119,546 | |
Multiexport Foods | | | 211,200 | | | | 65,764 | |
| | | | | | | | |
TOTAL CHILE | | | | | | | 185,310 | |
| | | | | | | | |
CHINA— 0.7% | | | | | | | | |
Consumer Goods — 0.7% | | | | | | | | |
China Marine Food Group * | | | 7,137 | | | | 11,348 | |
| | | | | | | | |
HONG KONG— 4.8% | | | | | | | | |
Consumer Goods — 4.8% | | | | | | | | |
China Ocean Resources | | | 14,123 | | | | 80,532 | |
| | | | | | | | |
JAPAN— 34.8% | | | | | | | | |
Consumer Goods — 34.8% | | | | | | | | |
Kyokuyo | | | 34,583 | | | | 78,336 | |
Maruha Nichiro Holdings | | | 90,118 | | | | 164,920 | |
Nippon Suisan Kaisha | | | 49,949 | | | | 170,673 | |
Toyo Suisan Kaisha | | | 6,522 | | | | 167,599 | |
| | | | | | | | |
TOTAL JAPAN | | | | | | | 581,528 | |
| | | | | | | | |
MALAYSIA— 4.9% | | | | | | | | |
Consumer Goods — 4.9% | | | | | | | | |
QL Resources | | | 87,398 | | | | 81,499 | |
| | | | | | | | |
NORWAY— 31.1% | | | | | | | | |
Consumer Goods — 31.1% | | | | | | | | |
Austevoll Seafood | | | 20,375 | | | | 80,955 | |
Cermaq | | | 6,532 | | | | 72,810 | |
Copeinca * | | | 10,900 | | | | 70,743 | |
Leroey Seafood Group | | | 5,285 | | | | 81,714 | |
Marine Harvest | | | 349,558 | | | | 156,485 | |
Morpol * | | | 27,800 | | | | 55,478 | |
| | | | | | | | |
TOTAL NORWAY | | | | | | | 518,185 | |
| | | | | | | | |
SOUTH KOREA— 9.0% | | | | | | | | |
Consumer Goods — 9.0% | | | | | | | | |
Dongwon Industries | | | 490 | | | | 73,157 | |
Sajo Industries | | | 900 | | | | 43,711 | |
The accompanying notes are an integral part of the financial statements.
15
| | |
| Schedule of Investments | | October 31, 2011 |
Global X Fishing Industry ETF
| | | | | | | | |
| | | Shares | | | Value | |
COMMON STOCK — continued | | | | | | | | |
Consumer Goods — continued | | | | | | | | |
Sajodaerim * | | | 300 | | | $ | 4,668 | |
Silla | | | 2,700 | | | | 28,534 | |
| | | | | | | | |
TOTAL SOUTH KOREA | | | | | | | 150,070 | |
| | | | | | | | |
SPAIN— 4.8% | | | | | | | | |
Consumer Goods — 4.8% | | | | | | | | |
Pescanova | | | 2,306 | | | | 79,565 | |
| | | | | | | | |
TOTAL COMMON STOCK
(Cost $2,183,908) | | | | | | | 1,688,037 | |
| | | | | | | | |
TOTAL INVESTMENTS — 101.2%
(Cost $2,183,908) | | | | | | $ | 1,688,037 | |
| | | | | | | | |
Percentages are based on Net Assets of $1,668,441.
* Non-income producing security.
The following is a summary of the inputs used as of October 31, 2011, in valuing the Fund’s investments carried at value:
| | | $1,688,037 A | | | | $1,688,037 A | | | | $1,688,037 A | | | | $1,688,037 A | |
| Investments in Securities | | Level 1 | | | Level 2 | | | Level 3 | | | Total | |
Common Stock | | $ | 1,688,037 | | | $ | — | | | $ | — | | | $ | 1,688,037 | |
| | | | | | | | | | | | | | | | |
Total Investments in Securities | | $ | 1,688,037 | | | $ | — | | | $ | — | | | $ | 1,688,037 | |
| | | | | | | | | | | | | | | | |
For the period ended October 31, 2011, there have been no significant transfers between Level 1 and Level 2 investments.
For the period ended October 31, 2011, there were no Level 3 investments.
The accompanying notes are an integral part of the financial statements.
16
| | |
| Schedule of Investments | | October 31, 2011 |
Global X Farming ETF
Sector Weightings (unaudited)†:
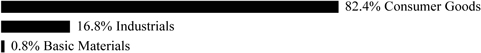
† Percentages based on total investments.
| | | | | | | | |
| | | Shares | | | Value | |
COMMON STOCK —99.8% | | | | | | | | |
| | |
AUSTRALIA— 2.3% | | | | | | | | |
| | |
Consumer Goods — 2.3% | | | | | | | | |
GrainCorp | | | 7,372 | | | $ | 61,450 | |
| | | | | | | | |
| | |
BELGIUM— 1.0% | | | | | | | | |
| | |
Consumer Goods — 1.0% | | | | | | | | |
Sipef | | | 327 | | | | 25,851 | |
| | | | | | | | |
| | |
BOSNIA AND HERZEGOVINA— 4.4% | | | | | | | | |
| | |
Consumer Goods — 4.4% | | | | | | | | |
Bunge | | | 1,929 | | | | 119,154 | |
| | | | | | | | |
| | |
BRAZIL— 3.6% | | | | | | | | |
| | |
Consumer Goods — 3.6% | | | | | | | | |
Cosan Industria e Comercio | | | 4,000 | | | | 62,383 | |
Sao Martinho | | | 1,000 | | | | 11,943 | |
SLC Agricola | | | 1,720 | | | | 17,085 | |
Tereos Internacional | | | 3,200 | | | | 4,586 | |
| | | | | | | | |
TOTAL BRAZIL | | | | | | | 95,997 | |
| | | | | | | | |
| | |
CANADA— 4.4% | | | | | | | | |
| | |
Consumer Goods — 4.4% | | | | | | | | |
Viterra, Common Subscription Receipt | | | 11,372 | | | | 117,063 | |
| | | | | | | | |
| | |
CHINA— 0.5% | | | | | | | | |
| | |
Consumer Goods — 0.5% | | | | | | | | |
China Modern Dairy Holdings * | | | 50,000 | | | | 12,100 | |
| | | | | | | | |
| | |
FRANCE— 0.4% | | | | | | | | |
| | |
Consumer Goods — 0.4% | | | | | | | | |
Vilmorin & Cie | | | 108 | | | | 11,889 | |
| | | | | | | | |
| | |
GERMANY— 0.8% | | | | | | | | |
| | |
Basic Materials — 0.2% | | | | | | | | |
Asian Bamboo | | | 320 | | | | 4,776 | |
| | | | | | | | |
Consumer Goods — 0.6% | | | | | | | | |
KWS Saat | | | 80 | | | | 16,387 | |
| | | | | | | | |
TOTAL GERMANY | | | | | | | 21,163 | |
| | | | | | | | |
The accompanying notes are an integral part of the financial statements.
17
| | |
| Schedule of Investments | | October 31, 2011 |
Global X Farming ETF
| | | | | | | | |
| | | Shares | | | Value | |
COMMON STOCK — continued | | | | | | | | |
| | |
HONG KONG— 3.8% | | | | | | | | |
Consumer Goods — 3.8% | | | | | | | | |
Asian Citrus Holdings | | | 26,800 | | | $ | 19,179 | |
China Agri-Industries Holdings | | | 57,100 | | | | 46,306 | |
CP Pokphand | | | 336,300 | | | | 37,230 | |
| | | | | | | | |
TOTAL HONG KONG | | | | | | | 102,715 | |
| | | | | | | | |
| | |
INDONESIA— 2.8% | | | | | | | | |
| | |
Consumer Goods — 2.8% | | | | | | | | |
Astra Agro Lestari | | | 11,600 | | | | 28,115 | |
Bakrie Sumatera Plantations | | | 400,000 | | | | 13,334 | |
Perusahaan Perkebunan London Sumatra Indonesia | | | 101,100 | | | | 25,132 | |
Sampoerna Agro | | | 22,600 | | | | 7,725 | |
| | | | | | | | |
TOTAL INDONESIA | | | | | | | 74,306 | |
| | | | | | | | |
| | |
JAPAN— 5.7% | | | | | | | | |
| | |
Consumer Goods — 0.7% | | | | | | | | |
Hokuto | | | 840 | | | | 17,533 | |
| | | | | | | | |
Industrials — 5.0% | | | | | | | | |
Kubota | | | 16,000 | | | | 134,323 | |
| | | | | | | | |
TOTAL JAPAN | | | | | | | 151,856 | |
| | | | | | | | |
| | |
LUXEMBOURG— 0.3% | | | | | | | | |
Consumer Goods — 0.3% | | | | | | | | |
Adecoagro * | | | 889 | | | | 8,641 | |
| | | | | | | | |
| | |
MALAYSIA— 12.8% | | | | | | | | |
| | |
Basic Materials — 0.6% | | | | | | | | |
HAP Seng Consolidated | | | 35,030 | | | | 17,475 | |
| | | | | | | | |
Consumer Goods — 12.2% | | | | | | | | |
Genting Plantations | | | 8,400 | | | | 20,130 | |
IOI | | | 40,000 | | | | 68,471 | |
Kuala Lumpur Kepong | | | 16,000 | | | | 109,866 | |
Kulim Malaysia | | | 16,800 | | | | 19,720 | |
PPB Group | | | 17,300 | | | | 96,230 | |
Tradewinds Malaysia | | | 4,000 | | | | 11,608 | |
| | | | | | | | |
| | | | | | | 326,025 | |
| | | | | | | | |
TOTAL MALAYSIA | | | | | | | 343,500 | |
| | | | | | | | |
| | |
NETHERLANDS— 4.3% | | | | | | | | |
| | |
Consumer Goods — 3.0% | | | | | | | | |
Nutreco | | | 1,206 | | | | 80,451 | |
| | | | | | | | |
Industrials — 1.3% | | | | | | | | |
CNH Global * | | | 976 | | | | 36,288 | |
| | | | | | | | |
TOTAL NETHERLANDS | | | | | | | 116,739 | |
| | | | | | | | |
The accompanying notes are an integral part of the financial statements.
18
| | |
| Schedule of Investments | | October 31, 2011 |
Global X Farming ETF
| | | | | | | | |
| | | Shares | | | Value | |
COMMON STOCK — continued | | | | | | | | |
| | |
SINGAPORE— 15.7% | | | | | | | | |
| | |
Consumer Goods — 15.7% | | | | | | | | |
First Resources | | | 14,400 | | | $ | 16,292 | |
GMG Global | | | 43,200 | | | | 8,089 | |
Golden Agri-Resources | | | 224,900 | | | | 116,473 | |
Indofood Agri Resources * | | | 11,200 | | | | 12,359 | |
Olam International | | | 61,200 | | | | 124,341 | |
Wilmar International | | | 32,800 | | | | 142,949 | |
| | | | | | | | |
TOTAL SINGAPORE | | | | | | | 420,503 | |
| | | | | | | | |
| | |
SOUTH AFRICA— 0.6% | | | | | | | | |
| | |
Consumer Goods — 0.6% | | | | | | | | |
Astral Foods | | | 1,000 | | | | 14,962 | |
| | | | | | | | |
| | |
UKRAINE— 1.4% | | | | | | | | |
| | |
Consumer Goods — 1.4% | | | | | | | | |
Kernel Holding * | | | 1,800 | | | | 38,771 | |
| | | | | | | | |
| | |
UNITED KINGDOM— 7.0% | | | | | | | | |
| | |
Consumer Goods — 7.0% | | | | | | | | |
Genus | | | 2,000 | | | | 36,300 | |
Tate & Lyle | | | 14,393 | | | | 151,034 | |
| | | | | | | | |
TOTAL UNITED KINGDOM | | | | | | | 187,334 | |
| | | | | | | | |
| | |
UNITED STATES— 28.0% | | | | | | | | |
| | |
Consumer Goods — 17.6% | | | | | | | | |
Andersons | | | 628 | | | | 23,186 | |
Archer-Daniels-Midland | | | 4,486 | | | | 129,825 | |
Chaoda Modern Agriculture Holdings 1,2 | | | 99,300 | | | | 14,060 | |
Corn Products International | | | 2,496 | | | | 121,056 | |
Fresh Del Monte Produce | | | 1,421 | | | | 36,179 | |
Monsanto | | | 2,040 | | | | 148,410 | |
| | | | | | | | |
| | | | | | | 472,716 | |
| | | | | | | | |
Industrials — 10.4% | | | | | | | | |
AGCO * | | | 2,882 | | | | 126,318 | |
Deere | | | 1,663 | | | | 126,221 | |
Lindsay | | | 448 | | | | 26,029 | |
| | | | | | | | |
| | | | | | | 278,568 | |
| | | | | | | | |
TOTAL UNITED STATES | | | | | | | 751,284 | |
| | | | | | | | |
TOTAL COMMON STOCK
(Cost $2,893,495) | | | | | | | 2,675,278 | |
| | | | | | | | |
TOTAL INVESTMENTS — 99.8%
(Cost $2,893,495) | | | | | | $ | 2,675,278 | |
| | | | | | | | |
The accompanying notes are an integral part of the financial statements.
19
| | |
| Schedule of Investments | | October 31, 2011 |
Global X Farming ETF
Percentages are based on Net Assets of $2,680,421.
| * | Non-income producing security. |
| 1 | Security is fair valued using methods determined in good faith by the Fair Value Committee of the Board of Trustees. The total value of such security as of October 31, 2011, was $14,060 and represented 0.5% of Net Assets. |
| 2 | Security considered illiquid. The total value of such security as of October 31, 2011, was $14,060 and represented 0.5% of Net Assets. |
The following is a summary of the inputs used as of October 31, 2011, in valuing the Fund’s investments carried at value:
| | | | | | | | | | | | | | | | |
| Investments in Securities | | Level 1 | | | Level 2 | | | Level 3 | | | Total | |
Common Stock | | | | | | | | | | | | | | | | |
Australia | | $ | 61,450 | | | $ | - | | | $ | - | | | $ | 61,450 | |
Belgium | | | 25,851 | | | | - | | | | - | | | | 25,851 | |
Bosnia and Herzegovina | | | 119,154 | | | | - | | | | - | | | | 119,154 | |
Brazil | | | 95,997 | | | | - | | | | - | | | | 95,997 | |
Canada | | | 117,063 | | | | - | | | | - | | | | 117,063 | |
China | | | 12,100 | | | | - | | | | - | | | | 12,100 | |
France | | | 11,889 | | | | - | | | | - | | | | 11,889 | |
Germany | | | 21,163 | | | | - | | | | - | | | | 21,163 | |
Hong Kong | | | 102,715 | | | | - | | | | - | | | | 102,715 | |
Indonesia | | | 74,306 | | | | - | | | | - | | | | 74,306 | |
Japan | | | 151,856 | | | | - | | | | - | | | | 151,856 | |
Luxembourg | | | 8,641 | | | | - | | | | - | | | | 8,641 | |
Malaysia | | | 343,500 | | | | - | | | | - | | | | 343,500 | |
Netherlands | | | 116,739 | | | | - | | | | - | | | | 116,739 | |
Singapore | | | 420,503 | | | | - | | | | - | | | | 420,503 | |
South Africa | | | 14,962 | | | | - | | | | - | | | | 14,962 | |
Ukraine | | | 38,771 | | | | - | | | | - | | | | 38,771 | |
United Kingdom | | | 187,334 | | | | - | | | | - | | | | 187,334 | |
United States | | | 737,224 | | | | - | | | | 14,060 | | | | 751,284 | |
| | | | | | | | | | | | | | | | |
Total Investments in Securities | | $ | 2,661,218 | | | $ | - | | | $ | 14,060 | | | $ | 2,675,278 | |
| | | | | | | | | | | | | | | | |
The following is a reconciliation of investments in which significant unobservable inputs (Level 3) were used in determining fair value:
| | | | |
| | | United States | |
| | | Investments in
Common Stock | |
Beginning balance as of June 1, 2011 | | $ | - | |
Accrued discounts/premiums | | | - | |
Realized gain/(loss) | | | - | |
Change in unrealized appreciation/(depreciation) | | | - | |
Net purchases | | | - | |
Net sales | | | - | |
Transfers into Level 3 | | | 14,060 | |
Transfers out of Level 3 | | | - | |
| | | | |
Ending balance as of October 31, 2011 | | $ | 14,060 | |
| | | | |
Net change in unrealized appreciation/(depreciation) from investments (Level 3) still held as of October 31, 2011 is $—.
For the period ended October 31, 2011, there have been no significant transfers between Level 1 and Level 2 investments.
The accompanying notes are an integral part of the financial statements.
20
| | |
| Schedule of Investments | | October 31, 2011 |
Global X Farming ETF
For the period ended October 31, 2011, transfers between Level 1 and Level 3 investments totaled $14,060.
The Level 3 investment presented above was considered a Level 1 investment at the beginning of the reporting period. The reason for the transfer was a temporary trading suspension of the investment’s shares, which necessitated a fair value determination by the Fair Value Committee at the end of the reporting period. The Fund’s policy is to transfer investments into/out of Level 3 at the end of the reporting period.
The accompanying notes are an integral part of the financial statements.
21
| | |
| Schedule of Investments | | October 31, 2011 |
Global X Auto ETF
Sector Weightings (unaudited)†:

†Percentages based on total investments.
| | | | | | | | |
| | | Shares | | | Value | |
COMMON STOCK —96.6% | | | | | | | | |
| | |
CANADA— 1.6% | | | | | | | | |
| | |
Consumer Goods — 1.6% | | | | | | | | |
Magna International | | | 2,157 | | | $ | 82,291 | |
| | | | | | | | |
| | |
CHINA— 4.6% | | | | | | | | |
| | |
Consumer Goods — 3.9% | | | | | | | | |
Dongfeng Motor Group, Cl H | | | 84,000 | | | | 139,703 | |
Guangzhou Automobile Group, Cl H | | | 59,800 | | | | 60,581 | |
| | | | | | | | |
| | | | | | | 200,284 | |
| | | | | | | | |
| | |
Industrials — 0.7% | | | | | | | | |
Byd, Cl H | | | 14,400 | | | | 35,405 | |
| | | | | | | | |
TOTAL CHINA | | | | | | | 235,689 | |
| | | | | | | | |
| | |
FRANCE— 5.1% | | | | | | | | |
| | |
Consumer Goods — 5.1% | | | | | | | | |
Cie Generale des Etablissements Michelin, Cl B | | | 1,713 | | | | 124,894 | |
Peugeot | | | 1,538 | | | | 33,792 | |
Renault | | | 1,744 | | | | 73,485 | |
Valeo | | | 662 | | | | 33,478 | |
| | | | | | | | |
TOTAL FRANCE | | | | | | | 265,649 | |
| | | | | | | | |
| | |
GERMANY— 19.4% | | | | | | | | |
| | |
Consumer Goods — 19.4% | | | | | | | | |
Bayerische Motoren Werke | | | 3,467 | | | | 283,391 | |
Continental | | | 971 | | | | 72,824 | |
Daimler | | | 8,460 | | | | 433,222 | |
Volkswagen | | | 1,373 | | | | 216,247 | |
| | | | | | | | |
TOTAL GERMANY | | | | | | | 1,005,684 | |
| | | | | | | | |
| | |
HONG KONG— 0.6% | | | | | | | | |
| | |
Consumer Goods — 0.6% | | | | | | | | |
Brilliance China Automotive Holdings * | | | 21,000 | | | | 23,004 | |
Geely Automobile Holdings | | | 35,600 | | | | 9,303 | |
| | | | | | | | |
TOTAL HONG KONG | | | | | | | 32,307 | |
| | | | | | | | |
The accompanying notes are an integral part of the financial statements.
22
| | |
| Schedule of Investments | | October 31, 2011 |
Global X Auto ETF
| | | | | | | | |
| | | Shares | | | Value | |
COMMON STOCK — continued | | | | | | | | |
| | |
INDIA— 2.0% | | | | | | | | |
Industrials — 2.0% | | | | | | | | |
Tata Motors ADR | | | 5,245 | | | $ | 105,162 | |
| | | | | | | | |
| | |
INDONESIA— 2.7% | | | | | | | | |
| | |
Consumer Goods — 2.7% | | | | | | | | |
Astra International | | | 17,800 | | | | 138,780 | |
| | | | | | | | |
| | |
ITALY— 1.5% | | | | | | | | |
| | |
Consumer Goods — 1.5% | | | | | | | | |
Fiat | | | 8,000 | | | | 49,160 | |
Pirelli & C | | | 3,200 | | | | 28,344 | |
| | | | | | | | |
TOTAL ITALY | | | | | | | 77,504 | |
| | | | | | | | |
| | |
JAPAN— 24.4% | | | | | | | | |
| | |
Consumer Goods — 23.9% | | | | | | | | |
Aisin Seiki | | | 860 | | | | 27,922 | |
Bridgestone | | | 2,975 | | | | 70,853 | |
Daihatsu Motor | | | 800 | | | | 14,385 | |
Denso | | | 2,118 | | | | 66,733 | |
Fuji Heavy Industries | | | 3,000 | | | | 19,580 | |
GS Yuasa | | | 1,600 | | | | 8,559 | |
Honda Motor ADR | | | 8,386 | | | | 250,741 | |
JTEKT | | | 825 | | | | 9,270 | |
Mazda Motor | | | 7,800 | | | | 16,870 | |
Mitsubishi Motors * | | | 18,000 | | | | 24,187 | |
Nissan Motor | | | 11,800 | | | | 110,993 | |
NSK | | | 2,400 | | | | 18,582 | |
Suzuki Motor | | | 1,815 | | | | 39,348 | |
Toyota Industries | | | 778 | | | | 22,432 | |
Toyota Motor ADR | | | 8,054 | | | | 537,282 | |
| | | | | | | | |
| | | | | | | 1,237,737 | |
| | | | | | | | |
Industrials — 0.5% | | | | | | | | |
Isuzu Motors | | | 5,600 | | | | 24,367 | |
| | | | | | | | |
TOTAL JAPAN | | | | | | | 1,262,104 | |
| | | | | | | | |
| | |
SOUTH KOREA— 12.1% | | | | | | | | |
| | |
Consumer Goods — 12.1% | | | | | | | | |
Hankook Tire | | | 668 | | | | 26,916 | |
Hyundai Mobis | | | 598 | | | | 173,723 | |
Hyundai Motor | | | 1,350 | | | | 275,622 | |
Kia Motors | | | 2,284 | | | | 148,521 | |
| | | | | | | | |
TOTAL SOUTH KOREA | | | | | | | 624,782 | |
| | | | | | | | |
The accompanying notes are an integral part of the financial statements.
23
| | |
| Schedule of Investments | | October 31, 2011 |
Global X Auto ETF
| | | | | | | | |
| | | Shares/Face
Amount | | | Value | |
COMMON STOCK — continued | | | | | | | | |
| | |
SWEDEN— 1.0% | | | | | | | | |
Consumer Goods — 1.0% | | | | | | | | |
Autoliv | | | 866 | | | $ | 50,029 | |
| | | | | | | | |
| | |
UNITED STATES— 21.6% | | | | | | | | |
| | |
Consumer Goods — 21.6% | | | | | | | | |
BorgWarner * | | | 1,040 | | | | 79,550 | |
Ford Motor * | | | 36,309 | | | | 424,089 | |
General Motors * | | | 5,951 | | | | 153,833 | |
Gentex | | | 1,340 | | | | 40,361 | |
Genuine Parts | | | 1,496 | | | | 85,915 | |
Goodyear Tire & Rubber * | | | 2,342 | | | | 33,631 | |
Johnson Controls | | | 6,506 | | | | 214,242 | |
Tesla Motors * | | | 342 | | | | 10,045 | |
TRW Automotive Holdings * | | | 1,000 | | | | 42,100 | |
WABCO Holdings * | | | 652 | | | | 32,737 | |
| | | | | | | | |
TOTAL UNITED STATES | | | | | | | 1,116,503 | |
| | | | | | | | |
TOTAL COMMON STOCK
(Cost $5,909,398) | | | | | | | 4,996,484 | |
| | | | | | | | |
| | |
PREFERRED STOCK — 3.3% | | | | | | | | |
| | |
GERMANY— 3.3% | | | | | | | | |
| | |
Consumer Goods — 3.3% | | | | | | | | |
Porsche Automobil Holding
(Cost $211,265) | | | 2,866 | | | | 168,123 | |
| | | | | | | | |
| | |
TIME DEPOSIT — 0.1% | | | | | | | | |
| | |
Brown Brothers Harriman, 0.030%
(Cost $4,160) | | $ | 4,160 | | | | 4,160 | |
| | | | | | | | |
TOTAL INVESTMENTS — 100.0%
(Cost $6,124,823) | | | | | | $ | 5,168,767 | |
| | | | | | | | |
Percentages are based on Net Assets of $5,170,395.
| * | Non-income producing security. |
ADR — American Depositary Receipt
Cl — Class
The accompanying notes are an integral part of the financial statements.
24
| | |
| Schedule of Investments | | October 31, 2011 |
Global X Auto ETF
The following is a summary of the inputs used as of October 31, 2011, in valuing the Fund’s investments carried at value:
| | | | | | | | | | | | | | | | |
| Investments in Securities | | Level 1 | | | Level 2 | | | Level 3 | | | Total | |
Common Stock | | $ | 4,996,484 | | | $ | — | | | $ | — | | | $ | 4,996,484 | |
Preferred Stock | | | 168,123 | | | | — | | | | — | | | | 168,123 | |
Time Deposit | | | — | | | | 4,160 | | | | — | | | | 4,160 | |
| | | | | | | | | | | | | | | | |
Total Investments in Securities | | $ | 5,164,607 | | | $ | 4,160 | | | $ | — | | | $ | 5,168,767 | |
| | | | | | | | | | | | | | | | |
For the period ended October 31, 2011, there have been no significant transfers between Level 1 and Level 2 investments.
For the period ended October 31, 2011, there were no Level 3 investments.
The accompanying notes are an integral part of the financial statements.
25
| | |
| Schedule of Investments | | October 31, 2011 |
Global X Canada Preferred ETF
Sector Weightings (unaudited)†:
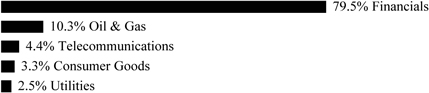
† Percentages based on total investments.
| | | | | | | | |
| | | Shares | | | Value | |
PREFERRED STOCK — 99.9% | | | | | | | | |
CANADA— 99.9% | | | | | | | | |
Consumer Goods — 3.3% | | | | | | | | |
George Weston | | | 5,361 | | | $ | 125,755 | |
RONA | | | 4,687 | | | | 111,497 | |
Yellow Media | | | 5,617 | | | | 23,106 | |
| | | | | | | | |
| | | | | | | 260,358 | |
| | | | | | | | |
| | |
Financials — 79.4% | | | | | | | | |
Bank of Montreal | | | 21,795 | | | | 566,453 | |
Bank of Nova Scotia | | | 21,938 | | | | 571,837 | |
Brookfield Asset Management | | | 15,162 | | | | 381,389 | |
Brookfield Office Properties | | | 14,799 | | | | 378,715 | |
Canadian Imperial Bank of Commerce | | | 24,840 | | | | 643,598 | |
Fairfax Financial Holdings | | | 15,209 | | | | 371,939 | |
Great-West Lifeco | | | 16,190 | | | | 391,627 | |
HSBC Bank Canada | | | 9,388 | | | | 247,003 | |
Husky Energy | | | 8,035 | | | | 205,974 | |
IGM Financial | | | 4,064 | | | | 106,422 | |
Manulife Financial | | | 15,137 | | | | 377,626 | |
National Bank of Canada | | | 5,361 | | | | 136,351 | |
Power Corp of Canada | | | 6,761 | | | | 165,515 | |
Power Financial | | | 14,317 | | | | 356,115 | |
Royal Bank of Canada | | | 24,193 | | | | 648,334 | |
Sun Life Financial | | | 16,854 | | | | 383,372 | |
Toronto-Dominion Bank | | | 14,690 | | | | 387,776 | |
| | | | | | | | |
| | | | | | | 6,320,046 | |
| | | | | | | | |
| | |
Oil & Gas — 10.3% | | | | | | | | |
AltaGas | | | 5,373 | | | | 138,543 | |
TransCanada | | | 26,367 | | | | 678,144 | |
| | | | | | | | |
| | | | | | | 816,687 | |
| | | | | | | | |
| | |
Telecommunications — 4.4% | | | | | | | | |
BCE | | | 15,829 | | | | 353,857 | |
| | | | | | | | |
Utilities — 2.5% | | | | | | | | |
TransAlta | | | 8,030 | | | | 203,026 | |
| | | | | | | | |
The accompanying notes are an integral part of the financial statements.
26
| | |
| Schedule of Investments | | October 31, 2011 |
Global X Canada Preferred ETF
| | | | |
| | | Value | |
PREFERRED STOCK — continued | | | | |
TOTAL CANADA | | $ | 7,953,974 | |
| | | | |
TOTAL PREFERRED STOCK
(Cost $8,292,540) | | | 7,953,974 | |
| | | | |
TOTAL INVESTMENTS — 99.9%
(Cost $8,292,540) | | $ | 7,953,974 | |
| | | | |
Percentages are based on Net Assets of $7,962,246.
The following is a summary of the inputs used as of October 31, 2011, in valuing the Fund’s investments carried at value:
| | | $7,953,974 | | | | $7,953,974 | | | | $7,953,974 | | | | $7,953,974 | |
| Investments in Securities | | Level 1 | | | Level 2 | | | Level 3 | | | Total | |
Preferred Stock | | $ | 7,953,974 | | | $ | — | | | $ | — | | | $ | 7,953,974 | |
| | | | | | | | | | | | | | | | |
Total Investments in Securities | | $ | 7,953,974 | | | $ | — | | | $ | — | | | $ | 7,953,974 | |
| | | | | | | | | | | | | | | | |
For the period ended October 31, 2011, there have been no significant transfers between Level 1 and Level 2 investments.
For the period ended October 31, 2011, there were no Level 3 investments.
The accompanying notes are an integral part of the financial statements.
27
| | |
| Schedule of Investments | | October 31, 2011 |
Global X SuperDividend ETF
Sector Weightings (unaudited)†:
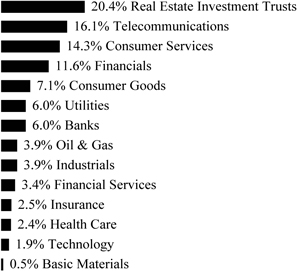
† Percentages based on total investments.
| | | | | | | | |
| | | Shares | | | Value | |
COMMON STOCK — 97.4% | | | | | | | | |
AUSTRALIA— 25.0% | | | | | | | | |
Banks — 5.9% | | | | | | | | |
Bank of Queensland | | | 37,800 | | | $ | 335,796 | |
Bendigo and Adelaide Bank | | | 38,150 | | | | 380,314 | |
Commonwealth Bank of Australia | | | 6,325 | | | | 328,397 | |
National Australia Bank | | | 12,980 | | | | 351,532 | |
Westpac Banking | | | 14,600 | | | | 343,403 | |
| | | | | | | | |
| | | | | | | 1,739,442 | |
| | | | | | | | |
| | |
Consumer Goods — 3.7% | | | | | | | | |
Fleetwood | | | 29,400 | | | | 379,835 | |
Foster’s Group | | | 70,750 | | | | 397,384 | |
GUD Holdings | | | 35,050 | | | | 288,467 | |
| | | | | | | | |
| | | | | | | 1,065,686 | |
| | | | | | | | |
| | |
Consumer Services — 7.2% | | | | | | | | |
APN News & Media | | | 235,000 | | | | 216,687 | |
David Jones | | | 79,200 | | | | 282,932 | |
Metcash | | | 82,300 | | | | 361,653 | |
Myer Holdings | | | 115,900 | | | | 318,772 | |
Seven West Media | | | 78,100 | | | | 296,285 | |
TABCORP Holdings | | | 96,600 | | | | 299,282 | |
Tatts Group | | | 140,000 | | | | 342,273 | |
| | | | | | | | |
| | | | | | | 2,117,884 | |
| | | | | | | | |
The accompanying notes are an integral part of the financial statements.
28
| | |
| Schedule of Investments | | October 31, 2011 |
Global X SuperDividend ETF
| | | | | | | | |
| | | Shares | | | Value | |
COMMON STOCK — continued | | | | | | | | |
| | |
Financial Services — 1.0% | | | | | | | | |
Perpetual | | | 11,860 | | | $ | 284,330 | |
| | | | | | | | |
Industrials — 1.7% | | | | | | | | |
GWA Group | | | 107,800 | | | | 261,278 | |
Salmat | | | 83,700 | | | | 246,086 | |
| | | | | | | | |
| | | | | | | 507,364 | |
| | | | | | | | |
| | |
Oil & Gas — 1.1% | | | | | | | | |
APA Group | | | 73,100 | | | | 335,092 | |
| | | | | | | | |
Real Estate Investment Trusts — 1.1% | | | | | | | | |
Commonwealth Property Office Fund | | | 335,100 | | | | 328,408 | |
| | | | | | | | |
Telecommunications — 1.1% | | | | | | | | |
Telstra | | | 102,200 | | | | 333,864 | |
| | | | | | | | |
Utilities — 2.2% | | | | | | | | |
DUET Group | | | 181,700 | | | | 319,763 | |
Spark Infrastructure Group | | | 248,700 | | | | 318,426 | |
| | | | | | | | |
| | | | | | | 638,189 | |
| | | | | | | | |
TOTAL AUSTRALIA | | | | | | | 7,350,259 | |
| | | | | | | | |
| | |
AUSTRIA— 1.0% | | | | | | | | |
| | |
Telecommunications — 1.0% | | | | | | | | |
Telekom Austria | | | 26,375 | | | | 300,421 | |
| | | | | | | | |
| | |
BELGIUM— 1.0% | | | | | | | | |
| | |
Telecommunications — 1.0% | | | | | | | | |
Belgacom | | | 9,450 | | | | 286,688 | |
| | | | | | | | |
| | |
BERMUDA— 0.9% | | | | | | | | |
| | |
Industrials — 0.9% | | | | | | | | |
Ship Finance International | | | 18,783 | | | | 268,785 | |
| | | | | | | | |
| | |
BRAZIL— 1.0% | | | | | | | | |
| | |
Utilities — 1.0% | | | | | | | | |
Light | | | 18,900 | | | | 297,952 | |
| | | | | | | | |
| | |
CANADA— 4.9% | | | | | | | | |
| | |
Basic Materials — 0.5% | | | | | | | | |
Canfor Pulp Products | | | 11,989 | | | | 161,185 | |
| | | | | | | | |
Consumer Services — 1.6% | | | | | | | | |
Parkland Fuel | | | 26,518 | | | | 276,166 | |
Superior Plus | | | 28,732 | | | | 198,907 | |
| | | | | | | | |
| | | | | | | 475,073 | |
| | | | | | | | |
| | |
Health Care — 1.2% | | | | | | | | |
CML HealthCare | | | 35,051 | | | | 340,769 | |
| | | | | | | | |
The accompanying notes are an integral part of the financial statements.
29
| | |
| Schedule of Investments | | October 31, 2011 |
Global X SuperDividend ETF
| | | | | | | | |
| | | Shares | | | Value | |
COMMON STOCK — continued | | | | | | | | |
| | |
Oil & Gas — 0.8% | | | | | | | | |
Zargon Oil & Gas | | | 15,414 | | | $ | 217,593 | |
| | | | | | | | |
Utilities — 0.8% | | | | | | | | |
Just Energy Group | | | 22,926 | | | | 247,504 | |
| | | | | | | | |
TOTAL CANADA | | | | | | | 1,442,124 | |
| | | | | | | | |
CZECH REPUBLIC— 2.3% | | | | | | | | |
Consumer Goods — 1.3% | | | | | | | | |
Philip Morris CR | | | 596 | | | | 391,559 | |
| | | | | | | | |
Telecommunications — 1.0% | | | | | | | | |
Telefonica Czech Republic | | | 13,170 | | | | 277,244 | |
| | | | | | | | |
TOTAL CZECH REPUBLIC | | | | | | | 668,803 | |
| | | | | | | | |
FINLAND— 0.8% | | | | | | | | |
Consumer Services — 0.8% | | | | | | | | |
Sanoma | | | 17,840 | | | | 240,240 | |
| | | | | | | | |
FRANCE— 0.9% | | | | | | | | |
Telecommunications — 0.9% | | | | | | | | |
France Telecom | | | 15,320 | | | | 276,487 | |
| | | | | | | | |
GERMANY— 1.1% | | | | | | | | |
Telecommunications — 1.1% | | | | | | | | |
Freenet | | | 24,050 | | | | 311,052 | |
| | | | | | | | |
HUNGARY— 0.9% | | | | | | | | |
Telecommunications — 0.9% | | | | | | | | |
Magyar Telekom Telecommunications | | | 111,100 | | | | 258,783 | |
| | | | | | | | |
ITALY— 0.8% | | | | | | | | |
Consumer Services — 0.8% | | | | | | | | |
Mediaset | | | 64,800 | | | | 240,173 | |
| | | | | | | | |
NEW ZEALAND— 2.4% | | | | | | | | |
Financials — 1.2% | | | | | | | | |
Goodman Property Trust | | | 432,900 | | | | 342,958 | |
| | | | | | | | |
Telecommunications — 1.2% | | | | | | | | |
Telecom Corp of New Zealand | | | 177,600 | | | | 363,955 | |
| | | | | | | | |
TOTAL NEW ZEALAND | | | | | | | 706,913 | |
| | | | | | | | |
NORWAY— 1.1% | | | | | | | | |
Oil & Gas — 1.1% | | | | | | | | |
Seadrill | | | 9,720 | | | | 321,716 | |
| | | | | | | | |
POLAND— 0.9% | | | | | | | | |
Telecommunications — 0.9% | | | | | | | | |
Telekomunikacja Polska | | | 51,100 | | | | 271,552 | |
| | | | | | | | |
The accompanying notes are an integral part of the financial statements.
30
| | |
| Schedule of Investments | | October 31, 2011 |
Global X SuperDividend ETF
| | | | | | | | |
| | | Shares | | | Value | |
COMMON STOCK — continued | | | | | | | | |
SINGAPORE— 4.3% | | | | | | | | |
Real Estate Investment Trusts — 3.2% | | | | | | | | |
Ascendas Real Estate Investment Trust | | | 208,100 | | | $ | 339,897 | |
Mapletree Logistics Trust | | | 451,200 | | | | 307,367 | |
Suntec Real Estate Investment Trust | | | 279,500 | | | | 276,137 | |
| | | | | | | | |
| | | | | | | 923,401 | |
| | | | | | | | |
Telecommunications — 1.1% | | | | | | | | |
StarHub | | | 148,300 | | | | 333,206 | |
| | | | | | | | |
TOTAL SINGAPORE | | | | | | | 1,256,607 | |
| | | | | | | | |
SPAIN— 1.9% | | | | | | | | |
Consumer Services — 0.9% | | | | | | | | |
Antena 3 de Television | | | 40,500 | | | | 243,827 | |
| | | | | | | | |
Telecommunications — 1.0% | | | | | | | | |
Telefonica | | | 14,080 | | | | 299,707 | |
| | | | | | | | |
TOTAL SPAIN | | | | | | | 543,534 | |
| | | | | | | | |
TAIWAN— 0.7% | | | | | | | | |
Technology — 0.7% | | | | | | | | |
Macronix International | | | 530,600 | | | | 204,036 | |
| | | | | | | | |
TURKEY— 0.9% | | | | | | | | |
Consumer Goods — 0.9% | | | | | | | | |
Ford Otomotiv Sanayi | | | 36,550 | | | | 266,864 | |
| | | | | | | | |
UNITED KINGDOM— 8.6% | | | | | | | | |
Consumer Services — 2.0% | | | | | | | | |
Firstgroup | | | 61,900 | | | | 332,490 | |
Home Retail Group | | | 98,600 | | | | 158,728 | |
Thomas Cook Group | | | 142,500 | | | | 119,168 | |
| | | | | | | | |
| | | | | | | 610,386 | |
| | | | | | | | |
Financial Services — 1.3% | | | | | | | | |
Provident Financial | | | 20,925 | | | | 373,198 | |
| | | | | | | | |
Financials — 1.2% | | | | | | | | |
Standard Life | | | 99,900 | | | | 346,704 | |
| | | | | | | | |
Industrials — 1.3% | | | | | | | | |
Interserve | | | 70,200 | | | | 373,348 | |
| | | | | | | | |
Insurance — 1.8% | | | | | | | | |
Aviva | | | 49,050 | | | | 268,832 | |
RSA Insurance Group | | | 147,900 | | | | 265,683 | |
| | | | | | | | |
| | | | | | | 534,515 | |
| | | | | | | | |
The accompanying notes are an integral part of the financial statements.
31
| | |
| Schedule of Investments | | October 31, 2011 |
Global X SuperDividend ETF
| | | | | | | | |
| | | Shares | | | Value | |
COMMON STOCK — continued | | | | | | | | |
Telecommunications — 1.0% | | | | | | | | |
Cable & Wireless Communications | | | 492,300 | | | $ | 286,920 | |
| | | | | | | | |
TOTAL UNITED KINGDOM | | | | | | | 2,525,071 | |
| | | | | | | | |
UNITED STATES— 36.0% | | | | | | | | |
Consumer Goods — 1.2% | | | | | | | | |
Vector Group | | | 19,536 | | | | 343,248 | |
| | | | | | | | |
Consumer Services — 0.7% | | | | | | | | |
Halfords Group | | | 39,932 | | | | 210,060 | |
| | | | | | | | |
Financial Services — 1.1% | | | | | | | | |
BGC Partners, Cl A | | | 44,719 | | | | 306,325 | |
| | | | | | | | |
Financials — 9.1% | | | | | | | | |
Apollo Investment * | | | 31,707 | | | | 262,534 | |
Ares Capital | | | 20,262 | | | | 313,453 | |
BlackRock Kelso Capital | | | 35,384 | | | | 302,180 | |
Capstead Mortgage | | | 25,693 | | | | 311,399 | |
CYS Investments | | | 26,130 | | | | 331,328 | |
Fifth Street Finance | | | 28,075 | | | | 276,820 | |
PennantPark Investment | | | 28,206 | | | | 302,368 | |
Prospect Capital | | | 29,816 | | | | 285,339 | |
Solar Capital | | | 13,765 | | | | 305,583 | |
| | | | | | | | |
| | | | | | | 2,691,004 | |
| | | | | | | | |
Health Care — 1.2% | | | | | | | | |
PDL BioPharma | | | 55,305 | | | | 335,701 | |
| | | | | | | | |
Insurance — 0.7% | | | | | | | | |
QBE Insurance Group | | | 13,896 | | | | 215,992 | |
| | | | | | | | |
Real Estate Investment Trusts — 16.0% | | | | | | | | |
American Capital Agency | | | 11,074 | | | | 304,646 | |
Annaly Capital Management | | | 18,484 | | | | 311,455 | |
Anworth Mortgage Asset | | | 46,485 | | | | 299,828 | |
Chimera Investment | | | 92,210 | | | | 277,552 | |
CommonWealth REIT | | | 13,452 | | | | 260,296 | |
CreXus Investment | | | 20,934 | | | | 200,129 | |
Extendicare Real Estate Investment Trust, Cl Trust Unit | | | 24,824 | | | | 185,800 | |
Getty Realty | | | 13,670 | | | | 217,900 | |
Hatteras Financial | | | 11,666 | | | | 299,816 | |
Hospitality Properties Trust | | | 14,723 | | | | 353,794 | |
Invesco Mortgage Capital | | | 15,220 | | | | 240,172 | |
Investors Real Estate Trust | | | 36,238 | | | | 268,524 | |
Medical Properties Trust | | | 28,731 | | | | 290,183 | |
MFA Financial | | | 41,624 | | | | 280,962 | |
Omega Healthcare Investors | | | 16,887 | | | | 299,913 | |
The accompanying notes are an integral part of the financial statements.
32
| | |
| Schedule of Investments | | October 31, 2011 |
Global X SuperDividend ETF
| | | | | | | | |
| | | Shares | | | Value | |
COMMON STOCK — continued | | | | | | | | |
Real Estate Investment Trusts — continued | | | | | | | | |
Starwood Property Trust | | | 16,646 | | | $ | 312,778 | |
Two Harbors Investment | | | 31,907 | | | | 298,331 | |
| | | | | | | | |
| | | | | | | 4,702,079 | |
| | | | | | | | |
| | |
Technology — 1.2% | | | | | | | | |
United Online | | | 59,983 | | | | 354,500 | |
| | | | | | | | |
Telecommunications — 3.8% | | | | | | | | |
CenturyLink | | | 5,518 | | | | 194,565 | |
Consolidated Communications Holdings | | | 17,994 | | | | 339,727 | |
Frontier Communications | | | 41,844 | | | | 261,943 | |
Windstream | | | 26,064 | | | | 317,199 | |
| | | | | | | | |
| | | | | | | 1,113,434 | |
| | | | | | | | |
| | |
Utilities — 1.0% | | | | | | | | |
Atlantic Power | | | 21,990 | | | | 296,303 | |
| | | | | | | | |
TOTAL UNITED STATES | | | | | | | 10,568,646 | |
| | | | | | | | |
TOTAL COMMON STOCK
(Cost $31,094,328) | | | | | | | 28,606,706 | |
| | | | | | | | |
| | |
PREFERRED STOCK — 2.0% | | | | | | | | |
Brazil — 1.1% | | | | | | | | |
Utilities — 1.1% | | | | | | | | |
AES Tiete | | | 21,600 | | | | 309,309 | |
| | | | | | | | |
| | |
Russia — 0.9% | | | | | | | | |
Oil & Gas — 0.9% | | | | | | | | |
Surgutneftega | | | 660,443 | | | | 285,311 | |
| | | | | | | | |
TOTAL PREFERRED STOCK
(Cost $651,569) | | | | | | | 594,620 | |
| | | | | | | | |
TOTAL INVESTMENTS — 99.4%
(Cost $31,745,897) | | | | | | $ | 29,201,326 | |
| | | | | | | | |
Percentages are based on Net Assets of $29,372,161.
* Non-income producing security.
Cl — Class
REIT — Real Estate Investment Trust
The following is a summary of the inputs used as of October 31, 2011, in valuing the Fund’s investments carried at value:
| | | $28,606,706 a | | | | $28,606,706 a | | | | $28,606,706 a | | | | $28,606,706 a | |
| Investments in Securities | | Level 1 | | | Level 2 | | | Level 3 | | | Total | |
Common Stock | | $ | 28,606,706 | | | $ | — | | | $ | — | | | $ | 28,606,706 | |
Preferred Stock | | | 594,620 | | | | — | | | | — | | | | 594,620 | |
| | | | | | | | | | | | | | | | |
Total Investments in Securities | | $ | 29,201,326 | | | $ | | | | $ | — | | | $ | 29,201,326 | |
| | | | | | | | | | | | | | | | |
For the period ended October 31, 2011, there have been no significant transfers between Level 1 and Level 2 investments.
For the period ended October 31, 2011, there were no Level 3 investments.
The accompanying notes are an integral part of the financial statements.
33
STATEMENTSOF ASSETSAND LIABILITIES
October 31, 2011
| | | | | | | | | | | | | | | | |
| | | Global X Waste
Management ETF | | | Global X Food ETF | | | Global X Fishing
Industry ETF | | | Global X Farming
ETF | |
Assets: | | | | | | | | | | | | | | | | |
Cost of Investments | | $ | 2,225,869 | | | $ | 3,643,457 | | | $ | 2,183,908 | | | $ | 2,893,495 | |
Cost of Foreign Currency | | | 4,785 | | | | 8,834 | | | | 5,061 | | | | 9,119 | |
| | | | | | | | | | | | | | | | |
Investments at Value | | $ | 1,883,369 | | | $ | 3,629,392 | | | $ | 1,688,037 | | | $ | 2,675,278 | |
Foreign Currency at Value | | | 4,795 | | | | 8,748 | | | | 4,908 | | | | 9,100 | |
Reclaim Receivable | | | 1,533 | | | | 61 | | | | — | | | | 103 | |
Dividend and Interest Receivable | | | 900 | | | | 4,405 | | | | 4,555 | | | | 3,210 | |
Receivable for Investment Securities Sold | | | — | | | | 183,643 | | | | 186,053 | | | | — | |
| | | | | | | | | | | | | | | | |
Total Assets | | | 1,890,597 | | | | 3,826,249 | | | | 1,883,553 | | | | 2,687,691 | |
| | | | | | | | | | | | | | | | |
| | | | |
Liabilities: | | | | | | | | | | | | | | | | |
| | | | |
Payable for Investment Securities Purchased | | | — | | | | 93,068 | | | | 213,299 | | | | — | |
Payable due to Investment Adviser | | | 1,007 | | | | 1,915 | | | | 957 | | | | 1,451 | |
Due to Custodian | | | — | | | | 19,884 | | | | 856 | | | | 5,819 | |
| | | | | | | | | | | | | | | | |
Total Liabilities | | | 1,007 | | | | 114,867 | | | | 215,112 | | | | 7,270 | |
| | | | | | | | | | | | | | | | |
| | | | |
Net Assets | | $ | 1,889,590 | | | $ | 3,711,382 | | | $ | 1,668,441 | | | $ | 2,680,421 | |
| | | | | | | | | | | | | | | | |
| | | | |
Net Assets Consist of: | | | | | | | | | | | | | | | | |
| | | | |
Paid-in Capital | | $ | 2,218,026 | | | $ | 3,709,500 | | | $ | 2,211,128 | | | $ | 2,896,738 | |
Undistributed Net Investment Income | | | 23,299 | | | | 20,450 | | | | 38,692 | | | | 12,106 | |
Accumulated Net Realized Loss on Investments
and Foreign Currency Translations | | | (9,169) | | | | (4,409) | | | | (84,877) | | | | (10,159) | |
Net Unrealized Depreciation on Investments | | | (342,500) | | | | (14,065) | | | | (495,871) | | | | (218,217) | |
Net Unrealized Depreciation on Foreign
Currency Translations | | | (66) | | | | (94) | | | | (631) | | | | (47) | |
| | | | | | | | | | | | | | | | |
Net Assets | | $ | 1,889,590 | | | $ | 3,711,382 | | | $ | 1,668,441 | | | $ | 2,680,421 | |
| | | | | | | | | | | | | | | | |
| | | | |
Outstanding Shares of Beneficial Interest
(unlimited authorization — no par value) | | | 150,000 | | | | 250,000 | | | | 150,000 | | | | 200,000 | |
| | | | | | | | | | | | | | | | |
Net Asset Value, Offering and Redemption
Price Per Share | | | $12.60 | | | | $14.85 | | | | $11.12 | | | | $13.40 | |
| | | | | | | | | | | | | | | | |
The accompanying notes are an integral part of the financial statements.
34
STATEMENTSOF ASSETSAND LIABILITIES
October 31, 2011
| | | | | | | | | | | | |
| | | Global X Auto ETF | | | Global X Canada
Preferred ETF | | | Global X
SuperDividend
ETF | |
Assets: | | | | | | | | | | | | |
Cost of Investments | | $ | 6,124,823 | | | $ | 8,292,540 | | | $ | 31,745,897 | |
Cost of Foreign Currency | | | 85 | | | | 27,578 | | | | 57,750 | |
| | | | | | | | | | | | |
Investments at Value | | $ | 5,168,767 | | | $ | 7,953,974 | | | $ | 29,201,326 | |
Foreign Currency at Value | | | 84 | | | | 27,547 | | | | 58,661 | |
Cash | | | — | | | | — | | | | 8,336 | |
Dividend and Interest Receivable | | | 4,209 | | | | 21,787 | | | | 118,020 | |
Reclaim Receivable | | | 41 | | | | — | | | | — | |
| | | | | | | | | | | | |
Total Assets | | | 5,173,101 | | | | 8,003,308 | | | | 29,386,343 | |
| | | | | | | | | | | | |
| | | |
Liabilities: | | | | | | | | | | | | |
| | | |
Payable due to Investment Adviser | | | 2,706 | | | | 3,834 | | | | 14,182 | |
Due to Custodian | | | — | | | | 37,228 | | | | — | |
| | | | | | | | | | | | |
Total Liabilities | | | 2,706 | | | | 41,062 | | | | 14,182 | |
| | | | | | | | | | | | |
| | | |
Net Assets | | $ | 5,170,395 | | | $ | 7,962,246 | | | $ | 29,372,161 | |
| | | | | | | | | | | | |
| | | |
Net Assets Consist of: | | | | | | | | | | | | |
Paid-in Capital | | $ | 6,115,500 | | | $ | 8,279,536 | | | $ | 32,642,128 | |
Undistributed Net Investment Income | | | 12,500 | | | | 24,691 | | | | 131,585 | |
Accumulated Net Realized Loss on Investments and Foreign Currency Translations | | | (1,478) | | | | (3,513) | | | | (859,829) | |
Net Unrealized Depreciation on Investments | | | (956,056) | | | | (338,566) | | | | (2,544,571) | |
Net Unrealized Appreciation (Depreciation) on Foreign Currency Translations | | | (71) | | | | 98 | | | | 2,848 | |
| | | | | | | | | | | | |
Net Assets | | $ | 5,170,395 | | | $ | 7,962,246 | | | $ | 29,372,161 | |
| | | | | | | | | | | | |
Outstanding Shares of Beneficial Interest (unlimited authorization — no par value) | | | 400,000 | | | | 550,000 | | | | 1,350,000 | |
| | | | | | | | | | | | |
Net Asset Value, Offering and Redemption
| | | | | | | | | | | | |
Price Per Share | | | $12.93 | | | | $14.48 | | | | $21.76 | |
| | | | | | | | | | | | |
The accompanying notes are an integral part of the financial statements.
35
STATEMENTSOF OPERATIONS
For the period ended October 31, 2011
| | | | | | | | | | | | | | | | |
| | | Global X Waste
Management ETF(1) | | | Global X
Food ETF(2) | | | Global X Fishing
Industry ETF(3) | | | Global X
Farming ETF(4) | |
Investment Income: | | | | | | | | | | | | | | | | |
Dividend Income | | $ | 34,785 | | | $ | 30,311 | | | $ | 45,228 | | | $ | 28,360 | |
Interest Income | | | 2 | | | | 6 | | | | 1 | | | | 8 | |
Less: Foreign Taxes Withheld | | | (3,146) | | | | (1,794) | | | | (8,192) | | | | (1,549) | |
| | | | | | | | | | | | | | | | |
| | | | |
Total Investment Income | | | 31,641 | | | | 28,523 | | | | 37,037 | | | | 26,819 | |
| | | | | | | | | | | | | | | | |
| | | | |
Supervision and Administration Fees(5) | | | 7,864 | | | | 8,612 | | | | 6,882 | | | | 8,351 | |
| | | | | | | | | | | | | | | | |
| | | | |
Total Expenses | | | 7,864 | | | | 8,612 | | | | 6,882 | | | | 8,351 | |
| | | | | | | | | | | | | | | | |
| | | | |
Net Expenses | | | 7,864 | | | | 8,612 | | | | 6,882 | | | | 8,351 | |
| | | | | | | | | | | | | | | | |
| | | | |
Net Investment Income | | | 23,777 | | | | 19,911 | | | | 30,155 | | | | 18,468 | |
| | | | | | | | | | | | | | | | |
| | | | |
Net Realized Gain (Loss) on: | | | | | | | | | | | | | | | | |
| | | | |
Investments | | | (34,143)(6) | | | | (4,409) | | | | (147,749)(6) | | | | (90,899)(6) | |
Foreign Currency Transactions | | | (478) | | | | 539 | | | | 8,537 | | | | (3,384) | |
| | | | | | | | | | | | | | | | |
| | | | |
Net Realized Loss on Investments | | | (34,621) | | | | (3,870) | | | | (139,212) | | | | (94,283) | |
| | | | | | | | | | | | | | | | |
| | | | |
Net Change in Unrealized Depreciation on: | | | | | | | | | | | | | | | | |
| | | | |
Investments | | | (342,500) | | | | (14,065) | | | | (495,871) | | | | (218,217) | |
Foreign Currency Transactions | | | (66) | | | | (94) | | | | (631) | | | | (47) | |
| | | | | | | | | | | | | | | | |
| | | | |
Net Change in Unrealized Depreciation on Investments | | | (342,566) | | | | (14,159) | | | | (496,502) | | | | (218,264) | |
| | | | | | | | | | | | | | | | |
| | | | |
Net Realized and Unrealized Loss on Investments | | | (377,187) | | | | (18,029) | | | | (635,714) | | | | (312,547) | |
| | | | | | | | | | | | | | | | |
| | | | |
Net Increase (Decrease) in Net Assets
Resulting from Operations | | $ | (353,410) | | | $ | 1,882 | | | $ | (605,559) | | | $ | (294,079) | |
| | | | | | | | | | | | | | | | |
| (1) | The Fund commenced operations on April 12, 2011. |
| (2) | The Fund commenced operations on May 2, 2011. |
| (3) | The Fund commenced operations on May 3, 2011. |
| (4) | The Fund commenced operations on June 1, 2011. |
| (5) | The Supervision and Administration fees include fees paid by the Funds for the investment advisory services provided by the Adviser. (See Note 3 in Notes to Financial Statements.) |
| (6) | Includes realized loss as a result of in-kind transactions. (See Note 4 in Notes to Financial Statements.) |
The accompanying notes are an integral part of the financial statements.
36
STATEMENTSOF OPERATIONS
For the period ended October 31, 2011
| | | | | | | | | | | | |
| | | Global X
Auto ETF(1) | | | Global X Canada
Preferred ETF(2) | | | Global X
SuperDividend ETF(3) | |
Investment Income: | | | | | | | | | | | | |
Dividend Income | | $ | 13,736 | | | $ | 167,959 | | | $ | 1,041,679 | |
Interest Income | | | — | | | | 35 | | | | — | |
Less: Foreign Taxes Withheld | | | (1,373) | | | | (25,263) | | | | (65,154) | |
| | | | | | | | | | | | |
| | | |
Total Investment Income | | | 12,363 | | | | 142,731 | | | | 976,525 | |
| | | | | | | | | | | | |
Supervision and Administration Fees(4) | | | 11,112 | | | | 16,953 | | | | 72,139 | |
| | | | | | | | | | | | |
| | | |
Total Expenses | | | 11,112 | | | | 16,953 | | | | 72,139 | |
| | | | | | | | | | | | |
| | | |
Net Expenses | | | 11,112 | | | | 16,953 | | | | 72,139 | |
| | | | | | | | | | | | |
| | | |
Net Investment Income | | | 1,251 | | | | 125,778 | | | | 904,386 | |
| | | | | | | | | | | | |
| | | |
Net Realized Gain (Loss) on: | | | | | | | | | | | | |
Investments | | | (1,478) | | | | (84,477)(5) | | | | (2,750,306)(5) | |
Foreign Currency Transactions | | | 11,249 | | | | (8,592) | | | | (19,368) | |
| | | | | | | | | | | | |
| | | |
Net Realized Gain (Loss) on Investments | | | 9,771 | | | | (93,069) | | | | (2,769,674) | |
| | | | | | | | | | | | |
| | | |
Net Change in Unrealized Appreciation (Depreciation) on: | | | | | | | | | | | | |
Investments | | | (956,056) | | | | (338,566) | | | | (2,544,571) | |
Foreign Currency Transactions | | | (71) | | | | 98 | | | | 2,848 | |
| | | | | | | | | | | | |
| | | |
Net Change in Unrealized Depreciation on Investments | | | (956,127) | | | | (338,468) | | | | (2,541,723) | |
| | | | | | | | | | | | |
| | | |
Net Realized and Unrealized Loss on Investments | | | (946,356) | | | | (431,537) | | | | (5,311,397) | |
| | | | | | | | | | | | |
| | | |
Net Decrease in Net Assets Resulting from Operations | | $ | (945,105) | | | $ | (305,759) | | | $ | (4,407,011) | |
| | | | | | | | | | | | |
| (1) | The Fund commenced operations on May 18, 2011. |
| (2) | The Fund commenced operations on May 24, 2011. |
| (3) | The Fund commenced operations on June 8, 2011. |
| (4) | The Supervision and Administration fees include fees paid by the Funds for the investment advisory services provided by the Adviser. (See Note 3 in Notes to Financial Statements.) |
| (5) | Includes realized loss as a result of in-kind transactions. (See Note 4 in Notes to Financial Statements.) |
The accompanying notes are an integral part of the financial statements.
37
STATEMENTSOF CHANGESIN NET ASSETS
| | | | | | | | | | | | | | | | |
| | | Global X Waste
Management
ETF | | | Global X Food
ETF | | | Global X Fishing
Industry ETF | | | Global X
Farming ETF | |
| | | Period Ended
October 31,
2011 (1) | | | Period Ended
October 31,
2011 (2) | | | Period Ended
October 31,
2011 (3) | | | Period Ended
October 31,
2011 (4) | |
Operations: | | | | | | | | | | | | | | | | |
Net Investment Income | | $ | 23,777 | | | $ | 19,911 | | | $ | 30,155 | | | $ | 18,468 | |
Net Realized Loss on Investments and Foreign Currency Transactions | | | (34,621 | )(5) | | | (3,870 | ) | | | (139,212 | )(5) | | | (94,283 | )(5) |
| | | | |
Net Change in Unrealized Depreciation on Investments and Foreign Currency Transactions | | | (342,566 | ) | | | (14,159 | ) | | | (496,502 | ) | | | (218,264 | ) |
| | | | | | | | | | | | | | | | |
| | | | |
Net Increase (Decrease) in Net Assets Resultingfrom Operations | | | (353,410 | ) | | | 1,882 | | | | (605,559 | ) | | | (294,079 | ) |
| | | | | | | | | | | | | | | | |
| | | | |
Capital Share Transactions: | | | | | | | | | | | | | | | | |
Issued | | | 3,600,500 | | | | 3,709,500 | | | | 2,942,000 | | | | 3,634,000 | |
Redeemed | | | (1,357,500 | ) | | | — | | | | (668,000 | ) | | | (659,500 | ) |
| | | | | | | | | | | | | | | | |
| | | | |
Increase in Net Assets from Capital Share Transactions | | | 2,243,000 | | | | 3,709,500 | | | | 2,274,000 | | | | 2,974,500 | |
| | | | | | | | | | | | | | | | |
| | | | |
Total Increase in Net Assets | | | 1,889,590 | | | | 3,711,382 | | | | 1,668,441 | | | | 2,680,421 | |
| | | | | | | | | | | | | | | | |
| | | | |
Net Assets: | | | | | | | | | | | | | | | | |
Beginning of Period | | | — | | | | — | | | | — | | | | — | |
| | | | | | | | | | | | | | | | |
End of Period | | $ | 1,889,590 | | | $ | 3,711,382 | | | $ | 1,668,441 | | | $ | 2,680,421 | |
| | | | | | | | | | | | | | | | |
| | | | |
Undistributed Net Investment Income | | $ | 23,299 | | | $ | 20,450 | | | $ | 38,692 | | | $ | 12,106 | |
| | | | | | | | | | | | | | | | |
| | | | |
Share Transactions: | | | | | | | | | | | | | | | | |
Issued | | | 250,000 | | | | 250,000 | | | | 200,000 | | | | 250,000 | |
Redeemed | | | (100,000 | ) | | | — | | | | (50,000 | ) | | | (50,000 | ) |
| | | | | | | | | | | | | | | | |
| | | | |
Net Increase in Shares Outstanding from Share Transactions | | | 150,000 | | | | 250,000 | | | | 150,000 | | | | 200,000 | |
| | | | | | | | | | | | | | | | |
| (1) | The Fund commenced operations on April 12, 2011. |
| (2) | The Fund commenced operations on May 2, 2011. |
| (3) | The Fund commenced operations on May 3, 2011. |
| (4) | The Fund commenced operations on June 1, 2011. |
| (5) | Includes realized loss as a result of in-kind transactions. (See Note 4 in Notes to Financial Statements.) |
The accompanying notes are an integral part of the financial statements.
38
STATEMENTSOF CHANGESIN NET ASSETS
| | | | | | | | | | | | |
| | | Global X Auto
ETF | | | Global X
Canada
Preferred ETF | | | Global X
SuperDividend
ETF | |
| | | Period Ended
October 31,
2011 (1) | | | Period Ended
October 31,
2011 (2) | | | Period Ended
October 31,
2011 (3) | |
Operations: | | | | | | | | | | | | |
Net Investment Income | | $ | 1,251 | | | $ | 125,778 | | | $ | 904,386 | |
Net Realized Gain (Loss) on Investments and Foreign Currency Transactions | | | 9,771 | | | | (93,069) | (4) | | | (2,769,674) | (4) |
Net Change in Unrealized Depreciation on Investments and Foreign Currency Transactions | | | (956,127) | | | | (338,468) | | | | (2,541,723) | |
| | | | | | | | | | | | |
Net Decrease in Net Assets Resulting from Operations | | | (945,105) | | | | (305,759) | | | | (4,407,011) | |
| | | | | | | | | | | | |
Dividends and Distributions: | | | | | | | | | | | | |
Net Investment Income | | | — | | | | (92,495) | | | | (831,828) | |
| | | | | | | | | | | | |
Total Dividends and Distributions | | | — | | | | (92,495) | | | | (831,828) | |
| | | | | | | | | | | | |
| | | |
Capital Share Transactions: | | | | | | | | | | | | |
Issued | | | 6,115,500 | | | | 9,047,500 | | | | 46,445,500 | |
Redeemed | | | — | | | | (687,000) | | | | (11,834,500) | |
| | | | | | | | | | | | |
| | | |
Increase in Net Assets from Capital Share Transactions | | | 6,115,500 | | | | 8,360,500 | | | | 34,611,000 | |
| | | | | | | | | | | | |
| | | |
Total Increase in Net Assets | | | 5,170,395 | | | | 7,962,246 | | | | 29,372,161 | |
| | | | | | | | | | | | |
Net Assets: | | | | | | | | | | | | |
Beginning of Period | | | — | | | | — | | | | — | |
| | | | | | | | | | | | |
End of Period | | | $5,170,395 | | | | $7,962,246 | | | | $29,372,161 | |
| | | | | | | | | | | | |
Undistributed Net Investment Income | | $ | 12,500 | | | $ | 24,691 | | | $ | 131,585 | |
| | | | | | | | | | | | |
| | | |
Share Transactions: | | | | | | | | | | | | |
Issued | | | 400,000 | | | | 600,000 | | | | 1,900,000 | |
Redeemed | | | — | | | | (50,000) | | | | (550,000) | |
| | | | | | | | | | | | |
| | | |
Net Increase in Shares Outstanding from Share Transactions | | | 400,000 | | | | 550,000 | | | | 1,350,000 | |
| | | | | | | | | | | | |
| (1) | The Fund commenced operations on May 18, 2011. |
| (2) | The Fund commenced operations on May 24, 2011. |
| (3) | The Fund commenced operations on June 8, 2011. |
| (4) | Includes realized loss as a result of in-kind transactions. (See Note 4 in Notes to Financial Statements.) |
The accompanying notes are an integral part of the financial statements.
39
FINANCIAL HIGHLIGHTS
Selected Per Share Data & Ratios
For a Share Outstanding Throughout the Period
| | | | | | | | | | | | | | | | | | | | | | | | | | |
| | | Net Asset
Value,
Beginning
of Period
($) | | Net
Investment
Income
($)* | | Net
Realized
and
Unrealized
Loss on
Investments
($) | | Total from
Operations
($) | | Distribution
from Net
Investment
Income ($) | | Distribution
from
Capital
Gains ($) | | Total from
Distributions
($) | | Net
Asset
Value,
End of
Period
($) | | Total
Return
(%)** | | Net
Assets
End of
Period
($)(000) | | Ratio of
Expenses
to
Average
Net
Assets
(%) | | Ratio of
Net
Investment
Income to
Average
Net Assets
(%) | | Portfolio
Turnover
(%) |
Global X Waste Management ETF (1) |
2011 | | 14.87 | | 0.15 | | (2.42) | | (2.27) | | — | | — | | — | | 12 .60 | | (15 .27) | | 1,890 | | 0.65 † | | 1 .96† | | 4.27 †† |
Global X Food ETF (2) |
2011 | | 15.17 | | 0 .11 | | (0.43) | | (0.32) | | — | | — | | — | | 14 .85 | | (2 .11) | | 3,711 | | 0.65 † | | 1 .49† | | 6.71 †† |
Global X Fishing Industry ETF (3) |
2011 | | 14.92 | | 0 .19 | | (3.99) | | (3.80) | | — | | — | | — | | 11 .12 | | (25 .47) | | 1,668 | | 0.69 † | | 3 .01† | | 19.45 †† |
Global X Farming ETF (4) |
2011 | | 14.89 | | 0 .08 | | (1.57) | | (1.49) | | — | | — | | — | | 13 .40 | | (10 .01) | | 2,680 | | 0.68 † | | 1 .49† | | 3.40 †† |
Global X Auto ETF (5) |
2011 | | 15.20 | | — | | (2.27) | | (2.27) | | — | | — | | — | | 12 .93 | | (14 .93) | | 5,170 | | 0.65 † | | 0 .07† | | 0.34 †† |
Global X Canada Preferred ETF (6) |
2011 | | 14.97 | | 0 .27 | | (0.56) | | (0.29) | | (0.20) | | — | | (0.20) | | 14 .48 | | (1 .94) | | 7,962 | | 0.58 † | | 4 .28† | | 3.02 †† |
Global X SuperDividend ETF (7) |
2011 | | 24.70 | | 0 .64 | | (3.02) | | (2.38) | | (0.56) | | — | | (0.56) | | 21 .76 | | (9 .56) | | 29,372 | | 0.58 † | | 7 .22† | | 4.58 †† |
| (1) | The Fund commenced operations on April 12, 2011. |
| (2) | The Fund commenced operations on May 2, 2011. |
| (3) | The Fund commenced operations on May 3, 2011. |
| (4) | The Fund commenced operations on June 1, 2011. |
| (5) | The Fund commenced operations on May 18, 2011. |
| (6) | The Fund commenced operations on May 24, 2011. |
| (7) | The Fund commenced operations on June 8, 2011. |
| * | Per share data calculated using average shares method. |
| ** | Total Return is for the period indicated and has not been annualized. The return shown does not reflect the deduction of taxes that a shareholder would pay on Fund distributions or the redemption of Fund shares. |
| †† | Portfolio turnover rate is for the period indicated and has not been annualized. Excludes effect of in-kind transfers. |
Amounts designated as “—” are either $0 or have been rounded to $0.
The accompanying notes are an integral part of the financial statements.
40
NOTESTO FINANCIAL STATEMENTS
OCTOBER 31, 2011
1. ORGANIZATION
The Global X Funds (the “Trust”) is a Delaware Statutory Trust formed on March 6, 2008. The Trust is registered under the Investment Company Act of 1940, as amended, as an open-end management investment company with eighty-six portfolios as of October 31, 2011. The financial statements herein and the related notes pertain to the Global X Waste Management ETF, Global X Food ETF, Global X Fishing Industry ETF, Global X Farming ETF, Global X Auto ETF, Global X Canada Preferred ETF and the Global X SuperDividend ETF (each a “Fund”, collectively, the “Funds”). Each Fund is non-diversified.
2. SIGNIFICANT ACCOUNTING POLICIES
The following is a summary of the Significant Accounting Policies followed by the Funds.
USE OF ESTIMATES — The preparation of financial statements in conformity with U.S. Generally Accepted Accounting Principles (“U.S. GAAP”) requires management to make estimates and assumptions that affect the reported amounts of assets and liabilities and disclosure of contingent assets and liabilities at the date of the financial statements and the reported amounts of increases and decreases in net assets from operations during the reporting period. Actual results could differ from those estimates, and could have a material impact to the Funds.
SECURITY VALUATION — Securities listed on a securities exchange, market or automated quotation system for which quotations are readily available (except for securities traded on NASDAQ), including securities traded over the counter, are valued at the last quoted sale price on the primary exchange or market (foreign or domestic) on which they are traded (or at approximately 4:00 pm if a security’s primary exchange is normally open at that time), or, if there is no such reported sale, at the most recent mean between the quoted bid and asked prices (absent both bid and asked prices on such exchange, the bid price may be used).
For securities traded on NASDAQ, the NASDAQ Official Closing Price will be used. If available, debt securities are priced based upon valuations provided by independent, third-party pricing agents. Such values generally reflect the last reported sales price if the security is actively traded. The third-party pricing agents may also value debt securities at an evaluated bid price by employing methodologies that utilize actual market transactions, broker-supplied valuations, or other methodologies designed to identify the market value for such securities. Debt obligations with remaining maturities of sixty days or less may be valued at their amortized cost, which approximates market value. The prices for foreign securities are reported in local currency and converted to U.S. dollars using currency exchange rates. Prices for most securities held in the Funds are provided daily by recognized independent pricing agents. If a security price cannot be obtained from an independent, third-party pricing agent, the Funds seek to obtain a bid price from at least one independent broker.
41
NOTESTO FINANCIAL STATEMENTS (CONTINUED)
OCTOBER 31, 2011
2. SIGNIFICANT ACCOUNTING POLICIES (continued)
SECURITY VALUATION (continued)
Securities for which market prices are not “readily available” are valued in accordance with Fair Value Procedures established by the Board of Trustees (the “Board”). The Funds’ Fair Value Procedures are implemented through a Fair Value Committee (the “Committee”) designated by the Board. Some of the more common reasons that may necessitate that a security be valued using Fair Value Procedures include: the security’s trading has been halted or suspended; the security has been de-listed from a national exchange; the security’s primary trading market is temporarily closed at a time when under normal conditions it would be open; the security has not been traded for an extended period of time; the security’s primary pricing source is not able or willing to provide a price; or trading of the security is subject to local government-imposed restrictions. When a security is valued in accordance with the Fair Value Procedures, the Committee will determine the value after taking into consideration relevant information reasonably available to the Committee. As of October 31, 2011, there was $14,060 of a fair valued security in the Global X Farming ETF Fund. There were no other securities priced using the Fair Value Procedures.
For securities that principally trade on a foreign market or exchange, a significant gap in time can exist between the time of a particular security’s last trade and the time at which the Funds calculated their net asset value. The closing prices of such securities may no longer reflect their market value at the time the Funds calculated net asset value if an event that could materially affect the value of those securities (a “Significant Event”) has occurred between the time of the security’s last close and the time that the Funds calculate net asset value. A Significant Event may relate to a single issuer or to an entire market sector. If Global X Management Company LLC (the “Adviser”) becomes aware of a Significant Event that has occurred with respect to a security or group of securities after the closing of the exchange or market on which the security or securities principally trade, but before the time at which the Funds calculate net asset value, it may request that a Committee meeting be called. In addition, the Funds’ Sub-administrator, SEI Investments Global Funds Services (“SEIGFS”), monitors price movements among certain selected indices, securities and/or baskets of securities that may be an indicator that the closing prices received earlier from foreign exchanges or markets may not reflect market value at the time the Funds calculate net asset value. If price movements in a monitored index or security exceed levels established by the Sub-administrator, the Sub-administrator notifies the Adviser that such limits have been exceeded. In such event, the Adviser makes the determination whether a Committee meeting should be called based on the information provided.
In accordance with the authoritative guidance on fair value measurements and disclosure under U.S. GAAP, the Funds disclose the fair value of their investments in a hierarchy that prioritizes the inputs to valuation techniques used to measure the fair value. The objective of a fair value measurement is to determine the price that would be received to sell an asset or paid to transfer a liability in an orderly transaction between market participants at the measurement date (an exit price). Accordingly, the fair value hierarchy gives the highest priority to quoted prices (unadjusted) in active markets for identical assets or liabilities (Level 1) and the lowest priority to unobservable inputs (Level 3). The three levels of the fair value hierarchy are described below:
Level 1 – Unadjusted quoted prices in active markets for identical, unrestricted assets or liabilities that the Funds have the ability to access at the measurement date
42
NOTESTO FINANCIAL STATEMENTS (CONTINUED)
OCTOBER 31, 2011
2. SIGNIFICANT ACCOUNTING POLICIES (continued)
SECURITY VALUATION (concluded)
Level 2 – Other significant observable inputs (including quoted prices for similar investments, fair value of investments for which the Funds have the ability to fully redeem tranches at net asset value as of the measurement date or within the near term, and short-term investments valued at amortized cost)
Level 3 – Significant unobservable inputs (including the Funds own assumptions in determining the fair value of investments, fair value of investments for which the Funds do not have the ability to fully redeem tranches at net asset value as of the measurement date or within the near term)
Investments are classified within the level of the lowest significant input considered in determining fair value. Investments classified within Level 3 whose fair value measurement considers several inputs may include Level 1 or Level 2 inputs as components of the overall fair value measurement.
For the period ended October 31, 2011 there have been no significant changes to the Funds’ fair valuation methodologies.
FEDERAL INCOME TAXES — It is each Fund’s intention to qualify or continue to qualify as a regulated investment company for Federal income tax purposes by complying with the appropriate provisions of Subchapter M of the Internal Revenue Code of 1986, as amended. Accordingly, no provisions for Federal income taxes have been made in the financial statements.
The Funds evaluate tax positions taken or expected to be taken in the course of preparing the Funds’ tax returns to determine whether it is “more-likely-than-not” (i.e., greater than 50 percent) that each tax position will be sustained upon examination by a taxing authority based on the technical merits of the position. Tax positions not deemed to meet the more-likely-than-not threshold are recorded as a tax benefit or expense in the current year. The Funds did not record any tax provisions in the current period. However, management’s conclusions regarding tax positions may be subject to review and adjustment at a later date based on factors including, but not limited to, examination by tax authorities (i.e., the last three tax year ends, as applicable), on-going analysis of and changes to tax laws, regulations and interpretations thereof.
SECURITY TRANSACTIONS AND INVESTMENT INCOME — Security transactions are accounted for on the trade date for financial reporting purposes. Costs used in determining realized gains and losses on the sale of investment securities are based on specific identification. Dividend income is recorded on the ex-dividend date. Interest income is recognized on the accrual basis from the settlement date.
FOREIGN CURRENCY TRANSLATION — The books and records of the Funds are maintained in U.S. dollars. Investment securities and other assets and liabilities denominated in a foreign currency are translated into U.S. dollars on the date of valuation. Purchases and sales of investment securities, income and expenses are translated into U.S. dollars at the relevant rates of exchange prevailing on the respective dates of such transactions. The Funds do not isolate that portion of realized or unrealized gains and losses resulting from changes in the foreign exchange rate from fluctuations arising from changes in the market prices of the securities. These gains and losses are included in net realized and unrealized gains and losses on investments on the Statement of Operations. Net
43
NOTESTO FINANCIAL STATEMENTS (CONTINUED)
OCTOBER 31, 2011
2. SIGNIFICANT ACCOUNTING POLICIES (concluded)
FOREIGN CURRENCY TRANSLATION (concluded)
realized and unrealized gains and losses on foreign currency transactions represent net foreign exchange gains or losses from foreign currency exchange contracts, disposition of foreign currencies, currency gains or losses realized between trade and settlement dates on securities transactions and the difference between the amount of the investment income and foreign withholding taxes recorded on the Funds’ books and the U.S. dollar equivalent amounts actually received or paid.
DIVIDENDS AND DISTRIBUTIONS TO SHAREHOLDERS — The Funds distribute their net investment income on a pro rata basis. Any net realized capital gains are distributed annually. All distributions are recorded on the ex-dividend date.
CREATION UNITS — The Funds issue and redeem shares (“Shares”) at Net Asset Value (“NAV”) and only in large blocks of Shares, (each block of Shares for a Fund is called a “Creation Unit” or multiples thereof). Purchasers of Creation Units (“Authorized Participants”) at NAV must pay a standard creation transaction fee per transaction. The fee is a single charge and will be the same regardless of the number of Creation Units purchased by an investor on the same day. An Authorized Participant who holds Creation Units and wishes to redeem at NAV would also pay a standard Redemption Fee per transaction on the date of such redemption, regardless of the number of Creation Units redeemed that day.
If a Creation Unit is purchased or redeemed for cash, a higher Transaction Fee will be charged. The following table discloses Creation Unit breakdown:
| | | | | | | | | | | | | | | | |
| | | Creation
Unit Shares | | | Transaction
Fee | | | Value | | | Redemption
Fee | |
| | | | |
Global X Waste Management ETF | | | 50,000 | | | $ | 1,000 | | | $ | 630,000 | | | $ | 1,000 | |
Global X Food ETF | | | 50,000 | | | | 1,000 | | | | 742,500 | | | | 1,000 | |
Global X Fishing Industry ETF | | | 50,000 | | | | 1,000 | | | | 556,000 | | | | 1,000 | |
Global X Farming ETF | | | 50,000 | | | | 1,000 | | | | 670,000 | | | | 1,000 | |
Global X Auto ETF | | | 50,000 | | | | 1,000 | | | | 646,500 | | | | 1,000 | |
Global X Canada Preferred ETF | | | 50,000 | | | | 1,000 | | | | 724,000 | | | | 1,000 | |
Global X SuperDividend ETF | | | 50,000 | | | | 3,800 | | | | 1,088,000 | | | | 3,800 | |
3. RELATED PARTY TRANSACTIONS
The Adviser serves as the investment adviser and the administrator for the Funds. Subject to the supervision of the Board of Trustees, the Adviser is responsible for managing the investment activities of the Funds and the Funds’ business affairs and other administrative matters and provides or causes to be furnished all supervisory, administrative and other services reasonably necessary for the operation of the Funds, including certain distribution services (provided pursuant to a separate Distribution Agreement), certain shareholder and distribution-related services (provided pursuant to a separate Rule 12b-1 Plan and related agreements) and investment advisory services (provided pursuant to a separate Investment Advisory Agreement), under what is essentially an “all-in” fee structure. For its service to the Funds, under the Supervision and Administration Agreement, each Fund pays a monthly fee to the Adviser at the annual rate (stated as a percentage of the average daily net assets of the Fund). In addition, the Funds bear other expenses that are not covered by the
44
NOTESTO FINANCIAL STATEMENTS (CONTINUED)
OCTOBER 31, 2011
3. RELATED PARTY TRANSACTIONS (concluded)
Supervision and Administration Agreement, which may vary and affect the total expense ratios of the Funds, such as taxes, brokerage fees, commissions and other transaction expenses, interest expenses and extraordinary expenses (such as litigation and indemnification expenses).
| | | | |
| | | | Supervision and
Administration Fee |
Global X Waste Management ETF | | | | 0.65% |
Global X Food ETF | | | | 0.65% |
Global X Fishing Industry ETF | | | | 0.69% |
Global X Farming ETF | | | | 0.68% |
Global X Auto ETF | | | | 0.65% |
Global X Canada Preferred ETF | | | | 0.58% |
Global X SuperDividend ETF | | | | 0.58% |
SEIGFS serves as Sub-Administrator to the Funds. As Sub-Administrator, SEIGFS provides the Funds with the required general administrative services, including, without limitation: office space, equipment, and personnel; clerical and general back office services; bookkeeping, internal accounting and secretarial services; the calculation of NAV; and assistance with the preparation and filing of reports, registration statements, proxy statements and other materials required to be filed or furnished by the Funds under federal and state securities laws. As compensation for these services, the Sub-Administrator receives certain out-of-pocket costs, transaction fees and asset-based fees which are accrued daily and paid monthly by the Adviser.
SEI Investments Distribution Co. (“SIDCO”) serves as each Funds underwriter and distributor of Shares pursuant to a Distribution Agreement. Under the Distribution Agreement, SIDCO, as agent, receives orders to create and redeem Shares in Creation Unit Aggregations and transmits such orders to the Trust’s custodian and transfer agent. The Distributor has no obligation to sell any specific quantity of Fund Shares. SIDCO bears the following costs and expenses relating to the distribution of Shares: (i) the costs of processing and maintaining records of creations of Creation Units; (ii) all costs of maintaining the records required of a registered broker/dealer; (iii) the expenses of maintaining its registration or qualification as a dealer or broker under Federal or state laws; (iv) filing fees; and (v) all other expenses incurred in connection with the distribution services as contemplated in the Distribution Agreement. SIDCO receives no fee for its distribution services under the Distribution Agreement.
45
NOTESTO FINANCIAL STATEMENTS (CONTINUED)
OCTOBER 31, 2011
4. INVESTMENT TRANSACTIONS
For the period ended October 31, 2011, the purchases and sales of investments in securities excluding in-kind transactions, long-term U.S. Government and short-term securities were:
| | | | | | | | |
| | | Purchases | | | Sales | |
Global X Waste Management ETF | | $ | 223,155 | | | $ | 97,252 | |
Global X Food ETF | | | 261,070 | | | | 189,673 | |
Global X Fishing Industry ETF | | | 1,183,931 | | | | 385,452 | |
Global X Farming ETF | | | 658,568 | | | | 107,009 | |
Global X Auto ETF | | | 742,930 | | | | 13,439 | |
Global X Canada Preferred ETF | | | 236,843 | | | | 198,651 | |
Global X SuperDividend ETF | | | 2,681,452 | | | | 1,544,244 | |
During the period ended October 31, 2011, there were no purchases or sales of long-term U.S. Government securities for the Funds.
For the period ended October 31, 2011, in-kind transactions associated with creations and redemptions were:
| | | | | | | | | | | | |
| | | Purchases | | | Sales | | | Realized
Loss | |
Global X Waste Management ETF | | $ | 2,923,494 | | | $ | 790,025 | | | $ | (24,975 | ) |
Global X Food ETF | | | 3,576,469 | | | | - | | | | - | |
Global X Fishing Industry ETF | | | 2,002,175 | | | | 468,988 | | | | (62,872 | ) |
Global X Farming ETF | | | 2,986,081 | | | | 553,246 | | | | (80,740 | ) |
Global X Auto ETF | | | 5,392,622 | | | | - | | | | - | |
Global X Canada Preferred ETF | | | 9,024,193 | | | | 685,410 | | | | (80,963 | ) |
Global X SuperDividend ETF | | | 44,934,699 | | | | 11,497,261 | | | | (1,968,872 | ) |
46
NOTESTO FINANCIAL STATEMENTS (CONTINUED)
OCTOBER 31, 2011
5. TAX INFORMATION
The amount and character of income and capital gain distributions to be paid, if any, are determined in accordance with Federal income tax regulations, which may differ from U.S. GAAP. As a result, net investment income (loss) and net realized gain (loss) on investment transactions for a reporting period may differ significantly from distributions during such period. These book/tax differences may be temporary or permanent. To the extent these differences are permanent in nature, they are charged or credited to undistributed net investment income (loss), accumulated net realized gain (loss) or paid-in capital, as appropriate, in the period that the differences arise.
The following differences, primarily attributable to foreign currency, redemptions in-kind, sales of passive foreign investment companies, net operating losses and the utilization of earnings and profits on shareholder redemptions, have been reclassified to/from the following accounts during the fiscal period ended October 31, 2011.
| | | | | | |
Global X Funds | | Paid-in
Capital | | Undistributed
Net
Investment
Income/(Loss) | | Accumulated
Net Realized
Gain/(Loss) |
Global X Waste Management ETF | | $(24,974) | | $(478) | | $25,452 |
Global X Food ETF | | – | | 539 | | (539) |
Global X Fishing Industry ETF | | (62,872) | | 8,537 | | 54,335 |
Global X Farming ETF | | (77,762) | | (6,362) | | 84,124 |
Global X Auto ETF | | – | | 11,249 | | (11,249) |
Global X Canada Preferred ETF | | (80,964) | | (8,592) | | 89,556 |
Global X SuperDividend ETF | | (1,968,872) | | 59,027 | | 1,909,845 |
These reclassifications have no impact on net assets or net asset value per share.
The tax character of dividends and distributions paid during the last period ended October 31, 2011 were as follows:
| | | | | | | | | | | | |
Global X Funds | | Ordinary
Income | | | Long-Term
Capital Gain | | | Totals | |
| | | |
Global X Canada Preferred ETF | | | | | | | | | | | | |
2011 | | $ | 92,495 | | | $ | – | | | $ | 92,495 | |
Global X SuperDividend ETF | | | | | | | | | | | | |
2011 | | $ | 831,828 | | | $ | – | | | $ | 831,828 | |
47
NOTESTO FINANCIAL STATEMENTS (CONTINUED)
OCTOBER 31, 2011
5. TAX INFORMATION (continued)
As of October 31, 2011, the Components of Tax Basis Distributable Earnings (Accumulated Losses) were as follows:
| | | | | | | | | | | | |
| | | Global X Funds | |
| | | Global X Waste
Management ETF | | | Global X Food
ETF | | | Global X Fishing
Industry ETF | |
Undistributed Ordinary Income | | $ | 23,299 | | | $ | 20,459 | | | $ | 38,692 | |
Capital Loss Carryforwards | | | (9,169) | | | | – | | | | (84,877) | |
Unrealized Depreciation on Investments and Foreign Currency | | | (342,566) | | | | (18,577) | | | | (496,502) | |
| | | | | | | | | | | | |
Total Distributable Earnings (Accumulated Losses) | | $ | (328,436) | | | $ | 1,882 | | | $ | (542,687) | |
| | | | | | | | | | | | |
| |
| | | Global X Funds | |
| | | Global X Farming
ETF | | | Global X Auto
ETF | | | Global X Canada
Preferred ETF | |
Undistributed Ordinary Income | | $ | 12,106 | | | $ | 12,529 | | | $ | 24,691 | |
Capital Loss Carryforwards | | | (9,385) | | | | (18) | | | | (3,513) | |
Unrealized Depreciation on Investments and Foreign Currency | | | (219,038) | | | | (957,616) | | | | (338,468) | |
| | | | | | | | | | | | |
Total Accumulated Losses | | $ | (216,317) | | | $ | (945,105) | | | $ | (317,290) | |
| | | | | | | | | | | | |
| | |
| | | Global X Funds | | | | |
| | | Global X
SuperDividend
ETF | | |
Undistributed Ordinary Income | | $ | 184,525 | | |
Capital Loss Carryforwards | | | (851,369) | | |
Unrealized Depreciation on Investments and Foreign Currency | | | (2,603,123) | | |
| | | | | |
Total Accumulated Losses | | $ | (3,269,967) | | | | | | | | | |
| | | | | | | | | | | | |
48
NOTESTO FINANCIAL STATEMENTS (CONTINUED)
OCTOBER 31, 2011
5. TAX INFORMATION (concluded)
For Federal income tax purposes, capital loss carryforwards represent realized losses of the Funds that may be carried forward for a maximum period of eight years and applied against future gains.
Under the recently enacted Regulated Investment Company Modernization Act of 2010, the Funds will be permitted to carry forward capital losses incurred in taxable years beginning after December 22, 2010 for an unlimited period. However, any losses incurred during those future taxable years will be required to be used prior to the losses incurred in pre-enactment taxable years. As a result of this ordering rule, preenactment capital loss carryforwards may be more likely to expire unused. Additionally, post-enactment capital losses that are carried forward will retain their character as either short-term or long-term capital losses rather than being considered all short-term as under previous law. Losses carried forward under these new provisions are as follows:
| | | | | | | | | | | | |
| | | Short-Term | | | Long-Term | | | | |
Global X Funds | | Loss | | | Loss | | | Total | |
Global X Waste Management ETF | | $ | 9,169 | | | $ | - | | | $ | 9,169 | |
Global X Fishing Industry ETF | | | 84,877 | | | | - | | | | 84,877 | |
Global X Farming ETF | | | 9,385 | | | | - | | | | 9,385 | |
Global X Auto ETF | | | 18 | | | | - | | | | 18 | |
Global X Canada Preferred ETF | | | 3,513 | | | | - | | | | 3,513 | |
Global X SuperDividend ETF | | | 851,369 | | | | - | | | | 851,369 | |
The Federal tax cost and aggregate gross unrealized appreciation and depreciation on investments held by the Funds at October 31, 2011 were as follows:
| | | | | | | | | | | | | | | | |
Global X Funds | | Federal Tax
Cost | | | Aggregated
Gross
Unrealized
Appreciation | | | Aggregated
Gross
Unrealized
Depreciation | | | Net
Unrealized
Depreciation | |
Global X Waste Management ETF | | $ | 2,225,869 | | | $ | 45,670 | | | $ | (388,170 | ) | | $ | (342,500 | ) |
Global X Food ETF | | | 3,647,875 | | | | 81,414 | | | | (99,897 | ) | | | (18,483 | ) |
Global X Fishing Industry ETF | | | 2,183,908 | | | | 67,875 | | | | (563,746 | ) | | | (495,871 | ) |
Global X Farming ETF | | | 2,894,269 | | | | 14,179 | | | | (233,170 | ) | | | (218,991 | ) |
Global X Auto ETF | | | 6,126,312 | | | | 9,819 | | | | (967,364 | ) | | | (957,545 | ) |
Global X Canada Preferred ETF | | | 8,292,540 | | | | 3,494 | | | | (342,060 | ) | | | (338,566 | ) |
Global X SuperDividend ETF | | | 31,807,297 | | | | 520,256 | | | | (3,126,227 | ) | | | (2,605,971 | ) |
The preceding differences between book and tax cost are primarily due to mark to market treatment of passive foreign investment companies and wash sales.
49
NOTESTO FINANCIAL STATEMENTS (CONTINUED)
OCTOBER 31, 2011
6. CONCENTRATION OF RISKS
The Funds invest in securities of foreign issuers in several countries. These investments may involve certain considerations and risks not typically associated with investments in the United States as a result of, among other factors, the possibility of future political and economic developments and the level of governmental supervision and regulation of securities markets in the respective countries.
The securities markets of emerging countries are less liquid and subject to greater price volatility, and have a smaller market capitalization, than the U.S. securities markets. In certain countries, there may be fewer publicly traded securities and the market may be dominated by a few issuers or sectors. Issuers and securities markets in such countries are not subject to as extensive and frequent accounting, financial and other reporting requirements or as comprehensive government regulations as are issuers and securities markets in the U.S. In particular, the assets and profits appearing on the financial statements of emerging country issuers may not reflect their financial position or results of operations in the same manner as financial statements for U.S. issuers. Substantially less information may be publicly available about emerging country issuers than is available about issuers in the United States.
The Funds may be subject to taxes imposed by countries in which it invests. Such taxes are generally based on either income or gains earned or repatriated. The Funds accrue and apply such taxes to net investment income, net realized gains and net unrealized gains as income and/or capital gains are earned.
The Funds use a replication strategy. A replication strategy is an indexing strategy that involves investing in the securities of the Underlying Index in approximately the same proportions as in the Underlying Indices. The Funds may utilize a representative sampling strategy with respect to their Underlying Indices when a replication strategy might be detrimental to their shareholders, such as when there are practical difficulties or substantial costs involved in compiling a portfolio of equity securities to follow its Underlying Index, or, in certain instances, when securities in the Underlying Indices become temporarily illiquid, unavailable or less liquid, or due to legal restrictions (such as diversification requirements that apply to the Funds but not the Underlying Indices).
7. OTHER
At October 31, 2011, the total Shares outstanding that were held by Authorized Participants were as follows. The Authorized Participants have entered into an agreement with the Funds’ Distributor.
| | | | |
| | | Authorized
Participants | | Percentage of Shares Outstanding |
| | |
Global X Waste Management ETF | | 2 | | 100% |
Global X Food ETF | | 2 | | 100% |
Global X Fishing Industry ETF | | 1 | | 100% |
Global X Farming ETF | | 2 | | 100% |
Global X Auto ETF | | 2 | | 100% |
Global X Canada Preferred ETF | | 3 | | 100% |
Global X SuperDividend ETF | | 3 | | 100% |
50
NOTESTO FINANCIAL STATEMENTS (CONTINUED)
OCTOBER 31, 2011
7. OTHER (concluded)
Pursuant to the Trust’s organizational documents, the Trustees of the Trust and the Trust’s officers are indemnified against certain liabilities that may arise out of the performance of their duties.
8. CHANGE OF INDEPENDENT REGISTERED PUBLIC ACCOUNTING FIRM
The Global X Funds have selected Ernst & Young LLP (“E&Y”) to serve as the Funds’ independent registered public accounting firm for the Funds’ fiscal year ended October 31, 2011. The decision to select E&Y was recommended by the Funds’ Audit Committee on December 21, 2010 and was approved by the Funds’ Board of Trustees on January 28, 2011. During the Global X Funds’ fiscal years ended October 31, 2009 and October 31, 2010, neither the Funds, their portfolios, nor anyone on their behalf, consulted with E&Y on items which: (i) concerned the application of accounting principles to a specified transaction, either completed or proposed, or the type of audit opinion that might be rendered on the Global X Funds’ financial statements; or (ii) concerned the subject of a disagreement (as defined in paragraph (a)(1)(iv) of Item 304 of Regulation S-K) or reportable events (as described in paragraph (a)(1)(iv) of said Item 304).
The selection of E&Y does not reflect any disagreements with or dissatisfaction by the Global X Funds or the Funds’ Board of Trustees with the performance of the Global X Funds prior independent registered public accounting firm, Sanville & Company (“Sanville”). The decision not to renew the engagement of Sanville, effective upon its completion of its audit for the fiscal year ended October 31, 2010, and to select E&Y was recommended by the Funds’ Audit Committee and approved by the Funds’ Board of Trustees. Sanville’s report on the Global X Funds’ financial statements for the fiscal years ended October 31, 2009 and October 31, 2010 contained no adverse opinion or disclaimer of opinion, nor were they qualified or modified as to uncertainty, audit scope, or accounting principles. During the Global X Funds’ fiscal years ended October 31, 2009 and October 31, 2010 (i) there were no disagreements with Sanville on any matter of accounting principles or practices, financial statement disclosure, or auditing scope or procedure, which disagreements, if not resolved to the satisfaction of Sanville, would have caused them to make reference to the subject matter of the disagreements in connection with their reports on the Global X Funds’ financial statements for such years; and (ii) there were no “reportable events” of the kind described in Item 304(a)(1)(v) of Regulation S-K.
9. LOANS OF PORTFOLIO SECURITIES
The Funds may lend portfolio securities having a market value up to one-third of the Funds’ total assets. Such loans are secured by collateral equal to no less than the market value of the loaned securities determined daily. Such collateral will be cash or debt securities issued or guaranteed by the U.S. Government or any agencies. Cash collateral received in connection with these loans is invested in short-term money market instruments. It is the Funds’ policy to obtain additional collateral from or return excess collateral to the borrower by the end of the next business day, following the valuation date of the securities loaned. Therefore, the value of the collateral held may be temporarily less than the value of the securities on loan. Lending securities entails a risk of loss to the Funds if and to the extent that the market value of the securities loans were to increase and the borrower did
51
NOTESTO FINANCIAL STATEMENTS (CONTINUED)
OCTOBER 31, 2011
9. LOANS OF PORTFOLIO SECURITIES (concluded)
not increase the collateral accordingly, and the borrower fails to return the securities. The Funds could also experience delays and costs in gaining access to the collateral. The Funds bear the risk of any deficiency in the amount of the collateral available for return to the borrower due to any loss on the collateral invested. As of October 31, 2011, there were no securities on loan for any of the Funds.
10. CONTRACTUAL OBLIGATIONS
The Funds enter into contracts in the normal course of business that contain a variety of indemnifications. The Funds maximum exposure under these arrangements is unknown. However the Funds have not had prior gains or losses pursuant to these contracts. Management has reviewed the Funds’ existing contracts and expects the risk of loss to be remote.
11. NEW ACCOUNTING PROUNCEMENTS
In May 2011, the Financial Accounting Standards Board issued Accounting Standards Updates (“ASU”) No. 2011-04 “Amendments to Achieve Common Fair Value Measurement and Disclosure Requirements in U.S. GAAP and International Financial Reporting Standards (“IFRS”).” ASU 2011-04 includes common requirements for measurement of and disclosure about fair value between U.S. GAAP and IFRS.ASU 2011-04 will require reporting entities to disclose the following information for fair value measurements categorized within Level 3 of the fair value hierarchy: quantitative information about the unobservable inputs used in the fair value measurement, the valuation processes used by the reporting entity, and a narrative description of the sensitivity of the fair value measurement to changes in unobservable inputs and the interrelationships between those unobservable inputs. In addition, ASU 2011-04 will require reporting entities to make disclosures about amounts and reasons for all transfers in and out of Level 1 and Level 2 fair value measurements. The new and revised disclosures are effective for interim and annual reporting periods beginning after December 15, 2011. At this time, management is evaluating the implications of ASU 2011-04 and its impact on the financial statements.
12. SUBSEQUENT EVENT
The Funds have evaluated the need for additional disclosures and/or adjustments resulting from subsequent events. Based on this evaluation, no additional disclosures or adjustments were required to the financial statements as of the date the financial statements were issued.
Subsequent to fiscal year end, on November 11, 2011, the continuation of the Investment Advisory Agreement and Supervision and Administration Agreement for the Funds was considered and approved by the Board of Trustees of the Trust.
Subsequent to year end, on December, 19, 2011, the Board of Trustees of the Trust, based upon the recommendation of the Adviser, determined to liquidate and terminate the Global X Fishing Industry ETF, Global X Food ETF, Global X Waste Management ETF, and Global X Farming ETF (the “Liquidating Funds.”). Due to the Liquidating Funds’ low levels of assets, the Adviser does not believe that it can continue to conduct the Liquidating Funds’ business and operations in an economically efficient manner. As such, the Board concluded that it would be in the best interests of the Liquidating Funds and their shareholders to liquidate and terminate the Liquidating Funds. As of
52
NOTESTO FINANCIAL STATEMENTS (CONCLUDED)
OCTOBER 31, 2011
12. SUBSEQUENT EVENT (concluded)
the close of regular trading on the NYSE Arca, Inc. (“NYSE”) on February 16, 2012 (“Closing Date”), the shares of the Liquidating Funds will cease trading on the NYSE and will close to purchases by investors.
Shareholders may sell their holdings in the Liquidating Funds prior to the Closing Date and customary brokerage charges may apply to these transactions. However, from February 17, 2012, through February 27, 2012 (“Liquidation Date”), shareholders only may be able to sell their shares to certain broker-dealers and there is no assurance that there will be a market for the Liquidating Funds during this time period. Between the Closing Date and the Liquidation Date, the Liquidating Funds will be in the process of winding up their operations and liquidating their portfolio. This process will result in the Liquidating Funds not tracking their underlying indexes and their cash holdings increasing, which may not be consistent with the Liquidating Funds’ investment objective and strategy.
On or about the Liquidation Date, the Liquidating Funds will liquidate their assets and distribute cash pro rata to all remaining shareholders who have not previously redeemed their shares. These distributions are taxable events. In addition, these payments to shareholders will include accrued capital gains and dividends, if any. Once the distributions are complete, the Liquidating Funds will terminate.
Subsequent to fiscal year end, on December 21, 2011, based on the recommendation of the Adviser, the Board of Trustees of the Trust approved the discontinuance of the Global X Philippines PSEi ETF and Global X Shipping ETF, each a separate investment portfolio of the Trust that had never commenced operations.
Subsequent to year end, the following investment portfolios were added to the Trust.
Fund Name
Global X NASDAQ 100 Global Technology Index ETF
Global X NASDAQ 500 ETF
Global X NASDAQ 400 Mid Cap ETF
Global X FTSE Permanent ETF
Subsequent to year end, the following investment portfolios of the Trust commenced operations.
| | | | |
Fund Name | | | | Commenced Operations |
| | |
Global X Social Media Index ETF | | | | November 14, 2011 |
Global X NASDAQ 500 ETF | | | | December 5, 2011 |
Global X NASDAQ 400 Mid Cap ETF | | | | December 5, 2011 |
Global X FTSE Greece 20 ETF | | | | December 7, 2011 |
53
REPORTOF INDEPENDENT REGISTERED PUBLIC ACCOUNTING FIRM
To the Shareholders and Board of Trustees of Global X Funds
We have audited the accompanying statements of assets and liabilities, including the schedules of investments, of Global X Waste Management ETF, Global X Food ETF, Global X Fishing Industry ETF, Global X Farming ETF, Global X Auto ETF, Global X Canada Preferred ETF and Global X SuperDividend ETF (seven of the series constituting the Global X Funds) (the “Funds”) as of October 31, 2011, and the related statements of operations, statements of changes in net assets, and financial highlights for the year or period then ended. These financial statements and financial highlights are the responsibility of the Funds’ management. Our responsibility is to express an opinion on these financial statements and financial highlights based on our audits.
We conducted our audits in accordance with the standards of the Public Company Accounting Oversight Board (United States). Those standards require that we plan and perform the audit to obtain reasonable assurance about whether the financial statements and financial highlights are free of material misstatement. We were not engaged to perform an audit of the Funds’ internal control over financial reporting. Our audits included consideration of internal control over financial reporting as a basis for designing audit procedures that are appropriate in the circumstances, but not for the purpose of expressing an opinion on the effectiveness of the Funds’ internal control over financial reporting. Accordingly, we express no such opinion. An audit also includes examining, on a test basis, evidence supporting the amounts and disclosures in the financial statements and financial highlights, assessing the accounting principles used and significant estimates made by management, and evaluating the overall financial statement presentation. Our procedures included confirmation of securities owned as of October 31, 2011, by correspondence with the custodian and brokers, or by other appropriate auditing procedures where replies from brokers were not received. We believe that our audits provide a reasonable basis for our opinion.
In our opinion, the financial statements and financial highlights referred to above present fairly, in all material respects, the financial position of each of the Funds listed above at October 31, 2011, and the results of their operations, the changes in their net assets, and their financial highlights for the year or period then ended, in conformity with U.S. generally accepted accounting principles.
Philadelphia, Pennsylvania
December 22, 2011
54
DISCLOSUREOF FUND EXPENSES (unaudited)
All Exchange Traded Funds (“ETF”) have operating expenses. As a shareholder of an ETF, your investment is affected by these ongoing costs, which include (among others) costs for ETF management, administrative services, brokerage fees, and shareholder reports like this one. It is important for you to understand the impact of these costs on your investment returns.
Operating expenses such as these are deducted from an ETF’s gross income and directly reduce your final investment return. These expenses are expressed as a percentage of the ETF’s average net assets; this percentage is known as the ETF’s expense ratio.
The following examples use the expense ratio and are intended to help you understand the ongoing costs (in dollars) of investing in your Fund and to compare these costs with those of other funds. The examples are based on an investment of $1,000 made at the beginning of the period shown and held for the entire period.
The table on the next page illustrates your Fund’s costs in two ways:
Actual Fund Return. This section helps you to estimate the actual expenses that your Fund incurred over the period. The “Expenses Paid During Period” column shows the actual dollar expense cost incurred by a $1,000 investment in the Fund, and the “Ending Account Value” number is derived from deducting that expense cost from the Fund’s gross investment return.
You can use this information, together with the actual amount you invested in the Funds, to estimate the expenses you paid over that period. Simply divide your actual account value by $1,000 to arrive at a ratio (for example, an $8,600 account value divided by $1,000 = 8.6), then multiply that ratio by the number shown for your Funds under “Expenses Paid During Period.”
Hypothetical 5% Return. This section helps you compare your Fund’s costs with those of other funds. It assumes that the Funds had an annual 5% return before expenses during the year, but that the expense ratio (Column 3) for the period is unchanged. This example is useful in making comparisons because the Securities and Exchange Commission requires all funds to make this 5% calculation. You can assess your Fund’s comparative cost by comparing the hypothetical result for your Fund in the “Expense Paid During Period” column with those that appear in the same charts in the shareholder reports for other funds.
NOTE: Because the return is set at 5% for comparison purposes — NOT your Fund’s actual return — the account values shown may not apply to your specific investment.
55
DISCLOSUREOF FUND EXPENSES (unaudited) (concluded)
| | | | | | | | | | | | | | | | |
| | | Beginning | | | Ending | | | | | | Expenses | |
| | | Account | | | Account | | | Annualized | | | Paid | |
| | | Value | | | Value | | | Expense | | | During | |
| | | 5/1/2011 | | | 10/31/2011 | | | Ratios | | | Period(1) | |
Global X Waste Management ETF | | | | | | | | | | | | | | | | |
| | | | |
Actual Fund Return | | | $1,000.00 | | | | $826.20 | | | | 0.65 | % | | | $2.99 | |
Hypothetical 5% Return | | | 1,000.00 | | | | 1,021.93 | | | | 0.65 | | | | 3 .31 | |
Global X Food ETF | | | | | | | | | | | | | | | | |
| | | | |
Actual Fund Return(2) | | | $1,000.00 | | | | 978.00 | | | | 0.65 | | | | 3 .24 | |
Hypothetical 5% Return | | | 1,000.00 | | | | 1,021.93 | | | | 0.65 | | | | 3 .31 | |
Global X Fishing Industry ETF | | | | | | | | | | | | | | | | |
| | | | |
Actual Fund Return(3) | | | $1,000.00 | | | | 745.30 | | | | 0.69 | | | | 3 .00 | |
Hypothetical 5% Return | | | 1,000.00 | | | | 1,021.73 | | | | 0.69 | | | | 3 .52 | |
Global X Farming ETF | | | | | | | | | | | | | | | | |
| | | | |
Actual Fund Return(4) | | | $1,000.00 | | | | 899.90 | | | | 0.68 | | | | 2 .71 | |
Hypothetical 5% Return | | | 1,000.00 | | | | 1,021.78 | | | | 0.68 | | | | 3 .47 | |
Global X Auto ETF | | | | | | | | | | | | | | | | |
| | | | |
Actual Fund Return(5) | | | $1,000.00 | | | | 850.70 | | | | 0.65 | | | | 2 .75 | |
Hypothetical 5% Return | | | 1,000.00 | | | | 1,021.93 | | | | 0.65 | | | | 3 .31 | |
Global X Canada Preferred ETF | | | | | | | | | | | | | | | | |
| | | | |
Actual Fund Return(6) | | | $1,000.00 | | | | 980.60 | | | | 0.58 | | | | 2 .53 | |
Hypothetical 5% Return | | | 1,000.00 | | | | 1,022.28 | | | | 0.58 | | | | 2 .96 | |
Global X SuperDividend ETF | | | | | | | | | | | | | | | | |
| | | | |
Actual Fund Return(7) | | | $1,000.00 | | | | 904.40 | | | | 0.58 | | | | 2 .21 | |
Hypothetical 5% Return | | | 1,000.00 | | | | 1,022.28 | | | | 0.58 | | | | 2 .96 | |
| (1) | Expenses are equal to the Fund’s annualized expense ratio multiplied by the average account value over the period, multiplied 184/365 (to reflect the one-half year period.) |
| (2) | Expenses are equal to the Fund’s annualized expense ratio multiplied by the average account value over the period, multiplied 183/365 (to reflect the period from inception to date.) |
| (3) | Expenses are equal to the Fund’s annualized expense ratio multiplied by the average account value over the period, multiplied 182/365 (to reflect the period from inception to date.) |
| (4) | Expenses are equal to the Fund’s annualized expense ratio multiplied by the average account value over the period, multiplied 153/365 (to reflect the period from inception to date.) |
| (5) | Expenses are equal to the Fund’s annualized expense ratio multiplied by the average account value over the period, multiplied 167/365 (to reflect the period from inception to date.) |
| (6) | Expenses are equal to the Fund’s annualized expense ratio multiplied by the average account value over the period, multiplied 161/365 (to reflect the period from inception to date.) |
| (7) | Expenses are equal to the Fund’s annualized expense ratio multiplied by the average account value over the period, multiplied 146/365 (to reflect the period from inception to date.) |
56
APPROVALOF INVESTMENT ADVISORY AGREEMENT (unaudited)
Section 15(c) of the Investment Company Act of 1940, as amended (“1940 Act”), requires that the mutual fund’s board of trustees, including a majority of those trustees who are not “interested persons” of the mutual fund, as defined in the 1940 Act (“Independent Trustees”), consider on an initial basis and periodically thereafter (as required by the 1940 Act), at an in person meeting called for such purpose, the terms of the fund’s investment advisory agreement and approve the agreement with such changes as the Independent Trustees deem appropriate.
At a quarterly Board meeting held on February 25, 2011, the Board of Trustees (“Board”) (including the Independent Trustees) of the Global X Funds (“Trust”) initially considered and unanimously approved (i) the initial Investment Advisory Agreement for the, Global X SuperDividend ETF and Global X Canada Preferred ETF (each a “New Fund”) and (ii) the Supervision and Administration Agreement between the Trust, on behalf each of each New Fund, and Global X Management Company (“Global X Management”).1
At a special Board meeting held on May 12, 2011, the Board (including the Independent Trustees) initially considered and unanimously approved (i) the initial Investment Advisory Agreement for the Global X Farming ETF (a “New Fund”) and (ii) the Supervision and Administration Agreement between the Trust, on behalf the New Fund, and Global X Management. At the same Board meeting, the Board (including the Independent Trustees) also considered and unanimously approved an increase in the unitary fee (including the investment advisory fee) (“Management Fee”) for the Global X Auto ETF (“Auto Fund”) and other changes to the Investment Advisory Agreement and Supervision and Administration Agreement (“Auto Fund Agreements”), which were originally approved by the Board in November 2010.2 Because the Auto Fund had not yet commenced operations, the Auto Fund was considered to be and referred to herein as a New Fund. In considering revisions to the Auto Fund Agreements, the Board took into account the same factors and considerations as it did with respect to the Agreements (as defined below) for the other New Funds considered at the meeting.
The Investment Advisory Agreement and Supervision and Administration Agreement for each New Funds are referred to herein as the “Agreements.”
In advance of the Board meetings noted above, the Board (including the Independent Trustees) requested (in writing) detailed information from Global X Management in connection with their consideration of the Agreements and received and reviewed written responses from Global X Management and supporting materials relating to those requests for information.
In determining to approve the Agreements for each New Fund, the Board concluded that the Agreements are fair and reasonable and in the best interests of each New Fund and its shareholders, respectively. In approving Agreements for each New Fund, the Board considered among other
1 At the Feburary 25, 2011 quarterly Board meeting, the Board also approved the (i) initial Investment Advisory Agreement for the Global X UK Small-Cap ETF, Global X Germany Small-Cap ETF, Global X Mexico Small-Cap ETF, Global X Hong Kong Small-Cap ETF, Global X Singapore Small-Cap ETF, Global X South Korea Small-Cap ETF, Global X Taiwan Small-Cap ETF, Global X Rare Earths ETF, Global X Strategic Metals ETF and Global X Fertilizers/Potash ETF and (ii) the Supervision and Administration Agreement between the Trust, on behalf of each of these funds, and Global X Management.
2 At the same Board meeting, the Board (including the Independent Trustees), initially considered and unanimously approved (i) the initial Investment Advisory Agreement for the Global X MLP ETF and Global X MLP Natural Gas ETF and (ii) the Supervision and Administration Agreement between the Trust, on behalf each fund, and Global X Management.
57
APPROVALOF INVESTMENT ADVISORY AGREEMENT (unaudited) (continued)
things the following categories of material factors.
In reaching this decision, the Board did not assign relative weights to the factors discussed below nor did the Board deem any one factor or group of them to be controlling in and of themselves.
Nature, extent and quality of services
With respect to this factor, the Board considered:
| | • | | the terms of the Agreements and the range of services to be provided to each New Fund in accordance with the Agreements; |
| | • | | Global X Management’s key personnel and the portfolio managers who would provide investment advisory services to each New Fund; |
| | • | | Global X Management’s responsibilities under the Agreements to, among other things, (i) manage the investment operations of each New Fund and the composition of each New Fund’s assets, including the purchase, retention and disposition of its holdings, (ii) provide quarterly reports to the Trust’s officers and Board and other reports as the Board deems necessary or appropriate, (iii) vote proxies, exercise consents, and exercise all other rights appertaining to securities and assets held by each New Fund, (iv) select broker-dealers to execute portfolio transactions for each New Fund when necessary, (v) provide or arrange for the provision of various third-party services required by each New Fund, (vi) assist in the preparation and filing of reports and proxy statements (if any) to the shareholders of each New Fund, draft and periodically update the registration statement and other reports and documents for each New Fund that are required to be filed by the Trust with the Securities and Exchange Commission (“SEC”) and other regulatory or governmental bodies, and (vii) monitor anticipated purchases and redemptions of the shares (including creation units) of each New Fund by shareholders and new investors; |
| | • | | the nature, extent and quality of Global X Management’s services (including advisory, administrative and compliance services) that would be made available to each New Fund; and |
| | • | | the quality of Global X Management’s resources and personnel that would be made available to each New Fund, including Global X Management’s experience and the qualifications of Global X Management’s key personnel and the portfolio managers who would provide investment advisory services to each New Fund. |
Based on these considerations, the Board concluded that it was satisfied with the nature, extent and quality of the services to be provided to each New Fund.
Performance
The Board determined that because each New Fund had not commenced operations, meaningful data relating to investment performance of each New Fund was not available and, therefore, could not be a factor in approving the Agreements.
58
APPROVALOF INVESTMENT ADVISORY AGREEMENT (unaudited) (continued)
Cost of Services and Profitability
With respect to this factor, the Board considered:
| | • | | Global X Management’s expected cost to provide investment management, supervision and administrative and related services to each New Fund; |
| | • | | the unitary Management Fee (including the proposed investment advisory fee) that was proposed to be borne by each New Fund under the Agreements for the investment advisory, supervisory and administrative services that each New Fund requires under a unitary fee structure (including the types of fees and expenses that are not included within the unitary fee and would be borne by each New Fund); and |
| | • | | the expected profitability to Global X Management, if any, from all services to be provided to each New Fund and all aspects of the relationship between Global X Management and each New Fund. In connection with these considerations, the Board noted that Global X Management advised the Board that it was expected that it would not generate profits from its services to any of each New Fund during the first 12 months of each New Fund’s operations, but expected to do so after that initial start up period. |
Based on these considerations, the Board concluded that the profits anticipated to be realized by Global X Management from its relationship with each New Fund would not be excessive.
Comparison of Fees and Services
With respect to this factor, the Board considered:
| | • | | comparative information with respect to the Management Fee proposed to be paid to Global X Management by each New Fund. In connection with this consideration, Global X Management provided the Board with detailed comparative expense data for each New Fund, including fees and expenses paid by comparable affiliated and unaffiliated exchange- traded funds and other registered funds and the reasons for any differences in the proposed expense ratios for each New Fund and those presented for comparison; |
| | • | | the proposed unified Management Fee structure (which includes as one component the proposed investment advisory fee for each New Fund), the expected total expense ratios for each New Fund and that Global X Management would be responsible for paying all of designated expenses of each New Fund (discussed in more detail below). In this regard, the Board took into consideration that the purpose of having a unitary Management Fee structure was to create a simple, all-inclusive fee that would provide a level of predictability with respect to the overall expense ratio (i.e., the total fees) of each New Fund and that the proposed Management Fee for each New Fund was set at a competitive rate to make each New Fund viable in the marketplace; and |
| | • | | that Global X Management would be responsible for most ordinary expenses of each New Fund, including the costs of various third-party services required by each New Fund, including investment advisory, administrative, audit, certain custody, portfolio accounting, legal, transfer agency services, printing costs and other services for each New Fund, but that each New Fund would bear other expenses not covered under the proposed all-inclusive Management Fee, such as taxes, brokerage fees, commissions, and other transaction expenses, interest expenses, and extraordinary expenses. |
59
APPROVALOF INVESTMENT ADVISORY AGREEMENT (unaudited) (concluded)
Based on these considerations, the Board concluded that the proposed Management Fee and expected total expense ratio of each New Fund should not preclude approval of the Agreements.
Economies of Scale
With respect to this factor, the Board considered:
| | • | | the extent to which economies of scale would be realized as each New Fund grows and whether the proposed unitary Management Fee for each New Fund reflected these economies of scale; |
| | • | | the significant investment of time, personnel and other resources that Global X Management intends to made in each New Fund in order to seek to assure that each New Fund is attractive to investors; and |
| | • | | that the proposed unitary Management Fee would provide a significant amount of certainty regarding the total fees and expenses of each New Fund and its shareholders. |
Based on these considerations, the Board concluded that approval of the proposed Management Fee for each New Fund was reasonable.
Other Benefits
In considering the Agreement, in addition to the categories discussed above, the Board considered other benefits that may be realized by Global X Management as a result of its relationships with each New Fund.
60
SUPPLEMENTAL INFORMATION (unaudited)
Net asset value, or “NAV”, is the price per Share at which the Funds issue and redeem Shares. It is calculated in accordance with the standard formula for valuing mutual fund shares. The “Market Price” of the Funds generally is determined using the midpoint between the highest bid and the lowest offer on the stock exchange on which the Shares of the Funds are listed for trading, as of the time that the Funds’ NAV is calculated. The Funds’ Market Price may be at, above or below their NAV. The NAV of the Funds will fluctuate with changes in the market value of their Funds’ holdings. The Market Price of the Funds will fluctuate in accordance with changes in its NAV, as well as market supply and demand.
Premiums or discounts are the differences (expressed as a percentage) between the NAV and Market Price of the Funds on a given day, generally at the time NAV is calculated. A premium is the amount that the Funds are trading above the reported NAV, expressed as a percentage of the NAV. A discount is the amount that the Funds are trading below the reported NAV, expressed as a percentage of the NAV.
The following information shows the frequency distributions of premiums and discounts for the Funds. The information shown is for the full calendar quarter completed after the inception date through the date of the most recent calendar quarter end.
Each line in the table shows the number of trading days in which the Funds traded within the premium/discount range indicated. The number of trading days in each premium/discount range is also shown as a percentage of the total number of trading days in the period covered by each table. All data presented here represents past performance, which cannot be used to predict future results.
61
SUPPLEMENTAL INFORMATION (unaudited) (concluded)
| | | | | | | | | | | | | | | | | | | | | | | | | | | | |
| | | Percentage of Total Days | |
| Premium/Discount Range | | Global X Waste
Management
ETF(1) | | | Global X
Food ETF (2) | | | Global X
Fishing
Industry
ETF(3) | | | Global X
Farming
ETF(4) | | | Global X
Auto ETF(5) | | | Global X
Canada Preferred ETF(6) | | | Global X
SuperDividend ETF(7) | |
| |
Greater than 3.0% and Less than 3.5% | | | - | | | | - | | | | 0.85% | | | | - | | | | - | | | | - | | | | - | |
Greater than 2.5% and Less than 3.0% | | | - | | | | - | | | | - | | | | - | | | | - | | | | - | | | | - | |
Greater than 2.0% and Less than 2.5% | | | - | | | | - | | | | - | | | | - | | | | - | | | | - | | | | - | |
Greater than 1.5% and Less than 2.0% | | | - | | | | 6.72% | | | | 9.40% | | | | - | | | | 0.93% | | | | 5.83% | | | | - | |
Greater than 1.0% and Less than 1.5% | | | 3.79% | | | | 31.09% | | | | 13.69% | | | | 17.35% | | | | 19.63% | | | | 25.24% | | | | 21.51% | |
Greater than 0.5% and Less than 1.0% | | | 22.73% | | | | 52.94% | | | | 21.38% | | | | 34.69% | | | | 39.25% | | | | 41.75% | | | | 39.78% | |
Between 0.5% and -0.5% | | | 50.76% | | | | 8.40% | | | | 24.79% | | | | 23.47% | | | | 20.56% | | | | 21.36% | | | | 19.35% | |
Less than -0.5% and Greater than -1.0% | | | 15.91% | | | | 0.85% | | | | 20.51% | | | | 14.29% | | | | 11.21% | | | | 3.88% | | | | 9.68% | |
Less than -1.0% and Greater than -1.5% | | | 5.30% | | | | - | | | | 4.27% | | | | 5.10% | | | | 3.74% | | | | 1.94% | | | | 6.45% | |
Less than -1.5% and Greater than -2.0% | | | 1.51% | | | | - | | | | 2.56% | | | | 2.04% | | | | 2.80% | | | | - | | | | 1.08% | |
Less than -2.0% and Greater than -2.5% | | | - | | | | - | | | | 0.85% | | | | 2.04% | | | | 1.88% | | | | - | | | | 2.15% | |
Less than -2.5% and Greater than -3.0% | | | - | | | | - | | | | 0.85% | | | | - | | | | - | | | | - | | | | - | |
Less than -3.0% and Greater than -3.5% | | | - | | | | - | | | | 0.85% | | | | 1.02% | | | | - | | | | - | | | | - | |
| | | | |
Total | | | 100.00% | | | | 100.00% | | | | 100.00% | | | | 100.00% | | | | 100.00% | | | | 100.00% | | | | 100.00% | |
| | | | |
| |
| | | Number of Business Days | |
| Premium/Discount Range | | Global X
Waste
Management
ETF(1) | | | Global X
Food ETF (2) | | | Global X
Fishing
Industry
ETF(3) | | | Global X
Farming
ETF(4) | | | Global X
Auto ETF(5) | | | Global X
Canada Preferred ETF(6) | | | Global X SuperDividend ETF(7) | |
| |
Greater than 3.0% and Less than 3.5% | | | - | | | | - | | | | 1 | | | | - | | | | - | | | | - | | | | - | |
Greater than 2.5% and Less than 3.0% | | | - | | | | - | | | | - | | | | - | | | | - | | | | - | | | | - | |
Greater than 2.0% and Less than 2.5% | | | - | | | | - | | | | - | | | | - | | | | - | | | | - | | | | - | |
Greater than 1.5% and Less than 2.0% | | | - | | | | 8 | | | | 11 | | | | - | | | | 1 | | | | 6 | | | | 20 | |
Greater than 1.0% and Less than 1.5% | | | 5 | | | | 37 | | | | 16 | | | | 17 | | | | 21 | | | | 26 | | | | 37 | |
Greater than 0.5% and Less than 1.0% | | | 30 | | | | 63 | | | | 25 | | | | 34 | | | | 42 | | | | 43 | | | | 18 | |
Between 0.5% and -0.5% | | | 67 | | | | 10 | | | | 29 | | | | 23 | | | | 22 | | | | 22 | | | | 9 | |
Less than -0.5% and Greater than -1.0% | | | 21 | | | | 1 | | | | 24 | | | | 14 | | | | 12 | | | | 4 | | | | 6 | |
Less than -1.0% and Greater than -1.5% | | | 7 | | | | - | | | | 5 | | | | 5 | | | | 4 | | | | 2 | | | | 1 | |
Less than -1.5% and Greater than -2.0% | | | 2 | | | | - | | | | 3 | | | | 2 | | | | 3 | | | | - | | | | 2 | |
Less than -2.0% and Greater than -2.5% | | | - | | | | - | | | | 1 | | | | 2 | | | | 2 | | | | - | | | | - | |
Less than -2.5% and Greater than -3.0% | | | - | | | | - | | | | 1 | | | | - | | | | - | | | | - | | | | - | |
Less than -3.0% and Greater than -3.5% | | | - | | | | - | | | | 1 | | | | 1 | | | | - | | | | - | | | | - | |
| | | | |
Total | | | 132 | | | | 119 | | | | 117 | | | | 98 | | | | 107 | | | | 103 | | | | 93 | |
| | | | |
(1) The Fund commenced operations on April 12, 2011.
(2) The Fund commenced operations on May 2, 2011.
(3) The Fund commenced operations on May 3, 2011.
(4) The Fund commenced operations on June 1, 2011.
(5) The Fund commenced operations on May 18, 2011.
(6) The Fund commenced operations on May 24, 2011.
(7) The Fund commenced operations on June 8, 2011.
62
TRUSTEESAND OFFICERSOFTHE TRUST (unaudited)
Set forth below are the names, addresses, ages, position with the Trust, Term of Office and Length of Time Served, the principal occupations for the last five years, number of Funds in fund complex overseen by trustee, and other directorships outside the fund complex of each of the persons currently serving as Trustees and Officers of the Trust.
| | | | | | | | |
Name, Address (Year of Birth) | | Position(s)
Held with Funds | | Principal Occupation(s) During the Past 5 Years | | Number of
Funds in
Trust
Overseen by
Director | | Other
Directorships
Held by Trustees |
| Independent Trustees2 | | |
Sanjay Ram Bharwani 399 Park Ave, 32nd floor New York, NY 10022 (1974) | | Trustee (since 2008) | | CEO of Risk Advisors Inc. (since 2007) (consulting firm); Chief Information Officer, M. Safra & Co (2004-2006) (hedge fund). | | 353 | | None. |
Scott R. Chichester1 399 Park Ave, 32nd floor New York, NY 10022 (1970) | | Trustee (since 2008) | | President & Treasurer, Bayview Acquisition Corp (since 2010), CPA, Penda Aiken Inc. (since 2009) (consultant); Founder and President, DirectPay USA LLC (since 2006) (payroll company); Chief Financial Officer, Ong Corporation (2002-2010) (technology company); Proprietor, Scott R. Chichester CPA (since 2001) (CPA firm). | | 353 | | None. |
Kartik Kiran Shah 399 Park Ave, 32nd floor New York, NY 10022 (1977) | | Trustee (since 2008) | | Director, Wireless Generation (since 2008) (software); Manager, Amgen (2003-2006) (biotechnology firm). | | 353 | | None. |
63
TRUSTEESAND OFFICERSOFTHE TRUST (unaudited) (continued)
The Trust’s Statement of Additional Information (“SAI”) includes additional information about the Trustees and Officers. The SAI may be obtained without charge by calling 1-888-493-8631. The following chart lists Trustees and Officers as of October 31, 2011.
| | | | | | | | |
Name, Address
(Year of Birth) | | Position(s) Held with Funds | | Principal Occupation(s) During the Past 5 Years | | Number of Funds
in Trust
Overseen by
Director | | Other
Directorships Held
by Trustees |
| Interested Trustee / Officers2 |
| Bruno del Ama 399 Park Ave, 32nd floor New York, NY 10022 (1976) | | Trustee (since 2008), President, Chief Executive Officer (since 2008) | | Chief Executive Officer and Chief Compliance Officer, Global X Management Company LLC (since 2008); Head of Global Structured Products Operations at Radian Asset Assurance (2004-2008) (financial services firm). | | 353 | | None. |
| | | | | |
| Jose C. Gonzalez 399 Park Ave, 32nd floor New York, NY 10022 (1976) | | Chief Operating Officer, Chief Compliance Officer and Chief Financial Officer, Secretary (since 2008) | | Chief Executive Officer and Chief Compliance Officer, Global X Management Company LLC (since 2008); Head of Global Structured Products Operations at Radian Asset Assurance (2004-2008) (financial services firm). | | N/A | | N/A |
| | | | | |
| Dianne Sulzbach4 One Freedom Valley Drive Oaks, PA 19456 (1977) | | Assistant Secretary (since 2011) | | Corporate Counsel, SEI Investments (since 2010); Associate, Morgan, Lewis & Bockius LLP (2006-2010). | | N/A | | N/A |
64
TRUSTEESAND OFFICERSOFTHE TRUST (unaudited) (concluded)
| | | | | | |
Name, Address (Year of Birth) | | Position(s) Held with Funds | | Principal Occupation(s) During the Past 5 Years | | Other Directorships
Held by Trustees |
Peter Rodriguez4 One Freedom Valley Drive Oaks, PA 19456 (1962) | | Assistant Treasurer (since 2011) | | Fund Accounting Director of the Administrator (since 2011); Mutual Fund Trading Director, SEI Global Trust Company (2009-2011); Asset Data Services Director at the Administrator (2006-2009). | | N/A |
| 1 | Mr. Chichester is currently married to a sister of Mr. del Ama’s wife. While an “immediate family member” (as defined in Section 2(a)(19) of the 1940 Act) of Mr. del Ama would be considered an Interested Person, Mr. Chichester is not considered an immediate family member for this purpose. Although this fact was taken into consideration in determining whether Mr. Chichester should be considered to be an Independent Trustee for purposes of the Section 2(a)(19) of the 1940 Act, it was determined that this relationship was not one that should disqualify Mr. Chichester from serving as an Independent Trustee of the Trust. |
| 2 | Each Trustee serves until his or her successor is duly elected or appointed and qualified. |
| 3 | As of October 31, 2011, the Trust had eighty-six investment portfolios, thirty-five of which were operational. |
| 4 | These officers of the Trust also serve as officers of one or more mutual funds for which SEI Investments Company or an affiliate acts as investment manager, administrator or distributor. |
65
NOTICETO SHAREHOLDERS
For shareholders that do not have an October 31, 2011 tax year end, this notice is for informational purposes only. For shareholders with an October 31, 2011 tax year end, please consult your tax advisor as to the pertinence of this notice. For the fiscal year ended October 31, 2011, the Funds are designating the following items with regard to distributions paid during the year.
| | | | | | | | | | | | | | | | | | | | | | | | | | | | |
| | | Long-Term
Capital Gain
Distributions | | | Ordinary
Income
Distributions | | | Total
Distributions | | | Qualifying
for
Corporate
Dividends
Received
Deduction (1) | | | Qualifying
Dividend
Income (2) | | | Interest
Related
Dividends (3) | | | Short Term
Capital
Gain
Dividends (4) | |
Global X Waste Management ETF | | | 0.00% | | | | 0.00% | | | | 0.00% | | | | 0.00% | | | | 0.00% | | | | 0.00% | | | | 0.00% | |
Global X Food ETF | | | 0.00% | | | | 100.00% | | | | 100.00% | | | | 21.97% | | | | 100.00% | | | | 0.02% | | | | 0.00% | |
Global X Fishing Industry ETF | | | 0.00% | | | | 100.00% | | | | 100.00% | | | | 0.00% | | | | 59.08% | | | | 0.00% | | | | 0.00% | |
Global X Farming ETF | | | 0.00% | | | | 100.00% | | | | 100.00% | | | | 5.87% | | | | 100.00% | | | | 0.03% | | | | 0.00% | |
Global X Auto ETF | | | 0.00% | | | | 100.00% | | | | 100.00% | | | | 33.56% | | | | 95.50% | | | | 0.00% | | | | 0.00% | |
Global X Canada Preferred ETF | | | 0.00% | | | | 100.00% | | | | 100.00% | | | | 0.00% | | | | 95.57% | | | | 0.00% | | | | 0.00% | |
Global X SuperDividend ETF | | | 0.00% | | | | 100.00% | | | | 100.00% | | | | 8.03% | | | | 64.05% | | | | 0.00% | | | | 0.00% | |
(1) Qualifying dividends represent dividends which qualify for the corporate dividends received deduction and is reflected as a percentage of ordinary income distributions (the total of short term capital gain and net investment income distributions).
(2) The percentage in this column represents the amount of “Qualifying Dividend Income” as created by the Jobs and Growth Relief Reconciliation Act of 2003 and is reflected as a percentage of ordinary income distributions (the total of short term capital gain and net investment income distributions). It is the intention of each of the aforementioned funds to designate the maximum amount permitted by law.
(3) The percentage in this column represents the amount of “Interest Related Dividends” as created by the American Jobs Creation Act of 2004 and is reflected as a percentage of net investment income distributions that is exempt from U.S. withholding tax when paid for foreign investors.
(4) The percentage in this column represents the amount of “Short-Term Capital Gain Dividends” as created by the American Jobs Creation Act of 2004 and is reflected as a percentage of short-term capital gain distributions that is exempt from U.S. withholding tax when paid to foreign investors.
The Fund intends to pass through a foreign tax credit to shareholders. For the fiscal year ended October 31, 2011, the total amount of foreign source income and foreign tax credit are as follows:
| | | | | | | | |
Global X Funds | | Foreign Source
Income | | | Foreign Tax
Credit Pass
through | |
Global X Waste Management ETF | | $ | - | | | $ | - | |
| | |
Global X Food ETF | | | 12,264 | | | | 1,241 | |
| | |
Global X Fishing ETF | | | 45,228 | | | | 8,192 | |
| | |
Global X Farming ETF | | | 22,719 | | | | 920 | |
| | |
Global X Auto ETF | | | 10,482 | | | | 1,373 | |
| | |
Global X Canada Preferred ETF | | | 167,993 | | | | 25,263 | |
| | |
Global X SuperDividend ETF | | | 678,162 | | | | 56,103 | |
The information reported herein may differ from the information and distributions taxable to the shareholders for the calendar year ending December 31, 2011. Complete information will be computed and reported in conjunction with your 2011 Form 1099-DIV.
66
NOTES

399 Park Ave, 32nd floor
New York, NY 10022
1-888-GXFund-1
(1-888-493-8631)
www.globalxfunds.com
Investment Adviser:
Global X Management Company LLC
399 Park Avenue, 32nd floor
New York, NY 10022
Distributor:
SEI Investments Distribution Co.
One Freedom Valley Drive
Oaks, PA 19456
Sub-Administrator:
SEI Investments Global Funds Services
One Freedom Valley Drive
Oaks, PA 19456
Counsel for the Independent Trustees:
Dechert LLP
1175 I Street N.W.
Washington, DC 20007
This information must be preceded or accompanied by a current prospectus for the Funds described.
GLX-AR-003-0100
The registrant has adopted a code of ethics that applies to the registrant’s principal executive officer, principal financial officer, comptroller or principal accounting officer, and any person who performs a similar function.
| Item 3. | Audit Committee Financial Expert. |
(a)(1) The registrant’s board of trustees has determined that the registrant has at least one audit committee financial expert serving on the audit committee.
(a)(2) The audit committee financial expert is Scott Chichester and is independent as defined in Form N-CSR Item 3(a)(2).
| Item 4. | Principal Accountant Fees and Services. |
Fees billed by Ernst & Young LLP in 2011and by Sanville & Company in 2010 related to the Trust.
In 2011, Ernst & Young, LLP and in 2010 Sanville & Company billed the Trust aggregate fees for services rendered to the Trust for the last two fiscal years was as follows:
| | | | | | | | | | | | | | |
| | | 2011 | | 2010 |
| | | | | All fees and services to the Trust that were pre-
approved | | All fees and
services to
service affiliates that
were pre-
approved | | All other fees
and services to service
affiliates that
did not require pre-
approval | | All fees and
services to the Trust that
were pre-
approved | | All fees and
services to
service affiliates that
were pre-
approved | | All other fees
and services to service
affiliates that
did not require pre-
approval |
| (a) | | Audit Fees | | $353,500 | | $0 | | $0 | | $112,000 | | $0 | | $0 |
| (b) | | Audit-Related Fees | | $0 | | $0 | | $0 | | $0 | | $0 | | $0 |
| (c) | | Tax Fees | | $142,500 | | $0 | | $0 | | $0 | | $0 | | $0 |
| (d) | | All Other Fees | | $0 | | $0 | | $0 | | $0 | | $0 | | $0 |
(e)(1) Not applicable.
(e)(2) Percentage of fees billed applicable to non-audit services pursuant to waiver of pre-approval requirement were as follows for Ernst & Young LLP in 2011 and Sanville & Company in 2010:
| | | | |
| | | 2011 | | 2010 |
Audit-Related Fees | | 0% | | 0% |
Tax Fees | | 0% | | 0% |
All Other Fees | | 0% | | 0% |
(f) Not applicable.
(g) The aggregate non-audit fees and services billed by Ernst & Young, LLP in 2011 and Sanville & Company in 2010 for the last two fiscal years were $142,500 and $0, respectively.
(h) During the past fiscal year, all non-audit services provided by Registrant’s principal accountant to either Registrant’s investment adviser or to any entity controlling, controlled by, or under common control with Registrant’s investment adviser that provides ongoing services to Registrant were pre-approved by the audit committee of Registrant’s Board of Trustees. Included in the audit committee’s pre-approval was the review and consideration as to whether the provision of these non-audit services is compatible with maintaining the principal accountant’s independence.
| Item 5. | Audit Committee of Listed Registrants. |
Not applicable to open-end management investment companies.
| Item 6. | Schedule of Investments. |
Not applicable.
| Item 7. | Disclosure of Proxy Voting Policies and Procedures for Closed-End Management Investment Companies. |
Not applicable to open-end management investment companies.
| Item 8. | Portfolio Managers of Closed-End Management Investment Companies. |
Not applicable to open-end management investment companies. Effective for closed-end management investment companies for fiscal years ending on or after December 31, 2005
| Item 9. | Purchases of Equity Securities by Closed-End Management Company and Affiliated Purchasers. |
Not applicable to open-end management investment companies.
| Item 10. | Submission of Matters to a Vote of Security Holders. |
There have been no material changes.
| Item 11. | Controls and Procedures. |
(a) The certifying officers, whose certifications are included herewith, have evaluated the registrant’s disclosure controls and procedures within 90 days of the filing date of this report. In their opinion, based on their evaluation, the registrant’s disclosure controls and procedures are adequately designed, and are operating effectively to ensure, that information required to be disclosed by the registrant in the reports it files or submits under the Securities Exchange Act of 1934 is recorded, processed, summarized and reported within the time periods specified in the Securities and Exchange Commission’s rules and forms.
(b) There were no significant changes in the registrant’s internal control over financial reporting that occurred during the registrant’s last fiscal half-year that has materially affected, or is reasonably likely to materially affect, the registrants internal control over financial reporting.
(a)(1) Code of Ethics attached hereto.
(a)(2) A separate certification for the principal executive officer and the principal financial officer of the registrant as required by Rule 30a-2(a) under the Investment Company Act of 1940, as amended (17 CFR 270.30a-2(a)), are filed herewith.
(b) Officer certifications as required by Rule 30a-2(b) under the Investment Company Act of 1940, as amended (17 CFR 270.30a-2(b)) also accompany this filing as an Exhibit.
SIGNATURES
Pursuant to the requirements of the Securities Exchange Act of 1934 and the Investment Company Act of 1940, the registrant has duly caused this report to be signed on its behalf by the undersigned, thereunto duly authorized.
| | | | | | |
| (Registrant) | | | | Global X Funds | | |
| | | |
| By (Signature and Title)* | | | | /s/ Bruno del Ama | | |
| | | | Bruno del Ama | | |
| | | | President | | |
| | | |
| Date: January 3, 2012 | | | | | | |
|
| Pursuant to the requirements of the Securities Exchange Act of 1934 and the Investment Company Act of 1940, this report has been signed below by the following persons on behalf of the registrant and in the capacities and on the dates indicated. |
| | | |
| By (Signature and Title)* | | | | /s/ Bruno del Ama | | |
| | | | Bruno del Ama | | |
| | | | President | | |
| | | |
| Date: January 3, 2012 | | | | | | |
| | | |
| By (Signature and Title)* | | | | /s/ Jose C. Gonzalez | | |
| | | | Jose C. Gonzalez | | |
| | | | CFO | | |
| | | |
| Date: January 3, 2012 | | | | | | |
| * | Print the name and title of each signing officer under his or her signature. |