UNITED STATES
SECURITIES AND EXCHANGE COMMISSION
WASHINGTON, D.C. 20549
FORM N-CSR
CERTIFIED SHAREHOLDER REPORT OF REGISTERED MANAGEMENT
INVESTMENT COMPANIES
Investment Company Act file number 811-22208
Valued Advisers Trust
(Exact name of registrant as specified in charter)
Huntington Asset Services, Inc. 2960 N. Meridian Street, Suite 300 Indianapolis, IN 46208
(Address of principal executive offices) (Zip code)
Capitol Services, Inc.
615 S. Dupont Hwy.
Dover,DE 19901
(Name and address of agent for service)
With a copy to:
John H. Lively, Esq.
The Law Offices of John H. Lively & Associates, Inc.
A member firm of The 1940 Act Law Group
2041 W. 141st Terrace
Suite 119
Leawood, KS 66224
Registrant's telephone number, including area code: 317-917-7000
Date of fiscal year end: 10/31
Date of reporting period: 4/30/11
Item 1. Reports to Stockholders.
To the Shareholders of the Geier Strategic Total Return Fund (the “Fund”):
We would like to take this opportunity to welcome you as shareholders to the Fund in this first semi-annual shareholder report.
Over the past few years, more and more investors like yourselves have expressed concern for, and exhaustion with, the “roller coaster” feel of the markets. The stock market crash of 2008 brought a heightened sense of worry over the inherent risks of investing. Although the rebound since early 2009 has helped restore depleted portfolios, many investors acknowledge that they do not want to go through such an experience again.
Since the beginning of 2002, Geier Asset Management, Inc., the Fund’s investment adviser (“Geier”), has offered its advisory clients a strategy that seeks growth without unnecessary risk. This strategy utilizes a conservative mind set with an emphasis on absolute return.
Geier made the decision to offer this strategy to a broader base of investors in the form of a mutual fund. We believe that many investors are seeking just this type of strategy as they attempt to reduce the amount of volatility, risk, and loss on their investments. Accordingly, Geier initiated efforts to establish the Fund, which commenced operations on December 27, 2010.
To achieve the Fund’s objective, Geier will employ the same tactics learned over the last nine years. For example, because of its conservative emphasis, the Fund may, at times, be heavily positioned in bonds and debt securities. The Fund also may go entirely into cash and also may employ hedging strategies through use of ETFs and other products that move inversely to the Fund's positions or to the specific market indices, when we believe a defensive posture is needed.
We will attempt to maintain the purchasing power of the Fund by considering the impact of CPI inflation and the relationship of the US dollar to other currencies, and, as a result, we may add investments to the Fund's portfolio that offset inflationary and currency effects when it deems necessary.
Because of its flexibility, the Fund can take advantage of favorable growth trends and opportunities.
Please refer to the Fund’s prospectus for a full description of the investment strategy and for more information about the fund. You may obtain a current copy of the Fund’s prospectus by calling 877-747-4268.
Thank you very much for investing in the Fund.
Sincerely,
Geier Asset Management, Inc.
Investment Results – (Unaudited)
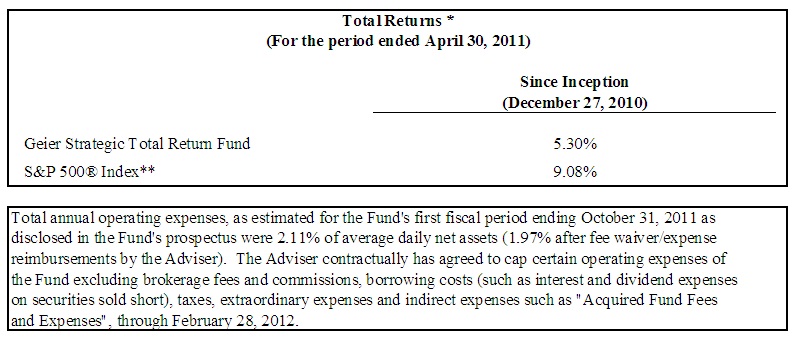
The performance quoted represents past performance, which does not guarantee future results. The investment return and principal value of an investment will fluctuate so that an investor’s shares, when redeemed, may be worth more or less than their original cost. The returns shown do not reflect deduction of taxes that a shareholder would pay on Fund distributions or the redemption of Fund shares. The Fund’s investment objectives, risks, charges and expenses must be considered carefully before investing. Current performance of a Fund may be lower or higher than the performance quoted. Performance data current to the most recent month end may be obtained by calling 1-877-747-4268.
* Return figures reflect any change in price per share and assume the reinvestment of all distributions.
** The S&P 500® Index is a widely recognized unmanaged index of equity prices and is representative of a broader market and range of securities than is found in the Fund’s portfolio. The Index is an unmanaged benchmark that assumes reinvestment of all distributions and excludes the effect of taxes and fees. Individuals cannot invest directly in this Index; however, an individual can invest in exchange traded funds or other investment vehicles that attempt to track the performance of a benchmark index
The Fund’s investment objectives, risks, charges and expenses must be considered carefully before investing. The prospectus contains this and other important information about the investment company and may be obtained by calling 1-877-747-4268. Please read it carefully before investing.
The Fund is distributed by Unified Financial Securities, Inc., Member FINRA.
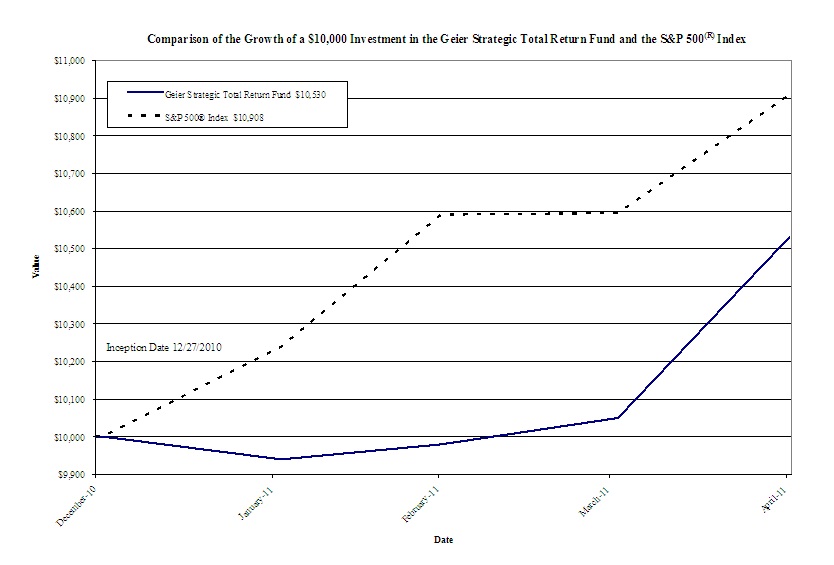
The chart above assumes an initial investment of $10,000 made on December 27, 2010 (commencement of Fund operations) and held through April 30, 2011. THE FUND’S RETURNS REPRESENT PAST PERFORMANCE AND DO NOT GUARANTEE FUTURE RESULTS. The returns shown do not reflect deduction of taxes that a shareholder would pay on the Fund’s distributions or the redemption of the Fund’s shares. Investment returns and principal values will fluctuate so that your shares, when redeemed, may be worth more or less than their original purchase price.
Current performance may be lower or higher than the performance data quoted. For more information on the Fund, and to obtain performance data current to the most recent month-end, or to request a prospectus, please call 1-877-747-4268. You should carefully consider the investment objectives, potential risks, management fees, and charges and expenses of the Fund before investing. The Fund’s prospectus contains this and other information about the Fund, and should be read carefully before investing.
The Fund is distributed by Unified Financial Securities, Inc., member FINRA.
FUND HOLDINGS – (Unaudited)
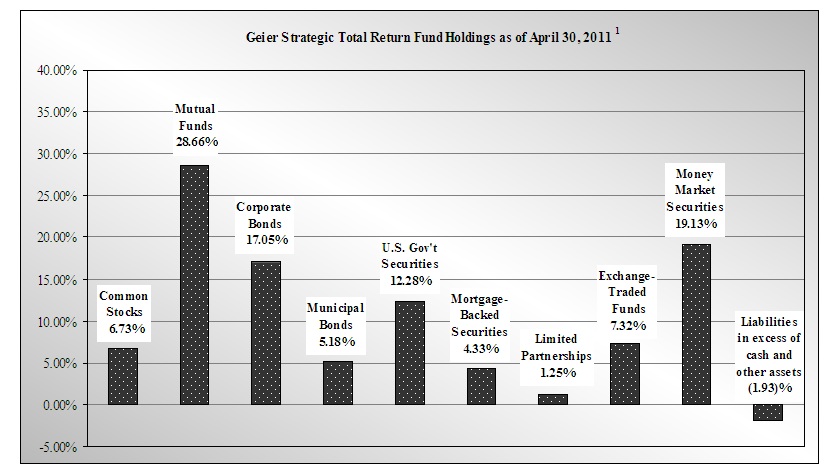
The investment objective of the Geier Strategic Total Return Fund is to provide long-term total return from income and capital appreciation, with an emphasis on absolute return.
AVAILABILITY OF PORTFOLIO SCHEDULE – (Unaudited)
The Fund files its complete schedule of portfolio holdings with the Securities and Exchange Commission (“SEC”) for the first and third quarters of each fiscal year on Form N-Q. The Fund’s Forms N-Q are available at the SEC’s website at www.sec.gov. The Forms N-Q may be reviewed and copied at the Public Reference Room in Washington DC. Information on the operation of the Public Reference Room may be obtained by calling 1-800-SEC-0330.
ABOUT THE FUND’S EXPENSES – (Unaudited)
As a shareholder of the Fund, you incur two types of costs: (1) transaction costs (such as short-term redemption fees); and (2) ongoing costs, including management fees; and other Fund expenses. This Example is intended to help you understand your ongoing costs (in dollars) of investing in the Fund and to compare these costs with the ongoing costs of investing in other mutual funds. The Example is based on an investment of $1,000 invested at the beginning of the period, and held for the entire period from December 27, 2010 to April 30, 2011.
Actual Expenses
The first line of the table below provides information about actual account values and actual expenses. You may use the information in this line, together with the amount you invested, to estimate the expenses that you paid over the period. Simply divide your account value by $1,000 (for example, an $8,600 account value divided by $1,000 = 8.60), then multiply the result by the number in the first line under the heading entitled “Expenses Paid During Period” to estimate the expenses you paid on your account during this period.
Hypothetical Example for Comparison Purposes
The second line of the table below provides information about hypothetical account values and hypothetical expenses based on the Fund’s actual expense ratios and an assumed rate of return of 5% per year before expenses, which is not the Fund’s actual return. The hypothetical account values and expenses may not be used to estimate the actual ending account balance or expenses you paid for the period. You may use this information to compare the ongoing costs of investing in the Fund and other funds. To do so, compare this 5% hypothetical example with the 5% hypothetical examples that appear in the shareholder reports of the other funds.
Please note that the expenses shown in the table are meant to highlight your ongoing costs only and do not reflect any transactional costs, such as sales charges (loads), redemption fees, or exchange fees. Therefore, the second line of the table is useful in comparing ongoing costs only, and will not help you determine the relative total costs of owning different funds. In addition, if these transactional costs were included, your costs would have been higher.
| Geier Strategic Total Return Fund | Beginning Account Value | Ending Account Value April 30, 2011 | Expenses Paid During the Period Ended April 30, 2011* |
Actual | $1,000.00 | $1,053.00 | $6.85 |
Hypothetical ** (5% return before expenses) | $1,000.00 | $1,015.12 | $9.74 |
*Expenses are equal to the Fund’s annualized expense ratio of 1.95%, multiplied by the average account value over the period, multiplied by 125/365 (to reflect the period since commencement of Fund operations on December 27, 2010).
** Assumes a 5% return before expenses. The hypothetical example is calculated based on a six month period from November 1, 2010 to April 30, 2011. Accordingly, expenses are equal to the Fund’s annualized expense ratio of 1.95% multiplied by the average account value over the six month period, multiplied by 181/365 (to reflect the partial year period).
| Geier Strategic Total Return Fund | ||||||||
| Schedule of Investments | ||||||||
| April 30, 2011 | ||||||||
| (Unaudited) | ||||||||
| Common Stocks - 6.73% | Shares | Fair Value | ||||||
| Consumer Staples - 0.88% | ||||||||
| Procter & Gamble Co. / The | 4,000 | $ | 259,600 | |||||
| Energy - 1.32% | ||||||||
| El Paso Corp. | 20,000 | 388,200 | ||||||
| Health Care - 0.89% | ||||||||
| Johnson & Johnson | 4,000 | 262,880 | ||||||
| Information Technology - 2.71% | ||||||||
| Intel Corp. | 12,000 | 278,280 | ||||||
| Microsoft Corp. | 20,000 | 520,400 | ||||||
| 798,680 | ||||||||
| Materials - 0.93% | ||||||||
| Freeport-McMoRan Copper & Gold, Inc. | 5,000 | 275,150 | ||||||
| TOTAL COMMON STOCKS (Cost $1,935,260) | 1,984,510 | |||||||
| Mutual Funds - 28.66% | ||||||||
| Artio Total Return Bond Fund - Class I | 204,613 | 2,786,830 | ||||||
| Central Fund of Canada Limited - Class A (a) | 115,000 | 2,823,250 | ||||||
| Templeton Global Bond Fund - Advisor Class | 202,802 | 2,845,317 | ||||||
| TOTAL MUTUAL FUNDS (Cost $7,892,999) | 8,455,397 | |||||||
| Corporate Bonds - 17.05% | Principal Amount | |||||||
| Allied Waste North America, Inc., 6.875%, 06/01/2017 | $ | 250,000 | 272,214 | |||||
| Ally Financial, Inc., 7.125%, 10/15/2017 | 250,000 | 247,605 | ||||||
| Arch Coal, Inc., 8.750%, 08/01/2016 | 250,000 | 281,250 | ||||||
| Atlas Pipeline Partners L.P., 8.750%, 06/15/2018 | 250,000 | 272,500 | ||||||
| Chesapeake Energy Corp., 6.875%, 08/15/2018 | 250,000 | 274,375 | ||||||
| Citigroup, Inc., 0.580%, 06/09/2016 (b) | 250,000 | 236,409 | ||||||
| Federal Farm Credit Bank, 5.875%, 08/16/2021 | 250,000 | 272,801 | ||||||
| General Electric Capital Corp., 0.493%, 01/08/2016 (b) | 250,000 | 242,433 | ||||||
| Goldman Sachs Capital II, 5.793%, 06/01/2043 (b) | 250,000 | 216,875 | ||||||
| Goodyear Tire & Rubber, 10.500%, 05/15/2016 | 250,000 | 284,375 | ||||||
| Icahn Enterprises Finance Corp., 7.750%, 01/15/2016 | 250,000 | 258,750 | ||||||
| JPMorgan Chase & Co., 7.900%, 04/29/2049 (b) | 250,000 | 275,639 | ||||||
| Lincoln National Corp., 7.000%, 05/17/2066 (b) | 250,000 | 260,950 | ||||||
| National City Preferred Capital Tr I, 12.000%, 12/29/2049 (b) | 250,000 | 280,874 | ||||||
| Netflix Inc., 8.500%, 11/15/2017 | 250,000 | 283,750 | ||||||
| Quicksilver Resources, Inc., 8.250%, 08/01/2015 | 250,000 | 266,250 | ||||||
| Steel Dynamics Inc., 7.750%, 4/15/2016 | 250,000 | 268,750 | ||||||
| Tesoro Corp., 6.500%, 06/01/2017 | 250,000 | 259,375 | ||||||
| Wells Fargo Capital XV, 9.750%, 09/29/2049 (b) | 250,000 | 276,563 | ||||||
| TOTAL CORPORATE BONDS (Cost $4,981,921) | 5,031,738 | |||||||
| Municipal Bonds - 5.18% | ||||||||
| City of East Orange NJ, 5.300%, 04/01/2017 | 250,000 | 255,028 | ||||||
| City of Las Vegas NV, 5.900%, 05/01/2024 | 235,000 | 239,874 | ||||||
| County of Reeves TX, 6.875%, 12/01/2020 | 250,000 | 245,780 | ||||||
| County of Wayne MI, 9.250%, 12/01/2025 | 250,000 | 263,090 | ||||||
| Indiana Bond Bank, 5.790%, 01/15/2025 | 250,000 | 252,732 | ||||||
| Maricopa County Unified School District No 97-Deer Valley AZ, 5.250%, 07/01/2017 | 250,000 | 270,580 | ||||||
| TOTAL MUNICIPAL BONDS (COST $1,520,993) | 1,527,084 | |||||||
See accompanying notes which are an integral part of these financial statements.
| Geier Strategic Total Return Fund | ||||||||
| Schedule of Investments - continued | ||||||||
| April 30, 2011 | ||||||||
| (Unaudited) | ||||||||
| U.S. Government Securities - 12.28% | Principal Amount | Fair Value | ||||||
| TIP, 2.000%, 01/15/2014 | $ | 300,000 | $ | 395,560 | ||||
| TIP, 2.500%, 07/15/2016 | 300,000 | 380,489 | ||||||
| TIP, 1.625%, 01/15/2018 | 300,000 | 349,252 | ||||||
| U.S. Treasury Bill, 0.000%, 12/15/2011 | 10,000 | 9,994 | ||||||
| U.S. Treasury N/B, 6.125%, 08/15/2029 | 250,000 | 315,078 | ||||||
| U.S. Treasury N/B, 8.750%, 05/15/2020 | 1,500,000 | 2,172,774 | ||||||
| TOTAL U.S. GOVERNMENT SECURITIES (Cost $3,595,107) | 3,623,147 | |||||||
| Mortgage Backed Securities - 4.33% | ||||||||
| Countrywide Alternative Loan Trust, 0.503%, 05/25/2034 (b) | 657,340 | 557,294 | ||||||
| Credit Suisse First Boston Mortgage Securities Corp., 2.729%, 10/25/2033 (b) | 264,604 | 236,253 | ||||||
| Morgan Stanley Mortgage Loan Trust, 2.656%, 10/25/2034 (b) | 273,129 | 258,508 | ||||||
| Structured Asset Securities Corp., 2.540%, 04/25/2033 (b) | 230,639 | 225,575 | ||||||
| TOTAL MORTGAGE BACKED SECURITIES (Cost $1,295,943) | 1,277,630 | |||||||
| Limited Partnerships - 1.25% | Shares | |||||||
| Atlas Pipeline Partners, L.P. | 10,000 | 369,600 | ||||||
| TOTAL LIMITED PARTNERSHIPS (Cost $245,969) | 369,600 | |||||||
| Exchange-Traded Funds - 7.32% | ||||||||
| ProShares UltraShort 20+ Year Treasury (c) | 30,000 | 1,069,500 | ||||||
| ProShares UltraShort Silver (c) | 80,000 | 1,091,200 | ||||||
| TOTAL EXCHANGE-TRADED FUNDS (Cost $2,150,176) | 2,160,700 | |||||||
| Money Market Securities - 19.13% | ||||||||
| Fidelity Institutional Money Market Portfolio - Institutional Class, 0.23% (d) | 5,644,473 | 5,644,473 | ||||||
| TOTAL MONEY MARKET SECURITIES (Cost $5,644,473) | 5,644,473 | |||||||
| TOTAL INVESTMENTS (Cost $29,262,841) - 101.93% | $ | 30,074,279 | ||||||
| Liabilities in excess of cash and other assets - (1.93)% | (569,639 | ) | ||||||
| TOTAL NET ASSETS - 100.00% | $ | 29,504,640 | ||||||
| (a) Closed-end Fund. | ||||||||
| (b) Variable rate security, the coupon rate shown represents the rate at April 30, 2011. | ||||||||
| (c) Non-income producing. | ||||||||
| (d) Variable rate security; the rate shown represents the yield at April 30, 2011. | ||||||||
See accompanying notes which are an integral part of these financial statements.
| Geier Strategic Total Return Fund | ||||
| Statement of Assets and Liabilities | ||||
| April 30, 2011 | ||||
| (Unaudited) | ||||
| Assets | ||||
| Cash | $ | 9,875 | ||
| Investments in securities, at fair value (cost $29.262.841) | 30,074,279 | |||
| Receivable for investments sold | 15,661,643 | |||
| Receivable for fund shares sold | 55,000 | |||
| Interest receivable | 196,880 | |||
| Dividends receivable | 8,798 | |||
| Prepaid expenses | 23,428 | |||
| Prepaid offering cost | 5,195 | |||
| Total assets | 46,035,098 | |||
| Liabilities | ||||
| Payable to Adviser (a) | 24,673 | |||
| Payable for investments purchased | 16,479,509 | |||
| Payable for Fund shares redeemed | 735 | |||
| Payable to administrator, fund accountant and transfer agent | 11,741 | |||
| Payable to custodian | 1,823 | |||
| Payable to trustees | 76 | |||
| 12b-1 fees accrued | 5,909 | |||
| Other accrued expenses | 5,992 | |||
| Total liabilities | 16,530,458 | |||
| Net Assets | $ | 29,504,640 | ||
| Net Assets consist of: | ||||
| Paid in capital | $ | 28,027,099 | ||
| Accumulated undistributed net investment income | 58,308 | |||
| Accumulated undistributed net realized gain (loss) from investment transactions | 607,795 | |||
| Net unrealized appreciation (depreciation) on investments | 811,438 | |||
| Net Assets | $ | 29,504,640 | ||
| Shares outstanding (unlimited number of shares authorized) | 2,801,747 | |||
| Net asset value and offering price per share | $ | 10.53 | ||
| Redemption price per share (b) (NAV * 99%) | $ | 10.42 | ||
| (a) See Note 4 in the Notes to the Financial Statements. | ||||
| (b) The redemption price per share reflects a redemption fee of 1.00% | ||||
| on shares redeemed within 30 calendar days of purchase. | ||||
See accompanying notes which are an integral part of these financial statements.
| Geier Strategic Total Return Fund | ||||
| Statement of Operations | ||||
| For the period ended April 30, 2011 (a) | ||||
| (Unaudited) | ||||
| Investment Income | ||||
| Dividend income | $ | 90,780 | ||
| Interest income | 141,400 | |||
| Total Income | 232,180 | |||
| Expenses | ||||
| Investment Adviser fee (b) | 97,194 | |||
| 12b-1 fees (b) | 22,090 | |||
| Transfer agent expenses | 16,704 | |||
| Organizational expense | 15,000 | |||
| Administration expenses | 9,437 | |||
| Fund accounting expenses | 8,651 | |||
| Audit expenses | 6,147 | |||
| Legal expenses | 5,044 | |||
| Miscellaneous expenses | 4,918 | |||
| Custodian expenses | 4,222 | |||
| Registration expenses | 3,425 | |||
| Offering expense | 2,724 | |||
| Trustee expenses | 2,118 | |||
| 24f-2 expense | 1,478 | |||
| Pricing expenses | 1,173 | |||
| Report printing expense | 1,106 | |||
| Total Expenses | 201,431 | |||
| Fees waived by Adviser (a) | (27,559 | ) | ||
| Net operating expenses | 173,872 | |||
| Net Investment Income (Loss) | 58,308 | |||
| Realized & Unrealized Gain (Loss) | ||||
| Net realized gain (loss) on investment securities: | 607,795 | |||
| Change in unrealized appreciation (depreciation) on investment securities: | 811,438 | |||
| Net realized and unrealized gain (loss) on investment securities, | 1,419,233 | |||
| Net increase (decrease) in net assets resulting from operations | $ | 1,477,541 | ||
| (a) For the period December 27, 2010 (commencement of operations) to April 30, 2011. | ||||
| (b) See Note 4 in the Notes to the Financial Statements. | ||||
See accompanying notes which are an integral part of these financial statements.
| Geier Strategic Total Return Fund | |||||
| Statements of Changes In Net Assets | |||||
| Period Ended | |||||
| April 30, 2011 | |||||
| (Unaudited) | (a) | ||||
| Operations | |||||
| Net investment income (loss) | $ | 58,308 | |||
| Net realized gain (loss) on investment securities | 607,795 | ||||
| Change in unrealized appreciation (depreciation) | |||||
| on investment securities | 811,438 | �� | |||
| Net increase (decrease) in net assets resulting from operations | 1,477,541 | ||||
| Capital Share Transactions | |||||
| Proceeds from shares sold | 29,260,483 | ||||
| Amount paid for shares redeemed | (1,233,384 | ) | |||
| Net increase (decrease) in net assets resulting | |||||
| from share transactions | 28,027,099 | ||||
| Total Increase (Decrease) in Net Assets | 29,504,640 | ||||
| Net Assets | |||||
| Beginning of period | - | ||||
| End of period | $ | 29,504,640 | |||
| Accumulated undistributed net investment income (loss) | |||||
| included in net assets at end of period | $ | 58,308 | |||
| Capital Share Transactions | |||||
| Shares sold | 2,924,599 | ||||
| Shares redeemed | (122,852 | ) | |||
| Net increase (decrease) from capital share transactions | 2,801,747 | ||||
| (a) For the period December 27, 2010 (commencement of operations) to April 30, 2011. | |||||
See accompanying notes which are an integral part of these financial statements.
| Geier Strategic Total Return Fund | |||||
| Financial Highlights | |||||
| (For a share outstanding throughout each period) | |||||
| Period ended | |||||
| April 30, 2011 | |||||
| (Unaudited) | (a) | ||||
| Selected Per Share Data | |||||
| Net asset value, beginning of period | $ | 10.00 | |||
| Income from investment operations: | |||||
| Net investment income (loss) | 0.02 | ||||
| Net realized and unrealized gains (losses) | 0.51 | ||||
| Total income (loss) from investment operations | 0.53 | ||||
| Net asset value, end of period | $ | 10.53 | |||
Total Return (b) | 5.30 | % | (c) | ||
| Ratios and Supplemental Data | |||||
| Net assets, end of year (000) | $ | 29,505 | |||
| Ratio of expenses to average net assets | 1.95 | % | (d) | ||
| Ratio of expenses to average net assets before | |||||
| waiver & reimbursement by Advisor | 2.26 | % | (d) | ||
| Ratio of net investment income to | |||||
| average net assets | 0.65 | % | (d) | ||
| Ratio of net investment income to average net assets | |||||
| before waiver & reimbursement by Advisor | 0.34 | % | (d) | ||
| Portfolio turnover rate | 232.08 | % | |||
| (a) For the period December 27, 2010 (commencement of operations) through April 30, 2011. | |||||
| (b) Total return in the above table represents the rate that the investor would have earned | |||||
| or lost on an investment in the Fund, assuming reinvestment of dividends. | |||||
| (c) Not Annualized | |||||
| (d) Annualized | |||||
See accompanying notes which are an integral part of these financial statements.
Geier Strategic Total Return Fund
Notes to the Financial Statements
April 30, 2011
(Unaudited)
NOTE 1. ORGANIZATION
The Geier Strategic Total Return Fund (the “Fund”) is an open-end, non-diversified series of the Valued Advisers Trust (the “Trust”). The Trust is a management investment company established under the laws of Delaware by an Agreement and Declaration of Trust dated June 13, 2008 (the “Trust Agreement”). The Trust Agreement permits the Trustees to issue an unlimited number of shares of beneficial interest of separate series without par value. The Fund is one of a series of funds authorized by the Board of Trustees (the “Board”). The Fund’s investment Adviser is Geier Asset Management, Inc. (the “Adviser”). The investment objective of the Fund is to provide long-term total return from income and capital appreciation, with an emphasis on absolute return.
NOTE 2. SIGNIFICANT ACCOUNTING POLICIES
The following is a summary of significant accounting policies followed by the Fund in the preparation of its financial statements.
Securities Valuation – All investments in securities are recorded at their estimated fair value as described in Note 3.
Federal Income Taxes – The Fund makes no provision for federal income or excise tax. The Fund intends to qualify each year as a “regulated investment company” (“RIC”) under subchapter M of the Internal Revenue Code of 1986, as amended, by complying with the requirements applicable to RICs and by distributing substantially all of its taxable income. The Fund also intends to distribute sufficient net investment income and net capital gains, if any, so that it will not be subject to excise tax on undistributed income and gains. If the required amount of net investment income or gains is not distributed, the Fund could incur a tax expense.
As of and during the period ended April 30, 2011, the Fund did not have a liability for any unrecognized tax benefits. The Fund recognizes interest and penalties, if any, related to unrecognized tax benefits as income tax expense in the Statement of Operations. During the year, the Fund did not incur any interest or penalties. The Fund is subject to examination by U.S. federal tax authorities for the period ended October 31, 2011.
Expenses – Expenses incurred by the Trust that do not relate to a specific fund of the Trust are allocated to the individual funds based on each fund’s relative net assets or other appropriate basis (as determined by the Board).
Security Transactions and Related Income - The Fund follows industry practice and records security transactions on the trade date. The specific identification method is used for determining gains or losses for financial statements and income tax purposes. Dividend income is recorded on the ex-dividend date and interest income is recorded on an accrual basis. Distributions from Limited Partnerships are recognized on the ex-date. Income or loss from Limited Partnerships is reclassified in the components of net assets upon receipt of K-1’s. Discounts and premiums on securities purchased are amortized or accreted using the effective interest method. Withholding taxes on foreign dividends have been provided for in accordance with the Fund’s understanding of the applicable country’s tax rules and rates. The ability of issuers of debt securities held by the Fund to meet their obligations may be affected by economic and political developments in a specific country or region.
Redemption Fees – The Fund charges a 1.00% redemption fee for shares redeemed within 30 days. These fees are deducted from the redemption proceeds otherwise payable to the shareholder. The Fund will retain the fee charged as an increase in paid-in capital and such fees become part of the Fund’s daily NAV calculation.
Geier Strategic Total Return Fund
Notes to the Financial Statements - continued
April 30, 2011
(Unaudited)
NOTE 2. SIGNIFICANT ACCOUNTING POLICIES - continued
Dividends and Distributions - The Fund intends to distribute substantially all of its net investment income, net realized long-term capital gains and its net realized short-term capital gains, if any, to its shareholders on at least an annual basis. Dividends to shareholders, which are determined in accordance with income tax regulations, are recorded on the ex-dividend date. The treatment for financial reporting purposes of distributions made to shareholders during the year from net investment income or net realized capital gains may differ from their ultimate treatment for federal income tax purposes. These differences are caused primarily by differences in the timing of the recognition of certain components of income, expense or realized capital gain for federal income tax purposes. Where such differences are permanent in nature, they are reclassified in the components of net assets based on their ultimate characterization for federal income tax purposes. Any such reclassifications will have no effect on net assets, results of operations or net asset values per share of the Fund.
NOTE 3. SECURITIES VALUATION AND FAIR VALUE MEASUREMENTS
Fair value is defined as the price that a Fund would receive upon selling an investment in a timely transaction to an independent buyer in the principal or most advantageous market of the investment. Generally Accepted Accounting Principles in the United States of America (“GAAP”) establishes a three-tier hierarchy to maximize the use of observable market data and minimize the use of unobservable inputs and to establish classification of fair value measurements for disclosure purposes.
Inputs refer broadly to the assumptions that market participants would use in pricing the asset or liability, including assumptions about risk (the risk inherent in a particular valuation technique used to measure fair value such as pricing model and/or the risk inherent in the inputs to the valuation technique). Inputs may be observable or unobservable. Observable inputs are inputs that reflect the assumptions market participants would use in pricing the asset or liability developed based on market data obtained from sources independent of the reporting entity. Unobservable inputs are
inputs that reflect the reporting entity’s own assumptions about the assumptions market participants would use in pricing the asset or liability developed based on the best information available in the circumstances.
Various inputs are used in determining the value of the Fund’s investments. These inputs are summarized in the three broad levels listed below.
| · | Level 1 – quoted prices in active markets for identical securities |
| · | Level 2 – other significant observable inputs (including, but not limited to, quoted prices for an identical security in an inactive market, quoted prices for similar securities, interest rates, prepayment speeds, credit risk, etc.) |
| · | Level 3 – significant unobservable inputs (including the Fund’s own assumptions in determining fair value of investments based on the best information available) |
The inputs used to measure fair value may fall into different levels of the fair value hierarchy. In such cases, for disclosure purposes, the level in the fair value hierarchy within which the fair value measurement falls in its entirety, is determined based on the lowest level input that is significant to the fair value measurement in its entirety.
Geier Strategic Total Return Fund
Notes to the Financial Statements - continued
April 30, 2011
(Unaudited)
NOTE 3. SECURITIES VALUATION AND FAIR VALUE MEASUREMENTS – continued
Equity securities, including common stocks, exchange-traded funds, and limited partnerships are generally valued by using market quotations, furnished by a pricing service. Securities that are traded on any stock exchange are generally valued at the last quoted sale price. Lacking a last sale price, an exchange traded security is generally valued at its last bid price. Securities traded in the NASDAQ over-the-counter market are generally valued at the NASDAQ Official Closing Price. When using the market quotations or close prices provided by the pricing service and when the market is considered active, the security is classified as a Level 1 security. Sometimes, an equity security owned by the Fund will be valued by the pricing service with factors other than market quotations or when the market is considered inactive. When this happens, the security is classified as a Level 2 security. When market quotations are not readily available, when the Fund determines that the market quotation or the price provided by the pricing service does not accurately reflect the current fair value, or when restricted or illiquid securities are being valued, such securities are valued as determined in good faith by the Fund, in conformity with guidelines adopted by and subject to review by the Board. These securities are categorized as Level 3 securities.
Investments in mutual funds, including money market mutual funds, are generally priced at the ending net asset value (NAV) provided by the service agent of the funds. These securities are categorized as Level 1 securities.
Call and put options that the Fund invests in are generally traded on an exchange. The options in which the Fund invests are generally valued at the last trade price as provided by a pricing service. If the last sale price is not available, the options will be valued using the last bid price. The options will generally be categorized as Level 1 securities.
Fixed income securities such as corporate bonds, municipal bonds, U.S. government securities, and mortgage-backed securities when valued using market quotations in an active market, will be categorized as Level 1 securities. However, they may be valued on the basis of prices furnished by a pricing service when the Fund believes such prices more accurately reflect the fair value of such securities. A pricing service utilizes electronic data processing techniques based on yield spreads relating to securities with similar characteristics to determine prices for normal institutional-size trading units of debt securities without regard to sale or bid prices. These securities will generally be categorized as Level 2 securities. If the Fund decides that a price provided by the pricing service does not accurately reflect the fair value of the securities, when prices are not readily available from a pricing service, or when restricted or illiquid securities are being valued, securities are valued at fair value as determined in good faith by the Fund, in conformity with guidelines adopted by and subject to review of the Board. These securities will be categorized as Level 3 securities.
Short-term investments in fixed income securities, (those with maturities of less than 60 days when acquired, or which subsequently are within 60 days of maturity), including certificates of deposit, are valued by using the amortized cost method of valuation, which the Board has determined will represent fair value. These securities will be classified as Level 2 securities.
If the Fund decides that a price provided by the pricing service does not accurately reflect the fair value of the securities, when prices are not readily available from a pricing service, or when restricted or illiquid securities are being valued, securities are valued at fair value as determined in good faith by the Fund, in conformity with guidelines adopted by and subject to review of the Board. These securities will be categorized as Level 3 securities.
In accordance with the Trust’s good faith pricing guidelines, the Fund is required to consider all appropriate factors relevant to the value of securities for which it has determined other pricing sources are not available or reliable as described above. No single standard exists for determining fair value, because fair value depends upon the circumstances of each individual case. As a general principle, the current fair value of an issue of securities being valued by the Fund
would appear to be the amount which the owner might reasonably expect to receive for them upon their current sale. Methods which are in accordance with this principle may, for example, be based on (i) a multiple of earnings; (ii) a discount from market of a similar freely traded security (including a derivative security or a basket of securities traded on other markets, exchanges or among dealers); or (iii) yield to maturity with respect to debt issues, or a combination of
Geier Strategic Total Return Fund
Notes to the Financial Statements - continued
April 30, 2011
(Unaudited)
NOTE 3. SECURITIES VALUATION AND FAIR VALUE MEASUREMENTS – continued
these and other methods. Good faith pricing is permitted if, in the Fund’s opinion, the validity of market quotations appears to be questionable based on factors such as evidence of a thin market in the security based on a small number of quotations, a significant event occurs after the close of a market but before a Fund’s NAV calculation that may affect a security’s value, or the Fund is aware of any other data that calls into question the reliability of market quotations. Good faith pricing may also be used in instances when the bonds the Fund invests in may default or otherwise cease to have market quotations readily available. Any fair value pricing done outside the Fund’s approved pricing methods must be approved by the Pricing Committee of the Board.
The following is a summary of the inputs used to value the Fund’s investments as of April 30, 2011:
| Valuation Inputs | ||||||||||||||||
| Assets | Level 1 - Quoted Prices in Active Markets | Level 2 - Other Significant Observable Inputs | Level 3 - Significant Unobservable Inputs | Total | ||||||||||||
| Common Stocks* | $ | 1,984,510 | $ | - | $ | - | $ | 1,984,510 | ||||||||
| Mutual Funds | 8,455,397 | - | - | 8,455,397 | ||||||||||||
| Corporate Bonds | - | 5,031,738 | - | 5,031,738 | ||||||||||||
| Municipal Bonds | - | 1,527,084 | - | 1,527,084 | ||||||||||||
| U.S. Government Securities | - | 3,623,147 | - | 3,623,147 | ||||||||||||
| Mortgage-Backed Securities | - | 1,277,630 | - | 1,277,630 | ||||||||||||
| Master Limited Partnerships | 369,600 | - | - | 369,600 | ||||||||||||
| Exchange-Traded Funds | 2,160,700 | - | - | 2,160,700 | ||||||||||||
| Money Market Securities | 5,644,473 | - | - | 5,644,473 | ||||||||||||
| Total | $ | 18,614,680 | $ | 11,459,599 | $ | - | $ | 30,074,279 | ||||||||
* Refer to Schedule of Investments for industry classifications
The Fund did not hold any investments at any time during the reporting period in which significant unobservable inputs were used in determining fair value; therefore, no reconciliation of Level 3 securities is included for this reporting period. The Fund did not hold any derivative instruments during the reporting period. The Trust recognizes significant transfers between fair value hierarchy levels at the reporting period end. There were no significant transfers between all Levels as of April 30, 2011.
Geier Strategic Total Return Fund
Notes to the Financial Statements - continued
April 30, 2011
(Unaudited)
NOTE 4. FEES AND OTHER TRANSACTIONS WITH AFFILIATES
The Adviser, under the terms of the management agreement (the “Agreement”), manages the Fund’s investments. As compensation for its management services, the Fund is obligated to pay the Adviser a fee computed and accrued daily and paid monthly at an annual rate of 1.10% of the Fund’s average net assets. For the period from December 27, 2010 (commencement of Fund Operations) to April 30, 2011, the Adviser earned fees of $97,194 from the Fund before the reimbursement described below.
The Adviser has contractually agreed to waive its management fee and/or reimburse certain Fund operating expenses, excluding brokerage fees and commissions, borrowing costs (such as interest and dividend expenses on securities sold short), taxes, extraordinary expenses and indirect expenses (such as “Acquired Fund Fees and Expenses) do not exceed 1.95% of net assets. For the period from December 27, 2010 (commencement of Fund operations) to April 30, 2011, the Adviser waived fees of $27,559. At April 30, 2011, the Adviser was owed $24,673 from the Fund for advisory services.
The waiver and/or reimbursement by the Adviser with respect to the Fund is subject to repayment by the Fund within the three fiscal years following the fiscal year in which that particular waiver and/or reimbursement occurred, provided that the Fund is able to make the repayment without exceeding the expense limitations described above. For the period December 27, 2010 (commencement of Fund operations) to April 30, 2011, $27,559 may be subject to potential repayment to the Adviser by the Fund through October 31, 2014.
The Trust retains Huntington Asset Services, Inc. (“HASI”), to manage the Fund’s business affairs and to provide the Fund with administrative services, including all regulatory reporting and necessary office equipment and personnel. For the period from December 27, 2010 (commencement of Fund operations) to April 30, 2011, HASI earned fees of $9,437 for administrative services provided to the Fund. At April 30, 2011, the Fund owed HASI $2,562 for administrative services. Certain officers of the Trust are members of management and/or employees of HASI. HASI operates as a wholly-owned subsidiary of Huntington Bancshares, Inc., the parent company of Unified Financial Securities, Inc. (the “Distributor”) and Huntington National Bank, the custodian of the Fund’s investments (the “Custodian”). For the period ended April 30, 2011, the Custodian earned fees of $4,222 for custody services provided to the Fund. At April 30, 2011, the Fund owed the Custodian $1,823 for custody services.
The Trust retains HASI to act as the Fund’s transfer agent and to provide fund accounting services. For the period December 27, 2010 (commencement of Fund Operations) to April 30, 2011, HASI earned fees of $16,704 from the Fund for transfer agent services. For the period December 27, 2010 (commencement of Fund Operations) to April 30, 2011, HASI earned fees of $8,651 from the Fund for fund accounting services. At April 30, 2011, the Fund owed HASI $2,401 for fund accounting services. At April 30, 2011, the Fund owed HASI $6,778 for transfer agent services.
The Fund has adopted a Distribution Plan (the “Plan”) pursuant to Rule 12b-1 under the 1940 Act. The Plan provides that the Fund will pay the Distributor and/or any registered securities dealer, financial institution or any other person (the “Recipient”) a shareholder servicing fee of 0.25% of the average daily net assets of the Fund in connection with the promotion and distribution of the Fund’s shares or the provision of personal services to shareholders, including, but not necessarily limited to, advertising, compensation to underwriters, dealers and selling personnel, the printing and mailing
of prospectuses to other than current Fund shareholders, the printing and mailing of sales literature and servicing shareholder accounts. The Fund or Adviser may pay all or a portion of these fees to any Recipient who renders assistance in distributing or promoting the sale of shares, or who provides certain shareholder services, pursuant to a written agreement. The Plan is a compensation plan, which means that compensation is provided regardless of 12b-1 Expenses actually incurred. It is anticipated that the Plan will benefit shareholders because an effective sales program typically is necessary in order for the Fund to reach and maintain a sufficient size to achieve efficiently its investment
Geier Strategic Total Return Fund
Notes to the Financial Statements - continued
April 30, 2011
(Unaudited)
NOTE 4. FEES AND OTHER TRANSACTIONS WITH AFFILIATES - continued
objectives and to realize economies of scale. For the period December 27, 2010 (commencement of operations) to April 30, 2011, the 12b-1 expense incurred by the Fund was $22,090. The Fund owed $5,909 for 12b-1 fees as of April 30, 2011.
The Distributor acts as the principal underwriter of the Fund’s shares. For the period December 27, 2010 (commencement of operations) to April 30, 2011, the Fund paid $22,090 to the Distributor. An officer of the Trust is an officer of the Distributor and such person may be deemed to be an affiliate of the Distributor.
NOTE 5. INVESTMENT TRANSACTIONS
For the period ended April 30, 2011, purchases and sales of investment securities, other than short-term investments, written options, and short securities were as follows:
As of April 30, 2011, the net unrealized appreciation (depreciation) of investments for tax purposes was as follows:
| Amount | ||||
| Gross Appreciation | $ | 907,156 | ||
| Gross (Depreciation) | (95,718 | ) | ||
| Net Appreciation | ||||
| (Depreciation) on Investments | $ | 811,438 | ||
At April 30, 2011, the aggregate cost of securities for federal income tax purposes, was $29,262,841.
NOTE 6. ESTIMATES
The preparation of financial statements in conformity with GAAP requires management to make estimates and assumptions that affect the reported amounts of assets and liabilities and disclosure of contingent assets and liabilities at the date of the financial statements and the reported amounts of increases and decreases in net assets from operations during the reporting period. Actual results could differ from those estimates.
NOTE 7. DISTRIBUTIONS TO SHAREHOLDERS
The Fund did not make any distributions during the period ended April 30, 2011.
Geier Strategic Total Return Fund
Notes to the Financial Statements - continued
April 30, 2011
(Unaudited)
NOTE 8. COMMITMENTS AND CONTINGENCIES
The Fund indemnifies its officers and trustees for certain liabilities that may arise from their performance of their duties to the Fund. Additionally, in the normal course of business, the Fund enters into contracts that contain a variety of representatives and warranties which provide general indemnifications. The Fund’s maximum exposure under these arrangements is unknown, as this would involve future claims that may be made against the Fund that have not yet occurred.
NOTE 9. SUBSEQUENT EVENTS
In connection with the preparation of the financial statements of the Fund as of and for the period ended April 30, 2011, events and transactions subsequent to April 30, 2011, have been evaluated by the Fund’s management for possible adjustment and/or disclosure. Management has not identified any subsequent events requiring financial statement disclosure as of the date these financial statements were issued.
OTHER INFORMATION
The Fund’s Statement of Additional Information (“SAI”) includes additional information about the trustees and is available without charge, upon request. You may call toll-free at (877) 747-4268 to request a copy of the SAI or to make shareholder inquiries.
Approval of Investment Advisory and Sub-Advisory Agreements – (Unaudited)
At a meeting held on December 9, 2010, the Board of Trustees (the “Board”) considered the initial approval of the Investment Advisory Agreement between the Trust and Geier Asset Management, Inc. (the “Adviser”). Legal counsel noted that the 1940 Act requires the approval of the investment advisory and distribution agreements between the Trust and its service providers by a majority of the Independent Trustees. The Board discussed the arrangements between the Adviser and the Trust with respect to the Geier Strategic Total Return Fund (the “Fund”). The Board reflected on its discussions with members of Geier regarding the proposed Advisory Agreement, the Expense Limitation Agreement and the manner in which the Fund was to be managed.
Legal counsel referred the Board to the Board materials, which included, among other things, a memorandum from Counsel addressing the duties of Trustees regarding the approval of the proposed Advisory Agreement, a letter from Counsel to the Adviser and the Adviser’s responses to that letter, a copy of the Adviser’s financial statements, a copy of the Adviser’s Form ADV, a fee comparison analysis for the Fund and comparable mutual funds, and the Advisory Agreement and Expense Limitation Agreement. Legal Counsel reviewed with the Board the memorandum from Counsel and the proposed Advisory Agreement and Expense Limitation Agreement. He outlined the various factors the Board should consider in deciding whether to approve the Advisory Agreement.
In deciding whether to approve the agreements, the Board considered numerous factors, including:
| 1. | The nature, extent, and quality of the services to be provided by the Adviser. In this regard, the Board considered the responsibilities the Adviser would have under the Advisory Agreement. The Board reviewed the services to be provided by the Adviser to the Fund including, without limitation: the Adviser’s procedures for formulating investment recommendations and assuring compliance with the Fund’s investment objectives and limitations; the efforts of the Adviser during the Fund’s start-up phase, its coordination of services for the Fund among the Fund’s service providers, and the anticipated efforts to promote the Fund, grow its assets, and assist in the distribution of Fund shares. The Board considered: the Adviser’s staffing, personnel, and methods of operating; the education and experience of the Adviser’s personnel; and the Adviser’s compliance program, policies, and procedures. After reviewing the foregoing and further information from the Adviser (e.g., the Adviser’s compliance programs and disclosure brochure), the Board concluded that the quality, extent, and nature of the services to be provided by the Adviser were satisfactory and adequate for the Fund. |
| 2. | Investment Performance of the Fund and the Adviser. The Board noted that while the Fund had not commenced operations and thus did not have investment performance information to review, the Board could consider the investment performance of the Adviser. The Board concluded, in light of the foregoing factors, that the investment performance of the Adviser was satisfactory. |
| 3. | The costs of the services to be provided and profits to be realized by the Adviser from the relationship with the Fund. In this regard, the Board considered: the financial condition of the Adviser and the level of commitment to the Fund and the Adviser by the principals of the Adviser; the projected asset levels of the Fund; the Adviser’s payment of startup costs for the Fund; and the overall anticipated expenses of the Fund, including the expected nature and frequency of advisory fee payments. The Board also considered potential benefits for the Adviser in managing the Fund. The Board compared the expected fees and expenses of the Fund (including the management fee) to other funds comparable to the Fund in terms of the type of fund, the style of investment management, the anticipated size of fund and the nature of the investment strategy and markets invested in, among other factors. The Board determined that the Fund’s anticipated expense ratio, in light of the contractual Expense Limitation Agreement, and the management fees were generally comparable to those of similar funds. Following this comparison and upon further consideration and discussion of the foregoing, the Board concluded that the fees to be paid to the Adviser by the Fund were and reasonable. |
| 4. | The extent to which economies of scale would be realized as the Fund grows and whether advisory fee levels reflect these economies of scale for the benefit of the Fund’s investors. In this regard, the Board considered the Fund’s fee arrangements with the Adviser. The Board noted that the management fee would stay the same as asset levels increased, although it also noted that the shareholders of the Fund would benefit from the Expense Limitation Agreement until the Funds’ expenses fell below the expense cap. The Board also noted that the Fund would benefit from economies of scale under its agreements with service providers other than the Adviser. Following further discussion of the Fund’s projected asset levels, expectations for growth, and levels of fees, the Board determined that the Fund’s fee arrangements with the Adviser were fair and reasonable and reasonable in relation to the nature and quality of the services to be provided by the Adviser. |
| 5. | Brokerage and portfolio transactions. In regard to brokerage and portfolio transactions, the Board considered the Adviser’s standards for seeking best execution and the relevancy of those standards to the strategies that would be employed in managing the Fund. After further review, the Board determined that the Adviser’s practices regarding brokerage and portfolio transactions were satisfactory. |
| 6. | Possible conflicts of interest. In evaluating the possibility for conflicts of interest, the Board considered such matters as: the experience and ability of the advisory personnel assigned to the Fund; the basis of decisions to buy or sell securities for the Fund and/or the Adviser’s other accounts; the method for bunching of portfolio securities transactions; the substance and administration of the Adviser’s code of ethics and other relevant policies described in the Adviser’s Form ADV. Following further consideration and discussion, the Board indicated that the Adviser’s standards and practices relating to the identification and mitigation of potential conflicts of interest were satisfactory. |
Having considered these factors and additional information provided to the Board in advance of the meeting, the Board of Trustees determined that the Advisory Agreement is fair and in the best interests of the Fund and its shareholders and unanimously approved the appointment of the Adviser to serve as the investment Adviser to the Fund under the terms and conditions set forth in the Advisory Agreement.
PROXY VOTING
A description of the policies and procedures that the Fund uses to determine how to vote proxies relating to portfolio securities and information regarding how the Funds voted those proxies during the most recent twelve month period ended June 30, is available without charge upon request by (1) calling the Fund at (877) 747-4268 and (2) from Fund documents filed with the Securities and Exchange Commission (“SEC”) on the SEC’s website at www.sec.gov.
TRUSTEES
R. Jeffrey Young, Chairman
Dr. Merwyn R. Vanderlind
Ira Cohen
OFFICERS
R. Jeffrey Young, Principal Executive Officer and President
John C. Swhear, Chief Compliance Officer, AML Officer and Vice-President
Carol J. Highsmith, Vice President
William J. Murphy, Principal Financial Officer and Treasurer
Deborah Wells, Secretary
INVESTMENT ADVISER
Geier Asset Management, Inc.
2205 Warwick Way, Suite 200
Marriottsville, MD 21104
DISTRIBUTOR
Unified Financial Securities, Inc.
2960 North Meridian Street, Suite 300
Indianapolis, IN 46208
INDEPENDENT REGISTERED PUBLIC ACCOUNTING FIRM
BBD, LLP
1835 Market Street, 26th Floor
Philadelphia, PA 19103
LEGAL COUNSEL
The Law Offices of John H. Lively & Associates, Inc.,
A member firm of The 1940 Act Law Group
2041 West 141st Terrace, Suite 119
Leawood, KS 66224
CUSTODIAN
Huntington National Bank
41 S. High St.
Columbus, OH 43215
ADMINISTRATOR, TRANSFER AGENT AND FUND ACCOUNTANT
Huntington Asset Services, Inc.
2960 North Meridian Street, Suite 300
Indianapolis, IN 46208
This report is intended only for the information of shareholders or those who have received the Fund’s prospectus which contains information about the Fund’s management fee and expenses. Please read the prospectus carefully before investing.
Distributed by Unified Financial Securities, Inc.
Member FINRA/SIPC
| TEAM Asset Strategy Fund |
Semi-Annual Report
April 30, 2011
Fund Adviser:
TEAM Financial Asset Management, LLC
800 Corporate Circle, Suite 106
Harrisburg, PA 17110
Toll Free (877) 832-6952
Management’s Discussion of Fund Performance
As we remind our shareholders in each annual and semi-annual report, our investment process is active on three basic timeframes: secular, cyclical, and tactical. These could also be labeled as long, intermediate, and short term. It is within this context that we discuss the Fund’s performance.
On a long term basis, we continue to believe that commodities and natural resource investment opportunities are among the most attractive. Our view is based upon secular trend analysis, as well as what we expect to be the continued ascension of emerging markets’ middle classes the increased consumption that should accompany that growth. The Fund continues to hold very significant exposure to three related themes: agriculture, energy and precious metals.
Agricultural commodity prices began to rise significantly in the summer of 2010 following drought conditions in Eastern Europe, which reduced the global wheat harvest. The Fund’s positions in Elements Rogers Agriculture ETN and Intrepid Potash benefited from the rise in agricultural commodity prices.
The energy sector benefited from a strong revival in the global industrial cycle, as West Texas Intermediate (WTI) crude oil prices broke out to the upside from a trading range of $70-$85 over most of 2010. During the first four months of 2011, WTI broke out from that range on a sustained basis, as global demand tightened markets at the same time geopolitical risks increased with the “Arab Spring” unfolding in the Middle East and North Africa. The Fund benefited from common stock positions in energy businesses such as Statoil, Total, Exxon Mobile, Canadian Oil Sands, Chesapeake Energy, Encana and Diamond Offshore. The Fund also benefited from tactical trading positions in call options on Exchange Traded Funds exposed to crude oil and natural gas.
The Fund’s exposure to precious metals mining stocks was a positive contributor to performance as well. Positions in Royal Gold and Minefinders, which had lagged the industry in 2010, assumed strong relative performance gains during the first four months of 2011. The Fund also benefited from tactical trading positions in call options in Newmont Mining and Goldcorp. The Fund experienced a modest loss on put options positions on the Market Vectors Gold Miners ETF held during the fourth quarter of 2010, which were acquired as a short term hedge.
In addition to precious metals mining stocks, the fund also benefited from intermediate term positions in two ETF’s holding physical metals: platinum and palladium. We expected those metals to enjoy a favorable pricing environment due to aggressive monetary policy in the US, as well as healthy rebound in the global industrial cycle. Our thesis turned out to be timely, and we exited the positions once they reached our price targets.
The Fund was also active in telecom, utilities, financial services, basic materials, and consumer goods sectors. These positions are considered to be either intermediate or short term in nature. The Fund benefited from short term positions in common stock and call options in PPL, Kellogg, and Proctor & Gamble. The Fund benefited from intermediate term positions in Annaly Capital Management, Redwood Trust, US Global Investors, which are in the financial services sector. Intermediate term positions in Verizon and AT&T common stock in the telecom sector, as well as Vulcan Materials and Martin Marietta in basic materials, were also positive contributors.
The largest detractor to performance for the Fund related to put options held on various broad stock market indexes in the US and emerging markets. The Fund accumulated significant put options exposure during the fourth quarter of 2010 and maintained a significant amount of exposure into March 2011. The maintenance of these positions resulted in loss of value via time decay on options held with strike prices “out of the money”, as well as loss in intrinsic value for put options acquired “in the money” during periods when US and emerging market stock market indexes rallied.
The put positions were acquired and maintained to hedge against market conditions which have historically resulted in 5%-10% market declines, which finally did arrive in March of 2011. The decline coincided with the earthquake, tsunami and nuclear crises in Japan. The Fund was well insulated from the broad market decline due to the put option positions, but the short term gains were not large enough to offset losses accrued by establishing and maintaining the exposure for several months. However, the put option exposure did contribute to the Fund being in a strong position to increase portfolio exposure during the March 2011 stock market decline, which positioned the Fund to perform very well for the remainder of the period ending April 30th, 2011.
We believe that global imbalances will continue to create significant opportunities in foreign exchange markets. To date, the Fund has maintained modest exposure to foreign exchange markets, but we expect that exposure to increase over time as we believe opportunities present themselves. In total, foreign exchange positions were a modest detractor to performance, as losses in short euro and Swiss franc positions versus the US dollar were modestly larger than gains in long Canadian dollar versus US dollar.
The views in the foregoing discussion were those of the Fund’s investment adviser as of the date set forth above and may not reflect its views on the date this Semi-Annual Report is first published or anytime thereafter. These views are intended to assist shareholders in understanding their investment in the Fund and do not constitute investment advice.
The performance information quoted above represents past performance and past performance does not guarantee future results. Investment return and principal value of an investment will fluctuate so that an investor’s shares, when redeemed, may be worth more or less than their original cost. Current performance may be lower or higher than the performance data quoted. Performance data, current to the most recent month end, may be obtained by calling the Fund at 1-877-832-6952. Fee waivers and expense reimbursements have positively impacted Fund performance. An investor should consider the Fund’s investment objectives, risks, and charges and expenses carefully before investing. The Fund’s Prospectus contains this and other important information. For information on the Fund’s expense ratio, please see the Financial Highlights Table found within the accompanying Semi-Annual Report.
Investment Results – (Unaudited)
[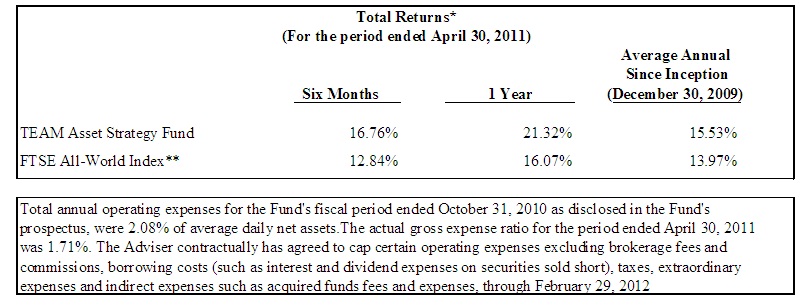
The performance quoted represents past performance, which does not guarantee future results. The investment return and principal value of an investment will fluctuate so that an investor’s shares, when redeemed, may be worth more or less than their original cost. The returns shown do not reflect deduction of taxes that a shareholder would pay on Fund distributions or the redemption of Fund shares. Current performance of the Fund may be lower or higher than the performance quoted. The Fund’s investment objectives, risks, charges and expenses must be considered carefully before investing. Performance data current to the most recent month end may be obtained by calling 1-877-832-6952.
* Return figures reflect any change in price per share and assume the reinvestment of all distributions.
** The FTSE All-World Index is a widely recognized unmanaged index of equity prices and is representative of a broader market and range of securities than is found in the Fund’s portfolio. Individuals cannot invest directly in the Index; however, an individual can invest in exchange-traded funds or other investment vehicles that attempt to track the performance of a benchmark index.
The Fund’s investment objectives, risks, charges and expenses must be considered carefully before investing. The prospectus contains this and other important information about the investment company and may be obtained by calling the same number as above. Please read it carefully before investing. The Fund is distributed by Unified Financial Securities, Inc. Member FINRA.
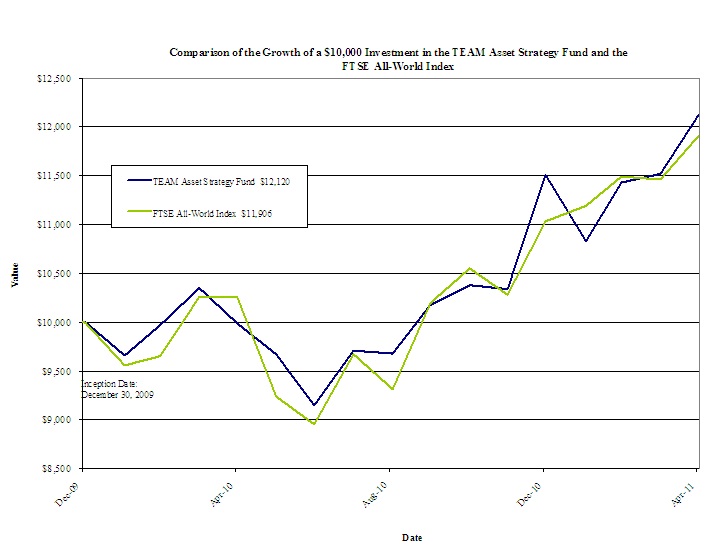
The chart above assumes an initial investment of $10,000 made on December 30, 2009 (commencement of Fund operations) and held through April 30, 2011. The FTSE All-World Index is a widely recognized unmanaged index of equity prices and is representative of a broader market and range of securities than is found in the Fund’s portfolio. Individuals cannot invest directly in the Index; however, an individual can invest in exchange- traded funds or other investment vehicles that attempt to track the performance of a benchmark index. THE FUND’S RETURN REPRESENTS PAST PERFORMANCE AND DOES NOT GUARANTEE FUTURE RESULTS. The returns shown do not reflect deduction of taxes that a shareholder would pay on Fund distributions or the redemption of Fund shares. Investment returns and principal values will fluctuate so that your shares, when redeemed, may be worth more or less than their original purchase price.
Current performance may be lower or higher than the performance data quoted. For more information on the Fund, and to obtain performance data current to the most recent month end or to request a prospectus, please call 1-877-832-6952. You should carefully consider the investment objectives, potential risks, management fees, and charges and expenses of the Fund before investing. The Fund’s prospectus contains this and other information about the Fund, and should be read carefully before investing.
The Fund is distributed by Unified Financial Securities, Inc., member FINRA.
Fund Holdings – (Unaudited)
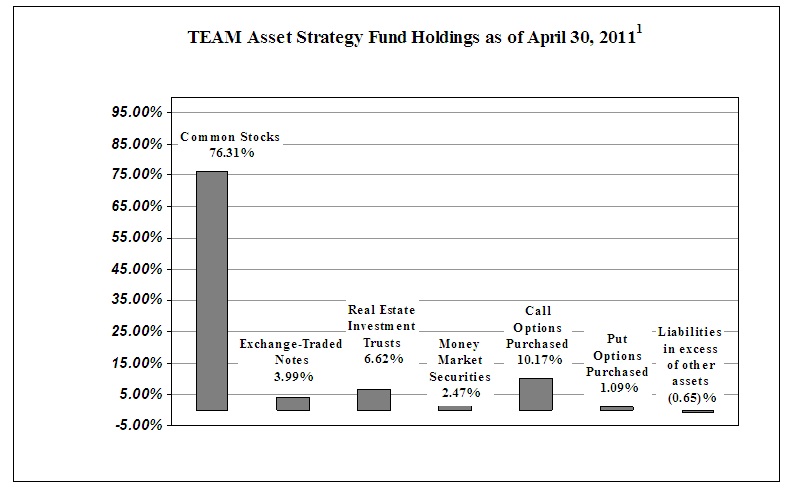
1As a percentage of net assets.
The investment objective of the TEAM Asset Strategy Fund (the “Fund”) is to provide high total investment return, which will generally be achieved through a combination of appreciation in capital and income.
Availability of Portfolio Schedule
The Fund files its complete schedule of portfolio holdings with the Securities and Exchange Commission (“SEC”) for the first and third quarters of each fiscal year on Form N-Q. The Fund’s Forms N-Q are available at the SEC’s website at www.sec.gov. The Fund’s Forms N-Q may be reviewed and copied at the SEC’s Public Reference Room in Washington DC. Information on the operation of the Public Reference Room may be obtained by calling 1-800-SEC-0330.
Summary of Fund’s Expenses
As a shareholder of the Fund, you incur two types of costs: (1) transaction costs, such as short-term redemption fees; and (2) ongoing costs, including management fees and other Fund expenses. This Example is intended to help you understand your ongoing costs (in dollars) of investing in the Fund and to compare these costs with the ongoing costs of investing in other mutual funds.
The Example is based on an investment of $1,000 invested at the beginning and held for the entire period from November 1, 2010 through April 30, 2011.
Actual Expenses
The first line of the table below provides information about actual account values and actual expenses. You may use the information in this line, together with the amount you invested, to estimate the expenses that you paid over the period. Simply divide your account value by $1,000 (for example, an $8,600 account value divided by $1,000 = $8.60), then multiply the result by the number in the first line under the heading entitled “Expenses Paid During Period” to estimate the expenses you paid on your account during this period.
Hypothetical Example for Comparison Purposes
The second line of the table below provides information about hypothetical account values and hypothetical expenses based on the Fund’s actual expense ratio and an assumed rate of return of 5% per year before expenses, which is not the Fund’s actual return. The hypothetical account values and expenses may not be used to estimate the actual ending account balance or expenses you paid for the period. You may use this information to compare the ongoing costs of investing in the Fund and other funds. To do so, compare this 5% hypothetical example with the 5% hypothetical examples that appear in the shareholder reports of the other funds.
Please note that the expenses shown in the table are meant to highlight your ongoing costs only and do not reflect any transactional costs such as the redemption fee imposed on short-term redemptions. Therefore, the second line of the table below is useful in comparing ongoing costs only and will not help you determine the relative costs of owning different funds. In addition, if the short-term redemption fee imposed by the Fund were included, your costs would have been higher.
TEAM Asset Strategy Fund | Beginning Account Value | Ending Account Value April 30, 2011 | Expenses Paid During the Period Ended April 30, 2011 |
| Actual* | $1,000.00 | $1,167.63 | $9.19 |
| Hypothetical** | $1,000.00 | $1,016.31 | $8.55 |
*Expenses are equal to the Fund’s annualized expense ratio of 1.71%, multiplied by the average account value over the period, multiplied by 181/365 (to reflect the partial year).
** Assumes a 5% return before expenses
| TEAM Asset Strategy Fund | ||||||||
| Schedule of Investments | ||||||||
| April 30, 2011 | ||||||||
| (unaudited) | ||||||||
| Shares | Value | |||||||
| Common Stocks - 76.31% | ||||||||
| Banks - 3.65% | ||||||||
| Mitsubishi UFJ Financial Group, Inc. (b) | 434,000 | $ | 2,070,180 | |||||
| Chemicals - 4.77% | ||||||||
| Intrepid Potash, Inc. (a) (c) | 79,000 | 2,706,540 | ||||||
| Gold & Silver Ores - 27.70% | ||||||||
| Minefinders Corp., Ltd. (a) | 324,000 | 5,430,240 | ||||||
| Northgate Minerals Corp. (a) | 940,000 | 2,838,800 | ||||||
| Royal Gold, Inc. | 78,372 | 4,779,125 | ||||||
| Yamana Gold, Inc. (c) | 210,000 | 2,669,100 | ||||||
| 15,717,265 | ||||||||
| Mining - 8.57% | ||||||||
| Martin Marietta Materials, Inc. | 31,000 | 2,826,890 | ||||||
| Vulcan Materials Company | 45,000 | 2,034,000 | ||||||
| 4,860,890 | ||||||||
| Petroleum & Natural Gas - 17.81% | ||||||||
| Canadian Oil Sands, Ltd. | 87,000 | 3,003,240 | ||||||
| Diamond Offshore Drilling, Inc. | 32,000 | 2,427,840 | ||||||
| Ecana Corp. (c) | 65,000 | 2,178,800 | ||||||
| Statoil ASA (b) | 85,000 | 2,491,350 | ||||||
| 10,101,230 | ||||||||
| Retail - 2.77% | ||||||||
| Winn-Dixie Stores, Inc. (a) | 222,000 | 1,573,980 | ||||||
| Services - 11.04% | ||||||||
| Heckmann Corp. (a) | 100,000 | 630,000 | ||||||
| Jacobs Engineering Group, Inc. (a) | 45,000 | 2,232,450 | ||||||
| U.S. Global Investors, Inc. - Class A (c) | 345,200 | 3,400,220 | ||||||
| 6,262,670 | ||||||||
| TOTAL COMMON STOCKS (Cost $34,198,099) | 43,292,755 | |||||||
| Exchange-Traded Notes - 3.99% | ||||||||
| ELEMENTS - Linked to the Rogers International Commodity | ||||||||
| Index - Agriculture Total Return - MLPF&S - 10/24/2022 (a) | 205,000 | 2,261,150 | ||||||
| TOTAL EXCHANGE-TRADED NOTES (Cost $1,563,416) | 2,261,150 | |||||||
| Real Estate Investment Trusts - 6.62% | ||||||||
| Annaly Capital Management, Inc. | 112,000 | 1,998,080 | ||||||
| Redwood Trust, Inc. | 111,000 | 1,757,130 | ||||||
| TOTAL REAL ESTATE INVESTMENT TRUSTS (Cost $3,536,752) | 3,755,210 | |||||||
| Money Market Securities - 2.47% | ||||||||
| Federated Prime Obligations Fund - Institutional Shares, 0.11% (d) | 1,400,449 | 1,400,449 | ||||||
| TOTAL MONEY MARKET SECURITIES (Cost $1,400,449) | 1,400,449 | |||||||
See accompanying notes which are an integral part of these financial statements
| TEAM Asset Strategy Fund | ||||||
| Schedule of Investments - continued | ||||||
| April 30, 2011 | ||||||
| (unaudited) | ||||||
| Call Options Purchased - 10.17% | ||||||
| Outstanding Contracts | Value | |||||
| Abbott Laboratories / January 2012 / Strike $45.00 (e) | 500 | $ 377,500 | ||||
| Berkshire Hathaway, Inc. - Class B / June 2011 / Strike $85.00 (e) | 2,000 | 238,000 | ||||
| Dell, Inc. / August 2011 / Strike $14.00 (e) | 1,000 | 188,000 | ||||
| Encana Corp. / January 2012 / Strike $30.00 (e) | 1,000 | 480,000 | ||||
| Hewlett-Packard Co. / January 2012 / Strike $45.00 (e) | 2,000 | 314,000 | ||||
| Intrepid Potash, Inc. / June 2011 \ Strike $35.00 (e) | 1,500 | 236,250 | ||||
| Kinross Gold Corp. / August 2011 / Strike $16.00 (e) | 4,000 | 464,000 | ||||
| Microsoft Corp. / October 2011 / Strike $25.00 (e) | 4,000 | 776,000 | ||||
| Newmont Mining Corp. / June 2011 / Strike $55.00 (e) | 2,000 | 904,000 | ||||
| Nokia Corp. / July 2011 / Strike $8.00 (e) | 2,000 | 250,000 | ||||
| Petroleo Brasileiro / July 2011 / Strike $35.00 (b) (e) | 1,000 | 315,000 | ||||
| PPL Corp. / July 2011 / Strike $26.00 (e) | 1,000 | 160,000 | ||||
| Vulcan Materials Co. / May 2011 / Strike $40.00 (e) | 1,000 | 540,000 | ||||
| Wal-Mart Stores, Inc. / June 2011 / Strike $52.50 (e) | 2,000 | 528,000 | ||||
| TOTAL CALL OPTIONS PURCHASED (Cost $4,601,428) | 5,770,750 | |||||
| Put Options Purchased - 1.09% | ||||||
| Apple, Inc. / June 2011 / Strike $345.00 (e) | 300 | 291,000 | ||||
| Ford Motor Co. / January 2012 / Strike $10.00 (e) | 1,800 | 32,400 | ||||
| iShares MSCI Emerging Market Index / June 2011 / Strike $46.00 (e) | 4,000 | 184,000 | ||||
| iShares Russell 2000 / May 2011 / Strike $80.00 (e) | 5,000 | 110,000 | ||||
| TOTAL PUT OPTIONS PURCHASED (Cost $2,792,803) | 617,400 | |||||
| TOTAL INVESTMENTS (Cost $48,092,947) - 100.65% | $ 57,097,714 | |||||
| Liabilities in excess of other assets - (0.65)% | (367,044) | |||||
| TOTAL NET ASSETS - 100.00% | $ 56,730,670 | |||||
| (a) Non-income producing. | ||||||
| (b) American Depositary Receipt. | ||||||
| (c) All or a portion of this security is held as collateral on forward currency contracts. | ||||||
| (d) Variable rate security; the rate shown represents the 7 day yield at April 30, 2011. | ||||||
| (e) Each Call/Put contract has a multiplier of 100 shares | ||||||
See accompanying notes which are an integral part of these financial statements
| TEAM Asset Strategy Fund | ||||||
| Forward Currency | ||||||
| April 30, 2011 | ||||||
| (unaudited) | ||||||
Original | Underlying Face Amount at | Unrealized Appreciation | ||||
| Long Forward Currency | Face Value | Fair Value | (Depreciation) | |||
| CHF FX Contract, May 2, 2011 | 4,716,000 | $ 5,430,596 | $ (430,364) | |||
| USD FX Contract, May 2, 2011 | 5,000,000 | 5,000,000 | - | |||
| USD FX Contract, August 8, 2011 | 15,000,000 | 15,000,000 | - | |||
| Total Long Forward Currency | $ (430,364) | |||||
Original | Underlying Face Amount at | Unrealized Appreciation | ||||
| Short Forward Currency | Face Value | Fair Value | (Depreciation) | |||
| CHF FX Contract, May 2, 2011 | (4,716,000) | $ (5,430,596) | $ 267,626 | |||
| JPY FX Contract, August 8, 2011 | (1,223,700,000) | (15,094,213) | (94,074) | |||
| USD FX Contract, May 2, 2011 | (5,162,738) | (5,162,738) | - | |||
| Total Short Forward Currency | $ 173,552 | |||||
See accompanying notes which are an integral part of these financial statements
| TEAM Asset Strategy Fund | ||||
| Statement of Assets and Liabilities | ||||
| April 30, 2011 | ||||
| (Unaudited) | ||||
| Assets | ||||
| Investments in securities, at fair value (cost $48,092,947) | $ | 57,097,714 | ||
| Dividends receivable | 57,634 | |||
| Receivable for Fund shares sold | 61,108 | |||
| Prepaid expenses | 17,242 | |||
| Interest receivable | 118 | |||
| Total assets | 57,233,816 | |||
| Liabilities | ||||
| Payable for investments purchased | 172,871 | |||
| Payable for fund shares redeemed | 73 | |||
| Payable to Adviser (a) | 56,346 | |||
| Payable for forward currency contracts | 256,812 | |||
| Payable to administrator, fund accountant, and transfer agent | 8,289 | |||
| Payable to custodian | 595 | |||
| Other accrued expenses | 8,160 | |||
| Total liabilities | 503,146 | |||
| Net Assets | $ | 56,730,670 | ||
| Net Assets consist of: | ||||
| Paid in capital | $ | 45,666,674 | ||
| Accumulated undistributed net investment income (loss) | 68,678 | |||
| Accumulated net realized gain (loss) from investment transactions | 2,247,363 | |||
| Net unrealized appreciation (depreciation) on: | ||||
| Investment securities | 9,004,767 | |||
| Foreign currency translations | (256,812 | ) | ||
| Net Assets | $ | 56,730,670 | ||
| Shares outstanding (unlimited number of shares authorized) | 4,682,069 | |||
| Net Asset Value and offering price per share | $ | 12.12 | ||
| Redemption price per share (NAV * 99%) (b) | $ | 12.00 | ||
| (a) See Note 5 in the Notes to the Financial Statements. | ||||
| (b) The Fund charges a 1.00% redemption fee on shares redeemed within 30 days of purchase. | ||||
See accompanying notes which are an integral part of these financial statements
| TEAM Asset Strategy Fund | ||||
| Statement of Operations | ||||
| April 30, 2011 | ||||
| (Unaudited) | ||||
| Investment Income | ||||
| Dividend income (net of foreign withholding tax of $30,023) | $ | 496,606 | ||
| Interest income | 1,199 | |||
| Total Investment Income | 497,805 | |||
| Expenses | ||||
| Investment Adviser fee (a) | 307,237 | |||
| Administration expenses | 23,598 | |||
| Transfer agent expenses | 20,088 | |||
| Registration expenses | 18,038 | |||
| Fund accounting expenses | 13,462 | |||
| Custodian expenses | 12,215 | |||
| Auditing expenses | 7,788 | |||
| Legal expenses | 5,708 | |||
| Offering cost expenses | 2,936 | |||
| 24f-2 expense | 2,760 | |||
| Trustee expenses | 2,634 | |||
| Pricing expenses | 1,211 | |||
| Insurance expense | 1,060 | |||
| Printing expenses | 968 | |||
| Miscellaneous expenses | 710 | |||
| Total Expenses | 420,413 | |||
| Net Investment Income (Loss) | 77,392 | |||
| Realized & Unrealized Gain (Loss) on Investments | ||||
| Net realized gain (loss) on: | ||||
| Investment securities | 1,620,870 | |||
| Foreign currency translations | (928,775 | ) | ||
| Change in unrealized appreciation (depreciation) on: | ||||
| Investment securities | 5,514,639 | |||
| Foreign currency translations | 1,527,646 | |||
| Net realized and unrealized gain (loss) on investment securities | 7,734,380 | |||
| Net increase (decrease) in net assets resulting from operations | $ | 7,811,772 | ||
| (a) See Note 5 in the Notes to the Financial Statements. | ||||
See accompanying notes which are an integral part of these financial statements
| TEAM Asset Strategy Fund | |||||||||
| Statement of Changes In Net Assets | |||||||||
| For the six months | For the | ||||||||
| ended April 30, 2011 | Period Ended | ||||||||
| (unaudited) | October 31, 2010 | (a) | |||||||
| Increase (Decrease) in Net Assets due to: | |||||||||
| Operations | |||||||||
| Net investment income (loss) | $ | 77,392 | $ | (25,942 | ) | ||||
| Net realized gain (loss) on: | |||||||||
| Investment securities | 1,620,870 | (229,190 | ) | ||||||
| Foreign currency translations | (928,775 | ) | - | ||||||
| Change in unrealized appreciation (depreciation) on: | |||||||||
| Investment securities | 5,514,639 | 3,490,128 | |||||||
| Foreign currency translations | 1,527,646 | (1,784,458 | ) | ||||||
| Net increase (decrease) in net assets resulting from operations | 7,811,772 | 1,450,538 | |||||||
| Capital Share Transactions | |||||||||
| Proceeds from shares sold | 6,426,004 | 42,566,630 | |||||||
| Amount paid for shares redeemed | (828,579 | ) | (690,718 | ) | |||||
| Proceeds from redemption fees collected (b) | (5,274 | ) | 297 | ||||||
| Net increase (decrease) in net assets resulting from capital share transactions | 5,592,151 | 41,876,209 | |||||||
| Total Increase (Decrease) in Net Assets | 13,403,923 | 43,326,747 | |||||||
| Net Assets | |||||||||
| Beginning of period | 43,326,747 | - | |||||||
| End of period | $ | 56,730,670 | $ | 43,326,747 | |||||
| Undistributed net investment income (loss) | |||||||||
| included in net assets at end of period | $ | 68,678 | $ | (8,714 | ) | ||||
| Capital Share Transactions | |||||||||
| Shares sold | 580,020 | 4,243,528 | |||||||
| Shares redeemed | (73,502 | ) | (67,977 | ) | |||||
| Net increase (decrease) from capital share transactions | 506,518 | 4,175,551 | |||||||
| (a) For the period December 30, 2009 (Commencement of Operations) to October 31, 2010. | |||||||||
| (b) The Fund charges a 1% redemption fee on shares redeemed within 30 calendar days of purchase. | |||||||||
See accompanying notes which are an integral part of these financial statements
| TEAM Asset Strategy Fund | |||||||||
| Financial Highlights | |||||||||
| (For a share outstanding during the period) | |||||||||
| For the six months | For the | ||||||||
| ended April 30, 2011 | Period Ended | ||||||||
| (unaudited) | October 31, 2010 | (a) | |||||||
| Selected Per Share Data: | |||||||||
| Net asset value, beginning of period | $ | 10.38 | $ | 10.00 | |||||
| Income from investment operations: | |||||||||
| Net investment income (loss) | 0.02 | (0.01 | ) | ||||||
| Net realized and unrealized gain (loss) on investments | 1.72 | 0.39 | |||||||
| Total from investment operations | 1.74 | 0.38 | |||||||
| Paid in capital from redemption fees (e) | - | - | |||||||
| Net asset value, end of period | $ | 12.12 | $ | 10.38 | |||||
Total Return (b) (c) | 16.76 | % | 3.80 | % | |||||
| Ratios and Supplemental Data: | |||||||||
| Net assets, end of period (000) | $ | 56,731 | $ | 43,327 | |||||
| Ratio of expenses to average net assets (d) | 1.71 | % | 1.93 | % | |||||
| Ratio of net investment income (loss) to | |||||||||
| average net assets (d) | 0.31 | % | (0.09 | )% | |||||
| Portfolio turnover rate | 50.94 | % | 313.40 | % | |||||
| (a) For the period December 30, 2009 (Commencement of Operations) to October 31, 2010. | |||||||||
| (b) Total return in the above table represents the rate that the investor would have earned or | |||||||||
| lost on an investment in the Fund, assuming reinvestment of dividends if any. | |||||||||
| (c) Not annualized. | |||||||||
| (d) Annualized. | |||||||||
| (e) Less than $0.01/share | |||||||||
See accompanying notes which are an integral part of these financial statements
TEAM Asset Strategy Fund
Notes to the Financial Statements
April 30, 2011
(Unaudited)
NOTE 1. ORGANIZATION
The TEAM Asset Strategy Fund (the “Fund”) is an open-end, non-diversified series of the Valued Advisers Trust (the “Trust”). The Trust is a management investment company established under the laws of Delaware by an Agreement and Declaration of Trust dated June 13, 2008 (the “Trust Agreement”). The Trust Agreement permits the Trustees to issue an unlimited number of shares of beneficial interest of separate series without par value. The Fund is one of a series of funds authorized by the Board of Trustees (the “Board”). The Fund’s investment adviser is TEAM Financial Asset Management, LLC (the “Adviser”). The investment objective of the Fund is to provide high total investment return, which will generally be achieved through a combination of appreciation in capital and income.
NOTE 2. SIGNIFICANT ACCOUNTING POLICIES
The following is a summary of significant accounting policies followed by the Fund in the preparation of its financial statements in accordance with accounting principles generally accepted in the United States of America (“GAAP”).
Securities Valuation – All investments in securities are recorded at their estimated fair value as described in Note 3.
Federal Income Taxes – The Fund makes no provision for federal income or excise tax. The Fund intends to qualify each year as a regulated investment company (“RIC”) under subchapter M of the Internal Revenue Code of 1986, as amended, by complying with the requirements applicable to RICs and by distributing substantially all of its taxable income. The Fund also intends to distribute sufficient net investment income and net capital gains, if any, so that it will not be subject to excise tax on undistributed income and gains. If the required amount of net investment income or gains is not distributed, the Fund could incur a tax expense.
As of and during the period ended April 30, 2011, the Fund did not have a liability for any unrecognized tax benefits. The Fund recognizes interest and penalties, if any, related to unrecognized tax benefits as income tax expense in the statement of operations. During the period, the Fund did not incur any interest or penalties. The Fund is subject to examination by U.S. federal tax authorities for the tax period ending October 31, 2010.
Expenses – Expenses incurred by the Trust that do not relate to a specific fund of the Trust are allocated to the individual funds based on each fund’s relative net assets or another appropriate basis (as determined by the Trustees).
Security Transactions and Related Income - The Fund follows industry practice and records security transactions on the trade date. The specific identification method is used for determining gains or losses for financial statement and income tax purposes. Dividend income is recorded on the ex-dividend date and interest income is recorded on an accrual basis. Discounts and premiums on securities purchased are amortized or accreted using the effective interest method. Withholding taxes on foreign dividends have been provided for in accordance with the Fund’s understanding of the applicable country’s tax rules and rates. The ability of issuers of debt securities held by the Fund to meet their obligations may be affected by economic and political developments in a specific country or region.
Dividends and Distributions - The Fund intends to distribute substantially all of its net investment income, net realized long-term capital gains and its net realized short-term capital gains, if any, to its shareholders on at least an annual basis. Dividends to shareholders, which are determined in accordance with income tax regulations, are recorded on the ex-dividend date. The treatment for financial reporting purposes of distributions made to shareholders during the year from net investment income or net realized capital gains may differ from their ultimate treatment for federal income tax purposes. These differences are caused primarily by differences in the timing of the recognition of certain components of income, expense or realized capital gain for federal income tax purposes. Where such differences are permanent in nature, they are reclassified in the components of net assets based on their ultimate characterization for federal income tax purposes. Any such reclassifications will have no effect on net assets, results of operations or net asset values per share of the Fund.
TEAM Asset Strategy Fund
Notes to the Financial Statements - continued
April 30, 2011
(Unaudited)
NOTE 2. SIGNIFICANT ACCOUNTING POLICIES – continued
Forward Currency Contracts - The Fund may engage in foreign currency exchange transactions. The value of the Fund’s portfolio securities that are invested in non-U.S. dollar denominated instruments as measured in U.S. dollars may be affected favorably or unfavorably by changes in foreign currency exchange rates, and the Fund may incur costs in connection with conversions between various currencies. The Fund will conduct its foreign currency exchange transactions either on a spot (i.e., cash) basis at the spot rate prevailing in the foreign currency exchange market, or through forward contracts to purchase or sell foreign currencies. A forward foreign currency exchange contract involves an obligation to purchase or sell a specific currency at a future date, which may be any fixed number of days from the date of the contract agreed upon by the parties, at a price set at the time of the contract. These contracts are traded directly between currency traders (usually large commercial banks) and their customers. The Fund will not, however, hold foreign currency except in connection with the purchase and sale of foreign portfolio securities. The Fund has engaged in foreign currency exchange transactions for the purpose of capitalizing on the movements of foreign currency value versus the U.S. dollar.
Purchasing Put Options - The Fund may purchase put options. As the holder of a put option, the Fund has the right to sell the underlying security at the exercise price at any time during the option period. The Fund may enter into closing sale transactions with respect to such options, exercise them or permit them to expire. The Fund may purchase a put option on an underlying security (a “protective put”) owned as a defensive technique in order to protect against an anticipated decline in the value of the security. Such hedge protection is provided only during the life of the put option when the Fund, as the holder of the put option, is able to sell the underlying security at the put exercise price regardless of any decline in the underlying security’s market price. For example, a put option may be purchased in order to protect unrealized appreciation of a security where the Adviser deems it desirable to continue to hold the security because of tax considerations. The premium paid for the put option and any transaction costs would reduce any capital gain otherwise available for distribution when the security is eventually sold.
Purchasing Call Options - The Fund may purchase call options. As the holder of a call option, the Fund has the right to purchase the underlying security at the exercise price at any time during the option period. The Fund may enter into closing sale transactions with respect to such options, exercise them or permit them to expire. The Fund may also purchase call options on relevant stock indexes. Call options may also be purchased by the Fund for the purpose of acquiring the underlying securities for its portfolio. Utilized in this fashion, the purchase of call options enables the Fund to acquire the securities at the exercise price of the call option plus the premium paid. At times the net cost of acquiring securities in this manner may be less than the cost of acquiring the securities directly. This technique may also be useful to the Fund in purchasing a large block of securities that would be more difficult to acquire by direct market purchases. So long as it holds such a call option rather than the underlying security itself, the Fund is partially protected from any unexpected decline in the market price of the underlying security and in such event could allow the call option to expire, incurring a loss only to the extent of the premium paid for the option.
NOTE 3. SECURITIES VALUATION AND FAIR VALUE MEASUREMENTS
Fair value is defined as the price that a Fund would receive upon selling an investment in a timely transaction to an independent buyer in the principal or most advantageous market of the investment. GAAP establishes a three-tier hierarchy to maximize the use of observable market data and minimize the use of unobservable inputs and to establish classification of fair value measurements for disclosure purposes.
Inputs refer broadly to the assumptions that market participants would use in pricing the asset or liability, including assumptions about risk (the risk inherent in a particular valuation technique used to measure fair value such as pricing model and/or the risk inherent in the inputs to the valuation technique). Inputs may be observable or unobservable. Observable inputs are inputs that reflect the assumptions market participants would use in pricing the asset or liability developed based on market data obtained from sources independent of the reporting entity. Unobservable inputs are inputs that reflect the reporting entity’s own assumptions about the assumptions market participants would use in pricing the asset or liability developed based on the best information available in the circumstances.
TEAM Asset Strategy Fund
Notes to the Financial Statements - continued
April 30, 2011
(Unaudited)
NOTE 3. SECURITIES VALUATION AND FAIR VALUE MEASUREMENTS – continued
Various inputs are used in determining the value of the Fund’s investments. These inputs are summarized in the three broad levels listed below.
| · | Level 1 – quoted prices in active markets for identical securities |
| · | Level 2 – other significant observable inputs (including, but not limited to, quoted prices for an identical security in an inactive market, quoted prices for similar securities, interest rates, prepayment speeds, credit risk, etc.) |
| · | Level 3 – significant unobservable inputs (including the Fund’s own assumptions in determining fair value of investments based on the best information available) |
The inputs used to measure fair value may fall into different levels of the fair value hierarchy. In such cases, for disclosure purposes, the level in the fair value hierarchy within which the fair value measurement falls in its entirety, is determined based on the lowest level input that is significant to the fair value measurement in its entirety.
Equity securities, including common stocks, real estate investment trusts and exchange-traded notes, are generally valued by using market quotations, furnished by a pricing service. Securities that are traded on any stock exchange are generally valued at the last quoted sale price. Lacking a last sale price, an exchange traded security is generally valued at its last bid price. Securities traded in the NASDAQ over-the-counter market are generally valued at the NASDAQ Official Closing Price. When using the market quotations or close prices provided by the pricing service and when the market is considered active, the security is classified as a Level 1 security. Sometimes, an equity security owned by the Fund will be valued by the pricing service with factors other than market quotations or when the market is considered inactive. When this happens, the security is classified as a Level 2 security. When market quotations are not readily available, when the Fund determines that the market quotation or the price provided by the pricing service does not accurately reflect the current fair value, or when restricted or illiquid securities are being valued, such securities are valued as determined in good faith by the Fund, in conformity with guidelines adopted by and subject to review by the Board. These securities are categorized as Level 3 securities.
Investments in mutual funds, including money market mutual funds, are generally priced at the ending net asset value (NAV) provided by the service agent of the funds. These securities are categorized as Level 1 securities.
Fixed income securities that are valued using market quotations in an active market are categorized as Level 1 securities. However, they may be valued on the basis of prices furnished by a pricing service when the Fund believes such prices more accurately reflect the fair value of such securities. A pricing service utilizes electronic data processing techniques based on yield spreads relating to securities with similar characteristics to determine prices for normal institutional-size trading units of debt securities without regard to sale or bid prices. These securities are generally categorized as Level 2 securities. If the Fund decides that a price provided by the pricing service does not accurately reflect the fair value of the securities, when prices are not readily available from a pricing service, or when restricted or illiquid securities are being valued, securities are valued at fair value as determined in good faith by the Fund, in conformity with guidelines adopted by and subject to review of the Board. These securities are categorized as Level 3 securities.
Short-term investments in fixed income securities, (those with maturities of less than 60 days when acquired, or which subsequently are within 60 days of maturity), are valued using the amortized cost method of valuation, which the Board has determined represents fair value. These securities will be classified as Level 2 securities.
If the Fund decides that a price provided by the pricing service does not accurately reflect the fair value of the securities, when prices are not readily available from a pricing service, or when restricted or illiquid securities are being valued, securities are valued at fair value as determined in good faith by the Fund, in conformity with guidelines adopted by and subject to review of the Board. These securities will be categorized as Level 3 securities.
TEAM Asset Strategy Fund
Notes to the Financial Statements - continued
April 30, 2011
(Unaudited)
NOTE 3. SECURITIES VALUATION AND FAIR VALUE MEASUREMENTS - continued
Derivative instruments the Fund invests in, such as forward currency contracts, are valued at the interpolated rates based on the prevailing banking rates and are generally categorized as Level 2 securities.
In accordance with the Trust’s good faith pricing guidelines, the Fund is required to consider all appropriate factors relevant to the value of securities for which it has determined other pricing sources are not available or reliable as described above. No single standard exists for determining fair value, because fair value depends upon the circumstances of each individual case. As a general principle, the current fair value of an issue of securities being valued by the Fund would appear to be the amount which the owner might reasonably expect to receive for them upon their current sale. Methods which are in accordance with this principle may, for example, be based on (i) a multiple of earnings; (ii) a discount from market of a similar freely traded security (including a derivative security or a basket of securities traded on other markets, exchanges or among dealers); or (iii) yield to maturity with respect to debt issues, or a combination of these and other methods. Good faith pricing is permitted if, in the Fund’s opinion, the validity of market quotations appears to be questionable based on factors such as evidence of a thin market in the security based on a small number of quotations, a significant event occurs after the close of a market but before a Fund’s NAV calculation that may affect a security’s value, or the Fund is aware of any other data that calls into question the reliability of market quotations. Good faith pricing may also be used in instances when the bonds the Fund invests in may default or otherwise cease to have market quotations readily available. Any fair value pricing done outside the Fund’s approved pricing methods must be approved by the Pricing Committee of the Board.
The following is a summary of the inputs used to value the Fund’s investments as of April 30, 2011:
| Valuation Inputs | ||||||||||||||||
| Assets | Level 1 - Quoted Prices in Active Markets | Level 2 - Other Significant Observable Inputs | Level 3 - Significant Unobservable Inputs | Total | ||||||||||||
| Common Stocks* | $ | 43,292,755 | $ | - | $ | - | $ | 43,292,755 | ||||||||
| Exchange-Traded Notes | 2,261,150 | - | - | 2,261,150 | ||||||||||||
| Real Estate Investment Trusts | 3,755,210 | - | - | 3,755,210 | ||||||||||||
| Money Market Securities | 1,400,449 | - | - | 1,400,449 | ||||||||||||
| Call Options Purchased | 5,770,750 | - | - | 5,770,750 | ||||||||||||
| Put Options Purchased | 617,400 | - | - | 617,400 | ||||||||||||
| Total | $ | 57,097,714 | $ | - | $ | - | $ | 57,097,714 | ||||||||
| *Refer to the Schedule of Investments for industry classifications. | ||||||||||||||||
| Valuation Inputs | ||||||||||||||||
| Liabilities | Level 1 - Quoted Prices in Active Markets | Level 2 - Other Significant Observable Inputs | Level 3 - Significant Unobservable Inputs | Total | ||||||||||||
| Long Currency Forward Contract | $ | - | $ | (430,596 | ) | $ | - | $ | (430,596 | ) | ||||||
| Short Currency Forward Contract | - | 173,784 | - | 173,784 | ||||||||||||
| Total | $ | - | $ | (256,812 | ) | $ | - | $ | (256,812 | ) | ||||||
TEAM Asset Strategy Fund
Notes to the Financial Statements - continued
April 30, 2011
(Unaudited)
NOTE 3. SECURITIES VALUATION AND FAIR VALUE MEASUREMENTS - continued
The Fund did not hold any assets at any time during the reporting period in which significant unobservable inputs were used in determining fair value; therefore, no reconciliation of Level 3 securities is included for this reporting period. The Fund did not hold any derivative instruments during the reporting period. During the six months ended April 30, 2011, there were no significant transfers between Levels 1 and 2.
NOTE 4. DERIVATIVE TRANSACTIONS
Call and put options purchased and long and short forward currency contracts are represented on the Statement of Assets and Liabilities under investments in securities at value and payable for forward currency contracts, respectively and on the Statement of Operations under net realized gain (loss) on investment securities and change in unrealized appreciation (depreciation) on investment securities and foreign currency, respectively.
Please see the chart below for information regarding call and put options purchased and long and short forward currency contracts for the Fund.
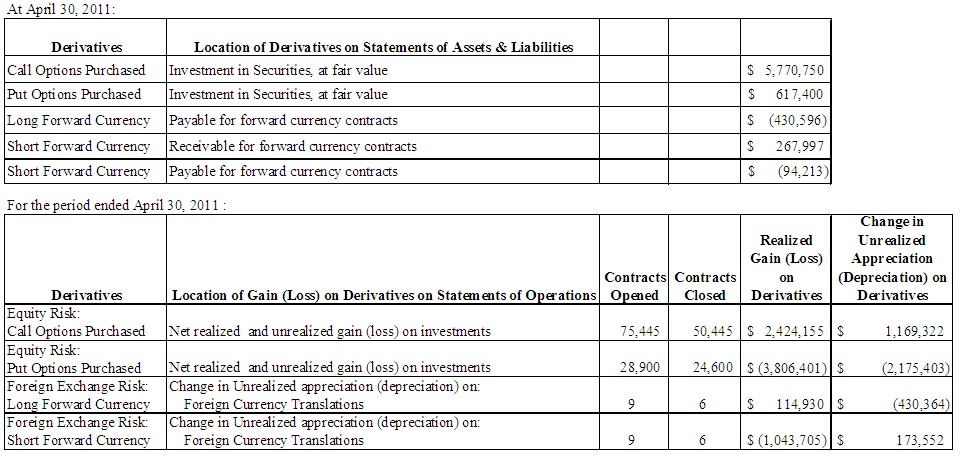
NOTE 5. FEES AND OTHER TRANSACTIONS WITH AFFILIATES
Under the terms of the management agreement (the “Agreement”), the Adviser manages the Fund’s investments subject to the approval of the Board. As compensation for its management services, the Fund is obligated to pay the Adviser a fee computed and accrued daily and paid monthly at an annual rate of 1.25% of the average daily net assets of the Fund. For the six months ended April 30, 2011, the Adviser earned a fee of $307,237 from the Fund. At April 30, 2011, the Fund owed the Adviser $56,346 for advisory fees.
The Advisor has contractually agreed to waive all or a portion of its management fee and/or reimburse certain Fund operating expenses, but only to the extent necessary to maintain each Fund’s total annual expenses, excluding brokerage fees and commissions, borrowing costs (such as interest and dividend expenses on securities sold short), taxes, extraordinary litigation expenses and any indirect expenses (such as expenses incurred by other investment companies acquired by the Fund), at 1.95% of the Fund’s average daily net assets through February 28, 2012.
TEAM Asset Strategy Fund
Notes to the Financial Statements - continued
April 30, 2011
(Unaudited)
NOTE 5. FEES AND OTHER TRANSACTIONS WITH AFFILIATES - continued
The Adviser may be entitled to the reimbursement of any fees waived or expenses reimbursed pursuant to the agreement, provided overall expenses fall below the limitations set forth above. The Adviser may recoup the sum of all fees previously waived or expenses reimbursed during any of the previous three (3) years, less any reimbursement previously paid, provided total expenses do not exceed the limitation set forth above.
The Trust retains Huntington Asset Services, Inc. (“HASI”) to manage the Fund’s business affairs and provide the Fund with administrative services, including all regulatory reporting and necessary office equipment and personnel. For the six months ended April 30, 2011, HASI earned fees of $23,598 for administrative services provided to the Fund. At April 30, 2011, HASI was owed $2,986 from the Fund for administrative services. Certain officers of the Trust are members of management and/or employees of HASI. HASI operates as a wholly-owned subsidiary of Huntington Bancshares, Inc., the parent company of Unified Financial Securities, Inc. (the “Distributor”) and Huntington National Bank, the custodian of the Fund’s investments (the “Custodian”). For the six months ended April 30, 2011, the Custodian earned fees of $12,215 for custody services provided to the Fund. At April 30, 2011, the Custodian was owed $595 from the Fund for custody services.
The Trust also retains HASI to act as the Fund’s transfer agent and to provide fund accounting services. For the six months ended April 30, 2011, HASI earned fees of $10,019 for transfer agent services and $10,069 in reimbursement of out-of-pocket expenses incurred in providing transfer agent services to the Fund. At April 30, 2011, the Fund owed HASI $1,503 for transfer agent services and $754 for out-of-pocket expenses. For the six months ended April 30, 2011, HASI earned fees of $13,462 from the Fund for fund accounting services. At April 30, 2011, HASI was owed $3,046 from the Fund for fund accounting services.
The Fund has adopted a Distribution Plan (the “Plan”) pursuant to Rule 12b-1 under the 1940 Act. The Plan provides that the Fund will pay the Distributor and/or any registered securities dealer, financial institution or any other person (the “Recipient”) a shareholder servicing fee of 0.25% of the average daily net assets of the Fund in connection with the promotion and distribution of the Fund’s shares or the provision of personal services to shareholders, including, but not necessarily limited to, advertising, compensation to underwriters, dealers and selling personnel, the printing and mailing
of prospectuses to other than current Fund shareholders, the printing and mailing of sales literature and servicing shareholder accounts. The Fund or Distributor may pay all or a portion of these fees to any Recipient who renders assistance in distributing or promoting the sale of shares, or who provides certain shareholder services, pursuant to a written agreement. The Plan will not be activated prior to February 28, 2012. However, effective March 1, 2012, the Plan will be activated and the Fund will, as a result, begin to incur the fees associated with the Plan.
The Distributor acts as the principal underwriter of the Fund’s shares. There were no payments made by the Fund to the Distributor during the six months ended April 30, 2011. An officer of the Trust is an officer of the Distributor and such person may be deemed to be an affiliate of the Distributor.
TEAM Asset Strategy Fund
Notes to the Financial Statements - continued
April 30, 2011
(Unaudited)
NOTE 6. PURCHASES AND SALES OF INVESTMENTS
For the six months ended April 30, 2011, purchases and sales of investment securities, other than short-term investments and short-term U.S. government obligations, were as follows:
| Purchases | ||||
| U.S. Government Obligations | $ | - | ||
| Other | 22,429,542 | |||
| Sales | ||||
| U.S. Government Obligations | $ | - | ||
| Other | 25,637,318 | |||
At April 30, 2011, the net unrealized appreciation (depreciation) of investments for tax purposes excluding forward currency contracts was as follows:
| Gross Appreciation | $ | 11,564,410 | ||
| Gross (Depreciation) | (2,620,474 | ) | ||
| Net Appreciation (Depreciation) on Investments | $ | 8,943,936 | ||
At April 30, 2011, the aggregate cost of securities for federal income tax purposes was $48,153,778.
NOTE 7. ESTIMATES
The preparation of financial statements in conformity with GAAP requires management to make estimates and assumptions that affect the reported amounts of assets and liabilities and disclosure of contingent assets and liabilities at the date of the financial statements and the reported amounts of increases and decreases in net assets from operations during the reporting period. Actual results could differ from those estimates.
NOTE 8. BENEFICIAL OWNERSHIP
The beneficial ownership, either directly or indirectly, of 25% or more of the voting securities of a fund creates a presumption of control of a fund, under Section 2(a) (9) of the Investment Company Act of 1940. At April 30, 2011, Charles Schwab, for the benefit of its customers, held 69.99% of the voting securities. The Trust does not know whether Charles Schwab or any of the accounts having a beneficial interest in accounts held of record by Charles Schwab (the "Underlying Accounts") hold beneficially 25% or more of the outstanding voting securities of the Fund. Accordingly, it is not known whether Charles Schwab or any of the Underlying Accounts could be deemed to control the Fund.
NOTE 9. DISTRIBUTIONS TO SHAREHOLDERS
There were no distributions made by the Fund during the six months ended April 30, 2011.
NOTE 10. COMMITMENTS AND CONTINGENCIES
The Fund indemnifies its officers and trustees for certain liabilities that may arise from their performance of their duties to the Fund. Additionally, in the normal course of business, the Fund enters into contracts that contain a variety of representatives and warranties which provide general indemnifications. The Fund’s maximum exposure under these arrangements is unknown, as this would involve future claims that may be made against the Fund that have not yet occurred.
TEAM Asset Strategy Fund
Notes to the Financial Statements - continued
April 30, 2011
(Unaudited)
NOTE 11. RECENT ACCOUNTING PRONOUNCEMENTS
In January 2010, the Financial Accounting Standards Board issued Accounting Standards Update (“ASU”) No. 2010-06 “Improving Disclosures about Fair Value Measurements.” ASU No. 2010-06 clarifies existing disclosure and requires additional disclosures regarding fair value measurements. Effective for fiscal years beginning after December 15, 2010, and for interim periods within those fiscal years, entities will need to disclose information about purchases, sales, issuances and settlements of Level 3 securities on a gross basis, rather than as a net number as currently required. Management is currently evaluating the impact ASU No. 2010-06 will have on its financial statement disclosures.
NOTE 12. TAX COMPONENTS OF CAPITAL
At October 31, 2010, the components of distributable earnings (accumulated losses) on a tax basis were as follows:
| Capital loss carryforward | $ | (177,073 | ) | |
| Unrealized appreciation (depreciation) | 3,429,297 | |||
| $ | 3,252,224 |
The differences between the federal income tax cost of investments and the financial statements is due to certain differences in the recognition of capital gains or losses under income tax reporting regulations and GAAP. These “book/tax” differences are temporary in nature and are primarily due to tax deferral of losses on wash sales and passive foreign investment company gains.
As of October 31, 2010, the Fund recorded reclassifications due to foreign exchange gains/losses and non-deductible offering costs. The Fund increased accumulated realized gains by $1,784,458 and reduced undistributed net investment loss and paid in capital by $17,228 and $1,801,686, respectively.
NOTE 13. CAPITAL LOSS CARRYFORWARD
At October 31, 2010, the Fund had available for federal tax purposes unused capital loss carryforwards of $177,073, which are available to offset future realized capital gains. To the extent that these carryforwards are used to offset future gains, it is probable that the amount offset will not be distributed to shareholders. The carryforward expires as follows:
| Amount | Expires October 31, | |||
| $177,073 | 2018 |
NOTE 14. SUBSEQUENT EVENT
In accordance with GAAP, Management has evaluated subsequent events through the date the financial statements were issued and determined there were no material subsequent events.
PROXY VOTING
A description of the policies and procedures that the Fund uses to determine how to vote proxies relating to
portfolio securities is available without charge upon request by calling the Fund at (877) 832-6952 and from Fund documents filed with the Securities and Exchange Commission (“SEC”) on the SEC’s website at www.sec.gov.
TRUSTEES
R. Jeffrey Young, Chairman
Dr. Merwyn R. Vanderlind
Ira Cohen
OFFICERS
R. Jeffrey Young, Principal Executive Officer and President
John C. Swhear, Chief Compliance Officer, AML Officer and Vice-President
Carol J. Highsmith, Vice President
William J. Murphy, Principal Financial Officer and Treasurer
Deborah Wells, Secretary
INVESTMENT ADVISER
TEAM Financial Asset Management, LLC
800 Corporate Circle, Suite 106
Harrisburg, PA 17110
DISTRIBUTOR
Unified Financial Securities, Inc.
2960 North Meridian Street, Suite 300
Indianapolis, IN 46208
INDEPENDENT REGISTERED PUBLIC ACCOUNTING FIRM
BBD, LLP
1835 Market Street, 26th Floor
Philadelphia, PA 19103
LEGAL COUNSEL
The Law Offices of John H. Lively & Associates, Inc.,
A member firm of The 1940 Act Law Group
2041 West 141st Terrace, Suite 119
Leawood, KS 66224
CUSTODIAN
Huntington National Bank
41 South Street
Columbus, OH 43125
ADMINISTRATOR, TRANSFER AGENT AND FUND ACCOUNTANT
Huntington Asset Services, Inc.
2960 North Meridian Street, Suite 300
Indianapolis, IN 46208
This report is intended only for the information of shareholders or those who have received the Fund’s prospectus which contains information about the Fund’s management fee and expenses. Please read the prospectus carefully before investing.
Distributed by Unified Financial Securities, Inc.
Member FINRA/SIPC
Item 2. Code of Ethics. NOT APPLICABLE – disclosed with annual report
Item 3. Audit Committee Financial Expert. NOT APPLICABLE- disclosed with annual report
Item 4. Principal Accountant Fees and Services. NOT APPLICABLE – disclosed with annual report
Item 5. Audit Committee of Listed Companies. NOT APPLICABLE – applies to listed companies only
Item 6. Schedule of Investments. Schedule filed with Item 1.
Item 7. Disclosure of Proxy Voting Policies and Procedures for Closed-End Management Investment Companies. NOT APPLICABLE – applies to closed-end funds only
Item 8. Portfolio Managers of Closed-End Investment Companies. NOT APPLICABLE – applies to closed-end funds only
Item 9. Purchases of Equity Securities by Closed-End Management Investment Company and Affiliated Purchasers. NOT APPLICABLE – applies to closed-end funds only
Item 10. Submission of Matters to a Vote of Security Holders.
The guidelines applicable to shareholders desiring to submit recommendations for nominees to the Registrant's board of trustees are contained in the statement of additional information of the Trust with respect to the Fund(s) for which this Form N-CSR is being filed.
Item 11. Controls and Procedures.
(a) Based on their evaluation of the registrant’s disclosure controls and procedures (as defined in Rule 30a-3(c) under the Investment Company Act of 1940, as amended (the “Act”)) as of a date within 90 days of the filing date of this report, the registrant’s principal executive officer and principal financial officer have concluded that such disclosure controls and procedures are reasonably designed and are operating effectively to ensure that material information relating to the registrant is made known to them by others within those entities, particularly during the period in which this report is being prepared, and that the information required in filings on Form N-CSR is recorded, processed, summarized, and reported on a timely basis.
(b) There were no changes in the registrant’s internal control over financial reporting (as defined in Rule 30a-3(d) under the Investment Company Act of 1940) that occurred during the second fiscal quarter of the period covered by this report that have materially affected, or are reasonably likely to materially affect, the registrant’s internal control over financial reporting.
Item 12. Exhibits.
(a) (1) Not Applicable – filed with annual report
| (2) | Certifications by the registrant's principal executive officer and principal financial officer, pursuant to Section 302 of the Sarbanes- Oxley Act of 2002 and required by Rule 30a-2under the Investment Company Act of 1940 are filed herewith. |
(3) Not Applicable
| (b) | Certification pursuant to 18 U.S.C. Section 1350, as adopted pursuant to Section 906 of the Sarbanes-Oxley Act of 2002 is filed herewith. |
SIGNATURES
Pursuant to the requirements of the Securities Exchange Act of 1934 and the Investment Company Act of 1940, the registrant has duly caused this report to be signed on its behalf by the undersigned, thereunto duly authorized.
(Registrant) Valued Advisers Trust
By /s/ R. Jeffrey Young
R. Jeffrey Young, President and Principal Executive Officer
Date 6/28/11
Pursuant to the requirements of the Securities Exchange Act of 1934 and the Investment Company Act of 1940, this report has been signed below by the following persons on behalf of the registrant and in the capacities and on the dates indicated.
By /s/ R. Jeffrey Young
R. Jeffrey Young, President and Principal Executive Officer
Date 6/28/11
By /s/ William J. Murphy
William J. Murphy, Treasurer and Principal Financial Officer
Date 6/27/11