UNITED STATES
SECURITIES AND EXCHANGE COMMISSION
WASHINGTON, D.C. 20549
FORM N-CSR
CERTIFIED SHAREHOLDER REPORT OF REGISTERED
MANAGEMENT INVESTMENT COMPANIES
Investment Company Act file number 811-22208
Valued Advisers Trust
(Exact name of registrant as specified in charter)
| Huntington Asset Services, Inc. | 2960 N. Meridian Street, Suite 300 | Indianapolis, IN 46208 | ||
| (Address of principal executive offices) | (Zip code) | |||
Capitol Services, Inc.
615 S. Dupont Hwy.
Dover, DE 19901
(Name and address of agent for service)
With a copy to:
John H. Lively, Esq.
The Law Offices of John H. Lively & Associates, Inc.
A member firm of The 1940 Act Law GroupTM
11300 Tomahawk Creek Parkway,
Suite 310
Leawood, KS 66221
Registrant’s telephone number, including area code: 317-917-7000
Date of fiscal year end: 10/31
Date of reporting period: 4/30/15
Item 1. Reports to Stockholders.
BRC
Large Cap
Focus Equity Fund
Semi-Annual Report
April 30, 2015
Fund Adviser:
BRC Investment Management LLC
8400 East Prentice Avenue, Suite 1401
Greenwood Village, Colorado 80111
Toll Free (877) 272-1214
INVESTMENT RESULTS – (Unaudited)
| Total Returns* (For the periods ended April 30, 2015) | ||||||||||||
| Average Annual Returns | ||||||||||||
| Six Months | One Year | Since Inception (December 21, 2012) | ||||||||||
BRC Large Cap Focus Equity Fund - Institutional Class | 7.63 | % | 13.04 | % | 20.10 | % | ||||||
S&P 500 Index®** | 4.40 | % | 12.98 | % | 19.29 | % | ||||||
Total annual operating expenses, as disclosed in the Fund’s prospectus dated February 28, 2015 were 2.03% of net assets for the Institutional Class (0.55% after fee waivers/expense reimbursements by the Adviser). The Adviser has contractually agreed to waive or limit its fees and to assume other expenses of the Fund until February 28, 2018, so that the Total Annual Fund Operating Expenses does not exceed 0.55%. This operating expense limitation does not apply to interest, taxes, brokerage commissions, other expenditures which are capitalized in accordance with generally accepted accounting principles, other extraordinary expenses not incurred in the ordinary course of the Fund’s business, dividend expense on short sales, expenses incurred under a Rule 12b-1 plan of distribution, “acquired fund fees and expenses,” and expenses that the Fund has incurred but did not actually pay because of an expense offset arrangement. Additional information pertaining to the Fund’s expense ratios as of April 30, 2015 can be found in the financial highlights.
The performance quoted represents past performance, which does not guarantee future results. The investment return and principal value of an investment will fluctuate so that an investor’s shares, when redeemed, may be worth more or less than their original cost. The returns shown do not reflect deduction of taxes that a shareholder would pay on Fund distributions or the redemption of Fund shares. Current performance of the Fund may be lower or higher than the performance quoted. The Fund’s investment objectives, risks, charges and expenses must be considered carefully before investing. Performance data current to the most recent month end may be obtained by calling (877) 272-1214.
| * | Return figures reflect any change in price per share and assume the reinvestment of all distributions. |
| ** | The S&P 500® Index is a widely recognized unmanaged index of equity securities and is representative of a broader domestic equity market and range of securities than is found in the Fund’s portfolio. Individuals cannot invest directly in an Index; however, an individual can invest in exchange traded funds or other investment vehicles that attempt to track the performance of a benchmark index. |
The Fund’s investment objectives, strategies, risks, charges and expenses must be considered carefully before investing. The prospectus contains this and other important information about the Fund and may be obtained by calling the same number as above. Please read it carefully before investing.
The Fund is distributed by Unified Financial Securities, Inc., member FINRA.
1
Comparison of the Growth of a $100,000 Investment in the BRC Large Cap Focus Equity Fund - Institutional Class and the S&P 500® Index (Unaudited)
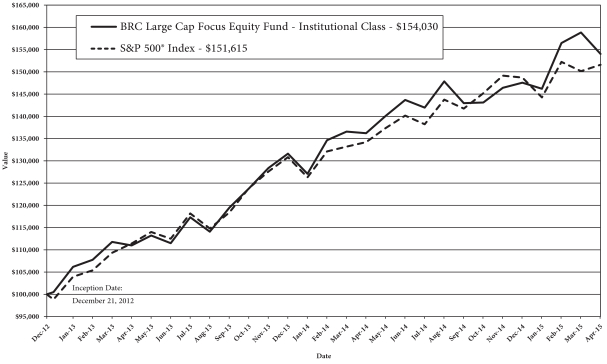
The chart above assumes an initial investment of $100,000 made on December 21, 2012 (commencement of Institutional Class operations) and held through April 30, 2015. The S&P 500® Index is a widely recognized unmanaged index of equity securities and is representative of a broader domestic equity market and range of securities than is found in the Fund’s portfolio. Individuals cannot invest directly in an Index; however, an individual can invest in exchange traded funds or other investment vehicles that attempt to track the performance of a benchmark index. THE FUND’S RETURN REPRESENTS PAST PERFORMANCE AND DOES NOT GUARANTEE FUTURE RESULTS. The returns shown do not reflect deduction of taxes that a shareholder would pay on Fund distributions or the redemption of Fund shares. Investment returns and principal values will fluctuate so that your shares, when redeemed, may be worth more or less than their original purchase price.
Current performance may be lower or higher than the performance data quoted. For more information on the Fund, and to obtain performance data current to the most recent month end or to request a prospectus, please call (877) 272-1214. You should carefully consider the investment objectives, potential risks, management fees, and charges and expenses of the Fund before investing. The Fund’s prospectus contains this and other information about the Fund, and should be read carefully before investing.
The Fund is distributed by Unified Financial Securities, Inc., member FINRA.
2
FUND HOLDINGS – (Unaudited)
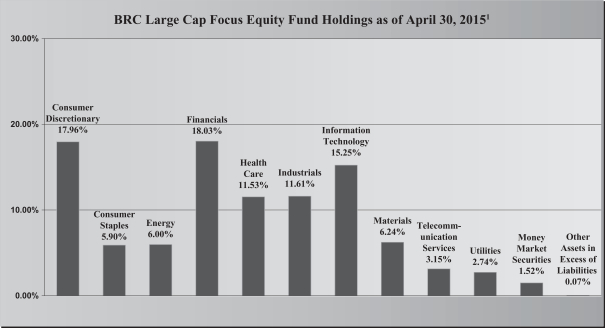
| 1 | As a percentage of net assets. |
The investment objective of the BRC Large Cap Focus Equity Fund is to seek long-term capital appreciation that will exceed the S&P 500® Index over a three-to-five year time horizon.
Availability of Portfolio Schedule – (Unaudited)
The Fund files its complete schedule of portfolio holdings with the Securities and Exchange Commission (“SEC”) for the first and third quarters of each fiscal year on Form N-Q. The Fund’s Forms N-Q are available at the SEC’s website at www.sec.gov. The Fund’s Forms N-Q may be reviewed and copied at the SEC’s Public Reference Room in Washington DC. Information on the operation of the Public Reference Room may be obtained by calling 1-800-SEC-0330.
3
SUMMARY OF FUND’S EXPENSES – (Unaudited)
As a shareholder of the Fund, you incur two types of costs: (1) transaction costs, such as short-term redemption fees; and (2) ongoing costs, including management fees and other Fund expenses. This Example is intended to help you understand your ongoing costs (in dollars) of investing in the Fund and to compare these costs with the ongoing costs of investing in other mutual funds. The example is based on an investment of $1,000 invested at the beginning and held for the entire period from November 1, 2014 to April 30, 2015.
Actual Expenses
The first line of the table below provides information about actual account values and actual expenses. You may use the information in this line, together with the amount you invested, to estimate the expenses that you paid over the period. Simply divide your account value by $1,000 (for example, an $8,600 account value divided by $1,000 = $8.60), then multiply the result by the number in the first line under the heading entitled “Expenses Paid During the Period” to estimate the expenses you paid on your account during this period.
Hypothetical Example for Comparison Purposes
The second line of the table below provides information about hypothetical account values and hypothetical expenses based on the Fund’s actual expense ratio and an assumed rate of return of 5% per year before expenses, which is not the Fund’s actual return. The hypothetical account values and expenses may not be used to estimate the actual ending account balance or expenses you paid for the period. You may use this information to compare the ongoing costs of investing in the Fund and other funds. To do so, compare this 5% hypothetical example with the 5% hypothetical examples that appear in the shareholder reports of the other funds.
Please note that the expenses shown in the table are meant to highlight your ongoing costs only. Therefore, the second line of the table below is useful in comparing ongoing costs only and will not help you determine the relative costs of owning different funds.
BRC Large Cap Focus Equity Fund – Institutional Class | Beginning Account Value November 1, 2014 | Ending Account Value April 30, 2015 | Expenses Paid During Period November 1, 2014 – April 30, 2015 | |||||||||
Actual* | $ | 1,000.00 | $ | 1,076.30 | $ | 2.83 | ||||||
Hypothetical** | $ | 1,000.00 | $ | 1,022.07 | $ | 2.76 | ||||||
| * | Expenses are equal to the Fund’s annualized expense ratio of 0.55%, multiplied by the average account value over the period, multiplied by 181/365. |
| ** | Assumes a 5% return before expenses. |
4
BRC LARGE CAP FOCUS EQUITY FUND
SCHEDULE OF INVESTMENTS
April 30, 2015 (Unaudited)
| Common Stocks – 98.41% | Shares | Fair Value | ||||||
Consumer Discretionary – 17.96% | ||||||||
AutoZone, Inc. * | 883 | $ | 593,959 | |||||
Darden Restaurants, Inc. | 8,077 | 515,070 | ||||||
Hanesbrands, Inc. | 19,084 | 593,131 | ||||||
Lear Corp. | 4,920 | 546,268 | ||||||
Marriott International, Inc. – Class A | 6,443 | 515,762 | ||||||
Snap-on, Inc. | 3,907 | 584,292 | ||||||
|
| |||||||
| 3,348,482 | ||||||||
|
| |||||||
Consumer Staples – 5.90% | ||||||||
Constellation Brands, Inc. – Class A * | 4,884 | 566,251 | ||||||
Kroger Co./The | 7,739 | 533,294 | ||||||
|
| |||||||
| 1,099,545 | ||||||||
|
| |||||||
Energy – 6.00% | ||||||||
Marathon Petroleum Corp. | 5,522 | 544,304 | ||||||
Valero Energy Corp. | 10,087 | 573,950 | ||||||
|
| |||||||
| 1,118,254 | ||||||||
|
| |||||||
Financials – 18.03% | ||||||||
Affiliated Managers Group, Inc. * | 2,498 | 564,873 | ||||||
CBRE Group, Inc. * | 15,102 | 579,011 | ||||||
Jones Lang LaSalle, Inc. | 3,297 | 547,500 | ||||||
KeyCorp | 40,122 | 579,763 | ||||||
Lincoln National Corp. | 9,429 | 532,644 | ||||||
Morgan Stanley | 14,971 | 558,568 | ||||||
|
| |||||||
| 3,362,359 | ||||||||
|
| |||||||
Health Care – 11.53% | ||||||||
Aetna, Inc. | 5,390 | 576,029 | ||||||
Amgen, Inc. | 3,156 | 498,364 | ||||||
Biogen Idec, Inc. * | 1,390 | 519,763 | ||||||
Laboratory Corp. of America Holdings * | 4,640 | 554,758 | ||||||
|
| |||||||
| 2,148,914 | ||||||||
|
| |||||||
Industrials – 11.61% | ||||||||
Boeing Co./The | 4,000 | 573,360 | ||||||
Cintas Corp. | 6,894 | 551,175 | ||||||
PACCAR, Inc. | 7,476 | 488,557 | ||||||
Southwest Airlines Co. | 13,605 | 551,819 | ||||||
|
| |||||||
| 2,164,911 | ||||||||
|
| |||||||
See accompanying notes which are an integral part of these financial statements.
5
BRC LARGE CAP FOCUS EQUITY FUND
SCHEDULE OF INVESTMENTS – (continued)
April 30, 2015 (Unaudited)
| Common Stocks – 98.41% – continued | Shares | Fair Value | ||||||
Information Technology – 15.25% | ||||||||
Apple, Inc. | 4,733 | $ | 592,335 | |||||
Avago Technologies Ltd. | 4,819 | 563,245 | ||||||
Broadridge Financial Solutions, Inc. | 10,519 | 567,184 | ||||||
Electronic Arts, Inc. * | 9,636 | 559,755 | ||||||
Synopsys, Inc. * | 11,965 | 560,919 | ||||||
|
| |||||||
| 2,843,438 | ||||||||
|
| |||||||
Materials – 6.24% | ||||||||
Lyondellbasell Industries NV – Class A | 5,315 | 550,209 | ||||||
Sealed Air Corp. | 13,430 | 612,408 | ||||||
|
| |||||||
| 1,162,617 | ||||||||
|
| |||||||
Telecommunication Services – 3.15% | ||||||||
Level 3 Communications, Inc. * | 10,500 | 587,370 | ||||||
|
| |||||||
Utilities – 2.74% | ||||||||
Edison International | 8,377 | 510,494 | ||||||
|
| |||||||
Total Common Stocks (Cost $16,348,089) |
| 18,346,384 | ||||||
|
| |||||||
Money Market Securities – 1.52% |
| |||||||
Fidelity Institutional Money Market Portfolio – Institutional shares, 0.13% (a) | 283,249 | 283,249 | ||||||
|
| |||||||
Total Money Market Securities (Cost $283,249) | 283,249 | |||||||
|
| |||||||
Total Investments – 99.93% (Cost $16,631,338) | 18,629,633 | |||||||
|
| |||||||
Other Assets in Excess of Liabilities – 0.07% | 13,243 | |||||||
|
| |||||||
| TOTAL NET ASSETS – 100.00% | $ | 18,642,876 | ||||||
|
| |||||||
| (a) | Rate disclosed is the seven day yield as of April 30, 2015. |
| * | Non-income producing security. |
See accompanying notes which are an integral part of these financial statements.
6
BRC LARGE CAP FOCUS EQUITY FUND
STATEMENT OF ASSETS AND LIABILITIES
April 30, 2015 (Unaudited)
Assets | ||||
Investments in securities at fair value (cost $16,631,338) | $ | 18,629,633 | ||
Receivable for investments sold | 1,678,259 | |||
Dividends receivable | 9,358 | |||
Receivable from Adviser | 7,852 | |||
Prepaid expenses | 16,311 | |||
|
| |||
Total Assets | 20,341,413 | |||
|
| |||
Liabilities | ||||
Payable for investments purchased | 1,668,188 | |||
Payable to administrator, fund accountant, and transfer agent | 16,351 | |||
Payable to custodian | 1,314 | |||
Payable to trustees | 492 | |||
Other accrued expenses | 12,192 | |||
|
| |||
Total Liabilities | 1,698,537 | |||
|
| |||
Net Assets | $ | 18,642,876 | ||
|
| |||
Net Assets consist of: | ||||
Paid-in capital | $ | 16,211,323 | ||
Accumulated undistributed net investment income | 31,114 | |||
Accumulated undistributed net realized gain from investment transactions | 402,144 | |||
Net unrealized appreciation on investments | 1,998,295 | |||
|
| |||
Net Assets | $ | 18,642,876 | ||
|
| |||
Institutional Class: | ||||
Shares outstanding (unlimited number of shares authorized, no par value) | 1,307,099 | |||
|
| |||
Net asset value, offering and redemption price per share | $ | 14.26 | ||
|
| |||
See accompanying notes which are an integral part of these financial statements.
7
BRC LARGE CAP FOCUS EQUITY FUND
STATEMENT OF OPERATIONS
For the six months ended April 30, 2015 (Unaudited)
Investment Income | ||||
Dividend income | $ | 111,446 | ||
|
| |||
Total investment income | 111,446 | |||
|
| |||
Expenses | ||||
Investment Adviser | 40,890 | |||
Administration | 18,596 | |||
Fund accounting | 12,398 | |||
Transfer agent | 18,568 | |||
Legal | 8,520 | |||
Registration | 12,050 | |||
Custodian | 4,786 | |||
Audit | 7,527 | |||
Trustee | 2,524 | |||
Pricing | 1,194 | |||
Miscellaneous | 10,359 | |||
|
| |||
Total expenses | 137,412 | |||
|
| |||
Fees waived and reimbursed by Adviser | (89,522 | ) | ||
|
| |||
Net operating expenses | 47,890 | |||
|
| |||
Net investment income | 63,556 | |||
|
| |||
Net Realized and Unrealized Gain on Investments | ||||
Net realized gain on investment securities transactions | 403,340 | |||
Net change in unrealized appreciation of investment securities | 821,464 | |||
|
| |||
Net realized and unrealized gain on investments | 1,224,804 | |||
|
| |||
Net increase in net assets resulting from operations | $ | 1,288,360 | ||
|
| |||
See accompanying notes which are an integral part of these financial statements.
8
BRC LARGE CAP FOCUS EQUITY FUND
STATEMENTS OF CHANGES IN NET ASSETS
| For the Six Months Ended April 30, 2015 (Unaudited) | For the Year Ended October 31, 2014 | |||||||
Increase in Net Assets due to: | ||||||||
Operations | ||||||||
Net investment income | $ | 63,556 | $ | 113,370 | ||||
Net realized gains on investment transactions | 403,340 | 1,010,366 | ||||||
Net change in unrealized appreciation of investments | 821,464 | 402,177 | ||||||
|
|
|
| |||||
Net increase in net assets resulting from operations | 1,288,360 | 1,525,913 | ||||||
|
|
|
| |||||
Distributions | ||||||||
From net investment income – Institutional Class | (123,164 | ) | (55,395 | ) | ||||
From net realized gains – Institutional Class | (1,011,562 | ) | (242 | ) | ||||
|
|
|
| |||||
Total distributions | (1,134,726 | ) | (55,637 | ) | ||||
|
|
|
| |||||
Capital Transactions – Institutional Class | ||||||||
Proceeds from shares sold | 3,865,485 | 8,031,528 | ||||||
Reinvestment of distributions | 823,845 | 54,011 | ||||||
Amount paid for shares redeemed | (2,324,084 | ) | (1,543,486 | ) | ||||
|
|
|
| |||||
Net increase in net assets resulting from capital transactions | 2,365,246 | 6,542,053 | ||||||
|
|
|
| |||||
Total Increase in Net Assets | 2,518,880 | 8,012,329 | ||||||
|
|
|
| |||||
Net Assets | ||||||||
Beginning of period | 16,123,996 | 8,111,667 | ||||||
|
|
|
| |||||
End of period | $ | 18,642,876 | $ | 16,123,996 | ||||
|
|
|
| |||||
Accumulated undistributed net investment income | $ | 31,114 | $ | 90,722 | ||||
|
|
|
| |||||
Share Transactions – Institutional Class | ||||||||
Shares sold | 277,279 | 586,219 | ||||||
Shares issued in reinvestment of distributions | 59,742 | 4,152 | ||||||
Shares redeemed | (163,557 | ) | (111,818 | ) | ||||
|
|
|
| |||||
Net increase in shares | 173,464 | 478,553 | ||||||
|
|
|
| |||||
See accompanying notes which are an integral part of these financial statements.
9
BRC LARGE CAP FOCUS EQUITY FUND
FINANCIAL HIGHLIGHTS – INSTITUTIONAL CLASS
(For a share outstanding during each period)
| For the Six Months Ended April 30, 2015 (Unaudited) | For the Year Ended October 31, 2014 | For the Period Ended October 31, 2013 (a) | ||||||||||
Selected Per Share Data: | ||||||||||||
Net asset value, beginning of period | $ | 14.22 | $ | 12.38 | $ | 10.00 | ||||||
|
|
|
|
|
| |||||||
Investment Operations: | ||||||||||||
Net investment income | 0.05 | 0.11 | 0.05 | |||||||||
Net realized and unrealized gain on investments | 1.00 | 1.81 | 2.33 | |||||||||
|
|
|
|
|
| |||||||
Total from investment operations | 1.05 | 1.92 | 2.38 | |||||||||
|
|
|
|
|
| |||||||
Less distributions to shareholders from: | ||||||||||||
Net investment income | (0.11 | ) | (0.08 | ) | – | |||||||
Net realized gains | (0.90 | ) | – | (b) | – | |||||||
|
|
|
|
|
| |||||||
Total distributions | (1.01 | ) | (0.08 | ) | – | |||||||
|
|
|
|
|
| |||||||
Net asset value, end of period | $ | 14.26 | $ | 14.22 | $ | 12.38 | ||||||
|
|
|
|
|
| |||||||
Total Return (c) | 7.63 | %(d) | 15.60 | % | 23.80 | %(d) | ||||||
Ratios and Supplemental Data: | ||||||||||||
Net assets, end of period (000) | $ | 18,643 | $ | 16,124 | $ | 8,112 | ||||||
Ratio of net expenses to average net assets | 0.55 | %(e) | 0.55 | % | 0.56 | %(e) | ||||||
Ratio of expenses to average net assets before waiver and reimbursement | 1.58 | %(e) | 2.03 | % | 6.49 | %(e) | ||||||
Ratio of net investment income to average net assets | 0.73 | %(e) | 0.90 | % | 0.98 | %(e) | ||||||
Portfolio turnover rate | 98 | %(d) | 192 | % | 154 | %(d) | ||||||
| (a) | For the period December 21, 2012 (commencement of operations) to October 31, 2013. |
| (b) | Amount is less than $0.005. |
| (c) | Total return in the above table represents the rate that the investor would have earned or lost on an investment in the Fund, assuming reinvestment of distributions. |
| (d) | Not annualized. |
| (e) | Annualized. |
See accompanying notes which are an integral part of these financial statements.
10
BRC LARGE CAP FOCUS EQUITY FUND
NOTES TO THE FINANCIAL STATEMENTS
April 30, 2015 (Unaudited)
NOTE 1. ORGANIZATION
The BRC Large Cap Focus Equity Fund (the “Fund”) is an open-end diversified series of the Valued Advisers Trust (the “Trust”). The Trust is a management investment company established under the laws of Delaware by an Agreement and Declaration of Trust dated June 13, 2008 (the “Trust Agreement”). The Trust Agreement permits the Trust to issue an unlimited number of shares of beneficial interest of separate series without par value. The Fund is one of a series of funds authorized by the Board of Trustees (the “Board”). The Fund commenced operations December 21, 2012. The Fund’s investment adviser is BRC Investment Management LLC (the “Adviser”). The investment objective of the Fund is to seek long-term capital appreciation that will exceed the S&P 500 Index over a three-to five-year time horizon.
The Fund is authorized to offer two classes of shares: Institutional Class and Advisor Class. Each share represents an equal proportionate interest in the assets and liabilities belonging to the Fund and is entitled to such dividends and distributions out of income belonging to the applicable class as are declared by the Trustees. Expenses attributable to any class are borne by that class. Income, expenses, and realized and unrealized gains/losses are allocated to the respective classes on the basis of relative daily net assets. On matters that affect the Fund as a whole, each class has the same voting and other rights and preferences as any other class. On matters that affect only one class, only shareholders of that class may vote. Each class votes separately on matters affecting only that class, or on matters expressly required to be voted on separately by state or federal law. Shares of each class of a series have the same voting and other rights and preferences as the other classes and series of the Trust for matters that affect the Trust as a whole. As of April 30, 2015, only Institutional Class shares have commenced operations. The Fund may offer additional classes of shares in the future.
NOTE 2. SIGNIFICANT ACCOUNTING POLICIES
The Fund is an investment company and follows accounting and reporting guidance under Financial Accounting Standards Board (“FASB”) Accounting Standards Codification (“ASC”) Topic 946, “Financial Services-Investment Companies”. The following is a summary of significant accounting policies followed by the Fund in the preparation of its financial statements. These policies are in conformity with generally accepted accounting principles in the United States of America (“GAAP”).
Securities Valuation – All investments in securities are recorded at their estimated fair value as described in Note 3.
Federal Income Taxes – The Fund makes no provision for federal income or excise tax. The Fund intends to qualify each year as a regulated investment company (“RIC”) under subchapter M of the Internal Revenue Code of 1986, as amended, by complying with the requirements applicable to RICs and by distributing substantially all of its taxable income. The Fund also intends to distribute sufficient net investment income and net capital gains, if any, so that it will not be subject to excise tax on undistributed income and gains. If the required amount of net investment income or gains is not distributed, the Fund could incur a tax expense.
As of and during the period ended April 30, 2015, the Fund did not have a liability for any unrecognized tax benefits. The Fund recognizes interest and penalties, if any, related to unrecognized tax benefits as income tax expense in the Statement of Operations. During the year, the Fund did not incur any interest or penalties. The Fund is subject to examination by U.S. federal tax authorities for all tax years since inception.
11
BRC LARGE CAP FOCUS EQUITY FUND
NOTES TO THE FINANCIAL STATEMENTS – (continued)
April 30, 2015 (Unaudited)
NOTE 2. SIGNIFICANT ACCOUNTING POLICIES – continued
Expenses – Expenses incurred by the Trust that do not relate to a specific fund of the Trust are allocated to the individual funds based on each fund’s relative net assets or other appropriate basis.
Security Transactions and Related Income – The Fund follows industry practice and records security transactions on the trade date for financial reporting purposes. The specific identification accounting method is used for determining gains or losses for financial statements and income tax purposes. Dividend income is recorded on the ex-dividend date and interest income is recorded on an accrual basis. Discounts and premiums on securities purchased are amortized or accreted using the effective interest method. Withholding taxes on foreign dividends, if any, have been provided for in accordance with the Fund’s understanding of the applicable country’s tax rules and rates. The ability of issuers of debt securities held by the Fund to meet their obligations may be affected by economic and political developments in a specific country or region.
Dividends and Distributions – The Fund intends to distribute substantially all of its net investment income, net realized long-term capital gains and its net realized short-term capital gains, if any, to its shareholders on at least an annual basis. Dividends to shareholders, which are determined in accordance with income tax regulations, are recorded on the ex-dividend date. The treatment for financial reporting purposes of distributions made to shareholders during the year from net investment income or net realized capital gains may differ from their ultimate treatment for federal income tax purposes. These differences are caused primarily by differences in the timing of the recognition of certain components of income, expense or realized capital gain for federal income tax purposes. Where such differences are permanent in nature, they are reclassified among the components of net assets based on their ultimate characterization for federal income tax purposes. Any such reclassifications have no effect on net assets, results of operations or net asset values per share of the Fund. There were no such material reclassifications made as of April 30, 2015.
NOTE 3. SECURITIES VALUATION AND FAIR VALUE MEASUREMENTS
Fair value is defined as the price that a Fund would receive upon selling an investment in a orderly transaction to an independent buyer in the principal or most advantageous market of the investment. GAAP established a three-tier hierarchy to maximize the use of observable market data and minimize the use of unobservable inputs and to establish classification of fair value measurements for disclosure purposes.
Inputs refer broadly to the assumptions that market participants would use in pricing the asset or liability, including assumptions about risk, (ex., the risk inherent in a particular valuation technique used to measure fair value including items such as a pricing model and/or the risk inherent in the inputs to the valuation technique). Inputs may be observable or unobservable. Observable inputs are inputs that reflect the assumptions market participants would use in pricing the asset or liability developed based on market data obtained from sources independent of the reporting entity. Unobservable inputs are inputs that reflect the reporting entity’s own assumptions about the assumptions market participants would use in pricing the asset or liability developed based on the best information available in the circumstances.
Various inputs are used in determining the value of the Fund’s investments. These inputs are summarized in the three broad levels listed below.
| • | Level 1 – quoted prices in active markets for identical securities |
12
BRC LARGE CAP FOCUS EQUITY FUND
NOTES TO THE FINANCIAL STATEMENTS – (continued)
April 30, 2015 (Unaudited)
NOTE 3. SECURITIES VALUATION AND FAIR VALUE MEASUREMENTS – continued
| • | Level 2 – other significant observable inputs (including, but not limited to, quoted prices for an identical security in an inactive market, quoted prices for similar securities, interest rates, prepayment speeds, credit risk, etc.) |
| • | Level 3 – significant unobservable inputs (including the Fund’s own assumptions in determining fair value of investments based on the best information available) |
The inputs used to measure fair value may fall into different levels of the fair value hierarchy. In such cases, for disclosure purposes, the level in the fair value hierarchy within which the fair value measurement falls in its entirety, is determined based on the lowest level input that is significant to the fair value measurement in its entirety.
Equity securities, including common stocks, are generally valued by using market quotations, furnished by a pricing service. Securities that are traded on any stock exchange are generally valued at the last quoted sale price. Lacking a last sale price, an exchange traded security is generally valued at its last bid price. Securities traded in the NASDAQ over-the-counter market are generally valued at the NASDAQ Official Closing Price. When using the market quotations or close prices provided by the pricing service and when the market is considered active, the security is classified as a Level 1 security. Sometimes, an equity security owned by the Fund will be valued by the pricing service with factors other than market quotations or when the market is considered inactive. When this happens, the security is classified as a Level 2 security. When market quotations are not readily available, when the Fund determines that the market quotation or the price provided by the pricing service does not accurately reflect the current fair value, or when restricted or illiquid securities are being valued, such securities are valued as determined in good faith by the Fund, in conformity with guidelines adopted by and subject to review by the Board. These securities are generally categorized as Level 3 securities.
Investments in open-end mutual funds, including money market mutual funds, are generally priced at the ending net asset value (NAV) provided by the service agent of the funds. These securities will be categorized as Level 1 securities.
In accordance with the Trust’s good faith pricing guidelines, the Adviser is required to consider all appropriate factors relevant to the value of securities for which it has determined other pricing sources are not available or reliable as described above. No single standard exists for determining fair value, because fair value depends upon the circumstances of each individual case. As a general principle, the current fair value of an issue of securities being valued by the Adviser would appear to be the amount which the owner might reasonably expect to receive for them upon their current sale. Methods which are in accordance with this principle may, for example, be based on (i) a multiple of earnings; (ii) a discount from market of a similar freely traded security (including a derivative security or a basket of securities traded on other markets, exchanges or among dealers); or (iii) yield to maturity with respect to debt issues, or a combination of these and other methods. Good faith pricing is permitted if, in the Adviser’s opinion, the validity of market quotations appears to be questionable based on factors such as evidence of a thin market in the security based on a small number of quotations, a significant event occurs after the close of a market but before a Fund’s NAV calculation that may affect a security’s value, or the Adviser is aware of any other data that calls into question the reliability of market quotations. Good faith pricing may also be used in instances when the bonds the Fund invests in may default or otherwise cease to have market quotations readily available. Any fair value pricing done outside the Fund’s approved pricing methods must be approved by the Pricing Committee of the Board.
13
BRC LARGE CAP FOCUS EQUITY FUND
NOTES TO THE FINANCIAL STATEMENTS – (continued)
April 30, 2015 (Unaudited)
NOTE 3. SECURITIES VALUATION AND FAIR VALUE MEASUREMENTS – continued
The following is a summary of the inputs used to value the Fund’s investments as of April 30, 2015:
| Valuation Inputs | ||||||||||||||||
| Assets | Level 1 – Quoted Prices in Active Markets | Level 2 – Other Significant Observable Inputs | Level 3 – Significant Unobservable Inputs | Total | ||||||||||||
Common Stocks* | $ | 18,346,384 | $ | – | $ | – | $ | 18,346,384 | ||||||||
Money Market Securities | 283,249 | – | – | 283,249 | ||||||||||||
Total | $ | 18,629,633 | $ | – | $ | – | $ | 18,629,633 | ||||||||
| * | Refer to the Schedule of Investments for industry classifications. |
The Fund did not hold any investments at any time during the reporting period in which significant unobservable inputs were used in determining fair value; therefore, no reconciliation of Level 3 securities is included for this reporting period. The Trust recognizes transfers between fair value hierarchy levels at the reporting period end. There were no transfers between any Levels as of April 30, 2015 and the previous reporting period end.
NOTE 4. ADVISER FEES AND OTHER TRANSACTIONS
Under the terms of the management agreement, on behalf of the Fund (the “Agreement”), the Adviser manages the Fund’s investments subject to approval of the Trustees. As compensation for its management services, the Fund is obligated to pay the Adviser a fee computed and accrued daily and paid monthly at an annual rate of 0.47% of the average daily net assets of the Fund. For the period ended April 30, 2015, the Adviser earned a fee of $40,890 from the Fund before the reimbursement described below.
The Adviser has contractually agreed to waive its management fee and/or reimburse expenses through February 28, 2018, so that total annual fund operating expenses, excluding interest, taxes, brokerage commissions, other expenditures which are capitalized in accordance with GAAP, other extraordinary expenses not incurred in the ordinary course of the Fund’s business, dividend expense on short sales, 12b-1 expenses, and expenses that the Fund has incurred but did not actually pay because of an expense offset arrangement, if applicable, incurred by the Fund in any fiscal year, do not exceed 0.55% of the Fund’s average daily net assets. The operating expense limitation also excludes any fees and expenses of acquired funds. For the period ended April 30, 2015, expenses totaling $89,522 were waived or reimbursed by the Adviser and may be subject to potential recoupment by the Adviser until October 31, 2018. At April 30, 2015, the Adviser owed the Fund $7,852.
The amount subject to repayment by the Fund pursuant to the aforementioned conditions are as follows:
Amount | Recoverable through October 31, | |
$198,220 | 2016 | |
185,217 | 2017 | |
89,522 | 2018 |
14
BRC LARGE CAP FOCUS EQUITY FUND
NOTES TO THE FINANCIAL STATEMENTS – (continued)
April 30, 2015 (Unaudited)
NOTE 4. ADVISER FEES AND OTHER TRANSACTIONS – continued
The Trust retains Huntington Asset Services, Inc. (“HASI”) to manage the Fund’s business affairs and provide the Fund with administration services, including all regulatory reporting and necessary office equipment and personnel. For the period ended April 30, 2015, HASI earned fees of $18,596 for administration services provided to the Fund. At April 30, 2015, HASI was owed $6,096 from the Fund for administration services. Certain officers and trustees of the Trust are members of management and/or employees of HASI. HASI is a wholly-owned subsidiary of Huntington Bancshares, Inc., the parent company of Unified Financial Securities, Inc. (the “Distributor”) and Huntington National Bank, the custodian of the Fund’s investments (the “Custodian”). For the period ended April 30, 2015, the Custodian earned fees of $4,786 for custody services provided to the Fund. At April 30, 2015, the Custodian was owed $1,314 from the Fund for custody services.
The Trust also retains HASI to act as the Fund’s transfer agent and to provide transfer agent and fund accounting services. For the period ended April 30, 2015, HASI earned fees of $18,568 for transfer agent services to the Fund. At April 30, 2015, the Fund owed HASI $6,192 for transfer agent services. For the period ended April 30, 2015, HASI earned fees of $12,398 from the Fund for fund accounting services. At April 30, 2015, HASI was owed $4,063 from the Fund for fund accounting services.
Unified Financial Securities, Inc. acts as the principal underwriter of the Fund’s shares. There were no payments made by the Fund to the Distributor during the period ended April 30, 2015. An officer of the Trust is also an officer of the Distributor.
NOTE 5. PURCHASES AND SALES
For the period ended April 30, 2015, purchases and sales of investment securities, other than short-term investments and short-term U.S. government obligations, were as follows:
Purchases | ||||
U.S. Government Obligations | $ | – | ||
Other | 18,287,740 | |||
Sales | ||||
U.S. Government Obligations | $ | – | ||
Other | 16,833,275 |
NOTE 6. ESTIMATES
The preparation of financial statements in conformity with GAAP requires management to make estimates and assumptions that affect the reported amounts of assets and liabilities and disclosure of contingent assets and liabilities at the date of the financial statements and the reported amounts of increases and decreases in net assets from operations during the reporting period. Actual results could differ from those estimates.
NOTE 7. BENEFICIAL OWNERSHIP
The beneficial ownership, either directly or indirectly, of 25% or more of the voting securities of a fund creates a presumption of control of a fund, under Section 2(a) (9) of the Investment Company Act of 1940. At April 30, 2015, Charles Schwab & Co., Inc. for the benefit of its customers, owned 46.98% and Band & Co. owned 31.87%. It is not known whether Charles Schwab & Co., Band & Co., or any of the underlying beneficial owners controlled 25% or more of the voting securities of the Fund.
15
BRC LARGE CAP FOCUS EQUITY FUND
NOTES TO THE FINANCIAL STATEMENTS – (continued)
April 30, 2015 (Unaudited)
NOTE 8. FEDERAL TAX INFORMATION
At April 30, 2015, the net unrealized appreciation (depreciation) of investments for tax purposes was as follows:
Gross Appreciation | $ | 2,084,466 | ||
Gross (Depreciation) | (87,366 | ) | ||
|
| |||
Net Appreciation (Depreciation) on Investments | $ | 1,997,100 | ||
|
|
At April 30, 2015, the aggregate cost of securities for federal income tax purposes was $16,632,533 for the Fund.
The tax characterization of distributions for the fiscal year ended October 31, 2014 was as follows:
| 2014 | ||||
Distributions paid from: | ||||
Ordinary income* | $ | 55,637 | ||
Long-Term Capital Gain | – | |||
|
| |||
| $ | 55,637 | |||
|
| |||
| * | Short-term capital gain distributions are treated as ordinary income for tax purposes. |
At October 31, 2014, the components of distributable earnings (accumulated losses) on a tax basis were as follows:
Undistributed ordinary income | $ | 568,501 | ||
Undistributed long-term capital gains | 533,782 | |||
Net unrealized appreciation (depreciation) | 1,175,636 | |||
|
| |||
| $ | 2,277,919 | |||
|
|
At October 31, 2014, the difference between book basis and tax basis unrealized appreciation (depreciation) is primarily attributable to the tax deferral of losses on wash sales in the amount of $1,195.
At October 31, 2014, for federal income tax purposes, the Fund has no capital loss carryforwards.
NOTE 9. COMMITMENTS AND CONTINGENCIES
The Fund indemnifies its officers and trustees for certain liabilities that may arise from the performance of their duties to the Fund. Additionally, in the normal course of business, the Fund enters into contracts that contain a variety of representations and warranties which provide general indemnifications. The Fund’s maximum exposure under these arrangements is unknown, as this would involve future claims that may be made against the Fund that have not yet occurred.
NOTE 10. SUBSEQUENT EVENTS
Management of the Fund has evaluated the need for disclosures and/or adjustments resulting from subsequent events through the date these financial statements were issued. There were no items requiring adjustment of the financial statements or additional disclosure.
16
OTHER INFORMATION
The Fund’s Statement of Additional Information (“SAI”) includes additional information about the trustees and is available without charge, upon request. You may call toll-free at (877) 272-1214 to request a copy of the SAI or to make shareholder inquiries.
PROXY VOTING
A description of the policies and procedures that the Fund uses to determine how to vote proxies relating to portfolio securities and information regarding how the Fund voted those proxies is available without charge upon request by (1) calling the Fund at (877) 272-1214 and (2) from Fund documents filed with the Securities and Exchange Commission (“SEC”) on the SEC’s website at www.sec.gov.
TRUSTEES
R. Jeffrey Young, Chairman
Ira Cohen
Andrea N. Mullins
OFFICERS
| R. | Jeffrey Young, Principal Executive Officer and President |
| John | C. Swhear, Chief Compliance Officer, AML Officer and Vice President |
| Carol | J. Highsmith, Vice President and Secretary |
| Matthew | J. Miller, Vice President |
| Bryan | W. Ashmus, Principal Financial Officer and Treasurer |
INVESTMENT ADVISER
BRC Investment Management LLC
8400 East Prentice Avenue, Suite 1401
Greenwood Village, Colorado 80111
DISTRIBUTOR
Unified Financial Securities, Inc.
2960 North Meridian Street, Suite 300
Indianapolis, IN 46208
INDEPENDENT REGISTERED PUBLIC ACCOUNTING FIRM
Cohen Fund Audit Services Ltd.
1350 Euclid Avenue, Suite 800
Cleveland, OH 44115
LEGAL COUNSEL
The Law Offices of John H. Lively & Associates, Inc.
A member firm of The 1940 Act Law GroupTM
11300 Tomahawk Creek Parkway, Ste. 310
Leawood, KS 66211
CUSTODIAN
Huntington National Bank
41 South High Street
Columbus, OH 43215
ADMINISTRATOR, TRANSFER AGENT AND FUND ACCOUNTANT
Huntington Asset Services, Inc.
2960 North Meridian Street, Suite 300
Indianapolis, IN 46208
This report is intended only for the information of shareholders or those who have received the Fund’s prospectus which contains information about the Fund’s management fee and expenses. Please read the prospectus carefully before investing.
Distributed by Unified Financial Securities, Inc.
Member FINRA/SIPC
17
PRIVACY POLICY
The following is a description of the Fund’s policies regarding disclosure of nonpublic personal information that you provide to the Fund or that the Fund collects from other sources. In the event that you hold shares of the Fund through a broker-dealer or other financial intermediary, the privacy policy of your financial intermediary would govern how your nonpublic personal information would be shared with nonaffiliated third parties.
Categories of Information the Fund Collects. The Fund collects the following nonpublic personal information about you:
| • | Information the Fund receives from you on applications or other forms, correspondence, or conversations (such as your name, address, phone number, social security number, and date of birth); and |
| • | Information about your transactions with the Fund, its affiliates, or others (such as your account number and balance, payment history, cost basis information, and other financial information). |
Categories of Information the Fund Discloses. The Fund does not disclose any nonpublic personal information about its current or former shareholders to unaffiliated third parties, except as required or permitted by law. The Fund is permitted by law to disclose all of the information it collects, as described above, to service providers (such as the Fund’s custodian, administrator, transfer agent, accountant and legal counsel) to process your transactions and otherwise provide services to you.
Confidentiality and Security. The Fund restricts access to your nonpublic personal information to those persons who require such information to provide products or services to you. The Fund maintains physical, electronic, and procedural safeguards that comply with federal standards to guard your nonpublic personal information.
Disposal of Information. The Fund, through its transfer agent, has taken steps to reasonably ensure that the privacy of your nonpublic personal information is maintained at all times, including in connection with the disposal of information that is no longer required to be maintained by the Fund. Such steps shall include, whenever possible, shredding paper documents and records prior to disposal, requiring off-site storage vendors to shred documents maintained in such locations prior to disposal, and erasing and/or obliterating any data contained on electronic media in such a manner that the information can no longer be read or reconstructed.
18
Semi-Annual Report
April 30, 2015
Fund Adviser:
Granite Investment Advisors, Inc.
11 South Main Street, Suite 501
Concord, New Hampshire 03301
Toll Free (888) 442-9893
INVESTMENT RESULTS – (Unaudited)
Total Returns* (For the periods ended April 30, 2015) | ||||||||||||
| Average Annual Returns | ||||||||||||
| Six Month | One Year | Since Inception (December 22, 2011) | ||||||||||
Granite Value Fund | 1.81 | % | 2.03 | % | 12.87 | % | ||||||
S&P 500® Index** | 4.40 | % | 12.98 | % | 19.13 | % | ||||||
Russell 1000® Value Index** | 2.89 | % | 9.31 | % | 19.00 | % | ||||||
Total annual operating expenses, as disclosed in the Fund’s prospectus dated February 28, 2015, were 2.39% of average daily net assets (1.35% after fee waivers/expense reimbursements by the adviser). The adviser has contractually agreed to waive or limit its fees and to assume other expenses of the Fund until February 29, 2016, so that the Total Annual Fund Operating Expenses does not exceed 1.35%. This operating expense limitation does not apply to brokerage fees and commissions, borrowing costs (such as interest and dividend expenses on securities sold short), taxes, 12b-1 fees; extraordinary expenses and indirect expenses (such as “acquired fund fees and expenses”). Additional information pertaining to the Fund’s expense ratios as of April 30, 2015 can be found in the financial highlights.
The performance quoted represents past performance, which does not guarantee future results. The investment return and principal value of an investment will fluctuate so that an investor’s shares, when redeemed, may be worth more or less than their original cost. The returns shown do not reflect deduction of taxes that a shareholder would pay on Fund distributions or the redemption of Fund shares. Current performance of the Fund may be lower or higher than the performance quoted. The Fund’s investment objectives, risks, charges and expenses must be considered carefully before investing. Performance data current to the most recent month end may be obtained by calling 1-888-442-9893.
| * | Return figures reflect any change in price per share and assume the reinvestment of all distributions. |
| ** | The S&P 500® Index and the Russell 1000® Value Index are widely recognized unmanaged indices of equity securities and are representative of a broader domestic equity market and range of securities than is found in the Fund’s portfolio. Individuals cannot invest directly in an Index; however, an individual can invest in exchange traded funds or other investment vehicles that attempt to track the performance of a benchmark index. |
The Fund’s investment objectives, strategies, risks, charges and expenses must be considered carefully before investing. The prospectus contains this and other important information about the Fund and may be obtained by calling the same number as above. Please read it carefully before investing.
The Fund is distributed by Unified Financial Securities, Inc., member FINRA.
1
Comparison of the Growth of a $10,000 Investment in the Granite Value Fund,
the Russell 1000® Value Index, and the S&P 500® Index (Unaudited)
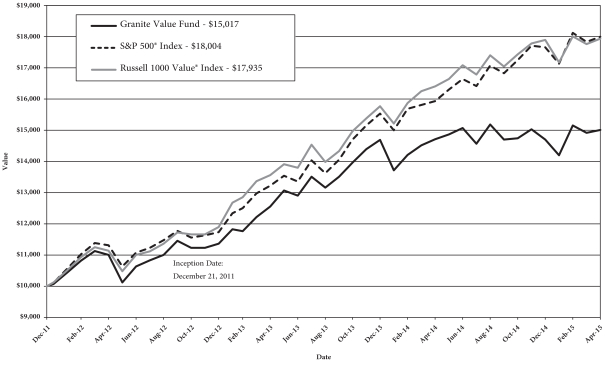
The chart above assumes an initial investment of $10,000 made on December 22, 2011 (commencement of Fund operations) and held through April 30, 2015. The S&P 500® Index and Russell 1000® Value Index are widely recognized unmanaged indices of equity securities and are representative of a broader domestic equity market and range of securities than is found in the Fund’s portfolio. Individuals cannot invest directly in an Index; however, an individual can invest in exchange traded funds or other investment vehicles that attempt to track the performance of a benchmark index. THE FUND’S RETURN REPRESENTS PAST PERFORMANCE AND DOES NOT GUARANTEE FUTURE RESULTS. The returns shown do not reflect deduction of taxes that a shareholder would pay on Fund distributions or the redemption of Fund shares. Investment returns and principal values will fluctuate so that your shares, when redeemed, may be worth more or less than their original purchase price.
Current performance may be lower or higher than the performance data quoted. For more information on the Fund, and to obtain performance data current to the most recent month end or to request a prospectus, please call 1-888-442-9893. You should carefully consider the investment objectives, potential risks, management fees, and charges and expenses of the Fund before investing. The Fund’s prospectus contains this and other information about the Fund, and should be read carefully before investing.
The Fund is distributed by Unified Financial Securities, Inc., member FINRA.
2
FUND HOLDINGS – (Unaudited)
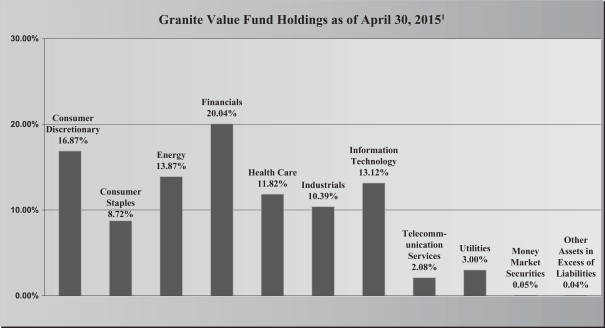
| 1 | As a percentage of net assets. |
The investment objective of the Granite Value Fund is to seek long-term capital appreciation.
Availability of Portfolio Schedule – (Unaudited)
The Fund files its complete schedule of portfolio holdings with the Securities and Exchange Commission (“SEC”) for the first and third quarters of each fiscal year on Form N-Q. The Fund’s Forms N-Q are available at the SEC’s website at www.sec.gov. The Fund’s Forms N-Q may be reviewed and copied at the SEC’s Public Reference Room in Washington DC. Information on the operation of the Public Reference Room may be obtained by calling 1-800-SEC-0330.
Summary of Fund’s Expenses – (Unaudited)
As a shareholder of the Fund, you incur two types of costs: (1) transaction costs, such as short-term redemption fees; and (2) ongoing costs, including management fees and other Fund expenses. This Example is intended to help you understand your ongoing costs (in dollars) of investing in the Fund and to compare these costs with the ongoing costs of investing in other mutual funds. The example is based on an investment of $1,000 invested at the beginning and held for the six month period, November 1, 2014 to April 30, 2015.
3
Actual Expenses
The first line of the table below provides information about actual account values and actual expenses. You may use the information in this line, together with the amount you invested, to estimate the expenses that you paid over the period. Simply divide your account value by $1,000 (for example, an $8,600 account value divided by $1,000 = $8.60), then multiply the result by the number in the first line under the heading entitled “Expenses Paid During the Period” to estimate the expenses you paid on your account during this period.
Hypothetical Example for Comparison Purposes
The second line of the table below provides information about hypothetical account values and hypothetical expenses based on the Fund’s actual expense ratio and an assumed rate of return of 5% per year before expenses, which is not the Fund’s actual return. The hypothetical account values and expenses may not be used to estimate the actual ending account balance or expenses you paid for the period. You may use this information to compare the ongoing costs of investing in the Fund and other funds. To do so, compare this 5% hypothetical example with the 5% hypothetical examples that appear in the shareholder reports of the other funds.
Please note that the expenses shown in the table are meant to highlight your ongoing costs only. Therefore, the second line of the table below is useful in comparing ongoing costs only and will not help you determine the relative costs of owning different funds.
| Granite Value Fund | Beginning November 1, 2014 | Ending Account Value April 30, 2015 | Expenses Paid November 1, 2014 – | |||||||||
Actual* | $ | 1,000.00 | $ | 1,002.27 | $ | 6.72 | ||||||
Hypothetical** | $ | 1,000.00 | $ | 1,018.08 | $ | 6.77 | ||||||
| * | Expenses are equal to the Fund’s annualized expense ratio of 1.35%, multiplied by the average account value over the period, multiplied by 181/365 (to reflect the one-half year period). |
| ** | Assumes a 5% return before expenses. |
4
GRANITE VALUE FUND
SCHEDULE OF INVESTMENTS
April 30, 2015 (Unaudited)
| Common Stocks – 99.91% | Shares | Fair Value | ||||||
Consumer Discretionary – 16.87% | ||||||||
Bed Bath & Beyond, Inc. * | 4,650 | $ | 327,639 | |||||
Comcast Corp. – Class A | 7,000 | 404,320 | ||||||
Foot Locker, Inc. | 4,750 | 282,387 | ||||||
General Motors Co. | 13,795 | 483,653 | ||||||
Starz * | 11,605 | 456,425 | ||||||
Whirlpool Corp. | 1,690 | 296,764 | ||||||
|
| |||||||
| 2,251,188 | ||||||||
|
| |||||||
Consumer Staples – 8.72% | ||||||||
Coca-Cola Co./The | 9,150 | 371,124 | ||||||
Unilever PLC ADR | 10,590 | 464,054 | ||||||
Wal-Mart Stores, Inc. | 4,210 | 328,590 | ||||||
|
| |||||||
| 1,163,768 | ||||||||
|
| |||||||
Energy – 13.87% | ||||||||
Apache Corp. | 5,065 | 346,446 | ||||||
Cimarex Energy Co. | 1,185 | 147,414 | ||||||
Exxon Mobil Corp. | 5,740 | 501,504 | ||||||
Southwestern Energy Co. * | 12,340 | 345,890 | ||||||
Ultra Petroleum Corp. * | 17,255 | 293,853 | ||||||
Unit Corp. * | 6,175 | 215,137 | ||||||
|
| |||||||
| 1,850,244 | ||||||||
|
| |||||||
Financials – 20.04% | ||||||||
Alleghany Corp. * | 925 | 438,006 | ||||||
American Express Co. | 4,030 | 312,123 | ||||||
American International Group, Inc. | 9,730 | 547,702 | ||||||
Berkshire Hathaway, Inc. – Class B * | 3,655 | 516,122 | ||||||
Citigroup, Inc. | 8,990 | 479,347 | ||||||
Franklin Resources, Inc. | 7,375 | 380,255 | ||||||
|
| |||||||
| 2,673,555 | ||||||||
|
| |||||||
Health Care – 11.82% | ||||||||
Baxter International, Inc. | 5,190 | 356,761 | ||||||
C.R. Bard, Inc. | 2,230 | 371,473 | ||||||
Gilead Sciences, Inc. * | 2,570 | 258,311 | ||||||
Johnson & Johnson | 3,490 | 346,208 | ||||||
UnitedHealth Group, Inc. | 2,200 | 245,080 | ||||||
|
| |||||||
| 1,577,833 | ||||||||
|
| |||||||
See accompanying notes which are an integral part of these financial statements.
5
GRANITE VALUE FUND
SCHEDULE OF INVESTMENTS – (continued)
April 30, 2015 (Unaudited)
| Common Stocks – 99.91% – continued | Shares | Fair Value | ||||||
Industrials – 10.39% | ||||||||
Boeing Co./The | 2,580 | $ | 369,817 | |||||
Cummins, Inc. | 2,725 | 376,758 | ||||||
Honeywell International, Inc. | 2,550 | 257,346 | ||||||
United Technologies Corp. | 3,365 | 382,769 | ||||||
|
| |||||||
| 1,386,690 | ||||||||
|
| |||||||
Information Technology – 13.12% | ||||||||
Apple, Inc. | 3,130 | 391,719 | ||||||
Corning, Inc. | 11,930 | 249,695 | ||||||
Microsoft Corp. | 8,295 | 403,469 | ||||||
Oracle Corp. | 6,285 | 274,152 | ||||||
Western Union Co./The | 21,270 | 431,356 | ||||||
|
| |||||||
| 1,750,391 | ||||||||
|
| |||||||
Telecommunication Services – 2.08% | ||||||||
AT&T, Inc. | 8,000 | 277,120 | ||||||
|
| |||||||
Utilities – 3.00% | ||||||||
Calpine Corp. * | 18,375 | 400,759 | ||||||
|
| |||||||
Total Common Stocks (Cost $11,711,525) | 13,331,548 | |||||||
|
| |||||||
Money Market Securities – 0.05% | ||||||||
Fidelity Institutional Money Market Funds – Prime Money Market Portfolio – Institutional Class, 0.11% (a) | 6,305 | 6,305 | ||||||
|
| |||||||
Total Money Market Securities (Cost $6,305) | 6,305 | |||||||
|
| |||||||
Total Investments – 99.96% (Cost $11,717,830) | 13,337,853 | |||||||
|
| |||||||
Other Assets in Excess of Liabilities – 0.04% | 4,826 | |||||||
|
| |||||||
TOTAL NET ASSETS – 100.00% | $ | 13,342,679 | ||||||
|
| |||||||
| (a) | Rate disclosed is the seven day yield as of April 30, 2015. |
| * | Non-income producing security. |
ADR – American Depositary Receipt
See accompanying notes which are an integral part of these financial statements.
6
GRANITE VALUE FUND
STATEMENT OF ASSETS AND LIABILITIES
April 30, 2015 (Unaudited)
Assets | ||||
Investments in securities at fair value (cost $11,717,830) | $ | 13,337,853 | ||
Dividends receivable | 11,138 | |||
Receivable from Adviser | 1,224 | |||
Prepaid expenses | 10,292 | |||
|
| |||
Total Assets | 13,360,507 | |||
|
| |||
Liabilities | ||||
Payable to administrator, fund accountant, and transfer agent | 15,745 | |||
Payable to custodian | 585 | |||
Payable to trustees | 667 | |||
Other accrued expenses | 831 | |||
|
| |||
Total Liabilities | 17,828 | |||
|
| |||
Net Assets | $ | 13,342,679 | ||
|
| |||
Net Assets consist of: | ||||
Paid-in capital | $ | 11,294,820 | ||
Accumulated undistributed net investment income (loss) | (510 | ) | ||
Accumulated undistributed net realized gain from investments | 428,346 | |||
Net unrealized appreciation on investments | 1,620,023 | |||
|
| |||
Net Assets | $ | 13,342,679 | ||
|
| |||
Shares outstanding (unlimited number of shares authorized, no par value) | 961,466 | |||
|
| |||
Net asset value (“NAV”) and offering price per share | $ | 13.88 | ||
|
| |||
Redemption price per share (NAV * 98%) (a) | $ | 13.60 | ||
|
| |||
| (a) | The Fund charges a 2.00% redemption fee on shares redeemed in 60 days or less of purchase. Shares are redeemed at the NAV if held longer than 60 calendar days. |
See accompanying notes which are an integral part of these financial statements.
7
GRANITE VALUE FUND
STATEMENT OF OPERATIONS
For the six months ended April 30, 2015 (Unaudited)
Investment Income | ||||
Dividend income | $ | 107,121 | ||
|
| |||
Total investment income | 107,121 | |||
|
| |||
Expenses | ||||
Investment Adviser | 65,776 | |||
Administration | 18,596 | |||
Fund accounting | 12,397 | |||
Transfer agent | 19,119 | |||
Custodian | 1,785 | |||
Trustee | 2,545 | |||
Pricing | 1,366 | |||
Legal | 11,004 | |||
Registration | 7,579 | |||
Audit | 7,476 | |||
Miscellaneous | 10,146 | |||
|
| |||
Total expenses | 157,789 | |||
|
| |||
Fees waived and reimbursed by Adviser | (68,786 | ) | ||
|
| |||
Net operating expenses | 89,003 | |||
|
| |||
Net investment income | 18,118 | |||
|
| |||
Net Realized and Unrealized Gain on Investments | ||||
Net realized gain on investment securities transactions | 433,448 | |||
Net change in unrealized appreciation of investment securities | (205,088 | ) | ||
|
| |||
Net realized and unrealized gain on investments | 228,360 | |||
|
| |||
Net increase in net assets resulting from operations | $ | 246,478 | ||
|
| |||
See accompanying notes which are an integral part of these financial statements.
8
GRANITE VALUE FUND
STATEMENTS OF CHANGES IN NET ASSETS
| For the Six Months Ended April 30, 2015 (Unaudited) | For the Year Ended October 31, 2014 | |||||||
Increase in Net Assets due to: | ||||||||
Operations | ||||||||
Net investment income | $ | 18,118 | $ | 20,639 | ||||
Net realized gain on investment transactions | 433,448 | 490,691 | ||||||
Net change in unrealized appreciation (depreciation) of investments | (205,088 | ) | 169,429 | |||||
|
|
|
| |||||
Net increase in net assets resulting from operations | 246,478 | 680,759 | ||||||
|
|
|
| |||||
Distributions | ||||||||
From net investment income | (31,319 | ) | (17,290 | ) | ||||
From net realized gains | (484,049 | ) | (287,895 | ) | ||||
|
|
|
| |||||
Total distributions | (515,368 | ) | (305,185 | ) | ||||
|
|
|
| |||||
Capital Transactions | ||||||||
Proceeds from shares sold | 1,316,272 | 2,872,894 | ||||||
Proceeds from redemption fees (a) | – | 141 | ||||||
Reinvestment of distributions | 446,979 | 261,021 | ||||||
Amount paid for shares redeemed | (1,363,850 | ) | (874,557 | ) | ||||
|
|
|
| |||||
Net increase in net assets resulting from capital transactions | 399,401 | 2,259,499 | ||||||
|
|
|
| |||||
Total Increase in Net Assets | 130,511 | 2,635,073 | ||||||
|
|
|
| |||||
Net Assets | ||||||||
Beginning of period | 13,212,168 | 10,577,095 | ||||||
|
|
|
| |||||
End of period | $ | 13,342,679 | $ | 13,212,168 | ||||
|
|
|
| |||||
Accumulated undistributed net investment income (loss) included in net assets at end of period | $ | (510 | ) | $ | 12,691 | |||
|
|
|
| |||||
Share Transactions | ||||||||
Shares sold | 95,405 | 207,718 | ||||||
Shares issued in reinvestment of distributions | 33,607 | 19,067 | ||||||
Shares redeemed | (96,855 | ) | (61,652 | ) | ||||
|
|
|
| |||||
Net increase in shares outstanding | 32,157 | 165,133 | ||||||
|
|
|
| |||||
| (a) | The Fund charges a 2% redemption fee on shares redeemed in 60 days or less of purchase. Shares are redeemed at the NAV if held longer than 60 calendar days. |
See accompanying notes which are an integral part of these financial statements.
9
GRANITE VALUE FUND
FINANCIAL HIGHLIGHTS
(For a share outstanding during each period)
| For the Six Months Ended April 30, 2015 (Unaudited) | For the Year Ended October 31, 2014 | For the Year Ended October 31, 2013 | For the Period Ended October 31, 2012 (a) | |||||||||||||
Selected Per Share Data: | ||||||||||||||||
Net asset value, beginning of period | $ | 14.22 | $ | 13.84 | $ | 11.24 | $ | 10.00 | ||||||||
|
|
|
|
|
|
|
| |||||||||
Income from investment operations: | ||||||||||||||||
Net investment income | 0.02 | 0.02 | 0.02 | 0.05 | (b) | |||||||||||
Net realized and unrealized gain on investments | 0.21 | 0.74 | 2.68 | 1.19 | ||||||||||||
|
|
|
|
|
|
|
| |||||||||
Total income from investment operations | 0.23 | 0.76 | 2.70 | 1.24 | ||||||||||||
|
|
|
|
|
|
|
| |||||||||
Less distributions to shareholders from: | ||||||||||||||||
Net investment income | (0.03 | ) | (0.02 | ) | (0.10 | ) | – | |||||||||
Net realized gains | (0.54 | ) | (0.36 | ) | – | – | ||||||||||
|
|
|
|
|
|
|
| |||||||||
Total distributions | (0.57 | ) | (0.38 | ) | (0.10 | ) | – | |||||||||
|
|
|
|
|
|
|
| |||||||||
Paid in capital from redemption fees | – | – | (c) | – | – | (c) | ||||||||||
|
|
|
|
|
|
|
| |||||||||
Net asset value, end of period | $ | 13.88 | $ | 14.22 | $ | 13.84 | $ | 11.24 | ||||||||
|
|
|
|
|
|
|
| |||||||||
Total Return (d) | 1.81 | %(e) | 5.65 | % | 24.21 | % | 12.40 | %(e) | ||||||||
Ratios and Supplemental Data: | ||||||||||||||||
Net assets, end of period (000) | $ | 13,343 | $ | 13,212 | $ | 10,577 | $ | 4,750 | ||||||||
Ratio of net expenses to average net assets | 1.35 | %(f) | 1.35 | % | 1.35 | % | 1.35 | %(f) | ||||||||
Ratio of expenses to average net assets before waiver and reimbursement | 2.40 | %(f) | 2.39 | % | 3.32 | % | 8.11 | %(f) | ||||||||
Ratio of net investment income to average net assets | 0.28 | %(f) | 0.17 | % | 0.27 | % | 0.55 | %(f) | ||||||||
Portfolio turnover rate | 19 | %(e) | 30 | % | 33 | % | 20 | %(e) | ||||||||
| (a) | For the period December 22, 2011 (commencement of operations) to October 31, 2012. |
| (b) | Calculated using the average shares method. |
| (c) | Resulted in less than $0.005 per share. |
| (d) | Total return in the above table represents the rate that the investor would have earned or lost on an investment in the Fund, assuming reinvestment of distributions. |
| (e) | Not annualized. |
| (f) | Annualized. |
See accompanying notes which are an integral part of these financial statements.
10
GRANITE VALUE FUND
NOTES TO THE FINANCIAL STATEMENTS
April 30, 2015 (Unaudited)
NOTE 1. ORGANIZATION
The Granite Value Fund (the “Fund”) is an open-end diversified series of the Valued Advisers Trust (the “Trust”). The Trust is a management investment company established under the laws of Delaware by an Agreement and Declaration of Trust dated June 13, 2008 (the “Trust Agreement”). The Trust Agreement permits the Trust to issue an unlimited number of shares of beneficial interest of separate series without par value. The Fund is one of a series of funds authorized by the Board of Trustees (the “Board”). The Fund commenced operations December 22, 2011. The Fund’s investment adviser is Granite Investment Advisors, Inc. (the “Adviser”). The investment objective of the Fund is to provide long-term capital appreciation.
NOTE 2. SIGNIFICANT ACCOUNTING POLICIES
The Fund is an investment company and follows accounting and reporting guidance under Financial Accounting Standards Board (“FASB”) Accounting Standards Codification (“ASC”) Topic 946, “Financial Services-Investment Companies”. The following is a summary of significant accounting policies followed by the Fund in the preparation of its financial statements. These policies are in conformity with generally accepted accounting principles in the United States of America (“GAAP”).
Securities Valuation – All investments in securities are recorded at their estimated fair value as described in Note 3.
Federal Income Taxes – The Fund makes no provision for federal income or excise tax. The Fund intends to qualify each year as a regulated investment company (“RIC”) under subchapter M of the Internal Revenue Code of 1986, as amended, by complying with the requirements applicable to RICs and by distributing substantially all of its taxable income. The Fund also intends to distribute sufficient net investment income and net capital gains, if any, so that it will not be subject to excise tax on undistributed income and gains. If the required amount of net investment income or gains is not distributed, the Fund could incur a tax expense.
As of and during the period ended April 30, 2015, the Fund did not have a liability for any unrecognized tax benefits. The Fund recognizes interest and penalties, if any, related to unrecognized tax benefits as income tax expense in the Statement of Operations. During the period, the Fund did not incur any interest or penalties. The Fund is subject to examination by U.S. federal tax authorities for all tax years since inception.
Expenses – Expenses incurred by the Trust that do not relate to a specific fund of the Trust are allocated to the individual funds based on each fund’s relative net assets or other appropriate basis.
Security Transactions and Related Income – The Fund follows industry practice and records security transactions on the trade date for financial reporting purposes. The specific identification method is used for determining gains or losses for financial statements and income tax purposes. Dividend income is recorded on the ex-dividend date and interest income is recorded on an accrual basis. Discounts and premiums on securities purchased are amortized or accreted using the effective interest method. Withholding taxes on foreign dividends have been provided for in accordance with the Fund’s understanding of the applicable country’s tax rules and rates. The ability of issuers of debt securities held by the Fund to meet their obligations may be affected by economic and political developments in a specific country or region.
Redemption Fees – The Fund charges a 2.00% redemption fee for shares redeemed within 60 days. These fees are deducted from the redemption proceeds otherwise payable to the shareholder. The Fund will retain the fee charged as an increase in paid-in capital and such fees become part of the Fund’s daily NAV calculation.
11
GRANITE VALUE FUND
NOTES TO THE FINANCIAL STATEMENTS – (continued)
April 30, 2015 (Unaudited)
NOTE 2. SIGNIFICANT ACCOUNTING POLICIES – continued
Dividends and Distributions – The Fund intends to distribute substantially all of its net investment income, net realized long-term capital gains and its net realized short-term capital gains, if any, to its shareholders on at least an annual basis. Dividends to shareholders, which are determined in accordance with income tax regulations, are recorded on the ex-dividend date. The treatment for financial reporting purposes of distributions made to shareholders during the year from net investment income or net realized capital gains may differ from their ultimate treatment for federal income tax purposes. These differences are caused primarily by differences in the timing of the recognition of certain components of income, expense or realized capital gain for federal income tax purposes. Where such differences are permanent in nature, they are reclassified among the components of net assets based on their ultimate characterization for federal income tax purposes. Any such reclassifications have no effect on net assets, results of operations or net asset values per share of the Fund. There were no such material reclassifications made as of April 30, 2015.
NOTE 3. SECURITIES VALUATION AND FAIR VALUE MEASUREMENTS
Fair value is defined as the price that a Fund would receive upon selling an investment in a orderly transaction to an independent buyer in the principal or most advantageous market of the investment. GAAP established a three-tier hierarchy to maximize the use of observable market data and minimize the use of unobservable inputs and to establish classification of fair value measurements for disclosure purposes.
Inputs refer broadly to the assumptions that market participants would use in pricing the asset or liability, including assumptions about risk, (ex., the risk inherent in a particular valuation technique used to measure fair value including items such as a pricing model and/or the risk inherent in the inputs to the valuation technique). Inputs may be observable or unobservable. Observable inputs are inputs that reflect the assumptions market participants would use in pricing the asset or liability developed based on market data obtained from sources independent of the reporting entity. Unobservable inputs are inputs that reflect the reporting entity’s own assumptions about the assumptions market participants would use in pricing the asset or liability developed based on the best information available in the circumstances.
Various inputs are used in determining the value of the Fund’s investments. These inputs are summarized in the three broad levels listed below.
| • | Level 1 – quoted prices in active markets for identical securities |
| • | Level 2 – other significant observable inputs (including, but not limited to, quoted prices for an identical security in an inactive market, quoted prices for similar securities, interest rates, prepayment speeds, credit risk, etc.) |
| • | Level 3 – significant unobservable inputs (including the Fund’s own assumptions in determining fair value of investments based on the best information available) |
The inputs used to measure fair value may fall into different levels of the fair value hierarchy. In such cases, for disclosure purposes, the level in the fair value hierarchy within which the fair value measurement falls in its entirety, is determined based on the lowest level input that is significant to the fair value measurement in its entirety.
Equity securities, including common stocks, are generally valued by using market quotations, furnished by a pricing service. Securities that are traded on any stock exchange are generally valued at the last quoted sale price.
12
GRANITE VALUE FUND
NOTES TO THE FINANCIAL STATEMENTS – (continued)
April 30, 2015 (Unaudited)
NOTE 3. SECURITIES VALUATION AND FAIR VALUE MEASUREMENTS – continued
Lacking a last sale price, an exchange traded security is generally valued at its last bid price. Securities traded in the NASDAQ over-the-counter market are generally valued at the NASDAQ Official Closing Price. When using the market quotations or close prices provided by the pricing service and when the market is considered active, the security is classified as a Level 1 security. Sometimes, an equity security owned by the Fund will be valued by the pricing service with factors other than market quotations or when the market is considered inactive. When this happens, the security is classified as a Level 2 security. When market quotations are not readily available, when the Fund determines that the market quotation or the price provided by the pricing service does not accurately reflect the current fair value, or when restricted or illiquid securities are being valued, such securities are valued as determined in good faith by the Fund, in conformity with guidelines adopted by and subject to review by the Board. These securities may be categorized as Level 3 securities.
Investments in open-end mutual funds, including money market mutual funds, are generally priced at the ending net asset value (NAV) provided by the service agent of the funds. These securities will be categorized as Level 1 securities.
In accordance with the Trust’s good faith pricing guidelines, the Adviser is required to consider all appropriate factors relevant to the value of securities for which it has determined other pricing sources are not available or reliable as described above. No single standard exists for determining fair value, because fair value depends upon the circumstances of each individual case. As a general principle, the current fair value of an issue of securities being valued by the Adviser would appear to be the amount which the owner might reasonably expect to receive for them upon their current sale. Methods which are in accordance with this principle may, for example, be based on (i) a multiple of earnings; (ii) a discount from market of a similar freely traded security (including a derivative security or a basket of securities traded on other markets, exchanges or among dealers); or (iii) yield to maturity with respect to debt issues, or a combination of these and other methods. Good faith pricing is permitted if, in the Adviser’s opinion, the validity of market quotations appears to be questionable based on factors such as evidence of a thin market in the security based on a small number of quotations, a significant event occurs after the close of a market but before a Fund’s NAV calculation that may affect a security’s value, or the Adviser is aware of any other data that calls into question the reliability of market quotations. Good faith pricing may also be used in instances when the bonds the Fund invests in may default or otherwise cease to have market quotations readily available. Any fair value pricing done outside the Fund’s approved pricing methods must be approved by the Pricing Committee of the Board.
The following is a summary of the inputs used to value the Fund’s investments as of April 30, 2015:
| Valuation Inputs | ||||||||||||||||
| Assets | Level 1 Quoted Prices in Active Markets | Level 2 Other Significant Observable Inputs | Level 3 Significant Unobservable Inputs | Total | ||||||||||||
Common Stocks* | $ | 13,331,548 | $ | – | $ | – | $ | 13,331,548 | ||||||||
Money Market Securities | 6,305 | – | – | 6,305 | ||||||||||||
Total | $ | 13,337,853 | $ | – | $ | – | $ | 13,337,853 | ||||||||
* Refer to the Schedule of Investments for industry classifications.
13
GRANITE VALUE FUND
NOTES TO THE FINANCIAL STATEMENTS – (continued)
April 30, 2015 (Unaudited)
NOTE 3. SECURITIES VALUATION AND FAIR VALUE MEASUREMENTS – continued
The Fund did not hold any investments at any time during the reporting period in which significant unobservable inputs were used in determining fair value; therefore, no reconciliation of Level 3 securities is included for this reporting period. The Trust recognizes transfers between fair value hierarchy levels at the reporting period end. There were no transfers between any Levels for the period ended April 30, 2015 compared to the previous measurement period.
NOTE 4. FEES AND OTHER TRANSACTIONS WITH AFFILIATES
Under the terms of the management agreement, on behalf of the Fund (the “Agreement”), the Adviser manages the Fund’s investments subject to approval of the Trustees. As compensation for its management services, the Fund is obligated to pay the Adviser a fee computed and accrued daily and paid monthly at an annual rate of 1.00% of the average daily net assets of the Fund. For the period ended April 30, 2015, the Adviser earned a fee of $65,776 from the Fund before the reimbursement described below.
The Adviser has contractually agreed to waive its management fee and/or reimburse expenses through February 29, 2016, so that total annual fund operating expenses, excluding interest, taxes, brokerage commissions, other expenditures which are capitalized in accordance with GAAP, other extraordinary expenses not incurred in the ordinary course of the Fund’s business, dividend expense on short sales, and expenses that the Fund has incurred but did not actually pay because of an expense offset arrangement, if applicable, incurred by the Fund in any fiscal year, do not exceed 1.35% of the Fund’s average daily net assets. The operating expense limitation also excludes any fees and expenses of acquired funds. For the period ended April 30, 2015, expenses totaling $68,786 were waived or reimbursed by the Adviser and are subject to potential recoupment by the Adviser until October 31, 2018. At April 30, 2015, the Adviser owed the Fund $1,224.
The amounts subject to repayment by the Fund pursuant to the aforementioned conditions are as follows:
Amount | Recoverable through October 31, | |
$171,698 | 2015 | |
150,231 | 2016 | |
129,076 | 2017 | |
68,786 | 2018 |
The Trust retains Huntington Asset Services, Inc. (“HASI”) to manage the Fund’s business affairs and provide the Fund with administration services, including all regulatory reporting and necessary office equipment and personnel. For the period ended April 30, 2015, HASI earned fees of $18,596 for administration services provided to the Fund. At April 30, 2015, HASI was owed $6,096 from the Fund for administration services. Certain officers and one Trustee of the Trust are members of management and/or employees of HASI. HASI is a wholly-owned subsidiary of Huntington Bancshares, Inc., the parent company of Unified Financial Securities, Inc. (the “Distributor”) and Huntington National Bank, the custodian of the Fund’s investments (the “Custodian”). For the period ended April 30, 2015, the Custodian earned fees of $1,785 for custody services provided to the Fund. At April 30, 2015, the Custodian was owed $585 from the Fund for custody services.
The Trust also retains HASI to act as the Fund’s transfer agent and to provide fund accounting services. For the period ended April 30, 2015, HASI earned fees of $19,119 for transfer agent services to the Fund. At April 30, 2015, the Fund owed HASI $5,585 for transfer agent services. For the period ended April 30, 2015, HASI earned fees of $12,397 from the Fund for fund accounting services. At April 30, 2015, HASI was owed $4,064 from the Fund for fund accounting services.
14
GRANITE VALUE FUND
NOTES TO THE FINANCIAL STATEMENTS – (continued)
April 30, 2015 (Unaudited)
NOTE 4. FEES AND OTHER TRANSACTIONS WITH AFFILIATES – continued
Unified Financial Securities, Inc. acts as the principal underwriter of the Fund’s shares. There were no payments made by the Fund to the Distributor during the period ended April 30, 2015. An officer and Trustee of the Trust is an officer of the Distributor and such person may be deemed to be an affiliate of the Distributor.
The Fund has adopted a 12b-1 Plan that permits the Fund to pay 0.25% of its average daily net assets to financial institutions that provide distribution and/or shareholder servicing. The Plan has not been activated as of April 30, 2015.
NOTE 5. INVESTMENTS
For the period ended April 30, 2015, purchases and sales of investment securities, other than short-term investments and short-term U.S. government obligations, were as follows:
Purchases | ||||
U.S. Government Obligations | $ | – | ||
Other | 2,465,281 | |||
Sales | ||||
U.S. Government Obligations | $ | – | ||
Other | 2,423,946 |
NOTE 6. ESTIMATES
The preparation of financial statements in conformity with GAAP requires management to make estimates and assumptions that affect the reported amounts of assets and liabilities and disclosure of contingent assets and liabilities at the date of the financial statements and the reported amounts of increases and decreases in net assets from operations during the reporting period. Actual results could differ from those estimates.
NOTE 7. BENEFICIAL OWNERSHIP
The beneficial ownership, either directly or indirectly, of 25% or more of the voting securities of a fund creates a presumption of control of a fund, under Section 2(a) (9) of the Investment Company Act of 1940. At April 30, 2015, Charles Schwab & Co., Inc. for the benefit of its customers, owned 53.59%. The Trust does not know whether Charles Schwab & Co. or any of the underlying beneficial owners controlled 25% or more of the voting securities of the Fund.
NOTE 8. FEDERAL TAX INFORMATION
At April 30, 2015, the net unrealized appreciation (depreciation) of investments for tax purposes was as follows:
Gross Appreciation | $ | 2,016,009 | ||
Gross (Depreciation) | (401,087 | ) | ||
|
| |||
Net Appreciation (Depreciation) on Investments | $ | 1,614,922 | ||
|
|
At April 30, 2015, the aggregate cost of securities, excluding U.S. government obligations, for federal income tax purposes was $11,722,931 for the Fund.
15
GRANITE VALUE FUND
NOTES TO THE FINANCIAL STATEMENTS – (continued)
April 30, 2015 (Unaudited)
NOTE 8. FEDERAL TAX INFORMATION – continued
The tax characterization of distributions for the fiscal year ended October 31, 2014 was as follows:
| Distributions paid from: | 2014 | |||
Ordinary Income* | $ | 164,135 | ||
Long-Term Capital Gains | $ | 141,050 | ||
|
| |||
Total Distributions | $ | 305,185 | ||
|
| |||
| * | Short term capital gain distributions are treated as ordinary income for tax purposes. |
At October 31, 2014, the components of distributable earnings (accumulated losses) on a tax basis were as follows:
Undistributed ordinary income | $ | 15,725 | ||
Undistributed long-term capital gain | 484,049 | |||
Accumulated capital and other losses | (3,035 | ) | ||
Net realized appreciation (depreciation) | 1,820,010 | |||
|
| |||
| $ | 2,316,749 | |||
|
|
At October 31, 2014, the difference between book basis and tax basis unrealized appreciation (depreciation) is primarily attributable to the tax deferral of losses on wash sales in the amount of $5,101.
At October 31, 2014, for federal income tax purposes, the Fund has no capital loss carryforwards.
NOTE 9. COMMITMENTS AND CONTINGENCIES
The Fund indemnifies its officers and trustees for certain liabilities that may arise from their performance of their duties to the Fund. Additionally, in the normal course of business, the Fund enters into contracts that contain a variety of representations and warranties which provide general indemnifications. The Fund’s maximum exposure under these arrangements is unknown, as this would involve future claims that may be made against the Fund that have not yet occurred.
NOTE 10. SUBSEQUENT EVENTS
Management of the Fund has evaluated the need for disclosures and/or adjustments resulting from subsequent events through the date these financial statements were issued. There were no items requiring adjustment of the financial statements or additional disclosure.
16
OTHER INFORMATION
The Fund’s Statement of Additional Information (“SAI”) includes additional information about the trustees and is available without charge, upon request. You may call toll-free at (888) 442-9893 to request a copy of the SAI or to make shareholder inquiries.
PROXY VOTING
A description of the policies and procedures that the Fund uses to determine how to vote proxies relating to portfolio securities and information regarding how the Fund voted those proxies is available without charge upon request by (1) calling the Fund at (888) 442-9893 and (2) from Fund documents filed with the Securities and Exchange Commission (“SEC”) on the SEC’s website at www.sec.gov.
TRUSTEES
R. Jeffrey Young, Chairman
Ira Cohen
Andrea N. Mullins
OFFICERS
R. Jeffrey Young, Principal Executive Officer and President
John C. Swhear, Chief Compliance Officer, AML Officer and Vice President
Carol J. Highsmith, Vice President and Secretary
Matthew J. Miller, Vice President
Bryan W. Ashmus, Principal Financial Officer and Treasurer
INVESTMENT ADVISER
Granite Investment Advisors
11 South Main Street, Suite 501
Concord, NH 03301
DISTRIBUTOR
Unified Financial Securities, Inc.
2960 North Meridian Street, Suite 300
Indianapolis, IN 46208
INDEPENDENT REGISTERED PUBLIC ACCOUNTING FIRM
Cohen Fund Audit Services Ltd.
1350 Euclid Avenue, Suite 800
Cleveland, OH 44115
LEGAL COUNSEL
The Law Offices of John H. Lively & Associates, Inc.
A member firm of The 1940 Act Law GroupTM
11300 Tomahawk Creek Parkway, Ste. 310
Leawood, KS 66211
CUSTODIAN
Huntington National Bank
41 South High Street
Columbus, OH 43215
ADMINISTRATOR, TRANSFER AGENT AND FUND ACCOUNTANT
Huntington Asset Services, Inc.
2960 North Meridian Street, Suite 300
Indianapolis, IN 46208
This report is intended only for the information of shareholders or those who have received the Fund’s prospectus which contains information about the Fund’s management fee and expenses. Please read the prospectus carefully before investing.
Distributed by Unified Financial Securities, Inc.
Member FINRA/SIPC
17
PRIVACY POLICY
The following is a description of the policies of the Valued Advisers Trust (the “Trust”) regarding disclosure of nonpublic personal information that shareholders provide to a series of the Trust (each, a “Fund”) or that the Fund collects from other sources. In the event that a shareholder holds shares of a Fund through a broker-dealer or other financial intermediary, the privacy policy of the financial intermediary would govern how shareholder nonpublic personal information would be shared with nonaffiliated third parties.
Categories of Information A Fund May Collect. A Fund may collect the following nonpublic personal information about its shareholders:
| • | Information the Fund receives from a shareholder on applications or other forms, correspondence, or conversations (such as the shareholder’s name, address, phone number, social security number, and date of birth); and |
| • | Information about the shareholder’s transactions with the Fund, its affiliates, or others (such as the shareholder’s account number and balance, payment history, cost basis information, and other financial information). |
Categories of Information A Fund May Disclose. A Fund may not disclose any nonpublic personal information about its current or former shareholders to unaffiliated third parties, except as required or permitted by law. A Fund is permitted by law to disclose all of the information it collects, as described above, to its service providers (such as the Fund’s custodian, administrator, transfer agent, accountant and legal counsel) to process shareholder transactions and otherwise provide services to the shareholder.
Confidentiality and Security. Each Fund shall restrict access to shareholder nonpublic personal information to those persons who require such information to provide products or services to the shareholder. Each Fund shall maintain physical, electronic, and procedural safeguards that comply with federal standards to guard shareholder nonpublic personal information.
Disposal of Information. The Funds, through their transfer agent, have taken steps to reasonably ensure that the privacy of a shareholder’s nonpublic personal information is maintained at all times, including in connection with the disposal of information that is no longer required to be maintained by the Funds. Such steps shall include, whenever possible, shredding paper documents and records prior to disposal, requiring off-site storage vendors to shred documents maintained in such locations prior to disposal, and erasing and/or obliterating any data contained on electronic media in such a manner that the information can no longer be read or reconstructed.
18

Semi-Annual Report
April 30, 2015
Fund Adviser:
Kovitz Investment Group, LLC
115 South LaSalle Street, 27th Floor
Chicago, IL 60603
Toll Free (888) 695-3729
MANAGEMENT DISCUSSION & ANALYSIS – APRIL 30, 2015 – (Unaudited)
Kovitz Investment Group launched the Green Owl Intrinsic Value Fund (the Fund) with the goal of seeking long-term capital appreciation through high risk-adjusted returns. Relying on a fundamental, research-driven process, the Fund strives to build a diversified portfolio of equity investments through the purchase of competitively advantaged and financially strong companies at prices substantially less than our estimate of their intrinsic values.
We remain focused on the careful and patient application of our investment criteria and valuation requirements. We are more concerned with the risk of suffering a permanent loss of capital than about the risk of missing opportunities, especially those that are short-term in nature. Our bottom-up research emphasizes business quality, industry structures, growth opportunities, management skill and corporate culture. It is further augmented by our assessment of the company’s ability to sustain earnings power over the long haul through an understanding of its competitive advantages, business model and management’s skill in the allocation of capital. We use absolute, rather than relative, methods to estimate companies’ intrinsic values and we use the movement of market prices around these intrinsic value estimates to construct and manage a portfolio of high-quality businesses that have the potential to create sustained shareholder value over many years. One of the challenges we have faced over the last twelve months is that there has been very little stress, very little fear and very little volatility in the markets as a whole. Losing the opportunity to take advantage of large price swings doesn’t play to our strengths.
MARKET PERFORMANCE SUMMARY
The Fund increased in value by 5.70% during the first half of the fiscal year (November 1, 2014 through April 30, 2015), while our primary benchmark, the S&P 500, increased 4.40% over the same period.
As long-term investors, our research process emphasizes the appraisal of factors that we believe matter most to a business’s long-term success. These include the quality of the business, the strength of the balance sheet, the predictability of the cash flows, and the ability of the management team to allocate capital intelligently and judiciously. We believe these attributes are the most reliable predictors of a company’s ability to maximize intrinsic value on a per share basis.
Business quality may mean different things to different investors. When we think about a high quality business, we are referring to a company that not only earns high returns on capital today, but is likely to sustain high returns on capital long into the future due to a strong competitive position. Warren Buffett notably refers to such businesses as possessing a competitive “moat.” Buffett asserts,
“A truly great business must have an enduring ‘moat’ that protects excellent returns on invested capital. The dynamics of capitalism guarantee that competitors will repeatedly assault any business ‘castle’ that is earning high returns.”
Buffett’s symbolic moat is formed when a business possesses one or more sustainable competitive advantages. The primary competitive advantages that we focus on include a low cost position, strong brand loyalty, high customer switching costs, and network effects.
As taught in introductory business classes, the value of any financial asset (e.g., stocks) should equal the present value of all of its future cash flows. Therefore, to effectively value a business we have to make a reasonably accurate forecast of that business’s future. Accurately predicting the future cash flow of a business is difficult. Without a moat, it becomes even more difficult because competition can quickly disrupt a business’s sales and margins resulting in diminished cash flow. On the other hand, predictability of cash flow increases if a business has a moat. The wider and more enduring we perceive a business’s moat to be, the more conviction we can have in our intrinsic value estimates. Assessing and appraising the strength and endurance of competitive advantages is the most difficult task in investing. Most of our mistakes can be traced back to an incorrect assessment of a
1
company’s moat. Given the foundational nature of this exercise in our research process and its critical role in our future success, continual improvement in this area will always be our main focus.
While it is mandatory for a company to possess a defensible moat before the possibility of an investment is considered, the overriding factor for inclusion in our portfolio is price. Regardless of positive qualitative attributes, quantitatively, the company’s stock must trade at a significant discount to our determination of its private market value (intrinsic value) before we will make an investment. This margin of safety provides further insurance against a permanent loss of capital should our assessment of a company’s moat prove overly optimistic.
PERFORMANCE ATTRIBUTION
Top contributors to performance over the period were Kohl’s (KSS), Target (TGT), Walgreen Boots Alliance (WBA), Apple (AAPL), and Boeing (BA). Kohl’s efforts in building out its omni-channel offering along with targeted marketing reforms have resulted in recent sales momentum that appears sustainable. We have long felt Kohl’s business possessed unique advantages that, if harnessed properly, would ultimately lead to same-store sales growth. Target benefitted primarily from addition by subtraction as it announced that it was discontinuing its foray into Canada. The ill-conceived venture has been a drag on company profits since inception and new management made the bold decision to stop deploying capital into what was likely a money losing effort for the foreseeable future. Walgreens is benefitting from strong sales in its U.S. stores and earnings accretion from its two-stage acquisition of Alliance Boots, which was completed in 2014. All three of these actions – Kohl’s decision to invest in its omni-channel offering, Target’s decision to stop throwing good money after bad in Canada, and Walgreens acquisition of Alliance Boots – are excellent examples of how capital allocation by management is one of the primary determinants of shareholder value.
The largest detractors from performance were Ocwen Financial (OCN), Ensco (ESV), National Oilwell Varco (NOV), Bank of America (BAC) and American Express (AXP). As investors, our primary job is to match valuation with expectations, meaning we are trying to determine what expectations for earnings growth are priced into the current valuation. Secondarily, we need to determine whether recent negative news signifies a busted investment thesis, or whether it falls in the normal range of “things happen.” In each of these cases (except NOV, which we sold as discussed below), we believe the expectations priced in at current levels are far below what we believe will likely happen over the next few years.
On a sector basis, outperformance for the period was due primarily to stock selection in Consumer Discretionary (Kohl’s, Target, Walt Disney (DIS)), Consumer Staples (Walgreens, CVS Health (CVS)), Information Technology (Apple, Accenture (ACN)), Industrials (Boeing) and lack of exposure to Utilities, the second worst performing sector for the time period. Hurting relative performance during the period was poor stock selection in Financials (Ocwen, Bank of America, American Express) combined with a lack of any meaningful exposure to Health Care, which was the second best performing sector. Frankly, we see little value in the Health Care sector currently and will be patient about putting new money to work in the sector regardless of recent positive price performance.
PORTFOLIO ACTIVITY
Over the period, we initiated seven new positions, added to three current positions, trimmed exposure to five, and sold out of four completely.
BUYS
For the past several quarters we have lamented the stark lack of opportunities for us to put money to work in new names. We believed that just about every sector of the market had elevated valuations and very few individual companies were trading at significant discounts to our estimates of fair value. This latest bull market has seen
2
almost no meaningful corrections and had not delivered any industry or sector declines that are normal even in a market that is rising overall. This set of circumstances had made it difficult for investors like us who tend to be opportunistic in building portfolios.
During the quarter, however, the price of crude oil swooned, and shares of companies in the energy sector and those in the industrial sector with energy-related businesses underwent a major correction. Historically, we have had very low exposure to these names. In recent years, with the price of crude trading near $100 per barrel and market sentiment that it would remain there, our feeling was that most stocks in the energy group provided little margin of safety. As the price of oil collapsed almost 50% from June to December 2014, we determined that valuations were more favorable, and, with oil prices having collapsed approximately 50% since mid-June, we believe that valuations in energy and energy-related names began to look attractive.
To be clear, we are not making a call on where we believe oil will trade over the next several months or quarters. In the short run, we don’t know if the current plunge in the price of a barrel of oil will continue, stabilize, or even trend upward. Looking out over the next several years, however, our feeling is that oil prices will likely be higher. We say this not out of any sense of clairvoyance but from an understanding about how commodity markets generally work and our comprehension of how marginal cost economics typically play out. In a sense, commodity prices are self-correcting – the interaction between supply and demand in setting prices at the margin makes this so. Commodity prices will decline if demand decreases or if there is too much supply. Conversely, prices will rise if demand increases or supply falls. In the current case of oil, the drop has largely stemmed from oversupplied conditions caused by increased production in Northern Iraq and Libya coinciding with huge gains in production in the United States due to the “shale revolution.” Even more fuel was added to fire on Thanksgiving Day when OPEC announced they would not cut current production levels. The most common interpretation of this decision was that it was meant as a shot across the bow warning U.S. shale producers that the Saudis are determined to not be the first to blink in the face of falling oil prices.
The recent surge of U.S. oil and natural gas production has been nothing short of astonishing. This transformation is the product of advances in oil and natural gas production technology – notably, a new combination of horizontal drilling and hydraulic fracturing. (Hydraulic fracturing, or “fracking,” is the process of injecting sand, water, and chemicals into shale rocks to crack them open and release the hydrocarbons trapped inside.) These technological advances combined with high oil and gas prices have enabled increased production of the abundant oil and natural gas resources in the United States.
In the past five years, this technological revolution in the oil patch has made the United States the world’s fastest-growing hydrocarbon producer. In 2000, shale gas provided only 1% of U.S. natural gas production. By 2010, it was over 20%, and the U.S. government’s Energy Information Administration predicts that 46% of the United States’ natural gas supply will come from shale gas by 2035. U.S. natural gas production has risen by 25 percent since 2010, and the only reason it has temporarily stalled is that investments are required to facilitate further growth. Having already outstripped Russia as the world’s largest gas producer, the United States will become one of the world’s largest gas exporters by the end of the decade, fundamentally changing pricing and trade patterns in global energy markets. U.S. oil production, meanwhile, has grown by 60 percent since 2008, growing at a clip of around 1 million barrels a day annually for the past several years. To put this in context, OPEC member Libya’s production is currently about 900,000 barrels per day.
While the supply glut is the major factor contributing to the fall in the price of oil, other factors have been at work as well. On the demand side, slowing Chinese economic growth and a sputtering European economy have helped to keep demand growth under wraps putting little pressure on the surging supply of oil. Even geopolitical tensions, which heretofore served as a buttress for high oil prices in the form of a perceived risk premium, seemed to lose its sway on oil’s pricing mechanism. Oil had rallied into midyear, buoyed in part by geopolitical tensions surrounding Russia’s annexation of the Crimea, civil war in Syria, and broad advances by Sunni insurgents across northern Iraq. But the risk premium soon dissipated as oil investors came around to the view
3
that none of the scenarios posed an imminent danger to supply. Finally, the strength in the U.S. dollar (up 10% vs. a basket of foreign currencies since the beginning of May), which is generally inversely correlated to dollar-priced commodities, has added to the oil price woes.
So why are we confident that oil prices will ultimately move higher? There is an old adage in the world of commodities that “low prices are the cure for low prices.” Around the world, the cost of drilling oil varies widely. Ultimately, when the price of oil falls below a particular breakeven level (typically referred to as the marginal cost of production), then a drilling project becomes unprofitable and it makes sense for the driller to just shut down the particular project. These actions decrease supply, bringing it more in line with demand. We also don’t discount the possibility that demand may increase as cheaper prices stimulate more use. The simultaneous lowering of supply and increasing demand serves as a natural buoy to reinforce higher prices. (There is a lot of talk that with slow global economic activity currently, it may take time for the demand side of the equation to increase. This is likely true, but keep in mind, we are looking out several years for this to play out.)
Importantly, drilling projects can’t just be turned off like the flip of a light switch. In general, oil production is a high fixed cost, capital intensive business with low variable production costs. Current well and rig infrastructure will likely continue to be used for pumping oil from the ground. Most new drilling, however, is likely to be curtailed until such time as internal rate of return hurdles can once again be cleared. While the daily news reports contain lots of headlines and a great deal of noise, we believe there is a salient data point: capital expenditure budgets for many oil exploration and production companies are already being slashed with a focus on cancelling the projects to drill new wells. In other words, the supply response has started. It may take several years for these actions to help the oil market regain its supply and demand balance, which is a timeframe many investors find too long to participate in. On the other hand, we like buying businesses with a margin of safety where the primary cost to earn the outsized return is a willingness to wait.
In order to prepare for this eventuality, our research process has focused on preparing a “wish list” of energy and related companies we would want to own. In early December, with the price of oil and related companies continuing to fall, we firmed up our list. Toward mid-month, with prices seemingly in freefall, we implemented the purchase of a basket of high quality stocks at valuations that imply oil will stay at or near the current price forever. We may be early (we usually are), but we feel these stocks provide risk/reward characteristics we are extremely comfortable with over a sufficiently long time horizon.
Our basket focused on oilfield services companies, including Halliburton (HAL), Baker Hughes (BHI), Schlumberger (SLB), and FMC Technologies (FTI), and engineering and construction companies, including Jacobs Engineering (JEC) and Quanta Services (PWR). These are the companies that provide the proverbial picks and shovels to the 49ers of the energy industry. All of these companies have substantial exposure to oil and gas production activity, but none have their revenues directly determined by the fluctuating price of oil.
Schlumberger, Halliburton, and Baker Hughes are three of the largest and most globally diversified oilfield services companies in the world. These companies provide services and solutions to independent exploration and production companies and integrated oil and gas companies at every stage in the process of production. These services range from exploring for and locating hydrocarbons under the ground to completing wells drilled to access oil and gas to enhancing and optimizing the recovery of these commodities from deep below the surface of the Earth. The three firms function effectively as an oligopoly in many parts of their business, which keeps pricing rational, and their breadth of offerings and strength in those areas provide meaningful barriers to entry against smaller players taking market share.
Schlumberger is the largest player in the industry and has the most exposure to producers outside the U.S., including long relationships with many national oil companies. Halliburton, long removed from any involvement in government-contracted engineering and construction that made headlines during the Iraq War, provides their services globally, but with more of a focus inside the U.S. Baker Hughes is a solid third place in terms of size and
4
efficiency behind Schlumberger and Halliburton, but the company agreed to be acquired by Halliburton in a cash and stock deal shortly before we initiated our positions. Due to this pending transaction, we view our position in Baker Hughes as part of our position in Halliburton where the cash portion of the deal will provide a buffer against further downside should oil prices continue to slide in the short run. The substantial $3.5 billion termination fee owed to the company by Halliburton should the deal fall apart, will also provide additional protection from loss in that scenario.
Our combined position in Halliburton and Baker Hughes is the largest position in our energy basket because the combination of falling oil prices and the market perception that the announced merger was poorly timed – also due to falling oil prices – has caused the stock price to deviate the most from what we consider the company’s intrinsic value. Schlumberger also saw its share price decline substantially, although not to the same degree as Halliburton. Nevertheless, the stock was trading at a below-market multiple on depressed near-term earnings despite our opinion that Schlumberger’s business deserves to be valued at a premium multiple on normalized earnings – an opinion that the market has generally agreed with for at least the last decade.
FMC Technologies is also classified within the oilfield services industry, but they are primarily engaged in providing subsea “trees” used in offshore oil and gas production. These “trees” are individual or multiple structures that reside on the sea floor that allow the teams operating the well at the surface to regulate pressure in the well and optimize the stimulation of the well. These structures are highly complex as they are intended to operate up to two miles below the surface under incredible amounts of pressure and at widely varying temperatures between the water at those depths and in the well itself. FMC dominates this industry and offshore oil production can’t function without these types of products. As long as offshore production of oil and gas continues, and we believe it must to meet global demand in the intermediate- and long-term, FMC’s business is well-positioned while the company’s share price seems to be pricing in a permanent decline in offshore drilling that doesn’t seem like a viable assumption to us over the long-term.
Jacobs Engineering and Quanta Services are both engineering and construction firms, but with very different areas of focus. Jacobs is one of the largest diversified engineering and construction firms in the world that engages in the design and building of structures and infrastructure related to oil and gas, chemicals, government projects, infrastructure, and various other industrial sectors. The new construction projects Jacobs takes on are typically large scale and take place over multiple years. Projects can include oil refineries, chemical plants, light rail stations and tracks, water reclamation facilities, office buildings, and the list goes on. Despite the oil and gas-related portions of their business representing only about a quarter of revenue last year and the prospects for most of the other sectors they are exposed to remaining the same, or even improving with lower oil prices, the shares are trading at a level implying that most of their oil and gas-related business will disappear and never return. While some projects could easily get pushed out or delayed, cancellation of most or all of these projects, many of which have been planned for years and are designed to meet demands of the industry looking out decades into the future, seems like an extreme and unlikely assumption. We believe the shares are priced attractively with downside risk further reduced by the diverse nature of their business and competitive position outside of oil and gas projects.
Quanta Services is a similar company, but about 70% of their revenue is derived from power generation and transmission projects with most of the remainder related to oil and gas pipeline construction. Quanta’s revenues from power and transmission have been growing nicely over the past decade as utilities have increased capital spending on such projects in an effort to upgrade and expand the often inadequate state of the electric grid in the United States. Their involvement in oil and gas pipelines was the cause of the recent decline in the price of the company’s shares that provided the opportunity for us to initiate the position, but even this seems overdone to us. Quanta’s near-term pipeline projects are predominantly located in areas that produce natural gas as opposed to oil, and the price of natural gas, which plummeted several years ago when shale drilling created a supply glut in that market, has been relatively stable since that time. This means that the prospects for a natural gas pipeline are unlikely to be reassessed because of what is going on in the oil market and we expect Quanta to retain much of
5
their currently booked business in this area. If that is the case, returns on Quanta’s shares from these levels should be quite satisfactory and there is a comfortable margin for error in our assessment given what today’s price is implying.
CBS Corp. (CBS) is the only new addition to the portfolio unrelated to the energy sector. CBS is a household name to many people because they operate the highest rated broadcast network in the United States. They also own a number of cable networks, including Showtime and CBS Sports, production and syndication companies that produce content for network and cable television, the Simon & Schuster publishing business, 30 local broadcast CBS affiliates, and over 100 radio stations. Currently, about half of CBS’s revenues are generated from advertising on their networks, while the other half is generated by licensing and distributing content and affiliate and subscription fees paid by cable and satellite companies to carry their networks. Over time, however, CBS’s aggressive stance with the multi-channel video providers and local broadcasters in boosting retransmission and reverse retransmission fees, respectively, will likely make less reliant on advertising.
Because of the recent tumult in the media industry with content creators, broadcasters, cable/satellite companies, and companies that stream content over the internet all jockeying over how big of a slice of the media dollar pie they each will ultimately lay claim to, CBS and many similar companies have seen the price of their shares fall. The intense competition among these different groups of companies has created worries that CBS’s business model, which currently relies heavily on paid advertising, will be left behind in the new age of media consumption that is perceived to be just over the horizon. We tend to think a decline in advertising revenue is more than baked into the current price and that companies with desirable content and innovative operating histories, such as CBS, will end up retaining significant pricing power no matter how the media landscape evolves. Our entry price at a below-market multiple of about 13x next year’s earnings estimate for a good business like CBS offers a substantial margin of safety against future unfavorable developments in the media industry and attractive upside should the future bring nothing more than the status quo.
ADDITIONS
We increased our position size in three current holdings, Boeing, General Motors (GM) and Valmont Industries (VMI). Shares of Boeing came under pressure as the slide in oil prices caused investors to speculate that orders for its new fuel-efficient planes will slow and/or that its healthy backlog will dwindle due to cancellations. To us, this is short-termism at its finest. While the price of fuel is certainly a key input to an aircraft acquisition decision, it’s seldom based on where prices are currently. The decision is based on the range of prices that are likely over the useful life of the aircraft, which is measured in decades, and how large an improvement in fuel burn the new asset provides. It wouldn’t surprise us to see some orders cancelled or deferred, but we don’t think it would cause a meaningful deterioration to our business value estimate.
More importantly, regardless of what happens to the price of crude, cash flows will continue to build as the 787 first moves toward break-even on a cash basis and then gush cash thereafter. In fact, we estimate that Boeing’s free cash flow will likely eclipse earnings starting in 2015. Speaking to management’s confidence in future cash flow, in December 2013, Boeing shareholders received a dividend increase of just over 50%. This past December, the company tacked on another 25%, and the shares now yield almost 3%.
General Motors’ results from a sales perspective continue to impress. There is no sign that the massive recalls issued over the past year are tempering the demand for new GM vehicles. In the United States, industry-wide auto sales will approach 17 million units in 2014. While this may be the high water mark, we expect that sales could continue near this pace for several more years as the replacement cycle for aged vehicles remains intact. Its European business is still in a loss position (like it is for many other car makers), but management has taken steps to improve the cost structure and, at some point, the continent will see its economic fortunes improve. Meanwhile, sales in China remain strong. To be sure, liabilities from the ignition switch issues continue to grow, yet we feel they are easily manageable as company’s net cash position is extremely strong. In our opinion, the stock is severely undervalued and an upward adjustment to its multiple seems warranted. In other words, good things typically happen to cheap stocks.
6
Regarding Valmont, we felt investor fears about its decline in utility project orders appeared overdone. Our feeling is that this segment is undergoing a temporary cyclical decline as opposed to a more worrisome secular one. As is often the case, at current prices, the market is ignoring Valmont’s long-term earnings power and has focused instead on short-term disruptions.
SALES
We eliminated three holdings. We sold Abbott Laboratories (ABT) and DirecTV (DTV) as each approached our fair value estimates. The acquisition of DirecTV by AT&T has not yet been consummated, but what little upside we would stand to make did not seem enough to compensate for the deal risk (i.e. the risk that the transaction is delayed or terminated) we would be taking. We sold our position in National Oilwell Varco as we focused our energy basket in the more promising energy names mentioned above. Coach (COH) was also sold as it reached our recently downgraded assessment of intrinsic value. While sales have likely stabilized at Coach, today’s price could prove low only if sales improve dramatically from here over the next couple of years, which we view as a low probability. We still believe the brand has value and management’s turnaround plan is credible, but execution risk remains high. We also think that there may be too much competitive pressure for sales to grow, even from today’s dramatically lower base, at rates that would make our exit price seem too pessimistic. In hindsight, we should have been more skeptical before initially purchasing the stock because the genesis for this mistake can be traced back to a poor assessment of Coach’s moat. We initially believed Coach’s brand possessed wide moat characteristics, but increased competition and the fact that the company needed to make large investments as a result demonstrated that the moat was actually much narrower than we believed.
We can’t promise this will be our last mistake. They say mistakes are the portal to discovery and we will make sure we learn something from each one. On the other hand, we can promise to treat your money as if it were our own and to remain fully transparent in the decisions we make.
TRIMS
We also trimmed five positions that have performed very strongly this year: CarMax (KMX), CVS Health, Kohl’s, Target and Walgreens Boots Alliance. Financial results for each have been strong and that has been reflected in the share price. As they now trade closer to our intrinsic value estimates, we felt compelled to reduce our exposures.
7
INVESTMENT RESULTS – (Unaudited)
Total Returns*
(For the periods ended April 30, 2015)
| Average Annual Returns | ||||||||||||
| Six Months | One Year | Since Inception (December 22, 2011) (a) | ||||||||||
Green Owl Intrinsic Value Fund | 5.70 | % | 8.74 | % | 18.03 | % | ||||||
S&P 500® Index** | 4.40 | % | 12.98 | % | 18.61 | % | ||||||
Total annual operating expenses, as disclosed in the Fund’s prospectus dated February 28, 2015, were 1.38% of average daily net assets (1.11% after fee waivers/expense reimbursements by the adviser). Effective March 1, 2015, the adviser contractually agreed to waive or limit its fees and to assume other expenses of the Fund until February 28, 2017, so that the Total Annual Operating Expenses do not exceed 1.10%. This operating expense limitation does not apply to interest, taxes, brokerage commissions, other expenditures which are capitalized in accordance with generally accepted accounting principles, other extraordinary expenses not incurred in the ordinary course of the Fund’s business, dividend expense on short sales, expenses incurred under a Rule 12b-1 plan of distribution, “acquired fund fees and expenses,” and expenses that the Fund has incurred but did not actually pay because of an expense offset arrangement. Additional information pertaining to the Fund’s expense ratios as of April 30, 2015 can be found in the financial highlights.
The performance quoted represents past performance, which does not guarantee future results. The investment return and principal value of an investment will fluctuate so that an investor’s shares, when redeemed, may be worth more or less than their original cost. The returns shown do not reflect deduction of taxes that a shareholder would pay on Fund distributions or the redemption of Fund shares. Current performance of the Fund may be lower or higher than the performance quoted. The Fund’s investment objectives, risks, charges and expenses must be considered carefully before investing. Performance data current to the most recent month end may be obtained by calling 1-888-695-3729.
| (a) | The Fund commenced operations on December 22, 2011. However, the Fund did not invest in long-term securities towards the investment objective until December 28, 2011. December 28, 2011 is the performance calculation inception date. |
| * | Return figures reflect any change in price per share and assume the reinvestment of all distributions. |
| ** | The S&P 500® Index is a widely recognized unmanaged index of equity securities and is representative of a broader domestic equity market and range of securities than is found in the Fund’s portfolio. Individuals cannot invest directly in the Index; however, an individual can invest in exchange traded funds or other investment vehicles that attempt to track the performance of a benchmark index. |
The Fund’s investment objectives, strategies, risks, charges and expenses must be considered carefully before investing. The prospectus contains this and other important information about the Fund and may be obtained by calling the same number as above. Please read it carefully before investing.
The Fund is distributed by Unified Financial Securities, Inc., member FINRA.
8
Comparison of the Growth of a $10,000 Investment in the Green Owl Intrinsic Value
Fund and the S&P 500® Index (Unaudited)
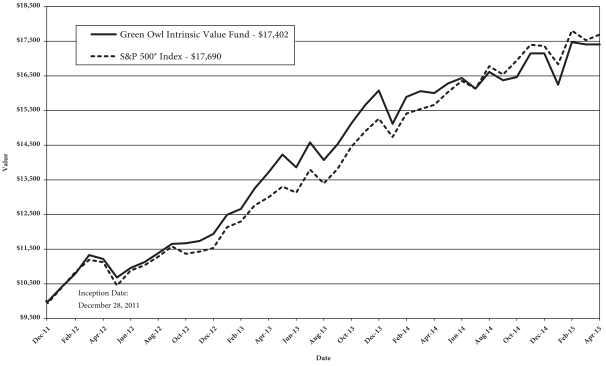
The Fund commenced operations on December 22, 2011. However, the Fund did not invest in long-term securities towards the investment objective until December 28, 2011. December 28, 2011 is the performance calculation inception date. The chart above assumes an initial investment of $10,000 made on December 28, 2011 and held through April 30, 2015. The S&P 500® Index is a widely recognized unmanaged index of equity securities and is representative of a broader domestic equity market and range of securities than is found in the Fund’s portfolio. Individuals cannot invest directly in the Index; however, an individual can invest in exchange traded funds or other investment vehicles that attempt to track the performance of a benchmark index. THE FUND’S RETURN REPRESENTS PAST PERFORMANCE AND DOES NOT GUARANTEE FUTURE RESULTS. The returns shown do not reflect deduction of taxes that a shareholder would pay on Fund distributions or the redemption of Fund shares. Investment returns and principal values will fluctuate so that your shares, when redeemed, may be worth more or less than their original purchase price.
Current performance may be lower or higher than the performance data quoted. For more information on the Fund, and to obtain performance data current to the most recent month end or to request a prospectus, please call 1-888-695-3729. You should carefully consider the investment objectives, potential risks, management fees, and charges and expenses of the Fund before investing. The Fund’s prospectus contains this and other information about the Fund, and should be read carefully before investing.
The Fund is distributed by Unified Financial Securities, Inc., member FINRA.
9
FUND HOLDINGS – (Unaudited)
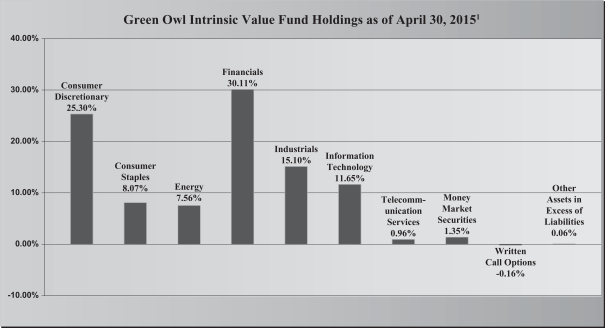
| 1As | a percentage of net assets. |
The investment objective of the Green Owl Intrinsic Value Fund is long-term capital appreciation.
Availability of Portfolio Schedule – (Unaudited)
The Fund files its complete schedule of portfolio holdings with the Securities and Exchange Commission (“SEC”) for the first and third quarters of each fiscal year on Form N-Q. The Fund’s Forms N-Q are available at the SEC’s website at www.sec.gov. The Fund’s Forms N-Q may be reviewed and copied at the SEC’s Public Reference Room in Washington DC. Information on the operation of the Public Reference Room may be obtained by calling 1-800-SEC-0330.
Summary of Fund’s Expenses – (Unaudited)
As a shareholder of the Fund, you incur ongoing costs, including management fees and other Fund expenses. This example is intended to help you understand your ongoing costs (in dollars) of investing in the Fund and to compare these costs with the ongoing costs of investing in other mutual funds.
The example is based on an investment of $1,000 invested at the beginning and held for the entire period from November 1, 2014 to April 30, 2015.
10
Actual Expenses
The first line of the table below provides information about actual account values and actual expenses. You may use the information in this line, together with the amount you invested, to estimate the expenses that you paid over the period. Simply divide your account value by $1,000 (for example, an $8,600 account value divided by $1,000 = $8.60), then multiply the result by the number in the first line under the heading entitled “Expenses Paid During the Period” to estimate the expenses you paid on your account during this period.
Hypothetical Example for Comparison Purposes
The second line of the table below provides information about hypothetical account values and hypothetical expenses based on the Fund’s actual expense ratio and an assumed rate of return of 5% per year before expenses, which is not the Fund’s actual return. The hypothetical account values and expenses may not be used to estimate the actual ending account balance or expenses you paid for the period. You may use this information to compare the ongoing costs of investing in the Fund and other funds. To do so, compare this 5% hypothetical example with the 5% hypothetical examples that appear in the shareholder reports of the other funds.
Please note that the expenses shown in the table are meant to highlight your ongoing costs only. Therefore, the second line of the table below is useful in comparing ongoing costs only and will not help you determine the relative costs of owning different funds.
| Green Owl Intrinsic Value Fund | Beginning November 1, 2014 | Ending Account Value April 30, 2015 | Expenses Paid November 1, 2014 – | |||||||||
Actual | $ | 1,000.00 | $ | 1,057.00 | $ | 5.61 | ||||||
Hypothetical** | $ | 1,000.00 | $ | 1,019.34 | $ | 5.51 | ||||||
| * | Expenses are equal to the Fund’s annualized expense ratio of 1.10%, multiplied by the average account value over the period, multiplied by 181/365 (to reflect the one-half year period). |
| ** | Assumes a 5% return before expenses. |
11
GREEN OWL INTRINSIC VALUE FUND
SCHEDULE OF INVESTMENTS
April 30, 2015 (Unaudited)
| Common Stocks – 98.75% | Shares | Fair Value | ||||||
Consumer Discretionary – 25.30% | ||||||||
Bed Bath & Beyond, Inc. * | 34,125 | $ | 2,404,447 | |||||
CarMax, Inc. * | 30,240 | 2,059,646 | ||||||
CBS Corp. – Class B | 29,500 | 1,832,835 | ||||||
General Motors Co. | 70,600 | 2,475,236 | ||||||
Harley-Davidson, Inc. | 14,250 | 800,993 | ||||||
Kohl’s Corp. | 32,500 | 2,328,625 | ||||||
Target Corp. | 18,955 | 1,494,223 | ||||||
Viacom, Inc. – Class B | 13,876 | 963,688 | ||||||
Walt Disney Co./The | 17,505 | 1,903,144 | ||||||
|
| |||||||
| 16,262,837 | ||||||||
|
| |||||||
Consumer Staples – 8.07% |
| |||||||
Coca-Cola Co./The | 28,170 | 1,142,575 | ||||||
CVS Health Corp. | 12,920 | 1,282,827 | ||||||
Walgreens Boots Alliance, Inc. | 14,925 | 1,237,730 | ||||||
Wal-Mart Stores, Inc. | 19,550 | 1,525,878 | ||||||
|
| |||||||
| 5,189,010 | ||||||||
|
| |||||||
Energy – 7.56% |
| |||||||
Baker Hughes, Inc. | 13,800 | 944,748 | ||||||
Ensco PLC – Class A | 10,000 | 272,800 | ||||||
FMC Technologies, Inc. * | 17,430 | 768,663 | ||||||
Halliburton Co. | 36,000 | 1,762,200 | ||||||
Noble Corp. PLC | 21,300 | 368,703 | ||||||
Schlumberger Ltd. | 7,895 | 746,946 | ||||||
|
| |||||||
| 4,864,060 | ||||||||
|
| |||||||
Financials – 30.11% |
| |||||||
American Express Co. | 12,060 | 934,047 | ||||||
American International Group, Inc. | 39,250 | 2,209,383 | ||||||
Bank of America Corp. | 121,600 | 1,937,088 | ||||||
Bank of New York Mellon Corp./The | 52,360 | 2,216,922 | ||||||
Berkshire Hathaway, Inc. – Class B * | 28,815 | 4,068,966 | ||||||
Citigroup, Inc. | 26,400 | 1,407,648 | ||||||
JPMorgan Chase & Co. | 41,230 | 2,608,210 | ||||||
Leucadia National Corp. | 56,485 | 1,342,648 | ||||||
Ocwen Financial Corp. * | 73,860 | 627,071 | ||||||
Wells Fargo & Co. | 36,350 | 2,002,885 | ||||||
|
| |||||||
| 19,354,868 | ||||||||
|
| |||||||
Industrials – 15.10% |
| |||||||
Boeing Co./The | 19,690 | 2,822,365 | ||||||
Expeditors International of Washington, Inc. | 25,605 | 1,173,477 | ||||||
Jacobs Engineering Group, Inc. * | 31,417 | 1,346,533 | ||||||
See accompanying notes which are an integral part of these financial statements.
12
GREEN OWL INTRINSIC VALUE FUND
SCHEDULE OF INVESTMENTS – (continued)
April 30, 2015 (Unaudited)
| Common Stocks – 98.75% – (continued) | Shares | Fair Value | ||||||
Industrials – 15.10% – (continued) |
| |||||||
Quanta Services, Inc. * | 66,190 | $ | 1,913,553 | |||||
United Parcel Service, Inc. – Class B | 9,420 | 946,993 | ||||||
Valmont Industries, Inc. | 11,953 | 1,506,317 | ||||||
|
| |||||||
| 9,709,238 | ||||||||
|
| |||||||
Information Technology – 11.65% |
| |||||||
Accenture PLC – Class A | 18,325 | 1,697,811 | ||||||
Apple, Inc. | 22,820 | 2,855,923 | ||||||
Corning, Inc. | 59,340 | 1,241,986 | ||||||
Google, Inc. – Class A * | 1,073 | 588,830 | ||||||
Google, Inc. – Class C * | 2,054 | 1,103,494 | ||||||
|
| |||||||
| 7,488,044 | ||||||||
|
| |||||||
Telecommunication Services – 0.96% |
| |||||||
Verizon Communications, Inc. | 12,233 | 617,033 | ||||||
|
| |||||||
Total Common Stocks (Cost $49,255,044) | 63,485,090 | |||||||
|
| |||||||
Money Market Securities – 1.35% | ||||||||
Federated Treasury Obligations Fund – Service Shares, 0.01% (a) | 864,657 | 864,657 | ||||||
|
| |||||||
Total Money Market Securities (Cost $864,657) | 864,657 | |||||||
|
| |||||||
Total Investments – 100.10% (Cost $50,119,701) | $ | 64,349,747 | ||||||
|
| |||||||
Total Written Call Options (Premiums Received $96,689) – (0.16)% | (103,740 | ) | ||||||
|
| |||||||
Other Assets in Excess of Liabilities – 0.06% | 41,469 | |||||||
|
| |||||||
TOTAL NET ASSETS – 100.00% | $ | 64,287,476 | ||||||
|
| |||||||
| (a) | Rate disclosed is the seven day yield as of April 30, 2015. |
| * | Non-income producing security. |
See accompanying notes which are an integral part of these financial statements.
13
GREEN OWL INTRINSIC VALUE FUND
SCHEDULE OF WRITTEN OPTIONS
April 30, 2015 (Unaudited)
| Written Call Options – (0.16)% | Outstanding Contracts | Fair Value | ||||||
Consumer Discretionary – (0.16)% |
| |||||||
Carmax, Inc./ July 2015/ Strike $65.00 (a) | (182 | ) | $ | (103,740 | ) | |||
|
| |||||||
Total Written Call Options (Premiums Received $96,689) – (0.16)% | $ | (103,740 | ) | |||||
|
| |||||||
| (a) | The call contract has a multiplier of 100 shares. |
See accompanying notes which are an integral part of these financial statements.
14
GREEN OWL INTRINSIC VALUE FUND
STATEMENT OF ASSETS AND LIABILITIES
April 30, 2015 (Unaudited)
Assets | ||||
Investments in securities at fair value (cost $50,119,701) | $ | 64,349,747 | ||
Receivable for fund shares sold | 34,563 | |||
Dividends receivable | 49,978 | |||
Prepaid expenses | 14,662 | |||
|
| |||
Total Assets | 64,448,950 | |||
|
| |||
Liabilities | ||||
Options written, at value (premium received $96,689) | 103,740 | |||
Payable to Adviser | 40,363 | |||
Payable to administrator, fund accountant, and transfer agent | 8,405 | |||
Payable to custodian | 1,624 | |||
Payable to trustees | 358 | |||
Other accrued expenses | 6,984 | |||
|
| |||
Total Liabilities | 161,474 | |||
|
| |||
Net Assets | $ | 64,287,476 | ||
|
| |||
Net Assets consist of: | ||||
Paid-in capital | $ | 49,998,738 | ||
Accumulated undistributed net investment income | 54,853 | |||
Accumulated undistributed net realized gain from investments and option contracts | 10,890 | |||
Net unrealized appreciation (depreciation) on: | ||||
Investment securities | 14,230,046 | |||
Option contracts | (7,051 | ) | ||
|
| |||
Net Assets | $ | 64,287,476 | ||
|
| |||
Shares outstanding | 4,072,754 | |||
|
| |||
Net asset value, offering and redemption price per share | $ | 15.78 | ||
|
| |||
See accompanying notes which are an integral part of these financial statements.
15
GREEN OWL INTRINSIC VALUE FUND
STATEMENT OF OPERATIONS
For the six months ended April 30, 2015 (Unaudited)
Investment Income | ||||
Dividend income | $ | 524,503 | ||
|
| |||
Total investment income | 524,503 | |||
|
| |||
Expenses | ||||
Investment Adviser | 311,769 | |||
Administration | 23,550 | |||
Fund accounting | 12,411 | |||
Transfer agent | 19,303 | |||
Legal | 8,772 | |||
Custodian | 5,256 | |||
Audit | 7,441 | |||
Trustee | 2,564 | |||
Miscellaneous | 31,734 | |||
|
| |||
Total expenses | 422,800 | |||
|
| |||
Fees waived and reimbursed by Adviser | (79,072 | ) | ||
|
| |||
Net operating expenses | 343,728 | |||
|
| |||
Net investment income | 180,775 | |||
|
| |||
Net Realized and Unrealized Gain on Investments |
| |||
Net realized gain on investment securities transactions | 188,933 | |||
Net realized loss on option transactions | (125,565 | ) | ||
Net change in unrealized appreciation of investment securities | 3,234,475 | |||
Net change in unrealized depreciation of option contracts | (7,051 | ) | ||
|
| |||
Net realized and unrealized gain on investments | 3,290,792 | |||
|
| |||
Net increase in net assets resulting from operations | $ | 3,471,567 | ||
|
| |||
See accompanying notes which are an integral part of these financial statements.
16
GREEN OWL INTRINSIC VALUE FUND
STATEMENTS OF CHANGES IN NET ASSETS
| For the Six Months Ended April 30, 2015 (Unaudited) | For the Year Ended October 31, 2014 | |||||||
Increase in Net Assets due to: | ||||||||
Operations | ||||||||
Net investment income | $ | 180,775 | $ | 716,657 | ||||
Net realized gain on investment securities transactions and option contracts | 63,368 | 2,261,772 | ||||||
Net change in unrealized appreciation of investment securities transactions and option contracts | 3,227,424 | 1,452,087 | ||||||
|
|
|
| |||||
Net increase in net assets resulting from operations | 3,471,567 | 4,430,516 | ||||||
|
|
|
| |||||
Distributions | ||||||||
From net investment income | (764,929 | ) | (84,105 | ) | ||||
From net realized gains | (2,314,248 | ) | (1,708,485 | ) | ||||
|
|
|
| |||||
Total distributions | (3,079,177 | ) | (1,792,590 | ) | ||||
|
|
|
| |||||
Capital Transactions | ||||||||
Proceeds from shares sold | 4,620,097 | 15,055,561 | ||||||
Reinvestment of distributions | 2,937,927 | 1,696,716 | ||||||
Amount paid for shares redeemed | (4,244,208 | ) | (5,937,474 | ) | ||||
|
|
|
| |||||
Net increase in net assets resulting from capital transactions | 3,313,816 | 10,814,803 | ||||||
|
|
|
| |||||
Total Increase in Net Assets | 3,706,206 | 13,452,729 | ||||||
|
|
|
| |||||
Net Assets | ||||||||
Beginning of period | 60,581,270 | 47,128,541 | ||||||
|
|
|
| |||||
End of period | $ | 64,287,476 | $ | 60,581,270 | ||||
|
|
|
| |||||
Accumulated undistributed net investment income included in net assets at end of period | $ | 54,853 | $ | 639,007 | ||||
|
|
|
| |||||
Share Transactions | ||||||||
Shares sold | 296,092 | 983,233 | ||||||
Shares issued in reinvestment of distributions | 194,051 | 114,954 | ||||||
Shares redeemed | (271,559 | ) | (387,209 | ) | ||||
|
|
|
| |||||
Net increase in shares | 218,584 | 710,978 | ||||||
|
|
|
| |||||
See accompanying notes which are an integral part of these financial statements.
17
GREEN OWL INTRINSIC VALUE FUND
FINANCIAL HIGHLIGHTS
(For a share outstanding during each period)
| For the Six Months Ended April 30, 2015 (Unaudited) | For the Year Ended October 31, 2014 | For the Year Ended October 31, 2013 | For the Period Ended October 31, 2012(a) | |||||||||||||
Selected Per Share Data: | ||||||||||||||||
Net asset value, beginning of period | $ | 15.72 | $ | 14.99 | $ | 11.67 | $ | 10.00 | ||||||||
|
|
|
|
|
|
|
| |||||||||
Income from investment operations: | ||||||||||||||||
Net investment income | 0.05 | 0.19 | 0.02 | 0.02 | ||||||||||||
Net realized and unrealized gain on investments | 0.81 | 1.11 | 3.41 | 1.65 | ||||||||||||
|
|
|
|
|
|
|
| |||||||||
Total from investment operations | 0.86 | 1.30 | 3.43 | 1.67 | ||||||||||||
|
|
|
|
|
|
|
| |||||||||
Less distributions to shareholders from: | ||||||||||||||||
Net investment income | (0.20 | ) | (0.03 | ) | (0.05 | ) | – | |||||||||
Net realized gains | (0.60 | ) | (0.54 | ) | (0.06 | ) | – | |||||||||
|
|
|
|
|
|
|
| |||||||||
Total distributions | (0.80 | ) | (0.57 | ) | (0.11 | ) | – | |||||||||
|
|
|
|
|
|
|
| |||||||||
Net asset value, end of period | $ | 15.78 | $ | 15.72 | $ | 14.99 | $ | 11.67 | ||||||||
|
|
|
|
|
|
|
| |||||||||
Total Return (b) | 5.70 | %(c) | 8.86 | % | 29.59 | % | 16.70 | %(c) | ||||||||
Ratios and Supplemental Data: | ||||||||||||||||
Net assets, end of period (000) | $ | 64,287 | $ | 60,581 | $ | 47,129 | $ | 24,756 | ||||||||
Ratio of net expenses to average net assets | 1.10 | %(d)(e) | 1.11 | %(e) | 1.40 | %(e) | 1.41 | %(d)(e) | ||||||||
Ratio of expenses to average net assets before waiver and reimbursement | 1.36 | %(d)(e) | 1.38 | %(e) | 1.52 | %(e) | 2.11 | %(d)(e) | ||||||||
Ratio of net investment income to average net assets | 0.58 | %(d) | 1.30 | % | 0.14 | % | 0.26 | %(d) | ||||||||
Portfolio turnover rate | 14 | %(c) | 35 | % | 20 | % | 11 | %(c) | ||||||||
| (a) | For the period December 22, 2011 (commencement of operations) to October 31, 2012. |
| (b) | Total return in the above table represents the rate that the investor would have earned or lost on an investment in the Fund, assuming reinvestment of distributions. |
| (c) | Not annualized. |
| (d) | Annualized |
| (e) | Includes 0.01%, less than 0.005%, 0.01% and less than 0.005% for line of credit fees for 2012, 2013, 2014 and 2015, respectively. |
See accompanying notes which are an integral part of these financial statements.
18
GREEN OWL INTRINSIC VALUE FUND
NOTES TO THE FINANCIAL STATEMENTS
April 30, 2015 (Unaudited)
NOTE 1. ORGANIZATION
The Green Owl Intrinsic Value Fund (the “Fund”) is an open-end diversified series of the Valued Advisers Trust (the “Trust”). The Trust is a management investment company established under the laws of Delaware by an Agreement and Declaration of Trust dated June 13, 2008 (the “Trust Agreement”). The Trust Agreement permits the Trustees to issue an unlimited number of shares of beneficial interest of separate series without par value. The Fund is one of a series of funds authorized by the Trustees. The Fund’s investment adviser is Kovitz Investment Group, LLC (the “Adviser”). The investment objective of the Fund is to provide long-term capital appreciation.
NOTE 2. SIGNIFICANT ACCOUNTING POLICIES
The Fund is an investment company and follows accounting and reporting guidance under Financial Accounting Standards Board (“FASB”) Accounting Standards Codification (“ASC”) Topic 946, “Financial Services-Investment Companies”. The following is a summary of significant accounting policies followed by the Fund in the preparation of its financial statements. These polices are in conformity with generally accepted accounting principles in the United States of America (“GAAP”).
Securities Valuation – All investments in securities are recorded at their estimated fair value as described in Note 3.
Federal Income Taxes – The Fund makes no provision for federal income or excise tax. The Fund intends to qualify each year as a regulated investment company (“RIC”) under subchapter M of the Internal Revenue Code of 1986, as amended, by complying with the requirements applicable to RICs and by distributing substantially all of its taxable income. The Fund also intends to distribute sufficient net investment income and net capital gains, if any, so that it will not be subject to excise tax on undistributed income and gains. If the required amount of net investment income or gains is not distributed, the Fund could incur a tax expense.
As of and during the six months ended April 30, 2015, the Fund did not have a liability for any unrecognized tax benefits. The Fund recognizes interest and penalties, if any, related to unrecognized tax benefits as income tax expense in the Statement of Operations. During the year, the Fund did not incur any interest or penalties. The Fund is subject to examination by U.S. federal tax authorities for all tax years since inception.
Expenses – Expenses incurred by the Trust that do not relate to a specific fund of the Trust are allocated to the individual funds based on each fund’s relative net assets or other appropriate basis.
Security Transactions and Related Income – The Fund follows industry practice and records security transactions on the trade date for financial reporting purposes. The specific identification method is used for determining gains or losses for financial statements and income tax purposes. Dividend income is recorded on the ex-dividend date and interest income is recorded on an accrual basis. Discounts and premiums on securities purchased are amortized or accreted using the effective interest method. Withholding taxes on foreign dividends have been provided for in accordance with the Fund’s understanding of the applicable country’s tax rules and rates. The ability of issuers of debt securities held by the Fund to meet their obligations may be affected by economic and political developments in a specific country or region.
Dividends and Distributions – The Fund intends to distribute substantially all of its net investment income, net realized long-term capital gains and its net realized short-term capital gains, if any, to its shareholders on at least an annual basis. Dividends to shareholders, which are determined in accordance with income tax regulations, are
19
GREEN OWL INTRINSIC VALUE FUND
NOTES TO THE FINANCIAL STATEMENTS – (continued)
April 30, 2015 (Unaudited)
NOTE 2. SIGNIFICANT ACCOUNTING POLICIES – continued
recorded on the ex-dividend date. The treatment for financial reporting purposes of distributions made to shareholders during the year from net investment income or net realized capital gains may differ from their ultimate treatment for federal income tax purposes. These differences are caused primarily by differences in the timing of the recognition of certain components of income, expense or realized capital gain for federal income tax purposes. Where such differences are permanent in nature, they are reclassified in the components of net assets based on their ultimate characterization for federal income tax purposes. Any such reclassifications will have no effect on net assets, results of operations or net asset values per share of the Fund.
Writing Options – The Fund may write covered call options on equity securities or futures contracts that the Fund is eligible to purchase to extend a holding period to obtain long-term capital gain treatment, to earn premium income, to assure a definite price for a security it has considered selling, or to close out options previously purchased. The Fund may write covered call options if, immediately thereafter, not more than 30% of its net assets would be committed to such transactions. A call option gives the holder (buyer) the right to purchase a security or futures contract at a specified price (the exercise price) at any time until a certain date (the expiration date). A call option is “covered” if the Fund owns the underlying security subject to the call option at all times during the option period, or to the extent that some or all of the risk of the option has been offset by another option. When the Fund writes a covered call option, it maintains a segregated position within its account with its Custodian or as otherwise required by the rules of the exchange the underlying security, cash or liquid portfolio securities in an amount not less than the exercise price at all times while the option is outstanding. See Note 4 for additional disclosures.
The Fund will receive a premium from writing a call option, which increases the Fund’s return in the event the option expires unexercised or is closed out at a profit. The amount of the premium will reflect, among other things, the relationship of the market price of the underlying security to the exercise price of the option and the remaining term of the option. However, there is no assurance that a closing transaction can be affected at a favorable price. During the option period, the covered call writer has, in return for the premium received, given up the opportunity for capital appreciation above the exercise price should the market price of the underlying security increase, but has retained the risk of loss should the price of the underlying security decline.
The Fund may write put options on equity securities and futures contracts that the Fund is eligible to purchase to earn premium income or to assure a definite price for a security if it is considering acquiring the security at a lower price than the current market price or to close out options previously purchased. The Fund may not write a put option if, immediately thereafter, more than 25% of its net assets would be committed to such transactions. A put option gives the holder of the option the right to sell, and the writer has the obligation to buy, the underlying security at the exercise price at any time during the option period. The operation of put options in other respects is substantially identical to that of call options. When the Fund writes a put option, it maintains a segregated position within its account with the Custodian of cash or liquid portfolio securities in an amount not less than the exercise price at all times while the put option is outstanding.
The Fund will receive a premium from writing a put option, which increases the Fund’s return in the event the option expires unexercised or is closed out at a profit. The amount of the premium will reflect, among other things, the relationship of the market price of the underlying security to the exercise price of the option and the remaining term of the option. The risks involved in writing put options include the risk that a closing transaction cannot be effected at a favorable price and the possibility that the price of the underlying security may fall below the exercise price, in which case the Fund may be required to purchase the underlying security at a higher price
20
GREEN OWL INTRINSIC VALUE FUND
NOTES TO THE FINANCIAL STATEMENTS – (continued)
April 30, 2015 (Unaudited)
NOTE 2. SIGNIFICANT ACCOUNTING POLICIES – continued
than the market price of the security at the time the option is exercised, resulting in a potential capital loss unless the security subsequently appreciates in value. During the six months ended April 30, 2015, the Fund utilized covered call options to extend the holding period to obtain long-term capital gain treatment and to take advantage of the option premium to garner a higher exit price than would have been available by immediately selling the stock.
NOTE 3. SECURITIES VALUATION AND FAIR VALUE MEASUREMENTS
Fair value is defined as the price that a Fund would receive upon selling an investment in an orderly transaction to an independent buyer in the principal or most advantageous market of the investment. GAAP established a three-tier hierarchy to maximize the use of observable market data and minimize the use of unobservable inputs and to establish classification of fair value measurements for disclosure purposes.
Inputs refer broadly to the assumptions that market participants would use in pricing the asset or liability, including assumptions about risk; for example, the risk inherent in a particular valuation technique used to measure fair value including items such as a pricing model and/or the risk inherent in the inputs to the valuation technique. Inputs may be observable or unobservable. Observable inputs are inputs that reflect the assumptions market participants would use in pricing the asset or liability developed based on market data obtained from sources independent of the reporting entity. Unobservable inputs are inputs that reflect the reporting entity’s own assumptions about the assumptions market participants would use in pricing the asset or liability developed based on the best information available in the circumstances.
Various inputs are used in determining the value of the Fund’s investments. These inputs are summarized in the three broad levels listed below.
| • | Level 1 – quoted prices in active markets for identical securities |
| • | Level 2 – other significant observable inputs (including, but not limited to, quoted prices for an identical security in an inactive market, quoted prices for similar securities, interest rates, prepayment speeds, credit risk, etc.) |
| • | Level 3 – significant unobservable inputs (including the Fund’s own assumptions in determining fair value of investments based on the best information available) |
The inputs used to measure fair value may fall into different levels of the fair value hierarchy. In such cases, for disclosure purposes, the level in the fair value hierarchy within which the fair value measurement falls in its entirety, is determined based on the lowest level input that is significant to the fair value measurement in its entirety.
Equity securities, including common stocks, are generally valued by using market quotations, but may be valued on the basis of prices furnished by a pricing service when the Fund believes such prices more accurately reflect the fair value of such securities. Securities that are traded on any stock exchange are generally valued by the pricing service at the last quoted sale price. Lacking a last sale price, an exchange traded security is generally valued by the pricing service at its last bid price. Securities traded in the NASDAQ over-the-counter market are generally valued by the pricing service at the NASDAQ Official Closing Price. When using the market quotations or close prices provided by the pricing service and when the market is considered active, the security will be classified as a Level 1 security. Sometimes, an equity security owned by the Fund will be valued by the
21
GREEN OWL INTRINSIC VALUE FUND
NOTES TO THE FINANCIAL STATEMENTS – (continued)
April 30, 2015 (Unaudited)
NOTE 3. SECURITIES VALUATION AND FAIR VALUE MEASUREMENTS – continued
pricing service with factors other than market quotations or when the market is considered inactive. When this happens, the security will be classified as a Level 2 security. When market quotations are not readily available, when the Fund determines that the market quotation or the price provided by the pricing service does not accurately reflect the current fair value, or when restricted or illiquid securities are being valued, such securities are valued as determined in good faith by the Fund, in conformity with guidelines adopted by and subject to review by the Board. These will generally be categorized as Level 3 securities.
Investments in open-end mutual funds, including money market mutual funds, are generally priced at the ending net asset value (NAV) provided by the service agent of the funds. These securities are categorized as Level 1 securities.
Written option contracts that the Fund invests in are generally traded on an exchange. The options in which the Fund invests are generally valued at the last trade price as provided by a pricing service. If the last sale price is not available, the options will be valued at the mean of the last bid and ask prices. The options will generally be categorized as Level 1 securities. If the Fund decides that a price provided by the pricing service does not accurately reflect the fair value of the securities, when prices are not readily available from a pricing service, or when restricted or illiquid securities are being valued, securities are valued at fair value as determined in good faith by the Fund, in conformity with guidelines adopted by and subject to review of the Board. These securities will generally be categorized as Level 3 securities.
In accordance with the Trust’s good faith pricing guidelines, the Adviser is required to consider all appropriate factors relevant to the value of securities for which it has determined other pricing sources are not available or reliable as described above. No single standard exists for determining fair value, because fair value depends upon the circumstances of each individual case. As a general principle, the current fair value of an issue of securities being valued by the Adviser would appear to be the amount which the owner might reasonably expect to receive for them upon their current sale. Methods which are in accordance with this principle may, for example, be based on (i) a multiple of earnings; (ii) a discount from market of a similar freely traded security (including a derivative security or a basket of securities traded on other markets, exchanges or among dealers); or (iii) yield to maturity with respect to debt issues, or a combination of these and other methods. Good faith pricing is permitted if, in the Adviser’s opinion, the validity of market quotations appears to be questionable based on factors such as evidence of a thin market in the security based on a small number of quotations, a significant event occurs after the close of a market but before a Fund’s NAV calculation that may affect a security’s value, or the Adviser is aware of any other data that calls into question the reliability of market quotations. Good faith pricing may also be used in instances when the bonds the Fund invests in may default or otherwise cease to have market quotations readily available. Any fair value pricing done outside the Fund’s approved pricing methods must be approved by the Pricing Committee of the Board.
22
GREEN OWL INTRINSIC VALUE FUND
NOTES TO THE FINANCIAL STATEMENTS – (continued)
April 30, 2015 (Unaudited)
NOTE 3. SECURITIES VALUATION AND FAIR VALUE MEASUREMENTS – continued
The following is a summary of the inputs used to value the Fund’s investments as of April 30, 2015:
| Valuation Inputs | ||||||||||||||||
| Assets | Level 1 – Quoted Prices in | Level 2 – Other Significant Observable Inputs | Level 3 – Significant Unobservable Inputs | Total | ||||||||||||
Common Stocks* | $ | 63,485,090 | $ | – | $ | – | $ | 63,485,090 | ||||||||
Money Market Securities | 864,657 | – | – | 864,657 | ||||||||||||
Total | $ | 64,349,747 | $ | – | $ | – | $ | 64,349,747 | ||||||||
| * | Refer to the Schedule of Investments for industry classifications. |
| Valuation Inputs | ||||||||||||||||
| Liabilities | Level 1 – Quoted Prices in | Level 2 – Other Significant Observable Inputs | Level 3 – Significant Unobservable Inputs | Total | ||||||||||||
Options Contracts | $ | (103,740) | $ | – | $ | – | $ | (103,740) | ||||||||
Total | $ | (103,740) | $ | – | $ | – | $ | (103,740) | ||||||||
The Fund did not hold any investments at any time during the reporting period in which significant unobservable inputs were used in determining fair value; therefore, no reconciliation of Level 3 securities is included for this reporting period. The Trust recognizes transfers between fair value hierarchy levels at the reporting period end. There were no transfers between any levels as of April 30, 2015 and the previous reporting period end.
NOTE 4. DERIVATIVE TRANSACTIONS
Call options written are presented separately on the Statement of Assets and Liabilities as a liability at fair value and on the Statement of Operations under net realized loss on option transactions and change in unrealized depreciation on option contracts, respectively.
At April 30, 2015:
Derivatives | Location of Derivatives on Statement of Assets & Liabilities | |||||
Equity Risk: | ||||||
Written Call Options | Options written, at value | $ | (103,740) | |||
23
GREEN OWL INTRINSIC VALUE FUND
NOTES TO THE FINANCIAL STATEMENTS – (continued)
April 30, 2015 (Unaudited)
NOTE 4. DERIVATIVE TRANSACTIONS – continued
For the six months ended April 30, 2015:
| Derivatives | Location of Gain (Loss) on Derivatives on Statement of Operations | Realized Gain (Loss) on Derivatives | Change in Unrealized Appreciation (Depreciation) on Derivatives | |||||||
Equity Risk: | ||||||||||
Written Call Options | Net realized and unrealized loss on option contracts | $ | (125,565) | $ | (7,051) | |||||
Transactions in written options by the Fund during the six months ended April 30, 2015, were as follows:
| Number of Contracts | Premiums Received | |||||||
Options outstanding at October 31, 2014 | – | $ | – | |||||
Options written | 616 | 215,316 | ||||||
Options exercised | (132 | ) | (23,012 | ) | ||||
Options closed | (302 | ) | (95,615 | ) | ||||
|
|
|
| |||||
Options outstanding at April 30, 2015 | 182 | $ | 96,689 | |||||
|
|
|
| |||||
NOTE 5. ADVISER FEES AND OTHER TRANSACTIONS
Under the terms of the management agreement, on behalf of the Fund (the “Agreement”), the Adviser manages the Fund’s investments subject to approval by the Trustees. As compensation for its management services, the Fund is obligated to pay the Adviser a fee computed and accrued daily and paid monthly at an annual rate of 1.00% of the average daily net assets of the Fund. For the six months ended April 30, 2015, the Adviser earned a fee of $311,769 from the Fund before the reimbursement described below. At April 30, 2015, the Fund owed the Adviser $40,363.
The Adviser has contractually agreed to waive its management fee and/or reimburse expenses so that total annual fund operating expenses, excluding interest, taxes, brokerage commissions, other expenditures which are capitalized in accordance with GAAP, other extraordinary expenses not incurred in the ordinary course of the Fund’s business, dividend expense on short sales, and expenses that the Fund has incurred but did not actually pay because of an expense offset arrangement, if applicable, incurred by the Fund in any fiscal year, do not exceed 1.10% of the Fund’s average daily net assets through February 28, 2017. The operating expense limitation also excludes any fees and expenses of acquired funds.
For the six months ended April 30, 2015, expenses totaling $79,072 were waived or reimbursed by the Adviser. Each waiver or reimbursement by the Adviser with respect to the Fund is subject to repayment by the Fund within the three fiscal years following the fiscal year in which that particular waiver or reimbursement occurred, provided that the Fund is able to make the repayment without exceeding the expense limitation in effect at the time of the waiver and any expense limitation in place at the time of repayment.
24
GREEN OWL INTRINSIC VALUE FUND
NOTES TO THE FINANCIAL STATEMENTS – (continued)
April 30, 2015 (Unaudited)
NOTE 5. ADVISER FEES AND OTHER TRANSACTIONS – continued
The amount subject to repayment by the Fund pursuant to the aforementioned conditions are as follows:
Amount | Recoverable through October 31, | |||
$ 115,029 | 2015 | |||
40,437 | 2016 | |||
150,715 | 2017 | |||
79,072 | 2018 | |||
The Trust retains Huntington Asset Services, Inc. (“HASI”) to manage the Fund’s business affairs and provide the Fund with administration services, including all regulatory reporting and necessary office equipment and personnel. For the six months ended April 30, 2015, HASI earned fees of $23,550 for administration services provided to the Fund. At April 30, 2015, HASI was owed $2,902 from the Fund for administration services. Certain officers and one Trustee of the Trust are members of management and/or employees of HASI. HASI is a wholly-owned subsidiary of Huntington Bancshares, Inc., the parent company of Unified Financial Securities, Inc. (the “Distributor”) and Huntington National Bank (“Huntington”), the custodian of the Fund’s investments (the “Custodian”). For the six months ended April 30, 2015, the Custodian earned fees of $5,256 for custody services provided to the Fund. At April 30, 2015, the Custodian was owed $1,624 from the Fund for custody services.
The Trust also retains HASI to act as the Fund’s transfer agent and to provide fund accounting services. For the six months ended April 30, 2015, HASI earned fees of $19,303 for transfer agent services to the Fund. At April 30, 2015, the Fund owed HASI $3,644 for transfer agent services. For the six months ended April 30, 2015, HASI earned fees of $12,411 from the Fund for fund accounting services. At April 30, 2015, HASI was owed $1,859 from the Fund for fund accounting services.
During the six months ended April 30, 2015, the Fund paid $4,337 to Kovitz Securities, LLC, an affiliate of the Adviser, on the execution of purchases and sales of the Fund’s portfolio investments.
Unified Financial Securities, Inc. (the “Distributor”) acts as the principal underwriter of the Fund’s shares. There were no payments made by the Fund to the Distributor during the six months ended April 30, 2015. An officer of the Trust is an officer of the Distributor and such person may be deemed to be an affiliate of the Distributor.
NOTE 6. LINE OF CREDIT
The Fund participates in a short-term credit agreement (“Line of Credit”) with Huntington expiring on September 11, 2015. Under the terms of the agreement, the Fund may borrow the lesser of $1,000,000 or 5% of the Fund’s daily market value at an interest rate of LIBOR plus 150 basis points. The purpose of the agreement is to meet temporary or emergency cash needs, including redemption requests that might otherwise require the untimely disposition of securities. As of April 30, 2015, the Fund had no outstanding borrowings under this Line of Credit.
25
GREEN OWL INTRINSIC VALUE FUND
NOTES TO THE FINANCIAL STATEMENTS – (continued)
April 30, 2015 (Unaudited)
NOTE 6. LINE OF CREDIT – continued
| Average Daily Loan Balance | Weighted Average Interest Rate | Number of Days Outstanding* | Interest Expense Incurred | Maximum Loan Outstanding | ||||||||||||
$ 7,105 | 1.67 | % | 7 | $ | 2 | $ | 7,105 | |||||||||
| * | Number of Days Outstanding represents the total days during the six months ended April 30, 2015 that the Fund utilized the Line of Credit. |
NOTE 7. INVESTMENTS
For the six months ended April 30, 2015, purchases and sales of investment securities, other than short-term investments and short-term U.S. government obligations, were as follows:
Purchases | ||||
U.S. Government Obligations | $ | – | ||
Other | 12,449,306 | |||
Sales | ||||
U.S. Government Obligations | $ | – | ||
Other | 8,452,453 |
NOTE 8. ESTIMATES
The preparation of financial statements in conformity with GAAP requires management to make estimates and assumptions that affect the reported amounts of assets and liabilities and disclosure of contingent assets and liabilities at the date of the financial statements and the reported amounts of increases and decreases in net assets from operations during the reporting period. Actual results could differ from those estimates.
NOTE 9. BENEFICIAL OWNERSHIP
The beneficial ownership, either directly or indirectly, of 25% or more of the voting securities of a fund creates a presumption of control of a fund, under Section 2(a) (9) of the Investment Company Act of 1940. At April 30, 2015, Charles Schwab & Co., Inc., for the benefit of its customers, owned 37.36% of the Fund. It is not know whether Charles Schwab or any of the underlying beneficial owners owned or controlled 25% or more of the voting securities of the Fund.
NOTE 10. FEDERAL TAX INFORMATION
At April 30, 2015, the net unrealized appreciation (depreciation) of investments for tax purposes was as follows:
Gross Appreciation | $ | 16,098,928 | ||
Gross (Depreciation) | (1,921,355 | ) | ||
|
| |||
Net Appreciation (Depreciation) on Investments | $ | 14,177,573 | ||
|
|
26
GREEN OWL INTRINSIC VALUE FUND
NOTES TO THE FINANCIAL STATEMENTS – (continued)
April 30, 2015 (Unaudited)
NOTE 10. FEDERAL TAX INFORMATION – continued
At April 30, 2015, the aggregate cost of securities for federal income tax purposes was $50,172,174.
The tax characterization of distributions for the fiscal year ended October 31, 2014 was as follows:
| 2014 | ||||
Distributions paid from: | ||||
Ordinary Income* | $ | 150,409 | ||
Long Term Capital Gains | 1,642,181 | |||
|
| |||
Total Distributions | $ | 1,792,590 | ||
|
| |||
| * | Short term capital gain distributions are treated as ordinary income for tax purposes. |
At October 31, 2014, the components of distributable earnings on a tax basis were as follows:
Undistributed ordinary income | $ | 642,020 | ||
Undistributed long term capital gains | 2,314,243 | |||
Net unrealized appreciation (depreciation) | 10,943,098 | |||
Accumulated capital and other losses | (3,013 | ) | ||
|
| |||
| $ | 13,896,348 | |||
|
|
As of October 31, 2014, the difference between book basis and tax basis unrealized appreciation/ (depreciation) is primarily attributable to wash sales.
NOTE 11. COMMITMENTS AND CONTINGENCIES
The Fund indemnifies its officers and trustees for certain liabilities that may arise from their performance of their duties to the Fund. Additionally, in the normal course of business, the Fund enters into contracts that contain a variety of representations and warranties which provide general indemnifications. The Fund’s maximum exposure under these arrangements is unknown, as this would involve future claims that may be made against the Fund that have not yet occurred.
NOTE 12. SUBSEQUENT EVENTS
Management of the Fund has evaluated the need for disclosures and/or adjustments resulting from subsequent events through the date these financial statements were issued. There were no items requiring adjustment of the financial statements or additional disclosure.
27
OTHER INFORMATION
The Fund’s Statement of Additional Information (“SAI”) includes additional information about the trustees and is available without charge, upon request. You may call toll-free at (888) 695-3729 to request a copy of the SAI or to make shareholder inquiries.
PROXY VOTING
A description of the policies and procedures that the Fund uses to determine how to vote proxies relating to portfolio securities and information regarding how the Fund voted those proxies is available without charge upon request by (1) calling the Fund at (888) 695-3729 and (2) from Fund documents filed with the Securities and Exchange Commission (“SEC”) on the SEC’s website at www.sec.gov.
TRUSTEES
R. Jeffrey Young, Chairman
Ira Cohen
Andrea N. Mullins
OFFICERS
R. Jeffrey Young, Principal Executive Officer and President
John C. Swhear, Chief Compliance Officer, AML Officer and Vice President
Carol J. Highsmith, Vice President and Secretary
Matthew J. Miller, Vice President
Bryan W. Ashmus, Principal Financial Officer and Treasurer
INVESTMENT ADVISER
Kovitz Investment Group, LLC
115 South LaSalle Street, 27th Floor
Chicago, IL 60603
DISTRIBUTOR
Unified Financial Securities, Inc.
2960 North Meridian Street, Suite 300
Indianapolis, IN 46208
INDEPENDENT REGISTERED PUBLIC ACCOUNTING FIRM
Cohen Fund Audit Services Ltd.
1350 Euclid Avenue, Suite 800
Cleveland, OH 44115
LEGAL COUNSEL
The Law Offices of John H. Lively & Associates, Inc.
A member firm of The 1940 Act Law GroupTM
11300 Tomahawk Creek Parkway, Ste. 310
Leawood, KS 66211
CUSTODIAN
Huntington National Bank
41 South High Street
Columbus, OH 43215
ADMINISTRATOR, TRANSFER AGENT AND FUND ACCOUNTANT
Huntington Asset Services, Inc.
2960 North Meridian Street, Suite 300
Indianapolis, IN 46208
This report is intended only for the information of shareholders or those who have received the Fund’s prospectus which contains information about the Fund’s management fee and expenses. Please read the prospectus carefully before investing.
Distributed by Unified Financial Securities, Inc.
Member FINRA/SIPC
28
PRIVACY POLICY
The following is a description of the Fund’s policies regarding disclosure of nonpublic personal information that you provide to the Fund or that the Fund collects from other sources. In the event that you hold shares of the Fund through a broker-dealer or other financial intermediary, the privacy policy of your financial intermediary would govern how your nonpublic personal information would be shared with nonaffiliated third parties.
Categories of Information the Fund Collects. The Fund collects the following nonpublic personal information about you:
| • | Information the Fund receives from you on applications or other forms, correspondence, or conversations (such as your name, address, phone number, social security number, and date of birth); and |
| • | Information about your transactions with the Fund, its affiliates, or others (such as your account number and balance, payment history, cost basis information, and other financial information). |
Categories of Information the Fund Discloses. The Fund does not disclose any nonpublic personal information about its current or former shareholders to unaffiliated third parties, except as required or permitted by law. The Fund is permitted by law to disclose all of the information it collects, as described above, to service providers (such as the Fund’s custodian, administrator, transfer agent, accountant and legal counsel) to process your transactions and otherwise provide services to you.
Confidentiality and Security. The Fund restricts access to your nonpublic personal information to those persons who require such information to provide products or services to you. The Fund maintains physical, electronic, and procedural safeguards that comply with federal standards to guard your nonpublic personal information.
Disposal of Information. The Fund, through its transfer agent, has taken steps to reasonably ensure that the privacy of your nonpublic personal information is maintained at all times, including in connection with the disposal of information that is no longer required to be maintained by the Fund. Such steps shall include, whenever possible, shredding paper documents and records prior to disposal, requiring off-site storage vendors to shred documents maintained in such locations prior to disposal, and erasing and/or obliterating any data contained on electronic media in such a manner that the information can no longer be read or reconstructed.
29
Semi-Annual Report
April 30, 2015
|
Dreman Contrarian Small Cap Value Fund
Fund Adviser:
Dreman Value Management, LLC
Harborside Financial Center, Plaza 10
Suite 800 Jersey City, NJ 07311
Toll Free: (800) 247-1014

Investment Results – (Unaudited) |
| Total Returns* As of April 30, 2015 | ||||||||||||||||||||
| Class A with Load | Class A without Load | Retail Class | Institutional Class | Russell 2000® Value Index1 | ||||||||||||||||
Six Months | -1.73 | % | 4.28 | % | 4.28 | % | 4.38 | % | 2.05 | % | ||||||||||
One Year | 0.24 | % | 6.35 | % | 6.35 | % | 6.58 | % | 4.89 | % | ||||||||||
Three Year | 13.30 | % | 15.55 | % | 15.53 | % | 15.74 | % | 14.52 | % | ||||||||||
Five Year | 9.47 | % | 10.78 | % | 10.75 | % | 10.97 | % | 10.55 | % | ||||||||||
Ten Year | N/A | N/A | 10.28 | % | N/A | 7.87 | % | |||||||||||||
Since Inception (11/20/09) | 11.85 | % | 13.07 | % | N/A | N/A | 14.36 | % | ||||||||||||
Since Inception (8/22/07) | N/A | N/A | N/A | 7.60 | % | 5.90 | % | |||||||||||||
Since Inception (12/31/03) | N/A | N/A | 10.95 | % | N/A | 7.77 | % | |||||||||||||
| Expense Ratios2 | ||||||||||||||||||||
| Class A | Retail Class | Institutional Class | ||||||||||||||||||
| 1.41 | % | 1.41 | % | 1.16 | % | |||||||||||||||
The investment return and principal value of an investment will fluctuate so that an investor’s shares, when redeemed, may be worth more or less than their original cost. The returns shown do not reflect deduction of taxes that a shareholder would pay on Fund distributions or the redemption of Fund shares. THE FUND’S RETURNS REPRESENT PAST PERFORMANCE AND DO NOT PREDICT FUTURE RESULTS. The returns shown are net of all recurring expenses. Current performance of the Fund may be lower or higher than the performance quoted. For more information on the Fund, and to obtain performance data current to the most recent month end, or to request a prospectus or summary prospectus, please call 1-800-247-1014.
You should carefully consider the investment objectives, potential risk, management fees, and charges and expenses of the Fund before investing. The Fund’s prospectus and summary prospectus contains this and other information about the Fund, and should be read carefully before investing.
| * | The total return figures set forth above include all waivers of fees for various periods since inception. Without such fee waivers, the total returns would have been lower. Total return figures reflect any change in price per share and assume reinvestment of all distributions. Total returns for periods less than 1 year are not annualized. |
| 1 | The Russell 2000® Value Index (“Index”) is an unmanaged benchmark that assumes reinvestment of all distributions and excludes the effect of taxes and fees. The Index is a widely recognized unmanaged index of equity prices and is representative of a broader market and range of securities than are found in the Fund’s portfolio. Individuals cannot invest directly in the Index; however, an individual can invest in ETFs or other investment vehicles that attempt to track the performance of a benchmark index. |
| 2 | The expense ratios are from the Fund’s prospectus dated February 28, 2015. The Adviser has contractually agreed to waive its management fee and/or reimburse certain operating expenses through February 29, 2016, but only to the extent necessary so that the Fund’s net expenses, excluding brokerage fees and commissions, borrowing costs (such as (a) interest expense and (b) dividends on securities sold short), taxes, extraordinary expenses, 12b-1 fees (Class A and Retail Class), and any indirect expenses (such as fees and expenses of acquired funds), do not exceed 1.25%. Information pertaining to the Fund’s expense ratios as of April 30, 2015 can be found on the financial highlights. |
The Fund is distributed by Unified Financial Securities, Inc., member FINRA.
Semi-Annual Report
1
Fund Holdings – (Unaudited) |
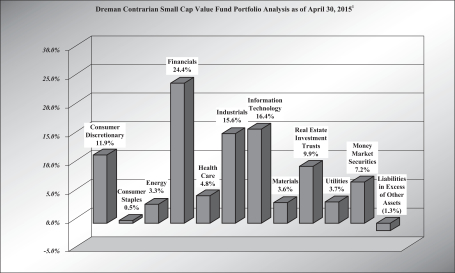
| 1 | As a percent of net assets. |
Availability of Portfolio Schedule – (Unaudited)
The Fund files its complete schedule of portfolio holdings with the Securities and Exchange Commission (“SEC”) for the first and third quarters of each fiscal year on Form N-Q, which is available on the SEC’s web site at www.sec.gov. The Fund’s Form N-Q may be reviewed and copied at the SEC’s Public Reference Room in Washington, DC. Information on the operation of the Public Reference Room may be obtained by calling 1-800-SEC-0330.
Semi-Annual Report
2
Summary of Fund’s Expenses – (Unaudited) | ||
As a shareholder of the Fund, you incur two types of costs: (1) transaction costs, including sales charges (loads) on purchases and short-term redemption fees and (2) ongoing costs, including management fees, distribution and service (12b-1) fees, and other Fund expenses. These examples are intended to help you understand your ongoing costs (in dollars) of investing in the Fund and to compare these costs with the ongoing costs of investing in other mutual funds.
The Example is based on an investment of $1,000 invested at the beginning of the period and held for the entire period (November 1, 2014 through April 30, 2015).
Actual Expenses
The first line of the table for each class provides information about actual account values and actual expenses. You may use the information in these lines, together with the amount you invested, to estimate the expenses that you paid over the period. Simply divide your account value by $1,000 (for example, an $8,600 account value divided by $1,000 = 8.60), then multiply the result by the number in the first line under the heading “Expenses Paid During Period” to estimate the expenses you paid on your account during this period.
Hypothetical Example for Comparison Purposes
The second line of the table for each class provides information about hypothetical account values and hypothetical expenses based on the Fund’s actual expense ratios and an assumed rate of return of 5% per year before expenses, which is not the Fund’s actual return. The hypothetical account values and expenses may not be used to estimate the actual ending account balances or expenses you paid for the period. You may use this information to compare the ongoing costs of investing in the Fund and other funds. To do so, compare this 5% hypothetical example with the 5% hypothetical examples that appear in the shareholder reports of the other funds.
Expenses shown in the table are meant to highlight your ongoing costs only and do not reflect any transactional costs such as the fee imposed on sales charges and short-term redemptions. Therefore, the second line of the table for each class is useful in comparing ongoing costs only and will not help you determine the relative total costs of owning different funds. In addition, if transaction costs were included, your costs would have been higher.
| Beginning Account Value, November 1, 2014 | Ending Account Value, April 30, 2015 | Expenses Paid During Period (1) | Annualized Expense Ratio | |||||||||||||||||
Dreman Contrarian Small Cap Value Fund |
| |||||||||||||||||||
Class A Shares | Actual | $ | 1,000.00 | $ | 1,042.80 | $ | 6.61 | 1.30 | % | |||||||||||
| Hypothetical | (2) | $ | 1,000.00 | $ | 1,018.33 | $ | 6.53 | 1.30 | % | |||||||||||
Retail Shares | Actual | $ | 1,000.00 | $ | 1,042.80 | $ | 6.61 | 1.30 | % | |||||||||||
| Hypothetical | (2) | $ | 1,000.00 | $ | 1,018.33 | $ | 6.53 | 1.30 | % | |||||||||||
Institutional Shares | Actual | $ | 1,000.00 | $ | 1,043.80 | $ | 5.34 | 1.05 | % | |||||||||||
| Hypothetical | (2) | $ | 1,000.00 | $ | 1,019.57 | $ | 5.27 | 1.05 | % | |||||||||||
| (1) | Expenses are equal to the Fund’s annualized expense ratios, multiplied by the average account value over the period, multiplied by 181/365 (to reflect the one-half year period). The annualized expense ratios reflect reimbursement of expenses by the Fund’s Adviser for the period beginning November 1, 2014 through April 30, 2015. The “Financial Highlights” tables in the Fund’s financial statements, included in the report, also show the gross expense ratios, without such reimbursements. |
| (2) | Hypothetical assumes 5% annual return before expenses. |
Semi-Annual Report
3
| Dreman Contrarian Small Cap Value Fund | April 30, 2015 |
| Portfolio of Investments (Unaudited) | ||
| Shares | Fair Value | |||||||||
| Common Stocks — 94.1% | |||||||||
| Consumer Discretionary — 11.9% | |||||||||
| 62,525 | Aaron’s, Inc. | $ | 2,125,850 | |||||||
| 87,025 | American Axle & Manufacturing Holdings, Inc. * | 2,169,533 | ||||||||
| 26,250 | Big 5 Sporting Goods Corp. | 358,050 | ||||||||
| 15,445 | Big Lots, Inc. | 703,829 | ||||||||
| 23,775 | Brinker International, Inc. | 1,316,422 | ||||||||
| 34,350 | Cooper Tire & Rubber Co. | 1,459,531 | ||||||||
| 22,330 | DeVry Education Group, Inc. | 675,259 | ||||||||
| 26,643 | Helen of Troy Ltd. * | 2,334,193 | ||||||||
| 26,817 | Hillenbrand, Inc. | 788,152 | ||||||||
| 12,609 | John Wiley & Sons, Inc., Class A | 717,200 | ||||||||
| 58,780 | KB Home | 851,722 | ||||||||
| 26,160 | Life Time Fitness, Inc. * | 1,870,440 | ||||||||
| 13,405 | Matthews International Corp., Class A | 650,545 | ||||||||
| 29,094 | Meredith Corp. | 1,514,052 | ||||||||
| 18,030 | TravelCenters of America LLC * | 309,755 | ||||||||
| 13,540 | Vista Outdoor, Inc. * | 592,510 | ||||||||
| 18,437,043 | ||||||||||
| Consumer Staples — 0.5% | |||||||||
| 27,490 | SpartanNash Co. | 829,373 | ||||||||
| Energy — 3.3% | |||||||||
| 42,110 | Atwood Oceanics, Inc. | 1,405,632 | ||||||||
| 160,120 | Bellatrix Exploration Ltd. * | 502,777 | ||||||||
| 115,880 | Denbury Resources, Inc. | 1,020,903 | ||||||||
| 188,800 | Gran Tierra Energy, Inc. * | 702,336 | ||||||||
| 86,390 | Ultra Petroleum Corp. * | 1,471,222 | ||||||||
| 5,102,870 | ||||||||||
| Financials — 24.4% | |||||||||
| 47,188 | Allied World Assurance Co. Holdings AG | 1,941,314 | ||||||||
| 40,405 | Aspen Insurance Holdings Ltd. | 1,888,126 | ||||||||
| 127,230 | Associated Banc-Corp. | 2,393,196 | ||||||||
| 19,946 | Blue Hills Bancorp, Inc. * | 267,675 | ||||||||
| 14,139 | Chemical Financial Corp. | 436,895 | ||||||||
| 75,090 | Clifton Bancorp, Inc. | 1,024,979 | ||||||||
| 25,125 | Endurance Specialty Holdings Ltd. | 1,517,047 | ||||||||
| 24,743 | Federated Investors, Inc., Class B | 851,159 | ||||||||
| 125,850 | First Horizon National Corp. | 1,793,362 | ||||||||
| 50,800 | First Midwest Bancorp, Inc. | 868,680 | ||||||||
| 233,369 | First Niagara Financial Group, Inc. | 2,122,491 | ||||||||
| 92,014 | FirstMerit Corp. | 1,782,311 | ||||||||
| 143,490 | Fulton Financial Corp. | 1,744,838 | ||||||||
| 56,865 | Hancock Holding Co. | 1,655,340 | ||||||||
| Shares | Fair Value | |||||||||
| Common Stocks — (Continued) | |||||||||
| Financials — (Continued) | |||||||||
| 32,980 | Hanover Insurance Group, Inc. | $ | 2,261,439 | |||||||
| 85,840 | Home Loan Servicing Solutions Ltd. | 57,856 | ||||||||
| 36,359 | International Bancshares Corp. | 944,607 | ||||||||
| 55,375 | Janus Capital Group, Inc. | 991,213 | ||||||||
| 29,970 | Montpelier Re Holdings Ltd. | 1,142,157 | ||||||||
| 18,250 | NBT Bancorp, Inc. | 440,738 | ||||||||
| 13,692 | Nelnet, Inc., Class A | 612,991 | ||||||||
| 113,590 | Old National Bancorp | 1,551,639 | ||||||||
| 49,435 | Prospect Capital Corp. (a) | 412,782 | ||||||||
| 21,168 | Prosperity Bancshares, Inc. | 1,129,101 | ||||||||
| 51,275 | Symetra Financial Corp. | 1,217,781 | ||||||||
| 61,467 | TCF Financial Corp. | 962,573 | ||||||||
| 42,560 | Umpqua Holdings Corp. | 723,946 | ||||||||
| 78,710 | Washington Federal, Inc. | 1,700,136 | ||||||||
| 36,720 | Webster Financial Corp. | 1,315,678 | ||||||||
| 10,430 | WesBanco, Inc. | 328,649 | ||||||||
| 38,196 | Wintrust Financial Corp. | 1,861,673 | ||||||||
| 37,942,372 | ||||||||||
| Health Care — 4.8% | |||||||||
| 9,442 | Charles River Laboratories International, Inc. * | 653,009 | ||||||||
| 35,790 | Hill-Rom Holdings, Inc. | 1,787,353 | ||||||||
| 23,665 | Integra LifeSciences Holdings Corp. * | 1,391,029 | ||||||||
| 40,357 | Owens & Minor, Inc. | 1,360,838 | ||||||||
| 122,250 | Select Medical Holdings Corp. | 1,778,737 | ||||||||
| 25,763 | Triple-S Management Corp., Class B * | 482,283 | ||||||||
| 7,453,249 | ||||||||||
| Industrials — 15.6% | |||||||||
| 50,266 | AAR Corp. | 1,520,044 | ||||||||
| 41,215 | ABM Industries, Inc. | 1,320,941 | ||||||||
| 33,432 | Aegion Corp. * | 615,817 | ||||||||
| 82,054 | Aircastle Ltd. | 1,967,655 | ||||||||
| 52,152 | Barnes Group, Inc. | 2,091,295 | ||||||||
| 27,059 | Brady Corp., Class A | 720,581 | ||||||||
| 59,375 | Brink’s Co./The | 1,571,656 | ||||||||
| 35,490 | Con-way, Inc. | 1,458,639 | ||||||||
| 23,262 | Crane Co. | 1,421,541 | ||||||||
| 22,450 | EMCOR Group, Inc. | 1,001,944 | ||||||||
| 18,685 | EnerSys | 1,268,711 | ||||||||
| 39,770 | Global Brass & Copper Holdings, Inc. | 606,095 | ||||||||
| 11,383 | Hyster-Yale Materials Handling, Inc., Class A | 834,829 | ||||||||
| 6,960 | LB Foster Co., Class A | 297,401 | ||||||||
| 13,275 | Orbital ATK, Inc. | 971,199 | ||||||||
See accompanying notes which are an integral part of these financial statements.
Semi-Annual Report
4
| Dreman Contrarian Small Cap Value Fund | April 30, 2015 |
| Portfolio of Investments (Unaudited) (Continued) | ||
| Shares | Fair Value | |||||||||
| Common Stocks — (Continued) | |||||||||
| Industrials — (Continued) | |||||||||
| 90,980 | R.R. Donnelley & Sons Co. | $ | 1,694,048 | |||||||
| 14,480 | Regal-Beloit Corp. | 1,132,336 | ||||||||
| 24,340 | Triumph Group, Inc. | 1,441,902 | ||||||||
| 67,365 | Tutor Perini Corp. * | 1,428,138 | ||||||||
| 15,300 | Universal Forest Products, Inc. | 846,396 | ||||||||
| 24,211,168 | ||||||||||
| Information Technology — 16.4% | |||||||||
| 21,443 | ARRIS Group, Inc. * | 722,093 | ||||||||
| 29,840 | AVX Corp. | 410,897 | ||||||||
| 47,835 | Brocade Communications Systems, Inc. | 540,536 | ||||||||
| 64,196 | Celestica, Inc. * | 783,833 | ||||||||
| 17,090 | ChipMOS Technologies (Bermuda) Ltd. | 394,779 | ||||||||
| 26,670 | CSG Systems International, Inc. | 776,630 | ||||||||
| 12,940 | DST Systems, Inc. | 1,489,135 | ||||||||
| 57,800 | Ingram Micro, Inc., Class A * | 1,454,248 | ||||||||
| 25,080 | Integrated Silicon Solution, Inc. | 465,234 | ||||||||
| 23,652 | Itron, Inc. * | 848,161 | ||||||||
| 29,680 | IXYS Corp. | 335,681 | ||||||||
| 113,139 | Kulicke & Soffa Industries, Inc. * | 1,709,530 | ||||||||
| 19,380 | Lexmark International, Inc., Class A | 860,278 | ||||||||
| 85,650 | Mentor Graphics Corp. | 2,049,604 | ||||||||
| 64,995 | Microsemi Corp. * | 2,168,233 | ||||||||
| 12,410 | NETGEAR, Inc. * | 375,651 | ||||||||
| 41,170 | Plantronics, Inc. | 2,193,126 | ||||||||
| 152,095 | QLogic Corp. * | 2,235,796 | ||||||||
| 18,360 | Rovi Corp. * | 339,844 | ||||||||
| 51,212 | Sanmina Corp. * | 1,041,140 | ||||||||
| 16,240 | Science Applications International Corp. | 813,624 | ||||||||
| 30,473 | Sykes Enterprises, Inc. * | 762,739 | ||||||||
| 16,597 | Tech Data Corp. * | 935,573 | ||||||||
| 141,365 | Vishay Intertechnology, Inc. | 1,792,508 | ||||||||
| 25,498,873 | ||||||||||
| Materials — 3.6% | |||||||||
| 17,355 | A. Schulman, Inc. | 736,720 | ||||||||
| 31,574 | Cabot Corp. | 1,349,473 | ||||||||
| 100,426 | Coeur Mining, Inc. * | 524,224 | ||||||||
| 36,955 | Olin Corp. | 1,091,281 | ||||||||
| 51,952 | Pan American Silver Corp. | 494,583 | ||||||||
| 25,110 | Rayonier Advanced Materials, Inc. | 419,588 | ||||||||
| 20,300 | Stepan Co. | 1,033,879 | ||||||||
| 5,649,748 | ||||||||||
| Shares | Fair Value | |||||||||
| Common Stocks — (Continued) | |||||||||
| Real Estate Investment Trusts — 9.9% | |||||||||
| 52,660 | Apollo Residential Mortgage, Inc. | $ | 835,188 | |||||||
| 29,012 | Ashford Hospitality Prime, Inc. | 454,328 | ||||||||
| 104,121 | Ashford Hospitality Trust, Inc. | 943,336 | ||||||||
| 117,310 | Brandywine Realty Trust | 1,710,380 | ||||||||
| 74,715 | CBL & Associates Properties, Inc. | 1,345,617 | ||||||||
| 39,449 | Geo Group, Inc./The | 1,538,511 | ||||||||
| 34,854 | Hospitality Properties Trust | 1,048,408 | ||||||||
| 84,100 | Mack-Cali Realty Corp. | 1,509,595 | ||||||||
| 113,130 | Medical Properties Trust, Inc. | 1,581,557 | ||||||||
| 91,167 | New Residential Investment Corp. | 1,553,486 | ||||||||
| 71,125 | Pennsylvania Real Estate Investment Trust | 1,608,136 | ||||||||
| 196,316 | RAIT Financial Trust | 1,272,128 | ||||||||
| 15,400,670 | ||||||||||
| Utilities — 3.7% | |||||||||
| 30,140 | ALLETE, Inc. | 1,516,042 | ||||||||
| 36,100 | IDACORP, Inc. | 2,177,913 | ||||||||
| 58,661 | Portland General Electric Co. | 2,062,521 | ||||||||
| 5,756,476 | ||||||||||
| Total Common Stocks | 146,281,842 | ||||||||
| Money Market Securities — 7.2% | |||||||||
| 11,128,222 | Huntington Money Market Fund, Institutional Shares, 0.04% (b) (c) | 11,128,222 | ||||||||
| Total Money Market Securities | 11,128,222 | ||||||||
| Total Investments | 157,410,064 | ||||||||
| Liabilities in Excess of Other | (1,978,796) | ||||||||
| Net Assets — 100.0% | $ | 155,431,268 | |||||||
| (a) | Business Development Company |
| (b) | Rate disclosed is the seven day yield as of April 30, 2015. |
| (c) | Affiliated fund. |
| * | Non-income producing security. |
See accompanying notes which are an integral part of these financial statements.
Semi-Annual Report
5
Statement of Assets and Liabilities
April 30, 2015 (Unaudited)
| Assets: | ||||
Investments in securities, at cost | $ | 128,246,015 | ||
Investments in affiliated securities, at cost | 11,128,222 | |||
Investments in securities, at fair value | 146,281,842 | |||
Investments in affiliated securities, at value | 11,128,222 | |||
Dividends receivable | 45,405 | |||
Receivable for investments sold | 967,809 | |||
Receivable for fund shares sold | 106,911 | |||
Prepaid expenses | 51,651 | |||
Total assets | 158,581,840 | |||
| Liabilities: | ||||
Payable for investments purchased | 2,893,781 | |||
Payable for shares redeemed | 87,399 | |||
Payable to Adviser | 109,750 | |||
Payable to administrator | 36,536 | |||
Payable to custodian | 1,831 | |||
Accrued 12b-1 fees | 14,061 | |||
Other accrued expenses | 7,214 | |||
Total liabilities | 3,150,572 | |||
Net Assets | $ | 155,431,268 | ||
| Net Assets consist of: | ||||
Paid in capital | $ | 130,685,263 | ||
Accumulated undistributed net investment income | 101,343 | |||
Accumulated undistributed net realized gain on investments | 6,608,835 | |||
Net unrealized appreciation | 18,035,827 | |||
Net Assets | $ | 155,431,268 | ||
| Net Assets (unlimited number of shares authorized) | ||||
| Class A: | ||||
Net Assets | $ | 3,738,830 | ||
Shares outstanding | 168,186 | |||
Net asset value and redemption price per share | $ | 22.23 | ||
Offering price per share (NAV/0.9425) (a) | $ | 23.59 | ||
| Retail Class: | ||||
Net Assets | $ | 63,729,697 | ||
Shares outstanding | 2,861,165 | |||
Net asset value and offering price per share | $ | 22.27 | ||
Redemption price per share (NAV * 0.99) (b) | $ | 22.05 | ||
| Institutional Class: | ||||
Net Assets | $ | 87,962,741 | ||
Shares outstanding | 3,934,326 | |||
Net asset value, offering and redemption price per share | $ | 22.36 | ||
| (a) | Class A shares impose a maximum 5.75% sales charge on purchases. |
| (b) | A redemption fee of 1.00% is charged on shares held less than 60 days. |
See accompanying notes which are an integral part of these financial statements.
Semi-Annual Report
6
Statement of Operations
For the Six Months Ended April 30, 2015 (Unaudited)
| Investment Income: | ||||
Dividend income | $ | 1,729,731 | ||
Dividend income from affiliated securities | 1,225 | |||
Foreign dividend taxes withheld | (1,851 | ) | ||
Total investment income | 1,729,105 | |||
| Expenses: | ||||
Investment Adviser | 636,586 | |||
Distribution/12b-1: | ||||
Class A | 4,385 | |||
Retail Class | 78,723 | |||
Administration | 122,682 | |||
Legal | 9,502 | |||
Registration | 30,039 | |||
Printing | 21,895 | |||
Audit | 8,005 | |||
Custodian | 16,588 | |||
Trustee | 3,145 | |||
Miscellaneous | 7,418 | |||
Total expenses | 938,968 | |||
Fees waived by Adviser | (67,514 | ) | ||
Net operating expenses | 871,454 | |||
Net investment income | 857,651 | |||
| Realized & Unrealized Gain/(Loss) on Investments | ||||
Net realized gain on investment securities | 7,085,435 | |||
Change in unrealized depreciation on investment securities | (1,518,274 | ) | ||
Net realized and unrealized gain/(loss) on investment securities | 5,567,161 | |||
Net increase in net assets resulting from operations | $ | 6,424,812 | ||
See accompanying notes which are an integral part of these financial statements.
Semi-Annual Report
7
Statements of Changes in Net Assets
| Six Months Ended April 30, 2015 | Year Ended October 31, 2014 | |||||||
| (Unaudited) | ||||||||
| Increase (Decrease) in Net Assets due to: | ||||||||
| Operations: | ||||||||
Net investment income | $ | 857,651 | $ | 987,341 | ||||
Net realized gain on investment securities | 7,085,435 | 13,426,386 | ||||||
Change in unrealized depreciation on investment securities | (1,518,274 | ) | (3,032,602 | ) | ||||
Net increase in net assets resulting from operations | 6,424,812 | 11,381,125 | ||||||
Distributions From: Net investment income: | ||||||||
Class A | (24,971 | ) | (33,863 | ) | ||||
Retail Class | (498,693 | ) | (418,477 | ) | ||||
Institutional Class | (815,096 | ) | (468,029 | ) | ||||
Realized gain: | ||||||||
Class A | (310,960 | ) | (490,209 | ) | ||||
Retail Class | (5,763,778 | ) | (6,225,188 | ) | ||||
Institutional Class | (7,217,207 | ) | (5,063,473 | ) | ||||
Total distributions | (14,630,705 | ) | (12,699,239 | ) | ||||
| Capital Transactions—Class A: | ||||||||
Proceeds from shares sold | 623,549 | 1,212,976 | ||||||
Reinvestment of distributions | 331,469 | 487,467 | ||||||
Amount paid for shares redeemed | (110,040 | ) | (3,654,017 | ) | ||||
Total Class A | 844,978 | (1,953,574 | ) | |||||
| Capital Transactions—Retail Class: | ||||||||
Proceeds from shares sold | 5,521,650 | 11,652,873 | ||||||
Reinvestment of distributions | 6,187,695 | 6,532,454 | ||||||
Amount paid for shares redeemed | (8,393,164 | ) | (17,461,939 | ) | ||||
Proceeds from redemption fees (a) | 85 | 1,182 | ||||||
Total Retail Class | 3,316,266 | 724,570 | ||||||
| Capital Transactions—Institutional Class: | ||||||||
Proceeds from shares sold | 9,513,262 | 72,236,519 | ||||||
Reinvestment of distributions | 7,244,917 | 4,944,506 | ||||||
Amount paid for shares redeemed | (6,465,839 | ) | (9,221,455 | ) | ||||
Total Institutional Class | 10,292,340 | 67,959,570 | ||||||
Net change resulting from capital transactions | 14,453,584 | 66,730,566 | ||||||
Total Increase in Net Assets | 6,247,691 | 65,412,452 | ||||||
Net Assets: | ||||||||
Beginning of period | 149,183,577 | 83,771,125 | ||||||
End of period | $ | 155,431,268 | $ | 149,183,577 | ||||
Accumulated net investment income included in net assets at end of period | $ | 101,343 | $ | 582,452 | ||||
See accompanying notes which are an integral part of these financial statements.
Semi-Annual Report
8
| Six Months Ended April 30, 2015 | Year Ended October 31, 2014 | |||||||
| (Unaudited) | ||||||||
| Share Transactions—Class A: | ||||||||
Shares sold | 27,297 | 51,197 | ||||||
Shares issued in reinvestment of distributions | 15,275 | 21,371 | ||||||
Shares redeemed | (4,930 | ) | (156,427 | ) | ||||
Total Class A | 37,642 | (83,859 | ) | |||||
| Share Transactions—Retail Class: | ||||||||
Shares sold | 246,156 | 500,748 | ||||||
Shares issued in reinvestment of distributions | 284,492 | 285,759 | ||||||
Shares redeemed | (379,168 | ) | (757,263 | ) | ||||
Total Retail Class | 151,480 | 29,244 | ||||||
| Share Transactions—Institutional Class: | ||||||||
Shares sold | 428,275 | 3,029,137 | ||||||
Shares issued in reinvestment of distributions | 332,183 | 215,619 | ||||||
Shares redeemed | (283,953 | ) | (399,425 | ) | ||||
Total Institutional Class | 476,505 | 2,845,331 | ||||||
| (a) | A redemption fee of 1.00% is charged on shares held less than 60 days. |
See accompanying notes which are an integral part of these financial statements.
Semi-Annual Report
9
Financial Highlights | ||
(For a share outstanding throughout each period ended October 31 and April 30)
| Net Asset Value, beginning of period | Net investment income (loss) | Net realized and unrealized gain (loss) on investments | Total from investment operations | Distributions from net investment income | Distributions | Total distributions | ||||||||||||||||||||||
| DREMAN CONTRARIAN SMALL CAP VALUE FUND | ||||||||||||||||||||||||||||
| Class A | ||||||||||||||||||||||||||||
| 2010(c) | $ | 16.04 | 0.10 | (d) | 2.30 | 2.40 | (0.14 | ) | — | (0.14 | ) | |||||||||||||||||
| 2011 | $ | 18.30 | 0.10 | (0.22 | ) | (0.12 | ) | (0.13 | ) | — | (0.13 | ) | ||||||||||||||||
| 2012 | $ | 18.07 | 0.11 | 1.47 | 1.58 | (0.19 | ) | (1.66 | ) | (1.85 | ) | |||||||||||||||||
| 2013 | $ | 17.80 | 0.12 | 6.14 | 6.26 | (0.08 | ) | (0.16 | ) | (0.24 | ) | |||||||||||||||||
| 2014 | $ | 23.82 | 0.15 | (d) | 2.12 | 2.27 | (0.16 | ) | (2.36 | ) | (2.52 | ) | ||||||||||||||||
| 2015(h) | $ | 23.57 | 0.10 | 0.85 | 0.95 | (0.17 | ) | (2.12 | ) | (2.29 | ) | |||||||||||||||||
| Retail Class | ||||||||||||||||||||||||||||
| 2010 | $ | 15.59 | 0.09 | 2.80 | 2.89 | (0.13 | ) | — | (0.13 | ) | ||||||||||||||||||
| 2011 | $ | 18.35 | 0.11 | (0.22 | ) | (0.11 | ) | (0.13 | ) | — | (0.13 | ) | ||||||||||||||||
| 2012 | $ | 18.11 | 0.11 | 1.47 | 1.58 | (0.17 | ) | (1.66 | ) | (1.83 | ) | |||||||||||||||||
| 2013 | $ | 17.86 | 0.17 | 6.08 | 6.25 | (0.08 | ) | (0.16 | ) | (0.24 | ) | |||||||||||||||||
| 2014 | $ | 23.87 | 0.15 | 2.13 | 2.28 | (0.16 | ) | (2.36 | ) | (2.52 | ) | |||||||||||||||||
| 2015(h) | $ | 23.63 | 0.11 | 0.83 | 0.94 | (0.18 | ) | (2.12 | ) | (2.30 | ) | |||||||||||||||||
| Institutional Class | ||||||||||||||||||||||||||||
| 2010 | $ | 15.47 | 0.14 | 2.93 | 3.07 | (0.14 | ) | — | (0.14 | ) | ||||||||||||||||||
| 2011 | $ | 18.40 | 0.31 | (0.38 | ) | (0.07 | ) | (0.14 | ) | — | (0.14 | ) | ||||||||||||||||
| 2012 | $ | 18.19 | 0.14 | 1.48 | 1.62 | (0.23 | ) | (1.66 | ) | (1.89 | ) | |||||||||||||||||
| 2013 | $ | 17.92 | 0.20 | 6.10 | 6.30 | (0.08 | ) | (0.16 | ) | (0.24 | ) | |||||||||||||||||
| 2014 | $ | 23.98 | 0.20 | (d) | 2.14 | 2.34 | (0.22 | ) | (2.36 | ) | (2.58 | ) | ||||||||||||||||
| 2015(h) | $ | 23.74 | 0.16 | 0.82 | 0.98 | (0.24 | ) | (2.12 | ) | (2.36 | ) | |||||||||||||||||
| (a) | Total return represents the rate the investor would have earned or lost on an investment in the Fund, assuming reinvestment of dividends, and excludes any sales charges and redemption fees. |
| (b) | Portfolio turnover is calculated on the basis of the Fund as a whole without distinguishing among the classes of shares. |
| (c) | For the period November 20, 2009 (commencement of operations) to October 31, 2010. |
| (d) | Per share amount has been calculated using the average shares method. |
| (e) | Not Annualized. |
| (f) | Annualized. |
| (g) | The expense ratios shown include overdraft fees charged to the Fund. Without these overdraft fees, the expense ratios would be 1.25% for Class A and Retail Class and 1.00% for Institutional Class. |
| (h) | Six months ended April 30, 2015 (Unaudited). |
| (i) | Amount is less than $0.005. |
See accompanying notes which are an integral part of these financial statements.
Semi-Annual Report
10
| Paid in capital from redemption fees | Net Asset Value, end of period | Total return(a) | Net Assets, end of period (000 omitted) | Ratio of net expenses to average net assets | Ratio of expenses (prior to reimbursements) to average net assets | Ratio of net investment income (loss) to average net assets | Ratio of net investment income (loss) to average net assets before waiver & reimbursement by Adviser | Portfolio turnover rate(b) | ||||||||||||||||||||||||||
| — | $ | 18.30 | 15.00 | %(e) | $ | 275 | 1.25 | %(f) | 1.59 | %(f) | 0.62 | %(f) | 0.28 | %(f) | 35.75 | %(e) | ||||||||||||||||||
| 0.02 | $ | 18.07 | (0.60 | )% | $ | 1,935 | 1.25 | % | 1.49 | % | 0.46 | % | 0.22 | % | 44.08 | % | ||||||||||||||||||
| — | $ | 17.80 | 9.92 | % | $ | 3,180 | 1.25 | % | 1.75 | % | 0.55 | % | 0.05 | % | 30.19 | % | ||||||||||||||||||
| — | $ | 23.82 | 35.56 | % | $ | 5,106 | 1.26 | %(g) | 1.51 | % | 0.65 | % | 0.40 | % | 28.28 | % | ||||||||||||||||||
| — | $ | 23.57 | 9.89 | % | $ | 3,077 | 1.25 | % | 1.37 | % | 0.63 | % | 0.51 | % | 36.66 | % | ||||||||||||||||||
| — | $ | 22.23 | 4.28 | %(e) | $ | 3,739 | 1.30 | %(f) | 1.39 | %(f) | 1.00 | %(f) | 0.91 | %(f) | 24.12 | %(e) | ||||||||||||||||||
| — | (i) | $ | 18.35 | 18.61 | % | $ | 105,796 | 1.25 | % | 1.58 | % | 0.53 | % | 0.20 | % | 35.75 | % | |||||||||||||||||
| — | (i) | $ | 18.11 | (0.66 | )% | $ | 82,840 | 1.25 | % | 1.51 | % | 0.57 | % | 0.32 | % | 44.08 | % | |||||||||||||||||
| — | (i) | $ | 17.86 | 9.93 | % | $ | 69,992 | 1.25 | % | 1.74 | % | 0.56 | % | 0.06 | % | 30.19 | % | |||||||||||||||||
| — | (i) | $ | 23.87 | 35.38 | % | $ | 63,976 | 1.26 | %(g) | 1.53 | % | 0.72 | % | 0.45 | % | 28.28 | % | |||||||||||||||||
| — | (i) | $ | 23.63 | 9.89 | % | $ | 64,020 | 1.25 | % | 1.37 | % | 0.63 | % | 0.51 | % | 36.66 | % | |||||||||||||||||
| — | (i) | $ | 22.27 | 4.28 | %(e) | $ | 63,730 | 1.30 | %(f) | 1.39 | %(f) | 1.00 | %(f) | 0.91 | %(f) | 24.12 | %(e) | |||||||||||||||||
| — | $ | 18.40 | 19.90 | % | $ | 19,300 | 1.00 | % | 1.34 | % | 0.79 | % | 0.45 | % | 35.75 | % | ||||||||||||||||||
| — | $ | 18.19 | (0.44 | )% | $ | 11,472 | 1.00 | % | 1.26 | % | 0.85 | % | 0.59 | % | 44.08 | % | ||||||||||||||||||
| — | $ | 17.92 | 10.14 | % | $ | 13,185 | 1.00 | % | 1.49 | % | 0.80 | % | 0.30 | % | 30.19 | % | ||||||||||||||||||
| — | $ | 23.98 | 35.55 | % | $ | 14,689 | 1.01 | %(g) | 1.27 | % | 0.95 | % | 0.68 | % | 28.28 | % | ||||||||||||||||||
| — | $ | 23.74 | 10.12 | % | $ | 82,086 | 1.00 | % | 1.12 | % | 0.85 | % | 0.73 | % | 36.66 | % | ||||||||||||||||||
| — | $ | 22.36 | 4.38 | %(e) | $ | 87,963 | 1.05 | %(f) | 1.14 | %(f) | 1.25 | %(f) | 1.16 | %(f) | 24.12 | %(e) | ||||||||||||||||||
Semi-Annual Report
11
Notes to the Financial Statements
April 30, 2015 (Unaudited)
Note 1. Organization
The Dreman Contrarian Small Cap Value Fund (the “Fund”) is an open-end diversified series of the Valued Advisers Trust (the “Trust”). The Trust is a management investment company established under the laws of Delaware by an Agreement and Declaration of Trust dated June 13, 2008 (the “Trust Agreement”). The Trust Agreement permits the Board of Trustees (the “Board”) to issue an unlimited number of shares of beneficial interest of separate series without par value. The Fund is one of a series of funds authorized by the Board. The Fund’s investment adviser is Dreman Value Management, LLC (the “Adviser”). The investment objective of the Fund is long-term capital appreciation.
The Fund currently offers Class A shares, Retail Class shares, and Institutional Class shares. Class A shares are offered with a front-end sales charge. The Retail Class shares impose a 1% redemption fee on all shares redeemed within 60 days of purchase. Institutional Class shares do not have sales charges on original purchases.
Note 2. Significant Accounting Policies
The Fund is an investment company and follows accounting and reporting guidance under Financial Accounting Standards Board (“FASB”) Accounting Standards Codification (“ASC”) Topic 946, “Financial Services-Investment Companies”. The following is a summary of significant accounting policies followed by the Fund in the preparation of its financial statements. These policies are in conformity with the generally accepted accounting principles in the United States of America (“GAAP”).
Estimates—The preparation of financial statements in conformity with GAAP requires management to make estimates and assumptions that affect the reported amounts of assets and liabilities and disclosure of contingent assets and liabilities at the date of the financial statements and the reported amounts of increases and decreases in net assets from operations during the reporting period. Actual results could differ from those estimates.
Securities Valuation—All investments in securities are recorded at their estimated fair value as described in Note 3.
Federal Income Taxes—The Fund makes no provision for federal income or excise tax. The Fund intends to qualify each year as a regulated investment company (“RIC”) under subchapter M of the Internal Revenue Code of 1986, as amended, by complying with the requirements applicable to RICs and by distributing substantially all of its taxable income. The Fund also intends to distribute sufficient net investment income and net capital gains, if any, so that it will not be subject to excise tax on undistributed income and gains. If the required amount of net investment income or gains is not distributed, the Fund could incur a tax expense.
During the six months ended April 30, 2015, the Fund did not have a liability for any unrecognized tax benefits. The Fund recognizes interest and penalties, if any, related to unrecognized tax benefits as income tax expense in the statement of operations. The Fund is
Semi-Annual Report
12
subject to examination by U.S. federal tax authorities for the last three tax year ends and the interim tax period since then.
Expenses—Expenses incurred by the Trust that do not relate to a specific fund of the Trust are allocated to the individual funds based on each fund’s relative net assets or other appropriate basis. Expenses attributable to any class are borne by that class. Income, realized gains and losses, unrealized appreciation and depreciation, and expenses are allocated to each class based on the net assets in relation to the relative net assets of the Fund.
Security Transactions and Related Income—The Fund follows industry practice and records security transactions on the trade date for financial reporting purposes. The specific identification method is used for determining gains or losses for financial statement and income tax purposes. Dividend income is recorded on the ex-dividend date and interest income is recorded on an accrual basis. Discounts and premiums on securities purchased are accreted or amortized using the effective interest method. Withholding taxes on foreign dividends have been provided for in accordance with the Fund’s understanding of the applicable country’s tax rules and rates.
Dividends and Distributions—Distributions to shareholders, which are determined in accordance with income tax regulations, are recorded on the ex-dividend date. The Fund intends to distribute substantially all of its net investment income on, at least, an annual basis. The Fund intends to distribute its net realized long-term and its net realized short-term capital gains, if any, at least once a year. The treatment for financial reporting purposes of distributions made to shareholders during the year from net investment income or net realized capital gains may differ from their ultimate treatment for federal income tax purposes. These differences are caused primarily by differences in the timing of the recognition of certain components of income, expense or realized capital gain for federal income tax purposes. Where such differences are permanent in nature, they are reclassified among the components of the net assets based on their ultimate characterization for federal income tax purposes. Any such reclassifications will have no effect on net assets, results of operations or net asset values per share of the Fund.
Note 3. Securities Valuation and Fair Value Measurements
Fair value is defined as the price that a Fund would receive upon selling an investment in a timely transaction to an independent buyer in the principal or most advantageous market of the investment. GAAP establishes a three-tier hierarchy to maximize the use of observable market data and minimize the use of unobservable inputs and to establish classification of fair value measurements for disclosure purposes.
Inputs refer broadly to the assumptions that market participants would use in pricing the asset or liability, including assumptions about risk (the risk inherent in a particular valuation technique used to measure fair value including such a pricing model and/or the risk inherent in the inputs to the valuation technique). Inputs may be observable or unobservable. Observable inputs are inputs that reflect the assumptions market participants would use in pricing the asset or liability developed based on market data obtained from sources independent of the reporting entity. Unobservable inputs are inputs that reflect the reporting entity’s own assumptions about the
Semi-Annual Report
13
Notes to the Financial Statements (Continued)
assumptions market participants would use in pricing the asset or liability developed based on the best information available in the circumstances.
Various inputs are used in determining the value of the Fund’s investments. These inputs are summarized in the three broad levels listed below.
| • | Level 1—quoted prices in active markets for identical securities |
| • | Level 2—other significant observable inputs (including, but not limited to, quoted prices for an identical security in an inactive market, quoted prices for similar securities, interest rates, prepayment speeds, credit risk, etc.) |
| • | Level 3—significant unobservable inputs (including the Fund’s own assumptions in determining fair value of investments based on the best information available) |
The inputs used to measure fair value may fall into different levels of the fair value hierarchy. In such cases, for disclosure purposes, the level in the fair value hierarchy within which the fair value measurement falls in its entirety, is determined based, on the lowest level input that is significant to the fair value measurement in its entirety.
Equity securities, including common stocks, exchanged-traded funds and real estate investment trusts, are generally valued by using market quotations, but may be valued on the basis of prices furnished by a pricing service when the Adviser believes such prices more accurately reflect the fair value of such securities. Securities traded in the NASDAQ over-the-counter market are generally valued by the pricing service at the NASDAQ Official Closing Price.
When using the market quotations or close prices provided by a pricing service and when the market is considered active, the security is classified as a Level 1 security. Sometimes, an equity security owned by the Fund will be valued by the pricing service with factors other than market quotations or when the market is considered inactive. When this happens, the security is classified as a Level 2 security. When market quotations are not readily available, when the Adviser determines that the market quotation or the price provided by the pricing service does not accurately reflect the current fair value, or when restricted or illiquid securities are being valued, such securities are valued as determined in good faith by the Adviser, in conformity with guidelines adopted by and subject to review by the Board. These securities are generally categorized as Level 3 securities.
Investments in mutual funds, including money market mutual funds, are generally priced at the ending NAV provided by the service agent of the funds. These securities are categorized as Level 1 securities.
Short-term investments in fixed income securities, (those with maturities of less than 60 days when acquired, or which subsequently are within 60 days of maturity), may be valued by using the amortized cost method of valuation, which the Board has determined represents fair value. These securities are classified as Level 2 securities.
In accordance with the Trust’s good faith pricing guidelines, the Adviser is required to consider all appropriate factors relevant to the value of securities for which it has determined other pricing sources are not available or reliable as described above. No single standard exists for
Semi-Annual Report
14
determining fair value, because fair value depends upon the circumstances of each individual case. As a general principle, the current fair value of an issue of securities being valued by the Adviser would appear to be the amount which the owner might reasonably expect to receive for them upon their current sale. Methods which are in accordance with this principle may, for example, be based on (i) a multiple of earnings; (ii) a discount from market of a similar freely traded security (including a derivative security or a basket of securities traded on other markets, exchanges or among dealers); or (iii) yield to maturity with respect to debt issues, or a combination of these and other methods. Good faith pricing is permitted if, in the Adviser’s opinion, the validity of market quotations appears to be questionable based on factors such as evidence of a thin market in the security based on a small number of quotations, a significant event occurs after the close of a market but before a Fund’s NAV calculation that may affect a security’s value, or the Adviser is aware of any other data that calls into question the reliability of market quotations. Good faith pricing may also be used in instances when the bonds the Fund invests in may default or otherwise cease to have market quotations readily available.
The following is a summary of the inputs used to value the Fund’s investments as of April 30, 2015:
| Valuation Inputs | ||||||||||||||||
| Assets | Level 1 Quoted Prices in Active Markets | Level 2 Other Significant Observable Inputs | Level 3 Significant Unobservable Inputs | Total | ||||||||||||
Common Stocks* | $ | 146,281,842 | $ | — | $ | — | $ | 146,281,842 | ||||||||
Money Market Securities | 11,128,222 | — | — | 11,128,222 | ||||||||||||
|
|
|
|
|
|
|
| |||||||||
Total | $ | 157,410,064 | $ | — | $ | — | $ | 157,410,064 | ||||||||
| * | Refer to Schedule of Investments for industry classifications. |
The Fund did not hold any investments at any time during the reporting period in which other significant observable inputs (Level 2) were used in determining fair value. The Fund did not hold any investments at any time during the reporting period in which significant unobservable inputs were used in determining fair value; therefore, no reconciliation of Level 3 securities is included for this reporting period.
The Trust recognizes transfers between fair value hierarchy levels at the reporting period end. There were no transfers between any levels as of April 30, 2015.
Note 4. Fees and Other Transactions with Affiliates and Other Service Providers
Under the terms of the management agreement between the Trust and the Adviser (the “Agreement”) for the Fund, the Adviser manages the Fund’s investments subject to oversight of the Board. As compensation for its management services, the Fund is obligated to pay the Adviser a fee computed and accrued daily and paid monthly at an annual rate of 0.85% of the average daily net assets of the Fund. For the six months ended April 30, 2015, the Adviser earned fees of $636,586 from the Fund before the waivers described below. At April 30, 2015, the Fund owed $109,750 to the Adviser.
Semi-Annual Report
15
Notes to the Financial Statements (Continued)
The Adviser has contractually agreed to waive its management fee and/or reimburse certain operating expenses, but only to the extent necessary so that the Fund’s net expenses, excluding brokerage fees and commissions, borrowing costs (such as interest and dividend expenses on securities sold short), taxes, distribution and service (12b-1) fees, extraordinary expenses and any indirect expenses (such as fees and expenses of acquired funds), do not exceed 1.25% (1.00% prior to March 1, 2015) of the net assets of the Fund. Each waiver or reimbursement of an expense by the Adviser is subject to repayment by the Fund within the three fiscal years following the fiscal year in which the expense was incurred, provided that the Fund is able to make the repayment without exceeding the expense limitation which was in place at the time of the waiver. The contractual agreement is in effect through February 29, 2016. The expense cap may not be terminated prior to this date except by the Board. For the six months ended April 30, 2015, the Adviser waived fees of $67,514 from the Fund. This amount is subject to potential recoupment by the Adviser through October 31, 2018.
The amounts subject to repayment by the Fund, pursuant to the aforementioned conditions are as follows:
| Amount | Recoverable through October 31, | |||||
| $459,430 | 2015 | |||||
| $215,534 | 2016 | |||||
| $166,367 | 2017 | |||||
| $67,514 | 2018 | |||||
The Trust retains Huntington Asset Services, Inc. (“HASI”) to manage the Fund’s business affairs and to provide the Fund with administrative services, including all regulatory, reporting and necessary office equipment and personnel. The Trust also retains HASI to act as the Fund’s transfer agent and to provide the Fund with fund accounting services. For the six months ended April 30, 2015, HASI earned fees of $122,682 for administrative services. At April 30, 2015, HASI was owed $36,536 for administrative services.
Certain officers and one Trustee of the Trust are members of management and/or employees of HASI. HASI operates as a wholly-owned subsidiary of Huntington Bancshares, Inc., the parent company of Unified Financial Securities, Inc. (the “Distributor” or “Unified”) and Huntington National Bank, the custodian of the Fund’s investments (the “Custodian”). For the six months ended April 30, 2015, the Custodian earned fees $16,588 for custody services. At April 30, 2015, the Custodian was owed $1,831 for custody services.
The Fund has adopted a Distribution Plan (the “Plan”) pursuant to Rule 12b-1 under the 1940 Act. The Plan provides that the Fund will pay the Distributor and/or any registered securities dealer, financial institution or any other person (a “Recipient”) a shareholder servicing fee aggregating up to: 0.25% of the average daily net assets of the Class A shares and Retail Class shares in connection with the promotion and distribution of the Fund’s shares or the provision of personal services to shareholders, including, but not necessarily limited to, advertising,
Semi-Annual Report
16
compensation to underwriters, dealers and selling personnel, the printing and mailing of prospectuses to other than current Fund shareholders, the printing and mailing of sales literature and servicing shareholder accounts. The Fund or the Adviser may pay all or a portion of these fees to any Recipient who renders assistance in distributing or promoting the sale of shares, or who provides certain shareholder services, pursuant to a written agreement. The Plan is a compensation plan, which means that compensation is paid regardless of 12b-1 expenses actually incurred. It is anticipated that the Plan will benefit shareholders because an effective sales program typically is necessary in order for the Fund to reach and maintain a sufficient size to efficiently achieve its investment objectives and to realize economies of scale. For the six months ended April 30, 2015, Class A shares 12b-1 expense incurred by the Fund was $4,385 and Retail Class shares 12b-1 expense incurred by the Fund was $78,723. The Fund owed $774 for Class A shares and $13,287 for Retail Class shares 12b-1 expenses as of April 30, 2015.
Unified acts as the principal distributor of the Fund’s shares. During the six months ended April 30, 2015, the Distributor received $1,752 from commissions earned on sales of Class A shares, of which $1,678 was re-allowed to intermediaries of the Fund. A trustee of the Trust is an officer of the Distributor and such person may be deemed to be an affiliate of the Distributor.
The Fund may invest in certain affiliated money market funds which are managed by an affiliated party of the Distributor. Income distributions earned from investments in this Fund are recorded as dividend income from affiliates in the accompanying financial statements. A summary of the Fund’s investment in such affiliated money market funds is presented in the table below:
| Affiliated Fund | 10/31/14 Fair Value | Purchases | Sales | 4/30/15 Fair Value | Income | |||||||||||||||
Huntington Money Market Fund, Institutional Shares | $ | 9,101,828 | $ | 21,981,118 | $ | (19,954,724 | ) | $ | 11,128,222 | $ | 1,225 | |||||||||
Note 5. Purchases and Sales of Securities
For the six months ended April 30, 2015, purchases and sales of investment securities, other than short-term investments and short-term U.S. government obligations were as follows:
| Amount | ||||
Purchases | ||||
U.S. Government Obligations | $ | — | ||
Other | 35,364,066 | |||
Sales | ||||
U.S. Government Obligations | $ | — | ||
Other | 34,587,631 | |||
Note 6. Beneficial Ownership
The beneficial ownership, either directly or indirectly, of more than 25% of the voting securities of a fund creates a presumption of control of the fund, under Section 2(a)(9) of the Investment Company Act of 1940. At April 30, 2015, Charles Schwab & Co. (“Schwab”) owned, as record
Semi-Annual Report
17
Notes to the Financial Statements (Continued)
shareholder, 40% of the outstanding shares of the Fund. It is not known whether Schwab or any other underlying beneficial owners owned or controlled 25% or more of the voting securities of the Fund.
Note 7. Federal Income Taxes
At April 30, 2015, the net unrealized appreciation (depreciation) of investments for tax purposes was as follows:
Gross Unrealized Appreciation | $ | 23,246,343 | ||
Gross Unrealized (Depreciation) | (5,957,892 | ) | ||
Net Unrealized Appreciation on Investments | $ | 17,288,451 |
At April 30, 2015, the difference between book basis and tax basis unrealized appreciation (depreciation) was attributable to the tax deferral of losses on wash sales, mark-to-market adjustments on passive foreign investment companies, return of capital from real estate investment trusts and income from certain investments.
At April 30, 2015, the aggregate cost of securities for federal income tax purposes was $140,121,613 for the Fund.
At October 31, 2014, the Fund’s most recent fiscal year end, the components of distributable earnings (accumulated losses) on a tax basis was as follows:
| Fund | Undistributed Ordinary Income | Undistributed Long-Term Capital Gains | Unrealized Appreciation/ (Depreciation)* | Total Accumulated Earnings/ (Deficit) | ||||||||||||
Small Cap Value Fund | $ | 3,693,263 | $ | 10,451,910 | $ | 18,806,725 | $ | 32,951,898 | ||||||||
| * | The difference between book basis and tax basis unrealized appreciation (depreciation) is attributable to the tax deferral of losses on wash sales, mark-to-market adjustments on passive foreign investment companies, return of capital from real estate investment trusts and income from certain investments. |
The tax character of distributions paid for the fiscal period ended October 31, 2014 was as follows:
| Distributions Paid From* | ||||||||||||||||||||
| Total Fund | Ordinary Income | Net Long Term Capital Gains | Total Taxable Distributions | Tax Return of Capital | Total Distributions Paid | |||||||||||||||
Small Cap Value Fund | $ | 1,629,931 | $ | 11,069,308 | $ | 12,699,239 | $ | — | $ | 12,699,239 | ||||||||||
| * | The tax character of distributions paid may differ from the character of distributions shown on the statements of changes in net assets due to short-term capital gains being treated as ordinary income for tax purposes. |
Semi-Annual Report
18
Note 8. Commitments and Contingencies
The Fund indemnifies its officers and trustees for certain liabilities that may arise from performance of their duties to the Fund. Additionally, in the normal course of business, the Fund enters into contracts that contain a variety of representations and warranties which provide general indemnifications. The Fund’s maximum exposure under these arrangements is unknown, as this would involve future claims that may be made against the Fund that have not yet occurred.
Note 9. Subsequent Events
Management of the Fund has evaluated the need for disclosures and/or adjustments resulting from subsequent events through the date these financial statements were issued. There were no items requiring adjustment of financial statements or additional disclosure.
OTHER INFORMATION
The Fund’s Statement of Additional Information (“SAI”) includes additional information about the trustees and is available without charge, upon request. You may call toll-free at (800) 247-1014 to request a copy of the SAI or to make shareholder inquiries.
Semi-Annual Report
19
Investment Advisory Agreement Approval (Unaudited)
At a meeting held on December 9-10, 2014, the Board of Trustees (the “Board”) considered the renewal of the Investment Advisory Agreement (the “Agreement”) between the Trust and Dreman Value Management, LLC (“Dreman” or “Adviser”) with respect to the Dreman Contrarian Small Cap Value Fund (“Fund”). Counsel noted that the 1940 Act requires the approval of the investment advisory agreement between the Trust and its investment adviser by the Board, including a majority of the Independent Trustees. The Board discussed the arrangements between the Adviser and the Trust with respect to the Fund.
Counsel discussed with the Trustees the types of information and factors that should be considered by the Board in order to make an informed decision regarding the approval of the Agreement, including the following material factors: (i) the nature, extent, and quality of the services to be provided by Dreman; (ii) the investment performance of the Fund; (iii) the costs of the services to be provided and anticipated profits to be realized by Dreman from the relationship with the Fund; (iv) the extent to which economies of scale would be realized if the Fund grows and whether advisory fee levels reflect those economies of scale for the benefit of the Fund’s investors; and (v) Dreman’s practices regarding possible conflicts of interest and potential benefits derived from its relationship with the Fund.
The Board then considered the proposed renewal of the Agreement between the Trust and Dreman with respect to the Fund. The Board discussed the contractual arrangements between Dreman and the Trust with respect to the Fund. Counsel reminded the Trustees of their fiduciary duties and responsibilities as summarized in the memorandum from Counsel, including the factors to be considered, and the application of those factors to Dreman. In assessing these factors and reaching its decisions, the Board took into consideration information furnished for the Board’s review and consideration throughout the year at regular Board meetings, as well as information specifically prepared and/or presented in connection with the annual renewal process, including information presented at the Meeting. The Board requested and was provided with, and reflected on, information and reports relevant to the annual renewal of the Agreement, including: (i) reports regarding the services and support provided to the Fund and its shareholders by Dreman; (ii) quarterly assessments of the investment performance of the Fund by personnel of Dreman; (iii) commentary on the reasons for the performance; (iv) presentations by Dreman addressing Dreman’s investment philosophy, investment strategy, personnel and operations; (v) compliance and audit reports concerning the Fund and Dreman; (vi) disclosure information contained in the registration statement of the Trust and the Form ADV of Dreman; and (vii) a memorandum from Counsel, that summarized the fiduciary duties and responsibilities of the Board in reviewing and approving the Agreement, including the material factors set forth above and the types of information included in each factor that should be considered by the Board in order to make an informed decision. The Board also requested and received various informational materials including, without limitation: (i) documents containing information about Dreman, including financial information, a description of personnel and the services provided to the Fund, information on investment advice, performance, summaries of Fund expenses, compliance program, current legal matters, and other general
Semi-Annual Report
20
information; (ii) comparative expense and performance information for other mutual funds with strategies similar to the Fund; and (iii) benefits to be realized by Dreman from its relationship with the Fund. The Board did not identify any particular information that was most relevant to its consideration to approve the Agreement and each Trustee may have afforded different weight to the various factors.
| 1. | The nature, extent, and quality of the services to be provided by the Adviser. In this regard, the Board considered the Adviser’s responsibilities under the Agreement. The Trustees considered the services provided by the Adviser to the Fund including, without limitation: the quality of its investment advisory services (including research and recommendations with respect to portfolio securities), its process for formulating investment recommendations and assuring compliance with the Fund’s investment objectives and limitations, its coordination of services for the Fund among the Fund’s service providers, and its anticipated efforts to promote the Fund and grow its assets. The Trustees considered the Adviser’s continuity of, and commitment to retain, qualified personnel and the Adviser’s commitment to maintain and enhance its resources and systems. The Trustees considered the Adviser’s personnel, including the education and experience of the Adviser’s personnel. After considering the foregoing information and further information in the Meeting materials provided by the Adviser (including the Adviser’s Form ADV), the Board concluded that, in light of all the facts and circumstances, the nature, extent, and quality of the services provided by the Adviser were satisfactory and adequate for the Fund. |
| 2. | Investment Performance of the Fund and the Adviser. In considering the investment performance of the Fund and the Adviser, the Trustees compared the one-month, three-month, one-year, year-to-date, and since inception performance of the Fund for the periods ending September 30, 2014 with the performance of funds with similar objectives managed by other investment advisers, as well as with aggregated peer group data. They also compared the performance of the Fund during various longer periods with the performance of the Fund’s benchmark. The Trustees also considered the consistency of the Adviser’s management of the Fund with its investment objective, strategies, and limitations. The Trustees noted that the Fund performed above average in its peer group category during the periods reviewed, and outperformed the benchmark during the one-year, three-year, ten-year and since inception periods. They also noted that the Fund slightly underperformed as compared to the index for the five-year period ended September 30, 2014. The Trustees also considered the Fund’s performance relative to the performance of the Adviser’s private accounts managed similarly to the Fund based on recent data and observed that the Fund performed comparably to those other accounts. After reviewing and discussing the investment performance of the Fund further, the Adviser’s experience managing the Fund, the Adviser’s historical performance, and other relevant factors, the Board concluded, in light of all the facts and circumstances, that the investment performance of the Fund and the Adviser was acceptable. |
Semi-Annual Report
21
Investment Advisory Agreement Approval (Unaudited) (Continued)
| 3. | The costs of the services to be provided and profits to be realized by the Adviser from the relationship with the Fund. In considering the costs of services to be provided and the profits to be realized by the Adviser from the relationship with the Fund, the Trustees considered: (1) the Adviser’s financial condition; (2) asset level of the Fund; (3) the overall expenses of the Fund; and (4) the nature and frequency of advisory fee payments. The Trustees reviewed information provided by the Adviser regarding its profits associated with managing the Fund. The Trustees also considered potential benefits for the Adviser in managing the Fund. The Trustees then compared the fees and expenses of the Fund (including the management fee) to other comparable mutual funds. The Trustees noted that the Fund’s management fee was somewhat higher than the average and median fees for the Fund’s peer group category. They also noted that the Fund’s total fees were below the average and median, due to the Adviser’s contractual agreement to limit fees. Based on the foregoing, the Board concluded that the fees to be paid to the Adviser by the Fund and the profits to be realized by the Adviser, in light of all the facts and circumstances, were fair and reasonable in relation to the nature and quality of the services provided by the Adviser. |
| 4. | The extent to which economies of scale would be realized as the Fund grows and whether advisory fee levels reflect these economies of scale for the benefit of the Fund’s investors. In this regard, the Board considered the Fund’s fee arrangements with the Adviser. The Board considered that while the management fee remained the same at all asset levels, the Fund’s shareholders had experienced benefits from the Fund’s expense limitation arrangement. In light of its ongoing consideration of the Fund’s asset levels, expectations for growth in the Fund, and fee levels, the Board determined that the Fund’s fee arrangements, in light of all the facts and circumstances, were fair and reasonable in relation to the nature and quality of the services provided by the Adviser. |
| 5. | Possible conflicts of interest. In considering the Adviser’s practices regarding conflicts of interest, the Trustees evaluated the potential for conflicts of interest and considered such matters as the experience and ability of the advisory personnel assigned to the Fund; the basis of decisions to buy or sell securities for the Fund and/or the Adviser’s other accounts; and the substance and administration of the Adviser’s code of ethics. The Trustees also considered disclosure in the registration statement of the Trust relating to the Adviser’s potential conflicts of interest. Based on the foregoing, the Board determined that the Adviser’s standards and practices of the Advisers relating to the identification and mitigation of potential conflicts of interest were satisfactory. |
After additional consideration of the factors delineated in the memorandum provided by Counsel and further discussion among the Board, the Board determined to approve the continuation of the Agreement between the Trust and the Adviser.
Semi-Annual Report
22
Valued Advisers Trust
PRIVACY POLICY
The following is a description of the policies of the Valued Advisers Trust (the “Trust”) regarding disclosure of nonpublic personal information that shareholders provide to a series of the Trust (each, a “Fund”) or that the Fund collects from other sources. In the event that a shareholder holds shares of a Fund through a broker-dealer or other financial intermediary, the privacy policy of the financial intermediary would govern how shareholder nonpublic personal information would be shared with nonaffiliated third parties.
Categories of Information A Fund May Collect.
A Fund may collect the following nonpublic personal information about its shareholders:
| • | Information the Fund receives from a shareholder on applications or other forms, correspondence, or conversations (such as the shareholder’s name, address, phone number, social security number, and date of birth); and |
| • | Information about the shareholder’s transactions with the Fund, its affiliates, or others (such as the shareholder’s account number and balance, payment history, cost basis information, and other financial information). |
Categories of Information A Fund May Disclose.
A Fund may not disclose any nonpublic personal information about its current or former shareholders to unaffiliated third parties, except as required or permitted by law. A Fund is permitted by law to disclose all of the information it collects, as described above, to its service providers (such as the Fund’s custodian, administrator, transfer agent, accountant and legal counsel) to process shareholder transactions and otherwise provide services to the shareholder.
Confidentiality and Security.
Each Fund shall restrict access to shareholder nonpublic personal information to those persons who require such information to provide products or services to the shareholder. Each Fund shall maintain physical, electronic, and procedural safeguards that comply with federal standards to guard shareholder nonpublic personal information.
Disposal of Information.
The Funds, through their transfer agent, have taken steps to reasonably ensure that the privacy of a shareholder’s nonpublic personal information is maintained at all times, including in connection with the disposal of information that is no longer required to be maintained by the Funds. Such steps shall include, whenever possible, shredding paper documents and records prior to disposal, requiring off-site storage vendors to shred documents maintained in such locations prior to disposal, and erasing and/or obliterating any data contained on electronic media in such a manner that the information can no longer be read or reconstructed.
Semi-Annual Report
23
PROXY VOTING
A description of the policies and procedures that the Fund uses to determine how to vote proxies relating to portfolio securities and information regarding how the Fund voted those proxies during the recent twelve month period ended June 30 are available without charge upon request by (1) calling the Fund at (800) 247-1014 or (2) from Fund documents filed with the Commission on the Commission’s website at www.sec.gov.
TRUSTEES
R. Jeffrey Young, Chairman
Ira Cohen
Andrea Mullins
OFFICERS
R. Jeffrey Young, Principal Executive Officer and President
Bryan W. Ashmus, Principal Financial Officer and Treasurer
John C. Swhear, Chief Compliance Officer, AML Officer and Vice-President
Carol J. Highsmith, Vice President and Secretary
Matthew J. Miller, Vice President
INVESTMENT ADVISER
Dreman Value Management, LLC
Harborside Financial Center
Plaza 10, Suite 800
Jersey City, NJ 07311
DISTRIBUTOR
Unified Financial Securities, Inc.
2960 North Meridian Street, Suite 300
Indianapolis, IN 46208
INDEPENDENT REGISTERED PUBLIC ACCOUNTING FIRM
Cohen Fund Audit Services, Ltd.
1350 Euclid Avenue, Suite 800
Cleveland, OH 44115
LEGAL COUNSEL
The Law Offices of John H. Lively & Associates, Inc.
A member firm of The 1940 Act Law Group TM
11300 Tomahawk Creek Parkway, Suite 310
Leawood, KS 66211
CUSTODIAN
Huntington National Bank
41 S. High St.
Columbus, OH 43215
ADMINISTRATOR, TRANSFER AGENT
AND FUND ACCOUNTANT
Huntington Asset Services, Inc.
2960 North Meridian Street, Suite 300
Indianapolis, IN 46208
This report is intended only for the information of shareholders or those who have received the Fund’s prospectus which contains information about the Fund’s management fee and expenses. Please read the prospectus carefully before investing.
Distributed by Unified Financial Securities, Inc.
Member FINRA/SIPC

SOUND MIND INVESTING FUND
SMI CONSERVATIVE
ALLOCATION FUND
SMI DYNAMIC
ALLOCATION FUND
SMI BOND FUND
SMI 50/40/10 FUND
| SEMI-ANNUAL REPORT |
| APRIL 30, 2015 |
Fund Adviser:
SMI Advisory Services, LLC
11135 Baker Hollow Road
Columbus, IN 47201
Toll Free (877) SMI-FUND
www.smifund.com
Dear Fellow Shareholder,
Nearly a decade ago (December 2005), SMI Advisory Services launched the original Sound Mind Investing Fund (SMIFX). The Sound Mind Investing Fund (SMIFX) follows an investing strategy called Fund Upgrading.
Two additional funds eventually joined SMIFX: the SMI Dynamic Allocation Fund (SMIDX), which is a managed approach to the Dynamic Asset Allocation strategy, and the SMI Conservative Allocation Fund (SMILX), which blends multiple approaches in a roughly 60% stock / 40% bond mix. (Dynamic Asset Allocation (“DAA”) is typically used for the “stock” portion despite the fact that DAA isn’t always invested solely in stocks, and Upgrading can also be used at the managers’ discretion; Bond Upgrading governs the 40% bond portion).
Both SMIFX and SMIDX grew rapidly, and today each of these two funds have grown to more than $200 million in assets.
At the end of April, SMI Advisory Services added a pair of new funds to the SMI Funds lineup. The SMI Bond Fund (SMIUX) will provide investors the opportunity to have SMI Advisory Services manage the bond portion of their portfolio. While SMI’s Conservative Allocation and Dynamic Allocation Funds include bonds in varying degrees, SMIUX is the first SMI Fund that will allow investors to pair a pure SMI Bond approach with SMI’s most popular stock strategies in the exact allocations they desire. The SMI Bond Fund relies on an objective momentum formula to steer investment between different types of bonds. Half of the Fund’s portfolio will be upgraded while the other part will consist of a less dynamic core where the priority is stability. It’s a natural complement to SMI’s equity funds, providing the opportunity for an investor to craft a managed solution for his or her total portfolio.
The second new fund is named the SMI 50/40/10 Fund (SMIRX). It will likewise offer a professionally managed option to those who desire to automate their investing in a blend of the popular Dynamic Asset Allocation, Upgrading, and Sector Rotation strategies. Both of these new funds are available to the public and are accepting investments.
The SMI Fund lineup, shown below, now offers investors a way to mix and match professionally managed funds to custom tailor the risk level desired for their portfolio. If you’d like assistance customizing your portfolio in this manner, please call a Stewardship Advisor at (800) 796-4975.
1
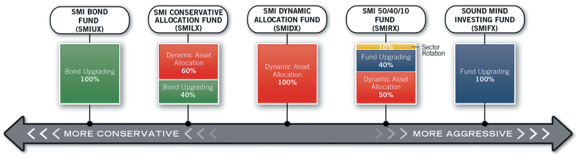
SMI Funds
Dynamic Allocation Fund (SMIDX)
For the past six years, SMI and many others have pointed to the policies of the Federal Reserve as a primary driver of investment returns. The first quarter of 2015 continued to illustrate the importance of central-bank policy in investment performance – but with a twist. With the U.S. having completed its quantitative-easing program that kept interest rates low, attention at home has shifted to the “guess when the Fed will start raising rates” game. Abroad, both Japan and Europe have initiated new QE policies, driving foreign returns higher, though these gains have been largely muted for U.S. investors due to the rising dollar and the cost of converting those foreign gains back into dollars.
As 2015 got underway, weaker economic data initially convinced many that the Fed would have to hold off on its first interest-rate increase longer than previously expected. Stocks lost ground on the perceived economic weakness, while investments that are sensitive to changes in interest rates (such as long-term bonds and real estate) soared.
The tide turned quickly, however. Economic numbers improved markedly by February, stocks soared, and interest rates rose back to where they’d started the year. These competing forces swayed back and forth throughout March and April.
These quick reversals put SMI’s Dynamic Asset Allocation in an unusual spot. Based on 2015’s early returns, one would have never guessed that SMIDX is SMI’s “risk-averse” strategy! Dramatic swings in interest rates – first lower, then higher again – pushed DAA’s monthly performance around more than we’re used to.
Upgrading and Dynamic Asset Allocation Are Complementary Strategies
Although SMIDX performance was more volatile than usual, it did continue to serve as an effective counterweight to the stock market’s performance. In January, as stocks fell, SMIDX soared. In February, it was the opposite: SMIDX fell while stocks soared. This aspect of DAA is probably underappreciated, as it gives SMI portfolios a more balanced feeling than our Upgrading-dominated portfolios typically had in the past.
2
The SMI Fund (SMIFX)
Over the past five years, the performance of our Upgrading portfolio has been strong in absolute terms, but weak in relative terms, as it has trailed the market (as well as SMI’s other stock-oriented strategies). So it was good to see Stock Upgrading leading the SMI strategy pack in performance during the first-quarter of 2015.
SMIFX benefited from a shift in market leadership away from large-company stocks and toward their small-company counterparts. And while foreign stock returns weren’t particularly great (again, after adjusting for the strong dollar and weakening foreign currencies), at least they weren’t the return-killing anchor they have often been for Upgrading in recent years.
The SMI Balanced Fund is now the SMI Conservative Allocation Fund (SMILX)
At the end of February, two significant changes were made to the SMI Balanced Fund. First, the approach utilized to manage the equity portion of the fund changed to allow the managers the flexibility to utilize either the dynamic allocation or fund upgrading strategies (or a combination of both). Second, the bond portion of the fund will continue to use Reams as the sub-advisor managing a portion as they have in the past, but a portion of the bond portfolio will also be invested using our new “bond upgrading” strategy. As a result of these changes, the name of the fund was changed to reflect what we anticipate will be a more conservative approach.
Going Direct With the SMI Funds
Slightly over two-thirds of the assets in the SMI Funds are owned through accounts held by other financial intermediaries (Fidelity, Schwab, TD Ameritrade, etc.). That’s perfectly fine. However, there are some advantages to having your account directly with the SMI Funds rather than through a third party.
The primary advantage of a direct account is the ability to buy or sell shares of the SMI Funds without paying any transaction fees. Most third-party accounts are charged some sort of transaction fee when the SMI Funds are bought or sold. Those fees can add up – particularly if you are regularly buying or selling shares in any of the SMI Funds. When your account is held directly with the SMI Funds, you never have to pay transaction fees. Additionally, in accounts held directly with the SMI Funds, the typical 2% redemption fee on shares sold within 60 days of purchase is waived if you are transferring money from one SMI Fund to another. To learn more about moving your account directly to the SMI Funds, visit www.smifund.com or call 1-877-SMI-FUND.
We appreciate the confidence you have placed in us to be a faithful steward of your assets, as you strive to be a faithful steward of His assets.
Sincerely,

Mark Biller
Senior Portfolio Manager
The Sound Mind Investing Funds
3
PERFORMANCE RESULTS – (Unaudited)
Total Return* (For the periods ended April 30, 2015) | ||||||||||||||||||||
| Average Annual | ||||||||||||||||||||
| Three Months | Six Months | One Year | Five Year | Since Inception (December 2, 2005) | ||||||||||||||||
Sound Mind Investing Fund | 4.72% | 3.91% | 7.05% | 9.79% | 6.90% | |||||||||||||||
S&P 500® Index** | 5.07% | 4.40% | 12.98% | 14.33% | 7.71% | |||||||||||||||
Wilshire 5000 Index** | 5.08% | 4.64% | 12.66% | 14.21% | 7.91% | |||||||||||||||
Total annual operating expense, as disclosed in the Fund’s prospectus dated February 28, 2015, were 2.03% of average daily net assets, which includes acquired fund fees and expenses. All expenses are reflected in performance results. The Fund’s adviser contractually has agreed to waive its fee and/or reimburse expenses to the extent necessary to maintain Total Annual Fund Operating Expenses (excluding brokerage fees and commissions; borrowing costs; any 12b-1 fees; taxes; indirect expenses, such as acquired fund fees and expenses; and extraordinary litigation expenses) at 1.50% of the Fund’s average daily net assets through February 29, 2016. This expense cap may not be terminated prior to this date except by the Board of Trustees.
Total Return* (For the periods ended April 30, 2015) | ||||||||||||||||
| Average Annual | ||||||||||||||||
| Three Months | Six Months | One Year | Since Inception (December 30, 2010) | |||||||||||||
SMI Conservative Allocation Fund | -1.26% | 0.76% | 2.09% | 6.53% | ||||||||||||
S&P 500® Index** | 5.07% | 4.40% | 12.98% | 14.73% | ||||||||||||
Wilshire 5000 Index** | 5.08% | 4.64% | 12.66% | 14.40% | ||||||||||||
Barclays Capital U.S. Aggregate Bond Index** | -0.84% | 2.06% | 4.46% | 3.98% | ||||||||||||
Custom Benchmark*** | 2.73% | 3.69% | 9.43% | 10.32% | ||||||||||||
Total annual operating expense, as disclosed in the Fund’s prospectus dated February 28, 2015, were 1.77% of average daily net assets (1.93% before fee waivers/expense reimbursements by the Adviser), which includes acquired fund fees and expenses and reflects the fee waiver/expense reimbursement discussed below. All expenses are reflected in performance results. The Fund’s adviser contractually has agreed to waive its fee and/or reimburse expenses to the extent necessary to maintain Total Annual Fund Operating Expenses (excluding brokerage fees and commissions; borrowing costs; any 12b-1 fees; taxes; indirect expenses, such as acquired fund fees and expenses; and extraordinary litigation expenses) at 1.15% of the Fund’s average daily net assets through February 29, 2016. Each waiver or reimbursement of an expense by the Adviser is subject to repayment by the Fund within the three fiscal years following the fiscal year in which the expense was incurred, provided that the Fund is able to make the repayment without exceeding the expense limitation in place at the time of the waiver or reimbursement. This expense cap may not be terminated prior to this date except by the Board of Trustees.
4
PERFORMANCE RESULTS – (Unaudited), (Continued)
Total Return* (For the periods ended April 30, 2015) | ||||||||||||||||
| Average Annual | ||||||||||||||||
| Three Months | Six Months | One Year | Since Inception (February 28, 2013) | |||||||||||||
SMI Dynamic Allocation Fund | -4.20% | 3.04% | 8.65% | 10.32% | ||||||||||||
Wilshire 5000 Index** | 5.08% | 4.64% | 12.66% | 18.13% | ||||||||||||
Barclays Capital U.S. Aggregate Bond Index** | -0.84% | 2.06% | 4.46% | 2.42% | ||||||||||||
Custom Benchmark*** | 2.73% | 3.69% | 9.43% | 11.72% | ||||||||||||
Total annual operating expense, as disclosed in the Fund’s prospectus dated February 28, 2015, were 1.44% of average daily net assets, which includes acquired fund fees and expenses. All expenses are reflected in performance results. The Fund’s adviser contractually has agreed to waive its fee and/or reimburse expenses to the extent necessary to maintain Total Annual Fund Operating Expenses (excluding brokerage fees and commissions; borrowing costs; any 12b-1 fees; taxes; indirect expenses, such as acquired fund fees and expenses; and extraordinary litigation expenses) at 1.45% of the Fund’s average daily net assets through February 29, 2016. This expense cap may not be terminated prior to this date except by the Board of Trustees.
Total Return* (For the period ended April 30, 2015) | ||||
| Since Inception (April 28, 2015) | ||||
SMI Bond Fund | 0.00% | |||
Barclays Capital U.S. Aggregate Bond Index** | -0.58% | |||
Total annual operating expense, as disclosed in the Fund’s prospectus dated April 27, 2015, were 1.21% of average daily net assets (1.75% before fee waivers/expense reimbursements by the Adviser). The Adviser has contractually has agreed to waive its fee and/or reimburse expenses to the extent necessary to maintain Total Annual Fund Operating Expenses (excluding interest, taxes, brokerage commissions, other expenses which are capitalized in accordance with generally accepted accounting principles, extraordinary expenses, dividend expense on short sales, 12b-1 fees, and acquired fund fees and expenses) at 0.85% of the Fund’s average daily net assets through February 28, 2017. Each waiver or reimbursement of an expense by the Adviser is subject to repayment by the Fund within the three fiscal years following the fiscal year in which the expense was incurred, provided that the Fund is able to make the repayment without exceeding the expense limitation in place at the time of the waiver or reimbursement. This expense cap may not be terminated prior to this date except by the Board of Trustees.
5
PERFORMANCE RESULTS – (Unaudited), (Continued)
Total Return* (For the period ended April 30, 2015) | ||||
| Since Inception (April 29, 2015) | ||||
SMI 50/40/10 Fund | -1.60% | |||
Wilshire 5000 Index** | -1.50% | |||
Barclays Capital U.S. Aggregate Bond Index** | -0.33% | |||
Custom Benchmark*** | -1.03% | |||
Total annual operating expense, as disclosed in the Fund’s prospectus dated April 27, 2015, were 2.01% of average daily net assets (2.21% before fee waivers/expense reimbursements by the Adviser). The Adviser has contractually has agreed to waive its fee and/or reimburse expenses to the extent necessary to maintain Total Annual Fund Operating Expenses (excluding interest, taxes, brokerage commissions, other expenses which are capitalized in accordance with generally accepted accounting principles, extraordinary expenses, dividend expense on short sales, 12b- 1 fees, and acquired fund fees and expenses) at 1.45% of the Fund’s average daily net assets through February 28, 2017. Each waiver or reimbursement of an expense by the Adviser is subject to repayment by the Fund within the three fiscal years following the fiscal year in which the expense was incurred, provided that the Fund is able to make the repayment without exceeding the expense limitation in place at the time of the waiver or reimbursement. This expense cap may not be terminated prior to this date except by the Board of Trustees.
The performance quoted represents past performance, which does not guarantee future results. The investment return and principal value of an investment will fluctuate so that an investor’s shares, when redeemed, may be worth more or less than their original cost. The returns shown do not reflect deduction of taxes that a shareholder would pay on Fund distributions or the redemption of Fund shares. Current performance of the Funds may be lower or higher than the performance quoted. Performance data current to the most recent month end may be obtained by calling 1-877-764-3863.
| * | Return figures reflect any change in price per share and assume the reinvestment of all distributions. |
| ** | The Standard & Poor’s 500® Index, Wilshire 5000 Index and Barclays Capital U.S. Aggregate Bond Index are unmanaged indices that assume reinvestment of all distributions and exclude the effect of taxes and fees. The Standard & Poor’s 500® Index, Wilshire 5000 Index and Barclays Capital U.S. Aggregate Bond Index are widely recognized unmanaged indices and are representative of a broader market and range of securities than is found in each Fund’s portfolio. The returns of the indices are not reduced by any fees or operating expenses. Individuals cannot invest directly in the Indices; however, an individual can invest in exchange traded funds or other investment vehicles that attempt to track the performance of a benchmark index. |
| *** | The Custom Benchmark for the SMI Conservative Allocation Fund, SMI Dynamic Allocation Fund and SMI 50/40/10 Fund is comprised of 60% Wilshire 5000 Index and 40% Barclays Capital U.S. Aggregate Bond Index. |
The Funds’ investment objectives, risks, charges and expenses must be considered carefully before investing. The prospectus contains this and other important information about the Funds and may be obtained by calling the same number as above. Please read it carefully before investing.
6
FUND HOLDINGS – (Unaudited)
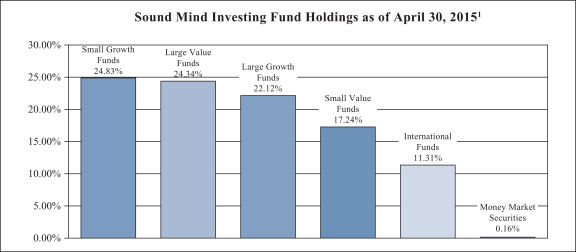
| 1 | As a percentage of total investments. |
Sound Mind Investing Fund seeks long term capital appreciation. The Fund seeks to achieve its objective by investing in a diversified portfolio of other investment companies using a “fund upgrading” strategy. The fund upgrading investment strategy is a systematic investment approach that is based on the belief of the Fund’s adviser, SMI Advisory Services, LLC, (“The Adviser”), that superior returns can be obtained by constantly monitoring the performance of a wide universe of other investment companies, and standing ready to move assets into the funds deemed by the adviser to be most attractive at the time of analysis.
7
FUND HOLDINGS – (Unaudited), (Continued)
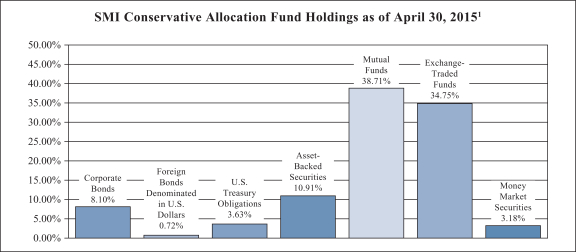
| 1 | As a percentage of total investments. |
SMI Conservative Allocation Fund seeks total return. Total return is composed of both income and capital appreciation. The Fund invests in a portfolio of equities and fixed income securities, including securities of other investment companies that focus their investments on equity and fixed income investments. To the extent the Adviser invests the Fund’s assets in equity securities, such investments will consist of investments in other investment companies (i.e., mutual funds), exchange traded funds (“ETFs”) and pooled investment vehicles, and the Adviser will select such portfolio holdings. The fixed income portion (if any) of the Fund will be comprised of fixed income investment companies and ETFs and individual fixed income securities. The Adviser will use its proprietary “Bond Upgrading” strategy to make all portfolio decisions with respect to investments in fixed income investment companies and ETFs. The Adviser’s “Bond Upgrading” strategy involves the use of momentum based performance indicators of the various bond categories to identify which categories may present the best investment opportunities. The Adviser scores the categories and uses the scores to make decisions on investments in the various categories.
8
FUND HOLDINGS – (Unaudited), (Continued)
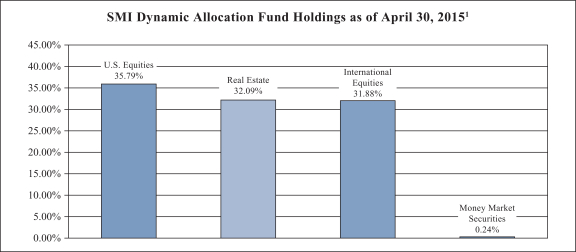
| 1 | As a percentage of total investments. |
SMI Dynamic Allocation Fund seeks total return. Total return is composed of both income and capital appreciation. The Fund uses a dynamic asset allocation investment strategy to achieve its investment objective. This is done by investing in securities from the following six asset classes – U.S. Equities, International Equities, Fixed Income Securities, Real Estate, Precious Metals, and Cash.
9
FUND HOLDINGS – (Unaudited), (Continued)
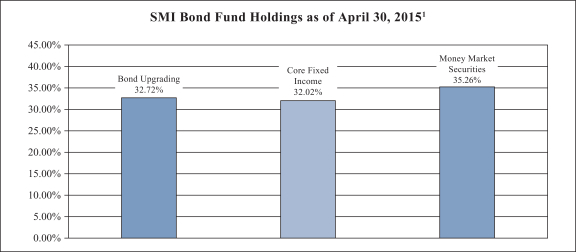
| 1 | As a percentage of total investments. |
SMI Bond Fund seeks total return. Total return is composed of both income and capital appreciation. The Fund invests at least 80% of its net assets in a portfolio of fixed income securities, including securities of other investment companies that focus their investments on fixed income investments. The Fund will be comprised of fixed income investment companies and ETFs and individual fixed income securities. The Adviser will use its proprietary “Bond Upgrading” strategy to make all portfolio decisions with respect to investments in fixed income investment companies and ETFs. The Adviser’s “Bond Upgrading” strategy involves the use of momentum based performance indicators of the various bond categories to identify which categories may present the best investment opportunities. The Adviser scores the categories and uses the scores to make decisions on investments in the various categories.
10
FUND HOLDINGS – (Unaudited), (Continued)
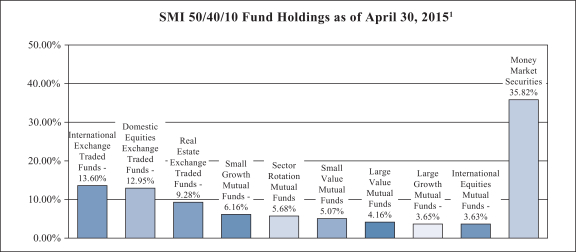
| 1 | As a percentage of total investments. |
SMI 50/40/10 Fund seeks total return. Total return is composed of both income and capital appreciation. The Fund’s adviser, allocates the Fund’s assets on a 50/40/10 basis among various investment strategies as follows:
| • | 50% – Dynamic Asset Allocation Strategy |
| • | 40% – Fund Upgrading Strategy |
| • | 10% – Sector Rotation Strategy |
The Sector Rotation Strategy involves the Adviser selecting from a universe of mutual funds and ETFs it has compiled using proprietary methods. This universe is specifically designed by the Adviser to balance exposure to a wide variety of market sectors and industries. This universe includes both leveraged and non-leveraged funds. The Adviser ranks these funds based on their recent performance across multiple short-term performance periods, then uses an upgrading approach to invest in the top performing market sector or sectors. Once a particular sector or sectors is identified, the Adviser purchases one or more mutual funds or ETFs to gain the desired exposure to that particular sector. This portion of the Fund may be concentrated, meaning that the Fund may be invested in as few as one or two sectors at a time and potentially as few as one underlying mutual fund or ETF.
Availability of Portfolio Schedule – (Unaudited)
Each Fund files its complete schedule of portfolio holdings with the Securities and Exchange Commission (“SEC”) for the first and third quarters of each fiscal year on Form N-Q. The Funds’ Forms N-Q are available at the SEC’s website at www.sec.gov. The Funds’ Forms N-Q may be reviewed and copied at the Public Reference Room in Washington DC. Information on the operation of the Public Reference Room may be obtained by calling 1-800-SEC-0330.
11
SUMMARY OF FUNDS’ EXPENSES – (Unaudited)
As a shareholder of one of the Funds, you incur two types of costs: (1) transaction costs (such as short-term redemption fees); and (2) ongoing costs, including management fees and other Fund expenses. This example is intended to help you understand your ongoing costs (in dollars) of investing in the Funds and to compare these costs with the ongoing costs of investing in other mutual funds.
Each Fund’s example is based on an investment of $1,000 invested at the beginning of the period and held for the entire period (November 1, 2014 through April 30, 2015).
Actual Expenses
The first line of the table below provides information about actual account values and actual expenses. You may use the information in this line, together with the amount you invested, to estimate the expenses that you paid over the period. Simply divide your account value by $1,000 (for example, an $8,600 account value divided by $1,000 = 8.60), then multiply the result by the number in the first line under the heading entitled “Expenses Paid During Period” to estimate the expenses you paid on your account during this period.
Hypothetical Example for Comparison Purposes
The second line of the table below provides information about hypothetical account values and hypothetical expenses based on the Funds’ actual expense ratio and an assumed rate of return of 5% per year before expenses, which is not the Funds’ actual return. The hypothetical account values and expenses may not be used to estimate the actual ending account balance or expenses you paid for the period. You may use this information to compare the ongoing costs of investing in the Funds and other funds. To do so, compare this 5% hypothetical example with the 5% hypothetical examples that appear in the shareholder reports of the other funds.
Expenses shown are meant to highlight your ongoing costs only and do not reflect any transactional costs such as the fee imposed on short-term redemptions. Therefore, the second line of the table below is useful in comparing ongoing costs only and will not help you determine the relative costs of owning different funds. If incurred, the short-term redemption fee imposed by the Funds would increase your expenses.
Sound Mind Investing Fund | Beginning Account Value November 1, 2014 | Ending Account Value April 30, 2015 | Expenses Paid During Period November 1, 2014 – April 30, 2015* | |||||||||
| Actual | $ | 1,000.00 | $ | 1,039.10 | $ | 5.71 | ||||||
| Hypothetical ** | $ | 1,000.00 | $ | 1,019.20 | $ | 5.65 | ||||||
| * | Expenses are equal to the Fund’s annualized expense ratio of 1.13%, multiplied by the average account value over the period, multiplied by 181/365 (to reflect the partial year period). |
| ** | Assumes a 5% return before expenses. |
12
SUMMARY OF FUNDS’ EXPENSES – (Unaudited), (Continued)
SMI Conservative Allocation | Beginning Account Value November 1, 2014 | Ending Account Value April 30, 2015 | Expenses Paid During Period November 1, 2014 – April 30, 2015* | |||||||||
| Actual | $ | 1,000.00 | $ | 1,007.60 | $ | 5.72 | ||||||
| Hypothetical ** | $ | 1,000.00 | $ | 1,019.09 | $ | 5.76 | ||||||
| * | Expenses are equal to the Fund’s annualized expense ratio of 1.15%, multiplied by the average account value over the period, multiplied by 181/365 (to reflect the partial year period). |
| ** | Assumes a 5% return before expenses. |
SMI Dynamic Allocation | Beginning Account Value November 1, 2014 | Ending Account Value April 30, 2015 | Expenses Paid During Period November 1, 2014 – April 30, 2015* | |||||||||
| Actual | $ | 1,000.00 | $ | 1,030.40 | $ | 5.73 | ||||||
| Hypothetical ** | $ | 1,000.00 | $ | 1,019.15 | $ | 5.69 | ||||||
| * | Expenses are equal to the Fund’s annualized expense ratio of 1.14%, multiplied by the average account value over the period, multiplied by 181/365 (to reflect the partial year period). |
| ** | Assumes a 5% return before expenses. |
SMI Bond | Beginning Account Value April 28, 2015 | Ending Account Value April 30, 2015 | Expenses Paid During The Period Ended April 30, 2015 | |||||||||
| Actual | $ | 1,000.00 | $ | 1,000.00 | $ | 0.07 | * | |||||
| Hypothetical ** | $ | 1,000.00 | $ | 1,020.58 | $ | 4.26 | ||||||
| * | Expenses are equal to the Fund’s annualized expense ratio of 0.85%, multiplied by the average account value over the period, multiplied by 3/365 (to reflect the period since commencement of operations on April 28, 2015). |
| ** | Assumes a 5% return before expenses. The hypothetical example is calculated based on a six month period from November 1, 2014 to April 30, 2015. Accordingly, expenses are equal to the Fund’s annualized expense ratio of 0.85% multiplied by the average account value over the six month period, multiplied by 181/365 (to reflect the partial year period). |
SMI 50/40/10 | Beginning Account Value April 29, 2015 | Ending Account Value April 30, 2015 | Expenses Paid During The Period Ended April 30, 2015 | |||||||||
| Actual | $ | 1,000.00 | $ | 984.00 | $ | 0.08 | * | |||||
| Hypothetical ** | $ | 1,000.00 | $ | 1,017.61 | $ | 7.25 | ||||||
| * | Expenses are equal to the Fund’s annualized expense ratio of 1.45%, multiplied by the average account value over the period, multiplied by 2/365 (to reflect the period since commencement of operations on April 29, 2015). |
| ** | Assumes a 5% return before expenses. The hypothetical example is calculated based on a six month period from November 1, 2014 to April 30, 2015. Accordingly, expenses are equal to the Fund’s annualized expense ratio of 1.45% multiplied by the average account value over the six month period, multiplied by 181/365 (to reflect the partial year period). |
13
SOUND MIND INVESTING FUND
SCHEDULE OF INVESTMENTS
April 30, 2015 – (Unaudited)
| Mutual Funds – 91.96% | Shares | Fair Value | ||||||
Mutual Funds Greater Than 1% of The Sound | ||||||||
AllianceBernstein Large-Cap Growth Fund – Advisor Class | 281,571 | $ | 11,744,319 | |||||
Ariel Fund – Investor Class | 201,764 | 15,261,407 | ||||||
BlackRock Mid-Cap Growth Equity Portfolio – Institutional Class | 252,535 | 4,578,459 | ||||||
Columbia Large Cap Enhanced Core Fund – Class A | 164,974 | 3,586,541 | ||||||
Eventide Gilead Fund – Institutional Class | 279,641 | 7,916,649 | ||||||
Fidelity Growth Strategies Fund | 279,385 | 9,490,713 | ||||||
Fidelity Mid Cap Value Fund | 471,390 | 11,808,322 | ||||||
Fidelity OTC Portfolio* | 147,284 | 12,379,206 | ||||||
Hartford Growth Opportunities Fund/The – Class Y | 141,826 | 5,668,786 | ||||||
Janus Forty Fund – Institutional Class | 469,208 | 15,488,544 | ||||||
Janus Venture Fund – Class T | 61,045 | 4,022,850 | ||||||
JOHCM International Select Fund – Class I | 459,688 | 9,570,701 | ||||||
JPMorgan Disciplined Equity Fund – Institutional Class | 547,460 | 13,128,085 | ||||||
JPMorgan Intrepid Mid Cap Fund – Select Class | 361,251 | 8,395,483 | ||||||
Lazard U.S. Equity Concentrated Portfolio – Institutional Class (a) | 843,082 | 11,567,085 | ||||||
Legg Mason Opportunity Trust – Institutional Class | 278,075 | 6,084,278 | ||||||
Nicholas Fund, Inc. | 168,462 | 12,167,988 | ||||||
Olstein All Cap Value Fund – Advisor Class (a) | 550,318 | 14,016,599 | ||||||
PIMCO StocksPLUS International Fund U.S. Dollar Hedged – Institutional Class | 1,067,592 | 8,903,715 | ||||||
PRIMECAP Odyssey Aggressive Growth Fund | 355,394 | 12,278,877 | ||||||
RS Small Cap Growth Fund – Class Y | 168,145 | 11,948,361 | ||||||
Thornburg International Value Fund – Class I | 110,925 | 3,495,247 | ||||||
Touchstone Large Cap Growth Fund – Class Y | 149,201 | 4,640,166 | ||||||
Vanguard Strategic Equity Fund – Investor Class | 235,213 | 7,858,452 | ||||||
Wells Fargo Advantage International Equity Fund – Institutional Class (a) | 513,428 | 6,422,986 | ||||||
|
| |||||||
TOTAL MUTUAL FUNDS GREATER THAN 1% OF SOUND | 232,423,819 | |||||||
|
| |||||||
Mutual Funds Less Than 1% of The Sound | ||||||||
Allianz NFJ Dividend Value Fund – Institutional Class | 200 | 3,430 | ||||||
Allianz NFJ Small-Cap Value Fund – Institutional Class | 162 | 4,581 | ||||||
American Century International Discovery Fund – Institutional Class | 250 | 3,429 | ||||||
Artisan International Small Cap Fund – Investor Class | 150 | 3,912 | ||||||
See accompanying notes which are an integral part of these financial statements.
14
SOUND MIND INVESTING FUND
SCHEDULE OF INVESTMENTS
April 30, 2015 – (Unaudited), (Continued)
| Mutual Funds – 91.96% – continued | Shares | Fair Value | ||||||
Mutual Funds Less Than 1% of The Sound | ||||||||
Artisan International Value Fund – Investor Class | 150 | $ | 5,383 | |||||
Artisan Mid Cap Value Fund – Investor Class | 200 | 5,060 | ||||||
Artisan Small Cap Fund – Investor Class * | 250 | 7,652 | ||||||
Artisan Small Cap Value Fund – Investor Class | 150 | 2,114 | ||||||
Aston TAMRO Small Cap Fund – Institutional Class | 100 | 2,047 | ||||||
BBH Core Select Fund – Class N | 100 | 2,280 | ||||||
Berwyn Fund | 100 | 3,229 | ||||||
BlackRock International Opportunities Portfolio – Institutional Class | 100 | 3,553 | ||||||
Bridgeway Small Cap Growth Fund – Class N | 205 | 4,189 | ||||||
Bridgeway Small Cap Value Fund – Class N | 179 | 3,950 | ||||||
Buffalo Small Cap Fund, Inc. | 150 | 4,824 | ||||||
Columbia Acorn International – Class Z | 100 | 4,499 | ||||||
Columbia Acorn Select – Class Z | 150 | 3,414 | ||||||
Columbia Small Cap Growth I Fund – Class Z | 100 | 2,760 | ||||||
Columbia Value and Restructuring Fund – Class Z | 50 | 2,366 | ||||||
Davis Opportunity Fund – Class Y | 100 | 3,506 | ||||||
Delaware Select Growth Fund – Institutional Class | 100 | 5,298 | ||||||
Delaware Small Cap Value Fund – Institutional Class | 100 | 5,547 | ||||||
Delaware SMID Cap Growth Fund – Institutional Class | 100 | 3,507 | ||||||
Delaware Value Fund – Institutional Class | 144 | 2,690 | ||||||
Deutsche Small Cap Value Fund – Institutional Class | 85 | 2,266 | ||||||
DFA International Small Cap Value Portfolio – Investor Class | 100 | 2,045 | ||||||
DFA International Small Company Portfolio – Institutional Class | 100 | 1,863 | ||||||
DFA U.S. Small Cap Value Portfolio – Institutional Class | 100 | 3,534 | ||||||
Dreyfus Opportunistic Small Cap Fund | 100 | 3,140 | ||||||
Fairholme Fund | 100 | 3,550 | ||||||
Fidelity Mid-Cap Stock Fund | 150 | 6,016 | ||||||
Fidelity Small Cap Discovery Fund | 100 | 3,062 | ||||||
Fidelity Small Cap Stock Fund | 150 | 2,988 | ||||||
Fidelity Small Cap Value Fund – Advisor Class | 150 | 2,868 | ||||||
Franklin Small Cap Value Fund – Advisor Class | 100 | 5,645 | ||||||
Hartford International Opportunities Fund/The – Class Y | 248 | 4,091 | ||||||
Heartland Value Fund | 100 | 4,340 | ||||||
Hennessy Focus Fund – Investor Class | 100 | 7,012 | ||||||
Hotchkis and Wiley Mid-Cap Value Fund – Institutional Class | 100 | 4,204 | ||||||
Invesco American Value Fund – Class R5 | 100 | 4,063 | ||||||
Janus Overseas Fund – Class T | 100 | 3,437 | ||||||
See accompanying notes which are an integral part of these financial statements.
15
SOUND MIND INVESTING FUND
SCHEDULE OF INVESTMENTS
April 30, 2015 – (Unaudited), (Continued)
| Mutual Funds – 91.96% – continued | Shares | Fair Value | ||||||
Mutual Funds Less Than 1% of The Sound | ||||||||
JPMorgan Mid Cap Value Fund – Institutional Class | 100 | $ | 3,783 | |||||
JPMorgan Small Cap Equity Fund – Select Class | 226 | 11,147 | ||||||
Longleaf Partners Fund | 150 | 4,785 | ||||||
Longleaf Partners International Fund | 100 | 1,430 | ||||||
Longleaf Partners Small-Cap Fund | 100 | 3,301 | ||||||
Lord Abbett Developing Growth Fund, Inc. – Institutional Class | 100 | 2,583 | ||||||
Morgan Stanley Institutional Fund, Inc. – International Small Cap Portfolio – Institutional Class | 100 | 4,202 | ||||||
Neuberger Berman Genesis Fund – Institutional Class | 100 | 5,783 | ||||||
Oakmark International Fund – Institutional Class | 150 | 3,801 | ||||||
Oakmark International Small Cap Fund – Institutional Class | 150 | 2,543 | ||||||
Oakmark Select Fund – Institutional Class | 150 | 6,214 | ||||||
Oppenheimer International Small Company Fund – Class Y | 100 | 3,544 | ||||||
Oppenheimer Small and Mid-Cap Value Fund – Class Y | 100 | 5,093 | ||||||
Perkins Mid Cap Value Fund – Class T | 200 | 4,008 | ||||||
Principal SmallCap Growth Fund I – Institutional Class | 200 | 2,476 | ||||||
Royce Low-Priced Stock Fund – Investment Class | 150 | 1,461 | ||||||
Royce Opportunity Fund – Investor Class | 151 | 2,033 | ||||||
Royce Premier Fund – Investment Class | 300 | 5,964 | ||||||
Royce Special Equity Fund – Institutional Class | 150 | 3,368 | ||||||
Royce Special Equity Fund – Investment Class | 100 | 2,259 | ||||||
Royce Value Fund – Institutional Class | 100 | 1,215 | ||||||
T. Rowe Price International Discovery Fund | 150 | 8,517 | ||||||
T. Rowe Price New Horizons Fund | 100 | 4,584 | ||||||
T. Rowe Price Small-Cap Value Fund | 100 | 4,636 | ||||||
Third Avenue Value Fund – Institutional Class | 335 | 19,645 | ||||||
TIAA-CREF International Equity Fund – Institutional Class | 100 | 1,178 | ||||||
Touchstone Sands Capital Select Growth Fund – Class Y | 100 | 1,856 | ||||||
Tweedy, Browne Global Value Fund | 150 | 4,115 | ||||||
Wasatch Emerging Markets Small Cap Fund | 1,000 | 2,810 | ||||||
Wasatch International Growth Fund | 150 | 4,315 | ||||||
|
| |||||||
TOTAL MUTUAL FUNDS LESS THAN 1% OF SOUND | 289,993 | |||||||
|
| |||||||
TOTAL MUTUAL FUNDS (Cost $226,478,442) | 232,713,812 | |||||||
|
| |||||||
See accompanying notes which are an integral part of these financial statements.
16
SOUND MIND INVESTING FUND
SCHEDULE OF INVESTMENTS
April 30, 2015 – (Unaudited), (Continued)
| Exchange-Traded Funds – 7.35% | Shares | Fair Value | ||||||
iShares U.S. Consumer Services ETF | 40,300 | $ | 5,750,810 | |||||
PowerShares Buyback Achievers Portfolio ETF | 263,300 | 12,846,407 | ||||||
|
| |||||||
TOTAL EXCHANGE-TRADED FUNDS (Cost $18,570,874) | 18,597,217 | |||||||
|
| |||||||
Money Market Securities – 0.16% | ||||||||
Fidelity Institutional Money Market Portfolio – Institutional Class, 0.13% (c) | 398,334 | 398,334 | ||||||
|
| |||||||
TOTAL MONEY MARKET SECURITIES (Cost $398,334) | 398,334 | |||||||
|
| |||||||
TOTAL INVESTMENTS – 99.47% (Cost $245,447,650) | $ | 251,709,363 | ||||||
|
| |||||||
Other Assets in Excess of Liabilities – 0.53% | 1,336,243 | |||||||
|
| |||||||
TOTAL NET ASSETS – 100.00% | $ | 253,045,606 | ||||||
|
| |||||||
| (a) | A portion of this security may be deemed illiquid due to the Investment Company Act of 1940 provision stating that no issuer of any investment company security purchased or acquired by a registered investment company shall be obligated to redeem such security in an amount exceeding 1 per centum of such issuer’s total outstanding shares during any period of less than thirty days. As of April 30, 2015, the fair value of illiquid securities held by the Fund was $32,006,670 or 12.65% of net assets. |
| (b) | Small investments are occasionally retained in mutual funds that are closed to new investment, or in the manager’s opinion are at risk to close, so as to allow the Fund the flexibility to reinvest in these funds in the future. |
| (c) | Rate disclosed is the seven day yield as of April 30, 2015. |
| ETF | – Exchange-Traded Fund |
| * | Non-income producing security. |
See accompanying notes which are an integral part of these financial statements.
17
SMI CONSERVATIVE ALLOCATION FUND
SCHEDULE OF INVESTMENTS
April 30, 2015 – (Unaudited)
| Corporate Bonds – 7.12% | Principal Amount | Fair Value | ||||||
AIG Global Funding, 1.650%, 12/15/2017 (a) | $ | 25,000 | $ | 25,119 | ||||
Ally Financial, Inc., 3.125%, 1/15/2016 | 25,000 | 25,156 | ||||||
Ally Financial, Inc., 5.500%, 2/15/2017 | 55,000 | 57,612 | ||||||
American Honda Finance Corp., 1.125%, 10/7/2016 | 80,000 | 80,392 | ||||||
American International Group, Inc., 5.050%, 10/1/2015 | 70,000 | 71,250 | ||||||
American International Group, Inc., MTN, 5.850%, 1/16/2018 | 45,000 | 50,169 | ||||||
Branch Banking & Trust Co., 1.350%, 10/1/2017 | 45,000 | 45,151 | ||||||
Burlington Northern Santa Fe LLC, 3.400%, 9/1/2024 | 70,000 | 72,345 | ||||||
Citigroup, Inc., 1.350%, 3/10/2017 | 55,000 | 54,947 | ||||||
Citigroup, Inc., 1.850%, 11/24/2017 | 60,000 | 60,422 | ||||||
Daimler Finance North America LLC, 1.250%, 1/11/2016 (a) | 90,000 | 90,399 | ||||||
Entergy Texas, Inc., 3.600%, 6/1/2015 | 55,000 | 55,123 | ||||||
Ford Motor Credit Co. LLC, 3.984%, 6/15/2016 (a) | 65,000 | 66,915 | ||||||
Ford Motor Credit Co. LLC, 4.250%, 2/3/2017 | 90,000 | 94,407 | ||||||
General Electric Capital Corp., 1.000%, 12/11/2015 | 90,000 | 90,322 | ||||||
General Electric Capital Corp., 1.000%, 1/8/2016 | 90,000 | 90,406 | ||||||
General Electric Capital Corp., 1.250%, 5/15/2017 | 85,000 | 85,631 | ||||||
Goldman Sachs Group, Inc./The, 3.700%, 8/1/2015 | 45,000 | 45,342 | ||||||
Goldman Sachs Group, Inc./The, 1.600%, 11/23/2015 | 85,000 | 85,438 | ||||||
Goldman Sachs Group, Inc./The, 1.478%, 4/30/2018 (b) | 85,000 | 86,312 | ||||||
Hartford Financial Services Group, Inc., 5.500%, 10/15/2016 | 60,000 | 63,725 | ||||||
Hartford Financial Services Group, Inc., 5.375%, 3/15/2017 | 65,000 | 69,602 | ||||||
JPMorgan Chase & Co., 0.881%, 2/26/2016 (b) | 75,000 | 75,167 | ||||||
Liberty Mutual Group, Inc., 6.700%, 8/15/2016 (a) | 25,000 | 26,730 | ||||||
Manufacturers & Traders Trust Co., 1.400%, 7/25/2017 | 55,000 | 55,112 | ||||||
Morgan Stanley, 1.512%, 2/25/2016 (b) | 40,000 | 40,275 | ||||||
New York Life Global Funding, 1.450%, 12/15/2017 (a) | 65,000 | 65,417 | ||||||
Noble Holding International Ltd., 4.900%, 8/1/2020 | 55,000 | 55,457 | ||||||
Rowan Companies, Inc., 4.750%, 1/15/2024 | 25,000 | 23,715 | ||||||
Verizon Communications, Inc., 1.350%, 6/9/2017 | 100,000 | 99,993 | ||||||
Wells Fargo & Co., 1.400%, 9/8/2017 | 60,000 | 60,272 | ||||||
|
| |||||||
TOTAL CORPORATE BONDS (Cost $1,942,986) | 1,968,323 | |||||||
|
| |||||||
Foreign Bonds Denominated in U.S. Dollars – 0.63% | ||||||||
Barclays PLC, 2.750%, 11/8/2019 | 40,000 | 40,500 | ||||||
Ensco PLC, 5.750%, 10/1/2044 | 35,000 | 34,651 | ||||||
Petrobras Global Finance BV, 2.415%, 1/15/2019 (b) | 35,000 | 32,466 | ||||||
Petroleos Mexicanos, 3.500%, 7/18/2018 | 25,000 | 25,844 | ||||||
See accompanying notes which are an integral part of these financial statements.
18
SMI CONSERVATIVE ALLOCATION FUND
SCHEDULE OF INVESTMENTS
April 30, 2015 – (Unaudited), (Continued)
| Foreign Bonds Denominated in U.S. Dollars – 0.63% – continued | Principal Amount | Fair Value | ||||||
Transocean, Inc., 3.800%, 10/15/2022 | $ | 20,000 | $ | 15,375 | ||||
Vale Overseas Ltd., 6.875%, 11/21/2036 | 25,000 | 25,363 | ||||||
|
| |||||||
TOTAL FOREIGN BONDS DENOMINATED | 174,199 | |||||||
|
| |||||||
U.S. Treasury Obligations – 3.18% | ||||||||
U.S. Treasury Note, 0.875%, 12/31/2016 | 425,000 | 427,789 | ||||||
U.S. Treasury Note, 2.000%, 2/15/2025 | 455,000 | 453,187 | ||||||
|
| |||||||
TOTAL U.S. TREASURY OBLIGATIONS (Cost $878,697) | 880,976 | |||||||
|
| |||||||
Asset-Backed Securities – 9.58% | ||||||||
American Airlines Pass Through Trust, | 21,684 | 23,527 | ||||||
Banc of America Merrill Lynch Commercial Mortgage, Inc., | 60,274 | 62,667 | ||||||
Banc of America Merrill Lynch Commercial Mortgage, Inc., | 44,003 | 44,356 | ||||||
Burlington Northern and Santa Fe Railway Co. Pass Through Trust, | 48,011 | 51,405 | ||||||
Burlington Northern and Santa Fe Railway Co. Pass Through Trust, | 19,331 | 21,566 | ||||||
Burlington Northern and Santa Fe Railway Co. Pass Through Trust, | 15,273 | 16,578 | ||||||
Citigroup Commercial Mortgage Trust, | 24,948 | 24,942 | ||||||
Commercial Mortgage Pass Through Certificates, | 18,606 | 18,549 | ||||||
Commercial Mortgage Trust, | 30,000 | 31,611 | ||||||
Commercial Mortgage Trust, | 28,496 | 28,625 | ||||||
Countrywide Asset-Backed Certificates, | 18,293 | 18,007 | ||||||
Credit Suisse First Boston Mortgage Securities Corp., | 47 | 47 | ||||||
Credit Suisse Mortgage Trust, | 5,955 | 6,094 | ||||||
See accompanying notes which are an integral part of these financial statements.
19
SMI CONSERVATIVE ALLOCATION FUND
SCHEDULE OF INVESTMENTS
April 30, 2015 – (Unaudited), (Continued)
| Asset-Backed Securities – 9.58% – continued | Principal Amount | Fair Value | ||||||
Delta Air Lines Pass Through Trust, | $ | 27,231 | $ | 32,097 | ||||
Fannie Mae, Pool #465468, 3.330%, 7/1/2020 | 43,496 | �� | 45,760 | |||||
Fannie Mae, Pool #466284, 3.330%, 10/1/2020 | 88,326 | 94,518 | ||||||
Fannie Mae, Pool #466319, 3.230%, 11/1/2020 | 87,772 | 93,252 | ||||||
Fannie Mae, Pool #AM2182, 2.160%, 1/1/2023 | 148,134 | 147,856 | ||||||
Fannie Mae, Pool #AA4328, 4.000%, 4/1/2024 | 27,956 | 29,943 | ||||||
Fannie Mae, Pool #AB2822, 2.500%, 3/1/2026 | 25,927 | 26,654 | ||||||
Fannie Mae, Pool #AM1671, 2.100%, 12/1/2027 | 52,596 | 51,668 | ||||||
Fannie Mae, Pool #464400, 5.970%, 1/1/2040 | 18,822 | 24,000 | ||||||
Fannie Mae, Pool #464398, 5.970%, 1/1/2040 | 14,117 | 17,177 | ||||||
Fannie Mae, Pool #466890, 5.100%, 12/1/2040 | 23,629 | 28,263 | ||||||
Fannie Mae REMICS, Series 2013-M14, Class A, 4.000%, 2/25/2033 | 88,987 | 89,806 | ||||||
Fannie Mae-Aces, Series 2013-M5, Class ASQ2, 0.595%, 8/25/2015 | 34,460 | 34,462 | ||||||
Fannie Mae-Aces, Series 2014-M2, Class ASQ2, 0.478%, 9/25/2015 | 36,445 | 36,446 | ||||||
Fannie Mae-Aces, Series 2014-M9, Class ASQ2, 1.462%, 4/25/2017 | 125,000 | 126,384 | ||||||
Fannie Mae-Aces, Series 2015-M7, Class ASQ1, 0.882%, 10/25/2017 | 35,000 | 34,961 | ||||||
Fannie Mae-Aces, Series 2015-M7, Class ASQ2, 1.550%, 4/25/2018 | 20,000 | 20,184 | ||||||
Fannie Mae-Aces, Series 2014-M5, Class ASQ1, 0.986%, 3/25/2019 | 85,688 | 85,601 | ||||||
Fannie Mae-Aces, Series 2014-M1, Class A1, 2.325%, 7/25/2023 (b) | 61,177 | 62,797 | ||||||
Fannie Mae-Aces, Series 2014-M13, Class AB2, 2.951%, 8/25/2024 | 40,000 | 41,185 | ||||||
Freddie Mac REMICS, Series 3609, Class LA, 4.000%, 12/15/2024 | 35,967 | 37,525 | ||||||
Freddie Mac REMICS, Series 3873, Class DG, 3.000%, 7/15/2027 | 7,090 | 7,182 | ||||||
Ginnie Mae, Pool #AB2583, 2.140%, 8/15/2023 | 79,209 | 79,349 | ||||||
Ginnie Mae, Pool #AD0091, 2.730%, 6/15/2032 | 216,959 | 218,599 | ||||||
GS Mortgage Securities Corp. II, | 28,066 | 28,053 | ||||||
GS Mortgage Securities Trust, | 89,849 | 96,791 | ||||||
Hertz Vehicle Financing LLC, | 90,000 | 90,027 | ||||||
Home Equity Mortgage Trust, Series 2006-1, Class A2, 5.800%, 5/25/2036 | 25,132 | 20,298 | ||||||
JPMBB Commercial Mortgage Securities Trust, | 96,874 | 97,185 | ||||||
JPMorgan Chase Commercial Mortgage Securities Trust, | 19,398 | 19,399 | ||||||
Mid-State Trust, Series 11, Class A1, 4.864%, 7/15/2038 | 14,865 | 15,899 | ||||||
See accompanying notes which are an integral part of these financial statements.
20
SMI CONSERVATIVE ALLOCATION FUND
SCHEDULE OF INVESTMENTS
April 30, 2015 – (Unaudited), (Continued)
| Asset-Backed Securities – 9.58% – continued | Principal Amount | Fair Value | ||||||
Morgan Stanley Bank of America Merrill Lynch Trust, | $ | 23,154 | $ | 23,063 | ||||
MSCC Heloc Trust, Series 2007-1, Class A, 0.281%, 12/25/2031 (b) | 55,014 | 52,560 | ||||||
Northwest Airlines Pass Through Trust, | 39,825 | 45,799 | ||||||
Residential Funding Mortgage Securities II, | 6,806 | 6,423 | ||||||
Structured Asset Securities Corp. Mortgage Loan Trust, | 11,424 | 11,180 | ||||||
U.S. Airways Pass Through Trust, | 23,537 | 27,891 | ||||||
U.S. Airways Pass Through Trust, | 43,106 | 49,248 | ||||||
UBS-Barclays Commercial Mortgage Trust, | 35,645 | 35,578 | ||||||
Union Pacific Railroad Co. 2003 Pass Through Trust, | 8,790 | 9,625 | ||||||
Union Pacific Railroad Co. 2004 Pass Through Trust, | 46,941 | 51,341 | ||||||
Union Pacific Railroad Co. 2005 Pass Through Trust, | 42,668 | 47,837 | ||||||
Union Pacific Railroad Co. 2006 Pass Through Trust, | 26,015 | 30,372 | ||||||
Wells Fargo Commercial Mortgage Trust, | 45,199 | 45,166 | ||||||
WF-RBS Commercial Mortgage Trust, | 32,241 | 32,223 | ||||||
|
| |||||||
TOTAL ASSET-BACKED SECURITIES (Cost $2,565,262) | 2,649,601 | |||||||
|
| |||||||
| Mutual Funds – 34.00% | Shares | |||||||
Ariel Fund | 14,437 | 1,092,039 | ||||||
Fidelity OTC Portfolio | 4,750 | 399,218 | ||||||
Hartford Growth Opportunities Fund/The – Class A | 15,052 | 601,627 | ||||||
John Hancock Funds II – Global Income Fund | 411,523 | 4,000,000 | ||||||
Lazard U.S. Equity Concentrated Portfolio – Institutional Class | 53,630 | 735,798 | ||||||
Lazard U.S. Mid Cap Equity Portfolio – Institutional Class | 56,396 | 1,112,688 | ||||||
Lord Abbett Developing Growth Fund, Inc. – Institutional Class | 100 | 2,583 | ||||||
See accompanying notes which are an integral part of these financial statements.
21
SMI CONSERVATIVE ALLOCATION FUND
SCHEDULE OF INVESTMENTS
April 30, 2015 – (Unaudited), (Continued)
| Mutual Funds – 34.00% – continued | Shares | Fair Value | ||||||
Olstein All Cap Value Fund – Adviser Class | 31,444 | $ | 800,873 | |||||
PRIMECAP Odyssey Aggressive Growth Fund | 19,054 | 658,304 | ||||||
|
| |||||||
TOTAL MUTUAL FUNDS (Cost $9,362,849) | 9,403,130 | |||||||
|
| |||||||
Exchange-Traded Funds – 30.51% | ||||||||
iShares MSCI EAFE ETF | 7,000 | 465,570 | ||||||
iShares MSCI Hong Kong ETF | 6,900 | 164,151 | ||||||
iShares MSCI Japan ETF | 12,800 | 164,608 | ||||||
iShares MSCI Netherlands ETF | 6,300 | 164,493 | ||||||
iShares MSCI Taiwan ETF | 10,000 | 164,400 | ||||||
SPDR Barclays High Yield Bond ETF | 42,000 | 1,656,480 | ||||||
Vanguard FTSE Emerging Markets ETF | 3,800 | 166,820 | ||||||
Vanguard REIT ETF | 69,200 | 5,493,096 | ||||||
|
| |||||||
TOTAL EXCHANGE-TRADED FUNDS (Cost $8,862,096) | 8,439,618 | |||||||
|
| |||||||
Money Market Securities – 2.80% | ||||||||
Fidelity Institutional Money Market Portfolio – Institutional Class, 0.13% (c) | 773,037 | 773,037 | ||||||
|
| |||||||
TOTAL MONEY MARKET SECURITIES (Cost $773,037) | 773,037 | |||||||
|
| |||||||
TOTAL INVESTMENTS – 87.82% (Cost $24,560,336) | $ | 24,288,884 | ||||||
|
| |||||||
Other Assets in Excess of Liabilities – 12.18% | 3,369,920 | |||||||
|
| |||||||
TOTAL NET ASSETS – 100.00% | $ | 27,658,804 | ||||||
|
| |||||||
| (a) | Security exempt from registration under Rule 144A or Section 4(2) of the Securities Act of 1933. The security may be resold in transactions exempt from registration, normally to qualified institutional buyers. |
| (b) | Variable or Floating Rate Security. Rate disclosed is as of April 30, 2015. |
| (c) | Rate disclosed is the seven day yield as of April 30, 2015. |
| * | Non-income producing security. |
| ETF | – Exchange-Traded Fund |
| MTN | – Medium-Term Note |
| REIT | – Real Estate Investment Trust |
| SPDR | – Standard & Poor’s Depositary Receipts |
See accompanying notes which are an integral part of these financial statements.
22
SMI DYNAMIC ALLOCATION FUND
SCHEDULE OF INVESTMENTS
April 30, 2015 – (Unaudited)
| Exchange-Traded Funds – 96.24% | Shares | Fair Value | ||||||
Health Care Select Sector SPDR Fund | 56,300 | $ | 4,035,584 | |||||
iShares MSCI EAFE ETF (a) | 809,100 | 53,813,241 | ||||||
iShares MSCI Hong Kong ETF | 84,100 | 2,000,739 | ||||||
iShares MSCI Japan ETF | 155,600 | 2,001,016 | ||||||
iShares MSCI Netherlands ETF | 76,600 | 2,000,026 | ||||||
iShares MSCI Taiwan ETF | 121,500 | 1,997,460 | ||||||
iShares U.S. Consumer Services ETF | 24,800 | 3,538,960 | ||||||
SPDR S&P 500 ETF Trust (a) | 288,630 | 60,185,128 | ||||||
Vanguard FTSE Emerging Markets ETF | 45,600 | 2,001,840 | ||||||
Vanguard REIT ETF (a) | 809,130 | 64,228,739 | ||||||
|
| |||||||
TOTAL EXCHANGE-TRADED FUNDS (Cost $184,706,499) | 195,802,733 | |||||||
|
| |||||||
Mutual Funds – 1.90% | ||||||||
Fidelity Select Electronics Portfolio | 2,418 | 199,915 | ||||||
ProFunds Biotechnology UltraSector ProFund – Investor Class | 54,911 | 3,673,524 | ||||||
|
| |||||||
TOTAL MUTUAL FUNDS (Cost $3,886,965) | 3,873,439 | |||||||
|
| |||||||
Money Market Securities – 0.23% | ||||||||
Fidelity Institutional Money Market Portfolio – Institutional Class, 0.13% (b) | 472,028 | 472,028 | ||||||
|
| |||||||
TOTAL MONEY MARKET SECURITIES (Cost $472,028) | 472,028 | |||||||
|
| |||||||
TOTAL INVESTMENTS – 98.37% (Cost $189,065,492) | $ | 200,148,200 | ||||||
|
| |||||||
Other Assets in Excess of Liabilities – 1.63% | 3,310,957 | |||||||
|
| |||||||
TOTAL NET ASSETS – 100.00% | $ | 203,459,157 | ||||||
|
| |||||||
| (a) | For a schedule of each Fund’s holdings please refer to each Fund’s most recent semi-annual or annual report filed at www.sec.gov. |
| (b) | Rate disclosed is the seven day yield as of April 30, 2015. |
| ETF | – Exchange-Traded Fund |
| REIT | – Real Estate Investment Trust |
| SPDR | – Standard & Poor’s Depositary Receipts |
See accompanying notes which are an integral part of these financial statements.
23
SMI BOND FUND
SCHEDULE OF INVESTMENTS
April 30, 2015 – (Unaudited)
| Exchange-Traded Funds – 170.08% | Shares | Fair Value | ||||||
SPDR Barclays High Yield Bond ETF (a) | 3,000 | $ | 118,320 | |||||
Vanguard Intermediate-Term Bond ETF (a) | 1,350 | 115,790 | ||||||
|
| |||||||
TOTAL EXCHANGE-TRADED FUNDS (Cost $233,974) | 234,110 | |||||||
|
| |||||||
Money Market Securities – 92.65% | ||||||||
Fidelity Institutional Money Market Portfolio – Institutional Class, 0.13% (b) | 127,520 | 127,520 | ||||||
|
| |||||||
TOTAL MONEY MARKET SECURITIES (Cost $127,520) | 127,520 | |||||||
|
| |||||||
TOTAL INVESTMENTS – 262.73% (Cost $361,494) | $ | 361,630 | ||||||
|
| |||||||
Liabilities in Excess of Other Assets – (162.73)% | (223,987 | ) | ||||||
|
| |||||||
TOTAL NET ASSETS – 100.00% | $ | 137,643 | ||||||
|
| |||||||
| (a) | For a schedule of each Fund’s holdings please refer to each Fund’s most recent semi-annual or annual report filed at www.sec.gov. |
| (b) | Rate disclosed is the seven day yield as of April 30, 2015. |
| ETF | – Exchange-Traded Fund |
| SPDR | – Standard & Poor’s Depositary Receipts |
See accompanying notes which are an integral part of these financial statements.
24
SMI 50/40/10 FUND
SCHEDULE OF INVESTMENTS
April 30, 2015 – (Unaudited)
| Exchange-Traded Funds – 43.31% | Shares | Fair Value | ||||||
iShares MSCI EAFE ETF | 2,800 | $ | 186,228 | |||||
SPDR S&P 500 ETF Trust | 850 | 177,242 | ||||||
Vanguard REIT ETF | 1,600 | 127,008 | ||||||
|
| |||||||
TOTAL EXCHANGE-TRADED FUNDS (Cost $495,417) | 490,478 | |||||||
|
| |||||||
Mutual Funds – 34.26% | ||||||||
BlackRock Mid-Cap Growth Equity Portfolio | 4,651 | 84,320 | ||||||
Fidelity OTC Portfolio | 595 | 49,971 | ||||||
Fidelity Select Biotechnology Portfolio | 328 | 77,733 | ||||||
Hodges Small Intrinsic Value Fund | 5,636 | 69,377 | ||||||
Legg Mason Opportunity Trust | 2,604 | 56,984 | ||||||
Wells Fargo Advantage International Equity Fund | 3,968 | 49,643 | ||||||
|
| |||||||
TOTAL MUTUAL FUNDS (Cost $394,000) | 388,028 | |||||||
|
| |||||||
Money Market Securities – 43.32% | ||||||||
Fidelity Institutional Money Market Portfolio – Institutional Class, 0.13% (a) | 490,614 | 490,614 | ||||||
|
| |||||||
TOTAL MONEY MARKET SECURITIES (Cost $490,614) | 490,614 | |||||||
|
| |||||||
TOTAL INVESTMENTS – 120.89% (Cost $1,380,031) | $ | 1,369,120 | ||||||
|
| |||||||
Liabilities in Excess of Other Assets – (20.89)% | (236,625 | ) | ||||||
|
| |||||||
TOTAL NET ASSETS – 100.00% | $ | 1,132,495 | ||||||
|
| |||||||
| (a) | Rate disclosed is the seven day yield as of April 30, 2015. |
| ETF | – Exchange-Traded Fund |
| REIT | – Real Estate Investment Trust |
| SPDR | – Standard & Poor’s Depositary Receipts |
See accompanying notes which are an integral part of these financial statements.
25
SMI FUNDS
STATEMENTS OF ASSETS AND LIABILITIES
April 30, 2015 – (Unaudited)
| Sound Mind Investing Fund | SMI Conservative Allocation Fund | SMI Dynamic Allocation Fund | ||||||||||
Assets | ||||||||||||
Investment in securities: | ||||||||||||
At cost | $ | 245,447,650 | $ | 24,560,336 | $ | 189,065,492 | ||||||
|
|
|
|
|
| |||||||
At fair value | $ | 251,709,363 | $ | 24,288,884 | $ | 200,148,200 | ||||||
Cash | — | — | 261,213 | |||||||||
Receivable for investments sold | 1,846,345 | 10,786,251 | 66,114,697 | |||||||||
Receivable for fund shares sold | 450,639 | 750 | 1,262,192 | |||||||||
Dividend and interest receivable | 102 | 25,980 | 149 | |||||||||
Prepaid expenses | 19,884 | 18,723 | 39,619 | |||||||||
|
|
|
|
|
| |||||||
Total Assets | 254,026,333 | 35,120,588 | 267,826,070 | |||||||||
|
|
|
|
|
| |||||||
Liabilities | ||||||||||||
Cash overdraft | — | 54,905 | — | |||||||||
Payable for investments purchased | 500,000 | 7,378,748 | 63,967,542 | |||||||||
Payable for fund shares redeemed | 239,046 | — | 216,616 | |||||||||
Payable to Adviser | 212,783 | 13,695 | 169,848 | |||||||||
Payable to administrator, fund accountant, and transfer agent | 16,551 | 3,023 | 3,003 | |||||||||
Payable to custodian | 1,615 | 1,124 | 1,105 | |||||||||
Other accrued expenses | 10,732 | 10,289 | 8,799 | |||||||||
|
|
|
|
|
| |||||||
Total Liabilities | 980,727 | 7,461,784 | 64,366,913 | |||||||||
|
|
|
|
|
| |||||||
Net Assets | $ | 253,045,606 | $ | 27,658,804 | $ | 203,459,157 | ||||||
|
|
|
|
|
| |||||||
Net Assets consist of: | ||||||||||||
Paid-in capital | $ | 215,593,619 | $ | 26,202,932 | $ | 191,418,671 | ||||||
Accumulated undistributed net investment income (loss) | (2,958,740 | ) | (254,948 | ) | 215,045 | |||||||
Accumulated undistributed net realized gain from investment transactions | 34,149,014 | 1,982,272 | 742,733 | |||||||||
Net unrealized appreciation (depreciation) on investment securities | 6,261,713 | (271,452 | ) | 11,082,708 | ||||||||
|
|
|
|
|
| |||||||
Net Assets | $ | 253,045,606 | $ | 27,658,804 | $ | 203,459,157 | ||||||
|
|
|
|
|
| |||||||
Shares outstanding (unlimited number of shares authorized, no par value) | 20,739,610 | 2,713,336 | 17,148,391 | |||||||||
|
|
|
|
|
| |||||||
Net asset value (“NAV”) and offering price per share | $ | 12.20 | $ | 10.19 | $ | 11.86 | ||||||
|
|
|
|
|
| |||||||
Redemption price per share (NAV * 98%) (a) | $ | 11.96 | $ | 9.99 | $ | 11.62 | ||||||
|
|
|
|
|
| |||||||
| (a) | The Funds charge a 2% redemption fee on shares redeemed within 60 days of purchase. Shares are redeemed at the NAV if held longer than 60 days. |
See accompanying notes which are an integral part of these financial statements.
26
SMI FUNDS
STATEMENTS OF ASSETS AND LIABILITIES
April 30, 2015 – (Unaudited), (Continued)
| SMI Bond Fund | SMI 50/40/10 Fund | |||||||
Assets | ||||||||
Investment in securities: | ||||||||
At cost | $ | 361,494 | $ | 1,380,031 | ||||
|
|
|
| |||||
At fair value | $ | 361,630 | $ | 1,369,120 | ||||
Receivable for fund shares sold | 10,000 | 344,841 | ||||||
Dividend and interest receivable | 1 | 3 | ||||||
Receivable from Adviser | 1,380 | 830 | ||||||
|
|
|
| |||||
Total Assets | 373,011 | 1,714,794 | ||||||
|
|
|
| |||||
Liabilities | ||||||||
Cash overdraft | 10 | 10 | ||||||
Payable for investments purchased | 233,973 | 581,416 | ||||||
Payable to administrator, fund accountant, and transfer agent | 135 | 90 | ||||||
Payable to custodian | 96 | 64 | ||||||
Payable to trustees | 34 | 23 | ||||||
Other accrued expenses | 1,120 | 696 | ||||||
|
|
|
| |||||
Total Liabilities | 235,368 | 582,299 | ||||||
|
|
|
| |||||
Net Assets | $ | 137,643 | $ | 1,132,495 | ||||
|
|
|
| |||||
Net Assets consist of: | ||||||||
Paid-in capital | $ | 137,510 | $ | 1,143,445 | ||||
Accumulated undistributed net investment (loss) | (3 | ) | (39 | ) | ||||
Net unrealized appreciation (depreciation) on investment securities | 136 | (10,911 | ) | |||||
|
|
|
| |||||
Net Assets | $ | 137,643 | $ | 1,132,495 | ||||
|
|
|
| |||||
Shares outstanding (unlimited number of shares authorized, no par value) | 13,762 | 115,123 | ||||||
|
|
|
| |||||
Net asset value (“NAV”) and offering price per share | $ | 10.00 | $ | 9.84 | ||||
|
|
|
| |||||
Redemption price per share (NAV * 98%) (a) | $ | 9.80 | $ | 9.64 | ||||
|
|
|
| |||||
| (a) | The Funds charge a 2% redemption fee on shares redeemed within 60 days of purchase. Shares are redeemed at the NAV if held longer than 60 days. |
See accompanying notes which are an integral part of these financial statements.
27
SMI FUNDS
STATEMENTS OF OPERATIONS
For the six months ended April 30, 2015 – (Unaudited)
| Sound Mind Investing Fund | SMI Conservative Allocation Fund | SMI Dynamic Allocation Fund | ||||||||||
Investment Income | ||||||||||||
Dividend income | $ | 1,007,648 | $ | 146,849 | $ | 2,654,416 | ||||||
Interest income | — | 75,448 | — | |||||||||
|
|
|
|
|
| |||||||
Total investment income | 1,007,648 | 222,297 | 2,654,416 | |||||||||
|
|
|
|
|
| |||||||
Expenses | ||||||||||||
Investment Adviser | 1,334,377 | 131,062 | 899,117 | |||||||||
Administration | 42,407 | 4,515 | 24,456 | |||||||||
Fund accounting | 21,273 | 2,260 | 12,263 | |||||||||
Transfer agent | 32,899 | 10,300 | 18,774 | |||||||||
Legal | 10,366 | 9,542 | 9,915 | |||||||||
Registration | 13,245 | 9,733 | 22,263 | |||||||||
Custodian | 13,108 | 5,982 | 4,860 | |||||||||
Audit | 7,540 | 9,002 | 7,530 | |||||||||
Trustee | 3,087 | 2,410 | 2,751 | |||||||||
Chief Compliance Officer | 5,365 | 5,346 | 5,360 | |||||||||
Miscellaneous | 36,126 | 15,411 | 17,185 | |||||||||
Line of credit | 280 | 31 | 213 | |||||||||
Interest expense | 2,173 | 55 | — | |||||||||
|
|
|
|
|
| |||||||
Total expenses | 1,522,246 | 205,649 | 1,024,687 | |||||||||
Fees waived by Adviser | — | (36,603 | ) | — | ||||||||
|
|
|
|
|
| |||||||
Net operating expenses | 1,522,246 | 169,046 | 1,024,687 | |||||||||
|
|
|
|
|
| |||||||
Net investment income (loss) | (514,598 | ) | 53,251 | 1,629,729 | ||||||||
|
|
|
|
|
| |||||||
Net Realized and Unrealized Gain on Investments and Swap Contracts | ||||||||||||
Long term capital gain dividends from investment companies | $ | 10,426,817 | $ | 711,659 | $ | 1,454 | ||||||
Net realized gain on investment transactions | 23,715,396 | 1,254,270 | 761,898 | |||||||||
Net realized gain on swap contracts | — | 17,757 | — | |||||||||
Net change in unrealized appreciation (depreciation) on investments | (23,035,932 | ) | (1,735,148 | ) | 1,145,861 | |||||||
Net change in unrealized depreciation on swap contracts | — | (4,717 | ) | — | ||||||||
|
|
|
|
|
| |||||||
Net realized and unrealized gain on investments and swap contracts | 11,106,281 | 243,821 | 1,909,213 | |||||||||
|
|
|
|
|
| |||||||
Net increase in net assets resulting from operations | $ | 10,591,683 | $ | 297,072 | $ | 3,538,942 | ||||||
|
|
|
|
|
| |||||||
See accompanying notes which are an integral part of these financial statements.
28
SMI FUNDS
STATEMENTS OF OPERATIONS
For the period ended April 30, 2015 – (Unaudited), (Continued)
| SMI Bond Fund (a) | SMI 50/40/10 Fund (b) | |||||||
Investment Income | ||||||||
Dividend income | $ | 1 | $ | 3 | ||||
|
|
|
| |||||
Total investment income | 1 | 3 | ||||||
|
|
|
| |||||
Expenses | ||||||||
Investment Adviser | 3 | 29 | ||||||
Transfer agent | 135 | 90 | ||||||
Legal | 136 | 91 | ||||||
Registration | 164 | 110 | ||||||
Custodian | 96 | 64 | ||||||
Audit | 297 | 198 | ||||||
Trustee | 34 | 23 | ||||||
Pricing | 116 | 26 | ||||||
Amortization of offering cost | 145 | 97 | ||||||
Organizational costs | 140 | 93 | ||||||
Chief Compliance Officer | 87 | 58 | ||||||
Miscellaneous | 34 | 22 | ||||||
|
|
|
| |||||
Total expenses | 1,387 | 901 | ||||||
Fees waived and reimbursed by Adviser | (1,383 | ) | (859 | ) | ||||
|
|
|
| |||||
Net operating expenses | 4 | 42 | ||||||
|
|
|
| |||||
Net investment loss | (3 | ) | (39 | ) | ||||
|
|
|
| |||||
Net Realized and Unrealized Gain (Loss) on Investments | ||||||||
Net change in unrealized appreciation (depreciation) on investments | $ | 136 | $ | (10,911 | ) | |||
|
|
|
| |||||
Net realized and unrealized gain (loss) on investments | 136 | (10,911 | ) | |||||
|
|
|
| |||||
Net increase (decrease) in net assets resulting from operations | $ | 133 | $ | (10,950 | ) | |||
|
|
|
| |||||
| (a) | For the period April 28, 2015 (commencement of operations) through April 30, 2015. |
| (b) | For the period April 29, 2015 (commencement of operations) through April 30, 2015. |
See accompanying notes which are an integral part of these financial statements.
29
SOUND MIND INVESTING FUND
STATEMENTS OF CHANGES IN NET ASSETS
| For the Six Months Ended April 30, 2015 (Unaudited) | Year Ended October 31, 2014 | |||||||
Decrease in Net Assets due to: | ||||||||
Operations | ||||||||
Net investment loss | $ | (514,598 | ) | $ | (1,892,841 | ) | ||
Long term capital gain dividends from investment companies | 10,426,817 | 7,771,975 | ||||||
Net realized gain on investment transactions | 23,715,396 | 39,721,511 | ||||||
Net change in unrealized (depreciation) on investments | (23,035,932 | ) | (24,395,804 | ) | ||||
|
|
|
| |||||
Net increase in net assets resulting from operations | 10,591,683 | 21,204,841 | ||||||
|
|
|
| |||||
Distributions | ||||||||
From net investment income | (1,347,114 | ) | (985,095 | ) | ||||
From net realized gains | (43,665,598 | ) | (30,426,944 | ) | ||||
|
|
|
| |||||
Total distributions | (45,012,712 | ) | (31,412,039 | ) | ||||
|
|
|
| |||||
Capital Transactions | ||||||||
Proceeds from shares sold | 12,442,656 | 34,893,201 | ||||||
Proceeds from redemption fees (a) | 3,399 | 7,583 | ||||||
Reinvestment of distributions | 44,074,918 | 30,865,319 | ||||||
Amount paid for shares redeemed | (51,724,325 | ) | (65,924,252 | ) | ||||
|
|
|
| |||||
Net increase (decrease) in net assets resulting from capital transactions | 4,796,648 | (158,149 | ) | |||||
|
|
|
| |||||
Total Decrease in Net Assets | (29,624,381 | ) | (10,365,347 | ) | ||||
|
|
|
| |||||
Net Assets | ||||||||
Beginning of period | 282,669,987 | 293,035,334 | ||||||
|
|
|
| |||||
End of period | $ | 253,045,606 | $ | 282,669,987 | ||||
|
|
|
| |||||
Accumulated net investment loss included in net assets at end of period | $ | (2,958,740 | ) | $ | (1,097,028 | ) | ||
|
|
|
| |||||
Share Transactions | ||||||||
Shares sold | 977,710 | 2,502,218 | ||||||
Shares issued in reinvestment of distributions | 3,648,586 | 2,266,176 | ||||||
Shares redeemed | (4,165,722 | ) | (4,741,258 | ) | ||||
|
|
|
| |||||
Net increase in shares outstanding | 460,574 | 27,136 | ||||||
|
|
|
| |||||
| (a) | The Fund charges a 2% redemption fee on shares redeemed within 60 days of purchase. Shares are redeemed at the NAV if held longer than 60 days. |
See accompanying notes which are an integral part of these financial statements.
30
SMI CONSERVATIVE ALLOCATION FUND
STATEMENTS OF CHANGES IN NET ASSETS
| For the Six Months Ended April 30, 2015 (Unaudited) | Year Ended October 31, 2014 | |||||||
Increase (Decrease) in Net Assets due to: | ||||||||
Operations | ||||||||
Net investment income (loss) | $ | 53,251 | $ | (52,865 | ) | |||
Long term capital gain dividends from investment companies | 711,659 | 481,460 | ||||||
Net realized gain on investment transactions and swap contracts | 1,272,027 | 3,137,249 | ||||||
Net change in unrealized (depreciation) on investments and swap contracts | (1,739,865 | ) | (2,219,765 | ) | ||||
|
|
|
| |||||
Net increase in net assets resulting from operations | 297,072 | 1,346,079 | ||||||
|
|
|
| |||||
Distributions | ||||||||
From net investment income | (234,212 | ) | (139,586 | ) | ||||
From net realized gains | (3,459,166 | ) | (2,841,565 | ) | ||||
|
|
|
| |||||
Total distributions | (3,693,378 | ) | (2,981,151 | ) | ||||
|
|
|
| |||||
Capital Transactions | ||||||||
Proceeds from shares sold | 4,600,036 | 8,927,185 | ||||||
Proceeds from redemption fees (a) | 288 | 1,026 | ||||||
Reinvestment of distributions | 3,636,441 | 2,960,793 | ||||||
Amount paid for shares redeemed | (7,787,562 | ) | (9,473,927 | ) | ||||
|
|
|
| |||||
Net increase in net assets resulting from capital transactions | 449,203 | 2,415,077 | ||||||
|
|
|
| |||||
Total Increase (Decrease) in Net Assets | (2,947,103 | ) | 780,005 | |||||
|
|
|
| |||||
Net Assets | ||||||||
Beginning of period | 30,605,907 | 29,825,902 | ||||||
|
|
|
| |||||
End of period | $ | 27,658,804 | $ | 30,605,907 | ||||
|
|
|
| |||||
Accumulated net investment loss | $ | (254,948 | ) | $ | (73,987 | ) | ||
|
|
|
| |||||
Share Transactions | ||||||||
Shares sold | 437,672 | 771,701 | ||||||
Shares issued in reinvestment of distributions | 353,052 | 260,404 | ||||||
Shares redeemed | (734,829 | ) | (818,915 | ) | ||||
|
|
|
| |||||
Net increase in shares outstanding | 55,895 | 213,190 | ||||||
|
|
|
| |||||
| (a) | The Fund charges a 2% redemption fee on shares redeemed within 60 days of purchase. Shares are redeemed at the NAV if held longer than 60 days. |
See accompanying notes which are an integral part of these financial statements.
31
SMI DYNAMIC ALLOCATION FUND
STATEMENTS OF CHANGES IN NET ASSETS
| For the Six Months Ended April 30, 2015 (Unaudited) | Year Ended October 31, 2014 | |||||||
Increase in Net Assets due to: | ||||||||
Operations | ||||||||
Net investment income | $ | 1,629,729 | $ | 2,265,111 | ||||
Long term capital gain dividends from investment companies | 1,454 | 1,422 | ||||||
Net realized gain on investment transactions | 761,898 | 3,206,693 | ||||||
Net change in unrealized appreciation on investments | 1,145,861 | 5,271,786 | ||||||
|
|
|
| |||||
Net increase in net assets resulting from operations | 3,538,942 | 10,745,012 | ||||||
|
|
|
| |||||
Distributions | ||||||||
From net investment income | (3,044,696 | ) | (1,285,357 | ) | ||||
From net realized gains | (1,173,745 | ) | — | |||||
|
|
|
| |||||
Total distributions | (4,218,441 | ) | (1,285,357 | ) | ||||
|
|
|
| |||||
Capital Transactions | ||||||||
Proceeds from shares sold | 65,250,795 | 80,949,324 | ||||||
Proceeds from redemption fees (a) | 4,223 | 769 | ||||||
Reinvestment of distributions | 4,160,062 | 1,264,696 | ||||||
Amount paid for shares redeemed | (12,278,971 | ) | (12,961,554 | ) | ||||
|
|
|
| |||||
Net increase in net assets resulting from capital transactions | 57,136,109 | 69,253,235 | ||||||
|
|
|
| |||||
Total Increase in Net Assets | 56,456,610 | 78,712,890 | ||||||
|
|
|
| |||||
Net Assets | ||||||||
Beginning of period | 147,002,547 | 68,289,657 | ||||||
|
|
|
| |||||
End of period | $ | 203,459,157 | $ | 147,002,547 | ||||
|
|
|
| |||||
Accumulated net investment income included in net assets at end of period | $ | 215,045 | $ | 1,630,012 | ||||
|
|
|
| |||||
Share Transactions | ||||||||
Shares sold | 5,362,876 | 7,252,340 | ||||||
Shares issued in reinvestment of distributions | 346,672 | 116,348 | ||||||
Shares redeemed | (1,008,480 | ) | (1,155,506 | ) | ||||
|
|
|
| |||||
Net increase in shares outstanding | 4,701,068 | 6,213,182 | ||||||
|
|
|
| |||||
| (a) | The Fund charges a 2% redemption fee on shares redeemed within 60 days of purchase. Shares are redeemed at the NAV if held longer than 60 days. |
See accompanying notes which are an integral part of these financial statements.
32
SMI BOND FUND
STATEMENT OF CHANGES IN NET ASSETS
| For the Period Ended April 30, 2015 (a) (Unaudited) | ||||
Increase in Net Assets due to: | ||||
Operations | ||||
Net investment loss | $ | (3 | ) | |
Net change in unrealized appreciation on investments | 136 | |||
|
| |||
Net increase in net assets resulting from operations | 133 | |||
|
| |||
Capital Transactions | ||||
Proceeds from shares sold | 137,510 | |||
|
| |||
Net increase in net assets resulting from capital transactions | 137,510 | |||
|
| |||
Total Increase in Net Assets | 137,643 | |||
|
| |||
Net Assets | ||||
Beginning of period | — | |||
|
| |||
End of period | $ | 137,643 | ||
|
| |||
Accumulated net investment loss included in net assets at end of period | $ | (3 | ) | |
|
| |||
Share Transactions | ||||
Shares sold | 13,762 | |||
|
| |||
Net increase in shares outstanding | 13,762 | |||
|
| |||
| (a) | For the period April 28, 2015 (commencement of operations) through April 30, 2015. |
See accompanying notes which are an integral part of these financial statements.
33
SMI 50/40/10 FUND
STATEMENT OF CHANGES IN NET ASSETS
| For the Period Ended April 30, 2015 (a) (Unaudited) | ||||
Increase in Net Assets due to: | ||||
Operations | ||||
Net investment loss | $ | (39 | ) | |
Net change in unrealized depreciation on investments | (10,911 | ) | ||
|
| |||
Net decrease in net assets resulting from operations | (10,950 | ) | ||
|
| |||
Capital Transactions | ||||
Proceeds from shares sold | 1,143,445 | |||
|
| |||
Net increase in net assets resulting from capital transactions | 1,143,445 | |||
|
| |||
Total Increase in Net Assets | 1,132,495 | |||
|
| |||
Net Assets | ||||
Beginning of period | — | |||
|
| |||
End of period | $ | 1,132,495 | ||
|
| |||
Accumulated net investment loss included in net assets at end of period | $ | (39 | ) | |
|
| |||
Share Transactions | ||||
Shares sold | 115,123 | |||
|
| |||
Net increase in shares outstanding | 115,123 | |||
|
| |||
| (a) | For the period April 29, 2015 (commencement of operations) through April 30, 2015. |
See accompanying notes which are an integral part of these financial statements.
34
This page intentionally left blank.
35
SOUND MIND INVESTING FUND
FINANCIAL HIGHLIGHTS
(For a share outstanding during each period)
| Six Months Ended April 30, 2015 (Unaudited) | ||||
Selected Per Share Data: | ||||
Net asset value, beginning of period | $ | 13.94 | ||
|
| |||
Income from investment operations: | ||||
Net investment income (loss)(a) | (0.02 | ) | ||
Net realized and unrealized gain | 0.54 | |||
|
| |||
Total from investment operations | 0.52 | |||
|
| |||
Less Distributions to Shareholders: | ||||
From net investment income | (0.07 | ) | ||
From net realized gain | (2.19 | ) | ||
|
| |||
Total distributions | (2.26 | ) | ||
|
| |||
Paid in capital from redemption fees(c) | — | |||
|
| |||
Net asset value, end of period | $ | 12.20 | ||
|
| |||
Total Return(d) | 3.91 | %(e) | ||
Ratios and Supplemental Data: | ||||
Net assets, end of period (000) | $ | 253,046 | ||
Ratio of expenses to average net assets(f) | 1.13 | %(j) | ||
Ratio of net investment income (loss) to average net assets(a)(h) | (0.38 | )%(j) | ||
Portfolio turnover rate | 114.20 | %(e) | ||
| (a) | Recognition of the net investment income by the Fund is affected by the timing of the declaration of dividends by the underlying investment companies in which the Fund invests. |
| (b) | Resulted in less than $0.005 per share. |
| (c) | Redemption fee resulted in less than $0.005 per share. |
| (d) | Total return in the above table represents the rate that the investor would have earned or lost on an investment in the Fund, assuming reinvestment of dividends. |
| (e) | Not annualized. |
| (f) | These ratios exclude the impact of expenses of the underlying funds in which the Fund invests as represented in the Schedule of Investments. |
| (g) | This ratio does not include the effects of other expenses refunded by the underlying funds in which the Fund invests. If these refunds had been included, the ratio of expenses to average net assets would have been 1.09%, 1.17%, 1.15%, 1.14%, and 1.21% for the years ended October 31, 2014, October 31, 2013, October 31, 2012, October 31, 2011, and October 31, 2010, respectively. |
| (h) | This ratio is presented net of the other expenses refunded by the underlying funds in which the Fund invests. |
| (i) | Portfolio turnover rate excludes $21,405,392 of purchases, which is the book value of securities acquired at the time of merger with SMI Managed Volatility Fund. |
| (j) | Annualized. |
See accompanying notes which are an integral part of these financial statements.
36
SOUND MIND INVESTING FUND
FINANCIAL HIGHLIGHTS
(For a share outstanding during each period) – (Continued)
Year Ended | Year Ended October 31, 2013 | Year Ended October 31, 2012 | Year Ended October 31, 2011 | Year Ended October 31, 2010 | ||||||||||||||
| $ | 14.47 | $ | 11.36 | $ | 10.74 | $ | 10.71 | $ | 8.84 | |||||||||
|
|
|
|
|
|
|
|
|
| |||||||||
| (0.09 | ) | (0.05 | ) | — | 0.02 | (0.04 | ) | |||||||||||
| 1.12 | 3.66 | 0.62 | 0.04 | 1.91 | ||||||||||||||
|
|
|
|
|
|
|
|
|
| |||||||||
| 1.03 | 3.61 | 0.62 | 0.06 | 1.87 | ||||||||||||||
|
|
|
|
|
|
|
|
|
| |||||||||
| (0.05 | ) | — | (b) | — | (0.03 | ) | — | |||||||||||
| (1.51 | ) | (0.50 | ) | — | — | — | ||||||||||||
|
|
|
|
|
|
|
|
|
| |||||||||
| (1.56 | ) | (0.50 | ) | — | (0.03 | ) | — | |||||||||||
|
|
|
|
|
|
|
|
|
| |||||||||
| — | — | — | — | — | ||||||||||||||
|
|
|
|
|
|
|
|
|
| |||||||||
| $ | 13.94 | $ | 14.47 | $ | 11.36 | $ | 10.74 | $ | 10.71 | |||||||||
|
|
|
|
|
|
|
|
|
| |||||||||
| 7.38 | % | 33.01 | % | 5.77 | % | 0.50 | % | 21.15 | % | |||||||||
| $ | 282,670 | $ | 293,035 | $ | 272,092 | $ | 288,727 | $ | 283,892 | |||||||||
| 1.11 | %(g) | 1.17 | %(g) | 1.15 | %(g) | 1.15 | %(g) | 1.22 | %(g) | |||||||||
| (0.64 | )% | (0.41 | )% | 0.00 | % | 0.13 | % | (0.41 | )% | |||||||||
| 135.60 | % | 93.59 | % | 187.39 | % | 165.12 | %(i) | 95.29 | % | |||||||||
See accompanying notes which are an integral part of these financial statements.
37
SMI CONSERVATIVE ALLOCATION FUND
FINANCIAL HIGHLIGHTS
(For a share outstanding during each period)
| Six Months Ended April 30, 2015 (Unaudited) | ||||
Selected Per Share Data: | ||||
Net asset value, beginning of period | $ | 11.52 | ||
|
| |||
Income from investment operations: | ||||
Net investment income (loss)(b) | 0.02 | |||
Net realized and unrealized gain (loss) | 0.08 | |||
|
| |||
Total from investment operations | 0.10 | |||
|
| |||
Less Distributions to Shareholders: | ||||
From net investment income | (0.09 | ) | ||
From net realized gain | (1.34 | ) | ||
|
| |||
Total distributions | (1.43 | ) | ||
|
| |||
Paid in capital from redemption fees | — | (c) | ||
|
| |||
Net asset value, end of period | $ | 10.19 | ||
|
| |||
Total Return(d) | 0.76 | %(e) | ||
Ratios and Supplemental Data: | ||||
Net assets, end of period (000) | $ | 27,659 | ||
Ratio of expenses to average net assets(f) | 1.15 | %(h) | ||
Ratio of expenses to average net assets before waiver and reimbursement(f) | 1.41 | %(h) | ||
Ratio of net investment income (loss) to average net assets(b)(i) | 0.37 | %(h) | ||
Portfolio turnover rate | 142.17 | %(e) | ||
| (a) | For the period December 30, 2010 (the date the Fund commenced operations) through October 31, 2011. |
| (b) | Recognition of net investment income by the Fund is affected by the timing of the declaration of dividends by the underlying investment companies in which the Fund invests. |
| (c) | Redemption fees resulted in less than $0.005 per share. |
| (d) | Total return in the above table represents the rate that the investor would have earned on an investment in the Fund, assuming reinvestment of dividends. |
| (e) | Not annualized. |
| (f) | These ratios exclude the impact of expenses of the underlying funds in which the Fund may invest, as represented in the Schedule of Investments. |
| (g) | This ratio does not include the effects of other expenses refunded by the underlying funds in which the Fund invests. If these refunds had been included, the ratio of expenses to average net assets would have been 1.13%, 1.14% and 1.14% for the periods ended October 31, 2014, October 31, 2012 and October 31, 2011, respectively. |
| (h) | Annualized. |
| (i) | This ratio is presented net of the other expenses refunded by the underlying funds in which the Fund invests. |
See accompanying notes which are an integral part of these financial statements.
38
SMI CONSERVATIVE ALLOCATION FUND
FINANCIAL HIGHLIGHTS
(For a share outstanding during each period) – (Continued)
Year Ended | Year Ended October 31, 2013 | Year Ended October 31, 2012 | Period Ended October 31, 2011(a) | |||||||||||
| $ | 12.20 | $ | 10.31 | $ | 9.70 | $ | 10.00 | |||||||
|
|
|
|
|
|
|
| |||||||
| (0.01 | ) | (0.02 | ) | 0.03 | (0.01 | ) | ||||||||
| 0.54 | 2.11 | 0.63 | (0.30 | ) | ||||||||||
|
|
|
|
|
|
|
| |||||||
| 0.53 | 2.09 | 0.66 | (0.31 | ) | ||||||||||
|
|
|
|
|
|
|
| |||||||
| (0.06 | ) | (0.03 | ) | (0.05 | ) | — | ||||||||
| (1.15 | ) | (0.17 | ) | — | — | |||||||||
|
|
|
|
|
|
|
| |||||||
| (1.21 | ) | (0.20 | ) | (0.05 | ) | — | ||||||||
|
|
|
|
|
|
|
| |||||||
| — | (c) | — | (c) | — | (c) | 0.01 | ||||||||
|
|
|
|
|
|
|
| |||||||
| $ | 11.52 | $ | 12.20 | $ | 10.31 | $ | 9.70 | |||||||
|
|
|
|
|
|
|
| |||||||
| 4.46 | % | 20.56 | % | 6.89 | % | -3.00 | %(e) | |||||||
| $ | 30,606 | $ | 29,826 | $ | 37,258 | $ | 34,830 | |||||||
| 1.15 | %(g) | 1.15 | % | 1.15 | %(g) | 1.15 | %(g)(h) | |||||||
| 1.31 | % | 1.52 | % | 1.49 | % | 1.80 | %(h) | |||||||
| (0.17 | )% | (0.06 | )% | 0.29 | % | (0.17 | )%(h) | |||||||
| 255.50 | % | 270.30 | % | 349.33 | % | 276.04 | %(e) | |||||||
See accompanying notes which are an integral part of these financial statements.
39
SMI DYNAMIC ALLOCATION FUND
FINANCIAL HIGHLIGHTS
(For a share outstanding during each period)
| Six Months Ended April 30, 2015 (Unaudited) | Year Ended October 31, 2014 | Period Ended October 31, 2013(a) | ||||||||||
Selected Per Share Data: | ||||||||||||
Net asset value, beginning of period | $ | 11.81 | $ | 10.95 | $ | 10.00 | ||||||
|
|
|
|
|
| |||||||
Income from investment operations: | ||||||||||||
Net investment income (loss)(b) | 0.11 | 0.23 | 0.05 | |||||||||
Net realized and unrealized gain (loss) | 0.26 | 0.81 | 0.90 | |||||||||
|
|
|
|
|
| |||||||
Total from investment operations | 0.37 | 1.04 | 0.95 | |||||||||
|
|
|
|
|
| |||||||
Less Distributions to Shareholders: | ||||||||||||
From net investment income | (0.23 | ) | (0.18 | ) | — | |||||||
From net realized gains | (0.09 | ) | — | — | ||||||||
|
|
|
|
|
| |||||||
Total distributions | (0.32 | ) | (0.18 | ) | — | |||||||
|
|
|
|
|
| |||||||
Paid in capital from redemption fees(c) | — | — | — | |||||||||
|
|
|
|
|
| |||||||
Net asset value, end of period | $ | 11.86 | $ | 11.81 | $ | 10.95 | ||||||
|
|
|
|
|
| |||||||
Total Return(d) | 3.04 | %(e) | 9.64 | % | 9.50 | %(e) | ||||||
Ratios and Supplemental Data: | ||||||||||||
Net assets, end of period (000) | $ | 203,459 | $ | 147,003 | $ | 68,290 | ||||||
Ratio of expenses to average net assets(f) | 1.14 | %(g) | 1.20 | % | 1.30 | %(g) | ||||||
Ratio of net investment income (loss) to average net assets(b) | 1.81 | %(g) | 2.13 | % | 0.94 | %(g) | ||||||
Portfolio turnover rate | 41.94 | %(e) | 134.71 | % | 68.64 | %(e) | ||||||
| (a) | For the period February 28, 2013 (the date the Fund commenced operations) through October 31, 2013. |
| (b) | Recognition of net investment income by the Fund is affected by the timing of the declaration of dividends by the underlying investment companies in which the Fund invests. |
| (c) | Redemption fees resulted in less than $0.005 per share. |
| (d) | Total return in the above table represents the rate that the investor would have earned on an investment in the Fund, assuming reinvestment of dividends. |
| (e) | Not annualized. |
| (f) | These ratios exclude the impact of expenses of the underlying funds in which the Fund may invest, as represented in the Schedule of Investments. |
| (g) | Annualized. |
See accompanying notes which are an integral part of these financial statements.
40
SMI BOND FUND
FINANCIAL HIGHLIGHTS
(For a share outstanding during the period)
| Period Ended April 30, 2015 (Unaudited)(a) | ||||
Selected Per Share Data: | ||||
Net asset value, beginning of period | $ | 10.00 | ||
|
| |||
Income from investment operations: | ||||
Net investment income (loss)(b) | — | (c) | ||
Net realized and unrealized gain (loss) | — | |||
|
| |||
Total from investment operations | — | |||
|
| |||
Net asset value, end of period | $ | 10.00 | ||
|
| |||
Total Return(d) | 0.00 | %(e) | ||
Ratios and Supplemental Data: | ||||
Net assets, end of period (000) | $ | 138 | ||
Ratio of expenses to average net assets(f) | 0.85 | %(g) | ||
Ratio of expenses to average net assets before waiver and reimbursement(f) | 348.94 | %(g) | ||
Ratio of net investment income (loss) to average net assets(b) | (0.78 | )%(g) | ||
Portfolio turnover rate | 0.00 | %(e) | ||
| (a) | For the period April 28, 2015 (the date the Fund commenced operations) through April 30, 2015. |
| (b) | Recognition of net investment income by the Fund is affected by the timing of the declaration of dividends by the underlying investment companies in which the Fund invests. |
| (c) | Amount is less than $0.005 per share. |
| (d) | Total return in the above table represents the rate that the investor would have earned on an investment in the Fund, assuming reinvestment of dividends. |
| (e) | Not annualized. |
| (f) | These ratios exclude the impact of expenses of the underlying funds in which the Fund may invest, as represented in the Schedule of Investments. |
| (g) | Annualized. |
See accompanying notes which are an integral part of these financial statements.
41
SMI 50/40/10 FUND
FINANCIAL HIGHLIGHTS
(For a share outstanding during the period)
| Period Ended April 30, 2015 (Unaudited)(a) | ||||
Selected Per Share Data: | ||||
Net asset value, beginning of period | $ | 10.00 | ||
|
| |||
Income from investment operations: | ||||
Net investment income (loss)(b) | — | (c) | ||
Net realized and unrealized gain (loss) | (0.16 | ) | ||
|
| |||
Total from investment operations | (0.16 | ) | ||
|
| |||
Net asset value, end of period | $ | 9.84 | ||
|
| |||
Total Return(d) | -1.60 | %(e) | ||
Ratios and Supplemental Data: | ||||
Net assets, end of period (000) | $ | 1,132 | ||
Ratio of expenses to average net assets(f) | 1.45 | %(g) | ||
Ratio of expenses to average net assets before waiver and reimbursement(f) | 31.20 | %(g) | ||
Ratio of net investment income (loss) to average net assets(b) | (1.35 | )%(g) | ||
Portfolio turnover rate | 0.00 | %(e) | ||
| (a) | For the period April 29, 2015 (the date the Fund commenced operations) through April 30, 2015. |
| (b) | Recognition of net investment income by the Fund is affected by the timing of the declaration of dividends by the underlying investment companies in which the Fund invests. |
| (c) | Amount is less than $0.005 per share. |
| (d) | Total return in the above table represents the rate that the investor would have earned on an investment in the Fund, assuming reinvestment of dividends. |
| (e) | Not annualized. |
| (f) | These ratios exclude the impact of expenses of the underlying funds in which the Fund may invest, as represented in the Schedule of Investments. |
| (g) | Annualized. |
See accompanying notes which are an integral part of these financial statements.
42
SMI FUNDS
NOTES TO THE FINANCIAL STATEMENTS
April 30, 2015 – (Unaudited)
NOTE 1. ORGANIZATION
The Sound Mind Investing Fund (“SMI Fund”), SMI Conservative Allocation Fund (formerly the Sound Mind Investing Balanced Fund), SMI Dynamic Allocation Fund, SMI Bond Fund and SMI 50/40/10 Fund (each a “Fund” and collectively, the “Funds”) are each a diversified series of The Valued Advisers Trust (the “Trust”). Pursuant to a reorganization that took place on February 28, 2013, the SMI Fund and SMI Conservative Allocation Fund are the successors to the series of the Unified Series Trust (the “Predecessor Funds”) with the same names. The Predecessor Funds had the same investment objectives and strategies and substantially the same investment policies as the Funds. The SMI Fund was organized on August 29, 2005 and commenced operations on December 2, 2005. The SMI Conservative Allocation Fund was organized on November 13, 2010 and commenced operations on December 30, 2010. The SMI Dynamic Allocation Fund was organized on December 11, 2012 and commenced operations on February 28, 2013. The SMI Bond Fund was organized on March 11, 2015 and commenced operations on April 28, 2015. The SMI 50/40/10 Fund was organized on March 11, 2015 and commenced operations on April 29, 2015. The Trust is a management investment company established under the laws of Delaware by an Agreement and Declaration of Trust dated June 13, 2008 (the “Trust Agreement”). The Trust Agreement permits the Trustees to issue an unlimited number of shares of beneficial interest of separate series without par value. Each Fund is one of a series of funds currently authorized by the Trustees. The investment adviser to the Funds is SMI Advisory Services, LLC (the “Adviser”). Scout Investments, Inc., (the “Subadviser”) through its Reams Asset Management division, is the subadviser for the fixed income portion of the SMI Conservative Allocation Fund and SMI Bond Fund and subadviser for the fixed income investments (other than ETFs and other investment companies that invest primarily in fixed income securities) and cash investments for the SMI Dynamic Allocation Fund and SMI 50/40/10 Fund. The SMI Fund seeks to provide long-term capital appreciation. The SMI Conservative Allocation Fund, SMI Dynamic Allocation Fund, SMI Bond Fund and SMI 50/40/10 Fund seek total return.
NOTE 2. SIGNIFICANT ACCOUNTING POLICIES
The Funds are investment companies and follow accounting and reporting guidance under Financial Accounting Standards Board (“FASB”) Accounting Standards Codification (“ASC”) Topic 946, “Financial Services-Investment Companies”. The following is a summary of significant accounting policies followed by the Funds in the preparation of their financial statements. These policies are in conformity with the generally accepted accounting principles in the United States of America (“GAAP”).
Securities Valuations – All investments in securities are recorded at their estimated fair value as described in Note 3.
Federal Income Taxes – The Funds make no provision for federal income or excise tax. The Funds intend to qualify each year as regulated investment companies (“RICs”) under subchapter M of the Internal Revenue Code of 1986, as amended, by complying with the requirements applicable to RICs and by distributing substantially all of their taxable income. The Funds also intend to distribute sufficient net
43
SMI FUNDS
NOTES TO THE FINANCIAL STATEMENTS
April 30, 2015 – (Unaudited), (Continued)
NOTE 2. SIGNIFICANT ACCOUNTING POLICIES – (Continued)
investment income and net capital gains, if any, so that they will not be subject to excise tax on undistributed income and gains. If the required amount of net investment income or gains is not distributed, the Funds could incur a tax expense.
As of, and during the period ended April 30, 2015, the Funds did not have a liability for any unrecognized tax benefits. The Funds recognize interest and penalties, if any, related to unrecognized tax benefits as income tax expense in the statement of operations. During the period, the Funds did not incur any interest or penalties. Management of the Funds has reviewed tax positions taken in tax years that remain subject to examination by all major tax jurisdictions, including federal (i.e., the last three tax year ends and the interim tax period since then, as applicable). Management believes that there is no tax liability resulting from unrecognized tax benefits related to uncertain tax positions taken.
Expenses – Expenses incurred by the Trust that do not relate to a specific fund of the Trust are allocated to the individual funds based on each fund’s relative net assets or other appropriate basis.
Security Transactions and Related Income – The Funds follow industry practice and record security transactions on the trade date for financial reporting purposes. For financial statement and income tax purposes, the specific identification method is used for determining gains or losses on mutual funds and exchange-traded funds while the first in, first out method is used for determining gains or losses on all other security types. Dividend income is recorded on the ex-dividend date and interest income is recorded on an accrual basis. Short-term capital gain distributions from underlying funds are classified as dividend income for financial reporting purposes. Long-term capital gain distributions are broken out as such. Discounts and premiums on securities purchased are amortized or accreted using the effective interest method. The ability of issuers of debt securities held by the Funds to meet their obligations may be affected by economic and political developments in a specific country or region.
Dividends and Distributions – The Funds typically distribute substantially all of their net investment income in the form of dividends and taxable capital gains to their shareholders at least annually. These distributions, which are recorded on the ex-dividend date, are automatically reinvested in each Fund unless shareholders request cash distributions on their application or through a written request. The treatment for financial reporting purposes of distributions made to shareholders during the year from net investment income or net realized capital gains may differ from their ultimate treatment for federal income tax purposes. Where such differences are permanent in nature, they are reclassified in the components of the net assets based on their ultimate characterization for federal income tax purposes. Any such reclassifications will have no effect on net assets, results of operations or net asset values per share of the Funds.
Swap Contracts – The SMI Conservative Allocation Fund, SMI Dynamic Allocation Fund, SMI Bond Fund and SMI 50/40/10 Fund may enter into credit default swap contracts. A credit default swap involves a protection buyer and a protection seller. These Funds may be either a protection buyer or seller. The protection buyer makes periodic premium payments to the protection seller during the swap term in
44
SMI FUNDS
NOTES TO THE FINANCIAL STATEMENTS
April 30, 2015 – (Unaudited), (Continued)
NOTE 2. SIGNIFICANT ACCOUNTING POLICIES – (Continued)
exchange for the protection seller agreeing to make certain defined payments to the protection buyer in the event that certain defined credit events occur with respect to a particular security, issuer, or basket of securities. The “notional amount” of the swap agreement is the agreed upon amount or value of the underlying asset used for calculating the obligations that the parties to a swap agreement have agreed to exchange. The Funds’ obligation under a swap agreement will be accrued daily (offset against amounts owed to the individual Fund) and any accrued but unpaid net amounts owed to a swap counterparty may be collateralized by designating liquid assets on the individual Fund’s books and records. The credit default swaps are marked to market daily based upon quotes received from a pricing service and any change in value is recorded in unrealized appreciation/depreciation. Periodic payments paid or received are recorded in realized gain/loss. Any premium paid or received by these Funds upon entering into a credit default swap contract is recorded as an asset or liability and amortized daily as a component of realized gain (loss) on the Statements of Operations. Payments made or received as a result of a credit event or termination of the contract are recognized, net of a proportional amount of the upfront payment, as realized gains/losses. In addition to bearing the risk that the credit event will occur as a protection seller, these Funds could be exposed to market risk due to unfavorable changes in interest rates or in the price of the underlying security or index, the possibility that these Funds may be unable to close out its position at the same time or at the same price as if it had purchased comparable publicly traded securities, or that the counterparty may default on its obligation to perform. Please see Note 4 for information on swap agreement activity during the period ended April 30, 2015.
NOTE 3. SECURITIES VALUATION AND FAIR VALUE MEASUREMENTS
Fair value is defined as the price that a Fund would receive upon selling an investment in an orderly transaction to an independent buyer in the principal or most advantageous market of the investment. GAAP establishes a three-tier hierarchy to maximize the use of observable market data and minimize the use of unobservable inputs and to establish classification of fair value measurements for disclosure purposes.
Inputs refer broadly to the assumptions that market participants would use in pricing the asset or liability, including assumptions about risk, for example, the risk inherent in a particular valuation technique used to measure fair value including such a pricing model and/or the risk inherent in the inputs to the valuation technique. Inputs may be observable or unobservable. Observable inputs are inputs that reflect the assumptions market participants would use in pricing the asset or liability developed based on market data obtained from sources independent of the reporting entity. Unobservable inputs are inputs that reflect the reporting entity’s own assumptions about the assumptions market participants would use in pricing the asset or liability developed based on the best information available in the circumstances.
45
SMI FUNDS
NOTES TO THE FINANCIAL STATEMENTS
April 30, 2015 – (Unaudited), (Continued)
NOTE 3. SECURITIES VALUATION AND FAIR VALUE MEASUREMENTS – (Continued)
Various inputs are used in determining the value of the Funds’ investments. These inputs are summarized in the three broad levels listed below.
| • | Level 1 – quoted prices in active markets for identical securities |
| • | Level 2 – other significant observable inputs (including, but not limited to, quoted prices for an identical security in an inactive market, quoted prices for similar securities, interest rates, prepayment speeds, credit risk, etc.) |
| • | Level 3 – significant unobservable inputs (including each Fund’s own assumptions in determining fair value of investments based on the best information available) |
The inputs used to measure fair value may fall into different levels of the fair value hierarchy. In such cases, for disclosure purposes, the level in the fair value hierarchy within which the fair value measurement falls in its entirety, is determined based on the lowest level input that is significant to the fair value measurement in its entirety.
Equity securities, including exchange-traded funds, are generally valued by using market quotations, but may be valued on the basis of prices furnished by a pricing service when the Adviser believes such prices more accurately reflect the fair value of such securities. Securities that are traded on any stock exchange are generally valued by the pricing service at the last quoted sale price. Lacking a last sale price, an exchange traded security is generally valued by the pricing service at its last bid price. Securities traded in the NASDAQ over-the-counter market are generally valued by the pricing service at the NASDAQ Official Closing Price.
When using the market quotations or close prices provided by the pricing service and when the market is considered active, the security will be classified as a Level 1 security. Sometimes, an equity security owned by the Funds will be valued by the pricing service with factors other than market quotations or when the market is considered inactive. When this happens, the security will be classified as a Level 2 security. When market quotations are not readily available, when the Adviser determines that the market quotation or the price provided by the pricing service does not accurately reflect the current fair value, or when restricted or illiquid securities are being valued, such securities are valued as determined in good faith by the Adviser, in conformity with guidelines adopted by and subject to review by the Board. These securities will generally be categorized as Level 3 securities.
Investments in mutual funds, including money market mutual funds, are generally priced at the ending net asset value (“NAV”) provided by the service agent of the funds. These securities will be categorized as Level 1 securities.
Derivative instruments that the Funds invest in, such as swap agreements, are generally traded over-the-counter. The credit default swaps the SMI Conservative Allocation Fund, SMI Dynamic Allocation Fund,
46
SMI FUNDS
NOTES TO THE FINANCIAL STATEMENTS
April 30, 2015 – (Unaudited), (Continued)
NOTE 3. SECURITIES VALUATION AND FAIR VALUE MEASUREMENTS – (Continued)
SMI Bond Fund and SMI 50/40/10 Fund invests in will generally be valued at the mean of bid and ask prices provided by a major credit default swap pricing provider and will generally be classified as Level 2 securities.
Fixed income securities, including corporate bonds, foreign bonds denominated in U.S. dollars, U.S. treasury obligations and asset-backed securities, when valued using market quotations in an active market, will be categorized as Level 1 securities. However, they may be valued on the basis of prices furnished by a pricing service when the Adviser believes such prices more accurately reflect the fair value of such securities. A pricing service uses various inputs and techniques, which include broker-dealer quotations, live trading levels, recently executed transactions in securities of the issuer or comparable issuers, and option adjusted spread models that include base curve and spread curve inputs. Adjustments to individual bonds can be applied to recognize trading differences compared to other bonds issued by the same issuer. The broker-dealer quotations received are supported by credit analysis of the issuer that takes into consideration credit quality assessments, daily trading activity, and the activity of the underlying equities, listed bonds and sector-specific trends. Data used to establish quotes for asset-backed securities includes analysis of cash flows, pre-payment speeds, default rates, delinquency assumptions, and assumptions regarding collateral and loss. To the extent that these inputs are observable, the fixed income securities are categorized as Level 2 securities. If the Adviser decides that a price provided by the pricing service does not accurately reflect the fair value of the securities, when prices are not readily available from a pricing service, or when restricted or illiquid securities are being valued, securities are valued at fair value as determined in good faith by the Adviser, in conformity with guidelines adopted by and subject to review of the Board. These securities may be categorized as Level 3 securities.
Short-term investments in fixed income securities, (those with maturities of less than 60 days when acquired, or which subsequently are within 60 days of maturity), may be valued by using the amortized cost method of valuation, which the Board has determined will represent fair value. These securities will be classified as Level 2 securities.
In accordance with the Trust’s good faith pricing guidelines, the Adviser is required to consider all appropriate factors relevant to the value of securities for which it has determined other pricing sources are not available or reliable as described above. No single standard exists for determining fair value, because fair value depends upon the circumstances of each individual case. As a general principle, the current fair value of an issue of securities being valued by the Adviser would appear to be the amount which the owner might reasonably expect to receive for them upon their current sale. Methods which are in accordance with this principle may, for example, be based on (i) a multiple of earnings; (ii) a discount from market of a similar freely traded security (including a derivative security or a basket of securities traded on other markets, exchanges or among dealers); or (iii) yield to maturity with respect to debt issues, or a combination of these and other methods. Good faith pricing is permitted if, in the Adviser’s opinion, the validity of market quotations appears to be questionable based on factors such as evidence of a thin market
47
SMI FUNDS
NOTES TO THE FINANCIAL STATEMENTS
April 30, 2015 – (Unaudited), (Continued)
NOTE 3. SECURITIES VALUATION AND FAIR VALUE MEASUREMENTS – (Continued)
in the security based on a small number of quotations, a significant event occurs after the close of a market but before a Fund’s NAV calculation that may affect a security’s value, or the Adviser is aware of any other data that calls into question the reliability of market quotations. Good faith pricing may also be used in instances when the bonds the Funds’ invest in may default or otherwise cease to have market quotations readily available.
The following is a summary of the inputs used to value the Funds’ investments as of April 30, 2015:
| Valuation Inputs | ||||||||||||||||
| SMI Fund | Level 1 – Quoted Prices in Active Markets | Level 2 – Other Significant Observable Inputs | Level 3 – Significant Unobservable Inputs | Total | ||||||||||||
| Mutual Funds – greater than 1% of net assets | $ | 232,423,819 | $ | — | $ | — | $ | 232,423,819 | ||||||||
| Mutual Funds – less than 1% of net assets | 289,993 | — | — | 289,993 | ||||||||||||
| Exchange-Traded Funds | 18,597,217 | — | — | 18,597,217 | ||||||||||||
| Money Market Securities | 398,334 | — | — | 398,334 | ||||||||||||
| Total | $ | 251,709,363 | $ | — | $ | — | $ | 251,709,363 | ||||||||
48
SMI FUNDS
NOTES TO THE FINANCIAL STATEMENTS
April 30, 2015 – (Unaudited), (Continued)
NOTE 3. SECURITIES VALUATION AND FAIR VALUE MEASUREMENTS – (Continued)
| Valuation Inputs | ||||||||||||||||
| SMI Conservative Allocation Fund | Level 1 – Quoted Prices in Active Markets | Level 2 – Other Significant Observable Inputs | Level 3 – Significant Unobservable Inputs | Total | ||||||||||||
| Corporate Bonds | $ | — | $ | 1,968,323 | $ | — | $ | 1,968,323 | ||||||||
| Foreign Bonds Denominated in U.S. Dollars | — | 174,199 | — | 174,199 | ||||||||||||
| U.S. Treasury Obligations | — | 880,976 | — | 880,976 | ||||||||||||
| Asset-Backed Securities | — | 2,649,601 | — | 2,649,601 | ||||||||||||
| Mutual Funds | 9,403,130 | — | — | 9,403,130 | ||||||||||||
| Exchange-Traded Funds | 8,439,618 | — | — | 8,439,618 | ||||||||||||
| Money Market Securities | 773,037 | — | — | 773,037 | ||||||||||||
| Total Investments | $ | 18,615,785 | $ | 5,673,099 | $ | — | $ | 24,288,884 | ||||||||
| Valuation Inputs | ||||||||||||||||
| SMI Dynamic Allocation Fund | Level 1 – Quoted Prices in Active Markets | Level 2 – Other Significant Observable Inputs | Level 3 – Significant Unobservable Inputs | Total | ||||||||||||
| Exchange-Traded Funds | $ | 195,802,733 | $ | — | $ | — | $ | 195,802,733 | ||||||||
| Mutual Funds | 3,873,439 | — | — | 3,873,439 | ||||||||||||
| Money Market Securities | 472,028 | — | — | 472,028 | ||||||||||||
| Total | $ | 200,148,200 | $ | — | $ | — | $ | 200,148,200 | ||||||||
49
SMI FUNDS
NOTES TO THE FINANCIAL STATEMENTS
April 30, 2015 – (Unaudited), (Continued)
NOTE 3. SECURITIES VALUATION AND FAIR VALUE MEASUREMENTS – (Continued)
| Valuation Inputs | ||||||||||||||||
| SMI Bond Fund | Level 1 – Quoted Prices in Active Markets | Level 2 – Other Significant Observable Inputs | Level 3 – Significant Unobservable Inputs | Total | ||||||||||||
| Exchange-Traded Funds | $ | 234,110 | $ | — | $ | — | $ | 234,110 | ||||||||
| Money Market Securities | 127,520 | — | — | 127,520 | ||||||||||||
| Total Investments | $ | 361,630 | $ | — | $ | — | $ | 361,630 | ||||||||
| Valuation Inputs | ||||||||||||||||
| SMI 50/40/10 Fund | Level 1 – Quoted Prices in Active Markets | Level 2 – Other Significant Observable Inputs | Level 3 – Significant Unobservable Inputs | Total | ||||||||||||
| Exchange-Traded Funds | $ | 490,478 | $ | — | $ | — | $ | 490,478 | ||||||||
| Mutual Funds | 388,028 | — | — | 388,028 | ||||||||||||
| Money Market Securities | 490,614 | — | — | 490,614 | ||||||||||||
| Total Investments | $ | 1,369,120 | $ | — | $ | — | $ | 1,369,120 | ||||||||
The Funds did not hold any investments at any time during the reporting period in which significant unobservable inputs were used in determining fair value; therefore, no reconciliation of Level 3 securities is included for this reporting period. During the period ended April 30, 2015, there were no transfers between levels. The Trust recognizes transfers between fair value hierarchy levels at the end of the reporting period.
NOTE 4. DERIVATIVE TRANSACTIONS
The SMI Conservative Allocation Fund, SMI Dynamic Allocation Fund, SMI Bond Fund and SMI 50/40/10 Fund may obtain exposure to the fixed income market by investing in credit default swap (“CDX”) contracts. These Funds use CDX contracts as an additional avenue in which to bring value to the Funds. These Funds may use CDX contracts as an alternative to buying, selling, or holding certain securities in the fixed income market. The use of CDX contracts may provide a less expensive, more expedient, or more specifically focused way to invest than traditional fixed income securities would. These Funds may enter into single name CDX agreements to gain exposure to a particular company when it is more economically attractive to do so rather than purchasing traditional bonds. These Funds may also invest in CDX index products and options thereon that allow these Funds to gain broad market exposure but with less company-specific risk than single name CDX agreements.
50
SMI FUNDS
NOTES TO THE FINANCIAL STATEMENTS
April 30, 2015 – (Unaudited), (Continued)
NOTE 4. DERIVATIVE TRANSACTIONS – (Continued)
These Funds enter into CDX contracts to gain exposure or to mitigate specific forms of credit risk. Swaps expose these Funds to counterparty risk (described below). These Funds could also suffer losses with respect to a swap agreement if these Funds are unable to terminate the agreement or reduce its exposure through offsetting transactions.
Many of the markets in which these Funds participate in credit default transactions are “over the counter” or “interdealer” markets. The participants in these markets are typically not subject to credit evaluation and regulatory oversight as are members of “exchange based markets”. When these Funds invest in CDX contracts, it is assuming a credit risk with regard to parties with whom it trades and also bears the risk of settlement default. These risks may differ materially from those associated with transactions effected on an exchange, which generally are backed by clearing organization guarantees, daily marking-to-market and settlement, and segregation and minimum capital requirements applicable to intermediaries. Transactions entered into directly between two counterparties generally do not benefit from such protections. This exposes these Funds to the risk that the counterparty will not settle a transaction in accordance with its terms and conditions because of a dispute over the terms of the contract (whether or not bona fide) or because of a credit or liquidity problem, thus causing these Funds to suffer a loss. To mitigate counterparty risk, these Funds will sometimes require the counterparty to post collateral to the Funds’ custodian to cover the exposure.
These Funds may also invest in credit default swap index products and in options on credit default swap index products. These instruments are designed to track segments of the credit default swap market and provide investors with exposure to specific “baskets” of issuers of bonds or loans. In general, the value of the credit default swap market provides investors with exposure to specific “baskets” of issuers of bonds or loans. In general, the value of the credit default swap index product will go up or down in response to changes in the perceived credit risk and default experience of the basket of issuers, instead of the exchange of the stream of payments for the payment of the notional amount (if a credit event occurs) that is the substance of a single name credit default swap. Such investments are subject to liquidity risks as well as counterparty and other risks associated with investments in credit default swaps discussed above.
The effect of trading in credit default swap contracts is reflected on the Statements of Operations under net realized gain on swap contracts and net change in unrealized appreciation on swap contracts.
51
SMI FUNDS
NOTES TO THE FINANCIAL STATEMENTS
April 30, 2015 – (Unaudited), (Continued)
NOTE 4. DERIVATIVE TRANSACTIONS – (Continued)
For the six months ended April 30, 2015:
| Derivatives | Location of Gain (Loss) on Derivatives on Statements of Operations | Realized Gain (Loss) on Derivatives | Change in Unrealized Appreciation (Depreciation) on Derivatives | |||||||
| SMI Conservative Allocation Fund: | ||||||||||
| Credit Default Swap Agreements | Net realized and unrealized gain (loss) on swap contracts | $ | 17,757 | $ | (4,717 | ) | ||||
The SMI Conservative Allocation Fund purchased a total notional value of swap agreements of $780,000 during the six months ended April 30, 2015. The total notional value of terminated swap agreements was $950,000. The SMI Conservative Allocation Fund utilized credit derivative instruments in conjunction with investment securities in an effort to achieve its investment objective for the six months ended April 30, 2015.
As of April 30, 2015, the SMI Conservative Allocation Fund had no segregated cash collateral for outstanding swap contracts.
NOTE 5. FEES AND OTHER TRANSACTIONS WITH AFFILIATES
The Adviser, under the terms of the management agreement with respect to each Fund (each an “Agreement”), manages the Funds’ investments. As compensation for its management services, each Fund is obligated to pay the Adviser a fee based on each Fund’s average daily net assets as follows:
Fund Assets | SMI Fund | SMI Conservative Allocation | SMI Dynamic Allocation | |||||||||
| $1 – $100 million | 1.00% | 0.90% | 1.00% | |||||||||
| $100,000,001 – $250 million | 1.00% | 0.80% | 1.00% | |||||||||
| $250,000,001 to $500 million | 0.90% | 0.70% | 0.90% | |||||||||
| Over $500 million | 0.80% | 0.60% | 0.80% | |||||||||
| Management fees earned | $ | 1,334,377 | $ | 131,062 | $ | 899,117 | ||||||
| Fees waived and expenses reimbursed | $ | — | $ | (36,603 | ) | $ | — | |||||
52
SMI FUNDS
NOTES TO THE FINANCIAL STATEMENTS
April 30, 2015 – (Unaudited), (Continued)
NOTE 5. FEES AND OTHER TRANSACTIONS WITH AFFILIATES – (Continued)
Fund Assets | SMI Bond Fund | SMI 50/40/10 Fund | ||
| $1 – $250 million | 0.75% | 1.00% | ||
| $250,000,001 to $500 million | 0.70% | 0.90% | ||
| Over $500 million | 0.65% | 0.80% | ||
| Management fees earned | $ 3 | $ 29 | ||
| Fees waived and expenses reimbursed | $ (1,383) | $ (859) |
The Adviser contractually has agreed to waive its management fee and/or reimburse certain operating expenses, but only to the extent necessary so that each Fund’s total annual operating expenses (excluding interest, taxes, brokerage commissions, other expenses which are capitalized in accordance with GAAP, extraordinary expenses, dividend expense on short sales, 12b-1 fees, and acquired fund fees and expenses) do not exceed 1.50% of the Fund’s average daily net assets with respect to the SMI Fund, 1.15% with respect to the SMI Conservative Allocation Fund, 1.45% with respect to the SMI Dynamic Allocation Fund, 0.85% with respect to the SMI Bond Fund, and 1.45% with respect to the SMI 50/40/10 Fund. The contractual arrangement for the SMI Fund, SMI Conservative Allocation Fund and SMI Dynamic Allocation Fund is in place through February 29, 2016 and for the SMI Bond Fund and SMI 50/40/10 Fund is in place through February 28, 2017. Each waiver or reimbursement by the Adviser is subject to repayment by the applicable Fund within the three fiscal years following the fiscal year in which the particular expense or reimbursement was incurred; provided that such Fund is able to make the repayment without exceeding the applicable expense limitation.
The amount subject to repayment by the SMI Conservative Allocation Fund, SMI Bond Fund and SMI 50/40/10 Fund, pursuant to the aforementioned conditions, at April 30, 2015 is as follows:
| Recoverable through October 31, | SMI Conservative | SMI Bond Fund | SMI 50/40/10 Fund | |||||||||
| 2015 | $ | 131,773 | $ | — | $ | — | ||||||
| 2016 | 116,168 | — | — | |||||||||
| 2017 | 50,773 | — | — | |||||||||
| 2018 | 36,603 | 1,383 | 859 | |||||||||
The Trust retains Huntington Asset Services, Inc. (“HASI”) to manage the Funds’ business affairs and to provide the Funds with administrative services, including all regulatory reporting and necessary office equipment and personnel. The Trust also retains HASI to act as each Fund’s transfer agent and to provide fund accounting services. Expenses incurred by the Funds for these expenses are allocated to the individual Funds based on each Fund’s relative net assets. Certain officers of the Trust are members of management and/or employees of HASI. HASI operates as a wholly-owned subsidiary of Huntington Bancshares, Inc., the parent company of the principal distributor of the Funds and Huntington National Bank, the custodian of the Funds’ investments (the “Custodian”). A Trustee of the Trust is a member of management of the
53
SMI FUNDS
NOTES TO THE FINANCIAL STATEMENTS
April 30, 2015 – (Unaudited), (Continued)
NOTE 5. FEES AND OTHER TRANSACTIONS WITH AFFILIATES – (Continued)
Custodian. For the period ended April 30, 2015, fees for administrative, transfer agent, and fund accounting services, reimbursement of out-of-pocket expenses, and Custodian expenses and the amounts due to HASI and the Custodian at April 30, 2015 were as follows:
SMI Fund | SMI Conservative | SMI Dynamic | SMI Bond | SMI 50/40/10 | ||||||||||||||||
Administration expenses | $ | 42,407 | $ | 4,515 | $ | 24,456 | $ | — | $ | — | ||||||||||
Transfer agent expenses | 32,899 | 10,300 | 18,774 | 135 | 90 | |||||||||||||||
Fund accounting expenses | 21,273 | 2,260 | 12,263 | — | — | |||||||||||||||
Custodian expenses | 13,108 | 5,982 | 4,860 | 96 | 64 | |||||||||||||||
Payable to HASI | 16,551 | 3,023 | 3,003 | 135 | 90 | |||||||||||||||
Payable to Custodian | 1,615 | 1,124 | 1,105 | 96 | 64 | |||||||||||||||
Unified Financial Securities, Inc. (the “Distributor”) acts as the principal distributor of the Funds. There were no payments made to the Distributor by the SMI Fund, SMI Conservative Allocation Fund, SMI Dynamic Allocation Fund, SMI Bond Fund or SMI 50/40/10 Fund for period ended April 30, 2015. The Distributor, HASI, and the Custodian are controlled by Huntington Bancshares, Inc. A Trustee of the Trust is a member of management of Huntington National Bank, a subsidiary of Huntington Bancshares, Inc. (the parent of the Distributor), and certain officers of the Trust are officers of the Distributor and such persons may be deemed to be affiliates of the Distributor.
NOTE 6. INVESTMENTS
For the period ended April 30, 2015, purchases and sales of investment securities, other than short-term investments and short-term U.S. government obligations were as follows:
SMI Fund | SMI Conservative | SMI Dynamic | SMI Bond | SMI 50/40/10 | ||||||||||||||||
Purchases | ||||||||||||||||||||
U.S. Government Obligations | $ | — | $ | 2,923,812 | $ | — | $ | — | $ | — | ||||||||||
Other | 308,316,322 | 37,392,214 | 126,069,520 | 233,974 | 889,417 | |||||||||||||||
Sales | ||||||||||||||||||||
U.S. Government Obligations | $ | — | $ | 7,439,296 | $ | — | $ | — | $ | — | ||||||||||
Other | 338,253,884 | 38,407,353 | 75,078,694 | — | — | |||||||||||||||
54
SMI FUNDS
NOTES TO THE FINANCIAL STATEMENTS
April 30, 2015 – (Unaudited), (Continued)
NOTE 7. RESTRICTED SECURITIES
Restricted securities are securities that may only be resold upon registration under federal securities laws or in transactions exempt from such registration. In some cases, the issuer of restricted securities has agreed to register such securities for resale, at the issuer’s expense, either upon demand by the Funds or in connection with another registered offering of the securities. Many restricted securities may be resold in the secondary market in transactions exempt from registration. Such restricted securities may be determined to be liquid. The Board of Trustees and management of the SMI Conservative Allocation Fund consider the restricted securities shown below to be liquid. The Fund will not incur any registration costs upon such resale. The Fund’s restricted securities are valued at the price provided by dealers in the secondary market or, if no market prices are available, at the fair value as determined by the Trust’s Pricing Committee. At April 30, 2015, the SMI Conservative Allocation Fund held restricted securities representing 1.38% of net assets, as listed below:
| Issuer Description | Acquisition Date | Principal Amount | Amortized Cost | Fair Value | ||||||||||||
| AIG Global Funding, 1.650%, 12/15/2017 | 12/8/2014 | $ | 25,000 | $ | 24,979 | $ | 25,119 | |||||||||
| Credit Suisse Mortgage Trust, Series 2009-12R, Class 41A1, 5.250%, 3/27/2037 | 6/13/2011 | 5,955 | 5,956 | 6,094 | ||||||||||||
| Daimler Finance North America LLC, 1.250%, 1/11/2016 | 1/9/2013 | 90,000 | 89,974 | 90,399 | ||||||||||||
| Ford Motor Credit Co. LLC, 3.984%, 6/15/2016 | (a | ) | 65,000 | 65,022 | 66,915 | |||||||||||
| Hertz Vehicle Financing LLC, Series 2013-1A, Class A1, 1.120%, 8/25/2017 | 1/18/2013 | 90,000 | 89,997 | 90,027 | ||||||||||||
| Liberty Mutual Group, Inc. 6.700%, 8/15/2016 | 1/19/2012 | 25,000 | 25,709 | 26,730 | ||||||||||||
| New York Life Global Funding, 1.450%, 12/15/2017 | 12/10/2014 | 65,000 | 64,935 | 65,417 | ||||||||||||
| Structured Asset Securities Corp. Mortgage Loan Trust, Series 2005-S7, Class A2, 0.481%, 12/25/2035 | (b | ) | 11,424 | 8,326 | 11,180 | |||||||||||
| $ | 381,881 | |||||||||||||||
| (a) | Purchased on various dates beginning 6/17/2011. |
| (b) | Purchased on various dates beginning 6/22/2011. |
55
SMI FUNDS
NOTES TO THE FINANCIAL STATEMENTS
April 30, 2015 – (Unaudited), (Continued)
NOTE 8. LINE OF CREDIT
During the six months ended April 30, 2015, the Trust, on behalf of the Funds, entered into in a short-term credit agreement (“Line of Credit”) with Huntington National Bank (“Huntington”), an affiliate of HASI, expiring on February 5, 2016. Under the terms of the agreement, the Funds may borrow up to $5 million at an interest rate of LIBOR plus 150 basis points. The purpose of the agreement is to meet temporary or emergency cash needs, including redemption requests that might otherwise require the untimely disposition of securities. Huntington receives an annual facility fee of 0.125% on $5 million as well as an additional annual fee of 0.125% on any unused portion of the credit facility, invoiced quarterly, for providing the Line of Credit. The Funds will not borrow money, except (a) from a bank, provided that immediately after such borrowing there is an asset coverage of 300% for all borrowings of a Fund; or (b) from a bank or other persons for temporary purposes only, provided that such temporary borrowings are in an amount not exceeding 5% of a Fund’s total assets at the time when the borrowing is made. This limitation does not preclude a Fund from entering into reverse repurchase transactions, provided that the Fund has asset coverage of 300% for all borrowings and repurchase commitments of the Fund pursuant to reverse repurchase transactions.
As of April 30, 2015, the Funds had no outstanding borrowings under this Line of Credit.
| Fund | Average Daily Loan Balance | Weighted Average Interest Rate | Number of Days Outstanding* | Interest Expense Incurred | Maximum Loan Outstanding | |||||||||||||||
| SMI Fund | $ | 1,495,238 | 1.68 | % | 21 | $ | 2,173 | $ | 1,900,000 | |||||||||||
| SMI Conservative Allocation Fund | 1,200,000 | 1.68 | % | 1 | 55 | 1,200,000 | ||||||||||||||
| * | Number of Days Outstanding represents the total days during the six months ended April 30, 2015 that a Fund utilized the Line of Credit. |
NOTE 9. ESTIMATES
The preparation of financial statements in conformity with GAAP requires management to make estimates and assumptions that affect the reported amounts of assets and liabilities and disclosure of contingent assets and liabilities at the date of the financial statements and the reported amounts of increases and decreases in net assets from operations during the reporting period. Actual results could differ from those estimates.
NOTE 10. BENEFICIAL OWNERSHIP
The beneficial ownership, either directly or indirectly, more than of 25% or more of the voting securities of a fund creates a presumption of control of the fund, under Section 2(a)(9) of the Investment Company Act
56
SMI FUNDS
NOTES TO THE FINANCIAL STATEMENTS
April 30, 2015 – (Unaudited), (Continued)
NOTE 10. BENEFICIAL OWNERSHIP – (Continued)
of 1940. At April 30, 2015, National Financial Services Corporation (“NFS”) for the benefit of others, held 31% and 33% of the SMI Conservative Allocation Fund and SMI Dynamic Allocation Fund, respectively. It is not known whether NFS, or any of the underlying beneficial owners, owned or controlled 25% or more of the voting securities of the Funds.
NOTE 11. FEDERAL TAX INFORMATION
At April 30, 2015, the net unrealized appreciation (depreciation) of investments for tax purposes was as follows:
| SMI Fund | SMI Conservative Allocation Fund | SMI Dynamic Allocation Fund | SMI Bond Fund | SMI 50/40/10 Fund | ||||||||||||||||
Gross Appreciation | $ | 9,074,332 | $ | 288,264 | $ | 11,310,303 | $ | 136 | $ | — | ||||||||||
Gross (Depreciation) | (2,816,386 | ) | (561,130 | ) | (248,205 | ) | — | (10,911 | ) | |||||||||||
|
|
|
|
|
|
|
|
|
| |||||||||||
Net Appreciation (Depreciation) on Investments | $ | 6,257,946 | $ | (272,866 | ) | $ | 11,062,098 | $ | 136 | $ | (10,911 | ) | ||||||||
|
|
|
|
|
|
|
|
|
| |||||||||||
At April 30, 2015, the aggregate cost of securities for federal income tax purposes was $245,451,417, $24,561,750, $189,086,102, $361,494 and $1,380,031 for the SMI Fund, SMI Conservative Allocation Fund, SMI Dynamic Allocation Fund, SMI Bond Fund, and the SMI 50/40/10 Fund, respectively.
The tax characterization of distributions for the fiscal year ended October 31, 2014, was as follows:
| SMI Fund | SMI Conservative Allocation Fund | SMI Dynamic Allocation Fund | ||||||||||
Distributions paid from: | ||||||||||||
Ordinary Income | $ | 17,659,948 | $ | 1,850,608 | $ | 1,285,357 | ||||||
Long-term Capital Gain | 13,752,091 | 1,130,543 | — | |||||||||
|
|
|
|
|
| |||||||
| $ | 31,412,039 | $ | 2,981,151 | $ | 1,285,357 | |||||||
|
|
|
|
|
| |||||||
57
SMI FUNDS
NOTES TO THE FINANCIAL STATEMENTS
April 30, 2015 – (Unaudited), (Continued)
NOTE 11. FEDERAL TAX INFORMATION – (Continued)
At October 31, 2014, the Funds’ most recent fiscal year end, the components of distributable earnings (accumulated losses) on a tax basis were as follows:
| SMI Fund | SMI Conservative Allocation Fund | SMI Dynamic Allocation Fund | ||||||||||
Accumulated undistributed ordinary income | $ | 1,347,440 | $ | 64,793 | $ | 1,630,013 | ||||||
Accumulated undistributed long-term capital gains | 43,676,165 | 3,408,063 | 1,173,735 | |||||||||
Accumulated capital and other losses | (2,444,468 | ) | (82,960 | ) | — | |||||||
Unrealized appreciation (depreciation) | 29,293,879 | 1,462,282 | 9,916,237 | |||||||||
|
|
|
|
|
| |||||||
| $ | 71,873,016 | $ | 4,852,178 | $ | 12,719,985 | |||||||
|
|
|
|
|
| |||||||
At October 31, 2014, the difference between book basis and tax basis unrealized appreciation is attributable to the tax deferral of losses on wash sales in the amount of $3,767, $1,414 and $20,610 for the SMI Fund, SMI Conservative Allocation Fund, and SMI Dynamic Allocation Fund, respectively.
As of October 31, 2014, accumulated capital and other losses consist of:
| Qualified Late Year Ordinary Losses | ||||
SMI Fund | $ | 2,444,468 | ||
SMI Conservative Allocation Fund | 82,960 | |||
NOTE 12. COMMITMENTS AND CONTIGENCIES
The Funds indemnify its officers and trustees for certain liabilities that may arise from performance of their duties to the Funds. Additionally, in the normal course of business, the Funds enter into contracts that contain a variety of representations and warranties which provide general indemnifications. The Funds’ maximum exposure under these arrangements is unknown, as this would involve future claims that may be made against the Funds that have not yet occurred.
NOTE 13. SUBSEQUENT EVENT
Management of the Funds has evaluated the need for disclosures and/or adjustments resulting from subsequent events through the date these financial statements were issued. There were no items requiring adjustment of financial statements or additional disclosure.
58
OTHER INFORMATION
The Funds’ Statement of Additional Information (“SAI”) includes additional information about the trustees and is available without charge, upon request. You may call toll-free at (877) 764-3863 to request a copy of the SAI or to make shareholder inquiries.
INVESTMENT ADVISORY AGREEMENT APPROVAL (Unaudited)
At a meeting held on December 9-10, 2014, the Board of Trustees (the “Board”) considered the renewal of the Investment Advisory Agreement between the Trust and SMI Advisory Services, LLC (“SMI” or “Adviser”) with respect to the Sound Mind Investing Fund, the SMI Conservative Allocation Fund (previously the Sound Mind Investing Balanced Fund), and the SMI Dynamic Allocation Fund (the “Funds” or “SMI Funds”) and the renewal of the Sub-Advisory between SMI and Reams Asset Management (“Reams”) with respect to the SMI Conservative Allocation Fund and the SMI Dynamic Allocation Fund (collectively, the agreements are referred to as “Agreement”). Counsel noted that the 1940 Act requires the approval of the investment advisory agreement between the Trust and its investment adviser by the Board, including a majority of the Independent Trustees. The Board discussed the arrangements between the Adviser and the Trust with respect to the Fund.
Counsel directed the Trustees to the memorandum from his firm that summarized, among other things, the fiduciary duties and responsibilities of the Board in reviewing and approving the Agreements. Counsel pointed out that the Board’s duties with respect to the Sub-Advisory Agreement are the same as those with respect to the Advisory Agreement. The Board discussed the contractual arrangements between SMI and the Trust, and between SMI and Reams with respect to the Funds.
Counsel discussed with the Trustees the types of information and factors that should be considered by the Board in order to make an informed decision regarding the approval of the Agreements, including the following material factors: (i) the nature, extent, and quality of the services to be provided by SMI and Reams; (ii) the investment performance of the Funds; (iii) the costs of the services to be provided and anticipated profits to be realized by SMI and Reams from the relationship with the Funds; (iv) the extent to which economies of scale would be realized if the Funds grow and whether advisory fee levels reflect those economies of scale for the benefit of the Funds’ investors; and (v) SMI’s and Reams’ practices regarding possible conflicts of interest and potential benefits derived from its relationship with the Funds.
With respect to the proposed renewal of the Advisory Agreement, Counsel discussed with the Trustees the factors that should be considered by the Board, including a review of the factors as applicable to SMI. In assessing these factors and reaching its decisions, the Board took into consideration information furnished for the Board’s review and consideration throughout the year at regular Board meetings, as well as information specifically prepared and/or presented in connection with the annual renewal process, including information presented at the Meeting. The Board requested and was provided with, and reflected on, information and reports relevant to the annual renewal of the Advisory Agreement, including: (i) reports regarding the services and support provided to the Funds and their shareholders by SMI; (ii) quarterly assessments of the investment performance of the Funds by personnel of SMI;
59
INVESTMENT ADVISORY AGREEMENT APPROVAL (Unaudited), (Continued)
(iii) commentary on the reasons for the performance; (iv) presentations by SMI addressing SMI’s investment philosophy, investment strategy, personnel and operations; (v) compliance and audit reports concerning the Funds and SMI and the oversight by SMI of similar reports concerning Reams; (vi) disclosure information contained in the registration statement of the Trust and the Form ADV of SMI; (vii) information relating to the manner in which SMI oversees Reams; and (viii) a memorandum from Counsel, that summarized the fiduciary duties and responsibilities of the Board in reviewing and approving the Advisory Agreement, including the material factors set forth above and the types of information included in each factor that should be considered by the Board in order to make an informed decision. The Board also requested and received various informational materials including, without limitation: (i) documents containing information about SMI, including financial information, a description of personnel and the services provided to the Funds, information on investment advice, performance, summaries of Fund expenses, compliance program, current legal matters, and other general information; (ii) comparative expense and performance information for other mutual funds with strategies similar to the Funds; and (iii) benefits to be realized by SMI from its relationship with the Funds. The Board did not identify any particular information that was most relevant to its consideration to approve the Advisory Agreements and each Trustee may have afforded different weight to the various factors.
| 1. | The nature, extent, and quality of the services to be provided by SMI. In this regard, the Board considered SMI’s responsibilities under the Advisory Agreement. The Trustees considered the services being provided by SMI to the SMI Funds, including, without limitation: the quality of its investment advisory services (including research and recommendations with respect to portfolio securities), its process for formulating investment recommendations and assuring compliance with the investment objectives and limitations, its coordination of services for the SMI Funds among the service providers to the SMI Funds (including the sub-advisor to the SMI Conservative Allocation Fund and the SMI Dynamic Allocation Fund) and its efforts to promote the SMI Funds and grow their assets. The Trustees considered SMI’s continuity of, and commitment to retain, qualified personnel and SMI’s commitment to maintain and enhance its resources and systems. The Trustees considered SMI’s personnel, including the education and experience of SMI’s personnel. After considering the foregoing information and further information in the Meeting materials provided by SMI (including SMI’s Form ADV), the Board concluded that, in light of all the facts and circumstances, the nature, extent, and quality of the services provided by SMI were satisfactory and adequate for the SMI Funds. |
| 2. | Investment Performance of the SMI Funds and SMI. In considering the investment performance of the SMI Funds and SMI, the Trustees compared the performance of the SMI Funds with the performance of funds with similar objectives managed by other investment advisers, as well as with aggregated peer group data. The Trustees also considered the consistency of SMI’s management of the SMI Funds with each Fund’s investment objective, strategies, and limitations. The Trustees noted that SMI did not manage accounts for clients with investment objectives similar to the SMI Funds. The Trustees noted and gave significant consideration to SMI’s view that the “upgrading” strategy utilized by the Sound Mind Investing Fund did not allow it to be appropriately compared to any particular peer category. Nonetheless, the Trustees observed that the Sound Mind Investing Fund performed comparably to its peers as it was categorized by an independent service although its performance |
60
INVESTMENT ADVISORY AGREEMENT APPROVAL (Unaudited), (Continued)
| generally was below the averages and medians (and during some periods near the bottom of the category) of those peers. With respect to the Sound Minding Investing Conservative Allocation Fund, the Trustees observed that the Fund performed below the average and median performance measures for its peer category during the most recent one-year measurement period but that it was close to the average and median performance measures since the Fund’s inception. The Trustees noted that the equity portion of the SMI Conservative Allocation Fund utilized the “upgrading” strategy of the Sound Mind Investing Fund and that, as such, there was likely an impact on the performance of that Fund. With respect to the Dynamic Allocation Fund, the Trustees noted that the Fund performed comparably to the peer group for the one-year period, and had performed above the median and average of the peer group for the period since the Fund’s inception. After reviewing and discussing the investment performance of the SMI Funds further, SMI’s experience managing the SMI Funds, and other relevant factors, the Board concluded, in light of all the facts and circumstances, that the investment performance of the SMI Funds was acceptable. |
| 3. | The costs of the services to be provided and profits to be realized by SMI from the relationship with the SMI Funds. In considering the costs of services to be provided and the profits to be realized by SMI from the relationship with the SMI Funds, the Trustees considered: (1) SMI’s financial condition; (2) asset levels of the SMI Funds; (3) the overall expenses of the SMI Funds; and (4) the nature and frequency of advisory fee payments. The Trustees reviewed information provided by SMI regarding its profits associated with managing the SMI Funds. The Trustees also considered potential benefits for SMI in managing the SMI Funds. The Trustees then compared the fees and expenses of the SMI Funds (including the management fee) to other comparable mutual funds. The Trustees noted that the SMI Funds’ management fees tended to be toward the higher end of the range of mutual funds in their peer categories; noting in particular that that the management fee for the Sound Mind Investing Fund was close to the top of the range of its peer category, the management fee for the SMI Conservative Allocation Fund was above the average and median for its peer category, and the management fee for the SMI Dynamic Allocation Fund was slightly higher than the average, but just below the median for its peer category. The Trustees also noted that the net fees for each of the three Funds were below the average and median for the respective peer group. In light of the unique services rendered to the SMI Funds by SMI, the view of SMI that the categorization with respect to the Sound Mind Investing Fund did not provide an appropriate peer group for a comparison, the profits realized by SMI in managing the SMI Funds, and all other facts and circumstances they deemed relevant, the Trustees concluded that the management fees paid by the SMI Funds were fair and reasonable in relation to the nature and quality of the services provided by SMI. |
| 4. | The extent to which economies of scale would be realized as the SMI Funds grow and whether advisory fee levels reflect these economies of scale for the benefit of the SMI Funds’ investors. In this regard, the Trustees considered the fee arrangements with SMI for the SMI Funds. The Trustees considered that the management fee for each of the SMI Funds had breakpoints that would allow shareholders to realize economies of scale as assets grow. The Trustees noted that the Sound Mind Investing Fund and the Dynamic Allocation Fund were realizing these economies as a result of each Fund’s current asset size. With respect to the Conservative Allocation Fund, they noted that its asset |
61
INVESTMENT ADVISORY AGREEMENT APPROVAL (Unaudited), (Continued)
| base had not grown sufficiently to allow it to realize the economies of scale; however, the Board also noted that SMI Conservative Allocation Fund’s shareholders had experienced benefits from the expense limitation arrangements in place for that Fund. In light of its ongoing consideration of the asset levels of each of the SMI Funds, expectations for growth, and fee levels, the Board determined that the fee arrangements for each of the Funds, in light of all the facts and circumstances, were fair and reasonable in relation to the nature and quality of the services provided by the Adviser. |
| 5. | Possible conflicts of interest. In considering SMI’s practices regarding conflicts of interest, the Trustees evaluated the potential for conflicts of interest and considered such matters as the experience and ability of the advisory personnel assigned to the SMI Funds; the basis of decisions to buy or sell securities for the SMI Funds; and the substance and administration of SMI’s code of ethics. The Trustees also considered disclosure in the registration statement of the Trust relating to SMI’s potential conflicts of interest. Based on the foregoing, the Board determined that SMI’s standards and practices relating to the identification and mitigation of potential conflicts of interest were satisfactory. |
After additional consideration of the factors delineated in the memorandum provided by Counsel and further discussion among the Board, the Board determined to approve the continuation of the Advisory Agreement between the Trust and the Adviser.
The Board then discussed the proposed renewal of the Sub-Advisory Agreement between SMI and Reams with respect to the SMI Conservative Allocation Fund and the SMI Dynamic Allocation Fund. Counsel again referenced the memorandum from Counsel that summarized, among other things, the fiduciary duties and responsibilities of the Board in reviewing and approving the renewal of the Sub-Advisory Agreement. Counsel reminded the Trustees of the types of information and factors that should be considered by the Board in order to make an informed decision regarding the approval of the renewal of the Sub-Advisory Agreement, including a review of the factors as applicable to Reams.
In assessing these factors and reaching its decisions, the Board took into consideration information furnished for the Board’s review and consideration throughout the year at regular Board meetings, as well as information specifically prepared and/or presented in connection with the annual renewal process, including information presented at the Meeting. The Board requested and was provided with, and reflected on, information and reports relevant to the annual renewal of the Sub-Advisory Agreement, including: (i) reports regarding the services and support provided to the Funds and their shareholders by Reams; (ii) quarterly assessments of the investment performance of the Funds by personnel of Reams; (iii) commentary on the reasons for the performance; (iv) presentations by Reams addressing Reams’ investment philosophy, investment strategy, personnel and operations; (v) compliance and audit reports concerning the Funds and Reams; (vi) disclosure information contained in the registration statement of the Trust and the Form ADV of Reams; and (vii) a memorandum from Counsel, that summarized the fiduciary duties and responsibilities of the Board in reviewing and approving the Sub-Advisory Agreement, including the material factors set forth above and the types of information included in each factor that should be considered by the Board in order to make an informed decision. The Board also requested and
62
INVESTMENT ADVISORY AGREEMENT APPROVAL (Unaudited), (Continued)
received various informational materials including, without limitation: (i) documents containing information about Reams, including financial information, a description of personnel and the services provided to the Funds, information on investment advice, performance, summaries of Fund expenses, compliance program, current legal matters, and other general information; (ii) comparative expense and performance information for other mutual funds with strategies similar to the Funds; and (iii) benefits to be realized by Reams from its relationship with the Funds. The Board did not identify any particular information that was most relevant to its consideration to approve the Sub-Advisory Agreement and each Trustee may have afforded different weight to the various factors.
| 1. | The nature, extent, and quality of the services to be provided by Reams. In this regard, the Board considered the responsibilities Reams has under the Sub-Advisory Agreement. The Board reviewed the services provided by Reams to SMI and the Funds including, without limitation Reams’ procedures for formulating investment recommendations and assuring compliance with each Fund’s investment objectives and limitations. The Board considered: Reams’ staffing, personnel, and methods of operating; the education and experience of Reams’ personnel; and Reams’ compliance program, policies, and procedures. After reviewing the foregoing and further information from Reams (e.g., compliance programs and the Form ADV of Scout Investments of which Reams is a division), the Board concluded that the quality, extent, and nature of the services provided by Reams were satisfactory and adequate for the Fund. |
| 2. | Investment Performance of the Fund and Reams. The Board considered the related investment performance information provided by Reams. The Board noted that the performance achieved by Reams with respect to the portion of Conservative Allocation Fund assets allocated to it was comparable to that of other mutual funds that were managed in a style comparable to the manner in which Reams managed its portion of the Fund. The Board also considered the performance of the portion of the Fund that Reams managed with that of a similarly managed composite of separate accounts managed by Reams. The Board noted that the performance of the composite of separate accounts was very comparable. The Board acknowledged that SMI had not yet allocated a portion of the Dynamic Allocation Fund’s assets to Reams for management. The Board concluded, in light of the foregoing factors, that the related investment performance information of Reams was satisfactory. |
| 3. | The costs of the services to be provided and profits to be realized by Reams from the relationship with the Funds. In this regard, the Board considered: the financial condition of Reams and the level of commitment to the Funds and the overall anticipated expenses of the Funds, including the expected nature and frequency of payments, and the profits to be derived in managing the Funds. The Board also considered potential benefits for Reams in sub-advising the Funds. The Board noted the representation from Reams that the sub-advisory fee paid to Reams for managing the Funds was less than what it charged to the accounts of other clients with similar investment strategies. Following this comparison and upon further consideration and discussion of the foregoing, the Board concluded that the fees to be paid to Reams for its services to the Funds were fair and reasonable. |
| 4. | The extent to which economies of scale would be realized as the Funds grow and whether advisory fee levels reflect these economies of scale for the benefit of the investors. In this regard, the Board |
63
INVESTMENT ADVISORY AGREEMENT APPROVAL (Unaudited), (Continued)
| considered the fee arrangements with Reams. The Board noted that the sub-advisory fee would stay the same as asset levels increased. The Board considered the arrangements with Reams in light of the overall arrangement for advisory services with SMI, as well as the fees charged by Reams for other clients, and the Board determined that the fee arrangements for Reams were fair and reasonable and reasonable in relation to the nature and quality of the services to be provided by Reams. |
| 5. | Possible conflicts of interest. In evaluating the possibility for conflicts of interest, the Board considered such matters as: the experience and ability of the sub-advisory personnel assigned to the Funds; the basis of decisions to buy or sell securities for the Funds and/or Reams’ other accounts; the method for bunching of portfolio securities transactions; the substance and administration of Reams’ code of ethics and other relevant policies described in Reams’ Form ADV. Following further consideration and discussion, the Board determined that Reams’ standards and practices relating to the identification and mitigation of potential conflicts of interest were satisfactory. |
After additional consideration of the factors delineated in the memorandum provided by Counsel and further discussion among the Board, the Board determined to approve the continuation of the Sub-Advisory Agreement between the Adviser and Reams.
At a meeting held on March 10-11, 2015, the Board considered the initial approval of the Investment Advisory Agreement between the Trust and the Adviser with respect to the SMI Bond Fund and the SMI 50/40/10 Fund (the “Funds”) and the initial approval of the Sub-Advisory Agreement between SMI and Reams with respect to the Funds (collectively, the agreements are referred to as “Agreements”). Counsel noted that the 1940 Act requires the approval of Agreements by the Board, including a majority of the Independent Trustees.
Counsel directed the Trustees to the memorandum from his firm that summarized, among other things, the fiduciary duties and responsibilities of the Board in reviewing and approving the Agreements. Counsel pointed out that the Board’s duties with respect to the Sub-Advisory Agreement are the same as those with respect to the Advisory Agreement. The Board discussed the contractual arrangements between SMI and the Trust, and between SMI and Reams with respect to the Funds.
Counsel discussed with the Trustees the types of information and factors that should be considered by the Board in order to make an informed decision regarding the approval of the Agreements, including the following material factors: (i) the nature, extent, and quality of the services to be provided by SMI and Reams; (ii) the investment performance of the Funds; (iii) the costs of the services to be provided and anticipated profits to be realized by SMI and Reams from the relationship with the Funds; (iv) the extent to which economies of scale would be realized if the Funds grow and whether advisory fee levels reflect those economies of scale for the benefit of the Funds’ investors; and (v) SMI’s and Reams’ practices regarding possible conflicts of interest and potential benefits derived from the relationship with the Funds.
With respect to the proposed approval of the Investment Advisory Agreement, Counsel discussed with the Trustees the factors above as applicable to SMI. In assessing the factors and reaching its decisions, the Board reflected upon their experience with SMI in connection with the management of other series of the
64
INVESTMENT ADVISORY AGREEMENT APPROVAL (Unaudited), (Continued)
Trust, and took into consideration information furnished for the Board’s review and consideration throughout the year at regular Board meetings, as well as information specifically prepared and/or presented in connection with the approval process at this meeting. They also considered the information specifically provided for their review in connection with the initial approval process, which included, among other things, a letter from Counsel to SMI, SMI’s response to that letter, financial statements of SMI, SMI’s Form ADV, SMI’s Compliance Manual, and a certification regarding SMI’s Code of Ethics, as well as drafts of the registration statement for the new Funds and a presentation by management of SMI at a previous meeting in which they described the strategies to be pursued by the Funds. The Board did not identify any particular information that was most relevant to its consideration to approve the Advisory Agreement and each Trustee may have afforded different weight to the various factors.
| 1. | The nature, extent, and quality of the services to be provided by SMI. In this regard, the Board considered responsibilities that SMI would have under the Advisory Agreement. The Trustees considered the services proposed to be provided by SMI to the Funds, including without limitation: SMI’s procedures for formulating investment recommendations and assuring compliance with the Fund’s investment objectives and limitations; the efforts of SMI during the Funds’ start-up phase, its anticipated coordination of services for the Funds among the Funds’ service providers (including the sub-advisor to the Funds), and its anticipated efforts to promote the Funds and grow assets. The Trustees considered SMI’s continuity of, and commitment to retain, qualified personnel, SMI’s commitment to maintain and enhance its resources and systems, and SMI’s cooperation with the Board and Counsel for the Funds. The Trustees acknowledged their reliance, in part, on their experience with SMI in its management of other series of the Trust. The Trustees considered SMI’s personnel, including the education and experience of SMI’s personnel and SMI’s compliance program, policies and procedures. After considering the foregoing information and further information in the meeting materials provided by SMI (including SMI’s Form ADV), the Board concluded that, in light of all the facts and circumstances, the nature, extent, and quality of the services proposed to be provided by SMI will be satisfactory and adequate for the Funds. |
| 2. | Investment Performance of the Funds and the Adviser. The Board noted that while the Funds had not commenced operations and thus did not have investment performance information to review, the Board could consider the investment performance of the Adviser in managing accounts similar to the manner in which the Funds would be managed. The Trustees noted that the Funds would employ strategies currently used by the other series of the Trust managed by SMI. The Board reviewed performance history of the SMI Dynamic Allocation Fund, noting that the fund performed comparably to its mixed benchmark for the period since inception of the fund. The Board also noted that the Sound Mind Investing Fund and the SMI Conservative Allocation Fund had underperformed somewhat as compared to the respective benchmarks. After reviewing the performance, the Board concluded, in light of the foregoing factors, that the investment performance of SMI was satisfactory. |
| 3. | The costs of the services to be provided and profits to be realized by the Adviser from the relationship with the Funds. In this regard, the Board considered: the financial condition of SMI and the level of commitment to the Funds and SMI by the principals of SMI; the projected asset levels of the Funds; |
65
INVESTMENT ADVISORY AGREEMENT APPROVAL (Unaudited), (Continued)
| SMI’s payment of startup costs for the Funds; and the overall anticipated expenses of the Funds, including the expected nature and frequency of advisory fee payments. The Board also considered potential benefits for SMI in managing the Funds. The Board compared the expected fees and expenses of the Funds (including the management fee) to other funds comparable to the Funds in terms of the type of fund, the style of investment management, the anticipated size of the Funds and the nature of the investment strategy and markets invested in, among other factors. With respect to the SMI Bond Fund, the Board determined that the management fee is comparable, although slightly higher than, the average and median of its anticipated peer group, and that, in light of the contractual Expense Limitation Agreement the Fund’s anticipated expense ratio was lower than the average and median of its peer group. With respect to the SMI 50/40/10 Fund, the Board determined that the management fee is very comparable to the average and median of its anticipated peer group, and that, in light of the contractual Expense Limitation Agreement the Fund’s anticipated expense ratio was lower than the average and median of its peer group. Following this comparison and upon further consideration and discussion of the foregoing, the Board concluded that the fees to be paid to SMI by the Funds were fair and reasonable. |
| 4. | The extent to which economies of scale would be realized as the Funds grow and whether advisory fee levels reflect these economies of scale for the benefit of the Funds’ investors. In this regard, the Board considered the Funds’ fee arrangements with SMI. The Board noted that the management fee schedule included breakpoints, and that the management fee will decrease as assets increase, allowing shareholders to benefit from economies of scale. The Board also observed that the shareholders of the Funds would benefit from the Expense Limitation Agreement, and that the Funds would benefit from economies of scale under the Trust’s agreements with service providers other than SMI. Following further discussion of the Fund’s projected asset levels, expectations for growth, and levels of fees, the Board determined that the Funds’ fee arrangements with SMI were fair and reasonable in relation to the nature and quality of the services to be provided by SMI. |
| 5. | Possible conflicts of interest and benefits to the Adviser. In evaluating the possibility for conflicts of interest, the Board considered such matters as: the experience and ability of the advisory personnel assigned to the Funds; the basis of decisions to buy or sell securities for the Funds; the substance and administration of SMI’s code of ethics and other relevant policies described in SMI’s Form ADV. With respect to benefits to SMI (in addition to the fees under the Advisory Agreement), the Board noted that SMI would benefit from its relationship with the Funds as the Funds would provide the ability to market a combination of SMI’s various strategies in a mutual fund format. Following further consideration and discussion, the Board indicated that SMI’s standards and practices relating to the identification and mitigation of potential conflicts of interest were satisfactory and the anticipated benefits to be realized by SMI from managing the Funds were acceptable. |
After additional consideration of the factors delineated in the memorandum provided by Counsel and further discussion among the Trustees, the Board determined to approve the Advisory Agreement between the Trust and the Adviser.
66
INVESTMENT ADVISORY AGREEMENT APPROVAL (Unaudited), (Continued)
The Board then discussed the proposed approval of the Sub-Advisory Agreement between SMI and Reams with respect to the Funds. Counsel reminded the Trustees of the types of information and factors that should be considered by the Board in order to make an informed decision regarding the approval of Sub-Advisory Agreement, including a review of the factors as applicable to Reams.
In assessing the factors and reaching its decisions, the Board reflected upon their experience with Reams in connection with the management of other series of the Trust, and took into consideration information furnished for the Board’s review and consideration at previous Board meetings. They also considered the information specifically provided for their review in connection with the initial approval process, which included, among other things, a letter from Counsel to Reams, Reams’ response to that letter, financial statements of Reams, Reams’ Form ADV, Reams’ Compliance Manual, and a certification regarding Reams’ Code of Ethics. The Board did not identify any particular information that was most relevant to its consideration to approve the Sub-Advisory Agreement and each Trustee may have afforded different weight to the various factors.
| 2. | The nature, extent, and quality of the services to be provided by Reams. In this regard, the Board considered the responsibilities that Reams would have under the Sub-Advisory Agreement. The Trustees considered the services proposed to be provided by Reams to the Funds, including without limitation: Reams’ procedures for formulating investment recommendations and assuring compliance with the Funds’ investment objectives and limitations. The Trustees considered Reams’ continuity of, and commitment to retain, qualified personnel, Reams’ commitment to maintain and enhance its resources and systems, and Reams’ cooperation with the Board, the Adviser, and Counsel for the Funds. The Trustees acknowledged their reliance, in part, on their experience with Reams in its management of other series of the Trust. The Board considered Reams’ personnel, including the education and experience of Reams’ personnel and Reams’ compliance program, policies and procedures. After considering the foregoing information and further information in the meeting materials provided by Reams (including the Form ADV of Scout Investments, of which Reams is a division), the Board concluded that, in light of all the facts and circumstances, the nature, extent, and quality of the services proposed to be provided by Reams will be satisfactory and adequate for the Funds. |
| 2. | Investment Performance of the Funds and Reams. The Board considered the related investment performance information provided by Reams and the performance of Reams in managing a portion of the assets of another series of the Trust. The Board noted that the performance achieved by Reams with respect to the portion of SMI Conservative Allocation Fund assets allocated to it was comparable to that of other mutual funds that were managed in a style comparable to the manner in which Reams managed its portion of the Fund. The Board acknowledged that Reams would be using similar strategies to managing the portion of the Funds’ assets allocated to it. The Board also considered the performance of the portion of the Conservative Allocation Fund that Reams managed with that of a similarly managed composite of separate accounts managed by Reams. The Board noted that the performance of the composite of separate accounts was very comparable. The Board concluded, in light of the foregoing factors, that the related investment performance information of Reams was satisfactory. |
67
INVESTMENT ADVISORY AGREEMENT APPROVAL (Unaudited), (Continued)
| 3. | The costs of the services to be provided and profits to be realized by Reams from the relationship with the Funds. In this regard, the Board considered: the financial condition of Reams and the level of commitment to the Funds and Reams by the principals of Reams; the projected asset levels of the Funds; and the overall anticipated expenses of the Funds, including the expected nature and frequency of sub-advisory fee payments. The Board considered the profits to be derived in managing the Funds and potential benefits for Reams in sub-advising the Funds. The Board noted the representation from Reams that the sub-advisory fee to be paid to Reams for managing the Funds was less than what it charged to the accounts of other clients with similar investment strategies. Following this comparison and upon further consideration and discussion of the foregoing, the Board concluded that the fees to be paid to Reams for its services to the Funds were fair and reasonable. |
| 4. | The extent to which economies of scale would be realized as the Funds grow and whether advisory fee levels reflect these economies of scale for the benefit of the investors. In this regard, the Board considered the fee arrangements with Reams. The Board noted that the sub-advisory fee would stay the same as asset levels increased. The Board considered the arrangements with Reams in light of the overall arrangement for advisory services with SMI, as well as the fees charged by Reams for other clients, and the Board determined that the fee arrangements for Reams were fair and reasonable and reasonable in relation to the nature and quality of the services to be provided by Reams. |
| 5. | Possible conflicts of interest. In evaluating the possibility for conflicts of interest, the Board considered such matters as: the experience and ability of the sub-advisory personnel to be assigned to the Funds; the basis of decisions to buy or sell securities for the Funds and/or Reams’ other accounts; the method for bunching of portfolio securities transactions; the substance and administration of Reams’ code of ethics and other relevant policies described in Reams’ Form ADV. Following further consideration and discussion, the Board determined that Reams’ standards and practices relating to the identification and mitigation of potential conflicts of interest were satisfactory. |
After additional consideration of the factors delineated in the memorandum provided by Counsel and further discussion among the Trustees, the Board determined to approve the Sub-Advisory Agreement between the Adviser and Reams.
68
PROXY VOTING
A description of the policies and procedures that the Funds use to determine how to vote proxies relating to portfolio securities and information regarding how the Funds voted those proxies during the most recent twelve month period ended June 30 is available without charge upon request by (1) calling the Funds at (877) 764-3863 and (2) from Fund documents filed with the Securities and Exchange Commission (“SEC”) on the SEC’s website at www.sec.gov.
TRUSTEES
R. Jeffrey Young, Chairman
Ira Cohen
Andrea N. Mullins
OFFICERS
R. Jeffrey Young, Principal Executive
Officer and President
Bryan W. Ashmus, Principal Financial
Officer and Treasurer
John C. Swhear, Chief Compliance Officer,
AML Officer and Vice-President
Carol J. Highsmith, Vice President and Secretary
Matthew J. Miller, Vice President
INVESTMENT ADVISOR
SMI Advisory Services, LLC
11135 Baker Hollow Road
Columbus, IN 47201
DISTRIBUTOR
Unified Financial Securities, Inc.
2960 North Meridian Street, Suite 300
Indianapolis, IN 46208
INDEPENDENT REGISTERED PUBLIC ACCOUNTING FIRM
Cohen Fund Audit Services Ltd.
1350 Euclid Avenue, Suite 800
Cleveland, OH 44115
LEGAL COUNSEL
The Law Offices of John H. Lively &
Associates, Inc.,
A member firm of The 1940 Act Law GroupTM
11300 Tomahawk Creek Pkwy, Suite 310
Leawood, KS 66211
CUSTODIAN
Huntington National Bank
41 South High Street
Columbus, OH 43125
ADMINISTRATOR, TRANSFER AGENT AND FUND ACCOUNTANT
Huntington Asset Services, Inc.
2960 North Meridian Street, Suite 300
Indianapolis, IN 46208
This report is intended only for the information of shareholders or those who have received the Funds prospectus which contains information about the Funds management fee and expenses. Please read the prospectus carefully before investing.
Distributed by Unified Financial Securities, Inc.
Member FINRA/SIPC
69
VALUED ADVISERS TRUST
PRIVACY POLICY
The following is a description of the policies of the Valued Advisers Trust (the “Trust”) regarding disclosure of nonpublic personal information that shareholders provide to a series of the Trust (each, a “Fund”) or that the Fund collects from other sources. In the event that a shareholder holds shares of a Fund through a broker-dealer or other financial intermediary, the privacy policy of the financial intermediary would govern how shareholder nonpublic personal information would be shared with nonaffiliated third parties.
Categories of Information A Fund May Collect. A Fund may collect the following nonpublic personal information about its shareholders:
| • | Information the Fund receives from a shareholder on applications or other forms, correspondence, or conversations (such as the shareholder’s name, address, phone number, social security number, and date of birth); and |
| • | Information about the shareholder’s transactions with the Fund, its affiliates, or others (such as the shareholder’s account number and balance, payment history, cost basis information, and other financial information). |
Categories of Information A Fund May Disclose. A Fund may not disclose any nonpublic personal information about its current or former shareholders to unaffiliated third parties, except as required or permitted by law. A Fund is permitted by law to disclose all of the information it collects, as described above, to its service providers (such as the Fund’s custodian, administrator, transfer agent, accountant and legal counsel) to process shareholder transactions and otherwise provide services to the shareholder.
Confidentiality and Security. Each Fund shall restrict access to shareholder nonpublic personal information to those persons who require such information to provide products or services to the shareholder. Each Fund shall maintain physical, electronic, and procedural safeguards that comply with federal standards to guard shareholder nonpublic personal information.
Disposal of Information. The Funds, through their transfer agent, have taken steps to reasonably ensure that the privacy of a shareholder’s nonpublic personal information is maintained at all times, including in connection with the disposal of information that is no longer required to be maintained by the Funds. Such steps shall include, whenever possible, shredding paper documents and records prior to disposal, requiring off-site storage vendors to shred documents maintained in such locations prior to disposal, and erasing and/or obliterating any data contained on electronic media in such a manner that the information can no longer be read or reconstructed.
70

SOUND MIND
INVESTING FUND
SMI CONSERVATIVE ALLOCATION FUND
SMI DYNAMIC ALLOCATION FUND
SMI BOND FUND
SMI 50/40/10 FUND
| SEMI-ANNUAL REPORT |
| April 30, 2015 |
Fund Adviser:
SMI Advisory Services, LLC
11135 Baker Hollow Road
Columbus, IN 47201
Toll Free (877) SMI-Fund
www.smifund.com

DANA LARGE CAP EQUITY FUND
Semi-Annual Report
April 30, 2015
Dana Investment Advisors, Inc.
15800 Bluemound Rd., Suite 250
Brookfield, WI 53005
(855) 280-9648
www.danafunds.com
Dear Fellow Shareholders:
We are excited to provide an update on the performance and growth of the Dana Large Cap Equity Fund (the “Fund”). Since last November, Fund assets have grown by over 180% and the Fund’s Class N Shares returned 5.29% while the S&P 500 Index® (“S&P 500”) returned 4.40% during the same time period. The Fund reached a few milestones during the last six months as assets rose to over $100 million and the Fund celebrated a five year inception anniversary on March 1st. These milestones and successes are attributed to you our fellow shareholders. Without your support and the skill of our portfolio management team, none of these would be possible. As always, we welcome your comments and questions and you may reach us via email at DanaFunds@danainvestment.com.
Market Recap:
The U.S. equity market has continued to move higher over the first half of the Fund’s fiscal year (November 1, 2014 to April 30, 2015), with the S&P 500 up 4.40% over those six months. Volatility, which has been remarkably low since late 2011, was modestly higher over the last six months. Economic statistics have been mixed, but most U.S. companies, outside of energy, have been able to continue to generate profit growth. GDP growth for Q1 in the U.S. was soft, joining most developed economies with GDP growth between 0% and 1% in the most recent quarter. Job growth dipped for a few months before returning to the 200,000+ level with the April report. Industrial production began a downward trend in December. Dollar strength, while reversing slightly recently, is increasing competitive pressures and discounting foreign earnings for many U.S. companies. Energy sector earnings are declining, and downward pressure exists in other areas. Even with these challenges, we have been able to find companies that show a favorable blend of expected future growth and fair valuations.
Performance:
Performance in the Fund has been ahead of the S&P 500 index over the November 1, 2014 to April 30, 2015 period, despite lagging performance in April during which the S&P 500 was led by several large higher-valuation stocks that don’t fit with our investment philosophy. Turnover during the six months was modest as we responded to changing oil economics and dollar strength. We will continue to cull underperformers from the portfolio and add companies that have favorable metrics based on our investment approach.
As always, security selection is the driver of our relative performance. During the six months ending April 30, 2015, the top contributors to our portfolio were Skyworks Solutions, Inc., Mylan N.V., Aetna Inc., and Kroger Company. Skyworks is benefitting from the success of the iPhone 6, and analysts expect revenue to rise 41% during the current fiscal year. Mylan was only added to the portfolio in March, but the stock jumped in April after Teva Pharma made an unsolicited offer for Mylan. Aetna rose steadily from mid-October until late March as the benefits to health insurers from Affordable Care Act (“ACA”) implementation began to show in financial results (and political uncertainty around ACA subsided). As the leading traditional grocer with rising sales and ROIC, Kroger continued a remarkable run that began in February 2014, until correcting in the second half of April. Information Technology was our strongest performing sector on both an absolute and relative basis.
1
The biggest detractor from portfolio performance during the first half the Fund’s fiscal year (November 1, 2014, to April 30, 2015) was Helmerich & Payne, Inc. Helmerich & Payne was hit hard by the dramatic fall of oil prices during the second half of 2014. The next biggest detractors from Fund performance were Trinity Industries, Inc., Gilead Sciences, Inc., and Discover Financial Services. Trinity slid during calendar Q4 and again in late April based on negative developments tied to a lawsuit against the company. Gilead fell in mid-December based on AbbVie’s introduction of a competing Hepatitis-C drug (expected) and an exclusivity arrangement for the drug with Express Scripts (unexpected). Discover’s stock tumbled in January as the company’s Q4 earnings fell well short of expectations. The Energy sector produced the weakest returns (the only one of the ten GICS sectors that was not positive in the Fund), but our poorest relative performance came in the Consumer Discretionary sector.
We always think of our shareholders as the key to our continued success, and we take seriously the trust you have placed in us. We continue to see opportunity in a market that is ever changing, and presents new challenges in different ways. Our investment approach has shown its success over the past five years, and we remain committed to our approach, which we have successfully implemented for over fifteen years and across multiple market cycles.
Respectfully submitted,

Mark R. Mirsberger, CPA
Chief Executive Officer – Dana Investment Advisors, Inc.

Duane Roberts, CFA
Portfolio Manager and Director of Equities – Dana Investment Advisors, Inc.
2
Investment Results (Unaudited)
Total Returns* as of April 30, 2015
| Six Months | One Year | Three Year | Five year | Since Inception (3/1/10) | Since Inception (7/28/10) | Since Inception (10/29/13) | ||||||||||||||||||||||
Dana Large Cap Equity Fund |
| |||||||||||||||||||||||||||
Class A with Load | 0.00% | 6.46% | 13.59% | N/A | N/A | 14.52% | N/A | |||||||||||||||||||||
Class A without Load | 5.24% | 12.07% | 15.54% | N/A | N/A | 15.77% | N/A | |||||||||||||||||||||
Class N | 5.29% | 12.06% | 15.75% | 14.83% | 16.65% | N/A | N/A | |||||||||||||||||||||
Institutional Class | 5.43% | 12.41% | N/A | N/A | N/A | N/A | 14.94% | |||||||||||||||||||||
S&P 500 Index1 | 4.40% | 12.98% | 16.73% | 14.33% | 15.48% | 16.53% | 14.17% | |||||||||||||||||||||
| Expense Ratios2 | ||||||||||||||||||||||||||||
| Class A | Class N | | Institutional Class | | ||||||||||||||||||||||||
Gross | 1.93% | 1.93% | 1.68 | % | ||||||||||||||||||||||||
With Applicable Waivers | 0.98% | 0.98% | 0.73 | % | ||||||||||||||||||||||||
The performance quoted represents past performance, which does not guarantee future results. The investment return and principal value of an investment will fluctuate so that an investor’s shares, when redeemed, may be worth more or less than their original cost. The returns shown do not reflect deduction of taxes that a shareholder would pay on Fund distributions or the redemption of Fund shares. Current performance of the Fund may be lower or higher than the performance quoted. The Fund's investment objectives, risks, charges and expenses must be considered carefully before investing. Performance data current to the most recent month end may be obtained by calling 1-(855)-280-9648.
* Return figures reflect any change in price per share and assume the reinvestment of all distributions. Returns for periods greater than 1 year are annualized.
1 The S&P 500® Index ("Index") is widely recognized unmanaged index of equity securities and is representative of a broader domestic equity market and range of securities than is found in the Fund's portfolio. Individuals cannot invest directly in the Index; however, an individual can invest in exchange traded funds or other investment vehicles that attempt to track the performance of a benchmark index.
2 The expense ratios are from the Fund's prospectus dated February 28, 2015. The Adviser has contractually agreed to waive its management fee and/or reimburse certain operating expenses through February 28, 2017, but only to the extent necessary so that the Fund's net expenses, excluding brokerage fees and commissions, borrowing costs (such as (a) interest expense and (b) dividends on securities sold short), taxes, extraordinary expenses, 12b-1 fees (if applicable), and any indirect expenses (such as fees and expenses of acquired funds), do not exceed 0.73%. Additional information pertaining to the Fund's expense ratios as of April 30, 2015 can be found on the financial highlights.
The Fund's investment objectives, strategies, risks, charges and expenses must be considered carefully before investing. The prospectus contains this and other important information about the Fund and may be obtained by calling the same number as above. Please read it carefully before investing.
The Fund is distributed by Unified Financial Securities, Inc., member FINRA.
3
Portfolio Illustration (Unaudited)
April 30, 2015
The following chart gives a visual breakdown of the Fund by the industry sectors the underlying securities represent as a percentage of the portfolio of investments.
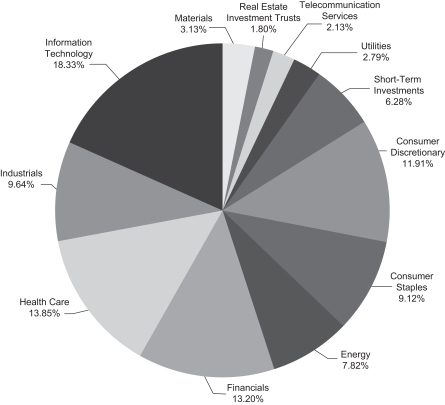
Availability of Portfolio Schedule – (Unaudited)
The Fund files its complete schedule of portfolio holdings with the Securities and Exchange Commission (“SEC”) for the first and third quarters of each fiscal year on Form N-Q. The Fund’s Forms N-Q are available at the SEC’s website at www.sec.gov. The Fund’s Forms N-Q may be reviewed and copied at the Public Reference Room in Washington DC. Information on the operation of the Public Reference Room may be obtained by calling 1-800-SEC-0330.
4
Summary of Fund’s Expenses – (Unaudited)
As a shareholder of the Fund, you incur two types of costs: (1) transaction costs, including sales charges (loads) on purchases and short-term redemption fees and (2) ongoing costs, including management fees, distribution and service (12b-1) fees, and other Fund expenses. These examples are intended to help you understand your ongoing costs (in dollars) of investing in the Fund and to compare these costs with the ongoing costs of investing in other mutual funds.
The Example is based on an investment of $1,000 invested at the beginning of the period and held for the entire period (November 1, 2014 through April 30, 2015).
Actual Expenses
The first line of the table for each class provides information about actual account values and actual expenses. You may use the information in these lines, together with the amount you invested, to estimate the expenses that you paid over the period. Simply divide your account value by $1,000 (for example, an $8,600 account value divided by $1,000 = 8.60), then multiply the result by the number in the first line under the heading “Expenses Paid During Period” to estimate the expenses you paid on your account during this period.
Hypothetical Example for Comparison Purposes
The second line of the table for each class provides information about hypothetical account values and hypothetical expenses based on the Fund’s actual expense ratios and an assumed rate of return of 5% per year before expenses, which is not the Fund’s actual return. The hypothetical account values and expenses may not be used to estimate the actual ending account balances or expenses you paid for the period. You may use this information to compare the ongoing costs of investing in the Fund and other funds. To do so, compare this 5% hypothetical example with the 5% hypothetical examples that appear in the shareholder reports of the other funds.
Expenses shown in the table are meant to highlight your ongoing costs only and do not reflect any transactional costs such as the fee imposed on sales charges and short-term redemptions. Therefore, the second line of the table for each class is useful in comparing ongoing costs only and will not help you determine the relative total costs of owning different funds. In addition, if transaction costs were included, your costs would have been higher.
5
Summary of Fund’s Expenses (Unaudited) (continued)
| Beginning Account Value, November 1, 2014 | Ending Account Value, April 30, 2015 | Expenses Paid During Period(1) | Annualized Expense Ratio | |||||||||||||||
Dana Large Cap Equity Fund | ||||||||||||||||||
Class A | Actual | $ | 1,000.00 | $ | 1,052.40 | $ | 4.99 | 0.98 | % | |||||||||
| Hypothetical(2) | $ | 1,000.00 | $ | 1,019.93 | $ | 4.91 | 0.98 | % | ||||||||||
Class N | Actual | $ | 1,000.00 | $ | 1,052.90 | $ | 4.99 | 0.98 | % | |||||||||
| Hypothetical(2) | $ | 1,000.00 | $ | 1,019.93 | $ | 4.91 | 0.98 | % | ||||||||||
Institutional Class | Actual | $ | 1,000.00 | $ | 1,054.30 | $ | 3.72 | 0.73 | % | |||||||||
| Hypothetical(2) | $ | 1,000.00 | $ | 1,021.17 | $ | 3.66 | 0.73 | % | ||||||||||
| (1) | Expenses are equal to the Fund’s annualized expense ratios, multiplied by the average account value over the period, multiplied by 181/365 (to reflect the one-half year period). The annualized expense ratios reflect reimbursement of expenses by the Fund’s Adviser for the period beginning November 1, 2014 to April 30, 2015. The “Financial Highlights” tables in the Fund’s financial statements, included in the report, also show the gross expense ratios, without such reimbursements. |
| (2) | Hypothetical assumes 5% annual return before expenses. |
6
Schedule of Investments
April 30, 2015 (Unaudited)
| Shares | Fair Value | |||||||
| COMMON STOCKS — 98.60% | ||||||||
| Consumer Discretionary — 12.53% | ||||||||
| 32,600 | Comcast Corp.—Class A | $ | 1,882,976 | |||||
| 60,000 | Hanesbrands, Inc. | 1,864,800 | ||||||
| 27,000 | Lowe’s Companies, Inc. | 1,859,220 | ||||||
| 30,800 | Macy’s, Inc. | 1,990,604 | ||||||
| 37,800 | Magna International, Inc. | 1,906,254 | ||||||
| 26,000 | Royal Caribbean Cruises Ltd. | 1,769,560 | ||||||
| 10,800 | Whirlpool Corp. | 1,896,480 | ||||||
|
| |||||||
| 13,169,894 | ||||||||
|
| |||||||
| Consumer Staples — 9.59% | ||||||||
| 21,800 | CVS Health Corp. | 2,164,522 | ||||||
| 25,000 | Dr. Pepper Snapple Group, Inc. | 1,864,500 | ||||||
| 16,600 | Kimberly-Clark Corp. | 1,820,854 | ||||||
| 31,600 | Kroger Co./The | 2,177,556 | ||||||
| 28,000 | Reynolds American, Inc. | 2,052,400 | ||||||
|
| |||||||
| 10,079,832 | ||||||||
|
| |||||||
| Energy — 8.23% | ||||||||
| 15,400 | Chevron Corp. | 1,710,324 | ||||||
| 21,000 | ConocoPhillips | 1,426,320 | ||||||
| 22,000 | Exxon Mobil Corp. | 1,922,140 | ||||||
| 15,000 | Schlumberger Ltd. | 1,419,150 | ||||||
| 20,000 | Tesoro Corp. | 1,716,600 | ||||||
| 8,000 | Valero Energy Corp. | 455,200 | ||||||
|
| |||||||
| 8,649,734 | ||||||||
|
| |||||||
| Financials — 13.89% | ||||||||
| 9,000 | ACE Ltd. | 962,910 | ||||||
| 29,800 | Allstate Corp./The | 2,075,868 | ||||||
| 15,000 | Ameriprise Financial, Inc. | 1,879,200 | ||||||
| 26,000 | Discover Financial Services | 1,507,220 | ||||||
| 36,800 | Lincoln National Corp. | 2,078,832 | ||||||
| 21,600 | PNC Financial Services Group, Inc. | 1,981,368 | ||||||
| 48,600 | SunTrust Banks, Inc. | 2,016,900 | ||||||
| 38,000 | Wells Fargo & Co. | 2,093,800 | ||||||
|
| |||||||
| 14,596,098 | ||||||||
|
| |||||||
| Health Care — 14.57% | ||||||||
| 32,000 | AbbVie, Inc. | 2,069,120 | ||||||
| 22,000 | Aetna, Inc. | 2,351,140 | ||||||
| 11,800 | Amgen, Inc. | 1,863,338 | ||||||
| 17,000 | Gilead Sciences, Inc. * | 1,708,670 | ||||||
| 23,600 | HCA Holdings, Inc. * | 1,746,636 | ||||||
| 14,000 | Johnson & Johnson | 1,388,800 | ||||||
See accompanying notes which are an integral part of the financial statements.
7
Schedule of Investments (continued)
April 30, 2015 (Unaudited)
| Shares | Fair Value | |||||||
| COMMON STOCKS – (continued) | ||||||||
| Health Care — 14.57% (continued) | ||||||||
| 8,800 | McKesson Corp. | $ | 1,965,920 | |||||
| 30,800 | Mylan NV * | 2,225,608 | ||||||
|
| |||||||
| 15,319,232 | ||||||||
|
| |||||||
| Industrials — 10.15% | ||||||||
| 12,600 | Boeing Co./The | 1,806,084 | ||||||
| 40,000 | Delta Air Lines, Inc. | 1,785,600 | ||||||
| 7,000 | General Dynamics Corp. | 961,240 | ||||||
| 14,000 | Raytheon Co. | 1,456,000 | ||||||
| 51,000 | Trinity Industries, Inc. | 1,381,590 | ||||||
| 15,400 | Union Pacific Corp. | 1,635,942 | ||||||
| 14,400 | United Technologies Corp. | 1,638,000 | ||||||
|
| |||||||
| 10,664,456 | ||||||||
|
| |||||||
| Information Technology — 19.28% | ||||||||
| 37,400 | Amdocs Ltd. | 2,059,618 | ||||||
| 19,400 | Apple, Inc. | 2,427,910 | ||||||
| 38,400 | Broadridge Financial Solutions, Inc. | 2,070,528 | ||||||
| 53,600 | CDW Corp. | 2,053,952 | ||||||
| 71,000 | Cisco Systems, Inc. | 2,046,930 | ||||||
| 41,000 | Oracle Corp. | 1,788,420 | ||||||
| 34,000 | Seagate Technology PLC | 1,996,480 | ||||||
| 25,000 | Skyworks Solutions, Inc. | 2,306,250 | ||||||
| 26,000 | TE Connectivity Ltd. | 1,730,300 | ||||||
| 33,000 | Texas Instruments, Inc. | 1,788,930 | ||||||
|
| |||||||
| 20,269,318 | ||||||||
|
| |||||||
| Materials — 3.29% | ||||||||
| 13,000 | International Paper Co. | 698,360 | ||||||
| 15,600 | Lyondellbasell Industries NV—Class A | 1,614,912 | ||||||
| 16,600 | Packaging Corp. of America | 1,148,554 | ||||||
|
| |||||||
| 3,461,826 | ||||||||
|
| |||||||
| Real Estate Investment Trusts — 1.89% | ||||||||
| 55,000 | Omega Healthcare Investors, Inc. | 1,984,950 | ||||||
|
| |||||||
| Telecommunication Services — 2.24% | ||||||||
| 33,000 | AT&T, Inc. | 1,143,120 | ||||||
| 24,000 | Verizon Communications, Inc. | 1,210,560 | ||||||
|
| |||||||
| 2,353,680 | ||||||||
|
| |||||||
See accompanying notes which are an integral part of the financial statements.
8
Schedule of Investments (continued)
April 30, 2015 (Unaudited)
| Shares | Fair Value | |||||||
| COMMON STOCKS – (continued) | ||||||||
| Utilities — 2.94% | ||||||||
| 47,000 | CMS Energy Corp. | $ | 1,594,710 | |||||
| 44,000 | Xcel Energy, Inc. | 1,492,040 | ||||||
|
| |||||||
| 3,086,750 | ||||||||
|
| |||||||
| Total Common Stocks (Cost $96,054,184) | 103,635,770 | |||||||
|
| |||||||
| SHORT-TERM INVESTMENTS — 6.61% | ||||||||
| 6,940,864 | Fidelity Institutional Money Market Portfolio—Institutional Class, 0.13% (a) | 6,940,864 | ||||||
|
| |||||||
| Total Short-Term Investments (Cost $6,940,864) | 6,940,864 | |||||||
|
| |||||||
| Total Investments – 105.21% (Cost $102,995,048) | 110,576,634 | |||||||
|
| |||||||
| Liabilities in Excess of Other Assets – (5.21)% | (5,471,445 | ) | ||||||
|
| |||||||
| NET ASSETS – 100.00% | $ | 105,105,189 | ||||||
|
| |||||||
| (a) | Rate disclosed is the seven day yield as of April 30, 2015. |
| * | Non-income producing security. |
See accompanying notes which are an integral part of the financial statements.
9
Statement of Assets and Liabilities
April 30, 2015 (Unaudited)
Assets | ||||
Investments in securities at fair value (cost $102,995,048) | $ | 110,576,634 | ||
Receivable for fund shares sold | 255,703 | |||
Dividends receivable | 122,789 | |||
Prepaid expenses | 26,584 | |||
Total Assets | 110,981,710 | |||
Liabilities | ||||
Payable for fund shares redeemed | 148,608 | |||
Payable for investments purchased | 5,658,587 | |||
Payable to Adviser | 33,106 | |||
Payable for Distribution Fees | 9,921 | |||
Payable to administrator, fund accountant and transfer agent | 13,421 | |||
Payable to custodian | 707 | |||
Payable to trustees | 1,217 | |||
Other accrued expenses | 10,954 | |||
Total Liabilities | 5,876,521 | |||
Net Assets | $ | 105,105,189 | ||
Net Assets consist of: | ||||
Paid-in capital | $ | 97,818,190 | ||
Accumulated undistributed net investment income | 105,228 | |||
Accumulated undistributed net realized loss from investment transactions | (399,815 | ) | ||
Net unrealized appreciation on investments | 7,581,586 | |||
Net Assets | $ | 105,105,189 | ||
Class N: | ||||
Net Assets | $ | 36,227,960 | ||
Shares outstanding | 1,946,382 | |||
Net asset value ("NAV") and offering price per share | $ | 18.61 | ||
Minimum redemption price per share (NAV * 98%) (a) | $ | 18.24 | ||
Class A: | ||||
Net Assets | $ | 1,189,036 | ||
Shares outstanding | 64,018 | |||
Net asset value ("NAV") per share | $ | 18.57 | ||
Maximum offering price per share (NAV/0.95) (b) | $ | 19.55 | ||
Minimum redemption price per share (NAV * 98%) (a) | $ | 18.20 | ||
Institutional Class: | ||||
Net Assets | $ | 67,688,193 | ||
Shares outstanding | 3,638,942 | |||
Net asset value ("NAV") and offering price per share | $ | 18.60 | ||
Minimum redemption price per share (NAV * 98%) (a) | $ | 18.23 |
| (a) | The Fund charges a 2.00% redemption fee on shares redeemed within 60 days of purchase. Shares held longer than 60 days are redeemed at NAV. |
| (b) | Class A shares impose a maximum 5.00% sales charge on purchases. |
10
See accompanying notes which are an integral part of the financial statements.
Statement of Operations
For the six months ended April 30, 2015 (Unaudited)
Investment Income | ||||
Dividend income (net of foreign taxes withheld of $1,690) | $ | 688,662 | ||
Total investment income | 688,662 | |||
Expenses | ||||
Investment Adviser | 240,986 | |||
Distribution (12b-1): | ||||
Class N | 46,785 | |||
Class A | 1,366 | |||
Administration | 24,464 | |||
Fund accounting | 18,082 | |||
Transfer agent | 23,901 | |||
Legal | 8,728 | |||
Registration | 22,110 | |||
Custodian | 8,470 | |||
Audit | 8,031 | |||
Trustee | 2,778 | |||
Insurance | 414 | |||
Pricing | 1,161 | |||
Report printing | 6,065 | |||
24f-2 | 1,561 | |||
Miscellaneous | 4,196 | |||
Total expenses | 419,098 | |||
Fees contractually waived by Adviser | (118,194 | ) | ||
Net operating expenses | 300,904 | |||
Net investment income | 387,758 | |||
Net Realized and Unrealized Gain (Loss) on Investments | ||||
Net realized loss on investment securities transactions | (393,083 | ) | ||
Net change in unrealized appreciation of investment securities | 2,300,676 | |||
Net realized and unrealized gain on investments | 1,907,593 | |||
Net increase in net assets resulting from operations | $ | 2,295,351 |
11
See accompanying notes which are an integral part of the financial statements.
Statements of Changes in Net Assets
| For the Six Months Ended April 30, 2015 (Unaudited) | For the Year Ended October 31, 2014 | |||||||
Increase in Net Assets due to: Operations: | ||||||||
Net investment income | $ | 387,758 | $ | 281,982 | ||||
Net realized gain (loss) on investment transactions | (393,083 | ) | 2,361,426 | |||||
Net change in unrealized appreciation of investments | 2,300,676 | 1,169,791 | ||||||
Net increase in net assets resulting from operations | 2,295,351 | 3,813,199 | ||||||
Distributions From: | ||||||||
Net investment income: | ||||||||
Class N | (145,356 | ) | (229,577 | ) | ||||
Class A | (4,033 | ) | (10,075 | ) | ||||
Institutional Class | (155,399 | ) | (22,020 | ) | ||||
Realized gains: | ||||||||
Class N | (1,380,628 | ) | (1,221,280 | ) | ||||
Class A | (47,055 | ) | (55,136 | ) | ||||
Institutional Class | (936,608 | ) | (17,698 | ) | ||||
Total distributions | (2,669,079 | ) | (1,555,786 | ) | ||||
Capital Transactions – Class N: | ||||||||
Proceeds from shares sold | 19,115,343 | 11,857,787 | ||||||
Reinvestment of distributions | 1,115,151 | 1,343,916 | ||||||
Amount paid for shares redeemed | (13,390,080 | ) | (4,169,188 | ) | ||||
Proceeds from redemption fees(a) | 118 | 225 | ||||||
Total Class N | 6,840,532 | 9,032,740 | ||||||
Capital Transactions – Class A: | ||||||||
Proceeds from shares sold | 132,715 | 124,623 | ||||||
Reinvestment of distributions | 50,223 | 65,169 | ||||||
Amount paid for shares redeemed | (41,496 | ) | (20,233 | ) | ||||
Total Class A | 141,442 | 169,559 | ||||||
Capital Transactions – Institutional Class: | ||||||||
Proceeds from shares sold | 63,151,693 | 7,689,531 | ||||||
Reinvestment of distributions | 155,770 | 34,586 | ||||||
Amount paid for shares redeemed | (1,978,037 | ) | (1,398,420 | ) | ||||
Proceeds from redemption fees(a) | 4,477 | — | ||||||
Total Institutional Class | 61,333,903 | 6,325,697 | ||||||
Net increase in net assets resulting from capital transactions | 68,315,877 | 15,527,996 | ||||||
Total Increase in Net Assets | 67,942,149 | 17,785,409 | ||||||
| (a) | The Fund charges a 2.00% redemption fee on shares redeemed within 60 days of purchase. |
12
See accompanying notes which are an integral part of the financial statements.
Statements of Changes in Net Assets (continued)
| For the Six Months Ended April 30, 2015 (Unaudited) | For the Year Ended October 31, 2014 | |||||||
Net Assets: | ||||||||
Beginning of period | 37,163,040 | 19,377,631 | ||||||
End of period | $ | 105,105,189 | $ | 37,163,040 | ||||
Accumulated net investment income included in net assets at end of period | $ | 105,228 | $ | 22,258 | ||||
Share Transactions – Class N: | ||||||||
Shares sold | 1,018,120 | 664,835 | ||||||
Shares issued in reinvestment of distributions | 60,410 | 80,043 | ||||||
Shares redeemed | (706,742 | ) | (235,215 | ) | ||||
Total Class N | 371,788 | 509,663 | ||||||
Share Transactions – Class A: | ||||||||
Shares sold | 7,022 | 7,269 | ||||||
Shares issued in reinvestment of distributions | 2,728 | 3,889 | ||||||
Shares redeemed | (2,299 | ) | (1,149 | ) | ||||
Total Class A | 7,451 | 10,009 | ||||||
Share Transactions – Institutional Class: | ||||||||
Shares sold | 3,361,537 | 430,805 | ||||||
Shares issued in reinvestment of distributions | 8,447 | 1,994 | ||||||
Shares redeemed | (104,575 | ) | (75,128 | ) | ||||
Total Institutional Class | 3,265,409 | 357,671 | ||||||
13
See accompanying notes which are an integral part of the financial statements.
Dana Large Cap Equity Fund – Class N
Financial Highlights
Selected data for a share outstanding throughout each period.
| Six Months Ended April 30, 2015 (Unaudited) | Years Ended October 31, | Period Ended October 31, 2010(a) | ||||||||||||||||||||||
| 2014 | 2013 | 2012 | 2011 | |||||||||||||||||||||
Net asset value, at | $18.54 | $17.19 | $13.88 | $12.50 | $11.83 | $10.00 | ||||||||||||||||||
|
|
|
|
|
|
|
|
|
|
|
| |||||||||||||
Income from investment operations: | ||||||||||||||||||||||||
Net investment income (loss) | 0.10 | * | 0.19 | 0.21 | * | 0.14 | * | 0.09 | * | 0.06 | * | |||||||||||||
Net realized and unrealized gain (loss) on investments | 0.87 | 2.46 | 3.40 | 1.51 | 0.67 | 1.81 | ||||||||||||||||||
|
|
|
|
|
|
|
|
|
|
|
| |||||||||||||
Total from investment operations | 0.97 | 2.65 | 3.61 | 1.65 | 0.76 | 1.87 | ||||||||||||||||||
|
|
|
|
|
|
|
|
|
|
|
| |||||||||||||
Distributions from: | ||||||||||||||||||||||||
Net investment income | (0.07 | ) | (0.18 | ) | (0.22 | ) | (0.14 | ) | (0.09 | ) | (0.04 | ) | ||||||||||||
Net realized gain | (0.83 | ) | (1.12 | ) | (0.08 | ) | (0.13 | ) | — | — | ||||||||||||||
|
|
|
|
|
|
|
|
|
|
|
| |||||||||||||
Total from distributions | (0.90 | ) | (1.30 | ) | (0.30 | ) | (0.27 | ) | (0.09 | ) | (0.04 | ) | ||||||||||||
|
|
|
|
|
|
|
|
|
|
|
| |||||||||||||
Redemption fees*** | — | — | — | — | — | — | ||||||||||||||||||
Net asset value, at | $18.61 | $18.54 | $17.19 | $13.88 | $12.50 | $11.83 | ||||||||||||||||||
|
|
|
|
|
|
|
|
|
|
|
| |||||||||||||
Total Return** | 5.29 | %(b) | 16.23 | % | 26.35 | % | 13.44 | % | 6.40 | % | 18.76 | %(b) | ||||||||||||
Ratios/Supplemental Data: | ||||||||||||||||||||||||
Net assets at end of period (thousands) | $36,228 | $29,197 | $18,306 | $12,819 | $8,961 | $3,524 | ||||||||||||||||||
Before waiver | ||||||||||||||||||||||||
Ratio of expenses to average net assets | 1.32 | %(c) | 1.93 | % | 1.99 | % | 2.30 | % | 3.50 | % | 9.63 | %(c) | ||||||||||||
Ratio of net investment income (loss) to average net assets | 0.67 | %(c) | 0.15 | % | 0.32 | % | 0.24 | % | (1.28 | )% | (7.32 | )%(c) | ||||||||||||
After waiver | ||||||||||||||||||||||||
Ratio of expenses to average net assets | 0.98 | %(c) | 0.98 | % | 0.98 | % | 1.50 | % | 1.50 | % | 1.50 | %(c) | ||||||||||||
Ratio of net investment income (loss) to average net assets | 1.01 | %(c) | 1.09 | % | 1.33 | % | 1.04 | % | 0.72 | % | 0.82 | %(c) | ||||||||||||
Portfolio turnover(d) | 12 | %(b) | 57 | % | 70 | % | 54 | % | 53 | % | 32 | %(b) | ||||||||||||
| (a) | The Dana Large Cap Equity Fund Class N commenced operations on March 1, 2010. |
| (b) | Not annualized |
| (c) | Annualized |
| (d) | Portfolio turnover is calculated on the basis of the Fund as a whole without distinguishing among the classes of shares. |
| * | Per share net investment income has been determined on the basis of average shares outstanding during the period. |
| ** | Total return in the above table represents the rate that the investor would have earned or lost on an investment in the Fund assuming reinvestment of dividends, and is not annualized for periods of less than one year. |
| *** | The amount is less than $0.005 per share. |
14
See accompanying notes which are an integral part of the financial statements.
Dana Large Cap Equity Fund – Class A
Financial Highlights
Selected data for a share outstanding throughout each period.
| Six Months Ended April 30, 2015 (Unaudited) | Years Ended October 31, | Period Ended October 31, 2010(a) | ||||||||||||||||||||||
| 2014 | 2013 | 2012 | 2011 | |||||||||||||||||||||
Net asset value, at | $18.51 | $17.17 | $13.92 | $12.52 | $11.84 | $10.95 | ||||||||||||||||||
|
|
|
|
|
|
|
|
|
|
|
| |||||||||||||
Income from investment operations: | ||||||||||||||||||||||||
Net investment income (loss) | 0.10 | * | 0.20 | 0.13 | * | 0.14 | * | 0.08 | * | — | *,*** | |||||||||||||
Net realized and unrealized gain (loss) on investments | 0.86 | 2.44 | 3.39 | 1.52 | 0.67 | 0.89 | ||||||||||||||||||
|
|
|
|
|
|
|
|
|
|
|
| |||||||||||||
Total from investment operations | 0.96 | 2.64 | 3.52 | 1.66 | 0.75 | 0.89 | ||||||||||||||||||
|
|
|
|
|
|
|
|
|
|
|
| |||||||||||||
Distributions from: | ||||||||||||||||||||||||
Net investment income | (0.07 | ) | (0.18 | ) | (0.19 | ) | (0.13 | ) | (0.07 | ) | — | |||||||||||||
Net realized gain | (0.83 | ) | (1.12 | ) | (0.08 | ) | (0.13 | ) | — | — | ||||||||||||||
|
|
|
|
|
|
|
|
|
|
|
| |||||||||||||
Total from distributions | (0.90 | ) | (1.30 | ) | (0.27 | ) | (0.26 | ) | (0.07 | ) | — | |||||||||||||
|
|
|
|
|
|
|
|
|
|
|
| |||||||||||||
Redemption fees*** | — | — | — | — | — | — | ||||||||||||||||||
Net asset value, | $18.57 | $18.51 | $17.17 | $13.92 | $12.52 | $11.84 | ||||||||||||||||||
|
|
|
|
|
|
|
|
|
|
|
| |||||||||||||
Total Return** | 5.24 | %(b) | 16.24 | % | 25.67 | % | 13.54 | % | 6.36 | % | 8.13 | %(b) | ||||||||||||
Ratios/Supplemental Data: | ||||||||||||||||||||||||
Net assets at end of period (thousands) | $1,189 | $1,047 | $799 | $678 | $301 | $3 | ||||||||||||||||||
Before waiver: | ||||||||||||||||||||||||
Ratio of expenses to average net assets | 1.32 | %(c) | 1.93 | % | 1.98 | % | 2.27 | % | 3.11 | % | 4.75 | %(c) | ||||||||||||
Ratio of net investment income (loss) to average net assets | 0.67 | %(c) | 0.15 | % | 0.35 | % | 0.22 | % | (0.95 | )% | (2.94 | )%(c) | ||||||||||||
After waiver: | ||||||||||||||||||||||||
Ratio of expenses to average net assets | 0.98 | %(c) | 0.98 | % | 1.49 | % | 1.50 | % | 1.50 | % | 1.50 | %(c) | ||||||||||||
Ratio of net investment income (loss) to average net assets | 1.01 | %(c) | 1.09 | % | 0.84 | % | 1.00 | % | 0.66 | % | 0.31 | %(c) | ||||||||||||
Portfolio turnover(d) | 12 | %(b) | 57 | % | 70 | % | 54 | % | 53 | % | 32 | %(b) | ||||||||||||
| (a) | The Dana Large Cap Equity Fund Class A commenced operations on July 28, 2010. |
| (b) | Not annualized |
| (c) | Annualized |
| (d) | Portfolio turnover is calculated on the basis of the Fund as a whole without distinguishing among the classes of shares. |
| * | Per share net investment income has been determined on the basis of average shares outstanding during the period. |
| ** | Total return in the above table represents the rate that the investor would have earned or lost on an investment in the Fund assuming reinvestment of dividends, excluding maximum sales charge, and is not annualized for periods of less than one year. |
| *** | The amount is less than $0.005 per share. |
15
See accompanying notes which are an integral part of the financial statements.
Dana Large Cap Equity Fund – Institutional Class
Financial Highlights
Selected data for a share outstanding throughout each period.
| Six Months Ended April 30, 2015 (Unaudited) | Year Ended October 31, 2014 | Period Ended October 31, 2013(a) | ||||||||||
Net asset value, at beginning of period | $18.52 | $17.19 | $17.14 | |||||||||
|
|
|
|
|
| |||||||
Income from investment operations: | ||||||||||||
Net investment income (loss) | 0.11 | * | 0.26 | — | *, *** | |||||||
Net realized and unrealized gain (loss) on investments | 0.88 | 2.44 | 0.05 | |||||||||
|
|
|
|
|
| |||||||
Total from investment operations | 0.99 | 2.70 | 0.05 | |||||||||
|
|
|
|
|
| |||||||
Distributions from: | ||||||||||||
Net investment income | (0.08 | ) | (0.25 | ) | — | |||||||
Net realized gain | (0.83 | ) | (1.12 | ) | — | |||||||
|
|
|
|
|
| |||||||
Total from distributions | (0.91 | ) | (1.37 | ) | — | |||||||
|
|
|
|
|
| |||||||
Redemption fees | — | *** | — | — | ||||||||
Net asset value, at end of period | $18.60 | $18.52 | $17.19 | |||||||||
|
|
|
|
|
| |||||||
Total Return ** | 5.43 | %(b) | 16.60 | % | 0.29 | %(b) | ||||||
Ratios/Supplemental Data: | ||||||||||||
Net assets at end of period (thousands) | $67,688 | $6,919 | $273 | |||||||||
Before waiver: | ||||||||||||
Ratio of expenses to average net assets | 1.07 | %(c) | 1.68 | % | 1.53 | %(c) | ||||||
Ratio of net investment income (loss) to average net assets | 0.92 | %(c) | 0.40 | % | (0.31 | )%(c) | ||||||
After waiver: | ||||||||||||
Ratio of expenses to average net assets | 0.73 | %(c) | 0.73 | % | 0.73 | %(c) | ||||||
Ratio of net investment income (loss) to average net assets | 1.26 | %(c) | 1.34 | % | 0.49 | %(c) | ||||||
Portfolio turnover(d) | 12 | %(b) | 57 | % | 70 | %(b) | ||||||
| (a) | The Dana Large Cap Equity Fund Institutional Class commenced operations on October 29, 2013. |
| (b) | Not annualized |
| (c) | Annualized |
| (d) | Portfolio turnover is calculated on the basis of the Fund as a whole without distinguishing among the classes of shares. |
| * | Per share net investment income has been determined on the basis of average shares outstanding during the period. |
| ** | Total return in the above table represents the rate that the investor would have earned or lost on an investment in the Fund assuming reinvestment of dividends, and is not annualized for periods of less than one year. |
| *** | The amount is less than $0.005 per share. |
16
See accompanying notes which are an integral part of the financial statements.
Notes to Financial Statements
April 30, 2015 (Unaudited)
NOTE 1. ORGANIZATION
The Dana Large Cap Equity Fund (the “Fund”) is an open-end diversified series of the Valued Advisers Trust (the “Trust”). The Trust is a management investment company established under the laws of Delaware by an Agreement and Declaration of Trust dated June 13, 2008 (the “Trust Agreement”). The Trust Agreement permits the Board of Trustees (“Board”) to issue an unlimited number of shares of beneficial interest of separate series without par value. The Fund is one of a series of funds currently authorized by the Board. The Fund’s investment adviser is Dana Investment Advisors, Inc. (the “Adviser”). The Fund seeks long-term growth of capital.
The Fund currently offers Class N shares, Class A shares, and Institutional Class shares. Each share represents an equal proportionate interest in the assets and liabilities belonging to the Fund and is entitled to such dividends and distributions out of income belonging to the Fund as declared by the Board. Class A currently has a maximum sales charge on purchases of 5.00% as a percentage of the original purchase price. All three share classes impose a 2.00% redemption fee on shares redeemed within 60 days of purchase.
NOTE 2. SIGNIFICANT ACCOUNTING POLICIES
The Fund is an investment company and follows accounting and reporting guidance under Financial Accounting Standards Board (“FASB”) Accounting Standards Codification (“ASC”) Topic 946, “Financial Services-Investment Companies”. The following is a summary of significant accounting policies followed by the Fund in the preparation of its financial statements. These policies are in conformity with the generally accepted accounting principles in the United States of America (“GAAP”).
Estimates – The preparation of financial statements in conformity with GAAP requires management to make estimates and assumptions that affect the reported amounts of assets and liabilities and disclosure of contingent assets and liabilities at the date of the financial statements and the reported amounts of increases and decreases in net assets from operations during the reporting period. Actual results could differ from those estimates.
Securities Valuation – All investments in securities are recorded at their estimated fair value as described in Note 3.
Federal Income Taxes – The Fund makes no provision for federal income or excise tax. The Fund intends to qualify each year as a regulated investment company (“RIC”) under subchapter M of the Internal Revenue Code of 1986, as amended, by complying with the requirements applicable to RICs and by distributing substantially all of its taxable income. The Fund also intends to distribute sufficient net investment income and net capital gains, if any, so that it will not be subject to excise tax on undistributed income and gains. If the required amount of net investment income or gains is not distributed, the Fund could incur a tax expense.
For the six months ended April 30, 2015, the Fund did not have a liability for any unrecognized tax benefits. The Fund recognizes interest and penalties, if any, related to unrecognized tax benefits as income tax expense in the statement of operations. The Fund is subject to examination by U.S. federal tax authorities for the last three tax year ends and the interim tax period since then.
17
Notes to Financial Statements (continued)
April 30, 2015 (Unaudited)
Expenses – Expenses incurred by the Trust that do not relate to a specific fund of the Trust are allocated to the individual funds based on each fund’s relative net assets or other appropriate basis. Expenses attributable to any class are borne by that class. Income, realized gains and losses, unrealized appreciation and depreciation, and expenses are allocated to each class based on the net assets in relation to the relative net assets of the Fund.
Security Transactions and Related Income – The Fund follows industry practice and records security transactions on the trade date for financial reporting purposes. The specific identification method is used for determining gains or losses for financial statement and income tax purposes. Dividend income is recorded on the ex-dividend date and interest income is recorded on an accrual basis. Discounts and premiums on securities purchased are accreted or amortized using the effective interest method. Withholding taxes on foreign dividends have been provided for in accordance with the Fund’s understanding of the applicable country’s tax rules and rates.
Dividends and Distributions – Distributions to shareholders, which are determined in accordance with income tax regulations, are recorded on the ex-dividend date. The Fund intends to distribute substantially all of its net investment income on a quarterly basis. The Fund intends to distribute its net realized long-term and short-term capital gains, if any, on an annual basis. The treatment for financial reporting purposes of distributions made to shareholders during the year from net investment income or net realized capital gains may differ from their ultimate treatment for federal income tax purposes. These differences are caused primarily by differences in the timing of the recognition of certain components of income, expense or realized capital gain for federal income tax purposes. Where such differences are permanent in nature, they are reclassified among the components of the net assets based on their ultimate characterization for federal income tax purposes. Any such reclassifications will have no effect on net assets, results of operations or net asset values per share of the Fund.
NOTE 3. SECURITIES VALUATION AND FAIR VALUE MEASUREMENTS
Fair value is defined as the price that a Fund would receive upon selling an investment in a timely transaction to an independent buyer in the principal or most advantageous market of the investment. GAAP establishes a three-tier hierarchy to maximize the use of observable market data and minimize the use of unobservable inputs and to establish classification of fair value measurements for disclosure purposes.
Inputs refer broadly to the assumptions that market participants would use in pricing the asset or liability, including assumptions about risk (the risk inherent in a particular valuation technique used to measure fair value including such a pricing model and/or the risk inherent in the inputs to the valuation technique). Inputs may be observable or unobservable. Observable inputs are inputs that reflect the assumptions market participants would use in pricing the asset or liability developed based on market data obtained from sources independent of the reporting entity. Unobservable inputs are inputs that reflect the reporting entity’s own assumptions about the assumptions market participants would use in pricing the asset or liability developed based on the best information available in the circumstances.
18
Notes to Financial Statements (continued)
April 30, 2015 (Unaudited)
Various inputs are used in determining the value of the Fund’s investments. These inputs are summarized in the three broad levels listed below.
| • | Level 1 – quoted prices in active markets for identical securities |
| • | Level 2 – other significant observable inputs (including, but not limited to, quoted prices for an identical security in an inactive market, quoted prices for similar securities, interest rates, prepayment speeds, credit risk, etc.) |
| • | Level 3 – significant unobservable inputs (including the Fund’s own assumptions in determining fair value of investments based on the best information available) |
The inputs used to measure fair value may fall into different levels of the fair value hierarchy. In such cases, for disclosure purposes, the level in the fair value hierarchy within which the fair value measurement falls in its entirety, is determined based, on the lowest level input that is significant to the fair value measurement in its entirety.
Equity securities, including common stocks, exchanged-traded funds and real estate investment trusts, are generally valued by using market quotations, but may be valued on the basis of prices furnished by a pricing service when the Adviser believes such prices more accurately reflect the fair value of such securities. Securities traded in the NASDAQ over-the-counter market are generally valued by a pricing service at the NASDAQ official closing price. Lacking a last sale price, an exchange security is generally valued by the pricing service at its last bid price.
When using the market quotations or close prices provided by a pricing service and when the market is considered active, the security is classified as a Level 1 security. Sometimes, an equity security owned by the Fund will be valued by the pricing service with factors other than market quotations or when the market is considered inactive. When this happens, the security is classified as a Level 2 security. When market quotations are not readily available, when the Adviser determines that the market quotation or the price provided by the pricing service does not accurately reflect the current fair value, or when restricted or illiquid securities are being valued, such securities are valued as determined in good faith by the Adviser, in conformity with guidelines adopted by and subject to review by the Board. These securities are generally categorized as Level 3 securities.
Investments in mutual funds, including money market mutual funds, are generally priced at the ending NAV provided by the service agent of the funds. These securities are categorized as Level 1 securities.
Short-term investments in fixed income securities, (those with maturities of less than 60 days when acquired, or which subsequently are within 60 days of maturity), may be valued by using the amortized cost method of valuation, which the Board has determined represents fair value. These securities are classified as Level 2 securities.
In accordance with the Trust’s good faith pricing guidelines, the Adviser is required to consider all appropriate factors relevant to the value of securities for which it has determined other pricing sources are not available or reliable as described above. No single standard exists for determining fair value, because fair value depends upon the circumstances of each individual case. As a general principle, the current fair value of an issue of securities being valued by the Adviser would appear to be the amount which the owner might reasonably expect to receive for them upon their current
19
Notes to Financial Statements (continued)
April 30, 2015 (Unaudited)
sale. Methods which are in accordance with this principle may, for example, be based on (i) a multiple of earnings; (ii) a discount from market of a similar freely traded security (including a derivative security or a basket of securities traded on other markets, exchanges or among dealers); or (iii) yield to maturity with respect to debt issues, or a combination of these and other methods. Good faith pricing is permitted if, in the Adviser’s opinion, the validity of market quotations appears to be questionable based on factors such as evidence of a thin market in the security based on a small number of quotations, a significant event occurs after the close of a market but before a Fund’s NAV calculation that may affect a security’s value, or the Adviser is aware of any other data that calls into question the reliability of market quotations. Good faith pricing may also be used in instances when the bonds the Fund may invest in may default or otherwise cease to have market quotations readily available.
The following is a summary of the inputs used to value the Fund’s investments as of April 30, 2015:
| Valuation Inputs | ||||||||||||||||
| Assets | Level 1 Quoted Prices in Active Markets | Level 2 Other Significant Observable Inputs | Level 3 Significant | Total | ||||||||||||
Common Stocks* | $ | 103,635,770 | $ | — | $ | — | $ | 103,635,770 | ||||||||
Short-Term Investments | 6,940,864 | — | — | 6,940,864 | ||||||||||||
Total | $ | 110,576,634 | $ | — | $ | — | $ | 110,576,634 | ||||||||
| * | Refer to Schedule of Investments for industry classifications. |
The Fund did not hold any investments at any time during the reporting period in which other significant observable inputs (Level 2) were used in determining fair value. The Fund did not hold any investments at any time during the reporting period in which significant unobservable inputs were used in determining fair value; therefore, no reconciliation of Level 3 securities is included for this reporting period.
The Trust recognizes transfers between fair value hierarchy levels at the reporting period end. There were no transfers between any levels as of April 30, 2015 and the previous reporting period end.
NOTE 4. FEES AND OTHER TRANSACTIONS WITH AFFILIATES AND OTHER SERVICE PROVIDERS
Under the terms of the management agreement between the Trust and the Adviser (the “Agreement”) for the Fund, the Adviser manages the Fund’s investments subject to oversight of the Board. As compensation for its management services, the Fund is obligated to pay the Adviser a fee computed and accrued daily and paid monthly at an annual rate of 0.70% of the average daily net assets of the Fund. For the six months ended April 30, 2015, the Adviser earned fees of $240,986 from the Fund before the waivers described below. At April 30, 2015, the Fund owed the Adviser $33,106.
The Adviser has contractually agreed to waive its management fee and/or reimburse certain operating expenses through February 28, 2017, but only to the extent necessary so that the Fund’s net expenses, excluding brokerage fees and commissions, borrowing costs (such as interest and dividend expenses on securities sold short), taxes, extraordinary expenses, fees and expenses paid
20
Notes to Financial Statements (continued)
April 30, 2015 (Unaudited)
under a distribution plan adopted pursuant to Rule 12b-1, fees and expenses paid under a shareholder services plan, and indirect expenses (such as “acquired funds fees and expenses”) do not exceed 0.73% for Class N, Class A and Institutional shares.
Each waiver or reimbursement of an expense by the Adviser is subject to repayment by the Fund within the three fiscal years following the fiscal year in which the expense was incurred, provided that the Fund is able to make the repayment without exceeding the expense limitation. The contractual agreement is in effect through February 28, 2017. The expense cap may not be terminated prior to this date except by the Board. For the six months ended April 30, 2015, the Adviser waived fees of $118,194 from the Fund.
The amounts subject to repayment by the Fund, pursuant to the aforementioned conditions are as follows:
| Amount | Recoverable through October 31, | |||
| $ 2,189 | 2016 | |||
| $239,324 | 2017 | |||
| $118,194 | 2018 | |||
The Trust retains Huntington Asset Services, Inc. (“HASI”) to manage the Fund’s business affairs and to provide the Fund with administrative services, including all regulatory, reporting and necessary office equipment and personnel. For the six months ended April 30, 2015, HASI earned fees of $24,464 from the Fund for administrative and compliance services provided to the Fund. At April 30, 2015, HASI was owed $5,197 from the Fund for administrative and compliance services. The Trust also retains HASI to act as the Fund’s transfer agent and to provide the Fund with fund accounting services. For the six months ended April 30, 2015, HASI earned fees of $23,901 for transfer agent services and reimbursement for out-of-pocket expenses incurred in providing transfer agent services to the Fund. At April 30, 2015, HASI was owed $4,931 for transfer agent services and out-of-pocket expenses. For the six months ended April 30, 2015, HASI earned fees of $18,082 from the Fund for fund accounting services. At April 30, 2015, HASI was owed $3,293 from the Fund for fund accounting services.
Certain officers and one Trustee of the Trust are members of management and/or employees of HASI. HASI operates as a wholly-owned subsidiary of Huntington Bancshares, Inc., the parent company of Unified Financial Securities, Inc. (the “Distributor” or “Unified”) and Huntington National Bank, the custodian of the Fund’s investments (the “Custodian”). For the six months ended April 30, 2015, the Custodian earned fees $8,470 for custody services. At April 30, 2015, the Custodian was owed $707 for custody services.
The Fund has adopted a Distribution Plan (the “Plan”) pursuant to Rule 12b-1 under the 1940 Act. The Plan provides that the Fund will pay the Distributor and/or any registered securities dealer, financial institution or any other person (a “Recipient”) a shareholder servicing fee aggregating up to 0.25% of the average daily net assets of the Class N and Class A shares in connection with the promotion and distribution of the Fund’s shares or the provision of personal services to shareholders, including, but not necessarily limited to, advertising, compensation to underwriters, dealers and selling personnel, the printing and mailing of prospectuses to other than current Fund
21
Notes to Financial Statements (continued)
April 30, 2015 (Unaudited)
shareholders, the printing and mailing of sales literature and servicing shareholder accounts. The Fund or the Adviser may pay all or a portion of these fees to any Recipient who renders assistance in distributing or promoting the sale of shares, or who provides certain shareholder services, pursuant to a written agreement. The Plan is a compensation plan, which means that compensation is paid regardless of 12b-1 expenses actually incurred. It is anticipated that the Plan will benefit shareholders because an effective sales program typically is necessary in order for the Fund to reach and maintain a sufficient size to efficiently achieve its investment objectives and to realize economies of scale. For the six months ended April 30, 2015, Class N shares 12b-1 expense incurred by the Fund was $46,785 and Class A shares 12b-1 expense incurred by the Fund was $1,366. The Fund owed $9,677 for Class N shares and $244 for Class A shares 12b-1 expenses as of April 30, 2015.
Unified acts as the principal distributor of the Fund’s shares. During the six months ended April 30, 2015, the Distributor received $200 from commissions earned on sales of Class A shares, of which $200 was re-allowed to intermediaries of the Fund. A trustee of the Trust is an officer of the Distributor and such person may be deemed to be an affiliate of the Distributor.
NOTE 5. PURCHASES AND SALES OF SECURITIES
For the six months ended April 30, 2015, purchases and sales of investment securities, other than short-term investments and short-term U.S. government obligations were as follows:
| Amount | ||||
Purchases | ||||
U.S. Government Obligations | $ | — | ||
Other | 73,850,707 | |||
Sales | ||||
U.S. Government Obligations | $ | — | ||
Other | 8,210,307 | |||
NOTE 6. BENEFICIAL OWNERSHIP
The beneficial ownership, either directly or indirectly, of more than 25% of the voting securities of a fund creates a presumption of control of a fund, under Section 2(a)(9) of the Investment Company Act of 1940. At April 30, 2015, there were no beneficial owners, either directly or indirectly, of more than 25% of the Fund.
NOTE 7. FEDERAL TAX INFORMATION
At April 30, 2015, the net unrealized appreciation (depreciation) of investments for tax purposes was as follows:
Gross Unrealized Appreciation | $ | 8,437,920 | ||
Gross Unrealized Depreciation | (859,738 | ) | ||
Net Unrealized Appreciation | $ | 7,578,182 |
At April 30, 2015, the aggregate cost of securities for federal income tax purposes was $102,998,452 for the Fund.
22
Notes to Financial Statements (continued)
April 30, 2015 (Unaudited)
At April 30, 2015, the difference between book basis and tax basis unrealized appreciation was attributable primarily to the tax deferral of losses on wash sales of $3,404.
At October 31, 2014, the Fund’s most recent fiscal year end, the components of distributable earnings (accumulated losses) on a tax basis was as follows:
Undistributed Ordinary Income | $ | 344,239 | ||
Undistributed Long-Term Capital Gains | 2,038,982 | |||
Unrealized Appreciation (Depreciation)* | 5,277,506 | |||
Total Accumulated Earnings (Deficit) | $ | 7,660,727 |
| * | The difference between book basis and tax basis unrealized appreciation (depreciation) is attributable to the tax deferral of losses on wash sales and income from certain investments. |
The tax character of distributions for the fiscal year ended October 31, 2014 was as follows:
| 2014 | ||||
Distributions paid from: | ||||
Ordinary Income | $ | 468,041 | ||
Net Long-Term Capital Gains | 1,087,745 | |||
| $ | 1,555,786 | |||
NOTE 8. COMMITMENTS AND CONTINGENCIES
The Fund indemnifies its officers and trustees for certain liabilities that may arise from performance of their duties to the Fund. Additionally, in the normal course of business, the Fund enters into contracts that contain a variety of representations and warranties which provide general indemnifications. The Fund’s maximum exposure under these arrangements is unknown, as this would involve future claims that may be made against the Fund that have not yet occurred.
NOTE 9. SUBSEQUENT EVENTS
Management of the Fund has evaluated the need for disclosures and/or adjustments resulting from subsequent events through the date these financial statements were issued. There were no items requiring adjustment of financial statements or additional disclosure.
23
Other Information
The Fund’s Statement of Additional Information (“SAI”) includes additional information about the trustees and is available without charge, upon request. You may call toll-free at (855) 280-9648 to request a copy of the SAI or to make shareholder inquiries.
24
VALUED ADVISERS TRUST
PRIVACY POLICY
The following is a description of the policies of the Valued Advisers Trust (the “Trust”) regarding disclosure of nonpublic personal information that shareholders provide to a series of the Trust (each, a “Fund”) or that the Fund collects from other sources. In the event that a shareholder hold shares of a Fund through a broker-dealer or other financial intermediary, the privacy policy of the financial intermediary would govern how shareholder nonpublic personal information would be shared with nonaffiliated third parties.
Categories of Information A Fund May Collect. A Fund may collect the following nonpublic personal information about its shareholders:
| • | Information the Fund receives from a shareholder on applications or other forms, correspondence, or conversations (such as the shareholder’s name, address, phone number, social security number, and date of birth); and |
| • | Information about the shareholder’s transactions with the Fund, its affiliates, or others (such as the shareholder’s account number and balance, payment history, cost basis information, and other financial information). |
Categories of Information A Fund May Disclose. A Fund may not disclose any nonpublic personal information about its current or former shareholders to unaffiliated third parties, except as required or permitted by law. A Fund is permitted by law to disclose all of the information it collects, as described above, to its service providers (such as the Fund’s custodian, administrator, transfer agent, accountant and legal counsel) to process shareholder transactions and otherwise provide services to the shareholder.
Confidentiality and Security. Each Fund shall restrict access to shareholder nonpublic personal information to those persons who require such information to provide products or services to the shareholder. Each Fund shall maintain physical, electronic, and procedural safeguards that comply with federal standards to guard shareholder nonpublic personal information.
Disposal of Information. The Funds, through their transfer agent, have taken steps to reasonably ensure that the privacy of a shareholder’s nonpublic personal information is maintained at all times, including in connection with the disposal of information that is no longer required to be maintained by the Funds. Such steps shall include, whenever possible, shredding paper documents and records prior to disposal, requiring off-site storage vendors to shred documents maintained in such locations prior to disposal, and erasing and/or obliterating any data contained on electronic media in such a manner that the information can no longer be read or reconstructed.
25
PROXY VOTING
A description of the policies and procedures that the Fund uses to determine how to vote proxies relating to portfolio securities and information regarding how the Fund voted those proxies is available without charge upon request by (1) calling the Fund at (855) 280-9648 and (2) from Fund documents filed with the Securities and Exchange Commission (“SEC”) on the SEC’s website at www.sec.gov.
TRUSTEES
R. Jeffrey Young, Chairman
Ira Cohen
Andrea N. Mullins
OFFICERS
R. Jeffrey Young, Principal Executive Officer and President
Bryan W. Ashmus, Principal Financial Officer and Treasurer
John C. Swhear, Chief Compliance Officer, AML Officer and Vice-President
Carol J. Highsmith, Vice President and Secretary
Matthew J. Miller, Vice President
INVESTMENT ADVISER
Dana Investment Advisors, Inc.
15800 Bluemound Rd., Suite 250
Brookfield, WI 53005
DISTRIBUTOR
Unified Financial Securities, Inc.
2960 North Meridian Street, Suite 300
Indianapolis, IN 46208
INDEPENDENT REGISTERED PUBLIC ACCOUNTING FIRM
Cohen Fund Audit Services, Ltd.
1350 Euclid Avenue, Suite 800
Cleveland, OH 44115
LEGAL COUNSEL
The Law Offices of John H. Lively & Associates, Inc.,
A member firm of The 1940 Act Law GroupTM
11300 Tomahawk Creek Parkway, Suite 310
Leawood, KS 66211
CUSTODIAN
Huntington National Bank
41 S. High St.
Columbus, OH 43215
ADMINISTRATOR, TRANSFER AGENT AND FUND ACCOUNTANT
Huntington Asset Services, Inc.
2960 North Meridian Street, Suite 300
Indianapolis, IN 46208
This report is intended only for the information of shareholders or those who have received the Fund’s prospectus which contains information about the Fund’s management fee and expenses. Please read the prospectus carefully before investing.
Distributed by Unified Financial Securities, Inc.
Member FINRA/SIPC
Item 2. Code of Ethics. NOT APPLICABLE – disclosed with annual report
Item 3. Audit Committee Financial Expert. NOT APPLICABLE – disclosed with annual report
Item 4. Principal Accountant Fees and Services. NOT APPLICABLE – disclosed with annual report
Item 5. Audit Committee of Listed Companies. NOT APPLICABLE – applies to listed companies only
Item 6. Schedule of Investments. Schedules filed with Item 1.
Item 7. Disclosure of Proxy Voting Policies and Procedures for Closed-End Management Investment Companies. NOT APPLICABLE – applies to closed-end funds only
Item 8. Portfolio Managers of Closed-End Investment Companies. NOT APPLICABLE – applies to closed-end funds only
Item 9. Purchases of Equity Securities by Closed-End Management Investment Company and Affiliated Purchasers. NOT APPLICABLE – applies to closed-end funds only
Item 10. Submission of Matters to a Vote of Security Holders.
The guidelines applicable to shareholders desiring to submit recommendations for nominees to the Registrant’s board of trustees are contained in the statement of additional information of the Trust with respect to the Fund(s) for which this Form N-CSR is being filed.
Item 11. Controls and Procedures.
(a) Based on their evaluation of the registrant’s disclosure controls and procedures (as defined in Rule 30a-3(c) under the Investment Company Act of 1940, as amended (the “Act”)) as of a date within 90 days of the filing date of this report, the registrant’s principal executive officer and principal financial officer have concluded that such disclosure controls and procedures are reasonably designed and are operating effectively to ensure that material information relating to the registrant is made known to them by others within those entities, particularly during the period in which this report is being prepared, and that the information required in filings on Form N-CSR is recorded, processed, summarized, and reported on a timely basis.
(b) There were no changes in the registrant’s internal control over financial reporting (as defined in Rule 30a-3(d) under the Investment Company Act of 1940) that occurred during the second fiscal quarter of the period covered by this report that have materially affected, or are reasonably likely to materially affect, the registrant’s internal control over financial reporting.
Item 12. Exhibits.
| (a)(1) | Not Applicable – filed with annual report | |
| (2) | Certifications by the registrant’s principal executive officer and principal financial officer, pursuant to Section 302 of the Sarbanes- Oxley Act of 2002 and required by Rule 30a-2 under the Investment Company Act of 1940 are filed herewith. | |
| (3) | Not Applicable | |
| (b) | Certification pursuant to 18 U.S.C. Section 1350, as adopted pursuant to Section 906 of the Sarbanes-Oxley Act of 2002 is filed herewith. | |
-2-
Pursuant to the requirements of the Securities Exchange Act of 1934 and the Investment Company Act of 1940, the registrant has duly caused this report to be signed on its behalf by the undersigned, thereunto duly authorized.
(Registrant) Valued Advisers Trust
| By | /s/ R. Jeffrey Young | |
| R. Jeffrey Young, President and Principal Executive Officer | ||
| Date 7/02/2015 | ||
Pursuant to the requirements of the Securities Exchange Act of 1934 and the Investment Company Act of 1940, this report has been signed below by the following persons on behalf of the registrant and in the capacities and on the dates indicated.
| By | /s/ R. Jeffrey Young | |
| R. Jeffrey Young, President and Principal Executive Officer | ||
| Date 7/02/2015 | ||
| By | /s/ Bryan W. Ashmus | |
| Bryan W. Ashmus, Treasurer and Principal Financial Officer | ||
| Date 7/02/2015 | ||
-3-