UNITED STATES
SECURITIES AND EXCHANGE COMMISSION
WASHINGTON, D.C. 20549
FORM N-CSR
CERTIFIED SHAREHOLDER REPORT OF REGISTERED
MANAGEMENT INVESTMENT COMPANIES
Investment Company Act file number 811-22208
Valued Advisers Trust
(Exact name of registrant as specified in charter)
Huntington Asset Services, Inc. 2960 N. Meridian Street, Suite 300 | Indianapolis, IN 46208 | |
| (Address of principal executive offices) | (Zip code) |
Capitol Services, Inc.
615 S. Dupont Hwy.
Dover, DE 19901
(Name and address of agent for service)
With a copy to:
John H. Lively, Esq.
The Law Offices of John H. Lively & Associates, Inc.
A member firm of The 1940 Act Law GroupTM
11300 Tomahawk Creek Parkway,
Suite 310
Leawood, KS 66221
Registrant’s telephone number, including area code: 317-917-7000
Date of fiscal year end: 10/31
Date of reporting period: 04/30/14
| Item 1. | Reports to Stockholders. |
-2-
BRC
Large Cap
Focus Equity Fund
Semi-Annual Report
April 30, 2014
Fund Adviser:
BRC Investment Management LLC
8400 East Prentice Avenue, Suite 1401
Greenwood Village, Colorado 80111
Toll Free (877) 272-1214
LETTER FROM CHIEF INVESTMENT OFFICER – (Unaudited)
The investment strategy of the BRC Large Cap Focus Equity Fund (the “Fund”) is based on our belief that future investor expectations are strongly influenced by the opinions, forecasts and announcements of perceived market experts, including Wall Street analysts and company management. By incorporating a combination of proprietary behavioral valuation techniques, we seek to invest in companies that are likely to be the beneficiaries of future favorable earnings announcements and upward earnings estimate revisions. Regardless of market conditions, so long as the predictive abilities of the quantitative models remain strong and investors continue to react to industry experts, the management team expects this investment strategy to provide above average returns over a typical 3-5 year investment cycle.
For this reporting period, the management team was satisfied with the predictive abilities of the quantitative model and the implementation of the investment process. The Fund held equity positions representing those securities that were highly ranked by our quantitative models and were evaluated and approved by our fundamental analysts.
| • | Holdings in the Fund’s portfolio received significantly more upward analyst revisions compared to a hypothetical portfolio of stocks randomly selected from the large-cap universe would have been expected to receive. |
| • | On the earnings-surprise front, a significant number of portfolio companies announced earnings that were materially higher than analyst expectations, with only a few companies reporting materially negative earnings surprises. |
As a result of our ability to select and manage the securities in the portfolio, the performance results exceeded the benchmark for the reporting period. The behavior we seek to identify and monetize was evident and achieved the intended results.
The Adviser has proprietary tools for tacking and monitoring risk factors. Some of the factors we focus on include; value factors (P/B, P/E, P/S, P/CF etc.); medium-term and short-term momentum; market capitalization; beta; and volatility, among others. Using analytical tools that are distinct from those of portfolio management, the risk management process assesses the risks embedded in the strategy.
We monitor the levels and trends of fundamental factor exposures, economic sector exposures, and the composition and magnitude of residual risk versus various benchmarks and indices. For the reporting period, this risk management process resulted in even sector and style exposures and a realized beta significantly lower than the market.
On behalf of the management team, I would like to thank you for your continued support. You have our commitment to the consistent application of our investment process and to a proprietary research agenda that will drive our ongoing effort to add value for our clients.
John R. Riddle, CFA
Managing Principal and Chief Investment Officer
1
INVESTMENT RESULTS – (Unaudited)
| Total Returns* (for the periods ended April 30, 2014) | ||||||||||||
| Six Months | One Year | Since Inception (December 21, 2012) | ||||||||||
BRC Large Cap Focus Equity Fund - Institutional Class | 10.07 | % | 22.76 | % | 25.57 | % | ||||||
S&P 500 Index®** | 8.36 | % | 20.44 | % | 24.17 | % | ||||||
Total annual operating expenses, as disclosed in the Fund’s prospectus dated February 28, 2014, were 6.44% of net assets for the Institutional Class (0.55% after fee waivers/expense reimbursements by the Adviser). The Adviser has contractually agreed to waive or limit its fees and to assume other expenses of the Fund until February 29, 2016, so that the Total Annual Fund Operating Expenses does not exceed 0.55%. This operating expense limitation does not apply to interest, taxes, brokerage commissions, other expenditures which are capitalized in accordance with generally accepted accounting principles, other extraordinary expenses not incurred in the ordinary course of the Fund’s business, dividend expense on short sales, expenses incurred under a Rule 12b-1 plan of distribution, “acquired fund fees and expenses,” and expenses that the Fund has incurred but did not actually pay because of an expense offset arrangement.
The performance quoted represents past performance, which does not guarantee future results. The investment return and principal value of an investment will fluctuate so that an investor’s shares, when redeemed, may be worth more or less than their original cost. The returns shown do not reflect deduction of taxes that a shareholder would pay on Fund distributions or the redemption of Fund shares. Current performance of the Fund may be lower or higher than the performance quoted. The Fund’s investment objectives, risks, charges and expenses must be considered carefully before investing. Performance data current to the most recent month end may be obtained by calling (877) 272-1214.
| * | Return figures reflect any change in price per share and assume the reinvestment of all distributions. |
| ** | The S&P 500® Index is a widely recognized unmanaged index of equity securities and are representative of a broader domestic equity market and range of securities than is found in the Fund’s portfolio. Individuals cannot invest directly in an Index; however, an individual can invest in exchange traded funds or other investment vehicles that attempt to track the performance of a benchmark index. |
The Fund’s investment objectives, strategies, risks, charges and expenses must be considered carefully before investing. The prospectus contains this and other important information about the Fund and may be obtained by calling the same number as above. Please read it carefully before investing.
The Fund is distributed by Unified Financial Securities, Inc., member FINRA.
2
INVESTMENT RESULTS – (Unaudited)
Comparison of the Growth of a $10,000 Investment in the BRC Large Cap Focus Equity Fund - Institutional Class and the S&P 500® Index (Unaudited)
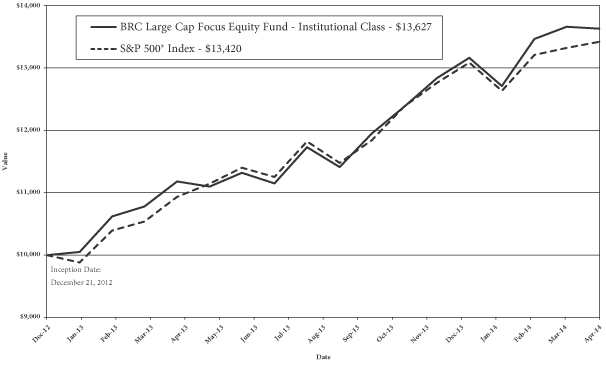
The chart above assumes an initial investment of $10,000 made on December 21, 2012 (commencement of Institutional Class operations) and held through April 30, 2014. The S&P 500® Index is a widely recognized unmanaged index of equity securities and is representative of a broader domestic equity market and range of securities than is found in the Fund’s portfolio. Individuals cannot invest directly in an Index; however, an individual can invest in exchange traded funds or other investment vehicles that attempt to track the performance of a benchmark index. THE FUND’S RETURN REPRESENTS PAST PERFORMANCE AND DOES NOT GUARANTEE FUTURE RESULTS. The returns shown do not reflect deduction of taxes that a shareholder would pay on Fund distributions or the redemption of Fund shares. Investment returns and principal values will fluctuate so that your shares, when redeemed, may be worth more or less than their original purchase price.
Current performance may be lower or higher than the performance data quoted. For more information on the Fund, and to obtain performance data current to the most recent month end or to request a prospectus, please call (877) 272-1214. You should carefully consider the investment objectives, potential risks, management fees, and charges and expenses of the Fund before investing. The Fund’s prospectus contains this and other information about the Fund, and should be read carefully before investing.
The Fund is distributed by Unified Financial Securities, Inc., member FINRA.
3
FUND HOLDINGS – (Unaudited)
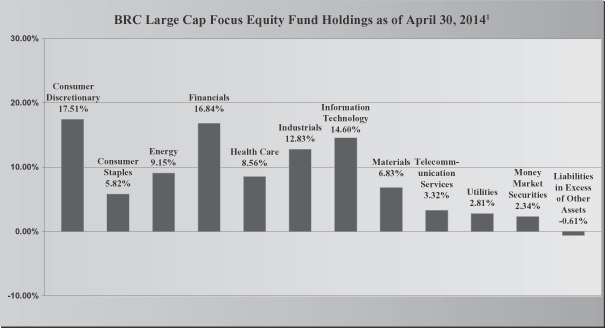
| 1 | As a percentage of net assets. |
The investment objective of the BRC Large Cap Focus Equity Fund is to seek long-term capital appreciation that will exceed the S&P 500 Index over a three-to-five year time horizon.
Availability of Portfolio Schedule – (Unaudited)
The Fund files its complete schedule of portfolio holdings with the Securities and Exchange Commission (“SEC”) for the first and third quarters of each fiscal year on Form N-Q. The Fund’s Forms N-Q are available at the SEC’s website at www.sec.gov. The Fund’s Forms N-Q may be reviewed and copied at the SEC’s Public Reference Room in Washington DC. Information on the operation of the Public Reference Room may be obtained by calling 1-800-SEC-0330.
Summary of Fund’s Expenses – (Unaudited)
As a shareholder of the Fund, you incur two types of costs: (1) transaction costs, such as short-term redemption fees; and (2) ongoing costs, including management fees and other Fund expenses. This Example is intended to help you understand your ongoing costs (in dollars) of investing in the Fund and to compare these costs with the ongoing costs of investing in other mutual funds. The example is based on an investment of $1,000 invested at the beginning and held for the entire period from November 1, 2013 to April 30, 2014.
4
Actual Expenses
The first line of the table below provides information about actual account values and actual expenses. You may use the information in this line, together with the amount you invested, to estimate the expenses that you paid over the period. Simply divide your account value by $1,000 (for example, an $8,600 account value divided by $1,000 = $8.60), then multiply the result by the number in the first line under the heading entitled “Expenses Paid During the Period” to estimate the expenses you paid on your account during this period.
Hypothetical Example for Comparison Purposes
The second line of the table below provides information about hypothetical account values and hypothetical expenses based on the Fund’s actual expense ratio and an assumed rate of return of 5% per year before expenses, which is not the Fund’s actual return. The hypothetical account values and expenses may not be used to estimate the actual ending account balance or expenses you paid for the period. You may use this information to compare the ongoing costs of investing in the Fund and other funds. To do so, compare this 5% hypothetical example with the 5% hypothetical examples that appear in the shareholder reports of the other funds.
Please note that the expenses shown in the table are meant to highlight your ongoing costs only. Therefore, the second line of the table below is useful in comparing ongoing costs only and will not help you determine the relative costs of owning different funds.
BRC Large Cap Focus Equity Fund – Institutional | Beginning November 1, 2013 | Ending Account Value April 30, 2014 | Expenses Paid April 30, 2014 | |||||||||
Actual* | $ | 1,000.00 | $ | 1,100.70 | $ | 2.86 | ||||||
Hypothetical** | $ | 1,000.00 | $ | 1,022.07 | $ | 2.76 | ||||||
| * | Expenses are equal to the Fund’s annualized expense ratio of 0.55%, multiplied by the average account value over the period, multiplied by 181/365. |
| ** | Assumes a 5% return before expenses. |
5
BRC LARGE CAP FOCUS EQUITY FUND
SCHEDULE OF INVESTMENTS
April 30, 2014 (Unaudited)
| COMMON STOCKS – 98.27% | Shares | Fair Value | ||||||
Consumer Discretionary – 17.51% |
| |||||||
BorgWarner, Inc. | 6,826 | $ | 424,168 | |||||
Foot Locker, Inc. | 9,139 | 425,238 | ||||||
Home Depot, Inc./The | 4,358 | 346,505 | ||||||
Michael Kors Holdings Ltd. * | 3,946 | 359,875 | ||||||
Viacom, Inc. – Class B | 4,403 | 374,167 | ||||||
Wyndham Worldwide Corp. | 5,165 | 368,471 | ||||||
|
| |||||||
| 2,298,424 | ||||||||
|
| |||||||
Consumer Staples – 5.82% |
| |||||||
Constellation Brands, Inc. – Class A * | 4,738 | 378,282 | ||||||
CVS Caremark Corp. | 5,302 | 385,561 | ||||||
|
| |||||||
| 763,843 | ||||||||
|
| |||||||
Energy – 9.15% |
| |||||||
EOG Resources, Inc. | 4,083 | 400,134 | ||||||
Helmerich & Payne, Inc. | 3,640 | 395,486 | ||||||
Valero Energy Corp. | 7,100 | 405,907 | ||||||
|
| |||||||
| 1,201,527 | ||||||||
|
| |||||||
Financials – 16.84% |
| |||||||
Discover Financial Services | 6,658 | 372,182 | ||||||
Lincoln National Corp. | 7,649 | 371,053 | ||||||
Prudential Financial, Inc. | 4,220 | 340,470 | ||||||
T. Rowe Price Group, Inc. | 4,692 | 385,354 | ||||||
Travelers Cos., Inc./The | 3,885 | 351,903 | ||||||
Wells Fargo & Co. | 7,862 | 390,270 | ||||||
|
| |||||||
| 2,211,232 | ||||||||
|
| |||||||
Health Care – 8.56% |
| |||||||
Aetna, Inc. | 5,333 | 381,043 | ||||||
Biogen Idec, Inc. * | 1,295 | 371,820 | ||||||
Cardinal Health, Inc. | 5,333 | 370,697 | ||||||
|
| |||||||
| 1,123,560 | ||||||||
|
| |||||||
Industrials – 12.83% |
| |||||||
ManpowerGroup | 4,754 | 386,690 | ||||||
Northrop Grumman Corp. | 3,794 | 461,009 | ||||||
Raytheon Co. | 4,266 | 407,318 | ||||||
Snap-on, Inc. | 3,702 | 429,432 | ||||||
|
| |||||||
| 1,684,449 | ||||||||
|
| |||||||
See accompanying notes which are an integral part of these financial statements.
6
BRC LARGE CAP FOCUS EQUITY FUND
SCHEDULE OF INVESTMENTS – (continued)
April 30, 2014 (Unaudited)
| COMMON STOCKS – 98.27%– continued | Shares | Fair Value | ||||||
Information Technology – 14.60% |
| |||||||
Accenture PLC – Class A | 4,403 | $ | 353,209 | |||||
Amdocs Ltd. | 8,453 | 393,318 | ||||||
Intuit, Inc. | 4,890 | 370,417 | ||||||
Microchip Technology, Inc. | 9,110 | 433,089 | ||||||
TE Connectivity Ltd. | 6,216 | 366,620 | ||||||
|
| |||||||
| 1,916,653 | ||||||||
|
| |||||||
Materials – 6.83% |
| |||||||
Lyondellbasell Industries NV – Class A | 4,693 | 434,102 | ||||||
Westlake Chemical Corp. | 6,490 | 462,088 | ||||||
|
| |||||||
| 896,190 | ||||||||
|
| |||||||
Telecommunication Services – 3.32% |
| |||||||
Level 3 Communications, Inc. * | 10,120 | 435,464 | ||||||
|
| |||||||
Utilities – 2.81% |
| |||||||
Public Service Enterprise Group, Inc. | 9,019 | 369,508 | ||||||
|
| |||||||
TOTAL COMMON STOCKS (Cost $11,752,859) |
| 12,900,850 | ||||||
|
| |||||||
MONEY MARKET SECURITIES – 2.34% |
| |||||||
Fidelity Institutional Money Market Portfolio – Institutional Class, 0.06% (a) | 307,697 | 307,697 | ||||||
|
| |||||||
TOTAL MONEY MARKET SECURITIES (Cost $307,697) | 307,697 | |||||||
|
| |||||||
TOTAL INVESTMENTS – 100.61% (Cost $12,060,556) | 13,208,547 | |||||||
|
| |||||||
| Liabilities in Excess of Other Assets – (0.61)% | (80,704) | |||||||
|
| |||||||
| TOTAL NET ASSETS – 100.00% | $ | 13,127,843 | ||||||
|
| |||||||
| (a) | Rate disclosed is the seven day yield as of April 30, 2014. |
| * | Non-income producing security. |
See accompanying notes which are an integral part of these financial statements.
7
BRC LARGE CAP FOCUS EQUITY FUND
STATEMENT OF ASSETS AND LIABILITIES
April 30, 2014 (Unaudited)
Assets | ||||
Investments in securities at fair value (cost $12,060,556) | $ | 13,208,547 | ||
Receivable for investments sold | 814,325 | |||
Dividends receivable | 16,410 | |||
Interest receivable | 18 | |||
Receivable from Adviser | 9,409 | |||
Prepaid expenses | 17,027 | |||
|
| |||
Total Assets | 14,065,736 | |||
|
| |||
Liabilities | ||||
Payable for investments purchased | 919,893 | |||
Payable to administrator, fund accountant, and transfer agent | 7,383 | |||
Payable to custodian | 2,223 | |||
Payable to trustees | 927 | |||
Other accrued expenses | 7,467 | |||
|
| |||
Total Liabilities | 937,893 | |||
|
| |||
Net Assets | $ | 13,127,843 | ||
|
| |||
Net Assets consist of: | ||||
Paid-in capital | $ | 11,486,063 | ||
Accumulated undistributed net investment income | 35,811 | |||
Accumulated undistributed net realized gain from investments | 457,978 | |||
Net unrealized appreciation on investments | 1,147,991 | |||
|
| |||
Net Assets | $ | 13,127,843 | ||
|
| |||
Institutional Class: | ||||
Shares outstanding (unlimited number of shares authorized, no par value) | 969,704 | |||
|
| |||
Net asset value, offering and redemption price per share | $ | 13.54 | ||
|
| |||
See accompanying notes which are an integral part of these financial statements.
8
BRC LARGE CAP FOCUS EQUITY FUND
STATEMENT OF OPERATIONS
For the six months ended April 30, 2014 (Unaudited)
Investment Income | ||||
Dividend income (net of foreign taxes withheld of $486) | $ | 85,639 | ||
Interest income | 116 | |||
|
| |||
Total investment income | 85,755 | |||
|
| |||
Expenses | ||||
Investment Adviser | 23,316 | |||
Administration | 20,102 | |||
Fund accounting | 12,408 | |||
Transfer agent | 18,825 | |||
Legal | 8,590 | |||
Registration | 8,401 | |||
Custodian | 3,583 | |||
Audit | 7,363 | |||
Trustee | 4,067 | |||
Pricing | 1,117 | |||
Offering costs | 6,169 | |||
Miscellaneous | 2,790 | |||
|
| |||
Total expenses | 116,731 | |||
|
| |||
Fees waived and reimbursed by Adviser | (89,435 | ) | ||
|
| |||
Net operating expenses | 27,296 | |||
|
| |||
Net investment income | 58,459 | |||
|
| |||
Net Realized and Unrealized Gains on Investments |
| |||
Net realized gains on investment securities transactions | 457,978 | |||
Net change in unrealized appreciation of investment securities | 373,337 | |||
|
| |||
Net realized and unrealized gains on investments | 831,315 | |||
|
| |||
Net increase in net assets resulting from operations | $ | 889,774 | ||
|
| |||
See accompanying notes which are an integral part of these financial statements.
9
BRC LARGE CAP FOCUS EQUITY FUND
STATEMENTS OF CHANGES IN NET ASSETS
| For the Six Months Ended April 30, 2014 (Unaudited) | For the Period Ended October 31, 2013 (a) | |||||||
Increase in Net Assets due to: | ||||||||
Operations | ||||||||
Net investment income | $ | 58,459 | $ | 32,747 | ||||
Net realized gains on investment transactions | 457,978 | 242 | ||||||
Net change in unrealized appreciation of investments | 373,337 | 774,654 | ||||||
|
|
|
| |||||
Net increase in net assets resulting from operations | 889,774 | 807,643 | ||||||
|
|
|
| |||||
Distributions from: | ||||||||
Net investment income – Institutional Class | (55,395 | ) | – | |||||
Net realized gains – Institutional Class | (242 | ) | – | |||||
|
|
|
| |||||
Total distributions | (55,637 | ) | – | |||||
|
|
|
| |||||
Capital Transactions – Institutional Class | ||||||||
Proceeds from shares sold | 4,374,598 | 7,316,024 | ||||||
Reinvestment of distributions | 54,011 | – | ||||||
Amount paid for shares redeemed | (246,570 | ) | (12,000 | ) | ||||
|
|
|
| |||||
Net increase in net assets resulting from capital transactions | 4,182,039 | 7,304,024 | ||||||
|
|
|
| |||||
Total Increase in Net Assets | 5,016,176 | 8,111,667 | ||||||
|
|
|
| |||||
Net Assets | ||||||||
Beginning of period | 8,111,667 | – | ||||||
|
|
|
| |||||
End of period | $ | 13,127,843 | $ | 8,111,667 | ||||
|
|
|
| |||||
Accumulated undistributed net investment income | $ | 35,811 | $ | 32,747 | ||||
|
|
|
| |||||
Share Transactions – Institutional Class | ||||||||
Shares sold | 329,720 | 656,072 | ||||||
Shares issued in reinvestment of distributions | 4,152 | – | ||||||
Shares redeemed | (19,250 | ) | (990 | ) | ||||
|
|
|
| |||||
Net increase in shares | 314,622 | 655,082 | ||||||
|
|
|
| |||||
| (a) | For the period December 21, 2012 (commencement of operations) to October 31, 2013. |
See accompanying notes which are an integral part of these financial statements.
10
BRC LARGE CAP FOCUS EQUITY FUND
FINANCIAL HIGHLIGHTS – INSTITUTIONAL CLASS
(For a share outstanding during the period)
| For the Six Months Ended April 30, 2014 (Unaudited) | For the Period Ended October 31, 2013 (a) | |||||||
Selected Per Share Data: | ||||||||
Net asset value, beginning of period | $ | 12.38 | $ | 10.00 | ||||
|
|
|
| |||||
Investment Operations: | ||||||||
Net investment income | 0.07 | 0.05 | ||||||
Net realized and unrealized gain on investments | 1.17 | 2.33 | ||||||
|
|
|
| |||||
Total from investment operations | 1.24 | 2.38 | ||||||
|
|
|
| |||||
Less distributions to shareholders from: | ||||||||
Net investment income | (0.08 | ) | – | |||||
Net realized gains | – | (b) | – | |||||
|
|
|
| |||||
Total distributions | (0.08 | ) | – | |||||
|
|
|
| |||||
Net asset value, end of period | $ | 13.54 | $ | 12.38 | ||||
|
|
|
| |||||
Total Return (c) | 10.07 | %(d) | 23.80 | %(d) | ||||
Ratios and Supplemental Data: | ||||||||
Net assets, end of period (000) | $ | 13,128 | $ | 8,112 | ||||
Ratio of net expenses to average net assets | 0.55 | %(e) | 0.56 | %(e) | ||||
Ratio of expenses to average net assets before waiver and reimbursement | 2.35 | %(e) | 6.49 | %(e) | ||||
Ratio of net investment income to average net assets | 1.18 | %(e) | 0.98 | %(e) | ||||
Portfolio turnover rate | 71 | %(d) | 154 | %(d) | ||||
| (a) | For the period December 21, 2012 (commencement of operations) to October 31, 2013. |
| (b) | Amount is less than $0.005. |
| (c) | Total return in the above table represents the rate that the investor would have earned or lost on an investment in the Fund, assuming reinvestment of distributions. |
| (d) | Not annualized. |
| (e) | Annualized. |
See accompanying notes which are an integral part of these financial statements.
11
BRC LARGE CAP FOCUS EQUITY FUND
NOTES TO THE FINANCIAL STATEMENTS
April 30, 2014 (Unaudited)
NOTE 1. ORGANIZATION
The BRC Large Cap Focus Equity Fund (the “Fund”) is an open-end non-diversified series of the Valued Advisers Trust (the “Trust”). The Trust is a management investment company established under the laws of Delaware by an Agreement and Declaration of Trust dated June 13, 2008 (the “Trust Agreement”). The Trust Agreement permits the Trustees to issue an unlimited number of shares of beneficial interest of separate series without par value. The Fund is one of a series of funds authorized by the Board of Trustees (the “Board”). The Fund commenced operations December 21, 2012. The Fund’s investment adviser is BRC Investment Management LLC. (the “Adviser”). The investment objective of the Fund is to seek long-term capital appreciation that will exceed the S&P 500 Index over a three-to five-year time horizon.
The Fund is authorized to offer two classes of shares: Institutional Class and Advisor Class. Each share represents an equal proportionate interest in the assets and liabilities belonging to the Fund and is entitled to such dividends and distributions out of income belonging to the applicable class as are declared by the Trustees. Expenses attributable to any class are borne by that class. Income, expenses, and realized and unrealized gains/losses are allocated to the respective classes on the basis of relative daily net assets. On matters that affect the Fund as a whole, each class has the same voting and other rights and preferences as any other class. On matters that affect only one class, only shareholders of that class may vote. Each class votes separately on matters affecting only that class, or on matters expressly required to be voted on separately by state or federal law. Shares of each class of a series have the same voting and other rights and preferences as the other classes and series of the Trust for matters that affect the Trust as a whole. As of April 30, 2014, only Institutional Class shares are available for purchase. The Fund may offer additional classes of shares in the future.
NOTE 2. SIGNIFICANT ACCOUNTING POLICIES
The following is a summary of significant accounting policies followed by the Fund in the preparation of its financial statements. These policies are in conformity with generally accepted accounting principles in the United States of America (“GAAP”).
Securities Valuation – All investments in securities are recorded at their estimated fair value as described in Note 3.
Federal Income Taxes – The Fund makes no provision for federal income or excise tax. The Fund intends to qualify each year as a regulated investment company (“RIC”) under subchapter M of the Internal Revenue Code of 1986, as amended, by complying with the requirements applicable to RICs and by distributing substantially all of its taxable income. The Fund also intends to distribute sufficient net investment income and net capital gains, if any, so that it will not be subject to excise tax on undistributed income and gains. If the required amount of net investment income or gains is not distributed, the Fund could incur a tax expense.
As of and during the period ended April 30, 2014, the Fund did not have a liability for any unrecognized tax benefits. The Fund recognizes interest and penalties, if any, related to unrecognized tax benefits as income tax expense in the Statement of Operations. During the year, the Fund did not incur any interest or penalties. The Fund is subject to examination by U.S. federal tax authorities for all tax years since inception.
Expenses – Expenses incurred by the Trust that do not relate to a specific fund of the Trust are allocated to the individual funds based on each fund’s relative net assets or other appropriate basis (as determined by the Board of Trustees).
12
BRC LARGE CAP FOCUS EQUITY FUND
NOTES TO THE FINANCIAL STATEMENTS – (continued)
April 30, 2014 (Unaudited)
NOTE 2. SIGNIFICANT ACCOUNTING POLICIES – continued
Security Transactions and Related Income – The Fund follows industry practice and records security transactions on the trade date for financial reporting purposes. The average cost method is used for determining gains or losses for financial statements and income tax purposes. Dividend income is recorded on the ex-dividend date and interest income is recorded on an accrual basis. Discounts and premiums on securities purchased are amortized or accreted using the effective interest method. Withholding taxes on foreign dividends, if any, have been provided for in accordance with the Fund’s understanding of the applicable country’s tax rules and rates. The ability of issuers of debt securities held by the Fund to meet their obligations may be affected by economic and political developments in a specific country or region.
Dividends and Distributions – The Fund intends to distribute substantially all of its net investment income, net realized long-term capital gains and its net realized short-term capital gains, if any, to its shareholders on at least an annual basis. Dividends to shareholders, which are determined in accordance with income tax regulations, are recorded on the ex-dividend date. The treatment for financial reporting purposes of distributions made to shareholders during the year from net investment income or net realized capital gains may differ from their ultimate treatment for federal income tax purposes. These differences are caused primarily by differences in the timing of the recognition of certain components of income, expense or realized capital gain for federal income tax purposes. Where such differences are permanent in nature, they are reclassified in the components of net assets based on their ultimate characterization for federal income tax purposes. Any such reclassifications will have no effect on net assets, results of operations or net asset values per share of the Fund. There were no such material reclassifications made as of April 30, 2014.
NOTE 3. SECURITIES VALUATION AND FAIR VALUE MEASUREMENTS
Fair value is defined as the price that a Fund would receive upon selling an investment in a orderly transaction to an independent buyer in the principal or most advantageous market of the investment. GAAP established a three-tier hierarchy to maximize the use of observable market data and minimize the use of unobservable inputs and to establish classification of fair value measurements for disclosure purposes.
Inputs refer broadly to the assumptions that market participants would use in pricing the asset or liability, including assumptions about risk, (ex., the risk inherent in a particular valuation technique used to measure fair value including items such as a pricing model and/or the risk inherent in the inputs to the valuation technique). Inputs may be observable or unobservable. Observable inputs are inputs that reflect the assumptions market participants would use in pricing the asset or liability developed based on market data obtained from sources independent of the reporting entity. Unobservable inputs are inputs that reflect the reporting entity’s own assumptions about the assumptions market participants would use in pricing the asset or liability developed based on the best information available in the circumstances.
Various inputs are used in determining the value of the Fund’s investments. These inputs are summarized in the three broad levels listed below.
| • | Level 1 – quoted prices in active markets for identical securities |
| • | Level 2 – other significant observable inputs (including, but not limited to, quoted prices for an identical security in an inactive market, quoted prices for similar securities, interest rates, prepayment speeds, credit risk, etc.) |
13
BRC LARGE CAP FOCUS EQUITY FUND
NOTES TO THE FINANCIAL STATEMENTS – (continued)
April 30, 2014 (Unaudited)
NOTE 3. SECURITIES VALUATION AND FAIR VALUE MEASUREMENTS – continued
| • | Level 3 – significant unobservable inputs (including the Fund’s own assumptions in determining fair value of investments based on the best information available) |
The inputs used to measure fair value may fall into different levels of the fair value hierarchy. In such cases, for disclosure purposes, the level in the fair value hierarchy within which the fair value measurement falls in its entirety, is determined based on the lowest level input that is significant to the fair value measurement in its entirety.
Equity securities, including common stocks, are generally valued by using market quotations, furnished by a pricing service. Securities that are traded on any stock exchange are generally valued at the last quoted sale price. Lacking a last sale price, an exchange traded security is generally valued at its last bid price. Securities traded in the NASDAQ over-the-counter market are generally valued at the NASDAQ Official Closing Price. When using the market quotations or close prices provided by the pricing service and when the market is considered active, the security is classified as a Level 1 security. Sometimes, an equity security owned by the Fund will be valued by the pricing service with factors other than market quotations or when the market is considered inactive. When this happens, the security is classified as a Level 2 security. When market quotations are not readily available, when the Fund determines that the market quotation or the price provided by the pricing service does not accurately reflect the current fair value, or when restricted or illiquid securities are being valued, such securities are valued as determined in good faith by the Fund, in conformity with guidelines adopted by and subject to review by the Board. These securities may be categorized as Level 3 securities.
Investments in open-end mutual funds, including money market mutual funds, are generally priced at the ending net asset value (NAV) provided by the service agent of the funds. These securities will be categorized as Level 1 securities.
Fixed income securities when valued using market quotations in an active market, will be categorized as Level 1 securities. However, they may be valued on the basis of prices furnished by a pricing service when the Fund believes such prices more accurately reflect the fair value of such securities. A pricing service uses various inputs and techniques, which include broker-dealer quotations, live trading levels, recently executed transactions in securities of the issuer or comparable issuers, and option adjusted spread models that include base curve and spread curve inputs. Adjustments to individual bonds can be applied to recognize trading differences compared to other bonds issued by the same issuer. The broker-dealer quotations received are supported by credit analysis of the issuer that takes into consideration credit quality assessments, daily trading activity, and the activity of the underlying equities, listed bonds and sector-specific trends. To the extent that these inputs are observable, the values of fixed income securities are categorized as Level 2 securities. If the Fund decides that a price provided by the pricing service does not accurately reflect the fair value of the securities, when prices are not readily available from a pricing service, or when restricted or illiquid securities are being valued, securities are valued at fair value as determined in good faith by the Fund, in conformity with guidelines adopted by and subject to review of the Board. These securities may be categorized as Level 3 securities.
Short-term investments in fixed income securities (those with maturities of less than 60 days when acquired, or which subsequently are within 60 days of maturity), including certificates of deposit and U.S. government securities, are valued by using the amortized cost method of valuation, which the Board has determined represents fair value. These securities will be classified as Level 2 securities.
14
BRC LARGE CAP FOCUS EQUITY FUND
NOTES TO THE FINANCIAL STATEMENTS – (continued)
April 30, 2014 (Unaudited)
NOTE 3. SECURITIES VALUATION AND FAIR VALUE INSTRUMENTS – continued
In accordance with the Trust’s good faith pricing guidelines, the Fund is required to consider all appropriate factors relevant to the value of securities for which it has determined other pricing sources are not available or reliable as described above. No single standard exists for determining fair value, because fair value depends upon the circumstances of each individual case. As a general principle, the current fair value of an issue of securities being valued by the Fund would appear to be the amount which the owner might reasonably expect to receive for them upon their current sale. Methods which are in accordance with this principle may, for example, be based on (i) a multiple of earnings; (ii) a discount from market of a similar freely traded security (including a derivative security or a basket of securities traded on other markets, exchanges or among dealers); or (iii) yield to maturity with respect to debt issues, or a combination of these and other methods. Good faith pricing is permitted if, in the Fund’s opinion, the validity of market quotations appears to be questionable based on factors such as evidence of a thin market in the security based on a small number of quotations, a significant event occurs after the close of a market but before a Fund’s NAV calculation that may affect a security’s value, or the Fund is aware of any other data that calls into question the reliability of market quotations. Good faith pricing may also be used in instances when the bonds the Fund invests in may default or otherwise cease to have market quotations readily available. Any fair value pricing done outside the Fund’s approved pricing methods must be approved by the Pricing Committee of the Board.
The following is a summary of the inputs used to value the Fund’s investments as of April 30, 2014:
| Valuation Inputs | ||||||||||||||||
| Assets | Level 1 – Quoted Prices in Active Markets | Level 2 – Other Significant Observable Inputs | Level 3 – Significant | Total | ||||||||||||
Common Stocks* | $ | 12,900,850 | $ | – | $ | – | $ | 12,900,850 | ||||||||
Money Market Securities | 307,697 | – | – | 307,697 | ||||||||||||
Total | $ | 13,208,547 | $ | – | $ | – | $ | 13,208,547 | ||||||||
| * | Refer to the Schedule of Investments for industry classifications. |
The Fund did not hold any investments at any time during the reporting period in which significant unobservable inputs were used in determining fair value; therefore, no reconciliation of Level 3 securities is included for this reporting period. The Trust recognizes transfers between fair value hierarchy levels at the reporting period end. There were no transfers between any Levels for the period ended April 30, 2014 and the previous measurement period.
NOTE 4. ADVISER FEES AND OTHER TRANSACTIONS
Under the terms of the management agreement, on behalf of the Fund (the “Agreement”), the Adviser manages the Fund’s investments subject to approval of the Trustees. As compensation for its management services, the Fund is obligated to pay the Adviser a fee computed and accrued daily and paid monthly at an annual rate of 0.47% of the average daily net assets of the Fund. For the period ended April 30, 2014, the Adviser earned a fee of $23,316 from the Fund before the reimbursement described below.
15
BRC LARGE CAP FOCUS EQUITY FUND
NOTES TO THE FINANCIAL STATEMENTS – (continued)
April 30, 2014 (Unaudited)
NOTE 4. ADVISER FEES AND OTHER TRANSACTIONS – continued
The Adviser has contractually agreed to waive its management fee and/or reimburse expenses through February 29, 2016, so that total annual fund operating expenses, excluding interest, taxes, brokerage commissions, other expenditures which are capitalized in accordance with GAAP, other extraordinary expenses not incurred in the ordinary course of the Fund’s business, dividend expense on short sales, 12b-1 expenses, and expenses that the Fund has incurred but did not actually pay because of an expense offset arrangement, if applicable, incurred by the Fund in any fiscal year, do not exceed 0.55% of the Fund’s average daily net assets. The operating expense limitation also excludes any fees and expenses of acquired funds. For the period ended April 30, 2014, expenses totaling $89,435 were waived or reimbursed by the Adviser and may be subject to potential recoupment by the Adviser until October 31, 2017. At April 30, 2014, the Adviser owed the Fund $9,409.
The amount subject to repayment by the Fund pursuant to the aforementioned conditions are as follows:
Amount | Recoverable through October 31, | |
$ 198,220 | 2016 | |
89,435 | 2017 |
The Trust retains Huntington Asset Services, Inc. (“HASI”) to manage the Fund’s business affairs and provide the Fund with administrative services, including all regulatory reporting and necessary office equipment and personnel. For the period ended April 30, 2014, HASI earned fees of $18,613 for administrative services provided to the Fund. At April 30, 2014, HASI was owed $2,988 from the Fund for administrative services. Certain officers and trustees of the Trust are members of management and/or employees of HASI. HASI is a wholly-owned subsidiary of Huntington Bancshares, Inc., the parent company of Unified Financial Securities, Inc. (the “Distributor”) and Huntington National Bank, the custodian of the Fund’s investments (the “Custodian”). For the period ended April 30, 2014, the Custodian earned fees of $3,583 for custody services provided to the Fund. At April 30, 2014, the Custodian was owed $2,223 from the Fund for custody services.
The Trust also retains HASI to act as the Fund’s transfer agent and to provide fund accounting services. For the period ended April 30, 2014, HASI earned fees of $18,825 for transfer agent services to the Fund. At April 30, 2014, the Fund owed HASI $2,403 for transfer agent services. For the period ended April 30, 2014, HASI earned fees of $12,408 from the Fund for fund accounting services. At April 30, 2014, HASI was owed $1,992 from the Fund for fund accounting services.
Unified Financial Securities, Inc. acts as the principal underwriter of the Fund’s shares. There were no payments made by the Fund to the Distributor during period ended April 30, 2014. An officer of the Trust is also an officer of the Distributor.
16
BRC LARGE CAP FOCUS EQUITY FUND
NOTES TO THE FINANCIAL STATEMENTS – (continued)
April 30, 2014 (Unaudited)
NOTE 5. PURCHASES AND SALES
For the period ended April 30, 2014, purchases and sales of investment securities, other than short-term investments and short-term U.S. government obligations, were as follows:
Purchases | ||||
U.S. Government Obligations | $ | – | ||
Other | 11,123,490 | |||
Sales | ||||
U.S. Government Obligations | $ | – | ||
Other | 7,072,220 |
NOTE 6. ESTIMATES
The preparation of financial statements in conformity with GAAP requires management to make estimates and assumptions that affect the reported amounts of assets and liabilities and disclosure of contingent assets and liabilities at the date of the financial statements and the reported amounts of increases and decreases in net assets from operations during the reporting period. Actual results could differ from those estimates.
NOTE 7. BENEFICIAL OWNERSHIP
The beneficial ownership, either directly or indirectly, of 25% or more of the voting securities of a fund creates a presumption of control of a fund, under Section 2(a) (9) of the Investment Company Act of 1940. At April 30, 2014, Charles Schwab & Co., Inc. for the benefit of its customers, owned 54.17%. It is not known whether Charles Schwab & Co. or any of the underlying beneficial owners controlled 25% or more of the voting securities of the Fund.
NOTE 8. FEDERAL TAX INFORMATION
At April 30, 2014, the net unrealized appreciation (depreciation) of investments for tax purposes was as follows:
Gross Appreciation | $ | 1,186,695 | ||
Gross (Depreciation) | (38,704 | ) | ||
|
| |||
Net Appreciation (Depreciation) on Investments | $ | 1,147,991 | ||
|
|
At April 30, 2014, the aggregate cost of securities for federal income tax purposes was $12,060,556 for the Fund.
At October 31, 2013, the components of distributable earnings (accumulated losses) on a tax basis were as follows:
Undistributed ordinary income | $ | 32,989 | ||
Net unrealized appreciation (depreciation) | 774,654 | |||
|
| |||
| $ | 807,643 | |||
|
|
17
BRC LARGE CAP FOCUS EQUITY FUND
NOTES TO THE FINANCIAL STATEMENTS – (continued)
April 30, 2014 (Unaudited)
NOTE 9. COMMITMENTS AND CONTINGENCIES
The Fund indemnifies its officers and trustees for certain liabilities that may arise from the performance of their duties to the Fund. Additionally, in the normal course of business, the Fund enters into contracts that contain a variety of representations and warranties which provide general indemnifications. The Fund’s maximum exposure under these arrangements is unknown, as this would involve future claims that may be made against the Fund that have not yet occurred.
NOTE 10. SUBSEQUENT EVENTS
Management of the Fund has evaluated the need for disclosures and/or adjustments resulting from subsequent events through the date these financial statements were issued. There were no items requiring adjustment of the financial statements or additional disclosure.
18
VALUED ADVISERS TRUST
PRIVACY POLICY
The following is a description of the policies of the Valued Advisers Trust (the “Trust”) regarding disclosure of nonpublic personal information that shareholders provide to a series of the Trust (each, a “Fund”) or that the Fund collects from other sources. In the event that a shareholder holds shares of a Fund through a broker-dealer or other financial intermediary, the privacy policy of the financial intermediary would govern how shareholder nonpublic personal information would be shared with nonaffiliated third parties.
Categories of Information A Fund May Collect. A Fund may collect the following nonpublic personal information about its shareholders:
| • | Information the Fund receives from a shareholder on applications or other forms, correspondence, or conversations (such as the shareholder’s name, address, phone number, social security number, and date of birth); and |
| • | Information about the shareholder’s transactions with the Fund, its affiliates, or others (such as the shareholder’s account number and balance, payment history, cost basis information, and other financial information). |
Categories of Information A Fund May Disclose. A Fund may not disclose any nonpublic personal information about its current or former shareholders to unaffiliated third parties, except as required or permitted by law. A Fund is permitted by law to disclose all of the information it collects, as described above, to its service providers (such as the Fund’s custodian, administrator, transfer agent, accountant and legal counsel) to process shareholder transactions and otherwise provide services to the shareholder.
Confidentiality and Security. Each Fund shall restrict access to shareholder nonpublic personal information to those persons who require such information to provide products or services to the shareholder. Each Fund shall maintain physical, electronic, and procedural safeguards that comply with federal standards to guard shareholder nonpublic personal information.
Disposal of Information. The Funds, through their transfer agent, have taken steps to reasonably ensure that the privacy of a shareholder’s nonpublic personal information is maintained at all times, including in connection with the disposal of information that is no longer required to be maintained by the Funds. Such steps shall include, whenever possible, shredding paper documents and records prior to disposal, requiring off-site storage vendors to shred documents maintained in such locations prior to disposal, and erasing and/or obliterating any data contained on electronic media in such a manner that the information can no longer be read or reconstructed.
19
OTHER INFORMATION
The Fund’s Statement of Additional Information (“SAI”) includes additional information about the trustees and is available without charge, upon request. You may call toll-free at (877) 272-1214 to request a copy of the SAI or to make shareholder inquiries.
PROXY VOTING
A description of the policies and procedures that the Fund uses to determine how to vote proxies relating to portfolio securities and information regarding how the Fund voted those proxies is available without charge upon request by (1) calling the Fund at (877) 272-1214 and (2) from Fund documents filed with the Securities and Exchange Commission (“SEC”) on the SEC’s website at www.sec.gov.
TRUSTEES
R. Jeffrey Young, Chairman
Ira Cohen
Andrea N. Mullins
OFFICERS
R. Jeffrey Young, Principal Executive Officer and President
John C. Swhear, Chief Compliance Officer, AML Officer and Vice President
Carol J. Highsmith, Vice President and Secretary
Matthew J. Miller, Vice President
Bryan W. Ashmus, Principal Financial Officer and Treasurer
INVESTMENT ADVISER
BRC Investment Management LLC
8400 East Prentice Avenue, Suite 1401
Greenwood Village, Colorado 80111
DISTRIBUTOR
Unified Financial Securities, Inc.
2960 North Meridian Street, Suite 300
Indianapolis, IN 46208
INDEPENDENT REGISTERED
PUBLIC ACCOUNTING FIRM
Cohen Fund Audit Services Ltd.
1350 Euclid Avenue, Suite 800
Cleveland, OH 44115
LEGAL COUNSEL
The Law Offices of John H. Lively & Associates, Inc.
A member firm of The 1940 Act Law GroupTM
11300 Tomahawk Creek Parkway, Ste. 310
Leawood, KS 66211
CUSTODIAN
Huntington National Bank
41 South High Street
Columbus, OH 43215
ADMINISTRATOR, TRANSFER AGENT AND FUND ACCOUNTANT
Huntington Asset Services, Inc.
2960 North Meridian Street, Suite 300
Indianapolis, IN 46208
This report is intended only for the information of shareholders or those who have received the Fund’s prospectus which contains information about the Fund’s management fee and expenses. Please read the prospectus carefully before investing.
Distributed by Unified Financial Securities, Inc.
Member FINRA/SIPC
20
Semi-Annual Report
April 30, 2014
Fund Adviser:
Granite Investment Advisors, Inc.
11 South Main Street, Suite 501
Concord, New Hampshire 03301
Toll Free (888) 442-9893
INVESTMENT RESULTS – (Unaudited)
| Average Annual Total Returns* (for the periods ended April 30, 2014) | ||||||||||||
| Six Month | One Year | Since Inception (December 22, 2011) | ||||||||||
Granite Value Fund | 5.43 | % | 17.20 | % | 17.80 | % | ||||||
S&P 500® Index** | 8.36 | % | 20.44 | % | 21.84 | % | ||||||
Russell 1000® Value Index** | 9.61 | % | 20.90 | % | 23.35 | % | ||||||
Total annual operating expenses, as disclosed in the Fund’s prospectus dated February 28, 2014, were 3.32% of average daily net assets (1.35% after fee waivers/expense reimbursements by the adviser). The adviser has contractually agreed to waive or limit its fees and to assume other expenses of the Fund until February 28, 2015, so that the Total Annual Fund Operating Expenses does not exceed 1.35%. This operating expense limitation does not apply to interest, taxes, brokerage commissions, other expenditures which are capitalized in accordance with generally accepted accounting principles, other extraordinary expenses not incurred in the ordinary course of the Fund’s business, dividend expense on short sales, expenses incurred under a Rule 12b-1 plan of distribution, “acquired fund fees and expenses,” and expenses that the Fund has incurred but did not actually pay because of an expense offset arrangement.
The performance quoted represents past performance, which does not guarantee future results. The investment return and principal value of an investment will fluctuate so that an investor’s shares, when redeemed, may be worth more or less than their original cost. The returns shown do not reflect deduction of taxes that a shareholder would pay on Fund distributions or the redemption of Fund shares. Current performance of the Fund may be lower or higher than the performance quoted. The Fund’s investment objectives, risks, charges and expenses must be considered carefully before investing. Performance data current to the most recent month end may be obtained by calling 1-888-442-9893.
| * | Return figures reflect any change in price per share and assume the reinvestment of all distributions. |
| ** | The S&P 500® Index and the Russell 1000® Value Index are widely recognized unmanaged indices of equity securities and are representative of a broader domestic equity market and range of securities than is found in the Fund’s portfolio. Individuals cannot invest directly in an Index; however, an individual can invest in exchange traded funds or other investment vehicles that attempt to track the performance of a benchmark index. |
The Fund’s investment objectives, strategies, risks, charges and expenses must be considered carefully before investing. The prospectus contains this and other important information about the Fund and may be obtained by calling the same number as above. Please read it carefully before investing.
The Fund is distributed by Unified Financial Securities, Inc., member FINRA.
1
Comparison of the Growth of a $10,000 Investment in the Granite Value Fund,
the Russell 1000® Value Index, and the S&P 500® Index (Unaudited)

The chart above assumes an initial investment of $10,000 made on December 22, 2011 (commencement of Fund operations) and held through April 30, 2014. The S&P 500® Index and Russell 1000® Value Index are widely recognized unmanaged indices of equity securities and are representative of a broader domestic equity market and range of securities than is found in the Fund’s portfolio. Individuals cannot invest directly in an Index; however, an individual can invest in exchange traded funds or other investment vehicles that attempt to track the performance of a benchmark index. THE FUND’S RETURN REPRESENTS PAST PERFORMANCE AND DOES NOT GUARANTEE FUTURE RESULTS. The returns shown do not reflect deduction of taxes that a shareholder would pay on Fund distributions or the redemption of Fund shares. Investment returns and principal values will fluctuate so that your shares, when redeemed, may be worth more or less than their original purchase price.
Current performance may be lower or higher than the performance data quoted. For more information on the Fund, and to obtain performance data current to the most recent month end or to request a prospectus, please call 1-888-442-9893. You should carefully consider the investment objectives, potential risks, management fees, and charges and expenses of the Fund before investing. The Fund’s prospectus contains this and other information about the Fund, and should be read carefully before investing.
The Fund is distributed by Unified Financial Securities, Inc., member FINRA.
2
FUND HOLDINGS – (Unaudited)
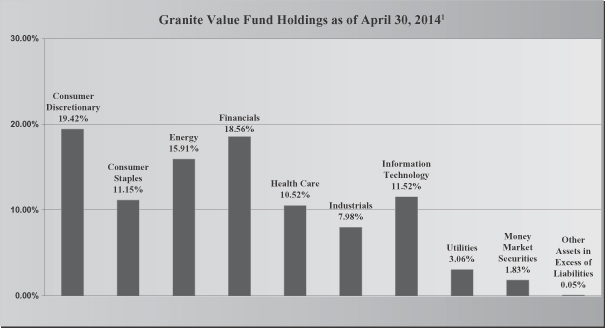
| 1 | As a percentage of net assets. |
The investment objective of the Granite Value Fund is to seek long-term capital appreciation.
Availability of Portfolio Schedule – (Unaudited)
The Fund files its complete schedule of portfolio holdings with the Securities and Exchange Commission (“SEC”) for the first and third quarters of each fiscal year on Form N-Q. The Fund’s Forms N-Q are available at the SEC’s website at www.sec.gov. The Fund’s Forms N-Q may be reviewed and copied at the SEC’s Public Reference Room in Washington DC. Information on the operation of the Public Reference Room may be obtained by calling 1-800-SEC-0330.
Summary of Fund’s Expenses – (Unaudited)
As a shareholder of the Fund, you incur two types of costs: (1) transaction costs, such as short-term redemption fees; and (2) ongoing costs, including management fees and other Fund expenses. This Example is intended to help you understand your ongoing costs (in dollars) of investing in the Fund and to compare these costs with the ongoing costs of investing in other mutual funds. The example is based on an investment of $1,000 invested at the beginning and held for the six month period, November 1, 2013 to April 30, 2014.
3
Actual Expenses
The first line of the table below provides information about actual account values and actual expenses. You may use the information in this line, together with the amount you invested, to estimate the expenses that you paid over the period. Simply divide your account value by $1,000 (for example, an $8,600 account value divided by $1,000 = $8.60), then multiply the result by the number in the first line under the heading entitled “Expenses Paid During the Period” to estimate the expenses you paid on your account during this period.
Hypothetical Example for Comparison Purposes
The second line of the table below provides information about hypothetical account values and hypothetical expenses based on the Fund’s actual expense ratio and an assumed rate of return of 5% per year before expenses, which is not the Fund’s actual return. The hypothetical account values and expenses may not be used to estimate the actual ending account balance or expenses you paid for the period. You may use this information to compare the ongoing costs of investing in the Fund and other funds. To do so, compare this 5% hypothetical example with the 5% hypothetical examples that appear in the shareholder reports of the other funds.
Please note that the expenses shown in the table are meant to highlight your ongoing costs only. Therefore, the second line of the table below is useful in comparing ongoing costs only and will not help you determine the relative costs of owning different funds.
| Granite Value Fund | Beginning November 1, 2013 | Ending Account Value April 30, 2014 | Expenses Paid November 1, 2013 – | |||||||||
Actual* | $ | 1,000.00 | $ | 1,054.30 | $ | 6.88 | ||||||
Hypothetical** | $ | 1,000.00 | $ | 1,018.10 | $ | 6.75 | ||||||
| * | Expenses are equal to the Fund’s annualized expense ratio of 1.35%, multiplied by the average account value over the period, multiplied by 181/365 (to reflect the one-half year period). |
| ** | Assumes a 5% return before expenses. |
4
GRANITE VALUE FUND
SCHEDULE OF INVESTMENTS
April 30, 2014 (Unaudited)
| COMMON STOCKS – 98.12% | Shares | Fair Value | ||||||
Consumer Discretionary – 19.42% | ||||||||
Bed Bath & Beyond, Inc. * | 5,550 | $ | 344,822 | |||||
Coach, Inc. | 7,010 | 312,997 | ||||||
Comcast Corp. – Class A | 6,300 | 326,088 | ||||||
Foot Locker, Inc. | 8,700 | 404,811 | ||||||
General Motors Co. | 12,390 | 427,207 | ||||||
News Corp. – Class A * | 20,830 | 354,527 | ||||||
TRW Automotive Holdings Corp. * | 3,500 | 281,225 | ||||||
|
| |||||||
| 2,451,677 | ||||||||
|
| |||||||
Consumer Staples – 11.15% |
| |||||||
Coca-Cola Co. / The | 9,150 | 373,229 | ||||||
Tesco PLC ADR | 20,870 | 308,876 | ||||||
Unilever PLC ADR | 8,720 | 390,133 | ||||||
Wal-Mart Stores, Inc. | 4,210 | 335,579 | ||||||
|
| |||||||
| 1,407,817 | ||||||||
|
| |||||||
Energy – 15.91% |
| |||||||
Apache Corp. | 4,065 | 352,842 | ||||||
Exxon Mobil Corp. | 4,640 | 475,182 | ||||||
Southwestern Energy Co. * | 7,840 | 375,379 | ||||||
Ultra Petroleum Corp. * | 15,555 | 463,539 | ||||||
Unit Corp. * | 5,175 | 341,291 | ||||||
|
| |||||||
| 2,008,233 | ||||||||
|
| |||||||
Financials – 18.56% |
| |||||||
Alleghany Corp. * | 925 | 377,381 | ||||||
American Express Co. | 2,765 | 241,744 | ||||||
American International Group, Inc. | 9,730 | 516,955 | ||||||
Berkshire Hathaway, Inc. – Class B * | 3,855 | 496,717 | ||||||
Citigroup, Inc. | 7,640 | 366,032 | ||||||
Franklin Resources, Inc. | 6,575 | 344,201 | ||||||
|
| |||||||
| 2,343,030 | ||||||||
|
| |||||||
Health Care – 10.52% |
| |||||||
Baxter International, Inc. | 5,450 | 396,705 | ||||||
Johnson & Johnson | 2,590 | 262,341 | ||||||
Sanofi ADR | 6,595 | 354,811 | ||||||
UnitedHealth Group, Inc. | 4,185 | 314,042 | ||||||
|
| |||||||
| 1,327,899 | ||||||||
|
| |||||||
See accompanying notes which are an integral part of these financial statements.
5
GRANITE VALUE FUND
SCHEDULE OF INVESTMENTS – (continued)
April 30, 2014 (Unaudited)
| COMMON STOCKS – 98.12% – continued | Shares | Fair Value | ||||||
Industrials – 7.98% |
| |||||||
Boeing Co. / The | 2,530 | $ | 326,421 | |||||
FedEx Corp. | 2,550 | 347,438 | ||||||
Kennametal, Inc. | 7,140 | 333,652 | ||||||
|
| |||||||
| 1,007,511 | ||||||||
|
| |||||||
Information Technology – 11.52% |
| |||||||
Apple, Inc. | 680 | 401,261 | ||||||
Cisco Systems, Inc. | 16,385 | 378,657 | ||||||
Microsoft Corp. | 8,395 | 339,158 | ||||||
Western Union Co. / The | 21,170 | 335,968 | ||||||
|
| |||||||
| 1,455,044 | ||||||||
|
| |||||||
Utilities – 3.06% |
| |||||||
Calpine Corp. * | 16,875 | 386,944 | ||||||
|
| |||||||
TOTAL COMMON STOCKS (Cost $10,210,958) | 12,388,155 | |||||||
|
| |||||||
MONEY MARKET SECURITIES – 1.83% | ||||||||
Fidelity Institutional Money Market Funds – Prime Money Market Portfolio – Institutional Class, 0.06% (a) | 230,616 | 230,616 | ||||||
|
| |||||||
TOTAL MONEY MARKET SECURITIES (Cost $230,616) | 230,616 | |||||||
|
| |||||||
TOTAL INVESTMENTS – 99.95% (Cost $10,441,574) | $ | 12,618,771 | ||||||
|
| |||||||
| Other Assets in Excess of Liabilities – 0.05% | 6,011 | |||||||
|
| |||||||
| TOTAL NET ASSETS – 100.00% | $ | 12,624,782 | ||||||
|
| |||||||
| (a) | Rate disclosed is the seven day yield as of April 30, 2014. |
| * | Non-income producing security. |
ADR – American Depositary Receipt
See accompanying notes which are an integral part of these financial statements.
6
GRANITE VALUE FUND
STATEMENT OF ASSETS AND LIABILITIES
April 30, 2014 (Unaudited)
Assets | ||||
Investments in securities at fair value (cost $10,441,574) | $ | 12,618,771 | ||
Dividends receivable | 13,803 | |||
Interest receivable | 15 | |||
Receivable from Adviser | 106 | |||
Prepaid expenses | 8,303 | |||
|
| |||
Total Assets | 12,640,998 | |||
|
| |||
Liabilities | ||||
Payable to administrator, fund accountant, and transfer agent | 6,629 | |||
Payable to custodian | 1,954 | |||
Payable to trustees | 548 | |||
Other accrued expenses | 7,085 | |||
|
| |||
Total Liabilities | 16,216 | |||
|
| |||
Net Assets | $ | 12,624,782 | ||
|
| |||
Net Assets consist of: | ||||
Paid-in capital | $ | 10,339,143 | ||
Accumulated undistributed net investment income | 3,707 | |||
Accumulated undistributed net realized gains from investments | 104,735 | |||
Net unrealized appreciation on investments | 2,177,197 | |||
|
| |||
Net Assets | $ | 12,624,782 | ||
|
| |||
Shares outstanding | 889,421 | |||
|
| |||
Net asset value (“NAV”) and offering price per share | $ | 14.19 | ||
|
| |||
Redemption price per share (NAV * 98%) (a) | $ | 13.91 | ||
|
| |||
| (a) | The Fund charges a 2.00% redemption fee on shares redeemed in 60 days or less of purchase. Share are redeemed at the NAV if held longer than 60 calendar days. |
See accompanying notes which are an integral part of these financial statements.
7
GRANITE VALUE FUND
STATEMENT OF OPERATIONS
For the six months ended April 30, 2014 (Unaudited)
Investment Income | ||||
Dividend income | $ | 89,451 | ||
Interest income | 71 | |||
|
| |||
Total investment income | 89,522 | |||
|
| |||
Expenses | ||||
Investment Adviser | 57,672 | |||
Administration | 18,596 | |||
Fund accounting | 12,397 | |||
Transfer agent | 18,396 | |||
Legal | 6,444 | |||
Registration | 7,929 | |||
Custodian | 2,628 | |||
Audit | 7,438 | |||
Trustee | 3,874 | |||
Pricing | 1,047 | |||
Miscellaneous | 4,639 | |||
|
| |||
Total expenses | 141,060 | |||
|
| |||
Fees waived and reimbursed by Adviser | (63,194 | ) | ||
|
| |||
Net operating expenses | 77,866 | |||
|
| |||
Net investment income | 11,656 | |||
|
| |||
Net Realized and Unrealized Gains on Investments | ||||
Net realized gains on investment securities transactions | 116,479 | |||
Net change in unrealized appreciation of investment securities | 521,515 | |||
|
| |||
Net realized and unrealized gains on investments | 637,994 | |||
|
| |||
Net increase in net assets resulting from operations | $ | 649,650 | ||
|
| |||
See accompanying notes which are an integral part of these financial statements.
8
GRANITE VALUE FUND
STATEMENTS OF CHANGES IN NET ASSETS
| For the Six Months Ended April 30, 2014 (Unaudited) | For the Year Ended October 31, 2013 | |||||||
Increase in Net Assets due to: | ||||||||
Operations | ||||||||
Net investment income | $ | 11,656 | $ | 20,979 | ||||
Net realized gain on investment transactions | 116,479 | 307,429 | ||||||
Net change in unrealized appreciation of investments | 521,515 | 1,365,378 | ||||||
|
|
|
| |||||
Net increase in net assets resulting from operations | 649,650 | 1,693,786 | ||||||
|
|
|
| |||||
Distributions | ||||||||
From net investment income | (17,291 | ) | (48,544 | ) | ||||
From net realized gains | (287,895 | ) | – | |||||
|
|
|
| |||||
Total distributions | (305,186 | ) | (48,544 | ) | ||||
|
|
|
| |||||
Capital Transactions | ||||||||
Proceeds from shares sold | 1,639,277 | 5,330,630 | ||||||
Reinvestment of distributions | 261,021 | 46,272 | ||||||
Amount paid for shares redeemed | (197,075 | ) | (1,194,939 | ) | ||||
|
|
|
| |||||
Net increase in net assets resulting from capital transactions | 1,703,223 | 4,181,963 | ||||||
|
|
|
| |||||
Total Increase in Net Assets | 2,047,687 | 5,827,205 | ||||||
|
|
|
| |||||
Net Assets | ||||||||
Beginning of period | 10,577,095 | 4,749,890 | ||||||
|
|
|
| |||||
End of period | $ | 12,624,782 | $ | 10,577,095 | ||||
|
|
|
| |||||
Accumulated undistributed net investment income | $ | 3,707 | $ | 9,342 | ||||
|
|
|
| |||||
Share Transactions | ||||||||
Shares sold | 120,411 | 435,459 | ||||||
Shares issued in reinvestment of distributions | 19,067 | 4,120 | ||||||
Shares redeemed | (14,233 | ) | (97,956 | ) | ||||
|
|
|
| |||||
Net increase in shares | 125,245 | 341,623 | ||||||
|
|
|
| |||||
See accompanying notes which are an integral part of these financial statements.
9
GRANITE VALUE FUND
FINANCIAL HIGHLIGHTS
For a share outstanding during each period
| For the Six Months Ended April 30, 2014 (Unaudited) | For the Year Ended October 31, 2013 | For the Period Ended October 31, 2012 (a) | ||||||||||
Selected Per Share Data: | ||||||||||||
Net asset value, beginning of period | $ | 13.84 | $ | 11.24 | $ | 10.00 | ||||||
|
|
|
|
|
| |||||||
Income from investment operations: | ||||||||||||
Net investment income | 0.01 | 0.02 | 0.05 | (b) | ||||||||
Net realized and unrealized gains on investments | 0.72 | 2.68 | 1.19 | |||||||||
|
|
|
|
|
| |||||||
Total Income from investment operations | 0.73 | 2.70 | 1.24 | |||||||||
|
|
|
|
|
| |||||||
Less Distributions to shareholders from: | ||||||||||||
Net investment income | (0.02 | ) | (0.10 | ) | – | |||||||
Net realized gains | (0.36 | ) | – | – | ||||||||
|
|
|
|
|
| |||||||
Total distributions | (0.38 | ) | (0.10 | ) | – | |||||||
|
|
|
|
|
| |||||||
Paid in capital from redemption fees | – | – | – | (c) | ||||||||
|
|
|
|
|
| |||||||
Net asset value, end of period | $ | 14.19 | $ | 13.84 | $ | 11.24 | ||||||
|
|
|
|
|
| |||||||
Total Return (d) | 5.43 | %(e) | 24.21 | % | 12.40 | %(e) | ||||||
Ratios and Supplemental Data: | ||||||||||||
Net assets, end of period (000) | $ | 12,625 | $ | 10,577 | $ | 4,750 | ||||||
Ratio of net expenses to average net assets | 1.35 | %(f) | 1.35 | % | 1.35 | %(f) | ||||||
Ratio of expenses to average net assets before waiver and reimbursement | 2.45 | %(f) | 3.32 | % | 8.11 | %(f) | ||||||
Ratio of net investment income to average net assets | 0.20 | %(f) | 0.27 | % | 0.55 | %(f) | ||||||
Portfolio turnover rate | 9 | %(e) | 33 | % | 20 | %(e) | ||||||
| (a) | For the period December 22, 2011 (commencement of operations) to October 31, 2012. |
| (b) | Calculated using the average shares method. |
| (c) | Resulted in less than $0.005 per share. |
| (d) | Total return in the above table represents the rate that the investor would have earned or lost on an investment in the Fund, assuming reinvestment of distributions. |
| (e) | Not annualized. |
| (f) | Annualized. |
See accompanying notes which are an integral part of these financial statements.
10
GRANITE VALUE FUND
NOTES TO THE FINANCIAL STATEMENTS
April 30, 2014 (Unaudited)
NOTE 1. ORGANIZATION
The Granite Value Fund (the “Fund”) is an open-end diversified series of the Valued Advisers Trust (the “Trust”). The Trust is a management investment company established under the laws of Delaware by an Agreement and Declaration of Trust dated June 13, 2008 (the “Trust Agreement”). The Trust Agreement permits the Trustees to issue an unlimited number of shares of beneficial interest of separate series without par value. The Fund is one of a series of funds authorized by the Board of Trustees (the “Board”). The Fund commenced operations December 22, 2011. The Fund’s investment adviser is Granite Investment Advisors, Inc. (the “Adviser”). The investment objective of the Fund is to provide long-term capital appreciation.
NOTE 2. SIGNIFICANT ACCOUNTING POLICIES
The following is a summary of significant accounting policies followed by the Fund in the preparation of its financial statements. These policies are in conformity with generally accepted accounting principles in the United States of America (“GAAP”).
Securities Valuation – All investments in securities are recorded at their estimated fair value as described in Note 3.
Federal Income Taxes – The Fund makes no provision for federal income or excise tax. The Fund intends to qualify each year as a regulated investment company (“RIC”) under subchapter M of the Internal Revenue Code of 1986, as amended, by complying with the requirements applicable to RICs and by distributing substantially all of its taxable income. The Fund also intends to distribute sufficient net investment income and net capital gains, if any, so that it will not be subject to excise tax on undistributed income and gains. If the required amount of net investment income or gains is not distributed, the Fund could incur a tax expense.
As of and during the period ended April 30, 2014, the Fund did not have a liability for any unrecognized tax benefits. The Fund recognizes interest and penalties, if any, related to unrecognized tax benefits as income tax expense in the Statement of Operations. During the period, the Fund did not incur any interest or penalties. The Fund is subject to examination by U.S. federal tax authorities for all tax years since inception.
Expenses – Expenses incurred by the Trust that do not relate to a specific fund of the Trust are allocated to the individual funds based on each fund’s relative net assets or other appropriate basis.
Security Transactions and Related Income – The Fund follows industry practice and records security transactions on the trade date for financial reporting purposes. The First In, First Out method is used for determining gains or losses for financial statements and income tax purposes. Dividend income is recorded on the ex-dividend date and interest income is recorded on an accrual basis. Discounts and premiums on securities purchased are amortized or accreted using the effective interest method. Withholding taxes on foreign dividends have been provided for in accordance with the Fund’s understanding of the applicable country’s tax rules and rates. The ability of issuers of debt securities held by the Fund to meet their obligations may be affected by economic and political developments in a specific country or region.
Redemption Fees – The Fund charges a 2.00% redemption fee for shares redeemed within 60 days. These fees are deducted from the redemption proceeds otherwise payable to the shareholder. The Fund will retain the fee charged as an increase in paid-in capital and such fees become part of the Fund’s daily NAV calculation.
11
GRANITE VALUE FUND
NOTES TO THE FINANCIAL STATEMENTS – (continued)
April 30, 2014 (Unaudited)
NOTE 2. SIGNIFICANT ACCOUNTING POLICIES – continued
Dividends and Distributions – The Fund intends to distribute substantially all of its net investment income, net realized long-term capital gains and its net realized short-term capital gains, if any, to its shareholders on at least an annual basis. Dividends to shareholders, which are determined in accordance with income tax regulations, are recorded on the ex-dividend date. The treatment for financial reporting purposes of distributions made to shareholders during the year from net investment income or net realized capital gains may differ from their ultimate treatment for federal income tax purposes. These differences are caused primarily by differences in the timing of the recognition of certain components of income, expense or realized capital gain for federal income tax purposes. Where such differences are permanent in nature, they are reclassified in the components of net assets based on their ultimate characterization for federal income tax purposes. Any such reclassifications will have no effect on net assets, results of operations or net asset values per share of the Fund. There were no such material reclassifications made as of April 30, 2014.
NOTE 3. SECURITIES VALUATION AND FAIR VALUE MEASUREMENTS
Fair value is defined as the price that a Fund would receive upon selling an investment in a orderly transaction to an independent buyer in the principal or most advantageous market of the investment. GAAP established a three-tier hierarchy to maximize the use of observable market data and minimize the use of unobservable inputs and to establish classification of fair value measurements for disclosure purposes.
Inputs refer broadly to the assumptions that market participants would use in pricing the asset or liability, including assumptions about risk, (ex., the risk inherent in a particular valuation technique used to measure fair value including items such as a pricing model and/or the risk inherent in the inputs to the valuation technique). Inputs may be observable or unobservable. Observable inputs are inputs that reflect the assumptions market participants would use in pricing the asset or liability developed based on market data obtained from sources independent of the reporting entity. Unobservable inputs are inputs that reflect the reporting entity’s own assumptions about the assumptions market participants would use in pricing the asset or liability developed based on the best information available in the circumstances.
Various inputs are used in determining the value of the Fund’s investments. These inputs are summarized in the three broad levels listed below.
| • | Level 1 – quoted prices in active markets for identical securities |
| • | Level 2 – other significant observable inputs (including, but not limited to, quoted prices for an identical security in an inactive market, quoted prices for similar securities, interest rates, prepayment speeds, credit risk, etc.) |
| • | Level 3 – significant unobservable inputs (including the Fund’s own assumptions in determining fair value of investments based on the best information available) |
The inputs used to measure fair value may fall into different levels of the fair value hierarchy. In such cases, for disclosure purposes, the level in the fair value hierarchy within which the fair value measurement falls in its entirety, is determined based on the lowest level input that is significant to the fair value measurement in its entirety.
Equity securities, including common stocks, are generally valued by using market quotations, furnished by a pricing service. Securities that are traded on any stock exchange are generally valued at the last quoted sale price.
12
GRANITE VALUE FUND
NOTES TO THE FINANCIAL STATEMENTS – (continued)
April 30, 2014 (Unaudited)
NOTE 3. SECURITIES VALUATION AND FAIR VALUE MEASUREMENTS – continued
Lacking a last sale price, an exchange traded security is generally valued at its last bid price. Securities traded in the NASDAQ over-the-counter market are generally valued at the NASDAQ Official Closing Price. When using the market quotations or close prices provided by the pricing service and when the market is considered active, the security is classified as a Level 1 security. Sometimes, an equity security owned by the Fund will be valued by the pricing service with factors other than market quotations or when the market is considered inactive. When this happens, the security is classified as a Level 2 security. When market quotations are not readily available, when the Fund determines that the market quotation or the price provided by the pricing service does not accurately reflect the current fair value, or when restricted or illiquid securities are being valued, such securities are valued as determined in good faith by the Fund, in conformity with guidelines adopted by and subject to review by the Board. These securities may be categorized as Level 3 securities.
Investments in open-end mutual funds, including money market mutual funds, are generally priced at the ending net asset value (NAV) provided by the service agent of the funds. These securities will be categorized as Level 1 securities.
Fixed income securities when valued using market quotations in an active market, will be categorized as Level 1 securities. However, they may be valued on the basis of prices furnished by a pricing service when the Fund believes such prices more accurately reflect the fair value of such securities. A pricing service uses various inputs and techniques, which include broker-dealer quotations, live trading levels, recently executed transactions in securities of the issuer or comparable issuers, and option adjusted spread models that include base curve and spread curve inputs. Adjustments to individual bonds can be applied to recognize trading differences compared to other bonds issued by the same issuer. The broker-dealer quotations received are supported by credit analysis of the issuer that takes into consideration credit quality assessments, daily trading activity, and the activity of the underlying equities, listed bonds and sector-specific trends. To the extent that these inputs are observable, the values of fixed income securities are categorized as Level 2 securities. If the Fund decides that a price provided by the pricing service does not accurately reflect the fair value of the securities, when prices are not readily available from a pricing service, or when restricted or illiquid securities are being valued, securities are valued at fair value as determined in good faith by the Fund, in conformity with guidelines adopted by and subject to review of the Board. These securities may be categorized as Level 3 securities.
Short-term investments in fixed income securities (those with maturities of less than 60 days when acquired, or which subsequently are within 60 days of maturity), including certificates of deposit and U.S. government securities, are valued by using the amortized cost method of valuation, which the Board has determined represents fair value. These securities will be classified as Level 2 securities.
In accordance with the Trust’s good faith pricing guidelines, the Fund is required to consider all appropriate factors relevant to the value of securities for which it has determined other pricing sources are not available or reliable as described above. No single standard exists for determining fair value, because fair value depends upon the circumstances of each individual case. As a general principle, the current fair value of an issue of securities being valued by the Fund would appear to be the amount which the owner might reasonably expect to receive for them upon their current sale. Methods which are in accordance with this principle may, for example, be based on (i) a multiple of earnings; (ii) a discount from market of a similar freely traded security (including a derivative security or a basket of securities traded on other markets, exchanges or among dealers); or (iii) yield to maturity with respect to debt issues, or a combination of these and other methods. Good faith pricing is permitted if, in the Fund’s opinion, the validity of market quotations appears to be questionable based on factors such as evidence of
13
GRANITE VALUE FUND
NOTES TO THE FINANCIAL STATEMENTS – (continued)
April 30, 2014 (Unaudited)
NOTE 3. SECURITIES VALUATION AND FAIR VALUE MEASUREMENTS – continued
a thin market in the security based on a small number of quotations, a significant event occurs after the close of a market but before a Fund’s NAV calculation that may affect a security’s value, or the Fund is aware of any other data that calls into question the reliability of market quotations. Good faith pricing may also be used in instances when the bonds the Fund invests in may default or otherwise cease to have market quotations readily available. Any fair value pricing done outside the Fund’s approved pricing methods must be approved by the Pricing Committee of the Board.
The following is a summary of the inputs used to value the Fund’s investments as of April 30, 2014:
| Valuation Inputs | ||||||||||||||||
| Assets | Level 1 – Quoted Prices in | Level 2 – Other Significant Observable Inputs | Level 3 – Significant Unobservable Inputs | Total | ||||||||||||
Common Stocks* | $ | 12,388,155 | $ | – | $ | – | $ | 12,388,155 | ||||||||
Money Market Securities | 230,616 | – | – | 230,616 | ||||||||||||
Total | $ | 12,618,771 | $ | – | $ | – | $ | 12,618,771 | ||||||||
* Refer to the Schedule of Investments for industry classifications.
The Fund did not hold any investments at any time during the reporting period in which significant unobservable inputs were used in determining fair value; therefore, no reconciliation of Level 3 securities is included for this reporting period. The Trust recognizes transfers between fair value hierarchy levels at the reporting period end. There were no transfers between any Levels for the period ended April 30, 2014 compared to the previous measurement period.
NOTE 4. FEES AND OTHER TRANSACTIONS WITH AFFILIATES
Under the terms of the management agreement, on behalf of the Fund (the “Agreement”), the Adviser manages the Fund’s investments subject to approval of the Trustees. As compensation for its management services, the Granite Value Fund is obligated to pay the Adviser a fee computed and accrued daily and paid monthly at an annual rate of 1.00% of the average daily net assets of the Fund. For the period ended April 30, 2014, the Adviser earned a fee of $57,672 from the Fund before the reimbursement described below.
The Adviser has contractually agreed to waive its management fee and/or reimburse expenses through February 28, 2015, so that total annual fund operating expenses, excluding interest, taxes, brokerage commissions, other expenditures which are capitalized in accordance with GAAP, other extraordinary expenses not incurred in the ordinary course of the Fund’s business, dividend expense on short sales, and expenses that the Fund has incurred but did not actually pay because of an expense offset arrangement, if applicable, incurred by the Fund in any fiscal year, do not exceed 1.35% of the Fund’s average daily net assets. The operating expense limitation also excludes any fees and expenses of acquired funds. For the period ended April 30, 2014, expenses totaling $63,194 were waived or reimbursed by the Adviser and are subject to potential recoupment by the Adviser until October 31, 2017. At April 30, 2014, the Adviser owed the Fund $106.
14
GRANITE VALUE FUND
NOTES TO THE FINANCIAL STATEMENTS – (continued)
April 30, 2014 (Unaudited)
NOTE 4. FEES AND OTHER TRANSACTIONS WITH AFFILIATES – continued
The amount subject to repayment by the Fund pursuant to the aforementioned conditions are as follows:
Amount | Recoverable through October 31, | |
$171,698 | 2015 | |
150,231 | 2016 | |
63,194 | 2017 |
The Trust retains Huntington Asset Services, Inc. (“HASI”) to manage the Fund’s business affairs and provide the Fund with administrative services, including all regulatory reporting and necessary office equipment and personnel. For the period ended April 30, 2014, HASI earned fees of $18,596 for administrative services provided to the Fund. At April 30, 2014, HASI was owed $2,971 from the Fund for administrative services. Certain officers and one Trustee of the Trust are members of management and/or employees of HASI. HASI is a wholly-owned subsidiary of Huntington Bancshares, Inc., the parent company of Unified Financial Securities, Inc. (the “Distributor”) and Huntington National Bank, the custodian of the Fund’s investments (the “Custodian”). For the period ended April 30, 2014, the Custodian earned fees of $2,628 for custody services provided to the Fund. At April 30, 2014, the Custodian was owed $1,954 from the Fund for custody services.
The Trust also retains HASI to act as the Fund’s transfer agent and to provide fund accounting services. For the period ended April 30, 2014, HASI earned fees of $18,396 for transfer agent services to the Fund. At April 30, 2014, the Fund owed HASI $1,678 for transfer agent services. For the period ended April 30, 2014, HASI earned fees of $12,397 from the Fund for fund accounting services. At April 30, 2014, HASI was owed $1,980 from the Fund for fund accounting services.
Unified Financial Securities, Inc. acts as the principal underwriter of the Fund’s shares. There were no payments made by the Fund to the Distributor during the period ended April 30, 2014. An officer of the Trust is an officer of the Distributor and such person may be deemed to be an affiliate of the Distributor.
The Fund has adopted a 12b-1 Plan that permits the Fund to pay 0.25% of its average daily net assets to financial institutions that provide distribution and/or shareholder servicing. The Plan has not been activated as of April 30, 2014.
15
GRANITE VALUE FUND
NOTES TO THE FINANCIAL STATEMENTS – (continued)
April 30, 2014 (Unaudited)
NOTE 5. INVESTMENTS
For the period ended April 30, 2014, purchases and sales of investment securities, other than short-term investments and short-term U.S. government obligations, were as follows:
Purchases | ||||
U.S. Government Obligations | $ | – | ||
Other | 2,364,096 | |||
Sales | ||||
U.S. Government Obligations | $ | – | ||
Other | 1,031,824 |
NOTE 6. ESTIMATES
The preparation of financial statements in conformity with GAAP requires management to make estimates and assumptions that affect the reported amounts of assets and liabilities and disclosure of contingent assets and liabilities at the date of the financial statements and the reported amounts of increases and decreases in net assets from operations during the reporting period. Actual results could differ from those estimates.
NOTE 7. BENEFICIAL OWNERSHIP
The beneficial ownership, either directly or indirectly, of 25% or more of the voting securities of a fund creates a presumption of control of a fund, under Section 2(a) (9) of the Investment Company Act of 1940. At April 30, 2014, Charles Schwab & Co., Inc. for the benefit of its customers, owned 60.23%. It is not known whether Charles Schwab & Co. or any of the underlying beneficial owners controlled 25% or more of the voting securities of the Fund.
NOTE 8. FEDERAL TAX INFORMATION
At April 30, 2014, the net unrealized appreciation (depreciation) of investments for tax purposes was as follows:
Gross Appreciation | $ | 2,245,827 | ||
Gross (Depreciation) | (80,374 | ) | ||
|
| |||
Net Appreciation (Depreciation) on Investments | $ | 2,165,453 | ||
|
|
At April 30, 2014, the aggregate cost of securities, excluding U.S. government obligations, for federal income tax purposes was $10,453,318 for the Fund.
The tax characterization of distributions for the fiscal years ended October 31, 2013 was as follows:
| Distributions paid from: | 2013 | |||
Ordinary Income* | $ | 48,544 | ||
|
| |||
Total Distributions | $ | 48,544 | ||
|
| |||
| * | Short term capital gain distributions are treated as ordinary income for tax purposes. |
16
GRANITE VALUE FUND
NOTES TO THE FINANCIAL STATEMENTS – (continued)
April 30, 2014 (Unaudited)
NOTE 8. FEDERAL TAX INFORMATION – continued
At October 31, 2013, the components of distributable earnings (accumulated losses) on a tax basis were as follows:
Undistributed ordinary income | $ | 159,471 | ||
Undistributed long-term capital gain (loss) | 141,051 | |||
Accumulated capital and other losses | (3,285 | ) | ||
Net Unrealized appreciation (depreciation) | 1,643,938 | |||
|
| |||
| $ | 1,941,175 | |||
|
|
At October 31, 2013, the difference between book basis and tax basis unrealized appreciation (depreciation) is primarily attributable to the tax deferral of losses on wash sales in the amount of $11,744.
At October 31, 2013, for federal income tax purposes, the Fund has no capital loss carryforwards.
NOTE 9. COMMITMENTS AND CONTINGENCIES
The Fund indemnifies its officers and trustees for certain liabilities that may arise from their performance of their duties to the Fund. Additionally, in the normal course of business, the Fund enters into contracts that contain a variety of representations and warranties which provide general indemnifications. The Fund’s maximum exposure under these arrangements is unknown, as this would involve future claims that may be made against the Fund that have not yet occurred.
NOTE 10. SUBSEQUENT EVENTS
Management of the Fund has evaluated the need for disclosures and/or adjustments resulting from subsequent events through the date these financial statements were issued. There were no items requiring adjustment of the financial statements or additional disclosure.
17
VALUED ADVISERS TRUST
PRIVACY POLICY
The following is a description of the policies of the Valued Advisers Trust (the “Trust”) regarding disclosure of nonpublic personal information that shareholders provide to a series of the Trust (each, a “Fund”) or that the Fund collects from other sources. In the event that a shareholder holds shares of a Fund through a broker-dealer or other financial intermediary, the privacy policy of the financial intermediary would govern how shareholder nonpublic personal information would be shared with nonaffiliated third parties.
Categories of Information A Fund May Collect. A Fund may collect the following nonpublic personal information about its shareholders:
| • | Information the Fund receives from a shareholder on applications or other forms, correspondence, or conversations (such as the shareholder’s name, address, phone number, social security number, and date of birth); and |
| • | Information about the shareholder’s transactions with the Fund, its affiliates, or others (such as the shareholder’s account number and balance, payment history, cost basis information, and other financial information). |
Categories of Information A Fund May Disclose. A Fund may not disclose any nonpublic personal information about its current or former shareholders to unaffiliated third parties, except as required or permitted by law. A Fund is permitted by law to disclose all of the information it collects, as described above, to its service providers (such as the Fund’s custodian, administrator, transfer agent, accountant and legal counsel) to process shareholder transactions and otherwise provide services to the shareholder.
Confidentiality and Security. Each Fund shall restrict access to shareholder nonpublic personal information to those persons who require such information to provide products or services to the shareholder. Each Fund shall maintain physical, electronic, and procedural safeguards that comply with federal standards to guard shareholder nonpublic personal information.
Disposal of Information. The Funds, through their transfer agent, have taken steps to reasonably ensure that the privacy of a shareholder’s nonpublic personal information is maintained at all times, including in connection with the disposal of information that is no longer required to be maintained by the Funds. Such steps shall include, whenever possible, shredding paper documents and records prior to disposal, requiring off-site storage vendors to shred documents maintained in such locations prior to disposal, and erasing and/or obliterating any data contained on electronic media in such a manner that the information can no longer be read or reconstructed.
18
OTHER INFORMATION
The Fund’s Statement of Additional Information (“SAI”) includes additional information about the trustees and is available without charge, upon request. You may call toll-free at (888) 442-9893 to request a copy of the SAI or to make shareholder inquiries.
PROXY VOTING
A description of the policies and procedures that the Fund uses to determine how to vote proxies relating to portfolio securities and information regarding how the Fund voted those proxies is available without charge upon request by (1) calling the Fund at (888) 442-9893 and (2) from Fund documents filed with the Securities and Exchange Commission (“SEC”) on the SEC’s website at www.sec.gov.
TRUSTEES
R. Jeffrey Young, Chairman
Ira Cohen
Andrea N. Mullins
OFFICERS
R. Jeffrey Young, Principal Executive Officer and President
John C. Swhear, Chief Compliance Officer, AML Officer and Vice President
Carol J. Highsmith, Vice President and Secretary
Matthew J. Miller, Vice President
Bryan W. Ashmus, Principal Financial Officer and Treasurer
INVESTMENT ADVISER
Granite Investment Advisors
11 South Main Street, Suite 501
Concord, NH 03301
DISTRIBUTOR
Unified Financial Securities, Inc.
2960 North Meridian Street, Suite 300
Indianapolis, IN 46208
INDEPENDENT REGISTERED PUBLIC ACCOUNTING FIRM
Cohen Fund Audit Services Ltd.
1350 Euclid Avenue, Suite 800
Cleveland, OH 44115
LEGAL COUNSEL
The Law Offices of John H. Lively & Associates, Inc.
A member firm of The 1940 Act Law GroupTM
11300 Tomahawk Creek Parkway, Ste. 310
Leawood, KS 66211
CUSTODIAN
Huntington National Bank
41 South High Street
Columbus, OH 43215
ADMINISTRATOR, TRANSFER AGENT AND FUND ACCOUNTANT
Huntington Asset Services, Inc.
2960 North Meridian Street, Suite 300
Indianapolis, IN 46208
This report is intended only for the information of shareholders or those who have received the Fund’s prospectus which contains information about the Fund’s management fee and expenses. Please read the prospectus carefully before investing.
Distributed by Unified Financial Securities, Inc.
Member FINRA/SIPC
19

Semi-Annual Report
April 30, 2014
Fund Adviser:
Kovitz Investment Group, LLC
115 South LaSalle Street, 27th Floor
Chicago, IL 60603
Toll Free (888) 695-3729
MANAGEMENT’S DISCUSSION OF FUND PERFORMANCE – (Unaudited)
Kovitz Investment Group launched the Green Owl Intrinsic Value Fund (the Fund) with the goal of seeking long-term capital appreciation through high risk-adjusted returns. Relying on a fundamental, research-driven process, the Fund strives to build a diversified portfolio of equity investments through the purchase of competitively advantaged and financially strong companies at prices substantially less than our estimate of their intrinsic values.
MARKET AND PERFORMANCE SUMMARY
The Fund increased in value by 5.82% during the first half of the fiscal year (November 1, 2013 through April 30, 2014), while our primary benchmark, the S&P 500, increased 8.36% over the same period. Admittedly, a poor showing on a relative basis. Fortunately, long-term outperformance is not predicated on outperforming the benchmark over every short-term interval along the way. Six months is simply not a meaningful period in this regard. Given that our investment orientation is more long-term in nature, this result is unsurprising and, frankly, not a cause for concern.
As a matter of fact, we would go so far as to argue that an acceptance of underperformance over very short periods is what allows for consistent outperformance over more meaningful periods. This may seem counterintuitive, but attempting to outperform over short time periods means you are almost certainly basing your investment decisions on expectations of near-term stock price movements, which are largely unpredictable, rather than making decisions based on the ultimate value of the businesses underlying those stock prices.
For a concrete example of how we think about the trade-off between short-term and long-term performance, consider the activity surrounding our position in Hertz that took place towards the end of 2013. As part of the company’s third quarter earnings release, management lowered its earnings guidance for the full fiscal year by roughly 5% due to an expectation of weaker volumes in its U.S. airport segment, and the need to reduce excess capacity of its rental fleet. The excess capacity issues were widely known, and it did not surprise us that travel would be slightly impaired given the soft economy at the time. Our analysis indicated that these were short-term issues unlikely to impair longer-term earnings power. This meant our investment thesis was still intact: that Hertz Global Holdings (HTZ) should benefit from a more rational pricing environment, given industry consolidation. From our standpoint, the next quarter was irrelevant as we felt the positive structural changes occurring in the rental car industry were likely to play out over the next several years, and the valuation of Hertz did not reflect the earnings power these changes would produce. Other market participants thought otherwise, sending the shares down 15% in a single day.
With the discount to our estimate of Hertz’s intrinsic value now wider, our inclination was to buy more, which we did, making Hertz one of our ten largest positions. We weren’t under any delusions that increasing our stake in a company that just disappointed Wall Street would have any beneficial impact on our performance over the next few months. We did believe, however, that the company’s fundamentals would improve over the next two to three years, and our overall performance during this time period would be better off having a bigger stake in Hertz. By being more patient as to the ultimate outcome we accepted the trade-off between short and long-term performance.
As indicated, there is nothing magical – or even informative – in looking at performance over a six-month period. Randomness alone can produce just about any outcome in the short run. For a broader perspective, the Fund has produced an annualized return of 22.23% since inception (December, 22, 2011), whereas the S&P 500 has returned 21.10% over the same period.
COMPANY UPDATES
Almost all of the quarter’s underperformance was due to a handful of stocks, which is not atypical. Except for times where correlation of investment returns among various stocks is extremely high (as it has been the past few years), a small group of stocks generally drives underperformance, as well as outperformance, over both short
1
and long time periods. As correlations continue to normalize lower (as they have in the past few months), the spread between our best performers and worst performers widens.
Detracting from performance, Bed Bath & Beyond (BBBY) (“Bed Bath”) and Coach (COH) both sold off on earnings-related fears, while General Motors (GM) declined primarily due to the announcement that it was recalling 1.6 million older model cars due to faulty ignition switches. As investors, our primary job is to match valuation with expectations, meaning we are trying to determine what expectations for earnings growth are priced into the current valuation. Secondarily, we need to determine whether recent negative news signifies a busted investment thesis, or whether it falls in the normal range of “things happen.”
Bed Bath has had the realm of the home goods space largely to itself since the bankruptcy and liquidation of its primary competitor, Linens ‘n Things, in late 2008. Recently, fears of online competition have focused investors on the possibility that Bed Bath is the next brick and mortar retailer to get “Amazon’d.” While we believe that Bed Bath’s management is among the best of the traditional merchants, it has taken longer than expected to build a significant online presence. Given the cash generative nature of Bed Bath’s operation, it has the ability to keep investing in this area. Regardless, at its current valuation of 11x earnings (excluding cash), we believe the risk of any major incursion by Amazon on Bed Bath’s market share is already reflected in the price.
Coach is also being assailed, not by online competition, but by a couple of fashion forward rivals, namely Michael Kors and Kate Spade. We don’t doubt the significance of the increased competition, but we believe Coach’s current valuation more than discounts these fears. We think Coach’s brand is much like the fabled tortoise, except Coach doesn’t necessarily have to win the race – it just needs to finish higher than where the current odds place it.
Regarding GM, we do not want to minimize the significance of the recall (especially in terms of human lives lost), but, purely from an investment standpoint, we believe we’ve seen this type of headline risk play out many times before. Whether it was Johnson & Johnson (JNJ) and the Tylenol poisonings in 1982 or the Coca-Cola (KO) recall in Belgium in 1999, scary headlines have a way of receding with the passage of time. If the brand is solid and the company handles the tragedy well, typically there is no long-term impact to sales and profits. GM has work to do to reclaim customer trust, but its new CEO, Mary Barra, seems up to the task.
In each of these cases, we believe our investment theses are intact and that the expectations priced in at current levels are far below what will likely happen over the next few years.
Top contributors to performance over the period were Berkshire Hathaway (BRK.B), DirecTV (DTV), Apple (AAPL), CVS Caremark (CVS), and Wells Fargo (WFC). While happy with the performance of these companies, it’s important to not get complacent. Just as we determine what expectations are priced into a stock price that has recently fallen, we apply the same thought process to companies experiencing positive expectation revisions. While the recent increase in prices has taken these companies closer to our intrinsic value estimates, we do not believe their valuations incorporate excessive growth expectations, and are content to continue to be holders.
PORTFOLIO ACTIVITY
Over the period, we initiated three new positions, added to six current positions, trimmed exposure to four, and sold out of three completely. Two of the three newly purchased securities are energy-related companies. Generally, we have had little exposure to this sector as many of its constituents’ fortunes are inextricably tied to the whims of the oil and natural gas markets. Since we have no expertise in determining intrinsic values of non-income producing assets, such as commodities, we have found it tough to have any degree of conviction when analyzing a specific company. While not immune to the vagaries of the oil market, we believe we have found two candidates that have many other characteristics that make them attractive investments.
2
BUYS
National Oilwell Varco (NOV)
Headquartered in Houston, Texas, National Oilwell Varco is a global manufacturer of diversified drilling and production equipment and provider of support services for the upstream oil and gas industry. In plain English, NOV provides equipment and services for oil and gas drillers. Rig technology, NOV’s largest segment at about 50% of revenues, manufactures, sells, and services complete systems used throughout the life of oil and gas wells, both onshore and offshore. Drilling rigs are often the most technically sophisticated and expensive investments of a drilling operation. NOV has built a reputation as the world’s leading rig manufacturer and is the market share leader in many categories.
The demand for NOV’s capital equipment is dependent on the capital expenditures of oil drillers and rig operators, as well as the aftermarket environment for replacement parts, spare parts, or service requests. As oil and gas discoveries have moved farther offshore, recovering these resources has become a more complex undertaking, which we believe will benefit a technology leader such as NOV. Furthermore, the company’s substantial geographic diversification will alleviate the inevitable lumpiness in regional demand. Trading at roughly 12x current year earnings, we believe downside is limited while the potential for upside is significant.
Ensco (ESV)
Ensco is a leading contractor of offshore drilling services to the global oil and gas industry. While NOV makes the rigs, Ensco purchases them and contracts with exploration companies to utilize them. The company owns and operates a fleet of 75 offshore drilling rigs (including eight under construction) with about half dedicated to deep water drilling and half that operate in shallow water. While we just stated above that we have no ability to predict future oil prices, we believe this stock, which is currently trading at only 8x current year earnings, will prove to be incredibly cheap as long as oil prices can stay above $80 per barrel (currently near $100). From a portfolio (hedge) standpoint, we take additional comfort from the fact that many of our other holdings (i.e. consumer-related) should reap substantial benefits if oil does break below $80 for an extended period of time. Ensco is also coming close to the end of a hefty investment cycle, which should increase free cash flow in coming years.
Ocwen Financial (OCN)
Ocwen is the leading servicer of subprime and Alt-A mortgages originated prior to the financial crisis and the 4th largest servicer of mortgage loans overall. Mortgage servicing consists of collecting payments from borrowers, transmitting those payments to note holders, and servicing delinquent loans by pursuing either a loan modification or foreclosure. The company has significantly expanded its portfolio of mortgage servicing rights over the last couple years in primarily two ways: through acquisitions of mortgage servicing rights from large financial institutions that are looking to scale back, or completely exit the business due to increased regulatory scrutiny and higher capital requirements; and a recent venture of its own into originating and servicing prime loans.
Ocwen is not exposed to the credit risk of the loans it services except that a delinquent loan is no longer paying the servicing fee (which is built into the mortgage rate). However, the company has established a strong track record of modifying delinquent loans with a lower rate of re-default than the rest of the industry. This, along with its onshore/offshore labor model, has provided it with a cost advantage over its competitors.
The acquisition of servicing rights by Ocwen and other non-bank servicers has drawn scrutiny from regulators who are concerned about the firms’ ability to handle the increased volume. In February, the New York Superintendent of Financial Services halted a deal in which Wells Fargo & Co. agreed to sell to Ocwen the rights to service $39 billion of loans. Our belief is that as regulators gain comfort that Ocwen’s focused service model is likely to produce better overall outcomes for delinquent borrowers, Ocwen will ultimately be allowed to continue growing its servicing portfolio. In the meantime, further growth from originations and reductions in delinquent loans in its existing servicing portfolio holds the potential for substantial upside from the current price with limited downside (if you find the company name a little odd, try reading it backwards).
3
ADDITIONS
We used the price volatility during the quarter to add to the following positions: Bed, Bath & Beyond (BBBY), Boeing (BA), Carmax (KMX), General Motors (GM), JP Morgan (JPM) and Target (TGT).
SALES
In the category of busted investment theses, we sold our entire position of International Business Machines (IBM). Our belief had been that revenue growth had only temporarily stalled and that management’s continued return of capital in the form of buybacks would see it through this tough period. We’re not sure why we were so sanguine on the return of top line growth. It now seems painfully obvious that IBM faces too many headwinds which are longer-term in nature. Principally, the company seems to have missed its opportunity to be a leader in cloud hosting and storage, having ceded the advantage to Amazon and Google. The shift to the cloud not only hurts IBM’s hardware sales but negatively affects its software and services revenues. Even a large investment by IBM at this point would be fruitless as Amazon and Google are content to work on very low margins, thus making an adequate return on investment a dubious prospect. Fortunately, the price at which we bought shares for our clients created such a substantial margin of safety that even though our investment thesis failed, we did not substantially impair invested capital.
We also exited Johnson & Johnson and Trinity Industries (TRN) for good reasons in that they reached our fair value estimates.
TRIMS
In order to fund the purchase of Ocwen shares without increasing our overall exposure to the finance sector, we trimmed back two other financial services holdings, Franklin Resources (BEN) and Goldman Sachs (GS). In our opinion, though not overvalued, both of these longer-term holdings have less potential upside than Ocwen. We also trimmed our exposure slightly to United Parcel Service (UPS) and Walgreen (WAG) as strong price performance took each closer to our targets.
Our current portfolio contains proven franchises and industry leaders managed by capable operators and capital allocators. While the strong performance of the market in recent years has made it difficult to find new purchases that meet our requisite discount for purchase, we have approximately 5% in available cash to deploy as opportunities emerge either via market dislocations or company-specific disappointments. Our own capital is invested alongside yours and we believe we have a strong process in place to deliver strong long-term relative returns.
4
INVESTMENT RESULTS – (Unaudited)
Total Returns*
(For the periods ended April 30, 2014)
| Average Annual Returns | ||||||||||||
| Six Months | One Year | Since Inception (December 22, 2011) (a) | ||||||||||
Green Owl Intrinsic Value Fund | 5.82 | % | 16.63 | % | 22.23 | % | ||||||
S&P 500® Index** | 8.36 | % | 20.44 | % | 21.10 | % | ||||||
Total annual operating expenses, as disclosed in the Fund’s prospectus dated February 28, 2014, were 1.54% of average daily net assets (1.12% after fee waivers/expense reimbursements by the adviser). Effective November 1, 2013, the adviser contractually agreed to waive or limit its fees and to assume other expenses of the Fund until February 28, 2015, so that the Total Annual Operating Expenses do not exceed 1.10%. This operating expense limitation does not apply to interest, taxes, brokerage commissions, other expenditures which are capitalized in accordance with generally accepted accounting principles, other extraordinary expenses not incurred in the ordinary course of the Fund’s business, dividend expense on short sales, expenses incurred under a Rule 12b-1 plan of distribution, “acquired fund fees and expenses,” and expenses that the Fund has incurred but did not actually pay because of an expense offset arrangement. Prior to November 1, 2013, the expense cap was 1.40%.
The performance quoted represents past performance, which does not guarantee future results. The investment return and principal value of an investment will fluctuate so that an investor’s shares, when redeemed, may be worth more or less than their original cost. The returns shown do not reflect deduction of taxes that a shareholder would pay on Fund distributions or the redemption of Fund shares. Current performance of the Fund may be lower or higher than the performance quoted. The Fund’s investment objectives, risks, charges and expenses must be considered carefully before investing. Performance data current to the most recent month end may be obtained by calling 1-888-695-3729.
| (a) | The Fund commenced operations on December 22, 2011. However, the Fund did not invest in long-term securities towards the investment objective until December 28, 2011. December 28, 2011 is the performance calculation inception date. |
| * | Return figures reflect any change in price per share and assume the reinvestment of all distributions. |
| ** | The S&P 500® Index is a widely recognized unmanaged index of equity securities and is representative of a broader domestic equity market and range of securities than is found in the Fund’s portfolio. Individuals cannot invest directly in the Index; however, an individual can invest in exchange traded funds or other investment vehicles that attempt to track the performance of a benchmark index. |
The Fund’s investment objectives, strategies, risks, charges and expenses must be considered carefully before investing. The prospectus contains this and other important information about the Fund and may be obtained by calling the same number as above. Please read it carefully before investing.
The Fund is distributed by Unified Financial Securities, Inc., member FINRA.
5
Comparison of the Growth of a $10,000 Investment in the Green Owl Intrinsic Value
Fund and the S&P 500® Index (Unaudited)
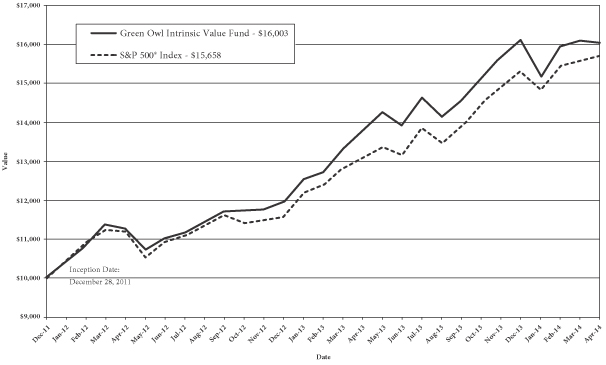
The Fund commenced operations on December 22, 2011. However, the Fund did not invest in long-term securities towards the investment objective until December 28, 2011. December 28, 2011 is the performance calculation inception date. The chart above assumes an initial investment of $10,000 made on December 28, 2011 and held through April 30, 2014. The S&P 500® Index is a widely recognized unmanaged index of equity securities and is representative of a broader domestic equity market and range of securities than is found in the Fund’s portfolio. Individuals cannot invest directly in the Index; however, an individual can invest in exchange traded funds or other investment vehicles that attempt to track the performance of a benchmark index. THE FUND’S RETURN REPRESENTS PAST PERFORMANCE AND DOES NOT GUARANTEE FUTURE RESULTS. The returns shown do not reflect deduction of taxes that a shareholder would pay on Fund distributions or the redemption of Fund shares. Investment returns and principal values will fluctuate so that your shares, when redeemed, may be worth more or less than their original purchase price.
Current performance may be lower or higher than the performance data quoted. For more information on the Fund, and to obtain performance data current to the most recent month end or to request a prospectus, please call 1-888-695-3729. You should carefully consider the investment objectives, potential risks, management fees, and charges and expenses of the Fund before investing. The Fund’s prospectus contains this and other information about the Fund, and should be read carefully before investing.
The Fund is distributed by Unified Financial Securities, Inc., member FINRA.
6
FUND HOLDINGS – (Unaudited)
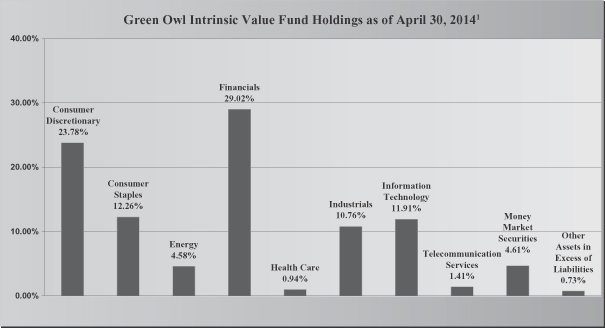
| 1As | a percentage of net assets. |
The investment objective of the Green Owl Intrinsic Value Fund is long-term capital appreciation.
Availability of Portfolio Schedule – (Unaudited)
The Fund files its complete schedule of portfolio holdings with the Securities and Exchange Commission (“SEC”) for the first and third quarters of each fiscal year on Form N-Q. The Fund’s Forms N-Q are available at the SEC’s website at www.sec.gov. The Fund’s Forms N-Q may be reviewed and copied at the SEC’s Public Reference Room in Washington DC. Information on the operation of the Public Reference Room may be obtained by calling 1-800-SEC-0330.
Summary of Fund’s Expenses – (Unaudited)
As a shareholder of the Fund, you incur ongoing costs, including management fees and other Fund expenses. This example is intended to help you understand your ongoing costs (in dollars) of investing in the Fund and to compare these costs with the ongoing costs of investing in other mutual funds.
The example is based on an investment of $1,000 invested at the beginning and held for the entire period from November 1, 2013 to April 30, 2014.
7
Actual Expenses
The first line of the table below provides information about actual account values and actual expenses. You may use the information in this line, together with the amount you invested, to estimate the expenses that you paid over the period. Simply divide your account value by $1,000 (for example, an $8,600 account value divided by $1,000 = $8.60), then multiply the result by the number in the first line under the heading entitled “Expenses Paid During the Period” to estimate the expenses you paid on your account during this period.
Hypothetical Example for Comparison Purposes
The second line of the table below provides information about hypothetical account values and hypothetical expenses based on the Fund’s actual expense ratio and an assumed rate of return of 5% per year before expenses, which is not the Fund’s actual return. The hypothetical account values and expenses may not be used to estimate the actual ending account balance or expenses you paid for the period. You may use this information to compare the ongoing costs of investing in the Fund and other funds. To do so, compare this 5% hypothetical example with the 5% hypothetical examples that appear in the shareholder reports of the other funds.
Please note that the expenses shown in the table are meant to highlight your ongoing costs only. Therefore, the second line of the table below is useful in comparing ongoing costs only and will not help you determine the relative costs of owning different funds.
| Green Owl Intrinsic Value Fund | Beginning November 1, 2013 | Ending Account Value April 30, 2014 | Expenses Paid November 1, 2013 – | |||||||||
Actual | $ | 1,000.00 | $ | 1,058.20 | $ | 5.66 | ||||||
Hypothetical** | $ | 1,000.00 | $ | 1,019.29 | $ | 5.56 | ||||||
| * | Expenses are equal to the Fund’s annualized expense ratio of 1.11%, multiplied by the average account value over the period, multiplied by 181/365 (to reflect the one-half year period). |
| ** | Assumes a 5% return before expenses. |
8
GREEN OWL INTRINSIC VALUE FUND
SCHEDULE OF INVESTMENTS
April 30, 2014 (Unaudited)
| Common Stocks – 94.66% | Shares | Fair Value | ||||||
Consumer Discretionary – 23.78% | ||||||||
Bed Bath & Beyond, Inc. * | 26,265 | $ | 1,631,844 | |||||
CarMax, Inc. * | 30,240 | 1,323,907 | ||||||
Coach, Inc. | 24,920 | 1,112,678 | ||||||
DIRECTV – Class A * | 19,650 | 1,524,840 | ||||||
General Motors Co. | 48,950 | 1,687,796 | ||||||
Kohl’s Corp. | 37,500 | 2,054,625 | ||||||
Nordstrom, Inc. | 3,600 | 220,608 | ||||||
Target Corp. | 34,465 | 2,128,214 | ||||||
Walt Disney Co. / The | 17,505 | 1,388,847 | ||||||
Weight Watchers International, Inc. | 6,045 | 119,691 | ||||||
|
| |||||||
| 13,193,050 | ||||||||
|
| |||||||
Consumer Staples – 12.26% |
| |||||||
Coca-Cola Co./The | 28,170 | 1,149,054 | ||||||
CVS Caremark Corp. | 25,890 | 1,882,721 | ||||||
Walgreen Co. | 27,815 | 1,888,639 | ||||||
Wal-Mart Stores, Inc. | 23,565 | 1,878,366 | ||||||
|
| |||||||
| 6,798,780 | ||||||||
|
| |||||||
Energy – 4.58% |
| |||||||
Ensco PLC – Class A | 26,500 | 1,336,925 | ||||||
National Oilwell Varco, Inc. | 15,350 | 1,205,436 | ||||||
|
| |||||||
| 2,542,361 | ||||||||
|
| |||||||
Financials – 29.02% |
| |||||||
American Express Co. | 10,815 | 945,555 | ||||||
American International Group, Inc. | 32,250 | 1,713,443 | ||||||
Bank of America Corp. | 96,600 | 1,462,524 | ||||||
Bank of New York Mellon Corp. / The | 52,360 | 1,773,433 | ||||||
Berkshire Hathaway, Inc. – Class B * | 28,815 | 3,712,813 | ||||||
Franklin Resources, Inc. | 10,210 | 534,494 | ||||||
Goldman Sachs Group, Inc./The | 600 | 95,892 | ||||||
JPMorgan Chase & Co. | 34,000 | 1,903,320 | ||||||
Leucadia National Corp. | 44,735 | 1,141,637 | ||||||
Ocwen Financial Corp. * | 26,560 | 1,006,624 | ||||||
Wells Fargo & Co. | 36,350 | 1,804,414 | ||||||
|
| |||||||
| 16,094,149 | ||||||||
|
| |||||||
Health Care – 0.94% |
| |||||||
Abbott Laboratories | 13,430 | 520,278 | ||||||
|
| |||||||
Industrials – 10.76% |
| |||||||
Boeing Co./The | 12,690 | 1,637,264 | ||||||
Expeditors International of Washington, Inc. | 25,605 | 1,055,950 | ||||||
See accompanying notes which are an integral part of these financial statements.
9
GREEN OWL INTRINSIC VALUE FUND
SCHEDULE OF INVESTMENTS – (continued)
April 30, 2014 (Unaudited)
| Common Stocks – 94.66% – continued | Shares | Fair Value | ||||||
Hertz Global Holdings, Inc. * | 71,929 | $ | 2,047,819 | |||||
Robert Half International, Inc. | 13,500 | 604,800 | ||||||
United Parcel Service, Inc. (UPS) – Class B | 6,320 | 622,520 | ||||||
|
| |||||||
| 5,968,353 | ||||||||
|
| |||||||
Information Technology – 11.91% |
| |||||||
Accenture PLC – Class A | 18,315 | 1,469,229 | ||||||
Apple, Inc. | 4,360 | 2,572,792 | ||||||
Corning, Inc. | 59,340 | 1,240,799 | ||||||
Google, Inc. – Class A * | 1,073 | 573,926 | ||||||
Google, Inc. * | 1,423 | 749,437 | ||||||
|
| |||||||
| 6,606,183 | ||||||||
|
| |||||||
Telecommunication Services – 1.41% |
| |||||||
Verizon Communications, Inc. | 6,233 | 291,268 | ||||||
Vodafone Group PLC ADR | 12,927 | 490,709 | ||||||
|
| |||||||
| 781,977 | ||||||||
|
| |||||||
TOTAL COMMON STOCKS (Cost $42,029,990) | 52,505,131 | |||||||
|
| |||||||
MONEY MARKET SECURITIES – 4.61% | ||||||||
Federated Treasury Obligations Fund – Service Shares, 0.01% (a) | 2,555,230 | 2,555,230 | ||||||
|
| |||||||
TOTAL MONEY MARKET SECURITIES (Cost $2,555,230) | 2,555,230 | |||||||
|
| |||||||
TOTAL INVESTMENTS – 99.27% (Cost $44,585,220) | $ | 55,060,361 | ||||||
|
| |||||||
| Other Assets in Excess of Liabilities – 0.73% | 404,405 | |||||||
|
| |||||||
| TOTAL NET ASSETS – 100.00% | $ | 55,464,766 | ||||||
|
| |||||||
| (a) | Rate disclosed is the seven day yield as of April 30, 2014. |
| * | Non-income producing security. |
ADR – American Depositary Receipt
See accompanying notes which are an integral part of these financial statements.
10
GREEN OWL INTRINSIC VALUE FUND
STATEMENT OF ASSETS AND LIABILITIES
April 30, 2014 (Unaudited)
Assets | ||||
Investments in securities at fair value (cost $44,585,220) | $ | 55,060,361 | ||
Receivable for fund shares sold | 20,557 | |||
Receivable for investments sold | 622,082 | |||
Dividends receivable | 41,799 | |||
Interest receivable | 17 | |||
Prepaid expenses | 19,703 | |||
|
| |||
Total Assets | 55,764,519 | |||
|
| |||
Liabilities | ||||
Payable for fund shares redeemed | 3,056 | |||
Payable for investments purchased | 240,174 | |||
Payable to Adviser | 32,141 | |||
Payable to administrator, fund accountant, and transfer agent | 7,034 | |||
Payable to custodian | 3,181 | |||
Payable to trustees | 642 | |||
Other accrued expenses | 13,525 | |||
|
| |||
Total Liabilities | 299,753 | |||
|
| |||
Net Assets | $ | 55,464,766 | ||
|
| |||
Net Assets consist of: | ||||
Paid-in capital | $ | 43,208,875 | ||
Accumulated undistributed net investment income | 471,749 | |||
Accumulated undistributed net realized gains from investments | 1,309,001 | |||
Net unrealized appreciation on investments | 10,475,141 | |||
|
| |||
Net Assets | $ | 55,464,766 | ||
|
| |||
Shares outstanding | 3,630,651 | |||
|
| |||
Net asset value, offering and redemption price per share | $ | 15.28 | ||
|
| |||
See accompanying notes which are an integral part of these financial statements.
11
GREEN OWL INTRINSIC VALUE FUND
STATEMENT OF OPERATIONS
For the six months ended April 30, 2014 (Unaudited)
Investment Income | ||||
Dividend income | $ | 831,898 | ||
Interest income | 51 | |||
|
| |||
Total investment income | 831,949 | |||
|
| |||
Expenses | ||||
Investment Adviser | 255,195 | |||
Administration | 20,488 | |||
Fund accounting | 12,397 | |||
Transfer agent | 19,119 | |||
Legal | 7,969 | |||
Custodian | 5,780 | |||
Audit | 7,439 | |||
Trustee | 4,045 | |||
Miscellaneous | 18,266 | |||
|
| |||
Total expenses | 350,698 | |||
|
| |||
Fees waived and reimbursed by Adviser | (68,143 | ) | ||
|
| |||
Net operating expenses | 282,555 | |||
|
| |||
Net investment income | 549,394 | |||
|
| |||
Net Realized and Unrealized Gain on Investments |
| |||
Net realized gains on investment securities transactions | 1,266,687 | |||
Net realized gains on option transactions | 42,321 | |||
Net change in unrealized appreciation on investment securities | 959,948 | |||
Net change in unrealized depreciation on option contracts | (28,291 | ) | ||
|
| |||
Net realized and unrealized gain on investments | 2,240,665 | |||
|
| |||
Net increase in net assets resulting from operations | $ | 2,790,059 | ||
|
| |||
See accompanying notes which are an integral part of these financial statements.
12
GREEN OWL INTRINSIC VALUE FUND
STATEMENTS OF CHANGES IN NET ASSETS
| For the Six Months Ended April 30, 2014 (Unaudited) | For the Year Ended October 31, 2013 | |||||||
Increase in Net Assets due to: | ||||||||
Operations | ||||||||
Net investment income | $ | 549,394 | $ | 48,093 | ||||
Net realized gain on investment transactions and option transactions | 1,309,008 | 1,708,484 | ||||||
Net change in unrealized appreciation of investment securities and option transactions | 931,657 | 7,163,572 | ||||||
|
|
|
| |||||
Net increase in net assets resulting from operations | 2,790,059 | 8,920,149 | ||||||
|
|
|
| |||||
Distributions | ||||||||
From net investment income | (84,105 | ) | (104,736 | ) | ||||
From net realized gains | (1,708,485 | ) | (132,334 | ) | ||||
|
|
|
| |||||
Total distributions | (1,792,590 | ) | (237,070 | ) | ||||
|
|
|
| |||||
Capital Transactions | ||||||||
Proceeds from shares sold | 9,277,860 | 18,027,338 | ||||||
Reinvestment of distributions | 1,696,716 | 233,845 | ||||||
Amount paid for shares redeemed | (3,635,820 | ) | (4,571,936 | ) | ||||
|
|
|
| |||||
Net increase in net assets resulting from capital transactions | 7,338,756 | 13,689,247 | ||||||
|
|
|
| |||||
Total Increase in Net Assets | 8,336,225 | 22,372,326 | ||||||
|
|
|
| |||||
Net Assets | ||||||||
Beginning of period | 47,128,541 | 24,756,215 | ||||||
|
|
|
| |||||
End of period | $ | 55,464,766 | $ | 47,128,541 | ||||
|
|
|
| |||||
Accumulated undistributed net investment income included in net assets at end of period | $ | 471,749 | $ | 6,460 | ||||
|
|
|
| |||||
Share Transactions | ||||||||
Shares sold | 611,842 | 1,334,642 | ||||||
Shares issued in reinvestment of distributions | 114,953 | 19,868 | ||||||
Shares redeemed | (239,336 | ) | (333,405 | ) | ||||
|
|
|
| |||||
Net increase in shares | 487,459 | 1,021,105 | ||||||
|
|
|
| |||||
See accompanying notes which are an integral part of these financial statements.
13
GREEN OWL INTRINSIC VALUE FUND
FINANCIAL HIGHLIGHTS
(For a share outstanding during each period)
| For the Six Months Ended April 30, 2014 (Unaudited) | For the Year Ended October 31, 2013 | For the Period Ended October 31, 2012(a) | ||||||||||
Selected Per Share Data: | ||||||||||||
Net asset value, beginning of period | $ | 14.99 | $ | 11.67 | $ | 10.00 | ||||||
|
|
|
|
|
| |||||||
Income from investment operations: | ||||||||||||
Net investment income | 0.15 | 0.02 | 0.02 | |||||||||
Net realized and unrealized gain on investments | 0.71 | 3.41 | 1.65 | |||||||||
|
|
|
|
|
| |||||||
Total from investment operations | 0.86 | 3.43 | 1.67 | |||||||||
|
|
|
|
|
| |||||||
Less distributions to shareholders from: | ||||||||||||
Net investment income | (0.03 | ) | (0.05 | ) | – | |||||||
Net realized gains | (0.54 | ) | (0.06 | ) | – | |||||||
|
|
|
|
|
| |||||||
Total distributions | (0.57 | ) | (0.11 | ) | – | |||||||
|
|
|
|
|
| |||||||
Net asset value, end of period | $ | 15.28 | $ | 14.99 | $ | 11.67 | ||||||
|
|
|
|
|
| |||||||
Total Return (b) | 5.82 | %(c) | 29.59 | % | 16.70 | %(c) | ||||||
Ratios and Supplemental Data: | ||||||||||||
Net assets, end of period (000) | $ | 55,465 | $ | 47,129 | $ | 24,756 | ||||||
Ratio of net expenses to average net assets | 1.11 | %(d)(e) | 1.40 | %(e) | 1.41 | %(d)(e) | ||||||
Ratio of expenses to average net assets before waiver and reimbursement | 1.37 | %(d)(e) | 1.52 | %(e) | 2.11 | %(d)(e) | ||||||
Ratio of net investment income to average net assets | 2.15 | %(d) | 0.14 | % | 0.26 | %(d) | ||||||
Portfolio turnover rate | 16 | %(c) | 20 | % | 11 | %(c) | ||||||
| (a) | For the period December 22, 2011 (commencement of operations) to October 31, 2012. |
| (b) | Total return in the above table represents the rate that the investor would have earned or lost on an investment in the Fund, assuming reinvestment of distributions. |
| (c) | Not annualized. |
| (d) | Annualized |
| (e) | Includes 0.01%, less than 0.005% and 0.01% for line of credit fees for 2012, 2013 and 2014, respectively. |
See accompanying notes which are an integral part of these financial statements.
14
GREEN OWL INTRINSIC VALUE FUND
NOTES TO THE FINANCIAL STATEMENTS
April 30, 2014 (Unaudited)
NOTE 1. ORGANIZATION
The Green Owl Intrinsic Value Fund (the “Fund”) is an open-end diversified series of the Valued Advisers Trust (the “Trust”). The Trust is a management investment company established under the laws of Delaware by an Agreement and Declaration of Trust dated June 13, 2008 (the “Trust Agreement”). The Trust Agreement permits the Trustees to issue an unlimited number of shares of beneficial interest of separate series without par value. The Fund is one of a series of funds authorized by the Trustees. The Fund’s investment adviser is Kovitz Investment Group, LLC (the “Adviser”). The investment objective of the Fund is to provide long-term capital appreciation.
NOTE 2. SIGNIFICANT ACCOUNTING POLICIES
The following is a summary of significant accounting policies followed by the Fund in the preparation of its financial statements. These polices are in conformity with generally accepted accounting principles in the United States of America (“GAAP”).
Securities Valuation – All investments in securities are recorded at their estimated fair value as described in Note 3.
Federal Income Taxes – The Fund makes no provision for federal income or excise tax. The Fund intends to qualify each year as a regulated investment company (“RIC”) under subchapter M of the Internal Revenue Code of 1986, as amended, by complying with the requirements applicable to RICs and by distributing substantially all of its taxable income. The Fund also intends to distribute sufficient net investment income and net capital gains, if any, so that it will not be subject to excise tax on undistributed income and gains. If the required amount of net investment income or gains is not distributed, the Fund could incur a tax expense.
As of and during the six months ended April 30, 2014, the Fund did not have a liability for any unrecognized tax benefits. The Fund recognizes interest and penalties, if any, related to unrecognized tax benefits as income tax expense in the Statement of Operations. During the year, the Fund did not incur any interest or penalties. The Fund is subject to examination by U.S. federal tax authorities for all tax years since inception.
Expenses – Expenses incurred by the Trust that do not relate to a specific fund of the Trust are allocated to the individual funds based on each fund’s relative net assets or other appropriate basis (as determined by the Board of Trustees).
Security Transactions and Related Income – The Fund follows industry practice and records security transactions on the trade date for financial reporting purposes. The First In, First Out method is used for determining gains or losses for financial statements and income tax purposes. Dividend income is recorded on the ex-dividend date and interest income is recorded on an accrual basis. Discounts and premiums on securities purchased are amortized or accreted using the effective interest method. Withholding taxes on foreign dividends have been provided for in accordance with the Fund’s understanding of the applicable country’s tax rules and rates. The ability of issuers of debt securities held by the Fund to meet their obligations may be affected by economic and political developments in a specific country or region.
Dividends and Distributions – The Fund intends to distribute substantially all of its net investment income, net realized long-term capital gains and its net realized short-term capital gains, if any, to its shareholders on at least an annual basis. Dividends to shareholders, which are determined in accordance with income tax regulations, are recorded on the ex-dividend date. The treatment for financial reporting purposes of distributions made to shareholders during the year from net investment income or net realized capital gains may differ from their
15
GREEN OWL INTRINSIC VALUE FUND
NOTES TO THE FINANCIAL STATEMENTS – (continued)
April 30, 2014 (Unaudited)
NOTE 2. SIGNIFICANT ACCOUNTING POLICIES – continued
ultimate treatment for federal income tax purposes. These differences are caused primarily by differences in the timing of the recognition of certain components of income, expense or realized capital gain for federal income tax purposes. Where such differences are permanent in nature, they are reclassified in the components of net assets based on their ultimate characterization for federal income tax purposes. Any such reclassifications will have no effect on net assets, results of operations or net asset values per share of the Fund. There were no such material reclassifications made as of April 30, 2014.
Writing Options – The Fund may write covered call options on equity securities or futures contracts that the Fund is eligible to purchase to extend a holding period to obtain long-term capital gain treatment, to earn premium income, to assure a definite price for a security it has considered selling, or to close out options previously purchased. The Fund may write covered call options if, immediately thereafter, not more than 30% of its net assets would be committed to such transactions. A call option gives the holder (buyer) the right to purchase a security or futures contract at a specified price (the exercise price) at any time until a certain date (the expiration date). A call option is “covered” if the Fund owns the underlying security subject to the call option at all times during the option period, or to the extent that some or all of the risk of the option has been offset by another option. When the Fund writes a covered call option, it maintains a segregated position within its account with the Custodian or as otherwise required by the rules of the exchange of the underlying security, cash or liquid portfolio securities in an amount not less than the exercise price at all times while the option is outstanding. See Note 4 for additional disclosures.
The Fund will receive a premium from writing a call option, which increases the Fund’s return in the event the option expires unexercised or is closed out at a profit. The amount of the premium will reflect, among other things, the relationship of the market price of the underlying security to the exercise price of the option and the remaining term of the option. However, there is no assurance that a closing transaction can be affected at a favorable price. During the option period, the covered call writer has, in return for the premium received, given up the opportunity for capital appreciation above the exercise price should the market price of the underlying security increase, but has retained the risk of loss should the price of the underlying security decline.
The Fund may write put options on equity securities and futures contracts that the Fund is eligible to purchase to earn premium income or to assure a definite price for a security if it is considering acquiring the security at a lower price than the current market price or to close out options previously purchased. The Fund may not write a put option if, immediately thereafter, more than 25% of its net assets would be committed to such transactions. A put option gives the holder of the option the right to sell, and the writer has the obligation to buy, the underlying security at the exercise price at any time during the option period. The operation of put options in other respects is substantially identical to that of call options. When the Fund writes a put option, it maintains a segregated position within its account with the Custodian, cash or liquid portfolio securities in an amount not less than the exercise price at all times while the put option is outstanding.
The Fund will receive a premium from writing a put option, which increases the Fund’s return in the event the option expires unexercised or is closed out at a profit. The amount of the premium will reflect, among other things, the relationship of the market price of the underlying security to the exercise price of the option and the remaining term of the option. The risks involved in writing put options include the risk that a closing transaction cannot be effected at a favorable price and the possibility that the price of the underlying security may fall below the exercise price, in which case the Fund may be required to purchase the underlying security at a higher price than the market price of the security at the time the option is exercised, resulting in a potential capital loss unless the security subsequently appreciates in value. During the six months ended April 30, 2014, the Fund utilized
16
GREEN OWL INTRINSIC VALUE FUND
NOTES TO THE FINANCIAL STATEMENTS – (continued)
April 30, 2014 (Unaudited)
NOTE 2. SIGNIFICANT ACCOUNTING POLICIES – continued
covered call options to extend the holding period to obtain long-term capital gain treatment and to take advantage of the option premium to garner a higher exit price than would have been available by immediately selling the stock.
NOTE 3. SECURITIES VALUATION AND FAIR VALUE MEASUREMENTS
Fair value is defined as the price that a Fund would receive upon selling an investment in an orderly transaction to an independent buyer in the principal or most advantageous market of the investment. GAAP established a three-tier hierarchy to maximize the use of observable market data and minimize the use of unobservable inputs and to establish classification of fair value measurements for disclosure purposes.
Inputs refer broadly to the assumptions that market participants would use in pricing the asset or liability, including assumptions about risk; for example, the risk inherent in a particular valuation technique used to measure fair value including items such as a pricing model and/or the risk inherent in the inputs to the valuation technique. Inputs may be observable or unobservable. Observable inputs are inputs that reflect the assumptions market participants would use in pricing the asset or liability developed based on market data obtained from sources independent of the reporting entity. Unobservable inputs are inputs that reflect the reporting entity’s own assumptions about the assumptions market participants would use in pricing the asset or liability developed based on the best information available in the circumstances.
Various inputs are used in determining the value of the Fund’s investments. These inputs are summarized in the three broad levels listed below.
| • | Level 1 – quoted prices in active markets for identical securities |
| • | Level 2 – other significant observable inputs (including, but not limited to, quoted prices for an identical security in an inactive market, quoted prices for similar securities, interest rates, prepayment speeds, credit risk, etc.) |
| • | Level 3 – significant unobservable inputs (including the Fund’s own assumptions in determining fair value of investments based on the best information available) |
The inputs used to measure fair value may fall into different levels of the fair value hierarchy. In such cases, for disclosure purposes, the level in the fair value hierarchy within which the fair value measurement falls in its entirety, is determined based on the lowest level input that is significant to the fair value measurement in its entirety.
Equity securities, including common stocks, are generally valued by using market quotations, but may be valued on the basis of prices furnished by a pricing service when the Fund believes such prices more accurately reflect the fair value of such securities. Securities that are traded on any stock exchange are generally valued by the pricing service at the last quoted sale price. Lacking a last sale price, an exchange traded security is generally valued by the pricing service at its last bid price. Securities traded in the NASDAQ over-the-counter market are generally valued by the pricing service at the NASDAQ Official Closing Price. When using the market quotations or close prices provided by the pricing service and when the market is considered active, the security will be classified as a Level 1 security. Sometimes, an equity security owned by the Fund will be valued by the pricing service with factors other than market quotations or when the market is considered inactive. When this happens, the security will be classified as a Level 2 security. When market quotations are not readily available,
17
GREEN OWL INTRINSIC VALUE FUND
NOTES TO THE FINANCIAL STATEMENTS – (continued)
April 30, 2014 (Unaudited)
NOTE 3. SECURITIES VALUATION AND FAIR VALUE MEASUREMENTS – continued
when the Fund determines that the market quotation or the price provided by the pricing service does not accurately reflect the current fair value, or when restricted or illiquid securities are being valued, such securities are valued as determined in good faith by the Fund, in conformity with guidelines adopted by and subject to review by the Board. These securities may be categorized as Level 3 securities.
Investments in open-end mutual funds, including money market mutual funds, are generally priced at the ending net asset value (NAV) provided by the service agent of the funds. These securities are categorized as Level 1 securities.
Written option contracts that the Fund invests in are generally traded on an exchange. The options in which the Fund invests are generally valued at the last trade price as provided by a pricing service. If the last sale price is not available, the options will be valued at the mean of the last bid and ask prices. The options will generally be categorized as Level 1 securities. If the Fund decides that a price provided by the pricing service does not accurately reflect the fair value of the securities, when prices are not readily available from a pricing service, or when restricted or illiquid securities are being valued, securities are valued at fair value as determined in good faith by the Fund, in conformity with guidelines adopted by and subject to review of the Board. These securities may be categorized as Level 3 securities.
Fixed income securities, when valued using market quotations in an active market, will be categorized as Level 1 securities. However, they may be valued on the basis of prices furnished by a pricing service when the Fund believes such prices more accurately reflect the fair value of such securities. A pricing service uses various inputs and techniques, which include broker-dealer quotations, like trading levels, recently executed transactions in securities of the issuer or comparable issuers, and option adjusted spread models that include base curve and spread curve inputs. Adjustments to individual bonds can be applied to recognize trading differences compared to other bonds issued by the same issuer. The broker-dealer quotations received are supported by credit analysis of the issuer that takes into consideration credit quality assessments, daily trading activity, and the activity of the underlying equities, listed bonds and sector-specific trends. To the extent that these inputs are observable, the fixed income securities are categorized as Level 2 securities. If the Fund decides that a price provided by the pricing service does not accurately reflect the fair value of the securities, when prices are not readily available from a pricing service, or when restricted or illiquid securities are being valued, securities are valued at fair value as determined in good faith by the Fund, in conformity with guidelines adopted by and subject to review of the Board. These securities will be categorized as Level 3 securities.
Short-term investments in fixed income securities, (those with maturities of less than 60 days when acquired, or which subsequently are within 60 days of maturity), are valued by using the amortized cost method of valuation, which the Board has determined represents fair value. These securities will be classified as Level 2 securities.
In accordance with the Trust’s good faith pricing guidelines, the Fund is required to consider all appropriate factors relevant to the value of securities for which it has determined other pricing sources are not available or reliable as described above. No single standard exists for determining fair value, because fair value depends upon the circumstances of each individual case. As a general principle, the current fair value of an issue of securities being valued by the Fund would appear to be the amount which the owner might reasonably expect to receive for them upon their current sale. Methods which are in accordance with this principle may, for example, be based on (i) a multiple of earnings; (ii) a discount from market of a similar freely traded security (including a derivative security or a basket of securities traded on other markets, exchanges or among dealers); or (iii) yield to maturity with respect to debt issues, or a combination of these and other methods. Good faith pricing is permitted if, in the
18
GREEN OWL INTRINSIC VALUE FUND
NOTES TO THE FINANCIAL STATEMENTS – (continued)
April 30, 2014 (Unaudited)
NOTE 3. SECURITIES VALUATION AND FAIR VALUE MEASUREMENTS – continued
Fund’s opinion, the validity of market quotations appears to be questionable based on factors such as evidence of a thin market in the security based on a small number of quotations, a significant event occurs after the close of a market but before a Fund’s NAV calculation that may affect a security’s value, or the Fund is aware of any other data that calls into question the reliability of market quotations. Good faith pricing may also be used in instances when the bonds the Fund invests in may default or otherwise cease to have market quotations readily available. Any fair value pricing done outside the Fund’s approved pricing methods must be approved by the Pricing Committee of the Board.
The following is a summary of the inputs used to value the Fund’s investments as of April 30, 2014:
| Valuation Inputs | ||||||||||||||||
| Assets | Level 1 – Quoted Prices in | Level 2 – Other Significant Observable Inputs | Level 3 – Significant Unobservable Inputs | Total | ||||||||||||
Common Stocks* | $ | 52,505,131 | $ | – | $ | – | $ | 52,505,131 | ||||||||
Money Market Securities | 2,555,230 | – | – | 2,555,230 | ||||||||||||
Total | $ | 55,060,361 | $ | – | $ | – | $ | 55,060,361 | ||||||||
* Refer to the Schedule of Investments for industry classifications.
The Fund did not hold any investments at any time during the reporting period in which significant unobservable inputs were used in determining fair value; therefore, no reconciliation of Level 3 securities is included for this reporting period. The Trust recognizes transfers between fair value hierarchy levels at the reporting period end. There were no transfers between any Levels for the six months ended April 30, 2014.
NOTE 4. DERIVATIVE TRANSACTIONS
Call options written are presented separately on the Statement of Assets and Liabilities as a liability at fair value and on the Statement of Operations under net realized gain on option transactions and change in unrealized appreciation on option contracts, respectively. As of April 30, 2014, there were no open written call options outstanding.
For the six months ended April 30, 2014:
| Derivatives | Location of Gain (Loss) on Derivatives on Statement of Operations | Realized Gain (Loss) on Derivatives | Change in Unrealized Appreciation (Depreciation) on Derivatives | |||||||
Equity Risk: | ||||||||||
Written Call Options | Net realized and unrealized gain on option contracts | $ | 42,321 | $ | (28,291) | |||||
19
GREEN OWL INTRINSIC VALUE FUND
NOTES TO THE FINANCIAL STATEMENTS – (continued)
April 30, 2014 (Unaudited)
NOTE 4. DERIVATIVE TRANSACTIONS – continued
Transactions in written options by the Fund during the six months ended April 30, 2014, were as follows:
| Number of Contracts | Premiums Received | |||||||
Options outstanding at October 31, 2013 | 122 | $ | 42,321 | |||||
Options expired | (122 | ) | (42,321 | ) | ||||
Options outstanding at April 30, 2014 | – | $ | – | |||||
NOTE 5. ADVISER FEES AND OTHER TRANSACTIONS
Under the terms of the management agreement, on behalf of the Fund (the “Agreement”), the Adviser manages the Fund’s investments subject to approval by the Trustees. As compensation for its management services, the Fund is obligated to pay the Adviser a fee computed and accrued daily and paid monthly at an annual rate of 1.00% of the average daily net assets of the Fund. For the six months ended April 30, 2014, the Adviser earned a fee of $255,195 from the Fund before the reimbursement described below. At April 30, 2014, the Fund owed the Adviser $32,141.
Effective November 1, 2013, the Adviser has contractually agreed to waive its management fee and/or reimburse expenses so that total annual fund operating expenses, excluding interest, taxes, brokerage commissions, other expenditures which are capitalized in accordance with GAAP, other extraordinary expenses not incurred in the ordinary course of the Fund’s business, dividend expense on short sales, and expenses that the Fund has incurred but did not actually pay because of an expense offset arrangement, if applicable, incurred by the Fund in any fiscal year, do not exceed 1.10% of the Fund’s average daily net assets through February 28, 2015. The operating expense limitation also excludes any fees and expenses of acquired funds. Prior to November 1, 2013, the expense cap was 1.40%
For the six months ended April 30, 2014, expenses totaling $68,143 were waived or reimbursed by the Adviser. Each waiver or reimbursement by the Adviser with respect to the Fund is subject to repayment by the Fund within the three fiscal years following the fiscal year in which that particular waiver or reimbursement occurred, provided that the Fund is able to make the repayment without exceeding the expense limitation in effect at the time of the waiver and any expense limitation in place at the time of repayment.
The amount subject to repayment by the Fund pursuant to the aforementioned conditions are as follows:
Amount | Recoverable through October 31, | |||
$ 115,029 | 2015 | |||
40,437 | 2016 | |||
68,143 | 2017 | |||
The Trust retains Huntington Asset Services, Inc. (“HASI”) to manage the Fund’s business affairs and provide the Fund with administrative services, including all regulatory reporting and necessary office equipment and personnel. For the six months ended April 30, 2014, HASI earned fees of $19,002 for administrative services provided to the Fund. At April 30, 2014, HASI was owed $2,204 from the Fund for administrative services. Certain officers and one Trustee of the Trust are members of management and/or employees of HASI. HASI is a wholly-owned subsidiary of Huntington Bancshares, Inc., the parent company of Unified Financial Securities, Inc. (the “Distributor”) and Huntington National Bank, the custodian of the Fund’s investments (the “Custodian”). For the six months ended April 30, 2014, the Custodian earned fees of $5,780 for custody services provided to the Fund. At April 30, 2014, the Custodian was owed $3,181 from the Fund for custody services.
20
GREEN OWL INTRINSIC VALUE FUND
NOTES TO THE FINANCIAL STATEMENTS – (continued)
April 30, 2014 (Unaudited)
NOTE 5. ADVISER FEES AND OTHER TRANSACTIONS – continued
The Trust also retains HASI to act as the Fund’s transfer agent and to provide fund accounting services. For the six months ended April 30, 2014, HASI earned fees of $19,119 for transfer agent services to the Fund. At April 30, 2014, the Fund owed HASI $2,850 for transfer agent services. For the six months ended April 30, 2014, HASI earned fees of $12,397 from the Fund for fund accounting services. At April 30, 2014, HASI was owed $1,980 from the Fund for fund accounting services.
During the six months ended April 30, 2014, the Fund paid $3,581 to Kovitz Securities, LLC, an affiliate of the Adviser, on the execution of purchases and sales of the Fund’s portfolio investments.
Unified Financial Securities, Inc. (the “Distributor”) acts as the principal underwriter of the Fund’s shares. There were no payments made by the Fund to the Distributor during the six months ended April 30, 2014. An officer of the Trust is an officer of the Distributor and such person may be deemed to be an affiliate of the Distributor.
NOTE 6. LINE OF CREDIT
The Fund participates in a short-term credit agreement (“Line of Credit”) with Huntington National Bank (“Huntington”). Under the terms of the agreement, the Fund may borrow the lesser of $1,000,000 or 5% of the Fund’s daily market value at an interest rate of LIBOR plus 150 basis points. The purpose of the agreement is to meet temporary or emergency cash needs, including redemption requests that might otherwise require the untimely disposition of securities. As of April 30, 2014, the Fund had no outstanding borrowings under this Line of Credit.
| Average Daily Loan Balance | Weighted Average Interest Rate | Number of Days Outstanding* | Interest Expense Incurred | Maximum Loan Outstanding | ||||||||||||
$ 370,674 | 1.67 | % | 5 | $ | 69 | $ | 370,674 | |||||||||
| * | Number of Days Outstanding represents the total days during the six months ended April 30, 2014 that the Fund utilized the Line of Credit. |
NOTE 7. INVESTMENTS
For the six months ended April 30, 2014, purchases and sales of investment securities, other than short-term investments and short-term U.S. government obligations, were as follows:
Purchases | ||||
U.S. Government Obligations | $ | – | ||
Other | 11,663,280 | |||
Sales | ||||
U.S. Government Obligations | $ | – | ||
Other | 7,845,367 |
21
GREEN OWL INTRINSIC VALUE FUND
NOTES TO THE FINANCIAL STATEMENTS – (continued)
April 30, 2014 (Unaudited)
NOTE 8. ESTIMATES
The preparation of financial statements in conformity with GAAP requires management to make estimates and assumptions that affect the reported amounts of assets and liabilities and disclosure of contingent assets and liabilities at the date of the financial statements and the reported amounts of increases and decreases in net assets from operations during the reporting period. Actual results could differ from those estimates.
NOTE 9. BENEFICIAL OWNERSHIP
The beneficial ownership, either directly or indirectly, of 25% or more of the voting securities of a fund creates a presumption of control of a fund, under Section 2(a) (9) of the Investment Company Act of 1940. At April 30, 2014, Charles Schwab & Co., Inc., for the benefit of its customers, owned 39.94% of the Fund. It is not known whether Charles Schwab or any of the underlying beneficial owners owned or controlled 25% or more of the voting securities of the Fund.
NOTE 10. FEDERAL TAX INFORMATION
At April 30, 2014, the net unrealized appreciation (depreciation) of investments, including written options, for tax purposes was as follows:
Gross Appreciation | $ | 10,776,279 | ||
Gross (Depreciation) | (301,138 | ) | ||
|
| |||
Net Appreciation (Depreciation) on Investments | $ | 10,475,141 | ||
|
|
At April 30, 2014, the aggregate cost of securities, excluding U.S. government obligations, for federal income tax purposes was $44,585,220 for the Fund.
The tax characterization of distributions for the fiscal year ended October 31, 2013 was as follows:
| Distributions paid from: | 2013 | |||
Ordinary Income* | $ | 237,070 | ||
|
| |||
Total Distributions | $ | 237,070 | ||
|
| |||
| * | Short term capital gain distributions are treated as ordinary income for tax purposes. |
At October 31, 2013, the components of distributable earnings on a tax basis were as follows:
Undistributed ordinary income | $ | 76,019 | ||
Undistributed long term capital gains | 1,642,180 | |||
Net unrealized appreciation (depreciation) | 9,543,484 | |||
Accumulated capital and other losses | (3,261 | ) | ||
|
| |||
| $ | 11,258,422 | |||
|
|
22
GREEN OWL INTRINSIC VALUE FUND
NOTES TO THE FINANCIAL STATEMENTS – (continued)
April 30, 2014 (Unaudited)
NOTE 11. COMMITMENTS AND CONTINGENCIES
The Fund indemnifies its officers and trustees for certain liabilities that may arise from their performance of their duties to the Fund. Additionally, in the normal course of business, the Fund enters into contracts that contain a variety of representations and warranties which provide general indemnifications. The Fund’s maximum exposure under these arrangements is unknown, as this would involve future claims that may be made against the Fund that have not yet occurred.
NOTE 12. SUBSEQUENT EVENTS
Management of the Fund has evaluated the need for disclosures and/or adjustments resulting from subsequent events through the date these financial statements were issued. There were no items requiring adjustment of the financial statements or additional disclosure.
23
VALUED ADVISERS TRUST
PRIVACY POLICY
The following is a description of the policies of the Valued Advisers Trust (the “Trust”) regarding disclosure of nonpublic personal information that shareholders provide to a series of the Trust (each, a “Fund”) or that the Fund collects from other sources. In the event that a shareholder holds shares of a Fund through a broker-dealer or other financial intermediary, the privacy policy of the financial intermediary would govern how shareholder nonpublic personal information would be shared with nonaffiliated third parties.
Categories of Information A Fund May Collect. A Fund may collect the following nonpublic personal information about its shareholders:
| • | Information the Fund receives from a shareholder on applications or other forms, correspondence, or conversations (such as the shareholder’s name, address, phone number, social security number, and date of birth); and |
| • | Information about the shareholder’s transactions with the Fund, its affiliates, or others (such as the shareholder’s account number and balance, payment history, cost basis information, and other financial information). |
Categories of Information A Fund May Disclose. A Fund may not disclose any nonpublic personal information about its current or former shareholders to unaffiliated third parties, except as required or permitted by law. A Fund is permitted by law to disclose all of the information it collects, as described above, to its service providers (such as the Fund’s custodian, administrator, transfer agent, accountant and legal counsel) to process shareholder transactions and otherwise provide services to the shareholder.
Confidentiality and Security. Each Fund shall restrict access to shareholder nonpublic personal information to those persons who require such information to provide products or services to the shareholder. Each Fund shall maintain physical, electronic, and procedural safeguards that comply with federal standards to guard shareholder nonpublic personal information.
Disposal of Information. The Funds, through their transfer agent, have taken steps to reasonably ensure that the privacy of a shareholder’s nonpublic personal information is maintained at all times, including in connection with the disposal of information that is no longer required to be maintained by the Funds. Such steps shall include, whenever possible, shredding paper documents and records prior to disposal, requiring off-site storage vendors to shred documents maintained in such locations prior to disposal, and erasing and/or obliterating any data contained on electronic media in such a manner that the information can no longer be read or reconstructed.
24
OTHER INFORMATION
The Fund’s Statement of Additional Information (“SAI”) includes additional information about the trustees and is available without charge, upon request. You may call toll-free at (888) 695-3729 to request a copy of the SAI or to make shareholder inquiries.
PROXY VOTING
A description of the policies and procedures that the Fund uses to determine how to vote proxies relating to portfolio securities and information regarding how the Fund voted those proxies is available without charge upon request by (1) calling the Fund at (888) 695-3729 and (2) from Fund documents filed with the Securities and Exchange Commission (“SEC”) on the SEC’s website at www.sec.gov.
TRUSTEES
R. Jeffrey Young, Chairman
Ira Cohen
Andrea N. Mullins
OFFICERS
R. Jeffrey Young, Principal Executive Officer and President
John C. Swhear, Chief Compliance Officer, AML Officer and Vice President
Carol J. Highsmith, Vice President and Secretary
Matthew J. Miller, Vice President
Bryan W. Ashmus, Principal Financial Officer and Treasurer
INVESTMENT ADVISER
Kovitz Investment Group, LLC
115 South LaSalle Street, 27th Floor
Chicago, IL 60603
DISTRIBUTOR
Unified Financial Securities, Inc.
2960 North Meridian Street, Suite 300
Indianapolis, IN 46208
INDEPENDENT REGISTERED PUBLIC ACCOUNTING FIRM
Cohen Fund Audit Services Ltd.
1350 Euclid Avenue, Suite 800
Cleveland, OH 44115
LEGAL COUNSEL
The Law Offices of John H. Lively & Associates, Inc.
A member firm of The 1940 Act Law GroupTM
11300 Tomahawk Creek Parkway, Ste. 310
Leawood, KS 66211
CUSTODIAN
Huntington National Bank
41 South High Street
Columbus, OH 43215
ADMINISTRATOR, TRANSFER AGENT AND FUND ACCOUNTANT
Huntington Asset Services, Inc.
2960 North Meridian Street, Suite 300
Indianapolis, IN 46208
This report is intended only for the information of shareholders or those who have received the Fund’s prospectus which contains information about the Fund’s management fee and expenses. Please read the prospectus carefully before investing.
Distributed by Unified Financial Securities, Inc.
Member FINRA/SIPC
25
Semi-Annual Report April 30, 2014
|
Dreman Contrarian Small Cap Value Fund
Fund Adviser:
Dreman Value Management, LLC
Harborside Financial Center, Plaza 10
Suite 800 Jersey City, NJ 07311
Toll Free: (800) 247-1014

Investment Results (Unaudited) |
| Average Annual Total Returns* (unaudited) As of April 30, 2014 | ||||||||||||||||||||
| Class A with Load | Class A without Load | Retail Class | Institutional Class | Russell 2000® Value Index1 | |||||||||||||||
Six Months | 1.56 | % | 7.74 | % | 7.75 | % | 7.85 | % | 4.97 | % | ||||||||||
One Year | 18.60 | % | 25.81 | % | 25.71 | % | 25.91 | % | 19.61 | % | ||||||||||
Three Year | 8.16 | % | 10.32 | % | 10.27 | % | 10.48 | % | 11.16 | % | ||||||||||
Five Year | N/A | N/A | 18.34 | % | 18.68 | % | 19.13 | % | ||||||||||||
Ten Year | N/A | N/A | 11.53 | % | N/A | 8.37 | % | |||||||||||||
Since Inception (11/20/09) | 13.12 | % | 14.64 | % | N/A | N/A | 16.60 | % | ||||||||||||
Since Inception (8/22/07) | N/A | N/A | N/A | 7.75 | % | 6.05 | % | |||||||||||||
Since Inception (12/31/03) | N/A | N/A | 11.41 | % | N/A | 8.06 | % | |||||||||||||
| Expense Ratios2 | |||||||||||||||||||
Gross | 1.57 | % | 1.57 | % | 1.32 | % | ||||||||||||||
With Applicable Waivers | 1.29 | % | 1.29 | % | 1.04 | % | ||||||||||||||
The investment return and principal value of an investment will fluctuate so that an investor’s shares, when redeemed, may be worth more or less than their original cost. The returns shown do not reflect deduction of taxes that a shareholder would pay on Fund distributions or the redemption of Fund shares. THE FUND’S RETURNS REPRESENT PAST PERFORMANCE AND DO NOT PREDICT FUTURE RESULTS. The returns shown are net of all recurring expenses. Current performance of the Fund may be lower or higher than the performance quoted. For more information on the Fund, and to obtain performance data current to the most recent month end, or to request a prospectus or summary prospectus, please call 1-800-247-1014.
You should carefully consider the investment objectives, potential risk, management fees, and charges and expenses of the Fund before investing. The Fund’s prospectus and summary prospectus contains this and other information about the Fund, and should be read carefully before investing.
| * | The total return figures set forth above include all waivers of fees for various periods since inception. Without such fee waivers, the total returns would have been lower. Total return figures reflect any change in price per share and assume reinvestment of all distributions. Total returns for periods less than 1 year are not annualized. |
| 1 | The Russell 2000® Value Index is an unmanaged benchmark that assumes reinvestment of all distributions and excludes the effect of taxes and fees. The Index is a widely recognized unmanaged index of equity prices and is representative of a broader market and range of securities than are found in the Fund’s portfolio. Individuals cannot invest directly in the Index; however, an individual can invest in ETFs or other investment vehicles that attempt to track the performance of a benchmark index. |
| 2 | The expense ratios are from the Fund’s prospectus dated February 28, 2014. The Adviser has contractually agreed to waive its management fee and/or reimburse certain operating expenses through February 28, 2015, but only to the extent necessary so that the Fund’s net expenses, excluding brokerage fees and commissions, borrowing costs (such as (a) interest expense and (b) dividends on securities sold short), taxes, extraordinary expenses, 12b-1 fees (Class A and Retail Class), and any indirect expenses (such as fees and expenses of acquired funds), do not exceed 1.00%. Information pertaining to the Fund’s expense ratios as of April 30, 2014 can be found on the financial highlights. |
The Fund is distributed by Unified Financial Securities, Inc., member FINRA.
Semi-Annual Report
1
Fund Holdings (Unaudited)
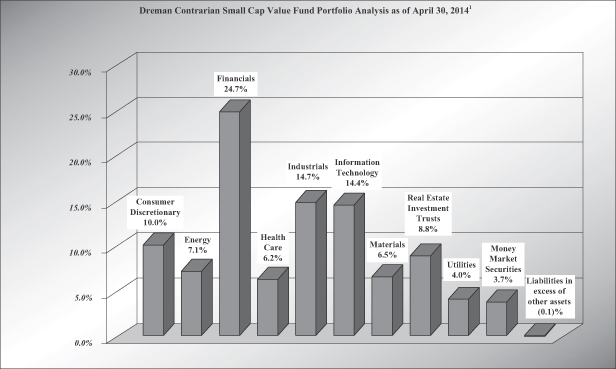
| 1 | As a percent of net assets. |
Availability of Portfolio Schedule – (Unaudited)
The Fund files its complete schedule of portfolio holdings with the Securities and Exchange Commission (“SEC”) for the first and third quarters of each fiscal year on Form N-Q, which is available on the SEC’s web site at www.sec.gov. The Fund’s Form N-Q may be reviewed and copied at the SEC’s Public Reference Room in Washington, DC. Information on the operation of the Public Reference Room may be obtained by calling 1-800-SEC-0330.
Summary of Fund’s Expenses – (Unaudited)
As a shareholder of the Fund, you incur two types of costs: (1) transaction costs (such as short-term redemption fees) and (2) ongoing costs, including management fees and other Fund expenses. This Example is intended to help you understand your ongoing costs (in dollars) of investing in the Fund and to compare these costs with the ongoing costs of investing in other mutual funds.
The Fund’s Example is based on an investment of $1,000 invested at the beginning of the period and held for the entire period November 1, 2013 to April 30, 2014.
Actual Expenses
The first line of the table provide information about actual account values and actual expenses. You may use the information in this line, together with the amount you invested, to estimate the expenses that you paid over the period. Simply divide your account value by $1,000 (for example, an $8,600 account value divided by $1,000 = 8.60), then multiply the result by the number in the first line under the heading entitled “Expenses Paid During Period” to estimate the expenses you paid on your account during this period.
Hypothetical Example for Comparison Purposes
The second line of the table provides information about hypothetical account values and hypothetical expenses based on the Fund’s actual expense ratios and an assumed rate of return of 5% per year before expenses, which is not the Fund’s actual return. The hypothetical account values and expenses may not be used to estimate the actual ending account balances or expenses you paid for the period. You may use this information to compare the ongoing costs of investing in the Fund and other funds. To do so, compare this 5% hypothetical example with the 5% hypothetical examples that appear in the shareholder reports of the other funds.
Semi-Annual Report
2
Expenses shown in the table are meant to highlight your ongoing costs only and do not reflect any transactional costs, such as the fee imposed on short-term redemptions. Therefore, the second line of the table are useful in comparing ongoing costs only, and will not help you determine the relative total costs of owning different funds. If incurred, the short-term redemption fee imposed by the Fund would increase your expenses.
| Beginning Account Value, November 1, 2013 | Ending Account Value, April 30, 2014 | Expenses Paid During Period(1) | Annualized Expense Ratio | |||||||||||||||
Dreman Contrarian Small Cap Value Fund |
| |||||||||||||||||
Class A Shares | Actual | $ | 1,000.00 | $ | 1,077.40 | $ | 6.44 | 1.25 | % | |||||||||
| Hypothetical (2) | $ | 1,000.00 | $ | 1,018.60 | $ | 6.26 | 1.25 | % | ||||||||||
Retail Shares | Actual | $ | 1,000.00 | $ | 1,077.50 | $ | 6.44 | 1.25 | % | |||||||||
| Hypothetical (2) | $ | 1,000.00 | $ | 1,018.60 | $ | 6.26 | 1.25 | % | ||||||||||
Institutional Shares | Actual | $ | 1,000.00 | $ | 1,078.50 | $ | 5.15 | 1.00 | % | |||||||||
| Hypothetical (2) | $ | 1,000.00 | $ | 1,019.84 | $ | 5.01 | 1.00 | % | ||||||||||
| (1) | Expenses are equal to the Fund’s annualized expense ratios, multiplied by the average account value over the period, multiplied by 181/365 (to reflect the one-half year period). The annualized expense ratios reflect reimbursement of expenses by the Fund’s Adviser for the period beginning November 1, 2013 through April 30, 2014. The “Financial Highlights” tables in the Fund’s financial statements, included in the report, also show the gross expense ratios, without such reimbursements. |
| (2) | Hypothetical assumes 5% annual return before expenses. |
Semi-Annual Report
3
| Dreman Contrarian Small Cap Value Fund | April 30, 2014 |
| Schedule of Investments (Unaudited) |
| Shares | Value | |||||||||
| Common Stocks — 96.4% | |||||||||
| Consumer Discretionary — 10.0% | |||||||||
| 35,225 | Aaron’s, Inc. | $ | 1,038,081 | |||||||
| 97,375 | American Axle & Manufacturing Holdings, Inc. * | 1,718,669 | ||||||||
| 20,685 | Big Lots, Inc. * | 817,057 | ||||||||
| 35,595 | Brinker International, Inc. | 1,749,138 | ||||||||
| 28,940 | Cooper Tire & Rubber Co. | 727,841 | ||||||||
| 44,540 | CST Brands, Inc. | 1,453,340 | ||||||||
| 73,430 | CTC Media, Inc. | 636,638 | ||||||||
| 20,913 | Helen of Troy Ltd. * | 1,311,245 | ||||||||
| 21,227 | Hillenbrand, Inc. | 645,301 | ||||||||
| 14,549 | John Wiley & Sons, Inc., Class A | 835,986 | ||||||||
| 21,780 | Life Time Fitness, Inc. * | 1,045,440 | ||||||||
| 10,415 | Matthews International Corp., Class A | 420,245 | ||||||||
| 28,774 | Meredith Corp. | 1,268,070 | ||||||||
| 13,667,051 | ||||||||||
| Energy — 7.1% | |||||||||
| 32,070 | Atwood Oceanics, Inc. * | 1,589,389 | ||||||||
| 133,540 | Bellatrix Exploration Ltd. * | 1,298,009 | ||||||||
| 46,420 | Energy XXI Bermuda Ltd. | 1,110,831 | ||||||||
| 94,840 | Gran Tierra Energy, Inc. * | 678,106 | ||||||||
| 47,670 | Superior Energy Services, Inc. | 1,569,296 | ||||||||
| 60,060 | Ultra Petroleum Corp. * | 1,789,788 | ||||||||
| 26,865 | Unit Corp. * | 1,771,747 | ||||||||
| 9,807,166 | ||||||||||
| Financials — 24.7% | |||||||||
| 14,276 | Allied World Assurance Co. Holdings AG | 1,537,382 | ||||||||
| 31,675 | Aspen Insurance Holdings Ltd. | 1,450,081 | ||||||||
| 99,570 | Associated Banc-Corp. | 1,747,453 | ||||||||
| 55,405 | BancorpSouth, Inc. | 1,294,261 | ||||||||
| 9,259 | Chemical Financial Corp. | 259,900 | ||||||||
| 9,855 | City National Corp. | 715,177 | ||||||||
| 59,040 | Clifton Bancorp, Inc. | 684,274 | ||||||||
| 23,955 | Endurance Specialty Holdings Ltd. | 1,217,393 | ||||||||
| 21,053 | Federated Investors, Inc., Class B | 600,853 | ||||||||
| 119,760 | First Horizon National Corp. | 1,376,042 | ||||||||
| 33,550 | First Midwest Bancorp, Inc. | 549,213 | ||||||||
| 147,049 | First Niagara Financial Group, Inc. | 1,311,677 | ||||||||
| 60,944 | FirstMerit Corp. | 1,181,704 | ||||||||
| 108,140 | Fulton Financial Corp. | 1,318,227 | ||||||||
| 44,935 | Hancock Holding Co. | 1,515,658 | ||||||||
| 32,330 | Hanover Insurance Group, Inc. | 1,889,688 | ||||||||
| 60,990 | Home Loan Servicing Solutions Ltd. | 1,350,928 | ||||||||
| 8,595 | Independent Bank Corp. | 319,046 | ||||||||
| 16,269 | International Bancshares Corp. | 373,536 | ||||||||
| 105,685 | Janus Capital Group, Inc. | 1,281,959 | ||||||||
| 9,355 | Lakeland Financial Corp. | 342,393 | ||||||||
| 23,520 | Montpelier Re Holdings Ltd. | 719,242 | ||||||||
| 14,290 | NBT Bancorp, Inc. | 323,669 | ||||||||
| 10,862 | Nelnet, Inc., Class A | 459,028 | ||||||||
| 14,297 | Platinum Underwriters Holdings Ltd. | 896,565 | ||||||||
| 44,875 | Prospect Capital Corp. | 485,099 | ||||||||
| 19,248 | Prosperity Bancshares, Inc. | 1,135,632 | ||||||||
| 33,838 | Protective Life Corp. | 1,730,814 | ||||||||
| 40,165 | Symetra Financial Corp. | 829,809 | ||||||||
| 42,827 | TCF Financial Corp. | 672,384 | ||||||||
| Shares | Value | |||||||||
| Common Stocks — (Continued) | |||||||||
| Financials — (Continued) | |||||||||
| 33,730 | Umpqua Holdings Corp. | $ | 560,930 | |||||||
| 61,340 | Washington Federal, Inc. | 1,323,717 | ||||||||
| 28,890 | Webster Financial Corp. | 870,745 | ||||||||
| 8,300 | WesBanco, Inc. | 250,992 | ||||||||
| 30,186 | Wintrust Financial Corp. | 1,352,937 | ||||||||
| 33,928,408 | ||||||||||
| Health Care — 6.2% | |||||||||
| 17,212 | Charles River Laboratories International, Inc. * | 924,629 | ||||||||
| 51,830 | Gentiva Health Services, Inc. * | 390,280 | ||||||||
| 35,750 | Hill-Rom Holdings, Inc. | 1,335,620 | ||||||||
| 18,565 | Integra LifeSciences Holdings Corp. * | 846,193 | ||||||||
| 26,660 | Kindred Healthcare, Inc. | 669,166 | ||||||||
| 26,165 | LifePoint Hospitals, Inc. * | 1,463,147 | ||||||||
| 37,787 | Owens & Minor, Inc. | 1,267,376 | ||||||||
| 94,400 | Select Medical Holdings Corp. | 1,317,824 | ||||||||
| 20,403 | Triple-S Management Corp, Class B * | 305,637 | ||||||||
| 8,519,872 | ||||||||||
| Industrials — 14.7% | |||||||||
| 25,601 | AAR Corp. | 663,066 | ||||||||
| 32,285 | ABM Industries, Inc. | 874,601 | ||||||||
| 28,302 | Aegion Corp. * | 721,418 | ||||||||
| 93,964 | Aircastle Ltd. | 1,650,947 | ||||||||
| 12,505 | Alliant Techsystems, Inc. | 1,803,471 | ||||||||
| 22,177 | Barnes Group, Inc. | 854,258 | ||||||||
| 20,939 | Brady Corp., Class A | 540,017 | ||||||||
| 47,295 | Brink’s Co./The | 1,203,185 | ||||||||
| 21,252 | Crane Co. | 1,545,658 | ||||||||
| 17,770 | EMCOR Group, Inc. | 817,242 | ||||||||
| 14,755 | EnerSys | 997,143 | ||||||||
| 9,432 | Esterline Technologies Corp. * | 1,028,277 | ||||||||
| 31,000 | Global Brass & Copper Holdings, Inc. | 491,660 | ||||||||
| 5,143 | Hyster-Yale Materials Handling, Inc., Class A | 495,734 | ||||||||
| 31,150 | ITT Corp. | 1,343,811 | ||||||||
| 5,490 | LB Foster Co., Class A | 259,952 | ||||||||
| 25,550 | Ryder System, Inc. | 2,099,699 | ||||||||
| 52,705 | Tutor Perini Corp. * | 1,560,068 | ||||||||
| 25,340 | URS Corp. | 1,194,021 | ||||||||
| 20,144,228 | ||||||||||
| Information Technology — 14.4% | |||||||||
| 34,763 | ARRIS Group, Inc. * | 906,967 | ||||||||
| 146,569 | Brocade Communications Systems, Inc. * | 1,364,557 | ||||||||
| 49,770 | Celestica, Inc. * | 552,447 | ||||||||
| 20,850 | CSG Systems International, Inc. | 549,606 | ||||||||
| 14,890 | DST Systems, Inc. | 1,372,709 | ||||||||
| 18,974 | EPIQ Systems, Inc. | 242,677 | ||||||||
| 54,390 | Ingram Micro, Inc., Class A * | 1,466,354 | ||||||||
| 19,872 | Itron, Inc. * | 755,136 | ||||||||
| 112,119 | Kulicke & Soffa Industries, Inc. * | 1,649,270 | ||||||||
| 67,060 | Mentor Graphics Corp. | 1,388,142 | ||||||||
| 71,145 | Microsemi Corp. * | 1,673,330 | ||||||||
| 32,990 | Plantronics, Inc. | 1,437,374 | ||||||||
| 121,555 | QLogic Corp. * | 1,407,607 | ||||||||
See accompanying notes which are an integral part of these portfolios of investments.
Semi-Annual Report
4
| Dreman Contrarian Small Cap Value Fund | (Continued) |
| Shares | Value | |||||||||
| Common Stocks — (Continued) | |||||||||
| Information Technology — (Continued) | |||||||||
| 40,132 | Sanmina Corp. * | $ | 812,673 | |||||||
| 18,770 | Science Applications International Corp. | 732,030 | ||||||||
| 18,893 | Sykes Enterprises, Inc. * | 373,892 | ||||||||
| 12,987 | Tech Data Corp. * | 811,558 | ||||||||
| 27,876 | TTM Technologies, Inc. * | 219,942 | ||||||||
| 20,060 | Unisys Corp. * | 488,862 | ||||||||
| 109,155 | Vishay Intertechnology, Inc. | 1,552,184 | ||||||||
| 19,757,317 | ||||||||||
| Materials — 6.5% | |||||||||
| 13,465 | A. Schulman, Inc. | 483,663 | ||||||||
| 31,934 | Cabot Corp. | 1,845,785 | ||||||||
| 91,186 | Coeur Mining, Inc. * | 789,671 | ||||||||
| 17,347 | Koppers Holdings, Inc. | 740,717 | ||||||||
| 56,460 | Olin Corp. | 1,586,526 | ||||||||
| 77,802 | Pan American Silver Corp. | 1,008,314 | ||||||||
| 77,784 | Steel Dynamics, Inc. | 1,421,114 | ||||||||
| 29,106 | Worthington Industries, Inc. | 1,071,101 | ||||||||
| 8,946,891 | ||||||||||
| Real Estate Investment Trusts — 8.8% | |||||||||
| 22,752 | Ashford Hospitality Prime, Inc. | 349,016 | ||||||||
| 81,000 | Ashford Hospitality Trust, Inc. | 831,060 | ||||||||
| 38,959 | Associated Estates Realty Corp. | 653,732 | ||||||||
| 113,520 | Brandywine Realty Trust | 1,651,716 | ||||||||
| 59,075 | CBL & Associates Properties, Inc. | 1,073,393 | ||||||||
| 49,974 | Hospitality Properties Trust | 1,501,719 | ||||||||
| 50,730 | Mack-Cali Realty Corp. | 1,033,370 | ||||||||
| 200,685 | New Residential Investment Corp. | 1,224,178 | ||||||||
| 45,150 | Omega Healthcare Investors, Inc. | 1,570,317 | ||||||||
| 55,035 | Pennsylvania Real Estate Investment Trust | 910,829 | ||||||||
| 151,776 | RAIT Financial Trust | 1,241,528 | ||||||||
| 12,040,858 | ||||||||||
| Utilities — 4.0% | |||||||||
| 53,120 | Hawaiian Electric Industries, Inc. | 1,274,349 | ||||||||
| 28,950 | IDACORP, Inc. | 1,625,253 | ||||||||
| 47,001 | Portland General Electric Co. | 1,573,123 | ||||||||
| 60,290 | TECO Energy, Inc. | 1,082,808 | ||||||||
| 5,555,533 | ||||||||||
| Total Common Stocks (Cost $111,011,425) | 132,367,324 | ||||||||
| Money Market Securities — 3.7% | |||||||||
| 5,132,048 | Huntington Money Market Fund, Institutional Shares, 0.010% (a) (b) | 5,132,048 | ||||||||
| Total Money Market Securities (Cost $5,132,048) | 5,132,048 | ||||||||
| Total Investments | 137,499,372 | ||||||||
| Liabilities in Excess of Other Assets — (0.1)% | (103,919) | ||||||||
| Net Assets — 100.0% | $ | 137,395,453 | |||||||
| (a) | Rate disclosed is the seven day yield as of April 30, 2014. |
| (b) | Affiliated fund. |
| * | Non-income producing security. |
See accompanying notes which are an integral part of these portfolios of investments.
Semi-Annual Report
5
Statement of Assets and Liabilities
April 30, 2014 (Unaudited)
| Dreman Contrarian Small Cap Value Fund | ||||
| Assets: | ||||
Investments in securities, at cost | $ | 111,011,425 | ||
Investments in affiliated securities, at cost | 5,132,048 | |||
Investments in securities, at fair value | 132,367,324 | |||
Investments in affiliated securities, at fair value | 5,132,048 | |||
Dividends receivable | 87,469 | |||
Receivable for fund shares sold | 82,955 | |||
Prepaid expenses | 47,229 | |||
Total assets | 137,717,025 | |||
| Liabilities: | ||||
Payable for shares redeemed | 190,790 | |||
Payable to Adviser | 80,356 | |||
Payable to administrator | 15,985 | |||
Accrued Distribution/12b-1 | 13,333 | |||
Payable to trustees | 1,128 | |||
Other accrued expenses | 19,980 | |||
Total Liabilities | 321,572 | |||
Net Assets | $ | 137,395,453 | ||
| Net Assets consist of: | ||||
Paid in capital | $ | 107,309,805 | ||
Accumulated undistributed net investment income | 107,013 | |||
Accumulated undistributed net realized gain on investments | 8,622,736 | |||
Net unrealized appreciation | 21,355,899 | |||
Net Assets | $ | 137,395,453 | ||
| Net Assets (unlimited number of shares authorized) | ||||
| Class A: | ||||
Net Assets | $ | 4,541,816 | ||
Shares outstanding | 196,494 | |||
Net asset value and redemption price per share | $ | 23.11 | ||
Offering price per share (NAV/0.9425) (a) | $ | 24.52 | ||
| Retail Class: | ||||
Net Assets | $ | 59,494,720 | ||
Shares outstanding | 2,567,710 | |||
Net asset value and offering price per share | $ | 23.17 | ||
Redemption price per share (NAV * 0.99) (b) | $ | 22.94 | ||
| Institutional Class: | ||||
Net Assets | $ | 73,358,917 | ||
Shares outstanding | 3,154,630 | |||
Net asset value, offering and redemption price per share | $ | 23.25 | ||
| (a) | Class A shares impose a maximum 5.75% sales charge on purchases. |
| (b) | A redemption fee of 1.00% is charged on shares held less than 60 days. |
See accompanying notes which are an integral part of these financial statements.
Semi-Annual Report
6
Statement of Operations
For the Six Months Ended April 30, 2014 (Unaudited)
| Dreman Contrarian Small Cap Value Fund | ||||
| Investment Income: | ||||
Dividend income | $ | 1,196,307 | ||
Dividend income from affiliated securities | 161 | |||
Foreign dividend taxes withheld | (2,151 | ) | ||
Total investment income | 1,194,317 | |||
| Expenses: | ||||
Investment Adviser | 516,973 | |||
Distribution/12b-1: | ||||
Class A | 6,020 | |||
Retail Class | 76,966 | |||
Administration | 72,185 | |||
Legal | 6,929 | |||
Registration | 30,395 | |||
Printing | 11,999 | |||
Auditing | 7,935 | |||
Custodian | 12,951 | |||
Trustee | 3,164 | |||
Miscellaneous | 8,205 | |||
Total expenses | 753,722 | |||
Fees waived by Adviser | (61,078 | ) | ||
Net operating expenses | 692,644 | |||
Net investment income | 501,673 | |||
| Realized & Unrealized Gains (Loss) on Investments | ||||
Net realized gains on investment transactions | 9,244,006 | |||
Change in unrealized depreciation on investment securities | (1,230,804 | ) | ||
Net realized and unrealized gains on investment securities | 8,013,202 | |||
Net increase in net assets resulting from operations | $ | 8,514,875 | ||
See accompanying notes which are an integral part of these financial statements.
Semi-Annual Report
7
Statements of Changes in Net Assets
| Dreman Contrarian Small Cap Value Fund | ||||||||
| Six Months Ended April 30, 2014 | Year Ended October 31, 2013 | |||||||
| (Unaudited) | ||||||||
| Increase (Decrease) in Net Assets due to: | ||||||||
| Operations: | ||||||||
Net investment income | $ | 501,673 | $ | 607,096 | ||||
Net realized gains on investment transactions | 9,244,006 | 12,164,654 | ||||||
Change in unrealized appreciation (depreciation) on investment securities | (1,230,804 | ) | 11,804,804 | |||||
Net increase in net assets resulting from operations | 8,514,875 | 24,576,554 | ||||||
| Distributions from: | ||||||||
Net investment income, Class A | (33,863 | ) | (16,349 | ) | ||||
Net investment income, Retail Class | (418,477 | ) | (292,834 | ) | ||||
Net investment income, Institutional Class | (468,029 | ) | (55,644 | ) | ||||
Realized gains, Class A | (490,209 | ) | (33,363 | ) | ||||
Realized gains, Retail Class | (6,225,188 | ) | (597,247 | ) | ||||
Realized gains, Institutional Class | (5,063,473 | ) | (113,488 | ) | ||||
Total distributions | (12,699,239 | ) | (1,108,925 | ) | ||||
| Capital Transactions—Class A: | ||||||||
Proceeds from shares sold | 239,733 | 1,779,662 | ||||||
Reinvestment of distributions | 487,467 | 48,434 | ||||||
Amount paid for shares redeemed | (1,129,827 | ) | (1,184,391 | ) | ||||
Total Class A | (402,627 | ) | 643,705 | |||||
| Capital Transactions—Retail Class: | ||||||||
Proceeds from shares sold | 3,343,953 | 9,514,704 | ||||||
Reinvestment of distributions | 6,532,454 | 871,077 | ||||||
Amount paid for shares redeemed | (12,463,927 | ) | (34,677,105 | ) | ||||
Proceeds from redemption fees (a) | 588 | 616 | ||||||
Total Retail Class | (2,586,720 | ) | (24,290,708 | ) | ||||
| Capital Transactions—Institutional Class: | ||||||||
Proceeds from shares sold | 61,116,992 | 6,044,510 | ||||||
Reinvestment of distributions | 4,944,506 | 111,665 | ||||||
Amount paid for shares redeemed | (5,263,459 | ) | (8,563,303 | ) | ||||
Total Institutional Class | 60,798,039 | (2,407,128 | ) | |||||
Net change resulting from capital transactions | 57,808,692 | (26,054,131 | ) | |||||
Total Increase (Decrease) in Net Assets | 53,624,328 | (2,586,502 | ) | |||||
Net Assets: | ||||||||
Beginning of period | 83,771,125 | 86,357,627 | ||||||
End of period | $ | 137,395,453 | $ | 83,771,125 | ||||
Accumulated undistributed net investment income | $ | 107,013 | $ | 525,709 | ||||
| Share Transactions—Class A: | ||||||||
Shares sold | 10,340 | 92,723 | ||||||
Shares issued in reinvestment of distributions | 21,371 | 2,644 | ||||||
Shares redeemed | (49,620 | ) | (59,581 | ) | ||||
Total Class A | (17,909 | ) | 35,786 | |||||
| Share Transactions—Retail Class: | ||||||||
Shares sold | 144,634 | 476,871 | ||||||
Shares issued in reinvestment of distributions | 285,759 | 47,419 | ||||||
Shares redeemed | (543,124 | ) | (1,763,072 | ) | ||||
Total Retail Class | (112,731 | ) | (1,238,782 | ) | ||||
| Share Transactions—Institutional Class: | ||||||||
Shares sold | 2,557,306 | 280,658 | ||||||
Shares issued in reinvestment of distributions | 215,619 | 6,056 | ||||||
Shares redeemed | (230,785 | ) | (409,909 | ) | ||||
Total Institutional Class | 2,542,140 | (123,195 | ) | |||||
| (a) | A redemption fee of 1.00% is charged on shares held less than 60 days. |
See accompanying notes which are an integral part of these financial statements.
Semi-Annual Report
8
[THIS PAGE INTENTIONALLY LEFT BLANK]
Financial Highlights
(For a share outstanding throughout each period)
| Net Asset Value, beginning of period | Net investment income (loss) | Net realized and unrealized gain (loss) on investments | Total from investment operations | Distributions from net investment income | Distributions from net realized gain on investment transactions | Total distributions | ||||||||||||||||||||||
| DREMAN CONTRARIAN SMALL CAP VALUE FUND | ||||||||||||||||||||||||||||
| Class A | ||||||||||||||||||||||||||||
| 2010(b) | $ | 16.04 | 0.10 | (c) | 2.30 | 2.40 | (0.14 | ) | — | (0.14 | ) | |||||||||||||||||
| 2011 | $ | 18.30 | 0.10 | (0.22 | ) | (0.12 | ) | (0.13 | ) | — | (0.13 | ) | ||||||||||||||||
| 2012 | $ | 18.07 | 0.11 | 1.47 | 1.58 | (0.19 | ) | (1.66 | ) | (1.85 | ) | |||||||||||||||||
| 2013 | $ | 17.80 | 0.12 | 6.14 | 6.26 | (0.08 | ) | (0.16 | ) | (0.24 | ) | |||||||||||||||||
| 2014(g) | $ | 23.82 | 0.09 | 1.72 | 1.81 | (0.16 | ) | (2.36 | ) | (2.52 | ) | |||||||||||||||||
| Retail Class | ||||||||||||||||||||||||||||
| 2009 | $ | 13.51 | 0.07 | 2.12 | 2.19 | (0.06 | ) | (0.06 | ) | (0.12 | ) | |||||||||||||||||
| 2010 | $ | 15.59 | 0.09 | 2.80 | 2.89 | (0.13 | ) | — | (0.13 | ) | ||||||||||||||||||
| 2011 | $ | 18.35 | 0.11 | (0.22 | ) | (0.11 | ) | (0.13 | ) | — | (0.13 | ) | ||||||||||||||||
| 2012 | $ | 18.11 | 0.11 | 1.47 | 1.58 | (0.17 | ) | (1.66 | ) | (1.83 | ) | |||||||||||||||||
| 2013 | $ | 17.86 | 0.17 | 6.08 | 6.25 | (0.08 | ) | (0.16 | ) | (0.24 | ) | |||||||||||||||||
| 2014(g) | $ | 23.87 | 0.09 | 1.73 | 1.82 | (0.16 | ) | (2.36 | ) | (2.52 | ) | |||||||||||||||||
| Institutional Class | ||||||||||||||||||||||||||||
| 2009 | $ | 13.55 | 0.10 | (c) | 1.94 | 2.04 | (0.06 | ) | (0.06 | ) | (0.12 | ) | ||||||||||||||||
| 2010 | $ | 15.47 | 0.14 | 2.93 | 3.07 | (0.14 | ) | — | (0.14 | ) | ||||||||||||||||||
| 2011 | $ | 18.40 | 0.31 | (0.38 | ) | (0.07 | ) | (0.14 | ) | — | (0.14 | ) | ||||||||||||||||
| 2012 | $ | 18.19 | 0.14 | 1.48 | 1.62 | (0.23 | ) | (1.66 | ) | (1.89 | ) | |||||||||||||||||
| 2013 | $ | 17.92 | 0.20 | 6.10 | 6.30 | (0.08 | ) | (0.16 | ) | (0.24 | ) | |||||||||||||||||
| 2014(g) | $ | 23.98 | 0.11 | (c) | 1.74 | 1.85 | (0.22 | ) | (2.36 | ) | (2.58 | ) | ||||||||||||||||
| (a) | Total return represents the rate the investor would have earned or lost on an investment in the Fund, assuming reinvestment of dividends, and excludes any sales charges and redemption fees. |
| (b) | For the period November 20, 2009 (commencement of operations) to October 31, 2010. |
| (c) | Per share amount has been calculated using the average shares method. |
| (d) | Not Annualized. |
| (e) | Annualized. |
| (f) | The expense ratios shown include overdraft fees charged to the Fund. Without these overdraft fees, the expense ratios would be 1.25% for Class A and Retail Class and 1.00% for Institutional Class. |
| (g) | Six months ended April 30, 2014 (Unaudited). |
| (h) | Effective June 1, 2009, the Adviser discontinued the voluntary waiver of 12b-1 fees. Accordingly, if the Adviser had not voluntarily reimbursed the Fund for these expenses, each expense ratio would have been 0.12% higher and each net investment income ratio would have been 0.12% lower. |
| (i) | Amount is less than $0.005. |
| (j) | Effective June 1, 2009, the Adviser agreed to waive fees to maintain Fund expenses at 1.00%. Prior to that date, the expense cap was 1.25%. |
See accompanying notes which are an integral part of these financial statements.
Semi-Annual Report
10
| Paid in capital from redemption fees | Net Asset Value, end of period | Total return(a) | Net Assets, end of period (000 omitted) | Ratio of net expenses to average net assets | Ratio of expenses (prior to reimbursements) to average net assets | Ratio of net investment income (loss) to average net assets | Ratio of net investment income (loss) to average net assets before waiver & reimbursement by advisor | Portfolio turnover rate | ||||||||||||||||||||||||||
| — | $ | 18.30 | 15.00 | %(d) | $ | 275 | 1.25 | %(e) | 1.59 | %(e) | 0.62 | %(e) | 0.28 | %(e) | 35.75 | % | ||||||||||||||||||
| 0.02 | $ | 18.07 | (0.60 | )% | $ | 1,935 | 1.25 | % | 1.49 | % | 0.46 | % | 0.22 | % | 44.08 | % | ||||||||||||||||||
| — | $ | 17.80 | 9.92 | % | $ | 3,180 | 1.25 | % | 1.75 | % | 0.55 | % | 0.05 | % | 30.19 | % | ||||||||||||||||||
| — | $ | 23.82 | 35.56 | % | $ | 5,106 | 1.26 | %(f) | 1.51 | % | 0.65 | % | 0.40 | % | 28.28 | % | ||||||||||||||||||
| — | $ | 23.11 | 7.74 | %(d) | $ | 4,542 | 1.25 | %(e) | 1.36 | %(e) | 0.74 | %(e) | 0.63 | %(e) | 24.57 | % | ||||||||||||||||||
| 0.01 | $ | 15.59 | 16.51 | % | $ | 72,442 | 1.38 | %(h) | 2.18 | % | 0.54 | %(h) | (0.26 | )% | 80.75 | % | ||||||||||||||||||
| — | (i) | $ | 18.35 | 18.61 | % | $ | 105,796 | 1.25 | % | 1.58 | % | 0.53 | % | 0.20 | % | 35.75 | % | |||||||||||||||||
| — | (i) | $ | 18.11 | (0.66 | )% | $ | 82,840 | 1.25 | % | 1.51 | % | 0.57 | % | 0.32 | % | 44.08 | % | |||||||||||||||||
| — | (i) | $ | 17.86 | 9.93 | % | $ | 69,992 | 1.25 | % | 1.74 | % | 0.56 | % | 0.06 | % | 30.19 | % | |||||||||||||||||
| — | (i) | $ | 23.87 | 35.38 | % | $ | 63,976 | 1.26 | %(f) | 1.53 | % | 0.72 | % | 0.45 | % | 28.28 | % | |||||||||||||||||
| — | (i) | $ | 23.17 | 7.75 | %(d) | $ | 59,495 | 1.25 | %(e) | 1.36 | %(e) | 0.74 | %(e) | 0.63 | %(e) | 24.57 | % | |||||||||||||||||
| — | $ | 15.47 | 15.27 | % | $ | 15,309 | 1.09 | %(j) | 2.06 | % | 0.74 | % | (0.23 | )% | 80.75 | % | ||||||||||||||||||
| — | $ | 18.40 | 19.90 | % | $ | 19,300 | 1.00 | % | 1.34 | % | 0.79 | % | 0.45 | % | 35.75 | % | ||||||||||||||||||
| — | $ | 18.19 | (0.44 | )% | $ | 11,472 | 1.00 | % | 1.26 | % | 0.85 | % | 0.59 | % | 44.08 | % | ||||||||||||||||||
| — | $ | 17.92 | 10.14 | % | $ | 13,185 | 1.00 | % | 1.49 | % | 0.80 | % | 0.30 | % | 30.19 | % | ||||||||||||||||||
| — | $ | 23.98 | 35.55 | % | $ | 14,689 | 1.01 | %(f) | 1.27 | % | 0.95 | % | 0.68 | % | 28.28 | % | ||||||||||||||||||
| — | $ | 23.25 | 7.85 | %(d) | $ | 73,359 | 1.00 | %(e) | 1.09 | %(e) | 0.92 | %(e) | 0.83 | %(e) | 24.57 | % | ||||||||||||||||||
Semi-Annual Report
11
Notes to the Financial Statements
April 30, 2014 (Unaudited)
Note 1. Organization
The Dreman Contrarian Small Cap Value Fund (the “Fund”) is an open-end diversified series of the Valued Advisers Trust (the “Trust”). The Trust is a management investment company established under the laws of Delaware by an Agreement and Declaration of Trust dated June 13, 2008 (the “Trust Agreement”). The Trust Agreement permits the Trustees to issue an unlimited number of shares of beneficial interest of separate series without par value. The Fund is one of a series of funds authorized by the Board of Trustees (the “Board”). The Fund’s investment adviser is Dreman Value Management, LLC (the “Adviser”). The investment objective of the Fund is long-term capital appreciation.
The Fund currently offers Class A shares, Retail Class shares, and Institutional Class shares. Class A shares are offered with a front-end sales charge. The Retail Class shares impose a 1% redemption fee on all shares redeemed within 60 days of purchase. Institutional Class shares do not have sales charges on original purchases.
Note 2. Significant Accounting Policies
The following is a summary of significant accounting policies followed by the Fund in the preparation of its financial statements. These policies are in conformity with the generally accepted accounting principles in the United States of America (“GAAP”).
Estimates—The preparation of financial statements in conformity with GAAP requires management to make estimates and assumptions that affect the reported amounts of assets and liabilities and disclosure of contingent assets and liabilities at the date of the financial statements and the reported amounts of increases and decreases in net assets from operations during the reporting period. Actual results could differ from those estimates.
Securities Valuation—All investments in securities are recorded at their estimated fair value as described in Note 3.
Federal Income Taxes—The Fund makes no provision for federal income or excise tax. The Fund intends to qualify each year as a regulated investment company (“RIC”) under subchapter M of the Internal Revenue Code of 1986, as amended, by complying with the requirements applicable to RICs and by distributing substantially all of its taxable income. The Fund also intends to distribute sufficient net investment income and net capital gains, if any, so that it will not be subject to excise tax on undistributed income and gains. If the required amount of net investment income or gains is not distributed, the Fund could incur a tax expense.
During the six months ended April 30, 2014, the Fund did not have a liability for any unrecognized tax benefits. The Fund recognizes interest and penalties, if any, related to unrecognized tax benefits as income tax expense in the statement of operations. The Fund is subject to examination by U.S. federal tax authorities for the last four tax year ends and the interim tax period since then.
Expenses—Expenses incurred by the Trust that do not relate to a specific fund of the Trust are allocated to the individual funds based on each fund’s relative net assets or other appropriate basis as (determined by the Board). Expenses attributable to any class are borne by that class. Income, realized gains and losses, unrealized appreciation and depreciation, and expenses are allocated to each class based on the net assets in relation to the relative net assets of the Fund.
Security Transactions and Related Income—The Fund follows industry practice and records security transactions on the trade date, for financial purposes. The specific identification method is used for determining gains or losses for financial statement and income tax purposes. Dividend income is recorded on the ex-dividend date and interest income is recorded on an accrual basis. Discounts and premiums on securities purchased are accreted or amortized using the effective interest method. Withholding taxes on foreign dividends have been provided for in accordance with the Fund’s understanding of the applicable country’s tax rules and rates.
Dividends and Distributions—Distributions to shareholders, which are determined in accordance with income tax regulations, are recorded on the ex-dividend date. The Fund intends to distribute substantially all of its net investment income on, at least, an annual basis. The Fund intends to distribute its net realized long-term and short-term capital gains, if any, at least once a year. The treatment for financial reporting purposes of distributions made to shareholders during the year from net investment income or net realized capital gains may differ from their ultimate treatment for federal income tax purposes. These differences are caused primarily by differences in the timing of the recognition of certain components of income, expense or realized capital gain for federal income tax purposes. Where such differences are permanent in nature, they are reclassified in the components of the net assets based on their ultimate characterization for federal income tax purposes. Any such reclassifications will have no effect on net assets, results of operations or net asset values per share of the Fund.
Note 3. Securities Valuation and Fair Value Measurements
Fair value is defined as the price that a Fund would receive upon selling an investment in a timely transaction to an independent buyer in the principal or most advantageous market of the investment. GAAP establishes a three-tier hierarchy to maximize the use of observable market data and minimize the use of unobservable inputs and to establish classification of fair value measurements for disclosure purposes.
Inputs refer broadly to the assumptions that market participants would use in pricing the asset or liability, including assumptions about risk (the risk inherent in a particular valuation technique used to measure fair value including such a pricing model and/or the risk inherent in the
Semi-Annual Report
12
inputs to the valuation technique). Inputs may be observable or unobservable. Observable inputs are inputs that reflect the assumptions market participants would use in pricing the asset or liability developed based on market data obtained from sources independent of the reporting entity. Unobservable inputs are inputs that reflect the reporting entity’s own assumptions about the assumptions market participants would use in pricing the asset or liability developed based on the best information available in the circumstances.
Various inputs are used in determining the value of the Fund’s investments. These inputs are summarized in the three broad levels listed below.
| • | Level 1—quoted prices in active markets for identical securities |
| • | Level 2—other significant observable inputs (including, but not limited to, quoted prices for an identical security in an inactive market, quoted prices for similar securities, interest rates, prepayment speeds, credit risk, etc.) |
| • | Level 3—significant unobservable inputs (including the Fund’s own assumptions in determining fair value of investments based on the best information available) |
The inputs used to measure fair value may fall into different levels of the fair value hierarchy. In such cases, for disclosure purposes, the level in the fair value hierarchy within which the fair value measurement falls in its entirety, is determined based, on the lowest level input that is significant to the fair value measurement in its entirety.
Equity securities, including common stocks, exchanged-traded funds and real estate investment trusts, are generally valued by using market quotations, but may be valued on the basis of prices furnished by a pricing service when the Adviser believes such prices more accurately reflect the fair value of such securities. Securities traded in the NASDAQ over-the-counter market are generally valued by the pricing service at the NASDAQ Official Closing Price.
When using the market quotations or close prices provided by the pricing service and when the market is considered active, the security is classified as a Level 1 security. Sometimes, an equity security owned by the Fund will be valued by the pricing service with factors other than market quotations or when the market is considered inactive. When this happens, the security is classified as a Level 2 security. When market quotations are not readily available, when the Adviser
determines that the market quotation or the price provided by the pricing service does not accurately reflect the current fair value, or when restricted or illiquid securities are being valued, such securities are valued as determined in good faith by the Adviser, in conformity with guidelines adopted by and subject to review by the Board. These securities are categorized as Level 3 securities.
Investments in mutual funds, including money market mutual funds, are generally priced at the ending NAV provided by the service agent of the funds. These securities are categorized as Level 1 securities.
Short-term investments in fixed income securities, (those with maturities of less than 60 days when acquired, or which subsequently are within 60 days of maturity), are valued by using the amortized cost method of valuation, which the Board has determined represents fair value. These securities are classified as Level 2 securities.
In accordance with the Trust’s good faith pricing guidelines, the Adviser is required to consider all appropriate factors relevant to the value of securities for which it has determined other pricing sources are not available or reliable as described above. No single standard exists for determining fair value, because fair value depends upon the circumstances of each individual case. As a general principle, the current fair value of an issue of securities being valued by the Adviser would appear to be the amount which the owner might reasonably expect to receive for them upon their current sale. Methods which are in accordance with this principle may, for example, be based on (i) a multiple of earnings; (ii) a discount from market of a similar freely traded security (including a derivative security or a basket of securities traded on other markets, exchanges or among dealers); or (iii) yield to maturity with respect to debt issues, or a combination of these and other methods. Good faith pricing is permitted if, in the Adviser’s opinion, the validity of market quotations appears to be questionable based on factors such as evidence of a thin market in the security based on a small number of quotations, a significant event occurs after the close of a market but before a Fund’s NAV calculation that may affect a security’s value, or the Adviser is aware of any other data that calls into question the reliability of market quotations. Good faith pricing may also be used in instances when the securities the Fund invests in may default or otherwise cease to have market quotations readily available.
The following is a summary of the inputs used to value the Fund’s investments as of April 30, 2014:
| Valuation Inputs | ||||||||||||||||
| Assets | Level 1—Quoted Prices in Active Markets | Level 2—Other Significant Observable Inputs | Level 3—Significant Unobservable Inputs | Total | ||||||||||||
Common Stocks* | $ | 132,367,324 | $ | — | $ | — | $ | 132,367,324 | ||||||||
Money Market Securities | 5,132,048 | — | — | 5,132,048 | ||||||||||||
|
|
|
|
|
|
|
| |||||||||
Total | $ | 137,499,372 | $ | — | $ | — | $ | 137,499,372 | ||||||||
| * | Refer to Schedule of Investments for industry classifications. |
Semi-Annual Report
13
Notes to the Financial Statements (Continued)
The Fund did not hold any investments at any time during the reporting period in which other significant observable inputs (Level 2) were used in determining fair value. The Fund also did not hold any investments at any time during the reporting period in which significant unobservable inputs were used in determining fair value; therefore, no reconciliation of Level 3 securities is included for this reporting period.
The Trust recognizes transfers between fair value hierarchy levels at the reporting period end. There were no transfers between any levels as of April 30, 2014 and the previous measurement period.
Note 4. Adviser Fees and Other Transactions
Under the terms of the management agreement between the Trust and the Adviser (the “Agreement”) for the Fund, the Adviser manages the Fund’s investments subject to oversight of the Board. As compensation for its management services, the Fund is obligated to pay the Adviser a fee computed and accrued daily and paid monthly at an annual rate of 0.85% of the average daily net assets of the Fund. For the six months ended April 30, 2014, the Adviser earned fees of $516,973 from the Fund before the waivers described below. At April 30, 2014, the Fund owed $80,356 to the Adviser.
The Adviser has contractually agreed to waive its management fee and/or reimburse certain operating expenses, but only to the extent necessary so that the Fund’s net expenses, excluding brokerage fees and commissions, borrowing costs (such as (a) interest expense and (b) dividends on securities sold short), taxes, extraordinary expenses, 12b-1 fees (if applicable), and any indirect expenses (such as fees and expenses of acquired funds), do not exceed 1.00%. Each waiver or reimbursement of an expense by the Adviser is subject to repayment by the Fund within the three fiscal years following the fiscal year in which the expense was incurred, provided that the Fund is able to make the repayment without exceeding the expense limitation. The contractual agreement is in effect through February 28, 2015. The expense cap may not be terminated prior to this date except by the Board. For the six months ended April 30, 2014, the Adviser waived fees of $61,078 from the Fund. This amount is subject to potential recoupment by the Adviser through October 31, 2017.
The amounts subject to repayment by the Fund, pursuant to the aforementioned conditions are as follows:
| Amount | Recoverable through October 31, | |||||||
| $ | 307,826 | 2014 | ||||||
| 459,430 | 2015 | |||||||
| 215,534 | 2016 | |||||||
| 61,078 | 2017 | |||||||
The Trust retains Huntington Asset Services, Inc. (“HASI”) to manage the Fund’s business affairs and to provide the Fund with administrative services, including all regulatory, reporting and necessary office equipment and personnel. The Trust also retains HASI to act as the Fund’s transfer agent and to provide the Fund with fund accounting services. For the six months ended April 30, 2014, HASI earned fees of $72,185 for administrative services. At April 30, 2014, HASI was owed $15,985 for administrative services.
Certain officers and one Trustee of the Trust are members of management and/or employees of HASI. HASI operates as a wholly-owned subsidiary of Huntington Bancshares, Inc., the parent company of the Unified Financial Securities, Inc. (the “Distributor”) and Huntington National Bank, the custodian of the Fund’s investments (the “Custodian”). For the six months ended April 30, 2014, the Custodian earned fees $12,951 for custody services.
The Distributor acts as the principal distributor of the Fund’s shares. During the six months ended April 30, 2014, there were no commissions earned on sales of Class A Shares. The Distributor, HASI and the Custodian are controlled by Huntington Bancshares, Inc.
The Fund has adopted a Distribution Plan (the “Plan”) pursuant to Rule 12b-1 under the 1940 Act. The Plan provides that the Fund will pay the Adviser and/or any registered securities dealer, financial institution or any other person (a “Recipient”) a shareholder servicing fee aggregating up to: 0.25% of the average daily net assets of the Class A shares and 0.25% of the average daily net assets of the Retail Class shares in connection with the promotion and distribution of the Fund’s shares or the provision of personal services to shareholders, including, but not necessarily limited to, advertising, compensation to underwriters, dealers and selling personnel, the printing and mailing of prospectuses to other than current Fund shareholders, the printing and mailing of sales literature and servicing shareholder accounts. The Fund or the Adviser may pay all or a portion of these fees to any Recipient who renders assistance in distributing or promoting the sale of shares, or who provides certain shareholder services, pursuant to a written agreement. The Plan is a compensation plan, which means compensation is paid regardless of 12b-1 expense actually incurred. It is anticipated that the Plan will benefit shareholders because an effective sales program typically is necessary in order for the Fund to reach and maintain a sufficient size to achieve efficiently its investment objectives and to realize economies of scale. For the six months ended April 30, 2014, Class A shares 12b-1 expense incurred by the Fund was $6,020 and Retail Class shares 12b-1 expense incurred by the Fund was $76,966. The Fund owed $956 for Class A shares and $12,377 for Retail Class shares 12b-1 fees as of April 30, 2014.
Semi-Annual Report
14
The Fund may invest in certain affiliated money market funds which are managed by an affiliated party of the Distributor. Income distributions earned from investments in this Fund are recorded as dividend income from affiliates in the accompanying financial statements. A summary of the Fund’s investment in such affiliated money market funds is presented in the table below:
| Affiliated Fund | 10/31/13 Fair Value | Purchases | Sales | 4/30/14 Fair Value | Income | |||||||||||||||
Huntington Money Market Fund | $ | 778,785 | $ | 29,343,677 | $ | (24,990,414 | ) | $ | 5,132,048 | $ | 161 | |||||||||
Note 5. Purchases and Sales of Securities
For the six months ended April 30, 2014, purchases and sales of investment securities, other than short-term investments and short-term U.S. government obligations were as follows:
| Purchases | Sales | |||
$70,574,336 | $ | 28,924,556 | ||
Note 6. Beneficial Ownership
The beneficial ownership, either directly or indirectly, of more than 25% of the voting securities of a fund creates a presumption of control of the fund, under Section 2(a)(9) of the Investment Company Act of 1940. At April 30, 2014, there were no shareholders owning more than 25% of the voting shares of the Fund.
Note 7. Federal Income Taxes
At April 30, 2014, the net unrealized appreciation (depreciation) of investments for tax purposes was as follows:
Gross Unrealized Appreciation | $ | 22,701,461 | ||
Gross Unrealized (Depreciation) | (2,174,321 | ) | ||
Net Unrealized Appreciation on Investments | $ | 20,527,140 |
At April 30, 2014, the difference between book basis and tax basis unrealized appreciation (depreciation) is attributable to the tax deferral of losses on wash sales, mark-to-market adjustments on passive foreign investment companies, return of capital from real estate investment trusts and income from certain investments.
At April 30, 2014, the aggregate cost of securities for federal income tax purposes was $116,972,232 for the Fund.
At October 31, 2013, the Fund’s most recent fiscal year end, the components of distributable earnings (accumulated losses) on a tax basis were as follows:
Undistributed ordinary income | $ | 1,442,915 | ||
Undistributed long-term capital gains | 11,069,153 | |||
Unrealized appreciation | 21,757,944 | |||
| $ | 34,270,012 |
| * | The difference between book basis and tax basis unrealized appreciation (depreciation) is attributable to the tax deferral of losses on wash sales, mark-to-market adjustments on passive foreign investment companies, return of capital from real estate investment trusts and income from certain investments. |
The tax character of distributions paid for the fiscal year ended October 31, 2013 was as follows:
| 2013 | ||||
Distributions paid from*: | ||||
Ordinary Income | $ | 652,447 | ||
Net Long-Term Capital Gain | 456,478 | |||
| $ | 1,108,925 | |||
| * | The tax character of distributions paid may differ from the character of distributions shown on the statements of changes in net assets due to short-term capital gains being treated as ordinary income for tax purposes. |
Note 8. Commitments and Contingencies
The Fund indemnities its officers and trustees for certain liabilities that may arise from performance of their duties to the Fund. Additionally, in the normal course of business, the Fund enters into contracts that contain a variety of representations and warranties which provide general indemnifications. The Fund’s maximum exposure under these arrangements is unknown, as this would involve future claims that may be made against the Fund that have not yet occurred.
Note 9. Subsequent Events
Management of the Fund has evaluated the need for disclosure and/or adjustments resulting from subsequent events through the date these financials were issued. Based upon this evaluation, there are no subsequent events to report.
Semi-Annual Report
15
Valued Advisers Trust
PRIVACY POLICY
The following is a description of the policies of the Valued Advisers Trust (the “Trust”) regarding disclosure of nonpublic personal information that shareholders provide to a series of the Trust (each, a “Fund”) or that the Fund collects from other sources. In the event that a shareholder holds shares of a Fund through a broker-dealer or other financial intermediary, the privacy policy of the financial intermediary would govern how shareholder nonpublic personal information would be shared with nonaffiliated third parties.
Categories of Information A Fund May Collect.
A Fund may collect the following nonpublic personal information about its shareholders:
| • | Information the Fund receives from a shareholder on applications or other forms, correspondence, or conversations (such as the shareholder’s name, address, phone number, social security number, and date of birth); and |
| • | Information about the shareholder’s transactions with the Fund, its affiliates, or others (such as the shareholder’s account number and balance, payment history, cost basis information, and other financial information). |
Categories of Information A Fund May Disclose.
A Fund may not disclose any nonpublic personal information about its current or former shareholders to unaffiliated third parties, except as required or permitted by law. A Fund is permitted by law to disclose all of the information it collects, as described above, to its service providers (such as the Fund’s custodian, administrator, transfer agent, accountant and legal counsel) to process shareholder transactions and otherwise provide services to the shareholder.
Confidentiality and Security.
Each Fund shall restrict access to shareholder nonpublic personal information to those persons who require such information to provide products or services to the shareholder. Each Fund shall maintain physical, electronic, and procedural safeguards that comply with federal standards to guard shareholder nonpublic personal information.
Disposal of Information.
The Funds, through their transfer agent, have taken steps to reasonably ensure that the privacy of a shareholder’s nonpublic personal information is maintained at all times, including in connection with the disposal of information that is no longer required to be maintained by the Funds. Such steps shall include, whenever possible, shredding paper documents and records prior to disposal, requiring off-site storage vendors to shred documents maintained in such locations prior to disposal, and erasing and/or obliterating any data contained on electronic media in such a manner that the information can no longer be read or reconstructed.
Semi-Annual Report
16
OTHER INFORMATION
The Fund’s Statement of Additional Information (“SAI”) includes additional information about the Trustees and is available without charge, upon request. You may call toll-free at (800) 247-1014 to request a copy of the SAI or to make shareholder inquiries.
PROXY VOTING
A description of the policies and procedures that each Fund uses to determine how to vote proxies relating to portfolio securities and information regarding how the Funds voted those proxies during the recent twelve month period ended June 30 are available without charge upon request by (1) calling the Funds at (800) 247-1014 or (2) from Fund documents filed with the Commission on the Commission’s website at www.sec.gov.
TRUSTEES
R. Jeffrey Young, Chairman
Ira Cohen
Andrea Mullins
OFFICERS
R. Jeffrey Young, Principal Executive Officer and President
John C. Swhear, Chief Compliance Officer, AML Officer and Vice-President
Carol J. Highsmith, Vice President and Secretary
Matthew J. Miller, Vice President
Bryan W. Ashmus, Principal Financial Officer and Treasurer
INVESTMENT ADVISER
Dreman Value Management, LLC
Harborside Financial Center
Plaza 10, Suite 800
Jersey City, NJ 07311
DISTRIBUTOR
Unified Financial Securities, Inc.
2960 North Meridian Street, Suite 300
Indianapolis, IN 46208
INDEPENDENT REGISTERED PUBLIC ACCOUNTING FIRM
Cohen Fund Audit Services, Ltd.
1350 Euclid Avenue, Suite 800
Cleveland, OH 44115
LEGAL COUNSEL
The Law Offices of John H. Lively & Associates, Inc.
A member firm of The 1940 Act Law Group TM
11300 Tomahawk Creek Parkway, Suite 310
Leawood, KS 66211
CUSTODIAN
Huntington National Bank
41 S. High St.
Columbus, OH 43215
ADMINISTRATOR, TRANSFER AGENT
AND FUND ACCOUNTANT
Huntington Asset Services, Inc.
2960 North Meridian Street, Suite 300
Indianapolis, IN 46208
This report is intended only for the information of shareholders or those who have received the Fund’s prospectus which contains information about the Fund’s management fee and expenses. Please read the prospectus carefully before investing.
Distributed by Unified Financial Securities, Inc.
Member FINRA/SIPC

THE SOUND MIND INVESTING FUND
THE SOUND MIND INVESTING
BALANCED FUND
THE SMI DYNAMIC ALLOCATION FUND
| SEMI-ANNUAL REPORT |
| APRIL 30, 2014 |
Fund Adviser:
SMI Advisory Services, LLC
11135 Baker Hollow Road
Columbus, IN 47201
Toll Free (877) SMI-FUND
www.smifund.com
Dear Fellow Shareholder,
To the casual stock market observer, the early months of 2014 may have seemed dull. The largest, most recognizable stock indexes – like the S&P 500 – made small advances and ended April sitting close to their all-time highs. Following 2013’s abnormally large gains, it would be easy to chalk up this year’s performance to-date as merely a pause for investors to digest some of those big gains.
The reality is more complicated than that. Beneath the calm exterior of the broad market indexes, a fairly pronounced shift has occurred. The stocks that led the market during 2013’s strong run have largely given way to those that lagged. Specifically, this means that riskier funds from the smaller-company and growth-oriented categories have fallen out of favor, while more conservative funds from the larger-company and value-oriented categories have taken the lead.
Consider the following table, which illustrates the degree of the market’s leadership change from last year to this year. Performance shown for each of SMI’s five stock risk categories is taken from the corresponding iShares exchange-traded fund that tracks it.
| Category (ETF) | 2013 | 2014 YTD thru April 30 | ||
| Foreign (EFA) | 21.39% | 1.83% | ||
| Small Growth (IWO) | 43.33% | (4.58)% | ||
| Small Value (IWN) | 34.34% | (0.86)% | ||
| Large Growth (IWF) | 33.14% | 1.09% | ||
| Large Value (IWD) | 32.09% | 3.92% |
Ignoring the foreign category for a moment, the most striking feature of this table is the way the four domestic risk categories perfectly inverted their performance from 2013 to early 2014. In 2013, small-growth stocks were clearly the best performers, with performance dropping along with risk exposure as we move through the bottom of the table. In 2014, it has been exactly the opposite: the best performance has been at the bottom rung of the risk ladder in large-value, with performance dropping – and actually turning negative – as we move into the higher risk categories.
The reason this transition has gone undetected by many is that the most popular stock market indexes are “capitalization weighted,” which means the largest stocks dominate their movement. The fact that small-company stocks have struggled so far in 2014 doesn’t factor much, if at all, into the pricing of the most recognizable indexes like the S&P 500.
For investors utilizing Upgrading through either the Sound Mind Investing Fund (SMIFX) or the SMI Balanced Fund (SMILX), this market leadership reversal has had a significant impact. First, the good news: our Upgrading strategy has been allocated well for 2014, with significantly larger allocations to the large-company risk categories than the small. In fact, our U.S. stock allocations for 2014 have closely matched the “bottom-up” performance of the market, with our largest allocation to large-value, followed by slightly less to large-growth, and so forth. Unfortunately, that allocation advantage has only offset a small part of the performance lag Upgrading has suffered as a result of this leadership change.
1
When Upgrading lags the market by a significant margin, it usually reflects a substantial change to the market’s primary trend. As a trend-following system, Upgrading takes time to adjust to significant trend changes. We don’t want our Upgrading formula to be so sensitive that it responds to every wiggle in market direction. But the cost of building a degree of patience into the system is that we occasionally lag for a short time while Upgrading plays catch-up to the new market trends.
As new market trends are revealed, Upgrading steers us to funds that are taking advantage of those trends. That’s what has been happening throughout 2014: the old former leaders have been gradually replaced with new funds that are better positioned to take advantage of the new market leadership trends.
Specifically, Upgrading’s mix of funds shifted throughout 2013 to take maximum advantage of the higher-risk, growth and small-company orientation that was leading the market. This orientation helped Upgrading and SMIFX outperform the market in 2013. As the market trends began to change, however, those funds began to lag rather than lead, and Upgrading began replacing them with funds better suited to the new market emphasis on safety. But during this transition period, which encompassed most of the six months being discussed in this letter, Upgrading’s performance lagged the market overall.
The Sound Mind Investing Fund (SMIFX)
Upgrading’s significant allocations to small-company funds, which have lagged significantly in 2014, pulled the performance of SMIFX down. Foreign stocks, which lagged badly in 2013, have performed better this year, though still not quite as well as the U.S. stock market. During the six months ended April 30, 2014, SMIFX gained 4.23%. That’s not a bad absolute result for a six-month period, but it did lag the 8.36% gain of the S&P 500, as well as the 7.89% gain of the Wilshire 5000.
The SMI Balanced Fund (SMILX)
The same factors that impacted SMIFX’s performance (discussed above) weighed down the stock portion of the SMI Balanced Fund. The bond portion of the portfolio lagged the Barclays U.S. Aggregate Bond Index slightly (1.36% vs. 1.74%). That isn’t surprising, given that our bond subadvisor attempts to opportunistically take advantage of volatility in the bond market when it occurs, and there hasn’t been much volatility to be taken advantage of in recent months. We can live with this type of short-term “patient lagging” knowing that opportunities will inevitably present themselves, and when they do our bond managers have a strong track record of taking full advantage of those opportunities.
Overall, during the six months ended April 30, 2014, SMILX gained 3.10%. That lagged the performance of a “blended benchmark” portfolio made up of 60% Wilshire 5000 and 40% Barclays U.S. Aggregate Bond Index, which would have gained 5.46%. (The Wilshire 5000 stock index gained 7.89%, while Barclays U.S. Aggregate Bond Index gained 1.74%.)
The SMI Dynamic Allocation Fund (SMIDX)
As was the case throughout 2013, SMIDX maintained a constant allocation to U.S. Stocks and Foreign Stocks. Our U.S. Stock allocation did well, with primary holding SPY gaining 8.18% over the six month period. Foreign stocks didn’t perform as well as the U.S. stock market indexes, with primary holding EFA gaining 4.59%. SMIDX’s performance was further held back by its third allocation, which shifted between real estate, bonds, and cash during the period.
2
Overall, SMIDX gained 3.98% during the six months ended April 30, 2014. That lagged the performance of a “blended benchmark” portfolio made up of 60% Wilshire 5000 stock index and 40% Barclays U.S. Aggregate Bond Index, which would have gained 5.46%. (The Wilshire 5000 gained 7.89%, while Barclays U.S. Aggregate Bond Index gained 1.74%.)
It’s worth remembering that SMIDX is designed to “win by not losing.” So while we’d love to have market-beating gains when stocks are advancing, we don’t really expect to. As long as the fund is making steady progress during those periods, we’re generally satisfied. We expect SMIDX to really add value when stocks stop advancing and start declining. Avoiding the worst of those bear market losses is what we expect will make SMIDX a valuable long-term addition to most investor portfolios.
Conclusion
We don’t ever like trailing our benchmarks. But realistically, we know those periods will occur occasionally with Upgrading, as they do with all trend-following systems. Within the two Upgrading-based portfolios (SMIFX and SMILX), each fund’s significant allocation to foreign securities (roughly 20% of the stock portfolio) as well as small-company stocks (roughly 34% of the stock portfolio) meant that more than half of our stock money was invested in risk categories that lagged the large-company dominated market indexes during the past six months. These allocations, along with the internal rotation each risk category experienced as the transition from more-risky to less-risky holdings took place, were the specific factors that hurt the performance of our Upgrading-based funds relative to the market indexes. But we have confidence that our Upgrading strategy will have us positioned correctly more often than not, so we’re willing to endure brief transition periods as part of the process.
We appreciate the confidence you have placed in us to be a faithful steward of your assets, even as you strive to be a faithful steward of His assets.
Sincerely,

Mark Biller
Senior Portfolio Manager
The Sound Mind Investing Funds
3
PERFORMANCE RESULTS – (Unaudited)
Total Return* (For the periods ended April 30, 2014) | ||||||||||||||||||||
| Average Annual | ||||||||||||||||||||
| Three Months | Six Months | One Year | Five Year | Since Inception (December 2, 2005) | ||||||||||||||||
The Sound Mind Investing Fund | 0.59% | 4.23% | 19.79% | 16.39% | 6.88% | |||||||||||||||
S&P 500® Index** | 6.23% | 8.36% | 20.44% | 19.14% | 7.10% | |||||||||||||||
Wilshire 5000 Index** | 5.54% | 7.89% | 20.52% | 19.37% | 7.36% | |||||||||||||||
Gross Expenses 2.18% (as stated in the most recent prospectus dated February 28, 2014). Net Expenses 2.18% (as stated in the most recent prospectus dated February 28, 2014), which excludes acquired fund fees and expenses and reflects the fee waiver/expense reimbursement discussed. All expenses are reflected in performance results. The Fund’s advisor contractually has agreed to waive its fee and/or reimburse expenses to the extent necessary to maintain Total Annual Fund Operating Expenses (excluding brokerage fees and commissions; borrowing costs; any 12b-1 fees; taxes; indirect expenses, such as acquired fund fees and expenses; and extraordinary litigation expenses) at 1.50% of the Fund’s average daily net assets through February 28, 2015. This expense cap may not be terminated prior to this date except by the Board of Trustees.
Total Return* (For the periods ended April 30, 2014) | ||||||||||||||||
| Average Annual | ||||||||||||||||
| Three Months | Six Months | One Year | Since Inception (December 30, 2010) | |||||||||||||
The Sound Mind Investing Balanced Fund | 0.62% | 3.10% | 12.50% | 7.90% | ||||||||||||
S&P 500® Index** | 6.23% | 8.36% | 20.44% | 15.26% | ||||||||||||
Wilshire 5000 Index** | 5.54% | 7.89% | 20.52% | 14.93% | ||||||||||||
Barclays Capital U.S. Aggregate Bond Index** | 1.21% | 1.74% | -0.26% | 3.84% | ||||||||||||
Custom Benchmark*** | 3.80% | 5.46% | 11.90% | 10.59% | ||||||||||||
Gross Expenses 2.20% (as stated in the most recent prospectus dated February 28, 2014). Net Expenses 1.15% (as stated in the most recent prospectus dated February 28, 2014), which excludes acquired fund fees and expenses and reflects the fee waiver/expense reimbursement discussed below. All expenses are reflected in performance results. The Fund’s advisor contractually has agreed to waive its fee and/or reimburse expenses to the extent necessary to maintain Total Annual Fund Operating Expenses (excluding brokerage fees and commissions; borrowing costs; any 12b-1 fees; taxes; indirect expenses, such as acquired fund fees and expenses; and extraordinary litigation expenses) at 1.15% of the Fund’s average daily net assets through February 28, 2015. This expense cap may not be terminated prior to this date except by the Board of Trustees.
4
PERFORMANCE RESULTS – (Unaudited), (Continued)
Total Return* (For the periods ended April 30, 2014) | ||||||||||||||||
| Average Annual | ||||||||||||||||
| Three Months | Six Months | One Year | Since Inception (February 28, 2013) | |||||||||||||
The SMI Dynamic Allocation Fund | 5.46% | 3.98% | 5.33% | 11.76% | ||||||||||||
Wilshire 5000 Index** | 5.54% | 7.89% | 20.52% | 23.03% | ||||||||||||
Barclays Capital U.S. Aggregate Bond Index** | 1.21% | 1.74% | -0.26% | 0.71% | ||||||||||||
Custom Benchmark*** | 3.80% | 5.46% | 11.90% | 13.73% | ||||||||||||
Gross Expenses 1.66% (as stated in the most recent prospectus dated February 28, 2014). Net Expenses 1.66% (as stated in the most recent prospectus dated February 28, 2014), which excludes acquired fund fees and expenses and reflects the fee waiver/expense reimbursement discussed below. All expenses are reflected in performance results. The Fund’s advisor contractually has agreed to waive its fee and/or reimburse expenses to the extent necessary to maintain Total Annual Fund Operating Expenses (excluding brokerage fees and commissions; borrowing costs; any 12b-1 fees; taxes; indirect expenses, such as acquired fund fees and expenses; and extraordinary litigation expenses) at 1.45% of the Fund’s average daily net assets through February 28, 2015. This expense cap may not be terminated prior to this date except by the Board of Trustees.
The performance quoted represents past performance, which does not guarantee future results. The investment return and principal value of an investment will fluctuate so that an investor’s shares, when redeemed, may be worth more or less than their original cost. The returns shown do not reflect deduction of taxes that a shareholder would pay on Fund distributions or the redemption of Fund shares. Current performance of the Fund may be lower or higher than the performance quoted. Performance data current to the most recent month end may be obtained by calling 1-877-764-3863.
| * | Return figures reflect any change in price per share and assume the reinvestment of all distributions. |
| ** | The Standard & Poor’s 500® Index, Wilshire 5000 Index and Barclays Capital U.S. Aggregate Bond Index are unmanaged indices that assume reinvestment of all distributions and exclude the effect of taxes and fees. The Standard & Poor’s 500® Index, Wilshire 5000 Index and Barclays Capital U.S. Aggregate Bond Index are widely recognized unmanaged indices and are representative of a broader market and range of securities than is found in each Fund’s portfolio. The returns of the indices are not reduced by any fees or operating expenses. Individuals cannot invest directly in the Indices; however, an individual can invest in exchange traded funds or other investment vehicles that attempt to track the performance of a benchmark index. |
| *** | The Custom Benchmark for the Sound Mind Investing Balanced Fund and SMI Dynamic Allocation Fund is comprised of 60% Wilshire 5000 Index and 40% Barclays Capital U.S. Aggregate Bond Index. |
The Funds’ investment objectives, risks, charges and expenses must be considered carefully before investing. The prospectus contains this and other important information about the Funds and may be obtained by calling the same number as above. Please read it carefully before investing.
5
FUND HOLDINGS – (Unaudited)
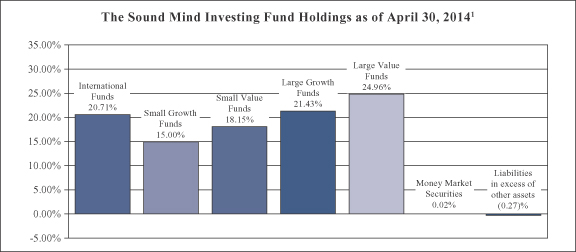
| 1 | As a percentage of net assets. |
The Sound Mind Investing Fund seeks long term capital appreciation. The Fund seeks to achieve its objective by investing in a diversified portfolio of other investment companies using a “fund upgrading” strategy. The fund upgrading investment strategy is a systematic investment approach that is based on the belief of the Fund’s adviser, SMI Advisory Services, LLC, that superior returns can be obtained by constantly monitoring the performance of a wide universe of other investment companies, and standing ready to move assets into the funds deemed by the adviser to be most attractive at the time of analysis.
6
FUND HOLDINGS – (Unaudited), (Continued)
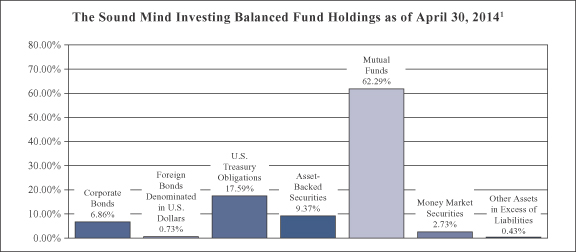
| 1 | As a percentage of net assets. |
The Sound Mind Investing Balanced Fund seeks total return. Total return is composed of both income and capital appreciation. The Fund seeks to achieve its objective by investing in a diversified portfolio of equities and fixed income securities. The Fund’s adviser determines how the Fund’s assets will be allocated between equity and fixed income securities. Under normal circumstances the Fund will target an approximate mix of 60% equity securities and 40% fixed income securities. The adviser periodically rebalances the Fund’s asset allocation in response to market conditions and to ensure an appropriate mix of elements in the Fund.
7
FUND HOLDINGS – (Unaudited), (Continued)
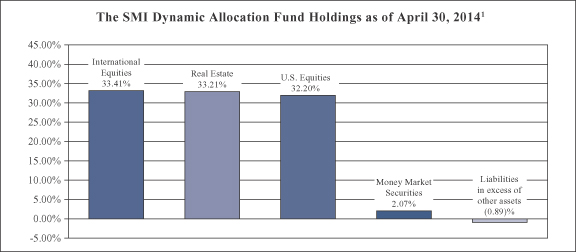
| 1 | As a percentage of net assets. |
The SMI Dynamic Allocation Fund seeks total return. Total return is composed of both income and capital appreciation. The Fund uses a dynamic asset allocation investment strategy to achieve its investment objective. This is done by investing in securities from the following six asset classes – U.S. Equities, International Equities, Fixed Income Securities, Real Estate, Precious Metals, and Cash.
Availability of Portfolio Schedule – (Unaudited)
Each Fund files its complete schedule of portfolio holdings with the Securities and Exchange Commission (“SEC”) for the first and third quarters of each fiscal year on Form N-Q. The Funds’ Forms N-Q are available at the SEC’s website at www.sec.gov. The Funds’ Forms N-Q may be reviewed and copied at the Public Reference Room in Washington DC. Information on the operation of the Public Reference Room may be obtained by calling 1-800-SEC-0330.
Summary of Fund’s Expenses – (Unaudited)
As a shareholder of one of the Funds, you incur two types of costs: (1) transaction costs (such as short-term redemption fees); and (2) ongoing costs, including management fees and other Fund expenses. This Example is intended to help you understand your ongoing costs (in dollars) of investing in the Funds and to compare these costs with the ongoing costs of investing in other mutual funds.
Each Fund’s example is based on an investment of $1,000 invested at the beginning of the period and held for the entire period (November 1, 2013 through April 30, 2014).
8
FUND HOLDINGS – (Unaudited), (Continued)
Actual Expenses
The first line of the table below provides information about actual account values and actual expenses. You may use the information in this line, together with the amount you invested, to estimate the expenses that you paid over the period. Simply divide your account value by $1,000 (for example, an $8,600 account value divided by $1,000 = 8.60), then multiply the result by the number in the first line under the heading entitled “Expenses Paid During Period” to estimate the expenses you paid on your account during this period.
Hypothetical Example for Comparison Purposes
The second line of the table below provides information about hypothetical account values and hypothetical expenses based on the Fund’s actual expense ratio and an assumed rate of return of 5% per year before expenses, which is not the Fund’s actual return. The hypothetical account values and expenses may not be used to estimate the actual ending account balance or expenses you paid for the period. You may use this information to compare the ongoing costs of investing in the Fund and other funds. To do so, compare this 5% hypothetical example with the 5% hypothetical examples that appear in the shareholder reports of the other funds.
Expenses shown are meant to highlight your ongoing costs only and do not reflect any transactional costs such as the fee imposed on short-term redemptions. Therefore, the second line of the table below is useful in comparing ongoing costs only and will not help you determine the relative costs of owning different funds. If incurred, the short-term redemption fee imposed by the Fund would increase your expenses.
The Sound Mind | Beginning Account Value November 1, 2013 | Ending Account Value April 30, 2014 | Expenses Paid During Period November 1, 2013 – April 30, 2014* | |||||||||
| Actual | $ | 1,000.00 | $ | 1,042.30 | $ | 5.57 | ||||||
| Hypothetical ** | $ | 1,000.00 | $ | 1,019.34 | $ | 5.51 | ||||||
| * | Expenses are equal to the Fund’s annualized expense ratio of 1.10%, multiplied by the average account value over the period, multiplied by 181/365 (to reflect the partial year period). |
| ** | Assumes a 5% return before expenses. |
The Sound Mind | Beginning Account Value November 1, 2013 | Ending Account Value April 30, 2014 | Expenses Paid During Period November 1, 2013 – April 30, 2014* | |||||||||
| Actual | $ | 1,000.00 | $ | 1,031.00 | $ | 5.71 | ||||||
| Hypothetical ** | $ | 1,000.00 | $ | 1,019.17 | $ | 5.68 | ||||||
| * | Expenses are equal to the Fund’s annualized expense ratio of 1.13%, multiplied by the average account value over the period, multiplied by 181/365 (to reflect the partial year period). |
| ** | Assumes a 5% return before expenses. |
9
FUND HOLDINGS – (Unaudited), (Continued)
The SMI | Beginning Account Value November 1, 2013 | Ending Account Value April 30, 2014 | Expenses Paid During Period November 1, 2013 – April 30, 2014* | |||||||||
| Actual | $ | 1,000.00 | $ | 1,039.80 | $ | 6.04 | ||||||
| Hypothetical ** | $ | 1,000.00 | $ | 1,018.87 | $ | 5.98 | ||||||
| * | Expenses are equal to the Fund’s annualized expense ratio of 1.19%, multiplied by the average account value over the period, multiplied by 181/365 (to reflect the partial year period). |
| ** | Assumes a 5% return before expenses. |
10
THE SOUND MIND INVESTING FUND
SCHEDULE OF INVESTMENTS
April 30, 2014 – (Unaudited)
| Mutual Funds 100.25% | Shares | Fair Value | ||||||
Mutual Funds Greater Than 1% of The Sound | ||||||||
American Century International Discovery Fund – Institutional Class (a) | 1,205,182 | $ | 15,908,405 | |||||
AMG Managers Skyline Special Equities Fund (a) | 355,926 | 13,777,889 | ||||||
Aston/Fairpointe Mid Cap Fund – Class I | 222,573 | 10,349,634 | ||||||
Baron Partners Fund – Institutional Class * | 260,828 | 9,157,683 | ||||||
Bogle Investment Management Small Cap Growth Fund (a) | 197,797 | 6,905,106 | ||||||
Cambiar Aggressive Value Fund – Investor Class (a) * | 314,272 | 5,594,034 | ||||||
ClearBridge Aggressive Growth Fund – Institutional Class | 56,937 | 11,600,310 | ||||||
Davis Opportunity Fund (a) | 311,230 | 10,980,183 | ||||||
DFA International Small Cap Value Portfolio – Institutional Class | 617,545 | 13,277,212 | ||||||
Dreyfus Opportunistic Midcap Value Fund – Institutional Class | 321,243 | 13,119,580 | ||||||
Federated MDT Stock Trust – Institutional Class (a) | 238,471 | 6,796,413 | ||||||
Fidelity Mid Cap Value Fund | 426,280 | 9,753,289 | ||||||
Fidelity OTC Portfolio | 152,485 | 11,594,990 | ||||||
Hotchkis and Wiley Mid-Cap Value Fund – Institutional Class | 372,913 | 15,852,531 | ||||||
Janus Contrarian Fund – Class T | 615,150 | 13,318,003 | ||||||
Legg Mason Opportunity Trust – Institutional Class (a) | 1,194,544 | 22,122,950 | ||||||
Longleaf Partners International Fund | 374,333 | 6,928,906 | ||||||
Lord Abbett Developing Growth Fund – Institutional Class | 519,413 | 14,050,120 | ||||||
Morgan Stanley Institutional Fund, Inc. – Growth Portfolio – Institutional Class | 399,750 | 14,538,903 | ||||||
Oakmark Select Fund – Institutional Class | 164,768 | 6,892,243 | ||||||
Oppenheimer International Small Co. Fund – Class Y | 501,816 | 16,454,537 | ||||||
PRIMECAP Odyssey Aggressive Growth Fund | 507,659 | 14,981,026 | ||||||
Touchstone Sands Capital Select Growth Fund – Class Y | 691,283 | 11,717,243 | ||||||
Vanguard International Explorer Fund | 224,513 | 4,290,437 | ||||||
Wasatch Small Cap Value Fund (a) * | 505,919 | 2,934,333 | ||||||
|
| |||||||
TOTAL MUTUAL FUNDS GREATER THAN 1% OF THE SOUND |
| 282,895,960 | ||||||
|
| |||||||
Mutual Funds Less Than 1% of The Sound | ||||||||
AllianzGI NFJ Dividend Value Fund – Institutional Class | 200 | 3,314 | ||||||
AllianzGI NFJ Small-Cap Value Fund – Institutional Class | 162 | 5,774 | ||||||
Artisan International Small Cap Fund – Investor Class | 150 | 4,076 | ||||||
Artisan International Value Fund – Investor Class | 150 | 5,572 | ||||||
Artisan Mid Cap Value Fund – Investor Class | 200 | 5,416 | ||||||
See accompanying notes which are an integral part of these financial statements.
11
THE SOUND MIND INVESTING FUND
SCHEDULE OF INVESTMENTS
April 30, 2014 – (Unaudited), (Continued)
| Mutual Funds 100.25% – continued | Shares | Fair Value | ||||||
Mutual Funds Less Than 1% of The Sound | �� | |||||||
Artisan Small Cap Fund – Investor Class * | 250 | $ | 6,510 | |||||
Artisan Small Cap Value Fund – Investor Class | 150 | 2,783 | ||||||
Aston TAMRO Small Cap Fund – Institutional Class | 100 | 2,157 | ||||||
BBH Core Select Fund – Class N | 100 | 2,193 | ||||||
Berwyn Fund | 100 | 3,877 | ||||||
BlackRock International Opportunities Portfolio – Institutional Class | 100 | 4,059 | ||||||
Bridgeway Small Cap Growth Fund – Class N | 205 | 3,575 | ||||||
Bridgeway Small Cap Value Fund – Class N | 179 | 3,978 | ||||||
Buffalo Small Cap Fund | 150 | 5,053 | ||||||
Columbia Acorn International – Class Z | 100 | 4,714 | ||||||
Columbia Acorn Select – Class Z | 150 | 3,965 | ||||||
Columbia Small Cap Growth I Fund – Class Z | 100 | 2,946 | ||||||
Columbia Value and Restructuring Fund – Class Z | 50 | 2,475 | ||||||
Delaware Select Growth Fund – Institutional Class | 100 | 5,087 | ||||||
Delaware Small Cap Value Fund – Institutional Class | 100 | 5,556 | ||||||
Delaware SMID Cap Growth Fund – Institutional Class | 100 | 3,302 | ||||||
Delaware Value Fund – Institutional Class | 144 | 2,419 | ||||||
DFA International Small Company Portfolio – Institutional Class | 100 | 2,003 | ||||||
DFA U.S. Small Cap Value Portfolio | 100 | 3,515 | ||||||
Dodge & Cox International Stock Fund | 54,200 | 2,426,521 | ||||||
Dodge & Cox Stock Fund | 11,026 | 1,884,604 | ||||||
Dreyfus Opportunistic Small Cap Fund | 100 | 3,498 | ||||||
DWS Dreman Small Cap Value Fund – Institutional Class | 85 | 2,347 | ||||||
Fairholme Fund | 100 | 4,090 | ||||||
FBR Focus Fund – Investor Class * | 100 | 6,390 | ||||||
Fidelity International Small Cap Fund | 53,331 | 1,424,481 | ||||||
Fidelity Mid-Cap Stock Fund | 150 | 6,039 | ||||||
Fidelity Small Cap Discovery Fund | 100 | 3,077 | ||||||
Fidelity Small Cap Stock Fund | 150 | 3,125 | ||||||
Fidelity Small Cap Value Fund – Institutional Class | 150 | 2,961 | ||||||
Franklin Small Cap Value Fund – Advisor Class | 100 | 6,105 | ||||||
Hartford International Opportunities Fund/The – Class Y | 248 | 4,463 | ||||||
Heartland Value Fund | 100 | 4,972 | ||||||
Invesco American Value R5 Fund | 100 | 4,028 | ||||||
Janus Overseas Fund – Class T | 100 | 3,551 | ||||||
Janus Venture Fund – Class T | 100 | 6,174 | ||||||
See accompanying notes which are an integral part of these financial statements.
12
THE SOUND MIND INVESTING FUND
SCHEDULE OF INVESTMENTS
April 30, 2014 – (Unaudited), (Continued)
| Mutual Funds 100.25% – continued | Shares | Fair Value | ||||||
Mutual Funds Less Than 1% of The Sound | ||||||||
JPMorgan Mid Cap Value Fund – Institutional Class | 100 | $ | 3,618 | |||||
JPMorgan Small Cap Equity Fund – Class S | 226 | 11,149 | ||||||
Kinetics Small Cap Opportunities Fund – Institutional Class * | 70,036 | 2,801,445 | ||||||
Longleaf Partners Fund | 150 | 5,202 | ||||||
Longleaf Partners Small-Cap Fund | 100 | 3,411 | ||||||
Morgan Stanley Institutional Fund, Inc. – International Small Cap Portfolio – Institutional Class | 36 | 538 | ||||||
Neuberger Berman Genesis Fund – Institutional Class | 100 | 5,939 | ||||||
Oakmark International Fund – Institutional Class | 150 | 4,017 | ||||||
Oakmark International Small Cap Fund – Institutional Class | 150 | 2,691 | ||||||
Oppenheimer Small and Mid Cap Value Fund – Class Y | 100 | 4,631 | ||||||
Perkins Mid Cap Value Fund – Class T | 200 | 4,754 | ||||||
Principal SmallCap Growth Fund I – Institutional Class | 200 | 2,668 | ||||||
Royce Low-Priced Stock Fund – Investment Class | 150 | 2,113 | ||||||
Royce Opportunity Fund – Investor Class | 151 | 2,353 | ||||||
Royce Premier Fund – Investor Class | 300 | 6,777 | ||||||
Royce Special Equity Fund – Investor Class | 100 | 2,401 | ||||||
Royce Special Equity Fund – Institutional Class | 150 | 3,582 | ||||||
Royce Value Fund – Institutional Class | 100 | 1,349 | ||||||
Sterling Capital Special Opportunities Fund | 108,803 | 2,452,412 | ||||||
T. Rowe Price International Discovery Fund | 150 | 8,553 | ||||||
T. Rowe Price New Horizons Fund | 100 | 4,417 | ||||||
T. Rowe Price Small-Cap Value Fund | 100 | 4,963 | ||||||
TIAA-CREF International Equity Fund – Institutional Class | 100 | 1,185 | ||||||
Tweedy Browne Global Value Fund | 150 | 4,112 | ||||||
Vanguard Strategic Equity Fund – Investor Class | 100 | 3,110 | ||||||
Wasatch Emerging Markets Small Cap Fund | 1,000 | 2,610 | ||||||
Wasatch International Growth Fund | 150 | 4,212 | ||||||
|
| |||||||
TOTAL MUTUAL FUNDS LESS THAN 1% OF THE SOUND |
| 11,244,957 | ||||||
|
| |||||||
TOTAL MUTUAL FUNDS (Cost $265,855,344) | 294,140,917 | |||||||
|
| |||||||
See accompanying notes which are an integral part of these financial statements.
13
THE SOUND MIND INVESTING FUND
SCHEDULE OF INVESTMENTS
April 30, 2014 – (Unaudited), (Continued)
| Money Market Securities – 0.02% | Shares | Fair Value | ||||||
Fidelity Institutional Money Market Portfolio – Institutional Class, 0.090% (c) | 66,584 | $ | 66,584 | |||||
|
| |||||||
TOTAL MONEY MARKET SECURITIES (Cost $66,584) | 66,584 | |||||||
|
| |||||||
TOTAL INVESTMENTS – 100.27% (Cost $265,921,928) | $ | 294,207,501 | ||||||
|
| |||||||
Liabilities in excess of other assets – (0.27)% | (793,868 | ) | ||||||
|
| |||||||
TOTAL NET ASSETS – 100.00% | $ | 293,413,633 | ||||||
|
| |||||||
| (a) | A portion of this security may be deemed illiquid due to the Investment Company Act of 1940 provision stating that no issuer of any investment company security purchased or acquired by a registered investment company shall be obligated to redeem such security in an amount exceeding 1 per centum of such issuer’s total outstanding shares during any period of less than thirty days. |
| (b) | Small investments are occasionally retained in mutual funds that are closed to new investment, or in the manager’s opinion are at risk to close, so as to allow the Fund the flexibility to reinvest in these funds in the future. |
| (c) | Rate disclosed is the seven day yield as of April 30, 2014. |
| * | Non-income producing security. |
See accompanying notes which are an integral part of these financial statements.
14
THE SOUND MIND INVESTING BALANCED FUND
SCHEDULE OF INVESTMENTS
April 30, 2014 – (Unaudited)
| Corporate Bonds – 6.86% | Principal Amount | Fair Value | ||||||
Ally Financial, Inc., 3.125%, 1/15/2016 | $ | 25,000 | $ | 25,687 | ||||
Ally Financial, Inc., 5.500%, 2/15/2017 | 55,000 | 59,916 | ||||||
American Honda Finance Corp., 1.125%, 10/7/2016 | 80,000 | 80,674 | ||||||
American International Group, Inc., 5.050%, 10/1/2015 | 70,000 | 74,248 | ||||||
American International Group, Inc., 4.875%, 9/15/2016 | 65,000 | 70,761 | ||||||
American International Group, Inc., 3.800%, 3/22/2017 | 70,000 | 74,934 | ||||||
American International Group, Inc., 6.400%, 12/15/2020 | 50,000 | 60,438 | ||||||
Bank of America Corp., 4.500%, 4/1/2015 | 200,000 | 207,045 | ||||||
Bank of America Corp., 1.500%, 10/9/2015 | 160,000 | 161,579 | ||||||
Citigroup, Inc., 1.350%, 3/10/2017 | 55,000 | 54,849 | ||||||
Daimler Finance North America LLC, 1.250%, 1/11/2016 (a) | 90,000 | 90,761 | ||||||
Entergy Texas, Inc., 3.600%, 6/1/2015 | 55,000 | 56,651 | ||||||
Ford Motor Credit Co. LLC, 3.875%, 1/15/2015 | 100,000 | 102,323 | ||||||
Ford Motor Credit Co. LLC, 3.984%, 6/15/2016 (a) | 65,000 | 68,033 | ||||||
Ford Motor Credit Co. LLC, 4.250%, 2/3/2017 | 90,000 | 96,884 | ||||||
Ford Motor Credit Co. LLC, 5.000%, 5/15/2018 | 140,000 | 155,569 | ||||||
Ford Motor Credit Co. LLC, 4.375%, 8/6/2023 | 55,000 | 57,740 | ||||||
General Electric Capital Corp., 1.000%, 12/11/2015 | 90,000 | 90,711 | ||||||
General Electric Capital Corp., 1.000%, 1/8/2016 | 90,000 | 90,639 | ||||||
Goldman Sachs Group, Inc./The, 3.700%, 8/1/2015 | 45,000 | 46,632 | ||||||
Goldman Sachs Group, Inc./The, 1.600%, 11/23/2015 | 85,000 | 85,923 | ||||||
Goldman Sachs Group, Inc./The, 1.425%, 4/30/2018 (b) | 85,000 | 86,286 | ||||||
Hartford Financial Services Group, Inc., 5.500%, 10/15/2016 | 60,000 | 66,283 | ||||||
Hartford Financial Services Group, Inc., 5.375%, 3/15/2017 | 65,000 | 71,933 | ||||||
JPMorgan Chase & Co., 0.854%, 2/26/2016 (b) | 75,000 | 75,428 | ||||||
JPMorgan Chase & Co., 3.250%, 9/23/2022 | 55,000 | 54,443 | ||||||
Liberty Mutual Group, Inc., 6.700%, 8/15/2016 (a) | 25,000 | 28,036 | ||||||
Morgan Stanley, 1.485%, 2/25/2016 (b) | 40,000 | 40,593 | ||||||
|
| |||||||
TOTAL CORPORATE BONDS (Cost $2,161,260) | 2,234,999 | |||||||
|
| |||||||
Foreign Bonds Denominated in U.S. Dollars – 0.73% | ||||||||
ING Bank NV, 3.750%, 3/7/2017 (a) | 165,000 | 175,665 | ||||||
Petrobras Global Finance BV, 2.366%, 1/15/2019 (b) | 35,000 | 34,860 | ||||||
Petroleos Mexicanos, 3.500%, 7/18/2018 | 25,000 | 25,969 | ||||||
|
| |||||||
TOTAL FOREIGN BONDS DENOMINATED | 236,494 | |||||||
|
| |||||||
See accompanying notes which are an integral part of these financial statements.
15
THE SOUND MIND INVESTING BALANCED FUND
SCHEDULE OF INVESTMENTS
April 30, 2014 – (Unaudited), (Continued)
| U.S. Treasury Obligations – 17.59% | Principal Amount | Fair Value | ||||||
U.S. Treasury Note, 0.250%, 3/31/2015 | $ | 2,330,000 | $ | 2,333,504 | ||||
U.S. Treasury Note, 0.250%, 5/31/2015 | 2,680,000 | 2,683,926 | ||||||
U.S. Treasury Note, 1.500%, 1/31/2019 | 715,000 | 711,202 | ||||||
|
| |||||||
TOTAL U.S. TREASURY OBLIGATIONS (Cost $5,726,373) | 5,728,632 | |||||||
|
| |||||||
Asset-Backed Securities – 9.37% | ||||||||
American Airlines Pass Through Trust, | 24,364 | 26,313 | ||||||
Banc of America Merrill Lynch Commercial Mortgage, Inc., Series 2006-3, 5.889%, 7/10/2044 (b) | 63,883 | 69,299 | ||||||
Burlington Northern and Santa Fe Railway Co. Pass Through Trust, Series 2004-1, 4.575%, 1/15/2021 | 57,101 | 61,614 | ||||||
Burlington Northern and Santa Fe Railway Co. Pass Through Trust, Series 2001-2, 6.462%, 1/15/2021 | 22,452 | 25,505 | ||||||
Burlington Northern and Santa Fe Railway Co. Pass Through Trust, Series 2005-4, 4.967%, 4/1/2023 | 16,918 | 18,411 | ||||||
Citigroup Commercial Mortgage Trust, | 35,890 | 35,801 | ||||||
Commercial Mortgage Pass Through Certificates, 0.666%, 10/15/2045 | 25,731 | 25,632 | ||||||
Commercial Mortgage Trust, | 30,000 | 32,859 | ||||||
Conseco Financial Corp., 7.600%, 4/15/2026 (b) | 36,801 | 32,012 | ||||||
Countrywide Asset-Backed Certificates, 0.372%, 10/25/2036 (b) | 16,292 | 15,849 | ||||||
Credit Suisse First Boston Mortgage Securities Corp., | 704 | 707 | ||||||
Credit Suisse Mortgage Capital Certificates, | 13,979 | 14,655 | ||||||
DBRR Trust, Series 2012-EZ1, Class A, 0.946%, 9/25/2045 (a) | 49,558 | 49,562 | ||||||
Delta Air Lines Pass Through Trust, | 29,277 | 34,474 | ||||||
Fannie Mae, Pool # 465468, 3.330%, 7/1/2020 | 74,321 | 79,420 | ||||||
Fannie Mae, Pool # 466284, 3.330%, 10/1/2020 | 89,942 | 94,500 | ||||||
Fannie Mae, Pool # 466890, 3.230%, 11/1/2020 | 89,533 | 93,623 | ||||||
Fannie Mae, Pool # AM2182, 2.160%, 1/1/2023 | 151,242 | 144,020 | ||||||
Fannie Mae, Pool # AA4328, 4.000%, 4/1/2024 | 37,929 | 40,357 | ||||||
Fannie Mae, Pool # AB2822, 2.500%, 3/1/2026 | 29,547 | 29,814 | ||||||
Fannie Mae, Pool # AM1671, 2.100%, 12/1/2027 | 55,840 | 53,092 | ||||||
Fannie Mae, Pool # MA1604, 2.000%, 7/1/2028 | 52,205 | 50,834 | ||||||
See accompanying notes which are an integral part of these financial statements.
16
THE SOUND MIND INVESTING BALANCED FUND
SCHEDULE OF INVESTMENTS
April 30, 2014 – (Unaudited), (Continued)
| Asset-Backed Securities – 9.37% – continued | Principal Amount | Fair Value | ||||||
Fannie Mae, Pool # 464398, 5.970%, 1/1/2040 | $ | 19,083 | $ | 21,521 | ||||
Fannie Mae, Pool # 464400, 5.970%, 1/1/2040 | 14,312 | 16,140 | ||||||
Fannie Mae, Pool # 466890, 5.100%, 12/1/2040 | 23,978 | 25,874 | ||||||
Fannie Mae REMICS, Series 2004-67, Class VC, 4.500%, 2/25/2025 | 14,936 | 15,061 | ||||||
Fannie Mae REMICS, 4.000%, 2/25/2033 | 94,446 | 94,223 | ||||||
Fannie Mae-Aces, Series 2013-M5, Class ASQ2, 0.595%, 8/25/2015 | 111,952 | 112,214 | ||||||
Fannie Mae-Aces, 0.478%, 9/25/2015 (b) | 130,000 | 130,102 | ||||||
Fannie Mae-Aces, 2.325%, 7/25/2023 (b) | 78,371 | 78,940 | ||||||
Freddie Mac REMICS, Series 3609, Class LA, 4.000%, 12/15/2024 | 54,210 | 57,126 | ||||||
Freddie Mac REMICS, Series 3873, Class DG, 3.000%, 7/15/2027 | 13,288 | 13,658 | ||||||
GE Capital Commercial Mortgage Corp., | 1,552 | 1,553 | ||||||
Ginnie Mae, Pool # AB2583, 2.140%, 8/15/2023 | 87,678 | 86,833 | ||||||
Ginnie Mae, Pool # AD0091, 2.730%, 6/15/2032 | 226,500 | 220,160 | ||||||
GS Mortgage Securities Corp. II, | 40,118 | 39,988 | ||||||
GS Mortgage Securities Trust, | 91,095 | 101,277 | ||||||
Hertz Vehicle Financing LLC, | 110,000 | 111,164 | ||||||
Hertz Vehicle Financing LLC, | 90,000 | 90,132 | ||||||
Home Equity Loan Trust, | 9,865 | 9,173 | ||||||
Home Equity Mortgage Trust, | 28,690 | 24,581 | ||||||
JPMBB Commercial Mortgage Securities Trust, | 120,105 | 120,689 | ||||||
JPMorgan Chase Commercial Mortgage Securities Trust, Series 2012-C8, Class A1, 0.705%, 10/15/2045 | 32,290 | 32,307 | ||||||
Mid-State Trust, Series 11, Class A1, 4.864%, 7/15/2038 | 16,009 | 17,206 | ||||||
Morgan Stanley Bank of America Merrill Lynch Trust, | 32,724 | 32,626 | ||||||
MSCC Heloc Trust, Series 2007-1, Class A, 0.252%, 12/25/2031 (b) | 70,556 | 65,993 | ||||||
Northwest Airlines Pass Through Trust, | 42,350 | 48,279 | ||||||
Structured Asset Securities Corp. Mortgage Loan Trust, | 528 | 528 | ||||||
See accompanying notes which are an integral part of these financial statements.
17
THE SOUND MIND INVESTING BALANCED FUND
SCHEDULE OF INVESTMENTS
April 30, 2014 – (Unaudited), (Continued)
| Asset-Backed Securities – 9.37% – continued | Principal Amount or Shares | Fair Value | ||||||
Structured Asset Securities Corp. Mortgage Loan Trust, | $ | 18,003 | $ | 17,467 | ||||
Structured Asset Securities Corp. Mortgage Loan Trust, | 59,940 | 40,022 | ||||||
UBS-Barclays Commercial Mortgage Trust, 0.726%, 8/10/2049 | 49,725 | 49,403 | ||||||
Union Pacific Railroad Co. 2003 Pass Through Trust, | 9,631 | 10,328 | ||||||
Union Pacific Railroad Co. 2004 Pass Through Trust, | 61,683 | 66,917 | ||||||
Union Pacific Railroad Co. 2005 Pass Through Trust, | 44,936 | 49,547 | ||||||
Union Pacific Railroad Co. 2006 Pass Through Trust, | 27,346 | 31,569 | ||||||
US Airways Pass 2011-1 Through Trust, Series A, 7.125%, 10/22/2023 | 25,393 | 29,456 | ||||||
US Airways Pass 2012-1 Through Trust, Series A, 5.900%, 10/1/2024 | 46,355 | 51,802 | ||||||
Wells Fargo Commercial Mortgage Trust, | 65,133 | 65,016 | ||||||
WF-RBS Commercial Mortgage Trust, | 44,644 | 44,572 | ||||||
|
| |||||||
TOTAL ASSET-BACKED SECURITIES (Cost $2,979,464) | 3,051,800 | |||||||
|
| |||||||
Mutual Funds – 62.29% | ||||||||
American Century International Discovery Fund | 68,925 | 909,808 | ||||||
AMG Managers Skyline Special Equities Fund | 20,351 | 787,786 | ||||||
Bogle Investment Management Small Cap Growth Fund | 27,219 | 950,204 | ||||||
Cambiar Aggressive Value Fund * | 71,408 | 1,271,065 | ||||||
Davis Opportunity Fund | 6,896 | 243,299 | ||||||
DFA International Small Cap Value Portfolio | 52,444 | 1,127,538 | ||||||
Dreyfus Opportunistic Midcap Value Fund – Institutional Class | 19,887 | 812,176 | ||||||
Federated MDT Stock Trust | 40,279 | 1,147,944 | ||||||
Fidelity International Small Cap Fund | 100 | �� | 2,671 | |||||
Fidelity OTC Portfolio | 14,098 | 1,072,008 | ||||||
Hotchkis and Wiley Mid-Cap Value Fund – Institutional Class | 19,210 | 816,637 | ||||||
Janus Contrarian Fund – Class T | 45,304 | 980,829 | ||||||
Kinetics Small Cap Opportunities Fund – Institutional Class * | 34,621 | 1,384,839 | ||||||
Legg Mason Opportunity Trust – Institutional Class | 97,679 | 1,809,022 | ||||||
Longleaf Partners Small-Cap Fund | 89 | 3,019 | ||||||
See accompanying notes which are an integral part of these financial statements.
18
THE SOUND MIND INVESTING BALANCED FUND
SCHEDULE OF INVESTMENTS
April 30, 2014 – (Unaudited), (Continued)
| Mutual Funds – 62.29% – continued | Shares | Fair Value | ||||||
Lord Abbett Developing Growth Fund – Institutional Class | 28,033 | $ | 758,294 | |||||
Morgan Stanley Institutional Fund, Inc. – Growth Portfolio | 29,571 | 1,075,489 | ||||||
Oakmark International Fund – Institutional Class | 100 | 2,678 | ||||||
Oberweis Micro-Cap Fund (c) * | 46,686 | 893,095 | ||||||
Oppenheimer International Small Co. Fund – Class Y | 33,227 | 1,089,512 | ||||||
PRIMECAP Odyssey Aggressive Growth Fund | 33,558 | 990,286 | ||||||
Scout Unconstrained Bond Fund – Institutional Class | 29,586 | 347,337 | ||||||
Sterling Capital Special Opportunities Fund – Institutional Class | 7,381 | 166,369 | ||||||
Touchstone Sands Capital Select Growth Fund – Class Y | 31,667 | 536,759 | ||||||
Vanguard International Explorer Fund | 57,742 | 1,103,445 | ||||||
Wasatch Emerging Markets Small Cap Fund | 700 | 1,827 | ||||||
|
| |||||||
TOTAL MUTUAL FUNDS (Cost $18,594,669) | 20,283,936 | |||||||
|
| |||||||
Money Market Securities – 2.73% | ||||||||
Fidelity Institutional Money Market Portfolio – Institutional Class, 0.09% (d) | 888,025 | 888,025 | ||||||
|
| |||||||
TOTAL MONEY MARKET SECURITIES (Cost $888,025) | 888,025 | |||||||
|
| |||||||
TOTAL INVESTMENTS – 99.57% (Cost $30,574,303) | $ | 32,423,886 | ||||||
|
| |||||||
Other assets in excess of liabilities – 0.43% | 140,476 | |||||||
|
| |||||||
TOTAL NET ASSETS – 100.00% | $ | 32,564,362 | ||||||
|
| |||||||
| (a) | Security exempt from registration under Rule 144A or Section 4(2) of the Securities Act of 1933. The security may be resold in transactions exempt from registration, normally to qualified institutional buyers. |
| (b) | Variable or Floating Rate Security. Rate disclosed is as of April 30, 2014. |
| (c) | A portion of this security may be deemed illiquid due to the Investment Company Act of 1940 provision stating that no issuer of any investment company security purchased or acquired by a registered investment company shall be obligated to redeem such security in an amount exceeding 1 per centum of such issuer’s total outstanding shares during any period of less than thirty days. |
| (d) | Rate disclosed is the seven day yield as of April 30, 2014. |
| * | Non-income producing security. |
Centrally Cleared Credit | Name | Acquisition Date | Maturity Date | Implied Credit Spread at April 30, 2014 (f) | Notional Amount (g) | Appreciation/ (Depreciation) | ||||||||||||
CDX North America Investment Grade Credit Default Swap Index | Markit CDX. NA. IG. 22 | 4/15/2014 | 6/20/2019 | 0.64 | % | $ | 610,000 | $ | 1,243 | |||||||||
|
|
|
| |||||||||||||||
(Markit CDX. NA. IG. 22) contract to pay a premium equal to 1% of the notional amount. | ||||||||||||||||||
See accompanying notes which are an integral part of these financial statements.
19
THE SOUND MIND INVESTING BALANCED FUND
SCHEDULE OF INVESTMENTS
April 30, 2014 – (Unaudited), (Continued)
| (e) | When a credit event occurs as defined under the terms of the swap contract, the Fund as a buyer of credit protection will either (i) receive a net amount equal to the par value of the defaulted reference entity and deliver the reference entity or (ii) receive a net amount equal to the par value of the defaulted reference entity less its recovery value. |
| (f) | Implied credit spread, represented in absolute terms, utilized in determining the market value of the credit default swap contracts as of period will serve as an indicator of the payment/performance risk and represent the likelihood of risk of default for the credit derivative. The implied credit spread of a referenced entity reflects the cost of buying/selling protection and may include upfront payments required to be made to enter into the contract. Generally, wider credit spreads represent a perceived deterioration of the referenced entity’s credit soundness and a greater likelihood or risk of default or other credit event occurring as defined under the terms of the swap contract. |
| (g) | The notional amount represents the maximum potential the Fund may receive as a buyer of credit protection if a credit event occurs, as defined under the terms of the swap contract, for each security included in the CDX North America Investment Grade Index. |
See accompanying notes which are an integral part of these financial statements.
20
THE SMI DYNAMIC ALLOCATION FUND
SCHEDULE OF INVESTMENTS
April 30, 2014 – (Unaudited)
| Exchange-Traded Funds – 95.67% | Shares | Fair Value | ||||||
Health Care Select Sector SPDR Fund | 37,930 | $ | 2,204,492 | |||||
iShares MSCI EAFE ETF (b) | 428,380 | 29,266,922 | ||||||
iShares MSCI France ETF | 39,260 | 1,179,371 | ||||||
iShares MSCI Germany Fund | 35,840 | 1,135,411 | ||||||
iShares MSCI Italy Capped ETF | 70,190 | 1,266,228 | ||||||
iShares MSCI Netherlands ETF | 43,870 | 1,127,898 | ||||||
iShares MSCI Spain Capped ETF | 28,390 | 1,191,528 | ||||||
iShares MSCI Switzerland Capped ETF | 33,680 | 1,179,810 | ||||||
iShares U.S. Technology ETF | 21,620 | 1,964,826 | ||||||
SPDR S&P 500 ETF Trust (b) | 145,605 | 27,436,350 | ||||||
Vanguard REIT ETF (b) | 495,370 | 36,132,288 | ||||||
|
| |||||||
TOTAL EXCHANGE-TRADED FUNDS (Cost $96,978,903) | 104,085,124 | |||||||
|
| |||||||
Mutual Funds – 3.15% | ||||||||
Fidelity Select Electronics Portfolio | 49,217 | 3,425,030 | ||||||
|
| |||||||
TOTAL MUTUAL FUNDS (Cost $3,515,000) | 3,425,030 | |||||||
|
| |||||||
Money Market Securities – 2.07% | ||||||||
Fidelity Institutional Money Market Portfolio – Institutional Class, 0.09% (a) | 2,250,479 | 2,250,479 | ||||||
|
| |||||||
TOTAL MONEY MARKET SECURITIES (Cost $2,250,479) | 2,250,479 | |||||||
|
| |||||||
TOTAL INVESTMENTS – 100.89% (Cost $102,744,382) | $ | 109,760,633 | ||||||
|
| |||||||
Liabilities in excess of other assets – (0.89)% | (963,905 | ) | ||||||
|
| |||||||
TOTAL NET ASSETS – 100.00% | $ | 108,796,728 | ||||||
|
| |||||||
| (a) | Rate disclosed is the seven day yield as of April 30, 2014. |
| (b) | For a schedule of each Fund’s holdings please refer to each Fund’s most recent semi annual or annual report filed at www.sec.gov. |
| ETF | – Exchange-Traded Fund |
See accompanying notes which are an integral part of these financial statements.
21
THE SOUND MIND INVESTING FUNDS
STATEMENTS OF ASSETS AND LIABILITIES
April 30, 2014 – (Unaudited)
| The Sound Mind Investing Fund | The Sound Mind Investing Balanced Fund | The SMI Dynamic Allocation Fund | ||||||||||
Assets | ||||||||||||
Investment in securities: | ||||||||||||
At cost | $ | 265,921,928 | $ | 30,574,303 | $ | 102,744,382 | ||||||
|
|
|
|
|
| |||||||
At fair value | $ | 294,207,501 | $ | 32,423,886 | $ | 109,760,633 | ||||||
Receivable for investments sold | 1,504,165 | 239,097 | — | |||||||||
Receivable for fund shares sold | 261,289 | 113,523 | 1,308,763 | |||||||||
Dividend and interest receivable | 25 | 33,466 | 109 | |||||||||
Receivable for variation margin on swap contracts | — | 408 | — | |||||||||
Segregated cash collateral for outstanding swap contracts | — | 10,251 | — | |||||||||
Prepaid expenses | 15,274 | 12,233 | 42,418 | |||||||||
|
|
|
|
|
| |||||||
Total assets | 295,988,254 | 32,832,864 | 111,111,923 | |||||||||
|
|
|
|
|
| |||||||
Liabilities | ||||||||||||
Cash overdraft | — | 119,633 | — | |||||||||
Payable for investments purchased | 750,000 | — | 2,201,695 | |||||||||
Payable for fund shares redeemed | 1,505,848 | 91,624 | 9,405 | |||||||||
Payable to Adviser | 242,942 | 22,073 | 82,903 | |||||||||
Payable to administrator, fund accountant, and transfer agent | 35,657 | 11,693 | 7,248 | |||||||||
Payable to custodian | 8,385 | 3,908 | 3,497 | |||||||||
Payable to trustees | 479 | 900 | 596 | |||||||||
Other accrued expenses | 31,310 | 18,671 | 9,851 | |||||||||
|
|
|
|
|
| |||||||
Total liabilities | 2,574,621 | 268,502 | 2,315,195 | |||||||||
|
|
|
|
|
| |||||||
Net Assets | $ | 293,413,633 | $ | 32,564,362 | $ | 108,796,728 | ||||||
|
|
|
|
|
| |||||||
Net Assets consist of: | ||||||||||||
Paid-in capital | $ | 230,546,307 | $ | 28,187,114 | $ | 102,985,187 | ||||||
Accumulated undistributed net investment (loss) | (2,016,775 | ) | (177,476 | ) | (345,530 | ) | ||||||
Accumulated undistributed net realized gain (loss) from investment transactions | 36,598,528 | 2,703,898 | (859,180 | ) | ||||||||
Net unrealized appreciation on: | ||||||||||||
Investments | 28,285,573 | 1,849,583 | 7,016,251 | |||||||||
Swap contracts | — | 1,243 | — | |||||||||
|
|
|
|
|
| |||||||
Net Assets | $ | 293,413,633 | $ | 32,564,362 | $ | 108,796,728 | ||||||
|
|
|
|
|
| |||||||
Shares outstanding (unlimited number of shares authorized, no par value) | 21,693,009 | 2,864,252 | 9,714,261 | |||||||||
|
|
|
|
|
| |||||||
Net Asset Value (“NAV”) and offering price per share | $ | 13.53 | $ | 11.37 | $ | 11.20 | ||||||
|
|
|
|
|
| |||||||
Redemption price per share (NAV * 98%) (a) | $ | 13.26 | $ | 11.14 | $ | 10.98 | ||||||
|
|
|
|
|
| |||||||
| (a) | The Funds charge a 2% redemption fee on shares redeemed within 60 days of purchase. Shares are redeemed at the NAV if held longer than 60 days. |
See accompanying notes which are an integral part of these financial statements.
22
THE SOUND MIND INVESTING FUNDS
STATEMENTS OF OPERATIONS
For the six months ended April 30, 2014 – (Unaudited)
| The Sound Mind Investing Fund | The Sound Mind Investing Balanced Fund | The SMI Dynamic Allocation Fund | ||||||||||
Investment Income | ||||||||||||
Dividend income | $ | 1,716,735 | $ | 72,004 | $ | 1,139,457 | ||||||
Interest income | — | 116,379 | — | |||||||||
|
|
|
|
|
| |||||||
Total Investment Income | 1,716,735 | 188,383 | 1,139,457 | |||||||||
|
|
|
|
|
| |||||||
Expenses | ||||||||||||
Investment Adviser | 1,477,099 | 141,711 | 426,525 | |||||||||
Administration | 55,645 | 5,032 | 14,096 | |||||||||
Fund accounting | 29,613 | 1,661 | 6,937 | |||||||||
Transfer agent | 35,437 | 9,179 | 13,983 | |||||||||
Legal | 8,097 | 8,632 | 8,790 | |||||||||
Registration | 16,111 | 11,908 | 11,107 | |||||||||
Custodian | 11,759 | 4,856 | 4,502 | |||||||||
Audit | 7,052 | 8,926 | 9,686 | |||||||||
Trustee | 3,285 | 3,285 | 2,490 | |||||||||
CCO | 1,844 | 1,844 | 1,124 | |||||||||
Miscellaneous | 37,038 | 14,723 | 11,664 | |||||||||
|
|
|
|
|
| |||||||
Total Expenses | 1,682,980 | 211,757 | 510,904 | |||||||||
Fees waived by Adviser | — | (30,559 | ) | — | ||||||||
Other expense reductions (a) | (28,486 | ) | (2,455 | ) | — | |||||||
|
|
|
|
|
| |||||||
Net Operating Expenses | 1,654,494 | 178,743 | 510,904 | |||||||||
|
|
|
|
|
| |||||||
Net Investment Income | 62,241 | 9,640 | 628,553 | |||||||||
|
|
|
|
|
| |||||||
Net Realized and Unrealized Gain (Loss) on Investments and Swap Contracts | ||||||||||||
Long term capital gain dividends from investment companies | $ | 6,981,522 | $ | 475,604 | $ | 338,947 | ||||||
Net realized gain on investment transactions | 30,566,747 | 2,228,979 | 517,878 | |||||||||
Net change in unrealized appreciation (depreciation) on investments | (25,407,876 | ) | (1,838,595 | ) | 2,351,190 | |||||||
Net change in unrealized appreciation on swap contracts | — | 1,243 | — | |||||||||
|
|
|
|
|
| |||||||
Net realized and unrealized gain on investments and swap contracts | 12,140,393 | 867,231 | 3,208,015 | |||||||||
|
|
|
|
|
| |||||||
Net increase in net assets resulting from operations | $ | 12,202,634 | $ | 876,871 | $ | 3,836,568 | ||||||
|
|
|
|
|
| |||||||
| (a) | Certain funds in which the Fund invests refund a portion of the distribution fee charged. |
See accompanying notes which are an integral part of these financial statements.
23
THE SOUND MIND INVESTING FUND
STATEMENTS OF CHANGES IN NET ASSETS
| For the six months ended April 30, 2014 (Unaudited) | Year ended October 31, 2013 | |||||||
Increase in Net Assets due to: | ||||||||
Operations | ||||||||
Net investment income (loss) | $ | 62,241 | $ | (1,093,921 | ) | |||
Long term capital gain dividends from investment companies | 6,981,522 | 2,086,102 | ||||||
Net realized gain on investment transactions | 30,566,747 | 29,446,203 | ||||||
Net change in unrealized appreciation (depreciation) on investments | (25,407,876 | ) | 46,265,588 | |||||
|
|
|
| |||||
Net increase in net assets resulting from operations | 12,202,634 | 76,703,972 | ||||||
|
|
|
| |||||
Distributions | ||||||||
From net investment income | (985,095 | ) | (8,906 | ) | ||||
From net realized gains | (30,426,944 | ) | (11,101,278 | ) | ||||
|
|
|
| |||||
Total distributions | (31,412,039 | ) | (11,110,184 | ) | ||||
|
|
|
| |||||
Capital Transactions | ||||||||
Proceeds from shares sold | 21,696,113 | 28,410,260 | ||||||
Proceeds from redemption fees (a) | 5,632 | 3,705 | ||||||
Reinvestment of distributions | 30,865,319 | 10,902,326 | ||||||
Amount paid for shares redeemed | (32,979,360 | ) | (83,966,360 | ) | ||||
|
|
|
| |||||
Net increase (decrease) in net assets resulting from capital transactions | 19,587,704 | (44,650,069 | ) | |||||
|
|
|
| |||||
Total Increase in Net Assets | 378,299 | 20,943,719 | ||||||
|
|
|
| |||||
Net Assets | ||||||||
Beginning of period | 293,035,334 | 272,091,615 | ||||||
|
|
|
| |||||
End of period | $ | 293,413,633 | $ | 293,035,334 | ||||
|
|
|
| |||||
Accumulated net investment loss | $ | (2,016,775 | ) | $ | (1,093,921 | ) | ||
|
|
|
| |||||
Share Transactions | ||||||||
Shares sold | 1,548,561 | 2,233,548 | ||||||
Shares issued in reinvestment of distributions | 2,266,176 | 968,235 | ||||||
Shares redeemed | (2,373,628 | ) | (6,893,624 | ) | ||||
|
|
|
| |||||
Net increase (decrease) in share transactions | 1,441,109 | (3,691,841 | ) | |||||
|
|
|
| |||||
| (a) | The Fund charges a 2% redemption fee on shares redeemed within 60 days of purchase. Shares are redeemed at the NAV if held longer than 60 days. |
See accompanying notes which are an integral part of these financial statements.
24
THE SOUND MIND INVESTING BALANCED FUND
STATEMENTS OF CHANGES IN NET ASSETS
| For the six months ended April 30, 2014 (Unaudited) | Year ended October 31, 2013 | |||||||
Increase (decrease) in Net Assets due to: | ||||||||
Operations | ||||||||
Net investment income (loss) | $ | 9,640 | $ | (18,965 | ) | |||
Long term capital gain dividends from investment companies | 475,604 | 136,250 | ||||||
Net realized gain on investment transactions and swap contracts | 2,228,979 | 2,823,594 | ||||||
Net change in unrealized appreciation (depreciation) on investments and swap contracts | (1,837,352 | ) | 2,910,633 | |||||
|
|
|
| |||||
Net increase in net assets resulting from operations | 876,871 | 5,851,512 | ||||||
|
|
|
| |||||
Distributions | ||||||||
From net investment income | (139,586 | ) | (87,797 | ) | ||||
From net realized gains | (2,841,565 | ) | (576,661 | ) | ||||
|
|
|
| |||||
Total distributions | (2,981,151 | ) | (664,458 | ) | ||||
|
|
|
| |||||
Capital Transactions | ||||||||
Proceeds from shares sold | 5,469,543 | 8,796,270 | ||||||
Proceeds from redemption fees (a) | 759 | 5,091 | ||||||
Reinvestment of distributions | 2,960,793 | 660,917 | ||||||
Amount paid for shares redeemed | (3,588,355 | ) | (22,081,663 | ) | ||||
|
|
|
| |||||
Net increase (decrease) in net assets resulting from capital transactions | 4,842,740 | (12,619,385 | ) | |||||
|
|
|
| |||||
Total Increase (Decrease) in Net Assets | 2,738,460 | (7,432,331 | ) | |||||
|
|
|
| |||||
Net Assets | ||||||||
Beginning of period | 29,825,902 | 37,258,233 | ||||||
|
|
|
| |||||
End of period | $ | 32,564,362 | $ | 29,825,902 | ||||
|
|
|
| |||||
Accumulated net investment loss | $ | (177,476 | ) | $ | (47,530 | ) | ||
|
|
|
| |||||
Share Transactions | ||||||||
Shares sold | 470,052 | 800,432 | ||||||
Shares issued in reinvestment of distributions | 260,404 | 63,919 | ||||||
Shares redeemed | (310,455 | ) | (2,034,213 | ) | ||||
|
|
|
| |||||
Net increase (decrease) in share transactions | 420,001 | (1,169,862 | ) | |||||
|
|
|
| |||||
| (a) | The Fund charges a 2% redemption fee on shares redeemed within 60 days of purchase. Shares are redeemed at the NAV if held longer than 60 days. |
See accompanying notes which are an integral part of these financial statements.
25
THE SMI DYNAMIC ALLOCATION FUND
STATEMENTS OF CHANGES IN NET ASSETS
| For the six months ended April 30, 2014 (Unaudited) | Period ended October 31, 2013 (a) | |||||||
Increase in Net Assets due to: | ||||||||
Operations | ||||||||
Net investment income | $ | 628,553 | $ | 311,274 | ||||
Long term capital gain dividends from investment companies | 338,947 | — | ||||||
Net realized gain (loss) on investment transactions | 517,878 | (1,716,005 | ) | |||||
Net change in unrealized appreciation on investments | 2,351,190 | 4,665,061 | ||||||
|
|
|
| |||||
Net increase in net assets resulting from operations | 3,836,568 | 3,260,330 | ||||||
|
|
|
| |||||
Distributions | ||||||||
From net investment income | (1,285,357 | ) | — | |||||
|
|
|
| |||||
Total distributions | (1,285,357 | ) | — | |||||
|
|
|
| |||||
Capital Transactions | ||||||||
Proceeds from shares sold | 42,208,437 | 72,307,252 | ||||||
Proceeds from redemption fees (b) | 275 | 985 | ||||||
Reinvestment of distributions | 1,264,696 | — | ||||||
Amount paid for shares redeemed | (5,517,548 | ) | (7,278,910 | ) | ||||
|
|
|
| |||||
Net increase in net assets resulting from capital transactions | 37,955,860 | 65,029,327 | ||||||
|
|
|
| |||||
Total Increase in Net Assets | 40,507,071 | 68,289,657 | ||||||
|
|
|
| |||||
Net Assets | ||||||||
Beginning of period | 68,289,657 | — | ||||||
|
|
|
| |||||
End of period | $ | 108,796,728 | $ | 68,289,657 | ||||
|
|
|
| |||||
Accumulated net investment income (loss) | $ | (345,530 | ) | $ | 311,274 | |||
|
|
|
| |||||
Share Transactions | ||||||||
Shares sold | 3,869,251 | 6,916,492 | ||||||
Shares issued in reinvestment of distributions | 116,347 | — | ||||||
Shares redeemed | (505,478 | ) | (682,351 | ) | ||||
|
|
|
| |||||
Net increase in share transactions | 3,480,120 | 6,234,141 | ||||||
|
|
|
| |||||
| (a) | For the period February 28, 2013 (commencement of operations) through October 31, 2013. |
| (b) | The Fund charges a 2% redemption fee on shares redeemed within 60 days of purchase. Shares are redeemed at the NAV if held longer than 60 days. |
See accompanying notes which are an integral part of these financial statements.
26
This page intentionally left blank.
27
THE SOUND MIND INVESTING FUND
FINANCIAL HIGHLIGHTS
(For a share outstanding during each period)
| Six months ended April 30, 2014 (Unaudited) | ||||
Selected Per Share Data: | ||||
Net asset value, beginning of period | $ | 14.47 | ||
|
| |||
Income from investment operations: | ||||
Net investment income (loss)(a) | 0.01 | |||
Net realized and unrealized gain (loss) | 0.61 | |||
|
| |||
Total from investment operations | 0.62 | |||
|
| |||
Less Distributions to Shareholders: | ||||
From net investment income | (0.05 | ) | ||
From net realized gain | (1.51 | ) | ||
From return of capital | — | |||
|
| |||
Total distributions | (1.56 | ) | ||
|
| |||
Paid in capital from redemption fees(c) | — | |||
|
| |||
Net asset value, end of period | $ | 13.53 | ||
|
| |||
Total Return(d) | 4.23 | %(e) | ||
Ratios and Supplemental Data: | ||||
Net assets, end of period (000) | $ | 293,414 | ||
Ratio of expenses to average net assets(f)(g) | 1.12 | %(j) | ||
Ratio of net investment income (loss) to average net assets(a)(h) | 0.04 | %(j) | ||
Portfolio turnover rate | 49.02 | %(e) | ||
| (a) | Recognition of the net investment income by the Fund is affected by the timing of the declaration of dividends by the underlying investment companies in which the Fund invests. |
| (b) | Resulted in less than $0.005 per share. |
| (c) | Redemption fee resulted in less than $0.005 per share. |
| (d) | Total return in the above table represents the rate that the investor would have earned or lost on an investment in the Fund, assuming reinvestment of dividends. |
| (e) | Not annualized. |
| (f) | These ratios exclude the impact of expenses of the underlying funds in which the Fund invests as represented in the Schedule of Investments. |
| (g) | This ratio does not include the effects of other expenses refunded by the underlying funds in which the Fund invests. If these refunds had been included, the ratio of expenses to average net assets would have been 1.10%, 1.17%, 1.15%, 1.14%, 1.21%, and 1.26% for the periods ended April 30, 2014, October 31, 2013, October 31, 2012, October 31, 2011, October 31, 2010 and October 31, 2009, respectively. |
| (h) | This ratio is presented net of the other expenses refunded by the underlying funds in which the Fund invests. |
| (i) | Portfolio turnover rate excludes $21,405,392 of purchases, which is the book value of securities acquired at the time of merger with SMI Managed Volatility Fund. |
| (j) | Annualized. |
See accompanying notes which are an integral part of these financial statements.
28
THE SOUND MIND INVESTING FUND
FINANCIAL HIGHLIGHTS
(For a share outstanding during each period) – (Continued)
Year ended | Year ended October 31, 2012 | Year ended October 31, 2011 | Year ended October 31, 2010 | Year ended October 31, 2009 | ||||||||||||||
| $ | 11.36 | $ | 10.74 | $ | 10.71 | $ | 8.84 | $ | 7.63 | |||||||||
|
|
|
|
|
|
|
|
|
| |||||||||
| (0.05 | ) | — | 0.02 | (0.04 | ) | (0.02 | ) | |||||||||||
| 3.66 | 0.62 | 0.04 | 1.91 | 1.27 | ||||||||||||||
|
|
|
|
|
|
|
|
|
| |||||||||
| 3.61 | 0.62 | 0.06 | 1.87 | 1.25 | ||||||||||||||
|
|
|
|
|
|
|
|
|
| |||||||||
| — | (b) | — | (0.03 | ) | — | — | ||||||||||||
| (0.50 | ) | — | — | — | — | |||||||||||||
| — | — | — | — | (0.04 | ) | |||||||||||||
|
|
|
|
|
|
|
|
|
| |||||||||
| (0.50 | ) | — | (0.03 | ) | — | (0.04 | ) | |||||||||||
|
|
|
|
|
|
|
|
|
| |||||||||
| — | — | — | — | — | ||||||||||||||
|
|
|
|
|
|
|
|
|
| |||||||||
| $ | 14.47 | $ | 11.36 | $ | 10.74 | $ | 10.71 | $ | 8.84 | |||||||||
|
|
|
|
|
|
|
|
|
| |||||||||
| 33.01 | % | 5.77 | % | 0.50 | % | 21.15 | % | 16.57 | % | |||||||||
| $ | 293,035 | $ | 272,092 | $ | 288,727 | $ | 283,892 | $ | 244,379 | |||||||||
| 1.17 | % | 1.15 | % | 1.15 | % | 1.22 | % | 1.28 | % | |||||||||
| (0.41 | )% | 0.00 | % | 0.13 | % | (0.41 | )% | (0.26 | )% | |||||||||
| 93.59 | % | 187.39 | % | 165.12 | %(i) | 95.29 | % | 124.85 | % | |||||||||
See accompanying notes which are an integral part of these financial statements.
29
THE SOUND MIND INVESTING BALANCED FUND
FINANCIAL HIGHLIGHTS
(For a share outstanding during each period)
| Six months ended April 30, 2014 (Unaudited) | ||||
Selected Per Share Data: | ||||
Net asset value, beginning of period | $ | 12.20 | ||
|
| |||
Income from investment operations: | ||||
Net investment income (loss)(b) | 0.01 | |||
Net realized and unrealized gain (loss) | 0.37 | |||
|
| |||
Total from investment operations | 0.38 | |||
|
| |||
Less Distributions to Shareholders: | ||||
From net investment income | (0.06 | ) | ||
From net realized gain | (1.15 | ) | ||
|
| |||
Total distributions | (1.21 | ) | ||
|
| |||
Paid in capital from redemption fees | — | (c) | ||
|
| |||
Net asset value, end of period | $ | 11.37 | ||
|
| |||
Total Return(d) | 3.10 | %(e) | ||
Ratios and Supplemental Data: | ||||
Net assets, end of period (000) | $ | 32,564 | ||
Ratio of expenses to average net assets(f)(g) | 1.15 | %(h) | ||
Ratio of expenses to average net assets before waiver and reimbursement(f) | 1.34 | %(h) | ||
Ratio of net investment income (loss) to average net assets(b)(f)(i) | 0.06 | %(h) | ||
Portfolio turnover rate | 148.03 | %(e) | ||
| (a) | For the period December 30, 2010 (the date the Fund commenced operations) through October 31, 2011. |
| (b) | Recognition of net investment income by the Fund is affected by the timing of the declaration of dividends by the underlying investment companies in which the Fund invests. |
| (c) | Redemption fees resulted in less than $0.005 per share. |
| (d) | Total return in the above table represents the rate that the investor would have earned on an investment in the Fund, assuming reinvestment of dividends. |
| (e) | Not annualized. |
| (f) | These ratios exclude the impact of expenses of the underlying funds in which the Fund may invest, as represented in the Schedule of Investments. |
| (g) | This ratio does not include the effects of other expenses refunded by the underlying funds in which the Fund invests. If these refunds had been included, the ratio of expenses to average net assets would have been 1.13%, 1.14% and 1.14% for the periods ended April 30, 2014, October 31, 2012 and October 31, 2011, respectively. |
| (h) | Annualized. |
| (i) | This ratio is presented net of the other expenses refunded by the underlying funds in which the Fund invests. |
See accompanying notes which are an integral part of these financial statements.
30
THE SOUND MIND INVESTING BALANCED FUND
FINANCIAL HIGHLIGHTS
(For a share outstanding during each period) – (Continued)
| Year ended October 31, 2012 | Period Ended October 31, 2011(a) | ||||||||
| $ | 10.31 | $ | 9.70 | $ | 10.00 | |||||
|
|
|
|
|
| |||||
| (0.02 | ) | 0.03 | (0.01 | ) | ||||||
| 2.11 | 0.63 | (0.30 | ) | |||||||
|
|
|
|
|
| |||||
| 2.09 | 0.66 | (0.31 | ) | |||||||
|
|
|
|
|
| |||||
| (0.03 | ) | (0.05 | ) | — | ||||||
| (0.17 | ) | — | — | |||||||
|
|
|
|
|
| |||||
| (0.20 | ) | (0.05 | ) | — | ||||||
|
|
|
|
|
| |||||
| — | (c) | — | (c) | 0.01 | ||||||
|
|
|
|
|
| |||||
| $ | 12.20 | $ | 10.31 | $ | 9.70 | |||||
|
|
|
|
|
| |||||
| 20.56 | % | 6.89 | % | -3.00 | %(e) | |||||
| $ | 29,826 | $ | 37,258 | $ | 34,830 | |||||
| 1.15 | % | 1.15 | % | 1.15 | %(h) | |||||
| 1.52 | % | 1.49 | % | 1.80 | %(h) | |||||
| (0.06 | )% | 0.29 | % | (0.17 | )%(h) | |||||
| 270.30 | % | 349.33 | % | 276.04 | % | |||||
See accompanying notes which are an integral part of these financial statements.
31
THE SMI DYNAMIC ALLOCATION FUND
FINANCIAL HIGHLIGHTS
(For a share outstanding during each period)
| Six months ended April 30, 2014 (Unaudited) | Period Ended October 31, 2013(a) | |||||||
Selected Per Share Data: | ||||||||
Net asset value, beginning of period | $ | 10.95 | $ | 10.00 | ||||
|
|
|
| |||||
Income from investment operations: | ||||||||
Net investment income (loss)(b) | 0.09 | 0.05 | ||||||
Net realized and unrealized gain (loss) | 0.34 | 0.90 | ||||||
|
|
|
| |||||
Total from investment operations | 0.43 | 0.95 | ||||||
|
|
|
| |||||
Less Distributions to Shareholders: | ||||||||
From net investment income | (0.18 | ) | — | |||||
|
|
|
| |||||
Total distributions | (0.18 | ) | — | |||||
|
|
|
| |||||
Paid in capital from redemption fees(c) | — | — | ||||||
|
|
|
| |||||
Net asset value, end of period | $ | 11.20 | $ | 10.95 | ||||
|
|
|
| |||||
Total Return(d) | 3.98 | %(e) | 9.50 | %(e) | ||||
Ratios and Supplemental Data: | ||||||||
Net assets, end of period (000) | $ | 108,797 | $ | 68,290 | ||||
Ratio of expenses to average net assets(f) | 1.19 | %(g) | 1.30 | %(g) | ||||
Ratio of net investment income (loss) to | 1.47 | %(g) | 0.94 | %(g) | ||||
Portfolio turnover rate | 92.25 | %(e) | 68.64 | %(e) | ||||
| (a) | For the period February 28, 2013 (the date the Fund commenced operations) through October 31, 2013. |
| (b) | Recognition of net investment income by the Fund is affected by the timing of the declaration of dividends by the underlying investment companies in which the Fund invests. |
| (c) | Redemption fees resulted in less than $0.005 per share. |
| (d) | Total return in the above table represents the rate that the investor would have earned on an investment in the Fund, assuming reinvestment of dividends. |
| (e) | Not annualized. |
| (f) | These ratios exclude the impact of expenses of the underlying funds in which the Fund may invest, as represented in the Schedule of Investments. |
| (g) | Annualized. |
See accompanying notes which are an integral part of these financial statements.
32
THE SOUND MIND INVESTING FUNDS
NOTES TO THE FINANCIAL STATEMENTS
April 30, 2014 – (Unaudited)
NOTE 1. ORGANIZATION
The Sound Mind Investing Fund (“SMI Fund”), Sound Mind Investing Balanced Fund (“SMI Balanced Fund”), and SMI Dynamic Allocation Fund (each a “Fund” and collectively, the “Funds”) are each a diversified series of The Valued Advisers Trust (the “Trust”). Pursuant to a reorganization that took place on February 28, 2013, the SMI Fund and SMI Balanced Fund are the successors to the series of the Unified Series Trust (the “Predecessor Funds”) with the same names. The Predecessor Funds had the same investment objectives and strategies and substantially the same investment policies as the Funds. The SMI Fund was organized on August 29, 2005 and commenced operations on December 2, 2005. The SMI Balanced Fund was organized on November 13, 2010 and commenced operations on December 30, 2010. The SMI Dynamic Allocation Fund was organized on December 11, 2012 and commenced operations on February 28, 2013. The Trust is a management investment company established under the laws of Delaware by an Agreement and Declaration of Trust dated June 13, 2008 (the “Trust Agreement”). The Trust Agreement permits the Trustees to issue an unlimited number of shares of beneficial interest of separate series without par value. Each Fund is one of a series of funds currently authorized by the Trustees. The investment adviser to the Funds is SMI Advisory Services, LLC (the “Adviser”). Scout Investments, Inc., (the “Subadviser”) through its REAMS Asset Management division, is the subadviser for the fixed income portion of the SMI Balanced Fund and subadviser for the fixed income investments (other than ETFs and other investment companies that invest primarily in fixed income securities) and cash investments for the SMI Dynamic Allocation Fund. The SMI Fund seeks to provide long-term capital appreciation. The SMI Balanced Fund seeks total return. The SMI Dynamic Allocation Fund seeks total return.
NOTE 2. SIGNIFICANT ACCOUNTING POLICIES
The following is a summary of significant accounting policies followed by the Funds in the preparation of their financial statements. These policies are in conformity with generally accepted accounting principles in the United States of America (“GAAP”).
Securities Valuations – All investments in securities are recorded at their estimated fair value as described in Note 3.
Federal Income Taxes – The Funds make no provision for federal income or excise tax. The Funds intend to qualify each year as regulated investment companies (“RICs”) under subchapter M of the Internal Revenue Code of 1986, as amended, by complying with the requirements applicable to RICs and by distributing substantially all of their taxable income. The Funds also intend to distribute sufficient net investment income and net capital gains, if any, so that they will not be subject to excise tax on undistributed income and gains. If the required amount of net investment income or gains is not distributed, the Funds could incur a tax expense.
33
THE SOUND MIND INVESTING FUNDS
NOTES TO THE FINANCIAL STATEMENTS
April 30, 2014 – (Unaudited), (Continued)
NOTE 2. SIGNIFICANT ACCOUNTING POLICIES – (Continued)
As of and during the six months ended April 30, 2014, the Funds did not have a liability for any unrecognized tax benefits. The Funds recognize interest and penalties, if any, related to unrecognized tax benefits as income tax expense in the statements of operations. During the period, the Funds did not incur any interest or penalties. Management of the Funds has reviewed tax positions taken in tax years that remain subject to examination by all major tax jurisdictions, including federal (i.e., the last four tax year ends and the interim tax period since then, as applicable). Management believes that there is no tax liability resulting from unrecognized tax benefits related to uncertain tax positions taken.
Expenses – Expenses incurred by the Trust that do not relate to a specific fund of the Trust are allocated to the individual funds based on each fund’s relative net assets or other appropriate basis (as determined by the Board).
Security Transactions and Related Income – The Funds follow industry practice and record security transactions on the trade date for financial reporting purposes. For financial statement and income tax purposes, the specific identification method is used for determining gains or losses on mutual funds and exchange-traded funds while the first in, first out method is used for determining gains or losses on all other security types. Dividend income is recorded on the ex-dividend date and interest income is recorded on an accrual basis. Short-term capital gain distributions from underlying funds are classified as dividend income for financial reporting purposes. Long-term capital gain distributions are broken out as such. Discounts and premiums on securities purchased are amortized or accreted using the effective interest method. The ability of issuers of debt securities held by the Funds to meet their obligations may be affected by economic and political developments in a specific country or region.
Dividends and Distributions – The Funds typically distribute substantially all of their net investment income in the form of dividends and taxable capital gains to their shareholders at least annually. These distributions, which are recorded on the ex-dividend date, are automatically reinvested in each Fund unless shareholders request cash distributions on their application or through a written request. The treatment for financial reporting purposes of distributions made to shareholders during the year from net investment income or net realized capital gains may differ from their ultimate treatment for federal income tax purposes. These differences are caused primarily by differences in the timing of the recognition of certain components of income, expense or realized capital gain for federal income tax purposes. Where such differences are permanent in nature, they are reclassified in the components of net assets based on their ultimate characterization for federal income tax purposes. Any such reclassifications will have no effect on net assets, results of operations, or net asset values per share of the Funds.
34
THE SOUND MIND INVESTING FUNDS
NOTES TO THE FINANCIAL STATEMENTS
April 30, 2014 – (Unaudited), (Continued)
NOTE 2. SIGNIFICANT ACCOUNTING POLICIES – (Continued)
Swap Contracts – The SMI Balanced Fund may enter into credit default swap contracts. A credit default swap involves a protection buyer and a protection seller. The Fund may be either a protection buyer or seller. The protection buyer makes periodic premium payments to the protection seller during the swap term in exchange for the protection seller agreeing to make certain defined payments to the protection buyer in the event that certain defined credit events occur with respect to a particular security, issuer, or basket of securities. The “notional amount” of the swap agreement is the agreed upon amount or value of the underlying asset used for calculating the obligations that the parties to a swap agreement have agreed to exchange. The Fund’s obligation under a swap agreement will be accrued daily (offset against amounts owed to the Fund) and any accrued but unpaid net amounts owed to a swap counterparty may be collateralized by designating liquid assets on the Fund’s books and records. The credit default swaps are marked to market daily based upon quotes received from a pricing service and any change in value is recorded in unrealized appreciation/depreciation. Periodic payments paid or received are recorded as realized gains/losses. Any premium paid or received by the Fund upon entering into a credit default swap contract is recorded as an asset or liability and amortized daily as a component of realized gain (loss) on the Statement of Operations. Payments made or received as a result of a credit event or termination of the contract are recognized, net of a proportional amount of the upfront payment, as realized gains/losses. In addition to bearing the risk that the credit event will occur as a protection seller, the Fund could be exposed to market risk due to unfavorable changes in interest rates or in the price of the underlying security or index, the possibility that the Fund may be unable to close out its position at the same time or at the same price as if it had purchased comparable publicly traded securities, or that the counterparty may default on its obligation to perform. Please see Note 4 for information on swap agreement activity during the fiscal period ended April 30, 2014.
NOTE 3. SECURITIES VALUATION AND FAIR VALUE MEASUREMENTS
Fair value is defined as the price that a Fund would receive upon selling an investment in a orderly transaction to an independent buyer in the principal or most advantageous market of the investment. GAAP establishes a three-tier hierarchy to maximize the use of observable market data and minimize the use of unobservable inputs and to establish classification of fair value measurements for disclosure purposes.
Inputs refer broadly to the assumptions that market participants would use in pricing the asset or liability, including assumptions about risk, for example, the risk inherent in a particular valuation technique used to measure fair value including such a pricing model and/or the risk inherent in the inputs to the valuation technique. Inputs may be observable or unobservable. Observable inputs are inputs that reflect the assumptions market participants would use in pricing the asset or liability developed based on market data obtained from sources independent of the reporting entity. Unobservable inputs are inputs that reflect the reporting entity’s own assumptions about the assumptions market participants would use in pricing the asset or liability developed based on the best information available in the circumstances.
35
THE SOUND MIND INVESTING FUNDS
NOTES TO THE FINANCIAL STATEMENTS
April 30, 2014 – (Unaudited), (Continued)
NOTE 3. SECURITIES VALUATION AND FAIR VALUE MEASUREMENTS – (Continued)
Various inputs are used in determining the value of the Funds’ investments. These inputs are summarized in the three broad levels listed below.
| • | Level 1 – quoted prices in active markets for identical securities |
| • | Level 2 – other significant observable inputs (including, but not limited to, quoted prices for an identical security in an inactive market, quoted prices for similar securities, interest rates, prepayment speeds, credit risk, etc.) |
| • | Level 3 – significant unobservable inputs (including each Fund’s own assumptions in determining fair value of investments based on the best information available) |
The inputs used to measure fair value may fall into different levels of the fair value hierarchy. In such cases, for disclosure purposes, the level in the fair value hierarchy within which the fair value measurement falls in its entirety, is determined based on the lowest level input that is significant to the fair value measurement in its entirety.
Equity securities, including exchange-traded funds, are generally valued by using market quotations, but may be valued on the basis of prices furnished by a pricing service when the Adviser believes such prices more accurately reflect the fair value of such securities. Securities that are traded on any stock exchange are generally valued by the pricing service at the last quoted sale price. Lacking a last sale price, an exchange traded security is generally valued by the pricing service at its last bid price. Securities traded in the NASDAQ over-the-counter market are generally valued by the pricing service at the NASDAQ Official Closing Price.
When using the market quotations or close prices provided by the pricing service and when the market is considered active, the security will be classified as a Level 1 security. Sometimes, an equity security owned by the Funds will be valued by the pricing service with factors other than market quotations or when the market is considered inactive. When this happens, the security will be classified as a Level 2 security. When market quotations are not readily available, when the Adviser determines that the market quotation or the price provided by the pricing service does not accurately reflect the current fair value, or when restricted or illiquid securities are being valued, such securities are valued as determined in good faith by the Adviser, in conformity with guidelines adopted by and subject to review by the Board. These securities will be categorized as Level 3 securities.
Investments in mutual funds, including money market mutual funds, are generally priced at the ending net asset value (“NAV”) provided by the service agent of the funds. These securities will be categorized as Level 1 securities.
36
THE SOUND MIND INVESTING FUNDS
NOTES TO THE FINANCIAL STATEMENTS
April 30, 2014 – (Unaudited), (Continued)
NOTE 3. SECURITIES VALUATION AND FAIR VALUE MEASUREMENTS – (Continued)
Derivative instruments that a Fund invests in, such as swap agreements, are generally traded over-the-counter. The credit default swaps the SMI Balanced Fund invests in will generally be valued at the mean of bid and ask prices provided by a major credit default swap pricing provider and will generally be classified as Level 2 securities.
Fixed income securities, including corporate bonds, foreign bonds denominated in U.S. dollars, U.S. treasury obligations and asset-backed securities, when valued using market quotations in an active market, will be categorized as Level 1 securities. However, they may be valued on the basis of prices furnished by a pricing service when the Adviser believes such prices more accurately reflect the fair value of such securities. A pricing service uses various inputs and techniques, which include broker-dealer quotations, live trading levels, recently executed transactions in securities of the issuer or comparable issuers, and option adjusted spread models that include base curve and spread curve inputs. Adjustments to individual bonds can be applied to recognize trading differences compared to other bonds issued by the same issuer. The broker-dealer quotations received are supported by credit analysis of the issuer that takes into consideration credit quality assessments, daily trading activity, and the activity of the underlying equities, listed bonds and sector-specific trends. Data used to establish quotes for asset-backed securities includes analysis of cash flows, pre-payment speeds, default rates, delinquency assumptions, and assumptions regarding collateral and loss. To the extent that these inputs are observable, the fixed income securities are categorized as Level 2 securities. If the Adviser decides that a price provided by the pricing service does not accurately reflect the fair value of the securities, when prices are not readily available from a pricing service, or when illiquid securities are being valued, securities are valued at fair value as determined in good faith by the Adviser, in conformity with guidelines adopted by and subject to review of the Board. These securities may be categorized as Level 3 securities.
Short-term investments in fixed income securities, (those with maturities of less than 60 days when acquired, or which subsequently are within 60 days of maturity), are valued by using the amortized cost method of valuation, which the Board has determined will represent fair value. These securities will be classified as Level 2 securities.
37
THE SOUND MIND INVESTING FUNDS
NOTES TO THE FINANCIAL STATEMENTS
April 30, 2014 – (Unaudited), (Continued)
NOTE 3. SECURITIES VALUATION AND FAIR VALUE MEASUREMENTS – (Continued)
In accordance with the Trust’s good faith pricing guidelines, the Adviser is required to consider all appropriate factors relevant to the value of securities for which it has determined other pricing sources are not available or reliable as described above. No single standard exists for determining fair value, because fair value depends upon the circumstances of each individual case. As a general principle, the current fair value of an issue of securities being valued by the Adviser would appear to be the amount which the owner might reasonably expect to receive for them upon their current sale. Methods which are in accordance with this principle may, for example, be based on (i) a multiple of earnings; (ii) a discount from market of a similar freely traded security (including a derivative security or a basket of securities traded on other markets, exchanges or among dealers); or (iii) yield to maturity with respect to debt issues, or a combination of these and other methods. Good faith pricing is permitted if, in the Adviser’s opinion, the validity of market quotations appears to be questionable based on factors such as evidence of a thin market in the security based on a small number of quotations, a significant event occurs after the close of a market but before a Fund’s NAV calculation that may affect a security’s value, or the Adviser is aware of any other data that calls into question the reliability of market quotations. Good faith pricing may also be used in instances when the bonds the Funds’ invest in may default or otherwise cease to have market quotations readily available.
The following is a summary of the inputs used to value the Funds’ investments as of April 30, 2014:
| Valuation Inputs | ||||||||||||||||
| SMI Fund | Level 1 – Quoted Prices in Active Markets | Level 2 – Other Significant Observable Inputs | Level 3 – Significant Unobservable Inputs | Total | ||||||||||||
| Mutual Funds – greater than 1% of net assets | $ | 282,895,960 | $ | — | $ | — | $ | 282,895,960 | ||||||||
| Mutual Funds – less than 1% of net assets | 11,244,957 | — | — | 11,244,957 | ||||||||||||
| Money Market Securities | 66,584 | — | — | 66,584 | ||||||||||||
| Total | $ | 294,207,501 | $ | — | $ | — | $ | 294,207,501 | ||||||||
38
THE SOUND MIND INVESTING FUNDS
NOTES TO THE FINANCIAL STATEMENTS
April 30, 2014 – (Unaudited), (Continued)
NOTE 3. SECURITIES VALUATION AND FAIR VALUE MEASUREMENTS – (Continued)
| Valuation Inputs | ||||||||||||||||
| SMI Balanced Fund | Level 1 – Quoted Prices in Active Markets | Level 2 – Other Significant Observable Inputs | Level 3 – Significant Unobservable Inputs | Total | ||||||||||||
| Corporate Bonds | $ | — | $ | 2,234,999 | $ | — | $ | 2,234,999 | ||||||||
| Foreign Bonds Denominated in U.S. Dollars | — | 236,494 | — | 236,494 | ||||||||||||
| U.S. Treasury Obligations | — | 5,728,632 | — | 5,728,632 | ||||||||||||
| Asset-Backed Securities | — | 3,051,800 | — | 3,051,800 | ||||||||||||
| Mutual Funds | 20,283,936 | — | — | 20,283,936 | ||||||||||||
| Money Market Securities | 888,025 | — | — | 888,025 | ||||||||||||
| Total | $ | 21,171,961 | $ | 11,251,925 | $ | — | $ | 32,423,886 | ||||||||
| Valuation Inputs | ||||||||||||||||
| Assets | Level 1 – Quoted Prices in Active Markets | Level 2 – Other Significant Observable Inputs | Level 3 – Significant Unobservable Inputs | Total | ||||||||||||
| Other Financial Instruments* | $ | — | $ | 1,243 | $ | — | $ | 1,243 | ||||||||
| Total | $ | — | $ | 1,243 | $ | — | $ | 1,243 | ||||||||
* Credit Default Swaps (reflects net appreciation as of April 30, 2014)—See Note 4 for additional information related to these instruments.
39
THE SOUND MIND INVESTING FUNDS
NOTES TO THE FINANCIAL STATEMENTS
April 30, 2014 – (Unaudited), (Continued)
NOTE 3. SECURITIES VALUATION AND FAIR VALUE MEASUREMENTS – (Continued)
| Valuation Inputs | ||||||||||||||||
| SMI Dynamic Allocation Fund | Level 1 – Quoted Prices in Active Markets | Level 2 – Other Significant Observable Inputs | Level 3 – Significant Unobservable Inputs | Total | ||||||||||||
| Exchange-Traded Funds | $ | 104,085,124 | $ | — | $ | — | $ | 104,085,124 | ||||||||
| Mutual Funds | 3,425,030 | — | — | 3,425,030 | ||||||||||||
| Money Market Securities | 2,250,479 | — | — | 2,250,479 | ||||||||||||
| Total | $ | 109,760,633 | $ | — | $ | — | $ | 109,760,633 | ||||||||
The Funds did not hold any investments at any time during the reporting period in which significant unobservable inputs were used in determining fair value; therefore, no reconciliation of Level 3 securities is included for this reporting period. During the six months ended April 30, 2014, there were no transfers between levels. The Trust recognizes transfers between fair value hierarchy levels at the end of the reporting period.
NOTE 4. DERIVATIVE TRANSACTIONS
The SMI Balanced Fund may obtain exposure to the fixed income market by investing in credit default swap (“CDX”) contracts. The Fund used CDX contracts as an additional avenue in which to bring value to the Fund. The Fund may use CDX contracts as an alternative to buying, selling, or holding certain securities in the fixed income market. The use of CDX contracts may provide a less expensive, more expedient, or more specifically focused way to invest than traditional fixed income securities would. The Fund may enter into single name CDX agreements to gain exposure to a particular company when it is more economically attractive to do so rather than purchasing traditional bonds. The Fund may also invest in CDX index products and options thereon that allow the Fund to gain broad market exposure but with less company-specific risk than single name CDX agreements.
The SMI Balanced Fund enters into CDX contracts to gain exposure or to mitigate specific forms of credit risk. Swaps expose the Fund to counterparty risk (described below). The Fund could also suffer losses with respect to a swap agreement if the Fund is unable to terminate the agreement or reduce its exposure through offsetting transactions.
40
THE SOUND MIND INVESTING FUNDS
NOTES TO THE FINANCIAL STATEMENTS
April 30, 2014 – (Unaudited), (Continued)
NOTE 4. DERIVATIVE TRANSACTIONS – (Continued)
Many of the markets in which the SMI Balanced Fund participates in credit default transactions are “over the counter” or “interdealer” markets. The participants in these markets are typically not subject to credit evaluation and regulatory oversight as are members of “exchange based markets”. When the Fund invests in CDX contracts, it is assuming a credit risk with regard to parties with whom it trades and also bears the risk of settlement default. These risks may differ materially from those associated with transactions effected on an exchange, which generally are backed by clearing organization guarantees, daily marking-to-market and settlement, and segregation and minimum capital requirements applicable to intermediaries. Transactions entered into directly between two counterparties generally do not benefit from such protections. This exposes the Fund to the risk that the counterparty will not settle a transaction in accordance with its terms and conditions because of a dispute over the terms of the contract (whether or not bona fide) or because of a credit or liquidity problem, thus causing the Fund to suffer a loss. To mitigate counterparty risk, the Fund will sometimes require the counterparty to post collateral to the Fund’s custodian to cover the exposure.
The SMI Balanced Fund may also invest in credit default swap index products and in options on credit default swap index products. These instruments are designed to track segments of the credit default swap market and provide investors with exposure to specific “baskets” of issuers of bonds or loans. In general, the value of the credit default swap market provides investors with exposure to specific “baskets” of issuers of bonds or loans. In general, the value of the credit default swap index product will go up or down in response to changes in the perceived credit risk and default experience of the basket of issuers, instead of the exchange of the stream of payments for the payment of the notional amount (if a credit event occurs) that is the substance of a single name credit default swap. Such investments are subject to liquidity risks as well as counterparty and other risks associated with investments in credit default swaps discussed above.
In accordance with GAAP, the fair value of any credit default swaps can be found on the Statements of Operations under net realized gain on swap contracts.
At April 30, 2014:
| Derivatives – Credit Risk | Location of Derivatives on Statements of Assets & Liabilities | |||||
| Credit Default Swap Agreements | Receivable for variation margin on swap contracts | $ | 408 | |||
41
THE SOUND MIND INVESTING FUNDS
NOTES TO THE FINANCIAL STATEMENTS
April 30, 2014 – (Unaudited), (Continued)
NOTE 4. DERIVATIVE TRANSACTIONS – (Continued)
For the six months ended April 30, 2014:
| Derivatives | Location of Gain (Loss) on Derivatives on Statements of Operations | Contracts Opened | Contracts Closed | Realized Gain (Loss) on Derivatives | Change in Unrealized Appreciation (Depreciation) on Derivatives | |||||||||||||
Credit Risk: Credit Default Swap Agreements | Net unrealized gain on swap contracts | 1 | — | $ | — | $ | 1,243 | |||||||||||
The Fund purchased a total notional value of swap agreements of $610,000 during the six months ended April 30, 2014. The Fund utilized credit derivative instruments in conjunction with investment securities in an effort to achieve its investment objective for the six months ended April 30, 2014.
As of April 30, 2014, the Fund segregated cash collateral for outstanding swap contracts in the amount of $10,251.
Balance Sheet Offsetting Information
The following table provides a summary of offsetting financial liabilities and derivatives and the effect of derivative instruments on the Statements of Assets and Liabilities as of April 30, 2014.
| Gross Amounts Not Offset in Statements of Assets and Liabilities | ||||||||||||||||||||||
| Gross Amounts of Recognized Assets | Gross Amounts Offset in Statements of Assets and Liabilities | Net Amounts of Assets Presented in Statements of Assets and Liabilities | Financial Instruments | Cash Collateral Pledged | Net Amount (not less than 0) | |||||||||||||||||
| Credit Default Swap Agreements | $ 408 | $ | — | $ | 408 | $ | — | $ | (10,251 | ) | $ | — | ||||||||||
42
THE SOUND MIND INVESTING FUNDS
NOTES TO THE FINANCIAL STATEMENTS
April 30, 2014 – (Unaudited), (Continued)
NOTE 5. FEES AND OTHER TRANSACTIONS WITH AFFILIATES
The Adviser, under the terms of the management agreement with respect to each Fund (each an “Agreement”), manages the Funds’ investments. As compensation for its management services, each Fund is obligated to pay the Adviser a fee based on the Fund’s average daily net assets as follows:
Fund Assets | SMI Fund | SMI Balanced Fund | SMI Dynamic Allocation | |||
| $1 – $100 million | 1.00% | 0.90% | 1.00% | |||
| $100,000,001 – $250 million | 1.00% | 0.80% | 1.00% | |||
| $250,000,001 to $500 million | 0.90% | 0.70% | 0.90% | |||
| Over $500 million | 0.80% | 0.60% | 0.80% | |||
| Management fees earned | $ 1,477,099 | $ 141,711 | $ 426,525 | |||
| Fees waived and expenses reimbursed | $ — | $ (30,559) | $ — |
The Adviser contractually has agreed to waive its management fee and/or reimburse certain operating expenses, but only to the extent necessary so that each Fund’s total annual operating expenses (excluding interest, taxes, brokerage commissions, other expenses which are capitalized in accordance with generally accepted accounting principles, extraordinary expenses, dividend expense on short sales, 12b-1 fees, and acquired fund fees and expenses) do not exceed 1.50% of the Fund’s average daily net assets with respect to the SMI Fund, 1.15% with respect to the SMI Balanced Fund, and 1.45% with respect to the SMI Dynamic Allocation Fund. The contractual arrangement for each Fund is in place through February 28, 2015. Each waiver or reimbursement by the Adviser is subject to repayment by the applicable Fund within the three fiscal years following the fiscal year in which the particular expense or reimbursement was incurred; provided that such Fund is able to make the repayment without exceeding the applicable expense limitation.
The amount subject to repayment by the SMI Balanced Fund, pursuant to the aforementioned conditions, at April 30, 2014 is as follows:
| Amount | Recoverable through | |||||
| $ | 126,597 | 2014 | ||||
| 131,773 | 2015 | |||||
| 116,168 | 2016 | |||||
| 30,559 | 2017 | |||||
43
THE SOUND MIND INVESTING FUNDS
NOTES TO THE FINANCIAL STATEMENTS
April 30, 2014 – (Unaudited), (Continued)
NOTE 5. FEES AND OTHER TRANSACTIONS WITH AFFILIATES – (Continued)
The Trust retains Huntington Asset Services, Inc. (“HASI”) to manage the Funds’ business affairs and to provide the Funds with administrative services, including all regulatory reporting and necessary office equipment and personnel. The Trust also retains HASI to act as each Fund’s transfer agent and to provide fund accounting services. Expenses incurred by the Funds for these expenses are allocated to the individual Funds based on each Fund’s relative net assets. Certain officers of the Trust are members of management and/or employees of HASI. HASI operates as a wholly-owned subsidiary of Huntington Bancshares, Inc., the parent company of the principal distributor of the Funds and Huntington National Bank, the custodian of the Funds’ investments (the “Custodian”). A Trustee of the Trust is a member of management of the Custodian. For the six months ended April 30, 2014, fees for administrative, transfer agent, and fund accounting services, reimbursement of out-of-pocket expenses, and Custodian expenses and the amounts due to HASI and the Custodian at April 30, 2014 were as follows:
SMI Fund | SMI | SMI Dynamic | ||||||||||
| Administration expenses | $ | 55,645 | $ | 5,032 | $ | 14,096 | ||||||
| Transfer agent expenses | 35,437 | 9,179 | 13,983 | |||||||||
| Fund accounting expenses | 29,613 | 1,661 | 6,937 | |||||||||
| Custodian expenses | 11,759 | 4,856 | 4,502 | |||||||||
| Payable to HASI | 35,657 | 11,693 | 7,248 | |||||||||
| Payable to Custodian | 8,385 | 3,908 | 3,497 | |||||||||
Unified Financial Securities, Inc. (the “Distributor”) acts as the principal distributor of the Funds. There were no payments made to the Distributor by the SMI Fund, the SMI Balanced Fund, or the SMI Dynamic Allocation Fund for six months ended April 30, 2014. The Distributor, HASI, and the Custodian are controlled by Huntington Bancshares, Inc. A Trustee of the Trust is a member of management of Huntington National Bank, a subsidiary of Huntington Bancshares, Inc. (the parent of the Distributor), and certain officers of the Trust are officers of the Distributor and such persons may be deemed to be affiliates of the Distributor.
44
THE SOUND MIND INVESTING FUNDS
NOTES TO THE FINANCIAL STATEMENTS
April 30, 2014 – (Unaudited), (Continued)
NOTE 6. INVESTMENTS
For the six months ended April 30, 2014, purchases and sales of investment securities, other than short-term investments and short-term U.S. government obligations were as follows:
| SMI Fund | SMI Balanced Fund | SMI Dynamic Allocation Fund | ||||||||||
Purchases | ||||||||||||
U.S. Government Obligations | $ | — | $ | 36,065,235 | $ | — | ||||||
Other | 147,956,000 | 11,987,684 | 108,970,736 | |||||||||
Sales | ||||||||||||
U.S. Government Obligations | $ | — | $ | 33,535,347 | $ | — | ||||||
Other | 148,188,525 | 11,870,238 | 72,008,403 | |||||||||
NOTE 7. RESTRICTED SECURITIES
Restricted securities are securities that may only be resold upon registration under federal securities laws or in transactions exempt from such registration. In some cases, the issuer of restricted securities has agreed to register such securities for resale, at the issuer’s expense, either upon demand by the Funds or in connection with another registered offering of the securities. Many restricted securities may be resold in the secondary market in transactions exempt from registration. Such restricted securities may be determined to be liquid. The Board of Trustees and management of the SMI Balanced Fund consider the restricted securities shown below to be liquid. The Fund will not incur any registration costs upon such resale. The Fund’s restricted securities are valued at the price provided by dealers in the secondary market or, if no market prices are available, at the fair value as determined by the Trust’s Pricing Committee. At April 30, 2014, the SMI Balanced Fund held restricted securities representing 1.98% of net assets, as listed below:
45
THE SOUND MIND INVESTING FUNDS
NOTES TO THE FINANCIAL STATEMENTS
April 30, 2014 – (Unaudited), (Continued)
NOTE 7. RESTRICTED SECURITIES – (Continued)
| Issuer Description | Acquisition Date | Principal Amount | Amortized Cost | Fair Value | ||||||||||||
| Credit Suisse Mortgage Capital Certificates, Series 2009-12R, Class 41A1, 5.250%, 3/27/2037 | 6/13/2011 | $ | 13,979 | $ | 13,983 | $ | 14,655 | |||||||||
| Daimler Finance North America LLC, 1.250%, 1/11/2016 | 1/9/2013 | 90,000 | 89,937 | 90,761 | ||||||||||||
| DBRR Trust, Series 2012-EZ1, Class A, 0.946%, 9/25/2045 | (a | ) | 49,558 | 49,595 | 49,562 | |||||||||||
| Ford Motor Credit Co. LLC, 3.984%, 6/15/2016 | (b | ) | 65,000 | 65,042 | 68,033 | |||||||||||
| Hertz Vehicle Financing LLC, Series 2011-1A, Class A1, 2.200%, 3/25/2016 | (c | ) | 110,000 | 110,352 | 111,164 | |||||||||||
| Hertz Vehicle Financing LLC, Series 2013-1A, Class A1, 1.200%, 8/25/2017 | 1/18/2013 | 90,000 | 89,995 | 90,132 | ||||||||||||
| ING Bank NV, 3.750%, 3/7/2017 | (d | ) | 165,000 | 164,610 | 175,665 | |||||||||||
| Liberty Mutual Group, Inc., 6.700%, 8/15/2016 | 1/19/2012 | 25,000 | 26,235 | 28,036 | ||||||||||||
| Structured Asset Securities Corp. Mortgage Loan Trust, 2005-S7, Class A2, 0.452%, 12/25/2035 | (e | ) | 18,003 | 12,941 | 17,467 | |||||||||||
| $ | 645,475 | |||||||||||||||
| (a) | Purchased on various dates beginning 9/21/2012. |
| (b) | Purchased on various dates beginning 6/17/2011. |
| (c) | Purchased on various dates beginning 6/13/2011. |
| (d) | Purchased on various dates beginning 3/1/2012. |
| (e) | Purchased on various dates beginning 6/22/2011. |
NOTE 8. ESTIMATES
The preparation of financial statements in conformity with GAAP requires management to make estimates and assumptions that affect the reported amounts of assets and liabilities and disclosure of contingent assets and liabilities at the date of the financial statements and the reported amounts of increases and decreases in net assets from operations during the reporting period. Actual results could differ from those estimates.
46
THE SOUND MIND INVESTING FUNDS
NOTES TO THE FINANCIAL STATEMENTS
April 30, 2014 – (Unaudited), (Continued)
NOTE 9. BENEFICIAL OWNERSHIP
The beneficial ownership, either directly or indirectly, of more than 25% of the voting securities of a fund creates a presumption of control of the fund, under Section 2(a)(9) of the Investment Company Act of 1940. At April 30, 2014, National Financial Services Corporation (“NFS”), for the benefit of others, held 25.59%, 34.33% and 28.77% of the SMI Fund, SMI Balanced Fund and the SMI Dynamic Allocation Fund, respectively. It is not known whether NFS, or any of the underlying beneficial owners, owned or controlled 25% or more of the voting securities of the Funds. As a result, NFS may be deemed to control the SMI Fund, SMI Balanced Fund and the SMI Dynamic Allocation Fund.
NOTE 10. FEDERAL TAX INFORMATION
At April 30, 2014, the net unrealized appreciation (depreciation) of investments for tax purposes, was as follows:
| SMI Fund | SMI Balanced Fund | SMI Dynamic Allocation Fund | ||||||||||
Gross Appreciation | $ | 30,951,896 | $ | 2,100,322 | $ | 7,117,541 | ||||||
Gross (Depreciation) | (2,667,851 | ) | (251,660 | ) | (103,221 | ) | ||||||
|
|
|
|
|
| |||||||
Net Appreciation (Depreciaton) on Investments | $ | 28,284,045 | $ | 1,848,662 | $ | 7,014,320 | ||||||
|
|
|
|
|
| |||||||
At April 30, 2014, the aggregate cost of securities for federal income tax purposes was $265,923,456, $30,575,224 and $102,746,313 for the SMI Fund, SMI Balanced Fund and SMI Dynamic Allocation Fund respectively.
SMI Fund: On December 27, 2013, SMI Fund paid an income distribution of $0.0490 per share, a short-term capital gain distribution of $0.8291, and a long-term capital gain distribution of $0.6838 per share to shareholders of record on December 26, 2013.
The tax characterization of distributions for the fiscal year ended October 31, 2013 was as follows:
| 2013 | ||||
Distributions paid from: | ||||
Ordinary Income | $ | 8,906 | ||
Long-term Capital Gain | 11,101,278 | |||
|
| |||
| $ | 11,110,184 | |||
|
| |||
47
THE SOUND MIND INVESTING FUNDS
NOTES TO THE FINANCIAL STATEMENTS
April 30, 2014 – (Unaudited), (Continued)
NOTE 10. FEDERAL TAX INFORMATION – Continued
SMI Balanced Fund: On December 27, 2013, SMI Balanced Fund paid an income distribution of $0.0565 per share, a short-term capital gain distribution of $0.6931 per share, and a long-term capital gain distribution of $0.4579 per share to shareholders of record on December 26, 2013.
The tax characterization of distributions for the fiscal year ended October 31, 2013 was as follows:
| 2013 | ||||
Distributions paid from: | ||||
Ordinary Income | $ | 322,336 | ||
Long-term Capital Gain | 342,122 | |||
|
| |||
| $ | 664,458 | |||
|
| |||
SMI Dynamic Allocation Fund: On December 27, 2013, SMI Dynamic Allocation Fund paid an income distribution of $0.1805 per share to shareholders of record on December 26, 2013.
At October 31, 2013, the components of distributable earnings (accumulated losses) on a tax basis were as follows:
SMI Fund | SMI | SMI Dynamic | ||||||||||
Accumulated undistributed ordinary income | $ | 16,674,842 | $ | 1,711,136 | $ | 311,274 | ||||||
Accumulated undistributed long-term capital gains | 13,751,346 | 1,130,543 | — | |||||||||
Accumulated capital and other losses | (2,041,378 | ) | (47,408 | ) | (1,714,074 | ) | ||||||
Unrealized appreciation (depreciation) | 53,691,921 | 3,687,257 | 4,663,130 | |||||||||
|
|
|
|
|
| |||||||
| $ | 82,076,731 | $ | 6,481,528 | $ | 3,260,330 | |||||||
|
|
|
|
|
| |||||||
At October 31, 2013, the difference between book basis and tax basis unrealized appreciation is attributable to the tax deferral of losses on wash sales in the amount of $1,528, $921, and $1,931 for the SMI Fund, SMI Balanced Fund, and SMI Dynamic Allocation Fund, respectively.
As of October 31, 2013, accumulated capital and other losses consist of:
Qualified | Capital Loss | |||||||
SMI Fund | $ | 1,093,920 | $ | 947,458 | ||||
SMI Balanced Fund | 47,408 | — | ||||||
SMI Dynamic Allocation Fund | — | 1,714,074 | ||||||
48
THE SOUND MIND INVESTING FUNDS
NOTES TO THE FINANCIAL STATEMENTS
April 30, 2014 – (Unaudited), (Continued)
NOTE 10. FEDERAL TAX INFORMATION – Continued
At October 31, 2013, for federal income tax purposes, the Funds had capital loss carryforwards, in the following amounts:
| No Expiration – Short Term | Expiring October 31, 2016 | |||||||
SMI Fund | $ | — | $ | 947,458 | ||||
SMI Dynamic Allocation Fund | 1,714,074 | — | ||||||
NOTE 11. COMMITMENTS AND CONTIGENCIES
The Funds indemnify its officers and trustees for certain liabilities that may arise from performance of their duties to the Funds. Additionally, in the normal course of business, the Funds enter into contracts that contain a variety of representations and warranties which provide general indemnifications. The Funds’ maximum exposure under these arrangements is unknown, as this would involve future claims that may be made against the Funds that have not yet occurred.
NOTE 12. SUBSEQUENT EVENT
Management of the Funds has evaluated the need for disclosures and/or adjustments resulting from subsequent events through the date these financial statements were issued. There were no items requiring adjustment of financial statements or additional disclosure.
49
OTHER INFORMATION
The Funds’ Statement of Additional Information (“SAI”) includes additional information about the trustees and is available without charge, upon request. You may call toll-free at (877) 764-3863 to request a copy of the SAI or to make shareholder inquiries.
PROXY VOTING
A description of the policies and procedures that the Funds use to determine how to vote proxies relating to portfolio securities and information regarding how the Funds voted those proxies during the most recent twelve month period ended June 30 is available without charge upon request by (1) calling the Funds at (877) 764-3863 and (2) from Fund documents filed with the Securities and Exchange Commission (“SEC”) on the SEC’s website at www.sec.gov.
TRUSTEES
R. Jeffrey Young, Chairman
Ira Cohen
Andrea N. Mullins
OFFICERS
R. Jeffrey Young, Principal Executive Officer
and President
Bryan W. Ashmus, Principal Financial Officer
and Treasurer
John C. Swhear, Chief Compliance Officer,
AML Officer and Vice President
Carol J. Highsmith, Vice President and Secretary
Matthew J. Miller, Vice President
INVESTMENT ADVISOR
SMI Advisory Services, LLC
11135 Baker Hollow Road
Columbus, IN 47201
DISTRIBUTOR
Unified Financial Securities, Inc.
2960 North Meridian Street, Suite 300
Indianapolis, IN 46208
INDEPENDENT REGISTERED PUBLIC ACCOUNTING FIRM
Cohen Fund Audit Services Ltd.
1350 Euclid Avenue, Suite 800
Cleveland, OH 44115
LEGAL COUNSEL
The Law Offices of John H. Lively &
Associates, Inc.,
A member firm of The 1940 Act Law GroupTM
11300 Tomahawk Creek Pkwy, Suite 310
Leawood, KS 66211
CUSTODIAN
Huntington National Bank
41 South High Street
Columbus, OH 43125
ADMINISTRATOR, TRANSFER AGENT AND FUND ACCOUNTANT
Huntington Asset Services, Inc.
2960 North Meridian Street, Suite 300
Indianapolis, IN 46208
This report is intended only for the information of shareholders or those who have received the Funds prospectus which contains information about the Funds management fee and expenses. Please read the prospectus carefully before investing.
Distributed by Unified Financial Securities, Inc.
Member FINRA/SIPC
50
VALUED ADVISERS TRUST
PRIVACY POLICY
The following is a description of the policies of the Valued Advisers Trust (the “Trust”) regarding disclosure of nonpublic personal information that shareholders provide to a series of the Trust (each, a “Fund”) or that the Fund collects from other sources. In the event that a shareholder holds shares of a Fund through a broker-dealer or other financial intermediary, the privacy policy of the financial intermediary would govern how shareholder nonpublic personal information would be shared with nonaffiliated third parties.
Categories of Information A Fund May Collect. A Fund may collect the following nonpublic personal information about its shareholders:
| • | Information the Fund receives from a shareholder on applications or other forms, correspondence, or conversations (such as the shareholder’s name, address, phone number, social security number, and date of birth); and |
| • | Information about the shareholder’s transactions with the Fund, its affiliates, or others (such as the shareholder’s account number and balance, payment history, cost basis information, and other financial information). |
Categories of Information A Fund May Disclose. A Fund may not disclose any nonpublic personal information about its current or former shareholders to unaffiliated third parties, except as required or permitted by law. A Fund is permitted by law to disclose all of the information it collects, as described above, to its service providers (such as the Fund’s custodian, administrator, transfer agent, accountant and legal counsel) to process shareholder transactions and otherwise provide services to the shareholder.
Confidentiality and Security. Each Fund shall restrict access to shareholder nonpublic personal information to those persons who require such information to provide products or services to the shareholder. Each Fund shall maintain physical, electronic, and procedural safeguards that comply with federal standards to guard shareholder nonpublic personal information.
Disposal of Information. The Funds, through their transfer agent, have taken steps to reasonably ensure that the privacy of a shareholder’s nonpublic personal information is maintained at all times, including in connection with the disposal of information that is no longer required to be maintained by the Funds. Such steps shall include, whenever possible, shredding paper documents and records prior to disposal, requiring off-site storage vendors to shred documents maintained in such locations prior to disposal, and erasing and/or obliterating any data contained on electronic media in such a manner that the information can no longer be read or reconstructed.
51

THE SOUND MIND
INVESTING FUND
SOUND MIND INVESTING
BALANCED FUND
THE SMI DYNAMIC ALLOCATION FUND
| SEMI-ANNUAL |
| April 30, 2014 |
Fund Adviser:
SMI Advisory Services, LLC
11135 Baker Hollow Road
Columbus, IN 47201
Toll Free (877) SMI-Fund
www.smifund.com

DANA LARGE CAP EQUITY FUND
Semi-Annual Report
April 30, 2014
Dana Investment Advisors, Inc.
15800 Bluemound Rd., Suite 250
Brookfield, WI 53005
(855) 280-9648
www.danafunds.com
Investment Results (Unaudited)
Total Returns* as of April 30, 2014
Six Months | One Year | Three Year | Since Inception (3/1/10) | Since Inception (7/28/10) | Since Inception (10/29/13) | |||||||||||||||||||
Dana Large Cap Equity Fund |
| |||||||||||||||||||||||
Class A with Load | 3.72% | 14.69% | 10.06% | N/A | 15.18% | N/A | ||||||||||||||||||
Class A without Load | 9.15% | 20.74% | 11.95% | N/A | 16.77% | N/A | ||||||||||||||||||
Class N | 9.21% | 21.08% | 12.18% | 17.78% | N/A | N/A | ||||||||||||||||||
Institutional Class | 9.36% | N/A | N/A | N/A | N/A | 9.68% | ||||||||||||||||||
S&P 500 Index1 | 8.36% | 20.44% | 13.83% | 16.09% | 17.49% | 16.58% | ||||||||||||||||||
| Expense Ratios2 | ||||||||||||||||||||||||
| Class A | Class N | Institutional Class | ||||||||||||||||||||||
Gross | 2.19% | 2.19% | 1.94% | |||||||||||||||||||||
With Applicable Waivers | 0.98% | 0.98% | 0.73% | |||||||||||||||||||||
The performance quoted represents past performance, which does not guarantee future results. The investment return and principal value of an investment will fluctuate so that an investor’s shares, when redeemed, may be worth more or less than their original cost. The returns shown do not reflect deduction of taxes that a shareholder would pay on Fund distributions or the redemption of Fund shares. Current performance of the Fund may be lower or higher than the performance quoted. The Fund's investment objectives, risks, charges and expenses must be considered carefully before investing. Performance data current to the most recent month end may be obtained by calling 1-855-280-9648.
* Return figures reflect any change in price per share and assume the reinvestment of all distributions. Returns for periods less than 1 year are not annualized.
1 The S&P 500® Index ("Index") is widely recognized unmanaged index of equity securities and is representative of a broader domestic equity market and range of securities than is found in the Fund's portfolio. Individuals cannot invest directly in the Index; however, an individual can invest in exchange traded funds or other investment vehicles that attempt to track the performance of a benchmark index.
2 The expense ratios are from the Fund's prospectus dated February 28, 2014. The Adviser has contractually agreed to waive its management fee and/or reimburse certain operating expenses through February 28, 2017, but only to the extent necessary so that the Fund's net expenses, excluding brokerage fees and commissions, borrowing costs (such as (a) interest expense and (b) dividends on securities sold short), taxes, extraordinary expenses, 12b-1 fees (if applicable), and any indirect expenses (such as fees and expenses of acquired funds), do not exceed 0.73%. Information pertaining to the Fund's expense ratios as of April 30, 2014 can be found on the financial highlights.
The Fund's investment objectives, strategies, risks, charges and expenses must be considered carefully before investing. The prospectus contains this and other important information about the Fund and may be obtained by calling the same number as above. Please read it carefully before investing.
The Fund is distributed by Unified Financial Securities, Inc., member FINRA.
1
Portfolio Illustration (Unaudited)
April 30, 2014
The following chart gives a visual breakdown of the Fund by the industry sectors the underlying securities represent as a percentage of the portfolio of investments.
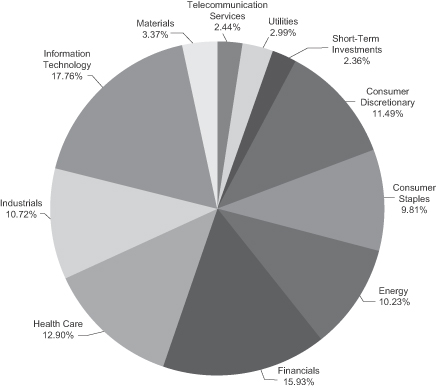
Availability of Portfolio Schedule
The Fund files its complete schedule of portfolio holdings with the Securities and Exchange Commission (“SEC”) for the first and third quarters of each fiscal year on Form N-Q. The Fund’s Forms N-Q are available at the SEC’s website at www.sec.gov. The Fund’s Forms N-Q may be reviewed and copied at the Public Reference Room in Washington DC. Information on the operation of the Public Reference Room may be obtained by calling 1-800-SEC-0330.
2
Summary of Fund’s Expenses (Unaudited)
As a shareholder of the Fund, you may incur two types of costs: (1) transaction costs, including sales charges (loads) on purchases and short-term redemption fees and (2) ongoing costs, including management fees, distribution and service (12b-1) fees, and other Fund expenses. These examples are intended to help you understand your ongoing costs (in dollars) of investing in the Fund and to compare these costs with the ongoing costs of investing in other mutual funds.
Each Fund’s example is based on an investment of $1,000 invested at the beginning of the period and held for the entire period (November 1, 2013 through April 30, 2014).
Actual Expenses
The first line of the table below provides information about actual account values and actual expenses. You may use the information in this line, together with the amount you invested, to estimate the expenses that you paid over the period. Simply divide your account value by $1,000 (for example, an $8,600 account value divided by $1,000 = 8.60), then multiply the result by the number in the first line under the heading entitled “Expenses Paid During Period” to estimate the expenses you paid on your account during this period.
Hypothetical Example for Comparison Purposes
The second line of the table below provides information about hypothetical account values and hypothetical expenses based on the Fund’s actual expense ratio and an assumed rate of return of 5% per year before expenses, which is not the Fund’s actual return. The hypothetical account values and expenses may not be used to estimate the actual ending account balance or expenses you paid for the period. You may use this information to compare the ongoing costs of investing in the Fund and other funds. To do so, compare this 5% hypothetical example with the 5% hypothetical examples that appear in the shareholder reports of the other funds.
Expenses shown are meant to highlight your ongoing costs only and do not reflect any transactional costs such as the fee imposed on sales charges and short-term redemptions. Therefore, the second line of the table below is useful in comparing ongoing costs only and will not help you determine the relative costs of owning different funds. If incurred, the short-term redemption fee imposed by the Fund would increase your expenses.
3
Summary of Fund’s Expenses (Unaudited) (continued)
| Beginning Account Value, November 1, 2013 | Ending Account Value, April 30, 2014 | Expenses Paid During Period1 | Annualized Expense Ratio | |||||||||||||||
Dana Large Cap Equity Fund | ||||||||||||||||||
Class A | Actual | $ | 1,000.00 | $ | 1,091.50 | $ | 5.08 | 0.98 | % | |||||||||
| Hypothetical2 | $ | 1,000.00 | $ | 1,019.93 | $ | 4.91 | 0.98 | % | ||||||||||
Class N | Actual | $ | 1,000.00 | $ | 1,092.10 | $ | 5.08 | 0.98 | % | |||||||||
| Hypothetical2 | $ | 1,000.00 | $ | 1,019.93 | $ | 4.91 | 0.98 | % | ||||||||||
Institutional Class | Actual | $ | 1,000.00 | $ | 1,093.60 | $ | 3.79 | 0.73 | % | |||||||||
| Hypothetical2 | $ | 1,000.00 | $ | 1,021.17 | $ | 3.66 | 0.73 | % | ||||||||||
| 1 | Expenses are equal to the Fund’s annualized expense ratios, multiplied by the average account value over the period, multiplied by 181/365 (to reflect the one-half year period). The annualized expense ratios reflect reimbursement of expenses by the Fund’s Adviser for the period beginning November 1, 2013 to April 30, 2014. The “Financial Highlights” tables in the Fund’s financial statements, included in the report, also show the gross expense ratios, without such reimbursements. |
| 2 | Hypothetical assumes 5% annual return before expenses. |
4
Schedule of Investments (Unaudited)
April 30, 2014
| Shares | Fair Value | |||||||
| COMMON STOCKS – 98.58% | ||||||||
| Consumer Discretionary 11.60% | ||||||||
| 7,800 | Comcast Corp. – Class A | $ | 403,728 | |||||
| 5,500 | Hanesbrands, Inc. | 451,495 | ||||||
| 4,200 | Magna International, Inc. | 411,558 | ||||||
| 7,800 | Royal Caribbean Cruises Ltd. | 414,414 | ||||||
| 5,000 | Viacom, Inc. – Class B | 424,900 | ||||||
| 2,900 | Whirlpool Corp. | 444,802 | ||||||
| 5,100 | Wyndham Worldwide Corp. | 363,834 | ||||||
|
| |||||||
| 2,914,731 | ||||||||
|
| |||||||
| Consumer Staples 9.90% | ||||||||
| 10,700 | Coca-Cola Enterprises, Inc. | 486,208 | ||||||
| 6,500 | CVS Caremark Corp. | 472,680 | ||||||
| 9,000 | General Mills, Inc. | 477,180 | ||||||
| 4,600 | Kimberly-Clark Corp. | 516,350 | ||||||
| 9,000 | Lorillard, Inc. | 534,780 | ||||||
|
| |||||||
| 2,487,198 | ||||||||
|
| |||||||
| Energy 10.33% | ||||||||
| 3,000 | Chevron Corp. | 376,560 | ||||||
| 5,600 | ConocoPhillips | 416,136 | ||||||
| 4,200 | Exxon Mobil Corp. | 430,122 | ||||||
| 4,800 | Helmerich & Payne, Inc. | 521,520 | ||||||
| 4,100 | Schlumberger Ltd. | 416,355 | ||||||
| 7,600 | Valero Energy Corp. | 434,492 | ||||||
|
| |||||||
| 2,595,185 | ||||||||
|
| |||||||
| Financials 16.08% | ||||||||
| 8,000 | Allstate Corp./The | 455,600 | ||||||
| 4,500 | Ameriprise Financial, Inc. | 502,335 | ||||||
| 8,000 | Discover Financial Services | 447,200 | ||||||
| 21,000 | Fifth Third Bancorp. | 432,810 | ||||||
| 7,700 | JPMorgan Chase & Co. | 431,046 | ||||||
| 9,500 | Lincoln National Corp. | 460,845 | ||||||
| 8,400 | MetLife, Inc. | 439,740 | ||||||
| 4,800 | PNC Financial Services Group, Inc. | 403,392 | ||||||
| 9,400 | Wells Fargo & Co. | 466,616 | ||||||
|
| |||||||
| 4,039,584 | ||||||||
|
| |||||||
| Health Care 13.03% | ||||||||
| 8,400 | AbbVie, Inc. | 437,472 | ||||||
| 6,700 | Aetna, Inc. | 478,715 | ||||||
| 4,200 | Amgen, Inc. | 469,350 | ||||||
| 6,400 | Covidien PLC | 456,000 | ||||||
| 4,600 | Johnson & Johnson | 465,934 | ||||||
| 2,700 | McKesson Corp. | 456,813 | ||||||
| 10,000 | Mylan, Inc. * | 507,800 | ||||||
|
| |||||||
| 3,272,084 | ||||||||
|
| |||||||
The accompanying notes are an integral part of these financial statements.
5
Schedule of Investments (Unaudited) (continued)
April 30, 2014
| Shares | Fair Value | |||||||
| COMMON STOCKS – (continued) | ||||||||
| Industrials 10.82% | ||||||||
| 1,800 | Alaska Air Group, Inc. | $ | 169,344 | |||||
| 3,200 | Boeing Co./The | 412,864 | ||||||
| 13,000 | Delta Air Lines, Inc. | 478,790 | ||||||
| 4,600 | Dover Corp. | 397,440 | ||||||
| 4,200 | Raytheon Co. | 401,016 | ||||||
| 2,400 | Union Pacific Corp. | 457,032 | ||||||
| 3,400 | United Technologies Corp. | 402,322 | ||||||
|
| |||||||
| 2,718,808 | ||||||||
|
| |||||||
| Information Technology 17.94% | ||||||||
| 1,577 | Alliance Data Systems Corp. * | 381,476 | ||||||
| 9,800 | Amdocs Ltd. | 455,994 | ||||||
| 850 | Apple, Inc. | 501,576 | ||||||
| 9,000 | Avnet, Inc. | 388,170 | ||||||
| 11,000 | CA, Inc. | 331,540 | ||||||
| 2,370 | International Business Machines Corp. | 465,634 | ||||||
| 4,400 | KLA-Tencor Corp. | 281,556 | ||||||
| 10,400 | Oracle Corp. | 425,152 | ||||||
| 5,700 | QUALCOMM, Inc. | 448,647 | ||||||
| 6,267 | Seagate Technology PLC | 329,519 | ||||||
| 12,100 | Skyworks Solutions, Inc. * | 496,705 | ||||||
|
| |||||||
| 4,505,969 | ||||||||
|
| |||||||
| Materials 3.40% | ||||||||
| 4,700 | Lyondellbasell Industries N.V. – Class A | 434,750 | ||||||
| 6,300 | Packaging Corp. of America | 419,769 | ||||||
|
| |||||||
| 854,519 | ||||||||
|
| |||||||
| Telecommunication Services 2.46% | ||||||||
| 7,900 | AT&T, Inc. | 282,030 | ||||||
| 7,200 | Verizon Communications, Inc. | 336,456 | ||||||
|
| |||||||
| 618,486 | ||||||||
|
| |||||||
| Utilities 3.02% | ||||||||
| 13,000 | CMS Energy Corp. | 394,030 | ||||||
| 11,400 | Xcel Energy, Inc. | 363,318 | ||||||
|
| |||||||
| 757,348 | ||||||||
|
| |||||||
Total Common Stocks (Cost $19,958,383) | 24,763,912 | |||||||
|
| |||||||
The accompanying notes are an integral part of these financial statements.
6
Schedule of Investments (Unaudited) (continued)
April 30, 2014
| Shares | Fair Value | |||||||
| SHORT-TERM INVESTMENTS – 2.38% | ||||||||
| 598,875 | Fidelity Institutional Money Market Portfolio – Institutional Class, 0.090%(a) | $ | 598,875 | |||||
|
| |||||||
Total Short-Term Investments (Cost $598,875) | 598,875 | |||||||
|
| |||||||
Total Investments (Cost $20,557,257) 100.96% | 25,362,787 | |||||||
|
| |||||||
Liabilities in Excess of Other Assets (0.96)% | (241,640 | ) | ||||||
|
| |||||||
TOTAL NET ASSETS 100.00% | $ | 25,121,147 | ||||||
|
| |||||||
| (a) | Rate disclosed is the seven day yield as of April 30, 2014. |
| * | Non-income producing security. |
The accompanying notes are an integral part of these financial statements.
7
Statement of Assets and Liabilities (Unaudited)
April 30, 2014
Assets | ||||
Investments in securities at fair value (Cost $20,557,257) | $ | 25,362,787 | ||
Receivable for fund shares sold | 20,399 | |||
Dividends receivable | 28,034 | |||
Receivable from Adviser | 7,111 | |||
Prepaid expenses | 25,291 | |||
Total Assets | 25,443,622 | |||
Liabilities | ||||
Payable for investments purchased | 288,514 | |||
Payable for Distribution Fees | 4,631 | |||
Payable to administrator, fund accountant, and transfer agent | 10,584 | |||
Payable to custodian | 2,286 | |||
Payable to trustees and officers | 2,622 | |||
Other accrued expenses | 13,838 | |||
Total Liabilities | 322,475 | |||
Net Assets | $ | 25,121,147 | ||
Net Assets Consist of: | ||||
Paid-in capital | $ | 19,228,470 | ||
Accumulated undistributed net investment income | 14,710 | |||
Accumulated undistributed net realized gain from investments | 1,072,437 | |||
Net unrealized appreciation on investments | 4,805,530 | |||
Net Assets | $ | 25,121,147 | ||
Class N: | ||||
Net Assets | $ | 22,314,250 | ||
Shares outstanding | 1,274,304 | |||
Net asset value (“NAV”) and offering price per share | $ | 17.51 | ||
Redemption price per share (NAV*98%) (a) | $ | 17.16 | ||
Class A: | ||||
Net Assets | $ | 995,280 | ||
Shares outstanding | 56,955 | |||
Net asset value (“NAV”) per share | $ | 17.47 | ||
Offering price per share (NAV/0.95) (b) | $ | 18.39 | ||
Redemption price per share (NAV*98%) (a) | $ | 17.12 | ||
Institutional Class: | ||||
Net Assets | $ | 1,811,617 | ||
Shares outstanding (unlimited number of shares authorized, no par value) | 103,625 | |||
Net asset value (“NAV”) and offering price per share | $ | 17.48 | ||
Redemption price per share (NAV*98%) (a) | $ | 17.13 |
| (a) | The Fund charges a 2.00% redemption fee on shares redeemed within 60 days of purchase. |
| (b) | Class A shares impose a maximum 5.00% sales charge on purchases. |
8
The accompanying notes are an integral part of these financial statements.
Statement of Operations (Unaudited)
For the six months ended April 30, 2014
Investment Income | ||||
Dividend income (Net of foreign taxes withheld of $460) | $ | 220,295 | ||
Total investment income | 220,295 | |||
Expenses | ||||
Adviser fees | 73,622 | |||
Distribution (12b-1) fees: | ||||
Class N | 24,626 | |||
Class A | 1,134 | |||
Administration fees | 21,167 | |||
Fund accounting fees | 17,610 | |||
Transfer agent fees | 24,246 | |||
Legal fees | 7,926 | |||
Registration fees | 21,652 | |||
Custodian fees | 2,816 | |||
Audit fees | 9,480 | |||
Trustee fees | 3,413 | |||
Printing fees | 9,021 | |||
Miscellaneous fees | 9,000 | |||
Total expenses | 225,713 | |||
Fees contractually waived by Adviser | (123,019 | ) | ||
Net operating expenses | 102,694 | |||
Net investment income | 117,601 | |||
Realized & Unrealized Gain on Investments | ||||
Net realized gain on investment securities | 1,074,355 | |||
Change in unrealized appreciation of investment securities | 694,411 | |||
Net realized and unrealized gain on investment securities | 1,768,766 | |||
Net increase in net assets resulting from operations | $ | 1,886,367 |
9
The accompanying notes are an integral part of these financial statements.
Statements of Changes in Net Assets
| For the Six Months Ended April 30, 2014 (Unaudited) | For the Year Ended October 31, 2013 | |||||||
Increase in Net Assets due to: Operations: | ||||||||
Net investment income | $ | 117,601 | $ | 208,819 | ||||
Net realized gain on investment securities | 1,074,355 | 1,297,323 | ||||||
Change in unrealized appreciation of investments securities | 694,411 | 2,231,812 | ||||||
Net increase in net assets resulting from operations | 1,886,367 | 3,737,954 | ||||||
Distributions: | ||||||||
From net investment income, Class N | (95,476 | ) | (213,577 | ) | ||||
From net investment income, Class A | (4,775 | ) | (3,890 | ) | ||||
From net investment income, Class C | — | (139 | )(a) | |||||
From net investment income, Institutional Class | (2,640 | ) | — | |||||
From realized gain, Class N | (1,221,280 | ) | (74,911 | ) | ||||
From realized gain, Class A | (55,136 | ) | (1,602 | ) | ||||
From realized gain, Class C | — | (304 | )(a) | |||||
From realized gain, Institutional Class | (17,697 | ) | — | |||||
Total distributions | (1,397,004 | ) | (294,423 | ) | ||||
Capital Transactions – Class N: | ||||||||
Proceeds from shares sold | 4,129,207 | 3,559,617 | ||||||
Reinvestment of distributions | 1,232,480 | 276,526 | ||||||
Amount paid for shares redeemed | (1,778,790 | ) | (1,715,924 | ) | ||||
Proceeds from redemption fees (b) | 208 | — | ||||||
Total Class N | 3,583,105 | 2,120,219 | ||||||
Capital Transactions – Class A: | ||||||||
Proceeds from shares sold | 124,623 | 533,513 | ||||||
Proceeds from shares converted from Class C | — | 62,900 | ||||||
Reinvestment of distributions | 59,910 | 5,492 | ||||||
Amount paid for shares redeemed | (8,001 | ) | (540,288 | ) | ||||
Total Class A | 176,532 | 61,617 | ||||||
Capital Transactions – Class C (a): | ||||||||
Proceeds from shares sold | — | 33,000 | ||||||
Reinvestment of distributions | — | 443 | ||||||
Amount paid for shares redeemed | — | (52,323 | ) | |||||
Amount converted to Class A | — | (62,900 | ) | |||||
Total Class C | — | (81,780 | ) | |||||
Capital Transactions – Institutional Class: |
| |||||||
Proceeds from shares sold | 1,474,622 | 271,870 | (c) | |||||
Reinvestment of distributions | 19,894 | — | ||||||
Total Institutional Class | 1,494,516 | 271,870 | (c) | |||||
Net increase in net assets resulting from capital transactions | 5,254,153 | 2,371,926 | ||||||
Total Increase in Net Assets | 5,743,516 | 5,815,457 | ||||||
10
The accompanying notes are an integral part of these financial statements.
Statements of Changes in Net Assets (continued)
| For the Six Months Ended April 30, 2014 (Unaudited) | For the Year Ended October 31, 2013 | |||||||
Net Assets: | ||||||||
Beginning of period | $ | 19,377,631 | $ | 13,562,174 | ||||
End of period | $ | 25,121,147 | $ | 19,377,631 | ||||
Accumulated net investment income included in net assets at end of period | $ | 14,710 | $ | — | ||||
Share Transactions – Class N: | ||||||||
Shares sold | 238,722 | 230,138 | ||||||
Shares issued in reinvestment of distributions | 74,007 | 18,834 | ||||||
Shares redeemed | (103,356 | ) | (107,298 | ) | ||||
Total Class N | 209,373 | 141,674 | ||||||
Share Transactions – Class A: | ||||||||
Shares sold | 7,268 | 31,099 | ||||||
Shares converted from Class C | — | 3,876 | ||||||
Shares issued in reinvestment of distributions | 3,604 | 387 | ||||||
Shares redeemed | (475 | ) | (37,550 | ) | ||||
Total Class A | 10,397 | (2,188 | ) | |||||
Share Transactions – Class C (a): | ||||||||
Shares sold | — | 2,126 | ||||||
Shares issued in reinvestment of distributions | — | 32 | ||||||
Shares redeemed | — | (2,973 | ) | |||||
Shares converted to Class A | — | (3,876 | ) | |||||
Total Class C | — | (4,691 | ) | |||||
Share Transactions – Institutional Class: | ||||||||
Shares sold | 86,567 | 15,862 | (c) | |||||
Shares issued in reinvestment of distributions | 1,196 | — | ||||||
Total Institutional Class | 87,763 | 15,862 | (c) | |||||
| (a) | For the period November 1, 2012 to August 19, 2013 (effective date of Class C shares conversion to Class A shares). |
| (b) | The Fund charges a 2.00% redemption fee on shares redeemed within 60 days of purchase. |
| (c) | For the period October 29, 2013 (Institutional Class shares commenced operations) to October 31, 2013. |
11
The accompanying notes are an integral part of these financial statements.
Dana Large Cap Equity Fund – Class N
Financial Highlights
Selected data for a share outstanding throughout each period.
| Six Months Ended April 30, 2014 (Unaudited) | Years Ended October 31, | Period Ended October 31, 2010(a) | ||||||||||||||||||
| 2013 | 2012 | 2011 | ||||||||||||||||||
Net asset value, at | $17.19 | $13.88 | $12.50 | $11.83 | $10.00 | |||||||||||||||
|
|
|
|
|
|
|
|
|
| |||||||||||
Income from investment operations: | ||||||||||||||||||||
Net investment income (loss) | 0.09 | 0.21 | * | 0.14 | * | 0.09 | * | 0.06 | * | |||||||||||
Net realized and unrealized gain (loss) on investments | 1.43 | 3.40 | 1.51 | 0.67 | 1.81 | |||||||||||||||
|
|
|
|
|
|
|
|
|
| |||||||||||
Total from investment operations | 1.52 | 3.61 | 1.65 | 0.76 | 1.87 | |||||||||||||||
|
|
|
|
|
|
|
|
|
| |||||||||||
Distributions from: | ||||||||||||||||||||
Net investment income | (0.08 | ) | (0.22 | ) | (0.14 | ) | (0.09 | ) | (0.04 | ) | ||||||||||
Net realized gain | (1.12 | ) | (0.08 | ) | (0.13 | ) | – | – | ||||||||||||
|
|
|
|
|
|
|
|
|
| |||||||||||
Total from distributions | (1.20 | ) | (0.30 | ) | (0.27 | ) | (0.09 | ) | (0.04 | ) | ||||||||||
|
|
|
|
|
|
|
|
|
| |||||||||||
Redemption fees*** | – | – | – | – | – | |||||||||||||||
Net asset value, at | $17.51 | $17.19 | $13.88 | $12.50 | $11.83 | |||||||||||||||
|
|
|
|
|
|
|
|
|
| |||||||||||
Total Return** | 9.21 | %(b) | 26.35 | % | 13.44 | % | 6.40 | % | 18.76 | %(b) | ||||||||||
Ratios/Supplemental Data: | ||||||||||||||||||||
Net assets at end of period (thousands) | $22,314 | $18,306 | $12,819 | $8,961 | $3,524 | |||||||||||||||
Before waiver | ||||||||||||||||||||
Ratio of expenses to average net assets | 2.15 | %(c) | 1.99 | % | 2.30 | % | 3.50 | % | 9.63 | %(c) | ||||||||||
Ratio of net investment income (loss) to average net assets | (0.05 | )%(c) | 0.32 | % | 0.24 | % | (1.28 | )% | (7.32 | )%(c) | ||||||||||
After waiver | ||||||||||||||||||||
Ratio of expenses to average net assets | 0.98 | %(c) | 0.98 | % | 1.50 | % | 1.50 | % | 1.50 | %(c) | ||||||||||
Ratio of net investment income (loss) to average net assets | 1.12 | %(c) | 1.33 | % | 1.04 | % | 0.72 | % | 0.82 | %(c) | ||||||||||
Portfolio turnover | 30 | %(b) | 70 | % | 54 | % | 53 | % | 32 | %(b) | ||||||||||
| (a) | The Dana Large Cap Equity Fund Class N commenced operations on March 1, 2010. |
| (b) | Not annualized |
| (c) | Annualized |
| * | Per share net investment income has been determined on the basis of average shares outstanding during the period. |
| ** | Total return in the above table represents the rate that the investor would have earned or lost on an investment in the Fund assuming reinvestment of dividends, and is not annualized for periods of less than one year. |
| *** | The amount is less than $0.005 per share. |
12
The accompanying notes are an integral part of these financial statements.
Dana Large Cap Equity Fund – Class A
Financial Highlights
Selected data for a share outstanding throughout each period.
| Six Months Ended April 30, 2014 (Unaudited) | Years ended October 31, | Period Ended October 31, 2010(a) | ||||||||||||||||||
| 2013 | 2012 | 2011 | ||||||||||||||||||
Net asset value, at | $17.17 | $13.92 | $12.52 | $11.84 | $10.95 | |||||||||||||||
|
|
|
|
|
|
|
|
|
| |||||||||||
Income from investment operations: | ||||||||||||||||||||
Net investment income (loss) | 0.10 | 0.13 | * | 0.14 | * | 0.08 | * | – | *,*** | |||||||||||
Net realized and unrealized gain (loss) on investments | 1.41 | 3.39 | 1.52 | 0.67 | 0.89 | |||||||||||||||
|
|
|
|
|
|
|
|
|
| |||||||||||
Total from investment operations | 1.51 | 3.52 | 1.66 | 0.75 | 0.89 | |||||||||||||||
|
|
|
|
|
|
|
|
|
| |||||||||||
Distributions from: | ||||||||||||||||||||
Net investment income | (0.09 | ) | (0.19 | ) | (0.13 | ) | (0.07 | ) | – | |||||||||||
Net realized gain | (1.12 | ) | (0.08 | ) | (0.13 | ) | – | – | ||||||||||||
|
|
|
|
|
|
|
|
|
| |||||||||||
Total from distributions | (1.21 | ) | (0.27 | ) | (0.26 | ) | (0.07 | ) | – | |||||||||||
|
|
|
|
|
|
|
|
|
| |||||||||||
Redemption fees *** | – | – | – | – | – | |||||||||||||||
Net asset value, at | $17.47 | $17.17 | $13.92 | $12.52 | $11.84 | |||||||||||||||
|
|
|
|
|
|
|
|
|
| |||||||||||
Total Return ** | 9.15 | %(b) | 25.67 | % | 13.54 | % | 6.36 | % | 8.13 | %(b) | ||||||||||
Ratios/Supplemental Data: |
| |||||||||||||||||||
Net assets at end of period (thousands) | $995 | $799 | $678 | $301 | $3 | |||||||||||||||
Before waiver: | ||||||||||||||||||||
Ratio of expenses to average net assets | 2.15 | %(c) | 1.98 | % | 2.27 | % | 3.11 | % | 4.75 | %(c) | ||||||||||
Ratio of net investment income (loss) to average net assets | (0.06 | )%(c) | 0.35 | % | 0.22 | % | (0.95 | )% | (2.94 | )%(c) | ||||||||||
After waiver: | ||||||||||||||||||||
Ratio of expenses to average net assets | 0.98 | %(c) | 1.49 | % | 1.50 | % | 1.50 | % | 1.50 | %(c) | ||||||||||
Ratio of net investment income (loss) to average net assets | 1.11 | %(c) | 0.84 | % | 1.00 | % | 0.66 | % | 0.31 | %(c) | ||||||||||
Portfolio turnover | 30 | %(b) | 70 | % | 54 | % | 53 | % | 32 | %(b) | ||||||||||
| (a) | The Dana Large Cap Equity Fund Class A commenced operations on July 28, 2010. |
| (b) | Not annualized |
| (c) | Annualized |
| * | Per share net investment income has been determined on the basis of average shares outstanding during the period. |
| ** | Total return in the above table represents the rate that the investor would have earned or lost on an investment in the Fund assuming reinvestment of dividends, excluding maximum sales charge, and is not annualized for periods of less than one year. |
| *** | The amount is less than $0.005 per share. |
13
The accompanying notes are an integral part of these financial statements.
Dana Large Cap Equity Fund – Institutional Class
Financial Highlights
Selected data for a share outstanding throughout each period.
| Six Months Ended April 30, 2014 (Unaudited) | Period Ended October 31, 2013(a) | |||||||
Net asset value, at beginning of period | $17.19 | $17.14 | ||||||
|
|
|
| |||||
Income from investment operations: | ||||||||
Net investment income (loss) | 0.13 | – | * | |||||
Net realized and unrealized gain (loss) on investments | 1.41 | 0.05 | ||||||
|
|
|
| |||||
Total from investment operations | 1.54 | 0.05 | ||||||
|
|
|
| |||||
Distributions from: | ||||||||
Net investment income | (0.13 | ) | – | |||||
Net realized gain | (1.12 | ) | – | |||||
|
|
|
| |||||
Total from distributions | (1.25 | ) | – | |||||
|
|
|
| |||||
Net asset value, at end of period | $17.48 | $17.19 | ||||||
|
|
|
| |||||
Total Return ** | 9.36 | %(b) | 0.29 | %(b) | ||||
Ratios/Supplemental Data: | ||||||||
Net assets at end of period (thousands) | $1,812 | $273 | ||||||
Before waiver: | ||||||||
Ratio of expenses to average net assets | 1.86 | %(c) | 1.53 | %(c) | ||||
Ratio of net investment income (loss) to average net assets | (0.12 | )%(c) | (0.31 | )%(c) | ||||
After waiver: | ||||||||
Ratio of expenses to average net assets | 0.73 | %(c) | 0.73 | %(c) | ||||
Ratio of net investment income (loss) to average net assets | 1.01 | %(c) | 0.49 | %(c) | ||||
Portfolio turnover | 30 | %(b) | 70 | %(b) | ||||
| (a) | The Dana Large Cap Equity Fund Institutional Class commenced operations on October 29, 2013. |
| (b) | Not annualized |
| (c) | Annualized |
| * | Per share net investment income has been determined on the basis of average shares outstanding during the period. The amount is less than $0.005 per share. |
| ** | Total return in the above table represents the rate that the investor would have earned or lost on an investment in the Fund assuming reinvestment of dividends, and is not annualized for periods of less than one year. |
14
The accompanying notes are an integral part of these financial statements.
Notes to the Financial Statements (Unaudited)
April 30, 2014
NOTE 1. ORGANIZATION
The Dana Large Cap Equity Fund (the “Fund”) is an open-end diversified series of the Valued Advisers Trust (the “Trust”). The Trust is a management investment company established under the laws of Delaware by an Agreement and Declaration of Trust dated June 13, 2008 (the “Trust Agreement”). The Trust Agreement permits the Board of Trustees (“Board”) to issue an unlimited number of shares of beneficial interest of separate series without par value. The Fund is one of a series of funds currently authorized by the Board. The Fund’s investment adviser is Dana Investment Advisors, Inc. (the “Adviser”). The Fund seeks long-term growth of capital.
The Fund currently offers Class N shares, Class A shares, and Institutional Class shares. Each share represents an equal proportionate interest in the assets and liabilities belonging to the Fund and is entitled to such dividends and distributions out of income belonging to the Fund as declared by the Board. Class A currently has a maximum sales charge on purchases of 5.00% as a percentage of the original purchase price. All three share classes impose a 2.00% redemption fee on shares redeemed within 60 days of purchase.
The Fund was previously a series of the Epiphany Funds, an unaffiliated registered investment company and was named Dana Large Cap Core Fund. On October 22, 2013, shareholders of the Fund voted to reorganize the Fund into the Trust effective October 28, 2013.
NOTE 2. SIGNIFICANT ACCOUNTING POLICIES
The following is a summary of significant accounting policies followed by the Fund in the preparation of its financial statements. These policies are in conformity with the generally accepted accounting principles in the United States of America (“GAAP”).
Estimates – The preparation of financial statements in conformity with GAAP requires management to make estimates and assumptions that affect the reported amounts of assets and liabilities and disclosure of contingent assets and liabilities at the date of the financial statements and the reported amounts of increases and decreases in net assets from operations during the reporting period. Actual results could differ from those estimates.
Securities Valuation – All investments in securities are recorded at their estimated fair value as described in Note 3.
Federal Income Taxes – The Fund makes no provision for federal income or excise tax. The Fund intends to qualify each year as a regulated investment company (“RIC”) under subchapter M of the Internal Revenue Code of 1986, as amended, by complying with the requirements applicable to RICs and by distributing substantially all of its taxable income. The Fund also intends to distribute sufficient net investment income and net capital gains, if any, so that it will not be subject to excise tax on undistributed income and gains. If the required amount of net investment income or gains is not distributed, the Fund could incur a tax expense.
For the six months ended April 30, 2014, the Fund did not have a liability for any unrecognized tax benefits. The Fund recognizes interest and penalties, if any, related to unrecognized tax benefits as income tax expense in the statement of operations. The Fund is subject to examination by U.S. federal tax authorities for the last four tax year ends and the interim tax period since then.
15
Notes to the Financial Statements (Unaudited) (continued)
April 30, 2014
Expenses – Expenses incurred by the Trust that do not relate to a specific fund of the Trust are allocated to the individual funds based on each fund’s relative net assets or other appropriate basis (as determined by the Board). Expenses attributable to any class are borne by that class. Income, realized gains and losses, unrealized appreciation and depreciation, and expenses are allocated to each class based on the net assets in relation to the relative net assets of the Fund.
Security Transactions and Related Income – The Fund follows industry practice and records security transactions on the trade date for financial reporting purposes. The specific identification method is used for determining gains or losses for financial statement and income tax purposes. Dividend income is recorded on the ex-dividend date and interest income is recorded on an accrual basis. Discounts and premiums on securities purchased are accreted or amortized using the effective interest method. Withholding taxes on foreign dividends have been provided for in accordance with the Fund’s understanding of the applicable country’s tax rules and rates.
Dividends and Distributions – Distributions to shareholders, which are determined in accordance with income tax regulations, are recorded on the ex-dividend date. The Fund intends to distribute substantially all of its net investment income on a quarterly basis. The Fund intends to distribute its net realized long-term and short-term capital gains, if any, on an annual basis. The treatment for financial reporting purposes of distributions made to shareholders during the year from net investment income or net realized capital gains may differ from their ultimate treatment for federal income tax purposes. These differences are caused primarily by differences in the timing of the recognition of certain components of income, expense or realized capital gain for federal income tax purposes. Where such differences are permanent in nature, they are reclassified in the components of the net assets based on their ultimate characterization for federal income tax purposes. Any such reclassifications will have no effect on net assets, results of operations or net asset values per share of the Fund.
NOTE 3. SECURITIES VALUATION AND FAIR VALUE MEASUREMENTS
Fair value is defined as the price that a Fund would receive upon selling an investment in a timely transaction to an independent buyer in the principal or most advantageous market of the investment. GAAP establishes a three-tier hierarchy to maximize the use of observable market data and minimize the use of unobservable inputs and to establish classification of fair value measurements for disclosure purposes.
Inputs refer broadly to the assumptions that market participants would use in pricing the asset or liability, including assumptions about risk (the risk inherent in a particular valuation technique used to measure fair value including such a pricing model and/or the risk inherent in the inputs to the valuation technique). Inputs may be observable or unobservable. Observable inputs are inputs that reflect the assumptions market participants would use in pricing the asset or liability developed based on market data obtained from sources independent of the reporting entity. Unobservable inputs are inputs that reflect the reporting entity’s own assumptions about the assumptions market participants would use in pricing the asset or liability developed based on the best information available in the circumstances.
16
Notes to the Financial Statements (Unaudited) (continued)
April 30, 2014
Various inputs are used in determining the value of the Fund’s investments. These inputs are summarized in the three broad levels listed below.
| • | Level 1 – quoted prices in active markets for identical securities |
| • | Level 2 – other significant observable inputs (including, but not limited to, quoted prices for an identical security in an inactive market, quoted prices for similar securities, interest rates, prepayment speeds, credit risk, etc.) |
| • | Level 3 – significant unobservable inputs (including the Fund’s own assumptions in determining fair value of investments based on the best information available) |
The inputs used to measure fair value may fall into different levels of the fair value hierarchy. In such cases, for disclosure purposes, the level in the fair value hierarchy within which the fair value measurement falls in its entirety, is determined based, on the lowest level input that is significant to the fair value measurement in its entirety.
Equity securities, including common stocks, exchanged-traded funds and real estate investment trusts, are generally valued by using market quotations, but may be valued on the basis of prices furnished by a pricing service when the Adviser believes such prices more accurately reflect the fair value of such securities. Securities traded in the NASDAQ over-the-counter market are generally valued by a pricing service at the NASDAQ official closing price. Lacking a last sale price, an exchange security is generally valued by the pricing service at its last bid price.
When using the market quotations or close prices provided by a pricing service and when the market is considered active, the security is classified as a Level 1 security. Sometimes, an equity security owned by the Fund will be valued by the pricing service with factors other than market quotations or when the market is considered inactive. When this happens, the security is classified as a Level 2 security. When market quotations are not readily available, when the Adviser determines that the market quotation or the price provided by the pricing service does not accurately reflect the current fair value, or when restricted or illiquid securities are being valued, such securities are valued as determined in good faith by the Adviser, in conformity with guidelines adopted by and subject to review by the Board. These securities are categorized as Level 3 securities.
Investments in mutual funds, including money market mutual funds, are generally priced at the ending NAV provided by the service agent of the funds. These securities are categorized as Level 1 securities.
Short-term investments in fixed income securities, (those with maturities of less than 60 days when acquired, or which subsequently are within 60 days of maturity), are valued by using the amortized cost method of valuation, which the Board has determined represents fair value. These securities are classified as Level 2 securities.
In accordance with the Trust’s good faith pricing guidelines, the Adviser is required to consider all appropriate factors relevant to the value of securities for which it has determined other pricing sources are not available or reliable as described above. No single standard exists for determining fair value, because fair value depends upon the circumstances of each individual case. As a general principle, the current fair value of an issue of securities being valued by the Adviser would appear to be the amount which the owner might reasonably expect to receive for them upon their current
17
Notes to the Financial Statements (Unaudited) (continued)
April 30, 2014
sale. Methods which are in accordance with this principle may, for example, be based on (i) a multiple of earnings; (ii) a discount from market of a similar freely traded security (including a derivative security or a basket of securities traded on other markets, exchanges or among dealers); or (iii) yield to maturity with respect to debt issues, or a combination of these and other methods. Good faith pricing is permitted if, in the Adviser’s opinion, the validity of market quotations appears to be questionable based on factors such as evidence of a thin market in the security based on a small number of quotations, a significant event occurs after the close of a market but before a Fund’s NAV calculation that may affect a security’s value, or the Adviser is aware of any other data that calls into question the reliability of market quotations. Good faith pricing may also be used in instances when the bonds the Fund invests in may default or otherwise cease to have market quotations readily available.
The following is a summary of the inputs used to value the Fund’s investments as of April 30, 2014:
| Valuation Inputs | ||||||||||||||||
| Assets | Level 1 Quoted Prices in Active Markets | Level 2 Other Significant | Level 3 Significant | Total | ||||||||||||
Common Stocks* | $ | 24,763,912 | $ | – | $ | – | $ | 24,763,912 | ||||||||
Short-Term Investments | 598,875 | – | – | 598,875 | ||||||||||||
Total | $ | 25,362,787 | $ | – | $ | – | $ | 25,362,787 | ||||||||
| * | Refer to Schedule of Investments for industry classifications. |
The Fund did not hold any investments at any time during the reporting period in which other significant observable inputs (Level 2) were used in determining fair value. The Fund did not hold any investments at any time during the reporting period in which significant unobservable inputs were used in determining fair value; therefore, no reconciliation of Level 3 securities is included for this reporting period.
The Trust recognizes transfers between fair value hierarchy levels at the reporting period end. There were no transfers between any levels as of April 30, 2014 and the previous reporting period end.
NOTE 4. ADVISER FEES AND OTHER TRANSACTIONS
Under the terms of the management agreement between the Trust and the Adviser (the “Agreement”) for the Fund, the Adviser manages the Fund’s investments subject to oversight of the Board. As compensation for its management services, the Fund is obligated to pay the Adviser a fee computed and accrued daily and paid monthly at an annual rate of 0.70% of the average daily net assets of the Fund. For the six months ended April 30, 2014, the Adviser earned fees of $73,622 from the Fund before the waivers described below. At April 30, 2014, the Adviser owed $7,111 to the Fund including fee waivers and expense reimbursements.
Beginning October 28, 2013, the Adviser contractually agreed to waive its management fee and/or reimburse certain operating expenses through February 28, 2017, but only to the extent necessary so that the Fund’s net expenses, excluding brokerage fees and commissions, borrowing costs (such as interest and dividend expenses on securities sold short), taxes, extraordinary expenses, fees and expenses paid under a distribution plan adopted pursuant to Rule 12b-1, fees and expenses paid
18
Notes to the Financial Statements (Unaudited) (continued)
April 30, 2014
under a shareholder services plan, and indirect expenses (such as “acquired funds fees and expenses”) do not exceed 0.73% for Class N, Class A and Institutional shares.
Each waiver or reimbursement of an expense by the Adviser is subject to repayment by the Fund within the three fiscal years following the fiscal year in which the expense was incurred, provided that the Fund is able to make the repayment without exceeding the expense limitation. The contractual agreement is in effect through February 28, 2017. The expense cap may not be terminated prior to this date except by the Board. For the six months ended April 30, 2014, the Adviser waived fees or reimbursed expenses of $123,019 from the Fund.
The amounts subject to repayment by the Fund, pursuant to the aforementioned conditions are as follows:
| Amount | Recoverable through October 31, | |||
| $ 2,189 | 2016 | |||
| 123,019 | 2017 | |||
The Trust retains Huntington Asset Services, Inc. (“HASI”) to manage the Fund’s business affairs and to provide the Fund with administrative services, including all regulatory, reporting and necessary office equipment and personnel. For the six months ended April 30, 2014, HASI earned fees of $21,167 from the Fund for administrative services. At April 30, 2014 HASI was owed $3,762 from the Fund for administrative services. The Trust also retains HASI to act as the Fund’s transfer agent and to provide the Fund with fund accounting services. For the six months ended April 30, 2014, the HASI earned fees of $24,246 for transfer agent services and reimbursement for out-of-pocket expenses incurred in providing transfer agent services to the Fund. At April 30, 2014, HASI was owed $3,795 for transfer agent services and out-of-pocket expenses.
For the six months ended April 30, 2014, the HASI earned fees of $17,610 from the Fund for fund accounting services. At April 30, 2014, HASI was owed $3,026 from the Fund for fund accounting services.
Certain officers and one Trustee of the Trust are members of management and/or employees of HASI. HASI operates as a wholly-owned subsidiary of Huntington Bancshares, Inc., the parent company of Unified Financial Securities, Inc. (the “Distributor” or “Unified”) and Huntington National Bank, the custodian of the Fund’s investments (the “Custodian”). For the six months ended April 30, 2014, the Custodian earned fees $2,816 for custody services. At April 30, 2014, the Custodian was owed $2,286 for custody services.
The Fund has adopted a Distribution Plan (the “Plan”) pursuant to Rule 12b-1 under the 1940 Act. The Plan provides that the Fund will pay the Distributor and/or any registered securities dealer, financial institution or any other person (a “Recipient”) a shareholder servicing fee aggregating up to 0.25% of the average daily net assets of the Class N and Class A shares in connection with the promotion and distribution of the Fund’s shares or the provision of personal services to shareholders, including, but not necessarily limited to, advertising, compensation to underwriters, dealers and selling personnel, the printing and mailing of prospectuses to other than current Fund shareholders, the printing and mailing of sales literature and servicing shareholder accounts. The Fund or the Adviser may pay all or a portion of these fees to any Recipient who renders assistance
19
Notes to the Financial Statements (Unaudited) (continued)
April 30, 2014
in distributing or promoting the sale of shares, or who provides certain shareholder services, pursuant to a written agreement. The Plan is a compensation plan, which means that compensation is paid regardless of 12b-1 expenses actually incurred. It is anticipated that the Plan will benefit shareholders because an effective sales program typically is necessary in order for the Fund to reach and maintain a sufficient size to achieve efficiently its investment objectives and to realize economies of scale. For the six months ended April 30, 2014, Class N shares 12b-1 expense incurred by the Fund was $24,626 and Class A shares 12b-1 expense incurred by the Fund was $1,134. The Fund owed $4,429 for Class N shares and $202 for Class A shares 12b-1 fees as of April 30, 2014.
Unified acts as the principal distributor of the Fund’s shares. During the six months ended April 30, 2014, the Distributor received $7,388 from commissions earned on sales of Class A shares. An officer of the Trust is an officer of the Distributor and such person may be deemed to be an affiliate of the Distributor.
NOTE 5. PURCHASES AND SALES OF SECURITIES
For the six months ended April 30, 2014, purchases and sales of investment securities, other than short-term investments and short-term U.S. government obligations, were as follows:
| Amount | ||||
Purchases | ||||
U.S. Government Obligations | $ | – | ||
Other | 10,253,742 | |||
Sales | ||||
U.S. Government Obligations | $ | – | ||
Other | 6,278,867 | |||
NOTE 6. BENEFICIAL OWNERSHIP
The beneficial ownership, either directly or indirectly, of more than 25% of the voting securities of a fund creates a presumption of control of the fund, under Section 2(a)(9) of the Investment Company Act of 1940. At April 30, 2014, Charles Schwab & Co. (“Schwab”) owned, as record shareholders, 35% of the Fund. The Trust does not know whether Schwab, or any of the underlying beneficial owners, owned or controlled 25% or more of the voting securities of the Fund. As a result, Schwab may be deemed to control the Fund.
NOTE 7. FEDERAL TAX INFORMATION
At April 30, 2014, the net unrealized appreciation (depreciation) of investments for tax purposes was as follows:
Gross Unrealized Appreciation | $ | 4,858,260 | ||
Gross Unrealized Depreciation | (52,730 | ) | ||
Net Unrealized Appreciation | $ | 4,805,530 |
20
Notes to the Financial Statements (Unaudited) (continued)
April 30, 2014
At April 30, 2014, the aggregate cost of securities for federal income tax purposes was $20,557,257 for the Fund.
At October 31, 2013, the Fund’s most recent fiscal year end, the components of distributable earnings (accumulated losses) on a tax basis was as follows:
Undistributed Ordinary Income | $ | 206,368 | ||
Undistributed Long-Term Capital Gains | 1,085,827 | |||
Unrealized Appreciation (Depreciation) | 4,111,119 | |||
Total Accumulated Earnings (Deficit) | $ | 5,403,314 |
The tax character of distributions paid for the fiscal year ended October 31, 2013 was as follows:
| 2013 | ||||
Distributions paid from: | ||||
Ordinary Income | $ | 217,606 | ||
Net Long-Term Capital Gains | 76,816 | |||
| $ | 294,422 | |||
NOTE 8. COMMITMENTS AND CONTINGENCIES
The Fund indemnifies its officers and trustees for certain liabilities that may arise from performance of their duties to the Fund. Additionally, in the normal course of business, the Fund enters into contracts that contain a variety of representations and warranties which provide general indemnifications. The Fund’s maximum exposure under these arrangements is unknown, as this would involve future claims that may be made against the Fund that have not yet occurred.
NOTE 9. SUBSEQUENT EVENTS
Management of the Fund has evaluated the need for disclosures and/or adjustments resulting from subsequent events through the date these financial statements were issued. There were no items requiring adjustment of financial statements or additional disclosure.
21
Other Information
The Fund’s Statement of Additional Information (“SAI”) includes additional information about the trustees and is available without charge, upon request. You may call toll-free at (855) 280-9648 to request a copy of the SAI or to make shareholder inquiries.
22
VALUED ADVISERS TRUST
PRIVACY POLICY
The following is a description of the policies of the Valued Advisers Trust (the “Trust”) regarding disclosure of nonpublic personal information that shareholders provide to a series of the Trust (each, a “Fund”) or that the Fund collects from other sources. In the event that a shareholder hold shares of a Fund through a broker-dealer or other financial intermediary, the privacy policy of the financial intermediary would govern how shareholder nonpublic personal information would be shared with nonaffiliated third parties.
Categories of Information A Fund May Collect. A Fund may collect the following nonpublic personal information about its shareholders:
| • | Information the Fund receives from a shareholder on applications or other forms, correspondence, or conversations (such as the shareholder’s name, address, phone number, social security number, and date of birth); and |
| • | Information about the shareholder’s transactions with the Fund, its affiliates, or others (such as the shareholder’s account number and balance, payment history, cost basis information, and other financial information). |
Categories of Information A Fund May Disclose. A Fund may not disclose any nonpublic personal information about its current or former shareholders to unaffiliated third parties, except as required or permitted by law. A Fund is permitted by law to disclose all of the information it collects, as described above, to its service providers (such as the Fund’s custodian, administrator, transfer agent, accountant and legal counsel) to process shareholder transactions and otherwise provide services to the shareholder.
Confidentiality and Security. Each Fund shall restrict access to shareholder nonpublic personal information to those persons who require such information to provide products or services to the shareholder. Each Fund shall maintain physical, electronic, and procedural safeguards that comply with federal standards to guard shareholder nonpublic personal information.
Disposal of Information. The Funds, through their transfer agent, have taken steps to reasonably ensure that the privacy of a shareholder’s nonpublic personal information is maintained at all times, including in connection with the disposal of information that is no longer required to be maintained by the Funds. Such steps shall include, whenever possible, shredding paper documents and records prior to disposal, requiring off-site storage vendors to shred documents maintained in such locations prior to disposal, and erasing and/or obliterating any data contained on electronic media in such a manner that the information can no longer be read or reconstructed.
23
PROXY VOTING
A description of the policies and procedures that the Fund uses to determine how to vote proxies relating to portfolio securities and information regarding how the Fund voted those proxies is available without charge upon request by (1) calling the Fund at (855) 280-9648 and (2) from Fund documents filed with the Securities and Exchange Commission (“SEC”) on the SEC’s website at www.sec.gov.
TRUSTEES
R. Jeffrey Young, Chairman
Ira Cohen
Andrea N. Mullins
OFFICERS
R. Jeffrey Young, Principal Executive Officer and President
John C. Swhear, Chief Compliance Officer, AML Officer and Vice-President
Bryan W. Ashmus, Principal Financial Officer and Treasurer
Carol J. Highsmith, Vice President and Secretary
Matthew J. Miller, Vice President
INVESTMENT ADVISER
Dana Investment Advisors, Inc.
15800 Bluemound Rd., Suite 250
Brookfield, WI 53005
DISTRIBUTOR
Unified Financial Securities, Inc.
2960 North Meridian Street, Suite 300
Indianapolis, IN 46208
INDEPENDENT REGISTERED PUBLIC ACCOUNTING FIRM
Cohen Fund Audit Services, Ltd.
1350 Euclid Avenue, Suite 800
Cleveland, OH 44115
LEGAL COUNSEL
The Law Offices of John H. Lively & Associates, Inc.,
A member firm of The 1940 Act Law GroupTM
11300 Tomahawk Creek Parkway, Suite 310
Leawood, KS 66211
CUSTODIAN
Huntington National Bank
41 S. High St.
Columbus, OH 43215
ADMINISTRATOR, TRANSFER AGENT AND FUND ACCOUNTANT
Huntington Asset Services, Inc.
2960 North Meridian Street, Suite 300
Indianapolis, IN 46208
This report is intended only for the information of shareholders or those who have received the Fund’s prospectus which contains information about the Fund’s management fee and expenses. Please read the prospectus carefully before investing.
Distributed by Unified Financial Securities, Inc.
Member FINRA/SIPC
| Item 2. | Code of Ethics. NOT APPLICABLE – disclosed with annual report |
| Item 3. | Audit Committee Financial Expert. NOT APPLICABLE – disclosed with annual report |
| Item 4. | Principal Accountant Fees and Services. NOT APPLICABLE – disclosed with annual report |
| Item 5. | Audit Committee of Listed Companies. NOT APPLICABLE – applies to listed companies only |
| Item 6. | Schedule of Investments. Schedules filed with Item 1. |
| Item 7. | Disclosure of Proxy Voting Policies and Procedures for Closed-End Management Investment Companies. NOT APPLICABLE – applies to closed-end funds only |
| Item 8. | Portfolio Managers of Closed-End Investment Companies. NOT APPLICABLE – applies to closed-end funds only |
| Item 9. | Purchases of Equity Securities by Closed-End Management Investment Company and Affiliated Purchasers. NOT APPLICABLE – applies to closed-end funds only |
| Item 10. | Submission of Matters to a Vote of Security Holders. |
The guidelines applicable to shareholders desiring to submit recommendations for nominees to the Registrant’s board of trustees are contained in the statement of additional information of the Trust with respect to the Fund(s) for which this Form N-CSR is being filed.
| Item 11. | Controls and Procedures. |
(a) Based on their evaluation of the registrant’s disclosure controls and procedures (as defined in Rule 30a-3(c) under the Investment Company Act of 1940, as amended (the “Act”)) as of a date within 90 days of the filing date of this report, the registrant’s principal executive officer and principal financial officer have concluded that such disclosure controls and procedures are reasonably designed and are operating effectively to ensure that material information relating to the registrant is made known to them by others within those entities, particularly during the period in which this report is being prepared, and that the information required in filings on Form N-CSR is recorded, processed, summarized, and reported on a timely basis.
(b) There were no changes in the registrant’s internal control over financial reporting (as defined in Rule 30a-3(d) under the Investment Company Act of 1940) that occurred during the second fiscal quarter of the period covered by this report that have materially affected, or are reasonably likely to materially affect, the registrant’s internal control over financial reporting.
| Item 12. | Exhibits. |
(a) (1) Not Applicable – filed with annual report
| (2) | Certifications by the registrant’s principal executive officer and principal financial officer, pursuant to Section 302 of the Sarbanes-Oxley Act of 2002 and required by Rule 30a-2 under the Investment Company Act of 1940 are filed herewith. |
| (3) | Not Applicable |
(b) Certification pursuant to 18 U.S.C. Section 1350, as adopted pursuant to Section 906 of the Sarbanes-Oxley Act of 2002 is
filed herewith.
-3-
SIGNATURES
Pursuant to the requirements of the Securities Exchange Act of 1934 and the Investment Company Act of 1940, the registrant has duly caused this report to be signed on its behalf by the undersigned, thereunto duly authorized.
| (Registrant) Valued Advisers Trust | ||
| By * | /s/ R. Jeffrey Young | |
| R. Jeffrey Young, President and Principal Executive Officer | ||
| Date | June 27, 2014 | |
Pursuant to the requirements of the Securities Exchange Act of 1934 and the Investment Company Act of 1940, this report has been signed below by the following persons on behalf of the registrant and in the capacities and on the dates indicated.
| By * | /s/ R. Jeffrey Young | |
| R. Jeffrey Young, President and Principal Executive Officer | ||
| Date | June 27, 2014 | |
| By * | /s/ Bryan W. Ashmus | |
| Bryan W. Ashmus, Treasurer and Principal Financial Officer | ||
| Date | June 27, 2014 | |
-4-