UNITED STATES
SECURITIES AND EXCHANGE COMMISSION
WASHINGTON, D.C. 20549
FORM N-CSR
CERTIFIED SHAREHOLDER REPORT OF REGISTERED
MANAGEMENT INVESTMENT COMPANIES
Investment Company Act file number 811-22208
Valued Advisers Trust
(Exact name of registrant as specified in charter)
Huntington Asset Services, Inc. 2960 N. Meridian Street, Suite 300 Indianapolis, IN 46208
(Address of principal executive offices) (Zip code)
Capitol Services, Inc.
615 S. Dupont Hwy.
Dover, DE 19901
(Name and address of agent for service)
With a copy to:
John H. Lively, Esq.
The Law Offices of John H. Lively & Associates, Inc.
A member firm of The 1940 Act Law Group
2041 W. 141st Terrace
Suite 119
Leawood, KS 66224
Registrant’s telephone number, including area code: 317-917-7000
Date of fiscal year end: 10/31
Date of reporting period: 4/30/2013
| Item 1. | Reports to Stockholders. |
 |  | |
| ||
For the period ending April 30, 2013 | ||
Geier Asset Management, Inc. | ||
2205 Warwick Way, Suite 200 Marriottsville, Maryland 21104 410-997-8000 | ||

Investment Results – (Unaudited)
Total Returns *
(For the periods ended April 30, 2013)
| Average Annual Returns | ||||||||||||
| Since Inception | ||||||||||||
| 6 Months | One Year | (December 27, 2010) | ||||||||||
Geier Strategic Total Return Fund | -5.09 | % | -1.83 | % | 0.51 | % | ||||||
S&P 500® Index** | 14.42 | % | 16.89 | % | 13.19 | % | ||||||
Total annual operating expenses, as disclosed in the Fund’s prospectus dated February 28, 2013, were 2.04% of average daily net assets (2.08% after fee waivers/expense reimbursements by the Adviser). The Adviser contractually has agreed to cap certain operating expenses of the Fund until February 28, 2014, so that total annual fund operating expenses do not exceed 1.70%. This operating expense limitation does not apply to brokerage fees and commissions, borrowing costs (such as interest and dividend expenses on securities sold short), taxes, 12b-1 fees, extraordinary expenses and indirect expenses (such as “acquired fund fees and expenses”). Under certain circumstances, the Adviser may recover any expenses waived and/or reimbursed during the three-year period prior to the period in which such expenses are waived and/or reimbursed (the “Recoupment Right”). To the extent the Adviser reimburses the Fund for any Excluded Expenses, the Adviser is entitled to include such reimbursed Excluded Expenses in the amounts that are subject to recovery under the Recoupment Right.
The performance quoted represents past performance, which does not guarantee future results. The investment return and principal value of an investment will fluctuate so that an investor’s shares, when redeemed, may be worth more or less than their original cost. The returns shown do not reflect deduction of taxes that a shareholder would pay on Fund distributions or the redemption of Fund shares. The Fund’s investment objectives, risks, charges and expenses must be considered carefully before investing. Current performance of a Fund may be lower or higher than the performance quoted. Performance data current to the most recent month end may be obtained by calling 1-877-747-4268.
| * | Return figures reflect any change in price per share and assume the reinvestment of all distributions. |
| ** | The S&P 500® Index is a widely recognized unmanaged index of equity prices and is representative of a broader market and range of securities than is found in the Fund’s portfolio. The Index is an unmanaged benchmark that assumes reinvestment of all distributions and excludes the effect of taxes and fees. Individuals cannot invest directly in this Index; however, an individual can invest in exchange traded funds or other investment vehicles that attempt to track the performance of a benchmark index |
The Fund’s investment objectives, risks, charges and expenses must be considered carefully before investing. The prospectus contains this and other important information about the investment company and may be obtained by calling 1-877-747-4268. Please read it carefully before investing.
The Fund is distributed by Unified Financial Securities, Inc., Member FINRA.
1
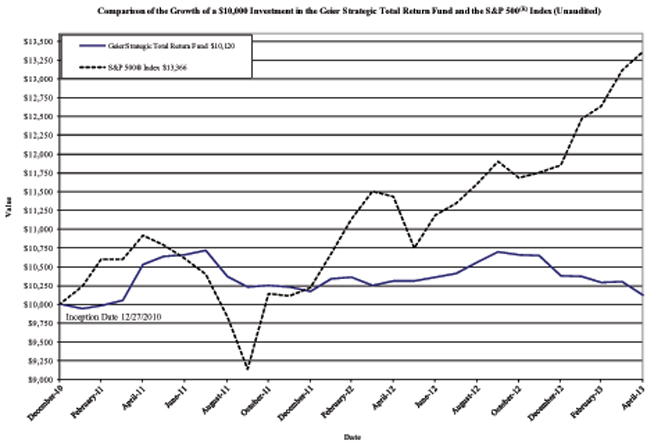
The chart above assumes an initial investment of $10,000 made on December 27, 2010 (inception date of the Fund) and held through April 30, 2013. THE FUND’S RETURNS REPRESENT PAST PERFORMANCE AND DO NOT GUARANTEE FUTURE RESULTS. The returns shown do not reflect deduction of taxes that a shareholder would pay on the Fund’s distributions or the redemption of the Fund’s shares; although the performance does reflect the effect of the Fund paying certain taxes resulting from its failure to satisfy certain requirements under the Internal Revenue Code applicable to “regulated investment companies.” Investment returns and principal values will fluctuate so that your shares, when redeemed, may be worth more or less than their original purchase price.
Current performance may be lower or higher than the performance data quoted. For more information on the Fund, and to obtain performance data current to the most recent month-end, or to request a prospectus, please call 1-877-747-4268. You should carefully consider the investment objectives, potential risks, management fees, and charges and expenses of the Fund before investing. The Fund’s prospectus contains this and other information about the Fund, and should be read carefully before investing.
The Fund is distributed by Unified Financial Securities, Inc., member FINRA.
2
FUND HOLDINGS – (Unaudited)
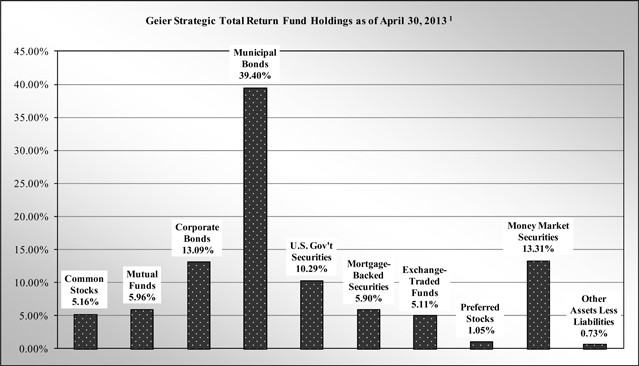
| 1. | As a percentage of net assets. |
The investment objective of the Geier Strategic Total Return Fund is to provide long-term total return from income and capital appreciation, with an emphasis on absolute return.
AVAILABILITY OF PORTFOLIO SCHEDULE – (Unaudited)
The Fund files its complete schedule of portfolio holdings with the Securities and Exchange Commission (“SEC”) for the first and third quarters of each fiscal year on Form N-Q. The Fund’s Forms N-Q are available at the SEC’s website at www.sec.gov. The Forms N-Q may be reviewed and copied at the Public Reference Room in Washington DC. Information on the operation of the Public Reference Room may be obtained by calling 1-800-SEC-0330.
ABOUT THE FUND’S EXPENSES – (Unaudited)
As a shareholder of the Fund, you incur two types of costs: (1) transaction costs (such as short-term redemption fees); and (2) ongoing costs, including management fees; and other Fund expenses. This Example is intended to help you understand your ongoing costs (in dollars) of investing in the Fund and to compare these costs with the ongoing costs of investing in other mutual funds. The Example is based on an investment of $1,000 invested at the beginning of the period, and held for the entire period from November 1, 2012 to April 30, 2013.
Actual Expenses
The first line of the table below provides information about actual account values and actual expenses. You may use the information in this line, together with the amount you invested, to estimate the expenses that you paid over the period. Simply divide your account value by $1,000 (for example, an $8,600 account value divided by $1,000 = 8.60), then multiply the result by the number in the first line under the heading entitled “Expenses Paid During Period” to estimate the expenses you paid on your account during this period.
3
Hypothetical Example for Comparison Purposes
The second line of the table below provides information about hypothetical account values and hypothetical expenses based on the Fund’s actual expense ratios and an assumed rate of return of 5% per year before expenses, which is not the Fund’s actual return. The hypothetical account values and expenses may not be used to estimate the actual ending account balance or expenses you paid for the period. You may use this information to compare the ongoing costs of investing in the Fund and other funds. To do so, compare this 5% hypothetical example with the 5% hypothetical examples that appear in the shareholder reports of the other funds.
Please note that the expenses shown in the table are meant to highlight your ongoing costs only and do not reflect any transactional costs, such as sales charges (loads), redemption fees, or exchange fees. Therefore, the second line of the table is useful in comparing ongoing costs only, and will not help you determine the relative total costs of owning different funds. In addition, if these transactional costs were included, your costs would have been higher.
Geier Strategic Total Return Fund | Beginning Account Value November 1, 2012 | Ending Account Value April 30, 2013 | Expenses Paid During the Period Ended April 30, 2013* | |||||||||
Actual | $ | 1,000.00 | $ | 949.10 | $ | 9.42 | ||||||
Hypothetical ** (5% return before expenses) | $ | 1,000.00 | $ | 1,015.13 | $ | 9.74 | ||||||
| * | Expenses are equal to the Fund’s annualized expense ratio of 1.95%, multiplied by the average account value over the period, multiplied by 181/365. |
| ** | Assumes a 5% return before expenses. |
4
Geier Strategic Total Return Fund
Schedule of Investments
April 30, 2013
(Unaudited)
| Shares | Fair Value | |||||||
Common Stocks - 5.16% | ||||||||
Materials - 5.16% | ||||||||
Agnico-Eagle Mines Ltd. | 10,000 | $ | 322,900 | |||||
Freeport-McMoRan Copper & Gold, Inc. | 10,000 | 304,300 | ||||||
Pan American Silver Corp. | 35,000 | 462,000 | ||||||
Yamana Gold, Inc. | 20,000 | 246,000 | ||||||
|
| |||||||
TOTAL COMMON STOCKS (Cost $1,611,299) | 1,335,200 | |||||||
|
| |||||||
Mutual Funds - 5.96% | ||||||||
Central Fund of Canada, Ltd. - Class A (a) (e) | 90,000 | 1,542,600 | ||||||
|
| |||||||
TOTAL MUTUAL FUNDS (Cost $1,826,947) | 1,542,600 | |||||||
|
| |||||||
| Principal Amount | ||||||||
Corporate Bonds - 13.09% | ||||||||
Ally Financial, Inc., 7.125%, 10/15/2017 | $ | 250,000 | 247,605 | |||||
AngloGold Holdings PLC, 5.125%, 08/01/2022 (f) | 200,000 | 201,817 | ||||||
Citigroup, Inc., 0.551%, 06/09/2016 (b) | 250,000 | 242,783 | ||||||
Federal Farm Credit Bank, 5.875%, 08/16/2021 | 250,000 | 253,812 | ||||||
General Electric Capital Corp., 0.480%, 01/08/2016 (b) | 250,000 | 248,514 | ||||||
Kemper Corp., 6.000%, 05/15/2017 | 250,000 | 278,259 | ||||||
Lincoln National Corp., 7.000%, 05/17/2066 (b) | 250,000 | 258,125 | ||||||
Macys Retail Holdings, Inc., 7.450%, 10/15/2016 | 500,000 | 596,248 | ||||||
SLM Corp., 2.967%, 11/1/2016 (b) | 300,000 | 289,134 | ||||||
Tyson Foods, Inc., 6.600%, 04/01/2016 | 350,000 | 401,886 | ||||||
Whirlpool Corp., 6.500%, 06/15/2016 | 325,000 | 371,267 | ||||||
|
| |||||||
TOTAL CORPORATE BONDS (Cost $3,273,291) | 3,389,450 | |||||||
|
| |||||||
Municipal Bonds - 39.40% | ||||||||
Carroll County Water Authority, 3.000%, 07/01/2015 | 60,000 | 62,875 | ||||||
City of Alexandria, LA, 1.095%, 06/01/2015 | 300,000 | 300,585 | ||||||
City of Broussard, LA, Sales Tax Revenue, 1.000%, 05/01/2013 | 110,000 | 110,000 | ||||||
City of Denton, TX, 5.000%, 02/15/2021 | 560,000 | 677,914 | ||||||
City of Edgewood, WA, 3.900%, 12/01/2019 | 280,000 | 315,115 | ||||||
City of Garland, TX, 4.375%, 02/15/2025 | 100,000 | 109,375 | ||||||
City of Port St. Lucie, FL, 4.000%, 07/01/2013 | 50,000 | 50,308 | ||||||
City of San Antonio, TX, 5.000%, 08/01/2014 | 100,000 | 105,872 | ||||||
Colorado Housing & Finance Authority, 1.098%, 05/01/2014 (b) | 100,000 | 100,290 | ||||||
County of Bertie, NC, 1.000%, 11/01/2013 | 200,000 | 200,444 | ||||||
County of Bertie, NC, 2.000%, 11/01/2014 | 200,000 | 203,858 | ||||||
County of Bertie, NC, 2.000%, 11/01/2016 | 35,000 | 36,224 | ||||||
County of Bertie, NC, 2.000%, 11/01/2017 | 35,000 | 36,362 | ||||||
County of Bertie, NC, 2.000%, 11/01/2018 | 50,000 | 52,093 | ||||||
County of Douglas, MN, 3.000%, 08/01/2013 | 250,000 | 251,722 | ||||||
County of Mahoning OH, 5.500%, 12/01/2025 | 75,000 | 84,322 | ||||||
County of Maury, TN, 3.000%, 04/01/2016 | 530,000 | 564,588 | ||||||
County of New Hanover, NC, 4.000%, 12/01/2018 | 190,000 | 218,950 | ||||||
County of Wayne MI, 9.250%, 12/01/2025 | 250,000 | 288,825 | ||||||
Florida State Board of Governors, 4.000%, 07/01/2018 | 260,000 | 293,127 | ||||||
Georgia State Road & Tollway Authority, 5.000%, 06/01/2016 | 100,000 | 113,004 | ||||||
Indiana Bond Bank, 5.790%, 01/15/2025 | 250,000 | 256,270 | ||||||
Louisiana State University & Agricultural & Mechanical College, 4.000%, 07/01/2014 | 100,000 | 104,047 | ||||||
Maryland Stadium Authority, 1.900%, 06/15/2018 | 420,000 | 423,087 | ||||||
Maryland State Transportation Authority, 5.000%, 07/01/2017 | 400,000 | 468,976 | ||||||
Medical Center Educational Building Corp., 3.000%, 06/01/2015 | 100,000 | 104,186 | ||||||
Metropolitan Nashville Airport Authority, 6.793%, 07/01/2029 | 130,000 | 146,288 | ||||||
North Texas Municipal Water District, 3.250%, 06/01/2015 | 50,000 | 52,614 | ||||||
South Carolina State Public Service Authority, 5.000%, 01/01/2019 | 510,000 | 619,492 | ||||||
State of Florida, 5.000%, 06/01/2016 | 220,000 | 250,633 | ||||||
State of Louisiana, 5.000%, 05/01/2019 | 300,000 | 367,497 | ||||||
State of Mississippi, 3.000%, 11/01/2018 | 250,000 | 276,950 | ||||||
State of North Carolina, 4.000%, 06/01/2016 | 100,000 | 104,000 | ||||||
Tarrant County Cultural Education Facilities Finance Corp., 5.000%, 11/15/2014 | 175,000 | 186,846 | ||||||
Texas Tech University, 5.000%, 08/15/2020 | 535,000 | 664,561 | ||||||
University of Arkansas, 3.000%, 12/01/2023 | 340,000 | 351,502 | ||||||
University of Missouri, 4.000%, 11/01/2016 | 270,000 | 301,598 | ||||||
University of South Carolina, 2.000%, 05/01/2013 | 245,000 | 245,000 | ||||||
University of South Carolina, 5.000%, 05/01/2025 | 325,000 | 383,464 | ||||||
Utah State Board of Regents, 4.000%, 04/01/2019 | 305,000 | 350,396 | ||||||
Vermont State Colleges, 6.101%, 07/01/2025 | 310,000 | 343,877 | ||||||
Virginia Public Building Authority, 5.500%, 08/01/2027 | 20,000 | 23,763 | ||||||
|
| |||||||
TOTAL MUNICIPAL BONDS (COST $10,060,535) | 10,200,900 | |||||||
|
| |||||||
See accompanying notes which are an integral part of these financial statements.
5
Geier Strategic Total Return Fund
Schedule of Investments - continued
April 30, 2013
(Unaudited)
| Principal Amount | Fair Value | |||||||
U.S. Government Securities - 10.29% | ||||||||
U.S. Treasury N/B, 6.125%, 08/15/2029 | $ | 250,000 | $ | 379,805 | ||||
U.S. Treasury N/B, 8.750%, 05/15/2020 | 1,500,000 | 2,285,742 | ||||||
|
| |||||||
TOTAL U.S. GOVERNMENT SECURITIES (Cost $2,350,122) | 2,665,547 | |||||||
|
| |||||||
Mortgage Backed Securities - 5.90% | ||||||||
Countrywide Alternative Loan Trust, 0.490%, 05/25/2034 (b) | 466,866 | 442,860 | ||||||
Credit Suisse First Boston Mortgage Securities Corp., 2.664%, 10/25/2033 (b) | 200,728 | 202,133 | ||||||
Freddie Mac REMICS, 0.000%, 06/15/2036 (b) | 65,841 | 65,493 | ||||||
Government National Mortgage Association, 0.000%, 01/20/2038 (b) | 420,145 | 413,856 | ||||||
Morgan Stanley Mortgage Loan Trust, 2.653%, 10/25/2034 (b) | 228,398 | 227,696 | ||||||
Structured Asset Securities Corp., 2.539%, 04/25/2033 (b) | 178,069 | 176,281 | ||||||
|
| |||||||
TOTAL MORTGAGE BACKED SECURITIES (Cost $1,455,350) | 1,528,319 | |||||||
|
| |||||||
| Shares | ||||||||
Exchange-Traded Funds - 5.11% | ||||||||
Sprott Physical Gold Trust (c) (e) | 50,000 | 617,165 | ||||||
Sprott Physical Platinum and Palladium Trust (c) (e) | 25,000 | 227,750 | ||||||
Sprott Physical Silver Trust (c) (e) | 50,000 | 479,000 | ||||||
|
| |||||||
TOTAL EXCHANGE-TRADED FUNDS (Cost $1,688,184) | 1,323,915 | |||||||
|
| |||||||
Preferred Stocks - 1.05% | ||||||||
Public Storage, 6.350%, callable 07/26/2016 | 10,000 | 272,100 | ||||||
|
| |||||||
TOTAL PREFERRED STOCKS (Cost $250,000) | 272,100 | |||||||
|
| |||||||
Money Market Securities - 13.31% | ||||||||
Fidelity Institutional Treasury Only Portfolio - Class I, 0.01% (d) | 3,446,347 | 3,446,347 | ||||||
|
| |||||||
TOTAL MONEY MARKET SECURITIES (Cost $3,446,347) | 3,446,347 | |||||||
|
| |||||||
TOTAL INVESTMENTS (Cost $25,962,075) - 99.27% | $ | 25,704,378 | ||||||
|
| |||||||
Other assets less liabilities - 0.73% | 189,546 | |||||||
|
| |||||||
TOTAL NET ASSETS - 100.00% | $ | 25,893,924 | ||||||
|
| |||||||
| (a) | Closed-end Fund. |
| (b) | Variable rate security; the coupon rate shown represents the rate at April 30, 2013. |
| (c) | Non-income producing. |
| (d) | Variable rate security; the rate shown represents the 7-day yield at April 30, 2013. |
| (e) | Passive foreign investment company. |
| (f) | Foreign corporate bond denominated in U.S. dollars. |
See accompanying notes which are an integral part of these financial statements.
6
Geier Strategic Total Return Fund
Statement of Assets and Liabilities
April 30, 2013
(Unaudited)
Assets | ||||
Investments in securities, at fair value (cost $25,962,075) | $ | 25,704,378 | ||
Dividends receivable | 3,125 | |||
Interest receivable | 226,281 | |||
Prepaid expenses | 16,455 | |||
|
| |||
Total assets | 25,950,239 | |||
|
| |||
Liabilities | ||||
Payable to Adviser (a) | 24,161 | |||
Payable for Fund shares redeemed | 12,500 | |||
Payable to administrator, fund accountant and transfer agent (a) | 6,898 | |||
Payable to custodian (a) | 1,297 | |||
Payable to trustees | 216 | |||
12b-1 fees accrued (a) | 5,781 | |||
Other accrued expenses | 5,462 | |||
|
| |||
Total liabilities | 56,315 | |||
|
| |||
Net Assets | $ | 25,893,924 | ||
|
| |||
Net Assets consist of: | ||||
Paid in capital | $ | 26,579,008 | ||
Accumulated undistributed net investment loss | (283,283 | ) | ||
Accumulated undistributed net realized gain (loss) from investment transactions | (144,105 | ) | ||
Net unrealized appreciation (depreciation) on investments | (257,696 | ) | ||
|
| |||
Net Assets | $ | 25,893,924 | ||
|
| |||
Shares outstanding (unlimited number of shares authorized) | 2,631,612 | |||
|
| |||
Net asset value and offering price per share | $ | 9.84 | ||
|
| |||
Redemption price per share (b) (NAV * 99%) | $ | 9.74 | ||
|
|
| (a) | See Note 4 in the Notes to the Financial Statements. |
| (b) | The redemption price per share reflects a redemption fee of 1.00% on shares redeemed within 30 calendar days of purchase. |
See accompanying notes which are an integral part of these financial statements.
7
Geier Strategic Total Return Fund
Statement of Operations
For the six months ended April 30, 2013
(Unaudited)
Investment Income | ||||
Dividend income (net of foreign withholding tax $908) | $ | 39,484 | ||
Interest income | 253,120 | |||
|
| |||
Total Income | 292,604 | |||
|
| |||
Expenses | ||||
Investment Adviser fee (a) | 184,381 | |||
12b-1 fees (a) | 41,863 | |||
Administration expenses (a) | 14,599 | |||
Transfer Agent expenses (a) | 12,937 | |||
Fund accounting expenses (a) | 12,397 | |||
Registration expenses | 11,887 | |||
Legal expenses | 8,878 | |||
Audit expenses | 7,439 | |||
Pricing expenses | 6,247 | |||
Report printing expense | 5,970 | |||
Custodian expenses (a) | 4,942 | |||
Trustee expenses | 3,448 | |||
Insurance expense | 2,511 | |||
Miscellaneous expenses | 453 | |||
24f-2 expense | 179 | |||
|
| |||
Total Expenses | 318,131 | |||
Fees recouped by Adviser (a) | 8,614 | |||
|
| |||
Net operating expenses | 326,745 | |||
|
| |||
Net Investment Loss | (34,141 | ) | ||
|
| |||
Realized & Unrealized Gain (Loss) | ||||
Net realized gain (loss) on investment securities | (144,285 | ) | ||
Change in unrealized appreciation (depreciation) on investment securities | (1,558,490 | ) | ||
|
| |||
Net realized and unrealized gain (loss) on investment securities | (1,702,775 | ) | ||
|
| |||
Net increase (decrease) in net assets resulting from operations | $ | (1,736,916 | ) | |
|
|
| (a) | See Note 4 in the Notes to the Financial Statements. |
See accompanying notes which are an integral part of these financial statements.
8
Geier Strategic Total Return Fund
Statements of Changes In Net Assets
| For the Six Months Ended April 30, 2013 (Unaudited) | Year Ended October 31, 2012 | |||||||
Operations | ||||||||
Net investment income (loss) | $ | (34,141 | ) | $ | 158,876 | |||
Net realized gain (loss) on investment securities | (144,285 | ) | 252,511 | |||||
Change in unrealized appreciation (depreciation) on investment securities | (1,558,490 | ) | 1,046,048 | |||||
|
|
|
| |||||
Net increase (decrease) in net assets resulting from operations | (1,736,916 | ) | 1,457,435 | |||||
|
|
|
| |||||
Distributions | ||||||||
From net investment income | (194,830 | ) | (217,686 | ) | ||||
From net realized gain | (344,119 | ) | (240,354 | ) | ||||
|
|
|
| |||||
Total distributions | (538,949 | ) | (458,040 | ) | ||||
|
|
|
| |||||
Capital Share Transactions | ||||||||
Proceeds from shares sold | 1,924,027 | 6,195,156 | ||||||
Reinvestment of distributions | 20,806 | 45,555 | ||||||
Amount paid for shares redeemed | (11,534,269 | ) | (4,069,011 | ) | ||||
Proceeds from redemption fees (a) | 645 | 10 | ||||||
|
|
|
| |||||
Net increase (decrease) in net assets resulting from share transactions | (9,588,791 | ) | 2,171,710 | |||||
|
|
|
| |||||
Total Increase in Net Assets | (11,864,656 | ) | 3,171,105 | |||||
|
|
|
| |||||
Net Assets | ||||||||
Beginning of period | 37,758,580 | 34,587,475 | ||||||
|
|
|
| |||||
End of period | $ | 25,893,924 | $ | 37,758,580 | ||||
|
|
|
| |||||
Accumulated undistributed net investment income (loss) included in net assets at end of period | $ | (283,283 | ) | $ | (54,312 | ) | ||
|
|
|
| |||||
Capital Share Transactions | ||||||||
Shares sold | 187,375 | 606,695 | ||||||
Shares issued in reinvestment of distributions | 2,064 | 4,537 | ||||||
Shares redeemed | (1,144,704 | ) | (399,656 | ) | ||||
|
|
|
| |||||
Net increase from capital share transactions | (955,265 | ) | 211,576 | |||||
|
|
|
| |||||
| (a) | The Fund charges a redemption fee of 1.00% on shares redeemed within 30 calendar days of purchase. |
See accompanying notes which are an integral part of these financial statements.
9
Geier Strategic Total Return Fund
Financial Highlights
(For a share outstanding throughout each period)
| For the Six Months Ended April 30, 2013 (Unaudited) | Year Ended October 31, 2012 | Period Ended October 31, 2011 (a) | ||||||||||
Selected Per Share Data | ||||||||||||
Net asset value, beginning of period | $ | 10.53 | $ | 10.25 | $ | 10.00 | ||||||
|
|
|
|
|
| |||||||
Income from investment operations: | ||||||||||||
Net investment income (loss) | (0.03 | ) | 0.04 | — | ||||||||
Net realized and unrealized gains (losses) | (0.50 | ) | 0.37 | 0.25 | ||||||||
|
|
|
|
|
| |||||||
Total income (loss) from investment operations | (0.53 | ) | 0.41 | 0.25 | ||||||||
|
|
|
|
|
| |||||||
Less Distributions to Shareholders: | ||||||||||||
From net investment income | (0.06 | ) | (0.06 | ) | — | |||||||
From net realized gain | (0.10 | ) | (0.07 | ) | — | |||||||
|
|
|
|
|
| |||||||
Total distributions | (0.16 | ) | (0.13 | ) | — | |||||||
|
|
|
|
|
| |||||||
Paid in capital from redemption fees (b) | — | — | — | |||||||||
|
|
|
|
|
| |||||||
Net asset value, end of period | $ | 9.84 | $ | 10.53 | $ | 10.25 | ||||||
|
|
|
|
|
| |||||||
Total Return (c) | (5.09 | )% (d) | 4.03 | % | 2.50 | % (d) | ||||||
Ratios and Supplemental Data | ||||||||||||
Net assets, end of period (000) | $ | 25,894 | $ | 37,759 | $ | 34,587 | ||||||
Ratio of expenses to average net assets | 1.95 | % (e) | 1.95 | % | 2.65 | % (e) (f) | ||||||
Ratio of expenses to average net assets before recoupment/reimbursement | 1.90 | % (e) | 1.91 | % | 2.97 | % (e) (g) | ||||||
Ratio of net investment income (loss) to average net assets | (0.20 | )% (e) | 0.44 | % | (0.06 | )% (e) (f) | ||||||
Ratio of net investment income (loss) to average net assets before recoupment/reimbursement | (0.15 | )% (e) | 0.48 | % | (0.37 | )% (e) (h) | ||||||
Portfolio turnover rate | 26.83 | % (d) | 91.30 | % | 502.14 | % (d) | ||||||
| (a) | For the period December 27, 2010 (commencement of operations) through October 31, 2011. |
| (b) | Redemption fees resulted in less than $0.005 per share in each period. |
| (c) | Total return in the above table represents the rate that the investor would have earned or lost on an investment in the Fund, assuming reinvestment of dividends. |
| (d) | Not Annualized |
| (e) | Annualized |
| (f) | The expense ratio and net investment income ratio includes the effect of federal tax expense of 0.70%, which is the portion of federal tax expense not reimbursed by the Adviser. |
| (g) | The expense ratio before reimbursements includes taxes of 0.92%, a portion of which was voluntarily reimbursed by the Adviser. |
| (h) | The net investment income (loss) ratio includes federal tax expense of (0.92)%, a portion of which was voluntarily reimbursed by the Adviser. |
See accompanying notes which are an integral part of these financial statements.
10
Geier Strategic Total Return Fund
Notes to the Financial Statements
April 30, 2013
(Unaudited)
NOTE 1. ORGANIZATION
The Geier Strategic Total Return Fund (the “Fund”) is an open-end, non-diversified series of the Valued Advisers Trust (the “Trust”). The Trust is a management investment company established under the laws of Delaware by an Agreement and Declaration of Trust dated June 13, 2008 (the “Trust Agreement”). The Trust Agreement permits the Trustees to issue an unlimited number of shares of beneficial interest of separate series without par value. The Fund is one of a series of funds authorized by the Board of Trustees (the “Board”). The Fund commenced operations on December 27, 2010. The Fund’s investment Adviser is Geier Asset Management, Inc. (the “Adviser”). The investment objective of the Fund is to provide long-term total return from income and capital appreciation, with an emphasis on absolute return.
NOTE 2. SIGNIFICANT ACCOUNTING POLICIES
The following is a summary of significant accounting policies followed by the Fund in the preparation of its financial statements.
Securities Valuation – All investments in securities are recorded at their estimated fair value as described in Note 3.
Federal Taxes – The Fund intends to qualify each year as a “regulated investment company” (“RIC”) under subchapter M of the Internal Revenue Code of 1986, as amended, by complying with the requirements applicable to RICs and by distributing substantially all of its taxable income. The Fund also intends to distribute sufficient net investment income and net capital gains, if any, so that it will not be subject to excise tax on undistributed income and gains. If the required amount of net investment income or gains is not distributed, the Fund could incur a tax expense.
As of and during the six months ended April 30, 2013, the Fund did not have a liability for any unrecognized tax benefits. The Fund recognizes interest and penalties, if any, related to unrecognized tax benefits as income tax expense in the Statement of Operations. During the year, the Fund did not incur any interest or penalties. The Fund is subject to examination by U.S. federal tax authorities for all tax years since inception.
Expenses – Expenses incurred by the Trust that do not relate to a specific fund of the Trust are allocated to the individual funds based on each fund’s relative net assets or other appropriate basis (as determined by the Board).
Security Transactions and Related Income - The Fund follows industry practice and records security transactions on the trade date. The First In, First Out method is used for determining gains or losses for financial statements and income tax purposes. Dividend income is recorded on the ex-dividend date and interest income is recorded on an accrual basis. Distributions from Limited Partnerships are recognized on the ex-date. Income or loss from Limited Partnerships is reclassified in the components of net assets upon receipt of K-1’s. Discounts and premiums on securities purchased are amortized or accreted using the effective interest method. Withholding taxes on foreign dividends have been provided for in accordance with the Fund’s understanding of the applicable country’s tax rules and rates. The ability of issuers of debt securities held by the Fund to meet their obligations may be affected by economic and political developments in a specific country or region.
Redemption Fees – The Fund charges a 1.00% redemption fee for shares redeemed within 30 days. These fees are deducted from the redemption proceeds otherwise payable to the shareholder. The Fund will retain the fee charged as an increase in paid-in capital and such fees become part of the Fund’s daily NAV calculation.
11
Geier Strategic Total Return Fund
Notes to the Financial Statements - continued
April 30, 2013
(Unaudited)
NOTE 2. SIGNIFICANT ACCOUNTING POLICIES - continued
Dividends and Distributions - The Fund intends to distribute substantially all of its net investment income, net realized long-term capital gains and its net realized short-term capital gains, if any, to its shareholders on at least an annual basis. Dividends to shareholders, which are determined in accordance with income tax regulations, are recorded on the ex-dividend date. The treatment for financial reporting purposes of distributions made to shareholders during the year from net investment income or net realized capital gains may differ from their ultimate treatment for federal income tax purposes. These differences are caused primarily by differences in the timing of the recognition of certain components of income, expense or realized capital gain for federal income tax purposes. Where such differences are permanent in nature, they are reclassified in the components of net assets based on their ultimate characterization for federal income tax purposes. Any such reclassifications will have no effect on net assets, results of operations or net asset values per share of the Fund.
NOTE 3. SECURITIES VALUATION AND FAIR VALUE MEASUREMENTS
Fair value is defined as the price that a Fund would receive upon selling an investment in an orderly transaction to an independent buyer in the principal or most advantageous market of the investment. Generally Accepted Accounting Principles in the United States of America (“GAAP”) establishes a three-tier hierarchy to maximize the use of observable market data and minimize the use of unobservable inputs and to establish classification of fair value measurements for disclosure purposes.
Inputs refer broadly to the assumptions that market participants would use in pricing the asset or liability, including assumptions about risk (the risk inherent in a particular valuation technique used to measure fair value such as pricing model and/or the risk inherent in the inputs to the valuation technique). Inputs may be observable or unobservable. Observable inputs are inputs that reflect the assumptions market participants would use in pricing the asset or liability developed based on market data obtained from sources independent of the reporting entity. Unobservable inputs are inputs that reflect the reporting entity’s own assumptions about the assumptions market participants would use in pricing the asset or liability developed based on the best information available in the circumstances.
Various inputs are used in determining the value of the Fund’s investments. These inputs are summarized in the three broad levels listed below.
| • | Level 1 – quoted prices in active markets for identical securities |
| • | Level 2 – other significant observable inputs (including, but not limited to, quoted prices for an identical security in an inactive market, quoted prices for similar securities, interest rates, prepayment speeds, credit risk, etc.) |
| • | Level 3 – significant unobservable inputs (including the Fund’s own assumptions in determining fair value of investments based on the best information available) |
The inputs used to measure fair value may fall into different levels of the fair value hierarchy. In such cases, for disclosure purposes, the level in the fair value hierarchy within which the fair value measurement falls in its entirety, is determined based on the lowest level input that is significant to the fair value measurement in its entirety.
12
Geier Strategic Total Return Fund
Notes to the Financial Statements - continued
April 30, 2013
(Unaudited)
NOTE 3. SECURITIES VALUATION AND FAIR VALUE MEASUREMENTS – continued
Equity securities, including common stocks, exchange-traded funds, closed end funds, and preferred stocks, are generally valued by using market quotations, furnished by a pricing service. Securities that are traded on any stock exchange are generally valued at the last quoted sale price. Lacking a last sale price, an exchange traded security is generally valued at its last bid price. Securities traded in the NASDAQ over-the-counter market are generally valued at the NASDAQ Official Closing Price. When using the market quotations or close prices provided by the pricing service and when the market is considered active, the security is classified as a Level 1 security. Sometimes, an equity security owned by the Fund will be valued by the pricing service with factors other than market quotations or when the market is considered inactive. When this happens, the security is classified as a Level 2 security. When market quotations are not readily available, when the Fund determines that the market quotation or the price provided by the pricing service does not accurately reflect the current fair value, or when restricted or illiquid securities are being valued, such securities are valued as determined in good faith by the Fund, in conformity with guidelines adopted by and subject to review by the Board. These securities are categorized as Level 3 securities.
Investments in open-end mutual funds, including money market mutual funds, are generally priced at the ending net asset value (NAV) provided by the service agent of the funds. These securities are categorized as Level 1 securities.
Fixed income securities such as corporate bonds, municipal bonds, U.S. government securities, and mortgage-backed securities when valued using market quotations in an active market, will be categorized as Level 1 securities. However, they may be valued on the basis of prices furnished by a pricing service when the Fund believes such prices more accurately reflect the fair value of such securities. A pricing service utilizes electronic data processing techniques based on yield spreads relating to securities with similar characteristics to determine prices for normal institutional-size trading units of debt securities without regard to sale or bid prices. Data used to establish quotes for mortgage-backed securities includes analysis of cash flows, pre-payment speeds, default rates delinquency assumptions and assumptions regarding collateral and loss assumptions. These securities will generally be categorized as Level 2 securities. If the Fund decides that a price provided by the pricing service does not accurately reflect the fair value of the securities, when prices are not readily available from a pricing service, or when restricted or illiquid securities are being valued, securities are valued at fair value as determined in good faith by the Fund, in conformity with guidelines adopted by and subject to review of the Board. These securities will be categorized as Level 3 securities.
Short-term investments in fixed income securities, (those with maturities of less than 60 days when acquired, or which subsequently are within 60 days of maturity), including U.S. government securities, are valued by using the amortized cost method of valuation, which the Board has determined will represent fair value. These securities will be classified as Level 2 securities.
In accordance with the Trust’s good faith pricing guidelines, the Fund is required to consider all appropriate factors relevant to the value of securities for which it has determined other pricing sources are not available or reliable as described above. No single standard exists for determining fair value, because fair value depends upon the circumstances of each individual case. As a general principle, the current fair value of an issue of securities being valued by the Fund would appear to be the amount which the owner might reasonably expect to receive for them upon their current sale. Methods which are in accordance with this principle may, for example, be based on (i) a multiple of earnings; (ii) a discount from market of a similar freely traded security (including a derivative security or a basket of securities traded on other markets, exchanges or among dealers); or (iii) yield to maturity with respect to debt issues, or a combination of these and other methods. Good faith pricing is permitted if, in the Fund’s opinion, the validity of market quotations appears to be questionable based on factors such as evidence of a thin market in the security based on a small number of
13
Geier Strategic Total Return Fund
Notes to the Financial Statements - continued
April 30, 2013
(Unaudited)
NOTE 3. SECURITIES VALUATION AND FAIR VALUE MEASUREMENTS – continued
quotations, a significant event occurs after the close of a market but before a Fund’s NAV calculation that may affect a security’s value, or the Fund is aware of any other data that calls into question the reliability of market quotations. Good faith pricing may also be used in instances when the bonds the Fund invests in may default or otherwise cease to have market quotations readily available. Any fair value pricing done outside the Fund’s approved pricing methods must be approved by the Pricing Committee of the Board.
The following is a summary of the inputs used to value the Fund’s investments as of April 30, 2013:
| Valuation Inputs | ||||||||||||||||
Assets | Level 1 - Quoted Prices in Active Markets | Level 2 - Other Significant Observable Inputs | Level 3 - Significant Unobservable Inputs | Total | ||||||||||||
Common Stocks | $ | 1,335,200 | $ | — | $ | — | $ | 1,335,200 | ||||||||
Mutual Funds | 1,542,600 | — | — | 1,542,600 | ||||||||||||
Corporate Bonds | — | 3,389,450 | — | 3,389,450 | ||||||||||||
Municipal Bonds | — | 10,200,900 | — | 10,200,900 | ||||||||||||
U.S. Government Securities | — | 2,665,547 | — | 2,665,547 | ||||||||||||
Mortgage Backed Securities | — | 1,528,319 | — | 1,528,319 | ||||||||||||
Exchange-Traded Funds | 1,323,915 | — | — | 1,323,915 | ||||||||||||
Preferred Stocks | 272,100 | — | — | 272,100 | ||||||||||||
Money Market Securities | 3,446,347 | — | — | 3,446,347 | ||||||||||||
Total | $ | 7,920,162 | $ | 17,784,216 | $ | — | $ | 25,704,378 | ||||||||
The Fund did not hold any investments at any time during the reporting period in which significant unobservable inputs were used in determining fair value; therefore, no reconciliation of Level 3 securities is included for this reporting period. The Fund did not hold any derivative instruments during the reporting period. The Fund recognizes transfers between fair value hierarchy levels at the reporting period end. There were no transfers between any Levels for the six months ended April 30, 2013.
NOTE 4. FEES AND OTHER TRANSACTIONS WITH AFFILIATES
The Adviser, under the terms of the management agreement (the “Agreement”), manages the Fund’s investments. As compensation for its management services, the Fund is obligated to pay the Adviser a fee computed and accrued daily and paid monthly at an annual rate of 1.10% of the Fund’s average net assets. For the six months ended April 30, 2013, the Adviser earned fees of $184,381 from the Fund before the reimbursement/recoupment described below.
The Adviser contractually has agreed to cap certain operating expenses of the Fund until February 28, 2014, so that total annual fund operating expenses do not exceed 1.70%. This operating expense limitation does not apply to brokerage fees and commissions, borrowing costs (such as interest and dividend expenses on securities sold short), taxes, 12b-1 fees, extraordinary expenses and indirect expenses (such as “acquired fund fees and expenses”).
14
Geier Strategic Total Return Fund
Notes to the Financial Statements - continued
April 30, 2013
(Unaudited)
NOTE 4. FEES AND OTHER TRANSACTIONS WITH AFFILIATES - continued
Under certain circumstances, the Adviser may recover any expenses waived and/or reimbursed during the three-year period prior to the period in which such expenses are waived and/or reimbursed (the “Recoupment Right”). The Trust agreed to amend the expense limitation arrangements with the Adviser as of October 31, 2011 to: (i) extend the foregoing limitation arrangement to February 28, 2014 and (ii) provide that to the extent the Adviser were to reimburse the Fund for any Excluded Expenses, the Adviser would be entitled to include such reimbursed Excluded Expenses in the amounts that are subject to recovery under the Recoupment Right. For the six months ended April 30, 2013, the Adviser recouped fees of $8,614. At April 30, 2013, the Adviser was owed $24,161 from the Fund for advisory services. The amended expense limitation agreement was executed on December 30, 2011.
The amount subject to repayment by the Fund pursuant to the aforementioned conditions at April 30, 2013 was:
| Recoverable through | ||
Amount | October 31, | |
$ 52,040 | 2014 |
The Trust retains Huntington Asset Services, Inc. (“HASI”), to manage the Fund’s business affairs and to provide the Fund with administrative services, including all regulatory reporting and necessary office equipment and personnel. For the six months ended April 30, 2013, HASI earned fees of $14,599 for administrative services provided to the Fund. At April 30, 2013, the Fund owed HASI $2,692 for administrative services. Certain officers of the Trust are members of management and/or employees of HASI. HASI operates as a wholly-owned subsidiary of Huntington Bancshares, Inc., the parent company of Unified Financial Securities, Inc. (the “Distributor”) and Huntington National Bank, the custodian of the Fund’s investments (the “Custodian”). For the six months ended April 30, 2013, the Custodian earned fees of $4,942 for custody services provided to the Fund. At April 30, 2013, the Fund owed the Custodian $1,297 for custody services.
The Trust retains HASI to act as the Fund’s transfer agent and to provide fund accounting services. For the six months ended April 30, 2013, HASI earned fees of $12,937 from the Fund for transfer agent services. For the six months ended April 30, 2013, HASI earned fees of $12,397 from the Fund for fund accounting services. At April 30, 2013, the Fund owed HASI $2,226 for transfer agent services. At April 30, 2013, the Fund owed HASI $1,980 for fund accounting services.
Unified Financial Securities, Inc. acts as the principal distributor of the Fund’s shares. There were no payments made to the Distributor by the Fund for the six months ended April 30, 2013. A Trustee of the Trust is a member of management of Huntington National Bank, a subsidiary of Huntington Bancshares, Inc. (the parent of the Distributor) and officers of the Trust are officers of the Distributor and such persons may be deemed to be affiliates of the Distributor.
The Fund has adopted a Distribution Plan (the “Plan”) pursuant to Rule 12b-1 under the 1940 Act. The Plan provides that the Fund will pay the Distributor and/or any registered securities dealer, financial institution or any other person (the “Recipient”) a shareholder servicing fee of 0.25% of the average daily net assets of the Fund in connection with the promotion and distribution of the Fund’s shares or the provision of personal services to shareholders, including, but not necessarily limited to, advertising, compensation to underwriters, dealers and selling personnel, the printing and mailing of prospectuses to other than current Fund shareholders, the printing and mailing of sales literature and servicing shareholder accounts. The Fund or Adviser may pay all or a portion of these fees to any Recipient who renders assistance
15
Geier Strategic Total Return Fund
Notes to the Financial Statements - continued
April 30, 2013
(Unaudited)
NOTE 4. FEES AND OTHER TRANSACTIONS WITH AFFILIATES - continued
in distributing or promoting the sale of shares, or who provides certain shareholder services, pursuant to a written agreement. The Plan is a compensation plan, which means that compensation is provided regardless of 12b-1 expenses actually incurred. It is anticipated that the Plan will benefit shareholders because an effective sales program typically is necessary in order for the Fund to reach and maintain a sufficient size to efficiently achieve its investment objectives and to realize economies of scale. For the six months ended April 30, 2013, the 12b-1 expense incurred by the Fund was $41,863. The Fund owed $5,781 for 12b-1 fees as of April 30, 2013.
NOTE 5. INVESTMENT TRANSACTIONS
For the six months ended April 30, 2013, purchases and sales of investment securities were as follows:
Purchases | ||||
U.S. Government Obligations | $ | — | ||
Other | 7,670,898 | |||
Sales | ||||
U.S. Government Obligations | $ | 5,884,600 | ||
Other | 10,189,966 |
As of April 30, 2013, the net unrealized appreciation (depreciation) of investments for tax purposes was as follows:
| Amount | ||||
Gross Appreciation | $ | 505,033 | ||
Gross (Depreciation) | (944,311 | ) | ||
|
| |||
Net Appreciation | ||||
(Depreciation) on Investments | $ | (439,278 | ) | |
|
| |||
At April 30, 2013, the aggregate cost of securities for federal income tax purposes, was $26,143,656.
NOTE 6. ESTIMATES
The preparation of financial statements in conformity with GAAP requires management to make estimates and assumptions that affect the reported amounts of assets and liabilities and disclosure of contingent assets and liabilities at the date of the financial statements and the reported amounts of increases and decreases in net assets from operations during the reporting period. Actual results could differ from those estimates.
16
Geier Strategic Total Return Fund
Notes to the Financial Statements - continued
April 30, 2013
(Unaudited)
NOTE 7. DISTRIBUTIONS TO SHAREHOLDERS
On December 24, 2012, the Fund paid an income distribution of $0.0569 per share, a short-term capital gain of $0.0860 per share, and a long-term capital gain of $0.0145 per share to shareholders of record on December 21, 2012.
The tax characterization of distributions for the fiscal periods ended October 31, 2012 and October 31, 2011 were as follows:
| 2012 | 2011 | |||||||
Distributions paid from: | ||||||||
Ordinary Income* | $ | 397,472 | $ | — | ||||
Long-term capital gains | 60,568 | — | ||||||
|
|
|
| |||||
Total Distributions | $ | 458,040 | $ | — | ||||
|
|
|
| |||||
| * | Short term capital gain distributions are treated as ordinary income for tax purposes. |
At October 31, 2012, the components of distributable earnings (accumulated losses) on a tax basis were as follows:
Undistributed ordinary income | $ | 430,525 | ||
Undistributed long-term capital gains | 49,765 | |||
Unrealized appreciation (depreciation) | 1,119,213 | |||
Accumulated other differences | (8,722 | ) | ||
|
| |||
| $ | 1,590,781 | |||
|
|
At October 31, 2012, the difference between book basis and tax basis unrealized appreciation (depreciation) is attributable to cumulative wash sales and mark to market of passive foreign investment companies.
17
PROXY VOTING
A description of the policies and procedures that the Fund uses to determine how to vote proxies relating to portfolio securities and information regarding how the Fund voted those proxies is available without charge upon request by (1) calling the Fund at (877)-747-4268 and (2) from Fund documents filed with the Securities and Exchange Commission (“SEC”) on the SEC’s website at www.sec.gov.
TRUSTEES
R. Jeffrey Young, Chairman
Dr. Merwyn R. Vanderlind
Ira Cohen
OFFICERS
R. Jeffrey Young, Principal Executive Officer and President
John C. Swhear, Chief Compliance Officer, AML Officer and Vice-President
Carol J. Highsmith, Vice President
Matthew J. Miller, Vice President
Robert W. Silva, Principal Financial Officer and Treasurer
Heather Bonds, Secretary
INVESTMENT ADVISER
Geier Asset Management, Inc.
2205 Warwick Way, Suite 200
Marriottsville, MD 21104
DISTRIBUTOR
Unified Financial Securities, Inc.
2960 North Meridian Street, Suite 300
Indianapolis, IN 46208
INDEPENDENT REGISTERED PUBLIC ACCOUNTING FIRM
Cohen Fund Audit Services, Ltd.
1350 Euclid Avenue, Suite 800
Cleveland, OH 44115
LEGAL COUNSEL
The Law Offices of John H. Lively & Associates, Inc.,
A member firm of The 1940 Act Law GroupTM
11300 Tomahawk Creek Pkwy, Suite 310
Leawood, KS 66211
CUSTODIAN
Huntington National Bank
41 S. High St.
Columbus, OH 43215
ADMINISTRATOR, TRANSFER AGENT AND FUND ACCOUNTANT
Huntington Asset Services, Inc.
2960 North Meridian Street, Suite 300
Indianapolis, IN 46208
This report is intended only for the information of shareholders or those who have received the Fund’s prospectus which contains information about the Fund’s management fee and expenses. Please read the prospectus carefully before investing.
Distributed by Unified Financial Securities, Inc.
Member FINRA/SIPC
Semi-Annual Report
April 30, 2013
BRC Large Cap Focus Equity Fund
Fund Adviser:
BRC Investment Management LLC
8400 East Prentice Avenue, Suite 1401
Greenwood Village, Colorado 80111
303-414-1100
Discussion
Investment Results – (Unaudited)
Total Returns*
(For the period ended April 30, 2013)
| Since Inception | ||||
| (December 21, 2012) | ||||
BRC Large Cap Focus Equity Fund | 11.00 | % | ||
S&P 500® Index ** | 11.43 | % | ||
Total Annual Operating Expenses, as estimated for the Fund’s first fiscal period ending October 31, 2013 and disclosed in the Fund’s prospectus, are 1.98% of average daily net assets. Effective April 1, 2013 Annual Fund Operating Expenses After Fee Waiver/Expense Reimbursement reflect that the Adviser has contractually agreed to waive or limit its fees and to assume other expenses of the Fund until February 29, 2016, so that the Total Annual Fund Operating Expenses does not exceed 0.55%. This operating expense limitation does not apply to brokerage fees and commissions, borrowing costs (such as interest and dividend expenses on securities sold short), taxes, 12b-1 fees; extraordinary expenses and indirect expenses (such as “acquired fund fees and expense”).
The performance quoted represents past performance, which does not guarantee future results. The investment return and principal value of an investment will fluctuate so that an investor’s shares, when redeemed, may be worth more or less than their original cost. The returns shown do not reflect deduction of taxes that a shareholder would pay on Fund distributions or the redemption of Fund shares. Current performance of the Fund may be lower or higher than the performance quoted. The Fund’s investment objectives, risks, charges and expenses must be considered carefully before investing. Performance data current to the most recent month end may be obtained by calling 1-303-414-1100.
| * | Return figures reflect any change in price per share and assume the reinvestment of all distributions. |
| ** | The S&P 500® Index is a widely recognized unmanaged index of equity securities and are representative of a broader domestic equity market and range of securities than is found in the Fund’s portfolio. Individuals cannot invest directly in an Index; however, an individual can invest in exchange traded funds or other investment vehicles that attempt to track the performance of a benchmark index. |
The Fund’s investment objectives, strategies, risks, charges and expenses must be considered carefully before investing. The prospectus contains this and other important information about the Fund and may be obtained by calling the same number as above. Please read it carefully before investing. The Fund is distributed by Unified Financial Securities, Inc., member FINRA.
1
Investment Results – (Unaudited)
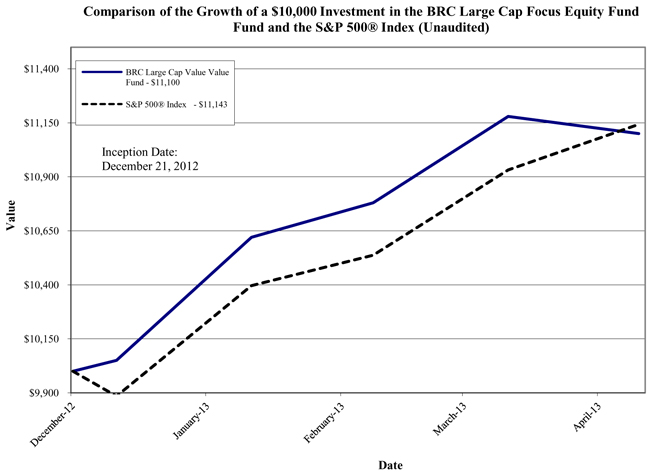
The chart above assumes an initial investment of $10,000 made on December 21, 2012 (commencement of Fund operations) and held through April 30, 2013. The S&P 500® Index is a widely recognized unmanaged index of equity securities and is representative of a broader domestic equity market and range of securities than is found in the Fund’s portfolio. Individuals cannot invest directly in an Index; however, an individual can invest in exchange traded funds or other investment vehicles that attempt to track the performance of a benchmark index. THE FUND’S RETURN REPRESENTS PAST PERFORMANCE AND DOES NOT GUARANTEE FUTURE RESULTS. The returns shown do not reflect deduction of taxes that a shareholder would pay on Fund distributions or the redemption of Fund shares. Investment returns and principal values will fluctuate so that your shares, when redeemed, may be worth more or less than their original purchase price.
Current performance may be lower or higher than the performance data quoted. For more information on the Fund, and to obtain performance data current to the most recent month end or to request a prospectus, please call 1-303-414-1100. You should carefully consider the investment objectives, potential risks, management fees, and charges and expenses of the Fund before investing. The Fund’s prospectus contains this and other information about the Fund, and should be read carefully before investing.
The Fund is distributed by Unified Financial Securities, Inc., member FINRA.
2
Fund Holdings – (Unaudited)
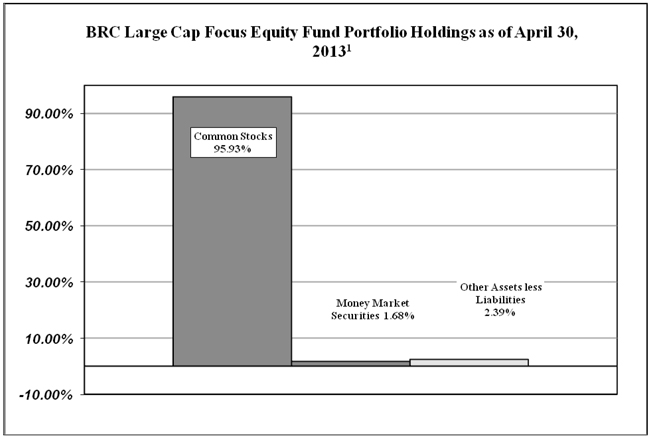
| 1 | As a percentage of net assets. |
The investment objective of the BRC Large Cap Focus Equity Fund is to seek long-term capital appreciation.
Availability of Portfolio Schedule – (Unaudited)
The Fund files its complete schedule of portfolio holdings with the Securities and Exchange Commission (“SEC”) for the first and third quarters of each fiscal year on Form N-Q. The Fund’s Forms N-Q are available at the SEC’s website at www.sec.gov. The Fund’s Forms N-Q may be reviewed and copied at the SEC’s Public Reference Room in Washington DC. Information on the operation of the Public Reference Room may be obtained by calling 1-800-SEC-0330.
Summary of Fund’s Expenses – (Unaudited)
As a shareholder of the Fund, you incur two types of costs: (1) transaction costs, such as short-term redemption fees; and (2) ongoing costs, including management fees and other Fund expenses. This Example is intended to help you understand your ongoing costs (in dollars) of investing in the Fund and to compare these costs with the ongoing costs of investing in other mutual funds. The example is based on an investment of $1,000 invested at the beginning and held for the entire period from December 21, 2012 (commencement of operations) to April 30, 2013.
3
Actual Expenses
The first line of the table below provides information about actual account values and actual expenses. You may use the information in this line, together with the amount you invested, to estimate the expenses that you paid over the period. Simply divide your account value by $1,000 (for example, an $8,600 account value divided by $1,000 = $8.60), then multiply the result by the number in the first line under the heading entitled “Expenses Paid During the Period” to estimate the expenses you paid on your account during this period.
Hypothetical Example for Comparison Purposes
The second line of the table below provides information about hypothetical account values and hypothetical expenses based on the Fund’s actual expense ratio and an assumed rate of return of 5% per year before expenses, which is not the Fund’s actual return. The hypothetical account values and expenses may not be used to estimate the actual ending account balance or expenses you paid for the period. You may use this information to compare the ongoing costs of investing in the Fund and other funds. To do so, compare this 5% hypothetical example with the 5% hypothetical examples that appear in the shareholder reports of the other funds.
Please note that the expenses shown in the table are meant to highlight your ongoing costs only. Therefore, the second line of the table below is useful in comparing ongoing costs only and will not help you determine the relative costs of owning different funds.
BRC Large Cap Focus Equity Fund | Beginning Account Value | Ending Account Value April 30, 2013 | Expenses Paid During Period Ended April 30, 2013 | |||||||||
Actual* | $ | 1,000.00 | $ | 1,110.00 | $ | 2.37 | ||||||
Hypothetical** | $ | 1,000.00 | $ | 1,021.69 | 3.14 | |||||||
| * | Expenses are equal to the Fund’s annualized expense ratio of 0.63%, 131/366 (to reflect the period since commencement of operations on December 21, 2012). |
| ** | Assumes a 5% return before expenses. The hypothetical example is calculated based on a six month period from November 1, 2012 to April 30, 2013. Accordingly, expenses are equal to the Fund’s annualized expense ratio of 0.63% multiplied by the average account value over the six month period, multiplied by 181/365 (to reflect the partial year period). |
4
BRC Large Cap Focus Equity Fund
Schedule of Investments
April 30, 2013
(Unaudited)
| Common Stocks - 95.93% | Shares | Fair Value | ||||||
Consumer Discretionary - 21.14% | ||||||||
BorgWarner, Inc. (a) | 1,060 | $ | 82,860 | |||||
Gap, Inc./The | 2,409 | 91,518 | ||||||
Home Depot, Inc./The | 1,155 | 84,719 | ||||||
Northrop Grumman Corp. | 1,098 | 83,163 | ||||||
TJX Companies, Inc./The | 1,704 | 83,104 | ||||||
Wyndham Worldwide Corp. | 1,340 | 80,507 | ||||||
Wynn Resorts Ltd | 613 | 84,165 | ||||||
|
| |||||||
| 590,036 | ||||||||
|
| |||||||
Consumer Staples - 6.25% | ||||||||
CVS Caremark Corp. | 1,542 | 89,714 | ||||||
Dr. Pepper Snapple Group, Inc. | 1,735 | 84,720 | ||||||
|
| |||||||
| 174,434 | ||||||||
|
| |||||||
Energy - 8.42% | ||||||||
Denbury Resources, Inc. (a) | 4,691 | 83,922 | ||||||
Helmerich & Payne, Inc. | 1,324 | 77,613 | ||||||
Marathon Petroleum Corp. | 937 | 73,423 | ||||||
|
| |||||||
| 234,958 | ||||||||
|
| |||||||
Financials - 18.11% | ||||||||
Allstate Corp./The | 1,683 | 82,905 | ||||||
BlackRock, Inc | 339 | 90,344 | ||||||
Discover Financial Services | 1,764 | 77,157 | ||||||
Fifth Third Bancorp | 4,877 | 83,055 | ||||||
JPMorgan Chase & Co. | 1,716 | 84,101 | ||||||
Travelers Companies, Inc./The | 1,030 | 87,972 | ||||||
|
| |||||||
| 505,534 | ||||||||
|
| |||||||
Health Care - 8.73% | ||||||||
Humana, Inc. | 1,110 | 82,262 | ||||||
Mylan, Inc. (a) | 2,692 | 78,364 | ||||||
WellPoint, Inc. | 1,141 | 83,202 | ||||||
|
| |||||||
| 243,828 | ||||||||
|
| |||||||
Industrials - 6.54% | ||||||||
Deere & Co. | 892 | 79,656 | ||||||
Ryder System, Inc. | 1,538 | 89,312 | ||||||
Snap-on, Inc. | 157 | 13,533 | ||||||
|
| |||||||
| 182,501 | ||||||||
|
| |||||||
See accompanying notes which are an integral part of these financial statements.
5
BRC Large Cap Focus Equity Fund
Schedule of Investments - continued
April 30, 2013
(Unaudited)
| Common Stocks - 95.93%- continued | Shares | Fair Value | ||||||
Information Technology - 14.64% | ||||||||
Adobe Systems, Inc. (a) | 1,934 | $ | 87,185 | |||||
Amphenol Corp. - Class A | 1,121 | 84,658 | ||||||
QUALCOMM, Inc. | 1,122 | 69,138 | ||||||
Symantec Corp. (a) | 3,461 | 84,102 | ||||||
Texas Instruments Incorporated | 2,311 | 83,681 | ||||||
|
| |||||||
| 408,764 | ||||||||
|
| |||||||
Materials - 6.08% | ||||||||
Bemis Company, Inc. | 2,148 | 84,524 | ||||||
Celanese Corp. | 1,723 | 85,133 | ||||||
|
| |||||||
| 169,657 | ||||||||
|
| |||||||
Telecmmunication Services - 2.55% | ||||||||
CenturyLink, Inc. | 1,894 | 71,158 | ||||||
|
| |||||||
Utilities - 3.47% | ||||||||
NRG Energy, Inc. | 3,479 | 96,960 | ||||||
|
| |||||||
TOTAL COMMON STOCKS (Cost $2,637,795) | 2,677,830 | |||||||
|
| |||||||
Money Market Securities - 1.68% | ||||||||
Fidelity Institutional Money Market Portfolio - Institutional shares, 0.14% (b) | 46,982 | 46,982 | ||||||
|
| |||||||
TOTAL MONEY MARKET SECURITIES (Cost $46,982) | 46,982 | |||||||
|
| |||||||
TOTAL INVESTMENTS (Cost $2,684,777) - 97.61% | $ | 2,724,812 | ||||||
|
| |||||||
Other assets less liabilities - 2.39% | 66,867 | |||||||
|
| |||||||
TOTAL NET ASSETS - 100.00% | $ | 2,791,679 | ||||||
|
| |||||||
| (a) | Non-income producing. |
| (b) | The rate shown represents the seven day yield at April 30, 2013. |
6
BRC Large Cap Focus Equity Fund
Statement of Assets and Liabilities
April 30, 2013
(Unaudited)
Assets | ||||
Investments in securities, at value (cost $2,684,777) | $ | 2,724,812 | ||
Receivable for securities sold | 594,030 | |||
Receivable from Adviser (a) | 17,838 | |||
Dividends receivable | 1,104 | |||
Interest receivable | 19 | |||
Prepaid expenses | 7,447 | |||
Total assets | 3,345,250 | |||
|
| |||
Liabilities | ||||
Payable for securities purchased | 515,611 | |||
Payable to administrator, fund accountant, and transfer agent (a) | 19,714 | |||
Payable to trustees and officers | 2,272 | |||
Payable to custodian (a) | 657 | |||
Other accrued expenses | 15,317 | |||
|
| |||
Total liabilities | 553,571 | |||
|
| |||
Net Assets | $ | 2,791,679 | ||
|
| |||
Net Assets consist of: | ||||
Paid in capital | $ | 2,773,159 | ||
Accumulated undistributed net investment income (loss) | 793 | |||
Accumulated net realized gain (loss) from investment transactions | (22,308 | ) | ||
Net unrealized appreciation (depreciation) on investments | 40,035 | |||
|
| |||
Net Assets | $ | 2,791,679 | ||
|
| |||
Shares outstanding (unlimited number of shares authorized; no par value) | 251,442 | |||
|
| |||
Net Asset Value, offering and redemption price per share | $ | 11.10 | ||
|
|
| (a) | See Note 4 in the Notes to the Financial Statements. |
See accompanying notes which are an integral part of these financial statements.
7
BRC Large Cap Focus Equity Fund (a)
Statement of Operations
April 30, 2013
(Unaudited)
Investment Income | ||||
Dividend income | $ | 2,580 | ||
Interest income | 59 | |||
|
| |||
Total Investment Income | 2,639 | |||
|
| |||
Expenses | ||||
Transfer agent expenses (b) | 15,790 | |||
Administration expenses (b) | 13,459 | |||
Offering expenses | 11,975 | |||
Fund accounting expenses (b) | 8,972 | |||
Audit expenses | 6,447 | |||
Legal expenses | 6,238 | |||
Miscellaneous expenses | 4,159 | |||
Organizational expenses | 3,639 | |||
Report printing expenses | 3,119 | |||
Custodian expenses (b) | 3,014 | |||
Investment Adviser fee (b) | 2,161 | |||
Trustee expenses | 1,917 | |||
Registration expenses | 1,310 | |||
24f-2 expenses | 1,135 | |||
CCO expenses | 1,077 | |||
Pricing expenses | 862 | |||
|
| |||
Total Expenses | 85,274 | |||
Less: Fees waived and reimbursed by Adviser | (83,428 | ) | ||
|
| |||
Net operating expenses | 1,846 | |||
|
| |||
Net Investment Income | 793 | |||
|
| |||
Realized & Unrealized Gain on Investments | ||||
Net realized gain (loss) on investment securities | (22,308 | ) | ||
Change in unrealized appreciation (depreciation) on investment securities | 40,035 | |||
|
| |||
| 17,727 | ||||
|
| |||
Net increase in net assets resulting from operations | $ | 18,520 | ||
|
|
| (a) | For the period December 21, 2012 (commencement of operations) to April 30, 2013. |
| (b) | See Note 4 in the Notes to the Financial Statements. |
See accompanying notes which are an integral part of these financial statements.
8
BRC Large Cap Focus Equity Fund
Statement of Changes In Net Assets
April 30, 2013
| For the Period Ended April 30, 2013 (Unaudited) (a) | ||||
Increase (Decrease) in Net Assets due to: | ||||
Operations | ||||
Net investment income | $ | 793 | ||
Net realized gain (loss) on investment securities | (22,308 | ) | ||
Change in unrealized appreciation (depreciation) on investment securities | 40,035 | |||
|
| |||
Net increase in net assets resulting from operations | 18,520 | |||
|
| |||
Capital Share Transactions | ||||
Proceeds from shares sold | 2,773,159 | |||
Amount paid for shares redeemed | — | |||
|
| |||
Net increase in net assets resulting from capital share transactions | 2,773,159 | |||
|
| |||
Total Increase in Net Assets | 2,791,679 | |||
|
| |||
Net Assets | ||||
Beginning of period | — | |||
|
| |||
End of period | $ | 2,791,679 | ||
|
| |||
Undistributed net investment income included in net assets at end of period | $ | 793 | ||
|
| |||
Capital Share Transactions | ||||
Shares sold | 251,442 | |||
Shares issued in reinvestment of distributions | — | |||
Shares redeemed | — | |||
|
| |||
Net increase from capital share transactions | 251,442 | |||
|
| |||
| (a) | For the period December 21, 2012 (commencement of operations) to April 30, 2013. |
See accompanying notes which are an integral part of these financial statements.
9
BRC Large Cap Focus Equity Fund
Financial Highlights
April 30, 2013
| For the | ||||
| Period Ended | ||||
| April 30, 2013 | ||||
| (Unaudited) (a) | ||||
Selected Per Share Data: | ||||
Net asset value, beginning of period | $ | 10.00 | ||
|
| |||
Income from investment operations: | ||||
Net investment income | 0.01 | (b) | ||
Net realized and unrealized gain on investments | 1.09 | |||
|
| |||
Total Income from investment operations | 1.10 | |||
|
| |||
Net asset value, end of period | $ | 11.10 | ||
|
| |||
Total Return (c) | 11.00 | %(d) | ||
Ratios and Supplemental Data: | ||||
Net assets, end of period (000) | $ | 2,792 | ||
Ratio of net expenses to average net assets | 0.63 | %(e) | ||
Ratio of expenses to average net assets before waiver and reimbursement | �� | 28.92 | %(e) | |
Ratio of net investment income to average net assets | 0.27 | %(e) | ||
Ratio of net investment income to average net assets before waiver and reimbursement | (28.02 | )%(e) | ||
Portfolio turnover rate | 98.62 | %(d) | ||
| (a) | For the period December 21, 2012 (commencement of operations) to April 30, 2013. |
| (b) | Calculated using the average shares method. |
| (c) | Total return in the above table represents the rate that the investor would have earned or lost on an investment in the Fund, assuming reinvestment of distributions. |
| (d) | Not annualized. |
| (e) | Annualized. |
See accompanying notes which are an integral part of these financial statements.
10
BRC Large Cap Focus Equity Fund
Notes to the Financial Statements
April 30, 2013
(Unaudited)
NOTE 1. ORGANIZATION
The BRC Large Cap Focus Equity Fund (the “Fund”) is an open-end diversified series of the Valued Advisers Trust (the “Trust”). The Trust is a management investment company established under the laws of Delaware by an Agreement and Declaration of Trust dated June 13, 2008 (the “Trust Agreement”). The Trust Agreement permits the Trustees to issue an unlimited number of shares of beneficial interest of separate series without par value. The Fund is one of a series of funds authorized by the Board of Trustees (the “Board”). The Fund commenced operations December 21, 2012. The Fund’s investment adviser is BRC Investment Management LLC. (the “Adviser”). The investment objective of the Fund is to seek long-term capital appreciation.
NOTE 2. SIGNIFICANT ACCOUNTING POLICIES
The following is a summary of significant accounting policies followed by the Fund in the preparation of its financial statements.
Securities Valuation – All investments in securities are recorded at their estimated fair value as described in Note 3.
Federal Income Taxes – The Fund makes no provision for federal income or excise tax. The Fund intends to qualify each year as a regulated investment company (“RIC”) under subchapter M of the Internal Revenue Code of 1986, as amended, by complying with the requirements applicable to RICs and by distributing substantially all of its taxable income. The Fund also intends to distribute sufficient net investment income and net capital gains, if any, so that it will not be subject to excise tax on undistributed income and gains. If the required amount of net investment income or gains is not distributed, the Fund could incur a tax expense.
As of and during the period ended April 30, 2013, the Fund did not have a liability for any unrecognized tax benefits. The Fund recognizes interest and penalties, if any, related to unrecognized tax benefits as income tax expense in the Statement of Operations. During the year, the Fund did not incur any interest or penalties. The Fund is subject to examination by U.S. federal tax authorities for all tax years since inception.
Expenses – Expenses incurred by the Trust that do not relate to a specific fund of the Trust are allocated to the individual funds based on each fund’s relative net assets or other appropriate basis (as determined by the Board of Trustees).
Security Transactions and Related Income - The Fund follows industry practice and records security transactions on the trade date. The First In, First Out method is used for determining gains or losses for financial statements and income tax purposes. Dividend income is recorded on the ex-dividend date and interest income is recorded on an accrual basis. Discounts and premiums on securities purchased are amortized or accreted using the effective interest method. Withholding taxes on foreign dividends have been provided for in accordance with the Fund’s understanding of the applicable country’s tax rules and rates. The ability of issuers of debt securities held by the Fund to meet their obligations may be affected by economic and political developments in a specific country or region.
Dividends and Distributions - The Fund intends to distribute substantially all of its net investment income, net realized long-term capital gains and its net realized short-term capital gains, if any, to its shareholders on at least an annual basis. Dividends to shareholders, which are determined in accordance with income tax regulations, are recorded on the ex-dividend date. The treatment for financial reporting purposes of distributions made to shareholders during the year from net investment income or net realized capital gains may differ from their ultimate treatment for federal income tax purposes. These differences are caused primarily by differences in the timing of the recognition of certain components of income, expense or realized capital gain for federal income tax purposes. Where such differences are permanent in nature, they are reclassified in the components of net assets based on their ultimate characterization for federal income tax purposes. Any such reclassifications will have no effect on net assets, results of operations or net asset values per share of the Fund.
11
BRC Large Cap Focus Equity Fund
Notes to the Financial Statements - continued
April 30, 2013
(Unaudited)
NOTE 3. SECURITIES VALUATION AND FAIR VALUE MEASUREMENTS
Fair value is defined as the price that a Fund would receive upon selling an investment in a orderly transaction to an independent buyer in the principal or most advantageous market of the investment. Accounting principles generally accepted in the United States of America (“GAAP”) establish a three-tier hierarchy to maximize the use of observable market data and minimize the use of unobservable inputs and to establish classification of fair value measurements for disclosure purposes.
Inputs refer broadly to the assumptions that market participants would use in pricing the asset or liability, including assumptions about risk, (ex., the risk inherent in a particular valuation technique used to measure fair value including such as a pricing model and/or the risk inherent in the inputs to the valuation technique). Inputs may be observable or unobservable. Observable inputs are inputs that reflect the assumptions market participants would use in pricing the asset or liability developed based on market data obtained from sources independent of the reporting entity. Unobservable inputs are inputs that reflect the reporting entity’s own assumptions about the assumptions market participants would use in pricing the asset or liability developed based on the best information available in the circumstances.
Various inputs are used in determining the value of the Fund’s investments. These inputs are summarized in the three broad levels listed below.
| • | Level 1 – quoted prices in active markets for identical securities |
| • | Level 2 – other significant observable inputs (including, but not limited to, quoted prices for an identical security in an inactive market, quoted prices for similar securities, interest rates, prepayment speeds, credit risk, etc.) |
| • | Level 3 – significant unobservable inputs (including the Fund’s own assumptions in determining fair value of investments based on the best information available) |
The inputs used to measure fair value may fall into different levels of the fair value hierarchy. In such cases, for disclosure purposes, the level in the fair value hierarchy within which the fair value measurement falls in its entirety, is determined based on the lowest level input that is significant to the fair value measurement in its entirety.
Equity securities, including common stocks, are generally valued by using market quotations, furnished by a pricing service. Securities that are traded on any stock exchange are generally valued at the last quoted sale price. Lacking a last sale price, an exchange traded security is generally valued at its last bid price. Securities traded in the NASDAQ over-the-counter market are generally valued at the NASDAQ Official Closing Price. When using the market quotations or close prices provided by the pricing service and when the market is considered active, the security is classified as a Level 1 security. Sometimes, an equity security owned by the Fund will be valued by the pricing service with factors other than market quotations or when the market is considered inactive. When this happens, the security is classified as a Level 2 security. When market quotations are not readily available, when the Fund determines that the market quotation or the price provided by the pricing service does not accurately reflect the current fair value, or when restricted or illiquid securities are being valued, such securities are valued as determined in good faith by the Fund, in conformity with guidelines adopted by and subject to review by the Board. These securities are categorized as Level 3 securities.
Investments in open-end mutual funds, including money market mutual funds, are generally priced at the ending net asset value (NAV) provided by the service agent of the funds. These securities will be categorized as Level 1 securities.
12
BRC Large Cap Focus Equity Fund
Notes to the Financial Statements - continued
April 30, 2013
(Unaudited)
NOTE 3. SECURITIES VALUATION AND FAIR VALUE MEASUREMENTS – continued
Fixed income securities when valued using market quotations in an active market, will be categorized as Level 1 securities. However, they may be valued on the basis of prices furnished by a pricing service when the Fund believes such prices more accurately reflect the fair value of such securities. A pricing service utilizes electronic data processing techniques based on yield spreads relating to securities with similar characteristics to determine prices for normal institutional-size trading units of debt securities without regard to sale or bid prices. These securities will generally be categorized as Level 2 securities. If the Fund decides that a price provided by the pricing service does not accurately reflect the fair value of the securities, when prices are not readily available from a pricing service, or when restricted or illiquid securities are being valued, securities are valued at fair value as determined in good faith by the Fund, in conformity with guidelines adopted by and subject to review of the Board. These securities will be categorized as Level 3 securities.
Short-term investments in fixed income securities (those with maturities of less than 60 days when acquired, or which subsequently are within 60 days of maturity), including certificates of deposit and U.S. government securities, are valued by using the amortized cost method of valuation, which the Board has determined will represent fair value. These securities will be classified as Level 2 securities.
If the Fund decides that a price provided by the pricing service does not accurately reflect the fair value of the securities, when prices are not readily available from a pricing service, or when restricted or illiquid securities are being valued, securities are valued at fair value as determined in good faith by the Fund, in conformity with guidelines adopted by and subject to review of the Board. These securities will be categorized as Level 3 securities.
In accordance with the Trust’s good faith pricing guidelines, the Fund is required to consider all appropriate factors relevant to the value of securities for which it has determined other pricing sources are not available or reliable as described above. No single standard exists for determining fair value, because fair value depends upon the circumstances of each individual case. As a general principle, the current fair value of an issue of securities being valued by the Fund would appear to be the amount which the owner might reasonably expect to receive for them upon their current sale. Methods which are in accordance with this principle may, for example, be based on (i) a multiple of earnings; (ii) a discount from market of a similar freely traded security (including a derivative security or a basket of securities traded on other markets, exchanges or among dealers); or (iii) yield to maturity with respect to debt issues, or a combination of these and other methods. Good faith pricing is permitted if, in the Fund’s opinion, the validity of market quotations appears to be questionable based on factors such as evidence of a thin market in the security based on a small number of quotations, a significant event occurs after the close of a market but before a Fund’s NAV calculation that may affect a security’s value, or the Fund is aware of any other data that calls into question the reliability of market quotations. Good faith pricing may also be used in instances when the bonds the Fund invests in may default or otherwise cease to have market quotations readily available. Any fair value pricing done outside the Fund’s approved pricing methods must be approved by the Pricing Committee of the Board.
13
BRC Large Cap Focus Equity Fund
Notes to the Financial Statements - continued
April 30, 2013
(Unaudited)
NOTE 3. SECURITIES VALUATION AND FAIR VALUE MEASUREMENTS – continued
The following is a summary of the inputs used to value the Fund’s investments as of April 30, 2013:
| Valuation Inputs | ||||||||||||||||
Assets | Level 1 - Quoted Prices in Active Markets | Level 2 - Other Significant Observable Inputs | Level 3 - Significant Unobservable Inputs | Total | ||||||||||||
Common Stocks* | $ | 2,677,830 | $ | — | $ | — | $ | 2,677,830 | ||||||||
Money Market Securities | 46,982 | — | — | 46,982 | ||||||||||||
Total | $ | 2,724,812 | $ | — | $ | — | $ | 2,724,812 | ||||||||
| * | Refer to the Schedule of Investments for industry classifications. |
The Fund did not hold any investments at any time during the reporting period in which significant unobservable inputs were used in determining fair value; therefore, no reconciliation of Level 3 securities is included for this reporting period. The Fund did not hold any derivative instruments during the reporting period. The Trust recognizes transfers between fair value hierarchy levels at the reporting period end. There were no transfers between any Levels for the period December 21, 2012 (commencement of operations) through April 31, 2013.
NOTE 4. FEES AND OTHER TRANSACTIONS WITH AFFILIATES
Under the terms of the management agreement, on behalf of the Fund (the “Agreement”), the Adviser manages the Fund’s investments subject to approval of the Trustees. As compensation for its management services, the BRC Large Cap Focus Equity Value Fund is obligated to pay the Adviser a fee computed and accrued daily and paid monthly at an annual rate of 0.75% of the average daily net assets of the Fund. For the period December 21, 2012 (commencement of operations) through April 31, 2013, the Adviser earned a fee of $2,161 from the Fund before the reimbursement described below. At April 30, 2013, the Adviser owed the Fund $17,838.
The Adviser has contractually agreed to waive its management fee and/or reimburse expenses through February 29, 2016, so that total annual fund operating expenses, excluding interest, taxes, brokerage commissions, other expenditures which are capitalized in accordance with GAAP, other extraordinary expenses not incurred in the ordinary course of the Fund’s business, dividend expense on short sales, and expenses that the Fund has incurred but did not actually pay because of an expense offset arrangement, if applicable, incurred by the Fund in any fiscal year, do not exceed 0.55% of the Fund’s average daily net assets. The operating expense limitation also excludes any fees and expenses of acquired funds. Prior to April 1, 2013 the Adviser contractually agreed to limit its fees to 0.84% of the Total Annual Fund Operating expenses. For the period December 21, 2012 (commencement of operations) through April 31, 2013, expenses totaling $83,428 were waived or reimbursed by the Adviser and may be subject to potential recoupment by the Adviser until October 31, 2016.
The Trust retains Huntington Asset Services, Inc. (“HASI”) to manage the Fund’s business affairs and provide the Fund with administrative services, including all regulatory reporting and necessary office equipment and personnel. For the period December 21, 2012 (commencement of operations) through April 31, 2013, HASI earned fees of $13,459 for administrative services provided to the Fund. At April 30, 2013, HASI was owed $6,100 from the Fund for administrative services. Certain officers of the Trust are members of management and/or employees of HASI. HASI is a wholly-owned subsidiary of Huntington Bancshares, Inc., the parent company of Unified Financial Securities, Inc. (the “Distributor”) and Huntington National Bank, the custodian of the Fund’s investments (the “Custodian”). For the period December 21, 2012 (commencement of operations) through April 31, 2013, the Custodian earned fees of $3,014 for custody services provided to the Fund. At April 30, 2013, the Custodian was owed $657 from the Fund for custody services.
14
BRC Large Cap Focus Equity Fund
Notes to the Financial Statements - continued
April 30, 2013
(Unaudited)
NOTE 4. FEES AND OTHER TRANSACTIONS WITH AFFILIATES – continued
The Trust also retains HASI to act as the Fund’s transfer agent and to provide transfer agent services. For the period December 21, 2012 (commencement of operations) through April 31, 2013, HASI earned fees of $15,790 for transfer agent services to the Fund. At April 30, 2013, the Fund owed HASI $9,547 for transfer agent services.
For the period December 21, 2012 (commencement of operations) through April 31, 2013, HASI earned fees of $8,972 from the Fund for fund accounting services. At April 30, 2013, HASI was owed $4,067 from the Fund for fund accounting services.
Unified Financial Securities, Inc. acts as the principal underwriter of the Fund’s shares. There were no payments made by the Fund to the Distributor during the six months ended April 30, 2013. An officer of the Trust is also an officer of the Distributor.
NOTE 5. INVESTMENTS
For the period December 21, 2012 (commencement of operations) through April 31, 2013, purchases and sales of investment securities, other than short-term investments and short-term U.S. government obligations, were as follows:
Purchases | ||||
U.S. Government Obligations | $ | — | ||
Other | 3,747,129 | |||
Sales | ||||
U.S. Government Obligations | $ | — | ||
Other | 1,087,026 |
At April 30, 2013, the net unrealized appreciation (depreciation) of investments for tax purposes was as follows:
Gross Appreciation | $ | 64,408 | ||
Gross (Depreciation) | (24,373 | ) | ||
|
| |||
Net Appreciation (Depreciation) on Investments | $ | 40,035 | ||
|
|
At April 30, 2013, the aggregate cost of securities, excluding U.S. government obligations, for federal income tax purposes was $2,684,777 for the Fund.
NOTE 6. ESTIMATES
The preparation of financial statements in conformity with GAAP requires management to make estimates and assumptions that affect the reported amounts of assets and liabilities and disclosure of contingent assets and liabilities at the date of the financial statements and the reported amounts of increases and decreases in net assets from operations during the reporting period. Actual results could differ from those estimates.
NOTE 7. BENEFICIAL OWNERSHIP
The beneficial ownership, either directly or indirectly, of 25% or more of the voting securities of a fund creates a presumption of control of a fund, under Section 2(a) (9) of the Investment Company Act of 1940. At April 30, 2013,
15
BRC Large Cap Focus Equity Fund
Notes to the Financial Statements - continued
April 30, 2013
(Unaudited)
NOTE 7. BENEFICIAL OWNERSHIP - continued
Charles Schwab & Co., Inc. for the benefit of it’s customers, owned 92.84%. The Trust does not know whether Charles Schwab & Co. or any of the underlying beneficial owners controlled 25% or more of the voting securities of the Fund.
NOTE 8. COMMITMENTS AND CONTINGENCIES
The Fund indemnifies its officers and trustees for certain liabilities that may arise from their performance of their duties to the Fund. Additionally, in the normal course of business, the Fund enters into contracts that contain a variety of representatives and warranties which provide general indemnifications. The Fund’s maximum exposure under these arrangements is unknown, as this would involve future claims that may be made against the Fund that have not yet occurred.
OTHER INFORMATION
The Fund’s Statement of Additional Information (“SAI”) includes additional information about the trustees and is available without charge, upon request. You may call toll-free at (303) 414-1100 to request a copy of the SAI or to make shareholder inquiries.
Approval of Investment Advisory Agreement – (Unaudited)
At a meeting held on December 10-11, 2012, the Board of Trustees (the “Board”) considered the initial approval of an Investment Advisory Agreement (the “Advisory Agreement”) between the Trust and BRC Investment Management LLC (the “Adviser”) on behalf of the BRC Large Cap Focused Equity Fund (the “Fund”). Counsel reviewed with the Board the requirements of the Investment Company Act of 1940 (the “1940 Act”) and the applicable disclosure obligations associated therewith. The Board discussed the arrangements between the Adviser and the Trust with respect to the Fund and reflected on discussions with the Adviser regarding the Advisory Agreement, the expense limitation agreement and the manner in which the Fund would be managed.
Counsel referred the Board to the Meeting materials, which included, among other things, a memorandum from Counsel addressing the duties of Trustees regarding the approval of the proposed Advisory Agreement, a letter from Counsel to the Adviser and the Adviser’s responses to that letter, a copy of the Adviser’s financial related information, a copy of the Adviser’s Form ADV, and the Advisory Agreement and expense limitation agreement.
Counsel noted that the 1940 Act requires the approval of the investment advisory agreement between the Trust and the Adviser by a majority of the Independent Trustees. The Board discussed the arrangements between the Adviser and the Trust with respect to the Fund. The Board reviewed a memorandum from Counsel, and addressed to the Trustees that summarized, among other things, the fiduciary duties and responsibilities of the Board in reviewing and approving the Advisory Agreement. Counsel discussed with the Trustees the types of information and factors that should be considered by the Board in order to make an informed decision regarding the approval of the Advisory Agreement, including the following material factors: (i) the nature, extent, and quality of the services provided by the Adviser; (ii) the investment performance of the Fund; (iii) the costs of the services to be provided and profits to be realized by the Adviser from the relationship with the Fund; (iv) the extent to which economies of scale would be realized if the Fund grows and whether advisory fee levels reflect those economies of scale for the benefit of the investors of the Fund; and (v) the Adviser’s practices regarding possible conflicts of interest.
The Board did not identify any particular information that was most relevant to its consideration to approve the Agreement and each Trustee may have afforded different weight to the various factors.
| 1. | The nature, extent, and quality of the services to be provided by the Adviser. In this regard, the Board considered the responsibilities the Adviser would have under the Advisory Agreement. The Board reviewed the services to be provided by the Adviser to the Fund including, without limitation: the Adviser’s procedures for |
16
| formulating investment recommendations and assuring compliance with the Fund’s investment objectives and limitations; the efforts of the Adviser during the Fund’s start-up phase, its anticipated coordination of services for the Fund among the Fund’s service providers, and the anticipated efforts to promote the Fund, grow its assets, and assist in the distribution of the Fund shares. The Board considered: the Adviser’s staffing, personnel, and methods of operating; the education and experience of the Adviser’s personnel; and the Adviser’s compliance program, policies, and procedures. After reviewing the foregoing and further information from the Adviser (e.g., the Adviser’s compliance programs and Form ADV), the Board concluded that the quality, extent, and nature of the services to be provided by the Adviser were satisfactory and adequate for the Fund. |
| 2. | Investment Performance of the Fund and the Adviser. The Board noted that while the Fund had not commenced operations and thus did not have investment performance information to review, that the Board could consider the investment performance of the Adviser in managing accounts similar to the manner in which the Fund would be managed. The Board observed that while the separate accounts would not be subjected to the same operations, expenses and restrictions as the Fund, the performance was very good. The Board concluded, in light of the foregoing factors, that the investment performance of the Adviser was satisfactory. |
| 3. | The costs of the services to be provided and profits to be realized by the Adviser from the relationship with the Fund. In this regard, the Board considered: the financial condition of the Adviser and the level of commitment to the Fund and the Adviser by the principals of the Adviser; the projected asset levels of the Fund; the Adviser’s payment of startup costs for the Fund; and the overall anticipated expenses of the Fund, including the expected nature and frequency of advisory fee payments. The Board also considered potential benefits for the Adviser in managing the Fund. The Board compared the expected fees and expenses of the Fund (including the management fee) to other funds comparable to the Fund in terms of the type of fund, the style of investment management, the anticipated size of fund and the nature of the investment strategy and markets invested in, among other factors. The Board determined that the Fund’s management fee was generally comparable to those of similar funds although anticipated expense ratio, in light of the contractual Expense Limitation Agreement was generally lower than the peer group reviewed by the Board. Following this comparison and upon further consideration and discussion of the foregoing, the Board concluded that the fees to be paid to the Adviser by the Fund were fair and reasonable. |
| 4. | The extent to which economies of scale would be realized as the Fund grows and whether advisory fee levels reflect these economies of scale for the benefit of the Fund’s investors. In this regard, the Board considered the Fund’s fee arrangements with the Adviser. The Board noted that the management fee would stay the same as asset levels increased, although it also noted that the shareholders of the Fund would benefit from the Expense Limitation Agreement until the Fund’s expenses fell below the expense cap. The Board also noted that the Fund would benefit from economies of scale under its agreements with service providers other than the Adviser. Following further discussion of the Fund’s projected asset levels, expectations for growth, and levels of fees, the Board determined that the Fund’s fee arrangements with the Adviser were fair and reasonable and reasonable in relation to the nature and quality of the services to be provided by the Adviser. |
| 5. | Possible conflicts of interest. In evaluating the possibility for conflicts of interest, the Board considered such matters as: the experience and ability of the advisory personnel assigned to the Fund; the basis of decisions to buy or sell securities for the Fund and/or the Adviser’s other accounts; the method for bunching of portfolio securities transactions; the substance and administration of the Adviser’s code of ethics and other relevant policies described in the Adviser’s Form ADV. Following further consideration and discussion, the Board indicated that the Adviser’s standards and practices relating to the identification and mitigation of potential conflicts of interest were satisfactory. |
After additional consideration of the factors delineated in the memorandum provided by Counsel and further discussion among the Board, the Board determined to approve the Advisory Agreement between the Trust and the Adviser.
17
PROXY VOTING
A description of the policies and procedures that the Fund uses to determine how to vote proxies relating to portfolio securities and information regarding how the Fund voted those proxies is available without charge upon request by (1) calling the Fund at (303) 414-1100 and (2) from Fund documents filed with the Securities and Exchange Commission (“SEC”) on the SEC’s website at www.sec.gov.
TRUSTEES
R. Jeffrey Young, Chairman
Dr. Merwyn R. Vanderlind
Ira Cohen
OFFICERS
R. Jeffrey Young, Principal Executive Officer and President
John C. Swhear, Chief Compliance Officer, AML Officer and Vice-President
Carol J. Highsmith, Vice President
Matthew J. Miller, Vice President
Robert W. Silva, Principal Financial Officer and Treasurer
Heather Bonds, Secretary
INVESTMENT ADVISER
BRC Investment Management LLC
8400 East Prentice Avenue, Suite 1401
Greenwood Village, Colorado 80111
DISTRIBUTOR
Unified Financial Securities, Inc.
2960 North Meridian Street, Suite 300
Indianapolis, IN 46208
INDEPENDENT REGISTERED PUBLIC ACCOUNTING FIRM
Cohen Fund Audit Services Ltd.
1350 Euclid Avenue, Suite 800
Cleveland, OH 44115
LEGAL COUNSEL
The Law Offices of John H. Lively & Associates, Inc.
A member firm of The 1940 Act Law GroupTM
11300 Tomahawk Creek Parkway, Ste. 310
Leawood, KS 66211
CUSTODIAN
Huntington National Bank
41 South High Street
Columbus, OH 43125
ADMINISTRATOR, TRANSFER AGENT AND FUND ACCOUNTANT
Huntington Asset Services, Inc.
2960 North Meridian Street, Suite 300
Indianapolis, IN 46208
This report is intended only for the information of shareholders or those who have received the Fund’s prospectus which contains information about the Fund’s management fee and expenses. Please read the prospectus carefully before investing.
Distributed by Unified Financial Securities, Inc.
Member FINRA/SIPC
Semi-Annual Report
April 30, 2013
Fund Adviser:
Granite Investment Advisors, Inc.
11 South Main Street, Suite 501
Concord, New Hampshire 03301
Toll Free (888) 442-9893
Investment Results – (Unaudited)
Total Returns*
(For the period ended April 30, 2013)
| Average Annual | ||||||||||||
| Cumulative | Returns | |||||||||||
| Since Inception | ||||||||||||
| Six Month | One Year | (December 22, 2011) | ||||||||||
Granite Value Fund | 11.73 | % | 14.07 | % | 18.25 | % | ||||||
S&P 500® Index** | 14.42 | % | 16.89 | % | 22.95 | % | ||||||
Russell 1000® Value Index** | 16.31 | % | 21.80 | % | 25.25 | % | ||||||
Total annual operating expenses, as disclosed in the Fund’s prospectus dated February 28, 2013, were 8.11% of average daily net assets (1.35% after fee waivers/expense reimbursements by the adviser). The adviser has contractually agreed to waive or limit its fees and to assume other expenses of the Fund until February 28, 2014, so that the Total Annual Fund Operating Expenses does not exceed 1.35%. This operating expense limitation does not apply to brokerage fees and commissions, borrowing costs (such as interest and dividend expenses on securities sold short), taxes, 12b-1 fees; extraordinary expenses and indirect expenses (such as “acquired fund fees and expenses”).
The performance quoted represents past performance, which does not guarantee future results. The investment return and principal value of an investment will fluctuate so that an investor’s shares, when redeemed, may be worth more or less than their original cost. The returns shown do not reflect deduction of taxes that a shareholder would pay on Fund distributions or the redemption of Fund shares. Current performance of the Fund may be lower or higher than the performance quoted. The Fund’s investment objectives, risks, charges and expenses must be considered carefully before investing. Performance data current to the most recent month end may be obtained by calling 1-888-442-9893.
| * | Return figures reflect any change in price per share and assume the reinvestment of all distributions. |
| ** | The S&P 500® Index and the Russell 1000® Value Index are widely recognized unmanaged indices of equity securities and are representative of a broader domestic equity market and range of securities than is found in the Fund’s portfolio. Individuals cannot invest directly in an Index; however, an individual can invest in exchange traded funds or other investment vehicles that attempt to track the performance of a benchmark index. |
The Fund’s investment objectives, strategies, risks, charges and expenses must be considered carefully before investing. The prospectus contains this and other important information about the Fund and may be obtained by calling the same number as above. Please read it carefully before investing. The Fund is distributed by Unified Financial Securities, Inc., member FINRA.
1
Investment Results – (Unaudited)
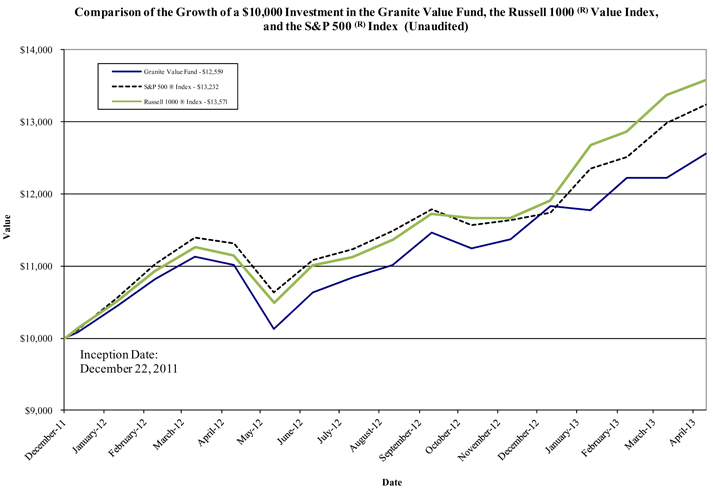
The chart above assumes an initial investment of $10,000 made on December 22, 2011 (commencement of Fund operations) and held through April 30, 2013. The S&P 500® Index and Russell 1000® Value Index are widely recognized unmanaged indices of equity securities and are representative of a broader domestic equity market and range of securities than is found in the Fund’s portfolio. Individuals cannot invest directly in an Index; however, an individual can invest in exchange traded funds or other investment vehicles that attempt to track the performance of a benchmark index. THE FUND’S RETURN REPRESENTS PAST PERFORMANCE AND DOES NOT GUARANTEE FUTURE RESULTS. The returns shown do not reflect deduction of taxes that a shareholder would pay on Fund distributions or the redemption of Fund shares. Investment returns and principal values will fluctuate so that your shares, when redeemed, may be worth more or less than their original purchase price.
Current performance may be lower or higher than the performance data quoted. For more information on the Fund, and to obtain performance data current to the most recent month end or to request a prospectus, please call 1-888-442-9893. You should carefully consider the investment objectives, potential risks, management fees, and charges and expenses of the Fund before investing. The Fund’s prospectus contains this and other information about the Fund, and should be read carefully before investing.
The Fund is distributed by Unified Financial Securities, Inc., member FINRA.
2
Fund Holdings – (Unaudited)
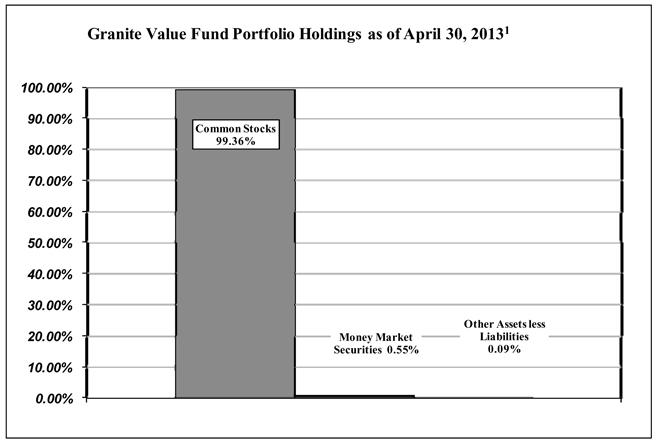
| 1 | As a percentage of net assets. |
The investment objective of the Granite Value Fund is to seek long-term capital appreciation.
Availability of Portfolio Schedule – (Unaudited)
The Fund files its complete schedule of portfolio holdings with the Securities and Exchange Commission (“SEC”) for the first and third quarters of each fiscal year on Form N-Q. The Fund’s Forms N-Q are available at the SEC’s website at www.sec.gov. The Fund’s Forms N-Q may be reviewed and copied at the SEC’s Public Reference Room in Washington DC. Information on the operation of the Public Reference Room may be obtained by calling 1-800-SEC-0330.
Summary of Fund’s Expenses – (Unaudited)
As a shareholder of the Fund, you incur two types of costs: (1) transaction costs, such as short-term redemption fees; and (2) ongoing costs, including management fees and other Fund expenses. This Example is intended to help you understand your ongoing costs (in dollars) of investing in the Fund and to compare these costs with the ongoing costs of investing in other mutual funds. The example is based on an investment of $1,000 invested at the beginning and held for the six month period, November 1, 2012 to April 30, 2013.
3
Actual Expenses
The first line of the table below provides information about actual account values and actual expenses. You may use the information in this line, together with the amount you invested, to estimate the expenses that you paid over the period. Simply divide your account value by $1,000 (for example, an $8,600 account value divided by $1,000 = $8.60), then multiply the result by the number in the first line under the heading entitled “Expenses Paid During the Period” to estimate the expenses you paid on your account during this period.
Hypothetical Example for Comparison Purposes
The second line of the table below provides information about hypothetical account values and hypothetical expenses based on the Fund’s actual expense ratio and an assumed rate of return of 5% per year before expenses, which is not the Fund’s actual return. The hypothetical account values and expenses may not be used to estimate the actual ending account balance or expenses you paid for the period. You may use this information to compare the ongoing costs of investing in the Fund and other funds. To do so, compare this 5% hypothetical example with the 5% hypothetical examples that appear in the shareholder reports of the other funds.
Please note that the expenses shown in the table are meant to highlight your ongoing costs only. Therefore, the second line of the table below is useful in comparing ongoing costs only and will not help you determine the relative costs of owning different funds.
Granite Value Fund | Beginning Account Value November 1, 2012 | Ending Account Value April 30, 2013 | Expenses Paid During Period* November 1, 2012 – April 30, 2013 | |||||||||
Actual* | $ | 1,000.00 | $ | 1,117.35 | $ | 7.11 | ||||||
Hypothetical** | $ | 1,000.00 | $ | 1,018.08 | $ | 6.78 | ||||||
| * | Expenses are equal to the Fund’s annualized expense ratio of 1.35%, multiplied by the average account value over the period, multiplied by 181/365 (to reflect the one-half year period). |
| ** | Assumes a 5% return before expenses. |
4
Granite Value Fund
Schedule of Investments
April 30, 2013
(Unaudited)
| Shares | Fair Value | |||||||
Common Stocks - 99.36% | ||||||||
Consumer Discretionary - 18.82% | ||||||||
Bed Bath & Beyond, Inc. (a) | 3,550 | $ | 244,240 | |||||
Coach, Inc. | 3,860 | 227,200 | ||||||
Comcast Corp. - Class A | 4,790 | 197,827 | ||||||
General Motors Co. (a) | 9,990 | 308,092 | ||||||
Tesco plc (b) | 12,970 | 226,716 | ||||||
TRW Automotive Holdings Corp. (a) | 3,890 | 233,672 | ||||||
|
| |||||||
| 1,437,747 | ||||||||
|
| |||||||
Consumer Staples - 8.58% | ||||||||
Coca-Cola Co. / The | 4,900 | 207,417 | ||||||
Unilever PLC (b) | 5,170 | 223,964 | ||||||
Wal-Mart Stores, Inc. | 2,885 | 224,222 | ||||||
|
| |||||||
| 655,603 | ||||||||
|
| |||||||
Energy - 16.06% | ||||||||
Apache Corp. | 2,465 | 182,114 | ||||||
Exxon Mobil Corp. | 2,540 | 226,035 | ||||||
QEP Resources, Inc. | 6,205 | 178,145 | ||||||
Southwestern Energy Co. (a) | 6,040 | 226,017 | ||||||
Ultra Petroleum Corp. (a) | 11,755 | 251,557 | ||||||
Unit Corp. (a) | 3,875 | 162,866 | ||||||
|
| |||||||
| 1,226,734 | ||||||||
|
| |||||||
Financials - 19.97% | ||||||||
Allegahany Corp. (a) | 555 | 218,526 | ||||||
American Express Co. | 3,065 | 209,677 | ||||||
American International Group, Inc. (a) | 5,550 | 229,881 | ||||||
Berkshire Hathaway, Inc. - Class B (a) | 2,780 | 295,570 | ||||||
Goldman Sachs Group, Inc. / The | 1,310 | 191,352 | ||||||
Humana, Inc. | 2,880 | 213,437 | ||||||
JPMorgan Chase & Co. | 3,405 | 166,879 | ||||||
|
| |||||||
| 1,525,322 | ||||||||
|
| |||||||
Health Care - 8.93% | ||||||||
Johnson & Johnson | 2,590 | 220,746 | ||||||
Sanofi (b) | 4,395 | 234,473 | ||||||
UnitedHealth Group, Inc. | 3,785 | 226,835 | ||||||
|
| |||||||
| 682,054 | ||||||||
|
| |||||||
Industrials - 12.05% | ||||||||
Boeing Co. / The | 2,530 | 231,267 | ||||||
Fedex Corp. | 2,350 | 220,923 | ||||||
Kennametal, Inc. | 6,240 | 249,538 | ||||||
Lockheed Martin Corp. | 2,205 | 218,493 | ||||||
|
| |||||||
| 920,221 | ||||||||
|
| |||||||
See accompanying notes which are an integral part of these financial statements.
5
Granite Value Fund
Schedule of Investments - continued
April 30, 2013
(Unaudited)
| Shares | Fair Value | |||||||
Common Stocks - 99.36% - continued | ||||||||
Information Technology - 12.05% | ||||||||
Accenture PLC - Class A | ||||||||
Apple, Inc. | 530 | $ | 234,657 | |||||
Cisco Systems, Inc. | 10,385 | 217,254 | ||||||
Microsoft Corp. | 7,595 | 251,394 | ||||||
Western Union | 14,670 | 217,263 | ||||||
|
| |||||||
| 920,568 | ||||||||
|
| |||||||
Utilities - 2.90% | ||||||||
Calpine Corp. (a) | 10,175 | 221,103 | ||||||
|
| |||||||
TOTAL COMMON STOCKS (Cost $6,756,064) | 7,589,352 | |||||||
|
| |||||||
Money Market Securities - 0.55% | ||||||||
Fidelity Institutional - Prime Money Market Portfolio, 0.10% (c) | 41,989 | 41,989 | ||||||
|
| |||||||
TOTAL MONEY MARKET SECURITIES (Cost $41,989) | 41,989 | |||||||
|
| |||||||
TOTAL INVESTMENTS (Cost $6,798,053) - 99.91% | $ | 7,631,341 | ||||||
|
| |||||||
Other assets less liabilities - 0.09% | 6,832 | |||||||
|
| |||||||
TOTAL NET ASSETS - 100.00% | $ | 7,638,173 | ||||||
|
| |||||||
| (a) | Non-income producing. |
| (b) | American Depositary Receipt. |
| (c) | Variable rate security; the rate shown represents the 7-day yield at April 30, 2013. |
See accompanying notes which are an integral part of these financial statements.
6
Granite Value Fund
Statement of Assets and Liabilities
April 30, 2013
(Unaudited)
Assets | ||||
Investments in securities, at value (cost $6,798,053) | $ | 7,631,341 | ||
Receivable from Adviser (a) | 6,042 | |||
Dividends receivable | 2,791 | |||
Interest receivable | 6 | |||
Prepaid expenses | 13,817 | |||
|
| |||
Total assets | 7,653,997 | |||
|
| |||
Liabilities | ||||
Payable to administrator, fund accountant, and transfer agent (a) | 6,846 | |||
Payable to trustees | 179 | |||
Payable to custodian (a) | 170 | |||
Other accrued expenses | 8,629 | |||
|
| |||
Total liabilities | 15,824 | |||
|
| |||
Net Assets | $ | 7,638,173 | ||
|
| |||
Net Assets consist of: | ||||
Paid in capital | $ | 6,618,098 | ||
Accumulated undistributed net investment income (loss) | (5,662 | ) | ||
Accumulated net realized gain (loss) from investment transactions | 192,449 | |||
Net unrealized appreciation (depreciation) on investments | 833,288 | |||
|
| |||
Net Assets | $ | 7,638,173 | ||
|
| |||
Shares outstanding (unlimited number of shares authorized; no par value) | 613,503 | |||
|
| |||
Net Asset Value, offering and redemption price per share | $ | 12.45 | ||
|
| |||
Redemption price per share (Net Asset Value * 98%) (b) | $ | 12.20 | ||
|
|
| (a) | See Note 4 in the Notes to the Financial Statements. |
| (b) | The Fund charges a 2% redemption fee on shares redeemed in 60 days or less of purchase. |
Shares are redeemed at the net asset value if held longer than 60 calendar days.
See accompanying notes which are an integral part of these financial statements.
7
Granite Value Fund
Statement of Operations
For the period ended April 30, 2013
(Unaudited)
Investment Income | ||||
Dividend income (net of foreign withholding tax of $700) | $ | 48,785 | ||
Interest income | 62 | |||
|
| |||
Total Investment Income | 48,847 | |||
|
| |||
Expenses | ||||
Investment Adviser fee (a) | 31,633 | |||
Administration expenses (a) | 18,596 | |||
Transfer agent expenses (a) | 17,049 | |||
Fund accounting expenses (a) | 12,397 | |||
Legal expenses | 7,800 | |||
Audit expenses | 7,438 | |||
Registration expenses | 4,609 | |||
Custodian expenses (a) | 4,384 | |||
Trustee expenses | 3,433 | |||
Report printing expenses | 2,754 | |||
Insurance expenses | 2,510 | |||
Offering expenses | 1,458 | |||
Pricing expenses | 1,220 | |||
Miscellaneous expenses | 362 | |||
24f-2 expenses | 231 | |||
Excise tax expenses | 84 | |||
|
| |||
Total Expenses | 115,958 | |||
Less: Fees waived and reimbursed by Adviser | (73,086 | ) | ||
|
| |||
Net operating expenses | 42,872 | |||
|
| |||
Net Investment Income | 5,975 | |||
|
| |||
Realized & Unrealized Gain on Investments | ||||
Net realized gain on investment securities | 223,727 | |||
Change in unrealized appreciation on investment securities | 542,984 | |||
|
| |||
| 766,711 | ||||
|
| |||
Net increase in net assets resulting from operations | $ | 772,686 | ||
|
|
| (a) | See Note 4 in the Notes to the Financial Statements. |
See accompanying notes which are an integral part of these financial statements.
8
Granite Value Fund
Statement of Changes In Net Assets
| For the | ||||||||
| Period Ended | For the | |||||||
| April 30, 2013 | Period Ended | |||||||
| (Unaudited) | October 31, 2012 (a) | |||||||
Increase (Decrease) in Net Assets due to: | ||||||||
Operations | ||||||||
Net investment income | $ | 5,975 | $ | 13,983 | ||||
Net realized gain (loss) on investment securities | 223,727 | (31,278 | ) | |||||
Change in unrealized appreciation on investment securities | 542,984 | 290,304 | ||||||
|
|
|
| |||||
Net increase in net assets resulting from operations | 772,686 | 273,009 | ||||||
|
|
|
| |||||
Distributions | ||||||||
From net investment income | (48,544 | ) | — | |||||
|
|
|
| |||||
Total distributions | (48,544 | ) | — | |||||
|
|
|
| |||||
Capital Share Transactions | ||||||||
Proceeds from shares sold | 2,800,383 | 4,476,924 | ||||||
Reinvestment of distributions | 46,272 | — | ||||||
Proceeds from redemption fees (b) | — | 1 | ||||||
Amount paid for shares redeemed | (682,514 | ) | (44 | ) | ||||
|
|
|
| |||||
Net increase in net assets resulting from capital share transactions | 2,164,141 | 4,476,881 | ||||||
|
|
|
| |||||
Total Increase in Net Assets | 2,888,283 | 4,749,890 | ||||||
|
|
|
| |||||
Net Assets | ||||||||
Beginning of period | 4,749,890 | — | ||||||
|
|
|
| |||||
End of period | $ | 7,638,173 | $ | 4,749,890 | ||||
|
|
|
| |||||
Undistributed net investment income included in net assets at end of period | $ | (5,662 | ) | $ | 36,907 | |||
|
|
|
| |||||
Capital Share Transactions | ||||||||
Shares sold | 245,872 | 422,557 | ||||||
Shares issued in reinvestment of distributions | 4,121 | — | ||||||
Shares redeemed | (59,043 | ) | (4 | ) | ||||
|
|
|
| |||||
Net increase from capital share transactions | 190,950 | 422,553 | ||||||
|
|
|
| |||||
| (a) | For the period December 22, 2011 (commencement of operations) to October 31, 2012. |
| (b) | The Fund charges a 2% redemption fee on shares redeemed in 60 days or less of purchase. |
Shares are redeemed at the net asset value if held longer than 60 calendar days.
See accompanying notes which are an integral part of these financial statements.
9
Granite Value Fund
Financial Highlights
(For a share outstanding during each period)
| For the | ||||||||
| Period Ended | For the | |||||||
| April 30, 2013 | Period Ended | |||||||
| (Unaudited) | October 31, 2012 (a) | |||||||
Selected Per Share Data: | ||||||||
Net asset value, beginning of period | $ | 11.24 | $ | 10.00 | ||||
|
|
|
| |||||
Income from investment operations: | ||||||||
Net investment income (b) | — | 0.05 | ||||||
Net realized and unrealized gain on investments | 1.31 | 1.19 | ||||||
|
|
|
| |||||
Total Income from investment operations | 1.31 | 1.24 | ||||||
|
|
|
| |||||
Less distributions to shareholders: | ||||||||
From net investment income | (0.10 | ) | — | |||||
|
|
|
| |||||
Total distributions | (0.10 | ) | — | |||||
|
|
|
| |||||
Paid in capital from redemption fees (c) | — | — | (c) | |||||
|
|
|
| |||||
Net asset value, end of period | $ | 12.45 | $ | 11.24 | ||||
|
|
|
| |||||
Total Return (d) | 11.73 | %(e) | 12.40 | %(e) | ||||
Ratios and Supplemental Data: | ||||||||
Net assets, end of period (000) | $ | 7,638 | $ | 4,750 | ||||
Ratio of net expenses to average net assets | 1.35 | %(f) | 1.35 | %(f) | ||||
Ratio of expenses to average net assets before waiver and reimbursement | 3.66 | %(f) | 8.11 | %(f) | ||||
Ratio of net investment income to average net assets | 0.19 | %(f) | 0.55 | %(f) | ||||
Ratio of net investment income to average net assets before waiver and reimbursement | (2.12 | )%(f) | (6.21 | )%(f) | ||||
Portfolio turnover rate | 26.86 | %(e) | 19.98 | %(e) | ||||
| (a) | For the period December 22, 2011 (commencement of operations) to October 31, 2012. |
| (b) | Calculated using the average shares method. |
| (c) | Resulted in less than $0.005 per share. |
| (d) | Total return in the above table represents the rate that the investor would have earned or lost on an investment in the Fund, assuming reinvestment of distributions. |
| (e) | Not annualized. |
| (f) | Annualized. |
See accompanying notes which are an integral part of these financial statements.
10
Granite Value Fund
Notes to the Financial Statements
April 30, 2013
(Unaudited)
NOTE 1. ORGANIZATION
The Granite Value Fund (the “Fund”) is an open-end diversified series of the Valued Advisers Trust (the “Trust”). The Trust is a management investment company established under the laws of Delaware by an Agreement and Declaration of Trust dated June 13, 2008 (the “Trust Agreement”). The Trust Agreement permits the Trustees to issue an unlimited number of shares of beneficial interest of separate series without par value. The Fund is one of a series of funds authorized by the Board of Trustees (the “Board”). The Fund commenced operations December 22, 2011. The Fund’s investment adviser is Granite Investment Advisors, Inc. (the “Adviser”). The investment objective of the Fund is to provide long-term capital appreciation.
NOTE 2. SIGNIFICANT ACCOUNTING POLICIES
The following is a summary of significant accounting policies followed by the Fund in the preparation of its financial statements.
Securities Valuation – All investments in securities are recorded at their estimated fair value as described in Note 3.
Federal Income Taxes – The Fund makes no provision for federal income or excise tax. The Fund intends to qualify each year as a regulated investment company (“RIC”) under subchapter M of the Internal Revenue Code of 1986, as amended, by complying with the requirements applicable to RICs and by distributing substantially all of its taxable income. The Fund also intends to distribute sufficient net investment income and net capital gains, if any, so that it will not be subject to excise tax on undistributed income and gains. If the required amount of net investment income or gains is not distributed, the Fund could incur a tax expense.
As of and during the six months ended April 30, 2013, the Fund did not have a liability for any unrecognized tax benefits. The Fund recognizes interest and penalties, if any, related to unrecognized tax benefits as income tax expense in the Statement of Operations. During the year, the Fund did not incur any interest or penalties. The Fund is subject to examination by U.S. federal tax authorities for all tax years since inception.
Expenses – Expenses incurred by the Trust that do not relate to a specific fund of the Trust are allocated to the individual funds based on each fund’s relative net assets or other appropriate basis (as determined by the Board of Trustees).
Security Transactions and Related Income - The Fund follows industry practice and records security transactions on the trade date. The First In, First Out method is used for determining gains or losses for financial statements and income tax purposes. Dividend income is recorded on the ex-dividend date and interest income is recorded on an accrual basis. Discounts and premiums on securities purchased are amortized or accreted using the effective interest method. Withholding taxes on foreign dividends have been provided for in accordance with the Fund’s understanding of the applicable country’s tax rules and rates. The ability of issuers of debt securities held by the Fund to meet their obligations may be affected by economic and political developments in a specific country or region.
Redemption Fees – The Fund charges a 2.00% redemption fee for shares redeemed within 60 days. These fees are deducted from the redemption proceeds otherwise payable to the shareholder. The Fund will retain the fee charged as an increase in paid-in capital and such fees become part of the Fund’s daily NAV calculation.
Dividends and Distributions - The Fund intends to distribute substantially all of its net investment income, net realized long-term capital gains and its net realized short-term capital gains, if any, to its shareholders on at least an annual basis. Dividends to shareholders, which are determined in accordance with income tax regulations, are recorded on the ex-dividend date. The treatment for financial reporting purposes of distributions made to shareholders during the year from net investment income or net realized capital gains may differ from their ultimate treatment for federal income tax purposes. These differences are caused primarily by differences in the timing of the recognition of certain components of income, expense or realized capital gain for federal income tax purposes. Where such differences are permanent in nature, they are reclassified in the components of net assets based on their ultimate characterization for federal income tax purposes. Any such reclassifications will have no effect on net assets, results of operations or net asset values per share of the Fund.
11
Granite Value Fund
Notes to the Financial Statements - continued
April 30, 2013
(Unaudited)
NOTE 3. SECURITIES VALUATION AND FAIR VALUE MEASUREMENTS
Fair value is defined as the price that a Fund would receive upon selling an investment in a orderly transaction to an independent buyer in the principal or most advantageous market of the investment. Accounting principles generally accepted in the United States of America (“GAAP”) establish a three-tier hierarchy to maximize the use of observable market data and minimize the use of unobservable inputs and to establish classification of fair value measurements for disclosure purposes.
Inputs refer broadly to the assumptions that market participants would use in pricing the asset or liability, including assumptions about risk, (ex., the risk inherent in a particular valuation technique used to measure fair value including such as a pricing model and/or the risk inherent in the inputs to the valuation technique). Inputs may be observable or unobservable. Observable inputs are inputs that reflect the assumptions market participants would use in pricing the asset or liability developed based on market data obtained from sources independent of the reporting entity. Unobservable inputs are inputs that reflect the reporting entity’s own assumptions about the assumptions market participants would use in pricing the asset or liability developed based on the best information available in the circumstances.
Various inputs are used in determining the value of the Fund’s investments. These inputs are summarized in the three broad levels listed below.
| • | Level 1 – quoted prices in active markets for identical securities |
| • | Level 2 – other significant observable inputs (including, but not limited to, quoted prices for an identical security in an inactive market, quoted prices for similar securities, interest rates, prepayment speeds, credit risk, etc.) |
| • | Level 3 – significant unobservable inputs (including the Fund’s own assumptions in determining fair value of investments based on the best information available) |
The inputs used to measure fair value may fall into different levels of the fair value hierarchy. In such cases, for disclosure purposes, the level in the fair value hierarchy within which the fair value measurement falls in its entirety, is determined based on the lowest level input that is significant to the fair value measurement in its entirety.
Equity securities, including common stocks, are generally valued by using market quotations, furnished by a pricing service. Securities that are traded on any stock exchange are generally valued at the last quoted sale price. Lacking a last sale price, an exchange traded security is generally valued at its last bid price. Securities traded in the NASDAQ over-the-counter market are generally valued at the NASDAQ Official Closing Price. When using the market quotations or close prices provided by the pricing service and when the market is considered active, the security is classified as a Level 1 security. Sometimes, an equity security owned by the Fund will be valued by the pricing service with factors other than market quotations or when the market is considered inactive. When this happens, the security is classified as a Level 2 security. When market quotations are not readily available, when the Fund determines that the market quotation or the price provided by the pricing service does not accurately reflect the current fair value, or when restricted or illiquid securities are being valued, such securities are valued as determined in good faith by the Fund, in conformity with guidelines adopted by and subject to review by the Board. These securities are categorized as Level 3 securities.
Investments in open-end mutual funds, including money market mutual funds, are generally priced at the ending net asset value (NAV) provided by the service agent of the funds. These securities will be categorized as Level 1 securities.
12
Granite Value Fund
Notes to the Financial Statements - continued
April 30, 2013
(Unaudited)
NOTE 3. SECURITIES VALUATION AND FAIR VALUE MEASUREMENTS – continued
Fixed income securities when valued using market quotations in an active market, will be categorized as Level 1 securities. However, they may be valued on the basis of prices furnished by a pricing service when the Fund believes such prices more accurately reflect the fair value of such securities. A pricing service utilizes electronic data processing techniques based on yield spreads relating to securities with similar characteristics to determine prices for normal institutional-size trading units of debt securities without regard to sale or bid prices. These securities will generally be categorized as Level 2 securities. If the Fund decides that a price provided by the pricing service does not accurately reflect the fair value of the securities, when prices are not readily available from a pricing service, or when restricted or illiquid securities are being valued, securities are valued at fair value as determined in good faith by the Fund, in conformity with guidelines adopted by and subject to review of the Board. These securities will be categorized as Level 3 securities.
Short-term investments in fixed income securities (those with maturities of less than 60 days when acquired, or which subsequently are within 60 days of maturity), including certificates of deposit and U.S. government securities, are valued by using the amortized cost method of valuation, which the Board has determined will represent fair value. These securities will be classified as Level 2 securities.
If the Fund decides that a price provided by the pricing service does not accurately reflect the fair value of the securities, when prices are not readily available from a pricing service, or when restricted or illiquid securities are being valued, securities are valued at fair value as determined in good faith by the Fund, in conformity with guidelines adopted by and subject to review of the Board. These securities will be categorized as Level 3 securities.
In accordance with the Trust’s good faith pricing guidelines, the Fund is required to consider all appropriate factors relevant to the value of securities for which it has determined other pricing sources are not available or reliable as described above. No single standard exists for determining fair value, because fair value depends upon the circumstances of each individual case. As a general principle, the current fair value of an issue of securities being valued by the Fund would appear to be the amount which the owner might reasonably expect to receive for them upon their current sale. Methods which are in accordance with this principle may, for example, be based on (i) a multiple of earnings; (ii) a discount from market of a similar freely traded security (including a derivative security or a basket of securities traded on other markets, exchanges or among dealers); or (iii) yield to maturity with respect to debt issues, or a combination of these and other methods. Good faith pricing is permitted if, in the Fund’s opinion, the validity of market quotations appears to be questionable based on factors such as evidence of a thin market in the security based on a small number of quotations, a significant event occurs after the close of a market but before a Fund’s NAV calculation that may affect a security’s value, or the Fund is aware of any other data that calls into question the reliability of market quotations. Good faith pricing may also be used in instances when the bonds the Fund invests in may default or otherwise cease to have market quotations readily available. Any fair value pricing done outside the Fund’s approved pricing methods must be approved by the Pricing Committee of the Board.
13
Granite Value Fund
Notes to the Financial Statements - continued
April 30, 2013
(Unaudited)
NOTE 3. SECURITIES VALUATION AND FAIR VALUE MEASUREMENTS – continued
The following is a summary of the inputs used to value the Fund’s investments as of April 30, 2013:
| Valuation Inputs | ||||||||||||||||
Assets | Level 1 - Quoted Prices in Active Markets | Level 2 - Other Significant Observable Inputs | Level 3 - Significant Unobservable Inputs | Total | ||||||||||||
Common Stocks* | $ | 7,589,352 | $ | — | $ | — | $ | 7,589,352 | ||||||||
Money Market Securities | 41,989 | — | — | 41,989 | ||||||||||||
Total | $ | 7,631,341 | $ | — | $ | — | $ | 7,631,341 | ||||||||
| * | Refer to the Schedule of Investments for industry classifications. |
The Fund did not hold any investments at any time during the reporting period in which significant unobservable inputs were used in determining fair value; therefore, no reconciliation of Level 3 securities is included for this reporting period. The Fund did not hold any derivative instruments during the reporting period. The Trust recognizes transfers between fair value hierarchy levels at the reporting period end. There were no transfers between any Levels for the six months ended April 31, 2013.
NOTE 4. FEES AND OTHER TRANSACTIONS WITH AFFILIATES
Under the terms of the management agreement, on behalf of the Fund (the “Agreement”), the Adviser manages the Fund’s investments subject to approval of the Trustees. As compensation for its management services, the Granite Value Fund is obligated to pay the Adviser a fee computed and accrued daily and paid monthly at an annual rate of 1.00% of the average daily net assets of the Fund. For the six months ended April 30, 2013, the Adviser earned a fee of $31,633 from the Fund before the reimbursement described below. At April 30, 2013, the Adviser owed the Fund $6,042.
The Adviser has contractually agreed to waive its management fee and/or reimburse expenses through February 28, 2014, so that total annual fund operating expenses, excluding interest, taxes, brokerage commissions, other expenditures which are capitalized in accordance with GAAP, other extraordinary expenses not incurred in the ordinary course of the Fund’s business, dividend expense on short sales, and expenses that the Fund has incurred but did not actually pay because of an expense offset arrangement, if applicable, incurred by the Fund in any fiscal year, do not exceed 1.35% of the Fund’s average daily net assets. The operating expense limitation also excludes any fees and expenses of acquired funds. For the six months ended April 30, 2013, expenses totaling $73,086 were waived or reimbursed by the Adviser and are subject to potential recoupment by the Adviser until October 31, 2016.
The amount subject to repayment by the Fund pursuant to the aforementioned conditions are as follows:
| Recoverable through | ||
Amount | October 31, | |
$171,698 | 2015 |
The Trust retains Huntington Asset Services, Inc. (“HASI”) to manage the Fund’s business affairs and provide the Fund with administrative services, including all regulatory reporting and necessary office equipment and personnel. For the six months ended April 30, 2013, HASI earned fees of $18,596 for administrative services provided to the Fund. At April 30, 2013, HASI was owed $2,971 from the Fund for administrative services. Certain officers and one Trustee of the Trust are members of management and/or employees of HASI. HASI is a wholly-owned subsidiary of Huntington Bancshares, Inc., the parent company of Unified Financial Securities, Inc. (the “Distributor”) and Huntington National Bank, the custodian of the Fund’s investments (the “Custodian”). For the six months ended April 30, 2013, the Custodian earned fees of $4,384 for custody services provided to the Fund. At April 30, 2013, the Custodian was owed $170 from the Fund for custody services.
14
Granite Value Fund
Notes to the Financial Statements - continued
April 30, 2013
(Unaudited)
NOTE 4. FEES AND OTHER TRANSACTIONS WITH AFFILIATES – continued
The Trust also retains HASI to act as the Fund’s transfer agent and to provide transfer agent services. For the six months ended April 30, 2013, HASI earned fees of $17,049 for transfer agent services to the Fund. At April 30, 2013, the Fund owed HASI $1,895 for transfer agent services.
For the six months ended April 30, 2013, HASI earned fees of $12,397 from the Fund for fund accounting services. At April 30, 2013, HASI was owed $1,980 from the Fund for fund accounting services.
Unified Financial Securities, Inc. acts as the principal underwriter of the Fund’s shares. There were no payments made by the Fund to the Distributor during the six months ended April 30, 2013. An officer of the Trust is an officer of the Distributor and such person may be deemed to be an affiliate of the Distributor.
The Fund has adopted a 12b-1 Plan that permits the Fund to pay 0.25% of its average daily net assets to financial institutions that provide distribution and/or shareholder servicing. The Plan will not be activated prior to February 28, 2014.
NOTE 5. INVESTMENTS
For the six months ended April 30, 2013, purchases and sales of investment securities, other than short-term investments and short-term U.S. government obligations, were as follows:
Purchases | ||||
U.S. Government Obligations | $ | — | ||
Other | 3,764,318 | |||
Sales | ||||
U.S. Government Obligations | $ | — | ||
Other | 1,684,014 |
At April 30, 2013, the net unrealized appreciation (depreciation) of investments for tax purposes was as follows:
Gross Appreciation | $ | 900,110 | ||
Gross (Depreciation) | (66,914 | ) | ||
|
| |||
Net Appreciation (Depreciation) on Investments | $ | 833,196 | ||
|
|
At April 30, 2013, the aggregate cost of securities, excluding U.S. government obligations, for federal income tax purposes was $6,798,145 for the Fund.
NOTE 6. ESTIMATES
The preparation of financial statements in conformity with GAAP requires management to make estimates and assumptions that affect the reported amounts of assets and liabilities and disclosure of contingent assets and liabilities at the date of the financial statements and the reported amounts of increases and decreases in net assets from operations during the reporting period. Actual results could differ from those estimates.
15
Granite Value Fund
Notes to the Financial Statements - continued
April 30, 2013
(Unaudited)
NOTE 7. BENEFICIAL OWNERSHIP
The beneficial ownership, either directly or indirectly, of 25% or more of the voting securities of a fund creates a presumption of control of a fund, under Section 2(a) (9) of the Investment Company Act of 1940. At April 30, 2013, Charles Schwab & Co., Inc. for the benefit of it’s customers, owned 59.15%. The Trust does not know whether Charles Schwab & Co. or any of the underlying beneficial owners controlled 25% or more of the voting securities of the Fund.
NOTE 8. DISTRIBUTIONS TO SHAREHOLDERS
On December 27, 2012, the Fund paid an income distribution of $0.0981 per share to shareholders of record on December 26, 2012.
At October 31, 2012, the components of distributable earnings (accumulated losses) on a tax basis were as follows:
Undistributed ordinary income | $ | 40,442 | ||
Accumulated capital and other losses | (34,721 | ) | ||
Net Unrealized appreciation (depreciation) | 290,212 | |||
|
| |||
| $ | 295,933 | |||
|
|
At October 31, 2012, the difference between book basis and tax basis unrealized appreciation (depreciation) is primarily attributable to the tax deferral of losses on wash sales in the amount of $92.
NOTE 9. CAPITAL LOSS CARRYFORWARD
At October 31, 2012, for federal income tax purposes, the Fund has capital loss carryforwards, in the following amounts:
No expiration - short term | $ | 31,186 | ||
|
|
Capital loss carryforwards are available to offset future realized capital gains. To the extent that these carryforwards are used to offset future capital gains, it is probable that the amount offset will not be distributed to shareholders.
NOTE 10. COMMITMENTS AND CONTINGENCIES
The Fund indemnifies its officers and trustees for certain liabilities that may arise from their performance of their duties to the Fund. Additionally, in the normal course of business, the Fund enters into contracts that contain a variety of representatives and warranties which provide general indemnifications. The Fund’s maximum exposure under these arrangements is unknown, as this would involve future claims that may be made against the Fund that have not yet occurred.
16
PROXY VOTING
A description of the policies and procedures that the Fund uses to determine how to vote proxies relating to portfolio securities and information regarding how the Fund voted those proxies is available without charge upon request by (1) calling the Fund at (888) 442-9893 and (2) from Fund documents filed with the Securities and Exchange Commission (“SEC”) on the SEC’s website at www.sec.gov.
TRUSTEES
R. Jeffrey Young, Chairman
Dr. Merwyn R. Vanderlind
Ira Cohen
OFFICERS
R. Jeffrey Young, Principal Executive Officer and President
John C. Swhear, Chief Compliance Officer, AML Officer and Vice-President
Carol J. Highsmith, Vice President
Matthew J. Miller, Vice President
Robert W. Silva, Principal Financial Officer and Treasurer
Heather Bonds, Secretary
INVESTMENT ADVISER
Granite Investment Advisors
11 South Main Street, Suite 501
Concord, NH 03301
DISTRIBUTOR
Unified Financial Securities, Inc.
2960 North Meridian Street, Suite 300
Indianapolis, IN 46208
INDEPENDENT REGISTERED PUBLIC ACCOUNTING FIRM
Cohen Fund Audit Services Ltd.
1350 Euclid Avenue, Suite 800
Cleveland, OH 44115
LEGAL COUNSEL
The Law Offices of John H. Lively & Associates, Inc.
A member firm of The 1940 Act Law GroupTM
11300 Tomahawk Creek Parkway, Ste. 310
Leawood, KS 66211
CUSTODIAN
Huntington National Bank
41 South High Street
Columbus, OH 43125
ADMINISTRATOR, TRANSFER AGENT AND FUND ACCOUNTANT
Huntington Asset Services, Inc.
2960 North Meridian Street, Suite 300
Indianapolis, IN 46208
This report is intended only for the information of shareholders or those who have received the Fund’s prospectus which contains information about the Fund’s management fee and expenses. Please read the prospectus carefully before investing.
Distributed by Unified Financial Securities, Inc.
Member FINRA/SIPC

Semi-Annual Report
April 30, 2013
Fund Adviser:
Kovitz Investment Group, LLC
115 South LaSalle Street, 27th Floor
Chicago, IL 60603
Toll Free (888) 695-3729
Discussion
In a rapidly rising market like the one experienced during the six month period ended April 30, 2013, we are more than content to be average. Knowing that our management approach is better suited to outperform in down markets, our goal is to consistently outperform when the market declines while participating fully, but not necessarily more so, when the market rises. Therefore, we consider outperforming during a period like this where the market experiences an above-average return as gravy.
Strong gains in our holdings in the consumer staples and financial sectors continued to underpin performance. We have been substantially overweight in these sectors versus the S&P 500’s® weightings since the aftershocks of the financial crisis sent valuations of many of the companies in these sectors to levels we felt were unsustainably low. Even after the strong gains realized last year and again in this most recent period, we feel our holdings in these sectors continue to be undervalued (to varying degrees) relative to our estimates of intrinsic value.
Double digit gains for a six-month period are rare. The results are even more surprising as this period included the U.S. nearly “falling off” the fiscal cliff, sequestration (government spending cuts) taking effect March 1, and increasing tension in Europe surrounding the potential default of the tiny island nation of Cyprus. Any one of these events would normally be enough to spook the market into selling off. Yet, those who stayed put (i.e. weren’t scared out of the market) were amply rewarded – a theme we consistently stress to fund shareholders.
1
Investment Results – (Unaudited)
Total Returns*
(For the period ended April 30, 2013)
| Cumulative | Average Annual Returns | |||||||||||
| Six Month | One Year | Since Inception (December 22, 2011) (a) | ||||||||||
Green Owl Intrinsic Value Fund | 17.58 | % | 22.29 | % | 26.57 | % | ||||||
S&P 500® Index** | 14.42 | % | 16.89 | % | 21.59 | % | ||||||
Total annual operating expenses, as disclosed in the Fund’s prospectus dated February 28, 2013, were 2.10% of average daily net assets (1.40% after fee waivers/expense reimbursements by the adviser). The adviser has contractually agreed to waive or limit its fees and to assume other expenses of the Fund until October 31, 2014, so that the Total Annual Operating Expenses do not exceed 1.40%. This operating expense limitation does not apply to brokerage fees and commissions, borrowing costs (such as interest and dividend expenses on securities sold short), taxes, 12b-1 fees; extraordinary expenses and indirect expenses (such as “acquired fund fees and expenses”).
The performance quoted represents past performance, which does not guarantee future results. The investment return and principal value of an investment will fluctuate so that an investor’s shares, when redeemed, may be worth more or less than their original cost. The returns shown do not reflect deduction of taxes that a shareholder would pay on Fund distributions or the redemption of Fund shares. Current performance of the Fund may be lower or higher than the performance quoted. The Fund’s investment objectives, risks, charges and expenses must be considered carefully before investing. Performance data current to the most recent month end may be obtained by calling 1-888-695-3729.
(a) The Fund commenced operations on December 22, 2011. However, the Fund did not invest in long-term securities towards the investment objective until December 28, 2011. December 28, 2011 is the performance calculation inception date.
| * | Return figures reflect any change in price per share and assume the reinvestment of all distributions. |
| ** | The S&P 500® Index is a widely recognized unmanaged index of equity securities and is representative of a broader domestic equity market and range of securities than is found in the Fund’s portfolio. Individuals cannot invest directly in the Index; however, an individual can invest in exchange traded funds or other investment vehicles that attempt to track the performance of a benchmark index. |
The Fund’s investment objectives, strategies, risks, charges and expenses must be considered carefully before investing. The prospectus contains this and other important information about the Fund and may be obtained by calling the same number as above. Please read it carefully before investing. The Fund is distributed by Unified Financial Securities, Inc., member FINRA.
2
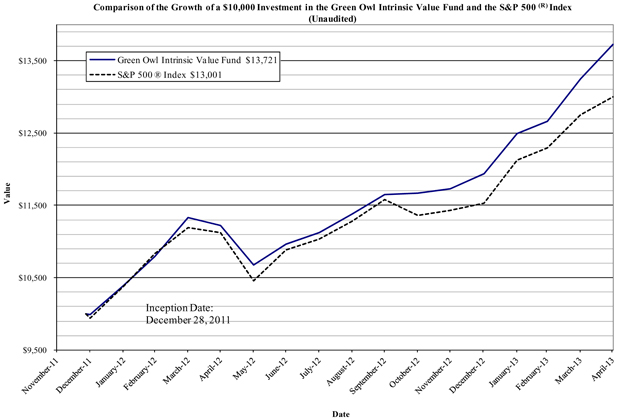
The Fund commenced operations on December 22, 2011. However, the Fund did not invest in long-term securities towards the investment objective until December 28, 2011. December 28, 2011 is the performance calculation inception date. The chart above assumes an initial investment of $10,000 made on December 28, 2011 and held through April 30, 2013. The S&P 500® Index is a widely recognized unmanaged index of equity securities and is representative of a broader domestic equity market and range of securities than is found in the Fund’s portfolio. Individuals cannot invest directly in the Index; however, an individual can invest in exchange traded funds or other investment vehicles that attempt to track the performance of a benchmark index. THE FUND’S RETURN REPRESENTS PAST PERFORMANCE AND DOES NOT GUARANTEE FUTURE RESULTS. The returns shown do not reflect deduction of taxes that a shareholder would pay on Fund distributions or the redemption of Fund shares. Investment returns and principal values will fluctuate so that your shares, when redeemed, may be worth more or less than their original purchase price.
Current performance may be lower or higher than the performance data quoted. For more information on the Fund, and to obtain performance data current to the most recent month end or to request a prospectus, please call 1-888-695-3729. You should carefully consider the investment objectives, potential risks, management fees, and charges and expenses of the Fund before investing. The Fund’s prospectus contains this and other information about the Fund, and should be read carefully before investing.
The Fund is distributed by Unified Financial Securities, Inc., member FINRA.
3
Fund Holdings – (Unaudited)
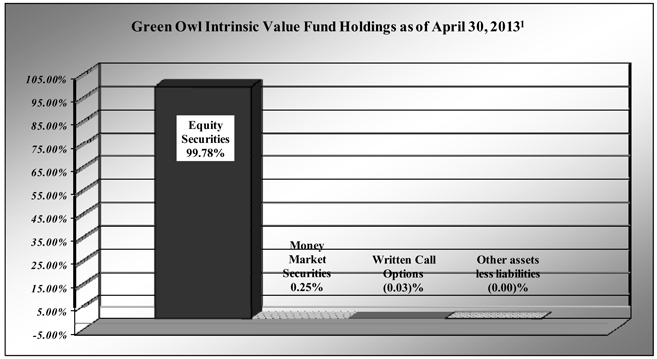
| 1 | As a percentage of net assets. |
The investment objective of the Green Owl Intrinsic Value Fund is long-term capital appreciation.
Availability of Portfolio Schedule – (Unaudited)
The Fund files its complete schedule of portfolio holdings with the Securities and Exchange Commission (“SEC”) for the first and third quarters of each fiscal year on Form N-Q. The Fund’s Forms N-Q are available at the SEC’s website at www.sec.gov. The Fund’s Forms N-Q may be reviewed and copied at the SEC’s Public Reference Room in Washington DC. Information on the operation of the Public Reference Room may be obtained by calling 1-800-SEC-0330.
Summary of Fund’s Expenses – (Unaudited)
As a shareholder of the Fund, you incur ongoing costs, including management fees and other Fund expenses. This Example is intended to help you understand your ongoing costs (in dollars) of investing in the Fund and to compare these costs with the ongoing costs of investing in other mutual funds.
The Example is based on an investment of $1,000 invested at the beginning and held for the entire period from November 1, 2012 to April 30, 2013.
4
Actual Expenses
The first line of the table below provides information about actual account values and actual expenses. You may use the information in this line, together with the amount you invested, to estimate the expenses that you paid over the period. Simply divide your account value by $1,000 (for example, an $8,600 account value divided by $1,000 = $8.60), then multiply the result by the number in the first line under the heading entitled “Expenses Paid During the Period” to estimate the expenses you paid on your account during this period.
Hypothetical Example for Comparison Purposes
The second line of the table below provides information about hypothetical account values and hypothetical expenses based on the Fund’s actual expense ratio and an assumed rate of return of 5% per year before expenses, which is not the Fund’s actual return. The hypothetical account values and expenses may not be used to estimate the actual ending account balance or expenses you paid for the period. You may use this information to compare the ongoing costs of investing in the Fund and other funds. To do so, compare this 5% hypothetical example with the 5% hypothetical examples that appear in the shareholder reports of the other funds.
Please note that the expenses shown in the table are meant to highlight your ongoing costs only. Therefore, the second line of the table below is useful in comparing ongoing costs only and will not help you determine the relative costs of owning different funds.
Green Owl Intrinsic Value Fund | Beginning Account Value November 1, 2012 | Ending Account Value April 30, 2013 | Expenses Paid During Period* November 1, 2012 – April 30, 2013 | |||||||||
Actual* | $ | 1,000.00 | $ | 1,175.80 | $ | 7.56 | ||||||
Hypothetical** | $ | 1,000.00 | $ | 1,017.84 | $ | 7.01 | ||||||
| * | Expenses are equal to the Fund’s annualized expense ratio of 1.40%, multiplied by the average account value over the period, multiplied by 181/365 (to reflect the one-half year period). |
| ** | Assumes a 5% return before expenses. |
5
Green Owl Intrinsic Value Fund
Schedule of Investments
April 30, 2013
(Unaudited)
| Shares | Fair Value | |||||||
Common Stocks - 99.78% | ||||||||
Consumer Discretionary - 28.92% | ||||||||
Bed Bath & Beyond, Inc. (a) | 17,815 | $ | 1,225,672 | |||||
Biglari Holdings, Inc. (a) | 1,948 | 754,421 | ||||||
CarMax, Inc. (a) | 25,240 | 1,162,050 | ||||||
Coach, Inc. | 14,000 | 824,040 | ||||||
General Motors Co. (a) | 23,730 | 731,833 | ||||||
Kohl’s Corp. | 26,405 | 1,242,619 | ||||||
Lowe’s Companies, Inc. (b) | 31,365 | 1,205,043 | ||||||
Target Corp. | 20,710 | 1,461,298 | ||||||
Walt Disney Co. / The | 15,805 | 993,186 | ||||||
|
| |||||||
| 9,600,162 | ||||||||
|
| |||||||
Consumer Staples - 12.57% | ||||||||
Coca-Cola Co. / The | 11,570 | 489,758 | ||||||
CVS Caremark Corp. | 18,290 | 1,064,112 | ||||||
Sysco Corp. | 15,840 | 552,182 | ||||||
Wal-Mart Stores, Inc. | 12,365 | 961,008 | ||||||
Walgreen Co. | 22,315 | 1,104,816 | ||||||
|
| |||||||
| 4,171,876 | ||||||||
|
| |||||||
Financials - 30.54% | ||||||||
American Express Co. | 9,665 | 661,183 | ||||||
American International Group, Inc. (a) | 25,650 | 1,062,423 | ||||||
Bank of America Corp. | 77,300 | 951,563 | ||||||
Bank of New York Mellon Corp. / The | 41,160 | 1,161,535 | ||||||
Berkshire Hathaway, Inc. - Class B (a) | 26,665 | 2,835,023 | ||||||
Franklin Resources, Inc. | 3,865 | 597,761 | ||||||
Goldman Sachs Group, Inc. / The | 4,500 | 657,315 | ||||||
Leucadia National Corp. | 12,960 | 400,334 | ||||||
Wells Fargo & Co. | 47,750 | 1,813,545 | ||||||
|
| |||||||
| 10,140,682 | ||||||||
|
| |||||||
Health Care - 5.74% | ||||||||
Abbott Laboratories | 8,630 | 318,620 | ||||||
Becton, Dickinson and Co. | 6,905 | 651,141 | ||||||
Johnson & Johnson | 10,995 | 937,104 | ||||||
|
| |||||||
| 1,906,865 | ||||||||
|
| |||||||
Industrials - 8.01% | ||||||||
Boeing Co. / The | 8,820 | 806,236 | ||||||
Expeditors International of Washington, Inc. | 18,675 | 670,993 | ||||||
Robert Half International, Inc. | 17,285 | 567,294 | ||||||
United Parcel Service, Inc. (UPS) - Class B | 7,170 | 615,473 | ||||||
|
| |||||||
| 2,659,996 | ||||||||
|
| |||||||
See accompanying notes which are an integral part of these financial statements.
6
Green Owl Intrinsic Value Fund
Schedule of Investments - continued
April 30, 2013
(Unaudited)
| Shares | Fair Value | |||||||
Common Stocks - 99.78% - continued | ||||||||
Information Technology - 14.00% | ||||||||
Accenture PLC - Class A | 12,315 | $ | 1,002,933 | |||||
Apple, Inc. | 3,308 | 1,464,617 | ||||||
Automatic Data Processing, Inc. | 6,895 | 464,309 | ||||||
Google, Inc. - Class A (a) | 803 | 662,130 | ||||||
International Business Machines Corp. | 5,200 | 1,053,208 | ||||||
|
| |||||||
| 4,647,197 | ||||||||
|
| |||||||
TOTAL COMMON STOCKS (Cost $26,432,836) | 33,126,778 | |||||||
|
| |||||||
Money Market Securities - 0.25% | ||||||||
Federated Treasury Obligations Fund, 0.01% (c) | 83,559 | $ | 83,559 | |||||
|
| |||||||
TOTAL MONEY MARKET SECURITIES (Cost $83,559) | 83,559 | |||||||
|
| |||||||
TOTAL INVESTMENTS (Cost $26,516,395) - 100.03% | $ | 33,210,337 | ||||||
|
| |||||||
TOTAL WRITTEN CALL OPTIONS (Premiums Received $10,482) - (0.03)% | $ | (11,055 | ) | |||||
|
| |||||||
Other assets less liabilities - (0.00%) | 1,491 | |||||||
|
| |||||||
TOTAL NET ASSETS - 100.00% | $ | 33,200,773 | ||||||
|
| |||||||
| (a) | Non-income producing |
| (b) | All or a portion of this security is held for collateral for written call options. |
| (c) | Variable rate security; the rate shown represents the 7-day yield at April 30, 2013. |
See accompanying notes which are an integral part of these financial statements.
7
Green Owl Intrinsic Value Fund
Schedule of Written Options
April 30, 2013
(Unaudited)
| Outstanding Contracts | Fair Value | |||||||
Written Call Options - (0.03)% | ||||||||
Information Technology - (0.03)% | ||||||||
Lowe’s Companies, Inc./ July 2013/ Strike $38.00 (a) | (55 | ) | $ | (11,055 | ) | |||
|
| |||||||
TOTAL WRITTEN CALL OPTIONS (Premiums Received $10,482) - (0.03)% | $ | (11,055 | ) | |||||
|
| |||||||
| (a) | The call contract has a multiplier of 100 shares. |
See accompanying notes which are an integral part of these financial statements.
8
Green Owl Intrinsic Value Fund
Statement of Assets and Liabilities
April 30, 2013
(Unaudited)
Assets | ||||
Investments in securities, at fair value (cost $26,516,395) | $ | 33,210,337 | ||
Dividends receivable | 26,573 | |||
Interest receivable | 2 | |||
Receivable for investments redeemed | 7,288 | |||
Prepaid expenses | 5,262 | |||
|
| |||
Total assets | 33,249,462 | |||
|
| |||
Liabilities | ||||
Written call options, at fair value (premiums received $10,482) | 11,055 | |||
Payable to Adviser (a) | 23,283 | |||
Payable to administrator, fund accountant, and transfer agent (a) | 6,459 | |||
Payable to trustees and officers | 2,071 | |||
Payable to custodian (a) | 1,112 | |||
Other accrued expenses | 4,709 | |||
|
| |||
Total liabilities | 48,689 | |||
|
| |||
Net Assets | $ | 33,200,773 | ||
|
| |||
Net Assets consist of: | ||||
Paid in capital | $ | 26,023,928 | ||
Accumulated undistributed net investment income | 4,243 | |||
Accumulated net realized gain from investment transactions and options contracts | 479,233 | |||
Net unrealized appreciation (depreciation) on: | ||||
Investment securities | 6,693,942 | |||
Options contracts | (573 | ) | ||
|
| |||
Net Assets | $ | 33,200,773 | ||
|
| |||
Shares outstanding (unlimited number of shares authorized; no par value) | 2,442,030 | |||
|
| |||
Net Asset Value, offering and redemption price per share | $ | 13.60 | ||
|
|
| (a) | See Note 5 in the Notes to the Financial Statements. |
See accompanying notes which are an integral part of these financial statements.
9
Green Owl Intrinsic Value Fund
Statement of Operations
For the six months ended April 30, 2013
(Unaudited)
Investment Income | ||||
Dividend income | $ | 247,126 | ||
Interest income | 22 | |||
|
| |||
Total Investment Income | 247,148 | |||
|
| |||
Expenses | ||||
Investment adviser fee (a) | 143,453 | |||
Administration expenses (a) | 18,596 | |||
Transfer agent expenses (a) | 16,690 | |||
Fund accounting expenses (a) | 12,397 | |||
Legal expenses | 7,566 | |||
Audit expenses | 7,438 | |||
Custodian expenses (a) | 4,937 | |||
Trustee expenses | 3,183 | |||
Report printing expenses | 3,715 | |||
Offering expenses | 2,701 | |||
Registration expenses | 2,584 | |||
Insurance expenses | 2,511 | |||
CCO expenses | 1,488 | |||
Pricing expenses | 1,220 | |||
Miscellaneous expenses | 430 | |||
24f-2 expenses | 323 | |||
Line of credit fees | 28 | |||
|
| |||
Total Expenses | 229,260 | |||
Less: Fees waived and reimbursed by Adviser | (27,988 | ) | ||
|
| |||
Net operating expenses | 201,272 | |||
|
| |||
Net Investment Income | 45,876 | |||
|
| |||
Realized & Unrealized Gain (Loss) on Investments | ||||
Net realized gain (loss): | ||||
on investment securities | 462,971 | |||
on options contracts | 16,268 | |||
Change in unrealized appreciation (depreciation): | ||||
on investment securities | 4,328,885 | |||
on options contracts | (15,428 | ) | ||
|
| |||
Net realized and unrealized gain (loss) on investment securities and options contracts | 4,792,696 | |||
|
| |||
Net increase (decrease) in net assets resulting from operations | $ | 4,838,572 | ||
|
|
| (a) | See Note 5 in the Notes to the Financial Statements. |
See accompanying notes which are an integral part of these financial statements.
10
Green Owl Intrinsic Value Fund
Statement of Changes In Net Assets
| For the Six Months Ended April 30, 2013 (Unaudited) | For the Period Ended October 31, 2012 (a) | |||||||
Increase (Decrease) in Net Assets due to: | ||||||||
Operations | ||||||||
Net investment income | $ | 45,876 | $ | 43,166 | ||||
Net realized gain on investment securities and options contracts | 479,239 | 132,328 | ||||||
Change in unrealized appreciation (depreciation) on investment securities and options contracts | 4,313,457 | 2,379,912 | ||||||
|
|
|
| |||||
Net increase (decrease) in net assets resulting from operations | 4,838,572 | 2,555,406 | ||||||
|
|
|
| |||||
Distributions | ||||||||
From net investment income | (104,736 | ) | — | |||||
From net realized gains | (132,334 | ) | — | |||||
|
|
|
| |||||
Total distributions | (237,070 | ) | — | |||||
|
|
|
| |||||
Capital Share Transactions | ||||||||
Proceeds from shares sold | 5,380,994 | 22,579,737 | ||||||
Reinvestment of distributions | 233,845 | — | ||||||
Amount paid for shares redeemed | (1,771,783 | ) | (378,928 | ) | ||||
|
|
|
| |||||
Net increase in net assets resulting from capital share transactions | 3,843,056 | 22,200,809 | ||||||
|
|
|
| |||||
Total Increase in Net Assets | 8,444,558 | 24,756,215 | ||||||
|
|
|
| |||||
Net Assets | ||||||||
Beginning of period | 24,756,215 | — | ||||||
|
|
|
| |||||
End of period | $ | 33,200,773 | $ | 24,756,215 | ||||
|
|
|
| |||||
Undistributed net investment income included in net assets at end of period | $ | 4,243 | $ | 63,103 | ||||
|
|
|
| |||||
Capital Share Transactions | ||||||||
Shares sold | 437,568 | 21,056,091 | ||||||
Shares issued in reinvestment of distributions | 19,868 | — | ||||||
Shares redeemed | (137,493 | ) | (34,004 | ) | ||||
|
|
|
| |||||
Net increase from capital share transactions | 319,943 | 21,022,087 | ||||||
|
|
|
| |||||
| (a) | For the period December 22, 2011 (commencement of operations) to October 31, 2012. |
See accompanying notes which are an integral part of these financial statements.
11
Green Owl Intrinsic Value Fund
Financial Highlights
(For a share outstanding during each period)
| For the Six Months Ended April 30, 2013 (Unaudited) | For the Period Ended October 31, 2012 (a) | |||||||
Selected Per Share Data: | ||||||||
Net asset value, beginning of period | $ | 11.67 | $ | 10.00 | ||||
|
|
|
| |||||
Income from investment operations: | ||||||||
Net investment income | 0.02 | 0.02 | ||||||
Net realized and unrealized gain on investments | 2.02 | 1.65 | ||||||
|
|
|
| |||||
Total from investment operations | 2.04 | 1.67 | ||||||
|
|
|
| |||||
Less distributions to shareholders: | ||||||||
From net investment income | (0.05 | ) | — | |||||
From net realized gains | (0.06 | ) | — | |||||
|
|
|
| |||||
Total distributions | (0.11 | ) | — | |||||
|
|
|
| |||||
Net asset value, end of period | $ | 13.60 | $ | 11.67 | ||||
|
|
|
| |||||
Total Return (b) | 17.58 | %(c) | 16.70 | %(c) | ||||
Ratios and Supplemental Data: | ||||||||
Net assets, end of period (000) | $ | 33,201 | $ | 24,756 | ||||
Ratio of net expenses to average net assets | 1.40 | %(d) | 1.41 | %(d)(e) | ||||
Ratio of expenses to average net assets before waiver and reimbursement | 1.60 | %(d) | 2.11 | %(d)(e) | ||||
Ratio of net investment income to average net assets | 0.32 | %(d) | 0.26 | %(d) | ||||
Ratio of net investment income to average net assets before waiver and reimbursement | 0.12 | %(d) | (0.44 | )%(d) | ||||
Portfolio turnover rate | 8.74 | %(c) | 11.30 | %(c) | ||||
| (a) | For the period December 22, 2011 (commencement of operations) to October 31, 2012. |
| (b) | Total return in the above table represents the rate that the investor would have earned or lost on an investment in the Fund, assuming reinvestment of distributions. |
| (c) | Not annualized. |
| (d) | Annualized. |
| (e) | Includes 0.01% for line of credit fees for 2012. |
See accompanying notes which are an integral part of these financial statements.
12
Green Owl Intrinsic Value Fund
Notes to the Financial Statements
April 30, 2013
(Unaudited)
NOTE 1. ORGANIZATION
The Green Owl Intrinsic Value Fund (the “Fund”) is an open-end diversified series of the Valued Advisers Trust (the “Trust”). The Trust is a management investment company established under the laws of Delaware by an Agreement and Declaration of Trust dated June 13, 2008 (the “Trust Agreement”). The Trust Agreement permits the Trustees to issue an unlimited number of shares of beneficial interest of separate series without par value. The Fund is one of a series of funds authorized by the Trustees. The Fund’s investment adviser is Kovitz Investment Group, LLC (the “Adviser”). The investment objective of the Fund is to provide long-term capital appreciation.
NOTE 2. SIGNIFICANT ACCOUNTING POLICIES
The following is a summary of significant accounting policies followed by the Fund in the preparation of its financial statements.
Securities Valuation – All investments in securities are recorded at their estimated fair value as described in Note 3.
Federal Income Taxes – The Fund makes no provision for federal income or excise tax. The Fund intends to qualify each year as a regulated investment company (“RIC”) under subchapter M of the Internal Revenue Code of 1986, as amended, by complying with the requirements applicable to RICs and by distributing substantially all of its taxable income. The Fund also intends to distribute sufficient net investment income and net capital gains, if any, so that it will not be subject to excise tax on undistributed income and gains. If the required amount of net investment income or gains is not distributed, the Fund could incur a tax expense.
As of and during the six months ended April 30, 2013, the Fund did not have a liability for any unrecognized tax benefits. The Fund recognizes interest and penalties, if any, related to unrecognized tax benefits as income tax expense in the Statement of Operations. During the year, the Fund did not incur any interest or penalties. The Fund is subject to examination by U.S. federal tax authorities for all tax years since inception.
Expenses – Expenses incurred by the Trust that do not relate to a specific fund of the Trust are allocated to the individual funds based on each fund’s relative net assets or other appropriate basis (as determined by the Board of Trustees).
Security Transactions and Related Income - The Fund follows industry practice and records security transactions on the trade date. The First In, First Out method is used for determining gains or losses for financial statements and income tax purposes. Dividend income is recorded on the ex-dividend date and interest income is recorded on an accrual basis. Discounts and premiums on securities purchased are amortized or accreted using the effective interest method. Withholding taxes on foreign dividends have been provided for in accordance with the Fund’s understanding of the applicable country’s tax rules and rates. The ability of issuers of debt securities held by the Fund to meet their obligations may be affected by economic and political developments in a specific country or region.
Dividends and Distributions - The Fund intends to distribute substantially all of its net investment income, net realized long-term capital gains and its net realized short-term capital gains, if any, to its shareholders on at least an annual basis. Dividends to shareholders, which are determined in accordance with income tax regulations, are recorded on the ex-dividend date. The treatment for financial reporting purposes of distributions made to shareholders during the year from net investment income or net realized capital gains may differ from their ultimate treatment for federal income tax purposes. These differences are caused primarily by differences in the timing of the recognition of certain components of income, expense or realized capital gain for federal income tax purposes. Where such differences are permanent in nature, they are reclassified in the components of net assets based on their ultimate characterization for federal income tax purposes. Any such reclassifications will have no effect on net assets, results of operations or net asset values per share of the Fund.
13
Green Owl Intrinsic Value Fund
Notes to the Financial Statements - continued
April 30, 2013
(Unaudited)
NOTE 2. SIGNIFICANT ACCOUNTING POLICIES – continued
Writing Options - The Fund may write covered call options on equity securities or futures contracts that the Fund is eligible to purchase to extend a holding period to obtain long-term capital gain treatment, to earn premium income, to assure a definite price for a security it has considered selling, or to close out options previously purchased. The Fund may write covered call options if, immediately thereafter, not more than 30% of its net assets would be committed to such transactions. A call option gives the holder (buyer) the right to purchase a security or futures contract at a specified price (the exercise price) at any time until a certain date (the expiration date). A call option is “covered” if the Fund owns the underlying security subject to the call option at all times during the option period. When the Fund writes a covered call option, it maintains a segregated account with its Custodian or as otherwise required by the rules of the exchange the underlying security, cash or liquid portfolio securities in an amount not less than the exercise price at all times while the option is outstanding. See Note 4 for additional disclosures.
The Fund will receive a premium from writing a call option, which increases the Fund’s return in the event the option expires unexercised or is closed out at a profit. The amount of the premium will reflect, among other things, the relationship of the market price of the underlying security to the exercise price of the option and the remaining term of the option. However, there is no assurance that a closing transaction can be affected at a favorable price. During the option period, the covered call writer has, in return for the premium received, given up the opportunity for capital appreciation above the exercise price should the market price of the underlying security increase, but has retained the risk of loss should the price of the underlying security decline.
The Fund may write put options on equity securities and futures contracts that the Fund is eligible to purchase to earn premium income or to assure a definite price for a security if it is considering acquiring the security at a lower price than the current market price or to close out options previously purchased. The Fund may not write a put option if, immediately thereafter, more than 25% of its net assets would be committed to such transactions. A put option gives the holder of the option the right to sell, and the writer has the obligation to buy, the underlying security at the exercise price at any time during the option period. The operation of put options in other respects is substantially identical to that of call options. When the Fund writes a put option, it maintains in a segregated account with its Custodian cash or liquid portfolio securities in an amount not less than the exercise price at all times while the put option is outstanding.
The Fund will receive a premium from writing a put option, which increases the Fund’s return in the event the option expires unexercised or is closed out at a profit. The amount of the premium will reflect, among other things, the relationship of the market price of the underlying security to the exercise price of the option and the remaining term of the option. The risks involved in writing put options include the risk that a closing transaction cannot be effected at a favorable price and the possibility that the price of the underlying security may fall below the exercise price, in which case the Fund may be required to purchase the underlying security at a higher price than the market price of the security at the time the option is exercised, resulting in a potential capital loss unless the security subsequently appreciates in value.
NOTE 3. SECURITIES VALUATION AND FAIR VALUE MEASUREMENTS
Fair value is defined as the price that a Fund would receive upon selling an investment in an orderly transaction to an independent buyer in the principal or most advantageous market of the investment. Accounting principles generally accepted in the United States of America (“GAAP”) establishes a three-tier hierarchy to maximize the use of observable market data and minimize the use of unobservable inputs and to establish classification of fair value measurements for disclosure purposes.
Inputs refer broadly to the assumptions that market participants would use in pricing the asset or liability, including assumptions about risk; for example, the risk inherent in a particular valuation technique used to measure fair value including such as a pricing model and/or the risk inherent in the inputs to the valuation technique. Inputs may be observable or unobservable. Observable inputs are inputs that reflect the assumptions market participants would use in pricing the asset or liability developed based on market data obtained from sources independent of the reporting entity.
14
Green Owl Intrinsic Value Fund
Notes to the Financial Statements - continued
April 30, 2013
(Unaudited)
NOTE 3. SECURITIES VALUATION AND FAIR VALUE MEASUREMENTS – continued
Unobservable inputs are inputs that reflect the reporting entity’s own assumptions about the assumptions market participants would use in pricing the asset or liability developed based on the best information available in the circumstances.
Various inputs are used in determining the value of the Fund’s investments. These inputs are summarized in the three broad levels listed below.
| • | Level 1 – quoted prices in active markets for identical securities |
| • | Level 2 – other significant observable inputs (including, but not limited to, quoted prices for an identical security in an inactive market, quoted prices for similar securities, interest rates, prepayment speeds, credit risk, etc.) |
| • | Level 3 – significant unobservable inputs (including the Fund’s own assumptions in determining fair value of investments based on the best information available) |
The inputs used to measure fair value may fall into different levels of the fair value hierarchy. In such cases, for disclosure purposes, the level in the fair value hierarchy within which the fair value measurement falls in its entirety, is determined based on the lowest level input that is significant to the fair value measurement in its entirety.
Equity securities, including common stocks, are generally valued by using market quotations, but may be valued on the basis of prices furnished by a pricing service when the Fund believes such prices more accurately reflect the fair value of such securities. Securities that are traded on any stock exchange are generally valued by the pricing service at the last quoted sale price. Lacking a last sale price, an exchange traded security is generally valued by the pricing service at its last bid price. Securities traded in the NASDAQ over-the-counter market are generally valued by the pricing service at the NASDAQ Official Closing Price. When using the market quotations or close prices provided by the pricing service and when the market is considered active, the security will be classified as a Level 1 security. Sometimes, an equity security owned by the Fund will be valued by the pricing service with factors other than market quotations or when the market is considered inactive. When this happens, the security will be classified as a Level 2 security. When market quotations are not readily available, when the Fund determines that the market quotation or the price provided by the pricing service does not accurately reflect the current fair value, or when restricted or illiquid securities are being valued, such securities are valued as determined in good faith by the Fund, in conformity with guidelines adopted by and subject to review by the Board. These securities will be categorized as Level 3 securities.
Investments in open-end mutual funds, including money market mutual funds, are generally priced at the ending net asset value (NAV) provided by the service agent of the funds. These securities are categorized as Level 1 securities.
Written Option contracts are generally valued using the closing price based on quote data from an outside pricing source and are typically categorized as Level 1 in the fair value hierarchy.
Fixed income securities, when valued using market quotations in an active market, will be categorized as Level 1 securities. However, they may be valued on the basis of prices furnished by a pricing service when the Fund believes such prices more accurately reflect the fair value of such securities. A pricing service utilizes electronic data processing techniques based on yield spreads relating to securities with similar characteristics to determine prices for normal institutional-size trading units of debt securities without regard to sale or bid prices. These securities will generally be categorized as Level 2 securities. If the Fund decides that a price provided by the pricing service does not accurately reflect the fair value of the securities, when prices are not readily available from a pricing service, or when restricted or illiquid securities are being valued, securities are valued at fair value as determined in good faith by the Fund, in conformity with guidelines adopted by and subject to review of the Board. These securities will be categorized as Level 3 securities.
15
Green Owl Intrinsic Value Fund
Notes to the Financial Statements - continued
April 30, 2013
(Unaudited)
NOTE 3. SECURITIES VALUATION AND FAIR VALUE MEASUREMENTS – continued
Short-term investments in fixed income securities, (those with maturities of less than 60 days when acquired, or which subsequently are within 60 days of maturity), are valued by using the amortized cost method of valuation, which the Board has determined will represent fair value. These securities will be classified as Level 2 securities.
If the Fund decides that a price provided by the pricing service does not accurately reflect the fair value of the securities, when prices are not readily available from a pricing service, or when restricted or illiquid securities are being valued, securities are valued at fair value as determined in good faith by the Fund, in conformity with guidelines adopted by and subject to review of the Board. These securities will be categorized as Level 3 securities.
In accordance with the Trust’s good faith pricing guidelines, the Fund is required to consider all appropriate factors relevant to the value of securities for which it has determined other pricing sources are not available or reliable as described above. No single standard exists for determining fair value, because fair value depends upon the circumstances of each individual case. As a general principle, the current fair value of an issue of securities being valued by the Fund would appear to be the amount which the owner might reasonably expect to receive for them upon their current sale. Methods which are in accordance with this principle may, for example, be based on (i) a multiple of earnings; (ii) a discount from market of a similar freely traded security (including a derivative security or a basket of securities traded on other markets, exchanges or among dealers); or (iii) yield to maturity with respect to debt issues, or a combination of these and other methods. Good faith pricing is permitted if, in the Fund’s opinion, the validity of market quotations appears to be questionable based on factors such as evidence of a thin market in the security based on a small number of quotations, a significant event occurs after the close of a market but before a Fund’s NAV calculation that may affect a security’s value, or the Fund is aware of any other data that calls into question the reliability of market quotations. Good faith pricing may also be used in instances when the bonds the Fund invests in may default or otherwise cease to have market quotations readily available. Any fair value pricing done outside the Fund’s approved pricing methods must be approved by the Pricing Committee of the Board.
The following is a summary of the inputs used to value the Fund’s investments as of April 30, 2013:
| Valuation Inputs | ||||||||||||||||
Assets | Level 1 - Quoted Prices in Active Markets | Level 2 - Other Significant Observable Inputs | Level 3 - Significant Unobservable Inputs | Total | ||||||||||||
Common Stocks* | $ | 33,126,778 | $ | — | $ | — | $ | 33,126,778 | ||||||||
Money Market Securities | 83,559 | — | — | 83,559 | ||||||||||||
Total | $ | 33,210,337 | $ | — | $ | — | $ | 33,210,337 | ||||||||
| * | Refer to the Schedule of Investments for industry classifications. |
| Valuation Inputs | ||||||||||||||||
Liabilities | Level 1 - Quoted Prices in Active Markets | Level 2 - Other Significant Observable Inputs | Level 3 - Significant Unobservable Inputs | Total | ||||||||||||
Options Contracts | $ | (11,055 | ) | $ | — | $ | — | $ | (11,055 | ) | ||||||
Total | $ | (11,055 | ) | $ | — | $ | — | $ | (11,055 | ) | ||||||
16
Green Owl Intrinsic Value Fund
Notes to the Financial Statements - continued
April 30, 2013
(Unaudited)
NOTE 3. SECURITIES VALUATION AND FAIR VALUE MEASUREMENTS – continued
The Fund did not hold any investments at any time during the reporting period in which significant unobservable inputs were used in determining fair value; therefore, no reconciliation of Level 3 securities is included for this reporting period. The Trust recognizes transfers between fair value hierarchy levels at the reporting period end. There were no transfers between any Levels for the period ended April 30, 2013.
NOTE 4. DERIVATIVE TRANSACTIONS
Call options written are presented separately on the Statement of Assets and Liabilities as a liability at fair value and on the Statement of Operations under change in unrealized appreciation (depreciation) on options contracts, respectively. There were no realized gains or losses on written call options during the fiscal year ended October 31, 2012.
Written Call Options | Written Call Options at fair value | $ | 11,055 | |||
Written Call Options | Unrealized appreciation on Options Contracts | $ | — | |||
Written Call Options | Unrealized depreciation on Options Contracts | $ | 573 |
For the period ended October 31, 2012 :
Derivatives | Location of Gain (Loss) on Derivatives on Statements of | Realized Gain (Loss) on Derivatives | Change in Unrealized Appreciation (Depreciation) on Derivatives | |||||||
Equity Risk: | ||||||||||
Written Call Options | Net realized and unrealized gain (loss) on options contracts | $ | 16,268 | $ | (15,428 | ) | ||||
Transactions in written options by the Fund during the period ended April 30, 2013, were as follows:
| Number of Contracts | Premiums Received | |||||||
Options outstanding at October 31, 2012 | 4 | $ | 21,095 | |||||
Options Sold | (4 | ) | (21,095 | ) | ||||
Options written | 55 | 10,482 | ||||||
|
|
|
| |||||
Options outstanding at April 30, 2013 | 55 | $ | 10,482 | |||||
|
|
|
| |||||
NOTE 5. FEES AND OTHER TRANSACTIONS WITH AFFILIATES
Under the terms of the management agreement, on behalf of the Fund (the “Agreement”), the Adviser manages the Fund’s investments subject to approval of the Trustees. As compensation for its management services, the Green Owl Intrinsic Value Fund is obligated to pay the Adviser a fee computed and accrued daily and paid monthly at an annual rate of 1.00% of the average daily net assets of the Fund. For the six months ended April 30, 2013, the Adviser earned a fee of $143,453 from the Fund before the reimbursement described below. At April 30, 2013, the Fund owed the Adviser $23,283.
The Adviser has contractually agreed to waive its management fee and/or reimburse expenses so that total annual fund operating expenses, excluding interest, taxes, brokerage commissions, other expenditures which are capitalized in accordance with GAAP, other extraordinary expenses not incurred in the ordinary course of the Fund’s business, dividend expense on short sales, and expenses that the Fund has incurred but did not actually pay because of an expense offset arrangement, if applicable, incurred by the Fund in any fiscal year, do not exceed 1.40% of the Fund’s average daily net assets through October 31, 2014. The operating expense limitation also excludes any fees and expenses of acquired funds.
17
Green Owl Intrinsic Value Fund
Notes to the Financial Statements - continued
April 30, 2013
(Unaudited)
NOTE 5. FEES AND OTHER TRANSACTIONS WITH AFFILIATES - continued
For the six months ended April 30, 2013, expenses totaling $27,988 were waived or reimbursed by the Adviser and may be subject to potential recoupment by the Adviser until October 31, 2016.
The amount subject to repayment by the Fund pursuant to the aforementioned conditions are as follows:
Amount | Recoverable through October 31, | |
$115,029 | 2015 |
The Trust retains Huntington Asset Services, Inc. (“HASI”) to manage the Fund’s business affairs and provide the Fund with administrative services, including all regulatory reporting and necessary office equipment and personnel. For the six months ended April 30, 2013, HASI earned fees of $18,596 for administrative services provided to the Fund. At April 30, 2013, HASI was owed $2,971 from the Fund for administrative services. Certain officers and one Trustee of the Trust are members of management and/or employees of HASI. HASI is a wholly-owned subsidiary of Huntington Bancshares, Inc., the parent company of Unified Financial Securities, Inc. (the “Distributor”) and Huntington National Bank, the custodian of the Fund’s investments (the “Custodian”). For the six months ended April 30, 2013, the Custodian earned fees of $4,937 for custody services provided to the Fund. At April 30, 2013, the Custodian was owed $1,112 from the Fund for custody services.
The Trust also retains HASI to act as the Fund’s transfer agent and to provide fund accounting services. For the six months ended April 30, 2013, HASI earned fees of $16,690 for transfer agent services to the Fund. At April 30, 2013, the Fund owed HASI $1,508 for transfer agent services.
For the six months ended April 30, 2013, HASI earned fees of $12,397 from the Fund for fund accounting services. At April 30, 2013, HASI was owed $1,980 from the Fund for fund accounting services.
Kovitz Securities, LLC, an affiliate of the Adviser, is a broker dealer of the Fund. At April 30, 2013 the Fund made $2,365 of payment to Kovitz Securities, LLC for broker commissions.
Unified Financial Securities, Inc. (the “Distributor”) acts as the principal underwriter of the Fund’s shares. There were no payments made by the Fund to the Distributor during the six months ended April 30, 2013. An officer of the Trust is an officer of the Distributor and such person may be deemed to be an affiliate of the Distributor.
NOTE 6. LINE OF CREDIT
During the six months ended April 30, 2013, the Trust, on behalf of the Fund, entered into an agreement with The Huntington National Bank, the custodian of the Fund’s investments, to open a secured line of credit, expiring on September 12, 2013; borrowings under these arrangements bear interest at LIBOR and plus 1.250%. As of April 30, 2013, the Fund has no outstanding balances. The Fund has a line of credit available for the lesser of $1,000,000 or 5% of the Fund’s daily market value; however, the Fund did not borrow on its line of credit during the six months ended April 30, 2013.
18
Green Owl Intrinsic Value Fund
Notes to the Financial Statements - continued
April 30, 2013
(Unaudited)
NOTE 7. INVESTMENTS
For the six months ended April 30, 2013, purchases and sales of investment securities, other than short-term investments and short-term U.S. government obligations, were as follows:
Purchases | ||||
U.S. Government Obligations | $ | — | ||
Other | 6,291,493 | |||
Sales | ||||
U.S. Government Obligations | $ | — | ||
Other | 2,505,387 |
At April 30, 2013, the net unrealized appreciation (depreciation) of investments, including written options, for tax purposes was as follows:
Gross Appreciation | $ | 6,810,423 | ||
Gross (Depreciation) | (117,054 | ) | ||
|
| |||
Net Appreciation (Depreciation) on Investments | $ | 6,693,369 | ||
|
|
At April 30, 2013, the aggregate cost of securities, excluding U.S. government obligations, for federal income tax purposes was $26,516,395 and premiums received for written options was $10,482 for the Fund.
NOTE 8. ESTIMATES
The preparation of financial statements in conformity with GAAP requires management to make estimates and assumptions that affect the reported amounts of assets and liabilities and disclosure of contingent assets and liabilities at the date of the financial statements and the reported amounts of increases and decreases in net assets from operations during the reporting period. Actual results could differ from those estimates.
NOTE 9. BENEFICIAL OWNERSHIP
The beneficial ownership, either directly or indirectly, of 25% or more of the voting securities of a fund creates a presumption of control of a fund, under Section 2(a) (9) of the Investment Company Act of 1940. At April 30, 2013, Charles Schwab & Co., Inc., for the benefit of its customers, owned 32.97%. The Trust does not know whether Charles Schwab or any of the underlying beneficial owners owned or controlled 25% or more of the voting securities of the Green Owl Intrinsic Value Fund.
19
Green Owl Intrinsic Value Fund
Notes to the Financial Statements - continued
April 30, 2013
(Unaudited)
NOTE 10. DISTRIBUTIONS TO SHAREHOLDERS
On December 27, 2012, the Fund paid an income distribution of $0.0463 per share and a short-term capital gain of $0.0585 per share to shareholders of record on December 26, 2012.
At October 31, 2012, the components of distributable earnings on a tax basis were as follows:
Undistributed ordinary income | $ | 198,940 | ||
Net Unrealized appreciation (depreciation) | 2,379,912 | |||
Accumulated capital and other losses | (3,509 | ) | ||
|
| |||
| $ | 2,575,343 | |||
|
|
NOTE 11. COMMITMENTS AND CONTINGENCIES
The Fund indemnifies its officers and trustees for certain liabilities that may arise from their performance of their duties to the Fund. Additionally, in the normal course of business, the Fund enters into contracts that contain a variety of representatives and warranties which provide general indemnifications. The Fund’s maximum exposure under these arrangements is unknown, as this would involve future claims that may be made against the Fund that have not yet occurred.
20
PROXY VOTING
A description of the policies and procedures that the Fund uses to determine how to vote proxies relating to portfolio securities and information regarding how the Fund voted those proxies is available without charge upon request by (1) calling the Fund at (888) 695-3729 and (2) from Fund documents filed with the Securities and Exchange Commission (“SEC”) on the SEC’s website at www.sec.gov.
TRUSTEES
R. Jeffrey Young, Chairman
Dr. Merwyn R. Vanderlind
Ira Cohen
OFFICERS
R. Jeffrey Young, Principal Executive Officer and President
John C. Swhear, Chief Compliance Officer, AML Officer and Vice-President
Carol J. Highsmith, Vice President
Matthew J. Miller, Vice President
Robert W. Silva, Principal Financial Officer and Treasurer
Heather Bonds, Secretary
INVESTMENT ADVISER
Kovitz Investment Group, LLC
115 LaSalle Street, 27th Floor
Chicago, IL 60603
DISTRIBUTOR
Unified Financial Securities, Inc.
2960 North Meridian Street, Suite 300
Indianapolis, IN 46208
INDEPENDENT REGISTERED PUBLIC ACCOUNTING FIRM
Cohen Fund Audit Services Ltd.
1350 Euclid Avenue, Suite 800
Cleveland, OH 44115
LEGAL COUNSEL
The Law Offices of John H. Lively & Associates, Inc.
A member firm of The 1940 Act Law GroupTM
11300 Tomahawk Creek Parkway, Ste. 310
Leawood, KS 66211
CUSTODIAN
Huntington National Bank
41 South High Street
Columbus, OH 43125
ADMINISTRATOR, TRANSFER AGENT AND FUND ACCOUNTANT
Huntington Asset Services, Inc.
2960 North Meridian Street, Suite 300
Indianapolis, IN 46208
This report is intended only for the information of shareholders or those who have received the Fund’s prospectus which contains information about the Fund’s management fee and expenses. Please read the prospectus carefully before investing.
Distributed by Unified Financial Securities, Inc.
Member FINRA/SIPC
Semi-Annual Report
April 30, 2013
|
Dreman Contrarian Small Cap Value Fund
Fund Adviser:
Dreman Value Management, LLC
Harborside Financial Center, Plaza 10
Suite 800 Jersey City, NJ 07311
Toll Free: (800) 247-1014

Dreman Contrarian Small Cap Value Fund |
Investment Results – (Unaudited)
Average Annual Total Returns (unaudited) As of April 30, 2013 | ||||||||||||||||||||
| Class A with Load | Class A without Load | Retail Class | Institutional Class | Russell 2000® Value Index1 | ||||||||||||||||
Six Months | 9.40 | % | 16.10 | % | 16.04 | % | 16.10 | % | 16.58 | % | ||||||||||
One Year | 8.71 | % | 15.32 | % | 15.33 | % | 15.52 | % | 19.71 | % | ||||||||||
Three Year | 5.52 | % | 7.63 | % | 7.61 | % | 7.84 | % | 9.58 | % | ||||||||||
Five Year | N/A | N/A | 6.03 | % | 6.19 | % | 6.60 | % | ||||||||||||
Since Inception (11/20/09) | 9.68 | % | 11.59 | % | N/A | N/A | 15.74 | % | ||||||||||||
Since Inception (8/22/07) | N/A | N/A | N/A | 4.84 | % | 3.83 | % | |||||||||||||
Since Inception (12/31/03) | N/A | N/A | 9.97 | % | N/A | 6.89 | % | |||||||||||||
| Expense Ratios2 | ||||||||||||||||||||
Gross | 1.44 | % | 1.44 | % | 1.44 | % | 1.19 | % | ||||||||||||
With Applicable Waivers | 1.25 | % | 1.25 | % | 1.25 | % | 1.00 | % | ||||||||||||
The investment return and principal value of an investment will fluctuate so that an investor’s shares, when redeemed, may be worth more or less than their original cost. The returns shown do not reflect deduction of taxes that a shareholder would pay on Fund distributions or the redemption of Fund shares. THE FUND’S RETURNS REPRESENT PAST PERFORMANCE AND DO NOT PREDICT FUTURE RESULTS. The returns shown are net of all recurring operating expenses, although the returns reflect the impact of certain expense limitation arrangements that were in place during the periods reflected in the table. Current performance of the Fund may be lower or higher than the performance quoted. For more information on the Fund, and to obtain performance data current to the most recent month end, or to request a prospectus or summary prospectus, please call 1-800-247-1014.
You should carefully consider the investment objectives, potential risk, management fees, and charges and expenses of the Fund before investing. The Fund’s prospectus and summary prospectus contains this and other information about the Fund, and should be read carefully before investing.
The total return figures set forth above include all waivers of fees for various periods since inception. Without such fee waivers, the total returns would have been lower. Total return figures reflect any change in price per share and assume reinvestment of all distributions. Total return figures exclude any applicable sales charges.
| 1 | The Russell 2000® Value Index is an unmanaged benchmark that assumes reinvestment of all distributions and excludes the effect of taxes and fees. The Index is a widely recognized unmanaged index of equity prices and is representative of a broader market and range of securities than are found in the Fund’s portfolio. Individuals cannot invest directly in the Index; however, an individual can invest in ETFs or other investment vehicles that attempt to track the performance of a benchmark index. |
| 2 | The expense ratios are from the Fund’s prospectus dated February 28, 2013. The Adviser contractually has agreed to cap total annual operating expenses for each class (excluding (i) interest, (ii) taxes, (iii) brokerage commissions, (iv) other expenditures which are capitalized in accordance with generally accepted accounting principles, (v) other extraordinary expenses not incurred in the ordinary course of the Fund’s business, (vi) dividend expense on short sales, and (vii) expenses incurred under a plan of distribution adopted pursuant to Rule 12b-1 under the 1940 Act) of the Fund at 1.00% through February 28, 2014. Due to those excluded fees and expenses, however, the final expense ratios after applicable waivers for each share class may be reported as more than 1.00%. Additional information pertaining to the Fund’s expense ratios as of April 30, 2013 can be found in the financial highlights. |
The Fund is distributed by Unified Financial Securities, Inc., member FINRA.
Semi-Annual Report
1
Fund Holdings (Unaudited) |
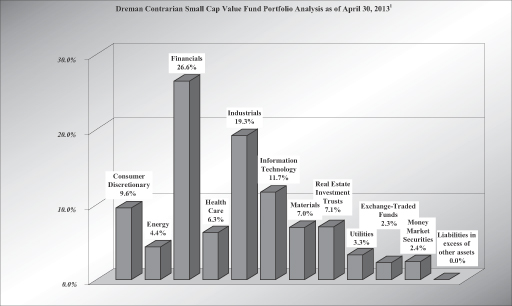
| 1 | As a percent of net assets. |
Under normal circumstances, the Dreman Contrarian Small Cap Value Fund (the “Fund”) will invest at least 80% of its net assets in equity securities of small capitalization companies that the investment adviser to the Fund defines as companies that are similar in market capitalization to those listed on the Russell 2000® Value Index. As of the prospectus dated February 28, 2013, the market capitalizations included Russell 2000® Value Index ranged from $101 million to $2.6 billion.
Availability of Portfolio Schedule – (Unaudited)
The Fund files its complete schedule of portfolio holdings with the Securities and Exchange Commission (“SEC”) for the first and third quarters of each fiscal year on Form N-Q, which is available on the SEC’s web site at www.sec.gov. The Fund’s Form N-Q may be reviewed and copied at the SEC’s Public Reference Room in Washington, DC. Information on the operation of the Public Reference Room may be obtained by calling 1-800-SEC-0330.
Semi-Annual Report
2
Shareholder Expense Example (Unaudited)
As a shareholder of the Fund, you incur two types of costs: (1) transaction costs, such as redemption fees; and (2) ongoing costs, including management fees; distribution and/or service (12b-1) fees; and other fund expenses. This Example is intended to help you understand your ongoing costs (in dollars) of investing in the Fund and to compare these costs with the ongoing costs of investing in other mutual funds. The Example is based on an investment of $1,000 invested at the beginning of the period and held for the entire six-month period from November 1, 2012 to April 30, 2013.
Actual Expenses—The “Actual” lines of the table provide information about actual account values and actual expenses. You may use the information in this line, together with the amount you invested, to estimate the expenses that you paid over the period. Simply divide your account value by $1,000 (for example, an $8,600 account value divided by $1,000 = 8.60), then multiply the result by the number in the “Actual” line under the heading entitled “Expenses Paid During Period” to estimate the expenses you paid on your account during this period.
Hypothetical Example for Comparison Purposes—The “Hypothetical” lines of the table provides information about hypothetical account values and hypothetical expenses based on the Fund’s actual expense ratios and an assumed rate of return of 5% per year before expenses, which is not the Fund’s actual return. The hypothetical account values and expenses may not be used to estimate the actual ending account balances or expenses you paid for the period. You may use this information to compare the ongoing costs of investing in the Fund and other funds. To do so, compare this 5% hypothetical example with the 5% hypothetical examples that appear in the shareholder reports of the other funds.
Please note that the expenses shown in the table are meant to highlight your ongoing costs only and do not reflect any transactional costs, such as sales charges (loads), redemption fees, or exchange fees. Therefore, the “Hypothetical” lines of the table are useful in comparing ongoing costs only, and will not help you determine the relative total costs of owning different funds. In addition, if these transactional costs were included, your costs would have been higher.
Beginning Value, | Ending Account Value, April 30, 2013 | Expenses Paid During Period(1) | Annualized Expense Ratio | |||||||||||||||
Dreman Contrarian Small Cap Value Fund | ||||||||||||||||||
Class A Shares | Actual | $ | 1,000.00 | $ | 1,161.00 | $ | 6.70 | 1.25 | % | |||||||||
| Hypothetical (2) | $ | 1,000.00 | $ | 1,018.60 | $ | 6.26 | 1.25 | % | ||||||||||
Retail Shares | Actual | $ | 1,000.00 | $ | 1,160.40 | $ | 6.70 | 1.25 | % | |||||||||
| Hypothetical (2) | $ | 1,000.00 | $ | 1,018.60 | $ | 6.26 | 1.25 | % | ||||||||||
Institutional Shares | Actual | $ | 1,000.00 | $ | 1,161.00 | $ | 5.36 | 1.00 | % | |||||||||
| Hypothetical (2) | $ | 1,000.00 | $ | 1,019.84 | $ | 5.01 | 1.00 | % | ||||||||||
| (1) | Expenses are equal to the Fund’s annualized expense ratios, multiplied by the average account value over the period, multiplied by 181/365 (to reflect the one-half year period). The annualized expense ratios reflect reimbursement of expenses by the Fund’s investment adviser for the period beginning November 1, 2012 through April 30, 2013. The “Financial Highlights” tables in the Fund’s financial statements, included in the report, also show the gross expense ratios, without such reimbursements. |
| (2) | Hypothetical assumes 5% annual return before expenses. |
Semi-Annual Report
3
| Dreman Contrarian Small Cap Value Fund | April 30, 2013 |
| Schedule of Investments (Unaudited) |
| Shares | Value | |||||||||
| Common Stocks — 95.3% | |||||||||
| Consumer Discretionary — 9.6% | |||||||||
| 5,810 | Aaron’s, Inc. | $ | 166,805 | |||||||
| 74,150 | American Axle & Manufacturing | 991,385 | ||||||||
| 1,597 | America’s Car-Mart, Inc. * | 73,893 | ||||||||
| 21,900 | Brinker International, Inc. | 851,910 | ||||||||
| 6,410 | CEC Entertainment, Inc. | 213,902 | ||||||||
| 32,577 | Cooper Tire & Rubber Co. | 810,842 | ||||||||
| 25,630 | Hanesbrands, Inc. | 1,285,601 | ||||||||
| 14,783 | Helen of Troy Ltd. * | 515,631 | ||||||||
| 12,467 | Hillenbrand, Inc. | 313,296 | ||||||||
| 8,774 | John Wiley & Sons, Inc., Class A | 334,904 | ||||||||
| 54,718 | Jones Group, Inc./The | 766,052 | ||||||||
| 6,290 | Matthews International Corp., Class A | 231,535 | ||||||||
| 17,354 | Meredith Corp. | 673,682 | ||||||||
| 7,229,438 | ||||||||||
| Energy — 4.4% | |||||||||
| 17,065 | Atwood Oceanics, Inc. * | 837,038 | ||||||||
| 12,781 | Berry Petroleum Co. | 612,338 | ||||||||
| 15,999 | Energen Corp. | 758,673 | ||||||||
| 16,490 | Ship Finance International Ltd. | 271,755 | ||||||||
| 30,455 | Superior Energy Services, Inc. * | 840,253 | ||||||||
| 3,320,057 | ||||||||||
| Financials — 26.6% | |||||||||
| 8,621 | Allied World Assurance Co. Holdings AG | 782,873 | ||||||||
| 19,090 | Aspen Insurance Holdings Ltd. | 729,047 | ||||||||
| 72,630 | Associated Banc-Corp. | 1,036,430 | ||||||||
| 48,110 | BancorpSouth, Inc. | 769,760 | ||||||||
| 16,734 | Bank of Hawaii Corp. | 798,044 | ||||||||
| 9,109 | Chemical Financial Corp. | 225,903 | ||||||||
| 6,335 | City National Corp. | 362,552 | ||||||||
| 11,450 | DFC Global Corp. * | 154,575 | ||||||||
| 26,930 | East West Bancorp, Inc. | 655,207 | ||||||||
| 14,470 | Endurance Specialty Holdings Ltd. | 708,596 | ||||||||
| 17,133 | Federated Investors, Inc., Class B | 393,374 | ||||||||
| 74,920 | First Horizon National Corp. | 779,168 | ||||||||
| 21,020 | First Midwest Bancorp, Inc. | 263,801 | ||||||||
| 81,889 | First Niagara Financial Group, Inc. | 778,764 | ||||||||
| 48,299 | FirstMerit Corp. | 827,362 | ||||||||
| 87,700 | Fulton Financial Corp. | 969,962 | ||||||||
| 11,753 | Glacier Bancorp, Inc. | 216,843 | ||||||||
| 24,725 | Hancock Holding Co. | 674,251 | ||||||||
| 19,515 | Hanover Insurance Group, Inc. | 984,141 | ||||||||
| 5,395 | Independent Bank Corp. | 167,461 | ||||||||
| 23,230 | Interactive Brokers Group, Inc., Class A | 349,844 | ||||||||
| 9,834 | International Bancshares Corp. | 190,780 | ||||||||
| 13,300 | KKR Financial Holdings LLC (a) | 142,177 | ||||||||
| 5,885 | Lakeland Financial Corp. | 157,718 | ||||||||
| 14,195 | Montpelier Re Holdings Ltd. | 365,663 | ||||||||
| 8,955 | NBT Bancorp, Inc. | 181,339 | ||||||||
| 6,567 | Nelnet, Inc., Class A | 223,278 | ||||||||
| 9,842 | Platinum Underwriters Holdings Ltd. | 558,533 | ||||||||
| 27,595 | Prospect Capital Corp. | 304,373 | ||||||||
| 12,323 | Prosperity Bancshares, Inc. | 566,119 | ||||||||
| Shares | Value | |||||||||
| Common Stocks — (Continued) | |||||||||
| Financials — (Continued) | |||||||||
| 21,628 | Protective Life Corp. | $ | 823,162 | |||||||
| 24,210 | Symetra Financial Corp. | 329,982 | ||||||||
| 39,877 | TCF Financial Corp. | 580,210 | ||||||||
| 11,090 | Umpqua Holdings Corp. | 133,080 | ||||||||
| 17,869 | Waddell & Reed Financial, Inc., Class A | 766,044 | ||||||||
| 56,610 | Washington Federal, Inc. | 971,994 | ||||||||
| 18,100 | Webster Financial Corp. | 422,997 | ||||||||
| 5,220 | WesBanco, Inc. | 130,657 | ||||||||
| 18,916 | Wintrust Financial Corp. | 678,328 | ||||||||
| 20,154,392 | ||||||||||
| Health Care — 6.3% | |||||||||
| 3,790 | Almost Family, Inc. | 74,815 | ||||||||
| 20,152 | Charles River Laboratories International, Inc. * | 876,410 | ||||||||
| 12,660 | Gentiva Health Services, Inc. * | 132,803 | ||||||||
| 19,035 | Hill-Rom Holdings, Inc. | 648,522 | ||||||||
| 11,210 | Integra LifeSciences Holdings Corp. * | 392,686 | ||||||||
| 25,700 | Kindred Healthcare, Inc. * | 269,593 | ||||||||
| 19,070 | LifePoint Hospitals, Inc. * | 915,360 | ||||||||
| 7,960 | Orthofix International NV * | 257,904 | ||||||||
| 24,980 | Owens & Minor, Inc. | 813,599 | ||||||||
| 10,160 | PharMerica Corp. * | 130,962 | ||||||||
| 28,550 | Select Medical Holdings Corp. | 235,537 | ||||||||
| 4,748,191 | ||||||||||
| Industrials — 19.3% | |||||||||
| 14,659 | AAR Corp. | 261,810 | ||||||||
| 19,490 | ABM Industries, Inc. | 439,499 | ||||||||
| 56,574 | Aircastle Ltd. | 789,773 | ||||||||
| 11,700 | Alliant Techsystems, Inc. | 870,012 | ||||||||
| 15,987 | Barnes Group, Inc. | 443,959 | ||||||||
| 12,619 | Brady Corp., Class A | 427,532 | ||||||||
| 15,387 | Briggs & Stratton Corp. | 346,054 | ||||||||
| 28,510 | Brink’s Co./The | 755,800 | ||||||||
| 11,620 | Carlisle Cos., Inc. | 753,789 | ||||||||
| 13,020 | CBIZ, Inc. * | 84,500 | ||||||||
| 18,162 | Crane Co. | 977,660 | ||||||||
| 23,512 | Curtiss-Wright Corp. | 772,134 | ||||||||
| 10,750 | EMCOR Group, Inc. | 402,050 | ||||||||
| 19,770 | EnerSys * | 906,257 | ||||||||
| 10,092 | Esterline Technologies Corp. * | 757,304 | ||||||||
| 30,674 | Foster Wheeler AG * | 647,221 | ||||||||
| 24,564 | General Cable Corp. * | 846,967 | ||||||||
| 3,133 | Hyster-Yale Materials Handling, Inc., | 163,511 | ||||||||
| 36,550 | ITT Corp. | 1,008,780 | ||||||||
| 3,350 | L.B. Foster Co., Class A | 147,902 | ||||||||
| 4,083 | McGrath RentCorp | 126,818 | ||||||||
| 5,788 | Navigant Consulting, Inc. * | 71,366 | ||||||||
| 15,730 | Ryder System, Inc. | 913,441 | ||||||||
| 8,000 | SPX Corp. | 596,080 | ||||||||
| 31,770 | Tutor Perini Corp. * | 522,299 | ||||||||
| 12,550 | URS Corp. | 551,196 | ||||||||
| 14,583,714 | ||||||||||
See accompanying notes which are an integral part of these Financial Statements.
Semi-Annual Report
4
| Dreman Contrarian Small Cap Value Fund | (Continued) |
| Shares | Value | |||||||||
| Common Stocks — (Continued) | |||||||||
| Information Technology — 11.7% | |||||||||
| 46,268 | ARRIS Group, Inc. * | $ | 763,885 | |||||||
| 140,209 | Brocade Communications Systems, Inc. * | 816,016 | ||||||||
| 30,010 | Celestica, Inc. * | 259,286 | ||||||||
| 7,900 | CSG Systems International, Inc. * | 170,719 | ||||||||
| 11,175 | DST Systems, Inc. | 772,751 | ||||||||
| 6,160 | EPIQ Systems, Inc. | 86,055 | ||||||||
| 9,301 | Euronet Worldwide, Inc. * | 283,960 | ||||||||
| 21,800 | Global Cash Access Holdings, Inc. * | 155,434 | ||||||||
| 42,035 | Ingram Micro, Inc., Class A * | 748,643 | ||||||||
| 12,247 | Itron, Inc. * | 485,594 | ||||||||
| 34,289 | Kulicke & Soffa Industries, Inc. * | 396,381 | ||||||||
| 11,430 | ManTech International Corp., Class A | 305,067 | ||||||||
| 32,500 | Mentor Graphics Corp. | 593,450 | ||||||||
| 41,005 | Microsemi Corp. * | 852,904 | ||||||||
| 26,326 | NCR Corp. * | 717,910 | ||||||||
| 19,890 | Plantronics, Inc. | 871,580 | ||||||||
| 32,867 | Sanmina Corp. * | 414,782 | ||||||||
| 3,507 | TESSCO Technologies, Inc. | 71,683 | ||||||||
| 16,821 | TTM Technologies, Inc. * | 121,616 | ||||||||
| 8,887,716 | ||||||||||
| Materials — 7.0% | |||||||||
| 8,145 | A. Schulman, Inc. | 211,526 | ||||||||
| 9,235 | AMCOL International Corp. | 284,161 | ||||||||
| 19,659 | Cabot Corp. | 738,392 | ||||||||
| 29,746 | Coeur d’Alene Mines Corp. * | 453,329 | ||||||||
| 37,482 | Huntsman Corp. | 706,910 | ||||||||
| 5,037 | Koppers Holdings, Inc. | 221,175 | ||||||||
| 35,150 | Olin Corp. | 849,575 | ||||||||
| 37,022 | Pan American Silver Corp. | 488,690 | ||||||||
| 47,814 | Steel Dynamics, Inc. | 719,123 | ||||||||
| 17,556 | Worthington Industries, Inc. | 564,952 | ||||||||
| 5,046 | Zep, Inc. | 76,699 | ||||||||
| 5,314,532 | ||||||||||
| Real Estate Investment Trusts — 7.1% | |||||||||
| 13,720 | Ashford Hospitality Trust, Inc. | 176,714 | ||||||||
| 9,590 | Associated Estates Realty Corp. | 171,373 | ||||||||
| 68,355 | Brandywine Realty Trust | 1,020,540 | ||||||||
| 37,270 | CapLease, Inc. | 261,635 | ||||||||
| 35,605 | CBL & Associates Properties, Inc. | 859,505 | ||||||||
| 31,934 | Hospitality Properties Trust | 939,179 | ||||||||
| 37,520 | Omega Healthcare Investors, Inc. | 1,233,282 | ||||||||
| 33,175 | Pennsylvania Real Estate Investment Trust | 687,718 | ||||||||
| 5,349,946 | ||||||||||
| Shares | Value | |||||||||
| Common Stocks — (Continued) | |||||||||
| Utilities — 3.3% | |||||||||
| 17,460 | IDACORP, Inc. | $ | 859,207 | |||||||
| 28,316 | Portland General Electric Co. | 913,191 | ||||||||
| 37,060 | TECO Energy, Inc. | 708,958 | ||||||||
| 2,481,356 | ||||||||||
| Total Common Stocks (Cost $57,295,452) | 72,069,342 | ||||||||
| Exchange-Traded Funds — 2.3% | |||||||||
| 18,759 | iShares Russell 2000 Index Fund | 1,765,972 | ||||||||
| Total Exchange-Traded Funds (Cost $1,571,168) | 1,765,972 | ||||||||
| Money Market Securities — 2.4% | |||||||||
| 1,790,327 | Huntington Money Market Fund, Trust Shares, 0.010% (b) | 1,790,327 | ||||||||
| Total Money Market Securities (Cost $1,790,327) | 1,790,327 | ||||||||
| Total Investments | 75,625,641 | ||||||||
| Liabilities in Excess of Other Assets — (0.0)% | (5,570) | ||||||||
| Net Assets — 100.0% | $ | 75,620,071 | |||||||
| (a) | Master Limited Partnership. |
| (b) | Rate disclosed is the seven day yield as of April 30, 2013. |
| * | Non-income producing security. |
See accompanying notes which are an integral part of these Financial Statements.
Semi-Annual Report
5
Statement of Assets and Liabilities
April 30, 2013 (Unaudited)
| Dreman Contrarian Small Cap Value Fund | ||||
| Assets: | ||||
Investments in securities | ||||
At cost | $ | 60,656,947 | ||
At fair value | 75,625,641 | |||
Dividends receivable | 55,602 | |||
Receivable for investments sold | 74,204 | |||
Receivable for fund shares sold | 20,969 | |||
Prepaid expenses | 37,859 | |||
Total assets | 75,814,275 | |||
| Liabilities: | ||||
Payable for investments purchased | 44,237 | |||
Payable for shares redeemed | 65,314 | |||
Payable to administrator (a) | 12,590 | |||
Payable to custodian (a) | 8,481 | |||
Payable to Adviser (a) | 33,376 | |||
Accrued 12b-1 fees (a) | 13,112 | |||
Other accrued expenses | 17,094 | |||
Total Liabilities | 194,204 | |||
Net Assets | $ | 75,620,071 | ||
| Net Assets consist of: | ||||
Paid in capital | $ | 53,217,333 | ||
Accumulated undistributed net investment income | 390,698 | |||
Accumulated undistributed net realized gain on investments | 7,043,346 | |||
Net unrealized appreciation appreciation | 14,968,694 | |||
Net Assets | $ | 75,620,071 | ||
| Net Assets (unlimited number of shares authorized) | ||||
| Class A: | ||||
Net Assets | $ | 4,225,671 | ||
Shares outstanding | 207,105 | |||
Net asset value and redemption price per share | $ | 20.40 | ||
Offering price per share (NAV/0.9425) (b) | $ | 21.64 | ||
| Retail Class: | ||||
Net Assets | $ | 60,314,788 | ||
Shares outstanding | 2,948,498 | |||
Net asset value and offering price per share | $ | 20.46 | ||
Redemption price per share (NAV * 0.99) (c) | $ | 20.26 | ||
| Institutional Class: | ||||
Net Assets | $ | 11,079,612 | ||
Shares outstanding | 539,335 | |||
Net asset value, offering and redemption price per share | $ | 20.54 | ||
| (a) | See Note 4 in the Notes to the Financial Statements. |
| (b) | Class A shares impose a maximum 5.75% sales charge on purchases. |
| (c) | A redemption fee of 1.00% is charged on shares held less than 60 days. |
See accompanying notes which are an integral part of these Financial Statements.
Semi-Annual Report
6
Statement of Operations
For the Six Months Ended April 30, 2013 (Unaudited)
| Dreman Contrarian Small Cap Value Fund | ||||
| Investment Income: | ||||
Dividend income | $ | 958,456 | ||
Foreign dividend taxes withheld | (960 | ) | ||
Total investment income | 957,496 | |||
| Expenses: | ||||
Investment Adviser fee(a) | 344,510 | |||
12b-1 expense(a): | ||||
Class A | 4,893 | |||
Retail Class | 80,094 | |||
Administration expenses(a) | 98,556 | |||
Legal expenses | 20,252 | |||
Registration expenses | 24,245 | |||
Printing expenses | 13,740 | |||
Auditing expenses | 8,912 | |||
Custodian expenses(a) | 25,812 | |||
Trustee fees and expenses | 8,052 | |||
Miscellaneous expenses | 5,104 | |||
Pricing expenses | 2,687 | |||
Insurance expenses | 503 | |||
Other expenses—overdraft fee | 4,822 | |||
Total expenses | 642,182 | |||
Fees waived by Adviser(a) | (147,440 | ) | ||
Net operating expenses | 494,742 | |||
Net investment income | 462,754 | |||
| Realized & Unrealized Gain on Investments | ||||
Net realized gain on investment securities | 7,656,917 | |||
Change in unrealized appreciation on investment securities | 4,186,795 | |||
Net realized and unrealized gain on investment securities | 11,843,712 | |||
Net increase in net assets resulting from operations | $ | 12,306,466 | ||
| (a) | See Note 4 in the Notes to the Financial Statements. |
See accompanying notes which are an integral part of these Financial Statements.
Semi-Annual Report
7
Statements of Changes in Net Assets
Dreman Contrarian Small Cap Value Fund | ||||||||
Six Months Ended 2013 (Unaudited) | Year Ended October 31, 2012 | |||||||
| Increase (Decrease) in Net Assets due to: | ||||||||
| Operations: | ||||||||
Net investment income | $ | 462,754 | $ | 549,304 | ||||
Net realized gain on investment securities | 7,656,917 | 1,026,473 | ||||||
Change in unrealized appreciation on investment securities | 4,186,795 | 7,273,010 | ||||||
Net increase in net assets resulting from operations | 12,306,466 | 8,848,787 | ||||||
| Distributions: | ||||||||
From net investment income, Class A | (16,349 | ) | (19,922 | ) | ||||
From net investment income, Retail Class | (292,834 | ) | (763,271 | ) | ||||
From net investment income, Institutional Class | (55,644 | ) | (138,006 | ) | ||||
From realized gain, Class A | (33,363 | ) | (177,353 | ) | ||||
From realized gain, Retail Class | (597,248 | ) | (7,279,617 | ) | ||||
From realized gain, Institutional Class | (113,488 | ) | (993,737 | ) | ||||
Total distributions | (1,108,926 | ) | (9,371,906 | ) | ||||
| Capital Transactions—Class A: | ||||||||
Proceeds from shares sold | 1,334,091 | 1,476,196 | ||||||
Reinvestment of distributions | 48,434 | 190,845 | ||||||
Amount paid for shares redeemed | (895,408 | ) | (429,013 | ) | ||||
Total Class A | 487,117 | 1,238,028 | ||||||
| Capital Transactions—Retail Class: | ||||||||
Proceeds from shares sold | 6,093,628 | 9,832,906 | ||||||
Reinvestment of distributions | 871,077 | 7,922,754 | ||||||
Amount paid for shares redeemed | (25,364,601 | ) | (30,077,921 | ) | ||||
Proceeds from redemption fees(a) | 400 | 3,978 | ||||||
Total Retail Class | (18,399,496 | ) | (12,318,283 | ) | ||||
| Capital Transactions—Institutional Class: | ||||||||
Proceeds from shares sold | 1,876,641 | 5,757,622 | ||||||
Reinvestment of distributions | 111,665 | 539,086 | ||||||
Amount paid for shares redeemed | (6,011,023 | ) | (4,582,110 | ) | ||||
Total Institutional Class | (4,022,717 | ) | 1,714,598 | |||||
Net change resulting from capital transactions | (21,935,096 | ) | (9,365,657 | ) | ||||
Total Decrease in Net Assets | (10,737,556 | ) | (9,888,776 | ) | ||||
Net Assets: | ||||||||
Beginning of period | 86,357,627 | 96,246,403 | ||||||
End of period | $ | 75,620,071 | $ | 86,357,627 | ||||
Accumulated net investment income included in net assets at end of period | $ | 390,698 | $ | 292,771 | ||||
| Share Transactions—Class A: | ||||||||
Shares sold | 72,147 | 84,226 | ||||||
Shares issued in reinvestment of distributions | 2,644 | 11,995 | ||||||
Shares redeemed | (46,303 | ) | (24,654 | ) | ||||
Total Class A | 28,488 | 71,567 | ||||||
| Share Transactions—Retail Class: | ||||||||
Shares sold | 321,280 | 576,620 | ||||||
Shares issued in reinvestment of distributions | 47,418 | 496,102 | ||||||
Shares redeemed | (1,339,423 | ) | (1,726,963 | ) | ||||
Total Retail Class | (970,725 | ) | (654,241 | ) | ||||
| Share Transactions—Institutional Class: | ||||||||
Shares sold | 95,599 | 331,118 | ||||||
Shares issued in reinvestment of distributions | 6,056 | 33,693 | ||||||
Shares redeemed | (298,005 | ) | (259,732 | ) | ||||
Total Institutional Class | (196,350 | ) | 105,079 | |||||
| (a) | A redemption fee of 1.00% is charged on shares held less than 60 days. |
See notes which are an integral part of these Financial Statements.
Semi-Annual Report
8
[THIS PAGE INTENTIONALLY LEFT BLANK]
Financial Highlights
(For a share outstanding throughout each period)
| Net Asset Value, beginning of period | Net investment income (loss) | Net realized and unrealized gain (loss) on investments | Total from investment operations | Distributions from net investment income | Distributions from net realized gain on investment transactions | Total distributions | ||||||||||||||||||||||
| DREMAN CONTRARIAN SMALL CAP VALUE FUND | ||||||||||||||||||||||||||||
| Class A Shares | ||||||||||||||||||||||||||||
| 2010(b) | $ | 16.04 | 0.10 | (c) | 2.30 | 2.40 | (0.14 | ) | — | (0.14 | ) | |||||||||||||||||
| 2011 | $ | 18.30 | 0.10 | (0.22 | ) | (0.12 | ) | (0.13 | ) | — | (0.13 | ) | ||||||||||||||||
| 2012 | $ | 18.07 | 0.11 | 1.47 | 1.58 | (0.19 | ) | (1.66 | ) | (1.85 | ) | |||||||||||||||||
| 2013(f) | $ | 17.80 | 0.09 | 2.75 | 2.84 | (0.08 | ) | (0.16 | ) | (0.24 | ) | |||||||||||||||||
| Retail Class | ||||||||||||||||||||||||||||
| 2008 | $ | 18.83 | 0.03 | (5.34 | ) | (5.31 | ) | (0.03 | ) | — | (0.03 | ) | ||||||||||||||||
| 2009 | $ | 13.51 | 0.07 | 2.12 | 2.19 | (0.06 | ) | (0.06 | ) | (0.12 | ) | |||||||||||||||||
| 2010 | $ | 15.59 | 0.09 | 2.80 | 2.89 | (0.13 | ) | — | (0.13 | ) | ||||||||||||||||||
| 2011 | $ | 18.35 | 0.11 | (0.22 | ) | (0.11 | ) | (0.13 | ) | — | (0.13 | ) | ||||||||||||||||
| 2012 | $ | 18.11 | 0.11 | 1.47 | 1.58 | (0.17 | ) | (1.66 | ) | (1.83 | ) | |||||||||||||||||
| 2013(f) | $ | 17.86 | 0.12 | 2.72 | 2.84 | (0.08 | ) | (0.16 | ) | (0.24 | ) | |||||||||||||||||
| Institutional Class Shares | ||||||||||||||||||||||||||||
| 2008 | $ | 18.86 | 0.07 | (5.35 | ) | (5.28 | ) | (0.03 | ) | — | (0.03 | ) | ||||||||||||||||
| 2009 | $ | 13.55 | 0.10 | (c) | 1.94 | 2.04 | (0.06 | ) | (0.06 | ) | (0.12 | ) | ||||||||||||||||
| 2010 | $ | 15.47 | 0.14 | 2.93 | 3.07 | (0.14 | ) | — | (0.14 | ) | ||||||||||||||||||
| 2011 | $ | 18.40 | 0.31 | (0.38 | ) | (0.07 | ) | (0.14 | ) | — | (0.14 | ) | ||||||||||||||||
| 2012 | $ | 18.19 | 0.14 | 1.48 | 1.62 | (0.23 | ) | (1.66 | ) | (1.89 | ) | |||||||||||||||||
| 2013(f) | $ | 17.92 | 0.16 | 2.70 | 2.86 | (0.08 | ) | (0.16 | ) | (0.24 | ) | |||||||||||||||||
| (a) | Total return represents the rate the investor would have earned or lost on an investment in the Fund, assuming reinvestment of dividends. |
| (b) | For the period November 20, 2009 (commencement of operations) to October 31, 2010. |
| (c) | Per share amount has been calculated using the average shares method. |
| (d) | Not Annualized. |
| (e) | Annualized. |
| (f) | Six months ended April 30, 2013 (Unaudited). |
| (g) | The Adviser was not contractually obligated to reimburse 12b-1 expenses. Accordingly, if the Adviser had not voluntarily reimbursed the Fund for these expenses, each expense ratio would have been 0.25% higher and each net investment income ratio would have been 0.25% lower. |
| (h) | Effective June 1, 2009, the Adviser discontinued the voluntary waiver of 12b-1 fees. Accordingly, if the Adviser had not voluntarily reimbursed the Fund for these expenses, each expense ratio would have been 0.12% higher and each net investment income ratio would have been 0.12% lower. |
| (i) | Amount is less than $0.005. |
| (j) | Effective June 1, 2009, the Adviser agreed to waive fees to maintain Fund expenses at 1.00%. Prior to that date, the expense cap was 1.25%. |
See notes which are an integral part of these Financial Statements.
Semi-Annual Report
10
| Paid in capital from redemption fees | Net Asset Value, end of period | Total return(a) | Net Assets, end of period (000 omitted) | Ratio of net expenses to average net assets | Ratio of expenses to average net assets before waiver | Ratio of net investment income (loss) to average net assets | Ratio of net investment income (loss) to average net assets before waiver | Portfolio turnover rate | ||||||||||||||||||||||||||
| — | $ | 18.30 | 15.00 | %(d) | $ | 275 | 1.25 | %(e) | 1.59 | %(e) | 0.62 | %(e) | 0.28 | %(e) | 35.75 | % | ||||||||||||||||||
| 0.02 | $ | 18.07 | (0.60 | )% | $ | 1,935 | 1.25 | % | 1.49 | % | 0.46 | % | 0.22 | % | 44.08 | % | ||||||||||||||||||
| — | $ | 17.80 | 9.92 | % | $ | 3,180 | 1.25 | % | 1.75 | % | 0.55 | % | 0.05 | % | 30.19 | % | ||||||||||||||||||
| — | $ | 20.40 | 16.10 | %(d) | $ | 4,226 | 1.25 | %(e) | 1.60 | %(e) | 1.01 | %(e) | 0.66 | %(e) | 13.18 | % | ||||||||||||||||||
| 0.02 | $ | 13.51 | (28.14 | )% | $ | 46,298 | 1.50 | %(g) | 1.70 | % | 0.25 | %(g) | 0.05 | % | 46.95 | % | ||||||||||||||||||
| 0.01 | $ | 15.59 | 16.51 | % | $ | 72,442 | 1.38 | %(h) | 2.18 | % | 0.54 | %(h) | (0.26 | )% | 80.75 | % | ||||||||||||||||||
| — | (i) | $ | 18.35 | 18.61 | % | $ | 105,796 | 1.25 | % | 1.58 | % | 0.53 | % | 0.20 | % | 35.75 | % | |||||||||||||||||
| — | (i) | $ | 18.11 | (0.66 | )% | $ | 82,840 | 1.25 | % | 1.51 | % | 0.57 | % | 0.32 | % | 44.08 | % | |||||||||||||||||
| — | (i) | $ | 17.86 | 9.93 | % | $ | 69,992 | 1.25 | % | 1.74 | % | 0.56 | % | 0.06 | % | 30.19 | % | |||||||||||||||||
| — | (i) | $ | 20.46 | 16.04 | %(d) | $ | 60,315 | 1.25 | %(e) | 1.62 | %(e) | 1.12 | %(e) | 0.75 | %(e) | 13.18 | % | |||||||||||||||||
| — | $ | 13.55 | (28.05 | )% | $ | 4,253 | 1.25 | % | 1.45 | % | 0.50 | % | 0.30 | % | 46.95 | % | ||||||||||||||||||
| — | $ | 15.47 | 15.27 | % | $ | 15,309 | 1.09 | %(j) | 2.06 | % | 0.74 | % | (0.23 | )% | 80.75 | % | ||||||||||||||||||
| — | $ | 18.40 | 19.90 | % | $ | 19,300 | 1.00 | % | 1.34 | % | 0.79 | % | 0.45 | % | 35.75 | % | ||||||||||||||||||
| — | $ | 18.19 | (0.44 | )% | $ | 11,472 | 1.00 | % | 1.26 | % | 0.85 | % | 0.59 | % | 44.08 | % | ||||||||||||||||||
| — | $ | 17.92 | 10.14 | % | $ | 13,185 | 1.00 | % | 1.49 | % | 0.80 | % | 0.30 | % | 30.19 | % | ||||||||||||||||||
| — | $ | 20.54 | 16.10 | %(d) | $ | 11,080 | 1.00 | %(e) | 1.36 | %(e) | 1.33 | %(e) | 0.97 | %(e) | 13.18 | % | ||||||||||||||||||
Semi-Annual Report
11
Notes to Financial Statements
April 30, 2013 (Unaudited)
Note 1. Organization
The Dreman Contrarian Small Cap Value Fund (the “Fund”) is an open-end diversified series of the Valued Advisers Trust (the “Trust”). The Trust is a management investment company established under the laws of Delaware by an Agreement and Declaration of Trust dated June 13, 2008 (the “Trust Agreement”). The Trust Agreement permits the Trustees to issue an unlimited number of shares of beneficial interest of separate series without par value. The Fund is one of a series of funds authorized by the Board of Trustees (the “Board”). The Fund’s investment adviser is Dreman Value Management, LLC (the “Adviser”). The investment objective of the Fund is long-term capital appreciation.
The Fund currently offers Class A shares, Retail Class shares, and Institutional Class shares. Class A shares are offered with a front-end sales charge. The Retail Class shares impose a 1% redemption fee on all shares redeemed within 60 days of purchase. Institutional Class shares do not have sales charges on original purchases.
The Fund was previously a series of the Dreman Contrarian Funds, an unaffiliated registered investment company. On February 8, 2013, shareholders voted to reorganize the Fund into the Trust.
Note 2. Significant Accounting Policies
The following is a summary of significant accounting policies followed by the Fund in the preparation of its financial statements. These policies are in conformity with the generally accepted accounting principles in the United States of America (“GAAP”).
Estimates—The preparation of financial statements in conformity with GAAP requires management to make estimates and assumptions that affect the reported amounts of assets and liabilities and disclosure of contingent assets and liabilities at the date of the financial statements and the reported amounts of increases and decreases in net assets from operations during the reporting period. Actual results could differ from those estimates.
Securities Valuation—All investments in securities are recorded at their estimated fair value as described in Note 3.
Federal Income Taxes—The Fund makes no provision for federal income or excise tax. The Fund intends to qualify each year as a regulated investment company (“RIC”) under subchapter M of the Internal Revenue Code of 1986, as amended, by complying with the requirements applicable to RICs and by distributing substantially all of its taxable income. The Fund also intends to distribute sufficient net investment income and net capital gains, if any, so that it will not be subject to excise tax on undistributed income and gains. If the required amount of net investment income or gains is not distributed, the Fund could incur a tax expense.
As of and during the six months ended April 30, 2013, the Fund did not have a liability for any unrecognized tax benefits. The Fund recognizes interest and penalties, if any, related to
unrecognized tax benefits as income tax expense in the statement of operations. The Fund is subject to examination by U.S. federal tax authorities for the last four tax year ends and the interim tax period since then.
Expenses —Expenses incurred by the Trust that do not relate to a specific fund of the Trust are allocated to the individual funds based on each fund’s relative net assets or other appropriate basis as (determined by the Board). Expenses attributable to any class are borne by that class. Income, realized gains and losses, unrealized appreciation and depreciation, and expenses are allocated to each class based on the net assets in relation to the relative net assets of the Fund.
Security Transactions and Related Income—The Fund follows industry practice and records security transactions on the trade date. The specific identification method is used for determining gains or losses for financial statement and income tax purposes. Dividend income is recorded on the ex-dividend date and interest income is recorded on an accrual basis. Discounts and premiums on securities purchased are accreted or amortized using the effective interest method. Withholding taxes on foreign dividends have been provided for in accordance with the Fund’s understanding of the applicable country’s tax rules and rates.
Dividends and Distributions—Distributions to shareholders, which are determined in accordance with income tax regulations, are recorded on the ex-dividend date. The Fund intends to distribute substantially all of its net investment income on at least an annual basis. The Fund intends to distribute its net realized long-term capital gains and its net realized short-term capital gains at least once a year. The treatment for financial reporting purposes of distributions made to shareholders during the year from net investment income or net realized capital gains may differ from their ultimate treatment for federal income tax purposes. These differences are caused primarily by differences in the timing of the recognition of certain components of income, expense or realized capital gain for federal income tax purposes. Where such differences are permanent in nature, they are reclassified in the components of the net assets based on their ultimate characterization for federal income tax purposes. Any such reclassifications will have no effect on net assets, results of operations or net asset values per share of the Fund.
New Accounting Pronouncement—In December 2011, Financial Accounting Standards Board issued Accounting Standards Update (“ASU”) No. 2011-11, Balance Sheet (Topic 210): Disclosures about Offsetting Assets and Liabilities (“ASU 2011-11”). ASU 2011-11 relates to disclosures about offsetting assets and liabilities. In January 2013, the Financial Accounting Standards Board issued Accounting Standards Update No. 2013-01, Clarifying the Scope of Disclosures about Offsetting Assets and Liabilities (“ASU 2013-01”). This update gives additional clarifications to ASU 2011-11. The amendments in ASU 2013-01 require an entity to disclose information about offsetting and related arrangements to
Semi-Annual Report
12
enable user of its financial statements to understand the effect of those arrangements on its financial position. ASU 2013-01 is effective for annual reporting periods beginning on or after January 1, 2013, and interim periods within those annual periods. At this time, management is evaluating the implications of ASU 2013-01 and its impact on the financial statements. However, management believes the adoption of these ASUs will not have a material impact on the financial statements.
Note 3. Securities Valuation and Fair Value Measurements
Fair value is defined as the price that a Fund would receive upon selling an investment in a timely transaction to an independent buyer in the principal or most advantageous market of the investment. GAAP establishes a three-tier hierarchy to maximize the use of observable market data and minimize the use of unobservable inputs and to establish classification of fair value measurements for disclosure purposes.
Inputs refer broadly to the assumptions that market participants would use in pricing the asset or liability, including assumptions about risk (the risk inherent in a particular valuation technique used to measure fair value including such a pricing model and/or the risk inherent in the inputs to the valuation technique). Inputs may be observable or unobservable. Observable inputs are inputs that reflect the assumptions market participants would use in pricing the asset or liability developed based on market data obtained from sources independent of the reporting entity. Unobservable inputs are inputs that reflect the reporting entity’s own assumptions about the assumptions market participants would use in pricing the asset or liability developed based on the best information available in the circumstances.
Various inputs are used in determining the value of the Fund’s investments. These inputs are summarized in the three broad levels listed below.
| • | Level 1—quoted prices in active markets for identical securities |
| • | Level 2—other significant observable inputs (including, but not limited to, quoted prices for an identical security in an inactive market, quoted prices for similar securities, interest rates, prepayment speeds, credit risk, etc.) |
| • | Level 3—significant unobservable inputs (including the Fund’s own assumptions in determining fair value of investments based on the best information available) |
The inputs used to measure fair value may fall into different levels of the fair value hierarchy. In such cases, for disclosure purposes, the level in the fair value hierarchy within which the fair value measurement falls in its entirety, is determined based, on the lowest level input that is significant to the fair value measurement in its entirety.
Equity securities, including common stocks, exchanged-traded funds and real estate investment trusts, are generally valued by using market quotations, but may be valued on the basis of prices furnished by a pricing service when the Adviser believes such prices more accurately reflect the fair value of such securities. Securities that are traded on any stock
exchange are generally valued by the pricing service at the last quoted sale price. Lacking a last sale price, an exchange traded security is generally valued by the pricing service at its last bid price. Securities traded in the NASDAQ over-the-counter market are generally valued by the pricing service at the NASDAQ Official Closing Price.
When using the market quotations or close prices provided by the pricing service and when the market is considered active, the security is classified as a Level 1 security. Sometimes, an equity security owned by the Fund will be valued by the pricing service with factors other than market quotations or when the market is considered inactive. When this happens, the security is classified as a Level 2 security. When market quotations are not readily available, when the Adviser determines that the market quotation or the price provided by the pricing service does not accurately reflect the current fair value, or when restricted or illiquid securities are being valued, such securities are valued as determined in good faith by the Adviser, in conformity with guidelines adopted by and subject to review by the Board. These securities are categorized as Level 3 securities.
Investments in mutual funds, including money market mutual funds, are generally priced at the ending NAV provided by the service agent of the funds. These securities are categorized as Level 1 securities.
Short-term investments in fixed income securities, (those with maturities of less than 60 days when acquired, or which subsequently are within 60 days of maturity), are valued by using the amortized cost method of valuation, which the Board has determined represents fair value. These securities are classified as Level 2 securities.
In accordance with the Trust’s good faith pricing guidelines, the Adviser is required to consider all appropriate factors relevant to the value of securities for which it has determined other pricing sources are not available or reliable as described above. No single standard exists for determining fair value, because fair value depends upon the circumstances of each individual case. As a general principle, the current fair value of an issue of securities being valued by the Adviser would appear to be the amount which the owner might reasonably expect to receive for them upon their current sale. Methods which are in accordance with this principle may, for example, be based on (i) a multiple of earnings; (ii) a discount from market of a similar freely traded security (including a derivative security or a basket of securities traded on other markets, exchanges or among dealers); or (iii) yield to maturity with respect to debt issues, or a combination of these and other methods. Good faith pricing is permitted if, in the Adviser’s opinion, the validity of market quotations appears to be questionable based on factors such as evidence of a thin market in the security based on a small number of quotations, a significant event occurs after the close of a market but before a Fund’s NAV calculation that may affect a security’s value, or the Adviser is aware of any other data that calls into question the reliability of market quotations. Good faith pricing may also be used in instances when the bonds the Fund invests in may default or otherwise cease to have market quotations readily available.
Semi-Annual Report
13
Notes to Financial Statements (Continued)
The following is a summary of the inputs used to value the Fund’s investments as of April 30, 2013:
| Valuation Inputs | ||||||||||||||||
| Assets | Level 1—Quoted Prices in Active Markets | Level 2—Other Significant Observable Inputs | Level 3—Significant Unobservable Inputs | Total | ||||||||||||
Common Stocks* | $ | 72,069,342 | $ | — | $ | — | $ | 72,069,342 | ||||||||
Exchange-Traded Funds | 1,765,972 | — | — | 1,765,972 | ||||||||||||
Money Market Securities | 1,790,327 | — | — | 1,790,327 | ||||||||||||
|
|
|
|
|
|
|
| |||||||||
Total | $ | 75,625,641 | $ | — | $ | — | $ | 75,625,641 | ||||||||
| * | Refer to Schedule of Investments for industry classifications. |
The Fund did not hold any investments at any time during the reporting period in which other significant observable inputs (Level 2) were used in determining fair value. The Fund did not hold any investments at any time during the reporting period in which significant unobservable inputs were used in determining fair value; therefore, no reconciliation of Level 3 securities is included for this reporting period.
The Trust recognizes transfers between fair value hierarchy levels at the reporting period end. There were no transfers between any levels as of April 30, 2013.
Note 4. Fees and Other Transactions with Affiliates
Under the terms of the management agreement between the Trust and the Adviser (the “Agreement”) for the Fund, the Adviser manages the Fund’s investments subject to oversight of the Trustees. As compensation for its management services, the Fund is obligated to pay the Adviser a fee computed and accrued daily and paid monthly at an annual rate of 0.85% of the average daily net assets of the Fund. For the six months ended April 30, 2013, the Adviser earned fees of $344,510 from the Fund before the waivers described below. At April 30, 2013, the Fund owed $33,376 to the Adviser.
The Adviser has contractually agreed to waive its management fee and/or reimburse certain operating expenses, but only to the extent necessary so that the Fund’s net expenses,
excluding brokerage fees and commissions, borrowing costs (such as (a) interest expense and (b) dividends on securities sold short), taxes, extraordinary expenses, 12b-1 fees (if applicable), and any indirect expenses (such as fees and expenses of acquired funds), do not exceed 1.00%. Each waiver or reimbursement of an expense by the Adviser is subject to repayment by the Fund within the three fiscal years following the fiscal year in which the expense was incurred, provided that the Fund is able to make the repayment without exceeding the expense limitation. The contractual agreement is in effect through February 28, 2014. The expense cap may not be terminated prior to this date except by the Board. For the six months ended April 30, 2013, the Adviser waived fees of $147,440 from the Fund. This amount is subject to potential recoupment by the Adviser through October 31, 2016.
Semi-Annual Report
14
The amounts subject to repayment by the Fund, pursuant to the aforementioned conditions are as follows:
| Amount | Recoverable October 31, | |||||||
| $374,325 | 2013 | |||||||
| 307,826 | 2014 | |||||||
| 459,430 | 2015 | |||||||
The Trust retains Huntington Asset Services, Inc. (“HASI”) to manage the Fund’s business affairs and to provide the Fund with administrative services, including all regulatory, reporting and necessary office equipment and personnel. The Trust also retains HASI to act as the Fund’s transfer agent and to provide the Fund with fund accounting services. For the six months ended April 30, 2013, HASI earned fees of $98,556 for administrative services. At April 30, 2013, HASI was owed $12,590 for administrative services.
Certain officers and one Trustee of the Trust are members of management and/or employees of HASI. HASI operates as a wholly-owned subsidiary of Huntington Bancshares, Inc., the parent company of the Unified Financial Securities, Inc. (the “Distributor”) and Huntington National Bank, the custodian of the Fund’s investments (the “Custodian”). For the six months ended April 30, 2013, the Custodian earned fees $25,812 for custody services. At April 30, 2013, the Custodian was owed $8,481 for custody services.
The Distributor acts as the principal distributor of the Fund’s shares. During the six months ended April 30, 2013, the Distributor received $733 from commissions earned on sales of Class A shares. The Distributor, HASI and the Custodian are controlled by Huntington Bancshares, Inc.
The Fund has adopted a Distribution Plan (the “Plan”) pursuant to Rule 12b-1 under the 1940 Act. The Plan provides that the Fund will pay the Distributor and/or any registered securities dealer, financial institution or any other person (a “Recipient”) a shareholder servicing fee aggregating up to: 0.25% of the average daily net assets of the Class A shares and 0.25% of the average daily net assets of the Retail Class shares in connection with the promotion and distribution of the Fund’s shares or the provision of personal services to shareholders, including, but not necessarily limited to, advertising, compensation to underwriters, dealers and selling personnel, the printing and mailing of prospectuses to other than current Fund shareholders, the printing and mailing of sales literature and servicing shareholder accounts. The Fund
or the Adviser may pay all or a portion of these fees to any Recipient who renders assistance in distributing or promoting the sale of shares, or who provides certain shareholder services, pursuant to a written agreement. The Plan is a compensation plan, which means that compensation is paid regardless of 12b-1 expenses actually incurred. It is anticipated that the Plan will benefit shareholders because an effective sales program typically is necessary in order for the Fund to reach and maintain a sufficient size to achieve efficiently its investment objectives and to realize economies of scale. For the six months ended April 30, 2013, Class A shares 12b-1 expense incurred by the Fund was $4,893 and Retail Class shares 12b-1 expense incurred by the Fund was $80,094. The Fund owed $851 for Class A shares and $12,261 for Class C shares 12b-1 fees as of April 30, 2013.
Note 5. Purchases and Sales of Securities
For the six months ended April 30, 2013, purchases and sales of investment securities, other than short-term investments and short-term U.S. government obligations were as follows:
| Purchases | Sales | |||
$10,616,017 | $ | 33,591,817 | ||
At April 30, 2013, the net unrealized appreciation (depreciation) of investments for tax purposes was as follows:
Gross Unrealized Appreciation | $ | 15,692,031 | ||
Gross Unrealized (Depreciation) | (1,334,832 | ) | ||
|
| |||
Net Unrealized Appreciation on Investments | $ | 14,357,199 |
At April 30, 2013, the aggregate cost of securities for federal income tax purposes was $61,268,442 for the Fund.
Note 6. Beneficial Ownership
The beneficial ownership, either directly or indirectly, of 25% or more of the voting securities of a fund creates a presumption of control of a fund, under Section 2(a) (9) of the Investment Company Act of 1940. At April 30, 2013, UBS Financial Services, Inc (“UBS”) owned, as a record shareholder, 52.11% of the outstanding shares of Class A. At April 30, 2013, Charles Schwab & Co. (“Charles Schwab”) and National Financial Services Co. (“NFS”) owned, as record shareholders, 33.19% and 42.63%, respectively, of the outstanding shares of Retail Class. The Trust does not know whether UBS, Charles Schwab, and NFS or any of the underlying beneficial owners owned or controlled 25% or more of the voting securities of the Fund.
Semi-Annual Report
15
Notes to Financial Statements (Continued)
Note 7. Distributions to Shareholders
The Fund paid the following income distributions to shareholders for the six months ended April 30, 2013:
| Record Date | Ex-Dividend Date | Per Share Amount | ||||||||||
Class A | 12/17/2012 | 12/18/2012 | $ | 0.0784 | ||||||||
Retail Class | 12/17/2012 | 12/18/2012 | $ | 0.0784 | ||||||||
Institutional Class | 12/17/2012 | 12/18/2012 | $ | 0.0784 | ||||||||
The Fund paid the following capital gains distributions to shareholders for the six months ended April 30, 2013:
| Record Date | Ex-Dividend Date | Per Share Amount | ||||||||||||||
Class A | Short-Term | 12/17/2012 | 12/18/2012 | $ | 0.0659 | |||||||||||
| Long-Term | 12/17/2012 | 12/18/2012 | $ | 0.0940 | ||||||||||||
Retail Class | Short-Term | 12/17/2012 | 12/18/2012 | $ | 0.0659 | |||||||||||
| Long-Term | 12/17/2012 | 12/18/2012 | $ | 0.0940 | ||||||||||||
Institutional Class | Short-Term | 12/17/2012 | 12/18/2012 | $ | 0.0659 | |||||||||||
| Long-Term | 12/17/2012 | 12/18/2012 | $ | 0.0940 | ||||||||||||
The tax character of distributions paid for the fiscal period ended October 31, 2012 was as follows:
| 2012 | 2011 | |||||||
Distributions paid from: | ||||||||
Ordinary Income | $ | 902,146 | $ | 872,401 | ||||
Net Long-Term Capital Gain | 8,469,760 | — | ||||||
|
|
|
| |||||
| $ | 9,371,906 | $ | 872,401 | |||||
At October 31, 2012, the components of distributable earnings (accumulated losses) on a tax basis were as follows:
Undistributed ordinary income | $ | 537,907 | ||
Undistributed long-term capital gains | 496,887 | |||
Unrealized appreciation | 10,170,404 | |||
|
| |||
| $ | 11,205,198 |
Note 8: Proxy Voting Results
A special meeting was held February 8, 2013 to obtain shareholder approval to reorganize the Dreman Contrarian Small Cap Value Fund from a series of the Dreman Contrarian Funds to a series of Valued Advisers Trust.
The result of this special meeting shareholder vote was as follows:
For | 1,945,176 | |||
Against | 28,946 | |||
Abstain | 589,701 |
Semi-Annual Report
16
Board Approval Of Investment Advisory Agreement (Unaudited)
Note to Reader: References in the following section to the Dreman Contrarian Small Cap Value Fund or the Fund or its predecessor also refer to the Fund as it existed and operated in another fund family (e.g., references to performance).
At a meeting held on December 10-11, 2012, the Board of Trustees (the “Board”) considered the initial approval of an Investment Advisory Agreement (the “Advisory Agreement”) between the Trust and Dreman Value Management, LLC (the “Adviser” or “Dreman”) on behalf of the Dreman Contrarian Small Cap Value Fund (the “Fund”). Counsel reviewed with the Board the requirements of the 1940 Act and the applicable disclosure obligations associated therewith. The Board discussed the arrangements between the Adviser and the Trust with respect to the Fund and reflected on discussions with representatives of the Adviser regarding the Advisory Agreement, the expense limitation agreement and the manner in which the Fund would be managed. The Board also reflected on the presentation by representatives of the Adviser at a special meeting of the Board held on November 27, 2012 regarding the Fund. The Board noted that the Fund was currently in operations in another fund family that is administered by Huntington Asset Services, Inc, the Trust’s administrator, transfer agent and fund accountant.
Counsel referred the Board to the Meeting materials, which included, among other things, a memorandum from Counsel addressing the duties of Trustees regarding the approval of the proposed Advisory Agreement, a letter from Counsel to the Adviser and the Adviser’s responses to that letter, a copy of the Adviser’s financial related information, a copy of the Adviser’s Form ADV, a fee comparison analysis for the Fund and comparable mutual funds, and the Advisory Agreement and expense limitation agreement.
Counsel noted that the 1940 Act requires the approval of the investment advisory agreement between the Trust and Dreman by a majority of the Independent Trustees. The Board discussed the arrangements between Dreman and the Trust with respect to the Fund. The Board reviewed a memorandum from Counsel, and addressed to the Trustees that summarized, among other things, the fiduciary duties and responsibilities of the Board in reviewing and approving the Advisory Agreement. Mr. Lively discussed with the Trustees the types of information and factors that should be considered by the Board in order to make an informed decision regarding the approval of the Advisory Agreement, including the following material factors: (i) the nature, extent, and quality of the services provided by Dreman; (ii) the investment performance of the predecessor to Fund; (iii) the costs of the services to be provided and profits to be realized by Dreman from the relationship with the Fund; (iv) the extent to which economies of scale would be realized if the Fund grows and whether advisory fee levels reflect those economies of scale for the benefit of the investors of the Fund; and (v) Dreman’s practices regarding possible conflicts of interest.
In assessing these factors and reaching its decisions, the Board took into consideration information specifically prepared and/or presented in connection with this approval process, including information presented at the Meeting. The Board requested and was provided with information and reports relevant to the approval of the Advisory Agreement, including: (i) information regarding the services and support and to be provided (and provided) to the Dreman Fund (and its predecessor) and shareholders by Dreman; (ii) commentary on the performance of the predecessor of the Dreman Fund; (iii) a presentation by Dreman management addressing investment philosophy, investment strategy, personnel and operations; (iv) an overview of the compliance culture of Dreman; and (v) disclosure information contained in the draft prospectus and SAI of the Trust with respect to the Dreman Fund and the Form ADV of Dreman. The Board also requested and received various informational materials including, without limitation: (i) documents containing information about Dreman, including financial information, a description of personnel and the services to be provided to the Dreman Fund, information on investment advice, performance, summaries of Dreman Fund expenses, compliance program, current legal matters, and other general information; (ii) comparative expense and performance information for other mutual funds with strategies similar to the Dreman Fund; and (iii) benefits to be realized by Dreman from its relationship with the Dreman Fund. The Board did not identify any particular information that was most relevant to its consideration to approve the Agreement and each Trustee may have afforded different weight to the various factors.
The Board did not identify any particular information that was most relevant to its consideration to approve the Agreement and each Trustee may have afforded different weight to the various factors.
| 1. | The nature, extent, and quality of the services to be provided by the Adviser. In this regard, the Board considered the Adviser’s responsibilities under the Advisory Agreement. The Board considered the services that have been provided by the Adviser to a predecessor of the Fund. The Trustees considered the services provided (and to be provided) by the Adviser to the Fund including, without limitation: the quality of its investment advisory services (including research and recommendations with respect to portfolio securities), its process for formulating investment recommendations and assuring compliance with the Fund’s investment objectives and limitations, its coordination of services for the Fund among the Fund’s service providers, and its anticipated efforts to promote the Fund and grow its assets. The Trustees considered the Adviser’s continuity of, and commitment to retain, qualified personnel and the Adviser’s commitment to maintain and enhance its resources and systems. The Trustees considered the Adviser’s personnel, including the education and experience of the Adviser’s personnel. After considering the foregoing information and further information in the Meeting materials provided by the Adviser (including the Adviser’s Form ADV), the Board concluded that, in light of all the facts and circumstances, the nature, extent, and quality of the services provided by the Adviser were satisfactory and adequate for the Fund. |
Semi-Annual Report
17
| 2. | Investment Performance of the Fund and the Adviser. In considering the investment performance of the Fund and the Adviser, the Trustees compared the short-term, one-year, three-year and five-year performance of the Fund with the performance of funds with similar objectives managed by other investment advisers, as well as with aggregated peer group data. The Trustees also considered the consistency of the Adviser’s management of the Fund with its investment objective, strategies, and limitations. The Trustees noted that the Fund performed above average in its peer group category in the short-term and one-year periods, but performed significantly under the averages and means of the peers for the three-year and five-year periods that were reviewed. The Trustees also considered the Fund’s performance relative to the performance of the Adviser’s composite for accounts managed similarly to the Fund based on recent data and observed that the Fund performed comparably to those other accounts. After reviewing and discussing the investment performance of the Fund further, the Adviser’s experience managing the Fund, the Adviser’s historical performance, and other relevant factors, the Board concluded, in light of all the facts and circumstances, that the investment performance of the Fund and the Adviser was acceptable. |
| 3. | The costs of the services to be provided and profits to be realized by the Adviser from the relationship with the Fund. In considering the costs of services to be provided and the profits to be realized by the Adviser from the relationship with the Fund, the Trustees considered: (1) the Adviser’s financial condition, which were consolidated with those of a subsidiary; (2) asset level of the Fund; (3) the overall expenses of the Fund; and (4) the nature and frequency of advisory fee payments. The Trustees reviewed information provided by the Adviser regarding its profits associated with managing the Fund. The Trustees also considered potential benefits for the Adviser in managing the Fund. The Trustees then compared the fees and expenses of the Fund (including the management fee) to other comparable mutual funds. The Trustees noted that the Fund’s management fee was very comparable to the average and median fees for the Fund’s peer group category. Based on the foregoing, the Board concluded that the fees to be paid to the Adviser by the Fund and the profits to be realized by the Adviser, in light of all the facts and circumstances, were fair and reasonable in relation to the nature and quality of the services provided by the Adviser. |
| 4. | The extent to which economies of scale would be realized as the Fund grows and whether advisory fee levels reflect these economies of scale for the benefit of the Fund’s investors. In this regard, the Board considered the Fund’s fee arrangements with the Adviser. The Board considered that while the management fee remained the same at all asset levels, the Fund’s shareholders had experienced benefits from the Fund’s expense limitation arrangement. In light of its ongoing consideration of the Fund’s asset levels, expectations for growth in the Fund, and fee levels, the Board determined that the Fund’s fee arrangements, in light of all the facts and circumstances, were fair and reasonable in relation to the nature and quality of the services provided by the Adviser. |
| 5. | Possible conflicts of interest. In considering the Adviser’s practices regarding conflicts of interest, the Trustees evaluated the potential for conflicts of interest and considered such matters as the experience and ability of the advisory personnel assigned to the Fund; the basis of decisions to buy or sell securities for the Fund and/or the Adviser’s other accounts; and the substance and administration of the Adviser’s code of ethics. The Trustees also considered disclosure in the registration statement of the Trust relating to the Adviser’s potential conflicts of interest. Based on the foregoing, the Board determined that the Adviser’s standards and practices of the Advisers relating to the identification and mitigation of potential conflicts of interest were satisfactory. |
After additional consideration of the factors delineated in the memorandum provided by Counsel and further discussion among the Board, the Board determined to approve the Advisory Agreement between the Trust and the Adviser.
Semi-Annual Report
18
OTHER INFORMATION
The Fund’s Statement of Additional Information (“SAI”) includes additional information about the Trustees and is available without charge, upon request. You may call toll-free at (800) 247-1014 to request a copy of the SAI or to make shareholder inquiries.
PROXY VOTING
A description of the policies and procedures that the Fund uses to determine how to vote proxies relating to portfolio securities and information regarding how the Fund voted those proxies during the recent twelve month period ended June 30 are available without charge upon request by (1) calling the Fund at (800) 247-1014 or (2) from Fund documents filed with the Commission on the Commission’s website at www.sec.gov.
TRUSTEES
R. Jeffrey Young, Chairman
Dr. Merwyn R. Vanderlind
Ira Cohen
OFFICERS
R. Jeffrey Young, Principal Executive Officer and President
John C. Swhear, Chief Compliance Officer, AML Officer and Vice-President
Carol J. Highsmith, Vice President
Matthew J. Miller, Vice President
Robert W. Silva, Principal Financial Officer and Treasurer
Heather Bonds, Secretary
INVESTMENT ADVISER
Dreman Value Management, LLC
Harborside Financial Center
Plaza 10, Suite 800
Jersey City, NJ 07311
DISTRIBUTOR
Unified Financial Securities, Inc.
2960 North Meridian Street, Suite 300
Indianapolis, IN 46208
INDEPENDENT REGISTERED PUBLIC ACCOUNTING FIRM
Cohen Fund Audit Services, Ltd.
1350 Euclid Avenue, Suite 800
Cleveland, OH 44115
LEGAL COUNSEL
The Law Offices of John H. Lively & Associates, Inc.
A member firm of The 1940 Act Law GroupTM
11300 Tomahawk Creek Parkway, Ste. 310
Leawood, KS 66224
CUSTODIAN
Huntington National Bank
41 S. High St.
Columbus, OH 43215
ADMINISTRATOR, TRANSFER AGENT
AND FUND ACCOUNTANT
Huntington Asset Services, Inc.
2960 North Meridian Street, Suite 300
Indianapolis, IN 46208
This report is intended only for the information of shareholders or those who have received the Fund’s prospectus which contains information about the Fund’s management fee and expenses. Please read the prospectus carefully before investing.
Distributed by Unified Financial Securities, Inc.
Member FINRA/SIPC
Notes

THE SOUND MIND INVESTING FUND
THE SOUND MIND INVESTING
BALANCED FUND
THE SMI DYNAMIC ALLOCATION FUND
| SEMI-ANNUAL REPORT |
| April 30, 2013 |
Fund Adviser:
SMI Advisory Services, LLC
11135 Baker Hollow Road
Columbus, IN 47201
Toll Free (877) SMI-Fund
www.smifund.com
Dear Fellow Shareholders,
For the semi-annual period ended April 30, 2013, the SMI Funds delivered both strong absolute and relative returns. The Sound Mind Investing Fund (SMIFX) gained 15.73% compared with the S&P 500’s total return of 14.42% and the Wilshire 5000’s total return of 14.96%. The Sound Mind Investing Balanced Fund (SMILX) gained 10.48% which compares favorably to its Blended Benchmark’s return of 9.19%. The newest fund in the SMI Family, the SMI Dynamic Allocation Fund (SMIDX) was launched on February 28, 2013. During its first two months, SMIDX returned 8.10% which compares favorably to both the all-stock Wilshire 5000 (5.68%) and SMIDX’s Blended Benchmark (3.84%).
Last October we wrote about bright spots emerging that suggested better days ahead for Upgrading. Those trends continued through the fourth quarter of 2012, propelling International stocks to a strong finish and the top performance of our five risk categories. Then, as 2013 began, the stock market rocketed out of the starting gate, earning as much in the first quarter as it typically does in the average year. While celebrating such rapid gains is natural, last year’s experience – when stocks had an even better first quarter, but were then limited to a small gain over the remaining nine months of the year – provides a reminder that such rapid gains don’t necessarily offer any insight as to what comes next.
Despite these strong returns, SMI continues to believe that it’s difficult to predict what the markets will do next. Rather than adjusting your portfolio based on economic and political considerations, we continue to advocate investing based on a personalized long-term plan that takes into account your season of life and specific risk/return needs.
Enter Dynamic Asset Allocation
Economic uncertainty is always present, but today’s level of economic uncertainty is unlike anything most of us have experienced. Decades-long government deficit-spending policies, combined with unprecedented actions aimed at diffusing the 2008 financial crisis, have created an investing climate that calls for fresh thinking about how to minimize risk without giving up the opportunity for attractive returns.
In March, we launched the SMI Dynamic Allocation Fund (SMIDX) and shareholders have welcomed it with great enthusiasm since its inception. In its first two months (thru April 30, 2013), the Fund accumulated over $42 million in assets, showing that this approach resonates with SMI Fund investors. This strategy seeks to capitalize on the fact that economic conditions change over time. In response to those changes in the economy, certain types of investments will respond positively while other kinds will respond negatively. The goal of SMIDX is to be invested in those asset classes that are best suited to the current economic environment – and just as importantly, to avoid those classes which are not. In so doing, the strategy attempts to win by not losing. SMIDX will call for us to completely leave the stock market at times, which is obviously a very different approach than SMI’s Upgrading-based strategies.
These first two months provided a glimpse of what this may look like, as the SMIDX portfolio consisted of U.S. stocks, Foreign stocks, and Real Estate Investment Trusts. All three of these asset classes produced significant gains, resulting in a total return for SMIDX of 8.1% in just two months. As importantly, consider the performance of the three asset classes SMIDX avoided: owning those three classes would have resulted in a loss of -3.23%! Gold alone lost 6.69% during this period. This illustrates the principal of
1
winning by not losing. By mechanically and unemotionally rotating between asset classes as their relative strengths shift, the fund hopes to be able to profit from volatile asset classes, like gold, when they are in favor, while avoiding them when they are stuck in their inevitable down periods. This goal of being invested in the best asset classes, and out of the worst ones, was certainly met during these opening months of the fund’s life.
While we were very pleased with the returns of SMIDX, it is important to point out that the fund will sometimes lag the broad stock market’s returns during periods when stocks are exceptionally strong, as was the case during the first quarter of 2013. That SMIDX was able to outperform the Wilshire 5000 during these first two months was very encouraging, though we suspect that will likely be the exception rather than the rule during periods of strong stock market appreciation. Where we expect SMIDX to really shine is in protecting our capital when the stock market is falling. If the fund can keep up reasonably well during rising markets and then hold those gains better than the market does during downturns, SMIDX will be performing exactly as it was designed.
The SMI Funds’ Upgrading Results
Not to be out done, the Sound Mind Investing Fund’s upgrading strategy turned in a strong semi-annual period gain of 15.73%, beating the Wilshire 5000 by 0.77%. The Sound Mind Investing Balanced Fund, with its 40% allocated to bonds, returned 10.48%, beating its blended benchmark by 1.29%. (The blended benchmark is comprised of 60% Wilshire 5000 and 40% Barclays Capital U.S. Aggregate Bond Index.)
As the table below shows, Upgrading did a good job of steering us to good funds during this very strong period. Comparing the “SMI Holdings” column to the representative ETF for each category, Upgrading improved performance in our Small Value, Large Growth, and Large Value categories, while Foreign and Small Growth trailed slightly.
| Performance of SMIFX Holdings 10/31/2012 through 04/30/2013 | ||||
| Risk Category | SMI Holdings | Category ETF | ||
| Foreign Stock Funds | 16.45% | 16.87% (EFA) | ||
| Small Company/Growth | 16.41% | 16.82% (IWO) | ||
| Small Company/Value | 22.67% | 16.75% (IWN) | ||
| Large Company/Growth | 14.35% | 13.63% (IWF) | ||
| Large Company/Value | 16.28% | 16.12% (IWD) | ||
While the early asset growth of the SMI Dynamic Allocation Fund demonstrates the excitement surrounding that new investment approach, it is worth noting that Upgrading and Dynamic Allocation are complementary strategies. Owning both within a portfolio provides an excellent degree of diversification, as Upgrading will typically perform better during rising markets while SMI Dynamic Allocation’s strength is preserving wealth during falling markets. More aggressive investors might prefer to combine the Sound Mind Investing Fund (SMIFX) and SMI Dynamic Allocation (SMIDX), while more conservative investors, perhaps those nearing or already in retirement, might favor a combination of the Sound Mind Balanced (SMILX) and SMI Dynamic Allocation (SMIDX) funds.
As strong as the stock market was in the first quarter, the bond market was equally weak. The Barclays Capital U.S. Aggregate Bond Index actually lost ground (-0.12%) during the first quarter. That bond index is broad; much like the Wilshire 5000 measures the broad stock market. So while it masks a little variation
2
between bond sectors, it’s fair to say that, overall, the first quarter was a poor one for bond investors. We were pleased with the performance of the bond portion of the Sound Mind Balanced Fund, but this was another reminder of SMI Dynamic Allocation’s virtues, as that fund avoided bonds entirely during the period.
We appreciate the confidence you have placed in us to be a faithful steward of your assets, even as you strive to be a faithful steward of His assets.
Sincerely,

Mark Biller
Senior Portfolio Manager
The Sound Mind Investing Funds
3
PERFORMANCE RESULTS – (Unaudited)
Total Return* (For the periods ended April 30, 2013) | ||||||||||||||||||||
| Average Annual Return | ||||||||||||||||||||
| Three Months | Six Months | One Year | Five Year | Since Inception (December 2, 2005) | ||||||||||||||||
The Sound Mind Investing Fund | 5.62% | 15.73% | 13.53% | 2.92% | 5.25% | |||||||||||||||
S&P 500® Index** | 7.18% | 14.42% | 16.89% | 5.21% | 5.41% | |||||||||||||||
Wilshire 5000 Index** | 7.05% | 14.96% | 16.98% | 5.61% | 5.70% | |||||||||||||||
Gross Expenses 2.13% (As stated in the most recent prospectus dated February 28, 2013). Net Expenses 1.14% (as stated in the most recent prospectus dated February 28, 2013), excluding acquired fund fees and expenses. All expenses are reflected in performance results.
Total Return* (For the periods ended April 30, 2013) | ||||||||||||||||
| Average Annual | ||||||||||||||||
| Three Months | Six Months | One Year | Since Inception (December 30, 2010) | |||||||||||||
The Sound Mind Investing Balanced Fund | 4.29% | 10.48% | 10.69% | 5.99% | ||||||||||||
S&P 500® Index** | 7.18% | 14.42% | 16.89% | 13.11% | ||||||||||||
Wilshire 5000 Index** | 7.05% | 14.96% | 16.98% | 12.61% | ||||||||||||
Barclay’s Capital U.S. Aggregate Bond Index** | 1.60% | 0.90% | 3.68% | 5.64% | ||||||||||||
Custom Benchmark*** | 4.86% | 9.19% | 11.64% | 10.04% | ||||||||||||
Gross Expenses 2.07% (As stated in the most recent prospectus dated February 28, 2013). Net Expenses 1.15% (as stated in the most recent prospectus dated February 28, 2013), which excludes acquired fund fees and expenses and reflects the fee waiver/expense reimbursement discussed below. All expenses are reflected in performance results. The Fund’s adviser contractually has agreed to waive its fee and/or reimburse expenses to the extent necessary to maintain Total Annual Fund Operating Expenses (excluding brokerage fees and commissions; borrowing costs; any 12b-1 fees; taxes; indirect expenses, such as acquired fund fees and expenses; and extraordinary litigation expenses) at 1.15% of the Fund’s average daily net assets through February 28, 2014. This expense cap may not be terminated prior to this date except by the Board of Trustees.
The performance quoted represents past performance, which does not guarantee future results. The investment return and principal value of an investment will fluctuate so that an investor’s shares, when redeemed, may be worth more or less than their original cost. The returns shown do not reflect deduction of taxes that a shareholder would pay on Fund distributions or the redemption of Fund shares. Current performance of the Fund may be lower or higher than the performance quoted. Performance data current to the most recent month end may be obtained by calling 1-877-764-3863.
| * | Return figures reflect any change in price per share and assume the reinvestment of all distributions. |
| ** | The Standard & Poor’s 500® Index, Wilshire 5000 Index and Barclay’s Capital U.S. Aggregate Bond Index are unmanaged indices that assume reinvestment of all distributions and exclude the effect of taxes and fees. The Standard & Poor’s 500® Index, Wilshire 5000 Index and Barclay’s Capital U.S. Aggregate Bond Index are widely recognized unmanaged indices of equity prices and are representative of a broader market and range of securities than is found in each Fund’s portfolio. The returns of the Indices are not reduced by any fees or operating expenses. Individuals cannot invest directly in the Indices; however, an individual can invest in exchange traded funds or other investment vehicles that attempt to track the performance of a benchmark index. |
| *** | The Custom Benchmark for the Sound Mind Investing Balanced Fund is comprised of 60% Wilshire 5000 Index and 40% Barclay’s Capital U.S. Aggregate Bond Index. |
The Funds’ investment objectives, risks, charges and expenses must be considered carefully before investing. The prospectus contains this and other important information about the Funds and may be obtained by calling the same number as above. Please read it carefully before investing.
4
PERFORMANCE RESULTS – (Unaudited), (Continued)
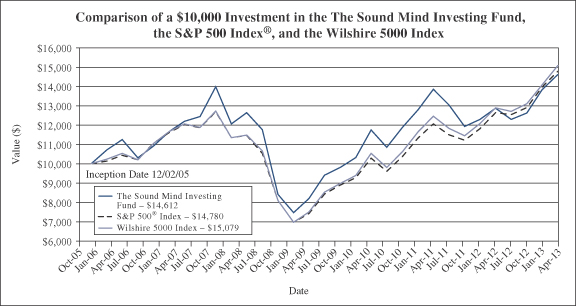
The chart above assumes an initial investment of $10,000 made on December 2, 2005 (commencement of Fund operations) and held through April 30, 2013. The S&P 500 Index® and Wilshire 5000 Index are widely recognized unmanaged indices of equity prices and are representative of a broader market and range of securities than is found in the Fund’s portfolio. Individuals cannot invest directly in the indices; however, an individual can invest in ETFs or other investment vehicles that attempt to track the performance of a benchmark index. THE FUND’S RETURN REPRESENTS PAST PERFORMANCE AND DOES NOT GUARANTEE FUTURE RESULTS. The returns shown do not reflect deduction of taxes that a shareholder would pay on Fund distributions or the redemption of Fund shares. Investment returns and principal values will fluctuate so that your shares, when redeemed, may be worth more or less than their original purchase price.
Current performance of the Fund may be lower or higher than the performance quoted. For more information on the Fund, and to obtain performance data current to the most recent month end or to request a prospectus, please call 1-877-764-3863. You should carefully consider the investment objectives, potential risks, management fees, and charges and expenses of the Fund before investing. The Fund’s prospectus contains this and other information about the Fund, and should be read carefully before investing.
The Fund is distributed by Unified Financial Securities, Inc., member FINRA.
5
PERFORMANCE RESULTS – (Unaudited), (Continued)
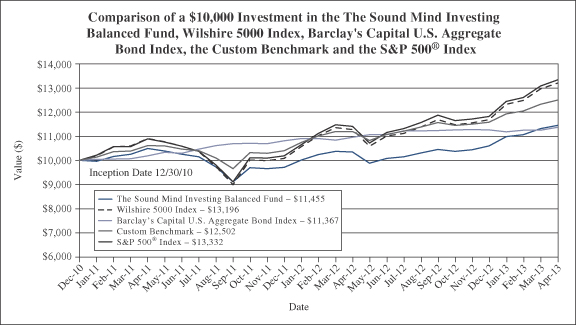
The chart above assumes an initial investment of $10,000 made on December 30, 2010 (commencement of Fund operations) and held through April 30, 2013. The S&P 500 Index®, The Barclay’s Capital U.S. Aggregate Bond Index and Wilshire 5000 Index are widely recognized unmanaged indices of equity prices and are representative of a broader market and range of securities than is found in the Fund’s portfolio. Individuals cannot invest directly in these indices; however, an individual can invest in ETFs or other investment vehicles that attempt to track the performance of a benchmark index. THE FUND’S RETURN REPRESENTS PAST PERFORMANCE AND DOES NOT GUARANTEE FUTURE RESULTS. The returns shown do not reflect deduction of taxes that a shareholder would pay on Fund distributions or the redemption of Fund shares. Investment returns and principal values will fluctuate so that your shares, when redeemed, may be worth more or less than their original purchase price.
Current performance of the Fund may be lower or higher than the performance quoted. For more information on the Fund, and to obtain performance data current to the most recent month end or to request a prospectus, please call 1-877-764-3863. You should carefully consider the investment objectives, potential risks, management fees, and charges and expenses of the Fund before investing. The Fund’s prospectus contains this and other information about the Fund, and should be read carefully before investing.
The Custom Benchmark is comprised of 60% Wilshire 5000 Index and 40% Barclay’s Capital U.S. Aggregate Bond Index.
The Fund is distributed by Unified Financial Securities, Inc., member FINRA.
6
FUND HOLDINGS – (Unaudited)
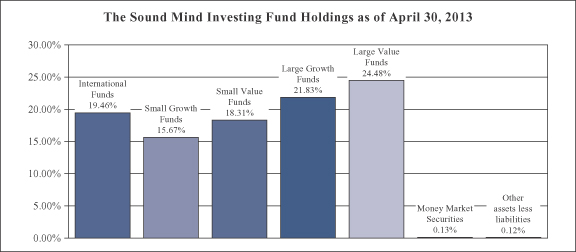
| 1 | As a percentage of net assets. |
The Sound Mind Investing Fund seeks long term capital appreciation. The Fund seeks to achieve its objective by investing in a diversified portfolio of other investment companies using a “fund upgrading” strategy. The fund upgrading investment strategy is a systematic investment approach that is based on the belief of the Fund’s adviser, SMI Advisory Services, LLC, that superior returns can be obtained by constantly monitoring the performance of a wide universe of other investment companies, and standing ready to move assets into the funds deemed by the adviser to be most attractive at the time of analysis.
7
FUND HOLDINGS – (Unaudited), (Continued)
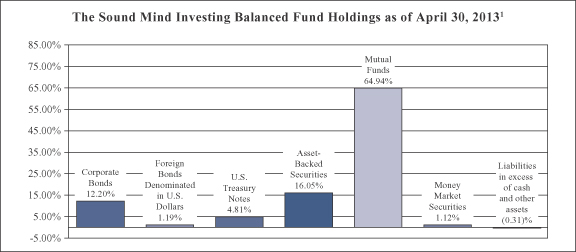
| 1 | As a percentage of net assets. |
The Sound Mind Investing Balanced Fund seeks total return. Total return is composed of both income and capital appreciation. The Fund seeks to achieve its objective by investing in a diversified portfolio of equities and fixed income securities. The Fund’s adviser determines how the Fund’s assets will be allocated between equity and fixed income securities. Under normal circumstances the Fund will target an approximate mix of 60% equity securities and 40% fixed income securities. The adviser periodically rebalances the Fund’s asset allocation in response to market conditions and to ensure an appropriate mix of elements in the Fund.
8
FUND HOLDINGS – (Unaudited), (Continued)
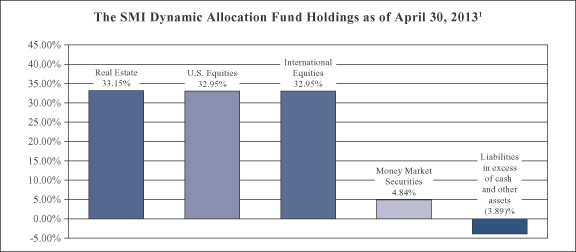
| 1 | As a percentage of net assets. |
The SMI Dynamic Allocation Fund seeks total return. Total return is composed of both income and capital appreciation. The Fund uses a dynamic asset allocation investment strategy to achieve its investment objective. This is done by investing in securities from the following six asset classes – U.S. Equities, International Equities, Fixed Income Securities, Real Estate, Precious Metals, and Cash.
Availability of Portfolio Schedule – (Unaudited)
Each Fund files its complete schedule of portfolio holdings with the Securities and Exchange Commission (“SEC”) for the first and third quarters of each fiscal year on Form N-Q. The Funds’ Forms N-Q are available at the SEC’s website at www.sec.gov. The Funds’ Forms N-Q may be reviewed and copied at the Public Reference Room in Washington DC. Information on the operation of the Public Reference Room may be obtained by calling 1-800-SEC-0330.
9
SUMMARY OF FUND’S EXPENSES – (Unaudited)
As a shareholder of one of the Funds, you incur two types of costs: (1) transaction costs (such as short-term redemption fees); and (2) ongoing costs, including management fees and other Fund expenses. This Example is intended to help you understand your ongoing costs (in dollars) of investing in the Funds and to compare these costs with the ongoing costs of investing in other mutual funds.
Each Fund’s example is based on an investment of $1,000 invested at the beginning of the period and held for the entire period (November 1, 2012 through April 30, 2013).
Actual Expenses
The first line of the table below provides information about actual account values and actual expenses. You may use the information in this line, together with the amount you invested, to estimate the expenses that you paid over the period. Simply divide your account value by $1,000 (for example, an $8,600 account value divided by $1,000 = 8.60), then multiply the result by the number in the first line under the heading entitled “Expenses Paid During Period” to estimate the expenses you paid on your account during this period.
Hypothetical Example for Comparison Purposes
The second line of the table below provides information about hypothetical account values and hypothetical expenses based on the Fund’s actual expense ratio and an assumed rate of return of 5% per year before expenses, which is not the Fund’s actual return. The hypothetical account values and expenses may not be used to estimate the actual ending account balance or expenses you paid for the period. You may use this information to compare the ongoing costs of investing in the Fund and other funds. To do so, compare this 5% hypothetical example with the 5% hypothetical examples that appear in the shareholder reports of the other funds.
Expenses shown are meant to highlight your ongoing costs only and do not reflect any transactional costs such as the fee imposed on short-term redemptions. Therefore, the second line of the table below is useful in comparing ongoing costs only and will not help you determine the relative costs of owning different funds. If incurred, the short-term redemption fee imposed by the Fund would increase your expenses.
The Sound Mind Investing Fund | Beginning Account Value November 1, 2012 | Ending Account Value April 30, 2013 | Expenses Paid During Period November 1, 2012 – April 30, 2013* | |||||||||
Actual | $ | 1,000.00 | $ | 1,157.30 | $ | 6.26 | ||||||
Hypothetical ** | $ | 1,000.00 | $ | 1,018.99 | $ | 5.86 | ||||||
| * | Expenses are equal to the Fund’s annualized expense ratio of 1.17%, multiplied by the average account value over the period, multiplied by 181/365 (to reflect the partial year period). |
| ** | Assumes a 5% return before expenses. |
10
SUMMARY OF FUND’S EXPENSES – (Unaudited), (Continued)
The Sound Mind | Beginning Account Value November 1, 2012 | Ending Account Value April 30, 2013 | Expenses Paid During Period November 1, 2012 – April 30, 2013* | |||||||||
Actual | $ | 1,000.00 | $ | 1,104.80 | $ | 6.01 | ||||||
Hypothetical ** | $ | 1,000.00 | $ | 1,019.09 | $ | 5.76 | ||||||
| * | Expenses are equal to the Fund’s annualized expense ratio of 1.15%, multiplied by the average account value over the period, multiplied by 181/365 (to reflect the partial year period). |
| ** | Assumes a 5% return before expenses. |
The SMI | Beginning Account Value | Ending Account Value | Expenses Paid During The Period Ended April 30, 2013* | |||||||||
Actual | $ | 1,000.00 | $ | 1,081.00 | $ | 2.50 | ||||||
Hypothetical ** | $ | 1,000.00 | $ | 1,017.67 | $ | 7.19 | ||||||
| * | Expenses are equal to the Fund’s annualized expense ratio of 1.44%, multiplied by the average account value over the period, multiplied by 61/365 (to reflect the period since commencement of operations on February 28, 2013). |
| ** | Assumes a 5% return before expenses. The hypothetical example is calculated based on a six month period from November 1, 2012 to April 30, 2013. Accordingly, expenses are equal to the Fund’s annualized expense ratio of 1.44% multiplied by the average account value over the six month period, multiplied by 181/365 (to reflect the partial year period). |
11
THE SOUND MIND INVESTING FUND
SCHEDULE OF INVESTMENTS
April 30, 2013 – (Unaudited)
| Mutual Funds – 99.75% | Shares | Fair Value | ||||||
Mutual Funds Greater Than 1% of The Sound | ||||||||
Ariel Appreciation Fund – Investor Class | 177,422 | $ | 8,549,934 | |||||
Artisan International Fund – Investor Class | 331,859 | 8,920,382 | ||||||
Baron Partners Fund – Institutional Class (a) | 343,995 | 9,452,965 | ||||||
BBH Core Select Fund – Class N | 320,012 | 6,233,835 | ||||||
Brown Capital Management Small Company Fund – Institutional | 91,209 | 5,117,757 | ||||||
ClearBridge Aggressive Growth Fund – Institutional Class (a) | 23,942 | 3,849,369 | ||||||
Dreyfus Opportunistic Small Cap Fund (b) | 320,557 | 9,809,053 | ||||||
Dreyfus Opportunistic MidCap Value Fund – Class A | 330,719 | 11,796,725 | ||||||
Fidelity International Small Cap Fund | 315,354 | 7,436,036 | ||||||
Fidelity Leveraged Company Stock Fund | 378,796 | 13,791,962 | ||||||
Fidelity Mid-Cap Stock Value Fund (a) | 515,389 | 10,823,160 | ||||||
Fidelity Small Cap Discovery Fund | 550,755 | 15,123,733 | ||||||
Fidelity Small Cap Value Fund – Institutional Class (b) | 616,716 | 11,483,257 | ||||||
Hotchkis and Wiley Mid-Cap Value Fund – Institutional Class | 535,968 | 17,992,457 | ||||||
Janus Contrarian Fund – Class T | 294,432 | 5,002,399 | ||||||
Legg Mason Capital Management Opportunity Trust – Institutional | 1,288,302 | 17,997,582 | ||||||
Longleaf Partners International Fund | 396,487 | 6,133,660 | ||||||
Longleaf Partners Small-Cap Fund | 109,665 | 3,573,994 | ||||||
Mairs & Power Growth Fund | 169,398 | 15,977,641 | ||||||
Neuberger Berman Focus Fund – Institutional Class (b) | 573,444 | 14,525,328 | ||||||
Nicholas Fund, Inc. | 194,015 | 10,769,795 | ||||||
Oakmark International Fund – Institutional Class | 566,750 | 13,205,280 | ||||||
PRIMECAP Odyssey Aggressive Growth Fund (a) | 208,151 | 4,766,652 | ||||||
Thornburg Core Growth Fund – Institutional Class (a) (b) | 536,867 | 11,923,806 | ||||||
Wasatch International Growth Fund (b) | 505,025 | 13,645,781 | ||||||
|
| |||||||
TOTAL MUTUAL FUNDS GREATER THAN 1% OF THE SOUND MIND INVESTING FUND’S NET ASSETS (Cost $228,317,165) | 257,902,543 | |||||||
|
| |||||||
Mutual Funds Less Than 1% of The Sound | ||||||||
Allianz NFJ Dividend Value Fund – Institutional Class | 200 | 2,818 | ||||||
Allianz NFJ Small-Cap Value Fund – Institutional Class | 162 | 5,397 | ||||||
American Century International Discovery Fund – Institutional Class | 250 | 2,799 | ||||||
Artisan International Small Cap Fund – Investor Class | 77,010 | 1,898,290 | ||||||
See accompanying notes which are an integral part of these financial statements.
12
THE SOUND MIND INVESTING FUND
SCHEDULE OF INVESTMENTS
April 30, 2013 – (Unaudited), (Continued)
| Mutual Funds – 99.75% – continued | Shares | Fair Value | ||||||
Mutual Funds Less Than 1% of The Sound | ||||||||
Artisan International Value Fund – Investor Class | 150 | $ | 4,986 | |||||
Artisan Mid Cap Value Fund – Investor Class | 200 | 4,818 | ||||||
Artisan Small Cap Fund – Investor Class (a) | 150 | 2,434 | ||||||
Artisan Small Cap Value Fund – Investor Class | 150 | 3,441 | ||||||
Aston TAMRO Small Cap Fund – Institutional Class (a) | 100 | 2,177 | ||||||
Berwyn Fund – Institutional Class | 100 | 3,513 | ||||||
BlackRock International Opportunities Portfolio – Institutional Class | 100 | 3,742 | ||||||
Bridgeway Small Cap Growth Fund – Class N (a) | 205 | 2,912 | ||||||
Bridgeway Small Cap Value Fund – Class N | 179 | 3,383 | ||||||
Brown Capital Management Small Company Fund – Investor Class (a) | 109 | 6,100 | ||||||
Buffalo Small Cap Fund, Inc. (a) | 150 | 4,680 | ||||||
Columbia Acorn International – Class Z | 100 | 4,515 | ||||||
Columbia Acorn Select – Class Z | 150 | 4,232 | ||||||
Columbia Small Cap Growth I Fund – Class Z (a) | 100 | 3,043 | ||||||
Columbia Value and Restructuring Fund – Class Z | 50 | 2,487 | ||||||
Delaware Select Growth Fund – Institutional Class (a) | 100 | 4,584 | ||||||
Delaware Small Cap Value Fund – Institutional Class | 100 | 4,693 | ||||||
Delaware SMID Cap Growth Fund – Institutional Class (a) | 100 | 2,940 | ||||||
Delaware Value Fund – Institutional Class | 144 | 2,058 | ||||||
DFA International Small Company Portfolio – Institutional Class | 100 | 1,737 | ||||||
DFA U.S. Small Cap Value Portfolio | 100 | 2,948 | ||||||
Dodge & Cox Stock Fund | 11,026 | 1,524,487 | ||||||
DWS Dreman Small Cap Value Fund – Institutional Class | 85 | 3,463 | ||||||
Fairholme Fund (a) | 100 | 3,528 | ||||||
Fidelity Mid-Cap Stock Fund | 150 | 5,052 | ||||||
Fidelity Small Cap Stock Fund | 150 | 2,967 | ||||||
Franklin Small Cap Value Fund – Advisor Class | 100 | 5,219 | ||||||
Hartford International Opportunities Fund – Class Y | 248 | 4,119 | ||||||
Heartland Value Fund (a) | 100 | 4,261 | ||||||
Hennessy Cornerstone Growth Fund – Retail Class (a) | 93,839 | 1,298,736 | ||||||
Hennessy Focus Fund – Investor Class (a) | 100 | 5,645 | ||||||
Invesco Van Kampen American Value Fund – Institutional Class | 100 | 3,590 | ||||||
Janus Overseas Fund – Class T | 100 | 3,535 | ||||||
Janus Venture Fund – Class T (a) | 100 | 6,144 | ||||||
JPMorgan Mid Cap Value Fund – Institutional Class | 100 | 3,177 | ||||||
JPMorgan Small Cap Equity Fund – Class S | 226 | 9,844 | ||||||
See accompanying notes which are an integral part of these financial statements.
13
THE SOUND MIND INVESTING FUND
SCHEDULE OF INVESTMENTS
April 30, 2013 – (Unaudited), (Continued)
| Mutual Funds – 99.75% – continued | Shares | Fair Value | ||||||
Mutual Funds Less Than 1% of The Sound | ||||||||
Longleaf Partners Fund | 150 | $ | 4,366 | |||||
Morgan Stanley Institutional Fund, Inc. – International Small Cap | 37 | 472 | ||||||
Neuberger Berman Genesis Fund – Institutional Class | 100 | 5,364 | ||||||
Oakmark International Small Cap Fund – Institutional Class | 150 | 2,289 | ||||||
Oakmark Select Fund – Institutional Class | 150 | 5,091 | ||||||
Oberweis Micro-Cap Fund (a) | 175 | 2,403 | ||||||
Oppenheimer International Small Company Fund – Class Y | 100 | 2,546 | ||||||
Oppenheimer Small & Mid Cap Value Fund – Class Y | 100 | 3,779 | ||||||
Perkins Mid Cap Value Fund – Class T | 200 | 4,754 | ||||||
Principal SmallCap Growth Fund I – Institutional Class (a) | 200 | 2,416 | ||||||
Royce Low-Priced Stock Fund – Investor Class | 150 | 2,056 | ||||||
Royce Opportunity Fund – Investor Class | 151 | 2,025 | ||||||
Royce Premier Fund – Investor Class | 300 | 5,970 | ||||||
Royce Special Equity Fund – Institutional Class | 150 | 3,405 | ||||||
Royce Special Equity Fund – Investor Class | 100 | 2,281 | ||||||
Royce Value Fund – Institutional Class | 100 | 1,186 | ||||||
T. Rowe Price International Discovery Fund – Retail Class | 150 | 7,545 | ||||||
T Rowe Price New Horizons Fund – Retail Class (a) | 100 | 3,806 | ||||||
T. Rowe Price Small-Cap Value Fund – Retail Class | 100 | 4,318 | ||||||
TIAA-CREF International Equity Fund – Institutional Class | 100 | 1,017 | ||||||
Tweedy, Browne Global Value Fund | 150 | 3,831 | ||||||
Vanguard Strategic Equity Fund – Investor Class | 100 | 2,460 | ||||||
Wasatch Emerging Markets Small Cap Fund | 1,000 | 3,030 | ||||||
|
| |||||||
TOTAL MUTUAL FUNDS LESS THAN 1% OF THE SOUND | 4,944,904 | |||||||
|
| |||||||
TOTAL MUTUAL FUNDS (Cost $232,715,750) | 262,847,447 | |||||||
|
| |||||||
Money Market Securities – 0.13% | ||||||||
Fidelity Institutional Money Market Portfolio – Class I, 0.12% (d) | 348,200 | 348,200 | ||||||
|
| |||||||
TOTAL MONEY MARKET SECURITIES (Cost $348,200) | 348,200 | |||||||
|
| |||||||
TOTAL INVESTMENTS (Cost $233,063,950) – 99.88% | $ | 263,195,647 | ||||||
|
| |||||||
Other assets less liabilities – 0.12% | 303,422 | |||||||
|
| |||||||
TOTAL NET ASSETS – 100.00% | $ | 263,499,069 | ||||||
|
| |||||||
See accompanying notes which are an integral part of these financial statements.
14
THE SOUND MIND INVESTING FUND
SCHEDULE OF INVESTMENTS
April 30, 2013 – (Unaudited), (Continued)
| (a) | Non-income producing. |
| (b) | A portion of this security may be deemed illiquid due to the Investment Company Act of 1940 provision stating that no issuer of any investment company security purchased or acquired by a registered investment company shall be obligated to redeem such security in an amount exceeding 1 per centum of such issuer’s total outstanding shares during any period of less than thirty days. |
| (c) | Small investments are occasionally retained in mutual funds that are closed to new investment, or in the manager’s opinion are at risk to close, so as to allow the Fund the flexibility to reinvest in these funds in the future. |
| (d) | Variable rate security; the money market rate shown represents the 7 day yield at April 30, 2013. |
See accompanying notes which are an integral part of these financial statements.
15
THE SOUND MIND INVESTING BALANCED FUND
SCHEDULE OF INVESTMENTS
April 30, 2013 – (Unaudited)
| Corporate Bonds – 12.20% | Principal Amount | Fair Value | ||||||
Ally Financial, Inc., 3.125%, 01/15/2016 | $ | 25,000 | $ | 25,520 | ||||
Ally Financial, Inc., 5.500%, 02/15/2017 | 55,000 | 60,203 | ||||||
Ally Financial, Inc., 7.500%, 09/15/2020 | 65,000 | 80,519 | ||||||
American International Group, 5.050%, 10/01/2015 | 70,000 | 76,647 | ||||||
American International Group, 4.875%, 09/15/2016 | 65,000 | 72,418 | ||||||
American International Group, 3.800%, 03/22/2017 | 70,000 | 76,019 | ||||||
American International Group, 6.400%, 12/15/2020 | 50,000 | 62,658 | ||||||
AT&T, Inc., 5.100%, 09/15/2014 | 95,000 | 100,895 | ||||||
Bank of America Corp., 4.500%, 04/01/2015 | 200,000 | 212,251 | ||||||
Bank of America Corp., 1.500%, 10/09/2015 | 160,000 | 161,047 | ||||||
Bank of Montreal, 0.880%, 04/09/2018 (b) | 75,000 | 75,309 | ||||||
Citigroup, Inc. 5.500%, 10/15/2014 | 60,000 | 63,934 | ||||||
Citigroup, Inc. 4.587%, 12/15/2015 | 275,000 | 299,843 | ||||||
Daimler Finance North America LLC, 1.250%, 01/11/2016 (a) | 90,000 | 90,469 | ||||||
Entergy Arkansas, Inc., 5.000%, 07/01/2018 | 35,000 | 34,948 | ||||||
Entergy Texas, Inc., 3.600%, 06/01/2015 | 55,000 | 57,833 | ||||||
Ford Motor Credit Co. LLC, 3.875%, 01/15/2015 | 100,000 | 104,097 | ||||||
Ford Motor Credit Co. LLC, 3.984%, 06/15/2016 (a) | 65,000 | 69,175 | ||||||
Ford Motor Credit Co. LLC, 4.250%, 02/03/2017 | 90,000 | 96,998 | ||||||
Ford Motor Credit Co. LLC, 5.000%, 05/15/2018 | 140,000 | 156,469 | ||||||
General Electric Cap Corp., 1.625%, 07/02/2015 | 80,000 | 81,541 | ||||||
General Electric Cap Corp., 1.000%, 12/11/2015 | 90,000 | 90,728 | ||||||
General Electric Cap Corp., 1.000%, 01/08/2016 | 90,000 | 90,517 | ||||||
Goldman Sachs Group, Inc., 5.500%, 11/15/2014 | 80,000 | 85,571 | ||||||
Goldman Sachs Group, Inc., 3.700%, 08/01/2015 | 45,000 | 47,611 | ||||||
Goldman Sachs Group, Inc., 1.600%, 11/23/2015 | 85,000 | 86,206 | ||||||
Goldman Sachs Group, Inc., 1.480%, 04/30/2018 (b) | 85,000 | 85,020 | ||||||
Hartford Financial Services Group, 5.500%, 10/15/2016 | 60,000 | 67,903 | ||||||
Hartford Financial Services Group, 5.375%, 03/15/2017 | 65,000 | 74,577 | ||||||
JPMorgan Chase & Co., 0.890%, 02/26/2016 (b) | 75,000 | 75,199 | ||||||
JPMorgan Chase & Co., 1.180%, 01/25/2018 (b) | 130,000 | 131,057 | ||||||
JPMorgan Chase & Co., 3.250%, 09/23/2022 | 55,000 | 56,435 | ||||||
Liberty Mutual Group, 6.700%, 08/15/2016 (a) | 25,000 | 29,076 | ||||||
MetLife Institutional Funding II, 0.650%, 01/06/2015 (a) (b) | 75,000 | 75,111 | ||||||
Metropolitan Life Global Funding I, 1.700%, 06/29/2015 (a) | 55,000 | 56,120 | ||||||
Morgan Stanley, 4.200%, 11/20/2014 | 105,000 | 109,920 | ||||||
Morgan Stanley, 1.520%, 02/25/2016 (b) | 40,000 | 40,248 | ||||||
Northrop Grumman Corp., 3.700%, 08/01/2014 | 40,000 | 41,516 | ||||||
See accompanying notes which are an integral part of these financial statements.
16
THE SOUND MIND INVESTING BALANCED FUND
SCHEDULE OF INVESTMENTS
April 30, 2013 – (Unaudited), (Continued)
| Corporate Bonds – 12.20% – continued | Principal Amount | Fair Value | ||||||
Prudential Insurance Co. of America/The, 8.300%, 07/01/2025 (a) | $ | 85,000 | $ | 118,912 | ||||
Verizon Communications, Inc. 0.470%, 03/06/2015 (a) (b) | 55,000 | 54,955 | ||||||
Viacom, Inc., 4.375%, 09/15/2014 | 65,000 | 68,210 | ||||||
Wells Fargo & Co., 3.750%, 10/01/2014 | 35,000 | 36,594 | ||||||
Wells Fargo & Co., 0.910%, 04/23/2018 (b) | 115,000 | 115,309 | ||||||
|
| |||||||
TOTAL CORPORATE BONDS (Cost $3,574,699) | 3,695,588 | |||||||
|
| |||||||
Foreign Bonds Denominated in US Dollars – 1.19% | ||||||||
Anheuser-Busch InBev Worldwide, Inc., 5.375%, 11/15/2014 | 45,000 | 48,249 | ||||||
Deutsche Bank AG / London, 4.875%, 05/20/2013 | 45,000 | 45,098 | ||||||
ING Bank NV, 3.750%, 03/07/2017 (a) | 165,000 | 177,604 | ||||||
Toronto-Dominion Bank/The, 0.830%. 04/30/2018 (b) | 90,000 | 90,376 | ||||||
|
| |||||||
TOTAL FOREIGN BONDS DENOMINATED | 361,327 | |||||||
|
| |||||||
U. S. Treasury Notes – 4.81% | ||||||||
U.S. Treasury Note, 2.000%, 02/15/2023 | 1,115,000 | 1,147,753 | ||||||
U.S. Treasury Note, 2.750%, 08/15/2042 | 320,000 | 310,450 | ||||||
|
| |||||||
TOTAL U.S. TREASURY NOTES (Cost $1,451,642) | 1,458,203 | |||||||
|
| |||||||
Asset-Backed Securities – 16.05% | ||||||||
Ally Master Owner Trust, | 100,000 | 100,462 | ||||||
American Airlines 2011-1 Class A Pass Through Trust, | 27,052 | 29,486 | ||||||
American Airlines 2013-1 Class A Pass Through Trust, | 50,000 | 50,188 | ||||||
Banc of America Commerical Mortgage, Inc., | 105,000 | 119,152 | ||||||
Bank of America Auto Trust, | 45,680 | 45,710 | ||||||
Bear Stearns Commercial Mortgage Securities, | 22,112 | 22,263 | ||||||
Burlington Northern and Santa Fe Railway Co 2001-2 Pass Through Trust, 6.462%, 01/15/2021 | 26,387 | 30,848 | ||||||
Burlington Northern and Santa Fe Railway Co 2004-1 Pass Through Trust, 4.575%, 01/15/2021 | 53,446 | 58,556 | ||||||
Burlington Northern and Santa Fe Railway Co 2005-4 Pass Through Trust, 4.967%, 04/01/2023 | 18,718 | 20,938 | ||||||
See accompanying notes which are an integral part of these financial statements.
17
THE SOUND MIND INVESTING BALANCED FUND
SCHEDULE OF INVESTMENTS
April 30, 2013 – (Unaudited), (Continued)
| Asset-Backed Securities – 16.05% – continued | Principal Amount | Fair Value | ||||||
Chase Issuance Trust, | $ | 40,000 | $ | 40,233 | ||||
Citigroup Commercial Mortgage Trust, | 35,000 | 36,207 | ||||||
Citigroup Commercial Mortgage Trust, | 44,888 | 44,940 | ||||||
Commercial Mortgage Pass Through Certificates, | 32,107 | 32,171 | ||||||
Commercial Mortgage Trust 2004-GG1, Class A7, 5.320%, 06/10/2037 (b) | 28,204 | 28,927 | ||||||
Commercial Mortgage Trust 2007-GG9, Class A7, 5.440%, 03/10/2039 | 30,000 | 34,387 | ||||||
Credit Suisse First Boston Mortgage Securities, | 1,616 | 1,624 | ||||||
Credit Suisse Mortgage Capital Certificate, | 22,604 | 23,208 | ||||||
DBRR Trust, Series 2012-EZ1, Class A, 0.946%, 09/25/2045 (a) | 145,655 | 145,975 | ||||||
Delta Air Lines 2007-1 Class A Pass Through Trust, | 82,569 | 95,879 | ||||||
Delta Air Lines 2012-1 Class A Pass Through Trust, | 30,000 | 32,700 | ||||||
Fannie Mae, Pool # 464398, 5.970%, 01/01/2040 | 19,325 | 23,648 | ||||||
Fannie Mae, Pool # 464400, 5.970%, 01/01/2040 | 14,494 | 17,736 | ||||||
Fannie Mae, Pool # 465468, 3.330%, 07/01/2020 | 84,406 | 92,969 | ||||||
Fannie Mae, Pool # 466284, 3.330%, 10/01/2020 | 96,294 | 105,778 | ||||||
Fannie Mae, Pool # 466319, 3.230%, 11/01/2020 | 105,622 | 115,397 | ||||||
Fannie Mae, Pool # 466582, 0.670%, 11/01/2020 (b) | 435,000 | 434,879 | ||||||
Fannie Mae, Pool # 466890, 5.100%, 12/01/2040 | 24,307 | 27,430 | ||||||
Fannie Mae, Pool # 468338, 0.620%, 06/01/2018 (b) | 120,000 | 120,037 | ||||||
Fannie Mae, Pool # 468625, 0.590%, 07/01/2018 (b) | 50,000 | 50,763 | ||||||
Fannie Mae, Pool # 468910, 0.609%, 08/01/2018 (b) | 135,886 | 135,998 | ||||||
Fannie Mae, Pool # AA4328, 4.000%, 04/01/2024 | 71,911 | 76,901 | ||||||
Fannie Mae, Pool AB2822, 2.500%, 03/01/2026 | 44,868 | 46,974 | ||||||
Fannie Mae Aces, Series 2012-M6, Class AFL, 0.690%, 06/25/2022 (b) | 143,905 | 145,916 | ||||||
Fannie Mae Aces, Series 2013-M2, Class AFL, 0.540%, 01/25/2023 (b) | 119,787 | 120,331 | ||||||
Fannie Mae Aces, Series 2013-M2, Class ASQ2, 0.590%, 08/25/2015 | 130,000 | 130,066 | ||||||
See accompanying notes which are an integral part of these financial statements.
18
THE SOUND MIND INVESTING BALANCED FUND
SCHEDULE OF INVESTMENTS
April 30, 2013 – (Unaudited), (Continued)
| Asset-Backed Securities – 16.05% – continued | Principal Amount | Fair Value | ||||||
Fannie Mae REMICS, Series 2010-46, Class A, 4.000%, 05/25/2024 | $ | 5,274 | $ | 5,315 | ||||
Fannie Mae REMICS, Series 2004-67, Class VC, 4.500%, 02/25/2025 | 69,309 | 70,430 | ||||||
Ford Credit Auto Owners Trust, | 67,618 | 67,663 | ||||||
Ford Credit Auto Owners Trust, | 51,953 | 51,992 | ||||||
Freddie Mac REMICS, Series 3609, Class LA, 4.000%, 12/15/2024 | 80,923 | 85,814 | ||||||
Freddie Mac REMICS, Series 3873, Class DG, 3.000%, 07/15/2027 | 23,407 | 23,819 | ||||||
GE Capital Commercial Mortgage Corp., | 6,117 | 6,157 | ||||||
GE Capital Commercial Mortgage Corp., | 17,913 | 18,701 | ||||||
Ginnie Mae I Pool, 2.140%, 08/15/2023 | 95,943 | 98,349 | ||||||
Ginnie Mae II Pool, 3.500%, 11/20/2042 | 122,099 | 129,816 | ||||||
Green Tree Financial Corp., Series 1996-2, Class M1, 7.600%, 04/15/2026 (b) | 42,370 | 37,969 | ||||||
GS Mortgage Securities Corp. II, Series 2007-EOP, Class A1, 1.103%, 03/06/2020 (a) (b) | 35,187 | 35,213 | ||||||
GS Mortgage Securities Corp. II, Series 2012-GCJ9, Class A1, 0.660%, 11/10/2045 | 50,690 | 50,754 | ||||||
GS Mortgage Securities Trust, Series 2007-GG10, Class A4, 5.791%, 08/10/2045 (b) | 130,000 | 150,332 | ||||||
Hertz Vehicle Financing, LLC, Series 2011-1A, Class A1, 2.200%, 03/25/2016 (a) | 110,000 | 112,448 | ||||||
Hertz Vehicle Financing, LLC, Series 2013-1A, Class A1, 1.120%, 08/25/2017 (a) | 90,000 | 90,459 | ||||||
Home Equity Loan Trust, Series 2003-HS3, Class A2A, 0.470%, 08/25/2033 (b) | 13,817 | 11,881 | ||||||
Home Equity Mortgage Trust, Series 2006-1, Class A2, 5.300%, 05/25/2036 (b) | 33,667 | 29,610 | ||||||
Honda Auto Receivables Owner Trust, Series 2010-3, Class A3, 0.700%, 04/21/2014 | 2,101 | 2,101 | ||||||
Honda Auto Receivables Owner Trust, Series 2012-1, Class A2, | 42,262 | 46,286 | ||||||
Hyundai Auto Receivables Trust, Series 2010-B, Class A3, | 11,613 | 11,639 | ||||||
JP Morgan Chase Commercial Mortgage Securities Corp, | 95,000 | 96,762 | ||||||
See accompanying notes which are an integral part of these financial statements.
19
THE SOUND MIND INVESTING BALANCED FUND
SCHEDULE OF INVESTMENTS
April 30, 2013 – (Unaudited), (Continued)
| Asset-Backed Securities – 16.05% – continued | Principal Amount | Fair Value | ||||||
JP Morgan Chase Commercial Mortgage Securities Corp, | $ | 59,812 | $ | 59,894 | ||||
Mid-State Trust, Series 11, Class A1, 4.864%, 07/15/2038 | 17,005 | 18,206 | ||||||
Morgan Stanley Bank of America Merrill Lynch Trust, | 41,294 | 41,331 | ||||||
NCUA Guaranteed Notes, Series 2010-A1, Class A, 0.549%, 12/07/2020 (b) | 116,825 | 117,166 | ||||||
Northwest Airlines Pass Through Trust, | 49,134 | 55,030 | ||||||
Structured Asset Securities Corp., 2005-S6, Class A2, | 4,516 | 4,400 | ||||||
Structured Asset Securities Corp., 2005-S7, Class A2, | 25,451 | 24,388 | ||||||
Structured Asset Securities Corp., 2006-S2, Class A2, | 66,782 | 41,728 | ||||||
UAL 2007 Pass Through Trust, Series 071A, 6.636%, 07/02/2022 | 92,194 | 100,837 | ||||||
UBS-Barclays Commercial Pass Through Trust, | 53,924 | 54,093 | ||||||
Union Pacific Railroad Co. 2003 Pass Through Trust, | 11,553 | 12,654 | ||||||
Union Pacific Railroad Co. 2004 Pass Through Trust, | 60,512 | 69,120 | ||||||
Union Pacific Railroad Co. 2005 Pass Through Trust, | 47,393 | 54,520 | ||||||
Union Pacific Railroad Co. 2006 Pass Through Trust, | 28,660 | 35,085 | ||||||
US Airways 2010-1A Pass Through Trust, | 56,607 | 63,542 | ||||||
US Airways 2011-1A Pass Through Trust, | 31,871 | 37,210 | ||||||
US Airways 2012-1A Pass Through Trust, | 54,901 | 61,626 | ||||||
Wells Fargo Commercial Mortgage Trust, | 81,887 | 82,051 | ||||||
WF-RBS Commercial Mortgage Trust, | 56,240 | 56,407 | ||||||
|
| |||||||
TOTAL ASSET-BACKED SECURITIES (Cost $4,709,390) | 4,861,475 | |||||||
|
| |||||||
See accompanying notes which are an integral part of these financial statements.
20
THE SOUND MIND INVESTING BALANCED FUND
SCHEDULE OF INVESTMENTS
April 30, 2013 – (Unaudited), (Continued)
| Mutual Funds – 64.94% | Shares | Fair Value | ||||||
Ariel Appreciation Fund – Investor Class | 17,214 | $ | 829,520 | |||||
Artisan International Fund – Investor Class | 42,936 | 1,154,110 | ||||||
Baron Partners Fund – Institutional Class (c) | 6,901 | 189,632 | ||||||
BBH Core Select Fund – Class N | 25,698 | 500,602 | ||||||
Dreyfus Opportunistic Midcap Value Fund – Institutional Class | 23,310 | 831,468 | ||||||
Dreyfus Opportunistic Small Cap Fund (c) | 26,966 | 825,168 | ||||||
Fidelity International Small Cap Fund | 23,385 | 551,411 | ||||||
Fidelity Leveraged Company Stock Fund | 37,278 | 1,357,278 | ||||||
Fidelity Small Cap Discovery Fund | 51,913 | 1,425,540 | ||||||
Hotchkis and Wiley Mid-Cap Value Fund – Institutional Class | 48,964 | 1,643,728 | ||||||
Janus Contrarian Fund – Class T | 52,775 | 896,642 | ||||||
Kinetics Small Cap Opportunities Fund – Institutional Class (c) | 38,069 | 1,191,530 | ||||||
Legg Mason Capital Management Opportunity Trust – Institutional Class (c) | 136,185 | 1,902,504 | ||||||
Longleaf Partners Small-Cap Fund | 88 | 2,885 | ||||||
Lord Abbett Developing Growth Fund, Inc. – Institutional Class (c) | 100 | 2,420 | ||||||
Mairs & Power Growth Fund | 13,172 | 1,242,371 | ||||||
Morgan Stanley Focus Growth Fund – Institutional Class (c) | 100 | 4,338 | ||||||
Neuberger Berman Focus Fund – Institutional Class | 52,529 | 1,330,543 | ||||||
Nicholas Fund, Inc. | 16,340 | 907,026 | ||||||
Oakmark International Fund – Institutional Class | 49,598 | 1,155,641 | ||||||
RidgeWorth Mid Cap Value Equity Fund (c) | 34,093 | 449,001 | ||||||
Thornburg Core Growth Fund – Institutional Class (c) | 14,334 | 318,345 | ||||||
Wasatch International Growth Fund | 35,666 | 963,680 | ||||||
Wasatch Emerging Markets Small Cap Fund | 700 | 2,121 | ||||||
|
| |||||||
TOTAL MUTUAL FUNDS (Cost $17,243,511) | 19,677,504 | |||||||
|
| |||||||
Money Market Securities – 1.12% | ||||||||
Fidelity Institutional Money Market Portfolio – Class I, 0.12% (d) | 339,336 | 339,336 | ||||||
|
| |||||||
TOTAL MONEY MARKET SECURITIES (Cost $339,336) | 339,336 | |||||||
|
| |||||||
TOTAL INVESTMENTS (Cost $27,666,396) – 100.31% | $ | 30,393,433 | ||||||
|
| |||||||
Liabilities in excess of cash and other assets – (0.31)% | (93,794 | ) | ||||||
|
| |||||||
TOTAL NET ASSETS – 100.00% | $ | 30,299,639 | ||||||
|
| |||||||
| (a) | Security exempt from registration under Rule 144A or Section 4(2) of the Securities Act of 1933. |
| (b) | Variable rate security; the rate shown represents the rate at April 30, 2013. |
| (c) | Non-income producing. |
| (d) | Variable rate security; the money market rate shown represents the 7 day yield at April 30, 2013. |
See accompanying notes which are an integral part of these financial statements.
21
THE SMI DYNAMIC ALLOCATION FUND
SCHEDULE OF INVESTMENTS
April 30, 2013 – (Unaudited)
| Exchange-Traded Funds – 94.99% | Shares | Fair Value | ||||||
iShares Dow Jones US Consumer Services Sector Index Fund | 8,650 | $ | 864,395 | |||||
iShares Dow Jones US Healthcare Sector Index Fund | 8,945 | 891,190 | ||||||
iShares MSCI Australia Index Fund | 15,005 | 421,641 | ||||||
iShares MSCI EAFE Index Fund | 178,530 | 11,058,148 | ||||||
iShares MSCI Japan Index Fund | 36,070 | 422,019 | ||||||
iShares MSCI Spain Capped Index Fund | 13,400 | 417,946 | ||||||
iShares MSCI Sweden Index Fund (a) | 12,710 | 421,337 | ||||||
iShares MSCI Switzerland Capped Index Fund (a) | 13,760 | 419,680 | ||||||
SPDR S&P 500 ETF Trust | 65,865 | 10,517,323 | ||||||
Vanguard FTSE Emerging Markets ETF | 19,350 | 846,756 | ||||||
Vanguard REIT ETF | 187,200 | 14,092,416 | ||||||
|
| |||||||
TOTAL EXCHANGE-TRADED FUNDS (Cost $38,586,551) | 40,372,851 | |||||||
|
| |||||||
Mutual Funds – 4.06% | ||||||||
ProFunds Biotechnology UltraSector ProFund – Investor Class (a) | 11,275 | 1,727,146 | ||||||
|
| |||||||
TOTAL MUTUAL FUNDS (Cost $1,460,540) | 1,727,146 | |||||||
|
| |||||||
Money Market Securities – 4.84% | ||||||||
Fidelity Institutional Money Market Portfolio – Class I, 0.12% (b) | 2,057,251 | 2,057,251 | ||||||
|
| |||||||
TOTAL MONEY MARKET SECURITIES (Cost $2,057,251) | 2,057,251 | |||||||
|
| |||||||
TOTAL INVESTMENTS (Cost $42,104,342) – 103.89% | $ | 44,157,248 | ||||||
|
| |||||||
Liabilities in excess of other assets – (3.89)% | (1,651,371 | ) | ||||||
|
| |||||||
TOTAL NET ASSETS – 100.00% | $ | 42,505,877 | ||||||
|
| |||||||
| (a) | Non-income producing. |
| (b) | Variable rate security; the money market rate shown represents the 7 day yield at April 30, 2013. |
See accompanying notes which are an integral part of these financial statements.
22
THE SOUND MIND INVESTING FUNDS
STATEMENTS OF ASSETS AND LIABILITIES
April 30, 2013 – (Unaudited)
| The Sound Mind Investing Fund | The Sound Mind Investing Balanced Fund | The SMI Dynamic Allocation Fund | ||||||||||
Assets | ||||||||||||
Investment in securities: | ||||||||||||
At cost | $ | 233,063,950 | $ | 27,666,396 | $ | 42,104,342 | ||||||
|
|
|
|
|
| |||||||
At fair value | $ | 263,195,647 | $ | 30,393,433 | $ | 44,157,248 | ||||||
Receivable for investments sold | 1,818,950 | 90,169 | 430,328 | |||||||||
Receivable for Fund shares sold | 7,000 | 350 | 271,304 | |||||||||
Interest receivable | 95 | 57,713 | 210 | |||||||||
Dividends receivable | — | 278 | — | |||||||||
Prepaid expenses | 30,788 | 12,309 | 14,689 | |||||||||
|
|
|
|
|
| |||||||
Total assets | 265,052,480 | 30,554,252 | 44,873,779 | |||||||||
|
|
|
|
|
| |||||||
Liabilities | ||||||||||||
Payable for investments purchased | 834,000 | 215,000 | 2,320,225 | |||||||||
Payable for Fund shares redeemed | 460,833 | — | — | |||||||||
Payable to Adviser (a) | 213,874 | 11,642 | 30,922 | |||||||||
Payable to administrator, transfer agent, and fund accountant (a) | 26,676 | 7,483 | 3,702 | |||||||||
Payable to custodian (a) | 7,987 | 4,760 | 10,452 | |||||||||
Payable to trustees and officers | 973 | 973 | 1,148 | |||||||||
Payable for interest purchased | — | 63 | — | |||||||||
Other accrued expenses | 9,068 | 14,692 | 1,453 | |||||||||
|
|
|
|
|
| |||||||
Total liabilities | 1,553,411 | 254,613 | 2,367,902 | |||||||||
|
|
|
|
|
| |||||||
Net Assets | $ | 263,499,069 | $ | 30,299,639 | $ | 42,505,877 | ||||||
|
|
|
|
|
| |||||||
Net Assets consist of: | ||||||||||||
Paid in capital | $ | 219,665,519 | $ | 26,376,299 | $ | 40,417,812 | ||||||
Accumulated undistributed net investment income (loss) | 52,876 | (147,808 | ) | 14,300 | ||||||||
Accumulated undistributed net realized gain (loss) from investment transactions | 13,648,977 | 1,344,111 | 20,859 | |||||||||
Net unrealized appreciation (depreciation) on: | ||||||||||||
Investment Securities | 30,131,697 | 2,727,037 | 2,052,906 | |||||||||
|
|
|
|
|
| |||||||
Net Assets | $ | 263,499,069 | $ | 30,299,639 | $ | 42,505,877 | ||||||
|
|
|
|
|
| |||||||
Shares outstanding (unlimited number of shares authorized) | 20,926,578 | 2,709,361 | 3,933,375 | |||||||||
|
|
|
|
|
| |||||||
Net Asset Value and offering price per share | $ | 12.59 | $ | 11.18 | $ | 10.81 | ||||||
|
|
|
|
|
| |||||||
Redemption price per share (Net Asset Value * 98%) (b) | $ | 12.34 | $ | 10.96 | $ | 10.59 | ||||||
|
|
|
|
|
| |||||||
| (a) | See Note 4 in the Notes to the Financial Statements. |
| (b) | The Funds charge a 2.00% redemption fee on shares redeemed within 60 calendar days of purchase. Shares are redeemed at the net asset value if held longer than 60 calendar days. |
See accompanying notes which are an integral part of these financial statements.
23
THE SOUND MIND INVESTING FUNDS
STATEMENTS OF OPERATIONS
For the period ended April 30, 2013 – (Unaudited)
| The Sound Mind Investing Fund | The Sound Mind Investing Balanced Fund | The SMI Dynamic Allocation Fund (a) | ||||||||||
Investment Income | ||||||||||||
Dividend income | $ | 1,589,868 | $ | 41,482 | $ | 74,289 | ||||||
Interest income | 577 | 135,865 | 515 | |||||||||
|
|
|
|
|
| |||||||
Total Investment Income | 1,590,445 | 177,347 | 74,804 | |||||||||
|
|
|
|
|
| |||||||
Expenses | ||||||||||||
Investment Adviser fee (b) | 1,306,522 | 148,281 | 42,023 | |||||||||
Administration expense (b) | 63,186 | 8,606 | �� | 201 | ||||||||
Transfer agent expense (b) | 48,342 | 21,444 | 5,014 | |||||||||
Fund accounting expense (b) | 26,707 | 3,807 | 100 | |||||||||
Printing expense | 20,193 | 2,596 | 1,170 | |||||||||
Custodian expense (b) | 18,434 | 9,260 | 2,006 | |||||||||
Registration expense | 18,097 | 13,949 | 610 | |||||||||
Legal expense | 10,973 | 10,741 | 2,490 | |||||||||
Auditing expense | 7,112 | 8,926 | 3,734 | |||||||||
Trustee expense | 5,271 | 5,271 | 1,245 | |||||||||
CCO expense | 4,255 | 4,255 | 167 | |||||||||
Insurance expense | 3,571 | 1,866 | — | |||||||||
Pricing expense | 2,068 | 10,810 | 1,003 | |||||||||
Miscellaneous expense | 2,641 | 483 | 62 | |||||||||
Overdraft expense | 1,265 | 362 | — | |||||||||
24f-2 expense | — | 339 | 679 | |||||||||
|
|
|
|
|
| |||||||
Total Expenses | 1,538,637 | 250,996 | 60,504 | |||||||||
Adviser fees waived (b) | — | (61,193 | ) | — | ||||||||
|
|
|
|
|
| |||||||
Net Expenses | 1,538,637 | 189,803 | 60,504 | |||||||||
|
|
|
|
|
| |||||||
Net Investment Income (Loss) | 51,808 | (12,456 | ) | 14,300 | ||||||||
|
|
|
|
|
| |||||||
See accompanying notes which are an integral part of these financial statements.
24
THE SOUND MIND INVESTING FUNDS
STATEMENTS OF OPERATIONS
For the period ended April 30, 2013 – (Unaudited), (Continued)
| The Sound Mind Investing Fund | The Sound Mind Investing Balanced Fund | The SMI Dynamic Allocation Fund (a) | ||||||||||
Realized & Unrealized Gain on Investments and Swap Contracts | ||||||||||||
Long Term Capital Gain Dividends from investment companies | $ | 1,416,745 | $ | 194,592 | $ | — | ||||||
Net realized gain on: | ||||||||||||
Investment securities | 14,286,607 | 1,149,949 | 20,859 | |||||||||
Swap contracts | — | 11,748 | — | |||||||||
Change in unrealized appreciation on investment securities | 22,703,836 | 1,949,492 | 2,052,906 | |||||||||
|
|
|
|
|
| |||||||
Net realized and unrealized gain on investments and swap contracts | 38,407,188 | 3,305,781 | 2,073,765 | |||||||||
|
|
|
|
|
| |||||||
Net increase in net assets resulting from operations | $ | 38,458,996 | $ | 3,293,325 | $ | 2,088,065 | ||||||
|
|
|
|
|
| |||||||
| (a) | Reflects operations from the period February 28, 2013 (commencement of operations) to April 30, 2013. |
| (b) | See Note 5 in the Notes to the Financial Statements. |
See accompanying notes which are an integral part of these financial statements.
25
THE SOUND MIND INVESTING FUND
STATEMENTS OF CHANGES IN NET ASSETS
| Six months ended April 30, 2013 (Unaudited) | Year Ended October 31, 2012 | |||||||
Increase (decrease) in Net Assets due to: | ||||||||
Operations | ||||||||
Net investment income | $ | 51,808 | $ | 9,995 | ||||
Long term capital gain dividends from investment companies | 1,416,745 | 3,693,858 | ||||||
Net realized gain on investment securities | 14,286,607 | 16,835,771 | ||||||
Change in unrealized appreciation (depreciation) on investment securities | 22,703,836 | (4,202,474 | ) | |||||
|
|
|
| |||||
Net increase in net assets resulting from operations | 38,458,996 | 16,337,150 | ||||||
|
|
|
| |||||
Distributions: | ||||||||
From net investment income | (8,927 | ) | — | |||||
From net realized gain | (11,101,278 | ) | — | |||||
|
|
|
| |||||
Total distributions | (11,110,205 | ) | — | |||||
|
|
|
| |||||
Capital Share Transactions | ||||||||
Proceeds from Fund shares sold | 14,584,756 | 35,377,039 | ||||||
Reinvestment of distributions | 10,902,348 | — | ||||||
Amount paid for Fund shares redeemed | (61,433,080 | ) | (68,373,694 | ) | ||||
Proceeds from redemption fees collected (a) | 4,639 | 24,172 | ||||||
|
|
|
| |||||
Net decrease in net assets resulting from capital share transactions | (35,941,337 | ) | (32,972,483 | ) | ||||
|
|
|
| |||||
Total Increase (Decrease) in Net Assets | (8,592,546 | ) | (16,635,333 | ) | ||||
|
|
|
| |||||
Net Assets | ||||||||
Beginning of period | 272,091,615 | 288,726,948 | ||||||
|
|
|
| |||||
End of period | $ | 263,499,069 | $ | 272,091,615 | ||||
|
|
|
| |||||
Accumulated undistributed net investment income included in net assets at end of period | $ | 52,876 | $ | 9,995 | ||||
|
|
|
| |||||
Capital Share Transactions | ||||||||
Shares sold | 1,223,717 | 3,174,087 | ||||||
Shares issued in reinvestment of distributions | 968,237 | — | ||||||
Shares redeemed | (5,209,117 | ) | (6,125,856 | ) | ||||
|
|
|
| |||||
Net decrease from capital share transactions | (3,017,163 | ) | (2,951,769 | ) | ||||
|
|
|
| |||||
| (a) | The Fund charges a 2% redemption fee on shares redeemed within 60 calendar days of purchase. Shares are redeemed at the Net Asset Value if held longer than 60 calendar days. |
See accompanying notes which are an integral part of these financial statements.
26
THE SOUND MIND INVESTING BALANCED FUND
STATEMENTS OF CHANGES IN NET ASSETS
| Six months ended April 30, 2013 (Unaudited) | Year Ended October 31, 2012 | |||||||
Increase (decrease) in Net Assets due to: | ||||||||
Operations | ||||||||
Net investment income (loss) | $ | (12,456 | ) | $ | 114,732 | |||
Long term capital gain dividends from investment companies | 194,592 | 124,226 | ||||||
Net realized gain on investment securities and swap contracts | 1,161,697 | 1,910,338 | ||||||
Change in unrealized appreciation on investment securities | 1,949,492 | 333,206 | ||||||
|
|
|
| |||||
Net increase in net assets resulting from operations | 3,293,325 | 2,482,502 | ||||||
|
|
|
| |||||
Distributions: | ||||||||
From net investment income | (87,797 | ) | (198,642 | ) | ||||
From net realized gain | (576,662 | ) | — | |||||
|
|
|
| |||||
Total distributions | (664,459 | ) | (198,642 | ) | ||||
|
|
|
| |||||
Capital Share Transactions | ||||||||
Proceeds from Fund shares sold | 5,739,884 | 14,284,283 | ||||||
Reinvestment of distributions | 660,917 | 196,650 | ||||||
Amount paid for Fund shares redeemed | (15,988,935 | ) | (14,338,724 | ) | ||||
Proceeds from redemption fees collected (a) | 674 | 1,917 | ||||||
|
|
|
| |||||
Net increase in net assets resulting from capital share transactions | (9,587,460 | ) | 144,126 | |||||
|
|
|
| |||||
Total Increase (Decrease) in Net Assets | (6,958,594 | ) | 2,427,986 | |||||
|
|
|
| |||||
Net Assets | ||||||||
Beginning of period | 37,258,233 | 34,830,247 | ||||||
|
|
|
| |||||
End of period | $ | 30,299,639 | $ | 37,258,233 | ||||
|
|
|
| |||||
Accumulated undistributed net investment (loss) included in net assets at end of period | $ | (147,808 | ) | $ | (47,555 | ) | ||
|
|
|
| |||||
Capital Share Transactions | ||||||||
Shares sold | 537,500 | 1,430,599 | ||||||
Shares issued in reinvestment of distributions | 63,919 | 20,357 | ||||||
Shares redeemed | (1,506,171 | ) | (1,425,974 | ) | ||||
|
|
|
| |||||
Net increase (decrease) from capital share transactions | (904,752 | ) | 24,982 | |||||
|
|
|
| |||||
| (a) | The Fund charges a 2% redemption fee on shares redeemed within 60 calendar days of purchase. Shares are redeemed at the Net Asset Value if held longer than 60 calendar days. |
See accompanying notes which are an integral part of these financial statements.
27
THE SMI DYNAMIC ALLOCATION FUND
STATEMENT OF CHANGES IN NET ASSETS
| Period Ended April 30, 2013 (a) | ||||
Increase in Net Assets due to: | ||||
Operations | ||||
Net investment income | $ | 14,300 | ||
Net realized gain on investment securities | 20,859 | |||
Change in unrealized appreciation on investment securities | 2,052,906 | |||
|
| |||
Net increase in net assets resulting from operations | 2,088,065 | |||
|
| |||
Capital Share Transactions | ||||
Proceeds from Fund shares sold | 40,499,536 | |||
Amount paid for Fund shares redeemed | (83,211 | ) | ||
Proceeds from redemption fees collected (b) | 1,487 | |||
|
| |||
Net increase in net assets resulting from capital share transactions | 40,417,812 | |||
|
| |||
Total Increase (Decrease) in Net Assets | 42,505,877 | |||
|
| |||
Net Assets | ||||
Beginning of period | — | |||
|
| |||
End of period | $ | 42,505,877 | ||
|
| |||
Accumulated undistributed net investment income included in net assets | $ | 14,300 | ||
|
| |||
Capital Share Transactions | ||||
Shares sold | 3,941,423 | |||
Shares redeemed | (8,048 | ) | ||
|
| |||
Net increase from capital share transactions | 3,933,375 | |||
|
| |||
| (a) | For the period February 28, 2013 (commencement of operations) through April 30, 2013. |
| (b) | The Fund charges a 2% redemption fee on shares redeemed within 60 calendar days of purchase. Shares are redeemed at the Net Asset Value if held longer than 60 calendar days. |
See accompanying notes which are an integral part of these financial statements.
28
This page intentionally left blank.
29
THE SOUND MIND INVESTING FUND
FINANCIAL HIGHLIGHTS
(For a share outstanding during each period)
| Six months ended April 30, 2013 (Unaudited) | ||||
Selected Per Share Data: | ||||
Net asset value, beginning of period | $ | 11.36 | ||
|
| |||
Income from investment operations: | ||||
Net investment income (loss)(b) | — | (c) | ||
Net realized and unrealized gain (loss) | 1.73 | |||
|
| |||
Total from investment operations | 1.73 | |||
|
| |||
Less Distributions to Shareholders: | ||||
From net investment income | — | (c) | ||
From net realized gain | (0.50 | ) | ||
From return of capital | — | |||
|
| |||
Total distributions | (0.50 | ) | ||
|
| |||
Paid in capital from redemption fees(c) | — | |||
|
| |||
Net asset value, end of period | $ | 12.59 | ||
|
| |||
Total Return(d) | 15.73 | %(i) | ||
Ratios and Supplemental Data: | ||||
Net assets, end of period (000) | $ | 263,499 | ||
Ratio of expenses to average net assets(e)(f) | 1.17 | %(j) | ||
Ratio of net investment income (loss) to | 0.04 | %(j) | ||
Portfolio turnover rate | 62.79 | %(i) | ||
| (a) | Per share net investment income has been calculated using the average shares method. |
| (b) | Recognition of the net investment income by the Fund is affected by the timing of the declaration of dividends by the underlying investment companies in which the Fund invests. |
| (c) | Resulted in less than $0.005 per share. |
| (d) | Total return in the above table represents the rate that the investor would have earned or lost on an investment in the Fund, assuming reinvestment of dividends. |
| (e) | These ratios exclude the impact of expenses of the underlying funds in which the Fund invests as represented in the Schedule of Investments. |
| (f) | This ratio does not include the effects of other expenses refunded by the underlying funds in which the Fund invests. If these refunds had been included, the ratio of expenses to average net assets would have been 1.17%, 1.15%, 1.14%, 1.21%, 1.26%, and 1.22%, for the periods ended April 30, 2013, October 31, 2012, October 31, 2011, October 31, 2010, October 31, 2009, and October 31, 2008, respectively. |
| (g) | This ratio is presented net of the other expenses refunded by the underlying funds in which the Fund invests. |
| (h) | Portfolio turnover rate excludes $21,405,392 of purchases, which is the book value of securities acquired at the time of merger with SMI Managed Volatility Fund. |
| (i) | Not annualized |
| (j) | Annualized |
See accompanying notes which are an integral part of these financial statements.
30
THE SOUND MIND INVESTING FUND
FINANCIAL HIGHLIGHTS
(For a share outstanding during the period) – (Continued)
Year ended | Year ended October 31, 2011 | Year ended October 31, 2010 | Year ended October 31, 2009 | Year ended October 31, 2008 | ||||||||||||||
| $ | 10.74 | $ | 10.71 | $ | 8.84 | $ | 7.63 | $ | 13.87 | |||||||||
|
|
|
|
|
|
|
|
|
| |||||||||
| — | 0.02 | (0.04 | ) | (0.02 | ) | 0.18 | (a) | |||||||||||
| 0.62 | 0.04 | 1.91 | 1.27 | (5.30 | ) | |||||||||||||
|
|
|
|
|
|
|
|
|
| |||||||||
| 0.62 | 0.06 | 1.87 | 1.25 | (5.12 | ) | |||||||||||||
|
|
|
|
|
|
|
|
|
| |||||||||
| — | (0.03 | ) | — | — | (0.21 | ) | ||||||||||||
| — | — | — | — | (0.86 | ) | |||||||||||||
| — | — | — | (0.04 | ) | (0.05 | ) | ||||||||||||
|
|
|
|
|
|
|
|
|
| |||||||||
| — | (0.03 | ) | — | (0.04 | ) | (1.12 | ) | |||||||||||
|
|
|
|
|
|
|
|
|
| |||||||||
| — | — | — | — | — | ||||||||||||||
|
|
|
|
|
|
|
|
|
| |||||||||
| $ | 11.36 | $ | 10.74 | $ | 10.71 | $ | 8.84 | $ | 7.63 | |||||||||
|
|
|
|
|
|
|
|
|
| |||||||||
| 5.77 | % | 0.50 | % | 21.15 | % | 16.57 | % | -39.86 | % | |||||||||
| $ | 272,092 | $ | 288,727 | $ | 283,892 | $ | 244,379 | $ | 195,625 | |||||||||
| 1.15 | % | 1.15 | % | 1.22 | % | 1.28 | % | 1.24 | % | |||||||||
| | 0.00 | % | 0.13 | % | (0.41 | )% | (0.26 | )% | 1.64 | % | ||||||||
| 187.39 | % | 165.12 | %(h) | 95.29 | % | 124.85 | % | 141.12 | % | |||||||||
See accompanying notes which are an integral part of these financial statements.
31
THE SOUND MIND INVESTING BALANCED FUND
FINANCIAL HIGHLIGHTS
(For a share outstanding during each period)
| Six months ended April 30, 2013 (Unaudited) | Year Ended | Period Ended October 31, 2011(a) | ||||||||||
Selected Per Share Data: | ||||||||||||
Net asset value, beginning of period | $ | 10.31 | $ | 9.70 | $ | 10.00 | ||||||
|
|
|
|
|
| |||||||
Income from investment operations: | ||||||||||||
Net investment income (loss)(b) | (0.02 | ) | 0.03 | (0.01 | ) | |||||||
Net realized and unrealized gain (loss) | 1.08 | 0.63 | (0.30 | ) | ||||||||
|
|
|
|
|
| |||||||
Total from investment operations | 1.06 | 0.66 | (0.31 | ) | ||||||||
|
|
|
|
|
| |||||||
Less Distributions to Shareholders: | ||||||||||||
From net investment income | (0.02 | ) | (0.05 | ) | — | |||||||
From realized gain | (0.17 | ) | — | — | ||||||||
|
|
|
|
|
| |||||||
Total distributions | (0.19 | ) | (0.05 | ) | — | |||||||
|
|
|
|
|
| |||||||
Paid in capital from redemption fees | — | (c) | — | (c) | 0.01 | |||||||
|
|
|
|
|
| |||||||
Net asset value, end of period | $ | 11.18 | $ | 10.31 | $ | 9.70 | ||||||
|
|
|
|
|
| |||||||
Total Return(d) | 10.48 | %(e) | 6.89 | % | -3.00 | %(e) | ||||||
Ratios and Supplemental Data: | ||||||||||||
Net assets, end of period (000) | $ | 30,300 | $ | 37,258 | $ | 34,830 | ||||||
Ratio of expenses to average net assets(f)(g) | 1.15 | %(h) | 1.15 | % | 1.15 | %(h) | ||||||
Ratio of expenses to average net assets before waiver and reimbursement(f) | 1.52 | %(h) | 1.49 | % | 1.80 | %(h) | ||||||
Ratio of net investment income (loss) to average net assets(b)(f)(i) | (0.08 | )%(h) | 0.29 | % | (0.17 | )%(h) | ||||||
Ratio of net investment loss to average net assets before waiver and reimbursement(b)(f) | (0.45 | )%(h) | (0.05 | )% | (0.82 | )%(h) | ||||||
Portfolio turnover rate | 115.31 | %(e) | 349.33 | % | 276.04 | % | ||||||
| (a) | For the period December 30, 2010 (the date the Fund commenced operations) through October 31, 2011. |
| (b) | Recognition of net investment income by the Fund is affected by the timing of the declaration of dividends by the underlying investment companies in which the Fund invests. |
| (c) | Redemption fees resulted in less than $0.005 per share. |
| (d) | Total return in the above table represents the rate that the investor would have earned on an investment in the Fund, assuming reinvestment of dividends. |
| (e) | Not annualized. |
| (f) | These ratios exclude the impact of expenses of the underlying funds in which the Fund may invest, as represented in the Schedule of Investments. |
| (g) | This ratio does not include the effects of other expenses refunded by the underlying funds in which the Fund invests. If these refunds had been included, the ratio of expenses to average net assets would have been 1.15%, 1.14% and 1.14% for the periods ended April 30, 2013, October 31, 2012 and October 31, 2011, respectively. |
| (h) | Annualized. |
| (i) | This ratio is presented net of the other expenses refunded by the underlying funds in which the Fund invests. |
See accompanying notes which are an integral part of these financial statements.
32
THE SMI DYNAMIC ALLOCATION FUND
FINANCIAL HIGHLIGHTS
(For a share outstanding during the period)
| Period Ended April 30, 2013 (Unaudited)(a) | ||||
Selected Per Share Data: | ||||
Net asset value, beginning of period | $ | 10.00 | ||
|
| |||
Income from investment operations: | ||||
Net investment income(b) | — | (c) | ||
Net realized and unrealized gain | 0.81 | |||
|
| |||
Total from investment operations | 0.81 | |||
|
| |||
Paid in capital from redemption fees | — | (c) | ||
|
| |||
Net asset value, end of period | $ | 10.81 | ||
|
| |||
Total Return(d) | 8.10 | %(e) | ||
Ratios and Supplemental Data: | ||||
Net assets, end of period (000) | $ | 42,506 | ||
Ratio of expenses to average net assets(f) | 1.44 | %(g) | ||
Ratio of net investment income to average net assets(b)(f) | 0.34 | %(g) | ||
Portfolio turnover rate | 3.49 | %(e) | ||
| (a) | For the period February 28, 2013 (commencement of operations) through April 30, 2013. |
| (b) | Recognition of net investment income by the Fund is affected by the timing of the declaration of dividends by the underlying investment companies in which the Fund invests. |
| (c) | Resulted in less than $0.005 per share. |
| (d) | Total return in the above table represents the rate that the investor would have earned on an investment in the Fund, assuming reinvestment of dividends. |
| (e) | Not annualized. |
| (f) | These ratios exclude the impact of expenses of the underlying funds in which the Fund may invest, as represented in the Schedule of Investments. |
| (g) | Annualized. |
See accompanying notes which are an integral part of these financial statements.
33
THE SOUND MIND INVESTING FUNDS
NOTES TO THE FINANCIAL STATEMENTS
April 30, 2013 – (Unaudited)
NOTE 1. ORGANIZATION
The Sound Mind Investing Fund (“SMI Fund”), Sound Mind Investing Balanced Fund and Sound Mind Dynamic Allocation Fund (each a “Fund” and collectively, the “Funds”) are each a diversified series of The Valued Advisers Trust (the “Trust”). Pursuant to a reorganization that took place on February 28, 2013, the SMI Fund and SMI Balanced Fund are the successors to a series of the Unified Series Trust (the “Predecessor Funds”). See Note 12 regarding Proxy Voting Results. The Predecessor Funds had the same investment objectives and strategies and substantially the same investment policies as the Funds. The SMI Fund was organized on August 29, 2005 and commenced operations on December 2, 2005. The SMI Balanced Fund was organized on November 13, 2010 and commenced operations on December 30, 2010. The SMI Dynamic Allocation Fund was organized on December 11, 2012 and commenced operations on February 28, 2013. The Trust is a management investment company established under the laws of Delaware by an Agreement and Declaration of Trust dated June 13, 2008 (the “Trust Agreement”). The Trust Agreement permits the Trustees to issue an unlimited number of shares of beneficial interest of separate series without par value. Each Fund is one of a series of funds currently authorized by the Trustees. The investment adviser to the Funds is SMI Advisory Services, LLC (the “Adviser”). Scout Investments, Inc., through its REAMS Asset Management division, is the subadviser for the fixed income portion of the Sound Mind Investing Balanced Fund and subadviser for the fixed income investments (other than ETFs and other investment companies that invest primarily in fixed income securities) and cash investments for the SMI Dynamic Allocation Fund (the “Subadviser”). The SMI Fund seeks to provide long-term capital appreciation. The SMI Balanced Fund seeks total return. The SMI Dynamic Allocation Fund seeks total return.
NOTE 2. SIGNIFICANT ACCOUNTING POLICIES
The following is a summary of significant accounting policies followed by the Funds in the preparation of their financial statements.
Securities Valuations – All investments in securities are recorded at their estimated fair value as described in Note 3.
Federal Income Taxes – The Funds make no provision for federal income or excise tax. The Funds intend to qualify each year as regulated investment companies (“RICs”) under subchapter M of the Internal Revenue Code of 1986, as amended, by complying with the requirements applicable to RICs and by distributing substantially all of their taxable income. The Funds also intend to distribute sufficient net investment income and net capital gains, if any, so that they will not be subject to excise tax on undistributed income and gains. If the required amount of net investment income or gains is not distributed, the Funds could incur a tax expense.
As of and during the period ended April 30, 2013, the Funds did not have a liability for any unrecognized tax benefits. The Funds recognize interest and penalties, if any, related to unrecognized tax benefits as income tax expense in the statements of operations. During the year, the Funds did not incur any interest or penalties. The Funds are not subject to examination by U.S. federal tax authorities for tax years prior to 2008.
34
THE SOUND MIND INVESTING FUNDS
NOTES TO THE FINANCIAL STATEMENTS
April 30, 2013 – (Unaudited), (Continued)
NOTE 2. SIGNIFICANT ACCOUNTING POLICIES – (Continued)
Expenses – Expenses incurred by the Trust that do not relate to a specific fund of the Trust are allocated to the individual funds based on each fund’s relative net assets or other appropriate basis (as determined by the Board).
Security Transactions and Related Income – The Funds follow industry practice and record security transactions on the trade date. For financial statement and income tax purposes, the specific identification method is used for determining gains or losses on mutual funds and exchange-traded funds while the first in, first out method is used for determining gains or losses on all other security types. Dividend income is recorded on the ex-dividend date and interest income is recorded on an accrual basis. Short-term capital gain distributions from underlying funds are classified as dividend income for financial reporting purposes. Long-term capital gain distributions are broken out as such. Discounts and premiums on securities purchased are amortized or accreted using the effective interest method. The ability of issuers of debt securities held by the Funds to meet their obligations may be affected by economic and political developments in a specific country or region.
Dividends and Distributions – The Funds typically distribute substantially all of their net investment income in the form of dividends and taxable capital gains to their shareholders at least annually. These distributions, which are recorded on the ex-dividend date, are automatically reinvested in each Fund unless shareholders request cash distributions on their application or through a written request. The treatment for financial reporting purposes of distributions made to shareholders during the year from net investment income or net realized capital gains may differ from their ultimate treatment for federal income tax purposes. These differences are caused primarily by differences in the timing of the recognition of certain components of income, expense or realized capital gain for federal income tax purposes. Where such differences are permanent in nature, they are reclassified in the components of net assets based on their ultimate characterization for federal income tax purposes. Any such reclassifications will have no effect on net assets, results of operations, or net asset values per share of the Funds.
Swap Contracts – The SMI Balanced Fund may enter into credit default swap contracts. A credit default swap involves a protection buyer and a protection seller. The Fund may be either a protection buyer or seller. The protection buyer makes periodic premium payments to the protection seller during the swap term in exchange for the protection seller agreeing to make certain defined payments to the protection buyer in the event that certain defined credit events occur with respect to a particular security, issuer, or basket of securities. The “notional amount” of the swap agreement is the agreed upon amount or value of the underlying asset used for calculating the obligations that the parties to a swap agreement have agreed to exchange. The Fund’s obligation under a swap agreement will be accrued daily (offset against amounts owed to the Fund) and any accrued but unpaid net amounts owed to a swap counterparty may be collateralized by designating liquid assets on the Fund’s books and records. The credit default swaps are marked to market daily based upon quotes received from a pricing service and any change in value is recorded in unrealized appreciation/depreciation. Periodic payments paid or received are recorded in
35
THE SOUND MIND INVESTING FUNDS
NOTES TO THE FINANCIAL STATEMENTS
April 30, 2013 – (Unaudited), (Continued)
NOTE 2. SIGNIFICANT ACCOUNTING POLICIES – (Continued)
realized gain/loss. Any premium paid or received by the Fund upon entering into a credit default swap contract is recorded as an asset or liability and amortized daily as a component of realized gain (loss) on the Statement of Operations. Payments made or received as a result of a credit event or termination of the contract are recognized, net of a proportional amount of the upfront payment, as realized gains/losses. In addition to bearing the risk that the credit event will occur as a protection seller, the Fund could be exposed to market risk due to unfavorable changes in interest rates or in the price of the underlying security or index, the possibility that the Fund may be unable to close out its position at the same time or at the same price as if it had purchased comparable publicly traded securities, or that the counterparty may default on its obligation to perform. Please see Note 4 for information on swap agreement activity during the period ended April 30, 2013.
NOTE 3. SECURITIES VALUATION AND FAIR VALUE MEASUREMENTS
Fair value is defined as the price that a Fund would receive upon selling an investment in a orderly transaction to an independent buyer in the principal or most advantageous market of the investment. Accounting principles generally accepted in the United States of America, (“GAAP”), establishes a three-tier hierarchy to maximize the use of observable market data and minimize the use of unobservable inputs and to establish classification of fair value measurements for disclosure purposes.
Inputs refer broadly to the assumptions that market participants would use in pricing the asset or liability, including assumptions about risk, for example, the risk inherent in a particular valuation technique used to measure fair value including such a pricing model and/or the risk inherent in the inputs to the valuation technique. Inputs may be observable or unobservable. Observable inputs are inputs that reflect the assumptions market participants would use in pricing the asset or liability developed based on market data obtained from sources independent of the reporting entity. Unobservable inputs are inputs that reflect the reporting entity’s own assumptions about the assumptions market participants would use in pricing the asset or liability developed based on the best information available in the circumstances.
Various inputs are used in determining the value of the Funds’ investments. These inputs are summarized in the three broad levels listed below.
| • | Level 1 – quoted prices in active markets for identical securities |
| • | Level 2 – other significant observable inputs (including, but not limited to, quoted prices for an identical security in an inactive market, quoted prices for similar securities, interest rates, prepayment speeds, credit risk, etc.) |
| • | Level 3 – significant unobservable inputs (including each Fund’s own assumptions in determining fair value of investments based on the best information available) |
36
THE SOUND MIND INVESTING FUNDS
NOTES TO THE FINANCIAL STATEMENTS
April 30, 2013 – (Unaudited), (Continued)
NOTE 3. SECURITIES VALUATION AND FAIR VALUE MEASUREMENTS – (Continued)
The inputs used to measure fair value may fall into different levels of the fair value hierarchy. In such cases, for disclosure purposes, the level in the fair value hierarchy within which the fair value measurement falls in its entirety, is determined based on the lowest level input that is significant to the fair value measurement in its entirety.
Equity securities, including exchanged-traded funds, are generally valued by using market quotations, but may be valued on the basis of prices furnished by a pricing service when the Adviser believes such prices more accurately reflect the fair value of such securities. Securities that are traded on any stock exchange are generally valued by the pricing service at the last quoted sale price. Lacking a last sale price, an exchange traded security is generally valued by the pricing service at its last bid price. Securities traded in the NASDAQ over-the-counter market are generally valued by the pricing service at the NASDAQ Official Closing Price. When using the market quotations or close prices provided by the pricing service and when the market is considered active, the security will be classified as a Level 1 security. Sometimes, an equity security owned by the Funds will be valued by the pricing service with factors other than market quotations or when the market is considered inactive. When this happens, the security will be classified as a Level 2 security. When market quotations are not readily available, when the Adviser determines that the market quotation or the price provided by the pricing service does not accurately reflect the current fair value, or when restricted or illiquid securities are being valued, such securities are valued as determined in good faith by the Adviser, in conformity with guidelines adopted by and subject to review by the Board. These securities will be categorized as Level 3 securities.
Investments in mutual funds, including money market mutual funds, are generally priced at the ending net asset value (“NAV”) provided by the service agent of the funds. These securities will be categorized as Level 1 securities.
Derivative instruments that the Funds invests in, such as swap agreements, are generally traded over-the-counter. The credit default swaps the SMI Balanced Fund invests in will generally be valued at the mean of bid and ask prices provided by a major credit default swap pricing provider and will generally be classified as Level 2 securities.
Fixed income securities, including corporate bonds, foreign bonds denominated in U.S. dollars, U.S. treasury obligations and asset-backed securities, when valued using market quotations in an active market, will be categorized as Level 1 securities. However, they may be valued on the basis of prices furnished by a pricing service when the Adviser believes such prices more accurately reflect the fair value of such securities. A pricing service utilizes electronic data processing techniques based on yield spreads relating to securities with similar characteristics to determine prices for normal institutional-size trading units of debt securities without regard to sale or bid prices. Data used to establish quotes for asset-backed securities includes analysis of cash flows, pre-payment speeds, default rates delinquency assumptions and assumptions regarding collateral and loss assumptions. These securities will generally be categorized as Level 2 securities. If the Adviser decides that a price provided by the pricing service does not accurately
37
THE SOUND MIND INVESTING FUNDS
NOTES TO THE FINANCIAL STATEMENTS
April 30, 2013 – (Unaudited), (Continued)
NOTE 3. SECURITIES VALUATION AND FAIR VALUE MEASUREMENTS – (Continued)
reflect the fair value of the securities, when prices are not readily available from a pricing service, or when restricted or illiquid securities are being valued, securities are valued at fair value as determined in good faith by the Adviser, in conformity with guidelines adopted by and subject to review of the Board. These securities will be categorized as Level 2 or Level 3 securities, depending on the nature of the inputs used.
Short-term investments in fixed income securities, (those with maturities of less than 60 days when acquired, or which subsequently are within 60 days of maturity), are valued by using the amortized cost method of valuation, which the Board has determined will represent fair value. These securities will be classified as Level 2 securities.
In accordance with the Trust’s good faith pricing guidelines, the Adviser is required to consider all appropriate factors relevant to the value of securities for which it has determined other pricing sources are not available or reliable as described above. No single standard exists for determining fair value, because fair value depends upon the circumstances of each individual case. As a general principle, the current fair value of an issue of securities being valued by the Adviser would appear to be the amount which the owner might reasonably expect to receive for them upon their current sale. Methods which are in accordance with this principle may, for example, be based on (i) a multiple of earnings; (ii) a discount from market of a similar freely traded security (including a derivative security or a basket of securities traded on other markets, exchanges or among dealers); or (iii) yield to maturity with respect to debt issues, or a combination of these and other methods. Good faith pricing is permitted if, in the Adviser’s opinion, the validity of market quotations appears to be questionable based on factors such as evidence of a thin market in the security based on a small number of quotations, a significant event occurs after the close of a market but before a Fund’s NAV calculation that may affect a security’s value, or the Adviser is aware of any other data that calls into question the reliability of market quotations. Good faith pricing may also be used in instances when the bonds the Funds’ invest in may default or otherwise cease to have market quotations readily available.
38
THE SOUND MIND INVESTING FUNDS
NOTES TO THE FINANCIAL STATEMENTS
April 30, 2013 – (Unaudited), (Continued)
NOTE 3. SECURITIES VALUATION AND FAIR VALUE MEASUREMENTS – (Continued)
The following is a summary of the inputs used to value the SMI Fund’s investments as of April 30, 2013:
| Valuation Inputs | ||||||||||||||||
| Assets | Level 1 – Quoted Prices in Active Markets | Level 2 – Other Significant Observable Inputs | Level 3 – Significant Unobservable Inputs | Total | ||||||||||||
| Mutual Funds – greater than 1% of net assets | $ | 257,902,543 | $ | — | $ | — | $ | 257,902,543 | ||||||||
| Mutual Funds – less than 1% of net assets | 4,944,904 | — | — | 4,944,904 | ||||||||||||
| Money Market Securities | 348,200 | — | — | 348,200 | ||||||||||||
| Total | $ | 263,195,647 | $ | — | $ | — | $ | 263,195,647 | ||||||||
The SMI Fund did not hold any investments at any time during the reporting period in which significant unobservable inputs were used in determining fair value; therefore, no reconciliation of Level 3 securities is included for this reporting period. The SMI Fund did not hold any derivative instruments during the reporting period. During the period ended April 30, 2013, there were no transfers between levels. The SMI Fund recognizes transfers between fair value hierarchy levels at the end of the reporting period.
39
THE SOUND MIND INVESTING FUNDS
NOTES TO THE FINANCIAL STATEMENTS
April 30, 2013 – (Unaudited), (Continued)
NOTE 3. SECURITIES VALUATION AND FAIR VALUE MEASUREMENTS – (Continued)
The following is a summary of the inputs used to value the SMI Balanced Fund’s investments as of April 30, 2013:
| Valuation Inputs | ||||||||||||||||
| Assets | Level 1 – Quoted Prices in Active Markets | Level 2 – Other Significant Observable Inputs | Level 3 – Significant Unobservable Inputs | Total | ||||||||||||
| Corporate Bonds | $ | — | $ | 3,695,588 | $ | — | $ | 3,695,588 | ||||||||
| Foreign Bonds Denominated in U.S. Dollars | — | 361,327 | — | 361,327 | ||||||||||||
| U.S. Treasury Notes | — | 1,458,203 | — | 1,458,203 | ||||||||||||
| Asset-Backed Securities | — | 4,861,475 | — | 4,861,475 | ||||||||||||
| Mutual Funds | 19,677,504 | — | — | 19,677,504 | ||||||||||||
| Money Market Securities | 339,336 | — | — | 339,336 | ||||||||||||
| Total | $ | 20,016,840 | $ | 10,376,593 | $ | — | $ | 30,393,433 | ||||||||
The SMI Balanced Fund did not hold any investments at any time during the reporting period in which significant unobservable inputs were used in determining fair value; therefore, no reconciliation of Level 3 securities is included for this reporting period. During the period ended April 30, 2013, there were no transfers between levels. The SMI Balanced Fund recognizes transfers between fair value hierarchy levels at the end of the reporting period.
40
THE SOUND MIND INVESTING FUNDS
NOTES TO THE FINANCIAL STATEMENTS
April 30, 2013 – (Unaudited), (Continued)
NOTE 3. SECURITIES VALUATION AND FAIR VALUE MEASUREMENTS – (Continued)
The following is a summary of the inputs used to value the SMI Dynamic Allocation Fund’s investments as of April 30, 2013:
| Valuation Inputs | ||||||||||||||||
| Assets | Level 1 – Quoted Prices in Active Markets | Level 2 – Other Significant Observable Inputs | Level 3 – Significant | Total | ||||||||||||
| Exchange-Traded Funds | $ | 40,372,851 | $ | — | $ | — | $ | 40,372,851 | ||||||||
| Mutual Funds | 1,727,146 | — | — | 1,727,146 | ||||||||||||
| Money Market Securities | 2,057,251 | — | — | 2,057,251 | ||||||||||||
| Total | $ | 44,157,248 | $ | — | $ | — | $ | 44,157,248 | ||||||||
The SMI Dynamic Allocation Fund did not hold any investments at any time during the reporting period in which significant unobservable inputs were used in determining fair value; therefore, no reconciliation of Level 3 securities is included for this reporting period. The SMI Dynamic Allocation Fund did not hold any derivative instruments during the reporting period. During the period ended April 30, 2013, there were no transfers between levels. The SMI Dynamic Allocation Fund recognizes transfers between fair value hierarchy levels at the end of the reporting period.
NOTE 4. DERIVATIVE TRANSACTIONS
The SMI Balanced Fund may obtain exposure to the fixed income market by investing in credit default swap (“CDX”) contracts. The Fund used CDX contracts as an additional avenue in which to bring value to the Fund. The Fund may use CDX contracts as an alternative to buying, selling, or holding certain securities in the fixed income market. The use of CDX contracts may provide a less expensive, more expedient, or more specifically focused way to invest than traditional fixed income securities would. The Fund may enter into single name CDX agreements to gain exposure to a particular company when it is more economically attractive to do so rather than purchasing traditional bonds. The Fund may also invest in CDX index products and options thereon that allow the Fund to gain broad market exposure but with less company-specific risk than single name CDX agreements.
The SMI Balanced Fund enters into CDX contracts to gain exposure or to mitigate specific forms of credit risk. Swaps expose the Fund to counterparty risk (described below). The Fund could also suffer losses with respect to a swap agreement if the Fund is unable to terminate the agreement or reduce its exposure through offsetting transactions.
Many of the markets in which the Fund participates in credit default transactions are “over the counter” or “interdealer” markets. The participants in these markets are typically not subject to credit evaluation and regulatory oversight as are members of “exchange based markets. When the Fund invests in CDX
41
THE SOUND MIND INVESTING FUNDS
NOTES TO THE FINANCIAL STATEMENTS
April 30, 2013 – (Unaudited), (Continued)
NOTE 4. DERIVATIVE TRANSACTIONS – (Continued)
contracts, it is assuming a credit risk with regard to parties with whom it trades and also bears the risk of settlement default. These risks may differ materially from those associated with transactions effected on an exchange, which generally are backed by clearing organization guarantees, daily marking-to-market and settlement, and segregation and minimum capital requirements applicable to intermediaries. Transactions entered into directly between two counterparties generally do not benefit from such protections. This exposes the Fund to the risk that the counterparty will not settle a transaction in accordance with its terms and conditions because of a dispute over the terms of the contract (whether or not bona fide) or because of a credit or liquidity problem, thus causing the Fund to suffer a loss. To mitigate counterparty risk, the Fund will sometimes require the counterparty to post collateral to the Fund’s custodian to cover the exposure.
The SMI Balanced Fund may also invest in credit default swap index products and in options on credit default swap index products. These instruments are designed to track segments of the credit default swap market and provide investors with exposure to specific “baskets” of issuers of bonds or loans. In general, the value of the credit default swap market provides investors with exposure to specific “baskets” of issuers of bonds or loans. In general, the value of the credit default swap index product will go up or down in response to changes in the perceived credit risk and default experience of the basket of issuers, instead of the exchange of the stream of payments for the payment of the notional amount (if a credit event occurs) that is the substance of a single name credit default swap. Such investments are subject to liquidity risks as well as counterparty and other risks associated with investments in credit default swaps discussed above.
In accordance with GAAP, the fair value of any credit default swaps can be found on the Statement of Assets and Liabilities under receivable for investments sold and on the Statement of Operations under net realized gain (loss) on swap contracts. There were no open contracts as of April 30, 2013. For the period ended April 30, 2013, the realized gain (loss) on swap agreements was as follows:
| Derivatives | Location of Gain (Loss) on Derivatives in Statements of Operations | Realized Gain (Loss) on Derivatives | ||||
Credit Risk: Credit Default Swap Contracts | Net realized gain (loss) on swap contracts and Change in unrealized appreciation (depreciation) on swap contracts | $ | 11,748 | |||
During the period ended April 30, 2013, the Fund had written total notional value of swap contracts of $1,430,000. The total notional value of terminated swap contracts was $1,430,000. No collateral was posted by either party as of April 30, 2013. No swap positions were held as of April 30, 2013. The Fund utilized credit derivative instruments in conjunction with investment securities in an effort to achieve its investment objective for the period ended April 30, 2013.
42
THE SOUND MIND INVESTING FUNDS
NOTES TO THE FINANCIAL STATEMENTS
April 30, 2013 – (Unaudited), (Continued)
NOTE 5. FEES AND OTHER TRANSACTIONS WITH AFFILIATES
The Adviser, under the terms of the management agreement with respect to each Fund (each an “Agreement”), manages the Funds’ investments. As compensation for its management services, each Fund is obligated to pay the Advisor a fee based on the Fund’s average daily net assets as follows:
Fund Assets | SMI Fund | SMI Balanced Fund | SMI Dynamic Allocation | |||
| $1 – $100 million | 1.00% | 0.90% | 1.00% | |||
| $100,000,001 – $250 million | 1.00% | 0.80% | 1.00% | |||
| $250,000,001 to $500 million | 0.90% | 0.70% | 0.90% | |||
| Over $500 million | 0.80% | 0.60% | 0.80% | |||
| Management fees earned | $ 1,306,522 | $ 148,281 | $ 42,023 | |||
| Fees waived and expenses reimbursed | $ — | $ (61,193) | $ — |
The Adviser contractually has agreed to waive its management fee and/or reimburse certain operating expenses, but only to the extent necessary so that each Fund’s total annual operating expenses (excluding interest, taxes, brokerage commissions, other expenses which are capitalized in accordance with generally accepted accounting principles, extraordinary expenses, dividend expense on short sales, 12b-1 fees, and acquired fund fees and expenses) do not exceed 1.50% of the Fund’s average daily net assets with respect to the SMI Fund, 1.15% with respect to the Sound Mind Investing Balanced Fund, and 1.45% with respect to the SMI Dynamic Allocation Fund. The contractual arrangement for each Fund is in place through February 28, 2014. Each waiver or reimbursement by the Adviser is subject to repayment by the applicable Fund within the three fiscal years following the fiscal year in which the particular expense or reimbursement was incurred; provided that such Fund is able to make the repayment without exceeding the applicable expense limitation.
The amount subject to repayment by the SMI Balanced Fund, pursuant to the aforementioned conditions, at April 30, 2013 is as follows:
| Amount | Recoverable through | |||||
| $ | 126,597 | 2014 | ||||
| 131,773 | 2015 | |||||
| 61,193 | 2016 | |||||
The Trust retains Huntington Asset Services, Inc. (“HASI”) to manage the Funds’ business affairs and to provide the Funds with administrative services, including all regulatory reporting and necessary office equipment and personnel. The Trust also retains HASI to act as each Fund’s transfer agent and to provide fund accounting services. Expenses incurred by the Funds for these expenses are allocated to the individual Funds based on each Fund’s relative net assets. Certain officers of the Trust are members of management
43
THE SOUND MIND INVESTING FUNDS
NOTES TO THE FINANCIAL STATEMENTS
April 30, 2013 – (Unaudited), (Continued)
NOTE 5. FEES AND OTHER TRANSACTIONS WITH AFFILIATES – (Continued)
and/or employees of HASI. HASI operates as a wholly-owned subsidiary of Huntington Bancshares, Inc., the parent company of the principal distributor of the Funds and Huntington National Bank, the custodian of the Funds’ investments (the “Custodian”). A Trustee of the Trust is a member of management of the Custodian. For the period ended April 30, 2013, fees for administrative, transfer agent, and fund accounting services, reimbursement of out-of-pocket expenses, and Custodian expenses and the amounts due to HASI and the Custodian at April 30, 2013 were as follows:
| SMI Fund | SMI Balanced Fund | SMI Dynamic Allocation Fund | ||||||||||
Administration expenses | $ | 63,186 | $ | 8,606 | $ | 201 | ||||||
Transfer agent expenses | 48,342 | 21,444 | 5,014 | |||||||||
Fund accounting expenses | 26,707 | 3,807 | 100 | |||||||||
Custodian expenses | 18,434 | 9,260 | 2,006 | |||||||||
Payable to HASI | 26,676 | 7,483 | 3,702 | |||||||||
Payable to Custodian | 7,987 | 4,760 | 10,452 | |||||||||
Unified Financial Securities, Inc. (the “Distributor”) acts as the principal distributor of the Funds. There were no payments made to the Distributor by the SMI Fund, the SMI Balanced Fund, or the SMI Dynamic Allocation Fund for period ended April 30, 2013. The Distributor, HASI, and the Custodian are controlled by Huntington Bancshares, Inc. A Trustee of the Trust is a member of management of Huntington National Bank, a subsidiary of Huntington Bancshares, Inc. (the parent of the Distributor), and certain officers of the Trust are officers of the Distributor and such persons may be deemed to be affiliates of the Distributor.
NOTE 6. INVESTMENTS
For the period ended April 30, 2013, purchases and sales of investment securities, other than short-term investments and short-term U.S. government obligations were as follows:
| SMI Fund | SMI Balanced Fund | SMI Dynamic Allocation Fund | ||||||||||
Purchases | ||||||||||||
U.S. Government Obligations | $ | — | $ | 23,694,453 | $ | — | ||||||
Other | 166,539,015 | 12,548,963 | 41,207,185 | |||||||||
Sales | ||||||||||||
U.S. Government Obligations | $ | — | $ | 23,185,248 | $ | — | ||||||
Other | 211,753,772 | 21,679,509 | 1,180,955 | |||||||||
44
THE SOUND MIND INVESTING FUNDS
NOTES TO THE FINANCIAL STATEMENTS
April 30, 2013 – (Unaudited), (Continued)
NOTE 6. INVESTMENTS – (Continued)
At April 30, 2013, the net unrealized appreciation (depreciation) of investments for tax purposes, was as follows:
| SMI Fund | SMI Balanced Fund | SMI Dynamic Allocation Fund | ||||||||||
Gross Appreciation | $ | 30,174,822 | $ | 2,724,753 | $ | 2,053,438 | ||||||
Gross (Depreciation) | (44,653 | ) | (9,949 | ) | (532 | ) | ||||||
|
|
|
|
|
| |||||||
Net Appreciation (Depreciaton) on Investments | $ | 30,130,169 | $ | 2,714,804 | $ | 2,052,906 | ||||||
|
|
|
|
|
| |||||||
At April 30, 2013, the aggregate cost of securities for federal income tax purposes was $233,065,478, $27,678,629 and $42,104,342 for the SMI Fund, SMI Balanced Fund and SMI Dynamic Allocation Fund respectively.
NOTE 7. RESTRICTED SECURITIES
Restricted securities are securities that may only be resold upon registration under federal securities laws or in transactions exempt from such registration. In some cases, the issuer of restricted securities has agreed to register such securities for resale, at the issuer’s expense, either upon demand by the Funds or in connection with another registered offering of the securities. Many restricted securities may be resold in the secondary market in transactions exempt from registration. Such restricted securities may be determined to be liquid. The Board of Trustees and management of the SMI Balanced Fund consider the restricted securities shown below to be liquid. The Fund will not incur any registration costs upon such resale. The Fund’s restricted securities are valued at the price provided by dealers in the secondary market or, if no market prices are available, at the fair value as determined by the Trust’s Pricing Committee. At April 30, 2013, the SMI Balanced Fund held restricted securities representing 3.81% of net assets, as listed below:
| Issuer Description | Acquisition Date | Principal Amount | Amortized Cost | Fair Value | ||||||||||||
| American Airlines 2013-1 Class A Pass Through Trust, 4.000%, 07/15/2025 | 3/6/2013 | $ | 50,000 | $ | 50,000 | $ | 50,188 | |||||||||
| Credit Suisse Mortgage Capital Certificate, Series 2009-12R, Class 41A1, 5.250%, 03/27/2037 | 6/13/2011 | 22,604 | 26,100 | 23,208 | ||||||||||||
| Daimler Finance North America LLC 1.250%, 01/11/2016 | 1/9/2013 | 90,000 | 89,900 | 90,469 | ||||||||||||
| DBRR Trust, Series 2012-EZ1, Class A, 0.946%, 09/25/2045 | (a | ) | 145,655 | 145,913 | 145,975 | |||||||||||
45
THE SOUND MIND INVESTING FUNDS
NOTES TO THE FINANCIAL STATEMENTS
April 30, 2013 – (Unaudited), (Continued)
NOTE 7. RESTRICTED SECURITIES – (Continued)
| Issuer Description | Acquisition Date | Principal Amount | Amortized Cost | Fair Value | ||||||||||||
| Ford Motor Credit Co. LLC, 3.984%, 06/15/2016 | (b | ) | $ | 65,000 | $ | 65,062 | $ | 69,175 | ||||||||
| GS Mortgage Securities Corp. II, Series 2007-EOP, Class A1, 1.103%, 03/06/2020 | (c | ) | 35,187 | 34,912 | 35,213 | |||||||||||
| Hertz Vehicle Financing, LLC, Series 2011-1A, Class A1, 2.200%, 03/25/2016 | (d | ) | 110,000 | 110,542 | 112,448 | |||||||||||
| Hertz Vehicle Financing, LLC, Series 2013-1A, Class A1, 1.200%, 08/25/2017 | 1/18/2013 | 90,000 | 89,993 | 90,459 | ||||||||||||
| ING Bank NV, 3.750%, 03/07/2017 | (e | ) | 165,000 | 164,486 | 177,604 | |||||||||||
| Liberty Mutual Group, 6.700%, 08/15/2016 | 1/19/2012 | 25,000 | 26,738 | 29,076 | ||||||||||||
| MetLife Institutional Funding II, 0.650%, 01/06/2015 | 1/8/2013 | 75,000 | 75,000 | 75,111 | ||||||||||||
| Metropolitan Life Global Funding I, 1.700%, 06/29/2015 | 3/25/2013 | 55,000 | 56,178 | 56,120 | ||||||||||||
| Prudential Insurance Co. of America/The, 8.300%, 07/01/2025 | (g | ) | 85,000 | 104,328 | 118,912 | |||||||||||
| Structured Asset Securities Corp., 2005-S7, Class A2, 0.490%, 12/25/2035 | (h | ) | 25,451 | 19,351 | 24,388 | |||||||||||
| Verizon Communications, Inc. 0.470%, 03/06/2015 | 3/5/2013 | 55,000 | 50,000 | 54,955 | ||||||||||||
| $ | 1,153,301 | |||||||||||||||
| (a) | Purchased on various dates beginning 09/21/2012. |
| (b) | Purchased on various dates beginning 06/17/2011. |
| (c) | Purchased on various dates beginning 03/10/2011. |
| (d) | Purchased on various dates beginning 06/13/2011. |
| (e) | Purchased on various dates beginning 03/01/2012. |
| (g) | Purchased on various dates beginning 05/17/2011. |
| (h) | Purchased on various dates beginning 06/22/2011. |
46
THE SOUND MIND INVESTING FUNDS
NOTES TO THE FINANCIAL STATEMENTS
April 30, 2013 – (Unaudited), (Continued)
NOTE 8. ESTIMATES
The preparation of financial statements in conformity with GAAP requires management to make estimates and assumptions that affect the reported amounts of assets and liabilities and disclosure of contingent assets and liabilities at the date of the financial statements and the reported amounts of increases and decreases in net assets from operations during the reporting period. Actual results could differ from those estimates.
NOTE 9. BENEFICIAL OWNERSHIP
The beneficial ownership, either directly or indirectly, of more than 25% of the voting securities of a fund creates a presumption of control of the fund, under Section 2(a)(9) of the Investment Company Act of 1940. At April 30, 2013, National Financial Services Corporation, for the benefit of others, held 33.12% and 25.08% of the SMI Balanced Fund and the SMI Dynamic Allocation Fund, respectively. As a result, National Financial Services Corporation may be deemed to control the SMI Balanced Fund and the SMI Dynamic Allocation Fund.
NOTE 10. DISTRIBUTIONS TO SHAREHOLDERS
SMI Fund: On December 31, 2012, SMI Fund paid an income distribution of $0.0004 per share and a long-term capital gain distribution of $0.4974 per share to shareholders of record on December 28, 2012.
The tax characterization of distributions for the fiscal years ended October 31, 2012 and October 31, 2011, was as follows:
| 2012 | 2011 | |||||||
Distributions paid from: | ||||||||
Ordinary Income | $ | — | $ | 687,868 | ||||
|
|
|
| |||||
| $ | — | $ | 687,868 | |||||
|
|
|
| |||||
At October 31, 2012, the components of distributable earnings (accumulated losses) on a tax basis were as follows:
Accumulated undistributed | $ | 9,995 | ||
Accumulated undistributed | 11,102,006 | |||
Capital loss carryforward | (2,053,575 | ) | ||
Unrealized appreciation (depreciation) | 7,426,333 | |||
|
| |||
| $ | 16,484,759 | |||
|
|
At October 31, 2012, the difference between book basis and tax basis unrealized appreciation is attributable to the tax deferral of losses on wash sales in the amount of $1,528.
47
THE SOUND MIND INVESTING FUNDS
NOTES TO THE FINANCIAL STATEMENTS
April 30, 2013 – (Unaudited), (Continued)
NOTE 10. DISTRIBUTIONS TO SHAREHOLDERS – (Continued)
SMI Investing Balanced Fund: On December 31, 2012, SMI Investing Balanced Fund paid an income distribution of $0.0257 per share, a short-term capital gain distribution of $0.0687 per share, and a long-term capital gain distribution of $0.1001 per share to shareholders of record on December 28, 2012.
The tax characterization of distributions for the fiscal year ended October 31, 2012 was as follows:
| 2012 | ||||
Distributions paid from: | ||||
Ordinary Income | $ | 198,642 | ||
|
| |||
| $ | 198,642 | |||
|
| |||
At October 31, 2012, the components of distributable earnings (accumulated losses) on a tax basis were as follows:
Accumulated undistributed | $ | 234,595 | ||
Accumulated undistributed | 342,122 | |||
Accumulated capital and other losses | (47,555 | ) | ||
Unrealized appreciation (depreciation) | 765,312 | |||
|
| |||
| $ | 1,294,474 | |||
|
|
At October 31, 2012, the difference between book basis and tax basis unrealized appreciation is attributable to the tax deferral of losses on wash sales in the amount of $12,233.
Under current tax law, net investment losses realized after December 31 of a fund’s fiscal year may be deferred and are treated as occurring on the first business day of the following fiscal year for tax purposes. The SMI Balanced Fund deferred net investment losses in the amount of $47,555.
NOTE 11. CAPITAL LOSS CARRYFORWARD
At October 31, 2012, the SMI Fund had available for federal tax purposes an unused capital loss carryforward of $2,053,575 which is available for offset against future taxable net capital gains. To the extent these carryforwards are used to offset future capital gains, it is probable that the amount, which is offset, will not be distributed to shareholders. The carryforwards expire as follows:
| SMI Fund | Expires | |||||
| $ | 2,053,575 | * | 2016 | |||
| * | Due to IRC Section 382 limitations, utilization of these carryforwards is limited to a maximum of $1,106,117 per year. |
48
THE SOUND MIND INVESTING FUNDS
NOTES TO THE FINANCIAL STATEMENTS
April 30, 2013 – (Unaudited), (Continued)
NOTE 12. PROXY VOTING RESULTS
A special meeting was held February 14, 2013 to obtain shareholder approval to reorganize the Sound Mind Investing Fund and the Sound Mind Investing Balanced Fund from a series of the series of Unified Series Trust to a series of Valued Advisers Trust.
The result of this special meeting shareholder vote was as follows:
For the SMI Fund: | ||||
For | 11,246,816 | |||
Against | 89,183 | |||
Abstain | 102,741 | |||
For the SMI Balanced Fund: | ||||
For | 2,191,436 | |||
Against | — | |||
Abstain | 11,335 | |||
49
OTHER INFORMATION
The Funds’ Statement of Additional Information (“SAI”) includes additional information about the trustees and is available without charge, upon request. You may call toll-free at 1-877-764-3863 to request a copy of the SAI or to make shareholder inquiries.
MANAGEMENT AGREEMENT RENEWAL FOR SOUND MIND INVESTING FUND AND SOUND MIND BALANCED FUND – (Unaudited)
Note to Reader: References in the following section to the SMI Funds also refer to each of those Funds as they existed and operated in another fund family (e.g., references to performance).
At a meeting held on December 10, 2012, the Board of Trustees (the “Board”) considered the initial approval of an Investment Advisory Agreement (the “Advisory Agreement”) between the Trust and SMI Advisory Services, LLC (“SMI” or the “Adviser”) on behalf of the Sounding Mind Investing Fund and the Sound Mind Investing Balanced Fund (the “SMI Funds”). Counsel reviewed with the Board the requirements of the 1940 Act and the applicable disclosure obligations associated therewith. The Board discussed the arrangements between SMI and the Trust with respect to the SMI Funds and reflected on its discussions with representatives from SMI at the meeting, regarding the Advisory Agreement, the expense limitation agreement and the manner in which the SMI Funds were to be managed. The Board also reflected on the presentation by representatives of SMI at a special meeting of the Board held on November 27, 2012. The Board noted that each of the SMI Funds was currently in operations in another fund family that is administered by Huntington Asset Services, Inc., the Trust’s administrator, transfer agent and fund accountant.
Counsel referred the Board to the Meeting materials, which included, among other things, a memorandum from Counsel addressing the duties of Trustees regarding the approval of the Advisory Agreement, a letter from Counsel to SMI and SMI’s responses to that letter, a copy of SMI’s financial related information, a copy of SMI’s Form ADV, a fee comparison analysis for each of the SMI Funds and comparable mutual funds, and the Advisory Agreement and expense limitation agreement. Counsel outlined the various factors the Board should consider in deciding whether to approve the Advisory Agreement.
Counsel noted that the 1940 Act requires the approval of the investment advisory agreement between the Trust and SMI by a majority of the Independent Trustees. The Board discussed the arrangements between SMI and the Trust with respect to the SMI Funds. The Board reviewed a memorandum from Counsel, and addressed to the Trustees that summarized, among other things, the fiduciary duties and responsibilities of the Board in reviewing and approving the Advisory Agreement. Counsel discussed with the Trustees the types of information and factors that should be considered by the Board in order to make an informed decision regarding the approval of the Advisory Agreement, including the following material factors: (i) the nature, extent, and quality of the services provided by SMI; (ii) the investment performance of the SMI Funds; (iii) the costs of the services to be provided and profits to be realized by SMI from the relationship with the SMI Funds; (iv) the extent to which economies of scale would be realized if the SMI Funds grow and whether advisory fee levels reflect those economies of scale for the benefit of the investors of the SMI Funds; and (v) SMI’s practices regarding possible conflicts of interest.
50
MANAGEMENT AGREEMENT RENEWAL FOR SOUND MIND INVESTING FUND AND SOUND MIND BALANCED FUND – (Unaudited), (Continued)
In assessing these factors and reaching its decisions, the Board took into consideration information specifically prepared and/or presented in connection with this approval process, including information presented at the Meeting. The Board requested and was provided with information and reports relevant to the approval of the Advisory Agreement, including: (i) information regarding the services and support to be provided to the SMI Funds and their shareholders by SMI; (ii) commentary on the performance of the SMI Funds; (iii) presentations by SMI management addressing investment philosophy, investment strategy, personnel and operations; (iv) reports concerning the compliance culture of SMI and the compliance record of the SMI Funds; and (v) disclosure information contained in the draft prospectus and SAI of the Trust with respect to the SMI Funds and the Form ADV of SMI. The Board also requested and received various informational materials including, without limitation: (i) documents containing information about SMI, including financial statements, a description of personnel and the services provided to the existing SMI Funds, information on investment advice, performance, summaries of SMI Fund expenses, compliance program, current legal matters, and other general information; (ii) SMI’s Form ADV; (iii) comparative expense and performance information for other mutual funds with strategies similar to the SMI Funds; and (iv) benefits to be realized by SMI from its relationship with the SMI Funds. The Board did not identify any particular information that was most relevant to its consideration to approve the Agreement and each Trustee may have afforded different weight to the various factors.
| 1. | The nature, extent, and quality of the services to be provided by SMI. In this regard, the Board considered SMI’s responsibilities under the Advisory Agreement. The Trustees considered the services being provided (and to be provided) by SMI to the SMI Funds, including, without limitation: the quality of its investment advisory services (including research and recommendations with respect to portfolio securities), its process for formulating investment recommendations and assuring compliance with the investment objectives and limitations, its coordination of services for the SMI Funds among the service providers to the SMI Funds (including the sub-advisor to the Sound Mind Investment Balanced Fund) and its efforts to promote the SMI Funds and grow their assets. The Trustees considered SMI’s continuity of, and commitment to retain, qualified personnel and SMI’s commitment to maintain and enhance its resources and systems. The Trustees considered SMI’s personnel, including the education and experience of SMI’s personnel. After considering the foregoing information and further information in the Meeting materials provided by SMI (including SMI’s Form ADV), the Board concluded that, in light of all the facts and circumstances, the nature, extent, and quality of the services provided (and to be provided) by SMI were satisfactory and adequate for the SMI Funds. |
| 2. | Investment Performance of the SMI Funds and SMI. In considering the investment performance of the SMI Funds and SMI, the Trustees compared the performance of the SMI Funds with the performance of funds with similar objectives managed by other investment advisers, as well as with aggregated peer group data. The Trustees also considered the consistency of SMI’s management of the SMI Funds with its investment objective, strategies, and limitations. The Trustees noted that SMI did not manage accounts for clients with investment objectives similar to the SMI Funds. The Trustees noted and gave significant consideration to SMI’s view that the “upgrading” strategy utilized by the Sound |
51
MANAGEMENT AGREEMENT RENEWAL FOR SOUND MIND INVESTING FUND AND SOUND MIND BALANCED FUND – (Unaudited), (Continued)
| Mind Investing Fund did not allow it to be appropriately compared to any particular peer category. Nonetheless, the Trustees observed that the Sound Mind Investing Fund performed comparably to its peers as it was categorized by an independent service although its performance generally was below the averages and medians (and during some periods near the bottom of the category) of those peers. With respect to the Sound Minding Investing Balanced Fund, the Trustees observed that the Fund performed comparably to the average and median performance measures for its peer category during the most recent 1-year measurement periods, but that it slightly lagged the average and median performance measures since the Fund’s inception. The Trustees noted that the equity portion of the Sound Mind Investing Balanced Fund utilized the “upgrading” strategy of the Sound Mind Investing Fund and that, as such, there was likely an impact on the performance of that Fund. After reviewing and discussing the investment performance of the SMI Funds further, SMI’s experience managing the SMI Funds, and other relevant factors, the Board concluded, in light of all the facts and circumstances, that the investment performance of the SMI Fund was acceptable. |
| 3. | The costs of the services to be provided and profits to be realized by SMI from the relationship with the SMI Funds. In considering the costs of services to be provided and the profits to be realized by SMI from the relationship with the SMI Funds, the Trustees considered: (1) SMI’s financial condition; (2) asset levels of the SMI Funds; (3) the overall expenses of the SMI Funds; and (4) the nature and frequency of advisory fee payments. The Trustees reviewed information provided by SMI regarding its profits associated with managing the SMI Funds. The Trustees also considered potential benefits for SMI in managing the SMI Fund. The Trustees then compared the fees and expenses of the SMI Fund (including the management fee) to other comparable mutual funds. The Trustees noted that the SMI Funds’ management fees tended to be toward the higher end of the range of mutual funds in their peer categories; noting in particular that that the management fee for the Sound Mind Investing Fund was close to the top of the range of its peer category, and the management fee for the Sound Mind Investing Balanced Fund was above the average and median for its peer category. Nonetheless, in light of the unique services rendered to the SMI Funds by SMI, the view of SMI that the categorization with respect to the Sound Mind Investing Fund did not provide an appropriate for a comparison, the profits realized by SMI in managing the SMI Funds, and all other facts and circumstances they deemed relevant, the Trustees concluded that the management fees paid by the SMI Funds were fair and reasonable in relation to the nature and quality of the services provided by SMI. |
| 4. | The extent to which economies of scale would be realized as the existing SMI Funds grow and whether advisory fee levels reflect these economies of scale for the benefit of the investors of the SMI Funds. In this regard, the Trustees considered the fee arrangements with SMI for the SMI Funds. The Trustees considered that the management fee for each of the SMI Funds had breakpoints that would allow shareholders to realize economies of scale as assets grow. The Trustees noted that the existing Sound Mind Investing Fund was realizing these economies as a result of its current asset size. With respect to the Sound Mind Investing Balanced Fund, the noted that its asset base had not grown sufficiently to allow it to realize the economies of scale in the short period of time since its inception; however, the Board also noted that Sound Mind Investing Balanced Fund’s shareholders had |
52
MANAGEMENT AGREEMENT RENEWAL FOR SOUND MIND INVESTING FUND AND SOUND MIND BALANCED FUND – (Unaudited), (Continued)
| experienced benefits from the expense limitation arrangements in place for that Fund. In light of its ongoing consideration of the asset levels of each of the SMI Funds, expectations for growth, and fee levels, the Board determined that the fee arrangements for each of the existing SMI Funds, in light of all the facts and circumstances, were fair and reasonable in relation to the nature and quality of the services provided by the Adviser. |
| 5. | Possible conflicts of interest. In considering SMI’s practices regarding conflicts of interest, the Trustees evaluated the potential for conflicts of interest and considered such matters as the experience and ability of the advisory personnel assigned to the SMI Funds; the basis of decisions to buy or sell securities for the SMI Funds; and the substance and administration of SMI’s code of ethics. The Trustees also considered disclosure in the registration statement of the Trust relating to SMI’s potential conflicts of interest. Based on the foregoing, the Board determined that SMI’s standards and practices relating to the identification and mitigation of potential conflicts of interest were satisfactory. |
After additional consideration of the factors delineated in the memorandum provided by Counsel and further discussion among the Board, the Board determined to approve the Advisory Agreement between the Trust and SMI.
SCOUT INVESTMENTS, INC., THROUGH ITS REAMS ASSET MANAGEMENT DIVISION (SUB-ADVISER TO SOUND MIND INVESTING BALANCED FUND)
At a meeting held on December 10-11, 2012, the Board of Trustees (the “Board”) considered the initial approval of a Sub-Advisory Agreement (the “Sub-Advisory Agreement”) between SMI Advisory Services, LLC (the “Adviser”) and Scout Investments, Inc. through its Reams Asset Management division (the “Sub-Adviser” or “Reams”) on behalf of the Sound Mind Investing Balanced Fund (the “Fund”). Counsel reviewed with the Board the requirements of the 1940 Act and the applicable disclosure obligations associated therewith. It was noted that Reams would be responsible for the management of the fixed income portion of the Fund. The Board discussed the arrangements between the Adviser and Reams with respect to the Fund, and reflected on its discussions with representatives of the Adviser regarding the proposed Sub-Advisory Agreement and the manner in which the Fund was to be managed, as well as the manner in which the Fund was currently managed as a series of Unified Series Trust.
Counsel referred the Board to the Meeting materials, which included, among other things, a memorandum from Counsel addressing the duties of Trustees regarding the approval of the proposed Sub-Advisory Agreement, a letter from Counsel to the Sub-Adviser and the Sub-Adviser’s responses to that letter, a copy of the Form ADV of Scout Investments, Inc of which the Sub-Adviser is a division, a fee comparison analysis for the Sub-Adviser’s composite accounts and comparable mutual funds, and the Sub-Advisory Agreement.
53
SCOUT INVESTMENTS, INC., THROUGH ITS REAMS ASSET MANAGEMENT DIVISION (SUB-ADVISER TO SOUND MIND INVESTING BALANCED FUND) – (Continued)
Counsel noted that the 1940 Act requires the approval of the investment sub-advisory agreement between the Adviser and the Sub-Adviser by a majority of the Independent Trustees. The Board discussed the arrangements between the Adviser and the Sub-Adviser with respect to the Fund. The Board reviewed a memorandum from Counsel, and addressed to the Trustees that summarized, among other things, the fiduciary duties and responsibilities of the Board in reviewing and approving the Sub-Advisory Agreement. Counsel discussed with the Trustees the types of information and factors that should be considered by the Board in order to make an informed decision regarding the approval of the Sub-Advisory Agreement, including the following material factors: (i) the nature, extent, and quality of the services provided by the Sub-Adviser; (ii) the investment performance of the Fund; (iii) the costs of the services to be provided and profits to be realized by the Sub-Adviser from the relationship with the Fund; (iv) the extent to which economies of scale would be realized if the Fund grows and whether advisory fee levels reflect those economies of scale for the benefit of the investors of the Fund; and (v) the Sub-Adviser’s practices regarding possible conflicts of interest.
The Board did not identify any particular information that was most relevant to its consideration to approve the Agreement and each Trustee may have afforded different weight to the various factors.
| 1. | The nature, extent, and quality of the services to be provided by Reams. In this regard, the Board considered the responsibilities Reams would have under the Sub-Advisory Agreement. The Board reviewed the services provided (and to be provided) by Reams to the Adviser and the Fund including, without limitation Reams’ procedures for formulating investment recommendations and assuring compliance with the Fund’s investment objectives and limitations. The Board considered: Reams’ staffing, personnel, and methods of operating; the education and experience of Reams’ personnel; and Reams’ compliance program, policies, and procedures. After reviewing the foregoing and further information from Reams (e.g., the compliance programs and the Form ADV of Scout Investments of which Reams is a division), the Board concluded that the quality, extent, and nature of the services to be provided by Reams were satisfactory and adequate for the Fund. |
| 2. | Investment Performance of the Fund and Reams. The Board considered the related investment performance information provided by Reams. The Board noted that the performance achieved by Reams with respect to the portion of assets allocated to it in the Fund was comparable to that of other mutual funds that were managed in a style comparable to the manner in which Reams managed its portion of the Fund. The Board also considered the performance of the portion of the Fund that Reams managed with that of a similarly managed composite of separate accounts managed by Reams. The Board noted that the performance of the composite of separate accounts compared to that of the Fund was very comparable. The Board concluded, in light of the foregoing factors, that the related investment performance information of Reams was satisfactory. |
| 3. | The costs of the services to be provided and profits to be realized by Reams from the relationship with the Fund. In this regard, the Board considered: the financial condition of Reams and the level of commitment to the Fund and the overall anticipated expenses of the Fund, including the expected |
54
SCOUT INVESTMENTS, INC., THROUGH ITS REAMS ASSET MANAGEMENT DIVISION (SUB-ADVISER TO SOUND MIND INVESTING BALANCED FUND) – (Continued)
| nature, the profits to be derived in managing the Fund and frequency of sub-advisory fee payments. The Board also considered potential benefits for Reams in sub-advising the Fund. The Board noted the representation from Reams that the sub-advisory fee paid to Reams for managing the Fund was substantially less than what it charged to the accounts of other clients with similar investment strategies. Following this comparison and upon further consideration and discussion of the foregoing, the Board concluded that the fees to be paid to Reams for its services to the Fund were fair and reasonable. |
| 4. | The extent to which economies of scale would be realized as the Fund grows and whether advisory fee levels reflect these economies of scale for the benefit of the investors. In this regard, the Board considered the fee arrangements with Reams. The Board noted that the sub-advisory fee would stay the same as asset levels increased. The Board considered the arrangements with Reams in light of the overall arrangement for advisory services with the Adviser, as well as the fees charged by Reams for other clients and, the Board determined that the fee arrangements for Reams were fair and reasonable and reasonable in relation to the nature and quality of the services to be provided by Reams. |
| 5. | Possible conflicts of interest. In evaluating the possibility for conflicts of interest, the Board considered such matters as: the experience and ability of the sub-advisory personnel assigned to the Fund; the basis of decisions to buy or sell securities for the Fund and/or Reams’ other accounts; the method for bunching of portfolio securities transactions; the substance and administration of Reams’ code of ethics and other relevant policies described in Reams’ Form ADV. Following further consideration and discussion, the Board indicated that Reams’ standards and practices relating to the identification and mitigation of potential conflicts of interest were satisfactory. |
After additional consideration of the factors delineated in the memorandum provided by Counsel and further discussion among the Board, the Board determined to approve the Sub-Advisory Agreement between the Adviser and the Sub-Adviser.
MANAGEMENT AGREEMENT APPROVAL FOR SMI DYNAMIC ALLOCATION FUND – (Unaudited)
At a meeting held on December 10, 2012, the Board of Trustees (the “Board”) considered the initial approval of an Investment Advisory Agreement (the “Advisory Agreement”) between the Trust and SMI Advisory Services, LLC (“SMI” or the “Adviser”) on behalf of the SMI Dynamic Allocation Fund (the “Fund”). Counsel reviewed with the Board the requirements of the 1940 Act and the applicable disclosure obligations associated therewith. The Board discussed the arrangements between SMI and the Trust with respect to the Fund and reflected on its discussions with representatives from SMI at the meeting, regarding the Advisory Agreement, the expense limitation agreement and the manner in which the Fund was to be managed. The Board also reflected on the presentation by representatives of SMI at a special meeting of the Board held on November 27, 2012.
55
MANAGEMENT AGREEMENT APPROVAL FOR SMI DYNAMIC ALLOCATION FUND – (Unaudited), (Continued)
Counsel referred the Board to the Meeting materials, which included, among other things, a memorandum from Counsel addressing the duties of Trustees regarding the approval of the Advisory Agreement, a letter from Counsel to SMI and SMI’s responses to that letter, a copy of SMI’s financial related information, a copy of SMI’s Form ADV, the Advisory Agreement and expense limitation agreement. Counsel outlined the various factors the Board should consider in deciding whether to approve the Advisory Agreement.
Counsel noted that the 1940 Act requires the approval of the investment advisory agreement between the Trust and SMI by a majority of the Independent Trustees. The Board discussed the arrangements between SMI and the Trust with respect to the Fund. The Board reviewed a memorandum from Counsel, and addressed to the Trustees that summarized, among other things, the fiduciary duties and responsibilities of the Board in reviewing and approving the Advisory Agreement. Counsel discussed with the Trustees the types of information and factors that should be considered by the Board in order to make an informed decision regarding the approval of the Advisory Agreement, including the following material factors: (i) the nature, extent, and quality of the services provided by SMI; (ii) the investment performance of the Fund; (iii) the costs of the services to be provided and profits to be realized by SMI from the relationship with the Fund; (iv) the extent to which economies of scale would be realized if the Fund grows and whether advisory fee levels reflect those economies of scale for the benefit of the investors of the Fund; and (v) SMI’s practices regarding possible conflicts of interest.
In assessing these factors and reaching its decisions, the Board took into consideration information specifically prepared and/or presented in connection with this approval process, including information presented at the Meeting. The Board requested and was provided with information and reports relevant to the approval of the Advisory Agreement, including: (i) information regarding the services and support to be provided to the Fund and its shareholders by SMI; (ii) presentations by SMI management addressing investment philosophy, investment strategy, personnel and operations; (iii) reports concerning the compliance culture of SMI; and (iv) disclosure information contained in the draft prospectus and SAI of the Trust with respect to the Fund and the Form ADV of SMI. The Board also requested and received various informational materials including, without limitation: (i) documents containing information about SMI, including financial statements, a description of personnel and the services to be provided to the Fund, information on investment advice, compliance program, current legal matters, and other general information; (ii) SMI’s Form ADV; (iii) benefits to be realized by SMI from its relationship with the SMI Fund. The Board did not identify any particular information that was most relevant to its consideration to approve the Advisory Agreement and each Trustee may have afforded different weight to the various factors.
| 1. | The nature, extent, and quality of the services to be provided by SMI. In this regard, the Board considered the responsibilities SMI would have under the Advisory Agreement with respect to the SMI Dynamic Allocation Fund. The Board reviewed the services to be provided by SMI to the SMI Dynamic Allocation Fund including, without limitation: SMI’s procedures for formulating investment recommendations and assuring compliance with the SMI Dynamic Allocation Fund’s investment objectives and limitations; the efforts of SMI during the SMI Dynamic Allocation Fund’s start-up phase, its coordination of services for the SMI Dynamic Allocation Fund among its service providers, |
56
MANAGEMENT AGREEMENT APPROVAL FOR SMI DYNAMIC ALLOCATION FUND – (Unaudited), (Continued)
| and the anticipated efforts to promote the SMI Dynamic Allocation Fund, grow its assets, and assist in the distribution of SMI Dynamic Allocation Fund shares. The Board considered: SMI’s staffing, personnel, and methods of operating; the education and experience of SMI’s personnel; and SMI’s compliance program, policies, and procedures. After reviewing the foregoing and further information from SMI (e.g., SMI’s compliance programs and Form ADV), the Board concluded that the quality, extent, and nature of the services to be provided by SMI were satisfactory and adequate for the Fund. |
| 2. | Investment Performance of the Fund. The Board noted that the SMI Dynamic Allocation Fund had not commenced operations and thus did not have investment performance information to review. |
| 3. | The costs of the services to be provided and profits to be realized by SMI from the relationship with the Fund. In this regard, the Board considered: the financial condition of SMI and the level of commitment to the SMI Dynamic Allocation Fund and SMI by the principals of SMI; the projected asset levels of the SMI Dynamic Allocation Fund; SMI’s payment of startup costs for the SMI Dynamic Allocation Fund; and the overall anticipated expenses of the SMI Dynamic Allocation Fund, including the expected nature and frequency of advisory fee payments. The Board also considered potential benefits for SMI in managing the SMI Dynamic Allocation Fund. The Board considered the expected fees and expenses of the SMI Dynamic Allocation Fund (including the management fee), the style of investment management, the anticipated size of the fund and the nature of the investment strategy and markets invested in, among other factors. The Board determined that the SMI Dynamic Allocation Fund’s management fee and anticipated expense ratio, in light of the contractual Expense Limitation Agreement, was reasonable. Upon further consideration and discussion of the foregoing, the Board concluded that the fee to be paid to SMI by the SMI Dynamic Allocation Fund was fair and reasonable. |
| 4. | The extent to which economies of scale would be realized as the SMI Dynamic Allocation Fund grows and whether advisory fee levels reflect these economies of scale for the benefit of the investors of the SMI Dynamic Allocation Fund. In this regard, the Trustees considered the fee arrangements with SMI for the SMI Dynamic Allocation Fund. The Trustees considered that the management fee for the SMI Dynamic Allocation Fund had breakpoints that would allow shareholders to realize economies of scale as assets grow. The Trustees noted that the SMI Dynamic Allocation Fund had not commenced operations and therefore at the outset, investors would not benefit from the breakpoints in the advisory agreement. However, the Trustees noted that the SMI Dynamic Allocation Fund’s shareholders would experience benefits from the expense limitation arrangements in place for that Fund. In light of the foregoing, the Trustees determined that the fee arrangements for the SMI Dynamic Allocation Fund, in light of all the facts and circumstances, were fair and reasonable in relation to the nature and quality of the services provided by the Adviser. |
| 5. | Possible conflicts of interest. In considering SMI’s practices regarding conflicts of interest, the Trustees evaluated the potential for conflicts of interest and considered such matters as the experience and ability of the advisory personnel assigned to the SMI Dynamic Allocation Fund; the basis of decisions to buy or sell securities for the SMI Dynamic Allocation Fund and/or SMI’s other accounts; and the substance and administration of SMI’s code of ethics. The Trustees also considered disclosure in the registration statement of the Trust relating to SMI’s potential conflicts of interest. Based on the |
57
MANAGEMENT AGREEMENT APPROVAL FOR SMI DYNAMIC ALLOCATION FUND – (Unaudited), (Continued)
| foregoing, the Board determined that SMI’s standards and practices relating to the identification and mitigation of potential conflicts of interest were satisfactory. |
After additional consideration of the factors delineated in the memorandum provided by Counsel and further discussion among the Board, the Board determined to approve the Advisory Agreement between the Trust and SMI.
SCOUT INVESTMENTS, INC., THROUGH ITS REAMS ASSET MANAGEMENT DIVISION (SUB-ADVISER TO SOUND DYNAMIC ALLOCATION FUND)
At a meeting held on December 10-11, 2012, the Board of Trustees (the “Board”) considered the initial approval of a Sub-Advisory Agreement (the “Sub-Advisory Agreement”) between SMI Advisory Services, LLC (the “Adviser”) and Scout Investments, Inc. through its Reams Asset Management division (the “Sub-Adviser” or “Reams”) on behalf of the SMI Dynamic Allocation Fund (the “Fund”). Counsel reviewed with the Board the requirements of the 1940 Act and the applicable disclosure obligations associated therewith. It was also noted that Reams would be responsible for the management of fixed income and cash portions of the Fund allocated to it by the Adviser – it was noted that the Adviser may elect not to allocate any of the assets to Reams. The Board discussed the arrangements between the Adviser and Reams with respect to the Fund, and reflected on its discussions with representatives of the Adviser regarding the proposed Sub-Advisory Agreement and the manner in which the Fund was to be managed.
Counsel referred the Board to the Meeting materials, which included, among other things, a memorandum from Counsel addressing the duties of Trustees regarding the approval of the proposed Sub-Advisory Agreement, a letter from Counsel to the Sub-Adviser and the Sub-Adviser’s responses to that letter, a copy of the Form ADV of Scout Investments, Inc of which the Sub-Adviser is a division, a fee comparison analysis for the Sub-Adviser’s composite accounts and comparable mutual funds, and the Sub-Advisory Agreement.
Counsel noted that the 1940 Act requires the approval of the investment sub-advisory agreement between the Adviser and the Sub-Adviser by a majority of the Independent Trustees. The Board discussed the arrangements between the Adviser and the Sub-Adviser with respect to the Fund. The Board reviewed a memorandum from Counsel, and addressed to the Trustees that summarized, among other things, the fiduciary duties and responsibilities of the Board in reviewing and approving the Sub-Advisory Agreement. Counsel discussed with the Trustees the types of information and factors that should be considered by the Board in order to make an informed decision regarding the approval of the Sub-Advisory Agreement, including the following material factors: (i) the nature, extent, and quality of the services provided by the Sub-Adviser; (ii) the investment performance of the Fund; (iii) the costs of the services to be provided and profits to be realized by the Sub-Adviser from the relationship with the Fund; (iv) the extent to which economies of scale would be realized if the Fund grows and whether advisory fee levels reflect those economies of scale for the benefit of the investors of the Fund; and (v) the Sub-Adviser’s practices regarding possible conflicts of interest.
58
SCOUT INVESTMENTS, INC., THROUGH ITS REAMS ASSET MANAGEMENT DIVISION (SUB-ADVISER TO SOUND DYNAMIC ALLOCATION FUND) – (Continued)
The Board did not identify any particular information that was most relevant to its consideration to approve the Agreement and each Trustee may have afforded different weight to the various factors.
| 1. | The nature, extent, and quality of the services to be provided by Reams. In this regard, the Board considered the responsibilities Reams would have under the Sub-Advisory Agreement. The Board reviewed the services provided (and to be provided) by Reams to the Adviser and the Fund including, without limitation Reams’ procedures for formulating investment recommendations and assuring compliance with the Fund’s investment objectives and limitations. The Board considered: Reams’ staffing, personnel, and methods of operating; the education and experience of Reams’ personnel; and Reams’ compliance program, policies, and procedures. After reviewing the foregoing and further information from Reams (e.g., SMI’s compliance programs and the Form ADV of Scout Investments of which Reams is a division), the Board concluded that the quality, extent, and nature of the services to be provided by Reams were satisfactory and adequate for the Fund. |
| 2. | Investment Performance of the Fund and Reams. The Board noted that while the Fund had not commenced operations and thus did not have investment performance information to review, that the Board could consider the related investment performance information provided by Reams. The Board noted that the performance was comparable to that of other mutual funds that were managed in a style comparable to the manner in which Reams would manage its portion of the Fund. The Board concluded, in light of the foregoing factors, that the related investment performance information of Reams was satisfactory. |
| 3. | The costs of the services to be provided and profits to be realized by Reams from the relationship with the Fund. In this regard, the Board considered: the financial condition of Reams and the level of commitment to the Fund and the overall anticipated expenses of the Fund, including the expected nature, the profits to be derived in managing the Fund and frequency of sub-advisory fee payments. The Board also considered potential benefits for Reams in sub-advising the Fund. The Board noted the representation from Reams that the sub-advisory fee paid to Reams for managing the Fund was substantially less than what it charged to the accounts of other clients with similar investment strategies. Following this comparison and upon further consideration and discussion of the foregoing, the Board concluded that the fees to be paid to Reams for its services to the Fund were fair and reasonable. |
| 4. | The extent to which economies of scale would be realized as the Fund grows and whether advisory fee levels reflect these economies of scale for the benefit of the investors. In this regard, the Board considered the fee arrangements with Reams. The Board noted that the sub-advisory fee would stay the same as asset levels increased for the fixed income and the cash management services that Reams may deliver. The Board considered the arrangements with Reams in light of the overall arrangement for advisory services with the Adviser, as well as the fees charged Reams for other clients and, the Board determined that the fee arrangements for Reams were fair and reasonable and reasonable in relation to the nature and quality of the services to be provided by Reams. |
59
SCOUT INVESTMENTS, INC., THROUGH ITS REAMS ASSET MANAGEMENT DIVISION (SUB-ADVISER TO SOUND DYNAMIC ALLOCATION FUND) – (Continued)
| 5. | Possible conflicts of interest. In evaluating the possibility for conflicts of interest, the Board considered such matters as: the experience and ability of the sub-advisory personnel assigned to the Fund; the basis of decisions to buy or sell securities for the Fund and/or Reams’ other accounts; the method for bunching of portfolio securities transactions; the substance and administration of Reams’ code of ethics and other relevant policies described in Reams’ Form ADV. Following further consideration and discussion, the Board indicated that Reams’ standards and practices relating to the identification and mitigation of potential conflicts of interest were satisfactory. |
After additional consideration of the factors delineated in the memorandum provided by Counsel and further discussion among the Board, the Board determined to approve the Sub-Advisory Agreement between the Adviser and the Sub-Adviser.
60
PROXY VOTING
A description of the policies and procedures that the Funds use to determine how to vote proxies relating to portfolio securities and information regarding how the Funds voted those proxies during the most recent twelve month period ended June 30 is available without charge upon request by (1) calling the Funds at (877) 764-3863 and (2) from Fund documents filed with the Securities and Exchange Commission (“SEC”) on the SEC’s website at www.sec.gov.
TRUSTEES
R. Jeffrey Young, Chairman
Dr. Merwyn R. Vanderlind
Ira Cohen
OFFICERS
R. Jeffrey Young, Principal Executive
Officer and President
John C. Swhear, Chief Compliance Officer,
AML Officer and Vice-President
Carol J. Highsmith, Vice President
Matthew J. Miller, Vice President
Robert W. Silva, Principal Financial Officer and
Treasurer
Heather Bonds, Secretary
INVESTMENT ADVISOR
SMI Advisory Services, LLC
11135 Baker Hollow Road
Columbus, IN 47201
DISTRIBUTOR
Unified Financial Securities, Inc.
2960 North Meridian Street, Suite 300
Indianapolis, IN 46208
INDEPENDENT REGISTERED PUBLIC ACCOUNTING FIRM
Cohen Fund Audit Services Ltd.
1350 Euclid Avenue, Suite 800
Cleveland, OH 44115
LEGAL COUNSEL
The Law Offices of John H. Lively & Associates, Inc.,
A member firm of The 1940 Act Law GroupTM
11300 Tomahawk Creek Pkwy, Suite 310
Leawood, KS 66211
CUSTODIAN
Huntington National Bank
41 South High Street
Columbus, OH 43125
ADMINISTRATOR, TRANSFER AGENT AND FUND ACCOUNTANT
Huntington Asset Services, Inc.
2960 North Meridian Street, Suite 300
Indianapolis, IN 46208
This report is intended only for the information of shareholders or those who have received the Funds prospectus which contains information about the Funds management fee and expenses. Please read the prospectus carefully before investing.
Distributed by Unified Financial Securities, Inc.
Member FINRA/SIPC
61
PRIVACY POLICY
The following is a description of the Fund’s policies regarding disclosure of nonpublic personal information that you provide to the Fund or that the Fund collects from other sources. In the event that you hold shares of the Fund through a broker-dealer or other financial intermediary, the privacy policy of your financial intermediary would govern how your nonpublic personal information would be shared with nonaffiliated third parties.
Categories of Information the Fund Collects. The Fund collects the following nonpublic personal information about you:
| • | Information the Fund receives from you on applications or other forms, correspondence, or conversations (such as your name, address, phone number, social security number, and date of birth); and |
| • | Information about your transactions with the Fund, its affiliates, or others (such as your account number and balance, payment history, cost basis information, and other financial information). |
Categories of Information the Fund Discloses. The Fund does not disclose any nonpublic personal information about its current or former shareholders to unaffiliated third parties, except as required or permitted by law. The Fund is permitted by law to disclose all of the information it collects, as described above, to service providers (such as the Fund’s custodian, administrator, transfer agent, accountant and legal counsel) to process your transactions and otherwise provide services to you.
Confidentiality and Security. The Fund restricts access to your nonpublic personal information to those persons who require such information to provide products or services to you. The Fund maintains physical, electronic, and procedural safeguards that comply with federal standards to guard your nonpublic personal information.
Disposal of Information. The Fund, through its transfer agent, has taken steps to reasonably ensure that the privacy of your nonpublic personal information is maintained at all times, including in connection with the disposal of information that is no longer required to be maintained by the Fund. Such steps shall include, whenever possible, shredding paper documents and records prior to disposal, requiring off-site storage vendors to shred documents maintained in such locations prior to disposal, and erasing and/or obliterating any data contained on electronic media in such a manner that the information can no longer be read or reconstructed.
62

THE SOUND MIND
INVESTING FUND
SOUND MIND INVESTING
BALANCED FUND
THE SMI DYNAMIC ALLOCATION FUND
| SEMI-ANNUAL |
| APRIL 30, 2013 |
Fund Adviser:
SMI Advisory Services, LLC
11135 Baker Hollow Road
Columbus, IN 47201
Toll Free (877) SMI-Fund
www.smifund.com

Semi-Annual Report
April 30, 2013
Fund Adviser:
TEAM Financial Asset Management, LLC
800 Corporate Circle, Suite 106
Harrisburg, PA 17110
Toll Free (877) 832-6952
Investment Results – (Unaudited)
Total Returns* (For the period ended April 30, 2013) | ||||||||||||||||
| Average Annual | |||||||||||||||
| Six Months | 1 Year | 3 Year | Since Inception (December 30, 2009) | ||||||||||||
TEAM Asset Strategy Fund - Investor Class | -59.88 | % | -62.39 | % | -26.18 | % | -23.90% | |||||||||
FTSE All-World Index** | 13.78 | % | 15.83 | % | 9.23 | % | 9.19% | |||||||||
Total annual operating expenses, as disclosed in the Team Asset Strategy Fund (the “Fund”) prospectus dated February 28, 2013 were 2.08% of average daily net assets. The Adviser has contractually agreed to waive or limit its fees and to assume other expenses of the Fund until February 28, 2014, so that Total Annual Fund Operating Expenses do not exceed 1.95%. This agreement may not be terminated by the Adviser until after February 28, 2014. This operating expense limitation does not apply to (i) interest, (ii) taxes, (iii) brokerage commissions, (iv) other expenditures which are capitalized in accordance with generally accepted accounting principles, (v) other extraordinary expenses not incurred in the ordinary course of the Fund’s business, (vi) dividend expense on short sales, and (vii) expenses incurred under a plan of distribution adopted pursuant to Rule 12b-1 under the 1940 Act. A significant decline in assets could result in higher expenses in the absence of the expense limitation agreement. Since February 28, 2013, the Fund has experienced a significant decline in assets.
1
Total Returns* (For the period ended April 30, 2013) | ||||||||||||
| Six Months | 1 Year | Average Annual Since Inception (February 28, 2012) | |||||||||
TEAM Asset Strategy Fund - Institutional Class | -59.90 | % | -62.41 | % | -63.31% | |||||||
FTSE All-World Index** | 13.78 | % | 15.83 | % | 13.26% | |||||||
Total annual operating expenses, as disclosed in the Fund’s prospectus dated February 28, 2013 were 1.83% of average daily net assets. The Adviser has contractually agreed to waive or limit its fees and to assume other expenses of the Fund until February 28, 2014, so that Total Annual Fund Operating Expenses do not exceed 1.95%. This agreement may not be terminated by the Adviser until after February 28, 2014. This operating expense limitation does not apply to (i) interest, (ii) taxes, (iii) brokerage commissions, (iv) other expenditures which are capitalized in accordance with generally accepted accounting principles, (v) other extraordinary expenses not incurred in the ordinary course of the Fund’s business, (vi) dividend expense on short sales, and (vii) expenses incurred under a plan of distribution adopted pursuant to Rule 12b-1 under the 1940 Act. A significant decline in assets could result in higher expenses in the absence of the expense limitation agreement. Since February 28, 2013, the Fund has experienced a significant decline in assets.
The performance quoted represents past performance, which does not guarantee future results. The investment return and principal value of an investment will fluctuate so that an investor’s shares, when redeemed, may be worth more or less than their original cost. The returns shown do not reflect deduction of taxes that a shareholder would pay on Fund distributions or the redemption of Fund shares. Current performance of the Fund may be lower or higher than the performance quoted. The Fund’s investment objectives, risks, charges and expenses must be considered carefully before investing. Performance data current to the most recent month end may be obtained by calling 1-877-832-6952.
* Total return figures reflect any change in price per share and assume the reinvestment of all distributions. The total return figures set forth above include all waivers of fees for various periods since inception. Without such fee waivers, the total returns would have been lower.
** The FTSE All-World Index is a widely recognized unmanaged index of equity prices and is representative of a broader market and range of securities than is found in the Fund’s portfolio. Individuals cannot invest directly in the
2
Index; however, an individual can invest in exchange-traded funds or other investment vehicles that attempt to track the performance of a benchmark index.
The Fund’s investment objectives, risks, charges and expenses must be considered carefully before investing. The prospectus contains this and other important information about the investment company and may be obtained by calling the same number as above. Please read it carefully before investing. The Fund is distributed by Unified Financial Securities, Inc. Member FINRA.
3
Fund Holdings – (Unaudited)
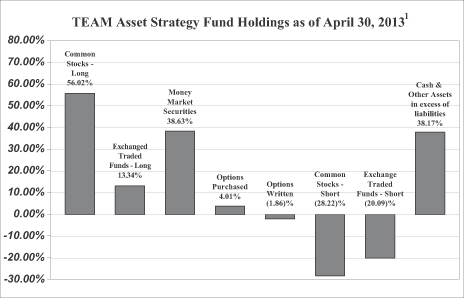
1As a percentage of net assets.
The investment objective of the Fund is to provide high total investment return, which will generally be achieved through a combination of appreciation in capital and income.
Availability of Portfolio Schedule
The Fund files its complete schedule of portfolio holdings with the Securities and Exchange Commission (“SEC”) for the first and third quarters of each fiscal year on Form N-Q. The Fund’s Forms N-Q are available at the SEC’s website at www.sec.gov. The Fund’s Forms N-Q may be reviewed and copied at the SEC’s Public Reference Room in Washington DC. Information on the operation of the Public Reference Room may be obtained by calling 1-800-SEC-0330.
Summary of Fund’s Expenses
As a shareholder of the Fund, you incur two types of costs: (1) transaction costs, such as short-term redemption fees; and (2) ongoing costs, including management fees and other Fund expenses. This Example is intended to help you understand your ongoing costs (in dollars) of investing in the Fund and to compare these costs with the ongoing costs of investing in other mutual funds.
The Example is based on an investment of $1,000 invested at the beginning and held for the entire period from November 1, 2012 through April 30, 2013.
4
Actual Expenses
The first line of the table below provides information about actual account values and actual expenses. You may use the information in this line, together with the amount you invested, to estimate the expenses that you paid over the period. Simply divide your account value by $1,000 (for example, an $8,600 account value divided by $1,000 = $8.60), then multiply the result by the number in the first line under the heading entitled “Expenses Paid During the Period” to estimate the expenses you paid on your account during this period.
Hypothetical Example for Comparison Purposes
The second line of the table below provides information about hypothetical account values and hypothetical expenses based on the Fund’s actual expense ratio and an assumed rate of return of 5% per year before expenses, which is not the Fund’s actual return. The hypothetical account values and expenses may not be used to estimate the actual ending account balance or expenses you paid for the period. You may use this information to compare the ongoing costs of investing in the Fund and other funds. To do so, compare this 5% hypothetical example with the 5% hypothetical examples that appear in the shareholder reports of the other funds.
Please note that the expenses shown in the table are meant to highlight your ongoing costs only and do not reflect any transactional costs such as the redemption fee imposed on short-term redemptions. Therefore, the second line of the table below is useful in comparing ongoing costs only and will not help you determine the relative costs of owning different funds. In addition, if the short-term redemption fee imposed by the Fund were included, your costs would have been higher.
TEAM Asset Strategy Fund Investor Class | Beginning Account Value November 1, 2012 | Ending Account Value April 30, 2013 | Expenses Paid During the Period Ended April 30, 2013 | |||||||||
Actual* | $ | 1,000.00 | $ | 399.80 | $ | 11.14 | ||||||
Hypothetical** | $ | 1,000.00 | $ | 1,008.88 | $ | 15.99 | ||||||
*Expenses are equal to the Investor Class’s annualized expense ratio of 3.21%, multiplied by the average account value over the period, multiplied by 181/365 (to reflect the partial year).
** Assumes a 5% return before expenses
TEAM Asset Strategy Fund Institutional Class | Beginning Account November 1, 2012 | Ending Account Value April 30, 2013 | Expenses Paid During the Period Ended April 30, 2013 | |||||||||
Actual* | $ | 1,000.00 | $ | 403.90 | $ | 10.30 | ||||||
Hypothetical** | $ | 1,000.00 | $ | 1,010.12 | $ | 14.75 | ||||||
*Expenses are equal to the Institutional Class’s annualized expense ratio of 2.96%, multiplied by the average account value over the period, multiplied by 181/365 (to reflect the partial year).
** Assumes a 5% return before expenses.
5
TEAM Asset Strategy Fund
Schedule of Investments
April 30, 2013 (Unaudited)
| Shares | Fair Value | |||||||
Common Stocks - Long - 56.02% | ||||||||
Crude Petroleum & Natural Gas - 13.06% |
| |||||||
Encana Corp. (b) | 60,000 | $ | 1,107,000 | |||||
EXCO Resources, Inc. (b) | 97,000 | 704,220 | ||||||
|
| |||||||
| 1,811,220 | ||||||||
|
| |||||||
Electric & Other Services - 22.86% | ||||||||
Consolidated Edison, Inc. (b)(c) | 18,000 | 1,145,700 | ||||||
Entergy Corp. (b)(c) | 10,000 | 712,300 | ||||||
Exelon Corp. (b)(c) | 35,000 | 1,312,850 | ||||||
|
| |||||||
| 3,170,850 | ||||||||
|
| |||||||
Gold & Silver Ores - 4.58% | ||||||||
Gold Resource Corp. (f) | 62,000 | 634,880 | ||||||
|
| |||||||
Real Estate Investment Trusts - 4.60% |
| |||||||
Annaly Capital Management, Inc. (b) | 40,000 | 637,600 | ||||||
|
| |||||||
Semiconductors & Related Devices - 6.26% |
| |||||||
Cypress Semiconductor Corp. (b) | 86,000 | 867,740 | ||||||
|
| |||||||
Services - 4.66% | ||||||||
U.S. Global Investors, Inc. - Class A | 236,800 | 646,464 | ||||||
|
| |||||||
TOTAL COMMON STOCKS - LONG (Cost $8,767,490) | 7,768,754 | |||||||
|
| |||||||
Exchanged Traded Funds - Long - 13.34% |
| |||||||
iShares MSCI All Peru Capped Index Fund (a) | 15,000 | 597,150 | ||||||
ProShares UltraShort Europe Fund (a) | 56,000 | 1,252,720 | ||||||
|
| |||||||
TOTAL EXCHANGE TRADED FUNDS - LONG | 1,849,870 | |||||||
|
| |||||||
Money Market Securities - 38.63% | ||||||||
Federated U.S. Treasury Cash Reserves, 0.00% (b)(d) | 1,400,000 | 1,400,000 | ||||||
Fidelity Institutional Treasury Only Portfolio, 0.01% (d)(g) | 640,219 | 640,219 | ||||||
Fidelity Institutional Treasury Only Portfolio, 0.01% (d) | 3,317,265 | 3,317,265 | ||||||
|
| |||||||
TOTAL MONEY MARKET SECURITIES (Cost $5,357,484) | 5,357,484 | |||||||
|
| |||||||
| Outstanding Contracts | ||||||||
Call Options Purchased - 0.02% | ||||||||
Gold Resource Corp. / September 2013 / Strike $17.50 (a)(e) | 500 | 2,500 | ||||||
|
| |||||||
TOTAL CALL OPTIONS PURCHASED (Cost $20,393) | 2,500 | |||||||
|
| |||||||
See accompanying notes which are an integral part of these financial statements.
6
TEAM Asset Strategy Fund
Schedule of Investments - continued
April 30, 2013 (Unaudited)
| Outstanding Contracts | Fair Value | |||||||
Put Options Purchased - 3.99% (a)(e) | ||||||||
Consumer Staples Select Sector SPDR Fund / May 2013 / | 1,000 | $ | 7,000 | |||||
iShares MSCI Emerging Markets Index / May 2013 / | 5,000 | 35,000 | ||||||
iShares MSCI EAFE Index / June 2013 / Strike $55.00 | 2,000 | 40,000 | ||||||
iShares Russell 2000 Index / June 2013 / Strike $90.00 | 2,000 | 240,000 | ||||||
PowerShares QQQ Trust, Series 1 / May 2013 / Strike $67.00 | 3,000 | 39,000 | ||||||
Materials Select Sector SPDR Fund / June 2013 / | 1,000 | 85,000 | ||||||
SPDR Dow Jones Industrial Average ETF Trust / May 2013 / | 1,000 | 60,000 | ||||||
SPDR S&P 500 ETF Trust/ May 2013 / Strike $154.00 | 1,000 | 36,000 | ||||||
Utilities Select Sector SPDR Fund / May 2013 / Strike $40.00 | 1,000 | 11,000 | ||||||
|
| |||||||
TOTAL PUT OPTIONS PURCHASED (Cost $1,451,481) | 553,000 | |||||||
|
| |||||||
TOTAL INVESTMENTS - LONG | $ | 15,531,608 | ||||||
|
| |||||||
TOTAL INVESTMENTS - SHORT | (6,957,117 | ) | ||||||
|
| |||||||
Liabilities in excess of cash & other assets - 38.17% | 5,292,602 | |||||||
|
| |||||||
TOTAL NET ASSETS - 100.00% | $ | 13,867,093 | ||||||
|
| |||||||
| (a) | Non-income producing. |
| (b) | All or a portion of this security is held as collateral for securities sold short. |
| (c) | All or a portion of this security is held as collateral for written call options. |
| (d) | Variable rate security; the rate shown represents the 7 day yield at April 30, 2013. |
| (e) | Each option contract has a multiplier of 100 shares. |
| (f) | The security or a partial position of the security was on loan as of April 30, 2013. The total value of securities on loan as of April 30, 2013 was $633,856. |
| (g) | Purchased with cash collateral held from securities lending. This represents the value of collateral as of April 30, 2013. |
See accompanying notes which are an integral part of these financial statements.
7
TEAM Asset Strategy Fund
Schedule of Securities Sold Short
April 30, 2013 (Unaudited)
| Shares | Fair Value | |||||||
Common Stocks - Short - (28.22)% | ||||||||
Aircraft - (3.96)% | ||||||||
Boeing Co. | (6,000 | ) | $ | (548,460 | ) | |||
|
| |||||||
Finance Services - (3.95)% | ||||||||
American Express Co. | (8,000 | ) | (547,280 | ) | ||||
|
| |||||||
Banks - (9.82)% | ||||||||
Banco Bilbao Vizcaya Argentaria SA (a) | (45,000 | ) | (441,000 | ) | ||||
Banco Santander SA (a) | (63,463 | ) | (460,107 | ) | ||||
Deutsche Bank AG | (10,000 | ) | (460,500 | ) | ||||
|
| |||||||
| (1,361,607 | ) | |||||||
|
| |||||||
Chemicals - (3.42)% | ||||||||
Dow Chemical Co. | (14,000 | ) | (474,740 | ) | ||||
|
| |||||||
Paint Stores - (3.96)% | ||||||||
Sherwin-Williams Co. | (3,000 | ) | (549,330 | ) | ||||
|
| |||||||
Semiconductors - (3.11)% | ||||||||
Intel Corp. | (18,000 | ) | (431,100 | ) | ||||
|
| |||||||
TOTAL COMMON STOCKS - SHORT (Proceeds $3,697,763) | (3,912,517 | ) | ||||||
|
| |||||||
Exchanged Traded Funds - Short - (20.09)% | ||||||||
Industrial Select Sector SPDR Fund | (17,000 | ) | (704,650 | ) | ||||
iShares MSCI Hong Kong Index Fund | (40,000 | ) | (818,400 | ) | ||||
Market Vectors Semiconductor ETF | (15,000 | ) | (555,750 | ) | ||||
PowerShares QQQ Trust, Series 1 | (10,000 | ) | (707,300 | ) | ||||
|
| |||||||
TOTAL EXCHANGE TRADED FUNDS - SHORT | (2,786,100 | ) | ||||||
|
| |||||||
TOTAL INVESTMENTS - SHORT - COMMON STOCKS & EXCHANGE TRADED FUNDS | $ | (6,698,617 | ) | |||||
|
| |||||||
| (a) | American Depositary Receipt |
See accompanying notes which are an integral part of these financial statements.
8
TEAM Asset Strategy Fund
Schedule of Written Call Options
April 30, 2013 (Unaudited)
| Outstanding Contracts | Fair Value | |||||||
Written Covered Call Options - (1.86)% (a) | ||||||||
Consolidated Edison, Inc. / August 2013 / Strike $57.50 | (180 | ) | $ (108,000 | ) | ||||
Entergy Corp. / June 2013 / Strike $65.00 | (100 | ) | (63,000 | ) | ||||
Excelon Corp. / July 2013 / Strike $35.00 | (350 | ) | (87,500 | ) | ||||
|
| |||||||
TOTAL WRITTEN COVERED CALL OPTIONS | $ | (258,500 | ) | |||||
|
| |||||||
| (a) | Each option contract has a multiplier of 100 shares. |
TEAM Asset Strategy Fund
Schedule of Short Futures Contracts
April 30, 2013 (Unaudited)
Short Futures Contracts | Number of (Short) Contracts | Underlying Face Amount at Fair Value | Unrealized Appreciation (Depreciation) | |||||||||
CAC 40 10 Euro Futures Contracts May 2013 (a) | (100 | ) | $ | (5,009,229 | ) | $ | (339,443 | ) | ||||
E-Mini S&P 500 Futures Contracts May 2013 (b) | (50 | ) | (3,980,500 | ) | (128,625 | ) | ||||||
Russell 2000 Mini Index Futures Contracts May 2013 (c) | (50 | ) | (4,725,500 | ) | (96,460 | ) | ||||||
|
| |||||||||||
Total Short Futures Contracts | $ | (564,528 | ) | |||||||||
|
| |||||||||||
| (a) | Each CAC 40 Futures contract has a multiplier of 10 shares. |
| (b) | Each E-Mini S&P 500 Futures contract has a multiplier of 50 shares. |
| (c) | Each Russell 2000 Mini Index Futures contract has a multiplier of 100 shares. |
TEAM Asset Strategy Fund
Schedule of Forward Currency Exchange Contracts
April 30, 2013 (Unaudited)
Settlement Date | Currency to be Delivered | U.S. $ Value at April 30, 2013 | Currency to be Received | U.S. $ Value at April 30, 2013 | Unrealized Appreciation (Depreciation) | |||||||||||
5/23/13 | 2,000,000 Australian Dollars (a) | $ | 2,071,892 | 2,059,348 U.S. Dollars | $ | 2,059,348 | $ | (12,544 | ) | |||||||
5/23/13 | 1,000,000 Australian Dollars (a) | 1,035,946 | 1,028,306 U.S. Dollars | 1,028,306 | (7,640 | ) | ||||||||||
5/23/13 | 2,000,000 Euro (a) | 2,636,863 | 2,615,930 U.S. Dollars | 2,615,930 | (20,933 | ) | ||||||||||
5/23/13 | 1,000,000 Euro (a) | 1,318,432 | 1,309,697 U.S. Dollars | 1,309,697 | (8,735 | ) | ||||||||||
5/23/13 | 25,068,010 Mexican Peso (a) | 2,058,341 | 2,029,606 U.S. Dollars | 2,029,606 | (28,735 | ) | ||||||||||
5/23/13 | 3,000,000 New Zealand Dollar (a) | 2,568,547 | 2,517,693 U.S. Dollars | 2,517,693 | (50,854 | ) | ||||||||||
5/23/13 | 18,909,431 Swedish Krona (a) | 2,920,449 | 2,894,410 U.S. Dollars | 2,894,410 | (26,039 | ) | ||||||||||
5/23/13 | 1,033,880 U.S. Dollars (a) | 1,033,880 | 1,000,000 Australian Dollars | 1,035,946 | 2,066 | |||||||||||
5/23/13 | 1,309,968 U.S. Dollars (a) | 1,309,968 | 1,000,000 Euro | 1,318,432 | 8,464 | |||||||||||
|
|
|
|
|
| |||||||||||
| $ | 16,954,318 | $ | 16,809,368 | $ | (144,950 | ) | ||||||||||
|
|
|
|
|
| |||||||||||
| (a) | UBS AG is the counterparty for the open forward currency exchange contracts held by the Fund as of April 30, 2013. |
See accompanying notes which are an integral part of these financial statements.
9
TEAM Asset Strategy Fund
Statement of Assets and Liabilities
April 30, 2013 (Unaudited)
Assets | ||||
Investments in securities, at fair value (cost $17,937,657) | $ | 15,531,608 | ||
Cash (a)(b) | 5,477,337 | |||
Cash held at broker (c) | 905,858 | |||
Receivables for forward currency exchange contracts | 10,529 | |||
Receivable for net variation margin on futures contracts | 16,480 | |||
Receivable for investments sold | 991,581 | |||
Receivable from Investment Adviser (d) | 26,329 | |||
Prepaid expenses | 25,544 | |||
Receivables for securities lending | 1,595 | |||
Receivable for fund shares sold | 94,330 | |||
Dividends receivable | 45 | |||
|
| |||
Total assets | 23,081,236 | |||
|
| |||
Liabilities | ||||
Investments in securities sold short, at fair value (Proceeds $6,436,475) | 6,698,617 | |||
Options written, at fair value (Premium received $189,600) | 258,500 | |||
Payable for investments purchased | 1,267,550 | |||
Payable upon return of securities loaned | 640,219 | |||
Payable for forward currency exchange contracts | 155,479 | |||
Payable for fund shares redeemed | 102,563 | |||
Payable for net variation margin on futures contracts | 38,500 | |||
Dividend expense payable on short positions | 20,527 | |||
Payable to administrator, fund accountant, and transfer agent (d) | 13,639 | |||
Payable to custodian (d) | 6,348 | |||
12b-1 fees accrued, Investor Class (d) | 1,026 | |||
Other accrued expenses | 11,175 | |||
|
| |||
Total liabilities | 9,214,143 | |||
|
| |||
Net Assets | $ | 13,867,093 | ||
|
| |||
Net Assets consist of: | ||||
Paid in capital | $ | 58,667,073 | ||
Accumulated undistributed net investment income (loss) | (1,898,790 | ) | ||
Accumulated net realized gain (loss) from investment securities, securities sold short, options, futures and foreign currency transactions | (39,454,622 | ) | ||
Net unrealized appreciation (depreciation) on: | ||||
Investment securities and securities sold short | (1,751,817 | ) | ||
Options | (985,274 | ) | ||
Foreign currency transactions | (144,949 | ) | ||
Futures contracts | (564,528 | ) | ||
|
| |||
Net Assets | $ | 13,867,093 | ||
|
| |||
Net Assets: Investor Class | $ | 4,153,942 | ||
|
| |||
Shares outstanding (unlimited number of shares authorized) | 1,472,691 | |||
|
| |||
Net Asset Value and offering price per share | $ | 2.82 | ||
|
| |||
Redemption price per share (NAV * 99%) (e) | $ | 2.79 | ||
|
| |||
Net Assets: Institutional Class | $ | 9,713,151 | ||
|
| |||
Shares outstanding (unlimited number of shares authorized) | 3,449,673 | |||
|
| |||
Net Asset Value and offering price per share | $ | 2.82 | ||
|
| |||
Redemption price per share (NAV * 99%) (e) | $ | 2.79 | ||
|
|
| (a) | See Note 2 in the Notes to the Financial Statements. |
| (b) | A portion of cash is used as collateral for securities sold short. |
| (c) | Cash used as collateral for futures contract transactions. |
| (d) | See Note 5 in the Notes to the Financial Statements. |
| (e) | The Fund charges a 1.00% redemption fee on shares redeemed within 30 days of purchase. |
See accompanying notes which are an integral part of these financial statements.
10
TEAM Asset Strategy Fund
Statement of Operations
For the Six Months Ended April 30, 2013 (Unaudited)
Investment Income | ||||
Dividend income (net of foreign withholding tax of $3,081) | $ | 201,365 | ||
Income from securities loaned | 92,663 | |||
|
| |||
Total Investment Income | 294,028 | |||
|
| |||
Expenses | ||||
Investment Adviser fee (a) | 188,673 | |||
Administration expenses (a) | 27,562 | |||
Transfer agent expenses (a) | 24,389 | |||
Fund accounting expenses (a) | 23,154 | |||
Custodian expenses (a) | 22,065 | |||
Registration expenses | 19,354 | |||
12b-1 fees, Investor Class (a) | 16,304 | |||
Legal expenses | 11,525 | |||
Printing expenses | 10,516 | |||
Auditing expenses | 7,438 | |||
Trustee expenses | 3,387 | |||
Insurance expense | 2,510 | |||
CCO expenses | 1,446 | |||
24f-2 expense | 660 | |||
Pricing expenses | 602 | |||
Miscellaneous expenses | 1,002 | |||
Other expense – short sale & interest expense | 68,404 | |||
Dividends on securities sold short | 82,274 | |||
|
| |||
Total Expenses | 511,265 | |||
Less: Fees waived by investment adviser | (51,970 | ) | ||
|
| |||
Net operating expenses | 459,295 | |||
|
| |||
Net Investment Income (Loss) | (165,267 | ) | ||
|
| |||
Realized & Unrealized Gain (Loss) on Investments | ||||
Net realized gain (loss) on: | ||||
Investment securities | (2,942,184 | ) | ||
Short securities | (1,363,705 | ) | ||
Options | (9,295,611 | ) | ||
Foreign currency transactions | (1,932,387 | ) | ||
Futures contracts | (5,852,778 | ) | ||
Change in unrealized appreciation (depreciation) on: | ||||
Investment securities | (2,995,851 | ) | ||
Short securities | (383,883 | ) | ||
Options | (1,769,660 | ) | ||
Foreign currency transactions | (1,434,125 | ) | ||
Futures contracts | (497,532 | ) | ||
|
| |||
Net realized and unrealized gain (loss) on investment securities | (28,467,716 | ) | ||
|
| |||
Net increase (decrease) in net assets resulting from operations | $ | (28,632,983 | ) | |
|
| |||
See accompanying notes which are an integral part of these financial statements.
11
TEAM Asset Strategy Fund
Statements of Changes In Net Assets
| For the Six Months Ended April 30, 2013 (Unaudited) | For the Year Ended October 31, 2012 | |||||||||
Increase (Decrease) in Net Assets due to: | ||||||||||
Operations | ||||||||||
Net investment income (loss) | $ | (165,267 | ) | $ | 13,586 | |||||
Net realized gain (loss) on investment securities, securities sold short, options, futures and foreign currency transactions | (21,386,665 | ) | (14,703,562 | ) | ||||||
Change in unrealized appreciation (depreciation) on investment securities, securities sold short, options, futures and foreign currency transactions | (7,081,051 | ) | (1,915,618 | ) | ||||||
|
|
|
|
| ||||||
Net increase (decrease) in net assets resulting from operations | (28,632,983 | ) | (16,605,594 | ) | ||||||
|
|
|
|
| ||||||
Distributions | ||||||||||
From net investment income | (3,088,773 | ) | (3,645,856 | ) | ||||||
From net realized gains | - | (7,600,904 | ) | |||||||
|
|
|
|
| ||||||
Total distributions | (3,088,773 | ) | (11,246,760 | ) | ||||||
|
|
|
|
| ||||||
Capital Share Transactions - Investor Class | ||||||||||
Proceeds from shares sold | 2,129,176 | 34,719,994 | ||||||||
Reinvestment of distributions | 941,125 | 11,230,739 | ||||||||
Amount paid for shares redeemed | (17,829,595 | ) | (57,473,322 | ) | ||||||
Proceeds from redemption fees collected (a) | 2,538 | 3,783 | ||||||||
|
|
|
|
| ||||||
Net increase (decrease) in net assets resulting from Investor Class capital share transactions | (14,756,756 | ) | (11,518,806 | ) | ||||||
|
|
|
|
| ||||||
Capital Share Transactions - Institutional Class | ||||||||||
Proceeds from shares sold | 583,618 | 32,606,506 | ||||||||
Reinvestment of distributions | 2,147,648 | - | ||||||||
Amount paid for shares redeemed | (2,630,212 | ) | (2,237,243 | ) | ||||||
Proceeds from redemption fees collected (a) | 47 | 30 | ||||||||
|
|
|
|
| ||||||
Net increase (decrease) in net assets resulting from Institutional Class capital share transactions | 101,101 | 30,369,293 | ||||||||
|
|
|
|
| ||||||
Total Increase (Decrease) in Net Assets | (46,377,411 | ) | (9,001,867 | ) | ||||||
|
|
|
|
| ||||||
Net Assets | ||||||||||
Beginning of period | 60,244,504 | 69,246,371 | ||||||||
|
|
|
|
| ||||||
End of period | $ | 13,867,093 | $ | 60,244,504 | ||||||
|
|
|
|
| ||||||
Undistributed net investment income (loss) included in net assets at end of period | $ | (1,898,790 | ) | $ | 1,355,250 | |||||
|
|
|
|
| ||||||
Share Transactions - Investor Class | ||||||||||
Shares sold | 441,006 | 3,840,041 | ||||||||
Shares issued in reinvestment of distributions | 177,571 | 1,298,351 | ||||||||
Shares redeemed | (3,324,057 | ) | (6,340,490 | ) | ||||||
|
|
|
|
| ||||||
Net increase (decrease) in Investor Class shares outstanding | (2,705,480 | ) | (1,202,098 | ) | ||||||
|
|
|
|
| ||||||
Share Transactions - Institutional Class | ||||||||||
Shares sold | 126,610 | 3,843,662 | ||||||||
Shares issued in reinvestment of distributions | 408,298 | - | ||||||||
Shares redeemed | (660,050 | ) | (268,847 | ) | ||||||
|
|
|
|
| ||||||
Net increase (decrease) in Institutional Class shares outstanding | (125,142 | ) | 3,574,815 | |||||||
|
|
|
|
| ||||||
| (a) | The Fund charges a 1.00% redemption fee on shares redeemed within 30 calendar days of purchase. |
See accompanying notes which are an integral part of these financial statements.
12
TEAM Asset Strategy Fund - Investor Class
Financial Highlights
(For a share outstanding during each period)
| For the Six Months Ended April 30, 2013 (Unaudited) | For the Year Ended October 31, 2012 | For the Year Ended October 31, 2011 | For the Period Ended October 31, 2010 (a) | |||||||||||||||||||
Selected Per Share Data: | ||||||||||||||||||||||
Net asset value, beginning of period | $ | 7.77 | $ | 12.87 | $ | 10.38 | $ | 10.00 | ||||||||||||||
|
|
|
|
|
|
|
| |||||||||||||||
Income from investment operations: | ||||||||||||||||||||||
Net investment income (loss) | (0.03) | (b) | 0.04 | (0.01) | (0.01) | |||||||||||||||||
Net realized and unrealized gain (loss) on investments | (4.37) | (2.64) | 2.50 | 0.39 | ||||||||||||||||||
|
|
|
|
|
|
|
| |||||||||||||||
Total from investment operations | (4.40) | (2.60) | 2.49 | 0.38 | ||||||||||||||||||
|
|
|
|
|
|
|
| |||||||||||||||
Less Distributions to shareholders: | ||||||||||||||||||||||
From net investment income | (0.55) | (0.81) | - | - | ||||||||||||||||||
From net realized gains | - | (1.69) | - | - | ||||||||||||||||||
|
|
|
|
|
|
|
| |||||||||||||||
Total distributions | (0.55) | (2.50) | - | - | ||||||||||||||||||
|
|
|
|
|
|
|
| |||||||||||||||
Paid in capital from redemption fees (f) | - | - | - | - | ||||||||||||||||||
|
|
|
|
|
|
|
| |||||||||||||||
Net asset value, end of period | $ | 2.82 | $ | 7.77 | $ | 12.87 | $ | 10.38 | ||||||||||||||
|
|
|
|
|
|
|
| |||||||||||||||
Total Return (c) | (60.02)% | (d) | (22.21)% | 23.99% | 3.80% | (d) | ||||||||||||||||
Ratios and Supplemental Data: | ||||||||||||||||||||||
Net assets, end of period (000) | $ | 4,154 | $ | 32,455 | $ | 69,246 | $ | 43,327 | ||||||||||||||
Ratio of expenses to average net assets | 3.21% | (e)(h) | 1.98% | (g) | 1.74% | 1.93% | (e) | |||||||||||||||
Ratio of expenses to average net assets before waiver | 3.55% | (e)(h) | 1.98% | (g) | 1.74% | 1.93% | (e) | |||||||||||||||
Ratio of net investment income (loss) to average net assets | (1.24)% | (e) | 0.12% | (0.08)% | (0.09)% | (e) | ||||||||||||||||
Portfolio turnover rate | 191.67% | 439.34% | 490.64% | 313.40% | ||||||||||||||||||
| (a) | For the period December 30, 2009 (Commencement of Operations) to October 31, 2010. |
| (b) | Calculated using the average shares method. |
| (c) | Total return in the above table represents the rate that the investor would have earned or lost on an investment in the Fund, assuming reinvestment of dividends, if any. |
| (d) | Not annualized. |
| (e) | Annualized. |
| (f) | Redemption fees resulted in less than $0.005 per share. |
| (g) | Includes dividend and interest expense of 0.05% for the year ended October 31, 2012. |
| (h) | Includes dividend and interest expense of 1.01% for the six months ended April 30, 2013. |
See accompanying notes which are an integral part of these financial statements.
13
TEAM Asset Strategy Fund - Institutional Class
Financial Highlights - continued
(For a share outstanding during each period)
| For the Six Months Ended April 30, 2013 (Unaudited) | For the Period Ended October 31, 2012 (a) | |||||||||
Selected Per Share Data: | ||||||||||
Net asset value, beginning of period | $ | 7.77 | $ | 10.11 | ||||||
|
|
|
| |||||||
Income from investment operations: | ||||||||||
Net investment income (loss) | (0.02) | (b) | (0.03) | (b) | ||||||
Net realized and unrealized gain (loss) on investments | (4.33) | (2.31) | ||||||||
|
|
|
| |||||||
Total from investment operations | (4.35) | (2.34) | ||||||||
|
|
|
| |||||||
Less Distributions to shareholders: | ||||||||||
From net investment income | (0.60) | - | ||||||||
|
|
|
| |||||||
Paid in capital from redemption fees (c) | - | - | ||||||||
|
|
|
| |||||||
Net asset value, end of period | $ | 2.82 | $ | 7.77 | ||||||
|
|
|
| |||||||
Total Return (d) | (59.61)% | (e) | (23.15)% | (e) | ||||||
Ratios and Supplemental Data: | ||||||||||
Net assets, end of period (000) | $ | 9,713 | $ | 27,790 | ||||||
Ratio of expenses to average net assets | 2.96% | (f)(h) | 1.80% | (f)(g) | ||||||
Ratio of expenses to average net assets before waiver | 3.30% | (f)(h) | 1.80% | (f)(g) | ||||||
Ratio of net investment income (loss) to average net assets | (0.99)% | (f) | (0.58)% | (f) | ||||||
Portfolio turnover rate | 191.67% | 439.34% | ||||||||
| (a) | For the period February 28, 2012 (Commencement of Operations) to October 31, 2012. |
| (b) | Calculated using the average shares method. |
| (c) | Redemption fees resulted in less than $0.005 per share. |
| (d) | Total return in the above table represents the rate that the investor would have earned or lost on an investment in the Fund, assuming reinvestment of dividends, if any. |
| (e) | Not annualized. |
| (f) | Annualized. |
| (g) | Includes dividend and interest expense of 0.25% for the period ended October 31, 2012. |
| (h) | Includes dividend and interest expense of 1.01% for the six months ended April 30, 2013. |
See accompanying notes which are an integral part of these financial statements.
14
TEAM Asset Strategy Fund
Notes to the Financial Statements
April 30, 2013
(Unaudited)
NOTE 1. ORGANIZATION
The TEAM Asset Strategy Fund (the “Fund”) is an open-end, non-diversified series of the Valued Advisers Trust (the “Trust”). The Trust is a management investment company established under the laws of Delaware by an Agreement and Declaration of Trust dated June 13, 2008 (the “Trust Agreement”). The Trust Agreement permits the Trustees to issue an unlimited number of shares of beneficial interest of separate series without par value. The Fund is one of a series of funds authorized by the Board of Trustees (the “Board”). The Fund’s investment adviser is TEAM Financial Asset Management, LLC (the “Adviser”). The investment objective of the Fund is to provide high total investment return, which will generally be achieved through a combination of appreciation in capital and income.
The Fund currently offers two classes of shares, Investor Class and Institutional Class. Investor Class shares were first offered to the public on December 30, 2009; and Institutional Class shares were first offered to the public on February 29, 2012. Each share represents an equal proportionate interest in the assets and liabilities belonging to the Fund and is entitled to such dividends and distributions out of income belonging to the Fund as are declared by the Trustees. On matters that affect the Fund as a whole, each class has the same voting and other rights and preferences as any other class. On matters that affect only one class, only shareholders of that class may vote. Each class votes separately on matters affecting only that class, or on matters expressly required to be voted on separately by state or federal law. Shares of each class of a series have the same voting and other rights and preferences as the other classes and series of the Trust for matters that affect the Trust as a whole. The Fund may offer additional classes of shares in the future.
NOTE 2. SIGNIFICANT ACCOUNTING POLICIES
The following is a summary of significant accounting policies followed by the Fund in the preparation of its financial statements in accordance with accounting principles generally accepted in the United States of America (“GAAP”).
Securities Valuation – All investments in securities are recorded at their estimated fair value as described in Note 3.
Futures Contracts – The Fund may enter into futures contracts and may short futures contracts to hedge various investments for risk management, obtain market exposure, and for speculative purposes. The Fund may also use futures for leverage and to manage cash. Initial margin deposits are made upon entering into futures contracts and
15
TEAM Asset Strategy Fund
Notes to the Financial Statements - continued
April 30, 2013
(Unaudited)
NOTE 2. SIGNIFICANT ACCOUNTING POLICIES – continued
can be either cash or securities. Secondary margin limits are required to be maintained while futures are held, as defined by each contract. Cash held at the broker as of April 30, 2013, is held for collateral for futures transactions and is restricted from withdrawal.
During the period a futures contract is open, changes in the value of the contract are recognized as unrealized gains or losses by “marking-to-market” on a daily basis to reflect the fair value of the contract at the end of each day’s trading. Variation margin receivables or payables represent the difference between the change in unrealized appreciation and depreciation on the open contracts and the cash deposits made on the margin accounts. When the contract is closed, the Fund records a realized gain or loss equal to the difference between the proceeds from the closing transaction and the Fund’s cost of entering into a contract. The use of futures contracts involves the risk of illiquid markets or imperfect correlation between the value of the instruments and the underlying securities, or that the counterparty will fail to perform its obligations. Futures contracts are valued at the settlement price established each day by the board of trade or exchange on which they are traded. Should market conditions move unexpectedly, the Fund may not achieve the anticipated benefits of the futures contract and may realize a loss. See Note 4 for information on futures contract activity during the six-month period ended April 30, 2013.
Inverse and Leveraged ETFs – The Fund may invest in inverse and leveraged exchange traded funds (“ETFs”). These ETFs are subject to additional risks not generally associated with traditional ETFs. To the extent that the Fund invests in inverse ETFs, the value of the Fund’s investment will decrease when the index underlying the ETFs benchmark rises. Because inverse and leveraged ETFs typically seek to obtain their objective on a daily basis, holding inverse ETFs for longer than a day may produce unexpected results particularly when the benchmark index experiences large ups and downs. The net asset value and market price of leveraged or inverse ETFs is usually more volatile than the value of the tracked index or of other ETFs that do not use leverage.
Federal Income Taxes – The Fund makes no provision for federal income or excise tax. The Fund intends to qualify each year as a regulated investment company (“RIC”) under subchapter M of the Internal Revenue Code of 1986, as amended, by complying with the requirements applicable to RICs and by distributing substantially all of its taxable income. The Fund also intends to distribute sufficient net investment income and net capital gains, if any, so that it will not be subject to excise tax on undistributed
16
TEAM Asset Strategy Fund
Notes to the Financial Statements - continued
April 30, 2013
(Unaudited)
NOTE 2. SIGNIFICANT ACCOUNTING POLICIES – continued
income and gains. If the required amount of net investment income or gains is not distributed, the Fund could incur a tax expense.
As of and during the six-month period ended April 30, 2013, the Fund did not have a liability for any unrecognized tax benefits. The Fund recognizes interest and penalties, if any, related to unrecognized tax benefits as income tax expense in the statement of operations. During the period, the Fund did not incur any interest or penalties. The Fund is subject to examination by U.S. federal tax authorities for all tax years since inception.
Expenses – Expenses incurred by the Trust that do not relate to a specific fund of the Trust are allocated to the individual funds based on each fund’s relative net assets or another appropriate basis (as determined by the Trustees).
Security Transactions and Related Income – The Fund follows industry practice and records security transactions on the trade date. The first in, first out method is used for determining gains or losses for financial statement and income tax purposes. Dividend income and expense is recorded on the ex-dividend date and interest income is recorded on an accrual basis. Discounts and premiums on securities purchased are amortized or accreted using the effective interest method. Withholding taxes on foreign dividends have been provided for in accordance with the Fund’s understanding of the applicable country’s tax rules and rates. The ability of issuers of debt securities held by the Fund to meet their obligations may be affected by economic and political developments in a specific country or region.
Dividends and Distributions – The Fund intends to distribute substantially all of its net investment income, net realized long-term capital gains and its net realized short-term capital gains, if any, to its shareholders on at least an annual basis. Dividends to shareholders, which are determined in accordance with income tax regulations, are recorded on the ex-dividend date. The treatment for financial reporting purposes of distributions made to shareholders during the year from net investment income or net realized capital gains may differ from their ultimate treatment for federal income tax purposes. These differences are caused primarily by differences in the timing of the recognition of certain components of income, expense or realized capital gain for federal income tax purposes. Where such differences are permanent in nature, they are reclassified in the components of net assets based on their ultimate characterization for federal income tax purposes. Any such reclassifications will have no effect on net assets, results of operations or net asset values per share of the Fund.
17
TEAM Asset Strategy Fund
Notes to the Financial Statements - continued
April 30, 2013
(Unaudited)
NOTE 2. SIGNIFICANT ACCOUNTING POLICIES – continued
Security loans – Under the terms of the securities lending agreement with Huntington National Bank, the Fund may make loans of its portfolio securities (in an amount up to 33 1/3% of Fund assets) to parties such as broker-dealers, banks, or institutional investors. Securities lending allows the Fund to retain ownership of the securities loaned and, at the same time, to earn additional income. Since there may be delays in the recovery of loaned securities, or even a loss of rights in collateral supplied, should the borrower fail financially, loans will be made only to parties whose creditworthiness has been reviewed and deemed satisfactory by the Adviser. Furthermore, loans will only be made if, in the judgment of the Adviser, the consideration to be earned from such loans would justify the risk. In accordance with current positions of the staff of the U.S. Securities and Exchange Commission that a Fund may engage in loan transactions only under the following conditions: (1) a Fund must receive 100% collateral in the form of cash, cash equivalents (e.g., U.S. Treasury bills or notes) or other high grade liquid debt instruments from the borrower; (2) the borrower must increase the collateral whenever the market value of the securities loaned (determined on a daily basis) rises above the value of the collateral; (3) after giving notice, the Fund must be able to terminate the loan at any time; (4) the Fund must receive reasonable interest on the loan or a flat fee from the borrower, as well as amounts equivalent to any dividends, interest, or other distributions on the securities loaned and to any increase in market value; (5) the Fund may pay only reasonable fees in connection with the loan; and (6) the Fund must be able to vote proxies on the securities loaned as deemed appropriate by the Adviser, either by terminating the loan or by entering into an alternative arrangement with the borrower. Cash received through loan transactions may be invested in any security in which a Fund is authorized to invest. Investing this cash subjects that investment, as well as the security loaned, to market forces (i.e., capital appreciation or depreciation). The margin of collateral to market value of loaned securities shall be at least 102%. If the collateral falls below 102%, the borrower will provide additional collateral to bring the collateralization to 102% on the next business day. As of April 30, 2013, the Fund loaned securities having a fair value of $633,856 and received $640,219 of cash collateral for the loan from its counterparty, Morgan Stanley. This cash was invested in a money market mutual fund. The average fair value of loaned securities during the six months ended April 30, 2013 was $2,665,176.
Foreign Currency Translation – The accounting records of the Fund are maintained in U.S. dollars. Foreign currency amounts are translated into U.S. dollars at the current rate of exchange each business day to determine the value of investments, and other assets and liabilities. Purchases and sales of foreign securities, and income and
18
TEAM Asset Strategy Fund
Notes to the Financial Statements - continued
April 30, 2013
(Unaudited)
NOTE 2. SIGNIFICANT ACCOUNTING POLICIES – continued
expenses, are translated at the prevailing rate of exchange on the respective date of these transactions. The Fund does not isolate that portion of the results of operations resulting from changes in foreign exchange rates on investments from fluctuation arising from changes in market prices of securities held. These fluctuations are included with the net realized and unrealized gain or loss from investments and foreign currency transactions.
Forward Currency Exchange Contracts – The Fund may engage in foreign currency exchange transactions. The value of the Fund’s portfolio securities that are invested in non-U.S. dollar denominated instruments as measured in U.S. dollars may be affected favorably or unfavorably by changes in foreign currency exchange rates, and the Fund may incur costs in connection with conversions between various currencies. The Fund will conduct its foreign currency exchange transactions either on a spot (i.e., cash) basis at the spot rate prevailing in the foreign currency exchange market, or through forward contracts to purchase or sell foreign currencies. A forward foreign currency exchange contract involves an obligation to purchase or sell a specific currency at a future date, which may be any fixed number of days from the date of the contract agreed upon by the parties, at a price set at the time of the contract. These contracts are traded directly between currency traders (usually large commercial banks) and their customers. The Fund will not, however, hold foreign currency except in connection with the purchase and sale of foreign portfolio securities. The Fund has engaged in foreign currency exchange transactions for the purpose of capitalizing on the movements of foreign currency value versus the U.S. dollar. See Note 4 for additional disclosures.
Purchasing Put Options – The Fund may purchase put options. As the holder of a put option, the Fund has the right to sell the underlying security at the exercise price at any time during the option period. The Fund may enter into closing sale transactions with respect to such options, exercise them or permit them to expire. The Fund may also purchase put options at a time when it does not own the underlying security. By purchasing put options on a security it does not own, the Fund seeks to benefit from a decline in the market price of the underlying security. If the put option is not sold when it has remaining value, and if the market price of the underlying security remains equal to or greater than the exercise price during the life of the put option, the Fund will lose its entire investment in the put option. In order for the purchase of a put option to be profitable, the market price of the underlying security must decline sufficiently below the exercise price to cover the premium and transaction costs, unless the put option is sold in a closing sale transaction. See Note 4 for additional disclosures.
19
TEAM Asset Strategy Fund
Notes to the Financial Statements - continued
April 30, 2013
(Unaudited)
NOTE 2. SIGNIFICANT ACCOUNTING POLICIES – continued
Purchasing Call Options – The Fund may purchase call options. As the holder of a call option, the Fund has the right to purchase the underlying security at the exercise price at any time during the option period. The Fund may enter into closing sale transactions with respect to such options, exercise them or permit them to expire. The Fund may also purchase call options on relevant stock indexes. Call options may also be purchased by the Fund for the purpose of acquiring the underlying securities for its portfolio. Utilized in this fashion, the purchase of call options enables the Fund to acquire the securities at the exercise price of the call option plus the premium paid. At times the net cost of acquiring securities in this manner may be less than the cost of acquiring the securities directly. This technique may also be useful to the Fund in purchasing a large block of securities that would be more difficult to acquire by direct market purchases. So long as it holds such a call option rather than the underlying security itself, the Fund is partially protected from any unexpected decline in the market price of the underlying security and in such event could allow the call option to expire, incurring a loss only to the extent of the premium paid for the option. See Note 4 for additional disclosures.
Writing Covered Call Options – The Fund may write covered call options on equity securities or futures contracts that the Fund is eligible to purchase to earn premium income, to assure a definite price for a security it has considered selling, or to close out options previously purchased. A call option gives the holder (buyer) the right to purchase a security or futures contract at a specified price (the exercise price) at any time until a certain date (the expiration date). A call option is “covered” if the Fund owns the underlying security subject to the call option at all times during the option period. When the Fund writes a covered call option, it maintains a segregated account with its custodian or as otherwise required by the rules of the exchange the underlying security, cash or liquid portfolio securities in an amount not less than the exercise price at all times while the option is outstanding. The writing of covered call options is considered to be a conservative investment technique. The Fund will receive a premium from writing a call option, which increases the Fund’s return in the event the option expires unexercised or is closed out at a profit. The amount of the premium will reflect, among other things, the relationship of the market price of the underlying security to the exercise price of the option and the remaining term of the option. However, there is no assurance that a closing transaction can be effected at a favorable price. During the option period, the covered call writer has, in return for the premium received, given up the opportunity for capital appreciation above the exercise price should the market price of the underlying security increase, but has retained the risk of loss should the price of the underlying security decline. See Note 4 for additional disclosures.
20
TEAM Asset Strategy Fund
Notes to the Financial Statements - continued
April 30, 2013
(Unaudited)
NOTE 2. SIGNIFICANT ACCOUNTING POLICIES – continued
Writing Covered Put Options – The Fund may write covered put options on equity securities and futures contracts that the Fund is eligible to purchase to earn premium income or to assure a definite price for a security if it is considering acquiring the security at a lower price than the current market price or to close out options previously purchased. A put option gives the holder of the option the right to sell, and the writer has the obligation to buy, the underlying security at the exercise price at any time during the option period. The operation of put options in other respects is substantially identical to that of call options. When the Fund writes a covered put option, it maintains in a segregated account with its custodian cash or liquid portfolio securities in an amount not less than the exercise price at all times while the put option is outstanding. The Fund will receive a premium from writing a put option, which increases the Fund’s return in the event the option expires unexercised or is closed out at a profit. The amount of the premium will reflect, among other things, the relationship of the market price of the underlying security to the exercise price of the option and the remaining term of the option. The risks involved in writing put options include the risk that a closing transaction cannot be effected at a favorable price and the possibility that the price of the underlying security may fall below the exercise price, in which case the Fund may be required to purchase the underlying security at a higher price than the market price of the security at the time the option is exercised, resulting in a potential capital loss unless the security subsequently appreciates in value. See Note 4 for additional disclosures.
The following is a summary of the Fund’s written option activity for the six-month period ended April 30, 2013:
| Number of Contracts | Premium | |||||||
Outstanding at 10/31/12 | - | $ | - | |||||
Options written | 7,030 | 1,173,054 | ||||||
Options expired | (1,000 | ) | (17,352 | ) | ||||
Options closed | (5,400 | ) | (966,102 | ) | ||||
|
|
|
| |||||
Outstanding at 4/30/13 | 630 | $ | 189,600 | |||||
|
|
|
| |||||
Short Sales – The Fund may make short sales as part of its overall portfolio management strategies or to offset a potential decline in value of a security. The Fund may engage in short sales with respect to various types of securities, including Common Stocks, Futures, and Exchange Traded Funds (ETFs). A short sale involves the sale of a security that is borrowed from a broker or other institution to complete the
21
TEAM Asset Strategy Fund
Notes to the Financial Statements - continued
April 30, 2013
(Unaudited)
NOTE 2. SIGNIFICANT ACCOUNTING POLICIES – continued
sale. The Fund may engage in short sales with respect to securities it owns, as well as securities that it does not own. Short sales expose the Fund to the risk that it will be required to acquire, convert or exchange securities to replace the borrowed securities (also known as “covering” the short position) at a time when the securities sold short have appreciated in value, thus resulting in a loss to the Fund. The Fund’s investment performance may also suffer if the Fund is required to close out a short position earlier than it had intended. The Fund must segregate assets determined to be liquid in accordance with procedures established by the Board of Trustees, or otherwise cover its position in a permissible manner. The Fund will be required to pledge its liquid assets to the broker in order to secure its performance on short sales. As a result, the assets pledged may not be available to meet the Fund’s needs for immediate cash or other liquidity. In addition, the Fund may be subject to expenses related to short sales that are not typically associated with investing in securities directly, such as costs of borrowing and margin account maintenance costs associated with the Fund’s open short positions. These types of short sales expenses are sometimes referred to as the “negative cost of carry,” and will tend to cause the Fund to lose money on a short sale even in instances where the price of the underlying security sold short does not change over the duration of the short sale. Dividend expenses on securities sold short and borrowing costs are not covered under the Adviser’s expense limitation agreement with the Fund and, therefore, these expenses will be borne by the shareholders of the Fund. The amount of restricted cash held at the broker as collateral for securities sold short was $5,477,337 as of April 30, 2013.
New Accounting Pronouncement – In December 2011, Financial Accounting Standards Board issued Accounting Standards Update (“ASU”) No. 2011-11, Balance Sheet (Topic 210): Disclosures about Offsetting Assets and Liabilities (“ASU 2011-11”). ASU 2011-11 relates to disclosures about offsetting assets and liabilities. In January 2013, the Financial Accounting Standards Board issued Accounting Standards Update No. 2013-01, Clarifying the Scope of Disclosures about Offsetting Assets and Liabilities (“ASU 2013-01”). This update gives additional clarifications to ASU 2011-11. The amendments in ASU 2013-01 require an entity to disclose information about offsetting and related arrangements to enable user of its financial statements to understand the effect of those arrangements on its financial position. ASU 2013-01 is effective for annual reporting periods beginning on or after January 1, 2013, and interim periods within those annual periods. At this time, management is evaluating the implications of ASU 2013-01 and its impact on the financial statements. However, management believes the adoption of these ASUs will not have a material impact on the financial statements.
22
TEAM Asset Strategy Fund
Notes to the Financial Statements - continued
April 30, 2013
(Unaudited)
NOTE 3. SECURITIES VALUATION AND FAIR VALUE MEASUREMENTS
Fair value is defined as the price that a Fund would receive upon selling an investment in a timely transaction to an independent buyer in the principal or most advantageous market of the investment. GAAP establishes a three-tier hierarchy to maximize the use of observable market data and minimize the use of unobservable inputs and to establish classification of fair value measurements for disclosure purposes.
Inputs refer broadly to the assumptions that market participants would use in pricing the asset or liability, including assumptions about risk (the risk inherent in a particular valuation technique used to measure fair value such as pricing model and/or the risk inherent in the inputs to the valuation technique). Inputs may be observable or unobservable. Observable inputs are inputs that reflect the assumptions market participants would use in pricing the asset or liability developed based on market data obtained from sources independent of the reporting entity. Unobservable inputs are inputs that reflect the reporting entity’s own assumptions about the assumptions market participants would use in pricing the asset or liability developed based on the best information available in the circumstances.
Various inputs are used in determining the value of the Fund’s investments. These inputs are summarized in the three broad levels listed below.
— Level 1 – quoted prices in active markets for identical securities
— Level 2 – other significant observable inputs (including, but not limited to, quoted prices for an identical security in an inactive market, quoted prices for similar securities, interest rates, prepayment speeds, credit risk, etc.)
— Level 3 – significant unobservable inputs (including the Fund’s own assumptions in determining fair value of investments based on the best information available)
The inputs used to measure fair value may fall into different levels of the fair value hierarchy. In such cases, for disclosure purposes, the level in the fair value hierarchy within which the fair value measurement falls in its entirety, is determined based on the lowest level input that is significant to the fair value measurement in its entirety.
Equity securities, including common stocks, exchange traded funds and exchange traded notes, are generally valued by using market quotations furnished by a pricing service. Securities that are traded on any stock exchange are generally valued at the last quoted sale price. Lacking a last sale price, an exchange traded security is generally valued at its last bid price. Securities traded in the NASDAQ over-the-counter market
23
TEAM Asset Strategy Fund
Notes to the Financial Statements - continued
April 30, 2013
(Unaudited)
NOTE 3. SECURITIES VALUATION AND FAIR VALUE MEASUREMENTS – continued
are generally valued at the NASDAQ Official Closing Price. When using the market quotations or close prices provided by the pricing service and when the market is considered active, the security is classified as a Level 1 security. Sometimes, an equity security owned by the Fund will be valued by the pricing service with factors other than market quotations or when the market is considered inactive. When this happens, the security is classified as a Level 2 security.
Investments in mutual funds, including money market mutual funds, are generally priced at the ending net asset value (NAV) provided by the service agent of the funds. These securities are categorized as Level 1 securities.
Fixed income securities that are valued using market quotations in an active market are categorized as Level 1 securities. However, they may be valued on the basis of prices furnished by a pricing service when the Fund believes such prices more accurately reflect the fair value of such securities. A pricing service utilizes electronic data processing techniques based on yield spreads relating to securities with similar characteristics to determine prices for normal institutional-size trading units of debt securities without regard to sale or bid prices. These securities are generally categorized as Level 2 securities.
Short-term investments in fixed income securities (those with maturities of less than 60 days when acquired, or which subsequently are within 60 days of maturity), are valued using the amortized cost method of valuation, which the Board has determined represents fair value. These securities will be classified as Level 2 securities.
If the Fund decides that a price provided by the pricing service does not accurately reflect the fair value of the securities, when prices are not readily available from a pricing service, or when restricted or illiquid securities are being valued, securities are valued at fair value as determined in good faith by the Fund, in conformity with guidelines adopted by and subject to review of the Board. These securities will be categorized as Level 3 securities.
Derivative instruments the Fund invests in, such as forward currency exchange contracts, are valued by a pricing service at the interpolated rates based on the prevailing banking rates and are generally categorized as Level 2 securities.
24
TEAM Asset Strategy Fund
Notes to the Financial Statements - continued
April 30, 2013
(Unaudited)
NOTE 3. SECURITIES VALUATION AND FAIR VALUE MEASUREMENTS – continued
Call and put options that the Fund invests in are generally traded on an exchange. The options in which the Funds invest are generally valued at the last trade price as provided by a pricing service. If the last sale price is not available, the options will be valued using the last bid price. The options will generally be categorized as Level 1 securities.
Futures contracts that the Funds invest in are valued at the settlement price established each day by the board of trade or exchange on which they are traded and when the market is considered active will generally be categorized as Level 1 securities.
In accordance with the Trust’s good faith pricing guidelines, the Fund is required to consider all appropriate factors relevant to the value of securities for which it has determined other pricing sources are not available or reliable as described above. No single standard exists for determining fair value, because fair value depends upon the circumstances of each individual case. As a general principle, the current fair value of an issue of securities being valued by the Fund would appear to be the amount which the owner might reasonably expect to receive for them upon their current sale. Methods which are in accordance with this principle may, for example, be based on (i) a multiple of earnings; (ii) a discount from market of a similar freely traded security (including a derivative security or a basket of securities traded on other markets, exchanges or among dealers); or (iii) yield to maturity with respect to debt issues, or a combination of these and other methods. Good faith pricing is permitted if, in the Fund’s opinion, the validity of market quotations appears to be questionable based on factors such as evidence of a thin market in the security based on a small number of quotations, a significant event occurs after the close of a market but before a Fund’s NAV calculation that may affect a security’s value, or the Fund is aware of any other data that calls into question there liability of market quotations. Good faith pricing may also be used in instances when the bonds the Fund invests in may default or otherwise cease to have market quotations readily available. Any fair value pricing done outside the Fund’s approved pricing methods must be approved by the Pricing Committee of the Board.
25
TEAM Asset Strategy Fund
Notes to the Financial Statements - continued
April 30, 2013
(Unaudited)
NOTE 3. SECURITIES VALUATION AND FAIR VALUE MEASUREMENTS – continued
The following is a summary of the inputs used to value the Fund’s investments as of April 30, 2013.
| Valuation Inputs | ||||||||||||||||
| Assets | Level 1 - Quoted Prices in Active Markets | Level 2 - Other Significant Observable Inputs | Level 3 - Significant Unobservable Inputs | Total | ||||||||||||
Common Stocks* | $ | 7,768,754 | $ | - | $ | - | $ | 7,768,754 | ||||||||
Exchange-Traded Funds | 1,849,870 | - | - | 1,849,870 | ||||||||||||
Money Market Securities | 5,357,484 | - | - | 5,357,484 | ||||||||||||
Call Options Purchased | 2,500 | - | - | 2,500 | ||||||||||||
Put Options Purchased | 553,000 | - | - | 553,000 | ||||||||||||
Total Investments | $ | 15,531,608 | $ | - | $ | - | $ | 15,531,608 | ||||||||
Long Forward Currency Exchange Contracts | - | 10,530 | - | 10,530 | ||||||||||||
Total | $ | 15,531,608 | $ | 10,530 | $ | - | $ | 15,542,138 | ||||||||
* Refer to the Schedule of Investments for industry classifications.
| Valuation Inputs | ||||||||||||||||
| Liabilities | Level 1 - Quoted Prices in Active Markets | Level 2 - Other Significant Observable Inputs | Level 3 - Significant Unobservable Inputs | Total | ||||||||||||
Short Common Stocks* | $ | (3,912,517 | ) | $ | - | $ | - | $ | (3,912,517 | ) | ||||||
Short Exchange-Traded Funds | (2,786,100 | ) | - | - | (2,786,100 | ) | ||||||||||
Written Covered Call Options | (258,500 | ) | - | - | (258,500 | ) | ||||||||||
Short Futures Contracts** | (564,528 | ) | - | - | (564,528 | ) | ||||||||||
Short Forward Currency Exchange Contracts | - | (155,480 | ) | - | (155,480 | ) | ||||||||||
Total | $ | (7,521,645 | ) | $ | (155,480 | ) | $ | - | $ | (7,677,125 | ) | |||||
* Refer to the Schedule of Securities Sold Short for industry classifications.
** Reflects net depreciation on short futures contracts.
26
TEAM Asset Strategy Fund
Notes to the Financial Statements - continued
April 30, 2013
(Unaudited)
NOTE 3. SECURITIES VALUATION AND FAIR VALUE MEASUREMENTS – continued
The Fund did not hold any assets at any time during the reporting period in which significant unobservable inputs were used in determining fair value; therefore, no reconciliation of Level 3 securities is included for this reporting period. During the six-month period ended April 30, 2013, the Fund had no transfers between Levels. The Trust recognizes transfers between fair value hierarchy levels at the end of the reporting period.
| NOTE 4. | DERIVATIVE TRANSACTIONS |
Call and put options purchased and written, futures contracts and long and short forward currency exchange contracts are represented on the Statement of Assets and Liabilities under investments in securities at value, cash held at broker and receivable for forward currency exchange contracts, respectively and on the Statement of Operations under net realized gain (loss) on investment securities and change in unrealized appreciation (depreciation) on options, forward currency transactions, and futures contracts, respectively.
Please see the chart below for information regarding call and put options purchased and long and short forward currency exchange contracts for the Fund.
At April 30, 2013:
| Derivatives | Location of Derivatives on Statement of Assets & Liabilities | |||||
Call Options Purchased | Investment in Securities, at fair value | $ | 2,500 | |||
Put Options Purchased | Investment in Securities, at fair value | 553,000 | ||||
Futures Contracts | Receivable for net variation margin on futures contracts | 16,480 | ||||
Futures Contracts | Payable for net variation margin on futures contracts | (38,500 | ) | |||
Written Covered Call Options | Options written, at fair value | (258,500 | ) | |||
Long Forward Currency Exchange Contracts | Receivable for forward currency exchange contracts | 10,529 | ||||
Long Forward Currency Exchange Contracts | Payable for forward currency exchange contracts | (155,479 | ) | |||
27
TEAM Asset Strategy Fund
Notes to the Financial Statements - continued
April 30, 2013
(Unaudited)
| NOTE 4. | DERIVATIVE TRANSACTIONS – continued |
For the six-month period ended April 30, 2013:
| Derivatives | Location of Gain (Loss) on Derivatives on Statement of Operations | Contracts Opened | Contracts Closed/ Expired | Realized Gain (Loss) on Derivatives | Change in Unrealized Appreciation (Depreciation) on Derivatives | |||||||||||||
Equity Risk: | ||||||||||||||||||
Call Options Purchased | Net realized and unrealized gain (loss) on options | 31,850 | 31,350 | $ | (698,901 | ) | $ | (17,893) | ||||||||||
Equity Risk. | ||||||||||||||||||
Put Options Purchased | Net realized and unrealized gain (loss) on options | 243,700 | 267,300 | (8,087,131 | ) | (1,601,513) | ||||||||||||
Equity Risk: | ||||||||||||||||||
Written Covered Call Options | Net realized and unrealized gain (loss) on options | 3,380 | 2,750 | (216,602 | ) | (68,900) | ||||||||||||
Equity Risk: | ||||||||||||||||||
Written Covered Put Options | Net realized and unrealized gain (loss) on options | 3,650 | 3,650 | 33,821 | - | |||||||||||||
Foreign Exchange Risk: | ||||||||||||||||||
Foreign Currency Call Options Purchased | Net realized and unrealized gain (loss) on options | 66,000,000 | * | 142,000,000 | * | (639,598 | ) | (81,354) | ||||||||||
Foreign Exchange Risk: | ||||||||||||||||||
Foreign Currency Put Options Purchased | Net realized and unrealized gain (loss) on options | 40,000,000 | * | 40,000,000 | * | (120,500 | ) | - | ||||||||||
Foreign Exchange Risk: | ||||||||||||||||||
Foreign Currency Call Options Written | Net realized and unrealized gain (loss) on options | 36,000,000 | * | 36,000,000 | * | 338,360 | - | |||||||||||
Foreign Exchange Risk: | ||||||||||||||||||
Foreign Currency Put Options Written | Net realized and unrealized gain (loss) on options | 15,000,000 | * | 15,000,000 | * | 94,940 | - | |||||||||||
Equity Risk: | ||||||||||||||||||
Long Futures Contracts | Net realized and unrealized gain (loss) on futures | 100 | 100 | (71,875 | ) | - | ||||||||||||
28
TEAM Asset Strategy Fund
Notes to the Financial Statements - continued
April 30, 2013
(Unaudited)
NOTE 4. DERIVATIVE TRANSACTIONS – continued
| Derivatives | Location of Gain (Loss) on Derivatives on Statement of Operations | Contracts Opened | Contracts Closed/ Expired | Realized Gain (Loss) on Derivatives | Change in Unrealized Appreciation (Depreciation) on Derivatives | |||||||||||||
Equity Risk: | ||||||||||||||||||
Short Futures Contracts | Net realized and unrealized gain (loss) on futures | 18,065 | 18,335 | $ | (5,780,903 | ) | $ | (497,532) | ||||||||||
Foreign Exchange Risk: | ||||||||||||||||||
Long Forward Currency Exchange Contracts | Net realized and unrealized gain (loss) on Foreign Currency Transactions | 186 | 193 | (5,780,243 | ) | (1,211,094) | ||||||||||||
Foreign Exchange Risk: | ||||||||||||||||||
Short Forward Currency Exchange Contracts | Net realized and unrealized gain (loss) on Foreign Currency Transactions | 203 | 204 | 3,217,178 | (223,031) | |||||||||||||
Foreign Exchange Risk: | ||||||||||||||||||
Long Spot Forward Currency Exchange Contracts | Net realized and unrealized gain (loss) on Foreign Currency Transactions | 3 | 3 | (45,643 | ) | - | ||||||||||||
Foreign Exchange Risk: | ||||||||||||||||||
Short Spot Forward Currency Exchange Contracts | Net realized and unrealized gain (loss) on Foreign Currency Transactions | 15 | 15 | 436,581 | - | |||||||||||||
* Represents $100,000 notional value per contract.
NOTE 5. FEES AND OTHER TRANSACTIONS WITH AFFILIATES
Under the terms of the management agreement (the “Agreement”), the Adviser manages the Fund’s investments subject to the approval of the Board. As compensation
29
TEAM Asset Strategy Fund
Notes to the Financial Statements - continued
April 30, 2013
(Unaudited)
NOTE 5. FEES AND OTHER TRANSACTIONS WITH AFFILIATES – continued
for its management services, the Fund is obligated to pay the Adviser a fee computed and accrued daily and paid monthly at an annual rate of 1.25% of the average daily net assets of the Fund. For the six-month period ended April 30, 2013, before the waivers disclosed below, the Adviser earned a fee of $188,673 from the Fund.
The Adviser has contractually agreed to waive or limit its fees and to assume other expenses of the Fund until February 28, 2014, so that total annual fund operating expenses do not exceed 1.95%. This agreement may not be terminated by the Adviser until after February 28, 2014. This operating expense limitation does not apply to (i) interest, (ii) taxes, (iii) brokerage commissions, (iv) other expenditures which are capitalized in accordance with generally accepted accounting principles, (v) other extraordinary expenses not incurred in the ordinary course of the Fund’s business, (vi) dividend expense on short sales, and (vii) expenses incurred under a plan of distribution adopted pursuant to Rule 12b-1 under the 1940 Act. For the six-month period ended April 30, 2013, the Adviser waived fees of $51,970. At April 30, 2013, the Fund was owed $26,329 by the Adviser.
The Adviser may be entitled to the reimbursement of any fees waived or expenses reimbursed pursuant to the agreement, provided overall expenses fall below the limitations set forth above. The Adviser may recoup the sum of all fees previously waived or expenses reimbursed during any of the previous three years, less any reimbursement previously paid, provided total expenses do not exceed the limitation set forth above. Fees waived during the six months ended April 30, 2013 totaling $51,970 may be subject to potential recoupment by the Adviser through October 31, 2016.
The Trust retains Huntington Asset Services, Inc. (“HASI”) to manage the Fund’s business affairs and provide the Fund with administrative services, including all regulatory reporting and necessary office equipment and personnel. For the six-month period ended April 30, 2013, HASI earned fees of $27,562 for administrative services provided to the Fund. At April 30, 2013, HASI was owed $6,069 from the Fund for administrative services. Certain officers of the Trust are members of management and/or employees of HASI. HASI operates as a wholly-owned subsidiary of Huntington Bancshares, Inc., the parent company of Unified Financial Securities, Inc. (the “Distributor”) and Huntington National Bank, the custodian of the Fund’s investments (the “Custodian”). For the six-month period ended April 30, 2013, the Custodian
30
TEAM Asset Strategy Fund
Notes to the Financial Statements - continued
April 30, 2013
(Unaudited)
NOTE 5. FEES AND OTHER TRANSACTIONS WITH AFFILIATES – continued
earned fees of $22,065 for custody services provided to the Fund. At April 30, 2013, the Custodian was owed $6,348 from the Fund for custody services.
The Trust also retains HASI to act as the Fund’s transfer agent and to provide fund accounting services. For the six-month period ended April 30, 2013, HASI earned fees of $24,389 for transfer agent services expenses incurred in providing transfer agent services to the Fund. At April 30, 2013, the Fund owed HASI $4,400 for transfer agent services. For the six-month period ended April 30, 2013, HASI earned fees of $23,154 from the Fund for fund accounting services. At April 30, 2013, HASI was owed $3,170 from the Fund for fund accounting services.
The Fund has adopted a Distribution Plan (the “Plan”) for its Investor Class shares pursuant to Rule 12b-1 under the 1940 Act. The Plan provides that the Fund will pay the Adviser and/or any registered securities dealer, financial institution or any other person (the “Recipient”) a shareholder servicing fee of up to 0.25% of the average daily net assets of the Investor Class shares in connection with the promotion and distribution of Investor Class shares or the provision of personal services to shareholders, including, but not necessarily limited to, advertising, compensation to underwriters, dealers and selling personnel, the printing and mailing of prospectuses to other than current shareholders of the Fund, the printing and mailing of sales literature and servicing shareholder accounts (“12b-1 Expenses”). The Fund or Adviser may pay all or a portion of these fees to any recipient who renders assistance in distributing or promoting the sale of Investor Class shares, or who provides certain shareholder services, pursuant to a written agreement. The Plan is a compensation plan, which means that compensation is provided regardless of 12b-1 Expenses actually incurred. It is anticipated that the Plan will benefit shareholders because an effective sales program typically is necessary in order for the Fund to reach and maintain a sufficient size to achieve efficiently its investment objectives and to realize economies of scale. For the six months ended April 30, 2013, the 12b-1 expense incurred by the Investor Class was $16,304. The Fund owed TEAM Financial Asset Management, LLC $1,026 for 12b-1 fees as of April 30, 2013.
31
TEAM Asset Strategy Fund
Notes to the Financial Statements
April 30, 2013
(Unaudited)
NOTE 6. PURCHASES AND SALES OF INVESTMENTS
For the six-month period ended April 30, 2013, purchases and sales of investment securities, other than short-term investments, securities sold short and short-term U.S. government obligations, were as follows:
Purchases | ||||
U.S. Government Obligations | $ | - | ||
Other | 40,858,398 | |||
Sales | ||||
U.S. Government Obligations | $ | - | ||
Other | 63,043,260 |
At April 30, 2013, the net unrealized appreciation (depreciation) of investments in securities, securities sold short and options for tax purposes, excluding forward currency exchange and futures contracts, was as follows:
Gross Appreciation | $ | 494,530 | ||
Gross (Depreciation) | (3,675,801 | ) | ||
|
| |||
Net Appreciation (Depreciation) on Investments | $ | (3,181,271 | ) | |
|
|
At April 30, 2013, the aggregate cost of securities and proceeds for securities sold short for federal income tax purposes was $16,909,962 and $6,436,475 respectively.
The difference between book basis and tax basis unrealized appreciation (depreciation) is attributable primarily to the mark to market on Passive Foreign Investment Companies.
NOTE 7. ESTIMATES
The preparation of financial statements in conformity with GAAP requires management to make estimates and assumptions that affect the reported amounts of assets and liabilities and disclosure of contingent assets and liabilities at the date of the financial statements and the reported amounts of increases and decreases in net assets from operations during the reporting period. Actual results could differ from those estimates.
32
TEAM Asset Strategy Fund
Notes to the Financial Statements - continued
April 30, 2013
(Unaudited)
NOTE 8. BENEFICIAL OWNERSHIP
The beneficial ownership, either directly or indirectly, of 25% or more of the voting securities of a fund creates a presumption of control of a fund, under Section 2(a)(9) of the Investment Company Act of 1940. At April 30, 2013, Charles Schwab & Co., owned as record shareholder, 36.48% of the outstanding shares the Investor Class and 99.62% of the outstanding shares of the Institutional Class. The Trust does not believe Charles Schwab & Co., or any of the underlying beneficial owners owned or controlled 25% or more of the voting securities of the Fund or any class thereof.
NOTE 9. DISTRIBUTIONS TO SHAREHOLDERS
On December 24, 2012, the Fund paid an income distribution of $0.5463 per share to Investor Class shareholders and $0.6013 per share to Institutional Class shareholders of record on December 21, 2012.
The tax characterization of distributions for the years ended October 31, 2012 and 2011 was as follows:
| 2012 | 2011 | |||||||||
Distributions paid from: | ||||||||||
Ordinary income* | $ | 9,436,408 | $ | - | ||||||
Long-term capital gains | 1,810,352 | - | ||||||||
|
|
|
| |||||||
Total distributions | $ | 11,246,760 | $ | - | ||||||
|
|
|
| |||||||
* Short-term capital gain distributions are treated as ordinary income for tax purposes.
NOTE 10. CAPITAL LOSS CARRYFORWARD
As of October 31, 2012, for federal income tax purposes, the Funds have capital loss carryforwards available to offset future capital gains, if any, in the following amounts:
| | Amount | Expiration | ||||||
Short Term Capital Gains | $ | 17,919,121 | N/A | |||||
Long Term Capital Gains | $ | 242,721 | N/A | |||||
33
TEAM Asset Strategy Fund
Notes to the Financial Statements - continued
April 30, 2013
(Unaudited)
NOTE 11. COMMITMENTS AND CONTINGENCIES
The Fund indemnifies its officers and trustees for certain liabilities that may arise from their performance of their duties to the Fund. Additionally, in the normal course of business, the Fund enters into contracts that contain a variety of representations and warranties which provide general indemnifications. The Fund’s maximum exposure under these arrangements is unknown, as this would involve future claims that may be made against the Fund that have not yet occurred.
NOTE 12. TAX COMPONENTS OF CAPITAL
At October 31, 2012, the components of distributable earnings (accumulated losses) on a tax basis were as follows:
Undistributed ordinary income | $ | 3,088,607 | ||
Capital loss carryforward | (18,161,842 | ) | ||
Unrealized appreciation (depreciation) | 1,968,122 | |||
Other temporary differences | 26,889 | |||
|
| |||
| $ | (13,078,224 | ) | ||
|
|
At October 31, 2012, the difference between book and tax basis unrealized appreciation (depreciation) is attributable to the tax treatment of passive foreign investment companies, futures, and foreign currency exchange contracts.
34
PROXY VOTING
A description of the policies and procedures that the Fund uses to determine how to vote proxies relating to portfolio securities is available without charge upon request by calling the Fund at (877) 832-6952 and from Fund documents filed with the Securities and Exchange Commission (“SEC”) on the SEC’s website at www.sec.gov.
TRUSTEES
R. Jeffrey Young, Chairman
Dr. Merwyn R. Vanderlind
Ira Cohen
OFFICERS
R. Jeffrey Young, Principal Executive Officer and President
John C. Swhear, Chief Compliance Officer, AML Officer and Vice-President
Carol J. Highsmith, Vice President
Matthew J. Miller, Vice President
Robert W. Silva, Principal Financial Officer and Treasurer
Heather A. Bonds, Secretary
INVESTMENT ADVISER
TEAM Financial Asset Management, LLC
800 Corporate Circle, Suite 106
Harrisburg, PA 17110
DISTRIBUTOR
Unified Financial Securities, Inc.
2960 North Meridian Street, Suite 300
Indianapolis, IN 46208
INDEPENDENT REGISTERED PUBLIC ACCOUNTING FIRM
Cohen Fund Audit Services, Ltd.
1350 Euclid Avenue, Suite 800
Cleveland, OH 44115
LEGAL COUNSEL
The Law Offices of John H. Lively & Associates, Inc.,
A member firm of The 1940 Act Law GroupTM
11300 Tomahawk Creek Parkway, Suite 310
Leawood, KS 66211
CUSTODIAN
Huntington National Bank
41 South High Street
Columbus, OH 43215
ADMINISTRATOR, TRANSFER AGENT AND FUND ACCOUNTANT
Huntington Asset Services, Inc.
2960 North Meridian Street, Suite 300
Indianapolis, IN 46208
This report is intended only for the information of shareholders or those who have received the Fund’s prospectus which contains information about the Fund’s management fee and expenses. Please read the prospectus carefully before investing.
Distributed by Unified Financial Securities, Inc.
Member FINRA/SIPC
Item 2. Code of Ethics. NOT APPLICABLE – disclosed with annual report
Item 3. Audit Committee Financial Expert. NOT APPLICABLE- disclosed with annual report
Item 4. Principal Accountant Fees and Services. NOT APPLICABLE – disclosed with annual report
Item 5. Audit Committee of Listed Companies. NOT APPLICABLE – applies to listed companies only
Item 6. Schedule of Investments. Schedule filed with Item 1
Item 7. Disclosure of Proxy Voting Policies and Procedures for Closed-End Management Investment Companies. NOT APPLICABLE – applies to closed-end funds only
Item 8. Portfolio Managers of Closed-End Investment Companies. NOT APPLICABLE – applies to closed-end funds only
Item 9. Purchases of Equity Securities by Closed-End Management Investment Company and Affiliated Purchasers. NOT APPLICABLE – applies to closed-end funds only
| Item 10. | Submission of Matters to a Vote of Security Holders. |
The guidelines applicable to shareholders desiring to submit recommendations for nominees to the Registrant’s board of trustees are contained in the statement of additional information of the Trust with respect to the Fund(s) for which this Form N-CSR is being filed.
| Item 11. | Controls and Procedures. |
(a) Based on their evaluation of the registrant’s disclosure controls and procedures (as defined in Rule 30a-3(c) under the Investment Company Act of 1940, as amended) as of a date within 90 days of the filing date of this report, the registrant’s principal executive officer and principal financial officer have concluded that such disclosure controls and procedures are reasonably designed and are operating effectively to ensure that material information relating to the registrant is made known to them by others within those entities and that the information required in filings on Form N-CSR is recorded, processed, summarized, and reported on a timely basis.
(b) There were no significant changes in the registrant’s internal control over financial reporting that occurred during the registrant’s second fiscal quarter of the period covered by this report that have materially affected, or are reasonably likely to materially affect, the registrant’s internal control over financial reporting.
| Item 12. | Exhibits. |
| (a)(1) | Not Applicable – filed with annual report | |
| (2) | Certifications by the registrant’s principal executive officer and principal financial officer, pursuant to Section 302 of the Sarbanes- Oxley Act of 2002 and required by Rule 30a-2under the | |
| Investment Company Act of 1940 are filed herewith. | ||
| (3) | Not Applicable – | |
| (b) | Certification pursuant to 18 U.S.C. Section 1350, as adopted pursuant to Section 906 of the Sarbanes-Oxley Act of 2002 is filed herewith | |
-2-
SIGNATURES
Pursuant to the requirements of the Securities Exchange Act of 1934 and the Investment Company Act of 1940, the registrant has duly caused this report to be signed on its behalf by the undersigned, thereunto duly authorized.
(Registrant) Valued Advisers Trust
| By* | /s/ R. Jeffrey Young | |
| R. Jeffrey Young, President and Principal Executive Officer | ||
| Date | 6/28/2013 | |
Pursuant to the requirements of the Securities Exchange Act of 1934 and the Investment Company Act of 1940, this report has been signed below by the following persons on behalf of the registrant and in the capacities and on the dates indicated.
| By* | /s/ R. Jeffrey Young | |
| R. Jeffrey Young, President and Principal Executive Officer | ||
| Date | 6/28/13 | |
| By* | /s/ Robert W. Silva | |
| Robert W. Silva, Treasurer and Principal Financial Officer | ||
| Date | 6/28/13 | |